JHVIT Quarterly Holdings 12.31.2021 - John Hancock - Life insurance
195
500 Index Trust Shares or Principal Amount Value COMMON STOCKS – 97.4% Communication services – 9.9% Diversified telecommunication services – 1.0% AT&T, Inc. 1,451,242 $ 35,700,553 Lumen Technologies, Inc. 181,806 2,281,665 Verizon Communications, Inc. 841,500 43,724,340 81,706,558 Entertainment – 1.6% Activision Blizzard, Inc. 158,073 10,516,597 Electronic Arts, Inc. 57,843 7,629,492 Live Nation Entertainment, Inc. (A) 26,780 3,205,298 Netflix, Inc. (A) 90,363 54,438,286 Take-Two Interactive Software, Inc. (A) 23,683 4,208,943 The Walt Disney Company (A) 370,961 57,458,149 137,456,765 Interactive media and services – 6.1% Alphabet, Inc., Class A (A) 61,280 177,530,611 Alphabet, Inc., Class C (A) 56,936 164,749,440 Match Group, Inc. (A) 58,231 7,701,050 Meta Platforms, Inc., Class A (A) 481,964 162,108,591 Twitter, Inc. (A) 162,191 7,009,895 519,099,587 Media – 1.0% Charter Communications, Inc., Class A (A) 25,173 16,412,041 Comcast Corp., Class A 930,968 46,855,619 Discovery, Inc., Series A (A)(B) 34,370 809,070 Discovery, Inc., Series C (A) 61,733 1,413,686 DISH Network Corp., Class A (A) 50,596 1,641,334 Fox Corp., Class A 65,733 2,425,548 Fox Corp., Class B 30,146 1,033,103 News Corp., Class A 79,517 1,774,024 News Corp., Class B 24,750 556,875 Omnicom Group, Inc. 43,579 3,193,033 The Interpublic Group of Companies, Inc. 80,005 2,996,187 ViacomCBS, Inc., Class B 123,135 3,716,214 82,826,734 Wireless telecommunication services – 0.2% T-Mobile US, Inc. (A) 119,218 13,826,904 834,916,548 Consumer discretionary – 12.2% Auto components – 0.1% Aptiv PLC (A) 54,982 9,069,281 BorgWarner, Inc. 48,739 2,196,667 11,265,948 Automobiles – 2.5% Ford Motor Company 797,556 16,565,238 General Motors Company (A) 295,071 17,300,013 Tesla, Inc. (A) 165,680 175,087,310 208,952,561 Distributors – 0.1% Genuine Parts Company 29,109 4,081,082 LKQ Corp. 54,953 3,298,829 Pool Corp. 8,151 4,613,466 11,993,377 Hotels, restaurants and leisure – 1.9% Booking Holdings, Inc. (A) 8,346 20,023,974 Caesars Entertainment, Inc. (A) 43,381 4,057,425 Carnival Corp. (A) 162,307 3,265,617 Chipotle Mexican Grill, Inc. (A) 5,710 9,982,508 Darden Restaurants, Inc. 26,488 3,990,152 Domino’s Pizza, Inc. 7,491 4,227,396 Expedia Group, Inc. (A) 29,532 5,337,023 Hilton Worldwide Holdings, Inc. (A) 56,644 8,835,898 500 Index Trust (continued) Shares or Principal Amount Value COMMON STOCKS (continued) Hotels, restaurants and leisure (continued) Las Vegas Sands Corp. (A) 69,878 $ 2,630,208 Marriott International, Inc., Class A (A) 55,601 9,187,509 McDonald’s Corp. 152,712 40,937,506 MGM Resorts International 81,294 3,648,475 Norwegian Cruise Line Holdings, Ltd. (A)(B) 75,206 1,559,772 Penn National Gaming, Inc. (A) 31,868 1,652,356 Royal Caribbean Cruises, Ltd. (A) 45,556 3,503,256 Starbucks Corp. 239,658 28,032,796 Wynn Resorts, Ltd. (A) 21,395 1,819,431 Yum! Brands, Inc. 60,092 8,344,375 161,035,677 Household durables – 0.4% D.R. Horton, Inc. 66,251 7,184,921 Garmin, Ltd. 30,881 4,205,066 Lennar Corp., A Shares 55,833 6,485,561 Mohawk Industries, Inc. (A) 11,365 2,070,476 Newell Brands, Inc. 76,953 1,680,654 NVR, Inc. (A) 643 3,799,403 PulteGroup, Inc. 52,750 3,015,190 Whirlpool Corp. 12,745 2,990,742 31,432,013 Internet and direct marketing retail – 3.7% Amazon.com, Inc. (A) 88,834 296,202,760 eBay, Inc. 127,529 8,480,679 Etsy, Inc. (A) 25,727 5,632,669 310,316,108 Leisure products – 0.0% Hasbro, Inc. 26,306 2,677,425 Multiline retail – 0.5% Dollar General Corp. 46,932 11,067,974 Dollar Tree, Inc. (A) 45,406 6,380,451 Target Corp. 99,309 22,984,075 40,432,500 Specialty retail – 2.3% Advance Auto Parts, Inc. 13,301 3,190,644 AutoZone, Inc. (A) 4,260 8,930,621 Bath & Body Works, Inc. 53,812 3,755,539 Best Buy Company, Inc. 45,819 4,655,210 CarMax, Inc. (A) 33,117 4,312,827 Lowe’s Companies, Inc. 140,974 36,438,960 O’Reilly Automotive, Inc. (A) 13,660 9,647,102 Ross Stores, Inc. 72,587 8,295,242 The Gap, Inc. 43,747 772,135 The Home Depot, Inc. 214,894 89,183,159 The TJX Companies, Inc. 245,225 18,617,482 Tractor Supply Company 23,240 5,545,064 Ulta Beauty, Inc. (A) 11,130 4,589,344 197,933,329 Textiles, apparel and luxury goods – 0.7% NIKE, Inc., Class B 259,778 43,297,199 PVH Corp. 14,504 1,546,852 Ralph Lauren Corp. 9,884 1,174,812 Tapestry, Inc. 56,679 2,301,167 Under Armour, Inc., Class A (A) 38,345 812,531 Under Armour, Inc., Class C (A) 42,357 764,120 VF Corp. 66,239 4,850,020 54,746,701 1,030,785,639 Consumer staples – 5.7% Beverages – 1.4% Brown-Forman Corp., Class B 37,138 2,705,875 John Hancock Variable Insurance Trust Portfolio of Investments — December 31, 2021 (showing percentage of total net assets) The accompanying notes are an integral part of the financial statements. 1
-
Upload
khangminh22 -
Category
Documents
-
view
0 -
download
0
Transcript of JHVIT Quarterly Holdings 12.31.2021 - John Hancock - Life insurance

500 Index TrustShares orPrincipalAmount Value
COMMON STOCKS – 97.4%Communication services – 9.9%Diversified telecommunication services – 1.0%AT&T, Inc. 1,451,242 $ 35,700,553Lumen Technologies, Inc. 181,806 2,281,665Verizon Communications, Inc. 841,500 43,724,340
81,706,558Entertainment – 1.6%Activision Blizzard, Inc. 158,073 10,516,597Electronic Arts, Inc. 57,843 7,629,492Live Nation Entertainment, Inc. (A) 26,780 3,205,298Netflix, Inc. (A) 90,363 54,438,286Take-Two Interactive Software, Inc. (A) 23,683 4,208,943The Walt Disney Company (A) 370,961 57,458,149
137,456,765Interactive media and services – 6.1%Alphabet, Inc., Class A (A) 61,280 177,530,611Alphabet, Inc., Class C (A) 56,936 164,749,440Match Group, Inc. (A) 58,231 7,701,050Meta Platforms, Inc., Class A (A) 481,964 162,108,591Twitter, Inc. (A) 162,191 7,009,895
519,099,587Media – 1.0%Charter Communications, Inc., Class A (A) 25,173 16,412,041Comcast Corp., Class A 930,968 46,855,619Discovery, Inc., Series A (A)(B) 34,370 809,070Discovery, Inc., Series C (A) 61,733 1,413,686DISH Network Corp., Class A (A) 50,596 1,641,334Fox Corp., Class A 65,733 2,425,548Fox Corp., Class B 30,146 1,033,103News Corp., Class A 79,517 1,774,024News Corp., Class B 24,750 556,875Omnicom Group, Inc. 43,579 3,193,033The Interpublic Group of Companies, Inc. 80,005 2,996,187ViacomCBS, Inc., Class B 123,135 3,716,214
82,826,734Wireless telecommunication services – 0.2%T-Mobile US, Inc. (A) 119,218 13,826,904
834,916,548Consumer discretionary – 12.2%Auto components – 0.1%Aptiv PLC (A) 54,982 9,069,281BorgWarner, Inc. 48,739 2,196,667
11,265,948Automobiles – 2.5%Ford Motor Company 797,556 16,565,238General Motors Company (A) 295,071 17,300,013Tesla, Inc. (A) 165,680 175,087,310
208,952,561Distributors – 0.1%Genuine Parts Company 29,109 4,081,082LKQ Corp. 54,953 3,298,829Pool Corp. 8,151 4,613,466
11,993,377Hotels, restaurants and leisure – 1.9%Booking Holdings, Inc. (A) 8,346 20,023,974Caesars Entertainment, Inc. (A) 43,381 4,057,425Carnival Corp. (A) 162,307 3,265,617Chipotle Mexican Grill, Inc. (A) 5,710 9,982,508Darden Restaurants, Inc. 26,488 3,990,152Domino’s Pizza, Inc. 7,491 4,227,396Expedia Group, Inc. (A) 29,532 5,337,023Hilton Worldwide Holdings, Inc. (A) 56,644 8,835,898
500 Index Trust (continued)Shares orPrincipalAmount Value
COMMON STOCKS (continued)Hotels, restaurants and leisure (continued)Las Vegas Sands Corp. (A) 69,878 $ 2,630,208Marriott International, Inc., Class A (A) 55,601 9,187,509McDonald’s Corp. 152,712 40,937,506MGM Resorts International 81,294 3,648,475Norwegian Cruise Line
Holdings, Ltd. (A)(B) 75,206 1,559,772Penn National Gaming, Inc. (A) 31,868 1,652,356Royal Caribbean Cruises, Ltd. (A) 45,556 3,503,256Starbucks Corp. 239,658 28,032,796Wynn Resorts, Ltd. (A) 21,395 1,819,431Yum! Brands, Inc. 60,092 8,344,375
161,035,677Household durables – 0.4%D.R. Horton, Inc. 66,251 7,184,921Garmin, Ltd. 30,881 4,205,066Lennar Corp., A Shares 55,833 6,485,561Mohawk Industries, Inc. (A) 11,365 2,070,476Newell Brands, Inc. 76,953 1,680,654NVR, Inc. (A) 643 3,799,403PulteGroup, Inc. 52,750 3,015,190Whirlpool Corp. 12,745 2,990,742
31,432,013Internet and direct marketing retail – 3.7%Amazon.com, Inc. (A) 88,834 296,202,760eBay, Inc. 127,529 8,480,679Etsy, Inc. (A) 25,727 5,632,669
310,316,108Leisure products – 0.0%Hasbro, Inc. 26,306 2,677,425Multiline retail – 0.5%Dollar General Corp. 46,932 11,067,974Dollar Tree, Inc. (A) 45,406 6,380,451Target Corp. 99,309 22,984,075
40,432,500Specialty retail – 2.3%Advance Auto Parts, Inc. 13,301 3,190,644AutoZone, Inc. (A) 4,260 8,930,621Bath & Body Works, Inc. 53,812 3,755,539Best Buy Company, Inc. 45,819 4,655,210CarMax, Inc. (A) 33,117 4,312,827Lowe’s Companies, Inc. 140,974 36,438,960O’Reilly Automotive, Inc. (A) 13,660 9,647,102Ross Stores, Inc. 72,587 8,295,242The Gap, Inc. 43,747 772,135The Home Depot, Inc. 214,894 89,183,159The TJX Companies, Inc. 245,225 18,617,482Tractor Supply Company 23,240 5,545,064Ulta Beauty, Inc. (A) 11,130 4,589,344
197,933,329Textiles, apparel and luxury goods – 0.7%NIKE, Inc., Class B 259,778 43,297,199PVH Corp. 14,504 1,546,852Ralph Lauren Corp. 9,884 1,174,812Tapestry, Inc. 56,679 2,301,167Under Armour, Inc., Class A (A) 38,345 812,531Under Armour, Inc., Class C (A) 42,357 764,120VF Corp. 66,239 4,850,020
54,746,7011,030,785,639
Consumer staples – 5.7%Beverages – 1.4%Brown-Forman Corp., Class B 37,138 2,705,875
John Hancock Variable Insurance TrustPortfolio of Investments — December 31, 2021 (showing percentage of total net assets)
The accompanying notes are an integral part of the financial statements. 1

500 Index Trust (continued)Shares orPrincipalAmount Value
COMMON STOCKS (continued)Beverages (continued)Constellation Brands, Inc., Class A 33,187 $ 8,328,941Molson Coors Beverage Company, Class B 38,292 1,774,834Monster Beverage Corp. (A) 76,324 7,330,157PepsiCo, Inc. 282,342 49,045,629The Coca-Cola Company 793,835 47,002,970
116,188,406Food and staples retailing – 1.4%Costco Wholesale Corp. 89,853 51,009,548Sysco Corp. 103,982 8,167,786The Kroger Company 138,211 6,255,430Walgreens Boots Alliance, Inc. 145,925 7,611,448Walmart, Inc. 290,471 42,028,249
115,072,461Food products – 0.8%Archer-Daniels-Midland Company 113,694 7,684,577Campbell Soup Company 41,270 1,793,594Conagra Brands, Inc. 97,630 3,334,065General Mills, Inc. 123,229 8,303,170Hormel Foods Corp. 57,293 2,796,471Kellogg Company 51,964 3,347,521Lamb Weston Holdings, Inc. 29,496 1,869,456McCormick & Company, Inc. 50,650 4,893,297Mondelez International, Inc., Class A 284,114 18,839,599The Hershey Company 29,559 5,718,780The J.M. Smucker Company 22,021 2,990,892The Kraft Heinz Company 144,293 5,180,119Tyson Foods, Inc., Class A 59,923 5,222,889
71,974,430Household products – 1.3%Church & Dwight Company, Inc. 49,908 5,115,570Colgate-Palmolive Company 171,449 14,631,458Kimberly-Clark Corp. 68,449 9,782,731The Clorox Company 24,962 4,352,374The Procter & Gamble Company 493,387 80,708,245
114,590,378Personal products – 0.2%The Estee Lauder Companies, Inc.,
Class A 47,134 17,449,007Tobacco – 0.6%Altria Group, Inc. 374,818 17,762,625Philip Morris International, Inc. 316,782 30,094,290
47,856,915483,131,597
Energy – 2.6%Energy equipment and services – 0.2%Baker Hughes Company 179,896 4,328,298Halliburton Company 180,998 4,139,424Schlumberger NV 284,239 8,512,958
16,980,680Oil, gas and consumable fuels – 2.4%APA Corp. 76,835 2,066,093Chevron Corp. 393,078 46,127,703ConocoPhillips 268,729 19,396,859Coterra Energy, Inc. 166,639 3,166,141Devon Energy Corp. 127,972 5,637,167Diamondback Energy, Inc. 34,592 3,730,747EOG Resources, Inc. 118,672 10,541,634Exxon Mobil Corp. 860,494 52,653,628Hess Corp. 56,019 4,147,087Kinder Morgan, Inc. 396,186 6,283,510Marathon Oil Corp. 160,247 2,631,256Marathon Petroleum Corp. 125,818 8,051,094
500 Index Trust (continued)Shares orPrincipalAmount Value
COMMON STOCKS (continued)Oil, gas and consumable fuels (continued)Occidental Petroleum Corp. 180,297 $ 5,226,810ONEOK, Inc. 90,583 5,322,657Phillips 66 89,024 6,450,679Pioneer Natural Resources Company 46,115 8,387,396The Williams Companies, Inc. 246,946 6,430,474Valero Energy Corp. 83,095 6,241,265
202,492,200219,472,880
Financials – 10.4%Banks – 3.9%Bank of America Corp. 1,466,663 65,251,837Citigroup, Inc. 403,692 24,378,960Citizens Financial Group, Inc. 86,604 4,092,039Comerica, Inc. 27,221 2,368,227Fifth Third Bancorp 140,392 6,114,072First Republic Bank 37,019 7,644,794Huntington Bancshares, Inc. 300,118 4,627,820JPMorgan Chase & Co. 601,678 95,275,711KeyCorp 183,844 4,252,312M&T Bank Corp. 26,154 4,016,731People’s United Financial, Inc. 86,983 1,550,037Regions Financial Corp. 194,015 4,229,527Signature Bank 12,323 3,986,121SVB Financial Group (A) 11,924 8,087,334The PNC Financial Services Group, Inc. 86,382 17,321,319Truist Financial Corp. 271,312 15,885,318U.S. Bancorp 274,229 15,403,443Wells Fargo & Company 811,687 38,944,742Zions Bancorp NA 32,941 2,080,554
325,510,898Capital markets – 2.9%Ameriprise Financial, Inc. 23,119 6,974,078BlackRock, Inc. 29,079 26,623,569Cboe Global Markets, Inc. 21,672 2,826,029CME Group, Inc. 72,996 16,676,666FactSet Research Systems, Inc. 7,673 3,729,155Franklin Resources, Inc. 57,236 1,916,834Intercontinental Exchange, Inc. 114,464 15,655,241Invesco, Ltd. 69,397 1,597,519MarketAxess Holdings, Inc. 7,724 3,176,649Moody’s Corp. 32,926 12,860,237Morgan Stanley 292,315 28,693,640MSCI, Inc. 16,757 10,266,846Nasdaq, Inc. 23,790 4,996,138Northern Trust Corp. 42,357 5,066,321Raymond James Financial, Inc. 37,644 3,779,458S&P Global, Inc. 48,985 23,117,491State Street Corp. 74,316 6,911,388T. Rowe Price Group, Inc. 46,126 9,070,217The Bank of New York Mellon Corp. 154,502 8,973,476The Charles Schwab Corp. 305,132 25,661,601The Goldman Sachs Group, Inc. 69,142 26,450,272
245,022,825Consumer finance – 0.5%American Express Company 127,815 20,910,534Capital One Financial Corp. 86,565 12,559,716Discover Financial Services 58,749 6,789,034Synchrony Financial 110,579 5,129,760
45,389,044Diversified financial services – 1.3%Berkshire Hathaway, Inc., Class B (A) 372,849 111,481,851Insurance – 1.8%Aflac, Inc. 125,425 7,323,566
John Hancock Variable Insurance TrustPortfolio of Investments — December 31, 2021 (showing percentage of total net assets)
The accompanying notes are an integral part of the financial statements. 2

500 Index Trust (continued)Shares orPrincipalAmount Value
COMMON STOCKS (continued)Insurance (continued)American International Group, Inc. 169,174 $ 9,619,234Aon PLC, Class A 44,886 13,490,936Arthur J. Gallagher & Company 42,023 7,130,042Assurant, Inc. 11,954 1,863,150Brown & Brown, Inc. 47,508 3,338,862Chubb, Ltd. 87,619 16,937,629Cincinnati Financial Corp. 30,468 3,471,219Everest Re Group, Ltd. 8,104 2,219,848Globe Life, Inc. 19,021 1,782,648Lincoln National Corp. 35,905 2,450,875Loews Corp. 41,311 2,386,123Marsh & McLennan Companies, Inc. 102,974 17,898,941MetLife, Inc. 144,037 9,000,872Principal Financial Group, Inc. 50,733 3,669,518Prudential Financial, Inc. 76,340 8,263,042The Allstate Corp. 57,953 6,818,170The Hartford Financial Services
Group, Inc. 70,567 4,871,946The Progressive Corp. 118,938 12,208,986The Travelers Companies, Inc. 49,172 7,691,976W.R. Berkley Corp. 28,506 2,348,609Willis Towers Watson PLC 25,190 5,982,373
150,768,565878,173,183
Health care – 13.0%Biotechnology – 1.7%AbbVie, Inc. 361,059 48,887,389Amgen, Inc. 114,308 25,715,871Biogen, Inc. (A) 30,292 7,267,657Gilead Sciences, Inc. 254,843 18,504,150Incyte Corp. (A) 38,153 2,800,430Moderna, Inc. (A) 72,238 18,347,007Regeneron Pharmaceuticals, Inc. (A) 21,363 13,491,162Vertex Pharmaceuticals, Inc. (A) 51,576 11,326,090
146,339,756Health care equipment and supplies – 2.9%Abbott Laboratories 360,334 50,713,407ABIOMED, Inc. (A) 9,224 3,312,984Align Technology, Inc. (A) 14,935 9,814,983Baxter International, Inc. 101,609 8,722,117Becton, Dickinson and Company 58,373 14,679,642Boston Scientific Corp. (A) 289,406 12,293,967Dentsply Sirona, Inc. 44,422 2,478,303DexCom, Inc. (A) 19,665 10,559,122Edwards Lifesciences Corp. (A) 126,695 16,413,337Hologic, Inc. (A) 51,523 3,944,601IDEXX Laboratories, Inc. (A) 17,292 11,386,090Intuitive Surgical, Inc. (A) 72,501 26,049,609Medtronic PLC 275,477 28,498,096ResMed, Inc. 29,577 7,704,217STERIS PLC 20,277 4,935,625Stryker Corp. 68,216 18,242,323Teleflex, Inc. 9,513 3,124,830The Cooper Companies, Inc. 10,010 4,193,589Zimmer Biomet Holdings, Inc. 42,448 5,392,594
242,459,436Health care providers and services – 2.7%AmerisourceBergen Corp. 30,408 4,040,919Anthem, Inc. 49,557 22,971,652Cardinal Health, Inc. 58,974 3,036,571Centene Corp. (A) 118,507 9,764,977Cigna Corp. 67,512 15,502,781CVS Health Corp. 268,211 27,668,647DaVita, Inc. (A) 13,633 1,550,890
500 Index Trust (continued)Shares orPrincipalAmount Value
COMMON STOCKS (continued)Health care providers and services (continued)HCA Healthcare, Inc. 48,803 $ 12,538,467Henry Schein, Inc. (A) 28,393 2,201,309Humana, Inc. 26,119 12,115,559Laboratory Corp. of America Holdings (A) 19,655 6,175,798McKesson Corp. 31,438 7,814,544Quest Diagnostics, Inc. 24,834 4,296,530UnitedHealth Group, Inc. 191,653 96,236,637Universal Health Services, Inc., Class B 15,422 1,999,617
227,914,898Health care technology – 0.1%Cerner Corp. 60,079 5,579,537Life sciences tools and services – 2.0%Agilent Technologies, Inc. 61,676 9,846,573Bio-Rad Laboratories, Inc., Class A (A) 4,368 3,300,330Bio-Techne Corp. 7,905 4,089,573Charles River Laboratories
International, Inc. (A) 10,243 3,859,358Danaher Corp. 129,916 42,743,663Illumina, Inc. (A) 31,856 12,119,297IQVIA Holdings, Inc. (A) 38,946 10,988,224Mettler-Toledo International, Inc. (A) 4,699 7,975,190PerkinElmer, Inc. 25,714 5,170,057Thermo Fisher Scientific, Inc. 80,336 53,603,393Waters Corp. (A) 12,472 4,647,067West Pharmaceutical Services, Inc. 15,037 7,052,503
165,395,228Pharmaceuticals – 3.6%Bristol-Myers Squibb Company 451,656 28,160,752Catalent, Inc. (A) 34,623 4,432,783Eli Lilly & Company 161,377 44,575,555Johnson & Johnson 536,490 91,777,344Merck & Company, Inc. 514,515 39,432,430Organon & Company 51,529 1,569,058Pfizer, Inc. 1,143,733 67,537,434Viatris, Inc. 245,795 3,325,606Zoetis, Inc. 96,332 23,507,898
304,318,8601,092,007,715
Industrials – 7.6%Aerospace and defense – 1.3%General Dynamics Corp. 47,159 9,831,237Howmet Aerospace, Inc. 78,461 2,497,414Huntington Ingalls Industries, Inc. 8,159 1,523,612L3Harris Technologies, Inc. 39,699 8,465,415Lockheed Martin Corp. 50,094 17,803,909Northrop Grumman Corp. 30,590 11,840,471Raytheon Technologies Corp. 306,484 26,376,013Textron, Inc. 45,557 3,517,000The Boeing Company (A) 111,990 22,545,827TransDigm Group, Inc. (A) 10,642 6,771,292
111,172,190Air freight and logistics – 0.6%CH Robinson Worldwide, Inc. 26,771 2,881,363Expeditors International of
Washington, Inc. 34,531 4,637,168FedEx Corp. 49,993 12,930,190United Parcel Service, Inc., Class B 148,029 31,728,536
52,177,257Airlines – 0.2%Alaska Air Group, Inc. (A) 25,454 1,326,153American Airlines Group, Inc. (A) 131,599 2,363,518Delta Air Lines, Inc. (A) 130,066 5,082,979Southwest Airlines Company (A) 120,255 5,151,724
John Hancock Variable Insurance TrustPortfolio of Investments — December 31, 2021 (showing percentage of total net assets)
The accompanying notes are an integral part of the financial statements. 3

500 Index Trust (continued)Shares orPrincipalAmount Value
COMMON STOCKS (continued)Airlines (continued)United Airlines Holdings, Inc. (A) 65,776 $ 2,879,673
16,804,047Building products – 0.5%A.O. Smith Corp. 27,073 2,324,217Allegion PLC 18,231 2,414,514Carrier Global Corp. 176,365 9,566,038Fortune Brands Home & Security, Inc. 28,025 2,995,873Johnson Controls International PLC 144,763 11,770,680Masco Corp. 50,237 3,527,642Trane Technologies PLC 48,295 9,757,039
42,356,003Commercial services and supplies – 0.4%Cintas Corp. 17,789 7,883,551Copart, Inc. (A) 43,277 6,561,659Republic Services, Inc. 42,708 5,955,631Rollins, Inc. 46,008 1,573,934Waste Management, Inc. 78,743 13,142,207
35,116,982Construction and engineering – 0.1%Quanta Services, Inc. 28,283 3,242,929Electrical equipment – 0.5%AMETEK, Inc. 46,994 6,909,998Eaton Corp. PLC 81,018 14,001,531Emerson Electric Company 121,506 11,296,413Generac Holdings, Inc. (A) 12,830 4,515,134Rockwell Automation, Inc. 23,583 8,226,930
44,950,006Industrial conglomerates – 1.0%3M Company 117,611 20,891,242General Electric Company 223,106 21,076,824Honeywell International, Inc. 140,327 29,259,583Roper Technologies, Inc. 21,428 10,539,576
81,767,225Machinery – 1.5%Caterpillar, Inc. 110,069 22,755,665Cummins, Inc. 29,189 6,367,288Deere & Company 57,698 19,784,067Dover Corp. 29,261 5,313,798Fortive Corp. 72,845 5,557,345IDEX Corp. 15,447 3,650,435Illinois Tool Works, Inc. 58,257 14,377,828Ingersoll Rand, Inc. 82,354 5,095,242Otis Worldwide Corp. 86,745 7,552,887PACCAR, Inc. 70,565 6,228,067Parker-Hannifin Corp. 26,231 8,344,606Pentair PLC 33,712 2,461,987Snap-on, Inc. 10,970 2,362,719Stanley Black & Decker, Inc. 33,123 6,247,660Wabtec Corp. 38,422 3,539,050Xylem, Inc. 36,619 4,391,350
124,029,994Professional services – 0.4%Equifax, Inc. 24,764 7,250,652IHS Markit, Ltd. 81,020 10,769,178Jacobs Engineering Group, Inc. 26,487 3,687,785Leidos Holdings, Inc. 28,774 2,558,009Nielsen Holdings PLC 72,928 1,495,753Robert Half International, Inc. 22,758 2,537,972Verisk Analytics, Inc. 32,795 7,501,200
35,800,549Road and rail – 0.9%CSX Corp. 451,557 16,978,543
500 Index Trust (continued)Shares orPrincipalAmount Value
COMMON STOCKS (continued)Road and rail (continued)JB Hunt Transport Services, Inc. 17,105 $ 3,496,262Norfolk Southern Corp. 49,351 14,692,286Old Dominion Freight Line, Inc. 19,067 6,833,231Union Pacific Corp. 130,873 32,970,835
74,971,157Trading companies and distributors – 0.2%Fastenal Company 116,818 7,483,361United Rentals, Inc. (A) 14,714 4,889,315W.W. Grainger, Inc. 8,891 4,607,672
16,980,348639,368,687
Information technology – 28.4%Communications equipment – 0.9%Arista Networks, Inc. (A) 45,532 6,545,225Cisco Systems, Inc. 860,625 54,537,806F5, Inc. (A) 12,259 2,999,900Juniper Networks, Inc. 66,088 2,360,002Motorola Solutions, Inc. 34,416 9,350,827
75,793,760Electronic equipment, instruments and components – 0.7%Amphenol Corp., Class A 121,584 10,633,737CDW Corp. 27,947 5,722,987Corning, Inc. 156,228 5,816,368IPG Photonics Corp. (A) 7,285 1,254,040Keysight Technologies, Inc. (A) 37,445 7,732,767TE Connectivity, Ltd. 66,667 10,756,054Teledyne Technologies, Inc. (A) 9,473 4,138,659Trimble, Inc. (A) 51,143 4,459,158Zebra Technologies Corp., Class A (A) 10,854 6,460,301
56,974,071IT services – 4.3%Accenture PLC, Class A 128,892 53,432,179Akamai Technologies, Inc. (A) 33,096 3,873,556Automatic Data Processing, Inc. 85,993 21,204,154Broadridge Financial Solutions, Inc. 23,612 4,316,746Cognizant Technology Solutions Corp.,
Class A 106,830 9,477,958DXC Technology Company (A) 51,201 1,648,160EPAM Systems, Inc. (A) 11,569 7,733,298Fidelity National Information Services, Inc. 123,268 13,454,702Fiserv, Inc. (A) 121,137 12,572,809FleetCor Technologies, Inc. (A) 16,790 3,758,274Gartner, Inc. (A) 17,002 5,684,109Global Payments, Inc. 59,706 8,071,057IBM Corp. 182,182 24,350,446Jack Henry & Associates, Inc. 15,098 2,521,215Mastercard, Inc., Class A 177,067 63,623,714Paychex, Inc. 65,092 8,885,058PayPal Holdings, Inc. (A) 238,831 45,038,750VeriSign, Inc. (A) 19,783 5,021,321Visa, Inc., Class A 341,602 74,028,569
368,696,075Semiconductors and semiconductor equipment – 6.2%Advanced Micro Devices, Inc. (A) 246,542 35,477,394Analog Devices, Inc. 109,330 19,216,934Applied Materials, Inc. 183,795 28,921,981Broadcom, Inc. 83,777 55,746,054Enphase Energy, Inc. (A) 27,362 5,005,604Intel Corp. 829,415 42,714,873KLA Corp. 31,045 13,352,765Lam Research Corp. 28,615 20,578,477Microchip Technology, Inc. 114,171 9,939,727Micron Technology, Inc. 228,815 21,314,117
John Hancock Variable Insurance TrustPortfolio of Investments — December 31, 2021 (showing percentage of total net assets)
The accompanying notes are an integral part of the financial statements. 4

500 Index Trust (continued)Shares orPrincipalAmount Value
COMMON STOCKS (continued)Semiconductors and semiconductor equipment (continued)Monolithic Power Systems, Inc. 8,773 $ 4,327,984NVIDIA Corp. 509,181 149,755,224NXP Semiconductors NV 53,890 12,275,064Qorvo, Inc. (A) 22,590 3,532,850QUALCOMM, Inc. 227,985 41,691,617Skyworks Solutions, Inc. 33,567 5,207,584SolarEdge Technologies, Inc. (A) 10,695 3,000,696Teradyne, Inc. 33,532 5,483,488Texas Instruments, Inc. 187,647 35,365,830Xilinx, Inc. 50,299 10,664,897
523,573,160Software – 9.3%Adobe, Inc. (A) 96,831 54,908,987ANSYS, Inc. (A) 17,735 7,113,863Autodesk, Inc. (A) 44,719 12,574,536Cadence Design Systems, Inc. (A) 56,257 10,483,492Ceridian HCM Holding, Inc. (A) 27,414 2,863,666Citrix Systems, Inc. 25,251 2,388,492Fortinet, Inc. (A) 27,552 9,902,189Intuit, Inc. 57,699 37,113,151Microsoft Corp. 1,529,179 514,293,481NortonLifeLock, Inc. 118,147 3,069,459Oracle Corp. 328,556 28,653,369Paycom Software, Inc. (A) 9,771 4,056,821PTC, Inc. (A) 21,473 2,601,454salesforce.com, Inc. (A) 199,452 50,686,737ServiceNow, Inc. (A) 40,642 26,381,129Synopsys, Inc. (A) 31,012 11,427,922Tyler Technologies, Inc. (A) 8,302 4,466,061
782,984,809Technology hardware, storage and peripherals – 7.0%Apple, Inc. 3,174,353 563,669,851Hewlett Packard Enterprise Company 265,437 4,185,941HP, Inc. 234,477 8,832,749NetApp, Inc. 45,532 4,188,489Seagate Technology Holdings PLC 42,561 4,808,542Western Digital Corp. (A) 62,288 4,061,800
589,747,3722,397,769,247
Materials – 2.5%Chemicals – 1.7%Air Products & Chemicals, Inc. 44,994 13,689,874Albemarle Corp. 23,771 5,556,947Celanese Corp. 22,585 3,795,635CF Industries Holdings, Inc. 43,720 3,094,502Corteva, Inc. 149,227 7,055,453Dow, Inc. 151,582 8,597,731DuPont de Nemours, Inc. 106,314 8,588,045Eastman Chemical Company 27,599 3,336,995Ecolab, Inc. 50,589 11,867,674FMC Corp. 26,159 2,874,613International Flavors & Fragrances, Inc. 52,304 7,879,598Linde PLC 104,240 36,111,863LyondellBasell Industries NV, Class A 53,714 4,954,042PPG Industries, Inc. 48,244 8,319,195The Mosaic Company 76,965 3,023,955The Sherwin-Williams Company 49,236 17,338,950
146,085,072Construction materials – 0.1%Martin Marietta Materials, Inc. 12,678 5,584,913
500 Index Trust (continued)Shares orPrincipalAmount Value
COMMON STOCKS (continued)Construction materials (continued)Vulcan Materials Company 26,967 $ 5,597,810
11,182,723Containers and packaging – 0.3%Amcor PLC 313,377 3,763,658Avery Dennison Corp. 16,846 3,648,338Ball Corp. 66,385 6,390,884International Paper Company 79,439 3,732,044Packaging Corp. of America 19,308 2,628,784Sealed Air Corp. 30,466 2,055,541Westrock Company 54,270 2,407,417
24,626,666Metals and mining – 0.4%Freeport-McMoRan, Inc. 298,392 12,451,898Newmont Corp. 162,427 10,073,723Nucor Corp. 57,443 6,557,118
29,082,739210,977,200
Real estate – 2.7%Equity real estate investment trusts – 2.6%Alexandria Real Estate Equities, Inc. 29,297 6,532,059American Tower Corp. 92,510 27,059,175AvalonBay Communities, Inc. 28,378 7,167,999Boston Properties, Inc. 28,885 3,326,974Crown Castle International Corp. 87,846 18,336,974Digital Realty Trust, Inc. 57,439 10,159,236Duke Realty Corp. 76,900 5,047,716Equinix, Inc. 18,540 15,681,874Equity Residential 69,260 6,268,030Essex Property Trust, Inc. 13,219 4,656,128Extra Space Storage, Inc. 27,197 6,166,376Federal Realty Investment Trust 14,226 1,939,288Healthpeak Properties, Inc. 109,548 3,953,587Host Hotels & Resorts, Inc. (A) 145,119 2,523,619Iron Mountain, Inc. 58,834 3,078,783Kimco Realty Corp. 124,700 3,073,855Mid-America Apartment Communities, Inc. 23,582 5,410,654Prologis, Inc. 150,257 25,297,269Public Storage 30,986 11,606,116Realty Income Corp. 115,405 8,261,844Regency Centers Corp. 31,075 2,341,501SBA Communications Corp. 22,267 8,662,308Simon Property Group, Inc. 66,792 10,671,358UDR, Inc. 60,802 3,647,512Ventas, Inc. 79,976 4,088,373Vornado Realty Trust 32,316 1,352,748Welltower, Inc. 88,867 7,622,123Weyerhaeuser Company 152,398 6,275,750
220,209,229Real estate management and development – 0.1%CBRE Group, Inc., Class A (A) 68,240 7,404,722
227,613,951Utilities – 2.4%Electric utilities – 1.6%Alliant Energy Corp. 50,866 3,126,733American Electric Power Company, Inc. 104,472 9,294,874Duke Energy Corp. 156,372 16,403,423Edison International 77,177 5,267,330Entergy Corp. 40,845 4,601,189Evergy, Inc. 46,606 3,197,638Eversource Energy 69,847 6,354,680Exelon Corp. 198,750 11,479,800FirstEnergy Corp. 110,610 4,600,270NextEra Energy, Inc. 401,387 37,473,490
John Hancock Variable Insurance TrustPortfolio of Investments — December 31, 2021 (showing percentage of total net assets)
The accompanying notes are an integral part of the financial statements. 5

500 Index Trust (continued)Shares orPrincipalAmount Value
COMMON STOCKS (continued)Electric utilities (continued)NRG Energy, Inc. 49,752 $ 2,143,316Pinnacle West Capital Corp. 22,924 1,618,205PPL Corp. 156,426 4,702,166The Southern Company 215,212 14,759,239Xcel Energy, Inc. 109,440 7,409,088
132,431,441Gas utilities – 0.0%Atmos Energy Corp. 26,584 2,785,206Independent power and renewable electricity producers –0.0%The AES Corp. 135,441 3,291,216Multi-utilities – 0.7%Ameren Corp. 52,266 4,652,197CenterPoint Energy, Inc. 129,183 3,605,498CMS Energy Corp. 58,874 3,829,754Consolidated Edison, Inc. 71,827 6,128,280Dominion Energy, Inc. 164,329 12,909,686DTE Energy Company 39,381 4,707,605NiSource, Inc. 79,760 2,202,174Public Service Enterprise Group, Inc. 102,761 6,857,242Sempra Energy 64,905 8,585,633WEC Energy Group, Inc. 64,114 6,223,546
59,701,615Water utilities – 0.1%American Water Works Company, Inc. 36,890 6,967,045
205,176,523TOTAL COMMON STOCKS (Cost $2,827,877,112) $ 8,219,393,170
SHORT-TERM INVESTMENTS – 2.8%U.S. Government – 0.1%U.S. Treasury Bill
0.010%, 02/22/2022 * $ 8,000,000 7,999,8060.045%, 02/17/2022 * 2,000,000 1,999,925
9,999,731
500 Index Trust (continued)Shares orPrincipalAmount Value
SHORT-TERM INVESTMENTS (continued)U.S. Government Agency – 2.6%Federal Home Loan Bank Discount Note
0.030%, 02/02/2022 * $ 65,000,000 $ 64,998,9170.030%, 03/01/2022 * 27,000,000 26,997,8630.035%, 01/12/2022 * 10,000,000 9,999,9750.045%, 02/16/2022 * 75,000,000 74,998,167
Tennessee Valley Authority Discount Note0.030%, 01/05/2022 * 35,150,000 35,149,9800.031%, 01/12/2022 * 8,000,000 7,999,980
220,144,882Short-term funds – 0.0%John Hancock Collateral Trust,
0.1697% (C)(D) 243,230 2,433,032Repurchase agreement – 0.1%Repurchase Agreement with State Street
Corp. dated 12-31-21 at 0.000% to berepurchased at $9,180,000 on 1-3-22,collateralized by $9,459,000U.S. Treasury Notes, 1.250% due6-30-28 (valued at $9,363,672) $ 9,180,000 9,180,000
TOTAL SHORT-TERM INVESTMENTS (Cost $241,755,534) $ 241,757,645Total Investments (500 Index Trust)
(Cost $3,069,632,646) – 100.2% $ 8,461,150,815Other assets and liabilities, net – (0.2%) (20,338,627)TOTAL NET ASSETS – 100.0% $ 8,440,812,188
Security Abbreviations and Legend(A) Non-income producing security.(B) All or a portion of this security is on loan as of 12-31-21.(C) The rate shown is the annualized seven-day yield as of 12-31-21.(D) Investment is an affiliate of the fund, the advisor and/or subadvisor.
This security represents the investment of cash collateral received forsecurities lending.
* Yield represents either the annualized yield at the date of purchase,the stated coupon rate or, for floating rate securities, the rate atperiod end.
DERIVATIVES
FUTURES
Open contractsNumber of
contracts PositionExpiration
dateNotional
basis^Notional
value^
Unrealizedappreciation
(depreciation)S&P 500 Index E-Mini Futures 935 Long Mar 2022 $217,971,239 $222,459,875 $4,488,636
$4,488,636
^ Notional basis refers to the contractual amount agreed upon at inception of open contracts; notional value represents the current value of the open contract.
See Notes to financial statements regarding investment transactions and other derivatives information.
American Asset Allocation TrustShares orPrincipalAmount Value
INVESTMENT COMPANIES - 100.0%American Funds Insurance Series - 100.0%American Asset Allocation Fund - Class 1 48,939,797 $ 1,423,169,307TOTAL INVESTMENT COMPANIES (Cost $995,830,895) $ 1,423,169,307Total Investments (American Asset Allocation
Trust) (Cost $995,830,895) - 100.0% $ 1,423,169,307Other assets and liabilities, net - (0.0%) (23,206)TOTAL NET ASSETS - 100.0% $ 1,423,146,101
American Global Growth TrustShares orPrincipalAmount Value
INVESTMENT COMPANIES - 100.0%American Funds Insurance Series - 100.0%American Global Growth Fund - Class 1 5,511,001 $ 250,530,109TOTAL INVESTMENT COMPANIES (Cost $157,748,280) $ 250,530,109Total Investments (American Global Growth
Trust) (Cost $157,748,280) - 100.0% $ 250,530,109Other assets and liabilities, net - (0.0%) (14,594)TOTAL NET ASSETS - 100.0% $ 250,515,515
John Hancock Variable Insurance TrustPortfolio of Investments — December 31, 2021 (showing percentage of total net assets)
The accompanying notes are an integral part of the financial statements. 6

American Growth TrustShares orPrincipalAmount Value
INVESTMENT COMPANIES - 100.0%American Funds Insurance Series - 100.0%American Growth Fund - Class 1 8,703,196 $ 1,110,353,743TOTAL INVESTMENT COMPANIES (Cost $675,900,572) $ 1,110,353,743Total Investments (American Growth Trust)
(Cost $675,900,572) - 100.0% $ 1,110,353,743Other assets and liabilities, net - (0.0%) (23,313)TOTAL NET ASSETS - 100.0% $ 1,110,330,430
American Growth-Income TrustShares orPrincipalAmount Value
INVESTMENT COMPANIES - 100.0%American Funds Insurance Series - 100.0%American Growth-Income Fund - Class 1 16,197,870 $ 1,090,926,541TOTAL INVESTMENT COMPANIES (Cost $752,530,914) $ 1,090,926,541Total Investments (American Growth-Income
Trust) (Cost $752,530,914) - 100.0% $ 1,090,926,541Other assets and liabilities, net - (0.0%) (23,786)TOTAL NET ASSETS - 100.0% $ 1,090,902,755
American International TrustShares orPrincipalAmount Value
INVESTMENT COMPANIES - 100.0%American Funds Insurance Series - 100.0%American International Fund - Class 1 20,899,308 $ 474,414,300TOTAL INVESTMENT COMPANIES (Cost $398,270,114) $ 474,414,300Total Investments (American International
Trust) (Cost $398,270,114) - 100.0% $ 474,414,300Other assets and liabilities, net - (0.0%) (18,189)TOTAL NET ASSETS - 100.0% $ 474,396,111
Blue Chip Growth TrustShares orPrincipalAmount Value
COMMON STOCKS – 99.7%Communication services – 23.3%Entertainment – 4.1%Netflix, Inc. (A) 73,354 $ 44,191,384Roku, Inc. (A) 9,790 2,234,078Sea, Ltd., ADR (A) 170,228 38,081,706Spotify Technology SA (A) 31,898 7,465,089The Walt Disney Company (A) 54,671 8,467,991
100,440,248Interactive media and services – 19.0%Alphabet, Inc., Class A (A) 11,438 33,136,344Alphabet, Inc., Class C (A) 74,566 215,763,432Meta Platforms, Inc., Class A (A) 481,395 161,917,208Pinterest, Inc., Class A (A) 239,780 8,716,003Snap, Inc., Class A (A) 640,504 30,122,903Tencent Holdings, Ltd. 204,500 11,932,800
461,588,690Wireless telecommunication services – 0.2%T-Mobile US, Inc. (A) 41,049 4,760,863
566,789,801
Blue Chip Growth Trust (continued)Shares orPrincipalAmount Value
COMMON STOCKS (continued)Consumer discretionary – 19.7%Automobiles – 3.6%Rivian Automotive, Inc., Class A (A)(B) 100,399 $ 10,410,369Tesla, Inc. (A) 73,856 78,049,544
88,459,913Hotels, restaurants and leisure – 1.4%Booking Holdings, Inc. (A) 4,891 11,734,634Chipotle Mexican Grill, Inc. (A) 9,959 17,410,822Starbucks Corp. 49,286 5,764,983
34,910,439Internet and direct marketing retail – 10.5%Amazon.com, Inc. (A) 71,589 238,702,066Delivery Hero SE (A)(C) 19,585 2,167,874DoorDash, Inc., Class A (A) 99,257 14,779,367
255,649,307Multiline retail – 0.7%Dollar General Corp. 68,430 16,137,847Specialty retail – 1.9%Carvana Company (A) 99,232 23,000,985Ross Stores, Inc. 154,675 17,676,259The TJX Companies, Inc. 60,368 4,583,139
45,260,383Textiles, apparel and luxury goods – 1.6%Lululemon Athletica, Inc. (A) 47,006 18,400,499NIKE, Inc., Class B 119,071 19,845,564
38,246,063478,663,952
Financials – 2.7%Capital markets – 2.2%MSCI, Inc. 4,800 2,940,912S&P Global, Inc. 34,861 16,451,952The Charles Schwab Corp. 132,455 11,139,466The Goldman Sachs Group, Inc. 61,180 23,404,409
53,936,739Insurance – 0.5%Chubb, Ltd. 34,386 6,647,158Marsh & McLennan Companies, Inc. 24,015 4,174,287
10,821,44564,758,184
Health care – 9.8%Health care equipment and supplies – 2.7%Align Technology, Inc. (A) 6,262 4,115,261Intuitive Surgical, Inc. (A) 110,441 39,681,451Stryker Corp. 63,260 16,916,989Teleflex, Inc. 16,336 5,366,049
66,079,750Health care providers and services – 3.0%HCA Healthcare, Inc. 77,659 19,952,150Humana, Inc. 16,567 7,684,769UnitedHealth Group, Inc. 92,807 46,602,107
74,239,026Health care technology – 0.3%Veeva Systems, Inc., Class A (A) 26,163 6,684,123Life sciences tools and services – 1.8%Danaher Corp. 84,424 27,776,340Thermo Fisher Scientific, Inc. 23,075 15,396,563
43,172,903Pharmaceuticals – 2.0%AstraZeneca PLC, ADR 91,403 5,324,225Eli Lilly & Company 96,379 26,621,807
John Hancock Variable Insurance TrustPortfolio of Investments — December 31, 2021 (showing percentage of total net assets)
The accompanying notes are an integral part of the financial statements. 7

Blue Chip Growth Trust (continued)Shares orPrincipalAmount Value
COMMON STOCKS (continued)Pharmaceuticals (continued)Zoetis, Inc. 64,670 $ 15,781,420
47,727,452237,903,254
Industrials – 1.4%Commercial services and supplies – 0.4%Cintas Corp. 6,473 2,868,639Copart, Inc. (A) 43,750 6,633,375
9,502,014Industrial conglomerates – 0.7%General Electric Company 70,170 6,628,960Roper Technologies, Inc. 23,062 11,343,275
17,972,235Professional services – 0.3%CoStar Group, Inc. (A) 2,224 175,763Equifax, Inc. 11,765 3,444,674TransUnion 31,400 3,723,412
7,343,84934,818,098
Information technology – 42.4%Electronic equipment, instruments and components – 0.2%TE Connectivity, Ltd. 27,158 4,381,672IT services – 8.1%Affirm Holdings, Inc. (A) 72,527 7,293,315Block, Inc. (A) 85,384 13,790,370Fiserv, Inc. (A) 103,704 10,763,438Mastercard, Inc., Class A 122,850 44,142,462MongoDB, Inc. (A) 30,425 16,105,474PayPal Holdings, Inc. (A) 121,943 22,996,011Shopify, Inc., Class A (A) 11,582 15,952,931Snowflake, Inc., Class A (A) 13,684 4,635,455Toast, Inc., Class A (A)(B) 9,984 346,545Twilio, Inc., Class A (A) 13,023 3,429,477Visa, Inc., Class A 258,965 56,120,305
195,575,783Semiconductors and semiconductor equipment – 6.9%Advanced Micro Devices, Inc. (A) 208,901 30,060,854ASML Holding NV, NYRS 25,511 20,310,328Marvell Technology, Inc. 135,434 11,849,121Monolithic Power Systems, Inc. 15,644 7,717,655NVIDIA Corp. 269,453 79,248,822Taiwan Semiconductor Manufacturing
Company, Ltd., ADR 61,323 7,377,770Texas Instruments, Inc. 58,008 10,932,768
167,497,318Software – 19.5%Atlassian Corp. PLC, Class A (A) 28,537 10,880,873Bill.com Holdings, Inc. (A) 32,925 8,203,264Coupa Software, Inc. (A) 23,198 3,666,444Crowdstrike Holdings, Inc., Class A (A) 11,473 2,349,097Datadog, Inc., Class A (A) 37,036 6,596,482DocuSign, Inc. (A) 47,844 7,287,120Fortinet, Inc. (A) 43,073 15,480,436HashiCorp, Inc., Class A (A) 18,641 1,697,077Intuit, Inc. 76,314 49,086,691Microsoft Corp. 805,106 270,773,250Paycom Software, Inc. (A) 4,829 2,004,953salesforce.com, Inc. (A) 19,393 4,928,343ServiceNow, Inc. (A) 86,268 55,997,421Synopsys, Inc. (A) 68,459 25,227,142
Blue Chip Growth Trust (continued)Shares orPrincipalAmount Value
COMMON STOCKS (continued)Software (continued)Zoom Video Communications, Inc.,
Class A (A) 56,718 $ 10,431,007474,609,600
Technology hardware, storage and peripherals – 7.7%Apple, Inc. 1,057,103 187,709,780
1,029,774,153Materials – 0.3%Chemicals – 0.3%Linde PLC 19,595 6,788,296The Sherwin-Williams Company 4,273 1,504,780
8,293,076Real estate – 0.1%Real estate management and development – 0.1%Opendoor Technologies, Inc. (A) 212,700 3,107,547TOTAL COMMON STOCKS (Cost $1,406,021,622) $ 2,424,108,065
SHORT-TERM INVESTMENTS – 0.6%Short-term funds – 0.6%John Hancock Collateral Trust,
0.1697% (D)(E) 798,574 7,988,139State Street Institutional U.S. Government
Money Market Fund, Premier Class,0.0250% (D) 500,015 500,015
T. Rowe Price Government Reserve Fund,0.0570% (D) 6,897,060 6,897,060
TOTAL SHORT-TERM INVESTMENTS (Cost $15,385,214) $ 15,385,214Total Investments (Blue Chip Growth Trust)
(Cost $1,421,406,836) – 100.3% $ 2,439,493,279Other assets and liabilities, net – (0.3%) (8,422,541)TOTAL NET ASSETS – 100.0% $ 2,431,070,738
Security Abbreviations and LegendADR American Depositary ReceiptNYRS New York Registry Shares(A) Non-income producing security.(B) All or a portion of this security is on loan as of 12-31-21.(C) These securities are exempt from registration under Rule 144A of
the Securities Act of 1933. Such securities may be resold, normallyto qualified institutional buyers, in transactions exempt fromregistration.
(D) The rate shown is the annualized seven-day yield as of 12-31-21.(E) Investment is an affiliate of the fund, the advisor and/or subadvisor.
This security represents the investment of cash collateral received forsecurities lending.
Capital Appreciation TrustShares orPrincipalAmount Value
COMMON STOCKS – 99.6%Communication services – 15.8%Entertainment – 4.9%Netflix, Inc. (A) 40,051 $ 24,128,324ROBLOX Corp., Class A (A) 66,343 6,843,944Sea, Ltd., ADR (A) 25,605 5,728,095Spotify Technology SA (A) 8,550 2,000,957
38,701,320Interactive media and services – 10.9%Alphabet, Inc., Class A (A) 8,559 24,795,765Alphabet, Inc., Class C (A) 8,553 24,748,875
John Hancock Variable Insurance TrustPortfolio of Investments — December 31, 2021 (showing percentage of total net assets)
The accompanying notes are an integral part of the financial statements. 8

Capital Appreciation Trust (continued)Shares orPrincipalAmount Value
COMMON STOCKS (continued)Interactive media and services (continued)Match Group, Inc. (A) 61,209 $ 8,094,890Meta Platforms, Inc., Class A (A) 47,923 16,118,901Snap, Inc., Class A (A) 204,883 9,635,647ZoomInfo Technologies, Inc. (A) 52,058 3,342,124
86,736,202125,437,522
Consumer discretionary – 27.8%Automobiles – 7.3%Tesla, Inc. (A) 54,924 58,042,585Hotels, restaurants and leisure – 3.1%Airbnb, Inc., Class A (A) 56,613 9,425,498Chipotle Mexican Grill, Inc. (A) 5,169 9,036,704Marriott International, Inc., Class A (A) 37,771 6,241,280
24,703,482Internet and direct marketing retail – 7.2%Amazon.com, Inc. (A) 14,451 48,184,546MercadoLibre, Inc. (A) 6,736 9,082,822
57,267,368Multiline retail – 1.2%Target Corp. 43,351 10,033,155Specialty retail – 2.7%The Home Depot, Inc. 27,241 11,305,287The TJX Companies, Inc. 130,652 9,919,100
21,224,387Textiles, apparel and luxury goods – 6.3%Kering SA 12,032 9,653,894Lululemon Athletica, Inc. (A) 22,128 8,662,006LVMH Moet Hennessy Louis Vuitton SE 19,955 16,491,483NIKE, Inc., Class B 91,893 15,315,806
50,123,189221,394,166
Consumer staples – 3.4%Food and staples retailing – 1.5%Costco Wholesale Corp. 20,160 11,444,832Personal products – 1.9%The Estee Lauder Companies, Inc.,
Class A 41,386 15,321,09726,765,929
Financials – 2.3%Capital markets – 2.3%KKR & Company, Inc. 53,070 3,953,715S&P Global, Inc. 13,440 6,342,739The Goldman Sachs Group, Inc. 20,039 7,665,919
17,962,373Health care – 5.8%Biotechnology – 0.5%BioNTech SE, ADR (A)(B) 15,800 4,073,240Health care equipment and supplies – 1.3%DexCom, Inc. (A) 10,442 5,606,832Intuitive Surgical, Inc. (A) 12,058 4,332,439
9,939,271Health care providers and services – 1.1%UnitedHealth Group, Inc. 17,767 8,921,521Life sciences tools and services – 1.1%Danaher Corp. 27,727 9,122,460Pharmaceuticals – 1.8%Eli Lilly & Company 52,005 14,364,821
46,421,313
Capital Appreciation Trust (continued)Shares orPrincipalAmount Value
COMMON STOCKS (continued)Industrials – 1.8%Road and rail – 1.8%Uber Technologies, Inc. (A) 344,511 $ 14,445,346Information technology – 42.7%IT services – 13.9%Adyen NV (A)(C) 5,202 13,655,248Block, Inc. (A) 63,362 10,233,597Mastercard, Inc., Class A 33,909 12,184,182Okta, Inc. (A) 17,641 3,954,583PayPal Holdings, Inc. (A) 43,119 8,131,381Shopify, Inc., Class A (A) 24,107 33,204,741Snowflake, Inc., Class A (A) 31,290 10,599,488Twilio, Inc., Class A (A) 21,635 5,697,361Visa, Inc., Class A 60,726 13,159,931
110,820,512Semiconductors and semiconductor equipment – 6.8%NVIDIA Corp. 152,089 44,730,896Taiwan Semiconductor Manufacturing
Company, Ltd., ADR 76,050 9,149,57653,880,472
Software – 16.1%Adobe, Inc. (A) 40,793 23,132,079Atlassian Corp. PLC, Class A (A) 37,773 14,402,467Crowdstrike Holdings, Inc., Class A (A) 48,070 9,842,333HubSpot, Inc. (A) 6,105 4,024,111Microsoft Corp. 122,452 41,183,057salesforce.com, Inc. (A) 88,951 22,605,118The Trade Desk, Inc., Class A (A) 87,481 8,016,759Workday, Inc., Class A (A) 18,675 5,101,637
128,307,561Technology hardware, storage and peripherals – 5.9%Apple, Inc. 264,752 47,012,013
340,020,558TOTAL COMMON STOCKS (Cost $523,253,478) $ 792,447,207
SHORT-TERM INVESTMENTS – 0.4%Short-term funds – 0.4%John Hancock Collateral Trust,
0.1697% (D)(E) 10,465 104,677State Street Institutional U.S. Government
Money Market Fund, Premier Class,0.0250% (D) 3,383,413 3,383,413
TOTAL SHORT-TERM INVESTMENTS (Cost $3,488,108) $ 3,488,090Total Investments (Capital Appreciation Trust)
(Cost $526,741,586) – 100.0% $ 795,935,297Other assets and liabilities, net – (0.0%) (317,788)TOTAL NET ASSETS – 100.0% $ 795,617,509
Security Abbreviations and LegendADR American Depositary Receipt(A) Non-income producing security.(B) All or a portion of this security is on loan as of 12-31-21.(C) These securities are exempt from registration under Rule 144A of
the Securities Act of 1933. Such securities may be resold, normallyto qualified institutional buyers, in transactions exempt fromregistration.
(D) The rate shown is the annualized seven-day yield as of 12-31-21.(E) Investment is an affiliate of the fund, the advisor and/or subadvisor.
This security represents the investment of cash collateral received forsecurities lending.
John Hancock Variable Insurance TrustPortfolio of Investments — December 31, 2021 (showing percentage of total net assets)
The accompanying notes are an integral part of the financial statements. 9

Capital Appreciation Value TrustShares orPrincipalAmount Value
COMMON STOCKS – 72.0%Communication services – 6.6%Interactive media and services – 6.6%Alphabet, Inc., Class A (A)(B) 3,987 $ 11,550,498Alphabet, Inc., Class C (A)(B) 5,466 15,816,363Meta Platforms, Inc., Class A (B) 15,091 5,075,858
32,442,719Consumer discretionary – 10.4%Hotels, restaurants and leisure – 5.1%Hilton Worldwide Holdings, Inc. (A)(B) 20,907 3,261,283Marriott International, Inc., Class A (A)(B) 15,178 2,508,013McDonald’s Corp. (A) 4,916 1,317,832Yum! Brands, Inc. 132,659 18,421,029
25,508,157Internet and direct marketing retail – 5.3%Amazon.com, Inc. (A)(B) 7,802 26,014,521Specialty retail – 0.0%Ross Stores, Inc. (A) 1,800 205,704
51,728,382Consumer staples – 1.9%Beverages – 1.9%Keurig Dr. Pepper, Inc. 206,142 7,598,394PepsiCo, Inc. 5,300 920,663The Coca-Cola Company (A) 18,100 1,071,701
9,590,758Financials – 9.4%Banks – 5.4%Bank of America Corp. (A) 172,937 7,693,967The PNC Financial Services Group, Inc. 94,931 19,035,564
26,729,531Capital markets – 1.5%CME Group, Inc. 3,800 868,148Intercontinental Exchange, Inc. 49,266 6,738,111
7,606,259Insurance – 2.5%Marsh & McLennan Companies, Inc. 70,982 12,338,091
46,673,881Health care – 16.4%Health care equipment and supplies – 2.5%Becton, Dickinson and Company 40,802 10,260,887Hologic, Inc. (B) 25,192 1,928,700Medtronic PLC (A) 3,800 393,110
12,582,697Health care providers and services – 6.4%Humana, Inc. 29,445 13,658,358UnitedHealth Group, Inc. 35,969 18,061,474
31,719,832Life sciences tools and services – 7.5%Danaher Corp. (A) 33,997 11,185,353PerkinElmer, Inc. 42,000 8,444,520Thermo Fisher Scientific, Inc. 26,069 17,394,280
37,024,15381,326,682
Industrials – 7.3%Aerospace and defense – 0.4%Lockheed Martin Corp. 2,700 959,607Northrop Grumman Corp. (A) 2,000 774,140
1,733,747Commercial services and supplies – 1.3%Aurora Innovation, Inc. (B)(C) 145,000 1,632,700Waste Connections, Inc. 34,511 4,702,814
Capital Appreciation Value Trust (continued)Shares orPrincipalAmount Value
COMMON STOCKS (continued)Commercial services and supplies (continued)Waste Management, Inc. (A) 1,300 $ 216,970
6,552,484Industrial conglomerates – 4.9%General Electric Company 233,930 22,099,367Roper Technologies, Inc. 4,090 2,011,707
24,111,074Machinery – 0.7%Ingersoll Rand, Inc. 58,254 3,604,175Professional services – 0.0%TransUnion 951 112,770
36,114,250Information technology – 13.8%Communications equipment – 0.4%Cisco Systems, Inc. 29,700 1,882,089Electronic equipment, instruments and components – 1.1%TE Connectivity, Ltd. 26,941 4,346,661Teledyne Technologies, Inc. (B) 2,093 914,411
5,261,072IT services – 2.0%Fiserv, Inc. (A)(B) 12,777 1,326,125FleetCor Technologies, Inc. (B) 12,782 2,861,123Mastercard, Inc., Class A 2,200 790,504Visa, Inc., Class A (A) 24,200 5,244,382
10,222,134Semiconductors and semiconductor equipment – 0.2%NXP Semiconductors NV 4,500 1,025,010Software – 9.1%Microsoft Corp. (A) 112,880 37,963,795salesforce.com, Inc. (B) 28,220 7,171,549
45,135,344Technology hardware, storage and peripherals – 1.0%Apple, Inc. 26,979 4,790,661
68,316,310Utilities – 6.2%Electric utilities – 1.8%American Electric Power Company, Inc. 27,949 2,486,623Exelon Corp. 110,838 6,402,003
8,888,626Multi-utilities – 4.4%Ameren Corp. 99,280 8,836,913CMS Energy Corp. 79,835 5,193,267Public Service Enterprise Group, Inc. 119,540 7,976,904
22,007,08430,895,710
TOTAL COMMON STOCKS (Cost $262,170,798) $ 357,088,692
PREFERRED SECURITIES – 0.8%Financials – 0.0%Capital markets – 0.0%The Charles Schwab Corp., 5.950% 1,000 25,480Utilities – 0.8%Electric utilities – 0.2%American Electric Power Company, Inc.,
6.125% 12,402 621,588SCE Trust IV (5.375% to 9-15-25, then 3
month LIBOR + 3.132%) 22,431 562,1211,183,709
Multi-utilities – 0.6%CMS Energy Corp., 5.875% 33,067 884,542
John Hancock Variable Insurance TrustPortfolio of Investments — December 31, 2021 (showing percentage of total net assets)
The accompanying notes are an integral part of the financial statements. 10

Capital Appreciation Value Trust (continued)Shares orPrincipalAmount Value
PREFERRED SECURITIES (continued)Multi-utilities (continued)CMS Energy Corp., 5.875% (C) 40,379 $ 1,086,195NiSource, Inc., 7.750% 6,487 726,479NiSource, Inc. (6.500% to 3-15-24, then 5
Year CMT + 3.632%) 10,867 295,8002,993,0164,176,725
TOTAL PREFERRED SECURITIES (Cost $3,959,807) $ 4,202,205
CORPORATE BONDS - 7.2%Communication services - 3.1%Altice France Holding SA
10.500%, 05/15/2027 (D) $ 450,000 483,750CCO Holdings LLC
4.000%, 03/01/2023 (D) 416,000 416,0175.000%, 02/01/2028 (D) 2,595,000 2,698,8005.125%, 05/01/2027 (D) 2,381,000 2,452,430
Netflix, Inc.4.375%, 11/15/2026 1,260,000 1,395,4504.875%, 04/15/2028 1,790,000 2,040,6004.875%, 06/15/2030 (D) 40,000 46,6505.500%, 02/15/2022 45,000 45,2485.875%, 02/15/2025 to 11/15/2028 2,810,000 3,347,1526.375%, 05/15/2029 1,165,000 1,447,513
Photo Holdings Merger Sub, Inc.8.500%, 10/01/2026 (D) 411,000 427,530
Sirius XM Radio, Inc.5.000%, 08/01/2027 (D) 555,000 576,834
15,377,974Consumer discretionary - 1.9%Cedar Fair LP
5.250%, 07/15/2029 384,000 393,6005.375%, 04/15/2027 676,000 692,9005.500%, 05/01/2025 (D) 410,000 424,3506.500%, 10/01/2028 345,000 367,425
Clarios Global LP6.250%, 05/15/2026 (D) 222,000 232,2686.750%, 05/15/2025 (D) 147,000 153,9838.500%, 05/15/2027 (D) 305,000 323,300
Hilton Domestic Operating Company, Inc.5.375%, 05/01/2025 (D) 30,000 31,218
IRB Holding Corp.6.750%, 02/15/2026 (D) 25,000 25,469
KFC Holding Company/Pizza HutHoldings LLC/Taco Bell ofAmerica LLC4.750%, 06/01/2027 (D) 1,657,000 1,712,924
Life Time, Inc.5.750%, 01/15/2026 (D) 365,000 377,775
Marriott International, Inc.3.125%, 06/15/2026 120,000 124,623
Six Flags Entertainment Corp.4.875%, 07/31/2024 (D) 1,405,000 1,419,0505.500%, 04/15/2027 (D) 711,000 735,885
Six Flags Theme Parks, Inc.7.000%, 07/01/2025 (D) 494,000 527,564
Yum! Brands, Inc.3.875%, 11/01/2023 440,000 458,1504.750%, 01/15/2030 (D) 2,000 2,1655.350%, 11/01/2043 579,000 640,2586.875%, 11/15/2037 367,000 465,0997.750%, 04/01/2025 (D) 165,000 173,869
9,281,875
Capital Appreciation Value Trust (continued)Shares orPrincipalAmount Value
CORPORATE BONDS (continued)Financials - 0.8%Acrisure LLC
7.000%, 11/15/2025 (D) $ 775,000 $ 774,434Alliant Holdings Intermediate LLC
4.250%, 10/15/2027 (D) 75,000 75,0005.875%, 11/01/2029 (D) 75,000 76,3056.750%, 10/15/2027 (D) 125,000 129,688
AmWINS Group, Inc.4.875%, 06/30/2029 (D) 135,000 136,350
HUB International, Ltd.5.625%, 12/01/2029 (D) 165,000 169,9867.000%, 05/01/2026 (D) 1,780,000 1,828,950
State Street Corp. (3 month LIBOR +3.597%)3.800%, 03/15/2022 (E)(F) 145,000 145,345
USI, Inc.6.875%, 05/01/2025 (D) 679,000 684,093
4,020,151Health care - 0.3%Avantor Funding, Inc.
4.625%, 07/15/2028 (D) 180,000 187,650Hadrian Merger Sub, Inc.
8.500%, 05/01/2026 (D) 362,000 371,955Surgery Center Holdings, Inc.
10.000%, 04/15/2027 (D) 410,000 435,625Teleflex, Inc.
4.625%, 11/15/2027 285,000 296,400Tenet Healthcare Corp.
4.625%, 09/01/2024 (D) 150,000 153,3751,445,005
Industrials - 0.9%Delta Air Lines, Inc.
4.500%, 10/20/2025 (D) 700,000 735,7084.750%, 10/20/2028 (D) 390,000 425,873
General Electric Company (3 monthLIBOR + 3.330%)3.533%, 03/15/2022 (E)(F) 1,340,000 1,326,600
Korn Ferry4.625%, 12/15/2027 (D) 90,000 92,700
Lennox International, Inc.3.000%, 11/15/2023 90,000 92,556
Mileage Plus Holdings LLC6.500%, 06/20/2027 (D) 280,000 298,900
Sensata Technologies BV4.875%, 10/15/2023 (D) 110,000 115,5005.000%, 10/01/2025 (D) 325,000 352,6255.625%, 11/01/2024 (D) 90,000 98,937
United Airlines 2012-1 Class A PassThrough Trust4.150%, 04/11/2024 145,410 149,709
US Airways 2010-1 Class A Pass ThroughTrust6.250%, 04/22/2023 82,143 83,726
US Airways 2012-2 Class A Pass ThroughTrust4.625%, 06/03/2025 11,845 11,726
US Airways 2013-1 Class A Pass ThroughTrust3.950%, 11/15/2025 127,403 127,962
Welbilt, Inc.9.500%, 02/15/2024 362,000 365,620
4,278,142Information technology - 0.1%Clarivate Science Holdings Corp.
3.875%, 07/01/2028 (D) 240,000 241,200
John Hancock Variable Insurance TrustPortfolio of Investments — December 31, 2021 (showing percentage of total net assets)
The accompanying notes are an integral part of the financial statements. 11

Capital Appreciation Value Trust (continued)Shares orPrincipalAmount Value
CORPORATE BONDS (continued)Information technology (continued)Clarivate Science
Holdings Corp. (continued)4.875%, 07/01/2029 (D) $ 80,000 $ 81,130
322,330Real estate - 0.0%SBA Communications Corp.
3.875%, 02/15/2027 195,000 200,850Utilities - 0.1%NiSource, Inc. (5.650% to 6-15-23, then 5
Year CMT + 2.843%)06/15/2023 (E) 575,000 590,813
TOTAL CORPORATE BONDS (Cost $33,167,908) $ 35,517,140
TERM LOANS (G) – 9.9%Communication services – 0.2%Delta 2 Lux Sarl, 2018 USD Term Loan (1
month LIBOR + 2.500%)3.500%, 02/01/2024 895,000 893,505
Eagle Broadband Investments LLC, TermLoan (3 month LIBOR + 3.000%)3.750%, 11/12/2027 188,552 188,199
1,081,704Consumer discretionary – 0.4%Cedar Fair LP, 2017 Term Loan B (1
month LIBOR + 1.750%)1.854%, 04/13/2024 50,000 48,922
Four Seasons Hotels, Ltd., New 1st LienTerm Loan (1 month LIBOR + 2.000%)2.104%, 11/30/2023 515,504 512,926
IRB Holding Corp., 2020 4th AmendmentIncremental Term Loan (3 monthLIBOR + 3.250%)4.250%, 12/15/2027 530,022 529,524
IRB Holding Corp., 2020 Term Loan B (3month LIBOR + 2.750%)3.750%, 02/05/2025 323,903 323,129
Life Time, Inc., 2021 Term Loan B (3month LIBOR + 4.750%)5.750%, 12/16/2024 151,739 152,403
SeaWorld Parks & Entertainment, Inc.,2021 Term Loan B (1 month LIBOR +3.000%)3.500%, 08/25/2028 506,747 504,213
Woof Holdings, Inc., 1st Lien Term Loan(3 month LIBOR + 3.750%)4.500%, 12/21/2027 198,500 198,500
2,269,617Consumer staples – 0.3%Sunshine Luxembourg VII Sarl, 2021 Term
Loan B3 (3 month LIBOR + 3.750%)4.500%, 10/01/2026 1,286,717 1,290,745
Financials – 3.8%Acrisure LLC, 2021 Incremental Term
Loan B (3 month LIBOR + 3.750%)4.250%, 02/15/2027 249,375 248,647
Alliant Holdings Intermediate LLC, 2018Term Loan B (1 month LIBOR +3.250%)3.354%, 05/09/2025 902,939 893,187
Alliant Holdings Intermediate LLC, 2021Term Loan B4 (1 month LIBOR +3.500%)4.000%, 11/06/2027 1,381,538 1,378,830
Capital Appreciation Value Trust (continued)Shares orPrincipalAmount Value
TERM LOANS (G)(continued)Financials (continued)Alliant Holdings Intermediate LLC, Term
Loan B (1 month LIBOR + 3.250%)3.354%, 05/09/2025 $ 405,960 $ 401,612
Howden Group Holdings, Ltd., 2021 TermLoan B (1 month LIBOR + 3.250%)4.000%, 11/12/2027 1,446,348 1,438,812
HUB International, Ltd., 2018 Term LoanB (3 month LIBOR + 2.750%)2.875%, 04/25/2025 7,130,426 7,042,936
HUB International, Ltd., 2021 Term LoanB (3 month LIBOR + 3.250%)4.000%, 04/25/2025 4,550,646 4,546,369
Ryan Specialty Group LLC, Term Loan (1month LIBOR + 3.000%)3.750%, 09/01/2027 266,774 266,374
USI, Inc., 2017 Repriced Term Loan (3month LIBOR + 3.000%)3.224%, 05/16/2024 1,961,376 1,944,920
USI, Inc., 2019 Incremental Term Loan B(3 month LIBOR + 3.250%)3.474%, 12/02/2026 821,798 815,486
18,977,173Health care – 1.8%ADMI Corp., 2021 Incremental Term Loan
B3 (1 month LIBOR + 3.500%)4.000%, 12/23/2027 1,062,338 1,059,512
ADMI Corp., 2021 Term Loan B2 (1month LIBOR + 3.375%)3.875%, 12/23/2027 585,575 581,429
Avantor Funding, Inc., 2021 Term Loan B4(1 month LIBOR + 2.000%)2.500%, 11/21/2024 54,539 54,402
Eyecare Partners LLC, 2020 Term Loan (3month LIBOR + 3.750%)3.974%, 02/18/2027 74,811 74,320
Eyecare Partners LLC, 2021 Delayed DrawTerm Loan4.250%, 11/15/2028 3,409 3,393
Eyecare Partners LLC, 2021 IncrementalTerm Loan (3 month LIBOR + 3.750%)4.250%, 11/15/2028 20,000 19,905
Heartland Dental LLC, 2018 1st Lien TermLoan (1 month LIBOR + 3.500%)3.604%, 04/30/2025 1,612,820 1,595,354
Heartland Dental LLC, 2021 IncrementalTerm Loan (1 month LIBOR + 4.000%)4.104%, 04/30/2025 149,250 148,877
Loire Finco Luxembourg Sarl, Term Loan(1 month LIBOR + 3.250%)3.354%, 04/21/2027 1,147,634 1,133,288
Mozart Borrower LP, USD Term Loan B(1 month LIBOR + 3.250%)3.750%, 10/23/2028 2,790,000 2,788,772
Pacific Dental Services, Inc., 2021 TermLoan (1 month LIBOR + 3.250%)4.000%, 05/05/2028 144,275 144,139
Pathway Vet Alliance LLC, 2021 TermLoan (1 month LIBOR + 3.750%)3.854%, 03/31/2027 124,685 124,173
PetVet Care Centers LLC, 2018 1st LienTerm Loan (1 month LIBOR + 2.750%)2.854%, 02/14/2025 83,696 82,650
John Hancock Variable Insurance TrustPortfolio of Investments — December 31, 2021 (showing percentage of total net assets)
The accompanying notes are an integral part of the financial statements. 12

Capital Appreciation Value Trust (continued)Shares orPrincipalAmount Value
TERM LOANS (G)(continued)Health care (continued)PetVet Care Centers LLC, 2018
Incremental Term Loan (1 monthLIBOR + 3.250%)3.354%, 02/14/2025 $ 198,083 $ 196,722
PetVet Care Centers LLC, 2021 Term LoanB3 (1 month LIBOR + 3.500%)4.250%, 02/14/2025 764,269 763,314
8,770,250Industrials – 1.3%Camelot US Acquisition LLC, 2020
Incremental Term Loan B (1 monthLIBOR + 3.000%)4.000%, 10/30/2026 945,450 943,975
CoreLogic, Inc., Term Loan (1 monthLIBOR + 3.500%)4.000%, 06/02/2028 1,057,350 1,055,235
Filtration Group Corp., 2018 1st Lien TermLoan (1 month LIBOR + 3.000%)3.104%, 03/29/2025 276,816 274,133
Filtration Group Corp., 2018 EUR TermLoan (3 month EURIBOR + 3.500%)3.500%, 03/29/2025 EUR 515,323 584,131
Filtration Group Corp., 2021 IncrementalTerm Loan (1 month LIBOR + 3.500%)4.000%, 10/21/2028 $ 204,488 204,019
Mileage Plus Holdings LLC, 2020 TermLoan B (3 month LIBOR + 5.250%)6.250%, 06/21/2027 1,765,000 1,858,774
SkyMiles IP, Ltd., 2020 Skymiles TermLoan B (3 month LIBOR + 3.750%)4.750%, 10/20/2027 865,000 913,656
TK Elevator U.S. Newco, Inc., Term LoanB (6 month LIBOR + 3.500%)4.000%, 07/30/2027 266,642 266,605
Welbilt, Inc., 2018 Term Loan B (1 monthLIBOR + 2.500%)2.590%, 10/23/2025 200,000 199,084
6,299,612Information technology – 2.1%Applied Systems, Inc., 2017 1st Lien Term
Loan (Prime rate + 2.250% and 3 monthLIBOR + 3.500%)3.502%, 09/19/2024 932,581 931,649
Applied Systems, Inc., 2021 2nd LienTerm Loan (3 month LIBOR + 5.500%)6.250%, 09/19/2025 164,028 165,053
Ascend Learning LLC, 2021 2nd LienTerm Loan (3 month LIBOR + 5.750%)6.250%, 12/10/2029 260,000 260,434
Ascend Learning LLC, 2021 Term LoanTBD 12/11/2028 (H) 1,825,000 1,820,821
Azalea TopCo, Inc., 2021 Term Loan B (3month LIBOR + 3.750%)4.500%, 07/24/2026 24,875 24,852
Azalea TopCo, Inc., Term Loan (3 monthLIBOR + 3.500%)3.629%, 07/24/2026 973,347 968,178
Celestial Saturn Parent, Inc., 2nd LienTerm Loan (1 month LIBOR + 6.500%)7.000%, 06/04/2029 80,000 80,550
Project Boost Purchaser LLC, 2021Incremental Term Loan (1 monthLIBOR + 3.500%)4.000%, 05/30/2026 174,125 173,980
Capital Appreciation Value Trust (continued)Shares orPrincipalAmount Value
TERM LOANS (G)(continued)Information technology (continued)RealPage, Inc., 1st Lien Term Loan (1
month LIBOR + 3.250%)3.750%, 04/24/2028 $ 1,421,438 $ 1,416,335
RealPage, Inc., 2nd Lien Term Loan (1month LIBOR + 6.500%)7.250%, 04/23/2029 75,000 75,863
Sophia LP, 2021 Term Loan B (3 monthLIBOR + 3.500%)4.000%, 10/07/2027 299,250 299,026
UKG, Inc., 2021 2nd Lien Term Loan (1month LIBOR + 5.250%)5.750%, 05/03/2027 290,000 290,545
UKG, Inc., 2021 Term Loan (3 monthLIBOR + 3.250%)3.750%, 05/04/2026 3,759,787 3,737,454
UKG, Inc., Term Loan B (1 month LIBOR+ 3.750%)3.854%, 05/04/2026 161,288 160,683
10,405,423Materials – 0.0%HB Fuller Company, 2017 Term Loan B (1
month LIBOR + 2.000%)2.104%, 10/20/2024 121,655 121,563
TOTAL TERM LOANS (Cost $49,162,655) $ 49,216,087
ASSET BACKED SECURITIES - 0.2%Domino’s Pizza Master Issuer LLC
Series 2017-1A, Class A234.118%, 07/25/2047 (D) 500,500 523,755
Domino’s Pizza Master Issuer LLCSeries 2018-1A, Class A2I4.116%, 07/25/2048 (D) 475,300 485,807
Domino’s Pizza Master Issuer LLCSeries 2019-1A, Class A23.668%, 10/25/2049 (D) 211,238 222,329
TOTAL ASSET BACKED SECURITIES (Cost $1,182,413) $ 1,231,891
SHORT-TERM INVESTMENTS – 12.8%Short-term funds – 11.7%John Hancock Collateral Trust,
0.1697% (I)(J) 195,416 1,954,744T. Rowe Price Government Reserve Fund,
0.0570% (I) 55,850,435 55,850,43557,805,179
Repurchase agreement – 1.1%Repurchase Agreement with State Street
Corp. dated 12-31-21 at 0.000% to berepurchased at $5,570,000 on 1-3-22,collateralized by $5,194,400U.S. Treasury Notes, 2.875% due5-15-28 (valued at $5,681,481) $ 5,570,000 5,570,000
TOTAL SHORT-TERM INVESTMENTS (Cost $63,375,532) $ 63,375,179Total Investments (Capital Appreciation Value Trust)
(Cost $413,019,113) – 102.9% $ 510,631,194Other assets and liabilities, net – (2.9%) (14,500,972)TOTAL NET ASSETS – 100.0% $ 496,130,222
Currency AbbreviationsEUR Euro
Security Abbreviations and LegendCMT Constant Maturity TreasuryEURIBOR Euro Interbank Offered RateLIBOR London Interbank Offered Rate
John Hancock Variable Insurance TrustPortfolio of Investments — December 31, 2021 (showing percentage of total net assets)
The accompanying notes are an integral part of the financial statements. 13

Capital Appreciation Value Trust (continued)(A) All or a portion of this security is segregated at the custodian as
collateral for certain derivatives.(B) Non-income producing security.(C) All or a portion of this security is on loan as of 12-31-21.(D) These securities are exempt from registration under Rule 144A of
the Securities Act of 1933. Such securities may be resold, normallyto qualified institutional buyers, in transactions exempt fromregistration.
(E) Perpetual bonds have no stated maturity date. Date shown asmaturity date is next call date.
(F) Variable rate obligation. The coupon rate shown represents the rateat period end.
Capital Appreciation Value Trust (continued)(G) Term loans are variable rate obligations. The coupon rate shown
represents the rate at period end.(H) This position represents an unsettled loan commitment at period end.
Certain details associated with this purchase are not known prior tothe settlement date, including coupon rate, which is disclosed asTBD (To Be Determined).
(I) The rate shown is the annualized seven-day yield as of 12-31-21.(J) Investment is an affiliate of the fund, the advisor and/or subadvisor.
This security represents the investment of cash collateral received forsecurities lending.
DERIVATIVES
WRITTEN OPTIONS
Options on securitiesCounterparty (OTC)/Exchange-traded Name of issuer Currency
Exerciseprice
Expirationdate
Number ofcontracts
Notionalamount Premium Value
CallsGSI Alphabet, Inc., Class A USD 1,960.00 Sep 2022 1 100 $ 18,442 $ (97,790)GSI Alphabet, Inc., Class A USD 1,960.00 Sep 2022 1 100 24,090 (97,790)GSI Alphabet, Inc., Class A USD 1,980.00 Sep 2022 1 100 17,800 (95,949)GSI Alphabet, Inc., Class A USD 2,000.00 Sep 2022 1 100 17,130 (94,116)GSI Alphabet, Inc., Class A USD 2,100.00 Sep 2022 1 100 14,073 (85,086)SFG Alphabet, Inc., Class A USD 2,450.00 Sep 2022 1 100 26,747 (55,903)GSI Alphabet, Inc., Class A USD 3,200.00 Jan 2023 1 100 18,097 (20,665)GSI Alphabet, Inc., Class A USD 3,300.00 Jan 2023 1 100 15,497 (17,404)GSI Alphabet, Inc., Class A USD 3,400.00 Jan 2023 1 100 13,047 (14,592)GSI Alphabet, Inc., Class A USD 3,500.00 Jan 2023 1 100 11,097 (12,189)GSI Alphabet, Inc., Class C USD 1,760.00 Jan 2022 5 500 50,362 (567,417)GSI Alphabet, Inc., Class C USD 1,780.00 Jan 2022 5 500 47,406 (557,418)GSI Alphabet, Inc., Class C USD 1,800.00 Jan 2022 4 400 35,760 (437,935)GSI Alphabet, Inc., Class C USD 1,980.00 Jun 2022 1 100 21,210 (93,508)GSI Alphabet, Inc., Class C USD 2,000.00 Jun 2022 1 100 20,353 (91,604)GSI Alphabet, Inc., Class C USD 2,100.00 Jun 2022 1 100 16,634 (82,179)SFG Alphabet, Inc., Class C USD 2,550.00 Jun 2022 1 100 22,096 (43,277)CSFB Amazon.com, Inc. USD 3,800.00 Jan 2022 1 100 33,115 (212)CSFB Amazon.com, Inc. USD 3,800.00 Jan 2022 1 100 34,542 (212)CSFB Amazon.com, Inc. USD 3,900.00 Jan 2022 1 100 30,277 (117)CSFB Amazon.com, Inc. USD 3,900.00 Jan 2022 1 100 38,338 (117)RBC Amazon.com, Inc. USD 3,900.00 Jan 2022 1 100 23,997 (117)CITI Amazon.com, Inc. USD 4,000.00 Jan 2022 1 100 27,327 (68)CSFB Amazon.com, Inc. USD 4,000.00 Jan 2022 1 100 27,686 (68)CSFB Amazon.com, Inc. USD 4,000.00 Jan 2022 1 100 35,706 (68)RBC Amazon.com, Inc. USD 4,000.00 Jan 2022 1 100 21,797 (68)CITI Amazon.com, Inc. USD 4,100.00 Jan 2022 1 100 25,167 (40)RBC Amazon.com, Inc. USD 4,100.00 Jan 2022 1 100 19,697 (40)CITI Amazon.com, Inc. USD 4,200.00 Jan 2022 1 100 23,127 (24)RBC Amazon.com, Inc. USD 4,200.00 Jan 2022 1 100 17,827 (24)CITI Amazon.com, Inc. USD 4,300.00 Jan 2022 2 200 42,614 (28)GSI Amazon.com, Inc. USD 4,000.00 Jan 2023 1 100 34,022 (18,169)GSI Amazon.com, Inc. USD 4,200.00 Jan 2023 1 100 27,523 (13,927)GSI Amazon.com, Inc. USD 4,400.00 Jan 2023 1 100 22,230 (10,661)JPM American Electric Power Company, Inc. USD 90.00 Jan 2022 63 6,300 22,934 (4,426)JPM American Electric Power Company, Inc. USD 90.00 Jan 2022 11 1,100 3,946 (773)JPM American Electric Power Company, Inc. USD 90.00 Jan 2022 7 700 2,418 (492)JPM American Electric Power Company, Inc. USD 95.00 Jan 2022 63 6,300 13,893 (40)JPM American Electric Power Company, Inc. USD 95.00 Jan 2022 22 2,200 4,975 (14)JPM American Electric Power Company, Inc. USD 95.00 Jan 2022 14 1,400 2,930 (9)JPM American Electric Power Company, Inc. USD 97.50 Jan 2022 30 3,000 2,930 (1)JPM American Electric Power Company, Inc. USD 100.00 Jan 2022 30 3,000 1,813 —CSFB Bank of America Corp. USD 35.00 Jan 2022 259 25,900 40,559 (246,727)RBC Bank of America Corp. USD 37.00 Jan 2022 190 19,000 52,947 (143,297)CSFB Bank of America Corp. USD 40.00 Jan 2022 39 3,900 13,323 (18,026)CSFB Bank of America Corp. USD 45.00 Jan 2022 38 3,800 7,138 (3,128)CSFB Bank of America Corp. USD 45.00 Jan 2023 423 42,300 136,202 (195,262)
John Hancock Variable Insurance TrustPortfolio of Investments — December 31, 2021 (showing percentage of total net assets)
The accompanying notes are an integral part of the financial statements. 14

Capital Appreciation Value Trust (continued)
Options on securities (continued)Counterparty (OTC)/Exchange-traded Name of issuer Currency
Exerciseprice
Expirationdate
Number ofcontracts
Notionalamount Premium Value
Calls (continued)JPM Bank of America Corp. USD 45.00 Jan 2023 240 24,000 $ 99,605 $ (110,788)CSFB Bank of America Corp. USD 50.00 Jan 2023 104 10,400 26,441 (28,278)JPM Bank of America Corp. USD 50.00 Jan 2023 118 11,800 41,536 (32,085)JPM Cisco Systems, Inc. USD 45.00 Jan 2022 48 4,800 22,416 (88,185)JPM Cisco Systems, Inc. USD 45.00 Jan 2022 25 2,500 11,425 (45,930)JPM Cisco Systems, Inc. USD 45.00 Jan 2022 26 2,600 11,102 (47,767)JPM Cisco Systems, Inc. USD 47.50 Jan 2022 48 4,800 17,136 (76,186)JPM Cisco Systems, Inc. USD 47.50 Jan 2022 25 2,500 8,675 (39,680)JPM Cisco Systems, Inc. USD 47.50 Jan 2022 26 2,600 8,502 (41,268)JPM Cisco Systems, Inc. USD 50.00 Jan 2022 48 4,800 12,816 (64,188)JPM Cisco Systems, Inc. USD 50.00 Jan 2022 25 2,500 6,550 (33,431)JPM Cisco Systems, Inc. USD 50.00 Jan 2022 26 2,600 6,292 (34,768)JPM CME Group, Inc. USD 220.00 Jan 2022 19 1,900 20,869 (18,624)JPM CME Group, Inc. USD 230.00 Jan 2022 19 1,900 16,115 (5,598)CSFB Danaher Corp. USD 270.00 Jan 2022 4 400 6,485 (23,715)CSFB Danaher Corp. USD 280.00 Jan 2022 4 400 5,280 (19,796)CSFB Danaher Corp. USD 280.00 Jan 2022 6 600 7,557 (29,694)CSFB Danaher Corp. USD 290.00 Jan 2022 6 600 5,707 (23,912)JPM Danaher Corp. USD 300.00 Jan 2022 22 2,200 21,785 (66,884)JPM Danaher Corp. USD 300.00 Jan 2022 22 2,200 25,115 (66,884)CITI Exelon Corp. USD 50.00 Jan 2022 30 3,000 2,341 (23,390)GSI Fiserv, Inc. USD 130.00 Jan 2022 13 1,300 6,634 (88)GSI Fiserv, Inc. USD 135.00 Jan 2022 13 1,300 4,869 (117)JPM FleetCor Technologies, Inc. USD 300.00 Jan 2022 5 500 9,985 —JPM FleetCor Technologies, Inc. USD 310.00 Jan 2022 3 300 4,791 —JPM General Electric Company USD 96.00 Jan 2022 20 2,000 24,437 (3,074)JPM General Electric Company USD 96.00 Jan 2022 20 2,000 25,825 (3,074)JPM General Electric Company USD 120.00 Jan 2022 20 2,000 13,309 (4)JPM General Electric Company USD 120.00 Jan 2022 20 2,000 13,361 (4)SFG General Electric Company USD 120.00 Jan 2022 80 8,000 69,324 (17)CITI Hilton Worldwide Holdings, Inc. USD 125.00 Jan 2022 8 800 8,222 (24,964)CITI Hilton Worldwide Holdings, Inc. USD 125.00 Jan 2022 4 400 3,927 (12,482)CITI Hilton Worldwide Holdings, Inc. USD 125.00 Jan 2022 5 500 5,015 (15,603)CITI Hilton Worldwide Holdings, Inc. USD 130.00 Jan 2022 8 800 6,917 (21,020)CITI Hilton Worldwide Holdings, Inc. USD 130.00 Jan 2022 4 400 3,288 (10,510)CITI Hilton Worldwide Holdings, Inc. USD 130.00 Jan 2022 5 500 4,196 (13,137)CITI Hilton Worldwide Holdings, Inc. USD 130.00 Jan 2022 12 1,200 17,773 (31,530)CITI Hilton Worldwide Holdings, Inc. USD 135.00 Jan 2022 12 1,200 15,717 (25,685)GSI Hilton Worldwide Holdings, Inc. USD 135.00 Jan 2022 38 3,800 53,311 (81,335)GSI Hilton Worldwide Holdings, Inc. USD 140.00 Jan 2022 38 3,800 45,916 (63,285)JPM Intercontinental Exchange, Inc. USD 125.00 Jan 2022 15 1,500 4,761 (18,027)JPM Intercontinental Exchange, Inc. USD 130.00 Jan 2022 16 1,600 9,747 (11,621)JPM Intercontinental Exchange, Inc. USD 130.00 Jan 2022 16 1,600 3,208 (11,621)JPM Intercontinental Exchange, Inc. USD 135.00 Jan 2022 16 1,600 7,294 (5,005)JPM Lockheed Martin Corp. USD 340.00 Jan 2022 9 900 28,233 (15,029)JPM Lockheed Martin Corp. USD 360.00 Jan 2022 9 900 20,583 (2,570)JPM Lockheed Martin Corp. USD 375.00 Jan 2022 9 900 15,993 (297)CSFB Marriott International, Inc., Class A USD 145.00 Jan 2022 15 1,500 18,440 (30,973)CSFB Marriott International, Inc., Class A USD 145.00 Jan 2022 2 200 2,376 (4,130)CSFB Marriott International, Inc., Class A USD 145.00 Jan 2022 8 800 10,193 (16,519)CSFB Marriott International, Inc., Class A USD 150.00 Jan 2022 15 1,500 16,180 (23,888)CSFB Marriott International, Inc., Class A USD 150.00 Jan 2022 2 200 2,097 (3,185)CSFB Marriott International, Inc., Class A USD 150.00 Jan 2022 8 800 8,956 (12,740)CSFB Marriott International, Inc., Class A USD 155.00 Jan 2022 13 1,300 14,757 (14,894)CSFB Marriott International, Inc., Class A USD 160.00 Jan 2022 13 1,300 12,430 (9,685)CSFB Marriott International, Inc., Class A USD 165.00 Jan 2022 9 900 15,242 (3,766)CSFB Marriott International, Inc., Class A USD 170.00 Jan 2022 9 900 13,778 (1,770)RBC McDonald’s Corp. USD 220.00 Jan 2022 7 700 9,709 (33,772)CITI McDonald’s Corp. USD 230.00 Jan 2022 8 800 8,456 (30,619)RBC McDonald’s Corp. USD 230.00 Jan 2022 6 600 6,132 (22,964)GSI McDonald’s Corp. USD 260.00 Jan 2023 6 600 8,262 (15,371)GSI McDonald’s Corp. USD 260.00 Jan 2023 8 800 10,364 (20,494)GSI McDonald’s Corp. USD 270.00 Jan 2023 6 600 6,102 (12,192)GSI McDonald’s Corp. USD 270.00 Jan 2023 8 800 7,912 (16,256)
John Hancock Variable Insurance TrustPortfolio of Investments — December 31, 2021 (showing percentage of total net assets)
The accompanying notes are an integral part of the financial statements. 15

Capital Appreciation Value Trust (continued)
Options on securities (continued)Counterparty (OTC)/Exchange-traded Name of issuer Currency
Exerciseprice
Expirationdate
Number ofcontracts
Notionalamount Premium Value
Calls (continued)CSFB Medtronic PLC USD 115.00 Jan 2022 13 1,300 $ 15,756 $ (14)CSFB Medtronic PLC USD 125.00 Jan 2022 13 1,300 9,711 —CSFB Medtronic PLC USD 130.00 Jan 2022 12 1,200 6,684 —JPM Meta Platforms, Inc., Class A USD 340.00 Jan 2022 12 1,200 30,925 (8,259)JPM Meta Platforms, Inc., Class A USD 345.00 Jan 2022 12 1,200 28,983 (5,866)JPM Meta Platforms, Inc., Class A USD 380.00 Jan 2022 4 400 7,756 (135)JPM Meta Platforms, Inc., Class A USD 400.00 Jan 2022 50 5,000 107,635 (457)JPM Meta Platforms, Inc., Class A USD 400.00 Jan 2022 35 3,500 43,552 (320)JPM Meta Platforms, Inc., Class A USD 345.00 Sep 2022 6 600 23,363 (20,768)JPM Meta Platforms, Inc., Class A USD 360.00 Sep 2022 6 600 20,104 (17,032)SFG Microsoft Corp. USD 250.00 Jan 2022 21 2,100 27,447 (181,717)SFG Microsoft Corp. USD 255.00 Jan 2022 21 2,100 24,717 (171,268)SFG Microsoft Corp. USD 260.00 Jan 2022 21 2,100 22,197 (160,825)SFG Microsoft Corp. USD 265.00 Jan 2022 16 1,600 23,712 (114,582)BOA Microsoft Corp. USD 270.00 Jan 2022 9 900 12,085 (59,980)SFG Microsoft Corp. USD 270.00 Jan 2022 17 1,700 22,559 (113,296)BOA Microsoft Corp. USD 275.00 Jan 2022 9 900 10,565 (55,509)SFG Microsoft Corp. USD 275.00 Jan 2022 16 1,600 19,472 (98,683)BOA Microsoft Corp. USD 280.00 Jan 2022 9 900 9,182 (51,039)CITI Microsoft Corp. USD 280.00 Jan 2022 65 6,500 133,380 (368,615)SFG Microsoft Corp. USD 300.00 Jan 2023 31 3,100 56,637 (184,951)SFG Microsoft Corp. USD 300.00 Jan 2023 32 3,200 60,224 (190,917)SFG Microsoft Corp. USD 320.00 Jan 2023 11 1,100 19,554 (51,944)SFG Microsoft Corp. USD 320.00 Jan 2023 10 1,000 19,093 (47,222)CITI Microsoft Corp. USD 330.00 Jan 2023 8 800 11,752 (33,322)CITI Microsoft Corp. USD 330.00 Jan 2023 7 700 10,343 (29,157)CITI Microsoft Corp. USD 330.00 Jan 2023 6 600 10,666 (24,991)SFG Microsoft Corp. USD 330.00 Jan 2023 11 1,100 16,639 (45,818)SFG Microsoft Corp. USD 330.00 Jan 2023 10 1,000 16,190 (41,652)CITI Microsoft Corp. USD 340.00 Jan 2023 8 800 9,933 (29,224)CITI Microsoft Corp. USD 340.00 Jan 2023 7 700 8,727 (25,571)CITI Microsoft Corp. USD 340.00 Jan 2023 6 600 9,046 (21,918)CITI Microsoft Corp. USD 340.00 Jan 2023 15 1,500 30,384 (54,796)CITI Microsoft Corp. USD 340.00 Jan 2023 7 700 14,213 (25,571)SFG Microsoft Corp. USD 340.00 Jan 2023 11 1,100 14,179 (40,183)SFG Microsoft Corp. USD 340.00 Jan 2023 10 1,000 13,686 (36,530)CITI Microsoft Corp. USD 350.00 Jan 2023 8 800 8,353 (25,469)CITI Microsoft Corp. USD 350.00 Jan 2023 7 700 7,388 (22,285)CITI Microsoft Corp. USD 350.00 Jan 2023 6 600 7,637 (19,101)CITI Microsoft Corp. USD 350.00 Jan 2023 15 1,500 25,849 (47,754)CITI Microsoft Corp. USD 350.00 Jan 2023 7 700 12,179 (22,285)JPM Microsoft Corp. USD 350.00 Jan 2023 22 2,200 33,594 (70,038)SFG Microsoft Corp. USD 350.00 Jan 2023 11 1,100 11,924 (35,019)SFG Microsoft Corp. USD 350.00 Jan 2023 10 1,000 11,583 (31,836)JPM Microsoft Corp. USD 355.00 Jan 2023 21 2,100 29,127 (62,255)CITI Microsoft Corp. USD 360.00 Jan 2023 15 1,500 21,905 (41,337)CITI Microsoft Corp. USD 360.00 Jan 2023 7 700 10,368 (19,291)JPM Microsoft Corp. USD 360.00 Jan 2023 22 2,200 27,654 (60,628)CITI Microsoft Corp. USD 365.00 Jan 2023 15 1,500 19,959 (38,361)CSFB Northrop Grumman Corp. USD 315.00 Jan 2022 5 500 10,285 (36,180)CSFB Northrop Grumman Corp. USD 315.00 Jan 2022 5 500 10,835 (36,180)CSFB Northrop Grumman Corp. USD 325.00 Jan 2022 5 500 8,785 (31,199)CSFB Northrop Grumman Corp. USD 325.00 Jan 2022 5 500 9,085 (31,199)JPM NXP Semiconductors NV USD 195.00 Jan 2022 8 800 14,105 (26,638)JPM NXP Semiconductors NV USD 195.00 Jan 2022 7 700 13,563 (23,308)JPM NXP Semiconductors NV USD 200.00 Jan 2022 8 800 13,168 (22,791)JPM NXP Semiconductors NV USD 200.00 Jan 2022 7 700 12,245 (19,942)JPM NXP Semiconductors NV USD 210.00 Jan 2022 8 800 11,205 (15,424)JPM NXP Semiconductors NV USD 210.00 Jan 2022 7 700 10,451 (13,496)SFG PepsiCo, Inc. USD 145.00 Jan 2022 13 1,300 11,856 (37,477)SFG PepsiCo, Inc. USD 145.00 Jan 2022 14 1,400 11,998 (40,360)SFG PepsiCo, Inc. USD 155.00 Jan 2022 12 1,200 6,504 (22,639)SFG PepsiCo, Inc. USD 155.00 Jan 2022 14 1,400 7,028 (26,412)CSFB Ross Stores, Inc. USD 130.00 Jan 2022 6 600 6,143 (8)
John Hancock Variable Insurance TrustPortfolio of Investments — December 31, 2021 (showing percentage of total net assets)
The accompanying notes are an integral part of the financial statements. 16

Capital Appreciation Value Trust (continued)
Options on securities (continued)Counterparty (OTC)/Exchange-traded Name of issuer Currency
Exerciseprice
Expirationdate
Number ofcontracts
Notionalamount Premium Value
Calls (continued)BOA Ross Stores, Inc. USD 135.00 Jan 2022 3 300 $ 3,132 —CSFB Ross Stores, Inc. USD 135.00 Jan 2022 6 600 5,599 $ (1)BOA Ross Stores, Inc. USD 140.00 Jan 2022 3 300 2,596 —CSFB The Coca-Cola Company USD 52.50 Jan 2022 38 3,800 11,420 (25,700)CSFB The Coca-Cola Company USD 52.50 Jan 2022 52 5,200 11,544 (35,168)CSFB The Coca-Cola Company USD 55.00 Jan 2022 39 3,900 8,341 (16,741)CSFB The Coca-Cola Company USD 55.00 Jan 2022 52 5,200 8,164 (22,321)CITI The PNC Financial Services Group, Inc. USD 175.00 Jan 2022 12 1,200 14,316 (30,966)CITI The PNC Financial Services Group, Inc. USD 180.00 Jan 2022 12 1,200 12,237 (25,098)CITI The PNC Financial Services Group, Inc. USD 180.00 Jan 2022 13 1,300 17,112 (27,190)CITI The PNC Financial Services Group, Inc. USD 185.00 Jan 2022 12 1,200 10,459 (19,362)CITI The PNC Financial Services Group, Inc. USD 185.00 Jan 2022 13 1,300 14,782 (20,976)CITI The PNC Financial Services Group, Inc. USD 190.00 Jan 2022 13 1,300 12,714 (15,049)CITI The PNC Financial Services Group, Inc. USD 220.00 Jan 2023 12 1,200 15,986 (13,918)CITI The PNC Financial Services Group, Inc. USD 220.00 Jan 2023 8 800 10,400 (9,279)CITI The PNC Financial Services Group, Inc. USD 220.00 Jan 2023 2 200 2,581 (2,320)CITI The PNC Financial Services Group, Inc. USD 220.00 Jan 2023 7 700 9,078 (8,119)CITI The PNC Financial Services Group, Inc. USD 230.00 Jan 2023 12 1,200 12,656 (10,280)CITI The PNC Financial Services Group, Inc. USD 230.00 Jan 2023 8 800 8,226 (6,853)CITI The PNC Financial Services Group, Inc. USD 230.00 Jan 2023 2 200 2,040 (1,713)CITI The PNC Financial Services Group, Inc. USD 230.00 Jan 2023 7 700 7,146 (5,997)CITI Thermo Fisher Scientific, Inc. USD 560.00 Jan 2022 6 600 11,722 (64,682)CITI Thermo Fisher Scientific, Inc. USD 580.00 Jan 2022 3 300 8,122 (26,434)CITI Thermo Fisher Scientific, Inc. USD 580.00 Jan 2022 5 500 14,180 (44,056)CITI Thermo Fisher Scientific, Inc. USD 580.00 Jan 2022 6 600 8,456 (52,867)CITI Thermo Fisher Scientific, Inc. USD 600.00 Jan 2022 3 300 6,712 (20,635)CITI Thermo Fisher Scientific, Inc. USD 600.00 Jan 2022 5 500 11,735 (34,392)CITI UnitedHealth Group, Inc. USD 400.00 Jan 2022 6 600 14,447 (61,556)CITI UnitedHealth Group, Inc. USD 410.00 Jan 2022 6 600 11,921 (55,602)CITI UnitedHealth Group, Inc. USD 420.00 Jan 2022 6 600 10,918 (49,664)CITI UnitedHealth Group, Inc. USD 460.00 Jan 2022 3 300 4,789 (13,193)CITI UnitedHealth Group, Inc. USD 470.00 Jan 2022 3 300 3,917 (10,449)JPM Visa, Inc., Class A USD 220.00 Jan 2022 19 1,900 26,638 (5,105)CSFB Visa, Inc., Class A USD 225.00 Jan 2022 22 2,200 29,373 (2,613)GSI Visa, Inc., Class A USD 225.00 Jan 2022 7 700 8,344 (831)GSI Visa, Inc., Class A USD 225.00 Jan 2022 6 600 8,082 (713)GSI Visa, Inc., Class A USD 225.00 Jan 2022 14 1,400 18,239 (1,663)JPM Visa, Inc., Class A USD 225.00 Jan 2022 18 1,800 22,176 (2,138)CSFB Visa, Inc., Class A USD 230.00 Jan 2022 22 2,200 25,978 (1,076)GSI Visa, Inc., Class A USD 230.00 Jan 2022 7 700 7,154 (342)GSI Visa, Inc., Class A USD 230.00 Jan 2022 6 600 7,032 (293)GSI Visa, Inc., Class A USD 230.00 Jan 2022 14 1,400 16,317 (685)JPM Visa, Inc., Class A USD 230.00 Jan 2022 19 1,900 20,463 (929)CSFB Visa, Inc., Class A USD 235.00 Jan 2022 22 2,200 22,406 (466)CSFB Visa, Inc., Class A USD 240.00 Jan 2022 12 1,200 15,050 (127)CSFB Visa, Inc., Class A USD 245.00 Jan 2022 12 1,200 13,240 (73)CSFB Visa, Inc., Class A USD 245.00 Jan 2022 17 1,700 17,798 (103)CITI Visa, Inc., Class A USD 250.00 Jan 2022 23 2,300 19,637 (85)CSFB Waste Management, Inc. USD 130.00 Jan 2022 6 600 2,502 (22,198)CSFB Waste Management, Inc. USD 130.00 Jan 2022 7 700 2,639 (25,898)JPM Yum! Brands, Inc. USD 105.00 Jan 2022 7 700 7,854 (23,754)JPM Yum! Brands, Inc. USD 110.00 Jan 2022 7 700 6,209 (20,264)JPM Yum! Brands, Inc. USD 120.00 Jan 2022 22 2,200 9,424 (41,801)JPM Yum! Brands, Inc. USD 120.00 Jan 2022 6 600 2,742 (11,400)JPM Yum! Brands, Inc. USD 120.00 Jan 2022 14 1,400 6,398 (26,600)JPM Yum! Brands, Inc. USD 120.00 Jan 2022 19 1,900 9,063 (36,101)JPM Yum! Brands, Inc. USD 125.00 Jan 2022 25 2,500 8,050 (35,148)
$4,108,696 $(8,867,376)
Derivatives Currency AbbreviationsUSD U.S. Dollar
John Hancock Variable Insurance TrustPortfolio of Investments — December 31, 2021 (showing percentage of total net assets)
The accompanying notes are an integral part of the financial statements. 17

Capital Appreciation Value Trust (continued)Derivatives AbbreviationsBOA Bank of America, N.A.CITI Citibank, N.A.CSFB Credit Suisse First Boston InternationalGSI Goldman Sachs InternationalJPM JPMorgan Chase Bank, N.A.OTC Over-the-counterRBC Royal Bank of CanadaSFG Susquehanna Financial Group, LLLP
See Notes to financial statements regarding investment transactions and other derivatives information.
Disciplined Value International TrustShares orPrincipalAmount Value
COMMON STOCKS - 97.1%Austria - 0.5%ANDRITZ AG 30,245 $ 1,555,591Bermuda - 1.7%Everest Re Group, Ltd. 19,660 5,385,267Canada - 5.4%Canadian Natural Resources, Ltd. 109,412 4,623,164Cenovus Energy, Inc. 785,923 9,636,480Kinross Gold Corp. 186,328 1,081,187Kinross Gold Corp. (New York
Stock Exchange) 323,086 1,877,13017,217,961
China - 0.8%Angang Steel Company, Ltd., H Shares 2,856,000 1,273,493Topsports International Holdings, Ltd. (A) 1,156,000 1,170,837
2,444,330Finland - 1.9%Metso Outotec OYJ 250,698 2,662,447Sampo OYJ, A Shares 69,447 3,475,684
6,138,131France - 14.8%Airbus SE (B) 37,849 4,842,540AXA SA 105,076 3,127,401BNP Paribas SA 73,703 5,095,896Capgemini SE 12,605 3,089,238Eiffage SA 23,898 2,463,971Imerys SA 50,823 2,111,400Klepierre SA (B) 96,155 2,275,241Rexel SA (B) 266,307 5,393,368Sanofi 95,134 9,546,119TotalEnergies SE 175,480 8,931,959
46,877,133Germany - 6.5%Allianz SE 11,211 2,644,210Deutsche Telekom AG 231,882 4,284,594E.ON SE 178,320 2,478,189Hannover Rueck SE 19,629 3,721,586Rheinmetall AG 12,823 1,206,772Siemens AG 35,746 6,191,301
20,526,652Greece - 0.7%Hellenic Telecommunications
Organization SA 112,054 2,070,099India - 0.3%HDFC Bank, Ltd., ADR 15,772 1,026,284Ireland - 1.8%CRH PLC 62,465 3,306,895CRH PLC (London Stock Exchange) 764 40,481
Disciplined Value International Trust (continued)Shares orPrincipalAmount Value
COMMON STOCKS (continued)Ireland (continued)Flutter Entertainment PLC (London Stock
Exchange) (B) 14,795 $ 2,366,8895,714,265
Italy - 0.7%Enel SpA 295,696 2,364,407Japan - 11.4%Asahi Group Holdings, Ltd. 99,500 3,873,415Fuji Corp. (Aichi) 99,900 2,240,664Honda Motor Company, Ltd. 151,200 4,301,753Komatsu, Ltd. 119,300 2,789,950Mitsubishi Gas Chemical Company, Inc. 101,700 1,723,965Nihon Unisys, Ltd. 67,900 1,905,516Sanwa Holdings Corp. 105,800 1,129,730Sony Group Corp. 39,900 5,038,503Sumitomo Heavy Industries, Ltd. 121,200 2,941,866Sumitomo Mitsui Financial Group, Inc. 143,300 4,893,309Tosoh Corp. 102,800 1,527,250TS Tech Company, Ltd. 116,700 1,436,504Yamaha Motor Company, Ltd. 93,000 2,233,778
36,036,203Macau - 0.2%Wynn Macau, Ltd. (B) 755,600 613,584Malta - 0.0%BGP Holdings PLC (B)(C) 2,126,418 0Netherlands - 4.8%ING Groep NV 292,404 4,065,289Royal Dutch Shell PLC, A Shares 231,044 5,063,179Stellantis NV 316,783 6,010,070
15,138,538Norway - 1.0%DNB Bank ASA 69,433 1,588,192Norsk Hydro ASA 184,953 1,455,319
3,043,511South Korea - 6.3%Hana Financial Group, Inc. 110,120 3,890,440KB Financial Group, Inc. 84,154 3,891,644POSCO 6,314 1,464,134Samsung Electronics Company, Ltd. 106,754 7,011,066SK Square Company, Ltd. (B) 29,086 1,624,656SK Telecom Company, Ltd. 44,993 2,186,498
20,068,438Spain - 0.6%Applus Services SA 193,469 1,773,737Sweden - 4.1%Svenska Handelsbanken AB, A Shares 572,445 6,186,957Volvo AB, B Shares 297,637 6,883,304
13,070,261
John Hancock Variable Insurance TrustPortfolio of Investments — December 31, 2021 (showing percentage of total net assets)
The accompanying notes are an integral part of the financial statements. 18

Disciplined Value International Trust (continued)Shares orPrincipalAmount Value
COMMON STOCKS (continued)Switzerland - 13.2%Adecco Group AG 53,606 $ 2,731,621Glencore PLC (B) 1,181,138 6,018,213Novartis AG 92,091 8,092,223Roche Holding AG 19,610 8,135,429STMicroelectronics NV 55,108 2,709,929Swiss Re AG 50,082 4,943,771UBS Group AG 512,137 9,192,500
41,823,686United Kingdom - 17.2%BAE Systems PLC 247,782 1,847,755Coca-Cola Europacific Partners PLC 154,157 8,622,001GlaxoSmithKline PLC 120,716 2,628,313IMI PLC 187,936 4,432,268Liberty Global PLC, Series A (B) 228,495 6,338,451Melrose Industries PLC 1,200,881 2,611,652NatWest Group PLC 1,086,239 3,326,398Nomad Foods, Ltd. (B) 94,925 2,410,146Persimmon PLC 59,889 2,321,235Reckitt Benckiser Group PLC 40,117 3,453,408SSE PLC 240,931 5,386,043Tesco PLC 1,711,193 6,737,079Travis Perkins PLC 203,718 4,300,597
54,415,346United States - 3.2%Applied Materials, Inc. 14,380 2,262,837Envista Holdings Corp. (B) 111,312 5,015,719FMC Corp. 26,780 2,942,854
10,221,410TOTAL COMMON STOCKS (Cost $280,071,358) $ 307,524,834
PREFERRED SECURITIES - 0.7%Germany - 0.7%Volkswagen AG 11,801 2,370,621TOTAL PREFERRED SECURITIES (Cost $2,570,931) $ 2,370,621
SHORT-TERM INVESTMENTS - 1.8%Short-term funds - 1.8%Fidelity Institutional Money Market
Government Portfolio, InstitutionalClass, 0.0100% (D) 5,573,832 5,573,832
TOTAL SHORT-TERM INVESTMENTS (Cost $5,573,832) $ 5,573,832Total Investments (Disciplined Value International Trust)
(Cost $288,216,121) - 99.6% $ 315,469,287Other assets and liabilities, net - 0.4% 1,213,490TOTAL NET ASSETS - 100.0% $ 316,682,777
Security Abbreviations and LegendADR American Depositary Receipt(A) These securities are exempt from registration under Rule 144A of
the Securities Act of 1933. Such securities may be resold, normallyto qualified institutional buyers, in transactions exempt fromregistration.
(B) Non-income producing security.(C) Security is valued using significant unobservable inputs and is
classified as Level 3 in the fair value hierarchy. Refer to Note 2 tothe financial statements.
(D) The rate shown is the annualized seven-day yield as of 12-31-21.
Emerging Markets Value TrustShares orPrincipalAmount Value
COMMON STOCKS - 97.3%Australia - 0.0%MMG, Ltd. (A) 108,000 $ 34,741Belgium - 0.0%Titan Cement International SA (A) 2,489 37,859Brazil - 2.6%Banco Bradesco SA 63,196 183,187Banco do Brasil SA 54,283 280,556Banco Santander Brasil SA 17,518 94,227BrasilAgro - Company Brasileira de
Propriedades Agricolas 4,600 23,806Camil Alimentos SA 10,600 21,610Cia Brasileira de Distribuicao 10,547 42,014Cia Siderurgica Nacional SA 10,719 48,009Cia Siderurgica Nacional SA, ADR 9,153 40,639Cielo SA 59,300 23,792Cogna Educacao (A) 186,166 81,653Construtora Tenda SA 4,000 11,961Cyrela Brazil Realty SA Empreendimentos
e Participacoes 17,823 50,273Direcional Engenharia SA 8,400 19,112Embraer SA (A) 32,800 146,499Enauta Participacoes SA 16,860 40,251Getnet Adquirencia e Servicos para Meios
de Pagamento SA (A) 4,380 3,027Guararapes Confeccoes SA 4,400 7,759International Meal Company Alimentacao
SA (A) 26,670 11,587Iochpe Maxion SA 11,411 31,322JBS SA 71,790 489,827JHSF Participacoes SA 28,427 28,400M Dias Branco SA 5,032 23,048Marisa Lojas SA (A) 14,758 10,008MRV Engenharia e Participacoes SA 15,337 32,999Petroleo Brasileiro SA 349,947 1,927,192Positivo Tecnologia SA 9,000 17,571Sao Carlos Empreendimentos e
Participacoes SA 5,205 38,464TIM SA 55,934 132,491Trisul SA 13,137 14,011Tupy SA 9,951 35,535Ultrapar Participacoes SA 3,860 10,235Usinas Siderurgicas de Minas Gerais SA 14,738 38,303Vale SA 184,570 2,571,671
6,531,039Canada - 0.0%Atlas Corp. (B) 1,512 21,440Chile - 0.4%Camanchaca SA (A) 214,992 9,333CAP SA 5,458 53,104Cementos BIO BIO SA 16,447 13,522Cencosud SA 133,449 223,146Cristalerias de Chile SA 3,626 13,019Empresa Nacional de
Telecomunicaciones SA 15,564 52,561Empresas CMPC SA 53,560 89,694Empresas COPEC SA 21,339 165,029Empresas Hites SA (A) 46,731 9,778Enel Americas SA 284,900 31,098Grupo Security SA 147,513 20,663Hortifrut SA 9,101 9,087Inversiones Aguas Metropolitanas SA 42,648 19,380Itau CorpBanca Chile SA (A) 10,081,598 19,471Masisa SA (A) 321,066 4,357PAZ Corp. SA 16,523 5,936Ripley Corp. SA 137,631 22,226
John Hancock Variable Insurance TrustPortfolio of Investments — December 31, 2021 (showing percentage of total net assets)
The accompanying notes are an integral part of the financial statements. 19

Emerging Markets Value Trust (continued)Shares orPrincipalAmount Value
COMMON STOCKS (continued)Chile (continued)Salfacorp SA 54,622 $ 19,997Sigdo Koppers SA 50,989 47,548SMU SA 43,046 4,331Sociedad Matriz SAAM SA 670,600 43,995Socovesa SA 113,429 14,623SONDA SA 17,248 5,037
896,935China - 26.2%360 Security Technology, Inc., Class A (A) 30,100 60,080361 Degrees International, Ltd. (A) 119,000 61,1193SBio, Inc. (A)(C) 146,500 122,088AAC Technologies Holdings, Inc. 79,500 313,324Addsino Company, Ltd., Class A 9,800 25,689Agile Group Holdings, Ltd. 157,000 85,225Agricultural Bank of China, Ltd., H Shares 1,681,000 578,327Air China, Ltd., H Shares (A) 152,000 106,157Alibaba Group Holding, Ltd. (A) 174,600 2,565,849Allmed Medical Products Company, Ltd.,
Class A 6,100 15,656Aluminum Corp. of China, Ltd., H
Shares (A) 372,000 204,974Angang Steel Company, Ltd., H Shares 193,800 86,416Anhui Conch Cement Company, Ltd.,
H Shares 137,000 685,242Anhui Guangxin Agrochemical
Company, Ltd., Class A 3,200 19,579Anhui Truchum Advanced Materials &
Technology Company, Ltd., Class A 12,200 25,391Anhui Zhongding Sealing Parts
Company, Ltd., Class A 9,200 31,461Anton Oilfield Services Group (A) 284,000 15,516Asia Cement China Holdings Corp. 65,000 41,565AsiaInfo Technologies, Ltd. (C) 17,200 28,073Avary Holding Shenzhen Company, Ltd.,
Class A 4,500 29,987AviChina Industry & Technology
Company, Ltd., H Shares 230,000 159,125BAIC Motor Corp., Ltd., H Shares (C) 207,000 88,918Baidu, Inc., ADR (A) 14,801 2,202,241Baidu, Inc., Class A (A) 15,600 290,954BAIOO Family Interactive, Ltd. (C) 126,000 9,715Bank of Beijing Company, Ltd., Class A 90,000 62,707Bank of Changsha Company, Ltd., Class A 24,300 29,778Bank of Chengdu Company, Ltd., Class A 28,200 53,114Bank of China, Ltd., H Shares 5,614,694 2,019,978Bank of Chongqing Company, Ltd.,
H Shares 69,500 39,766Bank of Communications Company, Ltd.,
H Shares 705,876 426,711Bank of Guiyang Company, Ltd., Class A 19,600 20,022Bank of Hangzhou Company, Ltd., Class A 28,200 56,737Bank of Jiangsu Company, Ltd., Class A 53,800 49,224Bank of Nanjing Company, Ltd., Class A 54,200 76,179Bank of Ningbo Company, Ltd., Class A 36,960 221,962Bank of Shanghai Company, Ltd., Class A 57,000 63,762Bank of Suzhou Company, Ltd., Class A 19,100 20,294Bank of Tianjin Company, Ltd., H
Shares (A) 74,000 20,395Baoshan Iron & Steel Company, Ltd.,
Class A 156,200 176,071Baoye Group Company, Ltd., H Shares (A) 22,000 11,064Baozun, Inc., Class A (A) 1,300 5,838BBMG Corp., H Shares 220,000 34,172
Emerging Markets Value Trust (continued)Shares orPrincipalAmount Value
COMMON STOCKS (continued)China (continued)Beijing Capital Eco-Environment
Protection Group Company, Ltd.,Class A 50,000 $ 26,761
Beijing Capital International AirportCompany, Ltd., H Shares (A) 236,000 144,627
Beijing Dabeinong Technology GroupCompany, Ltd., Class A 18,200 29,989
Beijing Enlight Media Company, Ltd.,Class A 14,200 28,644
Beijing GeoEnviron Engineering &Technology, Inc., Class A 6,000 16,546
Beijing Jetsen Technology Company, Ltd.,Class A (A) 27,000 26,840
Beijing New Building Materials PLC,Class A 12,300 69,220
Beijing North Star Company, Ltd.,H Shares 132,000 19,804
Beijing Orient National CommunicationScience & Technology Company, Ltd.,Class A (A) 10,200 17,294
Beijing Originwater TechnologyCompany, Ltd., Class A 11,500 12,984
Beijing Shougang Company, Ltd., Class A 20,200 18,225Beijing Shunxin Agriculture
Company, Ltd., Class A 3,700 22,173Beijing Sinnet Technology Company, Ltd.,
Class A 10,500 24,469Beijing Thunisoft Corp, Ltd., Class A 6,500 12,968Beijing Urban Construction Design &
Development Group Company, Ltd., HShares (C) 35,000 9,248
Beijing Yanjing Brewery Company, Ltd.,Class A 18,000 23,944
Beijing-Shanghai High Speed RailwayCompany, Ltd., Class A 62,900 47,657
Blue Sail Medical Company, Ltd., Class A 7,100 18,164Bluefocus Intelligent Communications
Group Company, Ltd., Class A 32,100 54,063BOC International China Company, Ltd.,
Class A 8,800 18,595BOE Technology Group Company, Ltd.,
Class A 248,600 197,009Bohai Leasing Company, Ltd., Class A (A) 50,900 23,249Boyaa Interactive International, Ltd. (A) 63,000 4,045Bright Dairy & Food Company, Ltd.,
Class A 9,600 21,879BTG Hotels Group Company, Ltd.,
Class A (A) 4,500 18,488BYD Electronic International
Company, Ltd. 63,500 232,444Cabbeen Fashion, Ltd. 40,000 14,432Caitong Securities Company, Ltd., Class A 25,900 45,235Cangzhou Mingzhu Plastic Company, Ltd.,
Class A 15,000 18,423CECEP Solar Energy Company, Ltd.,
Class A 13,500 23,754CECEP Wind-Power Corp., Class A 19,600 20,015Central China Management Company, Ltd. 113,732 23,087Central China Real Estate, Ltd. 113,732 13,720Changjiang Securities Company, Ltd.,
Class A 20,700 24,507Changsha Broad Homes Industrial Group
Company, Ltd., H Shares (A)(B)(C) 9,000 13,850Chaowei Power Holdings, Ltd. 88,000 23,019Cheetah Mobile, Inc., ADR (A) 4,594 6,294
John Hancock Variable Insurance TrustPortfolio of Investments — December 31, 2021 (showing percentage of total net assets)
The accompanying notes are an integral part of the financial statements. 20

Emerging Markets Value Trust (continued)Shares orPrincipalAmount Value
COMMON STOCKS (continued)China (continued)Chengtun Mining Group Company, Ltd.,
Class A 12,000 $ 20,277Chengzhi Company, Ltd., Class A (A) 5,100 12,656China Aoyuan Group, Ltd. 75,000 13,573China BlueChemical, Ltd., H Shares 242,000 67,372China Cinda Asset Management
Company, Ltd., H Shares 1,012,000 184,327China CITIC Bank Corp., Ltd., H Shares 730,775 316,989China Coal Energy Company, Ltd.,
H Shares 178,000 102,908China Communications Services Corp.,
Ltd., H Shares 217,200 105,854China Conch Venture Holdings, Ltd. 109,000 533,145China Construction Bank Corp., H Shares 7,619,000 5,279,555China Development Bank Financial
Leasing Company, Ltd., H Shares (C) 122,000 18,461China Dili Group (A)(B) 190,600 48,635China Dongxiang Group Company, Ltd. 361,000 31,529China East Education
Holdings, Ltd. (A)(C) 45,000 28,191China Eastern Airlines Corp., Ltd., H
Shares (A) 276,000 104,497China Electronics Optics Valley Union
Holding Company, Ltd. 308,000 15,807China Energy Engineering Corp., Ltd., H
Shares (B) 162,000 27,428China Everbright Bank Company, Ltd.,
H Shares 286,000 101,273China Express Airlines Company, Ltd.,
Class A 8,200 16,231China Galaxy Securities Company, Ltd.,
H Shares 301,000 173,006China Great Wall Securities
Company, Ltd., Class A 11,800 23,999China Hanking Holdings, Ltd. 61,000 10,517China Harmony Auto Holding, Ltd. 105,500 66,753China Hongqiao Group, Ltd. 249,000 263,181China Huarong Asset Management
Company, Ltd., H Shares (A)(C)(D) 1,070,000 55,987China Huiyuan Juice Group, Ltd. (A)(D) 212,500 13,762China International Capital Corp., Ltd., H
Shares (C) 8,400 23,182China International Marine Containers
Group Company, Ltd., H Shares 64,700 116,240China Jushi Company, Ltd., Class A 18,200 51,995China Kepei Education Group, Ltd. 68,000 27,979China Lesso Group Holdings, Ltd. 133,000 191,210China Life Insurance Company, Ltd.,
H Shares 379,000 628,258China Lilang, Ltd. 72,000 40,262China Literature, Ltd. (A)(C) 2,800 17,619China Maple Leaf Educational
Systems, Ltd. (A) 222,000 15,380China Medical System Holdings, Ltd. 146,000 244,055China Meheco Company, Ltd., Class A 8,700 16,120China Merchants Bank Company, Ltd.,
H Shares 298,000 2,318,314China Merchants Energy Shipping
Company, Ltd., Class A 24,100 15,548China Merchants Securities Company, Ltd.,
H Shares (C) 29,480 45,158China Merchants Shekou Industrial Zone
Holdings Company, Ltd., Class A 19,600 41,077China Minsheng Banking Corp., Ltd., H
Shares (B) 371,400 142,012
Emerging Markets Value Trust (continued)Shares orPrincipalAmount Value
COMMON STOCKS (continued)China (continued)China Modern Dairy Holdings, Ltd. (B) 171,000 $ 28,757China Molybdenum Company, Ltd.,
H Shares 213,000 112,516China National Accord Medicines Corp.,
Ltd., Class A 2,100 12,193China National Building Material
Company, Ltd., H Shares 539,450 662,304China National Medicines Corp, Ltd.,
Class A 3,200 15,834China New Higher Education
Group, Ltd. (C) 88,000 37,304China Oilfield Services, Ltd., H Shares 182,000 159,648China Oriental Group Company, Ltd. 164,000 49,507China Pacific Insurance Group
Company, Ltd., H Shares 220,200 598,257China Petroleum & Chemical Corp., ADR 6,198 288,269China Petroleum & Chemical Corp.,
H Shares 1,262,000 587,866China Railway Group, Ltd., H Shares 379,000 200,550China Railway Signal & Communication
Corp., Ltd., H Shares (C) 207,000 75,650China Reinsurance Group Corp., H Shares 554,000 53,310China Resources Double Crane
Pharmaceutical Company, Ltd., Class A 6,300 13,217China Resources Medical Holdings
Company, Ltd. 103,000 61,262China Resources Pharmaceutical
Group, Ltd. (C) 195,500 89,048China Resources Sanjiu Medical &
Pharmaceutical Company, Ltd., Class A 5,700 30,651China Sanjiang Fine Chemicals
Company, Ltd. 105,000 34,368China SCE Group Holdings, Ltd. 229,200 55,607China Shanshui Cement Group, Ltd. (A) 117,000 29,370China Shenhua Energy Company, Ltd.,
H Shares 333,000 779,314China Shineway Pharmaceutical
Group, Ltd. 32,000 28,333China Silver Group, Ltd. (A) 94,000 7,128China South Publishing & Media Group
Company, Ltd., Class A 14,900 22,378China Southern Airlines Company, Ltd., H
Shares (A) 132,000 79,087China Sunshine Paper Holdings
Company, Ltd. (A) 31,500 9,378China Taifeng Beddings
Holdings, Ltd. (A)(D) 204,000 12,715China Tower Corp., Ltd., H Shares (C) 3,970,000 438,038China TransInfo Technology
Company, Ltd., Class A 9,500 22,279China Tungsten And Hightech Materials
Company, Ltd., Class A (A) 8,600 21,735China Vanke Company, Ltd., H Shares 182,692 425,408China XLX Fertiliser, Ltd. 58,000 39,698China Yongda Automobiles Services
Holdings, Ltd. 101,000 135,339China Yuhua Education Corp., Ltd. (C) 162,000 57,990China ZhengTong Auto Services
Holdings, Ltd. (A) 160,000 17,870China Zheshang Bank Company, Ltd.,
H Shares 42,000 17,781China Zhongwang Holdings, Ltd. (A)(D) 196,800 42,401Chinese Universe Publishing and Media
Group Company, Ltd., Class A 6,200 12,029
John Hancock Variable Insurance TrustPortfolio of Investments — December 31, 2021 (showing percentage of total net assets)
The accompanying notes are an integral part of the financial statements. 21

Emerging Markets Value Trust (continued)Shares orPrincipalAmount Value
COMMON STOCKS (continued)China (continued)Chongqing Changan Automobile
Company, Ltd., Class A 26,300 $ 62,672Chongqing Rural Commercial Bank
Company, Ltd., H Shares 311,000 110,529Chow Tai Seng Jewellery Company, Ltd.,
Class A 3,700 10,330CIFI Holdings Group Company, Ltd. 358,449 215,626CITIC Securities Company, Ltd., H Shares 123,500 322,565CITIC, Ltd. 460,130 455,224CMGE Technology Group, Ltd. (A) 30,000 11,939CMST Development Company, Ltd.,
Class A 21,400 20,962CNOOC Energy Technology &
Services, Ltd., Class A 33,000 15,187COFCO Biotechnology Company, Ltd.,
Class A 15,200 25,912Cogobuy Group (A)(C) 74,000 25,443Colour Life Services Group
Company, Ltd. (A)(B) 6,169 744Consun Pharmaceutical Group, Ltd. 19,000 10,741COSCO SHIPPING Development
Company, Ltd., H Shares 434,000 79,007COSCO SHIPPING Energy Transportation
Company, Ltd., H Shares 168,000 64,040COSCO SHIPPING Holdings
Company, Ltd., H Shares (A) 30,000 58,169Cosmo Lady China Holdings
Company, Ltd. (A)(C) 29,000 1,821Country Garden Holdings Company, Ltd. 879,155 780,755CPMC Holdings, Ltd. 76,000 42,494CSG Holding Company, Ltd., Class A 13,900 21,671CSPC Pharmaceutical Group, Ltd. 76,000 82,756CT Environmental Group, Ltd. (A)(D) 164,000 2,503CTS International Logistics Corp, Ltd.,
Class A 8,000 17,189DaFa Properties Group, Ltd. (B) 27,000 15,924Dali Foods Group Company, Ltd. (C) 180,500 94,561Dexin China Holdings
Company, Ltd. (A)(B) 66,000 22,601DHC Software Company, Ltd., Class A 10,800 13,223Dian Diagnostics Group Company, Ltd.,
Class A 2,300 12,114Digital China Information Service
Company, Ltd., Class A 7,800 15,592Dong-E-E-Jiao Company, Ltd., Class A 2,100 16,071Dongfang Electric Corp., Ltd., H Shares 29,000 48,820Dongfeng Motor Group Company, Ltd.,
H Shares 210,000 174,573Dongxing Securities Company, Ltd.,
Class A 12,000 21,906DouYu International Holdings, Ltd.,
ADR (A) 3,398 8,971E-Commodities Holdings, Ltd. 348,000 52,197E-House China Enterprise
Holdings, Ltd. (B) 75,000 16,468Everbright Securities Company, Ltd., H
Shares (C) 25,600 19,805Fang Holdings, Ltd., ADR (A) 10 38Fangda Carbon New Material
Company, Ltd., Class A 13,200 22,425Fangda Special Steel Technology
Company, Ltd., Class A 8,800 10,778Fantasia Holdings Group
Company, Ltd. (A) 172,500 7,191
Emerging Markets Value Trust (continued)Shares orPrincipalAmount Value
COMMON STOCKS (continued)China (continued)FAW Jiefang Group Company, Ltd.,
Class A 9,300 $ 15,012Fiberhome Telecommunication
Technologies Company, Ltd., Class A 5,000 14,109FinVolution Group, ADR 6,795 33,499First Capital Securities Company, Ltd.,
Class A 18,600 21,376First Tractor Company, Ltd., H Shares 36,000 18,250Fosun International, Ltd. 195,460 210,962Founder Securities Company, Ltd., Class A 31,500 38,786Fu Shou Yuan International Group, Ltd. 103,000 80,946Fufeng Group, Ltd. (A) 208,200 71,846Fujian Star-net Communication
Company, Ltd., Class A 5,700 21,090Fujian Sunner Development
Company, Ltd., Class A 6,700 25,380Gansu Shangfeng Cement Company, Ltd.,
Class A 8,400 26,474GDS Holdings, Ltd., Class A (A) 21,200 122,816GEM Company, Ltd., Class A 25,800 41,979Gemdale Corp., Class A 16,600 33,818Genertec Universal Medical Group
Company, Ltd. (C) 99,000 71,517GF Securities Company, Ltd., H Shares 69,200 131,965Giant Network Group Company, Ltd.,
Class A 8,000 15,026Grand Baoxin Auto Group, Ltd. (A) 219,500 19,168Grandjoy Holdings Group Company, Ltd.,
Class A (A) 22,500 13,178Greatview Aseptic Packaging
Company, Ltd. 44,000 16,095Gree Electric Appliances, Inc. of Zhuhai,
Class A 20,300 118,115Greenland Holdings Corp., Ltd., Class A 35,400 24,113Greenland Hong Kong Holdings, Ltd. 88,000 16,935Greentown China Holdings, Ltd. 102,500 165,239Greentown Service Group Company, Ltd. 98,000 90,491GRG Banking Equipment Company, Ltd.,
Class A 6,800 12,718Guangdong Tapai Group Company, Ltd.,
Class A 13,200 21,937Guangdong Xinbao Electrical Appliances
Holdings Company, Ltd., Class A 5,400 20,958Guanghui Energy Company, Ltd.,
Class A (A) 34,100 35,052Guangshen Railway Company, Ltd., H
Shares (A) 211,600 36,088Guangxi Liugong Machinery
Company, Ltd., Class A 12,000 14,512Guangxi Wuzhou Zhongheng Group
Company, Ltd., Class A 44,700 27,082Guangzhou Automobile Group
Company, Ltd., H Shares 210,000 207,254Guangzhou Baiyunshan Pharmaceutical
Holdings Company, Ltd., H Shares 24,000 69,137Guangzhou Haige Communications
Group, Inc. Company, Class A 9,600 16,442Guangzhou R&F Properties
Company, Ltd., H Shares (B) 201,600 75,018Guangzhou Yuexiu Financial Holdings
Group Company, Ltd., Class A 17,000 23,210Guizhou Panjiang Refined Coal
Company, Ltd., Class A 18,700 21,367Guizhou Xinbang Pharmaceutical
Company, Ltd., Class A (A) 10,700 12,465
John Hancock Variable Insurance TrustPortfolio of Investments — December 31, 2021 (showing percentage of total net assets)
The accompanying notes are an integral part of the financial statements. 22

Emerging Markets Value Trust (continued)Shares orPrincipalAmount Value
COMMON STOCKS (continued)China (continued)Guorui Properties, Ltd. (A) 84,000 $ 3,292Guosen Securities Company, Ltd., Class A 35,700 64,335Guotai Junan Securities Company, Ltd., H
Shares (C) 34,600 53,728Guoyuan Securities Company, Ltd.,
Class A 17,400 21,031Haier Smart Home Company, Ltd.,
H Shares 191,600 810,339Haitian International Holdings, Ltd. 70,000 194,457Haitong Securities Company, Ltd.,
H Shares 188,000 166,672Hang Zhou Great Star Industrial
Company, Ltd., Class A (A) 4,300 20,568Hangcha Group Company, Ltd., Class A 5,800 15,611Hangzhou Binjiang Real Estate Group
Company, Ltd., Class A 20,300 14,847Hangzhou Oxygen Plant Group
Company, Ltd., Class A 5,100 24,030Hangzhou Robam Appliances
Company, Ltd., Class A 4,400 24,873Harbin Bank Company, Ltd., H
Shares (A)(C) 74,000 7,498Harbin Electric Company, Ltd., H
Shares (A) 84,000 37,929HBIS Resources Company, Ltd., Class A 4,700 10,588HC Group, Inc. (A) 98,000 8,445Heilongjiang Agriculture Company, Ltd.,
Class A 9,100 20,798Hello Group, Inc., ADR 17,548 157,581Henan Shenhuo Coal & Power
Company, Ltd., Class A 6,200 8,888Hengan International Group Company, Ltd. 70,000 360,634Hengdian Group DMEGC Magnetics
Company, Ltd., Class A 10,000 29,639Hengli Petrochemical Company, Ltd.,
Class A 35,401 127,690Hengyi Petrochemical Company, Ltd.,
Class A 23,800 39,696Hesteel Company, Ltd., Class A 54,700 21,141Hiroca Holdings, Ltd. 8,000 16,325Hisense Home Appliances Group
Company, Ltd., H Shares 39,000 46,265Hongda Xingye Company, Ltd., Class A 28,900 27,492Honghua Group, Ltd. (A) 367,000 12,972Honworld Group, Ltd. (A)(C)(D) 56,000 19,843Hope Education Group Company, Ltd. (C) 352,000 67,821Hua Hong Semiconductor, Ltd. (A)(C) 25,000 138,072Huadong Medicine Company, Ltd.,
Class A 4,620 29,186Huafa Industrial Company Ltd Zhuhai,
Class A 26,900 25,425Huafon Chemical Company, Ltd., Class A 21,100 34,579Huaibei Mining Holdings Company, Ltd.,
Class A 10,300 18,119Huapont Life Sciences Company, Ltd.,
Class A 10,700 12,178Huatai Securities Company, Ltd., H
Shares (C) 112,800 187,892Huaxi Securities Company, Ltd., Class A 7,000 10,823Huaxia Bank Company, Ltd., Class A 65,400 57,475Huaxin Cement Company, Ltd., Class A 7,100 21,516Huayu Automotive Systems
Company, Ltd., Class A 14,900 66,169Hubei Biocause Pharmaceutical
Company, Ltd., Class A 20,900 10,860
Emerging Markets Value Trust (continued)Shares orPrincipalAmount Value
COMMON STOCKS (continued)China (continued)Hubei Jumpcan Pharmaceutical
Company, Ltd., Class A 7,400 $ 32,907Huishang Bank Corp., Ltd., H Shares (A) 63,300 21,197Humanwell Healthcare Group
Company, Ltd., Class A 12,500 44,260Hunan Valin Steel Company, Ltd., Class A 44,000 35,367Hytera Communications Corp, Ltd.,
Class A 14,800 12,821iDreamSky Technology
Holdings, Ltd. (A)(C) 32,000 25,677Industrial & Commercial Bank of
China, Ltd., H Shares 4,921,000 2,775,854Industrial Bank Company, Ltd., Class A 131,700 393,374Industrial Securities Company, Ltd.,
Class A 29,200 45,330Inke, Ltd. (A) 75,000 16,179Inner Mongolia BaoTou Steel Union
Company, Ltd., Class A (A) 166,200 72,892Inner Mongolia Dian Tou Energy
Corp, Ltd., Class A 8,600 20,081Inner Mongolia ERDOS Resources
Company, Ltd., Class A 4,500 16,622Inner Mongolia Junzheng Energy &
Chemical Industry GroupCompany, Ltd., Class A 43,700 35,898
Inner Mongolia Xingye MiningCompany, Ltd., Class A (A) 13,800 15,676
Inner Mongolia Yitai Coal Company, Ltd.,H Shares 25,700 19,847
Inner Mongolia Yuan Xing EnergyCompany, Ltd., Class A (A) 18,500 21,226
Inspur Electronic Information IndustryCompany, Ltd., Class A 9,300 52,337
JCET Group Company, Ltd., Class A 10,100 49,164JD.com, Inc., Class A (A) 13,650 470,275JH Educational Technology, Inc. (A) 42,000 15,194Jiangsu Changshu Rural Commercial Bank
Company, Ltd., Class A 18,200 18,878Jiangsu Guotai International Group
Company, Ltd., Class A 7,600 16,391Jiangsu Jiangyin Rural Commercial Bank
Company, Ltd., Class A 17,900 10,816Jiangsu Linyang Energy Company, Ltd.,
Class A 13,300 25,327Jiangsu Provincial Agricultural
Reclamation and Development Corp. 11,200 20,957Jiangsu Shagang Company, Ltd., Class A 27,000 24,768Jiangsu Shuangxing Color Plastic New
Materials Company, Ltd., Class A 5,200 22,126Jiangsu Zhangjiagang Rural Commercial
Bank Company, Ltd., Class A 13,900 12,562Jiangsu Zhongnan Construction Group
Company, Ltd., Class A 31,500 20,480Jiangsu Zhongtian Technology
Company, Ltd., Class A 17,400 46,296Jiangxi Copper Company, Ltd., H Shares 99,000 159,047Jiangxi Zhengbang Technology
Company, Ltd., Class A 14,100 21,402Jilin Aodong Pharmaceutical Group
Company, Ltd., Class A 4,700 13,638Jinduicheng Molybdenum Company, Ltd.,
Class A 17,700 19,064Jingrui Holdings, Ltd. (A)(B) 69,000 15,306JinkoSolar Holding Company, Ltd.,
ADR (A)(B) 4,563 209,715
John Hancock Variable Insurance TrustPortfolio of Investments — December 31, 2021 (showing percentage of total net assets)
The accompanying notes are an integral part of the financial statements. 23

Emerging Markets Value Trust (continued)Shares orPrincipalAmount Value
COMMON STOCKS (continued)China (continued)Jinneng Science&Technology
Company, Ltd., Class A 8,700 $ 22,268Jizhong Energy Resources Company, Ltd.,
Class A 18,200 15,781JNBY Design, Ltd. 11,000 17,524Joincare Pharmaceutical Group Industry
Company, Ltd., Class A 11,400 22,975Jointown Pharmaceutical Group
Company, Ltd., Class A 7,700 17,797Juneyao Airlines Company, Ltd., Class A 6,700 18,676Kaisa Prosperity Holdings, Ltd. (A) 4,000 6,146Kangda International Environmental
Company, Ltd. (A)(C) 140,000 14,176Kasen International Holdings, Ltd. (A) 119,000 11,740Keshun Waterproof Technologies
Company, Ltd., Class A 10,700 27,329Kingfa Sci & Tech Company, Ltd.,
Class A 12,500 24,673Kingsoft Corp., Ltd. 93,600 411,687Kunlun Tech Company, Ltd., Class A 3,100 11,281KWG Group Holdings, Ltd. 154,013 100,864KWG Living Group Holdings, Ltd. 88,506 36,394LB Group Company, Ltd., Class A 13,400 60,106Legend Holdings Corp., H Shares (C) 66,200 97,875Lenovo Group, Ltd. 674,000 774,619Lens Technology Company, Ltd., Class A 31,900 115,065Leo Group Company, Ltd., Class A 58,700 22,668Lepu Medical Technology Beijing
Company, Ltd., Class A 12,600 44,791LexinFintech Holdings, Ltd., ADR (A) 14,967 57,773Leyard Optoelectronic Company, Ltd.,
Class A 9,800 15,772Liaoning Cheng Da Company, Ltd.,
Class A 7,000 21,452Liaoning Port Company, Ltd., H Shares 204,000 18,588Lier Chemical Company, Ltd., Class A 3,900 20,674Lingyi iTech Guangdong Company,
Class A (A) 40,900 47,297Livzon Pharmaceutical Group, Inc.,
H Shares 17,400 63,640Logan Group Company, Ltd. 166,000 126,900Longfor Group Holdings, Ltd. (C) 197,000 929,200Lonking Holdings, Ltd. 277,000 77,874Luxi Chemical Group Company, Ltd.,
Class A 14,600 35,006Luye Pharma Group, Ltd. (A)(C) 235,000 107,184Maanshan Iron & Steel Company, Ltd.,
H Shares 108,000 39,707Mayinglong Pharmaceutical Group
Company, Ltd., Class A 5,200 23,485Metallurgical Corp. of China, Ltd.,
H Shares 185,000 47,264Ming Yang Smart Energy Group, Ltd.,
Class A 9,200 37,709Minth Group, Ltd. 88,000 387,674MLS Company, Ltd., Class A 9,700 23,049Modern Land China Company, Ltd. (D) 88,000 4,289Monalisa Group Company, Ltd., Class A 6,100 27,452Nanjing Iron & Steel Company, Ltd.,
Class A 38,000 22,098Nanjing Securities Company, Ltd., Class A 15,100 23,497NavInfo Company, Ltd., Class A (A) 11,700 29,218NetDragon Websoft Holdings, Ltd. 17,000 40,000New China Life Insurance Company, Ltd.,
H Shares 86,800 232,243
Emerging Markets Value Trust (continued)Shares orPrincipalAmount Value
COMMON STOCKS (continued)China (continued)New Hope Liuhe Company, Ltd.,
Class A (A) 16,500 $ 39,393Newland Digital Technology
Company, Ltd., Class A 4,600 13,094Ningbo Joyson Electronic Corp., Class A 8,100 27,929Ningbo Sanxing Medical Electric
Company, Ltd., Class A 4,500 11,524Ningbo Zhoushan Port Company, Ltd.,
Class A 17,900 11,144Ningxia Baofeng Energy Group
Company, Ltd., Class A 15,500 42,230NVC International Holdings, Ltd. (A) 267,000 4,822Offshore Oil Engineering Company, Ltd.,
Class A 30,700 22,223OFILM Group Company, Ltd., Class A (A) 9,000 13,704Orient Securities Company, Ltd., H
Shares (C) 42,000 35,890Pangang Group Vanadium Titanium &
Resources Company, Ltd., Class A (A) 42,500 25,995PCI Technology Group Company, Ltd.,
Class A 17,100 22,358Pengdu Agriculture & Animal Husbandry
Company, Ltd., Class A (A) 44,000 26,367Perfect World Company, Ltd., Class A 9,000 28,690PetroChina Company, Ltd., H Shares 2,098,000 929,196PICC Property & Casualty Company, Ltd.,
H Shares 578,000 472,481Ping An Bank Company, Ltd., Class A 90,100 232,946Ping An Insurance Group Company of
China, Ltd., H Shares 482,000 3,473,350Pingdingshan Tianan Coal Mining
Company, Ltd., Class A 15,000 19,752Postal Savings Bank of China
Company, Ltd., H Shares (C) 519,000 364,466Power Construction Corp. of China, Ltd.,
Class A 61,800 78,391Powerlong Real Estate Holdings, Ltd. 178,000 93,194Q Technology Group Company, Ltd. 37,000 47,866Qingdao Port International Company, Ltd.,
H Shares (C) 19,000 10,522Qingdao Rural Commercial Bank Corp.,
Class A 34,400 20,834Qingling Motors Company, Ltd., H Shares 128,000 25,953Qunxing Paper Holdings
Company, Ltd. (A)(D) 634,371 0Red Star Macalline Group Corp., Ltd., H
Shares (A)(C) 62,480 29,894Redco Properties Group, Ltd. (B)(C) 96,000 32,143Redsun Properties Group, Ltd. (B) 93,000 26,112Renhe Pharmacy Company, Ltd., Class A 14,800 21,689Risen Energy Company, Ltd., Class A 2,800 14,279RiseSun Real Estate Development
Company, Ltd., Class A 16,000 10,923Ronshine China Holdings, Ltd. (A)(B) 61,500 23,657SAIC Motor Corp., Ltd., Class A 32,700 105,916Sailun Group Company, Ltd., Class A 14,200 33,004Sansteel Minguang Company, Ltd.,
Class A 16,900 18,063Sany Heavy Equipment International
Holdings Company, Ltd. 99,000 95,921Sany Heavy Industry Company, Ltd.,
Class A 52,400 187,591Sealand Securities Company, Ltd., Class A 25,200 16,256Seazen Group, Ltd. (A) 240,000 162,329Seazen Holdings Company, Ltd., Class A 14,800 67,724
John Hancock Variable Insurance TrustPortfolio of Investments — December 31, 2021 (showing percentage of total net assets)
The accompanying notes are an integral part of the financial statements. 24

Emerging Markets Value Trust (continued)Shares orPrincipalAmount Value
COMMON STOCKS (continued)China (continued)Shaanxi Coal Industry Company, Ltd.,
Class A 59,000 $ 113,138Shan Xi Hua Yang Group New Energy
Company, Ltd., Class A 18,100 33,712Shandong Bohui Paper Industrial
Company, Ltd., Class A 7,000 11,361Shandong Buchang Pharmaceuticals
Company, Ltd., Class A 3,600 11,918Shandong Chenming Paper Holdings, Ltd.,
H Shares (B) 41,000 19,644Shandong Gold Mining Company, Ltd., H
Shares (B)(C) 33,000 56,626Shandong Himile Mechanical Science &
Technology Company, Ltd., Class A 5,200 22,650Shandong Hualu Hengsheng Chemical
Company, Ltd., Class A 14,600 71,666Shandong Linglong Tyre Company, Ltd.,
Class A 8,600 49,345Shandong Longda Meishi Company, Ltd.,
Class A 6,800 11,156Shandong Molong Petroleum Machinery
Company, Ltd., H Shares (A) 33,600 22,690Shandong Nanshan Aluminum
Company, Ltd., Class A 48,800 36,214Shandong Sun Paper Industry JSC, Ltd.,
Class A 13,600 24,533Shandong Weigao Group Medical Polymer
Company, Ltd., H Shares 252,000 314,167Shanghai AJ Group Company, Ltd.,
Class A 21,300 22,595Shanghai Bailian Group Company, Ltd.,
Class A 13,400 28,037Shanghai Construction Group
Company, Ltd., Class A 41,000 23,137Shanghai Electric Group Company, Ltd.,
H Shares 158,000 48,235Shanghai Environment Group
Company, Ltd., Class A 11,800 23,324Shanghai Fosun Pharmaceutical Group
Company, Ltd., H Shares 22,500 99,062Shanghai International Airport
Company, Ltd., Class A (A) 2,900 21,223Shanghai International Port Group
Company, Ltd., Class A 44,200 38,023Shanghai Jin Jiang Capital Company, Ltd.,
H Shares 244,000 91,717Shanghai Jinjiang International Hotels
Company, Ltd., Class A 3,300 30,395Shanghai Lingang Holdings Corp, Ltd.,
Class A 7,000 16,338Shanghai Lujiazui Finance & Trade Zone
Development Company, Ltd., Class A 6,500 11,083Shanghai Mechanical and Electrical
Industry Company, Ltd., Class A 4,400 10,987Shanghai Pharmaceuticals Holding
Company, Ltd., H Shares 91,200 173,056Shanghai Pudong Development Bank
Company, Ltd., Class A 121,600 162,760Shanghai RAAS Blood Products
Company, Ltd., Class A 29,400 31,476Shanghai Sinyang Semiconductor Materials
Company, Ltd., Class A 2,800 17,965Shanghai Yuyuan Tourist Mart Group
Company, Ltd., Class A 7,000 11,319
Emerging Markets Value Trust (continued)Shares orPrincipalAmount Value
COMMON STOCKS (continued)China (continued)Shanghai Zhangjiang High-Tech Park
Development Company, Ltd., Class A 13,300 $ 31,445Shanxi Coking Coal Energy Group
Company, Ltd., Class A 22,900 29,763Shanxi Coking Company, Ltd., Class A 16,400 16,001Shanxi Lu’an Environmental Energy
Development Company, Ltd., Class A 11,400 20,275Shanxi Taigang Stainless Steel
Company, Ltd., Class A 40,100 44,488Shanying International Holding
Company, Ltd., Class A 40,100 20,706Shengjing Bank Company, Ltd., H
Shares (A)(C) 17,500 15,493Shenguan Holdings Group, Ltd. 90,000 4,905Shenwan Hongyuan Group Company, Ltd.,
H Shares (C) 143,200 34,907Shenzhen Agricultural Products Group
Company, Ltd., Class A 22,100 22,161Shenzhen Airport Company, Ltd.,
Class A (A) 12,200 14,011Shenzhen Aisidi Company, Ltd., Class A 13,100 23,424Shenzhen Desay Battery Technology
Company, Class A 2,100 19,243Shenzhen Everwin Precision Technology
Company, Ltd., Class A 6,000 18,691Shenzhen Huaqiang Industry
Company, Ltd., Class A 4,300 11,634Shenzhen Jinjia Group Company, Ltd.,
Class A 11,500 27,325Shenzhen Kaifa Technology
Company, Ltd., Class A 8,800 21,874Shenzhen Kinwong Electronic
Company, Ltd., Class A 2,900 15,718Shenzhen MTC Company, Ltd.,
Class A (A) 26,800 20,449Shenzhen Overseas Chinese Town
Company, Ltd., Class A 44,000 48,633Shenzhen Suntak Circuit Technology
Company, Ltd., Class A 8,500 22,488Shenzhen YUTO Packaging Technology
Company, Ltd., Class A 2,400 12,696Shenzhen Zhongjin Lingnan Nonfemet
Company, Ltd., Class A 16,500 12,736Shijiazhuang Yiling Pharmaceutical
Company, Ltd., Class A 8,800 27,027Shui On Land, Ltd. 390,961 52,627Sichuan Hebang Biotechnology
Company, Ltd., Class A (A) 32,700 17,512Sichuan Kelun Pharmaceutical
Company, Ltd., Class A 11,400 33,831Sichuan Road & Bridge Company, Ltd.,
Class A 26,700 50,532Sihuan Pharmaceutical Holdings
Group, Ltd. (B) 177,000 33,627Sinolink Securities Company, Ltd., Class A 14,300 25,439Sino-Ocean Group Holding, Ltd. 333,973 77,996Sinopec Engineering Group
Company, Ltd., H Shares 129,000 63,669Sinopec Shanghai Petrochemical
Company, Ltd., H Shares 300,000 68,911Sinopharm Group Company, Ltd.,
H Shares 156,800 341,268Sinosoft Technology Group, Ltd. 104,000 10,925Sinotrans, Ltd., H Shares 242,000 77,612Sinotruk Hong Kong, Ltd. 92,500 142,419
John Hancock Variable Insurance TrustPortfolio of Investments — December 31, 2021 (showing percentage of total net assets)
The accompanying notes are an integral part of the financial statements. 25

Emerging Markets Value Trust (continued)Shares orPrincipalAmount Value
COMMON STOCKS (continued)China (continued)Skyfame Realty Holdings, Ltd. 286,000 $ 31,544SOHO China, Ltd. (A) 247,000 54,483SooChow Securities Company, Ltd.,
Class A 19,110 26,587Southwest Securities Company, Ltd.,
Class A 28,700 23,836Sunac China Holdings, Ltd. 279,000 422,053Sunac Services Holdings, Ltd. (C) 2,400 2,450Suning Universal Company, Ltd.,
Class A (A) 15,000 11,105Suning.com Company, Ltd., Class A (A) 26,300 17,002Sunshine 100 China Holdings, Ltd. (A)(C) 77,000 4,146Suzhou Anjie Technology Company, Ltd.,
Class A 7,300 19,516Suzhou Dongshan Precision Manufacturing
Company, Ltd., Class A 11,700 49,733Suzhou Gold Mantis Construction
Decoration Company, Ltd., Class A 21,200 20,236Tangshan Jidong Cement Company, Ltd.,
Class A 11,000 20,651TangShan Port Group Company, Ltd.,
Class A 52,100 22,493Tangshan Sanyou Chemical Industries
Company, Ltd., Class A 14,700 20,101TBEA Company, Ltd., Class A 22,600 74,955TCL Technology Group Corp., Class A 98,900 95,792Ten Pao Group Holdings, Ltd. 80,000 19,301Tencent Music Entertainment Group,
ADR (A) 44,713 306,284Tenwow International
Holdings, Ltd. (A)(D) 121,000 4,423The People’s Insurance Company Group of
China, Ltd., H Shares 514,000 155,651Tian Di Science & Technology
Company, Ltd., Class A 33,600 23,094Tian Ge Interactive Holdings, Ltd. (A)(C) 44,000 4,463Tiangong International Company, Ltd. (B) 108,000 66,219Tianjin Capital Environmental Protection
Group Company, Ltd., H Shares 24,000 13,208Tianjin Chase Sun Pharmaceutical
Company, Ltd., Class A 36,600 45,028Tianjin Guangyu Development
Company, Ltd., Class A 7,500 28,412Tianli Education International
Holdings, Ltd. (D) 150,000 33,068Tianneng Power International, Ltd. (B) 78,000 82,543Tianyun International Holdings, Ltd. (A) 54,000 10,243Times China Holdings, Ltd. 28,000 13,544Tingyi Cayman Islands Holding Corp. 172,000 353,734Tong Ren Tang Technologies
Company, Ltd., H Shares 62,000 66,572Tongcheng Travel Holdings, Ltd. (A) 74,000 137,173TongFu Microelectronics Company, Ltd.,
Class A 7,500 22,873Tongkun Group Company, Ltd., Class A 12,900 42,905Tongling Nonferrous Metals Group
Company, Ltd., Class A 72,500 39,686Topsec Technologies Group, Inc., Class A 7,000 21,058Transfar Zhilian Company, Ltd., Class A 16,500 22,508TravelSky Technology, Ltd., H Shares 52,000 87,405Trigiant Group, Ltd. (A) 158,000 11,753Trip.com Group, Ltd. (A) 750 18,395Trip.com Group, Ltd., ADR (A) 35,226 867,264Uni-President China Holdings, Ltd. 120,000 116,322Unisplendour Corp., Ltd., Class A 11,600 41,628
Emerging Markets Value Trust (continued)Shares orPrincipalAmount Value
COMMON STOCKS (continued)China (continued)Universal Scientific Industrial Shanghai
Company, Ltd., Class A 10,400 $ 26,197Valiant Company, Ltd., Class A 3,500 12,990Viomi Technology Company, Ltd.,
ADR (A) 4,620 11,180Vipshop Holdings, Ltd., ADR (A) 43,158 362,527Virscend Education
Company, Ltd. (B)(C)(D) 59,000 3,133VNET Group, Inc., ADR (A) 1,915 17,292Wangfujing Group Company, Ltd., Class A 4,500 19,071Wangsu Science & Technology
Company, Ltd., Class A 23,700 24,877Want Want China Holdings, Ltd. 269,000 246,885Wanxiang Qianchao Company, Ltd.,
Class A 23,700 23,705Wasu Media Holding Company, Ltd.,
Class A 8,900 11,816Weibo Corp., ADR (A) 540 16,729Weichai Power Company, Ltd., H Shares 193,000 378,514Weifu High-Technology Group
Company, Ltd., Class A 4,400 14,873Weiqiao Textile Company, H Shares 73,500 24,707Wens Foodstuffs Group Company, Ltd.,
Class A 29,500 89,232West China Cement, Ltd. 298,000 53,133Western Securities Company, Ltd., Class A 28,800 36,461Wisdom Education International Holdings
Company, Ltd. 122,000 10,816Wolong Electric Group Company, Ltd.,
Class A 10,400 29,881Wuchan Zhongda Group Company, Ltd.,
Class A 41,000 38,128Wuxi Taiji Industry Company, Ltd.,
Class A 16,400 20,785XCMG Construction Machinery
Company, Ltd., Class A 26,000 24,413Xiabuxiabu Catering Management China
Holdings Company, Ltd. (A)(C) 62,500 48,841Xiamen C & D, Inc., Class A 9,700 13,814Xiamen International Port Company, Ltd.,
H Shares 260,000 28,685Xiamen ITG Group Corp, Ltd., Class A 18,100 20,498Xiamen Xiangyu Company, Ltd., Class A 17,400 23,185Xingda International Holdings, Ltd. 147,515 32,363Xingfa Aluminium Holdings, Ltd. 29,000 27,340Xinhua Winshare Publishing and Media
Company, Ltd., H Shares 51,000 38,674Xinjiang Goldwind Science & Technology
Company, Ltd., H Shares (B) 47,000 91,756Xinjiang Zhongtai Chemical
Company, Ltd., Class A 8,100 12,142Xinte Energy Company, Ltd., H Shares (B) 14,400 26,727Xinxing Ductile Iron Pipes Company, Ltd.,
Class A 33,500 22,776Xinyangfeng Agricultural Technology
Company, Ltd., Class A 5,900 15,635Xinyu Iron & Steel Company, Ltd.,
Class A 24,700 20,518Xuji Electric Company, Ltd., Class A 5,200 21,309Yangtze Optical Fibre and Cable Joint
Stock Company, Ltd., H Shares (C) 15,500 25,752Yankuang Energy Group Company, Ltd., H
Shares (B) 178,000 353,776Yantai Jereh Oilfield Services Group
Company, Ltd., Class A 2,300 14,486
John Hancock Variable Insurance TrustPortfolio of Investments — December 31, 2021 (showing percentage of total net assets)
The accompanying notes are an integral part of the financial statements. 26

Emerging Markets Value Trust (continued)Shares orPrincipalAmount Value
COMMON STOCKS (continued)China (continued)YiChang HEC ChangJiang Pharmaceutical
Company, Ltd., H Shares (A)(B)(C) 33,400 $ 26,098Yifan Pharmaceutical Company, Ltd.,
Class A 5,200 14,371Yintai Gold Company, Ltd., Class A 9,100 12,557Yiren Digital, Ltd., ADR (A)(B) 7,156 20,466Yixintang Pharmaceutical Group
Company, Ltd., Class A 2,200 13,290Yonghui Superstores Company, Ltd.,
Class A 33,100 21,029Youngor Group Company, Ltd., Class A 10,400 11,248YTO Express Group Company, Ltd.,
Class A 14,800 38,749Yum China Holdings, Inc. 15,341 764,595Yunda Holding Company, Ltd., Class A 10,700 34,366Yunnan Aluminium Company, Ltd.,
Class A (A) 16,200 28,549Yunnan Baiyao Group Company, Ltd.,
Class A 4,400 72,296Yunnan Copper Company, Ltd., Class A 10,000 21,030Yunnan Tin Company, Ltd., Class A (A) 5,500 16,956Yutong Bus Company, Ltd., Class A 11,900 20,586Yuzhou Group Holdings Company, Ltd. 341,376 28,040Zepp Health Corp., ADR (A) 2,968 14,988Zhaojin Mining Industry Company, Ltd.,
H Shares 122,500 104,860Zhejiang Century Huatong Group
Company, Ltd., Class A (A) 30,600 40,347Zhejiang China Commodities City Group
Company, Ltd., Class A 28,122 21,398Zhejiang Chint Electrics Company, Ltd.,
Class A 11,000 92,986Zhejiang Dahua Technology
Company, Ltd., Class A 14,900 54,917Zhejiang Glass Company, Ltd., H
Shares (A)(D) 162,000 0Zhejiang Hailiang Company, Ltd., Class A 6,500 12,685Zhejiang Hisoar Pharmaceutical
Company, Ltd., Class A 12,100 15,654Zhejiang Huace Film & Television
Company, Ltd., Class A 11,400 12,106Zhejiang Jiahua Energy Chemical Industry
Company, Ltd., Class A 8,500 15,428Zhejiang JIULI Hi-tech Metals
Company, Ltd., Class A 6,300 17,686Zhejiang Juhua Company, Ltd., Class A 8,900 18,066Zhejiang Longsheng Group Company, Ltd.,
Class A 17,400 34,513Zhejiang NHU Company, Ltd., Class A 12,000 58,597Zhejiang Semir Garment Company, Ltd.,
Class A 15,300 18,560Zhejiang Wanliyang Company, Ltd.,
Class A 6,300 14,580Zhejiang Xianju Pharmaceutical
Company, Ltd., Class A 10,900 22,576Zhejiang Xinan Chemical Industrial Group
Company, Ltd., Class A 4,900 19,253Zhengzhou Coal Mining Machinery Group
Company, Ltd., H Shares (B) 25,400 26,739Zhenro Properties Group, Ltd. (B) 131,000 62,308Zheshang Securities Company, Ltd.,
Class A 10,800 22,350Zhong An Group, Ltd. (A) 409,000 16,787Zhongji Innolight Company, Ltd., Class A 4,900 32,707Zhongjin Gold Corp, Ltd., Class A 31,200 40,356
Emerging Markets Value Trust (continued)Shares orPrincipalAmount Value
COMMON STOCKS (continued)China (continued)Zhongshan Broad Ocean Motor
Company, Ltd., Class A 20,000 $ 27,576Zhou Hei Ya International Holdings
Company, Ltd. (A)(C) 58,000 43,767Zhuzhou CRRC Times Electric
Company, Ltd. 35,300 204,609Zhuzhou Kibing Group Company, Ltd.,
Class A 18,700 50,295Zibo Qixiang Tengda Chemical
Company, Ltd., Class A 11,900 19,625Zoomlion Heavy Industry Science and
Technology Company, Ltd., H Shares 135,200 85,166ZTE Corp., H Shares 62,400 170,977ZTO Express Cayman, Inc., ADR 7,597 214,387
65,623,501Colombia - 0.1%Cementos Argos SA 24,726 37,152Grupo Argos SA 36,406 121,209Grupo de Inversiones Suramericana SA 23,322 172,043
330,404Czech Republic - 0.1%CEZ AS 3,671 138,943Komercni banka AS 2,458 105,094
244,037Greece - 0.2%Alpha Services and Holdings SA (A) 98,073 120,189Bank of Greece 667 12,827Eurobank Ergasias Services and Holdings
SA (A) 158,083 160,155Fourlis Holdings SA (A) 3,756 16,483Hellenic Petroleum Holdings SA 4,654 32,977JUMBO SA 3,509 50,348Motor Oil Hellas Corinth Refineries SA 3,190 49,964Mytilineos SA 2,731 47,049National Bank of Greece SA (A) 28,623 95,495Piraeus Financial Holdings SA (A) 2,005 2,940
588,427Hong Kong - 4.9%AAG Energy Holdings, Ltd. (C) 68,000 12,303Ajisen China Holdings, Ltd. 147,000 23,774Anxin-China Holdings, Ltd. (A)(D) 1,648,000 0APT Satellite Holdings, Ltd. 28,000 8,190Asian Citrus Holdings, Ltd. (A) 249,000 4,977Ausnutria Dairy Corp., Ltd. (A) 70,000 84,806Beijing Energy International Holding
Company, Ltd. (A) 814,000 30,807Beijing Enterprises Clean Energy
Group, Ltd. (A) 600,000 7,475Beijing Enterprises Holdings, Ltd. 63,500 219,084Beijing Enterprises Water Group, Ltd. 532,000 206,707Brilliance China Automotive
Holdings, Ltd. (A) 216,000 103,896C C Land Holdings, Ltd. 125,126 27,899C&D International Investment Group, Ltd. 15,260 32,195CA Cultural Technology
Group, Ltd. (A)(B) 35,000 2,021CECEP COSTIN New Materials
Group, Ltd. (A)(D) 348,000 0CGN New Energy Holdings
Company, Ltd. (B) 150,000 156,941China Aerospace International
Holdings, Ltd. 190,000 13,163China Aircraft Leasing Group
Holdings, Ltd. (B) 23,000 16,883
John Hancock Variable Insurance TrustPortfolio of Investments — December 31, 2021 (showing percentage of total net assets)
The accompanying notes are an integral part of the financial statements. 27

Emerging Markets Value Trust (continued)Shares orPrincipalAmount Value
COMMON STOCKS (continued)Hong Kong (continued)China Boton Group Company, Ltd. (A)(B) 20,000 $ 10,652China Education Group Holdings, Ltd. (B) 36,000 58,500China Everbright Greentech, Ltd. (B)(C) 114,000 42,849China Everbright, Ltd. 76,000 90,845China Fiber Optic Network System
Group, Ltd. (A)(D) 150,800 5,415China Foods, Ltd. 74,000 29,013China Gas Holdings, Ltd. 254,000 528,342China High Precision Automation
Group, Ltd. (A)(D) 18,000 2,147China High Speed Transmission
Equipment Group Company, Ltd. (A) 45,000 32,472China Jinmao Holdings Group, Ltd. 500,000 154,639China Longevity Group
Company, Ltd. (A)(D) 93,000 4,902China Lumena New Materials
Corp. (A)(D) 50,900 0China Merchants Land, Ltd. (A) 260,000 24,696China Merchants Port Holdings
Company, Ltd. 72,622 132,540China New Town Development
Company, Ltd. (A) 300,165 3,161China Oil & Gas Group, Ltd. (A) 600,000 36,184China Overseas Grand Oceans Group, Ltd. 191,500 97,290China Overseas Land & Investment, Ltd. 380,000 900,144China Resources Cement Holdings, Ltd. 282,000 213,286China Resources Gas Group, Ltd. 86,000 485,949China Resources Land, Ltd. 344,000 1,449,478China South City Holdings, Ltd. 498,000 46,644China Taiping Insurance Holdings
Company, Ltd. 178,600 245,249China Traditional Chinese Medicine
Holdings Company, Ltd. 336,000 222,632China Travel International Investment
Hong Kong, Ltd. (A) 314,000 62,070China Vast Industrial Urban Development
Company, Ltd. (C) 36,000 7,064Chu Kong Shipping Enterprises Group
Company, Ltd. 26,000 3,199CIMC Enric Holdings, Ltd. 86,000 125,211CITIC Resources Holdings, Ltd. (A) 488,000 30,070Concord New Energy Group, Ltd. 690,000 72,589COSCO SHIPPING International Hong
Kong Company, Ltd. 59,625 18,202COSCO SHIPPING Ports, Ltd. 162,371 141,121CP Pokphand Company, Ltd. (D) 870,000 127,489Dawnrays Pharmaceutical Holdings, Ltd. 117,000 25,091Digital China Holdings, Ltd. 73,000 46,381ESR Cayman, Ltd. (A)(C) 13,000 43,974Far East Horizon, Ltd. 183,000 162,497GCL-Poly Energy Holdings, Ltd. (A)(B) 1,373,000 497,955Geely Automobile Holdings, Ltd. 490,000 1,338,590Gemdale Properties & Investment
Corp., Ltd. 778,000 82,817Glorious Property Holdings, Ltd. (A) 88,000 2,729Glory Sun Financial Group, Ltd. (A)(B) 612,000 15,694Glory Sun Land Group, Ltd. (A) 61,506 823Goldlion Holdings, Ltd. 36,000 7,467Goldpac Group, Ltd. 46,000 9,854Grand Pharmaceutical Group, Ltd. (B) 86,000 71,278Health & Happiness H&H International
Holdings, Ltd. 24,500 37,987Hi Sun Technology China, Ltd. (A) 240,000 31,797Hopson Development Holdings, Ltd. 91,460 190,554
Emerging Markets Value Trust (continued)Shares orPrincipalAmount Value
COMMON STOCKS (continued)Hong Kong (continued)Hua Han Health Industry
Holdings, Ltd. (A)(D) 880,000 $ 23,925IMAX China Holding, Inc. (C) 7,000 10,383Jiayuan International Group, Ltd. 111,625 37,657Joy City Property, Ltd. 328,000 16,821Ju Teng International Holdings, Ltd. 130,000 21,475Kingboard Holdings, Ltd. 77,130 375,782Kingboard Laminates Holdings, Ltd. 103,500 176,035Kunlun Energy Company, Ltd. 438,000 410,988Lee & Man Paper Manufacturing, Ltd. 129,000 89,704Lee’s Pharmaceutical Holdings, Ltd. 54,000 23,086Lifestyle China Group, Ltd. (A) 42,000 6,575LVGEM China Real Estate Investment
Company, Ltd. (A) 60,000 10,546Min Xin Holdings, Ltd. 24,000 12,253Mingyuan Medicare Development
Company, Ltd. (A)(D) 1,300,000 0Minmetals Land, Ltd. 118,000 12,569New World Department Store
China, Ltd. (A) 34,000 5,456Nine Dragons Paper Holdings, Ltd. 185,000 198,676Overseas Chinese Town Asia
Holdings, Ltd. (A) 52,000 8,488PAX Global Technology, Ltd. 84,000 59,465Poly Property Group Company, Ltd. 266,453 70,063Pou Sheng International Holdings, Ltd. (A) 223,000 32,636Prinx Chengshan Holdings, Ltd. 18,000 16,782Shanghai Industrial Holdings, Ltd. 37,000 53,922Shanghai Industrial Urban Development
Group, Ltd. 359,400 35,010Shanghai Zendai Property, Ltd. (A) 765,000 3,141Shenzhen International Holdings, Ltd. 135,199 140,449Shenzhen Investment, Ltd. 373,271 80,438Shimao Group Holdings, Ltd. 150,000 98,202Shoucheng Holdings, Ltd. 128,000 25,452Shougang Fushan Resources Group, Ltd. 272,565 92,352Silver Grant International Holdings
Group, Ltd. (A) 160,000 10,259Sinofert Holdings, Ltd. (A) 300,000 45,062Sinopec Kantons Holdings, Ltd. 124,000 48,719Skyworth Group, Ltd. (A) 175,190 122,611SSY Group, Ltd. 182,000 93,932Sun Art Retail Group, Ltd. 22,500 9,032Symphony Holdings, Ltd. 20,000 2,513TCL Electronics Holdings, Ltd. (A) 114,600 59,598Texhong Textile Group, Ltd. 10,000 13,209The Wharf Holdings, Ltd. 99,000 304,100Tian An China Investment Company, Ltd. 54,000 29,921Tianjin Port Development Holdings, Ltd. 478,000 38,021Tomson Group, Ltd. 45,714 12,252Tongda Group Holdings, Ltd. (A) 885,000 28,378Truly International Holdings, Ltd. 88,000 36,032United Energy Group, Ltd. 542,000 45,215Vinda International Holdings, Ltd. (B) 39,000 95,005Wasion Holdings, Ltd. 90,000 39,612Yuexiu Property Company, Ltd. 165,908 146,326
12,248,781Hungary - 0.2%MOL Hungarian Oil & Gas PLC 53,879 418,165OTP Bank NYRT (A) 1,899 96,833
514,998India - 13.1%ACC, Ltd. 5,847 174,519Adani Enterprises, Ltd. 5,450 124,719Adani Green Energy, Ltd. (A) 3,790 67,633
John Hancock Variable Insurance TrustPortfolio of Investments — December 31, 2021 (showing percentage of total net assets)
The accompanying notes are an integral part of the financial statements. 28

Emerging Markets Value Trust (continued)Shares orPrincipalAmount Value
COMMON STOCKS (continued)India (continued)Adani Total Gas, Ltd. 1,936 $ 44,995Adani Transmission, Ltd. (A) 9,644 226,871Aditya Birla Capital, Ltd. (A) 55,560 92,002Allcargo Logistics, Ltd. 10,467 54,500Amara Raja Batteries, Ltd. 3,251 27,785Ambuja Cements, Ltd. 55,925 283,379Andhra Sugars, Ltd. 6,880 12,578Apollo Tyres, Ltd. 28,578 83,874Arvind Fashions, Ltd. (A) 4,879 17,691Arvind, Ltd. (A) 12,009 19,429Aster DM Healthcare, Ltd. (A)(C) 8,448 19,815Aurobindo Pharma, Ltd. 33,905 333,161Axis Bank, Ltd. (A) 128,852 1,173,156Axis Bank, Ltd., GDR (A) 310 14,295Bajaj Holdings & Investment, Ltd. 3,104 229,651Balmer Lawrie & Company, Ltd. 11,041 18,211Balrampur Chini Mills, Ltd. 17,968 88,802Bandhan Bank, Ltd. (C) 32,073 108,388Bank of Baroda (A) 88,922 97,632Bank of India (A) 19,819 13,678BEML, Ltd. 1,822 40,183Bharat Dynamics, Ltd. 1,195 6,221Bharat Electronics, Ltd. 59,808 168,103Bharat Heavy Electricals, Ltd. (A) 72,839 57,640Bharti Airtel, Ltd., Partly Paid Up
Shares (A) 557 2,630Birla Corp., Ltd. 2,709 51,916Birlasoft, Ltd. 13,384 97,983Bombay Burmah Trading Company 681 10,143Brigade Enterprises, Ltd. 9,013 59,252BSE, Ltd. 724 18,594Can Fin Homes, Ltd. 2,623 19,486Canara Bank (A) 21,738 58,123Ceat, Ltd. 2,623 42,601Century Textiles & Industries, Ltd. 2,062 25,353CESC Ventures, Ltd. (A) 849 8,199Chambal Fertilizers & Chemicals, Ltd. 19,376 102,288Chennai Super Kings Cricket, Ltd. (A)(D) 207,315 6,275Cholamandalam Financial Holdings, Ltd. 6,154 53,509Cipla, Ltd. 35,701 452,821City Union Bank, Ltd. 14,539 26,333Cochin Shipyard, Ltd. (C) 2,163 10,348Container Corp. of India, Ltd. 14,589 120,178Cosmo Films, Ltd. 1,053 19,781CreditAccess Grameen, Ltd. (A) 1,190 9,541CSB Bank, Ltd. (A) 2,395 7,558Cyient, Ltd. 5,147 71,091Dalmia Bharat, Ltd. 3,913 96,967DB Corp., Ltd. 6,129 7,693DCB Bank, Ltd. (A) 23,624 25,020DCM Shriram, Ltd. 4,769 61,179Deepak Fertilisers & Petrochemicals
Corp., Ltd. 2,609 13,025Delta Corp., Ltd. 4,521 15,688Dhampur Sugar Mills, Ltd. 2,503 10,279Dilip Buildcon, Ltd. (C) 1,316 7,784Dish TV India, Ltd. (A) 48,852 12,339Dishman Carbogen Amcis, Ltd. (A) 5,361 14,452DLF, Ltd. 42,524 222,860Edelweiss Financial Services, Ltd. 46,814 44,959EID Parry India, Ltd. 12,265 74,076Exide Industries, Ltd. 26,285 59,310Federal Bank, Ltd. 191,615 213,229Finolex Cables, Ltd. 3,327 23,583Finolex Industries, Ltd. 25,360 70,283
Emerging Markets Value Trust (continued)Shares orPrincipalAmount Value
COMMON STOCKS (continued)India (continued)Firstsource Solutions, Ltd. 16,189 $ 39,711Fortis Healthcare, Ltd. (A) 23,713 94,673GAIL India, Ltd. 193,496 335,302General Insurance Corp. of India (A)(C) 8,025 15,203GHCL, Ltd. 6,390 32,523Glenmark Pharmaceuticals, Ltd. 13,855 98,210Godfrey Phillips India, Ltd. 603 9,129Godrej Industries, Ltd. (A) 2,755 23,091Granules India, Ltd. 18,738 84,432Grasim Industries, Ltd. 23,906 521,449Gujarat Alkalies & Chemicals, Ltd. 3,130 27,430Gujarat Ambuja Exports, Ltd. 15,820 36,004Gujarat Fluorochemicals, Ltd. (A) 4,397 143,827Gujarat Narmada Valley Fertilizers &
Chemicals, Ltd. 10,255 60,443Gujarat Pipavav Port, Ltd. 15,449 20,633Gujarat State Fertilizers & Chemicals, Ltd. 6,962 11,332Gujarat State Petronet, Ltd. 26,721 105,508Hero MotoCorp, Ltd. 1,166 38,526HFCL, Ltd. 95,724 100,819Hindalco Industries, Ltd. 148,861 945,023Hinduja Global Solutions, Ltd. 209 9,293Hindustan Aeronautics, Ltd. 1,878 30,490Housing Development Finance Corp., Ltd. 9,167 317,237ICICI Bank, Ltd. 196,478 1,954,896ICICI Bank, Ltd., ADR 8,648 171,144IDFC First Bank, Ltd. (A) 126,067 81,826IDFC, Ltd. (A) 67,378 57,191IIFL Finance, Ltd. 15,622 58,327IIFL Securities, Ltd. 28,932 35,584Indiabulls Housing Finance, Ltd. 33,338 97,391Indiabulls Real Estate, Ltd. (A) 28,092 59,147Indian Bank 13,953 26,091Indian Overseas Bank (A) 71,034 19,345Indus Towers, Ltd. 32,463 108,068IndusInd Bank, Ltd. 12,252 145,755Infibeam Avenues, Ltd. 17,674 9,542IOL Chemicals and Pharmaceuticals, Ltd. 1,292 8,347Jagran Prakashan, Ltd. (A) 12,700 10,560Jindal Poly Films, Ltd. 1,066 14,888Jindal Saw, Ltd. 29,627 39,357Jindal Stainless Hisar, Ltd. (A) 2,829 13,224Jindal Stainless, Ltd. (A) 11,232 29,876Jindal Steel & Power, Ltd. (A) 52,794 266,584JK Paper, Ltd. 7,330 20,185JK Tyre & Industries, Ltd. 8,887 16,590JM Financial, Ltd. 33,116 33,035JSW Energy, Ltd. 40,045 162,326JSW Steel, Ltd. 84,341 740,398Jubilant Ingrevia, Ltd. 11,603 89,759Jubilant Pharmova, Ltd. 11,603 91,279Just Dial, Ltd. (A) 344 3,735Jyothy Labs, Ltd. 5,194 9,653Kalpataru Power Transmission, Ltd. 9,196 45,876Kalyani Steels, Ltd. 2,643 11,254Kaveri Seed Company, Ltd. 1,661 12,688KEC International, Ltd. 3,954 25,425Kiri Industries, Ltd. (A) 2,637 17,119Kirloskar Oil Engines, Ltd. 3,612 8,928KPIT Technologies, Ltd. 13,384 109,663KPR Mill, Ltd. 18,150 163,499KRBL, Ltd. 2,618 8,520L&T Finance Holdings, Ltd. (A) 74,021 76,914Larsen & Toubro, Ltd. 51,797 1,316,263Laurus Labs, Ltd. (C) 4,802 34,788
John Hancock Variable Insurance TrustPortfolio of Investments — December 31, 2021 (showing percentage of total net assets)
The accompanying notes are an integral part of the financial statements. 29
Emerging Markets Value Trust (continued)Shares orPrincipalAmount Value
COMMON STOCKS (continued)India (continued)LG Balakrishnan & Bros, Ltd. 1,757 $ 15,238LIC Housing Finance, Ltd. 39,247 194,539Linde India, Ltd. 1,282 42,763LT Foods, Ltd. 11,217 11,283Lupin, Ltd. 23,401 298,347Maharashtra Scooters, Ltd. 192 9,865Maharashtra Seamless, Ltd. 4,212 28,768Mahindra & Mahindra Financial
Services, Ltd. 59,708 119,378Mahindra & Mahindra, Ltd. 70,868 794,917Mahindra CIE Automotive, Ltd. (A) 17,673 55,665Mahindra Lifespace Developers, Ltd. (A) 10,389 33,804Maithan Alloys, Ltd. 902 12,257Manappuram Finance, Ltd. 27,778 61,386Max Healthcare Institute, Ltd. (A) 21,489 129,792MOIL, Ltd. 14,559 33,022Mphasis, Ltd. 7,042 321,280MRF, Ltd. 111 108,622National Aluminium Company, Ltd. 84,797 114,415Nava Bharat Ventures, Ltd. 8,719 12,870Navneet Education, Ltd. 6,921 8,254NCC, Ltd. 25,675 24,142NIIT, Ltd. 6,437 38,951Nilkamal, Ltd. 695 22,773NMDC, Ltd. 47,542 85,034Oberoi Realty, Ltd. (A) 6,103 70,396Omaxe, Ltd. (A) 5,567 5,647Orient Cement, Ltd. 11,282 24,048Persistent Systems, Ltd. 6,112 401,217Petronet LNG, Ltd. 52,168 151,593Phillips Carbon Black, Ltd. 7,735 25,041Piramal Enterprises, Ltd. 7,847 277,650PNB Housing Finance, Ltd. (A)(C) 3,409 22,600PNC Infratech, Ltd. 5,394 19,028Polyplex Corp., Ltd. 2,563 64,460Power Finance Corp., Ltd. 90,707 145,574Prestige Estates Projects, Ltd. 20,468 130,079PTC India, Ltd. 31,315 45,932Punjab National Bank (A) 97,317 48,725Quess Corp., Ltd. (C) 1,882 21,497Rain Industries, Ltd. 22,684 72,776Rajesh Exports, Ltd. 8,931 88,592Ramco Industries, Ltd. 4,270 14,388Ramkrishna Forgings, Ltd. 1,073 13,577Rashtriya Chemicals & Fertilizers, Ltd. 10,276 10,485Raymond, Ltd. (A) 1,181 9,853RBL Bank, Ltd. (A)(C) 21,550 36,863REC, Ltd. 89,160 160,007Redington India, Ltd. 81,148 157,552Reliance Industries, Ltd., GDR (C) 87,194 5,578,280Reliance Power, Ltd. (A) 121,528 22,208Sharda Cropchem, Ltd. 2,311 10,924Shipping Corp. of India, Ltd. 14,077 25,418Shriram City Union Finance, Ltd. 2,480 59,063Shriram Transport Finance Company, Ltd. 13,889 225,887Sobha, Ltd. 4,273 51,227State Bank of India 109,237 673,663State Bank of India, GDR 1,997 123,014Steel Authority of India, Ltd. 106,244 152,632Strides Pharma Science, Ltd. 2,675 15,996Sun Pharmaceutical Industries, Ltd. 54,244 615,813Sun TV Network, Ltd. 7,964 53,407Sundaram-Clayton, Ltd. 227 11,545TAKE Solutions, Ltd. (A) 7,707 5,026Tata Chemicals, Ltd. 13,942 166,988
Emerging Markets Value Trust (continued)Shares orPrincipalAmount Value
COMMON STOCKS (continued)India (continued)Tata Coffee, Ltd. 3,872 $ 11,098Tata Consumer Products, Ltd. 31,789 317,198Tata Motors, Ltd. (A) 206,227 1,330,492Tata Steel, Ltd. 58,310 867,800Tech Mahindra, Ltd. 8,219 197,368Techno Electric & Engineering
Company, Ltd. 7,028 22,698The Great Eastern Shipping Company, Ltd. 12,279 49,176The India Cements, Ltd. 20,619 53,194The Jammu & Kashmir Bank, Ltd. (A) 20,576 10,012The Karnataka Bank, Ltd. 33,585 27,710The Karur Vysya Bank, Ltd. 24,026 14,715The South Indian Bank, Ltd. (A) 134,442 16,024Thirumalai Chemicals, Ltd. 3,185 10,068Transport Corp. of India, Ltd. 3,182 31,890Trident, Ltd. 171,050 122,225Triveni Engineering & Industries, Ltd. 5,573 16,597TV18 Broadcast, Ltd. (A) 95,709 57,648UCO Bank (A) 19,949 3,486Uflex, Ltd. 5,261 36,040Unichem Laboratories, Ltd. 4,453 14,876UPL, Ltd. 42,377 425,303Usha Martin, Ltd. (A) 9,317 11,291VA Tech Wabag, Ltd. (A) 3,621 15,033Vardhman Textiles, Ltd. 3,223 101,675Vedanta, Ltd. 14,777 67,494Vodafone Idea, Ltd. (A) 275,824 56,536Welspun Corp., Ltd. 14,025 33,488Welspun Enterprises, Ltd. 9,451 12,015Welspun India, Ltd. 12,315 24,022Wipro, Ltd. 105,250 1,008,473Wockhardt, Ltd. (A) 4,216 23,321Yes Bank, Ltd. (A) 49,153 9,007Yes Bank, Ltd., Lock-In Shares (D)(E) 147,461 23,084Zee Entertainment Enterprises, Ltd. 43,394 186,284Zee Media Corp., Ltd. (A) 54,429 9,786Zydus Wellnes, Ltd. 386 9,774
32,763,905Indonesia - 1.6%Adaro Energy Tbk PT 1,772,000 281,016Adhi Karya Persero Tbk PT (A) 235,600 14,784AKR Corporindo Tbk PT 152,300 43,901Alam Sutera Realty Tbk PT (A) 1,741,800 19,796Aneka Tambang Tbk 67,900 10,746Astra Agro Lestari Tbk PT 49,555 33,019Astra International Tbk PT 1,140,800 456,608Bakrie Telecom Tbk PT (A)(D) 17,557,300 30,797Bank Mandiri Persero Tbk PT 960,140 474,097Bank Negara Indonesia Persero Tbk PT 548,981 259,508Bank Pan Indonesia Tbk PT (A) 695,197 37,556Bank Pembangunan Daerah Jawa Barat
Dan Banten Tbk PT 284,100 26,583Bank Pembangunan Daerah Jawa Timur
Tbk PT 625,600 32,933Bank Tabungan Negara Persero Tbk
PT (A) 376,361 45,615Bekasi Fajar Industrial Estate Tbk PT (A) 817,800 6,434BISI International Tbk PT 290,800 20,339Blue Bird Tbk PT 5,500 533Buana Lintas Lautan Tbk PT (A) 1,186,800 19,783Bukit Asam Tbk PT 380,100 72,355Bumi Serpong Damai Tbk PT (A) 499,400 35,381Ciputra Development Tbk PT 1,290,744 87,849Delta Dunia Makmur Tbk PT (A) 610,700 11,316Elnusa Tbk PT 742,600 14,374
John Hancock Variable Insurance TrustPortfolio of Investments — December 31, 2021 (showing percentage of total net assets)
The accompanying notes are an integral part of the financial statements. 30

Emerging Markets Value Trust (continued)Shares orPrincipalAmount Value
COMMON STOCKS (continued)Indonesia (continued)Erajaya Swasembada Tbk PT 1,113,500 $ 46,855Gudang Garam Tbk PT 32,400 69,577Indah Kiat Pulp & Paper Tbk PT 279,700 153,641Indika Energy Tbk PT (A) 225,300 24,455Indo Tambangraya Megah Tbk PT 34,600 49,533Indocement Tunggal Prakarsa Tbk PT 110,800 94,059Indofood CBP Sukses Makmur Tbk PT 38,600 23,577Indofood Sukses Makmur Tbk PT 483,100 214,510Intiland Development Tbk PT (A) 1,316,300 14,404Japfa Comfeed Indonesia Tbk PT 499,770 60,241Jaya Real Property Tbk PT 215,500 7,849Kawasan Industri Jababeka Tbk PT (A) 2,384,099 27,747Krakatau Steel Persero Tbk PT (A) 733,900 21,223Link Net Tbk PT 58,200 16,332Lippo Karawaci Tbk PT (A) 4,020,148 39,751Malindo Feedmill Tbk PT (A) 128,500 6,040Map Aktif Adiperkasa PT (A) 105,900 18,845Medco Energi Internasional Tbk PT (A) 1,194,526 38,982Media Nusantara Citra Tbk PT 718,600 45,330Mitra Adiperkasa Tbk PT (A) 715,200 35,625MNC Vision Networks Tbk PT (A) 614,600 7,241Pabrik Kertas Tjiwi Kimia Tbk PT 101,200 53,516Panin Financial Tbk PT (A) 949,400 11,459Paninvest Tbk PT (A) 116,800 5,570Perusahaan Perkebunan London Sumatra
Indonesia Tbk PT 318,000 26,481PP Persero Tbk PT (A) 292,600 20,288Puradelta Lestari Tbk PT 1,584,700 21,233Ramayana Lestari Sentosa Tbk PT (A) 463,200 21,265Salim Ivomas Pratama Tbk PT 670,100 21,433Semen Indonesia Persero Tbk PT 259,300 131,836Siloam International Hospitals Tbk PT 36,900 22,197Sri Rejeki Isman Tbk PT (A)(D) 1,260,900 12,916Suryainti Permata Tbk PT (A)(D) 1,446,000 0Timah Tbk PT (A) 210,500 21,482Truba Alam Manunggal Engineering
PT (A)(D) 11,991,500 0Tunas Baru Lampung Tbk PT 484,800 27,083United Tractors Tbk PT 202,200 313,931Vale Indonesia Tbk PT 224,100 73,799Waskita Karya Persero Tbk PT (A) 533,700 23,785Wijaya Karya Persero Tbk PT (A) 349,400 27,057XL Axiata Tbk PT 403,300 89,751
3,976,222Malaysia - 1.6%Aeon Company M BHD 28,600 9,669AFFIN Bank BHD 92,555 38,409Alliance Bank Malaysia BHD 129,100 88,571AMMB Holdings BHD (A) 171,362 130,325Bank Islam Malaysia BHD 26,300 18,943Batu Kawan BHD 3,100 16,902Berjaya Assets BHD (A) 77,400 4,812Berjaya Corp. BHD (A)(B) 439,496 26,349Berjaya Land BHD (A) 244,400 13,188Boustead Holdings BHD (A) 116,088 14,764Bumi Armada BHD (A) 163,800 18,467Cahya Mata Sarawak BHD 52,100 15,997CIMB Group Holdings BHD 487,703 637,951Cypark Resources BHD (A) 54,200 11,829Dayang Enterprise Holdings BHD 83,900 16,195DRB-Hicom BHD 93,400 32,034Eco World Development Group BHD 84,300 17,094Ekovest BHD (A) 146,600 14,606FGV Holdings BHD 33,400 11,866Gamuda BHD (A) 136,030 94,733
Emerging Markets Value Trust (continued)Shares orPrincipalAmount Value
COMMON STOCKS (continued)Malaysia (continued)Genting BHD 138,000 $ 154,578Genting Malaysia BHD 181,000 125,034Genting Plantations BHD 22,400 36,021Hengyuan Refining Company BHD 28,800 26,743Hibiscus Petroleum BHD 171,900 33,614Hong Leong Financial Group BHD 27,099 112,716IJM Corp. BHD 264,060 96,304Insas BHD 88,369 20,552IOI Properties Group BHD 29,900 7,892JAKS Resources BHD (A) 177,060 16,567Jaya Tiasa Holdings BHD (A) 58,826 8,753Keck Seng Malaysia BHD (A) 11,300 9,255KNM Group BHD (A) 571,500 20,586Land & General BHD 437,820 10,491Lotte Chemical Titan Holding BHD (C) 30,231 17,415Magnum BHD (B) 110,314 50,266Mah Sing Group BHD 192,300 31,847Malayan Banking BHD 318,660 634,730Malaysia Airports Holdings BHD (A) 36,700 52,675Malaysia Building Society BHD (B) 190,704 24,481Malaysian Resources Corp. BHD 207,000 17,636Matrix Concepts Holdings BHD 17,400 9,187MBM Resources BHD 11,400 8,757Mega First Corp. BHD 12,600 10,579MISC BHD 106,200 179,546MKH BHD 49,230 14,518MNRB Holdings BHD 36,891 9,926Muhibbah Engineering M BHD (A) 69,300 13,628Oriental Holdings BHD 35,720 45,001OSK Holdings BHD 111,397 23,266Pos Malaysia BHD (A) 30,900 4,854PPB Group BHD 30,500 125,271RHB Bank BHD 146,176 188,278Sapura Energy BHD (A) 1,155,500 13,901Sime Darby BHD 307,400 171,314Sime Darby Property BHD 271,300 38,752SP Setia BHD Group (A) 173,900 53,845Sunway BHD 140,407 57,955Ta Ann Holdings BHD 50,348 42,353Tan Chong Motor Holdings BHD 6,300 1,665Tropicana Corp. BHD (A) 161,380 41,038UEM Edgenta BHD (A) 32,900 12,782UEM Sunrise BHD (A) 372,300 28,570UMW Holdings BHD 48,800 34,782United Malacca BHD 11,900 14,729UOA Development BHD 117,500 47,050Velesto Energy BHD (A) 428,800 12,356WCT Holdings BHD (A) 194,483 23,803Yinson Holdings BHD 26,500 38,188YNH Property BHD (A) 34,619 22,018YTL Corp. BHD 536,837 74,748
4,103,520Mexico - 2.1%Alfa SAB de CV, Class A 370,181 271,731Alpek SAB de CV 49,200 53,464Arca Continental SAB de CV 25,987 165,018Banco del Bajio SA (C) 68,070 121,509Cemex SAB de CV, Series CPO (A) 730,985 499,450Coca-Cola Femsa SAB de CV 23,422 128,701Consorcio ARA SAB de CV 25,993 5,446Corp. Actinver SAB de CV 16,024 9,274Credito Real SAB de CV SOFOM
ER (A)(B) 33,638 13,455El Puerto de Liverpool SAB de CV,
Series C1 13,794 59,554
John Hancock Variable Insurance TrustPortfolio of Investments — December 31, 2021 (showing percentage of total net assets)
The accompanying notes are an integral part of the financial statements. 31

Emerging Markets Value Trust (continued)Shares orPrincipalAmount Value
COMMON STOCKS (continued)Mexico (continued)Fomento Economico Mexicano SAB
de CV 10,629 $ 82,793GCC SAB de CV 14,906 114,477Genomma Lab Internacional SAB de CV,
Class B (B) 28,340 29,786Gentera SAB de CV (A) 115,192 74,261Grupo Carso SAB de CV, Series A1 27,578 88,099Grupo Comercial Chedraui SA de CV 34,106 70,692Grupo Financiero Banorte SAB de CV,
Series O 131,299 853,952Grupo Financiero Inbursa SAB de CV,
Series O (A) 145,540 174,644Grupo KUO SAB de CV, Series B (B) 42,698 94,653Grupo Mexico SAB de CV, Series B 185,616 809,166Grupo Pochteca SAB de CV (A) 9,600 3,390Grupo Sanborns SAB de CV (A) 95,919 133,510Grupo Televisa SAB, Series CPO 202,588 380,035Industrias Bachoco SAB de CV, Series B 14,121 49,207Industrias CH SAB de CV, Series B (A) 18,800 175,270Industrias Penoles SAB de CV 8,071 93,038La Comer SAB de CV 16,584 29,887Megacable Holdings SAB de CV,
Series CPO 23,643 80,817Minera Frisco SAB de CV, Series A1 (A) 168,003 29,538Nemak SAB de CV (A)(C) 159,261 47,213Orbia Advance Corp. SAB de CV 73,770 188,285Organizacion Cultiba SAB de CV (A) 17,095 10,837Organizacion Soriana SAB de CV,
Series B 190,849 242,249Promotora y Operadora de Infraestructura
SAB de CV 8,737 68,170Promotora y Operadora de Infraestructura
SAB de CV, L Shares 3,141 15,340Unifin Financiera SAB de CV (A) 32,326 59,362Vitro SAB de CV, Series A 6,357 7,498
5,333,771Philippines - 0.8%Alliance Global Group, Inc. 334,100 77,274Ayala Corp. 9,390 153,066Bank of the Philippine Islands 74,260 134,179BDO Unibank, Inc. 154,227 364,990Cebu Air, Inc. (A) 15,220 12,578China Banking Corp. 75,528 38,516Cosco Capital, Inc. 388,900 39,675DMCI Holdings, Inc. 144,200 21,813East West Banking Corp. (A) 74,300 13,989EEI Corp. (A) 43,000 5,474Filinvest Development Corp. 119,475 18,666Filinvest Land, Inc. 937,500 20,226First Philippine Holdings Corp. 29,660 40,758Global Ferronickel Holdings, Inc. 283,424 11,945GT Capital Holdings, Inc. 4,619 48,903JG Summit Holdings, Inc. 157,922 163,924LT Group, Inc. 159,800 31,015Megaworld Corp. 839,700 51,853Metropolitan Bank & Trust Company 130,973 143,035Petron Corp. (A) 289,400 17,989Philex Mining Corp. 161,300 17,238Philippine National Bank (A) 65,310 25,741Philtown Properties, Inc. (A)(D) 3,844 116Phoenix Petroleum Philippines, Inc. (A) 22,200 4,725PNB Holdings Corp. (A)(D) 10,246 64Premium Leisure Corp. 815,000 6,873RFM Corp. 133,500 11,903Rizal Commercial Banking Corp. 62,703 24,596
Emerging Markets Value Trust (continued)Shares orPrincipalAmount Value
COMMON STOCKS (continued)Philippines (continued)Robinsons Land Corp. 247,568 $ 93,214Robinsons Retail Holdings, Inc. 16,680 21,388San Miguel Corp. 46,220 104,148Security Bank Corp. 27,730 64,702Top Frontier Investment Holdings, Inc. (A) 18,024 45,116Union Bank of the Philippines 54,938 107,201Vista Land & Lifescapes, Inc. 569,000 39,396
1,976,289Poland - 0.7%Alior Bank SA (A) 6,632 89,767Asseco Poland SA 4,655 99,662Bank Handlowy w Warszawie SA 2,586 37,874Bank Millennium SA (A) 57,979 117,541Bank Polska Kasa Opieki SA 411 12,405Ciech SA 2,826 29,510Develia SA 22,340 16,560Enea SA (A) 19,073 40,329Famur SA (A) 24,204 20,091Grupa Azoty SA (A) 4,728 39,642Grupa Lotos SA (A) 6,814 102,989Jastrzebska Spolka Weglowa SA (A) 2,583 22,268KGHM Polska Miedz SA 5,396 187,302Lubelski Wegiel Bogdanka SA (A) 2,164 17,124mBank SA (A) 914 97,677PGE Polska Grupa Energetyczna SA (A) 66,331 132,359PKP Cargo SA (A) 5,709 19,863Polski Koncern Naftowy ORLEN SA 29,861 550,396Santander Bank Polska SA 729 62,602Stalexport Autostrady SA (B) 15,820 13,658Tauron Polska Energia SA (A) 90,488 59,465
1,769,084Qatar - 0.6%Aamal Company 210,501 62,645Alijarah Holding Company QPSC 77,548 20,015Baladna 72,138 28,625Barwa Real Estate Company 175,600 147,479Commercial Bank PSQC 142,087 262,892Doha Bank QPSC 139,323 122,473Doha Insurance Company QSC 25,407 13,408Gulf International Services QSC (A) 102,379 48,171Gulf Warehousing Company 19,525 24,336Investment Holding Group (A) 88,748 29,961Mannai Corp. QSC 5,422 7,073Mesaieed Petrochemical Holding Company 223,749 128,272Ooredoo QPSC 80,019 154,400Qatar Fuel QSC 29,535 148,200Qatar Insurance Company SAQ (A) 100,863 76,161Qatar National Cement Company QSC 23,781 33,329Qatar Navigation QSC 41,293 86,592United Development Company QSC 177,150 74,814Vodafone Qatar QSC 145,471 66,592
1,535,438Russia - 1.5%Gazprom PJSC, ADR (London
Stock Exchange) 196,506 1,814,566LUKOIL PJSC, ADR 18,564 1,663,351Rosneft Oil Company PJSC, GDR
(London Stock Exchange) 3,675 29,557RusHydro PJSC, ADR 63,164 63,157VTB Bank PJSC, GDR 86,297 108,865
3,679,496Saudi Arabia - 2.9%Al Babtain Power &
Telecommunication Company 2,665 22,357
John Hancock Variable Insurance TrustPortfolio of Investments — December 31, 2021 (showing percentage of total net assets)
The accompanying notes are an integral part of the financial statements. 32

Emerging Markets Value Trust (continued)Shares orPrincipalAmount Value
COMMON STOCKS (continued)Saudi Arabia (continued)Al Jouf Cement Company (A) 7,491 $ 21,697Al-Etihad Cooperative Insurance
Company (A) 3,266 17,277Alinma Bank 103,065 656,565Arab National Bank 43,307 263,747Arabian Cement Company 4,196 42,173Aseer Trading Tourism & Manufacturing
Company (A) 3,891 19,737AXA Cooperative Insurance Company (A) 2,090 18,332Bank Al-Jazira 25,377 130,186Banque Saudi Fransi 28,776 361,530City Cement Company 6,807 40,836Dar Al Arkan Real Estate Development
Company (A) 35,107 93,982Eastern Province Cement Company 2,857 33,442Emaar Economic City (A) 21,759 69,208Etihad Etisalat Company 42,915 355,958Hail Cement Company 4,570 16,139Middle East Healthcare Company (A) 2,179 18,332Mobile Telecommunications Company
Saudi Arabia (A) 47,765 152,888Najran Cement Company 7,837 37,699National Industrialization Company (A) 21,450 113,571Northern Region Cement Company 3,711 13,238Riyad Bank 104,376 752,982Sahara International
Petrochemical Company 31,147 347,126Saudi Basic Industries Corp. 49,313 1,520,784Saudi Chemical Company Holding 3,283 29,635Saudi Industrial Investment Group 10,444 86,501Saudi Kayan Petrochemical Company (A) 87,313 394,451Saudi Re for Cooperative Reinsurance
Company (A) 5,052 22,303Tabuk Cement Company (A) 4,675 21,732The Saudi British Bank 56,303 493,802The Saudi Investment Bank 20,379 106,080The Saudi National Bank 52,357 897,544Umm Al-Qura Cement Company 2,316 14,515Walaa Cooperative Insurance Company (A) 2,461 12,409Yamama Cement Company (A) 8,393 58,105Yanbu Cement Company 6,565 63,157
7,320,020Singapore - 0.1%JOYY, Inc., ADR 5,041 229,013South Africa - 3.4%Absa Group, Ltd. 53,337 510,465AECI, Ltd. 11,686 81,884African Rainbow Minerals, Ltd. 10,677 154,793Alexander Forbes Group Holdings, Ltd. 120,790 33,955Alviva Holdings, Ltd. 22,754 23,660AngloGold Ashanti, Ltd. 4,187 88,160Aspen Pharmacare Holdings, Ltd. 20,940 294,631Astral Foods, Ltd. 4,628 50,135Balwin Properties, Ltd. 6,271 1,346Barloworld, Ltd. 21,853 206,415Blue Label Telecoms, Ltd. (A) 44,582 14,236Caxton & CTP Publishers & Printers, Ltd. 19,879 10,769DataTec, Ltd. 19,918 48,207Discovery, Ltd. (A) 23,369 210,695Exxaro Resources, Ltd. 12,725 122,062Gold Fields, Ltd., ADR 47,738 524,641Grindrod, Ltd. (A) 45,556 14,213Harmony Gold Mining Company, Ltd. 10,790 45,253Harmony Gold Mining Company, Ltd.,
ADR (B) 18,219 74,880
Emerging Markets Value Trust (continued)Shares orPrincipalAmount Value
COMMON STOCKS (continued)South Africa (continued)Hudaco Industries, Ltd. 5,065 $ 41,880Impala Platinum Holdings, Ltd. 47,215 666,049Imperial Logistics, Ltd. 19,928 80,045Investec, Ltd. 19,898 109,341KAP Industrial Holdings, Ltd. 257,249 70,611Lewis Group, Ltd. 14,408 42,931Liberty Holdings, Ltd. (A) 15,664 93,026Life Healthcare Group Holdings, Ltd. 45,978 69,350Long4Life, Ltd. 31,563 11,555Metair Investments, Ltd. 23,633 40,758Momentum Metropolitan Holdings 97,843 116,332Motus Holdings, Ltd. 14,065 97,074Mpact, Ltd. (A) 23,460 51,445MTN Group, Ltd. (A) 121,450 1,301,817Murray & Roberts Holdings, Ltd. (A) 60,191 53,790Nedbank Group, Ltd. 30,206 331,788Netcare, Ltd. (A) 25,774 25,701Oceana Group, Ltd. 5,108 17,856Old Mutual, Ltd. 238,727 196,100Omnia Holdings, Ltd. 19,012 76,557Pepkor Holdings, Ltd. (A)(C) 50,172 68,837PPC, Ltd. (A) 168,790 53,518PSG Group, Ltd. (A) 5,957 33,353Raubex Group, Ltd. 20,799 51,937RCL Foods, Ltd. 35,643 29,048Reunert, Ltd. 19,682 65,514Royal Bafokeng Platinum, Ltd. 13,281 130,685Sappi, Ltd. (A) 61,862 177,110Sasol, Ltd. (A) 30,590 500,837Sibanye Stillwater, Ltd. 79,031 245,733Sibanye Stillwater, Ltd., ADR 2,067 25,920Standard Bank Group, Ltd. 86,012 755,649Super Group, Ltd. 42,421 90,590Telkom SA SOC, Ltd. (A) 37,622 127,697Tiger Brands, Ltd. 5,674 64,436Trencor, Ltd. (A) 40,666 11,690Wilson Bayly Holmes-Ovcon, Ltd. 5,366 38,109
8,475,069South Korea - 13.5%Aekyung Chemical Company, Ltd. (A) 2,084 18,968AJ Networks Company, Ltd. (A) 2,832 12,876Ajin Industrial Company, Ltd. (A) 8,098 21,739AK Holdings, Inc. (A) 743 12,036AMOREPACIFIC Group (A) 1,900 70,796Asia Cement Company, Ltd. (A) 32 3,273ASIA Holdings Company, Ltd. (A) 241 25,897Asia Paper Manufacturing
Company, Ltd. (A) 565 24,968BNK Financial Group, Inc. (A) 20,556 145,030Bookook Securities Company, Ltd. (A) 501 10,297Chongkundang Holdings Corp. (A) 288 18,510Chosun Refractories Company, Ltd. (A) 338 23,042CJ CheilJedang Corp. (A) 900 293,195CJ Corp. (A) 1,674 117,304CJ ENM Company, Ltd. (A) 651 75,894CJ Logistics Corp. (A) 826 87,477Com2uS Corp. 216 28,703Dae Han Flour Mills Company, Ltd. (A) 232 30,131Dae Won Kang Up Company, Ltd. (A) 4,385 13,740Daedong Corp. (A) 3,364 28,550Daesang Corp. (A) 2,028 39,698Daesang Holdings Company, Ltd. (A) 2,310 18,827Daewoo Engineering & Construction
Company, Ltd. (A) 20,805 100,874Dahaam E-Tec Company, Ltd. (A) 2,630 147,789
John Hancock Variable Insurance TrustPortfolio of Investments — December 31, 2021 (showing percentage of total net assets)
The accompanying notes are an integral part of the financial statements. 33

Emerging Markets Value Trust (continued)Shares orPrincipalAmount Value
COMMON STOCKS (continued)South Korea (continued)Daihan Pharmaceutical Company, Ltd. (A) 563 $ 13,585Daishin Securities Company, Ltd. (A) 3,901 61,109Daou Data Corp. 1,778 22,520Daou Technology, Inc. (A) 2,309 44,150DB Financial Investment
Company, Ltd. (A) 3,849 21,260DB Insurance Company, Ltd. (A) 5,058 229,647DB, Inc. (A) 19,825 15,806Deutsch Motors, Inc. (A) 3,903 24,939DGB Financial Group, Inc. (A) 19,003 149,741DL E&C Company, Ltd. (A) 2,017 201,590DL Holdings Company, Ltd. (A) 1,609 82,285DMS Company, Ltd. 3,275 18,584Dongkuk Industries Company, Ltd. (A) 8,476 25,228Dongkuk Steel Mill Company, Ltd. (A) 6,404 85,525Dongwon Development Company, Ltd. (A) 5,212 23,375Dongwon F&B Company, Ltd. (A) 122 19,937Dongwon Industries Company, Ltd. (A) 176 33,571Doosan Bobcat, Inc. (A) 4,079 139,595Doosan Company, Ltd. (A) 554 54,873DTR Automotive Corp. 741 44,737Easy Holdings Company, Ltd. 3,872 13,088E-MART, Inc. 1,480 187,622ENF Technology Company, Ltd. (A) 1,003 28,815Eugene Corp. (A) 6,888 27,956Eugene Investment & Securities
Company, Ltd. (A) 11,471 34,634Eusu Holdings Company, Ltd. (A) 1,407 7,453Farmsco (A) 2,687 13,851Fila Holdings Corp. (A) 728 21,939GS Engineering & Construction Corp. (A) 6,176 205,378GS Global Corp. (A) 7,813 15,562GS Holdings Corp. (A) 5,061 166,230GS Retail Company, Ltd. (A) 3,309 84,472Gwangju Shinsegae Company, Ltd. 152 23,126Halla Holdings Corp. (A) 837 32,261Han Kuk Carbon Company, Ltd. (A) 2,438 22,004Hana Financial Group, Inc. 22,866 807,835Handok, Inc. (A) 729 13,956Handsome Company, Ltd. (A) 1,545 46,210Hanil Cement Company, Ltd. 1,450 25,575Hanil Holdings Company, Ltd. 3,183 36,100Hanjin Transportation Company, Ltd. (A) 1,052 26,588Hankook Tire & Technology
Company, Ltd. (A) 7,854 262,381Hanshin Construction Company, Ltd. (A) 1,844 24,350Hansol Holdings Company, Ltd. (A) 5,241 15,636Hansol Paper Company, Ltd. 2,920 33,124Hansol Technics Company, Ltd. (A) 3,325 21,796Hanwha Aerospace Company, Ltd. (A) 2,248 90,618Hanwha Corp. (A) 3,675 96,909Hanwha General Insurance
Company, Ltd. (A) 5,427 16,920Hanwha Investment & Securities
Company, Ltd. (A) 15,071 80,728Hanwha Life Insurance Company, Ltd. (A) 34,108 84,073Hanwha Solutions Corp. (A) 10,905 325,241Hanyang Eng Company, Ltd. (A) 1,654 23,406Harim Holdings Company, Ltd. (A) 5,472 43,417HDC Hyundai Development
Co-Engineering & Construction,Series E (A) 969 18,633
Hitejinro Holdings Company, Ltd. (A) 995 10,197HS Industries Company, Ltd. (A) 4,056 20,778Huchems Fine Chemical Corp. (A) 1,170 22,720
Emerging Markets Value Trust (continued)Shares orPrincipalAmount Value
COMMON STOCKS (continued)South Korea (continued)Huvis Corp. (A) 3,715 $ 26,800Huvitz Company, Ltd. (A) 1,341 10,069Hyosung Corp. (A) 540 42,940Hyosung Heavy Industries Corp. (A) 742 36,320Hyundai Construction Equipment
Company, Ltd. (A) 1,613 54,875Hyundai Corp. (A) 1,339 18,875Hyundai Corp. Holdings, Inc. (A) 1,811 18,108Hyundai Department Store
Company, Ltd. (A) 1,243 78,429Hyundai Doosan Infracore
Company, Ltd. (A) 12,566 74,808Hyundai Electric & Energy System
Company, Ltd. (A) 2,220 37,069Hyundai Engineering & Construction
Company, Ltd. (A) 5,407 201,751Hyundai Futurenet Company, Ltd. (A) 8,894 31,465Hyundai Glovis Company, Ltd. (A) 1,173 165,413Hyundai Greenfood Company, Ltd. (A) 5,234 37,684Hyundai Heavy Industries Holdings
Company, Ltd. 3,580 161,566Hyundai Home Shopping Network
Corp. (A) 652 34,764Hyundai Livart Furniture
Company, Ltd. (A) 1,327 16,881Hyundai Marine & Fire Insurance
Company, Ltd. (A) 6,179 119,113Hyundai Mipo Dockyard Company, Ltd. 1,765 103,764Hyundai Mobis Company, Ltd. 4,311 921,507Hyundai Motor Company 7,321 1,285,051Hyundai Motor Securities
Company, Ltd. (A) 3,480 36,120Hyundai Steel Company (A) 6,801 234,213Hyundai Wia Corp. (A) 1,286 86,272ICD Company, Ltd. (A) 1,893 20,421Iljin Holdings Company, Ltd. (A) 4,669 21,479Industrial Bank of Korea 23,318 201,718Innocean Worldwide, Inc. 469 21,832INTOPS Company, Ltd. 1,374 37,202Inzi Controls Company, Ltd. (A) 1,760 22,582IS Dongseo Company, Ltd. (A) 1,227 45,644Jahwa Electronics Company, Ltd. (A) 1,056 22,230JB Financial Group Company, Ltd. (A) 13,171 92,366Jeil Savings Bank (A)(D) 1,820 0KB Financial Group, Inc. 550 25,434KB Financial Group, Inc., ADR 30,974 1,429,760KC Company, Ltd. (A) 1,496 28,699KCC Corp. 347 91,854KCC Glass Corp. 939 47,236KCTC (A) 4,403 22,991KG Chemical Corp. 799 20,613Kginicis Company, Ltd. 1,417 22,612KGMobilians Company, Ltd. 2,700 27,631Kia Corp. (A) 18,836 1,299,931KISCO Corp. 4,131 26,857KISCO Holdings Company, Ltd. 1,536 18,794KISWIRE, Ltd. (A) 1,553 25,360KIWOOM Securities Company, Ltd. (A) 1,432 128,593Kolmar Korea Holdings Company, Ltd. (A) 1,323 21,811Kolon Corp. (A) 898 24,907Kolon Industries, Inc. 1,911 113,822Korea Asset In Trust Company, Ltd. (A) 9,060 31,105Korea Electric Terminal Company, Ltd. 561 35,924Korea Investment Holdings
Company, Ltd. (A) 4,028 272,899
John Hancock Variable Insurance TrustPortfolio of Investments — December 31, 2021 (showing percentage of total net assets)
The accompanying notes are an integral part of the financial statements. 34

Emerging Markets Value Trust (continued)Shares orPrincipalAmount Value
COMMON STOCKS (continued)South Korea (continued)Korea Line Corp. (A) 23,137 $ 51,290Korea Petrochemical Industrial
Company, Ltd. (A) 441 67,788Korea Real Estate Investment & Trust
Company, Ltd. (A) 14,635 32,055Korea Shipbuilding & Offshore
Engineering Company, Ltd. (A) 2,882 229,088Korea Zinc Company, Ltd. (A) 595 256,011Korean Air Lines Company, Ltd. (A) 869 21,399Korean Reinsurance Company (A) 9,470 73,589Kortek Corp. (A) 1,806 15,141KPX Chemical Company, Ltd. 660 29,739KSS LINE, Ltd. (A) 3,562 35,471KT Skylife Company, Ltd. (A) 1,768 13,583KT&G Corp. 8,656 575,086KTB Investment & Securities
Company, Ltd. (A) 4,729 20,604Kukdo Chemical Company, Ltd. (A) 466 22,107Kumho Petrochemical Company, Ltd. (A) 1,206 168,121Kumho Tire Company, Inc. (A) 7,054 27,366KUMHOE&C Company, Ltd. (A) 2,357 22,986Kwang Dong Pharmaceutical
Company, Ltd. (A) 3,313 20,689Kyeryong Construction Industrial
Company, Ltd. 844 23,110Kyung-In Synthetic Corp. (A) 4,181 24,383LF Corp. (A) 2,312 33,512LG Corp. (A) 6,087 414,326LG Display Company, Ltd., ADR (A)(B) 52,646 531,725LG Electronics, Inc. 10,548 1,221,254LG HelloVision Company, Ltd. (A) 3,836 17,896LG Uplus Corp. 18,651 212,814Lotte Chemical Corp. (A) 1,193 217,628Lotte Chilsung Beverage
Company, Ltd. (A) 305 34,253Lotte Corp. (A) 2,012 50,564Lotte Data Communication Company (A) 697 21,153LOTTE Fine Chemical Company, Ltd. (A) 1,504 94,728Lotte Food Company, Ltd. (A) 34 9,846LOTTE Himart Company, Ltd. (A) 1,006 21,239Lotte Non-Life Insurance
Company, Ltd. (A) 5,459 7,430Lotte Shopping Company, Ltd. (A) 881 64,553LS Corp. (A) 1,793 81,522LS Electric Company, Ltd. (A) 438 20,508LX Hausys, Ltd. (A) 659 34,034LX Holdings Corp. (A) 2,952 24,801LX International Corp. (A) 2,902 64,417Mando Corp. (A) 1,993 106,049Meritz Financial Group, Inc. (A) 3,839 142,202Meritz Fire & Marine Insurance
Company, Ltd. (A) 2,860 80,531Meritz Securities Company, Ltd. (A) 35,902 155,445Mirae Asset Life Insurance
Company, Ltd. (A) 8,582 28,890Mirae Asset Securities Company, Ltd. (A) 27,337 198,596Motonic Corp. (A) 2,259 20,084Muhak Company, Ltd. (A) 2,080 14,603Namyang Dairy Products
Company, Ltd. (A) 58 19,838Nexen Corp. (A) 3,733 14,308Nexen Tire Corp. (A) 6,465 37,061NH Investment & Securities
Company, Ltd. (A) 12,340 129,608NHN Corp. (A) 1,882 71,203
Emerging Markets Value Trust (continued)Shares orPrincipalAmount Value
COMMON STOCKS (continued)South Korea (continued)Nice Information &
Telecommunication, Inc. (A) 705 $ 17,474Nong Shim Holdings Company, Ltd. (A) 402 25,646NongShim Company, Ltd. (A) 255 68,382NS Shopping Company, Ltd. (A) 1,078 11,502OCI Company, Ltd. 1,606 140,282Orion Holdings Corp. (A) 2,756 36,943Ottogi Corp. (A) 107 41,030Paik Kwang Industrial Company, Ltd. (A) 4,235 18,334Pan Ocean Company, Ltd. (A) 26,446 120,279Paradise Company, Ltd. (A) 2,760 34,623Partron Company, Ltd. 2,739 30,557Poongsan Corp. (A) 2,423 63,423Poongsan Holdings Corp. (A) 1,129 26,854POSCO 5,684 1,318,045Posco International Corp. (A) 4,844 91,309Protec Company, Ltd. (A) 1,070 24,134Pyeong Hwa Automotive
Company, Ltd. (A) 2,626 22,262RFTech Company, Ltd. (A) 4,033 20,587Sam Young Electronics Company, Ltd. (A) 938 8,974Samho Development Company, Ltd. (A) 4,213 18,049Sammok S-Form Company, Ltd. (A) 1,315 15,291SAMPYO Cement Company, Ltd. (A) 4,134 16,391Samsung C&T Corp. (A) 4,883 487,910Samsung Card Company, Ltd. (A) 2,454 65,030Samsung Electronics Company, Ltd. 33,034 2,169,507Samsung Fire & Marine Insurance
Company, Ltd. (A) 3,065 520,669Samsung Heavy Industries
Company, Ltd. (A) 39,786 189,677Samsung Life Insurance
Company, Ltd. (A) 4,666 251,251Samsung Securities Company, Ltd. (A) 4,810 181,359Samyang Corp. (A) 258 13,598Samyang Holdings Corp. (A) 535 44,150Sangsangin Company, Ltd. 3,653 25,459Seah Besteel Corp. (A) 1,017 17,007Sebang Company, Ltd. (A) 1,153 11,552Sebang Global Battery Company, Ltd. (A) 601 38,306Sejong Industrial Company, Ltd. (A) 1,547 11,314Sejong Telecom, Inc. (A) 42,334 21,026Seohee Construction Company, Ltd. 13,592 18,939Seoul Semiconductor Company, Ltd. (A) 3,322 42,898Seoyon Company, Ltd. (A) 2,508 25,862SFA Engineering Corp. (A) 683 20,661SGC eTec E&C Company, Ltd. (A) 178 9,279Shindaeyang Paper Company, Ltd. (A) 267 19,226Shinhan Financial Group Company, Ltd. 2,494 77,062Shinhan Financial Group
Company, Ltd., ADR 35,708 1,103,734Shinsegae Engineering & Construction
Company, Ltd. (A) 621 18,097Shinsegae Food Company, Ltd. 268 18,458Shinsegae, Inc. 668 142,552Shinwha Intertek Corp. (A) 4,441 11,399Shinyoung Securities Company, Ltd. 580 29,253SK Discovery Company, Ltd. (A) 1,496 58,367SK Gas, Ltd. (A) 304 32,568SK Hynix, Inc. 34,604 3,800,647SK Innovation Company, Ltd. (A) 2,536 507,787SK Networks Company, Ltd. (A) 16,268 68,632SK Securities Company, Ltd. (A) 27,076 22,736SK, Inc. 2,806 591,559SL Corp. (A) 1,618 42,379
John Hancock Variable Insurance TrustPortfolio of Investments — December 31, 2021 (showing percentage of total net assets)
The accompanying notes are an integral part of the financial statements. 35

Emerging Markets Value Trust (continued)Shares orPrincipalAmount Value
COMMON STOCKS (continued)South Korea (continued)SNT Holdings Company, Ltd. 1,460 $ 21,610SNT Motiv Company, Ltd. 882 34,850Songwon Industrial Company, Ltd. (A) 1,547 27,858Spigen Korea Company, Ltd. 525 18,971Sungshin Cement Company, Ltd. (A) 3,637 50,533Sungwoo Hitech Company, Ltd. (A) 2,984 14,301Sunjin Company, Ltd. (A) 2,276 22,015Taekwang Industrial Company, Ltd. (A) 48 42,087Taeyoung Engineering & Construction
Company, Ltd. (A) 2,234 19,728Tongyang Life Insurance
Company, Ltd. (A) 7,644 42,396Toptec Company, Ltd. (A) 2,535 19,722Tovis Company, Ltd. (A) 1,305 9,395TS Corp. (A) 12,730 32,313TY Holdings Company, Ltd. (A) 2,153 50,974Unick Corp. 2,729 14,363Unid Company, Ltd. 534 45,039WiSoL Company, Ltd. 2,256 20,638Wonik Holdings Company, Ltd. (A) 5,948 24,882Wonik Materials Company, Ltd. (A) 880 26,176Woori Financial Group, Inc. 41,842 446,217Young Poong Corp. (A) 51 28,083Youngone Corp. 2,509 92,053Youngone Holdings Company, Ltd. (A) 920 36,159Yuanta Securities Korea Company, Ltd. (A) 11,703 39,499Zeus Company, Ltd. 1,798 35,387
33,771,174Taiwan - 17.4%Abico Avy Company, Ltd. 24,990 24,362AcBel Polytech, Inc. 38,000 50,155Acer, Inc. 256,452 281,593ACES Electronic Company, Ltd. 19,323 36,243Acter Group Corp., Ltd. 4,000 32,073Advanced International Multitech
Company, Ltd. 13,000 35,163Advancetek Enterprise Company, Ltd. 35,186 29,247AGV Products Corp. (A) 11,716 4,593Alpha Networks, Inc. 31,773 38,539Altek Corp. 16,000 27,445AmTRAN Technology Company, Ltd. 49,767 31,572Apacer Technology, Inc. 11,000 19,321APCB, Inc. 37,000 29,659Apex International Company, Ltd. 7,000 32,913Arcadyan Technology Corp. 8,000 36,791Ardentec Corp. 45,000 90,027Argosy Research, Inc. 7,000 34,109ASE Technology Holding Company, Ltd. 229,000 884,905Asia Cement Corp. 195,805 313,059Asia Polymer Corp. 50,607 66,904Asia Tech Image, Inc. 12,000 24,049Asia Vital Components Company, Ltd. 29,328 93,190Asustek Computer, Inc. 68,000 923,132AU Optronics Corp. 450,000 371,997Audix Corp. 21,000 45,190Bank of Kaohsiung Company, Ltd. 27,810 12,153Basso Industry Corp. 8,000 12,622BES Engineering Corp. 163,700 53,585Capital Securities Corp. 183,403 112,246Career Technology MFG.
Company, Ltd. (A) 61,200 58,359Catcher Technology Company, Ltd. 53,000 299,619Cathay Financial Holding Company, Ltd. 690,423 1,555,421Cathay Real Estate Development
Company, Ltd. 46,400 32,271
Emerging Markets Value Trust (continued)Shares orPrincipalAmount Value
COMMON STOCKS (continued)Taiwan (continued)Celxpert Energy Corp. 12,000 $ 18,493Central Reinsurance Company, Ltd. 31,500 33,721Chang Hwa Commercial Bank, Ltd. (B) 334,238 205,262Channel Well Technology Company, Ltd. 16,000 22,951Charoen Pokphand Enterprise 10,000 29,126CHC Healthcare Group 21,000 28,883Chen Full International Company, Ltd. 15,000 22,318Chenbro Micom Company, Ltd. 10,000 28,159Cheng Loong Corp. 68,320 87,095Cheng Shin Rubber Industry
Company, Ltd. 132,000 172,023Cheng Uei Precision Industry
Company, Ltd. 37,629 53,728Chicony Electronics Company, Ltd. 18,000 53,498Chilisin Electronics Corp. 24,000 81,981China Airlines, Ltd. (A) 264,910 263,288China Bills Finance Corp. 95,000 59,023China Chemical & Pharmaceutical
Company, Ltd. 34,000 27,817China Development Financial
Holding Corp. 1,035,535 654,035China General Plastics Corp. 37,485 46,969China Man-Made Fiber Corp. 178,414 65,347China Metal Products Company, Ltd. 42,513 50,702China Motor Corp. 30,250 69,240China Petrochemical Development
Corp. (A)(B) 309,245 146,669China Steel Corp. 919,180 1,172,934Chin-Poon Industrial Company, Ltd. 43,571 57,678Chipbond Technology Corp. 70,000 168,593ChipMOS Technologies, Inc. 66,938 117,252Chong Hong Construction Company, Ltd. 19,000 50,118Chun Yuan Steel Industry Company, Ltd. 50,874 44,811Chung Hung Steel Corp. 38,625 57,208Chung-Hsin Electric & Machinery
Manufacturing Corp. 46,500 75,946CMC Magnetics Corp. (A) 72,470 29,943Compal Electronics, Inc. 450,000 393,391Compeq Manufacturing Company, Ltd. 111,000 175,305Concord Securities Company, Ltd. 26,000 14,090Continental Holdings Corp. 49,050 44,565Coretronic Corp. 40,000 133,267CTBC Financial Holding Company, Ltd. 1,714,348 1,606,002CTCI Corp. 8,000 10,750DA CIN Construction Company, Ltd. 20,000 23,651Darfon Electronics Corp. 16,000 29,292Darwin Precisions Corp. (A) 37,000 21,380Depo Auto Parts Industrial Company, Ltd. 21,000 47,588D-Link Corp. 50,600 34,716Dyaco International, Inc. 5,000 9,759Dynamic Electronics Company, Ltd. 35,584 29,049Dynapack International Technology Corp. 10,000 36,991E Ink Holdings, Inc. 5,000 27,228E.Sun Financial Holding Company, Ltd. 81,344 82,447Edom Technology Company, Ltd. 37,400 44,029Elite Semiconductor Microelectronics
Technology, Inc. 27,000 160,257Elitegroup Computer Systems
Company, Ltd. 42,104 34,190Ennoconn Corp. 6,233 53,194Ennostar, Inc. (A) 20,656 57,105EnTie Commercial Bank Company, Ltd. 58,000 34,257Eson Precision Ind Company, Ltd. 12,000 28,842Eternal Materials Company, Ltd. 12,000 17,508Eva Airways Corp. (A) 266,725 268,950
John Hancock Variable Insurance TrustPortfolio of Investments — December 31, 2021 (showing percentage of total net assets)
The accompanying notes are an integral part of the financial statements. 36

Emerging Markets Value Trust (continued)Shares orPrincipalAmount Value
COMMON STOCKS (continued)Taiwan (continued)Everest Textile Company, Ltd. (A) 64,835 $ 22,532Evergreen International Storage &
Transport Corp. 67,600 71,279Evergreen Marine Corp. Taiwan, Ltd. 11,655 59,708Everlight Chemical Industrial Corp. 49,250 48,378Everlight Electronics Company, Ltd. 46,000 87,382Excelsior Medical Company, Ltd. 16,573 34,489Far Eastern Department Stores, Ltd. 102,720 79,594Far Eastern International Bank 324,637 126,034Far Eastern New Century Corp. 252,249 266,760Farglory Land Development
Company, Ltd. 28,530 63,690Federal Corp. 13,000 13,536First Financial Holding Company, Ltd. 613,053 542,275First Steamship Company, Ltd. (A) 84,809 39,974FLEXium Interconnect, Inc. (A) 10,000 37,685Formosa Advanced Technologies
Company, Ltd. 25,000 35,303Formosa Chemicals & Fibre Corp. 184,000 536,654Formosa Laboratories, Inc. (A) 9,543 20,858Formosa Plastics Corp. 171,000 641,810Formosa Taffeta Company, Ltd. 67,000 70,534Formosan Rubber Group, Inc. 33,020 27,433Formosan Union Chemical 48,812 40,644Foxconn Technology Company, Ltd. 64,626 151,341Fubon Financial Holding Company, Ltd. 741,053 2,039,768Fulgent Sun International Holding
Company, Ltd. 11,000 38,508Fulltech Fiber Glass Corp. (A) 45,000 28,160G Shank Enterprise Company, Ltd. 15,535 42,853Gemtek Technology Corp. 32,000 37,292General Interface Solution Holding, Ltd. 29,000 106,736Giantplus Technology Company, Ltd. (A) 31,000 15,608Gigabyte Technology Company, Ltd. 9,000 50,500Ginko International Company, Ltd. 4,000 38,730Global Brands Manufacture, Ltd. 37,541 52,272Global Lighting Technologies, Inc. 6,000 18,001Globe Union Industrial Corp. 51,750 28,225Gloria Material Technology Corp. 39,684 31,368Gold Circuit Electronics, Ltd. 44,000 120,470Goldsun Building Materials Company, Ltd. 93,540 98,520Grand Ocean Retail Group, Ltd. 13,000 8,349Grand Pacific Petrochemical 77,000 79,720Great China Metal Industry 33,000 31,463Great Wall Enterprise Company, Ltd. 41,976 80,981Hannstar Board Corp. 39,750 65,135HannStar Display Corp. 276,842 180,654HannsTouch Solution, Inc. 64,000 39,836Hey Song Corp. 40,000 51,653Highwealth Construction Corp. 45,000 75,172Ho Tung Chemical Corp. 88,399 35,568Hon Hai Precision Industry Company, Ltd. 732,448 2,746,784Hong Pu Real Estate Development
Company, Ltd. 27,000 22,577Hsing TA Cement Company, Ltd. 38,000 28,569Hua Nan Financial Holdings
Company, Ltd. 499,126 382,047Hung Sheng Construction, Ltd. 42,240 36,615IBF Financial Holdings Company, Ltd. 237,780 137,802Ichia Technologies, Inc. 25,000 15,431IEI Integration Corp. 12,000 20,279Innolux Corp. 657,561 464,666Inpaq Technology Company, Ltd. (A) 12,000 31,502Integrated Service Technology, Inc. 9,000 17,263
Emerging Markets Value Trust (continued)Shares orPrincipalAmount Value
COMMON STOCKS (continued)Taiwan (continued)International CSRC Investment
Holdings Company 81,383 $ 82,777Inventec Corp. 240,000 216,153Iron Force Industrial Company, Ltd. 6,000 15,329Jarllytec Company, Ltd. 9,000 20,445Jess-Link Products Company, Ltd. 13,000 19,443Kaimei Electronic Corp. 13,300 48,459Kenda Rubber Industrial Company, Ltd. 39,520 44,325King Yuan Electronics Company, Ltd. 122,796 198,331King’s Town Bank Company, Ltd. 83,000 121,481King’s Town Construction
Company, Ltd. (A) 7,300 10,763Kinko Optical Company, Ltd. (A) 15,758 20,795Kinpo Electronics, Inc. 160,269 93,298Kinsus Interconnect Technology Corp. 22,000 184,420Kuo Toong International Company, Ltd. 18,248 14,513L&K Engineering Company, Ltd. 17,000 19,969Largan Precision Company, Ltd. 7,000 622,760Laster Tech Corp., Ltd. 11,000 17,465Lealea Enterprise Company, Ltd. (A) 90,124 36,741Li Peng Enterprise Company, Ltd. (A) 62,000 23,061Lida Holdings, Ltd. 4,640 5,362Lien Hwa Industrial Holdings Corp. 42,900 95,919Lingsen Precision Industries, Ltd. (A) 49,481 49,275Lite-On Technology Corp. 164,000 377,650Longchen Paper & Packaging
Company, Ltd. 64,177 56,504Lung Yen Life Service Corp. 9,000 14,395Macauto Industrial Company, Ltd. 8,000 22,793Macronix International Company, Ltd. 129,000 196,277Mega Financial Holding Company, Ltd. 547,472 703,101Mercuries & Associates Holding, Ltd. 47,815 39,129Mercuries Life Insurance
Company, Ltd. (A) 55,949 18,658Merry Electronics Company, Ltd. 11,000 37,492Mitac Holdings Corp. 58,316 74,079MPI Corp. 11,000 46,347Namchow Holdings Company, Ltd. 9,000 16,330Nan Ya Plastics Corp. 334,000 1,028,969Nanya Technology Corp. 121,000 340,811Nichidenbo Corp. 14,000 27,228Nishoku Technology, Inc. 7,800 25,781O-Bank Company, Ltd. 52,538 15,176OptoTech Corp. 26,439 67,783Pacific Construction Company 38,289 13,472Paiho Shih Holdings Corp. 11,000 14,012Pan German Universal Motors, Ltd. 2,000 15,639Pan-International Industrial Corp. (B) 44,481 63,198Pegatron Corp. 204,660 510,647PharmaEngine, Inc. 9,000 23,583Phison Electronics Corp. 5,000 92,304Pou Chen Corp. 163,348 195,418Powertech Technology, Inc. 39,000 137,437President Securities Corp. 99,549 84,997Primax Electronics, Ltd. 26,000 53,159Prince Housing & Development Corp. 142,555 68,941Prodisc Technology, Inc. (A)(D) 762,000 0Qisda Corp. 162,280 178,350Quanta Computer, Inc. 201,000 686,461Quanta Storage, Inc. 23,000 40,349Radiant Opto-Electronics Corp. 26,000 94,786Radium Life Tech Company, Ltd. 102,621 40,192Rechi Precision Company, Ltd. 20,000 13,802Ritek Corp. (A) 57,799 24,524Roo Hsing Company, Ltd. (A) 67,000 17,431
John Hancock Variable Insurance TrustPortfolio of Investments — December 31, 2021 (showing percentage of total net assets)
The accompanying notes are an integral part of the financial statements. 37

Emerging Markets Value Trust (continued)Shares orPrincipalAmount Value
COMMON STOCKS (continued)Taiwan (continued)Ruentex Development Company, Ltd. 85,880 $ 197,599Ruentex Industries, Ltd. 33,800 118,817Sampo Corp. 43,470 46,936San Far Property, Ltd. 28,964 15,791Sanyang Motor Company, Ltd. 48,000 46,906Savior Lifetec Corp. (A) 18,957 13,085SCI Pharmtech, Inc. 7,200 21,859Sercomm Corp. 22,000 60,128Sesoda Corp. 26,064 31,988Shan-Loong Transportation Company, Ltd. 23,000 30,330Sheng Yu Steel Company, Ltd. 22,000 26,231ShenMao Technology, Inc. 8,000 23,374Shihlin Electric & Engineering Corp. 21,000 40,866Shin Kong Financial Holding
Company, Ltd. 870,344 346,843Shin Zu Shing Company, Ltd. 8,000 27,887Shining Building Business
Company, Ltd. (A) 55,118 21,896Shinkong Insurance Company, Ltd. 27,000 46,318Shinkong Synthetic Fibers Corp. 132,239 96,428Sigurd Microelectronics Corp. 47,773 101,263Simplo Technology Company, Ltd. 8,000 94,887Sincere Navigation Corp. 24,000 25,236Sinher Technology, Inc. 8,000 11,889Sinon Corp. 45,650 46,557SinoPac Financial Holdings Company, Ltd. 706,931 412,276Sirtec International Company, Ltd. 23,800 24,508Siward Crystal Technology Company, Ltd. 20,000 28,181Soft-World International Corp. 4,000 14,238Sunonwealth Electric Machine Industry
Company, Ltd. 18,000 28,862Sunrex Technology Corp. 11,678 20,116Supreme Electronics Company, Ltd. 13,268 24,194Syncmold Enterprise Corp. 6,000 15,226SYNergy ScienTech Corp. 10,000 11,911Synmosa Biopharma Corp. 20,176 17,201Synnex Technology International Corp. 120,000 286,716TA Chen Stainless Pipe (A) 99,489 165,923Ta Ya Electric Wire & Cable 58,889 53,011TA-I Technology Company, Ltd. 8,000 18,861Taichung Commercial Bank Company, Ltd. 452,227 198,444TaiDoc Technology Corp. 4,000 26,225Taiflex Scientific Company, Ltd. 24,100 41,331Tainan Spinning Company, Ltd. 135,638 124,936Taishin Financial Holding Company, Ltd. 890,946 609,515Taita Chemical Company, Ltd. (B) 26,494 33,042Taiwan Business Bank 509,790 182,270Taiwan Cement Corp. 388,318 673,011Taiwan Chinsan Electronic Industrial
Company, Ltd. 14,852 25,472Taiwan Cooperative Financial Holding
Company, Ltd. 607,939 558,594Taiwan Fertilizer Company, Ltd. 52,000 131,322Taiwan Fire & Marine Insurance
Company, Ltd. 41,000 30,209Taiwan FU Hsing Industrial Company, Ltd. 21,000 31,487Taiwan Glass Industry Corp. 112,319 108,378Taiwan Hon Chuan Enterprise
Company, Ltd. 34,000 87,944Taiwan Kolin Company, Ltd. (A)(D) 327,000 0Taiwan PCB Techvest Company, Ltd. 36,000 63,143Taiwan Semiconductor Company, Ltd. 14,000 39,705Taiwan Shin Kong Security Company, Ltd. 8,000 11,377Taiwan Styrene Monomer 38,000 23,862
Emerging Markets Value Trust (continued)Shares orPrincipalAmount Value
COMMON STOCKS (continued)Taiwan (continued)Taiwan Surface Mounting
Technology Corp. 26,225 $ 116,791Taiwan Union Technology Corp. 4,000 14,720Taiyen Biotech Company, Ltd. 26,137 31,369Tatung Company, Ltd. (A) 116,000 136,475TBI Motion Technology Company, Ltd. 12,000 21,624Teco Electric & Machinery Company, Ltd. 132,000 150,773Test Research, Inc. 13,000 27,476The Ambassador Hotel (A) 29,000 32,576The Shanghai Commercial & Savings
Bank, Ltd. 134,000 228,579Thye Ming Industrial Company, Ltd. 24,800 34,180Ton Yi Industrial Corp. 97,000 50,967Tong Yang Industry Company, Ltd. 40,627 48,585Tong-Tai Machine & Tool
Company, Ltd. (A) 26,588 16,658TOPBI International Holdings, Ltd. (A) 8,077 3,488Topkey Corp. 6,000 32,438Topoint Technology Company, Ltd. 29,190 44,457TPK Holding Company, Ltd. 41,000 64,331Tripod Technology Corp. 14,000 62,893Tsann Kuen Enterprise Company, Ltd. 7,000 9,723TSRC Corp. 28,000 40,839Tung Ho Steel Enterprise Corp. 61,640 149,482TXC Corp. 27,000 102,690TYC Brother Industrial Company, Ltd. 15,511 10,855Tyntek Corp. 36,000 36,749U-Ming Marine Transport Corp. 38,000 82,595Unimicron Technology Corp. 7,000 58,254Union Bank of Taiwan (A) 261,544 128,382Unitech Printed Circuit Board Corp. (A) 74,194 53,832United Microelectronics Corp. 699,794 1,639,457Universal Cement Corp. 27,483 21,448Unizyx Holding Corp. (A) 34,000 42,950UPC Technology Corp. 89,751 69,881USI Corp. 80,996 92,242Wah Lee Industrial Corp. 26,520 102,428Walsin Lihwa Corp. 180,000 171,941Walsin Technology Corp. (A) 25,000 150,508Walton Advanced Engineering, Inc. (A) 39,584 26,924Wei Chuan Foods Corp. 33,000 26,526Weikeng Industrial Company, Ltd. 25,000 28,835Well Shin Technology Company, Ltd. 15,000 26,103Winbond Electronics Corp. 316,793 387,901Wintek Corp. (A)(D) 543,000 0Wisdom Marine Lines Company, Ltd. 26,343 77,327Wistron Corp. 297,291 312,865Wistron NeWeb Corp. 19,000 53,526WPG Holdings, Ltd. 165,400 314,249WT Microelectronics Company, Ltd. 45,174 119,931Xxentria Technology Materials Corp. 8,000 19,662Yang Ming Marine Transport Corp. (A) 22,000 95,690YC INOX Company, Ltd. 40,104 46,659Yea Shin International Development
Company, Ltd. 20,906 17,344Yem Chio Company, Ltd. 42,717 23,835Yeong Guan Energy Technology Group
Company, Ltd. 13,553 30,827YFY, Inc. 132,202 169,842Yieh Phui Enterprise Company, Ltd. (A) 68,899 62,848Youngtek Electronics Corp. 17,000 51,476Yuanta Financial Holding Company, Ltd. 848,371 774,931Yulon Motor Company, Ltd. 64,470 97,451YungShin Global Holding Corp. 8,000 12,415Zeng Hsing Industrial Company, Ltd. 4,000 21,102
John Hancock Variable Insurance TrustPortfolio of Investments — December 31, 2021 (showing percentage of total net assets)
The accompanying notes are an integral part of the financial statements. 38

Emerging Markets Value Trust (continued)Shares orPrincipalAmount Value
COMMON STOCKS (continued)Taiwan (continued)Zenitron Corp. 45,000 $ 56,572Zhen Ding Technology Holding, Ltd. 44,000 159,409Zig Sheng Industrial Company, Ltd. 38,908 23,046
43,594,917Thailand - 1.9%AAPICO Hitech PCL 35,352 28,498AP Thailand PCL 223,670 63,932Bangchak Corp. PCL 91,600 69,168Bangkok Airways PCL (A) 85,500 24,909Bangkok Bank PCL 12,800 46,393Bangkok Bank PCL, NVDR 14,500 52,554Bangkok Insurance PCL 4,550 36,498Bangkok Land PCL 1,059,200 33,858Bangkok Life Assurance PCL, NVDR 29,900 33,144Bangkok Ranch PCL (A) 92,300 8,292Banpu PCL 535,067 170,126Berli Jucker PCL 86,900 80,578Cal-Comp Electronics Thailand PCL 123,800 11,995Charoen Pokphand Foods PCL 377,100 288,130GFPT PCL 43,900 16,793Indorama Ventures PCL 82,600 106,792IRPC PCL 943,100 108,228Italian-Thai Development PCL (A) 477,400 32,512Kasikornbank PCL, NVDR 101,600 430,167Khon Kaen Sugar Industry PCL (A) 192,600 20,860Kiatnakin Phatra Bank PCL 19,400 34,626Krung Thai Bank PCL 265,400 104,624LH Financial Group PCL 709,300 28,640LPN Development PCL 52,900 7,764MBK PCL (A) 48,672 19,528Millcon Steel PCL 152,625 5,506Polyplex Thailand PCL 14,000 9,977Pruksa Holding PCL 78,800 30,699PTT Exploration & Production PCL 119,900 422,699PTT Global Chemical PCL 133,900 235,345PTT PCL 938,700 1,065,268Quality Houses PCL 377,100 25,501Rojana Industrial Park PCL 113,100 22,521Saha-Union PCL 16,100 15,642Sansiri PCL 1,026,866 37,755SC Asset Corp. PCL 238,196 23,928Somboon Advance Technology PCL 51,300 33,412SPCG PCL 58,900 32,444Sri Trang Agro-Industry PCL 49,100 45,612Srithai Superware PCL (A) 283,000 11,606STP & I PCL (A) 21,600 4,128Supalai PCL 151,900 103,107Super Energy Corp. PCL 743,000 21,150Syntec Construction PCL 156,500 9,130Thai Oil PCL 85,600 126,671Thai Stanley Electric PCL 700 3,669Thai Union Group PCL 35,600 20,790Thaicom PCL 79,400 26,848Thanachart Capital PCL 37,300 42,106The Siam Cement PCL 9,500 109,830The Siam Commercial Bank PCL 42,400 160,940Thitikorn PCL 100 27TMBThanachart Bank PCL 1,334,352 58,613TPI Polene PCL 559,900 28,824TPI Polene Power PCL 283,200 35,256True Corp. PCL 927,400 132,617Univentures PCL 51,700 5,824Vinythai PCL 9,700 11,171
4,777,225
Emerging Markets Value Trust (continued)Shares orPrincipalAmount Value
COMMON STOCKS (continued)Turkey - 0.5%Akbank TAS 217,215 $ 117,307Anadolu Efes Biracilik Ve Malt Sanayii AS 14,921 33,420Arcelik AS 7,251 26,569Dogan Sirketler Grubu Holding AS 52,374 10,876EIS Eczacibasi Ilac ve Sinai ve Finansal
Yatirimlar Sanayi ve Ticaret AS 30,810 17,410Enka Insaat ve Sanayi AS 70,950 81,080Eregli Demir ve Celik Fabrikalari TAS 66,873 142,268Goldas Kuyumculuk Sanayi Ithalat Ve
Bagli Ortakliklari (A)(D) 54,846 392Gozde Girisim Sermayesi Yatirim Ortakligi
AS (A) 28,775 19,773GSD Holding AS (A) 78,125 17,629KOC Holding AS 34,979 74,929Koza Anadolu Metal Madencilik
Isletmeleri AS (A) 15,600 21,256NET Holding AS (A) 40,130 20,163Sekerbank Turk AS (A) 178,589 13,680Tekfen Holding AS 11,038 16,894Turk Hava Yollari AO (A) 64,941 98,533Turkiye Garanti Bankasi AS 204,338 173,902Turkiye Halk Bankasi AS (A) 56,201 19,164Turkiye Sinai Kalkinma Bankasi AS 141,027 15,380Turkiye Sise ve Cam Fabrikalari AS 110,611 112,148Turkiye Vakiflar Bankasi TAO,
Class D (A) 91,535 25,373Uzel Makina Sanayii AS (A)(D) 22,930 0Vestel Elektronik Sanayi ve Ticaret AS 6,172 11,718Yapi ve Kredi Bankasi AS 254,969 65,298
1,135,162Ukraine - 0.1%Kernel Holding SA 7,742 112,489United Arab Emirates - 0.7%Abu Dhabi Commercial Bank PJSC 222,448 516,099Agthia Group PJSC 5,450 7,632Air Arabia PJSC (A) 3,024 1,191Ajman Bank PJSC (A) 110,663 24,819Aldar Properties PJSC 344,351 373,926Amanat Holdings PJSC (A) 77,820 24,347Dana Gas PJSC 87,037 25,027Deyaar Development PJSC (A) 246,958 32,527Dubai Investments PJSC 195,034 102,318Emaar Development PJSC (A) 74,937 88,902Emaar Properties PJSC 266,138 353,665Emirates NBD Bank PJSC 32,397 119,418Eshraq Investments PJSC (A) 223,571 21,613National Central Cooling Company PJSC 14,445 9,947RAK Properties PJSC (A) 77,735 16,250Ras Al Khaimah Ceramics 24,868 19,269SHUAA Capital PSC 76,875 14,290
1,751,240United States - 0.1%Bizlink Holding, Inc. 4,000 37,645Nexteer Automotive Group, Ltd. 95,000 117,938
155,583TOTAL COMMON STOCKS (Cost $232,391,166) $ 243,531,779
PREFERRED SECURITIES - 1.5%Brazil - 1.5%Banco ABC Brasil SA 9,841 27,950Banco Bradesco SA 213,071 738,677Banco do Estado do Rio Grande do Sul
SA, B Shares 22,600 39,095Cia Ferro Ligas da Bahia 5,956 52,209
John Hancock Variable Insurance TrustPortfolio of Investments — December 31, 2021 (showing percentage of total net assets)
The accompanying notes are an integral part of the financial statements. 39

Emerging Markets Value Trust (continued)Shares orPrincipalAmount Value
PREFERRED SECURITIES (continued)Brazil (continued)Eucatex SA Industria e Comercio 4,200 $ 6,627Gerdau SA 91,576 450,170Marcopolo SA 55,200 30,115Petroleo Brasileiro SA 445,844 2,264,953Randon SA Implementos e Participacoes 11,172 21,704Usinas Siderurgicas de Minas Gerais SA,
A Shares 40,910 110,9893,742,489
Colombia - 0.0%Grupo Argos SA 23,975 54,796Grupo de Inversiones Suramericana SA 11,343 62,025
116,821Philippines - 0.0%Cebu Air, Inc., 6.000% 15,189 13,343South Korea - 0.0%Hyundai Engineering & Construction
Company, Ltd. 101 6,250Taiwan - 0.0%China Development Financial Holding
Corp. (A) 42,273 14,653TOTAL PREFERRED SECURITIES (Cost $4,440,027) $ 3,893,556
RIGHTS - 0.0%Marisa Lojas SA (Expiration
Date: 1-12-22; Strike Price: BRL3.08) (A) 4,580 921
Waskita Karya Persero Tbk PT (ExpirationDate: 1-13-22; Strike Price: IDR620.00) (A) 758,656 692
TOTAL RIGHTS (Cost $0) $ 1,613
WARRANTS - 0.0%MBK PCL (Expiration Date: 12-31-24;
Strike Price: THB 3.00) (A) 1,947 611TOTAL WARRANTS (Cost $0) $ 611
Emerging Markets Value Trust (continued)Shares orPrincipalAmount Value
SHORT-TERM INVESTMENTS - 0.8%Short-term funds - 0.8%John Hancock Collateral Trust,
0.1697% (F)(G) 194,200 $ 1,942,586TOTAL SHORT-TERM INVESTMENTS (Cost $1,942,889) $ 1,942,586Total Investments (Emerging Markets Value Trust)
(Cost $238,774,082) - 99.6% $ 249,370,145Other assets and liabilities, net - 0.4% 943,604TOTAL NET ASSETS - 100.0% $ 250,313,749
Currency AbbreviationsBRL Brazilian RealIDR Indonesian RupiahTHB Thai BhatSecurity Abbreviations and LegendADR American Depositary ReceiptGDR Global Depositary ReceiptNVDR Non-Voting Depositary Receipt(A) Non-income producing security.(B) All or a portion of this security is on loan as of 12-31-21.(C) These securities are exempt from registration under Rule 144A of
the Securities Act of 1933. Such securities may be resold, normallyto qualified institutional buyers, in transactions exempt fromregistration.
(D) Security is valued using significant unobservable inputs and isclassified as Level 3 in the fair value hierarchy. Refer to Note 2 tothe financial statements.
(E) Restricted security as to resale, excluding 144A securities. For moreinformation on this security refer to the Notes to financialstatements.
(F) The rate shown is the annualized seven-day yield as of 12-31-21.(G) Investment is an affiliate of the fund, the advisor and/or subadvisor.
This security represents the investment of cash collateral received forsecurities lending.
DERIVATIVES
FUTURES
Open contractsNumber of
contracts PositionExpiration
dateNotional
basis^Notional
value^
Unrealizedappreciation
(depreciation)Mini MSCI Emerging Markets Index Futures 26 Long Mar 2022 $1,612,864 $1,594,060 $(18,804)
$(18,804)
^ Notional basis refers to the contractual amount agreed upon at inception of open contracts; notional value represents the current value of the open contract.
See Notes to financial statements regarding investment transactions and other derivatives information.
Equity Income TrustShares orPrincipalAmount Value
COMMON STOCKS – 97.2%Communication services – 4.6%Diversified telecommunication services – 0.4%AT&T, Inc. 207,642 $ 5,107,993
Equity Income Trust (continued)Shares orPrincipalAmount Value
COMMON STOCKS (continued)Diversified telecommunication services (continued)Verizon Communications, Inc. 38,633 $ 2,007,371
7,115,364Entertainment – 1.1%The Walt Disney Company (A) 114,596 17,749,774Media – 3.1%Comcast Corp., Class A 497,731 25,050,801
John Hancock Variable Insurance TrustPortfolio of Investments — December 31, 2021 (showing percentage of total net assets)
The accompanying notes are an integral part of the financial statements. 40

Equity Income Trust (continued)Shares orPrincipalAmount Value
COMMON STOCKS (continued)Media (continued)Fox Corp., Class B 268,859 $ 9,213,798News Corp., Class A 821,665 18,331,346
52,595,94577,461,083
Consumer discretionary – 3.6%Automobiles – 1.0%Volkswagen AG, ADR 839,664 16,860,453Hotels, restaurants and leisure – 0.7%Las Vegas Sands Corp. (A) 297,270 11,189,243Leisure products – 0.6%Mattel, Inc. (A) 514,906 11,101,373Multiline retail – 0.6%Kohl’s Corp. 208,293 10,287,591Specialty retail – 0.7%The TJX Companies, Inc. 155,253 11,786,808
61,225,468Consumer staples – 6.9%Beverages – 0.6%The Coca-Cola Company 155,237 9,191,583Food and staples retailing – 0.4%Walmart, Inc. 43,171 6,246,412Food products – 3.0%Conagra Brands, Inc. 517,370 17,668,186Mondelez International, Inc., Class A 16,165 1,071,901Tyson Foods, Inc., Class A 375,229 32,704,960
51,445,047Household products – 1.5%Kimberly-Clark Corp. 178,823 25,557,383Tobacco – 1.4%Altria Group, Inc. 81,687 3,871,147Philip Morris International, Inc. 211,948 20,135,060
24,006,207116,446,632
Energy – 5.5%Energy equipment and services – 0.1%Halliburton Company 59,739 1,366,231Oil, gas and consumable fuels – 5.4%Chevron Corp. 23,845 2,798,211EOG Resources, Inc. 206,531 18,346,149Exxon Mobil Corp. 222,609 13,621,445Hess Corp. 15,834 1,172,191Occidental Petroleum Corp. 114,542 3,320,573Targa Resources Corp. 27,240 1,423,018TC Energy Corp. 212,459 9,887,842TotalEnergies SE 621,908 31,655,247TotalEnergies SE, ADR 171,335 8,474,229
90,698,90592,065,136
Financials – 22.6%Banks – 8.6%Bank of America Corp. 213,571 9,501,774Citigroup, Inc. 79,000 4,770,810Citizens Financial Group, Inc. 50,088 2,366,658Fifth Third Bancorp 678,393 29,544,015Huntington Bancshares, Inc. 1,128,000 17,393,760JPMorgan Chase & Co. 62,031 9,822,609The PNC Financial Services Group, Inc. 28,976 5,810,268
Equity Income Trust (continued)Shares orPrincipalAmount Value
COMMON STOCKS (continued)Banks (continued)Wells Fargo & Company 1,374,374 $ 65,942,460
145,152,354Capital markets – 4.4%Franklin Resources, Inc. 58,805 1,969,379Morgan Stanley 169,136 16,602,390Raymond James Financial, Inc. 25,875 2,597,850State Street Corp. 217,798 20,255,214The Bank of New York Mellon Corp. 33,429 1,941,556The Charles Schwab Corp. 117,845 9,910,765The Goldman Sachs Group, Inc. 52,283 20,000,862
73,278,016Diversified financial services – 1.2%Equitable Holdings, Inc. 616,288 20,208,084Insurance – 8.4%American International Group, Inc. 728,512 41,423,192Chubb, Ltd. 167,801 32,437,611Loews Corp. 481,251 27,797,058Marsh & McLennan Companies, Inc. 15,357 2,669,354MetLife, Inc. 485,893 30,363,454The Hartford Financial Services
Group, Inc. 112,400 7,760,096142,450,765381,089,219
Health care – 16.7%Biotechnology – 2.3%AbbVie, Inc. 242,367 32,816,492Biogen, Inc. (A) 16,707 4,008,343Gilead Sciences, Inc. 36,873 2,677,349
39,502,184Health care equipment and supplies – 3.5%Becton, Dickinson and Company 105,780 26,601,554Medtronic PLC 203,458 21,047,730Zimmer Biomet Holdings, Inc. 82,584 10,491,471
58,140,755Health care providers and services – 6.3%Anthem, Inc. 85,730 39,739,283Cardinal Health, Inc. 149,300 7,687,457Centene Corp. (A) 132,817 10,944,121Cigna Corp. 73,905 16,970,805CVS Health Corp. 222,346 22,937,213UnitedHealth Group, Inc. 17,100 8,586,594
106,865,473Pharmaceuticals – 4.6%AstraZeneca PLC, ADR 112,258 6,539,029GlaxoSmithKline PLC 85,962 1,871,629Johnson & Johnson 118,548 20,280,006Merck & Company, Inc. 165,794 12,706,452Organon & Company 7,189 218,905Pfizer, Inc. 376,479 22,231,085Sanofi 95,952 9,628,203Sanofi, ADR 95,700 4,794,570
78,269,879282,778,291
Industrials – 10.6%Aerospace and defense – 2.3%L3Harris Technologies, Inc. 110,273 23,514,615
John Hancock Variable Insurance TrustPortfolio of Investments — December 31, 2021 (showing percentage of total net assets)
The accompanying notes are an integral part of the financial statements. 41

Equity Income Trust (continued)Shares orPrincipalAmount Value
COMMON STOCKS (continued)Aerospace and defense (continued)The Boeing Company (A) 75,058 $ 15,110,677
38,625,292Air freight and logistics – 2.6%United Parcel Service, Inc., Class B 205,139 43,969,493Airlines – 0.2%Southwest Airlines Company (A) 103,900 4,451,076Commercial services and supplies – 0.8%Stericycle, Inc. (A) 228,977 13,656,188Industrial conglomerates – 3.5%3M Company 18,400 3,268,392General Electric Company 454,231 42,911,203Siemens AG, ADR 149,250 12,925,050
59,104,645Machinery – 0.7%Flowserve Corp. 39,087 1,196,062PACCAR, Inc. 87,035 7,681,709Snap-on, Inc. 14,518 3,126,887
12,004,658Professional services – 0.5%Nielsen Holdings PLC 391,597 8,031,654
179,843,006Information technology – 9.2%Communications equipment – 0.6%Cisco Systems, Inc. 161,360 10,225,383Electronic equipment, instruments and components – 0.3%TE Connectivity, Ltd. 31,553 5,090,761IT services – 0.4%Fiserv, Inc. (A) 66,300 6,881,277Semiconductors and semiconductor equipment – 5.5%Applied Materials, Inc. 114,023 17,942,659NXP Semiconductors NV 29,924 6,816,089QUALCOMM, Inc. 277,642 50,772,393Texas Instruments, Inc. 95,691 18,034,883
93,566,024Software – 2.4%Citrix Systems, Inc. 136,885 12,947,952Microsoft Corp. 80,949 27,224,768
40,172,720155,936,165
Materials – 5.0%Chemicals – 3.5%Akzo Nobel NV 56,376 6,193,743CF Industries Holdings, Inc. 413,499 29,267,459DuPont de Nemours, Inc. 46,052 3,720,081International Flavors & Fragrances, Inc. 123,807 18,651,525RPM International, Inc. 16,300 1,646,300
59,479,108Containers and packaging – 1.5%International Paper Company 542,988 25,509,576Paper and forest products – 0.0%Sylvamo Corp. (A) 1,253 34,946
85,023,630Real estate – 4.6%Equity real estate investment trusts – 4.6%Equity Residential 291,602 26,389,981Rayonier, Inc. 338,234 13,651,124Vornado Realty Trust 42,393 1,774,571Welltower, Inc. 71,075 6,096,103
Equity Income Trust (continued)Shares orPrincipalAmount Value
COMMON STOCKS (continued)Equity real estate investment trusts (continued)Weyerhaeuser Company 734,996 $ 30,267,135
78,178,914Utilities – 7.9%Electric utilities – 3.6%Entergy Corp. 37,313 4,203,309NextEra Energy, Inc. 105,398 9,839,957The Southern Company 632,641 43,386,520Xcel Energy, Inc. 37,700 2,552,290
59,982,076Multi-utilities – 4.3%Ameren Corp. 119,879 10,670,430Dominion Energy, Inc. 209,000 16,419,040NiSource, Inc. 653,751 18,050,065Sempra Energy 209,170 27,669,008
72,808,543132,790,619
TOTAL COMMON STOCKS (Cost $1,189,289,328) $ 1,642,838,163
PREFERRED SECURITIES – 1.4%Health care – 0.3%Health care equipment and supplies – 0.3%Becton, Dickinson and Company,
6.000% (B) 115,427 6,088,774Utilities – 1.1%Electric utilities – 0.8%NextEra Energy, Inc., 5.279% 98,770 5,683,226The Southern Company, 6.750% 134,102 7,207,983
12,891,209Multi-utilities – 0.3%NiSource, Inc., 7.750% 47,031 5,267,002
18,158,211TOTAL PREFERRED SECURITIES (Cost $22,062,709) $ 24,246,985
SHORT-TERM INVESTMENTS – 1.4%Short-term funds – 1.4%John Hancock Collateral Trust,
0.1697% (C)(D) 614,764 6,149,481State Street Institutional U.S. Government
Money Market Fund, Premier Class,0.0250% (C) 4,579,629 4,579,629
T. Rowe Price Government Reserve Fund,0.0570% (C) 13,297,349 13,297,349
TOTAL SHORT-TERM INVESTMENTS (Cost $24,026,399) $ 24,026,459Total Investments (Equity Income Trust)
(Cost $1,235,378,436) – 100.0% $ 1,691,111,607Other assets and liabilities, net – 0.0% 4,761TOTAL NET ASSETS – 100.0% $ 1,691,116,368
Security Abbreviations and LegendADR American Depositary Receipt(A) Non-income producing security.(B) All or a portion of this security is on loan as of 12-31-21.(C) The rate shown is the annualized seven-day yield as of 12-31-21.(D) Investment is an affiliate of the fund, the advisor and/or subadvisor.
This security represents the investment of cash collateral received forsecurities lending.
John Hancock Variable Insurance TrustPortfolio of Investments — December 31, 2021 (showing percentage of total net assets)
The accompanying notes are an integral part of the financial statements. 42

Financial Industries TrustShares orPrincipalAmount Value
COMMON STOCKS – 98.5%Financials – 94.7%Banks – 55.8%1st Source Corp. 21,579 $ 1,070,318American Business Bank (A) 27,647 1,091,780Ameris Bancorp 36,024 1,789,672Atlantic Union Bankshares Corp. 50,436 1,880,758Bank of America Corp. 132,668 5,902,399Bank of Marin Bancorp 33,633 1,252,157BayCom Corp. (A) 37,730 707,815Business First Bancshares, Inc. 34,109 965,626California BanCorp (A) 27,567 552,443Cambridge Bancorp 16,898 1,581,484Central Valley Community Bancorp 25,555 530,777Citizens Community Bancorp, Inc. 20,008 275,510Citizens Financial Group, Inc. 105,362 4,978,355Close Brothers Group PLC 87,372 1,666,431Coastal Financial Corp. (A) 31,594 1,599,288East West Bancorp, Inc. 66,849 5,259,679Evans Bancorp, Inc. 16,798 676,959Farmers & Merchants Bancorp, Inc. 8,008 262,903Fifth Third Bancorp 137,537 5,989,736First Horizon Corp. 91,220 1,489,623First Merchants Corp. 39,604 1,659,012German American Bancorp, Inc. 9,421 367,231Glacier Bancorp, Inc. 17,271 979,266HBT Financial, Inc. 41,534 777,932Heritage Commerce Corp. 41,523 495,785Heritage Financial Corp. 6,143 150,135JPMorgan Chase & Co. 26,184 4,146,236KeyCorp 250,967 5,804,867Landmark Bancorp, Inc. 9,937 283,205Level One Bancorp, Inc. 15,706 619,445Limestone Bancorp, Inc. (A) 5,901 110,054Live Oak Bancshares, Inc. 24,594 2,146,810M&T Bank Corp. 26,211 4,025,485Metrocity Bankshares, Inc. 14,106 388,338Mid Penn Bancorp, Inc. 13,471 427,570Nicolet Bankshares, Inc. (A) 21,159 1,814,384Nordea Bank ABP (Nasdaq
Stockholm Exchange) 217,407 2,652,049Pacific Premier Bancorp, Inc. 7,632 305,509Pinnacle Financial Partners, Inc. 49,259 4,704,235Popular, Inc. 29,588 2,427,400Shore Bancshares, Inc. 10,670 222,470Southern First Bancshares, Inc. (A) 12,586 786,499Stock Yards Bancorp, Inc. 35,344 2,257,775SVB Financial Group (A) 8,949 6,069,563Synovus Financial Corp. 109,898 5,260,817The First Bancshares, Inc. 18,748 724,048Third Coast Bancshares, Inc. (A) 16,135 419,187TriCo Bancshares 50,733 2,179,490U.S. Bancorp 63,058 3,541,968Univest Financial Corp. 28,493 852,511Western Alliance Bancorp 40,865 4,399,117Zions Bancorp NA 70,575 4,457,517
104,979,623Capital markets – 17.0%AllianceBernstein Holding LP 49,892 2,436,725Ameriprise Financial, Inc. 18,348 5,534,858Ares Management Corp., Class A 45,463 3,694,778Brookfield Asset Management, Inc.,
Class A 76,182 4,599,869KKR & Company, Inc. 46,972 3,499,414Morgan Stanley 59,607 5,851,023Onex Corp. 38,028 2,984,640
Financial Industries Trust (continued)Shares orPrincipalAmount Value
COMMON STOCKS (continued)Capital markets (continued)The Blackstone Group, Inc. 25,753 $ 3,332,181
31,933,488Consumer finance – 5.5%American Express Company 30,166 4,935,158Capital One Financial Corp. 20,717 3,005,830Discover Financial Services 20,404 2,357,886
10,298,874Diversified financial services – 1.0%Eurazeo SE 20,968 1,829,359Insurance – 14.2%American International Group, Inc. 91,401 5,197,061Arthur J. Gallagher & Company 22,782 3,865,422Chubb, Ltd. 14,057 2,717,359Markel Corp. (A) 2,230 2,751,820Marsh & McLennan Companies, Inc. 29,708 5,163,845The Hartford Financial Services
Group, Inc. 60,832 4,199,841Unum Group 117,533 2,887,786
26,783,134Thrifts and mortgage finance – 1.2%ESSA Bancorp, Inc. 14,776 256,068OP Bancorp 38,618 492,766Premier Financial Corp. 43,710 1,351,076Timberland Bancorp, Inc. 6,181 171,214
2,271,124178,095,602
Real estate – 3.8%Equity real estate investment trusts – 3.1%Prologis, Inc. 20,399 3,434,376Rexford Industrial Realty, Inc. 28,854 2,340,348
5,774,724Real estate management and development – 0.7%VGP NV 4,815 1,405,178
7,179,902TOTAL COMMON STOCKS (Cost $146,399,639) $ 185,275,504
SHORT-TERM INVESTMENTS – 1.5%Repurchase agreement – 1.5%Repurchase Agreement with State Street
Corp. dated 12-31-21 at 0.000% to berepurchased at $2,871,000 on 1-3-22,collateralized by $2,958,300U.S. Treasury Notes, 1.250% due6-30-28 (valued at $2,928,486) $ 2,871,000 2,871,000
TOTAL SHORT-TERM INVESTMENTS (Cost $2,871,000) $ 2,871,000Total Investments (Financial Industries Trust)
(Cost $149,270,639) – 100.0% $ 188,146,504Other assets and liabilities, net – (0.0%) (84,660)TOTAL NET ASSETS – 100.0% $ 188,061,844
Security Abbreviations and Legend(A) Non-income producing security.
John Hancock Variable Insurance TrustPortfolio of Investments — December 31, 2021 (showing percentage of total net assets)
The accompanying notes are an integral part of the financial statements. 43
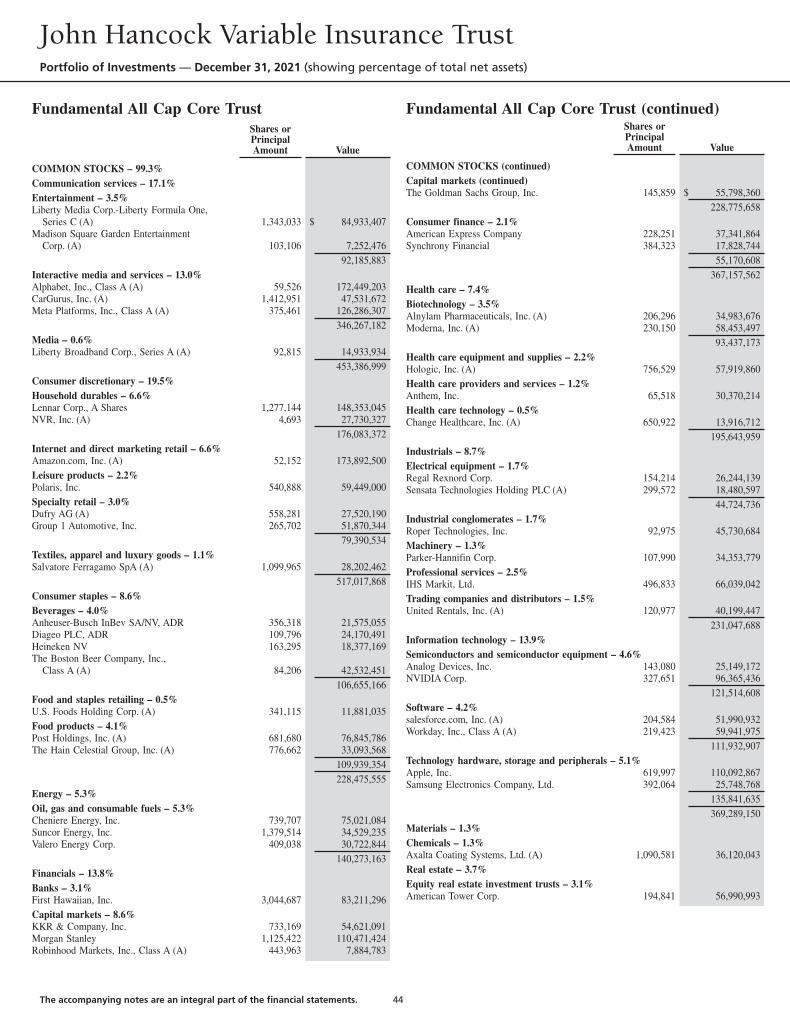
Fundamental All Cap Core TrustShares orPrincipalAmount Value
COMMON STOCKS – 99.3%Communication services – 17.1%Entertainment – 3.5%Liberty Media Corp.-Liberty Formula One,
Series C (A) 1,343,033 $ 84,933,407Madison Square Garden Entertainment
Corp. (A) 103,106 7,252,47692,185,883
Interactive media and services – 13.0%Alphabet, Inc., Class A (A) 59,526 172,449,203CarGurus, Inc. (A) 1,412,951 47,531,672Meta Platforms, Inc., Class A (A) 375,461 126,286,307
346,267,182Media – 0.6%Liberty Broadband Corp., Series A (A) 92,815 14,933,934
453,386,999Consumer discretionary – 19.5%Household durables – 6.6%Lennar Corp., A Shares 1,277,144 148,353,045NVR, Inc. (A) 4,693 27,730,327
176,083,372Internet and direct marketing retail – 6.6%Amazon.com, Inc. (A) 52,152 173,892,500Leisure products – 2.2%Polaris, Inc. 540,888 59,449,000Specialty retail – 3.0%Dufry AG (A) 558,281 27,520,190Group 1 Automotive, Inc. 265,702 51,870,344
79,390,534Textiles, apparel and luxury goods – 1.1%Salvatore Ferragamo SpA (A) 1,099,965 28,202,462
517,017,868Consumer staples – 8.6%Beverages – 4.0%Anheuser-Busch InBev SA/NV, ADR 356,318 21,575,055Diageo PLC, ADR 109,796 24,170,491Heineken NV 163,295 18,377,169The Boston Beer Company, Inc.,
Class A (A) 84,206 42,532,451106,655,166
Food and staples retailing – 0.5%U.S. Foods Holding Corp. (A) 341,115 11,881,035Food products – 4.1%Post Holdings, Inc. (A) 681,680 76,845,786The Hain Celestial Group, Inc. (A) 776,662 33,093,568
109,939,354228,475,555
Energy – 5.3%Oil, gas and consumable fuels – 5.3%Cheniere Energy, Inc. 739,707 75,021,084Suncor Energy, Inc. 1,379,514 34,529,235Valero Energy Corp. 409,038 30,722,844
140,273,163Financials – 13.8%Banks – 3.1%First Hawaiian, Inc. 3,044,687 83,211,296Capital markets – 8.6%KKR & Company, Inc. 733,169 54,621,091Morgan Stanley 1,125,422 110,471,424Robinhood Markets, Inc., Class A (A) 443,963 7,884,783
Fundamental All Cap Core Trust (continued)Shares orPrincipalAmount Value
COMMON STOCKS (continued)Capital markets (continued)The Goldman Sachs Group, Inc. 145,859 $ 55,798,360
228,775,658Consumer finance – 2.1%American Express Company 228,251 37,341,864Synchrony Financial 384,323 17,828,744
55,170,608367,157,562
Health care – 7.4%Biotechnology – 3.5%Alnylam Pharmaceuticals, Inc. (A) 206,296 34,983,676Moderna, Inc. (A) 230,150 58,453,497
93,437,173Health care equipment and supplies – 2.2%Hologic, Inc. (A) 756,529 57,919,860Health care providers and services – 1.2%Anthem, Inc. 65,518 30,370,214Health care technology – 0.5%Change Healthcare, Inc. (A) 650,922 13,916,712
195,643,959Industrials – 8.7%Electrical equipment – 1.7%Regal Rexnord Corp. 154,214 26,244,139Sensata Technologies Holding PLC (A) 299,572 18,480,597
44,724,736Industrial conglomerates – 1.7%Roper Technologies, Inc. 92,975 45,730,684Machinery – 1.3%Parker-Hannifin Corp. 107,990 34,353,779Professional services – 2.5%IHS Markit, Ltd. 496,833 66,039,042Trading companies and distributors – 1.5%United Rentals, Inc. (A) 120,977 40,199,447
231,047,688Information technology – 13.9%Semiconductors and semiconductor equipment – 4.6%Analog Devices, Inc. 143,080 25,149,172NVIDIA Corp. 327,651 96,365,436
121,514,608Software – 4.2%salesforce.com, Inc. (A) 204,584 51,990,932Workday, Inc., Class A (A) 219,423 59,941,975
111,932,907Technology hardware, storage and peripherals – 5.1%Apple, Inc. 619,997 110,092,867Samsung Electronics Company, Ltd. 392,064 25,748,768
135,841,635369,289,150
Materials – 1.3%Chemicals – 1.3%Axalta Coating Systems, Ltd. (A) 1,090,581 36,120,043Real estate – 3.7%Equity real estate investment trusts – 3.1%American Tower Corp. 194,841 56,990,993
John Hancock Variable Insurance TrustPortfolio of Investments — December 31, 2021 (showing percentage of total net assets)
The accompanying notes are an integral part of the financial statements. 44
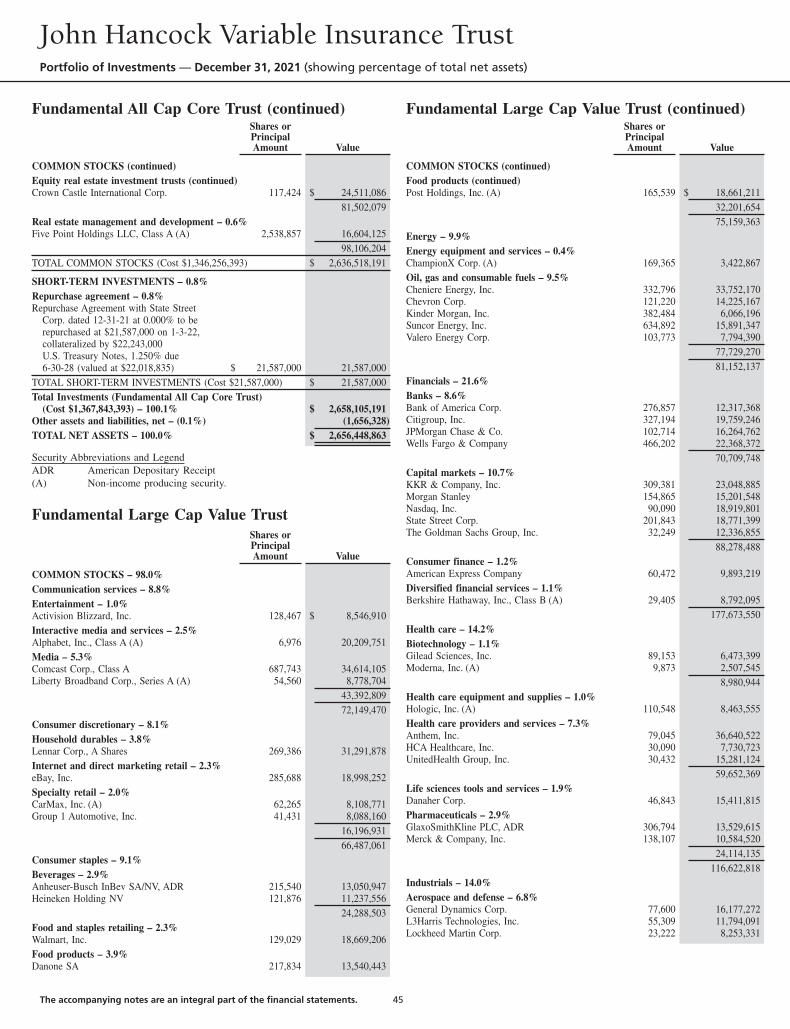
Fundamental All Cap Core Trust (continued)Shares orPrincipalAmount Value
COMMON STOCKS (continued)Equity real estate investment trusts (continued)Crown Castle International Corp. 117,424 $ 24,511,086
81,502,079Real estate management and development – 0.6%Five Point Holdings LLC, Class A (A) 2,538,857 16,604,125
98,106,204TOTAL COMMON STOCKS (Cost $1,346,256,393) $ 2,636,518,191
SHORT-TERM INVESTMENTS – 0.8%Repurchase agreement – 0.8%Repurchase Agreement with State Street
Corp. dated 12-31-21 at 0.000% to berepurchased at $21,587,000 on 1-3-22,collateralized by $22,243,000U.S. Treasury Notes, 1.250% due6-30-28 (valued at $22,018,835) $ 21,587,000 21,587,000
TOTAL SHORT-TERM INVESTMENTS (Cost $21,587,000) $ 21,587,000Total Investments (Fundamental All Cap Core Trust)
(Cost $1,367,843,393) – 100.1% $ 2,658,105,191Other assets and liabilities, net – (0.1%) (1,656,328)TOTAL NET ASSETS – 100.0% $ 2,656,448,863
Security Abbreviations and LegendADR American Depositary Receipt(A) Non-income producing security.
Fundamental Large Cap Value TrustShares orPrincipalAmount Value
COMMON STOCKS – 98.0%Communication services – 8.8%Entertainment – 1.0%Activision Blizzard, Inc. 128,467 $ 8,546,910Interactive media and services – 2.5%Alphabet, Inc., Class A (A) 6,976 20,209,751Media – 5.3%Comcast Corp., Class A 687,743 34,614,105Liberty Broadband Corp., Series A (A) 54,560 8,778,704
43,392,80972,149,470
Consumer discretionary – 8.1%Household durables – 3.8%Lennar Corp., A Shares 269,386 31,291,878Internet and direct marketing retail – 2.3%eBay, Inc. 285,688 18,998,252Specialty retail – 2.0%CarMax, Inc. (A) 62,265 8,108,771Group 1 Automotive, Inc. 41,431 8,088,160
16,196,93166,487,061
Consumer staples – 9.1%Beverages – 2.9%Anheuser-Busch InBev SA/NV, ADR 215,540 13,050,947Heineken Holding NV 121,876 11,237,556
24,288,503Food and staples retailing – 2.3%Walmart, Inc. 129,029 18,669,206Food products – 3.9%Danone SA 217,834 13,540,443
Fundamental Large Cap Value Trust (continued)Shares orPrincipalAmount Value
COMMON STOCKS (continued)Food products (continued)Post Holdings, Inc. (A) 165,539 $ 18,661,211
32,201,65475,159,363
Energy – 9.9%Energy equipment and services – 0.4%ChampionX Corp. (A) 169,365 3,422,867Oil, gas and consumable fuels – 9.5%Cheniere Energy, Inc. 332,796 33,752,170Chevron Corp. 121,220 14,225,167Kinder Morgan, Inc. 382,484 6,066,196Suncor Energy, Inc. 634,892 15,891,347Valero Energy Corp. 103,773 7,794,390
77,729,27081,152,137
Financials – 21.6%Banks – 8.6%Bank of America Corp. 276,857 12,317,368Citigroup, Inc. 327,194 19,759,246JPMorgan Chase & Co. 102,714 16,264,762Wells Fargo & Company 466,202 22,368,372
70,709,748Capital markets – 10.7%KKR & Company, Inc. 309,381 23,048,885Morgan Stanley 154,865 15,201,548Nasdaq, Inc. 90,090 18,919,801State Street Corp. 201,843 18,771,399The Goldman Sachs Group, Inc. 32,249 12,336,855
88,278,488Consumer finance – 1.2%American Express Company 60,472 9,893,219Diversified financial services – 1.1%Berkshire Hathaway, Inc., Class B (A) 29,405 8,792,095
177,673,550Health care – 14.2%Biotechnology – 1.1%Gilead Sciences, Inc. 89,153 6,473,399Moderna, Inc. (A) 9,873 2,507,545
8,980,944Health care equipment and supplies – 1.0%Hologic, Inc. (A) 110,548 8,463,555Health care providers and services – 7.3%Anthem, Inc. 79,045 36,640,522HCA Healthcare, Inc. 30,090 7,730,723UnitedHealth Group, Inc. 30,432 15,281,124
59,652,369Life sciences tools and services – 1.9%Danaher Corp. 46,843 15,411,815Pharmaceuticals – 2.9%GlaxoSmithKline PLC, ADR 306,794 13,529,615Merck & Company, Inc. 138,107 10,584,520
24,114,135116,622,818
Industrials – 14.0%Aerospace and defense – 6.8%General Dynamics Corp. 77,600 16,177,272L3Harris Technologies, Inc. 55,309 11,794,091Lockheed Martin Corp. 23,222 8,253,331
John Hancock Variable Insurance TrustPortfolio of Investments — December 31, 2021 (showing percentage of total net assets)
The accompanying notes are an integral part of the financial statements. 45

Fundamental Large Cap Value Trust (continued)Shares orPrincipalAmount Value
COMMON STOCKS (continued)Aerospace and defense (continued)Raytheon Technologies Corp. 227,901 $ 19,613,160
55,837,854Machinery – 4.6%Fortive Corp. 111,656 8,518,236Parker-Hannifin Corp. 91,912 29,239,045
37,757,281Trading companies and distributors – 2.6%United Rentals, Inc. (A) 64,422 21,406,786
115,001,921Information technology – 9.1%Electronic equipment, instruments and components – 1.5%Vontier Corp. 396,199 12,175,195Semiconductors and semiconductor equipment – 1.0%Analog Devices, Inc. 47,754 8,393,721Software – 5.4%Microsoft Corp. 66,716 22,437,925Oracle Corp. 252,107 21,986,251
44,424,176Technology hardware, storage and peripherals – 1.2%Samsung Electronics Company, Ltd. 157,290 10,330,007
75,323,099Materials – 0.8%Chemicals – 0.8%LyondellBasell Industries NV, Class A 73,401 6,769,774Real estate – 2.4%Equity real estate investment trusts – 2.4%American Tower Corp. 69,089 20,208,533TOTAL COMMON STOCKS (Cost $552,854,330) $ 806,547,726
SHORT-TERM INVESTMENTS – 2.3%Repurchase agreement – 2.3%Repurchase Agreement with State Street
Corp. dated 12-31-21 at 0.000% to berepurchased at $19,292,000 on 1-3-22,collateralized by $19,878,200U.S. Treasury Notes, 1.250% due6-30-28 (valued at $19,677,868) $ 19,292,000 19,292,000
TOTAL SHORT-TERM INVESTMENTS (Cost $19,292,000) $ 19,292,000Total Investments (Fundamental Large Cap Value Trust)
(Cost $572,146,330) – 100.3% $ 825,839,726Other assets and liabilities, net – (0.3%) (2,793,902)TOTAL NET ASSETS – 100.0% $ 823,045,824
Security Abbreviations and LegendADR American Depositary Receipt(A) Non-income producing security.
Global Equity TrustShares orPrincipalAmount Value
COMMON STOCKS - 97.7%France - 13.2%Air Liquide SA 53,022 $ 9,247,255Capgemini SE 25,200 6,176,025Carrefour SA 295,512 5,417,761Cie Generale des Etablissements
Michelin SCA 31,933 5,230,116Sanofi 96,340 9,667,129
Global Equity Trust (continued)Shares orPrincipalAmount Value
COMMON STOCKS (continued)France (continued)TotalEnergies SE 222,509 $ 11,325,743
47,064,029Germany - 1.7%Deutsche Post AG 95,167 6,121,209Ireland - 2.2%CRH PLC (London Stock Exchange) 147,862 7,834,582Japan - 4.5%FANUC Corp. 32,771 6,965,869Mitsubishi Estate Company, Ltd. 190,069 2,636,731Sumitomo Mitsui Financial Group, Inc. 194,900 6,655,310
16,257,910Netherlands - 7.8%Akzo Nobel NV 46,774 5,138,816ING Groep NV 407,424 5,664,411Koninklijke Ahold Delhaize NV 203,858 6,995,655Stellantis NV 531,909 10,041,680
27,840,562Switzerland - 4.4%Chubb, Ltd. 28,014 5,415,386Roche Holding AG 25,328 10,507,606
15,922,992United Kingdom - 10.1%Associated British Foods PLC 246,371 6,744,130AstraZeneca PLC 72,266 8,438,438Ferguson PLC 32,539 5,779,782Reckitt Benckiser Group PLC 62,598 5,388,650RELX PLC 145,194 4,740,125Unilever PLC 92,920 4,984,817
36,075,942United States - 53.8%Alphabet, Inc., Class A (A) 5,591 16,197,351Apple, Inc. 78,034 13,856,497Arthur J. Gallagher & Company 42,906 7,279,861AutoZone, Inc. (A) 4,242 8,892,886Bank of America Corp. 231,643 10,305,797Cisco Systems, Inc. 131,663 8,343,484Comcast Corp., Class A 134,810 6,784,987Corteva, Inc. 183,305 8,666,660Electronic Arts, Inc. 52,957 6,985,028Huntington Bancshares, Inc. 410,938 6,336,664Johnson & Johnson 59,005 10,093,985Johnson Controls International PLC 65,038 5,288,240Lennar Corp., A Shares 50,045 5,813,227Meta Platforms, Inc., Class A (A) 7,555,037 15,363,459Microsoft Corp. 28,970 9,743,190Northrop Grumman Corp. 12,410 4,803,539Philip Morris International, Inc. 135,724 12,893,780Stanley Black & Decker, Inc. 28,895 5,450,175T-Mobile US, Inc. (A) 53,603 6,216,876UnitedHealth Group, Inc. 20,256 10,171,348Waste Management, Inc. 43,310 7,228,439Wells Fargo & Company 120,538 5,783,413
192,498,886TOTAL COMMON STOCKS (Cost $280,271,429) $ 349,616,112
PREFERRED SECURITIES - 1.9%South Korea - 1.9%Samsung Electronics Company, Ltd. 111,065 6,640,096TOTAL PREFERRED SECURITIES (Cost $4,797,979) $ 6,640,096
John Hancock Variable Insurance TrustPortfolio of Investments — December 31, 2021 (showing percentage of total net assets)
The accompanying notes are an integral part of the financial statements. 46

Global Equity Trust (continued)Shares orPrincipalAmount Value
SHORT-TERM INVESTMENTS - 1.2%Short-term funds - 1.2%Federated Government Obligations Fund,
Institutional Class, 0.0300% (B) 4,395,441 $ 4,395,441TOTAL SHORT-TERM INVESTMENTS (Cost $4,395,441) $ 4,395,441Total Investments (Global Equity Trust)
(Cost $289,464,849) - 100.8% $ 360,651,649Other assets and liabilities, net - (0.8%) (2,939,282)TOTAL NET ASSETS - 100.0% $ 357,712,367
Security Abbreviations and Legend(A) Non-income producing security.(B) The rate shown is the annualized seven-day yield as of 12-31-21.
Health Sciences TrustShares orPrincipalAmount Value
COMMON STOCKS – 98.6%Consumer discretionary – 0.7%Specialty retail – 0.7%Warby Parker, Inc., Class A (A) 48,065 $ 2,237,906Financials – 0.2%Capital markets – 0.2%BCLS Acquisition Corp., Class A (A) 12,029 118,606Dynamics Special Purpose Corp.,
Class A (A) 18,789 185,260Eucrates Biomedical Acquisition Corp. (A) 11,914 118,902Health Sciences Acquisitions Corp. 2 (A) 13,354 133,540Helix Acquisition Corp., Class A (A) 12,247 121,123
677,431Health care – 97.7%Biotechnology – 28.1%Aadi Bioscience, Inc. (A) 3,700 89,355AbbVie, Inc. 46,643 6,315,462Abcam PLC (A) 26,439 618,219ACADIA Pharmaceuticals, Inc. (A) 23,708 553,345Adagio Therapeutics, Inc. (A) 6,100 44,286ADC Therapeutics SA (A) 19,326 390,385Agios Pharmaceuticals, Inc. (A) 8,938 293,792Akero Therapeutics, Inc. (A) 4,936 104,396Alector, Inc. (A) 11,904 245,818Alkermes PLC (A) 3,287 76,456Allakos, Inc. (A) 3,100 30,349Allogene Therapeutics, Inc. (A) 18,074 269,664Alnylam Pharmaceuticals, Inc. (A) 21,834 3,702,610Amgen, Inc. 10,308 2,318,991Annexon, Inc. (A) 16,751 192,469Apellis Pharmaceuticals, Inc. (A) 21,739 1,027,820Arcutis Biotherapeutics, Inc. (A) 5,800 120,292Argenx SE, ADR (A) 14,579 5,105,420Ascendis Pharma A/S, ADR (A) 14,965 2,013,241Avidity Biosciences, Inc. (A) 20,231 480,891BeiGene, Ltd., ADR (A) 4,485 1,215,121Bicycle Therapeutics PLC, ADR (A) 6,391 389,020Biogen, Inc. (A) 6,345 1,522,292BioNTech SE, ADR (A) 20,380 5,253,964Blueprint Medicines Corp. (A) 13,364 1,431,418Burning Rock Biotech, Ltd., ADR (A) 9,445 90,011C4 Therapeutics, Inc. (A) 22,317 718,607Celldex Therapeutics, Inc. (A) 13,022 503,170Centessa Pharmaceuticals PLC, ADR (A) 18,009 202,781Cerevel Therapeutics Holdings, Inc. (A) 29,170 945,691CRISPR Therapeutics AG (A) 4,552 344,951
Health Sciences Trust (continued)Shares orPrincipalAmount Value
COMMON STOCKS (continued)Biotechnology (continued)CureVac NV (A) 7,486 $ 256,845Cytokinetics, Inc. (A) 1,600 72,928Day One Biopharmaceuticals, Inc. (A) 8,112 136,687Denali Therapeutics, Inc. (A) 25,147 1,121,556Design Therapeutics, Inc. (A) 13,731 293,981Enanta Pharmaceuticals, Inc. (A) 4,200 314,076Entrada Therapeutics, Inc. (A) 11,328 193,935EQRx, Inc. (A) 22,514 153,545Exact Sciences Corp. (A) 21,357 1,662,215Exelixis, Inc. (A) 72,356 1,322,668Exscientia PLC (A) 4,147 81,945Fate Therapeutics, Inc. (A) 20,672 1,209,519Frontier Acquisition Corp. (A) 12,607 124,557F-star Therapeutics, Inc. (A) 12,596 63,232Generation Bio Company (A) 31,607 223,778Genmab A/S (A) 3,987 1,591,423Ginkgo Bioworks Holdings, Inc. (A) 104,300 866,733Global Blood Therapeutics, Inc. (A) 6,332 185,338Ideaya Biosciences, Inc. (A) 14,847 350,983IGM Biosciences, Inc. (A) 6,866 201,380Imago Biosciences, Inc. (A) 12,479 295,877Immuneering Corp., Class A (A) 23,271 376,292Immunocore Holdings PLC, ADR (A) 5,762 197,291Incyte Corp. (A) 37,491 2,751,839Insmed, Inc. (A) 42,782 1,165,382Intellia Therapeutics, Inc. (A) 7,017 829,690Invitae Corp. (A) 12,344 188,493Ionis Pharmaceuticals, Inc. (A) 24,058 732,085Iovance Biotherapeutics, Inc. (A) 28,633 546,604IVERIC bio, Inc. (A) 46,124 771,193Karuna Therapeutics, Inc. (A) 7,771 1,018,001Kodiak Sciences, Inc. (A) 24,412 2,069,649Kronos Bio, Inc. (A) 7,495 101,857Kymera Therapeutics, Inc. (A) 13,525 858,702LianBio, ADR (A) 30,782 189,617Lyell Immunopharma, Inc. (A) 32,649 252,703MeiraGTx Holdings PLC (A) 10,086 239,442Mirati Therapeutics, Inc. (A) 12,786 1,875,578Moderna, Inc. (A) 20,712 5,260,434Monte Rosa Therapeutics, Inc. (A) 21,606 441,195Morphic Holding, Inc. (A) 4,583 217,143Neurocrine Biosciences, Inc. (A) 6,765 576,175Novavax, Inc. (A) 2,476 354,241Nurix Therapeutics, Inc. (A) 15,120 437,724Orion Acquisition Corp. (A) 12,953 127,587Pardes Biosciences, Inc. (A) 16,438 269,090Prelude Therapeutics, Inc. (A) 3,938 49,028Progenics Pharmaceuticals, Inc. (A)(B) 21,900 935Protagonist Therapeutics, Inc. (A) 8,019 274,250Prothena Corp. PLC (A) 16,560 818,064PTC Therapeutics, Inc. (A) 9,074 361,417RAPT Therapeutics, Inc. (A) 13,742 504,744Recursion Pharmaceuticals, Inc.,
Class A (A) 10,414 178,392Regeneron Pharmaceuticals, Inc. (A) 7,374 4,656,828REGENXBIO, Inc. (A) 4,300 140,610Relay Therapeutics, Inc. (A) 17,071 524,250Repare Therapeutics, Inc. (A) 6,100 128,649Replimune Group, Inc. (A) 22,880 620,048Revolution Healthcare Acquisition
Corp. (A) 31,883 314,048REVOLUTION Medicines, Inc. (A) 15,300 385,101Rocket Pharmaceuticals, Inc. (A) 8,094 176,692Rubius Therapeutics, Inc. (A) 12,530 121,290Sage Therapeutics, Inc. (A) 7,887 335,513
John Hancock Variable Insurance TrustPortfolio of Investments — December 31, 2021 (showing percentage of total net assets)
The accompanying notes are an integral part of the financial statements. 47
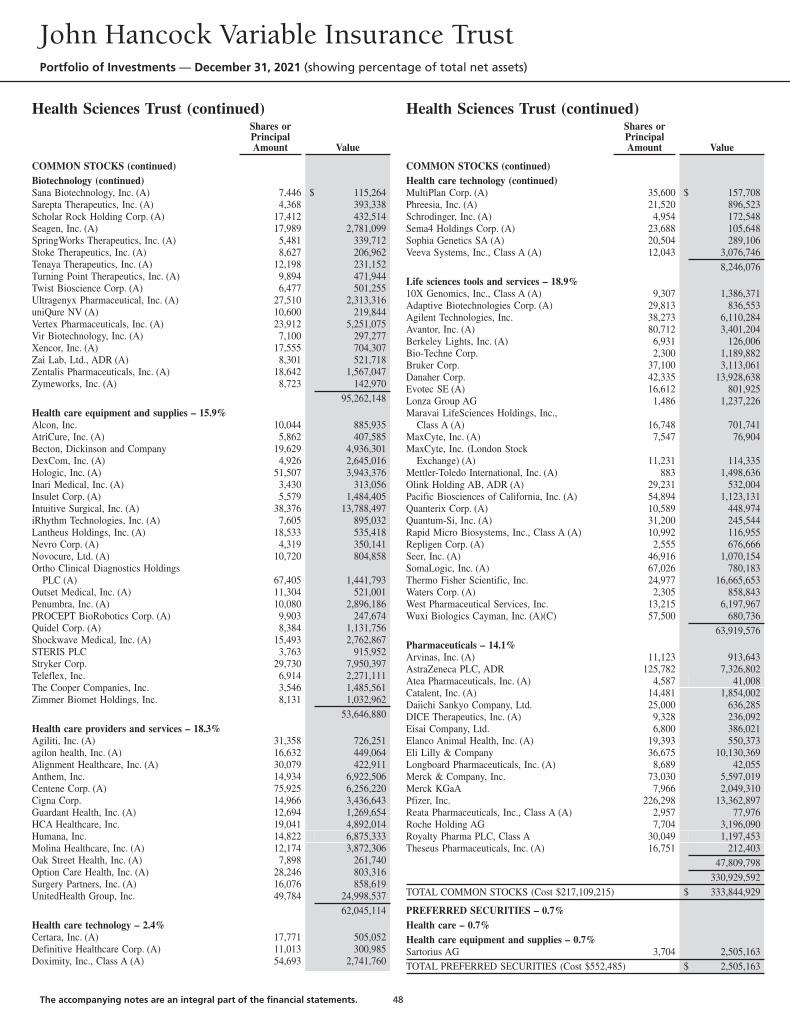
Health Sciences Trust (continued)Shares orPrincipalAmount Value
COMMON STOCKS (continued)Biotechnology (continued)Sana Biotechnology, Inc. (A) 7,446 $ 115,264Sarepta Therapeutics, Inc. (A) 4,368 393,338Scholar Rock Holding Corp. (A) 17,412 432,514Seagen, Inc. (A) 17,989 2,781,099SpringWorks Therapeutics, Inc. (A) 5,481 339,712Stoke Therapeutics, Inc. (A) 8,627 206,962Tenaya Therapeutics, Inc. (A) 12,198 231,152Turning Point Therapeutics, Inc. (A) 9,894 471,944Twist Bioscience Corp. (A) 6,477 501,255Ultragenyx Pharmaceutical, Inc. (A) 27,510 2,313,316uniQure NV (A) 10,600 219,844Vertex Pharmaceuticals, Inc. (A) 23,912 5,251,075Vir Biotechnology, Inc. (A) 7,100 297,277Xencor, Inc. (A) 17,555 704,307Zai Lab, Ltd., ADR (A) 8,301 521,718Zentalis Pharmaceuticals, Inc. (A) 18,642 1,567,047Zymeworks, Inc. (A) 8,723 142,970
95,262,148Health care equipment and supplies – 15.9%Alcon, Inc. 10,044 885,935AtriCure, Inc. (A) 5,862 407,585Becton, Dickinson and Company 19,629 4,936,301DexCom, Inc. (A) 4,926 2,645,016Hologic, Inc. (A) 51,507 3,943,376Inari Medical, Inc. (A) 3,430 313,056Insulet Corp. (A) 5,579 1,484,405Intuitive Surgical, Inc. (A) 38,376 13,788,497iRhythm Technologies, Inc. (A) 7,605 895,032Lantheus Holdings, Inc. (A) 18,533 535,418Nevro Corp. (A) 4,319 350,141Novocure, Ltd. (A) 10,720 804,858Ortho Clinical Diagnostics Holdings
PLC (A) 67,405 1,441,793Outset Medical, Inc. (A) 11,304 521,001Penumbra, Inc. (A) 10,080 2,896,186PROCEPT BioRobotics Corp. (A) 9,903 247,674Quidel Corp. (A) 8,384 1,131,756Shockwave Medical, Inc. (A) 15,493 2,762,867STERIS PLC 3,763 915,952Stryker Corp. 29,730 7,950,397Teleflex, Inc. 6,914 2,271,111The Cooper Companies, Inc. 3,546 1,485,561Zimmer Biomet Holdings, Inc. 8,131 1,032,962
53,646,880Health care providers and services – 18.3%Agiliti, Inc. (A) 31,358 726,251agilon health, Inc. (A) 16,632 449,064Alignment Healthcare, Inc. (A) 30,079 422,911Anthem, Inc. 14,934 6,922,506Centene Corp. (A) 75,925 6,256,220Cigna Corp. 14,966 3,436,643Guardant Health, Inc. (A) 12,694 1,269,654HCA Healthcare, Inc. 19,041 4,892,014Humana, Inc. 14,822 6,875,333Molina Healthcare, Inc. (A) 12,174 3,872,306Oak Street Health, Inc. (A) 7,898 261,740Option Care Health, Inc. (A) 28,246 803,316Surgery Partners, Inc. (A) 16,076 858,619UnitedHealth Group, Inc. 49,784 24,998,537
62,045,114Health care technology – 2.4%Certara, Inc. (A) 17,771 505,052Definitive Healthcare Corp. (A) 11,013 300,985Doximity, Inc., Class A (A) 54,693 2,741,760
Health Sciences Trust (continued)Shares orPrincipalAmount Value
COMMON STOCKS (continued)Health care technology (continued)MultiPlan Corp. (A) 35,600 $ 157,708Phreesia, Inc. (A) 21,520 896,523Schrodinger, Inc. (A) 4,954 172,548Sema4 Holdings Corp. (A) 23,688 105,648Sophia Genetics SA (A) 20,504 289,106Veeva Systems, Inc., Class A (A) 12,043 3,076,746
8,246,076Life sciences tools and services – 18.9%10X Genomics, Inc., Class A (A) 9,307 1,386,371Adaptive Biotechnologies Corp. (A) 29,813 836,553Agilent Technologies, Inc. 38,273 6,110,284Avantor, Inc. (A) 80,712 3,401,204Berkeley Lights, Inc. (A) 6,931 126,006Bio-Techne Corp. 2,300 1,189,882Bruker Corp. 37,100 3,113,061Danaher Corp. 42,335 13,928,638Evotec SE (A) 16,612 801,925Lonza Group AG 1,486 1,237,226Maravai LifeSciences Holdings, Inc.,
Class A (A) 16,748 701,741MaxCyte, Inc. (A) 7,547 76,904MaxCyte, Inc. (London Stock
Exchange) (A) 11,231 114,335Mettler-Toledo International, Inc. (A) 883 1,498,636Olink Holding AB, ADR (A) 29,231 532,004Pacific Biosciences of California, Inc. (A) 54,894 1,123,131Quanterix Corp. (A) 10,589 448,974Quantum-Si, Inc. (A) 31,200 245,544Rapid Micro Biosystems, Inc., Class A (A) 10,992 116,955Repligen Corp. (A) 2,555 676,666Seer, Inc. (A) 46,916 1,070,154SomaLogic, Inc. (A) 67,026 780,183Thermo Fisher Scientific, Inc. 24,977 16,665,653Waters Corp. (A) 2,305 858,843West Pharmaceutical Services, Inc. 13,215 6,197,967Wuxi Biologics Cayman, Inc. (A)(C) 57,500 680,736
63,919,576Pharmaceuticals – 14.1%Arvinas, Inc. (A) 11,123 913,643AstraZeneca PLC, ADR 125,782 7,326,802Atea Pharmaceuticals, Inc. (A) 4,587 41,008Catalent, Inc. (A) 14,481 1,854,002Daiichi Sankyo Company, Ltd. 25,000 636,285DICE Therapeutics, Inc. (A) 9,328 236,092Eisai Company, Ltd. 6,800 386,021Elanco Animal Health, Inc. (A) 19,393 550,373Eli Lilly & Company 36,675 10,130,369Longboard Pharmaceuticals, Inc. (A) 8,689 42,055Merck & Company, Inc. 73,030 5,597,019Merck KGaA 7,966 2,049,310Pfizer, Inc. 226,298 13,362,897Reata Pharmaceuticals, Inc., Class A (A) 2,957 77,976Roche Holding AG 7,704 3,196,090Royalty Pharma PLC, Class A 30,049 1,197,453Theseus Pharmaceuticals, Inc. (A) 16,751 212,403
47,809,798330,929,592
TOTAL COMMON STOCKS (Cost $217,109,215) $ 333,844,929
PREFERRED SECURITIES – 0.7%Health care – 0.7%Health care equipment and supplies – 0.7%Sartorius AG 3,704 2,505,163TOTAL PREFERRED SECURITIES (Cost $552,485) $ 2,505,163
John Hancock Variable Insurance TrustPortfolio of Investments — December 31, 2021 (showing percentage of total net assets)
The accompanying notes are an integral part of the financial statements. 48

Health Sciences Trust (continued)Shares orPrincipalAmount Value
WARRANTS – 0.0%EQRx, Inc. (Expiration Date: 12-20-26;
Strike Price: $11.50) (A) 4,502 $ 4,682Sema4 Holdings Corp. (Expiration
Date: 9-24-27; Strike Price: $11.50) (A) 4,862 4,765SomaLogic, Inc. (Expiration
Date: 8-31-26; Strike Price: $11.50) (A) 2,050 6,888TOTAL WARRANTS (Cost $29,139) $ 16,335
SHORT-TERM INVESTMENTS – 0.5%Short-term funds – 0.5%State Street Institutional U.S. Government
Money Market Fund, Premier Class,0.0250% (D) 626,852 626,852
T. Rowe Price Government Reserve Fund,0.0570% (D) 938,393 938,393
TOTAL SHORT-TERM INVESTMENTS (Cost $1,565,245) $ 1,565,245Total Investments (Health Sciences Trust)
(Cost $219,256,084) – 99.8% $ 337,931,672Other assets and liabilities, net – 0.2% 681,207TOTAL NET ASSETS – 100.0% $ 338,612,879
Security Abbreviations and LegendADR American Depositary Receipt(A) Non-income producing security.(B) Security is valued using significant unobservable inputs and is
classified as Level 3 in the fair value hierarchy. Refer to Note 2 tothe financial statements.
(C) These securities are exempt from registration under Rule 144A ofthe Securities Act of 1933. Such securities may be resold, normallyto qualified institutional buyers, in transactions exempt fromregistration.
(D) The rate shown is the annualized seven-day yield as of 12-31-21.
International Equity Index TrustShares orPrincipalAmount Value
COMMON STOCKS - 96.8%Australia - 4.5%Afterpay, Ltd. (A) 7,435 $ 448,829Ampol, Ltd. 9,411 203,211APA Group 39,169 286,551Aristocrat Leisure, Ltd. 21,040 667,441ASX, Ltd. 6,626 447,812Aurizon Holdings, Ltd. 61,567 156,418AusNet Services, Ltd. 86,871 162,508Australia & New Zealand Banking
Group, Ltd. 96,280 1,928,612BHP Group PLC 71,227 2,119,334BHP Group, Ltd. (B) 97,792 2,952,502BlueScope Steel, Ltd. 18,252 278,641Brambles, Ltd. 50,212 388,455Cochlear, Ltd. 2,361 370,559Coles Group, Ltd. 45,471 593,308Commonwealth Bank of Australia 60,047 4,414,119Computershare, Ltd. 20,019 291,419Crown Resorts, Ltd. (A) 14,067 122,451CSL, Ltd. 15,989 3,381,670Dexus 39,487 319,286Domino’s Pizza Enterprises, Ltd. 1,999 171,577Endeavour Group, Ltd. 43,228 212,135Evolution Mining, Ltd. 56,369 167,234Fortescue Metals Group, Ltd. 58,162 817,567Goodman Group 57,212 1,102,862
International Equity Index Trust (continued)Shares orPrincipalAmount Value
COMMON STOCKS (continued)Australia (continued)IDP Education, Ltd. 6,944 $ 174,935Insurance Australia Group, Ltd. 88,042 272,844Lendlease Corp., Ltd. 25,385 197,661Macquarie Group, Ltd. 11,780 1,760,931Magellan Financial Group, Ltd. (B) 4,563 70,510Medibank Private, Ltd. 99,625 242,646Mirvac Group 141,329 299,161MMG, Ltd. (A) 148,000 47,608National Australia Bank, Ltd. 110,955 2,329,727Newcrest Mining, Ltd. 28,639 512,926Northern Star Resources, Ltd. 39,419 271,098Orica, Ltd. 15,709 156,654Origin Energy, Ltd. 58,812 224,455Qantas Airways, Ltd. (A) 30,851 112,540QBE Insurance Group, Ltd. 49,235 406,569Ramsay Health Care, Ltd. 6,659 346,068REA Group, Ltd. 1,952 238,029Reece, Ltd. 9,597 188,736Rio Tinto, Ltd. 12,705 927,110Santos, Ltd. 110,431 508,696Scentre Group 177,637 408,631SEEK, Ltd. 11,910 283,930Sonic Healthcare, Ltd. 16,282 552,224South32, Ltd. 112,851 330,041South32, Ltd. (London Stock Exchange) 48,980 143,988Stockland 87,409 269,657Suncorp Group, Ltd. 43,155 347,444Sydney Airport (A) 47,614 300,609Tabcorp Holdings, Ltd. 82,609 301,796Telstra Corp., Ltd. 142,464 432,975The GPT Group 71,628 282,442Transurban Group 104,007 1,044,674Treasury Wine Estates, Ltd. 26,341 237,499Vicinity Centres 148,057 182,085Washington H. Soul Pattinson &
Company, Ltd. 7,202 155,221Wesfarmers, Ltd. 37,640 1,624,027Westpac Banking Corp. 121,785 1,889,308WiseTech Global, Ltd. 5,291 224,398Woodside Petroleum, Ltd. 33,065 527,120Woolworths Group, Ltd. 43,228 1,194,972
42,026,446Austria - 0.1%Erste Group Bank AG 11,010 516,153OMV AG 5,543 313,472Raiffeisen Bank International AG 4,926 144,679Verbund AG 2,442 274,442voestalpine AG 4,357 158,086
1,406,832Belgium - 0.5%Ageas SA/NV 6,383 330,558Anheuser-Busch InBev SA/NV 26,526 1,599,249Elia Group SA/NV 1,076 141,823Etablissements Franz Colruyt NV 2,769 117,495Groupe Bruxelles Lambert SA 3,809 425,415KBC Group NV 8,597 738,664Proximus SADP (B) 5,996 117,100Sofina SA 537 263,778Solvay SA 2,881 334,933UCB SA 4,152 473,851Umicore SA 6,530 266,387
4,809,253Brazil - 0.8%Ambev SA 157,730 441,364
John Hancock Variable Insurance TrustPortfolio of Investments — December 31, 2021 (showing percentage of total net assets)
The accompanying notes are an integral part of the financial statements. 49

International Equity Index Trust (continued)Shares orPrincipalAmount Value
COMMON STOCKS (continued)Brazil (continued)Americanas SA (A) 13,014 $ 73,335Atacadao SA 13,900 37,955B3 SA - Brasil Bolsa Balcao 206,421 411,064Banco Bradesco SA 46,659 135,251Banco BTG Pactual SA 37,204 139,741Banco do Brasil SA 28,713 148,400Banco Inter SA 3,823 19,439Banco Santander Brasil SA 14,000 75,304BB Seguridade Participacoes SA 24,400 90,320BRF SA (A) 19,720 79,943CCR SA 40,100 83,252Centrais Eletricas Brasileiras SA 9,400 57,302Centrais Eletricas Brasileiras SA, ADR 1,429 8,574Cia Brasileira de Distribuicao, ADR (B) 628 2,506Cia de Saneamento Basico do Estado de
Sao Paulo 11,270 82,300Cia Siderurgica Nacional SA, ADR 11,800 52,392Cosan SA 40,344 158,508Energisa SA 6,100 48,509Engie Brasil Energia SA 7,275 50,129Equatorial Energia SA 30,700 124,489Hapvida Participacoes e Investimentos
SA (C) 38,400 71,280Hypera SA 10,908 55,221JBS SA 34,073 232,482Klabin SA 24,000 110,369Localiza Rent a Car SA 20,227 191,909Lojas Renner SA 32,186 139,289Magazine Luiza SA 94,607 121,947Natura & Company Holding SA (A) 26,929 124,172Notre Dame Intermedica Participacoes SA 17,255 186,280Petroleo Brasileiro SA 124,329 684,692Raia Drogasil SA 35,900 156,298Rede D’Or Sao Luiz SA (C) 13,400 107,628Rumo SA (A) 45,451 144,668Sendas Distribuidora SA 24,690 57,591Suzano SA (A) 22,263 240,465Suzano SA, ADR (A) 3,164 34,171Telefonica Brasil SA 9,652 83,790Telefonica Brasil SA, ADR (B) 6,017 52,047TIM SA 28,020 66,371TOTVS SA 17,746 90,187Ultrapar Participacoes SA 25,400 67,348Vale SA 137,550 1,916,527Via S/A (A) 44,400 41,671Vibra Energia SA 44,000 168,707WEG SA 56,116 330,532
7,795,719Canada - 7.4%Agnico Eagle Mines, Ltd. 8,536 453,404Air Canada (A) 5,400 90,203Algonquin Power & Utilities Corp. 20,729 299,394Alimentation Couche-Tard, Inc. 29,500 1,236,017AltaGas, Ltd. 11,500 248,283Ballard Power Systems, Inc. (A) 7,500 94,213Bank of Montreal 21,498 2,314,568Barrick Gold Corp. 40,477 769,573Barrick Gold Corp. (London
Stock Exchange) 20,657 383,065BCE, Inc. 2,424 126,110BlackBerry, Ltd. (A) 21,000 196,229Brookfield Asset Management, Inc.,
Class A 46,972 2,836,627CAE, Inc. (A) 10,400 262,353Cameco Corp. 13,200 287,803
International Equity Index Trust (continued)Shares orPrincipalAmount Value
COMMON STOCKS (continued)Canada (continued)Canadian Apartment Properties REIT 2,900 $ 137,463Canadian Imperial Bank of Commerce 15,200 1,771,801Canadian National Railway Company 24,000 2,948,037Canadian Natural Resources, Ltd. 40,360 1,705,397Canadian Pacific Railway, Ltd. 31,000 2,229,638Canadian Tire Corp., Ltd., Class A 2,100 301,217Canadian Utilities, Ltd., Class A 4,600 133,423Canopy Growth Corp. (A)(B) 8,000 69,821CCL Industries, Inc., Class B 5,400 289,562Cenovus Energy, Inc. 43,859 537,771CGI, Inc. (A) 7,900 698,537Constellation Software, Inc. 700 1,298,753Dollarama, Inc. 10,100 505,499Emera, Inc. 8,900 444,807Empire Company, Ltd., Class A 6,200 188,899Enbridge, Inc. 68,500 2,675,667Fairfax Financial Holdings, Ltd. 900 442,718First Quantum Minerals, Ltd. 20,154 482,281FirstService Corp. 1,500 294,794Fortis, Inc. 16,404 791,443Franco-Nevada Corp. 6,438 890,362George Weston, Ltd. 2,799 324,520GFL Environmental, Inc. 6,400 241,995Gildan Activewear, Inc. 7,300 309,498Great-West Lifeco, Inc. 9,900 297,090Hydro One, Ltd. (C) 11,900 309,600iA Financial Corp., Inc. 3,600 205,991IGM Financial, Inc. 3,000 108,194Imperial Oil, Ltd. 8,630 311,238Intact Financial Corp. 6,100 792,887Ivanhoe Mines, Ltd., Class A (A) 19,900 162,353Keyera Corp. 8,500 191,711Kinross Gold Corp. 45,229 262,446Kirkland Lake Gold, Ltd. 8,700 364,589Lightspeed Commerce, Inc. (A) 3,200 129,219Loblaw Companies, Ltd. 6,140 503,063Lundin Mining Corp. 22,100 172,614Magna International, Inc. 9,800 792,940Manulife Financial Corp. (D) 66,100 1,259,869Metro, Inc. 8,257 439,433National Bank of Canada 11,500 876,762Northland Power, Inc. 8,100 243,010Nutrien, Ltd. 19,490 1,464,966Nuvei Corp. (A)(C) 1,900 123,167Onex Corp. 2,700 211,910Open Text Corp. 9,700 460,404Pan American Silver Corp. 7,300 182,132Parkland Corp. 5,400 148,431Pembina Pipeline Corp. 18,998 576,270Power Corp. of Canada 19,412 641,465Quebecor, Inc., Class B 6,400 144,448Restaurant Brands International, Inc. 10,046 609,137RioCan Real Estate Investment Trust 6,300 114,251Ritchie Brothers Auctioneers, Inc. 3,800 232,545Rogers Communications, Inc., Class B 12,200 580,897Royal Bank of Canada 48,200 5,115,499Saputo, Inc. 9,100 205,028Shaw Communications, Inc., Class B 16,926 513,688Shopify, Inc., Class A (A) 3,800 5,232,161Sun Life Financial, Inc. 20,000 1,113,246Suncor Energy, Inc. 52,235 1,306,959TC Energy Corp. 33,397 1,553,220Teck Resources, Ltd., Class B 16,161 465,430TELUS Corp. 14,509 341,692TFI International, Inc. 2,800 314,033
John Hancock Variable Insurance TrustPortfolio of Investments — December 31, 2021 (showing percentage of total net assets)
The accompanying notes are an integral part of the financial statements. 50

International Equity Index Trust (continued)Shares orPrincipalAmount Value
COMMON STOCKS (continued)Canada (continued)The Bank of Nova Scotia 40,200 $ 2,845,891The Toronto-Dominion Bank 61,572 4,720,544Thomson Reuters Corp. 5,954 712,014TMX Group, Ltd. 2,000 202,775Toromont Industries, Ltd. 2,800 253,139Tourmaline Oil Corp. 10,300 332,544West Fraser Timber Company, Ltd. 3,076 293,460Wheaton Precious Metals Corp. 15,183 651,514WSP Global, Inc. 3,800 551,638
68,949,252Chile - 0.1%Antofagasta PLC 13,250 240,980Banco Santander Chile, ADR 5,508 89,725Cencosud SA 61,383 102,641Enel Americas SA, ADR 14,968 81,426Enel Chile SA, ADR (B) 18,222 32,982Sociedad Quimica y Minera de
Chile SA, ADR 4,430 223,405771,159
China - 8.1%360 DigiTech, Inc., ADR 2,900 66,4973SBio, Inc. (A)(C) 40,500 33,75151job, Inc., ADR (A) 900 44,037AAC Technologies Holdings, Inc. 27,342 107,760AECC Aviation Power Company, Ltd.,
Class A 3,600 35,852Agile Group Holdings, Ltd. 54,000 29,313Agora, Inc., ADR (A) 2,400 38,904Agricultural Bank of China, Ltd., Class A 165,700 76,441Agricultural Bank of China, Ltd., H Shares 934,000 321,331Aier Eye Hospital Group Company, Ltd.,
Class A 11,596 77,006Air China, Ltd., H Shares (A) 84,534 59,039Airtac International Group 4,185 153,668Alibaba Group Holding, Ltd., ADR (A) 334,827 7,483,780A-Living Smart City Services
Company, Ltd. (C) 15,500 26,480Aluminum Corp. of China, Ltd., A
Shares (A) 29,100 27,965Aluminum Corp. of China, Ltd., H
Shares (A) 131,220 72,303Anhui Conch Cement Company, Ltd.,
Class A 8,900 56,340Anhui Conch Cement Company, Ltd.,
H Shares 44,290 221,528Anhui Gujing Distillery Company, Ltd.,
B Shares 3,600 51,232Anhui Gujing Distillery Company, Ltd.,
Class A 900 34,450ANTA Sports Products, Ltd. 37,000 555,678Autohome, Inc., ADR 2,100 61,908AVIC Industry-Finance Holdings
Company, Ltd., Class A 20,000 12,459AviChina Industry & Technology
Company, Ltd., H Shares 72,000 49,813Baidu, Inc., ADR (A) 9,500 1,413,505Bank of Beijing Company, Ltd., Class A 47,000 32,747Bank of China, Ltd., Class A 78,100 37,377Bank of China, Ltd., H Shares 2,682,563 965,096Bank of Communications Company, Ltd.,
Class A 87,300 63,169Bank of Communications Company, Ltd.,
H Shares 292,527 176,836Bank of Hangzhou Company, Ltd., Class A 11,400 22,936Bank of Jiangsu Company, Ltd., Class A 33,410 30,568
International Equity Index Trust (continued)Shares orPrincipalAmount Value
COMMON STOCKS (continued)China (continued)Bank of Nanjing Company, Ltd., Class A 13,600 $ 19,115Bank of Ningbo Company, Ltd., Class A 13,750 82,575Bank of Shanghai Company, Ltd., Class A 31,610 35,360Baoshan Iron & Steel Company, Ltd.,
Class A 41,300 46,554BeiGene, Ltd., ADR (A) 1,500 406,395Beijing Capital International Airport
Company, Ltd., H Shares (A) 52,789 32,351Beijing Shunxin Agriculture
Company, Ltd., Class A 1,700 10,188Beijing Yuanliu Hongyuan Electronic
Technology Company, Ltd., Class A 6,700 188,505Bilibili, Inc., ADR (A)(B) 5,800 269,120BOE Technology Group Company, Ltd.,
Class A 75,300 59,673BYD Company, Ltd., Class A 4,000 168,039BYD Company, Ltd., H Shares 26,105 882,985BYD Electronic International
Company, Ltd. 22,500 82,362CanSino Biologics, Inc., Class A (A) 254 11,942CanSino Biologics, Inc., H
Shares (A)(B)(C) 2,400 55,487CGN Power Company, Ltd., H Shares (C) 317,000 96,372Changchun High & New Technology
Industry Group, Inc., Class A 800 34,094China Bohai Bank Company, Ltd., H
Shares (C) 83,000 31,909China Cinda Asset Management
Company, Ltd., H Shares 304,800 55,517China CITIC Bank Corp., Ltd., H Shares 310,800 134,816China Communications Services Corp.,
Ltd., H Shares 129,600 63,161China Conch Venture Holdings, Ltd. 57,900 283,203China Construction Bank Corp., Class A 15,400 14,162China Construction Bank Corp., H Shares 3,209,914 2,224,300China Eastern Airlines Corp., Ltd.,
Class A (A) 15,800 12,806China Everbright Bank Company, Ltd.,
Class A 88,600 46,151China Everbright Bank Company, Ltd.,
H Shares 120,000 42,492China Evergrande Group (B) 65,959 13,464China Feihe, Ltd. (C) 119,000 159,662China Galaxy Securities Company, Ltd.,
H Shares 129,500 74,433China Greatwall Technology Group
Company, Ltd., Class A 6,500 14,448China Hongqiao Group, Ltd. 57,000 60,246China Huarong Asset Management
Company, Ltd., H Shares (A)(C)(E) 351,700 18,402China Huishan Dairy Holdings
Company, Ltd. (A)(E) 225,000 0China International Capital Corp., Ltd., H
Shares (C) 36,800 101,558China Lesso Group Holdings, Ltd. 36,000 51,756China Life Insurance Company, Ltd.,
Class A 4,500 21,241China Life Insurance Company, Ltd.,
H Shares 248,624 412,137China Literature, Ltd. (A)(C) 10,200 64,182China Longyuan Power Group Corp., Ltd.,
H Shares 99,000 231,246China Medical System Holdings, Ltd. 48,300 80,739China Meidong Auto Holdings, Ltd. 18,000 92,770
John Hancock Variable Insurance TrustPortfolio of Investments — December 31, 2021 (showing percentage of total net assets)
The accompanying notes are an integral part of the financial statements. 51

International Equity Index Trust (continued)Shares orPrincipalAmount Value
COMMON STOCKS (continued)China (continued)China Merchants Bank Company, Ltd.,
Class A 45,900 $ 350,887China Merchants Bank Company, Ltd.,
H Shares 131,823 1,025,527China Merchants Securities Company, Ltd.,
Class A 16,510 45,729China Merchants Shekou Industrial Zone
Holdings Company, Ltd., Class A 17,600 36,886China Minsheng Banking Corp., Ltd.,
Class A 78,880 48,278China Minsheng Banking Corp., Ltd., H
Shares (B) 194,496 74,369China Molybdenum Company, Ltd.,
Class A 28,400 24,921China Molybdenum Company, Ltd.,
H Shares 129,000 68,143China National Building Material
Company, Ltd., H Shares 138,000 169,428China National Nuclear Power
Company, Ltd., Class A 20,900 27,218China Oilfield Services, Ltd., H Shares 56,000 49,123China Pacific Insurance Group
Company, Ltd., Class A 14,000 59,572China Pacific Insurance Group
Company, Ltd., H Shares 94,100 255,658China Petroleum & Chemical Corp.,
Class A 56,700 37,652China Petroleum & Chemical Corp.,
H Shares 819,361 381,676China Railway Group, Ltd., Class A 30,000 27,271China Railway Group, Ltd., H Shares 126,000 66,674China Resources Mixc Lifestyle
Services, Ltd. (C) 19,000 88,659China Shenhua Energy Company, Ltd.,
Class A 9,800 34,665China Shenhua Energy Company, Ltd.,
H Shares 113,500 265,622China Southern Airlines Company, Ltd.,
Class A (A) 13,800 14,757China Southern Airlines Company, Ltd., H
Shares (A) 64,000 38,345China State Construction Engineering
Corp., Ltd., Class A 93,340 73,267China Tourism Group Duty Free Corp.,
Ltd., Class A 4,300 148,236China Tower Corp., Ltd., H Shares (C) 1,496,000 165,064China Vanke Company, Ltd., Class A 21,600 67,016China Vanke Company, Ltd., H Shares 56,900 132,495China Yangtze Power Company, Ltd.,
Class A 48,900 174,093Chinasoft International, Ltd. (A) 86,000 112,148Chongqing Zhifei Biological Products
Company, Ltd., Class A 3,100 60,582CIFI Ever Sunshine Services Group, Ltd. 22,000 34,167CIFI Holdings Group Company, Ltd. 140,161 84,314CITIC Securities Company, Ltd., Class A 21,900 90,791CITIC Securities Company, Ltd., H Shares 75,500 197,196CITIC, Ltd. 207,967 205,750Contemporary Amperex Technology
Company, Ltd., Class A 4,900 451,362COSCO SHIPPING Holdings
Company, Ltd., H Shares (A)(B) 119,600 231,899Country Garden Holdings Company, Ltd. 270,117 239,884Country Garden Services Holdings
Company, Ltd. 59,000 354,231
International Equity Index Trust (continued)Shares orPrincipalAmount Value
COMMON STOCKS (continued)China (continued)CRRC Corp., Ltd., H Shares 145,000 $ 62,335CSC Financial Company, Ltd., Class A 6,200 28,463CSPC Pharmaceutical Group, Ltd. 303,120 330,064Dali Foods Group Company, Ltd. (C) 73,000 38,243Daqo New Energy Corp., ADR (A) 2,500 100,800DiDi Global, Inc., ADR (A) 13,000 64,740Dongfeng Motor Group Company, Ltd.,
H Shares 91,220 75,831Dongyue Group, Ltd. 49,000 76,542East Money Information Company, Ltd.,
Class A 21,456 125,081Ecovacs Robotics Company, Ltd., Class A 2,300 54,475ENN Energy Holdings, Ltd. 26,600 501,456Eve Energy Company, Ltd., Class A 4,181 77,558Everbright Securities Company, Ltd.,
Class A 8,700 20,397Flat Glass Group Company, Ltd., H Shares 23,000 117,085Focus Media Information Technology
Company, Ltd., Class A 32,700 42,081Foshan Haitian Flavouring & Food
Company, Ltd., Class A 7,800 128,528Fosun International, Ltd. 85,000 91,741Founder Securities Company, Ltd., Class A 13,200 16,253Foxconn Industrial Internet Company, Ltd.,
Class A 6,400 11,971Fuyao Glass Industry Group
Company, Ltd., Class A 4,500 33,252Fuyao Glass Industry Group
Company, Ltd., H Shares (C) 16,800 86,881Ganfeng Lithium Company, Ltd., H
Shares (C) 8,600 135,420GCL System Integration Technology
Company, Ltd., Class A (A) 60,900 36,358GDS Holdings, Ltd., ADR (A) 3,400 160,344Gemdale Corp., Class A 7,300 14,872Genscript Biotech Corp. (A) 28,000 123,884GF Securities Company, Ltd., Class A 13,200 50,941GF Securities Company, Ltd., H Shares 47,800 91,155Gigadevice Semiconductor Beijing, Inc.,
Class A 1,372 37,871GoerTek, Inc., Class A 5,200 44,205GOME Retail Holdings, Ltd. (A) 386,127 32,699Great Wall Motor Company, Ltd.,
H Shares 104,500 359,001Greenland Holdings Corp., Ltd., Class A 13,755 9,369Greentown China Holdings, Ltd. (B) 29,000 46,751Greentown Service Group Company, Ltd. 48,000 44,322Guangdong Haid Group Company, Ltd.,
Class A 3,500 40,251Guangzhou Automobile Group
Company, Ltd., H Shares 100,310 98,998Guangzhou Baiyunshan Pharmaceutical
Holdings Company, Ltd., Class A 2,300 12,349Guangzhou R&F Properties
Company, Ltd., H Shares (B) 43,600 16,224Guosen Securities Company, Ltd., Class A 6,600 11,894Guotai Junan Securities Company, Ltd.,
Class A 16,700 46,895Haidilao International Holding, Ltd. (C) 26,000 58,780Haier Smart Home Company, Ltd., Class A 13,600 63,799Haier Smart Home Company, Ltd.,
H Shares 65,400 276,598Haitian International Holdings, Ltd. 21,000 58,337Haitong Securities Company, Ltd., Class A 18,000 34,638
John Hancock Variable Insurance TrustPortfolio of Investments — December 31, 2021 (showing percentage of total net assets)
The accompanying notes are an integral part of the financial statements. 52
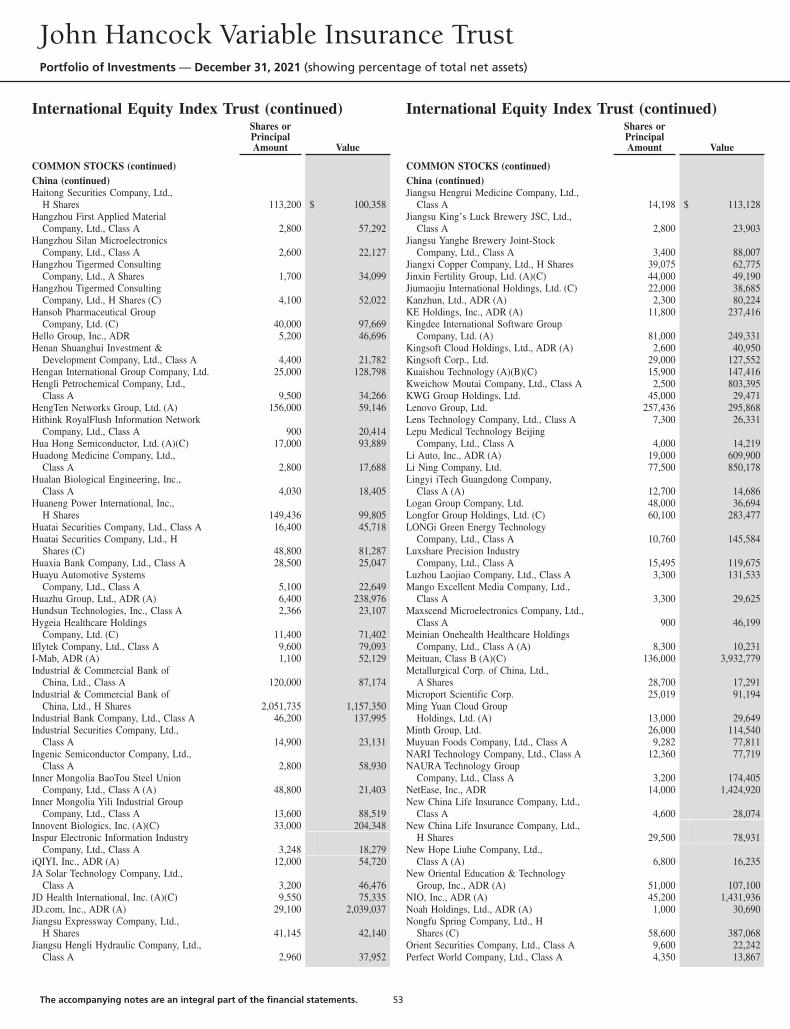
International Equity Index Trust (continued)Shares orPrincipalAmount Value
COMMON STOCKS (continued)China (continued)Haitong Securities Company, Ltd.,
H Shares 113,200 $ 100,358Hangzhou First Applied Material
Company, Ltd., Class A 2,800 57,292Hangzhou Silan Microelectronics
Company, Ltd., Class A 2,600 22,127Hangzhou Tigermed Consulting
Company, Ltd., A Shares 1,700 34,099Hangzhou Tigermed Consulting
Company, Ltd., H Shares (C) 4,100 52,022Hansoh Pharmaceutical Group
Company, Ltd. (C) 40,000 97,669Hello Group, Inc., ADR 5,200 46,696Henan Shuanghui Investment &
Development Company, Ltd., Class A 4,400 21,782Hengan International Group Company, Ltd. 25,000 128,798Hengli Petrochemical Company, Ltd.,
Class A 9,500 34,266HengTen Networks Group, Ltd. (A) 156,000 59,146Hithink RoyalFlush Information Network
Company, Ltd., Class A 900 20,414Hua Hong Semiconductor, Ltd. (A)(C) 17,000 93,889Huadong Medicine Company, Ltd.,
Class A 2,800 17,688Hualan Biological Engineering, Inc.,
Class A 4,030 18,405Huaneng Power International, Inc.,
H Shares 149,436 99,805Huatai Securities Company, Ltd., Class A 16,400 45,718Huatai Securities Company, Ltd., H
Shares (C) 48,800 81,287Huaxia Bank Company, Ltd., Class A 28,500 25,047Huayu Automotive Systems
Company, Ltd., Class A 5,100 22,649Huazhu Group, Ltd., ADR (A) 6,400 238,976Hundsun Technologies, Inc., Class A 2,366 23,107Hygeia Healthcare Holdings
Company, Ltd. (C) 11,400 71,402Iflytek Company, Ltd., Class A 9,600 79,093I-Mab, ADR (A) 1,100 52,129Industrial & Commercial Bank of
China, Ltd., Class A 120,000 87,174Industrial & Commercial Bank of
China, Ltd., H Shares 2,051,735 1,157,350Industrial Bank Company, Ltd., Class A 46,200 137,995Industrial Securities Company, Ltd.,
Class A 14,900 23,131Ingenic Semiconductor Company, Ltd.,
Class A 2,800 58,930Inner Mongolia BaoTou Steel Union
Company, Ltd., Class A (A) 48,800 21,403Inner Mongolia Yili Industrial Group
Company, Ltd., Class A 13,600 88,519Innovent Biologics, Inc. (A)(C) 33,000 204,348Inspur Electronic Information Industry
Company, Ltd., Class A 3,248 18,279iQIYI, Inc., ADR (A) 12,000 54,720JA Solar Technology Company, Ltd.,
Class A 3,200 46,476JD Health International, Inc. (A)(C) 9,550 75,335JD.com, Inc., ADR (A) 29,100 2,039,037Jiangsu Expressway Company, Ltd.,
H Shares 41,145 42,140Jiangsu Hengli Hydraulic Company, Ltd.,
Class A 2,960 37,952
International Equity Index Trust (continued)Shares orPrincipalAmount Value
COMMON STOCKS (continued)China (continued)Jiangsu Hengrui Medicine Company, Ltd.,
Class A 14,198 $ 113,128Jiangsu King’s Luck Brewery JSC, Ltd.,
Class A 2,800 23,903Jiangsu Yanghe Brewery Joint-Stock
Company, Ltd., Class A 3,400 88,007Jiangxi Copper Company, Ltd., H Shares 39,075 62,775Jinxin Fertility Group, Ltd. (A)(C) 44,000 49,190Jiumaojiu International Holdings, Ltd. (C) 22,000 38,685Kanzhun, Ltd., ADR (A) 2,300 80,224KE Holdings, Inc., ADR (A) 11,800 237,416Kingdee International Software Group
Company, Ltd. (A) 81,000 249,331Kingsoft Cloud Holdings, Ltd., ADR (A) 2,600 40,950Kingsoft Corp., Ltd. 29,000 127,552Kuaishou Technology (A)(B)(C) 15,900 147,416Kweichow Moutai Company, Ltd., Class A 2,500 803,395KWG Group Holdings, Ltd. 45,000 29,471Lenovo Group, Ltd. 257,436 295,868Lens Technology Company, Ltd., Class A 7,300 26,331Lepu Medical Technology Beijing
Company, Ltd., Class A 4,000 14,219Li Auto, Inc., ADR (A) 19,000 609,900Li Ning Company, Ltd. 77,500 850,178Lingyi iTech Guangdong Company,
Class A (A) 12,700 14,686Logan Group Company, Ltd. 48,000 36,694Longfor Group Holdings, Ltd. (C) 60,100 283,477LONGi Green Energy Technology
Company, Ltd., Class A 10,760 145,584Luxshare Precision Industry
Company, Ltd., Class A 15,495 119,675Luzhou Laojiao Company, Ltd., Class A 3,300 131,533Mango Excellent Media Company, Ltd.,
Class A 3,300 29,625Maxscend Microelectronics Company, Ltd.,
Class A 900 46,199Meinian Onehealth Healthcare Holdings
Company, Ltd., Class A (A) 8,300 10,231Meituan, Class B (A)(C) 136,000 3,932,779Metallurgical Corp. of China, Ltd.,
A Shares 28,700 17,291Microport Scientific Corp. 25,019 91,194Ming Yuan Cloud Group
Holdings, Ltd. (A) 13,000 29,649Minth Group, Ltd. 26,000 114,540Muyuan Foods Company, Ltd., Class A 9,282 77,811NARI Technology Company, Ltd., Class A 12,360 77,719NAURA Technology Group
Company, Ltd., Class A 3,200 174,405NetEase, Inc., ADR 14,000 1,424,920New China Life Insurance Company, Ltd.,
Class A 4,600 28,074New China Life Insurance Company, Ltd.,
H Shares 29,500 78,931New Hope Liuhe Company, Ltd.,
Class A (A) 6,800 16,235New Oriental Education & Technology
Group, Inc., ADR (A) 51,000 107,100NIO, Inc., ADR (A) 45,200 1,431,936Noah Holdings, Ltd., ADR (A) 1,000 30,690Nongfu Spring Company, Ltd., H
Shares (C) 58,600 387,068Orient Securities Company, Ltd., Class A 9,600 22,242Perfect World Company, Ltd., Class A 4,350 13,867
John Hancock Variable Insurance TrustPortfolio of Investments — December 31, 2021 (showing percentage of total net assets)
The accompanying notes are an integral part of the financial statements. 53

International Equity Index Trust (continued)Shares orPrincipalAmount Value
COMMON STOCKS (continued)China (continued)PetroChina Company, Ltd., Class A 36,000 $ 27,778PetroChina Company, Ltd., H Shares 712,261 315,457Pharmaron Beijing Company, Ltd., H
Shares (C) 4,200 64,859PICC Property & Casualty Company, Ltd.,
H Shares 252,363 206,292Pinduoduo, Inc., ADR (A) 14,600 851,180Ping An Bank Company, Ltd., Class A 38,200 98,763Ping An Healthcare and Technology
Company, Ltd. (A)(C) 17,400 63,425Ping An Insurance Group Company of
China, Ltd., Class A 24,100 190,702Ping An Insurance Group Company of
China, Ltd., H Shares 210,290 1,515,375Poly Developments and Holdings Group
Company, Ltd., Class A 26,500 65,020Postal Savings Bank of China
Company, Ltd., H Shares (C) 331,000 232,444Power Construction Corp. of China, Ltd.,
Class A 20,500 26,003Raytron Technology Company, Ltd.,
Class A 2,601 32,107RLX Technology, Inc., ADR (A)(B) 24,900 97,110Rongsheng Petrochemical Company, Ltd.,
Class A 13,950 39,802SAIC Motor Corp., Ltd., Class A 17,300 56,035Sangfor Technologies, Inc., Class A 700 20,991Sany Heavy Industry Company, Ltd.,
Class A 18,600 66,588SDIC Capital Company, Ltd., Class A 11,856 15,301SDIC Power Holdings Company, Ltd.,
Class A 10,900 19,621Seazen Group, Ltd. (A) 64,000 43,288Seazen Holdings Company, Ltd., Class A 5,000 22,880SF Holding Company, Ltd., Class A 3,600 38,969Shaanxi Coal Industry Company, Ltd.,
Class A 13,400 25,696Shandong Gold Mining Company, Ltd.,
Class A 5,880 17,388Shandong Gold Mining Company, Ltd., H
Shares (B)(C) 21,500 36,893Shandong Weigao Group Medical Polymer
Company, Ltd., H Shares 80,000 99,736Shanghai Fosun Pharmaceutical Group
Company, Ltd., Class A 3,200 24,546Shanghai Fosun Pharmaceutical Group
Company, Ltd., H Shares 17,500 77,048Shanghai International Airport
Company, Ltd., Class A (A) 1,600 11,709Shanghai International Port Group
Company, Ltd., Class A 13,700 11,785Shanghai Lujiazui Finance & Trade Zone
Development Company, Ltd., B Shares 39,240 35,768Shanghai M&G Stationery, Inc., Class A 2,000 20,240Shanghai Pharmaceuticals Holding
Company, Ltd., H Shares 31,100 59,014Shanghai Pudong Development Bank
Company, Ltd., Class A 65,300 87,403Shanxi Xinghuacun Fen Wine Factory
Company, Ltd., Class A 1,960 97,049Shengyi Technology Company, Ltd.,
Class A 5,100 18,839Shennan Circuits Company, Ltd., Class A 1,120 21,409Shenwan Hongyuan Group Company, Ltd.,
Class A 36,200 29,086
International Equity Index Trust (continued)Shares orPrincipalAmount Value
COMMON STOCKS (continued)China (continued)Shenzhen Goodix Technology
Company, Ltd., Class A 800 $ 13,543Shenzhen Inovance Technology
Company, Ltd., Class A 5,550 59,799Shenzhen Kangtai Biological Products
Company, Ltd., Class A 1,400 21,624Shenzhen Mindray Bio-Medical
Electronics Company, Ltd., Class A 700 41,834Shenzhen Overseas Chinese Town
Company, Ltd., Class A 13,200 14,590Shenzhen Sunway Communication
Company, Ltd., Class A 2,200 8,748Shenzhou International Group
Holdings, Ltd. 27,000 522,819Sichuan Chuantou Energy Company, Ltd.,
Class A 9,800 19,221Silergy Corp. 3,000 542,989Sinopharm Group Company, Ltd.,
H Shares 42,800 93,152Sinotruk Hong Kong, Ltd. 24,500 37,722Smoore International Holdings, Ltd. (C) 59,000 301,280Songcheng Performance Development
Company, Ltd., Class A 5,760 12,956Sunac China Holdings, Ltd. 87,000 131,608Sunac Services Holdings, Ltd. (C) 36,000 36,746Sungrow Power Supply Company, Ltd.,
Class A 9,100 208,255Suning.com Company, Ltd., Class A (A) 20,700 13,382Sunny Optical Technology Group
Company, Ltd. 23,800 753,855TAL Education Group, ADR (A) 12,800 50,304TCL Technology Group Corp., Class A 21,800 21,115Tencent Holdings, Ltd. 191,600 11,180,075Tencent Music Entertainment Group,
ADR (A) 25,200 172,620The People’s Insurance Company Group of
China, Ltd., H Shares 265,000 80,248Thunder Software Technology
Company, Ltd., Class A 8,300 180,096Tianjin Zhonghuan Semiconductor
Company, Ltd., Class A 27,000 176,760Tingyi Cayman Islands Holding Corp. 76,000 156,301Tongcheng Travel Holdings, Ltd. (A) 28,800 53,386Tongwei Company, Ltd., Class A 6,200 43,728Topsports International Holdings, Ltd. (C) 41,000 41,526TravelSky Technology, Ltd., H Shares 31,000 52,107Trip.com Group, Ltd., ADR (A) 16,000 393,920Tsingtao Brewery Company, Ltd.,
H Shares 12,000 112,294Unigroup Guoxin Microelectronics
Company, Ltd., Class A 1,200 42,365Uni-President China Holdings, Ltd. 46,000 44,590Unisplendour Corp., Ltd., Class A 5,320 19,091Vipshop Holdings, Ltd., ADR (A) 15,300 128,520VNET Group, Inc., ADR (A) 4,400 39,732Walvax Biotechnology Company, Ltd.,
Class A 3,400 29,901Wanhua Chemical Group Company, Ltd.,
Class A 7,000 110,884Want Want China Holdings, Ltd. 163,000 149,600Weibo Corp., ADR (A) 1,890 58,552Weichai Power Company, Ltd., Class A 9,600 26,919Weichai Power Company, Ltd., H Shares 64,720 126,930Weimob, Inc. (A)(C) 53,000 53,673
John Hancock Variable Insurance TrustPortfolio of Investments — December 31, 2021 (showing percentage of total net assets)
The accompanying notes are an integral part of the financial statements. 54

International Equity Index Trust (continued)Shares orPrincipalAmount Value
COMMON STOCKS (continued)China (continued)Wens Foodstuffs Group Company, Ltd.,
Class A 14,160 $ 42,831Will Semiconductor Company, Ltd.,
Class A 3,100 151,138Wuhu Sanqi Interactive Entertainment
Network Technology GroupCompany, Ltd., Class A 4,700 19,930
Wuliangye Yibin Company, Ltd., Class A 8,600 300,410WUS Printed Circuit Kunshan
Company, Ltd., Class A 4,180 10,886WuXi AppTec Company, Ltd., Class A 5,544 103,186WuXi AppTec Company, Ltd., H
Shares (C) 11,006 190,165Wuxi Biologics Cayman, Inc. (A)(C) 119,500 1,414,749Wuxi Shangji Automation Company, Ltd.,
Class A 1,100 28,795Xiaomi Corp., Class B (A)(C) 477,000 1,156,277Xinjiang Goldwind Science & Technology
Company, Ltd., Class A 7,700 19,913Xinjiang Goldwind Science & Technology
Company, Ltd., H Shares (B) 22,200 43,340Xinyi Solar Holdings, Ltd. 172,835 293,430XPeng, Inc., ADR (A) 12,800 644,224Yadea Group Holdings, Ltd. (C) 34,000 66,263Yankuang Energy Group Company, Ltd., H
Shares (B) 49,990 99,356Yihai International Holding, Ltd. (A)(B) 16,000 73,987Yonghui Superstores Company, Ltd.,
Class A 10,200 6,480Yonyou Network Technology
Company, Ltd., Class A 5,200 29,277Yum China Holdings, Inc. 12,700 632,968Yunda Holding Company, Ltd., Class A 3,120 10,021Yunnan Baiyao Group Company, Ltd.,
Class A 2,800 46,007Zai Lab, Ltd., ADR (A) 2,300 144,555Zhangzhou Pientzehuang Pharmaceutical
Company, Ltd., Class A 1,000 68,703Zhejiang Chint Electrics Company, Ltd.,
Class A 4,800 40,576Zhejiang Dahua Technology
Company, Ltd., Class A 4,800 17,691Zhejiang Expressway Company, Ltd.,
H Shares 49,718 44,310Zhejiang Jingsheng Mechanical &
Electrical Company, Ltd., Class A 2,600 28,333Zhejiang Longsheng Group Company, Ltd.,
Class A 7,200 14,281Zhejiang NHU Company, Ltd., Class A 5,760 28,126Zhejiang Sanhua Intelligent Controls
Company, Ltd., Class A 8,060 31,999Zhejiang Supor Company, Ltd., Class A 1,200 11,725ZhongAn Online P&C Insurance
Company, Ltd., H Shares (A)(C) 12,500 43,549Zhongsheng Group Holdings, Ltd. 20,000 156,066Zhuzhou CRRC Times Electric
Company, Ltd. 18,000 104,333Zijin Mining Group Company, Ltd.,
Class A 27,800 42,431Zijin Mining Group Company, Ltd.,
H Shares 193,469 231,058Zoomlion Heavy Industry Science and
Technology Company, Ltd., Class A 14,300 16,102Zoomlion Heavy Industry Science and
Technology Company, Ltd., H Shares 44,800 28,221
International Equity Index Trust (continued)Shares orPrincipalAmount Value
COMMON STOCKS (continued)China (continued)ZTE Corp., Class A 7,600 $ 39,943ZTE Corp., H Shares 25,887 70,931ZTO Express Cayman, Inc., ADR 15,400 434,588
75,771,834Colombia - 0.0%Bancolombia SA, ADR 3,847 121,527Ecopetrol SA, ADR 9,500 122,455
243,982Czech Republic - 0.1%CEZ AS 6,817 258,015Komercni banka AS 3,440 147,080Moneta Money Bank AS (C) 17,731 76,016
481,111Denmark - 1.7%A.P. Moller - Maersk A/S, Series A 107 354,979A.P. Moller - Maersk A/S, Series B 207 738,848Ambu A/S, Class B (B) 5,684 150,022Carlsberg A/S, Class B 3,581 618,252Chr. Hansen Holding A/S 3,557 280,471Coloplast A/S, B Shares 4,136 728,247Danske Bank A/S 26,235 452,921Demant A/S (A) 5,000 256,031DSV A/S 6,786 1,581,330Genmab A/S (A) 2,265 904,082GN Store Nord A/S 4,458 279,721Novo Nordisk A/S, B Shares 56,014 6,291,822Novozymes A/S, B Shares 7,019 576,329Orsted A/S (C) 6,586 843,450Pandora A/S 3,372 419,446Rockwool International A/S, B Shares 272 118,776Tryg A/S 13,079 322,759Vestas Wind Systems A/S 34,230 1,042,480
15,959,966Egypt - 0.0%Commercial International Bank Egypt
SAE (A) 68,774 231,465Finland - 0.8%Elisa OYJ 5,862 360,958Fortum OYJ 16,798 515,201Kesko OYJ, B Shares 9,211 307,010Kone OYJ, B Shares 11,833 849,120Neste OYJ 14,709 723,914Nokia OYJ (A) 123,099 779,670Nokia OYJ (Euronext Paris Exchange) (A) 56,247 356,533Nordea Bank ABP 1,569 19,224Nordea Bank ABP (Nasdaq
Stockholm Exchange) 109,335 1,333,728Orion OYJ, Class B 3,379 140,359Sampo OYJ, A Shares 15,885 795,013Stora Enso OYJ, R Shares 20,482 375,913UPM-Kymmene OYJ 19,972 759,906Wartsila OYJ ABP 15,222 213,500
7,530,049France - 7.1%Accor SA (A) 6,145 199,180Aeroports de Paris (A) 1,190 153,514Air Liquide SA 15,910 2,774,769Airbus SE (A) 19,831 2,537,251Alstom SA 10,563 375,097Amundi SA (C) 2,415 199,200Arkema SA 2,540 358,507AXA SA 66,841 1,989,404BioMerieux 1,432 203,655
John Hancock Variable Insurance TrustPortfolio of Investments — December 31, 2021 (showing percentage of total net assets)
The accompanying notes are an integral part of the financial statements. 55

International Equity Index Trust (continued)Shares orPrincipalAmount Value
COMMON STOCKS (continued)France (continued)BNP Paribas SA 37,933 $ 2,622,724Bollore SA 32,561 182,132Bouygues SA 8,158 292,024Bureau Veritas SA 10,297 341,849Capgemini SE 5,409 1,325,640Carrefour SA 20,604 377,743Cie de Saint-Gobain 18,075 1,271,513Cie Generale des Etablissements
Michelin SCA 5,963 976,644CNP Assurances 6,491 160,556Covivio 2,169 178,044Credit Agricole SA 41,519 591,949Danone SA 21,340 1,326,481Dassault Aviation SA 980 105,994Dassault Systemes SE 22,830 1,354,853Edenred 8,717 402,536Eiffage SA 3,075 317,044Electricite de France SA 24,054 282,906Engie SA 63,119 934,500EssilorLuxottica SA 9,828 2,092,152Eurazeo SE 1,144 99,809Faurecia SE 3,556 169,180Faurecia SE (Borsa Italiana Exchange) 633 29,487Gecina SA 1,814 253,834Getlink SE 14,784 244,857Hermes International 1,094 1,911,626Ipsen SA 1,496 136,898Kering SA 2,546 2,042,786Klepierre SA (A) 8,046 190,386La Francaise des Jeux SAEM (C) 2,992 132,599Legrand SA 9,225 1,080,441L’Oreal SA 8,487 4,046,705LVMH Moet Hennessy Louis Vuitton SE 9,234 7,631,279Orange SA 68,945 736,482Orpea SA 1,800 180,519Pernod Ricard SA 7,039 1,693,425Publicis Groupe SA 7,580 510,695Remy Cointreau SA 930 226,054Renault SA (A) 7,048 244,497Safran SA 11,283 1,381,300Sanofi 38,211 3,834,240Sartorius Stedim Biotech 961 527,786Schneider Electric SE 17,545 3,449,264Schneider Electric SE (Euronext
London Exchange) 623 123,360SEB SA 1,019 158,792Societe Generale SA 27,239 936,169Sodexo SA 3,211 281,502Suez SA 11,179 252,010Teleperformance 2,029 907,117Thales SA 4,046 344,179TotalEnergies SE 85,421 4,347,942Ubisoft Entertainment SA (A) 3,042 148,389Unibail-Rodamco-Westfield (Euronext
Amsterdam Exchange) (A) 3,595 251,575Unibail-Rodamco-Westfield, CHESS
Depositary Interest (A) 27,093 94,107Valeo 7,694 232,023Veolia Environnement SA 21,555 791,583Vinci SA 17,915 1,892,087Vivendi SE 23,492 317,774Wendel SE 1,176 140,915Worldline SA (A)(C) 8,074 449,400
66,350,934
International Equity Index Trust (continued)Shares orPrincipalAmount Value
COMMON STOCKS (continued)Germany - 5.2%adidas AG 6,334 $ 1,823,843Allianz SE 13,687 3,228,195BASF SE 30,975 2,173,989Bayer AG 32,613 1,741,673Bayerische Motoren Werke AG 11,166 1,117,070Bechtle AG 2,763 196,614Beiersdorf AG 3,796 389,109Brenntag SE 5,855 528,728Carl Zeiss Meditec AG, Bearer Shares 1,435 301,029Commerzbank AG (A) 37,723 285,396Continental AG (A) 3,710 389,792Covestro AG (C) 7,081 435,821Daimler AG 28,412 2,170,793Daimler Truck Holding AG (A) 14,206 522,243Delivery Hero SE (A)(C) 5,213 577,029Deutsche Bank AG (A) 68,610 854,538Deutsche Boerse AG 6,408 1,069,971Deutsche Lufthansa AG (A) 19,844 138,947Deutsche Post AG 32,906 2,116,537Deutsche Telekom AG 112,403 2,076,924E.ON SE 78,119 1,085,653Evonik Industries AG 6,743 217,836Fresenius Medical Care AG &
Company KGaA 7,798 505,530Fresenius SE & Company KGaA 15,294 614,717GEA Group AG 5,093 278,176Hannover Rueck SE 2,322 440,243HeidelbergCement AG 5,549 375,539HelloFresh SE (A) 5,483 420,206Henkel AG & Company KGaA 3,884 302,762Infineon Technologies AG 43,352 1,995,857KION Group AG 2,693 294,145Knorr-Bremse AG 2,408 237,825LANXESS AG 3,216 198,873LEG Immobilien SE 2,555 356,225Merck KGaA 4,441 1,142,478MTU Aero Engines AG 1,791 363,651Muenchener
Rueckversicherungs-Gesellschaft AG 4,871 1,437,960Nemetschek SE 2,010 257,006Puma SE 3,505 428,045Rational AG 173 176,938RWE AG 21,604 875,319SAP SE 35,216 4,956,277Scout24 SE (C) 3,211 224,212Siemens AG 25,893 4,484,736Siemens Energy AG (A) 13,485 344,060Siemens Healthineers AG (C) 9,063 675,729Symrise AG 4,417 653,250Telefonica Deutschland Holding AG 32,281 89,541Uniper SE 3,043 144,482United Internet AG 4,503 178,527Volkswagen AG 1,264 369,510Vonovia SE 25,841 1,423,894Zalando SE (A)(C) 7,670 617,867
48,305,310Greece - 0.1%Alpha Services and Holdings SA (A) 74,045 90,743Eurobank Ergasias Services and Holdings
SA (A) 85,715 86,838FF Group (A)(E) 1,869 3,192Hellenic Telecommunications
Organization SA 8,503 157,085JUMBO SA 5,651 81,082OPAP SA 9,360 132,570
John Hancock Variable Insurance TrustPortfolio of Investments — December 31, 2021 (showing percentage of total net assets)
The accompanying notes are an integral part of the financial statements. 56

International Equity Index Trust (continued)Shares orPrincipalAmount Value
COMMON STOCKS (continued)Greece (continued)Public Power Corp. SA (A) 6,989 $ 74,992
626,502Hong Kong - 2.3%AIA Group, Ltd. 404,000 4,077,510Alibaba Health Information
Technology, Ltd. (A) 134,000 113,493Alibaba Pictures Group, Ltd. (A) 500,000 45,553Beijing Enterprises Holdings, Ltd. 19,786 68,265Beijing Enterprises Water Group, Ltd. 198,000 76,932BOC Hong Kong Holdings, Ltd. 132,328 433,971Bosideng International Holdings, Ltd. 108,000 68,040Budweiser Brewing Company
APAC, Ltd. (C) 57,500 151,165China Common Rich Renewable Energy
Investments, Ltd. (A)(E) 428,695 11,820China Education Group Holdings, Ltd. (B) 12,000 19,500China Everbright Environment Group, Ltd. 117,851 94,659China Gas Holdings, Ltd. 86,800 180,551China Jinmao Holdings Group, Ltd. 224,000 69,278China Mengniu Dairy Company, Ltd. (A) 105,004 595,254China Merchants Port Holdings
Company, Ltd. 47,564 86,808China Overseas Land & Investment, Ltd. 127,882 302,927China Overseas Property Holdings, Ltd. 45,000 47,725China Power International
Development, Ltd. 88,000 59,269China Resources Beer Holdings
Company, Ltd. 49,979 409,282China Resources Cement Holdings, Ltd. 88,000 66,557China Resources Gas Group, Ltd. 30,000 169,517China Resources Land, Ltd. 110,964 467,558China Resources Power Holdings
Company, Ltd. 68,244 228,251China State Construction International
Holdings, Ltd. 71,250 88,672China Taiping Insurance Holdings
Company, Ltd. 60,500 83,077China Traditional Chinese Medicine
Holdings Company, Ltd. 80,000 53,008China Youzan, Ltd. (A) 464,000 32,191Chow Tai Fook Jewellery Group, Ltd. (A) 66,000 118,924CK Asset Holdings, Ltd. 66,546 419,770CK Hutchison Holdings, Ltd. 90,163 580,508CK Infrastructure Holdings, Ltd. 24,772 157,828CLP Holdings, Ltd. 54,900 554,752COSCO SHIPPING Ports, Ltd. 61,511 53,461ESR Cayman, Ltd. (A)(C) 66,000 223,252Far East Horizon, Ltd. 66,000 58,605Futu Holdings, Ltd., ADR (A) 1,700 73,610Galaxy Entertainment Group, Ltd. (A) 72,000 373,507Geely Automobile Holdings, Ltd. 196,000 535,436Guangdong Investment, Ltd. 99,220 126,125Hang Lung Properties, Ltd. 74,326 153,033Hang Seng Bank, Ltd. 27,319 500,254Henderson Land Development
Company, Ltd. 55,324 235,989HK Electric Investments & HK Electric
Investments, Ltd. 88,500 86,835HKT Trust & HKT, Ltd. 145,233 195,145Hong Kong & China Gas Company, Ltd. 374,091 583,494Hong Kong Exchanges & Clearing, Ltd. 40,214 2,351,875Hongkong Land Holdings, Ltd. 44,100 229,303Hopson Development Holdings, Ltd. 24,200 50,420Huabao International Holdings, Ltd. 42,000 77,622Hutchmed China, Ltd., ADR (A) 1,900 66,652
International Equity Index Trust (continued)Shares orPrincipalAmount Value
COMMON STOCKS (continued)Hong Kong (continued)Jardine Matheson Holdings, Ltd. (B) 7,400 $ 406,908Kingboard Holdings, Ltd. 22,500 109,621Kingboard Laminates Holdings, Ltd. 36,500 62,080Kunlun Energy Company, Ltd. 118,000 110,723Lee & Man Paper Manufacturing, Ltd. 56,000 38,941Link REIT 70,839 624,040Melco Resorts & Entertainment, Ltd.,
ADR (A) 7,185 73,143MTR Corp., Ltd. 51,605 277,018New World Development Company, Ltd. 57,618 228,126Nine Dragons Paper Holdings, Ltd. 55,000 59,066Power Assets Holdings, Ltd. 46,582 290,361Shenzhen International Holdings, Ltd. 38,049 39,527Shimao Group Holdings, Ltd. (B) 41,500 27,169Sino Biopharmaceutical, Ltd. 346,500 243,171Sino Land Company, Ltd. 128,364 159,834SITC International Holdings
Company, Ltd. 45,000 162,751Sun Art Retail Group, Ltd. 86,000 34,521Sun Hung Kai Properties, Ltd. 45,630 553,686Swire Pacific, Ltd., Class A 18,163 103,311Swire Properties, Ltd. 43,628 109,370Techtronic Industries Company, Ltd. 47,500 946,908The Wharf Holdings, Ltd. 51,876 159,348Vinda International Holdings, Ltd. 12,000 29,232WH Group, Ltd. (C) 245,843 154,329Wharf Real Estate Investment
Company, Ltd. 56,876 289,001Xinyi Glass Holdings, Ltd. 62,000 155,299Yuexiu Property Company, Ltd. 48,800 43,040
21,397,757Hungary - 0.1%MOL Hungarian Oil & Gas PLC 12,392 96,177OTP Bank NYRT (A) 7,225 368,412Richter Gedeon NYRT 4,794 128,819
593,408India - 3.5%ACC, Ltd. 2,508 74,858Adani Enterprises, Ltd. 9,077 207,719Adani Green Energy, Ltd. (A) 13,172 235,056Adani Ports & Special Economic
Zone, Ltd. 16,979 166,136Adani Total Gas, Ltd. 9,077 210,959Adani Transmission, Ltd. (A) 9,077 213,533Ambuja Cements, Ltd. 22,913 116,103Apollo Hospitals Enterprise, Ltd. 3,055 206,115Asian Paints, Ltd. 12,960 589,082Aurobindo Pharma, Ltd. 9,153 89,940Avenue Supermarts, Ltd. (A)(C) 5,887 368,771Axis Bank, Ltd. (A) 80,176 729,976Bajaj Auto, Ltd. 2,923 127,456Bajaj Finance, Ltd. 9,135 852,106Bajaj Finserv, Ltd. 1,261 277,965Balkrishna Industries, Ltd. 2,904 90,376Bandhan Bank, Ltd. (C) 27,747 93,768Berger Paints India, Ltd. 8,085 83,847Bharat Electronics, Ltd. 40,525 113,904Bharat Forge, Ltd. 9,316 86,990Bharat Petroleum Corp., Ltd. 27,177 140,533Bharti Airtel, Ltd. (A) 81,745 751,037Biocon, Ltd. (A) 14,021 68,484Britannia Industries, Ltd. 3,618 175,490Cholamandalam Investment and Finance
Company, Ltd. 13,536 94,369Cipla, Ltd. 18,101 229,588
John Hancock Variable Insurance TrustPortfolio of Investments — December 31, 2021 (showing percentage of total net assets)
The accompanying notes are an integral part of the financial statements. 57

International Equity Index Trust (continued)Shares orPrincipalAmount Value
COMMON STOCKS (continued)India (continued)Coal India, Ltd. 63,427 $ 124,514Colgate-Palmolive India, Ltd. 4,075 81,093Container Corp. of India, Ltd. 9,153 75,399Dabur India, Ltd. 17,709 137,863Divi’s Laboratories, Ltd. 4,431 278,384DLF, Ltd. 20,605 107,987Dr. Reddy’s Laboratories, Ltd., ADR 3,359 219,712Eicher Motors, Ltd. 4,250 147,525GAIL India, Ltd., GDR 9,954 108,970Godrej Consumer Products, Ltd. (A) 11,997 155,853Godrej Properties, Ltd. (A) 4,161 104,557Grasim Industries, Ltd. 10,574 230,645Havells India, Ltd. 11,177 209,245HCL Technologies, Ltd. 37,954 671,581Hero MotoCorp, Ltd. 4,200 138,773Hindalco Industries, Ltd. 56,656 359,673Hindustan Petroleum Corp., Ltd. 20,412 80,011Hindustan Unilever, Ltd. 27,452 869,320Housing Development Finance Corp., Ltd. 57,256 1,981,428ICICI Bank, Ltd. 82,343 819,287ICICI Bank, Ltd., ADR 44,559 881,823ICICI Lombard General Insurance
Company, Ltd. (C) 8,559 160,848ICICI Prudential Life Insurance
Company, Ltd. (C) 11,948 89,929Indian Oil Corp., Ltd. 38,494 57,596Indian Railway Catering & Tourism
Corp, Ltd. 7,983 88,958Indraprastha Gas, Ltd. 10,515 66,274Indus Towers, Ltd. 15,904 52,944Info Edge India, Ltd. 2,389 178,357Infosys, Ltd., ADR 113,913 2,883,138InterGlobe Aviation, Ltd. (A)(C) 4,138 111,983ITC, Ltd. 113,026 330,626JSW Steel, Ltd. 33,031 289,967Jubilant Foodworks, Ltd. 2,527 121,573Kotak Mahindra Bank, Ltd. 18,671 449,852Larsen & Toubro Infotech, Ltd. (C) 1,748 171,990Larsen & Toubro, Ltd. 23,240 590,574Lupin, Ltd. 7,740 98,680Mahindra & Mahindra, Ltd., GDR 23,120 263,720Marico, Ltd. 14,917 102,874Maruti Suzuki India, Ltd. 4,592 456,773Mindtree, Ltd. 2,193 140,553Motherson Sumi Systems, Ltd. 37,306 110,648Mphasis, Ltd. 2,804 127,928MRF, Ltd. 64 62,629Muthoot Finance, Ltd. 4,018 80,569Nestle India, Ltd. 1,140 301,484NTPC, Ltd. 146,266 244,040Oil & Natural Gas Corp., Ltd. 90,136 172,181Page Industries, Ltd. 194 105,640Petronet LNG, Ltd. 21,320 61,953PI Industries, Ltd. 2,778 113,052Pidilite Industries, Ltd. 4,359 144,164Piramal Enterprises, Ltd. 3,012 106,574Power Grid Corp. of India, Ltd. 115,586 317,344Reliance Capital, Ltd., GDR (A)(C) 4,327 835Reliance Industries, Ltd. 7,646 242,923Reliance Industries, Ltd., GDR (C) 44,280 2,832,835SBI Cards & Payment Services, Ltd. (A) 7,827 97,546Shree Cement, Ltd. 276 99,889Shriram Transport Finance Company, Ltd. 5,520 89,776Siemens, Ltd. 2,378 75,309SRF, Ltd. 4,927 159,942
International Equity Index Trust (continued)Shares orPrincipalAmount Value
COMMON STOCKS (continued)India (continued)State Bank of India, GDR 5,224 $ 321,795Sun Pharmaceutical Industries, Ltd. 29,344 333,132Tata Consultancy Services, Ltd. 31,310 1,571,063Tata Consumer Products, Ltd. 22,130 220,818Tata Motors, Ltd. (A) 12,317 79,464Tata Motors, Ltd., ADR (A)(B) 8,581 275,364Tata Steel, Ltd., GDR 23,969 355,408Tech Mahindra, Ltd. 22,395 537,784The Tata Power Company, Ltd. 47,830 141,656Titan Company, Ltd. 10,263 346,519Torrent Pharmaceuticals, Ltd. 1,767 77,931Trent, Ltd. 6,052 86,323UltraTech Cement, Ltd. 2,054 209,549UltraTech Cement, Ltd., GDR 1,026 104,774United Spirits, Ltd. (A) 10,125 122,074UPL, Ltd. 15,099 151,536Vedanta, Ltd., ADR 13,934 255,490Wipro, Ltd., ADR 43,037 420,041Yes Bank, Ltd. (A) 334,558 61,303Zomato, Ltd. (A) 52,192 95,884
32,200,182Indonesia - 0.4%Adaro Energy Tbk PT 315,000 49,955Astra International Tbk PT 679,000 271,771Bank Central Asia Tbk PT 1,804,500 924,176Bank Mandiri Persero Tbk PT 715,674 353,385Bank Negara Indonesia Persero Tbk PT 276,500 130,704Bank Rakyat Indonesia Persero Tbk PT 2,374,148 683,579Barito Pacific Tbk PT 1,273,500 76,268Charoen Pokphand Indonesia Tbk PT 276,000 115,033Gudang Garam Tbk PT 26,000 55,833Indah Kiat Pulp & Paper Tbk PT 97,300 53,448Indocement Tunggal Prakarsa Tbk PT 53,500 45,417Indofood CBP Sukses Makmur Tbk PT 114,400 69,875Indofood Sukses Makmur Tbk PT 147,500 65,494Kalbe Farma Tbk PT 855,000 96,869Merdeka Copper Gold Tbk PT (A) 486,300 133,118Sarana Menara Nusantara Tbk PT 1,016,100 80,123Semen Indonesia Persero Tbk PT 111,000 56,436Telkom Indonesia Persero Tbk PT 1,600,100 456,672Telkom Indonesia Persero Tbk PT, ADR 358 10,378Tower Bersama Infrastructure Tbk PT 379,100 78,549Unilever Indonesia Tbk PT 332,500 95,887United Tractors Tbk PT 55,279 85,825
3,988,795Ireland - 0.7%CRH PLC 27,337 1,447,220DCC PLC 3,819 312,635Experian PLC 31,530 1,553,034Flutter Entertainment PLC (A) 505 79,948Flutter Entertainment PLC (London Stock
Exchange) (A) 5,220 835,090James Hardie Industries PLC, CHESS
Depositary Interest 15,679 631,112Kerry Group PLC, Class A (London
Stock Exchange) 5,738 734,958Kingspan Group PLC 5,492 672,676Smurfit Kappa Group PLC 8,017 441,559
6,708,232Israel - 0.5%Azrieli Group, Ltd. 1,424 135,865Bank Hapoalim BM 40,928 421,229Bank Leumi Le-Israel BM 54,437 583,892
John Hancock Variable Insurance TrustPortfolio of Investments — December 31, 2021 (showing percentage of total net assets)
The accompanying notes are an integral part of the financial statements. 58

International Equity Index Trust (continued)Shares orPrincipalAmount Value
COMMON STOCKS (continued)Israel (continued)Check Point Software
Technologies, Ltd. (A) 4,016 $ 468,105CyberArk Software, Ltd. (A) 1,300 225,264Elbit Systems, Ltd. 787 136,037Fiverr International, Ltd. (A) 1,000 113,700ICL Group, Ltd. 27,153 261,541Inmode, Ltd. (A) 1,700 119,986Isracard, Ltd. 1 3Israel Discount Bank, Ltd., Class A 41,515 278,743Kornit Digital, Ltd. (A) 1,500 228,375Mizrahi Tefahot Bank, Ltd. 5,543 213,464Nice, Ltd. (A) 2,200 667,163Teva Pharmaceutical Industries, Ltd. (A) 33,126 270,562Teva Pharmaceutical Industries, Ltd.,
ADR (A) 5,800 46,458Wix.com, Ltd. (A) 1,900 299,801
4,470,188Italy - 1.3%Amplifon SpA 4,199 225,940Assicurazioni Generali SpA 37,206 786,338Atlantia SpA (A) 19,839 393,641Davide Campari-Milano NV 19,587 285,818DiaSorin SpA 876 166,655Enel SpA 277,869 2,221,861Eni SpA 89,209 1,239,806Ferrari NV 4,317 1,111,221FinecoBank Banca Fineco SpA 20,557 360,005Infrastrutture Wireless Italiane SpA (C) 8,355 101,313Intesa Sanpaolo SpA 577,542 1,491,745Mediobanca Banca di Credito
Finanziario SpA 22,013 252,719Moncler SpA 6,366 460,059Nexi SpA (A)(C) 14,507 229,883Poste Italiane SpA (C) 21,903 286,935Prysmian SpA 8,366 314,697Recordati Industria Chimica e
Farmaceutica SpA 4,564 293,073Snam SpA 68,229 410,955Telecom Italia SpA 387,741 190,760Terna - Rete Elettrica Nazionale 47,449 383,845UniCredit SpA 71,677 1,101,771
12,309,040Japan - 14.4%Advantest Corp. 6,700 634,485Aeon Company, Ltd. 22,700 534,953AGC, Inc. 6,500 310,525Aisin Corp. 6,200 237,879Ajinomoto Company, Inc. 16,300 496,207ANA Holdings, Inc. (A) 4,100 85,710Asahi Group Holdings, Ltd. 15,100 587,825Asahi Intecc Company, Ltd. 7,000 150,385Asahi Kasei Corp. 43,300 407,901Astellas Pharma, Inc. 62,400 1,015,593Azbil Corp. 4,200 191,556Bandai Namco Holdings, Inc. 6,899 539,422Benefit One, Inc. 2,700 116,004Bridgestone Corp. 18,700 802,841Brother Industries, Ltd. 8,700 167,688Canon, Inc. (B) 33,800 824,506Capcom Company, Ltd. 6,000 141,308Central Japan Railway Company 4,800 638,746Chubu Electric Power Company, Inc. 22,000 232,375Chugai Pharmaceutical Company, Ltd. 22,500 733,411Concordia Financial Group, Ltd. 39,100 141,994Cosmos Pharmaceutical Corp. 800 117,610
International Equity Index Trust (continued)Shares orPrincipalAmount Value
COMMON STOCKS (continued)Japan (continued)CyberAgent, Inc. 14,400 $ 240,046Dai Nippon Printing Company, Ltd. 8,400 211,401Daifuku Company, Ltd. 3,500 286,212Dai-ichi Life Holdings, Inc. 37,400 754,357Daiichi Sankyo Company, Ltd. 57,500 1,463,457Daikin Industries, Ltd. 8,400 1,902,762Daito Trust Construction Company, Ltd. 2,300 263,858Daiwa House Industry Company, Ltd. 19,700 566,160Daiwa House REIT Investment Corp. 78 236,292Daiwa Securities Group, Inc. 54,400 306,979Denso Corp. 15,000 1,243,063Dentsu Group, Inc. 7,500 266,949Disco Corp. 1,000 305,653East Japan Railway Company 10,400 639,345Eisai Company, Ltd. 8,800 499,557ENEOS Holdings, Inc. 109,211 407,992FANUC Corp. 6,500 1,381,653Fast Retailing Company, Ltd. 2,000 1,136,889Fuji Electric Company, Ltd. 4,600 251,289FUJIFILM Holdings Corp. 12,500 926,679Fujitsu, Ltd. 6,800 1,168,421GLP J-REIT 127 219,522GMO Payment Gateway, Inc. 1,500 186,790Hakuhodo DY Holdings, Inc. 9,300 154,752Hamamatsu Photonics KK 4,800 306,575Hankyu Hanshin Holdings, Inc. 8,400 238,718Hikari Tsushin, Inc. 800 123,206Hino Motors, Ltd. 10,000 82,460Hirose Electric Company, Ltd. 1,223 205,537Hitachi Construction Machinery
Company, Ltd. 4,100 118,469Hitachi Metals, Ltd. (A) 7,400 137,115Hitachi, Ltd. 32,700 1,771,468Honda Motor Company, Ltd. 55,100 1,567,636Hoshizaki Corp. 1,900 142,952Hoya Corp. 12,700 1,884,576Hulic Company, Ltd. 10,700 101,752Ibiden Company, Ltd. 3,600 213,788Idemitsu Kosan Company, Ltd. 7,206 183,895Iida Group Holdings Company, Ltd. 5,000 116,287Inpex Corp. 36,700 319,129Isuzu Motors, Ltd. 19,000 236,483Ito En, Ltd. 1,900 99,830ITOCHU Corp. 39,200 1,199,281Itochu Techno-Solutions Corp. 3,400 109,370Japan Airlines Company, Ltd. (A) 4,000 75,933Japan Exchange Group, Inc. 18,100 396,560Japan Metropolitan Fund Investment Corp. 259 223,128Japan Post Bank Company, Ltd. 14,000 128,333Japan Post Holdings Company, Ltd. (A) 81,500 634,908Japan Post Insurance Company, Ltd. 8,300 133,330Japan Real Estate Investment Corp. 47 266,802Japan Tobacco, Inc. 40,500 817,774JFE Holdings, Inc. 18,300 233,472JSR Corp. 6,500 247,023Kajima Corp. 16,500 189,627Kakaku.com, Inc. 5,000 133,666Kansai Paint Company, Ltd. 5,900 128,301Kao Corp. 16,300 853,702KDDI Corp. 54,500 1,593,783Keio Corp. 3,700 163,252Keisei Electric Railway Company, Ltd. 4,800 129,852Keyence Corp. 6,596 4,147,289Kikkoman Corp. 5,200 437,897
John Hancock Variable Insurance TrustPortfolio of Investments — December 31, 2021 (showing percentage of total net assets)
The accompanying notes are an integral part of the financial statements. 59

International Equity Index Trust (continued)Shares orPrincipalAmount Value
COMMON STOCKS (continued)Japan (continued)Kintetsu Group Holdings
Company, Ltd. (A) 6,200 $ 173,319Kirin Holdings Company, Ltd. 27,800 447,771Kobayashi Pharmaceutical Company, Ltd. 1,800 141,584Kobe Bussan Company, Ltd. 4,200 162,613Koei Tecmo Holdings Company, Ltd. 1,950 76,566Koito Manufacturing Company, Ltd. 3,500 185,374Komatsu, Ltd. 29,300 685,210Konami Holdings Corp. 3,100 148,799Kose Corp. 1,200 136,130Kubota Corp. 35,000 778,262Kurita Water Industries, Ltd. 3,500 165,930Kyocera Corp. 10,800 675,281Kyowa Kirin Company, Ltd. 9,473 258,288Lasertec Corp. 2,600 796,384Lawson, Inc. 1,900 90,154Lion Corp. 8,000 106,944Lixil Corp. 9,000 240,093M3, Inc. 14,900 751,279Makita Corp. 7,800 331,108Marubeni Corp. 57,400 559,248Mazda Motor Corp. (A) 20,300 155,760McDonald’s Holdings Company
Japan, Ltd. (B) 2,600 115,066Medipal Holdings Corp. 6,090 114,157MEIJI Holdings Company, Ltd. 4,100 244,744Mercari, Inc. (A) 3,000 152,632MINEBEA MITSUMI, Inc. 12,500 355,170MISUMI Group, Inc. 9,800 402,603Mitsubishi Chemical Holdings Corp. 46,900 347,875Mitsubishi Corp. 44,800 1,422,539Mitsubishi Electric Corp. 63,000 799,661Mitsubishi Estate Company, Ltd. 41,300 572,934Mitsubishi Gas Chemical Company, Inc. 5,814 98,556Mitsubishi HC Capital, Inc. 17,600 87,077Mitsubishi Heavy Industries, Ltd. 11,700 270,509Mitsubishi UFJ Financial Group, Inc. 412,200 2,243,307Mitsui & Company, Ltd. 54,700 1,296,274Mitsui Chemicals, Inc. 6,800 182,786Mitsui Fudosan Company, Ltd. 31,400 622,372Miura Company, Ltd. 3,100 106,719Mizuho Financial Group, Inc. 83,210 1,056,872MonotaRO Company, Ltd. 9,000 161,874MS&AD Insurance Group Holdings, Inc. 15,500 477,281Murata Manufacturing Company, Ltd. 19,400 1,547,392NEC Corp. 8,800 406,909Nexon Company, Ltd. 16,800 324,849NGK Insulators, Ltd. 9,000 152,325Nidec Corp. 15,100 1,786,246Nihon M&A Center Holdings, Inc. 10,400 255,103Nintendo Company, Ltd. 3,800 1,777,858Nippon Building Fund, Inc. 48 279,583Nippon Express Company, Ltd. 2,500 149,612Nippon Paint Holdings Company, Ltd. 24,500 267,559Nippon Prologis REIT, Inc. 66 233,293Nippon Sanso Holdings Corp. 4,600 100,614Nippon Shinyaku Company, Ltd. 1,700 118,380Nippon Steel Corp. 27,900 455,776Nippon Telegraph & Telephone Corp. 43,200 1,181,445Nippon Yusen KK 5,500 419,391Nissan Chemical Corp. 4,600 267,536Nissan Motor Company, Ltd. (A) 77,800 374,727Nisshin Seifun Group, Inc. 7,400 106,755Nissin Foods Holdings Company, Ltd. 2,200 160,563Nitori Holdings Company, Ltd. 2,800 418,800
International Equity Index Trust (continued)Shares orPrincipalAmount Value
COMMON STOCKS (continued)Japan (continued)Nitto Denko Corp. 5,400 $ 417,163Nomura Holdings, Inc. 109,800 478,250Nomura Real Estate Holdings, Inc. 4,500 103,689Nomura Real Estate Master Fund, Inc. 151 212,508Nomura Research Institute, Ltd. 11,146 476,500NTT Data Corp. 22,500 482,652Obayashi Corp. 22,500 174,135Obic Company, Ltd. 2,200 411,728Odakyu Electric Railway Company, Ltd. 10,900 202,647Oji Holdings Corp. 30,000 145,352Olympus Corp. 39,100 900,365Omron Corp. 6,200 617,814Ono Pharmaceutical Company, Ltd. 12,500 310,692Open House Company, Ltd. 2,700 141,093Oracle Corp. Japan 1,500 113,960Oriental Land Company, Ltd. 6,900 1,163,527ORIX Corp. 40,600 828,572Orix JREIT, Inc. 97 151,635Osaka Gas Company, Ltd. 13,800 228,242Otsuka Corp. 3,800 181,194Otsuka Holdings Company, Ltd. 13,600 494,781Pan Pacific International Holdings Corp. 15,000 206,758Panasonic Corp. 74,000 813,467Persol Holdings Company, Ltd. 6,200 180,254Pola Orbis Holdings, Inc. 3,200 53,331Rakuten Group, Inc. 29,700 297,988Recruit Holdings Company, Ltd. 46,000 2,799,363Renesas Electronics Corp. (A) 41,700 517,943Resona Holdings, Inc. 78,000 303,122Ricoh Company, Ltd. 24,000 223,707Rinnai Corp. 1,200 108,295Rohm Company, Ltd. 3,000 272,908Ryohin Keikaku Company, Ltd. 9,000 137,232Santen Pharmaceutical Company, Ltd. 12,500 152,609SBI Holdings, Inc. 8,213 224,014SCSK Corp. 5,400 107,472Secom Company, Ltd. 7,300 507,250Seiko Epson Corp. 9,600 172,900Sekisui Chemical Company, Ltd. 13,400 224,104Sekisui House, Ltd. 21,400 460,437Seven & i Holdings Company, Ltd. 26,000 1,143,689SG Holdings Company, Ltd. 10,200 239,174Sharp Corp. 7,400 84,986Shimadzu Corp. 8,000 337,904Shimano, Inc. 2,600 692,430Shimizu Corp. 21,600 133,927Shin-Etsu Chemical Company, Ltd. 11,900 2,065,547Shionogi & Company, Ltd. 9,200 647,187Shiseido Company, Ltd. 13,500 753,118SMC Corp. 1,900 1,284,130SoftBank Corp. 97,600 1,232,744SoftBank Group Corp. 41,400 1,984,723Sohgo Security Services Company, Ltd. 2,900 115,234Sompo Holdings, Inc. 11,600 489,215Sony Group Corp. 42,500 5,366,826Square Enix Holdings Company, Ltd. 3,400 174,418Stanley Electric Company, Ltd. 5,300 133,068Subaru Corp. 21,200 378,798SUMCO Corp. 8,200 166,975Sumitomo Chemical Company, Ltd. 56,000 264,085Sumitomo Corp. 41,300 611,215Sumitomo Dainippon Pharma
Company, Ltd. 5,300 61,148Sumitomo Electric Industries, Ltd. 26,200 341,936Sumitomo Metal Mining Company, Ltd. 7,800 295,421
John Hancock Variable Insurance TrustPortfolio of Investments — December 31, 2021 (showing percentage of total net assets)
The accompanying notes are an integral part of the financial statements. 60

International Equity Index Trust (continued)Shares orPrincipalAmount Value
COMMON STOCKS (continued)Japan (continued)Sumitomo Mitsui Financial Group, Inc. 44,100 $ 1,505,896Sumitomo Mitsui Trust Holdings, Inc. 11,000 367,822Sumitomo Realty & Development
Company, Ltd. 10,700 315,445Suntory Beverage & Food, Ltd. 5,000 181,065Suzuki Motor Corp. 12,800 493,604Sysmex Corp. 5,800 782,893T&D Holdings, Inc. 19,900 254,238Taisei Corp. 6,600 200,707Taisho Pharmaceutical Holdings
Company, Ltd. 1,200 55,392Takeda Pharmaceutical Company, Ltd. 52,876 1,443,954TDK Corp. 13,500 526,849Terumo Corp. 22,300 941,965The Chiba Bank, Ltd. 21,600 123,563The Kansai Electric Power Company, Inc. 24,300 227,132The Shizuoka Bank, Ltd. 17,000 121,363TIS, Inc. 7,800 231,941Tobu Railway Company, Ltd. 6,800 155,176Toho Company, Ltd. 4,067 174,036Tokio Marine Holdings, Inc. 21,200 1,180,196Tokyo Century Corp. 1,500 72,815Tokyo Electric Power Company
Holdings, Inc. (A) 50,400 130,295Tokyo Electron, Ltd. 5,000 2,877,864Tokyo Gas Company, Ltd. 13,900 249,510Tokyu Corp. 17,900 237,957Toppan, Inc. 10,300 193,287Toray Industries, Inc. 50,800 300,972Toshiba Corp. 13,400 551,389Tosoh Corp. 9,300 138,166TOTO, Ltd. 4,800 221,460Toyo Suisan Kaisha, Ltd. 3,100 131,435Toyota Industries Corp. 5,200 415,964Toyota Motor Corp. 357,400 6,605,679Toyota Tsusho Corp. 7,900 364,164Trend Micro, Inc. 4,600 255,374Tsuruha Holdings, Inc. 1,300 124,824Unicharm Corp. 14,000 609,101USS Company, Ltd. 7,770 121,396Welcia Holdings Company, Ltd. 3,400 106,192West Japan Railway Company 6,000 250,937Yakult Honsha Company, Ltd. 4,243 221,354Yamaha Corp. 4,700 231,877Yamaha Motor Company, Ltd. 10,100 242,593Yamato Holdings Company, Ltd. 11,000 258,407Yaskawa Electric Corp. 8,300 407,245Yokogawa Electric Corp. 7,886 142,338Z Holdings Corp. 88,900 512,952ZOZO, Inc. 4,800 149,665
133,609,982Jordan - 0.0%Hikma Pharmaceuticals PLC 5,739 172,348Luxembourg - 0.2%ArcelorMittal SA 24,275 778,709Aroundtown SA 37,519 226,328Eurofins Scientific SE 4,300 532,733Reinet Investments SCA 5,229 94,075Tenaris SA 16,418 171,355
1,803,200Macau - 0.0%Sands China, Ltd. (A) 81,200 188,449Malaysia - 0.4%AMMB Holdings BHD (A) 59,087 44,937
International Equity Index Trust (continued)Shares orPrincipalAmount Value
COMMON STOCKS (continued)Malaysia (continued)Axiata Group BHD 101,690 $ 101,522CIMB Group Holdings BHD 195,331 255,507Dialog Group BHD 166,000 104,362DiGi.Com BHD 110,800 115,985Genting BHD 72,900 81,658Genting Malaysia BHD 105,700 73,017HAP Seng Consolidated BHD 30,200 55,882Hartalega Holdings BHD 60,200 82,826Hong Leong Bank BHD 23,269 103,950Hong Leong Financial Group BHD 6,104 25,389IHH Healthcare BHD 108,100 190,617Inari Amertron BHD 98,100 93,973IOI Corp. BHD 114,466 102,414Kuala Lumpur Kepong BHD 17,415 91,080Malayan Banking BHD 127,999 254,958Malaysia Airports Holdings BHD (A) 34,427 49,412Maxis BHD 67,200 78,218MISC BHD 26,280 44,430Nestle Malaysia BHD 2,800 90,178Petronas Chemicals Group BHD 99,800 213,685Petronas Dagangan BHD 12,200 60,285Petronas Gas BHD 21,200 91,560PPB Group BHD 21,240 87,238Press Metal Aluminium Holdings BHD 120,800 167,548Public Bank BHD 486,890 485,948QL Resources BHD 54,400 59,695RHB Bank BHD 30,283 39,005Sime Darby BHD 108,224 60,313Sime Darby Plantation BHD 108,786 98,136Telekom Malaysia BHD 42,705 56,336Tenaga Nasional BHD 101,250 226,961Top Glove Corp. BHD 164,400 102,201
3,789,226Mexico - 0.6%Alfa SAB de CV, Class A 98,000 71,937America Movil SAB de CV, Series L 1,136,332 1,203,178Arca Continental SAB de CV 16,000 101,600Cemex SAB de CV, Series CPO (A) 521,849 356,556Coca-Cola Femsa SAB de CV 15,212 83,588Fibra Uno Administracion SA de CV 90,200 95,418Fomento Economico Mexicano SAB
de CV 65,020 506,461Gruma SAB de CV, Class B 7,685 98,219Grupo Aeroportuario del Pacifico SAB de
CV, B Shares (A) 9,700 133,963Grupo Aeroportuario del Sureste SAB de
CV, B Shares 5,780 119,162Grupo Bimbo SAB de CV, Series A 53,084 163,565Grupo Carso SAB de CV, Series A1 9,477 30,275Grupo Financiero Banorte SAB de CV,
Series O 86,662 563,638Grupo Financiero Inbursa SAB de CV,
Series O (A) 77,038 92,443Grupo Mexico SAB de CV, Series B 104,066 453,661Grupo Televisa SAB, Series CPO 80,326 150,684Industrias Penoles SAB de CV 4,883 56,288Kimberly-Clark de Mexico SAB de CV,
Class A 43,778 66,515Orbia Advance Corp. SAB de CV 37,631 96,046Promotora y Operadora de Infraestructura
SAB de CV 5,800 45,254Wal-Mart de Mexico SAB de CV 174,988 651,392
5,139,843Netherlands - 4.0%ABN AMRO Bank NV (C) 16,073 236,268
John Hancock Variable Insurance TrustPortfolio of Investments — December 31, 2021 (showing percentage of total net assets)
The accompanying notes are an integral part of the financial statements. 61

International Equity Index Trust (continued)Shares orPrincipalAmount Value
COMMON STOCKS (continued)Netherlands (continued)Adyen NV (A)(C) 655 $ 1,719,374Aegon NV 77,899 387,279Akzo Nobel NV 6,657 731,370Argenx SE (A) 1,553 552,259ASM International NV 1,660 732,752ASML Holding NV 13,749 11,013,219Euronext NV (C) 2,850 296,297EXOR NV 3,992 357,354Heineken Holding NV 4,217 388,828Heineken NV 9,090 1,022,985IMCD NV 1,896 419,022ING Groep NV 132,675 1,844,579JDE Peet’s NV 3,077 95,239Just Eat Takeaway.com NV (A)(C) 5,955 323,540Koninklijke Ahold Delhaize NV 34,784 1,193,659Koninklijke DSM NV 6,229 1,402,809Koninklijke KPN NV 126,323 391,680Koninklijke Philips NV 31,501 1,165,902NN Group NV (B) 8,988 486,073Prosus NV (A) 31,112 2,576,850QIAGEN NV (A) 8,350 463,012Randstad NV 4,395 299,814Royal Dutch Shell PLC, A Shares 138,310 3,030,974Royal Dutch Shell PLC, B Shares 124,526 2,734,158Stellantis NV 37,161 701,546Stellantis NV (Euronext Paris Exchange) 34,423 653,080Universal Music Group NV 23,492 663,908Wolters Kluwer NV 9,296 1,094,147
36,977,977New Zealand - 0.2%Auckland International Airport, Ltd. (A) 36,599 192,651Fisher & Paykel Healthcare Corp., Ltd. 19,921 446,301Mercury NZ, Ltd. 22,971 96,235Meridian Energy, Ltd. 44,474 147,621Ryman Healthcare, Ltd. 12,940 108,506Spark New Zealand, Ltd. 67,539 208,863Xero, Ltd. (A) 4,384 448,742
1,648,919Norway - 0.4%Adevinta ASA (A) 8,335 110,723Aker BP ASA 4,193 128,929DNB Bank ASA 30,942 707,759Equinor ASA 35,722 945,894Gjensidige Forsikring ASA 6,934 168,225Mowi ASA 14,928 353,297Norsk Hydro ASA 48,185 379,148Orkla ASA 29,206 292,748Schibsted ASA, B Shares 3,512 118,133Schibsted ASA, Class A 2,550 98,314Telenor ASA 26,898 422,811Yara International ASA 6,981 351,969
4,077,950Peru - 0.1%Cia de Minas Buenaventura SAA,
ADR (A) 8,064 59,028Credicorp, Ltd. 2,434 297,118Southern Copper Corp. 2,874 177,355
533,501Philippines - 0.2%Aboitiz Equity Ventures, Inc. 85,070 90,775Ayala Corp. 8,920 145,404Ayala Land, Inc. 253,800 182,634Bank of the Philippine Islands 34,118 61,647BDO Unibank, Inc. 77,140 182,558
International Equity Index Trust (continued)Shares orPrincipalAmount Value
COMMON STOCKS (continued)Philippines (continued)Globe Telecom, Inc. 970 $ 63,234GT Capital Holdings, Inc. 3,464 36,675International Container Terminal
Services, Inc. 33,760 132,335JG Summit Holdings, Inc. 89,355 92,751Jollibee Foods Corp. 18,900 80,204Manila Electric Company 8,090 46,814Metro Pacific Investments Corp. 509,100 38,934Metropolitan Bank & Trust Company 65,642 71,687PLDT, Inc. 3,730 132,530SM Investments Corp. 8,302 153,541SM Prime Holdings, Inc. 311,044 206,762Universal Robina Corp. 30,280 76,032
1,794,517Poland - 0.2%Allegro.eu SA (A)(C) 13,472 129,690Bank Polska Kasa Opieki SA 5,522 166,674CD Projekt SA 2,349 111,724Cyfrowy Polsat SA 6,360 54,527Dino Polska SA (A)(C) 1,719 156,292InPost SA (A) 6,603 79,293KGHM Polska Miedz SA 5,681 197,194LPP SA 42 178,539Orange Polska SA (A) 26,179 54,862PGE Polska Grupa Energetyczna SA (A) 26,654 53,186Polski Koncern Naftowy ORLEN SA 11,432 210,714Polskie Gornictwo Naftowe i
Gazownictwo SA 62,946 98,441Powszechna Kasa Oszczednosci Bank
Polski SA (A) 32,873 364,618Powszechny Zaklad Ubezpieczen SA 23,000 200,846Santander Bank Polska SA 1,219 104,680
2,161,280Portugal - 0.1%EDP - Energias de Portugal SA 91,820 504,395Galp Energia SGPS SA 18,673 181,187Jeronimo Martins SGPS SA 7,332 167,651
853,233Romania - 0.0%NEPI Rockcastle PLC 15,018 99,687Russia - 0.9%Gazprom PJSC, ADR 251,662 2,312,774Gazprom PJSC, ADR (London
Stock Exchange) 3,680 33,982LUKOIL PJSC, ADR 23,756 2,133,289MMC Norilsk Nickel PJSC, ADR 39,185 1,201,804Mobile TeleSystems PJSC, ADR 20,264 161,099Novatek PJSC, GDR 3,057 714,742Rosneft Oil Company PJSC, GDR 30,000 241,279Rosneft Oil Company PJSC, GDR
(London Stock Exchange) 9,131 73,437Sberbank of Russia PJSC, ADR 40,000 630,000Sberbank of Russia PJSC, ADR (London
Stock Exchange) 34,900 548,498Severstal PAO, GDR 4,250 91,672Surgutneftegas PJSC, ADR 22,274 117,161Surgutneftegas PJSC, ADR (London
Stock Exchange) 23,070 123,386Tatneft PJSC, ADR 7,986 311,454VTB Bank PJSC, GDR 50,760 64,034
8,758,611Saudi Arabia - 0.9%Advanced Petrochemical Company 3,771 70,623
John Hancock Variable Insurance TrustPortfolio of Investments — December 31, 2021 (showing percentage of total net assets)
The accompanying notes are an integral part of the financial statements. 62

International Equity Index Trust (continued)Shares orPrincipalAmount Value
COMMON STOCKS (continued)Saudi Arabia (continued)Al Rajhi Bank 43,550 $ 1,642,370Alinma Bank 34,699 221,046Almarai Company JSC 8,852 115,073Arab National Bank 21,244 129,380Bank AlBilad (A) 13,065 161,025Bank Al-Jazira 14,284 73,278Banque Saudi Fransi 19,205 241,284Bupa Arabia for Cooperative
Insurance Company 981 34,309Dar Al Arkan Real Estate Development
Company (A) 18,814 50,365Emaar Economic City (A) 13,598 43,250Etihad Etisalat Company 13,413 111,254Jarir Marketing Company 2,090 109,369National Industrialization Company (A) 11,652 61,694Rabigh Refining & Petrochemical
Company (A) 7,786 42,775Riyad Bank 42,488 306,514SABIC Agri-Nutrients Company 5,901 277,018Sahara International
Petrochemical Company 12,775 142,374Saudi Arabian Mining Company (A) 15,250 318,264Saudi Arabian Oil Company (C) 76,487 729,014Saudi Basic Industries Corp. 26,663 822,271Saudi Cement Company 2,665 38,859Saudi Electricity Company 29,505 188,185Saudi Industrial Investment Group 7,839 64,926Saudi Kayan Petrochemical Company (A) 26,130 118,047Saudi Telecom Company 20,888 624,787The Company for Cooperative Insurance 2,178 44,826The Saudi British Bank 25,464 223,330The Saudi National Bank 68,407 1,172,686The Savola Group 9,302 79,181Yanbu National Petrochemical Company 7,999 146,046
8,403,423Singapore - 0.8%Ascendas Real Estate Investment Trust 117,802 258,102BOC Aviation, Ltd. (C) 7,400 54,217CapitaLand Integrated Commercial Trust 164,531 248,931CapitaLand Investment, Ltd. (A) 93,902 237,424City Developments, Ltd. 16,600 83,986DBS Group Holdings, Ltd. 61,754 1,495,618Genting Singapore, Ltd. 226,200 130,112JOYY, Inc., ADR 2,000 90,860Keppel Corp., Ltd. 55,069 209,428Mapletree Commercial Trust 74,500 111,431Mapletree Logistics Trust 97,850 138,001Oversea-Chinese Banking Corp., Ltd. 113,002 956,420Sea, Ltd., ADR (A) 4,600 1,029,066Singapore Airlines, Ltd. (A) 57,850 214,493Singapore Exchange, Ltd. 28,000 193,283Singapore Technologies Engineering, Ltd. 54,000 150,699Singapore Telecommunications, Ltd. 294,940 507,734United Overseas Bank, Ltd. 40,908 817,003UOL Group, Ltd. 20,239 106,534Venture Corp., Ltd. 9,700 131,812Wilmar International, Ltd. 72,000 221,585
7,386,739South Africa - 0.9%Absa Group, Ltd. 25,092 240,144African Rainbow Minerals, Ltd. 5,157 74,765Anglo American Platinum, Ltd. 1,548 176,560AngloGold Ashanti, Ltd. 14,430 303,832Aspen Pharmacare Holdings, Ltd. 13,036 183,420Bid Corp., Ltd. 11,078 226,977
International Equity Index Trust (continued)Shares orPrincipalAmount Value
COMMON STOCKS (continued)South Africa (continued)Capitec Bank Holdings, Ltd. 2,672 $ 341,912Clicks Group, Ltd. 8,355 165,530Discovery, Ltd. (A) 13,271 119,651Exxaro Resources, Ltd. 8,997 86,302FirstRand, Ltd. 160,204 611,200Gold Fields, Ltd. 29,492 326,306Growthpoint Properties, Ltd. 109,582 105,786Harmony Gold Mining Company, Ltd. 18,873 79,154Impala Platinum Holdings, Ltd. 26,847 378,724Kumba Iron Ore, Ltd. 2,164 62,408Mr. Price Group, Ltd. 8,969 112,487MTN Group, Ltd. (A) 59,164 634,176MultiChoice Group 15,717 120,480Naspers, Ltd., N Shares 7,259 1,126,678Nedbank Group, Ltd. 15,440 169,601Northam Platinum Holdings, Ltd. (A) 11,870 156,413Old Mutual, Ltd. (B) 182,601 150,824Rand Merchant Investment Holdings, Ltd. 25,734 73,066Remgro, Ltd. 17,781 146,520Sanlam, Ltd. 59,860 223,080Sasol, Ltd. (A) 19,396 317,562Shoprite Holdings, Ltd. 16,492 216,121Sibanye Stillwater, Ltd. 101,051 314,200Standard Bank Group, Ltd. 43,543 382,542The Bidvest Group, Ltd. 9,718 115,406The SPAR Group, Ltd. 5,706 59,884Tiger Brands, Ltd. 5,421 61,563Vodacom Group, Ltd. 19,298 162,893Woolworths Holdings, Ltd. 33,746 109,737
8,135,904South Korea - 3.3%Alteogen, Inc. (A) 591 37,584Amorepacific Corp. (A) 975 136,827AMOREPACIFIC Group (A) 770 28,691BGF retail Company, Ltd. (A) 90 10,997Celltrion Healthcare Company, Ltd. 3,174 213,850Celltrion Pharm, Inc. (A) 570 59,539Celltrion, Inc. 3,173 528,241Cheil Worldwide, Inc. (A) 1,346 25,828CJ CheilJedang Corp. (A) 210 68,412CJ Corp. (A) 456 31,954CJ ENM Company, Ltd. (A) 178 20,751CJ Logistics Corp. (A) 312 33,042Coway Company, Ltd. (A) 1,211 75,871DB Insurance Company, Ltd. (A) 1,122 50,942Doosan Bobcat, Inc. (A) 1,103 37,748Doosan Heavy Industries & Construction
Company, Ltd. (A) 10,256 175,598Douzone Bizon Company, Ltd. (A) 955 58,572Ecopro BM Company, Ltd. 437 183,604E-MART, Inc. 496 62,879F&F Company, Ltd. (A) 115 91,302Green Cross Corp. (A) 274 50,147GS Engineering & Construction Corp. (A) 1,468 48,817GS Holdings Corp. (A) 1,749 57,446Hana Financial Group, Inc. 9,428 333,083Hankook Tire & Technology
Company, Ltd. (A) 1,937 64,710Hanmi Pharm Company, Ltd. (A) 148 34,310Hanon Systems 4,656 52,651Hanwha Solutions Corp. (A) 3,439 102,568HLB, Inc. (A) 2,702 79,056HMM Company, Ltd. (A) 8,540 193,180Hotel Shilla Company, Ltd. (A) 1,060 69,472HYBE Company, Ltd. (A) 560 164,025
John Hancock Variable Insurance TrustPortfolio of Investments — December 31, 2021 (showing percentage of total net assets)
The accompanying notes are an integral part of the financial statements. 63

International Equity Index Trust (continued)Shares orPrincipalAmount Value
COMMON STOCKS (continued)South Korea (continued)Hyundai Engineering & Construction
Company, Ltd. (A) 2,649 $ 98,842Hyundai Glovis Company, Ltd. (A) 539 76,008Hyundai Heavy Industries Holdings
Company, Ltd. 1,555 70,177Hyundai Mobis Company, Ltd. 2,223 475,182Hyundai Motor Company 4,857 852,547Hyundai Steel Company (A) 2,875 99,010Iljin Materials Company, Ltd. (A) 767 86,844Industrial Bank of Korea 5,941 51,394Kakao Corp. 10,321 974,636Kakao Games Corp. (A) 994 75,962KakaoBank Corp. (A) 2,156 106,584Kangwon Land, Inc. (A) 3,612 72,961KB Financial Group, Inc. 12,769 590,494KB Financial Group, Inc., ADR 430 19,849Kia Corp. (A) 8,435 582,126Korea Aerospace Industries, Ltd. (A) 1,710 46,592Korea Electric Power Corp. 6,370 118,276Korea Electric Power Corp., ADR 4,277 39,092Korea Investment Holdings
Company, Ltd. (A) 1,170 79,268Korea Shipbuilding & Offshore
Engineering Company, Ltd. (A) 1,127 89,584Korea Zinc Company, Ltd. (A) 225 96,811Korean Air Lines Company, Ltd. (A) 6,728 165,679Krafton, Inc. (A) 733 283,300KT&G Corp. 3,571 237,250Kumho Petrochemical Company, Ltd. (A) 614 85,594L&F Company, Ltd. 748 139,188LG Chem, Ltd. (A) 1,500 775,443LG Corp. (A) 2,922 198,893LG Display Company, Ltd. (A) 5,471 112,800LG Display Company, Ltd., ADR (A) 2,417 24,412LG Electronics, Inc. 3,460 400,601LG Household & Health Care, Ltd. (A) 295 272,275LG Innotek Company, Ltd. (A) 344 105,167LG Uplus Corp. 9,062 103,401Lotte Chemical Corp. (A) 562 102,520Lotte Shopping Company, Ltd. (A) 366 26,818Meritz Securities Company, Ltd. (A) 3,655 15,825Mirae Asset Securities Company, Ltd. (A) 7,084 51,463NAVER Corp. (A) 4,029 1,278,891NCSoft Corp. (A) 550 297,071Netmarble Corp. (A)(C) 515 54,091NH Investment & Securities
Company, Ltd. (A) 3,944 41,424Orion Corp. (A) 569 49,532Pan Ocean Company, Ltd. (A) 9,148 41,606Pearl Abyss Corp. (A) 1,020 118,538POSCO 2,396 555,601POSCO Chemical Company, Ltd. (A) 883 106,701S-1 Corp. (A) 252 15,680Samsung Biologics Company, Ltd. (A)(C) 550 417,619Samsung C&T Corp. (A) 2,732 272,982Samsung Electro-Mechanics
Company, Ltd. (A) 1,863 308,981Samsung Electronics Company, Ltd. 158,861 10,433,192Samsung Engineering Company, Ltd. (A) 3,731 71,736Samsung Fire & Marine Insurance
Company, Ltd. (A) 895 152,039Samsung Heavy Industries
Company, Ltd. (A) 20,659 98,490Samsung Life Insurance
Company, Ltd. (A) 2,349 126,487
International Equity Index Trust (continued)Shares orPrincipalAmount Value
COMMON STOCKS (continued)South Korea (continued)Samsung SDI Company, Ltd. 1,792 $ 985,550Samsung SDS Company, Ltd. (A) 1,018 133,721Samsung Securities Company, Ltd. (A) 1,475 55,614Seegene, Inc. 947 48,445Shin Poong Pharmaceutical
Company, Ltd. (A) 983 26,339Shinhan Financial Group Company, Ltd. 14,320 442,474Shinhan Financial Group
Company, Ltd., ADR 350 10,819SK Biopharmaceuticals Company, Ltd. (A) 528 43,130SK Bioscience Company, Ltd. (A) 763 144,373SK Chemicals Company, Ltd. (A) 385 48,200SK Hynix, Inc. 17,972 1,973,912SK IE Technology Company, Ltd. (A)(C) 601 84,862SK Innovation Company, Ltd. (A) 1,818 364,021SK Square Company, Ltd. (A) 2,419 135,118SK Telecom Company, Ltd. 3,741 181,799SK, Inc. 1,160 244,550SKC Company, Ltd. (A) 859 125,549S-Oil Corp. 1,203 86,462Woori Financial Group, Inc. 16,990 181,187Yuhan Corp. (A) 1,296 67,691
30,809,042Spain - 1.5%ACS Actividades de Construccion y
Servicios SA 11,166 297,697Aena SME SA (A)(C) 2,276 358,433Amadeus IT Group SA (A) 15,014 1,015,910Banco Bilbao Vizcaya Argentaria SA 228,360 1,354,397Banco Santander SA 580,136 1,926,674Banco Santander SA (Mexican
Stock Exchange) 22,856 71,575CaixaBank SA 144,982 396,038Cellnex Telecom SA (A)(C) 17,500 1,013,732EDP Renovaveis SA 9,513 236,564Enagas SA 7,812 181,483Endesa SA 12,378 284,959Ferrovial SA 16,976 530,901Grifols SA 10,824 208,282Iberdrola SA 195,460 2,314,240Industria de Diseno Textil SA 37,975 1,224,694Naturgy Energy Group SA 6,451 209,820Red Electrica Corp. SA 15,612 337,600Repsol SA 53,970 639,173Siemens Gamesa Renewable Energy
SA (A) 9,848 233,869Telefonica SA 196,462 851,899
13,687,940Sweden - 2.4%Alfa Laval AB 11,168 448,613Assa Abloy AB, B Shares 34,362 1,047,387Atlas Copco AB, A Shares 22,872 1,580,474Atlas Copco AB, B Shares 13,493 792,582Boliden AB 9,749 375,919Electrolux AB, Series B 7,536 182,520Embracer Group AB (A) 16,932 179,632Epiroc AB, A Shares 23,037 582,509Epiroc AB, B Shares 13,732 290,394EQT AB 9,842 533,535Essity AB, B Shares 21,531 702,445Evolution AB (C) 5,501 777,517Fastighets AB Balder, B Shares (A) 3,415 245,757Getinge AB, B Shares 7,609 331,617Hennes & Mauritz AB, B Shares 28,520 559,623Hexagon AB, B Shares 67,634 1,071,360
John Hancock Variable Insurance TrustPortfolio of Investments — December 31, 2021 (showing percentage of total net assets)
The accompanying notes are an integral part of the financial statements. 64

International Equity Index Trust (continued)Shares orPrincipalAmount Value
COMMON STOCKS (continued)Sweden (continued)Husqvarna AB, B Shares 13,967 $ 223,317Industrivarden AB, A Shares 4,452 141,459Industrivarden AB, C Shares 6,375 199,733Investment AB Latour, B Shares 5,154 209,399Investor AB, A Shares 16,589 436,418Investor AB, B Shares 62,172 1,560,101Kinnevik AB, B Shares (A) 8,775 311,983L.E. Lundbergforetagen AB, B Shares 2,546 142,641Lifco AB, B Shares 7,754 231,601Lundin Energy AB 6,210 222,211Nibe Industrier AB, B Shares 49,615 749,680Sagax AB, B Shares 5,357 180,196Sandvik AB 38,708 1,078,929Securitas AB, B Shares 10,739 147,731Sinch AB (A)(C) 15,030 189,654Skandinaviska Enskilda Banken AB,
A Shares 57,777 802,150Skanska AB, B Shares 11,367 293,736SKF AB, B Shares 14,059 332,492Svenska Cellulosa AB SCA, B Shares 21,092 374,263Svenska Handelsbanken AB, A Shares 55,216 596,772Swedbank AB, A Shares 31,626 635,551Swedish Match AB 57,080 453,140Tele2 AB, B Shares 17,728 252,902Telefonaktiebolaget LM Ericsson, B Shares 99,473 1,094,505Telia Company AB 82,751 323,636Volvo AB, A Shares 6,647 155,922Volvo AB, B Shares 48,024 1,110,627
22,152,633Switzerland - 6.9%ABB, Ltd. 57,261 2,182,377Adecco Group AG 6,058 308,700Alcon, Inc. 17,103 1,508,577Bachem Holding AG, Class B 206 161,308Baloise Holding AG 1,882 307,167Barry Callebaut AG 130 315,595Chocoladefabriken Lindt & Spruengli AG 4 536,219Chocoladefabriken Lindt & Spruengli AG,
Participation Certificates 42 581,635Cie Financiere Richemont SA, A Shares 17,877 2,671,447Clariant AG (A) 8,258 171,542Coca-Cola HBC AG (A) 8,067 279,322Credit Suisse Group AG 84,422 818,524EMS-Chemie Holding AG 321 358,743Geberit AG 1,249 1,018,102Givaudan SA 311 1,631,695Glencore PLC (A) 331,742 1,690,314Holcim, Ltd. (A) 10,906 554,669Holcim, Ltd. (Euronext Paris
Exchange) (A) 6,750 342,710Julius Baer Group, Ltd. 8,601 575,169Kuehne + Nagel International AG 2,065 665,048Logitech International SA 5,725 480,257Lonza Group AG 2,550 2,123,100Nestle SA 93,637 13,073,347Novartis AG 72,880 6,404,113Partners Group Holding AG 749 1,236,456Roche Holding AG 23,370 9,695,308Roche Holding AG, Bearer Shares 1,064 476,227Schindler Holding AG 806 215,394Schindler Holding AG,
Participation Certificates 1,582 424,656SGS SA 203 676,741Sika AG 4,781 1,987,067Sonova Holding AG 1,846 721,411
International Equity Index Trust (continued)Shares orPrincipalAmount Value
COMMON STOCKS (continued)Switzerland (continued)STMicroelectronics NV 22,367 $ 1,099,894Straumann Holding AG 344 727,420Swiss Life Holding AG 1,026 626,862Swiss Prime Site AG 3,037 298,136Swiss Re AG 9,637 951,302Swisscom AG 989 557,919Temenos AG 2,330 321,170The Swatch Group AG 2,395 140,028The Swatch Group AG, Bearer Shares 1,191 362,702UBS Group AG 116,998 2,100,032VAT Group AG (C) 898 444,980Vifor Pharma AG 1,821 323,497Zurich Insurance Group AG 5,231 2,291,591
64,438,473Taiwan - 4.4%Accton Technology Corp. 17,000 159,293Acer, Inc. 58,018 63,706Advantech Company, Ltd. 13,296 190,070ASE Technology Holding Company, Ltd. 111,338 430,234Asia Cement Corp. 72,863 116,496ASMedia Technology, Inc. 1,000 65,576Asustek Computer, Inc. 23,952 325,160AU Optronics Corp. 273,827 226,362Catcher Technology Company, Ltd. 22,184 125,410Cathay Financial Holding Company, Ltd. 263,839 594,390Chailease Holding Company, Ltd. 39,005 371,009Chang Hwa Commercial Bank, Ltd. 114,855 70,535Cheng Shin Rubber Industry
Company, Ltd. 43,680 56,924China Development Financial
Holding Corp. 504,133 318,406China Steel Corp. 363,388 463,707Chunghwa Telecom Company, Ltd. 127,148 535,242Compal Electronics, Inc. 139,764 122,182CTBC Financial Holding Company, Ltd. 586,465 549,401Delta Electronics, Inc. 64,866 643,612E.Sun Financial Holding Company, Ltd. 341,799 346,433Eclat Textile Company, Ltd. 6,259 142,619eMemory Technology, Inc. 2,000 157,849Evergreen Marine Corp. Taiwan, Ltd. 84,566 433,225Far Eastern New Century Corp. 64,875 68,607Far EasTone Telecommunications
Company, Ltd. 45,159 105,352Feng TAY Enterprise Company, Ltd. 14,520 121,369First Financial Holding Company, Ltd. 346,987 306,927Formosa Chemicals & Fibre Corp. 117,212 341,860Formosa Petrochemical Corp. 39,720 137,343Formosa Plastics Corp. 128,086 480,742Foxconn Technology Company, Ltd. 15,513 36,328Fubon Financial Holding Company, Ltd. 240,270 661,349Giant Manufacturing Company, Ltd. 10,000 124,460Globalwafers Company, Ltd. 7,000 224,253Hiwin Technologies Corp. 8,552 94,646Hon Hai Precision Industry Company, Ltd. 417,368 1,565,189Hotai Motor Company, Ltd. 9,000 199,428Hua Nan Financial Holdings
Company, Ltd. 286,485 219,285Innolux Corp. 275,841 194,923Inventec Corp. 89,899 80,967Largan Precision Company, Ltd. 3,143 279,619Lite-On Technology Corp. 70,626 162,634MediaTek, Inc. 50,340 2,160,066Mega Financial Holding Company, Ltd. 363,134 466,362Micro-Star International Company, Ltd. 23,000 133,215momo.com, Inc. 2,000 117,092
John Hancock Variable Insurance TrustPortfolio of Investments — December 31, 2021 (showing percentage of total net assets)
The accompanying notes are an integral part of the financial statements. 65

International Equity Index Trust (continued)Shares orPrincipalAmount Value
COMMON STOCKS (continued)Taiwan (continued)Nan Ya Plastics Corp. 171,992 $ 529,864Nan Ya Printed Circuit Board Corp. 8,000 164,787Nanya Technology Corp. 37,000 104,215Nien Made Enterprise Company, Ltd. 5,000 74,449Novatek Microelectronics Corp. 19,361 375,958Oneness Biotech Company, Ltd. (A) 8,000 83,159Pegatron Corp. 66,989 167,144Pou Chen Corp. 78,641 94,080President Chain Store Corp. 19,496 192,505Quanta Computer, Inc. 90,771 310,004Realtek Semiconductor Corp. 14,999 313,379Ruentex Development Company, Ltd. 38,400 88,353Shin Kong Financial Holding
Company, Ltd. 411,790 164,103SinoPac Financial Holdings Company, Ltd. 338,762 197,563Synnex Technology International Corp. 24,928 59,561Taishin Financial Holding Company, Ltd. 341,572 233,676Taiwan Cement Corp. 167,824 290,863Taiwan Cooperative Financial Holding
Company, Ltd. 296,127 272,091Taiwan High Speed Rail Corp. 66,000 70,521Taiwan Mobile Company, Ltd. 55,257 199,562Taiwan Semiconductor Manufacturing
Company, Ltd. 819,227 18,122,119The Shanghai Commercial & Savings
Bank, Ltd. 111,937 190,943Unimicron Technology Corp. 40,000 332,879Uni-President Enterprises Corp. 161,487 399,812United Microelectronics Corp. 388,313 909,728Vanguard International
Semiconductor Corp. 31,000 176,583Voltronic Power Technology Corp. 2,000 111,576Wan Hai Lines, Ltd. 19,800 141,223Win Semiconductors Corp. 11,000 148,427Winbond Electronics Corp. 102,000 124,895Wistron Corp. 92,598 97,449Wiwynn Corp. 3,000 120,668WPG Holdings, Ltd. 47,840 90,893Ya Hsin Industrial Company, Ltd. (A)(E) 36,000 0Yageo Corp. 12,584 217,573Yang Ming Marine Transport Corp. (A) 52,000 226,175Yuanta Financial Holding Company, Ltd. 324,837 296,717Zhen Ding Technology Holding, Ltd. 19,000 68,836
40,552,190Thailand - 0.4%Advanced Info Service PCL 48,400 332,940Airports of Thailand PCL (A) 163,100 296,990Bangkok Dusit Medical Services
PCL, NVDR 387,300 266,387Bangkok Expressway & Metro
PCL, NVDR 354,600 89,721Berli Jucker PCL, NVDR 21,300 19,750BTS Group Holdings PCL, NVDR (B) 301,600 84,301Bumrungrad Hospital PCL, NVDR 15,600 65,646Central Pattana PCL, NVDR 64,400 108,886Central Retail Corp. PCL 45,441 43,489Charoen Pokphand Foods PCL 136,200 104,066CP ALL PCL 184,600 325,804CP ALL PCL, NVDR 12,300 21,708Electricity Generating PCL 7,600 39,886Electricity Generating PCL, NVDR 1,400 7,348Energy Absolute PCL 56,900 163,307Gulf Energy Development PCL, NVDR 79,150 108,408Home Product Center PCL 204,400 88,674Indorama Ventures PCL, NVDR 54,900 70,979
International Equity Index Trust (continued)Shares orPrincipalAmount Value
COMMON STOCKS (continued)Thailand (continued)Krung Thai Bank PCL 164,375 $ 64,799Land & Houses PCL, NVDR 393,400 103,429Minor International PCL, NVDR (A) 131,483 113,054Muangthai Capital PCL, NVDR 11,300 19,826PTT Exploration & Production PCL 60,147 212,044PTT Global Chemical PCL 87,373 153,568PTT PCL 391,000 443,720PTT PCL, NVDR 10,500 11,916Ratch Group PCL, NVDR 12,800 17,256Thai Oil PCL 46,900 69,403Thai Union Group PCL 95,900 56,005The Siam Cement PCL 12,000 138,733The Siam Cement PCL, NVDR 14,300 165,324The Siam Commercial Bank PCL 23,348 88,623True Corp. PCL 448,802 64,178
3,960,168Turkey - 0.1%Akbank TAS 100,286 54,160Aselsan Elektronik Sanayi Ve Ticaret AS 14,026 22,112BIM Birlesik Magazalar AS 16,428 76,128Eregli Demir ve Celik Fabrikalari TAS 49,091 104,438Ford Otomotiv Sanayi AS 4,572 82,394KOC Holding AS 25,423 54,459Turkcell Iletisim Hizmetleri AS 38,572 53,668Turkiye Garanti Bankasi AS 86,216 73,374Turkiye Is Bankasi AS, Class C 60,572 32,809Turkiye Petrol Rafinerileri AS (A) 4,998 58,366
611,908United Arab Emirates - 0.0%NMC Health PLC (A) 4,471 89United Kingdom - 8.1%3i Group PLC 32,696 640,947abrdn PLC 72,446 236,030Admiral Group PLC 6,635 284,007Anglo American PLC 42,988 1,768,188Ashtead Group PLC 15,597 1,257,342Associated British Foods PLC 11,826 323,723AstraZeneca PLC 52,364 6,114,499Auto Trader Group PLC (C) 37,238 372,933AVEVA Group PLC 4,243 195,781Aviva PLC 131,970 735,622BAE Systems PLC 111,616 832,340Barclays PLC 576,321 1,468,038Barratt Developments PLC 33,805 343,271BP PLC 683,369 3,061,911British American Tobacco PLC 72,353 2,686,585BT Group PLC 308,640 710,025Bunzl PLC 11,691 456,711Burberry Group PLC 13,598 335,628CNH Industrial NV 37,712 729,131Coca-Cola Europacific Partners PLC 6,887 385,274Compass Group PLC (A) 59,219 1,333,235Croda International PLC 4,632 634,450Diageo PLC 78,828 4,309,993Entain PLC (A) 19,428 444,058Evraz PLC 18,017 147,303Ferguson PLC 7,801 1,385,663GlaxoSmithKline PLC 169,205 3,684,050Halma PLC 13,950 604,855Hargreaves Lansdown PLC 11,809 217,004HSBC Holdings PLC 686,857 4,148,099Imperial Brands PLC 31,799 696,867Informa PLC (A) 49,866 349,140InterContinental Hotels Group PLC (A) 6,064 392,031
John Hancock Variable Insurance TrustPortfolio of Investments — December 31, 2021 (showing percentage of total net assets)
The accompanying notes are an integral part of the financial statements. 66

International Equity Index Trust (continued)Shares orPrincipalAmount Value
COMMON STOCKS (continued)United Kingdom (continued)Intertek Group PLC 5,603 $ 427,437J Sainsbury PLC 71,585 267,582JD Sports Fashion PLC 85,615 252,436Johnson Matthey PLC 7,531 209,271Kingfisher PLC 70,070 322,303Land Securities Group PLC 25,882 273,157Legal & General Group PLC 200,480 809,595Lloyds Banking Group PLC 2,378,433 1,544,532London Stock Exchange Group PLC 10,980 1,032,888M&G PLC 94,053 254,442Melrose Industries PLC 146,910 319,497Mondi PLC 13,861 343,806Mondi PLC (Johannesburg
Stock Exchange) 4,137 102,949National Grid PLC 122,429 1,765,335NatWest Group PLC 181,551 555,965Next PLC 4,895 541,400Ocado Group PLC (A) 16,158 367,615Pearson PLC 25,020 207,559Persimmon PLC 10,716 415,341Phoenix Group Holdings PLC 19,903 176,181Prudential PLC 87,981 1,521,439Reckitt Benckiser Group PLC 23,897 2,057,135RELX PLC 40,612 1,325,854RELX PLC (Euronext
Amsterdam Exchange) 24,692 801,743Rentokil Initial PLC 67,951 537,882Rio Tinto PLC 37,839 2,495,335Rolls-Royce Holdings PLC (A) 275,192 459,332Schroders PLC 4,962 239,502Segro PLC 41,053 798,960Severn Trent PLC 7,990 319,055Smith & Nephew PLC 29,419 513,430Smiths Group PLC 15,498 331,738Spirax-Sarco Engineering PLC 2,625 571,278SSE PLC 36,273 810,888St. James’s Place PLC 20,193 461,454Standard Chartered PLC 93,128 566,290Taylor Wimpey PLC 125,790 299,899Tesco PLC 268,394 1,056,685The Berkeley Group Holdings PLC 4,051 262,322The British Land Company PLC 35,353 255,295The Sage Group PLC 41,847 484,208Unilever PLC 86,323 4,630,912United Utilities Group PLC 26,873 396,522Vodafone Group PLC 955,905 1,439,815Whitbread PLC (A) 7,168 291,576WPP PLC 42,535 647,710
75,050,284United States - 0.1%Bausch Health Companies, Inc. (A) 9,900 273,454Brookfield Renewable Corp., Class A 4,350 160,079Parade Technologies, Ltd. 3,000 228,240
661,773TOTAL COMMON STOCKS (Cost $613,215,841) $ 900,386,705
PREFERRED SECURITIES - 0.8%Brazil - 0.3%Alpargatas SA 8,500 56,293Banco Bradesco SA 163,047 565,253Banco BTG Pactual SA 4 4Banco Inter SA (C) 1 2Braskem SA, A Shares 8,200 86,661Centrais Eletricas Brasileiras SA, B Shares 5,700 33,679Cia Energetica de Minas Gerais 36,287 86,603
International Equity Index Trust (continued)Shares orPrincipalAmount Value
PREFERRED SECURITIES (continued)Brazil (continued)Gerdau SA 36,200 $ 177,952Itau Unibanco Holding SA 161,889 610,101Itausa SA 155,109 248,082Petroleo Brasileiro SA 165,151 838,992
2,703,622Germany - 0.3%Bayerische Motoren Werke AG 2,090 173,316Fuchs Petrolub SE 2,735 123,592Henkel AG & Company KGaA 6,138 495,282Porsche Automobil Holding SE 5,695 537,680Sartorius AG 872 589,768Volkswagen AG 6,259 1,257,327
3,176,965South Korea - 0.2%Hyundai Motor Company 705 58,327Hyundai Motor Company, 2nd Preferred 1,197 101,520LG Chem, Ltd. (A) 162 39,089LG Household & Health Care, Ltd. (A) 48 24,855Samsung Electronics Company, Ltd. 27,037 1,616,425
1,840,216Taiwan - 0.0%China Development Financial Holding
Corp. (A) 60,206 20,869TOTAL PREFERRED SECURITIES (Cost $6,920,618) $ 7,741,672
RIGHTS - 0.0%Doosan Heavy Industries & Construction
Company, Ltd. (ExpirationDate: 2-14-22; Strike Price: KRW16,000.00) (A) 1,304 4,827
TOTAL RIGHTS (Cost $0) $ 4,827
WARRANTS - 0.0%BTS Group Holdings PCL (Expiration
Date: 11-20-26; Strike Price: THB14.90) (A) 60,320 903
BTS Group Holdings PCL (ExpirationDate: 11-7-24; Strike Price: THB11.90) (A) 30,160 578
BTS Group Holdings PCL (ExpirationDate: 9-5-22; Strike Price: THB9.90) (A) 15,080 323
Minor International PCL (ExpirationDate: 2-15-24; Strike Price: THB31.00) (A) 3,972 379
TOTAL WARRANTS (Cost $0) $ 2,183
SHORT-TERM INVESTMENTS - 1.8%Short-term funds - 1.8%Fidelity Institutional Money Market
Government Portfolio, InstitutionalClass, 0.0100% (F) 13,483,146 13,483,146
John Hancock Collateral Trust,0.1697% (F)(G) 296,791 2,968,797
TOTAL SHORT-TERM INVESTMENTS (Cost $16,452,031) $ 16,451,943Total Investments (International Equity Index Trust)
(Cost $636,588,490) - 99.4% $ 924,587,330Other assets and liabilities, net - 0.6% 5,309,365TOTAL NET ASSETS - 100.0% $ 929,896,695
Currency AbbreviationsKRW Korean WonTHB Thai Bhat
John Hancock Variable Insurance TrustPortfolio of Investments — December 31, 2021 (showing percentage of total net assets)
The accompanying notes are an integral part of the financial statements. 67

International Equity Index Trust (continued)Security Abbreviations and LegendADR American Depositary ReceiptGDR Global Depositary ReceiptNVDR Non-Voting Depositary Receipt(A) Non-income producing security.(B) All or a portion of this security is on loan as of 12-31-21.(C) These securities are exempt from registration under Rule 144A of
the Securities Act of 1933. Such securities may be resold, normallyto qualified institutional buyers, in transactions exempt fromregistration.
International Equity Index Trust (continued)(D) Investment is an affiliate of the fund, the advisor and/or subadvisor.(E) Security is valued using significant unobservable inputs and is
classified as Level 3 in the fair value hierarchy. Refer to Note 2 tothe financial statements.
(F) The rate shown is the annualized seven-day yield as of 12-31-21.(G) Investment is an affiliate of the fund, the advisor and/or subadvisor.
This security represents the investment of cash collateral received forsecurities lending.
DERIVATIVES
FUTURES
Open contractsNumber of
contracts PositionExpiration
dateNotional
basis^Notional
value^
Unrealizedappreciation
(depreciation)Mini MSCI EAFE Index Futures 28 Long Mar 2022 $3,203,421 $3,249,260 $45,839Mini MSCI Emerging Markets Index Futures 301 Long Mar 2022 18,564,192 18,454,310 (109,882)
$(64,043)
^ Notional basis refers to the contractual amount agreed upon at inception of open contracts; notional value represents the current value of the open contract.
See Notes to financial statements regarding investment transactions and other derivatives information.
International Small Company TrustShares orPrincipalAmount Value
COMMON STOCKS - 98.2%Australia - 6.5%A2B Australia, Ltd. (A) 9,047 $ 8,758Accent Group, Ltd. 24,907 44,437Adairs, Ltd. 6,590 19,236Adbri, Ltd. 19,036 39,096Ainsworth Game Technology, Ltd. (A) 10,192 9,561Alcidion Group, Ltd. (A) 43,339 8,693Alkane Resources, Ltd. (A) 25,036 16,708Alliance Aviation Services, Ltd. (A) 3,238 9,658AMA Group, Ltd. (A)(B) 33,686 10,533AMP, Ltd. (A) 139,043 102,202Ansell, Ltd. 1,752 40,067Appen, Ltd. 3,751 30,407ARB Corp., Ltd. 3,816 145,831Archer Materials, Ltd. (A) 10,038 8,219Ardent Leisure Group, Ltd. (A) 39,016 38,347AUB Group, Ltd. 4,241 79,572Audinate Group, Ltd. (A) 1,532 9,871Aurelia Metals, Ltd. (A) 85,331 25,533Austal, Ltd. 23,155 32,843Australian Agricultural Company, Ltd. (A) 28,065 30,197Australian Finance Group, Ltd. 6,698 13,153Australian Pharmaceutical Industries, Ltd. 26,584 33,460Australian Strategic Materials, Ltd. (A) 2,300 17,850Auswide Bank, Ltd. 646 3,154Baby Bunting Group, Ltd. 3,113 12,725Bapcor, Ltd. 15,610 79,568Base Resources, Ltd. 32,069 7,811Beach Energy, Ltd. 86,667 79,571Bega Cheese, Ltd. 15,122 62,448Bell Financial Group, Ltd. 10,635 14,429Bellevue Gold, Ltd. (A) 32,369 19,963Betmakers Technology Group, Ltd. (A) 14,102 8,213Bigtincan Holdings, Ltd. (A)(B) 27,175 20,053Blackmores, Ltd. 587 39,051Bravura Solutions, Ltd. 17,804 31,953Breville Group, Ltd. 4,635 106,894
International Small Company Trust (continued)Shares orPrincipalAmount Value
COMMON STOCKS (continued)Australia (continued)Brickworks, Ltd. 3,876 $ 68,170BWX, Ltd. 8,729 27,675Calix, Ltd. (A) 10,443 50,523Capitol Health, Ltd. 41,735 11,856Capricorn Metals, Ltd. (A) 13,300 32,930Cardno, Ltd. 1,509 2,118Carnarvon Energy, Ltd. (A)(B) 45,055 11,146Cash Converters International, Ltd. 14,501 2,849Cedar Woods Properties, Ltd. 2,694 10,652Challenger, Ltd. 18,693 88,792Champion Iron, Ltd. (A)(B) 13,921 55,221City Chic Collective, Ltd. (A)(B) 9,410 37,616Cleanaway Waste Management, Ltd. 44,499 101,296Clinuvel Pharmaceuticals, Ltd. 2,335 46,141Clover Corp., Ltd. (B) 8,155 10,170Codan, Ltd. 5,320 36,082Collins Foods, Ltd. 5,764 56,065Cooper Energy, Ltd. (A) 98,256 20,016Corporate Travel Management, Ltd. (A) 4,034 64,694Costa Group Holdings, Ltd. 25,640 56,589Credit Corp. Group, Ltd. 3,047 74,276CSR, Ltd. 25,551 109,397Data#3, Ltd. 9,073 38,791De Grey Mining, Ltd. (A) 17,392 15,455Decmil Group, Ltd. (A) 1,519 359Deterra Royalties, Ltd. 16,722 52,369Dicker Data, Ltd. (B) 2,793 30,146Domain Holdings Australia, Ltd. 10,969 45,052Downer EDI, Ltd. 27,173 118,036Eagers Automotive, Ltd. 7,533 73,735Eclipx Group, Ltd. (A) 16,681 26,837Elders, Ltd. 8,609 76,878Emeco Holdings, Ltd. 22,924 14,693Emerald Resources NL (A)(B) 28,411 22,340EML Payments, Ltd. (A) 16,327 38,352Enero Group, Ltd. 3,952 11,506
John Hancock Variable Insurance TrustPortfolio of Investments — December 31, 2021 (showing percentage of total net assets)
The accompanying notes are an integral part of the financial statements. 68

International Small Company Trust (continued)Shares orPrincipalAmount Value
COMMON STOCKS (continued)Australia (continued)EQT Holdings, Ltd. 740 $ 14,282Estia Health, Ltd. 11,708 19,602EVENT Hospitality and
Entertainment, Ltd. (A) 4,397 47,358FAR, Ltd. (A)(B) 3,139 879Finbar Group, Ltd. 8,370 4,995Fleetwood, Ltd. 8,058 14,552Flight Centre Travel Group, Ltd. (A)(B) 4,755 61,014Frontier Digital Ventures, Ltd. (A) 10,734 12,198G8 Education, Ltd. (A) 51,376 41,511Galan Lithium, Ltd. (A) 13,760 19,507Genworth Mortgage Insurance
Australia, Ltd. 18,245 30,811Gold Road Resources, Ltd. 44,022 50,454GrainCorp, Ltd., Class A 13,614 81,955GUD Holdings, Ltd. 5,406 44,719GWA Group, Ltd. 12,453 24,947Hansen Technologies, Ltd. 11,735 45,674Healius, Ltd. 23,643 90,582HT&E, Ltd. 20,357 31,113HUB24, Ltd. 3,277 67,499Humm Group, Ltd. (A)(B) 26,650 17,455Iluka Resources, Ltd. 16,722 123,273Imdex, Ltd. 20,483 43,961Infomedia, Ltd. 17,584 19,582Inghams Group, Ltd. (B) 20,588 52,583Insignia Financial, Ltd. 30,144 79,428Integral Diagnostics, Ltd. 6,781 24,400Integrated Research, Ltd. (A) 3,367 3,064InvoCare, Ltd. 8,212 70,282Ioneer, Ltd. (A) 61,614 35,877IPH, Ltd. 9,953 63,551IRESS, Ltd. 8,152 74,164IVE Group, Ltd. 11,452 14,505Johns Lyng Group, Ltd. 4,969 33,000Jumbo Interactive, Ltd. 2,253 31,566Jupiter Mines, Ltd. 116,266 19,465Karoon Energy, Ltd. (A) 25,702 31,506Kelsian Group, Ltd. 2,432 13,069Kogan.com, Ltd. (B) 1,950 12,510Lifestyle Communities, Ltd. 3,310 50,029Link Administration Holdings, Ltd. 18,547 75,143Lovisa Holdings, Ltd. 3,846 56,265MA Financial Group, Ltd. 4,146 26,994MACA, Ltd. 23,711 14,155Macmahon Holdings, Ltd. 112,440 15,125Macquarie Telecom Group, Ltd. (A) 223 11,887Mayne Pharma Group, Ltd. (A) 99,135 21,335McMillan Shakespeare, Ltd. 3,346 29,429McPherson’s, Ltd. 9,168 5,438Medusa Mining, Ltd. 8,127 4,205Megaport, Ltd. (A) 3,727 50,218Mesoblast, Ltd. (A)(B) 11,677 11,846Metals X, Ltd. (A)(B) 48,765 20,430Metcash, Ltd. 51,856 169,617Mincor Resources NL (A) 14,651 19,038Monadelphous Group, Ltd. (B) 3,790 26,643Monash IVF Group, Ltd. 21,798 16,736Money3 Corp., Ltd. 8,682 22,417Mount Gibson Iron, Ltd. 19,096 5,906Myer Holdings, Ltd. (A) 63,302 20,742MyState, Ltd. 5,375 19,836Nanosonics, Ltd. (A) 8,226 37,779Navigator Global Investments, Ltd. 10,160 13,721Nearmap, Ltd. (A) 18,333 20,609
International Small Company Trust (continued)Shares orPrincipalAmount Value
COMMON STOCKS (continued)Australia (continued)Netwealth Group, Ltd. 3,669 $ 47,261New Energy Solar, Ltd. 2,820 1,681New Hope Corp., Ltd. (B) 24,235 39,358nib holdings, Ltd. 21,443 109,263Nick Scali, Ltd. 5,272 58,896Nickel Mines, Ltd. 30,650 31,939Nine Entertainment Company
Holdings, Ltd. 23,897 50,501Noumi, Ltd. (A) 6,482 1,957Novonix, Ltd. (A)(B) 6,100 40,781NRW Holdings, Ltd. 25,786 33,124Nufarm, Ltd. 12,991 45,901OceanaGold Corp. (A) 38,000 66,090OFX Group, Ltd. (A) 14,134 23,757Omni Bridgeway, Ltd. (A)(B) 15,737 42,150oOh!media, Ltd. (A) 31,712 39,084Orora, Ltd. 40,091 102,320OZ Minerals, Ltd. 16,141 332,766Pacific Current Group, Ltd. 1,717 9,136Pact Group Holdings, Ltd. 11,275 20,787Paladin Energy, Ltd. (A) 90,952 58,552Panoramic Resources, Ltd. (A) 68,650 13,467Pantoro, Ltd. (A)(B) 43,321 10,581Peet, Ltd. 13,800 10,697Pendal Group, Ltd. 12,114 49,099PeopleIN, Ltd. 4,673 14,941Perenti Global, Ltd. 35,432 23,831Perpetual, Ltd. 2,914 76,259Perseus Mining, Ltd. (A) 68,083 80,595Pinnacle Investment Management
Group, Ltd. 2,418 27,448Platinum Asset Management, Ltd. 14,631 28,740Praemium, Ltd. (A)(B) 28,131 30,096Premier Investments, Ltd. 4,691 103,507PWR Holdings, Ltd. 1,520 9,505Ramelius Resources, Ltd. 37,591 43,105Red 5, Ltd. (A) 106,879 22,596Redbubble, Ltd. (A)(B) 4,570 10,866Regis Healthcare, Ltd. 9,267 12,613Regis Resources, Ltd. 35,749 50,874Resolute Mining, Ltd. (A) 43,558 12,398Ridley Corp., Ltd. 19,540 21,278RPMGlobal Holdings, Ltd. (A) 6,670 10,431Sandfire Resources, Ltd. 19,142 91,964Select Harvests, Ltd. 6,954 31,419Senex Energy, Ltd. 11,103 37,372Servcorp, Ltd. 3,171 8,301Service Stream, Ltd. 27,275 15,958Seven West Media, Ltd. (A) 85,038 40,036SG Fleet Group, Ltd. 8,938 16,233Sigma Healthcare, Ltd. 86,903 30,380Silver Lake Resources, Ltd. (A) 48,508 62,888SmartGroup Corp., Ltd. 4,591 25,899Southern Cross Media Group, Ltd. 17,291 24,375SpeedCast International, Ltd. (A)(B)(C) 17,245 0SRG Global, Ltd. 31,157 11,568St. Barbara, Ltd. 33,249 35,543Steadfast Group, Ltd. 39,801 151,915Super Retail Group, Ltd. 7,649 69,310Superloop, Ltd. (A) 22,967 19,878Symbio Holdings, Ltd. 2,522 12,421Syrah Resources, Ltd. (A) 36,700 48,379Tassal Group, Ltd. 8,526 21,651Technology One, Ltd. 12,347 114,565Temple & Webster Group, Ltd. (A) 1,418 11,101
John Hancock Variable Insurance TrustPortfolio of Investments — December 31, 2021 (showing percentage of total net assets)
The accompanying notes are an integral part of the financial statements. 69

International Small Company Trust (continued)Shares orPrincipalAmount Value
COMMON STOCKS (continued)Australia (continued)The Reject Shop, Ltd. (A) 2,561 $ 13,356The Star Entertainment Group, Ltd. (A) 42,180 112,997Tiger Resources, Ltd. (A)(C) 92,816 2,485Tyro Payments, Ltd. (A) 10,423 21,715United Malt Grp, Ltd. 15,585 49,573Uniti Group, Ltd. (A) 18,144 58,717Virtus Health, Ltd. 8,580 42,744Viva Energy Group, Ltd. (D) 28,350 48,526Webjet, Ltd. (A) 16,369 61,651West African Resources, Ltd. (A) 42,178 40,686Western Areas, Ltd. (A) 21,598 53,960Westgold Resources, Ltd. 16,814 25,033Whitehaven Coal, Ltd. (A) 44,790 85,286Zip Company, Ltd. (A)(B) 16,135 50,815
8,398,255Austria - 1.6%Agrana Beteiligungs AG 724 14,127ams AG (A) 11,874 214,866ANDRITZ AG 3,025 155,585AT&S Austria Technologie &
Systemtechnik AG 1,801 88,350BAWAG Group AG (A)(D) 3,127 191,783DO & Company AG (A) 278 23,367EVN AG 2,014 60,766FACC AG (A) 1,116 8,928Flughafen Wien AG (A) 265 8,021IMMOFINANZ AG (A)(B) 4,356 111,868Kapsch TrafficCom AG (A)(B) 191 3,082Lenzing AG 693 95,509Mayr Melnhof Karton AG 378 75,722Oesterreichische Post AG (B) 1,378 58,955Palfinger AG 876 34,155POLYTEC Holding AG 995 7,788Porr AG (A) 876 13,680Raiffeisen Bank International AG 1,613 47,375RHI Magnesita NV 1,095 48,543RHI Magnesita NV (London
Stock Exchange) 545 24,330Rosenbauer International AG (B) 174 9,208S IMMO AG 2,772 68,538S&T AG (B) 2,318 38,510Schoeller-Bleckmann Oilfield Equipment
AG (A) 710 24,817Semperit AG Holding 822 27,268Strabag SE, Bearer Shares 893 37,124Telekom Austria AG (A) 7,836 68,134UBM Development AG 411 20,238UNIQA Insurance Group AG 6,525 59,740Vienna Insurance Group AG 2,128 60,402voestalpine AG 4,895 177,606Wienerberger AG 5,497 201,869Zumtobel Group AG 2,545 22,294
2,102,548Belgium - 1.6%Ackermans & van Haaren NV 1,132 217,191AGFA-Gevaert NV (A) 6,780 29,271Akka Technologies (A) 603 33,048Atenor 211 13,634Barco NV 3,212 69,981Bekaert SA 1,986 88,299Biocartis Group NV (A)(B)(D) 2,587 10,672bpost SA (A) 4,236 36,974Celyad Oncology SA (A)(B) 493 1,971Cie d’Entreprises CFE 416 57,881Deceuninck NV 2,515 9,643
International Small Company Trust (continued)Shares orPrincipalAmount Value
COMMON STOCKS (continued)Belgium (continued)D’ieteren Group 1,085 $ 211,512Econocom Group SA/NV 6,435 26,889Elia Group SA/NV 1,281 168,843Etablissements Franz Colruyt NV 695 29,491Euronav NV 8,334 73,872Euronav NV (New York Stock Exchange) 2,324 20,660EVS Broadcast Equipment SA 811 19,093Exmar NV 1,567 7,660Fagron 2,165 36,499Gimv NV 1,241 75,393Immobel SA (B) 209 17,313Ion Beam Applications 1,305 22,679Kinepolis Group NV (A) 585 36,448Lotus Bakeries NV 13 82,820Melexis NV 987 117,608Ontex Group NV (A) 3,927 31,340Orange Belgium SA 417 9,446Oxurion NV (A) 1,612 3,325Picanol (A) 88 6,339Proximus SADP (B) 5,977 116,729Recticel SA 2,296 45,833Sipef NV 420 27,183Telenet Group Holding NV 1,717 62,661Tessenderlo Group SA (A) 904 34,266Van de Velde NV 377 14,774VGP NV 243 70,915Viohalco SA 7,173 37,415X-Fab Silicon Foundries SE (A)(D) 3,484 36,030
2,011,601Bermuda - 0.1%Hiscox, Ltd. 13,928 163,571Cambodia - 0.0%NagaCorp, Ltd. 52,000 45,367Canada - 10.1%5N Plus, Inc. (A) 3,515 6,613Absolute Software Corp. 2,400 22,502Acadian Timber Corp. 800 12,130Advantage Energy, Ltd. (A) 11,500 67,366Aecon Group, Inc. 3,200 42,702Africa Oil Corp. (A) 34,602 48,964Ag Growth International, Inc. 1,100 27,549AGF Management, Ltd., Class B 4,298 28,371Aimia, Inc. (A) 7,777 30,433AirBoss of America Corp. 1,500 54,808Alamos Gold, Inc., Class A 22,032 169,470Alaris Equity Partners Income (B) 2,229 33,110Alcanna, Inc. (A)(B) 1,500 8,111Algoma Central Corp. 700 9,424AltaGas, Ltd. 1,178 25,433Altius Minerals Corp. 3,100 42,667Altus Group, Ltd. 1,818 101,999Amerigo Resources, Ltd. 13,502 15,584Andlauer Healthcare Group, Inc. (B) 618 26,397Andrew Peller, Ltd., Class A 2,300 14,837ARC Resources, Ltd. 9,626 87,513Aritzia, Inc. (A) 3,645 150,848Ascot Resources, Ltd. (A) 13,700 13,105Atco, Ltd., Class I 3,204 108,155Athabasca Oil Corp. (A) 42,135 39,638ATS Automation Tooling Systems, Inc. (A) 3,547 140,876AutoCanada, Inc. (A) 1,985 67,006Badger Infrastructure Solutions, Ltd. 1,522 38,250Birch Mountain Resources, Ltd. (A)(C) 9,200 1Birchcliff Energy, Ltd. 15,733 80,347Bird Construction, Inc. 4,995 38,777
John Hancock Variable Insurance TrustPortfolio of Investments — December 31, 2021 (showing percentage of total net assets)
The accompanying notes are an integral part of the financial statements. 70

International Small Company Trust (continued)Shares orPrincipalAmount Value
COMMON STOCKS (continued)Canada (continued)Black Diamond Group, Ltd. 2,750 $ 9,631BMTC Group, Inc. 500 6,206Bombardier, Inc., Class B (A) 86,004 114,223Boralex, Inc., Class A (B) 4,277 117,259Brookfield Infrastructure Corp., Class A 2,724 185,907Calian Group, Ltd. 905 44,028Calibre Mining Corp. (A) 11,500 12,182Canaccord Genuity Group, Inc. 5,281 62,957Canacol Energy, Ltd. 7,565 19,197Canada Goose Holdings, Inc. (A) 2,213 82,015Canadian Western Bank 4,515 129,566Canfor Corp. (A) 3,704 93,877Canfor Pulp Products, Inc. (A) 2,715 14,359Capital Power Corp. 5,927 184,892Capstone Mining Corp. (A) 29,467 129,986Cardinal Energy, Ltd. (A) 5,530 18,667Cascades, Inc. 5,723 63,204Celestica, Inc. (A) 5,019 55,945Celestica, Inc. (New York Stock
Exchange) (A) 3,200 35,616Centerra Gold, Inc. 12,177 93,858CES Energy Solutions Corp. 18,429 29,575China Gold International Resources
Corp., Ltd. 18,050 48,373CI Financial Corp. 8,900 186,028Cogeco Communications, Inc. 863 68,722Cogeco, Inc. 445 28,576Colliers International Group, Inc. 1,400 208,492Computer Modelling Group, Ltd. 4,420 14,885Copper Mountain Mining Corp. (A) 8,800 23,792Corby Spirit and Wine, Ltd. 700 9,280Corus Entertainment, Inc., B Shares 11,806 44,426Crescent Point Energy Corp. 9,519 50,795Crescent Point Energy Corp. (New York
Stock Exchange) 16,800 89,712Crew Energy, Inc. (A) 11,300 25,549Cronos Group, Inc. (A) 2,170 8,543Cronos Group, Inc. (Nasdaq
Exchange) (A)(B) 3,612 14,159Denison Mines Corp. (A) 42,724 58,769Dexterra Group, Inc. 1,621 11,008DIRTT Environmental Solutions (A)(B) 3,000 6,522Doman Building Materials Group, Ltd. 3,600 22,113Dorel Industries, Inc., Class B (A) 1,800 29,157DREAM Unlimited Corp., Class A 2,250 69,068Dundee Precious Metals, Inc. 7,687 47,522ECN Capital Corp. 16,900 71,344E-L Financial Corp., Ltd. 100 71,762Eldorado Gold Corp. (A) 9,374 87,889Element Fleet Management Corp. 17,965 182,924Endeavour Silver Corp. (A) 6,945 29,373Enerflex, Ltd. 6,400 38,756Enerplus Corp. 11,735 123,756Enghouse Systems, Ltd. 1,800 68,915Ensign Energy Services, Inc. (A) 9,800 13,016Equinox Gold Corp. (A) 7,935 53,697Equitable Group, Inc. 1,392 75,831ERO Copper Corp. (A) 2,900 44,247Evertz Technologies, Ltd. 1,900 19,737Exchange Income Corp. 568 18,922Exco Technologies, Ltd. 1,500 12,226Extendicare, Inc. 6,230 35,953Fiera Capital Corp. 3,035 25,169Finning International, Inc. 8,181 206,182Firm Capital Mortgage Investment Corp. 1,100 12,479
International Small Company Trust (continued)Shares orPrincipalAmount Value
COMMON STOCKS (continued)Canada (continued)First Majestic Silver Corp. 7,681 $ 85,436First Mining Gold Corp. (A)(B) 39,000 9,249First National Financial Corp. 700 22,999Fission Uranium Corp. (A) 19,500 12,024Fortuna Silver Mines, Inc. (A) 14,300 55,846Freehold Royalties, Ltd. 7,229 66,578Frontera Energy Corp. (A) 2,200 17,809Galiano Gold, Inc. (A)(B) 6,600 4,748Gamehost, Inc. (A) 100 549GDI Integrated Facility Services, Inc. (A) 300 12,762Gibson Energy, Inc. 7,398 131,122goeasy, Ltd. 672 95,237GoGold Resources, Inc. (A) 5,300 12,695Golden Star Resources, Ltd. (A) 5,011 19,173Gran Tierra Energy, Inc. (A)(B) 25,166 19,099Guardian Capital Group, Ltd., Class A 1,100 30,349Hanfeng Evergreen, Inc. (A)(C) 200 0Hardwoods Distribution, Inc. 800 28,333Headwater Exploration, Inc. (A) 4,930 20,072Heroux-Devtek, Inc. (A) 2,700 38,420HEXO Corp. (A)(B) 3,660 2,546High Liner Foods, Inc. 1,773 20,898HLS Therapeutics, Inc. 700 8,301Home Capital Group, Inc. (A) 3,379 104,366Hudbay Minerals, Inc. 12,257 88,758i-80 Gold Corp. (A) 1,651 4,033iA Financial Corp., Inc. 853 48,808IAMGOLD Corp. (A) 29,827 92,904IBI Group, Inc. (A) 1,700 18,197Imperial Metals Corp. (A) 5,060 12,681Information Services Corp. 800 16,108Innergex Renewable Energy, Inc. 6,800 99,988Interfor Corp. 3,520 112,728International Petroleum Corp. (A)(B) 5,324 29,757International Tower Hill Mines, Ltd. (A) 2,300 1,673Intertape Polymer Group, Inc. 2,700 56,179Jamieson Wellness, Inc. (D) 2,300 72,985KAB Distribution, Inc. (A)(C) 7,076 0Karora Resources, Inc. (A) 4,800 16,127K-Bro Linen, Inc. 600 16,222Kelt Exploration, Ltd. (A) 10,445 39,800Keyera Corp. (B) 5,287 119,244Kinaxis, Inc. (A) 1,068 149,720Kingsway Financial Services, Inc. (A) 425 2,329Knight Therapeutics, Inc. (A) 5,400 22,625Labrador Iron Ore Royalty Corp. 3,218 95,475Largo, Inc. (A) 780 7,227Lassonde Industries, Inc., Class A 200 24,877Laurentian Bank of Canada 2,414 76,659Leon’s Furniture, Ltd. 1,883 36,992LifeWorks, Inc. 3,098 62,526Linamar Corp. 2,366 140,151Logistec Corp., Class B 700 24,349Lucara Diamond Corp. (A) 25,184 11,746Lundin Gold, Inc. (A) 2,800 23,065MAG Silver Corp. (A) 1,400 21,947Magellan Aerospace Corp. 900 7,086Mainstreet Equity Corp. (A) 400 38,006Major Drilling Group
International, Inc. (A) 6,800 44,403Maple Leaf Foods, Inc. 3,940 91,138Martinrea International, Inc. 4,603 41,847Maverix Metals, Inc. 2,300 10,037Medical Facilities Corp. 2,104 15,552MEG Energy Corp. (A) 13,888 128,455
John Hancock Variable Insurance TrustPortfolio of Investments — December 31, 2021 (showing percentage of total net assets)
The accompanying notes are an integral part of the financial statements. 71

International Small Company Trust (continued)Shares orPrincipalAmount Value
COMMON STOCKS (continued)Canada (continued)Melcor Developments, Ltd. 1,000 $ 11,257Methanex Corp. 2,700 106,809Morguard Corp. 400 43,151Mountain Province Diamonds, Inc. (A) 6,800 4,086MTY Food Group, Inc. 742 37,119Mullen Group, Ltd. 5,582 51,321New Gold, Inc. (A) 28,915 43,203NFI Group, Inc. 2,960 47,409North American Construction Group, Ltd. 2,100 31,858NuVista Energy, Ltd. (A) 15,505 85,312Organigram Holdings, Inc. (A) 8,928 15,669Osisko Gold Royalties, Ltd. 7,774 95,135Osisko Mining, Inc. (A) 16,850 50,752Paramount Resources, Ltd., Class A 5,173 100,561Parex Resources, Inc. 7,016 119,859Park Lawn Corp. 1,792 58,791Parkland Corp. 6,096 167,562Pason Systems, Inc. 5,636 51,417Peyto Exploration & Development Corp. 10,197 76,178Pizza Pizza Royalty Corp. 1,729 16,430Polaris Infrastructure, Inc. (B) 1,500 19,993Pollard Banknote, Ltd. 1,000 31,503PolyMet Mining Corp. (A) 1,185 2,970PrairieSky Royalty, Ltd. 9,727 104,810Precision Drilling Corp. (A) 1,082 38,226Premium Brands Holdings Corp. 1,700 169,926Pretium Resources, Inc. (A) 8,300 116,926Quarterhill, Inc. (B) 9,800 20,918Questerre Energy Corp., Class A (A) 19,444 3,535Real Matters, Inc. (A) 3,500 22,965Recipe Unlimited Corp. (A) 1,300 18,211RF Capital Group, Inc. (A) 1,848 2,776Richelieu Hardware, Ltd. 2,800 96,576Rogers Sugar, Inc. (B) 6,474 30,452Russel Metals, Inc. 3,846 102,250Sabina Gold & Silver Corp. (A) 20,475 23,470Sandstorm Gold, Ltd. (A) 10,731 66,594Savaria Corp. (B) 2,300 34,838Seabridge Gold, Inc. (A)(B) 2,330 38,497Secure Energy Services, Inc. 15,677 65,189ShawCor, Ltd. (A) 4,173 16,198Sienna Senior Living, Inc. 3,606 42,846Sierra Wireless, Inc. (A) 2,600 45,836Sleep Country Canada Holdings, Inc. (D) 2,113 62,691SNC-Lavalin Group, Inc. 6,640 162,253Spin Master Corp. (A)(D) 1,400 53,058Sprott, Inc. 1,329 59,970SSR Mining, Inc. 9,961 176,313Stantec, Inc. 2,378 133,606Stelco Holdings, Inc. 500 16,293Stella-Jones, Inc. 2,400 75,911SunOpta, Inc. (A) 5,608 38,881Superior Plus Corp. (B) 9,057 93,080Tamarack Valley Energy, Ltd. (A) 20,085 61,131Taseko Mines, Ltd. (A) 16,100 33,092Tecsys, Inc. 609 25,329TerraVest Industries, Inc. 600 13,035The North West Company, Inc. 2,406 65,126Tidewater Midstream and
Infrastructure, Ltd. 6,650 6,834Timbercreek Financial Corp. 6,000 45,583TLC Vision Corp. (A)(C) 3,400 0Torex Gold Resources, Inc. (A) 5,460 56,760Total Energy Services, Inc. (A) 3,132 14,930TransAlta Corp. 15,282 169,740
International Small Company Trust (continued)Shares orPrincipalAmount Value
COMMON STOCKS (continued)Canada (continued)TransAlta Renewables, Inc. 6,098 $ 90,389Transcontinental, Inc., Class A 4,783 76,796Treasury Metals, Inc. (A) 1,301 792Trevali Mining Corp. (A) 3,713 5,049Trican Well Service, Ltd. (A) 26,009 56,955Tricon Residential, Inc. 9,442 144,509Trisura Group, Ltd. (A) 1,900 71,632Turquoise Hill Resources, Ltd. (A) 5,450 89,616Uni-Select, Inc. (A) 3,401 69,206Vecima Networks, Inc. 479 5,419Vermilion Energy, Inc. (A) 6,800 85,474Wajax Corp. 1,300 24,942Wesdome Gold Mines, Ltd. (A) 8,000 72,793Western Forest Products, Inc. 25,850 43,119Westshore Terminals Investment Corp. (B) 1,589 33,691Whitecap Resources, Inc. 35,380 209,491WildBrain, Ltd. (A) 10,382 28,234Winpak, Ltd. 1,577 46,339Yamana Gold, Inc. 40,341 169,662Yellow Pages, Ltd. 200 2,160Zenith Capital Corp. (A) 1,700 187
13,074,275Chile - 0.0%Aclara Resources, Inc. (A) 2,271 1,993China - 0.1%Fosun Tourism Group (A)(B)(D) 11,400 15,332Goodbaby International Holdings, Ltd. (A) 71,000 9,111Hygeia Healthcare Holdings
Company, Ltd. (D) 7,800 48,85473,297
Denmark - 2.2%ALK-Abello A/S (A) 301 157,974Alm Brand A/S 28,240 54,859Amagerbanken A/S (A)(C) 25,580 0Asetek A/S (A) 1,629 7,573Bang & Olufsen A/S (A) 7,788 33,168Bavarian Nordic A/S (A)(B) 3,285 134,918Better Collective A/S (A) 917 19,862CBrain A/S 389 16,778Chemometec A/S 721 91,299Columbus A/S 6,187 9,056D/S Norden A/S 1,788 45,393Dfds A/S (A) 1,395 74,558FLSmidth & Company A/S 2,221 83,026H Lundbeck A/S 1,368 35,223H+H International A/S, Class B (A) 1,146 40,409INVISIO AB 1,065 19,262ISS A/S (A) 7,129 135,171Jeudan A/S 380 15,998Jyske Bank A/S (A) 2,627 135,130Lan & Spar Bank A/S 225 21,595Matas A/S 2,910 55,575Netcompany Group A/S (D) 1,609 172,518Nilfisk Holding A/S (A) 903 29,441NKT A/S (A) 2,018 97,607NNIT A/S (D) 479 8,387NTG Nordic Transport Group A/S (A) 635 51,744Per Aarsleff Holding A/S 883 41,334Ringkjoebing Landbobank A/S 1,224 164,512Royal Unibrew A/S 2,377 267,372Scandinavian Tobacco Group A/S (D) 3,178 66,753Schouw & Company A/S 666 58,001SimCorp A/S 1,846 201,199Solar A/S, B Shares 410 49,909
John Hancock Variable Insurance TrustPortfolio of Investments — December 31, 2021 (showing percentage of total net assets)
The accompanying notes are an integral part of the financial statements. 72

International Small Company Trust (continued)Shares orPrincipalAmount Value
COMMON STOCKS (continued)Denmark (continued)SP Group A/S 203 $ 13,708Spar Nord Bank A/S 4,967 63,572Sparekassen Sjaelland-Fyn A/S (A) 507 12,812Sydbank AS 3,132 98,994TCM Group A/S 507 12,374The Drilling Company of 1972 A/S (A) 908 35,429Tivoli A/S (A) 102 12,667Topdanmark AS 2,239 125,592United International Enterprises, Ltd. 128 36,514Zealand Pharma A/S (A)(B) 1,273 28,096
2,835,362Finland - 2.4%Aktia Bank OYJ 2,328 32,355Alma Media OYJ 1,962 24,109Anora Group OYJ 837 10,362BasWare OYJ (A) 538 18,318Bittium OYJ (B) 2,708 16,368Cargotec OYJ, B Shares 2,007 100,162Caverion OYJ 3,325 24,155Citycon OYJ (B) 4,136 32,963Enento Group OYJ (A)(D) 860 32,435Finnair OYJ (A)(B) 44,891 30,415Fiskars OYJ ABP 2,196 57,539F-Secure OYJ 7,159 40,359Harvia OYJ 846 56,572HKScan OYJ, A Shares 316 599Huhtamaki OYJ 4,496 198,862Kamux Corp. 1,688 22,027Kemira OYJ 4,940 74,849Kojamo OYJ 5,330 128,979Konecranes OYJ 2,937 117,656Lassila & Tikanoja OYJ 1,929 29,584Lehto Group OYJ (A) 1,738 1,702Marimekko OYJ 127 12,160Metsa Board OYJ, B Shares 9,171 89,850Multitude SE (A) 459 1,987Musti Group OYJ (A) 1,222 43,259Neles OYJ 6,038 93,976Nokian Renkaat OYJ 6,368 240,618Olvi OYJ, A Shares 721 42,094Oriola OYJ, B Shares 9,290 21,279Orion OYJ, Class A 982 40,432Orion OYJ, Class B 4,360 181,109Outokumpu OYJ (A) 16,202 101,605Pihlajalinna OYJ 1,193 17,235Ponsse OYJ 543 26,188QT Group OYJ (A) 770 116,625Raisio OYJ, V Shares 8,267 31,724Rapala VMC OYJ (A) 908 9,015Revenio Group OYJ 1,101 69,624Rovio Entertainment OYJ (D) 1,642 12,350Sanoma OYJ 4,094 63,210Taaleri OYJ 956 12,173Talenom OYJ 637 8,520Terveystalo OYJ (D) 2,964 39,848TietoEVRY OYJ 4,031 125,918Tokmanni Group Corp. 2,438 54,578Uponor OYJ 2,530 59,931Vaisala OYJ, A Shares 952 57,828Valmet OYJ 6,841 293,312Verkkokauppa.com OYJ 1,047 8,517Wartsila OYJ ABP 10,139 142,207YIT OYJ 8,449 41,551
3,109,093
International Small Company Trust (continued)Shares orPrincipalAmount Value
COMMON STOCKS (continued)France - 4.7%ABC arbitrage 1,219 $ 9,916AKWEL 725 17,895Albioma SA 1,751 68,369ALD SA (D) 3,848 56,620Altamir 752 21,726Alten SA 1,382 249,345Assystem SA 763 32,608Aubay 399 28,421Axway Software SA 531 16,249Bastide le Confort Medical 256 13,100Beneteau SA (A) 2,839 46,079Bigben Interactive 460 8,476Boiron SA 274 11,166Bonduelle SCA 1,027 24,386Burelle SA 15 11,084Casino Guichard Perrachon SA (A) 2,173 57,322Catana Group (A) 1,588 11,920Cegedim SA (A) 495 13,473CGG SA (A) 29,813 21,674Chargeurs SA 1,491 44,198Cie des Alpes (A) 998 15,751Cie Plastic Omnium SA 3,159 82,002Claranova SE (A)(B) 1,250 7,904Coface SA 5,646 80,449DBV Technologies SA (A)(B) 1,786 6,149Delta Plus Group 116 12,467Derichebourg SA (A) 6,625 76,653Ekinops SAS (A) 1,302 11,499Electricite de Strasbourg SA 31 3,972Elior Group SA (A)(D) 8,308 60,183Elis SA (A) 9,898 171,486Eramet SA (A) 445 36,549ESI Group (A) 197 16,692Etablissements Maurel et Prom SA (A) 1,561 4,057Eurazeo SE 1,586 138,371Eutelsat Communications SA 9,105 111,122Exel Industries SA, A Shares 89 7,824Faurecia SE 5,689 270,660Fnac Darty SA 1,052 68,846Gaztransport Et Technigaz SA 1,087 101,423Groupe Crit 163 11,524Guerbet 326 13,890Haulotte Group SA (A) 962 5,249ID Logistics Group (A) 176 73,453Imerys SA 1,845 76,649Infotel SA 133 8,541Interparfums SA 462 38,701Ipsen SA 114 10,432IPSOS 2,460 115,236JCDecaux SA (A) 2,376 59,489Kaufman & Broad SA 901 37,903Korian SA 3,776 119,609Lagardere SA (A) 3,040 84,034Laurent-Perrier 110 12,952Lectra 1,618 77,308LISI 1,205 38,883LNA Sante SA 166 9,514Lumibird (A) 632 17,250Maisons du Monde SA (D) 1,925 44,553Manitou BF SA 880 27,658Manutan International 105 8,608Mersen SA 1,171 49,328Metropole Television SA 1,324 25,908Neoen SA (A)(D) 1,095 47,530Nexans SA 1,883 184,118
John Hancock Variable Insurance TrustPortfolio of Investments — December 31, 2021 (showing percentage of total net assets)
The accompanying notes are an integral part of the financial statements. 73

International Small Company Trust (continued)Shares orPrincipalAmount Value
COMMON STOCKS (continued)France (continued)Nexity SA 1,974 $ 92,957NRJ Group 782 5,004Orpea SA 1,358 136,191Pharmagest Interactive 161 17,233Plastivaloire 383 2,754Quadient SA 2,721 59,260Recylex SA (A)(C) 1,058 2,226Rexel SA (A) 14,693 297,569Robertet SA 28 31,056Rothschild & Company 1,855 85,254Rubis SCA 3,860 115,426Samse SA 48 11,273Savencia SA 372 25,932SCOR SE 7,559 235,980SMCP SA (A)(D) 1,921 15,933Societe BIC SA 1,252 67,356Societe LDC SA 80 8,820Societe pour l’Informatique Industrielle 438 24,052SOITEC (A) 1,082 265,102Solocal Group (A)(B) 6,121 8,539Somfy SA 326 65,490Sopra Steria Group SACA 839 150,565SPIE SA 6,716 173,982Stef SA 202 23,416Synergie SE 557 23,117Technicolor SA (A) 3,955 12,667Technip Energies NV (A) 4,570 66,856Television Francaise 1 3,803 37,788Thermador Groupe 453 52,258Tikehau Capital SCA 1,533 40,530Trigano SA 463 89,855Valeo 5,916 178,405Vallourec SA (A) 2,750 27,511Verallia SA (D) 2,380 83,858Vetoquinol SA 155 23,356Vicat SA 1,201 49,205VIEL & Cie SA 3,220 21,346Vilmorin & Cie SA 614 37,522Virbac SA 180 86,918Wavestone 331 20,466
6,019,434Gabon - 0.0%Total Gabon 20 3,136Georgia - 0.1%Bank of Georgia Group PLC 2,491 56,491Georgia Capital PLC (A) 1,145 10,998TBC Bank Group PLC 239 5,353
72,842Germany - 6.3%1&1 AG 2,192 59,8297C Solarparken AG 3,210 15,806Aareal Bank AG 2,902 94,692Adesso SE 90 21,328ADVA Optical Networking SE (A) 3,719 59,473AIXTRON SE 706 14,300Allgeier SE 498 31,551Amadeus Fire AG 197 40,636Atoss Software AG 218 53,784Aurubis AG 1,823 182,230Basler AG 162 29,201BayWa AG 1,025 45,051Bechtle AG 294 20,921Bertrandt AG 394 25,563Bijou Brigitte AG (A) 340 8,423
International Small Company Trust (continued)Shares orPrincipalAmount Value
COMMON STOCKS (continued)Germany (continued)Bilfinger SE 1,781 $ 60,234Borussia Dortmund GmbH & Company
KGaA (A)(B) 4,276 21,073CANCOM SE 2,024 135,704CECONOMY AG (A) 8,144 35,037CENIT AG 446 7,033Cewe Stiftung & Company KGAA 268 39,025Commerzbank AG (A) 11,272 85,279CompuGroup Medical SE &
Company KgaA 1,368 110,301CropEnergies AG 1,544 21,503CTS Eventim AG & Company KGaA (A) 429 31,357Dermapharm Holding SE 849 86,201Deutsche Beteiligungs AG 1,067 48,431Deutsche EuroShop AG 2,527 42,036Deutsche Lufthansa AG (A)(B) 6,567 45,982Deutsche Pfandbriefbank AG (D) 7,700 92,246Deutz AG (A) 7,260 54,149DIC Asset AG 3,005 52,523Dr. Hoenle AG (B) 420 18,629Draegerwerk AG & Company KGaA 82 5,020Duerr AG 2,558 116,254Eckert & Ziegler Strahlen- und
Medizintechnik AG 808 86,349Elmos Semiconductor SE 215 14,270ElringKlinger AG (A) 2,576 32,272Encavis AG 3,974 70,083Energiekontor AG 226 18,236Evotec SE (A) 1,588 76,659Fielmann AG 1,241 83,313First Sensor AG 433 22,425flatexDEGIRO AG (A)(B) 2,072 47,467Fraport AG Frankfurt Airport Services
Worldwide (A) 1,626 108,871Freenet AG 6,277 165,888Fuchs Petrolub SE 1,085 38,010GEA Group AG 7,088 387,142Gerresheimer AG 1,515 145,666GFT Technologies SE 961 50,341GRENKE AG 500 17,381H&R GmbH & Company KGaA (A) 1,324 10,554Hamburger Hafen und Logistik AG 1,330 31,143Heidelberger Druckmaschinen AG (A) 18,003 54,026Hella GmbH & Company KGaA 1,867 126,684Hornbach Baumarkt AG 590 31,914Hornbach Holding AG & Company KGaA 497 74,639HUGO BOSS AG 3,312 200,488Hypoport SE (A) 149 86,417Indus Holding AG 975 36,318Instone Real Estate Group SE (D) 2,299 43,326IVU Traffic Technologies AG 728 17,467Jenoptik AG 2,990 126,169JOST Werke AG (D) 517 29,066K+S AG (A) 9,654 166,068Kloeckner & Company SE (A) 5,538 67,414Koenig & Bauer AG (A) 912 32,414Krones AG 775 84,309KWS Saat SE & Company KGaA 607 50,387LANXESS AG 4,346 268,751Leifheit AG 437 18,198Leoni AG (A) 2,398 26,876Manz AG (A)(B) 233 13,198Medigene AG (A) 760 2,468METRO AG 3,920 41,122MLP SE 5,864 56,992
John Hancock Variable Insurance TrustPortfolio of Investments — December 31, 2021 (showing percentage of total net assets)
The accompanying notes are an integral part of the financial statements. 74

International Small Company Trust (continued)Shares orPrincipalAmount Value
COMMON STOCKS (continued)Germany (continued)Nagarro SE (A) 498 $ 114,042New Work SE 128 31,693Nexus AG 866 70,553Nordex SE (A)(B) 6,207 97,352Norma Group SE 1,576 60,840OHB SE 399 16,315PATRIZIA AG 2,719 63,382Pfeiffer Vacuum Technology AG 256 62,945PNE AG 3,180 30,426ProSiebenSat.1 Media SE 10,428 165,658PSI Software AG 815 42,930PVA TePla AG (A) 629 29,883q.beyond AG (A) 6,549 14,636Rheinmetall AG 2,219 208,830SAF-Holland SE (A) 3,149 44,085Salzgitter AG (A) 1,978 70,671Scout24 SE (D) 2,989 208,711Secunet Security Networks AG 53 24,848SGL Carbon SE (A) 3,072 26,842Siltronic AG (B) 981 156,926Sirius Real Estate, Ltd. 40,212 77,143Sixt SE (A) 694 122,430SMA Solar Technology AG (B) 563 23,782Software AG 2,610 103,984STRATEC SE 407 63,843Stroeer SE & Company KGaA 1,454 114,716Suedzucker AG 3,535 53,299SUESS MicroTec SE (A) 1,803 42,960TAG Immobilien AG 7,456 208,263Takkt AG 1,848 32,241Technotrans SE 530 17,802thyssenkrupp AG (A) 16,532 181,118Traffic Systems SE 106 4,014United Internet AG 3,980 157,792va-Q-Tec AG (A)(B) 318 9,107Varta AG (B) 624 80,753VERBIO Vereinigte BioEnergie AG 1,482 100,878Vossloh AG 859 44,072Wacker Chemie AG 495 73,587Wacker Neuson SE 2,039 58,324Washtec AG 611 38,154Westwing Group AG (A) 385 9,620Wuestenrot & Wuerttembergische AG 1,566 31,474Zeal Network SE 809 36,612
8,099,122Gibraltar - 0.1%888 Holdings PLC 15,858 65,071Greece - 0.0%Alapis Holding Industrial & Commercial
SA of Pharmaceutical ChemicalProducts (A)(C) 3,303 69
TT Hellenic Postbank SA (A)(C) 12,594 069
Guernsey, Channel Islands - 0.0%Raven Property Group, Ltd. (A) 4,994 2,302Hong Kong - 2.1%3D-Gold Jewellery Holdings, Ltd. (A)(C) 90,000 0Aidigong Maternal & Child
Health, Ltd. (A)(B) 108,000 11,913Allied Group, Ltd. 120,000 42,053APAC Resources, Ltd. 18,475 2,701Apollo Future Mobility Group, Ltd. (A) 56,000 3,233Asia Financial Holdings, Ltd. 14,000 6,556ASM Pacific Technology, Ltd. 10,400 112,390
International Small Company Trust (continued)Shares orPrincipalAmount Value
COMMON STOCKS (continued)Hong Kong (continued)Associated International Hotels, Ltd. 28,000 $ 45,243Blue River Holdings, Ltd. (A) 74,400 915BOE Varitronix, Ltd. 28,000 36,032Brightoil Petroleum Holdings, Ltd. (A)(C) 117,000 12,942Burwill Holdings, Ltd. (A)(C) 292,000 1,198Cafe de Coral Holdings, Ltd. 18,000 32,093Cathay Pacific Airways, Ltd. (A)(B) 49,000 40,158Chen Hsong Holdings 10,000 3,077Cheuk Nang Holdings, Ltd. 3,708 1,189China Energy Development
Holdings, Ltd. (A) 634,000 12,288China Solar Energy Holdings, Ltd. (A)(C) 42,500 0China Strategic Holdings, Ltd. (A) 885,000 5,223Chinese Estates Holdings, Ltd. 22,000 8,084Chow Sang Sang Holdings
International, Ltd. 22,000 30,741Chuang’s Consortium International, Ltd. 30,948 3,652CITIC Telecom International
Holdings, Ltd. 59,000 19,906CMBC Capital Holdings, Ltd. 10,750 6,659C-Mer Eye Care Holdings, Ltd. 18,000 15,907Crystal International Group, Ltd. (D) 19,000 6,387CSI Properties, Ltd. 245,066 6,512Dah Sing Banking Group, Ltd. 18,000 15,379Dah Sing Financial Holdings, Ltd. 6,520 19,748Dynamic Holdings, Ltd. 8,000 10,479EC Healthcare 13,000 18,578EganaGoldpfeil Holdings, Ltd. (A)(C) 103,373 0Emperor Capital Group, Ltd. (A) 192,000 1,921Emperor Entertainment Hotel, Ltd. 40,000 4,312Emperor International Holdings, Ltd. 97,333 11,614Esprit Holdings, Ltd. (A) 176,850 16,111Fairwood Holdings, Ltd. 3,500 6,958Far East Consortium International, Ltd. 86,473 31,504First Pacific Company, Ltd. 146,000 53,756Giordano International, Ltd. 82,000 15,678Gold-Finance Holdings, Ltd. (A)(C) 62,000 0Great Eagle Holdings, Ltd. 10,197 28,524G-Resources Group, Ltd. (A) 33,580 12,071Guotai Junan International Holdings, Ltd. 207,000 28,686Haitong International Securities
Group, Ltd. 114,070 24,601Hang Lung Group, Ltd. 31,000 66,284Hanison Construction Holdings, Ltd. 27,441 4,576Harbour Centre Development, Ltd. 38,000 33,954HKBN, Ltd. 36,000 44,180HKR International, Ltd. 51,920 20,665Hong Kong Ferry Holdings Company, Ltd. 29,000 20,392Hong Kong Technology Venture
Company, Ltd. 28,000 30,535Hongkong Chinese, Ltd. 66,000 4,915Hsin Chong Group Holdings, Ltd. (A)(C) 170,000 7,631Hutchison Port Holdings Trust 161,400 36,255Hutchison Telecommunications Hong Kong
Holdings, Ltd. 80,000 12,834Hysan Development Company, Ltd. 25,000 77,288Johnson Electric Holdings, Ltd. 20,883 44,286K Wah International Holdings, Ltd. 80,000 30,883Kerry Logistics Network, Ltd. 24,000 58,730Kerry Properties, Ltd. 28,500 74,224Kingston Financial Group, Ltd. (A) 38,000 1,879Kowloon Development Company, Ltd. 22,000 29,067Lai Sun Development Company, Ltd. (A) 22,980 12,544Landing International
Development, Ltd. (A) 75,600 2,260
John Hancock Variable Insurance TrustPortfolio of Investments — December 31, 2021 (showing percentage of total net assets)
The accompanying notes are an integral part of the financial statements. 75

International Small Company Trust (continued)Shares orPrincipalAmount Value
COMMON STOCKS (continued)Hong Kong (continued)Langham Hospitality Investments, Ltd. (A) 22,500 $ 2,423Lifestyle International Holdings, Ltd. (A) 25,000 13,764Lippo China Resources, Ltd. 36,000 560Liu Chong Hing Investment, Ltd. 16,000 15,903Luk Fook Holdings International, Ltd. 15,000 40,426Mandarin Oriental International, Ltd. (A) 8,000 17,914Mason Group Holdings, Ltd. (A) 1,548,800 3,969Melco International Development, Ltd. (A) 33,000 40,271MH Development, Ltd. (A)(C) 16,000 1,071Midland Holdings, Ltd. (A) 34,734 4,191Miramar Hotel & Investment 15,000 24,639Modern Dental Group, Ltd. 20,000 14,205NewOcean Energy Holdings, Ltd. (A)(B) 66,000 491NWS Holdings, Ltd. 52,000 48,781Oriental Watch Holdings 18,000 11,266Oshidori International Holdings, Ltd. (A) 204,000 14,674Pacific Andes International
Holdings, Ltd. (A)(C) 328,006 0Pacific Basin Shipping, Ltd. 239,000 87,859Pacific Century Premium
Developments, Ltd. (A) 2,376 183Pacific Textiles Holdings, Ltd. 42,000 19,831Paliburg Holdings, Ltd. (A) 46,000 11,789PC Partner Group, Ltd. 12,000 20,998PCCW, Ltd. 156,590 79,340Peace Mark Holdings, Ltd. (A)(C) 164,000 0Perfect Medical Health Management, Ltd. 32,000 23,251Pico Far East Holdings, Ltd. 60,000 9,770Public Financial Holdings, Ltd. 24,000 8,004Regal Hotels International
Holdings, Ltd. (A) 36,000 14,138Regina Miracle International
Holdings, Ltd. (D) 17,000 14,172Sa Sa International Holdings, Ltd. (A) 48,000 10,279Shangri-La Asia, Ltd. (A) 46,000 38,426Shenwan Hongyuan HK, Ltd. 20,000 2,386Shun Tak Holdings, Ltd. (A) 80,250 22,136Singamas Container Holdings, Ltd. 114,000 17,136SJM Holdings, Ltd. (A) 95,000 64,004SmarTone Telecommunications
Holdings, Ltd. 31,500 16,775Solomon Systech International, Ltd. (B) 72,000 7,120South China Holdings Company, Ltd. (A) 640,000 6,563Stella International Holdings, Ltd. 20,000 24,193Summit Ascent Holdings, Ltd. (A) 90,000 1,705Sun Hung Kai & Company, Ltd. 45,000 24,015SUNeVision Holdings, Ltd. 18,000 17,061Tao Heung Holdings, Ltd. 14,000 1,634Television Broadcasts, Ltd. (A) 19,100 11,536Texhong Textile Group, Ltd. 11,000 14,530Texwinca Holdings, Ltd. 60,000 11,930The Bank of East Asia, Ltd. 23,800 34,201The Hongkong & Shanghai
Hotels, Ltd. (A) 31,903 28,039The United Laboratories International
Holdings, Ltd. 42,000 23,445Theme International Holdings, Ltd. (A) 90,000 10,042Town Health International Medical
Group, Ltd. (A) 261,361 14,789Tradelink Electronic Commerce, Ltd. 50,000 7,437Transport International Holdings, Ltd. 11,721 19,247Upbest Group, Ltd. 164,000 17,247Value Partners Group, Ltd. 40,000 19,976Vitasoy International Holdings, Ltd. 26,000 52,575VSTECS Holdings, Ltd. 21,200 19,893
International Small Company Trust (continued)Shares orPrincipalAmount Value
COMMON STOCKS (continued)Hong Kong (continued)VTech Holdings, Ltd. 6,900 $ 54,045Wai Kee Holdings, Ltd. 24,000 11,301Wealthking Investments, Ltd. (A) 32,000 3,289Wing On Company International, Ltd. 4,000 9,023Wing Tai Properties, Ltd. 70,000 37,965Yue Yuen Industrial Holdings, Ltd. (A) 30,000 50,219Yunfeng Financial Group, Ltd. (A)(B) 26,000 4,503Zensun Enterprises, Ltd. (B) 21,000 10,399Zhaobangji Properties Holdings, Ltd. (A) 88,000 4,963
2,648,264Ireland - 0.7%AIB Group PLC (A) 3,760 9,162AIB Group PLC (London Stock
Exchange) (A) 9,959 24,234Bank of Ireland Group PLC (A) 10,584 59,942Bank of Ireland Group PLC (London
Stock Exchange) (A) 33,477 191,975C&C Group PLC (A) 22,471 71,002Cairn Homes PLC 15,034 19,294Cairn Homes PLC (London Stock
Exchange) 9,684 12,480COSMO Pharmaceuticals NV (A) 362 26,015Dalata Hotel Group PLC (A) 6,155 26,017FBD Holdings PLC (A) 778 6,720Glanbia PLC 1,213 16,947Glanbia PLC (London Stock Exchange) 7,811 112,330Glenveagh Properties PLC (A)(D) 24,326 34,059Grafton Group PLC 11,437 192,030Greencore Group PLC (A) 23,830 41,946Hostelworld Group PLC (A)(D) 3,065 2,859Irish Continental Group PLC (A) 5,309 27,360Keywords Studios PLC 1,446 57,922Permanent TSB Group Holdings PLC (A) 5,786 10,631
942,925Isle of Man - 0.1%Hansard Global PLC 6,816 4,450Playtech PLC (A) 15,546 154,895Strix Group PLC 6,042 24,836
184,181Israel - 1.8%Adgar Investment and Development, Ltd. 4,535 11,831AFI Properties, Ltd. 603 39,939Africa Israel Residences, Ltd. 201 12,902Airport City, Ltd. (A) 1 13Allot, Ltd. (A) 2,103 24,775Alrov Properties and Lodgings, Ltd. (A) 399 24,484Ashtrom Group, Ltd. 2,084 56,436AudioCodes, Ltd. 1,729 60,065Azorim-Investment Development &
Construction Company, Ltd. (A) 3,848 22,999Bet Shemesh Engines Holdings 1997,
Ltd. (A) 358 7,848BioLine RX, Ltd. (A) 48,850 6,711Blue Square Real Estate, Ltd. 215 19,426Camtek, Ltd. (A) 1,035 47,732Carasso Motors, Ltd. 2,020 13,277Cellcom Israel, Ltd. (A) 2,791 15,642Clal Insurance Enterprises
Holdings, Ltd. (A) 1,967 50,360Danel Adir Yeoshua, Ltd. 184 41,593Delek Automotive Systems, Ltd. 1,858 26,305Delek Group, Ltd. (A) 277 22,714Delta Galil Industries, Ltd. 618 42,489Duniec Brothers, Ltd. 142 10,323
John Hancock Variable Insurance TrustPortfolio of Investments — December 31, 2021 (showing percentage of total net assets)
The accompanying notes are an integral part of the financial statements. 76

International Small Company Trust (continued)Shares orPrincipalAmount Value
COMMON STOCKS (continued)Israel (continued)Electra Consumer Products 1970, Ltd. 445 $ 25,702Electra Real Estate, Ltd. 1,543 30,717Electra, Ltd. 91 63,031Energix-Renewable Energies, Ltd. 8,191 34,682Enlight Renewable Energy, Ltd. (A) 35,332 86,529Equital, Ltd. (A) 992 38,011Evogene, Ltd. (A) 3,768 6,180Fattal Holdings 1998, Ltd. (A) 137 13,803Formula Systems 1985, Ltd. 549 66,938Fox Wizel, Ltd. 488 87,634Gav-Yam Lands Corp., Ltd. 5,000 61,755Gilat Satellite Networks, Ltd. 1,452 10,373Hadera Paper, Ltd. 244 17,835Harel Insurance Investments & Financial
Services, Ltd. 4,995 56,703Hilan, Ltd. 803 53,703IDI Insurance Company, Ltd. 440 16,028Ilex Medical, Ltd. 211 11,021Inrom Construction Industries, Ltd. 4,264 21,130Isracard, Ltd. 6,691 32,973Israel Canada T.R, Ltd. 3,667 23,585Israel Discount Bank, Ltd., Class A 1 5Israel Land Development - Urban
Renewal, Ltd. 789 13,460Isras Investment Company, Ltd. 142 37,596Kamada, Ltd. (A) 1,616 10,665Kerur Holdings, Ltd. 418 13,432M Yochananof & Sons, Ltd. 155 11,740Magic Software Enterprises, Ltd. 1,349 28,617Malam - Team, Ltd. 476 17,375Matrix IT, Ltd. 2,095 63,597Mediterranean Towers, Ltd. 4,044 12,295Mega Or Holdings, Ltd. 757 34,703Mehadrin, Ltd. (A) 15 886Menora Mivtachim Holdings, Ltd. 1,766 41,748Migdal Insurance & Financial
Holdings, Ltd. 27,734 45,637Mivtach Shamir Holdings, Ltd. 397 14,613Naphtha Israel Petroleum Corp., Ltd. (A) 2,030 14,568Nawi Brothers, Ltd. 1,396 14,290Neto Malinda Trading, Ltd. (A) 451 15,986Novolog, Ltd. (B) 20,186 19,270Oil Refineries, Ltd. (A) 102,102 29,239One Software Technologies, Ltd. 1,700 33,798OPC Energy, Ltd. (A) 4,056 45,418Partner Communications
Company, Ltd. (A) 6,688 54,354Paz Oil Company, Ltd. (A) 525 65,283Perion Network, Ltd. (A) 1,368 33,176Plasson Industries, Ltd. 241 16,974Plus500, Ltd. 4,106 75,739Prashkovsky Investments &
Construction, Ltd. 318 13,064Priortech, Ltd. (A) 398 15,141Rami Levy Chain Stores Hashikma
Marketing 2006, Ltd. 449 33,688Sano-Brunos Enterprises, Ltd. 145 16,797Scope Metals Group, Ltd. 377 15,705Shikun & Binui, Ltd. (A) 1 6Shufersal, Ltd. 4,263 35,482Summit Real Estate Holdings, Ltd. (A) 2,363 49,724Tadiran Group, Ltd. 86 11,997Tel Aviv Stock Exchange, Ltd. 3,160 17,050Tera Light, Ltd. (A) 1,766 4,260Tiv Taam Holdings 1, Ltd. 3,848 13,766
International Small Company Trust (continued)Shares orPrincipalAmount Value
COMMON STOCKS (continued)Israel (continued)Tremor International, Ltd. (A) 2,825 $ 21,110YH Dimri Construction &
Development, Ltd. 285 27,6792,356,130
Italy - 3.4%A2A SpA 85,615 166,831ACEA SpA 2,494 53,287Anima Holding SpA (D) 14,880 75,982Aquafil SpA (A) 969 8,425Arnoldo Mondadori Editore SpA (A) 12,613 29,221Ascopiave SpA 4,243 16,718Avio SpA 877 11,667Azimut Holding SpA 6,169 172,462Banca Generali SpA (A) 3,053 133,925Banca IFIS SpA 1,607 31,043Banca Mediolanum SpA 8,278 81,608Banca Popolare di Sondrio SCPA 25,315 106,282Banca Profilo SpA 24,032 5,851Banco BPM SpA 92,714 277,595Banco di Desio e della Brianza SpA 2,610 8,958BFF Bank SpA (D) 8,562 68,848BPER Banca 48,081 99,370Brembo SpA 7,094 100,914Brunello Cucinelli SpA (A) 1,411 96,982Buzzi Unicem SpA 4,670 100,619Cairo Communication SpA 4,712 10,946Carel Industries SpA (D) 1,196 36,169Cementir Holding NV 4,165 39,720CIR SpA-Compagnie Industriali (A) 60,979 32,553Credito Emiliano SpA 6,238 41,174Danieli & C Officine Meccaniche SpA 788 24,146Danieli & C Officine Meccaniche SpA,
Savings Shares 2,118 41,397De’ Longhi SpA 2,969 106,216DeA Capital SpA (A) 4,665 6,930doValue SpA (D) 1,965 18,752Enav SpA (A)(D) 5,063 22,663ERG SpA 2,919 94,272Esprinet SpA 3,554 52,046Eurotech SpA (A) 1,562 8,969Fincantieri SpA (A)(B) 18,635 12,806Geox SpA (A) 8,390 10,193Gruppo MutuiOnline SpA 1,697 85,439Hera SpA 41,143 171,005Illimity Bank SpA (A) 3,374 50,501IMMSI SpA (A)(B) 6,756 3,347Interpump Group SpA 1,411 103,357Iren SpA 30,720 92,455Italgas SpA 24,861 170,891Italmobiliare SpA 1,039 38,359Juventus Football Club SpA (A) 58,054 22,673La Doria SpA 503 9,412Leonardo SpA (A) 17,860 127,663Maire Tecnimont SpA 10,323 48,787MFE-MediaForEurope NV, Class A (A) 18,917 19,286MFE-MediaForEurope NV, Class B 18,917 26,736OVS SpA (A)(D) 11,708 33,891Pharmanutra SpA 268 22,963Piaggio & C SpA 11,658 38,139Pirelli & C. SpA (D) 17,419 120,810Prima Industrie SpA (A) 178 3,723RAI Way SpA (D) 5,678 33,635Reply SpA 1,027 208,591Sabaf SpA 338 9,176SAES Getters SpA 409 11,509
John Hancock Variable Insurance TrustPortfolio of Investments — December 31, 2021 (showing percentage of total net assets)
The accompanying notes are an integral part of the financial statements. 77

International Small Company Trust (continued)Shares orPrincipalAmount Value
COMMON STOCKS (continued)Italy (continued)SAES Getters SpA, Savings Shares 538 $ 10,785Safilo Group SpA (A) 2,378 4,239Saipem SpA (A)(B) 30,422 63,786Salvatore Ferragamo SpA (A) 2,452 62,868Saras SpA (A) 28,012 17,547Sesa SpA 391 77,052Sogefi SpA (A) 3,551 4,770SOL SpA 2,802 67,343Tamburi Investment Partners SpA 5,435 61,089Technogym SpA (D) 6,815 65,504Tinexta SpA 1,069 46,333Tod’s SpA (A) 590 32,961Unieuro SpA (D) 1,088 25,950Unipol Gruppo SpA 22,660 122,712UnipolSai Assicurazioni SpA 9,024 25,400Webuild SpA 14,544 34,401Zignago Vetro SpA 1,669 32,837
4,413,465Japan - 22.1%A&D Company, Ltd. 900 9,888Access Company, Ltd. (A) 2,300 14,143Achilles Corp. 1,000 10,862Adastria Company, Ltd. 920 12,963ADEKA Corp. 4,700 104,974Ad-sol Nissin Corp. 800 12,442Advan Group Company, Ltd. 1,000 8,441Aeon Delight Company, Ltd. 800 23,448Aeon Fantasy Company, Ltd. 400 6,472AEON Financial Service Company, Ltd. 2,900 31,281Aeon Hokkaido Corp. 1,800 19,839Aeria, Inc. (B) 700 2,434Ai Holdings Corp. 1,900 31,813Aica Kogyo Company, Ltd. 1,800 52,108Aichi Corp. 3,200 22,509Aichi Steel Corp. 700 15,157Aida Engineering, Ltd. 4,500 41,845Aiful Corp. 15,500 47,957Ain Holdings, Inc. 1,100 54,830Aiphone Company, Ltd. 600 11,096Airport Facilities Company, Ltd. 1,200 5,736Aisan Industry Company, Ltd. 2,500 16,640Aizawa Securities Group Company, Ltd. 2,400 21,324Akatsuki, Inc. 400 10,020Akebono Brake Industry
Company, Ltd. (A) 9,400 15,117Albis Company, Ltd. 500 9,763Alconix Corp. 1,600 18,651Alpen Company, Ltd. 1,100 20,440Alps Alpine Company, Ltd. 10,900 102,809Altech Corp. 1,100 18,188Amano Corp. 2,200 50,656Amuse, Inc. 400 7,287Amvis Holdings, Inc. 600 27,569Anest Iwata Corp. 1,800 13,933Anicom Holdings, Inc. 3,700 26,661Anritsu Corp. 5,700 88,031AOKI Holdings, Inc. 3,100 16,649Aoyama Trading Company, Ltd. (A) 2,500 14,545Aoyama Zaisan Networks
Company, Ltd. (B) 1,100 14,554Aozora Bank, Ltd. 1,300 28,431Arakawa Chemical Industries, Ltd. 1,400 14,496Arata Corp. 700 26,826Arcland Service Holdings
Company, Ltd. (B) 1,000 19,675
International Small Company Trust (continued)Shares orPrincipalAmount Value
COMMON STOCKS (continued)Japan (continued)Arcs Company, Ltd. 2,125 $ 39,465Arealink Company, Ltd. 500 6,684Argo Graphics, Inc. 1,000 27,992Arisawa Manufacturing Company, Ltd. 2,900 24,892ARTERIA Networks Corp. 1,600 21,500ArtSpark Holdings, Inc. (B) 3,200 26,218Aruhi Corp. 1,800 16,357Asahi Company, Ltd. 800 10,075Asahi Diamond Industrial Company, Ltd. 3,900 22,149Asahi Holdings, Inc. 3,600 64,306Asahi Yukizai Corp. 1,200 18,011Asanuma Corp. 700 33,481Asia Pile Holdings Corp. 3,300 12,917ASKA Pharmaceutical Holdings
Company, Ltd. 1,600 14,004ASKUL Corp. 2,000 26,682Atrae, Inc. (A) 600 12,649Atsugi Company, Ltd. (A) 1,200 5,896Autobacs Seven Company, Ltd. 3,000 36,603Aval Data Corp. 600 13,618Avant Corp. 900 9,394Avex, Inc. 900 11,278Axell Corp. 100 1,043Axial Retailing, Inc. 800 23,463Bando Chemical Industries, Ltd. 2,500 19,432Bank of the Ryukyus, Ltd. 3,000 19,887Belc Company, Ltd. 500 24,481Bell System24 Holdings, Inc. 2,400 26,095Belluna Company, Ltd. 3,300 20,317Benesse Holdings, Inc. 3,700 72,658BeNext-Yumeshin Group Company 2,185 32,190Bengo4.com, Inc. (A)(B) 300 15,885Bic Camera, Inc. 3,500 29,302BML, Inc. 1,000 31,094Bourbon Corp. 500 10,463Br. Holdings Corp. 2,300 6,982BrainPad, Inc. (A) 900 11,890Broadleaf Company, Ltd. (B) 4,600 17,444Bunka Shutter Company, Ltd. 5,000 46,692Business Brain Showa-Ota, Inc. 700 12,474C Uyemura & Company, Ltd. 800 42,941CAC Holdings Corp. 900 11,361Can Do Company, Ltd. (B) 90 1,761Canon Electronics, Inc. 1,700 23,444Carenet, Inc. 1,200 11,169Carlit Holdings Company, Ltd. 2,100 12,872Cawachi, Ltd. 900 17,236CellSource Company, Ltd. (A) 600 28,300Central Automotive Products, Ltd. 500 12,922Central Glass Company, Ltd. 1,900 35,241Central Security Patrols Company, Ltd. 700 14,681Central Sports Company, Ltd. 600 12,778Ceres, Inc. 600 12,743Charm Care Corp. KK 1,000 12,672Chilled & Frozen Logistics Holdings
Company, Ltd. 1,600 23,410Chino Corp. 400 5,820Chiyoda Company, Ltd. 800 5,409Chiyoda Corp. (A) 9,100 27,814Chiyoda Integre Company, Ltd. 800 14,073Chofu Seisakusho Company, Ltd. 1,700 30,152Chori Company, Ltd. 1,200 19,063Chubu Shiryo Company, Ltd. 2,000 17,132Chudenko Corp. 1,900 35,107Chuetsu Pulp & Paper Company, Ltd. 500 4,179
John Hancock Variable Insurance TrustPortfolio of Investments — December 31, 2021 (showing percentage of total net assets)
The accompanying notes are an integral part of the financial statements. 78

International Small Company Trust (continued)Shares orPrincipalAmount Value
COMMON STOCKS (continued)Japan (continued)Chugai Ro Company, Ltd. 500 $ 7,071Chugoku Marine Paints, Ltd. 4,000 33,016CI Takiron Corp. 3,000 14,676Citizen Watch Company, Ltd. 16,000 69,255CKD Corp. 2,400 48,753Cleanup Corp. 2,100 9,980CMIC Holdings Company, Ltd. 1,200 15,970CMK Corp. 3,700 22,311COLOPL, Inc. 3,200 18,283Computer Engineering & Consulting, Ltd. 1,800 16,990Comture Corp. 1,000 31,315CONEXIO Corp. 1,300 16,668COOKPAD, Inc. (A) 2,700 6,091Corona Corp. 300 2,365Cosel Company, Ltd. 1,200 8,912Cosmo Energy Holdings Company, Ltd. 2,900 56,660Cota Company, Ltd. 484 6,943CRE, Inc. 800 11,579Create Restaurants Holdings, Inc. (A) 2,500 15,702Create SD Holdings Company, Ltd. 1,700 47,075Credit Saison Company, Ltd. 8,100 85,182Cresco, Ltd. 800 14,543CROOZ, Inc. (A) 600 5,094CTS Company, Ltd. 1,900 13,905Curves Holdings Company, Ltd. 600 4,144Cybozu, Inc. 900 14,313Dai Nippon Toryo Company, Ltd. 1,200 8,630Daibiru Corp. 3,400 65,535Daicel Corp. 9,100 62,977Dai-Dan Company, Ltd. 1,000 19,983Daido Metal Company, Ltd. 1,900 10,016Daido Steel Company, Ltd. 1,300 47,218Daidoh, Ltd. (A) 2,000 2,539Daihen Corp. 1,100 45,697Daiho Corp. 800 27,641Daiichi Jitsugyo Company, Ltd. 400 17,228Daiichi Kigenso Kagaku-Kogyo
Company, Ltd. 1,800 19,422Daiichikosho Company, Ltd. 300 9,083Daiken Corp. 1,000 18,866Daiken Medical Company, Ltd. 400 1,947Daiki Aluminium Industry Company, Ltd. 3,000 41,775Daikoku Denki Company, Ltd. 800 8,409Daikokutenbussan Company, Ltd. 300 13,440Daikyonishikawa Corp. 1,900 9,670Dainichiseika Color & Chemicals
Manufacturing Company, Ltd. 300 6,116Daiseki Company, Ltd. 2,160 95,957Daishi Hokuetsu Financial Group, Inc. 2,200 48,544Daishinku Corp. 1,600 21,686Daito Pharmaceutical Company, Ltd. 700 18,063Daitron Company, Ltd. 600 11,189Daiwa Industries, Ltd. 2,000 21,968Daiwabo Holdings Company, Ltd. 4,000 63,973DCM Holdings Company, Ltd. 6,500 60,170DeNA Company, Ltd. 4,300 66,215Densan System Holdings
Company, Ltd. (B) 700 16,627Denyo Company, Ltd. 900 14,459Dexerials Corp. 3,500 126,332DIC Corp. (B) 2,900 73,105Digital Arts, Inc. 700 51,148Digital Garage, Inc. 1,600 67,980Digital Hearts Holdings Company, Ltd. 900 18,249Digital Holdings, Inc. 600 6,875
International Small Company Trust (continued)Shares orPrincipalAmount Value
COMMON STOCKS (continued)Japan (continued)Dip Corp. 1,500 $ 51,062DKK Company, Ltd. 1,000 21,776DKS Company, Ltd. 400 11,180DMG Mori Company, Ltd. 4,600 79,142Doshisha Company, Ltd. 1,700 23,148Doutor Nichires Holdings Company, Ltd. 2,300 32,056Dowa Holdings Company, Ltd. 1,900 79,971DTS Corp. 1,800 39,534Duskin Company, Ltd. 2,100 51,293DyDo Group Holdings, Inc. 700 28,849Eagle Industry Company, Ltd. 2,200 21,111Earth Corp. 800 42,692Ebara Jitsugyo Company, Ltd. (B) 800 17,315Ebase Company, Ltd. 1,200 6,743EDION Corp. 5,000 46,678EF-ON, Inc. 1,500 8,060eGuarantee, Inc. 1,300 26,156E-Guardian, Inc. 900 26,695Eiken Chemical Company, Ltd. 1,800 30,212Eizo Corp. 800 28,113Elan Corp. 2,800 27,045Elecom Company, Ltd. 1,600 21,058Electric Power Development
Company, Ltd. 4,900 65,119Elematec Corp. 1,400 13,153Enigmo, Inc. 2,400 15,952en-japan, Inc. 1,200 33,913Enplas Corp. 600 14,229eRex Company, Ltd. 1,900 33,766ES-Con Japan, Ltd. 1,500 10,219ESPEC Corp. 1,600 31,027Exedy Corp. 1,900 27,506Ezaki Glico Company, Ltd. 1,900 60,473FAN Communications, Inc. 2,000 6,751FCC Company, Ltd. 2,200 28,630FDK Corp. (A) 1,100 9,585Feed One Company, Ltd. 1,600 9,751Ferrotec Holdings Corp. 1,600 58,638FIDEA Holdings Company, Ltd. 2,140 24,888Fields Corp. 1,500 6,661Fixstars Corp. 2,000 15,512Foster Electric Company, Ltd. 2,100 13,317France Bed Holdings Company, Ltd. 2,200 17,633Fronteo, Inc. (B) 1,900 54,282Fudo Tetra Corp. 1,080 15,729Fuji Company, Ltd. 1,400 23,795Fuji Corp. (Aichi) 2,600 58,316Fuji Corp., Ltd. 1,300 7,837Fuji Kyuko Company, Ltd. 900 31,912Fuji Media Holdings, Inc. 2,000 19,245Fuji Oil Company, Ltd. 4,400 9,777Fuji Oil Holdings, Inc. 2,500 50,487Fuji Pharma Company, Ltd. 1,400 12,512Fuji Seal International, Inc. 2,100 38,665Fuji Soft, Inc. 900 43,422Fujibo Holdings, Inc. 700 24,941Fujicco Company, Ltd. 1,500 24,536Fujikura Kasei Company, Ltd. 2,000 8,690Fujikura, Ltd. (A) 11,000 53,997Fujimi, Inc. 500 33,667Fujimori Kogyo Company, Ltd. 800 28,604Fujisash Company, Ltd. 4,900 3,192Fujitec Company, Ltd. 1,900 41,643Fujiya Company, Ltd. 500 9,856Fukuda Corp. 200 7,498
John Hancock Variable Insurance TrustPortfolio of Investments — December 31, 2021 (showing percentage of total net assets)
The accompanying notes are an integral part of the financial statements. 79

International Small Company Trust (continued)Shares orPrincipalAmount Value
COMMON STOCKS (continued)Japan (continued)Fukuda Denshi Company, Ltd. 500 $ 37,333Fukui Computer Holdings, Inc. 300 9,012Fukushima Galilei Company, Ltd. 500 20,754Fukuyama Transporting Company, Ltd. 1,000 34,167FULLCAST Holdings Company, Ltd. 1,000 21,397Funai Soken Holdings, Inc. 1,800 40,951Furukawa Company, Ltd. 1,900 20,986Furukawa Electric Company, Ltd. 3,400 68,693Furuno Electric Company, Ltd. 2,400 25,230Furyu Corp. 1,300 15,482Fuso Chemical Company, Ltd. 1,000 42,193Fuso Pharmaceutical Industries, Ltd. 500 11,303Futaba Corp. 1,600 9,725Futaba Industrial Company, Ltd. 3,400 12,864Future Corp. 2,400 36,497Fuyo General Lease Company, Ltd. 900 62,395G-7 Holdings, Inc. 2,000 29,333Gakken Holdings Company, Ltd. 1,600 14,554Gecoss Corp. 400 2,870Genki Sushi Company, Ltd. 500 11,078Genky DrugStores Company, Ltd. 600 32,012Geo Holdings Corp. 2,700 29,098Giftee, Inc. (A) 600 10,211GLOBERIDE, Inc. 1,200 32,969Glory, Ltd. 2,100 40,001GMO Financial Holdings, Inc. 1,600 11,752GMO GlobalSign Holdings KK (B) 500 18,196GNI Group, Ltd. (A) 2,100 27,089Goldcrest Company, Ltd. 990 13,929Golf Digest Online, Inc. (B) 800 8,247Grace Technology, Inc. 1,700 5,500Gremz, Inc. 800 17,180GS Yuasa Corp. 3,000 66,751G-Tekt Corp. 1,200 14,913Gun-Ei Chemical Industry Company, Ltd. 400 13,191GungHo Online Entertainment, Inc. (B) 2,000 44,960Gunze, Ltd. 800 28,096H.U. Group Holdings, Inc. 2,200 55,815H2O Retailing Corp. 4,900 34,533Hagihara Industries, Inc. 800 8,872Hagiwara Electric Holdings Company, Ltd. 500 9,110Hakuto Company, Ltd. 1,300 29,898Halows Company, Ltd. 600 14,737Hamakyorex Company, Ltd. 1,000 25,258Hanwa Company, Ltd. 1,600 45,393Happinet Corp. 1,000 13,051Hazama Ando Corp. 10,090 75,936Heiwa Corp. 2,700 44,464Heiwa Real Estate Company, Ltd. 1,500 50,557Heiwado Company, Ltd. 2,000 33,569Hennge KK (A) 1,000 16,766Hibiya Engineering, Ltd. 1,500 26,819HI-LEX Corp. 600 7,817Hinokiya Group Company, Ltd. 300 5,727Hioki EE Corp. 500 38,256Hirano Tecseed Company, Ltd. 1,100 30,726Hirata Corp. 500 27,743Hirogin Holdings, Inc. 13,500 80,810Hiroshima Gas Company, Ltd. 4,900 15,680Hisaka Works, Ltd. 2,000 15,011Hitachi Zosen Corp. 9,000 62,404Hochiki Corp. 600 6,792Hodogaya Chemical Company, Ltd. 700 35,990Hogy Medical Company, Ltd. 800 22,655Hokkaido Electric Power Company, Inc. 11,100 49,645
International Small Company Trust (continued)Shares orPrincipalAmount Value
COMMON STOCKS (continued)Japan (continued)Hokkaido Gas Company, Ltd. 600 $ 7,959Hokkan Holdings, Ltd. 1,000 12,616Hokko Chemical Industry Company, Ltd. 700 5,653Hokkoku Financial Holdings, Inc. 1,500 33,250Hokuetsu Corp. 7,900 49,385Hokuetsu Industries Company, Ltd. 2,000 17,511Hokuhoku Financial Group, Inc. 5,900 46,880Hokuriku Electric Power Company 9,400 47,873Hokuto Corp. 1,600 26,552H-One Company, Ltd. 1,000 5,879Honeys Holdings Company, Ltd. 1,350 11,957Hoosiers Holdings 3,400 20,077Hosiden Corp. 3,900 39,067Hosokawa Micron Corp. 1,000 29,621Ichigo, Inc. 15,700 38,243Ichikoh Industries, Ltd. 2,300 10,913Ichinen Holdings Company, Ltd. 1,900 22,064Ichiyoshi Securities Company, Ltd. 2,800 16,051Icom, Inc. 500 10,570IDEC Corp. 1,600 38,723IDOM, Inc. 3,900 24,515Iino Kaiun Kaisha, Ltd. 7,300 34,675IJTT Company, Ltd. 1,200 7,082Ikegami Tsushinki Company, Ltd. 400 2,360I’ll, Inc. 1,100 13,843Imasen Electric Industrial 500 2,577Imuraya Group Company, Ltd. 300 5,820Inaba Denki Sangyo Company, Ltd. 2,700 63,435Inaba Seisakusho Company, Ltd. 200 2,383Inabata & Company, Ltd. 2,000 29,196Inageya Company, Ltd. 900 10,846Ines Corp. 900 11,828i-Net Corp. 900 10,893Infocom Corp. 1,000 18,954Infomart Corp. 8,700 70,741Information Services
International-Dentsu, Ltd. 1,400 47,132INFRONEER Holdings, Inc. 6,468 58,881Insource Company, Ltd. 600 14,670Intage Holdings, Inc. 3,100 47,377I-PEX, Inc. 500 8,508IR Japan Holdings, Ltd. 400 23,858Iriso Electronics Company, Ltd. 1,000 37,711Iseki & Company, Ltd. 1,200 14,418Isetan Mitsukoshi Holdings, Ltd. 2,100 15,520Ishihara Sangyo Kaisha, Ltd. 2,100 21,745ITFOR, Inc. 1,000 7,027ITmedia, Inc. 900 14,534Itochu Enex Company, Ltd. 3,800 32,916Itochu-Shokuhin Company, Ltd. 300 13,028Itoham Yonekyu Holdings, Inc. 5,100 29,182Itoki Corp. 2,100 6,521IwaiCosmo Holdings, Inc. 900 10,598Izumi Company, Ltd. 1,400 39,261J Front Retailing Company, Ltd. 8,800 80,132J Trust Company, Ltd. 4,900 24,221JAC Recruitment Company, Ltd. 1,200 21,762Jaccs Company, Ltd. 1,600 41,217JAFCO Group Company, Ltd. 1,400 80,544Jalux, Inc. (A) 500 11,087Jamco Corp. (A) 500 4,190JANOME Corp. 1,200 7,246Japan Asset Marketing Company, Ltd. (A) 14,200 20,110Japan Aviation Electronics Industry, Ltd. 3,000 51,992Japan Cash Machine Company, Ltd. (A) 700 4,118
John Hancock Variable Insurance TrustPortfolio of Investments — December 31, 2021 (showing percentage of total net assets)
The accompanying notes are an integral part of the financial statements. 80

International Small Company Trust (continued)Shares orPrincipalAmount Value
COMMON STOCKS (continued)Japan (continued)Japan Elevator Service Holdings
Company, Ltd. 2,200 $ 41,096Japan Investment Adviser
Company, Ltd. (B) 1,000 11,316Japan Lifeline Company, Ltd. 2,600 24,811Japan Material Company, Ltd. 3,700 60,953Japan Medical Dynamic Marketing, Inc. 900 14,644Japan Petroleum Exploration
Company, Ltd. 2,000 43,552Japan Property Management Center
Company, Ltd. 800 6,968Japan Pulp & Paper Company, Ltd. 600 21,498Japan Securities Finance Company, Ltd. 5,500 45,915Japan Transcity Corp. 3,100 19,125Jastec Company, Ltd. 400 3,684JBCC Holdings, Inc. 1,200 18,618JCU Corp. 1,300 61,800JGC Holdings Corp. 10,700 89,385Jimoto Holdings, Inc. 980 5,495JINS Holdings, Inc. 800 48,787JM Holdings Company, Ltd. 600 8,594JMS Company, Ltd. 500 2,666J-Oil Mills, Inc. 1,200 17,435Joshin Denki Company, Ltd. 1,100 20,480Joyful Honda Company, Ltd. (B) 1,900 24,332JSB Company, Ltd. 400 10,992JSP Corp. 800 11,372Juki Corp. 1,400 10,320Juroku Financial Group, Inc. 1,700 32,066JVCKenwood Corp. 9,070 13,895K&O Energy Group, Inc. 800 9,996Kaga Electronics Company, Ltd. 1,100 31,265Kagome Company, Ltd. 1,400 36,472Kaken Pharmaceutical Company, Ltd. 1,300 47,597Kakiyasu Honten Company, Ltd. 500 12,211Kamakura Shinsho, Ltd. 1,200 6,344Kameda Seika Company, Ltd. 700 26,042Kamei Corp. 2,000 18,137Kamigumi Company, Ltd. 700 13,255Kanaden Corp. 1,100 10,172Kanagawa Chuo Kotsu Company, Ltd. 700 20,943Kanamic Network Company, Ltd. 600 2,557Kanamoto Company, Ltd. 1,900 39,859Kandenko Company, Ltd. 4,700 35,016Kaneka Corp. 1,400 45,967Kanematsu Corp. 3,500 38,991Kanematsu Electronics, Ltd. 700 24,159Kanto Denka Kogyo Company, Ltd. 2,000 19,703Kasai Kogyo Company, Ltd. (A) 1,000 2,549Katakura Industries Company, Ltd. (A)(B) 1,700 36,473Kato Sangyo Company, Ltd. 1,100 32,070Kato Works Company, Ltd. 400 2,884Kawada Technologies, Inc. 200 7,442KeePer Technical Laboratory
Company, Ltd. 500 9,656Keihanshin Building Company, Ltd. 2,000 27,169Keiyo Company, Ltd. 3,400 25,042Kenko Mayonnaise Company, Ltd. 900 10,490KFC Holdings Japan, Ltd. 1,500 37,746KH Neochem Company, Ltd. 900 24,882Kimoto Company, Ltd. 3,000 5,899Kintetsu World Express, Inc. 1,600 41,519Kissei Pharmaceutical Company, Ltd. 1,100 21,585Ki-Star Real Estate Company, Ltd. 600 46,540Kitanotatsujin Corp. 3,300 9,599
International Small Company Trust (continued)Shares orPrincipalAmount Value
COMMON STOCKS (continued)Japan (continued)Kito Corp. 800 $ 13,812Kitz Corp. 4,600 28,474KLab, Inc. (A) 2,100 9,047Koa Corp. 1,700 23,804Koatsu Gas Kogyo Company, Ltd. 3,000 20,578Kobe Electric Railway Company, Ltd. (A) 300 8,236Kobe Steel, Ltd. 13,000 65,188Kohnan Shoji Company, Ltd. 1,200 35,312Kojima Company, Ltd. 3,000 14,132Kokuyo Company, Ltd. 3,800 56,699Komatsu Matere Company, Ltd. 2,000 22,198KOMEDA Holdings Company, Ltd. 2,600 46,342Komeri Company, Ltd. 1,500 33,388Komori Corp. 3,700 22,131Kondotec, Inc. 1,300 11,327Konica Minolta, Inc. 21,700 99,017Konishi Company, Ltd. 2,200 33,119Konoike Transport Company, Ltd. 2,600 27,854Krosaki Harima Corp. 400 15,334K’s Holdings Corp. 7,300 70,937Kumagai Gumi Company, Ltd. 1,800 44,935Kumiai Chemical Industry Company, Ltd. 3,400 23,389Kurabo Industries, Ltd. 1,600 27,220Kureha Corp. 800 57,159Kurimoto, Ltd. 1,000 13,698Kusuri no Aoki Holdings Company, Ltd. 700 44,360KYB Corp. 1,000 28,057Kyodo Printing Company, Ltd. 500 12,450Kyoei Steel, Ltd. 1,800 22,152Kyokuto Kaihatsu Kogyo Company, Ltd. 2,300 30,580Kyokuto Securities Company, Ltd. 2,300 14,952Kyokuyo Company, Ltd. 700 18,731KYORIN Holdings, Inc. 1,900 30,485Kyosan Electric Manufacturing
Company, Ltd. 2,000 8,057Kyudenko Corp. 1,700 52,532Kyushu Financial Group, Inc. 20,200 73,386LAC Company, Ltd. 1,400 9,101Lacto Japan Company, Ltd. 800 16,814LEC, Inc. 1,600 12,029Life Corp. 800 23,696LIFULL Company, Ltd. 3,800 7,997Link And Motivation, Inc. 2,300 11,013Lintec Corp. 1,900 43,584Litalico, Inc. 600 21,034Locondo, Inc. 400 4,500M&A Capital Partners Company, Ltd. (A) 600 27,490Mabuchi Motor Company, Ltd. 2,300 76,075Macnica Fuji Electronics Holdings, Inc. 2,650 63,412Macromill, Inc. 2,300 22,171Maeda Kosen Company, Ltd. 1,100 37,533Maezawa Kasei Industries
Company, Ltd. (B) 1,100 12,301Maezawa Kyuso Industries Company, Ltd. 1,800 16,693Makino Milling Machine Company, Ltd. 1,200 42,944Management Solutions Company, Ltd. (A) 1,300 40,388Mandom Corp. 1,600 19,695Mani, Inc. 3,200 44,412MarkLines Company, Ltd. 400 9,593Mars Group Holdings Corp. 700 10,254Marubun Corp. 200 1,467Marudai Food Company, Ltd. 1,600 21,220Maruha Nichiro Corp. 1,500 31,425Maruichi Steel Tube, Ltd. 2,200 48,746Marusan Securities Company, Ltd. 4,700 21,218
John Hancock Variable Insurance TrustPortfolio of Investments — December 31, 2021 (showing percentage of total net assets)
The accompanying notes are an integral part of the financial statements. 81

International Small Company Trust (continued)Shares orPrincipalAmount Value
COMMON STOCKS (continued)Japan (continued)Maruwa Company, Ltd. 300 $ 42,474Maruwa Unyu Kikan Company, Ltd. (B) 1,100 13,951Maruzen Company, Ltd. 800 14,779Maruzen Showa Unyu Company, Ltd. 800 22,268Marvelous, Inc. 1,400 8,890Matsuda Sangyo Company, Ltd. 1,400 29,657Matsui Securities Company, Ltd. 4,900 33,678Max Company, Ltd. 2,000 33,384Maxell, Ltd. 2,200 26,186Maxvalu Tokai Company, Ltd. 1,100 26,396MCJ Company, Ltd. 3,200 30,127Mebuki Financial Group, Inc. 37,200 76,571MEC Company, Ltd. 1,500 52,169Media Do Company, Ltd. 600 21,381Medical Data Vision Company, Ltd. 1,700 18,379Medikit Company, Ltd. 500 12,392MedPeer, Inc. (A) 600 18,681Megachips Corp. 1,100 49,254Megmilk Snow Brand Company, Ltd. 1,800 31,207Meidensha Corp. 1,800 42,900Meiko Electronics Company, Ltd. 1,200 49,614Meisei Industrial Company, Ltd. 3,000 19,804Meitec Corp. 1,300 76,526Meito Sangyo Company, Ltd. 900 13,304Melco Holdings, Inc. 500 17,675Members Company, Ltd. 400 8,396Menicon Company, Ltd. 1,000 29,580METAWATER Company, Ltd. 1,600 28,112Micronics Japan Company, Ltd. 2,100 33,814Midac Holdings Company, Ltd. (B) 500 17,673Mie Kotsu Group Holdings, Inc. 3,700 15,526Milbon Company, Ltd. 1,112 55,165Mimasu Semiconductor Industry
Company, Ltd. 1,400 32,264Ministop Company, Ltd. 1,100 13,439Mirainovate Company, Ltd. (A)(B) 3,300 6,026Mirait Holdings Corp. 4,240 69,945Miroku Jyoho Service Company, Ltd. 700 8,401Mitani Corp. 2,000 35,308Mitani Sekisan Company, Ltd. (B) 600 39,919Mito Securities Company, Ltd. 6,300 14,941Mitsuba Corp. (A) 2,300 8,984Mitsubishi Logisnext Company, Ltd. 1,000 9,215Mitsubishi Logistics Corp. 1,600 40,184Mitsubishi Materials Corp. 1,900 32,653Mitsubishi Paper Mills, Ltd. (A) 2,600 7,329Mitsubishi Pencil Company, Ltd. 1,500 15,808Mitsubishi Research Institute, Inc. 500 17,550Mitsubishi Shokuhin Company, Ltd. 600 14,433Mitsubishi Steel Manufacturing
Company, Ltd. 1,000 9,154Mitsuboshi Belting, Ltd. 1,000 18,757Mitsui DM Sugar Holdings Company, Ltd. 1,000 16,868Mitsui E&S Holdings Company, Ltd. (A) 4,600 15,245Mitsui Matsushima Holdings
Company, Ltd. 1,000 16,440Mitsui Mining & Smelting Company, Ltd. 2,500 68,122Mitsui-Soko Holdings Company, Ltd. 1,700 36,741Mitsuuroko Group Holdings
Company, Ltd. 3,200 33,801Mixi, Inc. 1,800 31,522Mizuho Leasing Company, Ltd. 1,400 38,825Mizuno Corp. 1,400 27,300Mochida Pharmaceutical Company, Ltd. 900 27,235Modec, Inc. 1,700 20,361
International Small Company Trust (continued)Shares orPrincipalAmount Value
COMMON STOCKS (continued)Japan (continued)Monex Group, Inc. 8,000 $ 48,806Morinaga & Company, Ltd. 1,700 55,603Morinaga Milk Industry Company, Ltd. 500 23,752Morita Holdings Corp. 2,200 25,032Morningstar Japan KK 1,300 7,279MrMax Holdings, Ltd. 1,700 8,970MTG Company, Ltd. (B) 1,300 16,574m-up Holdings, Inc. 2,000 17,862Musashi Seimitsu Industry Company, Ltd. 2,600 43,333Nachi-Fujikoshi Corp. 600 21,508Nafco Company, Ltd. 1,100 16,753Nagano Keiki Company, Ltd. 1,800 24,643Nagase & Company, Ltd. 5,100 82,662Nagatanien Holdings Company, Ltd. 1,000 16,990Nagawa Company, Ltd. (B) 300 29,720Nakamuraya Company, Ltd. 300 9,544Nakanishi, Inc. 1,800 33,151Nakayama Steel Works, Ltd. 1,100 4,080Namura Shipbuilding Company, Ltd. (A) 3,252 5,902Nankai Electric Railway Company, Ltd. 4,600 87,026Natori Company, Ltd. 700 12,441NEC Capital Solutions, Ltd. 800 13,977NEC Networks & System
Integration Corp. 2,100 32,939Neturen Company, Ltd. 2,300 11,664Nextage Company, Ltd. 2,300 47,455NHK Spring Company, Ltd. 9,100 77,407Nice Corp. 600 8,810Nichias Corp. 2,400 57,919Nichiban Company, Ltd. 700 10,911Nichicon Corp. 3,400 37,359Nichiden Corp. 600 12,269Nichiha Corp. 1,200 31,906Nichi-iko Pharmaceutical Company, Ltd. 3,100 19,004Nichireki Company, Ltd. 2,000 24,720Nichirin Company, Ltd. 1,040 14,905Nihon Chouzai Company, Ltd. 800 9,566Nihon Flush Company, Ltd. 1,000 9,322Nihon House Holdings Company, Ltd. 1,000 4,407Nihon Kagaku Sangyo Company, Ltd. 1,000 12,039Nihon Nohyaku Company, Ltd. 4,000 17,204Nihon Parkerizing Company, Ltd. 3,900 38,171Nihon Tokushu Toryo Company, Ltd. 1,000 7,586Nikkiso Company, Ltd. 2,100 14,670Nikkon Holdings Company, Ltd. 2,900 54,638Nippn Corp. 2,700 38,909Nippon Air Conditioning Services
Company, Ltd. 1,600 11,286Nippon Beet Sugar
Manufacturing Company, Ltd. 900 13,349Nippon Carbon Company, Ltd. 500 18,143Nippon Chemical Industrial Company, Ltd. 700 16,561Nippon Chemi-Con Corp. (A) 1,100 17,099Nippon Coke & Engineering
Company, Ltd. 18,000 20,665Nippon Commercial Development
Company, Ltd. (B) 1,100 16,451Nippon Concrete Industries Company, Ltd. 2,600 6,309Nippon Denko Company, Ltd. 6,530 16,582Nippon Densetsu Kogyo Company, Ltd. 2,100 30,389Nippon Electric Glass Company, Ltd. 3,800 97,431Nippon Fine Chemical Company, Ltd. 800 16,610Nippon Gas Company, Ltd. 5,400 71,591Nippon Hume Corp. 2,000 12,049Nippon Kanzai Company, Ltd. 400 10,053
John Hancock Variable Insurance TrustPortfolio of Investments — December 31, 2021 (showing percentage of total net assets)
The accompanying notes are an integral part of the financial statements. 82

International Small Company Trust (continued)Shares orPrincipalAmount Value
COMMON STOCKS (continued)Japan (continued)Nippon Kayaku Company, Ltd. 5,300 $ 54,616Nippon Kodoshi Corp. 800 19,427Nippon Koei Company, Ltd. 1,000 27,748Nippon Light Metal Holdings
Company, Ltd. 2,820 42,346Nippon Paper Industries Company, Ltd. 4,600 43,442Nippon Parking Development
Company, Ltd. 8,400 10,076Nippon Pillar Packing Company, Ltd. 1,500 48,442Nippon Rietec Company, Ltd. 300 4,054Nippon Seiki Company, Ltd. 3,000 30,289Nippon Sharyo, Ltd. 600 10,738Nippon Shokubai Company, Ltd. 800 37,040Nippon Signal Company, Ltd. 3,000 23,871Nippon Soda Company, Ltd. 1,200 34,546Nippon Steel Trading Corp. 972 42,439Nippon Suisan Kaisha, Ltd. 13,000 61,445Nippon Thompson Company, Ltd. 4,700 27,862Nippon Yakin Kogyo Company, Ltd. 1,000 19,726Nipro Corp. 6,000 56,802Nishikawa Rubber Company, Ltd. 800 12,386Nishimatsu Construction Company, Ltd. 2,300 72,883Nishimatsuya Chain Company, Ltd. 1,600 19,189Nishi-Nippon Financial Holdings, Inc. 7,000 45,211Nishi-Nippon Railroad Company, Ltd. 3,000 68,038Nishio Rent All Company, Ltd. 800 19,969Nissan Shatai Company, Ltd. 3,400 20,849Nissei ASB Machine Company, Ltd. 500 13,760Nissei Plastic Industrial Company, Ltd. 1,600 14,574Nissha Company, Ltd. 2,300 33,419Nisshinbo Holdings, Inc. 6,168 46,956Nissin Corp. 1,400 20,169Nissin Electric Company, Ltd. 3,400 46,555Nissin Sugar Company, Ltd. 1,100 16,402Nisso Corp. 2,400 18,861Nitta Corp. 1,300 33,315Nittan Valve Company, Ltd. 1,200 2,914Nittetsu Mining Company, Ltd. 300 17,227Nitto Boseki Company, Ltd. 800 20,499Nitto Kogyo Corp. 1,600 22,121Nitto Kohki Company, Ltd. 1,000 15,898Nitto Seiko Company, Ltd. 1,700 9,614Noevir Holdings Company, Ltd. 800 37,505Nohmi Bosai, Ltd. 1,300 25,454Nojima Corp. 1,600 33,504NOK Corp. 4,700 51,194Nomura Micro Science Company, Ltd. 600 29,122Noritake Company, Ltd. 700 30,522Noritsu Koki Company, Ltd. 1,000 23,573Noritz Corp. 2,100 30,664North Pacific Bank, Ltd. 12,900 28,024NS Tool Company, Ltd. 800 10,976NS United Kaiun Kaisha, Ltd. 800 24,344NSD Company, Ltd. 3,000 54,494NTN Corp. (A) 18,400 38,432Obara Group, Inc. (B) 600 18,054Ohsho Food Service Corp. 700 37,184Oiles Corp. 1,380 20,286Oisix ra daichi, Inc. (A) 1,200 32,261Okabe Company, Ltd. 2,600 16,400Okamoto Industries, Inc. 600 22,045Okamura Corp. 3,700 41,352Okasan Securities Group, Inc. 7,000 23,174Oki Electric Industry Company, Ltd. 4,700 36,965Okinawa Cellular Telephone Company 400 17,789
International Small Company Trust (continued)Shares orPrincipalAmount Value
COMMON STOCKS (continued)Japan (continued)Okinawa Financial Group, Inc. 1,140 $ 21,924OKUMA Corp. 1,100 48,955Okumura Corp. 1,600 44,926Okura Industrial Company, Ltd. 800 15,223Okuwa Company, Ltd. 1,000 8,267Onoken Company, Ltd. 1,500 21,868Onward Holdings Company, Ltd. 7,100 18,471Optex Group Company, Ltd. 800 11,423Optim Corp. (A) 700 8,013Optorun Company, Ltd. 1,100 22,700Organo Corp. 600 45,102Orient Corp. 17,800 19,327Oriental Shiraishi Corp. (A) 7,600 15,394Origin Company, Ltd. 600 6,621Oro Company, Ltd. 700 17,692Osaka Organic Chemical Industry, Ltd. 800 23,104Osaka Soda Company, Ltd. 800 21,137Osaka Steel Company, Ltd. 700 7,043OSAKA Titanium Technologies
Company, Ltd. (A) 800 5,491Osaki Electric Company, Ltd. 3,000 12,212OSG Corp. 3,300 51,287Outsourcing, Inc. 5,800 78,259Oyo Corp. 1,300 24,286Pacific Industrial Company, Ltd. 3,000 31,717Pacific Metals Company, Ltd. 1,100 20,444PAL GROUP Holdings Company, Ltd. 700 10,453Paramount Bed Holdings Company, Ltd. 1,600 27,142Paris Miki Holdings, Inc. 1,100 2,122Park24 Company, Ltd. (A) 3,000 41,123Pasona Group, Inc. 1,300 37,298PC Depot Corp. 1,700 4,612Penta-Ocean Construction Company, Ltd. 12,400 70,092Pickles Corp. 800 12,591Pigeon Corp. (B) 3,400 65,067Pilot Corp. 1,200 45,938Piolax, Inc. 2,100 32,123Plenus Company, Ltd. 900 15,786Poletowin Pitcrew Holdings, Inc. 2,000 18,026Precision System Science
Company, Ltd. (A) 500 2,109Premium Group Company, Ltd. 800 26,262Premium Water Holdings, Inc. (A) 400 9,724Press Kogyo Company, Ltd. 7,000 23,748Pressance Corp. 700 12,756Prestige International, Inc. 5,000 29,070Prima Meat Packers, Ltd. 1,500 32,379Pronexus, Inc. 600 5,825Proto Corp. 400 4,777PS Mitsubishi Construction Company, Ltd. 2,600 13,719Punch Industry Company, Ltd. 1,300 6,152Qol Holdings Company, Ltd. 1,400 17,051Raccoon Holdings, Inc. (B) 800 9,810Raito Kogyo Company, Ltd. 2,400 41,339Raiznext Corp. 3,300 33,576Raysum Company, Ltd. 1,600 9,840Relia, Inc. 2,100 17,824Rengo Company, Ltd. 8,600 65,054Resorttrust, Inc. 3,700 60,464Restar Holdings Corp. 1,600 28,038Retail Partners Company, Ltd. 300 3,578Rheon Automatic Machinery
Company, Ltd. 1,500 16,979Ricoh Leasing Company, Ltd. 800 26,849Riken Corp. 600 13,434
John Hancock Variable Insurance TrustPortfolio of Investments — December 31, 2021 (showing percentage of total net assets)
The accompanying notes are an integral part of the financial statements. 83

International Small Company Trust (continued)Shares orPrincipalAmount Value
COMMON STOCKS (continued)Japan (continued)Riken Keiki Company, Ltd. 400 $ 20,429Riken Technos Corp. 3,000 13,575Riken Vitamin Company, Ltd. 1,400 20,768Rion Company, Ltd. 500 10,235Riso Kyoiku Company, Ltd. 9,300 31,808Rock Field Company, Ltd. 1,000 13,107Rokko Butter Company, Ltd. 600 8,115Roland Corp. 300 10,239Roland DG Corp. 900 29,316Rorze Corp. 400 43,079Ryobi, Ltd. 1,400 13,346Ryoden Corp. 1,500 23,806Ryosan Company, Ltd. 1,500 29,673Ryoyo Electro Corp. 500 10,422S Foods, Inc. 900 27,247S&B Foods, Inc. 600 19,724Sac’s Bar Holdings, Inc. 600 2,703Saibu Gas Holdings Company, Ltd. 1,500 27,747Saint-Care Holding Corp. 1,900 12,996Saizeriya Company, Ltd. 600 15,671Sakai Chemical Industry Company, Ltd. 1,400 27,891Sakai Moving Service Company, Ltd. 500 18,840Sakata INX Corp. 3,100 26,795Sakata Seed Corp. 200 5,713Sala Corp. 3,000 16,477SAMTY Company, Ltd. 1,600 30,554San ju San Financial Group, Inc. 1,700 21,736San-A Company, Ltd. 900 32,700San-Ai Oil Company, Ltd. 3,500 40,628Sangetsu Corp. 2,100 29,641Sanken Electric Company, Ltd. 400 21,927Sanki Engineering Company, Ltd. 2,000 25,035Sankyo Company, Ltd. 1,900 49,253Sankyo Seiko Company, Ltd. 3,200 15,498Sankyo Tateyama, Inc. 2,500 15,732Sanoh Industrial Company, Ltd. 1,900 15,640Sanshin Electronics Company, Ltd. 700 8,972Sanyo Chemical Industries, Ltd. 600 27,849Sanyo Denki Company, Ltd. 400 20,980Sanyo Electric Railway Company, Ltd. 1,600 28,063Sanyo Shokai, Ltd. (A) 700 5,408Sanyo Special Steel Company, Ltd. 1,400 24,823Sanyo Trading Company, Ltd. 1,200 10,860Sapporo Holdings, Ltd. 2,700 51,347Sato Holdings Corp. 1,700 32,552Sawada Holdings Company, Ltd. 1,000 10,629Sawai Group Holdings Company, Ltd. 1,800 68,814SB Technology Corp. 800 17,905SBS Holdings, Inc. 900 25,534Scroll Corp. 2,300 16,986Seika Corp. 500 7,118Seikagaku Corp. 1,700 13,915Seikitokyu Kogyo Company, Ltd. 1,600 11,294Seiko Holdings Corp. 1,400 27,329Seino Holdings Company, Ltd. 1,000 10,135Seiren Company, Ltd. 2,700 59,153Sekisui Jushi Corp. 1,600 29,104Sekisui Kasei Company, Ltd. 2,500 10,435Senko Group Holdings Company, Ltd. 4,700 37,858Senshu Electric Company, Ltd. 500 25,903Senshu Ikeda Holdings, Inc. 17,200 25,408Senshukai Company, Ltd. (B) 3,300 11,168Septeni Holdings Company, Ltd. 4,800 20,293Seria Company, Ltd. 400 11,586Seven Bank, Ltd. 23,300 48,168
International Small Company Trust (continued)Shares orPrincipalAmount Value
COMMON STOCKS (continued)Japan (continued)Shibaura Electronics Company, Ltd. 500 $ 37,972Shibaura Machine Company, Ltd. 1,600 52,359Shibaura Mechatronics Corp. 300 25,131Shibuya Corp. 800 20,778Shikibo, Ltd. 1,100 8,632Shikoku Chemicals Corp. 3,000 36,804Shikoku Electric Power Company, Inc. 5,600 39,588Shima Seiki Manufacturing, Ltd. 1,200 20,586Shinagawa Refractories Company, Ltd. 600 20,716Shindengen Electric Manufacturing
Company, Ltd. (A) 500 16,117Shin-Etsu Polymer Company, Ltd. 3,000 28,855Shinko Shoji Company, Ltd. 1,900 15,160Shinmaywa Industries, Ltd. 2,400 18,257Shinnihon Corp. 2,500 17,776Shinoken Group Company, Ltd. 2,000 16,136Shinwa Company, Ltd. 700 13,141Ship Healthcare Holdings, Inc. 2,400 55,925Shizuoka Gas Company, Ltd. 4,500 38,565SHO-BOND Holdings Company, Ltd. 900 40,436Shoei Company, Ltd. 1,200 47,310Shoei Foods Corp. 700 23,368Shofu, Inc. 600 10,662Showa Sangyo Company, Ltd. 1,000 23,116SIGMAXYZ Holdings, Inc. 900 20,464Siix Corp. 1,600 19,703Sinanen Holdings Company, Ltd. 800 25,288Sinfonia Technology Company, Ltd. 1,600 18,262Sinko Industries, Ltd. 1,500 26,238Sintokogio, Ltd. 3,400 20,995SKY Perfect JSAT Holdings, Inc. 7,800 28,483Smaregi, Inc. (A) 400 7,428SMK Corp. 300 5,953Snow Peak, Inc. (B) 1,200 33,132Sodick Company, Ltd. 2,400 17,080Softcreate Holdings Corp. 700 26,430Software Service, Inc. 200 11,263Soken Chemical & Engineering
Company, Ltd. 800 11,685Solasto Corp. 3,200 34,381Sotetsu Holdings, Inc. 2,400 43,965Space Value Holdings Company, Ltd. (A) 2,000 19,965Sparx Group Company, Ltd. (B) 7,400 19,249S-Pool, Inc. 5,000 52,842SRA Holdings 600 15,039SRE Holdings Corp. (A) 400 25,187ST Corp. 700 9,358St. Marc Holdings Company, Ltd. 800 10,178Star Mica Holdings Company, Ltd. 1,100 12,704Star Micronics Company, Ltd. 2,300 30,995Starts Corp., Inc. 1,900 41,517Starzen Company, Ltd. 600 10,441Stella Chemifa Corp. 800 18,418Strike Company, Ltd. 700 31,125Studio Alice Company, Ltd. 900 16,769Sugimoto & Company, Ltd. 700 14,786Sumida Corp. 1,600 17,638Suminoe Textile Company, Ltd. 500 6,610Sumitomo Bakelite Company, Ltd. 1,200 60,900Sumitomo Densetsu Company, Ltd. 1,300 23,605Sumitomo Mitsui Construction
Company, Ltd. 6,000 22,325Sumitomo Osaka Cement Company, Ltd. 1,500 46,131Sumitomo Riko Company, Ltd. 2,400 12,394Sumitomo Seika Chemicals Company, Ltd. 500 13,632
John Hancock Variable Insurance TrustPortfolio of Investments — December 31, 2021 (showing percentage of total net assets)
The accompanying notes are an integral part of the financial statements. 84

International Small Company Trust (continued)Shares orPrincipalAmount Value
COMMON STOCKS (continued)Japan (continued)Sun Frontier Fudousan Company, Ltd. 2,200 $ 19,155Suruga Bank, Ltd. 7,000 30,920SWCC Showa Holdings Company, Ltd. 2,400 34,721Systena Corp. 10,800 40,303Syuppin Company, Ltd. 1,200 11,346T Hasegawa Company, Ltd. 1,600 37,620T RAD Company, Ltd. 500 12,169T&K Toka Company, Ltd. 1,600 11,582Tachibana Eletech Company, Ltd. 1,360 18,939Tachi-S Company, Ltd. 2,400 26,380Tadano, Ltd. 5,000 48,210Taihei Dengyo Kaisha, Ltd. 1,000 24,950Taiheiyo Cement Corp. 600 11,849Taiho Kogyo Company, Ltd. 1,200 8,477Taikisha, Ltd. 900 24,518Taiko Pharmaceutical Company, Ltd. 1,200 8,594Taisei Lamick Company, Ltd. 500 11,880Taiyo Holdings Company, Ltd. 2,000 60,495Takamatsu Construction Group
Company, Ltd. 1,000 17,132Takaoka Toko Company, Ltd. 700 8,645Takara Holdings, Inc. 3,200 34,035Takara Leben Company, Ltd. 6,300 15,843Takara Standard Company, Ltd. 2,200 27,036Takasago International Corp. 1,200 30,161Takasago Thermal Engineering
Company, Ltd. 1,700 28,047Takashimaya Company, Ltd. 7,500 69,875Take And Give Needs Company, Ltd. (A) 200 1,675Takeuchi Manufacturing Company, Ltd. 1,600 37,957Takihyo Company, Ltd. 600 8,337Takuma Company, Ltd. 3,000 37,155Tama Home Company, Ltd. (B) 1,000 20,096Tamron Company, Ltd. 1,500 37,215Tamura Corp. (B) 6,000 34,934Tanseisha Company, Ltd. 1,100 7,502Tatsuta Electric Wire & Cable
Company, Ltd. 4,200 17,449Tayca Corp. 1,500 16,901TBS Holdings, Inc. 700 10,147TDC Soft, Inc. 1,200 12,052TechMatrix Corp. 1,400 23,132Techno Horizon Company, Ltd. 1,400 9,885Teijin, Ltd. 3,600 44,310Teikoku Electric Manufacturing
Company, Ltd. 1,700 21,875Teikoku Sen-I Company, Ltd. 1,200 24,238Tekken Corp. 800 12,466Tenma Corp. 1,000 22,980T-Gaia Corp. 900 12,971The 77 Bank, Ltd. 2,800 32,487The Aichi Bank, Ltd. 600 24,312The Akita Bank, Ltd. 1,100 15,635The Aomori Bank, Ltd. 1,700 26,203The Awa Bank, Ltd. 2,200 41,532The Bank of Iwate, Ltd. 1,100 17,859The Bank of Nagoya, Ltd. 1,100 26,240The Bank of Saga, Ltd. 1,000 12,581The Chiba Kogyo Bank, Ltd. 3,200 7,365The Chugoku Bank, Ltd. 6,700 52,462The Chukyo Bank, Ltd. 900 14,214The Ehime Bank, Ltd. 2,100 15,218The First Bank of Toyama, Ltd. 2,800 7,181The Fukui Bank, Ltd. 1,800 21,970The Fukushima Bank, Ltd. (A) 2,100 4,230
International Small Company Trust (continued)Shares orPrincipalAmount Value
COMMON STOCKS (continued)Japan (continued)The Gunma Bank, Ltd. 14,200 $ 43,422The Hachijuni Bank, Ltd. 14,100 48,170The Hyakugo Bank, Ltd. 12,500 37,345The Hyakujushi Bank, Ltd. 1,700 22,237The Iyo Bank, Ltd. 11,300 56,542The Japan Steel Works, Ltd. 1,900 63,770The Japan Wool Textile Company, Ltd. 4,000 31,834The Keiyo Bank, Ltd. 4,400 17,795The Kinki Sharyo Company, Ltd. 300 2,591The Kita-Nippon Bank, Ltd. 700 9,679The Kiyo Bank, Ltd. 3,800 46,614The Michinoku Bank, Ltd. 1,400 9,965The Miyazaki Bank, Ltd. 1,000 18,070The Monogatari Corp. 400 23,486The Musashino Bank, Ltd. 1,700 26,571The Nagano Bank, Ltd. 800 8,716The Nanto Bank, Ltd. 2,000 33,743The Nippon Road Company, Ltd. 500 35,822The Nisshin Oillio Group, Ltd. 1,200 30,274The Ogaki Kyoritsu Bank, Ltd. 1,600 26,873The Oita Bank, Ltd. 900 14,287The Okinawa Electric Power
Company, Inc. 1,990 25,214The Pack Corp. 800 18,767The San-In Godo Bank, Ltd. 8,000 45,019The Shibusawa Warehouse Company, Ltd. 1,000 20,333The Shiga Bank, Ltd. 2,200 39,561The Shikoku Bank, Ltd. 2,800 18,866The Shimizu Bank, Ltd. 500 6,916The Sumitomo Warehouse Company, Ltd. 3,324 56,204The Tochigi Bank, Ltd. 8,000 16,058The Toho Bank, Ltd. 12,000 22,122The Tohoku Bank, Ltd. 400 3,493The Tottori Bank, Ltd. 400 4,032The Towa Bank, Ltd. 2,900 13,667The Yamagata Bank, Ltd. 2,000 15,085The Yamanashi Chuo Bank, Ltd. 2,000 14,957Tigers Polymer Corp. 1,000 3,984TKC Corp. 1,200 36,073Toa Corp. (Hyogo) 1,400 9,849Toa Corp. (Tokyo) (B) 1,200 25,237Toagosei Company, Ltd. (B) 4,300 43,258Tobishima Corp. 720 6,380TOC Company, Ltd. 3,400 19,640Tocalo Company, Ltd. 3,200 41,044Toda Corp. 8,400 53,213Toda Kogyo Corp. (A) 300 11,493Toenec Corp. 600 17,630Toho Company, Ltd. (A) 600 6,696Toho Holdings Company, Ltd. 2,400 36,631Toho Titanium Company, Ltd. 3,000 24,636Toho Zinc Company, Ltd. 800 15,896Tokai Carbon Company, Ltd. 6,500 68,325Tokai Corp. 1,200 20,615TOKAI Holdings Corp. 4,000 30,230Tokai Rika Company, Ltd. 2,600 35,041Tokai Tokyo Financial Holdings, Inc. 11,500 39,438Token Corp. 410 33,701Tokushu Tokai Paper Company, Ltd. 600 21,505Tokuyama Corp. 3,200 50,884Tokyo Base Company, Ltd. (A) 900 4,723Tokyo Electron Device, Ltd. 400 22,797Tokyo Energy & Systems, Inc. 2,000 18,985Tokyo Keiki, Inc. 1,000 8,699Tokyo Kiraboshi Financial Group, Inc. 1,936 25,513
John Hancock Variable Insurance TrustPortfolio of Investments — December 31, 2021 (showing percentage of total net assets)
The accompanying notes are an integral part of the financial statements. 85

International Small Company Trust (continued)Shares orPrincipalAmount Value
COMMON STOCKS (continued)Japan (continued)Tokyo Rakutenchi Company, Ltd. 200 $ 6,979Tokyo Rope Manufacturing
Company, Ltd. (A) 200 1,514Tokyo Seimitsu Company, Ltd. 1,800 79,729Tokyo Steel Manufacturing Company, Ltd. 5,100 61,174Tokyo Tekko Company, Ltd. 800 9,214Tokyo Theatres Company, Inc. (A) 900 9,496Tokyotokeiba Company, Ltd. 600 22,224Tokyu Construction Company, Ltd. 3,900 22,589Tomato Bank, Ltd. 1,100 10,128Tomen Devices Corp. 200 13,051Tomoe Corp. 2,200 9,103Tomoku Company, Ltd. 500 7,772TOMONY Holdings, Inc. 10,600 29,182Tomy Company, Ltd. 4,500 43,003Tonami Holdings Company, Ltd. 500 16,946Topcon Corp. 4,700 67,860Topre Corp. 2,300 23,799Topy Industries, Ltd. 1,300 12,614Torex Semiconductor, Ltd. 700 20,437Toridoll Holdings Corp. 2,800 60,546Torii Pharmaceutical Company, Ltd. 1,100 27,515Torishima Pump Manufacturing
Company, Ltd. 900 7,490Tosei Corp. 2,500 21,948Toshiba TEC Corp. 1,100 45,064Totetsu Kogyo Company, Ltd. 1,000 21,814Towa Corp. 1,300 36,645Towa Pharmaceutical Company, Ltd. 1,500 37,385Toyo Construction Company, Ltd. 3,100 15,666Toyo Corp. 1,100 10,671Toyo Denki Seizo KK 600 5,577Toyo Engineering Corp. (A) 2,200 13,538Toyo Gosei Company, Ltd. 300 40,748Toyo Ink SC Holdings Company, Ltd. 2,200 36,856Toyo Kanetsu KK 400 8,724Toyo Securities Company, Ltd. 6,000 7,719Toyo Seikan Group Holdings, Ltd. 1,900 22,693Toyo Tanso Company, Ltd. 1,000 27,844Toyo Tire Corp. 2,300 35,906Toyo Wharf & Warehouse Company, Ltd. 600 7,547Toyobo Company, Ltd. 4,093 44,738Toyoda Gosei Company, Ltd. 700 15,226TPR Company, Ltd. 1,400 17,349Trancom Company, Ltd. 400 31,100Transaction Company, Ltd. 1,700 15,966Transcosmos, Inc. 800 22,813TRE Holdings Corp. 868 13,367Tri Chemical Laboratories, Inc. 1,200 38,035Trusco Nakayama Corp. 2,200 52,280TS Tech Company, Ltd. 4,400 54,161TSI Holdings Company, Ltd. (A) 5,270 15,528Tsubaki Nakashima Company, Ltd. 2,300 29,385Tsubakimoto Chain Company 1,600 43,969Tsugami Corp. 1,600 24,410Tsukishima Kikai Company, Ltd. 2,000 19,719Tsukuba Bank, Ltd. 5,700 8,771Tsumura & Company 2,400 68,359Tsurumi Manufacturing Company, Ltd. 1,000 14,403TV Asahi Holdings Corp. 700 8,714UACJ Corp. (A) 1,903 44,069Ube Industries, Ltd. 4,400 76,455Ubicom Holdings, Inc. 500 13,125Uchida Yoko Company, Ltd. 400 18,320Ulvac, Inc. 900 56,298
International Small Company Trust (continued)Shares orPrincipalAmount Value
COMMON STOCKS (continued)Japan (continued)Uniden Holdings Corp. 400 $ 12,727Union Tool Company 700 24,193Unipres Corp. 2,600 18,177United Super Markets Holdings, Inc. 2,400 22,073UNITED, Inc. 1,300 22,484Unitika, Ltd. (A) 5,900 15,386Universal Entertainment Corp. (A) 1,200 25,475Ushio, Inc. 5,200 86,396UT Group Company, Ltd. 1,500 56,336UUUM Company, Ltd. (A) 800 5,585Uzabase, Inc. (A) 800 10,194V Technology Company, Ltd. 400 12,495Valor Holdings Company, Ltd. 1,700 31,745Valqua, Ltd. 1,000 23,570ValueCommerce Company, Ltd. 900 35,021Vector, Inc. (A) 3,100 31,670Vital KSK Holdings, Inc. 3,500 24,540VT Holdings Company, Ltd. 6,600 26,772Wacoal Holdings Corp. 1,900 35,307Wacom Company, Ltd. 8,000 63,651Wakachiku Construction Company, Ltd. 900 14,636Wakita & Company, Ltd. 2,300 21,534Warabeya Nichiyo Holdings
Company, Ltd. 900 16,144Watahan & Company, Ltd. 600 6,598WDB Holdings Company, Ltd. 700 18,837Weathernews, Inc. 300 25,067West Holdings Corp. 1,416 70,401Will Group, Inc. 1,200 14,986WIN-Partners Company, Ltd. (B) 1,000 8,652World Company, Ltd. 700 7,232World Holdings Company, Ltd. 600 13,530Wowow, Inc. 600 9,154Xebio Holdings Company, Ltd. 2,800 22,456Yahagi Construction Company, Ltd. 2,000 13,314Yaizu Suisankagaku Industry
Company, Ltd. 1,100 8,703YAKUODO Holdings Company, Ltd. 700 13,675YAMABIKO Corp. 2,400 26,024YAMADA Consulting Group
Company, Ltd. 1,100 10,534Yamaguchi Financial Group, Inc. 9,600 56,115Yamaichi Electronics Company, Ltd. 1,700 34,373YA-MAN, Ltd. (B) 1,700 14,197Yamato Kogyo Company, Ltd. 2,100 68,061Yamazen Corp. 3,900 36,518Yaoko Company, Ltd. 800 48,614Yasuda Logistics Corp. 1,400 11,992Yellow Hat, Ltd. 2,000 28,781Yodogawa Steel Works, Ltd. 1,200 26,578Yokogawa Bridge Holdings Corp. 2,100 40,120Yokorei Company, Ltd. 2,900 21,061Yokowo Company, Ltd. 1,200 30,870Yomeishu Seizo Company, Ltd. 500 7,808Yondenko Corp. 1,200 17,947Yondoshi Holdings, Inc. 1,300 19,906Yorozu Corp. 1,800 16,803Yuasa Trading Company, Ltd. 1,100 28,510Yukiguni Maitake Company, Ltd. 1,000 10,403Yurtec Corp. 2,000 11,688Yushiro Chemical Industry Company, Ltd. 1,100 10,724Zenrin Company, Ltd. 1,950 16,835ZERIA Pharmaceutical Company, Ltd. 1,200 20,498
28,661,544
John Hancock Variable Insurance TrustPortfolio of Investments — December 31, 2021 (showing percentage of total net assets)
The accompanying notes are an integral part of the financial statements. 86

International Small Company Trust (continued)Shares orPrincipalAmount Value
COMMON STOCKS (continued)Jersey, Channel Islands - 0.2%Atrium European Real Estate, Ltd. 10,364 $ 42,454Breedon Group PLC 16,463 21,181Centamin PLC 57,981 70,202JTC PLC (D) 4,852 60,521Sanne Group PLC 4,126 51,105
245,463Liechtenstein - 0.1%Liechtensteinische Landesbank AG 726 41,832VP Bank AG, Class A 188 19,914
61,746Luxembourg - 0.6%APERAM SA 2,452 133,472B&S Group Sarl (D) 983 8,000Befesa SA (A)(D) 1,305 100,135Corestate Capital Holding SA (A)(B) 623 7,949Global Fashion Group SA (A) 1,789 9,007Grand City Properties SA 5,978 141,993IVS Group SA (A)(B) 880 5,726L’Occitane International SA 17,000 68,755RTL Group SA 241 12,773SES SA 15,214 120,570Shurgard Self Storage SA 1,086 71,212Stabilus SA 1,221 89,498Sword Group 278 13,858
782,948Macau - 0.0%MECOM Power and Construction, Ltd. 39,000 18,023Malaysia - 0.0%Frencken Group, Ltd. 15,400 22,481Malta - 0.0%Catena Media PLC (A)(B) 3,412 19,802Netherlands - 2.6%Aalberts NV 5,235 347,131Accell Group NV (A) 1,149 62,679Alfen Beheer BV (A)(D) 682 68,570AMG Advanced Metallurgical Group NV 1,350 43,376Arcadis NV 4,501 216,839ASR Nederland NV 6,907 318,090Basic-Fit NV (A)(D) 2,099 100,182BE Semiconductor Industries NV 3,676 312,506Beter Bed Holding NV (A) 1,056 6,093Boskalis Westminster 3,567 104,005Brack Capital Properties NV (A) 230 36,123Brunel International NV 1,126 14,376Corbion NV 3,074 145,147Flow Traders (D) 1,631 59,774ForFarmers NV 2,398 10,973Fugro NV (A) 4,034 31,656Heijmans NV 2,129 35,971Hunter Douglas NV (A) 112 21,970IMCD NV 1,818 401,783Innoconcepts NV (A)(C) 10,527 0Intertrust NV (A)(D) 4,292 95,740Kendrion NV 1,111 26,654Koninklijke BAM Groep NV (A) 15,496 47,558Koninklijke Vopak NV 1,840 64,514Nedap NV 225 15,947OCI NV (A) 2,846 74,286Ordina NV 5,537 25,839PostNL NV (B) 27,908 121,349SBM Offshore NV 6,900 102,858SIF Holding NV 504 7,025Signify NV (D) 5,815 270,000
International Small Company Trust (continued)Shares orPrincipalAmount Value
COMMON STOCKS (continued)Netherlands (continued)Sligro Food Group NV (A) 1,151 $ 27,926TKH Group NV 1,730 109,189TomTom NV (A) 3,258 33,551Van Lanschot Kempen NV 1,515 37,874
3,397,554New Zealand - 0.6%Air New Zealand, Ltd. (A) 12,658 13,083Arvida Group, Ltd. 12,619 17,040Chorus, Ltd. 15,977 78,475Delegat Group, Ltd. 1,200 11,672Freightways, Ltd. 5,543 48,727Gentrack Group, Ltd. (A)(B) 3,060 4,396Hallenstein Glasson Holdings, Ltd. 3,354 16,184Heartland Group Holdings, Ltd. 18,504 31,928Infratil, Ltd. 2,157 11,816Investore Property, Ltd. (B) 13,816 18,437Kathmandu Holdings, Ltd. 25,838 26,879NZME, Ltd. 13,259 12,930NZX, Ltd. 14,244 17,649Oceania Healthcare, Ltd. 39,361 36,105Pacific Edge, Ltd. (A) 27,936 25,390PGG Wrightson, Ltd. 819 2,861Pushpay Holdings, Ltd. (A) 16,847 15,200Restaurant Brands New Zealand, Ltd. (A) 886 8,371Sanford, Ltd. (A) 2,767 9,190Scales Corp., Ltd. 5,176 19,834Serko, Ltd. (A) 2,827 13,554Skellerup Holdings, Ltd. 7,637 33,170SKY Network Television, Ltd. (A) 7,518 13,891SKYCITY Entertainment Group, Ltd. 26,675 57,002Summerset Group Holdings, Ltd. 6,248 58,472Synlait Milk, Ltd. (A)(B) 5,495 13,007The New Zealand Refining
Company, Ltd. (A) 11,354 7,306The Warehouse Group, Ltd. 9,894 27,111Tourism Holdings, Ltd. (A) 6,508 13,140TOWER, Ltd. 12,717 6,361Trustpower, Ltd. 1,665 8,393Vista Group International, Ltd. (A) 7,682 12,573Z Energy, Ltd. 13,725 33,372
723,519Norway - 0.8%ABG Sundal Collier Holding ASA 13,972 14,631Akastor ASA (A) 6,104 3,690Aker Solutions ASA (A) 18,496 48,886American Shipping Company ASA (A) 1,661 6,083ArcticZymes Technologies ASA (A) 962 10,238Atea ASA (A) 3,574 66,507Axactor SE (A)(B) 14,729 12,566B2Holding ASA 23,929 28,073Bonheur ASA 1,672 67,401Bouvet ASA 1,310 11,220BW Offshore, Ltd. 4,568 13,787Crayon Group Holding ASA (A)(D) 1,229 25,540DNO ASA 36,835 43,563Europris ASA (D) 8,327 66,511Fjordkraft Holding ASA (D) 3,193 17,246FLEX LNG, Ltd. 1,570 35,014Frontline, Ltd. (A) 5,015 35,689Golden Ocean Group, Ltd. 1,891 17,013Grieg Seafood ASA (A)(B) 2,264 21,323Hexagon Composites ASA (A) 6,450 23,849IDEX Biometrics ASA (A) 19,564 6,975Kid ASA (D) 1,128 14,405Kitron ASA 9,158 24,501
John Hancock Variable Insurance TrustPortfolio of Investments — December 31, 2021 (showing percentage of total net assets)
The accompanying notes are an integral part of the financial statements. 87

International Small Company Trust (continued)Shares orPrincipalAmount Value
COMMON STOCKS (continued)Norway (continued)Medistim ASA 352 $ 14,632MPC Container Ships AS (A) 15,398 42,740Multiconsult ASA (D) 554 9,798Nordic Nanovector ASA (A) 2,098 5,471Norway Royal Salmon ASA 1,038 19,240Norwegian Energy Company ASA (A) 656 11,435Odfjell Drilling, Ltd. (A) 4,970 11,364Otello Corp. ASA (A) 33 100Pareto Bank ASA 1,457 9,821PGS ASA (A) 19,660 8,142PhotoCure ASA (A) 824 9,588Protector Forsikring ASA 4,177 51,246Self Storage Group ASA (A) 2,940 11,986Selvaag Bolig ASA 1,842 10,659Sparebank 1 Oestlandet 758 12,521SpareBank 1 Sorost-Norge 1,815 13,465Sparebanken More 246 12,407TGS ASA 3,905 37,350Treasure ASA 3,110 6,313Ultimovacs ASA (A) 584 7,456Veidekke ASA 4,419 66,350Wilh Wilhelmsen Holding ASA, Class A 862 20,272XXL ASA (A)(B)(D) 4,462 7,090
1,014,157Peru - 0.0%Hochschild Mining PLC 16,530 29,236Portugal - 0.3%Altri SGPS SA 3,125 19,920Banco Comercial Portugues SA (A) 454,458 72,730Corticeira Amorim SGPS SA 896 11,482CTT-Correios de Portugal SA 8,914 46,246Greenvolt-Energias Renovaveis SA (A) 56 406Mota-Engil SGPS SA (A)(B) 5,636 8,193NOS SGPS SA 13,982 54,208REN - Redes Energeticas Nacionais
SGPS SA 21,605 62,618Sonae SGPS SA 56,969 65,049The Navigator Company SA 12,847 48,937
389,789Russia - 0.0%Petropavlovsk PLC (A)(B) 156,141 41,027Singapore - 1.1%Accordia Golf Trust (C) 40,300 0AEM Holdings, Ltd. 9,100 35,514Ascendas India Trust 45,100 47,469Banyan Tree Holdings, Ltd. (A) 19,800 4,701Best World International, Ltd. (A)(C) 16,300 7,415BOC Aviation, Ltd. (D) 6,100 44,692Boustead Projects, Ltd. 3,000 2,223Boustead Singapore, Ltd. 10,000 7,375Bukit Sembawang Estates, Ltd. 11,000 40,887BW Energy, Ltd. (A) 932 2,113BW LPG, Ltd. (D) 4,059 22,952China Aviation Oil Singapore Corp., Ltd. 14,400 10,040Chip Eng Seng Corp., Ltd. 33,000 10,044ComfortDelGro Corp., Ltd. 86,000 89,314COSCO Shipping International Singapore
Company, Ltd. (A) 58,900 11,183CSE Global, Ltd. 34,000 12,488Delfi, Ltd. 21,900 12,429Ezion Holdings, Ltd. (A)(C) 131,300 4,190Far East Orchard, Ltd. 5,000 4,041First Resources, Ltd. 19,300 21,640Fraser and Neave, Ltd. 8,600 9,002
International Small Company Trust (continued)Shares orPrincipalAmount Value
COMMON STOCKS (continued)Singapore (continued)Gallant Venture, Ltd. (A) 71,000 $ 6,792Golden Agri-Resources, Ltd. 323,200 58,805GuocoLand, Ltd. 10,400 11,644Halcyon Agri Corp., Ltd. (A) 4,293 734Haw Par Corp., Ltd. 4,700 39,616Ho Bee Land, Ltd. 11,400 23,599Hong Fok Corp., Ltd. 20,100 11,319Hong Leong Finance, Ltd. 12,900 22,868Hyflux, Ltd. (A) 24,000 7iFAST Corp., Ltd. 7,000 43,638IGG, Inc. 38,000 33,805Indofood Agri Resources, Ltd. (A) 25,000 6,042Japfa, Ltd. 22,700 10,192Kenon Holdings, Ltd. 1,156 58,611Keppel Infrastructure Trust 157,190 63,589Metro Holdings, Ltd. 31,600 17,793Midas Holdings, Ltd. (A)(C) 86,000 10,415Oceanus Group, Ltd. (A)(B) 1,035,500 23,029OM Holdings, Ltd. (A) 10,791 7,069OUE, Ltd. 11,100 11,196Oxley Holdings, Ltd. 27,222 3,794Raffles Medical Group, Ltd. 35,758 36,332Razer, Inc. (A)(D) 186,000 57,748Riverstone Holdings, Ltd. 31,400 16,338SBS Transit, Ltd. 5,000 10,943Sembcorp Industries, Ltd. 36,100 53,590Sheng Siong Group, Ltd. 29,900 32,403SIA Engineering Company, Ltd. (A) 12,800 20,695SIIC Environment Holdings, Ltd. 35,800 6,494Sinarmas Land, Ltd. 94,200 17,059Singapore Land Group, Ltd. 7,100 14,106Singapore Post, Ltd. 66,100 31,860Singapore Press Holdings, Ltd. 66,000 113,945Stamford Land Corp., Ltd. 59,000 15,841StarHub, Ltd. 25,600 25,820Straits Trading Company, Ltd. 1,200 2,947Swiber Holdings, Ltd. (A)(C) 15,000 728The Hour Glass, Ltd. 10,100 15,292Thomson Medical Group, Ltd. 212,000 13,220UMS Holdings, Ltd. 17,500 19,714UOB-Kay Hian Holdings, Ltd. 14,981 17,653Wing Tai Holdings, Ltd. 21,205 28,160XP Power, Ltd. 824 56,788Yeo Hiap Seng, Ltd. 1,129 727
1,472,672South Africa - 0.1%Investec PLC 19,554 107,807Mediclinic International PLC (A) 18,139 78,518
186,325Spain - 1.9%Acerinox SA 7,380 94,971Aedas Homes SA (D) 426 11,614Alantra Partners SA 1,181 20,415Almirall SA 2,459 31,415Amper SA (A) 82,546 15,960Applus Services SA 6,225 57,071Atresmedia Corp. de Medios de
Comunicacion SA 6,046 23,043Banco de Sabadell SA (A) 236,360 157,524Bankinter SA 27,501 140,121Caja de Ahorros del Mediterraneo (A)(C) 5,428 0Cia de Distribucion Integral Logista
Holdings SA 1,900 37,915CIE Automotive SA 2,718 84,002
John Hancock Variable Insurance TrustPortfolio of Investments — December 31, 2021 (showing percentage of total net assets)
The accompanying notes are an integral part of the financial statements. 88

International Small Company Trust (continued)Shares orPrincipalAmount Value
COMMON STOCKS (continued)Spain (continued)Construcciones y Auxiliar de
Ferrocarriles SA 1,139 $ 47,080Ebro Foods SA 3,323 63,861eDreams ODIGEO SA (A) 4,905 54,167Elecnor SA 2,026 24,146Enagas SA 10,244 237,981Ence Energia y Celulosa SA (A) 6,294 16,165Ercros SA (A) 5,006 17,021Faes Farma SA 13,595 53,930Fluidra SA 2,959 118,011Fomento de Construcciones y
Contratas SA 2,366 29,674Gestamp Automocion SA (A)(D) 2,814 14,189Global Dominion Access SA (D) 5,439 28,698Grupo Catalana Occidente SA 2,346 80,167Grupo Empresarial San Jose SA 2,194 12,286Iberpapel Gestion SA 65 1,338Indra Sistemas SA (A) 6,017 64,996Laboratorios Farmaceuticos Rovi SA 987 82,374Linea Directa Aseguradora SA Cia de
Seguros y Reaseguros 27,501 49,985Mapfre SA 35,373 72,322Mediaset Espana Comunicacion SA (A) 7,779 36,524Melia Hotels International SA (A) 6,008 40,713Metrovacesa SA (A)(D) 1,256 10,113Miquel y Costas & Miquel SA 2,010 29,747Neinor Homes SA (A)(D) 1,978 23,579Obrascon Huarte Lain SA (A) 19,608 22,695Pharma Mar SA 664 43,038Promotora de Informaciones SA,
Class A (A) 11,711 7,504Prosegur Cash SA (D) 11,946 8,414Prosegur Cia de Seguridad SA 10,114 26,529Realia Business SA (A) 17,710 15,959Sacyr SA 22,231 57,685Solaria Energia y Medio Ambiente SA (A) 3,480 67,244Talgo SA (A)(D) 4,711 29,079Tecnicas Reunidas SA (A) 830 6,543Tubacex SA (A) 6,252 10,658Unicaja Banco SA (D) 62,819 61,804Vidrala SA 827 81,716Viscofan SA 1,837 119,017Zardoya Otis SA 4,290 34,531
2,475,534Sweden - 3.7%AcadeMedia AB (D) 3,665 22,500AddLife AB, B Shares 2,048 86,086AddNode Group AB 1,465 69,351AFRY AB 967 27,219Alimak Group AB (D) 2,141 27,076Alligo AB, Class B 2,270 48,155Ambea AB (D) 1,195 7,995Annehem Fastigheter AB, B Shares (A) 1,155 4,768AQ Group AB (A) 291 11,618Arjo AB, B Shares 10,690 130,807Atrium Ljungberg AB, B Shares 2,105 46,468Attendo AB (A)(D) 5,286 22,493Beijer Alma AB 2,393 72,513Bergman & Beving AB 2,270 37,787Betsson AB, B Shares (A) 5,105 30,750BHG Group AB (A) 2,406 25,286Bilia AB, A Shares 3,960 69,973BioGaia AB, B Shares 901 51,577Biotage AB 3,574 103,425Bonava AB, B Shares 3,323 28,764
International Small Company Trust (continued)Shares orPrincipalAmount Value
COMMON STOCKS (continued)Sweden (continued)Boozt AB (A)(B)(D) 993 $ 20,164Bravida Holding AB (D) 7,844 110,175BTS Group AB, B Shares 346 15,401Bufab AB 1,896 93,531Bulten AB (B) 717 7,363Bure Equity AB 1,211 58,545Byggmax Group AB 5,363 53,059Calliditas Therapeutics AB, B Shares (A) 1,333 16,603Careium AB (A) 2,295 7,657Catella AB 2,217 11,540Catena AB 1,429 89,020Cellavision AB 540 19,386Clas Ohlson AB, B Shares (A)(B) 3,185 48,314Cloetta AB, B Shares 10,640 30,805Collector AB (A) 1,870 7,844Coor Service Management Holding AB (D) 1,376 12,563Corem Property Group AB, B Shares 22,122 79,837Dios Fastigheter AB 3,582 47,034Doro AB (A) 2,295 7,840Duni AB (A) 2,559 33,078Dustin Group AB (D) 4,979 58,436Elanders AB, B Shares 508 9,779Electrolux Professional AB, B Shares (A) 3,716 25,726Enea AB (A) 1,522 45,659Fagerhult AB 4,609 31,064Fastighets AB Trianon 363 9,553FastPartner AB, A Shares 2,697 36,222FastPartner AB, D Shares 84 768Ferronordic AB 318 11,874Fingerprint Cards AB, B Shares (A)(B) 12,246 27,990G5 Entertainment AB 330 14,451GARO AB 1,075 25,633Granges AB 7,040 82,303Haldex AB (A) 3,364 19,684Heba Fastighets AB, Class B 684 11,905Hexatronic Group AB 1,111 61,564HMS Networks AB 1,433 88,433Hoist Finance AB (A)(D) 2,083 6,731Humana AB (A) 2,641 21,228Instalco AB 1,179 56,532Inwido AB 3,126 64,628JM AB 2,484 112,073John Mattson Fastighetsforetagen AB (A) 1,067 23,499Karnov Group AB 1,658 12,265Karo Pharma AB (A) 1,609 10,693K-fast Holding AB (A) 1,142 10,982KNOW IT AB 1,459 60,558Lagercrantz Group AB, B Shares 12,207 179,563LeoVegas AB (D) 2,160 8,352Lime Technologies AB 347 13,212Lindab International AB 4,565 162,383Loomis AB 2,298 61,170Mekonomen AB (A) 2,150 37,291MIPS AB 888 116,192Modern Times Group MTG AB, B
Shares (A) 5,362 54,614Munters Group AB (D) 2,324 17,922Mycronic AB 2,326 54,241NCAB Group AB 2,020 19,639NCC AB, B Shares 2,983 55,299Nederman Holding AB 887 21,361Nelly Group AB (A) 611 2,133New Wave Group AB, B Shares 4,353 80,650Nobia AB 6,676 40,201Nobina AB (D) 4,239 50,184
John Hancock Variable Insurance TrustPortfolio of Investments — December 31, 2021 (showing percentage of total net assets)
The accompanying notes are an integral part of the financial statements. 89

International Small Company Trust (continued)Shares orPrincipalAmount Value
COMMON STOCKS (continued)Sweden (continued)Nolato AB, B Shares 6,748 $ 80,271Nordic Waterproofing Holding AB 2,615 64,334Note AB (A) 776 19,775NP3 Fastigheter AB 1,683 67,362Nyfosa AB 9,287 159,844OEM International AB, B Shares 3,120 63,907Pandox AB (A) 3,303 53,214Peab AB, Class B 4,062 51,192Platzer Fastigheter Holding AB, Series B 3,454 51,731Pricer AB, B Shares 7,930 21,483Proact IT Group AB 1,428 13,711Qliro AB (A) 611 1,586Ratos AB, B Shares 14,845 94,877RaySearch Laboratories AB (A) 2,452 15,310Resurs Holding AB (D) 6,236 26,173Scandi Standard AB 4,648 21,068Scandic Hotels Group AB (A)(D) 5,932 23,869Sdiptech AB, Class B (A) 279 14,551Sectra AB, B Shares (A) 5,030 111,295Sensys Gatso Group AB (A) 23,414 2,473SkiStar AB 2,041 38,351Solid Forsakring AB (A) 623 4,051Stendorren Fastigheter AB (A) 407 13,696Systemair AB 3,604 40,427Tethys Oil AB 2,334 16,093Troax Group AB 1,308 66,996VBG Group AB, B Shares 630 13,074Vitec Software Group AB, B Shares 659 40,615
4,800,339Switzerland - 7.3%Allreal Holding AG 692 153,211ALSO Holding AG (A) 324 106,253APG SGA SA (A) 84 18,330Arbonia AG 2,962 66,783Aryzta AG (A) 57,916 72,197Ascom Holding AG (A) 1,310 16,861Autoneum Holding AG (A) 221 41,077Bachem Holding AG, Class B 205 160,525Baloise Holding AG 1,193 194,713Banque Cantonale de Geneve,
Bearer Shares 142 25,006Banque Cantonale Vaudoise 683 52,977Belimo Holding AG 500 317,493Bell Food Group AG 138 44,137Bellevue Group AG 467 21,089Berner Kantonalbank AG 242 53,778BKW AG 1,096 142,310Bobst Group SA (A) 632 57,341Bossard Holding AG, Class A 310 111,484Bucher Industries AG 390 192,180Burckhardt Compression Holding AG 143 67,607Burkhalter Holding AG 218 15,064Bystronic AG 74 103,883Calida Holding AG 285 15,185Carlo Gavazzi Holding AG, Bearer Shares 38 11,449Cembra Money Bank AG 1,587 115,439Cie Financiere Tradition SA, Bearer Shares 104 11,931Clariant AG (A) 8,756 181,887Coltene Holding AG (A) 198 24,416Comet Holding AG 339 124,669DKSH Holding AG 1,744 143,750dormakaba Holding AG 140 92,464Dufry AG (A) 2,523 124,370EFG International AG (A) 4,687 35,652Emmi AG 107 126,084
International Small Company Trust (continued)Shares orPrincipalAmount Value
COMMON STOCKS (continued)Switzerland (continued)Energiedienst Holding AG 979 $ 49,853Evolva Holding SA (A) 72,989 10,723Feintool International Holding AG (A) 142 9,001Fenix Outdoor International AG 225 30,558Ferrexpo PLC 22,757 92,627Flughafen Zurich AG (A) 933 167,552Forbo Holding AG 58 118,818Fundamenta Real Estate AG 1,024 21,858Galenica AG (D) 2,186 164,166GAM Holding AG (A) 11,204 16,690Georg Fischer AG 220 332,864Gurit Holding AG, Bearer Shares 22 37,418Helvetia Holding AG 1,730 203,232Hiag Immobilien Holding AG 420 43,757HOCHDORF Holding AG (A) 16 765Huber + Suhner AG 586 55,855Hypothekarbank Lenzburg AG 3 13,894Implenia AG (A) 994 22,609Ina Invest Holding AG (A) 199 4,085Inficon Holding AG 106 154,967Interroll Holding AG 35 157,360Intershop Holding AG 76 51,028Investis Holding SA 98 11,236IWG PLC (A) 38,584 152,069Jungfraubahn Holding AG (A) 199 29,271Kardex Holding AG 299 98,141Komax Holding AG (A) 221 61,228Kongsberg Automotive ASA (A) 23,611 8,080Kudelski SA, Bearer Shares (B) 2,497 10,142Landis+Gyr Group AG (A) 1,111 74,988LEM Holding SA 19 52,955Luzerner Kantonalbank AG 173 78,722Medacta Group SA (A)(D) 218 33,938Medartis Holding AG (A)(D) 288 41,114medmix AG (A)(D) 877 43,336Metall Zug AG, B Shares 12 27,114Mobilezone Holding AG 2,336 34,841Mobimo Holding AG (A) 347 116,229Novavest Real Estate AG (A) 212 10,819OC Oerlikon Corp. AG 9,769 99,908Orascom Development Holding AG (A) 533 6,289Orior AG 425 41,909Phoenix Mecano AG, Bearer Shares 38 16,901Plazza AG, Class A 68 25,150PSP Swiss Property AG 2,466 307,301Rieter Holding AG (A) 251 48,600Romande Energie Holding SA 34 50,899Schaffner Holding AG 40 13,291Schweiter Technologies AG, Bearer Shares 48 71,116Sensirion Holding AG (A)(D) 378 55,124SFS Group AG 907 125,209Siegfried Holding AG (A) 220 214,009SIG Combibloc Group AG (A) 2,109 58,745Softwareone Holding AG (A) 2,412 52,097St. Galler Kantonalbank AG, Class A 152 72,526Sulzer AG 877 86,154Swiss Prime Site AG 3,378 331,611Swiss Steel Holding AG (A) 39,436 14,855Swissquote Group Holding SA 588 128,748Tecan Group AG 453 275,137TX Group AG (A) 201 34,495u-blox Holding AG (A) 431 33,222Valiant Holding AG 835 83,506Valora Holding AG (A) 244 41,612VAT Group AG (D) 1,366 676,885
John Hancock Variable Insurance TrustPortfolio of Investments — December 31, 2021 (showing percentage of total net assets)
The accompanying notes are an integral part of the financial statements. 90

International Small Company Trust (continued)Shares orPrincipalAmount Value
COMMON STOCKS (continued)Switzerland (continued)Vaudoise Assurances Holding SA 64 $ 31,224Vetropack Holding AG 500 31,571Vifor Pharma AG 1,287 228,633Von Roll Holding AG, Bearer Shares (A) 7,878 9,226Vontobel Holding AG 1,521 133,001VZ Holding AG 805 86,382V-ZUG Holding AG (A) 120 16,187Walliser Kantonalbank 203 22,510Warteck Invest AG 8 20,794Ypsomed Holding AG 103 21,024Zehnder Group AG 615 62,589Zug Estates Holding AG, B Shares 16 34,780Zuger Kantonalbank AG, Bearer Shares 9 66,579
9,415,297Taiwan - 0.0%FIT Hon Teng, Ltd. (A)(D) 49,000 9,620Ya Hsin Industrial Company, Ltd. (A)(C) 138,000 0
9,620United Arab Emirates - 0.0%Lamprell PLC (A) 11,610 5,637United Kingdom - 12.3%4imprint Group PLC 1,523 58,620A.G. Barr PLC 4,718 33,204Advanced Medical Solutions Group PLC 7,031 31,965Airtel Africa PLC (D) 23,588 42,494AJ Bell PLC 6,808 35,078Alfa Financial Software Holdings PLC (D) 4,048 10,341Alliance Pharma PLC 16,518 24,482Anglo Pacific Group PLC 12,147 22,198Anglo-Eastern Plantations PLC 1,225 11,975AO World PLC (A) 8,013 11,934Aptitude Software Group PLC 2,037 15,999Ascential PLC (A) 15,022 82,613Ashmore Group PLC 15,764 62,279Aston Martin Lagonda Global Holdings
PLC (A)(D) 878 16,183Avon Protection PLC 1,565 23,921Babcock International Group PLC (A) 22,879 99,087Bakkavor Group PLC (D) 5,579 9,527Balfour Beatty PLC 34,581 123,182Beazley PLC (A) 24,625 155,715Begbies Traynor Group PLC 6,626 12,092Bellway PLC 5,109 232,204Biffa PLC (D) 14,189 68,694Bloomsbury Publishing PLC 2,159 10,627Bodycote PLC 9,417 110,374boohoo Group PLC (A) 3,748 6,285Braemar Shipping Services PLC 1,328 4,890Brewin Dolphin Holdings PLC 15,066 75,561Britvic PLC 13,590 169,892Bytes Technology Group PLC 8,409 64,903Capita PLC (A) 67,697 33,497Capricorn Energy PLC 24,079 62,147Card Factory PLC (A) 14,688 11,886CareTech Holdings PLC 4,102 32,047Carillion PLC (A)(C) 35,521 4,611Cazoo Group, Ltd. (A) 4,507 27,175Central Asia Metals PLC 8,189 28,756CentralNic Group PLC (A) 10,188 19,281Centrica PLC (A) 208,824 202,503Chemring Group PLC 13,921 56,623Chesnara PLC 7,709 29,806Circassia Group PLC (A) 9,034 4,986Clarkson PLC 1,348 70,713
International Small Company Trust (continued)Shares orPrincipalAmount Value
COMMON STOCKS (continued)United Kingdom (continued)Clinigen Group PLC 5,031 $ 62,045Clipper Logistics PLC 3,406 33,427Close Brothers Group PLC 8,356 159,372CLS Holdings PLC 10,759 31,877CMC Markets PLC (D) 7,009 25,043Coats Group PLC 45,029 42,215Computacenter PLC 3,949 156,860Concentric AB 2,526 78,383ContourGlobal PLC (D) 8,862 23,114Costain Group PLC (A) 4,797 3,499Countryside Properties PLC (A)(D) 23,711 145,371Cranswick PLC 2,746 138,321Crest Nicholson Holdings PLC 13,693 69,220Currys PLC 44,671 69,448CVS Group PLC 2,750 83,572De La Rue PLC (A) 10,028 21,130Debenhams PLC (A)(C) 76,182 0Devro PLC 12,253 34,198DFS Furniture PLC 12,509 44,931Dialight PLC (A) 105 465Dignity PLC (A) 3,439 27,582Diploma PLC 4,022 184,394DiscoverIE Group PLC 5,627 78,326Domino’s Pizza Group PLC 21,324 132,812dotdigital Group PLC 12,814 34,374Drax Group PLC 21,413 176,107Dunelm Group PLC 5,320 99,136DWF Group PLC (D) 5,285 8,156EKF Diagnostics Holdings PLC 8,242 8,455Elementis PLC (A) 35,393 63,653EMIS Group PLC 2,542 46,724Energean PLC (A) 2,940 34,136EnQuest PLC (A) 115,537 29,501Ergomed PLC (A) 895 18,198Esken, Ltd. (A) 25,251 4,795Essentra PLC 14,966 70,091Euromoney Institutional Investor PLC 4,334 54,643FD Technologies PLC (A) 243 6,621FDM Group Holdings PLC 3,208 55,370Fevertree Drinks PLC 5,193 189,122Firstgroup PLC (A) 22,251 31,075Forterra PLC (D) 10,957 41,135Foxtons Group PLC 23,551 12,702Frasers Group PLC (A) 10,048 105,429Frontier Developments PLC (A) 532 12,816Fuller Smith & Turner PLC, Class A 1,525 14,844Funding Circle Holdings PLC (A)(D) 3,849 5,849Future PLC 2,524 130,670Galliford Try Holdings PLC 5,675 13,824Games Workshop Group PLC 1,135 153,021Gamma Communications PLC 1,848 41,580GB Group PLC 2,086 20,776Gem Diamonds, Ltd. 12,666 8,146Genel Energy PLC 4,784 8,452Genuit Group PLC 12,035 96,177Genus PLC 250 16,767Grainger PLC 32,768 140,923Greggs PLC 5,441 246,287Gulf Keystone Petroleum, Ltd. 7,420 18,235Halfords Group PLC 15,547 72,772Hays PLC 77,290 153,462Headlam Group PLC 6,602 38,381Helical PLC 6,424 39,654Helios Towers PLC (A) 16,385 38,283Henry Boot PLC 5,301 20,382
John Hancock Variable Insurance TrustPortfolio of Investments — December 31, 2021 (showing percentage of total net assets)
The accompanying notes are an integral part of the financial statements. 91

International Small Company Trust (continued)Shares orPrincipalAmount Value
COMMON STOCKS (continued)United Kingdom (continued)Hill & Smith Holdings PLC 4,214 $ 102,593Hilton Food Group PLC 3,061 47,195Hollywood Bowl Group PLC (A) 8,153 26,240Hunting PLC 8,331 19,139Hyve Group PLC (A) 12,149 15,485Ibstock PLC (D) 19,043 52,817IDOX PLC 10,437 9,743IG Group Holdings PLC 16,821 185,928IMI PLC 11,803 278,361Impax Asset Management Group PLC 2,421 48,065Inchcape PLC 19,909 245,902Indivior PLC (A) 36,002 124,955IntegraFin Holdings PLC 9,972 75,834International Personal Finance PLC 12,526 21,736iomart Group PLC 2,265 5,243IP Group PLC 38,897 65,814IQE PLC (A) 9,568 4,495J.D. Wetherspoon PLC (A) 4,332 56,315James Fisher & Sons PLC (A) 2,814 14,139James Halstead PLC 4,194 32,710JET2 PLC (A) 4,917 74,635John Menzies PLC (A) 3,549 15,003John Wood Group PLC (A) 29,391 76,364Johnson Service Group PLC (A) 14,257 28,379Jupiter Fund Management PLC 22,824 79,143Just Group PLC (A) 37,116 42,018Kainos Group PLC 4,099 106,695Keller Group PLC 4,206 56,004Kier Group PLC (A) 22,531 33,660Kin & Carta PLC (A) 3,492 13,766Lancashire Holdings, Ltd. 11,586 83,339Learning Technologies Group PLC 21,193 50,935Liontrust Asset Management PLC 2,411 71,969Lookers PLC (A) 22,449 20,285LSL Property Services PLC 6,404 35,751Luceco PLC (D) 1,922 9,030M&C Saatchi PLC (A) 253 577Man Group PLC 73,477 226,385Marks & Spencer Group PLC (A) 55,905 175,866Marshalls PLC 10,383 97,815Marston’s PLC (A) 37,566 39,608McBride PLC (A) 14,770 12,058Mears Group PLC 8,289 21,066Meggitt PLC (A) 21,288 213,038Metro Bank PLC (A) 9,741 12,706Micro Focus International PLC 8,470 47,960Midwich Group PLC 1,185 10,001Mitchells & Butlers PLC (A) 16,776 58,264Mitie Group PLC 68,528 59,930MJ Gleeson PLC 2,770 28,275Moneysupermarket.com Group PLC 27,587 80,475Morgan Advanced Materials PLC 14,263 69,609Morgan Sindall Group PLC 2,381 81,723Mortgage Advice Bureau Holdings, Ltd. 1,276 25,246MP Evans Group PLC 203 2,285N. Brown Group PLC (A) 9,633 5,613National Express Group PLC (A) 23,513 82,187NCC Group PLC 13,335 42,341Next Fifteen Communications Group PLC 3,756 68,190Ninety One PLC 12,803 48,333Norcros PLC 6,666 28,292Numis Corp. PLC 2,926 13,569On the Beach Group PLC (A)(D) 5,451 21,180OSB Group PLC 16,331 122,788Oxford Biomedica PLC (A) 1,730 29,160
International Small Company Trust (continued)Shares orPrincipalAmount Value
COMMON STOCKS (continued)United Kingdom (continued)Oxford Instruments PLC 2,839 $ 101,952Pagegroup PLC 17,115 147,104Pan African Resources PLC 85,815 19,437Paragon Banking Group PLC 13,704 105,274PayPoint PLC 2,581 23,302Pendragon PLC (A) 102,667 32,330Pennon Group PLC 11,306 178,998Petrofac, Ltd. (A) 15,397 24,093Pets at Home Group PLC 24,400 153,580Pharos Energy PLC (A) 16,636 5,889Photo-Me International PLC (A) 18,684 15,981Polar Capital Holdings PLC 3,830 41,043Porvair PLC 2,468 24,087Premier Foods PLC 41,106 62,445Provident Financial PLC (A) 13,396 65,321Purplebricks Group PLC (A) 7,294 2,363PZ Cussons PLC 13,141 36,868QinetiQ Group PLC 27,714 99,755Quilter PLC (D) 84,985 171,729Rank Group PLC (A) 7,303 15,488Rathbones Group PLC 2,988 80,993Reach PLC 28,863 109,734Redcentric PLC 5,876 9,842Redde Northgate PLC 10,957 65,156Redrow PLC 14,867 141,887Renew Holdings PLC 4,150 47,010Renewi PLC (A) 5,276 54,609Renishaw PLC 503 32,596Ricardo PLC 2,982 18,130RM PLC 8,752 23,637Robert Walters PLC 4,693 48,930Rotork PLC 46,083 224,277Royal Mail PLC 36,820 252,445RPS Group PLC 15,418 25,950RWS Holdings PLC 6,891 60,705S&U PLC 303 11,094Sabre Insurance Group PLC (D) 5,914 14,727Saga PLC (A) 4,637 17,935Savills PLC 7,351 140,022Senior PLC (A) 21,835 43,666Serco Group PLC 28,829 52,353Serica Energy PLC 8,374 27,315Severfield PLC 11,941 10,936SIG PLC (A) 64,105 41,301Smart Metering Systems PLC 5,253 60,329Softcat PLC 6,128 150,071Spectris PLC 1,473 73,319Speedy Hire PLC 24,369 20,965Spire Healthcare Group PLC (A)(D) 12,358 41,761Spirent Communications PLC 33,589 126,729Sportech PLC (A) 4,748 2,443SSP Group PLC (A) 36,801 120,356Stagecoach Group PLC (A) 27,597 33,503SThree PLC 8,144 51,120Stolt-Nielsen, Ltd. 2,414 37,183Studio Retail Group PLC (A) 8,139 18,034STV Group PLC 2,712 12,947Superdry PLC (A) 3,110 11,694Synthomer PLC 17,828 96,262Tate & Lyle PLC 23,148 208,259Tatton Asset Management PLC 1,955 15,343Ted Baker PLC (A) 2,896 4,039Telecom Plus PLC 3,652 78,538The Go-Ahead Group PLC (A) 3,096 28,010The Gym Group PLC (A)(D) 5,959 20,623
John Hancock Variable Insurance TrustPortfolio of Investments — December 31, 2021 (showing percentage of total net assets)
The accompanying notes are an integral part of the financial statements. 92

International Small Company Trust (continued)Shares orPrincipalAmount Value
COMMON STOCKS (continued)United Kingdom (continued)The Restaurant Group PLC (A) 30,769 $ 39,551The Vitec Group PLC 2,842 54,949Thomas Cook Group PLC (A)(C) 58,171 0TI Fluid Systems PLC (D) 1,686 5,895Topps Tiles PLC 15,591 13,755TP ICAP Group PLC 45,423 94,516Travis Perkins PLC 10,742 226,769Treatt PLC 2,204 38,335Trifast PLC 7,237 15,711TT Electronics PLC 14,769 51,199Tullow Oil PLC (A)(B) 72,437 45,751Tyman PLC 9,005 48,792Ultra Electronics Holdings PLC 3,309 142,883Vesuvius PLC 12,719 77,948Victrex PLC 4,079 135,920Virgin Money UK PLC (A) 52,278 126,826Vistry Group PLC 11,609 185,702Vivo Energy PLC (D) 12,282 21,973Volex PLC 3,136 14,719Volution Group PLC 4,766 35,708Vp PLC 637 7,991Watches of Switzerland Group PLC (A)(D) 4,075 78,621Watkin Jones PLC 6,905 24,520Wickes Group PLC 13,094 41,679Wilmington PLC 8,076 23,690Wincanton PLC 10,534 52,551Xaar PLC (A) 5,629 14,010Young & Company’s Brewery PLC,
Class A 1,224 25,819Zotefoams PLC 1,549 8,396
15,938,900United States - 0.6%Argonaut Gold, Inc. (A) 16,734 31,750Atlantic Sapphire ASA (A)(B) 1,333 6,349Burford Capital, Ltd. 8,549 89,337Diversified Energy Company PLC 30,857 43,644Energy Fuels, Inc. (A)(B) 730 5,575Frontage Holdings Corp. (A)(D) 14,000 7,096Invesque, Inc. (A)(B) 2,000 4,100Primo Water Corp. 1,600 28,208Primo Water Corp. (Toronto
Stock Exchange) 6,607 116,580PureTech Health PLC (A) 9,879 38,719REC Silicon ASA (A) 13,597 27,551Reliance Worldwide Corp., Ltd. 32,462 148,332Samsonite International SA (A)(D) 7,200 14,621Sims, Ltd. 9,104 106,569Viemed Healthcare, Inc. (A) 2,600 13,572Vobile Group, Ltd. (A) 36,000 28,555
710,558TOTAL COMMON STOCKS (Cost $117,365,503) $ 127,044,474
International Small Company Trust (continued)Shares orPrincipalAmount Value
PREFERRED SECURITIES - 0.3%Germany - 0.3%Biotest AG 486 $ 21,435Draegerwerk AG & Company KGaA 565 35,398Fuchs Petrolub SE 2,535 114,554Jungheinrich AG 2,336 118,659Sixt SE 838 82,576STO SE & Company KGaA 163 40,968Villeroy & Boch AG 625 16,332
429,922TOTAL PREFERRED SECURITIES (Cost $301,180) $ 429,922
WARRANTS - 0.0%Treasury Metals, Inc. (Expiration
Date: 8-7-23; Strike Price: CAD1.50) (A) 650 80
Webuild SpA (ExpirationDate: 8-2-30) (A)(E) 1,316 1,429
TOTAL WARRANTS (Cost $0) $ 1,509
SHORT-TERM INVESTMENTS - 1.9%Short-term funds - 1.9%John Hancock Collateral Trust,
0.1697% (F)(G) 247,517 2,475,909TOTAL SHORT-TERM INVESTMENTS (Cost $2,476,437) $ 2,475,909Total Investments (International Small Company Trust)
(Cost $120,143,120) - 100.4% $ 129,951,814Other assets and liabilities, net - (0.4%) (491,305)TOTAL NET ASSETS - 100.0% $ 129,460,509
Currency AbbreviationsCAD Canadian DollarSecurity Abbreviations and Legend(A) Non-income producing security.(B) All or a portion of this security is on loan as of 12-31-21.(C) Security is valued using significant unobservable inputs and is
classified as Level 3 in the fair value hierarchy. Refer to Note 2 tothe financial statements.
(D) These securities are exempt from registration under Rule 144A ofthe Securities Act of 1933. Such securities may be resold, normallyto qualified institutional buyers, in transactions exempt fromregistration.
(E) Strike price and/or expiration date not available.(F) The rate shown is the annualized seven-day yield as of 12-31-21.(G) Investment is an affiliate of the fund, the advisor and/or subadvisor.
This security represents the investment of cash collateral received forsecurities lending.
DERIVATIVES
FUTURES
Open contractsNumber of
contracts PositionExpiration
dateNotional
basis^Notional
value^
Unrealizedappreciation
(depreciation)Mini MSCI EAFE Index Futures 11 Long Mar 2022 $1,265,923 $1,276,495 $10,572
$10,572
^ Notional basis refers to the contractual amount agreed upon at inception of open contracts; notional value represents the current value of the open contract.
See Notes to financial statements regarding investment transactions and other derivatives information.
John Hancock Variable Insurance TrustPortfolio of Investments — December 31, 2021 (showing percentage of total net assets)
The accompanying notes are an integral part of the financial statements. 93

Lifestyle Balanced PortfolioShares orPrincipalAmount Value
AFFILIATED INVESTMENT COMPANIES (A) - 100.0%Equity - 50.5%Strategic Equity Allocation, Series NAV, JHVIT
(MIM US) (B) 26,750,004 $ 605,352,589Fixed income - 49.5%Select Bond, Series NAV, JHVIT (MIM US) (B) 42,645,265 594,048,540TOTAL AFFILIATED INVESTMENT COMPANIES(Cost $1,072,255,122) $ 1,199,401,129Total Investments (Lifestyle Balanced
Portfolio) (Cost $1,072,255,122) - 100.0% $ 1,199,401,129Other assets and liabilities, net - (0.0%) (18,932)TOTAL NET ASSETS - 100.0% $ 1,199,382,197
Security Abbreviations and LegendJHVIT John Hancock Variable Insurance TrustMIM US Manulife Investment Management (US) LLC(A) The underlying portfolios’ subadvisor is shown parenthetically.(B) The subadvisor is an affiliate of the advisor.
Lifestyle Conservative PortfolioShares orPrincipalAmount Value
AFFILIATED INVESTMENT COMPANIES (A) - 100.0%Equity - 20.0%Strategic Equity Allocation, Series NAV, JHVIT
(MIM US) (B) 1,990,114 $ 45,036,283Fixed income - 80.0%Select Bond, Series NAV, JHVIT (MIM US) (B) 12,952,797 180,432,462TOTAL AFFILIATED INVESTMENT COMPANIES(Cost $218,392,306) $ 225,468,745
SHORT-TERM INVESTMENTS - 0.0%Short-term funds - 0.0%State Street Institutional U.S. Government Money
Market Fund, Premier Class, 0.0250% (C) 600 600TOTAL SHORT-TERM INVESTMENTS (Cost $600) $ 600Total Investments (Lifestyle Conservative
Portfolio) (Cost $218,392,906) - 100.0% $ 225,469,345Other assets and liabilities, net - (0.0%) (16,000)TOTAL NET ASSETS - 100.0% $ 225,453,345
Security Abbreviations and LegendJHVIT John Hancock Variable Insurance TrustMIM US Manulife Investment Management (US) LLC(A) The underlying portfolios’ subadvisor is shown parenthetically.(B) The subadvisor is an affiliate of the advisor.(C) The rate shown is the annualized seven-day yield as of 12-31-21.
Lifestyle Growth PortfolioShares orPrincipalAmount Value
AFFILIATED INVESTMENT COMPANIES (A) - 100.0%Equity - 70.7%Strategic Equity Allocation, Series NAV, JHVIT
(MIM US) (B) 200,684,313 $ 4,541,486,014
Lifestyle Growth Portfolio (continued)Shares orPrincipalAmount Value
AFFILIATED INVESTMENT COMPANIES (A) (continued)Fixed income - 29.3%Select Bond, Series NAV, JHVIT (MIM US) (B) 135,351,782 $ 1,885,450,327TOTAL AFFILIATED INVESTMENT COMPANIES(Cost $5,458,591,293) $ 6,426,936,341Total Investments (Lifestyle Growth Portfolio)
(Cost $5,458,591,293) - 100.0% $ 6,426,936,341Other assets and liabilities, net - (0.0%) (36,321)TOTAL NET ASSETS - 100.0% $ 6,426,900,020
Security Abbreviations and LegendJHVIT John Hancock Variable Insurance TrustMIM US Manulife Investment Management (US) LLC(A) The underlying portfolios’ subadvisor is shown parenthetically.(B) The subadvisor is an affiliate of the advisor.
Lifestyle Moderate PortfolioShares orPrincipalAmount Value
AFFILIATED INVESTMENT COMPANIES (A) - 100.0%Equity - 40.4%Strategic Equity Allocation, Series NAV, JHVIT
(MIM US) (B) 6,457,667 $ 146,136,996Fixed income - 59.6%Select Bond, Series NAV, JHVIT (MIM US) (B) 15,482,131 215,666,085TOTAL AFFILIATED INVESTMENT COMPANIES(Cost $333,697,255) $ 361,803,081
SHORT-TERM INVESTMENTS - 0.0%Short-term funds - 0.0%State Street Institutional U.S. Government Money
Market Fund, Premier Class, 0.0250% (C) 768 768TOTAL SHORT-TERM INVESTMENTS (Cost $768) $ 768Total Investments (Lifestyle Moderate
Portfolio) (Cost $333,698,023) - 100.0% $ 361,803,849Other assets and liabilities, net - (0.0%) (16,485)TOTAL NET ASSETS - 100.0% $ 361,787,364
Security Abbreviations and LegendJHVIT John Hancock Variable Insurance TrustMIM US Manulife Investment Management (US) LLC(A) The underlying portfolios’ subadvisor is shown parenthetically.(B) The subadvisor is an affiliate of the advisor.(C) The rate shown is the annualized seven-day yield as of 12-31-21.
Mid Cap Growth TrustShares orPrincipalAmount Value
COMMON STOCKS – 91.8%Communication services – 12.6%Entertainment – 7.4%Electronic Arts, Inc. 69,779 $ 9,203,850Live Nation Entertainment, Inc. (A) 99,996 11,968,521Roku, Inc. (A) 69,088 15,765,882Spotify Technology SA (A) 135,966 31,820,122
68,758,375Interactive media and services – 5.2%Match Group, Inc. (A) 233,349 30,860,405Snap, Inc., Class A (A) 172,984 8,135,438
John Hancock Variable Insurance TrustPortfolio of Investments — December 31, 2021 (showing percentage of total net assets)
The accompanying notes are an integral part of the financial statements. 94

Mid Cap Growth Trust (continued)Shares orPrincipalAmount Value
COMMON STOCKS (continued)Interactive media and services (continued)ZoomInfo Technologies, Inc. (A) 154,025 $ 9,888,405
48,884,248117,642,623
Consumer discretionary – 21.5%Automobiles – 1.6%Thor Industries, Inc. 148,145 15,373,007Diversified consumer services – 2.0%2U, Inc. (A) 178,819 3,588,897Chegg, Inc. (A) 475,320 14,592,324
18,181,221Hotels, restaurants and leisure – 2.1%DraftKings, Inc., Class A (A) 495,596 13,614,022Penn National Gaming, Inc. (A) 120,178 6,231,229
19,845,251Household durables – 2.4%Lennar Corp., A Shares 191,148 22,203,752Specialty retail – 10.5%Five Below, Inc. (A) 185,215 38,319,131Floor & Decor Holdings, Inc., Class A (A) 133,766 17,390,918Ross Stores, Inc. 132,253 15,113,873Ulta Beauty, Inc. (A) 64,424 26,564,592
97,388,514Textiles, apparel and luxury goods – 2.9%Lululemon Athletica, Inc. (A) 68,561 26,838,203
199,829,948Financials – 1.7%Capital markets – 1.7%Ares Management Corp., Class A 198,936 16,167,529Health care – 15.8%Biotechnology – 4.3%Apellis Pharmaceuticals, Inc. (A) 90,759 4,291,086Ascendis Pharma A/S, ADR (A) 39,188 5,271,962Exact Sciences Corp. (A) 318,742 24,807,690Kodiak Sciences, Inc. (A) 71,510 6,062,618
40,433,356Health care equipment and supplies – 5.6%ABIOMED, Inc. (A) 86,663 31,126,750DexCom, Inc. (A) 38,543 20,695,664
51,822,414Health care providers and services – 1.1%Oak Street Health, Inc. (A)(B) 312,048 10,341,271Health care technology – 2.9%GoodRx Holdings, Inc., Class A (A)(B) 390,622 12,765,527Inspire Medical Systems, Inc. (A) 62,333 14,340,330
27,105,857Life sciences tools and services – 1.5%Agilent Technologies, Inc. 85,957 13,723,035Pharmaceuticals – 0.4%Elanco Animal Health, Inc. (A) 101,487 2,880,201Reata Pharmaceuticals, Inc., Class A (A) 16,807 443,201
3,323,402146,749,335
Industrials – 9.2%Building products – 1.8%Johnson Controls International PLC 213,109 17,327,893Commercial services and supplies – 2.0%Copart, Inc. (A) 120,485 18,267,936Machinery – 3.3%Kornit Digital, Ltd. (A) 99,561 15,158,162
Mid Cap Growth Trust (continued)Shares orPrincipalAmount Value
COMMON STOCKS (continued)Machinery (continued)The Middleby Corp. (A) 79,832 $ 15,707,744
30,865,906Professional services – 2.1%CoStar Group, Inc. (A) 245,849 19,429,446
85,891,181Information technology – 30.0%Communications equipment – 4.0%Arista Networks, Inc. (A) 259,416 37,291,050IT services – 2.4%MongoDB, Inc. (A) 40,943 21,673,177Payoneer Global, Inc. (A) 93,200 685,020
22,358,197Semiconductors and semiconductor equipment – 4.1%MKS Instruments, Inc. 69,694 12,138,604SolarEdge Technologies, Inc. (A) 57,345 16,089,287Universal Display Corp. 60,038 9,908,071
38,135,962Software – 19.5%Fair Isaac Corp. (A) 54,301 23,548,715Five9, Inc. (A) 78,297 10,751,744Guidewire Software, Inc. (A) 132,807 15,077,579IronSource, Ltd., Class A (A)(B) 1,341,012 10,379,433Palo Alto Networks, Inc. (A) 38,375 21,365,665Paycom Software, Inc. (A) 61,301 25,451,562RingCentral, Inc., Class A (A) 116,120 21,755,081UiPath, Inc., Class A (A) 400,353 17,267,225Varonis Systems, Inc. (A) 296,885 14,482,050Workday, Inc., Class A (A) 77,835 21,262,965
181,342,019279,127,228
Materials – 0.9%Chemicals – 0.9%Albemarle Corp. 35,276 8,246,471Real estate – 0.1%Real estate management and development – 0.1%WeWork, Inc., Class A (A)(B) 105,472 907,059TOTAL COMMON STOCKS (Cost $749,419,359) $ 854,561,374
PREFERRED SECURITIES – 0.6%Information technology – 0.6%Software – 0.6%Essence Group Holdings Corp. (A)(C)(D) 1,663,188 3,692,277Lookout, Inc., Series F (A)(C)(D) 211,003 1,909,577
5,601,854TOTAL PREFERRED SECURITIES (Cost $5,070,285) $ 5,601,854
EXCHANGE-TRADED FUNDS – 5.4%iShares Russell Mid-Cap Growth ETF (B) 388,102 44,717,112Vanguard Mid-Cap Growth ETF 20,172 5,133,530TOTAL EXCHANGE-TRADED FUNDS (Cost $49,635,517) $ 49,850,642
SHORT-TERM INVESTMENTS – 6.7%Short-term funds – 5.5%John Hancock Collateral Trust,
0.1697% (E)(F) 5,093,530 50,950,585
John Hancock Variable Insurance TrustPortfolio of Investments — December 31, 2021 (showing percentage of total net assets)
The accompanying notes are an integral part of the financial statements. 95

Mid Cap Growth Trust (continued)Shares orPrincipalAmount Value
SHORT-TERM INVESTMENTS (continued)Repurchase agreement – 1.2%Deutsche Bank Tri-Party Repurchase
Agreement dated 12-31-21 at 0.040% tobe repurchased at $11,800,039 on1-3-22, collateralized by $12,036,100U.S. Treasury Bills, 0.000% due 1-25-22(valued at $12,036,004) $ 11,800,000 $ 11,800,000
TOTAL SHORT-TERM INVESTMENTS (Cost $62,756,666) $ 62,750,585Total Investments (Mid Cap Growth Trust)
(Cost $866,881,827) – 104.5% $ 972,764,455Other assets and liabilities, net – (4.5%) (41,910,683)TOTAL NET ASSETS – 100.0% $ 930,853,772
Security Abbreviations and LegendADR American Depositary Receipt(A) Non-income producing security.(B) All or a portion of this security is on loan as of 12-31-21.(C) Restricted security as to resale. For more information on this
security refer to the Notes to financial statements.(D) Security is valued using significant unobservable inputs and is
classified as Level 3 in the fair value hierarchy. Refer to Note 2 tothe financial statements.
(E) The rate shown is the annualized seven-day yield as of 12-31-21.(F) Investment is an affiliate of the fund, the advisor and/or subadvisor.
This security represents the investment of cash collateral received forsecurities lending.
Mid Cap Index TrustShares orPrincipalAmount Value
COMMON STOCKS – 97.6%Communication services – 1.6%Diversified telecommunication services – 0.2%Iridium Communications, Inc. (A) 76,278 $ 3,149,519Entertainment – 0.1%World Wrestling Entertainment, Inc.,
Class A 25,801 1,273,021Interactive media and services – 0.4%j2 Global, Inc. (A) 27,823 3,084,458TripAdvisor, Inc. (A) 57,150 1,557,909Yelp, Inc. (A) 39,601 1,435,140
6,077,507Media – 0.9%Cable One, Inc. 2,860 5,043,467John Wiley & Sons, Inc., Class A 25,128 1,439,081TEGNA, Inc. 127,675 2,369,648The New York Times Company, Class A 96,410 4,656,603
13,508,79924,008,846
Consumer discretionary – 15.1%Auto components – 1.7%Adient PLC (A) 54,362 2,602,853Dana, Inc. 83,220 1,899,080Fox Factory Holding Corp. (A) 24,293 4,132,239Gentex Corp. 136,468 4,755,910Lear Corp. 34,398 6,293,114The Goodyear Tire & Rubber
Company (A) 162,120 3,456,398
Mid Cap Index Trust (continued)Shares orPrincipalAmount Value
COMMON STOCKS (continued)Auto components (continued)Visteon Corp. (A) 16,154 $ 1,795,356
24,934,950Automobiles – 0.5%Harley-Davidson, Inc. 88,784 3,346,269Thor Industries, Inc. 32,040 3,324,791
6,671,060Diversified consumer services – 0.9%Graham Holdings Company, Class B 2,302 1,449,869Grand Canyon Education, Inc. (A) 23,122 1,981,787H&R Block, Inc. 101,334 2,387,429Service Corp. International 95,151 6,754,769
12,573,854Hotels, restaurants and leisure – 2.9%Boyd Gaming Corp. (A) 47,320 3,102,772Choice Hotels International, Inc. 18,937 2,953,983Churchill Downs, Inc. 19,862 4,784,756Cracker Barrel Old Country Store, Inc. 13,566 1,745,130Jack in the Box, Inc. 12,504 1,093,850Marriott Vacations Worldwide Corp. 24,577 4,153,021Papa John’s International, Inc. 18,673 2,492,285Scientific Games Corp. (A) 55,686 3,721,495Six Flags Entertainment Corp. (A) 44,649 1,901,154Texas Roadhouse, Inc. 40,184 3,587,628The Wendy’s Company 101,841 2,428,908Travel + Leisure Company 49,792 2,752,004Wingstop, Inc. 17,209 2,973,715Wyndham Hotels & Resorts, Inc. 53,762 4,819,763
42,510,464Household durables – 1.9%Helen of Troy, Ltd. (A) 13,921 3,403,267KB Home 49,451 2,211,943Leggett & Platt, Inc. 76,956 3,167,509Taylor Morrison Home Corp. (A) 70,906 2,478,874Tempur Sealy International, Inc. 111,075 5,223,857Toll Brothers, Inc. 66,015 4,778,826TopBuild Corp. (A) 18,997 5,241,462Tri Pointe Homes, Inc. (A) 64,125 1,788,446
28,294,184Leisure products – 1.3%Brunswick Corp. 44,482 4,480,672Callaway Golf Company (A) 67,616 1,855,383Mattel, Inc. (A) 202,140 4,358,138Polaris, Inc. 32,912 3,617,358YETI Holdings, Inc. (A) 50,568 4,188,547
18,500,098Multiline retail – 0.8%Kohl’s Corp. 86,855 4,289,768Macy’s, Inc. 178,694 4,678,209Nordstrom, Inc. (A) 64,187 1,451,910Ollie’s Bargain Outlet Holdings, Inc. (A) 34,917 1,787,401
12,207,288Specialty retail – 3.3%American Eagle Outfitters, Inc. (B) 88,522 2,241,377AutoNation, Inc. (A) 23,067 2,695,379Dick’s Sporting Goods, Inc. (B) 37,441 4,305,341Five Below, Inc. (A) 32,324 6,687,512Foot Locker, Inc. 52,109 2,273,516GameStop Corp., Class A (A)(B) 35,748 5,304,646Lithia Motors, Inc. 17,471 5,188,013Murphy USA, Inc. 13,607 2,711,059RH (A) 10,008 5,363,688Urban Outfitters, Inc. (A) 38,026 1,116,443
John Hancock Variable Insurance TrustPortfolio of Investments — December 31, 2021 (showing percentage of total net assets)
The accompanying notes are an integral part of the financial statements. 96

Mid Cap Index Trust (continued)Shares orPrincipalAmount Value
COMMON STOCKS (continued)Specialty retail (continued)Victoria’s Secret & Company (A) 41,803 $ 2,321,739Williams-Sonoma, Inc. 42,908 7,257,030
47,465,743Textiles, apparel and luxury goods – 1.8%Capri Holdings, Ltd. (A) 86,812 5,634,967Carter’s, Inc. 24,387 2,468,452Columbia Sportswear Company 19,944 1,943,343Crocs, Inc. (A) 33,954 4,353,582Deckers Outdoor Corp. (A) 15,837 5,801,251Hanesbrands, Inc. 201,484 3,368,812Skechers USA, Inc., Class A (A) 77,837 3,378,126
26,948,533220,106,174
Consumer staples – 3.4%Beverages – 0.2%The Boston Beer Company, Inc.,
Class A (A) 5,417 2,736,127Food and staples retailing – 1.2%BJ’s Wholesale Club Holdings, Inc. (A) 78,783 5,276,098Casey’s General Stores, Inc. 21,407 4,224,671Grocery Outlet Holding Corp. (A) 50,414 1,425,708Performance Food Group Company (A) 89,037 4,085,908Sprouts Farmers Market, Inc. (A) 64,771 1,922,403
16,934,788Food products – 1.7%Darling Ingredients, Inc. (A) 93,360 6,468,914Flowers Foods, Inc. 114,653 3,149,518Ingredion, Inc. 38,390 3,710,010Lancaster Colony Corp. 11,437 1,893,967Pilgrim’s Pride Corp. (A) 28,120 792,984Post Holdings, Inc. (A) 33,776 3,807,568Sanderson Farms, Inc. 12,240 2,338,819The Hain Celestial Group, Inc. (A) 53,591 2,283,513
24,445,293Household products – 0.1%Energizer Holdings, Inc. 36,293 1,455,349Personal products – 0.2%Coty, Inc., Class A (A) 193,621 2,033,021Nu Skin Enterprises, Inc., Class A 28,747 1,458,910
3,491,93149,063,488
Energy – 2.0%Energy equipment and services – 0.4%ChampionX Corp. (A) 116,591 2,356,304NOV, Inc. 225,423 3,054,482
5,410,786Oil, gas and consumable fuels – 1.6%Antero Midstream Corp. 187,348 1,813,529CNX Resources Corp. (A) 121,859 1,675,561DT Midstream, Inc. 55,813 2,677,908EQT Corp. (A) 174,456 3,804,885Equitrans Midstream Corp. 234,572 2,425,474HollyFrontier Corp. 86,257 2,827,504Murphy Oil Corp. 83,773 2,187,313Targa Resources Corp. 132,113 6,901,583
24,313,75729,724,543
Financials – 13.3%Banks – 6.1%Associated Banc-Corp. 86,590 1,956,068Bank of Hawaii Corp. 23,355 1,956,215
Mid Cap Index Trust (continued)Shares orPrincipalAmount Value
COMMON STOCKS (continued)Banks (continued)Bank OZK 69,749 $ 3,245,421Cadence Bank 113,057 3,367,968Cathay General Bancorp 44,556 1,915,462CIT Group, Inc. 57,219 2,937,623Commerce Bancshares, Inc. 64,046 4,402,522Cullen/Frost Bankers, Inc. 32,718 4,124,758East West Bancorp, Inc. 81,878 6,442,161First Financial Bankshares, Inc. (B) 73,984 3,761,347First Horizon Corp. 312,003 5,095,009FNB Corp. 184,015 2,232,102Fulton Financial Corp. 93,069 1,582,173Glacier Bancorp, Inc. 62,587 3,548,683Hancock Whitney Corp. 50,097 2,505,852Home BancShares, Inc. 86,973 2,117,793International Bancshares Corp. 30,712 1,301,882PacWest Bancorp 67,655 3,055,976Pinnacle Financial Partners, Inc. 43,929 4,195,220Prosperity Bancshares, Inc. 53,178 3,844,769Sterling Bancorp 111,185 2,867,461Synovus Financial Corp. 83,957 4,019,022Texas Capital Bancshares, Inc. (A) 29,200 1,759,300UMB Financial Corp. 24,833 2,635,030Umpqua Holdings Corp. 124,987 2,404,750United Bankshares, Inc. 78,659 2,853,749Valley National Bancorp 234,806 3,228,583Webster Financial Corp. 52,268 2,918,645Wintrust Financial Corp. 32,892 2,987,251
89,262,795Capital markets – 2.0%Affiliated Managers Group, Inc. 23,455 3,858,582Evercore, Inc., Class A 22,513 3,058,391Federated Hermes, Inc. 55,877 2,099,858Interactive Brokers Group, Inc., Class A 50,413 4,003,800Janus Henderson Group PLC 98,424 4,127,903Jefferies Financial Group, Inc. 113,347 4,397,864SEI Investments Company 61,151 3,726,542Stifel Financial Corp. 60,070 4,230,129
29,503,069Consumer finance – 0.6%FirstCash Holdings, Inc. 23,329 1,745,242Navient Corp. 92,993 1,973,311PROG Holdings, Inc. (A) 32,725 1,476,225SLM Corp. 169,158 3,327,338
8,522,116Diversified financial services – 0.3%Voya Financial, Inc. 66,025 4,378,118Insurance – 3.6%Alleghany Corp. (A) 7,904 5,276,631American Financial Group, Inc. 38,168 5,241,230Brighthouse Financial, Inc. (A) 46,054 2,385,597CNO Financial Group, Inc. 71,149 1,696,192First American Financial Corp. 63,334 4,954,619Kemper Corp. 34,523 2,029,607Kinsale Capital Group, Inc. 12,376 2,944,127Mercury General Corp. 15,335 813,675Old Republic International Corp. 164,738 4,049,260Primerica, Inc. 22,785 3,492,257Reinsurance Group of America, Inc. 39,004 4,270,548RenaissanceRe Holdings, Ltd. 26,553 4,496,219RLI Corp. 22,973 2,575,273Selective Insurance Group, Inc. 34,691 2,842,581The Hanover Insurance Group, Inc. 20,529 2,690,531
John Hancock Variable Insurance TrustPortfolio of Investments — December 31, 2021 (showing percentage of total net assets)
The accompanying notes are an integral part of the financial statements. 97

Mid Cap Index Trust (continued)Shares orPrincipalAmount Value
COMMON STOCKS (continued)Insurance (continued)Unum Group 117,966 $ 2,898,425
52,656,772Thrifts and mortgage finance – 0.7%Essent Group, Ltd. 63,717 2,901,035MGIC Investment Corp. 187,855 2,708,869New York Community Bancorp, Inc. 268,304 3,275,992Washington Federal, Inc. 37,587 1,254,654
10,140,550194,463,420
Health care – 9.7%Biotechnology – 1.4%Arrowhead Pharmaceuticals, Inc. (A) 60,156 3,988,343Exelixis, Inc. (A) 182,555 3,337,105Halozyme Therapeutics, Inc. (A) 81,232 3,266,339Neurocrine Biosciences, Inc. (A) 54,737 4,661,950United Therapeutics Corp. (A) 25,986 5,615,055
20,868,792Health care equipment and supplies – 3.2%Envista Holdings Corp. (A) 93,107 4,195,401Globus Medical, Inc., Class A (A) 45,605 3,292,681Haemonetics Corp. (A) 29,487 1,563,990ICU Medical, Inc. (A) 11,519 2,733,919Integra LifeSciences Holdings Corp. (A) 42,029 2,815,523LivaNova PLC (A) 30,710 2,684,975Masimo Corp. (A) 29,313 8,582,260Neogen Corp. (A) 62,022 2,816,419NuVasive, Inc. (A) 29,851 1,566,580Penumbra, Inc. (A) 20,262 5,821,678Quidel Corp. (A) 21,882 2,953,851STAAR Surgical Company (A) 27,464 2,507,463Tandem Diabetes Care, Inc. (A) 36,657 5,517,612
47,052,352Health care providers and services – 3.0%Acadia Healthcare Company, Inc. (A) 51,891 3,149,784Amedisys, Inc. (A) 18,811 3,045,125Chemed Corp. 8,883 4,699,462Encompass Health Corp. 57,405 3,746,250HealthEquity, Inc. (A) 48,183 2,131,616LHC Group, Inc. (A) 18,274 2,507,741Molina Healthcare, Inc. (A) 33,696 10,718,024Option Care Health, Inc. (A) 79,914 2,272,754Patterson Companies, Inc. 49,976 1,466,796Progyny, Inc. (A) 40,176 2,022,862R1 RCM, Inc. (A) 76,883 1,959,748Tenet Healthcare Corp. (A) 61,810 5,049,259
42,769,421Life sciences tools and services – 1.6%Bruker Corp. 58,627 4,919,392Medpace Holdings, Inc. (A) 16,589 3,610,430Repligen Corp. (A) 29,668 7,857,273Syneos Health, Inc. (A) 59,828 6,143,139
22,530,234Pharmaceuticals – 0.5%Jazz Pharmaceuticals PLC (A) 35,467 4,518,496Perrigo Company PLC 77,185 3,002,497
7,520,993140,741,792
Industrials – 18.6%Aerospace and defense – 0.9%Axon Enterprise, Inc. (A) 37,894 5,949,358Curtiss-Wright Corp. 22,641 3,139,627
Mid Cap Index Trust (continued)Shares orPrincipalAmount Value
COMMON STOCKS (continued)Aerospace and defense (continued)Hexcel Corp. (A) 48,405 $ 2,507,379Mercury Systems, Inc. (A) 32,684 1,799,581
13,395,945Air freight and logistics – 0.4%GXO Logistics, Inc. (A) 56,886 5,166,955Airlines – 0.2%JetBlue Airways Corp. (A) 183,498 2,613,012Building products – 2.8%Builders FirstSource, Inc. (A) 110,493 9,470,355Carlisle Companies, Inc. 30,168 7,485,284Lennox International, Inc. 19,422 6,299,720Owens Corning 57,979 5,247,100Simpson Manufacturing Company, Inc. 25,064 3,485,650Trex Company, Inc. (A) 66,420 8,968,693
40,956,802Commercial services and supplies – 1.5%Clean Harbors, Inc. (A) 28,883 2,881,657IAA, Inc. (A) 77,804 3,938,438MillerKnoll, Inc. 43,721 1,713,426MSA Safety, Inc. 21,038 3,175,896Stericycle, Inc. (A) 53,003 3,161,099Tetra Tech, Inc. 31,198 5,297,420The Brink’s Company 28,361 1,859,631
22,027,567Construction and engineering – 1.4%AECOM (A) 83,121 6,429,409Dycom Industries, Inc. (A) 17,408 1,632,174EMCOR Group, Inc. 30,796 3,923,102Fluor Corp. (A) 81,592 2,021,034MasTec, Inc. (A) 33,012 3,046,347Valmont Industries, Inc. 12,246 3,067,623
20,119,689Electrical equipment – 2.0%Acuity Brands, Inc. 20,151 4,266,370EnerSys 24,170 1,910,880Hubbell, Inc. 31,394 6,538,428nVent Electric PLC 97,070 3,688,660Regal Rexnord Corp. 39,096 6,653,357Sunrun, Inc. (A) 119,438 4,096,723Vicor Corp. (A) 12,374 1,571,251
28,725,669Machinery – 4.9%AGCO Corp. 35,406 4,107,804Colfax Corp. (A) 77,696 3,571,685Crane Company 28,802 2,930,027Donaldson Company, Inc. 71,312 4,225,949Flowserve Corp. 75,162 2,299,957Graco, Inc. 98,068 7,906,242ITT, Inc. 49,390 5,047,164Kennametal, Inc. 48,262 1,733,088Lincoln Electric Holdings, Inc. 34,070 4,751,743Nordson Corp. 31,184 7,960,340Oshkosh Corp. 39,602 4,463,541Terex Corp. 40,273 1,769,998The Middleby Corp. (A) 32,095 6,315,012The Timken Company 39,831 2,759,890The Toro Company 61,417 6,136,172Trinity Industries, Inc. 47,192 1,425,198
John Hancock Variable Insurance TrustPortfolio of Investments — December 31, 2021 (showing percentage of total net assets)
The accompanying notes are an integral part of the financial statements. 98

Mid Cap Index Trust (continued)Shares orPrincipalAmount Value
COMMON STOCKS (continued)Machinery (continued)Woodward, Inc. 36,375 $ 3,981,608
71,385,418Marine – 0.1%Kirby Corp. (A) 34,683 2,060,864Professional services – 1.5%ASGN, Inc. (A) 30,061 3,709,527CACI International, Inc., Class A (A) 13,459 3,623,297FTI Consulting, Inc. (A) 19,784 3,035,261Insperity, Inc. 20,660 2,440,153KBR, Inc. 80,942 3,854,458ManpowerGroup, Inc. 31,296 3,046,040Science Applications International Corp. 33,214 2,776,358
22,485,094Road and rail – 2.0%Avis Budget Group, Inc. (A) 23,124 4,795,224Knight-Swift Transportation Holdings, Inc. 95,754 5,835,249Landstar System, Inc. 21,988 3,936,292Ryder System, Inc. 30,980 2,553,681Saia, Inc. (A) 15,196 5,121,508Werner Enterprises, Inc. 35,118 1,673,724XPO Logistics, Inc. (A) 56,920 4,407,316
28,322,994Trading companies and distributors – 0.9%GATX Corp. 20,483 2,134,124MSC Industrial Direct Company, Inc.,
Class A 27,014 2,270,797Univar Solutions, Inc. (A) 98,639 2,796,416Watsco, Inc. 19,055 5,961,928
13,163,265270,423,274
Information technology – 14.0%Communications equipment – 0.9%Ciena Corp. (A) 89,391 6,880,425Lumentum Holdings, Inc. (A) 41,716 4,412,301ViaSat, Inc. (A) 42,376 1,887,427
13,180,153Electronic equipment, instruments and components – 3.2%Arrow Electronics, Inc. (A) 40,175 5,394,297Avnet, Inc. 57,249 2,360,376Belden, Inc. 25,905 1,702,736Cognex Corp. 102,010 7,932,298Coherent, Inc. (A) 14,156 3,773,140II-VI, Inc. (A) 61,241 4,184,598Jabil, Inc. 82,702 5,818,086Littelfuse, Inc. 14,212 4,472,232National Instruments Corp. 76,094 3,323,025TD SYNNEX Corp. 23,820 2,724,055Vishay Intertechnology, Inc. 76,571 1,674,608Vontier Corp. 97,544 2,997,527
46,356,978IT services – 1.9%Alliance Data Systems Corp. 28,725 1,912,223Concentrix Corp. 24,754 4,421,560Genpact, Ltd. 99,825 5,298,711Kyndryl Holdings, Inc. (A) 103,358 1,870,780LiveRamp Holdings, Inc. (A) 39,288 1,883,860MAXIMUS, Inc. 35,468 2,825,736Sabre Corp. (A) 186,616 1,603,031The Western Union Company 231,950 4,137,988
Mid Cap Index Trust (continued)Shares orPrincipalAmount Value
COMMON STOCKS (continued)IT services (continued)WEX, Inc. (A) 25,860 $ 3,630,485
27,584,374Semiconductors and semiconductor equipment – 4.2%Amkor Technology, Inc. 57,846 1,434,002Azenta, Inc. 42,897 4,423,110Cirrus Logic, Inc. (A) 32,966 3,033,531CMC Materials, Inc. 16,401 3,143,908First Solar, Inc. (A) 57,054 4,972,827Lattice Semiconductor Corp. (A) 79,012 6,088,665MKS Instruments, Inc. 31,999 5,573,266Power Integrations, Inc. 34,810 3,233,501Semtech Corp. (A) 37,156 3,304,283Silicon Laboratories, Inc. (A) 23,187 4,786,261SiTime Corp. (A) 8,648 2,529,886SunPower Corp. (A)(B) 47,909 999,861Synaptics, Inc. (A) 22,659 6,560,007Universal Display Corp. 25,016 4,128,390Wolfspeed, Inc. (A) 66,867 7,473,729
61,685,227Software – 3.7%ACI Worldwide, Inc. (A) 67,834 2,353,840Aspen Technology, Inc. (A) 38,611 5,876,594Blackbaud, Inc. (A) 23,906 1,888,096CDK Global, Inc. 68,277 2,849,882Cerence, Inc. (A) 21,929 1,680,639CommVault Systems, Inc. (A) 26,258 1,809,701Digital Turbine, Inc. (A) 50,734 3,094,267Envestnet, Inc. (A) 31,529 2,501,511Fair Isaac Corp. (A) 15,785 6,845,481Manhattan Associates, Inc. (A) 36,513 5,677,406Mimecast, Ltd. (A) 35,627 2,834,840NCR Corp. (A) 76,161 3,061,672Paylocity Holding Corp. (A) 22,859 5,398,381Qualys, Inc. (A) 19,265 2,643,543Sailpoint Technologies Holdings, Inc. (A) 53,812 2,601,272Teradata Corp. (A) 62,602 2,658,707
53,775,832Technology hardware, storage and peripherals – 0.1%Xerox Holdings Corp. 79,309 1,795,556
204,378,120Materials – 6.5%Chemicals – 2.6%Ashland Global Holdings, Inc. 32,589 3,508,532Avient Corp. 52,789 2,953,545Cabot Corp. 32,730 1,839,426Ingevity Corp. (A) 22,667 1,625,224Minerals Technologies, Inc. 19,211 1,405,285NewMarket Corp. 3,986 1,366,082Olin Corp. 82,762 4,760,470RPM International, Inc. 74,844 7,559,244Sensient Technologies Corp. 24,248 2,426,255The Chemours Company 94,025 3,155,479The Scotts Miracle-Gro Company 23,503 3,783,983Valvoline, Inc. 104,296 3,889,198
38,272,723Construction materials – 0.3%Eagle Materials, Inc. 23,468 3,906,483Containers and packaging – 0.8%AptarGroup, Inc. 37,981 4,651,913Greif, Inc., Class A 15,319 924,808Silgan Holdings, Inc. 48,416 2,074,141
John Hancock Variable Insurance TrustPortfolio of Investments — December 31, 2021 (showing percentage of total net assets)
The accompanying notes are an integral part of the financial statements. 99

Mid Cap Index Trust (continued)Shares orPrincipalAmount Value
COMMON STOCKS (continued)Containers and packaging (continued)Sonoco Products Company 56,732 $ 3,284,215
10,935,077Metals and mining – 2.5%Alcoa Corp. 107,955 6,431,959Cleveland-Cliffs, Inc. (A) 262,574 5,716,236Commercial Metals Company 69,579 2,525,022Compass Minerals International, Inc. 19,640 1,003,211Reliance Steel & Aluminum Company 36,151 5,864,415Royal Gold, Inc. 37,871 3,984,408Steel Dynamics, Inc. 108,778 6,751,850U.S. Steel Corp. 155,919 3,712,431Worthington Industries, Inc. 18,665 1,020,229
37,009,761Paper and forest products – 0.3%Louisiana-Pacific Corp. 50,768 3,977,673
94,101,717Real estate – 10.1%Equity real estate investment trusts – 9.6%American Campus Communities, Inc. 80,291 4,599,871Apartment Income REIT Corp. 90,577 4,951,845Brixmor Property Group, Inc. 171,356 4,354,156Camden Property Trust 58,966 10,536,045Corporate Office Properties Trust 64,809 1,812,708Cousins Properties, Inc. 85,791 3,455,661CyrusOne, Inc. 73,226 6,569,837Douglas Emmett, Inc. 101,252 3,391,942EastGroup Properties, Inc. 23,474 5,348,551EPR Properties 43,161 2,049,716First Industrial Realty Trust, Inc. 75,175 4,976,585Healthcare Realty Trust, Inc. 85,129 2,693,482Highwoods Properties, Inc. 60,227 2,685,522Hudson Pacific Properties, Inc. 87,977 2,173,912JBG SMITH Properties 65,867 1,891,042Kilroy Realty Corp. 60,477 4,019,301Kite Realty Group Trust 126,369 2,752,317Lamar Advertising Company, Class A 50,093 6,076,281Life Storage, Inc. 47,325 7,249,244Medical Properties Trust, Inc. 344,054 8,129,996National Retail Properties, Inc. 101,328 4,870,837National Storage Affiliates Trust 47,280 3,271,776Omega Healthcare Investors, Inc. 137,883 4,079,958Park Hotels & Resorts, Inc. (A) 136,444 2,576,063Pebblebrook Hotel Trust 75,806 1,695,780Physicians Realty Trust 127,102 2,393,331PotlatchDeltic Corp. 38,716 2,331,478PS Business Parks, Inc. 11,605 2,137,293Rayonier, Inc. 82,597 3,333,615Rexford Industrial Realty, Inc. 87,406 7,089,501Sabra Health Care REIT, Inc. 131,943 1,786,508SL Green Realty Corp. 38,500 2,760,450Spirit Realty Capital, Inc. 71,151 3,428,767STORE Capital Corp. 141,596 4,870,902The Macerich Company 122,918 2,124,023Urban Edge Properties 63,531 1,207,089
139,675,385Real estate management and development – 0.5%Jones Lang LaSalle, Inc. (A) 29,119 7,842,911
147,518,296
Mid Cap Index Trust (continued)Shares orPrincipalAmount Value
COMMON STOCKS (continued)Utilities – 3.3%Electric utilities – 1.0%ALLETE, Inc. 30,333 $ 2,012,595Hawaiian Electric Industries, Inc. 63,070 2,617,405IDACORP, Inc. 29,147 3,302,647OGE Energy Corp. 115,497 4,432,775PNM Resources, Inc. 49,525 2,258,835
14,624,257Gas utilities – 1.2%National Fuel Gas Company 52,610 3,363,883New Jersey Resources Corp. 55,640 2,284,578ONE Gas, Inc. 30,919 2,399,005Southwest Gas Holdings, Inc. 34,841 2,440,612Spire, Inc. 29,820 1,944,860UGI Corp. 120,645 5,538,812
17,971,750Multi-utilities – 0.6%Black Hills Corp. 36,823 2,598,599MDU Resources Group, Inc. 117,330 3,618,457NorthWestern Corp. 30,380 1,736,521
7,953,577Water utilities – 0.5%Essential Utilities, Inc. 132,704 7,124,878
47,674,462TOTAL COMMON STOCKS (Cost $1,019,764,709) $ 1,422,204,132
SHORT-TERM INVESTMENTS – 3.5%U.S. Government Agency – 2.4%Federal Home Loan Bank Discount Note
0.040%, 03/15/2022 * $ 35,000,000 34,996,550Short-term funds – 0.7%John Hancock Collateral Trust,
0.1697% (C)(D) 989,835 9,901,319Repurchase agreement – 0.4%Repurchase Agreement with State Street
Corp. dated 12-31-21 at 0.000% to berepurchased at $5,688,000 on 1-3-22,collateralized by $5,304,400U.S. Treasury Notes, 2.875% due5-15-28 (valued at $5,801,795) $ 5,688,000 5,688,000
TOTAL SHORT-TERM INVESTMENTS (Cost $50,588,185) $ 50,585,869Total Investments (Mid Cap Index Trust)
(Cost $1,070,352,894) – 101.1% $ 1,472,790,001Other assets and liabilities, net – (1.1%) (16,316,387)TOTAL NET ASSETS – 100.0% $ 1,456,473,614
Security Abbreviations and Legend(A) Non-income producing security.(B) All or a portion of this security is on loan as of 12-31-21.(C) The rate shown is the annualized seven-day yield as of 12-31-21.(D) Investment is an affiliate of the fund, the advisor and/or subadvisor.
This security represents the investment of cash collateral received forsecurities lending.
* Yield represents either the annualized yield at the date of purchase,the stated coupon rate or, for floating rate securities, the rate atperiod end.
John Hancock Variable Insurance TrustPortfolio of Investments — December 31, 2021 (showing percentage of total net assets)
The accompanying notes are an integral part of the financial statements. 100

Mid Cap Index Trust (continued)DERIVATIVES
FUTURES
Open contractsNumber of
contracts PositionExpiration
dateNotional
basis^Notional
value^
Unrealizedappreciation
(depreciation)S&P Mid 400 Index E-Mini Futures 128 Long Mar 2022 $35,387,833 $36,322,560 $934,727
$934,727
^ Notional basis refers to the contractual amount agreed upon at inception of open contracts; notional value represents the current value of the open contract.
See Notes to financial statements regarding investment transactions and other derivatives information.
Mid Value TrustShares orPrincipalAmount Value
COMMON STOCKS – 93.6%Communication services – 4.8%Entertainment – 0.2%Madison Square Garden Sports Corp. (A) 8,110 $ 1,408,950Media – 4.4%DISH Network Corp., Class A (A) 94,916 3,079,075Fox Corp., Class A 101,953 3,762,066News Corp., Class A 613,932 13,696,823Scholastic Corp. 99,213 3,964,551ViacomCBS, Inc., Class B 165,062 4,981,571
29,484,086Wireless telecommunication services – 0.2%Telephone & Data Systems, Inc. 60,403 1,217,120
32,110,156Consumer discretionary – 2.2%Diversified consumer services – 0.5%Strategic Education, Inc. 53,475 3,092,994Hotels, restaurants and leisure – 0.5%Compass Group PLC (A) 145,662 3,279,388Household durables – 0.3%Mohawk Industries, Inc. (A) 9,881 1,800,121Textiles, apparel and luxury goods – 0.9%Ralph Lauren Corp. 53,841 6,399,541
14,572,044Consumer staples – 8.6%Beverages – 0.6%Carlsberg A/S, Class B 24,092 4,159,429Food and staples retailing – 1.4%Sysco Corp. 114,511 8,994,839Food products – 5.9%Bunge, Ltd. 156,651 14,624,937Campbell Soup Company 169,776 7,378,465Flowers Foods, Inc. 572,599 15,729,295The Kraft Heinz Company 45,959 1,649,928
39,382,625Household products – 0.7%Kimberly-Clark Corp. 31,821 4,547,857
57,084,750Energy – 10.7%Energy equipment and services – 2.5%Expro Group Holdings NV (A) 268,099 3,847,221NOV, Inc. 289,644 3,924,676SEACOR Marine Holdings, Inc. (A) 120,598 410,033TechnipFMC PLC (A) 1,018,971 6,032,308
Mid Value Trust (continued)Shares orPrincipalAmount Value
COMMON STOCKS (continued)Energy equipment and services (continued)Tidewater, Inc. (A) 207,950 $ 2,227,145
16,441,383Oil, gas and consumable fuels – 8.2%APA Corp. 140,500 3,778,045Cameco Corp. 462,969 10,097,354Canadian Natural Resources, Ltd. 236,190 9,979,028EQT Corp. (A) 294,536 6,423,830Equitrans Midstream Corp. 569,939 5,893,169Imperial Oil, Ltd. (B) 401,868 14,507,435NAC Kazatomprom JSC, GDR 96,033 3,522,161
54,201,02270,642,405
Financials – 19.2%Banks – 4.3%Fifth Third Bancorp 344,783 15,015,300Popular, Inc. 59,883 4,912,801Sterling Bancorp 112,300 2,896,217Westamerica BanCorp 97,607 5,634,852
28,459,170Capital markets – 4.5%Lazard, Ltd., Class A 85,551 3,732,590Northern Trust Corp. 80,831 9,668,196Open Lending Corp., Class A (A) 40,000 899,200State Street Corp. 168,748 15,693,564
29,993,550Diversified financial services – 1.6%Groupe Bruxelles Lambert SA 62,496 6,979,981Jackson Financial, Inc., Class A 87,712 3,668,993
10,648,974Insurance – 8.4%Brighthouse Financial, Inc. (A) 119,285 6,178,963Brown & Brown, Inc. 143,330 10,073,232CNA Financial Corp. 163,445 7,204,656Kemper Corp. 104,221 6,127,153Loews Corp. 243,093 14,041,052Marsh & McLennan Companies, Inc. 25,832 4,490,118RenaissanceRe Holdings, Ltd. 44,449 7,526,549
55,641,723Thrifts and mortgage finance – 0.4%Capitol Federal Financial, Inc. 253,263 2,869,470
127,612,887Health care – 13.5%Biotechnology – 1.8%ACADIA Pharmaceuticals, Inc. (A) 108,100 2,523,054Alkermes PLC (A) 165,506 3,849,670BioMarin Pharmaceutical, Inc. (A) 27,974 2,471,503
John Hancock Variable Insurance TrustPortfolio of Investments — December 31, 2021 (showing percentage of total net assets)
The accompanying notes are an integral part of the financial statements. 101

Mid Value Trust (continued)Shares orPrincipalAmount Value
COMMON STOCKS (continued)Biotechnology (continued)Galapagos NV (A) 36,713 $ 2,037,325Incyte Corp. (A) 16,689 1,224,973
12,106,525Health care equipment and supplies – 4.3%Baxter International, Inc. 109,728 9,419,052Dentsply Sirona, Inc. 139,842 7,801,785Hologic, Inc. (A) 49,454 3,786,198Zimmer Biomet Holdings, Inc. 56,140 7,132,026
28,139,061Health care providers and services – 7.3%Cardinal Health, Inc. 305,705 15,740,750Centene Corp. (A) 55,500 4,573,200Covetrus, Inc. (A) 76,096 1,519,637Fresenius Medical Care AG &
Company KGaA 11,687 757,647Fresenius SE & Company KGaA 67,013 2,693,479Fresenius SE & Company KGaA, ADR (B) 135,772 1,355,005Patterson Companies, Inc. 315,830 9,269,611Select Medical Holdings Corp. 420,136 12,351,998
48,261,327Pharmaceuticals – 0.1%Perrigo Company PLC 21,396 832,304
89,339,217Industrials – 6.4%Aerospace and defense – 3.1%Rolls-Royce Holdings PLC (A) 2,713,272 4,528,819Textron, Inc. 210,237 16,230,296
20,759,115Air freight and logistics – 0.6%CH Robinson Worldwide, Inc. 36,541 3,932,908Airlines – 0.2%Southwest Airlines Company (A) 34,604 1,482,435Commercial services and supplies – 0.3%Cintas Corp. 3,772 1,671,637Machinery – 1.6%AGCO Corp. 15,028 1,743,549PACCAR, Inc. 101,638 8,970,570
10,714,119Road and rail – 0.6%JB Hunt Transport Services, Inc. 19,729 4,032,608
42,592,822Information technology – 1.8%Electronic equipment, instruments and components – 0.9%National Instruments Corp. 128,985 5,632,775Semiconductors and semiconductor equipment – 0.9%Applied Materials, Inc. 39,723 6,250,811
11,883,586Materials – 10.8%Chemicals – 2.4%Corteva, Inc. 205,032 9,693,913PPG Industries, Inc. 15,761 2,717,827Westlake Chemical Corp. 33,620 3,265,511
15,677,251Construction materials – 2.2%Summit Materials, Inc., Class A (A) 239,408 9,609,837Vulcan Materials Company 23,171 4,809,836
14,419,673Metals and mining – 6.2%AngloGold Ashanti, Ltd., ADR 252,698 5,301,604
Mid Value Trust (continued)Shares orPrincipalAmount Value
COMMON STOCKS (continued)Metals and mining (continued)Centerra Gold, Inc. 47,339 $ 364,880Cia de Minas Buenaventura SAA,
ADR (A)(B) 552,202 4,042,119Franco-Nevada Corp. 94,917 13,126,827Freeport-McMoRan, Inc. 193,161 8,060,609Fresnillo PLC 515,025 6,262,105Gold Fields, Ltd., ADR 379,967 4,175,837
41,333,98171,430,905
Real estate – 7.8%Equity real estate investment trusts – 7.5%Apartment Income REIT Corp. 37,990 2,076,913Apartment Investment and Management
Company, Class A (A) 417,176 3,220,599Equity Commonwealth (A) 314,972 8,157,775Equity Residential 59,856 5,416,968Rayonier, Inc. 256,894 10,368,242Regency Centers Corp. 98,281 7,405,473Weyerhaeuser Company 318,706 13,124,313
49,770,283Real estate management and development – 0.3%The St. Joe Company 32,761 1,705,210
51,475,493Utilities – 7.8%Electric utilities – 4.7%FirstEnergy Corp. 419,848 17,461,476PG&E Corp. (A) 1,139,900 13,838,386
31,299,862Gas utilities – 1.3%Atmos Energy Corp. 20,300 2,126,831National Fuel Gas Company 105,216 6,727,511
8,854,342Independent power and renewable electricity producers –0.7%Vistra Corp. 202,658 4,614,523Multi-utilities – 1.1%CenterPoint Energy, Inc. 259,605 7,245,576
52,014,303TOTAL COMMON STOCKS (Cost $457,460,667) $ 620,758,568
PREFERRED SECURITIES – 0.2%Consumer staples – 0.2%Food products – 0.2%Bunge, Ltd., 4.875% 8,102 1,026,847TOTAL PREFERRED SECURITIES (Cost $917,915) $ 1,026,847
CORPORATE BONDS - 0.0%Energy - 0.0%Weatherford International, Ltd.
11.000%, 12/01/2024 (C) $ 172,000 177,160TOTAL CORPORATE BONDS (Cost $136,766) $ 177,160
SHORT-TERM INVESTMENTS – 6.3%Short-term funds – 6.3%John Hancock Collateral Trust,
0.1697% (D)(E) 102,881 1,029,121
John Hancock Variable Insurance TrustPortfolio of Investments — December 31, 2021 (showing percentage of total net assets)
The accompanying notes are an integral part of the financial statements. 102

Mid Value Trust (continued)Shares orPrincipalAmount Value
SHORT-TERM INVESTMENTS (continued)Short-term funds (continued)State Street Institutional U.S. Government
Money Market Fund, Premier Class,0.0250% (D) 2,575,038 $ 2,575,038
T. Rowe Price Government Reserve Fund,0.0570% (D) 37,986,291 37,986,291
TOTAL SHORT-TERM INVESTMENTS (Cost $41,590,445) $ 41,590,450Total Investments (Mid Value Trust)
(Cost $500,105,793) – 100.1% $ 663,553,025Other assets and liabilities, net – (0.1%) (527,693)TOTAL NET ASSETS – 100.0% $ 663,025,332
Security Abbreviations and LegendADR American Depositary ReceiptGDR Global Depositary Receipt(A) Non-income producing security.(B) All or a portion of this security is on loan as of 12-31-21.(C) These securities are exempt from registration under Rule 144A of
the Securities Act of 1933. Such securities may be resold, normallyto qualified institutional buyers, in transactions exempt fromregistration.
(D) The rate shown is the annualized seven-day yield as of 12-31-21.(E) Investment is an affiliate of the fund, the advisor and/or subadvisor.
This security represents the investment of cash collateral received forsecurities lending.
Real Estate Securities TrustShares orPrincipalAmount Value
COMMON STOCKS – 98.7%Consumer discretionary – 2.0%Hotels, restaurants and leisure – 1.5%Casinos and gaming – 0.2%Caesars Entertainment, Inc. (A) 10,970 $ 1,026,024Hotels, resorts and cruise lines – 1.3%Bluegreen Vacations Holding Corp. (A) 20,200 709,020Playa Hotels & Resorts NV (A) 605,738 4,833,789
5,542,809Household durables – 0.5%Homebuilding – 0.5%D.R. Horton, Inc. 18,660 2,023,677
8,592,510Health care – 1.7%Health care providers and services –1.7%Health care facilities – 1.7%Brookdale Senior Living, Inc. (A) 178,403 920,559HCA Healthcare, Inc. 25,063 6,439,186
7,359,745Real estate – 95.0%Equity real estate investment trusts –89.5%Health care REITs – 4.6%Welltower, Inc. 230,479 19,768,185Hotel and resort REITs – 2.5%Pebblebrook Hotel Trust 134,659 3,012,322Ryman Hospitality Properties, Inc. (A) 83,512 7,679,764
10,692,086
Real Estate Securities Trust (continued)Shares orPrincipalAmount Value
COMMON STOCKS (continued)Industrial REITs – 17.6%First Industrial Realty Trust, Inc. 126,000 $ 8,341,200Innovative Industrial Properties, Inc. 21,118 5,552,133Prologis, Inc. 283,254 47,688,643Rexford Industrial Realty, Inc. 181,797 14,745,555
76,327,531Office REITs – 7.8%Alexandria Real Estate Equities, Inc. 62,978 14,041,575Douglas Emmett, Inc. 214,785 7,195,298SL Green Realty Corp. 139,586 10,008,314Veris Residential, Inc. (A) 130,280 2,394,546
33,639,733Residential REITs – 21.1%AvalonBay Communities, Inc. 87,326 22,057,674Camden Property Trust 76,828 13,727,627Independence Realty Trust, Inc. 349,379 9,024,460Invitation Homes, Inc. 314,868 14,276,115Sun Communities, Inc. 72,806 15,287,076UDR, Inc. 284,820 17,086,352
91,459,304Retail REITs – 11.6%Acadia Realty Trust 191,235 4,174,660Brixmor Property Group, Inc. 515,842 13,107,545Kimco Realty Corp. 482,608 11,896,287Phillips Edison & Company, Inc. 165,970 5,483,649Simon Property Group, Inc. 98,654 15,761,950
50,424,091Specialized REITs – 24.3%American Tower Corp. 61,637 18,028,823Equinix, Inc. 15,382 13,010,711Extra Space Storage, Inc. 113,264 25,680,347Life Storage, Inc. 107,321 16,439,431PotlatchDeltic Corp. 50,860 3,062,789Public Storage 16,906 6,332,311SBA Communications Corp. 30,225 11,758,130VICI Properties, Inc. 357,548 10,765,770
105,078,312387,389,242
Real estate management anddevelopment – 5.5%Real estate operating companies – 1.5%Tricon Residential, Inc. 427,906 6,549,081Real estate services – 4.0%CBRE Group, Inc., Class A (A) 78,274 8,493,512Colliers International Group, Inc. (New
York Stock Exchange) (B) 58,050 8,629,13317,122,64523,671,726
411,060,968TOTAL COMMON STOCKS (Cost $311,566,938) $ 427,013,223
John Hancock Variable Insurance TrustPortfolio of Investments — December 31, 2021 (showing percentage of total net assets)
The accompanying notes are an integral part of the financial statements. 103

Real Estate Securities Trust (continued)Shares orPrincipalAmount Value
SHORT-TERM INVESTMENTS – 0.9%Short-term funds – 0.9%John Hancock Collateral Trust,
0.1697% (C)(D) 155,508 $ 1,555,545State Street Institutional U.S. Government
Money Market Fund, Premier Class,0.0250% (C) 2,065,702 2,065,702
TOTAL SHORT-TERM INVESTMENTS(Cost $3,621,503) $ 3,621,247Total Investments (Real Estate Securities
Trust)(Cost $315,188,441) – 99.6% $ 430,634,470
Other assets and liabilities, net – 0.4% 1,885,181TOTAL NET ASSETS – 100.0% $ 432,519,651
Security Abbreviations and Legend(A) Non-income producing security.(B) All or a portion of this security is on loan as of 12-31-21.(C) The rate shown is the annualized seven-day yield as of 12-31-21.(D) Investment is an affiliate of the fund, the advisor and/or subadvisor.
This security represents the investment of cash collateral received forsecurities lending.
Science & Technology TrustShares orPrincipalAmount Value
COMMON STOCKS – 97.4%Communication services – 14.9%Entertainment – 0.8%CTS Eventim AG & Company KGaA (A) 67,717 $ 4,949,633ROBLOX Corp., Class A (A) 26,501 2,733,843Take-Two Interactive Software, Inc. (A) 2,580 458,518
8,141,994Interactive media and services – 14.1%Alphabet, Inc., Class A (A) 1,460 4,229,678Alphabet, Inc., Class C (A) 16,028 46,378,461Baidu, Inc., ADR (A) 179,611 26,724,321Kanzhun, Ltd., ADR (A)(B) 27,588 962,269Kuaishou Technology (A)(C) 13,100 121,456Meta Platforms, Inc., Class A (A) 123,222 41,445,720Pinterest, Inc., Class A (A) 191,911 6,975,965VK Company, Ltd., GDR (A) 732,550 8,479,709ZoomInfo Technologies, Inc. (A) 251,025 16,115,805
151,433,384159,575,378
Consumer discretionary – 21.8%Auto components – 0.3%Aptiv PLC (A) 17,495 2,885,800Automobiles – 1.0%Rivian Automotive, Inc., Class A (A)(B) 39,543 4,100,214Tesla, Inc. (A) 6,280 6,636,578
10,736,792Diversified consumer services – 0.2%New Oriental Education & Technology
Group, Inc., ADR (A) 1,182,568 2,483,393Hotels, restaurants and leisure – 5.6%Airbnb, Inc., Class A (A) 7,155 1,191,236Booking Holdings, Inc. (A) 9,738 23,363,702Expedia Group, Inc. (A) 16,925 3,058,686Tongcheng Travel Holdings, Ltd. (A) 2,788,400 5,168,838
Science & Technology Trust (continued)Shares orPrincipalAmount Value
COMMON STOCKS (continued)Hotels, restaurants and leisure (continued)Trip.com Group, Ltd., ADR (A) 1,106,412 $ 27,239,863
60,022,325Internet and direct marketing retail – 14.0%Alibaba Group Holding, Ltd., ADR (A) 230,537 27,385,490Amazon.com, Inc. (A) 14,932 49,788,365boohoo Group PLC (A) 3,378,782 5,665,512Coupang, Inc. (A) 162,752 4,781,654Deliveroo PLC (A)(C) 1,380,436 3,940,642Delivery Hero SE (A)(C) 125,444 13,885,463D-Market Elektronik Hizmetler ve Ticaret
AS, ADR (A) 345,590 660,077Etsy, Inc. (A) 16,938 3,708,406Naspers, Ltd., N Shares 39,312 6,101,656Prosus NV (A) 73,986 6,127,891Wayfair, Inc., Class A (A)(B) 17,028 3,234,809Zalando SE (A)(C) 306,247 24,670,178
149,950,143Specialty retail – 0.7%Auto1 Group SE (A)(C) 101,384 2,240,744Warby Parker, Inc., Class A (A) 106,647 4,965,484
7,206,228233,284,681
Industrials – 0.4%Electrical equipment – 0.0%Bloom Energy Corp., Class A (A) 2,605 57,128Professional services – 0.1%LegalZoom.com, Inc. (A)(B) 27,577 443,162Road and rail – 0.3%DiDi Global, Inc. (A) 9,513 189,499Lyft, Inc., Class A (A) 77,110 3,294,910
3,484,4093,984,699
Information technology – 60.3%Communications equipment – 0.3%Arista Networks, Inc. (A) 9,115 1,310,281F5, Inc. (A) 8,220 2,011,516
3,321,797Electronic equipment, instruments and components – 0.7%Cognex Corp. 6,880 534,989Flex, Ltd. (A) 51,735 948,303IPG Photonics Corp. (A) 4,810 827,993Samsung SDI Company, Ltd. 9,933 5,462,871
7,774,156IT services – 6.1%Adyen NV (A)(C) 650 1,706,250Block, Inc. (A) 3,545 572,553Cloudflare, Inc., Class A (A) 4,240 557,560DXC Technology Company (A) 134,655 4,334,544EPAM Systems, Inc. (A) 3,610 2,413,105Fiserv, Inc. (A) 16,042 1,664,999MongoDB, Inc. (A) 46,230 24,471,851Okta, Inc. (A) 68,310 15,313,053Shopify, Inc., Class A (A) 2,700 3,718,953Snowflake, Inc., Class A (A) 19,738 6,686,248Toast, Inc., Class A (A)(B) 320 11,107Twilio, Inc., Class A (A) 14,900 3,923,766
65,373,989Semiconductors and semiconductor equipment – 16.4%Advanced Micro Devices, Inc. (A) 28,605 4,116,260Applied Materials, Inc. 88,241 13,885,604ASML Holding NV, NYRS 3,730 2,969,602
John Hancock Variable Insurance TrustPortfolio of Investments — December 31, 2021 (showing percentage of total net assets)
The accompanying notes are an integral part of the financial statements. 104

Science & Technology Trust (continued)Shares orPrincipalAmount Value
COMMON STOCKS (continued)Semiconductors and semiconductor equipment (continued)Broadcom, Inc. 6,740 $ 4,484,863GlobalFoundries, Inc. (A) 38,850 2,524,085Infineon Technologies AG 145,345 6,691,459KLA Corp. 6,660 2,864,533Lam Research Corp. 7,730 5,559,030Marvell Technology, Inc. 130,705 11,435,380Micron Technology, Inc. 288,063 26,833,068NVIDIA Corp. 58,165 17,106,908NXP Semiconductors NV 27,345 6,228,644ON Semiconductor Corp. (A) 217,480 14,771,242QUALCOMM, Inc. 91,296 16,695,300SK Hynix, Inc. 67,525 7,416,447STMicroelectronics NV 111,416 5,478,873Taiwan Semiconductor Manufacturing
Company, Ltd., ADR 82,110 9,878,654Teradyne, Inc. 16,260 2,658,998Tokyo Electron, Ltd. 10,500 6,043,510Wolfspeed, Inc. (A) 11,190 1,250,706Xilinx, Inc. 31,296 6,635,691
175,528,857Software – 29.5%Altair Engineering, Inc., Class A (A) 8,755 676,937Alteryx, Inc., Class A (A) 19,785 1,196,993Asana, Inc., Class A (A) 161,790 12,061,445Atlassian Corp. PLC, Class A (A) 11,745 4,478,251Box, Inc., Class A (A) 48,545 1,271,394Citrix Systems, Inc. 317,522 30,034,406Coupa Software, Inc. (A) 5,292 836,401Crowdstrike Holdings, Inc., Class A (A) 54,040 11,064,690Datadog, Inc., Class A (A) 76,750 13,669,943DocuSign, Inc. (A) 9,700 1,477,407ForgeRock, Inc., Class A (A)(B) 33,915 905,191Fortinet, Inc. (A) 26,105 9,382,137HashiCorp, Inc., Class A (A) 8,360 761,094HubSpot, Inc. (A) 18,868 12,436,842Intuit, Inc. 19,960 12,838,671KnowBe4, Inc., Class A (A) 47,193 1,082,607Mandiant, Inc. (A) 28,035 491,734Microsoft Corp. 212,848 71,585,038Monday.com, Ltd. (A)(B) 6,765 2,088,491NortonLifeLock, Inc. 256,540 6,664,909Oracle Corp. 12,725 1,109,747Palo Alto Networks, Inc. (A) 16,580 9,231,081Paycom Software, Inc. (A) 31,295 12,993,371Procore Technologies, Inc. (A) 6,687 534,759salesforce.com, Inc. (A) 153,100 38,907,303Smartsheet, Inc., Class A (A) 7,590 587,846TeamViewer AG (A)(C) 220,467 2,958,380The Trade Desk, Inc., Class A (A) 118,130 10,825,433Workday, Inc., Class A (A) 18,995 5,189,054Zoom Video Communications, Inc.,
Class A (A) 135,420 24,905,092Zscaler, Inc. (A) 42,412 13,628,248
315,874,895Technology hardware, storage and peripherals – 7.3%Apple, Inc. 139,045 24,690,221Pure Storage, Inc., Class A (A) 838,711 27,300,043Samsung Electronics Company, Ltd. 254,805 16,734,296Seagate Technology Holdings PLC 88,255 9,971,050
78,695,610646,569,304
TOTAL COMMON STOCKS (Cost $920,544,891) $ 1,043,414,062
Science & Technology Trust (continued)Shares orPrincipalAmount Value
SHORT-TERM INVESTMENTS – 3.7%Short-term funds – 2.1%John Hancock Collateral Trust,
0.1697% (D)(E) 857,022 $ 8,572,790State Street Institutional U.S. Government
Money Market Fund, Premier Class,0.0250% (D) 500,010 500,010
T. Rowe Price Government Reserve Fund,0.0570% (D) 13,109,109 13,109,109
22,181,909Repurchase agreement – 1.6%Repurchase Agreement with State Street
Corp. dated 12-31-21 at 0.000% to berepurchased at $17,374,000 on 1-3-22,collateralized by $17,901,900U.S. Treasury Notes, 1.250% due6-30-28 (valued at $17,721,485) $ 17,374,000 17,374,000
TOTAL SHORT-TERM INVESTMENTS (Cost $39,556,337) $ 39,555,909Total Investments (Science & Technology Trust)
(Cost $960,101,228) – 101.1% $ 1,082,969,971Other assets and liabilities, net – (1.1%) (11,801,544)TOTAL NET ASSETS – 100.0% $ 1,071,168,427
Security Abbreviations and LegendADR American Depositary ReceiptGDR Global Depositary ReceiptNYRS New York Registry Shares(A) Non-income producing security.(B) All or a portion of this security is on loan as of 12-31-21.(C) These securities are exempt from registration under Rule 144A of
the Securities Act of 1933. Such securities may be resold, normallyto qualified institutional buyers, in transactions exempt fromregistration.
(D) The rate shown is the annualized seven-day yield as of 12-31-21.(E) Investment is an affiliate of the fund, the advisor and/or subadvisor.
This security represents the investment of cash collateral received forsecurities lending.
Small Cap Index TrustShares orPrincipalAmount Value
COMMON STOCKS – 95.8%Communication services – 2.9%Diversified telecommunication services – 0.6%Anterix, Inc. (A) 2,649 $ 155,655ATN International, Inc. 2,479 99,036Bandwidth, Inc., Class A (A) 5,062 363,249Cogent Communications Holdings, Inc. 8,974 656,717Consolidated Communications
Holdings, Inc. (A) 16,167 120,929EchoStar Corp., Class A (A) 8,210 216,334Globalstar, Inc. (A)(B) 132,259 153,420IDT Corp., Class B (A) 4,320 190,771Iridium Communications, Inc. (A) 25,468 1,051,574Liberty Latin America, Ltd., Class A (A) 13,599 158,564Liberty Latin America, Ltd., Class C (A) 29,113 331,888Ooma, Inc. (A) 5,130 104,857Radius Global Infrastructure, Inc.,
Class A (A) 12,875 207,288
John Hancock Variable Insurance TrustPortfolio of Investments — December 31, 2021 (showing percentage of total net assets)
The accompanying notes are an integral part of the financial statements. 105

Small Cap Index Trust (continued)Shares orPrincipalAmount Value
COMMON STOCKS (continued)Diversified telecommunication services (continued)Telesat Corp. (A) 3,096 $ 88,762
3,899,044Entertainment – 0.8%AMC Entertainment Holdings, Inc.,
Class A (A) 110,768 3,012,892Cinemark Holdings, Inc. (A) 23,768 383,140CuriosityStream, Inc. (A)(B) 6,306 37,395IMAX Corp. (A) 11,130 198,559Liberty Media Corp.-Liberty Braves,
Class A (A) 4,756 136,735Liberty Media Corp.-Liberty Braves,
Class C (A) 5,536 155,562Lions Gate Entertainment Corp.,
Class A (A) 11,706 194,788Lions Gate Entertainment Corp.,
Class B (A) 26,569 408,897Madison Square Garden Entertainment
Corp. (A) 5,729 402,978The Marcus Corp. (A)(B) 5,719 102,141
5,033,087Interactive media and services – 0.6%CarGurus, Inc. (A) 20,644 694,464Cars.com, Inc. (A) 15,027 241,784Eventbrite, Inc., Class A (A) 16,840 293,690EverQuote, Inc., Class A (A) 4,383 68,638FuboTV, Inc. (A)(B) 28,905 448,606j2 Global, Inc. (A) 9,331 1,034,435Liberty TripAdvisor Holdings, Inc.,
Class A (A) 17,825 38,680MediaAlpha, Inc., Class A (A) 4,652 71,827QuinStreet, Inc. (A) 11,322 205,947TrueCar, Inc. (A) 23,229 78,979Yelp, Inc. (A) 15,612 565,779
3,742,829Media – 0.8%Advantage Solutions, Inc. (A) 17,149 137,535AMC Networks, Inc., Class A (A) 6,316 217,523Audacy, Inc. (A) 27,481 70,626Boston Omaha Corp., Class A (A) 4,112 118,138Cardlytics, Inc. (A) 6,984 461,573Clear Channel Outdoor Holdings, Inc. (A) 81,140 268,573Daily Journal Corp. (A) 299 106,662Entravision Communications Corp.,
Class A 14,193 96,229Gannett Company, Inc. (A) 31,474 167,756Gray Television, Inc. 18,393 370,803Hemisphere Media Group, Inc. (A) 3,817 27,750iHeartMedia, Inc., Class A (A) 24,203 509,231Integral Ad Science Holding Corp. (A) 4,031 89,529John Wiley & Sons, Inc., Class A 9,218 527,915Scholastic Corp. 5,601 223,816Sinclair Broadcast Group, Inc., Class A 10,279 271,674Stagwell, Inc. (A) 14,230 123,374TechTarget, Inc. (A) 5,502 526,321TEGNA, Inc. 46,857 869,666The EW Scripps Company, Class A (A) 12,713 245,997WideOpenWest, Inc. (A) 11,418 245,715
5,676,406Wireless telecommunication services – 0.1%Gogo, Inc. (A) 13,208 178,704Shenandoah Telecommunications Company 10,587 269,969Telephone & Data Systems, Inc. 21,479 432,802
Small Cap Index Trust (continued)Shares orPrincipalAmount Value
COMMON STOCKS (continued)Wireless telecommunication services (continued)United States Cellular Corp. (A) 3,345 $ 105,434
986,90919,338,275
Consumer discretionary – 10.9%Auto components – 1.3%Adient PLC (A) 20,323 973,065American Axle & Manufacturing
Holdings, Inc. (A) 24,624 229,742Cooper-Standard Holdings, Inc. (A) 3,998 89,595Dana, Inc. 31,223 712,509Dorman Products, Inc. (A) 5,584 631,048Fox Factory Holding Corp. (A) 9,037 1,537,194Gentherm, Inc. (A) 7,121 618,815LCI Industries 5,271 821,591Modine Manufacturing Company (A) 11,609 117,135Motorcar Parts of America, Inc. (A) 5,014 85,589Patrick Industries, Inc. 4,846 391,024Standard Motor Products, Inc. 4,166 218,257Stoneridge, Inc. (A) 5,928 117,019Tenneco, Inc., Class A (A) 14,687 165,963The Goodyear Tire & Rubber
Company (A) 59,240 1,262,997Visteon Corp. (A) 5,989 665,617XPEL, Inc. (A) 3,829 261,444
8,898,604Automobiles – 0.2%Arcimoto, Inc. (A) 6,538 50,866Canoo, Inc. (A)(B) 23,698 182,949Fisker, Inc. (A) 35,229 554,152Lordstown Motors Corp., Class A (A)(B) 32,829 113,260Winnebago Industries, Inc. 6,877 515,225Workhorse Group, Inc. (A) 27,734 120,920
1,537,372Distributors – 0.0%Funko, Inc., Class A (A) 6,118 115,018Diversified consumer services – 0.6%2U, Inc. (A) 15,694 314,979Adtalem Global Education, Inc. (A) 10,694 316,115American Public Education, Inc. (A) 4,498 100,081Carriage Services, Inc. 3,425 220,707Coursera, Inc. (A) 14,561 355,871European Wax Center, Inc., Class A (A) 2,724 82,673Graham Holdings Company, Class B 781 491,897Houghton Mifflin Harcourt Company (A) 27,542 443,426Laureate Education, Inc., Class A 22,196 271,679OneSpaWorld Holdings, Ltd. (A) 12,883 129,088Perdoceo Education Corp. (A) 16,135 189,748PowerSchool Holdings, Inc., Class A (A) 10,828 178,337Strategic Education, Inc. 5,327 308,114Stride, Inc. (A) 8,909 296,937Vivint Smart Home, Inc. (A) 20,787 203,297WW International, Inc. (A) 11,815 190,576
4,093,525Hotels, restaurants and leisure – 2.3%Accel Entertainment, Inc. (A) 13,125 170,888Bally’s Corp. (A) 7,141 271,786BJ’s Restaurants, Inc. (A) 5,247 181,284Bloomin’ Brands, Inc. (A) 19,336 405,669Bluegreen Vacations Holding Corp. (A) 3,368 118,217Brinker International, Inc. (A) 9,856 360,631Century Casinos, Inc. (A) 6,753 82,252Chuy’s Holdings, Inc. (A) 4,706 141,745Cracker Barrel Old Country Store, Inc. 5,201 669,057
John Hancock Variable Insurance TrustPortfolio of Investments — December 31, 2021 (showing percentage of total net assets)
The accompanying notes are an integral part of the financial statements. 106

Small Cap Index Trust (continued)Shares orPrincipalAmount Value
COMMON STOCKS (continued)Hotels, restaurants and leisure (continued)Dave & Buster’s Entertainment, Inc. (A) 9,520 $ 365,568Denny’s Corp. (A) 14,192 227,072Dine Brands Global, Inc. 3,546 268,822El Pollo Loco Holdings, Inc. (A) 5,199 73,774Esports Technologies, Inc. (A) 1,955 40,195Everi Holdings, Inc. (A) 18,646 398,092F45 Training Holdings, Inc. (A) 5,361 58,381Full House Resorts, Inc. (A) 8,075 97,788GAN, Ltd. (A) 9,407 86,450Golden Entertainment, Inc. (A) 3,892 196,663Golden Nugget Online Gaming, Inc. (A) 9,155 91,092Hilton Grand Vacations, Inc. (A) 18,522 965,181International Game Technology PLC 21,535 622,577Jack in the Box, Inc. 4,809 420,691Krispy Kreme, Inc. 4,968 93,995Kura Sushi USA, Inc., Class A (A) 753 60,873Life Time Group Holdings, Inc. (A) 7,348 126,459Lindblad Expeditions Holdings, Inc. (A) 7,333 114,395Monarch Casino & Resort, Inc. (A) 2,807 207,578NeoGames SA (A) 1,941 53,921Noodles & Company (A) 10,109 91,689ONE Group Hospitality, Inc. (A) 5,325 67,148Papa John’s International, Inc. 7,156 955,111Portillo’s, Inc., Class A (A) 4,443 166,790RCI Hospitality Holdings, Inc. 1,994 155,293Red Robin Gourmet Burgers, Inc. (A) 3,708 61,293Red Rock Resorts, Inc., Class A 12,857 707,264Rush Street Interactive, Inc. (A) 11,691 192,902Ruth’s Hospitality Group, Inc. (A) 7,936 157,926Scientific Games Corp. (A) 20,727 1,385,185SeaWorld Entertainment, Inc. (A) 11,093 719,492Shake Shack, Inc., Class A (A) 8,103 584,712Texas Roadhouse, Inc. 15,152 1,352,771The Cheesecake Factory, Inc. (A) 10,113 395,924Wingstop, Inc. 6,456 1,115,597
15,080,193Household durables – 1.9%Aterian, Inc. (A) 6,545 26,900Beazer Homes USA, Inc. (A) 6,478 150,419Casper Sleep, Inc. (A)(B) 6,421 42,892Cavco Industries, Inc. (A) 1,992 632,759Century Communities, Inc. 6,381 521,902Ethan Allen Interiors, Inc. 5,161 135,683GoPro, Inc., Class A (A) 27,742 286,020Green Brick Partners, Inc. (A) 6,430 195,022Hamilton Beach Brands Holding Company,
Class B 1,197 17,189Helen of Troy, Ltd. (A) 5,140 1,256,576Hooker Furnishings Corp. 3,165 73,681Hovnanian Enterprises, Inc., Class A (A) 1,168 148,675Installed Building Products, Inc. 5,120 715,366iRobot Corp. (A) 5,854 385,662KB Home 16,830 752,806La-Z-Boy, Inc. 9,542 346,470LGI Homes, Inc. (A) 4,639 716,633Lifetime Brands, Inc. 2,755 43,997M/I Homes, Inc. (A) 6,040 375,567MDC Holdings, Inc. 12,092 675,096Meritage Homes Corp. (A) 7,857 959,025Purple Innovation, Inc. (A) 12,811 170,002Skyline Champion Corp. (A) 11,359 897,134Snap One Holdings Corp. (A) 2,167 45,680Sonos, Inc. (A) 25,928 772,654Taylor Morrison Home Corp. (A) 25,460 890,082The Lovesac Company (A) 2,807 185,992
Small Cap Index Trust (continued)Shares orPrincipalAmount Value
COMMON STOCKS (continued)Household durables (continued)Traeger, Inc. (A) 5,241 $ 63,731Tri Pointe Homes, Inc. (A) 23,695 660,854Tupperware Brands Corp. (A) 10,869 166,187Universal Electronics, Inc. (A) 3,026 123,310Vuzix Corp. (A) 13,223 114,643Weber, Inc., Class A 4,624 59,788
12,608,397Internet and direct marketing retail – 0.6%1-800-Flowers.com, Inc., Class A (A) 5,957 139,215CarParts.com, Inc. (A) 10,797 120,926Groupon, Inc. (A) 5,250 121,590Lands’ End, Inc. (A) 3,318 65,132Liquidity Services, Inc. (A) 5,988 132,215Magnite, Inc. (A) 28,205 493,588Overstock.com, Inc. (A) 9,295 548,498PetMed Express, Inc. (B) 4,673 118,040Porch Group, Inc. (A) 17,168 267,649Quotient Technology, Inc. (A) 20,072 148,934Revolve Group, Inc. (A) 7,786 436,327Shutterstock, Inc. 5,029 557,616Stitch Fix, Inc., Class A (A) 17,173 324,913The RealReal, Inc. (A) 17,749 206,066Xometry, Inc., Class A (A) 1,932 99,015
3,779,724Leisure products – 0.5%Acushnet Holdings Corp. 7,267 385,732American Outdoor Brands, Inc. (A) 3,430 68,360AMMO, Inc. (A)(B) 19,207 104,678Callaway Golf Company (A) 25,050 687,372Clarus Corp. 5,257 145,724Escalade, Inc. 3,519 55,565Genius Brands International, Inc. (A)(B) 65,366 68,634Johnson Outdoors, Inc., Class A 1,209 113,271Latham Group, Inc. (A) 6,040 151,181Malibu Boats, Inc., Class A (A) 4,584 315,058MasterCraft Boat Holdings, Inc. (A) 4,706 133,321Nautilus, Inc. (A) 6,915 42,389Smith & Wesson Brands, Inc. 10,243 182,325Sturm Ruger & Company, Inc. 3,696 251,402Vista Outdoor, Inc. (A) 12,329 567,997
3,273,009Multiline retail – 0.4%Big Lots, Inc. 6,984 314,629Dillard’s, Inc., Class A 1,255 307,500Franchise Group, Inc. 6,272 327,148Macy’s, Inc. 67,413 1,764,872
2,714,149Specialty retail – 2.4%Abercrombie & Fitch Company,
Class A (A) 12,643 440,356Academy Sports & Outdoors, Inc. (A) 16,602 728,828American Eagle Outfitters, Inc. (B) 32,823 831,078America’s Car-Mart, Inc. (A) 1,343 137,523Arko Corp. (A) 23,099 202,578Asbury Automotive Group, Inc. (A) 4,770 823,922Barnes & Noble Education, Inc. (A) 9,565 65,138Bed Bath & Beyond, Inc. (A) 22,160 323,093Big 5 Sporting Goods Corp. (B) 4,808 91,400Boot Barn Holdings, Inc. (A) 6,305 775,830Caleres, Inc. 8,371 189,854Camping World Holdings, Inc.,
Class A (B) 9,087 367,115CarLotz, Inc. (A)(B) 18,522 42,045Chico’s FAS, Inc. (A) 27,166 146,153
John Hancock Variable Insurance TrustPortfolio of Investments — December 31, 2021 (showing percentage of total net assets)
The accompanying notes are an integral part of the financial statements. 107

Small Cap Index Trust (continued)Shares orPrincipalAmount Value
COMMON STOCKS (continued)Specialty retail (continued)Citi Trends, Inc. (A) 1,956 $ 185,331Conn’s, Inc. (A) 4,183 98,384Designer Brands, Inc., Class A (A) 13,521 192,133Genesco, Inc. (A) 3,302 211,889Group 1 Automotive, Inc. 3,747 731,489GrowGeneration Corp. (A) 12,198 159,184Guess?, Inc. 8,963 212,244Haverty Furniture Companies, Inc. 3,737 114,240Hibbett, Inc. 3,260 234,492Kirkland’s, Inc. (A)(B) 3,454 51,568Lumber Liquidators Holdings, Inc. (A) 6,685 114,113MarineMax, Inc. (A) 4,551 268,691Monro, Inc. 7,235 421,583Murphy USA, Inc. 5,163 1,028,676National Vision Holdings, Inc. (A) 17,615 845,344OneWater Marine, Inc., Class A 2,309 140,780Party City Holdco, Inc. (A) 24,992 139,205Rent-A-Center, Inc. 14,183 681,351Sally Beauty Holdings, Inc. (A) 24,313 448,818Shift Technologies, Inc. (A)(B) 14,869 50,703Shoe Carnival, Inc. 3,983 155,656Signet Jewelers, Ltd. 11,328 985,876Sleep Number Corp. (A) 4,819 369,135Sonic Automotive, Inc., Class A 4,692 232,019Sportsman’s Warehouse Holdings, Inc. (A) 10,036 118,425The Aaron’s Company, Inc. 7,096 174,916The Buckle, Inc. 6,476 274,000The Cato Corp., Class A 5,090 87,344The Children’s Place, Inc. (A) 3,074 243,737The Container Store Group, Inc. (A) 7,443 74,281The ODP Corp. (A) 10,019 393,546Tilly’s, Inc., Class A 5,797 93,390Torrid Holdings, Inc. (A) 3,250 32,110TravelCenters of America, Inc. (A) 2,801 144,588Urban Outfitters, Inc. (A) 14,911 437,787Winmark Corp. 758 188,204Zumiez, Inc. (A) 4,779 229,344
15,729,489Textiles, apparel and luxury goods – 0.7%Crocs, Inc. (A) 12,490 1,601,468Fossil Group, Inc. (A) 10,919 112,357G-III Apparel Group, Ltd. (A) 9,407 260,009Kontoor Brands, Inc. 11,198 573,898Movado Group, Inc. 3,514 146,991Oxford Industries, Inc. 3,449 350,142PLBY Group, Inc. (A)(B) 5,713 152,194Rocky Brands, Inc. 1,701 67,700Steven Madden, Ltd. 17,373 807,323Superior Group of Companies, Inc. 1,856 40,721Unifi, Inc. (A) 3,265 75,585Wolverine World Wide, Inc. 17,703 510,023
4,698,41172,527,891
Consumer staples – 3.3%Beverages – 0.4%Celsius Holdings, Inc. (A) 11,670 870,232Coca-Cola Consolidated, Inc. 1,017 629,716MGP Ingredients, Inc. 3,122 265,339National Beverage Corp. 5,167 234,220Primo Water Corp. 33,755 595,101The Duckhorn Portfolio, Inc. (A) 6,068 141,627
2,736,235Food and staples retailing – 1.0%BJ’s Wholesale Club Holdings, Inc. (A) 29,379 1,967,512
Small Cap Index Trust (continued)Shares orPrincipalAmount Value
COMMON STOCKS (continued)Food and staples retailing (continued)HF Foods Group, Inc. (A) 9,279 $ 78,500Ingles Markets, Inc., Class A 3,064 264,546Performance Food Group Company (A) 32,678 1,499,593PriceSmart, Inc. 5,029 367,972Rite Aid Corp. (A) 12,403 182,200SpartanNash Company 7,943 204,612Sprouts Farmers Market, Inc. (A) 24,361 723,034The Andersons, Inc. 7,013 271,473The Chefs’ Warehouse, Inc. (A) 7,199 239,727United Natural Foods, Inc. (A) 12,018 589,843Village Super Market, Inc., Class A 2,410 56,370Weis Markets, Inc. 3,523 232,095
6,677,477Food products – 0.9%AppHarvest, Inc. (A)(B) 16,493 64,158B&G Foods, Inc. 13,726 421,800Calavo Growers, Inc. 3,867 163,961Cal-Maine Foods, Inc. 7,662 283,417Fresh Del Monte Produce, Inc. 7,447 205,537Hostess Brands, Inc. (A) 28,358 579,070J&J Snack Foods Corp. 3,196 504,840John B. Sanfilippo & Son, Inc. 1,902 171,484Lancaster Colony Corp. 4,097 678,463Landec Corp. (A) 7,067 78,444Mission Produce, Inc. (A) 8,466 132,916Sanderson Farms, Inc. 4,340 829,287Seneca Foods Corp., Class A (A) 1,542 73,939Sovos Brands, Inc. (A) 3,378 50,839Tattooed Chef, Inc. (A)(B) 10,537 163,745The Simply Good Foods Company (A) 18,421 765,761Tootsie Roll Industries, Inc. 3,388 122,747TreeHouse Foods, Inc. (A) 11,284 457,341Utz Brands, Inc. 12,312 196,376Vital Farms, Inc. (A) 5,788 104,531Whole Earth Brands, Inc. (A) 9,140 98,164
6,146,820Household products – 0.3%Central Garden & Pet Company (A) 3,509 184,679Central Garden & Pet Company,
Class A (A) 7,237 346,290Energizer Holdings, Inc. 14,683 588,788Oil-Dri Corp. of America 1,942 63,562WD-40 Company 2,923 715,083
1,898,402Personal products – 0.6%BellRing Brands, Inc., Class A (A) 8,927 254,687Edgewell Personal Care Company 11,697 534,670elf Beauty, Inc. (A) 10,559 350,664Inter Parfums, Inc. 3,870 413,703Medifast, Inc. 2,492 521,900Nu Skin Enterprises, Inc., Class A 10,782 547,187The Beauty Health Company (A) 18,745 452,879The Honest Company, Inc. (A) 16,689 135,014USANA Health Sciences, Inc. (A) 2,532 256,238Veru, Inc. (A) 14,697 86,565
3,553,507Tobacco – 0.1%22nd Century Group, Inc. (A)(B) 37,659 116,366Turning Point Brands, Inc. 3,221 121,689Universal Corp. 5,101 280,147Vector Group, Ltd. 30,917 354,927
873,12921,885,570
John Hancock Variable Insurance TrustPortfolio of Investments — December 31, 2021 (showing percentage of total net assets)
The accompanying notes are an integral part of the financial statements. 108

Small Cap Index Trust (continued)Shares orPrincipalAmount Value
COMMON STOCKS (continued)Energy – 4.2%Energy equipment and services – 0.8%Archrock, Inc. 30,693 $ 229,584Aspen Aerogels, Inc. (A) 4,821 240,038Bristow Group, Inc. (A) 4,880 154,550Cactus, Inc., Class A 12,139 462,860ChampionX Corp. (A) 44,001 889,260DMC Global, Inc. (A) 4,252 168,422Dril-Quip, Inc. (A) 8,447 166,237Expro Group Holdings NV (A) 8,215 117,885FTS International, Inc., Class A (A) 1,511 39,664Helix Energy Solutions Group, Inc. (A) 32,463 101,285Helmerich & Payne, Inc. 23,048 546,238Liberty Oilfield Services, Inc., Class A (A) 20,341 197,308Nabors Industries, Ltd. (A) 1,603 129,987National Energy Services Reunited
Corp. (A) 8,875 83,869Newpark Resources, Inc. (A) 15,084 44,347NexTier Oilfield Solutions, Inc. (A) 39,608 140,608Oceaneering International, Inc. (A) 22,439 253,785Oil States International, Inc. (A) 14,787 73,491Patterson-UTI Energy, Inc. 41,948 354,461ProPetro Holding Corp. (A) 19,638 159,068RPC, Inc. (A) 17,938 81,439Select Energy Services, Inc., Class A (A) 16,217 101,032TETRA Technologies, Inc. (A) 28,514 80,980Tidewater, Inc. (A) 10,477 112,209U.S. Silica Holdings, Inc. (A) 16,613 156,162
5,084,769Oil, gas and consumable fuels – 3.4%Aemetis, Inc. (A) 6,201 76,272Alto Ingredients, Inc. (A) 16,898 81,279Altus Midstream Company, Class A 637 39,054Antero Resources Corp. (A) 61,661 1,079,068Arch Resources, Inc. 3,240 295,877Berry Corp. 16,212 136,505Brigham Minerals, Inc., Class A 10,176 214,612California Resources Corp. 17,420 744,008Callon Petroleum Company (A) 10,030 473,918Centennial Resource Development, Inc.,
Class A (A) 40,613 242,866Centrus Energy Corp., Class A (A) 2,191 109,353Chesapeake Energy Corp. 22,571 1,456,281Civitas Resources, Inc. 9,384 459,534Clean Energy Fuels Corp. (A) 33,776 207,047CNX Resources Corp. (A) 45,475 625,281Comstock Resources, Inc. (A) 20,384 164,907CONSOL Energy, Inc. (A) 7,468 169,598Crescent Energy, Inc., Class A (A)(B) 6,781 85,983CVR Energy, Inc. 6,599 110,929Delek US Holdings, Inc. (A) 14,454 216,665Denbury, Inc. (A) 10,945 838,278DHT Holdings, Inc. 30,847 160,096Dorian LPG, Ltd. 6,940 88,069Energy Fuels, Inc. (A) 32,193 245,633Equitrans Midstream Corp. 88,087 910,820Frontline, Ltd. (A)(B) 25,905 183,148Gevo, Inc. (A) 43,949 188,102Golar LNG, Ltd. (A) 22,511 278,911Green Plains, Inc. (A) 10,321 358,758International Seaways, Inc. 10,534 154,639Kosmos Energy, Ltd. (A) 91,650 317,109Laredo Petroleum, Inc. (A) 2,752 165,478Magnolia Oil & Gas Corp., Class A 30,343 572,572Matador Resources Company 23,985 885,526Murphy Oil Corp. 31,701 827,713
Small Cap Index Trust (continued)Shares orPrincipalAmount Value
COMMON STOCKS (continued)Oil, gas and consumable fuels (continued)Nordic American Tankers, Ltd. 43,370 $ 73,295Northern Oil and Gas, Inc. 11,597 238,666Oasis Petroleum, Inc. 4,187 527,520Ovintiv, Inc. 56,496 1,903,915Par Pacific Holdings, Inc. (A) 10,428 171,958PBF Energy, Inc., Class A (A) 21,052 273,044PDC Energy, Inc. 21,119 1,030,185Peabody Energy Corp. (A) 18,336 184,644Range Resources Corp. (A) 51,612 920,242Ranger Oil Corp., Class A (A) 4,056 109,188Renewable Energy Group, Inc. (A) 9,648 409,461REX American Resources Corp. (A) 1,277 122,592Scorpio Tankers, Inc. 11,001 140,923SFL Corp., Ltd. 24,886 202,821SM Energy Company 25,861 762,382Southwestern Energy Company (A) 213,260 993,792Talos Energy, Inc. (A) 8,521 83,506Teekay Tankers, Ltd., Class A (A) 6,054 65,989Tellurian, Inc. (A) 80,864 249,061Uranium Energy Corp. (A)(B) 54,839 183,711Ur-Energy, Inc. (A) 45,696 55,749W&T Offshore, Inc. (A) 22,279 71,961Whiting Petroleum Corp. (A) 8,471 547,904World Fuel Services Corp. 13,236 350,357
22,836,75527,921,524
Financials – 15.3%Banks – 8.2%1st Source Corp. 3,224 159,910Allegiance Bancshares, Inc. 4,435 187,201Amalgamated Financial Corp. 4,063 68,137Amerant Bancorp, Inc. 4,877 168,500American National Bankshares, Inc. 3,114 117,336Ameris Bancorp 14,336 712,212Arrow Financial Corp. 3,233 113,899Associated Banc-Corp. 31,550 712,715Atlantic Capital Bancshares, Inc. (A) 4,886 140,570Atlantic Union Bankshares Corp. 16,261 606,373Banc of California, Inc. 10,260 201,301BancFirst Corp. 3,620 255,427Bank First Corp. 1,558 112,550Bank of Marin Bancorp 3,661 136,299BankUnited, Inc. 18,592 786,628Banner Corp. 7,134 432,820Bar Harbor Bankshares 4,123 119,278Berkshire Hills Bancorp, Inc. 10,456 297,264Blue Ridge Bankshares, Inc. 4,799 85,902Brookline Bancorp, Inc. 16,499 267,119Bryn Mawr Bank Corp. 4,411 198,539Business First Bancshares, Inc. 4,840 137,020Byline Bancorp, Inc. 5,233 143,123Cadence Bank 40,038 1,192,732Cambridge Bancorp 1,581 147,966Camden National Corp. 3,145 151,463Capital Bancorp, Inc. 1,400 36,680Capital City Bank Group, Inc. 3,946 104,174Capstar Financial Holdings, Inc. 5,458 114,782Carter Bankshares, Inc. (A) 6,652 102,374Cathay General Bancorp 15,316 658,435CBTX, Inc. 4,238 122,902Central Pacific Financial Corp. 6,333 178,401CIT Group, Inc. 21,219 1,089,383Citizens & Northern Corp. 4,341 113,387City Holding Company 2,753 225,168Civista Bancshares, Inc. 4,320 105,408
John Hancock Variable Insurance TrustPortfolio of Investments — December 31, 2021 (showing percentage of total net assets)
The accompanying notes are an integral part of the financial statements. 109

Small Cap Index Trust (continued)Shares orPrincipalAmount Value
COMMON STOCKS (continued)Banks (continued)CNB Financial Corp. 4,720 $ 125,080Coastal Financial Corp. (A) 2,381 120,526Columbia Banking System, Inc. 15,144 495,512Community Bank System, Inc. 11,176 832,388Community Trust Bancorp, Inc. 3,144 137,110ConnectOne Bancorp, Inc. 8,140 266,259CrossFirst Bankshares, Inc. (A) 11,174 174,426Customers Bancorp, Inc. (A) 6,388 417,584CVB Financial Corp. 26,828 574,387Dime Community Bancshares, Inc. 7,245 254,734Eagle Bancorp, Inc. 6,297 367,367Eastern Bankshares, Inc. 36,691 740,057Enterprise Financial Services Corp. 7,413 349,078Equity Bancshares, Inc., Class A 3,485 118,246Farmers National Banc Corp. 7,456 138,309FB Financial Corp. 7,282 319,097Financial Institutions, Inc. 4,153 132,065First Bancorp (North Carolina) 5,756 263,164First Bancorp (Puerto Rico) 43,353 597,404First Bank 5,943 86,233First Busey Corp. 10,375 281,370First Commonwealth Financial Corp. 20,045 322,524First Community Bankshares, Inc. 4,426 147,917First Financial Bancorp 19,946 486,283First Financial Bankshares, Inc. 27,555 1,400,896First Financial Corp. 2,723 123,325First Foundation, Inc. 8,942 222,298First Internet Bancorp 2,428 114,213First Interstate BancSystem, Inc., Class A 8,417 342,319First Merchants Corp. 11,480 480,897First Mid Bancshares, Inc. 3,971 169,919First Midwest Bancorp, Inc. 24,095 493,466Flushing Financial Corp. 6,175 150,053Fulton Financial Corp. 32,719 556,223German American Bancorp, Inc. 5,463 212,948Glacier Bancorp, Inc. 23,272 1,319,522Great Southern Bancorp, Inc. 2,026 120,041Great Western Bancorp, Inc. 11,789 400,354Guaranty Bancshares, Inc. 2,495 93,762Hancock Whitney Corp. 18,410 920,868Hanmi Financial Corp. 7,468 176,842HarborOne Bancorp, Inc. 11,487 170,467Heartland Financial USA, Inc. 7,770 393,240Heritage Commerce Corp. 14,319 170,969Heritage Financial Corp. 7,765 189,777Hilltop Holdings, Inc. 12,898 453,236Home BancShares, Inc. 32,579 793,299HomeStreet, Inc. 4,275 222,300HomeTrust Bancshares, Inc. 4,188 129,744Hope Bancorp, Inc. 24,048 353,746Horizon Bancorp, Inc. 9,979 208,062Howard Bancorp, Inc. (A) 4,012 87,421Independent Bank Corp. (Massachusetts) 9,721 792,553Independent Bank Corp. (Michigan) 5,696 135,964Independent Bank Group, Inc. 8,010 577,922International Bancshares Corp. 11,025 467,350Investors Bancorp, Inc. 47,776 723,806Lakeland Bancorp, Inc. 10,999 208,871Lakeland Financial Corp. 5,162 413,683Live Oak Bancshares, Inc. 6,817 595,056Macatawa Bank Corp. 11,882 104,799Mercantile Bank Corp. 3,746 131,222Meta Financial Group, Inc. 6,846 408,432Metrocity Bankshares, Inc. 4,451 122,536Metropolitan Bank Holding Corp. (A) 1,694 180,462
Small Cap Index Trust (continued)Shares orPrincipalAmount Value
COMMON STOCKS (continued)Banks (continued)Mid Penn Bancorp, Inc. 3,320 $ 105,377Midland States Bancorp, Inc. 5,377 133,296MidWestOne Financial Group, Inc. 4,114 133,170MVB Financial Corp. 2,480 102,970National Bank Holdings Corp., Class A 6,084 267,331NBT Bancorp, Inc. 8,592 330,964Nicolet Bankshares, Inc. (A) 2,391 205,028Northrim BanCorp, Inc. 2,230 96,916OceanFirst Financial Corp. 12,586 279,409OFG Bancorp 10,797 286,768Old National Bancorp 33,636 609,484Old Second Bancorp, Inc. 8,263 104,031Origin Bancorp, Inc. 4,942 212,111Orrstown Financial Services, Inc. 4,340 109,368Pacific Premier Bancorp, Inc. 20,248 810,527Park National Corp. 2,938 403,417Peapack-Gladstone Financial Corp. 4,314 152,716Peoples Bancorp, Inc. 6,029 191,782Peoples Financial Services Corp. 2,365 124,612Preferred Bank 2,969 213,145Primis Financial Corp. 7,166 107,777QCR Holdings, Inc. 3,268 183,008RBB Bancorp 3,609 94,556Reliant Bancorp, Inc. 3,922 139,231Renasant Corp. 11,710 444,395Republic Bancorp, Inc., Class A 1,745 88,716S&T Bancorp, Inc. 8,217 259,000Sandy Spring Bancorp, Inc. 9,458 454,741Seacoast Banking Corp. of Florida 11,357 401,924ServisFirst Bancshares, Inc. 10,515 893,144Sierra Bancorp 4,501 122,202Silvergate Capital Corp., Class A (A) 5,715 846,963Simmons First National Corp., Class A 22,770 673,537SmartFinancial, Inc. 3,910 106,978South Plains Financial, Inc. 2,745 76,338Southern First Bancshares, Inc. (A) 2,132 133,229Southside Bancshares, Inc. 6,368 266,310SouthState Corp. 14,906 1,194,120Spirit of Texas Bancshares, Inc. 3,670 105,623Stock Yards Bancorp, Inc. 5,156 329,365Texas Capital Bancshares, Inc. (A) 10,850 653,713The Bancorp, Inc. (A) 11,558 292,533The Bank of NT Butterfield & Son, Ltd. 10,856 413,722The First Bancorp, Inc. 3,046 95,644The First Bancshares, Inc. 4,398 169,851The First of Long Island Corp. 5,476 118,227Tompkins Financial Corp. 2,839 237,284Towne Bank 13,542 427,792TriCo Bancshares 5,719 245,688TriState Capital Holdings, Inc. (A) 6,606 199,898Triumph Bancorp, Inc. (A) 5,003 595,757Trustmark Corp. 12,866 417,630UMB Financial Corp. 9,118 967,511United Bankshares, Inc. 26,929 976,984United Community Banks, Inc. 18,587 668,017Univest Financial Corp. 6,756 202,140Valley National Bancorp 86,143 1,184,466Veritex Holdings, Inc. 10,072 400,664Washington Trust Bancorp, Inc. 3,627 204,454WesBanco, Inc. 13,134 459,559West BanCorp, Inc. 4,145 128,785
John Hancock Variable Insurance TrustPortfolio of Investments — December 31, 2021 (showing percentage of total net assets)
The accompanying notes are an integral part of the financial statements. 110

Small Cap Index Trust (continued)Shares orPrincipalAmount Value
COMMON STOCKS (continued)Banks (continued)Westamerica BanCorp 5,498 $ 317,400
54,754,659Capital markets – 1.6%Artisan Partners Asset Management, Inc.,
Class A 12,757 607,743AssetMark Financial Holdings, Inc. (A) 4,239 111,104B. Riley Financial, Inc. 4,420 392,761BGC Partners, Inc., Class A 70,318 326,979Blucora, Inc. (A) 11,249 194,833Brightsphere Investment Group, Inc. 12,322 315,443Cohen & Steers, Inc. 5,346 494,558Cowen, Inc., Class A 5,720 206,492Diamond Hill Investment Group, Inc. 739 143,536Donnelley Financial Solutions, Inc. (A) 6,455 304,289Ellington Financial, Inc. 10,330 176,540Federated Hermes, Inc. 19,938 749,270Focus Financial Partners, Inc., Class A (A) 12,867 768,417GCM Grosvenor, Inc., Class A 10,742 112,791Hamilton Lane, Inc., Class A 7,488 775,907Houlihan Lokey, Inc. 10,898 1,128,161Moelis & Company, Class A 13,121 820,194Open Lending Corp., Class A (A) 22,761 511,667Oppenheimer Holdings, Inc., Class A 2,075 96,218Piper Sandler Companies 3,726 665,128PJT Partners, Inc., Class A 5,151 381,638Sculptor Capital Management, Inc. 5,284 112,813StepStone Group, Inc., Class A 8,906 370,222StoneX Group, Inc. (A) 3,512 215,110Virtus Investment Partners, Inc. 1,551 460,802WisdomTree Investments, Inc. 31,318 191,666
10,634,282Consumer finance – 0.8%Atlanticus Holdings Corp. (A) 1,112 79,308Curo Group Holdings Corp. 5,048 80,818Encore Capital Group, Inc. (A) 6,284 390,299Enova International, Inc. (A) 7,854 321,700EZCORP, Inc., Class A (A) 11,932 87,939FirstCash Holdings, Inc. 8,623 645,087Green Dot Corp., Class A (A) 11,720 424,733LendingClub Corp. (A) 21,349 516,219LendingTree, Inc. (A) 2,593 317,902Navient Corp. 33,857 718,446Nelnet, Inc., Class A 3,455 337,484Oportun Financial Corp. (A) 5,047 102,202PRA Group, Inc. (A) 9,414 472,677PROG Holdings, Inc. (A) 14,131 637,449Regional Management Corp. 1,799 103,371World Acceptance Corp. (A) 963 236,349
5,471,983Diversified financial services – 0.2%Alerus Financial Corp. 3,801 111,293A-Mark Precious Metals, Inc. 1,943 118,717Banco Latinoamericano de Comercio
Exterior SA, Class E 7,338 121,811Cannae Holdings, Inc. (A) 18,237 641,031Marlin Business Services Corp. 2,493 58,037
1,050,889Insurance – 1.9%Ambac Financial Group, Inc. (A) 10,590 169,970American Equity Investment Life
Holding Company 17,290 672,927American National Group, Inc. 1,508 284,771AMERISAFE, Inc. 4,321 232,599Argo Group International Holdings, Ltd. 7,053 409,850
Small Cap Index Trust (continued)Shares orPrincipalAmount Value
COMMON STOCKS (continued)Insurance (continued)Bright Health Group, Inc. (A) 12,261 $ 42,178BRP Group, Inc., Class A (A) 10,378 374,750Citizens, Inc. (A) 14,894 79,087CNO Financial Group, Inc. 26,483 631,355Donegal Group, Inc., Class A 5,882 84,054eHealth, Inc. (A) 5,492 140,046Employers Holdings, Inc. 6,153 254,611Enstar Group, Ltd. (A) 2,585 640,020Genworth Financial, Inc., Class A (A) 108,141 437,971Goosehead Insurance, Inc., Class A 3,878 504,450HCI Group, Inc. 1,333 111,359Horace Mann Educators Corp. 8,990 347,913James River Group Holdings, Ltd. 8,131 234,254Kinsale Capital Group, Inc. 4,665 1,109,757MBIA, Inc. (A) 11,186 176,627MetroMile, Inc. (A) 19,152 41,943National Western Life Group, Inc., Class A 570 122,231Palomar Holdings, Inc. (A) 5,452 353,126ProAssurance Corp. 11,769 297,756RLI Corp. 8,648 969,441Safety Insurance Group, Inc. 3,202 272,266Selective Insurance Group, Inc. 12,773 1,046,620Selectquote, Inc. (A) 29,430 266,636SiriusPoint, Ltd. (A) 20,397 165,828State Auto Financial Corp. 3,887 200,919Stewart Information Services Corp. 5,802 462,593Tiptree, Inc. 5,864 81,099Trupanion, Inc. (A) 8,235 1,087,267United Fire Group, Inc. 5,376 124,669Universal Insurance Holdings, Inc. 7,376 125,392
12,556,335Mortgage real estate investment trusts – 1.2%AFC Gamma, Inc. 2,919 66,436Apollo Commercial Real Estate
Finance, Inc. 29,843 392,734Arbor Realty Trust, Inc. 29,179 534,559Ares Commercial Real Estate Corp. 10,100 146,854ARMOUR Residential REIT, Inc. 17,649 173,137Blackstone Mortgage Trust, Inc., Class A 31,030 950,139BrightSpire Capital, Inc. 19,690 202,019Broadmark Realty Capital, Inc. 26,745 252,205Chimera Investment Corp. 50,384 759,791Dynex Capital, Inc. 7,278 121,615Franklin BSP Realty Trust, Inc. 7,454 111,363Granite Point Mortgage Trust, Inc. 12,763 149,455Great Ajax Corp. 4,994 65,721Hannon Armstrong Sustainable
Infrastructure Capital, Inc. 16,714 887,848Invesco Mortgage Capital, Inc. 66,975 186,191KKR Real Estate Finance Trust, Inc. 5,951 123,959Ladder Capital Corp. 25,700 308,143MFA Financial, Inc. 94,047 428,854New York Mortgage Trust, Inc. 81,801 304,300Orchid Island Capital, Inc. 28,840 129,780PennyMac Mortgage Investment Trust 21,006 364,034Ready Capital Corp. 12,250 191,468Redwood Trust, Inc. 24,224 319,515TPG RE Finance Trust, Inc. 13,635 167,983Two Harbors Investment Corp. 68,476 395,107
7,733,210Thrifts and mortgage finance – 1.4%Axos Financial, Inc. (A) 12,040 673,156Blue Foundry Bancorp (A) 8,391 122,760Bridgewater Bancshares, Inc. (A) 6,105 107,997Capitol Federal Financial, Inc. 25,466 288,530
John Hancock Variable Insurance TrustPortfolio of Investments — December 31, 2021 (showing percentage of total net assets)
The accompanying notes are an integral part of the financial statements. 111

Small Cap Index Trust (continued)Shares orPrincipalAmount Value
COMMON STOCKS (continued)Thrifts and mortgage finance (continued)Columbia Financial, Inc. (A) 7,501 $ 156,471Essent Group, Ltd. 23,378 1,064,400Federal Agricultural Mortgage Corp.,
Class C 1,982 245,629Flagstar Bancorp, Inc. 10,589 507,637FS Bancorp, Inc. 2,225 74,827Home Bancorp, Inc. 2,554 106,017Kearny Financial Corp. 15,307 202,818Merchants Bancorp 2,176 102,990Mr. Cooper Group, Inc. (A) 13,275 552,373NMI Holdings, Inc., Class A (A) 18,525 404,771Northfield Bancorp, Inc. 9,922 160,340Northwest Bancshares, Inc. 25,727 364,294Ocwen Financial Corp. (A) 1,494 59,715PCSB Financial Corp. 4,896 93,220PennyMac Financial Services, Inc. 6,556 457,478Premier Financial Corp. 8,189 253,122Provident Bancorp, Inc. 5,883 109,424Provident Financial Services, Inc. 15,675 379,649Radian Group, Inc. 38,695 817,625Southern Missouri Bancorp, Inc. 1,946 101,523The Hingham Institution for Savings 307 128,903TrustCo Bank Corp. NY 4,629 154,192Walker & Dunlop, Inc. 6,285 948,281Washington Federal, Inc. 13,392 447,025Waterstone Financial, Inc. 4,900 107,114WSFS Financial Corp. 9,997 501,050
9,693,331101,894,689
Health care – 17.3%Biotechnology – 8.1%2seventy bio, Inc. (A) 5,086 130,3544D Molecular Therapeutics, Inc. (A) 5,778 126,76989bio, Inc. (A) 3,014 39,393ACADIA Pharmaceuticals, Inc. (A) 26,125 609,758Achillion Pharmaceuticals, Inc. (A)(C) 38,157 57,381Adagio Therapeutics, Inc. (A) 4,882 35,443Adicet Bio, Inc. (A) 4,397 76,904Aduro Biotech, Inc. (A)(C) 4,010 12,030Aeglea BioTherapeutics, Inc. (A) 10,692 50,787Affimed NV (A) 26,114 144,149Agenus, Inc. (A) 45,805 147,492Agios Pharmaceuticals, Inc. (A) 11,960 393,125Akebia Therapeutics, Inc. (A) 42,476 95,996Akero Therapeutics, Inc. (A) 6,063 128,232Akouos, Inc. (A)(B) 6,054 51,459Albireo Pharma, Inc. (A) 4,099 95,466Alder Biopharmaceuticals, Inc. (A)(B)(C) 20,275 29,478Aldeyra Therapeutics, Inc. (A) 11,406 45,624Alector, Inc. (A) 12,803 264,382Aligos Therapeutics, Inc. (A) 5,501 65,297Alkermes PLC (A) 34,610 805,029Allakos, Inc. (A) 7,676 75,148Allogene Therapeutics, Inc. (A) 15,185 226,560Allovir, Inc. (A) 6,716 86,905Altimmune, Inc. (A) 9,298 85,170ALX Oncology Holdings, Inc. (A) 4,101 88,130Amicus Therapeutics, Inc. (A) 57,300 661,815AnaptysBio, Inc. (A) 4,349 151,128Anavex Life Sciences Corp. (A) 14,167 245,656Anika Therapeutics, Inc. (A) 3,322 119,027Annexon, Inc. (A) 7,299 83,866Apellis Pharmaceuticals, Inc. (A) 15,182 717,805Applied Molecular Transport, Inc. (A) 5,583 78,050Applied Therapeutics, Inc. (A) 4,351 38,941
Small Cap Index Trust (continued)Shares orPrincipalAmount Value
COMMON STOCKS (continued)Biotechnology (continued)Arbutus Biopharma Corp. (A) 19,705 $ 76,652Arcturus Therapeutics Holdings, Inc. (A) 4,629 171,319Arcus Biosciences, Inc. (A) 9,719 393,328Arcutis Biotherapeutics, Inc. (A) 6,452 133,814Arena Pharmaceuticals, Inc. (A) 13,355 1,241,214Arrowhead Pharmaceuticals, Inc. (A) 21,813 1,446,202Atara Biotherapeutics, Inc. (A) 18,919 298,163Athenex, Inc. (A)(B) 20,866 28,378Athersys, Inc. (A)(B) 54,505 49,196Atossa Therapeutics, Inc. (A) 26,778 42,845Avid Bioservices, Inc. (A) 13,122 382,900Avidity Biosciences, Inc. (A) 8,542 203,043Avita Medical, Inc. (A) 5,827 69,807Avrobio, Inc. (A) 11,696 45,030Beam Therapeutics, Inc. (A) 10,892 867,983BioAtla, Inc. (A) 3,778 74,162BioCryst Pharmaceuticals, Inc. (A) 38,926 539,125Biohaven Pharmaceutical Holding
Company, Ltd. (A) 11,992 1,652,618Bioxcel Therapeutics, Inc. (A) 4,126 83,882Bluebird Bio, Inc. (A) 15,303 152,877Blueprint Medicines Corp. (A) 12,602 1,349,800Bridgebio Pharma, Inc. (A) 23,003 383,690Brooklyn ImmunoTherapeutics, Inc. (A) 7,236 30,174C4 Therapeutics, Inc. (A) 8,414 270,931Cardiff Oncology, Inc. (A) 9,099 54,685CareDx, Inc. (A) 10,994 500,007Caribou Biosciences, Inc. (A) 4,389 66,230Catalyst Pharmaceuticals, Inc. (A) 21,971 148,744Celldex Therapeutics, Inc. (A) 9,954 384,623CEL-SCI Corp. (A) 8,073 57,318Century Therapeutics, Inc. (A) 3,003 47,628Cerevel Therapeutics Holdings, Inc. (A) 8,799 285,264ChemoCentryx, Inc. (A) 11,722 426,798Chimerix, Inc. (A) 17,115 110,049Chinook Therapeutics, Inc. (A) 8,840 144,180Clovis Oncology, Inc. (A) 26,799 72,625Codiak Biosciences, Inc. (A) 3,837 42,744Cogent Biosciences, Inc. (A) 8,545 73,316Coherus Biosciences, Inc. (A) 14,340 228,866Cortexyme, Inc. (A)(B) 4,371 55,162Crinetics Pharmaceuticals, Inc. (A) 9,295 264,071Cue Biopharma, Inc. (A) 7,420 83,920Cullinan Oncology, Inc. (A) 6,059 93,490Curis, Inc. (A) 19,758 94,048Cytokinetics, Inc. (A) 17,136 781,059CytomX Therapeutics, Inc. (A) 15,783 68,340Day One Biopharmaceuticals, Inc. (A)(B) 2,827 47,635Deciphera Pharmaceuticals, Inc. (A) 8,975 87,686Denali Therapeutics, Inc. (A) 19,678 877,639DermTech, Inc. (A)(B) 5,357 84,641Design Therapeutics, Inc. (A)(B) 5,260 112,617Dynavax Technologies Corp. (A) 23,493 330,547Dyne Therapeutics, Inc. (A) 7,057 83,908Eagle Pharmaceuticals, Inc. (A) 2,552 129,948Editas Medicine, Inc. (A) 14,831 393,763Emergent BioSolutions, Inc. (A) 10,671 463,868Enanta Pharmaceuticals, Inc. (A) 4,186 313,029Epizyme, Inc. (A) 21,030 52,575Erasca, Inc. (A) 5,027 78,321Evelo Biosciences, Inc. (A)(B) 6,447 39,133Fate Therapeutics, Inc. (A) 17,517 1,024,920FibroGen, Inc. (A) 19,009 268,027Foghorn Therapeutics, Inc. (A)(B) 4,138 94,636Forma Therapeutics Holdings, Inc. (A) 8,178 116,291
John Hancock Variable Insurance TrustPortfolio of Investments — December 31, 2021 (showing percentage of total net assets)
The accompanying notes are an integral part of the financial statements. 112

Small Cap Index Trust (continued)Shares orPrincipalAmount Value
COMMON STOCKS (continued)Biotechnology (continued)G1 Therapeutics, Inc. (A)(B) 9,016 $ 92,053Generation Bio Company (A) 9,998 70,786Geron Corp. (A)(B) 76,613 93,468Global Blood Therapeutics, Inc. (A) 13,529 395,994Gossamer Bio, Inc. (A) 14,360 162,412Graphite Bio, Inc. (A) 4,094 50,888Gritstone bio, Inc. (A) 9,462 121,681Halozyme Therapeutics, Inc. (A) 29,866 1,200,912Heron Therapeutics, Inc. (A) 21,235 193,876Homology Medicines, Inc. (A) 11,201 40,772Humanigen, Inc. (A) 10,246 38,115iBio, Inc. (A) 68,193 37,438Icosavax, Inc. (A) 3,093 70,768Ideaya Biosciences, Inc. (A) 7,411 175,196IGM Biosciences, Inc. (A) 1,897 55,639Imago Biosciences, Inc. (A) 1,936 45,903Immuneering Corp., Class A (A) 1,648 26,648Immunic, Inc. (A) 4,094 39,180ImmunityBio, Inc. (A) 15,138 92,039ImmunoGen, Inc. (A) 44,436 329,715Immunovant, Inc. (A) 9,942 84,706Infinity Pharmaceuticals, Inc. (A) 22,317 50,213Inhibrx, Inc. (A) 6,178 269,793Inovio Pharmaceuticals, Inc. (A) 45,588 227,484Inozyme Pharma, Inc. (A) 5,548 37,837Insmed, Inc. (A) 25,530 695,437Instil Bio, Inc. (A)(B) 10,951 187,372Intellia Therapeutics, Inc. (A) 14,985 1,771,826Intercept Pharmaceuticals, Inc. (A)(B) 6,152 100,216Invitae Corp. (A) 43,512 664,428Ironwood Pharmaceuticals, Inc. (A) 31,752 370,228iTeos Therapeutics, Inc. (A) 4,506 209,799IVERIC bio, Inc. (A) 24,314 406,530Janux Therapeutics, Inc. (A) 3,255 64,221Jounce Therapeutics, Inc. (A) 8,236 68,771KalVista Pharmaceuticals, Inc. (A) 4,708 62,287Karuna Therapeutics, Inc. (A) 4,801 628,931Karyopharm Therapeutics, Inc. (A) 16,708 107,432Keros Therapeutics, Inc. (A) 3,488 204,083Kezar Life Sciences, Inc. (A) 7,156 119,648Kiniksa Pharmaceuticals, Ltd., Class A (A) 7,153 84,191Kinnate Biopharma, Inc. (A)(B) 6,273 111,158Kodiak Sciences, Inc. (A) 7,267 616,096Kronos Bio, Inc. (A) 8,934 121,413Krystal Biotech, Inc. (A) 3,956 276,722Kura Oncology, Inc. (A) 14,477 202,678Kymera Therapeutics, Inc. (A) 7,503 476,365Lexicon Pharmaceuticals, Inc. (A) 16,142 63,599Ligand Pharmaceuticals, Inc. (A) 3,253 502,458Lineage Cell Therapeutics, Inc. (A) 31,209 76,462Lyell Immunopharma, Inc. (A) 6,236 48,267MacroGenics, Inc. (A) 13,309 213,609Madrigal Pharmaceuticals, Inc. (A) 2,593 219,731MannKind Corp. (A)(B) 54,562 238,436MEI Pharma, Inc. (A) 27,787 74,191MeiraGTx Holdings PLC (A) 6,885 163,450Mersana Therapeutics, Inc. (A) 16,000 99,520MiMedx Group, Inc. (A) 25,227 152,371Molecular Templates, Inc. (A) 9,321 36,538Monte Rosa Therapeutics, Inc. (A) 2,747 56,094Morphic Holding, Inc. (A) 4,446 210,651Mustang Bio, Inc. (A) 24,493 40,658Myriad Genetics, Inc. (A) 17,271 476,680Neoleukin Therapeutics, Inc. (A) 7,501 36,155Nkarta, Inc. (A) 3,358 51,545
Small Cap Index Trust (continued)Shares orPrincipalAmount Value
COMMON STOCKS (continued)Biotechnology (continued)Nurix Therapeutics, Inc. (A) 6,996 $ 202,534Nuvalent, Inc., Class A (A) 2,476 47,143Ocugen, Inc. (A)(B) 40,342 183,556Olema Pharmaceuticals, Inc. (A) 5,936 55,561Oncocyte Corp. (A) 13,136 28,505Oncorus, Inc. (A)(B) 4,918 25,918OPKO Health, Inc. (A)(B) 86,762 417,325Organogenesis Holdings, Inc. (A) 8,727 80,637ORIC Pharmaceuticals, Inc. (A) 7,072 103,958Passage Bio, Inc. (A) 8,785 55,785PDL BioPharma, Inc. (A)(C) 28,581 51,160Pfenex, Inc. (A)(C) 9,241 10,131PMV Pharmaceuticals, Inc. (A) 6,083 140,517Praxis Precision Medicines, Inc. (A) 7,723 152,143Precigen, Inc. (A) 21,875 81,156Precision BioSciences, Inc. (A) 11,089 82,059Prelude Therapeutics, Inc. (A) 2,612 32,519Progenics Pharmaceuticals, Inc. (A)(C) 24,422 1,043Prometheus Biosciences, Inc. (A) 6,194 244,911Protagonist Therapeutics, Inc. (A) 9,774 334,271Prothena Corp. PLC (A) 7,730 381,862PTC Therapeutics, Inc. (A) 15,118 602,150Puma Biotechnology, Inc. (A) 8,186 24,885Radius Health, Inc. (A) 10,799 74,729RAPT Therapeutics, Inc. (A) 4,775 175,386Recursion Pharmaceuticals, Inc.,
Class A (A) 24,306 416,362REGENXBIO, Inc. (A) 8,733 285,569Relay Therapeutics, Inc. (A) 14,678 450,761Replimune Group, Inc. (A) 6,838 185,310REVOLUTION Medicines, Inc. (A) 13,226 332,898Rhythm Pharmaceuticals, Inc. (A) 10,323 103,024Rigel Pharmaceuticals, Inc. (A) 40,220 106,583Rocket Pharmaceuticals, Inc. (A) 9,033 197,190Rubius Therapeutics, Inc. (A) 10,233 99,055Sana Biotechnology, Inc. (A) 18,818 291,303Sangamo Therapeutics, Inc. (A) 26,511 198,833Scholar Rock Holding Corp. (A) 6,388 158,678Selecta Biosciences, Inc. (A) 21,386 69,718Sensei Biotherapeutics, Inc. (A) 6,097 35,363Seres Therapeutics, Inc. (A) 15,735 131,073Shattuck Labs, Inc. (A) 6,142 52,268Silverback Therapeutics, Inc. (A) 5,449 36,290Sorrento Therapeutics, Inc. (A)(B) 63,021 293,048Spectrum Pharmaceuticals, Inc. (A) 44,264 56,215Spero Therapeutics, Inc. (A) 5,918 94,747SpringWorks Therapeutics, Inc. (A) 6,371 394,875SQZ Biotechnologies Company (A) 5,739 51,249Stoke Therapeutics, Inc. (A) 4,441 106,540Surface Oncology, Inc. (A) 9,596 45,869Sutro Biopharma, Inc. (A) 10,069 149,827Syndax Pharmaceuticals, Inc. (A) 10,063 220,279Synergy Pharmaceuticals, Inc. (A)(C) 80,513 233Syros Pharmaceuticals, Inc. (A) 14,453 47,117Talaris Therapeutics, Inc. (A) 4,360 66,664Taysha Gene Therapies, Inc. (A)(B) 5,276 61,465TCR2 Therapeutics, Inc. (A) 7,496 34,931Tenaya Therapeutics, Inc. (A) 3,535 66,988TG Therapeutics, Inc. (A) 28,230 536,370Tonix Pharmaceuticals Holding
Corp. (A)(B) 111,592 39,916Travere Therapeutics, Inc. (A) 12,779 396,660Trevena, Inc. (A) 54,659 31,839Turning Point Therapeutics, Inc. (A) 10,024 478,145Twist Bioscience Corp. (A) 10,203 789,610
John Hancock Variable Insurance TrustPortfolio of Investments — December 31, 2021 (showing percentage of total net assets)
The accompanying notes are an integral part of the financial statements. 113

Small Cap Index Trust (continued)Shares orPrincipalAmount Value
COMMON STOCKS (continued)Biotechnology (continued)UroGen Pharma, Ltd. (A)(B) 5,139 $ 48,872Vanda Pharmaceuticals, Inc. (A) 12,098 189,818Vaxart, Inc. (A) 27,064 169,691Vaxcyte, Inc. (A) 9,252 220,105VBI Vaccines, Inc. (A) 43,426 101,617Vera Therapeutics, Inc. (A) 2,013 53,787Veracyte, Inc. (A) 14,668 604,322Verastem, Inc. (A) 39,946 81,889Vericel Corp. (A) 10,137 398,384Verve Therapeutics, Inc. (A)(B) 3,593 132,474Viking Therapeutics, Inc. (A) 16,767 77,128Vir Biotechnology, Inc. (A) 12,948 542,133Viracta Therapeutics, Inc. (A) 8,718 31,821VistaGen Therapeutics, Inc. (A) 45,780 89,271Vor BioPharma, Inc. (A) 4,149 48,211Werewolf Therapeutics, Inc. (A) 5,227 62,254Xencor, Inc. (A) 12,322 494,359Y-mAbs Therapeutics, Inc. (A) 8,019 129,988Zentalis Pharmaceuticals, Inc. (A) 7,862 660,880ZIOPHARM Oncology, Inc. (A) 52,558 57,288
53,942,997Health care equipment and supplies – 3.1%Accelerate Diagnostics, Inc. (A) 10,815 56,454Accuray, Inc. (A) 21,907 104,496Alphatec Holdings, Inc. (A) 15,674 179,154AngioDynamics, Inc. (A) 7,822 215,731Apyx Medical Corp. (A) 7,549 96,778Asensus Surgical, Inc. (A) 53,438 59,316Aspira Women’s Health, Inc. (A)(B) 17,279 30,584AtriCure, Inc. (A) 9,711 675,206Atrion Corp. 303 213,585Avanos Medical, Inc. (A) 10,562 366,185Axogen, Inc. (A) 8,848 82,906Axonics, Inc. (A) 9,908 554,848BioLife Solutions, Inc. (A) 2,369 88,293Bioventus, Inc., Class A (A) 5,389 78,087Butterfly Network, Inc. (A)(B) 27,727 185,494Cardiovascular Systems, Inc. (A) 8,941 167,912Cerus Corp. (A) 37,603 256,076ClearPoint Neuro, Inc. (A) 4,599 51,601CONMED Corp. 6,247 885,575CryoLife, Inc. (A) 8,608 175,173CryoPort, Inc. (A) 8,789 520,045Cutera, Inc. (A) 4,067 168,048CytoSorbents Corp. (A) 10,859 45,499DarioHealth Corp. (A) 2,914 37,795Eargo, Inc. (A)(B) 6,971 35,552Glaukos Corp. (A) 9,764 433,912Haemonetics Corp. (A) 10,928 579,621Heska Corp. (A) 2,142 390,894Inari Medical, Inc. (A) 7,426 677,771Inogen, Inc. (A) 4,377 148,818Integer Holdings Corp. (A) 7,050 603,410Intersect ENT, Inc. (A) 7,442 203,241iRadimed Corp. (A) 1,368 63,215iRhythm Technologies, Inc. (A) 6,387 751,686Lantheus Holdings, Inc. (A) 14,745 425,983LeMaitre Vascular, Inc. 4,115 206,696LivaNova PLC (A) 11,523 1,007,456Meridian Bioscience, Inc. (A) 9,386 191,474Merit Medical Systems, Inc. (A) 11,117 692,589Mesa Laboratories, Inc. 1,081 354,665Natus Medical, Inc. (A) 7,580 179,873Neogen Corp. (A) 23,096 1,048,789Nevro Corp. (A) 7,517 609,403
Small Cap Index Trust (continued)Shares orPrincipalAmount Value
COMMON STOCKS (continued)Health care equipment and supplies (continued)NuVasive, Inc. (A) 11,237 $ 589,718OraSure Technologies, Inc. (A) 15,993 138,979Ortho Clinical Diagnostics Holdings
PLC (A) 24,378 521,445Orthofix Medical, Inc. (A) 4,334 134,744OrthoPediatrics Corp. (A) 3,149 188,499Outset Medical, Inc. (A) 10,008 461,269PAVmed, Inc. (A) 17,355 42,693Pulmonx Corp. (A) 5,794 185,814Pulse Biosciences, Inc. (A) 2,633 38,995Quotient, Ltd. (A) 22,235 57,589SeaSpine Holdings Corp. (A) 7,463 101,646Senseonics Holdings, Inc. (A)(B) 93,468 249,560Shockwave Medical, Inc. (A) 7,274 1,297,172SI-BONE, Inc. (A) 7,380 163,910Sientra, Inc. (A) 13,994 51,358Sight Sciences, Inc. (A) 2,642 46,420Silk Road Medical, Inc. (A) 7,645 325,753STAAR Surgical Company (A) 10,235 934,456Stereotaxis, Inc. (A) 11,987 74,319Surmodics, Inc. (A) 3,132 150,806Tactile Systems Technology, Inc. (A) 4,358 82,933TransMedics Group, Inc. (A) 5,949 113,983Treace Medical Concepts, Inc. (A) 5,733 106,863Utah Medical Products, Inc. 924 92,400Vapotherm, Inc. (A) 5,309 109,949Varex Imaging Corp. (A) 8,505 268,333ViewRay, Inc. (A) 31,400 173,014
20,602,509Health care providers and services – 2.8%1Life Healthcare, Inc. (A) 25,505 448,123Accolade, Inc. (A) 11,222 295,812AdaptHealth Corp. (A) 15,714 384,364Addus HomeCare Corp. (A) 3,372 315,316Agiliti, Inc. (A) 5,146 119,181Alignment Healthcare, Inc. (A) 16,059 225,790AMN Healthcare Services, Inc. (A) 10,115 1,237,368Apollo Medical Holdings, Inc. (A) 8,108 595,776Apria, Inc. (A) 3,665 119,479Aveanna Healthcare Holdings, Inc. (A) 8,895 65,823Brookdale Senior Living, Inc. (A) 42,000 216,720Castle Biosciences, Inc. (A) 4,605 197,416Community Health Systems, Inc. (A) 27,202 362,059CorVel Corp. (A) 1,900 395,200Covetrus, Inc. (A) 22,868 456,674Cross Country Healthcare, Inc. (A) 8,062 223,801Fulgent Genetics, Inc. (A)(B) 4,508 453,460Hanger, Inc. (A) 8,559 155,175HealthEquity, Inc. (A) 17,745 785,039InfuSystem Holdings, Inc. (A) 3,058 52,078LHC Group, Inc. (A) 6,607 906,679LifeStance Health Group, Inc. (A) 10,595 100,864Magellan Health, Inc. (A) 5,028 477,610MEDNAX, Inc. (A) 16,609 451,931ModivCare, Inc. (A) 2,706 401,273National HealthCare Corp. 2,604 176,916National Research Corp. 3,166 131,452Option Care Health, Inc. (A) 33,419 950,436Owens & Minor, Inc. 15,582 677,817Patterson Companies, Inc. 18,380 539,453PetIQ, Inc. (A) 5,992 136,078Privia Health Group, Inc. (A) 3,745 96,883Progyny, Inc. (A) 13,857 697,700R1 RCM, Inc. (A) 25,696 654,991RadNet, Inc. (A) 9,976 300,377
John Hancock Variable Insurance TrustPortfolio of Investments — December 31, 2021 (showing percentage of total net assets)
The accompanying notes are an integral part of the financial statements. 114

Small Cap Index Trust (continued)Shares orPrincipalAmount Value
COMMON STOCKS (continued)Health care providers and services (continued)Select Medical Holdings Corp. 23,850 $ 701,190Surgery Partners, Inc. (A) 7,152 381,988Tenet Healthcare Corp. (A) 22,801 1,862,614The Ensign Group, Inc. 11,349 952,862The Joint Corp. (A) 3,071 201,734The Pennant Group, Inc. (A) 5,920 136,634Tivity Health, Inc. (A) 9,792 258,900Triple-S Management Corp. (A) 4,932 175,974US Physical Therapy, Inc. 2,777 265,342Viemed Healthcare, Inc. (A) 9,933 51,850
18,794,202Health care technology – 1.1%Allscripts Healthcare Solutions, Inc. (A) 26,447 487,947American Well Corp., Class A (A) 41,207 248,890Computer Programs & Systems, Inc. (A) 3,540 103,722Evolent Health, Inc., Class A (A) 17,110 473,434Health Catalyst, Inc. (A) 11,049 437,761HealthStream, Inc. (A) 5,315 140,103Inspire Medical Systems, Inc. (A) 5,785 1,330,897MultiPlan Corp. (A)(B) 79,686 353,009NextGen Healthcare, Inc. (A) 12,709 226,093Omnicell, Inc. (A) 9,315 1,680,799OptimizeRx Corp. (A) 3,745 232,602Phreesia, Inc. (A) 10,752 447,928Schrodinger, Inc. (A) 9,928 345,792Simulations Plus, Inc. (B) 3,504 165,739Tabula Rasa HealthCare, Inc. (A) 5,168 77,520Vocera Communications, Inc. (A) 7,305 473,656
7,225,892Life sciences tools and services – 0.8%Berkeley Lights, Inc. (A) 10,782 196,017Bionano Genomics, Inc. (A)(B) 63,323 189,336ChromaDex Corp. (A) 11,279 42,183Codexis, Inc. (A) 13,029 407,417Cytek Biosciences, Inc. (A) 3,751 61,216Fluidigm Corp. (A) 17,384 68,145Harvard Bioscience, Inc. (A) 10,064 70,951Inotiv, Inc. (A) 3,177 133,656MaxCyte, Inc. (A)(B) 19,813 201,894Medpace Holdings, Inc. (A) 6,207 1,350,891NanoString Technologies, Inc. (A) 9,915 418,710NeoGenomics, Inc. (A) 24,590 839,011Pacific Biosciences of California, Inc. (A) 41,977 858,849Personalis, Inc. (A) 8,159 116,429Quanterix Corp. (A) 6,859 290,822Seer, Inc. (A)(B) 9,382 214,003
5,459,530Pharmaceuticals – 1.4%9 Meters Biopharma, Inc. (A) 53,079 51,948Aclaris Therapeutics, Inc. (A) 11,349 165,014Aerie Pharmaceuticals, Inc. (A) 9,966 69,961Amneal Pharmaceuticals, Inc. (A) 22,604 108,273Amphastar Pharmaceuticals, Inc. (A) 8,256 192,282Ampio Pharmaceuticals, Inc. (A)(B) 46,000 26,220ANI Pharmaceuticals, Inc. (A) 2,535 116,813Antares Pharma, Inc. (A) 39,293 140,276Arvinas, Inc. (A) 9,958 817,950Atea Pharmaceuticals, Inc. (A) 14,066 125,750Athira Pharma, Inc. (A)(B) 7,405 96,487Axsome Therapeutics, Inc. (A)(B) 6,109 230,798BioDelivery Sciences
International, Inc. (A) 23,057 71,477Cara Therapeutics, Inc. (A) 10,308 125,551Cassava Sciences, Inc. (A)(B) 8,269 361,355
Small Cap Index Trust (continued)Shares orPrincipalAmount Value
COMMON STOCKS (continued)Pharmaceuticals (continued)Citius Pharmaceuticals, Inc. (A) 22,773 $ 35,070Collegium Pharmaceutical, Inc. (A) 7,798 145,667Corcept Therapeutics, Inc. (A)(B) 20,773 411,305CorMedix, Inc. (A) 8,051 36,632Cymabay Therapeutics, Inc. (A) 14,918 50,423DICE Therapeutics, Inc. (A) 2,527 63,958Edgewise Therapeutics, Inc. (A) 7,867 120,208Elanco Animal Health, Inc. (A)(C) 15,082 0Endo International PLC (A) 49,899 187,620Esperion Therapeutics, Inc. (A)(B) 6,159 30,795Evolus, Inc. (A)(B) 7,505 48,858EyePoint Pharmaceuticals, Inc. (A) 5,201 63,660Fulcrum Therapeutics, Inc. (A) 6,019 106,476Harmony Biosciences Holdings, Inc. (A) 4,991 212,816Ikena Oncology, Inc. (A) 5,787 72,569Innoviva, Inc. (A) 9,216 158,976Intra-Cellular Therapies, Inc. (A) 15,249 798,133KemPharm, Inc. (A)(B) 7,980 69,506Marinus Pharmaceuticals, Inc. (A)(B) 8,613 102,322Mind Medicine MindMed, Inc. (A) 79,004 109,026NGM Biopharmaceuticals, Inc. (A) 7,276 128,858Nuvation Bio, Inc. (A)(B) 32,284 274,414Ocular Therapeutix, Inc. (A) 17,574 122,491Omeros Corp. (A)(B) 13,931 89,576Oramed Pharmaceuticals, Inc. (A) 6,997 99,917Pacira BioSciences, Inc. (A) 9,548 574,503Paratek Pharmaceuticals, Inc. (A) 13,470 60,480Phathom Pharmaceuticals, Inc. (A) 4,746 93,354Phibro Animal Health Corp., Class A 4,993 101,957Pliant Therapeutics, Inc. (A) 5,531 74,669Prestige Consumer Healthcare, Inc. (A) 10,621 644,164Provention Bio, Inc. (A)(B) 13,613 76,505Rain Therapeutics, Inc. (A) 3,318 42,736Reata Pharmaceuticals, Inc., Class A (A) 6,011 158,510Relmada Therapeutics, Inc. (A) 3,661 82,482Revance Therapeutics, Inc. (A) 15,871 259,015SIGA Technologies, Inc. (A) 11,154 83,878Supernus Pharmaceuticals, Inc. (A) 10,700 312,012Tarsus Pharmaceuticals, Inc. (A) 1,658 37,305TherapeuticsMD, Inc. (A)(B) 118,358 42,076Theravance Biopharma, Inc. (A) 13,853 153,076Zogenix, Inc. (A) 12,884 209,365
9,245,518115,270,648
Industrials – 14.5%Aerospace and defense – 0.6%AAR Corp. (A) 7,538 294,208Aerojet Rocketdyne Holdings, Inc. 16,026 749,376AeroVironment, Inc. (A) 4,837 300,039Astronics Corp. (A) 6,078 72,936Byrna Technologies, Inc. (A) 4,298 57,378Ducommun, Inc. (A) 2,588 121,041Kaman Corp. 6,212 268,048Kratos Defense & Security
Solutions, Inc. (A) 26,459 513,305Maxar Technologies, Inc. 15,778 465,924Moog, Inc., Class A 6,183 500,638National Presto Industries, Inc. 1,222 100,241PAE, Inc. (A) 15,754 156,437Park Aerospace Corp. 5,600 73,920Parsons Corp. (A) 5,677 191,031Triumph Group, Inc. (A) 14,321 265,368
John Hancock Variable Insurance TrustPortfolio of Investments — December 31, 2021 (showing percentage of total net assets)
The accompanying notes are an integral part of the financial statements. 115

Small Cap Index Trust (continued)Shares orPrincipalAmount Value
COMMON STOCKS (continued)Aerospace and defense (continued)Vectrus, Inc. (A) 2,721 $ 124,540
4,254,430Air freight and logistics – 0.3%Air Transport Services Group, Inc. (A) 12,753 374,683Atlas Air Worldwide Holdings, Inc. (A) 6,175 581,191Forward Air Corp. 5,805 702,927Hub Group, Inc., Class A (A) 7,097 597,851
2,256,652Airlines – 0.3%Allegiant Travel Company (A) 3,369 630,138Frontier Group Holdings, Inc. (A) 7,635 103,607Hawaiian Holdings, Inc. (A) 11,658 214,157Mesa Air Group, Inc. (A) 8,384 46,950SkyWest, Inc. (A) 10,761 422,907Spirit Airlines, Inc. (A) 21,451 468,704Sun Country Airlines Holdings, Inc. (A) 5,150 140,338
2,026,801Building products – 1.3%AAON, Inc. 8,966 712,169American Woodmark Corp. (A) 3,732 243,326Apogee Enterprises, Inc. 5,380 259,047Caesarstone, Ltd. 6,340 71,896Cornerstone Building Brands, Inc. (A) 12,322 214,896CSW Industrials, Inc. 3,174 383,610Gibraltar Industries, Inc. (A) 7,090 472,761Griffon Corp. 10,158 289,300Insteel Industries, Inc. 4,250 169,193JELD-WEN Holding, Inc. (A) 18,367 484,154Masonite International Corp. (A) 5,141 606,381PGT Innovations, Inc. (A) 12,930 290,796Quanex Building Products Corp. 7,983 197,819Resideo Technologies, Inc. (A) 31,179 811,589Simpson Manufacturing Company, Inc. 9,289 1,291,821UFP Industries, Inc. 12,796 1,177,360View, Inc. (A)(B) 27,748 108,495Zurn Water Solutions Corp. 25,930 943,852
8,728,465Commercial services and supplies – 1.7%ABM Industries, Inc. 14,561 594,817ACCO Brands Corp. 21,340 176,268Brady Corp., Class A 10,050 541,695BrightView Holdings, Inc. (A) 9,411 132,507Casella Waste Systems, Inc., Class A (A) 10,557 901,779CECO Environmental Corp. (A) 7,119 44,351Cimpress PLC (A) 3,760 269,254CoreCivic, Inc. (A) 26,204 261,254Deluxe Corp. 9,212 295,797Ennis, Inc. 5,909 115,403Harsco Corp. (A) 17,364 290,152Healthcare Services Group, Inc. 16,345 290,778Heritage-Crystal Clean, Inc. (A) 3,832 122,701HNI Corp. 9,453 397,499Interface, Inc. 12,997 207,302KAR Auction Services, Inc. (A) 26,346 411,525Kimball International, Inc., Class B 9,622 98,433Matthews International Corp., Class A 6,985 256,140MillerKnoll, Inc. 16,097 630,841Montrose Environmental Group, Inc. (A) 5,193 366,158Pitney Bowes, Inc. 39,518 262,004RR Donnelley & Sons Company (A) 15,640 176,106SP Plus Corp. (A) 5,469 154,335Steelcase, Inc., Class A 19,284 226,008Tetra Tech, Inc. 11,506 1,953,719The Brink’s Company 10,462 685,993
Small Cap Index Trust (continued)Shares orPrincipalAmount Value
COMMON STOCKS (continued)Commercial services and supplies (continued)UniFirst Corp. 3,213 $ 676,015US Ecology, Inc. (A) 7,218 230,543Viad Corp. (A) 4,686 200,514VSE Corp. 2,627 160,089
11,129,980Construction and engineering – 1.5%Ameresco, Inc., Class A (A) 6,635 540,354API Group Corp. (A) 43,577 1,122,979Arcosa, Inc. 10,398 547,975Argan, Inc. 3,537 136,847Comfort Systems USA, Inc. 7,650 756,891Concrete Pumping Holdings, Inc. (A) 6,889 56,490Construction Partners, Inc., Class A (A) 6,195 182,195Dycom Industries, Inc. (A) 6,363 596,595EMCOR Group, Inc. 11,374 1,448,934Fluor Corp. (A) 30,786 762,569Granite Construction, Inc. 9,824 380,189Great Lakes Dredge & Dock Corp. (A) 13,947 219,247IES Holdings, Inc. (A) 2,028 102,698Infrastructure and Energy
Alternatives, Inc. (A) 6,942 63,866Matrix Service Company (A) 7,471 56,182MYR Group, Inc. (A) 3,512 388,252NV5 Global, Inc. (A) 2,888 398,891Primoris Services Corp. 11,812 283,252Sterling Construction Company, Inc. (A) 6,484 170,529Tutor Perini Corp. (A) 9,399 116,266WillScot Mobile Mini Holdings Corp. (A) 45,523 1,859,159
10,190,360Electrical equipment – 1.0%Allied Motion Technologies, Inc. 2,986 108,959American Superconductor Corp. (A) 6,886 74,920Array Technologies, Inc. (A) 27,787 435,978Atkore, Inc. (A) 9,883 1,098,891AZZ, Inc. 5,165 285,573Babcock & Wilcox Enterprises, Inc. (A) 12,873 116,114Beam Global (A) 2,122 39,469Blink Charging Company (A)(B) 8,035 213,008Bloom Energy Corp., Class A (A) 30,366 665,926Encore Wire Corp. 4,209 602,308EnerSys 9,206 727,826Eos Energy Enterprises, Inc. (A)(B) 10,356 77,877FuelCell Energy, Inc. (A) 78,765 409,578GrafTech International, Ltd. 43,095 509,814Romeo Power, Inc. (A)(B) 30,637 111,825Stem, Inc. (A) 23,356 443,063Thermon Group Holdings, Inc. (A) 8,113 137,353TPI Composites, Inc. (A) 8,082 120,907Vicor Corp. (A) 4,535 575,854
6,755,243Machinery – 3.6%Alamo Group, Inc. 2,064 303,780Albany International Corp., Class A 6,561 580,320Altra Industrial Motion Corp. 14,136 728,994Astec Industries, Inc. 4,993 345,865Barnes Group, Inc. 10,170 473,820Blue Bird Corp. (A) 3,902 61,027Chart Industries, Inc. (A) 7,842 1,250,721CIRCOR International, Inc. (A) 4,348 118,179Columbus McKinnon Corp. 6,094 281,908Commercial Vehicle Group, Inc. (A) 8,180 65,931Desktop Metal, Inc., Class A (A)(B) 42,737 211,548Douglas Dynamics, Inc. 5,005 195,495Energy Recovery, Inc. (A) 9,438 202,823
John Hancock Variable Insurance TrustPortfolio of Investments — December 31, 2021 (showing percentage of total net assets)
The accompanying notes are an integral part of the financial statements. 116

Small Cap Index Trust (continued)Shares orPrincipalAmount Value
COMMON STOCKS (continued)Machinery (continued)Enerpac Tool Group Corp. 13,598 $ 275,767EnPro Industries, Inc. 4,409 485,299ESCO Technologies, Inc. 5,482 493,325Evoqua Water Technologies Corp. (A) 24,934 1,165,665Federal Signal Corp. 12,789 554,275Franklin Electric Company, Inc. 9,837 930,187Helios Technologies, Inc. 7,006 736,821Hillenbrand, Inc. 15,782 820,506Hydrofarm Holdings Group, Inc. (A) 8,630 244,143Hyliion Holdings Corp. (A) 26,595 164,889Hyster-Yale Materials Handling, Inc. 2,296 94,366Ideanomics, Inc. (A)(B) 91,681 110,017John Bean Technologies Corp. 6,739 1,034,841Kadant, Inc. 2,463 567,672Kennametal, Inc. 18,089 649,576Lindsay Corp. 2,256 342,912Luxfer Holdings PLC 6,084 117,482Meritor, Inc. (A) 14,536 360,202Miller Industries, Inc. 2,781 92,885Mueller Industries, Inc. 11,956 709,708Mueller Water Products, Inc., Class A 34,244 493,114Nikola Corp. (A) 49,734 490,875Omega Flex, Inc. 709 90,008Park-Ohio Holdings Corp. 2,563 54,259Proto Labs, Inc. (A) 6,220 319,397RBC Bearings, Inc. (A) 5,621 1,135,273REV Group, Inc. 6,669 94,366SPX Corp. (A) 9,422 562,305SPX FLOW, Inc. 8,911 770,623Standex International Corp. 2,514 278,199Tennant Company 4,026 326,267Terex Corp. 14,645 643,648The Gorman-Rupp Company 4,903 218,429The Greenbrier Companies, Inc. 6,864 314,989The Manitowoc Company, Inc. (A) 7,823 145,430The Shyft Group, Inc. 7,426 364,839Titan International, Inc. (A) 12,077 132,364Trinity Industries, Inc. 16,778 506,696Wabash National Corp. 10,998 214,681Watts Water Technologies, Inc., Class A 5,848 1,135,506Welbilt, Inc. (A) 28,106 668,080
23,730,297Marine – 0.2%Costamare, Inc. 11,417 144,425Eagle Bulk Shipping, Inc. 2,035 92,593Genco Shipping & Trading, Ltd. 7,383 118,128Matson, Inc. 8,908 801,987Safe Bulkers, Inc. (A) 15,173 57,202
1,214,335Professional services – 1.7%Acacia Research Corp. (A) 12,793 65,628ASGN, Inc. (A) 10,917 1,347,158Barrett Business Services, Inc. 1,879 129,764CBIZ, Inc. (A) 10,486 410,212CRA International, Inc. 1,556 145,268Exponent, Inc. 11,123 1,298,388First Advantage Corp. (A) 10,142 193,104Forrester Research, Inc. (A) 2,678 157,279Franklin Covey Company (A) 2,920 135,371Heidrick & Struggles International, Inc. 4,428 193,636Huron Consulting Group, Inc. (A) 4,866 242,813ICF International, Inc. 3,969 407,021Insperity, Inc. 7,845 926,573KBR, Inc. 30,299 1,442,838Kelly Services, Inc., Class A 8,241 138,202
Small Cap Index Trust (continued)Shares orPrincipalAmount Value
COMMON STOCKS (continued)Professional services (continued)Kforce, Inc. 4,419 $ 332,397Korn Ferry 11,612 879,377ManTech International Corp., Class A 5,879 428,755Mistras Group, Inc. (A) 6,058 45,011Resources Connection, Inc. 7,654 136,547Sterling Check Corp. (A) 2,468 50,619TriNet Group, Inc. (A) 8,689 827,714TrueBlue, Inc. (A) 7,783 215,356Upwork, Inc. (A) 25,522 871,832Willdan Group, Inc. (A) 2,864 100,813
11,121,676Road and rail – 0.9%ArcBest Corp. 5,458 654,141Avis Budget Group, Inc. (A) 8,879 1,841,238Covenant Logistics Group, Inc. (A) 3,256 86,056Daseke, Inc. (A) 9,799 98,382Heartland Express, Inc. 10,660 179,301Marten Transport, Ltd. 13,645 234,148Saia, Inc. (A) 5,689 1,917,364Werner Enterprises, Inc. 13,120 625,299Yellow Corp. (A) 11,735 147,744
5,783,673Trading companies and distributors – 1.4%Applied Industrial Technologies, Inc. 8,260 848,302Beacon Roofing Supply, Inc. (A) 12,127 695,483BlueLinx Holdings, Inc. (A) 2,047 196,021Boise Cascade Company 8,418 599,362Custom Truck One Source, Inc. (A)(B) 10,466 83,728DXP Enterprises, Inc. (A) 4,446 114,129GATX Corp. 7,548 786,426Global Industrial Company 2,631 107,608GMS, Inc. (A) 9,276 557,580H&E Equipment Services, Inc. 7,141 316,132Herc Holdings, Inc. 5,379 842,082McGrath RentCorp 5,248 421,204MRC Global, Inc. (A) 18,532 127,500NOW, Inc. (A) 24,463 208,914Rush Enterprises, Inc., Class A 8,316 462,702Rush Enterprises, Inc., Class B 2,077 112,096Textainer Group Holdings, Ltd. 10,221 364,992Titan Machinery, Inc. (A) 4,482 150,999Transcat, Inc. (A) 1,655 152,972Triton International, Ltd. 14,307 861,711Veritiv Corp. (A) 3,092 378,986WESCO International, Inc. (A) 9,528 1,253,790
9,642,71996,834,631
Information technology – 14.0%Communications equipment – 0.8%ADTRAN, Inc. 10,624 242,546Aviat Networks, Inc. (A) 2,338 75,003CalAmp Corp. (A) 8,593 60,667Calix, Inc. (A) 11,850 947,645Cambium Networks Corp. (A) 2,508 64,280Clearfield, Inc. (A) 2,554 215,609Comtech Telecommunications Corp. 6,012 142,424Digi International, Inc. (A) 7,892 193,906DZS, Inc. (A) 2,913 47,249EMCORE Corp. (A) 8,801 61,431Extreme Networks, Inc. (A) 27,784 436,209Harmonic, Inc. (A) 20,242 238,046Infinera Corp. (A) 39,830 381,970Inseego Corp. (A)(B) 19,063 111,137NETGEAR, Inc. (A) 6,427 187,733
John Hancock Variable Insurance TrustPortfolio of Investments — December 31, 2021 (showing percentage of total net assets)
The accompanying notes are an integral part of the financial statements. 117

Small Cap Index Trust (continued)Shares orPrincipalAmount Value
COMMON STOCKS (continued)Communications equipment (continued)NetScout Systems, Inc. (A) 15,111 $ 499,872Plantronics, Inc. (A) 9,194 269,752Ribbon Communications, Inc. (A) 16,289 98,548Viavi Solutions, Inc. (A) 49,823 877,881
5,151,908Electronic equipment, instruments and components – 2.3%908 Devices, Inc. (A) 3,739 96,728Advanced Energy Industries, Inc. 8,139 741,137Aeva Technologies, Inc. (A)(B) 20,362 153,937Akoustis Technologies, Inc. (A)(B) 10,428 69,659Arlo Technologies, Inc. (A) 19,540 204,975Badger Meter, Inc. 6,207 661,418Belden, Inc. 9,432 619,965Benchmark Electronics, Inc. 7,724 209,320CTS Corp. 7,105 260,896Daktronics, Inc. (A) 12,237 61,797ePlus, Inc. (A) 5,630 303,344Fabrinet (A) 7,906 936,624FARO Technologies, Inc. (A) 4,036 282,601Identiv, Inc. (A) 5,222 146,947II-VI, Inc. (A) 22,775 1,556,216Insight Enterprises, Inc. (A) 7,343 782,764Itron, Inc. (A) 9,784 670,400Kimball Electronics, Inc. (A) 5,461 118,831Knowles Corp. (A) 18,920 441,782Luna Innovations, Inc. (A) 8,474 71,521Methode Electronics, Inc. 8,208 403,587MicroVision, Inc. (A)(B) 36,587 183,301Napco Security Technologies, Inc. (A) 3,291 164,484nLight, Inc. (A) 9,669 231,573Novanta, Inc. (A) 7,555 1,332,173OSI Systems, Inc. (A) 3,609 336,359Ouster, Inc. (A) 30,936 160,867PAR Technology Corp. (A)(B) 5,338 281,686PC Connection, Inc. 2,429 104,763Plexus Corp. (A) 5,934 569,011Rogers Corp. (A) 4,011 1,095,003Sanmina Corp. (A) 13,546 561,617ScanSource, Inc. (A) 5,553 194,799TTM Technologies, Inc. (A) 22,418 334,028Velodyne Lidar, Inc. (A) 18,740 86,954Vishay Intertechnology, Inc. 28,458 622,376Vishay Precision Group, Inc. (A) 3,177 117,930
15,171,373IT services – 1.5%BigCommerce Holdings, Inc., Series 1 (A) 10,621 375,665Brightcove, Inc. (A) 9,813 100,289Cantaloupe, Inc. (A) 13,611 120,866Cass Information Systems, Inc. 3,523 138,524Conduent, Inc. (A) 37,818 201,948CSG Systems International, Inc. 7,082 408,065DigitalOcean Holdings, Inc. (A) 10,882 874,151EVERTEC, Inc. 13,100 654,738EVO Payments, Inc., Class A (A) 10,573 270,669ExlService Holdings, Inc. (A) 7,058 1,021,787Flywire Corp. (A) 12,878 490,137Grid Dynamics Holdings, Inc. (A) 9,221 350,121i3 Verticals, Inc., Class A (A) 4,924 112,218International Money Express, Inc. (A) 7,743 123,578Limelight Networks, Inc. (A) 31,418 107,764LiveRamp Holdings, Inc. (A) 14,333 687,267MAXIMUS, Inc. 13,151 1,047,740MoneyGram International, Inc. (A) 20,119 158,739Paya Holdings, Inc. (A) 18,744 118,837Perficient, Inc. (A) 7,004 905,547
Small Cap Index Trust (continued)Shares orPrincipalAmount Value
COMMON STOCKS (continued)IT services (continued)Rackspace Technology, Inc. (A) 12,110 $ 163,122Repay Holdings Corp. (A) 19,537 356,941The Hackett Group, Inc. 5,795 118,971TTEC Holdings, Inc. 3,946 357,310Tucows, Inc., Class A (A) 2,224 186,416Unisys Corp. (A) 14,333 294,830Verra Mobility Corp. (A) 29,270 451,636
10,197,876Semiconductors and semiconductor equipment – 3.6%Alpha & Omega Semiconductor, Ltd. (A) 4,712 285,359Ambarella, Inc. (A) 7,594 1,540,747Amkor Technology, Inc. 21,822 540,967Atomera, Inc. (A)(B) 4,756 95,691Axcelis Technologies, Inc. (A) 7,171 534,670AXT, Inc. (A) 10,109 89,060CEVA, Inc. (A) 5,143 222,383CMC Materials, Inc. 6,103 1,169,884Cohu, Inc. (A) 10,533 401,202Diodes, Inc. (A) 9,315 1,022,880FormFactor, Inc. (A) 16,760 766,267Ichor Holdings, Ltd. (A) 6,177 284,327Impinj, Inc. (A) 4,135 366,775Kopin Corp. (A) 17,663 72,242Kulicke & Soffa Industries, Inc. 13,119 794,224Lattice Semiconductor Corp. (A) 29,079 2,240,828MACOM Technology Solutions
Holdings, Inc. (A) 10,475 820,193MaxLinear, Inc. (A) 15,264 1,150,753Meta Materials, Inc. (A)(B) 45,983 113,118NeoPhotonics Corp. (A) 11,466 176,232NVE Corp. 1,321 90,224Onto Innovation, Inc. (A) 10,470 1,059,878PDF Solutions, Inc. (A) 6,816 216,681Photronics, Inc. (A) 13,054 246,068Power Integrations, Inc. 12,912 1,199,396Rambus, Inc. (A) 23,393 687,520Semtech Corp. (A) 13,867 1,233,192Silicon Laboratories, Inc. (A) 8,560 1,766,955SiTime Corp. (A) 3,349 979,716SMART Global Holdings, Inc. (A) 3,851 273,382SunPower Corp. (A) 17,336 361,802Synaptics, Inc. (A) 8,269 2,393,958Ultra Clean Holdings, Inc. (A) 9,589 550,025Veeco Instruments, Inc. (A) 11,119 316,558
24,063,157Software – 5.5%8x8, Inc. (A) 24,551 411,475A10 Networks, Inc. 13,348 221,310ACI Worldwide, Inc. (A) 25,527 885,787Agilysys, Inc. (A) 4,363 193,979Alarm.com Holdings, Inc. (A) 10,237 868,200Alkami Technology, Inc. (A) 5,075 101,805Altair Engineering, Inc., Class A (A) 10,018 774,592American Software, Inc., Class A 7,131 186,618Appfolio, Inc., Class A (A) 4,086 494,651Appian Corp. (A) 8,539 556,828Asana, Inc., Class A (A) 15,295 1,140,242Avaya Holdings Corp. (A) 18,091 358,202AvidXchange Holdings, Inc. (A)(B) 3,581 53,930Benefitfocus, Inc. (A) 6,133 65,378Blackbaud, Inc. (A) 10,339 816,574Blackline, Inc. (A) 11,652 1,206,448Bottomline Technologies DE, Inc. (A) 9,657 545,331Box, Inc., Class A (A) 30,151 789,655BTRS Holdings, Inc., Class A (A) 14,786 115,627
John Hancock Variable Insurance TrustPortfolio of Investments — December 31, 2021 (showing percentage of total net assets)
The accompanying notes are an integral part of the financial statements. 118

Small Cap Index Trust (continued)Shares orPrincipalAmount Value
COMMON STOCKS (continued)Software (continued)Cerence, Inc. (A) 8,243 $ 631,744ChannelAdvisor Corp. (A) 6,737 166,269Cleanspark, Inc. (A)(B) 7,550 71,876CommVault Systems, Inc. (A) 9,902 682,446Consensus Cloud Solutions, Inc. (A) 3,148 182,175CoreCard Corp. (A) 1,799 69,801Couchbase, Inc. (A) 2,202 54,962CS Disco, Inc. (A) 1,855 66,316Digimarc Corp. (A)(B) 2,985 117,848Digital Turbine, Inc. (A) 19,542 1,191,867Domo, Inc., Class B (A) 5,987 296,955E2open Parent Holdings, Inc. (A) 40,619 457,370Ebix, Inc. 6,026 183,190eGain Corp. (A) 5,111 51,008Enfusion, Inc., Class A (A) 3,407 71,343EngageSmart, Inc. (A) 2,898 69,900Envestnet, Inc. (A) 11,755 932,642EverCommerce, Inc. (A) 3,862 60,827GTY Technology Holdings, Inc. (A) 7,660 51,322Instructure Holdings, Inc. (A) 2,895 69,422Intapp, Inc. (A) 2,354 59,227InterDigital, Inc. 6,688 479,061JFrog, Ltd. (A) 11,764 349,391LivePerson, Inc. (A) 14,117 504,259Marathon Digital Holdings, Inc. (A)(B) 20,586 676,456MeridianLink, Inc. (A) 3,103 66,963MicroStrategy, Inc., Class A (A)(B) 1,779 968,648Mimecast, Ltd. (A) 13,127 1,044,515Mitek Systems, Inc. (A) 9,740 172,885Model N, Inc. (A) 7,840 235,435Momentive Global, Inc. (A) 28,348 599,560ON24, Inc. (A) 6,350 110,173OneSpan, Inc. (A) 8,126 137,573PagerDuty, Inc. (A) 17,801 618,585Ping Identity Holding Corp. (A) 11,917 272,661Progress Software Corp. 9,483 457,744PROS Holdings, Inc. (A) 8,880 306,271Q2 Holdings, Inc. (A) 11,855 941,761Qualys, Inc. (A) 7,320 1,004,450Rapid7, Inc. (A) 12,089 1,422,754Rekor Systems, Inc. (A)(B) 7,540 49,387Rimini Street, Inc. (A) 10,896 65,049Riot Blockchain, Inc. (A)(B) 18,840 420,697Sailpoint Technologies Holdings, Inc. (A) 19,797 956,987Sapiens International Corp. NV 6,859 236,293SecureWorks Corp., Class A (A) 2,828 45,163ShotSpotter, Inc. (A) 2,147 63,379Sprout Social, Inc., Class A (A) 9,760 885,134SPS Commerce, Inc. (A) 7,756 1,104,067Sumo Logic, Inc. (A) 19,325 262,047Telos Corp. (A) 8,913 137,438Tenable Holdings, Inc. (A) 19,944 1,098,316Upland Software, Inc. (A) 6,587 118,171Varonis Systems, Inc. (A) 23,058 1,124,769Verint Systems, Inc. (A) 13,788 724,008Veritone, Inc. (A)(B) 6,326 142,208Vonage Holdings Corp. (A) 52,092 1,082,993Workiva, Inc. (A) 9,218 1,202,857Xperi Holding Corp. 22,855 432,188Yext, Inc. (A) 25,095 248,942Zuora, Inc., Class A (A) 24,368 455,194
36,549,574Technology hardware, storage and peripherals – 0.3%3D Systems Corp. (A) 26,541 571,693Avid Technology, Inc. (A) 7,870 256,326
Small Cap Index Trust (continued)Shares orPrincipalAmount Value
COMMON STOCKS (continued)Technology hardware, storage and peripherals (continued)Corsair Gaming, Inc. (A) 5,978 $ 125,598Diebold Nixdorf, Inc. (A) 16,369 148,139Eastman Kodak Company (A)(B) 10,835 50,708Quantum Corp. (A) 13,934 76,916Super Micro Computer, Inc. (A) 9,425 414,229Turtle Beach Corp. (A) 3,489 77,665
1,721,27492,855,162
Materials – 3.7%Chemicals – 1.9%AdvanSix, Inc. 5,756 271,971American Vanguard Corp. 7,492 122,794Amyris, Inc. (A)(B) 37,529 203,032Avient Corp. 19,443 1,087,836Balchem Corp. 6,814 1,148,840Cabot Corp. 12,018 675,412Chase Corp. 1,553 154,617Danimer Scientific, Inc. (A)(B) 18,407 156,828Ecovyst, Inc. 11,625 119,040Ferro Corp. (A) 17,510 382,243FutureFuel Corp. 7,839 59,890GCP Applied Technologies, Inc. (A) 10,801 341,960Hawkins, Inc. 4,301 169,674HB Fuller Company 11,065 896,265Ingevity Corp. (A) 8,540 612,318Innospec, Inc. 5,228 472,298Intrepid Potash, Inc. (A) 2,311 98,749Koppers Holdings, Inc. (A) 4,776 149,489Kraton Corp. (A) 6,731 311,780Kronos Worldwide, Inc. 5,345 80,228Livent Corp. (A) 34,857 849,814Minerals Technologies, Inc. 7,044 515,269Orion Engineered Carbons SA (A) 13,256 243,380PureCycle Technologies, Inc. (A)(B) 9,816 93,939Quaker Chemical Corp. 2,900 669,262Rayonier Advanced Materials, Inc. (A) 14,810 84,565Sensient Technologies Corp. 8,966 897,138Stepan Company 4,454 553,588Tredegar Corp. 7,266 85,884Trinseo PLC 8,260 433,320Tronox Holdings PLC, Class A 24,471 588,038Zymergen, Inc. (A) 16,379 109,576
12,639,037Construction materials – 0.2%Forterra, Inc. (A) 6,508 154,760Summit Materials, Inc., Class A (A) 25,547 1,025,457
1,180,217Containers and packaging – 0.3%Greif, Inc., Class A 4,878 294,485Greif, Inc., Class B 1,724 103,061Myers Industries, Inc. 8,423 168,544O-I Glass, Inc. (A) 33,872 407,480Pactiv Evergreen, Inc. 9,538 120,942Ranpak Holdings Corp. (A) 8,190 307,780TriMas Corp. 9,343 345,691UFP Technologies, Inc. (A) 1,627 114,313
1,862,296Metals and mining – 1.2%1911 Gold Corp. (A) 5,045 1,231Allegheny Technologies, Inc. (A) 27,887 444,240Arconic Corp. (A) 23,070 761,541Carpenter Technology Corp. 10,468 305,561Century Aluminum Company (A) 11,520 190,771
John Hancock Variable Insurance TrustPortfolio of Investments — December 31, 2021 (showing percentage of total net assets)
The accompanying notes are an integral part of the financial statements. 119

Small Cap Index Trust (continued)Shares orPrincipalAmount Value
COMMON STOCKS (continued)Metals and mining (continued)Coeur Mining, Inc. (A) 57,239 $ 288,485Commercial Metals Company 25,531 926,520Compass Minerals International, Inc. 7,438 379,933Constellium SE (A) 26,464 473,970Gatos Silver, Inc. (A) 10,419 108,149Haynes International, Inc. 3,105 125,225Hecla Mining Company 115,642 603,651Kaiser Aluminum Corp. 3,411 320,429Materion Corp. 4,396 404,168MP Materials Corp. (A) 15,763 715,955Novagold Resources, Inc. (A) 52,523 360,308Pan American Silver Corp., CVR (A)(D) 88,114 68,614Ryerson Holding Corp. 3,681 95,890Schnitzer Steel Industries, Inc., Class A 5,602 290,856SunCoke Energy, Inc. 18,821 124,030TimkenSteel Corp. (A) 10,322 170,313Warrior Met Coal, Inc. 11,053 284,173Worthington Industries, Inc. 7,042 384,916
7,828,929Paper and forest products – 0.1%Clearwater Paper Corp. (A) 3,730 136,779Glatfelter Corp. 9,703 166,892Neenah, Inc. 3,740 173,087Schweitzer-Mauduit International, Inc. 7,056 210,974Verso Corp., Class A 5,826 157,419
845,15124,355,630
Real estate – 7.2%Equity real estate investment trusts – 6.4%Acadia Realty Trust 19,049 415,840Agree Realty Corp. 14,179 1,011,813Alexander & Baldwin, Inc. 16,116 404,350Alexander’s, Inc. 463 120,519American Assets Trust, Inc. 10,752 403,523American Finance Trust, Inc. 27,287 249,130Apartment Investment and Management
Company, Class A (A) 33,111 255,617Apple Hospitality REIT, Inc. 46,477 750,604Armada Hoffler Properties, Inc. 14,110 214,754Ashford Hospitality Trust, Inc. (A) 4,903 47,069Braemar Hotels & Resorts, Inc. (A) 15,308 78,071Brandywine Realty Trust 36,121 484,744Broadstone Net Lease, Inc. 33,549 832,686BRT Apartments Corp. 2,982 71,538CareTrust REIT, Inc. 21,096 481,622CatchMark Timber Trust, Inc., Class A 12,533 109,162Centerspace 3,002 332,922Chatham Lodging Trust (A) 11,277 154,720City Office REIT, Inc. 9,872 194,676Community Healthcare Trust, Inc. 5,032 237,863CorePoint Lodging, Inc. (A) 9,360 146,952Corporate Office Properties Trust 24,052 672,734CTO Realty Growth, Inc. 1,874 115,101DiamondRock Hospitality Company (A) 46,306 445,001DigitalBridge Group, Inc. (A) 105,522 878,998Diversified Healthcare Trust 54,192 167,453Easterly Government Properties, Inc. 18,014 412,881EastGroup Properties, Inc. 8,331 1,898,218Empire State Realty Trust, Inc., Class A 31,502 280,368Equity Commonwealth (A) 23,493 608,469Essential Properties Realty Trust, Inc. 25,433 733,233Farmland Partners, Inc. 7,176 85,753Four Corners Property Trust, Inc. 16,411 482,648Franklin Street Properties Corp. 25,189 149,875
Small Cap Index Trust (continued)Shares orPrincipalAmount Value
COMMON STOCKS (continued)Equity real estate investment trusts (continued)Getty Realty Corp. 8,060 $ 258,645Gladstone Commercial Corp. 8,759 225,719Gladstone Land Corp. 6,813 230,007Global Medical REIT, Inc. 13,418 238,170Global Net Lease, Inc. 22,632 345,817Healthcare Realty Trust, Inc. 30,956 979,448Hersha Hospitality Trust (A) 9,792 89,793Independence Realty Trust, Inc. 21,988 567,950Indus Realty Trust, Inc. 1,261 102,217Industrial Logistics Properties Trust 13,486 337,824Innovative Industrial Properties, Inc. 5,122 1,346,625iStar, Inc. 14,717 380,140Kite Realty Group Trust 46,978 1,023,181LTC Properties, Inc. 8,691 296,711LXP Industrial Trust 57,765 902,289Monmouth Real Estate Investment Corp. 20,195 424,297National Health Investors, Inc. 9,346 537,115National Storage Affiliates Trust 17,373 1,202,212NETSTREIT Corp. 9,021 206,581NexPoint Residential Trust, Inc. 4,642 389,139Office Properties Income Trust 11,273 280,021One Liberty Properties, Inc. 3,956 139,568Outfront Media, Inc. 31,666 849,282Paramount Group, Inc. 41,253 344,050Pebblebrook Hotel Trust 28,376 634,771Phillips Edison & Company, Inc. 4,680 154,627Physicians Realty Trust 46,008 866,331Piedmont Office Realty Trust, Inc.,
Class A 26,574 488,430Plymouth Industrial REIT, Inc. 6,595 211,040Postal Realty Trust, Inc., Class A 4,212 83,398PotlatchDeltic Corp. 14,419 868,312Preferred Apartment Communities, Inc. 12,475 225,299PS Business Parks, Inc. 4,120 758,780Retail Opportunity Investments Corp. 26,039 510,364RLJ Lodging Trust 36,647 510,493RPT Realty 18,241 244,065Ryman Hospitality Properties, Inc. (A) 11,682 1,074,277Sabra Health Care REIT, Inc. 48,000 649,920Safehold, Inc. 3,665 292,650Saul Centers, Inc. 2,830 150,047Seritage Growth Properties, Class A (A) 8,315 110,340Service Properties Trust 37,015 325,362SITE Centers Corp. 37,790 598,216STAG Industrial, Inc. 35,100 1,683,396Summit Hotel Properties, Inc. (A) 23,585 230,190Sunstone Hotel Investors, Inc. (A) 47,640 558,817Tanger Factory Outlet Centers, Inc. 22,068 425,471Terreno Realty Corp. 14,671 1,251,290The GEO Group, Inc. 25,857 200,392The Macerich Company 46,453 802,708UMH Properties, Inc. 9,411 257,203Uniti Group, Inc. 42,639 597,372Universal Health Realty Income Trust 3,196 190,066Urban Edge Properties 25,080 476,520Urstadt Biddle Properties, Inc., Class A 7,346 156,470Veris Residential, Inc. (A) 19,789 363,722Washington Real Estate Investment Trust 18,617 481,249Whitestone REIT 10,937 110,792Xenia Hotels & Resorts, Inc. (A) 25,263 457,513
42,625,601Real estate management and development – 0.8%Cushman & Wakefield PLC (A) 30,156 670,669Douglas Elliman, Inc. (A) 15,459 177,773eXp World Holdings, Inc. 13,748 463,170
John Hancock Variable Insurance TrustPortfolio of Investments — December 31, 2021 (showing percentage of total net assets)
The accompanying notes are an integral part of the financial statements. 120

Small Cap Index Trust (continued)Shares orPrincipalAmount Value
COMMON STOCKS (continued)Real estate management and development (continued)Forestar Group, Inc. (A) 4,284 $ 93,177FRP Holdings, Inc. (A) 1,773 102,479Kennedy-Wilson Holdings, Inc. 25,813 616,414Marcus & Millichap, Inc. (A) 5,270 271,194Newmark Group, Inc., Class A 32,633 610,237RE/MAX Holdings, Inc., Class A 4,356 132,814Realogy Holdings Corp. (A) 24,556 412,786Redfin Corp. (A) 22,437 861,356Tejon Ranch Company (A) 5,037 96,106The RMR Group, Inc., Class A 3,750 130,050The St. Joe Company 7,206 375,072
5,013,29747,638,898
Utilities – 2.5%Electric utilities – 0.6%ALLETE, Inc. 11,153 740,002MGE Energy, Inc. 7,961 654,792Otter Tail Corp. 8,782 627,210PNM Resources, Inc. 17,927 817,650Portland General Electric Company 18,955 1,003,099Via Renewables, Inc. 5,509 62,968
3,905,721Gas utilities – 0.8%Brookfield Infrastructure Corp., Class A 12,333 841,851Chesapeake Utilities Corp. 3,656 533,081New Jersey Resources Corp. 20,834 855,444Northwest Natural Holding Company 6,910 337,070ONE Gas, Inc. 11,272 874,594South Jersey Industries, Inc. 22,320 582,998Southwest Gas Holdings, Inc. 12,226 856,431Spire, Inc. 10,843 707,180
5,588,649Independent power and renewable electricity producers –0.3%Clearway Energy, Inc., Class A 8,463 283,341Clearway Energy, Inc., Class C 16,778 604,511Ormat Technologies, Inc. 9,683 767,862Sunnova Energy International, Inc. (A) 18,610 519,591
2,175,305Multi-utilities – 0.4%Avista Corp. 15,068 640,239Black Hills Corp. 13,429 947,685NorthWestern Corp. 10,944 625,559Unitil Corp. 3,819 175,636
2,389,119Water utilities – 0.4%American States Water Company 7,766 803,315Artesian Resources Corp., Class A 2,741 126,991California Water Service Group 11,076 795,921Global Water Resources, Inc. 2,852 48,769Middlesex Water Company 3,708 446,072Pure Cycle Corp. (A) 5,830 85,118SJW Group 6,130 448,716
Small Cap Index Trust (continued)Shares orPrincipalAmount Value
COMMON STOCKS (continued)Water utilities (continued)The York Water Company 3,343 $ 166,415
2,921,31716,980,111
TOTAL COMMON STOCKS (Cost $453,764,675) $ 637,503,029
WARRANTS – 0.0%Nabors Industries, Ltd. (Expiration
Date: 6-11-26; Strike Price:$166.67) (A)(B) 668 2,492
TOTAL WARRANTS (Cost $0) $ 2,492
SHORT-TERM INVESTMENTS – 5.1%U.S. Government – 0.3%U.S. Treasury Bill
0.045%, 02/17/2022 * $ 2,000,000 1,999,925U.S. Government Agency – 3.0%Federal Home Loan Bank Discount Note
0.030%, 01/14/2022 * 13,000,000 12,999,9600.030%, 02/02/2022 * 5,000,000 4,999,917
Tennessee Valley Authority Discount Note0.031%, 01/12/2022 * 1,850,000 1,849,995
19,849,872Short-term funds – 0.9%John Hancock Collateral Trust,
0.1697% (E)(F) 612,451 6,126,348Repurchase agreement – 0.9%Repurchase Agreement with State Street
Corp. dated 12-31-21 at 0.000% to berepurchased at $6,075,000 on 1-3-22,collateralized by $5,665,300U.S. Treasury Notes, 2.875% due5-15-28 (valued at $6,196,537) $ 6,075,000 6,075,000
TOTAL SHORT-TERM INVESTMENTS (Cost $34,051,731) $ 34,051,145Total Investments (Small Cap Index Trust)
(Cost $487,816,406) – 100.9% $ 671,556,666Other assets and liabilities, net – (0.9%) (6,302,657)TOTAL NET ASSETS – 100.0% $ 665,254,009
Security Abbreviations and LegendCVR Contingent Value Right(A) Non-income producing security.(B) All or a portion of this security is on loan as of 12-31-21.(C) Security is valued using significant unobservable inputs and is
classified as Level 3 in the fair value hierarchy. Refer to Note 2 tothe financial statements.
(D) Strike price and/or expiration date not available.(E) The rate shown is the annualized seven-day yield as of 12-31-21.(F) Investment is an affiliate of the fund, the advisor and/or subadvisor.
This security represents the investment of cash collateral received forsecurities lending.
* Yield represents either the annualized yield at the date of purchase,the stated coupon rate or, for floating rate securities, the rate atperiod end.
John Hancock Variable Insurance TrustPortfolio of Investments — December 31, 2021 (showing percentage of total net assets)
The accompanying notes are an integral part of the financial statements. 121

Small Cap Index Trust (continued)DERIVATIVES
FUTURES
Open contractsNumber of
contracts PositionExpiration
dateNotional
basis^Notional
value^
Unrealizedappreciation
(depreciation)Russell 2000 E-Mini Index Futures 269 Long Mar 2022 $29,827,164 $30,165,660 $338,496
$338,496
^ Notional basis refers to the contractual amount agreed upon at inception of open contracts; notional value represents the current value of the open contract.
See Notes to financial statements regarding investment transactions and other derivatives information.
Small Cap Opportunities TrustShares orPrincipalAmount Value
COMMON STOCKS – 99.4%Communication services – 2.2%Diversified telecommunication services – 0.4%ATN International, Inc. 1,281 $ 51,176Consolidated Communications
Holdings, Inc. (A) 4,985 37,288EchoStar Corp., Class A (A) 4,430 116,731Liberty Latin America, Ltd., Class A (A) 4,204 49,019Liberty Latin America, Ltd., Class C (A) 11,346 129,344Lumen Technologies, Inc. 20,570 258,154
641,712Entertainment – 0.6%Ballantyne Strong, Inc. (A) 1,114 3,219Liberty Media Corp.-Liberty Formula One,
Series A (A) 1,330 78,922Liberty Media Corp.-Liberty Formula One,
Series C (A) 8,584 542,852Lions Gate Entertainment Corp.,
Class A (A) 5,809 96,662Lions Gate Entertainment Corp.,
Class B (A) 8,534 131,338Madison Square Garden Entertainment
Corp. (A) 1,034 72,732Reading International, Inc., Class A (A) 1,100 4,444The Marcus Corp. (A) 2,916 52,080
982,249Interactive media and services – 0.2%Cars.com, Inc. (A) 5,579 89,766DHI Group, Inc. (A) 5,212 32,523j2 Global, Inc. (A) 654 72,502QuinStreet, Inc. (A) 1,887 34,325Yelp, Inc. (A) 1,685 61,064
290,180Media – 0.9%AMC Networks, Inc., Class A (A) 1,328 45,736Audacy, Inc. (A) 6,702 17,224Beasley Broadcast Group, Inc.,
Class A (A) 502 949Boston Omaha Corp., Class A (A) 1,631 46,859comScore, Inc. (A) 2,845 9,502DallasNews Corp. 1,059 7,614Entravision Communications Corp.,
Class A 5,075 34,409Fluent, Inc. (A) 5,600 11,144Gannett Company, Inc. (A) 7,195 38,349Gray Television, Inc. 6,546 131,967Hemisphere Media Group, Inc. (A) 951 6,914John Wiley & Sons, Inc., Class A 1,937 110,932Loyalty Ventures, Inc. (A) 909 27,334News Corp., Class A 13,143 293,220
Small Cap Opportunities Trust (continued)Shares orPrincipalAmount Value
COMMON STOCKS (continued)Media (continued)News Corp., Class B 6,557 $ 147,533Nexstar Media Group, Inc., Class A 1,859 280,672Scholastic Corp. 1,876 74,965TEGNA, Inc. 8,149 151,245The EW Scripps Company, Class A (A) 5,843 113,062The Interpublic Group of Companies, Inc. 422 15,804
1,565,434Wireless telecommunication services – 0.1%Spok Holdings, Inc. 3,863 36,042Telephone & Data Systems, Inc. 7,131 143,690United States Cellular Corp. (A) 2,570 81,006
260,7383,740,313
Consumer discretionary – 14.2%Auto components – 2.7%Adient PLC (A) 3,399 162,744American Axle & Manufacturing
Holdings, Inc. (A) 6,125 57,146Autoliv, Inc. 4,789 495,230BorgWarner, Inc. 12,039 542,598Cooper-Standard Holdings, Inc. (A) 1,311 29,380Dana, Inc. 8,889 202,847Dorman Products, Inc. (A) 4,539 512,952Fox Factory Holding Corp. (A) 8,393 1,427,649Gentherm, Inc. (A) 162 14,078LCI Industries 237 36,941Lear Corp. 1,769 323,639Modine Manufacturing Company (A) 4,925 49,693Motorcar Parts of America, Inc. (A) 1,585 27,056Patrick Industries, Inc. 647 52,206Standard Motor Products, Inc. 1,901 99,593Stoneridge, Inc. (A) 1,672 33,005Strattec Security Corp. (A) 924 34,206The Goodyear Tire & Rubber
Company (A) 17,683 377,0024,477,965
Automobiles – 0.2%Harley-Davidson, Inc. 3,482 131,237Thor Industries, Inc. 1,759 182,531Winnebago Industries, Inc. 1,123 84,135
397,903Distributors – 0.0%Weyco Group, Inc. 1,316 31,505Diversified consumer services – 1.0%Adtalem Global Education, Inc. (A) 3,782 111,796American Public Education, Inc. (A) 1,450 32,263Carriage Services, Inc. 1,797 115,799Graham Holdings Company, Class B 347 218,551
John Hancock Variable Insurance TrustPortfolio of Investments — December 31, 2021 (showing percentage of total net assets)
The accompanying notes are an integral part of the financial statements. 122

Small Cap Opportunities Trust (continued)Shares orPrincipalAmount Value
COMMON STOCKS (continued)Diversified consumer services (continued)Grand Canyon Education, Inc. (A) 8,453 $ 724,507Houghton Mifflin Harcourt Company (A) 5,833 93,911Laureate Education, Inc., Class A 3,940 48,226Lincoln Educational Services Corp. (A) 1,100 8,217OneSpaWorld Holdings, Ltd. (A) 3,242 32,485Perdoceo Education Corp. (A) 5,378 63,245Stride, Inc. (A) 2,888 96,257Terminix Global Holdings, Inc. (A) 2,263 102,355Universal Technical Institute, Inc. (A) 3,087 24,140Zovio, Inc. (A) 3,463 4,398
1,676,150Hotels, restaurants and leisure – 1.3%Ark Restaurants Corp. (A) 64 1,066Biglari Holdings, Inc., Class A (A) 3 2,085Biglari Holdings, Inc., Class B (A) 102 14,542Bluegreen Vacations Holding Corp. (A) 348 12,215Carrols Restaurant Group, Inc. 1,688 4,996Churchill Downs, Inc. 3,149 758,594Chuy’s Holdings, Inc. (A) 18,916 569,750Del Taco Restaurants, Inc. 2,438 30,353El Pollo Loco Holdings, Inc. (A) 2,613 37,078Fiesta Restaurant Group, Inc. (A) 1,348 14,841Krispy Kreme, Inc. 26,675 504,691Marriott Vacations Worldwide Corp. 466 78,745Monarch Casino & Resort, Inc. (A) 1,074 79,422Playa Hotels & Resorts NV (A) 2,743 21,889RCI Hospitality Holdings, Inc. 396 30,840
2,161,107Household durables – 2.9%Bassett Furniture Industries, Inc. 1,234 20,694Beazer Homes USA, Inc. (A) 1,614 37,477Cavco Industries, Inc. (A) 510 162,002Century Communities, Inc. 1,378 112,707Ethan Allen Interiors, Inc. 1,706 44,851Flexsteel Industries, Inc. 1,118 30,029Green Brick Partners, Inc. (A) 900 27,297Hooker Furnishings Corp. 1,821 42,393iRobot Corp. (A) 743 48,949KB Home 6,043 270,303La-Z-Boy, Inc. 3,039 110,346Legacy Housing Corp. (A) 585 15,485LGI Homes, Inc. (A) 1,066 164,676Lifetime Brands, Inc. 2,931 46,808M/I Homes, Inc. (A) 2,195 136,485MDC Holdings, Inc. 4,059 226,614Meritage Homes Corp. (A) 2,251 274,757Mohawk Industries, Inc. (A) 3,344 609,210Newell Brands, Inc. 3,701 80,830PulteGroup, Inc. 8,788 502,322Taylor Morrison Home Corp. (A) 6,235 217,976Toll Brothers, Inc. 8,961 648,687TopBuild Corp. (A) 2,108 581,618Tri Pointe Homes, Inc. (A) 9,765 272,346Universal Electronics, Inc. (A) 745 30,359VOXX International Corp. (A) 3,131 31,842Whirlpool Corp. 98 22,997
4,770,060Internet and direct marketing retail – 0.1%1-800-Flowers.com, Inc., Class A (A) 890 20,799Lands’ End, Inc. (A) 1,503 29,504Qurate Retail, Inc., Series A 22,636 172,034
222,337Leisure products – 0.3%Acushnet Holdings Corp. 3,926 208,392
Small Cap Opportunities Trust (continued)Shares orPrincipalAmount Value
COMMON STOCKS (continued)Leisure products (continued)American Outdoor Brands, Inc. (A) 614 $ 12,237Callaway Golf Company (A) 392 10,756Escalade, Inc. 3,529 55,723Johnson Outdoors, Inc., Class A 766 71,767Nautilus, Inc. (A) 1,580 9,685Smith & Wesson Brands, Inc. 859 15,290Vista Outdoor, Inc. (A) 3,182 146,595
530,445Multiline retail – 1.0%Big Lots, Inc. 2,327 104,831Dillard’s, Inc., Class A (B) 2,339 573,102Franchise Group, Inc. 300 15,648Kohl’s Corp. 8,128 401,442Macy’s, Inc. 12,243 320,522Ollie’s Bargain Outlet Holdings, Inc. (A) 5,254 268,952
1,684,497Specialty retail – 3.8%Abercrombie & Fitch Company,
Class A (A) 4,970 173,105American Eagle Outfitters, Inc. (B) 6,833 173,012America’s Car-Mart, Inc. (A) 338 34,611Asbury Automotive Group, Inc. (A) 997 172,212AutoNation, Inc. (A) 5,555 649,102Barnes & Noble Education, Inc. (A) 4,024 27,403Bed Bath & Beyond, Inc. (A) 1,739 25,355Big 5 Sporting Goods Corp. (B) 2,004 38,096Boot Barn Holdings, Inc. (A) 2,080 255,944Build-A-Bear Workshop, Inc. 2,470 48,214Chico’s FAS, Inc. (A) 8,871 47,726Citi Trends, Inc. (A) 672 63,672Conn’s, Inc. (A) 2,177 51,203Dick’s Sporting Goods, Inc. 2,512 288,855Five Below, Inc. (A) 3,832 792,802Foot Locker, Inc. 4,562 199,040Genesco, Inc. (A) 1,311 84,127Group 1 Automotive, Inc. 1,593 310,985Guess?, Inc. 5,350 126,688Haverty Furniture Companies, Inc. 1,613 49,309Hibbett, Inc. 1,098 78,979Lithia Motors, Inc. 3,196 949,052Lumber Liquidators Holdings, Inc. (A) 1,480 25,264MarineMax, Inc. (A) 2,016 119,025Monro, Inc. 1,145 66,719Penske Automotive Group, Inc. 4,213 451,718Rent-A-Center, Inc. 418 20,081Shoe Carnival, Inc. 2,304 90,040Signet Jewelers, Ltd. 3,675 319,835Sonic Automotive, Inc., Class A 1,522 75,263The Aaron’s Company, Inc. 1,356 33,425The Buckle, Inc. 296 12,524The Cato Corp., Class A 1,957 33,582The Container Store Group, Inc. (A) 2,221 22,166The Gap, Inc. 1,861 32,847The ODP Corp. (A) 3,276 128,681Tilly’s, Inc., Class A 712 11,470Urban Outfitters, Inc. (A) 4,015 117,880Zumiez, Inc. (A) 1,822 87,438
6,287,450Textiles, apparel and luxury goods – 0.9%Capri Holdings, Ltd. (A) 3,763 244,256Culp, Inc. 334 3,176Delta Apparel, Inc. (A) 500 14,870Fossil Group, Inc. (A) 3,231 33,247G-III Apparel Group, Ltd. (A) 3,404 94,087
John Hancock Variable Insurance TrustPortfolio of Investments — December 31, 2021 (showing percentage of total net assets)
The accompanying notes are an integral part of the financial statements. 123

Small Cap Opportunities Trust (continued)Shares orPrincipalAmount Value
COMMON STOCKS (continued)Textiles, apparel and luxury goods (continued)Lakeland Industries, Inc. (A) 1,110 $ 24,087Movado Group, Inc. 1,758 73,537Oxford Industries, Inc. 4,559 462,830PVH Corp. 3,196 340,853Ralph Lauren Corp. 189 22,465Rocky Brands, Inc. 802 31,920Superior Group of Companies, Inc. 663 14,546Tapestry, Inc. 1,440 58,464Unifi, Inc. (A) 2,453 56,787Vera Bradley, Inc. (A) 2,034 17,309
1,492,43423,731,853
Consumer staples – 4.3%Beverages – 0.3%MGP Ingredients, Inc. 571 48,529Molson Coors Beverage Company, Class B 10,060 466,281
514,810Food and staples retailing – 1.3%Casey’s General Stores, Inc. 162 31,971Grocery Outlet Holding Corp. (A) 1,730 48,924Ingles Markets, Inc., Class A 1,895 163,614Natural Grocers by Vitamin Cottage, Inc. 1,014 14,450Performance Food Group Company (A) 12,652 580,600PriceSmart, Inc. 4,293 314,119Rite Aid Corp. (A)(B) 3,864 56,762SpartanNash Company 3,523 90,752Sprouts Farmers Market, Inc. (A) 4,445 131,928The Andersons, Inc. 3,384 130,995U.S. Foods Holding Corp. (A) 7,411 258,125United Natural Foods, Inc. (A) 4,429 217,375Village Super Market, Inc., Class A 685 16,022Weis Markets, Inc. 2,371 156,201
2,211,838Food products – 2.2%Alico, Inc. 341 12,627B&G Foods, Inc. (B) 1,941 59,647Bunge, Ltd. 7,506 700,760Cal-Maine Foods, Inc. 1,161 42,945Campbell Soup Company 2,425 105,391Darling Ingredients, Inc. (A) 5,430 376,245Farmer Brothers Company (A) 1,069 7,964Fresh Del Monte Produce, Inc. 2,635 72,726Hostess Brands, Inc. (A) 4,123 84,192Ingredion, Inc. 3,117 301,227J&J Snack Foods Corp. 853 134,740John B. Sanfilippo & Son, Inc. 400 36,064Landec Corp. (A) 3,130 34,743Limoneira Company 199 2,985Pilgrim’s Pride Corp. (A) 4,322 121,880Post Holdings, Inc. (A) 3,484 392,751Sanderson Farms, Inc. 1,082 206,749Seaboard Corp. 52 204,621Seneca Foods Corp., Class A (A) 1,409 67,562The Hain Celestial Group, Inc. (A) 3,255 138,696The J.M. Smucker Company 2,696 366,171The Simply Good Foods Company (A) 1,707 70,960Tootsie Roll Industries, Inc. 1,396 50,577TreeHouse Foods, Inc. (A) 1,806 73,197
3,665,420Household products – 0.2%Central Garden & Pet Company (A) 1,553 81,734Central Garden & Pet Company,
Class A (A) 3,288 157,331
Small Cap Opportunities Trust (continued)Shares orPrincipalAmount Value
COMMON STOCKS (continued)Household products (continued)Oil-Dri Corp. of America 531 $ 17,380Spectrum Brands Holdings, Inc. 1,089 110,773
367,218Personal products – 0.2%Edgewell Personal Care Company 3,300 150,843Natural Alternatives International, Inc. (A) 200 2,528Nature’s Sunshine Products, Inc. 1,118 20,683Nu Skin Enterprises, Inc., Class A 2,131 108,148
282,202Tobacco – 0.1%Universal Corp. 1,975 108,467
7,149,955Energy – 5.1%Energy equipment and services – 0.8%Archrock, Inc. 10,702 80,051Bristow Group, Inc. (A) 337 10,673ChampionX Corp. (A) 7,217 145,856Dawson Geophysical Company (A) 3,948 9,140Dril-Quip, Inc. (A) 2,386 46,956Expro Group Holdings NV (A) 2,209 31,699Exterran Corp. (A) 4,737 14,116Geospace Technologies Corp. (A) 516 3,468Gulf Island Fabrication, Inc. (A) 3,019 12,106Helix Energy Solutions Group, Inc. (A) 12,029 37,530Helmerich & Payne, Inc. 4,237 100,417Liberty Oilfield Services, Inc., Class A (A) 9,594 93,062Nabors Industries, Ltd. (A) 597 48,411National Energy Services Reunited
Corp. (A) 3,117 29,456Natural Gas Services Group, Inc. (A) 2,620 27,431Newpark Resources, Inc. (A) 6,750 19,845NexTier Oilfield Solutions, Inc. (A) 11,003 39,061NOV, Inc. 2,128 28,834Oceaneering International, Inc. (A) 5,817 65,790Oil States International, Inc. (A) 4,041 20,084Patterson-UTI Energy, Inc. 12,012 101,501ProPetro Holding Corp. (A) 7,061 57,194RPC, Inc. (A) 12,691 57,617SEACOR Marine Holdings, Inc. (A) 2,432 8,269Select Energy Services, Inc., Class A (A) 5,093 31,729Technip Energies NV, ADR (A) 2,809 40,731TechnipFMC PLC (A) 20,822 123,266Tidewater, Inc. (A) 2,791 29,892Transocean, Ltd. (A)(B) 13,252 36,576U.S. Silica Holdings, Inc. (A) 4,282 40,251
1,391,012Oil, gas and consumable fuels – 4.3%Adams Resources & Energy, Inc. 724 20,134Antero Midstream Corp. 21,451 207,646Antero Resources Corp. (A) 20,791 363,843APA Corp. 368 9,896Ardmore Shipping Corp. (A) 1,174 3,968Berry Corp. 3,197 26,919Callon Petroleum Company (A) 1,879 88,783Centennial Resource Development, Inc.,
Class A (A) 11,699 69,960Chesapeake Energy Corp. 564 36,389Civitas Resources, Inc. 1,183 57,932Clean Energy Fuels Corp. (A) 9,682 59,351CNX Resources Corp. (A) 15,258 209,798Comstock Resources, Inc. (A) 12,010 97,161CONSOL Energy, Inc. (A) 4,596 104,375Continental Resources, Inc. 8,416 376,700
John Hancock Variable Insurance TrustPortfolio of Investments — December 31, 2021 (showing percentage of total net assets)
The accompanying notes are an integral part of the financial statements. 124

Small Cap Opportunities Trust (continued)Shares orPrincipalAmount Value
COMMON STOCKS (continued)Oil, gas and consumable fuels (continued)Coterra Energy, Inc. 11,436 $ 217,284CVR Energy, Inc. 1,951 32,796Delek US Holdings, Inc. (A) 5,312 79,627Denbury, Inc. (A) 2,036 155,937DHT Holdings, Inc. 10,864 56,384Dorian LPG, Ltd. 3,417 43,362Earthstone Energy, Inc., Class A (A) 1,600 17,504EnLink Midstream LLC (A) 15,546 107,112EQT Corp. (A) 13,550 295,526Equitrans Midstream Corp. 25,675 265,480Green Plains, Inc. (A) 5,268 183,116HollyFrontier Corp. 8,800 288,464International Seaways, Inc. 2,070 30,388Kosmos Energy, Ltd. (A) 21,319 73,764Laredo Petroleum, Inc. (A) 56 3,367Magnolia Oil & Gas Corp., Class A 38,563 727,684Marathon Oil Corp. 42,707 701,249Matador Resources Company 5,228 193,018Murphy Oil Corp. 10,625 277,419NACCO Industries, Inc., Class A 700 25,403Nordic American Tankers, Ltd. 2,259 3,818Overseas Shipholding Group, Inc.,
Class A (A) 5,561 10,455PBF Energy, Inc., Class A (A) 7,833 101,594PDC Energy, Inc. 6,240 304,387Peabody Energy Corp. (A) 6,070 61,125PHX Minerals, Inc. 557 1,209Range Resources Corp. (A) 11,263 200,819Ranger Oil Corp., Class A (A) 651 17,525Renewable Energy Group, Inc. (A) 3,442 146,078REX American Resources Corp. (A) 429 41,184SandRidge Energy, Inc. (A) 1,746 18,263Scorpio Tankers, Inc. 2,441 31,269SFL Corp., Ltd. 10,526 85,787SilverBow Resources, Inc. (A) 324 7,053SM Energy Company 5,199 153,267Talos Energy, Inc. (A) 5,072 49,706Targa Resources Corp. 2,689 140,473Teekay Corp. (A) 286 898Teekay Tankers, Ltd., Class A (A) 2,780 30,302Whiting Petroleum Corp. (A) 2,713 175,477World Fuel Services Corp. 3,166 83,804
7,172,2328,563,244
Financials – 20.9%Banks – 11.7%1st Source Corp. 2,092 103,763Allegiance Bancshares, Inc. 604 25,495Amerant Bancorp, Inc. 686 23,701American National Bankshares, Inc. 991 37,341Ameris Bancorp 15,399 765,022Arrow Financial Corp. 1,085 38,225Associated Banc-Corp. 14,499 327,532Atlantic Capital Bancshares, Inc. (A) 1,267 36,452Atlantic Union Bankshares Corp. 13,813 515,087Banc of California, Inc. 5,646 110,775Bank of Marin Bancorp 2,443 90,953Bank OZK 8,966 417,188BankFinancial Corp. 2,146 22,898BankUnited, Inc. 3,257 137,804Banner Corp. 3,379 205,004Bar Harbor Bankshares 1,690 48,892BCB Bancorp, Inc. 1,477 22,790Berkshire Hills Bancorp, Inc. 3,539 100,614BOK Financial Corp. 4,528 477,659
Small Cap Opportunities Trust (continued)Shares orPrincipalAmount Value
COMMON STOCKS (continued)Banks (continued)Brookline Bancorp, Inc. 6,310 $ 102,159Bryn Mawr Bank Corp. 1,669 75,122Business First Bancshares, Inc. 500 14,155Byline Bancorp, Inc. 1,183 32,355C&F Financial Corp. 627 32,096Cadence Bank 8,890 264,833Cambridge Bancorp 121 11,324Camden National Corp. 1,722 82,932Capital City Bank Group, Inc. 1,865 49,236Capstar Financial Holdings, Inc. 600 12,618Cathay General Bancorp 2,466 106,013CBTX, Inc. 807 23,403Central Pacific Financial Corp. 2,460 69,298Chemung Financial Corp. 723 33,099CIT Group, Inc. 3,539 181,692Citizens & Northern Corp. 500 13,060City Holding Company 400 32,716Civista Bancshares, Inc. 1,114 27,182CNB Financial Corp. 1,562 41,393Columbia Banking System, Inc. 4,210 137,751Comerica, Inc. 4,267 371,229Community Trust Bancorp, Inc. 1,347 58,743ConnectOne Bancorp, Inc. 1,273 41,640CrossFirst Bankshares, Inc. (A) 1,824 28,473Customers Bancorp, Inc. (A) 2,568 167,870CVB Financial Corp. 3,612 77,333Dime Community Bancshares, Inc. 3,390 119,192Eagle Bancorp, Inc. 1,290 75,259Enterprise Bancorp, Inc. 246 11,050Enterprise Financial Services Corp. 1,485 69,929Equity Bancshares, Inc., Class A 1,097 37,221FB Financial Corp. 1,189 52,102Financial Institutions, Inc. 1,481 47,096First Bancorp (North Carolina) 2,905 132,817First Bancorp (Puerto Rico) 14,979 206,411First Bank 900 13,059First Busey Corp. 2,457 66,634First Business Financial Services, Inc. 1,366 39,846First Commonwealth Financial Corp. 8,341 134,207First Community Bankshares, Inc. 2,201 73,557First Financial Bancorp 7,516 183,240First Financial Corp. 1,432 64,855First Financial Northwest, Inc. 1,100 17,787First Foundation, Inc. 1,677 41,690First Hawaiian, Inc. 5,863 160,236First Horizon Corp. 25,469 415,909First Internet Bancorp 777 36,550First Interstate BancSystem, Inc., Class A 1,946 79,144First Merchants Corp. 4,369 183,017First Mid Bancshares, Inc. 349 14,934First Midwest Bancorp, Inc. 6,300 129,024First Northwest Bancorp 800 16,184Flushing Financial Corp. 2,921 70,980FNB Corp. 16,986 206,040Fulton Financial Corp. 11,240 191,080German American Bancorp, Inc. 755 29,430Great Southern Bancorp, Inc. 1,117 66,182Great Western Bancorp, Inc. 3,019 102,525Guaranty Bancshares, Inc. 293 11,011Hancock Whitney Corp. 7,556 377,951Hanmi Financial Corp. 3,082 72,982HarborOne Bancorp, Inc. 4,217 62,580Heartland Financial USA, Inc. 2,428 122,881Heritage Commerce Corp. 3,825 45,671Heritage Financial Corp. 1,981 48,416
John Hancock Variable Insurance TrustPortfolio of Investments — December 31, 2021 (showing percentage of total net assets)
The accompanying notes are an integral part of the financial statements. 125

Small Cap Opportunities Trust (continued)Shares orPrincipalAmount Value
COMMON STOCKS (continued)Banks (continued)Hilltop Holdings, Inc. 4,528 $ 159,114Home BancShares, Inc. 1,178 28,684HomeStreet, Inc. 1,802 93,704HomeTrust Bancshares, Inc. 560 17,349Hope Bancorp, Inc. 10,431 153,440Horizon Bancorp, Inc. 3,849 80,252Independent Bank Corp. (Massachusetts) 1,190 97,021Independent Bank Corp. (Michigan) 1,806 43,109Independent Bank Group, Inc. 1,953 140,909International Bancshares Corp. 4,680 198,385Investar Holding Corp. 500 9,205Investors Bancorp, Inc. 18,672 282,881Lakeland Bancorp, Inc. 3,580 67,984LCNB Corp. 600 11,718Macatawa Bank Corp. 5,091 44,903Mercantile Bank Corp. 1,666 58,360Meta Financial Group, Inc. 2,595 154,818Metropolitan Bank Holding Corp. (A) 456 48,578Midland States Bancorp, Inc. 1,070 26,525MidWestOne Financial Group, Inc. 1,343 43,473MVB Financial Corp. 300 12,456National Bank Holdings Corp., Class A 1,336 58,704National Bankshares, Inc. 622 22,554NBT Bancorp, Inc. 2,964 114,173Nicolet Bankshares, Inc. (A) 565 48,449Northeast Bank 770 27,512Northrim BanCorp, Inc. 1,530 66,494Norwood Financial Corp. 1,188 30,876OceanFirst Financial Corp. 1,393 30,925OFG Bancorp 4,124 109,533Old National Bancorp 10,998 199,284Old Second Bancorp, Inc. 2,721 34,257Origin Bancorp, Inc. 1,115 47,856Orrstown Financial Services, Inc. 500 12,600Pacific Premier Bancorp, Inc. 3,858 154,436PacWest Bancorp 6,109 275,944Park National Corp. 139 19,086Peapack-Gladstone Financial Corp. 1,625 57,525Penns Woods Bancorp, Inc. 1,188 28,001Peoples Bancorp, Inc. 3,445 109,585People’s United Financial, Inc. 22,779 405,922Pinnacle Financial Partners, Inc. 9,825 938,288Popular, Inc. 5,455 447,528Preferred Bank 589 42,284Primis Financial Corp. 3,850 57,904Prosperity Bancshares, Inc. 5,378 388,829QCR Holdings, Inc. 1,211 67,816RBB Bancorp 1,075 28,165Reliant Bancorp, Inc. 400 14,200Renasant Corp. 3,529 133,926Republic Bancorp, Inc., Class A 1,449 73,667Republic First Bancorp, Inc. (A) 2,700 10,044S&T Bancorp, Inc. 3,436 108,303Sandy Spring Bancorp, Inc. 2,800 134,624Seacoast Banking Corp. of Florida 1,753 62,039Shore Bancshares, Inc. 2,225 46,391Sierra Bancorp 1,759 47,757Simmons First National Corp., Class A 5,235 154,851SmartFinancial, Inc. 500 13,680Southern First Bancshares, Inc. (A) 537 33,557Southside Bancshares, Inc. 374 15,641SouthState Corp. 2,447 196,029Spirit of Texas Bancshares, Inc. 500 14,390Sterling Bancorp 10,264 264,709Synovus Financial Corp. 3,170 151,748
Small Cap Opportunities Trust (continued)Shares orPrincipalAmount Value
COMMON STOCKS (continued)Banks (continued)Texas Capital Bancshares, Inc. (A) 2,286 $ 137,732The Bancorp, Inc. (A) 3,253 82,333The Bank of NT Butterfield & Son, Ltd. 445 16,959The Community Financial Corp. 300 11,793The First Bancorp, Inc. 1,769 55,547The First Bancshares, Inc. 1,011 39,045The First of Long Island Corp. 1,039 22,432Towne Bank 3,708 117,136TriCo Bancshares 721 30,974TriState Capital Holdings, Inc. (A) 2,342 70,869Triumph Bancorp, Inc. (A) 617 73,472Trustmark Corp. 4,932 160,093UMB Financial Corp. 789 83,721Umpqua Holdings Corp. 11,863 228,244United Bankshares, Inc. 7,106 257,806United Community Banks, Inc. 4,271 153,500Univest Financial Corp. 2,067 61,845Valley National Bancorp 23,485 322,919Veritex Holdings, Inc. 1,384 55,056Washington Trust Bancorp, Inc. 1,035 58,343Webster Financial Corp. 466 26,021WesBanco, Inc. 5,027 175,895Westamerica BanCorp 169 9,756Wintrust Financial Corp. 3,040 276,093Zions Bancorp NA 8,295 523,912
19,548,049Capital markets – 1.8%Blucora, Inc. (A) 4,863 84,227Cowen, Inc., Class A 2,484 89,672Houlihan Lokey, Inc. 5,324 551,140Invesco, Ltd. 24,463 563,138Janus Henderson Group PLC 6,521 273,491Jefferies Financial Group, Inc. 9,310 361,228Oppenheimer Holdings, Inc., Class A 1,674 77,623PJT Partners, Inc., Class A 6,123 453,653Stifel Financial Corp. 7,688 541,389StoneX Group, Inc. (A) 1,346 82,443
3,078,004Consumer finance – 0.9%Encore Capital Group, Inc. (A) 1,949 121,052Enova International, Inc. (A) 1,321 54,108EZCORP, Inc., Class A (A) 3,087 22,751Navient Corp. 15,325 325,197Nelnet, Inc., Class A 2,648 258,657Nicholas Financial, Inc. (A) 75 884PRA Group, Inc. (A) 2,487 124,872Regional Management Corp. 573 32,925Santander Consumer USA Holdings, Inc. 15,045 632,191
1,572,637Diversified financial services – 0.4%California First Leasing Corp. 880 15,840Cannae Holdings, Inc. (A) 3,225 113,359Equitable Holdings, Inc. 1,531 50,201Marlin Business Services Corp. 1,698 39,529Voya Financial, Inc. 6,477 429,490
648,419Insurance – 4.7%Alleghany Corp. (A) 918 612,848Ambac Financial Group, Inc. (A) 1,536 24,653American Equity Investment Life
Holding Company 7,384 287,385American Financial Group, Inc. 513 70,445American National Group, Inc. 1,352 255,312Argo Group International Holdings, Ltd. 2,597 150,912
John Hancock Variable Insurance TrustPortfolio of Investments — December 31, 2021 (showing percentage of total net assets)
The accompanying notes are an integral part of the financial statements. 126

Small Cap Opportunities Trust (continued)Shares orPrincipalAmount Value
COMMON STOCKS (continued)Insurance (continued)Assured Guaranty, Ltd. 5,779 $ 290,106Athene Holding, Ltd., Class A (A) 9,251 770,886Axis Capital Holdings, Ltd. 4,518 246,095Brighthouse Financial, Inc. (A) 2,584 133,851CNA Financial Corp. 1,354 59,684CNO Financial Group, Inc. 7,507 178,967Donegal Group, Inc., Class A 2,876 41,098Employers Holdings, Inc. 2,283 94,471Enstar Group, Ltd. (A) 824 204,014Everest Re Group, Ltd. 2,137 585,367FedNat Holding Company (A) 1,090 1,537Fidelity National Financial, Inc. 2,998 156,436First American Financial Corp. 3,274 256,125Genworth Financial, Inc., Class A (A) 14,291 57,879Global Indemnity Group LLC, Class A 1,190 29,905Globe Life, Inc. 1,689 158,293Greenlight Capital Re, Ltd., Class A (A) 2,616 20,509Hallmark Financial Services, Inc. (A) 4,008 17,435Heritage Insurance Holdings, Inc. 657 3,863Horace Mann Educators Corp. 3,303 127,826Independence Holding Company 303 17,174Investors Title Company 189 37,261James River Group Holdings, Ltd. 73 2,103Kemper Corp. 2,781 163,495Lincoln National Corp. 8,094 552,496MBIA, Inc. (A) 4,333 68,418Mercury General Corp. 1,495 79,325National Western Life Group, Inc., Class A 221 47,391Old Republic International Corp. 13,924 342,252ProAssurance Corp. 2,566 64,920Reinsurance Group of America, Inc. 3,624 396,792RenaissanceRe Holdings, Ltd. 1,784 302,085Safety Insurance Group, Inc. 612 52,038SiriusPoint, Ltd. (A) 2,292 18,634State Auto Financial Corp. 3,187 164,736Stewart Information Services Corp. 1,817 144,869Tiptree, Inc. 2,600 35,958United Fire Group, Inc. 1,897 43,991United Insurance Holdings Corp. 5,283 22,928Universal Insurance Holdings, Inc. 2,200 37,400Unum Group 10,883 267,395White Mountains Insurance Group, Ltd. 168 170,335
7,867,898Thrifts and mortgage finance – 1.4%Capitol Federal Financial, Inc. 11,378 128,913ESSA Bancorp, Inc. 897 15,545Federal Agricultural Mortgage Corp.,
Class C 594 73,614Flagstar Bancorp, Inc. 3,861 185,096FS Bancorp, Inc. 400 13,452Home Bancorp, Inc. 902 37,442Kearny Financial Corp. 5,361 71,033Merchants Bancorp 341 16,140MGIC Investment Corp. 9,993 144,099Mr. Cooper Group, Inc. (A) 3,087 128,450New York Community Bancorp, Inc. 24,244 296,019NMI Holdings, Inc., Class A (A) 2,152 47,021Northfield Bancorp, Inc. 4,119 66,563Northwest Bancshares, Inc. 7,430 105,209OP Bancorp 1,000 12,760Premier Financial Corp. 1,989 61,480Provident Financial Holdings, Inc. 1,778 29,426Provident Financial Services, Inc. 4,010 97,122Prudential Bancorp, Inc. 1,696 23,032Radian Group, Inc. 10,338 218,442
Small Cap Opportunities Trust (continued)Shares orPrincipalAmount Value
COMMON STOCKS (continued)Thrifts and mortgage finance (continued)Riverview Bancorp, Inc. 5,483 $ 42,164Southern Missouri Bancorp, Inc. 1,012 52,796Territorial Bancorp, Inc. 1,722 43,481TrustCo Bank Corp. NY 1,826 60,824Washington Federal, Inc. 3,303 110,254Waterstone Financial, Inc. 3,099 67,744Western New England Bancorp, Inc. 4,739 41,514WSFS Financial Corp. 2,604 130,512
2,320,14735,035,154
Health care – 11.5%Biotechnology – 3.2%Achillion Pharmaceuticals, Inc. (A)(C) 10,940 16,452Agios Pharmaceuticals, Inc. (A) 229 7,527Akebia Therapeutics, Inc. (A) 11,211 25,337Albireo Pharma, Inc. (A) 21,350 497,242Alkermes PLC (A) 2,813 65,430AnaptysBio, Inc. (A) 1,489 51,743Anika Therapeutics, Inc. (A) 533 19,097Biohaven Pharmaceutical Holding
Company, Ltd. (A) 4,766 656,802Catalyst Pharmaceuticals, Inc. (A) 2,300 15,571ChemoCentryx, Inc. (A) 13,500 491,535Concert Pharmaceuticals, Inc. (A) 1,198 3,774Eagle Pharmaceuticals, Inc. (A) 236 12,017Emergent BioSolutions, Inc. (A) 495 21,518Enanta Pharmaceuticals, Inc. (A) 279 20,864Halozyme Therapeutics, Inc. (A) 18,345 737,652Insmed, Inc. (A) 17,845 486,098Ligand Pharmaceuticals, Inc. (A) 122 18,844Myriad Genetics, Inc. (A) 1,132 31,243OPKO Health, Inc. (A) 2,204 10,601Oyster Point Pharma, Inc. (A) 23,805 434,679PDL BioPharma, Inc. (A)(C) 5,434 9,727Travere Therapeutics, Inc. (A) 17,232 534,881United Therapeutics Corp. (A) 467 100,909Vanda Pharmaceuticals, Inc. (A) 3,697 58,006Veracyte, Inc. (A) 9,038 372,366Vericel Corp. (A) 16,002 628,879
5,328,794Health care equipment and supplies – 2.9%AngioDynamics, Inc. (A) 3,198 88,201AtriCure, Inc. (A) 10,168 706,981Avanos Medical, Inc. (A) 3,807 131,989Cardiovascular Systems, Inc. (A) 13,034 244,779CryoLife, Inc. (A) 17,303 352,116CryoPort, Inc. (A) 9,110 539,039Envista Holdings Corp. (A) 8,580 386,615FONAR Corp. (A) 463 6,936Globus Medical, Inc., Class A (A) 10,757 776,655ICU Medical, Inc. (A) 2,043 484,886Inogen, Inc. (A) 200 6,800Integer Holdings Corp. (A) 2,433 208,240Integra LifeSciences Holdings Corp. (A) 8,591 575,511IntriCon Corp. (A) 519 8,392Invacare Corp. (A) 3,396 9,237Kewaunee Scientific Corp. (A) 83 1,057LENSAR, Inc. (A) 783 4,667Meridian Bioscience, Inc. (A) 2,202 44,921Merit Medical Systems, Inc. (A) 691 43,049Natus Medical, Inc. (A) 1,669 39,605NuVasive, Inc. (A) 1,932 101,391Orthofix Medical, Inc. (A) 541 16,820Surgalign Holdings, Inc. (A) 4,931 3,533
John Hancock Variable Insurance TrustPortfolio of Investments — December 31, 2021 (showing percentage of total net assets)
The accompanying notes are an integral part of the financial statements. 127

Small Cap Opportunities Trust (continued)Shares orPrincipalAmount Value
COMMON STOCKS (continued)Health care equipment and supplies (continued)Utah Medical Products, Inc. 289 $ 28,900Varex Imaging Corp. (A) 1,166 36,787
4,847,107Health care providers and services – 2.5%Acadia Healthcare Company, Inc. (A) 15,182 921,547Addus HomeCare Corp. (A) 448 41,892Brookdale Senior Living, Inc. (A) 12,258 63,251Castle Biosciences, Inc. (A) 8,398 360,022Covetrus, Inc. (A) 5,548 110,794Cross Country Healthcare, Inc. (A) 2,734 75,896Encompass Health Corp. 160 10,442Five Star Senior Living, Inc. (A) 2,100 6,195HealthEquity, Inc. (A) 8,642 382,322LHC Group, Inc. (A) 3,685 505,693Magellan Health, Inc. (A) 902 85,681MEDNAX, Inc. (A) 5,689 154,798National HealthCare Corp. 1,428 97,018Option Care Health, Inc. (A) 4,058 115,410Owens & Minor, Inc. 3,760 163,560Patterson Companies, Inc. 3,536 103,782Premier, Inc., Class A 5,310 218,613Select Medical Holdings Corp. 1,122 32,987Star Equity Holdings, Inc. (A) 310 791Triple-S Management Corp. (A) 2,760 98,477Universal Health Services, Inc., Class B 2,878 373,161US Physical Therapy, Inc. 3,604 344,362
4,266,694Health care technology – 0.2%Allscripts Healthcare Solutions, Inc. (A) 10,106 186,456HealthStream, Inc. (A) 1,969 51,903NextGen Healthcare, Inc. (A) 2,165 38,515
276,874Life sciences tools and services – 1.0%Harvard Bioscience, Inc. (A) 5,200 36,660Medpace Holdings, Inc. (A) 4,213 916,917Syneos Health, Inc. (A) 7,411 760,961
1,714,538Pharmaceuticals – 1.7%Amphastar Pharmaceuticals, Inc. (A) 600 13,974ANI Pharmaceuticals, Inc. (A) 400 18,432BioDelivery Sciences
International, Inc. (A) 6,044 18,736Cara Therapeutics, Inc. (A) 2,825 34,409Cumberland Pharmaceuticals, Inc. (A) 956 4,465Elanco Animal Health, Inc. (A) 831 23,584Endo International PLC (A) 2,935 11,036Innoviva, Inc. (A) 1,860 32,085Intra-Cellular Therapies, Inc. (A) 9,297 486,605Jazz Pharmaceuticals PLC (A) 2,136 272,126Organon & Company 695 21,163Perrigo Company PLC 4,847 188,548Phathom Pharmaceuticals, Inc. (A) 24,846 488,721Prestige Consumer Healthcare, Inc. (A) 3,032 183,891Satsuma Pharmaceuticals, Inc. (A) 2,208 9,936SIGA Technologies, Inc. (A) 2,000 15,040Supernus Pharmaceuticals, Inc. (A) 18,453 538,089Taro Pharmaceutical Industries, Ltd. (A) 503 25,205Zogenix, Inc. (A) 24,421 396,841
2,782,88619,216,893
Industrials – 18.7%Aerospace and defense – 0.5%AAR Corp. (A) 3,093 120,720
Small Cap Opportunities Trust (continued)Shares orPrincipalAmount Value
COMMON STOCKS (continued)Aerospace and defense (continued)AeroVironment, Inc. (A) 455 $ 28,224Astronics Corp. (A) 1,700 20,400Curtiss-Wright Corp. 730 101,229Ducommun, Inc. (A) 1,674 78,293Kaman Corp. 1,770 76,376Kratos Defense & Security
Solutions, Inc. (A) 2,475 48,015Maxar Technologies, Inc. 1,500 44,295Mercury Systems, Inc. (A) 1,263 69,541Moog, Inc., Class A 1,548 125,342National Presto Industries, Inc. 244 20,015Park Aerospace Corp. 2,083 27,496Parsons Corp. (A) 721 24,262SIFCO Industries, Inc. (A) 1,000 6,500Vectrus, Inc. (A) 1,029 47,097
837,805Air freight and logistics – 0.3%Air Transport Services Group, Inc. (A) 1,985 58,319Atlas Air Worldwide Holdings, Inc. (A) 2,473 232,759Forward Air Corp. 625 75,681Hub Group, Inc., Class A (A) 2,418 203,692Radiant Logistics, Inc. (A) 1,875 13,669
584,120Airlines – 0.3%Allegiant Travel Company (A) 188 35,164Copa Holdings SA, Class A (A) 905 74,807Hawaiian Holdings, Inc. (A) 2,646 48,607JetBlue Airways Corp. (A) 4,207 59,908Mesa Air Group, Inc. (A) 1,399 7,834SkyWest, Inc. (A) 3,644 143,209Spirit Airlines, Inc. (A) 4,452 97,276
466,805Building products – 1.8%American Woodmark Corp. (A) 787 51,312Apogee Enterprises, Inc. 2,405 115,801Armstrong Flooring, Inc. (A) 1,831 3,625Builders FirstSource, Inc. (A) 8,339 714,736Carlisle Companies, Inc. 60 14,887Gibraltar Industries, Inc. (A) 11,844 789,758Griffon Corp. 2,832 80,655Insteel Industries, Inc. 1,689 67,239JELD-WEN Holding, Inc. (A) 9,650 254,374Masonite International Corp. (A) 1,068 125,971Owens Corning 1,092 98,826PGT Innovations, Inc. (A) 1,494 33,600Quanex Building Products Corp. 3,929 97,361Resideo Technologies, Inc. (A) 5,191 135,122Tecnoglass, Inc. (B) 900 23,571UFP Industries, Inc. 3,823 351,754Zurn Water Solutions Corp. 891 32,432
2,991,024Commercial services and supplies – 1.4%ABM Industries, Inc. 5,148 210,296ACCO Brands Corp. 6,712 55,441Acme United Corp. 733 24,702ADT, Inc. 13,007 109,389Brady Corp., Class A 1,082 58,320BrightView Holdings, Inc. (A) 3,879 54,616CECO Environmental Corp. (A) 1,395 8,691Civeo Corp. (A) 673 12,901Clean Harbors, Inc. (A) 1,725 172,103Deluxe Corp. 800 25,688Ennis, Inc. 2,608 50,934Harsco Corp. (A) 2,430 40,605
John Hancock Variable Insurance TrustPortfolio of Investments — December 31, 2021 (showing percentage of total net assets)
The accompanying notes are an integral part of the financial statements. 128

Small Cap Opportunities Trust (continued)Shares orPrincipalAmount Value
COMMON STOCKS (continued)Commercial services and supplies (continued)Heritage-Crystal Clean, Inc. (A) 1,877 $ 60,102HNI Corp. 1,502 63,159Interface, Inc. 2,884 46,000KAR Auction Services, Inc. (A) 3,101 48,438Kimball International, Inc., Class B 1,715 17,544Matthews International Corp., Class A 1,190 43,637MillerKnoll, Inc. 1,960 76,812NL Industries, Inc. 3,260 24,124Ritchie Brothers Auctioneers, Inc. 13,656 835,884Steelcase, Inc., Class A 4,596 53,865Team, Inc. (A) 2,106 2,296UniFirst Corp. 371 78,058Viad Corp. (A) 1,025 43,860Vidler Water Resouces, Inc. (A) 2,493 30,115Virco Manufacturing Corp. (A) 1,200 3,672VSE Corp. 1,368 83,366
2,334,618Construction and engineering – 1.6%API Group Corp. (A) 2,846 73,341Arcosa, Inc. 4,310 227,137Argan, Inc. 854 33,041Comfort Systems USA, Inc. 400 39,576Concrete Pumping Holdings, Inc. (A) 1,800 14,760Construction Partners, Inc., Class A (A) 936 27,528Dycom Industries, Inc. (A) 4,156 389,667EMCOR Group, Inc. 1,267 161,403Fluor Corp. (A) 3,410 84,466Granite Construction, Inc. 3,746 144,970Great Lakes Dredge & Dock Corp. (A) 6,888 108,279IES Holdings, Inc. (A) 237 12,002MasTec, Inc. (A) 3,659 337,653Matrix Service Company (A) 2,731 20,537MYR Group, Inc. (A) 1,465 161,956Northwest Pipe Company (A) 1,706 54,251NV5 Global, Inc. (A) 533 73,618Orion Group Holdings, Inc. (A) 4,263 16,072Primoris Services Corp. 3,474 83,307Quanta Services, Inc. 1,452 166,486Sterling Construction Company, Inc. (A) 2,528 66,486Tutor Perini Corp. (A) 4,167 51,546WillScot Mobile Mini Holdings Corp. (A) 7,715 315,081
2,663,163Electrical equipment – 1.5%Acuity Brands, Inc. 150 31,758Atkore, Inc. (A) 7,518 835,926AZZ, Inc. 1,376 76,079Encore Wire Corp. 1,949 278,902EnerSys 1,105 87,361LSI Industries, Inc. 4,131 28,339nVent Electric PLC 3,766 143,108Powell Industries, Inc. 1,244 36,686Preformed Line Products Company 984 63,665Regal Rexnord Corp. 1,743 296,624Sensata Technologies Holding PLC (A) 3,768 232,448Sunrun, Inc. (A) 2,009 68,909Thermon Group Holdings, Inc. (A) 14,010 237,189Ultralife Corp. (A) 1,984 11,983
2,428,977Machinery – 4.9%AGCO Corp. 3,375 391,568Alamo Group, Inc. 4,839 712,204Albany International Corp., Class A 1,875 165,844Altra Industrial Motion Corp. 2,998 154,607Astec Industries, Inc. 2,415 167,287
Small Cap Opportunities Trust (continued)Shares orPrincipalAmount Value
COMMON STOCKS (continued)Machinery (continued)Barnes Group, Inc. 3,344 $ 155,797Chart Industries, Inc. (A) 346 55,184CIRCOR International, Inc. (A) 1,614 43,869Colfax Corp. (A) 7,506 345,051Columbus McKinnon Corp. 2,178 100,754Crane Company 682 69,380EnPro Industries, Inc. 503 55,365ESCO Technologies, Inc. 1,885 169,631Federal Signal Corp. 3,670 159,058Flowserve Corp. 699 21,389Franklin Electric Company, Inc. 476 45,011Gates Industrial Corp. PLC (A) 8,586 136,603Gencor Industries, Inc. (A) 2,100 24,213Graham Corp. 333 4,143Helios Technologies, Inc. 4,930 518,488Hillenbrand, Inc. 1,385 72,006Hurco Companies, Inc. 1,054 31,304Hyster-Yale Materials Handling, Inc. 815 33,497Kadant, Inc. 218 50,245Kennametal, Inc. 1,573 56,486LB Foster Company, Class A (A) 1,699 23,361Meritor, Inc. (A) 2,572 63,734Miller Industries, Inc. 1,434 47,896Mueller Industries, Inc. 2,004 118,957Mueller Water Products, Inc., Class A 3,140 45,216NN, Inc. (A) 2,376 9,742Oshkosh Corp. 1,661 187,211Park-Ohio Holdings Corp. 749 15,856Perma-Pipe International Holdings, Inc. (A) 1,100 9,460RBC Bearings, Inc. (A) 3,610 729,112REV Group, Inc. 2,206 31,215Snap-on, Inc. 1,226 264,056SPX FLOW, Inc. 1,971 170,452Standex International Corp. 200 22,132Tennant Company 494 40,034Terex Corp. 1,393 61,222The Eastern Company 1,471 37,010The Gorman-Rupp Company 1,454 64,776The Greenbrier Companies, Inc. 2,830 129,869The LS Starrett Company, Class A (A) 1,530 14,306The Manitowoc Company, Inc. (A) 2,421 45,006The Shyft Group, Inc. 25,582 1,256,844The Timken Company 2,526 175,027Titan International, Inc. (A) 3,936 43,139Trinity Industries, Inc. 8,957 270,501Twin Disc, Inc. (A) 1,650 18,084Wabash National Corp. 1,980 38,650Woodward, Inc. 4,900 536,354
8,208,206Marine – 0.3%Costamare, Inc. 3,754 47,488Eagle Bulk Shipping, Inc. 393 17,882Eneti, Inc. 1,112 8,607Genco Shipping & Trading, Ltd. 3,003 48,048Kirby Corp. (A) 2,166 128,704Matson, Inc. 2,868 258,206
508,935Professional services – 2.3%Acacia Research Corp. (A) 2,172 11,142ASGN, Inc. (A) 1,021 125,991Barrett Business Services, Inc. 200 13,812BGSF, Inc. 800 11,480CACI International, Inc., Class A (A) 2,535 682,447CBIZ, Inc. (A) 4,080 159,610CRA International, Inc. 1,251 116,793
John Hancock Variable Insurance TrustPortfolio of Investments — December 31, 2021 (showing percentage of total net assets)
The accompanying notes are an integral part of the financial statements. 129

Small Cap Opportunities Trust (continued)Shares orPrincipalAmount Value
COMMON STOCKS (continued)Professional services (continued)Exponent, Inc. 7,192 $ 839,522Forrester Research, Inc. (A) 8,179 480,353FTI Consulting, Inc. (A) 616 94,507Heidrick & Struggles International, Inc. 1,672 73,117Hill International, Inc. (A) 3,275 6,386Huron Consulting Group, Inc. (A) 1,411 70,409ICF International, Inc. 1,429 146,544Kelly Services, Inc., Class A 4,330 72,614Korn Ferry 3,492 264,449ManpowerGroup, Inc. 1,407 136,943ManTech International Corp., Class A 1,905 138,932Mistras Group, Inc. (A) 2,232 16,584Nielsen Holdings PLC 9,392 192,630RCM Technologies, Inc. (A) 300 2,136Resources Connection, Inc. 4,120 73,501Science Applications International Corp. 1,299 108,583TrueBlue, Inc. (A) 2,519 69,701Willdan Group, Inc. (A) 400 14,080
3,922,266Road and rail – 1.3%AMERCO 711 516,350ArcBest Corp. 1,977 236,943Covenant Logistics Group, Inc. (A) 1,513 39,989Heartland Express, Inc. 4,107 69,080Knight-Swift Transportation Holdings, Inc. 8,121 494,894Marten Transport, Ltd. 6,368 109,275P.A.M. Transportation Services, Inc. (A) 1,350 95,864Patriot Transportation Holding, Inc. 450 3,632Ryder System, Inc. 3,393 279,685Schneider National, Inc., Class B 2,987 80,380U.S. Xpress Enterprises, Inc., Class A (A) 2,111 12,392USA Truck, Inc. (A) 1,375 27,335Werner Enterprises, Inc. 4,155 198,027
2,163,846Trading companies and distributors – 2.5%Air Lease Corp. 8,149 360,430Alta Equipment Group, Inc. (A) 1,696 24,829Applied Industrial Technologies, Inc. 938 96,333Beacon Roofing Supply, Inc. (A) 3,611 207,091Boise Cascade Company 2,003 142,614DXP Enterprises, Inc. (A) 1,367 35,091GATX Corp. 2,663 277,458GMS, Inc. (A) 1,138 68,405Lawson Products, Inc. (A) 591 32,357McGrath RentCorp 1,800 144,468MRC Global, Inc. (A) 2,745 18,886NOW, Inc. (A) 7,656 65,382Rush Enterprises, Inc., Class A 2,831 157,517Rush Enterprises, Inc., Class B 1,117 60,284SiteOne Landscape Supply, Inc. (A) 5,918 1,433,798Textainer Group Holdings, Ltd. 2,844 101,559Titan Machinery, Inc. (A) 2,366 79,711Transcat, Inc. (A) 145 13,402Triton International, Ltd. 4,778 287,779Univar Solutions, Inc. (A) 3,996 113,287Veritiv Corp. (A) 1,408 172,579WESCO International, Inc. (A) 2,696 354,767Willis Lease Finance Corp. (A) 406 15,286
4,263,31331,373,078
Information technology – 12.9%Communications equipment – 1.2%ADTRAN, Inc. 4,669 106,593BK Technologies Corp. 2,100 5,061
Small Cap Opportunities Trust (continued)Shares orPrincipalAmount Value
COMMON STOCKS (continued)Communications equipment (continued)Communications Systems, Inc. 1,800 $ 4,320Comtech Telecommunications Corp. 2,706 64,105Digi International, Inc. (A) 3,371 82,825Genasys, Inc. (A) 3,300 13,134Harmonic, Inc. (A) 4,356 51,227Juniper Networks, Inc. 11,858 423,449NETGEAR, Inc. (A) 2,513 73,405NetScout Systems, Inc. (A) 4,585 151,672Optical Cable Corp. (A) 931 4,999Ribbon Communications, Inc. (A) 2,987 18,071TESSCO Technologies, Inc. (A) 1,750 10,833ViaSat, Inc. (A) 2,775 123,599Viavi Solutions, Inc. (A) 46,887 826,149
1,959,442Electronic equipment, instruments and components – 3.0%ADDvantage Technologies Group, Inc. (A) 428 740Advanced Energy Industries, Inc. 999 90,969Arrow Electronics, Inc. (A) 6,456 866,847Avnet, Inc. 9,371 386,366Bel Fuse, Inc., Class B 1,641 21,218Belden, Inc. 1,293 84,989Benchmark Electronics, Inc. 3,813 103,332CTS Corp. 2,910 106,855Daktronics, Inc. (A) 3,929 19,841ePlus, Inc. (A) 1,596 85,992Fabrinet (A) 2,485 294,398FARO Technologies, Inc. (A) 295 20,656Flex, Ltd. (A) 22,654 415,248Frequency Electronics, Inc. (A) 1,783 17,580II-VI, Inc. (A) 192 13,119Insight Enterprises, Inc. (A) 2,190 233,454Itron, Inc. (A) 480 32,890Jabil, Inc. 2,426 170,669Key Tronic Corp. (A) 1,900 11,818Kimball Electronics, Inc. (A) 3,036 66,063Knowles Corp. (A) 5,768 134,683Methode Electronics, Inc. 1,701 83,638OSI Systems, Inc. (A) 880 82,016PC Connection, Inc. 2,391 103,124Plexus Corp. (A) 2,005 192,259RF Industries, Ltd. (A) 120 960Richardson Electronics, Ltd. 2,384 32,232Rogers Corp. (A) 1,055 288,015Sanmina Corp. (A) 4,939 204,771ScanSource, Inc. (A) 2,542 89,173TD SYNNEX Corp. 2,778 317,692TTM Technologies, Inc. (A) 8,193 122,076Vishay Intertechnology, Inc. 9,510 207,984Vishay Precision Group, Inc. (A) 1,686 62,584
4,964,251IT services – 1.1%Alliance Data Systems Corp. 2,273 151,314BM Technologies, Inc. (A) 367 3,380Concentrix Corp. 2,778 496,206Conduent, Inc. (A) 9,516 50,815CSG Systems International, Inc. 535 30,827DXC Technology Company (A) 10,684 343,918Endava PLC, ADR (A) 3,644 611,900Information Services Group, Inc. 4,400 33,528MAXIMUS, Inc. 710 56,566SolarWinds Corp. 430 6,102
1,784,556Semiconductors and semiconductor equipment – 4.2%Alpha & Omega Semiconductor, Ltd. (A) 2,746 166,298
John Hancock Variable Insurance TrustPortfolio of Investments — December 31, 2021 (showing percentage of total net assets)
The accompanying notes are an integral part of the financial statements. 130

Small Cap Opportunities Trust (continued)Shares orPrincipalAmount Value
COMMON STOCKS (continued)Semiconductors and semiconductor equipment (continued)Amkor Technology, Inc. 18,705 $ 463,697Amtech Systems, Inc. (A) 2,404 23,752Axcelis Technologies, Inc. (A) 3,360 250,522AXT, Inc. (A) 4,229 37,257Azenta, Inc. 9,655 995,527CMC Materials, Inc. 2,297 440,312Cohu, Inc. (A) 3,140 119,603Diodes, Inc. (A) 2,632 289,020Entegris, Inc. 6,622 917,677First Solar, Inc. (A) 4,689 408,693FormFactor, Inc. (A) 1,299 59,390Ichor Holdings, Ltd. (A) 526 24,212Kulicke & Soffa Industries, Inc. 4,804 290,834MACOM Technology Solutions
Holdings, Inc. (A) 8,541 668,760Magnachip Semiconductor Corp. (A) 799 16,755NeoPhotonics Corp. (A) 3,808 58,529Onto Innovation, Inc. (A) 1,461 147,897PDF Solutions, Inc. (A) 2,193 69,715Photronics, Inc. (A) 5,882 110,876Power Integrations, Inc. 5,314 493,617Rambus, Inc. (A) 3,601 105,833Silicon Laboratories, Inc. (A) 3,624 748,066Ultra Clean Holdings, Inc. (A) 2,274 130,437Veeco Instruments, Inc. (A) 2,996 85,296
7,122,575Software – 3.2%ACI Worldwide, Inc. (A) 2,573 89,283Asure Software, Inc. (A) 1,391 10,892Aware, Inc. (A) 2,160 6,804Bottomline Technologies DE, Inc. (A) 5,191 293,136Cerence, Inc. (A) 11,036 845,799Cognyte Software, Ltd. (A) 402 6,299Consensus Cloud Solutions, Inc. (A) 218 12,616Ebix, Inc. 954 29,002InterDigital, Inc. 1,490 106,729N-able, Inc. (A) 430 4,773OneSpan, Inc. (A) 1,048 17,743Paycor HCM, Inc. (A) 18,344 528,491Paylocity Holding Corp. (A) 4,898 1,156,712Ping Identity Holding Corp. (A) 630 14,414Rapid7, Inc. (A) 11,528 1,356,730The Descartes Systems Group, Inc. (A) 8,718 720,804Upland Software, Inc. (A) 280 5,023Verint Systems, Inc. (A) 1,067 56,028Xperi Holding Corp. 4,859 91,884
5,353,162Technology hardware, storage and peripherals – 0.2%AstroNova, Inc. (A) 1,439 19,427Stratasys, Ltd. (A) 2,906 71,168Super Micro Computer, Inc. (A) 3,994 175,536Xerox Holdings Corp. 7,509 170,004
436,13521,620,121
Materials – 7.1%Chemicals – 3.6%AdvanSix, Inc. 895 42,289American Vanguard Corp. 2,118 34,714Ashland Global Holdings, Inc. 2,848 306,616Avient Corp. 15,625 874,219Balchem Corp. 4,320 728,352Cabot Corp. 1,625 91,325Core Molding Technologies, Inc. (A) 1,000 8,510Ecovyst, Inc. 5,263 53,893
Small Cap Opportunities Trust (continued)Shares orPrincipalAmount Value
COMMON STOCKS (continued)Chemicals (continued)Element Solutions, Inc. 8,546 $ 207,497Ferro Corp. (A) 2,899 63,285Flotek Industries, Inc. (A) 1,771 2,001FutureFuel Corp. 4,276 32,669GCP Applied Technologies, Inc. (A) 2,486 78,707Hawkins, Inc. 1,460 57,597HB Fuller Company 3,615 292,815Huntsman Corp. 15,185 529,653Innospec, Inc. 1,794 162,070Intrepid Potash, Inc. (A) 504 21,536Koppers Holdings, Inc. (A) 1,200 37,560Kraton Corp. (A) 2,685 124,369Kronos Worldwide, Inc. 2,697 40,482LSB Industries, Inc. (A) 737 8,144Minerals Technologies, Inc. 2,102 153,761Olin Corp. 5,264 302,785Quaker Chemical Corp. 1,802 415,866Rayonier Advanced Materials, Inc. (A) 4,555 26,009Sensient Technologies Corp. 949 94,957Stepan Company 1,433 178,108The Mosaic Company 8,814 346,302Trecora Resources (A) 2,774 22,414Tredegar Corp. 1,654 19,550Trinseo PLC 940 49,312Tronox Holdings PLC, Class A 6,229 149,683Venator Materials PLC (A) 2,700 6,858Westlake Chemical Corp. 4,606 447,381
6,011,289Construction materials – 0.2%Summit Materials, Inc., Class A (A) 5,182 208,005United States Lime & Minerals, Inc. 686 88,508
296,513Containers and packaging – 0.8%Berry Global Group, Inc. (A) 4,721 348,315Graphic Packaging Holding Company 10,944 213,408Greif, Inc., Class A 1,410 85,122Greif, Inc., Class B 698 41,726Packaging Corp. of America 409 55,685Ranpak Holdings Corp. (A) 1,842 69,222Silgan Holdings, Inc. 1,982 84,909Sonoco Products Company 3,466 200,647TriMas Corp. 1,856 68,672UFP Technologies, Inc. (A) 300 21,078Westrock Company 3,785 167,903
1,356,687Metals and mining – 2.2%Alcoa Corp. 10,471 623,862Allegheny Technologies, Inc. (A) 1,638 26,093Ampco-Pittsburgh Corp. (A) 1,644 8,220Arconic Corp. (A) 5,309 175,250Carpenter Technology Corp. 3,575 104,354Century Aluminum Company (A) 4,285 70,960Cleveland-Cliffs, Inc. (A) 2,139 46,566Coeur Mining, Inc. (A) 7,490 37,750Commercial Metals Company 5,907 214,365Ferroglobe PLC (A) 3,057 18,984Friedman Industries, Inc. 1,511 14,173Gold Resource Corp. 6,900 10,764Haynes International, Inc. 458 18,471Hecla Mining Company 26,017 135,809Materion Corp. 1,721 158,229Nexa Resources SA 900 7,074Olympic Steel, Inc. 1,438 33,793Reliance Steel & Aluminum Company 3,854 625,196
John Hancock Variable Insurance TrustPortfolio of Investments — December 31, 2021 (showing percentage of total net assets)
The accompanying notes are an integral part of the financial statements. 131

Small Cap Opportunities Trust (continued)Shares orPrincipalAmount Value
COMMON STOCKS (continued)Metals and mining (continued)Schnitzer Steel Industries, Inc., Class A 3,077 $ 159,758Steel Dynamics, Inc. 10,944 679,294SunCoke Energy, Inc. 6,433 42,393Synalloy Corp. (A) 2,209 36,294TimkenSteel Corp. (A) 2,689 44,369U.S. Steel Corp. 8,605 204,885Universal Stainless & Alloy
Products, Inc. (A) 1,562 12,324Warrior Met Coal, Inc. 3,785 97,312Worthington Industries, Inc. 2,387 130,473
3,737,015Paper and forest products – 0.3%Clearwater Paper Corp. (A) 1,597 58,562Glatfelter Corp. 4,610 79,292Louisiana-Pacific Corp. 326 25,542Mercer International, Inc. 7,458 89,421Neenah, Inc. 193 8,932Resolute Forest Products, Inc. 9,682 147,844Schweitzer-Mauduit International, Inc. 1,971 58,933Verso Corp., Class A 2,848 76,953
545,47911,946,983
Real estate – 1.7%Equity real estate investment trusts – 0.8%Indus Realty Trust, Inc. 256 20,751Ryman Hospitality Properties, Inc. (A) 5,839 536,954STAG Industrial, Inc. 16,042 769,374
1,327,079Real estate management and development – 0.9%Cushman & Wakefield PLC (A) 5,399 120,074Five Point Holdings LLC, Class A (A) 2,659 17,390Forestar Group, Inc. (A) 2,613 56,833FRP Holdings, Inc. (A) 931 53,812Jones Lang LaSalle, Inc. (A) 2,736 736,914Kennedy-Wilson Holdings, Inc. 2,361 56,381Marcus & Millichap, Inc. (A) 1,253 64,479Rafael Holdings, Inc., Class B (A) 500 2,550RE/MAX Holdings, Inc., Class A 799 24,362Realogy Holdings Corp. (A) 9,125 153,391Stratus Properties, Inc. (A) 1,025 37,484Tejon Ranch Company (A) 1,709 32,608The Howard Hughes Corp. (A) 1,787 181,881
1,538,1592,865,238
Utilities – 0.8%Electric utilities – 0.1%NRG Energy, Inc. 2,766 119,159Gas utilities – 0.1%Macquarie Infrastructure Holdings LLC 4,124 15,053New Jersey Resources Corp. 4,232 173,766
188,819Independent power and renewable electricity producers –0.4%Brookfield Renewable Corp., Class A 1,875 69,056Ormat Technologies, Inc. 2,212 175,412Vistra Corp. 20,677 470,815
715,283Multi-utilities – 0.2%MDU Resources Group, Inc. 10,901 336,187
1,359,448TOTAL COMMON STOCKS (Cost $121,003,983) $ 166,602,280
Small Cap Opportunities Trust (continued)Shares orPrincipalAmount Value
PREFERRED SECURITIES – 0.0%Consumer discretionary – 0.0%Internet and direct marketing retail – 0.0%Qurate Retail, Inc., 8.000% 206 $ 21,263Industrials – 0.0%Trading companies and distributors – 0.0%WESCO International, Inc. (10.625% to
6-22-25, then 5 Year CMT + 10.325%) 1,507 46,190TOTAL PREFERRED SECURITIES (Cost $63,266) $ 67,453
SHORT-TERM INVESTMENTS – 1.0%Short-term funds – 1.0%John Hancock Collateral Trust,
0.1697% (D)(E) 80,585 806,089State Street Institutional Treasury Money
Market Fund, Premier Class,0.0051% (D) 735,198 735,198
State Street Institutional U.S. GovernmentMoney Market Fund, Premier Class,0.0250% (D) 111,131 111,131
TOTAL SHORT-TERM INVESTMENTS (Cost $1,652,434) $ 1,652,418Total Investments (Small Cap Opportunities Trust)
(Cost $122,719,683) – 100.4% $ 168,322,151Other assets and liabilities, net – (0.4%) (737,187)TOTAL NET ASSETS – 100.0% $ 167,584,964
Security Abbreviations and LegendADR American Depositary ReceiptCMT Constant Maturity Treasury(A) Non-income producing security.(B) All or a portion of this security is on loan as of 12-31-21.(C) Security is valued using significant unobservable inputs and is
classified as Level 3 in the fair value hierarchy. Refer to Note 2 tothe financial statements.
(D) The rate shown is the annualized seven-day yield as of 12-31-21.(E) Investment is an affiliate of the fund, the advisor and/or subadvisor.
This security represents the investment of cash collateral received forsecurities lending.
Small Cap Stock TrustShares orPrincipalAmount Value
COMMON STOCKS – 97.7%Communication services – 4.1%Diversified telecommunication services – 0.5%Bandwidth, Inc., Class A (A) 27,601 $ 1,980,648Interactive media and services – 1.9%CarGurus, Inc. (A) 90,780 3,053,839j2 Global, Inc. (A) 42,551 4,717,204
7,771,043Media – 1.7%Cardlytics, Inc. (A) 23,041 1,522,780Criteo SA, ADR (A) 137,632 5,349,756
6,872,53616,624,227
Consumer discretionary – 14.9%Diversified consumer services – 0.9%Mister Car Wash, Inc. (A) 202,019 3,678,766Hotels, restaurants and leisure – 2.6%Boyd Gaming Corp. (A) 55,432 3,634,676Planet Fitness, Inc., Class A (A) 29,818 2,700,914
John Hancock Variable Insurance TrustPortfolio of Investments — December 31, 2021 (showing percentage of total net assets)
The accompanying notes are an integral part of the financial statements. 132

Small Cap Stock Trust (continued)Shares orPrincipalAmount Value
COMMON STOCKS (continued)Hotels, restaurants and leisure (continued)Wingstop, Inc. 24,417 $ 4,219,258
10,554,848Household durables – 2.5%Cavco Industries, Inc. (A) 8,801 2,795,638Skyline Champion Corp. (A) 96,080 7,588,398
10,384,036Internet and direct marketing retail – 3.1%Porch Group, Inc. (A)(B) 36,062 562,207Porch.com, Inc. (A) 152,839 2,382,760Revolve Group, Inc. (A) 68,822 3,856,785Shutterstock, Inc. 51,436 5,703,224
12,504,976Specialty retail – 4.4%Five Below, Inc. (A) 45,033 9,316,877Floor & Decor Holdings, Inc., Class A (A) 30,137 3,918,111National Vision Holdings, Inc. (A) 95,800 4,597,442
17,832,430Textiles, apparel and luxury goods – 1.4%Crocs, Inc. (A) 43,596 5,589,879
60,544,935Energy – 2.2%Oil, gas and consumable fuels – 2.2%Chesapeake Energy Corp. 99,641 6,428,837Magnolia Oil & Gas Corp., Class A 134,771 2,543,129
8,971,966Financials – 4.0%Banks – 3.4%Ameris Bancorp 96,276 4,782,992Synovus Financial Corp. 77,102 3,690,873Western Alliance Bancorp 50,271 5,411,673
13,885,538Mortgage real estate investment trusts – 0.6%Hannon Armstrong Sustainable
Infrastructure Capital, Inc. 45,630 2,423,86616,309,404
Health care – 23.8%Biotechnology – 9.2%ALX Oncology Holdings, Inc. (A) 15,491 332,902Amicus Therapeutics, Inc. (A) 150,819 1,741,959Apellis Pharmaceuticals, Inc. (A) 30,865 1,459,297Arena Pharmaceuticals, Inc. (A) 14,964 1,390,754Ascendis Pharma A/S, ADR (A) 18,043 2,427,325BioAtla, Inc. (A) 24,698 484,822Blueprint Medicines Corp. (A) 30,787 3,297,596Celldex Therapeutics, Inc. (A) 24,010 927,746Crinetics Pharmaceuticals, Inc. (A) 30,404 863,778Fate Therapeutics, Inc. (A) 30,322 1,774,140ImmunoGen, Inc. (A) 285,460 2,118,113Intellia Therapeutics, Inc. (A) 19,008 2,247,506KalVista Pharmaceuticals, Inc. (A) 73,364 970,606Karuna Therapeutics, Inc. (A) 12,268 1,607,108Kodiak Sciences, Inc. (A) 13,536 1,147,582Kymera Therapeutics, Inc. (A) 36,920 2,344,051Madrigal Pharmaceuticals, Inc. (A) 14,533 1,231,526Mersana Therapeutics, Inc. (A) 116,713 725,955Myovant Sciences, Ltd. (A)(B) 81,671 1,271,617RAPT Therapeutics, Inc. (A) 48,347 1,775,785REVOLUTION Medicines, Inc. (A) 49,053 1,234,664Rocket Pharmaceuticals, Inc. (A) 42,315 923,736Scholar Rock Holding Corp. (A) 49,706 1,234,697Turning Point Therapeutics, Inc. (A) 29,875 1,425,038
Small Cap Stock Trust (continued)Shares orPrincipalAmount Value
COMMON STOCKS (continued)Biotechnology (continued)Veracyte, Inc. (A) 49,693 $ 2,047,352Y-mAbs Therapeutics, Inc. (A) 36,971 599,300
37,604,955Health care equipment and supplies – 3.2%Globus Medical, Inc., Class A (A) 51,998 3,754,256Integra LifeSciences Holdings Corp. (A) 80,379 5,384,589Tandem Diabetes Care, Inc. (A) 26,889 4,047,332
13,186,177Health care providers and services – 4.9%Accolade, Inc. (A) 103,562 2,729,894Cross Country Healthcare, Inc. (A) 238,796 6,628,977LHC Group, Inc. (A) 39,026 5,355,538R1 RCM, Inc. (A) 208,271 5,308,828
20,023,237Health care technology – 3.2%Health Catalyst, Inc. (A) 77,215 3,059,258Inspire Medical Systems, Inc. (A) 23,292 5,358,558Omnicell, Inc. (A) 24,647 4,447,305
12,865,121Life sciences tools and services – 2.9%Medpace Holdings, Inc. (A) 30,896 6,724,205NanoString Technologies, Inc. (A) 39,366 1,662,426NeoGenomics, Inc. (A) 104,530 3,566,564
11,953,195Pharmaceuticals – 0.4%Aclaris Therapeutics, Inc. (A) 97,669 1,420,107
97,052,792Industrials – 16.9%Aerospace and defense – 1.2%Curtiss-Wright Corp. 35,399 4,908,780Building products – 2.4%Builders FirstSource, Inc. (A) 82,757 7,093,102Gibraltar Industries, Inc. (A) 43,028 2,869,107
9,962,209Construction and engineering – 1.5%Fluor Corp. (A) 238,456 5,906,555Electrical equipment – 1.2%Acuity Brands, Inc. 23,790 5,036,819Machinery – 6.9%Altra Industrial Motion Corp. 133,463 6,882,686Colfax Corp. (A) 127,915 5,880,253Helios Technologies, Inc. 28,219 2,967,792Hydrofarm Holdings Group, Inc. (A) 50,000 1,414,500Kornit Digital, Ltd. (A) 28,139 4,284,163The Middleby Corp. (A) 33,482 6,587,918
28,017,312Road and rail – 0.7%Saia, Inc. (A) 8,474 2,855,992Trading companies and distributors – 3.0%Applied Industrial Technologies, Inc. 86,272 8,860,134WESCO International, Inc. (A) 26,379 3,471,213
12,331,34769,019,014
Information technology – 27.3%Communications equipment – 2.2%Calix, Inc. (A) 110,466 8,833,966Electronic equipment, instruments and components – 2.3%II-VI, Inc. (A)(B) 77,277 5,280,337
John Hancock Variable Insurance TrustPortfolio of Investments — December 31, 2021 (showing percentage of total net assets)
The accompanying notes are an integral part of the financial statements. 133

Small Cap Stock Trust (continued)Shares orPrincipalAmount Value
COMMON STOCKS (continued)Electronic equipment, instruments andcomponents (continued)Novanta, Inc. (A) 22,318 $ 3,935,333
9,215,670IT services – 5.9%Concentrix Corp. 31,016 5,540,078LiveRamp Holdings, Inc. (A) 73,441 3,521,496Payoneer Global, Inc. (A) 47,400 348,390Payoneer Global, Inc. (A) 198,338 1,457,784Perficient, Inc. (A) 40,201 5,197,587Repay Holdings Corp. (A) 153,711 2,808,300Verra Mobility Corp. (A) 350,078 5,401,704
24,275,339Semiconductors and semiconductor equipment – 7.3%Maxeon Solar Technologies, Ltd. (A)(B) 80,315 1,116,379MKS Instruments, Inc. 30,963 5,392,826Synaptics, Inc. (A) 42,315 12,250,616Tower Semiconductor, Ltd. (A) 275,985 10,951,085
29,710,906Software – 9.6%Digital Turbine, Inc. (A) 88,060 5,370,779Jamf Holding Corp. (A)(B) 180,976 6,878,898Manhattan Associates, Inc. (A) 21,353 3,320,178Mimecast, Ltd. (A) 93,939 7,474,726New Relic, Inc. (A) 43,995 4,837,690Rapid7, Inc. (A) 49,145 5,783,875Varonis Systems, Inc. (A) 114,961 5,607,798
39,273,944111,309,825
Materials – 1.0%Chemicals – 1.0%Cabot Corp. 70,377 3,955,187Real estate – 3.5%Equity real estate investment trusts – 3.5%Essential Properties Realty Trust, Inc. 130,785 3,770,532Independence Realty Trust, Inc. 166,428 4,298,835Pebblebrook Hotel Trust 94,000 2,102,780Ryman Hospitality Properties, Inc. (A) 44,794 4,119,256
14,291,403TOTAL COMMON STOCKS (Cost $346,892,766) $ 398,078,753
EXCHANGE-TRADED FUNDS – 0.3%iShares Russell 2000 Growth ETF 4,105 1,202,970TOTAL EXCHANGE-TRADED FUNDS (Cost $1,158,743) $ 1,202,970
SHORT-TERM INVESTMENTS – 3.0%Short-term funds – 0.7%John Hancock Collateral Trust,
0.1697% (C)(D) 294,096 2,941,841
Small Cap Stock Trust (continued)Shares orPrincipalAmount Value
SHORT-TERM INVESTMENTS (continued)Repurchase agreement – 2.3%Societe Generale SA Tri-Party Repurchase
Agreement dated 12-31-21 at 0.045% tobe repurchased at $9,300,035 on 1-3-22,collateralized by $6,641,257 FederalHome Loan Mortgage Corp., 3.500% -4.000% due 11-1-36 to 2-1-48 (valuedat $7,278,229), $1,896,557 FederalNational Mortgage Association, 2.500%- 4.500% due 11-1-48 to 6-1-50 (valuedat $2,107,379) and $98,786 GovernmentNational Mortgage Association, 1.875%due 4-20-27 (valued at $100,392) $ 9,300,000 $ 9,300,000
TOTAL SHORT-TERM INVESTMENTS (Cost $12,242,305) $ 12,241,841Total Investments (Small Cap Stock Trust)
(Cost $360,293,814) – 101.0% $ 411,523,564Other assets and liabilities, net – (1.0%) (4,243,552)TOTAL NET ASSETS – 100.0% $ 407,280,012
Security Abbreviations and LegendADR American Depositary Receipt(A) Non-income producing security.(B) All or a portion of this security is on loan as of 12-31-21.(C) The rate shown is the annualized seven-day yield as of 12-31-21.(D) Investment is an affiliate of the fund, the advisor and/or subadvisor.
This security represents the investment of cash collateral received forsecurities lending.
Small Cap Value TrustShares orPrincipalAmount Value
COMMON STOCKS – 97.3%Communication services – 1.2%Media – 1.2%WideOpenWest, Inc. (A) 299,165 $ 6,438,031Consumer discretionary – 6.5%Auto components – 1.7%Gentherm, Inc. (A) 31,539 2,740,739Visteon Corp. (A) 59,929 6,660,509
9,401,248Hotels, restaurants and leisure – 1.0%Aramark 27,430 1,010,796Wyndham Hotels & Resorts, Inc. 50,505 4,527,773
5,538,569Household durables – 1.3%Tri Pointe Homes, Inc. (A) 271,825 7,581,199Specialty retail – 1.1%Monro, Inc. 102,708 5,984,795Textiles, apparel and luxury goods – 1.4%Kontoor Brands, Inc. 150,614 7,718,968
36,224,779Consumer staples – 5.3%Beverages – 0.8%C&C Group PLC (A) 1,455,006 4,597,434Food products – 2.2%Cranswick PLC 121,766 6,133,608Hostess Brands, Inc. (A) 271,342 5,540,804
John Hancock Variable Insurance TrustPortfolio of Investments — December 31, 2021 (showing percentage of total net assets)
The accompanying notes are an integral part of the financial statements. 134

Small Cap Value Trust (continued)Shares orPrincipalAmount Value
COMMON STOCKS (continued)Food products (continued)Post Holdings, Inc. (A) 5,966 $ 672,547
12,346,959Household products – 2.3%Spectrum Brands Holdings, Inc. 121,444 12,353,284
29,297,677Energy – 1.0%Oil, gas and consumable fuels – 1.0%Chesapeake Energy Corp. 7,261 468,480Dorian LPG, Ltd. 421,881 5,353,670
5,822,150Financials – 25.3%Banks – 16.2%1st Source Corp. 100,081 4,964,018Atlantic Union Bankshares Corp. 194,866 7,266,553Banc of California, Inc. 475,528 9,329,859Cadence Bank 189,087 5,632,902Eastern Bankshares, Inc. 238,034 4,801,146First Busey Corp. 232,521 6,305,970First Citizens BancShares, Inc., Class A 887 736,068First Midwest Bancorp, Inc. 399,133 8,174,244Flushing Financial Corp. 292,202 7,100,509Great Western Bancorp, Inc. 252,814 8,585,563Hancock Whitney Corp. 169,304 8,468,586International Bancshares Corp. 190,208 8,062,917Synovus Financial Corp. 194,035 9,288,455Webster Financial Corp. 11,651 650,592
89,367,382Capital markets – 0.6%SLR Investment Corp. 185,047 3,410,416Insurance – 6.6%Alleghany Corp. (A) 1,661 1,108,867Argo Group International Holdings, Ltd. 73,053 4,245,110Assured Guaranty, Ltd. 107,841 5,413,618Kemper Corp. 134,687 7,918,249ProAssurance Corp. 221,689 5,608,732Reinsurance Group of America, Inc. 5,138 562,560SiriusPoint, Ltd. (A) 543,300 4,417,029White Mountains Insurance Group, Ltd. 7,408 7,510,971
36,785,136Thrifts and mortgage finance – 1.9%NMI Holdings, Inc., Class A (A) 241,154 5,269,215Northwest Bancshares, Inc. 354,100 5,014,056
10,283,271139,846,205
Health care – 8.4%Health care equipment and supplies – 2.9%Haemonetics Corp. (A) 150,015 7,956,796ICU Medical, Inc. (A) 11,204 2,659,157Lantheus Holdings, Inc. (A) 161,658 4,670,300Natus Medical, Inc. (A) 45,133 1,071,006
16,357,259Health care providers and services – 3.8%Apria, Inc. (A) 126,089 4,110,501LHC Group, Inc. (A) 16,100 2,209,403MEDNAX, Inc. (A) 230,417 6,269,647
Small Cap Value Trust (continued)Shares orPrincipalAmount Value
COMMON STOCKS (continued)Health care providers and services (continued)Owens & Minor, Inc. 194,816 $ 8,474,496
21,064,047Health care technology – 1.6%Allscripts Healthcare Solutions, Inc. (A) 468,925 8,651,666Life sciences tools and services – 0.1%Syneos Health, Inc. (A) 5,053 518,842
46,591,814Industrials – 19.0%Aerospace and defense – 1.1%Hexcel Corp. (A) 116,450 6,032,110Building products – 2.8%American Woodmark Corp. (A) 84,046 5,479,799Tyman PLC 1,866,871 10,115,226
15,595,025Commercial services and supplies – 4.0%ACCO Brands Corp. 718,261 5,932,836BrightView Holdings, Inc. (A) 316,387 4,454,729Clean Harbors, Inc. (A) 6,579 656,387SP Plus Corp. (A) 208,867 5,894,227UniFirst Corp. 25,426 5,349,630
22,287,809Construction and engineering – 0.9%Primoris Services Corp. 209,276 5,018,438Electrical equipment – 0.9%Thermon Group Holdings, Inc. (A) 285,898 4,840,253Machinery – 1.6%Albany International Corp., Class A 24,228 2,142,967Luxfer Holdings PLC 358,120 6,915,297
9,058,264Professional services – 5.5%CBIZ, Inc. (A) 166,056 6,496,111Huron Consulting Group, Inc. (A) 170,709 8,518,379ICF International, Inc. 73,564 7,543,988Science Applications International Corp. 89,786 7,505,212
30,063,690Trading companies and distributors – 2.2%Air Lease Corp. 123,687 5,470,676GATX Corp. 64,216 6,690,665
12,161,341105,056,930
Information technology – 8.3%Electronic equipment, instruments and components – 3.0%Belden, Inc. 130,174 8,556,337CTS Corp. 212,335 7,796,941
16,353,278IT services – 1.8%ExlService Holdings, Inc. (A) 28,332 4,101,624WNS Holdings, Ltd., ADR (A) 69,305 6,114,087
10,215,711Software – 3.5%ACI Worldwide, Inc. (A) 150,337 5,216,694CDK Global, Inc. 197,377 8,238,516Progress Software Corp. 124,754 6,021,876
19,477,08646,046,075
Materials – 8.3%Chemicals – 4.4%Axalta Coating Systems, Ltd. (A) 20,273 671,442Element Solutions, Inc. 451,870 10,971,404
John Hancock Variable Insurance TrustPortfolio of Investments — December 31, 2021 (showing percentage of total net assets)
The accompanying notes are an integral part of the financial statements. 135

Small Cap Value Trust (continued)Shares orPrincipalAmount Value
COMMON STOCKS (continued)Chemicals (continued)HB Fuller Company 67,673 $ 5,481,513Orion Engineered Carbons SA (A) 374,524 6,876,261
24,000,620Containers and packaging – 2.5%Sealed Air Corp. 18,450 1,244,822TriMas Corp. 342,858 12,685,744
13,930,566Paper and forest products – 1.4%Neenah, Inc. 170,962 7,912,121
45,843,307Real estate – 10.1%Equity real estate investment trusts – 10.1%Alexander & Baldwin, Inc. 320,168 8,033,015Brandywine Realty Trust 499,977 6,709,691Centerspace 46,558 5,163,282Corporate Office Properties Trust 138,275 3,867,552LXP Industrial Trust 332,213 5,189,167Physicians Realty Trust 377,505 7,108,419Piedmont Office Realty Trust, Inc.,
Class A 371,726 6,832,324PotlatchDeltic Corp. 82,137 4,946,290RPT Realty 577,240 7,723,471
55,573,211Utilities – 3.9%Electric utilities – 1.5%Portland General Electric Company 159,572 8,444,550Gas utilities – 2.4%New Jersey Resources Corp. 146,557 6,017,630Spire, Inc. 91,888 5,992,935UGI Corp. 19,488 894,694
12,905,25921,349,809
TOTAL COMMON STOCKS (Cost $427,623,010) $ 538,089,988
SHORT-TERM INVESTMENTS – 2.9%Repurchase agreement – 2.9%Bank of America Tri-Party Repurchase
Agreement dated 12-31-21 at 0.050% tobe repurchased at $15,900,066 on1-3-22, collateralized by $14,863,600U.S. Treasury Notes, 2.625% due2-15-29 (valued at $16,218,072) $ 15,900,000 15,900,000
TOTAL SHORT-TERM INVESTMENTS (Cost $15,900,000) $ 15,900,000Total Investments (Small Cap Value Trust)
(Cost $443,523,010) – 100.2% $ 553,989,988Other assets and liabilities, net – (0.2%) (1,241,946)TOTAL NET ASSETS – 100.0% $ 552,748,042
Security Abbreviations and LegendADR American Depositary Receipt(A) Non-income producing security.
Small Company Value TrustShares orPrincipalAmount Value
COMMON STOCKS – 98.2%Communication services – 2.3%Interactive media and services – 0.1%NerdWallet, Inc., Class A (A)(B) 15,110 $ 234,961Media – 2.2%Advantage Solutions, Inc. (A) 60,796 487,584Boston Omaha Corp., Class A (A) 27,321 784,932Cable One, Inc. 787 1,387,835Integral Ad Science Holding Corp. (A) 16,353 363,200Scholastic Corp. 17,953 717,402
3,740,9533,975,914
Consumer discretionary – 9.1%Auto components – 1.6%Dorman Products, Inc. (A) 8,721 985,560LCI Industries 6,515 1,015,493Visteon Corp. (A) 6,844 760,642
2,761,695Distributors – 0.7%Pool Corp. 2,022 1,144,452Diversified consumer services – 0.7%Strategic Education, Inc. 18,846 1,090,053Hotels, restaurants and leisure – 1.9%BJ’s Restaurants, Inc. (A) 17,418 601,792Marriott Vacations Worldwide Corp. 6,371 1,076,572Papa John’s International, Inc. 8,818 1,176,938Red Robin Gourmet Burgers, Inc. (A) 17,693 292,465Sweetgreen, Inc., Class A (A)(B) 4,154 132,928
3,280,695Household durables – 1.6%Cavco Industries, Inc. (A) 5,517 1,752,475Meritage Homes Corp. (A) 8,343 1,018,347
2,770,822Internet and direct marketing retail – 0.1%Rent the Runway, Inc., Class A (A)(B) 4,977 40,563Xometry, Inc., Class A (A) 1,588 81,385
121,948Specialty retail – 1.5%Hibbett, Inc. 8,668 623,489Lumber Liquidators Holdings, Inc. (A) 36,750 627,323Monro, Inc. 13,202 769,281Petco Health & Wellness
Company, Inc. (A) 25,770 509,9882,530,081
Textiles, apparel and luxury goods – 1.0%Allbirds, Inc., Class A (A)(B) 21,047 317,389On Holding AG, Class A (A)(B) 2,640 99,818Steven Madden, Ltd. 28,552 1,326,811
1,744,01815,443,764
Consumer staples – 3.0%Beverages – 0.9%Coca-Cola Consolidated, Inc. 2,449 1,516,396Food and staples retailing – 0.3%Grocery Outlet Holding Corp. (A) 17,148 484,945Food products – 1.8%Nomad Foods, Ltd. (A) 56,161 1,425,928Post Holdings, Inc. (A) 8,265 931,713The Simply Good Foods Company (A) 19,214 798,726
3,156,3675,157,708
John Hancock Variable Insurance TrustPortfolio of Investments — December 31, 2021 (showing percentage of total net assets)
The accompanying notes are an integral part of the financial statements. 136

Small Company Value Trust (continued)Shares orPrincipalAmount Value
COMMON STOCKS (continued)Energy – 6.4%Energy equipment and services – 2.1%Cactus, Inc., Class A 34,545 $ 1,317,201ChampionX Corp. (A) 73,279 1,480,969Liberty Oilfield Services, Inc., Class A (A) 78,660 763,002
3,561,172Oil, gas and consumable fuels – 4.3%Devon Energy Corp. 57,207 2,519,968International Seaways, Inc. 24,882 365,268Magnolia Oil & Gas Corp., Class A 84,991 1,603,780Matador Resources Company 55,415 2,045,922REX American Resources Corp. (A) 8,186 785,856
7,320,79410,881,966
Financials – 25.5%Banks – 15.0%BankUnited, Inc. 42,168 1,784,128Columbia Banking System, Inc. 29,224 956,209CrossFirst Bankshares, Inc. (A) 39,223 612,271Eastern Bankshares, Inc. 33,583 677,369FB Financial Corp. 28,980 1,269,904Glacier Bancorp, Inc. 21,244 1,204,535HarborOne Bancorp, Inc. 65,919 978,238Home BancShares, Inc. 80,398 1,957,691Independent Bank Corp. (Massachusetts) 15,982 1,303,012Live Oak Bancshares, Inc. 28,780 2,512,206National Bank Holdings Corp., Class A 27,092 1,190,422Origin Bancorp, Inc. 22,504 965,872Pinnacle Financial Partners, Inc. 24,689 2,357,800Popular, Inc. 16,204 1,329,376Southern First Bancshares, Inc. (A) 16,374 1,023,211Towne Bank 41,217 1,302,045Webster Financial Corp. 21,258 1,187,047Western Alliance Bancorp 27,271 2,935,723
25,547,059Capital markets – 2.5%Hercules Capital, Inc. 46,109 764,948Houlihan Lokey, Inc. 14,832 1,535,409StepStone Group, Inc., Class A 10,735 446,254Virtus Investment Partners, Inc. 5,055 1,501,841
4,248,452Consumer finance – 1.2%Green Dot Corp., Class A (A) 16,449 596,112PRA Group, Inc. (A) 8,424 422,969PROG Holdings, Inc. (A) 21,994 992,149
2,011,230Insurance – 2.3%BRP Group, Inc., Class A (A) 40,582 1,465,416James River Group Holdings, Ltd. 21,586 621,893Palomar Holdings, Inc. (A) 7,268 470,748ProAssurance Corp. 29,206 738,912Ryan Specialty Group Holdings, Inc.,
Class A (A) 17,158 692,3223,989,291
Mortgage real estate investment trusts – 1.4%Hannon Armstrong Sustainable
Infrastructure Capital, Inc. 29,643 1,574,636PennyMac Mortgage Investment Trust 44,125 764,686
2,339,322Thrifts and mortgage finance – 3.1%PCSB Financial Corp. 18,732 356,657PennyMac Financial Services, Inc. 13,507 942,518Radian Group, Inc. 52,105 1,100,979
Small Company Value Trust (continued)Shares orPrincipalAmount Value
COMMON STOCKS (continued)Thrifts and mortgage finance (continued)Walker & Dunlop, Inc. 7,435 $ 1,121,793WSFS Financial Corp. 37,218 1,865,366
5,387,31343,522,667
Health care – 9.3%Biotechnology – 3.6%Blueprint Medicines Corp. (A) 5,519 591,140C4 Therapeutics, Inc. (A) 10,356 333,463Fate Therapeutics, Inc. (A) 8,000 468,080Insmed, Inc. (A) 20,202 550,302Ionis Pharmaceuticals, Inc. (A) 5,500 167,365Karuna Therapeutics, Inc. (A) 3,198 418,938Kodiak Sciences, Inc. (A) 4,337 367,691Kymera Therapeutics, Inc. (A) 7,825 496,809Prothena Corp. PLC (A) 7,900 390,260Replimune Group, Inc. (A) 14,791 400,836Turning Point Therapeutics, Inc. (A) 7,500 357,750Ultragenyx Pharmaceutical, Inc. (A) 6,712 564,412Xencor, Inc. (A) 13,290 533,195Zentalis Pharmaceuticals, Inc. (A) 5,700 479,142
6,119,383Health care equipment and supplies – 1.8%Atrion Corp. 1,825 1,286,443Figs, Inc., Class A (A)(B) 23,833 656,837Ortho Clinical Diagnostics Holdings
PLC (A) 33,362 713,613Quidel Corp. (A) 2,748 370,953
3,027,846Health care providers and services – 3.1%Agiliti, Inc. (A) 31,885 738,457Molina Healthcare, Inc. (A) 1,119 355,932Option Care Health, Inc. (A) 53,336 1,516,876Select Medical Holdings Corp. 48,551 1,427,399The Ensign Group, Inc. 10,173 854,125The Pennant Group, Inc. (A) 18,323 422,895
5,315,684Health care technology – 0.3%Phreesia, Inc. (A) 12,200 508,252Life sciences tools and services – 0.2%Pacific Biosciences of California, Inc. (A) 19,600 401,016Pharmaceuticals – 0.3%Arvinas, Inc. (A) 6,196 508,939
15,881,120Industrials – 14.9%Aerospace and defense – 1.2%Parsons Corp. (A) 14,284 480,657Triumph Group, Inc. (A) 80,352 1,488,923
1,969,580Airlines – 0.2%Allegiant Travel Company (A) 1,872 350,139Building products – 2.1%JELD-WEN Holding, Inc. (A) 23,158 610,445UFP Industries, Inc. 26,967 2,481,234Zurn Water Solutions Corp. 14,500 527,800
3,619,479Commercial services and supplies – 2.0%ABM Industries, Inc. 8,774 358,418Aris Water Solution, Inc., Class A (A) 26,581 344,224Brady Corp., Class A 16,035 864,287MSA Safety, Inc. 5,029 759,178Stericycle, Inc. (A) 16,842 1,004,457
John Hancock Variable Insurance TrustPortfolio of Investments — December 31, 2021 (showing percentage of total net assets)
The accompanying notes are an integral part of the financial statements. 137

Small Company Value Trust (continued)Shares orPrincipalAmount Value
COMMON STOCKS (continued)Commercial services and supplies (continued)UniFirst Corp. 287 $ 60,385
3,390,949Construction and engineering – 0.2%Ameresco, Inc., Class A (A) 4,692 382,116Electrical equipment – 0.7%Regal Rexnord Corp. 4,100 697,738Shoals Technologies Group, Inc.,
Class A (A) 17,325 420,9981,118,736
Machinery – 4.0%Alamo Group, Inc. 3,038 447,133Blue Bird Corp. (A) 23,641 369,745Chart Industries, Inc. (A) 2,022 322,489CIRCOR International, Inc. (A) 21,105 573,634Enerpac Tool Group Corp. 30,545 619,453ESCO Technologies, Inc. 12,105 1,089,329Helios Technologies, Inc. 17,768 1,868,661SPX Corp. (A) 14,695 876,998The Timken Company 8,987 622,709
6,790,151Marine – 0.4%Matson, Inc. 7,703 693,501Professional services – 1.1%FTI Consulting, Inc. (A) 2,935 450,288Korn Ferry 18,400 1,393,432
1,843,720Road and rail – 0.7%Landstar System, Inc. 6,791 1,215,725Trading companies and distributors – 2.3%Beacon Roofing Supply, Inc. (A) 25,767 1,477,737Herc Holdings, Inc. 500 78,275McGrath RentCorp 12,158 975,801Rush Enterprises, Inc., Class A 9,816 546,162Univar Solutions, Inc. (A) 31,145 882,961
3,960,93625,335,032
Information technology – 8.1%Communications equipment – 1.1%Harmonic, Inc. (A) 161,723 1,901,862Electronic equipment, instruments and components – 3.2%Belden, Inc. 35,578 2,338,542Littelfuse, Inc. 8,357 2,629,781PAR Technology Corp. (A)(B) 7,645 403,427
5,371,750IT services – 0.3%Payoneer Global, Inc. (A) 80,100 588,735Semiconductors and semiconductor equipment – 2.1%Entegris, Inc. 7,778 1,077,875MaxLinear, Inc. (A) 17,176 1,294,899Onto Innovation, Inc. (A) 6,564 664,474Semtech Corp. (A) 6,632 589,784
3,627,032Software – 1.4%Ceridian HCM Holding, Inc. (A) 10,666 1,114,170Clearwater Analytics Holdings, Inc.,
Class A (A) 10,295 236,579NCino, Inc. (A) 7,729 424,013Workiva, Inc. (A) 4,310 562,412
2,337,17413,826,553
Small Company Value Trust (continued)Shares orPrincipalAmount Value
COMMON STOCKS (continued)Materials – 4.6%Chemicals – 1.9%Element Solutions, Inc. 46,100 $ 1,119,308Minerals Technologies, Inc. 2,439 178,413Orion Engineered Carbons SA (A) 49,540 909,554Quaker Chemical Corp. 4,143 956,122
3,163,397Containers and packaging – 0.4%Myers Industries, Inc. 32,742 655,167Metals and mining – 1.7%Carpenter Technology Corp. 22,443 655,111Constellium SE (A) 82,001 1,468,638Reliance Steel & Aluminum Company 5,197 843,057
2,966,806Paper and forest products – 0.6%Clearwater Paper Corp. (A) 26,317 965,044
7,750,414Real estate – 10.1%Equity real estate investment trusts – 8.9%American Campus Communities, Inc. 15,656 896,932Apartment Investment and Management
Company, Class A (A) 53,851 415,730EastGroup Properties, Inc. 7,848 1,788,167Essential Properties Realty Trust, Inc. 24,351 702,039Healthcare Realty Trust, Inc. 28,846 912,687JBG SMITH Properties 39,105 1,122,705NexPoint Residential Trust, Inc. 2,100 176,043PotlatchDeltic Corp. 22,854 1,376,268PS Business Parks, Inc. 6,115 1,126,200Safehold, Inc. 11,552 922,427Saul Centers, Inc. 24,337 1,290,348Sunstone Hotel Investors, Inc. (A) 118,177 1,386,216Terreno Realty Corp. 24,860 2,120,309Washington Real Estate Investment Trust 34,959 903,690
15,139,761Real estate management and development – 1.2%The St. Joe Company 34,487 1,795,048Tricon Residential, Inc. 16,307 249,171
2,044,21917,183,980
Utilities – 4.9%Electric utilities – 1.8%IDACORP, Inc. 14,821 1,679,368MGE Energy, Inc. 15,666 1,288,529
2,967,897Gas utilities – 1.4%Chesapeake Utilities Corp. 16,717 2,437,506Independent power and renewable electricity producers –0.1%Sunnova Energy International, Inc. (A) 8,217 229,419Multi-utilities – 0.8%NorthWestern Corp. 24,780 1,416,425Water utilities – 0.8%California Water Service Group 18,110 1,301,385
8,352,632TOTAL COMMON STOCKS (Cost $112,128,066) $ 167,311,750
WARRANTS – 0.0%Advantage Solutions, Inc. (Expiration
Date: 10-28-25; Strike Price:$11.50) (A) 4,703 11,616
TOTAL WARRANTS (Cost $6,099) $ 11,616
John Hancock Variable Insurance TrustPortfolio of Investments — December 31, 2021 (showing percentage of total net assets)
The accompanying notes are an integral part of the financial statements. 138

Small Company Value Trust (continued)Shares orPrincipalAmount Value
SHORT-TERM INVESTMENTS – 2.3%Short-term funds – 2.3%John Hancock Collateral Trust,
0.1697% (C)(D) 174,138 $ 1,741,904State Street Institutional U.S. Government
Money Market Fund, Premier Class,0.0250% (C) 451,734 451,734
T. Rowe Price Government Reserve Fund,0.0570% (C) 1,687,361 1,687,361
TOTAL SHORT-TERM INVESTMENTS (Cost $3,881,153) $ 3,880,999Total Investments (Small Company Value Trust)
(Cost $116,015,318) – 100.5% $ 171,204,365Other assets and liabilities, net – (0.5%) (804,318)TOTAL NET ASSETS – 100.0% $ 170,400,047
Security Abbreviations and Legend(A) Non-income producing security.(B) All or a portion of this security is on loan as of 12-31-21.(C) The rate shown is the annualized seven-day yield as of 12-31-21.(D) Investment is an affiliate of the fund, the advisor and/or subadvisor.
This security represents the investment of cash collateral received forsecurities lending.
Strategic Equity Allocation TrustShares orPrincipalAmount Value
COMMON STOCKS – 96.8%Communication services – 7.1%Diversified telecommunication services – 1.1%Anterix, Inc. (A) 1,926 $ 113,172AT&T, Inc. 884,707 21,763,792ATN International, Inc. 1,854 74,067Bandwidth, Inc., Class A (A) 3,793 272,186BT Group PLC 1,481,653 3,408,541Cellnex Telecom SA (A)(B) 84,568 4,898,821Cogent Communications Holdings, Inc. 6,795 497,258Consolidated Communications
Holdings, Inc. (A) 12,127 90,710Deutsche Telekom AG 553,226 10,222,225EchoStar Corp., Class A (A) 6,137 161,710Elisa OYJ 23,609 1,453,746Globalstar, Inc. (A)(C) 98,707 114,500HKT Trust & HKT, Ltd. 628,421 844,391IDT Corp., Class B (A) 3,221 142,239Infrastrutture Wireless Italiane SpA (B) 55,781 676,403Iridium Communications, Inc. (A) 54,299 2,242,006Koninklijke KPN NV 558,088 1,730,422Liberty Latin America, Ltd., Class A (A) 9,916 115,621Liberty Latin America, Ltd., Class C (A) 22,094 251,872Lumen Technologies, Inc. 110,826 1,390,866Nippon Telegraph & Telephone Corp. 213,616 5,842,026Ooma, Inc. (A) 3,875 79,205Orange SA 331,147 3,537,371Proximus SADP (C) 25,249 493,107Radius Global Infrastructure, Inc.,
Class A (A) 9,482 152,660Singapore Telecommunications, Ltd. 1,111,633 1,913,654Singapore Telecommunications, Ltd. 258,829 445,582Spark New Zealand, Ltd. 309,917 958,415Swisscom AG 4,299 2,425,169Telecom Italia SpA 1,653,843 813,652Telefonica Deutschland Holding AG 172,812 479,344Telefonica SA 842,241 3,652,131Telenor ASA 116,144 1,825,674
Strategic Equity Allocation Trust (continued)Shares orPrincipalAmount Value
COMMON STOCKS (continued)Diversified telecommunication services (continued)Telesat Corp. (A) 2,115 $ 60,637Telia Company AB 441,233 1,725,646Telstra Corp., Ltd. 690,931 2,099,875United Internet AG 16,100 638,305Verizon Communications, Inc. 515,935 26,807,983
104,414,984Entertainment – 1.2%Activision Blizzard, Inc. 96,364 6,411,097AMC Entertainment Holdings, Inc.,
Class A (A)(C) 83,398 2,268,426Bollore SA 146,767 820,952Capcom Company, Ltd. 29,200 687,699Cinemark Holdings, Inc. (A) 17,739 285,953CuriosityStream, Inc. (A) 5,137 30,462Electronic Arts, Inc. 35,262 4,651,058IMAX Corp. (A) 8,194 146,181Koei Tecmo Holdings Company, Ltd. 9,800 384,794Konami Holdings Corp. 15,509 744,425Liberty Media Corp.-Liberty Braves,
Class A (A) 3,085 88,694Liberty Media Corp.-Liberty Braves,
Class C (A) 4,488 126,113Lions Gate Entertainment Corp.,
Class A (A) 9,707 161,524Lions Gate Entertainment Corp.,
Class B (A) 19,130 294,411Live Nation Entertainment, Inc. (A) 16,325 1,953,939Madison Square Garden Entertainment
Corp. (A) 4,270 300,352Netflix, Inc. (A) 55,087 33,186,612Nexon Company, Ltd. 81,906 1,583,753Nintendo Company, Ltd. 18,539 8,673,603Sea, Ltd., ADR (A) 11,400 2,550,294Square Enix Holdings Company, Ltd. 14,200 728,453Take-Two Interactive Software, Inc. (A) 14,438 2,565,921The Marcus Corp. (A)(C) 3,971 70,922The Walt Disney Company (A) 226,145 35,027,599Toho Company, Ltd. 18,608 796,279Ubisoft Entertainment SA (A) 15,384 750,435Universal Music Group NV 120,387 3,402,263World Wrestling Entertainment, Inc.,
Class A (C) 11,882 586,258109,278,472
Interactive media and services – 3.6%Adevinta ASA (A) 42,634 566,353Alphabet, Inc., Class A (A) 37,368 108,256,591Alphabet, Inc., Class C (A) 34,738 100,517,529Auto Trader Group PLC (B) 159,139 1,593,756CarGurus, Inc. (A) 15,429 519,032Cars.com, Inc. (A) 11,223 180,578Eventbrite, Inc., Class A (A) 12,278 214,128EverQuote, Inc., Class A (A) 3,567 55,859FuboTV, Inc. (A)(C) 21,805 338,414j2 Global, Inc. (A) 19,817 2,196,913Kakaku.com, Inc. 22,300 596,152Liberty TripAdvisor Holdings, Inc.,
Class A (A) 15,390 33,396Match Group, Inc. (A) 35,499 4,694,743MediaAlpha, Inc., Class A (A) 3,787 58,471Meta Platforms, Inc., Class A (A) 293,998 98,886,227QuinStreet, Inc. (A) 8,453 153,760REA Group, Ltd. 8,772 1,069,672Scout24 SE (B) 14,523 1,014,087SEEK, Ltd. 55,753 1,329,133TripAdvisor, Inc. (A) 26,319 717,456
John Hancock Variable Insurance TrustPortfolio of Investments — December 31, 2021 (showing percentage of total net assets)
The accompanying notes are an integral part of the financial statements. 139

Strategic Equity Allocation Trust (continued)Shares orPrincipalAmount Value
COMMON STOCKS (continued)Interactive media and services (continued)TrueCar, Inc. (A) 17,658 $ 60,037Twitter, Inc. (A) 98,875 4,273,378Yelp, Inc. (A) 29,870 1,082,489Z Holdings Corp. 444,754 2,566,226
330,974,380Media – 0.8%Advantage Solutions, Inc. (A) 13,047 104,637AMC Networks, Inc., Class A (A) 4,681 161,214Audacy, Inc. (A) 22,099 56,794Boston Omaha Corp., Class A (A) 3,085 88,632Cable One, Inc. 1,317 2,322,464Cardlytics, Inc. (A) 5,243 346,510Charter Communications, Inc., Class A (A) 15,381 10,027,951Clear Channel Outdoor Holdings, Inc. (A) 61,030 202,009Comcast Corp., Class A 567,537 28,564,137comScore, Inc. (A) 14,824 49,512CyberAgent, Inc. 67,200 1,120,212Daily Journal Corp. (A) 217 77,410Dentsu Group, Inc. 35,865 1,276,551Discovery, Inc., Series A (A)(C) 20,950 493,163Discovery, Inc., Series C (A) 37,637 861,887DISH Network Corp., Class A (A) 30,844 1,000,579Embracer Group AB (A) 78,689 834,811Entravision Communications Corp.,
Class A 10,666 72,315Fox Corp., Class A 40,074 1,478,731Fox Corp., Class B 18,376 629,746Gannett Company, Inc. (A) 24,017 128,011Gray Television, Inc. 13,764 277,482Hakuhodo DY Holdings, Inc. 38,773 645,181iHeartMedia, Inc., Class A (A) 18,296 384,948Informa PLC (A) 249,490 1,746,823Integral Ad Science Holding Corp. (A) 2,963 65,808John Wiley & Sons, Inc., Class A 18,508 1,059,953National CineMedia, Inc. 9,598 26,970News Corp., Class A 48,475 1,081,477News Corp., Class B 15,088 339,480Omnicom Group, Inc. 26,567 1,946,564Pearson PLC 125,581 1,041,787Publicis Groupe SA 37,843 2,549,636Schibsted ASA, B Shares 16,158 543,506Schibsted ASA, Class A 12,138 467,977Scholastic Corp. 4,241 169,470Sinclair Broadcast Group, Inc., Class A 7,767 205,282Stagwell, Inc. (A) 10,213 88,547TechTarget, Inc. (A) 4,126 394,693TEGNA, Inc. 94,390 1,751,878The EW Scripps Company, Class A (A) 9,703 187,753The Interpublic Group of Companies, Inc. 48,773 1,826,549The New York Times Company, Class A 44,398 2,144,423ViacomCBS, Inc., Class B 75,066 2,265,492Vivendi SE 128,771 1,741,873WideOpenWest, Inc. (A) 8,624 185,588WPP PLC 197,941 3,014,191
76,050,607Wireless telecommunication services – 0.4%Gogo, Inc. (A)(C) 9,868 133,514KDDI Corp. 267,743 7,829,796Shenandoah Telecommunications Company 7,934 202,317SoftBank Corp. 476,800 6,022,255SoftBank Group Corp. 200,174 9,596,368Tele2 AB, B Shares 83,133 1,185,947Telephone & Data Systems, Inc. 16,175 325,926T-Mobile US, Inc. (A) 72,678 8,429,194United States Cellular Corp. (A) 2,466 77,728
Strategic Equity Allocation Trust (continued)Shares orPrincipalAmount Value
COMMON STOCKS (continued)Wireless telecommunication services (continued)Vodafone Group PLC 4,590,283 $ 6,914,049
40,717,094661,435,537
Consumer discretionary – 12.2%Auto components – 0.5%Adient PLC (A) 40,352 1,932,054Aisin Corp. 24,458 938,393American Axle & Manufacturing
Holdings, Inc. (A) 18,549 173,062Aptiv PLC (A) 33,518 5,528,794BorgWarner, Inc. 29,712 1,339,120Bridgestone Corp. 94,806 4,070,273Cie Generale des Etablissements
Michelin SCA 28,123 4,606,103Continental AG (A) 18,259 1,918,390Cooper-Standard Holdings, Inc. (A) 3,251 72,855Dana, Inc. 61,796 1,410,185Denso Corp. 71,895 5,957,998Dorman Products, Inc. (A) 4,199 474,529Faurecia SE 19,475 926,543Fox Factory Holding Corp. (A) 17,997 3,061,290Gentex Corp. 62,845 2,190,148Gentherm, Inc. (A) 5,347 464,654Koito Manufacturing Company, Ltd. 17,366 919,774LCI Industries 3,970 618,804Lear Corp. 15,841 2,898,111Modine Manufacturing Company (A) 9,277 93,605Motorcar Parts of America, Inc. (A) 3,659 62,459Patrick Industries, Inc. 3,678 296,778Standard Motor Products, Inc. 3,273 171,472Stanley Electric Company, Ltd. 21,567 541,484Stoneridge, Inc. (A) 4,706 92,896Sumitomo Electric Industries, Ltd. 125,143 1,633,239Tenneco, Inc., Class A (A) 11,453 129,419The Goodyear Tire & Rubber
Company (A) 119,305 2,543,583Valeo 38,115 1,149,410Visteon Corp. (A) 11,926 1,325,456XPEL, Inc. (A) 2,867 195,759
47,736,640Automobiles – 2.3%Arcimoto, Inc. (A)(C) 5,013 39,001Bayerische Motoren Werke AG 54,957 5,498,020Canoo, Inc. (A)(C) 17,503 135,123Daimler AG 142,060 10,853,972Ferrari NV 20,922 5,385,447Fisker, Inc. (A)(C) 26,442 415,933Ford Motor Company 486,205 10,098,478General Motors Company (A) 179,880 10,546,364Harley-Davidson, Inc. 40,886 1,540,993Honda Motor Company, Ltd. 270,573 7,698,000Isuzu Motors, Ltd. 96,746 1,204,147Lordstown Motors Corp., Class A (A)(C) 24,973 86,157Mazda Motor Corp. (A) 94,400 724,321Nissan Motor Company, Ltd. (A) 385,276 1,855,699Renault SA (A) 31,905 1,106,795Stellantis NV 337,864 6,378,391Subaru Corp. 102,127 1,824,786Suzuki Motor Corp. 61,143 2,357,847Tesla, Inc. (A) 101,056 106,793,901Thor Industries, Inc. 14,755 1,531,126Toyota Motor Corp. 1,760,200 32,533,047Volkswagen AG 5,388 1,575,094Winnebago Industries, Inc. 5,164 386,887
John Hancock Variable Insurance TrustPortfolio of Investments — December 31, 2021 (showing percentage of total net assets)
The accompanying notes are an integral part of the financial statements. 140

Strategic Equity Allocation Trust (continued)Shares orPrincipalAmount Value
COMMON STOCKS (continued)Automobiles (continued)Workhorse Group, Inc. (A)(C) 20,991 $ 91,521Yamaha Motor Company, Ltd. 49,413 1,186,856
211,847,906Distributors – 0.1%Funko, Inc., Class A (A) 4,654 87,495Genuine Parts Company 17,745 2,487,849LKQ Corp. 33,500 2,011,005Pool Corp. 4,969 2,812,454
7,398,803Diversified consumer services – 0.1%2U, Inc. (A) 11,763 236,083Adtalem Global Education, Inc. (A) 7,966 235,475American Public Education, Inc. (A) 3,443 76,607Carriage Services, Inc. 2,587 166,706Coursera, Inc. (A) 11,076 270,697European Wax Center, Inc., Class A (A) 1,989 60,366Graham Holdings Company, Class B 1,647 1,037,330Grand Canyon Education, Inc. (A) 10,648 912,640H&R Block, Inc. 46,666 1,099,451Houghton Mifflin Harcourt Company (A) 20,875 336,088IDP Education, Ltd. 34,649 872,887Laureate Education, Inc., Class A 16,745 204,959OneSpaWorld Holdings, Ltd. (A) 9,100 91,182Perdoceo Education Corp. (A) 11,842 139,262PowerSchool Holdings, Inc., Class A (A) 8,240 135,713Service Corp. International 43,818 3,110,640Strategic Education, Inc. 4,086 236,334Stride, Inc. (A) 6,538 217,912Vivint Smart Home, Inc. (A) 15,705 153,595WW International, Inc. (A) 8,884 143,299
9,737,226Hotels, restaurants and leisure – 1.8%Accel Entertainment, Inc. (A) 9,460 123,169Accor SA (A) 28,250 915,679Aristocrat Leisure, Ltd. 100,029 3,173,176Bally’s Corp. (A) 5,291 201,375BJ’s Restaurants, Inc. (A) 3,858 133,294Bloomin’ Brands, Inc. (A) 14,484 303,874Bluegreen Vacations Holding Corp. (A) 2,471 86,732Booking Holdings, Inc. (A) 5,088 12,207,282Boyd Gaming Corp. (A) 21,791 1,428,836Brinker International, Inc. (A) 7,431 271,900Caesars Entertainment, Inc. (A) 26,446 2,473,494Carnival Corp. (A) 98,945 1,990,773Century Casinos, Inc. (A) 4,903 59,719Chipotle Mexican Grill, Inc. (A) 3,481 6,085,658Choice Hotels International, Inc. 8,721 1,360,389Churchill Downs, Inc. 9,147 2,203,512Chuy’s Holdings, Inc. (A) 3,608 108,673Compass Group PLC (A) 296,119 6,666,730Cracker Barrel Old Country Store, Inc. 10,119 1,301,708Crown Resorts, Ltd. (A) 61,819 538,127Darden Restaurants, Inc. 16,148 2,432,535Dave & Buster’s Entertainment, Inc. (A) 7,070 271,488Del Taco Restaurants, Inc. 6,235 77,626Denny’s Corp. (A) 10,510 168,160Dine Brands Global, Inc. 2,622 198,774Domino’s Pizza Enterprises, Ltd. 10,054 862,950Domino’s Pizza, Inc. 4,566 2,576,731El Pollo Loco Holdings, Inc. (A) 3,782 53,667Entain PLC (A) 97,199 2,221,646Esports Technologies, Inc. (A) 1,495 30,737Everi Holdings, Inc. (A) 13,917 297,128Evolution AB (B) 28,564 4,037,263
Strategic Equity Allocation Trust (continued)Shares orPrincipalAmount Value
COMMON STOCKS (continued)Hotels, restaurants and leisure (continued)Expedia Group, Inc. (A) 18,003 $ 3,253,502F45 Training Holdings, Inc. (A)(C) 4,018 43,756Flutter Entertainment PLC (A) 27,655 4,378,164Full House Resorts, Inc. (A) 5,750 69,633Galaxy Entertainment Group, Ltd. (A) 361,153 1,873,518GAN, Ltd. (A) 7,366 67,694Genting Singapore, Ltd. 1,003,721 577,349Golden Entertainment, Inc. (A) 2,877 145,375Golden Nugget Online Gaming, Inc. (A) 6,976 69,411Hilton Grand Vacations, Inc. (A) 13,994 729,227Hilton Worldwide Holdings, Inc. (A) 34,531 5,386,491InterContinental Hotels Group PLC (A) 30,411 1,966,042International Game Technology PLC 16,300 471,233Jack in the Box, Inc. 9,321 815,401Krispy Kreme, Inc. 3,746 70,874Kura Sushi USA, Inc., Class A (A) 574 46,402La Francaise des Jeux SAEM (B) 15,852 702,524Las Vegas Sands Corp. (A) 42,599 1,603,426Life Time Group Holdings, Inc. (A) 5,617 96,669Lindblad Expeditions Holdings, Inc. (A) 5,569 86,876Marriott International, Inc., Class A (A) 33,895 5,600,810Marriott Vacations Worldwide Corp. 11,318 1,912,516McDonald’s Corp. 93,097 24,956,513McDonald’s Holdings Company
Japan, Ltd. (C) 13,261 586,879Melco Resorts & Entertainment, Ltd.,
ADR (A) 35,800 364,444MGM Resorts International 49,558 2,224,163Monarch Casino & Resort, Inc. (A) 2,218 164,021NeoGames SA (A) 1,518 42,170Noodles & Company (A) 7,500 68,025Norwegian Cruise Line Holdings, Ltd. (A) 45,849 950,908ONE Group Hospitality, Inc. (A) 4,021 50,705Oriental Land Company, Ltd. 33,200 5,598,419Papa John’s International, Inc. 13,965 1,863,909Penn National Gaming, Inc. (A) 20,577 1,066,917PlayAGS, Inc. (A) 4,132 28,056Portillo’s, Inc., Class A (A)(C) 3,350 125,759RCI Hospitality Holdings, Inc. 1,490 116,041Red Robin Gourmet Burgers, Inc. (A) 3,051 50,433Red Rock Resorts, Inc., Class A 9,710 534,147Royal Caribbean Cruises, Ltd. (A) 27,772 2,135,667Rush Street Interactive, Inc. (A) 8,776 144,804Ruth’s Hospitality Group, Inc. (A) 5,793 115,281Sands China, Ltd. (A) 403,082 935,471Scientific Games Corp. (A) 41,251 2,756,804SeaWorld Entertainment, Inc. (A) 8,331 540,349Shake Shack, Inc., Class A (A) 6,111 440,970Six Flags Entertainment Corp. (A) 20,562 875,530Sodexo SA 14,685 1,287,404Starbucks Corp. 146,100 17,089,317Tabcorp Holdings, Ltd. 368,753 1,347,169Texas Roadhouse, Inc. 29,844 2,664,472The Cheesecake Factory, Inc. (A) 7,564 296,131The Wendy’s Company 46,899 1,118,541Travel + Leisure Company 22,930 1,267,341Whitbread PLC (A) 33,527 1,363,799Wingstop, Inc. 12,768 2,206,310Wyndham Hotels & Resorts, Inc. 24,758 2,219,555Wynn Resorts, Ltd. (A) 13,043 1,109,177Yum! Brands, Inc. 36,633 5,086,858
168,622,157Household durables – 0.9%Barratt Developments PLC 169,191 1,718,047Beazer Homes USA, Inc. (A) 4,956 115,078
John Hancock Variable Insurance TrustPortfolio of Investments — December 31, 2021 (showing percentage of total net assets)
The accompanying notes are an integral part of the financial statements. 141

Strategic Equity Allocation Trust (continued)Shares orPrincipalAmount Value
COMMON STOCKS (continued)Household durables (continued)Casper Sleep, Inc. (A) 4,955 $ 33,099Cavco Industries, Inc. (A) 1,491 473,616Century Communities, Inc. 4,825 394,637D.R. Horton, Inc. 40,388 4,380,079Electrolux AB, Series B 37,437 906,712Ethan Allen Interiors, Inc. 3,788 99,587Garmin, Ltd. 18,826 2,563,536GoPro, Inc., Class A (A) 21,115 217,696Green Brick Partners, Inc. (A) 5,094 154,501Hamilton Beach Brands Holding Company,
Class B 853 12,249Helen of Troy, Ltd. (A) 10,279 2,512,907Hooker Furnishings Corp. 2,360 54,941Hovnanian Enterprises, Inc., Class A (A) 882 112,270Iida Group Holdings Company, Ltd. 24,400 567,482Installed Building Products, Inc. 3,847 537,503iRobot Corp. (A) 4,426 291,585KB Home 35,482 1,587,110La-Z-Boy, Inc. 7,198 261,359Leggett & Platt, Inc. 35,439 1,458,669Lennar Corp., A Shares 34,037 3,953,738LGI Homes, Inc. (A) 3,498 540,371Lifetime Brands, Inc. 2,079 33,202M/I Homes, Inc. (A) 4,595 285,717MDC Holdings, Inc. 9,114 508,835Meritage Homes Corp. (A) 5,921 722,717Mohawk Industries, Inc. (A) 6,928 1,262,143Newell Brands, Inc. 46,912 1,024,558NVR, Inc. (A) 417 2,463,999Open House Company, Ltd. 13,600 710,689Panasonic Corp. 366,609 4,030,055Persimmon PLC 52,966 2,052,910PulteGroup, Inc. 32,157 1,838,094Purple Innovation, Inc. (A) 9,801 130,059Rinnai Corp. 5,978 539,492SEB SA 4,593 715,731Sekisui Chemical Company, Ltd. 62,644 1,047,667Sekisui House, Ltd. 102,326 2,201,619Sharp Corp. 35,500 407,702Skyline Champion Corp. (A) 8,543 674,726Snap One Holdings Corp. (A) 1,746 36,806Sonos, Inc. (A) 19,498 581,040Sony Group Corp. 209,300 26,430,022Taylor Morrison Home Corp. (A) 51,878 1,813,655Taylor Wimpey PLC 605,269 1,443,039Tempur Sealy International, Inc. 51,151 2,405,632The Berkeley Group Holdings PLC 18,654 1,207,942The Lovesac Company (A) 2,115 140,140Toll Brothers, Inc. 30,401 2,200,728TopBuild Corp. (A) 8,748 2,413,661Traeger, Inc. (A) 3,966 48,227Tri Pointe Homes, Inc. (A) 47,403 1,322,070Tupperware Brands Corp. (A) 8,202 125,409Universal Electronics, Inc. (A) 2,238 91,199Vuzix Corp. (A)(C) 10,114 87,688Weber, Inc., Class A (C) 3,473 44,906Whirlpool Corp. 7,769 1,823,074
85,811,925Internet and direct marketing retail – 2.3%1-800-Flowers.com, Inc., Class A (A) 4,241 99,112Amazon.com, Inc. (A) 54,186 180,674,548CarParts.com, Inc. (A) 8,508 95,290Delivery Hero SE (A)(B) 26,889 2,976,358eBay, Inc. 77,869 5,178,289Etsy, Inc. (A) 15,684 3,433,855
Strategic Equity Allocation Trust (continued)Shares orPrincipalAmount Value
COMMON STOCKS (continued)Internet and direct marketing retail (continued)Fiverr International, Ltd. (A) 4,900 $ 557,130Groupon, Inc. (A)(C) 4,004 92,733Just Eat Takeaway.com NV (A)(B) 29,927 1,625,960Lands’ End, Inc. (A) 2,523 49,526Liquidity Services, Inc. (A) 4,573 100,972Magnite, Inc. (A) 21,229 371,508Mercari, Inc. (A) 17,100 870,004Overstock.com, Inc. (A) 7,016 414,014PetMed Express, Inc. (C) 3,242 81,893Porch Group, Inc. (A)(C) 12,653 197,260Prosus NV (A) 154,886 12,828,433Quotient Technology, Inc. (A) 15,233 113,029Rakuten Group, Inc. 144,105 1,445,843Revolve Group, Inc. (A) 5,863 328,563Shutterstock, Inc. 3,793 420,568Stitch Fix, Inc., Class A (A) 12,967 245,336The RealReal, Inc. (A) 12,937 150,199Xometry, Inc., Class A (A) 1,440 73,800Zalando SE (A)(B) 36,898 2,972,373ZOZO, Inc. 20,700 645,429
216,042,025Leisure products – 0.2%Acushnet Holdings Corp. 5,521 293,055American Outdoor Brands, Inc. (A) 2,388 47,593AMMO, Inc. (A)(C) 14,868 81,031Bandai Namco Holdings, Inc. 33,193 2,595,307Brunswick Corp. 20,485 2,063,454Callaway Golf Company (A) 50,076 1,374,085Clarus Corp. 4,206 116,590Escalade, Inc. 2,536 40,043Genius Brands International, Inc. (A)(C) 52,409 55,029Hasbro, Inc. 16,037 1,632,246Johnson Outdoors, Inc., Class A 909 85,164Latham Group, Inc. (A) 4,663 116,715Malibu Boats, Inc., Class A (A) 3,380 232,307MasterCraft Boat Holdings, Inc. (A) 3,430 97,172Mattel, Inc. (A) 93,088 2,006,977Nautilus, Inc. (A) 5,666 34,733Polaris, Inc. 15,156 1,665,796Shimano, Inc. 12,281 3,270,667Smith & Wesson Brands, Inc. 7,834 139,445Sturm Ruger & Company, Inc. 2,769 188,347Vista Outdoor, Inc. (A) 9,240 425,687Yamaha Corp. 22,273 1,098,848YETI Holdings, Inc. (A) 23,287 1,928,862
19,589,153Multiline retail – 0.5%Big Lots, Inc. 5,273 237,549Dillard’s, Inc., Class A (C) 950 232,769Dollar General Corp. 29,268 6,902,272Dollar Tree, Inc. (A) 27,680 3,889,594Franchise Group, Inc. 4,734 246,925Kohl’s Corp. 39,998 1,975,501Macy’s, Inc. 133,087 3,484,218Next PLC 22,067 2,440,677Nordstrom, Inc. (A) 29,559 668,625Ollie’s Bargain Outlet Holdings, Inc. (A) 16,080 823,135Pan Pacific International Holdings Corp. 68,400 942,814Ryohin Keikaku Company, Ltd. 41,960 639,807Target Corp. 60,583 14,021,330
John Hancock Variable Insurance TrustPortfolio of Investments — December 31, 2021 (showing percentage of total net assets)
The accompanying notes are an integral part of the financial statements. 142

Strategic Equity Allocation Trust (continued)Shares orPrincipalAmount Value
COMMON STOCKS (continued)Multiline retail (continued)Wesfarmers, Ltd. 188,199 $ 8,120,115
44,625,331Specialty retail – 1.9%Abercrombie & Fitch Company,
Class A (A) 9,547 332,522Academy Sports & Outdoors, Inc. (A) 12,525 549,848Advance Auto Parts, Inc. 8,108 1,944,947American Eagle Outfitters, Inc. 65,539 1,659,447America’s Car-Mart, Inc. (A) 1,009 103,322Arko Corp. (A) 17,503 153,501Asbury Automotive Group, Inc. (A) 3,605 622,692AutoNation, Inc. (A) 10,622 1,241,181AutoZone, Inc. (A) 2,597 5,444,325Barnes & Noble Education, Inc. (A) 7,147 48,671Bath & Body Works, Inc. 32,805 2,289,461Bed Bath & Beyond, Inc. (A) 16,730 243,923Best Buy Company, Inc. 27,932 2,837,891Big 5 Sporting Goods Corp. (C) 3,607 68,569Boot Barn Holdings, Inc. (A) 4,753 584,857Caleres, Inc. 6,204 140,707Camping World Holdings, Inc., Class A 6,860 277,144CarLotz, Inc. (A)(C) 13,757 31,228CarMax, Inc. (A) 20,189 2,629,213Chico’s FAS, Inc. (A) 20,603 110,844Chow Tai Fook Jewellery Group, Ltd. (A) 332,000 598,224Citi Trends, Inc. (A) 1,462 138,525Conn’s, Inc. (A) 3,197 75,193Designer Brands, Inc., Class A (A) 10,199 144,928Dick’s Sporting Goods, Inc. (C) 17,242 1,982,658Fast Retailing Company, Ltd. 9,646 5,483,216Five Below, Inc. (A) 14,885 3,079,558Foot Locker, Inc. 23,997 1,046,989GameStop Corp., Class A (A)(C) 16,463 2,442,945Genesco, Inc. (A) 2,394 153,623Group 1 Automotive, Inc. 2,825 551,497GrowGeneration Corp. (A) 9,208 120,164Guess?, Inc. 6,550 155,104Haverty Furniture Companies, Inc. 2,778 84,923Hennes & Mauritz AB, B Shares 121,223 2,378,650Hibbett, Inc. 2,471 177,739Hikari Tsushin, Inc. 3,500 539,026Industria de Diseno Textil SA 181,058 5,839,126JD Sports Fashion PLC 428,564 1,263,622Kingfisher PLC 350,478 1,612,109Lithia Motors, Inc. 8,046 2,389,260Lowe’s Companies, Inc. 85,942 22,214,288Lumber Liquidators Holdings, Inc. (A) 5,035 85,947MarineMax, Inc. (A) 3,376 199,319Monro, Inc. 5,440 316,989Murphy USA, Inc. 10,157 2,023,681National Vision Holdings, Inc. (A) 13,247 635,724Nitori Holdings Company, Ltd. 13,311 1,990,946OneWater Marine, Inc., Class A 1,744 106,332O’Reilly Automotive, Inc. (A) 8,328 5,881,483Party City Holdco, Inc. (A) 19,063 106,181Rent-A-Center, Inc. 10,671 512,635RH (A) 4,609 2,470,147Ross Stores, Inc. 44,250 5,056,890Sally Beauty Holdings, Inc. (A) 18,191 335,806Shift Technologies, Inc. (A)(C) 11,775 40,153Shoe Carnival, Inc. 3,009 117,592Signet Jewelers, Ltd. 8,508 740,451Sleep Number Corp. (A) 3,640 278,824Sonic Automotive, Inc., Class A 3,559 175,993Sportsman’s Warehouse Holdings, Inc. (A) 7,152 84,394
Strategic Equity Allocation Trust (continued)Shares orPrincipalAmount Value
COMMON STOCKS (continued)Specialty retail (continued)The Aaron’s Company, Inc. 5,400 $ 133,110The Buckle, Inc. 4,817 203,807The Cato Corp., Class A 3,648 62,600The Children’s Place, Inc. (A) 2,349 186,252The Container Store Group, Inc. (A) 5,591 55,798The Gap, Inc. 26,669 470,708The Home Depot, Inc. 131,030 54,378,760The ODP Corp. (A) 7,531 295,818The TJX Companies, Inc. 149,494 11,349,584Tilly’s, Inc., Class A 4,041 65,101Tractor Supply Company 14,167 3,380,246TravelCenters of America, Inc. (A) 2,077 107,215Ulta Beauty, Inc. (A) 6,785 2,797,727Urban Outfitters, Inc. (A) 28,694 842,456USS Company, Ltd. 36,348 567,891Victoria’s Secret & Company (A) 19,251 1,069,201Williams-Sonoma, Inc. 19,760 3,342,009Winmark Corp. 593 147,236Zumiez, Inc. (A) 3,600 172,764
174,573,430Textiles, apparel and luxury goods – 1.6%adidas AG 31,602 9,099,646Burberry Group PLC 67,202 1,658,696Capri Holdings, Ltd. (A) 39,978 2,594,972Carter’s, Inc. 11,230 1,136,701Cie Financiere Richemont SA, A Shares 86,643 12,947,481Columbia Sportswear Company 9,184 894,889Crocs, Inc. (A) 25,059 3,213,065Deckers Outdoor Corp. (A) 7,293 2,671,499EssilorLuxottica SA 47,660 10,145,708Fossil Group, Inc. (A) 8,688 89,400G-III Apparel Group, Ltd. (A) 7,450 205,918Hanesbrands, Inc. 92,786 1,551,382Hermes International 5,257 9,185,941Kering SA 12,451 9,990,079Kontoor Brands, Inc. 8,498 435,523LVMH Moet Hennessy Louis Vuitton SE 46,080 38,082,061Moncler SpA 34,070 2,462,179Movado Group, Inc. 2,645 110,640NIKE, Inc., Class B 158,366 26,394,861Oxford Industries, Inc. 2,644 268,419Pandora A/S 16,598 2,064,640PLBY Group, Inc. (A) 4,383 116,763Puma SE 17,524 2,140,105PVH Corp. 8,842 942,999Ralph Lauren Corp. 6,025 716,132Rocky Brands, Inc. 1,293 51,461Skechers USA, Inc., Class A (A) 35,845 1,555,673Steven Madden, Ltd. 13,141 610,662Superior Group of Companies, Inc. 1,439 31,572Tapestry, Inc. 34,553 1,402,852The Swatch Group AG 8,731 510,472The Swatch Group AG, Bearer Shares 4,803 1,462,686Under Armour, Inc., Class A (A) 23,374 495,295Under Armour, Inc., Class C (A) 25,823 465,847Vera Bradley, Inc. (A) 5,161 43,920VF Corp. 40,381 2,956,697Wolverine World Wide, Inc. 13,377 385,391
149,092,2271,135,076,823
Consumer staples – 6.8%Beverages – 1.4%Anheuser-Busch InBev SA/NV 126,472 7,624,991Asahi Group Holdings, Ltd. 75,781 2,950,062
John Hancock Variable Insurance TrustPortfolio of Investments — December 31, 2021 (showing percentage of total net assets)
The accompanying notes are an integral part of the financial statements. 143

Strategic Equity Allocation Trust (continued)Shares orPrincipalAmount Value
COMMON STOCKS (continued)Beverages (continued)Brown-Forman Corp., Class B 22,640 $ 1,649,550Budweiser Brewing Company
APAC, Ltd. (B) 285,800 751,355Carlsberg A/S, Class B 16,665 2,877,174Celsius Holdings, Inc. (A) 8,795 655,843Coca-Cola Consolidated, Inc. 761 471,204Coca-Cola Europacific Partners PLC 34,058 1,904,864Coca-Cola HBC AG (A) 33,325 1,153,889Constellation Brands, Inc., Class A 20,231 5,077,374Davide Campari-Milano NV 86,762 1,266,054Diageo PLC 387,398 21,181,388Heineken Holding NV 19,123 1,763,233Heineken NV 43,023 4,841,795Ito En, Ltd. 8,900 467,626Kirin Holdings Company, Ltd. (C) 136,492 2,198,459MGP Ingredients, Inc. 2,366 201,086Molson Coors Beverage Company, Class B 23,343 1,081,948Monster Beverage Corp. (A) 46,529 4,468,645National Beverage Corp. (C) 3,840 174,067PepsiCo, Inc. 172,121 29,899,139Pernod Ricard SA 34,774 8,365,847Primo Water Corp. 25,390 447,626Remy Cointreau SA 3,774 917,343Suntory Beverage & Food, Ltd. 23,059 835,035The Boston Beer Company, Inc.,
Class A (A) 2,494 1,259,719The Coca-Cola Company 483,938 28,653,969The Duckhorn Portfolio, Inc. (A) 4,702 109,745Treasury Wine Estates, Ltd. 119,815 1,080,292
134,329,322Food and staples retailing – 1.4%Aeon Company, Ltd. 108,578 2,558,769BJ’s Wholesale Club Holdings, Inc. (A) 58,408 3,911,584Carrefour SA 104,656 1,918,709Casey’s General Stores, Inc. 9,858 1,945,476Coles Group, Ltd. 221,410 2,888,976Cosmos Pharmaceutical Corp. 3,300 485,142Costco Wholesale Corp. 54,776 31,096,335Endeavour Group, Ltd. 222,630 1,092,524Etablissements Franz Colruyt NV 9,040 383,589Grocery Outlet Holding Corp. (A) 23,216 656,548HelloFresh SE (A) 27,416 2,101,109HF Foods Group, Inc. (A) 6,434 54,432ICA Gruppen AB 16,694 986,898Ingles Markets, Inc., Class A 2,277 196,596J Sainsbury PLC 290,261 1,084,985Jeronimo Martins SGPS SA 47,003 1,074,757Kesko OYJ, B Shares 45,335 1,511,051Kobe Bussan Company, Ltd. 22,700 878,887Koninklijke Ahold Delhaize NV 173,574 5,956,424Lawson, Inc. 8,289 393,308Ocado Group PLC (A) 80,993 1,842,699Performance Food Group Company (A) 65,600 3,010,384PriceSmart, Inc. 3,834 280,534Rite Aid Corp. (A)(C) 9,310 136,764Seven & i Holdings Company, Ltd. 125,029 5,499,775SpartanNash Company 5,997 154,483Sprouts Farmers Market, Inc. (A) 48,136 1,428,676Sysco Corp. 63,389 4,979,206Tesco PLC 1,283,334 5,052,580The Andersons, Inc. 5,240 202,840The Chefs’ Warehouse, Inc. (A) 5,176 172,361The Kroger Company 84,256 3,813,427Tsuruha Holdings, Inc. 6,598 633,532United Natural Foods, Inc. (A) 9,074 445,352
Strategic Equity Allocation Trust (continued)Shares orPrincipalAmount Value
COMMON STOCKS (continued)Food and staples retailing (continued)Village Super Market, Inc., Class A 1,739 $ 40,675Walgreens Boots Alliance, Inc. 88,959 4,640,101Walmart, Inc. 177,077 25,621,271Weis Markets, Inc. 2,684 176,822Welcia Holdings Company, Ltd. 15,700 490,358Woolworths Group, Ltd. 210,409 5,816,447
125,614,386Food products – 1.7%Ajinomoto Company, Inc. 77,496 2,359,142AppHarvest, Inc. (A)(C) 12,415 48,294Archer-Daniels-Midland Company 69,310 4,684,663Associated British Foods PLC 59,132 1,618,676B&G Foods, Inc. (C) 10,339 317,717Barry Callebaut AG 592 1,437,169Calavo Growers, Inc. 3,014 127,794Cal-Maine Foods, Inc. 5,603 207,255Campbell Soup Company 25,159 1,093,410Chocoladefabriken Lindt & Spruengli AG 18 2,412,984Chocoladefabriken Lindt & Spruengli AG,
Participation Certificates 176 2,437,325Conagra Brands, Inc. 59,517 2,032,506Danone SA 108,430 6,739,950Darling Ingredients, Inc. (A) 42,994 2,979,054Flowers Foods, Inc. 52,799 1,450,389Fresh Del Monte Produce, Inc. 5,620 155,112General Mills, Inc. 75,123 5,061,788Hormel Foods Corp. 34,927 1,704,787Hostess Brands, Inc. (A) 21,174 432,373Ingredion, Inc. 17,679 1,708,499J&J Snack Foods Corp. 2,366 373,733JDE Peet’s NV 16,663 515,752John B. Sanfilippo & Son, Inc. 1,455 131,183Kellogg Company 31,678 2,040,697Kerry Group PLC, Class A 25,244 3,256,871Kerry Group PLC, Class A (London
Stock Exchange) 1,204 154,216Kikkoman Corp. 24,146 2,033,360Lamb Weston Holdings, Inc. 17,981 1,139,636Lancaster Colony Corp. 8,305 1,375,308Landec Corp. (A) 5,408 60,029Limoneira Company 3,659 54,885McCormick & Company, Inc. 30,877 2,983,027MEIJI Holdings Company, Ltd. 20,300 1,211,783Mission Produce, Inc. (A) 5,860 92,002Mondelez International, Inc., Class A 173,201 11,484,958Mowi ASA 72,957 1,726,653Nestle SA 467,244 65,235,340Nisshin Seifun Group, Inc. 32,800 473,185Nissin Foods Holdings Company, Ltd. 10,575 771,799Orkla ASA 124,666 1,249,597Pilgrim’s Pride Corp. (A) 12,949 365,162Post Holdings, Inc. (A) 15,554 1,753,402Sanderson Farms, Inc. 8,896 1,699,848Seneca Foods Corp., Class A (A) 1,136 54,471Sovos Brands, Inc. (A) 2,718 40,906Tattooed Chef, Inc. (A) 7,579 117,778The Hain Celestial Group, Inc. (A) 24,679 1,051,572The Hershey Company 18,019 3,486,136The J.M. Smucker Company 13,425 1,823,384The Kraft Heinz Company 88,512 3,177,581The Simply Good Foods Company (A) 13,794 573,417Tootsie Roll Industries, Inc. 2,506 90,792Toyo Suisan Kaisha, Ltd. 14,750 625,376TreeHouse Foods, Inc. (A) 8,447 342,357Tyson Foods, Inc., Class A 36,530 3,183,955
John Hancock Variable Insurance TrustPortfolio of Investments — December 31, 2021 (showing percentage of total net assets)
The accompanying notes are an integral part of the financial statements. 144

Strategic Equity Allocation Trust (continued)Shares orPrincipalAmount Value
COMMON STOCKS (continued)Food products (continued)Utz Brands, Inc. 9,660 $ 154,077Vital Farms, Inc. (A) 4,707 85,008WH Group, Ltd. (B) 1,384,500 869,124Whole Earth Brands, Inc. (A) 6,899 74,095Wilmar International, Ltd. 318,903 981,447Yakult Honsha Company, Ltd. 21,303 1,111,361
157,034,150Household products – 1.0%Central Garden & Pet Company (A) 2,522 132,733Central Garden & Pet Company,
Class A (A) 5,521 264,180Church & Dwight Company, Inc. 30,425 3,118,563Colgate-Palmolive Company 104,518 8,919,566Energizer Holdings, Inc. 27,818 1,115,502Essity AB, B Shares 101,015 3,295,594Henkel AG & Company KGaA 17,248 1,344,501Kimberly-Clark Corp. 41,727 5,963,623Lion Corp. 37,200 497,291Oil-Dri Corp. of America 1,297 42,451Reckitt Benckiser Group PLC 118,548 10,205,040The Clorox Company 15,217 2,653,236The Procter & Gamble Company 300,778 49,201,265Unicharm Corp. 67,000 2,914,980WD-40 Company 2,188 535,272
90,203,797Personal products – 0.7%Beiersdorf AG 16,731 1,715,012BellRing Brands, Inc., Class A (A) 6,697 191,065Coty, Inc., Class A (A) 89,165 936,233Edgewell Personal Care Company 8,799 402,202elf Beauty, Inc. (A) 7,840 260,366Inter Parfums, Inc. 2,908 310,865Kao Corp. 78,875 4,131,023Kobayashi Pharmaceutical Company, Ltd. 8,900 700,052Kose Corp. 5,500 623,931L’Oreal SA 41,654 19,861,155Medifast, Inc. 1,876 392,891Nu Skin Enterprises, Inc., Class A 21,361 1,084,071Pola Orbis Holdings, Inc. 15,172 252,853Shiseido Company, Ltd. 66,360 3,701,990The Beauty Health Company (A) 14,059 339,665The Estee Lauder Companies, Inc.,
Class A 28,734 10,637,327The Honest Company, Inc. (A) 12,757 103,204Unilever PLC 430,749 23,108,154USANA Health Sciences, Inc. (A) 1,890 191,268Veru, Inc. (A) 10,866 64,001
69,007,328Tobacco – 0.6%22nd Century Group, Inc. (A)(C) 28,685 88,637Altria Group, Inc. 228,497 10,828,473British American Tobacco PLC 361,828 13,435,291Imperial Brands PLC 157,088 3,442,551Japan Tobacco, Inc. 199,166 4,021,548Philip Morris International, Inc. 193,116 18,346,020Swedish Match AB 262,254 2,081,951Turning Point Brands, Inc. 2,441 92,221Universal Corp. 3,720 204,302Vector Group, Ltd. 23,488 269,642
52,810,636628,999,619
Strategic Equity Allocation Trust (continued)Shares orPrincipalAmount Value
COMMON STOCKS (continued)Energy – 2.8%Energy equipment and services – 0.2%Archrock, Inc. 23,163 $ 173,259Aspen Aerogels, Inc. (A) 3,567 177,601Baker Hughes Company 109,738 2,640,296Bristow Group, Inc. (A) 3,646 115,469Cactus, Inc., Class A 8,874 338,366ChampionX Corp. (A) 86,865 1,755,542DMC Global, Inc. (A) 3,121 123,623Dril-Quip, Inc. (A) 6,049 119,044Expro Group Holdings NV (A) 6,353 91,166FTS International, Inc., Class A (A) 1,161 30,476Halliburton Company 110,340 2,523,476Helix Energy Solutions Group, Inc. (A) 25,850 80,652Helmerich & Payne, Inc. 17,052 404,132Liberty Oilfield Services, Inc., Class A (A) 15,506 150,408Nabors Industries, Ltd. (A) 1,263 102,417National Energy Services Reunited
Corp. (A) 6,472 61,160Newpark Resources, Inc. (A) 15,959 46,919NexTier Oilfield Solutions, Inc. (A) 30,851 109,521NOV, Inc. 103,810 1,406,626Oceaneering International, Inc. (A) 16,534 187,000Oil States International, Inc. (A) 11,965 59,466Patterson-UTI Energy, Inc. 30,891 261,029ProPetro Holding Corp. (A) 14,245 115,385RPC, Inc. (A) 12,911 58,616Schlumberger NV 173,278 5,189,676Select Energy Services, Inc., Class A (A) 12,222 76,143Tenaris SA 78,379 818,042TETRA Technologies, Inc. (A) 23,211 65,919Tidewater, Inc. (A) 7,583 81,214U.S. Silica Holdings, Inc. (A) 12,237 115,028
17,477,671Oil, gas and consumable fuels – 2.6%Aemetis, Inc. (A) 4,405 54,182Aker BP ASA 20,920 643,261Alto Ingredients, Inc. (A) 12,006 57,749Altus Midstream Company, Class A 493 30,226Ampol, Ltd. 39,554 854,087Antero Midstream Corp. 86,276 835,152Antero Resources Corp. (A) 46,466 813,155APA Corp. 46,840 1,259,528Arch Resources, Inc. 2,412 220,264Berry Corp. 11,684 98,379BP PLC 3,339,726 14,964,047Brigham Minerals, Inc., Class A 7,672 161,802California Resources Corp. 13,123 560,483Callon Petroleum Company (A)(C) 7,579 358,108Centennial Resource Development, Inc.,
Class A (A) 29,326 175,369Centrus Energy Corp., Class A (A) 1,615 80,605Chesapeake Energy Corp. 16,999 1,096,775Chevron Corp. 239,628 28,120,346Civitas Resources, Inc. 7,088 347,099Clean Energy Fuels Corp. (A) 25,258 154,832CNX Resources Corp. (A) 90,381 1,242,739Comstock Resources, Inc. (A) 15,406 124,635ConocoPhillips 163,821 11,824,600CONSOL Energy, Inc. (A) 5,650 128,312Coterra Energy, Inc. 100,664 1,912,616Crescent Energy, Inc., Class A (A) 5,363 68,003CVR Energy, Inc. 4,901 82,386Delek US Holdings, Inc. (A) 10,882 163,121Denbury, Inc. (A) 8,253 632,097Devon Energy Corp. 78,014 3,436,517
John Hancock Variable Insurance TrustPortfolio of Investments — December 31, 2021 (showing percentage of total net assets)
The accompanying notes are an integral part of the financial statements. 145

Strategic Equity Allocation Trust (continued)Shares orPrincipalAmount Value
COMMON STOCKS (continued)Oil, gas and consumable fuels (continued)DHT Holdings, Inc. 22,723 $ 117,932Diamondback Energy, Inc. 21,088 2,274,341Dorian LPG, Ltd. 4,865 61,737DT Midstream, Inc. 25,702 1,233,182ENEOS Holdings, Inc. 509,411 1,903,063Energy Fuels, Inc. (A) 24,177 184,471Eni SpA 418,931 5,822,208EOG Resources, Inc. 72,345 6,426,406EQT Corp. (A) 80,339 1,752,194Equinor ASA 162,217 4,295,390Equitrans Midstream Corp. 174,422 1,803,523Exxon Mobil Corp. 527,000 32,247,130Frontline, Ltd. (A)(C) 19,276 136,281Galp Energia SGPS SA 83,201 807,311Gevo, Inc. (A)(C) 32,204 137,833Golar LNG, Ltd. (A) 16,876 209,094Green Plains, Inc. (A) 7,800 271,128Hess Corp. 34,150 2,528,125HollyFrontier Corp. 39,722 1,302,087Idemitsu Kosan Company, Ltd. 34,586 882,626Inpex Corp. 169,941 1,477,738International Seaways, Inc. 7,862 115,414Kinder Morgan, Inc. 241,523 3,830,555Kosmos Energy, Ltd. (A) 69,640 240,954Laredo Petroleum, Inc. (A) 2,084 125,311Lundin Energy AB 33,221 1,188,739Magnolia Oil & Gas Corp., Class A 22,847 431,123Marathon Oil Corp. 97,689 1,604,053Marathon Petroleum Corp. 76,699 4,907,969Matador Resources Company 18,089 667,846Murphy Oil Corp. 62,536 1,632,815Neste OYJ 70,222 3,456,030Nordic American Tankers, Ltd. (C) 29,813 50,384Northern Oil and Gas, Inc. 8,641 177,832Oasis Petroleum, Inc. 3,159 398,002Occidental Petroleum Corp. 109,912 3,186,349OMV AG 24,444 1,382,375ONEOK, Inc. 55,221 3,244,786Ovintiv, Inc. 42,564 1,434,407Par Pacific Holdings, Inc. (A) 7,852 129,479PBF Energy, Inc., Class A (A) 15,890 206,093PDC Energy, Inc. 15,917 776,431Peabody Energy Corp. (A) 13,854 139,510Phillips 66 54,271 3,932,477Pioneer Natural Resources Company 28,113 5,113,192Range Resources Corp. (A) 38,844 692,589Ranger Oil Corp., Class A (A) 3,120 83,990Renewable Energy Group, Inc. (A) 7,267 308,411Repsol SA 240,847 2,852,381REX American Resources Corp. (A) 935 89,760Royal Dutch Shell PLC, A Shares 680,736 14,917,921Royal Dutch Shell PLC, B Shares 611,156 13,418,889Santos, Ltd. 516,775 2,380,509Scorpio Tankers, Inc. 7,930 101,583SFL Corp., Ltd. 17,209 140,253SM Energy Company 19,464 573,799Southwestern Energy Company (A) 161,095 750,703Talos Energy, Inc. (A) 6,791 66,552Targa Resources Corp. 60,839 3,178,229Teekay Tankers, Ltd., Class A (A) 4,002 43,622Tellurian, Inc. (A) 59,397 182,943The Williams Companies, Inc. 150,543 3,920,140TotalEnergies SE 416,355 21,192,556Uranium Energy Corp. (A) 39,695 132,978Ur-Energy, Inc. (A)(C) 30,865 37,655
Strategic Equity Allocation Trust (continued)Shares orPrincipalAmount Value
COMMON STOCKS (continued)Oil, gas and consumable fuels (continued)Valero Energy Corp. 50,657 $ 3,804,847W&T Offshore, Inc. (A) 15,862 51,234Washington H. Soul Pattinson &
Company, Ltd. 35,939 774,579Whiting Petroleum Corp. (A) 6,363 411,559Woodside Petroleum, Ltd. 159,939 2,549,741World Fuel Services Corp. 9,991 264,462
247,668,286265,145,957
Financials – 12.8%Banks – 5.6%1st Source Corp. 2,514 124,694ABN AMRO Bank NV (B) 70,212 1,032,095Allegiance Bancshares, Inc. 3,360 141,826Amalgamated Financial Corp. 2,860 47,962Amerant Bancorp, Inc. 3,716 128,388American National Bankshares, Inc. 2,209 83,235Ameris Bancorp 10,843 538,680Arrow Financial Corp. 2,651 93,395Associated Banc-Corp. 63,751 1,440,135Atlantic Capital Bancshares, Inc. (A) 3,573 102,795Atlantic Union Bankshares Corp. 12,304 458,816Australia & New Zealand Banking
Group, Ltd. 472,534 9,465,485Banc of California, Inc. 8,038 157,706BancFirst Corp. 2,513 177,317Banco Bilbao Vizcaya Argentaria SA 1,106,759 6,564,165Banco Espirito Santo SA (A) 625,609 188Banco Santander SA 2,878,257 9,558,911Bank First Corp. (C) 1,100 79,464Bank Hapoalim BM 188,555 1,940,600Bank Leumi Le-Israel BM 241,157 2,586,653Bank of America Corp. 894,707 39,805,514Bank of Hawaii Corp. 10,755 900,839Bank of Marin Bancorp 3,010 112,062Bank OZK 32,120 1,494,544BankUnited, Inc. 14,146 598,517Banner Corp. 5,242 318,032Bar Harbor Bankshares 3,156 91,303Barclays PLC 2,809,631 7,156,862Berkshire Hills Bancorp, Inc. 8,090 229,999Blue Ridge Bankshares, Inc. (C) 4,058 72,638BNP Paribas SA 186,702 12,908,768BOC Hong Kong Holdings, Ltd. 614,241 2,014,406Brookline Bancorp, Inc. 12,835 207,799Bryn Mawr Bank Corp. 3,181 143,177Business First Bancshares, Inc. 3,662 103,671Byline Bancorp, Inc. 4,268 116,730Cadence Bank 82,285 2,451,270CaixaBank SA 735,861 2,010,106Cambridge Bancorp 1,128 105,570Camden National Corp. 2,511 120,930Capital City Bank Group, Inc. 2,514 66,370Capstar Financial Holdings, Inc. 3,925 82,543Carter Bankshares, Inc. (A) 4,625 71,179Cathay General Bancorp 32,203 1,384,407CBTX, Inc. 3,044 88,276Central Pacific Financial Corp. 4,345 122,399CIT Group, Inc. 42,379 2,175,738Citigroup, Inc. 246,362 14,877,801Citizens & Northern Corp. 3,072 80,241Citizens Financial Group, Inc. 52,795 2,494,564City Holding Company 2,215 181,165Civista Bancshares, Inc. 3,360 81,984CNB Financial Corp. 3,429 90,869
John Hancock Variable Insurance TrustPortfolio of Investments — December 31, 2021 (showing percentage of total net assets)
The accompanying notes are an integral part of the financial statements. 146

Strategic Equity Allocation Trust (continued)Shares orPrincipalAmount Value
COMMON STOCKS (continued)Banks (continued)Coastal Financial Corp. (A) 1,761 $ 89,142Columbia Banking System, Inc. 11,763 384,885Comerica, Inc. 16,594 1,443,678Commerce Bancshares, Inc. 29,493 2,027,349Commerzbank AG (A) 166,297 1,258,132Commonwealth Bank of Australia 294,471 21,646,940Community Bank System, Inc. 8,455 629,728Community Trust Bancorp, Inc. 2,582 112,601Concordia Financial Group, Ltd. 180,746 656,388ConnectOne Bancorp, Inc. 6,131 200,545Credit Agricole SA 205,291 2,926,897CrossFirst Bankshares, Inc. (A) 8,530 133,153Cullen/Frost Bankers, Inc. 15,067 1,899,497Customers Bancorp, Inc. (A) 4,861 317,764CVB Financial Corp. 20,123 430,833Danske Bank A/S 114,488 1,976,520DBS Group Holdings, Ltd. 300,683 7,282,228Dime Community Bancshares, Inc. 5,701 200,447DNB Bank ASA 154,401 3,531,727Eagle Bancorp, Inc. 4,968 289,833East West Bancorp, Inc. 37,706 2,966,708Eastern Bankshares, Inc. 27,767 560,060Enterprise Financial Services Corp. 5,467 257,441Equity Bancshares, Inc., Class A 2,596 88,082Erste Group Bank AG 57,071 2,675,509Farmers National Banc Corp. 5,680 105,364FB Financial Corp. 5,281 231,413Fifth Third Bancorp 85,586 3,727,270Financial Institutions, Inc. 2,970 94,446FinecoBank Banca Fineco SpA 101,233 1,772,845First Bancorp (North Carolina) 4,556 208,300First Bancorp (Puerto Rico) 32,869 452,935First Busey Corp. 8,143 220,838First Commonwealth Financial Corp. 15,207 244,681First Community Bankshares, Inc. 3,153 105,373First Financial Bancorp 15,094 367,992First Financial Bankshares, Inc. 54,898 2,791,014First Financial Corp. 1,877 85,009First Foundation, Inc. 6,413 159,427First Horizon Corp. 143,681 2,346,311First Internet Bancorp 1,819 85,566First Interstate BancSystem, Inc., Class A 6,486 263,786First Merchants Corp. 8,620 361,092First Mid Bancshares, Inc. 2,910 124,519First Midwest Bancorp, Inc. 18,247 373,699First Republic Bank 22,568 4,660,518Flushing Financial Corp. 5,054 122,812FNB Corp. 84,741 1,027,908Fulton Financial Corp. 68,144 1,158,448German American Bancorp, Inc. 3,957 154,244Glacier Bancorp, Inc. 46,446 2,633,488Great Southern Bancorp, Inc. 1,649 97,703Great Western Bancorp, Inc. 8,682 294,841Guaranty Bancshares, Inc. 1,923 72,266Hancock Whitney Corp. 36,997 1,850,590Hang Seng Bank, Ltd. 126,890 2,323,554Hanmi Financial Corp. 5,128 121,431HarborOne Bancorp, Inc. 8,503 126,185Heartland Financial USA, Inc. 6,048 306,089Heritage Commerce Corp. 11,410 136,235Heritage Financial Corp. 5,946 145,320Hilltop Holdings, Inc. 9,783 343,775Home BancShares, Inc. 64,746 1,576,565HomeStreet, Inc. 3,252 169,104HomeTrust Bancshares, Inc. 3,035 94,024
Strategic Equity Allocation Trust (continued)Shares orPrincipalAmount Value
COMMON STOCKS (continued)Banks (continued)Hope Bancorp, Inc. 17,867 $ 262,824Horizon Bancorp, Inc. 7,703 160,608Howard Bancorp, Inc. (A) 2,845 61,993HSBC Holdings PLC 3,390,410 20,475,562Huntington Bancshares, Inc. 182,958 2,821,212Independent Bank Corp. (Massachusetts) 7,349 599,164Independent Bank Corp. (Michigan) 4,255 101,567Independent Bank Group, Inc. 6,150 443,723ING Groep NV 648,006 9,009,229International Bancshares Corp. 22,543 955,598Intesa Sanpaolo SpA 2,741,374 7,080,758Investors Bancorp, Inc. 36,451 552,233Israel Discount Bank, Ltd., Class A 193,207 1,297,243Japan Post Bank Company, Ltd. 67,200 615,998JPMorgan Chase & Co. 367,022 58,117,934KBC Group NV 41,499 3,565,645KeyCorp 112,071 2,592,202Lakeland Bancorp, Inc. 8,280 157,237Lakeland Financial Corp. 3,792 303,891Live Oak Bancshares, Inc. 5,204 454,257Lloyds Banking Group PLC 11,781,272 7,650,656M&T Bank Corp. 15,944 2,448,680Macatawa Bank Corp. 8,041 70,922Mediobanca Banca di Credito
Finanziario SpA 103,093 1,183,557Mercantile Bank Corp. 2,922 102,358Meta Financial Group, Inc. 5,144 306,891Metrocity Bankshares, Inc. 3,506 96,520Metropolitan Bank Holding Corp. (A) 1,239 131,991Mid Penn Bancorp, Inc. 3,097 98,299Midland States Bancorp, Inc. 4,246 105,258MidWestOne Financial Group, Inc. 3,009 97,401Mitsubishi UFJ Financial Group, Inc. 2,028,968 11,042,201Mizrahi Tefahot Bank, Ltd. 23,333 898,568Mizuho Financial Group, Inc. 400,450 5,086,216MVB Financial Corp. 1,886 78,307National Australia Bank, Ltd. 546,592 11,476,848National Bank Holdings Corp., Class A 4,417 194,083NatWest Group PLC 956,053 2,927,735NBT Bancorp, Inc. 6,453 248,570Nicolet Bankshares, Inc. (A) 1,825 156,494Nordea Bank ABP (Nasdaq
Stockholm Exchange) 537,781 6,560,146Northrim BanCorp, Inc. 1,390 60,409OceanFirst Financial Corp. 9,432 209,390OFG Bancorp 8,218 218,270Old National Bancorp 25,602 463,908Old Second Bancorp, Inc. 5,210 65,594Origin Bancorp, Inc. 3,774 161,980Orrstown Financial Services, Inc. 3,151 79,405Oversea-Chinese Banking Corp., Ltd. 562,024 4,756,829Pacific Premier Bancorp, Inc. 15,339 614,020PacWest Bancorp 31,156 1,407,317Park National Corp. 2,217 304,416Peapack-Gladstone Financial Corp. 3,279 116,077Peoples Bancorp, Inc. 4,066 129,339Peoples Financial Services Corp. 1,618 85,252People’s United Financial, Inc. 53,028 944,959Pinnacle Financial Partners, Inc. 20,230 1,931,965Preferred Bank 2,282 163,825Primis Financial Corp. 5,269 79,246Prosperity Bancshares, Inc. 24,489 1,770,555QCR Holdings, Inc. 2,518 141,008Raiffeisen Bank International AG 24,569 721,604RBB Bancorp 2,891 75,744
John Hancock Variable Insurance TrustPortfolio of Investments — December 31, 2021 (showing percentage of total net assets)
The accompanying notes are an integral part of the financial statements. 147
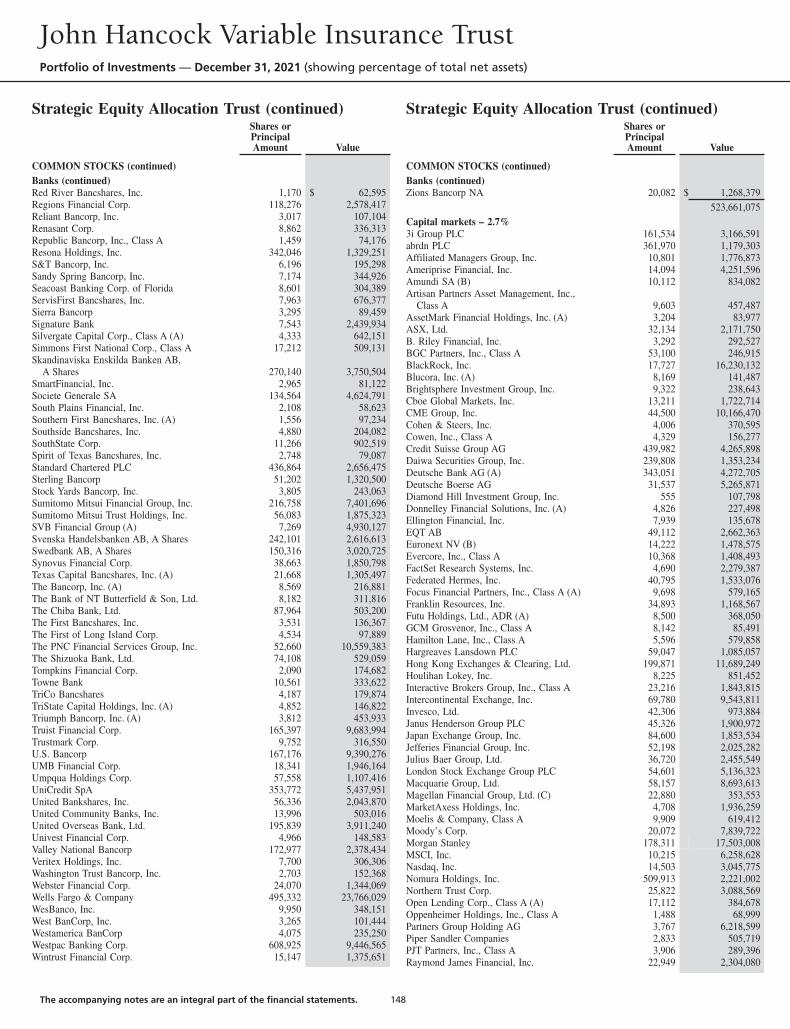
Strategic Equity Allocation Trust (continued)Shares orPrincipalAmount Value
COMMON STOCKS (continued)Banks (continued)Red River Bancshares, Inc. 1,170 $ 62,595Regions Financial Corp. 118,276 2,578,417Reliant Bancorp, Inc. 3,017 107,104Renasant Corp. 8,862 336,313Republic Bancorp, Inc., Class A 1,459 74,176Resona Holdings, Inc. 342,046 1,329,251S&T Bancorp, Inc. 6,196 195,298Sandy Spring Bancorp, Inc. 7,174 344,926Seacoast Banking Corp. of Florida 8,601 304,389ServisFirst Bancshares, Inc. 7,963 676,377Sierra Bancorp 3,295 89,459Signature Bank 7,543 2,439,934Silvergate Capital Corp., Class A (A) 4,333 642,151Simmons First National Corp., Class A 17,212 509,131Skandinaviska Enskilda Banken AB,
A Shares 270,140 3,750,504SmartFinancial, Inc. 2,965 81,122Societe Generale SA 134,564 4,624,791South Plains Financial, Inc. 2,108 58,623Southern First Bancshares, Inc. (A) 1,556 97,234Southside Bancshares, Inc. 4,880 204,082SouthState Corp. 11,266 902,519Spirit of Texas Bancshares, Inc. 2,748 79,087Standard Chartered PLC 436,864 2,656,475Sterling Bancorp 51,202 1,320,500Stock Yards Bancorp, Inc. 3,805 243,063Sumitomo Mitsui Financial Group, Inc. 216,758 7,401,696Sumitomo Mitsui Trust Holdings, Inc. 56,083 1,875,323SVB Financial Group (A) 7,269 4,930,127Svenska Handelsbanken AB, A Shares 242,101 2,616,613Swedbank AB, A Shares 150,316 3,020,725Synovus Financial Corp. 38,663 1,850,798Texas Capital Bancshares, Inc. (A) 21,668 1,305,497The Bancorp, Inc. (A) 8,569 216,881The Bank of NT Butterfield & Son, Ltd. 8,182 311,816The Chiba Bank, Ltd. 87,964 503,200The First Bancshares, Inc. 3,531 136,367The First of Long Island Corp. 4,534 97,889The PNC Financial Services Group, Inc. 52,660 10,559,383The Shizuoka Bank, Ltd. 74,108 529,059Tompkins Financial Corp. 2,090 174,682Towne Bank 10,561 333,622TriCo Bancshares 4,187 179,874TriState Capital Holdings, Inc. (A) 4,852 146,822Triumph Bancorp, Inc. (A) 3,812 453,933Truist Financial Corp. 165,397 9,683,994Trustmark Corp. 9,752 316,550U.S. Bancorp 167,176 9,390,276UMB Financial Corp. 18,341 1,946,164Umpqua Holdings Corp. 57,558 1,107,416UniCredit SpA 353,772 5,437,951United Bankshares, Inc. 56,336 2,043,870United Community Banks, Inc. 13,996 503,016United Overseas Bank, Ltd. 195,839 3,911,240Univest Financial Corp. 4,966 148,583Valley National Bancorp 172,977 2,378,434Veritex Holdings, Inc. 7,700 306,306Washington Trust Bancorp, Inc. 2,703 152,368Webster Financial Corp. 24,070 1,344,069Wells Fargo & Company 495,332 23,766,029WesBanco, Inc. 9,950 348,151West BanCorp, Inc. 3,265 101,444Westamerica BanCorp 4,075 235,250Westpac Banking Corp. 608,925 9,446,565Wintrust Financial Corp. 15,147 1,375,651
Strategic Equity Allocation Trust (continued)Shares orPrincipalAmount Value
COMMON STOCKS (continued)Banks (continued)Zions Bancorp NA 20,082 $ 1,268,379
523,661,075Capital markets – 2.7%3i Group PLC 161,534 3,166,591abrdn PLC 361,970 1,179,303Affiliated Managers Group, Inc. 10,801 1,776,873Ameriprise Financial, Inc. 14,094 4,251,596Amundi SA (B) 10,112 834,082Artisan Partners Asset Management, Inc.,
Class A 9,603 457,487AssetMark Financial Holdings, Inc. (A) 3,204 83,977ASX, Ltd. 32,134 2,171,750B. Riley Financial, Inc. 3,292 292,527BGC Partners, Inc., Class A 53,100 246,915BlackRock, Inc. 17,727 16,230,132Blucora, Inc. (A) 8,169 141,487Brightsphere Investment Group, Inc. 9,322 238,643Cboe Global Markets, Inc. 13,211 1,722,714CME Group, Inc. 44,500 10,166,470Cohen & Steers, Inc. 4,006 370,595Cowen, Inc., Class A 4,329 156,277Credit Suisse Group AG 439,982 4,265,898Daiwa Securities Group, Inc. 239,808 1,353,234Deutsche Bank AG (A) 343,051 4,272,705Deutsche Boerse AG 31,537 5,265,871Diamond Hill Investment Group, Inc. 555 107,798Donnelley Financial Solutions, Inc. (A) 4,826 227,498Ellington Financial, Inc. 7,939 135,678EQT AB 49,112 2,662,363Euronext NV (B) 14,222 1,478,575Evercore, Inc., Class A 10,368 1,408,493FactSet Research Systems, Inc. 4,690 2,279,387Federated Hermes, Inc. 40,795 1,533,076Focus Financial Partners, Inc., Class A (A) 9,698 579,165Franklin Resources, Inc. 34,893 1,168,567Futu Holdings, Ltd., ADR (A) 8,500 368,050GCM Grosvenor, Inc., Class A 8,142 85,491Hamilton Lane, Inc., Class A 5,596 579,858Hargreaves Lansdown PLC 59,047 1,085,057Hong Kong Exchanges & Clearing, Ltd. 199,871 11,689,249Houlihan Lokey, Inc. 8,225 851,452Interactive Brokers Group, Inc., Class A 23,216 1,843,815Intercontinental Exchange, Inc. 69,780 9,543,811Invesco, Ltd. 42,306 973,884Janus Henderson Group PLC 45,326 1,900,972Japan Exchange Group, Inc. 84,600 1,853,534Jefferies Financial Group, Inc. 52,198 2,025,282Julius Baer Group, Ltd. 36,720 2,455,549London Stock Exchange Group PLC 54,601 5,136,323Macquarie Group, Ltd. 58,157 8,693,613Magellan Financial Group, Ltd. (C) 22,880 353,553MarketAxess Holdings, Inc. 4,708 1,936,259Moelis & Company, Class A 9,909 619,412Moody’s Corp. 20,072 7,839,722Morgan Stanley 178,311 17,503,008MSCI, Inc. 10,215 6,258,628Nasdaq, Inc. 14,503 3,045,775Nomura Holdings, Inc. 509,913 2,221,002Northern Trust Corp. 25,822 3,088,569Open Lending Corp., Class A (A) 17,112 384,678Oppenheimer Holdings, Inc., Class A 1,488 68,999Partners Group Holding AG 3,767 6,218,599Piper Sandler Companies 2,833 505,719PJT Partners, Inc., Class A 3,906 289,396Raymond James Financial, Inc. 22,949 2,304,080
John Hancock Variable Insurance TrustPortfolio of Investments — December 31, 2021 (showing percentage of total net assets)
The accompanying notes are an integral part of the financial statements. 148
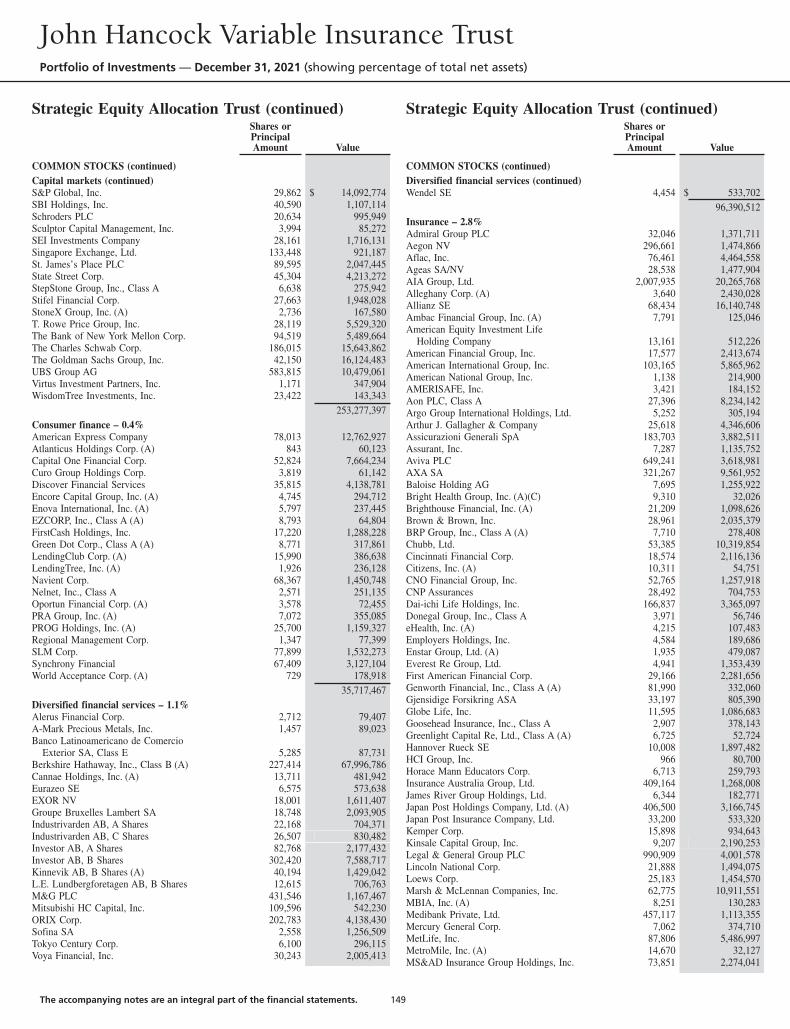
Strategic Equity Allocation Trust (continued)Shares orPrincipalAmount Value
COMMON STOCKS (continued)Capital markets (continued)S&P Global, Inc. 29,862 $ 14,092,774SBI Holdings, Inc. 40,590 1,107,114Schroders PLC 20,634 995,949Sculptor Capital Management, Inc. 3,994 85,272SEI Investments Company 28,161 1,716,131Singapore Exchange, Ltd. 133,448 921,187St. James’s Place PLC 89,595 2,047,445State Street Corp. 45,304 4,213,272StepStone Group, Inc., Class A 6,638 275,942Stifel Financial Corp. 27,663 1,948,028StoneX Group, Inc. (A) 2,736 167,580T. Rowe Price Group, Inc. 28,119 5,529,320The Bank of New York Mellon Corp. 94,519 5,489,664The Charles Schwab Corp. 186,015 15,643,862The Goldman Sachs Group, Inc. 42,150 16,124,483UBS Group AG 583,815 10,479,061Virtus Investment Partners, Inc. 1,171 347,904WisdomTree Investments, Inc. 23,422 143,343
253,277,397Consumer finance – 0.4%American Express Company 78,013 12,762,927Atlanticus Holdings Corp. (A) 843 60,123Capital One Financial Corp. 52,824 7,664,234Curo Group Holdings Corp. 3,819 61,142Discover Financial Services 35,815 4,138,781Encore Capital Group, Inc. (A) 4,745 294,712Enova International, Inc. (A) 5,797 237,445EZCORP, Inc., Class A (A) 8,793 64,804FirstCash Holdings, Inc. 17,220 1,288,228Green Dot Corp., Class A (A) 8,771 317,861LendingClub Corp. (A) 15,990 386,638LendingTree, Inc. (A) 1,926 236,128Navient Corp. 68,367 1,450,748Nelnet, Inc., Class A 2,571 251,135Oportun Financial Corp. (A) 3,578 72,455PRA Group, Inc. (A) 7,072 355,085PROG Holdings, Inc. (A) 25,700 1,159,327Regional Management Corp. 1,347 77,399SLM Corp. 77,899 1,532,273Synchrony Financial 67,409 3,127,104World Acceptance Corp. (A) 729 178,918
35,717,467Diversified financial services – 1.1%Alerus Financial Corp. 2,712 79,407A-Mark Precious Metals, Inc. 1,457 89,023Banco Latinoamericano de Comercio
Exterior SA, Class E 5,285 87,731Berkshire Hathaway, Inc., Class B (A) 227,414 67,996,786Cannae Holdings, Inc. (A) 13,711 481,942Eurazeo SE 6,575 573,638EXOR NV 18,001 1,611,407Groupe Bruxelles Lambert SA 18,748 2,093,905Industrivarden AB, A Shares 22,168 704,371Industrivarden AB, C Shares 26,507 830,482Investor AB, A Shares 82,768 2,177,432Investor AB, B Shares 302,420 7,588,717Kinnevik AB, B Shares (A) 40,194 1,429,042L.E. Lundbergforetagen AB, B Shares 12,615 706,763M&G PLC 431,546 1,167,467Mitsubishi HC Capital, Inc. 109,596 542,230ORIX Corp. 202,783 4,138,430Sofina SA 2,558 1,256,509Tokyo Century Corp. 6,100 296,115Voya Financial, Inc. 30,243 2,005,413
Strategic Equity Allocation Trust (continued)Shares orPrincipalAmount Value
COMMON STOCKS (continued)Diversified financial services (continued)Wendel SE 4,454 $ 533,702
96,390,512Insurance – 2.8%Admiral Group PLC 32,046 1,371,711Aegon NV 296,661 1,474,866Aflac, Inc. 76,461 4,464,558Ageas SA/NV 28,538 1,477,904AIA Group, Ltd. 2,007,935 20,265,768Alleghany Corp. (A) 3,640 2,430,028Allianz SE 68,434 16,140,748Ambac Financial Group, Inc. (A) 7,791 125,046American Equity Investment Life
Holding Company 13,161 512,226American Financial Group, Inc. 17,577 2,413,674American International Group, Inc. 103,165 5,865,962American National Group, Inc. 1,138 214,900AMERISAFE, Inc. 3,421 184,152Aon PLC, Class A 27,396 8,234,142Argo Group International Holdings, Ltd. 5,252 305,194Arthur J. Gallagher & Company 25,618 4,346,606Assicurazioni Generali SpA 183,703 3,882,511Assurant, Inc. 7,287 1,135,752Aviva PLC 649,241 3,618,981AXA SA 321,267 9,561,952Baloise Holding AG 7,695 1,255,922Bright Health Group, Inc. (A)(C) 9,310 32,026Brighthouse Financial, Inc. (A) 21,209 1,098,626Brown & Brown, Inc. 28,961 2,035,379BRP Group, Inc., Class A (A) 7,710 278,408Chubb, Ltd. 53,385 10,319,854Cincinnati Financial Corp. 18,574 2,116,136Citizens, Inc. (A) 10,311 54,751CNO Financial Group, Inc. 52,765 1,257,918CNP Assurances 28,492 704,753Dai-ichi Life Holdings, Inc. 166,837 3,365,097Donegal Group, Inc., Class A 3,971 56,746eHealth, Inc. (A) 4,215 107,483Employers Holdings, Inc. 4,584 189,686Enstar Group, Ltd. (A) 1,935 479,087Everest Re Group, Ltd. 4,941 1,353,439First American Financial Corp. 29,166 2,281,656Genworth Financial, Inc., Class A (A) 81,990 332,060Gjensidige Forsikring ASA 33,197 805,390Globe Life, Inc. 11,595 1,086,683Goosehead Insurance, Inc., Class A 2,907 378,143Greenlight Capital Re, Ltd., Class A (A) 6,725 52,724Hannover Rueck SE 10,008 1,897,482HCI Group, Inc. 966 80,700Horace Mann Educators Corp. 6,713 259,793Insurance Australia Group, Ltd. 409,164 1,268,008James River Group Holdings, Ltd. 6,344 182,771Japan Post Holdings Company, Ltd. (A) 406,500 3,166,745Japan Post Insurance Company, Ltd. 33,200 533,320Kemper Corp. 15,898 934,643Kinsale Capital Group, Inc. 9,207 2,190,253Legal & General Group PLC 990,909 4,001,578Lincoln National Corp. 21,888 1,494,075Loews Corp. 25,183 1,454,570Marsh & McLennan Companies, Inc. 62,775 10,911,551MBIA, Inc. (A) 8,251 130,283Medibank Private, Ltd. 457,117 1,113,355Mercury General Corp. 7,062 374,710MetLife, Inc. 87,806 5,486,997MetroMile, Inc. (A) 14,670 32,127MS&AD Insurance Group Holdings, Inc. 73,851 2,274,041
John Hancock Variable Insurance TrustPortfolio of Investments — December 31, 2021 (showing percentage of total net assets)
The accompanying notes are an integral part of the financial statements. 149

Strategic Equity Allocation Trust (continued)Shares orPrincipalAmount Value
COMMON STOCKS (continued)Insurance (continued)Muenchener
Rueckversicherungs-Gesellschaft AG 23,254 $ 6,864,782National Western Life Group, Inc., Class A 414 88,778NN Group NV 44,849 2,425,446Old Republic International Corp. 75,864 1,864,737Palomar Holdings, Inc. (A) 4,071 263,679Phoenix Group Holdings PLC 107,832 954,530Poste Italiane SpA (B) 86,718 1,136,029Primerica, Inc. 10,493 1,608,262Principal Financial Group, Inc. 30,929 2,237,095ProAssurance Corp. 8,850 223,905Prudential Financial, Inc. 46,538 5,037,273Prudential PLC 434,149 7,507,671QBE Insurance Group, Ltd. 244,853 2,021,931Reinsurance Group of America, Inc. 17,962 1,966,659RenaissanceRe Holdings, Ltd. 12,228 2,070,567RLI Corp. 17,049 1,911,193Safety Insurance Group, Inc. 2,405 204,497Sampo OYJ, A Shares 82,781 4,143,025Selective Insurance Group, Inc. 25,578 2,095,861Selectquote, Inc. (A) 22,083 200,072SiriusPoint, Ltd. (A) 15,494 125,966Sompo Holdings, Inc. 52,691 2,222,174State Auto Financial Corp. 2,805 144,990Stewart Information Services Corp. 4,373 348,659Suncorp Group, Ltd. 212,951 1,714,485Swiss Life Holding AG 5,233 3,197,242Swiss Re AG 50,065 4,942,089T&D Holdings, Inc. 89,325 1,141,195The Allstate Corp. 35,328 4,156,339The Hanover Insurance Group, Inc. 9,454 1,239,041The Hartford Financial Services
Group, Inc. 43,019 2,970,032The Progressive Corp. 72,507 7,442,844The Travelers Companies, Inc. 30,914 4,835,877Tiptree, Inc. 4,340 60,022Tokio Marine Holdings, Inc. 104,185 5,799,941Trupanion, Inc. (A) 6,204 819,114Tryg A/S 59,764 1,474,833United Fire Group, Inc. 3,987 92,459Universal Insurance Holdings, Inc. 5,402 91,834Unum Group 54,325 1,334,765W.R. Berkley Corp. 17,378 1,431,773Willis Towers Watson PLC 15,356 3,646,896Zurich Insurance Group AG 24,974 10,940,585
260,454,797Mortgage real estate investment trusts – 0.1%AFC Gamma, Inc. 2,135 48,593Apollo Commercial Real Estate
Finance, Inc. 22,216 292,363Arbor Realty Trust, Inc. 22,150 405,788Ares Commercial Real Estate Corp. 7,715 112,176ARMOUR Residential REIT, Inc. 12,476 122,390Blackstone Mortgage Trust, Inc., Class A 23,816 729,246BrightSpire Capital, Inc. 14,029 143,938Broadmark Realty Capital, Inc. 20,742 195,597Chimera Investment Corp. 37,974 572,648Dynex Capital, Inc. 5,815 97,169Franklin BSP Realty Trust, Inc. 5,603 83,709Granite Point Mortgage Trust, Inc. 9,585 112,240Great Ajax Corp. 4,706 61,931Hannon Armstrong Sustainable
Infrastructure Capital, Inc. 12,522 665,169Invesco Mortgage Capital, Inc. 47,216 131,260KKR Real Estate Finance Trust, Inc. 4,800 99,984
Strategic Equity Allocation Trust (continued)Shares orPrincipalAmount Value
COMMON STOCKS (continued)Mortgage real estate investment trusts (continued)Ladder Capital Corp. 18,253 $ 218,853MFA Financial, Inc. 71,293 325,096New York Mortgage Trust, Inc. 61,697 229,513Orchid Island Capital, Inc. 19,186 86,337PennyMac Mortgage Investment Trust 15,638 271,007Ready Capital Corp. 9,956 155,612Redwood Trust, Inc. 18,075 238,409TPG RE Finance Trust, Inc. 10,158 125,147Two Harbors Investment Corp. 49,989 288,437
5,812,612Thrifts and mortgage finance – 0.1%Axos Financial, Inc. (A) 9,166 512,471Blue Foundry Bancorp (A) 6,081 88,965Bridgewater Bancshares, Inc. (A) 4,471 79,092Capitol Federal Financial, Inc. 19,721 223,439Columbia Financial, Inc. (A) 5,785 120,675Essent Group, Ltd. 46,934 2,136,905Federal Agricultural Mortgage Corp.,
Class C 1,500 185,895Flagstar Bancorp, Inc. 8,058 386,301FS Bancorp, Inc. 1,806 60,736Home Bancorp, Inc. 1,546 64,174Kearny Financial Corp. 11,746 155,635Merchants Bancorp 1,574 74,497MGIC Investment Corp. 86,510 1,247,474Mr. Cooper Group, Inc. (A) 10,002 416,183New York Community Bancorp, Inc. 123,557 1,508,631NMI Holdings, Inc., Class A (A) 13,803 301,596Northfield Bancorp, Inc. 7,687 124,222Northwest Bancshares, Inc. 18,889 267,468Ocwen Financial Corp. (A) 1,152 46,045PCSB Financial Corp. 3,732 71,057PennyMac Financial Services, Inc. 4,942 344,853Premier Financial Corp. 6,055 187,160Provident Bancorp, Inc. 4,067 75,646Provident Financial Services, Inc. 11,846 286,910Radian Group, Inc. 29,141 615,749Southern Missouri Bancorp, Inc. 1,300 67,821The Hingham Institution for Savings 231 96,992TrustCo Bank Corp. NY 3,179 105,892Walker & Dunlop, Inc. 4,733 714,115Washington Federal, Inc. 27,497 917,850Waterstone Financial, Inc. 3,587 78,412WSFS Financial Corp. 7,543 378,055
11,940,9161,187,254,776
Health care – 12.7%Biotechnology – 1.8%2seventy bio, Inc. (A) 3,795 97,2664D Molecular Therapeutics, Inc. (A) 4,413 96,821AbbVie, Inc. 220,109 29,802,759ACADIA Pharmaceuticals, Inc. (A) 19,684 459,425Achillion Pharmaceuticals, Inc. (A)(D) 23,194 34,879Adagio Therapeutics, Inc. (A)(C) 3,685 26,753Adicet Bio, Inc. (A) 3,340 58,417Aduro Biotech, Inc. (A)(D) 2,435 7,305Aeglea BioTherapeutics, Inc. (A) 8,650 41,088Affimed NV (A) 19,988 110,334Agenus, Inc. (A) 35,358 113,853Agios Pharmaceuticals, Inc. (A) 9,018 296,422Akebia Therapeutics, Inc. (A) 31,205 70,523Akero Therapeutics, Inc. (A) 4,357 92,151Akouos, Inc. (A) 5,120 43,520Albireo Pharma, Inc. (A) 3,208 74,714
John Hancock Variable Insurance TrustPortfolio of Investments — December 31, 2021 (showing percentage of total net assets)
The accompanying notes are an integral part of the financial statements. 150

Strategic Equity Allocation Trust (continued)Shares orPrincipalAmount Value
COMMON STOCKS (continued)Biotechnology (continued)Alder Biopharmaceuticals, Inc. (A)(D) 13,115 $ 19,068Aldeyra Therapeutics, Inc. (A) 9,195 36,780Alector, Inc. (A) 9,583 197,889Aligos Therapeutics, Inc. (A) 4,000 47,480Alkermes PLC (A) 25,988 604,481Allakos, Inc. (A) 5,722 56,018Allogene Therapeutics, Inc. (A) 11,332 169,073Allovir, Inc. (A) 4,923 63,704Altimmune, Inc. (A)(C) 7,006 64,175ALX Oncology Holdings, Inc. (A) 3,066 65,888Amgen, Inc. 69,684 15,676,809Amicus Therapeutics, Inc. (A) 43,201 498,972AnaptysBio, Inc. (A) 3,126 108,629Anavex Life Sciences Corp. (A) 10,450 181,203Anika Therapeutics, Inc. (A) 2,618 93,803Annexon, Inc. (A) 5,710 65,608Apellis Pharmaceuticals, Inc. (A) 11,463 541,971Applied Molecular Transport, Inc. (A) 4,373 61,135Applied Therapeutics, Inc. (A) 3,659 32,748Arbutus Biopharma Corp. (A) 13,440 52,282Arcturus Therapeutics Holdings, Inc. (A) 3,535 130,830Arcus Biosciences, Inc. (A) 7,306 295,674Arcutis Biotherapeutics, Inc. (A) 4,931 102,269Arena Pharmaceuticals, Inc. (A) 10,024 931,631Argenx SE (A) 7,609 2,705,821Arrowhead Pharmaceuticals, Inc. (A) 44,138 2,926,349Atara Biotherapeutics, Inc. (A) 13,967 220,120Athenex, Inc. (A) 17,526 23,835Athersys, Inc. (A) 44,149 39,849Atossa Therapeutics, Inc. (A) 21,617 34,587Avid Bioservices, Inc. (A) 9,867 287,919Avidity Biosciences, Inc. (A) 6,257 148,729Avita Medical, Inc. (A) 4,764 57,073Avrobio, Inc. (A) 8,115 31,243Beam Therapeutics, Inc. (A) 8,194 652,980BioAtla, Inc. (A) 2,812 55,200BioCryst Pharmaceuticals, Inc. (A) 29,173 404,046Biogen, Inc. (A) 18,466 4,430,363Biohaven Pharmaceutical Holding
Company, Ltd. (A) 9,034 1,244,976Bioxcel Therapeutics, Inc. (A) 3,104 63,104Bluebird Bio, Inc. (A) 11,796 117,842Blueprint Medicines Corp. (A) 9,494 1,016,902Bridgebio Pharma, Inc. (A)(C) 17,342 289,265Brooklyn ImmunoTherapeutics, Inc. (A) 5,482 22,860C4 Therapeutics, Inc. (A) 6,292 202,602Cardiff Oncology, Inc. (A)(C) 7,567 45,478CareDx, Inc. (A) 8,292 377,120Caribou Biosciences, Inc. (A) 3,327 50,204Catalyst Pharmaceuticals, Inc. (A) 16,563 112,132Celldex Therapeutics, Inc. (A) 7,522 290,650CEL-SCI Corp. (A) 6,481 46,015Century Therapeutics, Inc. (A) 2,219 35,193Cerevel Therapeutics Holdings, Inc. (A) 6,571 213,032ChemoCentryx, Inc. (A) 8,840 321,864Chimerix, Inc. (A) 12,884 82,844Chinook Therapeutics, Inc. (A) 6,311 102,932Clovis Oncology, Inc. (A)(C) 20,138 54,574Codiak Biosciences, Inc. (A) 3,136 34,935Cogent Biosciences, Inc. (A) 6,489 55,676Coherus Biosciences, Inc. (A) 10,519 167,883Cortexyme, Inc. (A)(C) 3,371 42,542Crinetics Pharmaceuticals, Inc. (A) 7,085 201,285CSL, Ltd. 75,544 15,977,573Cue Biopharma, Inc. (A) 5,251 59,389
Strategic Equity Allocation Trust (continued)Shares orPrincipalAmount Value
COMMON STOCKS (continued)Biotechnology (continued)Cullinan Oncology, Inc. (A)(C) 4,570 $ 70,515Curis, Inc. (A) 14,952 71,172Cytokinetics, Inc. (A) 12,858 586,068CytomX Therapeutics, Inc. (A) 11,441 49,540Day One Biopharmaceuticals, Inc. (A) 1,622 27,331Deciphera Pharmaceuticals, Inc. (A) 6,895 67,364Denali Therapeutics, Inc. (A) 14,833 661,552DermTech, Inc. (A)(C) 4,174 65,949Design Therapeutics, Inc. (A) 4,060 86,925Dynavax Technologies Corp. (A) 17,616 247,857Dyne Therapeutics, Inc. (A) 5,607 66,667Eagle Pharmaceuticals, Inc. (A) 1,928 98,174Editas Medicine, Inc. (A) 11,185 296,962Eiger BioPharmaceuticals, Inc. (A) 6,247 32,422Emergent BioSolutions, Inc. (A) 8,054 350,107Enanta Pharmaceuticals, Inc. (A) 3,140 234,809Epizyme, Inc. (A) 17,043 42,608Erasca, Inc. (A)(C) 3,740 58,269Evelo Biosciences, Inc. (A)(C) 5,203 31,582Exelixis, Inc. (A) 84,069 1,536,781Fate Therapeutics, Inc. (A) 13,195 772,039FibroGen, Inc. (A) 14,447 203,703Foghorn Therapeutics, Inc. (A) 3,154 72,132Forma Therapeutics Holdings, Inc. (A) 6,051 86,045Fortress Biotech, Inc. (A) 15,632 39,080G1 Therapeutics, Inc. (A)(C) 7,095 72,440Generation Bio Company (A) 7,224 51,146Genmab A/S (A) 10,902 4,351,566Geron Corp. (A) 52,665 64,251Gilead Sciences, Inc. 155,357 11,280,472Global Blood Therapeutics, Inc. (A) 9,863 288,690Gossamer Bio, Inc. (A) 10,416 117,805Graphite Bio, Inc. (A)(C) 3,031 37,675Grifols SA 49,511 952,723Gritstone bio, Inc. (A)(C) 7,168 92,180Halozyme Therapeutics, Inc. (A) 59,911 2,409,021Heron Therapeutics, Inc. (A)(C) 15,512 141,625Homology Medicines, Inc. (A) 8,526 31,035Humanigen, Inc. (A) 8,493 31,594iBio, Inc. (A)(C) 48,290 26,511Icosavax, Inc. (A) 2,339 53,516Ideaya Biosciences, Inc. (A) 5,598 132,337IGM Biosciences, Inc. (A)(C) 1,362 39,947Imago Biosciences, Inc. (A)(C) 1,498 35,518Immuneering Corp., Class A (A) 1,294 20,924Immunic, Inc. (A) 3,145 30,098ImmunityBio, Inc. (A)(C) 11,905 72,382ImmunoGen, Inc. (A) 32,837 243,651Immunovant, Inc. (A) 7,609 64,829Incyte Corp. (A) 23,259 1,707,211Infinity Pharmaceuticals, Inc. (A) 16,691 37,555Inhibrx, Inc. (A) 4,614 201,493Inovio Pharmaceuticals, Inc. (A)(C) 33,771 168,517Insmed, Inc. (A) 18,844 513,311Instil Bio, Inc. (A) 8,367 143,159Intellia Therapeutics, Inc. (A) 11,236 1,328,545Intercept Pharmaceuticals, Inc. (A)(C) 4,586 74,706Invitae Corp. (A) 32,759 500,230Ironwood Pharmaceuticals, Inc. (A) 23,772 277,182iTeos Therapeutics, Inc. (A) 3,410 158,770IVERIC bio, Inc. (A) 18,385 307,397Janux Therapeutics, Inc. (A)(C) 2,423 47,806Jounce Therapeutics, Inc. (A) 6,009 50,175KalVista Pharmaceuticals, Inc. (A) 3,810 50,406Karuna Therapeutics, Inc. (A) 3,620 474,220
John Hancock Variable Insurance TrustPortfolio of Investments — December 31, 2021 (showing percentage of total net assets)
The accompanying notes are an integral part of the financial statements. 151

Strategic Equity Allocation Trust (continued)Shares orPrincipalAmount Value
COMMON STOCKS (continued)Biotechnology (continued)Karyopharm Therapeutics, Inc. (A) 12,947 $ 83,249Keros Therapeutics, Inc. (A) 2,596 151,892Kezar Life Sciences, Inc. (A) 5,468 91,425Kiniksa Pharmaceuticals, Ltd., Class A (A) 5,141 60,510Kinnate Biopharma, Inc. (A) 4,671 82,770Kodiak Sciences, Inc. (A) 5,479 464,510Kronos Bio, Inc. (A)(C) 6,807 92,507Krystal Biotech, Inc. (A) 2,993 209,360Kura Oncology, Inc. (A) 10,590 148,260Kymera Therapeutics, Inc. (A) 5,635 357,766Lexicon Pharmaceuticals, Inc. (A) 12,620 49,723Ligand Pharmaceuticals, Inc. (A) 2,453 378,890Lineage Cell Therapeutics, Inc. (A)(C) 25,249 61,860Lyell Immunopharma, Inc. (A) 4,537 35,116MacroGenics, Inc. (A) 10,242 164,384Madrigal Pharmaceuticals, Inc. (A) 1,979 167,700MannKind Corp. (A) 40,171 175,547MEI Pharma, Inc. (A) 21,240 56,711MeiraGTx Holdings PLC (A) 5,075 120,481Mersana Therapeutics, Inc. (A) 12,815 79,709MiMedx Group, Inc. (A) 19,092 115,316Moderna, Inc. (A) 44,038 11,184,771Monte Rosa Therapeutics, Inc. (A)(C) 2,062 42,106Morphic Holding, Inc. (A) 3,502 165,925Myriad Genetics, Inc. (A) 12,761 352,204Neoleukin Therapeutics, Inc. (A) 7,267 35,027Neurocrine Biosciences, Inc. (A) 25,207 2,146,880Nkarta, Inc. (A) 2,540 38,989Nurix Therapeutics, Inc. (A) 5,113 148,021Nuvalent, Inc., Class A (A)(C) 1,869 35,586Ocugen, Inc. (A)(C) 30,280 137,774Olema Pharmaceuticals, Inc. (A)(C) 4,459 41,736Oncocyte Corp. (A) 11,511 24,979OPKO Health, Inc. (A)(C) 65,621 315,637Organogenesis Holdings, Inc. (A) 6,613 61,104ORIC Pharmaceuticals, Inc. (A) 5,569 81,864Passage Bio, Inc. (A) 7,026 44,615PDL BioPharma, Inc. (A)(C)(D) 23,030 41,224Pfenex, Inc. (A)(D) 6,194 6,790PMV Pharmaceuticals, Inc. (A) 4,552 105,151Poseida Therapeutics, Inc. (A) 4,284 29,174Praxis Precision Medicines, Inc. (A) 5,787 114,004Precigen, Inc. (A)(C) 17,347 64,357Precision BioSciences, Inc. (A) 8,754 64,780Prelude Therapeutics, Inc. (A)(C) 1,976 24,601Progenics Pharmaceuticals, Inc. (A)(D) 15,140 646Prometheus Biosciences, Inc. (A)(C) 4,718 186,550Protagonist Therapeutics, Inc. (A) 7,335 250,857Prothena Corp. PLC (A) 5,719 282,519PTC Therapeutics, Inc. (A) 11,428 455,177Radius Health, Inc. (A) 7,747 53,609RAPT Therapeutics, Inc. (A) 3,618 132,889Recursion Pharmaceuticals, Inc.,
Class A (A)(C) 18,379 314,832Regeneron Pharmaceuticals, Inc. (A) 13,023 8,224,285REGENXBIO, Inc. (A) 6,520 213,204Relay Therapeutics, Inc. (A) 11,116 341,372Replimune Group, Inc. (A) 5,157 139,755REVOLUTION Medicines, Inc. (A) 9,811 246,943Rhythm Pharmaceuticals, Inc. (A) 8,119 81,028Rigel Pharmaceuticals, Inc. (A) 31,224 82,744Rocket Pharmaceuticals, Inc. (A) 6,752 147,396Rubius Therapeutics, Inc. (A) 7,950 76,956Sana Biotechnology, Inc. (A)(C) 14,181 219,522Sangamo Therapeutics, Inc. (A) 19,795 148,463
Strategic Equity Allocation Trust (continued)Shares orPrincipalAmount Value
COMMON STOCKS (continued)Biotechnology (continued)Scholar Rock Holding Corp. (A) 4,669 $ 115,978Selecta Biosciences, Inc. (A) 16,541 53,924Seres Therapeutics, Inc. (A) 11,931 99,385Sesen Bio, Inc. (A) 26,588 21,669Shattuck Labs, Inc. (A) 4,875 41,486Sorrento Therapeutics, Inc. (A)(C) 47,712 221,861Spectrum Pharmaceuticals, Inc. (A) 31,926 40,546Spero Therapeutics, Inc. (A) 4,515 72,285SpringWorks Therapeutics, Inc. (A) 4,804 297,752SQZ Biotechnologies Company (A) 4,541 40,551Stoke Therapeutics, Inc. (A) 3,410 81,806Surface Oncology, Inc. (A) 7,027 33,589Sutro Biopharma, Inc. (A) 7,152 106,422Syndax Pharmaceuticals, Inc. (A) 7,420 162,424Syros Pharmaceuticals, Inc. (A) 11,795 38,452Talaris Therapeutics, Inc. (A) 3,350 51,222Taysha Gene Therapies, Inc. (A)(C) 4,225 49,221TCR2 Therapeutics, Inc. (A) 6,126 28,547Tenaya Therapeutics, Inc. (A)(C) 2,402 45,518TG Therapeutics, Inc. (A) 20,982 398,658Tonix Pharmaceuticals Holding Corp. (A) 77,647 27,774Travere Therapeutics, Inc. (A) 9,550 296,432Turning Point Therapeutics, Inc. (A) 7,603 362,663Twist Bioscience Corp. (A) 7,691 595,206United Therapeutics Corp. (A) 11,967 2,585,829UroGen Pharma, Ltd. (A)(C) 3,538 33,646Vanda Pharmaceuticals, Inc. (A) 9,191 144,207Vaxart, Inc. (A)(C) 20,457 128,265Vaxcyte, Inc. (A) 6,738 160,297VBI Vaccines, Inc. (A) 34,168 79,953Vera Therapeutics, Inc. (A) 1,569 41,924Veracyte, Inc. (A) 11,026 454,271Verastem, Inc. (A) 27,978 57,355Vericel Corp. (A) 7,610 299,073Vertex Pharmaceuticals, Inc. (A) 31,441 6,904,444Verve Therapeutics, Inc. (A)(C) 2,718 100,213Viking Therapeutics, Inc. (A) 12,873 59,216Vincerx Pharma, Inc. (A) 2,677 27,279Vir Biotechnology, Inc. (A) 9,737 407,688Viracta Therapeutics, Inc. (A) 7,170 26,171VistaGen Therapeutics, Inc. (A) 35,755 69,722Vor BioPharma, Inc. (A) 3,067 35,639Werewolf Therapeutics, Inc. (A) 4,044 48,164XBiotech, Inc. (C) 3,068 34,147Xencor, Inc. (A) 9,269 371,872Y-mAbs Therapeutics, Inc. (A) 6,185 100,259Zentalis Pharmaceuticals, Inc. (A) 5,878 494,105ZIOPHARM Oncology, Inc. (A)(C) 40,464 44,106
163,354,556Health care equipment and supplies – 2.7%Abbott Laboratories 219,667 30,915,934ABIOMED, Inc. (A) 5,623 2,019,613Accuray, Inc. (A) 16,272 77,617Alcon, Inc. 82,942 7,315,928Align Technology, Inc. (A) 9,105 5,983,624Alphatec Holdings, Inc. (A) 12,258 140,109Ambu A/S, Class B (C) 27,809 733,985AngioDynamics, Inc. (A) 6,284 173,313Apyx Medical Corp. (A) 5,335 68,395Asahi Intecc Company, Ltd. 36,000 773,409Asensus Surgical, Inc. (A)(C) 42,796 47,504Aspira Women’s Health, Inc. (A)(C) 14,342 25,385AtriCure, Inc. (A) 7,278 506,039Atrion Corp. 224 157,898Avanos Medical, Inc. (A) 7,889 273,512
John Hancock Variable Insurance TrustPortfolio of Investments — December 31, 2021 (showing percentage of total net assets)
The accompanying notes are an integral part of the financial statements. 152

Strategic Equity Allocation Trust (continued)Shares orPrincipalAmount Value
COMMON STOCKS (continued)Health care equipment and supplies (continued)Axogen, Inc. (A) 6,940 $ 65,028Axonics, Inc. (A) 7,513 420,728Baxter International, Inc. 61,943 5,317,187Becton, Dickinson and Company 35,585 8,948,916BioLife Solutions, Inc. (A) 1,800 67,086BioMerieux 6,876 977,888Bioventus, Inc., Class A (A) 4,047 58,641Boston Scientific Corp. (A) 176,427 7,494,619Butterfly Network, Inc. (A)(C) 20,953 140,176Cardiovascular Systems, Inc. (A) 6,532 122,671Carl Zeiss Meditec AG, Bearer Shares 6,681 1,401,516Cerus Corp. (A) 27,985 190,578ClearPoint Neuro, Inc. (A) 3,534 39,651Cochlear, Ltd. 10,917 1,713,427Coloplast A/S, B Shares 19,719 3,472,027CONMED Corp. 4,693 665,280CryoLife, Inc. (A) 6,588 134,066CryoPort, Inc. (A) 6,634 392,534Cutera, Inc. (A) 3,028 125,117CytoSorbents Corp. (A) 8,150 34,149DarioHealth Corp. (A) 2,254 29,234Demant A/S (A) 17,936 918,433Dentsply Sirona, Inc. 27,080 1,510,793DexCom, Inc. (A) 11,988 6,436,957DiaSorin SpA 4,179 795,038Eargo, Inc. (A) 5,367 27,372Edwards Lifesciences Corp. (A) 77,235 10,005,794Envista Holdings Corp. (A) 42,877 1,932,038Fisher & Paykel Healthcare Corp., Ltd. 95,705 2,144,133Getinge AB, B Shares 37,967 1,654,684Glaukos Corp. (A) 7,385 328,189Globus Medical, Inc., Class A (A) 21,002 1,516,344GN Store Nord A/S 20,642 1,295,198Haemonetics Corp. (A) 21,827 1,157,704Heska Corp. (A) 1,598 291,619Hologic, Inc. (A) 31,409 2,404,673Hoya Corp. 61,407 9,112,291ICU Medical, Inc. (A) 5,305 1,259,089IDEXX Laboratories, Inc. (A) 10,542 6,941,485Inari Medical, Inc. (A) 5,582 509,469Inmode, Ltd. (A) 8,200 578,756Inogen, Inc. (A) 3,388 115,192Integer Holdings Corp. (A) 5,325 455,767Integra LifeSciences Holdings Corp. (A) 19,355 1,296,591Intersect ENT, Inc. (A) 5,409 147,720Intuitive Surgical, Inc. (A) 44,198 15,880,341iRadimed Corp. (A) 1,020 47,134iRhythm Technologies, Inc. (A) 4,812 566,324Koninklijke Philips NV 152,274 5,635,905Lantheus Holdings, Inc. (A) 11,073 319,899LeMaitre Vascular, Inc. 3,239 162,695LivaNova PLC (A) 22,824 1,995,502Masimo Corp. (A) 13,499 3,952,237Medtronic PLC 167,937 17,373,083Meridian Bioscience, Inc. (A) 7,187 146,615Merit Medical Systems, Inc. (A) 8,375 521,763Mesa Laboratories, Inc. 806 264,441Natus Medical, Inc. (A) 5,827 138,275Neogen Corp. (A) 45,944 2,086,317Nevro Corp. (A) 5,661 458,937NuVasive, Inc. (A) 22,211 1,165,633Olympus Corp. 183,308 4,221,075OraSure Technologies, Inc. (A) 12,339 107,226Ortho Clinical Diagnostics Holdings
PLC (A) 18,248 390,325
Strategic Equity Allocation Trust (continued)Shares orPrincipalAmount Value
COMMON STOCKS (continued)Health care equipment and supplies (continued)Orthofix Medical, Inc. (A) 3,350 $ 104,152OrthoPediatrics Corp. (A) 2,376 142,227Outset Medical, Inc. (A) 7,525 346,827PAVmed, Inc. (A) 12,862 31,641Penumbra, Inc. (A) 9,331 2,680,983Pulmonx Corp. (A) 4,566 146,432Pulse Biosciences, Inc. (A)(C) 2,001 29,635Quidel Corp. (A) 10,077 1,360,294Quotient, Ltd. (A) 13,310 34,473ResMed, Inc. 18,031 4,696,715SeaSpine Holdings Corp. (A) 5,960 81,175Senseonics Holdings, Inc. (A)(C) 70,561 188,398Shockwave Medical, Inc. (A) 5,482 977,605SI-BONE, Inc. (A) 5,841 129,729Siemens Healthineers AG (B) 46,807 3,489,892Sientra, Inc. (A) 11,358 41,684Sight Sciences, Inc. (A) 1,990 34,964Silk Road Medical, Inc. (A) 5,625 239,681Smith & Nephew PLC 145,934 2,546,894Sonova Holding AG 9,086 3,550,779STAAR Surgical Company (A) 20,359 1,858,777Stereotaxis, Inc. (A) 9,001 55,806STERIS PLC 12,361 3,008,791Straumann Holding AG 1,718 3,632,867Stryker Corp. 41,586 11,120,928Surmodics, Inc. (A) 2,388 114,982Sysmex Corp. 27,779 3,749,652Tactile Systems Technology, Inc. (A) 3,381 64,340Tandem Diabetes Care, Inc. (A) 16,881 2,540,928Teleflex, Inc. 5,799 1,904,856Terumo Corp. 107,134 4,525,404The Cooper Companies, Inc. 6,102 2,556,372TransMedics Group, Inc. (A) 4,301 82,407Treace Medical Concepts, Inc. (A) 4,426 82,501Utah Medical Products, Inc. 639 63,900Vapotherm, Inc. (A) 3,992 82,674Varex Imaging Corp. (A) 6,354 200,469ViewRay, Inc. (A) 22,866 125,992Zimmer Biomet Holdings, Inc. 25,877 3,287,414
249,205,080Health care providers and services – 2.0%1Life Healthcare, Inc. (A) 19,208 337,485Acadia Healthcare Company, Inc. (A) 23,897 1,450,548Accolade, Inc. (A) 8,294 218,630AdaptHealth Corp. (A) 11,699 286,158Addus HomeCare Corp. (A) 2,553 238,731Agiliti, Inc. (A) 4,118 95,373Alignment Healthcare, Inc. (A) 12,238 172,066Amedisys, Inc. (A) 8,663 1,402,366AmerisourceBergen Corp. 18,537 2,463,382AMN Healthcare Services, Inc. (A) 7,621 932,277Amplifon SpA 20,667 1,112,053Anthem, Inc. 30,211 14,004,007Apollo Medical Holdings, Inc. (A)(C) 6,099 448,155Apria, Inc. (A) 2,796 91,150Aveanna Healthcare Holdings, Inc. (A) 7,173 53,080Brookdale Senior Living, Inc. (A) 30,752 158,680Cardinal Health, Inc. 35,952 1,851,168Castle Biosciences, Inc. (A) 3,564 152,789Centene Corp. (A) 72,244 5,952,906Chemed Corp. 4,091 2,164,303Cigna Corp. 41,176 9,455,245Community Health Systems, Inc. (A) 20,334 270,646CorVel Corp. (A) 1,431 297,648Covetrus, Inc. (A) 17,207 343,624
John Hancock Variable Insurance TrustPortfolio of Investments — December 31, 2021 (showing percentage of total net assets)
The accompanying notes are an integral part of the financial statements. 153

Strategic Equity Allocation Trust (continued)Shares orPrincipalAmount Value
COMMON STOCKS (continued)Health care providers and services (continued)Cross Country Healthcare, Inc. (A) 6,074 $ 168,614CVS Health Corp. 163,506 16,867,279DaVita, Inc. (A) 8,311 945,459Encompass Health Corp. 26,436 1,725,213Fresenius Medical Care AG &
Company KGaA 34,041 2,206,817Fresenius SE & Company KGaA 69,518 2,794,164Fulgent Genetics, Inc. (A)(C) 3,360 337,982Hanger, Inc. (A) 6,556 118,860HCA Healthcare, Inc. 29,743 7,641,572HealthEquity, Inc. (A) 35,525 1,571,626Henry Schein, Inc. (A) 17,309 1,341,967Humana, Inc. 15,923 7,386,043InfuSystem Holdings, Inc. (A) 2,355 40,106Innovage Holding Corp. (A)(C) 3,587 17,935Laboratory Corp. of America Holdings (A) 11,982 3,764,864LHC Group, Inc. (A) 13,382 1,836,412LifeStance Health Group, Inc. (A)(C) 8,048 76,617Magellan Health, Inc. (A) 3,790 360,012McKesson Corp. 19,165 4,763,844Medipal Holdings Corp. 30,441 570,614MEDNAX, Inc. (A) 12,520 340,669ModivCare, Inc. (A) 2,037 302,067Molina Healthcare, Inc. (A) 15,517 4,935,647National HealthCare Corp. 2,085 141,655National Research Corp. 2,386 99,067NMC Health PLC (A) 19,536 391Option Care Health, Inc. (A) 62,038 1,764,361Orpea SA 8,582 860,673Owens & Minor, Inc. 11,733 510,386Patterson Companies, Inc. 36,846 1,081,430PetIQ, Inc. (A) 4,563 103,626Privia Health Group, Inc. (A) 2,841 73,497Progyny, Inc. (A) 28,855 1,452,849Quest Diagnostics, Inc. 15,139 2,619,198R1 RCM, Inc. (A) 54,759 1,395,807RadNet, Inc. (A) 7,500 225,825Ramsay Health Care, Ltd. 30,392 1,579,473Ryman Healthcare, Ltd. 70,543 591,525Select Medical Holdings Corp. 17,938 527,377Sonic Healthcare, Ltd. 75,411 2,557,664Surgery Partners, Inc. (A) 5,354 285,957Tenet Healthcare Corp. (A) 45,646 3,728,822The Ensign Group, Inc. 8,556 718,362The Joint Corp. (A) 2,326 152,795The Pennant Group, Inc. (A) 4,509 104,068Tivity Health, Inc. (A) 7,363 194,678Triple-S Management Corp. (A) 3,708 132,301UnitedHealth Group, Inc. 117,136 58,818,671Universal Health Services, Inc., Class B 9,401 1,218,934US Physical Therapy, Inc. 2,076 198,362
185,204,607Health care technology – 0.1%Allscripts Healthcare Solutions, Inc. (A) 19,941 367,911American Well Corp., Class A (A) 30,025 181,351Castlight Health, Inc., B Shares (A) 18,759 28,889Cerner Corp. 36,625 3,401,364Computer Programs & Systems, Inc. (A) 2,530 74,129Evolent Health, Inc., Class A (A) 12,750 352,793Health Catalyst, Inc. (A) 8,270 327,657HealthStream, Inc. (A) 4,185 110,317Inspire Medical Systems, Inc. (A) 4,357 1,002,371M3, Inc. 73,186 3,690,138MultiPlan Corp. (A) 60,446 267,776NextGen Healthcare, Inc. (A) 9,748 173,417
Strategic Equity Allocation Trust (continued)Shares orPrincipalAmount Value
COMMON STOCKS (continued)Health care technology (continued)Omnicell, Inc. (A) 6,995 $ 1,262,178OptimizeRx Corp. (A) 2,777 172,479Phreesia, Inc. (A) 8,019 334,072Schrodinger, Inc. (A) 7,431 258,822Simulations Plus, Inc. (C) 2,594 122,696Tabula Rasa HealthCare, Inc. (A) 4,031 60,465Vocera Communications, Inc. (A) 5,579 361,742
12,550,567Life sciences tools and services – 1.4%Agilent Technologies, Inc. 37,599 6,002,680Bachem Holding AG, Class B 1,029 805,755Berkeley Lights, Inc. (A) 8,034 146,058Bionano Genomics, Inc. (A)(C) 46,523 139,104Bio-Rad Laboratories, Inc., Class A (A) 2,663 2,012,083Bio-Techne Corp. 4,819 2,493,061Bruker Corp. 26,998 2,265,402Charles River Laboratories
International, Inc. (A) 6,245 2,352,991ChromaDex Corp. (A) 9,189 34,367Codexis, Inc. (A) 9,865 308,479Cytek Biosciences, Inc. (A)(C) 2,828 46,153Danaher Corp. 79,200 26,057,592Eurofins Scientific SE 22,167 2,746,304Fluidigm Corp. (A) 14,104 55,288Harvard Bioscience, Inc. (A) 7,852 55,357Illumina, Inc. (A) 19,459 7,402,982Inotiv, Inc. (A) 2,197 92,428IQVIA Holdings, Inc. (A) 23,742 6,698,568Lonza Group AG 12,361 10,291,620MaxCyte, Inc. (A) 15,108 153,951Medpace Holdings, Inc. (A) 12,317 2,680,672Mettler-Toledo International, Inc. (A) 2,864 4,860,809NanoString Technologies, Inc. (A) 7,474 315,627NeoGenomics, Inc. (A) 18,534 632,380Pacific Biosciences of California, Inc. (A) 31,596 646,454PerkinElmer, Inc. 15,751 3,166,896Personalis, Inc. (A) 6,454 92,099QIAGEN NV (A) 37,912 2,102,241Quanterix Corp. (A) 5,128 217,427Repligen Corp. (A) 13,662 3,618,244Sartorius Stedim Biotech 4,590 2,520,854Seer, Inc. (A)(C) 6,853 156,317Syneos Health, Inc. (A) 27,552 2,829,039Thermo Fisher Scientific, Inc. 48,975 32,678,079Waters Corp. (A) 7,603 2,832,878West Pharmaceutical Services, Inc. 9,167 4,299,415
133,809,654Pharmaceuticals – 4.7%9 Meters Biopharma, Inc. (A) 44,726 43,773Aclaris Therapeutics, Inc. (A) 8,427 122,529Aerie Pharmaceuticals, Inc. (A) 7,895 55,423Amneal Pharmaceuticals, Inc. (A) 17,304 82,886Amphastar Pharmaceuticals, Inc. (A) 6,091 141,859ANI Pharmaceuticals, Inc. (A) 1,695 78,106Antares Pharma, Inc. (A) 29,477 105,233Arvinas, Inc. (A) 7,513 617,118Astellas Pharma, Inc. 309,047 5,029,903AstraZeneca PLC 257,128 30,024,666Atea Pharmaceuticals, Inc. (A) 10,982 98,179Athira Pharma, Inc. (A) 5,520 71,926Axsome Therapeutics, Inc. (A)(C) 4,609 174,128Bayer AG 163,066 8,708,423BioDelivery Sciences
International, Inc. (A) 17,586 54,517Bristol-Myers Squibb Company 275,338 17,167,324
John Hancock Variable Insurance TrustPortfolio of Investments — December 31, 2021 (showing percentage of total net assets)
The accompanying notes are an integral part of the financial statements. 154

Strategic Equity Allocation Trust (continued)Shares orPrincipalAmount Value
COMMON STOCKS (continued)Pharmaceuticals (continued)Cara Therapeutics, Inc. (A) 7,748 $ 94,371Cassava Sciences, Inc. (A)(C) 6,240 272,688Catalent, Inc. (A) 21,107 2,702,329Chugai Pharmaceutical Company, Ltd. 111,502 3,634,519Citius Pharmaceuticals, Inc. (A) 17,697 27,253Collegium Pharmaceutical, Inc. (A) 5,838 109,054Corcept Therapeutics, Inc. (A) 15,642 309,712CorMedix, Inc. (A) 6,176 28,101Cymabay Therapeutics, Inc. (A) 14,809 50,054Daiichi Sankyo Company, Ltd. 290,858 7,402,748DICE Therapeutics, Inc. (A) 2,006 50,772Durect Corp. (A) 43,508 42,895Edgewise Therapeutics, Inc. (A)(C) 6,023 92,031Eisai Company, Ltd. 39,368 2,234,835Elanco Animal Health, Inc. (A)(D) 9,534 0Eli Lilly & Company 98,918 27,323,130Endo International PLC (A) 37,792 142,098Esperion Therapeutics, Inc. (A)(C) 5,167 25,835Evolus, Inc. (A) 6,245 40,655EyePoint Pharmaceuticals, Inc. (A) 3,779 46,255Fulcrum Therapeutics, Inc. (A) 4,595 81,286GlaxoSmithKline PLC 835,182 18,184,209Harmony Biosciences Holdings, Inc. (A) 3,654 155,807Hikma Pharmaceuticals PLC 28,816 865,374Ikena Oncology, Inc. (A) 4,422 55,452Innoviva, Inc. (A) 6,767 116,731Intra-Cellular Therapies, Inc. (A) 11,483 601,020Ipsen SA 6,260 572,851Jazz Pharmaceuticals PLC (A) 16,333 2,080,824Johnson & Johnson 327,106 55,958,023KemPharm, Inc. (A) 5,959 51,903Kyowa Kirin Company, Ltd. 44,859 1,223,112Marinus Pharmaceuticals, Inc. (A) 6,860 81,497Merck & Company, Inc. 313,658 24,038,749Merck KGaA 21,452 5,518,678Mind Medicine MindMed, Inc. (A) 59,512 82,127NGM Biopharmaceuticals, Inc. (A) 5,505 97,494Nippon Shinyaku Company, Ltd. 8,200 571,009Novartis AG 363,667 31,956,137Novo Nordisk A/S, B Shares 279,506 31,395,753Nuvation Bio, Inc. (A) 24,501 208,259Ocular Therapeutix, Inc. (A) 13,671 95,287Omeros Corp. (A)(C) 10,581 68,036Ono Pharmaceutical Company, Ltd. 61,400 1,526,121Oramed Pharmaceuticals, Inc. (A) 5,012 71,571Organon & Company 31,413 956,526Orion OYJ, Class B 17,616 731,747Otsuka Holdings Company, Ltd. 64,793 2,357,228Pacira BioSciences, Inc. (A) 7,166 431,178Paratek Pharmaceuticals, Inc. (A)(C) 7,494 33,648Perrigo Company PLC 35,545 1,382,701Pfizer, Inc. 697,305 41,175,860Phathom Pharmaceuticals, Inc. (A) 3,691 72,602Phibro Animal Health Corp., Class A 3,700 75,554Pliant Therapeutics, Inc. (A) 4,457 60,170Prestige Consumer Healthcare, Inc. (A) 7,984 484,230Provention Bio, Inc. (A)(C) 10,129 56,925Rain Therapeutics, Inc. (A) 2,557 32,934Reata Pharmaceuticals, Inc., Class A (A) 4,510 118,929Recordati Industria Chimica e
Farmaceutica SpA 17,356 1,114,499Relmada Therapeutics, Inc. (A) 2,909 65,540Revance Therapeutics, Inc. (A) 11,973 195,399Roche Holding AG 116,614 48,378,616Roche Holding AG, Bearer Shares 5,311 2,377,104
Strategic Equity Allocation Trust (continued)Shares orPrincipalAmount Value
COMMON STOCKS (continued)Pharmaceuticals (continued)Sanofi 188,738 $ 18,938,717Santen Pharmaceutical Company, Ltd. 59,800 730,083Seelos Therapeutics, Inc. (A) 16,168 26,354Shionogi & Company, Ltd. 43,911 3,088,978SIGA Technologies, Inc. (A) 8,282 62,281Sumitomo Dainippon Pharma
Company, Ltd. 29,692 342,569Supernus Pharmaceuticals, Inc. (A) 7,977 232,609Taisho Pharmaceutical Holdings
Company, Ltd. 6,316 291,546Takeda Pharmaceutical Company, Ltd. 262,598 7,171,102Tarsus Pharmaceuticals, Inc. (A) 1,280 28,800Teva Pharmaceutical Industries, Ltd.,
ADR (A) 183,008 1,465,894TherapeuticsMD, Inc. (A)(C) 83,719 29,762Theravance Biopharma, Inc. (A) 10,399 114,909UCB SA 20,985 2,394,933Viatris, Inc. 149,841 2,027,349Vifor Pharma AG 8,092 1,437,525Zoetis, Inc. 58,725 14,330,662Zogenix, Inc. (A) 9,475 153,969
435,832,0701,179,956,534
Industrials – 11.3%Aerospace and defense – 1.2%AAR Corp. (A) 5,693 222,198Aerojet Rocketdyne Holdings, Inc. 12,041 563,037AeroVironment, Inc. (A) 3,611 223,990Airbus SE (A) 97,850 12,519,303Astronics Corp. (A) 4,926 59,112Axon Enterprise, Inc. (A) 17,451 2,739,807BAE Systems PLC 533,811 3,980,731Byrna Technologies, Inc. (A) 3,275 43,721Curtiss-Wright Corp. 10,426 1,445,773Dassault Aviation SA 4,157 449,609Ducommun, Inc. (A) 1,957 91,529Elbit Systems, Ltd. 4,402 760,905General Dynamics Corp. 28,749 5,993,304Hexcel Corp. (A) 22,291 1,154,674Howmet Aerospace, Inc. 47,831 1,522,461Huntington Ingalls Industries, Inc. 4,974 928,845Kaman Corp. 4,573 197,325Kratos Defense & Security
Solutions, Inc. (A) 20,074 389,436L3Harris Technologies, Inc. 24,201 5,160,621Lockheed Martin Corp. 30,538 10,853,511Maxar Technologies, Inc. 11,753 347,066Mercury Systems, Inc. (A) 15,051 828,708Moog, Inc., Class A 4,660 377,320MTU Aero Engines AG 8,863 1,799,577National Presto Industries, Inc. 960 78,749Northrop Grumman Corp. 18,649 7,218,468PAE, Inc. (A) 11,818 117,353Park Aerospace Corp. 4,186 55,255Parsons Corp. (A) 4,223 142,104Raytheon Technologies Corp. 186,839 16,079,364Rolls-Royce Holdings PLC (A) 1,388,882 2,318,232Safran SA 56,732 6,945,311Singapore Technologies Engineering, Ltd. 259,152 723,220Textron, Inc. 27,773 2,144,076Thales SA 17,708 1,506,358The Boeing Company (A) 68,271 13,744,318TransDigm Group, Inc. (A) 6,487 4,127,548Triumph Group, Inc. (A) 10,456 193,750
John Hancock Variable Insurance TrustPortfolio of Investments — December 31, 2021 (showing percentage of total net assets)
The accompanying notes are an integral part of the financial statements. 155

Strategic Equity Allocation Trust (continued)Shares orPrincipalAmount Value
COMMON STOCKS (continued)Aerospace and defense (continued)Vectrus, Inc. (A) 1,974 $ 90,350
108,137,019Air freight and logistics – 0.6%Air Transport Services Group, Inc. (A) 9,662 283,870Atlas Air Worldwide Holdings, Inc. (A) 4,636 436,340CH Robinson Worldwide, Inc. 16,320 1,756,522Deutsche Post AG 164,531 10,582,758DSV A/S 33,861 7,890,570Expeditors International of
Washington, Inc. 21,051 2,826,939FedEx Corp. 30,476 7,882,313Forward Air Corp. 4,343 525,894GXO Logistics, Inc. (A) 26,197 2,379,474Hub Group, Inc., Class A (A) 5,268 443,776InPost SA (A) 33,196 398,641Radiant Logistics, Inc. (A) 7,915 57,700SG Holdings Company, Ltd. 53,100 1,245,112United Parcel Service, Inc., Class B 90,241 19,342,256Yamato Holdings Company, Ltd. 48,393 1,136,825
57,188,990Airlines – 0.2%Alaska Air Group, Inc. (A) 15,517 808,436Allegiant Travel Company (A) 2,507 468,909American Airlines Group, Inc. (A) 80,224 1,440,823ANA Holdings, Inc. (A) 26,549 555,003Delta Air Lines, Inc. (A) 79,290 3,098,653Deutsche Lufthansa AG (A) 99,215 694,698Frontier Group Holdings, Inc. (A) 6,090 82,641Hawaiian Holdings, Inc. (A) 8,873 162,997Japan Airlines Company, Ltd. (A) 23,940 454,460JetBlue Airways Corp. (A) 84,503 1,203,323Mesa Air Group, Inc. (A) 6,639 37,178Qantas Airways, Ltd. (A) 153,396 559,567Singapore Airlines, Ltd. (A) 222,427 824,703SkyWest, Inc. (A) 8,150 320,295Southwest Airlines Company (A) 73,310 3,140,600Spirit Airlines, Inc. (A) 16,030 350,256Sun Country Airlines Holdings, Inc. (A) 3,963 107,992United Airlines Holdings, Inc. (A) 40,098 1,755,490
16,066,024Building products – 1.0%A.O. Smith Corp. 16,504 1,416,868AAON, Inc. 6,727 534,326AGC, Inc. 32,076 1,532,369Allegion PLC 11,114 1,471,938American Woodmark Corp. (A) 2,832 184,646Apogee Enterprises, Inc. 4,190 201,749Assa Abloy AB, B Shares 166,365 5,070,967Builders FirstSource, Inc. (A) 50,883 4,361,182Caesarstone, Ltd. 4,720 53,525Carlisle Companies, Inc. 13,893 3,447,131Carrier Global Corp. 107,515 5,831,614Cie de Saint-Gobain 83,976 5,907,422Cornerstone Building Brands, Inc. (A) 9,363 163,291CSW Industrials, Inc. 2,359 285,109Daikin Industries, Ltd. 41,397 9,377,214Fortune Brands Home & Security, Inc. 17,084 1,826,280Geberit AG 5,955 4,854,121Gibraltar Industries, Inc. (A) 5,313 354,271Griffon Corp. 7,738 220,378Insteel Industries, Inc. 3,142 125,083JELD-WEN Holding, Inc. (A) 13,799 363,742Johnson Controls International PLC 88,250 7,175,608Kingspan Group PLC 25,566 3,049,639
Strategic Equity Allocation Trust (continued)Shares orPrincipalAmount Value
COMMON STOCKS (continued)Building products (continued)Lennox International, Inc. 8,944 $ 2,901,076Lixil Corp. 44,250 1,180,454Masco Corp. 30,625 2,150,488Masonite International Corp. (A) 3,871 456,584Nibe Industrier AB, B Shares 236,751 3,577,292Owens Corning 26,700 2,416,350PGT Innovations, Inc. (A) 9,463 212,823Quanex Building Products Corp. 5,993 148,507Resideo Technologies, Inc. (A) 23,475 611,054Rockwool International A/S, B Shares 1,390 606,982Simpson Manufacturing Company, Inc. 18,526 2,576,411TOTO, Ltd. 23,500 1,084,231Trane Technologies PLC 29,442 5,948,167Trex Company, Inc. (A) 30,587 4,130,163UFP Industries, Inc. 9,652 888,081View, Inc. (A)(C) 21,339 83,435Xinyi Glass Holdings, Ltd. 302,000 756,456Zurn Water Solutions Corp. 19,530 710,892
88,247,919Commercial services and supplies – 0.5%ABM Industries, Inc. 10,957 447,593ACCO Brands Corp. 15,973 131,937Brady Corp., Class A 7,477 403,010Brambles, Ltd. 239,311 1,851,387BrightView Holdings, Inc. (A) 7,156 100,756Casella Waste Systems, Inc., Class A (A) 7,949 679,004CECO Environmental Corp. (A) 4,840 30,153Cimpress PLC (A) 2,782 199,219Cintas Corp. 10,845 4,806,179Clean Harbors, Inc. (A) 13,301 1,327,041Copart, Inc. (A) 26,383 4,000,190CoreCivic, Inc. (A) 19,627 195,681Dai Nippon Printing Company, Ltd. 36,873 927,976Deluxe Corp. 6,884 221,045Ennis, Inc. 4,335 84,663Harsco Corp. (A) 13,152 219,770Healthcare Services Group, Inc. 12,571 223,638Heritage-Crystal Clean, Inc. (A) 2,836 90,809HNI Corp. 7,121 299,438IAA, Inc. (A) 35,830 1,813,715Interface, Inc. 10,061 160,473KAR Auction Services, Inc. (A) 19,280 301,154Kimball International, Inc., Class B 7,693 78,699Matthews International Corp., Class A 5,258 192,811MillerKnoll, Inc. 32,276 1,264,896Montrose Environmental Group, Inc. (A) 3,947 278,303MSA Safety, Inc. 9,688 1,462,500Pitney Bowes, Inc. 28,957 191,985Rentokil Initial PLC 308,618 2,442,941Republic Services, Inc. 26,036 3,630,720Rollins, Inc. 28,047 959,488RR Donnelley & Sons Company (A) 11,796 132,823Secom Company, Ltd. 34,855 2,421,943Securitas AB, B Shares 51,974 714,978Sohgo Security Services Company, Ltd. 11,900 472,856SP Plus Corp. (A) 4,069 114,827Steelcase, Inc., Class A 14,636 171,534Stericycle, Inc. (A) 24,409 1,455,753Tetra Tech, Inc. 23,032 3,910,834The Brink’s Company 20,928 1,372,249Toppan, Inc. 43,562 817,472UniFirst Corp. 2,415 508,116US Ecology, Inc. (A) 5,335 170,400Viad Corp. (A) 3,348 143,261VSE Corp. 1,949 118,772
John Hancock Variable Insurance TrustPortfolio of Investments — December 31, 2021 (showing percentage of total net assets)
The accompanying notes are an integral part of the financial statements. 156

Strategic Equity Allocation Trust (continued)Shares orPrincipalAmount Value
COMMON STOCKS (continued)Commercial services and supplies (continued)Waste Management, Inc. 48,003 $ 8,011,701
49,554,693Construction and engineering – 0.4%ACS Actividades de Construccion y
Servicios SA 40,709 1,085,345AECOM (A) 38,278 2,960,803Ameresco, Inc., Class A (A) 4,998 407,037API Group Corp. (A) 32,571 839,355Arcosa, Inc. 7,816 411,903Argan, Inc. 2,706 104,695Bouygues SA 37,958 1,358,744Comfort Systems USA, Inc. 5,766 570,488Concrete Pumping Holdings, Inc. (A) 5,156 42,279Construction Partners, Inc., Class A (A) 4,693 138,021Dycom Industries, Inc. (A) 12,821 1,202,097Eiffage SA 13,826 1,425,512EMCOR Group, Inc. 22,754 2,898,632Ferrovial SA 80,594 2,520,469Fluor Corp. (A) 60,797 1,505,942Granite Construction, Inc. 7,411 286,806Great Lakes Dredge & Dock Corp. (A) 10,640 167,261IES Holdings, Inc. (A) 1,488 75,352Infrastructure and Energy
Alternatives, Inc. (A) 5,254 48,337Kajima Corp. 74,585 857,169MasTec, Inc. (A) 15,202 1,402,841Matrix Service Company (A) 5,607 42,165MYR Group, Inc. (A) 2,653 293,289Northwest Pipe Company (A) 2,032 64,618NV5 Global, Inc. (A) 2,129 294,057Obayashi Corp. 107,815 834,417Primoris Services Corp. 8,639 207,163Quanta Services, Inc. 17,242 1,976,968Shimizu Corp. 91,629 568,131Skanska AB, B Shares 56,467 1,459,171Sterling Construction Company, Inc. (A) 4,883 128,423Taisei Corp. 31,673 963,179Tutor Perini Corp. (A) 7,083 87,617Valmont Industries, Inc. 5,639 1,412,570Vinci SA 89,279 9,429,182WillScot Mobile Mini Holdings Corp. (A) 34,203 1,396,851
39,466,889Electrical equipment – 1.1%ABB, Ltd. 272,631 10,390,724Acuity Brands, Inc. 9,280 1,964,762Allied Motion Technologies, Inc. 2,213 80,752American Superconductor Corp. (A) 5,408 58,839AMETEK, Inc. 28,648 4,212,402Array Technologies, Inc. (A) 20,946 328,643Atkore, Inc. (A) 7,453 828,699AZZ, Inc. 3,903 215,797Babcock & Wilcox Enterprises, Inc. (A) 9,757 88,008Beam Global (A)(C) 1,796 33,406Blink Charging Company (A)(C) 5,999 159,033Bloom Energy Corp., Class A (A) 22,801 500,026Eaton Corp. PLC 49,390 8,535,580Emerson Electric Company 74,072 6,886,474Encore Wire Corp. 3,180 455,058EnerSys 18,037 1,426,005Eos Energy Enterprises, Inc. (A)(C) 7,745 58,242FuelCell Energy, Inc. (A)(C) 59,560 309,712Fuji Electric Company, Ltd. 21,040 1,149,375Generac Holdings, Inc. (A) 7,821 2,752,366GrafTech International, Ltd. 32,537 384,913Hubbell, Inc. 14,457 3,010,959
Strategic Equity Allocation Trust (continued)Shares orPrincipalAmount Value
COMMON STOCKS (continued)Electrical equipment (continued)Legrand SA 44,392 $ 5,199,237Mitsubishi Electric Corp. 302,897 3,844,682Nidec Corp. 74,186 8,775,781nVent Electric PLC 44,702 1,698,676Powell Industries, Inc. 1,982 58,449Prysmian SpA 42,282 1,590,486Regal Rexnord Corp. 18,004 3,063,921Rockwell Automation, Inc. 14,377 5,015,416Romeo Power, Inc. (A)(C) 22,897 83,574Schneider Electric SE 89,728 17,640,112Siemens Energy AG (A) 66,336 1,692,516Siemens Gamesa Renewable Energy
SA (A) 39,570 939,703Stem, Inc. (A) 17,682 335,428Sunrun, Inc. (A) 55,003 1,886,603Thermon Group Holdings, Inc. (A) 5,840 98,871TPI Composites, Inc. (A) 6,220 93,051Vestas Wind Systems A/S 167,622 5,104,949Vicor Corp. (A) 9,107 1,156,407
102,107,637Industrial conglomerates – 1.0%3M Company 71,698 12,735,716CK Hutchison Holdings, Ltd. 446,738 2,876,288DCC PLC 16,368 1,339,936General Electric Company 136,009 12,848,770Hitachi, Ltd. 160,694 8,705,328Honeywell International, Inc. 85,546 17,837,196Investment AB Latour, B Shares 24,574 998,403Jardine Matheson Holdings, Ltd. 35,900 1,974,055Keppel Corp., Ltd. 241,745 919,357Lifco AB, B Shares 38,692 1,155,677Melrose Industries PLC 725,748 1,578,345Roper Technologies, Inc. 13,063 6,425,167Siemens AG 126,977 21,992,769Smiths Group PLC 65,792 1,408,296Toshiba Corp. 68,028 2,799,244
95,594,547Machinery – 2.4%AGCO Corp. 16,305 1,891,706Alamo Group, Inc. 1,528 224,891Albany International Corp., Class A 4,997 441,985Alfa Laval AB 52,217 2,097,533Alstom SA 52,668 1,870,264Altra Industrial Motion Corp. 10,637 548,550Astec Industries, Inc. 3,764 260,732Atlas Copco AB, A Shares 111,461 7,702,047Atlas Copco AB, B Shares 64,770 3,804,606Barnes Group, Inc. 7,672 357,438Blue Bird Corp. (A) 2,759 43,151Caterpillar, Inc. 67,102 13,872,667Chart Industries, Inc. (A) 5,909 942,426CIRCOR International, Inc. (A) 3,420 92,956CNH Industrial NV 169,850 3,283,914Colfax Corp. (A) 35,780 1,644,807Columbus McKinnon Corp. 4,539 209,974Commercial Vehicle Group, Inc. (A) 6,138 49,472Crane Company 13,264 1,349,347Cummins, Inc. 17,794 3,881,583Daifuku Company, Ltd. 16,800 1,373,818Daimler Truck Holding AG (A) 71,030 2,611,216Deere & Company 35,173 12,060,470Desktop Metal, Inc., Class A (A) 31,249 154,683Donaldson Company, Inc. 32,840 1,946,098Douglas Dynamics, Inc. 3,694 144,288Dover Corp. 17,838 3,239,381
John Hancock Variable Insurance TrustPortfolio of Investments — December 31, 2021 (showing percentage of total net assets)
The accompanying notes are an integral part of the financial statements. 157
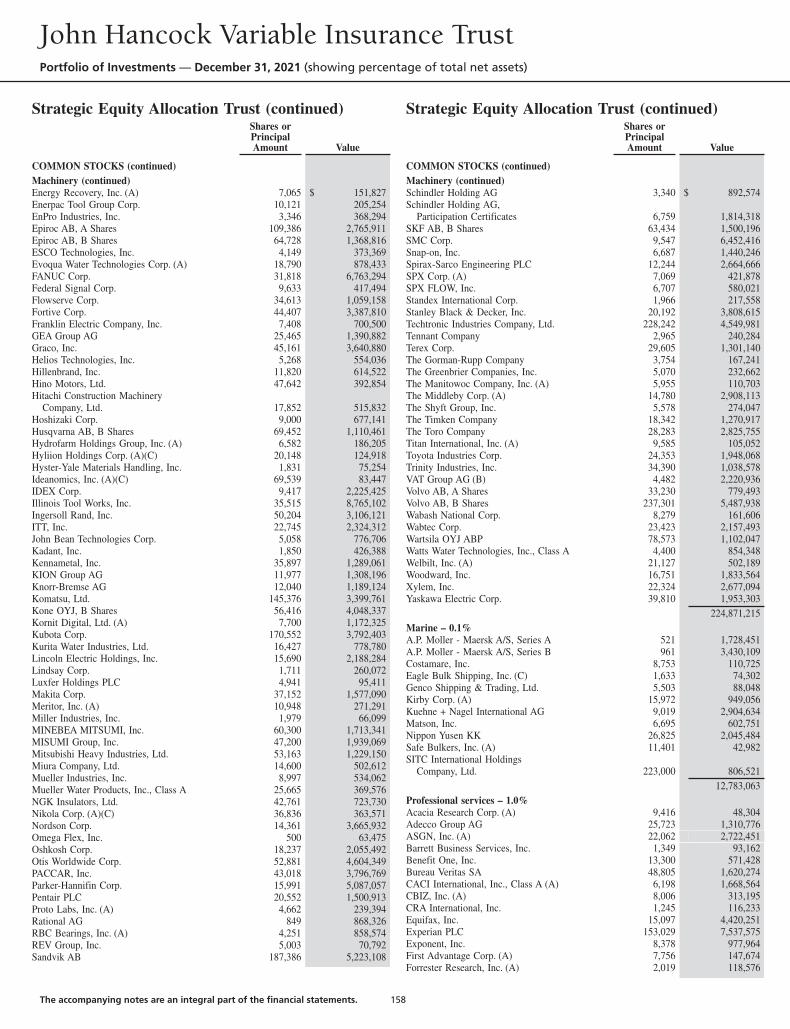
Strategic Equity Allocation Trust (continued)Shares orPrincipalAmount Value
COMMON STOCKS (continued)Machinery (continued)Energy Recovery, Inc. (A) 7,065 $ 151,827Enerpac Tool Group Corp. 10,121 205,254EnPro Industries, Inc. 3,346 368,294Epiroc AB, A Shares 109,386 2,765,911Epiroc AB, B Shares 64,728 1,368,816ESCO Technologies, Inc. 4,149 373,369Evoqua Water Technologies Corp. (A) 18,790 878,433FANUC Corp. 31,818 6,763,294Federal Signal Corp. 9,633 417,494Flowserve Corp. 34,613 1,059,158Fortive Corp. 44,407 3,387,810Franklin Electric Company, Inc. 7,408 700,500GEA Group AG 25,465 1,390,882Graco, Inc. 45,161 3,640,880Helios Technologies, Inc. 5,268 554,036Hillenbrand, Inc. 11,820 614,522Hino Motors, Ltd. 47,642 392,854Hitachi Construction Machinery
Company, Ltd. 17,852 515,832Hoshizaki Corp. 9,000 677,141Husqvarna AB, B Shares 69,452 1,110,461Hydrofarm Holdings Group, Inc. (A) 6,582 186,205Hyliion Holdings Corp. (A)(C) 20,148 124,918Hyster-Yale Materials Handling, Inc. 1,831 75,254Ideanomics, Inc. (A)(C) 69,539 83,447IDEX Corp. 9,417 2,225,425Illinois Tool Works, Inc. 35,515 8,765,102Ingersoll Rand, Inc. 50,204 3,106,121ITT, Inc. 22,745 2,324,312John Bean Technologies Corp. 5,058 776,706Kadant, Inc. 1,850 426,388Kennametal, Inc. 35,897 1,289,061KION Group AG 11,977 1,308,196Knorr-Bremse AG 12,040 1,189,124Komatsu, Ltd. 145,376 3,399,761Kone OYJ, B Shares 56,416 4,048,337Kornit Digital, Ltd. (A) 7,700 1,172,325Kubota Corp. 170,552 3,792,403Kurita Water Industries, Ltd. 16,427 778,780Lincoln Electric Holdings, Inc. 15,690 2,188,284Lindsay Corp. 1,711 260,072Luxfer Holdings PLC 4,941 95,411Makita Corp. 37,152 1,577,090Meritor, Inc. (A) 10,948 271,291Miller Industries, Inc. 1,979 66,099MINEBEA MITSUMI, Inc. 60,300 1,713,341MISUMI Group, Inc. 47,200 1,939,069Mitsubishi Heavy Industries, Ltd. 53,163 1,229,150Miura Company, Ltd. 14,600 502,612Mueller Industries, Inc. 8,997 534,062Mueller Water Products, Inc., Class A 25,665 369,576NGK Insulators, Ltd. 42,761 723,730Nikola Corp. (A)(C) 36,836 363,571Nordson Corp. 14,361 3,665,932Omega Flex, Inc. 500 63,475Oshkosh Corp. 18,237 2,055,492Otis Worldwide Corp. 52,881 4,604,349PACCAR, Inc. 43,018 3,796,769Parker-Hannifin Corp. 15,991 5,087,057Pentair PLC 20,552 1,500,913Proto Labs, Inc. (A) 4,662 239,394Rational AG 849 868,326RBC Bearings, Inc. (A) 4,251 858,574REV Group, Inc. 5,003 70,792Sandvik AB 187,386 5,223,108
Strategic Equity Allocation Trust (continued)Shares orPrincipalAmount Value
COMMON STOCKS (continued)Machinery (continued)Schindler Holding AG 3,340 $ 892,574Schindler Holding AG,
Participation Certificates 6,759 1,814,318SKF AB, B Shares 63,434 1,500,196SMC Corp. 9,547 6,452,416Snap-on, Inc. 6,687 1,440,246Spirax-Sarco Engineering PLC 12,244 2,664,666SPX Corp. (A) 7,069 421,878SPX FLOW, Inc. 6,707 580,021Standex International Corp. 1,966 217,558Stanley Black & Decker, Inc. 20,192 3,808,615Techtronic Industries Company, Ltd. 228,242 4,549,981Tennant Company 2,965 240,284Terex Corp. 29,605 1,301,140The Gorman-Rupp Company 3,754 167,241The Greenbrier Companies, Inc. 5,070 232,662The Manitowoc Company, Inc. (A) 5,955 110,703The Middleby Corp. (A) 14,780 2,908,113The Shyft Group, Inc. 5,578 274,047The Timken Company 18,342 1,270,917The Toro Company 28,283 2,825,755Titan International, Inc. (A) 9,585 105,052Toyota Industries Corp. 24,353 1,948,068Trinity Industries, Inc. 34,390 1,038,578VAT Group AG (B) 4,482 2,220,936Volvo AB, A Shares 33,230 779,493Volvo AB, B Shares 237,301 5,487,938Wabash National Corp. 8,279 161,606Wabtec Corp. 23,423 2,157,493Wartsila OYJ ABP 78,573 1,102,047Watts Water Technologies, Inc., Class A 4,400 854,348Welbilt, Inc. (A) 21,127 502,189Woodward, Inc. 16,751 1,833,564Xylem, Inc. 22,324 2,677,094Yaskawa Electric Corp. 39,810 1,953,303
224,871,215Marine – 0.1%A.P. Moller - Maersk A/S, Series A 521 1,728,451A.P. Moller - Maersk A/S, Series B 961 3,430,109Costamare, Inc. 8,753 110,725Eagle Bulk Shipping, Inc. (C) 1,633 74,302Genco Shipping & Trading, Ltd. 5,503 88,048Kirby Corp. (A) 15,972 949,056Kuehne + Nagel International AG 9,019 2,904,634Matson, Inc. 6,695 602,751Nippon Yusen KK 26,825 2,045,484Safe Bulkers, Inc. (A) 11,401 42,982SITC International Holdings
Company, Ltd. 223,000 806,52112,783,063
Professional services – 1.0%Acacia Research Corp. (A) 9,416 48,304Adecco Group AG 25,723 1,310,776ASGN, Inc. (A) 22,062 2,722,451Barrett Business Services, Inc. 1,349 93,162Benefit One, Inc. 13,300 571,428Bureau Veritas SA 48,805 1,620,274CACI International, Inc., Class A (A) 6,198 1,668,564CBIZ, Inc. (A) 8,006 313,195CRA International, Inc. 1,245 116,233Equifax, Inc. 15,097 4,420,251Experian PLC 153,029 7,537,575Exponent, Inc. 8,378 977,964First Advantage Corp. (A) 7,756 147,674Forrester Research, Inc. (A) 2,019 118,576
John Hancock Variable Insurance TrustPortfolio of Investments — December 31, 2021 (showing percentage of total net assets)
The accompanying notes are an integral part of the financial statements. 158

Strategic Equity Allocation Trust (continued)Shares orPrincipalAmount Value
COMMON STOCKS (continued)Professional services (continued)Franklin Covey Company (A) 2,291 $ 106,211FTI Consulting, Inc. (A) 9,111 1,397,810Heidrick & Struggles International, Inc. 3,293 144,003Huron Consulting Group, Inc. (A) 3,656 182,434ICF International, Inc. 2,971 304,676IHS Markit, Ltd. 49,391 6,565,052Insperity, Inc. 15,398 1,818,658Intertek Group PLC 26,789 2,043,663Jacobs Engineering Group, Inc. 16,147 2,248,147KBR, Inc. 60,127 2,863,248Kelly Services, Inc., Class A 6,115 102,549Kforce, Inc. 3,284 247,022Korn Ferry 8,736 661,577Leidos Holdings, Inc. 17,541 1,559,395ManpowerGroup, Inc. 14,412 1,402,720ManTech International Corp., Class A 4,370 318,704Nielsen Holdings PLC 44,458 911,834Nihon M&A Center Holdings, Inc. 50,300 1,233,816Persol Holdings Company, Ltd. 29,500 857,661Randstad NV 19,847 1,353,907Recruit Holdings Company, Ltd. 225,200 13,704,701RELX PLC 320,977 10,478,905Resources Connection, Inc. 5,997 106,986Robert Half International, Inc. 13,874 1,547,228Science Applications International Corp. 15,296 1,278,593SGS SA 995 3,317,028Sterling Check Corp. (A)(C) 1,982 40,651Teleperformance 9,749 4,358,544TriNet Group, Inc. (A) 6,539 622,905TrueBlue, Inc. (A) 5,811 160,790Upwork, Inc. (A) 19,143 653,925Verisk Analytics, Inc. 19,993 4,572,999Willdan Group, Inc. (A) 2,157 75,926Wolters Kluwer NV 44,403 5,226,272
94,134,967Road and rail – 0.9%ArcBest Corp. 4,083 489,348Aurizon Holdings, Ltd. 305,531 776,240Avis Budget Group, Inc. (A) 17,336 3,594,966Central Japan Railway Company 23,976 3,190,533Covenant Logistics Group, Inc. (A) 2,127 56,217CSX Corp. 275,276 10,350,378Daseke, Inc. (A) 7,297 73,262East Japan Railway Company 50,140 3,082,382Hankyu Hanshin Holdings, Inc. 38,000 1,079,913Heartland Express, Inc. 7,688 129,312JB Hunt Transport Services, Inc. 10,428 2,131,483Keio Corp. 17,115 755,150Keisei Electric Railway Company, Ltd. 21,494 581,467Kintetsu Group Holdings
Company, Ltd. (A) 28,474 795,980Knight-Swift Transportation Holdings, Inc. 44,096 2,687,210Landstar System, Inc. 10,126 1,812,757Marten Transport, Ltd. 10,031 172,132MTR Corp., Ltd. 256,815 1,378,596Nippon Express Company, Ltd. 12,746 762,781Norfolk Southern Corp. 30,086 8,956,903Odakyu Electric Railway Company, Ltd. 48,979 910,592Old Dominion Freight Line, Inc. 11,623 4,165,451Ryder System, Inc. 14,267 1,176,029Saia, Inc. (A) 11,279 3,801,361Tobu Railway Company, Ltd. 31,373 715,930Tokyu Corp. 83,008 1,103,482U.S. Xpress Enterprises, Inc., Class A (A) 5,913 34,709Union Pacific Corp. 79,890 20,126,688
Strategic Equity Allocation Trust (continued)Shares orPrincipalAmount Value
COMMON STOCKS (continued)Road and rail (continued)Werner Enterprises, Inc. 25,955 $ 1,237,015West Japan Railway Company 35,825 1,498,306XPO Logistics, Inc. (A) 26,212 2,029,595Yellow Corp. (A) 8,700 109,533
79,765,701Trading companies and distributors – 0.8%Alta Equipment Group, Inc. (A) 3,834 56,130Applied Industrial Technologies, Inc. 6,224 639,205Ashtead Group PLC 74,269 5,987,161Beacon Roofing Supply, Inc. (A) 9,099 521,828BlueLinx Holdings, Inc. (A) 1,553 148,715Boise Cascade Company 6,362 452,974Brenntag SE 25,645 2,315,841Bunzl PLC 55,986 2,187,110Custom Truck One Source, Inc. (A)(C) 8,004 64,032DXP Enterprises, Inc. (A) 3,132 80,398Fastenal Company 71,215 4,562,033Ferguson PLC 36,900 6,554,422GATX Corp. 15,082 1,571,394Global Industrial Company 2,153 88,058GMS, Inc. (A) 6,933 416,743H&E Equipment Services, Inc. 5,300 234,631Herc Holdings, Inc. 4,043 632,932IMCD NV 9,459 2,090,468ITOCHU Corp. 197,304 6,036,294Marubeni Corp. 259,659 2,529,857McGrath RentCorp 3,937 315,984Mitsubishi Corp. 209,606 6,655,640Mitsui & Company, Ltd. 259,003 6,137,817MonotaRO Company, Ltd. 41,600 748,217MRC Global, Inc. (A) 13,550 93,224MSC Industrial Direct Company, Inc.,
Class A 12,440 1,045,706NOW, Inc. (A) 18,290 156,197Reece, Ltd. 48,250 948,894Rush Enterprises, Inc., Class A 6,325 351,923Rush Enterprises, Inc., Class B 1,569 84,679Sumitomo Corp. 186,938 2,766,569Textainer Group Holdings, Ltd. 7,704 275,110Titan Machinery, Inc. (A) 3,357 113,097Toyota Tsusho Corp. 35,282 1,626,385Transcat, Inc. (A) 1,202 111,101Triton International, Ltd. 10,769 648,617United Rentals, Inc. (A) 8,970 2,980,641Univar Solutions, Inc. (A) 45,425 1,287,799Veritiv Corp. (A) 2,338 286,569W.W. Grainger, Inc. 5,420 2,808,861Watsco, Inc. 8,775 2,745,522WESCO International, Inc. (A) 7,191 946,264
70,305,042Transportation infrastructure – 0.1%Aena SME SA (A)(B) 12,449 1,960,518Aeroports de Paris (A) 4,928 635,730Atlantia SpA (A) 82,240 1,631,787Auckland International Airport, Ltd. (A) 207,770 1,093,666Getlink SE 73,033 1,209,593Sydney Airport (A) 219,489 1,385,739Transurban Group 506,202 5,084,442
13,001,4751,051,225,181
Information technology – 20.5%Communications equipment – 0.7%ADTRAN, Inc. 8,121 185,402Arista Networks, Inc. (A) 27,756 3,989,925
John Hancock Variable Insurance TrustPortfolio of Investments — December 31, 2021 (showing percentage of total net assets)
The accompanying notes are an integral part of the financial statements. 159

Strategic Equity Allocation Trust (continued)Shares orPrincipalAmount Value
COMMON STOCKS (continued)Communications equipment (continued)Aviat Networks, Inc. (A) 1,802 $ 57,808CalAmp Corp. (A) 7,023 49,582Calix, Inc. (A) 8,940 714,932Cambium Networks Corp. (A) 1,840 47,159Ciena Corp. (A) 41,166 3,168,547Cisco Systems, Inc. 524,656 33,247,451Clearfield, Inc. (A) 1,929 162,846Comtech Telecommunications Corp. 4,321 102,364Digi International, Inc. (A) 5,956 146,339DZS, Inc. (A) 2,269 36,803Extreme Networks, Inc. (A) 20,330 319,181F5, Inc. (A) 7,473 1,828,718Harmonic, Inc. (A) 14,796 174,001Infinera Corp. (A) 29,909 286,827Inseego Corp. (A)(C) 15,028 87,613Juniper Networks, Inc. 40,289 1,438,720Lumentum Holdings, Inc. (A) 19,211 2,031,947Motorola Solutions, Inc. 20,981 5,700,538NETGEAR, Inc. (A) 4,864 142,077NetScout Systems, Inc. (A) 11,288 373,407Nokia OYJ (A) 894,932 5,668,218Plantronics, Inc. (A) 7,021 205,996Ribbon Communications, Inc. (A) 12,828 77,609Telefonaktiebolaget LM Ericsson, B Shares 484,469 5,330,632ViaSat, Inc. (A) 19,515 869,198Viavi Solutions, Inc. (A) 37,324 657,649
67,101,489Electronic equipment, instruments and components – 1.3%908 Devices, Inc. (A) 2,871 74,273Advanced Energy Industries, Inc. 6,127 557,925Aeva Technologies, Inc. (A)(C) 15,765 119,183Akoustis Technologies, Inc. (A) 8,479 56,640Amphenol Corp., Class A 74,120 6,482,535Arlo Technologies, Inc. (A) 14,359 150,626Arrow Electronics, Inc. (A) 18,501 2,484,129Avnet, Inc. 26,364 1,086,988Azbil Corp. 20,500 934,975Badger Meter, Inc. 4,671 497,742Belden, Inc. 19,045 1,251,828Benchmark Electronics, Inc. 5,838 158,210CDW Corp. 17,037 3,488,837Cognex Corp. 46,977 3,652,932Coherent, Inc. (A) 6,519 1,737,574Corning, Inc. 95,240 3,545,785CTS Corp. 5,353 196,562Daktronics, Inc. (A) 9,075 45,829ePlus, Inc. (A) 4,332 233,408Fabrinet (A) 5,957 705,726FARO Technologies, Inc. (A) 3,029 212,091Halma PLC 63,015 2,732,259Hamamatsu Photonics KK 23,300 1,488,168Hexagon AB, B Shares 327,001 5,179,874Hirose Electric Company, Ltd. 5,375 903,319Ibiden Company, Ltd. 17,500 1,039,246Identiv, Inc. (A) 3,776 106,257II-VI, Inc. (A)(C) 45,297 3,095,144Insight Enterprises, Inc. (A) 5,545 591,097IPG Photonics Corp. (A) 4,441 764,474Itron, Inc. (A) 7,354 503,896Jabil, Inc. 38,085 2,679,280Keyence Corp. 32,300 20,308,886Keysight Technologies, Inc. (A) 22,827 4,714,004Kimball Electronics, Inc. (A) 3,971 86,409Knowles Corp. (A) 14,223 332,107Kyocera Corp. 53,263 3,330,324
Strategic Equity Allocation Trust (continued)Shares orPrincipalAmount Value
COMMON STOCKS (continued)Electronic equipment, instruments andcomponents (continued)Littelfuse, Inc. 6,545 $ 2,059,581Luna Innovations, Inc. (A) 6,244 52,699Methode Electronics, Inc. 6,068 298,364MicroVision, Inc. (A)(C) 27,715 138,852Murata Manufacturing Company, Ltd. 95,339 7,604,473Napco Security Technologies, Inc. (A) 2,373 118,603National Instruments Corp. 35,042 1,530,284nLight, Inc. (A) 7,070 169,327Novanta, Inc. (A) 5,690 1,003,318Omron Corp. 30,818 3,070,931OSI Systems, Inc. (A) 2,695 251,174Ouster, Inc. (A) 23,686 123,167PAR Technology Corp. (A)(C) 3,967 209,339PC Connection, Inc. 1,716 74,011Plexus Corp. (A) 4,472 428,820Rogers Corp. (A) 3,025 825,825Sanmina Corp. (A) 10,188 422,394ScanSource, Inc. (A) 4,049 142,039Shimadzu Corp. 39,292 1,659,615TD SYNNEX Corp. 10,969 1,254,415TDK Corp. 64,563 2,519,628TE Connectivity, Ltd. 40,642 6,557,180Teledyne Technologies, Inc. (A) 5,775 2,523,040Trimble, Inc. (A) 31,178 2,718,410TTM Technologies, Inc. (A) 17,068 254,313Velodyne Lidar, Inc. (A) 13,728 63,698Venture Corp., Ltd. 46,000 625,087Vishay Intertechnology, Inc. 56,768 1,241,516Vishay Precision Group, Inc. (A) 2,262 83,965Vontier Corp. 44,920 1,380,392Yokogawa Electric Corp. 37,892 683,929Zebra Technologies Corp., Class A (A) 6,617 3,938,438
119,555,369IT services – 3.2%Accenture PLC, Class A 78,575 32,573,266Adyen NV (A)(B) 3,286 8,625,749Afterpay, Ltd. (A) 36,112 2,179,979Akamai Technologies, Inc. (A) 20,176 2,361,399Alliance Data Systems Corp. 13,228 880,588Amadeus IT Group SA (A) 74,775 5,059,593Automatic Data Processing, Inc. 52,423 12,926,463Bechtle AG 13,594 967,343BigCommerce Holdings, Inc., Series 1 (A) 7,944 280,979Brightcove, Inc. (A) 7,687 78,561Broadridge Financial Solutions, Inc. 14,394 2,631,511Cantaloupe, Inc. (A) 9,780 86,846Capgemini SE 26,615 6,522,817Cass Information Systems, Inc. 2,618 102,940Cognizant Technology Solutions Corp.,
Class A 65,126 5,777,979Computershare, Ltd. 90,189 1,312,894Concentrix Corp. 11,399 2,036,089Conduent, Inc. (A) 28,619 152,825CSG Systems International, Inc. 5,277 304,061DigitalOcean Holdings, Inc. (A) 8,092 650,030DXC Technology Company (A) 31,213 1,004,746Edenred 41,428 1,913,077EPAM Systems, Inc. (A) 7,068 4,724,605EVERTEC, Inc. 9,807 490,154EVO Payments, Inc., Class A (A) 8,058 206,285ExlService Holdings, Inc. (A) 5,310 768,729Fidelity National Information Services, Inc. 75,146 8,202,186Fiserv, Inc. (A) 73,847 7,664,580FleetCor Technologies, Inc. (A) 10,235 2,291,002
John Hancock Variable Insurance TrustPortfolio of Investments — December 31, 2021 (showing percentage of total net assets)
The accompanying notes are an integral part of the financial statements. 160

Strategic Equity Allocation Trust (continued)Shares orPrincipalAmount Value
COMMON STOCKS (continued)IT services (continued)Flywire Corp. (A) 9,763 $ 371,580Fujitsu, Ltd. 32,623 5,605,495Gartner, Inc. (A) 10,365 3,465,227Genpact, Ltd. 45,971 2,440,141Global Payments, Inc. 36,398 4,920,282GMO Payment Gateway, Inc. 7,000 871,686Grid Dynamics Holdings, Inc. (A) 7,002 265,866i3 Verticals, Inc., Class A (A) 3,899 88,858IBM Corp. 111,062 14,844,547International Money Express, Inc. (A) 5,640 90,014Itochu Techno-Solutions Corp. 15,900 511,467Jack Henry & Associates, Inc. 9,204 1,536,976Kyndryl Holdings, Inc. (A) 47,598 861,524Limelight Networks, Inc. (A) 22,486 77,127LiveRamp Holdings, Inc. (A) 28,892 1,385,371Mastercard, Inc., Class A 107,944 38,786,438MAXIMUS, Inc. 26,239 2,090,461MoneyGram International, Inc. (A) 15,375 121,309NEC Corp. 40,784 1,885,840Nexi SpA (A)(B) 77,691 1,231,121Nomura Research Institute, Ltd. 55,800 2,385,494NTT Data Corp. 104,710 2,246,157Obic Company, Ltd. 11,600 2,170,930Otsuka Corp. 18,900 901,202Paya Holdings, Inc. (A) 14,560 92,310Paychex, Inc. 39,682 5,416,593PayPal Holdings, Inc. (A) 146,375 27,603,398Perficient, Inc. (A) 5,271 681,488Rackspace Technology, Inc. (A) 9,388 126,456Remitly Global, Inc. (A) 1,517 31,281Repay Holdings Corp. (A) 14,406 263,198Sabre Corp. (A) 85,939 738,216SCSK Corp. 25,900 515,467The Hackett Group, Inc. 4,170 85,610The Western Union Company 106,816 1,905,597TIS, Inc. 37,200 1,106,181TTEC Holdings, Inc. 2,965 268,481Tucows, Inc., Class A (A)(C) 1,671 140,063Unisys Corp. (A) 10,565 217,322VeriSign, Inc. (A) 12,060 3,061,069Verra Mobility Corp. (A) 22,098 340,972Visa, Inc., Class A 208,413 45,165,181WEX, Inc. (A) 11,909 1,671,905Wix.com, Ltd. (A) 9,300 1,467,447Worldline SA (A)(B) 39,570 2,202,472
295,033,096Semiconductors and semiconductor equipment – 5.0%Advanced Micro Devices, Inc. (A) 150,296 21,627,594Advantest Corp. 33,100 3,134,542Alpha & Omega Semiconductor, Ltd. (A) 3,509 212,505Ambarella, Inc. (A) 5,711 1,158,705Amkor Technology, Inc. 43,155 1,069,812Analog Devices, Inc. 66,650 11,715,071Applied Materials, Inc. 112,281 17,668,538ASM International NV 7,773 3,431,137ASML Holding NV 68,606 54,954,767Atomera, Inc. (A)(C) 3,439 69,193Axcelis Technologies, Inc. (A) 5,430 404,861AXT, Inc. (A) 8,158 71,872Azenta, Inc. 19,755 2,036,938Broadcom, Inc. 51,164 34,045,037CEVA, Inc. (A) 3,891 168,247Cirrus Logic, Inc. (A) 15,181 1,396,956CMC Materials, Inc. 12,160 2,330,950Cohu, Inc. (A) 7,884 300,302
Strategic Equity Allocation Trust (continued)Shares orPrincipalAmount Value
COMMON STOCKS (continued)Semiconductors and semiconductor equipment (continued)Diodes, Inc. (A) 7,043 $ 773,392Disco Corp. 4,800 1,467,132Enphase Energy, Inc. (A) 16,681 3,051,622First Solar, Inc. (A) 26,274 2,290,042FormFactor, Inc. (A) 12,678 579,638Ichor Holdings, Ltd. (A) 4,495 206,905Impinj, Inc. (A) 3,051 270,624Infineon Technologies AG 216,762 9,979,388Intel Corp. 505,629 26,039,894KLA Corp. 18,925 8,139,832Kopin Corp. (A)(C) 14,258 58,315Kulicke & Soffa Industries, Inc. 9,906 599,709Lam Research Corp. 17,444 12,544,853Lasertec Corp. 12,500 3,828,768Lattice Semiconductor Corp. (A) 58,328 4,494,756MACOM Technology Solutions
Holdings, Inc. (A) 7,919 620,058MaxLinear, Inc. (A) 11,522 868,644Meta Materials, Inc. (A)(C) 34,862 85,761Microchip Technology, Inc. 69,602 6,059,550Micron Technology, Inc. 139,490 12,993,494MKS Instruments, Inc. 14,736 2,566,569Monolithic Power Systems, Inc. 5,348 2,638,329NeoPhotonics Corp. (A) 8,642 132,828NVE Corp. 1,034 70,622NVIDIA Corp. 310,600 91,350,566NXP Semiconductors NV 32,852 7,483,029Onto Innovation, Inc. (A) 7,913 801,033PDF Solutions, Inc. (A) 4,959 157,647Photronics, Inc. (A) 9,876 186,163Power Integrations, Inc. 25,777 2,394,426Qorvo, Inc. (A) 13,771 2,153,647QUALCOMM, Inc. 138,983 25,415,821Rambus, Inc. (A) 17,641 518,469Renesas Electronics Corp. (A) 208,500 2,589,716Rohm Company, Ltd. 14,542 1,322,877Semtech Corp. (A) 27,575 2,452,245Silicon Laboratories, Inc. (A) 17,135 3,537,007SiTime Corp. (A) 6,514 1,905,606Skyworks Solutions, Inc. 20,463 3,174,630SMART Global Holdings, Inc. (A) 2,828 200,760SolarEdge Technologies, Inc. (A) 6,566 1,842,223STMicroelectronics NV 113,354 5,574,174SUMCO Corp. 55,200 1,124,026SunPower Corp. (A)(C) 35,149 733,560Synaptics, Inc. (A) 16,676 4,827,869Teradyne, Inc. 20,442 3,342,880Texas Instruments, Inc. 114,393 21,559,649Tokyo Electron, Ltd. 24,760 14,251,171Ultra Clean Holdings, Inc. (A) 7,253 416,032Universal Display Corp. 11,520 1,901,146Veeco Instruments, Inc. (A) 8,124 231,290Wolfspeed, Inc. (A) 30,793 3,441,734Xilinx, Inc. 30,663 6,501,476
467,548,624Software – 6.2%8x8, Inc. (A) 18,194 304,931A10 Networks, Inc. 9,971 165,319ACI Worldwide, Inc. (A) 50,436 1,750,129Adobe, Inc. (A) 59,030 33,473,552Agilysys, Inc. (A) 3,417 151,920Alarm.com Holdings, Inc. (A) 7,709 653,800Alkami Technology, Inc. (A) 3,939 79,016Altair Engineering, Inc., Class A (A) 7,548 583,611American Software, Inc., Class A 5,126 134,147
John Hancock Variable Insurance TrustPortfolio of Investments — December 31, 2021 (showing percentage of total net assets)
The accompanying notes are an integral part of the financial statements. 161

Strategic Equity Allocation Trust (continued)Shares orPrincipalAmount Value
COMMON STOCKS (continued)Software (continued)ANSYS, Inc. (A) 10,811 $ 4,336,508Appfolio, Inc., Class A (A) 3,071 371,775Appian Corp. (A)(C) 6,430 419,300Asana, Inc., Class A (A) 11,523 859,040Aspen Technology, Inc. (A) 17,781 2,706,268Autodesk, Inc. (A) 27,261 7,665,521Avaya Holdings Corp. (A) 13,512 267,538AVEVA Group PLC 19,997 922,706AvidXchange Holdings, Inc. (A) 2,935 44,201Benefitfocus, Inc. (A) 4,996 53,257Blackbaud, Inc. (A) 18,801 1,484,903Blackline, Inc. (A) 8,745 905,457Bottomline Technologies DE, Inc. (A) 7,270 410,537Box, Inc., Class A (A) 22,728 595,246BTRS Holdings, Inc., Class A (A) 11,174 87,381Cadence Design Systems, Inc. (A) 34,295 6,390,873CDK Global, Inc. 31,442 1,312,389Cerence, Inc. (A) 16,270 1,246,933Ceridian HCM Holding, Inc. (A) 16,712 1,745,736ChannelAdvisor Corp. (A) 5,027 124,066Check Point Software
Technologies, Ltd. (A) 17,626 2,054,487Citrix Systems, Inc. 15,393 1,456,024Cleanspark, Inc. (A)(C) 5,542 52,760CommVault Systems, Inc. (A) 19,516 1,345,043Consensus Cloud Solutions, Inc. (A) 2,408 139,351CoreCard Corp. (A) 1,329 51,565Couchbase, Inc. (A)(C) 1,670 41,683CS Disco, Inc. (A) 1,411 50,443CyberArk Software, Ltd. (A) 6,600 1,143,648Dassault Systemes SE 110,348 6,548,640Digimarc Corp. (A)(C) 2,148 84,803Digital Turbine, Inc. (A) 38,090 2,323,109Domo, Inc., Class B (A) 4,514 223,894E2open Parent Holdings, Inc. (A) 30,800 346,808Ebix, Inc. 4,326 131,510eGain Corp. (A) 3,659 36,517Enfusion, Inc., Class A (A) 2,741 57,397EngageSmart, Inc. (A) 2,261 54,535Envestnet, Inc. (A) 23,339 1,851,716EverCommerce, Inc. (A) 2,903 45,722Fair Isaac Corp. (A) 7,269 3,152,347Fortinet, Inc. (A) 16,796 6,036,482GTY Technology Holdings, Inc. (A) 5,567 37,299Intapp, Inc. (A)(C) 1,771 44,558InterDigital, Inc. 5,018 359,439Intuit, Inc. 35,208 22,646,490JFrog, Ltd. (A) 8,759 260,142LivePerson, Inc. (A) 10,632 379,775Manhattan Associates, Inc. (A) 16,814 2,614,409Marathon Digital Holdings, Inc. (A)(C) 15,459 507,983MeridianLink, Inc. (A) 2,278 49,159Microsoft Corp. 932,733 313,696,763MicroStrategy, Inc., Class A (A)(C) 1,343 731,250Mimecast, Ltd. (A) 26,279 2,091,020Mitek Systems, Inc. (A) 7,333 130,161Model N, Inc. (A) 5,785 173,724Momentive Global, Inc. (A) 21,328 451,087NCR Corp. (A) 35,073 1,409,935Nemetschek SE 9,586 1,225,704Nice, Ltd. (A) 10,477 3,177,208NortonLifeLock, Inc. 72,025 1,871,210ON24, Inc. (A) 4,785 83,020OneSpan, Inc. (A) 5,836 98,803Oracle Corp. 200,462 17,482,291
Strategic Equity Allocation Trust (continued)Shares orPrincipalAmount Value
COMMON STOCKS (continued)Software (continued)Oracle Corp. Japan 6,406 $ 486,686PagerDuty, Inc. (A) 13,230 459,743Paycom Software, Inc. (A) 5,956 2,472,872Paylocity Holding Corp. (A) 10,527 2,486,056Ping Identity Holding Corp. (A) 9,074 207,613Progress Software Corp. 7,093 342,379PROS Holdings, Inc. (A) 6,621 228,358PTC, Inc. (A) 13,090 1,585,854Q2 Holdings, Inc. (A) 8,933 709,638Qualys, Inc. (A) 14,374 1,972,400Rapid7, Inc. (A) 9,074 1,067,919Rekor Systems, Inc. (A)(C) 5,836 38,226Rimini Street, Inc. (A) 7,656 45,706Riot Blockchain, Inc. (A)(C) 14,247 318,136Sailpoint Technologies Holdings, Inc. (A) 39,709 1,919,533salesforce.com, Inc. (A) 121,700 30,927,621SAP SE 173,325 24,393,674Sapiens International Corp. NV 4,986 171,768SecureWorks Corp., Class A (A) 2,011 32,116ServiceNow, Inc. (A) 24,776 16,082,349ShotSpotter, Inc. (A) 1,614 47,645Sinch AB (A)(B) 86,696 1,093,959Smith Micro Software, Inc. (A) 9,065 44,600Sprout Social, Inc., Class A (A) 7,310 662,944SPS Commerce, Inc. (A) 5,829 829,758Sumo Logic, Inc. (A) 14,641 198,532Synopsys, Inc. (A) 18,905 6,966,493Telos Corp. (A) 6,796 104,794Temenos AG 11,149 1,536,793Tenable Holdings, Inc. (A) 14,850 817,790Teradata Corp. (A) 28,829 1,224,368The Sage Group PLC 174,898 2,023,734Trend Micro, Inc. (C) 22,164 1,230,457Tyler Technologies, Inc. (A) 5,061 2,722,565Upland Software, Inc. (A) 4,985 89,431Varonis Systems, Inc. (A) 17,312 844,479Verint Systems, Inc. (A) 10,378 544,949Veritone, Inc. (A)(C) 4,663 104,824VirnetX Holding Corp. (A)(C) 12,700 33,020Vonage Holdings Corp. (A) 39,236 815,716WiseTech Global, Ltd. 24,270 1,029,325Workiva, Inc. (A) 6,948 906,645Xero, Ltd. (A) 22,190 2,271,350Xperi Holding Corp. 17,253 326,254Yext, Inc. (A) 18,409 182,617Zuora, Inc., Class A (A) 18,216 340,275
578,937,938Technology hardware, storage and peripherals – 4.1%3D Systems Corp. (A) 19,786 426,190Apple, Inc. 1,936,236 343,817,427Avid Technology, Inc. (A) 5,788 188,515Brother Industries, Ltd. 39,136 754,327Canon, Inc. (C) 166,077 4,051,226Corsair Gaming, Inc. (A)(C) 4,539 95,364Diebold Nixdorf, Inc. (A) 12,681 114,763Eastman Kodak Company (A) 8,827 41,310FUJIFILM Holdings Corp. 59,838 4,436,045Hewlett Packard Enterprise Company 161,815 2,551,823HP, Inc. 143,175 5,393,402Logitech International SA 28,733 2,410,343NetApp, Inc. 27,757 2,553,366Quantum Corp. (A) 10,206 56,337Ricoh Company, Ltd. 111,277 1,037,225Seagate Technology Holdings PLC 25,946 2,931,379Seiko Epson Corp. 46,447 836,529
John Hancock Variable Insurance TrustPortfolio of Investments — December 31, 2021 (showing percentage of total net assets)
The accompanying notes are an integral part of the financial statements. 162

Strategic Equity Allocation Trust (continued)Shares orPrincipalAmount Value
COMMON STOCKS (continued)Technology hardware, storage and peripherals (continued)Super Micro Computer, Inc. (A) 6,954 $ 305,628Turtle Beach Corp. (A) 2,597 57,809Western Digital Corp. (A) 37,972 2,476,154Xerox Holdings Corp. 36,523 826,881
375,362,0431,903,538,559
Materials – 4.4%Chemicals – 2.3%AdvanSix, Inc. 4,338 204,971Air Liquide SA 78,635 13,714,282Air Products & Chemicals, Inc. 27,429 8,345,548Akzo Nobel NV 31,114 3,418,336Albemarle Corp. 14,491 3,387,561American Vanguard Corp. 4,962 81,327Amyris, Inc. (A)(C) 28,093 151,983Arkema SA 10,190 1,438,264Asahi Kasei Corp. 208,257 1,961,853Ashland Global Holdings, Inc. 15,008 1,615,761Avient Corp. 39,014 2,182,833Balchem Corp. 5,127 864,412BASF SE 152,452 10,699,897Cabot Corp. 24,181 1,358,972Celanese Corp. 13,768 2,313,850CF Industries Holdings, Inc. 26,653 1,886,499Chase Corp. 1,214 120,866Chr. Hansen Holding A/S 17,508 1,380,513Clariant AG (A) 35,813 743,936Corteva, Inc. 90,972 4,301,156Covestro AG (B) 32,068 1,973,720Croda International PLC 23,158 3,171,985Danimer Scientific, Inc. (A)(C) 14,106 120,183Dow, Inc. 92,407 5,241,325DuPont de Nemours, Inc. 64,811 5,235,433Eastman Chemical Company 16,825 2,034,311Ecolab, Inc. 30,840 7,234,756Ecovyst, Inc. 8,774 89,846EMS-Chemie Holding AG 1,165 1,301,981Evonik Industries AG 34,807 1,124,457Ferro Corp. (A) 13,438 293,352FMC Corp. 15,947 1,752,416FutureFuel Corp. 6,079 46,444GCP Applied Technologies, Inc. (A) 8,166 258,536Givaudan SA 1,533 8,043,043Hawkins, Inc. 3,258 128,528HB Fuller Company 8,359 677,079ICL Group, Ltd. 117,231 1,129,182Ingevity Corp. (A) 16,886 1,210,726Innospec, Inc. 3,933 355,307International Flavors & Fragrances, Inc. 31,886 4,803,626Intrepid Potash, Inc. (A) 1,678 71,701Johnson Matthey PLC 32,123 892,632JSR Corp. 33,790 1,284,137Kansai Paint Company, Ltd. 29,454 640,507Koninklijke DSM NV 29,012 6,533,685Koppers Holdings, Inc. (A) 3,569 111,710Kraton Corp. (A) 5,103 236,371LANXESS AG 13,789 852,694Linde PLC 63,553 22,016,666Livent Corp. (A) 26,229 639,463LyondellBasell Industries NV, Class A 32,745 3,020,071Minerals Technologies, Inc. 14,153 1,035,292Mitsubishi Chemical Holdings Corp. 212,559 1,576,629Mitsubishi Gas Chemical Company, Inc. 26,270 445,315Mitsui Chemicals, Inc. 30,618 823,018NewMarket Corp. 1,836 629,234
Strategic Equity Allocation Trust (continued)Shares orPrincipalAmount Value
COMMON STOCKS (continued)Chemicals (continued)Nippon Paint Holdings Company, Ltd. 118,000 $ 1,288,653Nippon Sanso Holdings Corp. 25,157 550,250Nissan Chemical Corp. 20,200 1,174,832Nitto Denko Corp. 23,587 1,822,153Novozymes A/S, B Shares 34,098 2,799,780Olin Corp. 38,113 2,192,260Orica, Ltd. 67,638 674,504Orion Engineered Carbons SA (A) 10,056 184,628PPG Industries, Inc. 29,410 5,071,460PureCycle Technologies, Inc. (A)(C) 7,597 72,703Quaker Chemical Corp. 2,198 507,254Rayonier Advanced Materials, Inc. (A) 11,369 64,917RPM International, Inc. 34,466 3,481,066Sensient Technologies Corp. 17,925 1,793,576Shin-Etsu Chemical Company, Ltd. 58,746 10,196,858Sika AG 23,533 9,780,719Solvay SA 12,302 1,430,180Stepan Company 3,351 416,496Sumitomo Chemical Company, Ltd. 247,344 1,166,427Symrise AG 21,355 3,158,290The Chemours Company 43,300 1,453,148The Mosaic Company 45,897 1,803,293The Scotts Miracle-Gro Company 10,824 1,742,664The Sherwin-Williams Company 30,015 10,570,082Toray Industries, Inc. 230,172 1,363,685Tosoh Corp. 43,200 641,801Tredegar Corp. 5,560 65,719Trinseo PLC 6,289 329,921Tronox Holdings PLC, Class A 18,413 442,464Umicore SA 32,719 1,334,752Valvoline, Inc. 48,029 1,791,001Yara International ASA 27,482 1,385,593Zymergen, Inc. (A) 12,487 83,538
218,042,848Construction materials – 0.3%CRH PLC 129,300 6,845,144Eagle Materials, Inc. 10,807 1,798,933Forterra, Inc. (A) 4,820 114,620HeidelbergCement AG 24,701 1,671,690Holcim, Ltd. (A) 86,900 4,419,650James Hardie Industries PLC, CHESS
Depositary Interest 73,884 2,973,989Martin Marietta Materials, Inc. 7,729 3,404,779Summit Materials, Inc., Class A (A) 19,266 773,337United States Lime & Minerals, Inc. 380 49,028Vulcan Materials Company 16,440 3,412,615
25,463,785Containers and packaging – 0.3%Amcor PLC 191,041 2,294,402AptarGroup, Inc. 17,491 2,142,298Avery Dennison Corp. 10,270 2,224,174Ball Corp. 40,469 3,895,951Greif, Inc., Class A 10,982 662,983Greif, Inc., Class B 1,195 71,437International Paper Company 48,428 2,275,147Myers Industries, Inc. 6,312 126,303O-I Glass, Inc. (A) 25,834 310,783Packaging Corp. of America 11,770 1,602,486Pactiv Evergreen, Inc. 7,348 93,173Ranpak Holdings Corp. (A) 6,163 231,606Sealed Air Corp. 18,573 1,253,120Silgan Holdings, Inc. 22,296 955,161Smurfit Kappa Group PLC 40,844 2,251,174Sonoco Products Company 26,126 1,512,434TriMas Corp. 7,060 261,220
John Hancock Variable Insurance TrustPortfolio of Investments — December 31, 2021 (showing percentage of total net assets)
The accompanying notes are an integral part of the financial statements. 163

Strategic Equity Allocation Trust (continued)Shares orPrincipalAmount Value
COMMON STOCKS (continued)Containers and packaging (continued)UFP Technologies, Inc. (A) 1,250 $ 87,825Westrock Company 33,084 1,467,606
23,719,283Metals and mining – 1.4%1911 Gold Corp. (A) 3,149 769Alcoa Corp. 49,715 2,962,020Allegheny Technologies, Inc. (A) 20,886 332,714Anglo American PLC 214,492 8,822,532Antofagasta PLC 65,454 1,190,425ArcelorMittal SA 111,429 3,574,491Arconic Corp. (A) 17,396 574,242BHP Group PLC 350,570 10,431,111BHP Group, Ltd. (C) 489,693 14,784,676BlueScope Steel, Ltd. 83,623 1,276,617Boliden AB 45,399 1,750,573Carpenter Technology Corp. 7,771 226,835Century Aluminum Company (A) 8,608 142,548Cleveland-Cliffs, Inc. (A) 120,919 2,632,407Coeur Mining, Inc. (A) 42,510 214,250Commercial Metals Company 51,299 1,861,641Compass Minerals International, Inc. 14,570 744,236Constellium SE (A) 19,977 357,788Evolution Mining, Ltd. 304,203 902,506Evraz PLC 84,741 692,827Fortescue Metals Group, Ltd. 281,082 3,951,100Freeport-McMoRan, Inc. 181,905 7,590,896Gatos Silver, Inc. (A) 7,813 81,099Glencore PLC (A) 1,657,477 8,445,306Haynes International, Inc. 2,289 92,315Hecla Mining Company 87,346 455,946Hitachi Metals, Ltd. (A) 35,564 658,967JFE Holdings, Inc. 81,633 1,041,474Kaiser Aluminum Corp. 2,638 247,814Materion Corp. 3,272 300,828MP Materials Corp. (A)(C) 11,880 539,590Newcrest Mining, Ltd. 135,657 2,429,632Newmont Corp. 99,018 6,141,096Nippon Steel Corp. 142,000 2,319,718Norsk Hydro ASA 223,222 1,756,442Northern Star Resources, Ltd. 183,584 1,262,571Novagold Resources, Inc. (A) 39,202 268,926Nucor Corp. 35,018 3,997,305Pan American Silver Corp., CVR (A)(E) 54,671 42,572Reliance Steel & Aluminum Company 16,648 2,700,639Rio Tinto PLC 186,414 12,293,301Rio Tinto, Ltd. 61,616 4,496,254Royal Gold, Inc. 17,440 1,834,862Ryerson Holding Corp. 2,803 73,018Schnitzer Steel Industries, Inc., Class A 4,241 220,193South32, Ltd. 775,898 2,269,177Steel Dynamics, Inc. 50,093 3,109,273Sumitomo Metal Mining Company, Ltd. 41,007 1,553,116SunCoke Energy, Inc. 14,420 95,028TimkenSteel Corp. (A) 7,919 130,664U.S. Steel Corp. 71,803 1,709,629voestalpine AG 19,263 698,923Warrior Met Coal, Inc. 8,351 214,704Worthington Industries, Inc. 13,922 760,977
127,258,563Paper and forest products – 0.1%Clearwater Paper Corp. (A) 2,801 102,713Glatfelter Corp. 7,281 125,233Louisiana-Pacific Corp. 23,379 1,831,745Mondi PLC 80,594 1,999,046Neenah, Inc. 2,769 128,149
Strategic Equity Allocation Trust (continued)Shares orPrincipalAmount Value
COMMON STOCKS (continued)Paper and forest products (continued)Oji Holdings Corp. 134,738 $ 652,813Schweitzer-Mauduit International, Inc. 5,313 158,859Stora Enso OYJ, R Shares 96,561 1,772,218Svenska Cellulosa AB SCA, B Shares 100,564 1,784,438UPM-Kymmene OYJ 88,592 3,370,801Verso Corp., Class A 4,394 118,726
12,044,741406,529,220
Real estate – 3.4%Equity real estate investment trusts – 2.9%Acadia Realty Trust 13,729 299,704Agree Realty Corp. 10,786 769,689Alexander & Baldwin, Inc. 11,664 292,650Alexander’s, Inc. 364 94,749Alexandria Real Estate Equities, Inc. 17,860 3,982,066American Assets Trust, Inc. 8,068 302,792American Campus Communities, Inc. 36,975 2,118,298American Finance Trust, Inc. 19,573 178,701American Tower Corp. 56,396 16,495,830Apartment Income REIT Corp. 41,712 2,280,395Apartment Investment and Management
Company, Class A (A) 23,978 185,110Apple Hospitality REIT, Inc. 34,685 560,163Armada Hoffler Properties, Inc. 10,119 154,011Ascendas Real Estate Investment Trust 557,078 1,220,549Ashford Hospitality Trust, Inc. (A) 3,478 33,389AvalonBay Communities, Inc. 17,300 4,369,807Boston Properties, Inc. 17,609 2,028,205Braemar Hotels & Resorts, Inc. (A) 11,031 56,258Brandywine Realty Trust 26,868 360,569Brixmor Property Group, Inc. 78,912 2,005,154Broadstone Net Lease, Inc. 25,111 623,255BRT Apartments Corp. 2,154 51,674Camden Property Trust 27,155 4,852,055CapitaLand Integrated Commercial Trust 806,530 1,220,257CareTrust REIT, Inc. 15,866 362,221CatchMark Timber Trust, Inc., Class A 9,831 85,628Centerspace 2,323 257,621Chatham Lodging Trust (A) 8,658 118,788City Office REIT, Inc. 7,110 140,209Community Healthcare Trust, Inc. 3,965 187,426CorePoint Lodging, Inc. (A) 7,046 110,622Corporate Office Properties Trust 47,845 1,338,225Cousins Properties, Inc. 39,508 1,591,382Covivio 8,634 708,728Crown Castle International Corp. 53,553 11,178,653CTO Realty Growth, Inc. 1,404 86,234CyrusOne, Inc. 33,721 3,025,448Daiwa House REIT Investment Corp. 364 1,102,695Dexus 178,527 1,443,545DiamondRock Hospitality Company (A) 34,033 327,057Digital Realty Trust, Inc. 35,016 6,193,280DigitalBridge Group, Inc. (A) 79,845 665,109Diversified Healthcare Trust 42,153 130,253Douglas Emmett, Inc. 46,628 1,562,038Duke Realty Corp. 46,880 3,077,203Easterly Government Properties, Inc. 13,523 309,947EastGroup Properties, Inc. 17,189 3,916,514Empire State Realty Trust, Inc., Class A 23,356 207,868EPR Properties 19,876 943,911Equinix, Inc. 11,303 9,560,530Equity Commonwealth (A) 17,527 453,949Equity Residential 42,223 3,821,182Essential Properties Realty Trust, Inc. 19,109 550,912Essex Property Trust, Inc. 8,058 2,838,269
John Hancock Variable Insurance TrustPortfolio of Investments — December 31, 2021 (showing percentage of total net assets)
The accompanying notes are an integral part of the financial statements. 164

Strategic Equity Allocation Trust (continued)Shares orPrincipalAmount Value
COMMON STOCKS (continued)Equity real estate investment trusts (continued)Extra Space Storage, Inc. 16,580 $ 3,759,183Farmland Partners, Inc. 5,722 68,378Federal Realty Investment Trust 8,672 1,182,167First Industrial Realty Trust, Inc. 34,619 2,291,778Four Corners Property Trust, Inc. 12,193 358,596Franklin Street Properties Corp. 20,331 120,969Gecina SA 7,621 1,066,412Getty Realty Corp. 6,286 201,718Gladstone Commercial Corp. 6,625 170,726Gladstone Land Corp. 5,151 173,898Global Medical REIT, Inc. 10,526 186,837Global Net Lease, Inc. 16,539 252,716GLP J-REIT 708 1,223,790Goodman Group 275,978 5,319,977Healthcare Realty Trust, Inc. 62,488 1,977,120Healthpeak Properties, Inc. 66,783 2,410,198Hersha Hospitality Trust (A) 6,927 63,521Highwoods Properties, Inc. 27,735 1,236,704Host Hotels & Resorts, Inc. (A) 88,466 1,538,424Hudson Pacific Properties, Inc. 40,515 1,001,126Independence Realty Trust, Inc. 16,982 438,645Indus Realty Trust, Inc. 970 78,628Industrial Logistics Properties Trust 10,510 263,276Innovative Industrial Properties, Inc. 3,867 1,016,673Iron Mountain, Inc. 35,866 1,876,868iStar, Inc. 11,227 289,993Japan Metropolitan Fund Investment Corp. 1,160 999,336Japan Real Estate Investment Corp. 207 1,175,062JBG SMITH Properties 30,332 870,832Kilroy Realty Corp. 27,850 1,850,911Kimco Realty Corp. 76,020 1,873,893Kite Realty Group Trust 93,547 2,037,454Klepierre SA (A) 33,736 798,269Lamar Advertising Company, Class A 23,068 2,798,148Land Securities Group PLC 116,920 1,233,969Life Storage, Inc. 21,794 3,338,405Link REIT 347,206 3,058,631LTC Properties, Inc. 6,607 225,563LXP Industrial Trust 43,881 685,421Mapletree Commercial Trust 358,300 535,915Mapletree Logistics Trust 499,200 704,039Medical Properties Trust, Inc. 158,441 3,743,961Mid-America Apartment Communities, Inc. 14,376 3,298,429Mirvac Group 654,496 1,385,420Monmouth Real Estate Investment Corp. 15,728 330,445National Health Investors, Inc. 7,052 405,278National Retail Properties, Inc. 46,663 2,243,090National Storage Affiliates Trust 35,018 2,423,246NETSTREIT Corp. 6,719 153,865NexPoint Residential Trust, Inc. 3,611 302,710Nippon Building Fund, Inc. 247 1,438,688Nippon Prologis REIT, Inc. 343 1,212,413Nomura Real Estate Master Fund, Inc. 704 990,766Office Properties Income Trust 8,480 210,643Omega Healthcare Investors, Inc. 63,497 1,878,876One Liberty Properties, Inc. 3,083 108,768Orix JREIT, Inc. 435 680,013Outfront Media, Inc. 23,760 637,243Paramount Group, Inc. 29,999 250,192Park Hotels & Resorts, Inc. (A) 62,834 1,186,306Pebblebrook Hotel Trust 56,129 1,255,606Phillips Edison & Company, Inc. 3,392 112,072Physicians Realty Trust 92,757 1,746,614Piedmont Office Realty Trust, Inc.,
Class A 19,596 360,174
Strategic Equity Allocation Trust (continued)Shares orPrincipalAmount Value
COMMON STOCKS (continued)Equity real estate investment trusts (continued)Plymouth Industrial REIT, Inc. 5,238 $ 167,616Postal Realty Trust, Inc., Class A 3,054 60,469PotlatchDeltic Corp. 28,620 1,723,496Preferred Apartment Communities, Inc. 9,306 168,066Prologis, Inc. 91,600 15,421,776PS Business Parks, Inc. 8,452 1,556,605Public Storage 18,890 7,075,438Rayonier, Inc. 38,037 1,535,173Realty Income Corp. 70,629 5,056,330Regency Centers Corp. 18,944 1,427,430Retail Opportunity Investments Corp. 18,679 366,108Rexford Industrial Realty, Inc. 40,251 3,264,759RLJ Lodging Trust 27,124 377,837RPT Realty 12,949 173,258Ryman Hospitality Properties, Inc. (A) 8,788 808,144Sabra Health Care REIT, Inc. 96,803 1,310,713Safehold, Inc. 2,879 229,888Saul Centers, Inc. 2,112 111,978SBA Communications Corp. 13,574 5,280,557Scentre Group 861,520 1,981,821Segro PLC 199,222 3,877,205Seritage Growth Properties, Class A (A) 6,726 89,254Service Properties Trust 27,178 238,895Simon Property Group, Inc. 40,718 6,505,515SITE Centers Corp. 28,008 443,367SL Green Realty Corp. 17,730 1,271,241Spirit Realty Capital, Inc. 32,766 1,578,994STAG Industrial, Inc. 26,491 1,270,508Stockland 396,234 1,222,388STORE Capital Corp. 65,207 2,243,121Summit Hotel Properties, Inc. (A) 17,113 167,023Sunstone Hotel Investors, Inc. (A) 35,392 415,148Tanger Factory Outlet Centers, Inc. 16,572 319,508Terreno Realty Corp. 11,105 947,145The British Land Company PLC 146,133 1,055,275The GEO Group, Inc. 19,300 149,575The GPT Group 317,957 1,253,766The Macerich Company 91,466 1,580,532UDR, Inc. 37,068 2,223,709UMH Properties, Inc. 7,247 198,061Unibail-Rodamco-Westfield (A) 20,704 1,448,850Uniti Group, Inc. 32,145 450,351Universal Health Realty Income Trust 2,426 144,274Urban Edge Properties 48,164 915,116Urstadt Biddle Properties, Inc., Class A 5,535 117,896Ventas, Inc. 48,755 2,492,356Veris Residential, Inc. (A) 14,349 263,735Vicinity Centres 642,269 789,885Vornado Realty Trust 19,701 824,684Washington Real Estate Investment Trust 13,498 348,923Welltower, Inc. 54,381 4,664,258Weyerhaeuser Company 92,905 3,825,828Whitestone REIT 8,282 83,897Xenia Hotels & Resorts, Inc. (A) 18,473 334,546
269,792,055Real estate management and development – 0.5%Aroundtown SA 165,827 1,000,329Azrieli Group, Ltd. 7,044 672,072CapitaLand Investment, Ltd. (A) 437,984 1,107,409CBRE Group, Inc., Class A (A) 41,600 4,514,016City Developments, Ltd. 67,913 343,598CK Asset Holdings, Ltd. 332,562 2,097,789Cushman & Wakefield PLC (A) 22,672 504,225Daito Trust Construction Company, Ltd. 10,911 1,251,722Daiwa House Industry Company, Ltd. 93,966 2,700,496
John Hancock Variable Insurance TrustPortfolio of Investments — December 31, 2021 (showing percentage of total net assets)
The accompanying notes are an integral part of the financial statements. 165

Strategic Equity Allocation Trust (continued)Shares orPrincipalAmount Value
COMMON STOCKS (continued)Real estate management and development (continued)Douglas Elliman, Inc. (A) 11,744 $ 135,056ESR Cayman, Ltd. (A)(B) 330,200 1,116,937eXp World Holdings, Inc. 10,349 348,658Fastighets AB Balder, B Shares (A) 17,455 1,256,131Forestar Group, Inc. (A) 3,232 70,296FRP Holdings, Inc. (A) 1,232 71,210Hang Lung Properties, Ltd. 336,313 692,451Henderson Land Development
Company, Ltd. 240,709 1,026,762Hongkong Land Holdings, Ltd. 193,734 1,007,342Hulic Company, Ltd. 62,969 598,803Jones Lang LaSalle, Inc. (A) 13,410 3,611,849Kennedy-Wilson Holdings, Inc. 19,513 465,970LEG Immobilien SE 12,090 1,685,621Lendlease Corp., Ltd. 114,294 889,955Marcus & Millichap, Inc. (A) 3,890 200,179Mitsubishi Estate Company, Ltd. 196,324 2,723,501Mitsui Fudosan Company, Ltd. 152,226 3,017,237New World Development Company, Ltd. 253,392 1,003,249Newmark Group, Inc., Class A 24,292 454,260Nomura Real Estate Holdings, Inc. 19,663 453,074RE/MAX Holdings, Inc., Class A 3,335 101,684Realogy Holdings Corp. (A) 19,091 320,920Redfin Corp. (A)(C) 16,672 640,038Sagax AB, Class B 26,732 899,197Sino Land Company, Ltd. 551,722 686,981Sumitomo Realty & Development
Company, Ltd. 51,383 1,514,814Sun Hung Kai Properties, Ltd. 216,314 2,624,808Swire Pacific, Ltd., Class A 82,518 469,362Swire Properties, Ltd. 194,287 487,054Swiss Prime Site AG 12,610 1,237,898Tejon Ranch Company (A) 3,868 73,801The RMR Group, Inc., Class A 2,872 99,601The St. Joe Company 5,372 279,613UOL Group, Ltd. 77,070 405,681Vonovia SE 90,709 4,998,262Wharf Real Estate Investment
Company, Ltd. 277,346 1,409,26251,269,173
321,061,228Utilities – 2.8%Electric utilities – 1.5%ALLETE, Inc. 22,426 1,487,965Alliant Energy Corp. 31,009 1,906,123American Electric Power Company, Inc. 63,689 5,666,410AusNet Services, Ltd. 317,856 594,607Chubu Electric Power Company, Inc. 106,929 1,129,439CK Infrastructure Holdings, Ltd. 109,843 699,833CLP Holdings, Ltd. 272,334 2,751,872Duke Energy Corp. 95,327 9,999,802Edison International 47,049 3,211,094EDP - Energias de Portugal SA 460,768 2,531,138Electricite de France SA 78,623 924,708Elia Group SA/NV 5,128 675,900Endesa SA 52,721 1,213,713Enel SpA 1,350,002 10,794,721Entergy Corp. 24,900 2,804,985Evergy, Inc. 28,412 1,949,347Eversource Energy 42,580 3,873,928Exelon Corp. 121,162 6,998,317FirstEnergy Corp. 67,430 2,804,414Fortum OYJ 73,720 2,261,024Hawaiian Electric Industries, Inc. 29,045 1,205,368
Strategic Equity Allocation Trust (continued)Shares orPrincipalAmount Value
COMMON STOCKS (continued)Electric utilities (continued)HK Electric Investments & HK Electric
Investments, Ltd. 440,000 $ 431,722Iberdrola SA 951,000 11,259,817IDACORP, Inc. 13,422 1,520,847Mercury NZ, Ltd. 113,060 473,655MGE Energy, Inc. 5,994 493,007NextEra Energy, Inc. 244,693 22,844,538NRG Energy, Inc. 30,329 1,306,573OGE Energy Corp. 53,188 2,041,355Origin Energy, Ltd. 292,336 1,115,696Orsted A/S (B) 31,399 4,021,178Otter Tail Corp. 6,655 475,300Pinnacle West Capital Corp. 13,975 986,495PNM Resources, Inc. 36,410 1,660,660Portland General Electric Company 14,419 763,053Power Assets Holdings, Ltd. 230,236 1,435,136PPL Corp. 95,361 2,866,552Red Electrica Corp. SA 71,848 1,553,669SSE PLC 173,163 3,871,088Terna - Rete Elettrica Nazionale 233,537 1,889,230The Kansai Electric Power Company, Inc. 116,824 1,091,952The Southern Company 131,198 8,997,559Tokyo Electric Power Company
Holdings, Inc. (A) 253,428 655,165Verbund AG 11,302 1,270,167Xcel Energy, Inc. 66,717 4,516,741
143,025,863Gas utilities – 0.3%APA Group 195,843 1,432,745Atmos Energy Corp. 16,206 1,697,903Brookfield Infrastructure Corp., Class A 9,378 640,142Chesapeake Utilities Corp. 2,776 404,769Enagas SA (C) 41,312 959,732Hong Kong & China Gas Company, Ltd. 1,858,022 2,898,076National Fuel Gas Company 24,228 1,549,138Naturgy Energy Group SA 32,188 1,046,920New Jersey Resources Corp. 41,341 1,697,461Northwest Natural Holding Company 5,230 255,119ONE Gas, Inc. 22,775 1,767,112Osaka Gas Company, Ltd. 62,275 1,029,983Snam SpA 334,709 2,016,011South Jersey Industries, Inc. 17,034 444,928Southwest Gas Holdings, Inc. 25,472 1,784,314Spire, Inc. 21,916 1,429,362Tokyo Gas Company, Ltd. 62,196 1,116,441UGI Corp. 55,559 2,550,714
24,720,870Independent power and renewable electricity producers –0.1%Clearway Energy, Inc., Class A 5,914 198,001Clearway Energy, Inc., Class C 13,155 473,975EDP Renovaveis SA 47,831 1,189,436Meridian Energy, Ltd. 212,634 705,790Ormat Technologies, Inc. 7,322 580,635Sunnova Energy International, Inc. (A) 14,079 393,086The AES Corp. 82,567 2,006,378Uniper SE 15,186 721,033
6,268,334Multi-utilities – 0.8%Ameren Corp. 31,862 2,836,037Avista Corp. 11,394 484,131Black Hills Corp. 27,157 1,916,469CenterPoint Energy, Inc. 78,908 2,202,322CMS Energy Corp. 35,890 2,334,645
John Hancock Variable Insurance TrustPortfolio of Investments — December 31, 2021 (showing percentage of total net assets)
The accompanying notes are an integral part of the financial statements. 166

Strategic Equity Allocation Trust (continued)Shares orPrincipalAmount Value
COMMON STOCKS (continued)Multi-utilities (continued)Consolidated Edison, Inc. 43,787 $ 3,735,907Dominion Energy, Inc. 100,178 7,869,984DTE Energy Company 24,007 2,869,797E.ON SE 372,653 5,178,922Engie SA 303,164 4,488,458MDU Resources Group, Inc. 54,032 1,666,347National Grid PLC 600,344 8,656,532NiSource, Inc. 48,621 1,342,426NorthWestern Corp. 22,325 1,276,097Public Service Enterprise Group, Inc. 62,645 4,180,301RWE AG 106,630 4,320,278Sempra Energy 39,567 5,233,923Suez SA 58,366 1,315,753Unitil Corp. 2,845 130,842Veolia Environnement SA 108,799 3,995,522WEC Energy Group, Inc. 39,085 3,793,981
69,828,674Water utilities – 0.1%American States Water Company 5,865 606,676American Water Works Company, Inc. 22,489 4,247,273Artesian Resources Corp., Class A 1,893 87,703California Water Service Group 8,321 597,947Essential Utilities, Inc. 61,112 3,281,103Global Water Resources, Inc. 2,121 36,269Middlesex Water Company 2,774 333,712Pure Cycle Corp. (A) 4,368 63,773Severn Trent PLC 41,531 1,658,412SJW Group 4,642 339,794The York Water Company 2,471 123,006United Utilities Group PLC 113,183 1,670,065
13,045,733256,889,474
TOTAL COMMON STOCKS (Cost $4,295,229,189) $ 8,997,112,908
PREFERRED SECURITIES – 0.2%Consumer discretionary – 0.1%Automobiles – 0.1%Bayerische Motoren Werke AG 9,575 794,022Porsche Automobil Holding SE 25,416 2,399,594Volkswagen AG 30,804 6,188,003
9,381,619Consumer staples – 0.0%Household products – 0.0%Henkel AG & Company KGaA 29,573 2,386,277Health care – 0.1%Health care equipment and supplies – 0.1%Sartorius AG 4,350 2,942,079Materials – 0.0%Chemicals – 0.0%Fuchs Petrolub SE 11,536 521,301TOTAL PREFERRED SECURITIES (Cost $10,304,099) $ 15,231,276
WARRANTS – 0.0%Cie Financiere Richemont SA (Expiration
Date: 11-22-23; Strike Price: CHF67.00) (A) 200,486 220,024
Nabors Industries, Ltd. (ExpirationDate: 6-11-26; Strike Price:$166.67) (A) 480 1,792
Strategic Equity Allocation Trust (continued)Shares orPrincipalAmount Value
WARRANTS (continued)Whiting Petroleum Corp., Class A
(Expiration Date: 9-1-24; Strike Price:$73.44) (A) 917 $ 12,710
Whiting Petroleum Corp., Class B(Expiration Date: 9-1-25; Strike Price:$83.45) (A) 458 5,404
TOTAL WARRANTS (Cost $15,655) $ 239,930
SHORT-TERM INVESTMENTS – 2.9%U.S. Government – 0.0%U.S. Treasury Bill
0.045%, 02/17/2022 * $ 2,000,000 1,999,925U.S. Government Agency – 2.4%Federal Home Loan Bank Discount Note
0.020%, 02/18/2022 * 400,000 399,9900.030%, 01/14/2022 * 5,000,000 4,999,9850.035%, 01/21/2022 * 10,000,000 9,999,9500.040%, 01/19/2022 * 16,000,000 15,999,9290.045%, 02/17/2022 * 1,100,000 1,099,9730.045%, 03/07/2022 * 166,200,000 166,185,463
Tennessee Valley Authority Discount Note0.031%, 01/12/2022 * 25,000,000 24,999,938
223,685,228Short-term funds – 0.3%John Hancock Collateral Trust,
0.1697% (F)(G) 2,669,343 26,701,436Repurchase agreement – 0.2%Repurchase Agreement with State Street
Corp. dated 12-31-21 at 0.000% to berepurchased at $16,463,000 on 1-3-22,collateralized by $15,352,900U.S. Treasury Notes, 2.875% due5-15-28 (valued at $16,792,546) $ 16,463,000 16,463,000
TOTAL SHORT-TERM INVESTMENTS (Cost $268,853,316) $ 268,849,589Total Investments (Strategic Equity Allocation Trust)
(Cost $4,574,402,259) – 99.9% $ 9,281,433,703Other assets and liabilities, net – 0.1% 9,789,247TOTAL NET ASSETS – 100.0% $ 9,291,222,950
Currency AbbreviationsCHF Swiss Franc
Security Abbreviations and LegendADR American Depositary ReceiptCVR Contingent Value Right(A) Non-income producing security.(B) These securities are exempt from registration under Rule 144A of
the Securities Act of 1933. Such securities may be resold, normallyto qualified institutional buyers, in transactions exempt fromregistration.
(C) All or a portion of this security is on loan as of 12-31-21.(D) Security is valued using significant unobservable inputs and is
classified as Level 3 in the fair value hierarchy. Refer to Note 2 tothe financial statements.
(E) Strike price and/or expiration date not available.(F) The rate shown is the annualized seven-day yield as of 12-31-21.(G) Investment is an affiliate of the fund, the advisor and/or subadvisor.
This security represents the investment of cash collateral received forsecurities lending.
* Yield represents either the annualized yield at the date of purchase,the stated coupon rate or, for floating rate securities, the rate atperiod end.
John Hancock Variable Insurance TrustPortfolio of Investments — December 31, 2021 (showing percentage of total net assets)
The accompanying notes are an integral part of the financial statements. 167

Strategic Equity Allocation Trust (continued)DERIVATIVES
FUTURES
Open contractsNumber of
contracts PositionExpiration
dateNotional
basis^Notional
value^
Unrealizedappreciation
(depreciation)MSCI EAFE Index Futures 1,058 Long Mar 2022 $120,860,545 $122,823,220 $1,962,675Russell 2000 E-Mini Index Futures 247 Long Mar 2022 27,365,657 27,698,580 332,923S&P 500 Index E-Mini Futures 478 Long Mar 2022 111,370,272 113,728,150 2,357,878S&P Mid 400 Index E-Mini Futures 58 Long Mar 2022 16,019,763 16,458,660 438,897
$5,092,373
^ Notional basis refers to the contractual amount agreed upon at inception of open contracts; notional value represents the current value of the open contract.
See Notes to financial statements regarding investment transactions and other derivatives information.
Total Stock Market Index TrustShares orPrincipalAmount Value
COMMON STOCKS – 97.3%Communication services – 9.6%Diversified telecommunication services – 0.8%AT&T, Inc. 125,631 $ 3,090,523ATN International, Inc. 316 12,624Bandwidth, Inc., Class A (A) 474 34,014Cogent Communications Holdings, Inc. 900 65,862Consolidated Communications
Holdings, Inc. (A) 1,652 12,357EchoStar Corp., Class A (A) 1,756 46,271Frontier Communications Parent, Inc. (A) 4,020 118,550Globalstar, Inc. (A) 32,049 37,177IDT Corp., Class B (A) 471 20,799Iridium Communications, Inc. (A) 2,396 98,931Lumen Technologies, Inc. 19,959 250,485Ooma, Inc. (A) 511 10,445Telesat Corp. (A) 472 13,532Verizon Communications, Inc. 72,714 3,778,219
7,589,789Entertainment – 1.6%Activision Blizzard, Inc. 13,809 918,713AMC Entertainment Holdings, Inc.,
Class A (A)(B) 9,060 246,432Chicken Soup For The Soul
Entertainment, Inc. (A) 150 2,076Cinedigm Corp., Class A (A) 1,763 2,045Cinemark Holdings, Inc. (A) 2,255 36,351Electronic Arts, Inc. 5,081 670,184Endeavor Group Holdings, Inc.,
Class A (A) 11,826 412,609Gaia, Inc. (A) 509 4,362Liberty Media Corp.-Liberty Braves,
Class A (A) 1,055 30,331Liberty Media Corp.-Liberty Formula One,
Series A (A) 225 13,352Lions Gate Entertainment Corp.,
Class B (A) 4,142 63,745Live Nation Entertainment, Inc. (A) 3,920 469,185LiveOne, Inc. (A) 841 1,076Madison Square Garden Entertainment
Corp. (A) 552 38,828Madison Square Garden Sports Corp. (A) 395 68,623Motorsport Games, Inc., Class A (A) 123 418Netflix, Inc. (A) 7,814 4,707,466Reservoir Media, Inc. (A) 628 4,967ROBLOX Corp., Class A (A) 10,056 1,037,377Roku, Inc. (A) 2,123 484,469Sciplay Corp., Class A (A) 2,344 32,300
Total Stock Market Index Trust (continued)Shares orPrincipalAmount Value
COMMON STOCKS (continued)Entertainment (continued)Skillz, Inc. (A)(B) 6,650 $ 49,476Take-Two Interactive Software, Inc. (A) 2,080 369,658The Marcus Corp. (A) 654 11,680The Walt Disney Company (A) 32,160 4,981,262Warner Music Group Corp., Class A 9,133 394,363World Wrestling Entertainment, Inc.,
Class A 1,386 68,385Zynga, Inc., Class A (A) 19,643 125,715
15,245,448Interactive media and services – 5.8%Actua Corp. (A)(C) 909 68Alphabet, Inc., Class A (A) 5,300 15,354,312Alphabet, Inc., Class C (A) 6,463 18,701,272Angi, Inc. (A) 9,083 83,654Bumble, Inc., Class A (A) 1,949 65,993CarGurus, Inc. (A) 2,085 70,139Cars.com, Inc. (A) 1,331 21,416Eventbrite, Inc., Class A (A) 1,726 30,101EverQuote, Inc., Class A (A) 566 8,864IAC/InterActiveCorp (A) 1,594 208,352j2 Global, Inc. (A) 853 94,564Kubient, Inc. (A) 256 773Liberty TripAdvisor Holdings, Inc.,
Class A (A) 1,370 2,973Match Group, Inc. (A) 4,895 647,364MediaAlpha, Inc., Class A (A) 859 13,263Meta Platforms, Inc., Class A (A) 49,858 16,769,738Outbrain, Inc. (A) 626 8,764Pinterest, Inc., Class A (A) 11,371 413,336QuinStreet, Inc. (A) 1,058 19,245Snap, Inc., Class A (A) 23,418 1,101,349Super League Gaming, Inc. (A) 993 2,343TripAdvisor, Inc. (A) 2,236 60,953TrueCar, Inc. (A) 2,265 7,701Twitter, Inc. (A) 14,101 609,445Vimeo, Inc. (A) 2,863 51,419Yelp, Inc. (A) 1,333 48,308ZipRecruiter, Inc., Class A (A) 1,805 45,017ZoomInfo Technologies, Inc. (A) 6,815 437,523
54,878,249Media – 1.1%Altice USA, Inc., Class A (A) 8,159 132,013AMC Networks, Inc., Class A (A) 803 27,655Audacy, Inc. (A) 3,101 7,970Boston Omaha Corp., Class A (A) 528 15,169Cable One, Inc. 111 195,743
John Hancock Variable Insurance TrustPortfolio of Investments — December 31, 2021 (showing percentage of total net assets)
The accompanying notes are an integral part of the financial statements. 168

Total Stock Market Index Trust (continued)Shares orPrincipalAmount Value
COMMON STOCKS (continued)Media (continued)Cardlytics, Inc. (A) 542 $ 35,821Charter Communications, Inc., Class A (A) 3,196 2,083,696Clear Channel Outdoor Holdings, Inc. (A) 8,922 29,532Comcast Corp., Class A 81,398 4,096,761comScore, Inc. (A) 384 1,283Discovery, Inc., Series A (A) 7,187 169,182Discovery, Inc., Series C (A) 724 16,580DISH Network Corp., Class A (A) 9,493 307,953Emerald Holding, Inc. (A) 1,734 6,884Entravision Communications Corp.,
Class A 1,680 11,390Fox Corp., Class A 2,199 81,143Fox Corp., Class B 7,492 256,751Gannett Company, Inc. (A) 2,798 14,913Gray Television, Inc. 1,888 38,062Hemisphere Media Group, Inc. (A) 614 4,464iHeartMedia, Inc., Class A (A) 2,155 45,341Integral Ad Science Holding Corp. (A) 2,544 56,502John Wiley & Sons, Inc., Class A 1,048 60,019Liberty Media Corp.-Liberty SiriusXM,
Series A (A) 2,949 149,957Liberty Media Corp.-Liberty SiriusXM,
Series C (A) 2,528 128,549Loyalty Ventures, Inc. (A) 372 11,186National CineMedia, Inc. 1,758 4,940News Corp., Class A 10,198 227,517Nexstar Media Group, Inc., Class A 776 117,160NextPlay Technologies, Inc. (A) 805 689Omnicom Group, Inc. 3,817 279,672PubMatic, Inc., Class A (A) 758 25,810Saga Communications, Inc., Class A 454 10,901Scholastic Corp. 697 27,852Sinclair Broadcast Group, Inc., Class A 1,490 39,381Sirius XM Holdings, Inc. (B) 72,583 460,902TechTarget, Inc. (A) 514 49,169TEGNA, Inc. 4,077 75,669The EW Scripps Company, Class A (A) 1,748 33,824The Interpublic Group of Companies, Inc. 7,042 263,723The New York Times Company, Class A 3,011 145,431Tremor International, Ltd. (A) 81 605Urban One, Inc. (A) 118 400ViacomCBS, Inc., Class B 11,516 347,553WideOpenWest, Inc. (A) 1,455 31,312
10,127,029Wireless telecommunication services – 0.3%Gogo, Inc. (A) 2,008 27,168Shenandoah Telecommunications Company 1,007 25,679Spok Holdings, Inc. 499 4,656Telephone & Data Systems, Inc. 2,276 45,861T-Mobile US, Inc. (A) 22,091 2,562,114United States Cellular Corp. (A) 1,559 49,140
2,714,61890,555,133
Consumer discretionary – 12.8%Auto components – 0.2%American Axle & Manufacturing
Holdings, Inc. (A) 2,288 21,347Autoliv, Inc. 1,369 141,568BorgWarner, Inc. 4,199 189,249Dana, Inc. 2,759 62,960Dorman Products, Inc. (A) 636 71,874Fox Factory Holding Corp. (A) 779 132,508Gentex Corp. 3,814 132,918Gentherm, Inc. (A) 626 54,399
Total Stock Market Index Trust (continued)Shares orPrincipalAmount Value
COMMON STOCKS (continued)Auto components (continued)Holley, Inc. (A) 1,608 $ 20,888Horizon Global Corp. (A) 154 1,229LCI Industries 484 75,441Lear Corp. 1,062 194,293Modine Manufacturing Company (A) 1,173 11,836Motorcar Parts of America, Inc. (A) 476 8,125Patrick Industries, Inc. 466 37,602QuantumScape Corp. (A)(B) 7,355 163,207Standard Motor Products, Inc. 472 24,728Stoneridge, Inc. (A) 619 12,219Superior Industries International, Inc. (A) 134 600Tenneco, Inc., Class A (A) 1,225 13,843The Goodyear Tire & Rubber
Company (A) 5,122 109,201Veoneer, Inc. (A)(B) 2,090 74,153Visteon Corp. (A) 531 59,015
1,613,203Automobiles – 2.6%Arcimoto, Inc. (A) 520 4,046AYRO, Inc. (A) 1,498 2,412Electric Last Mile Solutions I (A)(B) 1,775 12,478Faraday Future Intelligent
Electric, Inc. (A)(B) 5,346 28,441Ford Motor Company 72,712 1,510,228General Motors Company (A) 25,447 1,491,958Harley-Davidson, Inc. 2,784 104,929Lucid Group, Inc. (A) 28,574 1,087,241Rivian Automotive, Inc., Class A (A) 15,352 1,591,849Tesla, Inc. (A) 17,462 18,453,492Thor Industries, Inc. 999 103,666Winnebago Industries, Inc. 625 46,825
24,437,565Distributors – 0.1%Funko, Inc., Class A (A) 938 17,634Genuine Parts Company 2,627 368,305LKQ Corp. 5,411 324,822Pool Corp. 698 395,068Weyco Group, Inc. 262 6,272
1,112,101Diversified consumer services – 0.2%2U, Inc. (A) 1,345 26,994Adtalem Global Education, Inc. (A) 948 28,023American Public Education, Inc. (A) 372 8,277Bright Horizons Family Solutions, Inc. (A) 1,109 139,601Carriage Services, Inc. 377 24,294Chegg, Inc. (A) 2,536 77,855Coursera, Inc. (A) 2,210 54,012Duolingo, Inc. (A)(B) 621 65,894European Wax Center, Inc., Class A (A) 916 27,801frontdoor, Inc. (A) 1,584 58,054Graham Holdings Company, Class B 32 20,155Grand Canyon Education, Inc. (A) 744 63,768H&R Block, Inc. 3,294 77,607Houghton Mifflin Harcourt Company (A) 2,393 38,527ITT Educational Services, Inc. (A) 608 0Laureate Education, Inc., Class A 3,804 46,561Mister Car Wash, Inc. (A)(B) 4,643 84,549Nerdy, Inc. (A) 2,326 10,467Perdoceo Education Corp. (A) 1,522 17,899PowerSchool Holdings, Inc., Class A (A) 3,254 53,593Regis Corp. (A) 845 1,470Rover Group, Inc. (A) 2,832 27,612Service Corp. International 3,026 214,816StoneMor, Inc. (A) 3,034 6,918
John Hancock Variable Insurance TrustPortfolio of Investments — December 31, 2021 (showing percentage of total net assets)
The accompanying notes are an integral part of the financial statements. 169

Total Stock Market Index Trust (continued)Shares orPrincipalAmount Value
COMMON STOCKS (continued)Diversified consumer services (continued)Strategic Education, Inc. 459 $ 26,549Stride, Inc. (A) 765 25,497Terminix Global Holdings, Inc. (A) 2,287 103,441The Beachbody Company, Inc. (A) 4,559 10,805WW International, Inc. (A) 1,278 20,614XpresSpa Group, Inc. (A) 2,007 4,054
1,365,707Hotels, restaurants and leisure – 2.1%Accel Entertainment, Inc. (A) 1,164 15,155Airbnb, Inc., Class A (A) 10,941 1,821,567Ambassadors Group, Inc. (A)(C) 714 29Aramark 4,687 172,716Bally’s Corp. (A) 742 28,241BBQ Holdings, Inc. (A) 30 476Biglari Holdings, Inc., Class B (A) 58 8,269BJ’s Restaurants, Inc. (A) 418 14,442Bloomin’ Brands, Inc. (A) 1,726 36,211Bluegreen Vacations Holding Corp. (A) 472 16,567Booking Holdings, Inc. (A) 723 1,734,643Boyd Gaming Corp. (A) 2,063 135,271Brinker International, Inc. (A) 773 28,284Caesars Entertainment, Inc. (A) 3,709 346,903Carnival Corp. (A) 17,373 349,545Carrols Restaurant Group, Inc. 1,021 3,022Cedar Fair LP (A) 1,089 54,515Century Casinos, Inc. (A) 682 8,307Chipotle Mexican Grill, Inc. (A) 496 867,132Choice Hotels International, Inc. 1,011 157,706Churchill Downs, Inc. 699 168,389Chuy’s Holdings, Inc. (A) 395 11,897Cracker Barrel Old Country Store, Inc. 465 59,818Darden Restaurants, Inc. 2,351 354,155Dave & Buster’s Entertainment, Inc. (A) 672 25,805Denny’s Corp. (A) 1,245 19,920Dine Brands Global, Inc. 324 24,562Domino’s Pizza, Inc. 648 365,686DraftKings, Inc., Class A (A) 14,066 386,393Drive Shack, Inc. (A) 1,927 2,756Dutch Bros, Inc., Class A (A)(B) 2,817 143,413El Pollo Loco Holdings, Inc. (A) 824 11,693Esports Technologies, Inc. (A) 134 2,755Everi Holdings, Inc. (A) 1,659 35,420Expedia Group, Inc. (A) 2,679 484,149F45 Training Holdings, Inc. (A) 1,198 13,046FAT Brands, Inc., Class A 101 1,070Fiesta Restaurant Group, Inc. (A) 709 7,806Full House Resorts, Inc. (A) 163 1,974Golden Entertainment, Inc. (A) 568 28,701Hall of Fame Resort & Entertainment
Company (A) 655 996Hilton Grand Vacations, Inc. (A) 1,856 96,716Hilton Worldwide Holdings, Inc. (A) 4,755 741,732Hyatt Hotels Corp., Class A (A) 1,856 177,990Inspired Entertainment, Inc. (A) 189 2,449Jack in the Box, Inc. 422 36,917Krispy Kreme, Inc. (B) 2,475 46,827Kura Sushi USA, Inc., Class A (A) 110 8,892Las Vegas Sands Corp. (A) 13,573 510,888Marriott International, Inc., Class A (A) 5,798 958,062Marriott Vacations Worldwide Corp. 789 133,325McDonald’s Corp. 12,997 3,484,106Membership Collective Group, Inc.,
Class A (A) 3,166 40,461MGM Resorts International 8,601 386,013Monarch Casino & Resort, Inc. (A) 382 28,249
Total Stock Market Index Trust (continued)Shares orPrincipalAmount Value
COMMON STOCKS (continued)Hotels, restaurants and leisure (continued)Nathan’s Famous, Inc. 100 $ 5,839Noodles & Company (A) 1,045 9,478Norwegian Cruise Line Holdings, Ltd. (A) 6,309 130,849Papa John’s International, Inc. 670 89,425Penn National Gaming, Inc. (A) 2,894 150,054Planet Fitness, Inc., Class A (A) 1,554 140,761PlayAGS, Inc. (A) 812 5,513Potbelly Corp. (A) 25 140RCI Hospitality Holdings, Inc. 210 16,355Red Robin Gourmet Burgers, Inc. (A) 308 5,091Red Rock Resorts, Inc., Class A 2,105 115,796Restaurant Brands International LP 82 4,959Royal Caribbean Cruises, Ltd. (A) 4,419 339,821Ruth’s Hospitality Group, Inc. (A) 679 13,512Scientific Games Corp. (A) 1,726 115,349SeaWorld Entertainment, Inc. (A) 1,425 92,426Shake Shack, Inc., Class A (A) 773 55,780Six Flags Entertainment Corp. (A) 1,568 66,765Starbucks Corp. 20,947 2,450,171Target Hospitality Corp. (A) 729 2,595Texas Roadhouse, Inc. 1,322 118,028The Cheesecake Factory, Inc. (A) 940 36,801The Wendy’s Company 3,552 84,715Travel + Leisure Company 1,587 87,713Vail Resorts, Inc. 701 229,858Wingstop, Inc. 558 96,422Wyndham Hotels & Resorts, Inc. 1,716 153,839Wynn Resorts, Ltd. (A) 2,075 176,458Xponential Fitness, Inc., Class A (A) 696 14,226Yum! Brands, Inc. 5,153 715,546
20,126,317Household durables – 0.5%Aterian, Inc. (A) 878 3,609Bassett Furniture Industries, Inc. 298 4,997Beazer Homes USA, Inc. (A) 757 17,578Casper Sleep, Inc. (A) 560 3,741Cavco Industries, Inc. (A) 181 57,495Century Communities, Inc. 625 51,119Cricut, Inc., Class A (A)(B) 3,750 82,838D.R. Horton, Inc. 6,403 694,405Dream Finders Homes, Inc., Class A (A) 1,315 25,577Ethan Allen Interiors, Inc. 592 15,564Flexsteel Industries, Inc. 230 6,178GoPro, Inc., Class A (A) 2,917 30,074Green Brick Partners, Inc. (A) 1,021 30,967Hamilton Beach Brands Holding Company,
Class A 354 5,083Hamilton Beach Brands Holding Company,
Class B 241 3,461Helen of Troy, Ltd. (A) 444 108,545Hooker Furnishings Corp. 271 6,309Hovnanian Enterprises, Inc., Class A (A) 117 14,893Installed Building Products, Inc. 560 78,243iRobot Corp. (A) 525 34,587KB Home 1,336 59,759La-Z-Boy, Inc. 888 32,243Legacy Housing Corp. (A) 580 15,353Leggett & Platt, Inc. 2,474 101,830Lennar Corp., A Shares 5,343 620,643M/I Homes, Inc. (A) 560 34,821MDC Holdings, Inc. 1,048 58,510Meritage Homes Corp. (A) 612 74,701Mohawk Industries, Inc. (A) 1,250 227,725Newell Brands, Inc. 7,724 168,692NVR, Inc. (A) 56 330,897
John Hancock Variable Insurance TrustPortfolio of Investments — December 31, 2021 (showing percentage of total net assets)
The accompanying notes are an integral part of the financial statements. 170

Total Stock Market Index Trust (continued)Shares orPrincipalAmount Value
COMMON STOCKS (continued)Household durables (continued)PulteGroup, Inc. 4,699 $ 268,595Purple Innovation, Inc. (A) 922 12,235Skyline Champion Corp. (A) 1,047 82,692Snap One Holdings Corp. (A) 1,112 23,441Sonos, Inc. (A) 2,295 68,391Taylor Morrison Home Corp. (A) 2,343 81,911Tempur Sealy International, Inc. 3,514 165,263The Lovesac Company (A) 280 18,553Toll Brothers, Inc. 2,261 163,674TopBuild Corp. (A) 601 165,822Traeger, Inc. (A) 1,820 22,131Tri Pointe Homes, Inc. (A) 2,144 59,796Tupperware Brands Corp. (A) 955 14,602Universal Electronics, Inc. (A) 312 12,714Vizio Holding Corp., Class A (A)(B) 2,995 58,193VOXX International Corp. (A) 708 7,200Weber, Inc., Class A (B) 4,667 60,344Whirlpool Corp. 1,007 236,303
4,522,297Internet and direct marketing retail – 3.5%1-800-Flowers.com, Inc., Class A (A) 1,178 27,5301847 Goedeker, Inc. (A) 2,236 5,3661stDibs.com, Inc. (A) 442 5,529Aka Brands Holding Corp. (A) 1,841 17,029Amazon.com, Inc. (A) 8,934 29,788,994CarParts.com, Inc. (A) 587 6,574Chewy, Inc., Class A (A) 7,353 433,606ContextLogic, Inc., Class A (A)(B) 11,179 34,767DoorDash, Inc., Class A (A) 5,960 887,444Duluth Holdings, Inc., Class B (A) 700 10,626eBay, Inc. 11,488 763,952Etsy, Inc. (A) 2,236 489,550Groupon, Inc. (A) 572 13,248Just Eat Takeaway.com NV, ADR (A) 273 2,937Lands’ End, Inc. (A) 610 11,974Liquidity Services, Inc. (A) 666 14,705Magnite, Inc. (A) 2,098 36,715Overstock.com, Inc. (A) 765 45,143PetMed Express, Inc. 456 11,519Poshmark, Inc., Class A (A) 1,160 19,755Quotient Technology, Inc. (A) 1,823 13,527Qurate Retail, Inc., Series A 7,473 56,795Remark Holdings, Inc. (A) 554 549Revolve Group, Inc. (A) 1,292 72,404RumbleON, Inc., Class B (A) 206 8,553Shutterstock, Inc. 655 72,626Stitch Fix, Inc., Class A (A) 1,919 36,307The RealReal, Inc. (A) 1,706 19,807ThredUp, Inc., Class A (A) 1,512 19,293Wayfair, Inc., Class A (A) 1,829 347,455Xometry, Inc., Class A (A) 602 30,853
33,305,132Leisure products – 0.2%Acushnet Holdings Corp. 1,357 72,030American Outdoor Brands, Inc. (A) 307 6,119Brunswick Corp. 1,405 141,526Callaway Golf Company (A) 3,017 82,786Clarus Corp. 526 14,581Escalade, Inc. 418 6,600Hasbro, Inc. 2,488 253,229Hayward Holdings, Inc. (A) 3,667 96,185Johnson Outdoors, Inc., Class A 208 19,488Latham Group, Inc. (A) 1,896 47,457Malibu Boats, Inc., Class A (A) 395 27,148Marine Products Corp. 742 9,275
Total Stock Market Index Trust (continued)Shares orPrincipalAmount Value
COMMON STOCKS (continued)Leisure products (continued)MasterCraft Boat Holdings, Inc. (A) 427 $ 12,097Mattel, Inc. (A) 6,267 135,117Nautilus, Inc. (A) 464 2,844Peloton Interactive, Inc., Class A (A) 5,316 190,100Polaris, Inc. 1,084 119,142Smith & Wesson Brands, Inc. 903 16,073Sturm Ruger & Company, Inc. 342 23,263Vinco Ventures, Inc. (A) 1,543 3,672Vista Outdoor, Inc. (A) 1,047 48,235YETI Holdings, Inc. (A) 1,561 129,298
1,456,265Multiline retail – 0.4%Big Lots, Inc. 650 29,283Dillard’s, Inc., Class A (B) 378 92,618Dollar General Corp. 4,031 950,631Dollar Tree, Inc. (A) 4,004 562,642Franchise Group, Inc. 539 28,114Kohl’s Corp. 2,801 138,341Macy’s, Inc. 5,555 145,430Nordstrom, Inc. (A) 2,858 64,648Ollie’s Bargain Outlet Holdings, Inc. (A) 1,183 60,558Target Corp. 8,655 2,003,113
4,075,378Specialty retail – 2.3%Abercrombie & Fitch Company,
Class A (A) 1,134 39,497Academy Sports & Outdoors, Inc. (A) 1,506 66,113Advance Auto Parts, Inc. 1,105 265,067American Eagle Outfitters, Inc. 3,071 77,758America’s Car-Mart, Inc. (A) 119 12,186Asbury Automotive Group, Inc. (A) 403 69,610AutoNation, Inc. (A) 1,280 149,568AutoZone, Inc. (A) 375 786,146Barnes & Noble Education, Inc. (A) 1,158 7,886Bath & Body Works, Inc. 4,707 328,502Bed Bath & Beyond, Inc. (A) 1,937 28,241Best Buy Company, Inc. 4,386 445,618Big 5 Sporting Goods Corp. 321 6,102Boot Barn Holdings, Inc. (A) 531 65,340Brilliant Earth Group, Inc., Class A (A) 1,474 26,620Build-A-Bear Workshop, Inc. 144 2,811Burlington Stores, Inc. (A) 1,133 330,281Caleres, Inc. 774 17,554Camping World Holdings, Inc., Class A 1,591 64,276CarMax, Inc. (A) 2,901 377,797Carvana Company (A) 3,047 706,264Chico’s FAS, Inc. (A) 2,330 12,535Citi Trends, Inc. (A) 191 18,097Conn’s, Inc. (A) 510 11,995Designer Brands, Inc., Class A (A) 1,409 20,022Destination XL Group, Inc. (A) 752 4,271Dick’s Sporting Goods, Inc. 1,510 173,635EVgo, Inc. (A)(B) 4,917 48,875Express, Inc. (A) 817 2,516Five Below, Inc. (A) 1,006 208,131Floor & Decor Holdings, Inc., Class A (A) 1,885 245,069Foot Locker, Inc. 1,841 80,323GameStop Corp., Class A (A)(B) 1,360 201,810Genesco, Inc. (A) 296 18,994Group 1 Automotive, Inc. 331 64,618Guess?, Inc. 1,272 30,121Haverty Furniture Companies, Inc. 406 12,411Hibbett, Inc. 306 22,011J. Jill, Inc. (A) 28 537JOANN, Inc. 421 4,370
John Hancock Variable Insurance TrustPortfolio of Investments — December 31, 2021 (showing percentage of total net assets)
The accompanying notes are an integral part of the financial statements. 171

Total Stock Market Index Trust (continued)Shares orPrincipalAmount Value
COMMON STOCKS (continued)Specialty retail (continued)Kirkland’s, Inc. (A) 147 $ 2,195Lazydays Holdings, Inc. (A) 67 1,443Leslie’s, Inc. (A) 3,078 72,825Lithia Motors, Inc. 508 150,851LMP Automotive Holdings, Inc. (A) 105 734Lowe’s Companies, Inc. 12,258 3,168,448Lumber Liquidators Holdings, Inc. (A) 701 11,966MarineMax, Inc. (A) 429 25,328Monro, Inc. 639 37,235Murphy USA, Inc. 479 95,436National Vision Holdings, Inc. (A) 1,537 73,761OneWater Marine, Inc., Class A 187 11,401O’Reilly Automotive, Inc. (A) 1,212 855,951Party City Holdco, Inc. (A) 1,740 9,692Penske Automotive Group, Inc. 1,451 155,576Petco Health & Wellness
Company, Inc. (A) 3,669 72,610Rent-A-Center, Inc. 1,196 57,456RH (A) 375 200,978Ross Stores, Inc. 6,239 712,993Sally Beauty Holdings, Inc. (A) 2,075 38,305Shoe Carnival, Inc. 550 21,494Signet Jewelers, Ltd. 943 82,069Sleep Number Corp. (A) 444 34,010Sonic Automotive, Inc., Class A 786 38,868Sportsman’s Warehouse Holdings, Inc. (A) 611 7,210The Aaron’s Company, Inc. 685 16,885The Buckle, Inc. 930 39,348The Cato Corp., Class A 560 9,610The Children’s Place, Inc. (A) 273 21,646The Container Store Group, Inc. (A) 658 6,567The Gap, Inc. 6,794 119,914The Home Depot, Inc. 18,545 7,696,360The ODP Corp. (A) 969 38,062The TJX Companies, Inc. 21,330 1,619,374Tilly’s, Inc., Class A 687 11,068Torrid Holdings, Inc. (A) 1,663 16,430Tractor Supply Company 2,045 487,937TravelCenters of America, Inc. (A) 191 9,859Ulta Beauty, Inc. (A) 969 399,557Urban Outfitters, Inc. (A) 1,825 53,582Victoria’s Secret & Company (A) 1,578 87,642Vroom, Inc. (A) 2,301 24,828Warby Parker, Inc., Class A (A) 1,697 79,012Williams-Sonoma, Inc. 1,312 221,899Winmark Corp. 75 18,622Zumiez, Inc. (A) 521 25,003
21,995,618Textiles, apparel and luxury goods – 0.7%Carter’s, Inc. 593 60,023Columbia Sportswear Company 1,104 107,574Crocs, Inc. (A) 1,111 142,452Culp, Inc. 350 3,329Deckers Outdoor Corp. (A) 438 160,444Fossil Group, Inc. (A) 1,102 11,340G-III Apparel Group, Ltd. (A) 960 26,534Hanesbrands, Inc. 6,357 106,289Kontoor Brands, Inc. 1,067 54,684Levi Strauss & Company, Class A 7,232 181,017Movado Group, Inc. 465 19,451NIKE, Inc., Class B 27,837 4,639,593Oxford Industries, Inc. 331 33,603PVH Corp. 1,303 138,965Ralph Lauren Corp. 1,327 157,727Rocky Brands, Inc. 191 7,602
Total Stock Market Index Trust (continued)Shares orPrincipalAmount Value
COMMON STOCKS (continued)Textiles, apparel and luxury goods (continued)Skechers USA, Inc., Class A (A) 2,806 $ 121,780Steven Madden, Ltd. 1,517 70,495Superior Group of Companies, Inc. 407 8,930Tapestry, Inc. 5,025 204,015Under Armour, Inc., Class A (A) 7,212 152,822Unifi, Inc. (A) 438 10,140Vera Bradley, Inc. (A) 773 6,578VF Corp. 7,014 513,565Wolverine World Wide, Inc. 1,556 44,828
6,983,780120,993,363
Consumer staples – 5.8%Beverages – 1.3%Brown-Forman Corp., Class B 8,649 630,166Celsius Holdings, Inc. (A) 1,351 100,744Coca-Cola Consolidated, Inc. 176 108,977Constellation Brands, Inc., Class A 3,313 831,464Keurig Dr. Pepper, Inc. 25,472 938,898MGP Ingredients, Inc. 345 29,322Molson Coors Beverage Company, Class B 3,946 182,897Monster Beverage Corp. (A) 9,457 908,250National Beverage Corp. 1,726 78,240NewAge, Inc. (A) 1,610 1,658PepsiCo, Inc. 24,213 4,206,040Primo Water Corp. 398 7,017The Boston Beer Company, Inc.,
Class A (A) 221 111,627The Coca-Cola Company 76,619 4,536,611The Duckhorn Portfolio, Inc. (A) 1,652 38,558Zevia PBC, Class A (A) 777 5,478
12,715,947Food and staples retailing – 1.6%Albertsons Companies, Inc., Class A 8,180 246,954BJ’s Wholesale Club Holdings, Inc. (A) 2,465 165,081Blue Apron Holdings, Inc., Class A (A) 205 1,380Casey’s General Stores, Inc. 646 127,488Costco Wholesale Corp. 7,750 4,399,675Grocery Outlet Holding Corp. (A) 1,797 50,819HF Foods Group, Inc. (A) 1,021 8,638Ingles Markets, Inc., Class A 373 32,205Natural Grocers by Vitamin Cottage, Inc. 523 7,453Performance Food Group Company (A) 2,758 126,565PriceSmart, Inc. 622 45,512Rite Aid Corp. (A) 1,178 17,305SpartanNash Company 831 21,407Sprouts Farmers Market, Inc. (A) 2,118 62,862Sysco Corp. 9,168 720,146The Andersons, Inc. 755 29,226The Chefs’ Warehouse, Inc. (A) 665 22,145The Kroger Company 13,277 600,917U.S. Foods Holding Corp. (A) 4,092 142,524United Natural Foods, Inc. (A) 1,030 50,552Village Super Market, Inc., Class A 374 8,748Walgreens Boots Alliance, Inc. 15,405 803,525Walmart, Inc. 49,351 7,140,596Weis Markets, Inc. 552 36,366
14,868,089Food products – 1.0%Alico, Inc. 195 7,221Archer-Daniels-Midland Company 9,730 657,651B&G Foods, Inc. (B) 1,301 39,980Beyond Meat, Inc. (A)(B) 1,148 74,804Bunge, Ltd. 2,430 226,865Calavo Growers, Inc. 372 15,773
John Hancock Variable Insurance TrustPortfolio of Investments — December 31, 2021 (showing percentage of total net assets)
The accompanying notes are an integral part of the financial statements. 172

Total Stock Market Index Trust (continued)Shares orPrincipalAmount Value
COMMON STOCKS (continued)Food products (continued)Cal-Maine Foods, Inc. 948 $ 35,067Campbell Soup Company 5,137 223,254Conagra Brands, Inc. 8,584 293,144Darling Ingredients, Inc. (A) 2,955 204,752Flowers Foods, Inc. 4,141 113,753Fresh Del Monte Produce, Inc. 1,036 28,594Freshpet, Inc. (A) 763 72,691General Mills, Inc. 10,330 696,035Hormel Foods Corp. 8,869 432,896Hostess Brands, Inc. (A) 2,675 54,624Ingredion, Inc. 1,127 108,913J&J Snack Foods Corp. 393 62,078John B. Sanfilippo & Son, Inc. 247 22,270Kellogg Company 5,604 361,010Laird Superfood, Inc. (A) 38 496Lamb Weston Holdings, Inc. 2,655 168,274Lancaster Colony Corp. 432 71,539Landec Corp. (A) 729 8,092Limoneira Company 402 6,030McCormick & Company, Inc. 4,876 471,070Mission Produce, Inc. (A) 643 10,095Mondelez International, Inc., Class A 24,538 1,627,115Pilgrim’s Pride Corp. (A) 4,442 125,264Post Holdings, Inc. (A) 1,186 133,698Sanderson Farms, Inc. 331 63,247Seaboard Corp. 16 62,960Seneca Foods Corp., Class A (A) 231 11,076Sovos Brands, Inc. (A) 1,290 19,415The Hain Celestial Group, Inc. (A) 1,877 79,979The Hershey Company 3,454 668,245The J.M. Smucker Company 1,579 214,460The Kraft Heinz Company 22,038 791,164The Simply Good Foods Company (A) 1,833 76,198Tootsie Roll Industries, Inc. 1,302 47,171TreeHouse Foods, Inc. (A) 1,100 44,583Tyson Foods, Inc., Class A 6,279 547,278Vital Farms, Inc. (A) 450 8,127
8,986,951Household products – 1.1%Central Garden & Pet Company,
Class A (A) 1,140 54,549Church & Dwight Company, Inc. 4,398 450,795Colgate-Palmolive Company 15,081 1,287,013Energizer Holdings, Inc. 1,322 53,012Kimberly-Clark Corp. 5,698 814,358Oil-Dri Corp. of America 183 5,990Reynolds Consumer Products, Inc. 2,843 89,270Spectrum Brands Holdings, Inc. 789 80,257The Clorox Company 2,216 386,382The Procter & Gamble Company 42,439 6,942,172WD-40 Company 246 60,181
10,223,979Personal products – 0.3%BellRing Brands, Inc., Class A (A) 593 16,918Coty, Inc., Class A (A) 13,695 143,798Edgewell Personal Care Company 1,052 48,087elf Beauty, Inc. (A) 1,002 33,276Herbalife Nutrition, Ltd. (A) 2,106 86,199Inter Parfums, Inc. 609 65,102Medifast, Inc. 216 45,237Nature’s Sunshine Products, Inc. 585 10,823Nu Skin Enterprises, Inc., Class A 977 49,583Olaplex Holdings, Inc. (A) 11,131 324,246Revlon, Inc., Class A (A) 1,150 13,041
Total Stock Market Index Trust (continued)Shares orPrincipalAmount Value
COMMON STOCKS (continued)Personal products (continued)The Estee Lauder Companies, Inc.,
Class A 6,437 $ 2,382,977The Honest Company, Inc. (A) 1,180 9,546Thorne HealthTech, Inc. (A) 552 3,428USANA Health Sciences, Inc. (A) 381 38,557Veru, Inc. (A) 1,088 6,408
3,277,226Tobacco – 0.5%22nd Century Group, Inc. (A) 3,256 10,061Altria Group, Inc. 32,649 1,547,236Philip Morris International, Inc. 27,590 2,621,050Turning Point Brands, Inc. 361 13,639Universal Corp. 441 24,220Vector Group, Ltd. 2,811 32,270
4,248,47654,320,668
Energy – 2.9%Energy equipment and services – 0.2%Archrock, Inc. 3,041 22,747Aspen Aerogels, Inc. (A) 612 30,471Baker Hughes Company 18,576 446,939Bristow Group, Inc. (A) 260 8,234Cactus, Inc., Class A 1,384 52,772ChampionX Corp. (A) 3,261 65,905DMC Global, Inc. (A) 314 12,438Dril-Quip, Inc. (A) 785 15,449Exterran Corp. (A) 1,489 4,437Halliburton Company 15,903 363,702Helix Energy Solutions Group, Inc. (A) 3,143 9,806Helmerich & Payne, Inc. 2,014 47,732ION Geophysical Corp. (A) 100 88Liberty Oilfield Services, Inc., Class A (A) 2,697 26,161Mammoth Energy Services, Inc. (A) 213 388Nabors Industries, Ltd. (A) 179 14,515National Energy Services Reunited
Corp. (A) 1,682 15,895Newpark Resources, Inc. (A) 2,201 6,471NexTier Oilfield Solutions, Inc. (A) 4,459 15,829NOV, Inc. 7,253 98,278Oceaneering International, Inc. (A) 1,924 21,760Oil States International, Inc. (A) 1,360 6,759Patterson-UTI Energy, Inc. 4,208 35,558ProPetro Holding Corp. (A) 1,939 15,706RPC, Inc. (A) 4,336 19,685Schlumberger NV 24,867 744,767SEACOR Marine Holdings, Inc. (A) 67 228Select Energy Services, Inc., Class A (A) 2,431 15,145Solaris Oilfield Infrastructure, Inc., Class A 1,111 7,277TETRA Technologies, Inc. (A) 1,157 3,286Tidewater, Inc. (A) 820 8,782USA Compression Partners LP 2,120 36,994
2,174,204Oil, gas and consumable fuels – 2.7%Aemetis, Inc. (A) 638 7,847Alliance Resource Partners LP 2,471 31,233Alto Ingredients, Inc. (A) 841 4,045Amplify Energy Corp. (A) 157 488Antero Midstream Corp. 8,691 84,129Antero Resources Corp. (A) 5,638 98,665APA Corp. 6,760 181,776Arch Resources, Inc. 237 21,643Archaea Energy, Inc. (A) 1,370 25,044Black Stone Minerals LP 4,760 49,171BP Midstream Partners LP 1,216 18,605
John Hancock Variable Insurance TrustPortfolio of Investments — December 31, 2021 (showing percentage of total net assets)
The accompanying notes are an integral part of the financial statements. 173

Total Stock Market Index Trust (continued)Shares orPrincipalAmount Value
COMMON STOCKS (continued)Oil, gas and consumable fuels (continued)Brigham Minerals, Inc., Class A 1,168 $ 24,633California Resources Corp. 1,269 54,199Callon Petroleum Company (A) 932 44,037Calumet Specialty Products
Partners LP (A) 1,619 21,371Centennial Resource Development, Inc.,
Class A (A) 5,240 31,335Centrus Energy Corp., Class A (A) 198 9,882Cheniere Energy, Inc. 4,588 465,315Chesapeake Energy Corp. 1,955 126,137Chevron Corp. 33,682 3,952,583Civitas Resources, Inc. 958 46,913Clean Energy Fuels Corp. (A) 4,254 26,077CNX Resources Corp. (A) 4,230 58,163Comstock Resources, Inc. (A) 3,787 30,637ConocoPhillips 23,963 1,729,649CONSOL Energy, Inc. (A) 636 14,444Continental Resources, Inc. 6,582 294,610Coterra Energy, Inc. 14,695 279,205Crescent Energy, Inc., Class A (A) 550 6,974Crestwood Equity Partners LP 1,274 35,150CrossAmerica Partners LP 693 13,209CVR Energy, Inc. 1,445 24,290DCP Midstream LP 3,813 104,781Delek Logistics Partners LP 535 22,861Delek US Holdings, Inc. (A) 1,558 23,354Denbury, Inc. (A) 828 63,417Devon Energy Corp. 12,060 531,243Diamondback Energy, Inc. 3,260 351,591Dorchester Minerals LP 821 16,248Dorian LPG, Ltd. 943 11,967DT Midstream, Inc. 1,701 81,614Energy Transfer LP 56,224 462,724EnLink Midstream LLC (A) 9,120 62,837Enterprise Products Partners LP 36,288 796,884Enviva Partners LP 868 61,125EOG Resources, Inc. 10,460 929,162EQT Corp. (A) 6,413 139,868Equitrans Midstream Corp. 8,041 83,144Exxon Mobil Corp. 75,208 4,601,978Genesis Energy LP 2,417 25,886Gevo, Inc. (A) 3,343 14,308Global Partners LP 792 18,604Green Plains Partners LP 503 7,143Green Plains, Inc. (A) 849 29,511Gulfport Energy Corp. (A) 298 21,465Harvest Natural Resources, Inc. (A)(C) 270 0Hess Corp. 5,575 412,717Hess Midstream LP, Class A 701 19,369HighPeak Energy, Inc. 1,453 21,272Holly Energy Partners LP 2,024 33,376HollyFrontier Corp. 3,027 99,225International Seaways, Inc. 416 6,107Kimbell Royalty Partners LP 1,094 14,911Kinder Morgan, Inc. 38,418 609,309Laredo Petroleum, Inc. (A) 264 15,874LinnCo LLC (A)(C) 2,890 0Magellan Midstream Partners LP 3,296 153,066Magnolia Oil & Gas Corp., Class A 4,348 82,047Marathon Oil Corp. 14,222 233,525Marathon Petroleum Corp. 11,374 727,822Matador Resources Company 2,130 78,640MPLX LP 18,725 554,073Murphy Oil Corp. 2,467 64,413NACCO Industries, Inc., Class A 187 6,786
Total Stock Market Index Trust (continued)Shares orPrincipalAmount Value
COMMON STOCKS (continued)Oil, gas and consumable fuels (continued)Natural Resource Partners LP 290 $ 9,692New Fortress Energy, Inc. 3,618 87,339NextDecade Corp. (A) 1,344 3,830Northern Oil and Gas, Inc. 973 20,024NuStar Energy LP 2,314 36,746Oasis Midstream Partners LP 640 15,302Oasis Petroleum, Inc. 289 36,411Occidental Petroleum Corp. 16,662 483,031ONEOK, Inc. 7,959 467,671Ovintiv, Inc. 4,448 149,898PBF Energy, Inc., Class A (A) 2,277 29,533PBF Logistics LP 1,384 15,639PDC Energy, Inc. 1,834 89,463Peabody Energy Corp. (A) 2,102 21,167Phillips 66 7,896 572,144Phillips 66 Partners LP 3,796 136,922Pioneer Natural Resources Company 4,258 774,445Plains All American Pipeline LP 13,357 124,754Plains GP Holdings LP, Class A (A) 3,615 36,656Range Resources Corp. (A) 4,676 83,373Ranger Oil Corp., Class A (A) 135 3,634Rattler Midstream LP 2,920 33,230Renewable Energy Group, Inc. (A) 765 32,467REX American Resources Corp. (A) 157 15,072Riley Exploration Permian, Inc. 118 2,280SandRidge Energy, Inc. (A) 462 4,833SFL Corp., Ltd. 2,278 18,566Shell Midstream Partners LP 5,552 63,959SilverBow Resources, Inc. (A) 168 3,657SM Energy Company 2,191 64,591Southwestern Energy Company (A) 16,800 78,288Sprague Resources LP 617 8,360Sunoco LP 1,303 53,201Talos Energy, Inc. (A) 1,148 11,250Targa Resources Corp. 4,115 214,968Teekay Corp. (A) 2,383 7,483Tellurian, Inc. (A) 7,716 23,765Texas Pacific Land Corp. 129 161,104The Williams Companies, Inc. 20,941 545,304Uranium Energy Corp. (A) 4,770 15,980Valero Energy Corp. 7,352 552,209Vertex Energy, Inc. (A) 861 3,900Viper Energy Partners LP 3,095 65,954W&T Offshore, Inc. (A) 3,111 10,049Western Midstream Partners LP 7,527 167,626Whiting Petroleum Corp. (A) 580 37,514World Fuel Services Corp. 1,250 33,088
24,832,07827,006,282
Financials – 11.0%Banks – 3.9%1st Source Corp. 559 27,726Allegiance Bancshares, Inc. 511 21,569Amerant Bancorp, Inc. 655 22,630American National Bankshares, Inc. 218 8,214Ameris Bancorp 1,382 68,658Ames National Corp. 260 6,367Arrow Financial Corp. 442 15,572Associated Banc-Corp. 3,059 69,103Atlantic Union Bankshares Corp. 1,681 62,684Banc of California, Inc. 1,367 26,821BancFirst Corp. 701 49,463Bank of America Corp. 148,933 6,626,029Bank of Hawaii Corp. 693 58,046Bank of Marin Bancorp 328 12,211
John Hancock Variable Insurance TrustPortfolio of Investments — December 31, 2021 (showing percentage of total net assets)
The accompanying notes are an integral part of the financial statements. 174

Total Stock Market Index Trust (continued)Shares orPrincipalAmount Value
COMMON STOCKS (continued)Banks (continued)Bank OZK 2,476 $ 115,208BankFinancial Corp. 481 5,132BankUnited, Inc. 1,852 78,358Bankwell Financial Group, Inc. 211 6,929Banner Corp. 760 46,109Bar Harbor Bankshares 435 12,585BayCom Corp. (A) 336 6,303BCB Bancorp, Inc. 577 8,903Berkshire Hills Bancorp, Inc. 1,028 29,226BOK Financial Corp. 1,118 117,938Brookline Bancorp, Inc. 1,813 29,352Bryn Mawr Bank Corp. 470 21,155Business First Bancshares, Inc. 293 8,295Byline Bancorp, Inc. 825 22,564Cadence Bank 3,193 95,119Cambridge Bancorp 93 8,704Camden National Corp. 400 19,264Capital City Bank Group, Inc. 465 12,276Capstar Financial Holdings, Inc. 374 7,865Cathay General Bancorp 1,283 55,156CBTX, Inc. 597 17,313Central Pacific Financial Corp. 579 16,310Central Valley Community Bancorp 357 7,415Chemung Financial Corp. 161 7,371CIT Group, Inc. 1,515 77,780Citigroup, Inc. 35,055 2,116,971Citizens & Northern Corp. 324 8,463Citizens Financial Group, Inc. 7,007 331,081City Holding Company 404 33,043Civista Bancshares, Inc. 342 8,345CNB Financial Corp. 426 11,289Codorus Valley Bancorp, Inc. 267 5,767Columbia Banking System, Inc. 1,479 48,393Comerica, Inc. 2,455 213,585Commerce Bancshares, Inc. 1,726 118,645Community Bank System, Inc. 871 64,872Community Trust Bancorp, Inc. 310 13,519ConnectOne Bancorp, Inc. 882 28,850Cullen/Frost Bankers, Inc. 1,220 153,805Customers Bancorp, Inc. (A) 631 41,248Dime Community Bancshares, Inc. 892 31,363Eagle Bancorp, Inc. 547 31,912East West Bancorp, Inc. 2,607 205,119Eastern Bankshares, Inc. 1,120 22,590Enterprise Bancorp, Inc. 327 14,689Enterprise Financial Services Corp. 834 39,273Equity Bancshares, Inc., Class A 331 11,231Esquire Financial Holdings, Inc. (A) 291 9,201Farmers & Merchants Bancorp, Inc. 233 7,649FB Financial Corp. 964 42,242Fidelity D&D Bancorp, Inc. 112 6,608Fifth Third Bancorp 12,422 540,978Financial Institutions, Inc. 417 13,261First Bancorp (North Carolina) 687 31,410First Bancorp (Puerto Rico) 3,172 43,710First Busey Corp. 1,265 34,307First Citizens BancShares, Inc., Class A 128 106,220First Commonwealth Financial Corp. 2,106 33,886First Community Bankshares, Inc. 247 8,255First Financial Bancorp 2,135 52,051First Financial Bankshares, Inc. 2,671 135,794First Financial Corp. 338 15,308First Financial Northwest, Inc. 388 6,274First Hawaiian, Inc. 2,545 69,555First Horizon Corp. 10,207 166,680
Total Stock Market Index Trust (continued)Shares orPrincipalAmount Value
COMMON STOCKS (continued)Banks (continued)First Internet Bancorp 224 $ 10,537First Interstate BancSystem, Inc., Class A 1,351 54,945First Merchants Corp. 1,156 48,425First Midwest Bancorp, Inc. 2,364 48,415First Republic Bank 2,911 601,151Flushing Financial Corp. 465 11,300FNB Corp. 6,123 74,272Fulton Financial Corp. 3,475 59,075FVCBankcorp, Inc. (A) 432 8,558German American Bancorp, Inc. 635 24,752Glacier Bancorp, Inc. 2,143 121,508Great Southern Bancorp, Inc. 369 21,863Great Western Bancorp, Inc. 1,125 38,205Guaranty Bancshares, Inc. 278 10,447Hancock Whitney Corp. 1,723 86,184Hanmi Financial Corp. 645 15,274HarborOne Bancorp, Inc. 1,624 24,100Heartland Financial USA, Inc. 771 39,020Heritage Commerce Corp. 1,034 12,346Heritage Financial Corp. 813 19,870Hilltop Holdings, Inc. 1,026 36,054Home BancShares, Inc. 3,212 78,212HomeStreet, Inc. 549 28,548Hope Bancorp, Inc. 2,740 40,305Horizon Bancorp, Inc. 951 19,828Huntington Bancshares, Inc. 26,864 414,243Independent Bank Corp. (Massachusetts) 711 57,968Independent Bank Corp. (Michigan) 561 13,391Independent Bank Group, Inc. 910 65,657International Bancshares Corp. 1,166 49,427Investar Holding Corp. 319 5,873Investors Bancorp, Inc. 5,096 77,204JPMorgan Chase & Co. 52,348 8,289,306KeyCorp 16,756 387,566Lakeland Bancorp, Inc. 1,308 24,839Lakeland Financial Corp. 520 41,673Live Oak Bancshares, Inc. 804 70,181M&T Bank Corp. 1,974 303,167Macatawa Bank Corp. 926 8,167Mercantile Bank Corp. 434 15,203Meta Financial Group, Inc. 629 37,526Metropolitan Bank Holding Corp. (A) 184 19,602Midland States Bancorp, Inc. 539 13,362MidWestOne Financial Group, Inc. 336 10,876MVB Financial Corp. 370 15,362National Bank Holdings Corp., Class A 721 31,681National Bankshares, Inc. 188 6,817NBT Bancorp, Inc. 501 19,299Nicolet Bankshares, Inc. (A) 105 9,004Northrim BanCorp, Inc. 222 9,648Norwood Financial Corp. 211 5,484OceanFirst Financial Corp. 1,155 25,641OFG Bancorp 1,126 29,907Old National Bancorp 1,685 30,532Old Second Bancorp, Inc. 816 10,273Origin Bancorp, Inc. 516 22,147Pacific Premier Bancorp, Inc. 1,278 51,158PacWest Bancorp 2,292 103,530Park National Corp. 210 28,835Peapack-Gladstone Financial Corp. 485 17,169Penns Woods Bancorp, Inc. 222 5,233Peoples Bancorp of North Carolina, Inc. 237 6,539Peoples Bancorp, Inc. 778 24,748People’s United Financial, Inc. 7,377 131,458Pinnacle Financial Partners, Inc. 1,429 136,470
John Hancock Variable Insurance TrustPortfolio of Investments — December 31, 2021 (showing percentage of total net assets)
The accompanying notes are an integral part of the financial statements. 175

Total Stock Market Index Trust (continued)Shares orPrincipalAmount Value
COMMON STOCKS (continued)Banks (continued)Popular, Inc. 399 $ 32,734Preferred Bank 341 24,480Primis Financial Corp. 655 9,851Prosperity Bancshares, Inc. 925 66,878QCR Holdings, Inc. 353 19,768RBB Bancorp 407 10,663Red River Bancshares, Inc. 155 8,293Regions Financial Corp. 17,282 376,748Renasant Corp. 1,124 42,656Republic Bancorp, Inc., Class A 425 21,607Republic First Bancorp, Inc. (A) 1,584 5,892S&T Bancorp, Inc. 768 24,207Sandy Spring Bancorp, Inc. 750 36,060Seacoast Banking Corp. of Florida 1,186 41,973ServisFirst Bancshares, Inc. 997 84,685Shore Bancshares, Inc. 488 10,175Sierra Bancorp 373 10,127Signature Bank 1,007 325,734Silvergate Capital Corp., Class A (A) 431 63,874Simmons First National Corp., Class A 1,970 58,273South Plains Financial, Inc. 426 11,847Southern First Bancshares, Inc. (A) 207 12,935Southside Bancshares, Inc. 820 34,292SouthState Corp. 1,373 109,991Spirit of Texas Bancshares, Inc. 334 9,613Sterling Bancorp 3,615 93,231Stock Yards Bancorp, Inc. 419 26,766Summit Financial Group, Inc. 334 9,168SVB Financial Group (A) 1,047 710,117Synovus Financial Corp. 2,821 135,041Texas Capital Bancshares, Inc. (A) 987 59,467The Bancorp, Inc. (A) 1,124 28,448The Bank of Princeton 248 7,274The First Bancorp, Inc. 302 9,483The First of Long Island Corp. 648 13,990The PNC Financial Services Group, Inc. 7,247 1,453,168Tompkins Financial Corp. 330 27,581Towne Bank 1,654 52,250TriCo Bancshares 636 27,323TriState Capital Holdings, Inc. (A) 675 20,426Triumph Bancorp, Inc. (A) 474 56,444Truist Financial Corp. 23,995 1,404,907Trustmark Corp. 1,219 39,569U.S. Bancorp 26,294 1,476,934UMB Financial Corp. 563 59,740Umpqua Holdings Corp. 4,355 83,790United Bankshares, Inc. 2,146 77,857United Community Banks, Inc. 1,695 60,918Unity Bancorp, Inc. 355 9,319Univest Financial Corp. 733 21,931Valley National Bancorp 7,884 108,405Veritex Holdings, Inc. 1,027 40,854Washington Trust Bancorp, Inc. 335 18,884Webster Financial Corp. 1,717 95,877Wells Fargo & Company 72,888 3,497,166WesBanco, Inc. 1,220 42,688West BanCorp, Inc. 463 14,385Western Alliance Bancorp 1,882 202,597Wintrust Financial Corp. 1,081 98,176Zions Bancorp NA 2,947 186,133
36,668,188Capital markets – 3.3%Affiliated Managers Group, Inc. 769 126,508AllianceBernstein Holding LP 1,953 95,385Ameriprise Financial, Inc. 2,054 619,610
Total Stock Market Index Trust (continued)Shares orPrincipalAmount Value
COMMON STOCKS (continued)Capital markets (continued)Apollo Investment Corp. 1,528 $ 19,543Ares Capital Corp. (B) 8,591 182,043Ares Management Corp., Class A 4,922 400,011Artisan Partners Asset Management, Inc.,
Class A 1,550 73,842AssetMark Financial Holdings, Inc. (A) 1,278 33,496Associated Capital Group, Inc., Class A 454 19,522Bain Capital Specialty Finance, Inc. 1,190 18,100Barings BDC, Inc. 1,926 21,225BGC Partners, Inc., Class A 7,348 34,168BlackRock Capital Investment Corp. 2,127 8,508BlackRock TCP Capital Corp. 1,134 15,320BlackRock, Inc. 2,683 2,456,447Blucora, Inc. (A) 1,076 18,636Bridge Investment Group Holdings, Inc.,
Class A 1,456 36,356Capital Southwest Corp. 445 11,250Cboe Global Markets, Inc. 1,942 253,237CME Group, Inc. 6,387 1,459,174Cohen & Steers, Inc. 930 86,034Coinbase Global, Inc., Class A (A) 3,735 942,602Cowen, Inc., Class A 420 15,162Diamond Hill Investment Group, Inc. 83 16,121Donnelley Financial Solutions, Inc. (A) 686 32,338Ellington Financial, Inc. 880 15,039Evercore, Inc., Class A 743 100,937FactSet Research Systems, Inc. 632 307,158Federated Hermes, Inc. 1,908 71,703Fidus Investment Corp. 605 10,878Focus Financial Partners, Inc., Class A (A) 1,365 81,518Franklin Resources, Inc. 9,106 304,960FS KKR Capital Corp. 3,921 82,106GAMCO Investors, Inc., Class A 443 11,066Gladstone Capital Corp. 801 9,284Gladstone Investment Corp. 797 13,613Goldman Sachs BDC, Inc. 967 18,528Golub Capital BDC, Inc. 1,363 21,045Hamilton Lane, Inc., Class A 1,002 103,827Hercules Capital, Inc. 2,271 37,676Houlihan Lokey, Inc. 1,199 124,120Interactive Brokers Group, Inc., Class A 1,612 128,025Intercontinental Exchange, Inc. 9,750 1,333,508Invesco, Ltd. 8,492 195,486Jefferies Financial Group, Inc. 3,974 154,191Lazard, Ltd., Class A 2,131 92,976LPL Financial Holdings, Inc. 1,452 232,451Main Street Capital Corp. 1,316 59,036MarketAxess Holdings, Inc. 694 285,421MarketWise, Inc. (A) 5,323 40,135Moelis & Company, Class A 1,258 78,638Monroe Capital Corp. 561 6,294Moody’s Corp. 3,313 1,293,992Morgan Stanley 31,790 3,120,506Morningstar, Inc. 772 264,016MSCI, Inc. 1,465 897,591Nasdaq, Inc. 2,794 586,768New Mountain Finance Corp. 2,060 28,222Newtek Business Services Corp. 477 13,180Northern Trust Corp. 3,051 364,930Oaktree Specialty Lending Corp. 2,519 18,792Open Lending Corp., Class A (A) 2,053 46,151Oppenheimer Holdings, Inc., Class A 169 7,837Owl Rock Capital Corp. 4,673 66,170Oxford Square Capital Corp. 1,411 5,757P10, Inc., Class B (A) 665 9,297
John Hancock Variable Insurance TrustPortfolio of Investments — December 31, 2021 (showing percentage of total net assets)
The accompanying notes are an integral part of the financial statements. 176

Total Stock Market Index Trust (continued)Shares orPrincipalAmount Value
COMMON STOCKS (continued)Capital markets (continued)PennantPark Floating Rate Capital, Ltd. 874 $ 11,161PennantPark Investment Corp. 1,841 12,758Perella Weinberg Partners 815 10,481Piper Sandler Companies 319 56,945Portman Ridge Finance Corp. 340 8,418Prospect Capital Corp. 8,135 68,415Pzena Investment Management, Inc.,
Class A 1,693 16,033Raymond James Financial, Inc. 3,780 379,512Robinhood Markets, Inc., Class A (A)(B) 14,944 265,405S&P Global, Inc. 4,288 2,023,636Sculptor Capital Management, Inc. 1,110 23,699SEI Investments Company 2,764 168,438Sixth Street Specialty Lending, Inc. 1,483 34,687SLR Investment Corp. 825 15,205SLR Senior Investment Corp. 444 6,207State Street Corp. 6,212 577,716Stellus Capital Investment Corp. 500 6,510StepStone Group, Inc., Class A 1,560 64,849Stifel Financial Corp. 1,959 137,953StoneX Group, Inc. (A) 429 26,276T. Rowe Price Group, Inc. 4,082 802,684TCG BDC, Inc. 1,406 19,304The Bank of New York Mellon Corp. 15,350 891,528The Blackstone Group, Inc. 12,182 1,576,229The Carlyle Group, Inc. 6,391 350,866The Charles Schwab Corp. 32,113 2,700,703The Goldman Sachs Group, Inc. 5,926 2,266,991Tradeweb Markets, Inc., Class A 4,224 422,991TriplePoint Venture Growth BDC Corp. 568 10,201Victory Capital Holdings, Inc., Class A 1,360 49,681Virtu Financial, Inc., Class A 3,306 95,312Virtus Investment Partners, Inc. 128 38,029WhiteHorse Finance, Inc. 557 8,634WisdomTree Investments, Inc. 3,365 20,594
30,805,517Consumer finance – 0.6%Ally Financial, Inc. 6,479 308,465American Express Company 14,101 2,306,924Atlanticus Holdings Corp. (A) 243 17,331Capital One Financial Corp. 7,840 1,137,506Credit Acceptance Corp. (A)(B) 282 193,926Curo Group Holdings Corp. 881 14,105Discover Financial Services 5,337 616,744Elevate Credit, Inc. (A) 1,491 4,428Encore Capital Group, Inc. (A) 602 37,390Enova International, Inc. (A) 722 29,573EZCORP, Inc., Class A (A) 1,448 10,672FirstCash Holdings, Inc. 795 59,474Green Dot Corp., Class A (A) 1,032 37,400LendingTree, Inc. (A) 258 31,631Moneylion, Inc. (A) 3,076 12,396Navient Corp. 3,015 63,978Nelnet, Inc., Class A 367 35,849OneMain Holdings, Inc. 2,436 121,897Oportun Financial Corp. (A) 399 8,080OppFi, Inc. (A) 1,374 6,238PRA Group, Inc. (A) 950 47,700PROG Holdings, Inc. (A) 1,223 55,170Regional Management Corp. 233 13,388Santander Consumer USA Holdings, Inc. 5,022 211,024SLM Corp. 5,564 109,444Sunlight Financial Holdings, Inc. (A) 1,462 6,988Synchrony Financial 10,161 471,369Upstart Holdings, Inc. (A) 1,379 208,643
Total Stock Market Index Trust (continued)Shares orPrincipalAmount Value
COMMON STOCKS (continued)Consumer finance (continued)World Acceptance Corp. (A) 133 $ 32,642
6,210,375Diversified financial services – 1.3%Berkshire Hathaway, Inc., Class A (A) 11 4,957,282Berkshire Hathaway, Inc., Class B (A) 23,047 6,891,053Equitable Holdings, Inc. 7,560 247,892GWG Holdings, Inc. (A) 813 8,122Jackson Financial, Inc., Class A 1,342 56,136Voya Financial, Inc. 2,133 141,439
12,301,924Insurance – 1.6%Aflac, Inc. 11,866 692,856Alleghany Corp. (A) 196 130,848American Equity Investment Life
Holding Company 1,171 45,575American Financial Group, Inc. 1,581 217,103American International Group, Inc. 15,290 869,389American National Group, Inc. 390 73,648AMERISAFE, Inc. 412 22,178Arch Capital Group, Ltd. (A) 7,322 325,463Argo Group International Holdings, Ltd. 742 43,118Arthur J. Gallagher & Company 3,634 616,581Assurant, Inc. 1,120 174,563Assured Guaranty, Ltd. 1,401 70,330Axis Capital Holdings, Ltd. 1,664 90,638Bright Health Group, Inc. (A) 10,245 35,243Brighthouse Financial, Inc. (A) 1,248 64,646Brown & Brown, Inc. 5,126 360,255BRP Group, Inc., Class A (A) 1,594 57,559Cincinnati Financial Corp. 2,987 340,309Citizens, Inc. (A) 1,370 7,275CNA Financial Corp. 5,170 227,894CNO Financial Group, Inc. 2,745 65,441Crawford & Company, Class B 1,283 9,610Donegal Group, Inc., Class A 786 11,232eHealth, Inc. (A) 490 12,495Employers Holdings, Inc. 692 28,635Enstar Group, Ltd. (A) 196 48,528Erie Indemnity Company, Class A 826 159,137Everest Re Group, Ltd. 580 158,874Fidelity National Financial, Inc. 5,294 276,241First American Financial Corp. 2,102 164,439Genworth Financial, Inc., Class A (A) 9,926 40,200Globe Life, Inc. 1,425 133,551GoHealth, Inc., Class A (A) 5,260 19,935Goosehead Insurance, Inc., Class A 660 85,853HCI Group, Inc. 170 14,202Heritage Insurance Holdings, Inc. 734 4,316Hippo Holdings, Inc. (A) 8,118 22,974Horace Mann Educators Corp. 900 34,830Independence Holding Company 356 20,178Investors Title Company 50 9,858Kemper Corp. 1,246 73,252Kinsale Capital Group, Inc. 439 104,434Lemonade, Inc. (A)(B) 1,078 45,395Lincoln National Corp. 3,476 237,272Loews Corp. 4,301 248,426Markel Corp. (A) 208 256,672Marsh & McLennan Companies, Inc. 8,978 1,560,556MBIA, Inc. (A) 1,204 19,011Mercury General Corp. 1,157 61,390MetLife, Inc. 15,112 944,349National Western Life Group, Inc., Class A 35 7,505NI Holdings, Inc. (A) 641 12,121Old Republic International Corp. 5,866 144,186
John Hancock Variable Insurance TrustPortfolio of Investments — December 31, 2021 (showing percentage of total net assets)
The accompanying notes are an integral part of the financial statements. 177

Total Stock Market Index Trust (continued)Shares orPrincipalAmount Value
COMMON STOCKS (continued)Insurance (continued)Oscar Health, Inc., Class A (A) 3,277 $ 25,724Palomar Holdings, Inc. (A) 514 33,292Primerica, Inc. 766 117,405Principal Financial Group, Inc. 5,014 362,663ProAssurance Corp. 1,182 29,905Prudential Financial, Inc. 6,781 733,975Reinsurance Group of America, Inc. 1,269 138,943RenaissanceRe Holdings, Ltd. 725 122,764RLI Corp. 935 104,814Root, Inc., Class A (A) 4,139 12,831Ryan Specialty Group Holdings, Inc.,
Class A (A) 4,244 171,245Safety Insurance Group, Inc. 334 28,400Selective Insurance Group, Inc. 1,193 97,754Selectquote, Inc. (A) 2,662 24,118State Auto Financial Corp. 841 43,471Stewart Information Services Corp. 487 38,829The Allstate Corp. 4,827 567,897The Hanover Insurance Group, Inc. 727 95,281The Hartford Financial Services
Group, Inc. 6,282 433,709The Progressive Corp. 9,834 1,009,460The Travelers Companies, Inc. 4,415 690,638Trean Insurance Group, Inc. (A) 448 3,992Trupanion, Inc. (A) 731 96,514United Fire Group, Inc. 546 12,662United Insurance Holdings Corp. 1,080 4,687Universal Insurance Holdings, Inc. 656 11,152Unum Group 3,143 77,224W.R. Berkley Corp. 3,321 273,617White Mountains Insurance Group, Ltd. 18 18,250
14,881,785Mortgage real estate investment trusts – 0.1%AGNC Investment Corp. 6,319 95,038Angel Oak Mortgage, Inc. 54 885Annaly Capital Management, Inc. 21,305 166,605Apollo Commercial Real Estate
Finance, Inc. 3,205 42,178Arbor Realty Trust, Inc. 2,208 40,451Ares Commercial Real Estate Corp. 789 11,472ARMOUR Residential REIT, Inc. 1,413 13,862Blackstone Mortgage Trust, Inc., Class A 2,768 84,756BrightSpire Capital, Inc. 2,808 28,810Broadmark Realty Capital, Inc. 2,185 20,605Chimera Investment Corp. 3,772 56,882Dynex Capital, Inc. 611 10,210Ellington Residential Mortgage REIT 471 4,894Franklin BSP Realty Trust, Inc. 474 7,082Granite Point Mortgage Trust, Inc. 1,105 12,940Great Ajax Corp. 553 7,277Hannon Armstrong Sustainable
Infrastructure Capital, Inc. 1,402 74,474Invesco Mortgage Capital, Inc. 3,300 9,174KKR Real Estate Finance Trust, Inc. 1,084 22,580Ladder Capital Corp. 2,535 30,395MFA Financial, Inc. 9,090 41,450New Residential Investment Corp. 8,506 91,099New York Mortgage Trust, Inc. 5,225 19,437Orchid Island Capital, Inc. 1,157 5,207PennyMac Mortgage Investment Trust 1,761 30,518Ready Capital Corp. 1,430 22,351Redwood Trust, Inc. 2,127 28,055Starwood Property Trust, Inc. 5,131 124,683TPG RE Finance Trust, Inc. 1,656 20,402
Total Stock Market Index Trust (continued)Shares orPrincipalAmount Value
COMMON STOCKS (continued)Mortgage real estate investment trusts (continued)Two Harbors Investment Corp. 5,815 $ 33,553
1,157,325Thrifts and mortgage finance – 0.2%Axos Financial, Inc. (A) 1,170 65,415Bridgewater Bancshares, Inc. (A) 655 11,587Capitol Federal Financial, Inc. 1,954 22,139Columbia Financial, Inc. (A) 2,514 52,442Enact Holdings, Inc. 1,803 37,268Federal Agricultural Mortgage Corp.,
Class C 191 23,671Federal Home Loan Mortgage Corp. (A) 12,537 10,406Federal National Mortgage Association (A) 21,500 17,632Flagstar Bancorp, Inc. 306 14,670Home Bancorp, Inc. 185 7,679Home Point Capital, Inc. 1,484 6,678Kearny Financial Corp. 2,110 27,958LoanDepot, Inc., Class A 5,042 24,202Luther Burbank Corp. 1,316 18,477Merchants Bancorp 618 29,250MGIC Investment Corp. 6,433 92,764New York Community Bancorp, Inc. 6,179 75,446NMI Holdings, Inc., Class A (A) 1,463 31,967Northfield Bancorp, Inc. 1,247 20,152Northwest Bancshares, Inc. 2,105 29,807Ocwen Financial Corp. (A) 244 9,753PCSB Financial Corp. 498 9,482PDL Community Bancorp (A) 510 7,466PennyMac Financial Services, Inc. 824 57,499Premier Financial Corp. 968 29,921Provident Bancorp, Inc. 677 12,592Provident Financial Services, Inc. 1,019 24,680Radian Group, Inc. 3,644 76,998Riverview Bancorp, Inc. 881 6,775Rocket Companies, Inc., Class A (B) 35,120 491,680Southern Missouri Bancorp, Inc. 216 11,269Sterling Bancorp, Inc. (A) 1,248 7,176Territorial Bancorp, Inc. 238 6,010TFS Financial Corp. 3,937 70,354Timberland Bancorp, Inc. 255 7,064TrustCo Bank Corp. NY 512 17,055Velocity Financial, Inc. (A) 372 5,096Walker & Dunlop, Inc. 597 90,075Washington Federal, Inc. 1,204 40,190Western New England Bancorp, Inc. 789 6,912WSFS Financial Corp. 837 41,950
1,649,607103,674,721
Health care – 12.4%Biotechnology – 2.3%2seventy bio, Inc. (A) 390 9,9964D Molecular Therapeutics, Inc. (A) 496 10,88289bio, Inc. (A) 290 3,790Aadi Bioscience, Inc. (A) 304 7,342AbbVie, Inc. 31,305 4,238,697Abeona Therapeutics, Inc. (A) 5,173 1,743ACADIA Pharmaceuticals, Inc. (A) 3,016 70,393Achieve Life Sciences, Inc. (A) 143 1,113Achillion Pharmaceuticals, Inc. (A)(C) 3,410 5,128Acorda Therapeutics, Inc. (A) 1,089 2,603Acumen Pharmaceuticals, Inc. (A) 542 3,664Adagio Therapeutics, Inc. (A) 1,840 13,358Adicet Bio, Inc. (A) 550 9,620Aduro Biotech, Inc. (A)(C) 312 936Advaxis, Inc. (A) 7,965 1,239
John Hancock Variable Insurance TrustPortfolio of Investments — December 31, 2021 (showing percentage of total net assets)
The accompanying notes are an integral part of the financial statements. 178

Total Stock Market Index Trust (continued)Shares orPrincipalAmount Value
COMMON STOCKS (continued)Biotechnology (continued)Adverum Biotechnologies, Inc. (A) 1,924 $ 3,386Aeglea BioTherapeutics, Inc. (A) 797 3,786Aerovate Therapeutics, Inc. (A) 373 4,398Agenus, Inc. (A) 4,171 13,431Agios Pharmaceuticals, Inc. (A) 1,160 38,129Aileron Therapeutics, Inc. (A) 4,229 2,381Akebia Therapeutics, Inc. (A) 3,771 8,522Akero Therapeutics, Inc. (A) 639 13,515Akouos, Inc. (A) 482 4,097Albireo Pharma, Inc. (A) 301 7,010Alder Biopharmaceuticals, Inc. (A)(C) 1,872 2,722Aldeyra Therapeutics, Inc. (A) 778 3,112Alector, Inc. (A) 1,508 31,140Aligos Therapeutics, Inc. (A) 603 7,158Alkermes PLC (A) 3,013 70,082Allakos, Inc. (A) 977 9,565Allogene Therapeutics, Inc. (A) 2,589 38,628Allovir, Inc. (A) 1,052 13,613Alnylam Pharmaceuticals, Inc. (A) 2,118 359,170Alpine Immune Sciences, Inc. (A) 365 5,055Altimmune, Inc. (A) 589 5,395ALX Oncology Holdings, Inc. (A) 659 14,162Alzamend Neuro, Inc. (A)(B) 981 1,864Ambit Biosciences Corp. (A)(C) 515 309Amgen, Inc. 10,108 2,273,997Amicus Therapeutics, Inc. (A) 4,973 57,438AnaptysBio, Inc. (A) 595 20,676Anika Therapeutics, Inc. (A) 318 11,394Anixa Biosciences, Inc. (A) 267 793Annexon, Inc. (A) 614 7,055Annovis Bio, Inc. (A) 176 3,094Apellis Pharmaceuticals, Inc. (A) 1,496 70,731Applied Molecular Transport, Inc. (A) 578 8,080Applied Therapeutics, Inc. (A) 650 5,818Aprea Therapeutics, Inc. (A) 81 232Aptevo Therapeutics, Inc. (A) 90 708Aptinyx, Inc. (A) 243 649AquaBounty Technologies, Inc. (A) 439 922Aravive, Inc. (A) 701 1,535Arcus Biosciences, Inc. (A) 1,192 48,240Arcutis Biotherapeutics, Inc. (A) 769 15,949Ardelyx, Inc. (A) 4,272 4,699Arena Pharmaceuticals, Inc. (A) 1,074 99,818Arrowhead Pharmaceuticals, Inc. (A) 1,889 125,241Assembly Biosciences, Inc. (A) 313 729Astria Therapeutics, Inc. (A) 645 3,477Atara Biotherapeutics, Inc. (A) 1,373 21,638Athenex, Inc. (A) 2,350 3,196Atossa Therapeutics, Inc. (A) 2,741 4,386Atreca, Inc., Class A (A) 921 2,791aTyr Pharma, Inc. (A) 237 1,770Avalo Therapeutics, Inc. (A) 3,324 5,651AVEO Pharmaceuticals, Inc. (A) 932 4,371Avid Bioservices, Inc. (A) 992 28,947Avidity Biosciences, Inc. (A) 655 15,569Avrobio, Inc. (A) 1,365 5,255Axcella Health, Inc. (A) 968 2,023Ayala Pharmaceuticals, Inc. (A) 641 5,455Aziyo Biologics, Inc., Class A (A) 230 1,449Beam Therapeutics, Inc. (A) 1,141 90,926Bellicum Pharmaceuticals, Inc. (A) 1,059 1,578BioAtla, Inc. (A) 475 9,324BioCryst Pharmaceuticals, Inc. (A) 2,966 41,079Biogen, Inc. (A) 2,648 635,308BioMarin Pharmaceutical, Inc. (A) 3,306 292,085
Total Stock Market Index Trust (continued)Shares orPrincipalAmount Value
COMMON STOCKS (continued)Biotechnology (continued)Biomea Fusion, Inc. (A) 348 $ 2,593Bioxcel Therapeutics, Inc. (A) 451 9,169Black Diamond Therapeutics, Inc. (A) 960 5,117Bluebird Bio, Inc. (A) 1,170 11,688Blueprint Medicines Corp. (A) 1,044 111,823Bolt Biotherapeutics, Inc. (A) 540 2,646Bridgebio Pharma, Inc. (A) 2,737 45,653Brooklyn ImmunoTherapeutics, Inc. (A) 665 2,773C4 Therapeutics, Inc. (A) 755 24,311Cabaletta Bio, Inc. (A) 446 1,690Calithera Biosciences, Inc. (A) 3,295 2,192Calyxt, Inc. (A) 1,467 3,125Candel Therapeutics, Inc. (A) 331 2,588Capricor Therapeutics, Inc. (A)(B) 880 2,578Cardiff Oncology, Inc. (A) 1,062 6,383CareDx, Inc. (A) 890 40,477Caribou Biosciences, Inc. (A) 895 13,506Catalyst Biosciences, Inc. (A) 1,171 1,070Catalyst Pharmaceuticals, Inc. (A) 2,142 14,501Celcuity, Inc. (A) 72 950Celldex Therapeutics, Inc. (A) 768 29,676CEL-SCI Corp. (A) 784 5,566Celsion Corp. (A) 4,469 2,413Celularity, Inc. (A) 1,786 9,144Century Therapeutics, Inc. (A) 839 13,307Checkmate Pharmaceuticals, Inc. (A) 1,186 3,404Checkpoint Therapeutics, Inc. (A) 779 2,423ChemoCentryx, Inc. (A) 1,259 45,840Chimerix, Inc. (A) 1,055 6,784Chinook Therapeutics, Inc. (A) 797 12,999Cidara Therapeutics, Inc. (A) 179 227Clarus Therapeutics Holdings, Inc. (A) 22 53Clovis Oncology, Inc. (A) 2,326 6,303Codiak Biosciences, Inc. (A) 315 3,509Cogent Biosciences, Inc. (A) 816 7,001Coherus Biosciences, Inc. (A) 1,434 22,887Concert Pharmaceuticals, Inc. (A) 1,605 5,056Cortexyme, Inc. (A)(B) 576 7,269Corvus Pharmaceuticals, Inc. (A) 1,318 3,176Crinetics Pharmaceuticals, Inc. (A) 678 19,262CTI BioPharma Corp. (A) 2,424 6,012Cue Biopharma, Inc. (A) 664 7,510Cullinan Oncology, Inc. (A) 632 9,752Curis, Inc. (A) 1,714 8,159Cyclerion Therapeutics, Inc. (A) 1,852 3,185Cyteir Therapeutics, Inc. (A) 402 4,571Cytokinetics, Inc. (A) 1,360 61,989CytomX Therapeutics, Inc. (A) 1,018 4,408Day One Biopharmaceuticals, Inc. (A) 960 16,176Decibel Therapeutics, Inc. (A) 543 2,525Deciphera Pharmaceuticals, Inc. (A) 1,040 10,161Denali Therapeutics, Inc. (A) 2,075 92,545Design Therapeutics, Inc. (A) 812 17,385Dynavax Technologies Corp. (A) 1,897 26,691Dyne Therapeutics, Inc. (A) 642 7,633Eagle Pharmaceuticals, Inc. (A) 282 14,359Editas Medicine, Inc. (A) 1,143 30,347eFFECTOR Therapeutics, Inc. (A)(B) 584 4,836Eiger BioPharmaceuticals, Inc. (A) 622 3,228Eledon Pharmaceuticals, Inc. (A) 188 829Elevation Oncology, Inc. (A) 279 1,680Eliem Therapeutics, Inc. (A) 571 5,973Emergent BioSolutions, Inc. (A) 1,025 44,557Enanta Pharmaceuticals, Inc. (A) 386 28,865Entasis Therapeutics Holdings, Inc. (A) 1,850 4,052
John Hancock Variable Insurance TrustPortfolio of Investments — December 31, 2021 (showing percentage of total net assets)
The accompanying notes are an integral part of the financial statements. 179

Total Stock Market Index Trust (continued)Shares orPrincipalAmount Value
COMMON STOCKS (continued)Biotechnology (continued)Epizyme, Inc. (A) 1,858 $ 4,645Equillium, Inc. (A) 835 3,131Erasca, Inc. (A)(B) 1,961 30,552Evelo Biosciences, Inc. (A) 1,133 6,877Exact Sciences Corp. (A) 3,078 239,561Exagen, Inc. (A) 108 1,256Exelixis, Inc. (A) 5,688 103,977Fate Therapeutics, Inc. (A) 1,608 94,084Fennec Pharmaceuticals, Inc. (A) 143 629FibroGen, Inc. (A) 1,854 26,141Finch Therapeutics Group, Inc. (A) 641 6,391First Wave Biopharma, Inc. (A) 1,115 1,611Flexion Therapeutics, Inc. (A)(C) 867 538Foghorn Therapeutics, Inc. (A) 553 12,647Forma Therapeutics Holdings, Inc. (A) 728 10,352Forte Biosciences, Inc. (A) 1,003 2,146Fortress Biotech, Inc. (A) 1,857 4,643Frequency Therapeutics, Inc. (A) 850 4,361F-star Therapeutics, Inc. (A) 714 3,584G1 Therapeutics, Inc. (A) 777 7,933Gain Therapeutics, Inc. (A) 45 240Galectin Therapeutics, Inc. (A) 1,506 3,117Galera Therapeutics, Inc. (A)(B) 1,618 7,427Generation Bio Company (A) 907 6,422Genocea Biosciences, Inc. (A) 2,651 3,075Geron Corp. (A) 4,452 5,431Gilead Sciences, Inc. 22,302 1,619,348Ginkgo Bioworks Holdings, Inc. (A)(B) 34,305 285,075Global Blood Therapeutics, Inc. (A) 1,168 34,187GlycoMimetics, Inc. (A) 1,565 2,254Gossamer Bio, Inc. (A) 1,462 16,535Graphite Bio, Inc. (A) 860 10,690Greenwich Lifesciences, Inc. (A) 123 2,993Gritstone bio, Inc. (A) 987 12,693GTX Corp. (A)(C) 38 0Halozyme Therapeutics, Inc. (A) 2,610 104,948Harpoon Therapeutics, Inc. (A) 583 4,402HCW Biologics, Inc. (A) 248 575Heron Therapeutics, Inc. (A) 1,487 13,576Homology Medicines, Inc. (A) 999 3,636Hookipa Pharma, Inc. (A) 641 1,494Horizon Therapeutics PLC (A) 3,931 423,605Humacyte, Inc. (A) 1,629 11,810Icosavax, Inc. (A) 553 12,653Ideaya Biosciences, Inc. (A) 547 12,931Idera Pharmaceuticals, Inc. (A) 3,934 2,242IGM Biosciences, Inc. (A) 619 18,155Imago Biosciences, Inc. (A) 528 12,519Immuneering Corp., Class A (A) 361 5,837Immunic, Inc. (A) 341 3,263ImmunityBio, Inc. (A) 6,612 40,201ImmunoGen, Inc. (A) 3,467 25,725Immunome, Inc. (A) 203 2,631Immunovant, Inc. (A) 1,756 14,961Impel Neuropharma, Inc. (A) 519 4,479IN8bio, Inc. (A) 138 606Incyte Corp. (A) 3,981 292,205Indaptus Therapeutics, Inc. (A) 465 2,651Infinity Pharmaceuticals, Inc. (A) 736 1,656Inhibrx, Inc. (A) 678 29,608Inmune Bio, Inc. (A) 473 4,825Inovio Pharmaceuticals, Inc. (A) 3,313 16,532Inozyme Pharma, Inc. (A) 748 5,101Insmed, Inc. (A) 1,924 52,410Instil Bio, Inc. (A) 2,107 36,051
Total Stock Market Index Trust (continued)Shares orPrincipalAmount Value
COMMON STOCKS (continued)Biotechnology (continued)Intellia Therapeutics, Inc. (A) 1,264 $ 149,455Intercept Pharmaceuticals, Inc. (A) 671 10,931Invitae Corp. (A)(B) 3,645 55,659Ionis Pharmaceuticals, Inc. (A) 2,584 78,631Ironwood Pharmaceuticals, Inc. (A) 3,112 36,286iTeos Therapeutics, Inc. (A) 554 25,794IVERIC bio, Inc. (A) 1,864 31,166Janux Therapeutics, Inc. (A) 624 12,312Jasper Therapeutics, Inc. (A)(B) 483 3,792Jounce Therapeutics, Inc. (A) 886 7,398KalVista Pharmaceuticals, Inc. (A) 368 4,869Karuna Therapeutics, Inc. (A) 532 69,692Keros Therapeutics, Inc. (A) 375 21,941Kezar Life Sciences, Inc. (A) 542 9,062Kiniksa Pharmaceuticals, Ltd., Class A (A) 1,104 12,994Kinnate Biopharma, Inc. (A) 602 10,667Kiromic BioPharma, Inc. (A) 321 491Kodiak Sciences, Inc. (A) 899 76,217Kronos Bio, Inc. (A) 803 10,913Krystal Biotech, Inc. (A) 389 27,211Kura Oncology, Inc. (A) 1,043 14,602Kymera Therapeutics, Inc. (A) 836 53,078Lantern Pharma, Inc. (A) 11 88Larimar Therapeutics, Inc. (A) 512 5,524Leap Therapeutics, Inc. (A) 2,212 7,167Lexicon Pharmaceuticals, Inc. (A) 2,562 10,094Ligand Pharmaceuticals, Inc. (A) 309 47,728Lineage Cell Therapeutics, Inc. (A) 2,770 6,787LogicBio Therapeutics, Inc. (A) 1,123 2,594Lumos Pharma, Inc. (A) 43 298Lyell Immunopharma, Inc. (A) 3,921 30,349MacroGenics, Inc. (A) 1,031 16,548Madrigal Pharmaceuticals, Inc. (A) 323 27,371Magenta Therapeutics, Inc. (A) 934 4,138MannKind Corp. (A) 3,858 16,859Marker Therapeutics, Inc. (A) 2,986 2,837Matinas BioPharma Holdings, Inc. (A) 5,353 5,407MediciNova, Inc. (A) 1,166 3,125MEI Pharma, Inc. (A) 2,438 6,509MeiraGTx Holdings PLC (A) 698 16,571Mersana Therapeutics, Inc. (A) 1,237 7,694Metacrine, Inc. (A) 1,025 691Mirum Pharmaceuticals, Inc. (A) 659 10,511Moderna, Inc. (A) 7,122 1,808,846Molecular Templates, Inc. (A) 878 3,442Moleculin Biotech, Inc. (A) 1,245 2,316Monte Rosa Therapeutics, Inc. (A) 877 17,908Morphic Holding, Inc. (A) 687 32,550Mustang Bio, Inc. (A) 2,606 4,326Myriad Genetics, Inc. (A) 1,496 41,290Natera, Inc. (A) 1,602 149,611Navidea Biopharmaceuticals, Inc. (A) 2,439 2,439Neoleukin Therapeutics, Inc. (A) 455 2,193NeuroBo Pharmaceuticals, Inc. (A) 905 1,104Neurocrine Biosciences, Inc. (A) 1,740 148,196NexImmune, Inc. (A) 293 1,351NextCure, Inc. (A) 542 3,252Nkarta, Inc. (A) 548 8,412Northwest Biotherapeutics, Inc. (A) 11,656 8,159Novavax, Inc. (A) 1,306 186,849Nurix Therapeutics, Inc. (A) 723 20,931Nuvalent, Inc., Class A (A) 753 14,337Ocugen, Inc. (A)(B) 3,119 14,191Olema Pharmaceuticals, Inc. (A) 587 5,494Omega Therapeutics, Inc. (A) 709 8,033
John Hancock Variable Insurance TrustPortfolio of Investments — December 31, 2021 (showing percentage of total net assets)
The accompanying notes are an integral part of the financial statements. 180

Total Stock Market Index Trust (continued)Shares orPrincipalAmount Value
COMMON STOCKS (continued)Biotechnology (continued)Oncocyte Corp. (A) 2,198 $ 4,770Oncorus, Inc. (A) 335 1,765OncoSec Medical, Inc. (A) 2,111 2,026Oncternal Therapeutics, Inc. (A) 1,525 3,462OPKO Health, Inc. (A) 12,549 60,361Organogenesis Holdings, Inc. (A) 2,172 20,069Orgenesis, Inc. (A) 485 1,397ORIC Pharmaceuticals, Inc. (A) 607 8,923Outlook Therapeutics, Inc. (A) 2,083 2,833Ovid therapeutics, Inc. (A) 572 1,836Oyster Point Pharma, Inc. (A) 431 7,870Passage Bio, Inc. (A) 825 5,239PDL BioPharma, Inc. (A)(C) 1,734 3,104PDS Biotechnology Corp. (A) 660 5,346Pfenex, Inc. (A)(C) 763 836PhaseBio Pharmaceuticals, Inc. (A) 1,586 4,139Pieris Pharmaceuticals, Inc. (A) 1,728 6,532PMV Pharmaceuticals, Inc. (A) 729 16,840Point Biopharma Global, Inc. (A) 1,417 7,935Poseida Therapeutics, Inc. (A) 1,586 10,801Praxis Precision Medicines, Inc. (A) 714 14,066Precigen, Inc. (A) 3,241 12,024Precision BioSciences, Inc. (A) 1,182 8,747Prelude Therapeutics, Inc. (A) 793 9,873Progenics Pharmaceuticals, Inc. (A)(C) 1,955 83Prometheus Biosciences, Inc. (A) 584 23,091Protagonist Therapeutics, Inc. (A) 791 27,052PTC Therapeutics, Inc. (A) 1,304 51,938Puma Biotechnology, Inc. (A) 890 2,706Rallybio Corp. (A) 455 4,341RAPT Therapeutics, Inc. (A) 483 17,741Recursion Pharmaceuticals, Inc.,
Class A (A)(B) 2,835 48,564Regeneron Pharmaceuticals, Inc. (A) 1,892 1,194,836REGENXBIO, Inc. (A) 794 25,964Relay Therapeutics, Inc. (A) 1,768 54,295Reneo Pharmaceuticals, Inc. (A) 651 5,566Renovacor, Inc. (A) 158 1,217Replimune Group, Inc. (A) 698 18,916REVOLUTION Medicines, Inc. (A) 1,143 28,769Rhythm Pharmaceuticals, Inc. (A) 820 8,184Rigel Pharmaceuticals, Inc. (A) 3,503 9,283Rocket Pharmaceuticals, Inc. (A) 1,021 22,288Rubius Therapeutics, Inc. (A) 1,758 17,017Sage Therapeutics, Inc. (A) 1,099 46,751Sana Biotechnology, Inc. (A) 3,178 49,195Sangamo Therapeutics, Inc. (A) 2,664 19,980Sarepta Therapeutics, Inc. (A) 1,435 129,222Savara, Inc. (A) 3,273 4,059Scholar Rock Holding Corp. (A) 577 14,333Scopus Biopharma, Inc. (A) 811 1,326Seagen, Inc. (A) 3,236 500,286Selecta Biosciences, Inc. (A) 1,916 6,246SELLAS Life Sciences Group, Inc. (A) 418 2,312Sensei Biotherapeutics, Inc. (A) 400 2,320Sera Prognostics, Inc., Class A (A) 198 1,360Seres Therapeutics, Inc. (A) 1,482 12,345Shattuck Labs, Inc. (A) 541 4,604Sierra Oncology, Inc. (A) 126 2,739Sigilon Therapeutics, Inc. (A) 622 1,717Silverback Therapeutics, Inc. (A) 919 6,121Solid Biosciences, Inc. (A) 2,770 4,848Spectrum Pharmaceuticals, Inc. (A) 2,679 3,402Spero Therapeutics, Inc. (A) 578 9,254SpringWorks Therapeutics, Inc. (A) 861 53,365
Total Stock Market Index Trust (continued)Shares orPrincipalAmount Value
COMMON STOCKS (continued)Biotechnology (continued)Spruce Biosciences, Inc. (A) 208 $ 928SQZ Biotechnologies Company (A) 422 3,768Stoke Therapeutics, Inc. (A) 722 17,321Surface Oncology, Inc. (A) 690 3,298Surrozen, Inc. (A) 420 2,705Sutro Biopharma, Inc. (A) 635 9,449Syndax Pharmaceuticals, Inc. (A) 646 14,141Synergy Pharmaceuticals, Inc. (A)(C) 6,230 18Synlogic, Inc. (A) 1,786 4,322Synthetic Biologics, Inc. (A) 10,597 2,885Syros Pharmaceuticals, Inc. (A) 1,778 5,796Talaris Therapeutics, Inc. (A) 597 9,128Tango Therapeutics, Inc. (A) 1,346 14,725Taysha Gene Therapies, Inc. (A) 571 6,652TCR2 Therapeutics, Inc. (A) 1,031 4,804Tempest Therapeutics, Inc. (A) 96 507Tenaya Therapeutics, Inc. (A) 631 11,957Tracon Pharmaceuticals, Inc. (A) 986 2,731Travere Therapeutics, Inc. (A) 1,004 31,164Trevena, Inc. (A) 6,227 3,627TScan Therapeutics, Inc. (A) 202 909Turning Point Therapeutics, Inc. (A) 839 40,020Twist Bioscience Corp. (A) 827 64,002Tyra Biosciences, Inc. (A)(B) 661 9,300Ultragenyx Pharmaceutical, Inc. (A) 1,226 103,094United Therapeutics Corp. (A) 809 174,809UNITY Biotechnology, Inc. (A) 783 1,143UroGen Pharma, Ltd. (A) 495 4,707Vaccinex, Inc. (A) 1,664 1,747Vanda Pharmaceuticals, Inc. (A) 1,167 18,310Vaxart, Inc. (A) 2,037 12,772Vaxcyte, Inc. (A) 827 19,674Vera Therapeutics, Inc. (A) 459 12,264Veracyte, Inc. (A) 1,119 46,103Verastem, Inc. (A) 2,859 5,861Vericel Corp. (A) 881 34,623Vertex Pharmaceuticals, Inc. (A) 4,630 1,016,748Verve Therapeutics, Inc. (A) 788 29,054Viking Therapeutics, Inc. (A) 1,686 7,756Vir Biotechnology, Inc. (A) 2,250 94,208Viracta Therapeutics, Inc. (A) 919 3,354Viridian Therapeutics, Inc. (A) 323 6,386Virios Therapeutics, Inc. (A) 639 3,272Vor BioPharma, Inc. (A) 556 6,461Voyager Therapeutics, Inc. (A) 1,312 3,556Werewolf Therapeutics, Inc. (A) 346 4,121X4 Pharmaceuticals, Inc. (A) 590 1,351XBiotech, Inc. 761 8,470Xencor, Inc. (A) 1,123 45,055XOMA Corp. (A) 228 4,754Yield10 Bioscience, Inc. (A) 575 2,829Y-mAbs Therapeutics, Inc. (A) 853 13,827Yumanity Therapeutics, Inc. (A) 211 625Zentalis Pharmaceuticals, Inc. (A) 734 61,700ZIOPHARM Oncology, Inc. (A) 4,026 4,388
21,752,494Health care equipment and supplies – 2.4%Abbott Laboratories 31,427 4,423,036ABIOMED, Inc. (A) 813 292,005Accelerate Diagnostics, Inc. (A) 1,138 5,940Accuray, Inc. (A) 2,141 10,213Acutus Medical, Inc. (A) 1,511 5,153Align Technology, Inc. (A) 1,401 920,709Alphatec Holdings, Inc. (A) 1,472 16,825AngioDynamics, Inc. (A) 817 22,533
John Hancock Variable Insurance TrustPortfolio of Investments — December 31, 2021 (showing percentage of total net assets)
The accompanying notes are an integral part of the financial statements. 181

Total Stock Market Index Trust (continued)Shares orPrincipalAmount Value
COMMON STOCKS (continued)Health care equipment and supplies (continued)Apollo Endosurgery, Inc. (A) 285 $ 2,403Apyx Medical Corp. (A) 740 9,487Asensus Surgical, Inc. (A) 4,509 5,005Aspira Women’s Health, Inc. (A) 1,357 2,402AtriCure, Inc. (A) 851 59,170Atrion Corp. 38 26,786Avanos Medical, Inc. (A) 963 33,387Axogen, Inc. (A) 892 8,358Axonics, Inc. (A) 681 38,136Baxter International, Inc. 8,716 748,181Becton, Dickinson and Company 4,994 1,255,891BioLife Solutions, Inc. (A) 651 24,263Bioventus, Inc., Class A (A) 978 14,171Boston Scientific Corp. (A) 25,320 1,075,594Cardiovascular Systems, Inc. (A) 748 14,047Cerus Corp. (A) 3,177 21,635Chembio Diagnostics, Inc. (A) 638 727Co-Diagnostics, Inc. (A) 301 2,688CONMED Corp. 541 76,692CryoLife, Inc. (A) 840 17,094CryoPort, Inc. (A) 806 47,691Cue Health, Inc. (A)(B) 2,236 29,985Cutera, Inc. (A) 347 14,338CVRx, Inc. (A) 171 2,091CytoSorbents Corp. (A) 847 3,549Dentsply Sirona, Inc. 3,957 220,761DexCom, Inc. (A) 1,712 919,258Eargo, Inc. (A) 924 4,712Edwards Lifesciences Corp. (A) 11,060 1,432,823Envista Holdings Corp. (A) 2,952 133,017enVVeno Medical Corp. (A) 432 2,847Establishment Labs Holdings, Inc. (A) 465 31,429Figs, Inc., Class A (A)(B) 2,715 74,825Glaukos Corp. (A) 856 38,041Globus Medical, Inc., Class A (A) 1,836 132,559Haemonetics Corp. (A) 931 49,380Heska Corp. (A) 175 31,936Hologic, Inc. (A) 4,484 343,295ICU Medical, Inc. (A) 389 92,325IDEXX Laboratories, Inc. (A) 1,514 996,908Inari Medical, Inc. (A) 835 76,210Inogen, Inc. (A) 449 15,266Insulet Corp. (A) 1,236 328,863Integer Holdings Corp. (A) 625 53,494Integra LifeSciences Holdings Corp. (A) 1,566 104,906Intersect ENT, Inc. (A) 718 19,609Intuitive Surgical, Inc. (A) 6,334 2,275,806Invacare Corp. (A) 844 2,296iRadimed Corp. (A) 275 12,708iRhythm Technologies, Inc. (A) 538 63,317Lantheus Holdings, Inc. (A) 1,287 37,181LeMaitre Vascular, Inc. 458 23,005Lucira Health, Inc. (A) 556 4,787Masimo Corp. (A) 986 288,681Meridian Bioscience, Inc. (A) 942 19,217Merit Medical Systems, Inc. (A) 1,044 65,041Mesa Laboratories, Inc. 96 31,497Natus Medical, Inc. (A) 710 16,848Neogen Corp. (A) 1,989 90,320Neuronetics, Inc. (A) 394 1,757NeuroPace, Inc. (A) 100 1,008Nevro Corp. (A) 648 52,533NuVasive, Inc. (A) 954 50,066OraSure Technologies, Inc. (A) 1,505 13,078
Total Stock Market Index Trust (continued)Shares orPrincipalAmount Value
COMMON STOCKS (continued)Health care equipment and supplies (continued)Ortho Clinical Diagnostics Holdings
PLC (A) 3,734 $ 79,870Orthofix Medical, Inc. (A) 439 13,649OrthoPediatrics Corp. (A) 364 21,789Outset Medical, Inc. (A) 709 32,678Owlet, Inc. (A) 1,547 4,130PAVmed, Inc. (A) 1,090 2,681Penumbra, Inc. (A) 660 189,631PROCEPT BioRobotics Corp. (A) 603 15,081Pulmonx Corp. (A) 486 15,586Pulse Biosciences, Inc. (A) 394 5,835Quidel Corp. (A) 751 101,377ResMed, Inc. 2,565 668,131Retractable Technologies, Inc. (A) 238 1,649RxSight, Inc. (A) 159 1,789SeaSpine Holdings Corp. (A) 591 8,049Second Sight Medical Products, Inc. (A) 710 1,157Senseonics Holdings, Inc. (A)(B) 7,349 19,622Shockwave Medical, Inc. (A) 634 113,061SI-BONE, Inc. (A) 650 14,437Sientra, Inc. (A) 505 1,853Sight Sciences, Inc. (A) 684 12,018Silk Road Medical, Inc. (A) 667 28,421SmileDirectClub, Inc. (A)(B) 7,305 17,167STAAR Surgical Company (A) 849 77,514Stereotaxis, Inc. (A) 1,565 9,703Stryker Corp. 6,665 1,782,354Surmodics, Inc. (A) 315 15,167Tactile Systems Technology, Inc. (A) 415 7,897Talis Biomedical Corp. (A) 773 3,100Tandem Diabetes Care, Inc. (A) 1,121 168,733Tela Bio, Inc. (A) 31 397Teleflex, Inc. 846 277,894The Cooper Companies, Inc. 853 357,356TransMedics Group, Inc. (A) 477 9,139Treace Medical Concepts, Inc. (A) 685 12,768Utah Medical Products, Inc. 94 9,400Vapotherm, Inc. (A) 424 8,781Varex Imaging Corp. (A) 786 24,798Venus Concept, Inc. (A) 2,267 3,854Vicarious Surgical, Inc. (A)(B) 1,697 18,022Zimmer Biomet Holdings, Inc. 3,741 475,257
22,013,590Health care providers and services – 2.5%1Life Healthcare, Inc. (A) 2,297 40,358Acadia Healthcare Company, Inc. (A) 1,651 100,216Accolade, Inc. (A) 974 25,675Aceto Corp. (A)(C) 853 0Addus HomeCare Corp. (A) 306 28,614agilon health, Inc. (A) 6,679 180,333Alignment Healthcare, Inc. (A) 3,052 42,911Amedisys, Inc. (A) 587 95,024AmerisourceBergen Corp. 3,564 473,620AMN Healthcare Services, Inc. (A) 852 104,225Anthem, Inc. 4,319 2,002,029Apollo Medical Holdings, Inc. (A) 958 70,394Apria, Inc. (A) 377 12,290Aveanna Healthcare Holdings, Inc. (A) 2,590 19,166Biodesix, Inc. (A) 239 1,264Brookdale Senior Living, Inc. (A) 3,810 19,660Cardinal Health, Inc. 5,208 268,160Castle Biosciences, Inc. (A) 350 15,005Centene Corp. (A) 10,348 852,675Chemed Corp. 230 121,679Cigna Corp. 6,046 1,388,343
John Hancock Variable Insurance TrustPortfolio of Investments — December 31, 2021 (showing percentage of total net assets)
The accompanying notes are an integral part of the financial statements. 182

Total Stock Market Index Trust (continued)Shares orPrincipalAmount Value
COMMON STOCKS (continued)Health care providers and services (continued)Community Health Systems, Inc. (A) 2,429 $ 32,330CorVel Corp. (A) 325 67,600Covetrus, Inc. (A) 2,407 48,068Cross Country Healthcare, Inc. (A) 752 20,876CVS Health Corp. 23,381 2,411,984DaVita, Inc. (A) 1,875 213,300Encompass Health Corp. 1,801 117,533Five Star Senior Living, Inc. (A) 1,606 4,738Fulgent Genetics, Inc. (A) 470 47,277Guardant Health, Inc. (A) 1,818 181,836Hanger, Inc. (A) 810 14,685HCA Healthcare, Inc. 5,672 1,457,250HealthEquity, Inc. (A) 1,482 65,564Henry Schein, Inc. (A) 2,317 179,637Humana, Inc. 2,280 1,057,601InfuSystem Holdings, Inc. (A) 109 1,856Innovage Holding Corp. (A) 1,986 9,930Interpace Biosciences, Inc. (A) 276 2,062Laboratory Corp. of America Holdings (A) 1,739 546,411LHC Group, Inc. (A) 577 79,182LifeStance Health Group, Inc. (A)(B) 6,301 59,986Magellan Health, Inc. (A) 528 50,155McKesson Corp. 2,699 670,890MEDNAX, Inc. (A) 1,595 43,400ModivCare, Inc. (A) 241 35,738Molina Healthcare, Inc. (A) 1,044 332,076National HealthCare Corp. 341 23,168National Research Corp. 508 21,092Oak Street Health, Inc. (A) 4,161 137,896Ontrak, Inc. (A) 613 3,856Option Care Health, Inc. (A) 3,251 92,458Owens & Minor, Inc. 1,368 59,508Patterson Companies, Inc. 1,841 54,033PetIQ, Inc. (A) 575 13,058Precipio, Inc. (A) 1,078 1,703Premier, Inc., Class A 1,861 76,617Privia Health Group, Inc. (A) 1,729 44,729Progenity, Inc. (A)(B) 2,849 5,954Progyny, Inc. (A) 1,614 81,265Quest Diagnostics, Inc. 2,175 376,297R1 RCM, Inc. (A) 4,729 120,542RadNet, Inc. (A) 1,011 30,441Select Medical Holdings Corp. 2,459 72,295Signify Health, Inc., Class A (A) 3,684 52,386Surgery Partners, Inc. (A) 1,393 74,400Talkspace, Inc. (A) 2,060 4,058Tenet Healthcare Corp. (A) 1,918 156,681The Ensign Group, Inc. 1,028 86,311The Joint Corp. (A) 267 17,539The Pennant Group, Inc. (A) 613 14,148Tivity Health, Inc. (A) 1,003 26,519UnitedHealth Group, Inc. 16,542 8,306,400Universal Health Services, Inc., Class B 1,496 193,971US Physical Therapy, Inc. 274 26,181
23,787,112Health care technology – 0.3%Allscripts Healthcare Solutions, Inc. (A) 2,443 45,073American Well Corp., Class A (A) 4,475 27,029Castlight Health, Inc., B Shares (A) 3,656 5,630Cerner Corp. 5,325 494,533Certara, Inc. (A) 2,761 78,468Change Healthcare, Inc. (A) 4,981 106,494Computer Programs & Systems, Inc. (A) 332 9,728Convey Health Solutions
Holdings, Inc. (A) 707 5,911
Total Stock Market Index Trust (continued)Shares orPrincipalAmount Value
COMMON STOCKS (continued)Health care technology (continued)Definitive Healthcare Corp. (A)(B) 2,482 $ 67,833Doximity, Inc., Class A (A) 3,282 164,527Evolent Health, Inc., Class A (A) 1,650 45,656GoodRx Holdings, Inc., Class A (A)(B) 7,028 229,675Health Catalyst, Inc. (A) 714 28,289HealthStream, Inc. (A) 704 18,557HTG Molecular Diagnostics, Inc. (A) 68 369Inspire Medical Systems, Inc. (A) 489 112,499MultiPlan Corp. (A) 10,977 48,628NantHealth, Inc. (A) 2,869 3,027NextGen Healthcare, Inc. (A) 1,375 24,461Omnicell, Inc. (A) 790 142,548Phreesia, Inc. (A) 801 33,370Schrodinger, Inc. (A) 1,147 39,950Sema4 Holdings Corp. (A) 3,705 16,524Sharecare, Inc. (A) 5,224 23,456Simulations Plus, Inc. 395 18,684Tabula Rasa HealthCare, Inc. (A) 474 7,110Teladoc Health, Inc. (A) 2,766 253,974Veeva Systems, Inc., Class A (A) 2,704 690,818Vocera Communications, Inc. (A) 669 43,378
2,786,199Life sciences tools and services – 1.8%10X Genomics, Inc., Class A (A) 1,989 296,281Absci Corp. (A)(B) 1,492 12,234Adaptive Biotechnologies Corp. (A) 2,619 73,489Agilent Technologies, Inc. 5,388 860,194Akoya Biosciences, Inc. (A) 324 4,960Alpha Teknova, Inc. (A) 345 7,066Avantor, Inc. (A) 10,429 439,478Berkeley Lights, Inc. (A) 1,103 20,053Bionano Genomics, Inc. (A)(B) 4,957 14,821Bio-Rad Laboratories, Inc., Class A (A) 500 377,785Bio-Techne Corp. 704 364,207Bruker Corp. 2,721 228,319Charles River Laboratories
International, Inc. (A) 906 341,363Codex DNA, Inc. (A) 223 2,408Codexis, Inc. (A) 1,214 37,962Cytek Biosciences, Inc. (A) 1,914 31,236Danaher Corp. 12,585 4,140,591Fluidigm Corp. (A) 1,624 6,366ICON PLC (A) 19 5,884Illumina, Inc. (A) 2,602 989,905Inotiv, Inc. (A) 218 9,171IQVIA Holdings, Inc. (A) 3,420 964,919Maravai LifeSciences Holdings, Inc.,
Class A (A) 4,598 192,656Medpace Holdings, Inc. (A) 647 140,813Mettler-Toledo International, Inc. (A) 413 700,948Miromatrix Medical, Inc. (A) 173 804NanoString Technologies, Inc. (A) 769 32,475NeoGenomics, Inc. (A) 2,242 76,497Pacific Biosciences of California, Inc. (A) 3,737 76,459PerkinElmer, Inc. 2,144 431,073Personalis, Inc. (A) 696 9,932Quanterix Corp. (A) 548 23,235Rapid Micro Biosystems, Inc., Class A (A) 438 4,660Repligen Corp. (A) 982 260,073Seer, Inc. (A) 912 20,803Singular Genomics Systems, Inc. (A) 1,117 12,913SomaLogic, Inc. (A) 2,875 33,465Sotera Health Company (A) 5,138 121,000Syneos Health, Inc. (A) 1,866 191,601Thermo Fisher Scientific, Inc. 6,898 4,602,622
John Hancock Variable Insurance TrustPortfolio of Investments — December 31, 2021 (showing percentage of total net assets)
The accompanying notes are an integral part of the financial statements. 183

Total Stock Market Index Trust (continued)Shares orPrincipalAmount Value
COMMON STOCKS (continued)Life sciences tools and services (continued)Waters Corp. (A) 1,097 $ 408,742West Pharmaceutical Services, Inc. 1,314 616,279
17,185,742Pharmaceuticals – 3.1%9 Meters Biopharma, Inc. (A) 6,618 6,477Aclaris Therapeutics, Inc. (A) 1,008 14,656Aerie Pharmaceuticals, Inc. (A) 991 6,957Agile Therapeutics, Inc. (A) 5,254 2,564Alexza Pharmaceuticals, Inc. (A)(C) 2,067 72Amneal Pharmaceuticals, Inc. (A) 5,989 28,687Amphastar Pharmaceuticals, Inc. (A) 1,078 25,107Ampio Pharmaceuticals, Inc. (A) 2,637 1,503Angion Biomedica Corp. (A) 423 1,227ANI Pharmaceuticals, Inc. (A) 272 12,534Antares Pharma, Inc. (A) 3,736 13,338Aquestive Therapeutics, Inc. (A) 966 3,758Arvinas, Inc. (A) 830 68,176Atea Pharmaceuticals, Inc. (A) 1,534 13,714Athira Pharma, Inc. (A) 794 10,346Axsome Therapeutics, Inc. (A) 694 26,219Aytu BioPharma, Inc. (A) 92 124Baudax Bio, Inc. (A) 4,631 1,015BioDelivery Sciences
International, Inc. (A) 2,072 6,423Bristol-Myers Squibb Company 39,443 2,459,271Cara Therapeutics, Inc. (A) 906 11,035Cassava Sciences, Inc. (A)(B) 680 29,716Catalent, Inc. (A) 3,053 390,876cbdMD, Inc. (A) 231 249Clearside Biomedical, Inc. (A) 745 2,049Clever Leaves Holdings, Inc. (A) 99 307CNS Pharmaceuticals, Inc. (A) 3,118 2,190Collegium Pharmaceutical, Inc. (A) 742 13,861Corcept Therapeutics, Inc. (A) 2,211 43,778DICE Therapeutics, Inc. (A) 507 12,832Dova Pharmaceuticals, Inc. (A)(C) 702 0Durect Corp. (A) 4,211 4,152Edgewise Therapeutics, Inc. (A) 725 11,078Elanco Animal Health, Inc. (A) 7,996 226,926Elanco Animal Health, Inc. (A)(C) 1,239 0Eli Lilly & Company 16,920 4,673,642Eloxx Pharmaceuticals, Inc. (A) 3,360 2,352Endo International PLC (A) 4,250 15,980Esperion Therapeutics, Inc. (A) 591 2,955Evofem Biosciences, Inc. (A)(B) 6,577 2,470Evolus, Inc. (A) 1,243 8,092Eyenovia, Inc. (A) 1,099 4,396Fulcrum Therapeutics, Inc. (A) 625 11,056Graybug Vision, Inc. (A) 949 1,737Harmony Biosciences Holdings, Inc. (A) 852 36,329Harrow Health, Inc. (A) 642 5,547Hoth Therapeutics, Inc. (A) 3,937 2,594Ikena Oncology, Inc. (A) 556 6,972IMARA, Inc. (A) 1,085 2,441Innoviva, Inc. (A) 1,418 24,461Jaguar Health, Inc. (A) 1,652 1,718Johnson & Johnson 46,514 7,957,150Kala Pharmaceuticals, Inc. (A) 1,156 1,399Kaleido Biosciences, Inc. (A) 768 1,836Kiora Pharmaceuticals, Inc. (A) 1,182 1,785Landos Biopharma, Inc. (A) 554 2,659Lannett Company, Inc. (A) 920 1,490Liquidia Corp. (A) 907 4,417Longboard Pharmaceuticals, Inc. (A) 471 2,280Lyra Therapeutics, Inc. (A) 554 2,415
Total Stock Market Index Trust (continued)Shares orPrincipalAmount Value
COMMON STOCKS (continued)Pharmaceuticals (continued)Marinus Pharmaceuticals, Inc. (A) 569 $ 6,760Merck & Company, Inc. 44,288 3,394,232MyMD Pharmaceuticals, Inc. (A) 531 3,218Nektar Therapeutics (A) 3,478 46,988NGM Biopharmaceuticals, Inc. (A) 1,448 25,644Ocular Therapeutix, Inc. (A) 1,256 8,754Odonate Therapeutics, Inc. (A) 1,742 2,352Omeros Corp. (A) 1,206 7,755Onconova Therapeutics, Inc. (A) 947 2,415Optinose, Inc. (A) 2,082 3,373Oramed Pharmaceuticals, Inc. (A) 522 7,454Organon & Company 4,542 138,304Osmotica Pharmaceuticals PLC (A) 2,331 2,517Otonomy, Inc. (A) 2,342 4,871Pacira BioSciences, Inc. (A) 844 50,783Palisade Bio, Inc. (A) 1,200 1,560Paratek Pharmaceuticals, Inc. (A) 901 4,045Pfizer, Inc. 98,935 5,842,112Phathom Pharmaceuticals, Inc. (A) 484 9,520Phibro Animal Health Corp., Class A 851 17,377Pliant Therapeutics, Inc. (A) 485 6,548PLx Pharma, Inc. (A) 510 4,085Prestige Consumer Healthcare, Inc. (A) 936 56,768Prevail Therapeutics, Inc. (A)(C) 788 394Provention Bio, Inc. (A) 1,551 8,717Rain Therapeutics, Inc. (A) 373 4,804Rani Therapeutics Holdings, Inc.,
Class A (A)(B) 774 12,655Reata Pharmaceuticals, Inc., Class A (A) 634 16,719Relmada Therapeutics, Inc. (A) 215 4,844Revance Therapeutics, Inc. (A) 1,139 18,588Royalty Pharma PLC, Class A 10,381 413,683Satsuma Pharmaceuticals, Inc. (A) 287 1,292scPharmaceuticals, Inc. (A) 172 863SCYNEXIS, Inc. (A) 751 4,581Seelos Therapeutics, Inc. (A) 2,723 4,438SIGA Technologies, Inc. (A) 1,703 12,807Supernus Pharmaceuticals, Inc. (A) 1,044 30,443Tarsus Pharmaceuticals, Inc. (A) 267 6,008Terns Pharmaceuticals, Inc. (A) 403 2,849TFF Pharmaceuticals, Inc. (A) 273 2,422Tilray, Inc., Class 2 (A)(B) 7,922 55,692Tobira Therapeutics, Inc. (A)(C) 609 2,521Tricida, Inc. (A) 1,068 10,210Vallon Pharmaceuticals, Inc. (A) 476 2,846Verrica Pharmaceuticals, Inc. (A) 659 6,036Viatris, Inc. 21,862 295,793Virpax Pharmaceuticals, Inc. (A) 556 1,907VYNE Therapeutics, Inc. (A) 2,528 2,579Xeris Biopharma Holdings, Inc. (A) 2,993 8,769Zoetis, Inc. 8,323 2,031,062Zogenix, Inc. (A) 961 15,616Zomedica Corp. (A) 11,482 3,519Zynerba Pharmaceuticals, Inc. (A) 1,171 3,372
28,862,854116,387,991
Industrials – 8.3%Aerospace and defense – 1.2%AAR Corp. (A) 757 29,546Aerojet Rocketdyne Holdings, Inc. 1,530 71,543AeroVironment, Inc. (A) 487 30,209Applied Energetics, Inc. (A) 2,713 6,511Archer Aviation, Inc., Class A (A) 3,543 21,400Astra Space, Inc. (A) 4,206 29,148Astronics Corp. (A) 623 7,476
John Hancock Variable Insurance TrustPortfolio of Investments — December 31, 2021 (showing percentage of total net assets)
The accompanying notes are an integral part of the financial statements. 184

Total Stock Market Index Trust (continued)Shares orPrincipalAmount Value
COMMON STOCKS (continued)Aerospace and defense (continued)Axon Enterprise, Inc. (A) 1,184 $ 185,888BWX Technologies, Inc. 1,819 87,094Curtiss-Wright Corp. 780 108,163Ducommun, Inc. (A) 268 12,534General Dynamics Corp. 4,907 1,022,962HEICO Corp. 160 23,075HEICO Corp., Class A 2,183 280,559Hexcel Corp. (A) 1,553 80,445Howmet Aerospace, Inc. 7,729 246,014Huntington Ingalls Industries, Inc. 592 110,550Kaman Corp. 587 25,329Kratos Defense & Security
Solutions, Inc. (A) 2,288 44,387L3Harris Technologies, Inc. 3,534 753,590Lockheed Martin Corp. 4,781 1,699,215Maxar Technologies, Inc. 1,313 38,773Mercury Systems, Inc. (A) 1,052 57,923Momentus, Inc. (A) 826 3,453Moog, Inc., Class A 671 54,331National Presto Industries, Inc. 169 13,863Northrop Grumman Corp. 2,736 1,059,024PAE, Inc. (A) 1,340 13,306Park Aerospace Corp. 561 7,405Parsons Corp. (A) 1,963 66,055Raytheon Technologies Corp. 26,820 2,308,129Redwire Corp. (A) 767 5,177Spirit AeroSystems Holdings, Inc., Class A 1,918 82,647Textron, Inc. 4,054 312,969The Boeing Company (A) 10,367 2,087,084TransDigm Group, Inc. (A) 987 628,008Triumph Group, Inc. (A) 1,030 19,086Vectrus, Inc. (A) 260 11,900
11,644,771Air freight and logistics – 0.6%Air Transport Services Group, Inc. (A) 1,293 37,988Atlas Air Worldwide Holdings, Inc. (A) 480 45,178CH Robinson Worldwide, Inc. 2,237 240,768Expeditors International of
Washington, Inc. 2,817 378,295FedEx Corp. 4,736 1,224,919Forward Air Corp. 567 68,658GXO Logistics, Inc. (A) 1,949 177,028Hub Group, Inc., Class A (A) 691 58,210United Parcel Service, Inc., Class B 15,449 3,311,339
5,542,383Airlines – 0.2%Alaska Air Group, Inc. (A) 2,366 123,269Allegiant Travel Company (A) 324 60,601American Airlines Group, Inc. (A)(B) 11,117 199,661Delta Air Lines, Inc. (A) 11,545 451,179Frontier Group Holdings, Inc. (A) 3,244 44,021Hawaiian Holdings, Inc. (A) 993 18,241JetBlue Airways Corp. (A) 6,077 86,536Joby Aviation, Inc. (A)(B) 10,208 74,518Mesa Air Group, Inc. (A) 734 4,110SkyWest, Inc. (A) 1,002 39,379Southwest Airlines Company (A) 10,730 459,673Spirit Airlines, Inc. (A) 1,541 33,671Sun Country Airlines Holdings, Inc. (A) 623 16,977United Airlines Holdings, Inc. (A) 5,481 239,958Wheels Up Experience, Inc. (A) 3,103 14,398
1,866,192Building products – 0.5%A.O. Smith Corp. 2,908 249,652
Total Stock Market Index Trust (continued)Shares orPrincipalAmount Value
COMMON STOCKS (continued)Building products (continued)AAON, Inc. 1,042 $ 82,766Advanced Drainage Systems, Inc. 1,300 176,969American Woodmark Corp. (A) 357 23,276Apogee Enterprises, Inc. 557 26,820Armstrong World Industries, Inc. 856 99,399Builders FirstSource, Inc. (A) 3,718 318,670Carlisle Companies, Inc. 734 182,120Carrier Global Corp. 15,459 838,496Cornerstone Building Brands, Inc. (A) 2,433 42,432CSW Industrials, Inc. 335 40,488Fortune Brands Home & Security, Inc. 2,535 270,992Gibraltar Industries, Inc. (A) 643 42,875Griffon Corp. 1,054 30,018Insteel Industries, Inc. 400 15,924JELD-WEN Holding, Inc. (A) 1,838 48,450Johnson Controls International PLC 12,169 989,461Lennox International, Inc. 691 224,133Masco Corp. 4,518 317,254Owens Corning 1,903 172,222PGT Innovations, Inc. (A) 1,295 29,125Quanex Building Products Corp. 554 13,728Resideo Technologies, Inc. (A) 2,640 68,719Simpson Manufacturing Company, Inc. 858 119,322The AZEK Company, Inc. (A) 2,505 115,831Trex Company, Inc. (A) 2,066 278,972UFP Industries, Inc. 1,175 108,112Zurn Water Solutions Corp. 2,268 82,555
5,008,781Commercial services and supplies – 0.6%ABM Industries, Inc. 1,258 51,389ACCO Brands Corp. 2,109 17,420ACV Auctions, Inc., Class A (A) 2,502 47,138ADT, Inc. 13,826 116,277Aqua Metals, Inc. (A) 407 501Brady Corp., Class A 1,093 58,913BrightView Holdings, Inc. (A) 2,167 30,511Casella Waste Systems, Inc., Class A (A) 1,031 88,068CECO Environmental Corp. (A) 931 5,800Charah Solutions, Inc. (A) 247 1,168Cintas Corp. 1,839 814,990Civeo Corp. (A) 76 1,457Clean Harbors, Inc. (A) 1,074 107,153Copart, Inc. (A) 4,174 632,862CoreCivic, Inc. (A) 2,321 23,140Deluxe Corp. 840 26,972Driven Brands Holdings, Inc. (A) 2,702 90,841Ennis, Inc. 594 11,601Harsco Corp. (A) 1,705 28,491Healthcare Services Group, Inc. 1,493 26,560Heritage-Crystal Clean, Inc. (A) 532 17,035HNI Corp. 862 36,247IAA, Inc. (A) 2,440 123,513Interface, Inc. 1,167 18,614KAR Auction Services, Inc. (A) 2,327 36,348Kimball International, Inc., Class B 828 8,470Matthews International Corp., Class A 680 24,936MillerKnoll, Inc. 1,430 56,042Montrose Environmental Group, Inc. (A) 443 31,236MSA Safety, Inc. 721 108,842NL Industries, Inc. 1,334 9,872Performant Financial Corp. (A) 374 901Pitney Bowes, Inc. 3,538 23,457Quad/Graphics, Inc. (A) 1,350 5,400Republic Services, Inc. 5,240 730,718Rollins, Inc. 8,852 302,827
John Hancock Variable Insurance TrustPortfolio of Investments — December 31, 2021 (showing percentage of total net assets)
The accompanying notes are an integral part of the financial statements. 185

Total Stock Market Index Trust (continued)Shares orPrincipalAmount Value
COMMON STOCKS (continued)Commercial services and supplies (continued)RR Donnelley & Sons Company (A) 1,358 $ 15,291SP Plus Corp. (A) 517 14,590Steelcase, Inc., Class A 2,379 27,882Stericycle, Inc. (A) 1,811 108,008Team, Inc. (A) 728 794Tetra Tech, Inc. 1,023 173,705The Brink’s Company 928 60,849UniFirst Corp. 321 67,538US Ecology, Inc. (A) 492 15,714Viad Corp. (A) 446 19,084Vidler Water Resouces, Inc. (A) 513 6,197VSE Corp. 270 16,454Waste Management, Inc. 7,307 1,219,538
5,461,354Construction and engineering – 0.2%AECOM (A) 2,658 205,596Ameresco, Inc., Class A (A) 941 76,635Arcosa, Inc. 870 45,849Argan, Inc. 361 13,967Comfort Systems USA, Inc. 686 67,873Construction Partners, Inc., Class A (A) 1,071 31,498Dycom Industries, Inc. (A) 581 54,475EMCOR Group, Inc. 901 114,778Fluor Corp. (A) 2,601 64,427Granite Construction, Inc. 919 35,565Great Lakes Dredge & Dock Corp. (A) 1,462 22,983IES Holdings, Inc. (A) 478 24,206Infrastructure and Energy
Alternatives, Inc. (A) 472 4,342INNOVATE Corp. (A) 406 1,502MasTec, Inc. (A) 1,330 122,732Matrix Service Company (A) 663 4,986MYR Group, Inc. (A) 327 36,150Northwest Pipe Company (A) 252 8,014Orbital Energy Group, Inc. (A) 635 1,391Orion Group Holdings, Inc. (A) 985 3,713Primoris Services Corp. 1,046 25,083Quanta Services, Inc. 2,499 286,535Sterling Construction Company, Inc. (A) 650 17,095Tutor Perini Corp. (A) 1,152 14,250Valmont Industries, Inc. 334 83,667WillScot Mobile Mini Holdings Corp. (A) 4,093 167,158
1,534,470Electrical equipment – 0.6%Acuity Brands, Inc. 643 136,136Allied Motion Technologies, Inc. 333 12,151American Superconductor Corp. (A) 626 6,811AMETEK, Inc. 4,078 599,629Array Technologies, Inc. (A) 2,316 36,338Atkore, Inc. (A) 821 91,287AZZ, Inc. 556 30,741Babcock & Wilcox Enterprises, Inc. (A) 1,048 9,453BitNile Holdings, Inc. (A) 1,563 1,860Blink Charging Company (A)(B) 696 18,451Bloom Energy Corp., Class A (A) 2,966 65,044ChargePoint Holdings, Inc. (A)(B) 5,450 103,823Eaton Corp. PLC 7,027 1,214,406Emerson Electric Company 10,705 995,244Encore Wire Corp. 377 53,949Energous Corp. (A) 2,335 2,919EnerSys 815 64,434Enovix Corp. (A) 2,439 66,536FTC Solar, Inc. (A) 1,092 8,256FuelCell Energy, Inc. (A) 6,301 32,765Generac Holdings, Inc. (A) 1,079 379,722
Total Stock Market Index Trust (continued)Shares orPrincipalAmount Value
COMMON STOCKS (continued)Electrical equipment (continued)GrafTech International, Ltd. 4,843 $ 57,293Hubbell, Inc. 956 199,106nVent Electric PLC 3,080 117,040Ocean Power Technologies, Inc. (A) 567 839Orion Energy Systems, Inc. (A) 915 3,312Plug Power, Inc. (A) 10,058 283,937Powell Industries, Inc. 287 8,464Preformed Line Products Company 126 8,152Regal Rexnord Corp. 1,214 206,599Rockwell Automation, Inc. 1,995 695,956Shoals Technologies Group, Inc.,
Class A (A) 2,743 66,655Sunrun, Inc. (A) 3,673 125,984Sunworks, Inc. (A) 246 755Thermon Group Holdings, Inc. (A) 751 12,714TPI Composites, Inc. (A) 773 11,564Vicor Corp. (A) 789 100,187
5,828,512Industrial conglomerates – 0.8%3M Company 10,244 1,819,642General Electric Company 19,462 1,838,575Honeywell International, Inc. 12,207 2,545,282Icahn Enterprises LP 4,276 212,047Roper Technologies, Inc. 1,825 897,645
7,313,191Machinery – 1.6%AGCO Corp. 1,382 160,340Agrify Corp. (A) 374 3,441Alamo Group, Inc. 239 35,176Albany International Corp., Class A 621 54,927Allison Transmission Holdings, Inc. 1,324 48,127Altra Industrial Motion Corp. 1,239 63,895Astec Industries, Inc. 493 34,150Barnes Group, Inc. 1,066 49,665Berkshire Grey, Inc. (A) 3,321 18,266Caterpillar, Inc. 9,735 2,012,614Chart Industries, Inc. (A) 655 104,466CIRCOR International, Inc. (A) 461 12,530Colfax Corp. (A) 2,476 113,822Columbus McKinnon Corp. 532 24,610Commercial Vehicle Group, Inc. (A) 856 6,899Crane Company 1,111 113,022Cummins, Inc. 2,359 514,592Deere & Company 5,348 1,833,776Donaldson Company, Inc. 2,191 129,839Douglas Dynamics, Inc. 435 16,991Dover Corp. 2,215 402,244Energy Recovery, Inc. (A) 1,211 26,024Enerpac Tool Group Corp. 1,293 26,222EnPro Industries, Inc. 426 46,890ESCO Technologies, Inc. 519 46,705Evoqua Water Technologies Corp. (A) 2,177 101,775Federal Signal Corp. 1,215 52,658Flowserve Corp. 2,471 75,613Fortive Corp. 6,140 468,421Franklin Electric Company, Inc. 926 87,563Gates Industrial Corp. PLC (A) 5,553 88,348Gencor Industries, Inc. (A) 428 4,935Graco, Inc. 3,250 262,015Graham Corp. 310 3,856Helios Technologies, Inc. 627 65,942Hillenbrand, Inc. 1,455 75,645Hillman Solutions Corp. (A) 2,499 26,864Hurco Companies, Inc. 183 5,435Hydrofarm Holdings Group, Inc. (A) 570 16,125
John Hancock Variable Insurance TrustPortfolio of Investments — December 31, 2021 (showing percentage of total net assets)
The accompanying notes are an integral part of the financial statements. 186

Total Stock Market Index Trust (continued)Shares orPrincipalAmount Value
COMMON STOCKS (continued)Machinery (continued)Hyster-Yale Materials Handling, Inc. 296 $ 12,166Hyzon Motors, Inc. (A)(B) 3,912 25,389IDEX Corp. 1,049 247,900Illinois Tool Works, Inc. 5,437 1,341,852Ingersoll Rand, Inc. 7,599 470,150ITT, Inc. 1,610 164,526John Bean Technologies Corp. 615 94,439Kadant, Inc. 213 49,092Kennametal, Inc. 1,628 58,461LB Foster Company, Class A (A) 298 4,098Lincoln Electric Holdings, Inc. 1,032 143,933Lindsay Corp. 215 32,680Markforged Holding Corp. (A) 2,754 14,789Mayville Engineering Company, Inc. (A) 522 7,783Meritor, Inc. (A) 1,344 33,304Microvast Holdings, Inc. (A)(B) 5,831 33,003Miller Industries, Inc. 293 9,786Mueller Industries, Inc. 1,081 64,168Mueller Water Products, Inc., Class A 3,308 47,635Nikola Corp. (A)(B) 6,833 67,442NN, Inc. (A) 766 3,141Nordson Corp. 853 217,745Omega Flex, Inc. 223 28,310Oshkosh Corp. 1,251 141,000Otis Worldwide Corp. 7,399 644,231PACCAR, Inc. 5,813 513,055Parker-Hannifin Corp. 2,269 721,814Park-Ohio Holdings Corp. 316 6,690Proto Labs, Inc. (A) 533 27,370RBC Bearings, Inc. (A) 524 105,832REV Group, Inc. 1,210 17,122Sarcos Technology and Robotics
Corp. (A)(B) 1,472 14,691Snap-on, Inc. 835 179,842SPX Corp. (A) 887 52,936SPX FLOW, Inc. 803 69,443Standex International Corp. 280 30,985Stanley Black & Decker, Inc. 2,953 556,995Tennant Company 380 30,795Terex Corp. 1,289 56,652The Eastern Company 202 5,082The Gorman-Rupp Company 603 26,864The Greenbrier Companies, Inc. 586 26,892The Manitowoc Company, Inc. (A) 748 13,905The Middleby Corp. (A) 1,012 199,121The Shyft Group, Inc. 699 34,342The Timken Company 1,435 99,431The Toro Company 1,973 197,122Titan International, Inc. (A) 1,489 16,319Trinity Industries, Inc. 1,995 60,249Wabash National Corp. 1,110 21,667Wabtec Corp. 3,459 318,608Watts Water Technologies, Inc., Class A 551 106,988Welbilt, Inc. (A) 2,649 62,967Woodward, Inc. 1,184 129,601Xos, Inc. (A) 2,320 7,308Xylem, Inc. 3,301 395,856
15,297,995Marine – 0.0%Eagle Bulk Shipping, Inc. 275 12,513Kirby Corp. (A) 1,165 69,224Matson, Inc. 725 65,272
147,009Professional services – 0.5%Acacia Research Corp. (A) 1,357 6,961
Total Stock Market Index Trust (continued)Shares orPrincipalAmount Value
COMMON STOCKS (continued)Professional services (continued)ASGN, Inc. (A) 958 $ 118,217Barrett Business Services, Inc. 173 11,947BlackSky Technology, Inc. (A) 1,388 6,232Booz Allen Hamilton Holding Corp. 2,443 207,142CACI International, Inc., Class A (A) 328 88,301CBIZ, Inc. (A) 1,073 41,976CoStar Group, Inc. (A) 7,050 557,162CRA International, Inc. 162 15,124Dun & Bradstreet Holdings, Inc. (A) 7,238 148,307Equifax, Inc. 2,170 635,354Exponent, Inc. 947 110,543First Advantage Corp. (A) 2,261 43,049Forrester Research, Inc. (A) 420 24,667Franklin Covey Company (A) 312 14,464FTI Consulting, Inc. (A) 466 71,494Heidrick & Struggles International, Inc. 421 18,410Huron Consulting Group, Inc. (A) 468 23,353ICF International, Inc. 377 38,661Insperity, Inc. 704 83,149Jacobs Engineering Group, Inc. 2,341 325,937KBR, Inc. 2,611 124,336Kelly Services, Inc., Class A 813 13,634Kforce, Inc. 412 30,991Korn Ferry 1,010 76,487LegalZoom.com, Inc. (A)(B) 3,194 51,328Leidos Holdings, Inc. 2,555 227,140ManpowerGroup, Inc. 989 96,259ManTech International Corp., Class A 785 57,250Mistras Group, Inc. (A) 754 5,602Red Violet, Inc. (A) 54 2,143Resources Connection, Inc. 781 13,933Robert Half International, Inc. 2,007 223,821Science Applications International Corp. 855 71,469Spire Global, Inc. (A) 2,065 6,980Sterling Check Corp. (A) 1,453 29,801TransUnion 3,432 406,967TriNet Group, Inc. (A) 1,183 112,693TrueBlue, Inc. (A) 739 20,448Upwork, Inc. (A) 2,277 77,782Verisk Analytics, Inc. 2,863 654,854Willdan Group, Inc. (A) 264 9,293
4,903,661Road and rail – 1.1%AMERCO 313 227,310ArcBest Corp. 474 56,809Avis Budget Group, Inc. (A) 1,000 207,370Canadian Pacific Railway, Ltd. 4,793 344,808Covenant Logistics Group, Inc. (A) 436 11,523CSX Corp. 40,431 1,520,206Daseke, Inc. (A) 1,184 11,887Heartland Express, Inc. 1,522 25,600HyreCar, Inc. (A) 233 1,097JB Hunt Transport Services, Inc. 1,930 394,492Knight-Swift Transportation Holdings, Inc. 3,037 185,075Landstar System, Inc. 521 93,269Lyft, Inc., Class A (A) 5,983 255,654Marten Transport, Ltd. 1,666 28,589Norfolk Southern Corp. 4,396 1,308,733Old Dominion Freight Line, Inc. 1,964 703,858P.A.M. Transportation Services, Inc. (A) 239 16,971Ryder System, Inc. 1,009 83,172Saia, Inc. (A) 476 160,426Schneider National, Inc., Class B 3,485 93,781TuSimple Holdings, Inc., Class A (A) 3,576 128,200Uber Technologies, Inc. (A) 33,348 1,398,282
John Hancock Variable Insurance TrustPortfolio of Investments — December 31, 2021 (showing percentage of total net assets)
The accompanying notes are an integral part of the financial statements. 187

Total Stock Market Index Trust (continued)Shares orPrincipalAmount Value
COMMON STOCKS (continued)Road and rail (continued)Union Pacific Corp. 11,223 $ 2,827,410Universal Logistics Holdings, Inc. 647 12,202Werner Enterprises, Inc. 973 46,373XPO Logistics, Inc. (A) 1,938 150,059Yellow Corp. (A) 875 11,016
10,304,172Trading companies and distributors – 0.4%AeroCentury Corp. 37 2,209Air Lease Corp. 2,130 94,210Alta Equipment Group, Inc. (A) 98 1,435Applied Industrial Technologies, Inc. 732 75,176Beacon Roofing Supply, Inc. (A) 1,363 78,168BlueLinx Holdings, Inc. (A) 138 13,215Boise Cascade Company 747 53,186Core & Main, Inc., Class A (A) 3,569 108,283DXP Enterprises, Inc. (A) 424 10,884EVI Industries, Inc. (A) 281 8,776Fastenal Company 10,444 669,043Fortress Transportation & Infrastructure
Investors LLC 1,753 50,697GATX Corp. 601 62,618Global Industrial Company 777 31,779GMS, Inc. (A) 822 49,410H&E Equipment Services, Inc. 697 30,856Herc Holdings, Inc. 532 83,285Lawson Products, Inc. (A) 105 5,749McGrath RentCorp 476 38,204MRC Global, Inc. (A) 1,850 12,728MSC Industrial Direct Company, Inc.,
Class A 705 59,262NOW, Inc. (A) 2,251 19,224Rush Enterprises, Inc., Class A 1,071 59,590SiteOne Landscape Supply, Inc. (A) 801 194,066Textainer Group Holdings, Ltd. 934 33,353Titan Machinery, Inc. (A) 513 17,283United Rentals, Inc. (A) 1,287 427,657Univar Solutions, Inc. (A) 3,249 92,109Veritiv Corp. (A) 274 33,584W.W. Grainger, Inc. 838 434,285Watsco, Inc. 731 228,715WESCO International, Inc. (A) 915 120,405
3,199,44478,051,935
Information technology – 26.7%Communications equipment – 0.9%ADTRAN, Inc. 1,000 22,830Airspan Networks Holdings, Inc. (A) 603 2,285Applied Optoelectronics, Inc. (A) 524 2,693Arista Networks, Inc. (A) 5,452 783,725Aviat Networks, Inc. (A) 36 1,155CalAmp Corp. (A) 820 5,789Calix, Inc. (A) 1,143 91,406Cambium Networks Corp. (A) 562 14,404Casa Systems, Inc. (A) 2,022 11,465Ciena Corp. (A) 2,792 214,900Cisco Systems, Inc. 74,769 4,738,112Clearfield, Inc. (A) 289 24,397CommScope Holding Company, Inc. (A) 3,833 42,316Comtech Telecommunications Corp. 548 12,982Digi International, Inc. (A) 683 16,781DZS, Inc. (A) 566 9,181EMCORE Corp. (A) 60 419Extreme Networks, Inc. (A) 2,573 40,396F5, Inc. (A) 1,082 264,776
Total Stock Market Index Trust (continued)Shares orPrincipalAmount Value
COMMON STOCKS (continued)Communications equipment (continued)Harmonic, Inc. (A) 2,066 $ 24,296Infinera Corp. (A) 3,517 33,728Inseego Corp. (A) 1,798 10,482Juniper Networks, Inc. 5,594 199,762KVH Industries, Inc. (A) 504 4,632Lantronix, Inc. (A) 53 415Lumentum Holdings, Inc. (A) 1,347 142,472Motorola Solutions, Inc. 2,893 786,028NETGEAR, Inc. (A) 654 19,103NetScout Systems, Inc. (A) 1,447 47,867Plantronics, Inc. (A) 804 23,589Powerwave Technologies, Inc. (A)(C) 912 0Resonant, Inc. (A) 553 946Ribbon Communications, Inc. (A) 2,627 15,893Ubiquiti, Inc. 1,124 344,731ViaSat, Inc. (A) 1,289 57,412Viavi Solutions, Inc. (A) 4,348 76,612Vislink Technologies, Inc. (A) 1,137 1,342
8,089,322Electronic equipment, instruments and components – 0.7%908 Devices, Inc. (A) 290 7,502Advanced Energy Industries, Inc. 715 65,108AEye, Inc. (A) 2,196 10,629Akoustis Technologies, Inc. (A) 872 5,825Amphenol Corp., Class A 10,476 916,231Arlo Technologies, Inc. (A) 1,497 15,704Arrow Electronics, Inc. (A) 1,017 136,553Avnet, Inc. 1,858 76,605Badger Meter, Inc. 582 62,018Bel Fuse, Inc., Class B 346 4,474Belden, Inc. 836 54,950Benchmark Electronics, Inc. 800 21,680CDW Corp. 2,388 489,015Cognex Corp. 3,194 248,365Coherent, Inc. (A) 451 120,210Corning, Inc. 15,094 561,950CTS Corp. 667 24,492Daktronics, Inc. (A) 1,227 6,196ePlus, Inc. (A) 342 18,427Evolv Technologies Holdings, Inc. (A) 2,210 9,857FARO Technologies, Inc. (A) 391 27,378Identiv, Inc. (A) 100 2,814II-VI, Inc. (A) 1,909 130,442Insight Enterprises, Inc. (A) 655 69,823IPG Photonics Corp. (A) 978 168,353Iteris, Inc. (A) 1,032 4,128Itron, Inc. (A) 841 57,625Jabil, Inc. 2,648 186,287Keysight Technologies, Inc. (A) 3,278 676,940Kimball Electronics, Inc. (A) 554 12,055Knowles Corp. (A) 1,805 42,147Littelfuse, Inc. 461 145,067Methode Electronics, Inc. 768 37,763MicroVision, Inc. (A) 2,624 13,146Napco Security Technologies, Inc. (A) 371 18,543National Instruments Corp. 2,530 110,485Netlist, Inc. (A) 3,719 23,988nLight, Inc. (A) 848 20,310Novanta, Inc. (A) 656 115,672OSI Systems, Inc. (A) 333 31,036PAR Technology Corp. (A) 370 19,525PC Connection, Inc. 517 22,298Plexus Corp. (A) 489 46,890Rogers Corp. (A) 345 94,185Sanmina Corp. (A) 1,095 45,399
John Hancock Variable Insurance TrustPortfolio of Investments — December 31, 2021 (showing percentage of total net assets)
The accompanying notes are an integral part of the financial statements. 188

Total Stock Market Index Trust (continued)Shares orPrincipalAmount Value
COMMON STOCKS (continued)Electronic equipment, instruments andcomponents (continued)ScanSource, Inc. (A) 460 $ 16,137SmartRent, Inc. (A) 2,767 26,785TD SYNNEX Corp. 1,563 178,745Teledyne Technologies, Inc. (A) 813 355,192Trimble, Inc. (A) 4,534 395,319TTM Technologies, Inc. (A) 2,254 33,585Vishay Intertechnology, Inc. 2,794 61,105Vishay Precision Group, Inc. (A) 306 11,359Vontier Corp. 2,732 83,954Zebra Technologies Corp., Class A (A) 958 570,202
6,710,473IT services – 4.2%Affirm Holdings, Inc. (A) 4,641 466,699AgileThought, Inc. (A) 536 2,530Akamai Technologies, Inc. (A) 2,665 311,912Alliance Data Systems Corp. 889 59,181Automatic Data Processing, Inc. 7,262 1,790,664BigCommerce Holdings, Inc., Series 1 (A) 1,168 41,312Block, Inc. (A) 8,093 1,307,100BM Technologies, Inc. (A) 364 3,352Brightcove, Inc. (A) 983 10,046Broadridge Financial Solutions, Inc. 2,052 375,147Cass Information Systems, Inc. 256 10,066Cloudflare, Inc., Class A (A) 5,513 724,960Cognizant Technology Solutions Corp.,
Class A 9,376 831,839Concentrix Corp. 945 168,796Conduent, Inc. (A) 4,515 24,110CSG Systems International, Inc. 652 37,568Cyxtera Technologies, Inc. (A) 2,238 28,221DigitalOcean Holdings, Inc. (A) 1,853 148,851DXC Technology Company (A) 4,538 146,078EPAM Systems, Inc. (A) 1,007 673,129Euronet Worldwide, Inc. (A) 970 115,595EVO Payments, Inc., Class A (A) 1,591 40,730Exela Technologies, Inc. (A) 2,619 2,298ExlService Holdings, Inc. (A) 612 88,599Fastly, Inc., Class A (A) 1,995 70,723Fidelity National Information Services, Inc. 10,957 1,195,957Fiserv, Inc. (A) 11,750 1,219,533FleetCor Technologies, Inc. (A) 1,491 333,745Flywire Corp. (A) 1,698 64,626Gartner, Inc. (A) 1,486 496,800Genpact, Ltd. 3,430 182,064Global Payments, Inc. 5,234 707,532GoDaddy, Inc., Class A (A) 3,014 255,768GreenSky, Inc., Class A (A) 3,402 38,647i3 Verticals, Inc., Class A (A) 606 13,811IBM Corp. 15,804 2,112,363Information Services Group, Inc. 1,192 9,083Jack Henry & Associates, Inc. 1,234 206,066Kyndryl Holdings, Inc. (A) 3,160 57,196Limelight Networks, Inc. (A) 2,664 9,138LiveRamp Holdings, Inc. (A) 1,229 58,931Marqeta, Inc., Class A (A)(B) 9,562 164,180Mastercard, Inc., Class A 17,476 6,279,476MAXIMUS, Inc. 1,145 91,222MoneyGram International, Inc. (A) 1,519 11,985MongoDB, Inc. (A) 1,099 581,756Okta, Inc. (A) 2,348 526,351Paychex, Inc. 6,425 877,013Paymentus Holdings, Inc., Class A (A)(B) 1,879 65,727Payoneer Global, Inc. (A) 5,500 40,425PayPal Holdings, Inc. (A) 20,759 3,914,732
Total Stock Market Index Trust (continued)Shares orPrincipalAmount Value
COMMON STOCKS (continued)IT services (continued)Paysign, Inc. (A) 1,105 $ 1,768Perficient, Inc. (A) 594 76,798Rackspace Technology, Inc. (A) 3,379 45,515Remitly Global, Inc. (A)(B) 2,668 55,014Sabre Corp. (A) 5,716 49,100ServiceSource International, Inc. (A) 4,978 4,929Shift4 Payments, Inc., Class A (A) 1,389 80,465Snowflake, Inc., Class A (A) 5,222 1,768,953SolarWinds Corp. 2,988 42,400Squarespace, Inc., Class A (A) 2,323 68,529StarTek, Inc. (A) 653 3,409Switch, Inc., Class A 4,331 124,040TaskUS, Inc., Class A (A) 1,642 88,602The Glimpse Group, Inc. (A) 48 473The Hackett Group, Inc. 696 14,289The Western Union Company 7,400 132,016Thoughtworks Holding, Inc. (A) 5,068 135,873Toast, Inc., Class A (A)(B) 8,600 298,506TTEC Holdings, Inc. 869 78,688Twilio, Inc., Class A (A) 3,083 811,877Unisys Corp. (A) 1,317 27,091VeriSign, Inc. (A) 1,835 465,760Verra Mobility Corp. (A) 3,031 46,768Visa, Inc., Class A 34,391 7,452,874WEX, Inc. (A) 812 113,997
38,981,367Semiconductors and semiconductor equipment – 5.3%ACM Research, Inc., Class A (A) 360 30,697Advanced Micro Devices, Inc. (A) 21,423 3,082,770Aehr Test Systems (A) 328 7,931Allegro MicroSystems, Inc. (A) 3,523 127,462Alpha & Omega Semiconductor, Ltd. (A) 545 33,005Ambarella, Inc. (A) 657 133,299Amkor Technology, Inc. 4,453 110,390Analog Devices, Inc. 9,415 1,654,875Applied Materials, Inc. 16,007 2,518,862Atomera, Inc. (A) 385 7,746Axcelis Technologies, Inc. (A) 650 48,464AXT, Inc. (A) 115 1,013Azenta, Inc. 1,336 137,755Broadcom, Inc. 7,172 4,772,321CEVA, Inc. (A) 480 20,755Cirrus Logic, Inc. (A) 781 71,868CMC Materials, Inc. 564 108,113Cohu, Inc. (A) 925 35,233CyberOptics Corp. (A) 20 930Diodes, Inc. (A) 847 93,009EMagin Corp. (A) 532 686Enphase Energy, Inc. (A) 2,383 435,946Entegris, Inc. 2,452 339,798Everspin Technologies, Inc. (A) 78 881First Solar, Inc. (A) 1,923 167,609FormFactor, Inc. (A) 1,486 67,940GlobalFoundries, Inc. (A)(B) 9,454 614,226Ichor Holdings, Ltd. (A) 384 17,676Impinj, Inc. (A) 451 40,004Intel Corp. 71,155 3,664,483KLA Corp. 2,701 1,161,727Kopin Corp. (A) 1,117 4,569Kulicke & Soffa Industries, Inc. 1,125 68,108Lam Research Corp. 2,493 1,792,841Lattice Semiconductor Corp. (A) 2,469 190,261MACOM Technology Solutions
Holdings, Inc. (A) 1,271 99,519Marvell Technology, Inc. 14,630 1,279,979
John Hancock Variable Insurance TrustPortfolio of Investments — December 31, 2021 (showing percentage of total net assets)
The accompanying notes are an integral part of the financial statements. 189

Total Stock Market Index Trust (continued)Shares orPrincipalAmount Value
COMMON STOCKS (continued)Semiconductors and semiconductor equipment (continued)Maxeon Solar Technologies, Ltd. (A) 126 $ 1,751MaxLinear, Inc. (A) 1,397 105,320Meta Materials, Inc. (A)(B) 4,648 11,434Microchip Technology, Inc. 9,761 849,793Micron Technology, Inc. 19,776 1,842,134MKS Instruments, Inc. 1,002 174,518Monolithic Power Systems, Inc. 781 385,291NeoPhotonics Corp. (A) 1,119 17,199NVE Corp. 120 8,196NVIDIA Corp. 43,971 12,932,311ON Semiconductor Corp. (A) 7,689 522,237Onto Innovation, Inc. (A) 921 93,233PDF Solutions, Inc. (A) 745 23,684Photronics, Inc. (A) 1,478 27,860Pixelworks, Inc. (A) 598 2,631Power Integrations, Inc. 1,110 103,108Qorvo, Inc. (A) 1,939 303,240QUALCOMM, Inc. 19,962 3,650,451Rambus, Inc. (A) 2,201 64,687Semtech Corp. (A) 1,189 105,738Silicon Laboratories, Inc. (A) 734 151,512SiTime Corp. (A) 323 94,490SkyWater Technology, Inc. (A) 576 9,343Skyworks Solutions, Inc. 2,968 460,456SMART Global Holdings, Inc. (A) 506 35,921SunPower Corp. (A) 3,113 64,968Synaptics, Inc. (A) 681 197,156Teradyne, Inc. 2,943 481,269Texas Instruments, Inc. 16,112 3,036,629Ultra Clean Holdings, Inc. (A) 836 47,953Universal Display Corp. 856 141,266Veeco Instruments, Inc. (A) 1,119 31,858Wolfspeed, Inc. (A) 2,067 231,029Xilinx, Inc. 4,355 923,391
50,074,808Software – 9.8%8x8, Inc. (A) 2,080 34,861A10 Networks, Inc. 1,431 23,726ACI Worldwide, Inc. (A) 2,182 75,715Adobe, Inc. (A) 8,358 4,739,487Agilysys, Inc. (A) 497 22,097Alarm.com Holdings, Inc. (A) 928 78,704Alkami Technology, Inc. (A) 1,341 26,900Altair Engineering, Inc., Class A (A) 1,383 106,934Alteryx, Inc., Class A (A) 1,217 73,629American Software, Inc., Class A 667 17,455Amplitude, Inc., Class A (A) 1,760 93,174Anaplan, Inc. (A) 2,601 119,256ANSYS, Inc. (A) 1,564 627,352Appfolio, Inc., Class A (A) 633 76,631Appian Corp. (A) 1,266 82,556AppLovin Corp., Class A (A) 6,582 620,419Asana, Inc., Class A (A) 2,882 214,853Aspen Technology, Inc. (A) 1,205 183,401Autodesk, Inc. (A) 3,902 1,097,203Avalara, Inc. (A) 1,549 199,991Avaya Holdings Corp. (A) 1,627 32,215AvePoint, Inc. (A) 2,541 15,983Benefitfocus, Inc. (A) 722 7,697Bentley Systems, Inc., Class B 4,989 241,118Bill.com Holdings, Inc. (A) 1,645 409,852Black Knight, Inc. (A) 2,839 235,325Blackbaud, Inc. (A) 910 71,872Blackline, Inc. (A) 1,061 109,856Blend Labs, Inc., Class A (A) 3,398 24,941
Total Stock Market Index Trust (continued)Shares orPrincipalAmount Value
COMMON STOCKS (continued)Software (continued)Bottomline Technologies DE, Inc. (A) 850 $ 48,000Box, Inc., Class A (A) 2,797 73,253C3.ai, Inc., Class A (A) 1,825 57,031Cadence Design Systems, Inc. (A) 4,918 916,469CCC Intelligent Solutions
Holdings, Inc. (A)(B) 9,972 113,581CDK Global, Inc. 2,209 92,204Cerence, Inc. (A) 696 53,341Ceridian HCM Holding, Inc. (A) 2,675 279,431ChannelAdvisor Corp. (A) 600 14,808Citrix Systems, Inc. 2,218 209,801Clear Secure, Inc., Class A (A)(B) 2,462 77,233Clearwater Analytics Holdings, Inc.,
Class A (A) 3,883 89,231Cognyte Software, Ltd. (A) 99 1,551CommVault Systems, Inc. (A) 850 58,582Confluent, Inc., Class A (A) 4,598 350,552Consensus Cloud Solutions, Inc. (A) 297 17,187CoreCard Corp. (A) 191 7,411Couchbase, Inc. (A) 669 16,698Coupa Software, Inc. (A) 1,310 207,046Crowdstrike Holdings, Inc., Class A (A) 3,998 818,591CS Disco, Inc. (A) 897 32,068Datadog, Inc., Class A (A) 5,475 975,152Datto Holding Corp. (A) 2,301 60,631Digimarc Corp. (A) 294 11,607DocuSign, Inc. (A) 3,447 525,013Dolby Laboratories, Inc., Class A 1,849 176,062Domo, Inc., Class B (A) 570 28,272DoubleVerify Holdings, Inc. (A) 2,545 84,698Dropbox, Inc., Class A (A) 6,875 168,713Duck Creek Technologies, Inc. (A) 2,105 63,382Dynatrace, Inc. (A) 5,052 304,888Ebix, Inc. 593 18,027eGain Corp. (A) 755 7,535EngageSmart, Inc. (A) 2,523 60,855Envestnet, Inc. (A) 1,010 80,133Everbridge, Inc. (A) 700 47,131EverCommerce, Inc. (A)(B) 3,253 51,235Fair Isaac Corp. (A) 509 220,738Five9, Inc. (A) 1,205 165,471ForgeRock, Inc., Class A (A) 1,314 35,071Fortinet, Inc. (A) 2,891 1,039,025Freshworks, Inc., Class A (A) 4,778 125,470Greenidge Generation Holdings, Inc. (A) 613 9,839Guidewire Software, Inc. (A) 1,507 171,090HubSpot, Inc. (A) 834 549,731Instructure Holdings, Inc. (A) 2,069 49,615Intapp, Inc. (A) 876 22,040InterDigital, Inc. 575 41,187Intuit, Inc. 4,839 3,112,542Jamf Holding Corp. (A) 1,772 67,354JFrog, Ltd. (A) 1,737 51,589Kaltura, Inc. (A) 1,306 4,401KnowBe4, Inc., Class A (A) 2,865 65,723LivePerson, Inc. (A) 1,279 45,686Mandiant, Inc. (A) 4,371 76,667Manhattan Associates, Inc. (A) 1,136 176,637Matterport, Inc. (A) 4,076 84,129McAfee Corp., Class A 7,694 198,428MeridianLink, Inc. (A) 1,186 25,594Microsoft Corp. 132,625 44,604,440MicroStrategy, Inc., Class A (A) 173 94,197Mitek Systems, Inc. (A) 911 16,170Model N, Inc. (A) 719 21,592
John Hancock Variable Insurance TrustPortfolio of Investments — December 31, 2021 (showing percentage of total net assets)
The accompanying notes are an integral part of the financial statements. 190

Total Stock Market Index Trust (continued)Shares orPrincipalAmount Value
COMMON STOCKS (continued)Software (continued)Momentive Global, Inc. (A) 2,729 $ 57,718N-able, Inc. (A) 3,262 36,208NCino, Inc. (A) 1,572 86,240NCR Corp. (A) 2,373 95,395New Relic, Inc. (A) 1,168 128,433NortonLifeLock, Inc. 10,373 269,491Nuance Communications, Inc. (A) 5,647 312,392Nutanix, Inc., Class A (A) 3,791 120,781Olo, Inc., Class A (A) 2,432 50,610ON24, Inc. (A) 546 9,473OneSpan, Inc. (A) 856 14,492Oracle Corp. 48,916 4,265,964PagerDuty, Inc. (A) 1,558 54,141Palantir Technologies, Inc., Class A (A) 34,039 619,850Palo Alto Networks, Inc. (A) 1,723 959,297Paycom Software, Inc. (A) 1,066 442,593Paycor HCM, Inc. (A) 3,177 91,529Paylocity Holding Corp. (A) 973 229,784Pegasystems, Inc. 1,468 164,152Ping Identity Holding Corp. (A) 1,506 34,457Procore Technologies, Inc. (A) 2,210 176,734Progress Software Corp. 801 38,664PROS Holdings, Inc. (A) 854 29,454PTC, Inc. (A) 2,118 256,596Q2 Holdings, Inc. (A) 1,009 80,155Qualtrics International, Inc., Class A (A) 8,835 312,759Qualys, Inc. (A) 711 97,563Rapid7, Inc. (A) 1,011 118,985Rekor Systems, Inc. (A) 852 5,581Rimini Street, Inc. (A) 1,519 9,068RingCentral, Inc., Class A (A) 1,448 271,283Riot Blockchain, Inc. (A) 1,638 36,577Sailpoint Technologies Holdings, Inc. (A) 1,710 82,661salesforce.com, Inc. (A) 17,164 4,361,887SecureWorks Corp., Class A (A) 1,619 25,855SEMrush Holdings, Inc., Class A (A) 2,229 46,475SentinelOne, Inc., Class A (A) 4,539 229,174ServiceNow, Inc. (A) 3,506 2,275,780ShotSpotter, Inc. (A) 262 7,734Smartsheet, Inc., Class A (A) 2,230 172,714Smith Micro Software, Inc. (A) 28 138Splunk, Inc. (A) 2,920 337,902Sprinklr, Inc., Class A (A)(B) 4,476 71,034Sprout Social, Inc., Class A (A) 917 83,163SPS Commerce, Inc. (A) 634 90,250SS&C Technologies Holdings, Inc. 4,583 375,714Sumo Logic, Inc. (A) 1,696 22,998Synchronoss Technologies, Inc. (A) 1,177 2,872Synopsys, Inc. (A) 2,646 975,051Telos Corp. (A) 879 13,554Tenable Holdings, Inc. (A) 1,938 106,726Teradata Corp. (A) 1,965 83,454The Trade Desk, Inc., Class A (A) 8,445 773,900Tyler Technologies, Inc. (A) 728 391,628UiPath, Inc., Class A (A) 8,998 388,084Unity Software, Inc. (A) 4,988 713,234Upland Software, Inc. (A) 553 9,921Varonis Systems, Inc. (A) 1,938 94,536Verint Systems, Inc. (A) 1,254 65,848Veritone, Inc. (A) 504 11,330Vertex, Inc., Class A (A) 2,371 37,628Viant Technology, Inc., Class A (A) 801 7,774VirnetX Holding Corp. (A)(B) 1,593 4,142VMware, Inc., Class A 7,414 859,134Vonage Holdings Corp. (A) 4,627 96,195
Total Stock Market Index Trust (continued)Shares orPrincipalAmount Value
COMMON STOCKS (continued)Software (continued)Workday, Inc., Class A (A) 4,358 $ 1,190,518Workiva, Inc. (A) 906 118,224Xperi Holding Corp. 2,083 39,390Yext, Inc. (A) 2,330 23,114Zendesk, Inc. (A) 2,143 223,493Zeta Global Holdings Corp., Class A (A) 2,980 25,092Zoom Video Communications, Inc.,
Class A (A) 5,209 957,987Zscaler, Inc. (A) 2,407 773,441Zuora, Inc., Class A (A) 2,245 41,937
92,623,137Technology hardware, storage and peripherals – 5.8%3D Systems Corp. (A) 2,231 48,056Apple, Inc. 291,691 51,795,542Avid Technology, Inc. (A) 850 27,685Boxlight Corp., Class A (A) 1,426 1,968Corsair Gaming, Inc. (A)(B) 1,436 30,170CPI Card Group, Inc. (A) 115 2,133Dell Technologies, Inc., Class C (A) 13,515 759,138Diebold Nixdorf, Inc. (A) 1,599 14,471Eastman Kodak Company (A) 667 3,122Hewlett Packard Enterprise Company 23,098 364,255HP, Inc. 21,354 804,405Immersion Corp. (A) 809 4,619Intevac, Inc. (A) 745 3,509NetApp, Inc. 4,013 369,156Pure Storage, Inc., Class A (A) 5,116 166,526Sonim Technologies, Inc. (A) 1,394 1,285Turtle Beach Corp. (A) 144 3,205Western Digital Corp. (A) 5,528 360,481Xerox Holdings Corp. 3,431 77,678
54,837,404251,316,511
Materials – 2.3%Chemicals – 1.3%AdvanSix, Inc. 524 24,759Air Products & Chemicals, Inc. 3,733 1,135,803Albemarle Corp. 2,085 487,410American Vanguard Corp. 728 11,932Amyris, Inc. (A) 4,828 26,119Ashland Global Holdings, Inc. 1,039 111,859Avient Corp. 1,723 96,402Axalta Coating Systems, Ltd. (A) 4,358 144,337Balchem Corp. 457 77,050Cabot Corp. 1,144 64,293Celanese Corp. 1,702 286,038CF Industries Holdings, Inc. 3,859 273,140Chase Corp. 194 19,315Corteva, Inc. 13,316 629,580CVR Nitrogen LP (A)(C) 1,086 195Diversey Holdings, Ltd. (A) 4,552 60,587Dow, Inc. 13,369 758,290DuPont de Nemours, Inc. 9,247 746,973Eastman Chemical Company 2,537 306,749Ecolab, Inc. 5,046 1,183,741Ecovyst, Inc. 2,904 29,737Ferro Corp. (A) 1,719 37,526FMC Corp. 2,313 254,176FutureFuel Corp. 1,090 8,328GCP Applied Technologies, Inc. (A) 1,572 49,770Hawkins, Inc. 532 20,987HB Fuller Company 1,058 85,698Huntsman Corp. 4,120 143,706Ingevity Corp. (A) 765 54,851
John Hancock Variable Insurance TrustPortfolio of Investments — December 31, 2021 (showing percentage of total net assets)
The accompanying notes are an integral part of the financial statements. 191

Total Stock Market Index Trust (continued)Shares orPrincipalAmount Value
COMMON STOCKS (continued)Chemicals (continued)Innospec, Inc. 510 $ 46,073International Flavors & Fragrances, Inc. 4,466 672,803Intrepid Potash, Inc. (A) 302 12,904Koppers Holdings, Inc. (A) 482 15,087Kraton Corp. (A) 640 29,645Kronos Worldwide, Inc. 2,526 37,915Livent Corp. (A) 2,960 72,165LSB Industries, Inc. (A) 1,182 13,061Minerals Technologies, Inc. 673 49,230NewMarket Corp. 96 32,901Olin Corp. 2,899 166,750Origin Materials, Inc. (A) 1,904 12,281PPG Industries, Inc. 4,179 720,627Quaker Chemical Corp. 313 72,234Rayonier Advanced Materials, Inc. (A) 1,194 6,818RPM International, Inc. 2,026 204,626Sensient Technologies Corp. 828 82,850Stepan Company 50 6,215The Chemours Company 3,059 102,660The Mosaic Company 6,857 269,412The Scotts Miracle-Gro Company 1,022 164,542The Sherwin-Williams Company 4,723 1,663,252Trecora Resources (A) 757 6,117Tredegar Corp. 832 9,834Trinseo PLC 96 5,036Valhi, Inc. 636 18,285Valvoline, Inc. 3,402 126,861Westlake Chemical Corp. 2,365 229,712Westlake Chemical Partners LP 799 21,461Zymergen, Inc. (A) 1,577 10,550
12,011,258Construction materials – 0.1%Eagle Materials, Inc. 775 129,007Forterra, Inc. (A) 1,303 30,985Martin Marietta Materials, Inc. 984 433,472Summit Materials, Inc., Class A (A) 2,191 87,947United States Lime & Minerals, Inc. 134 17,289Vulcan Materials Company 2,073 430,313
1,129,013Containers and packaging – 0.3%AptarGroup, Inc. 916 112,192Avery Dennison Corp. 1,494 323,556Ball Corp. 5,789 557,307Berry Global Group, Inc. (A) 2,531 186,737Crown Holdings, Inc. 2,263 250,333Graphic Packaging Holding Company 5,834 113,763Greif, Inc., Class A 931 56,204International Paper Company 6,650 312,417Myers Industries, Inc. 844 16,888O-I Glass, Inc. (A) 3,104 37,341Packaging Corp. of America 1,509 205,450Pactiv Evergreen, Inc. 2,656 33,678Sealed Air Corp. 2,645 178,458Silgan Holdings, Inc. 1,469 62,932Sonoco Products Company 1,488 86,140TriMas Corp. 1,020 37,740Westrock Company 4,971 220,514
2,791,650Metals and mining – 0.6%Alcoa Corp. 3,330 198,401Allegheny Technologies, Inc. (A) 2,447 38,981Alpha Metallurgical Resources, Inc. (A) 352 21,490Arconic Corp. (A) 1,987 65,591Carpenter Technology Corp. 974 28,431
Total Stock Market Index Trust (continued)Shares orPrincipalAmount Value
COMMON STOCKS (continued)Metals and mining (continued)Century Aluminum Company (A) 1,740 $ 28,814Cleveland-Cliffs, Inc. (A) 8,588 186,961Coeur Mining, Inc. (A) 4,942 24,908Commercial Metals Company 2,266 82,233Compass Minerals International, Inc. 667 34,070Freeport-McMoRan, Inc. 25,986 1,084,396Gatos Silver, Inc. (A) 868 9,010Haynes International, Inc. 334 13,470Hecla Mining Company 9,827 51,297Kaiser Aluminum Corp. 336 31,564Materion Corp. 423 38,891MP Materials Corp. (A)(B) 2,977 135,215Newmont Corp. 14,198 880,560Nucor Corp. 5,208 594,493Olympic Steel, Inc. 325 7,638Pan American Silver Corp., CVR (A)(D) 7,232 5,632Ramaco Resources, Inc. (A) 575 7,820Rare Element Resources, Ltd. (A) 467 584Reliance Steel & Aluminum Company 900 145,998Royal Gold, Inc. 1,208 127,094Ryerson Holding Corp. 738 19,225Schnitzer Steel Industries, Inc., Class A 547 28,400Southern Copper Corp. 13,869 855,856Steel Dynamics, Inc. 3,662 227,300SunCoke Energy, Inc. 2,119 13,964TimkenSteel Corp. (A) 1,005 16,583U.S. Steel Corp. 4,538 108,050Warrior Met Coal, Inc. 968 24,887Worthington Industries, Inc. 793 43,345
5,181,152Paper and forest products – 0.0%Clearwater Paper Corp. (A) 390 14,301Glatfelter Corp. 999 17,183Louisiana-Pacific Corp. 1,758 137,739Neenah, Inc. 345 15,967Schweitzer-Mauduit International, Inc. 627 18,747Sylvamo Corp. (A) 673 18,770Verso Corp., Class A 710 19,184
241,89121,354,964
Real estate – 3.3%Equity real estate investment trusts – 3.1%Acadia Realty Trust 1,860 40,604Agree Realty Corp. 883 63,011Alexander & Baldwin, Inc. 1,506 37,786Alexander’s, Inc. 108 28,112Alexandria Real Estate Equities, Inc. 2,408 536,888American Assets Trust, Inc. 1,261 47,325American Campus Communities, Inc. 2,673 153,136American Finance Trust, Inc. 2,393 21,848American Homes 4 Rent, Class A 6,051 263,884American Tower Corp. 8,052 2,355,210Americold Realty Trust 4,031 132,176Apartment Income REIT Corp. 2,951 161,331Apartment Investment and Management
Company, Class A (A) 3,114 24,040Apple Hospitality REIT, Inc. 4,472 72,223Armada Hoffler Properties, Inc. 1,229 18,705Ashford Hospitality Trust, Inc. (A) 285 2,736AvalonBay Communities, Inc. 2,283 576,663Bluerock Residential Growth REIT, Inc. 683 18,024Boston Properties, Inc. 2,881 331,834Braemar Hotels & Resorts, Inc. (A) 978 4,988Brandywine Realty Trust 3,757 50,419
John Hancock Variable Insurance TrustPortfolio of Investments — December 31, 2021 (showing percentage of total net assets)
The accompanying notes are an integral part of the financial statements. 192

Total Stock Market Index Trust (continued)Shares orPrincipalAmount Value
COMMON STOCKS (continued)Equity real estate investment trusts (continued)Brixmor Property Group, Inc. 5,578 $ 141,737Broadstone Net Lease, Inc. 1,879 46,637BRT Apartments Corp. 385 9,236Camden Property Trust 1,440 257,299CareTrust REIT, Inc. 2,053 46,870CatchMark Timber Trust, Inc., Class A 1,315 11,454Centerspace 226 25,063Chatham Lodging Trust (A) 1,057 14,502CIM Commercial Trust Corp. 337 2,477Community Healthcare Trust, Inc. 472 22,311CorePoint Lodging, Inc. (A) 1,371 21,525Corporate Office Properties Trust 2,351 65,757Cousins Properties, Inc. 2,993 120,558Crown Castle International Corp. 7,775 1,622,954CubeSmart 3,744 213,071CyrusOne, Inc. 2,283 204,831DiamondRock Hospitality Company (A) 4,163 40,006Digital Realty Trust, Inc. 4,963 877,806DigitalBridge Group, Inc. (A) 9,145 76,178Diversified Healthcare Trust 5,157 15,935Douglas Emmett, Inc. 3,408 114,168Duke Realty Corp. 6,680 438,475Easterly Government Properties, Inc. 1,561 35,778EastGroup Properties, Inc. 743 169,293Empire State Realty Trust, Inc., Class A 3,543 31,533EPR Properties 1,457 69,193Equinix, Inc. 1,615 1,366,032Equity LifeStyle Properties, Inc. 2,967 260,087Equity Residential 6,637 600,649Essential Properties Realty Trust, Inc. 1,463 42,178Essex Property Trust, Inc. 922 324,756Extra Space Storage, Inc. 2,270 514,677Farmland Partners, Inc. 930 11,114Federal Realty Investment Trust 1,456 198,482First Industrial Realty Trust, Inc. 2,479 164,110Four Corners Property Trust, Inc. 1,453 42,733Franklin Street Properties Corp. 2,261 13,453Gaming and Leisure Properties, Inc. 4,534 220,624Getty Realty Corp. 966 30,999Gladstone Commercial Corp. 793 20,436Gladstone Land Corp. 706 23,835Global Medical REIT, Inc. 854 15,159Global Net Lease, Inc. 1,979 30,239Healthcare Realty Trust, Inc. 2,832 89,604Healthcare Trust of America, Inc., Class A 4,107 137,133Healthpeak Properties, Inc. 9,918 357,941Hersha Hospitality Trust (A) 1,005 9,216Highwoods Properties, Inc. 2,063 91,989Host Hotels & Resorts, Inc. (A) 13,023 226,470Hudson Pacific Properties, Inc. 3,068 75,810Independence Realty Trust, Inc. 2,095 54,114Indus Realty Trust, Inc. 186 15,077Industrial Logistics Properties Trust 1,490 37,325Innovative Industrial Properties, Inc. 372 97,803Invitation Homes, Inc. 10,409 471,944Iron Mountain, Inc. 5,295 277,087iStar, Inc. 1,236 31,926JBG SMITH Properties 2,682 77,000Kilroy Realty Corp. 2,211 146,943Kimco Realty Corp. 11,178 275,538Kite Realty Group Trust 4,091 89,102Lamar Advertising Company, Class A 1,855 225,012Life Storage, Inc. 1,345 206,027LTC Properties, Inc. 837 28,575LXP Industrial Trust 5,323 83,145
Total Stock Market Index Trust (continued)Shares orPrincipalAmount Value
COMMON STOCKS (continued)Equity real estate investment trusts (continued)Medical Properties Trust, Inc. 10,170 $ 240,317MGM Growth Properties LLC, Class A 2,079 84,927Mid-America Apartment Communities, Inc. 1,807 414,598Monmouth Real Estate Investment Corp. 2,045 42,965National Health Investors, Inc. 880 50,574National Retail Properties, Inc. 3,402 163,534National Storage Affiliates Trust 1,224 84,701New York REIT Liquidating LLC (A)(C) 457 7,416NexPoint Residential Trust, Inc. 522 43,759Office Properties Income Trust 1,104 27,423Omega Healthcare Investors, Inc. 4,522 133,806One Liberty Properties, Inc. 547 19,298Orion Office REIT, Inc. (A) 983 18,353Outfront Media, Inc. 2,732 73,272Paramount Group, Inc. 4,815 40,157Park Hotels & Resorts, Inc. (A) 4,447 83,959Pebblebrook Hotel Trust 2,611 58,408Pennsylvania Real Estate Investment
Trust (A) 968 987Phillips Edison & Company, Inc. 1,416 46,785Physicians Realty Trust 3,981 74,962Piedmont Office Realty Trust, Inc.,
Class A 2,477 45,527Plymouth Industrial REIT, Inc. 429 13,728PotlatchDeltic Corp. 1,335 80,394Preferred Apartment Communities, Inc. 904 16,326Prologis, Inc. 13,221 2,225,888PS Business Parks, Inc. 213 39,228Public Storage 2,878 1,077,984Rayonier, Inc. 2,771 111,838Realty Income Corp. 9,835 704,088Regency Centers Corp. 3,192 240,517Retail Opportunity Investments Corp. 2,507 49,137Retail Value, Inc. 522 3,351Rexford Industrial Realty, Inc. 2,347 190,365RLJ Lodging Trust 3,441 47,933RPT Realty 1,545 20,672Ryman Hospitality Properties, Inc. (A) 1,027 94,443Sabra Health Care REIT, Inc. 4,102 55,541Safehold, Inc. 890 71,067Saul Centers, Inc. 494 26,192SBA Communications Corp. 1,955 760,534Seritage Growth Properties, Class A (A) 866 11,492Service Properties Trust 3,498 30,747Simon Property Group, Inc. 5,860 936,252SITE Centers Corp. 4,024 63,700SL Green Realty Corp. 1,278 91,633Spirit Realty Capital, Inc. 2,024 97,537STAG Industrial, Inc. 2,912 139,660STORE Capital Corp. 4,908 168,835Summit Hotel Properties, Inc. (A) 2,173 21,208Sun Communities, Inc. 1,906 400,203Sunstone Hotel Investors, Inc. (A) 4,424 51,894Tanger Factory Outlet Centers, Inc. 1,977 38,117Terreno Realty Corp. 1,416 120,771The GEO Group, Inc. 2,079 16,112The Macerich Company 3,197 55,244UDR, Inc. 5,225 313,448UMH Properties, Inc. 958 26,182Uniti Group, Inc. 4,136 57,945Universal Health Realty Income Trust 293 17,425Urban Edge Properties 2,372 45,068Urstadt Biddle Properties, Inc., Class A 889 18,936Ventas, Inc. 7,160 366,019Veris Residential, Inc. (A) 1,996 36,686
John Hancock Variable Insurance TrustPortfolio of Investments — December 31, 2021 (showing percentage of total net assets)
The accompanying notes are an integral part of the financial statements. 193

Total Stock Market Index Trust (continued)Shares orPrincipalAmount Value
COMMON STOCKS (continued)Equity real estate investment trusts (continued)VICI Properties, Inc. 10,846 $ 326,573Vornado Realty Trust 3,603 150,822Washington Real Estate Investment Trust 1,739 44,953Welltower, Inc. 7,629 654,339Weyerhaeuser Company 13,518 556,671Whitestone REIT 991 10,039WP Carey, Inc. 3,402 279,134Xenia Hotels & Resorts, Inc. (A) 2,341 42,396
29,394,929Real estate management and development – 0.2%CBRE Group, Inc., Class A (A) 6,019 653,122Compass, Inc., Class A (A)(B) 6,964 63,303Doma Holdings, Inc. (A) 5,923 30,089Douglas Elliman, Inc. (A) 1,406 16,163eXp World Holdings, Inc. 2,650 89,279Fathom Holdings, Inc. (A) 187 3,826Five Point Holdings LLC, Class A (A) 2,953 19,313Forestar Group, Inc. (A) 1,120 24,360FRP Holdings, Inc. (A) 258 14,912Jones Lang LaSalle, Inc. (A) 918 247,254Kennedy-Wilson Holdings, Inc. 2,863 68,368Marcus & Millichap, Inc. (A) 768 39,521Maui Land & Pineapple Company, Inc. (A) 514 5,119Newmark Group, Inc., Class A 3,701 69,209Offerpad Solutions, Inc. (A) 3,542 22,669Opendoor Technologies, Inc. (A) 10,757 157,160Rafael Holdings, Inc., Class B (A) 347 1,770RE/MAX Holdings, Inc., Class A 431 13,141Redfin Corp. (A) 1,922 73,786Tejon Ranch Company (A) 613 11,696The Howard Hughes Corp. (A) 903 91,907The RMR Group, Inc., Class A 663 22,993The St. Joe Company 1,186 61,731Zillow Group, Inc., Class A (A) 45 2,800Zillow Group, Inc., Class C (A) 4,332 276,598
2,080,08931,475,018
Utilities – 2.2%Electric utilities – 1.3%ALLETE, Inc. 1,037 68,805Alliant Energy Corp. 3,250 199,778American Electric Power Company, Inc. 8,441 750,996Avangrid, Inc. 5,835 291,050Duke Energy Corp. 13,401 1,405,765Edison International 6,989 476,999Entergy Corp. 3,637 409,708Evergy, Inc. 4,456 305,726Eversource Energy 6,068 552,067Exelon Corp. 17,312 999,941FirstEnergy Corp. 10,226 425,299Genie Energy, Ltd., B Shares (A) 706 3,932Hawaiian Electric Industries, Inc. 2,097 87,026IDACORP, Inc. 972 110,137MGE Energy, Inc. 751 61,770NextEra Energy, Inc. 34,040 3,177,974NRG Energy, Inc. 4,438 191,189OGE Energy Corp. 4,136 158,740Otter Tail Corp. 842 60,136PG&E Corp. (A) 34,532 419,218Pinnacle West Capital Corp. 1,796 126,780PNM Resources, Inc. 1,686 76,898Portland General Electric Company 1,846 97,690PPL Corp. 13,860 416,632The Southern Company 19,232 1,318,931
Total Stock Market Index Trust (continued)Shares orPrincipalAmount Value
COMMON STOCKS (continued)Electric utilities (continued)Via Renewables, Inc. 849 $ 9,704Xcel Energy, Inc. 9,706 657,096
12,859,987Gas utilities – 0.1%Atmos Energy Corp. 2,179 228,294Chesapeake Utilities Corp. 361 52,637National Fuel Gas Company 1,834 117,266New Jersey Resources Corp. 1,858 76,289Northwest Natural Holding Company 666 32,487ONE Gas, Inc. 1,009 78,288RGC Resources, Inc. 260 5,983South Jersey Industries, Inc. 1,973 51,535Southwest Gas Holdings, Inc. 848 59,402Spire, Inc. 975 63,590Star Group LP 997 10,738Suburban Propane Partners LP 1,423 20,847UGI Corp. 3,959 181,758
979,114Independent power and renewable electricity producers –0.1%Brookfield Renewable Corp., Class A 270 9,944Clearway Energy, Inc., Class A 1,164 38,971Clearway Energy, Inc., Class C 1,928 69,466Montauk Renewables, Inc. (A) 2,059 21,105NextEra Energy Partners LP 1,301 109,804Ormat Technologies, Inc. 1,076 85,327Sunnova Energy International, Inc. (A) 1,925 53,746The AES Corp. 12,286 298,550Vistra Corp. 8,925 203,222
890,135Multi-utilities – 0.6%Ameren Corp. 4,077 362,894Avista Corp. 1,415 60,123Black Hills Corp. 1,306 92,164CenterPoint Energy, Inc. 10,525 293,753CMS Energy Corp. 5,182 337,089Consolidated Edison, Inc. 5,366 457,827Dominion Energy, Inc. 14,661 1,151,768DTE Energy Company 3,402 406,675MDU Resources Group, Inc. 3,916 120,769NiSource, Inc. 7,487 206,716NorthWestern Corp. 981 56,074Public Service Enterprise Group, Inc. 9,192 613,382Sempra Energy 5,251 694,602Unitil Corp. 366 16,832WEC Energy Group, Inc. 5,493 533,206
5,403,874Water utilities – 0.1%American States Water Company 707 73,132American Water Works Company, Inc. 3,291 621,538Artesian Resources Corp., Class A 287 13,297Cadiz, Inc. (A) 752 2,903California Water Service Group 1,017 73,082Essential Utilities, Inc. 3,802 204,129Global Water Resources, Inc. 678 11,594Middlesex Water Company 324 38,977Pure Cycle Corp. (A) 700 10,220SJW Group 625 45,750The York Water Company 308 15,332
1,109,95421,243,064
TOTAL COMMON STOCKS (Cost $356,187,188) $ 916,379,650
John Hancock Variable Insurance TrustPortfolio of Investments — December 31, 2021 (showing percentage of total net assets)
The accompanying notes are an integral part of the financial statements. 194

Total Stock Market Index Trust (continued)Shares orPrincipalAmount Value
PREFERRED SECURITIES – 0.0%Consumer discretionary – 0.0%Internet and direct marketing retail – 0.0%Qurate Retail, Inc., 8.000% 260 $ 26,837Industrials – 0.0%Industrial conglomerates – 0.0%Steel Partners Holdings LP, 6.000% 510 12,464Information technology – 0.0%Semiconductors and semiconductor equipment – 0.0%Meta Materials, Inc. (A) 2,456 3,709TOTAL PREFERRED SECURITIES (Cost $84,689) $ 43,010
WARRANTS – 0.0%Amplify Energy Corp. (Expiration
Date: 5-4-22; Strike Price: $42.60) (A) 57 1Basic Energy Services, Inc. (Expiration
Date: 12-23-23; Strike Price:$55.25) (A) 55 0
Denbury, Inc. (Expiration Date: 9-18-23;Strike Price: $35.41) (A) 23 958
FTS International, Inc. (ExpirationDate: 11-19-23; Strike Price:$33.04) (A) 24 134
FTS International, Inc. (ExpirationDate: 11-19-23; Strike Price:$37.14) (A) 62 288
Hycroft Mining Holding Corp. (ExpirationDate: 10-22-22) (A)(D) 196 35
Nabors Industries, Ltd. (ExpirationDate: 6-11-26; Strike Price:$166.67) (A) 77 287
Oasis Petroleum, Inc. (ExpirationDate: 11-19-24; Strike Price:$94.57) (A) 31 1,303
Tidewater, Inc., Class A (ExpirationDate: 7-31-23; Strike Price: $57.06) (A) 66 34
Tidewater, Inc., Class B (ExpirationDate: 7-31-23; Strike Price: $62.28) (A) 71 23
TOTAL WARRANTS (Cost $120,251) $ 3,063
SHORT-TERM INVESTMENTS – 3.8%U.S. Government – 1.3%U.S. Treasury Bill
0.040%, 02/24/2022 * $ 12,400,000 12,399,507
Total Stock Market Index Trust (continued)Shares orPrincipalAmount Value
SHORT-TERM INVESTMENTS (continued)U.S. Government Agency – 1.6%Federal Home Loan Bank Discount Note
0.035%, 01/21/2022 * $ 5,000,000 $ 4,999,975Tennessee Valley Authority Discount Note
0.031%, 01/12/2022 * 10,000,000 9,999,97514,999,950
Short-term funds – 0.7%John Hancock Collateral Trust,
0.1697% (E)(F) 611,257 6,114,405Repurchase agreement – 0.2%Repurchase Agreement with State Street
Corp. dated 12-31-21 at 0.000% to berepurchased at $1,872,000 on 1-3-22,collateralized by $1,745,800U.S. Treasury Notes, 2.875% due5-15-28 (valued at $1,909,504) $ 1,872,000 1,872,000
TOTAL SHORT-TERM INVESTMENTS (Cost $35,386,262) $ 35,385,862Total Investments (Total Stock Market Index Trust)
(Cost $391,778,390) – 101.1% $ 951,811,585Other assets and liabilities, net – (1.1%) (10,036,109)TOTAL NET ASSETS – 100.0% $ 941,775,476
Security Abbreviations and LegendADR American Depositary ReceiptCVR Contingent Value Right(A) Non-income producing security.(B) All or a portion of this security is on loan as of 12-31-21.(C) Security is valued using significant unobservable inputs and is
classified as Level 3 in the fair value hierarchy. Refer to Note 2 tothe financial statements.
(D) Strike price and/or expiration date not available.(E) The rate shown is the annualized seven-day yield as of 12-31-21.(F) Investment is an affiliate of the fund, the advisor and/or subadvisor.
This security represents the investment of cash collateral received forsecurities lending.
* Yield represents either the annualized yield at the date of purchase,the stated coupon rate or, for floating rate securities, the rate atperiod end.
DERIVATIVES
FUTURES
Open contractsNumber of
contracts PositionExpiration
dateNotional
basis^Notional
value^
Unrealizedappreciation
(depreciation)Russell 2000 E-Mini Index Futures 45 Long Mar 2022 $4,974,613 $5,046,300 $71,687S&P 500 Index E-Mini Futures 110 Long Mar 2022 25,626,149 26,171,750 545,601
$617,288
^ Notional basis refers to the contractual amount agreed upon at inception of open contracts; notional value represents the current value of the open contract.
See Notes to financial statements regarding investment transactions and other derivatives information.
John Hancock Variable Insurance TrustPortfolio of Investments — December 31, 2021 (showing percentage of total net assets)
The accompanying notes are an integral part of the financial statements. 195