Voya VARIABLE PORTFOLIOS INC Form NPORT-EX Filed ...
338
Business Address 7337 E. DOUBLETREE RANCH ROAD, STE 100 SCOTTSDALE AZ 85258 480-477-3000 Mailing Address 7337 E. DOUBLETREE RANCH ROAD, STE 100 SCOTTSDALE AZ 85258 SECURITIES AND EXCHANGE COMMISSION FORM NPORT-EX Filing Date: 2019-05-28 | Period of Report: 2019-03-31 SEC Accession No. 0001752724-19-044783 (HTML Version on secdatabase.com) FILER Voya VARIABLE PORTFOLIOS INC CIK:1015965| IRS No.: 000000000 | State of Incorp.:MD | Fiscal Year End: 1231 Type: NPORT-EX | Act: 40 | File No.: 811-07651 | Film No.: 19857515 Copyright © 2021 www.secdatabase.com . All Rights Reserved. Please Consider the Environment Before Printing This Document
-
Upload
khangminh22 -
Category
Documents
-
view
1 -
download
0
Transcript of Voya VARIABLE PORTFOLIOS INC Form NPORT-EX Filed ...

Business Address7337 E. DOUBLETREERANCH ROAD, STE 100SCOTTSDALE AZ 85258480-477-3000
Mailing Address7337 E. DOUBLETREERANCH ROAD, STE 100SCOTTSDALE AZ 85258
SECURITIES AND EXCHANGE COMMISSION
FORM NPORT-EX
Filing Date: 2019-05-28 | Period of Report: 2019-03-31SEC Accession No. 0001752724-19-044783
(HTML Version on secdatabase.com)
FILERVoya VARIABLE PORTFOLIOS INCCIK:1015965| IRS No.: 000000000 | State of Incorp.:MD | Fiscal Year End: 1231Type: NPORT-EX | Act: 40 | File No.: 811-07651 | Film No.: 19857515
Copyright © 2021 www.secdatabase.com. All Rights Reserved.Please Consider the Environment Before Printing This Document

Voya Australia Index PortfolioPORTFOLIO OF INVESTMENTSas of March 31, 2019 (Unaudited)
Shares ValuePercentage
of NetAssets
COMMON STOCK: 98.1%Communication Services: 3.6%
20,119 carsales.com Ltd. $ 181,071 0.219,321 Chorus Ltd. 76,891 0.119,209 Domain Holdings Australia Ltd. 34,829 0.0
6,010 News Corp. 75,351 0.1131,818 Nine Entertainment Co. Holdings Ltd. 160,150 0.2
19,478 oOh!media Ltd. 53,915 0.14,071 REA Group Ltd. 216,195 0.2
74,592 (1) Seven West Media Ltd. 26,045 0.062,951 Southern Cross Media Group Ltd. 52,365 0.119,139 (2) SpeedCast International Ltd. 51,047 0.019,156 Spark New Zealand Ltd. 49,403 0.0
993,511 Telstra Corp., Ltd. 2,342,764 2.428,493 TPG Telecom Ltd. 140,696 0.151,585 (1) Vocus Communications Ltd. 135,319 0.1
3,596,041 3.6
Consumer Discretionary: 6.2%5,753 ARB Corp. Ltd. 70,384 0.1
34,876 Ardent Leisure Group Ltd. 28,107 0.053,222 Aristocrat Leisure Ltd. 928,230 0.923,598 Bapcor Ltd. 92,685 0.1
7,580 Breville Group Ltd. 87,720 0.16,768 (2) Corporate Travel Management Ltd. 122,608 0.1
29,922 Crown Resorts Ltd. 244,710 0.25,206 Domino's Pizza Enterprises Ltd. 160,531 0.24,812 Flight Centre Travel Group Ltd. 143,751 0.1
38,040 G8 Education Ltd. 81,961 0.17,122 GUD Holdings Ltd. 60,395 0.1
52,724 (2) Harvey Norman Holdings Ltd. 150,552 0.110,454 IDP Education Ltd. 108,370 0.1
9,015 (2) Invocare Ltd. 91,006 0.19,351 (2) JB Hi-Fi Ltd. 165,825 0.2
25,538 Navitas Ltd. 104,921 0.18,009 Premier Investments Ltd. 92,594 0.1
24,546 SKYCITY Entertainment Group Ltd. 64,138 0.168,682 Star Entertainment Grp Ltd. 204,014 0.211,489 Super Retail Group Ltd. 65,595 0.1
167,913 Tabcorp Holdings Ltd. 551,018 0.619,461 Trade Me Ltd. 84,568 0.110,761 Webjet Ltd. 111,264 0.194,716 Wesfarmers Ltd. 2,332,378 2.3
6,147,325 6.2
Consumer Staples: 5.4%60,671 (1) a2 Milk Co. Ltd. 588,697 0.617,777 (2) Bega Cheese Ltd. 57,791 0.1
Copyright © 2021 www.secdatabase.com. All Rights Reserved.Please Consider the Environment Before Printing This Document

7,289 (1),(2) Bellamy's Australia Ltd. 57,617 0.11,050 (2) Blackmores Ltd. 69,514 0.1
42,336 Coca-Cola Amatil Ltd. 260,199 0.394,716 (1) Coles Group Ltd. 796,950 0.826,638 Costa Group Holdings Ltd. 97,425 0.1
9,305 Elders Ltd 40,169 0.019,067 GrainCorp Ltd. 124,333 0.120,329 (2) Inghams Group Ltd. 63,116 0.175,955 Metcash Ltd. 143,110 0.114,192 Tassal Group Ltd. 49,001 0.060,034 Treasury Wine Estates Ltd. 637,274 0.6
109,709 Woolworths Group Ltd 2,369,266 2.45,354,462 5.4
Energy: 5.5%145,331 Beach Energy Ltd. 212,073 0.2
21,787 Caltex Australia Ltd. 405,330 0.427,048 New Hope Corp., Ltd. 57,968 0.1
110,396 Oil Search Ltd. 614,216 0.6146,837 Origin Energy Ltd. 751,660 0.7147,167 Santos Ltd. 712,549 0.7
89,341 (3) Viva Energy Group Ltd. 155,690 0.29,768 Washington H Soul Pattinson & Co. Ltd. 182,797 0.2
58,288 Whitehaven Coal Ltd. 168,161 0.278,193 Woodside Petroleum Ltd. 1,919,643 1.926,045 WorleyParsons Ltd. 261,405 0.3
5,441,492 5.5
Financials: 30.9%244,529 AMP Ltd. 365,198 0.4
16,170 ASX Ltd. 803,248 0.8241,777 Australia & New Zealand Banking Group Ltd. 4,471,507 4.5
33,190 Bank of Queensland Ltd. 214,590 0.240,274 Bendigo and Adelaide Bank Ltd. 277,178 0.347,923 Challenger Ltd. 282,445 0.3
147,009 Commonwealth Bank of Australia 7,378,993 7.43,906 (2) Credit Corp. Group Ltd. 61,660 0.1
67,345 CYBG PLC 175,701 0.226,221 Eclipx Group Ltd. 11,913 0.0
4,679 HUB24 Ltd. 46,064 0.0193,025 Insurance Australia Group Ltd. 1,053,644 1.1
25,259 IOOF Holdings Ltd. 110,073 0.15,380 Janus Henderson Group PLC 133,771 0.1
26,436 Macquarie Group Ltd. 2,434,653 2.511,643 Magellan Financial Group Ltd. 301,965 0.3
230,057 Medibank Pvt Ltd. 451,572 0.5227,983 National Australia Bank Ltd. 4,096,445 4.1
37,996 NIB Holdings Ltd./Australia 141,515 0.1
Copyright © 2021 www.secdatabase.com. All Rights Reserved.Please Consider the Environment Before Printing This Document
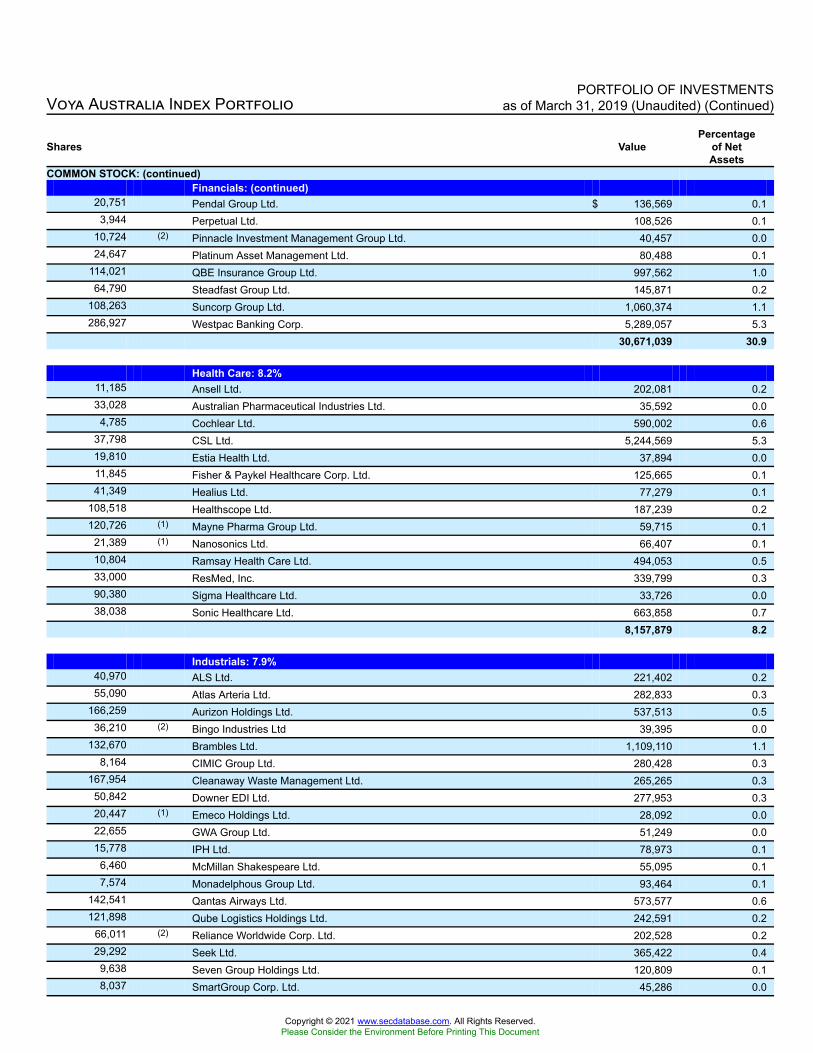
Voya Australia Index PortfolioPORTFOLIO OF INVESTMENTS
as of March 31, 2019 (Unaudited) (Continued)
Shares ValuePercentage
of NetAssets
COMMON STOCK: (continued)Financials: (continued)
20,751 Pendal Group Ltd. $ 136,569 0.13,944 Perpetual Ltd. 108,526 0.1
10,724 (2) Pinnacle Investment Management Group Ltd. 40,457 0.024,647 Platinum Asset Management Ltd. 80,488 0.1
114,021 QBE Insurance Group Ltd. 997,562 1.064,790 Steadfast Group Ltd. 145,871 0.2
108,263 Suncorp Group Ltd. 1,060,374 1.1286,927 Westpac Banking Corp. 5,289,057 5.3
30,671,039 30.9
Health Care: 8.2%11,185 Ansell Ltd. 202,081 0.233,028 Australian Pharmaceutical Industries Ltd. 35,592 0.0
4,785 Cochlear Ltd. 590,002 0.637,798 CSL Ltd. 5,244,569 5.319,810 Estia Health Ltd. 37,894 0.011,845 Fisher & Paykel Healthcare Corp. Ltd. 125,665 0.141,349 Healius Ltd. 77,279 0.1
108,518 Healthscope Ltd. 187,239 0.2120,726 (1) Mayne Pharma Group Ltd. 59,715 0.1
21,389 (1) Nanosonics Ltd. 66,407 0.110,804 Ramsay Health Care Ltd. 494,053 0.533,000 ResMed, Inc. 339,799 0.390,380 Sigma Healthcare Ltd. 33,726 0.038,038 Sonic Healthcare Ltd. 663,858 0.7
8,157,879 8.2
Industrials: 7.9%40,970 ALS Ltd. 221,402 0.255,090 Atlas Arteria Ltd. 282,833 0.3
166,259 Aurizon Holdings Ltd. 537,513 0.536,210 (2) Bingo Industries Ltd 39,395 0.0
132,670 Brambles Ltd. 1,109,110 1.18,164 CIMIC Group Ltd. 280,428 0.3
167,954 Cleanaway Waste Management Ltd. 265,265 0.350,842 Downer EDI Ltd. 277,953 0.320,447 (1) Emeco Holdings Ltd. 28,092 0.022,655 GWA Group Ltd. 51,249 0.015,778 IPH Ltd. 78,973 0.1
6,460 McMillan Shakespeare Ltd. 55,095 0.17,574 Monadelphous Group Ltd. 93,464 0.1
142,541 Qantas Airways Ltd. 573,577 0.6121,898 Qube Logistics Holdings Ltd. 242,591 0.2
66,011 (2) Reliance Worldwide Corp. Ltd. 202,528 0.229,292 Seek Ltd. 365,422 0.4
9,638 Seven Group Holdings Ltd. 120,809 0.18,037 SmartGroup Corp. Ltd. 45,286 0.0
Copyright © 2021 www.secdatabase.com. All Rights Reserved.Please Consider the Environment Before Printing This Document

188,077 Sydney Airport 992,829 1.0217,854 Transurban Group - Stapled Security 2,043,277 2.1231,429 (1),(4) Virgin Australia International Holdings – –
7,907,091 7.9
Information Technology: 2.3%14,024 (1) Afterpay Touch Group Ltd. 210,247 0.2
9,792 Altium Ltd. 225,635 0.28,386 Appen Ltd. 133,270 0.2
17,897 Bravura Solutions Ltd. 69,603 0.141,987 Computershare Ltd. 510,405 0.514,195 IRESS Ltd. 131,887 0.143,933 Link Administration Holdings Ltd. 230,716 0.237,103 MYOB Group Ltd. 87,840 0.128,662 (1) NEXTDC Ltd. 128,726 0.120,161 Technology One Ltd. 114,719 0.1
9,497 WiseTech Global Ltd. 156,773 0.28,905 (1) Xero Ltd. 308,393 0.3
2,308,214 2.3
Materials: 18.6%33,679 Adelaide Brighton Ltd. 107,702 0.1
194,657 Alumina Ltd. 335,221 0.396,746 Amcor Ltd. 1,058,536 1.144,493 Ausdrill Ltd. 51,592 0.1
245,873 BHP Group Ltd. 6,720,539 6.845,960 BlueScope Steel Ltd. 456,177 0.597,929 Boral Ltd. 319,632 0.3
6,396 Brickworks Ltd. 78,782 0.143,112 CSR Ltd. 101,817 0.131,835 DuluxGroup Ltd. 167,466 0.2
126,285 Evolution Mining Ltd. 328,199 0.328,635 Fletcher Building Ltd. 95,428 0.1
142,981 Fortescue Metals Group Ltd. 723,648 0.733,692 (1),(2) Galaxy Resources Ltd. 45,144 0.034,958 Iluka Resources Ltd. 223,901 0.2
139,974 Incitec Pivot Ltd. 310,388 0.338,619 Independence Group NL 133,581 0.137,039 James Hardie Industries SE 477,883 0.555,346 (1),(2) Lynas Corp. Ltd. 82,233 0.113,049 Mineral Resources Ltd. 146,722 0.263,766 Newcrest Mining Ltd. 1,154,806 1.253,417 Northern Star Resources Ltd. 339,364 0.322,892 Nufarm Ltd. 76,739 0.131,320 Orica Ltd. 392,289 0.419,165 (1),(2) Orocobre Ltd. 45,998 0.0
100,801 Orora Ltd. 213,958 0.225,992 OZ Minerals Ltd. 196,057 0.218,667 Pact Group Holdings Ltd. 37,014 0.0
134,070 (1),(2) Pilbara Minerals Ltd. 75,405 0.141,106 Regis Resources Ltd. 154,677 0.261,169 Resolute Mining Ltd. 52,567 0.131,010 Rio Tinto Ltd. 2,159,592 2.213,027 Sandfire Resources NL 64,028 0.1
Copyright © 2021 www.secdatabase.com. All Rights Reserved.Please Consider the Environment Before Printing This Document

Copyright © 2021 www.secdatabase.com. All Rights Reserved.Please Consider the Environment Before Printing This Document

Voya Australia Index PortfolioPORTFOLIO OF INVESTMENTS
as of March 31, 2019 (Unaudited) (Continued)
Shares ValuePercentage
of NetAssets
COMMON STOCK: (continued)Materials: (continued)
66,100 (1) Saracen Mineral Holdings Ltd. $ 136,139 0.113,357 Sims Metal Management Ltd. 101,745 0.1
429,255 South32 Ltd. - AUD 1,140,013 1.142,877 St Barbara Ltd. 102,600 0.128,367 (1) Syrah Resources Ltd. 21,651 0.021,935 Western Areas Ltd. 35,153 0.0
18,464,386 18.6
Real Estate: 7.5%26,925 Abacus Property Group 71,189 0.135,403 Aveo Group 49,562 0.040,397 BWP Trust 107,354 0.138,669 Charter Hall Group 282,125 0.327,440 Charter Hall Retail REIT 90,684 0.118,998 Charter Hall Long Wale REIT 61,541 0.1
137,523 Cromwell Property Group 106,937 0.184,303 Dexus 762,987 0.8
133,880 Goodman Group 1,269,684 1.3149,931 GPT Group 661,353 0.7
22,183 Growthpoint Properties Australia Ltd. 65,393 0.148,740 Lend Lease Corp., Ltd. 428,874 0.4
309,508 Mirvac Group 604,596 0.654,102 National Storage REIT 67,803 0.0
444,767 Scentre Group 1,298,318 1.373,719 Shopping Centres Australasia Property Group 138,254 0.1
203,364 Stockland 556,256 0.533,332 Unibail Group Stapled 273,832 0.3
268,435 Vicinity Centres 495,629 0.538,490 Viva Energy REIT 69,437 0.1
7,461,808 7.5
Utilities: 2.0%54,964 AGL Energy Ltd. 849,623 0.998,562 APA Group 699,654 0.7
144,476 AusNet Services 182,190 0.2140,507 Spark Infrastructure Group 227,690 0.2
1,959,157 2.0
Total Common Stock(Cost $94,314,073) 97,468,894 98.1
PrincipalAmount† Value
Percentageof NetAssets
SHORT-TERM INVESTMENTS: 1.9%Securities Lending Collateral(5): 1.0%
28,998 Bank of Montreal, Repurchase Agreement dated 03/29/19, 2.58%, due 04/01/19(Repurchase Amount $29,004, collateralized by various U.S. Government $ 28,998 0.0
Copyright © 2021 www.secdatabase.com. All Rights Reserved.Please Consider the Environment Before Printing This Document

Securities, 0.000%-3.750%, Market Value plus accrued interest $29,578, due 04/25/19-08/15/48)
1,000,000 Bank of Nova Scotia, Repurchase Agreement dated 03/29/19, 2.67%, due 04/01/19(Repurchase Amount $1,000,219, collateralized by various U.S. GovernmentAgency Obligations, 3.500%-4.571%, Market Value plus accrued interest$1,020,227, due 12/01/33-02/01/49)
1,000,000 1.0
1,028,998 1.0
Shares ValuePercentage
of NetAssets
Mutual Funds: 0.9%873,000 (6) Goldman Sachs Financial Square Government Fund - Institutional Shares, 2.350%
(Cost $873,000) 873,000 0.9
Total Short-Term Investments(Cost $1,901,998) 1,901,998 1.9
Total Investments in Securities(Cost $96,216,071) $ 99,370,892 100.0
Liabilities in Excess of Other Assets (28,122) –Net Assets $ 99,342,770 100.0
† Unless otherwise indicated, principal amount is shown in USD.(1) Non-income producing security.(2) Security, or a portion of the security, is on loan.
(3) Securities with purchases pursuant to Rule 144A or section 4(a)(2), under the Securities Act of 1933 and may not be resold subject tothat rule except to qualified institutional buyers.
(4) For fair value measurement disclosure purposes, security is categorized as Level 3, whose value was determined using significantunobservable inputs.
(5) Represents securities purchased with cash collateral received for securities on loan.(6) Rate shown is the 7-day yield as of March 31, 2019.
Copyright © 2021 www.secdatabase.com. All Rights Reserved.Please Consider the Environment Before Printing This Document

Voya Australia Index PortfolioPORTFOLIO OF INVESTMENTS
as of March 31, 2019 (Unaudited) (Continued)
Fair Value MeasurementsThe following is a summary of the fair valuations according to the inputs used as of March 31, 2019 in valuing the assets and liabilities:(1)
Quoted Pricesin Active Markets
for IdenticalInvestments
(Level 1)
SignificantOther
ObservableInputs#(Level 2)
SignificantUnobservable
Inputs(Level 3)
Fair Valueat
March 31, 2019
Asset TableInvestments, at fair valueCommon Stock
Communication Services $ – $ 3,596,041 $ – $ 3,596,041Consumer Discretionary 176,813 5,970,512 – 6,147,325Consumer Staples 796,950 4,557,512 – 5,354,462Energy – 5,441,492 – 5,441,492Financials – 30,671,039 – 30,671,039Health Care 187,239 7,970,640 – 8,157,879Industrials – 7,907,091 – 7,907,091Information Technology – 2,308,214 – 2,308,214Materials – 18,464,386 – 18,464,386Real Estate 341,635 7,120,173 – 7,461,808Utilities 849,623 1,109,534 – 1,959,157
Total Common Stock 2,352,260 95,116,634 – 97,468,894Short-Term Investments 873,000 1,028,998 – 1,901,998Total Investments, at fair value $ 3,225,260 $ 96,145,632 $ – $ 99,370,892Other Financial Instruments+Forward Foreign Currency Contracts – 576 – 576Total Assets $ 3,225,260 $ 96,146,208 $ – $ 99,371,468Liabilities TableOther Financial Instruments+Forward Foreign Currency Contracts $ – $ (150) $ – $ (150)Futures (4,541) – – (4,541)Total Liabilities $ (4,541) $ (150) $ – $ (4,691)
(1)
For the period ended March 31, 2019, as a result of the fair value pricing procedures for international equities utilized by the Portfolio certainsecurities have transferred in and out of Level 1 and Level 2 measurements during the year. The Portfolio's policy is to recognize transfersbetween levels at the beginning of the reporting period. At March 31, 2019, securities valued at $67,989 and $1,056,160 were transferred fromLevel 1 to Level 2 and Level 2 to Level 1, respectively, within the fair value hierarchy.
+Other Financial Instruments may include open forward foreign currency contracts, futures, centrally cleared swaps, OTC swaps and writtenoptions. Forward foreign currency contracts, futures and centrally cleared swaps are valued at the unrealized gain (loss) on the instrument. OTCswaps and written options are valued at the fair value of the instrument.
#
The earlier close of the foreign markets gives rise to the possibility that significant events, including broad market moves, may have occurred inthe interim and may materially affect the value of those securities. To account for this, the Portfolio may frequently value many of its foreign equitysecurities using fair value prices based on third party vendor modeling tools to the extent available. Accordingly, a portion of the Portfolio'sinvestments are categorized as Level 2 investments.
At March 31, 2019, the following forward foreign currency contracts were outstanding for Voya Australia Index Portfolio:
Currency Purchased Currency Sold Counterparty Settlement DateUnrealized
Appreciation(Depreciation)
AUD 2,000,000 USD 1,421,612 The Bank of New York Mellon 06/19/19 $ 576USD 213,178 AUD 300,000 The Bank of New York Mellon 06/19/19 (150)
$ 426
At March 31, 2019, the following futures contracts were outstanding for Voya Australia Index Portfolio:
Description Numberof Contracts
ExpirationDate
NotionalValue
UnrealizedAppreciation/(Depreciation)
Long Contracts:ASX SPI 200® Index 16 06/20/19 $ 1,752,689 $ (4,541)
$ 1,752,689 $ (4,541)
Copyright © 2021 www.secdatabase.com. All Rights Reserved.Please Consider the Environment Before Printing This Document

Copyright © 2021 www.secdatabase.com. All Rights Reserved.Please Consider the Environment Before Printing This Document

Voya Australia Index PortfolioPORTFOLIO OF INVESTMENTS
as of March 31, 2019 (Unaudited) (Continued)
Currency AbbreviationsAUD - Australian DollarUSD - United States Dollar
At March 31, 2019, the aggregate cost of securities and other investments and the composition of unrealized appreciation and depreciation of securitiesand other investments at period end were:
Cost for federal income tax purposes was $99,496,113.
Net unrealized appreciation consisted of:
Gross Unrealized Appreciation $ 11,787,735Gross Unrealized Depreciation (11,476,206)
Net Unrealized Appreciation $ 311,529
Copyright © 2021 www.secdatabase.com. All Rights Reserved.Please Consider the Environment Before Printing This Document
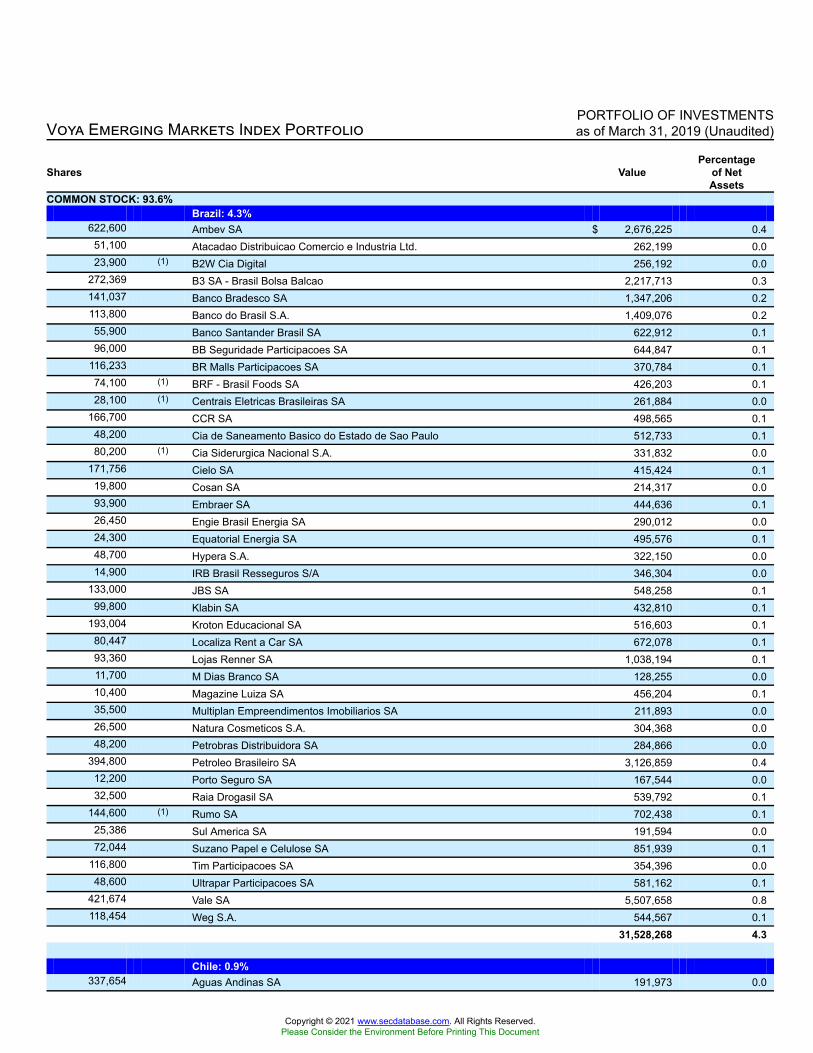
Voya Emerging Markets Index PortfolioPORTFOLIO OF INVESTMENTSas of March 31, 2019 (Unaudited)
Shares ValuePercentage
of NetAssets
COMMON STOCK: 93.6%Brazil: 4.3%
622,600 Ambev SA $ 2,676,225 0.451,100 Atacadao Distribuicao Comercio e Industria Ltd. 262,199 0.023,900 (1) B2W Cia Digital 256,192 0.0
272,369 B3 SA - Brasil Bolsa Balcao 2,217,713 0.3141,037 Banco Bradesco SA 1,347,206 0.2113,800 Banco do Brasil S.A. 1,409,076 0.255,900 Banco Santander Brasil SA 622,912 0.196,000 BB Seguridade Participacoes SA 644,847 0.1
116,233 BR Malls Participacoes SA 370,784 0.174,100 (1) BRF - Brasil Foods SA 426,203 0.128,100 (1) Centrais Eletricas Brasileiras SA 261,884 0.0
166,700 CCR SA 498,565 0.148,200 Cia de Saneamento Basico do Estado de Sao Paulo 512,733 0.180,200 (1) Cia Siderurgica Nacional S.A. 331,832 0.0
171,756 Cielo SA 415,424 0.119,800 Cosan SA 214,317 0.093,900 Embraer SA 444,636 0.126,450 Engie Brasil Energia SA 290,012 0.024,300 Equatorial Energia SA 495,576 0.148,700 Hypera S.A. 322,150 0.014,900 IRB Brasil Resseguros S/A 346,304 0.0
133,000 JBS SA 548,258 0.199,800 Klabin SA 432,810 0.1
193,004 Kroton Educacional SA 516,603 0.180,447 Localiza Rent a Car SA 672,078 0.193,360 Lojas Renner SA 1,038,194 0.111,700 M Dias Branco SA 128,255 0.010,400 Magazine Luiza SA 456,204 0.135,500 Multiplan Empreendimentos Imobiliarios SA 211,893 0.026,500 Natura Cosmeticos S.A. 304,368 0.048,200 Petrobras Distribuidora SA 284,866 0.0
394,800 Petroleo Brasileiro SA 3,126,859 0.412,200 Porto Seguro SA 167,544 0.032,500 Raia Drogasil SA 539,792 0.1
144,600 (1) Rumo SA 702,438 0.125,386 Sul America SA 191,594 0.072,044 Suzano Papel e Celulose SA 851,939 0.1
116,800 Tim Participacoes SA 354,396 0.048,600 Ultrapar Participacoes SA 581,162 0.1
421,674 Vale SA 5,507,658 0.8118,454 Weg S.A. 544,567 0.1
31,528,268 4.3
Chile: 0.9%337,654 Aguas Andinas SA 191,973 0.0
Copyright © 2021 www.secdatabase.com. All Rights Reserved.Please Consider the Environment Before Printing This Document

3,565,188 Banco de Chile 524,899 0.16,624 Banco de Credito e Inversiones SA 423,466 0.1
9,029,706 Banco Santander Chile 679,247 0.1194,995 Cencosud SA 337,578 0.0
20,071 Cia Cervecerias Unidas SA 287,336 0.01,043,724 Colbun SA 235,891 0.0
19,620 Empresa Nacional de Telecomunicaciones SA 204,300 0.0172,006 Empresas CMPC SA 606,629 0.1
50,176 Empresas COPEC SA 637,050 0.13,764,155 Enel Americas SA 669,190 0.14,011,820 Enel Chile SA 420,339 0.1
19,001,462 Itau CorpBanca 167,536 0.043,593 Latam Airlines Group SA 463,472 0.196,898 SACI Falabella 720,500 0.1
6,569,406 0.9
China: 32.0%174,500 (2),(3) 3SBio, Inc. 343,211 0.1
3,234 (1) 51job, Inc. ADR 251,864 0.012,721 (1) 58.com, Inc. ADR 835,515 0.198,500 AAC Technologies Holdings, Inc. 584,255 0.1
210,000 Agile Group Holdings, Ltd. 340,865 0.1113,600 Agricultural Bank of China Ltd. - A Shares 63,077 0.0
3,946,000 Agricultural Bank of China Ltd. - H Shares 1,824,094 0.3258,000 Air China Ltd. - H Shares 317,747 0.1173,128 (1) Alibaba Group Holding Ltd. ADR 31,587,204 4.3490,000 (1) Alibaba Health Information Technology Ltd. 567,448 0.1
2,000,000 (1),(2) Alibaba Pictures Group Ltd. 354,947 0.1524,000 (1) Aluminum Corp. of China Ltd. - H Shares 193,621 0.0140,000 Angang Steel Co., Ltd. - H Shares 102,574 0.0
11,600 Anhui Conch Cement Co., Ltd. - A Shares 65,907 0.0159,000 Anhui Conch Cement Co., Ltd. - H Shares 972,906 0.1143,000 Anta Sports Products Ltd. 974,830 0.1
7,959 (1),(2) Autohome, Inc. ADR 836,650 0.1273,000 AviChina Industry & Technology Co. Ltd. - H Shares 174,458 0.0213,000 (3) BAIC Motor Corp. Ltd. - H Shares 139,426 0.0
36,967 (1) Baidu, Inc. ADR 6,094,010 0.874,800 Bank of Beijing Co. Ltd. - A Shares 68,993 0.0
Copyright © 2021 www.secdatabase.com. All Rights Reserved.Please Consider the Environment Before Printing This Document

Voya Emerging Markets Index PortfolioPORTFOLIO OF INVESTMENTS
as of March 31, 2019 (Unaudited) (Continued)
Shares ValuePercentage
of NetAssets
COMMON STOCK: (continued)China: (continued)
199,100 Bank of China Ltd. - A Shares $ 111,695 0.010,415,000 Bank of China Ltd. - H Shares 4,733,308 0.7
164,800 Bank of Communications Co. Ltd. - A Shares 152,962 0.01,074,000 Bank of Communications Co., Ltd. - H Shares 881,117 0.1
31,900 Bank of Jiangsu Co. Ltd. - A Shares 33,814 0.039,057 Bank of Nanjing Co. Ltd. - A Shares 45,976 0.017,000 Bank of Ningbo Co. Ltd. - A Shares 53,681 0.037,400 Bank of Shanghai Co. Ltd. - A Shares 66,638 0.050,600 Baoshan Iron & Steel Co. Ltd. - A Shares 54,387 0.0
4,534 (1),(2) Baozun, Inc. ADR 188,342 0.0272,000 BBMG Corp. - H Shares 100,010 0.0226,000 Beijing Capital International Airport Co., Ltd. - H Shares 214,657 0.0
70,000 Beijing Enterprises Holdings Ltd. 397,489 0.1802,000 Beijing Enterprises Water Group Ltd. 496,131 0.1119,500 BOE Technology Group Co. Ltd. - A Shares 69,059 0.0426,000 Brilliance China Automotive Holdings Ltd. 423,157 0.1
6,600 BYD Co. Ltd. - A Shares 52,497 0.084,500 (2) Byd Co., Ltd. - H Shares 510,907 0.193,000 BYD Electronic International Co. Ltd. 120,267 0.0
107,000 (1) CAR, Inc. - H Shares 92,406 0.01,532,000 (3) CGN Power Co. Ltd. - H Shares 427,612 0.1
189,000 China Agri-Industries Holdings Ltd. - H Shares 64,781 0.01,229,000 China Cinda Asset Management Co. Ltd. - H Shares 341,780 0.11,306,000 China CITIC Bank Corp. Ltd - H Shares 832,788 0.1
223,000 China Coal Energy Co. - H Shares 92,399 0.0640,000 China Communications Construction Co., Ltd. - H Shares 663,303 0.1338,000 China Communications Services Corp., Ltd. - H Shares 302,007 0.1227,500 China Conch Venture Holdings Ltd. 814,650 0.1
12,787,000 China Construction Bank - H Shares 10,975,960 1.543,200 China Construction Bank Corp. - A Shares 44,636 0.0
136,000 (1),(2),(4) China Ding Yi Feng Holdings Ltd. 400,206 0.0170,000 China Eastern Airlines Corp. Ltd. - H Shares 120,636 0.0156,200 China Everbright Bank Co. Ltd. - A Shares 95,214 0.0275,000 China Everbright Bank Co. Ltd. - H Shares 130,211 0.0472,000 China Everbright International Ltd. 480,765 0.1124,000 China Everbright Ltd. 246,246 0.0349,000 (2) China Evergrande Group 1,162,349 0.2422,000 (1) China First Capital Group Ltd. 223,271 0.0
9,700 China Fortune Land Development Co. Ltd. - A Shares 44,646 0.0473,000 China Galaxy Securities Co. Ltd. - H Shares 311,760 0.1237,400 China Gas Holdings Ltd. 836,341 0.1272,000 China Hongqiao Group Ltd. 205,008 0.0
1,321,000 (3) China Huarong Asset Management Co. Ltd. - H Shares 281,464 0.0480,000 (1),(4) China Huishan Dairy Holdings Co. Ltd. – –144,400 (2),(3) China International Capital Corp. Ltd. - H Shares 335,209 0.1
6,312 China International Travel Service Corp. Ltd. - A Shares 65,818 0.0736,000 China Jinmao Holdings Group Ltd. 481,267 0.1
Copyright © 2021 www.secdatabase.com. All Rights Reserved.Please Consider the Environment Before Printing This Document
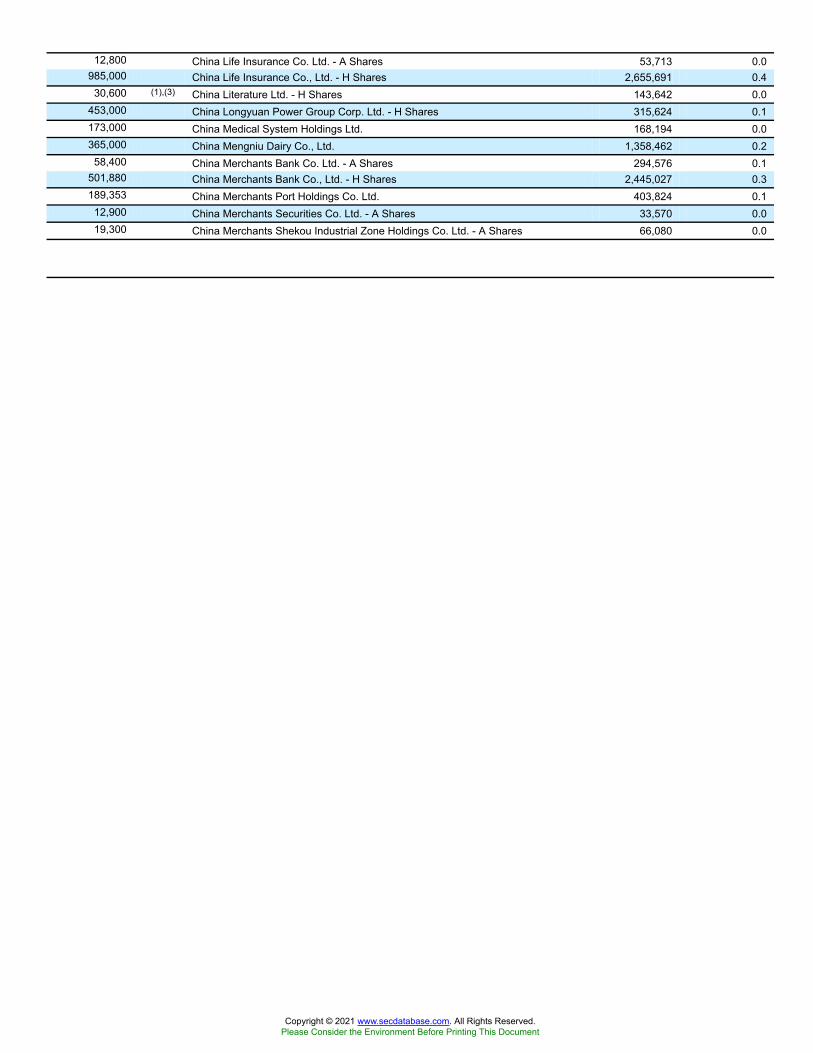
12,800 China Life Insurance Co. Ltd. - A Shares 53,713 0.0985,000 China Life Insurance Co., Ltd. - H Shares 2,655,691 0.4
30,600 (1),(3) China Literature Ltd. - H Shares 143,642 0.0453,000 China Longyuan Power Group Corp. Ltd. - H Shares 315,624 0.1173,000 China Medical System Holdings Ltd. 168,194 0.0365,000 China Mengniu Dairy Co., Ltd. 1,358,462 0.2
58,400 China Merchants Bank Co. Ltd. - A Shares 294,576 0.1501,880 China Merchants Bank Co., Ltd. - H Shares 2,445,027 0.3189,353 China Merchants Port Holdings Co. Ltd. 403,824 0.1
12,900 China Merchants Securities Co. Ltd. - A Shares 33,570 0.019,300 China Merchants Shekou Industrial Zone Holdings Co. Ltd. - A Shares 66,080 0.0
Copyright © 2021 www.secdatabase.com. All Rights Reserved.Please Consider the Environment Before Printing This Document

Voya Emerging Markets Index PortfolioPORTFOLIO OF INVESTMENTS
as of March 31, 2019 (Unaudited) (Continued)
Shares ValuePercentage
of NetAssets
COMMON STOCK: (continued)China: (continued)
142,580 China Minsheng Banking Corp. Ltd. - A Shares $ 134,541 0.0810,600 China Minsheng Banking Corp. Ltd. - H Shares 589,514 0.1817,500 China Mobile Ltd. 8,342,041 1.2534,000 China Molybdenum Co. Ltd. - H Shares 223,703 0.0552,000 China National Building Material Co., Ltd. - H Shares 436,891 0.1246,000 China Oilfield Services Ltd. - H Shares 265,557 0.0144,000 China Oriental Group Co. Ltd. 90,658 0.0514,000 China Overseas Land & Investment Ltd. 1,956,032 0.3
15,003 China Pacific Insurance Group Co. Ltd. - A Shares 75,767 0.0353,400 China Pacific Insurance Group Co., Ltd. - H Shares 1,388,591 0.2104,000 China Petroleum & Chemical Corp. - A Shares 88,612 0.0
3,353,600 China Petroleum & Chemical Corp. - H Shares 2,661,638 0.4524,000 China Power International Development Ltd. - H Shares 134,224 0.0
31,900 China Railway Construction Corp. Ltd. - A Shares 54,586 0.0284,000 China Railway Construction Corp. Ltd. - H Shares 372,753 0.1544,000 China Railway Group Ltd. - H Shares 496,680 0.1180,000 (3) China Railway Signal & Communication Corp. Ltd. - H Shares 142,567 0.0714,000 China Reinsurance Group Corp. - H Shares 151,120 0.0198,000 China Resources Beer Holdings Co Ltd. 835,133 0.1342,000 China Resources Cement Holdings Ltd. - H Shares 354,346 0.1126,000 China Resources Gas Group Ltd. 594,841 0.1370,444 China Resources Land Ltd. 1,664,746 0.2228,000 (3) China Resources Pharmaceutical Group Ltd. 322,307 0.1282,000 China Resources Power Holdings Co. 424,126 0.1
18,270 China Shenhua Energy Co. Ltd. - A Shares 53,275 0.0435,500 China Shenhua Energy Co., Ltd. - H Shares 993,894 0.1262,000 China Southern Airlines Co., Ltd. - H Shares 234,437 0.0117,740 China State Construction Engineering Corp. Ltd. - A Shares 107,062 0.0266,000 China State Construction International Holdings Ltd. 249,619 0.0228,428 China Taiping Insurance Holdings Co., Ltd. 682,785 0.1
1,856,000 China Telecom Corp., Ltd. - H Shares 1,032,723 0.25,314,000 (1),(3) China Tower Corp. Ltd. - H Shares 1,234,334 0.2
294,000 China Traditional Chinese Medicine Holdings Co. Ltd. 175,073 0.0290,000 China Travel International Inv HK 73,972 0.0826,000 China Unicom Hong Kong Ltd. 1,051,684 0.2112,100 China United Network Communications Ltd. - A Shares 113,114 0.027,600 China Vanke Co. Ltd. - A Shares 125,757 0.0
160,300 China Vanke Co. Ltd. - H Shares 674,687 0.129,700 China Yangtze Power Co. Ltd. - A Shares 74,501 0.0
166,400 China Zhongwang Holdings Ltd. - H Shares 90,793 0.0322,000 Chongqing Rural Commercial Bank Co. Ltd. - H Shares 186,355 0.0478,000 CIFI Holdings Group Co. Ltd. 363,052 0.1777,000 CITIC Ltd. 1,161,552 0.2
30,200 CITIC Securities Co. Ltd. - A Shares 111,195 0.0296,500 CITIC Securities Co. Ltd. - H Shares 692,773 0.1
2,389,000 CNOOC Ltd. 4,449,943 0.6230,000 COSCO Shipping Ports, Ltd. 248,713 0.0
Copyright © 2021 www.secdatabase.com. All Rights Reserved.Please Consider the Environment Before Printing This Document

132,000 COSCO Shipping Energy Transportation Co. Ltd. - H Shares 75,746 0.0311,500 (1),(2) COSCO SHIPPING Holdings Co., Ltd.. - H Shares 129,490 0.0
1,008,133 Country Garden Holdings Co. Ltd. 1,578,466 0.2158,000 (1) Country Garden Services Holdings Co. Ltd. - H Shares 295,007 0.1
67,900 CRRC Corp. Ltd. - A Shares 91,871 0.0
Copyright © 2021 www.secdatabase.com. All Rights Reserved.Please Consider the Environment Before Printing This Document

Voya Emerging Markets Index PortfolioPORTFOLIO OF INVESTMENTS
as of March 31, 2019 (Unaudited) (Continued)
Shares ValuePercentage
of NetAssets
COMMON STOCK: (continued)China: (continued)
551,000 CRRC Corp. Ltd. - H Shares $ 519,766 0.1622,000 CSPC Pharmaceutical Group Ltd. 1,158,874 0.2
54,504 (1) Ctrip.com International Ltd. ADR 2,381,280 0.3257,500 (3) Dali Foods Group Co. Ltd. 192,315 0.0
52,000 Daqin Railway Co. Ltd. - A Shares 64,495 0.0310,000 Datang International Power Generation Co., Ltd. - H Shares 83,050 0.0380,000 Dongfeng Motor Group Co., Ltd. - H Shares 381,223 0.1104,600 ENN Energy Holdings Ltd. 1,012,409 0.1302,000 Far East Horizon Ltd. 320,083 0.1
46,200 Focus Media Information Technology Co. Ltd. - A Shares 43,097 0.07,000 Foshan Haitian Flavouring & Food Co. Ltd. - A Shares 90,215 0.0
368,968 Fosun International Ltd 626,887 0.1910,000 (2) Fullshare Holdings Ltd. 121,872 0.0228,000 Future Land Development Holdings Ltd. - H Shares 283,101 0.0
70,000 (3) Fuyao Glass Industry Group Co. Ltd. - H Shares 235,413 0.07,666 (1),(2) GDS Holdings Ltd. ADR 273,599 0.1
657,000 Geely Automobile Holdings Ltd. 1,260,773 0.2120,000 (1) Genscript Biotech Corp. - H Shares 227,019 0.0
22,100 GF Securities Co. Ltd. - A Shares 53,048 0.0196,000 (2) GF Securities Co. Ltd. - H Shares 282,286 0.0
1,290,000 (1),(2) GOME Retail Holdings Ltd 120,118 0.0427,000 Great Wall Motor Co. Ltd. - H Shares 321,273 0.1
10,400 Gree Electric Appliances, Inc. of Zhuhai - A Shares 73,054 0.0110,500 Greentown China Holdings Ltd. - H Shares 110,591 0.0124,000 Greentown Service Group Co. Ltd. 110,159 0.0426,000 Guangdong Investment Ltd. 822,530 0.1417,200 Guangzhou Automobile Group Co. Ltd. - H Shares 493,763 0.1129,200 Guangzhou R&F Properties Co., Ltd. - H Shares 280,243 0.0
27,600 Guotai Junan Securities Co. Ltd. - A Shares 82,660 0.067,800 (3) Guotai Junan Securities Co. Ltd. - H Shares 151,072 0.0
183,000 Haier Electronics Group Co. Ltd. 532,800 0.182,000 Haitian International Holdings Ltd. 186,733 0.036,800 Haitong Securities Co. Ltd. - A Shares 76,602 0.0
419,200 Haitong Securities Co. Ltd. - H Shares 543,734 0.11,908,000 (1),(4) Hanergy Thin Film Power Group Ltd. – –
21,300 Hangzhou Hikvision Digital Technology Co. Ltd. - A Shares 110,927 0.012,400 Henan Shuanghui Investment & Development Co. Ltd. - A Shares 47,629 0.098,500 Hengan International Group Co., Ltd. 863,568 0.1
2,600,000 (1) HengTen Networks Group Ltd. - H Shares 78,965 0.055,000 (3) Hua Hong Semiconductor Ltd. 129,302 0.0
208,000 Huadian Power International Co. - H Shares 85,695 0.0626,000 Huaneng Power International, Inc. - H Shares 363,802 0.1636,000 Huaneng Renewables Corp. Ltd. 176,954 0.0
23,600 Huatai Securities Co. Ltd. - A Shares 78,584 0.0220,400 (3) Huatai Securities Co. Ltd. - H Shares 441,689 0.1
41,200 Huaxia Bank Co. Ltd. - A Shares 50,590 0.014,200 Huayu Automotive Systems Co. Ltd. - A Shares 43,036 0.0
Copyright © 2021 www.secdatabase.com. All Rights Reserved.Please Consider the Environment Before Printing This Document

17,941 Huazhu Group Ltd. ADR 756,034 0.16,615 (1) Hutchison China MediTech Ltd. ADR 202,287 0.06,200 Iflytek Co. Ltd. - A Shares 33,455 0.0
9,318,000 Industrial & Commercial Bank of China - H Shares 6,842,995 0.976,200 Industrial & Commercial Bank of China Ltd. - A Shares 63,142 0.072,100 Industrial Bank Co. Ltd. - A Shares 194,833 0.0
113,800 Inner Mongolia BaoTou Steel Union Co. Ltd. - A Shares 30,929 0.019,000 Inner Mongolia Yili Industrial Group Co. Ltd. - A Shares 82,065 0.0
132,400 (1) Inner Mongolia Yitai Coal Co. - A Shares 163,015 0.0
Copyright © 2021 www.secdatabase.com. All Rights Reserved.Please Consider the Environment Before Printing This Document

Voya Emerging Markets Index PortfolioPORTFOLIO OF INVESTMENTS
as of March 31, 2019 (Unaudited) (Continued)
Shares ValuePercentage
of NetAssets
COMMON STOCK: (continued)China: (continued)
17,147 (1),(2) iQIYI, Inc. ADR $ 410,156 0.197,453 (1) JD.com, Inc. ADR 2,938,208 0.4
162,000 Jiangsu Expressway Co. Ltd. - H Shares 229,228 0.011,940 Jiangsu Hengrui Medicine Co. Ltd. - A Shares 115,971 0.04,276 Jiangsu Yanghe Brewery Joint-Stock Co. Ltd. - A Shares 82,947 0.0
178,000 Jiangxi Copper Co., Ltd. - H Shares 236,460 0.0136,974 Jiayuan International Group Ltd. 72,459 0.0247,000 Kaisa Group Holdings Ltd. - H Shares 112,247 0.0
95,500 Kingboard Holdings Ltd 339,202 0.1135,000 Kingboard Laminates Holdings Ltd. 142,311 0.0316,000 Kingdee International Software Group Co., Ltd. 366,925 0.1108,000 Kingsoft Corp. Ltd. 275,364 0.0466,000 Kunlun Energy Co. Ltd. 487,800 0.1
2,400 Kweichow Moutai Co. Ltd. - A Shares 304,394 0.1158,500 KWG Group Holdings Ltd. 191,713 0.0196,000 Lee & Man Paper Manufacturing Ltd. 167,242 0.0
47,700 (3) Legend Holdings Corp. - H Shares 126,886 0.0958,000 Lenovo Group Ltd. 864,352 0.1186,000 Logan Property Holdings Co. Ltd. - H Shares 308,526 0.1206,000 Longfor Group Holdings Ltd 726,588 0.1
16,960 Luxshare Precision Industry Co. Ltd. - A Shares 62,280 0.0129,000 (3) Luye Pharma Group Ltd. - H Shares 113,009 0.0
6,900 Luzhou Laojiao Co. Ltd. - A Shares 68,258 0.0206,000 Maanshan Iron & Steel Co. Ltd. - H Shares 100,972 0.0195,500 (1),(2),(3) Meitu, Inc. 92,121 0.0
42,900 (1),(2) Meituan Dianping- Class B 289,960 0.182,300 Metallurgical Corp. of China Ltd. - A Shares 43,110 0.0
284,000 Metallurgical Corp. of China Ltd. - H Shares 84,078 0.018,200 Midea Group Co. Ltd. - A Shares 131,923 0.0
304,000 (1) Minmetals Resources Ltd. 123,799 0.019,579 (1) Momo, Inc. ADR 748,701 0.116,300 NARI Technology Co. Ltd. - A Shares 51,100 0.010,380 NetEase, Inc. ADR 2,506,251 0.4
6,200 New China Life Insurance Co. Ltd. - A Shares 49,354 0.0114,600 New China Life Insurance Co. Ltd. - H Shares 585,294 0.119,042 (1) New Oriental Education & Technology Group, Inc. ADR 1,715,494 0.2
103,000 Nexteer Automotive Group Ltd. 127,534 0.0211,000 Nine Dragons Paper Holdings Ltd. 201,397 0.0
3,553 (1) Noah Holdings Ltd. ADR 172,178 0.021,400 Orient Securities Co. Ltd./China - A Shares 37,796 0.0
1,033,000 Peoples Insurance Co. Group of China Ltd. - H Shares 442,978 0.167,300 PetroChina Co. Ltd. - A Shares 75,870 0.0
2,758,000 PetroChina Co., Ltd. - H Shares 1,805,424 0.3925,244 PICC Property & Casualty Co., Ltd. - H Shares 1,053,304 0.2
25,772 (1) Pinduoduo, Inc. ADR 639,146 0.146,700 Ping An Bank Co. Ltd. - A Shares 89,018 0.025,100 Ping An Insurance Group Co. of China Ltd. - A Shares 287,555 0.1
Copyright © 2021 www.secdatabase.com. All Rights Reserved.Please Consider the Environment Before Printing This Document

690,000 Ping An Insurance Group Co. of China Ltd. - H Shares 7,768,171 1.130,900 Poly Developments and Holdings Group Co. Ltd. - A Shares 65,279 0.0
991,000 (3) Postal Savings Bank of China Co. Ltd. - H Shares 567,420 0.117,700 Qingdao Haier Co. Ltd. - A Shares 44,980 0.024,000 SAIC Motor Corp. Ltd. - A Shares 93,008 0.021,200 Sany Heavy Industry Co. Ltd. - A Shares 40,247 0.0
425,900 (1),(2) Semiconductor Manufacturing International Corp. 431,621 0.1260,000 Shandong Weigao Group Medical Polymer Co., Ltd. - H Shares 248,628 0.0324,000 Shanghai Electric Group Co., Ltd. - H Shares 123,119 0.0
73,500 Shanghai Fosun Pharmaceutical Group Co. Ltd. - H Shares 266,031 0.058,000 Shanghai Industrial Holdings Ltd. 136,695 0.0
Copyright © 2021 www.secdatabase.com. All Rights Reserved.Please Consider the Environment Before Printing This Document
Voya Emerging Markets Index PortfolioPORTFOLIO OF INVESTMENTS
as of March 31, 2019 (Unaudited) (Continued)
Shares ValuePercentage
of NetAssets
COMMON STOCK: (continued)China: (continued)
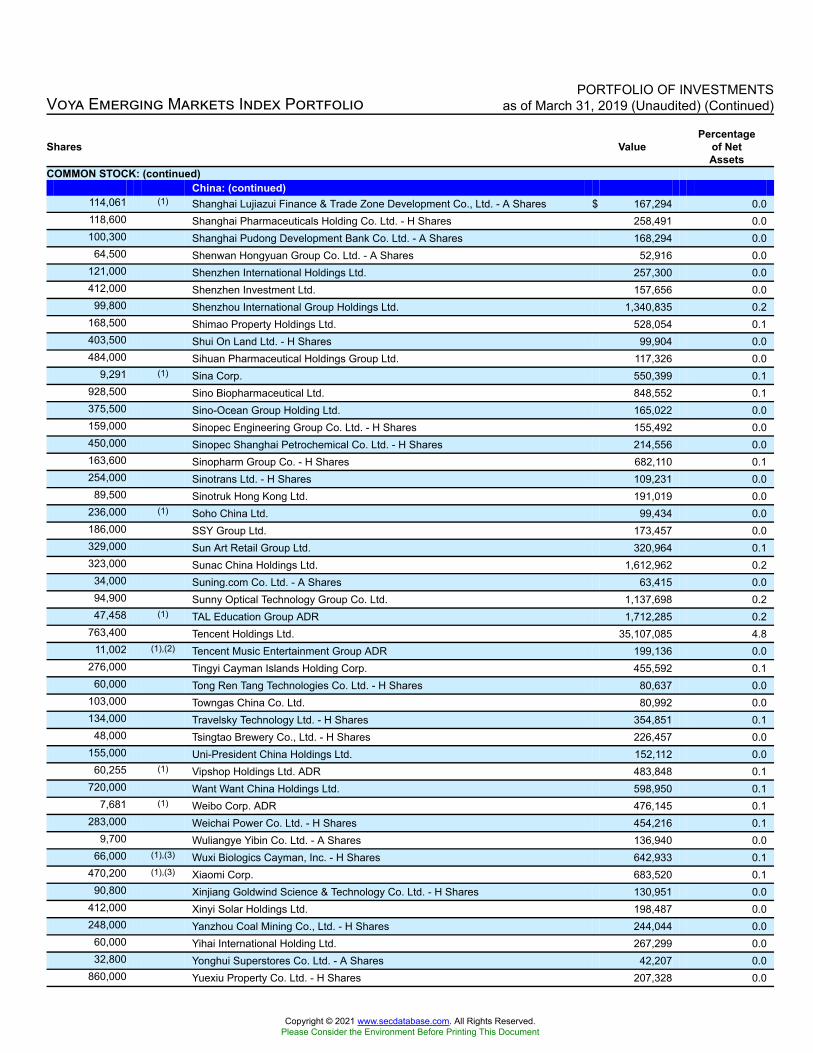
114,061 (1) Shanghai Lujiazui Finance & Trade Zone Development Co., Ltd. - A Shares $ 167,294 0.0118,600 Shanghai Pharmaceuticals Holding Co. Ltd. - H Shares 258,491 0.0100,300 Shanghai Pudong Development Bank Co. Ltd. - A Shares 168,294 0.0
64,500 Shenwan Hongyuan Group Co. Ltd. - A Shares 52,916 0.0121,000 Shenzhen International Holdings Ltd. 257,300 0.0412,000 Shenzhen Investment Ltd. 157,656 0.0
99,800 Shenzhou International Group Holdings Ltd. 1,340,835 0.2168,500 Shimao Property Holdings Ltd. 528,054 0.1403,500 Shui On Land Ltd. - H Shares 99,904 0.0484,000 Sihuan Pharmaceutical Holdings Group Ltd. 117,326 0.0
9,291 (1) Sina Corp. 550,399 0.1928,500 Sino Biopharmaceutical Ltd. 848,552 0.1375,500 Sino-Ocean Group Holding Ltd. 165,022 0.0159,000 Sinopec Engineering Group Co. Ltd. - H Shares 155,492 0.0450,000 Sinopec Shanghai Petrochemical Co. Ltd. - H Shares 214,556 0.0163,600 Sinopharm Group Co. - H Shares 682,110 0.1254,000 Sinotrans Ltd. - H Shares 109,231 0.0
89,500 Sinotruk Hong Kong Ltd. 191,019 0.0236,000 (1) Soho China Ltd. 99,434 0.0186,000 SSY Group Ltd. 173,457 0.0329,000 Sun Art Retail Group Ltd. 320,964 0.1323,000 Sunac China Holdings Ltd. 1,612,962 0.2
34,000 Suning.com Co. Ltd. - A Shares 63,415 0.094,900 Sunny Optical Technology Group Co. Ltd. 1,137,698 0.247,458 (1) TAL Education Group ADR 1,712,285 0.2
763,400 Tencent Holdings Ltd. 35,107,085 4.811,002 (1),(2) Tencent Music Entertainment Group ADR 199,136 0.0
276,000 Tingyi Cayman Islands Holding Corp. 455,592 0.160,000 Tong Ren Tang Technologies Co. Ltd. - H Shares 80,637 0.0
103,000 Towngas China Co. Ltd. 80,992 0.0134,000 Travelsky Technology Ltd. - H Shares 354,851 0.1
48,000 Tsingtao Brewery Co., Ltd. - H Shares 226,457 0.0155,000 Uni-President China Holdings Ltd. 152,112 0.0
60,255 (1) Vipshop Holdings Ltd. ADR 483,848 0.1720,000 Want Want China Holdings Ltd. 598,950 0.1
7,681 (1) Weibo Corp. ADR 476,145 0.1283,000 Weichai Power Co. Ltd. - H Shares 454,216 0.1
9,700 Wuliangye Yibin Co. Ltd. - A Shares 136,940 0.066,000 (1),(3) Wuxi Biologics Cayman, Inc. - H Shares 642,933 0.1
470,200 (1),(3) Xiaomi Corp. 683,520 0.190,800 Xinjiang Goldwind Science & Technology Co. Ltd. - H Shares 130,951 0.0
412,000 Xinyi Solar Holdings Ltd. 198,487 0.0248,000 Yanzhou Coal Mining Co., Ltd. - H Shares 244,044 0.0
60,000 Yihai International Holding Ltd. 267,299 0.032,800 Yonghui Superstores Co. Ltd. - A Shares 42,207 0.0
860,000 Yuexiu Property Co. Ltd. - H Shares 207,328 0.0
Copyright © 2021 www.secdatabase.com. All Rights Reserved.Please Consider the Environment Before Printing This Document

48,038 Yum China Holdings, Inc. 2,157,387 0.34,000 Yunnan Baiyao Group Co. Ltd. - A Shares 50,844 0.0
183,000 Yuzhou Properties Co. Ltd. - H Shares 110,704 0.06,864 (1) YY, Inc. ADR 576,645 0.1
138,000 Zhaojin Mining Industry Co. Ltd. - H Shares 138,144 0.0186,000 Zhejiang Expressway Co., Ltd. - H Shares 213,514 0.0
30,500 (1),(3) ZhongAn Online P&C Insurance Co. Ltd. - H Shares 109,827 0.070,000 Zhongsheng Group Holdings Ltd. 174,139 0.079,200 Zhuzhou CSR Times Electric Co., Ltd. - H Shares 468,867 0.181,600 Zijin Mining Group Co. Ltd. - A Shares 42,410 0.0
790,000 Zijin Mining Group Co., Ltd. - H Shares 327,084 0.18,600 (1) ZTE Corp. - A Shares 37,162 0.0
97,040 (1) ZTE Corp. - H Shares 292,660 0.143,962 ZTO Express Cayman, Inc. ADR 803,625 0.1
233,812,802 32.0
Copyright © 2021 www.secdatabase.com. All Rights Reserved.Please Consider the Environment Before Printing This Document

Voya Emerging Markets Index PortfolioPORTFOLIO OF INVESTMENTS
as of March 31, 2019 (Unaudited) (Continued)
Shares ValuePercentage
of NetAssets
COMMON STOCK: (continued)Colombia: 0.4%
24,026 Bancolombia SA $ 298,438 0.117,597 BanColombia SA ADR 898,503 0.155,054 Cementos Argos SA 136,079 0.0
693,934 Ecopetrol SA 743,338 0.137,047 Grupo Argos SA/Colombia 210,334 0.030,572 Grupo de Inversiones Suramericana SA 351,364 0.156,718 Interconexion Electrica SA ESP 283,943 0.0
2,921,999 0.4
Czech Republic: 0.2%23,048 (1) CEZ AS 541,625 0.110,839 (1) Komercni Banka AS 443,053 0.160,342 (1),(3) Moneta Money Bank AS 208,323 0.0
1,193,001 0.2
Egypt: 0.1%186,169 Commercial International Bank Egypt SAE 732,727 0.1108,230 Eastern Tobacco 113,663 0.0
80,497 ElSewedy Electric Co. 72,229 0.0918,619 0.1
Greece: 0.2%187,626 (1) Alpha Bank AE 260,352 0.0
4,349 (1),(4) FF Group – –33,724 Hellenic Telecommunications Organization SA 451,633 0.114,341 Jumbo SA 240,236 0.0
7,929 Motor Oil Hellas Corinth Refineries SA 184,114 0.029,725 OPAP S.A. 307,226 0.1
5,882 Titan Cement Co. SA 127,080 0.01,570,641 0.2
Hungary: 0.3%51,312 (1) MOL Hungarian Oil & Gas PLC 588,425 0.128,948 (1) OTP Bank Nyrt 1,276,197 0.219,708 (1) Richter Gedeon Nyrt 372,331 0.0
2,236,953 0.3
India: 8.9%72,617 Adani Ports & Special Economic Zone, Ltd. 396,190 0.179,700 Ambuja Cements Ltd. 270,733 0.0
168,962 Ashok Leyland Ltd. 222,524 0.037,405 Asian Paints Ltd. 805,361 0.136,642 Aurobindo Pharma Ltd. 414,740 0.117,343 (1),(3) Avenue Supermarts Ltd. 367,956 0.1
252,662 (1) Axis Bank Ltd. 2,831,384 0.411,690 Bajaj Auto Ltd. 491,073 0.122,921 Bajaj Finance Ltd. 1,000,141 0.1
Copyright © 2021 www.secdatabase.com. All Rights Reserved.Please Consider the Environment Before Printing This Document

5,357 Bajaj Finserv Ltd. 544,291 0.126,443 Bharat Forge Ltd. 195,520 0.0
102,413 Bharat Petroleum Corp. Ltd. 588,874 0.1182,053 Bharti Airtel Ltd. 874,969 0.1
41,782 Bharti Infratel Ltd. 188,966 0.0995 Bosch Ltd. 261,041 0.0
7,675 Britannia Industries Ltd. 341,523 0.024,596 Cadila Healthcare Ltd. 123,167 0.048,244 Cipla Ltd. 368,281 0.193,406 Coal India Ltd. 319,728 0.028,449 Container Corp. Of India Ltd. 215,682 0.074,977 Dabur India Ltd. 442,288 0.1
9,987 Divis Laboratories Ltd. 245,434 0.015,065 Dr Reddys Laboratories Ltd. 605,481 0.1
708 Dr. Reddys Laboratories Ltd. ADR 28,674 0.01,819 Eicher Motors Ltd. 539,308 0.1
106,768 GAIL India Ltd. 536,168 0.118,567 Glenmark Pharmaceuticals Ltd. 173,514 0.050,510 Godrej Consumer Products Ltd. 500,324 0.146,587 Grasim Industries Ltd. 577,059 0.135,446 Havells India Ltd. 395,494 0.171,376 HCL Technologies Ltd. 1,121,401 0.2
6,627 Hero Motocorp Ltd. 244,211 0.0167,197 Hindalco Industries Ltd. 495,959 0.1
83,313 Hindustan Petroleum Corp. Ltd. 342,645 0.084,500 Hindustan Unilever Ltd. 2,081,270 0.3
217,090 Housing Development Finance Corp. 6,165,994 0.8315,391 ICICI Bank Ltd. 1,821,990 0.3
38,714 Indiabulls Housing Finance Ltd. 478,972 0.1255,160 Indian Oil Corp. Ltd. 601,084 0.1
7,913 Infosys Ltd. ADR 86,489 0.0453,282 Infosys Ltd. 4,864,613 0.7
12,257 (3) InterGlobe Aviation Ltd. 252,446 0.0446,728 ITC Ltd. 1,916,039 0.3120,506 JSW Steel Ltd. 509,566 0.1
63,054 Larsen & Toubro Ltd. 1,261,344 0.2894 (2) Larsen & Toubro Ltd. GDS GDR 17,818 0.0
40,886 LIC Housing Finance Ltd. 314,088 0.030,273 Lupin Ltd. 322,928 0.041,443 Mahindra & Mahindra Financial Services Ltd. 252,071 0.0
102,075 Mahindra & Mahindra Ltd. 992,634 0.162,135 Marico Ltd. 310,858 0.013,695 Maruti Suzuki India Ltd. 1,318,410 0.2
128,724 Motherson Sumi Systems Ltd. 278,360 0.03,231 Nestle India Ltd. 510,806 0.1
321,200 NTPC Ltd. 624,100 0.1195,760 Oil & Natural Gas Corp., Ltd. 451,470 0.1
749 Page Industries Ltd. 269,861 0.081,876 Petronet LNG Ltd. 297,199 0.016,002 Pidilite Industries Ltd. 287,722 0.011,395 Piramal Enterprises, Ltd. 454,677 0.1
Copyright © 2021 www.secdatabase.com. All Rights Reserved.Please Consider the Environment Before Printing This Document
Voya Emerging Markets Index PortfolioPORTFOLIO OF INVESTMENTS
as of March 31, 2019 (Unaudited) (Continued)
Shares ValuePercentage
of NetAssets
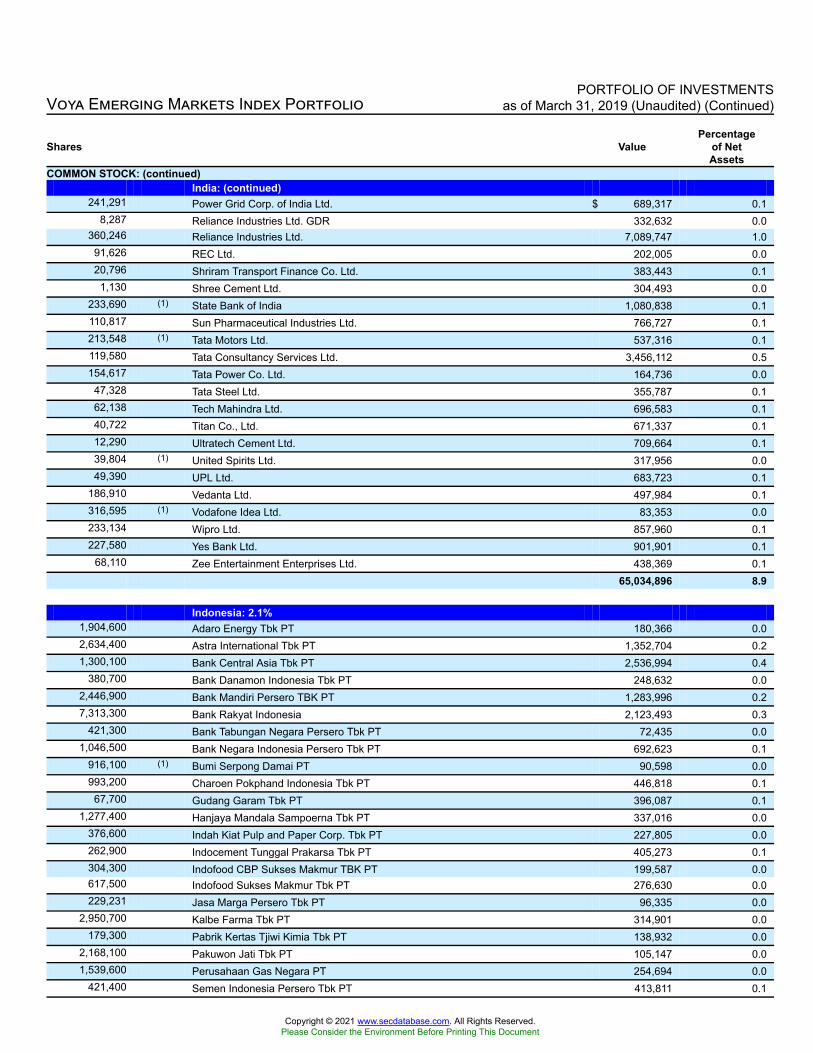
COMMON STOCK: (continued)India: (continued)
241,291 Power Grid Corp. of India Ltd. $ 689,317 0.18,287 Reliance Industries Ltd. GDR 332,632 0.0
360,246 Reliance Industries Ltd. 7,089,747 1.091,626 REC Ltd. 202,005 0.020,796 Shriram Transport Finance Co. Ltd. 383,443 0.1
1,130 Shree Cement Ltd. 304,493 0.0233,690 (1) State Bank of India 1,080,838 0.1110,817 Sun Pharmaceutical Industries Ltd. 766,727 0.1213,548 (1) Tata Motors Ltd. 537,316 0.1119,580 Tata Consultancy Services Ltd. 3,456,112 0.5154,617 Tata Power Co. Ltd. 164,736 0.0
47,328 Tata Steel Ltd. 355,787 0.162,138 Tech Mahindra Ltd. 696,583 0.140,722 Titan Co., Ltd. 671,337 0.112,290 Ultratech Cement Ltd. 709,664 0.139,804 (1) United Spirits Ltd. 317,956 0.049,390 UPL Ltd. 683,723 0.1
186,910 Vedanta Ltd. 497,984 0.1316,595 (1) Vodafone Idea Ltd. 83,353 0.0233,134 Wipro Ltd. 857,960 0.1227,580 Yes Bank Ltd. 901,901 0.1
68,110 Zee Entertainment Enterprises Ltd. 438,369 0.165,034,896 8.9
Indonesia: 2.1%1,904,600 Adaro Energy Tbk PT 180,366 0.02,634,400 Astra International Tbk PT 1,352,704 0.21,300,100 Bank Central Asia Tbk PT 2,536,994 0.4
380,700 Bank Danamon Indonesia Tbk PT 248,632 0.02,446,900 Bank Mandiri Persero TBK PT 1,283,996 0.27,313,300 Bank Rakyat Indonesia 2,123,493 0.3
421,300 Bank Tabungan Negara Persero Tbk PT 72,435 0.01,046,500 Bank Negara Indonesia Persero Tbk PT 692,623 0.1
916,100 (1) Bumi Serpong Damai PT 90,598 0.0993,200 Charoen Pokphand Indonesia Tbk PT 446,818 0.1
67,700 Gudang Garam Tbk PT 396,087 0.11,277,400 Hanjaya Mandala Sampoerna Tbk PT 337,016 0.0
376,600 Indah Kiat Pulp and Paper Corp. Tbk PT 227,805 0.0262,900 Indocement Tunggal Prakarsa Tbk PT 405,273 0.1304,300 Indofood CBP Sukses Makmur TBK PT 199,587 0.0617,500 Indofood Sukses Makmur Tbk PT 276,630 0.0229,231 Jasa Marga Persero Tbk PT 96,335 0.0
2,950,700 Kalbe Farma Tbk PT 314,901 0.0179,300 Pabrik Kertas Tjiwi Kimia Tbk PT 138,932 0.0
2,168,100 Pakuwon Jati Tbk PT 105,147 0.01,539,600 Perusahaan Gas Negara PT 254,694 0.0
421,400 Semen Indonesia Persero Tbk PT 413,811 0.1
Copyright © 2021 www.secdatabase.com. All Rights Reserved.Please Consider the Environment Before Printing This Document

646,500 Surya Citra Media Tbk PT 75,233 0.0360,200 Tambang Batubara Bukit Asam Persero Tbk PT 106,413 0.0
6,523,200 Telekomunikasi Indonesia Persero Tbk PT 1,803,078 0.3280,600 Tower Bersama Infrastructure Tbk PT 77,691 0.0210,300 Unilever Indonesia Tbk PT 727,753 0.1241,400 United Tractors Tbk PT 459,428 0.1
15,444,473 2.1
Malaysia: 2.1%188,000 AirAsia Group Bhd 122,714 0.0136,200 Alliance Bank Malaysia Bhd 136,632 0.0221,900 AMMB Holdings Bhd 248,132 0.0380,500 Axiata Group Bhd 387,557 0.1
18,200 British American Tobacco Malaysia Bhd 161,257 0.0660,000 CIMB Group Holdings Bhd 834,019 0.1504,342 Dialog Group BHD 391,512 0.1448,900 Digi.Com BHD 500,959 0.1
14,300 Fraser & Neave Holdings Bhd 122,166 0.0248,300 Gamuda BHD 175,662 0.0308,000 Genting Bhd 501,604 0.1407,100 Genting Malaysia BHD 319,773 0.1
28,400 Genting Plantations Bhd 73,780 0.077,700 HAP Seng Consolidated Bhd 188,446 0.0
179,300 Hartalega Holdings Bhd 203,618 0.090,172 Hong Leong Bank BHD 449,116 0.125,392 Hong Leong Financial Group Bhd 119,356 0.0
290,800 IHH Healthcare Bhd 411,725 0.1400,800 IJM Corp. Bhd 218,406 0.0286,900 IOI Corp. Bhd 313,633 0.1222,340 IOI Properties Group Bhd 71,968 0.0
64,600 Kuala Lumpur Kepong Bhd 392,426 0.0496,500 Malayan Banking BHD 1,128,209 0.2117,800 Malaysia Airports Holdings Bhd 209,248 0.0334,700 Maxis Bhd 440,018 0.1153,700 MISC Bhd 252,289 0.0
7,800 Nestle Malaysia Bhd 280,545 0.0344,900 Petronas Chemicals Group Bhd 774,420 0.1
29,900 Petronas Dagangan BHD 183,431 0.0
Copyright © 2021 www.secdatabase.com. All Rights Reserved.Please Consider the Environment Before Printing This Document

Voya Emerging Markets Index PortfolioPORTFOLIO OF INVESTMENTS
as of March 31, 2019 (Unaudited) (Continued)
Shares ValuePercentage
of NetAssets
COMMON STOCK: (continued)Malaysia: (continued)
95,300 Petronas Gas BHD $ 411,880 0.181,380 PPB Group Bhd 365,103 0.1
177,200 Press Metal Aluminium Holdings Bhd 196,209 0.0383,300 Public Bank BHD 2,176,154 0.3
65,500 QL Resources Bhd 110,449 0.077,500 (1),(4) RHB Bank Bhd – –96,976 RHB Capital Bhd 135,569 0.0
303,300 Sime Darby Bhd 165,819 0.0336,700 Sime Darby Plantation Bhd 414,308 0.1355,200 Sime Darby Property Bhd 96,679 0.0173,300 SP Setia Bhd Group 96,490 0.0125,700 Telekom Malaysia BHD 98,687 0.0409,000 Tenaga Nasional BHD 1,270,690 0.2190,400 Top Glove Corp. Bhd 215,782 0.0111,800 Westports Holdings Bhd 103,063 0.0427,134 YTL Corp. Bhd 110,977 0.0
15,580,480 2.1
Mexico: 2.6%437,900 Alfa SA de CV 464,290 0.1
61,100 Alsea SAB de CV 127,927 0.04,411,200 America Movil SAB de CV 3,152,115 0.4
58,700 Arca Continental SAB de CV 326,611 0.0246,855 Banco Santander Mexico SA Institucion de Banca Multiple Grupo Financiero
Santand 337,148 0.0
1,996,321 (1) Cemex SA de CV 931,810 0.172,600 Coca-Cola Femsa SAB de CV 479,730 0.122,600 El Puerto de Liverpool SAB de CV 142,654 0.0
481,200 Fibra Uno Administracion SA de CV 663,160 0.1253,300 Fomento Economico Mexicano SAB de CV 2,334,871 0.3
29,970 Gruma SAB de CV 306,922 0.051,200 Grupo Aeroportuario del Pacifico SA de CV 453,909 0.129,760 Grupo Aeroportuario del Sureste SA de CV 480,937 0.1
231,000 Grupo Bimbo SAB de CV 481,869 0.156,800 Grupo Carso SAB de CV 222,369 0.0
345,077 Grupo Financiero Banorte 1,874,699 0.3327,600 Grupo Financiero Inbursa SA 453,335 0.1457,900 Grupo Mexico SA de CV Series B 1,253,606 0.2327,400 (2) Grupo Televisa S.A. 723,610 0.1
17,870 Industrias Penoles, S.A. de C.V. 223,008 0.073,100 Infraestructura Energetica Nova SAB de CV 293,752 0.0
210,500 Kimberly-Clark de Mexico SA de CV 356,360 0.030,900 Megacable Holdings SAB de CV 143,307 0.0
149,550 Mexichem SA de CV 357,498 0.132,525 Promotora y Operadora de Infraestructura SAB de CV 322,498 0.011,901 Southern Copper Corp. 472,232 0.1
686,600 Wal-Mart de Mexico SAB de CV 1,835,508 0.3
Copyright © 2021 www.secdatabase.com. All Rights Reserved.Please Consider the Environment Before Printing This Document

19,215,735 2.6
Pakistan: 0.0%73,000 Habib Bank Ltd. 68,716 0.050,700 MCB Bank Ltd. 70,793 0.066,500 Oil & Gas Development Co. Ltd. 69,622 0.0
209,131 0.0
Peru: 0.4%25,934 Cia de Minas Buenaventura SAA ADR 448,140 0.1
8,911 Credicorp Ltd. 2,138,194 0.32,586,334 0.4
Philippines: 1.1%285,740 Aboitiz Equity Ventures, Inc. 320,963 0.1187,600 Aboitiz Power Corp. 126,472 0.0497,100 Alliance Global Group, Inc. 153,086 0.0
35,895 Ayala Corp. 642,821 0.11,011,000 Ayala Land, Inc. 865,087 0.1
122,440 Bank of the Philippine Islands 196,528 0.0277,279 BDO Unibank, Inc. 707,739 0.1469,850 DMCI Holdings, Inc. 107,374 0.0
4,170 Globe Telecom, Inc. 153,903 0.012,248 GT Capital Holdings, Inc. 217,434 0.0
107,750 International Container Terminal Services, Inc. 268,195 0.1410,080 JG Summit Holdings, Inc. 496,073 0.1
60,130 Jollibee Foods Corp. 363,002 0.127,390 Manila Electric Co. 198,476 0.0
1,457,700 Megaworld Corp. 161,028 0.01,859,100 Metro Pacific Investments Corp. 171,791 0.0
191,286 Metropolitan Bank & Trust Co. 291,349 0.111,805 PLDT, Inc. 258,772 0.0
263,995 Robinsons Land Corp. 123,174 0.025,570 Security Bank Corp. 84,243 0.033,402 SM Investments Corp. 594,746 0.1
1,313,000 SM Prime Holdings, Inc. 998,299 0.1120,100 Universal Robina Corp. 347,524 0.1
7,848,079 1.1
Copyright © 2021 www.secdatabase.com. All Rights Reserved.Please Consider the Environment Before Printing This Document

Voya Emerging Markets Index PortfolioPORTFOLIO OF INVESTMENTS
as of March 31, 2019 (Unaudited) (Continued)
Shares ValuePercentage
of NetAssets
COMMON STOCK: (continued)Poland: 1.1%
11,561 (1) Alior Bank SA $ 180,124 0.02,906 Bank Handlowy w Warszawie 51,111 0.0
74,981 (1) Bank Millennium SA 174,722 0.024,139 (1),(2) Bank Polska Kasa Opieki SA 692,291 0.1
3,615 (1) CCC SA 202,803 0.09,379 (1) CD Projekt SA 489,370 0.1
30,519 (1) Cyfrowy Polsat SA 204,183 0.05,979 (1),(3) Dino Polska SA 188,232 0.0
12,785 (1) Grupa Lotos SA 277,755 0.05,697 (1) Jastrzebska Spolka Weglowa SA 90,586 0.0
20,197 (1) KGHM Polska Miedz SA 563,041 0.1182 (1) LPP SA 394,613 0.1
1,947 (1) mBank SA 215,623 0.0116,151 (1) PGE Polska Grupa Energetyczna SA 300,915 0.139,308 (1) Polski Koncern Naftowy Orlen 1,000,559 0.1
242,848 (1) Polskie Gornictwo Naftowe I Gazownictwo SA 396,040 0.1115,275 (1) Powszechna Kasa Oszczednosci Bank Polski SA 1,158,996 0.280,358 (1) Powszechny Zaklad Ubezpieczen SA 848,244 0.1
4,941 (1) Santander Bank Polska SA 490,721 0.177,914 (1) Orange Polska SA 104,144 0.0
8,024,073 1.1
Qatar: 0.9%21,155 Barwa Real Estate Co. 212,959 0.027,411 Commercial Bank PQSC 338,508 0.1
112,058 (1) Ezdan Holding Group QSC 304,710 0.023,409 Industries Qatar QSC 798,054 0.154,013 Masraf Al Rayan 545,720 0.110,359 Ooredoo QPSC 188,928 0.0
6,654 Qatar Electricity & Water Co. QSC 314,885 0.120,107 Qatar Insurance Co. SAQ 201,850 0.016,660 Qatar Islamic Bank SAQ 694,357 0.159,887 Qatar National Bank QPSC 2,969,120 0.4
6,569,091 0.9
Romania: 0.1%52,867 NEPI Rockcastle PLC 444,957 0.1
Russia: 3.6%348,400 Alrosa PJSC 490,681 0.1
1,403,173 Gazprom PJSC 3,200,372 0.44,410,000 Inter RAO UES PJSC 251,230 0.0
64,768 Lukoil PJSC 5,816,229 0.847,565 Magnit PJSC GDR 672,064 0.1
289,100 Magnitogorsk Iron & Steel Works PJSC 202,260 0.08,269 MMC Norilsk Nickel OJSC 1,726,418 0.2
70,003 Mobile TeleSystems PJSC ADR 529,223 0.1
Copyright © 2021 www.secdatabase.com. All Rights Reserved.Please Consider the Environment Before Printing This Document

196,515 (1) Moscow Exchange MICEX-RTS PJ 273,563 0.012,125 Novatek PJSC GDR 2,078,918 0.3
172,330 Novolipetsk Steel PJSC 447,797 0.115,441 PhosAgro OJSC GDR 193,817 0.022,532 Polymetal International PLC 253,393 0.0
3,811 Polyus PJSC 315,566 0.1154,086 Rosneft Oil Co. PJSC 967,021 0.1
1,430,862 Sberbank of Russia PJSC 4,674,040 0.729,871 Severstal PJSC 467,964 0.1
981,851 Surgutneftegas PJSC 372,154 0.1202,575 Tatneft PJSC 2,332,179 0.3
443,227,930 VTB Bank PJSC 240,754 0.01,245 X5 Retail Group N.V. GDR 31,025 0.0
16,127 X5 Retail Group NV GDR 402,356 0.125,939,024 3.6
Singapore: 0.0%25,900 (3) BOC Aviation Ltd. 211,400 0.0
South Africa: 5.7%94,116 (2) Absa Group Ltd. 996,018 0.17,242 Anglo American Platinum Ltd. 369,722 0.1
52,978 (2) AngloGold Ashanti Ltd. 696,565 0.153,108 Aspen Pharmacare Holdings Ltd. 343,043 0.043,586 (2) Bid Corp. Ltd. 900,976 0.146,694 Bidvest Group Ltd. 628,930 0.1
5,644 Capitec Bank Holdings Ltd. 528,067 0.136,410 Clicks Group Ltd. 464,842 0.150,580 Discovery Ltd. 480,978 0.134,816 Exxaro Resources Ltd. 395,955 0.1
443,672 (2) FirstRand Ltd. 1,942,699 0.3129,933 (2) Fortress REIT Ltd. - Class A 164,979 0.0101,244 (2) Fortress REIT Ltd. - Class B 75,641 0.0
31,051 Foschini Group Ltd./The 352,373 0.0115,385 (2) Gold Fields Ltd. 425,303 0.1420,280 (2) Growthpoint Properties Ltd. 711,482 0.1
31,501 Hyprop Investments Ltd. 153,873 0.036,910 Investec Ltd. 216,115 0.0
8,230 (2) Kumba Iron Ore Ltd. 246,628 0.011,093 Liberty Holdings Ltd. 77,673 0.0
188,674 Life Healthcare Group Holdings Ltd. 351,438 0.099,019 MMI Holdings Ltd. 113,851 0.016,657 Mondi Ltd. 369,504 0.135,880 Mr Price Group Ltd. 471,291 0.1
223,062 (2) MTN Group Ltd. 1,373,029 0.260,498 (1) MultiChoice Group Ltd. 506,080 0.1
Copyright © 2021 www.secdatabase.com. All Rights Reserved.Please Consider the Environment Before Printing This Document

Voya Emerging Markets Index PortfolioPORTFOLIO OF INVESTMENTS
as of March 31, 2019 (Unaudited) (Continued)
Shares ValuePercentage
of NetAssets
COMMON STOCK: (continued)South Africa: (continued)
58,504 Naspers Ltd. $ 13,633,869 1.952,403 (2) Nedbank Group Ltd. 915,823 0.1
156,179 Netcare Ltd. 254,035 0.0649,727 (2) Old Mutual Ltd. 985,892 0.1
47,436 Pick n Pay Stores Ltd. 218,330 0.021,140 PSG Group Ltd. 383,295 0.177,636 (2) Rand Merchant Investment Holdings Ltd. 181,097 0.0
757,227 Redefine Properties Ltd. 509,063 0.119,913 Reinet Investments SCA 340,593 0.069,024 Remgro Ltd. 888,298 0.134,061 Resilient REIT Ltd. 128,676 0.0
100,470 RMB Holdings Ltd. 530,198 0.1235,320 Sanlam Ltd. 1,207,754 0.2
73,866 Sappi Ltd. 341,205 0.174,351 Sasol Ltd. 2,318,309 0.358,932 Shoprite Holdings Ltd. 649,258 0.126,640 Spar Group Ltd. 354,926 0.0
170,537 (2) Standard Bank Group Ltd. 2,199,751 0.333,455 Telkom SA Ltd. 169,909 0.022,624 Tiger Brands Ltd. 416,376 0.160,527 Truworths International Ltd. 292,731 0.086,887 Vodacom Group Pty Ltd. 670,911 0.1
141,323 Woolworths Holdings Ltd./South Africa 455,353 0.141,402,707 5.7
South Korea: 12.1%4,463 Amorepacific Corp. 742,825 0.13,782 AMOREPACIFIC Group 232,398 0.01,014 BGF retail Co. Ltd. 195,189 0.0
32,626 BNK Financial Group, Inc. 192,114 0.06,944 (1) Celltrion Healthcare Co. Ltd. 409,462 0.12,117 (1) Celltrion Pharm, Inc. 103,575 0.0
11,097 (1) Celltrion, Inc. 1,774,465 0.38,400 Cheil Worldwide, Inc. 179,141 0.01,109 CJ CheilJedang Corp. 315,760 0.11,919 CJ Corp. 210,768 0.01,489 CJ ENM Co. Ltd. 305,904 0.01,033 (1) CJ Logistics Corp. 150,791 0.07,271 Coway Co., Ltd. 605,330 0.13,845 Daelim Industrial Co., Ltd. 326,578 0.1
19,086 (1) Daewoo Engineering & Construction Co., Ltd. 85,564 0.04,353 (1) Daewoo Shipbuilding & Marine Engineering Co., Ltd. 107,441 0.0
20,950 DGB Financial Group, Inc. 150,914 0.07,077 DB Insurance Co. Ltd 428,323 0.15,292 Doosan Bobcat, Inc. 144,194 0.02,972 E-Mart, Inc. 450,862 0.16,635 Fila Korea Ltd. 456,360 0.1
Copyright © 2021 www.secdatabase.com. All Rights Reserved.Please Consider the Environment Before Printing This Document

7,443 GS Engineering & Construction Corp. 280,035 0.03,316 GS Retail Co. Ltd. 114,494 0.07,109 GS Holdings Corp. 331,124 0.1
39,876 Hana Financial Group, Inc. 1,280,337 0.210,236 Hankook Tire Co. Ltd. 337,713 0.0
896 Hanmi Pharm Co. Ltd. 360,487 0.11,497 Hanmi Science Co. Ltd. 102,243 0.0
24,844 Hanon Systems Corp. 248,868 0.014,491 Hanwha Chemical Corp. 267,678 0.0
5,005 Hanwha Corp. 134,364 0.030,988 Hanwha Life Insurance Co. Ltd. 109,314 0.0
4,548 (1) HLB, Inc. 321,715 0.12,335 Lotte Chemical Corp. 599,064 0.14,326 Hotel Shilla Co. Ltd. 364,564 0.13,284 HDC Hyundai Development Co-Engineering & Construction 146,873 0.01,632 Hyundai Department Store Co. Ltd. 145,466 0.0
10,738 Hyundai Engineering & Construction Co. Ltd. 506,170 0.12,611 Hyundai Glovis Co., Ltd. 295,963 0.05,155 (1) Hyundai Heavy Industries Co. Ltd 541,582 0.18,648 Hyundai Marine & Fire Insurance Co., Ltd. 288,975 0.09,048 Hyundai Mobis Co. Ltd. 1,663,876 0.2
18,968 Hyundai Motor Co. 1,999,931 0.311,448 Hyundai Steel Co. 453,936 0.11,374 Hyundai Heavy Industries Holdings Co., Ltd. 403,475 0.1
35,085 Industrial Bank Of Korea 434,416 0.14,245 (3) Orange Life Insurance Ltd. 134,750 0.06,853 Kakao Corp. 626,157 0.1
16,567 Kangwon Land, Inc. 467,309 0.152,828 KB Financial Group, Inc. 1,954,751 0.3
732 KCC Corp. 205,621 0.034,570 Kia Motors Corp. 1,077,381 0.210,073 Korea Aerospace Industries Ltd. 314,380 0.133,806 (1) Korea Electric Power Corp. 889,137 0.1
3,225 Korea Gas Corp. 128,308 0.05,596 Korea Investment Holdings Co., Ltd. 306,839 0.01,244 Korea Zinc Co., Ltd. 510,310 0.16,351 Korean Air Lines Co. Ltd. 178,571 0.02,336 KT Corp. 56,375 0.0
15,396 KT&G Corp. 1,403,913 0.22,418 Kumho Petrochemical Co. Ltd. 203,194 0.06,178 LG Chem Ltd. 1,995,550 0.3
12,847 LG Corp. 877,579 0.132,260 (1) LG Display Co., Ltd. 555,896 0.114,037 LG Electronics, Inc. 930,754 0.1
1,253 LG Household & Health Care Ltd. 1,565,803 0.21,752 LG Innotek Co. Ltd. 182,135 0.0
Copyright © 2021 www.secdatabase.com. All Rights Reserved.Please Consider the Environment Before Printing This Document

Voya Emerging Markets Index PortfolioPORTFOLIO OF INVESTMENTS
as of March 31, 2019 (Unaudited) (Continued)
Shares ValuePercentage
of NetAssets
COMMON STOCK: (continued)South Korea: (continued)
14,846 LG Uplus Corp. $ 202,189 0.03,594 Lotte Corp. 156,650 0.01,524 Lotte Shopping Co. Ltd. 239,318 0.0
632 Medy-Tox, Inc. 326,312 0.154,433 Mirae Asset Daewoo Co., Ltd. 352,434 0.118,737 NAVER Corp. 2,050,621 0.3
2,357 NCSoft Corp. 1,030,445 0.13,602 (1),(3) Netmarble Corp. 397,194 0.1
18,456 NH Investment & Securities Co., Ltd. 219,297 0.02,347 OCI Co. Ltd. 192,634 0.02,994 Orion Corp./Republic of Korea 263,959 0.0
122 Ottogi Corp. 82,903 0.028,290 (1) Pan Ocean Co. Ltd. 102,682 0.0
686 (1) Pearl Abyss Corp. 101,629 0.010,372 POSCO 2,316,066 0.3
2,902 POSCO Chemtech Co. Ltd. 154,325 0.06,259 Posco International Corp. 98,117 0.02,189 S-1 Corp. 193,811 0.02,218 (1),(3) Samsung Biologics Co. Ltd. 626,071 0.19,934 Samsung C&T Corp. 938,017 0.13,105 Samsung Card Co. 94,099 0.07,473 Samsung Electro-Mechanics Co. Ltd. 691,212 0.1
637,980 Samsung Electronics Co., Ltd. 25,163,801 3.562,145 (1) Samsung Heavy Industries Co., Ltd. 453,153 0.1
9,938 Samsung Life Insurance Co. Ltd. 736,583 0.17,300 Samsung SDI Co., Ltd. 1,383,404 0.24,682 Samsung SDS Co. Ltd. 971,440 0.18,578 Samsung Securities Co. Ltd. 252,375 0.0
21,960 (1) Samsung Engineering Co. Ltd. 312,452 0.04,146 Samsung Fire & Marine Insurance Co. Ltd. 1,099,415 0.2
56,825 Shinhan Financial Group Co., Ltd. 2,110,037 0.31,003 Shinsegae, Inc. 299,015 0.08,003 (1) SillaJen, Inc. 454,913 0.14,148 SK Holdings Co. Ltd. 989,997 0.1
77,697 SK Hynix, Inc. 5,094,307 0.78,550 SK Innovation Co. Ltd. 1,352,556 0.22,787 SK Telecom Co., Ltd. 617,233 0.16,337 S-Oil Corp. 500,192 0.11,862 (1) ViroMed Co. Ltd. 460,783 0.1
63,417 Woori Financial Group, Inc. 768,200 0.11,269 Yuhan Corp. 268,582 0.0
87,983,757 12.1
Taiwan: 11.0%398,462 Acer, Inc. 256,148 0.0
47,694 Advantech Co. Ltd. 396,897 0.115,000 Airtac International Group 195,054 0.0
463,243 ASE Industrial Holding Co. Ltd. 1,016,178 0.1
Copyright © 2021 www.secdatabase.com. All Rights Reserved.Please Consider the Environment Before Printing This Document

314,356 Asia Cement Corp. 409,543 0.197,000 Asustek Computer, Inc. 702,895 0.1
1,235,000 AU Optronics Corp. 455,251 0.188,000 Catcher Technology Co., Ltd. 679,821 0.1
1,072,611 Cathay Financial Holding Co., Ltd. 1,566,796 0.2162,710 Chailease Holding Co. Ltd. 666,728 0.1740,770 Chang Hwa Commercial Bank Ltd. 443,751 0.1275,650 Cheng Shin Rubber Industry Co. Ltd. 375,641 0.1
75,816 Chicony Electronics Co. Ltd. 176,655 0.0301,000 China Airlines Ltd. 96,386 0.0
1,979,000 China Development Financial Holding Corp. 662,389 0.1371,827 China Life Insurance Co., Ltd. 315,858 0.0
1,615,535 China Steel Corp. 1,326,949 0.22,300,170 CTBC Financial Holding Co. Ltd. 1,527,510 0.2
492,000 Chunghwa Telecom Co., Ltd. 1,749,532 0.2597,000 Compal Electronics, Inc. 371,523 0.1274,703 Delta Electronics, Inc. 1,419,346 0.2
1,305,273 E.Sun Financial Holding Co., Ltd. 1,007,258 0.125,386 Eclat Textile Co. Ltd. 342,313 0.1
291,335 Eva Airways Corp. 142,850 0.0271,966 Evergreen Marine Corp. Taiwan Ltd 105,623 0.0469,685 Far Eastern New Century Corp. 464,988 0.1228,000 Far EasTone Telecommunications Co., Ltd. 549,994 0.1
46,312 Feng TAY Enterprise Co., Ltd. 328,310 0.11,346,942 First Financial Holding Co., Ltd. 922,495 0.1
457,600 Formosa Chemicals & Fibre Co. 1,667,234 0.2168,000 Formosa Petrochemical Corp. 630,676 0.1578,600 Formosa Plastics Corp. 2,059,525 0.3
87,000 Formosa Taffeta Co. Ltd. 103,990 0.0124,849 Foxconn Technology Co., Ltd. 249,540 0.0869,000 Fubon Financial Holding Co., Ltd. 1,299,057 0.2
44,000 Giant Manufacturing Co., Ltd. 314,656 0.030,000 Globalwafers Co. Ltd. 296,377 0.0
106,300 Highwealth Construction Corp. 175,401 0.031,249 Hiwin Technologies Corp. 264,660 0.0
Copyright © 2021 www.secdatabase.com. All Rights Reserved.Please Consider the Environment Before Printing This Document

Voya Emerging Markets Index PortfolioPORTFOLIO OF INVESTMENTS
as of March 31, 2019 (Unaudited) (Continued)
Shares ValuePercentage
of NetAssets
COMMON STOCK: (continued)Taiwan: (continued)
1,744,170 HON HAI Precision Industry Co., Ltd. $ 4,168,417 0.639,000 Hotai Motor Co. Ltd. 478,653 0.1
1,104,824 Hua Nan Financial Holdings Co. Ltd. 695,841 0.11,279,439 Innolux Corp. 415,950 0.1
339,000 Inventec Co., Ltd. 258,275 0.013,000 Largan Precision Co. Ltd. 1,949,791 0.3
307,538 Lite-On Technology Corp. 448,260 0.1201,820 MediaTek, Inc. 1,855,598 0.3
1,425,826 Mega Financial Holdings Co., Ltd. 1,298,951 0.290,000 Micro-Star International Co., Ltd. 253,570 0.0
667,890 Nan Ya Plastics Corp. 1,712,558 0.2142,000 Nanya Technology Corp. 283,988 0.0
21,000 Nien Made Enterprise Co. Ltd. 185,383 0.083,000 Novatek Microelectronics Corp., Ltd. 534,410 0.1
281,000 Pegatron Corp. 487,272 0.118,000 Phison Electronics Corp. 176,726 0.0
302,000 Pou Chen Corp. 368,409 0.194,000 Powertech Technology, Inc. 222,588 0.076,000 President Chain Store Corp. 749,206 0.1
368,000 Quanta Computer, Inc. 691,200 0.164,760 Realtek Semiconductor Corp. 383,729 0.167,819 Ruentex Development Co. Ltd. 102,687 0.041,048 Ruentex Industries Ltd. 107,939 0.0
352,000 Shanghai Commercial & Savings Bank Ltd./The 556,674 0.11,485,943 Shin Kong Financial Holding Co., Ltd. 438,382 0.11,561,454 SinoPac Financial Holdings Co., Ltd. 578,324 0.1
53,914 Standard Foods Corp. 90,680 0.0192,800 Synnex Technology International Corp. 231,886 0.0
22,000 (1) TaiMed Biologics, Inc. 120,154 0.01,474,598 Taishin Financial Holdings Co., Ltd. 672,766 0.1
528,326 Taiwan Business Bank 205,912 0.0598,900 Taiwan Cement Corp. 802,990 0.1
1,266,420 Taiwan Cooperative Financial Holding Co. Ltd. 801,889 0.1252,000 Taiwan High Speed Rail Corp. 294,673 0.0198,000 Taiwan Mobile Co., Ltd. 716,309 0.1
3,290,000 Taiwan Semiconductor Manufacturing Co., Ltd. 26,349,804 3.6243,000 (1) Tatung Co., Ltd. 192,112 0.0627,209 Uni-President Enterprises Corp. 1,524,106 0.2
1,606,000 United Microelectronics Corp. 608,204 0.1118,000 Vanguard International Semiconductor Corp. 255,207 0.042,000 Walsin Technology Corp. 273,827 0.047,000 Win Semiconductors Corp. 333,357 0.1
366,000 Winbond Electronics Corp. 175,814 0.0374,382 Wistron Corp. 288,684 0.0211,280 WPG Holdings Ltd. 275,935 0.034,537 Yageo Corp. 363,915 0.1
Copyright © 2021 www.secdatabase.com. All Rights Reserved.Please Consider the Environment Before Printing This Document

1,343,586 Yuanta Financial Holding Co., Ltd. 766,384 0.157,000 Zhen Ding Technology Holding Ltd. 177,315 0.0
80,660,502 11.0
Thailand: 2.3%141,700 Advanced Info Service PCL 822,904 0.1556,800 Airports of Thailand PCL 1,194,836 0.2
31,400 Bangkok Bank PCL - Foreign Reg 205,065 0.0546,500 Bangkok Dusit Medical Services PCL 427,280 0.1
1,068,900 Bangkok Expressway & Metro PCL 340,402 0.1279,000 Banpu PCL (Foreign) 142,653 0.0162,800 Berli Jucker PCL 254,353 0.0797,300 BTS Group Holdings PCL 276,443 0.0
48,700 Bumrungrad Hospital PCL 275,482 0.0195,000 Central Pattana PCL 450,611 0.1476,100 Charoen Pokphand Foods PCL 382,738 0.1654,100 CP ALL PCL (Foreign) 1,541,341 0.2
61,200 Delta Electronics Thailand PCL 136,972 0.015,300 Electricity Generating PCL 140,899 0.0
172,700 Energy Absolute PCL 261,613 0.063,400 Glow Energy PCL 181,799 0.041,700 Gulf Energy Development PCL 125,670 0.0
533,551 Home Product Center PCL 257,510 0.0223,100 Indorama Ventures PCL 350,276 0.1
1,360,700 IRPC PCL 246,449 0.0240,700 Kasikornbank PCL - Foreign 1,423,859 0.2472,200 Krung Thai Bank PCL 285,973 0.1353,700 Land & House Pub Co. Ltd. 119,336 0.0318,600 Minor International PCL (Foreign) 391,733 0.1
78,700 Muangthai Capital PCL 109,404 0.0319,100 PTT Global Chemical PCL (Foreign) 677,746 0.1186,900 PTT Exploration & Production PCL 739,021 0.1
Copyright © 2021 www.secdatabase.com. All Rights Reserved.Please Consider the Environment Before Printing This Document

Voya Emerging Markets Index PortfolioPORTFOLIO OF INVESTMENTS
as of March 31, 2019 (Unaudited) (Continued)
Shares ValuePercentage
of NetAssets
COMMON STOCK: (continued)Thailand: (continued)
1,394,200 PTT PCL (Foreign) $ 2,108,887 0.362,800 (2) Robinson PCL 116,382 0.050,800 Siam Cement PCL 772,341 0.1
246,000 Siam Commercial Bank PCL 1,023,415 0.2154,500 Thai Oil PCL 338,442 0.1250,500 Thai Union Group PCL 152,447 0.0
1,319,000 TMB Bank PCL 84,771 0.01,360,490 (2) True Corp. PCL 204,383 0.0
16,563,436 2.3
Turkey: 0.5%404,251 Akbank Turk AS 460,293 0.1
21,928 Anadolu Efes Biracilik Ve Malt Sanayii AS 68,996 0.025,184 Arcelik A/S 76,559 0.047,160 Aselsan Elektronik Sanayi Ve Ticaret AS 180,489 0.030,135 BIM Birlesik Magazalar AS 411,853 0.0
196,880 Eregli Demir ve Celik Fabrikalari TAS 322,940 0.18,212 Ford Otomotiv Sanayi AS 72,006 0.0
126,214 Haci Omer Sabanci Holding AS 178,074 0.0105,956 KOC Holding AS 306,835 0.0
89,449 Petkim Petrokimya Holding 73,035 0.020,520 TAV Havalimanlari Holding AS 86,091 0.017,271 Tupras Turkiye Petrol Rafine 387,354 0.176,314 (1) Turk Hava Yollari 177,554 0.0
153,840 Turkcell Iletisim Hizmet AS 333,982 0.1322,415 Turkiye Garanti Bankasi A/S 485,029 0.1
74,319 (1) Turkiye Halk Bankasi AS 85,424 0.0207,419 Turkiye Is Bankasi 205,719 0.0
81,752 Turk Sise Ve Cam Fabrikalari 85,601 0.03,997,834 0.5
United Arab Emirates: 0.7%289,161 Abu Dhabi Commercial Bank PJSC 747,054 0.1480,988 Aldar Properties PJSC 237,769 0.0199,548 DAMAC Properties Dubai Co. PJSC 73,601 0.0
23,076 DP World Ltd. 369,216 0.1231,792 Dubai Islamic Bank PJSC 309,541 0.1
92,544 Emaar Development PJSC 97,800 0.0220,364 Emaar Malls PJSC 104,500 0.0507,296 Emaar Properties PJSC 649,102 0.1226,226 Emirates Telecommunications Group Co. PJSC 1,030,274 0.1360,105 First Abu Dhabi Bank PJSC 1,497,924 0.2
5,116,781 0.7
Total Common Stock(Cost $628,204,437) 683,584,379 93.6
PREFERRED STOCK: 3.5%
Copyright © 2021 www.secdatabase.com. All Rights Reserved.Please Consider the Environment Before Printing This Document

Brazil: 2.6%438,921 Banco Bradesco SA 4,797,992 0.6
23,300 Braskem SA 300,820 0.022,300 Cia Brasileira de Distribuicao 517,952 0.1
121,259 Cia Energetica de Minas Gerais 427,388 0.130,500 (1) Centrais Eletricas Brasileiras SA 293,600 0.0
143,500 Gerdau SA 553,791 0.1638,425 Itau Unibanco Holding S.A. 5,578,178 0.8575,187 Investimentos Itau SA 1,755,522 0.2105,160 Lojas Americanas SA 447,192 0.1524,700 Petroleo Brasileiro SA 3,729,526 0.5
59,800 Telefonica Brasil SA 725,478 0.119,127,439 2.6
Chile: 0.1%37,906 Embotelladora Andina SA 138,421 0.015,948 Sociedad Quimica y Minera de Chile SA 612,816 0.1
751,237 0.1
Colombia: 0.1%448,305 Grupo Aval Acciones y Valores 173,667 0.1
15,018 Grupo de Inversiones Suramericana SA 162,050 0.0335,717 0.1
Russia: 0.1%976,123 Surgutneftegas PJSC 609,640 0.1
53 Transneft PJSC 142,539 0.0752,179 0.1
South Korea: 0.6%941 Amorepacific Corp. 88,878 0.0383 (1),(4) CJ Corp. 12,385 0.0
2,217 Hyundai Motor Co. 135,329 0.04,615 Hyundai Motor Co.- Series 2 310,563 0.1
253 LG Household & Health Care Ltd. 186,380 0.0922 LG Chem Ltd. 169,346 0.0
109,636 Samsung Electronics Co., Ltd. 3,510,565 0.54,413,446 0.6
Total Preferred Stock(Cost $20,341,502) 25,380,018 3.5
Copyright © 2021 www.secdatabase.com. All Rights Reserved.Please Consider the Environment Before Printing This Document

Voya Emerging Markets Index PortfolioPORTFOLIO OF INVESTMENTS
as of March 31, 2019 (Unaudited) (Continued)
Shares ValuePercentage
of NetAssets
RIGHTS: 0.0%China: 0.0%
17,252 (1) Xinjiang Goldwind Science & Technology Co. Ltd. - H Shares $ 6,879 0.0
India: 0.0%724,835 (1) Vodafone Idea Ltd. 61,314 0.0
Taiwan: –%17,993 (1),(4) CTBC Financial Holding Co., Ltd. – –
Total Rights(Cost $105,674) 68,193 0.0
Total Long-Term Investments(Cost $648,651,613) 709,032,590 97.1
PrincipalAmount† Value
Percentageof NetAssets
SHORT-TERM INVESTMENTS: 4.9%Securities Lending Collateral(5): 2.4%
4,154,635 Bank of Montreal, Repurchase Agreement dated 03/29/19, 2.60%, due 04/01/19(Repurchase Amount $4,155,523, collateralized by various U.S. Government/U.S.Government Agency Obligations, 0.625%-4.500%, Market Value plus accruedinterest $4,237,732, due 03/31/19-03/01/49)
4,154,635 0.6
4,154,635 Bank of Nova Scotia, Repurchase Agreement dated 03/29/19, 2.67%, due 04/01/19(Repurchase Amount $4,155,547, collateralized by various U.S. GovernmentAgency Obligations, 3.500%-4.571%, Market Value plus accrued interest$4,238,671, due 12/01/33-02/01/49)
4,154,635 0.6
2,843,961 Citibank N.A., Repurchase Agreement dated 03/29/19, 2.65%, due 04/01/19(Repurchase Amount $2,844,580, collateralized by various U.S. Government/U.S.Government Agency Obligations, 2.960%-4.500%, Market Value plus accruedinterest $2,905,323, due 01/01/28-07/01/48)
2,843,961 0.4
4,154,635 Merrill Lynch & Co., Inc., Repurchase Agreement dated 03/29/19, 2.60%, due 04/01/19 (Repurchase Amount $4,155,523, collateralized by various U.S. GovernmentAgency Obligations, 3.500%-4.500%, Market Value plus accrued interest$4,237,728, due 03/20/47-12/20/48)
4,154,635 0.5
2,184,100 State of Wisconsin Investment Board, Repurchase Agreement dated 03/29/19,2.80%, due 04/01/19 (Repurchase Amount $2,184,603, collateralized by variousU.S. Government Securities, 0.125%-3.875%, Market Value plus accrued interest$2,231,468, due 07/15/20-02/15/47)
2,184,100 0.3
17,491,966 2.4
Shares ValuePercentage
of NetAssets
Mutual Funds: 2.5%18,356,000 (6) Goldman Sachs Financial Square Government Fund - Institutional Shares, 2.350%
(Cost $18,356,000) 18,356,000 2.5
Total Short-Term Investments(Cost $35,847,966) 35,847,966 4.9
Total Investments in Securities(Cost $684,499,579) $ 744,880,556 102.0
Liabilities in Excess of Other Assets (14,611,266) (2.0)Net Assets $ 730,269,290 100.0
† Unless otherwise indicated, principal amount is shown in USD.
Copyright © 2021 www.secdatabase.com. All Rights Reserved.Please Consider the Environment Before Printing This Document

ADR American Depositary ReceiptGDR Global Depositary Receipt(1) Non-income producing security.(2) Security, or a portion of the security, is on loan.
(3) Securities with purchases pursuant to Rule 144A or section 4(a)(2), under the Securities Act of 1933 and may not be resold subject tothat rule except to qualified institutional buyers.
(4) For fair value measurement disclosure purposes, security is categorized as Level 3, whose value was determined using significantunobservable inputs.
(5) Represents securities purchased with cash collateral received for securities on loan.(6) Rate shown is the 7-day yield as of March 31, 2019.
Copyright © 2021 www.secdatabase.com. All Rights Reserved.Please Consider the Environment Before Printing This Document

Voya Emerging Markets Index PortfolioPORTFOLIO OF INVESTMENTS
as of March 31, 2019 (Unaudited) (Continued)
Sector Diversification Percentageof Net Assets
Financials 23.5%Information Technology 14.2Consumer Discretionary 13.0Communication Services 11.9Energy 7.8Materials 7.1Consumer Staples 6.3Industrials 5.2Real Estate 3.0Health Care 2.6Utilities 2.5Short-Term Investments 4.9Liabilities in Excess of Other Assets (2.0)Net Assets 100.0%
Fair Value Measurements
The following is a summary of the fair valuations according to the inputs used as of March 31, 2019 in valuing the assets and liabilities:(1)
Quoted Pricesin Active Markets
for IdenticalInvestments
(Level 1)
SignificantOther
ObservableInputs#(Level 2)
SignificantUnobservable
Inputs(Level 3)
Fair Valueat
March 31, 2019
Asset TableInvestments, at fair valueCommon Stock
Brazil $ 31,528,268 $ – $ – $ 31,528,268Chile 6,569,406 – – 6,569,406China 59,816,472 173,596,124 400,206 233,812,802Colombia 2,921,999 – – 2,921,999Czech Republic – 1,193,001 – 1,193,001Egypt 185,892 732,727 – 918,619Greece 311,194 1,259,447 – 1,570,641Hungary – 2,236,953 – 2,236,953India 115,163 64,919,733 – 65,034,896Indonesia 248,632 15,195,841 – 15,444,473Malaysia 392,426 15,188,054 – 15,580,480Mexico 19,215,735 – – 19,215,735Pakistan 139,509 69,622 – 209,131Peru 2,586,334 – – 2,586,334Philippines 1,226,363 6,621,716 – 7,848,079Poland 215,623 7,808,450 – 8,024,073Qatar 1,021,482 5,547,609 – 6,569,091Romania 444,957 – – 444,957Russia 813,641 25,125,383 – 25,939,024Singapore – 211,400 – 211,400South Africa 2,820,155 38,582,552 – 41,402,707South Korea 3,722,080 84,261,677 – 87,983,757Taiwan 716,309 79,944,193 – 80,660,502Thailand 181,799 16,381,637 – 16,563,436Turkey 411,853 3,585,981 – 3,997,834United Arab Emirates 369,216 4,747,565 – 5,116,781
Total Common Stock 135,974,508 547,209,665 400,206 683,584,379Preferred Stock 20,824,033 4,543,600 12,385 25,380,018Rights – 68,193 – 68,193Short-Term Investments 18,356,000 17,491,966 – 35,847,966Total Investments, at fair value $ 175,154,541 $ 569,313,424 $ 412,591 $ 744,880,556Other Financial Instruments+Futures 206,776 – – 206,776Total Assets $ 175,361,317 $ 569,313,424 $ 412,591 $ 745,087,332Liabilities TableOther Financial Instruments+Forward Foreign Currency Contracts $ – $ (1,262) $ – $ (1,262)
Copyright © 2021 www.secdatabase.com. All Rights Reserved.Please Consider the Environment Before Printing This Document

Copyright © 2021 www.secdatabase.com. All Rights Reserved.Please Consider the Environment Before Printing This Document

Voya Emerging Markets Index PortfolioPORTFOLIO OF INVESTMENTS
as of March 31, 2019 (Unaudited) (Continued)
Quoted Pricesin Active Markets
for IdenticalInvestments
(Level 1)
SignificantOther
ObservableInputs#(Level 2)
SignificantUnobservable
Inputs(Level 3)
Fair Valueat
March 31, 2019
Total Liabilities $ – $ (1,262) $ – $ (1,262)
(1)
For the period ended March 31, 2019, as a result of the fair value pricing procedures for international equities utilized by the Portfolio certainsecurities have transferred in and out of Level 1 and Level 2 measurements during the year. The Portfolio's policy is to recognize transfersbetween levels at the beginning of the reporting period. At March 31, 2019, securities valued at $1,746,485 and $10,268,980 were transferredfrom Level 1 to Level 2 and Level 2 to Level 1, respectively, within the fair value hierarchy. In addition, securities valued at $9,278 and $70,423were transferred from Level 2 to Level 3 and Level 3 to Level 2, respectively, due to an increase and decrease in signficiant unobservable inputs.
+Other Financial Instruments may include open forward foreign currency contracts, futures, centrally cleared swaps, OTC swaps and writtenoptions. Forward foreign currency contracts, futures and centrally cleared swaps are valued at the unrealized gain (loss) on the instrument. OTCswaps and written options are valued at the fair value of the instrument.
#
The earlier close of the foreign markets gives rise to the possibility that significant events, including broad market moves, may have occurred inthe interim and may materially affect the value of those securities. To account for this, the Portfolio may frequently value many of its foreign equitysecurities using fair value prices based on third party vendor modeling tools to the extent available. Accordingly, a portion of the Portfolio'sinvestments are categorized as Level 2 investments.
At March 31, 2019, the following forward foreign currency contracts were outstanding for Voya Emerging Markets Index Portfolio:
Currency Purchased Currency Sold Counterparty SettlementDate
UnrealizedAppreciation
(Depreciation)USD 5,697 ZAR 82,533 The Bank of New York Mellon 04/03/19 $ (131)USD 4,406 ZAR 63,827 The Bank of New York Mellon 04/03/19 (101)USD 197 ZAR 2,859 The Bank of New York Mellon 04/03/19 (5)USD 42,536 ZAR 616,206 The Bank of New York Mellon 04/03/19 (978)USD 2,033 ZAR 29,458 The Bank of New York Mellon 04/03/19 (47)
$ (1,262)
At March 31, 2019, the following futures contracts were outstanding for Voya Emerging Markets Index Portfolio:
Description Numberof Contracts
ExpirationDate
NotionalValue
UnrealizedAppreciation/(Depreciation)
Long Contracts:Mini MSCI Emerging Markets Index 418 06/21/19 $ 22,099,660 $ 206,776
$ 22,099,660 $ 206,776
Currency AbbreviationsUSD - United States DollarZAR - South African Rand
At March 31, 2019, the aggregate cost of securities and other investments and the composition of unrealized appreciation and depreciation of securitiesand other investments at period end were:
Cost for federal income tax purposes was $714,332,147.
Net unrealized appreciation consisted of:
Gross Unrealized Appreciation $ 105,794,205Gross Unrealized Depreciation (74,449,481)
Net Unrealized Appreciation $ 31,344,724
Copyright © 2021 www.secdatabase.com. All Rights Reserved.Please Consider the Environment Before Printing This Document

Voya Euro STOXX 50® Index PortfolioPORTFOLIO OF INVESTMENTSas of March 31, 2019 (Unaudited)
Shares ValuePercentage
of NetAssets
COMMON STOCK: 97.6%Belgium: 2.6%
114,270 Anheuser-Busch InBev SA/NV $ 9,592,344 2.6
Finland: 1.2%753,018 Nokia OYJ - Finland 4,289,679 1.2
France: 35.8%57,377 Air Liquide SA 7,301,913 2.0
278,180 AXA S.A. 6,996,509 1.9154,060 BNP Paribas 7,331,474 2.0
86,038 Danone 6,625,040 1.8248,458 Engie SA 3,705,234 1.0
38,934 EssilorLuxottica SA 4,253,166 1.29,971 Kering SA 5,719,416 1.6
32,702 L'Oreal S.A. 8,806,408 2.435,675 LVMH Moet Hennessy Louis Vuitton SE 13,140,368 3.6
273,842 Orange SA 4,464,481 1.248,370 Safran S.A. 6,629,660 1.8
150,914 Sanofi 13,344,507 3.673,386 Schneider Electric SE 5,759,991 1.6
107,945 Societe Generale 3,118,922 0.9352,971 Total SA 19,642,690 5.4
18,476 (1) Unibail-Rodamco-Westfield 3,028,832 0.874,174 Vinci SA 7,217,299 2.0
128,590 Vivendi SA 3,726,565 1.0130,812,475 35.8
Germany: 25.6%24,611 Adidas AG 5,985,949 1.656,712 Allianz SE 12,638,194 3.4
122,717 BASF SE 9,050,031 2.5124,598 Bayer AG 8,023,141 2.2
42,814 Bayerische Motoren Werke AG 3,305,858 0.9119,312 Daimler AG 7,001,653 1.9131,291 Deutsche Post AG 4,272,617 1.2433,299 Deutsche Telekom AG 7,198,511 2.0
54,787 Fresenius SE & Co. KGaA 3,062,166 0.819,980 Muenchener Rueckversicherungs-Gesellschaft AG 4,735,170 1.3
144,525 SAP SE 16,707,823 4.6107,390 Siemens AG 11,549,040 3.2
93,530,153 25.6
Ireland: 1.0%112,684 CRH PLC 3,492,723 1.0
Italy: 4.9%1,037,922 Enel S.p.A. 6,650,837 1.8
Copyright © 2021 www.secdatabase.com. All Rights Reserved.Please Consider the Environment Before Printing This Document

339,408 ENI S.p.A. 5,996,869 1.62,180,574 Intesa Sanpaolo SpA 5,321,754 1.5
17,969,460 4.9
Netherlands: 13.0%76,345 Airbus SE 10,118,528 2.856,872 ASML Holding NV 10,689,127 2.9
519,960 ING Groep NV 6,300,540 1.7158,157 Koninklijke Ahold Delhaize NV 4,210,755 1.1123,748 Koninklijke Philips NV 5,056,067 1.4194,372 Unilever NV 11,332,217 3.1
47,707,234 13.0
Spain: 10.0%58,631 Amadeus IT Group SA 4,699,234 1.3
890,890 (1) Banco Bilbao Vizcaya Argentaria SA 5,090,423 1.42,169,349 Banco Santander SA 10,073,485 2.8
796,532 Iberdrola S.A. 6,993,400 1.9148,493 Industria de Diseno Textil SA 4,365,928 1.2623,097 Telefonica S.A. 5,219,631 1.4
36,442,101 10.0
United Kingdom: 3.5%73,738 Linde PLC 12,983,258 3.5
Total Common Stock(Cost $335,662,167) 356,819,427 97.6
PREFERRED STOCK: 1.1%Germany: 1.1%
24,460 Volkswagen AG 3,856,258 1.1
Total Preferred Stock(Cost $3,289,347) 3,856,258 1.1
Total Long-Term Investments(Cost $338,951,514) 360,675,685 98.7
PrincipalAmount† Value
Percentageof NetAssets
SHORT-TERM INVESTMENTS: 2.5%Securities Lending Collateral(2): 1.8%
321,441 Bank of Montreal, Repurchase Agreement dated 03/29/19, 2.58%, due 04/01/19(Repurchase Amount $321,509, collateralized by various U.S. GovernmentSecurities, 0.000%-3.750%, Market Value plus accrued interest $327,870, due 04/25/19-08/15/48)
321,441 0.1
1,528,973 Bank of Nova Scotia, Repurchase Agreement dated 03/29/19, 2.67%, due 04/01/19(Repurchase Amount $1,529,309, collateralized by various U.S. GovernmentAgency Obligations, 3.500%-4.571%, Market Value plus accrued interest$1,559,899, due 12/01/33-02/01/49)
1,528,973 0.4
Copyright © 2021 www.secdatabase.com. All Rights Reserved.Please Consider the Environment Before Printing This Document

Voya Euro STOXX 50® Index PortfolioPORTFOLIO OF INVESTMENTS
as of March 31, 2019 (Unaudited) (Continued)
PrincipalAmount† Value
Percentageof NetAssets
SHORT-TERM INVESTMENTS: (continued)Securities Lending Collateral(2) (continued)
1,528,973 Citigroup, Inc., Repurchase Agreement dated 03/29/19, 2.65%, due 04/01/19(Repurchase Amount $1,529,306, collateralized by various U.S. Government/U.S.Government Agency Obligations, 0.000%-10.500%, Market Value plus accruedinterest $1,559,553, due 04/02/19-10/20/68)
$ 1,528,973 0.4
1,528,973 Jefferies LLC, Repurchase Agreement dated 03/29/19, 2.67%, due 04/01/19(Repurchase Amount $1,529,309, collateralized by various U.S. GovernmentAgency Obligations, 0.000%-6.625%, Market Value plus accrued interest$1,559,564, due 04/03/19-07/15/36)
1,528,973 0.4
1,528,973 MUFG Securities America Inc., Repurchase Agreement dated 03/29/19, 2.63%,due 04/01/19 (Repurchase Amount $1,529,304, collateralized by various U.S.Government/U.S. Government Agency Obligations, 3.000%-5.000%, Market Valueplus accrued interest $1,559,552, due 01/01/29-01/01/49)
1,528,973 0.5
6,437,333 1.8
Shares ValuePercentage
of NetAssets
Mutual Funds: 0.7%2,519,000 (3) Goldman Sachs Financial Square Government Fund - Institutional Shares, 2.350%
(Cost $2,519,000) 2,519,000 0.7
Total Short-Term Investments(Cost $8,956,333) 8,956,333 2.5
Total Investments in Securities(Cost $347,907,847) $ 369,632,018 101.2
Liabilities in Excess of Other Assets (4,213,797) (1.2)Net Assets $ 365,418,221 100.0
† Unless otherwise indicated, principal amount is shown in USD.(1) Security, or a portion of the security, is on loan.(2) Represents securities purchased with cash collateral received for securities on loan.(3) Rate shown is the 7-day yield as of March 31, 2019.
Sector Diversification Percentageof Net Assets
Financials 16.9%Consumer Discretionary 13.1Industrials 12.5Consumer Staples 11.1Information Technology 9.9Materials 9.0Health Care 8.1Energy 7.0Communication Services 5.6Utilities 4.7Real Estate 0.8Short-Term Investments 2.5Liabilities in Excess of Other Assets (1.2)Net Assets 100.0%
Copyright © 2021 www.secdatabase.com. All Rights Reserved.Please Consider the Environment Before Printing This Document

Voya Euro STOXX 50® Index PortfolioPORTFOLIO OF INVESTMENTS
as of March 31, 2019 (Unaudited) (Continued)
Fair Value Measurements
The following is a summary of the fair valuations according to the inputs used as of March 31, 2019 in valuing the assets and liabilities:(1)
Quoted Pricesin Active Markets
for IdenticalInvestments
(Level 1)
SignificantOther
ObservableInputs#(Level 2)
SignificantUnobservable
Inputs(Level 3)
Fair Valueat
March 31, 2019
Asset TableInvestments, at fair valueCommon Stock
Belgium $ – $ 9,592,344 $ – $ 9,592,344Finland – 4,289,679 – 4,289,679France 3,028,832 127,783,643 – 130,812,475Germany – 93,530,153 – 93,530,153Ireland – 3,492,723 – 3,492,723Italy – 17,969,460 – 17,969,460Netherlands – 47,707,234 – 47,707,234Spain – 36,442,101 – 36,442,101United Kingdom – 12,983,258 – 12,983,258
Total Common Stock 3,028,832 353,790,595 – 356,819,427Preferred Stock – 3,856,258 – 3,856,258Short-Term Investments 2,519,000 6,437,333 – 8,956,333Total Investments, at fair value $ 5,547,832 $ 364,084,186 $ – $ 369,632,018Other Financial Instruments+Forward Foreign Currency Contracts – 10,196 – 10,196Futures 61,494 – – 61,494Total Assets $ 5,609,326 $ 364,094,382 $ – $ 369,703,708Liabilities TableOther Financial Instruments+Forward Foreign Currency Contracts $ – $ (47,605) $ – $ (47,605)Total Liabilities $ – $ (47,605) $ – $ (47,605)
(1)
For the period ended March 31, 2019, as a result of the fair value pricing procedures for international equities utilized by the Portfolio certainsecurities have transferred in and out of Level 1 and Level 2 measurements during the year. The Portfolio's policy is to recognize transfersbetween levels at the beginning of the reporting period. At March 31, 2019, securities valued at $12,042,463 and $2,945,875 were transferredfrom Level 1 to Level 2 and Level 2 to Level 1, respectively, within the fair value hierarchy.
+Other Financial Instruments may include open forward foreign currency contracts, futures, centrally cleared swaps, OTC swaps and writtenoptions. Forward foreign currency contracts, futures and centrally cleared swaps are valued at the unrealized gain (loss) on the instrument. OTCswaps and written options are valued at the fair value of the instrument.
#
The earlier close of the foreign markets gives rise to the possibility that significant events, including broad market moves, may have occurred inthe interim and may materially affect the value of those securities. To account for this, the Portfolio may frequently value many of its foreign equitysecurities using fair value prices based on third party vendor modeling tools to the extent available. Accordingly, a portion of the Portfolio'sinvestments are categorized as Level 2 investments.
At March 31, 2019, the following forward foreign currency contracts were outstanding for Voya Euro STOXX 50® Index Portfolio:
Currency Purchased Currency Sold Counterparty Settlement DateUnrealized
Appreciation(Depreciation)
EUR 1,800,000 USD 2,058,219 The Bank of New York Mellon 06/19/19 $ (25,512)EUR 2,000,000 USD 2,280,656 The Bank of New York Mellon 06/19/19 (22,093)USD 800,694 EUR 700,000 The Bank of New York Mellon 06/19/19 10,196
$ (37,409)
At March 31, 2019, the following futures contracts were outstanding for Voya Euro STOXX 50® Index Portfolio:
Description Numberof Contracts
ExpirationDate
NotionalValue
UnrealizedAppreciation/(Depreciation)
Long Contracts:EURO STOXX 50® Index 96 06/21/19 $ 3,523,568 $ 61,494
$ 3,523,568 $ 61,494
Copyright © 2021 www.secdatabase.com. All Rights Reserved.Please Consider the Environment Before Printing This Document

Currency AbbreviationsEUR - EU EuroUSD - United States Dollar
Copyright © 2021 www.secdatabase.com. All Rights Reserved.Please Consider the Environment Before Printing This Document

Voya Euro STOXX 50® Index PortfolioPORTFOLIO OF INVESTMENTS
as of March 31, 2019 (Unaudited) (Continued)
At March 31, 2019, the aggregate cost of securities and other investments and the composition of unrealized appreciation and depreciation of securitiesand other investments at period end were:
Cost for federal income tax purposes was $356,524,493.
Net unrealized appreciation consisted of:
Gross Unrealized Appreciation $ 48,991,151Gross Unrealized Depreciation (35,636,026)
Net Unrealized Appreciation $ 13,355,125
Copyright © 2021 www.secdatabase.com. All Rights Reserved.Please Consider the Environment Before Printing This Document

Voya FTSE 100 Index® PortfolioPORTFOLIO OF INVESTMENTSas of March 31, 2019 (Unaudited)
Shares ValuePercentage
of NetAssets
COMMON STOCK: 98.4%Australia: 2.1%
196,369 BHP Group PLC $ 4,737,813 2.1
Bermuda: 0.2%26,231 Hiscox Ltd. 533,093 0.2
Germany: 0.2%41,085 TUI AG 394,062 0.2
Ireland: 0.9%9,275 DCC PLC 802,510 0.47,265 Paddy Power Betfair PLC 563,028 0.2
22,420 Smurfit Kappa PLC 629,624 0.31,995,162 0.9
Mexico: 0.1%17,400 Fresnillo PLC 197,193 0.1
Netherlands: 10.7%420,830 Royal Dutch Shell PLC - Class A 13,225,038 5.8353,991 Royal Dutch Shell PLC - Class B 11,188,149 4.9
24,413,187 10.7
Switzerland: 2.8%18,602 Coca-Cola HBC AG 634,317 0.321,902 Ferguson PLC 1,394,968 0.6
1,065,814 Glencore PLC 4,416,927 1.96,446,212 2.8
United Arab Emirates: 0.1%8,126 NMC Health PLC 242,211 0.1
United Kingdom: 81.3%89,925 3i Group PLC 1,153,150 0.519,209 Admiral Group PLC 543,350 0.293,227 Anglo American PLC 2,493,497 1.132,686 Antofagasta PLC 411,247 0.244,635 Ashtead Group PLC 1,079,040 0.532,830 Associated British Foods PLC 1,043,934 0.5
119,696 AstraZeneca PLC 9,554,355 4.286,419 (1) Auto Trader Group PLC 587,772 0.3
370,104 Aviva PLC 1,990,219 0.9301,416 BAE Systems PLC 1,894,640 0.8
1,610,569 Barclays PLC 3,244,137 1.495,040 Barratt Developments PLC 742,392 0.311,322 Berkeley Group Holdings PLC 544,307 0.2
1,873,480 BP PLC 13,604,301 6.0
Copyright © 2021 www.secdatabase.com. All Rights Reserved.Please Consider the Environment Before Printing This Document

215,550 British American Tobacco PLC 8,992,324 3.990,154 British Land Co. PLC 692,173 0.3
787,767 BT Group PLC 2,288,727 1.031,706 Bunzl PLC 1,046,496 0.538,521 Burberry Group PLC 981,778 0.415,139 Carnival PLC 748,290 0.3
537,878 Centrica PLC 801,226 0.4149,397 Compass Group PLC 3,515,092 1.5
77,433 CRH PLC - London 2,399,238 1.111,999 Croda International PLC 788,312 0.3
224,091 Diageo PLC 9,170,310 4.0129,965 Direct Line Insurance Group PLC 597,871 0.3120,000 DS Smith PLC 525,691 0.2
23,349 easyJet PLC 340,165 0.147,853 Evraz PLC 387,159 0.286,421 Experian PLC 2,339,029 1.0
460,237 GlaxoSmithKline PLC 9,561,841 4.235,775 Halma PLC 779,969 0.324,814 Hargreaves Lansdown PLC 602,829 0.313,208 Hikma Pharmaceuticals PLC 308,465 0.1
1,897,924 HSBC Holdings PLC 15,422,337 6.889,679 Imperial Brands PLC 3,067,682 1.3
117,594 Informa PLC 1,140,319 0.517,094 InterContinental Hotels Group PLC 1,028,765 0.4
149,716 International Consolidated Airlines Group SA 996,212 0.415,238 Intertek Group PLC 965,321 0.4
351,834 ITV PLC 582,972 0.3152,651 J Sainsbury PLC 468,436 0.2
17,936 Johnson Matthey PLC 735,543 0.354,297 (2) Just Eat PLC 531,321 0.2
199,371 Kingfisher PLC 611,417 0.367,292 Land Securities Group PLC 801,181 0.3
558,879 Legal & General Group PLC 2,005,618 0.96,708,035 Lloyds Banking Group Plc 5,434,733 2.4
29,446 London Stock Exchange Group PLC 1,821,422 0.8153,469 Marks & Spencer Group PLC 556,984 0.2454,357 Melrose Industries PLC 1,085,257 0.5
38,521 Micro Focus International PLC 1,001,529 0.434,607 Mondi PLC 766,311 0.3
320,769 National Grid PLC 3,560,660 1.612,466 Next PLC 905,858 0.442,404 (2) Ocado Group PLC 757,104 0.373,542 Pearson PLC 802,326 0.429,688 Persimmon PLC 839,747 0.449,670 Phoenix Group Holdings PLC 438,735 0.2
244,716 Prudential PLC 4,905,474 2.159,111 Reckitt Benckiser Group PLC 4,919,398 2.2
178,549 Relx PLC (GBP Exchange) 3,820,839 1.7174,205 Rentokil Initial PLC 802,442 0.4
83,903 Rightmove PLC 557,899 0.2104,624 Rio Tinto PLC 6,081,100 2.7158,897 Rolls-Royce Holdings PLC 1,871,276 0.8
Copyright © 2021 www.secdatabase.com. All Rights Reserved.Please Consider the Environment Before Printing This Document

Voya FTSE 100 Index® PortfolioPORTFOLIO OF INVESTMENTS
as of March 31, 2019 (Unaudited) (Continued)
Shares ValuePercentage
of NetAssets
COMMON STOCK: (continued)United Kingdom: (continued)
426,665 Royal Bank of Scotland Group PLC $ 1,373,899 0.696,778 RSA Insurance Group PLC 640,443 0.3
102,358 Sage Group PLC/The 935,543 0.410,545 Schroders PLC 371,320 0.296,977 SSE PLC 1,500,419 0.7
101,883 Segro PLC 894,340 0.422,359 Severn Trent PLC 575,835 0.382,634 Smith & Nephew PLC 1,641,041 0.737,390 Smiths Group PLC 699,674 0.3
6,931 Spirax-Sarco Engineering PLC 649,565 0.349,269 St. James's Place PLC 660,265 0.3
255,379 Standard Chartered PLC 1,968,559 0.9233,330 Standard Life Aberdeen PLC 801,966 0.4307,117 Taylor Wimpey PLC 702,441 0.3912,633 Tesco PLC 2,762,095 1.2103,201 Unilever PLC 5,940,549 2.6
64,430 United Utilities Group PLC 684,293 0.32,521,088 Vodafone Group PLC 4,594,075 2.0
17,142 Whitbread PLC 1,134,398 0.5205,213 WM Morrison Supermarkets PLC 608,782 0.3115,746 WPP PLC 1,222,753 0.5
185,401,799 81.3
Total Common Stock(Cost $222,098,400) 224,360,732 98.4
CLOSED-END FUNDS: 0.4%United Kingdom: 0.4%
138,875 Scottish Mortgage Investment Trust PLC 927,656 0.4
Total Closed-End Funds(Cost $663,320) 927,656 0.4
Total Long-Term Investments(Cost $222,761,720) 225,288,388 98.8
SHORT-TERM INVESTMENTS: 0.2%Mutual Funds: 0.2%
377,000 (3) Goldman Sachs Financial Square Government Fund - Institutional Shares, 2.350%(Cost $377,000) 377,000 0.2
Total Short-Term Investments(Cost $377,000) 377,000 0.2
Total Investments in Securities(Cost $223,138,720) $ 225,665,388 99.0
Assets in Excess of Other Liabilities 2,385,193 1.0Net Assets $ 228,050,581 100.0
(1) Securities with purchases pursuant to Rule 144A or section 4(a)(2), under the Securities Act of 1933 and may not be resold subject tothat rule except to qualified institutional buyers.
Copyright © 2021 www.secdatabase.com. All Rights Reserved.Please Consider the Environment Before Printing This Document

(2) Non-income producing security.(3) Rate shown is the 7-day yield as of March 31, 2019.
Sector Diversification Percentageof Net Assets
Financials 19.5%Energy 16.7Consumer Staples 16.5Materials 10.8Health Care 9.3Industrials 8.7Consumer Discretionary 6.4Communication Services 5.2Utilities 3.1Information Technology 1.2Real Estate 1.0Financial 0.4Short-Term Investments 0.2Assets in Excess of Other Liabilities 1.0Net Assets 100.0%
Copyright © 2021 www.secdatabase.com. All Rights Reserved.Please Consider the Environment Before Printing This Document

Voya FTSE 100 Index® PortfolioPORTFOLIO OF INVESTMENTS
as of March 31, 2019 (Unaudited) (Continued)
Fair Value Measurements
The following is a summary of the fair valuations according to the inputs used as of March 31, 2019 in valuing the assets and liabilities:
Quoted Pricesin Active Markets
for IdenticalInvestments
(Level 1)
SignificantOther
ObservableInputs#(Level 2)
SignificantUnobservable
Inputs(Level 3)
Fair Valueat
March 31, 2019
Asset TableInvestments, at fair valueCommon Stock
Australia $ – $ 4,737,813 $ – $ 4,737,813Bermuda – 533,093 – 533,093Germany – 394,062 – 394,062Ireland – 1,995,162 – 1,995,162Mexico – 197,193 – 197,193Netherlands – 24,413,187 – 24,413,187Switzerland – 6,446,212 – 6,446,212United Arab Emirates – 242,211 – 242,211United Kingdom – 185,401,799 – 185,401,799
Total Common Stock – 224,360,732 – 224,360,732Closed-End Funds – 927,656 – 927,656Short-Term Investments 377,000 – – 377,000Total Investments, at fair value $ 377,000 $ 225,288,388 $ – $ 225,665,388Other Financial Instruments+Forward Foreign Currency Contracts – 11,783 – 11,783Futures 58,098 – – 58,098Total Assets $ 435,098 $ 225,300,171 $ – $ 225,735,269Liabilities TableOther Financial Instruments+Forward Foreign Currency Contracts $ – $ (30,431) $ – $ (30,431)Total Liabilities $ – $ (30,431) $ – $ (30,431)
+Other Financial Instruments may include open forward foreign currency contracts, futures, centrally cleared swaps, OTC swaps and writtenoptions. Forward foreign currency contracts, futures and centrally cleared swaps are valued at the unrealized gain (loss) on the instrument. OTCswaps and written options are valued at the fair value of the instrument.
#
The earlier close of the foreign markets gives rise to the possibility that significant events, including broad market moves, may have occurred inthe interim and may materially affect the value of those securities. To account for this, the Portfolio may frequently value many of its foreign equitysecurities using fair value prices based on third party vendor modeling tools to the extent available. Accordingly, a portion of the Portfolio'sinvestments are categorized as Level 2 investments.
At March 31, 2019, the following forward foreign currency contracts were outstanding for Voya FTSE 100 Index® Portfolio:
Currency Purchased Currency Sold Counterparty SettlementDate
UnrealizedAppreciation
(Depreciation)GBP 1,330,000 USD 1,769,530 The Bank of New York Mellon 06/19/19 $ (30,431)USD 439,678 GBP 330,000 The Bank of New York Mellon 06/19/19 8,172USD 265,130 GBP 200,000 The Bank of New York Mellon 06/19/19 3,611
$ (18,648)
At March 31, 2019, the following futures contracts were outstanding for Voya FTSE 100 Index® Portfolio:
Description Numberof Contracts
ExpirationDate
NotionalValue
UnrealizedAppreciation/(Depreciation)
Long Contracts:FTSE 100 Index 30 06/21/19 $ 2,817,799 $ 58,098
$ 2,817,799 $ 58,098
Currency AbbreviationsGBP - British PoundUSD - United States Dollar
Copyright © 2021 www.secdatabase.com. All Rights Reserved.Please Consider the Environment Before Printing This Document

Copyright © 2021 www.secdatabase.com. All Rights Reserved.Please Consider the Environment Before Printing This Document

Voya FTSE 100 Index® PortfolioPORTFOLIO OF INVESTMENTS
as of March 31, 2019 (Unaudited) (Continued)
At March 31, 2019, the aggregate cost of securities and other investments and the composition of unrealized appreciation and depreciation of securitiesand other investments at period end were:
Cost for federal income tax purposes was $231,884,543.
Net unrealized depreciation consisted of:
Gross Unrealized Appreciation $ 28,348,041Gross Unrealized Depreciation (33,891,186)
Net Unrealized Depreciation $ (5,543,145)
Copyright © 2021 www.secdatabase.com. All Rights Reserved.Please Consider the Environment Before Printing This Document

Voya Global Equity PortfolioPORTFOLIO OF INVESTMENTSas of March 31, 2019 (Unaudited)
Shares ValuePercentage
of NetAssets
COMMON STOCK: 97.9%Australia: 3.1%
214,440 AGL Energy Ltd. $ 3,314,772 0.5685,254 Aurizon Holdings Ltd. 2,215,417 0.4
70,652 BHP Group Ltd. 1,931,158 0.3105,034 Coca-Cola Amatil Ltd. 645,544 0.1
93,039 Computershare Ltd. 1,131,006 0.2144,809 Crown Resorts Ltd. 1,184,287 0.2
99,656 Newcrest Mining Ltd. 1,804,775 0.381,953 Sonic Healthcare Ltd. 1,430,285 0.3
255,656 Sydney Airport 1,349,569 0.2150,239 Wesfarmers Ltd. 3,699,631 0.6
18,706,444 3.1
Belgium: 0.6%39,812 UCB S.A. 3,419,960 0.6
Canada: 5.0%45,257 Bank of Montreal 3,386,274 0.654,967 Bank of Nova Scotia 2,926,144 0.574,891 BCE, Inc. 3,325,500 0.544,616 (1) Canadian Imperial Bank of Commerce - XTSE 3,525,610 0.675,041 CI Financial Corp. 1,024,244 0.248,158 Empire Co. Ltd. 1,042,549 0.265,502 Great-West Lifeco, Inc. 1,586,145 0.317,767 iA Financial Corp., Inc. 655,186 0.167,424 National Bank Of Canada 3,042,872 0.557,800 Open Text Corp. 2,219,267 0.491,294 TELUS Corp. 3,378,906 0.540,559 Waste Connections, Inc. 3,593,122 0.6
29,705,819 5.0
China: 0.5%689,500 BOC Hong Kong Holdings Ltd. 2,861,374 0.5
Denmark: 0.7%84,365 Novo Nordisk A/S 4,409,368 0.7
Finland: 0.8%32,718 Nokian Renkaat OYJ 1,096,537 0.220,442 (1) Orion Oyj 768,137 0.169,725 Sampo OYJ 3,160,150 0.5
5,024,824 0.8
France: 1.4%29,025 Edenred 1,321,821 0.278,819 Getlink SE 1,195,237 0.2
200,293 Orange SA 3,265,402 0.6
Copyright © 2021 www.secdatabase.com. All Rights Reserved.Please Consider the Environment Before Printing This Document

8,512 Societe BIC S.A. 758,831 0.162,313 Societe Generale 1,800,448 0.3
8,341,739 1.4
Germany: 1.8%5,637 Allianz SE 1,256,198 0.2
50,084 Deutsche Lufthansa AG 1,100,903 0.291,798 Deutsche Post AG 2,987,392 0.521,882 SAP SE 2,529,670 0.4
391,852 Telefonica Deutschland Holding AG 1,230,334 0.2152,671 TUI AG 1,464,325 0.3
10,568,822 1.8
Hong Kong: 1.6%316,500 CK Hutchison Holdings Ltd. 3,328,111 0.5749,000 HKT Trust / HKT Ltd. 1,204,133 0.2372,500 Power Assets Holdings Ltd. 2,584,383 0.4
24,800 Jardine Matheson Holdings Ltd. 1,548,255 0.3504,000 NWS Holdings Ltd. 1,103,436 0.2
9,768,318 1.6
Israel: 0.3%251,852 Bank Leumi Le-Israel BM 1,650,018 0.3
Italy: 1.1%192,248 Assicurazioni Generali S.p.A. 3,564,397 0.6652,956 Snam SpA 3,358,909 0.5
6,923,306 1.1
Japan: 7.1%123,100 Canon, Inc. 3,574,216 0.6
12,800 Central Japan Railway Co. 2,975,316 0.573,000 Fuji Film Holdings Corp. 3,325,008 0.689,100 Japan Airlines Co. Ltd. 3,139,844 0.5
188 Japan Prime Realty Investment Corp. 773,900 0.141,000 Kamigumi Co., Ltd. 950,927 0.213,200 Konami Holdings Corp. 574,328 0.171,500 Kyushu Railway Co. 2,351,989 0.429,400 Medipal Holdings Corp. 699,539 0.117,300 MEIJI Holdings Co., Ltd. 1,406,341 0.220,200 Mitsubishi Corp. 562,393 0.1
207,900 Mitsui & Co., Ltd. 3,235,015 0.549,600 Nippon Telegraph & Telephone Corp. 2,114,502 0.4
141,100 NTT DoCoMo, Inc. 3,127,289 0.513,200 Oracle Corp. Japan 887,683 0.2
161,700 ORIX Corp. 2,323,243 0.423,000 Sankyo Co., Ltd. 878,092 0.1
211,000 Sekisui House Ltd. 3,496,580 0.6225,200 Sumitomo Corp. 3,122,238 0.5
43,900 Sundrug Co., Ltd. 1,211,570 0.215,300 Suzuken Co., Ltd. 887,473 0.1
705 United Urban Investment Corp. 1,112,991 0.242,730,477 7.1
Netherlands: 3.5%41,931 (2) ABN AMRO Group NV 945,320 0.2
Copyright © 2021 www.secdatabase.com. All Rights Reserved.Please Consider the Environment Before Printing This Document

236,480 ING Groep NV 2,865,512 0.5137,849 Koninklijke Ahold Delhaize NV 3,670,077 0.6
36,645 LyondellBasell Industries NV - Class A 3,081,112 0.583,127 NN Group NV 3,458,636 0.6
Copyright © 2021 www.secdatabase.com. All Rights Reserved.Please Consider the Environment Before Printing This Document

Voya Global Equity PortfolioPORTFOLIO OF INVESTMENTS
as of March 31, 2019 (Unaudited) (Continued)
Shares ValuePercentage
of NetAssets
COMMON STOCK: (continued)Netherlands: (continued)
214,652 Royal Dutch Shell PLC - Class A $ 6,745,671 1.120,766,328 3.5
New Zealand: 0.3%634,570 Spark New Zealand Ltd. 1,643,777 0.3
Norway: 0.6%111,174 Mowi ASA 2,483,734 0.4116,781 Orkla ASA 896,853 0.128,914 Telenor ASA 578,972 0.1
3,959,559 0.6
Singapore: 0.7%672,300 ComfortDelgro Corp., Ltd. 1,277,804 0.2189,200 SATS Ltd 714,982 0.1218,300 Singapore Exchange Ltd. 1,180,056 0.2304,500 Singapore Technologies Engineering Ltd. 842,063 0.2
4,014,905 0.7
Spain: 2.2%18,839 (2) Aena SME SA 3,394,632 0.6
111,326 Enagas 3,240,985 0.5118,673 Endesa S.A. 3,028,600 0.5144,336 Ferrovial SA 3,382,307 0.6
13,046,524 2.2
Switzerland: 2.4%41,912 Nestle SA 3,996,326 0.722,370 Roche Holding AG 6,164,163 1.012,016 Zurich Insurance Group AG 3,977,737 0.7
14,138,226 2.4
United Kingdom: 5.2%336,507 Aviva PLC 1,809,552 0.3766,536 BT Group PLC 2,227,044 0.4113,272 Compass Group PLC 2,665,124 0.4422,318 Direct Line Insurance Group PLC 1,942,767 0.3222,244 GlaxoSmithKline PLC 4,617,320 0.8108,831 Imperial Brands PLC 3,722,821 0.6
1,055,992 Legal & General Group PLC 3,789,579 0.6730,205 Marks & Spencer Group PLC 2,650,129 0.4114,156 Persimmon PLC 3,228,988 0.5
1,018,612 Taylor Wimpey PLC 2,329,781 0.4807,844 Vodafone Group PLC 1,472,101 0.3320,292 WM Morrison Supermarkets PLC 950,174 0.2
31,405,380 5.2
United States: 59.0%
Copyright © 2021 www.secdatabase.com. All Rights Reserved.Please Consider the Environment Before Printing This Document

56,805 AbbVie, Inc. 4,577,915 0.89,345 Accenture PLC 1,644,907 0.3
75,893 Aflac, Inc. 3,794,650 0.6169,937 AGNC Investment Corp. 3,058,866 0.5
20,338 Air Products & Chemicals, Inc. 3,883,744 0.615,073 Allison Transmission Holdings, Inc. 677,079 0.123,234 Allstate Corp. 2,188,178 0.480,383 Altria Group, Inc. 4,616,396 0.859,352 Amdocs Ltd. 3,211,537 0.535,546 Ameren Corp. 2,614,408 0.418,764 Amgen, Inc. 3,564,785 0.639,410 Amphenol Corp. 3,721,880 0.6
313,562 Annaly Capital Management, Inc. 3,132,484 0.5104,215 Apple Hospitality REIT, Inc. 1,698,704 0.3
57,532 Apple, Inc. 10,928,203 1.8181,585 AT&T, Inc. 5,694,506 1.0142,073 Bank of America Corp. 3,919,794 0.7
56,953 Bemis Co., Inc. 3,159,752 0.5110,559 BGC Partners, Inc. 587,068 0.1
9,192 Boeing Co. 3,506,013 0.655,645 Booz Allen Hamilton Holding Corp. 3,235,200 0.579,609 Bristol-Myers Squibb Co. 3,798,145 0.633,705 Broadridge Financial Solutions, Inc. ADR 3,494,871 0.6
6,125 Camden Property Trust 621,688 0.158,214 CDK Global, Inc. 3,424,147 0.6
114,388 Centerpoint Energy, Inc. 3,511,712 0.647,639 CenturyLink, Inc. 571,192 0.148,558 Chevron Corp. 5,981,374 1.0
124,831 Chimera Investment Corp. 2,339,333 0.4129,017 Cisco Systems, Inc. 6,965,628 1.2
34,217 Citrix Systems, Inc. 3,410,066 0.653,834 CMS Energy Corp. 2,989,940 0.525,780 CNA Financial Corp. 1,117,563 0.229,457 Comerica, Inc. 2,159,787 0.430,003 CoreCivic, Inc. 583,558 0.128,888 Darden Restaurants, Inc. 3,509,025 0.623,070 Eaton Corp. PLC 1,858,519 0.337,763 Eli Lilly & Co. 4,900,127 0.8
9,881 Encompass Health Corp. 577,050 0.112,094 Everest Re Group Ltd. 2,611,820 0.446,912 Evergy, Inc. 2,723,242 0.511,897 Exelon Corp. 596,397 0.127,162 Expedia Group, Inc. 3,232,278 0.540,098 Expeditors International Washington, Inc. 3,043,438 0.561,775 Exxon Mobil Corp. 4,991,420 0.870,696 Flir Systems, Inc. 3,363,716 0.671,001 General Mills, Inc. 3,674,302 0.631,681 Genuine Parts Co. 3,549,222 0.676,605 Geo Group, Inc./The 1,470,816 0.249,625 Hartford Financial Services Group, Inc. 2,467,355 0.4
4,516 HCA Healthcare, Inc. 588,796 0.130,546 Hershey Co. 3,507,597 0.664,646 Hewlett Packard Enterprise Co. 997,488 0.214,365 Home Depot, Inc. 2,756,500 0.5
Copyright © 2021 www.secdatabase.com. All Rights Reserved.Please Consider the Environment Before Printing This Document

Copyright © 2021 www.secdatabase.com. All Rights Reserved.Please Consider the Environment Before Printing This Document

Voya Global Equity PortfolioPORTFOLIO OF INVESTMENTS
as of March 31, 2019 (Unaudited) (Continued)
Shares ValuePercentage
of NetAssets
COMMON STOCK: (continued)United States: (continued)
30,113 Honeywell International, Inc. $ 4,785,558 0.8109,891 Intel Corp. 5,901,147 1.0
37,468 InterDigital, Inc. 2,472,139 0.436,785 International Business Machines Corp. 5,190,364 0.929,400 j2 Global, Inc. 2,546,040 0.471,245 Jabil, Inc. 1,894,405 0.318,505 JM Smucker Co. 2,155,833 0.462,290 Johnson & Johnson 8,707,519 1.542,879 JPMorgan Chase & Co. 4,340,641 0.7
128,612 Juniper Networks, Inc. 3,404,360 0.639,982 KAR Auction Services, Inc. 2,051,476 0.326,294 Kimberly-Clark Corp. 3,257,827 0.533,145 Kohl's Corp. 2,279,382 0.4
5,355 Lear Corp. 726,727 0.158,175 Maxim Integrated Products 3,093,165 0.534,055 Maximus, Inc. 2,417,224 0.428,240 McDonald's Corp. 5,362,776 0.967,237 MDU Resources Group, Inc. 1,736,732 0.377,181 Merck & Co., Inc. 6,419,144 1.1
243,269 MFA Financial, Inc. 1,768,566 0.358,615 Microsoft Corp. 6,913,053 1.2
7,002 Motorola Solutions, Inc. 983,221 0.2192,177 New Residential Investment Corp. 3,249,713 0.5
32,053 OGE Energy Corp. 1,382,125 0.2116,131 Old Republic International Corp. 2,429,461 0.444,429 Omnicom Group 3,242,873 0.520,110 Oneok, Inc. 1,404,482 0.299,564 Oracle Corp. 5,347,582 0.944,996 Paychex, Inc. 3,608,679 0.644,433 PepsiCo, Inc. 5,445,264 0.953,279 Perspecta, Inc. 1,077,301 0.2
159,382 Pfizer, Inc. 6,768,954 1.159,672 Philip Morris International, Inc. 5,274,408 0.935,546 Phillips 66 3,382,913 0.613,802 Pinnacle West Capital Corp. 1,319,195 0.2
131,702 Plains GP Holdings L.P. 3,282,014 0.511,251 Popular, Inc. 586,515 0.153,897 Procter & Gamble Co. 5,607,983 0.936,785 Quest Diagnostics, Inc. 3,307,707 0.642,814 Republic Services, Inc. 3,441,389 0.634,162 Royal Gold, Inc. 3,106,351 0.5
126,862 Sabre Corp. 2,713,578 0.571,119 Service Corp. International 2,855,428 0.53,233 Simon Property Group, Inc. 589,085 0.1
50,934 Sonoco Products Co. 3,133,969 0.582,390 Starwood Property Trust, Inc. 1,841,417 0.344,203 Texas Instruments, Inc. 4,688,612 0.836,067 Total System Services, Inc. 3,426,726 0.6
232,190 Two Harbors Investment Corp. 3,141,531 0.548,465 Tyson Foods, Inc. 3,364,925 0.617,219 Valero Energy Corp. 1,460,688 0.260,030 Virtu Financial, Inc. 1,425,713 0.263,935 Walgreens Boots Alliance, Inc. 4,045,167 0.718,505 Walt Disney Co. 2,054,610 0.337,423 Waste Management, Inc. 3,888,624 0.7
100,498 Wells Fargo & Co. 4,856,063 0.8167,718 Western Union Co. 3,097,751 0.5
Copyright © 2021 www.secdatabase.com. All Rights Reserved.Please Consider the Environment Before Printing This Document

353,060,276 59.0
Total Common Stock(Cost $572,282,159) 586,145,444 97.9
EXCHANGE-TRADED FUNDS: 1.0%31,928 iShares MSCI EAFE ETF 2,070,850 0.314,940 SPDR S&P 500 ETF Trust 4,220,251 0.7
Total Exchange-Traded Funds(Cost $6,274,785) 6,291,101 1.0
Total Long-Term Investments(Cost $578,556,944) 592,436,545 98.9
PrincipalAmount† Value
Percentageof NetAssets
SHORT-TERM INVESTMENTS: 1.0%Securities Lending Collateral(3): 0.9%
1,283,752 Cantor Fitzgerald Securities, Repurchase Agreement dated 03/29/19, 2.65%, due04/01/19 (Repurchase Amount $1,284,032, collateralized by various U.S.Government/U.S. Government Agency Obligations, 0.000%-10.000%, MarketValue plus accrued interest $1,309,427, due 04/15/19-10/20/68)
1,283,752 0.2
1,283,752 Citibank N.A., Repurchase Agreement dated 03/29/19, 2.65%, due 04/01/19(Repurchase Amount $1,284,032, collateralized by various U.S. Government/U.S.Government Agency Obligations, 2.960%-4.500%, Market Value plus accruedinterest $1,311,450, due 01/01/28-07/01/48)
1,283,752 0.2
Copyright © 2021 www.secdatabase.com. All Rights Reserved.Please Consider the Environment Before Printing This Document

Voya Global Equity PortfolioPORTFOLIO OF INVESTMENTS
as of March 31, 2019 (Unaudited) (Continued)
PrincipalAmount† Value
Percentageof NetAssets
SHORT-TERM INVESTMENTS: (continued)Securities Lending Collateral(3) (continued)
1,283,752 Jefferies LLC, Repurchase Agreement dated 03/29/19, 2.67%, due 04/01/19(Repurchase Amount $1,284,034, collateralized by various U.S. GovernmentAgency Obligations, 0.000%-6.625%, Market Value plus accrued interest$1,309,437, due 04/03/19-07/15/36)
$ 1,283,752 0.2
268,336 Mizuho Securities USA LLC, Repurchase Agreement dated 03/29/19, 2.57%, due04/01/19 (Repurchase Amount $268,393, collateralized by various U.S.Government Securities, 0.875%-2.875%, Market Value plus accrued interest$273,703, due 12/31/20-05/15/43)
268,336 0.1
1,283,752 RBC Dominion Securities Inc., Repurchase Agreement dated 03/29/19, 2.65%, due04/01/19 (Repurchase Amount $1,284,032, collateralized by various U.S.Government/U.S. Government Agency Obligations, 0.000%-7.000%, Market Valueplus accrued interest $1,309,427, due 04/11/19-09/09/49)
1,283,752 0.2
5,403,344 0.9
Shares ValuePercentage
of NetAssets
Mutual Funds: 0.1%364,000 (4) Goldman Sachs Financial Square Government Fund - Institutional Shares, 2.350%
(Cost $364,000) 364,000 0.1
Total Short-Term Investments(Cost $5,767,344) 5,767,344 1.0
Total Investments in Securities(Cost $584,324,288) $ 598,203,889 99.9
Assets in Excess of Other Liabilities 364,712 0.1Net Assets $ 598,568,601 100.0
† Unless otherwise indicated, principal amount is shown in USD.ADR American Depositary Receipt(1) Security, or a portion of the security, is on loan.
(2) Securities with purchases pursuant to Rule 144A or section 4(a)(2), under the Securities Act of 1933 and may not be resold subject tothat rule except to qualified institutional buyers.
(3) Represents securities purchased with cash collateral received for securities on loan.(4) Rate shown is the 7-day yield as of March 31, 2019.
Sector Diversification Percentageof Net Assets
Information Technology 19.5%Financials 17.3Industrials 11.6Health Care 11.0Consumer Staples 10.2Consumer Discretionary 7.8Communication Services 6.0Energy 5.7Utilities 4.3Materials 3.4Real Estate 1.1Exchange-Traded Funds 1.0Short-Term Investments 1.0Assets in Excess of Other Liabilities 0.1Net Assets 100.0%
Copyright © 2021 www.secdatabase.com. All Rights Reserved.Please Consider the Environment Before Printing This Document

Voya Global Equity PortfolioPORTFOLIO OF INVESTMENTS
as of March 31, 2019 (Unaudited) (Continued)
Fair Value MeasurementsThe following is a summary of the fair valuations according to the inputs used as of March 31, 2019 in valuing the assets and liabilities:
Quoted Pricesin Active Markets
for IdenticalInvestments
(Level 1)
SignificantOther
ObservableInputs#(Level 2)
SignificantUnobservable
Inputs(Level 3)
Fair Valueat
March 31, 2019
Asset TableInvestments, at fair valueCommon Stock
Australia $ 3,314,772 $ 15,391,672 $ – $ 18,706,444Belgium – 3,419,960 – 3,419,960Canada 29,705,819 – – 29,705,819China – 2,861,374 – 2,861,374Denmark – 4,409,368 – 4,409,368Finland – 5,024,824 – 5,024,824France – 8,341,739 – 8,341,739Germany 1,230,334 9,338,488 – 10,568,822Hong Kong 1,204,133 8,564,185 – 9,768,318Israel – 1,650,018 – 1,650,018Italy – 6,923,306 – 6,923,306Japan – 42,730,477 – 42,730,477Netherlands 3,081,112 17,685,216 – 20,766,328New Zealand – 1,643,777 – 1,643,777Norway – 3,959,559 – 3,959,559Singapore – 4,014,905 – 4,014,905Spain – 13,046,524 – 13,046,524Switzerland – 14,138,226 – 14,138,226United Kingdom – 31,405,380 – 31,405,380United States 353,060,276 – – 353,060,276
Total Common Stock 391,596,446 194,548,998 – 586,145,444Exchange-Traded Funds 6,291,101 – – 6,291,101Short-Term Investments 364,000 5,403,344 – 5,767,344Total Investments, at fair value $ 398,251,547 $ 199,952,342 $ – $ 598,203,889Other Financial Instruments+Forward Foreign Currency Contracts – 16,458 – 16,458Total Assets $ 398,251,547 $ 199,968,800 $ – $ 598,220,347
+Other Financial Instruments may include open forward foreign currency contracts, futures, centrally cleared swaps, OTC swaps and writtenoptions. Forward foreign currency contracts, futures and centrally cleared swaps are valued at the unrealized gain (loss) on the instrument. OTCswaps and written options are valued at the fair value of the instrument.
#
The earlier close of the foreign markets gives rise to the possibility that significant events, including broad market moves, may have occurred inthe interim and may materially affect the value of those securities. To account for this, the Portfolio may frequently value many of its foreign equitysecurities using fair value prices based on third party vendor modeling tools to the extent available. Accordingly, a portion of the Portfolio'sinvestments are categorized as Level 2 investments.
At March 31, 2019, the following forward foreign currency contracts were outstanding for Voya Global Equity Portfolio:
Currency Purchased Currency Sold Counterparty SettlementDate
UnrealizedAppreciation
(Depreciation)USD 11,386,263 JPY 1,260,115,469 Credit Suisse International 04/02/19 $ 16,458
$ 16,458
Currency AbbreviationsJPY - Japanese YenUSD - United States Dollar
Copyright © 2021 www.secdatabase.com. All Rights Reserved.Please Consider the Environment Before Printing This Document

Voya Global Equity PortfolioPORTFOLIO OF INVESTMENTS
as of March 31, 2019 (Unaudited) (Continued)
At March 31, 2019, the aggregate cost of securities and other investments and the composition of unrealized appreciation and depreciation of securitiesand other investments at period end were:
Cost for federal income tax purposes was $584,358,397.
Net unrealized appreciation consisted of:
Gross Unrealized Appreciation $ 38,165,657Gross Unrealized Depreciation (24,325,051)
Net Unrealized Appreciation $ 13,840,606
Copyright © 2021 www.secdatabase.com. All Rights Reserved.Please Consider the Environment Before Printing This Document

Voya Hang Seng Index PortfolioPORTFOLIO OF INVESTMENTSas of March 31, 2019 (Unaudited)
Shares ValuePercentage
of NetAssets
COMMON STOCK: 98.2%China: 53.6%
26,500 AAC Technologies Holdings, Inc. $ 157,185 0.32,884,746 Bank of China Ltd. - H Shares 1,311,031 2.9
317,451 Bank of Communications Co., Ltd. - H Shares 260,439 0.6134,129 BOC Hong Kong Holdings Ltd. 556,626 1.2
3,929,107 China Construction Bank - H Shares 3,372,622 7.4269,911 China Life Insurance Co., Ltd. - H Shares 727,716 1.6100,000 China Mengniu Dairy Co., Ltd. 372,182 0.8223,101 China Mobile Ltd. 2,276,597 5.0138,991 China Overseas Land & Investment Ltd. 528,932 1.2926,438 China Petroleum & Chemical Corp. - H Shares 735,282 1.6100,444 China Resources Land Ltd. 451,387 1.0123,341 China Shenhua Energy Co., Ltd. - H Shares 281,488 0.6223,110 China Unicom Hong Kong Ltd. 284,069 0.6210,811 CITIC Ltd. 315,145 0.7648,714 CNOOC Ltd. 1,208,347 2.6275,000 Country Garden Holdings Co. Ltd. 430,576 0.9170,000 CSPC Pharmaceutical Group Ltd. 316,734 0.7196,000 Geely Automobile Holdings Ltd. 376,121 0.8
26,000 Hengan International Group Co., Ltd. 227,947 0.52,679,340 Industrial & Commercial Bank of China - H Shares 1,967,666 4.3
766,604 PetroChina Co., Ltd. - H Shares 501,829 1.1202,932 Ping An Insurance Group Co. of China Ltd. - H Shares 2,284,653 5.0
27,300 Shenzhou International Group Holdings Ltd. 366,781 0.8252,000 Sino Biopharmaceutical Ltd. 230,302 0.5
25,900 Sunny Optical Technology Group Co. Ltd. 310,499 0.796,875 Tencent Holdings Ltd. 4,455,068 9.8
203,000 Want Want China Holdings Ltd. 168,871 0.424,476,095 53.6
Hong Kong: 33.9%438,600 AIA Group Ltd. 4,385,899 9.6
94,036 CK Asset Holdings Ltd. 837,466 1.897,832 CK Hutchison Holdings Ltd. 1,028,738 2.223,830 CK Infrastructure Holdings Ltd. 195,595 0.468,931 CLP Holdings Ltd. 799,503 1.779,000 Galaxy Entertainment Group Ltd. 538,386 1.273,706 Hang Lung Properties Ltd. 180,022 0.427,743 Hang Seng Bank Ltd. 685,055 1.547,117 Henderson Land Development Co., Ltd. 299,869 0.7
335,494 Hong Kong & China Gas 804,596 1.843,141 Hong Kong Exchanges and Clearing Ltd. 1,507,283 3.350,322 Power Assets Holdings Ltd. 349,131 0.876,500 Link REIT 895,636 2.066,643 MTR Corp. 412,912 0.9
222,100 New World Development Ltd. 368,622 0.8109,265 Sino Land Co. 211,567 0.5
Copyright © 2021 www.secdatabase.com. All Rights Reserved.Please Consider the Environment Before Printing This Document

42,055 Sun Hung Kai Properties Ltd. 722,956 1.617,591 Swire Pacific Ltd - Class A 226,588 0.553,000 Techtronic Industries Co., Ltd. 356,937 0.8
319,500 (1) WH Group Ltd. 341,746 0.743,637 Wharf Real Estate Investment Co. Ltd. 325,214 0.7
15,473,721 33.9
Macau: 1.0%88,000 Sands China Ltd. 442,900 1.0
United Kingdom: 9.7%544,428 HSBC Holdings PLC (HKD) 4,432,579 9.7
Total Common Stock(Cost $26,797,592) 44,825,295 98.2
SHORT-TERM INVESTMENTS: 1.5%Mutual Funds: 1.5%
681,000 (2) Goldman Sachs Financial Square Government Fund - Institutional Shares, 2.350%(Cost $681,000) 681,000 1.5
Total Short-Term Investments(Cost $681,000) 681,000 1.5
Total Investments in Securities(Cost $27,478,592) $ 45,506,295 99.7
Assets in Excess of Other Liabilities 123,358 0.3Net Assets $ 45,629,653 100.0
Copyright © 2021 www.secdatabase.com. All Rights Reserved.Please Consider the Environment Before Printing This Document

Voya Hang Seng Index PortfolioPORTFOLIO OF INVESTMENTS
as of March 31, 2019 (Unaudited) (Continued)
(1) Securities with purchases pursuant to Rule 144A or section 4(a)(2), under the Securities Act of 1933 and may not be resold subject tothat rule except to qualified institutional buyers.
(2) Rate shown is the 7-day yield as of March 31, 2019.
Sector Diversification Percentageof Net Assets
Financials 47.1%Communication Services 15.4Real Estate 12.0Energy 6.0Utilities 4.7Consumer Discretionary 4.6Industrials 3.8Consumer Staples 2.4Health Care 1.2Information Technology 1.0Short-Term Investments 1.5Assets in Excess of Other Liabilities 0.3Net Assets 100.0%
Fair Value MeasurementsThe following is a summary of the fair valuations according to the inputs used as of March 31, 2019 in valuing the assets and liabilities:
Quoted Pricesin Active Markets
for IdenticalInvestments
(Level 1)
SignificantOther
ObservableInputs#(Level 2)
SignificantUnobservable
Inputs(Level 3)
Fair Valueat
March 31, 2019
Asset TableInvestments, at fair valueCommon Stock
China $ – $ 24,476,095 $ – $ 24,476,095Hong Kong – 15,473,721 – 15,473,721Macau – 442,900 – 442,900United Kingdom – 4,432,579 – 4,432,579
Total Common Stock – 44,825,295 – 44,825,295Short-Term Investments 681,000 – – 681,000Total Investments, at fair value $ 681,000 $ 44,825,295 $ – $ 45,506,295Other Financial Instruments+Forward Foreign Currency Contracts – 92 – 92Futures 9,988 – – 9,988Total Assets $ 690,988 $ 44,825,387 $ – $ 45,516,375Liabilities TableOther Financial Instruments+Forward Foreign Currency Contracts $ – $ (346) $ – $ (346)Total Liabilities $ – $ (346) $ – $ (346)
+Other Financial Instruments may include open forward foreign currency contracts, futures, centrally cleared swaps, OTC swaps and writtenoptions. Forward foreign currency contracts, futures and centrally cleared swaps are valued at the unrealized gain (loss) on the instrument. OTCswaps and written options are valued at the fair value of the instrument.
#
The earlier close of the foreign markets gives rise to the possibility that significant events, including broad market moves, may have occurred inthe interim and may materially affect the value of those securities. To account for this, the Portfolio may frequently value many of its foreign equitysecurities using fair value prices based on third party vendor modeling tools to the extent available. Accordingly, a portion of the Portfolio'sinvestments are categorized as Level 2 investments.
At March 31, 2019, the following forward foreign currency contracts were outstanding for Voya Hang Seng Index Portfolio:
Currency Purchased Currency Sold Counterparty SettlementDate
UnrealizedAppreciation
(Depreciation)USD 89,286 HKD 700,000 Citibank N.A. 04/11/19 $ 87HKD 9,500,000 USD 1,213,416 The Bank of New York Mellon 06/19/19 (333)USD 75,326 HKD 590,000 The Bank of New York Mellon 06/19/19 (13)
Copyright © 2021 www.secdatabase.com. All Rights Reserved.Please Consider the Environment Before Printing This Document

Voya Hang Seng Index PortfolioPORTFOLIO OF INVESTMENTS
as of March 31, 2019 (Unaudited) (Continued)
SettlementDate
UnrealizedAppreciation
(Depreciation)USD 153,236 HKD 1,200,000 The Bank of New York Mellon 06/19/19 $ 5
$ (254)
At March 31, 2019, the following futures contracts were outstanding for Voya Hang Seng Index Portfolio:
Description Numberof Contracts
ExpirationDate
NotionalValue
UnrealizedAppreciation/(Depreciation)
Long Contracts:Hang Seng Index 4 04/29/19 $ 740,820 $ 9,988
$ 740,820 $ 9,988
Currency AbbreviationsHKD - Hong Kong Sar DollarUSD - United States Dollar
At March 31, 2019, the aggregate cost of securities and other investments and the composition of unrealized appreciation and depreciation of securitiesand other investments at period end were:
Cost for federal income tax purposes was $28,473,409.
Net unrealized appreciation consisted of:
Gross Unrealized Appreciation $ 18,235,800Gross Unrealized Depreciation (1,191,122)
Net Unrealized Appreciation $ 17,044,678
Copyright © 2021 www.secdatabase.com. All Rights Reserved.Please Consider the Environment Before Printing This Document

Voya Index Plus LargeCap PortfolioPORTFOLIO OF INVESTMENTSas of March 31, 2019 (Unaudited)
Shares ValuePercentage
of NetAssets
COMMON STOCK: 99.1%Communication Services: 8.6%
19,463 (1) Alphabet, Inc. - Class A $ 22,905,810 2.439,780 (1) AMC Networks, Inc. 2,257,913 0.294,233 AT&T, Inc. 2,955,147 0.3
198,762 CenturyLink, Inc. 2,383,156 0.3302,204 Comcast Corp. – Class A 12,082,116 1.3
84,602 (1) Facebook, Inc. - Class A 14,102,307 1.554,225 (1) Liberty Global PLC - Class A 1,351,287 0.1
3,816 (1) Netflix, Inc. 1,360,633 0.1217,565 Verizon Communications, Inc. 12,864,619 1.4
53,092 Viacom, Inc. - Class B 1,490,292 0.270,925 Walt Disney Co. 7,874,803 0.8
81,628,083 8.6
Consumer Discretionary: 10.4%15,504 (1) Amazon.com, Inc. 27,608,748 2.9
3,438 (1) Autozone, Inc. 3,520,925 0.43,672 (1) Booking Holdings, Inc. 6,407,309 0.7
66,216 Brunswick Corp. 3,332,651 0.411,025 (1) Burlington Stores, Inc. 1,727,397 0.225,579 Darden Restaurants, Inc. 3,107,081 0.335,249 Expedia Group, Inc. 4,194,631 0.478,331 Extended Stay America, Inc. 1,406,041 0.176,503 Home Depot, Inc. 14,680,161 1.524,852 Kohl's Corp. 1,709,072 0.236,290 Lear Corp. 4,924,916 0.517,139 McDonald's Corp. 3,254,696 0.352,956 (1) Norwegian Cruise Line Holdings Ltd. 2,910,462 0.3
6,089 (1) O'Reilly Automotive, Inc. 2,364,359 0.254,451 Pulte Group, Inc. 1,522,450 0.219,935 Ralph Lauren Corp. 2,585,171 0.369,581 Ross Stores, Inc. 6,477,991 0.7
100,604 Starbucks Corp. 7,478,901 0.899,212,962 10.4
Consumer Staples: 7.4%136,639 Altria Group, Inc. 7,847,178 0.8
26,202 Church & Dwight Co., Inc. 1,866,368 0.249,013 Coca-Cola Co. 2,296,749 0.215,490 Costco Wholesale Corp. 3,750,749 0.440,642 Hershey Co. 4,666,921 0.536,699 Lamb Weston Holdings, Inc. 2,750,223 0.342,720 Molson Coors Brewing Co. 2,548,248 0.368,697 Mondelez International, Inc. 3,429,354 0.456,701 (1) Monster Beverage Corp. 3,094,740 0.331,506 Nu Skin Enterprises, Inc. 1,507,877 0.2
Copyright © 2021 www.secdatabase.com. All Rights Reserved.Please Consider the Environment Before Printing This Document

15,243 PepsiCo, Inc. 1,868,030 0.246,389 Philip Morris International, Inc. 4,100,324 0.4
157,484 Procter & Gamble Co. 16,386,210 1.768,339 Tyson Foods, Inc. 4,744,777 0.522,652 Walgreens Boots Alliance, Inc. 1,433,192 0.188,215 Walmart, Inc. 8,603,609 0.9
70,894,549 7.4
Energy: 5.3%125,759 Chevron Corp. 15,490,994 1.6114,821 ConocoPhillips 7,663,153 0.820,082 EOG Resources, Inc. 1,911,405 0.2
102,071 Exxon Mobil Corp. 8,247,337 0.8131,817 Halliburton Co. 3,862,238 0.4
33,519 HollyFrontier Corp. 1,651,481 0.245,361 Marathon Petroleum Corp. 2,714,856 0.353,638 PBF Energy, Inc. 1,670,287 0.227,846 Phillips 66 2,650,104 0.357,262 Valero Energy Corp. 4,857,535 0.5
50,719,390 5.3
Financials: 12.5%55,480 Ally Financial, Inc. 1,525,145 0.255,573 Ameriprise Financial, Inc. 7,118,901 0.760,824 (1) Athene Holding Ltd. 2,481,619 0.3
500,173 Bank of America Corp. 13,799,773 1.449,000 (1) Berkshire Hathaway, Inc. – Class B 9,843,610 1.017,608 Capital One Financial Corp. 1,438,398 0.1
126,768 Citigroup, Inc. 7,887,505 0.882,882 Citizens Financial Group, Inc. 2,693,665 0.375,316 Comerica, Inc. 5,522,169 0.657,108 Discover Financial Services 4,063,805 0.499,837 E*Trade Financial Corp. 4,635,432 0.522,413 Evercore, Inc. 2,039,583 0.229,372 Hartford Financial Services Group, Inc. 1,460,376 0.2
144,926 JPMorgan Chase & Co. 14,670,859 1.5120,871 Keycorp 1,903,718 0.2
61,288 Lazard Ltd. 2,214,948 0.260,634 Lincoln National Corp. 3,559,216 0.420,972 LPL Financial Holdings, Inc. 1,460,700 0.2
103,941 Morgan Stanley 4,386,310 0.536,153 Progressive Corp. 2,606,270 0.345,854 Prudential Financial, Inc. 4,213,066 0.425,533 Reinsurance Group of America, Inc. 3,625,175 0.431,761 S&P Global, Inc. 6,687,279 0.785,993 TCF Financial Corp. 1,779,195 0.274,951 Unum Group 2,535,592 0.380,330 Wells Fargo & Co. 3,881,546 0.431,940 Zions Bancorp NA 1,450,396 0.1
119,484,251 12.5
Health Care: 14.3%65,960 AbbVie, Inc. 5,315,716 0.6
8,757 (1) Align Technology, Inc. 2,489,878 0.352,524 Amgen, Inc. 9,978,510 1.1
Copyright © 2021 www.secdatabase.com. All Rights Reserved.Please Consider the Environment Before Printing This Document

Copyright © 2021 www.secdatabase.com. All Rights Reserved.Please Consider the Environment Before Printing This Document

Voya Index Plus LargeCap PortfolioPORTFOLIO OF INVESTMENTS
as of March 31, 2019 (Unaudited) (Continued)
Shares ValuePercentage
of NetAssets
COMMON STOCK: (continued)Health Care: (continued)
17,014 (1) Biogen, Inc. $ 4,021,769 0.431,274 Bristol-Myers Squibb Co. 1,492,083 0.282,903 Bruker Corp. 3,186,791 0.336,520 Cardinal Health, Inc. 1,758,438 0.224,457 (1) Celgene Corp. 2,307,273 0.287,814 (1) Centene Corp. 4,662,923 0.514,742 (1) Charles River Laboratories International, Inc. 2,141,276 0.213,461 Chemed Corp. 4,308,462 0.5
8,532 Cigna Corp. 1,372,116 0.132,228 (1) DaVita, Inc. 1,749,658 0.210,482 (1) Edwards Lifesciences Corp. 2,005,521 0.210,760 Eli Lilly & Co. 1,396,218 0.136,643 Encompass Health Corp. 2,139,951 0.258,546 Gilead Sciences, Inc. 3,806,076 0.447,271 HCA Healthcare, Inc. 6,163,193 0.713,901 Hill-Rom Holdings, Inc. 1,471,560 0.2
5,172 Humana, Inc. 1,375,752 0.128,670 (1) Idexx Laboratories, Inc. 6,410,612 0.710,335 (1) Illumina, Inc. 3,210,981 0.3
103,251 Johnson & Johnson 14,433,457 1.523,240 McKesson Corp. 2,720,474 0.3
114,911 Merck & Co., Inc. 9,557,148 1.0298,737 Pfizer, Inc. 12,687,360 1.3
23,459 (1) PRA Health Sciences, Inc. 2,587,293 0.314,698 Thermo Fisher Scientific, Inc. 4,023,137 0.455,510 UnitedHealth Group, Inc. 13,725,403 1.431,771 (1) Veeva Systems, Inc. 4,030,469 0.4
136,529,498 14.3
Industrials: 9.5%86,846 Allison Transmission Holdings, Inc. 3,901,122 0.445,027 Ametek, Inc. 3,735,890 0.434,204 Boeing Co. 13,046,090 1.434,761 Curtiss-Wright Corp. 3,939,812 0.436,677 Delta Air Lines, Inc. 1,894,367 0.257,046 Emerson Electric Co. 3,905,940 0.466,906 Fortune Brands Home & Security, Inc. 3,185,395 0.364,148 Honeywell International, Inc. 10,194,400 1.123,222 IDEX Corp. 3,523,706 0.470,292 Ingersoll-Rand PLC - Class A 7,588,021 0.832,606 KAR Auction Services, Inc. 1,673,014 0.217,167 Norfolk Southern Corp. 3,208,341 0.348,997 Regal Beloit Corp. 4,011,384 0.422,128 Robert Half International, Inc. 1,441,861 0.215,442 Spirit Aerosystems Holdings, Inc. 1,413,406 0.253,599 Union Pacific Corp. 8,961,753 0.9
Copyright © 2021 www.secdatabase.com. All Rights Reserved.Please Consider the Environment Before Printing This Document

41,330 (1) United Continental Holdings, Inc. 3,297,307 0.374,837 Waste Management, Inc. 7,776,313 0.868,493 (1) Wesco International, Inc. 3,630,814 0.4
90,328,936 9.5
Information Technology: 21.8%42,573 (1) Adobe, Inc. 11,345,279 1.250,864 (1) Akamai Technologies, Inc. 3,647,458 0.4
146,878 Apple, Inc. 27,899,476 2.919,318 (1) Atlassian Corp. PLC 2,171,150 0.226,547 Booz Allen Hamilton Holding Corp. 1,543,443 0.216,771 Broadcom, Inc. 5,043,207 0.536,697 Broadridge Financial Solutions, Inc. ADR 3,805,112 0.495,939 (1) Cadence Design Systems, Inc. 6,093,086 0.614,608 CDW Corp. 1,407,773 0.1
282,153 Cisco Systems, Inc. 15,233,441 1.666,102 Citrix Systems, Inc. 6,587,725 0.7
9,861 (1) Fair Isaac Corp. 2,678,543 0.374,840 (1) Fortinet, Inc. 6,284,315 0.718,762 (1) GoDaddy, Inc. 1,410,715 0.1
245,231 Hewlett Packard Enterprise Co. 3,783,914 0.4167,472 Intel Corp. 8,993,246 0.9
12,825 Intuit, Inc. 3,352,583 0.4156,737 Jabil, Inc. 4,167,637 0.4
12,822 KLA-Tencor Corp. 1,531,075 0.219,343 Lam Research Corp. 3,462,590 0.419,203 Mastercard, Inc. - Class A 4,521,346 0.532,583 Maxim Integrated Products 1,732,438 0.250,286 (1) Micron Technology, Inc. 2,078,320 0.2
274,576 Microsoft Corp. 32,383,493 3.474,878 NetApp, Inc. 5,192,041 0.566,669 (1) ON Semiconductor Corp. 1,371,381 0.151,092 Oracle Corp. 2,744,151 0.341,656 (1) PayPal Holdings, Inc. 4,325,559 0.5
116,194 Sabre Corp. 2,485,390 0.312,590 (1) Synopsys, Inc. 1,449,739 0.293,012 Texas Instruments, Inc. 9,865,783 1.077,507 Total System Services, Inc. 7,363,940 0.824,364 (1) VeriSign, Inc. 4,423,528 0.526,992 Visa, Inc. - Class A 4,215,881 0.4
7,995 VMware, Inc. 1,443,178 0.145,241 Xerox Corp. 1,446,807 0.2
207,484,743 21.8
Materials: 2.3%30,661 Air Products & Chemicals, Inc. 5,855,025 0.612,776 Avery Dennison Corp. 1,443,688 0.247,530 Celanese Corp. 4,686,933 0.528,841 Domtar Corp. 1,431,956 0.198,841 Huntsman Corp. 2,222,934 0.230,455 LyondellBasell Industries NV - Class A 2,560,656 0.3
Copyright © 2021 www.secdatabase.com. All Rights Reserved.Please Consider the Environment Before Printing This Document

Voya Index Plus LargeCap PortfolioPORTFOLIO OF INVESTMENTS
as of March 31, 2019 (Unaudited) (Continued)
Shares ValuePercentage
of NetAssets
COMMON STOCK: (continued)Materials: (continued)
24,567 Nucor Corp. $ 1,433,485 0.252,093 Steel Dynamics, Inc. 1,837,320 0.2
21,471,997 2.3
Real Estate: 3.3%73,320 Brookfield Property REIT, Inc. 1,502,327 0.235,820 Camden Property Trust 3,635,730 0.4
106,948 (1) CBRE Group, Inc. 5,288,579 0.546,168 Highwoods Properties, Inc. 2,159,739 0.2
139,026 Host Hotels & Resorts, Inc. 2,627,591 0.345,546 Lamar Advertising Co. 3,609,976 0.4
169,425 Outfront Media, Inc. 3,964,545 0.4214,540 Retail Properties of America, Inc. 2,615,243 0.3
33,626 Simon Property Group, Inc. 6,126,993 0.631,530,723 3.3
Utilities: 3.7%252,179 AES Corp. 4,559,396 0.5
90,442 Ameren Corp. 6,652,009 0.7114,336 Centerpoint Energy, Inc. 3,510,115 0.426,759 Edison International 1,656,917 0.2
148,643 Exelon Corp. 7,451,474 0.854,986 MDU Resources Group, Inc. 1,420,289 0.121,010 NextEra Energy, Inc. 4,061,653 0.493,086 NRG Energy, Inc. 3,954,293 0.427,845 UGI Corp. 1,543,170 0.2
34,809,316 3.7
Total Common Stock(Cost $807,137,782) 944,094,448 99.1
SHORT-TERM INVESTMENTS: 0.0%Mutual Funds: 0.0%
393,000 (2) Goldman Sachs Financial Square Government Fund - Institutional Shares, 2.350%(Cost $393,000) 393,000 0.0
Total Short-Term Investments(Cost $393,000) 393,000 0.0
Total Investments in Securities(Cost $807,530,782) $ 944,487,448 99.1
Assets in Excess of Other Liabilities 8,555,155 0.9Net Assets $ 953,042,603 100.0
ADR American Depositary Receipt(1) Non-income producing security.(2) Rate shown is the 7-day yield as of March 31, 2019.
Copyright © 2021 www.secdatabase.com. All Rights Reserved.Please Consider the Environment Before Printing This Document

Voya Index Plus LargeCap PortfolioPORTFOLIO OF INVESTMENTS
as of March 31, 2019 (Unaudited) (Continued)
Fair Value MeasurementsThe following is a summary of the fair valuations according to the inputs used as of March 31, 2019 in valuing the assets and liabilities:
Quoted Pricesin Active Markets
for IdenticalInvestments
(Level 1)
SignificantOther
ObservableInputs
(Level 2)
SignificantUnobservable
Inputs(Level 3)
Fair Valueat
March 31, 2019
Asset TableInvestments, at fair valueCommon Stock* $ 944,094,448 $ – $ – $ 944,094,448Short-Term Investments 393,000 – – 393,000Total Investments, at fair value $ 944,487,448 $ – $ – $ 944,487,448Liabilities TableOther Financial Instruments+Futures $ (2,124) $ – $ – $ (2,124)Total Liabilities $ (2,124) $ – $ – $ (2,124)
+Other Financial Instruments may include open forward foreign currency contracts, futures, centrally cleared swaps, OTC swaps and writtenoptions. Forward foreign currency contracts, futures and centrally cleared swaps are valued at the unrealized gain (loss) on the instrument. OTCswaps and written options are valued at the fair value of the instrument.
* For further breakdown of Common Stock by sector, please refer to the Portfolio of Investments.
At March 31, 2019, the following futures contracts were outstanding for Voya Index Plus LargeCap Portfolio:
Description Numberof Contracts
ExpirationDate
NotionalValue
UnrealizedAppreciation/(Depreciation)
Long Contracts:S&P 500® E-Mini 43 06/21/19 $ 6,101,270 $ (2,124)
$ 6,101,270 $ (2,124)
At March 31, 2019, the aggregate cost of securities and other investments and the composition of unrealized appreciation and depreciation of securitiesand other investments at period end were:
Cost for federal income tax purposes was $808,221,503.
Net unrealized appreciation consisted of:
Gross Unrealized Appreciation $ 157,192,601Gross Unrealized Depreciation (20,928,780)
Net Unrealized Appreciation $ 136,263,821
Copyright © 2021 www.secdatabase.com. All Rights Reserved.Please Consider the Environment Before Printing This Document

Voya Index Plus MidCap PortfolioPORTFOLIO OF INVESTMENTSas of March 31, 2019 (Unaudited)
Shares ValuePercentage
of NetAssets
COMMON STOCK: 99.3%Communication Services: 2.3%
46,805 Altice USA, Inc. $ 1,005,371 0.241,268 (1) AMC Networks, Inc. 2,342,372 0.4
1,508 Cable One, Inc. 1,479,921 0.313,016 Cinemark Holdings, Inc. 520,510 0.144,188 (1) Live Nation Entertainment, Inc. 2,807,706 0.564,747 Telephone & Data Systems, Inc. 1,989,675 0.423,478 World Wrestling Entertainment, Inc. 2,037,421 0.4
12,182,976 2.3
Consumer Discretionary: 12.1%28,345 (1) Adtalem Global Education, Inc. 1,312,940 0.290,911 American Eagle Outfitters, Inc. 2,015,497 0.417,839 Aramark 527,142 0.1
542 (1) Autozone, Inc. 555,073 0.131,071 Bed Bath & Beyond, Inc. 527,896 0.156,639 Brinker International, Inc. 2,513,639 0.565,935 Brunswick Corp. 3,318,508 0.610,010 (1) Burlington Stores, Inc. 1,568,367 0.317,903 Churchill Downs, Inc. 1,615,925 0.3
3,298 Cracker Barrel Old Country Store, Inc. 532,990 0.1169,502 Dana, Inc. 3,006,965 0.6
13,519 Darden Restaurants, Inc. 1,642,153 0.324,840 (1) Deckers Outdoor Corp. 3,651,232 0.737,146 Delphi Technologies PLC 715,432 0.138,867 Dick's Sporting Goods, Inc. 1,430,694 0.320,377 Domino's Pizza, Inc. 5,259,304 1.012,750 (1) Eldorado Resorts, Inc. 595,297 0.1
4,499 Expedia Group, Inc. 535,381 0.118,308 (1) Five Below, Inc. 2,274,769 0.492,905 Gentex Corp. 1,921,275 0.414,281 (1) Helen of Troy Ltd. 1,656,025 0.317,643 Jack in the Box, Inc. 1,430,142 0.3
109,088 KB Home 2,636,657 0.522,567 Kohl's Corp. 1,551,933 0.3
9,845 Lear Corp. 1,336,065 0.254,040 (1) Michaels Cos, Inc. 617,137 0.116,975 (1) Norwegian Cruise Line Holdings Ltd. 932,946 0.2
703 (1) NVR, Inc. 1,945,201 0.465,778 (1) Penn National Gaming, Inc. 1,322,138 0.222,949 Pulte Group, Inc. 641,654 0.1
7,110 Ralph Lauren Corp. 922,025 0.229,078 (1) Sally Beauty Holdings, Inc. 535,326 0.1
113,287 Service Corp. International 4,548,473 0.831,648 Signet Jewelers Ltd. 859,560 0.212,233 Six Flags Entertainment Corp. 603,698 0.114,204 (1) Sotheby's 536,201 0.1
Copyright © 2021 www.secdatabase.com. All Rights Reserved.Please Consider the Environment Before Printing This Document

12,935 Thor Industries, Inc. 806,756 0.140,316 Toll Brothers, Inc. 1,459,439 0.341,081 (1) Urban Outfitters, Inc. 1,217,641 0.227,746 (1) Weight Watchers International, Inc. 559,082 0.147,035 Wendy's Company 841,456 0.257,653 Wyndham Destinations, Inc. 2,334,370 0.4
64,814,404 12.1
Consumer Staples: 2.9%21,363 Church & Dwight Co., Inc. 1,521,686 0.3
6,494 Hershey Co. 745,706 0.133,684 Ingredion, Inc. 3,189,538 0.628,201 Lamb Weston Holdings, Inc. 2,113,383 0.444,013 Nu Skin Enterprises, Inc. 2,106,462 0.439,135 (1) Post Holdings, Inc. 4,281,369 0.819,169 Tyson Foods, Inc. 1,330,904 0.3
15,289,048 2.9
Energy: 3.5%455,954 (1),(2) Chesapeake Energy Corp. 1,413,457 0.3
59,308 (1) CNX Resources Corp. 638,747 0.1109,286 EQT Corp. 2,266,592 0.4
26,289 HollyFrontier Corp. 1,295,259 0.244,644 Marathon Oil Corp. 746,001 0.187,163 (1) McDermott International, Inc. 648,493 0.142,371 Murphy Oil Corp. 1,241,470 0.2
126,752 (1) Oasis Petroleum, Inc. 765,582 0.1109,104 Patterson-UTI Energy, Inc. 1,529,638 0.3
80,499 PBF Energy, Inc. 2,506,739 0.5119,259 (1) QEP Resources, Inc. 929,028 0.2396,259 (1) Southwestern Energy Co. 1,858,455 0.4
25,395 (1) Whiting Petroleum Corp. 663,825 0.126,875 World Fuel Services Corp. 776,419 0.2
126,521 (1) WPX Energy, Inc. 1,658,690 0.318,938,395 3.5
Financials: 16.1%958 (1) Alleghany Corp. 586,679 0.1
40,940 Ally Financial, Inc. 1,125,441 0.218,320 American Financial Group, Inc. 1,762,567 0.313,810 Ameriprise Financial, Inc. 1,769,061 0.322,589 (1) Athene Holding Ltd. 921,631 0.282,666 Bank OZK 2,395,661 0.475,636 Cathay General Bancorp. 2,564,817 0.564,591 Citizens Financial Group, Inc. 2,099,208 0.428,050 Comerica, Inc. 2,056,626 0.4
Copyright © 2021 www.secdatabase.com. All Rights Reserved.Please Consider the Environment Before Printing This Document

Voya Index Plus MidCap PortfolioPORTFOLIO OF INVESTMENTS
as of March 31, 2019 (Unaudited) (Continued)
Shares ValuePercentage
of NetAssets
COMMON STOCK: (continued)Financials: (continued)
19,301 Discover Financial Services $ 1,373,459 0.333,665 E*Trade Financial Corp. 1,563,066 0.385,122 East West Bancorp, Inc. 4,083,302 0.836,187 Evercore, Inc. 3,293,017 0.6
8,127 (2) Factset Research Systems, Inc. 2,017,690 0.477,022 First American Financial Corp. 3,966,633 0.720,159 (1) Green Dot Corp. 1,222,643 0.262,753 Hancock Whitney Corp. 2,535,221 0.518,938 Hanover Insurance Group, Inc. 2,162,151 0.433,292 Hartford Financial Services Group, Inc. 1,655,278 0.313,905 International Bancshares Corp. 528,807 0.117,461 Kemper Corp. 1,329,481 0.3
129,082 Keycorp 2,033,042 0.451,074 Lazard Ltd. 1,845,814 0.314,838 LPL Financial Holdings, Inc. 1,033,467 0.2
4,224 M&T Bank Corp. 663,252 0.15,652 MarketAxess Holdings, Inc. 1,390,844 0.3
177,851 Navient Corp. 2,057,736 0.4206,377 Old Republic International Corp. 4,317,407 0.8
24,551 Popular, Inc. 1,279,844 0.233,198 Primerica, Inc. 4,055,136 0.830,064 Reinsurance Group of America, Inc. 4,268,487 0.828,494 Santander Consumer USA Holdings, Inc. 602,078 0.116,204 Signature Bank 2,075,246 0.441,001 Sterling Bancorp 763,849 0.135,216 Stifel Financial Corp. 1,857,996 0.393,015 Synovus Financial Corp. 3,195,995 0.6
155,671 TCF Financial Corp. 3,220,833 0.673,865 Two Harbors Investment Corp. 999,393 0.240,043 Unum Group 1,354,655 0.347,431 Webster Financial Corp. 2,403,329 0.551,250 Wintrust Financial Corp. 3,450,663 0.6
6,469 WR Berkley Corp. 548,054 0.139,162 Zions Bancorp NA 1,778,346 0.3
86,207,905 16.1
Health Care: 9.9%17,860 (1) Amedisys, Inc. 2,201,424 0.455,414 Bruker Corp. 2,130,114 0.412,863 (1) Catalent, Inc. 522,109 0.112,449 (1) Centene Corp. 661,042 0.130,019 (1) Charles River Laboratories International, Inc. 4,360,260 0.8
9,991 Chemed Corp. 3,197,819 0.664,377 Encompass Health Corp. 3,759,617 0.779,617 (1) Exelixis, Inc. 1,894,885 0.410,714 (1) Globus Medical, Inc. 529,379 0.1
Copyright © 2021 www.secdatabase.com. All Rights Reserved.Please Consider the Environment Before Printing This Document

25,298 (1) Haemonetics Corp. 2,213,069 0.416,882 (1) HealthEquity, Inc. 1,248,930 0.244,754 Hill-Rom Holdings, Inc. 4,737,658 0.9
4,093 (1) ICU Medical, Inc. 979,578 0.25,481 (1) Idexx Laboratories, Inc. 1,225,552 0.2
11,114 (1),(2) Ligand Pharmaceuticals, Inc. 1,397,141 0.310,711 (1) LivaNova PLC 1,041,645 0.276,665 (1) Mallinckrodt PLC - W/I 1,666,697 0.333,079 (1) Masimo Corp. 4,574,164 0.919,786 (1) Molina Healthcare, Inc. 2,808,821 0.574,391 Patterson Cos., Inc. 1,625,443 0.323,602 (1) PRA Health Sciences, Inc. 2,603,065 0.523,798 (1) Prestige Consumer Healthcare, Inc. 711,798 0.1
7,251 (1) STERIS Public Ltd. Co. 928,345 0.228,870 (1) Syneos Health, Inc. 1,494,311 0.362,353 (1) Tenet Healthcare Corp. 1,798,260 0.316,099 (1) United Therapeutics Corp. 1,889,540 0.4
7,136 West Pharmaceutical Services, Inc. 786,387 0.152,987,053 9.9
Industrials: 15.1%19,107 AGCO Corp. 1,328,892 0.238,557 Allison Transmission Holdings, Inc. 1,731,980 0.315,205 Ametek, Inc. 1,261,559 0.2
8,714 Armstrong World Industries, Inc. 692,066 0.128,408 (1) ASGN, Inc. 1,803,624 0.325,749 (1) Avis Budget Group, Inc. 897,610 0.211,872 Brink's Co. 895,268 0.26,829 Carlisle Cos., Inc. 837,372 0.2
35,995 Crane Co. 3,045,897 0.635,651 Curtiss-Wright Corp. 4,040,684 0.844,496 Deluxe Corp. 1,945,365 0.451,911 EMCOR Group, Inc. 3,793,656 0.723,439 EnerSys 1,527,285 0.3
9,553 GATX Corp. 729,563 0.120,561 Graco, Inc. 1,018,181 0.271,153 Herman Miller, Inc. 2,503,163 0.511,738 Hubbell, Inc. 1,384,849 0.341,275 IDEX Corp. 6,263,068 1.222,706 Ingersoll-Rand PLC - Class A 2,451,113 0.522,593 Insperity, Inc. 2,793,850 0.531,007 ITT, Inc. 1,798,406 0.314,883 KAR Auction Services, Inc. 763,647 0.1
111,512 KBR, Inc. 2,128,764 0.42,249 Lennox International, Inc. 594,636 0.1
34,375 Manpowergroup, Inc. 2,842,469 0.525,803 (1) Mastec, Inc. 1,241,124 0.235,980 MSC Industrial Direct Co. 2,975,906 0.679,960 nVent Electric PLC 2,157,321 0.416,115 Old Dominion Freight Line 2,326,845 0.431,612 Oshkosh Corp. 2,375,010 0.4
Copyright © 2021 www.secdatabase.com. All Rights Reserved.Please Consider the Environment Before Printing This Document

Voya Index Plus MidCap PortfolioPORTFOLIO OF INVESTMENTS
as of March 31, 2019 (Unaudited) (Continued)
Shares ValuePercentage
of NetAssets
COMMON STOCK: (continued)Industrials: (continued)
235,324 Pitney Bowes, Inc. $ 1,616,676 0.336,158 Regal Beloit Corp. 2,960,255 0.611,680 Ryder System, Inc. 724,043 0.137,370 Schneider National, Inc. 786,638 0.1
3,512 (1) Teledyne Technologies, Inc. 832,379 0.283,542 Timken Co. 3,644,102 0.752,142 Toro Co. 3,589,455 0.716,325 (1) United Continental Holdings, Inc. 1,302,408 0.223,130 Werner Enterprises, Inc. 789,889 0.116,279 (1) Wesco International, Inc. 862,950 0.227,776 Woodward, Inc. 2,635,665 0.514,911 (1),(2) XPO Logistics, Inc. 801,317 0.2
80,694,950 15.1
Information Technology: 15.9%40,762 (1) ACI Worldwide, Inc. 1,339,847 0.396,027 Avnet, Inc. 4,164,691 0.841,460 Belden, Inc. 2,226,402 0.421,874 Broadridge Financial Solutions, Inc. ADR 2,268,115 0.413,078 (1) CACI International, Inc. 2,380,457 0.437,974 (1) Cadence Design Systems, Inc. 2,411,729 0.523,781 CDK Global, Inc. 1,398,798 0.313,187 CDW Corp. 1,270,831 0.251,552 (1) Cirrus Logic, Inc. 2,168,793 0.419,632 Citrix Systems, Inc. 1,956,525 0.410,481 Cognex Corp. 533,064 0.118,133 (1) Fair Isaac Corp. 4,925,467 0.928,412 (1) Fortinet, Inc. 2,385,756 0.442,700 j2 Global, Inc. 3,697,820 0.7
144,754 Jabil, Inc. 3,849,009 0.710,520 KLA-Tencor Corp. 1,256,193 0.223,876 Leidos Holdings, Inc. 1,530,213 0.3
5,691 Littelfuse, Inc. 1,038,494 0.26,460 LogMeIn, Inc. 517,446 0.1
29,129 (1) Lumentum Holdings, Inc. 1,646,954 0.313,514 (1) Manhattan Associates, Inc. 744,756 0.110,563 Maxim Integrated Products 561,635 0.113,949 Maximus, Inc. 990,100 0.243,330 MKS Instruments, Inc. 4,031,856 0.8
4,649 Monolithic Power Systems, Inc. 629,893 0.1120,428 (1) NCR Corp. 3,286,480 0.6
18,982 NetApp, Inc. 1,316,212 0.228,193 (1) Netscout Systems, Inc. 791,377 0.144,617 (1) ON Semiconductor Corp. 917,772 0.286,881 Perspecta, Inc. 1,756,734 0.310,197 (1) PTC, Inc. 939,959 0.2
Copyright © 2021 www.secdatabase.com. All Rights Reserved.Please Consider the Environment Before Printing This Document

162,538 Sabre Corp. 3,476,688 0.79,910 (1) Silicon Laboratories, Inc. 801,323 0.2
11,840 SYNNEX Corp. 1,129,418 0.228,775 (1) Tech Data Corp. 2,946,848 0.665,392 Teradyne, Inc. 2,605,217 0.5
6,509 Total System Services, Inc. 618,420 0.150,005 (1) Trimble, Inc. 2,020,202 0.4
3,731 (1) Tyler Technologies, Inc. 762,616 0.143,571 Versum Materials, Inc. 2,192,057 0.4
157,560 Vishay Intertechnology, Inc. 2,910,133 0.513,720 (1) WEX, Inc. 2,634,103 0.531,209 Xerox Corp. 998,064 0.215,330 (1) Zebra Technologies Corp. 3,212,095 0.6
85,240,562 15.9
Materials: 6.5%10,902 Avery Dennison Corp. 1,231,926 0.220,901 Cabot Corp. 870,109 0.220,257 Carpenter Technology Corp. 928,784 0.2
6,162 Celanese Corp. 607,635 0.163,710 Chemours Co. 2,367,464 0.489,964 Commercial Metals Co. 1,536,585 0.312,879 (2) Compass Minerals International, Inc. 700,231 0.139,664 Domtar Corp. 1,969,318 0.4
7,638 Eastman Chemical Co. 579,571 0.124,229 Greif, Inc. - Class A 999,446 0.238,641 Huntsman Corp. 869,036 0.213,389 (1) Ingevity Corp. 1,414,012 0.3
125,414 Louisiana-Pacific Corp. 3,057,593 0.623,676 Minerals Technologies, Inc. 1,391,912 0.219,436 Packaging Corp. of America 1,931,550 0.488,056 PolyOne Corp. 2,580,921 0.523,023 Reliance Steel & Aluminum Co. 2,078,056 0.4
9,171 RPM International, Inc. 532,285 0.143,098 Sonoco Products Co. 2,651,820 0.5
129,982 Steel Dynamics, Inc. 4,584,465 0.850,760 Worthington Industries, Inc. 1,894,363 0.3
34,777,082 6.5
Real Estate: 10.1%72,308 Brixmor Property Group, Inc. 1,328,298 0.330,017 Brookfield Property REIT, Inc. 615,048 0.131,791 Camden Property Trust 3,226,787 0.630,297 (1) CBRE Group, Inc. 1,498,187 0.3
140,720 CoreCivic, Inc. 2,737,004 0.511,704 Coresite Realty Corp. 1,252,562 0.2
394,133 Cousins Properties, Inc. 3,807,325 0.734,947 Douglas Emmett, Inc. 1,412,558 0.321,751 Equity Lifestyle Properties, Inc. 2,486,139 0.5
6,454 Extra Space Storage, Inc. 657,727 0.1121,612 First Industrial Realty Trust, Inc. 4,300,200 0.8123,211 Geo Group, Inc./The 2,365,651 0.4
Copyright © 2021 www.secdatabase.com. All Rights Reserved.Please Consider the Environment Before Printing This Document

Voya Index Plus MidCap PortfolioPORTFOLIO OF INVESTMENTS
as of March 31, 2019 (Unaudited) (Continued)
Shares ValuePercentage
of NetAssets
COMMON STOCK: (continued)Real Estate: (continued)
83,189 Highwoods Properties, Inc. $ 3,891,581 0.7135,923 Hospitality Properties Trust 3,576,134 0.7
18,235 Jones Lang LaSalle, Inc. 2,811,472 0.56,874 Kilroy Realty Corp. 522,149 0.1
63,492 Lamar Advertising Co. 5,032,376 0.918,343 Life Storage, Inc. 1,784,224 0.3
9,682 National Retail Properties, Inc. 536,286 0.120,471 Omega Healthcare Investors, Inc. 780,969 0.255,916 Outfront Media, Inc. 1,308,434 0.285,183 (2) Realogy Holdings Corp. 971,086 0.243,198 Retail Properties of America, Inc. 526,584 0.1
9,526 SL Green Realty Corp. 856,578 0.2125,376 (2) Tanger Factory Outlet Centers, Inc. 2,630,389 0.5
85,085 (2) Uniti Group, Inc. 952,101 0.2111,939 Urban Edge Properties 2,126,841 0.4
53,994,690 10.1
Utilities: 4.9%46,612 AES Corp. 842,745 0.231,607 Ameren Corp. 2,324,695 0.440,763 Idacorp, Inc. 4,057,549 0.885,247 MDU Resources Group, Inc. 2,201,930 0.449,905 NorthWestern Corp. 3,513,811 0.622,435 NRG Energy, Inc. 953,039 0.237,593 OGE Energy Corp. 1,621,010 0.320,855 Pinnacle West Capital Corp. 1,993,321 0.466,437 PNM Resources, Inc. 3,145,128 0.695,275 UGI Corp. 5,280,140 1.0
25,933,368 4.9
Total Common Stock(Cost $508,777,533) 531,060,433 99.3
PrincipalAmount† Value
Percentageof NetAssets
SHORT-TERM INVESTMENTS: 1.5%Securities Lending Collateral(3): 1.0%
263,594 Bank of Montreal, Repurchase Agreement dated 03/29/19, 2.58%, due 04/01/19(Repurchase Amount $263,650, collateralized by various U.S. GovernmentSecurities, 0.000%-3.750%, Market Value plus accrued interest $268,866, due 04/25/19-08/15/48)
263,594 0.1
1,253,446 Citigroup, Inc., Repurchase Agreement dated 03/29/19, 2.65%, due 04/01/19(Repurchase Amount $1,253,719, collateralized by various U.S. Government/U.S.Government Agency Obligations, 0.000%-10.500%, Market Value plus accruedinterest $1,278,515, due 04/02/19-10/20/68)
1,253,446 0.2
1,253,446 Daiwa Capital Markets, Repurchase Agreement dated 03/29/19, 2.65%, due 04/01/19 (Repurchase Amount $1,253,719, collateralized by various U.S. Government/U.S. Government Agency Obligations, 0.000%-6.500%, Market Value plus accruedinterest $1,278,515, due 04/11/19-03/20/49)
1,253,446 0.3
1,253,446 Jefferies LLC, Repurchase Agreement dated 03/29/19, 2.67%, due 04/01/19(Repurchase Amount $1,253,721, collateralized by various U.S. Government 1,253,446 0.2
Copyright © 2021 www.secdatabase.com. All Rights Reserved.Please Consider the Environment Before Printing This Document

Agency Obligations, 0.000%-6.625%, Market Value plus accrued interest$1,278,525, due 04/03/19-07/15/36)
1,253,446 MUFG Securities America Inc., Repurchase Agreement dated 03/29/19, 2.63%,due 04/01/19 (Repurchase Amount $1,253,717, collateralized by various U.S.Government/U.S. Government Agency Obligations, 3.000%-5.000%, Market Valueplus accrued interest $1,278,515, due 01/01/29-01/01/49)
1,253,446 0.2
5,277,378 1.0
Copyright © 2021 www.secdatabase.com. All Rights Reserved.Please Consider the Environment Before Printing This Document

Voya Index Plus MidCap PortfolioPORTFOLIO OF INVESTMENTS
as of March 31, 2019 (Unaudited) (Continued)
Shares ValuePercentage
of NetAssets
Mutual Funds: 0.5%2,900,000 (4) Goldman Sachs Financial Square Government Fund - Institutional Shares, 2.350%
(Cost $2,900,000) $ 2,900,000 0.5
Total Short-Term Investments(Cost $8,177,378) 8,177,378 1.5
Total Investments in Securities(Cost $516,954,911) $ 539,237,811 100.8
Liabilities in Excess of Other Assets (4,146,304) (0.8)Net Assets $ 535,091,507 100.0
† Unless otherwise indicated, principal amount is shown in USD.ADR American Depositary Receipt(1) Non-income producing security.(2) Security, or a portion of the security, is on loan.(3) Represents securities purchased with cash collateral received for securities on loan.(4) Rate shown is the 7-day yield as of March 31, 2019.
Fair Value MeasurementsThe following is a summary of the fair valuations according to the inputs used as of March 31, 2019 in valuing the assets and liabilities:
Quoted Pricesin Active Markets
for IdenticalInvestments
(Level 1)
SignificantOther
ObservableInputs
(Level 2)
SignificantUnobservable
Inputs(Level 3)
Fair Valueat
March 31, 2019
Asset TableInvestments, at fair valueCommon Stock* $ 531,060,433 $ – $ – $ 531,060,433Short-Term Investments 2,900,000 5,277,378 – 8,177,378Total Investments, at fair value $ 533,960,433 $ 5,277,378 $ – $ 539,237,811Other Financial Instruments+Futures 27,703 – – 27,703Total Assets $ 533,988,136 $ 5,277,378 $ – $ 539,265,514
+Other Financial Instruments may include open forward foreign currency contracts, futures, centrally cleared swaps, OTC swaps and writtenoptions. Forward foreign currency contracts, futures and centrally cleared swaps are valued at the unrealized gain (loss) on the instrument. OTCswaps and written options are valued at the fair value of the instrument.
* For further breakdown of Common Stock by sector, please refer to the Portfolio of Investments.
At March 31, 2019, the following futures contracts were outstanding for Voya Index Plus MidCap Portfolio:
Description Numberof Contracts
ExpirationDate
NotionalValue
UnrealizedAppreciation/(Depreciation)
Long Contracts:S&P Midcap 400® E-Mini 9 06/21/19 $ 1,710,900 $ 27,703
$ 1,710,900 $ 27,703
Copyright © 2021 www.secdatabase.com. All Rights Reserved.Please Consider the Environment Before Printing This Document

Voya Index Plus MidCap PortfolioPORTFOLIO OF INVESTMENTS
as of March 31, 2019 (Unaudited) (Continued)
At March 31, 2019, the aggregate cost of securities and other investments and the composition of unrealized appreciation and depreciation of securitiesand other investments at period end were:
Cost for federal income tax purposes was $517,485,247.
Net unrealized appreciation consisted of:
Gross Unrealized Appreciation $ 55,981,451Gross Unrealized Depreciation (34,201,184)
Net Unrealized Appreciation $ 21,780,267
Copyright © 2021 www.secdatabase.com. All Rights Reserved.Please Consider the Environment Before Printing This Document

Voya Index Plus SmallCap PortfolioPORTFOLIO OF INVESTMENTSas of March 31, 2019 (Unaudited)
Shares ValuePercentage
of NetAssets
COMMON STOCK: 98.7%Communication Services: 2.7%
26,764 (1) Care.com, Inc. $ 528,857 0.228,979 Cogent Communications Holdings, Inc. 1,572,111 0.633,180 Consolidated Communications Holdings, Inc. 361,994 0.2
104,155 Entravision Communications Corp. 337,462 0.1128,438 (1),(2) Frontier Communications Corp. 255,592 0.1
58,044 Gannett Co., Inc. 611,784 0.29,059 (1) Iridium Communications, Inc. 239,520 0.1
27,286 (1) Liberty TripAdvisor Holdings, Inc. 387,188 0.216,358 Marcus Corp. 655,138 0.323,964 (1) QuinStreet, Inc. 320,878 0.114,412 Scholastic Corp. 573,021 0.2
6,436 Sinclair Broadcast Group, Inc. 247,657 0.174,508 (1) Vonage Holdings Corp. 748,060 0.3
6,839,262 2.7
Consumer Discretionary: 13.1%33,176 Abercrombie & Fitch Co. 909,354 0.496,177 (1) American Axle & Manufacturing Holdings, Inc. 1,376,293 0.6
6,217 (1) Asbury Automotive Group, Inc. 431,211 0.272,011 (1) Barnes & Noble Education, Inc. 302,446 0.121,331 BJ's Restaurants, Inc. 1,008,530 0.414,812 Bloomin Brands, Inc. 302,905 0.110,579 Brinker International, Inc. 469,496 0.249,010 Caleres, Inc. 1,210,057 0.560,239 Callaway Golf Co. 959,607 0.463,656 (1) Career Education Corp. 1,051,597 0.4
2,721 (1) Cavco Industries, Inc. 319,799 0.111,191 Childrens Place, Inc./The 1,088,661 0.418,590 Citi Trends, Inc. 358,973 0.120,256 Clarus Corp. 259,479 0.119,853 Core-Mark Holding Co., Inc. 737,142 0.337,984 (1) CROCS, Inc. 978,088 0.444,945 Dana, Inc. 797,324 0.317,350 Dave & Buster's Entertainment, Inc. 865,245 0.3
4,883 (1) Deckers Outdoor Corp. 717,752 0.326,980 (2) DSW, Inc. 599,496 0.2
3,875 (1) Fox Factory Holding Corp. 270,824 0.140,144 GameStop Corp. 407,863 0.211,677 (1) Genesco, Inc. 531,887 0.28,089 Group 1 Automotive, Inc. 523,358 0.25,697 (1),(2) iRobot Corp. 670,480 0.3
47,873 La-Z-Boy, Inc. 1,579,330 0.68,265 (1) Liberty Expedia Holdings, Inc. 353,742 0.1
47,291 (1) M/I Homes, Inc. 1,258,886 0.59,451 (1) Malibu Boats, Inc. 374,071 0.2
Copyright © 2021 www.secdatabase.com. All Rights Reserved.Please Consider the Environment Before Printing This Document

16,355 (1) MarineMax, Inc. 313,362 0.111,320 (1) MasterCraft Boat Holdings, Inc. 255,492 0.130,099 MDC Holdings, Inc. 874,677 0.4
3,159 Monro, Inc. 273,317 0.118,694 Movado Group, Inc. 680,088 0.3
369,438 Office Depot, Inc. 1,341,060 0.55,220 Oxford Industries, Inc. 392,857 0.2
17,381 (2) PetMed Express, Inc. 395,939 0.223,215 (1) Rent-A-Center, Inc. 484,497 0.2
7,476 (1),(2) RH 769,654 0.341,182 Ruth's Hospitality Group, Inc. 1,053,847 0.417,472 (2) Shoe Carnival, Inc. 594,572 0.2
8,253 (1) Shutterfly, Inc. 335,402 0.15,091 (1) Stamps.com, Inc. 414,458 0.27,430 Steven Madden Ltd. 251,431 0.12,767 Strategic Education, Inc. 363,335 0.1
55,909 Superior Industries International 266,127 0.157,459 (2) Tailored Brands, Inc. 450,479 0.221,875 (1) TopBuild Corp. 1,417,938 0.625,401 Tower International, Inc. 534,183 0.222,086 Wolverine World Wide, Inc. 789,133 0.3
32,965,744 13.1
Consumer Staples: 3.2%147,018 (1) Avon Products, Inc. 432,233 0.2
14,328 B&G Foods, Inc. 349,890 0.115,486 (1),(2) Central Garden & Pet Co. 395,822 0.263,244 (1) Darling Ingredients, Inc. 1,369,233 0.531,345 (1) Hostess Brands, Inc. 391,812 0.210,576 John B Sanfilippo & Son, Inc. 760,097 0.3
9,722 Medifast, Inc. 1,240,041 0.527,048 (1) Performance Food Group Co. 1,072,183 0.416,650 (1) Primo Water Corp. 257,409 0.134,856 SpartanNash Co. 553,165 0.213,220 Universal Corp. 761,869 0.342,807 (2) Vector Group Ltd. 461,887 0.2
8,045,641 3.2
Energy: 4.7%5,468 Arch Coal, Inc. 499,064 0.2
22,466 (1) C&J Energy Services, Inc. 348,672 0.110,929 (1) Cactus, Inc. 389,072 0.256,976 (1) Carrizo Oil & Gas, Inc. 710,491 0.317,372 (1) CONSOL Energy, Inc. 594,470 0.2
172,672 (1) Denbury Resources, Inc. 353,978 0.137,364 (1) Exterran Corp. 629,583 0.224,412 (1) FTS International, Inc. 244,120 0.156,058 (1) Gulfport Energy Corp. 449,585 0.253,157 (1) Helix Energy Solutions Group, Inc. 420,472 0.279,969 (1) Laredo Petroleum, Inc. 247,104 0.1
Copyright © 2021 www.secdatabase.com. All Rights Reserved.Please Consider the Environment Before Printing This Document

Voya Index Plus SmallCap PortfolioPORTFOLIO OF INVESTMENTS
as of March 31, 2019 (Unaudited) (Continued)
Shares ValuePercentage
of NetAssets
COMMON STOCK: (continued)Energy: (continued)
46,060 (1) Matrix Service Co. $ 901,855 0.416,410 (1) PDC Energy, Inc. 667,559 0.313,427 Peabody Energy Corp. 380,387 0.162,361 (1) ProPetro Holding Corp. 1,405,617 0.640,484 (1) Renewable Energy Group, Inc. 889,029 0.3
4,698 (1) REX American Resources Corp. 378,706 0.158,295 (1) SRC Energy, Inc. 298,470 0.1
105,356 (1) Tetra Technologies, Inc. 246,533 0.147,450 (1) Unit Corp. 675,688 0.337,646 (2) US Silica Holdings, Inc. 653,535 0.317,551 (1) Whiting Petroleum Corp. 458,783 0.2
11,842,773 4.7
Financials: 16.5%59,503 American Equity Investment Life Holding Co. 1,607,771 0.618,024 Ameris Bancorp. 619,124 0.311,963 Amerisafe, Inc. 710,602 0.326,117 (2) Arbor Realty Trust, Inc. 338,738 0.118,832 Ares Commercial Real Estate Corp. 286,058 0.119,324 (1) Axos Financial, Inc. 559,623 0.253,537 (1) Bancorp, Inc. 432,579 0.221,388 Bank of NT Butterfield & Son Ltd. 767,401 0.342,994 Cadence BanCorp 797,539 0.310,545 Cathay General Bancorp. 357,581 0.137,872 Central Pacific Financial Corp. 1,092,229 0.425,323 Cherry Hill Mortgage Investment Corp. 436,062 0.212,779 Columbia Banking System, Inc. 417,746 0.2
4,700 Community Bank System, Inc. 280,919 0.143,590 (1) Customers Bancorp, Inc. 798,133 0.318,445 (1) Eagle Bancorp, Inc. 925,939 0.426,967 Employers Holdings, Inc. 1,081,646 0.424,302 (1) Essent Group Ltd. 1,055,922 0.4
151,285 First BanCorp. Puerto Rico 1,733,726 0.748,926 First Commonwealth Financial Corp. 616,468 0.213,791 First Financial Bancorp. 331,811 0.1
6,397 FirstCash, Inc. 553,341 0.227,291 Flagstar Bancorp, Inc. 898,420 0.415,999 Franklin Financial Network, Inc. 464,131 0.2
7,205 Glacier Bancorp., Inc. 288,704 0.139,510 Great Western Bancorp, Inc. 1,248,121 0.512,378 (1) Green Dot Corp. 750,726 0.355,219 Hanmi Financial Corp. 1,174,508 0.510,281 HCI Group, Inc. 439,307 0.265,340 Hope Bancorp, Inc. 854,647 0.3
6,588 Houlihan Lokey, Inc. 302,060 0.16,167 Iberiabank Corp. 442,236 0.2
Copyright © 2021 www.secdatabase.com. All Rights Reserved.Please Consider the Environment Before Printing This Document

24,114 Independent Bank Corp. Michigan 518,451 0.252,715 Ladder Capital Corp. 897,209 0.465,361 (1) MGIC Investment Corp. 862,112 0.3
5,805 Moelis & Co. 241,546 0.126,282 (1) Mr Cooper Group, Inc. 252,044 0.156,440 (1) NMI Holdings, Inc. 1,460,103 0.656,637 OFG Bancorp 1,120,846 0.416,301 Oppenheimer Holdings, Inc. 424,152 0.2
8,614 Federal Agricultural Mortgage Corp. 623,912 0.35,218 Primerica, Inc. 637,379 0.3
42,054 Radian Group, Inc. 872,200 0.476,937 Redwood Trust, Inc. 1,242,533 0.513,448 (1) Regional Management Corp. 328,400 0.1
3,636 RLI Corp. 260,883 0.120,812 (1) Seacoast Banking Corp. of Florida 548,396 0.236,730 Selective Insurance Group 2,324,274 0.960,501 Simmons First National Corp. 1,481,064 0.6
106,053 (1) Third Point Reinsurance Ltd. 1,100,830 0.463,733 United Community Banks, Inc./GA 1,588,864 0.631,184 Universal Insurance Holdings, Inc. 966,704 0.415,934 Veritex Holdings, Inc. 385,921 0.245,925 (2) Waddell & Reed Financial, Inc. 794,043 0.3
41,595,684 16.5
Health Care: 11.4%27,615 (1) Acorda Therapeutics, Inc. 367,003 0.123,627 (1) AMAG Pharmaceuticals, Inc. 304,316 0.1
7,072 (1) Amedisys, Inc. 871,695 0.329,943 (1) AMN Healthcare Services, Inc. 1,410,016 0.6
8,293 (1) Anika Therapeutics, Inc. 250,780 0.195,887 (1) Assertio Therapeutics, Inc. 486,147 0.212,261 (1) BioTelemetry, Inc. 767,784 0.316,905 (1) Cambrex Corp. 656,759 0.3
5,731 Conmed Corp. 476,705 0.223,857 (1),(2) Corcept Therapeutics, Inc. 280,081 0.110,645 (1) Corvel Corp. 694,480 0.359,940 (1) Cross Country Healthcare, Inc. 421,378 0.224,874 (1) Emergent Biosolutions, Inc. 1,256,634 0.5
4,919 (1) Enanta Pharmaceuticals, Inc. 469,863 0.280,338 (1) Endo International PLC 645,114 0.319,507 Ensign Group, Inc. 998,563 0.4
7,200 (1) Haemonetics Corp. 629,856 0.332,198 (1) HMS Holdings Corp. 953,383 0.420,683 (1) Integer Holdings Corp. 1,559,912 0.6
Copyright © 2021 www.secdatabase.com. All Rights Reserved.Please Consider the Environment Before Printing This Document

Voya Index Plus SmallCap PortfolioPORTFOLIO OF INVESTMENTS
as of March 31, 2019 (Unaudited) (Continued)
Shares ValuePercentage
of NetAssets
COMMON STOCK: (continued)Health Care: (continued)
34,741 (1),(2) Lannett Co., Inc. $ 273,412 0.136,175 (1) Lantheus Holdings, Inc. 885,564 0.4
2,786 (1) LHC Group, Inc. 308,856 0.13,692 (1) Ligand Pharmaceuticals, Inc. 464,121 0.2
42,141 Luminex Corp. 969,664 0.414,724 (1) Magellan Health, Inc. 970,606 0.414,529 (1) Mallinckrodt PLC - W/I 315,860 0.112,349 (1) Medpace Holdings, Inc. 728,221 0.329,231 (1) Merit Medical Systems, Inc. 1,807,353 0.724,156 (1) Myriad Genetics, Inc. 801,979 0.3
5,786 (1) Neogen Corp. 332,059 0.112,703 (1) NeoGenomics, Inc. 259,903 0.1
9,931 (1) Omnicell, Inc. 802,822 0.315,465 (1) Orthofix Medical, Inc. 872,381 0.370,665 Owens & Minor, Inc. 289,726 0.122,757 Phibro Animal Health Corp. 750,981 0.310,750 (1) REGENXBIO, Inc. 616,083 0.2
4,160 (1) Repligen Corp. 245,773 0.149,728 (1) Select Medical Holdings Corp. 700,668 0.325,292 (1) Spectrum Pharmaceuticals, Inc. 270,371 0.126,034 (1) Supernus Pharmaceuticals, Inc. 912,231 0.411,814 (1) SurModics, Inc. 513,673 0.240,423 (1) Tivity Health, Inc. 709,828 0.319,438 (1) Vanda Pharmaceuticals, Inc. 357,659 0.1
28,660,263 11.4
Industrials: 19.1%7,642 AAR Corp. 248,441 0.19,041 ABM Industries, Inc. 328,640 0.1
58,373 ACCO Brands Corp. 499,673 0.224,165 Actuant Corp. 588,901 0.214,111 Advanced Drainage Systems, Inc. 363,640 0.121,095 (1) Aegion Corp. 370,639 0.129,109 (1) Aerojet Rocketdyne Holdings, Inc. 1,034,243 0.419,087 Applied Industrial Technologies, Inc. 1,135,104 0.531,030 ArcBest Corp. 955,414 0.4
4,168 (1) ASGN, Inc. 264,626 0.125,948 (1) Atkore International Group, Inc. 558,660 0.2
8,816 (1) Atlas Air Worldwide Holdings, Inc. 445,737 0.24,616 (1) Axon Enterprise, Inc. 251,157 0.16,061 AZZ, Inc. 248,077 0.1
33,676 Barnes Group, Inc. 1,731,283 0.75,878 Barrett Business Services, Inc. 454,546 0.2
11,030 Brady Corp. 511,902 0.22,717 (1) Chart Industries, Inc. 245,943 0.1
11,274 Columbus McKinnon Corp. 387,262 0.2
Copyright © 2021 www.secdatabase.com. All Rights Reserved.Please Consider the Environment Before Printing This Document

10,785 Comfort Systems USA, Inc. 565,026 0.231,762 (1) Commercial Vehicle Group, Inc. 243,614 0.116,882 (1) Continental Building Products, Inc. 418,505 0.216,407 (1) Covenant Transportation Group, Inc. 311,405 0.111,065 (1) CSW Industrials, Inc. 633,914 0.38,312 EMCOR Group, Inc. 607,441 0.2
21,268 EnPro Industries, Inc. 1,370,723 0.54,717 Exponent, Inc. 272,265 0.1
46,328 Federal Signal Corp. 1,204,065 0.55,766 (1) FTI Consulting, Inc. 442,944 0.29,564 (1) Gibraltar Industries, Inc. 388,394 0.2
12,190 Global Brass & Copper Holdings, Inc. 419,824 0.227,552 (1) Great Lakes Dredge & Dock Corp. 245,488 0.113,165 Griffon Corp. 243,289 0.174,081 (1) Harsco Corp. 1,493,473 0.630,740 Hawaiian Holdings, Inc. 806,925 0.330,345 Heidrick & Struggles International, Inc. 1,163,124 0.521,583 Herman Miller, Inc. 759,290 0.342,752 Hillenbrand, Inc. 1,775,491 0.721,995 (1) HUB Group, Inc. 898,496 0.4
8,706 Insperity, Inc. 1,076,584 0.44,784 John Bean Technologies Corp. 439,602 0.2
14,423 Kaman Corp. 842,880 0.312,342 Kforce, Inc. 433,451 0.219,848 Knoll, Inc. 375,326 0.135,224 Korn Ferry 1,577,331 0.6
5,449 Lindsay Corp. 527,409 0.212,019 Matthews International Corp. 444,102 0.2
3,955 (1) Mercury Systems, Inc. 253,436 0.148,276 (1) Milacron Holdings Corp. 546,484 0.2
2,985 Moog, Inc. 259,546 0.14,449 (2) National Presto Industries, Inc. 482,939 0.2
29,026 Navigant Consulting, Inc. 565,136 0.27,919 (1) Patrick Industries, Inc. 358,889 0.1
23,854 (1) PGT Innovations, Inc. 330,378 0.12,333 (1) Proto Labs, Inc. 245,292 0.1
36,812 Quanex Building Products Corp. 584,943 0.264,201 RR Donnelley & Sons Co. 303,029 0.112,725 (1) Saia, Inc. 777,497 0.330,023 Simpson Manufacturing Co., Inc. 1,779,463 0.729,454 Skywest, Inc. 1,599,058 0.620,417 (1) SPX Corp. 710,307 0.337,663 (1) SPX FLOW, Inc. 1,201,450 0.519,518 (1) Sterling Construction Co., Inc. 244,365 0.110,591 Tennant Co. 657,595 0.336,050 Tetra Tech, Inc. 2,148,219 0.9
5,325 (1) Trex Co., Inc. 327,594 0.116,588 (1) Trimas Corp. 501,455 0.217,344 (1) TrueBlue, Inc. 410,012 0.2
Copyright © 2021 www.secdatabase.com. All Rights Reserved.Please Consider the Environment Before Printing This Document

Voya Index Plus SmallCap PortfolioPORTFOLIO OF INVESTMENTS
as of March 31, 2019 (Unaudited) (Continued)
Shares ValuePercentage
of NetAssets
COMMON STOCK: (continued)Industrials: (continued)
47,949 Universal Forest Products, Inc. $ 1,433,196 0.622,042 Watts Water Technologies, Inc. 1,781,434 0.7
48,105,986 19.1
Information Technology: 14.6%30,616 (1) Advanced Energy Industries, Inc. 1,521,003 0.6
7,741 (1) Alarm.com Holdings, Inc. 502,391 0.227,033 (1) Axcelis Technologies, Inc. 543,904 0.2
5,024 Belden, Inc. 269,789 0.150,338 Benchmark Electronics, Inc. 1,321,372 0.514,287 (1) Bottomline Technologies de, Inc. 715,636 0.3
3,198 Cabot Microelectronics Corp. 358,048 0.13,824 (1) CACI International, Inc. 696,044 0.3
65,324 (1) CalAmp Corp. 821,776 0.317,970 (1) Cardtronics plc 639,373 0.341,294 Cohu, Inc. 609,086 0.213,371 Comtech Telecommunications Corp. 310,475 0.141,845 (1) Control4 Corp. 708,436 0.317,460 CSG Systems International, Inc. 738,558 0.330,981 CTS Corp. 909,912 0.426,923 (1) Diodes, Inc. 934,228 0.418,058 (1) DSP Group, Inc. 254,076 0.110,353 Entegris, Inc. 369,499 0.1
5,099 (1) ePlus, Inc. 451,465 0.234,917 EVERTEC, Inc. 971,042 0.457,320 (1) Extreme Networks, Inc. 429,327 0.221,364 (1) Fabrinet 1,118,619 0.444,133 (1) Formfactor, Inc. 710,100 0.322,055 (1),(2) Ichor Holdings Ltd. 498,002 0.221,056 (1) Insight Enterprises, Inc. 1,159,343 0.543,993 Kemet Corp. 746,561 0.335,966 (1) Knowles Corp. 634,081 0.235,337 Kulicke & Soffa Industries, Inc. 781,301 0.3
8,175 Mantech International Corp. 441,613 0.231,075 (1) Nanometrics, Inc. 959,596 0.4
4,359 (1) New Relic, Inc. 430,233 0.247,751 NIC, Inc. 816,065 0.343,268 (1) Perficient, Inc. 1,185,111 0.524,707 (1) Plexus Corp. 1,505,892 0.642,193 Progress Software Corp. 1,872,103 0.710,101 (1) Qualys, Inc. 835,757 0.3
1,583 (1) Rogers Corp. 251,507 0.148,414 (1) Rudolph Technologies, Inc. 1,103,839 0.428,949 (1) Sanmina Corp. 835,179 0.321,064 (1) Scansource, Inc. 754,512 0.315,042 (1),(2) SecureWorks Corp. 276,773 0.1
Copyright © 2021 www.secdatabase.com. All Rights Reserved.Please Consider the Environment Before Printing This Document

23,430 (1) Semtech Corp. 1,192,821 0.513,078 (1) SMART Global Holdings, Inc. 251,098 0.111,094 (1),(2) SolarEdge Technologies, Inc. 418,022 0.24,480 (1) SPS Commerce, Inc. 475,149 0.2
25,218 (1) Sykes Enterprises, Inc. 713,165 0.32,752 (1) Tech Data Corp. 281,832 0.1
78,739 (1) TTM Technologies, Inc. 923,608 0.420,223 (1) Viavi Solutions, Inc. 250,361 0.119,550 (1) Virtusa Corp. 1,044,948 0.420,003 Vishay Intertechnology, Inc. 369,455 0.1
36,912,086 14.6
Materials: 3.6%13,153 (1) AdvanSix, Inc. 375,781 0.2
2,677 Balchem Corp. 248,426 0.112,465 Boise Cascade Co. 333,563 0.116,483 (1) Ferro Corp. 312,023 0.139,700 FutureFuel Corp. 531,980 0.2
7,099 Hawkins, Inc. 261,456 0.13,142 (1) Ingevity Corp. 331,827 0.13,566 Kaiser Aluminum Corp. 373,467 0.1
32,453 (1) Kraton Corp. 1,044,338 0.417,573 Materion Corp. 1,002,715 0.423,011 PolyOne Corp. 674,452 0.31,284 Quaker Chemical Corp. 257,224 0.1
19,626 Stepan Co. 1,717,668 0.715,353 Tredegar Corp. 247,797 0.112,318 Trinseo SA 558,005 0.219,642 (1) Verso Corp. 420,732 0.212,933 Worthington Industries, Inc. 482,660 0.2
9,174,114 3.6
Real Estate: 7.4%3,528 Agree Realty Corp. 244,632 0.1
20,562 American Assets Trust, Inc. 942,973 0.449,870 Armada Hoffler Properties, Inc. 777,473 0.376,974 Ashford Hospitality Trust, Inc. 365,627 0.1
155,239 (2) CBL & Associates Properties, Inc. 240,620 0.182,202 Cedar Realty Trust, Inc. 279,487 0.121,881 Chatham Lodging Trust 420,990 0.251,861 Chesapeake Lodging Trust 1,442,254 0.631,682 CoreCivic, Inc. 616,215 0.2
150,497 DiamondRock Hospitality Co. 1,629,883 0.720,113 EastGroup Properties, Inc. 2,245,415 0.928,657 Geo Group, Inc./The 550,214 0.231,302 HFF, Inc. 1,494,671 0.699,946 (2) iStar, Inc. 841,545 0.3
7,156 LTC Properties, Inc. 327,745 0.116,885 (1) Marcus & Millichap, Inc. 687,726 0.329,872 National Storage Affiliates Trust 851,651 0.313,695 PS Business Parks, Inc. 2,147,787 0.9
3,388 Ryman Hospitality Properties 278,629 0.1
Copyright © 2021 www.secdatabase.com. All Rights Reserved.Please Consider the Environment Before Printing This Document

Voya Index Plus SmallCap PortfolioPORTFOLIO OF INVESTMENTS
as of March 31, 2019 (Unaudited) (Continued)
Shares ValuePercentage
of NetAssets
COMMON STOCK: (continued)Real Estate: (continued)
13,661 Saul Centers, Inc. $ 701,766 0.322,122 Urstadt Biddle Properties, Inc. 456,598 0.2
186,079 (2) Washington Prime Group, Inc. 1,051,346 0.418,595,247 7.4
Utilities: 2.4%3,430 American States Water Co. 244,559 0.16,051 Avista Corp. 245,792 0.18,709 Black Hills Corp. 645,076 0.34,506 California Water Service Group 244,586 0.1
16,487 Clearway Energy, Inc.-Class C 249,118 0.117,616 El Paso Electric Co. 1,036,173 0.4
8,222 Idacorp, Inc. 818,418 0.312,929 NorthWestern Corp. 910,331 0.4
7,291 PNM Resources, Inc. 345,156 0.120,789 Portland General Electric Co. 1,077,702 0.4
8,207 South Jersey Industries, Inc. 263,198 0.16,080,109 2.4
Total Common Stock(Cost $244,337,423) 248,816,909 98.7
PrincipalAmount† Value
Percentageof NetAssets
SHORT-TERM INVESTMENTS: 3.1%Securities Lending Collateral(3): 2.8%
352,282 Bank of Montreal, Repurchase Agreement dated 03/29/19, 2.58%, due 04/01/19(Repurchase Amount $352,357, collateralized by various U.S. GovernmentSecurities, 0.000%-3.750%, Market Value plus accrued interest $359,328, due 04/25/19-08/15/48)
352,282 0.1
1,675,470 Bank of Nova Scotia, Repurchase Agreement dated 03/29/19, 2.67%, due 04/01/19(Repurchase Amount $1,675,838, collateralized by various U.S. GovernmentAgency Obligations, 3.500%-4.571%, Market Value plus accrued interest$1,709,360, due 12/01/33-02/01/49)
1,675,470 0.7
1,675,470 Citigroup, Inc., Repurchase Agreement dated 03/29/19, 2.65%, due 04/01/19(Repurchase Amount $1,675,835, collateralized by various U.S. Government/U.S.Government Agency Obligations, 0.000%-10.500%, Market Value plus accruedinterest $1,708,979, due 04/02/19-10/20/68)
1,675,470 0.7
1,675,470 Jefferies LLC, Repurchase Agreement dated 03/29/19, 2.67%, due 04/01/19(Repurchase Amount $1,675,838, collateralized by various U.S. GovernmentAgency Obligations, 0.000%-6.625%, Market Value plus accrued interest$1,708,992, due 04/03/19-07/15/36)
1,675,470 0.6
1,675,470 MUFG Securities America Inc., Repurchase Agreement dated 03/29/19, 2.63%,due 04/01/19 (Repurchase Amount $1,675,832, collateralized by various U.S.Government/U.S. Government Agency Obligations, 3.000%-5.000%, Market Valueplus accrued interest $1,708,979, due 01/01/29-01/01/49)
1,675,470 0.7
7,054,162 2.8
Shares ValuePercentage
of NetAssets
Mutual Funds: 0.3%758,000 (4) Goldman Sachs Financial Square Government Fund - Institutional Shares, 2.350%
Copyright © 2021 www.secdatabase.com. All Rights Reserved.Please Consider the Environment Before Printing This Document

(Cost $758,000) 758,000 0.3
Total Short-Term Investments(Cost $7,812,162) 7,812,162 3.1
Total Investments in Securities(Cost $252,149,585) $ 256,629,071 101.8
Liabilities in Excess of Other Assets (4,591,883) (1.8)Net Assets $ 252,037,188 100.0
Copyright © 2021 www.secdatabase.com. All Rights Reserved.Please Consider the Environment Before Printing This Document

Voya Index Plus SmallCap PortfolioPORTFOLIO OF INVESTMENTS
as of March 31, 2019 (Unaudited) (Continued)
† Unless otherwise indicated, principal amount is shown in USD.(1) Non-income producing security.(2) Security, or a portion of the security, is on loan.(3) Represents securities purchased with cash collateral received for securities on loan.(4) Rate shown is the 7-day yield as of March 31, 2019.
Fair Value MeasurementsThe following is a summary of the fair valuations according to the inputs used as of March 31, 2019 in valuing the assets and liabilities:
Quoted Pricesin Active Markets
for IdenticalInvestments
(Level 1)
SignificantOther
ObservableInputs
(Level 2)
SignificantUnobservable
Inputs(Level 3)
Fair Valueat
March 31, 2019
Asset TableInvestments, at fair valueCommon Stock* $ 248,816,909 $ – $ – $ 248,816,909Short-Term Investments 758,000 7,054,162 – 7,812,162Total Investments, at fair value $ 249,574,909 $ 7,054,162 $ – $ 256,629,071Other Financial Instruments+Futures 25,788 – – 25,788Total Assets $ 249,600,697 $ 7,054,162 $ – $ 256,654,859
+Other Financial Instruments may include open forward foreign currency contracts, futures, centrally cleared swaps, OTC swaps and writtenoptions. Forward foreign currency contracts, futures and centrally cleared swaps are valued at the unrealized gain (loss) on the instrument. OTCswaps and written options are valued at the fair value of the instrument.
* For further breakdown of Common Stock by sector, please refer to the Portfolio of Investments.
At March 31, 2019, the following futures contracts were outstanding for Voya Index Plus SmallCap Portfolio:
Description Numberof Contracts
ExpirationDate
NotionalValue
UnrealizedAppreciation/(Depreciation)
Long Contracts:Russell 2000® Mini Index 30 06/21/19 $ 2,315,700 $ 25,788
$ 2,315,700 $ 25,788
At March 31, 2019, the aggregate cost of securities and other investments and the composition of unrealized appreciation and depreciation of securitiesand other investments at period end were:
Cost for federal income tax purposes was $252,595,187.
Net unrealized appreciation consisted of:
Gross Unrealized Appreciation $ 29,262,375Gross Unrealized Depreciation (25,202,703)
Net Unrealized Appreciation $ 4,059,672
Copyright © 2021 www.secdatabase.com. All Rights Reserved.Please Consider the Environment Before Printing This Document

Voya International Index PortfolioPORTFOLIO OF INVESTMENTSas of March 31, 2019 (Unaudited)
Shares ValuePercentage
of NetAssets
COMMON STOCK: 96.0%Australia: 7.0%
83,050 AGL Energy Ltd. $ 1,283,771 0.1314,117 Alumina Ltd. 540,944 0.0146,479 Amcor Ltd. 1,602,684 0.1379,877 AMP Ltd. 567,337 0.0150,005 APA Group 1,064,829 0.1
72,728 Aristocrat Leisure Ltd. 1,268,429 0.124,646 ASX Ltd. 1,224,295 0.1
253,260 Aurizon Holdings Ltd. 818,786 0.0238,576 AusNet Services 300,854 0.0363,436 Australia & New Zealand Banking Group Ltd. 6,721,511 0.4
53,024 Bank of Queensland Ltd. 342,827 0.063,272 Bendigo and Adelaide Bank Ltd. 435,457 0.0
874,585 (1),(2) BGP Holdings PLC – –373,238 BHP Group Ltd. 10,201,854 0.6267,466 BHP Group PLC 6,453,177 0.4
66,650 BlueScope Steel Ltd. 661,535 0.0150,150 Boral Ltd. 490,076 0.0201,874 Brambles Ltd. 1,687,650 0.1
33,146 Caltex Australia Ltd. 616,656 0.071,754 Challenger Ltd. 422,898 0.012,027 CIMIC Group Ltd. 413,119 0.062,952 Coca-Cola Amatil Ltd. 386,906 0.0
7,309 Cochlear Ltd. 901,218 0.1143,462 (2) Coles Group Ltd. 1,207,104 0.0224,409 Commonwealth Bank of Australia 11,264,021 0.6
58,782 Computershare Ltd. 714,569 0.046,859 Crown Resorts Ltd. 383,226 0.057,392 CSL Ltd. 7,963,286 0.4
129,544 Dexus 1,172,443 0.17,346 Domino's Pizza Enterprises Ltd. 226,520 0.06,735 Flight Centre Travel Group Ltd. 201,197 0.0
198,473 Fortescue Metals Group Ltd. 1,004,502 0.1207,029 Goodman Group 1,963,410 0.1229,830 GPT Group 1,013,791 0.1
76,470 (3) Harvey Norman Holdings Ltd. 218,358 0.0202,875 Incitec Pivot Ltd. 449,869 0.0292,388 Insurance Australia Group Ltd. 1,596,026 0.1
73,346 Lend Lease Corp., Ltd. 645,388 0.040,959 Macquarie Group Ltd. 3,772,165 0.2
350,543 Medibank Pvt Ltd. 688,071 0.0457,432 Mirvac Group 893,552 0.1346,492 National Australia Bank Ltd. 6,225,838 0.4
97,116 Newcrest Mining Ltd. 1,758,776 0.1174,504 Oil Search Ltd. 970,897 0.1
48,284 Orica Ltd. 604,767 0.0
Copyright © 2021 www.secdatabase.com. All Rights Reserved.Please Consider the Environment Before Printing This Document

223,329 Origin Energy Ltd. 1,143,223 0.1168,884 QBE Insurance Group Ltd. 1,477,555 0.1
17,992 Ramsay Health Care Ltd. 822,751 0.16,390 REA Group Ltd. 339,348 0.0
46,958 Rio Tinto Ltd. 3,270,240 0.2224,712 Santos Ltd. 1,088,005 0.1673,385 Scentre Group 1,965,676 0.1
43,269 Seek Ltd. 539,788 0.055,171 Sonic Healthcare Ltd. 962,872 0.1
400,627 South32 Ltd. - AUD 1,063,983 0.1242,587 South32 Ltd. - GBP 634,590 0.0300,136 Stockland 820,955 0.0164,350 Suncorp Group Ltd. 1,609,714 0.1136,842 Sydney Airport 722,368 0.0246,197 Tabcorp Holdings Ltd. 807,912 0.0527,961 Telstra Corp., Ltd. 1,244,967 0.1
45,689 TPG Telecom Ltd. 225,608 0.0338,688 Transurban Group - Stapled Security 3,176,593 0.2
91,121 Treasury Wine Estates Ltd. 967,269 0.1417,609 Vicinity Centres 771,059 0.0
13,839 Washington H Soul Pattinson & Co. Ltd. 258,981 0.0143,319 Wesfarmers Ltd. 3,529,226 0.2435,327 Westpac Banking Corp. 8,024,582 0.5118,612 Woodside Petroleum Ltd. 2,911,933 0.2166,799 Woolworths Group Ltd 3,602,176 0.2
41,145 WorleyParsons Ltd. 412,958 0.0125,738,921 7.0
Austria: 0.2%9,530 Andritz AG 408,740 0.0
38,092 Erste Group Bank AG 1,400,027 0.118,708 OMV AG 1,015,875 0.119,268 Raiffeisen International Bank Holding AG 432,805 0.0
8,723 Verbund - Oesterreichische Elektrizitaetswirtschafts AG 418,940 0.014,732 Voestalpine AG 447,830 0.0
4,124,217 0.2
Belgium: 1.0%22,693 Ageas 1,094,638 0.196,599 Anheuser-Busch InBev SA/NV 8,108,960 0.4
7,534 Colruyt S.A. 556,702 0.010,439 Groupe Bruxelles Lambert S.A. 1,014,888 0.131,691 KBC Group NV 2,215,555 0.118,644 Proximus SADP 538,829 0.0
9,464 Solvay S.A. 1,024,631 0.16,894 Telenet Group Holding NV 331,533 0.0
16,061 UCB S.A. 1,379,684 0.126,552 Umicore SA 1,181,768 0.1
17,447,188 1.0
China: 0.2%4,171 (2) BeiGene Ltd. ADR 550,572 0.1
467,917 BOC Hong Kong Holdings Ltd. 1,941,821 0.1
Copyright © 2021 www.secdatabase.com. All Rights Reserved.Please Consider the Environment Before Printing This Document

Voya International Index PortfolioPORTFOLIO OF INVESTMENTS
as of March 31, 2019 (Unaudited) (Continued)
Shares ValuePercentage
of NetAssets
COMMON STOCK: (continued)China: (continued)
96,000 Minth Group Ltd. $ 302,703 0.02,795,096 0.2
Denmark: 1.7%481 AP Moller - Maersk A/S - Class A 582,086 0.0829 (3) AP Moller - Maersk A/S - Class B 1,051,046 0.1
13,533 Carlsberg A/S 1,692,277 0.112,501 Chr Hansen Holding A/S 1,268,902 0.115,055 Coloplast A/S 1,652,597 0.190,738 Danske Bank A/S 1,594,964 0.123,775 DSV A/S 1,967,436 0.1
7,786 (2) Genmab A/S 1,351,009 0.19,087 (3) H Lundbeck A/S 394,058 0.0
21,259 ISS A/S 647,479 0.0230,288 Novo Nordisk A/S 12,036,088 0.7
27,651 Novozymes A/S 1,271,692 0.123,991 (4) Orsted A/S 1,818,232 0.113,950 Pandora A/S 653,127 0.015,534 Tryg A/S 426,439 0.024,743 Vestas Wind Systems A/S 2,085,494 0.113,455 (2),(3) Demant A/S 398,223 0.0
30,891,149 1.7
Finland: 1.2%18,294 (3) Elisa OYJ 825,371 0.156,620 (3) Fortum OYJ 1,159,687 0.142,990 Kone OYJ 2,171,357 0.113,050 Metso Oyj 449,928 0.016,263 Neste OYJ 1,733,655 0.1
541,593 Nokia OYJ - Finland 3,085,265 0.2172,697 Nokia OYJ - France 986,297 0.1
15,074 Nokian Renkaat OYJ 505,202 0.0385,369 (3) Nordea Bank Abp 2,934,532 0.2
12,809 (3) Orion Oyj 481,317 0.056,304 Sampo OYJ 2,551,869 0.170,513 Stora Enso OYJ 863,313 0.067,431 (3) UPM-Kymmene OYJ 1,969,460 0.156,581 Wartsila OYJ 915,072 0.1
20,632,325 1.2
France: 10.1%24,054 Accor S.A. 974,414 0.1
3,689 Aeroports de Paris 713,745 0.054,334 Air Liquide SA 6,914,655 0.419,246 Alstom SA 834,547 0.1
7,381 (4) Amundi SA 464,833 0.08,538 Arkema SA 814,514 0.0
Copyright © 2021 www.secdatabase.com. All Rights Reserved.Please Consider the Environment Before Printing This Document

12,195 (3) Atos SE 1,177,289 0.1246,200 AXA S.A. 6,192,179 0.3
5,089 BioMerieux 420,910 0.0142,668 BNP Paribas 6,789,347 0.4114,183 Bollore SA 516,323 0.028,122 Bouygues SA 1,005,328 0.132,839 Bureau Veritas SA 770,433 0.020,364 Capgemini SE 2,471,017 0.175,118 Carrefour S.A. 1,402,996 0.16,917 (3) Casino Guichard Perrachon S.A. 299,892 0.0
63,085 Cie de Saint-Gobain 2,287,408 0.121,651 Cie Generale des Etablissements Michelin SCA 2,557,950 0.121,296 CNP Assurances 468,898 0.0
145,903 Credit Agricole SA 1,761,632 0.178,283 Danone 6,027,895 0.3
304 Dassault Aviation SA 448,433 0.016,610 Dassault Systemes SE 2,475,710 0.130,395 Edenred 1,384,211 0.1
9,780 Eiffage SA 940,135 0.176,651 Electricite de France SA 1,049,309 0.1
232,081 Engie SA 3,461,005 0.236,504 EssilorLuxottica SA 3,987,712 0.2
5,919 Eurazeo SE 445,073 0.01,459 (3) Eurofins Scientific SE 604,410 0.0
22,587 Eutelsat Communications 395,545 0.09,813 Faurecia SA 413,083 0.05,529 Covivio 586,727 0.05,639 Gecina S.A. 834,172 0.1
59,710 Getlink SE 905,462 0.14,025 Hermes International 2,657,609 0.24,228 ICADE 357,606 0.03,248 Iliad SA 326,361 0.04,761 Imerys SA 237,339 0.07,634 Ingenico Group SA 545,313 0.04,822 Ipsen SA 661,249 0.09,832 JC Decaux SA 299,109 0.09,604 Kering SA 5,508,903 0.3
25,349 Klepierre SA 886,941 0.133,886 Legrand S.A. 2,268,679 0.132,008 L'Oreal S.A. 8,619,519 0.535,217 LVMH Moet Hennessy Louis Vuitton SE 12,971,670 0.7
117,494 Natixis SA 629,335 0.0253,430 Orange SA 4,131,702 0.2
26,959 Pernod Ricard SA 4,840,800 0.374,563 Peugeot S.A. 1,819,468 0.126,845 Publicis Groupe 1,437,341 0.1
2,760 Remy Cointreau SA 368,120 0.024,376 Renault S.A. 1,611,693 0.139,287 Rexel SA 443,367 0.042,319 Safran S.A. 5,800,302 0.3
142,917 Sanofi 12,637,376 0.73,570 Sartorius Stedim Biotech 452,354 0.0
69,755 Schneider Electric SE 5,474,997 0.320,889 (2) SCOR SE 889,712 0.1
2,773 SEB SA 466,873 0.0
Copyright © 2021 www.secdatabase.com. All Rights Reserved.Please Consider the Environment Before Printing This Document

3,193 Societe BIC S.A. 284,651 0.097,291 Societe Generale 2,811,089 0.211,019 Sodexo SA 1,213,411 0.146,468 SUEZ 615,605 0.1
7,346 Teleperformance 1,320,574 0.113,514 Thales S.A. 1,619,122 0.1
306,290 Total SA 17,044,911 1.010,597 (2) UbiSoft Entertainment 944,968 0.117,559 (3) Unibail-Rodamco-Westfield 2,878,505 0.230,609 Valeo SA 888,667 0.168,475 Veolia Environnement 1,532,059 0.164,478 Vinci SA 6,273,856 0.4
132,422 Vivendi SA 3,837,617 0.2
Copyright © 2021 www.secdatabase.com. All Rights Reserved.Please Consider the Environment Before Printing This Document

Voya International Index PortfolioPORTFOLIO OF INVESTMENTS
as of March 31, 2019 (Unaudited) (Continued)
Shares ValuePercentage
of NetAssets
COMMON STOCK: (continued)France: (continued)
3,378 Wendel $ 425,693 0.0180,831,658 10.1
Germany: 7.7%22,857 Adidas AG 5,559,337 0.353,853 Allianz SE 12,001,070 0.799,891 Aroundtown SA 823,959 0.1
5,951 Axel Springer AG 307,628 0.0116,373 BASF SE 8,582,179 0.5118,204 Bayer AG 7,611,417 0.441,609 Bayerische Motoren Werke AG 3,212,814 0.212,860 Beiersdorf AG 1,338,806 0.119,664 Brenntag AG 1,010,994 0.1
127,261 (2) Commerzbank AG 986,608 0.113,936 Continental AG 2,102,380 0.124,331 (4) Covestro AG 1,342,378 0.1
115,256 Daimler AG 6,763,633 0.411,909 (2),(4) Delivery Hero SE 430,159 0.0
248,741 Deutsche Bank AG 2,027,750 0.124,109 Deutsche Boerse AG 3,091,262 0.230,181 Deutsche Lufthansa AG 663,412 0.0
125,400 Deutsche Post AG 4,080,905 0.2423,015 Deutsche Telekom AG 7,027,660 0.4
45,393 Deutsche Wohnen SE 2,202,718 0.16,540 (3) 1&1 Drillisch AG 233,065 0.0
279,304 E.ON AG 3,108,176 0.220,582 Evonik Industries AG 561,668 0.0
5,031 Fraport AG Frankfurt Airport Services Worldwide 385,954 0.052,879 Fresenius SE & Co. KGaA 2,955,524 0.227,430 Fresenius Medical Care AG & Co. KGaA 2,216,901 0.120,021 GEA Group AG 524,729 0.0
7,745 Hannover Rueck SE 1,112,890 0.118,880 HeidelbergCement AG 1,360,911 0.112,874 Henkel AG & Co. KGaA 1,225,004 0.1
2,576 Hochtief AG 373,243 0.08,118 Hugo Boss AG 555,067 0.0
143,777 Infineon Technologies AG 2,854,335 0.217,344 (4) Innogy SE 801,965 0.1
9,097 KION Group AG 476,032 0.011,084 Lanxess AG 592,565 0.016,406 Merck KGaA 1,873,098 0.122,082 Metro AG 366,753 0.0
6,599 MTU Aero Engines AG 1,495,744 0.118,980 Muenchener Rueckversicherungs-Gesellschaft AG 4,498,175 0.312,003 (3) Osram Licht AG 413,496 0.029,778 ProSiebenSat.1 Media SE 423,948 0.0
Copyright © 2021 www.secdatabase.com. All Rights Reserved.Please Consider the Environment Before Printing This Document

1,061 Puma SE 615,324 0.065,747 RWE AG 1,765,461 0.1
124,678 SAP SE 14,413,409 0.896,995 Siemens AG 10,431,131 0.618,570 (4) Siemens Healthineers AG 775,307 0.015,646 Symrise AG 1,410,462 0.192,198 Telefonica Deutschland Holding AG 289,483 0.055,249 ThyssenKrupp AG 760,003 0.056,308 TUI AG 540,071 0.025,033 Uniper SE 755,096 0.115,175 United Internet AG 554,891 0.0
4,313 Volkswagen AG 703,140 0.062,509 Vonovia SE 3,243,956 0.214,874 (3) Wirecard AG 1,868,522 0.114,300 (2),(3),(4) Zalando SE 557,428 0.0
138,259,996 7.7
Hong Kong: 3.7%1,530,299 AIA Group Ltd. 15,302,638 0.9
39,500 ASM Pacific Technology Ltd. 441,371 0.0162,952 Bank of East Asia Ltd. 529,723 0.0327,199 CK Asset Holdings Ltd. 2,913,968 0.2341,199 CK Hutchison Holdings Ltd. 3,587,829 0.2
84,902 CK Infrastructure Holdings Ltd. 696,869 0.0207,865 CLP Holdings Ltd. 2,410,942 0.1
44,787 Dairy Farm International Holdings Ltd. 376,659 0.0300,159 Galaxy Entertainment Group Ltd. 2,045,588 0.1113,000 Hang Lung Group Ltd. 363,258 0.0260,823 Hang Lung Properties Ltd. 637,044 0.0
96,836 Hang Seng Bank Ltd. 2,391,162 0.1167,509 Henderson Land Development Co., Ltd. 1,066,086 0.1324,000 HK Electric Investments & HK Electric Investments Ltd. 331,019 0.0483,867 HKT Trust / HKT Ltd. 777,890 0.1
1,169,744 Hong Kong & China Gas 2,805,331 0.2150,288 Hong Kong Exchanges and Clearing Ltd. 5,250,841 0.3176,845 Power Assets Holdings Ltd. 1,226,940 0.1149,133 Hongkong Land Holdings Ltd. - HKHGF 1,061,477 0.1
82,644 Hysan Development Co., Ltd. 442,988 0.028,004 Jardine Matheson Holdings Ltd. 1,748,279 0.128,200 Jardine Strategic Holdings Ltd. 1,057,777 0.182,060 Kerry Properties Ltd. 366,876 0.0
267,032 Link REIT 3,126,321 0.231,245 Melco Resorts & Entertainment Ltd ADR 705,825 0.0
194,144 MTR Corp. 1,202,892 0.1777,094 New World Development Ltd. 1,289,754 0.1192,660 NWS Holdings Ltd. 421,802 0.0550,000 PCCW Ltd. 341,944 0.0151,385 Shangri-La Asia Ltd. 215,219 0.0408,626 Sino Land Co. 791,211 0.0201,471 Sun Hung Kai Properties Ltd. 3,463,432 0.2
Copyright © 2021 www.secdatabase.com. All Rights Reserved.Please Consider the Environment Before Printing This Document

Voya International Index PortfolioPORTFOLIO OF INVESTMENTS
as of March 31, 2019 (Unaudited) (Continued)
Shares ValuePercentage
of NetAssets
COMMON STOCK: (continued)Hong Kong: (continued)
63,620 Swire Pacific Ltd - Class A $ 819,483 0.1151,225 Swire Properties Ltd. 650,855 0.0174,500 Techtronic Industries Co., Ltd. 1,175,197 0.1
1,118,500 (4) WH Group Ltd. 1,196,378 0.1155,857 Wharf Holdings Ltd. 471,166 0.0153,857 Wharf Real Estate Investment Co. Ltd. 1,146,651 0.1101,504 Wheelock & Co., Ltd. 744,947 0.0
90,949 Yue Yuen Industrial Holdings 313,115 0.065,908,747 3.7
Ireland: 0.5%106,081 AIB Group PLC 477,370 0.0124,022 Bank of Ireland Group PLC 740,168 0.0
42,961 CRH PLC 1,331,607 0.112,500 DCC PLC 1,081,550 0.156,941 James Hardie Industries SE 734,662 0.0
9,552 Kerry Group PLC - KYG 1,066,143 0.110,633 Kerry Group PLC - KYGAL 1,180,835 0.119,418 Kingspan Group Plc 899,774 0.110,030 Paddy Power Betfair PLC 773,520 0.0
2,975 (2) Ryanair Holdings PLC ADR 222,947 0.028,674 Smurfit Kappa PLC 801,410 0.0
9,309,986 0.5
Israel: 0.5%5,330 Azrieli Group Ltd. 315,716 0.0
136,413 Bank Hapoalim BM 906,558 0.1189,258 Bank Leumi Le-Israel BM 1,239,931 0.1244,825 Bezeq Israeli Telecommunication Corp., Ltd. 176,093 0.0
15,898 (2) Check Point Software Technologies 2,010,938 0.12,876 Elbit Systems Ltd. 372,549 0.0
91,881 Israel Chemicals Ltd. 480,074 0.017,569 Mizrahi Tefahot Bank Ltd. 362,104 0.0
7,903 (2) Nice Ltd. 965,234 0.1122,621 (2) Teva Pharmaceutical Industries Ltd. ADR 1,922,697 0.1
5,535 (2) Wix.com Ltd. 668,794 0.09,420,688 0.5
Italy: 2.0%149,322 Assicurazioni Generali S.p.A. 2,768,523 0.2
62,932 Atlantia S.p.A 1,632,081 0.174,182 Davide Campari-Milano SpA 728,814 0.0
1,032,356 Enel S.p.A. 6,615,171 0.4322,677 ENI S.p.A. 5,701,255 0.3
15,545 Ferrari NV 2,088,453 0.152,715 Leonardo SpA 613,962 0.0
1,886,680 Intesa Sanpaolo SpA 4,604,497 0.3
Copyright © 2021 www.secdatabase.com. All Rights Reserved.Please Consider the Environment Before Printing This Document
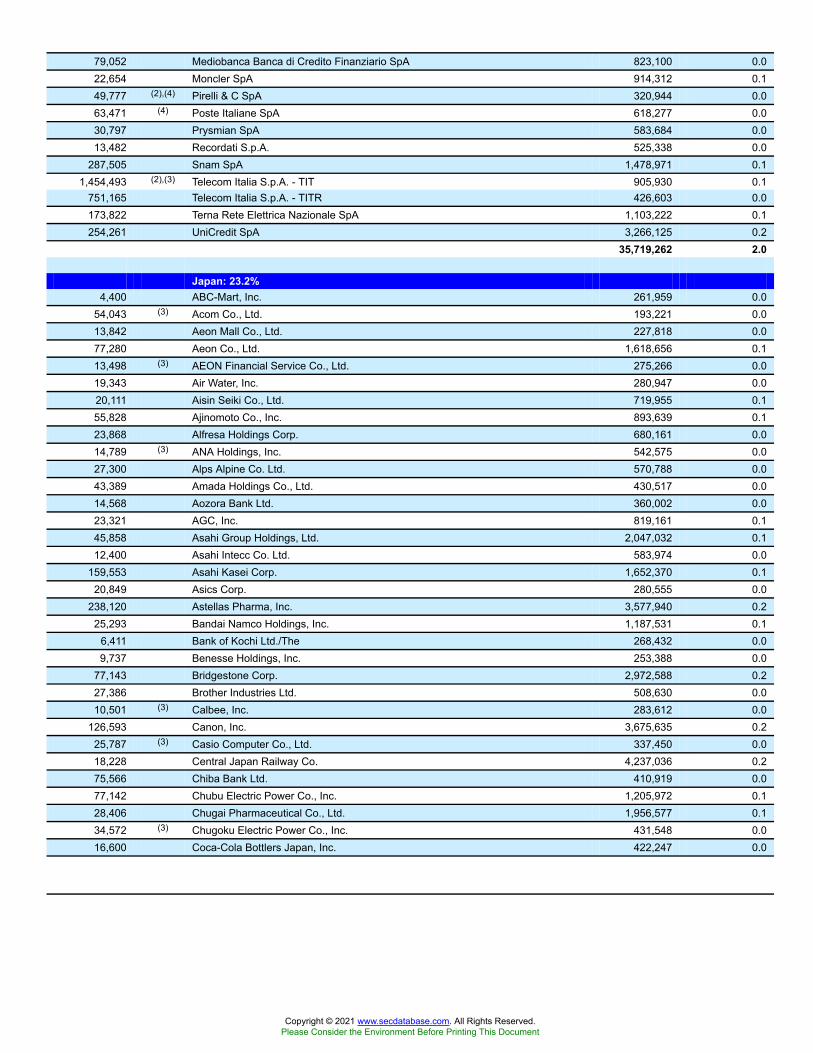
79,052 Mediobanca Banca di Credito Finanziario SpA 823,100 0.022,654 Moncler SpA 914,312 0.149,777 (2),(4) Pirelli & C SpA 320,944 0.063,471 (4) Poste Italiane SpA 618,277 0.030,797 Prysmian SpA 583,684 0.013,482 Recordati S.p.A. 525,338 0.0
287,505 Snam SpA 1,478,971 0.11,454,493 (2),(3) Telecom Italia S.p.A. - TIT 905,930 0.1
751,165 Telecom Italia S.p.A. - TITR 426,603 0.0173,822 Terna Rete Elettrica Nazionale SpA 1,103,222 0.1254,261 UniCredit SpA 3,266,125 0.2
35,719,262 2.0
Japan: 23.2%4,400 ABC-Mart, Inc. 261,959 0.0
54,043 (3) Acom Co., Ltd. 193,221 0.013,842 Aeon Mall Co., Ltd. 227,818 0.077,280 Aeon Co., Ltd. 1,618,656 0.113,498 (3) AEON Financial Service Co., Ltd. 275,266 0.019,343 Air Water, Inc. 280,947 0.020,111 Aisin Seiki Co., Ltd. 719,955 0.155,828 Ajinomoto Co., Inc. 893,639 0.123,868 Alfresa Holdings Corp. 680,161 0.014,789 (3) ANA Holdings, Inc. 542,575 0.027,300 Alps Alpine Co. Ltd. 570,788 0.043,389 Amada Holdings Co., Ltd. 430,517 0.014,568 Aozora Bank Ltd. 360,002 0.023,321 AGC, Inc. 819,161 0.145,858 Asahi Group Holdings, Ltd. 2,047,032 0.112,400 Asahi Intecc Co. Ltd. 583,974 0.0
159,553 Asahi Kasei Corp. 1,652,370 0.120,849 Asics Corp. 280,555 0.0
238,120 Astellas Pharma, Inc. 3,577,940 0.225,293 Bandai Namco Holdings, Inc. 1,187,531 0.1
6,411 Bank of Kochi Ltd./The 268,432 0.09,737 Benesse Holdings, Inc. 253,388 0.0
77,143 Bridgestone Corp. 2,972,588 0.227,386 Brother Industries Ltd. 508,630 0.010,501 (3) Calbee, Inc. 283,612 0.0
126,593 Canon, Inc. 3,675,635 0.225,787 (3) Casio Computer Co., Ltd. 337,450 0.018,228 Central Japan Railway Co. 4,237,036 0.275,566 Chiba Bank Ltd. 410,919 0.077,142 Chubu Electric Power Co., Inc. 1,205,972 0.128,406 Chugai Pharmaceutical Co., Ltd. 1,956,577 0.134,572 (3) Chugoku Electric Power Co., Inc. 431,548 0.016,600 Coca-Cola Bottlers Japan, Inc. 422,247 0.0
Copyright © 2021 www.secdatabase.com. All Rights Reserved.Please Consider the Environment Before Printing This Document

Voya International Index PortfolioPORTFOLIO OF INVESTMENTS
as of March 31, 2019 (Unaudited) (Continued)
Shares ValuePercentage
of NetAssets
COMMON STOCK: (continued)Japan: (continued)
133,209 Concordia Financial Group Ltd. $ 515,033 0.020,824 Credit Saison Co., Ltd. 275,522 0.013,000 CyberAgent, Inc. 531,966 0.029,874 Dai Nippon Printing Co., Ltd. 715,568 0.133,984 Daicel Corp. 370,117 0.012,800 (3) Daifuku Co., Ltd. 669,559 0.0
136,283 Dai-ichi Life Holdings, Inc. 1,897,241 0.171,893 Daiichi Sankyo Co., Ltd. 3,319,852 0.231,498 Daikin Industries Ltd. 3,702,423 0.2
9,081 Daito Trust Construction Co., Ltd. 1,266,963 0.171,654 Daiwa House Industry Co., Ltd. 2,282,009 0.1
236 Daiwa House REIT Investment Corp. 523,540 0.0205,121 Daiwa Securities Group, Inc. 999,824 0.1
14,100 Dena Co., Ltd. 212,546 0.054,867 Denso Corp. 2,143,612 0.127,403 Dentsu, Inc. 1,159,759 0.1
3,600 Disco Corp. 515,561 0.015,042 Pan Pacific International Holdings Corp. 996,596 0.138,733 East Japan Railway Co. 3,740,293 0.231,979 Eisai Co., Ltd. 1,799,357 0.118,942 Electric Power Development Co., Ltd. 461,908 0.032,152 (3) FamilyMart UNY Holdings Co., Ltd. 819,583 0.124,493 Fanuc Ltd. 4,188,638 0.2
7,342 Fast Retailing Co., Ltd. 3,457,796 0.215,423 Fuji Electric Holdings Co., Ltd. 439,107 0.048,860 Fuji Film Holdings Corp. 2,225,478 0.124,913 Fujitsu Ltd. 1,801,698 0.118,143 Fukuoka Financial Group, Inc. 402,877 0.028,700 Hakuhodo DY Holdings, Inc. 462,133 0.018,042 Hamamatsu Photonics KK 699,906 0.029,157 Hankyu Hanshin Holdings, Inc. 1,094,485 0.1
2,700 Hikari Tsushin, Inc. 512,479 0.031,532 Hino Motors Ltd. 266,198 0.0
3,864 Hirose Electric Co., Ltd. 406,871 0.07,129 Hisamitsu Pharmaceutical Co., Inc. 328,842 0.0
13,400 (3) Hitachi Chemical Co., Ltd. 298,204 0.013,410 Hitachi Construction Machinery Co., Ltd. 357,494 0.0
8,700 Hitachi High-Technologies Corp. 357,477 0.0122,391 Hitachi Ltd. 3,976,561 0.2
28,210 Hitachi Metals Ltd. 328,654 0.0206,442 Honda Motor Co., Ltd. 5,607,125 0.3
7,000 Hoshizaki Corp. 434,535 0.048,337 Hoya Corp. 3,201,711 0.237,164 Hulic Co. Ltd. 365,170 0.027,456 Idemitsu Kosan Co., Ltd. 918,345 0.119,142 IHI Corp. 461,139 0.019,191 Iida Group Holdings Co. Ltd. 348,226 0.0
Copyright © 2021 www.secdatabase.com. All Rights Reserved.Please Consider the Environment Before Printing This Document

129,716 Inpex Corp. 1,233,978 0.143,466 Isetan Mitsukoshi Holdings Ltd. 439,734 0.070,468 Isuzu Motors Ltd. 928,407 0.1
170,616 Itochu Corp. 3,092,207 0.228,652 J Front Retailing Co., Ltd. 341,408 0.014,778 Japan Airlines Co. Ltd. 520,770 0.0
6,100 (3) Japan Airport Terminal Co., Ltd. 258,457 0.064,714 Japan Exchange Group, Inc. 1,155,077 0.148,700 Japan Post Bank Co. Ltd. 532,105 0.0
200,000 Japan Post Holdings Co. Ltd. 2,340,773 0.1107 Japan Prime Realty Investment Corp. 440,465 0.0168 Japan Real Estate Investment Corp. 990,306 0.1339 Japan Retail Fund Investment Corp. 681,181 0.1
139,402 Japan Tobacco, Inc. 3,452,684 0.262,502 JFE Holdings, Inc. 1,063,835 0.127,439 (3) JGC Corp. 365,861 0.025,135 JSR Corp. 391,054 0.027,165 JTEKT Corp. 335,436 0.0
406,764 JXTG Holdings, Inc. 1,856,854 0.156,754 Kajima Corp. 839,547 0.116,623 Kakaku.com, Inc. 320,245 0.013,260 Kamigumi Co., Ltd. 307,544 0.0
6,400 Kaneka Corp. 240,273 0.089,162 Kansai Electric Power Co., Inc. 1,314,882 0.123,153 Kansai Paint Co., Ltd. 442,568 0.061,875 Kao Corp. 4,883,587 0.318,553 Kawasaki Heavy Industries Ltd. 458,874 0.0
224,601 KDDI Corp. 4,837,299 0.312,600 Keihan Holdings Co., Ltd. 530,451 0.027,508 Keikyu Corp. 467,359 0.012,768 Keio Corp. 825,922 0.115,898 Keisei Electric Railway Co., Ltd. 578,154 0.012,344 Keyence Corp. 7,717,408 0.418,534 Kikkoman Corp. 911,338 0.121,797 Kintetsu Group Holdings Co., Ltd. 1,016,740 0.1
104,156 Kirin Holdings Co., Ltd. 2,491,794 0.16,300 Kobayashi Pharmaceutical Co., Ltd. 533,030 0.0
38,276 Kobe Steel Ltd. 287,964 0.013,200 Koito Manufacturing Co., Ltd. 750,460 0.1
116,883 Komatsu Ltd. 2,726,128 0.211,566 Konami Holdings Corp. 503,233 0.058,123 Konica Minolta, Inc. 573,101 0.0
Copyright © 2021 www.secdatabase.com. All Rights Reserved.Please Consider the Environment Before Printing This Document

Voya International Index PortfolioPORTFOLIO OF INVESTMENTS
as of March 31, 2019 (Unaudited) (Continued)
Shares ValuePercentage
of NetAssets
COMMON STOCK: (continued)Japan: (continued)
3,800 Kose Corp. $ 700,382 0.1124,922 Kubota Corp. 1,815,775 0.1
41,167 Kuraray Co., Ltd. 525,138 0.012,748 Kurita Water Industries, Ltd. 326,413 0.040,594 Kyocera Corp. 2,390,291 0.133,214 Kyowa Hakko Kirin Co., Ltd. 724,844 0.147,360 Kyushu Electric Power Co., Inc. 559,406 0.020,400 Kyushu Railway Co. 671,057 0.0
6,564 Lawson, Inc. 364,139 0.08,800 (2) LINE Corp. 309,890 0.0
28,700 Lion Corp. 604,829 0.034,192 LIXIL Group Corp. 456,995 0.053,600 M3, Inc. 902,071 0.128,608 Makita Corp. 999,848 0.1
197,856 Marubeni Corp. 1,371,816 0.123,619 (3) Marui Group Co., Ltd. 477,556 0.0
7,500 Maruichi Steel Tube Ltd. 218,769 0.070,366 Mazda Motor Corp. 788,937 0.1
8,500 McDonald's Holdings Co. Japan Ltd. 393,240 0.0104,262 Mebuki Financial Group, Inc. 266,868 0.0
21,100 Medipal Holdings Corp. 502,050 0.015,488 MEIJI Holdings Co., Ltd. 1,259,041 0.148,600 Minebea Mitsumi, Inc. 733,592 0.136,300 Misumi Group, Inc. 906,309 0.1
171,193 Mitsubishi Corp. 4,766,223 0.3230,861 Mitsubishi Electric Corp. 2,978,659 0.2
13,151 Mitsubishi Materials Corp. 347,749 0.086,815 Mitsubishi Motors Corp. 462,565 0.031,213 Mitsubishi Tanabe Pharma Corp. 418,079 0.0
1,488,906 Mitsubishi UFJ Financial Group, Inc. 7,363,823 0.448,976 Mitsubishi UFJ Lease & Finance Co., Ltd. 250,009 0.0
149,727 Mitsubishi Estate Co., Ltd. 2,716,785 0.221,439 Mitsubishi Gas Chemical Co., Inc. 307,083 0.038,419 Mitsubishi Heavy Industries Ltd. 1,598,766 0.1
162,248 Mitsubishi Chemical Holdings Corp. 1,145,895 0.1209,401 Mitsui & Co., Ltd. 3,258,372 0.2
23,514 Mitsui Chemicals, Inc. 569,514 0.0113,019 Mitsui Fudosan Co., Ltd. 2,847,123 0.214,793 Mitsui OSK Lines Ltd. 319,176 0.060,154 MS&AD Insurance Group Holdings, Inc. 1,832,807 0.1
3,055,561 Mizuho Financial Group, Inc. 4,728,395 0.316,000 MonotaRO Co. Ltd. 357,676 0.068,544 Murata Manufacturing Co., Ltd. 3,430,284 0.214,421 Nabtesco Corp. 422,591 0.023,100 Nagoya Railroad Co., Ltd. 640,153 0.033,120 NEC Corp. 1,122,524 0.156,700 (2) Nexon Co. Ltd. 891,682 0.1
Copyright © 2021 www.secdatabase.com. All Rights Reserved.Please Consider the Environment Before Printing This Document

33,869 NGK Insulators Ltd. 493,430 0.019,185 NGK Spark Plug Co., Ltd. 357,330 0.012,009 (3) NH Foods Ltd. 432,708 0.028,292 Nidec Corp. 3,602,559 0.239,669 Nikon Corp. 560,866 0.014,394 Nintendo Co., Ltd. 4,126,630 0.2
214 Nippon Prologis REIT, Inc. 455,617 0.0171 Nippon Building Fund, Inc. 1,157,886 0.1
11,082 Nippon Electric Glass Co., Ltd. 294,440 0.09,622 Nippon Express Co., Ltd. 536,486 0.0
18,617 Nippon Paint Holdings Co., Ltd. 734,889 0.1101,880 Nippon Steel & Sumitomo Metal Corp. 1,803,340 0.1
81,598 Nippon Telegraph & Telephone Corp. 3,478,612 0.218,903 Nippon Yusen KK 277,595 0.016,100 Nissan Chemical Corp. 739,599 0.1
293,692 Nissan Motor Co., Ltd. 2,411,842 0.124,167 Nisshin Seifun Group, Inc. 555,557 0.0
8,217 Nissin Food Products Co., Ltd. 565,380 0.010,106 Nitori Co., Ltd. 1,306,660 0.120,842 Nitto Denko Corp. 1,098,565 0.1
437,826 Nomura Holdings, Inc. 1,582,151 0.116,245 Nomura Real Estate Holdings, Inc. 312,601 0.0
501 Nomura Real Estate Master Fund, Inc. 738,032 0.114,056 Nomura Research Institute Ltd. 640,245 0.046,249 NSK Ltd. 434,844 0.078,020 NTT Data Corp. 862,565 0.1
169,154 NTT DoCoMo, Inc. 3,749,067 0.282,215 Obayashi Corp. 828,619 0.1
8,200 Obic Co., Ltd. 829,222 0.137,327 Odakyu Electric Railway Co., Ltd. 905,798 0.1
109,226 Oji Holdings Corp. 679,697 0.0147,828 Olympus Corp. 1,608,254 0.1
24,323 Omron Corp. 1,142,724 0.148,190 Ono Pharmaceutical Co., Ltd. 946,954 0.1
4,700 Oracle Corp. Japan 316,069 0.025,380 Oriental Land Co., Ltd. 2,886,620 0.2
167,563 ORIX Corp. 2,407,480 0.147,765 Osaka Gas Co., Ltd. 944,368 0.113,322 Otsuka Corp. 498,407 0.049,446 Otsuka Holdings Co. Ltd. 1,946,834 0.1
278,831 Panasonic Corp. 2,404,108 0.114,899 Park24 Co., Ltd. 323,905 0.022,000 Persol Holdings Co. Ltd 357,245 0.014,600 Pigeon Corp. 599,020 0.011,500 Pola Orbis Holdings, Inc. 367,842 0.0
109,370 Rakuten, Inc. 1,037,904 0.1139,600 Recruit Holdings Co. Ltd. 4,002,397 0.2
Copyright © 2021 www.secdatabase.com. All Rights Reserved.Please Consider the Environment Before Printing This Document
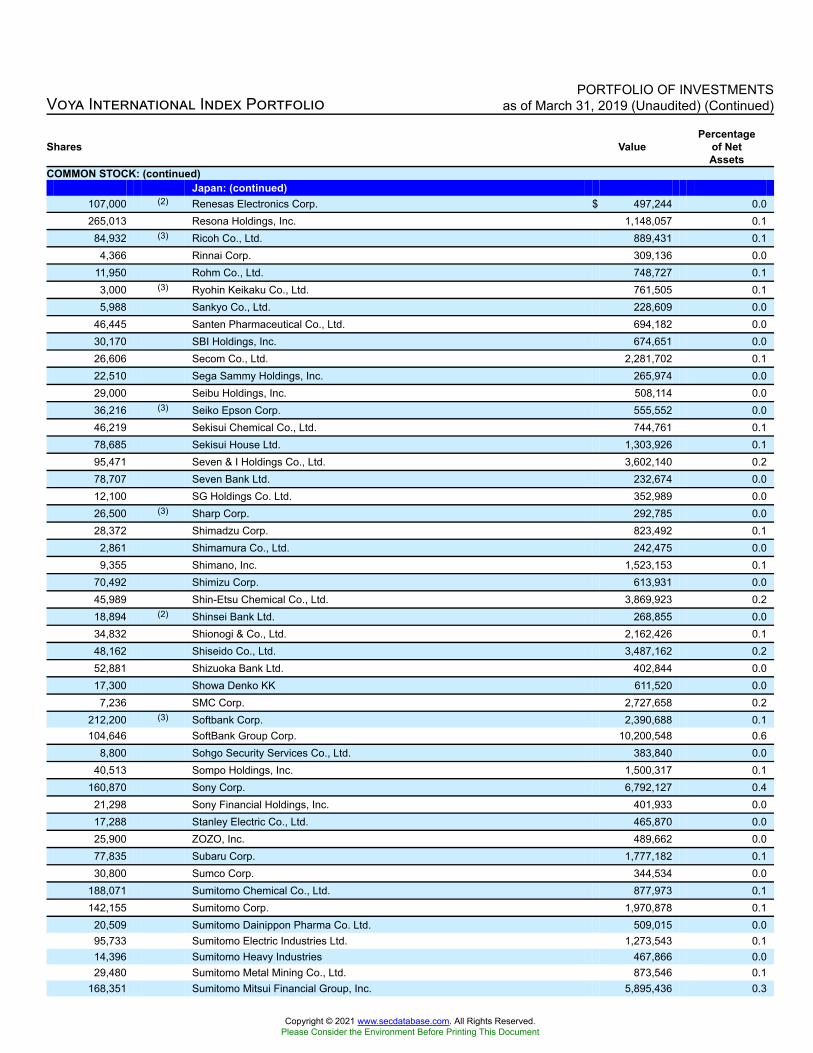
Voya International Index PortfolioPORTFOLIO OF INVESTMENTS
as of March 31, 2019 (Unaudited) (Continued)
Shares ValuePercentage
of NetAssets
COMMON STOCK: (continued)Japan: (continued)
107,000 (2) Renesas Electronics Corp. $ 497,244 0.0265,013 Resona Holdings, Inc. 1,148,057 0.1
84,932 (3) Ricoh Co., Ltd. 889,431 0.14,366 Rinnai Corp. 309,136 0.0
11,950 Rohm Co., Ltd. 748,727 0.13,000 (3) Ryohin Keikaku Co., Ltd. 761,505 0.15,988 Sankyo Co., Ltd. 228,609 0.0
46,445 Santen Pharmaceutical Co., Ltd. 694,182 0.030,170 SBI Holdings, Inc. 674,651 0.026,606 Secom Co., Ltd. 2,281,702 0.122,510 Sega Sammy Holdings, Inc. 265,974 0.029,000 Seibu Holdings, Inc. 508,114 0.036,216 (3) Seiko Epson Corp. 555,552 0.046,219 Sekisui Chemical Co., Ltd. 744,761 0.178,685 Sekisui House Ltd. 1,303,926 0.195,471 Seven & I Holdings Co., Ltd. 3,602,140 0.278,707 Seven Bank Ltd. 232,674 0.012,100 SG Holdings Co. Ltd. 352,989 0.026,500 (3) Sharp Corp. 292,785 0.028,372 Shimadzu Corp. 823,492 0.1
2,861 Shimamura Co., Ltd. 242,475 0.09,355 Shimano, Inc. 1,523,153 0.1
70,492 Shimizu Corp. 613,931 0.045,989 Shin-Etsu Chemical Co., Ltd. 3,869,923 0.218,894 (2) Shinsei Bank Ltd. 268,855 0.034,832 Shionogi & Co., Ltd. 2,162,426 0.148,162 Shiseido Co., Ltd. 3,487,162 0.252,881 Shizuoka Bank Ltd. 402,844 0.017,300 Showa Denko KK 611,520 0.0
7,236 SMC Corp. 2,727,658 0.2212,200 (3) Softbank Corp. 2,390,688 0.1104,646 SoftBank Group Corp. 10,200,548 0.6
8,800 Sohgo Security Services Co., Ltd. 383,840 0.040,513 Sompo Holdings, Inc. 1,500,317 0.1
160,870 Sony Corp. 6,792,127 0.421,298 Sony Financial Holdings, Inc. 401,933 0.017,288 Stanley Electric Co., Ltd. 465,870 0.025,900 ZOZO, Inc. 489,662 0.077,835 Subaru Corp. 1,777,182 0.130,800 Sumco Corp. 344,534 0.0
188,071 Sumitomo Chemical Co., Ltd. 877,973 0.1142,155 Sumitomo Corp. 1,970,878 0.1
20,509 Sumitomo Dainippon Pharma Co. Ltd. 509,015 0.095,733 Sumitomo Electric Industries Ltd. 1,273,543 0.114,396 Sumitomo Heavy Industries 467,866 0.029,480 Sumitomo Metal Mining Co., Ltd. 873,546 0.1
168,351 Sumitomo Mitsui Financial Group, Inc. 5,895,436 0.3
Copyright © 2021 www.secdatabase.com. All Rights Reserved.Please Consider the Environment Before Printing This Document

42,085 Sumitomo Mitsui Trust Holdings, Inc. 1,512,498 0.145,196 Sumitomo Realty & Development Co., Ltd. 1,875,198 0.122,959 Sumitomo Rubber Industries, Inc. 275,752 0.0
9,500 Sundrug Co., Ltd. 262,185 0.017,734 Suntory Beverage & Food Ltd. 834,057 0.1
9,217 Suzuken Co., Ltd. 534,630 0.043,544 Suzuki Motor Corp. 1,930,214 0.121,138 Sysmex Corp. 1,280,467 0.171,411 T&D Holdings, Inc. 752,014 0.115,500 Taiheiyo Cement Corp. 517,683 0.027,061 Taisei Corp. 1,258,953 0.1
4,400 Taisho Pharmaceutical Holdings Co. Ltd. 420,345 0.016,025 Taiyo Nippon Sanso Corp. 244,682 0.019,144 Takashimaya Co., Ltd. 255,108 0.0
188,022 Takeda Pharmaceutical Co., Ltd. 7,699,923 0.416,412 TDK Corp. 1,291,693 0.123,001 Teijin Ltd. 380,345 0.076,928 Terumo Corp. 2,354,435 0.115,278 THK Co., Ltd. 379,450 0.024,285 Tobu Railway Co., Ltd. 701,878 0.114,600 Toho Co., Ltd. 587,311 0.0
9,500 Toho Gas Co., Ltd. 427,237 0.055,213 Tohoku Electric Power Co., Inc. 704,988 0.182,088 Tokio Marine Holdings, Inc. 3,976,891 0.2
5,300 Tokyo Century Corp. 230,992 0.0183,666 (2) Tokyo Electric Power Co., Inc. 1,161,891 0.1
19,865 Tokyo Electron Ltd. 2,881,584 0.248,772 Tokyo Gas Co., Ltd. 1,320,245 0.163,694 Tokyu Corp. 1,113,447 0.176,835 Tokyu Fudosan Holdings Corp. 460,440 0.031,916 Toppan Printing Co., Ltd. 482,993 0.0
176,103 Toray Industries, Inc. 1,123,781 0.182,561 Toshiba Corp. 2,631,538 0.233,100 Tosoh Corp. 516,466 0.017,934 (3) Toto Ltd. 762,554 0.119,685 Toyo Seikan Group Holdings, Ltd. 403,808 0.011,388 Toyo Suisan Kaisha Ltd. 434,107 0.08,800 Toyoda Gosei Co., Ltd. 186,834 0.0
18,105 Toyota Industries Corp. 909,757 0.1289,458 (3) Toyota Motor Corp. 17,052,202 1.0
26,254 Toyota Tsusho Corp. 857,821 0.115,153 Trend Micro, Inc. 739,023 0.1
4,800 Tsuruha Holdings, Inc. 390,931 0.051,078 Unicharm Corp. 1,693,349 0.1
376 United Urban Investment Corp. 593,595 0.028,126 USS Co., Ltd. 523,074 0.0
5,800 Welcia Holdings Co. Ltd. 197,051 0.020,721 West Japan Railway Co. 1,561,239 0.1
361,744 Yahoo! Japan Corp. 887,232 0.1
Copyright © 2021 www.secdatabase.com. All Rights Reserved.Please Consider the Environment Before Printing This Document

Voya International Index PortfolioPORTFOLIO OF INVESTMENTS
as of March 31, 2019 (Unaudited) (Continued)
Shares ValuePercentage
of NetAssets
COMMON STOCK: (continued)Japan: (continued)
15,185 Yakult Honsha Co., Ltd. $ 1,064,676 0.180,037 (3) Yamada Denki Co., Ltd. 394,733 0.024,000 Yamaguchi Financial Group, Inc. 203,491 0.017,207 Yamaha Corp. 861,615 0.135,504 Yamaha Motor Co., Ltd. 698,377 0.039,101 Yamato Holdings Co., Ltd. 1,011,575 0.115,300 Yamazaki Baking Co., Ltd. 248,722 0.030,342 Yaskawa Electric Corp. 958,005 0.129,173 Yokogawa Electric Corp. 605,798 0.015,669 Yokohama Rubber Co., Ltd. 291,682 0.0
414,747,848 23.2
Luxembourg: 0.1%4,940 RTL Group SA 270,031 0.0
169 SES S.A. - France 2,635 0.046,075 SES S.A. - Luxembourg 716,611 0.060,211 Tenaris S.A. 848,199 0.1
1,837,476 0.1
Macau: 0.1%117,268 (3) MGM China Holdings Ltd. 245,916 0.0306,802 Sands China Ltd. 1,544,119 0.1261,365 SJM Holdings Ltd. 298,783 0.0198,079 Wynn Macau Ltd. 467,793 0.0
2,556,611 0.1
Mexico: 0.0%28,755 Fresnillo PLC 325,879 0.0
Netherlands: 6.0%53,972 (4) ABN AMRO Group NV 1,216,780 0.1
1,301 (2),(4) Adyen NV 1,020,447 0.1226,054 Aegon NV 1,085,847 0.1
15,723 (2) AerCap Holdings NV 731,748 0.173,829 Airbus SE 9,785,065 0.628,427 Akzo Nobel NV 2,525,279 0.184,003 ArcelorMittal 1,704,793 0.151,919 ASML Holding NV 9,758,208 0.513,914 EXOR NV 903,632 0.114,748 Heineken Holding NV 1,479,798 0.132,909 Heineken NV 3,478,301 0.2
493,201 ING Groep NV 5,976,292 0.3150,025 Koninklijke Ahold Delhaize NV 3,994,249 0.2
22,955 Koninklijke DSM NV 2,504,051 0.1426,907 Koninklijke KPN NV 1,355,168 0.1117,480 Koninklijke Philips NV 4,799,971 0.3
8,559 Koninklijke Vopak NV 409,953 0.039,007 NN Group NV 1,622,951 0.143,595 NXP Semiconductor NV - NXPI - US 3,853,362 0.229,328 (2) QIAGEN NV 1,190,492 0.114,797 (3) Randstad NV 722,511 0.0
571,067 Royal Dutch Shell PLC - Class A 17,946,398 1.0474,866 Royal Dutch Shell PLC - Class B 15,008,493 0.8195,684 Unilever NV 11,408,709 0.6
35,632 Wolters Kluwer NV 2,427,592 0.1106,910,090 6.0
New Zealand: 0.2%92,897 (2) a2 Milk Co. Ltd. 908,964 0.1
Copyright © 2021 www.secdatabase.com. All Rights Reserved.Please Consider the Environment Before Printing This Document

123,714 Auckland International Airport Ltd. 686,316 0.072,805 Fisher & Paykel Healthcare Corp. Ltd. 779,388 0.1
112,874 Fletcher Building Ltd. 380,650 0.0158,760 Meridian Energy Ltd. 452,904 0.0
49,082 Ryman Healthcare Ltd. 409,816 0.0237,328 Spark New Zealand Ltd. 614,770 0.0
4,232,808 0.2
Norway: 0.7%13,197 Det Norske Oljeselskap ASA 470,635 0.0
122,612 DNB ASA 2,258,488 0.1148,749 Equinor ASA 3,260,589 0.2
24,172 (3) Gjensidige Forsikring ASA 417,824 0.055,709 Mowi ASA 1,244,592 0.1
172,967 Norsk Hydro ASA 703,423 0.0100,594 Orkla ASA 772,540 0.1
12,045 Schibsted ASA - Class B 431,528 0.093,745 Telenor ASA 1,877,145 0.122,685 Yara International ASA 929,517 0.1
12,366,281 0.7
Portugal: 0.2%329,042 EDP - Energias de Portugal SA 1,294,590 0.1
62,063 Galp Energia SGPS SA 994,483 0.131,389 Jeronimo Martins SGPS SA 463,472 0.0
2,752,545 0.2
Singapore: 1.3%336,545 Ascendas Real Estate Investment Trust 723,365 0.1325,642 CapitaLand Commercial Trust 466,561 0.0319,896 CapitaLand Ltd. 863,128 0.1332,601 CapitaLand Mall Trust 584,458 0.1
50,981 City Developments Ltd. 341,188 0.0275,102 ComfortDelgro Corp., Ltd. 522,871 0.0227,420 DBS Group Holdings Ltd. 4,245,222 0.3770,712 Genting Singapore Ltd. 592,849 0.1849,769 Golden Agri-Resources Ltd. 175,688 0.0
12,570 Jardine Cycle & Carriage Ltd. 301,933 0.0186,304 Keppel Corp., Ltd. 857,250 0.1404,522 Oversea-Chinese Banking Corp., Ltd. 3,307,201 0.2
86,700 SATS Ltd 327,637 0.0131,094 SembCorp Industries Ltd. 247,246 0.0
70,160 Singapore Airlines Ltd. 500,987 0.0
Copyright © 2021 www.secdatabase.com. All Rights Reserved.Please Consider the Environment Before Printing This Document

Voya International Index PortfolioPORTFOLIO OF INVESTMENTS
as of March 31, 2019 (Unaudited) (Continued)
Shares ValuePercentage
of NetAssets
COMMON STOCK: (continued)Singapore: (continued)
98,551 Singapore Exchange Ltd. $ 532,733 0.0207,627 Singapore Press Holdings Ltd. 369,966 0.0
1,035,450 Singapore Telecommunications Ltd. 2,311,865 0.1190,306 Singapore Technologies Engineering Ltd. 526,271 0.0282,600 Suntec Real Estate Investment Trust 407,193 0.0170,256 United Overseas Bank Ltd. 3,176,535 0.2
65,100 UOL Group Ltd. 334,680 0.035,300 Venture Corp. Ltd. 469,004 0.0
233,076 Wilmar International Ltd. 569,901 0.0304,400 Yangzijiang Shipbuilding Holdings Ltd. 338,024 0.0
23,093,756 1.3
Spain: 2.9%32,423 ACS Actividades de Construccion y Servicios SA 1,425,382 0.1
8,624 (4) Aena SME SA 1,553,974 0.155,708 Amadeus IT Group SA 4,464,958 0.2
845,774 (3) Banco Bilbao Vizcaya Argentaria SA 4,832,636 0.3715,422 Banco de Sabadell SA 713,077 0.0
2,059,861 Banco Santander SA 9,565,072 0.5150,012 Bankia SA 388,956 0.0
86,463 Bankinter S.A. 659,001 0.0455,666 CaixaBank SA 1,424,957 0.1
28,094 Enagas 817,888 0.039,244 Endesa S.A. 1,001,528 0.161,376 Ferrovial SA 1,438,258 0.137,997 Grifols SA 1,065,442 0.1
789,109 Iberdrola S.A. 6,928,228 0.4138,325 Industria de Diseno Textil SA 4,066,972 0.2134,537 Mapfre SA 370,843 0.0
44,901 (3) Naturgy Energy Group SA 1,256,761 0.153,718 Red Electrica Corp. SA 1,145,095 0.1
177,231 Repsol SA 3,032,132 0.230,968 (2) Siemens Gamesa Renewable Energy SA 493,624 0.0
593,147 Telefonica S.A. 4,968,742 0.351,613,526 2.9
Sweden: 2.4%37,686 Alfa Laval AB 866,062 0.1
127,070 Assa Abloy AB 2,742,467 0.286,004 Atlas Copco AB - A Shares 2,313,597 0.148,453 Atlas Copco AB - B Shares 1,201,752 0.135,007 Boliden AB 997,666 0.130,548 Electrolux AB 786,640 0.084,711 (2) Epiroc AB - A Shares 855,552 0.148,074 (2) Epiroc AB - B Shares 460,588 0.076,881 Essity AB 2,218,657 0.110,062 (2),(3) ICA Gruppen AB 403,965 0.0
Copyright © 2021 www.secdatabase.com. All Rights Reserved.Please Consider the Environment Before Printing This Document

111,009 (3) Hennes & Mauritz AB 1,851,994 0.132,978 (2) Hexagon AB 1,723,516 0.151,290 Husqvarna AB - B Shares 419,472 0.020,699 Industrivarden AB-Class C 434,070 0.057,965 Investor AB - B Shares 2,612,879 0.230,810 Kinnevik AB 799,090 0.0
9,642 Lundbergforetagen AB 305,365 0.023,829 Lundin Petroleum AB 806,898 0.1
8,136 Millicom International Cellular S.A. 494,112 0.0142,976 Sandvik AB 2,325,378 0.1
40,290 Securitas AB 651,738 0.0206,622 (3) Skandinaviska Enskilda Banken AB 1,789,950 0.1
43,281 (3) Skanska AB 787,139 0.048,160 (3) SKF AB - B Shares 801,253 0.0
193,913 (3) Svenska Handelsbanken AB 2,047,333 0.1114,830 (3) Swedbank AB 1,622,883 0.122,415 Swedish Match AB 1,143,677 0.163,631 Tele2 AB 849,046 0.1
389,453 (3) Telefonaktiebolaget LM Ericsson 3,587,598 0.2357,631 Telia Co. AB 1,612,074 0.1198,490 Volvo AB - B Shares 3,079,799 0.2
42,592,210 2.4
Switzerland: 9.1%233,532 ABB Ltd. 4,389,096 0.2
20,145 Adecco Group AG 1,075,835 0.16,236 Baloise Holding AG 1,030,658 0.1
269 Barry Callebaut AG 486,226 0.013 Chocoladefabriken Lindt & Sprungli AG - REG - LISN 1,017,022 0.0
138 Chocoladefabriken Lindt & Sprungli AG - PC - LISP 938,316 0.066,097 Cie Financiere Richemont SA 4,821,996 0.324,725 Clariant AG 520,428 0.025,951 Coca-Cola HBC AG 884,913 0.0
323,658 Credit Suisse Group AG 3,772,694 0.24,093 Dufry Group 430,375 0.01,055 EMS-Chemie Holding AG 572,698 0.0
29,318 Ferguson PLC 1,867,303 0.14,693 Geberit AG - Reg 1,919,391 0.11,169 Givaudan 2,992,094 0.2
1,425,268 Glencore PLC 5,906,570 0.341,115 LafargeHolcim Ltd.-CHF 2,032,836 0.128,407 Julius Baer Group Ltd. 1,149,125 0.1
6,926 Kuehne & Nagel International AG 950,288 0.020,344 LafargeHolcim Ltd. 1,005,400 0.1
9,434 Lonza Group AG 2,928,849 0.2388,394 Nestle SA 37,033,528 2.1274,904 Novartis AG 26,423,645 1.5
4,814 Pargesa Holding SA 377,540 0.02,207 Partners Group 1,605,510 0.1
89,076 Roche Holding AG 24,545,326 1.4
Copyright © 2021 www.secdatabase.com. All Rights Reserved.Please Consider the Environment Before Printing This Document

Voya International Index PortfolioPORTFOLIO OF INVESTMENTS
as of March 31, 2019 (Unaudited) (Continued)
Shares ValuePercentage
of NetAssets
COMMON STOCK: (continued)Switzerland: (continued)
5,048 Schindler Holding AG - Part Cert $ 1,047,445 0.12,518 Schindler Holding AG - Reg 521,308 0.0
680 SGS SA 1,693,674 0.116,145 Sika AG 2,257,913 0.1
7,047 Sonova Holding AG - Reg 1,396,503 0.186,541 STMicroelectronics NV-STM1 1,283,610 0.1
1,316 Straumann Holding AG 1,075,830 0.13,948 Swatch Group AG - BR 1,130,714 0.16,771 Swatch Group AG - Reg 374,918 0.04,338 Swiss Life Holding AG 1,911,324 0.19,727 Swiss Prime Site AG 852,591 0.0
38,681 Swiss Re Ltd. 3,780,883 0.23,291 Swisscom AG 1,610,190 0.17,684 Temenos AG 1,133,662 0.1
488,592 UBS Group AG 5,928,355 0.35,631 Vifor Pharma AG 762,048 0.0
19,202 Zurich Insurance Group AG 6,356,567 0.4163,795,197 9.1
United Arab Emirates: 0.0%13,480 NMC Health PLC 401,797 0.0
United Kingdom: 14.0%123,354 3i Group PLC 1,581,826 0.1
25,994 Admiral Group PLC 735,271 0.0133,394 (3) Anglo American PLC 3,567,825 0.2
50,570 Antofagasta PLC 636,258 0.061,059 Ashtead Group PLC 1,476,086 0.145,215 Associated British Foods PLC 1,437,754 0.1
160,571 AstraZeneca PLC 12,817,073 0.7119,904 (4) Auto Trader Group PLC 815,518 0.0493,428 Aviva PLC 2,653,389 0.1
30,029 Babcock International Group 193,210 0.0404,254 BAE Systems PLC 2,541,059 0.1
2,169,703 Barclays PLC 4,370,390 0.2129,400 Barratt Developments PLC 1,010,790 0.1
15,546 Berkeley Group Holdings PLC 747,376 0.02,541,993 BP PLC 18,458,717 1.0
290,714 British American Tobacco PLC 12,128,019 0.7113,243 British Land Co. PLC 869,443 0.0
1,068,097 BT Group PLC 3,103,179 0.242,747 Bunzl PLC 1,410,917 0.152,571 Burberry Group PLC 1,339,867 0.121,505 Carnival PLC 1,062,949 0.1
721,608 Centrica PLC 1,074,911 0.1128,982 CNH Industrial NV 1,314,162 0.1
24,114 Coca-Cola European Partners PLC - EUR 1,242,922 0.1
Copyright © 2021 www.secdatabase.com. All Rights Reserved.Please Consider the Environment Before Printing This Document

3,435 Coca-Cola European Partners PLC - USD 177,727 0.0200,901 Compass Group PLC 4,726,905 0.3166,367 (4) ConvaTec Group PLC 306,977 0.0
60,857 CRH PLC - London 1,885,636 0.116,647 Croda International PLC 1,093,677 0.1
307,634 Diageo PLC 12,589,079 0.7175,123 Direct Line Insurance Group PLC 805,609 0.0
19,564 easyJet PLC 285,022 0.0115,285 Experian PLC 3,120,247 0.2137,445 (2) Fiat Chrysler Automobiles NV 2,052,846 0.1199,803 G4S PLC 478,123 0.0628,841 GlaxoSmithKline PLC 13,064,741 0.7
71,031 GVC Holdings PLC 517,862 0.095,554 Hammerson PLC 418,317 0.036,525 Hargreaves Lansdown PLC 887,335 0.0
2,539,994 HSBC Holdings PLC 20,639,732 1.2120,794 Imperial Brands PLC 4,132,044 0.2158,320 Informa PLC 1,535,242 0.1
21,897 InterContinental Hotels Group PLC 1,317,823 0.120,511 Intertek Group PLC 1,299,364 0.187,214 Investec PLC - INVP - GBP 502,579 0.0
462,847 ITV PLC 766,915 0.0226,639 J Sainsbury PLC 695,481 0.0
86,361 John Wood Group PLC 570,852 0.024,459 Johnson Matthey PLC 1,003,047 0.1
269,801 Kingfisher PLC 827,407 0.094,378 Land Securities Group PLC 1,123,668 0.1
753,780 Legal & General Group PLC 2,705,048 0.29,015,349 Lloyds Banking Group Plc 7,304,079 0.4
39,685 London Stock Exchange Group PLC 2,454,770 0.1205,778 Marks & Spencer Group PLC 746,829 0.0
99,208 Meggitt PLC 650,364 0.0614,589 Melrose Industries PLC 1,467,980 0.1
93,558 (4) Merlin Entertainments PLC 418,812 0.053,684 Micro Focus International PLC 1,395,760 0.146,317 Mondi PLC 1,025,608 0.1
430,765 National Grid PLC 4,781,658 0.317,756 Next PLC 1,290,263 0.199,027 Pearson PLC 1,080,361 0.139,907 Persimmon PLC 1,128,799 0.1
328,244 Prudential PLC 6,579,842 0.485,139 Reckitt Benckiser Group PLC 7,085,528 0.4
115,352 (2) Relx PLC (EUR Exchange) 2,465,615 0.1134,122 Relx PLC (GBP Exchange) 2,870,128 0.2146,383 Rio Tinto PLC 8,508,274 0.5214,861 Rolls-Royce Holdings PLC 2,530,345 0.1610,967 Royal Bank of Scotland Group PLC 1,967,367 0.1117,107 Royal Mail PLC 363,888 0.0
Copyright © 2021 www.secdatabase.com. All Rights Reserved.Please Consider the Environment Before Printing This Document

Voya International Index PortfolioPORTFOLIO OF INVESTMENTS
as of March 31, 2019 (Unaudited) (Continued)
Shares ValuePercentage
of NetAssets
COMMON STOCK: (continued)United Kingdom: (continued)
131,158 RSA Insurance Group PLC $ 867,958 0.0137,623 Sage Group PLC/The 1,257,862 0.1
15,953 Schroders PLC 561,751 0.0129,979 SSE PLC 2,011,023 0.1137,182 Segro PLC 1,204,198 0.1
30,116 Severn Trent PLC 775,610 0.0110,762 Smith & Nephew PLC 2,199,640 0.150,444 Smiths Group PLC 943,952 0.167,653 St. James's Place PLC 906,634 0.1
356,081 Standard Chartered PLC 2,744,809 0.2316,421 Standard Life Aberdeen PLC 1,087,554 0.1417,696 Taylor Wimpey PLC 955,359 0.1
1,240,151 Tesco PLC 3,753,333 0.2140,636 Unilever PLC 8,095,416 0.5
87,280 United Utilities Group PLC 926,977 0.13,385,421 Vodafone Group PLC 6,169,114 0.3
31,105 Weir Group PLC 632,213 0.023,239 Whitbread PLC 1,537,876 0.1
287,302 WM Morrison Supermarkets PLC 852,306 0.0159,662 WPP PLC 1,686,687 0.1
251,404,758 14.0
Total Common Stock(Cost $1,561,574,305) 1,719,710,015 96.0
PREFERRED STOCK: 0.5%Germany: 0.5%
7,483 Bayerische Motoren Werke AG 492,628 0.09,077 Fuchs Petrolub AG 374,698 0.0
22,830 Henkel AG & Co. KGaA 2,332,653 0.119,501 Porsche AG 1,223,741 0.1
4,521 Sartorius AG 776,971 0.123,341 Volkswagen AG 3,679,842 0.2
Total Preferred Stock(Cost $9,623,349) 8,880,533 0.5
Total Long-Term Investments(Cost $1,571,197,654) 1,728,590,548 96.5
PrincipalAmount† Value
Percentageof NetAssets
SHORT-TERM INVESTMENTS: 6.1%Securities Lending Collateral(5): 3.7%
10,639,934 Bank of Montreal, Repurchase Agreement dated 03/29/19, 2.58%, due 04/01/19(Repurchase Amount $10,642,190, collateralized by various U.S. GovernmentSecurities, 0.000%-3.750%, Market Value plus accrued interest $10,852,733, due04/25/19-08/15/48)
10,639,934 0.6
15,552,879 Citigroup, Inc., Repurchase Agreement dated 03/29/19, 2.65%, due 04/01/19(Repurchase Amount $15,556,267, collateralized by various U.S. Government/U.S.Government Agency Obligations, 0.000%-10.500%, Market Value plus accruedinterest $15,863,937, due 04/02/19-10/20/68)
15,552,879 0.9
15,552,879 Daiwa Capital Markets, Repurchase Agreement dated 03/29/19, 2.65%, due 04/01/19 (Repurchase Amount $15,556,267, collateralized by various U.S. Government/U.S. Government Agency Obligations, 0.000%-6.500%, Market Value plus accruedinterest $15,863,937, due 04/11/19-03/20/49)
15,552,879 0.9
15,552,879 Merrill Lynch & Co., Inc., Repurchase Agreement dated 03/29/19, 2.60%, due 04/01/19 (Repurchase Amount $15,556,203, collateralized by various U.S. 15,552,879 0.9
Copyright © 2021 www.secdatabase.com. All Rights Reserved.Please Consider the Environment Before Printing This Document

Government Agency Obligations, 3.500%-4.500%, Market Value plus accruedinterest $15,863,937, due 03/20/47-12/20/48)
8,181,569 State of Wisconsin Investment Board, Repurchase Agreement dated 03/29/19,2.80%, due 04/01/19 (Repurchase Amount $8,183,452, collateralized by variousU.S. Government Securities, 0.125%-3.875%, Market Value plus accrued interest$8,359,009, due 07/15/20-02/15/47)
8,181,569 0.4
65,480,140 3.7
Copyright © 2021 www.secdatabase.com. All Rights Reserved.Please Consider the Environment Before Printing This Document

Voya International Index PortfolioPORTFOLIO OF INVESTMENTS
as of March 31, 2019 (Unaudited) (Continued)
Shares ValuePercentage
of NetAssets
Mutual Funds: 2.4%43,927,000 (6) Goldman Sachs Financial Square Government Fund - Institutional Shares, 2.350%
(Cost $43,927,000) $ 43,927,000 2.4
Total Short-Term Investments(Cost $109,407,140) 109,407,140 6.1
Total Investments in Securities(Cost $1,680,604,794) $ 1,837,997,688 102.6
Liabilities in Excess of Other Assets (45,872,893) (2.6)Net Assets $ 1,792,124,795 100.0
† Unless otherwise indicated, principal amount is shown in USD.ADR American Depositary Receipt
(1) For fair value measurement disclosure purposes, security is categorized as Level 3, whose value was determined using significantunobservable inputs.
(2) Non-income producing security.(3) Security, or a portion of the security, is on loan.
(4) Securities with purchases pursuant to Rule 144A or section 4(a)(2), under the Securities Act of 1933 and may not be resold subject tothat rule except to qualified institutional buyers.
(5) Represents securities purchased with cash collateral received for securities on loan.(6) Rate shown is the 7-day yield as of March 31, 2019.
Sector Diversification Percentageof Net Assets
Financials 18.2%Industrials 13.9Consumer Staples 11.4Health Care 10.9Consumer Discretionary 10.6Materials 7.2Information Technology 6.1Energy 5.7Communication Services 5.2Real Estate 3.7Utilities 3.6Short-Term Investments 6.1Liabilities in Excess of Other Assets (2.6)Net Assets 100.0%
Fair Value Measurements
The following is a summary of the fair valuations according to the inputs used as of March 31, 2019 in valuing the assets and liabilities:(1)
Quoted Pricesin Active Markets
for IdenticalInvestments
(Level 1)
SignificantOther
ObservableInputs#(Level 2)
SignificantUnobservable
Inputs(Level 3)
Fair Valueat
March 31, 2019
Asset TableInvestments, at fair valueCommon Stock
Australia $ 2,490,875 $ 123,248,046 $ – $ 125,738,921Austria – 4,124,217 – 4,124,217Belgium – 17,447,188 – 17,447,188
Copyright © 2021 www.secdatabase.com. All Rights Reserved.Please Consider the Environment Before Printing This Document

Voya International Index PortfolioPORTFOLIO OF INVESTMENTS
as of March 31, 2019 (Unaudited) (Continued)
Quoted Pricesin Active Markets
for IdenticalInvestments
(Level 1)
SignificantOther
ObservableInputs#(Level 2)
SignificantUnobservable
Inputs(Level 3)
Fair Valueat
March 31, 2019
China $ 550,572 $ 2,244,524 $ – $ 2,795,096Denmark 2,471,359 28,419,790 – 30,891,149Finland 825,371 19,806,954 – 20,632,325France 7,494,332 173,337,326 – 180,831,658Germany 3,449,455 134,810,541 – 138,259,996Hong Kong 2,191,393 63,717,354 – 65,908,747Ireland 3,243,445 6,066,541 – 9,309,986Israel 4,602,429 4,818,259 – 9,420,688Italy – 35,719,262 – 35,719,262Japan 681,181 414,066,667 – 414,747,848Luxembourg 716,611 1,120,865 – 1,837,476Macau – 2,556,611 – 2,556,611Mexico – 325,879 – 325,879Netherlands 4,585,110 102,324,980 – 106,910,090New Zealand – 4,232,808 – 4,232,808Norway 431,528 11,934,753 – 12,366,281Portugal – 2,752,545 – 2,752,545Singapore – 23,093,756 – 23,093,756Spain – 51,613,526 – 51,613,526Sweden – 42,592,210 – 42,592,210Switzerland 1,017,022 162,778,175 – 163,795,197United Arab Emirates – 401,797 – 401,797United Kingdom 177,727 251,227,031 – 251,404,758
Total Common Stock 34,928,410 1,684,781,605 – 1,719,710,015Preferred Stock – 8,880,533 – 8,880,533Short-Term Investments 43,927,000 65,480,140 – 109,407,140Total Investments, at fair value $ 78,855,410 $ 1,759,142,278 $ – $ 1,837,997,688Other Financial Instruments+Futures 978,817 – – 978,817Total Assets $ 79,834,227 $ 1,759,142,278 $ – $ 1,838,976,505
(1)
For the period ended March 31, 2019, as a result of the fair value pricing procedures for international equities utilized by the Portfolio certainsecurities have transferred in and out of Level 1 and Level 2 measurements during the year. The Portfolio's policy is to recognize transfersbetween levels at the beginning of the reporting period. At March 31, 2019, securities valued at $2,752,991 and $15,570,488 were transferredfrom Level 1 to Level 2 and Level 2 to Level 1, respectively, within the fair value hierarchy.
+Other Financial Instruments may include open forward foreign currency contracts, futures, centrally cleared swaps, OTC swaps and writtenoptions. Forward foreign currency contracts, futures and centrally cleared swaps are valued at the unrealized gain (loss) on the instrument. OTCswaps and written options are valued at the fair value of the instrument.
#
The earlier close of the foreign markets gives rise to the possibility that significant events, including broad market moves, may have occurred inthe interim and may materially affect the value of those securities. To account for this, the Portfolio may frequently value many of its foreign equitysecurities using fair value prices based on third party vendor modeling tools to the extent available. Accordingly, a portion of the Portfolio'sinvestments are categorized as Level 2 investments.
At March 31, 2019, the following futures contracts were outstanding for Voya International Index Portfolio:
Description Numberof Contracts
ExpirationDate
NotionalValue
UnrealizedAppreciation/(Depreciation)
Long Contracts:Mini MSCI EAFE Index 635 06/21/19 $ 59,258,200 $ 978,817
$ 59,258,200 $ 978,817
Copyright © 2021 www.secdatabase.com. All Rights Reserved.Please Consider the Environment Before Printing This Document

Voya International Index PortfolioPORTFOLIO OF INVESTMENTS
as of March 31, 2019 (Unaudited) (Continued)
At March 31, 2019, the aggregate cost of securities and other investments and the composition of unrealized appreciation and depreciation of securitiesand other investments at period end were:
Cost for federal income tax purposes was $1,707,491,264.
Net unrealized appreciation consisted of:
Gross Unrealized Appreciation $ 314,367,837Gross Unrealized Depreciation (179,586,959)
Net Unrealized Appreciation $ 134,780,878
Copyright © 2021 www.secdatabase.com. All Rights Reserved.Please Consider the Environment Before Printing This Document

Voya Japan TOPIX Index® PortfolioPORTFOLIO OF INVESTMENTSas of March 31, 2019 (Unaudited)
Shares ValuePercentage
of NetAssets
COMMON STOCK: 98.0%Communication Services: 7.9%
400 Akatsuki, Inc. $ 23,055 0.0900 Amuse, Inc. 19,104 0.0
1,200 AOI TYO Holdings, Inc. 8,515 0.0700 Asahi Net, Inc. 3,445 0.0
1,200 Ateam, Inc. 19,573 0.02,800 Avex, Inc. 37,393 0.04,900 Capcom Co., Ltd. 109,975 0.13,500 COLOPL, Inc. 21,756 0.04,300 (1) Cookpad, Inc. 10,828 0.06,600 CyberAgent, Inc. 270,075 0.11,700 Daiichikosho Co., Ltd. 87,048 0.05,800 Dena Co., Ltd. 87,430 0.0
13,000 Dentsu, Inc. 550,190 0.21,700 Dip Corp. 29,485 0.04,500 F N Communications, Inc. 22,948 0.0
899 Faith, Inc. 7,430 0.011,400 Fuji Media Holdings, Inc. 157,476 0.1
300 Gakken Holdings Co., Ltd. 13,950 0.02,200 Gurunavi, Inc. 13,833 0.06,400 Gree, Inc. 26,196 0.02,000 (1) Gumi, Inc. 12,779 0.0
27,200 GungHo Online Entertainment, Inc. 99,288 0.114,800 Hakuhodo DY Holdings, Inc. 238,313 0.1
1,900 Intage Holdings, Inc. 14,771 0.01,700 Internet Initiative Japan, Inc. 34,482 0.0
12,100 (1),(2) Japan Communications, Inc. 12,274 0.03,486 Kadokawa Dwango Corp. 36,779 0.08,300 Kakaku.com, Inc. 159,901 0.11,100 Kamakura Shinsho Ltd. 14,206 0.0
95,900 KDDI Corp. 2,065,427 0.92,400 (1),(2) KLab, Inc. 18,909 0.02,352 Koei Tecmo Holdings Co. Ltd. 45,425 0.04,623 Konami Holdings Corp. 201,145 0.14,000 Lifull Co., Ltd. 21,033 0.03,500 (1) LINE Corp. 123,252 0.11,700 Macromill, Inc. 20,538 0.02,600 Marvelous, Inc. 20,201 0.0
28,000 (1) Nexon Co. Ltd. 440,337 0.26,800 Nintendo Co., Ltd. 1,949,499 0.8
74,800 Nippon Telegraph & Telephone Corp. 3,188,806 1.49,700 Nippon Television Holdings, Inc. 145,621 0.1
68,400 NTT DoCoMo, Inc. 1,515,993 0.7700 OPT Holding, Inc. 10,983 0.0
1,400 Shobunsha Publications, Inc. 5,388 0.0800 Shochiku Co., Ltd. 89,717 0.1
Copyright © 2021 www.secdatabase.com. All Rights Reserved.Please Consider the Environment Before Printing This Document

8,200 SKY Perfect JSAT Holdings, Inc. 34,139 0.086,600 (2) Softbank Corp. 975,653 0.445,550 SoftBank Group Corp. 4,440,064 1.9
5,200 (2) Square Enix Holdings Co., Ltd. 182,762 0.1400 Toei Co., Ltd. 53,308 0.0
7,200 Toho Co., Ltd. 289,633 0.16,700 Tokyo Broadcasting System Holdings, Inc. 122,800 0.12,900 TV Asahi Holdings Corp. 51,019 0.01,100 Tv Tokyo Holdings Corp. 23,159 0.0
800 ValueCommerce Co. Ltd. 14,977 0.01,500 (1) Vector, Inc. 19,008 0.0
400 (1) Vision, Inc./Tokyo Japan 18,637 0.0600 Wowow, Inc. 16,083 0.0
69,600 Yahoo! Japan Corp. 170,705 0.12,050 Zenrin Co., Ltd. 45,479 0.0
18,462,198 7.9
Consumer Discretionary: 16.9%1,700 ABC-Mart, Inc. 101,211 0.11,600 Adastria Co. Ltd. 35,522 0.0
400 Aeon Fantasy Co., Ltd. 10,339 0.02,400 Aisan Industry Co., Ltd. 14,782 0.09,170 Aisin Seiki Co., Ltd. 328,277 0.28,000 (1) Akebono Brake Industry Co., Ltd. 8,981 0.0
800 Alpen Co., Ltd. 12,371 0.0500 Amiyaki Tei Co., Ltd. 15,767 0.0
2,500 AOKI Holdings, Inc. 26,203 0.02,200 Aoyama Trading Co., Ltd. 50,048 0.0
600 Arata Corp. 20,718 0.02,200 Arcland Sakamoto Co. Ltd 29,828 0.0
600 Arcland Service Holdings Co. Ltd. 11,012 0.01,200 Asahi Co., Ltd. 16,614 0.0
11,100 Asics Corp. 149,367 0.11,000 ASKUL Corp. 24,991 0.01,800 Atsugi Co., Ltd. 15,684 0.04,000 (2) Autobacs Seven Co., Ltd. 66,508 0.0
11,500 Bandai Namco Holdings, Inc. 539,936 0.22,700 Belluna Co., Ltd. 20,975 0.03,800 Benesse Holdings, Inc. 98,888 0.16,000 BIC Camera, Inc. 63,109 0.0
34,100 Bridgestone Corp. 1,313,992 0.6800 BRONCO BILLY Co. Ltd. 19,068 0.0
1,400 Can Do Co., Ltd. 21,397 0.02,900 Canon Marketing Japan, Inc. 57,172 0.09,500 (2) Casio Computer Co., Ltd. 124,317 0.1
500 Central Sports Co., Ltd. 14,255 0.01,300 Chiyoda Co., Ltd. 20,926 0.0
800 Chofu Seisakusho Co., Ltd. 16,591 0.0900 Chori Co., Ltd. 12,669 0.0
1,600 Cleanup Corp. 8,553 0.03,800 Colowide Co., Ltd. 78,797 0.1
Copyright © 2021 www.secdatabase.com. All Rights Reserved.Please Consider the Environment Before Printing This Document

Voya Japan TOPIX Index® PortfolioPORTFOLIO OF INVESTMENTS
as of March 31, 2019 (Unaudited) (Continued)
Shares ValuePercentage
of NetAssets
COMMON STOCK: (continued)Consumer Discretionary: (continued)
3,600 Create Restaurants Holdings, Inc. $ 44,526 0.01,900 Daido Metal Co., Ltd. 12,176 0.01,900 Daidoh Ltd. 5,561 0.0
700 Daikoku Denki Co., Ltd. 9,753 0.02,600 Daikyonishikawa Corp. 23,942 0.01,500 Dainichi Co., Ltd. 9,228 0.0
600 Daisyo Corp. 8,143 0.05,400 DCM Holdings Co., Ltd. 50,367 0.0
300 DD Holdings Co. Ltd 4,919 0.024,300 Denso Corp. 949,383 0.4
2,900 Descente Ltd. 76,133 0.16,500 Pan Pacific International Holdings Corp. 430,653 0.21,300 Doshisha Co., Ltd. 20,307 0.02,000 Doutor Nichires Holdings Co., Ltd. 38,023 0.01,000 Dynic Corp. 6,496 0.01,600 (2) Eagle Industry Co., Ltd. 17,515 0.04,200 EDION Corp. 36,682 0.02,500 (2) ES-Con Japan Ltd. 16,535 0.01,400 Exedy Corp. 30,413 0.01,500 Fast Retailing Co., Ltd. 706,442 0.31,900 FCC Co., Ltd. 40,295 0.01,700 Foster Electric Co., Ltd. 25,609 0.01,900 France Bed Holdings Co., Ltd. 15,494 0.01,200 F-Tech, Inc. 9,689 0.01,500 Fuji Co., Ltd. 25,914 0.01,600 (2) Fuji Kyuko Co., Ltd. 60,233 0.0
800 Fujibo Holdings, Inc. 19,077 0.01,300 Fujikura Rubber Ltd. 5,117 0.0
700 Fujita Kanko, Inc. 17,275 0.03,800 Fujitsu General Ltd. 53,873 0.01,700 (1) Funai Electric Co., Ltd. 11,502 0.01,000 Furukawa Battery Co., Ltd. 6,320 0.04,000 Futaba Industrial Co., Ltd. 19,762 0.0
300 Genki Sushi Co., Ltd. 14,009 0.01,900 Geo Corp. 26,421 0.0
800 Globeride, Inc. 19,032 0.01,000 (2) Goldwin, Inc. 145,950 0.11,000 (1) Gourmet Kineya Co., Ltd. 10,452 0.01,400 G-Tekt Corp. 19,399 0.0
900 Gunze Ltd. 36,454 0.05,335 H2O Retailing Corp. 74,475 0.01,400 Happinet Corp. 18,102 0.01,500 Hard Off Corp. Co., Ltd. 10,719 0.01,400 Haruyama Trading Co., Ltd. 10,900 0.0
14,900 Haseko Corp. 187,797 0.12,788 (2) Heiwa Corp. 55,780 0.0
Copyright © 2021 www.secdatabase.com. All Rights Reserved.Please Consider the Environment Before Printing This Document

1,881 Hiday Hidaka Corp. 36,434 0.01,300 Hikari Tsushin, Inc. 246,749 0.13,000 (2) Hiramatsu, Inc. 9,254 0.02,000 HIS Co., Ltd. 73,654 0.0
93,800 Honda Motor Co., Ltd. 2,547,681 1.12,010 Honeys Holdings Co., Ltd. 20,034 0.02,500 Hoosiers Holdings Co. Ltd. 14,549 0.0
900 Ichibanya Co., Ltd. 39,376 0.02,000 Ichikoh Industries Ltd. 10,804 0.03,900 IDOM, Inc. 11,369 0.08,920 Iida Group Holdings Co. Ltd. 161,856 0.11,700 Imasen Electric Industrial 15,401 0.0
20,200 Isetan Mitsukoshi Holdings Ltd. 204,358 0.13,200 (2) Istyle, Inc. 26,620 0.0
34,500 Isuzu Motors Ltd. 454,533 0.22,100 Izumi Co., Ltd. 98,005 0.1
13,600 J Front Retailing Co., Ltd. 162,053 0.12,200 Janome Sewing Machine Co., Ltd. 9,454 0.01,200 Japan Best Rescue System Co. Ltd. 16,481 0.03,500 Japan Wool Textile Co., Ltd. 29,849 0.0
800 JINS, Inc. 43,304 0.0370 Joban Kosan Co. Ltd. 5,299 0.0
1,500 (2) Joshin Denki Co., Ltd. 34,657 0.03,200 Joyful Honda Co. Ltd. 40,509 0.05,500 JP-Holdings, Inc. 15,145 0.0
10,870 JVC Kenwood Corp. 26,367 0.01,900 Kappa Create Co., Ltd. 24,798 0.02,000 Kasai Kogyo Co., Ltd. 14,810 0.0
500 Kawai Musical Instruments Manufacturing Co., Ltd. 13,022 0.01,200 (1) KYB Corp. 29,519 0.02,700 Keihin Corp. 44,319 0.02,800 Keiyo Co., Ltd. 12,530 0.01,100 (1) KNT-CT Holdings Co., Ltd. 13,223 0.0
400 Kintetsu Department Store Co. Ltd. 12,598 0.01,600 Kisoji Co., Ltd. 38,363 0.01,800 Kohnan Shoji Co., Ltd. 44,698 0.06,600 Koito Manufacturing Co., Ltd. 375,230 0.21,300 (1) Kojima Co., Ltd. 6,966 0.02,700 Komatsu Matere Co. Ltd. 19,751 0.02,400 KOMEDA Holdings Co. Ltd. 45,643 0.01,700 Komeri Co., Ltd. 41,708 0.02,400 Konaka Co., Ltd. 9,288 0.03,200 Koshidaka Holdings Co. Ltd. 48,164 0.0
600 Kourakuen Holdings Corp. 14,360 0.011,240 Ks Holdings Corp. 99,725 0.1
700 Kura Corp. 32,112 0.01,300 Kurabo Industries Ltd. 23,910 0.01,520 Kyoritsu Maintenance Co., Ltd. 75,577 0.01,600 LEC, Inc. 20,490 0.0
640 Look Holdings, Inc. 8,780 0.0
Copyright © 2021 www.secdatabase.com. All Rights Reserved.Please Consider the Environment Before Printing This Document

Voya Japan TOPIX Index® PortfolioPORTFOLIO OF INVESTMENTS
as of March 31, 2019 (Unaudited) (Continued)
Shares ValuePercentage
of NetAssets
COMMON STOCK: (continued)Consumer Discretionary: (continued)
800 Mars Group Holdings Corp. $ 15,890 0.09,100 (2) Marui Group Co., Ltd. 183,994 0.1
400 Matsuoka Corp. 12,582 0.02,700 Matsuya Co., Ltd. 24,532 0.0
700 Matsuyafoods Holdings Co. Ltd. 23,337 0.034,100 Mazda Motor Corp. 382,326 0.2
500 Media Do Holdings Co. Ltd. 13,010 0.02,500 Meiko Network Japan Co., Ltd. 21,760 0.01,800 Meiwa Estate Co., Ltd. 9,289 0.01,500 Misawa Homes Co., Ltd. 10,740 0.02,700 Mitsuba Corp. 15,220 0.0
41,100 Mitsubishi Motors Corp. 218,988 0.11,200 Mizuno Corp. 27,851 0.0
300 Monogatari Corp. 24,462 0.01,800 MOS Food Services, Inc. 43,769 0.02,800 Musashi Seimitsu Industry Co., Ltd. 38,028 0.01,800 Nakayamafuku Co., Ltd. 8,537 0.02,200 Nextage Co. Ltd. 23,676 0.09,400 NGK Spark Plug Co., Ltd. 175,079 0.1
10,700 NHK Spring Co., Ltd. 96,289 0.14,200 Nifco, Inc. 107,228 0.1
800 Nihon Eslead Corp. 11,010 0.0700 Nihon Tokushu Toryo Co., Ltd. 7,302 0.0
19,300 Nikon Corp. 272,876 0.11,800 Nippon Felt Co., Ltd. 7,446 0.0
900 Nippon Piston Ring Co., Ltd. 12,803 0.02,900 Nishimatsuya Chain Co., Ltd. 24,371 0.0
130,100 Nissan Motor Co., Ltd. 1,068,400 0.51,300 Nissan Shatai Co., Ltd. 11,283 0.04,000 Nissan Tokyo Sales Holdings Co., Ltd. 10,599 0.02,300 Nissin Kogyo Co., Ltd. 28,883 0.04,800 Nitori Co., Ltd. 620,618 0.32,000 Nojima Corp. 36,371 0.05,800 (2) NOK Corp. 90,537 0.11,200 Ohashi Technica, Inc. 15,104 0.0
900 Ohsho Food Service Corp. 57,052 0.07,200 Onward Holdings Co., Ltd. 38,120 0.0
500 (1) Open Door, Inc. 15,232 0.012,600 Oriental Land Co., Ltd. 1,433,074 0.6
2,600 Pacific Industrial Co., Ltd. 36,670 0.0700 PAL Group Holdings Co., Ltd. 19,026 0.0
1,900 Paltac Corp. 103,623 0.1126,950 Panasonic Corp. 1,094,575 0.5
800 Parco Co., Ltd. 7,311 0.02,000 Paris Miki Holdings, Inc. 7,126 0.01,400 PC Depot Corp. 5,613 0.0
Copyright © 2021 www.secdatabase.com. All Rights Reserved.Please Consider the Environment Before Printing This Document

1,000 Pepper Food Service Co. Ltd. 20,792 0.0400 PIA Corp. 16,614 0.0
2,000 Piolax, Inc. 38,564 0.01,300 Plenus Co., Ltd. 20,753 0.06,500 Press Kogyo Co., Ltd. 34,562 0.01,800 Pressance Corp. 22,434 0.0
600 QB Net Holdings Co. Ltd. 11,147 0.048,600 Rakuten, Inc. 461,206 0.2
1,000 Renaissance, Inc. 17,701 0.04,700 Resorttrust, Inc. 63,819 0.01,400 Right On Co., Ltd. 9,328 0.0
600 Riken Corp. 27,311 0.01,900 (2) Ringer Hut Co., Ltd. 40,587 0.02,000 Rinnai Corp. 141,611 0.14,220 Riso Kyoiku Co. Ltd. 19,472 0.03,500 Round One Corp. 44,402 0.02,200 Royal Holdings Co., Ltd. 55,075 0.01,600 (2) Ryohin Keikaku Co., Ltd. 406,136 0.22,800 Sagami Holdings Corp. 32,303 0.01,900 Saizeriya Co., Ltd. 36,641 0.0
400 Sakai Ovex Co., Ltd. 6,542 0.0600 San Holdings, Inc. 13,517 0.0
1,800 (1) Sanden Holdings Corp. 12,302 0.04,100 Sangetsu Co., Ltd. 74,514 0.02,700 Sankyo Co., Ltd. 103,080 0.12,300 Sankyo Seiko Co., Ltd. 9,853 0.03,200 Sanrio Co., Ltd. 76,462 0.11,100 Sanyo Electric Railway Co. Ltd. 21,907 0.0
800 Sanyo Shokai Ltd. 12,500 0.02,200 Scroll Corp. 7,474 0.0
11,100 Sega Sammy Holdings, Inc. 131,156 0.11,900 Seiko Holdings Corp. 45,330 0.02,800 Seiren Co., Ltd. 41,438 0.0
23,900 Sekisui Chemical Co., Ltd. 385,118 0.238,500 Sekisui House Ltd. 638,002 0.3
3,700 (1) Senshukai Co., Ltd. 7,976 0.010,700 (2) Sharp Corp. 118,219 0.1
2,500 Shimachu Co., Ltd. 65,198 0.01,300 Shimamura Co., Ltd. 110,177 0.14,500 Shimano, Inc. 732,676 0.3
900 Shimojima Co., Ltd. 9,233 0.0700 Shoei Co. Ltd. 29,929 0.0
2,900 Showa Corp. 37,089 0.010,300 Skylark Holdings Co. Ltd 170,712 0.174,512 Sony Corp. 3,145,987 1.4
3,000 Space Value Holdings Co. Ltd. 13,888 0.01,100 St. Marc Holdings Co., Ltd. 24,751 0.07,800 Stanley Electric Co., Ltd. 210,191 0.1
11,900 (2) ZOZO, Inc. 224,980 0.11,500 Starts Corp., Inc. 32,073 0.0
800 Studio Alice Co., Ltd. 16,493 0.034,400 Subaru Corp. 785,444 0.4
500 Suminoe Textile Co., Ltd. 13,002 0.0
Copyright © 2021 www.secdatabase.com. All Rights Reserved.Please Consider the Environment Before Printing This Document

Copyright © 2021 www.secdatabase.com. All Rights Reserved.Please Consider the Environment Before Printing This Document

Voya Japan TOPIX Index® PortfolioPORTFOLIO OF INVESTMENTS
as of March 31, 2019 (Unaudited) (Continued)
Shares ValuePercentage
of NetAssets
COMMON STOCK: (continued)Consumer Discretionary: (continued)
40,700 Sumitomo Electric Industries Ltd. $ 541,435 0.28,100 Sumitomo Forestry Co., Ltd. 112,750 0.12,500 Sumitomo Riko Co., Ltd. 21,026 0.09,605 Sumitomo Rubber Industries, Inc. 115,362 0.11,300 Sushiro Global Holdings Ltd. 89,597 0.1
20,400 Suzuki Motor Corp. 904,289 0.4900 Syuppin Co. Ltd. 6,673 0.0500 T RAD Co., Ltd. 9,593 0.0
2,000 Tachi-S Co., Ltd. 28,680 0.01,300 Taiho Kogyo Co., Ltd. 10,651 0.08,400 Takashimaya Co., Ltd. 111,936 0.1
640 Take And Give Needs Co., Ltd. 8,209 0.0400 Takihyo Co., Ltd. 6,334 0.0
1,200 Tama Home Co. Ltd. 11,597 0.01,300 Tamron Co., Ltd. 23,753 0.02,700 TBK Co., Ltd. 9,983 0.01,000 T-Gaia Corp. 16,607 0.01,400 Toa Corp./Hyogo 14,153 0.02,800 Tokai Rika Co., Ltd. 47,829 0.0
520 Token Corp. 33,770 0.0600 (1) Tokyo Base Co. Ltd. 5,262 0.0
1,350 Sac's Bar Holdings, Inc. 14,010 0.04,800 Tokyo Dome Corp. 45,847 0.0
700 Tokyotokeiba Co., Ltd. 21,222 0.05,100 Tomy Co., Ltd. 52,747 0.02,100 Topre Corp. 39,328 0.01,600 (2) Toridoll Holdings Corp. 32,345 0.0
500 Torikizoku Co. Ltd. 7,822 0.0500 Tosho Co. Ltd. 13,894 0.0
5,900 Toyo Tire & Rubber Co., Ltd. 67,069 0.03,900 Toyoda Gosei Co., Ltd. 82,801 0.13,400 Toyota Boshoku Corp. 51,544 0.08,900 Toyota Industries Corp. 447,216 0.2
123,682 (2) Toyota Motor Corp. 7,286,205 3.11,400 TPR Co., Ltd. 26,719 0.02,500 TS Tech Co., Ltd. 72,174 0.04,750 TSI Holdings Co. Ltd. 27,255 0.0
500 Tsutsumi Jewelry Co., Ltd. 8,497 0.02,300 Unipres Corp. 36,023 0.01,400 United Arrows Ltd. 48,769 0.04,900 (1) Unitika Ltd. 18,865 0.01,300 (1) U-Shin Ltd. 11,550 0.0
12,700 USS Co., Ltd. 236,189 0.14,400 VT Holdings Co. Ltd. 16,600 0.03,300 Wacoal Holdings Corp. 82,159 0.11,600 WATAMI Co., Ltd. 23,324 0.0
Copyright © 2021 www.secdatabase.com. All Rights Reserved.Please Consider the Environment Before Printing This Document

900 World Co. Ltd. 18,106 0.01,700 Xebio Holdings Co., Ltd. 18,749 0.0
32,632 (2) Yamada Denki Co., Ltd. 160,937 0.16,500 Yamaha Corp. 325,478 0.2
15,900 Yamaha Motor Co., Ltd. 312,759 0.2700 Yasunaga Corp. 8,751 0.0
2,200 Yellow Hat Ltd. 28,984 0.06,100 Yokohama Rubber Co., Ltd. 113,553 0.1
500 Yomiuri Land Co., Ltd. 19,537 0.01,300 Yondoshi Holdings, Inc. 24,504 0.01,400 Yorozu Corp. 18,327 0.03,900 Yoshinoya D&C Co., Ltd. 63,002 0.05,000 (2) Zensho Holdings Co., Ltd. 115,947 0.12,400 Zojirushi Corp. 24,987 0.0
39,721,661 16.9
Consumer Staples: 9.2%42,245 Aeon Co., Ltd. 884,836 0.4
1,500 Ain Holdings, Inc. 112,805 0.124,900 Ajinomoto Co., Inc. 398,574 0.2
2,000 Arcs Co., Ltd. 44,054 0.01,000 Ariake Japan Co., Ltd. 53,639 0.02,300 Artnature, Inc. 13,183 0.0
23,400 Asahi Group Holdings, Ltd. 1,044,541 0.51,100 Axial Retailing, Inc. 33,904 0.0
600 Belc Co., Ltd. 27,207 0.05,100 (2) Calbee, Inc. 137,741 0.11,000 (2) Cawachi Ltd. 16,008 0.01,700 Chubu Shiryo Co., Ltd. 17,966 0.0
400 Ci:z Holdings Co. Ltd. 21,247 0.08,552 Coca-Cola Bottlers Japan, Inc. 217,533 0.11,220 Cocokara fine, Inc. 48,534 0.0
500 Cosmos Pharmaceutical Corp. 86,574 0.01,700 Create SD Holdings Co., Ltd. 40,063 0.0
400 Daikokutenbussan Co., Ltd. 13,884 0.0700 DyDo Group Holdings, Inc. 31,590 0.0900 Earth Corp. 41,794 0.0
5,100 (1),(2) Euglena Co. Ltd. 31,717 0.03,300 Ezaki Glico Co., Ltd. 173,675 0.1
12,360 (2) FamilyMart UNY Holdings Co., Ltd. 315,067 0.15,200 FANCL Corp. 134,860 0.19,680 Feed One Co., Ltd. 15,411 0.02,700 Fuji Oil Holdings, Inc. 92,563 0.11,300 Fujicco Co., Ltd. 25,292 0.0
900 Fujiya Co., Ltd. 17,724 0.0500 Genky DrugStores Co. Ltd. 10,840 0.0
1,200 Hayashikane Sangyo Co., Ltd. 6,274 0.02,500 Heiwado Co., Ltd. 53,270 0.01,600 Hokuto Corp. 27,731 0.04,300 House Foods Group, Inc. 173,242 0.1
500 Imuraya Group Co. Ltd. 10,989 0.01,500 Inageya Co., Ltd. 17,276 0.03,400 Ito En Ltd. 176,979 0.1
300 Itochu-Shokuhin Co., Ltd. 12,835 0.06,570 Itoham Yonekyu Holdings, Inc. 40,957 0.0
Copyright © 2021 www.secdatabase.com. All Rights Reserved.Please Consider the Environment Before Printing This Document

64,000 Japan Tobacco, Inc. 1,585,141 0.7
Copyright © 2021 www.secdatabase.com. All Rights Reserved.Please Consider the Environment Before Printing This Document

Voya Japan TOPIX Index® PortfolioPORTFOLIO OF INVESTMENTS
as of March 31, 2019 (Unaudited) (Continued)
Shares ValuePercentage
of NetAssets
COMMON STOCK: (continued)Consumer Staples: (continued)
600 J-Oil Mills, Inc. $ 22,342 0.04,400 Kagome Co., Ltd. 123,861 0.1
700 Kameda Seika Co. Ltd. 33,593 0.027,100 Kao Corp. 2,138,912 0.9
1,800 Kato Sangyo Co., Ltd. 59,455 0.0800 Kenko Mayonnaise Co. Ltd. 15,888 0.0
6,000 Kewpie Corp. 144,142 0.11,400 Key Coffee, Inc. 26,278 0.07,400 Kikkoman Corp. 363,867 0.2
50,600 Kirin Holdings Co., Ltd. 1,210,538 0.53,900 Kitanotatsujin Corp. 16,481 0.03,200 Kobayashi Pharmaceutical Co., Ltd. 270,746 0.11,800 Kobe Bussan Co. Ltd. 68,379 0.01,900 Kose Corp. 350,191 0.21,200 Kotobuki Spirits Co. Ltd. 46,046 0.0
900 Kusuri no Aoki Holdings Co. Ltd. 64,498 0.0800 Kyokuyo Co., Ltd. 20,523 0.0200 Lacto Japan Co. Ltd. 16,227 0.0
2,800 Lawson, Inc. 155,330 0.11,000 Life Corp. 21,495 0.0
15,500 Lion Corp. 326,650 0.22,300 Mandom Corp. 59,250 0.01,400 Marudai Food Co., Ltd. 23,813 0.02,400 Maruha Nichiro Corp. 85,996 0.04,600 Matsumotokiyoshi Holdings Co., Ltd. 153,699 0.12,600 Megmilk Snow Brand Co., Ltd. 63,413 0.07,800 MEIJI Holdings Co., Ltd. 634,073 0.3
700 Meito Sangyo Co., Ltd. 9,627 0.01,424 Milbon Co., Ltd. 66,372 0.01,100 Ministop Co., Ltd. 17,037 0.01,000 Mitsubishi Shokuhin Co. Ltd. 26,176 0.01,000 Mitsui Sugar Co., Ltd. 24,644 0.0
900 Miyoshi Oil & Fat Co., Ltd. 9,129 0.02,700 Morinaga & Co., Ltd. 117,422 0.12,400 Morinaga Milk Industry Co., Ltd. 81,595 0.0
300 Morozoff Ltd. 13,369 0.0500 Nagatanien Holdings Co., Ltd. 11,228 0.0600 Nakamuraya Co., Ltd. 22,974 0.0
1,000 Natori Co., Ltd. 14,876 0.04,500 (2) NH Foods Ltd. 162,144 0.15,700 Nichirei Corp. 140,785 0.1
620 Nihon Chouzai Co., Ltd. 21,012 0.01,100 Nippon Beet Sugar Manufacturing Co., Ltd. 19,030 0.03,800 Nippon Flour Mills Co., Ltd. 65,305 0.0
14,200 Nippon Suisan Kaisha Ltd. 108,565 0.1300 Nishimoto Co. Ltd. 11,780 0.0
Copyright © 2021 www.secdatabase.com. All Rights Reserved.Please Consider the Environment Before Printing This Document

1,400 Nisshin Oillio Group Ltd. 41,422 0.012,745 Nisshin Seifun Group, Inc. 292,985 0.1
4,700 Nissin Food Products Co., Ltd. 323,389 0.1700 Noevir Holdings Co. Ltd. 34,037 0.0
5,400 Oenon Holdings, Inc. 20,010 0.01,000 OIE Sangyo Co., Ltd. 11,793 0.02,000 Okuwa Co., Ltd. 20,091 0.06,700 Pigeon Corp. 274,893 0.14,800 Pola Orbis Holdings, Inc. 153,534 0.11,800 Prima Meat Packers Ltd. 33,448 0.01,400 Qol Holdings Co. Ltd. 19,120 0.01,700 Rock Field Co., Ltd. 25,130 0.01,000 Rokko Butter Co. Ltd. 19,307 0.0
800 S Foods, Inc. 29,350 0.02,000 Sakata Seed Corp. 68,134 0.0
900 San-A Co., Ltd. 36,042 0.04,200 Sapporo Holdings Ltd. 91,891 0.0
45,743 Seven & I Holdings Co., Ltd. 1,725,892 0.722,100 Shiseido Co., Ltd. 1,600,147 0.7
600 Shoei Foods Corp. 17,086 0.0900 Showa Sangyo Co., Ltd. 24,359 0.0
1,200 Sogo Medical Holdings Co. Ltd. 18,384 0.01,000 ST Corp. 17,125 0.0
600 (2) Starzen Co., Ltd. 20,536 0.02,500 Sugi Holdings Co., Ltd. 110,327 0.14,100 Sundrug Co., Ltd. 113,153 0.17,400 Suntory Beverage & Food Ltd. 348,033 0.28,400 Takara Holdings, Inc. 99,557 0.11,200 Toho Co., Ltd./Hyogo 23,999 0.01,600 Torigoe Co., Ltd. 11,042 0.05,600 Toyo Suisan Kaisha Ltd. 213,470 0.12,400 Tsuruha Holdings, Inc. 195,465 0.1
23,600 Unicharm Corp. 782,392 0.33,680 United Super Markets Holdings, Inc. 36,443 0.02,200 Valor Holdings Co., Ltd. 53,382 0.01,100 Warabeya Nichiyo Co., Ltd. 18,106 0.02,940 Welcia Holdings Co. Ltd. 99,884 0.11,500 Yaizu Suisankagaku Industry Co., Ltd. 15,097 0.08,300 Yakult Honsha Co., Ltd. 581,943 0.3
400 Yakuodo Co. Ltd. 9,610 0.01,700 YA-MAN Ltd. 17,590 0.01,400 Yamatane Corp. 19,799 0.09,000 Yamazaki Baking Co., Ltd. 146,307 0.11,300 Yaoko Co., Ltd. 63,958 0.03,500 Yokohama Reito Co., Ltd. 28,303 0.0
500 Yomeishu Seizo Co., Ltd. 9,623 0.021,581,864 9.2
Energy: 1.0%3,300 Cosmo Energy Holdings Co. Ltd. 66,276 0.03,400 Fuji Oil Co., Ltd. 7,725 0.0
12,705 Idemitsu Kosan Co., Ltd. 424,958 0.260,800 Inpex Corp. 578,386 0.3
Copyright © 2021 www.secdatabase.com. All Rights Reserved.Please Consider the Environment Before Printing This Document

Voya Japan TOPIX Index® PortfolioPORTFOLIO OF INVESTMENTS
as of March 31, 2019 (Unaudited) (Continued)
Shares ValuePercentage
of NetAssets
COMMON STOCK: (continued)Energy: (continued)
2,200 Itochu Enex Co., Ltd. $ 17,764 0.02,500 Iwatani Corp. 80,317 0.1
400 Japan Oil Transportation Co., Ltd. 10,374 0.01,900 Japan Petroleum Exploration Co., Ltd. 40,924 0.0
185,360 JXTG Holdings, Inc. 846,158 0.41,800 Mitsuuroko Group Holdings Co., Ltd. 13,778 0.01,000 Modec, Inc. 28,501 0.0
14,600 Nippon Coke & Engineering Co., Ltd. 13,200 0.02,300 Sala Corp. 12,810 0.03,200 San-Ai Oil Co., Ltd. 26,276 0.01,600 Shinko Plantech Co., Ltd. 17,086 0.0
800 Sinanen Holdings Co., Ltd. 15,206 0.0700 Toyo Kanetsu K K 12,703 0.0
2,212,442 1.0
Financials: 10.4%3,400 77 Bank Ltd. 47,529 0.0
21,800 Acom Co., Ltd. 77,942 0.06,800 (2) AEON Financial Service Co., Ltd. 138,673 0.1
500 Aichi Bank Ltd. 15,540 0.020,200 (1) Aiful Corp. 50,829 0.0
1,000 Akita Bank Ltd. 20,308 0.0900 (1) Anicom Holdings, Inc. 24,407 0.0
1,100 Aomori Bank Ltd. 29,189 0.06,200 Aozora Bank Ltd. 153,213 0.11,000 Aruhi Corp. 19,946 0.01,800 Awa Bank Ltd. 45,800 0.0
700 Bank of Iwate Ltd. 20,689 0.04,100 Bank of Kochi Ltd./The 171,669 0.1
900 (2) Bank of Nagoya Ltd. 29,077 0.01,200 Bank of Okinawa Ltd. 37,408 0.0
700 Bank of Saga Ltd. 12,065 0.02,400 Bank of the Ryukyus Ltd. 24,477 0.0
38,600 Chiba Bank Ltd. 209,902 0.15,200 Chiba Kogyo Bank Ltd. 14,067 0.07,300 Chugoku Bank Ltd. 68,465 0.0
500 Chukyo Bank Ltd. 10,257 0.067,528 Concordia Financial Group Ltd. 261,087 0.1
7,100 Credit Saison Co., Ltd. 93,940 0.162,000 Dai-ichi Life Holdings, Inc. 863,123 0.4
1,900 Daishi Hokuetsu Financial Group, Inc. 53,783 0.01,300 Daito Bank Ltd. 7,488 0.0
87,800 Daiwa Securities Group, Inc. 427,965 0.2500 (1) Dream Incubator, Inc. 7,598 0.0
1,600 eGuarantee, Inc. 15,986 0.01,600 Ehime Bank Ltd. 16,471 0.0
Copyright © 2021 www.secdatabase.com. All Rights Reserved.Please Consider the Environment Before Printing This Document

16,200 FIDEA Holdings Co., Ltd. 19,190 0.03,900 Financial Products Group Co. Ltd. 32,018 0.01,400 Fukui Bank Ltd. 21,479 0.09,584 Fukuoka Financial Group, Inc. 212,819 0.12,400 (1) Fukushima Bank Ltd. 8,213 0.01,300 Fuyo General Lease Co., Ltd. 64,486 0.02,000 GCA Corp. 14,258 0.0
20,900 Gunma Bank Ltd. 79,202 0.119,500 Hachijuni Bank Ltd. 80,945 0.115,700 Hiroshima Bank Ltd. 80,026 0.1
2,300 Hitachi Capital Corp. 53,415 0.01,400 Hokkoku Bank Ltd. 43,956 0.07,100 Hokuhoku Financial Group, Inc. 74,005 0.0
10,100 Hyakugo Bank Ltd. 32,161 0.01,200 Hyakujushi Bank Ltd. 24,870 0.02,200 IBJ Leasing Co., Ltd. 52,013 0.03,400 Ichiyoshi Securities Co., Ltd. 23,879 0.01,600 IwaiCosmo Holdings, Inc. 17,902 0.0
16,300 Iyo Bank Ltd. 86,288 0.11,300 Jaccs Co., Ltd. 20,956 0.01,700 (1) Jafco Co., Ltd. 61,032 0.0
29,900 Japan Exchange Group, Inc. 533,684 0.229,200 Japan Post Bank Co. Ltd. 319,045 0.286,100 Japan Post Holdings Co. Ltd. 1,007,703 0.4
4,000 (2) Japan Post Insurance Co. Ltd. 86,624 0.15,011 (2) Japan Securities Finance Co., Ltd. 26,483 0.0
10,200 Jimoto Holdings, Inc. 10,704 0.01,500 Juroku Bank Ltd. 30,485 0.08,600 kabu.com Securities Co., Ltd. 43,237 0.05,327 Kansai Mirai Financial Group, Inc. 37,995 0.05,000 Keiyo Bank Ltd. 29,224 0.0
500 Kita-Nippon Bank Ltd. 8,872 0.04,500 Kiyo Bank Ltd. 62,790 0.02,000 Kyokuto Securities Co., Ltd. 18,603 0.0
18,020 Kyushu Financial Group, Inc. 73,296 0.0300 (1) M&A Capital Partners Co. Ltd. 13,709 0.0
4,300 Marusan Securities Co., Ltd. 25,423 0.05,500 (2) Matsui Securities Co., Ltd. 51,842 0.0
54,590 Mebuki Financial Group, Inc. 139,728 0.11,000 Michinoku Bank Ltd. 14,537 0.05,400 Mito Securities Co., Ltd. 10,063 0.0
759,000 Mitsubishi UFJ Financial Group, Inc. 3,753,858 1.624,100 Mitsubishi UFJ Lease & Finance Co., Ltd. 123,024 0.128,611 MS&AD Insurance Group Holdings, Inc. 871,737 0.4
Copyright © 2021 www.secdatabase.com. All Rights Reserved.Please Consider the Environment Before Printing This Document

Voya Japan TOPIX Index® PortfolioPORTFOLIO OF INVESTMENTS
as of March 31, 2019 (Unaudited) (Continued)
Shares ValuePercentage
of NetAssets
COMMON STOCK: (continued)Financials: (continued)
900 Miyazaki Bank Ltd. $ 22,556 0.01,470,000 Mizuho Financial Group, Inc. 2,274,784 1.0
10,400 Monex Group, Inc. 36,066 0.01,900 Musashino Bank Ltd. 37,982 0.0
600 Nagano Bank Ltd. 9,123 0.01,400 Nanto Bank Ltd. 26,250 0.0
300 NEC Capital Solutions Ltd. 4,616 0.07,000 Nishi-Nippon Financial Holdings, Inc. 59,498 0.0
191,400 Nomura Holdings, Inc. 691,653 0.314,600 North Pacific Bank Ltd. 36,581 0.0
1,800 Ogaki Kyoritsu Bank Ltd. 37,462 0.0700 Oita Bank Ltd. 21,901 0.0
10,000 Okasan Securities Group, Inc. 37,220 0.022,500 (2) Orient Corp. 23,011 0.073,000 ORIX Corp. 1,048,836 0.5
119,500 Resona Holdings, Inc. 517,683 0.2900 Ricoh Leasing Co., Ltd. 27,181 0.0
1,240 San ju San Financial Group, Inc. 17,297 0.06,300 San-In Godo Bank Ltd. 45,240 0.0
13,060 SBI Holdings, Inc. 292,043 0.111,830 Senshu Ikeda Holdings, Inc. 30,386 0.035,500 Seven Bank Ltd. 104,945 0.1
2,000 Shiga Bank Ltd. 47,710 0.02,200 Shikoku Bank Ltd. 20,712 0.0
700 Shimizu Bank Ltd. 11,511 0.07,300 (1) Shinsei Bank Ltd. 103,876 0.1
26,900 Shizuoka Bank Ltd. 204,923 0.119,450 Sompo Holdings, Inc. 720,292 0.3
9,100 Sony Financial Holdings, Inc. 171,734 0.177,252 Sumitomo Mitsui Financial Group, Inc. 2,705,266 1.221,444 Sumitomo Mitsui Trust Holdings, Inc. 770,678 0.311,600 (1) Suruga Bank Ltd. 53,813 0.033,900 T&D Holdings, Inc. 356,994 0.2
700 Taiko Bank Ltd. 10,363 0.08,800 Tochigi Bank Ltd. 18,694 0.0
11,100 Toho Bank Ltd. 29,724 0.01,300 Tohoku Bank Ltd. 12,346 0.0
12,500 Tokai Tokyo Financial Holdings 45,362 0.040,000 Tokio Marine Holdings, Inc. 1,937,867 0.8
2,300 Tokyo Century Corp. 100,242 0.11,728 Tokyo Kiraboshi Financial Group, Inc. 24,487 0.01,100 Tomato Bank Ltd. 10,533 0.09,700 TOMONY Holdings, Inc. 36,928 0.02,200 Towa Bank Ltd. 14,179 0.07,000 Toyo Securities Co., Ltd. 8,998 0.06,200 Tsukuba Bank Ltd. 10,833 0.0
Copyright © 2021 www.secdatabase.com. All Rights Reserved.Please Consider the Environment Before Printing This Document

1,300 Yamagata Bank Ltd. 23,148 0.013,000 Yamaguchi Financial Group, Inc. 110,224 0.1
1,600 Yamanashi Chuo Bank Ltd. 19,858 0.03,100 Zenkoku Hosho Co. Ltd. 108,490 0.1
24,456,771 10.4
Health Care: 8.7%12,200 Alfresa Holdings Corp. 347,661 0.2
900 As One Corp. 71,619 0.04,700 Asahi Intecc Co. Ltd. 221,345 0.11,400 ASKA Pharmaceutical Co., Ltd. 14,520 0.0
102,800 Astellas Pharma, Inc. 1,544,651 0.71,500 BML, Inc. 43,570 0.0
11,600 Chugai Pharmaceutical Co., Ltd. 798,997 0.4700 CMIC Holdings Co., Ltd. 9,740 0.0900 Create Medic Co., Ltd. 7,752 0.0
31,600 Daiichi Sankyo Co., Ltd. 1,459,215 0.61,800 Daiken Medical Co. Ltd. 9,044 0.0
860 Daito Pharmaceutical Co. Ltd. 21,482 0.02,100 Eiken Chemical Co., Ltd. 49,512 0.0
13,400 Eisai Co., Ltd. 753,976 0.31,000 Elan Corp. 13,397 0.02,000 EPS Holdings, Inc. 33,445 0.0
500 Falco Holdings Co. Ltd. 6,150 0.0800 Fuso Pharmaceutical Industries Ltd. 18,297 0.0
3,300 Hisamitsu Pharmaceutical Co., Inc. 152,220 0.11,600 Hogy Medical Co., Ltd. 56,489 0.0
22,500 Hoya Corp. 1,490,338 0.73,300 Japan Lifeline Co. Ltd. 54,732 0.0
900 JCR Pharmaceuticals Co. Ltd. 53,186 0.02,200 Jeol Ltd. 39,706 0.01,900 Kaken Pharmaceutical Co., Ltd. 86,543 0.12,000 Kissei Pharmaceutical Co., Ltd. 52,495 0.02,400 Kyorin Co., Ltd. 46,897 0.0
13,900 Kyowa Hakko Kirin Co., Ltd. 303,346 0.122,600 M3, Inc. 380,351 0.2
1,500 Mani, Inc. 73,563 0.01,000 (1) Medical Data Vision Co. Ltd. 9,744 0.0
11,400 Medipal Holdings Corp. 271,250 0.11,700 Menicon Co. Ltd. 49,168 0.02,900 Miraca Holdings, Inc. 72,091 0.0
11,300 Mitsubishi Tanabe Pharma Corp. 151,357 0.11,600 Mochida Pharmaceutical Co., Ltd. 82,205 0.1
700 N Field Co. Ltd. 4,781 0.01,800 Nagaileben Co., Ltd. 39,107 0.01,300 NichiiGakkan Co., Ltd. 15,331 0.03,450 Nichi-iko Pharmaceutical Co., Ltd. 45,829 0.04,800 Nihon Kohden Corp. 143,055 0.14,200 Nikkiso Co., Ltd. 49,198 0.0
Copyright © 2021 www.secdatabase.com. All Rights Reserved.Please Consider the Environment Before Printing This Document

Voya Japan TOPIX Index® PortfolioPORTFOLIO OF INVESTMENTS
as of March 31, 2019 (Unaudited) (Continued)
Shares ValuePercentage
of NetAssets
COMMON STOCK: (continued)Health Care: (continued)
400 Nippon Chemiphar Co., Ltd. $ 10,596 0.03,000 Nippon Shinyaku Co., Ltd. 219,043 0.17,900 (2) Nipro Corp. 102,191 0.11,400 Nissui Pharmaceutical Co., Ltd. 14,738 0.0
66,800 Olympus Corp. 726,732 0.326,400 Ono Pharmaceutical Co., Ltd. 518,772 0.221,200 Otsuka Holdings Co. Ltd. 834,706 0.4
1,300 Paramount Bed Holdings Co. Ltd. 57,774 0.05,200 (1) PeptiDream, Inc. 256,101 0.1
500 Rion Co. Ltd. 9,220 0.05,600 Rohto Pharmaceutical Co., Ltd. 144,321 0.1
21,000 Santen Pharmaceutical Co., Ltd. 313,873 0.22,300 Sawai Pharmaceutical Co., Ltd. 133,401 0.12,300 Seikagaku Corp. 24,985 0.01,700 (1) Shin Nippon Biomedical Laboratories Ltd. 13,874 0.0
14,800 Shionogi & Co., Ltd. 918,808 0.42,400 Ship Healthcare Holdings, Inc. 98,723 0.12,500 Solasto Corp. 28,257 0.08,200 Sumitomo Dainippon Pharma Co. Ltd. 203,516 0.15,030 Suzuken Co., Ltd. 291,764 0.18,700 Sysmex Corp. 527,016 0.21,000 Taiko Pharmaceutical Co. Ltd. 16,983 0.02,500 Taisho Pharmaceutical Holdings Co. Ltd. 238,832 0.13,100 Takara Bio, Inc. 72,179 0.0
97,400 Takeda Pharmaceutical Co., Ltd. 3,988,749 1.731,800 Terumo Corp. 973,261 0.4
3,100 Toho Holdings Co., Ltd. 77,489 0.01,400 Tokai Corp./Gifu 34,164 0.0
800 Torii Pharmaceutical Co., Ltd. 16,098 0.01,800 Towa Pharmaceutical Co., Ltd. 47,470 0.03,500 Tsukui Corp. 22,056 0.03,700 Tsumura & Co. 112,693 0.12,400 (2) Vital KSK Holdings, Inc. 23,718 0.02,600 ZERIA Pharmaceutical Co., Ltd. 44,996 0.0
20,264,454 8.7
Industrials: 22.2%1,900 Advan Co., Ltd. 17,514 0.01,400 Aeon Delight Co., Ltd. 54,510 0.03,100 Aica Kogyo Co., Ltd. 103,632 0.12,900 Aichi Corp. 18,367 0.03,300 Aida Engineering Ltd. 23,877 0.01,600 Alconix Corp. 16,603 0.0
19,400 (2) ANA Holdings, Inc. 711,743 0.3900 Altech Corp. 15,043 0.0
16,200 Amada Holdings Co., Ltd. 160,741 0.1
Copyright © 2021 www.secdatabase.com. All Rights Reserved.Please Consider the Environment Before Printing This Document

3,000 Anest Iwata Corp. 26,417 0.03,700 Asahi Diamond Industrial Co., Ltd. 25,594 0.0
11,100 AGC, Inc. 389,893 0.2420 Asahi Kogyosha Co., Ltd. 11,312 0.0700 Asanuma Corp. 15,578 0.0
2,400 Bando Chemical Industries Ltd. 23,053 0.02,000 Bell System24 Holdings, Inc. 24,807 0.03,000 Benefit One, Inc. 59,005 0.03,300 Bunka Shutter Co., Ltd. 23,957 0.02,500 Central Glass Co., Ltd. 55,050 0.09,900 Central Japan Railway Co. 2,301,221 1.0
600 Central Security Patrols Co., Ltd. 26,412 0.08,400 (1),(2) Chiyoda Corp. 20,083 0.0
700 Chiyoda Integre Co., Ltd. 12,994 0.01,500 Chudenko Corp. 30,625 0.0
700 Chugai Ro Co., Ltd. 11,097 0.03,300 CKD Corp. 29,913 0.05,200 COMSYS Holdings Corp. 142,046 0.12,000 Cosel Co., Ltd. 21,097 0.01,500 CTI Engineering Co., Ltd. 20,437 0.0
15,200 Dai Nippon Printing Co., Ltd. 364,084 0.2900 Dai-Dan Co., Ltd. 20,922 0.0
6,000 (2) Daifuku Co., Ltd. 313,856 0.21,400 Daihen Corp. 36,063 0.0
600 Daiho Corp. 17,568 0.0800 Daiichi Jitsugyo Co., Ltd. 23,132 0.0
15,200 Daikin Industries Ltd. 1,786,680 0.82,100 Daiseki Co., Ltd. 51,208 0.01,900 Daiwa Industries Ltd. 19,506 0.01,200 Denyo Co., Ltd. 14,871 0.07,300 DMG Mori Co. Ltd. 90,756 0.13,000 Duskin Co., Ltd. 71,539 0.0
19,600 East Japan Railway Co. 1,892,695 0.85,100 Ebara Corp. 144,332 0.1
700 Ebara Jitsugyo Co. Ltd. 12,761 0.0700 Endo Lighting Corp. 4,817 0.0
1,200 en-japan, Inc. 35,055 0.010,500 Fanuc Ltd. 1,795,644 0.8
1,430 Fudo Tetra Corp. 18,659 0.07,000 Fuji Electric Holdings Co., Ltd. 199,296 0.13,400 Fuji Machine Manufacturing Co., Ltd. 45,405 0.0
13,500 Fujikura Ltd. 50,979 0.03,500 Fujitec Co., Ltd. 38,832 0.0
500 Fukuda Corp. 19,061 0.0700 Fukushima Industries Corp. 22,523 0.0
Copyright © 2021 www.secdatabase.com. All Rights Reserved.Please Consider the Environment Before Printing This Document

Voya Japan TOPIX Index® PortfolioPORTFOLIO OF INVESTMENTS
as of March 31, 2019 (Unaudited) (Continued)
Shares ValuePercentage
of NetAssets
COMMON STOCK: (continued)Industrials: (continued)
1,200 Fukuyama Transporting Co., Ltd. $ 46,275 0.01,100 Fullcast Co., Ltd. 23,535 0.02,310 Funai Soken Holdings, Inc. 55,697 0.01,900 Furukawa Co., Ltd. 23,987 0.03,400 Furukawa Electric Co., Ltd. 86,049 0.11,800 Futaba Corp. 27,365 0.01,000 Gakujo Co., Ltd. 11,145 0.01,100 Gecoss Corp. 10,301 0.0
700 Giken Ltd. 21,439 0.03,500 Glory Ltd. 84,141 0.14,000 GS Yuasa Corp. 78,651 0.1
900 Hamakyorex Co., Ltd. 34,607 0.013,900 Hankyu Hanshin Holdings, Inc. 521,773 0.2
2,000 Hanwa Co., Ltd. 55,918 0.08,900 Hazama Ando Corp. 59,672 0.01,800 Hibiya Engineering Ltd. 30,763 0.0
13,800 Hino Motors Ltd. 116,502 0.1500 (2) Hirata Corp. 34,672 0.0
2,700 Hisaka Works Ltd. 22,387 0.04,300 Hitachi Construction Machinery Co., Ltd. 114,633 0.12,300 Hitachi Transport System Ltd. 68,342 0.09,100 Hitachi Zosen Corp. 28,006 0.02,100 Hokuetsu Industries Co. Ltd. 21,922 0.03,300 Hoshizaki Corp. 204,852 0.1
500 Hosokawa Micron Corp. 22,400 0.01,100 Howa Machinery Ltd. 9,510 0.02,200 Ichinen Holdings Co., Ltd. 22,938 0.01,500 Idec Corp. 25,976 0.08,600 IHI Corp. 207,178 0.16,700 Iino Kaiun Kaisha Ltd. 22,634 0.01,500 Inaba Denki Sangyo Co., Ltd. 58,144 0.01,200 Inaba Seisakusho Co., Ltd. 15,199 0.02,600 Inabata & Co., Ltd. 35,421 0.01,330 Inui Global Logistics Co. Ltd. 10,771 0.01,500 Iseki & Co., Ltd. 22,127 0.0
400 (1) Ishikawa Seisakusho Ltd. 6,161 0.076,200 Itochu Corp. 1,381,032 0.6
4,000 Itoki Corp. 19,546 0.0600 Iwasaki Electric Co., Ltd. 7,534 0.0700 JAC Recruitment Co. Ltd. 15,493 0.0500 Jamco Corp. 10,479 0.0
19,200 Japan Airlines Co. Ltd. 676,599 0.33,500 (2) Japan Airport Terminal Co., Ltd. 148,295 0.1
800 Japan Elevator Service Holdings Co. Ltd. 16,308 0.0700 Japan Pulp & Paper Co., Ltd. 26,278 0.0
3,700 Japan Steel Works Ltd. 68,442 0.0
Copyright © 2021 www.secdatabase.com. All Rights Reserved.Please Consider the Environment Before Printing This Document

4,000 Japan Transcity Corp. 16,118 0.010,700 (2) JGC Corp. 142,669 0.1
1,300 JK Holdings Co., Ltd. 6,582 0.010,200 JTEKT Corp. 125,950 0.1
1,400 Juki Corp. 13,974 0.028,700 Kajima Corp. 424,551 0.2
6,100 Kamigumi Co., Ltd. 141,479 0.11,500 Kanaden Corp. 15,982 0.0
400 Kanagawa Chuo Kotsu Co., Ltd. 13,742 0.01,600 Kanamoto Co., Ltd. 39,697 0.04,500 Kandenko Co., Ltd. 38,516 0.04,800 Kanematsu Corp. 55,027 0.01,600 Katakura Industries Co., Ltd. 18,265 0.0
700 Kato Works Co., Ltd. 16,545 0.0300 Kawada Technologies, Inc. 21,371 0.0
8,700 Kawasaki Heavy Industries Ltd. 215,178 0.13,900 (1),(2) Kawasaki Kisen Kaisha Ltd. 42,048 0.04,800 Keihan Holdings Co., Ltd. 202,077 0.1
15,400 (2) Keikyu Corp. 261,645 0.16,200 Keio Corp. 401,059 0.28,100 Keisei Electric Railway Co., Ltd. 294,568 0.12,200 Kimura Chemical Plants Co., Ltd. 7,471 0.0
900 Kimura Unity Co., Ltd. 8,853 0.07,500 Kinden Corp. 124,456 0.12,000 King Jim Co., Ltd. 15,633 0.0
10,400 Kintetsu Group Holdings Co., Ltd. 485,117 0.22,100 Kintetsu World Express, Inc. 32,082 0.01,000 Kitagawa Corp. 20,373 0.0
400 Kitano Construction Corp. 11,237 0.01,000 Kito Corp. 15,152 0.05,000 Kitz Corp. 36,730 0.0
400 (1) Kobe Electric Railway Co. Ltd. 14,259 0.05,500 Kokuyo Co., Ltd. 80,802 0.1
395 Komaihal Tec, Inc. 6,625 0.050,300 Komatsu Ltd. 1,173,175 0.5
900 Komatsu Wall Industry Co., Ltd. 15,346 0.03,200 Komori Corp. 36,287 0.01,800 Konoike Transport Co. Ltd. 29,801 0.0
400 KRS Corp. 7,400 0.059,500 Kubota Corp. 864,848 0.4
1,900 Kumagai Gumi Co., Ltd. 59,520 0.05,800 Kurita Water Industries, Ltd. 148,509 0.1
500 Kyodo Printing Co., Ltd. 11,093 0.02,100 Kyokuto Kaihatsu Kogyo Co., Ltd. 28,146 0.04,716 Kyowa Exeo Corp. 130,464 0.12,500 Kyudenko Corp. 78,549 0.1
Copyright © 2021 www.secdatabase.com. All Rights Reserved.Please Consider the Environment Before Printing This Document

Voya Japan TOPIX Index® PortfolioPORTFOLIO OF INVESTMENTS
as of March 31, 2019 (Unaudited) (Continued)
Shares ValuePercentage
of NetAssets
COMMON STOCK: (continued)Industrials: (continued)
8,500 Kyushu Railway Co. $ 279,607 0.11,900 Link And Motivation, Inc. 13,804 0.0
16,170 LIXIL Group Corp. 216,121 0.13,100 Mabuchi Motor Co., Ltd. 108,117 0.18,900 Maeda Corp. 88,517 0.11,400 Maeda Kosen Co. Ltd. 30,928 0.04,000 Maeda Road Construction Co., Ltd. 77,793 0.11,600 Maezawa Kasei Industries Co., Ltd. 14,849 0.0
600 Maezawa Kyuso Industries Co., Ltd. 10,316 0.01,200 Makino Milling Machine Co., Ltd. 49,683 0.0
13,600 Makita Corp. 475,319 0.2106,800 Marubeni Corp. 740,488 0.3
700 Maruka Machinery Co. Ltd. 13,501 0.0600 Maruwa Unyu Kikan Co. Ltd. 20,593 0.0800 Maruzen Showa Unyu Co., Ltd. 21,713 0.0
1,100 Matsuda Sangyo Co., Ltd. 13,856 0.02,600 Matsui Construction Co., Ltd. 16,714 0.02,000 Max Co., Ltd. 29,469 0.02,000 Meidensha Corp. 27,505 0.02,800 Meisei Industrial Co. Ltd. 18,938 0.01,400 Meitec Corp. 63,772 0.02,400 Meiwa Corp. 9,659 0.0
20,558 Minebea Mitsumi, Inc. 310,312 0.24,110 Mirait Holdings Corp. 60,119 0.0
13,500 Misumi Group, Inc. 337,057 0.276,300 Mitsubishi Corp. 2,124,286 0.9
110,600 Mitsubishi Electric Corp. 1,427,005 0.63,500 (2) Mitsubishi Logistics Corp. 97,876 0.1
18,400 Mitsubishi Heavy Industries Ltd. 765,696 0.3900 Mitsubishi Kakoki Kaisha Ltd. 12,412 0.0
1,000 Mitsubishi Logisnext Co., Ltd. 10,930 0.02,000 Mitsubishi Pencil Co., Ltd. 38,836 0.01,500 Mitsuboshi Belting Co., Ltd. 26,733 0.0
89,600 Mitsui & Co., Ltd. 1,394,215 0.64,000 (1) Mitsui E&S Holdings Co. Ltd 37,818 0.0
900 Mitsui Matsushima Holdings Co. Ltd. 10,025 0.05,900 Mitsui OSK Lines Ltd. 127,299 0.12,000 Mitsui-Soko Holdings Co. Ltd. 32,968 0.04,900 Miura Co., Ltd. 113,289 0.1
600 Miyaji Engineering Group, Inc. 10,146 0.07,100 MonotaRO Co. Ltd. 158,719 0.11,900 Morita Holdings Corp. 31,293 0.06,100 Nabtesco Corp. 178,754 0.11,900 NAC Co., Ltd. 17,334 0.01,100 Nachi-Fujikoshi Corp. 44,406 0.06,400 Nagase & Co., Ltd. 92,145 0.1
Copyright © 2021 www.secdatabase.com. All Rights Reserved.Please Consider the Environment Before Printing This Document

8,200 Nagoya Railroad Co., Ltd. 227,240 0.12,000 Nakabayashi Co. Ltd. 9,663 0.03,544 Namura Shipbuilding Co., Ltd. 11,598 0.05,000 Nankai Electric Railway Co., Ltd. 138,127 0.1
500 Nexyz Group Corp. 9,937 0.013,200 NGK Insulators Ltd. 192,308 0.1
1,000 Nice Holdings, Inc. 8,053 0.03,000 Nichias Corp. 59,573 0.0
900 Nichiden Corp. 12,801 0.01,800 Nichiha Corp. 49,703 0.02,200 Nichireki Co., Ltd. 21,795 0.0
13,414 Nidec Corp. 1,708,071 0.77,900 Nihon M&A Center, Inc. 217,139 0.1
200 Nihon Trim Co., Ltd. 10,459 0.0800 Nikko Co. Ltd./Hyogo 17,374 0.0
2,400 Nippo Corp. 44,835 0.0600 (2) Nippon Carbon Co., Ltd. 26,752 0.0
1,700 Nippon Densetsu Kogyo Co., Ltd. 35,473 0.04,200 Nippon Express Co., Ltd. 234,176 0.12,100 Nippon Hume Corp. 14,512 0.01,400 Nippon Kanzai Co., Ltd. 25,015 0.0
900 Nippon Koei Co. Ltd. 19,088 0.03,800 Nikkon Holdings Co. Ltd 90,075 0.1
19,500 Nippon Parking Development Co. Ltd. 30,323 0.0400 Nippon Road Co., Ltd. 23,545 0.0400 Nippon Seisen Co., Ltd. 11,792 0.0400 (1) Nippon Sharyo Ltd. 9,265 0.0
5,900 Nippon Sheet Glass Co., Ltd. 47,703 0.0828 Nippon Steel & Sumikin Bussan Corp. 33,731 0.0
3,900 Nippon Thompson Co., Ltd. 18,011 0.08,688 Nippon Yusen KK 127,585 0.12,800 Nishimatsu Construction Co., Ltd. 62,208 0.03,000 (2) Nishi-Nippon Railroad Co., Ltd. 72,645 0.11,000 Nishio Rent All Co., Ltd. 28,865 0.0
400 Nissei ASB Machine Co. Ltd. 13,714 0.01,300 Nissei Plastic Industrial Co., Ltd. 10,652 0.05,480 Nisshinbo Holdings, Inc. 47,963 0.01,100 Nissin Corp. 18,436 0.02,300 Nissin Electric Co., Ltd. 21,130 0.01,100 Nitta Corp. 35,858 0.01,900 Nitto Boseki Co., Ltd. 34,050 0.02,100 Nitto Kogyo Corp. 42,115 0.0
700 Nitto Kohki Co., Ltd. 13,834 0.01,100 Nittoc Construction Co. Ltd. 5,931 0.02,700 Nomura Co., Ltd. 76,271 0.1
Copyright © 2021 www.secdatabase.com. All Rights Reserved.Please Consider the Environment Before Printing This Document

Voya Japan TOPIX Index® PortfolioPORTFOLIO OF INVESTMENTS
as of March 31, 2019 (Unaudited) (Continued)
Shares ValuePercentage
of NetAssets
COMMON STOCK: (continued)Industrials: (continued)
700 Noritake Co., Ltd. $ 33,624 0.02,900 Noritz Corp. 45,333 0.0
700 NS United Kaiun Kaisha Ltd. 15,020 0.022,700 NSK Ltd. 213,431 0.126,000 NTN Corp. 77,291 0.1
700 Obara Corp. 23,244 0.037,000 Obayashi Corp. 372,911 0.217,500 Odakyu Electric Railway Co., Ltd. 424,665 0.2
1,580 Oiles Corp. 25,265 0.02,700 Okabe Co., Ltd. 23,372 0.04,100 Okamura Corp. 43,056 0.01,300 Okuma Corp. 70,629 0.02,200 Okumura Corp. 69,964 0.01,300 Onoken Co., Ltd. 18,251 0.0
600 Organo Corp. 17,012 0.0600 Origin Electric Co. Ltd. 10,774 0.0
5,200 OSG Corp. 100,576 0.15,950 OSJB Holdings Corp. 14,906 0.05,500 Outsourcing, Inc. 68,286 0.01,700 Oyo Corp. 17,197 0.06,600 Park24 Co., Ltd. 143,484 0.11,100 Pasona Group, Inc. 16,674 0.01,400 Pegasus Sewing Machine Manufacturing Co., Ltd. 7,652 0.0
15,200 Penta-Ocean Construction Co., Ltd. 70,590 0.010,500 Persol Holdings Co. Ltd 170,503 0.1
2,000 Pilot Corp. 81,185 0.12,600 Prestige International, Inc. 32,744 0.01,900 Pronexus, Inc. 21,058 0.02,200 PS Mitsubishi Construction Co., Ltd. 13,174 0.0
800 Quick Co. Ltd. 13,001 0.02,500 Raito Kogyo Co., Ltd. 33,776 0.0
76,200 Recruit Holdings Co. Ltd. 2,184,689 1.02,000 Relia, Inc. 17,452 0.01,200 Rheon Automatic Machinery Co., Ltd. 17,209 0.01,400 Ryobi Ltd. 31,495 0.0
300 Sakai Heavy Industries Ltd. 7,409 0.0600 Sakai Moving Service Co., Ltd. 38,091 0.0
3,800 (1) Sanix, Inc. 8,191 0.03,100 Sanki Engineering Co., Ltd. 33,952 0.01,800 Sankyo Tateyama, Inc. 24,241 0.02,900 Sankyu, Inc. 141,742 0.1
10,600 Sanwa Holdings Corp. 126,412 0.1600 Sanyo Denki Co. Ltd. 21,630 0.0
1,700 Sato Holding Corp. 39,952 0.01,300 Sato Shoji Corp. 10,651 0.01,600 SBS Holdings, Inc. 26,952 0.0
Copyright © 2021 www.secdatabase.com. All Rights Reserved.Please Consider the Environment Before Printing This Document

11,300 Secom Co., Ltd. 969,076 0.414,200 Seibu Holdings, Inc. 248,801 0.1
2,500 Seikitokyu Kogyo Co., Ltd. 13,319 0.07,900 Seino Holdings Co. Ltd 105,573 0.12,000 Sekisui Jushi Corp. 35,276 0.06,700 Senko Group Holdings Co., Ltd. 55,715 0.0
10,000 SG Holdings Co. Ltd. 291,727 0.11,200 Shibusawa Warehouse Co., Ltd. 18,242 0.01,100 Shibuya Corp. 32,572 0.01,400 Shima Seiki Manufacturing Ltd. 43,185 0.0
37,800 Shimizu Corp. 329,209 0.21,100 Shin Nippon Air Technologies Co. Ltd. 19,256 0.0
400 Shin-Keisei Electric Railway Co., Ltd. 7,520 0.05,200 Shinmaywa Industries Ltd. 64,761 0.02,000 Shinnihon Corp. 17,759 0.0
500 Shinsho Corp. 11,681 0.01,200 Shinwa Co., Ltd./Nagoya 23,618 0.01,200 SHO-BOND Holdings Co., Ltd. 80,224 0.11,800 Sinfonia Technology Co. Ltd. 22,063 0.01,500 Sinko Industries Ltd. 20,333 0.02,800 Sintokogio Ltd. 24,190 0.03,300 SMC Corp. 1,243,957 0.54,400 SMS Co. Ltd. 79,728 0.12,000 Soda Nikka Co., Ltd. 10,437 0.02,800 Sodick Co., Ltd. 23,461 0.04,300 Sohgo Security Services Co., Ltd. 187,558 0.1
59,400 Sojitz Corp. 209,882 0.13,700 Sotetsu Holdings, Inc. 113,951 0.12,000 Star Micronics Co., Ltd. 30,522 0.0
800 Sugimoto & Co., Ltd. 12,870 0.08,600 Sumiseki Holdings, Inc. 9,877 0.0
65,100 Sumitomo Corp. 902,565 0.41,400 Sumitomo Densetsu Co., Ltd. 23,788 0.06,140 Sumitomo Heavy Industries 199,548 0.19,540 Sumitomo Mitsui Construction Co., Ltd. 66,555 0.0
400 Sumitomo Precision Products Co. Ltd. 11,102 0.04,000 Sumitomo Warehouse Co., Ltd./The 50,539 0.02,400 SWCC Showa Holdings Co., Ltd. 15,307 0.05,500 Tadano Ltd. 52,467 0.01,000 Taihei Dengyo Kaisha Ltd. 21,254 0.01,400 Taiheiyo Kouhatsu, Inc. 9,634 0.01,600 Taikisha Ltd. 48,715 0.0
12,400 Taisei Corp. 576,882 0.3700 Takamatsu Construction Group Co., Ltd. 15,130 0.0
1,000 Takaoka Toko Co. Ltd. 11,917 0.01,200 Takara Printing Co., Ltd. 18,421 0.0
Copyright © 2021 www.secdatabase.com. All Rights Reserved.Please Consider the Environment Before Printing This Document

Voya Japan TOPIX Index® PortfolioPORTFOLIO OF INVESTMENTS
as of March 31, 2019 (Unaudited) (Continued)
Shares ValuePercentage
of NetAssets
COMMON STOCK: (continued)Industrials: (continued)
2,300 Takara Standard Co., Ltd. $ 35,275 0.03,400 Takasago Thermal Engineering Co., Ltd. 54,855 0.02,000 Takeei Corp. 13,265 0.02,100 Takeuchi Manufacturing Co. Ltd. 37,128 0.0
700 Takisawa Machine Tool Co., Ltd. 9,485 0.04,100 Takuma Co., Ltd. 49,044 0.02,500 Tanseisha Co., Ltd. 29,646 0.02,600 Tatsuta Electric Wire and Cable Co., Ltd. 10,744 0.02,100 TechnoPro Holdings, Inc. 125,822 0.11,200 Teikoku Electric Manufacturing Co., Ltd. 12,206 0.01,400 Teikoku Sen-I Co., Ltd. 34,635 0.01,100 Tekken Corp. 27,124 0.07,000 THK Co., Ltd. 173,855 0.11,100 Toa Corp. 15,861 0.0
400 TOA Road Corp. 10,491 0.01,800 Tobishima Corp. 21,924 0.0
11,600 Tobu Railway Co., Ltd. 335,260 0.23,500 Tocalo Co., Ltd. 27,680 0.0
14,100 Toda Corp. 86,922 0.1400 Toenec Corp. 10,990 0.0
5,800 TOKAI Holdings Corp. 48,230 0.02,000 Tokyo Energy & Systems, Inc. 17,822 0.0
600 Tokyo Keiki, Inc. 5,974 0.02,500 Tokyo Sangyo Co. Ltd. 11,459 0.04,990 Tokyu Construction Co., Ltd. 37,477 0.0
30,000 Tokyu Corp. 524,436 0.24,700 Toli Corp. 11,313 0.01,900 Tomoe Corp. 5,935 0.0
200 Tonami Holdings Co., Ltd. 11,404 0.02,000 Toppan Forms Co., Ltd. 17,104 0.0
15,200 Toppan Printing Co., Ltd. 230,026 0.12,200 Torishima Pump Manufacturing Co., Ltd. 19,199 0.01,400 Toshiba Machine Co., Ltd. 28,261 0.02,800 Toshiba Plant Systems & Services Corp. 49,728 0.01,000 Tosho Printing Co., Ltd. 9,262 0.01,600 Totetsu Kogyo Co., Ltd. 44,147 0.08,600 (2) Toto Ltd. 365,672 0.25,100 Toyo Construction Co., Ltd. 19,713 0.02,200 (1) Toyo Engineering Corp. 12,146 0.05,000 Toyo Logistics Co., Ltd. 14,299 0.0
800 Toyo Tanso Co., Ltd. 14,919 0.0600 Toyo Wharf & Warehouse Co., Ltd. 8,078 0.0
12,200 Toyota Tsusho Corp. 398,622 0.2200 Trancom Co. Ltd. 11,778 0.0
2,400 Trusco Nakayama Corp. 66,563 0.0700 Trust Tech, Inc. 23,245 0.0
Copyright © 2021 www.secdatabase.com. All Rights Reserved.Please Consider the Environment Before Printing This Document

1,400 Tsubaki Nakashima Co. Ltd. 25,207 0.01,200 Tsubakimoto Chain Co. 42,947 0.0
400 Tsubakimoto Kogyo Co., Ltd. 13,693 0.03,300 Tsugami Corp. 25,531 0.02,300 Tsukishima Kikai Co., Ltd. 28,723 0.01,300 Tsurumi Manufacturing Co., Ltd. 23,320 0.0
800 Uchida Yoko Co., Ltd. 23,548 0.0410 Ueki Corp. 8,656 0.0500 Union Tool Co. 13,229 0.0
6,700 Ushio, Inc. 78,371 0.1700 Wakachiku Construction Co., Ltd. 9,411 0.0
2,600 Wakita & Co. Ltd. 26,006 0.0700 WDB Holdings Co. Ltd. 19,592 0.0700 Weathernews, Inc. 20,402 0.0
9,900 West Japan Railway Co. 745,923 0.32,800 Yahagi Construction Co., Ltd. 19,453 0.02,500 Yamabiko Corp. 24,072 0.01,500 Yamashin-Filter Corp. 9,624 0.0
18,500 Yamato Holdings Co., Ltd. 478,610 0.24,300 Yamazen Corp. 45,453 0.02,100 Yasuda Logistics Corp. 17,495 0.02,100 Yokogawa Bridge Holdings Corp. 36,193 0.01,100 Yuasa Trading Co., Ltd. 31,075 0.0
400 Yuken Kogyo Co., Ltd. 6,078 0.01,400 Yushin Precision Equipment Co., Ltd. 12,743 0.0
52,126,526 22.2
Information Technology: 10.5%1,500 A&D Co., Ltd. 10,383 0.0
600 Ad-sol Nissin Corp. 8,704 0.07,200 Advantest Corp. 168,174 0.12,000 Ai Holdings Corp. 33,127 0.0
400 Aichi Tokei Denki Co., Ltd. 14,689 0.01,200 Aiphone Co., Ltd. 18,931 0.0
680 Alpha Systems, Inc. 16,135 0.011,564 Alps Alpine Co. Ltd. 241,780 0.13,600 Amano Corp. 85,083 0.17,000 Anritsu Corp. 130,208 0.11,200 Argo Graphics, Inc. 25,637 0.02,300 (1) Arisawa Manufacturing Co., Ltd. 16,525 0.06,600 Azbil Corp. 154,728 0.1
300 (1) BrainPad, Inc. 16,127 0.06,800 Broadleaf Co. Ltd. 35,848 0.0
13,800 Brother Industries Ltd. 256,302 0.12,200 CAC Holdings Corp. 29,342 0.01,000 Canon Electronics, Inc. 15,866 0.0
59,666 Canon, Inc. 1,732,406 0.81,900 Computer Institute of Japan Ltd. 14,402 0.0
13,400 (2) Citizen Watch Co., Ltd. 74,879 0.02,700 CMK Corp. 15,817 0.0
Copyright © 2021 www.secdatabase.com. All Rights Reserved.Please Consider the Environment Before Printing This Document

Voya Japan TOPIX Index® PortfolioPORTFOLIO OF INVESTMENTS
as of March 31, 2019 (Unaudited) (Continued)
Shares ValuePercentage
of NetAssets
COMMON STOCK: (continued)Information Technology: (continued)
1,300 Computer Engineering & Consulting Ltd. $ 24,363 0.0700 Comture Corp. 23,097 0.0
1,400 Cybernet Systems Co., Ltd. 7,175 0.02,700 Cybozu, Inc. 23,080 0.0
800 Dai-ichi Seiko Co. Ltd 7,587 0.01,000 Daiwabo Holdings Co., Ltd. 57,737 0.0
800 (2) Denki Kogyo Co., Ltd. 24,103 0.03,500 Dexerials Corp. 23,260 0.0
600 Digital Arts, Inc. 49,179 0.02,100 Digital Garage, Inc. 61,785 0.01,200 Digital Hearts Holdings Co., Ltd. 13,998 0.01,500 Disco Corp. 214,817 0.11,200 DTS Corp. 44,436 0.0
700 E-Guardian, Inc. 14,197 0.01,100 Eizo Corp. 43,827 0.01,100 Elecom Co. Ltd. 33,990 0.0
500 Enplas Corp. 12,895 0.01,200 ESPEC Corp. 22,448 0.0
600 Excel Co., Ltd. 12,685 0.01,400 Fixstars Corp. 17,661 0.01,700 Fuji Soft, Inc. 67,425 0.0
23,100 Fuji Film Holdings Corp. 1,052,160 0.510,800 Fujitsu Ltd. 781,052 0.3
1,700 Furuno Electric Co., Ltd. 15,858 0.01,300 Future Corp. 22,347 0.04,200 GMO internet, Inc. 68,717 0.01,900 GMO Payment Gateway, Inc. 135,503 0.1
600 (1) Gunosy, Inc. 13,001 0.08,000 Hamamatsu Photonics KK 310,345 0.1
600 Hioki EE Corp. 25,760 0.01,563 Hirose Electric Co., Ltd. 164,581 0.13,200 Hitachi High-Technologies Corp. 131,486 0.1
50,229 Hitachi Ltd. 1,631,972 0.71,300 Hochiki Corp. 13,100 0.01,000 Hokuriku Electric Industry Co., Ltd. 9,565 0.02,300 Horiba Ltd. 128,265 0.13,400 Hosiden Corp. 28,606 0.06,800 Ibiden Co., Ltd. 103,628 0.1
800 Icom, Inc. 15,928 0.02,300 Ines Corp. 27,415 0.01,430 I-Net Corp. 17,046 0.06,300 Infomart Corp. 77,030 0.01,400 Innotech Corp. 12,241 0.0
800 Inter Action Corp. 12,190 0.01,000 Iriso Electronics Co. Ltd. 45,908 0.0
700 Information Services International-Dentsu Ltd. 24,183 0.0
Copyright © 2021 www.secdatabase.com. All Rights Reserved.Please Consider the Environment Before Printing This Document

1,900 (1) Itfor, Inc. 16,449 0.05,200 Itochu Techno-Solutions Corp. 121,662 0.13,000 Japan Aviation Electronics Industry Ltd. 41,922 0.01,500 Japan Cash Machine Co., Ltd. 16,061 0.0
27,200 (1),(2) Japan Display, Inc. 17,032 0.03,100 Japan Material Co. Ltd. 38,168 0.01,700 Jastec Co., Ltd. 15,475 0.01,100 JBCC Holdings, Inc. 14,948 0.01,900 Justsystems Corp. 48,442 0.01,200 Kaga Electronics Co., Ltd. 22,085 0.0
900 Kanematsu Electronics Ltd. 27,255 0.05,500 Keyence Corp. 3,438,573 1.51,600 Koa Corp. 21,601 0.0
23,900 Konica Minolta, Inc. 235,658 0.117,100 Kyocera Corp. 1,006,897 0.4
2,400 Lasertec Corp. 100,770 0.12,800 Macnica Fuji Electronics Holdings, Inc. 38,321 0.01,700 Mamezou Holdings Co. Ltd. 16,029 0.02,000 Marubun Corp. 11,528 0.0
400 Maruwa Co., Ltd./Aichi 18,953 0.02,600 Maxell Holdings, Ltd. 36,939 0.01,000 Megachips Corp. 15,395 0.0
600 Melco Holdings, Inc. 20,736 0.02,300 Micronics Japan Co. Ltd. 15,324 0.01,400 Mimasu Semiconductor Industry Co., Ltd. 18,694 0.01,200 Miroku Jyoho Service Co. Ltd. 30,872 0.0
400 Mitsubishi Research Institute, Inc. 12,110 0.01,600 Mitsui High-Tec, Inc. 14,666 0.0
600 m-up, Inc. 14,747 0.034,965 Murata Manufacturing Co., Ltd. 1,749,823 0.8
1,600 Nagano Keiki Co., Ltd. 11,646 0.014,300 NEC Corp. 484,665 0.2
1,300 NEC Networks & System Integration Corp. 31,454 0.04,100 Net One systems Co., Ltd. 103,681 0.13,800 Nichicon Corp. 34,893 0.02,000 (1) Nihon Dempa Kogyo Co., Ltd. 7,170 0.03,300 Nihon Unisys Ltd. 87,611 0.11,400 Nippon Ceramic Co., Ltd. 37,611 0.01,000 Nippon Chemi-Con Corp. 17,274 0.04,900 Nippon Electric Glass Co., Ltd. 130,189 0.13,800 Nippon Signal Company Ltd. 34,083 0.02,400 Nissha Co., Ltd. 25,445 0.01,400 Nohmi Bosai Ltd. 22,922 0.07,032 Nomura Research Institute Ltd. 320,305 0.21,100 Noritsu Koki Co., Ltd. 24,568 0.01,800 NS Solutions Corp. 48,675 0.02,150 NSD CO., Ltd. 50,094 0.0
29,100 NTT Data Corp. 321,721 0.2
Copyright © 2021 www.secdatabase.com. All Rights Reserved.Please Consider the Environment Before Printing This Document

Voya Japan TOPIX Index® PortfolioPORTFOLIO OF INVESTMENTS
as of March 31, 2019 (Unaudited) (Continued)
Shares ValuePercentage
of NetAssets
COMMON STOCK: (continued)Information Technology: (continued)
1,200 OBIC Business Consultants Co., Ltd. $ 49,409 0.03,800 Obic Co., Ltd. 384,274 0.2
500 Ohara, Inc. 5,746 0.04,800 Oki Electric Industry Ltd. 56,832 0.0
11,900 Omron Corp. 559,076 0.32,000 Optex Group Co., Ltd. 31,964 0.01,200 Optorun Co. Ltd. 23,326 0.02,200 Oracle Corp. Japan 147,947 0.13,200 Osaki Electric Co., Ltd. 19,960 0.05,900 Otsuka Corp. 220,733 0.11,800 Poletowin Pitcrew Holdings, Inc. 18,072 0.0
12,300 (1) Renesas Electronics Corp. 57,160 0.033,700 (2) Ricoh Co., Ltd. 352,916 0.2
800 Riken Keiki Co. Ltd. 15,440 0.01,100 Riso Kagaku Corp. 17,426 0.05,400 Rohm Co., Ltd. 338,337 0.21,000 Roland DG Corp. 21,069 0.0
600 Rorze Corp. 9,031 0.01,400 Ryosan Co., Ltd. 37,608 0.01,500 Ryoyo Electro Corp. 21,944 0.02,000 Sakura Internet, Inc. 8,964 0.01,400 Sanken Electric Co., Ltd. 26,074 0.01,400 Sanshin Electronics Co., Ltd. 23,996 0.01,400 Satori Electric Co., Ltd. 11,907 0.0
700 Saxa Holdings, Inc. 10,850 0.02,000 Screen Holdings Co. Ltd. 80,905 0.12,744 SCSK Corp. 122,522 0.1
13,600 (2) Seiko Epson Corp. 208,624 0.1200 Shibaura Mechatronics Corp. 6,205 0.0
14,200 Shimadzu Corp. 412,153 0.2500 Shindengen Electric Manufacturing Co., Ltd. 18,498 0.0
1,500 (1) Shinkawa Ltd. 5,654 0.04,800 Shinko Electric Industries 36,890 0.01,400 Shinko Shoji Co., Ltd. 23,790 0.01,600 Siix Corp. 24,297 0.0
400 SMK Corp. 9,478 0.0600 Softbank Technology Corp. 12,974 0.0
4,200 (2) Sourcenext Corp. 17,223 0.0900 SRA Holdings 20,074 0.0
11,600 Sumco Corp. 129,760 0.11,300 Sumida Corp. 18,415 0.03,600 Systena Corp. 39,255 0.01,040 Tachibana Eletech Co., Ltd. 15,644 0.05,300 (2) Taiyo Yuden Co., Ltd. 104,889 0.1
800 Takachiho Koheki Co. Ltd. 6,844 0.05,200 Tamura Corp. 28,822 0.0
Copyright © 2021 www.secdatabase.com. All Rights Reserved.Please Consider the Environment Before Printing This Document

1,300 TDC Software Engineering, Inc. 10,322 0.05,800 TDK Corp. 456,484 0.2
700 TechMatrix Corp. 11,737 0.03,800 TIS, Inc. 180,312 0.11,000 TKC Corp. 36,610 0.07,400 Tokyo Electron Ltd. 1,073,432 0.52,200 Tokyo Seimitsu Co., Ltd. 56,165 0.06,100 Topcon Corp. 72,242 0.01,200 Toshiba Tec Corp. 33,379 0.0
400 Toukei Computer Co., Ltd. 10,950 0.01,100 Towa Corp. 6,741 0.03,100 Toyo Corp./Chuo-ku 24,526 0.01,200 (1) Transcosmos, Inc. 23,444 0.05,900 Trend Micro, Inc. 287,747 0.11,500 UKC Holdings Corp. 27,809 0.02,100 Ulvac, Inc. 61,035 0.0
600 UMC Electronics Co. Ltd. 8,634 0.0500 Uniden Holdings Corp. 10,077 0.0300 V Technology Co. Ltd. 38,175 0.0
9,300 Wacom Co., Ltd. 39,287 0.01,100 Yamaichi Electronics Co., Ltd. 10,872 0.0
13,000 Yaskawa Electric Corp. 410,456 0.211,200 Yokogawa Electric Corp. 232,576 0.1
600 Yokowo Co., Ltd. 8,788 0.024,718,644 10.5
Materials: 6.3%1,300 Achilles Corp. 22,438 0.04,800 ADEKA Corp. 70,557 0.0
600 Agro-Kanesho Co. Ltd. 12,647 0.0600 Aichi Steel Corp. 18,661 0.0
9,100 Air Water, Inc. 132,173 0.11,900 Asahi Holdings, Inc. 34,396 0.0
77,200 Asahi Kasei Corp. 799,502 0.4800 Asahi Yukizia Corp. 11,808 0.0
2,700 Asia Pile Holdings Corp. 14,816 0.01,800 Carlit Holdings Co. Ltd. 12,687 0.0
800 Chuetsu Pulp & Paper Co., Ltd. 10,050 0.03,700 (2) Chugoku Marine Paints Ltd. 33,188 0.03,200 CI Takiron Corp. 17,376 0.02,000 Dai Nippon Toryo Co., Ltd. 20,020 0.0
16,000 Daicel Corp. 174,255 0.12,000 Daido Steel Co., Ltd. 79,167 0.0
600 DKS Co. Ltd. 18,897 0.01,100 Daiken Corp. 21,445 0.03,000 Daiki Aluminium Industry Co., Ltd. 18,047 0.01,000 Dainichiseika Color & Chemicals Manufacturing Co., Ltd. 27,362 0.04,700 Daio Paper Corp. 57,723 0.04,300 Denka Co., Ltd. 124,430 0.15,000 DIC Corp. 146,497 0.12,700 Dowa Holdings Co., Ltd. 88,909 0.11,000 FP Corp. 59,151 0.02,500 Fuji Seal International, Inc. 90,569 0.12,000 Fujikura Kasei Co., Ltd. 10,759 0.01,100 Fujimi, Inc. 24,142 0.0
Copyright © 2021 www.secdatabase.com. All Rights Reserved.Please Consider the Environment Before Printing This Document

1,000 Fujimori Kogyo Co., Ltd. 27,549 0.0
Copyright © 2021 www.secdatabase.com. All Rights Reserved.Please Consider the Environment Before Printing This Document
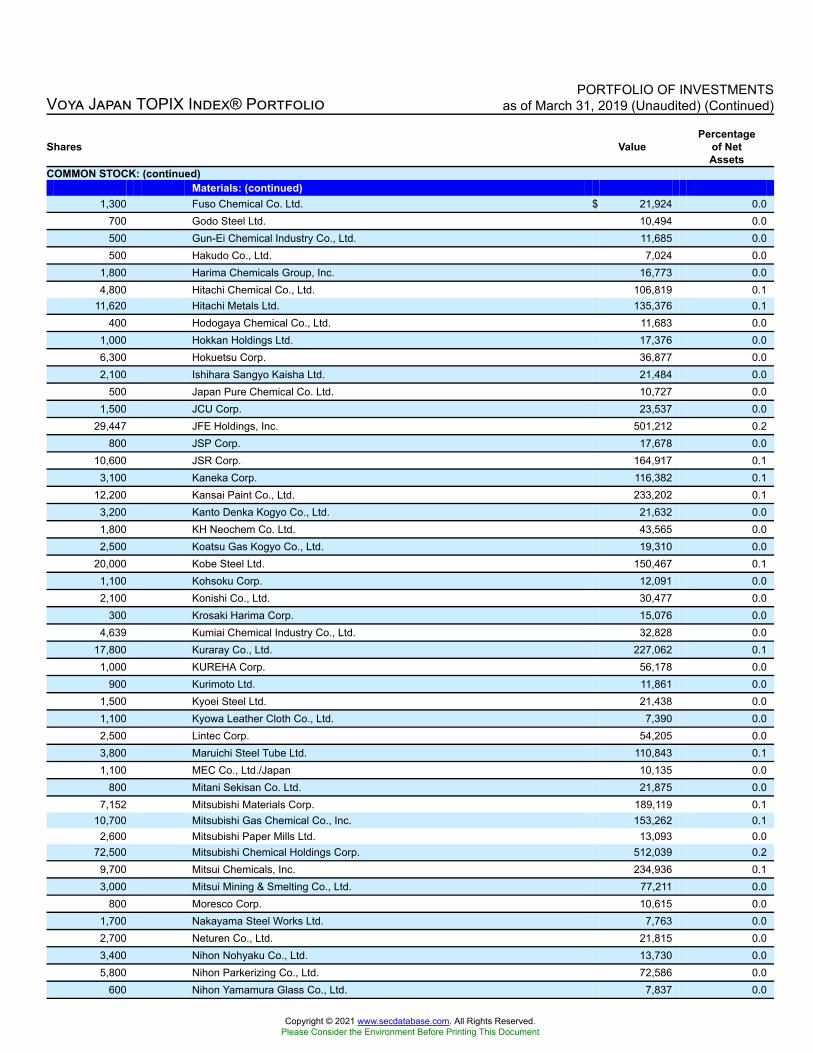
Voya Japan TOPIX Index® PortfolioPORTFOLIO OF INVESTMENTS
as of March 31, 2019 (Unaudited) (Continued)
Shares ValuePercentage
of NetAssets
COMMON STOCK: (continued)Materials: (continued)
1,300 Fuso Chemical Co. Ltd. $ 21,924 0.0700 Godo Steel Ltd. 10,494 0.0500 Gun-Ei Chemical Industry Co., Ltd. 11,685 0.0500 Hakudo Co., Ltd. 7,024 0.0
1,800 Harima Chemicals Group, Inc. 16,773 0.04,800 Hitachi Chemical Co., Ltd. 106,819 0.1
11,620 Hitachi Metals Ltd. 135,376 0.1400 Hodogaya Chemical Co., Ltd. 11,683 0.0
1,000 Hokkan Holdings Ltd. 17,376 0.06,300 Hokuetsu Corp. 36,877 0.02,100 Ishihara Sangyo Kaisha Ltd. 21,484 0.0
500 Japan Pure Chemical Co. Ltd. 10,727 0.01,500 JCU Corp. 23,537 0.0
29,447 JFE Holdings, Inc. 501,212 0.2800 JSP Corp. 17,678 0.0
10,600 JSR Corp. 164,917 0.13,100 Kaneka Corp. 116,382 0.1
12,200 Kansai Paint Co., Ltd. 233,202 0.13,200 Kanto Denka Kogyo Co., Ltd. 21,632 0.01,800 KH Neochem Co. Ltd. 43,565 0.02,500 Koatsu Gas Kogyo Co., Ltd. 19,310 0.0
20,000 Kobe Steel Ltd. 150,467 0.11,100 Kohsoku Corp. 12,091 0.02,100 Konishi Co., Ltd. 30,477 0.0
300 Krosaki Harima Corp. 15,076 0.04,639 Kumiai Chemical Industry Co., Ltd. 32,828 0.0
17,800 Kuraray Co., Ltd. 227,062 0.11,000 KUREHA Corp. 56,178 0.0
900 Kurimoto Ltd. 11,861 0.01,500 Kyoei Steel Ltd. 21,438 0.01,100 Kyowa Leather Cloth Co., Ltd. 7,390 0.02,500 Lintec Corp. 54,205 0.03,800 Maruichi Steel Tube Ltd. 110,843 0.11,100 MEC Co., Ltd./Japan 10,135 0.0
800 Mitani Sekisan Co. Ltd. 21,875 0.07,152 Mitsubishi Materials Corp. 189,119 0.1
10,700 Mitsubishi Gas Chemical Co., Inc. 153,262 0.12,600 Mitsubishi Paper Mills Ltd. 13,093 0.0
72,500 Mitsubishi Chemical Holdings Corp. 512,039 0.29,700 Mitsui Chemicals, Inc. 234,936 0.13,000 Mitsui Mining & Smelting Co., Ltd. 77,211 0.0
800 Moresco Corp. 10,615 0.01,700 Nakayama Steel Works Ltd. 7,763 0.02,700 Neturen Co., Ltd. 21,815 0.03,400 Nihon Nohyaku Co., Ltd. 13,730 0.05,800 Nihon Parkerizing Co., Ltd. 72,586 0.0
600 Nihon Yamamura Glass Co., Ltd. 7,837 0.0
Copyright © 2021 www.secdatabase.com. All Rights Reserved.Please Consider the Environment Before Printing This Document

600 Nippon Carbide Industries Co., Inc. 8,155 0.0400 Nippon Chemical Industrial Co., Ltd. 7,107 0.0
2,600 Nippon Concrete Industries Co., Ltd. 6,379 0.08,400 Nippon Denko Co., Ltd. 17,047 0.01,700 Nippon Fine Chemical Co., Ltd. 18,525 0.07,100 (2) Nippon Kayaku Co., Ltd. 84,052 0.1
500 Nippon Kinzoku Co., Ltd. 5,476 0.032,300 Nippon Light Metal Holdings Co. Ltd. 71,075 0.0
8,900 Nippon Paint Holdings Co., Ltd. 351,319 0.25,229 Nippon Paper Industries Co. Ltd. 108,025 0.11,400 Nippon Pillar Packing Co., Ltd. 16,197 0.01,800 Nippon Shokubai Co., Ltd. 117,745 0.11,600 Nippon Soda Co., Ltd. 42,351 0.0
50,148 Nippon Steel & Sumitomo Metal Corp. 887,651 0.41,200 Valqua Ltd. 24,060 0.0
11,500 (2) Nippon Yakin Kogyo Co., Ltd. 26,214 0.06,700 Nissan Chemical Corp. 307,784 0.1
400 Nittetsu Mining Co., Ltd. 16,559 0.08,400 Nitto Denko Corp. 442,757 0.24,200 NOF Corp. 143,349 0.1
48,600 Oji Holdings Corp. 302,431 0.1800 Okamoto Industries, Inc. 40,443 0.0800 Okura Industrial Co., Ltd. 12,886 0.0800 Osaka Steel Co., Ltd. 13,566 0.0
1,200 Osaka Soda Co., Ltd. 29,475 0.01,000 OSAKA Titanium Technologies Co., Ltd. 15,280 0.0
700 Pacific Metals Co., Ltd. 17,088 0.0800 Pack Corp. 24,591 0.0800 Rasa Industries Ltd. 10,666 0.0
11,400 Rengo Co., Ltd. 107,088 0.13,000 Riken Technos Corp. 12,307 0.01,000 Sakai Chemical Industry Co. Ltd. 22,019 0.02,500 Sakata INX Corp. 23,106 0.0
700 Sanyo Chemical Industries Ltd. 32,458 0.01,300 Sanyo Special Steel Co., Ltd. 26,700 0.01,100 (2) Seiko PMC Corp. 8,072 0.01,800 Sekisui Plastics Co., Ltd. 14,475 0.02,000 Shikoku Chemicals Corp. 21,896 0.0
400 Shinagawa Refractories Co., Ltd. 11,369 0.0
Copyright © 2021 www.secdatabase.com. All Rights Reserved.Please Consider the Environment Before Printing This Document

Voya Japan TOPIX Index® PortfolioPORTFOLIO OF INVESTMENTS
as of March 31, 2019 (Unaudited) (Continued)
Shares ValuePercentage
of NetAssets
COMMON STOCK: (continued)Materials: (continued)
19,200 Shin-Etsu Chemical Co., Ltd. $ 1,615,659 0.72,600 Shin-Etsu Polymer Co., Ltd. 19,258 0.07,200 Showa Denko KK 254,505 0.1
700 Stella Chemifa Corp. 19,284 0.02,000 Sumitomo Bakelite Co., Ltd. 71,814 0.0
84,900 Sumitomo Chemical Co., Ltd. 396,339 0.215,000 Sumitomo Metal Mining Co., Ltd. 444,477 0.2
2,100 Sumitomo Osaka Cement Co., Ltd. 82,785 0.1600 Sumitomo Seika Chemicals Co., Ltd. 22,114 0.0
1,300 T Hasegawa Co., Ltd. 20,996 0.06,912 Taiheiyo Cement Corp. 230,853 0.1
800 Taisei Lamick Co., Ltd. 19,961 0.0900 Taiyo Ink Manufacturing Co., Ltd. 29,714 0.0
8,900 Taiyo Nippon Sanso Corp. 135,892 0.1700 Takasago International Corp. 21,193 0.0200 Taki Chemical Co., Ltd. 11,053 0.0800 Tayca Corp. 18,459 0.0
8,200 Teijin Ltd. 135,595 0.11,100 Tenma Corp. 20,565 0.06,600 Toagosei Co., Ltd. 69,918 0.0
400 Toda Kogyo Corp. 8,039 0.02,600 Toho Titanium Co., Ltd. 22,385 0.0
700 Toho Zinc Co., Ltd. 19,841 0.010,300 (2) Tokai Carbon Co., Ltd. 129,160 0.1
700 Tokushu Tokai Holdings Co., Ltd. 25,638 0.02,900 Tokuyama Corp. 68,643 0.02,100 Tokyo Ohka Kogyo Co., Ltd. 57,503 0.01,100 Tokyo Rope Manufacturing Co., Ltd. 9,727 0.06,300 Tokyo Steel Manufacturing Co., Ltd. 54,821 0.01,000 Tokyo Tekko Co., Ltd. 11,263 0.0
600 Tomoegawa Co., Ltd. 5,409 0.0900 Tomoku Co., Ltd. 13,398 0.0
1,000 Topy Industries Ltd. 20,045 0.084,000 Toray Industries, Inc. 536,036 0.216,900 Tosoh Corp. 263,694 0.1
2,200 Toyo Ink SC Holdings Co., Ltd. 49,499 0.06,800 Toyo Seikan Group Holdings, Ltd. 139,492 0.14,600 Toyobo Co., Ltd. 58,893 0.01,400 TYK Corp. 4,631 0.01,733 (2) UACJ Corp. 32,553 0.05,200 Ube Industries Ltd. 107,219 0.11,000 Wood One Co., Ltd. 9,396 0.01,800 (2) W-Scope Corp. 25,308 0.02,400 Yamato Kogyo Co., Ltd. 65,638 0.01,800 Yodogawa Steel Works Ltd. 33,500 0.01,100 Yushiro Chemical Industry Co., Ltd. 12,733 0.0
Copyright © 2021 www.secdatabase.com. All Rights Reserved.Please Consider the Environment Before Printing This Document

9,800 Zeon Corp. 99,640 0.114,777,111 6.3
Real Estate: 3.0%5,370 Aeon Mall Co., Ltd. 88,382 0.01,800 Airport Facilities Co., Ltd. 9,000 0.03,200 Daibiru Corp. 30,424 0.04,500 Daito Trust Construction Co., Ltd. 627,831 0.3
34,560 Daiwa House Industry Co., Ltd. 1,100,654 0.51,120 Goldcrest Co., Ltd. 15,142 0.02,400 Heiwa Real Estate Co., Ltd. 46,293 0.0
23,300 Hulic Co. Ltd. 228,944 0.113,100 Ichigo, Inc. 44,933 0.0
1,300 Katitas Co. Ltd. 44,761 0.02,600 Keihanshin Building Co. Ltd. 25,421 0.0
10,500 Kenedix, Inc. 52,647 0.013,900 (1),(2) Leopalace21 Corp. 27,811 0.077,500 Mitsubishi Estate Co., Ltd. 1,406,232 0.658,200 Mitsui Fudosan Co., Ltd. 1,466,148 0.6
7,200 Nomura Real Estate Holdings, Inc. 138,549 0.11,900 Open House Co. Ltd. 65,390 0.05,800 Relo Holdings, Inc. 163,378 0.11,400 SAMTY Co. Ltd. 18,996 0.0
25,000 Sumitomo Realty & Development Co., Ltd. 1,037,259 0.51,800 Sun Frontier Fudousan Co., Ltd. 19,306 0.06,000 Takara Leben Co., Ltd. 18,669 0.02,200 (2) Tateru, Inc. 5,324 0.03,900 TOC Co., Ltd. 26,997 0.0
300 Tokyo Rakutenchi Co., Ltd. 13,395 0.012,400 Tokyo Tatemono Co., Ltd. 152,324 0.1
700 Tokyo Theatres Co., Inc. 8,294 0.027,096 Tokyu Fudosan Holdings Corp. 162,375 0.1
1,800 Tosei Corp. 16,312 0.01,500 Unizo Holdings Co. Ltd. 28,650 0.0
7,089,841 3.0
Utilities: 1.9%33,900 Chubu Electric Power Co., Inc. 529,963 0.215,100 (2) Chugoku Electric Power Co., Inc. 188,487 0.1
8,700 Electric Power Development Co., Ltd. 212,153 0.1
Copyright © 2021 www.secdatabase.com. All Rights Reserved.Please Consider the Environment Before Printing This Document

Voya Japan TOPIX Index® PortfolioPORTFOLIO OF INVESTMENTS
as of March 31, 2019 (Unaudited) (Continued)
Shares ValuePercentage
of NetAssets
COMMON STOCK: (continued)Utilities: (continued)
1,900 eRex Co. Ltd. $ 17,793 0.010,200 Hokkaido Electric Power Co., Inc. 58,715 0.0
400 Hokkaido Gas Co., Ltd. 5,202 0.011,200 (1) Hokuriku Electric Power Co. 87,943 0.0
800 K&O Energy Group, Inc. 11,009 0.045,600 Kansai Electric Power Co., Inc. 672,468 0.323,300 Kyushu Electric Power Co., Inc. 275,214 0.1
1,700 Nippon Gas Co., Ltd. 47,099 0.01,921 Okinawa Electric Power Co., Inc. 32,714 0.0
21,500 Osaka Gas Co., Ltd. 425,079 0.21,400 (1) RENOVA, Inc. 12,464 0.01,600 Saibu Gas Co., Ltd. 34,564 0.0
10,100 Shikoku Electric Power Co., Inc. 123,201 0.13,500 Shizuoka Gas Co., Ltd. 26,637 0.05,600 Toho Gas Co., Ltd. 251,845 0.1
26,000 Tohoku Electric Power Co., Inc. 331,982 0.287,200 (1) Tokyo Electric Power Co., Inc. 551,637 0.222,200 Tokyo Gas Co., Ltd. 600,948 0.3
4,497,117 1.9
Total Common Stock(Cost $182,797,816) 229,908,629 98.0
PrincipalAmount† Value
Percentageof NetAssets
SHORT-TERM INVESTMENTS: 7.3%Securities Lending Collateral(3): 6.5%
764,324 Bank of Montreal, Repurchase Agreement dated 03/29/19, 2.58%, due 04/01/19(Repurchase Amount $764,486, collateralized by various U.S. GovernmentSecurities, 0.000%-3.750%, Market Value plus accrued interest $779,611, due 04/25/19-08/15/48)
764,324 0.3
3,635,573 Bank of Nova Scotia, Repurchase Agreement dated 03/29/19, 2.67%, due 04/01/19(Repurchase Amount $3,636,371, collateralized by various U.S. GovernmentAgency Obligations, 3.500%-4.571%, Market Value plus accrued interest$3,709,110, due 12/01/33-02/01/49)
3,635,573 1.6
3,635,573 Citigroup, Inc., Repurchase Agreement dated 03/29/19, 2.65%, due 04/01/19(Repurchase Amount $3,636,365, collateralized by various U.S. Government/U.S.Government Agency Obligations, 0.000%-10.500%, Market Value plus accruedinterest $3,708,284, due 04/02/19-10/20/68)
3,635,573 1.5
3,635,573 Guggenheim Securities LLC, Repurchase Agreement dated 03/29/19, 2.65%, due04/01/19 (Repurchase Amount $3,636,365, collateralized by various U.S.Government/U.S. Government Agency Obligations, 2.302%-5.458%, Market Valueplus accrued interest $3,708,284, due 01/01/27-05/20/68)
3,635,573 1.6
3,635,573 Jefferies LLC, Repurchase Agreement dated 03/29/19, 2.67%, due 04/01/19(Repurchase Amount $3,636,371, collateralized by various U.S. GovernmentAgency Obligations, 0.000%-6.625%, Market Value plus accrued interest$3,708,312, due 04/03/19-07/15/36)
3,635,573 1.5
15,306,616 6.5
Shares ValuePercentage
of NetAssets
Mutual Funds: 0.8%
Copyright © 2021 www.secdatabase.com. All Rights Reserved.Please Consider the Environment Before Printing This Document

1,810,000 (4) Goldman Sachs Financial Square Government Fund - Institutional Shares, 2.350%(Cost $1,810,000) 1,810,000 0.8
Total Short-Term Investments(Cost $17,116,616) 17,116,616 7.3
Total Investments in Securities(Cost $199,914,432) $ 247,025,245 105.3
Liabilities in Excess of Other Assets (12,449,956) (5.3)Net Assets $ 234,575,289 100.0
Copyright © 2021 www.secdatabase.com. All Rights Reserved.Please Consider the Environment Before Printing This Document

Voya Japan TOPIX Index® PortfolioPORTFOLIO OF INVESTMENTS
as of March 31, 2019 (Unaudited) (Continued)
† Unless otherwise indicated, principal amount is shown in USD.(1) Non-income producing security.(2) Security, or a portion of the security, is on loan.(3) Represents securities purchased with cash collateral received for securities on loan.(4) Rate shown is the 7-day yield as of March 31, 2019.
Fair Value MeasurementsThe following is a summary of the fair valuations according to the inputs used as of March 31, 2019 in valuing the assets and liabilities:
Quoted Pricesin Active Markets
for IdenticalInvestments
(Level 1)
SignificantOther
ObservableInputs#(Level 2)
SignificantUnobservable
Inputs(Level 3)
Fair Valueat
March 31, 2019
Asset TableInvestments, at fair valueCommon Stock
Communication Services $ – $ 18,462,198 $ – $ 18,462,198Consumer Discretionary 35,771 39,685,890 – 39,721,661Consumer Staples 11,793 21,570,071 – 21,581,864Energy – 2,212,442 – 2,212,442Financials – 24,456,771 – 24,456,771Health Care – 20,264,454 – 20,264,454Industrials 17,374 52,109,152 – 52,126,526Information Technology – 24,718,644 – 24,718,644Materials – 14,777,111 – 14,777,111Real Estate – 7,089,841 – 7,089,841Utilities – 4,497,117 – 4,497,117
Total Common Stock 64,938 229,843,691 – 229,908,629Short-Term Investments 1,810,000 15,306,616 – 17,116,616Total Investments, at fair value $ 1,874,938 $ 245,150,307 $ – $ 247,025,245Other Financial Instruments+Forward Foreign Currency Contracts – 21,455 – 21,455Total Assets $ 1,874,938 $ 245,171,762 $ – $ 247,046,700Liabilities TableOther Financial Instruments+Forward Foreign Currency Contracts $ – $ (2,102) $ – $ (2,102)Futures (5,196) – – (5,196)Total Liabilities $ (5,196) $ (2,102) $ – $ (7,298)
+Other Financial Instruments may include open forward foreign currency contracts, futures, centrally cleared swaps, OTC swaps and writtenoptions. Forward foreign currency contracts, futures and centrally cleared swaps are valued at the unrealized gain (loss) on the instrument. OTCswaps and written options are valued at the fair value of the instrument.
#
The earlier close of the foreign markets gives rise to the possibility that significant events, including broad market moves, may have occurred inthe interim and may materially affect the value of those securities. To account for this, the Portfolio may frequently value many of its foreign equitysecurities using fair value prices based on third party vendor modeling tools to the extent available. Accordingly, a portion of the Portfolio'sinvestments are categorized as Level 2 investments.
At March 31, 2019, the following forward foreign currency contracts were outstanding for Voya Japan TOPIX Index® Portfolio:
Currency Purchased Currency Sold Counterparty Settlement DateUnrealized
Appreciation(Depreciation)
USD 588,068 JPY 65,000,000 Bank of America N.A. 06/19/19 $ (2,048)JPY 432,000,000 USD 3,901,928 The Bank of New York Mellon 06/19/19 20,079USD 517,434 JPY 57,000,000 The Bank of New York Mellon 06/19/19 (54)USD 482,548 JPY 53,000,000 The Bank of New York Mellon 06/19/19 1,376
$ 19,353
Copyright © 2021 www.secdatabase.com. All Rights Reserved.Please Consider the Environment Before Printing This Document

Voya Japan TOPIX Index® PortfolioPORTFOLIO OF INVESTMENTS
as of March 31, 2019 (Unaudited) (Continued)
At March 31, 2019, the following futures contracts were outstanding for Voya Japan TOPIX Index® Portfolio:
Description Numberof Contracts
ExpirationDate
NotionalValue
UnrealizedAppreciation/(Depreciation)
Long Contracts:Tokyo Price Index (TOPIX) 33 06/13/19 $ 4,740,233 $ (5,196)
$ 4,740,233 $ (5,196)
Currency AbbreviationsJPY - Japanese YenUSD - United States Dollar
At March 31, 2019, the aggregate cost of securities and other investments and the composition of unrealized appreciation and depreciation of securitiesand other investments at period end were:
Cost for federal income tax purposes was $205,732,590.
Net unrealized appreciation consisted of:
Gross Unrealized Appreciation $ 54,943,185Gross Unrealized Depreciation (13,301,183)
Net Unrealized Appreciation $ 41,642,002
Copyright © 2021 www.secdatabase.com. All Rights Reserved.Please Consider the Environment Before Printing This Document

Voya Russell™ Large Cap Growth Index PortfolioPORTFOLIO OF INVESTMENTSas of March 31, 2019 (Unaudited)
Shares ValuePercentage
of NetAssets
COMMON STOCK: 98.6%Communication Services: 14.2%
54,083 Activision Blizzard, Inc. $ 2,462,399 0.320,787 (1) Alphabet, Inc. - Class A 24,464,012 3.321,116 (1) Alphabet, Inc. - Class C 24,775,614 3.38,599 (1) Charter Communications, Inc. 2,983,079 0.4
21,296 (1) Electronic Arts, Inc. 2,164,313 0.3170,847 (1) Facebook, Inc. - Class A 28,478,486 3.9
29,934 (1) Netflix, Inc. 10,673,267 1.414,449 (1) T-Mobile US, Inc. 998,426 0.176,692 Walt Disney Co. 8,515,113 1.2
105,514,709 14.2
Consumer Discretionary: 14.3%28,028 (1) Amazon.com, Inc. 49,910,861 6.7
3,323 (1) Booking Holdings, Inc. 5,798,336 0.813,413 eBay, Inc. 498,159 0.1
3,337 (1) Garrett Motion, Inc. 49,154 0.081,141 Home Depot, Inc. 15,570,146 2.115,722 Las Vegas Sands Corp. 958,413 0.157,702 Lowe's Cos, Inc. 6,316,638 0.920,303 Marriott International, Inc. 2,539,702 0.310,861 McDonald's Corp. 2,062,504 0.388,457 Nike, Inc. 7,448,964 1.086,763 Starbucks Corp. 6,449,961 0.9
9,838 (1),(2) Tesla, Inc. 2,753,263 0.488,912 TJX Cos., Inc. 4,731,008 0.6
6,421 Yum! Brands, Inc. 640,880 0.1105,727,989 14.3
Consumer Staples: 6.5%136,024 Altria Group, Inc. 7,811,858 1.1213,260 Coca-Cola Co. 9,993,364 1.3
11,425 Colgate-Palmolive Co. 783,070 0.111,179 Constellation Brands, Inc. 1,960,014 0.331,387 Costco Wholesale Corp. 7,600,048 1.015,357 Estee Lauder Cos., Inc. 2,542,352 0.3
2,178 General Mills, Inc. 112,712 0.021,458 Kimberly-Clark Corp. 2,658,646 0.428,752 (1) Monster Beverage Corp. 1,569,284 0.290,275 PepsiCo, Inc. 11,063,201 1.533,707 Sysco Corp. 2,250,279 0.3
48,344,828 6.5
Energy: 0.5%12,205 Anadarko Petroleum Corp. 555,083 0.1
4,708 EOG Resources, Inc. 448,108 0.1
Copyright © 2021 www.secdatabase.com. All Rights Reserved.Please Consider the Environment Before Printing This Document

62,908 Halliburton Co. 1,843,204 0.26,722 Pioneer Natural Resources Co. 1,023,626 0.1
3,870,021 0.5
Financials: 3.6%9,231 American International Group, Inc. 397,487 0.1
34,185 American Express Co. 3,736,420 0.517,255 Aon PLC 2,945,429 0.417,537 (1) Berkshire Hathaway, Inc. – Class B 3,523,008 0.5
2,645 Capital One Financial Corp. 216,070 0.086,282 Charles Schwab Corp. 3,689,418 0.5
2,982 CME Group, Inc. 490,778 0.120,923 Intercontinental Exchange, Inc. 1,593,077 0.217,070 Marsh & McLennan Cos., Inc. 1,602,873 0.241,628 Progressive Corp. 3,000,963 0.417,837 S&P Global, Inc. 3,755,580 0.5
1,704 State Street Corp. 112,140 0.019,991 TD Ameritrade Holding Corp. 999,350 0.1
3,718 Travelers Cos., Inc. 509,961 0.126,572,554 3.6
Health Care: 12.7%108,868 AbbVie, Inc. 8,773,672 1.2
12,796 (1) Alexion Pharmaceuticals, Inc. 1,729,763 0.242,606 Amgen, Inc. 8,094,288 1.1
4,037 Baxter International, Inc. 328,249 0.01,737 Becton Dickinson & Co. 433,781 0.1
13,380 (1) Biogen, Inc. 3,162,764 0.476,100 (1) Boston Scientific Corp. 2,920,718 0.462,506 Bristol-Myers Squibb Co. 2,982,161 0.450,406 (1) Celgene Corp. 4,755,302 0.6
7,585 Cigna Corp. 1,219,820 0.27,036 CVS Health Corp. 379,452 0.1
38,978 Eli Lilly & Co. 5,057,785 0.768,300 Gilead Sciences, Inc. 4,440,183 0.614,022 HCA Healthcare, Inc. 1,828,188 0.2
9,232 Humana, Inc. 2,455,712 0.310,534 (1) Illumina, Inc. 3,272,808 0.4
8,097 (1) Intuitive Surgical, Inc. 4,619,986 0.634,720 Johnson & Johnson 4,853,509 0.7
1,743 McKesson Corp. 204,036 0.012,572 Merck & Co., Inc. 1,045,613 0.1
5,740 (1) Regeneron Pharmaceuticals, Inc. 2,356,959 0.324,531 Stryker Corp. 4,845,363 0.7
1,705 Thermo Fisher Scientific, Inc. 466,693 0.168,674 UnitedHealth Group, Inc. 16,980,333 2.318,316 (1) Vertex Pharmaceuticals, Inc. 3,369,228 0.534,786 Zoetis, Inc. 3,501,907 0.5
94,078,273 12.7
Industrials: 10.5%33,558 3M Co. 6,972,681 0.938,469 Boeing Co. 14,672,846 2.037,824 Caterpillar, Inc. 5,124,774 0.726,139 CSX Corp. 1,955,720 0.3
Copyright © 2021 www.secdatabase.com. All Rights Reserved.Please Consider the Environment Before Printing This Document

22,962 Deere & Co. 3,670,246 0.511,502 Delta Air Lines, Inc. 594,078 0.131,212 Emerson Electric Co. 2,137,086 0.3
Copyright © 2021 www.secdatabase.com. All Rights Reserved.Please Consider the Environment Before Printing This Document

Voya Russell™ Large Cap Growth Index PortfolioPORTFOLIO OF INVESTMENTS
as of March 31, 2019 (Unaudited) (Continued)
Shares ValuePercentage
of NetAssets
COMMON STOCK: (continued)Industrials: (continued)
17,528 FedEx Corp. $ 3,179,755 0.48,141 General Dynamics Corp. 1,378,109 0.2
32,457 Honeywell International, Inc. 5,158,066 0.723,744 Illinois Tool Works, Inc. 3,407,976 0.516,101 Lockheed Martin Corp. 4,832,876 0.611,308 Northrop Grumman Corp. 3,048,637 0.420,627 Raytheon Co. 3,755,764 0.5
5,562 (1) Resideo Technologies, Inc. 107,291 0.025,894 Southwest Airlines Co. 1,344,158 0.247,745 Union Pacific Corp. 7,982,964 1.149,610 United Parcel Service, Inc. - Class B 5,543,421 0.725,955 Waste Management, Inc. 2,696,984 0.4
77,563,432 10.5
Information Technology: 32.6%46,191 Accenture PLC 8,130,540 1.135,316 (1) Adobe, Inc. 9,411,361 1.3
341,219 Apple, Inc. 64,814,549 8.768,466 Applied Materials, Inc. 2,715,362 0.431,288 Automatic Data Processing, Inc. 4,997,945 0.717,457 Broadcom, Inc. 5,249,494 0.737,231 Cognizant Technology Solutions Corp. 2,697,386 0.447,456 International Business Machines Corp. 6,696,042 0.917,573 Intuit, Inc. 4,593,758 0.665,286 Mastercard, Inc. - Class A 15,371,589 2.162,915 (1) Micron Technology, Inc. 2,600,277 0.3
514,962 Microsoft Corp. 60,734,618 8.241,814 Nvidia Corp. 7,508,122 1.0
1,314 NXP Semiconductor NV - NXPI - US 116,144 0.016,816 Oracle Corp. 903,187 0.184,324 (1) PayPal Holdings, Inc. 8,756,204 1.251,836 (1) Salesforce.com, Inc. 8,209,267 1.169,054 Texas Instruments, Inc. 7,324,558 1.0
126,546 Visa, Inc. - Class A 19,765,220 2.75,111 VMware, Inc. 922,587 0.1
241,518,210 32.6
Materials: 1.3%8,299 Ecolab, Inc. 1,465,105 0.2
23,401 (1) Linde Public Ltd. 4,116,938 0.610,568 LyondellBasell Industries NV - Class A 888,557 0.1
1,133 PPG Industries, Inc. 127,882 0.05,980 Sherwin-Williams Co. 2,575,646 0.45,932 Southern Copper Corp. 235,382 0.0
9,409,510 1.3
Real Estate: 2.4%31,501 American Tower Corp. 6,207,587 0.822,422 Crown Castle International Corp. 2,870,016 0.4
5,926 Equinix, Inc. 2,685,426 0.410,654 Public Storage, Inc. 2,320,228 0.320,313 Simon Property Group, Inc. 3,701,232 0.5
17,784,489 2.4
Total Common Stock(Cost $275,508,673) 730,384,015 98.6
Copyright © 2021 www.secdatabase.com. All Rights Reserved.Please Consider the Environment Before Printing This Document

PrincipalAmount† Value
Percentageof NetAssets
SHORT-TERM INVESTMENTS: 1.6%Securities Lending Collateral(3): 0.4%
1,000,000 Bank of Montreal, Repurchase Agreement dated 03/29/19, 2.60%, due 04/01/19(Repurchase Amount $1,000,214, collateralized by various U.S. Government/U.S.Government Agency Obligations, 0.625%-4.500%, Market Value plus accruedinterest $1,020,001, due 03/31/19-03/01/49)
1,000,000 0.2
1,000,000 Citigroup, Inc., Repurchase Agreement dated 03/29/19, 2.65%, due 04/01/19(Repurchase Amount $1,000,218, collateralized by various U.S. Government/U.S.Government Agency Obligations, 0.000%-10.500%, Market Value plus accruedinterest $1,020,000, due 04/02/19-10/20/68)
1,000,000 0.1
776,451 HSBC Securities USA, Repurchase Agreement dated 03/29/19, 2.58%, due 04/01/19 (Repurchase Amount $776,616, collateralized by various U.S. GovernmentSecurities, 0.000%-4.375%, Market Value plus accrued interest $791,980, due 08/15/20-05/15/48)
776,451 0.1
2,776,451 0.4
Copyright © 2021 www.secdatabase.com. All Rights Reserved.Please Consider the Environment Before Printing This Document

Voya Russell™ Large Cap Growth Index PortfolioPORTFOLIO OF INVESTMENTS
as of March 31, 2019 (Unaudited) (Continued)
Shares ValuePercentage
of NetAssets
Mutual Funds: 1.2%8,716,000 (4) Goldman Sachs Financial Square Government Fund - Institutional Shares, 2.350%
(Cost $8,716,000) $ 8,716,000 1.2
Total Short-Term Investments(Cost $11,492,451) 11,492,451 1.6
Total Investments in Securities(Cost $287,001,124) $ 741,876,466 100.2
Liabilities in Excess of Other Assets (1,428,588) (0.2)Net Assets $ 740,447,878 100.0
† Unless otherwise indicated, principal amount is shown in USD.(1) Non-income producing security.(2) Security, or a portion of the security, is on loan.(3) Represents securities purchased with cash collateral received for securities on loan.(4) Rate shown is the 7-day yield as of March 31, 2019.
Fair Value MeasurementsThe following is a summary of the fair valuations according to the inputs used as of March 31, 2019 in valuing the assets and liabilities:
Quoted Pricesin Active Markets
for IdenticalInvestments
(Level 1)
SignificantOther
ObservableInputs
(Level 2)
SignificantUnobservable
Inputs(Level 3)
Fair Valueat
March 31, 2019
Asset TableInvestments, at fair valueCommon Stock* $ 730,384,015 $ – $ – $ 730,384,015Short-Term Investments 8,716,000 2,776,451 – 11,492,451Total Investments, at fair value $ 739,100,015 $ 2,776,451 $ – $ 741,876,466Other Financial Instruments+Futures 214,479 – – 214,479Total Assets $ 739,314,494 $ 2,776,451 $ – $ 742,090,945
+Other Financial Instruments may include open forward foreign currency contracts, futures, centrally cleared swaps, OTC swaps and writtenoptions. Forward foreign currency contracts, futures and centrally cleared swaps are valued at the unrealized gain (loss) on theinstrument. OTC swaps and written options are valued at the fair value of the instrument.
* For further breakdown of Common Stock by sector, please refer to the Portfolio of Investments.
At March 31, 2019, the following futures contracts were outstanding for Voya Russell™ Large Cap Growth Index Portfolio:
Description Numberof Contracts
ExpirationDate
NotionalValue
UnrealizedAppreciation/(Depreciation)
Long Contracts:S&P 500® E-Mini 69 06/21/19 $ 9,790,410 $ 214,479
$ 9,790,410 $ 214,479
At March 31, 2019, the aggregate cost of securities and other investments and the composition of unrealized appreciation and depreciation of securitiesand other investments at period end were:
Cost for federal income tax purposes was $287,125,012.
Net unrealized appreciation consisted of:
Gross Unrealized Appreciation $457,691,983Gross Unrealized Depreciation (2,726,050)
Net Unrealized Appreciation $454,965,933
Copyright © 2021 www.secdatabase.com. All Rights Reserved.Please Consider the Environment Before Printing This Document

Copyright © 2021 www.secdatabase.com. All Rights Reserved.Please Consider the Environment Before Printing This Document

Voya Russell™ Large Cap Index Portfolio PORTFOLIO OF INVESTMENTSas of March 31, 2019 (Unaudited)
Shares ValuePercentage
of NetAssets
COMMON STOCK: 99.5%Communication Services: 11.8%
37,018 Activision Blizzard, Inc. $ 1,685,429 0.214,691 (1) Alphabet, Inc. - Class A 17,289,691 1.814,974 (1) Alphabet, Inc. - Class C 17,569,144 1.9
357,454 AT&T, Inc. 11,209,757 1.28,337 (1) Charter Communications, Inc. 2,892,189 0.3
220,960 Comcast Corp. – Class A 8,833,981 0.914,576 (1) Electronic Arts, Inc. 1,481,359 0.1
116,938 (1) Facebook, Inc. - Class A 19,492,395 2.117,029 (1) Fox Corp. - Class A 625,135 0.1
7,970 (1) Fox Corp. - Class B 285,964 0.020,489 (1) Netflix, Inc. 7,305,558 0.815,093 (1) T-Mobile US, Inc. 1,042,926 0.1
203,424 Verizon Communications, Inc. 12,028,461 1.385,911 Walt Disney Co. 9,538,645 1.0
111,280,634 11.8
Consumer Discretionary: 9.6%20,239 (1) Amazon.com, Inc. 36,040,599 3.8
2,275 (1) Booking Holdings, Inc. 3,969,670 0.419,647 Carnival Corp. 996,496 0.142,308 eBay, Inc. 1,571,319 0.2
191,840 Ford Motor Co. 1,684,355 0.23,719 (1) Garrett Motion, Inc. 54,781 0.0
64,385 General Motors Co. 2,388,684 0.355,538 Home Depot, Inc. 10,657,187 1.117,552 Las Vegas Sands Corp. 1,069,970 0.139,495 Lowe's Cos, Inc. 4,323,518 0.513,897 Marriott International, Inc. 1,738,376 0.238,189 McDonald's Corp. 7,252,091 0.860,545 Nike, Inc. 5,098,494 0.559,386 Starbucks Corp. 4,414,755 0.525,895 Target Corp. 2,078,333 0.2
6,734 (1),(2) Tesla, Inc. 1,884,577 0.260,857 TJX Cos., Inc. 3,238,201 0.315,051 Yum! Brands, Inc. 1,502,240 0.2
89,963,646 9.6
Consumer Staples: 7.8%93,103 Altria Group, Inc. 5,346,905 0.6
188,103 Coca-Cola Co. 8,814,507 0.941,899 Colgate-Palmolive Co. 2,871,757 0.3
7,625 Constellation Brands, Inc. 1,336,891 0.121,484 Costco Wholesale Corp. 5,202,136 0.510,511 Estee Lauder Cos., Inc. 1,740,096 0.229,133 General Mills, Inc. 1,507,633 0.216,882 Kimberly-Clark Corp. 2,091,680 0.2
Copyright © 2021 www.secdatabase.com. All Rights Reserved.Please Consider the Environment Before Printing This Document

29,622 Kraft Heinz Co. 967,158 0.170,182 Mondelez International, Inc. 3,503,485 0.419,612 (1) Monster Beverage Corp. 1,070,423 0.169,662 PepsiCo, Inc. 8,537,078 0.976,388 Philip Morris International, Inc. 6,751,935 0.7
122,491 Procter & Gamble Co. 12,745,189 1.423,071 Sysco Corp. 1,540,220 0.239,815 Walgreens Boots Alliance, Inc. 2,519,095 0.369,035 Walmart, Inc. 6,732,984 0.7
73,279,172 7.8
Energy: 5.5%24,777 Anadarko Petroleum Corp. 1,126,858 0.125,231 Baker Hughes a GE Co. 699,403 0.193,670 Chevron Corp. 11,538,271 1.256,012 ConocoPhillips 3,738,241 0.428,421 EOG Resources, Inc. 2,705,111 0.3
208,337 Exxon Mobil Corp. 16,833,630 1.842,910 Halliburton Co. 1,257,263 0.195,688 Kinder Morgan, Inc. 1,914,717 0.232,947 Marathon Petroleum Corp. 1,971,878 0.237,142 Occidental Petroleum Corp. 2,458,800 0.320,229 Phillips 66 1,925,194 0.2
8,323 Pioneer Natural Resources Co. 1,267,426 0.168,156 Schlumberger Ltd. 2,969,557 0.320,830 Valero Energy Corp. 1,767,009 0.2
52,173,358 5.5
Financials: 12.9%36,645 Aflac, Inc. 1,832,250 0.243,728 American International Group, Inc. 1,882,928 0.216,296 Allstate Corp. 1,534,757 0.234,311 American Express Co. 3,750,192 0.411,811 Aon PLC 2,016,138 0.2
443,208 Bank of America Corp. 12,228,109 1.343,671 Bank of New York Mellon Corp. 2,202,329 0.237,833 BB&T Corp. 1,760,369 0.295,265 (1) Berkshire Hathaway, Inc. – Class B 19,137,786 2.0
5,962 BlackRock, Inc. 2,547,980 0.322,902 Capital One Financial Corp. 1,870,864 0.259,057 Charles Schwab Corp. 2,525,277 0.322,540 Chubb Ltd. 3,157,403 0.3
116,537 Citigroup, Inc. 7,250,932 0.817,387 CME Group, Inc. 2,861,552 0.317,137 Goldman Sachs Group, Inc. 3,290,133 0.327,605 Intercontinental Exchange, Inc. 2,101,845 0.2
162,729 JPMorgan Chase & Co. 16,473,057 1.824,933 Marsh & McLennan Cos., Inc. 2,341,209 0.240,019 Metlife, Inc. 1,703,609 0.259,617 Morgan Stanley 2,515,837 0.322,454 PNC Financial Services Group, Inc. 2,754,208 0.328,492 Progressive Corp. 2,053,988 0.220,294 Prudential Financial, Inc. 1,864,613 0.2
Copyright © 2021 www.secdatabase.com. All Rights Reserved.Please Consider the Environment Before Printing This Document

Voya Russell™ Large Cap Index PortfolioPORTFOLIO OF INVESTMENTS
as of March 31, 2019 (Unaudited) (Continued)
Shares ValuePercentage
of NetAssets
COMMON STOCK: (continued)Financials: (continued)
12,210 S&P Global, Inc. $ 2,570,815 0.318,451 State Street Corp. 1,214,260 0.113,683 TD Ameritrade Holding Corp. 684,013 0.113,004 Travelers Cos., Inc. 1,783,629 0.274,385 US Bancorp 3,584,613 0.4
203,062 Wells Fargo & Co. 9,811,956 1.0121,306,651 12.9
Health Care: 15.7%84,131 Abbott Laboratories 6,725,432 0.774,516 AbbVie, Inc. 6,005,244 0.610,516 (1) Alexion Pharmaceuticals, Inc. 1,421,553 0.216,659 Allergan PLC 2,439,044 0.330,992 Amgen, Inc. 5,887,860 0.612,792 Anthem, Inc. 3,671,048 0.424,587 Baxter International, Inc. 1,999,169 0.213,024 Becton Dickinson & Co. 3,252,484 0.4
9,661 (1) Biogen, Inc. 2,283,667 0.267,734 (1) Boston Scientific Corp. 2,599,631 0.380,419 Bristol-Myers Squibb Co. 3,836,791 0.434,501 (1) Celgene Corp. 3,254,824 0.418,321 Cigna Corp. 2,946,383 0.363,145 CVS Health Corp. 3,405,410 0.430,867 Danaher Corp. 4,075,061 0.443,400 Eli Lilly & Co. 5,631,584 0.662,750 Gilead Sciences, Inc. 4,079,378 0.413,415 HCA Healthcare, Inc. 1,749,048 0.2
6,659 Humana, Inc. 1,771,294 0.27,211 (1) Illumina, Inc. 2,240,386 0.25,582 (1) Intuitive Surgical, Inc. 3,184,978 0.3
132,027 Johnson & Johnson 18,456,054 2.09,415 McKesson Corp. 1,102,120 0.1
66,540 Medtronic PLC 6,060,463 0.6127,987 Merck & Co., Inc. 10,644,679 1.1281,944 Pfizer, Inc. 11,974,162 1.3
3,968 (1) Regeneron Pharmaceuticals, Inc. 1,629,340 0.216,791 Stryker Corp. 3,316,558 0.419,715 Thermo Fisher Scientific, Inc. 5,396,390 0.647,005 UnitedHealth Group, Inc. 11,622,456 1.212,538 (1) Vertex Pharmaceuticals, Inc. 2,306,365 0.223,810 Zoetis, Inc. 2,396,953 0.3
147,365,809 15.7
Industrials: 8.3%27,508 3M Co. 5,715,612 0.626,331 Boeing Co. 10,043,170 1.128,171 Caterpillar, Inc. 3,816,889 0.4
Copyright © 2021 www.secdatabase.com. All Rights Reserved.Please Consider the Environment Before Printing This Document

38,147 CSX Corp. 2,854,158 0.315,717 Deere & Co. 2,512,205 0.331,381 Delta Air Lines, Inc. 1,620,829 0.221,478 Eaton Corp. PLC 1,730,268 0.230,089 Emerson Electric Co. 2,060,194 0.211,999 FedEx Corp. 2,176,739 0.212,384 General Dynamics Corp. 2,096,363 0.2
423,876 General Electric Co. 4,234,521 0.535,775 Honeywell International, Inc. 5,685,363 0.616,252 Illinois Tool Works, Inc. 2,332,649 0.344,754 Johnson Controls International plc 1,653,213 0.212,071 Lockheed Martin Corp. 3,623,231 0.413,140 Norfolk Southern Corp. 2,455,735 0.3
7,740 Northrop Grumman Corp. 2,086,704 0.214,119 Raytheon Co. 2,570,787 0.36,033 (1) Resideo Technologies, Inc. 116,377 0.0
24,927 Southwest Airlines Co. 1,293,961 0.135,560 Union Pacific Corp. 5,945,632 0.633,956 United Parcel Service, Inc. - Class B 3,794,243 0.439,845 United Technologies Corp. 5,135,622 0.520,949 Waste Management, Inc. 2,176,811 0.2
77,731,276 8.3
Information Technology: 22.3%31,616 Accenture PLC 5,565,048 0.624,173 (1) Adobe, Inc. 6,441,863 0.7
233,551 Apple, Inc. 44,363,012 4.746,862 Applied Materials, Inc. 1,858,547 0.221,416 Automatic Data Processing, Inc. 3,420,992 0.419,948 Broadcom, Inc. 5,998,563 0.6
223,004 Cisco Systems, Inc. 12,039,986 1.328,252 Cognizant Technology Solutions Corp. 2,046,857 0.268,709 Hewlett Packard Enterprise Co. 1,060,180 0.176,423 HP, Inc. 1,484,899 0.2
221,389 Intel Corp. 11,888,589 1.345,176 International Business Machines Corp. 6,374,334 0.712,146 Intuit, Inc. 3,175,086 0.344,686 Mastercard, Inc. - Class A 10,521,319 1.154,997 (1) Micron Technology, Inc. 2,273,026 0.2
372,710 Microsoft Corp. 43,957,417 4.728,620 Nvidia Corp. 5,139,007 0.516,664 NXP Semiconductor NV - NXPI - US 1,472,931 0.2
118,660 Oracle Corp. 6,373,229 0.757,717 (1) PayPal Holdings, Inc. 5,993,333 0.659,604 Qualcomm, Inc. 3,399,216 0.435,746 (1) Salesforce.com, Inc. 5,661,094 0.647,265 Texas Instruments, Inc. 5,013,399 0.586,616 Visa, Inc. - Class A 13,528,553 1.4
3,525 VMware, Inc. 636,298 0.1209,686,778 22.3
Materials: 2.1%10,775 Air Products & Chemicals, Inc. 2,057,594 0.2
111,623 DowDuPont, Inc. 5,950,622 0.612,526 Ecolab, Inc. 2,211,340 0.2
Copyright © 2021 www.secdatabase.com. All Rights Reserved.Please Consider the Environment Before Printing This Document

27,102 (1) Linde Public Ltd. 4,768,055 0.5
Copyright © 2021 www.secdatabase.com. All Rights Reserved.Please Consider the Environment Before Printing This Document

Voya Russell™ Large Cap Index PortfolioPORTFOLIO OF INVESTMENTS
as of March 31, 2019 (Unaudited) (Continued)
Shares ValuePercentage
of NetAssets
COMMON STOCK: (continued)Materials: (continued)
15,132 LyondellBasell Industries NV - Class A $ 1,272,299 0.211,889 PPG Industries, Inc. 1,341,911 0.24,094 Sherwin-Williams Co. 1,763,327 0.24,056 Southern Copper Corp. 160,942 0.0
19,526,090 2.1
Real Estate: 1.6%21,563 American Tower Corp. 4,249,205 0.420,354 Crown Castle International Corp. 2,605,312 0.3
4,067 Equinix, Inc. 1,843,002 0.230,768 ProLogis, Inc. 2,213,757 0.2
7,294 Public Storage, Inc. 1,588,487 0.215,147 Simon Property Group, Inc. 2,759,935 0.3
15,259,698 1.6
Utilities: 1.9%24,246 American Electric Power Co., Inc. 2,030,603 0.237,304 Dominion Energy, Inc. 2,859,725 0.335,061 Duke Energy Corp. 3,155,490 0.347,419 Exelon Corp. 2,377,114 0.323,476 NextEra Energy, Inc. 4,538,380 0.550,626 Southern Co. 2,616,352 0.3
17,577,664 1.9
Total Common Stock(Cost $336,472,624) 935,150,776 99.5
PrincipalAmount† Value
Percentageof NetAssets
SHORT-TERM INVESTMENTS: 0.6%Securities Lending Collateral(3): 0.2%
1,000,000 Citigroup, Inc., Repurchase Agreement dated 03/29/19, 2.65%, due 04/01/19(Repurchase Amount $1,000,218, collateralized by various U.S. Government/U.S.Government Agency Obligations, 0.000%-10.500%, Market Value plus accruedinterest $1,020,000, due 04/02/19-10/20/68)
1,000,000 0.1
901,781 Morgan Stanley, Repurchase Agreement dated 03/29/19, 2.65%, due 04/01/19(Repurchase Amount $901,977, collateralized by various U.S. Government AgencyObligations, 3.000%-4.000%, Market Value plus accrued interest $919,817, due 02/01/46-07/01/47)
901,781 0.1
1,901,781 0.2
Shares ValuePercentage
of NetAssets
Mutual Funds: 0.4%3,548,000 (4) Goldman Sachs Financial Square Government Fund - Institutional
Shares, 2.350%(Cost $3,548,000) 3,548,000 0.4
Total Short-Term Investments(Cost $5,449,781) 5,449,781 0.6
Total Investments in Securities(Cost $341,922,405) $ 940,600,557 100.1
Liabilities in Excess of Other Assets (772,343) (0.1)Net Assets $ 939,828,214 100.0
† Unless otherwise indicated, principal amount is shown in USD.
Copyright © 2021 www.secdatabase.com. All Rights Reserved.Please Consider the Environment Before Printing This Document

(1) Non-income producing security.(2) Security, or a portion of the security, is on loan.(3) Represents securities purchased with cash collateral received for securities on loan.(4) Rate shown is the 7-day yield as of March 31, 2019.
Fair Value MeasurementsThe following is a summary of the fair valuations according to the inputs used as of March 31, 2019 in valuing the assets and liabilities:
Quoted Pricesin Active Markets
for IdenticalInvestments
(Level 1)
SignificantOther
ObservableInputs
(Level 2)
SignificantUnobservable
Inputs(Level 3)
Fair Valueat
March 31, 2019
Asset TableInvestments, at fair valueCommon Stock* $ 935,150,776 $ – $ – $ 935,150,776
Copyright © 2021 www.secdatabase.com. All Rights Reserved.Please Consider the Environment Before Printing This Document

Voya Russell™ Large Cap Index PortfolioPORTFOLIO OF INVESTMENTS
as of March 31, 2019 (Unaudited) (Continued)
Quoted Pricesin Active Markets
for IdenticalInvestments
(Level 1)
SignificantOther
ObservableInputs
(Level 2)
SignificantUnobservable
Inputs(Level 3)
Fair Valueat
March 31, 2019
Short-Term Investments $ 3,548,000 $ 1,901,781 $ – $ 5,449,781Total Investments, at fair value $ 938,698,776 $ 1,901,781 $ – $ 940,600,557Other Financial Instruments+Futures 131,725 – – 131,725Total Assets $ 938,830,501 $ 1,901,781 $ – $ 940,732,282
+Other Financial Instruments may include open forward foreign currency contracts, futures, centrally cleared swaps, OTC swaps and writtenoptions. Forward foreign currency contracts, futures and centrally cleared swaps are valued at the unrealized gain (loss) on the instrument. OTCswaps and written options are valued at the fair value of the instrument.
* For further breakdown of Common Stock by sector, please refer to the Portfolio of Investments.
At March 31, 2019, the following futures contracts were outstanding for Voya Russell™ Large Cap Index Portfolio:
Description Numberof Contracts
ExpirationDate
NotionalValue
UnrealizedAppreciation/(Depreciation)
Long Contracts:S&P 500® E-Mini 34 06/21/19 $ 4,824,260 $ 131,725
$ 4,824,260 $ 131,725
At March 31, 2019, the aggregate cost of securities and other investments and the composition of unrealized appreciation and depreciation of securitiesand other investments at period end were:
Cost for federal income tax purposes was $344,938,926.
Net unrealized appreciation consisted of:
Gross Unrealized Appreciation $ 603,492,464Gross Unrealized Depreciation (7,699,108)
Net Unrealized Appreciation $ 595,793,356
Copyright © 2021 www.secdatabase.com. All Rights Reserved.Please Consider the Environment Before Printing This Document

Voya Russell™ Large Cap Value Index PortfolioPORTFOLIO OF INVESTMENTSas of March 31, 2019 (Unaudited)
Shares ValuePercentage
of NetAssets
COMMON STOCK: 99.0%Communication Services: 8.7%
312,606 AT&T, Inc. $ 9,803,324 2.62,144 (1) Charter Communications, Inc. 743,775 0.2
193,239 Comcast Corp. – Class A 7,725,695 2.014,865 (1) Fox Corp. - Class A 545,694 0.1
6,957 (1) Fox Corp. - Class B 249,617 0.14,585 (1) T-Mobile US, Inc. 316,824 0.1
177,901 Verizon Communications, Inc. 10,519,286 2.829,252 Walt Disney Co. 3,247,858 0.8
33,152,073 8.7
Consumer Discretionary: 3.6%17,187 Carnival Corp. 871,725 0.228,979 eBay, Inc. 1,076,280 0.3
167,805 Ford Motor Co. 1,473,328 0.41,149 (1) Garrett Motion, Inc. 16,925 0.0
56,305 General Motors Co. 2,088,915 0.65,971 Las Vegas Sands Corp. 363,992 0.1
26,919 McDonald's Corp. 5,111,918 1.322,649 Target Corp. 1,817,809 0.5
9,319 Yum! Brands, Inc. 930,129 0.213,751,021 3.6
Consumer Staples: 9.2%36,854 Coca-Cola Co. 1,726,978 0.529,826 Colgate-Palmolive Co. 2,044,274 0.524,178 General Mills, Inc. 1,251,212 0.3
1,922 Kimberly-Clark Corp. 238,136 0.125,914 Kraft Heinz Co. 846,092 0.261,375 Mondelez International, Inc. 3,063,840 0.8
6,884 PepsiCo, Inc. 843,634 0.266,799 Philip Morris International, Inc. 5,904,364 1.6
107,117 Procter & Gamble Co. 11,145,524 2.934,823 Walgreens Boots Alliance, Inc. 2,203,251 0.660,374 Walmart, Inc. 5,888,276 1.5
35,155,581 9.2
Energy: 11.4%14,395 Anadarko Petroleum Corp. 654,685 0.222,065 Baker Hughes a GE Co. 611,642 0.281,915 Chevron Corp. 10,090,290 2.648,983 ConocoPhillips 3,269,125 0.922,046 EOG Resources, Inc. 2,098,338 0.5
182,196 Exxon Mobil Corp. 14,721,437 3.983,696 Kinder Morgan, Inc. 1,674,757 0.428,818 Marathon Petroleum Corp. 1,724,757 0.532,481 Occidental Petroleum Corp. 2,150,242 0.6
Copyright © 2021 www.secdatabase.com. All Rights Reserved.Please Consider the Environment Before Printing This Document

17,693 Phillips 66 1,683,843 0.43,269 Pioneer Natural Resources Co. 497,803 0.1
59,603 Schlumberger Ltd. 2,596,903 0.718,216 Valero Energy Corp. 1,545,263 0.4
43,319,085 11.4
Financials: 23.6%32,046 Aflac, Inc. 1,602,300 0.432,734 American International Group, Inc. 1,409,526 0.414,251 Allstate Corp. 1,342,159 0.3
9,541 American Express Co. 1,042,831 0.3387,588 Bank of America Corp. 10,693,553 2.8
38,191 Bank of New York Mellon Corp. 1,925,972 0.533,085 BB&T Corp. 1,539,445 0.472,812 (1) Berkshire Hathaway, Inc. – Class B 14,627,203 3.8
5,214 BlackRock, Inc. 2,228,307 0.618,486 Capital One Financial Corp. 1,510,121 0.419,713 Chubb Ltd. 2,761,397 0.7
101,917 Citigroup, Inc. 6,341,276 1.713,428 CME Group, Inc. 2,209,980 0.614,988 Goldman Sachs Group, Inc. 2,877,546 0.811,660 Intercontinental Exchange, Inc. 887,793 0.2
142,308 JPMorgan Chase & Co. 14,405,839 3.811,622 Marsh & McLennan Cos., Inc. 1,091,306 0.335,004 Metlife, Inc. 1,490,120 0.452,136 Morgan Stanley 2,200,139 0.619,639 PNC Financial Services Group, Inc. 2,408,920 0.617,750 Prudential Financial, Inc. 1,630,870 0.415,119 State Street Corp. 994,981 0.39,155 Travelers Cos., Inc. 1,255,700 0.3
65,050 US Bancorp 3,134,760 0.8177,579 Wells Fargo & Co. 8,580,617 2.2
90,192,661 23.6
Health Care: 19.0%73,577 Abbott Laboratories 5,881,745 1.5
1,565 (1) Alexion Pharmaceuticals, Inc. 211,557 0.114,568 Allergan PLC 2,132,901 0.6
1,599 Amgen, Inc. 303,778 0.111,187 Anthem, Inc. 3,210,445 0.819,097 Baxter International, Inc. 1,552,777 0.410,353 Becton Dickinson & Co. 2,585,455 0.7
440 (1) Biogen, Inc. 104,007 0.013,691 (1) Boston Scientific Corp. 525,461 0.132,920 Bristol-Myers Squibb Co. 1,570,613 0.411,504 Cigna Corp. 1,850,073 0.551,024 CVS Health Corp. 2,751,724 0.726,993 Danaher Corp. 3,563,616 0.914,576 Eli Lilly & Co. 1,891,382 0.513,998 Gilead Sciences, Inc. 910,010 0.2
3,367 HCA Healthcare, Inc. 438,990 0.1297 Humana, Inc. 79,002 0.0
94,675 Johnson & Johnson 13,234,618 3.57,215 McKesson Corp. 844,588 0.2
Copyright © 2021 www.secdatabase.com. All Rights Reserved.Please Consider the Environment Before Printing This Document

Copyright © 2021 www.secdatabase.com. All Rights Reserved.Please Consider the Environment Before Printing This Document

Voya Russell™ Large Cap Value Index PortfolioPORTFOLIO OF INVESTMENTS
as of March 31, 2019 (Unaudited) (Continued)
Shares ValuePercentage
of NetAssets
COMMON STOCK: (continued)Health Care: (continued)
58,187 Medtronic PLC $ 5,299,672 1.4104,430 Merck & Co., Inc. 8,685,443 2.3246,569 Pfizer, Inc. 10,471,786 2.8
16,224 Thermo Fisher Scientific, Inc. 4,440,833 1.272,540,476 19.0
Industrials: 5.7%3,971 3M Co. 825,094 0.21,997 Caterpillar, Inc. 270,574 0.1
17,719 CSX Corp. 1,325,736 0.320,589 Delta Air Lines, Inc. 1,063,422 0.318,786 Eaton Corp. PLC 1,513,400 0.4
7,631 Emerson Electric Co. 522,495 0.15,956 General Dynamics Corp. 1,008,232 0.3
370,714 General Electric Co. 3,703,433 1.011,857 Honeywell International, Inc. 1,884,314 0.539,146 Johnson Controls International plc 1,446,053 0.4
918 Lockheed Martin Corp. 275,547 0.111,490 Norfolk Southern Corp. 2,147,366 0.51,980 (1) Resideo Technologies, Inc. 38,194 0.06,300 Southwest Airlines Co. 327,033 0.12,519 Union Pacific Corp. 421,177 0.1
34,845 United Technologies Corp. 4,491,172 1.22,785 Waste Management, Inc. 289,389 0.1
21,552,631 5.7
Information Technology: 10.1%6,996 Broadcom, Inc. 2,103,767 0.6
195,024 Cisco Systems, Inc. 10,529,346 2.82,426 Cognizant Technology Solutions Corp. 175,764 0.1
60,107 Hewlett Packard Enterprise Co. 927,451 0.266,849 HP, Inc. 1,298,876 0.3
193,606 Intel Corp. 10,396,642 2.711,103 International Business Machines Corp. 1,566,633 0.410,437 (1) Micron Technology, Inc. 431,361 0.117,275 Microsoft Corp. 2,037,414 0.513,801 NXP Semiconductor NV - NXPI - US 1,219,870 0.393,709 Oracle Corp. 5,033,110 1.352,124 Qualcomm, Inc. 2,972,632 0.8
38,692,866 10.1
Materials: 3.0%9,423 Air Products & Chemicals, Inc. 1,799,416 0.5
97,615 DowDuPont, Inc. 5,203,856 1.46,004 Ecolab, Inc. 1,059,946 0.39,694 (1) Linde Public Ltd. 1,705,465 0.46,908 LyondellBasell Industries NV - Class A 580,825 0.1
Copyright © 2021 www.secdatabase.com. All Rights Reserved.Please Consider the Environment Before Printing This Document

9,724 PPG Industries, Inc. 1,097,548 0.311,447,056 3.0
Real Estate: 0.7%4,379 Crown Castle International Corp. 560,512 0.1
26,912 ProLogis, Inc. 1,936,318 0.51,088 Simon Property Group, Inc. 198,245 0.1
2,695,075 0.7
Utilities: 4.0%21,204 American Electric Power Co., Inc. 1,775,835 0.532,623 Dominion Energy, Inc. 2,500,879 0.730,658 Duke Energy Corp. 2,759,220 0.741,475 Exelon Corp. 2,079,142 0.520,530 NextEra Energy, Inc. 3,968,860 1.044,278 Southern Co. 2,288,287 0.6
15,372,223 4.0
Total Common Stock(Cost $271,354,657) 377,870,748 99.0
SHORT-TERM INVESTMENTS: 0.8%Mutual Funds: 0.8%
3,016,000 (2) Goldman Sachs Financial Square Government Fund - Institutional Shares, 2.350%(Cost $3,016,000) 3,016,000 0.8
Total Short-Term Investments(Cost $3,016,000) 3,016,000 0.8
Total Investments in Securities(Cost $274,370,657) $ 380,886,748 99.8
Assets in Excess of Other Liabilities 681,591 0.2Net Assets $ 381,568,339 100.0
(1) Non-income producing security.(2) Rate shown is the 7-day yield as of March 31, 2019.
Copyright © 2021 www.secdatabase.com. All Rights Reserved.Please Consider the Environment Before Printing This Document

Voya Russell™ Large Cap Value Index PortfolioPORTFOLIO OF INVESTMENTS
as of March 31, 2019 (Unaudited) (Continued)
Fair Value MeasurementsThe following is a summary of the fair valuations according to the inputs used as of March 31, 2019 in valuing the assets and liabilities:
Quoted Pricesin Active Markets
for IdenticalInvestments
(Level 1)
SignificantOther
ObservableInputs
(Level 2)
SignificantUnobservable
Inputs(Level 3)
Fair Valueat
March 31, 2019
Asset TableInvestments, at fair valueCommon Stock* $ 377,870,748 $ – $ – $ 377,870,748Short-Term Investments 3,016,000 – – 3,016,000Total Investments, at fair value $ 380,886,748 $ – $ – $ 380,886,748Other Financial Instruments+Futures 60,383 – – 60,383Total Assets $ 380,947,131 $ – $ – $ 380,947,131
+Other Financial Instruments may include open forward foreign currency contracts, futures, centrally cleared swaps, OTC swaps and writtenoptions. Forward foreign currency contracts, futures and centrally cleared swaps are valued at the unrealized gain (loss) on theinstrument. OTC swaps and written options are valued at the fair value of the instrument.
* For further breakdown of Common Stock by sector, please refer to the Portfolio of Investments.
At March 31, 2019, the following futures contracts were outstanding for Voya Russell™ Large Cap Value Index Portfolio:
Description Numberof Contracts
ExpirationDate
NotionalValue
UnrealizedAppreciation/(Depreciation)
Long Contracts:S&P 500® E-Mini 26 06/21/19 $ 3,689,140 $ 60,383
$ 3,689,140 $ 60,383
At March 31, 2019, the aggregate cost of securities and other investments and the composition of unrealized appreciation and depreciation of securitiesand other investments at period end were:
Cost for federal income tax purposes was $278,028,270.
Net unrealized appreciation consisted of:
Gross Unrealized Appreciation $119,318,383Gross Unrealized Depreciation (16,399,522)
Net Unrealized Appreciation $102,918,861
Copyright © 2021 www.secdatabase.com. All Rights Reserved.Please Consider the Environment Before Printing This Document

Voya Russell™ Mid Cap Growth Index PortfolioPORTFOLIO OF INVESTMENTSas of March 31, 2019 (Unaudited)
Shares ValuePercentage
of NetAssets
COMMON STOCK: 98.8%Communication Services: 3.7%
4,148 (1) AMC Networks, Inc. $ 235,440 0.1405 Cable One, Inc. 397,459 0.1
30,755 CBS Corp. - Class B 1,461,785 0.57,046 (1) IAC/InterActiveCorp 1,480,435 0.53,742 Interpublic Group of Cos., Inc. 78,619 0.0
285 Lions Gate Entertainment Corp. - Class A 4,457 0.0745 Lions Gate Entertainment Corp. - Class B 11,250 0.0
13,043 (1) Live Nation Entertainment, Inc. 828,752 0.3178 (1) Madison Square Garden Co. 52,177 0.0
4,976 Match Group, Inc. 281,691 0.113,916 Omnicom Group 1,015,729 0.3
156,787 Sirius XM Holdings, Inc. 888,982 0.36,264 (1) Take-Two Interactive Software, Inc. 591,134 0.29,850 (1) TripAdvisor, Inc. 506,783 0.2
67,737 (1) Twitter, Inc. 2,227,193 0.821,431 (1) Zayo Group Holdings, Inc. 609,069 0.2
3,844 (1) Zillow Group, Inc. - Class A 131,465 0.08,323 (1) Zillow Group, Inc. - Class C 289,141 0.1
11,091,561 3.7
Consumer Discretionary: 15.9%2,011 Advance Auto Parts, Inc. 342,936 0.1
21,344 Aptiv PLC 1,696,635 0.62,077 (1) Autozone, Inc. 2,127,097 0.75,567 Best Buy Co., Inc. 395,591 0.14,568 (1) Bright Horizons Family Solutions, Inc. 580,638 0.2
812 Brunswick Corp. 40,868 0.06,307 (1) Burlington Stores, Inc. 988,181 0.37,144 (1) Capri Holdings Ltd. 326,838 0.19,706 (1) Carmax, Inc. 677,479 0.24,272 Carter's, Inc. 430,575 0.12,305 (1) Chipotle Mexican Grill, Inc. 1,637,265 0.63,244 Choice Hotels International, Inc. 252,189 0.1
363 Columbia Sportswear Co. 37,817 0.05,907 Darden Restaurants, Inc. 717,523 0.2
25,168 Dollar General Corp. 3,002,542 1.03,777 (1) Dollar Tree, Inc. 396,736 0.13,922 Domino's Pizza, Inc. 1,012,268 0.3
18,937 D.R. Horton, Inc. 783,613 0.37,828 Dunkin Brands Group, Inc. 587,883 0.2
11,156 Expedia Group, Inc. 1,327,564 0.410,766 Extended Stay America, Inc. 193,250 0.1
5,526 (1) Floor & Decor Holdings, Inc. 227,782 0.18,006 (1) frontdoor, Inc. 275,567 0.11,304 Gap, Inc. 34,139 0.0
16,846 Gentex Corp. 348,375 0.1
Copyright © 2021 www.secdatabase.com. All Rights Reserved.Please Consider the Environment Before Printing This Document

4,462 (1) Grand Canyon Education, Inc. 510,944 0.28,533 (1) GrubHub, Inc. 592,788 0.23,553 H&R Block, Inc. 85,059 0.0
33,914 Hanesbrands, Inc. 606,382 0.28,608 Hasbro, Inc. 731,852 0.29,157 (1) Hilton Grand Vacations, Inc. 282,493 0.1
26,081 Hilton Worldwide Holdings, Inc. 2,167,592 0.7597 (2) International Game Technology PLC 7,755 0.0
4,101 L Brands, Inc. 113,106 0.0618 Lear Corp. 83,869 0.0
14,276 Lennar Corp. - Class A 700,809 0.2817 Lennar Corp. - Class B 31,961 0.0
5,032 (1) LKQ Corp. 142,808 0.19,035 (1) Lululemon Athletica, Inc. 1,480,565 0.57,247 (1),(2) Mattel, Inc. 94,211 0.04,205 MGM Resorts International 107,900 0.01,371 (1) Michaels Cos, Inc. 15,657 0.0
11,134 Nordstrom, Inc. 494,127 0.2295 (1) NVR, Inc. 816,265 0.3
7,338 (1) O'Reilly Automotive, Inc. 2,849,345 1.05,546 Polaris Industries, Inc. 468,249 0.23,719 Pool Corp. 613,523 0.27,561 Pulte Group, Inc. 211,406 0.1
34,578 Ross Stores, Inc. 3,219,212 1.17,738 Service Corp. International 310,681 0.1
12,832 (1) ServiceMaster Global Holdings, Inc. 599,254 0.26,827 Six Flags Entertainment Corp. 336,912 0.15,861 (1) Skechers USA, Inc. 196,988 0.15,389 Tapestry, Inc. 175,089 0.14,390 (1) Tempur Sealy International, Inc. 253,171 0.13,927 Thor Industries, Inc. 244,927 0.12,020 Tiffany & Co. 213,211 0.16,492 Toll Brothers, Inc. 235,010 0.1
11,539 Tractor Supply Co. 1,128,053 0.45,351 (1) Ulta Beauty, Inc. 1,866,054 0.6
13,346 (1) Under Armour, Inc. - Class A 282,134 0.113,648 (1) Under Armour, Inc. - Class C 257,538 0.1
7,001 (1) Urban Outfitters, Inc. 207,510 0.13,792 Vail Resorts, Inc. 824,002 0.3
23,578 VF Corp. 2,049,164 0.71,736 (1) Visteon Corp. 116,920 0.05,405 (1) Wayfair, Inc. 802,372 0.3
17,623 Wendy's Company 315,275 0.11,733 Williams-Sonoma, Inc. 97,516 0.0
Copyright © 2021 www.secdatabase.com. All Rights Reserved.Please Consider the Environment Before Printing This Document

Voya Russell™ Mid Cap Growth Index PortfolioPORTFOLIO OF INVESTMENTS
as of March 31, 2019 (Unaudited) (Continued)
Shares ValuePercentage
of NetAssets
COMMON STOCK: (continued)Consumer Discretionary: (continued)
9,045 Wyndham Destinations, Inc. $ 366,232 0.19,259 Wyndham Hotels & Resorts, Inc. 462,857 0.29,728 Wynn Resorts Ltd. 1,160,745 0.42,907 Yum China Holdings, Inc. 130,553 0.0
47,501,397 15.9
Consumer Staples: 3.0%4,864 Brown-Forman Corp. - Class A 248,891 0.1
26,402 Brown-Forman Corp. - Class B 1,393,498 0.511,570 Campbell Soup Co. 441,164 0.119,610 Church & Dwight Co., Inc. 1,396,820 0.510,568 Clorox Co. 1,695,741 0.6
3,420 Energizer Holdings, Inc. 153,661 0.11,860 (1) Herbalife Nutrition Ltd 98,561 0.0
12,083 Hershey Co. 1,387,491 0.511,745 Kellogg Co. 673,928 0.217,168 Keurig Dr Pepper, Inc. 480,189 0.2
674 McCormick & Co., Inc. 101,525 0.01,614 Nu Skin Enterprises, Inc. 77,246 0.03,542 (1) Post Holdings, Inc. 387,495 0.11,743 Spectrum Brands Holdings, Inc. 95,481 0.0
11,855 (1) Sprouts Farmers Market, Inc. 255,357 0.11,228 (1) US Foods Holding Corp. 42,869 0.0
8,929,917 3.0
Energy: 1.4%12,254 (1) Antero Resources Corp. 108,203 0.0
2,302 Apache Corp. 79,788 0.029,633 Cabot Oil & Gas Corp. 773,421 0.315,175 (1) Cheniere Energy, Inc. 1,037,363 0.312,912 (1),(2) Chesapeake Energy Corp. 40,027 0.0
1,147 Cimarex Energy Co. 80,175 0.02,398 Concho Resources, Inc./Midland TX 266,082 0.13,999 (1) Continental Resources, Inc. 179,035 0.12,472 Diamondback Energy, Inc. 250,982 0.14,596 Kosmos Energy Ltd. 28,633 0.0
16,057 Oneok, Inc. 1,121,421 0.417,343 (1) Parsley Energy, Inc. 334,720 0.1
2,077 (2) RPC, Inc. 23,699 0.04,323,549 1.4
Financials: 6.4%158 (1) Alleghany Corp. 96,759 0.0
2,085 Ameriprise Financial, Inc. 267,088 0.15,842 (1) Arch Capital Group Ltd. 188,813 0.1
854 Axis Capital Holdings Ltd. 46,782 0.0597 BOK Financial Corp. 48,685 0.0
Copyright © 2021 www.secdatabase.com. All Rights Reserved.Please Consider the Environment Before Printing This Document

1,284 Brown & Brown, Inc. 37,891 0.09,803 Cboe Global Markets, Inc. 935,598 0.3
895 Comerica, Inc. 65,621 0.0951 (1) Credit Acceptance Corp. 429,785 0.2
14,318 Discover Financial Services 1,018,869 0.35,272 E*Trade Financial Corp. 244,779 0.11,040 East West Bancorp, Inc. 49,889 0.0
10,610 Eaton Vance Corp. 427,689 0.11,779 Erie Indemnity Co. 317,587 0.13,800 Evercore, Inc. 345,800 0.11,513 Everest Re Group Ltd. 326,747 0.13,536 Factset Research Systems, Inc. 877,883 0.36,357 Interactive Brokers Group, Inc. 329,801 0.19,912 Lazard Ltd. 358,220 0.17,974 LPL Financial Holdings, Inc. 555,389 0.2
114 (1) Markel Corp. 113,571 0.03,465 MarketAxess Holdings, Inc. 852,667 0.3
15,775 Moody's Corp. 2,856,695 1.01,722 Morningstar, Inc. 216,955 0.17,805 MSCI, Inc. - Class A 1,551,946 0.55,366 Northern Trust Corp. 485,140 0.2
542 OneMain Holdings, Inc. 17,209 0.03,073 Pinnacle Financial Partners, Inc. 168,093 0.13,538 Raymond James Financial, Inc. 284,491 0.1
333 RenaissanceRe Holdings Ltd. 47,786 0.01,455 Santander Consumer USA Holdings, Inc. 30,744 0.0
12,257 SEI Investments Co. 640,428 0.23,093 Signature Bank 396,121 0.13,846 (1) SVB Financial Group 855,197 0.3
23,704 Synchrony Financial 756,158 0.34,536 Synovus Financial Corp. 155,857 0.1
20,435 T. Rowe Price Group, Inc. 2,045,952 0.73,020 (1) Texas Capital Bancshares, Inc. 164,862 0.13,894 Virtu Financial, Inc. 92,483 0.01,007 (3) Voya Financial, Inc. 50,310 0.05,612 (1) Western Alliance Bancorp. 230,316 0.1
18,982,656 6.4
Health Care: 14.3%4,038 (1) Abiomed, Inc. 1,153,212 0.44,478 (1),(2) Agios Pharmaceuticals, Inc. 301,996 0.17,501 (1) Align Technology, Inc. 2,132,759 0.7
14,550 (1) Alkermes PLC 530,930 0.27,892 (1) Alnylam Pharmaceuticals, Inc. 737,507 0.2
14,544 AmerisourceBergen Corp. 1,156,539 0.416,698 (1) BioMarin Pharmaceutical, Inc. 1,483,283 0.5
Copyright © 2021 www.secdatabase.com. All Rights Reserved.Please Consider the Environment Before Printing This Document

Voya Russell™ Mid Cap Growth Index PortfolioPORTFOLIO OF INVESTMENTS
as of March 31, 2019 (Unaudited) (Continued)
Shares ValuePercentage
of NetAssets
COMMON STOCK: (continued)Health Care: (continued)
3,514 Bio-Techne Corp. $ 697,705 0.23,520 (1) Bluebird Bio, Inc. 553,802 0.23,854 Bruker Corp. 148,148 0.03,488 Cantel Medical Corp. 233,312 0.13,197 (1) Catalent, Inc. 129,766 0.0
33,949 (1) Centene Corp. 1,802,692 0.613,103 (1) Cerner Corp. 749,623 0.3
3,206 (1) Charles River Laboratories International, Inc. 465,671 0.21,467 Chemed Corp. 469,543 0.2
730 Cooper Cos., Inc. 216,204 0.1870 (1) Covetrus, Inc. 27,710 0.0
6,380 (1) DaVita, Inc. 346,370 0.18,259 (1) DexCom, Inc. 983,647 0.3
19,874 (1) Edwards Lifesciences Corp. 3,802,492 1.314,744 (1) Elanco Animal Health, Inc. 472,840 0.2
9,255 Encompass Health Corp. 540,492 0.211,318 (1) Exact Sciences Corp. 980,365 0.327,730 (1) Exelixis, Inc. 659,974 0.2
2,122 (1) Henry Schein, Inc. 127,553 0.04,059 Hill-Rom Holdings, Inc. 429,686 0.11,476 (1) ICU Medical, Inc. 353,251 0.18,123 (1) Idexx Laboratories, Inc. 1,816,303 0.6
16,597 (1) Incyte Corp., Ltd. 1,427,508 0.55,520 (1),(2) Insulet Corp. 524,897 0.25,188 (1) Integra LifeSciences Holdings Corp. 289,075 0.1
11,804 (1),(2) Ionis Pharmaceuticals, Inc. 958,131 0.35,108 (1) Jazz Pharmaceuticals PLC 730,189 0.2
567 (1) Laboratory Corp. of America Holdings 86,740 0.04,362 (1) Masimo Corp. 603,177 0.22,322 (1) Mettler Toledo International, Inc. 1,678,806 0.62,246 (1),(2) Moderna, Inc. 45,706 0.04,969 (1) Molina Healthcare, Inc. 705,399 0.2
14,766 (1) Nektar Therapeutics 496,138 0.28,510 (1) Neurocrine Biosciences, Inc. 749,731 0.32,897 (1) Penumbra, Inc. 425,888 0.15,465 (1) PRA Health Sciences, Inc. 602,735 0.21,639 (1) Premier, Inc. 56,529 0.0
13,301 Resmed, Inc. 1,382,905 0.54,602 (1) Sage Therapeutics, Inc. 731,948 0.26,273 (1) Sarepta Therapeutics, Inc. 747,679 0.3
10,251 (1) Seattle Genetics, Inc. 750,783 0.3825 Teleflex, Inc. 249,282 0.1
8,654 (1) Varian Medical Systems, Inc. 1,226,445 0.411,804 (1) Veeva Systems, Inc. 1,497,455 0.56,603 (1) Waters Corp. 1,662,041 0.64,393 (1) WellCare Health Plans, Inc. 1,185,012 0.4
Copyright © 2021 www.secdatabase.com. All Rights Reserved.Please Consider the Environment Before Printing This Document

1,604 West Pharmaceutical Services, Inc. 176,761 0.142,494,335 14.3
Industrials: 15.5%716 Air Lease Corp. 24,595 0.0
7,432 Allegion Public Ltd. 674,157 0.210,843 Allison Transmission Holdings, Inc. 487,068 0.2
4,151 Ametek, Inc. 344,408 0.113,437 AO Smith Corp. 716,461 0.2
4,076 Armstrong World Industries, Inc. 323,716 0.19,412 BWX Technologies, Inc. 466,647 0.2
12,916 CH Robinson Worldwide, Inc. 1,123,563 0.48,093 Cintas Corp. 1,635,676 0.6
19,170 (1) Copart, Inc. 1,161,510 0.43,383 (1) CoStar Group, Inc. 1,577,899 0.55,083 Cummins, Inc. 802,453 0.3
332 Curtiss-Wright Corp. 37,629 0.011,309 Donaldson Co., Inc. 566,129 0.23,068 Equifax, Inc. 363,558 0.1
16,274 Expeditors International Washington, Inc. 1,235,197 0.427,190 Fastenal Co. 1,748,589 0.625,509 Fortive Corp. 2,139,950 0.7
5,580 Fortune Brands Home & Security, Inc. 265,664 0.13,960 (1) Gardner Denver Holdings, Inc. 110,128 0.01,149 (1) Genesee & Wyoming, Inc. 100,124 0.0
15,640 Graco, Inc. 774,493 0.311,219 Harris Corp. 1,791,786 0.65,028 (1) HD Supply Holdings, Inc. 217,964 0.13,678 Heico Corp. 348,932 0.17,163 Heico Corp. - Class A 602,122 0.21,685 Hexcel Corp. 116,535 0.03,498 Hubbell, Inc. 412,694 0.13,440 Huntington Ingalls Industries, Inc. 712,768 0.26,814 IDEX Corp. 1,033,956 0.3
12,541 Ingersoll-Rand PLC - Class A 1,353,801 0.58,237 JB Hunt Transport Services, Inc. 834,326 0.3
11,907 KAR Auction Services, Inc. 610,948 0.23,773 Landstar System, Inc. 412,728 0.13,175 Lennox International, Inc. 839,470 0.35,849 Lincoln Electric Holdings, Inc. 490,556 0.2
18,963 Masco Corp. 745,435 0.33,042 (1) Middleby Corp. 395,551 0.11,874 MSC Industrial Direct Co. 154,999 0.15,112 Nordson Corp. 677,442 0.26,229 Old Dominion Freight Line 899,405 0.3
Copyright © 2021 www.secdatabase.com. All Rights Reserved.Please Consider the Environment Before Printing This Document

Voya Russell™ Mid Cap Growth Index PortfolioPORTFOLIO OF INVESTMENTS
as of March 31, 2019 (Unaudited) (Continued)
Shares ValuePercentage
of NetAssets
COMMON STOCK: (continued)Industrials: (continued)
2,196 Parker Hannifin Corp. $ 376,877 0.14,020 Quanta Services, Inc. 151,715 0.11,348 Republic Services, Inc. 108,352 0.0
11,180 Robert Half International, Inc. 728,489 0.211,382 Rockwell Automation, Inc. 1,997,086 0.713,705 Rollins, Inc. 570,402 0.2
1,783 Roper Technologies, Inc. 609,732 0.2780 Schneider National, Inc. 16,419 0.0
8,349 (1) Sensata Technologies Holding PLC 375,872 0.110,016 Spirit Aerosystems Holdings, Inc. 916,764 0.3
3,854 Textron, Inc. 195,244 0.19,747 Toro Co. 670,983 0.24,586 (1) TransDigm Group, Inc. 2,081,998 0.7
17,401 TransUnion 1,163,083 0.47,518 (1) United Rentals, Inc. 858,931 0.31,675 (1) Univar, Inc. 37,118 0.0
15,178 Verisk Analytics, Inc. 2,018,674 0.74,926 (1) WABCO Holdings, Inc. 649,395 0.22,935 Wabtec Corp. 216,368 0.12,423 Watsco, Inc. 346,998 0.1
12,335 (1) Welbilt, Inc. 202,047 0.14,300 WW Grainger, Inc. 1,293,999 0.4
11,832 (1),(2) XPO Logistics, Inc. 635,852 0.29,476 Xylem, Inc. 748,983 0.3
46,302,413 15.5
Information Technology: 32.8%5,175 (1) 2U, Inc. 366,649 0.1
88,623 (1) Advanced Micro Devices, Inc. 2,261,659 0.814,034 (1) Akamai Technologies, Inc. 1,006,378 0.3
4,485 Alliance Data Systems Corp. 784,785 0.327,928 Amphenol Corp. 2,637,520 0.9
5,521 Analog Devices, Inc. 581,196 0.27,881 (1) ANSYS, Inc. 1,439,938 0.55,456 (1) Arista Networks, Inc. 1,715,694 0.66,231 (1) Aspen Technology, Inc. 649,644 0.29,500 (1) Atlassian Corp. PLC 1,067,705 0.4
17,438 (1) Autodesk, Inc. 2,717,189 0.913,426 (1) Black Knight, Inc. 731,717 0.212,279 Booz Allen Hamilton Holding Corp. 713,901 0.210,951 Broadridge Financial Solutions, Inc. ADR 1,135,509 0.426,417 (1) Cadence Design Systems, Inc. 1,677,744 0.611,798 CDK Global, Inc. 693,958 0.213,851 CDW Corp. 1,334,821 0.4
4,585 (1) Ceridian HCM Holding, Inc. 235,210 0.112,799 Citrix Systems, Inc. 1,275,548 0.4
Copyright © 2021 www.secdatabase.com. All Rights Reserved.Please Consider the Environment Before Printing This Document

15,636 Cognex Corp. 795,247 0.31,643 (1) Coherent, Inc. 232,846 0.14,772 (1) CoreLogic, Inc. 177,805 0.1
23,393 Cypress Semiconductor Corp. 349,024 0.11,014 (1) Dell Technologies, Inc. 59,512 0.07,391 (1) DocuSign, Inc. 383,149 0.1
628 (1),(2) Elastic NV 50,158 0.04,851 (1) EPAM Systems, Inc. 820,450 0.32,344 (1) Euronet Worldwide, Inc. 334,231 0.15,623 (1) F5 Networks, Inc. 882,417 0.32,712 (1) Fair Isaac Corp. 736,661 0.22,628 Fidelity National Information Services, Inc. 297,227 0.1
12,173 (1),(2) FireEye, Inc. 204,385 0.151,451 (1) First Data Corp. 1,351,618 0.537,727 (1) Fiserv, Inc. 3,330,540 1.1
8,066 (1) FleetCor Technologies, Inc. 1,988,995 0.71,162 Flir Systems, Inc. 55,288 0.0
13,331 (1) Fortinet, Inc. 1,119,404 0.48,377 (1) Gartner, Inc. 1,270,623 0.45,225 Genpact Ltd. 183,815 0.1
15,031 Global Payments, Inc. 2,052,032 0.715,957 (1) GoDaddy, Inc. 1,199,807 0.4
7,664 (1) Guidewire Software, Inc. 744,634 0.23,408 (1) IPG Photonics Corp. 517,266 0.27,280 Jack Henry & Associates, Inc. 1,010,027 0.3
15,385 KLA-Tencor Corp. 1,837,123 0.614,437 Lam Research Corp. 2,584,367 0.9
1,895 Littelfuse, Inc. 345,800 0.13,154 LogMeIn, Inc. 252,635 0.16,102 (1) Manhattan Associates, Inc. 336,281 0.1
14,228 Marvell Technology Group Ltd. 282,995 0.125,740 Maxim Integrated Products 1,368,596 0.522,011 Microchip Technology, Inc. 1,826,033 0.65,051 MKS Instruments, Inc. 469,996 0.23,847 Monolithic Power Systems, Inc. 521,230 0.21,737 Motorola Solutions, Inc. 243,910 0.18,484 National Instruments Corp. 376,350 0.19,185 (1) NCR Corp. 250,659 0.1
23,880 NetApp, Inc. 1,655,839 0.613,240 (1) Nutanix, Inc. 499,678 0.2
8,225 (1) Okta, Inc. 680,454 0.239,427 (1) ON Semiconductor Corp. 811,013 0.3
8,610 (1) Palo Alto Networks, Inc. 2,091,197 0.730,380 Paychex, Inc. 2,436,476 0.8
4,550 (1) Paycom Software, Inc. 860,541 0.33,565 Pegasystems, Inc. 231,725 0.14,124 (1) Pluralsight, Inc. 130,896 0.04,754 (1) Proofpoint, Inc. 577,278 0.2
11,043 (1) PTC, Inc. 1,017,944 0.315,563 (1) Pure Storage, Inc. 339,118 0.1
6,766 (1) RealPage, Inc. 410,629 0.116,758 (1) Red Hat, Inc. 3,061,687 1.0
6,451 (1) RingCentral, Inc. 695,418 0.2
Copyright © 2021 www.secdatabase.com. All Rights Reserved.Please Consider the Environment Before Printing This Document

Copyright © 2021 www.secdatabase.com. All Rights Reserved.Please Consider the Environment Before Printing This Document

Voya Russell™ Mid Cap Growth Index PortfolioPORTFOLIO OF INVESTMENTS
as of March 31, 2019 (Unaudited) (Continued)
Shares ValuePercentage
of NetAssets
COMMON STOCK: (continued)Information Technology: (continued)
21,037 Sabre Corp. $ 449,981 0.116,832 (1) ServiceNow, Inc. 4,148,920 1.411,637 Skyworks Solutions, Inc. 959,820 0.31,965 (1),(2) SolarWinds Corp. 38,357 0.0
13,860 (1) Splunk, Inc. 1,726,956 0.627,677 (1) Square, Inc. 2,073,561 0.718,947 SS&C Technologies Holdings, Inc. 1,206,734 0.4
3,636 (2) Switch, Inc. 37,487 0.01,323 (1) Synopsys, Inc. 152,343 0.16,748 (1) Tableau Software, Inc. 858,885 0.37,958 (1) Teradata Corp. 347,367 0.12,730 Teradyne, Inc. 108,763 0.0
17,028 Total System Services, Inc. 1,617,830 0.58,320 (1) Twilio, Inc. 1,074,778 0.43,609 (1) Tyler Technologies, Inc. 737,680 0.21,424 (2) Ubiquiti Networks, Inc. 213,187 0.12,873 (1) Ultimate Software Group, Inc. 948,463 0.34,020 Universal Display Corp. 614,457 0.29,713 (1) VeriSign, Inc. 1,763,492 0.6
10,280 Versum Materials, Inc. 517,187 0.211,505 Western Union Co. 212,497 0.13,899 (1) WEX, Inc. 748,569 0.3
13,739 (1) Workday, Inc. 2,649,566 0.92,526 (1) Worldpay, Inc. 286,701 0.1
24,104 Xilinx, Inc. 3,056,146 1.04,989 (1) Zebra Technologies Corp. 1,045,345 0.39,944 (1) Zendesk, Inc. 845,240 0.3
97,810,106 32.8
Materials: 3.5%8,170 Avery Dennison Corp. 923,210 0.37,799 (1) Axalta Coating Systems Ltd. 196,613 0.16,168 (1) Berry Global Group, Inc. 332,270 0.17,674 Celanese Corp. 756,733 0.3
16,186 Chemours Co. 601,472 0.212,221 (1) Crown Holdings, Inc. 666,900 0.2
3,696 Eagle Materials, Inc. 311,573 0.110,564 (1) Element Solutions, Inc. 106,697 0.0
5,163 FMC Corp. 396,622 0.14,780 Graphic Packaging Holding Co. 60,371 0.04,542 International Flavors & Fragrances, Inc. 584,964 0.24,384 International Paper Co. 202,848 0.15,450 Martin Marietta Materials, Inc. 1,096,431 0.4
670 NewMarket Corp. 290,485 0.18,840 Packaging Corp. of America 878,519 0.32,545 Royal Gold, Inc. 231,417 0.1
Copyright © 2021 www.secdatabase.com. All Rights Reserved.Please Consider the Environment Before Printing This Document

2,476 RPM International, Inc. 143,707 0.01,879 Scotts Miracle-Gro Co. 147,652 0.18,140 Sealed Air Corp. 374,928 0.12,494 Silgan Holdings, Inc. 73,897 0.03,207 Steel Dynamics, Inc. 113,111 0.0
11,690 Vulcan Materials Co. 1,384,096 0.53,184 Westlake Chemical Corp. 216,066 0.14,674 WR Grace & Co. 364,759 0.1
10,455,341 3.5
Real Estate: 2.3%831 Alexandria Real Estate Equities, Inc. 118,467 0.0
14,456 (1) CBRE Group, Inc. 714,849 0.32,636 Colony Capital, Inc. 14,024 0.03,443 Coresite Realty Corp. 368,470 0.18,095 Equity Lifestyle Properties, Inc. 925,258 0.3
10,005 Extra Space Storage, Inc. 1,019,610 0.46,875 Gaming and Leisure Properties, Inc. 265,169 0.11,493 (1) Howard Hughes Corp. 164,230 0.11,819 Hudson Pacific Properties, Inc. 62,610 0.07,234 Lamar Advertising Co. 573,367 0.2
253 Life Storage, Inc. 24,609 0.01,578 Omega Healthcare Investors, Inc. 60,201 0.0
10,603 (1) SBA Communications Corp. 2,116,995 0.75,609 Taubman Centers, Inc. 296,604 0.1
6,724,463 2.3
Total Common Stock(Cost $152,576,676) 294,615,738 98.8
PrincipalAmount† Value
Percentageof NetAssets
SHORT-TERM INVESTMENTS: 1.9%Securities Lending Collateral(4): 0.8%
1,000,000 Bank of Nova Scotia, Repurchase Agreement dated 03/29/19, 2.67%, due 04/01/19(Repurchase Amount $1,000,219, collateralized by various U.S. GovernmentAgency Obligations, 3.500%-4.571%, Market Value plus accrued interest$1,020,227, due 12/01/33-02/01/49)
1,000,000 0.4
354,355 Merrill Lynch & Co., Inc., Repurchase Agreement dated 03/29/19, 2.58%, due 04/01/19 (Repurchase Amount $354,430, collateralized by various U.S. GovernmentSecurities, 0.375%-2.500%, Market Value plus accrued interest $361,442, due 05/31/22-02/15/47)
354,355 0.1
Copyright © 2021 www.secdatabase.com. All Rights Reserved.Please Consider the Environment Before Printing This Document

Voya Russell™ Mid Cap Growth Index PortfolioPORTFOLIO OF INVESTMENTS
as of March 31, 2019 (Unaudited) (Continued)
PrincipalAmount† Value
Percentageof NetAssets
SHORT-TERM INVESTMENTS: (continued)Securities Lending Collateral(4) (continued)
1,000,000 Mizuho Securities USA LLC, Repurchase Agreement dated 03/29/19, 2.61%, due04/01/19 (Repurchase Amount $1,000,215, collateralized by various U.S.Government Agency Obligations, 2.000%-6.000%, Market Value plus accruedinterest $1,020,000, due 10/01/19-07/01/48)
$ 1,000,000 0.3
2,354,355 0.8
Shares ValuePercentage
of NetAssets
Mutual Funds: 1.1%3,333,000 (5) Goldman Sachs Financial Square Government Fund - Institutional Shares, 2.350%
(Cost $3,333,000) 3,333,000 1.1
Total Short-Term Investments(Cost $5,687,355) 5,687,355 1.9
Total Investments in Securities(Cost $158,264,031) $ 300,303,093 100.7
Liabilities in Excess of Other Assets (2,187,843) (0.7)Net Assets $ 298,115,250 100.0
† Unless otherwise indicated, principal amount is shown in USD.ADR American Depositary Receipt(1) Non-income producing security.(2) Security, or a portion of the security, is on loan.(3) Investment in affiliate(4) Represents securities purchased with cash collateral received for securities on loan.(5) Rate shown is the 7-day yield as of March 31, 2019.
Fair Value MeasurementsThe following is a summary of the fair valuations according to the inputs used as of March 31, 2019 in valuing the assets and liabilities:
Quoted Pricesin Active Markets
for IdenticalInvestments
(Level 1)
SignificantOther
ObservableInputs
(Level 2)
SignificantUnobservable
Inputs(Level 3)
Fair Valueat
March 31, 2019
Asset TableInvestments, at fair valueCommon Stock* $ 294,615,738 $ – $ – $ 294,615,738Short-Term Investments 3,333,000 2,354,355 – 5,687,355Total Investments, at fair value $ 297,948,738 $ 2,354,355 $ – $ 300,303,093Other Financial Instruments+Futures 29,966 – – 29,966
Copyright © 2021 www.secdatabase.com. All Rights Reserved.Please Consider the Environment Before Printing This Document

Voya Russell™ Mid Cap Growth Index PortfolioPORTFOLIO OF INVESTMENTS
as of March 31, 2019 (Unaudited) (Continued)
Quoted Pricesin Active Markets
for IdenticalInvestments
(Level 1)
SignificantOther
ObservableInputs
(Level 2)
SignificantUnobservable
Inputs(Level 3)
Fair Valueat
March 31, 2019
Total Assets $ 297,978,704 $ 2,354,355 $ – $ 300,333,059
+Other Financial Instruments may include open forward foreign currency contracts, futures, centrally cleared swaps, OTC swaps and writtenoptions. Forward foreign currency contracts, futures and centrally cleared swaps are valued at the unrealized gain (loss) on the instrument. OTCswaps and written options are valued at the fair value of the instrument.
* For further breakdown of Common Stock by sector, please refer to the Portfolio of Investments.
At March 31, 2019, the following futures contracts were outstanding for Voya Russell™ Mid Cap Growth Index Portfolio:
Description Numberof Contracts
ExpirationDate
NotionalValue
UnrealizedAppreciation/(Depreciation)
Long Contracts:S&P Midcap 400® E-Mini 19 06/21/19 $ 3,611,900 $ 29,966
$ 3,611,900 $ 29,966
At March 31, 2019, the aggregate cost of securities and other investments and the composition of unrealized appreciation and depreciation of securitiesand other investments at period end were:
Cost for federal income tax purposes was $158,672,541.
Net unrealized appreciation consisted of:
Gross Unrealized Appreciation $ 148,355,057Gross Unrealized Depreciation (6,694,539)
Net Unrealized Appreciation $ 141,660,518
Copyright © 2021 www.secdatabase.com. All Rights Reserved.Please Consider the Environment Before Printing This Document

Voya Russell™ Mid Cap Index PortfolioPORTFOLIO OF INVESTMENTSas of March 31, 2019 (Unaudited)
Shares ValuePercentage
of NetAssets
COMMON STOCK: 98.9%Communication Services: 3.3%
8,631 (1) AMC Networks, Inc. $ 489,895 0.0841 Cable One, Inc. 825,340 0.1
64,111 CBS Corp. - Class B 3,047,196 0.2188,640 CenturyLink, Inc. 2,261,794 0.2
21,106 Cinemark Holdings, Inc. 844,029 0.130,329 (1) Discovery Communications, Inc. - Class A 819,490 0.168,052 (1) Discovery Communications, Inc. - Class C 1,729,882 0.143,778 (1) Dish Network Corp. - Class A 1,387,325 0.119,870 (1) GCI Liberty, Inc. 1,104,971 0.114,689 (1) IAC/InterActiveCorp 3,086,306 0.275,740 Interpublic Group of Cos., Inc. 1,591,297 0.1
8,735 John Wiley & Sons, Inc. 386,262 0.04,894 (1) Liberty Media Corp. - Media A 166,592 0.0
38,906 (1) Liberty Media Corp. - Media C 1,363,655 0.116,613 (1) Liberty Media Corp. - SiriusXM A 634,284 0.032,578 (1) Liberty Media Corp. - SiriusXM C 1,245,783 0.1
5,030 (1) Liberty Broadband Corp. - Series A 460,949 0.020,521 (1) Liberty Broadband Corp. - Series C 1,882,596 0.1
9,702 Lions Gate Entertainment Corp. - Class A 151,739 0.019,400 Lions Gate Entertainment Corp. - Class B 292,940 0.027,193 (1) Live Nation Entertainment, Inc. 1,727,843 0.1
3,632 (1) Madison Square Garden Co. 1,064,648 0.110,358 Match Group, Inc. 586,366 0.075,320 News Corp - Class A 936,981 0.123,909 News Corp - Class B 298,623 0.043,890 Omnicom Group 3,203,531 0.2
326,874 Sirius XM Holdings, Inc. 1,853,376 0.1129,085 (1) Sprint Corp. 729,330 0.1
22,028 (1) Take-Two Interactive Software, Inc. 2,078,782 0.119,493 Telephone & Data Systems, Inc. 599,020 0.017,262 Tribune Media Co. 796,469 0.120,528 (1) TripAdvisor, Inc. 1,056,166 0.1
141,193 (1) Twitter, Inc. 4,642,426 0.32,587 (1) United States Cellular Corp. 118,769 0.01,984 Viacom, Inc. - Class A 64,381 0.0
69,670 Viacom, Inc. - Class B 1,955,637 0.144,690 (1) Zayo Group Holdings, Inc. 1,270,090 0.111,090 (1) Zillow Group, Inc. - Class A 379,278 0.023,942 (1) Zillow Group, Inc. - Class C 831,745 0.1
150,799 (1) Zynga, Inc. - Class A 803,759 0.148,769,545 3.3
Consumer Discretionary: 11.7%18,443 Adient plc 239,021 0.013,777 Advance Auto Parts, Inc. 2,349,392 0.251,257 Aptiv PLC 4,074,419 0.348,181 Aramark 1,423,749 0.1
Copyright © 2021 www.secdatabase.com. All Rights Reserved.Please Consider the Environment Before Printing This Document

10,815 (1) Autonation, Inc. 386,312 0.04,955 (1) Autozone, Inc. 5,074,515 0.3
45,541 Best Buy Co., Inc. 3,236,143 0.241,240 BorgWarner, Inc. 1,584,028 0.111,273 (1) Bright Horizons Family Solutions, Inc. 1,432,911 0.117,094 Brunswick Corp. 860,341 0.113,149 (1) Burlington Stores, Inc. 2,060,185 0.1
112,319 (1) Caesars Entertainment Corp. 976,052 0.127,661 (1) Capri Holdings Ltd. 1,265,491 0.133,453 (1) Carmax, Inc. 2,335,019 0.2
8,904 Carter's, Inc. 897,434 0.14,805 (1) Chipotle Mexican Grill, Inc. 3,413,040 0.26,750 Choice Hotels International, Inc. 524,745 0.05,946 Columbia Sportswear Co. 619,454 0.0
24,439 Darden Restaurants, Inc. 2,968,605 0.214,102 Dick's Sporting Goods, Inc. 519,095 0.052,460 Dollar General Corp. 6,258,478 0.446,299 (1) Dollar Tree, Inc. 4,863,247 0.3
8,175 Domino's Pizza, Inc. 2,109,968 0.167,263 D.R. Horton, Inc. 2,783,343 0.216,324 Dunkin Brands Group, Inc. 1,225,932 0.123,257 Expedia Group, Inc. 2,767,583 0.237,294 Extended Stay America, Inc. 669,427 0.011,491 (1) Floor & Decor Holdings, Inc. 473,659 0.022,131 Foot Locker, Inc. 1,341,139 0.116,705 (1) frontdoor, Inc. 574,986 0.042,595 Gap, Inc. 1,115,137 0.122,453 Garmin Ltd. 1,938,817 0.151,757 Gentex Corp. 1,070,335 0.128,203 Genuine Parts Co. 3,159,582 0.245,921 Goodyear Tire & Rubber Co. 833,466 0.1
815 Graham Holdings Co. 556,792 0.09,304 (1) Grand Canyon Education, Inc. 1,065,401 0.1
17,793 (1) GrubHub, Inc. 1,236,080 0.140,533 H&R Block, Inc. 970,360 0.170,720 Hanesbrands, Inc. 1,264,474 0.132,131 Harley-Davidson, Inc. 1,145,791 0.122,894 Hasbro, Inc. 1,946,448 0.1
Copyright © 2021 www.secdatabase.com. All Rights Reserved.Please Consider the Environment Before Printing This Document

Voya Russell™ Mid Cap Index PortfolioPORTFOLIO OF INVESTMENTS
as of March 31, 2019 (Unaudited) (Continued)
Shares ValuePercentage
of NetAssets
COMMON STOCK: (continued)Consumer Discretionary: (continued)
19,066 (1) Hilton Grand Vacations, Inc. $ 588,186 0.054,364 Hilton Worldwide Holdings, Inc. 4,518,192 0.3
7,811 Hyatt Hotels Corp. 566,844 0.019,424 (2) International Game Technology PLC 252,318 0.032,351 Kohl's Corp. 2,224,778 0.145,142 L Brands, Inc. 1,245,016 0.112,308 Lear Corp. 1,670,319 0.125,829 Leggett & Platt, Inc. 1,090,500 0.155,538 Lennar Corp. - Class A 2,726,360 0.2
3,079 Lennar Corp. - Class B 120,450 0.062,502 (1) LKQ Corp. 1,773,807 0.118,834 (1) Lululemon Athletica, Inc. 3,086,328 0.260,335 Macy's, Inc. 1,449,850 0.167,856 (1),(2) Mattel, Inc. 882,128 0.198,778 MGM Resorts International 2,534,643 0.218,575 (1) Michaels Cos, Inc. 212,127 0.012,272 (1) Mohawk Industries, Inc. 1,548,113 0.185,514 Newell Brands, Inc. 1,311,785 0.123,204 Nordstrom, Inc. 1,029,794 0.143,280 (1) Norwegian Cruise Line Holdings Ltd. 2,378,669 0.2
617 (1) NVR, Inc. 1,707,239 0.115,295 (1) O'Reilly Automotive, Inc. 5,939,049 0.4
6,986 Penske Auto Group, Inc. 311,925 0.011,559 Polaris Industries, Inc. 975,926 0.17,755 Pool Corp. 1,279,342 0.1
49,634 Pulte Group, Inc. 1,387,767 0.114,841 PVH Corp. 1,809,860 0.181,823 (1) Qurate Retail, Inc. 1,307,532 0.110,311 Ralph Lauren Corp. 1,337,130 0.172,072 Ross Stores, Inc. 6,709,903 0.532,842 Royal Caribbean Cruises Ltd. 3,764,350 0.334,286 Service Corp. International 1,376,583 0.126,757 (1) ServiceMaster Global Holdings, Inc. 1,249,552 0.114,222 Six Flags Entertainment Corp. 701,856 0.025,807 (1) Skechers USA, Inc. 867,373 0.156,831 Tapestry, Inc. 1,846,439 0.1
9,134 (1) Tempur Sealy International, Inc. 526,758 0.09,894 Thor Industries, Inc. 617,089 0.0
23,989 Tiffany & Co. 2,532,039 0.226,670 Toll Brothers, Inc. 965,454 0.124,057 Tractor Supply Co. 2,351,812 0.211,154 (1) Ulta Beauty, Inc. 3,889,734 0.336,616 (1) Under Armour, Inc. - Class A 774,062 0.137,430 (1) Under Armour, Inc. - Class C 706,304 0.014,555 (1) Urban Outfitters, Inc. 431,410 0.0
7,906 Vail Resorts, Inc. 1,717,974 0.1
Copyright © 2021 www.secdatabase.com. All Rights Reserved.Please Consider the Environment Before Printing This Document

63,829 VF Corp. 5,547,378 0.45,694 (1) Visteon Corp. 383,491 0.0
11,269 (1),(2) Wayfair, Inc. 1,672,883 0.136,695 Wendy's Company 656,474 0.012,320 Whirlpool Corp. 1,637,205 0.115,783 Williams-Sonoma, Inc. 888,109 0.118,847 Wyndham Destinations, Inc. 763,115 0.119,298 Wyndham Hotels & Resorts, Inc. 964,707 0.120,281 Wynn Resorts Ltd. 2,419,929 0.271,689 Yum China Holdings, Inc. 3,219,553 0.2
172,057,909 11.7
Consumer Staples: 4.1%110,180 Archer-Daniels-Midland Co. 4,752,063 0.310,121 Brown-Forman Corp. - Class A 517,892 0.055,040 Brown-Forman Corp. - Class B 2,905,011 0.227,760 Bunge Ltd. 1,473,223 0.134,947 Campbell Soup Co. 1,332,529 0.1
7,162 Casey's General Stores, Inc. 922,251 0.148,206 Church & Dwight Co., Inc. 3,433,713 0.225,321 Clorox Co. 4,063,008 0.395,128 Conagra Brands, Inc. 2,638,851 0.291,841 Coty, Inc - Class A 1,056,171 0.112,420 Energizer Holdings, Inc. 558,031 0.035,347 Flowers Foods, Inc. 753,598 0.118,036 (1) Hain Celestial Group, Inc. 416,992 0.021,379 (1) Herbalife Nutrition Ltd 1,132,873 0.127,680 Hershey Co. 3,178,494 0.253,572 (2) Hormel Foods Corp. 2,397,883 0.213,064 Ingredion, Inc. 1,237,030 0.121,703 JM Smucker Co. 2,528,400 0.248,980 Kellogg Co. 2,810,472 0.235,805 Keurig Dr Pepper, Inc. 1,001,466 0.1
156,525 Kroger Co. 3,850,515 0.328,881 Lamb Weston Holdings, Inc. 2,164,342 0.124,234 McCormick & Co., Inc. 3,650,367 0.334,223 Molson Coors Brewing Co. 2,041,402 0.110,836 Nu Skin Enterprises, Inc. 518,611 0.010,431 (1) Pilgrim's Pride Corp. 232,507 0.012,767 (1) Post Holdings, Inc. 1,396,710 0.1
51 Seaboard Corp. 218,520 0.07,986 Spectrum Brands Holdings, Inc. 437,473 0.0
24,677 (1) Sprouts Farmers Market, Inc. 531,543 0.010,734 (1) TreeHouse Foods, Inc. 692,880 0.057,370 Tyson Foods, Inc. 3,983,199 0.342,466 (1) US Foods Holding Corp. 1,482,488 0.1
60,310,508 4.1
Energy: 4.1%47,579 (1) Antero Resources Corp. 420,123 0.075,370 Apache Corp. 2,612,324 0.215,298 (1) Apergy Corp. 628,136 0.083,948 Cabot Oil & Gas Corp. 2,191,043 0.2
Copyright © 2021 www.secdatabase.com. All Rights Reserved.Please Consider the Environment Before Printing This Document

Voya Russell™ Mid Cap Index PortfolioPORTFOLIO OF INVESTMENTS
as of March 31, 2019 (Unaudited) (Continued)
Shares ValuePercentage
of NetAssets
COMMON STOCK: (continued)Energy: (continued)
36,077 (1) Centennial Resource Development, Inc./DE $ 317,117 0.045,520 (1) Cheniere Energy, Inc. 3,111,747 0.2
205,797 (1),(2) Chesapeake Energy Corp. 637,971 0.019,554 Cimarex Energy Co. 1,366,825 0.138,473 (1) CNX Resources Corp. 414,354 0.038,378 Concho Resources, Inc./Midland TX 4,258,423 0.317,231 (1) Continental Resources, Inc. 771,432 0.192,197 Devon Energy Corp. 2,909,737 0.230,987 Diamondback Energy, Inc. 3,146,110 0.250,063 EQT Corp. 1,038,307 0.141,793 Equitrans Midstream Corp. 910,251 0.121,983 (1) Extraction Oil & Gas, Inc. 92,988 0.020,925 Helmerich & Payne, Inc. 1,162,593 0.151,600 Hess Corp. 3,107,868 0.231,340 HollyFrontier Corp. 1,544,122 0.150,214 Kosmos Energy Ltd. 312,833 0.0
163,565 Marathon Oil Corp. 2,733,171 0.232,340 Murphy Oil Corp. 947,562 0.168,215 Nabors Industries Ltd. 234,660 0.075,354 National Oilwell Varco, Inc. 2,007,430 0.194,658 Noble Energy, Inc. 2,340,892 0.280,856 Oneok, Inc. 5,646,983 0.452,121 (1) Parsley Energy, Inc. 1,005,935 0.142,241 Patterson-UTI Energy, Inc. 592,219 0.023,477 PBF Energy, Inc. 731,074 0.146,571 (1) QEP Resources, Inc. 362,788 0.041,569 Range Resources Corp. 467,235 0.011,217 (2) RPC, Inc. 127,986 0.021,879 SM Energy Co. 382,664 0.044,544 Targa Resources Corp. 1,850,803 0.1
101,801 (1) Transocean Ltd. 886,687 0.1196,308 (1) Weatherford International PLC 137,023 0.0
17,678 (1) Whiting Petroleum Corp. 462,103 0.0235,208 Williams Cos., Inc. 6,755,174 0.5
78,255 (1) WPX Energy, Inc. 1,025,923 0.159,652,616 4.1
Financials: 12.5%10,353 Affiliated Managers Group, Inc. 1,108,910 0.1
105,625 AGNC Investment Corp. 1,901,250 0.12,834 (1) Alleghany Corp. 1,735,542 0.1
80,004 Ally Financial, Inc. 2,199,310 0.114,159 American Financial Group, Inc. 1,362,237 0.1
1,458 American National Insurance Co. 176,156 0.026,868 Ameriprise Financial, Inc. 3,441,791 0.2
272,795 Annaly Capital Management, Inc. 2,725,222 0.2
Copyright © 2021 www.secdatabase.com. All Rights Reserved.Please Consider the Environment Before Printing This Document

76,360 (1) Arch Capital Group Ltd. 2,467,955 0.235,577 Arthur J. Gallagher & Co. 2,778,564 0.232,360 Associated Banc-Corp. 690,886 0.011,770 Assurant, Inc. 1,117,091 0.120,461 Assured Guaranty Ltd. 909,082 0.131,313 (1) Athene Holding Ltd. 1,277,570 0.146,911 AXA Equitable Holdings, Inc. 944,788 0.116,182 Axis Capital Holdings Ltd. 886,450 0.1
8,116 Bank of Hawaii Corp. 640,109 0.023,917 Bank OZK 693,115 0.019,159 BankUnited, Inc. 639,911 0.053,858 BGC Partners, Inc. 285,986 0.0
6,399 BOK Financial Corp. 521,838 0.023,679 (1) Brighthouse Financial, Inc. 859,311 0.145,769 Brown & Brown, Inc. 1,350,643 0.122,046 Cboe Global Markets, Inc. 2,104,070 0.136,718 Chimera Investment Corp. 688,095 0.030,289 Cincinnati Financial Corp. 2,601,825 0.219,899 CIT Group, Inc. 954,555 0.192,319 Citizens Financial Group, Inc. 3,000,367 0.2
5,568 CNA Financial Corp. 241,373 0.031,789 Comerica, Inc. 2,330,769 0.219,641 Commerce Bancshares, Inc. 1,140,356 0.1
2,162 (1) Credit Acceptance Corp. 977,073 0.111,123 Cullen/Frost Bankers, Inc. 1,079,710 0.165,176 Discover Financial Services 4,637,924 0.348,684 E*Trade Financial Corp. 2,260,398 0.228,460 East West Bancorp, Inc. 1,365,226 0.122,129 Eaton Vance Corp. 892,020 0.1
4,855 Erie Indemnity Co. 866,715 0.17,918 Evercore, Inc. 720,538 0.07,978 Everest Re Group Ltd. 1,722,929 0.17,372 Factset Research Systems, Inc. 1,830,246 0.1
151,127 Fifth Third Bancorp 3,811,423 0.321,390 First American Financial Corp. 1,101,585 0.1
1,529 First Citizens BancShares, Inc. 622,609 0.025,977 First Hawaiian, Inc. 676,701 0.062,173 First Horizon National Corp. 869,179 0.132,237 First Republic Bank 3,238,529 0.263,639 FNB Corp. 674,573 0.052,073 Fidelity National Financial, Inc. 1,903,268 0.159,311 Franklin Resources, Inc. 1,965,567 0.18,354 Hanover Insurance Group, Inc. 953,776 0.1
70,526 Hartford Financial Services Group, Inc. 3,506,553 0.2
Copyright © 2021 www.secdatabase.com. All Rights Reserved.Please Consider the Environment Before Printing This Document

Voya Russell™ Mid Cap Index PortfolioPORTFOLIO OF INVESTMENTS
as of March 31, 2019 (Unaudited) (Continued)
Shares ValuePercentage
of NetAssets
COMMON STOCK: (continued)Financials: (continued)
205,271 Huntington Bancshares, Inc. $ 2,602,836 0.214,553 Interactive Brokers Group, Inc. 755,010 0.179,986 Invesco Ltd. 1,544,530 0.154,285 Jefferies Financial Group, Inc. 1,020,015 0.1
200,147 Keycorp 3,152,315 0.222,646 Lazard Ltd. 818,426 0.116,686 Legg Mason, Inc. 456,696 0.042,064 Lincoln National Corp. 2,469,157 0.254,879 Loews Corp. 2,630,350 0.216,627 LPL Financial Holdings, Inc. 1,158,071 0.127,275 M&T Bank Corp. 4,282,721 0.3
2,679 (1) Markel Corp. 2,668,927 0.27,224 MarketAxess Holdings, Inc. 1,777,682 0.15,384 Mercury General Corp. 269,577 0.0
88,083 MFA Financial, Inc. 640,363 0.032,881 Moody's Corp. 5,954,420 0.4
3,579 Morningstar, Inc. 450,918 0.016,270 MSCI, Inc. - Class A 3,235,127 0.222,783 Nasdaq, Inc. 1,993,285 0.148,101 Navient Corp. 556,529 0.079,318 New Residential Investment Corp. 1,341,267 0.190,669 New York Community Bancorp., Inc. 1,049,040 0.139,827 Northern Trust Corp. 3,600,759 0.255,833 Old Republic International Corp. 1,168,026 0.115,055 OneMain Holdings, Inc. 477,996 0.024,204 PacWest Bancorp 910,312 0.176,300 People's United Financial, Inc. 1,254,372 0.114,775 Pinnacle Financial Partners, Inc. 808,193 0.119,485 Popular, Inc. 1,015,753 0.154,443 Principal Financial Group, Inc. 2,732,494 0.213,115 Prosperity Bancshares, Inc. 905,722 0.125,026 Raymond James Financial, Inc. 2,012,341 0.1
203,870 Regions Financial Corp. 2,884,761 0.212,371 Reinsurance Group of America, Inc. 1,756,435 0.1
7,838 RenaissanceRe Holdings Ltd. 1,124,753 0.122,779 Santander Consumer USA Holdings, Inc. 481,320 0.025,558 SEI Investments Co. 1,335,406 0.110,289 Signature Bank 1,317,712 0.185,776 SLM Corp. 850,040 0.152,893 Starwood Property Trust, Inc. 1,182,159 0.142,132 Sterling Bancorp 784,919 0.188,576 SunTrust Banks, Inc. 5,248,128 0.410,426 (1) SVB Financial Group 2,318,325 0.2
142,017 Synchrony Financial 4,530,342 0.331,621 Synovus Financial Corp. 1,086,498 0.145,802 T. Rowe Price Group, Inc. 4,585,696 0.3
Copyright © 2021 www.secdatabase.com. All Rights Reserved.Please Consider the Environment Before Printing This Document

31,643 TCF Financial Corp. 654,694 0.09,878 (1) Texas Capital Bancshares, Inc. 539,240 0.09,758 TFS Financial Corp. 160,714 0.0
20,415 Torchmark Corp. 1,673,009 0.148,414 Two Harbors Investment Corp. 655,041 0.043,210 Umpqua Holdings Corp. 712,965 0.040,087 Unum Group 1,356,143 0.1
8,052 Virtu Financial, Inc. 191,235 0.029,752 (3) Voya Financial, Inc. 1,486,410 0.118,012 Webster Financial Corp. 912,668 0.119,367 (1) Western Alliance Bancorp. 794,822 0.1
605 White Mountains Insurance Group Ltd. 559,915 0.025,592 Willis Towers Watson PLC 4,495,235 0.310,999 Wintrust Financial Corp. 740,563 0.118,731 WR Berkley Corp. 1,586,890 0.136,495 Zions Bancorp NA 1,657,238 0.1
182,828,175 12.5
Health Care: 10.1%8,416 (1) Abiomed, Inc. 2,403,525 0.2
17,055 (1) Acadia Healthcare Co., Inc. 499,882 0.062,872 Agilent Technologies, Inc. 5,053,651 0.3
9,970 (1),(2) Agios Pharmaceuticals, Inc. 672,377 0.015,634 (1) Align Technology, Inc. 4,445,215 0.330,324 (1) Alkermes PLC 1,106,523 0.118,595 (1) Alnylam Pharmaceuticals, Inc. 1,737,703 0.130,319 AmerisourceBergen Corp. 2,410,967 0.234,809 (1) BioMarin Pharmaceutical, Inc. 3,092,083 0.2
4,170 (1) Bio-Rad Laboratories, Inc. 1,274,686 0.17,327 Bio-Techne Corp. 1,454,776 0.1
10,670 (1) Bluebird Bio, Inc. 1,678,711 0.119,795 Bruker Corp. 760,920 0.1
7,256 Cantel Medical Corp. 485,354 0.058,788 Cardinal Health, Inc. 2,830,642 0.228,453 (1) Catalent, Inc. 1,154,907 0.180,053 (1) Centene Corp. 4,250,814 0.361,118 (1) Cerner Corp. 3,496,561 0.29,319 (1) Charles River Laboratories International, Inc. 1,353,585 0.13,057 Chemed Corp. 978,454 0.19,540 Cooper Cos., Inc. 2,825,462 0.2
11,970 (1) Covetrus, Inc. 381,244 0.025,560 (1) DaVita, Inc. 1,387,652 0.143,121 Dentsply Sirona, Inc. 2,138,370 0.117,217 (1) DexCom, Inc. 2,050,545 0.141,424 (1) Edwards Lifesciences Corp. 7,925,654 0.5
Copyright © 2021 www.secdatabase.com. All Rights Reserved.Please Consider the Environment Before Printing This Document

Voya Russell™ Mid Cap Index PortfolioPORTFOLIO OF INVESTMENTS
as of March 31, 2019 (Unaudited) (Continued)
Shares ValuePercentage
of NetAssets
COMMON STOCK: (continued)Health Care: (continued)
65,707 (1) Elanco Animal Health, Inc. $ 2,107,223 0.119,301 Encompass Health Corp. 1,127,178 0.123,595 (1) Exact Sciences Corp. 2,043,799 0.157,820 (1) Exelixis, Inc. 1,376,116 0.129,924 (1) Henry Schein, Inc. 1,798,732 0.113,035 Hill-Rom Holdings, Inc. 1,379,885 0.152,488 (1) Hologic, Inc. 2,540,419 0.2
3,073 (1) ICU Medical, Inc. 735,461 0.116,933 (1) Idexx Laboratories, Inc. 3,786,219 0.334,598 (1) Incyte Corp., Ltd. 2,975,774 0.211,511 (1) Insulet Corp. 1,094,581 0.113,958 (1) Integra LifeSciences Holdings Corp. 777,740 0.124,609 (1) Ionis Pharmaceuticals, Inc. 1,997,513 0.134,208 (1) IQVIA Holdings, Inc. 4,920,821 0.311,588 (1) Jazz Pharmaceuticals PLC 1,656,505 0.119,847 (1) Laboratory Corp. of America Holdings 3,036,194 0.2
9,095 (1) Masimo Corp. 1,257,657 0.117,242 (1) Mednax, Inc. 468,465 0.0
4,840 (1) Mettler Toledo International, Inc. 3,499,320 0.25,196 (1),(2) Moderna, Inc. 105,739 0.0
12,257 (1) Molina Healthcare, Inc. 1,740,004 0.1101,262 (1) Mylan NV 2,869,765 0.2
30,794 (1) Nektar Therapeutics 1,034,678 0.117,745 (1) Neurocrine Biosciences, Inc. 1,563,334 0.1
6,037 (1) Penumbra, Inc. 887,499 0.121,686 PerkinElmer, Inc. 2,089,663 0.125,182 Perrigo Co. PLC 1,212,765 0.111,396 (1) PRA Health Sciences, Inc. 1,256,865 0.110,281 (1) Premier, Inc. 354,592 0.043,706 (1) QIAGEN NV 1,777,960 0.126,763 Quest Diagnostics, Inc. 2,406,529 0.227,727 Resmed, Inc. 2,882,776 0.2
9,595 (1) Sage Therapeutics, Inc. 1,526,085 0.113,079 (1) Sarepta Therapeutics, Inc. 1,558,886 0.121,375 (1) Seattle Genetics, Inc. 1,565,505 0.116,506 (1) STERIS Public Ltd. Co. 2,113,263 0.1
8,984 Teleflex, Inc. 2,714,605 0.28,464 (1) United Therapeutics Corp. 993,420 0.1
16,489 Universal Health Services, Inc. 2,205,734 0.218,037 (1) Varian Medical Systems, Inc. 2,556,204 0.224,608 (1) Veeva Systems, Inc. 3,121,771 0.214,832 (1) Waters Corp. 3,733,363 0.3
9,825 (1) WellCare Health Plans, Inc. 2,650,294 0.214,415 West Pharmaceutical Services, Inc. 1,588,533 0.140,172 Zimmer Biomet Holdings, Inc. 5,129,964 0.4
148,069,661 10.1
Copyright © 2021 www.secdatabase.com. All Rights Reserved.Please Consider the Environment Before Printing This Document

Industrials: 13.5%7,860 Acuity Brands, Inc. 943,279 0.1
20,975 (2) ADT, Inc. 134,030 0.030,691 (1) AECOM 910,602 0.112,919 AGCO Corp. 898,516 0.119,140 Air Lease Corp. 657,459 0.023,699 Alaska Air Group, Inc. 1,329,988 0.118,716 Allegion Public Ltd. 1,697,728 0.122,598 Allison Transmission Holdings, Inc. 1,015,102 0.1
1,378 AMERCO 511,941 0.081,551 American Airlines Group, Inc. 2,590,060 0.245,033 Ametek, Inc. 3,736,388 0.228,018 AO Smith Corp. 1,493,920 0.185,313 Arconic, Inc. 1,630,331 0.1
9,562 Arcosa, Inc. 292,119 0.08,486 Armstrong World Industries, Inc. 673,958 0.0
19,615 BWX Technologies, Inc. 972,512 0.111,511 Carlisle Cos., Inc. 1,411,479 0.126,927 CH Robinson Worldwide, Inc. 2,342,380 0.216,868 Cintas Corp. 3,409,191 0.210,147 (1) Clean Harbors, Inc. 725,815 0.016,676 (1) Colfax Corp. 494,944 0.0
6,159 Copa Holdings S.A.- Class A 496,477 0.039,965 (1) Copart, Inc. 2,421,479 0.2
7,052 (1) CoStar Group, Inc. 3,289,194 0.29,853 Crane Co. 833,761 0.1
29,355 Cummins, Inc. 4,634,274 0.38,667 Curtiss-Wright Corp. 982,318 0.1
25,276 Donaldson Co., Inc. 1,265,317 0.128,560 Dover Corp. 2,678,928 0.223,574 Equifax, Inc. 2,793,519 0.233,925 Expeditors International Washington, Inc. 2,574,907 0.256,677 Fastenal Co. 3,644,898 0.225,795 Flowserve Corp. 1,164,386 0.127,654 Fluor Corp. 1,017,667 0.157,922 Fortive Corp. 4,859,077 0.327,981 Fortune Brands Home & Security, Inc. 1,332,175 0.124,911 (1) Gardner Denver Holdings, Inc. 692,775 0.08,755 (1) Gates Industrial Corp. PLC 125,547 0.0
11,389 (1) Genesee & Wyoming, Inc. 992,437 0.132,610 Graco, Inc. 1,614,847 0.111,497 GrafTech International Ltd. 147,047 0.023,386 Harris Corp. 3,734,978 0.235,104 (1) HD Supply Holdings, Inc. 1,521,758 0.1
7,662 Heico Corp. 726,894 0.014,937 Heico Corp. - Class A 1,255,604 0.1
Copyright © 2021 www.secdatabase.com. All Rights Reserved.Please Consider the Environment Before Printing This Document

Voya Russell™ Mid Cap Index PortfolioPORTFOLIO OF INVESTMENTS
as of March 31, 2019 (Unaudited) (Continued)
Shares ValuePercentage
of NetAssets
COMMON STOCK: (continued)Industrials: (continued)
16,695 Hexcel Corp. $ 1,154,626 0.110,769 Hubbell, Inc. 1,270,527 0.1
8,379 Huntington Ingalls Industries, Inc. 1,736,129 0.115,112 IDEX Corp. 2,293,095 0.276,351 (1) IHS Markit Ltd. 4,151,967 0.348,322 Ingersoll-Rand PLC - Class A 5,216,360 0.417,225 ITT, Inc. 999,050 0.124,735 Jacobs Engineering Group, Inc. 1,859,825 0.117,174 JB Hunt Transport Services, Inc. 1,739,554 0.160,058 (1) JetBlue Airways Corp. 982,549 0.119,859 Kansas City Southern 2,303,247 0.226,529 KAR Auction Services, Inc. 1,361,203 0.111,624 (1) Kirby Corp. 873,079 0.124,866 Knight-Swift Transportation Holdings, Inc. 812,621 0.115,437 L3 Technologies, Inc. 3,185,734 0.2
7,871 Landstar System, Inc. 861,009 0.17,064 Lennox International, Inc. 1,867,722 0.1
12,198 Lincoln Electric Holdings, Inc. 1,023,046 0.115,673 Macquarie Infrastructure Co. LLC 646,041 0.012,154 Manpowergroup, Inc. 1,005,014 0.157,890 Masco Corp. 2,275,656 0.210,797 (1) Middleby Corp. 1,403,934 0.1
8,680 MSC Industrial Direct Co. 717,923 0.070,317 Nielsen Holdings PLC 1,664,403 0.111,414 Nordson Corp. 1,512,583 0.131,717 nVent Electric PLC 855,725 0.112,987 Old Dominion Freight Line 1,875,193 0.113,741 Oshkosh Corp. 1,032,361 0.121,334 Owens Corning, Inc. 1,005,258 0.166,718 Paccar, Inc. 4,546,165 0.325,453 Parker Hannifin Corp. 4,368,244 0.330,874 Pentair PLC 1,374,202 0.128,764 Quanta Services, Inc. 1,085,553 0.1
8,516 Regal Beloit Corp. 697,205 0.042,914 Republic Services, Inc. 3,449,427 0.223,311 Robert Half International, Inc. 1,518,945 0.123,725 Rockwell Automation, Inc. 4,162,788 0.328,580 Rollins, Inc. 1,189,500 0.119,985 Roper Technologies, Inc. 6,834,270 0.510,261 Ryder System, Inc. 636,079 0.0
9,356 Schneider National, Inc. 196,944 0.031,925 (1) Sensata Technologies Holding PLC 1,437,263 0.110,885 Snap-On, Inc. 1,703,720 0.120,883 Spirit Aerosystems Holdings, Inc. 1,911,421 0.129,838 Stanley Black & Decker, Inc. 4,063,040 0.316,334 (1) Stericycle, Inc. 888,896 0.1
Copyright © 2021 www.secdatabase.com. All Rights Reserved.Please Consider the Environment Before Printing This Document

6,962 (1) Teledyne Technologies, Inc. 1,650,064 0.112,998 Terex Corp. 417,626 0.047,965 Textron, Inc. 2,429,907 0.213,517 Timken Co. 589,612 0.020,323 Toro Co. 1,399,035 0.1
9,559 (1) TransDigm Group, Inc. 4,339,690 0.336,277 TransUnion 2,424,755 0.228,686 Trinity Industries, Inc. 623,347 0.048,250 (1) United Continental Holdings, Inc. 3,849,385 0.315,674 (1) United Rentals, Inc. 1,790,754 0.124,676 (1) Univar, Inc. 546,820 0.016,066 USG Corp. 695,658 0.0
4,260 Valmont Industries, Inc. 554,226 0.031,638 Verisk Analytics, Inc. 4,207,854 0.310,270 (1) WABCO Holdings, Inc. 1,353,894 0.126,081 Wabtec Corp. 1,922,691 0.1
6,285 Watsco, Inc. 900,075 0.125,637 (1) Welbilt, Inc. 419,934 0.0
9,254 (1) Wesco International, Inc. 490,555 0.08,962 WW Grainger, Inc. 2,696,935 0.2
24,673 (1),(2) XPO Logistics, Inc. 1,325,927 0.135,343 Xylem, Inc. 2,793,511 0.2
197,843,357 13.5
Information Technology: 19.0%10,782 (1) 2U, Inc. 763,905 0.1
184,732 (1) Advanced Micro Devices, Inc. 4,714,361 0.331,225 (1) Akamai Technologies, Inc. 2,239,145 0.2
9,351 Alliance Data Systems Corp. 1,636,238 0.163 Amdocs Ltd. 3,409 0.0
27,172 Amdocs Ltd. 1,470,277 0.158,214 Amphenol Corp. 5,497,730 0.472,866 Analog Devices, Inc. 7,670,604 0.516,430 (1) ANSYS, Inc. 3,001,925 0.211,373 (1) Arista Networks, Inc. 3,576,354 0.232,187 (1) ARRIS International PLC 1,017,431 0.116,621 (1) Arrow Electronics, Inc. 1,280,814 0.113,734 (1) Aspen Technology, Inc. 1,431,907 0.119,805 (1) Atlassian Corp. PLC 2,225,884 0.243,269 (1) Autodesk, Inc. 6,742,176 0.521,220 Avnet, Inc. 920,311 0.127,994 (1) Black Knight, Inc. 1,525,673 0.126,979 Booz Allen Hamilton Holding Corp. 1,568,559 0.122,830 Broadridge Financial Solutions, Inc. ADR 2,367,243 0.255,067 (1) Cadence Design Systems, Inc. 3,497,305 0.224,600 CDK Global, Inc. 1,446,972 0.128,874 CDW Corp. 2,782,587 0.2
9,557 (1) Ceridian HCM Holding, Inc. 490,274 0.026,681 Citrix Systems, Inc. 2,659,028 0.2
Copyright © 2021 www.secdatabase.com. All Rights Reserved.Please Consider the Environment Before Printing This Document

Voya Russell™ Mid Cap Index PortfolioPORTFOLIO OF INVESTMENTS
as of March 31, 2019 (Unaudited) (Continued)
Shares ValuePercentage
of NetAssets
COMMON STOCK: (continued)Information Technology: (continued)
32,599 Cognex Corp. $ 1,657,985 0.14,765 (1) Coherent, Inc. 675,296 0.0
37,420 (1) CommScope Holding Co., Inc. 813,137 0.137,550 (1) Conduent, Inc. 519,316 0.015,833 (1) CoreLogic, Inc. 589,938 0.0
155,485 Corning, Inc. 5,146,553 0.370,633 Cypress Semiconductor Corp. 1,053,844 0.129,522 (1) Dell Technologies, Inc. 1,732,646 0.115,415 (1) DocuSign, Inc. 799,114 0.112,279 Dolby Laboratories, Inc. 773,209 0.152,877 DXC Technology Co. 3,400,520 0.2
9,418 (1) EchoStar Corp. 343,286 0.01,592 (1),(2) Elastic NV 127,153 0.0
10,113 (1) EPAM Systems, Inc. 1,710,412 0.19,704 (1) Euronet Worldwide, Inc. 1,383,693 0.1
11,722 (1) F5 Networks, Inc. 1,839,533 0.15,654 (1) Fair Isaac Corp. 1,535,796 0.1
64,359 Fidelity National Information Services, Inc. 7,279,003 0.538,114 (1) FireEye, Inc. 639,934 0.0
107,256 (1) First Data Corp. 2,817,615 0.216,157 (1) First Solar, Inc. 853,736 0.178,636 (1) Fiserv, Inc. 6,941,986 0.516,813 (1) FleetCor Technologies, Inc. 4,145,918 0.326,506 Flir Systems, Inc. 1,261,155 0.127,793 (1) Fortinet, Inc. 2,333,778 0.217,462 (1) Gartner, Inc. 2,648,636 0.230,676 Genpact Ltd. 1,079,182 0.131,333 Global Payments, Inc. 4,277,581 0.333,265 (1) GoDaddy, Inc. 2,501,195 0.215,981 (1) Guidewire Software, Inc. 1,552,714 0.1
7,106 (1) IPG Photonics Corp. 1,078,549 0.129,813 Jabil, Inc. 792,728 0.115,175 Jack Henry & Associates, Inc. 2,105,379 0.167,289 Juniper Networks, Inc. 1,781,140 0.136,913 (1) Keysight Technologies, Inc. 3,218,814 0.232,071 KLA-Tencor Corp. 3,829,598 0.330,093 Lam Research Corp. 5,386,948 0.427,829 Leidos Holdings, Inc. 1,783,561 0.1
4,749 Littelfuse, Inc. 866,598 0.19,929 LogMeIn, Inc. 795,313 0.1
12,729 (1) Manhattan Associates, Inc. 701,495 0.0109,296 Marvell Technology Group Ltd. 2,173,897 0.1
53,658 Maxim Integrated Products 2,852,996 0.245,882 Microchip Technology, Inc. 3,806,371 0.310,527 MKS Instruments, Inc. 979,537 0.1
8,019 Monolithic Power Systems, Inc. 1,086,494 0.1
Copyright © 2021 www.secdatabase.com. All Rights Reserved.Please Consider the Environment Before Printing This Document

31,971 Motorola Solutions, Inc. 4,489,368 0.321,770 National Instruments Corp. 965,717 0.123,256 (1) NCR Corp. 634,656 0.049,779 NetApp, Inc. 3,451,676 0.256,270 (1) Nuance Communications, Inc. 952,651 0.127,593 (1) Nutanix, Inc. 1,041,360 0.117,149 (1) Okta, Inc. 1,418,737 0.182,202 (1) ON Semiconductor Corp. 1,690,895 0.117,946 (1) Palo Alto Networks, Inc. 4,358,724 0.363,323 Paychex, Inc. 5,078,505 0.3
9,487 (1) Paycom Software, Inc. 1,794,276 0.17,416 Pegasystems, Inc. 482,040 0.0
10,665 (1) Pluralsight, Inc. 338,507 0.09,913 (1) Proofpoint, Inc. 1,203,736 0.1
23,024 (1) PTC, Inc. 2,122,352 0.132,415 (1) Pure Storage, Inc. 706,323 0.024,177 (1) Qorvo, Inc. 1,734,216 0.114,100 (1) RealPage, Inc. 855,729 0.134,929 (1) Red Hat, Inc. 6,381,528 0.413,451 (1) RingCentral, Inc. 1,450,018 0.154,330 Sabre Corp. 1,162,119 0.135,081 (1) ServiceNow, Inc. 8,647,116 0.634,267 Skyworks Solutions, Inc. 2,826,342 0.2
4,988 (1),(2) SolarWinds Corp. 97,366 0.028,892 (1) Splunk, Inc. 3,599,943 0.257,691 (1) Square, Inc. 4,322,210 0.342,424 SS&C Technologies Holdings, Inc. 2,701,985 0.2
7,453 Switch, Inc. 76,840 0.0125,449 Symantec Corp. 2,884,072 0.2
29,184 (1) Synopsys, Inc. 3,360,538 0.214,069 (1) Tableau Software, Inc. 1,790,702 0.123,391 (1) Teradata Corp. 1,021,017 0.135,314 Teradyne, Inc. 1,406,910 0.135,497 Total System Services, Inc. 3,372,570 0.249,172 (1) Trimble, Inc. 1,986,549 0.117,346 (1),(2) Twilio, Inc. 2,240,756 0.2
7,526 (1) Tyler Technologies, Inc. 1,538,314 0.12,961 (2) Ubiquiti Networks, Inc. 443,291 0.05,990 (1) Ultimate Software Group, Inc. 1,977,479 0.18,383 Universal Display Corp. 1,281,342 0.1
20,248 (1) VeriSign, Inc. 3,676,227 0.221,425 Versum Materials, Inc. 1,077,892 0.157,182 Western Digital Corp. 2,748,167 0.287,011 Western Union Co. 1,607,093 0.18,131 (1) WEX, Inc. 1,561,071 0.1
28,638 (1) Workday, Inc. 5,522,838 0.459,047 (1) Worldpay, Inc. 6,701,834 0.539,666 Xerox Corp. 1,268,519 0.150,242 Xilinx, Inc. 6,370,183 0.410,402 (1) Zebra Technologies Corp. 2,179,531 0.120,733 (1) Zendesk, Inc. 1,762,305 0.1
278,567,529 19.0
Materials: 4.9%20,834 Albemarle Corp. 1,707,971 0.1
Copyright © 2021 www.secdatabase.com. All Rights Reserved.Please Consider the Environment Before Printing This Document

36,842 (1) Alcoa Corp. 1,037,471 0.112,256 Aptargroup, Inc. 1,303,916 0.1
3,636 Ardagh Group SA 47,268 0.0
Copyright © 2021 www.secdatabase.com. All Rights Reserved.Please Consider the Environment Before Printing This Document

Voya Russell™ Mid Cap Index PortfolioPORTFOLIO OF INVESTMENTS
as of March 31, 2019 (Unaudited) (Continued)
Shares ValuePercentage
of NetAssets
COMMON STOCK: (continued)Materials: (continued)
12,286 Ashland Global Holdings, Inc. $ 959,905 0.117,034 Avery Dennison Corp. 1,924,842 0.140,805 (1) Axalta Coating Systems Ltd. 1,028,694 0.165,870 Ball Corp. 3,811,238 0.317,848 Bemis Co., Inc. 990,207 0.125,684 (1) Berry Global Group, Inc. 1,383,597 0.111,511 Cabot Corp. 479,203 0.025,235 Celanese Corp. 2,488,423 0.245,478 CF Industries Holdings, Inc. 1,859,141 0.133,753 Chemours Co. 1,254,262 0.125,483 (1) Crown Holdings, Inc. 1,390,607 0.112,307 Domtar Corp. 611,043 0.0
8,774 Eagle Materials, Inc. 739,648 0.127,525 Eastman Chemical Co. 2,088,597 0.143,751 (1) Element Solutions, Inc. 441,885 0.026,436 FMC Corp. 2,030,814 0.1
285,483 Freeport-McMoRan, Inc. 3,679,876 0.358,933 Graphic Packaging Holding Co. 744,324 0.143,008 Huntsman Corp. 967,250 0.119,899 International Flavors & Fragrances, Inc. 2,562,792 0.280,656 International Paper Co. 3,731,953 0.312,390 Martin Marietta Materials, Inc. 2,492,620 0.269,237 Mosaic Co. 1,890,862 0.1
1,488 NewMarket Corp. 645,137 0.0105,163 Newmont Mining Corp. 3,761,681 0.3
60,290 Nucor Corp. 3,517,922 0.232,516 Olin Corp. 752,420 0.131,391 Owens-Illinois, Inc. 595,801 0.018,430 Packaging Corp. of America 1,831,573 0.113,468 Reliance Steel & Aluminum Co. 1,215,622 0.112,844 Royal Gold, Inc. 1,167,905 0.125,484 RPM International, Inc. 1,479,091 0.1
7,925 Scotts Miracle-Gro Co. 622,747 0.030,837 Sealed Air Corp. 1,420,352 0.115,248 Silgan Holdings, Inc. 451,798 0.019,383 Sonoco Products Co. 1,192,636 0.143,401 Steel Dynamics, Inc. 1,530,753 0.134,757 United States Steel Corp. 677,414 0.037,100 Valvoline, Inc. 688,576 0.025,926 Vulcan Materials Co. 3,069,638 0.2
7,173 Westlake Chemical Corp. 486,760 0.049,552 WestRock Co. 1,900,319 0.113,089 WR Grace & Co. 1,021,466 0.1
71,678,020 4.9
Real Estate: 9.2%
Copyright © 2021 www.secdatabase.com. All Rights Reserved.Please Consider the Environment Before Printing This Document

21,978 Alexandria Real Estate Equities, Inc. 3,133,184 0.226,851 American Campus Communities, Inc. 1,277,571 0.150,968 American Homes 4 Rent 1,157,993 0.130,576 Apartment Investment & Management Co. 1,537,667 0.142,699 Apple Hospitality REIT, Inc. 695,994 0.027,235 AvalonBay Communities, Inc. 5,466,882 0.430,469 Boston Properties, Inc. 4,079,190 0.334,615 Brandywine Realty Trust 548,994 0.059,462 Brixmor Property Group, Inc. 1,092,317 0.124,736 Brookfield Property REIT, Inc. 506,841 0.017,503 Camden Property Trust 1,776,554 0.162,665 (1) CBRE Group, Inc. 3,098,784 0.294,767 Colony Capital, Inc. 504,160 0.023,319 Columbia Property Trust, Inc. 524,911 0.0
7,172 Coresite Realty Corp. 767,547 0.120,345 Corporate Office Properties Trust SBI MD 555,418 0.036,545 CubeSmart 1,170,902 0.120,632 CyrusOne, Inc. 1,081,942 0.140,552 Digital Realty Trust, Inc. 4,825,688 0.331,657 Douglas Emmett, Inc. 1,279,576 0.170,342 Duke Realty Corp. 2,151,058 0.127,945 Empire State Realty Trust, Inc. 441,531 0.014,534 EPR Properties 1,117,665 0.123,144 Equity Commonwealth 756,577 0.116,877 Equity Lifestyle Properties, Inc. 1,929,041 0.170,800 Equity Residential 5,332,656 0.412,966 Essex Property Trust, Inc. 3,750,286 0.324,058 Extra Space Storage, Inc. 2,451,751 0.214,363 Federal Realty Investment Trust 1,979,940 0.139,740 Gaming and Leisure Properties, Inc. 1,532,772 0.194,286 HCP, Inc. 2,951,152 0.240,656 Healthcare Trust of America, Inc. 1,162,355 0.120,037 Highwoods Properties, Inc. 937,331 0.132,079 Hospitality Properties Trust 843,998 0.1
144,436 Host Hotels & Resorts, Inc. 2,729,840 0.27,650 (1) Howard Hughes Corp. 841,500 0.1
30,383 Hudson Pacific Properties, Inc. 1,045,783 0.167,393 Invitation Homes, Inc. 1,639,672 0.155,999 Iron Mountain, Inc. 1,985,725 0.120,620 JBG SMITH Properties 852,637 0.1
8,939 Jones Lang LaSalle, Inc. 1,378,215 0.119,473 Kilroy Realty Corp. 1,479,169 0.180,160 Kimco Realty Corp. 1,482,960 0.116,631 Lamar Advertising Co. 1,318,173 0.129,070 Liberty Property Trust 1,407,569 0.1
9,034 Life Storage, Inc. 878,737 0.126,812 Macerich Co. 1,162,300 0.1
Copyright © 2021 www.secdatabase.com. All Rights Reserved.Please Consider the Environment Before Printing This Document

Voya Russell™ Mid Cap Index PortfolioPORTFOLIO OF INVESTMENTS
as of March 31, 2019 (Unaudited) (Continued)
Shares ValuePercentage
of NetAssets
COMMON STOCK: (continued)Real Estate: (continued)
72,687 Medical Properties Trust, Inc. $ 1,345,436 0.122,362 Mid-America Apartment Communities, Inc. 2,444,837 0.231,224 National Retail Properties, Inc. 1,729,497 0.139,031 Omega Healthcare Investors, Inc. 1,489,033 0.127,316 Outfront Media, Inc. 639,194 0.040,312 Paramount Group, Inc. 572,027 0.039,620 Park Hotels & Resorts, Inc. 1,231,390 0.125,422 Rayonier, Inc. 801,301 0.123,184 (2) Realogy Holdings Corp. 264,298 0.058,218 Realty Income Corp. 4,282,516 0.329,953 Regency Centers Corp. 2,021,528 0.142,398 Retail Properties of America, Inc. 516,832 0.0
3,035 Retail Value, Inc. 94,601 0.022,102 (1) SBA Communications Corp. 4,412,885 0.346,357 Senior Housing Properties Trust 546,085 0.030,082 SITE Centers Corp. 409,717 0.015,944 SL Green Realty Corp. 1,433,684 0.116,868 Spirit Realty Capital, Inc. 670,166 0.037,773 Store Capital Corp. 1,265,396 0.116,577 Sun Communities, Inc. 1,964,706 0.111,678 Taubman Centers, Inc. 617,533 0.053,881 UDR, Inc. 2,449,430 0.233,108 (2) Uniti Group, Inc. 370,479 0.070,225 Ventas, Inc. 4,481,057 0.3
191,193 Vereit, Inc. 1,600,285 0.179,933 VICI Properties, Inc. 1,748,934 0.133,997 Vornado Realty Trust 2,292,758 0.223,541 Weingarten Realty Investors 691,399 0.073,436 Welltower, Inc. 5,698,634 0.4
147,860 Weyerhaeuser Co. 3,894,632 0.331,351 WP Carey, Inc. 2,455,724 0.2
135,058,502 9.2
Utilities: 6.5%130,383 AES Corp. 2,357,325 0.2
46,537 Alliant Energy Corp. 2,193,289 0.147,967 Ameren Corp. 3,527,973 0.235,631 American Water Works Co., Inc. 3,714,888 0.335,091 Aqua America, Inc. 1,278,716 0.122,590 Atmos Energy Corp. 2,325,189 0.211,060 Avangrid, Inc. 556,871 0.098,893 Centerpoint Energy, Inc. 3,036,015 0.255,553 CMS Energy Corp. 3,085,414 0.261,435 Consolidated Edison, Inc. 5,210,302 0.435,678 DTE Energy Co. 4,450,474 0.362,687 Edison International 3,881,579 0.3
Copyright © 2021 www.secdatabase.com. All Rights Reserved.Please Consider the Environment Before Printing This Document

35,668 Entergy Corp. 3,410,931 0.251,810 Evergy, Inc. 3,007,570 0.262,463 Eversource Energy 4,431,750 0.395,896 FirstEnergy Corp. 3,990,233 0.321,337 Hawaiian Electric Industries 869,909 0.138,244 MDU Resources Group, Inc. 987,842 0.116,008 National Fuel Gas Co. 975,848 0.173,300 NiSource, Inc. 2,100,778 0.157,115 NRG Energy, Inc. 2,426,245 0.239,323 OGE Energy Corp. 1,695,608 0.1
101,998 (1) PG&E Corp. 1,815,564 0.122,017 Pinnacle West Capital Corp. 2,104,385 0.1
142,377 PPL Corp. 4,519,046 0.399,536 Public Service Enterprise Group, Inc. 5,913,434 0.454,004 Sempra Energy 6,796,943 0.534,058 UGI Corp. 1,887,494 0.177,954 Vistra Energy Corp. 2,029,143 0.162,261 WEC Energy Group, Inc. 4,923,600 0.3
100,364 Xcel Energy, Inc. 5,641,460 0.495,145,818 6.5
Total Common Stock(Cost $719,890,232) 1,449,981,640 98.9
PrincipalAmount† Value
Percentageof NetAssets
SHORT-TERM INVESTMENTS: 1.5%Securities Lending Collateral(4): 0.6%
2,120,876 Bank of Nova Scotia, Repurchase Agreement dated 03/29/19, 2.67%, due 04/01/19(Repurchase Amount $2,121,341, collateralized by various U.S. GovernmentAgency Obligations, 3.500%-4.571%, Market Value plus accrued interest$2,163,775, due 12/01/33-02/01/49)
2,120,876 0.2
2,120,876 Citigroup, Inc., Repurchase Agreement dated 03/29/19, 2.65%, due 04/01/19(Repurchase Amount $2,121,338, collateralized by various U.S. Government/U.S.Government Agency Obligations, 0.000%-10.500%, Market Value plus accruedinterest $2,163,294, due 04/02/19-10/20/68)
2,120,876 0.1
Copyright © 2021 www.secdatabase.com. All Rights Reserved.Please Consider the Environment Before Printing This Document

Voya Russell™ Mid Cap Index PortfolioPORTFOLIO OF INVESTMENTS
as of March 31, 2019 (Unaudited) (Continued)
PrincipalAmount† Value
Percentageof NetAssets
SHORT-TERM INVESTMENTS: (continued)Securities Lending Collateral(4) (continued)
2,120,876 Jefferies LLC, Repurchase Agreement dated 03/29/19, 2.67%, due 04/01/19(Repurchase Amount $2,121,341, collateralized by various U.S. GovernmentAgency Obligations, 0.000%-6.625%, Market Value plus accrued interest$2,163,310, due 04/03/19-07/15/36)
$ 2,120,876 0.1
445,977 Mizuho Securities USA LLC, Repurchase Agreement dated 03/29/19, 2.57%, due04/01/19 (Repurchase Amount $446,071, collateralized by various U.S.Government Securities, 0.875%-2.875%, Market Value plus accrued interest$454,897, due 12/31/20-05/15/43)
445,977 0.0
2,120,876 MUFG Securities America Inc., Repurchase Agreement dated 03/29/19, 2.63%,due 04/01/19 (Repurchase Amount $2,121,334, collateralized by various U.S.Government/U.S. Government Agency Obligations, 3.000%-5.000%, Market Valueplus accrued interest $2,163,294, due 01/01/29-01/01/49)
2,120,876 0.2
8,929,481 0.6
Shares ValuePercentage
of NetAssets
Mutual Funds: 0.9%13,030,000 (5) Goldman Sachs Financial Square Government Fund - Institutional Shares, 2.350%
(Cost $13,030,000) 13,030,000 0.9
Total Short-Term Investments(Cost $21,959,481) 21,959,481 1.5
Total Investments in Securities(Cost $741,849,713) $ 1,471,941,121 100.4
Liabilities in Excess of Other Assets (6,105,787) (0.4)Net Assets $ 1,465,835,334 100.0
† Unless otherwise indicated, principal amount is shown in USD.ADR American Depositary Receipt(1) Non-income producing security.(2) Security, or a portion of the security, is on loan.(3) Investment in affiliate(4) Represents securities purchased with cash collateral received for securities on loan.(5) Rate shown is the 7-day yield as of March 31, 2019.
Copyright © 2021 www.secdatabase.com. All Rights Reserved.Please Consider the Environment Before Printing This Document

Voya Russell™ Mid Cap Index PortfolioPORTFOLIO OF INVESTMENTS
as of March 31, 2019 (Unaudited) (Continued)
Fair Value MeasurementsThe following is a summary of the fair valuations according to the inputs used as of March 31, 2019 in valuing the assets and liabilities:
Quoted Pricesin Active Markets
for IdenticalInvestments
(Level 1)
SignificantOther
ObservableInputs
(Level 2)
SignificantUnobservable
Inputs(Level 3)
Fair Valueat
March 31, 2019
Asset TableInvestments, at fair valueCommon Stock* $ 1,449,981,640 $ – $ – $ 1,449,981,640Short-Term Investments 13,030,000 8,929,481 – 21,959,481Total Investments, at fair value $ 1,463,011,640 $ 8,929,481 $ – $ 1,471,941,121Other Financial Instruments+Futures 321,442 – – 321,442Total Assets $ 1,463,333,082 $ 8,929,481 $ – $ 1,472,262,563
+Other Financial Instruments may include open forward foreign currency contracts, futures, centrally cleared swaps, OTC swaps and writtenoptions. Forward foreign currency contracts, futures and centrally cleared swaps are valued at the unrealized gain (loss) on the instrument. OTCswaps and written options are valued at the fair value of the instrument.
* For further breakdown of Common Stock by sector, please refer to the Portfolio of Investments.
At March 31, 2019, the following futures contracts were outstanding for Voya Russell™ Mid Cap Index Portfolio:
Description Numberof Contracts
ExpirationDate
NotionalValue
UnrealizedAppreciation/(Depreciation)
Long Contracts:S&P Midcap 400® E-Mini 86 06/21/19 $ 16,348,600 $ 321,442
$ 16,348,600 $ 321,442
At March 31, 2019, the aggregate cost of securities and other investments and the composition of unrealized appreciation and depreciation of securitiesand other investments at period end were:
Cost for federal income tax purposes was $752,417,761.
Net unrealized appreciation consisted of:
Gross Unrealized Appreciation $ 778,695,509Gross Unrealized Depreciation (58,850,707)
Net Unrealized Appreciation $ 719,844,802
Copyright © 2021 www.secdatabase.com. All Rights Reserved.Please Consider the Environment Before Printing This Document

Voya Russell™ Small Cap Index PortfolioPORTFOLIO OF INVESTMENTSas of March 31, 2019 (Unaudited)
Shares ValuePercentage
of NetAssets
COMMON STOCK: 99.0%Communication Services: 3.2%
21,198 (1) AMC Entertainment Holdings, Inc. $ 314,790 0.14,337 ATN International, Inc. 244,563 0.0
16,966 (2) Boingo Wireless, Inc. 394,968 0.12,714 (2) Boston Omaha Corp. 67,687 0.02,794 (2) Cardlytics, Inc. 46,213 0.08,323 (2) Care.com, Inc. 164,462 0.0
20,462 (2) Cargurus, Inc. 819,708 0.128,834 (2) Cars.com, Inc. 657,415 0.140,362 (2) Central European Media Enterprises Ltd. 160,641 0.018,696 (2) Cincinnati Bell, Inc. 178,360 0.016,451 (2) Clear Channel Outdoor Holdings, Inc. 88,013 0.016,888 Cogent Communications Holdings, Inc. 916,174 0.128,335 Consolidated Communications Holdings, Inc. 309,135 0.0
691 (1),(2) Daily Journal Corp. 147,943 0.011,056 Emerald Expositions Events, Inc. 140,411 0.052,884 Entercom Communications Corp. 277,641 0.028,885 Entravision Communications Corp. 93,587 0.013,785 (1),(2) Eros International PLC 125,995 0.019,218 EW Scripps Co. 403,578 0.115,331 (2) Fluent, Inc. 86,160 0.044,469 (1),(2) Frontier Communications Corp. 88,493 0.046,292 Gannett Co., Inc. 487,918 0.145,949 (2) Glu Mobile, Inc. 502,682 0.123,826 (1),(2) Gogo, Inc. 106,979 0.032,647 (2) Gray Television, Inc. 697,340 0.122,158 (2) Imax Corp. 502,543 0.122,625 (2) Intelsat SA 354,308 0.138,611 (2) Iridium Communications, Inc. 1,020,875 0.119,571 (2) Liberty Media Corp. - Braves C 543,487 0.130,154 (2) Liberty TripAdvisor Holdings, Inc. 427,885 0.145,781 (2) Liberty Latin America Ltd. 890,440 0.118,286 (2) Liberty Latin America Ltd. - Class A 353,651 0.111,999 (1),(2) LiveXLive Media, Inc. 64,555 0.06,397 (2) Loral Space & Communications, Inc. 230,612 0.08,347 Marcus Corp. 334,297 0.1
25,906 (1),(2) MDC Partners, Inc. 58,289 0.028,570 (2) Meet Group, Inc./The 143,707 0.015,969 Meredith Corp. 882,447 0.124,854 (2) MSG Networks, Inc. 540,575 0.133,111 National CineMedia, Inc. 233,433 0.025,206 New Media Investment Group, Inc. 264,663 0.052,971 (1) New York Times Co. 1,740,097 0.218,115 Nexstar Media Group, Inc. 1,963,123 0.235,974 (2) NII Holdings, Inc. 70,509 0.0
8,192 (2) Ooma, Inc. 108,462 0.031,113 (2) Orbcomm, Inc. 210,946 0.0
Copyright © 2021 www.secdatabase.com. All Rights Reserved.Please Consider the Environment Before Printing This Document
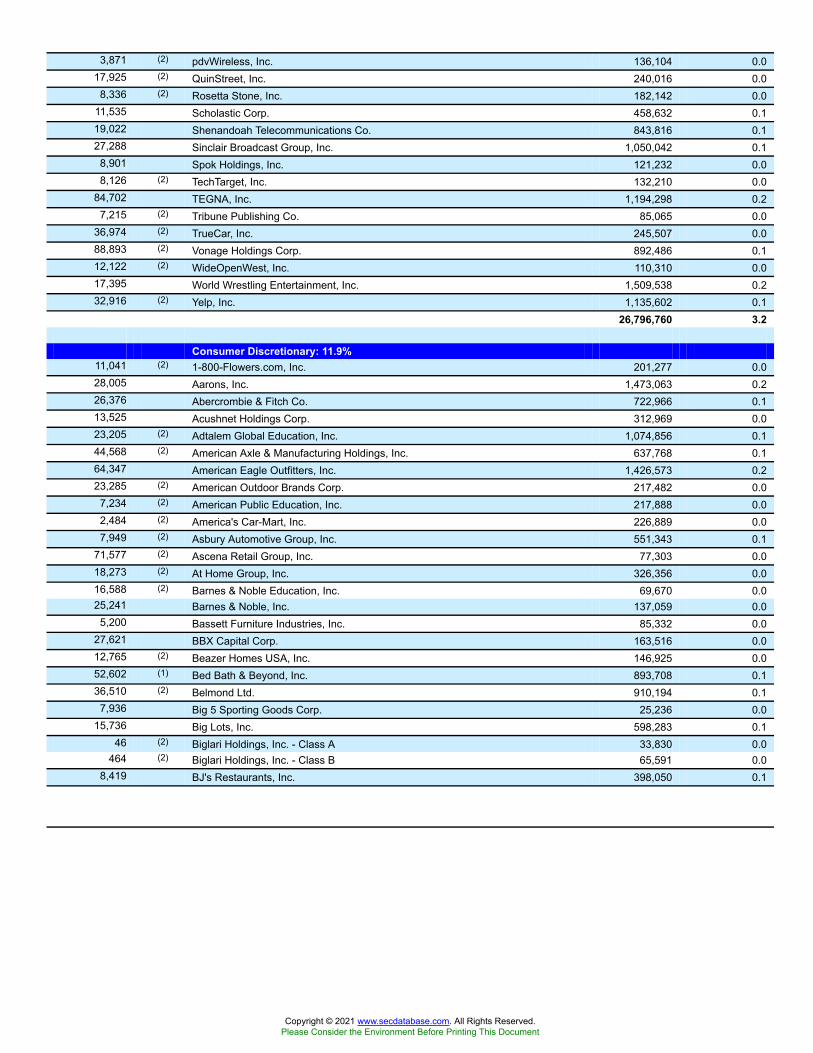
3,871 (2) pdvWireless, Inc. 136,104 0.017,925 (2) QuinStreet, Inc. 240,016 0.0
8,336 (2) Rosetta Stone, Inc. 182,142 0.011,535 Scholastic Corp. 458,632 0.119,022 Shenandoah Telecommunications Co. 843,816 0.127,288 Sinclair Broadcast Group, Inc. 1,050,042 0.1
8,901 Spok Holdings, Inc. 121,232 0.08,126 (2) TechTarget, Inc. 132,210 0.0
84,702 TEGNA, Inc. 1,194,298 0.27,215 (2) Tribune Publishing Co. 85,065 0.0
36,974 (2) TrueCar, Inc. 245,507 0.088,893 (2) Vonage Holdings Corp. 892,486 0.112,122 (2) WideOpenWest, Inc. 110,310 0.017,395 World Wrestling Entertainment, Inc. 1,509,538 0.232,916 (2) Yelp, Inc. 1,135,602 0.1
26,796,760 3.2
Consumer Discretionary: 11.9%11,041 (2) 1-800-Flowers.com, Inc. 201,277 0.028,005 Aarons, Inc. 1,473,063 0.226,376 Abercrombie & Fitch Co. 722,966 0.113,525 Acushnet Holdings Corp. 312,969 0.023,205 (2) Adtalem Global Education, Inc. 1,074,856 0.144,568 (2) American Axle & Manufacturing Holdings, Inc. 637,768 0.164,347 American Eagle Outfitters, Inc. 1,426,573 0.223,285 (2) American Outdoor Brands Corp. 217,482 0.0
7,234 (2) American Public Education, Inc. 217,888 0.02,484 (2) America's Car-Mart, Inc. 226,889 0.07,949 (2) Asbury Automotive Group, Inc. 551,343 0.1
71,577 (2) Ascena Retail Group, Inc. 77,303 0.018,273 (2) At Home Group, Inc. 326,356 0.016,588 (2) Barnes & Noble Education, Inc. 69,670 0.025,241 Barnes & Noble, Inc. 137,059 0.0
5,200 Bassett Furniture Industries, Inc. 85,332 0.027,621 BBX Capital Corp. 163,516 0.012,765 (2) Beazer Homes USA, Inc. 146,925 0.052,602 (1) Bed Bath & Beyond, Inc. 893,708 0.136,510 (2) Belmond Ltd. 910,194 0.1
7,936 Big 5 Sporting Goods Corp. 25,236 0.015,736 Big Lots, Inc. 598,283 0.1
46 (2) Biglari Holdings, Inc. - Class A 33,830 0.0464 (2) Biglari Holdings, Inc. - Class B 65,591 0.0
8,419 BJ's Restaurants, Inc. 398,050 0.1
Copyright © 2021 www.secdatabase.com. All Rights Reserved.Please Consider the Environment Before Printing This Document

Voya Russell™ Small Cap Index PortfolioPORTFOLIO OF INVESTMENTS
as of March 31, 2019 (Unaudited) (Continued)
Shares ValuePercentage
of NetAssets
COMMON STOCK: (continued)Consumer Discretionary: (continued)
33,634 Bloomin Brands, Inc. $ 687,815 0.111,506 (2) Boot Barn Holdings, Inc. 338,737 0.133,519 Boyd Gaming Corp. 917,080 0.115,071 Brinker International, Inc. 668,851 0.112,275 (1) Buckle, Inc. 229,788 0.016,958 Caleres, Inc. 418,693 0.139,092 Callaway Golf Co. 622,736 0.113,114 (1) Camping World Holdings, Inc. 182,416 0.028,406 (2) Career Education Corp. 469,267 0.116,122 (2) Carrols Restaurant Group, Inc. 160,736 0.013,141 (1),(2) Carvana Co. 762,966 0.110,058 Cato Corp. 150,669 0.0
3,446 (2) Cavco Industries, Inc. 405,008 0.16,635 (2) Century Casinos, Inc. 60,113 0.0
11,102 (2) Century Communities, Inc. 266,115 0.016,864 Cheesecake Factory 824,987 0.143,876 (2) Chegg, Inc. 1,672,553 0.252,856 Chico's FAS, Inc. 225,695 0.0
6,195 Childrens Place, Inc./The 602,650 0.114,488 Churchill Downs, Inc. 1,307,687 0.2
7,536 (2) Chuy's Holdings, Inc. 171,595 0.05,771 Citi Trends, Inc. 111,438 0.05,336 Clarus Corp. 68,354 0.08,038 (2) Conn's, Inc. 183,749 0.06,436 (2) Container Store Group, Inc. 56,637 0.0
20,709 Cooper Tire & Rubber Co. 618,992 0.17,142 (2) Cooper-Standard Holdings, Inc. 335,388 0.0
18,434 Core-Mark Holding Co., Inc. 684,454 0.17,513 Cracker Barrel Old Country Store, Inc. 1,214,176 0.2
26,626 (2) CROCS, Inc. 685,620 0.15,604 Culp, Inc. 107,765 0.0
57,776 Dana, Inc. 1,024,946 0.115,779 Dave & Buster's Entertainment, Inc. 786,899 0.111,794 (2) Deckers Outdoor Corp. 1,733,600 0.213,452 (2) Del Friscos Restaurant Group, Inc. 86,227 0.013,403 (1),(2) Del Taco Restaurants, Inc. 134,834 0.026,310 (2) Denny's Corp. 482,789 0.1
4,553 (1) Dillards, Inc. 327,907 0.06,738 Dine Brands Global, Inc. 615,112 0.1
10,866 (2) Dorman Products, Inc. 957,186 0.124,295 (2) Drive Shack, Inc. 109,085 0.027,123 DSW, Inc. 602,673 0.1
3,540 (1),(2) Duluth Holdings, Inc. 84,394 0.09,713 (2) El Pollo Loco Holdings, Inc. 126,366 0.0
26,742 (2) Eldorado Resorts, Inc. 1,248,584 0.29,850 Ethan Allen Interiors, Inc. 188,431 0.0
Copyright © 2021 www.secdatabase.com. All Rights Reserved.Please Consider the Environment Before Printing This Document

48,582 (2) Etsy, Inc. 3,265,682 0.426,422 (2) Express, Inc. 113,086 0.010,977 (2) Fiesta Restaurant Group, Inc. 143,908 0.022,136 (2) Five Below, Inc. 2,750,398 0.3
3,544 Flexsteel Industries, Inc. 82,185 0.018,584 (2) Fossil Group, Inc. 254,972 0.014,486 (2) Fox Factory Holding Corp. 1,012,427 0.114,857 (2) Francesca's Holdings Corp. 10,049 0.0
4,227 (2) Funko, Inc. 91,810 0.03,982 (1),(2) Gaia, Inc. 36,435 0.0
40,373 GameStop Corp. 410,190 0.18,064 (2) Genesco, Inc. 367,315 0.1
14,053 (2) Gentherm, Inc. 517,994 0.117,462 (2) G-III Apparel Group Ltd. 697,782 0.134,003 (1),(2) GNC Holdings, Inc. 92,828 0.0
7,474 (2) Golden Entertainment, Inc. 105,832 0.045,592 (1),(2) GoPro, Inc. 296,348 0.012,287 (2) Green Brick Partners, Inc. 107,511 0.0
7,605 Group 1 Automotive, Inc. 492,044 0.1180,456 (2) Groupon, Inc. 640,619 0.1
23,138 Guess?, Inc. 453,505 0.18,008 (2) Habit Restaurants, Inc. 86,647 0.02,652 Hamilton Beach Brands Holding Co. 56,912 0.08,866 Haverty Furniture Cos., Inc. 193,988 0.0
10,396 (2) Helen of Troy Ltd. 1,205,520 0.27,883 (2) Hibbett Sports, Inc. 179,811 0.04,832 Hooker Furniture Corp. 139,307 0.0
43,004 (2) Houghton Mifflin Harcourt Co. 312,639 0.02,009 (2) Hovnanian Enterprises, Inc. 22,040 0.0
16,341 (2) Hudson Ltd. 224,689 0.09,174 (2) Installed Building Products, Inc. 444,939 0.1
10,045 International Speedway Corp. 438,263 0.110,897 (1),(2) iRobot Corp. 1,282,468 0.2
7,979 (2) J Alexander's Holdings, Inc. 78,354 0.08,169 (1) J. Jill, Inc. 44,848 0.0
10,464 Jack in the Box, Inc. 848,212 0.1125,969 (1),(2) JC Penney Co., Inc. 187,694 0.0
2,216 Johnson Outdoors, Inc. 158,134 0.015,632 (2) K12, Inc. 533,520 0.134,494 KB Home 833,720 0.1
7,089 (2) Kirkland's, Inc. 49,836 0.04,079 (2) Lands' End, Inc. 67,752 0.0
38,655 (2) Laureate Education Inc.- Class A 578,665 0.119,098 La-Z-Boy, Inc. 630,043 0.1
9,760 LCI Industries 749,763 0.16,865 (2) Leaf Group Ltd. 55,057 0.07,692 (2) LGI Homes, Inc. 463,366 0.1
21,740 (2) Liberty Expedia Holdings, Inc. 930,472 0.16,146 Lifetime Brands, Inc. 58,080 0.0
11,618 (2) Liquidity Services, Inc. 89,575 0.09,023 Lithia Motors, Inc. 836,883 0.12,161 (2) Lovesac Co/The 60,097 0.0
Copyright © 2021 www.secdatabase.com. All Rights Reserved.Please Consider the Environment Before Printing This Document

Voya Russell™ Small Cap Index PortfolioPORTFOLIO OF INVESTMENTS
as of March 31, 2019 (Unaudited) (Continued)
Shares ValuePercentage
of NetAssets
COMMON STOCK: (continued)Consumer Discretionary: (continued)
11,259 (1),(2) Lumber Liquidators Holdings, Inc. $ 113,716 0.011,837 (2) M/I Homes, Inc. 315,101 0.08,751 (2) Malibu Boats, Inc. 346,365 0.17,951 (2) MarineMax, Inc. 152,341 0.0
15,795 Marriott Vacations Worldwide Corp. 1,476,833 0.28,072 (2) MasterCraft Boat Holdings, Inc. 182,185 0.0
20,494 MDC Holdings, Inc. 595,556 0.115,477 (2) Meritage Homes Corp. 691,977 0.120,370 (2) Modine Manufacturing Co. 282,532 0.0
4,407 (2) Monarch Casino & Resort, Inc. 193,555 0.012,861 Monro, Inc. 1,112,734 0.1
8,284 (2) Motorcar Parts of America, Inc. 156,319 0.06,857 Movado Group, Inc. 249,458 0.0
11,889 (2) Murphy USA, Inc. 1,017,936 0.11,128 Nathan's Famous, Inc. 77,155 0.0
25,580 (2) National Vision Holdings, Inc. 803,979 0.113,560 (2) Nautilus, Inc. 75,394 0.0
6,208 (2) Noodles & Co. 42,214 0.0220,468 Office Depot, Inc. 800,299 0.1
19,926 (2) Ollie's Bargain Outlet Holdings, Inc. 1,700,286 0.29,634 (1),(2) Overstock.com, Inc. 160,117 0.06,713 Oxford Industries, Inc. 505,220 0.18,894 (1) Papa Johns International, Inc. 470,937 0.1
23,203 (2) Party City Holdco, Inc. 184,232 0.044,575 (2) Penn National Gaming, Inc. 895,958 0.1
7,989 (1) PetMed Express, Inc. 181,989 0.030,054 (2) Pier 1 Imports, Inc. 22,946 0.036,008 (2) Planet Fitness, Inc. 2,474,470 0.3
9,436 (2) PlayAGS, Inc. 225,803 0.010,436 (2) Potbelly Corp. 88,810 0.033,223 (2) Quotient Technology, Inc. 327,911 0.0
3,183 RCI Hospitality Holdings, Inc. 73,114 0.06,562 (2) Red Lion Hotels Corp. 53,021 0.05,310 (2) Red Robin Gourmet Burgers, Inc. 152,981 0.0
28,498 Red Rock Resorts, Inc. 736,673 0.113,274 (2) Regis Corp. 261,100 0.013,820 (1),(2) Remark Holdings, Inc. 25,567 0.018,063 (2) Rent-A-Center, Inc. 376,975 0.1
7,665 (1),(2) RH 789,112 0.12,653 Rocky Brands, Inc. 63,566 0.0
17,434 (2) Roku, Inc. 1,124,667 0.112,554 Ruth's Hospitality Group, Inc. 321,257 0.048,080 (2) Sally Beauty Holdings, Inc. 885,153 0.122,851 (2) Scientific Games Corp. 466,617 0.122,086 (2) SeaWorld Entertainment, Inc. 568,935 0.1
9,840 (2) Shake Shack, Inc. 582,036 0.1
Copyright © 2021 www.secdatabase.com. All Rights Reserved.Please Consider the Environment Before Printing This Document

4,383 (1) Shoe Carnival, Inc. 149,153 0.013,392 (2) Shutterfly, Inc. 544,251 0.1
7,920 Shutterstock, Inc. 369,310 0.120,650 Signet Jewelers Ltd. 560,854 0.112,235 Skyline Champion Corp. 232,465 0.013,057 (2) Sleep Number Corp. 613,679 0.110,674 Sonic Automotive, Inc. 158,082 0.0
6,863 (1),(2) Sonos, Inc. 70,620 0.013,471 (2) Sotheby's 508,530 0.1
6,307 Speedway Motorsports, Inc. 91,262 0.017,638 (1),(2) Sportsman's Warehouse Holdings, Inc. 84,662 0.0
7,057 (2) Stamps.com, Inc. 574,510 0.19,013 Standard Motor Products, Inc. 442,538 0.1
35,132 Steven Madden Ltd. 1,188,867 0.211,261 (2) Stoneridge, Inc. 324,992 0.08,510 Strategic Education, Inc. 1,117,448 0.17,030 Sturm Ruger & Co., Inc. 372,731 0.1
10,627 Superior Industries International 50,585 0.020,201 Tailored Brands, Inc. 158,376 0.043,573 (2) Taylor Morrison Home Corp. 773,421 0.119,878 Tenneco, Inc. 440,496 0.127,284 Texas Roadhouse, Inc. 1,696,792 0.216,940 Tile Shop Holdings, Inc. 95,880 0.0
7,959 Tilly's, Inc. 88,584 0.014,447 (2) TopBuild Corp. 936,455 0.1
8,435 Tower International, Inc. 177,388 0.06,373 (2) Town Sports International Holdings, Inc. 30,335 0.0
58,113 (2) TRI Pointe Group, Inc. 734,548 0.119,548 Tupperware Brands Corp. 500,038 0.1
3,287 (2) Turtle Beach Corp. 37,340 0.07,167 (2) Unifi, Inc. 138,681 0.05,409 (2) Universal Electronics, Inc. 200,944 0.09,419 (2) Vera Bradley, Inc. 124,802 0.0
24,446 (2) Vista Outdoor, Inc. 195,812 0.010,016 (1),(2) Vuzix Corp. 30,649 0.015,190 (2) Weight Watchers International, Inc. 306,079 0.0
3,504 Weyco Group, Inc. 108,484 0.013,606 (2) William Lyon Homes 209,124 0.011,712 Wingstop, Inc. 890,463 0.1
939 Winmark Corp. 177,086 0.012,623 Winnebago Industries 393,206 0.137,432 Wolverine World Wide, Inc. 1,337,445 0.2
6,656 (1),(2) YETI Holdings, Inc. 201,344 0.011,015 (2) Zagg, Inc. 99,906 0.07,377 (2) Zumiez, Inc. 183,614 0.0
98,627,037 11.9
Consumer Staples: 2.7%47,701 (1),(2) 22nd Century Group, Inc. 81,569 0.011,571 Andersons, Inc. 372,933 0.026,733 (1) B&G Foods, Inc. 652,820 0.1
Copyright © 2021 www.secdatabase.com. All Rights Reserved.Please Consider the Environment Before Printing This Document

Voya Russell™ Small Cap Index PortfolioPORTFOLIO OF INVESTMENTS
as of March 31, 2019 (Unaudited) (Continued)
Shares ValuePercentage
of NetAssets
COMMON STOCK: (continued)Consumer Staples: (continued)
48,551 (2) BJ's Wholesale Club Holdings, Inc. $ 1,330,297 0.23,342 (2) Boston Beer Co., Inc. 984,988 0.16,290 Calavo Growers, Inc. 527,416 0.1
12,272 Cal-Maine Foods, Inc. 547,699 0.152,875 (2) Castle Brands, Inc. 36,827 0.020,272 (2) Central Garden & Pet Co. - Class A 471,324 0.1
8,838 (2) Chefs' Warehouse Holdings, Inc. 274,420 0.01,985 Coca-Cola Consolidated, Inc. 571,342 0.15,020 (2) Craft Brew Alliance, Inc. 70,180 0.0
66,072 (2) Darling Ingredients, Inc. 1,430,459 0.236,965 Dean Foods Co. 112,004 0.021,272 (2) Edgewell Personal Care Co. 933,628 0.1
9,665 (2) elf Beauty, Inc. 102,449 0.04,078 (2) Farmer Bros Co. 81,601 0.0
12,136 Fresh Del Monte Produce, Inc. 328,036 0.010,719 (2) Freshpet, Inc. 453,306 0.139,944 (2) Hostess Brands, Inc. 499,300 0.1
6,501 Ingles Markets, Inc. 179,558 0.07,304 Inter Parfums, Inc. 554,154 0.16,052 J&J Snack Foods Corp. 961,300 0.13,699 John B Sanfilippo & Son, Inc. 265,847 0.07,400 Lancaster Colony Corp. 1,159,506 0.1
11,610 (2) Landec Corp. 142,571 0.05,919 Limoneira Co. 139,274 0.04,772 Medifast, Inc. 608,669 0.15,464 (1) MGP Ingredients, Inc. 421,548 0.14,728 National Beverage Corp. 272,947 0.03,842 (2) Natural Grocers by Vitamin Cottage, Inc. 45,912 0.03,072 (1) Natural Health Trends Corp. 39,813 0.0
41,150 (2) Performance Food Group Co. 1,631,186 0.29,176 Pricesmart, Inc. 540,283 0.1
13,530 (2) Primo Water Corp. 209,174 0.03,099 (2) Pyxus International, Inc. 74,035 0.03,810 (1),(2) Revlon, Inc. - Class A 73,838 0.0
434,545 (2) Rite Aid Corp. 275,936 0.07,934 Sanderson Farms, Inc. 1,046,018 0.13,682 (2) Seneca Foods Corp. 90,577 0.0
24,876 (2) Simply Good Foods Co/The 512,197 0.110,390 (2) Smart & Final Stores, Inc. 51,327 0.015,146 SpartanNash Co. 240,367 0.0
7,336 Tootsie Roll Industries, Inc. 273,193 0.03,347 Turning Point Brands, Inc. 154,263 0.0
20,686 (2) United Natural Foods, Inc. 273,469 0.09,962 Universal Corp. 574,110 0.15,217 (2) USANA Health Sciences, Inc. 437,550 0.1
40,806 Vector Group Ltd. 440,297 0.1
Copyright © 2021 www.secdatabase.com. All Rights Reserved.Please Consider the Environment Before Printing This Document

5,664 (1) WD-40 Co. 959,708 0.14,475 Weis Markets, Inc. 182,625 0.0
22,693,850 2.7
Energy: 3.7%66,290 (2) Abraxas Petroleum Corp. 82,863 0.038,666 (2) Alta Mesa Resources, Inc. 10,262 0.0
7,107 Arch Coal, Inc. 648,656 0.151,918 Archrock, Inc. 507,758 0.114,753 (2) Ardmore Shipping Corp. 90,879 0.0
8,014 (2) Basic Energy Services, Inc. 30,453 0.018,745 Berry Petroleum Corp. 216,317 0.0
8,253 (2) Bonanza Creek Energy, Inc. 187,261 0.013,444 (1),(2) Bristow Group, Inc. 14,923 0.025,784 (2) C&J Energy Services, Inc. 400,168 0.115,212 (2) Cactus, Inc. 541,547 0.118,339 (1),(2) California Resources Corp. 471,496 0.191,857 (2) Callon Petroleum Co. 693,520 0.1
9,466 (2) CARBO Ceramics, Inc. 33,131 0.034,885 (2) Carrizo Oil & Gas, Inc. 435,016 0.154,979 (2) Clean Energy Fuels Corp. 169,885 0.011,098 (2) CONSOL Energy, Inc. 379,774 0.113,104 (1),(2) Covia Holdings Corp. 73,251 0.0
7,139 CVR Energy, Inc. 294,127 0.09,493 (2) Dawson Geophysical Co. 27,815 0.0
32,870 Delek US Holdings, Inc. 1,197,125 0.2187,448 (2) Denbury Resources, Inc. 384,268 0.1
40,811 DHT Holdings, Inc. 182,017 0.025,656 (1),(2) Diamond Offshore Drilling 269,132 0.0
5,785 DMC Global, Inc. 287,167 0.011,051 (2) Dorian L.P.G Ltd. 70,947 0.014,138 (2) Dril-Quip, Inc. 648,227 0.1
8,878 (2) Earthstone Energy, Inc. 62,856 0.034,207 (1),(2) Energy Fuels, Inc./Canada 113,909 0.012,968 (2) EP Energy Corp. 3,372 0.0
9,629 (2) Era Group, Inc. 111,119 0.010,656 Evolution Petroleum Corp. 71,928 0.013,758 (2) Exterran Corp. 231,822 0.033,146 (2) Forum Energy Technologies, Inc. 169,376 0.031,273 (1),(2) Frank's International N.V. 194,205 0.032,838 (2) Frontline Ltd./Bermuda 212,134 0.013,549 (2) FTS International, Inc. 135,490 0.017,766 GasLog Ltd. 310,194 0.138,658 Golar LNG Ltd. 815,297 0.116,562 Green Plains, Inc. 276,254 0.071,092 (2) Gulfport Energy Corp. 570,158 0.155,032 (2) Halcon Resources Corp. 74,293 0.057,575 (2) Helix Energy Solutions Group, Inc. 455,418 0.148,029 (2) HighPoint Resources Corp. 106,144 0.0
Copyright © 2021 www.secdatabase.com. All Rights Reserved.Please Consider the Environment Before Printing This Document

Voya Russell™ Small Cap Index PortfolioPORTFOLIO OF INVESTMENTS
as of March 31, 2019 (Unaudited) (Continued)
Shares ValuePercentage
of NetAssets
COMMON STOCK: (continued)Energy: (continued)
18,763 (2) Independence Contract Drilling, Inc. $ 51,974 0.09,336 (2) International Seaways, Inc. 160,019 0.04,070 (2) ION Geophysical Corp. 58,771 0.0
27,260 (1),(2) Jagged Peak Energy, Inc. 285,412 0.021,206 (2) Keane Group, Inc. 230,933 0.0
5,060 (1),(2) Key Energy Services, Inc. 20,544 0.08,441 (2) KLX Energy Services Holdings, Inc. 212,207 0.0
62,201 (2) Laredo Petroleum, Inc. 192,201 0.018,204 (1) Liberty Oilfield Services, Inc. 280,160 0.020,088 (2) Lilis Energy, Inc. 23,503 0.0
5,038 (1) Mammoth Energy Services, Inc. 83,883 0.042,621 (2) Matador Resources Co. 823,864 0.111,097 (2) Matrix Service Co. 217,279 0.072,905 (2) McDermott International, Inc. 542,413 0.1
5,684 (2) Midstates Petroleum Co., Inc. 55,533 0.02,579 (1),(2) Montage Resources Corp. 38,788 0.01,740 Nacco Industries, Inc. 66,503 0.06,001 (2) Natural Gas Services Group, Inc. 103,877 0.05,430 (1),(2) NCS Multistage Holdings, Inc. 28,127 0.0
37,302 (2) Newpark Resources, Inc. 341,686 0.16,711 (2) Nine Energy Service, Inc. 152,004 0.0
97,589 (2) Noble Corp. PLC 280,080 0.057,665 Nordic American Tankers Ltd. 116,483 0.078,479 (2) Northern Oil And Gas, Inc. 215,033 0.0
106,008 (2) Oasis Petroleum, Inc. 640,288 0.138,852 (2) Oceaneering International, Inc. 612,696 0.123,439 (2) Oil States International, Inc. 397,525 0.121,710 (2) Overseas Shipholding Group, Inc. 49,716 0.0
7,528 Panhandle Oil and Gas, Inc. 118,190 0.014,138 (2) Par Pacific Holdings, Inc. 251,798 0.026,918 (2) PDC Energy, Inc. 1,095,024 0.131,646 Peabody Energy Corp. 896,531 0.1
5,193 (2) Penn Virginia Corp. 229,011 0.033,278 (2) Pioneer Energy Services Corp. 58,902 0.028,557 (2) ProPetro Holding Corp. 643,675 0.115,215 (2) Renewable Energy Group, Inc. 334,121 0.1
2,595 (2) REX American Resources Corp. 209,183 0.06,545 (2) RigNet, Inc. 63,945 0.0
22,706 (2) Ring Energy, Inc. 133,284 0.051,077 (2) Rowan Companies PLC 551,121 0.115,097 (2) SandRidge Energy, Inc. 121,078 0.018,424 Scorpio Tankers, Inc. 365,532 0.1
7,099 (2) SEACOR Holdings, Inc. 300,146 0.17,315 (2) SEACOR Marine Holdings, Inc. 97,363 0.0
20,102 (2) Select Energy Services, Inc. 241,626 0.031,942 SemGroup Corp. - Class A 470,825 0.1
Copyright © 2021 www.secdatabase.com. All Rights Reserved.Please Consider the Environment Before Printing This Document

31,823 (1) Ship Finance International Ltd. 392,696 0.13,404 (2) SilverBow Resources, Inc. 78,292 0.09,431 (1),(2) Smart Sand Inc. 41,968 0.0
11,729 Solaris Oilfield Infrastructure, Inc. 192,825 0.0237,490 (2) Southwestern Energy Co. 1,113,828 0.1
99,140 (2) SRC Energy, Inc. 507,597 0.163,073 (2) Superior Energy Services 294,551 0.0
8,590 (1),(2) Talos Energy, Inc. 228,150 0.027,413 (1) Teekay Corp. 107,459 0.077,777 Teekay Tankers Ltd. Class A 75,452 0.034,721 (1),(2) Tellurian, Inc. 388,875 0.149,988 (2) Tetra Technologies, Inc. 116,972 0.010,030 (2) Tidewater, Inc. 232,596 0.072,859 (1),(2) Ultra Petroleum Corp. 44,444 0.021,545 (2) Unit Corp. 306,801 0.165,225 (2) Uranium Energy Corp. 91,315 0.032,044 (1) US Silica Holdings, Inc. 556,284 0.138,260 (2) W&T Offshore, Inc. 263,994 0.027,174 World Fuel Services Corp. 785,057 0.122,101 (2) Zion Oil & Gas, Inc. 16,686 0.0
30,560,653 3.7
Financials: 16.9%7,928 1st Source Corp. 356,046 0.11,276 ACNB Corp. 47,212 0.0
14,664 AG Mortgage Investment Trust, Inc. 246,942 0.05,921 (2) Allegiance Bancshares, Inc. 199,656 0.0
17,955 (2) Ambac Financial Group, Inc. 325,345 0.035,976 American Equity Investment Life Holding Co. 972,072 0.116,555 Ameris Bancorp. 568,664 0.1
7,932 Amerisafe, Inc. 471,161 0.15,884 Ames National Corp. 161,280 0.0
53,564 Anworth Mortgage Asset Corp. 216,399 0.048,641 Apollo Commercial Real Estate Finance, Inc. 885,266 0.131,525 (1) Arbor Realty Trust, Inc. 408,879 0.110,674 Ares Commercial Real Estate Corp. 162,138 0.013,212 Argo Group International Holdings Ltd. 933,560 0.118,085 ARMOUR Residential REIT, Inc. 353,200 0.1
7,207 Arrow Financial Corp. 237,038 0.0
Copyright © 2021 www.secdatabase.com. All Rights Reserved.Please Consider the Environment Before Printing This Document

Voya Russell™ Small Cap Index PortfolioPORTFOLIO OF INVESTMENTS
as of March 31, 2019 (Unaudited) (Continued)
Shares ValuePercentage
of NetAssets
COMMON STOCK: (continued)Financials: (continued)
18,788 Artisan Partners Asset Management, Inc. $ 472,894 0.11,342 (1) Associated Capital Group, Inc. 53,090 0.0
11,496 (2) Atlantic Capital Bancshares, Inc. 204,974 0.023,497 (2) Axos Financial, Inc. 680,473 0.1
8,252 B. Riley Financial, Inc. 137,726 0.017,469 Banc of California, Inc. 241,771 0.0
8,466 Bancfirst Corp. 441,502 0.122,403 (2) Bancorp, Inc. 181,016 0.035,601 BancorpSouth Bank 1,004,660 0.1
5,925 Bank of Marin Bancorp 241,088 0.022,771 Bank of NT Butterfield & Son Ltd. 817,023 0.1
8,707 BankFinancial Corp. 129,473 0.013,504 Banner Corp. 731,512 0.1
6,322 Bar Harbor Bankshares 163,550 0.03,620 (2) Baycom Corp. 81,957 0.05,893 BCB Bancorp, Inc. 78,966 0.0
17,256 Berkshire Hills Bancorp, Inc. 470,053 0.142,073 (1) Blackstone Mortgage Trust, Inc. 1,454,043 0.213,063 Banco Latinoamericano de Comercio Exterior SA 260,215 0.019,542 (2) Blucora, Inc. 652,312 0.110,592 Blue Hills Bancorp, Inc. 253,149 0.035,734 Boston Private Financial Holdings, Inc. 391,645 0.1
9,326 Bridge Bancorp, Inc. 273,252 0.030,605 BrightSphere Investment Group PLC 415,004 0.120,044 OceanFirst Financial Corp. 482,259 0.134,497 Brookline Bancorp, Inc. 496,757 0.1
9,882 Bryn Mawr Bank Corp. 357,037 0.12,036 Business First Bancshares, Inc. 49,963 0.07,707 (2) Byline Bancorp, Inc. 142,425 0.0
47,817 Cadence BanCorp 887,005 0.11,405 Cambridge Bancorp 116,404 0.07,959 Camden National Corp. 332,049 0.0
28,063 (2) Cannae Holdings, Inc. 680,808 0.154,191 Capitol Federal Financial, Inc. 723,450 0.1
4,902 Capstar Financial Holdings, Inc. 70,785 0.041,941 Capstead Mortgage Corp. 360,273 0.1
9,861 Carolina Financial Corp. 341,092 0.129,958 Cathay General Bancorp. 1,015,876 0.1
9,196 CBTX, Inc. 298,594 0.036,960 CenterState Bank Corp. 880,018 0.112,160 Central Pacific Financial Corp. 350,694 0.1
6,496 Central Valley Community Bancorp 126,997 0.028,609 Chemical Financial Corp. 1,177,546 0.2
6,846 Citizens & Northern Corp. 171,424 0.022,894 (1),(2) Citizens, Inc. 152,703 0.0
7,162 City Holding Co. 545,673 0.1
Copyright © 2021 www.secdatabase.com. All Rights Reserved.Please Consider the Environment Before Printing This Document

5,498 Civista Bancshares, Inc. 120,021 0.08,775 CNB Financial Corp. 221,744 0.0
65,991 CNO Financial Group, Inc. 1,067,734 0.12,990 Codorus Valley Bancorp, Inc. 63,836 0.08,954 Cohen & Steers, Inc. 378,486 0.1
35,774 Colony Credit Real Estate, Inc. 560,221 0.129,688 Columbia Banking System, Inc. 970,501 0.124,232 (2) Columbia Financial, Inc. 379,715 0.120,301 Community Bank System, Inc. 1,213,391 0.213,486 Community Bankers Trust Corp. 98,718 0.0
8,271 Community Trust Bancorp, Inc. 339,607 0.114,477 ConnectOne Bancorp, Inc. 285,197 0.011,664 (2) Cowen, Inc. 169,011 0.05,201 (2) Curo Group Holdings Corp. 52,166 0.0
13,080 (2) Customers Bancorp, Inc. 239,495 0.044,866 CVB Financial Corp. 944,429 0.1
1,430 Diamond Hill Investment Group, Inc. 200,200 0.014,749 Dime Community Bancshares 276,249 0.013,758 (2) Donnelley Financial Solutions, Inc. 204,719 0.031,807 Dynex Capital, Inc. 193,705 0.012,968 (2) Eagle Bancorp, Inc. 650,994 0.1
8,450 (2) eHealth, Inc. 526,773 0.19,271 (2) Elevate Credit, Inc. 40,236 0.0
13,398 Employers Holdings, Inc. 537,394 0.111,044 (2) Encore Capital Group, Inc. 300,728 0.013,449 (2) Enova International, Inc. 306,906 0.0
4,928 (2) Enstar Group Ltd. 857,472 0.14,069 Enterprise Bancorp, Inc./MA 116,902 0.0
10,011 Enterprise Financial Services Corp. 408,148 0.16,169 (2) Equity Bancshares, Inc. 177,667 0.02,844 (2) Esquire Financial Holdings, Inc. 64,729 0.0
39,056 (2) Essent Group Ltd. 1,696,983 0.22,217 Evans Bancorp, Inc. 79,036 0.0
16,852 Exantas Capital Corp. 179,137 0.021,414 (2) Ezcorp, Inc. 199,578 0.0
3,755 Farmers & Merchants Bancorp, Inc./Archbold OH 113,025 0.014,968 Farmers National Banc Corp. 206,409 0.0
8,114 FB Financial Corp. 257,701 0.04,582 FBL Financial Group, Inc. 287,383 0.0
39,039 Federated Investors, Inc. 1,144,233 0.15,750 FedNat Holding Co. 92,230 0.0
55,479 FGL Holdings 436,620 0.1
Copyright © 2021 www.secdatabase.com. All Rights Reserved.Please Consider the Environment Before Printing This Document

Voya Russell™ Small Cap Index PortfolioPORTFOLIO OF INVESTMENTS
as of March 31, 2019 (Unaudited) (Continued)
Shares ValuePercentage
of NetAssets
COMMON STOCK: (continued)Financials: (continued)
1,287 Fidelity D&D Bancorp, Inc. $ 76,087 0.09,871 Fidelity Southern Corp. 270,367 0.08,923 Financial Institutions, Inc. 242,527 0.0
86,419 First BanCorp. Puerto Rico 990,362 0.113,161 First BanCorp. Southern Pines NC 457,476 0.1
6,145 First Bancshares, Inc./The 189,880 0.020,718 First Busey Corp. 505,519 0.142,869 First Commonwealth Financial Corp. 540,149 0.1
7,999 First Community Bancshares, Inc. 265,087 0.010,433 First Defiance Financial Corp. 299,844 0.039,496 First Financial Bancorp. 950,274 0.126,426 First Financial Bankshares, Inc. 1,526,894 0.2
6,004 First Financial Corp. 252,168 0.017,980 First Foundation, Inc. 243,989 0.0
3,478 First Internet Bancorp 67,230 0.011,515 First Interstate Bancsystem, Inc. 458,527 0.122,267 First Merchants Corp. 820,539 0.1
5,858 First Mid-Illinois Bancshares, Inc. 195,189 0.042,602 First Midwest Bancorp., Inc. 871,637 0.111,021 First of Long Island Corp. 241,691 0.03,265 First United Corp. 56,354 0.0
17,437 FirstCash, Inc. 1,508,300 0.212,731 Flagstar Bancorp, Inc. 419,105 0.114,758 Flushing Financial Corp. 323,643 0.0
9,017 (2) Focus Financial Partners, Inc. 321,366 0.05,698 Franklin Financial Network, Inc. 165,299 0.01,531 FS Bancorp, Inc. 77,285 0.0
67,066 Fulton Financial Corp. 1,038,182 0.112,618 (1) GAIN Capital Holdings, Inc. 79,241 0.0
2,926 GAMCO Investors, Inc. 59,983 0.0205,253 (2) Genworth Financial, Inc. 786,119 0.1
10,893 German American Bancorp, Inc. 320,254 0.033,507 Glacier Bancorp., Inc. 1,342,625 0.2
3,281 Global Indemnity Ltd. 99,677 0.04,223 Goosehead Insurance, Inc. 117,737 0.0
20,335 Granite Point Mortgage Trust, Inc. 377,621 0.15,873 Great Southern Bancorp., Inc. 304,809 0.0
22,698 Great Western Bancorp, Inc. 717,030 0.119,332 (2) Green Dot Corp. 1,172,486 0.2
7,236 Greenhill & Co., Inc. 155,646 0.013,694 (2) Greenlight Capital Re Ltd. 148,854 0.0
2,698 Guaranty Bancshares, Inc./TX 78,836 0.06,259 Hamilton Lane, Inc. 272,767 0.0
33,954 Hancock Whitney Corp. 1,371,742 0.213,643 Hanmi Financial Corp. 290,187 0.0
8,380 (1),(2) HarborOne Bancorp, Inc. 144,136 0.0
Copyright © 2021 www.secdatabase.com. All Rights Reserved.Please Consider the Environment Before Printing This Document

3,024 HCI Group, Inc. 129,216 0.05,376 (1),(2) Health Insurance Innovations, Inc. 144,184 0.0
11,697 Heartland Financial USA, Inc. 498,877 0.118,696 Heritage Commerce Corp. 226,222 0.015,661 Heritage Financial Corp. 472,023 0.1
8,682 Heritage Insurance Holdings, Inc. 126,757 0.029,305 Hilltop Holdings, Inc. 534,816 0.1
512 Hingham Institution for Savings 88,069 0.01,965 Home Bancorp, Inc. 65,336 0.0
65,205 Home Bancshares, Inc./Conway AR 1,145,652 0.110,558 (2) HomeStreet, Inc. 278,203 0.0
8,731 HomeTrust Bancshares, Inc. 220,021 0.049,453 Hope Bancorp, Inc. 646,845 0.116,830 Horace Mann Educators Corp. 592,584 0.120,193 Horizon Bancorp, Inc. 324,905 0.012,206 Houlihan Lokey, Inc. 559,645 0.1
4,766 (2) Howard Bancorp, Inc. 70,584 0.021,477 Iberiabank Corp. 1,540,116 0.2
5,187 (2) Impac Mortgage Holdings, Inc. 20,333 0.011,639 Independent Bank Corp. 942,875 0.111,307 Independent Bank Corp. Michigan 243,101 0.013,650 Independent Bank Group, Inc. 700,109 0.122,828 International Bancshares Corp. 868,149 0.1
6,546 (2) Intl. FCStone, Inc. 253,723 0.047,311 Invesco Mortgage Capital, Inc. 747,514 0.14,819 Investar Holding Corp. 109,439 0.0
94,198 Investors Bancorp, Inc. 1,116,246 0.1590 Investors Title Co. 93,161 0.0
10,386 James River Group Holdings Ltd. 416,271 0.138,829 Kearny Financial Corp./MD 499,729 0.121,471 Kemper Corp. 1,634,802 0.2
4,140 Kingstone Cos, Inc. 61,024 0.07,744 Kinsale Capital Group, Inc. 531,006 0.15,091 KKR Real Estate Finance Trust, Inc. 101,922 0.0
37,518 Ladder Capital Corp. 638,556 0.145,047 Ladenburg Thalmann Financial Services, Inc. 127,483 0.020,429 Lakeland Bancorp, Inc. 305,005 0.011,195 Lakeland Financial Corp. 506,238 0.1
Copyright © 2021 www.secdatabase.com. All Rights Reserved.Please Consider the Environment Before Printing This Document

Voya Russell™ Small Cap Index PortfolioPORTFOLIO OF INVESTMENTS
as of March 31, 2019 (Unaudited) (Continued)
Shares ValuePercentage
of NetAssets
COMMON STOCK: (continued)Financials: (continued)
19,758 LegacyTexas Financial Group, Inc. $ 738,752 0.1131,550 (2) LendingClub Corp. 406,490 0.1
3,207 (1),(2) LendingTree, Inc. 1,127,453 0.111,820 (1) Live Oak Bancshares, Inc. 172,690 0.029,527 Maiden Holdings Ltd. 21,930 0.0
4,094 (2) Malvern Bancorp, Inc. 82,371 0.04,123 Marlin Business Services Corp. 88,645 0.0
37,079 (2) MBIA, Inc. 352,992 0.17,697 Mercantile Bank Corp. 251,846 0.07,942 Merchants Bancorp/IN 170,753 0.0
23,638 Meridian Bancorp, Inc. 370,880 0.112,065 Meta Financial Group, Inc. 237,439 0.0
2,485 (2) Metropolitan Bank Holding Corp. 86,453 0.0143,163 (2) MGIC Investment Corp. 1,888,320 0.2
9,712 Midland States Bancorp, Inc. 233,671 0.04,551 MidWestOne Financial Group, Inc. 124,015 0.0
17,723 Moelis & Co. 737,454 0.130,832 (2) Mr Cooper Group, Inc. 295,679 0.012,596 National Bank Holdings Corp. 418,943 0.1
3,275 National Bankshares, Inc. 140,334 0.08,094 (2) National Commerce Corp. 317,366 0.0
25,717 National General Holdings Corp. 610,264 0.1990 National Western Life Group, Inc. 259,845 0.0
7,685 Navigators Group, Inc. 536,951 0.119,041 NBT Bancorp., Inc. 685,666 0.1
8,027 Nelnet, Inc. 442,047 0.163,655 New York Mortgage Trust, Inc. 387,659 0.1
4,191 (2) Nicolet Bankshares, Inc. 249,784 0.025,722 (2) NMI Holdings, Inc. 665,428 0.123,224 Northfield Bancorp, Inc. 322,814 0.039,792 Northwest Bancshares, Inc. 675,270 0.1
3,210 Norwood Financial Corp. 98,996 0.045,466 (2) Ocwen Financial Corp. 82,748 0.018,317 OFG Bancorp 362,493 0.1
7,215 Old Line Bancshares, Inc. 179,870 0.057,507 Old National Bancorp. 943,115 0.114,944 Old Second Bancorp, Inc. 188,145 0.020,846 (2) On Deck Capital, Inc. 112,985 0.0
3,945 Oppenheimer Holdings, Inc. 102,649 0.08,983 Opus Bank 177,863 0.0
23,026 (1) Orchid Island Capital, Inc. 151,511 0.07,820 Origin Bancorp, Inc. 266,271 0.0
19,042 Oritani Financial Corp. 316,668 0.04,064 Federal Agricultural Mortgage Corp. 294,356 0.0
18,411 Pacific Premier Bancorp, Inc. 488,444 0.16,026 (1) Park National Corp. 570,964 0.1
Copyright © 2021 www.secdatabase.com. All Rights Reserved.Please Consider the Environment Before Printing This Document

5,757 PCSB Financial Corp. 112,664 0.07,783 Peapack Gladstone Financial Corp. 204,070 0.0
26,716 PennyMac Mortgage Investment Trust 553,288 0.18,210 PennyMac Financial Services, Inc. 182,590 0.0
10,033 Peoples Bancorp., Inc. 310,722 0.04,066 Peoples Financial Services Corp. 183,946 0.08,344 People's Utah Bancorp 220,031 0.05,814 Piper Jaffray Cos. 423,434 0.18,284 PJT Partners, Inc. 346,271 0.1
18,141 (2) PRA Group, Inc. 486,360 0.16,282 Preferred Bank/Los Angeles CA 282,502 0.0
17,497 Primerica, Inc. 2,137,259 0.321,295 ProAssurance Corp. 737,020 0.126,230 Provident Financial Services, Inc. 679,095 0.1
6,103 QCR Holdings, Inc. 207,014 0.087,090 Radian Group, Inc. 1,806,247 0.2
8,212 RBB Bancorp 154,386 0.011,926 Ready Capital Corp. 174,954 0.036,498 Redwood Trust, Inc. 589,443 0.1
3,056 (2) Regional Management Corp. 74,628 0.04,090 Reliant Bancorp, Inc. 91,289 0.0
19,754 Renasant Corp. 668,673 0.15,029 Republic Bancorp., Inc. 224,897 0.0
21,942 (2) Republic First Bancorp, Inc. 115,196 0.015,597 RLI Corp. 1,119,085 0.115,212 S&T Bancorp, Inc. 601,330 0.1
9,637 (2) Safeguard Scientifics, Inc. 104,561 0.06,637 Safety Insurance Group, Inc. 578,348 0.1
15,282 Sandy Spring Bancorp, Inc. 478,021 0.118,959 (2) Seacoast Banking Corp. of Florida 499,570 0.123,693 Selective Insurance Group 1,499,293 0.219,799 ServisFirst Bancshares, Inc. 668,414 0.1
3,007 (2) Siebert Financial Corp. 35,513 0.05,242 Sierra Bancorp. 127,381 0.0
36,205 Simmons First National Corp. 886,298 0.13,726 (2) SmartFinancial, Inc. 70,459 0.0
14,304 South State Corp. 977,535 0.14,466 (2) Southern First Bancshares, Inc. 151,263 0.05,382 Southern National Bancorp of Virginia, Inc. 78,846 0.0
Copyright © 2021 www.secdatabase.com. All Rights Reserved.Please Consider the Environment Before Printing This Document

Voya Russell™ Small Cap Index PortfolioPORTFOLIO OF INVESTMENTS
as of March 31, 2019 (Unaudited) (Continued)
Shares ValuePercentage
of NetAssets
COMMON STOCK: (continued)Financials: (continued)
14,044 Southside Bancshares, Inc. $ 466,682 0.17,557 State Auto Financial Corp. 248,776 0.0
10,705 Sterling Bancorp, Inc./MI 108,549 0.09,411 Stewart Information Services Corp. 401,756 0.1
27,876 Stifel Financial Corp. 1,470,738 0.210,376 Stock Yards Bancorp, Inc. 350,813 0.1
3,385 Summit Financial Group, Inc. 89,736 0.05,804 Territorial Bancorp, Inc. 156,186 0.0
31,865 (2) Third Point Reinsurance Ltd. 330,759 0.016,339 Tiptree Financial, Inc. 103,426 0.0
6,657 Tompkins Financial Corp. 506,398 0.128,877 TowneBank/Portsmouth VA 714,706 0.111,543 TPG RE Finance Trust, Inc. 226,243 0.011,460 Trico Bancshares 450,263 0.111,451 (2) Tristate Capital Holdings, Inc. 233,944 0.010,149 (2) Triumph Bancorp, Inc. 298,279 0.010,294 (1),(2) Trupanion, Inc. 337,026 0.046,032 Trustco Bank Corp. 357,208 0.125,860 Trustmark Corp. 869,672 0.117,964 UMB Financial Corp. 1,150,415 0.130,831 Union Bankshares Corp. 996,766 0.140,189 (1) United Bankshares, Inc. 1,456,449 0.230,798 United Community Banks, Inc./GA 767,794 0.127,720 United Community Financial Corp. 259,182 0.023,948 United Financial Bancorp, Inc. 343,654 0.1
9,165 United Fire Group, Inc. 400,602 0.110,446 United Insurance Holdings Corp. 166,091 0.013,127 Universal Insurance Holdings, Inc. 406,937 0.113,817 Univest Financial Corp. 337,964 0.1
123,286 Valley National Bancorp 1,181,080 0.218,836 Veritex Holdings, Inc. 456,208 0.1
2,717 Virtus Investment Partners, Inc. 265,043 0.029,520 Waddell & Reed Financial, Inc. 510,401 0.111,463 Walker & Dunlop, Inc. 583,581 0.133,396 Washington Federal, Inc. 964,810 0.1
7,659 Washington Trust Bancorp, Inc. 368,781 0.114,787 Waterstone Financial, Inc. 243,394 0.022,187 WesBanco, Inc. 881,933 0.110,741 Westamerica Bancorp. 663,794 0.122,605 Western Asset Mortgage Capital Corp. 231,249 0.011,712 Western New England Bancorp, Inc. 108,102 0.03,925 Westwood Holdings Group, Inc. 138,435 0.0
48,299 WisdomTree Investments, Inc. 340,991 0.12,568 (2) World Acceptance Corp. 300,790 0.0
21,150 WSFS Financial Corp. 816,390 0.1139,932,102 16.9
Copyright © 2021 www.secdatabase.com. All Rights Reserved.Please Consider the Environment Before Printing This Document

Health Care: 15.9%5,767 (2) AAC Holdings, Inc. 10,611 0.0
12,969 (1),(2) Abeona Therapeutics, Inc. 95,452 0.045,648 (2) Acadia Pharmaceuticals, Inc. 1,225,649 0.210,755 (1),(2) Accelerate Diagnostics, Inc. 226,070 0.016,831 (2) Acceleron Pharma, Inc. 783,820 0.135,781 (2) Accuray, Inc. 170,675 0.013,932 (2) Achaogen, Inc. 6,357 0.055,819 (2) Achillion Pharmaceuticals, Inc. 165,224 0.014,187 (2) Aclaris Therapeutics, Inc. 84,980 0.017,741 (2) Acorda Therapeutics, Inc. 235,778 0.0
8,666 (1),(2) Adamas Pharmaceuticals, Inc. 61,615 0.03,827 (2) Addus HomeCare Corp. 243,359 0.0
20,214 (1),(2) Adverum Biotechnologies, Inc. 105,921 0.09,689 (1),(2) ADMA Biologics, Inc. 36,721 0.0
25,233 (2) Aduro Biotech, Inc. 100,427 0.06,991 (2) Aeglea BioTherapeutics, Inc. 56,278 0.0
14,475 (2) Aerie Pharmaceuticals, Inc. 687,562 0.136,895 (2) Agenus, Inc. 109,578 0.0
3,249 (2) AgeX Therapeutics, Inc. 13,158 0.017,985 (1),(2) Aimmune Therapeutics, Inc. 401,965 0.1
5,401 (1),(2) Akcea Therapeutics, Inc. 153,010 0.035,460 (2) Akebia Therapeutics, Inc. 290,417 0.039,837 (2) Akorn, Inc. 140,226 0.0
3,336 (2) Albireo Pharma, Inc. 107,453 0.023,673 (1),(2) Alder Biopharmaceuticals, Inc. 323,136 0.1
8,446 (1),(2) Aldeyra Therapeutics, Inc. 76,267 0.05,568 (1),(2) Allakos, Inc. 225,504 0.05,288 (2) Allena Pharmaceuticals, Inc. 37,122 0.08,605 (1),(2) Allogene Therapeutics, Inc. 248,771 0.0
69,744 (2) Allscripts Healthcare Solutions, Inc. 665,358 0.114,445 (2) AMAG Pharmaceuticals, Inc. 186,052 0.010,741 (2) Amedisys, Inc. 1,323,936 0.2
5,807 (2) American Renal Associates Holdings, Inc. 35,655 0.077,999 (2) Amicus Therapeutics, Inc. 1,060,786 0.118,553 (2) AMN Healthcare Services, Inc. 873,661 0.135,611 (2) Amneal Pharmaceuticals, Inc. 504,608 0.1
Copyright © 2021 www.secdatabase.com. All Rights Reserved.Please Consider the Environment Before Printing This Document

Voya Russell™ Small Cap Index PortfolioPORTFOLIO OF INVESTMENTS
as of March 31, 2019 (Unaudited) (Continued)
Shares ValuePercentage
of NetAssets
COMMON STOCK: (continued)Health Care: (continued)
15,505 (2) Amphastar Pharmaceuticals, Inc. $ 316,767 0.139,169 (2) Ampio Pharmaceuticals, Inc. 22,013 0.0
8,578 (2) AnaptysBio, Inc. 626,623 0.115,473 (2) Angiodynamics, Inc. 353,713 0.1
3,280 (2) ANI Pharmaceuticals, Inc. 231,371 0.05,886 (2) Anika Therapeutics, Inc. 177,993 0.0
62,618 (2) Antares Pharma, Inc. 189,733 0.015,036 (2) Apellis Pharmaceuticals, Inc. 293,202 0.0
1,637 (1),(2) Apollo Medical Holdings, Inc. 29,990 0.05,910 (1),(2) Aptinyx, Inc. 23,935 0.0
19,530 (2) Aratana Therapeutics, Inc. 70,308 0.013,404 (2) Arbutus Biopharma Corp. 47,986 0.012,952 (1),(2) Arcus Biosciences, Inc. 161,770 0.015,121 (2) Ardelyx, Inc. 42,339 0.020,271 (2) Arena Pharmaceuticals, Inc. 908,749 0.144,549 (2) Arqule, Inc. 213,390 0.084,257 (2) Array Biopharma, Inc. 2,054,186 0.337,212 (1),(2) Arrowhead Pharmaceuticals, Inc. 682,840 0.1
3,486 (2) Arvinas, Inc. 51,453 0.08,979 (2) Assembly Biosciences, Inc. 176,797 0.0
23,992 (2) Assertio Therapeutics, Inc. 121,639 0.017,145 (2) Atara Biotherapeutics, Inc. 681,514 0.117,927 (2) Athenex, Inc. 219,606 0.043,410 (2) Athersys, Inc. 65,115 0.014,874 (2) AtriCure, Inc. 398,474 0.1
602 Atrion Corp. 528,965 0.115,046 (2) Audentes Therapeutics, Inc. 587,095 0.118,895 (2) Avanos Medical, Inc. 806,439 0.142,590 (1),(2) AVEO Pharmaceuticals, Inc. 34,928 0.022,020 (2) Avid Bioservices, Inc. 93,585 0.0
4,857 (2) Avrobio, Inc. 107,097 0.013,475 (2) AxoGen, Inc. 283,783 0.0
2,716 (2) Axonics Modulation Technologies, Inc. 65,048 0.015,804 (2) Bellicum Pharmaceuticals, Inc. 53,259 0.054,429 (2) BioScrip, Inc. 108,858 0.045,599 (2) BioCryst Pharmaceuticals, Inc. 371,176 0.112,326 (2) Biohaven Pharmaceutical Holding Co. Ltd. 634,419 0.1
2,437 (2) BioSpecifics Technologies Corp. 151,898 0.013,146 (2) BioTelemetry, Inc. 823,203 0.146,234 (1),(2) Biotime, Inc. 60,567 0.016,938 (2) Blueprint Medicines Corp. 1,355,887 0.275,069 (2) Brookdale Senior Living, Inc. 493,954 0.111,591 (2) Calithera Biosciences, Inc. 78,123 0.02,253 (2) Calyxt, Inc. 39,630 0.0
13,391 (2) Cambrex Corp. 520,240 0.111,194 (2) Capital Senior Living Corp. 44,664 0.0
Copyright © 2021 www.secdatabase.com. All Rights Reserved.Please Consider the Environment Before Printing This Document

13,780 (2) Cara Therapeutics, Inc. 270,364 0.013,820 (2) Cardiovascular Systems, Inc. 534,281 0.114,420 (2) CareDx, Inc. 454,518 0.121,893 (1),(2) CASI Pharmaceuticals, Inc. 62,833 0.032,585 (2) Castlight Health, Inc. 122,194 0.0
6,308 (1),(2) Catalyst Biosciences, Inc. 51,158 0.041,149 (1),(2) Catalyst Pharmaceuticals, Inc. 209,860 0.0
3,011 (2) Celcuity, Inc. 65,971 0.04,581 (2) Cellular Biomedicine Group, Inc. 79,251 0.0
57,086 (2) Cerus Corp. 355,646 0.110,588 (2) ChemoCentryx, Inc. 147,067 0.022,359 (2) Chimerix, Inc. 46,954 0.015,662 (1),(2) ChromaDex Corp. 65,624 0.011,485 (2) Clearside Biomedical, Inc. 15,849 0.019,533 (2) Clovis Oncology, Inc. 484,809 0.120,652 (2) Codexis, Inc. 423,986 0.1
8,641 (2) Cohbar, Inc. 28,170 0.021,230 (2) Coherus Biosciences, Inc. 289,577 0.012,410 (1),(2) Collegium Pharmaceutical, Inc. 187,887 0.034,127 (1),(2) Community Health Systems, Inc. 127,294 0.0
4,512 Computer Programs & Systems, Inc. 133,961 0.09,069 (2) Concert Pharmaceuticals, Inc. 109,463 0.0
10,412 Conmed Corp. 866,070 0.16,415 (2) Constellation Pharmaceuticals, Inc. 86,923 0.0
21,836 (1),(2) Corbus Pharmaceuticals Holdings, Inc. 151,760 0.039,711 (1),(2) Corcept Therapeutics, Inc. 466,207 0.13,870 (2) Corvel Corp. 252,479 0.05,808 (2) Corvus Pharmaceuticals, Inc. 23,348 0.03,101 (2) Crinetics Pharmaceuticals, Inc. 70,579 0.0
16,063 (2) Cross Country Healthcare, Inc. 112,923 0.014,877 (2) CryoLife, Inc. 433,962 0.111,329 (1),(2) CryoPort, Inc. 146,371 0.018,717 (2) CTI BioPharma Corp. 18,159 0.0
6,718 (2) Cue Biopharma, Inc. 51,930 0.05,293 (2) Cutera, Inc. 93,474 0.0
24,021 (2) Cymabay Therapeutics, Inc. 318,999 0.120,041 (2) Cytokinetics, Inc. 162,132 0.0
Copyright © 2021 www.secdatabase.com. All Rights Reserved.Please Consider the Environment Before Printing This Document

Voya Russell™ Small Cap Index PortfolioPORTFOLIO OF INVESTMENTS
as of March 31, 2019 (Unaudited) (Continued)
Shares ValuePercentage
of NetAssets
COMMON STOCK: (continued)Health Care: (continued)
18,041 (2) CytomX Therapeutics, Inc. $ 193,941 0.012,570 (2) CytoSorbents Corp. 95,155 0.0
3,872 (2) Deciphera Pharmaceuticals, Inc. 89,869 0.018,601 (1),(2) Denali Therapeutics, Inc. 431,915 0.113,486 (2) Dermira, Inc. 182,735 0.022,263 (2) Dicerna Pharmaceuticals, Inc. 326,153 0.123,641 (2) Diplomat Pharmacy, Inc. 137,354 0.0
4,569 (1),(2) Dova Pharmaceuticals, Inc. 40,618 0.061,156 (2) Durect Corp. 38,278 0.025,736 (1),(2) Dynavax Technologies Corp. 188,130 0.0
4,278 (2) Eagle Pharmaceuticals, Inc./DE 215,996 0.018,992 (1),(2) Editas Medicine, Inc. 464,354 0.1
6,353 (1),(2) Eidos Therapeutics, Inc. 148,978 0.05,830 (1),(2) ElectroCore, Inc. 40,810 0.09,223 (2) Eloxx Pharmaceuticals, Inc. 107,725 0.0
18,317 (2) Emergent Biosolutions, Inc. 925,375 0.16,861 (2) Enanta Pharmaceuticals, Inc. 655,363 0.1
91,238 (2) Endo International PLC 732,641 0.13,449 (2) Endologix, Inc. 22,798 0.0
20,132 Ensign Group, Inc. 1,030,557 0.120,254 (2) Enzo Biochem, Inc. 55,293 0.024,892 (2) Epizyme, Inc. 308,412 0.0
9,451 (1),(2) Esperion Therapeutics, Inc. 379,458 0.15,217 (1),(2) Evelo Biosciences, Inc. 41,736 0.0
26,948 (2) Evolent Health, Inc. 339,006 0.13,559 (1),(2) Evolus, Inc. 80,327 0.0
25,112 (2) Fate Therapeutics, Inc. 441,218 0.16,411 (2) Fennec Pharmaceuticals, Inc. 31,093 0.0
31,091 (2) FibroGen, Inc. 1,689,796 0.214,130 (2) Five Prime Therapeutics, Inc. 189,342 0.014,280 (2) Flexion Therapeutics, Inc. 178,214 0.011,796 (2) Fluidigm Corp. 156,769 0.02,729 (2) FONAR Corp. 55,863 0.0
14,506 (2) Fortress Biotech, Inc. 25,821 0.05,332 (2) Forty Seven, Inc. 86,165 0.09,592 (2) G1 Therapeutics, Inc. 159,227 0.0
26,148 (2) Genesis Healthcare, Inc. 37,653 0.019,725 (2) GenMark Diagnostics, Inc. 139,850 0.0
8,558 (2) Genomic Health, Inc. 599,488 0.165,206 (1),(2) Geron Corp. 108,242 0.013,812 (2) Glaukos Corp. 1,082,446 0.121,145 (2) Global Blood Therapeutics, Inc. 1,119,205 0.129,614 (2) Globus Medical, Inc. 1,463,228 0.214,882 (2) GlycoMimetics, Inc. 185,430 0.0
2,919 (2) Gossamer Bio, Inc. 63,255 0.03,379 (1),(2) Gritstone Oncology, Inc. 44,941 0.0
Copyright © 2021 www.secdatabase.com. All Rights Reserved.Please Consider the Environment Before Printing This Document

2,733 (2) GTx, Inc. 3,280 0.05,759 (1),(2) Guardant Health, Inc. 441,715 0.1
20,690 (2) Haemonetics Corp. 1,809,961 0.251,582 (2) Halozyme Therapeutics, Inc. 830,470 0.114,990 (2) Harvard Bioscience, Inc. 64,607 0.021,856 (2) HealthEquity, Inc. 1,616,907 0.211,126 (2) HealthStream, Inc. 312,196 0.06,498 (1),(2) Helius Medical Technologies, Inc. 43,277 0.0
28,255 (2) Heron Therapeutics, Inc. 690,552 0.12,745 (2) Heska Corp. 233,654 0.0
33,797 (2) HMS Holdings Corp. 1,000,729 0.16,894 (1),(2) Homology Medicines, Inc. 191,171 0.0
71,312 (2) Horizon Pharma PLC 1,884,776 0.27,760 (2) Idera Pharmaceuticals, Inc. 19,788 0.0
13,415 (2) Immune Design Corp. 78,478 0.059,748 (2) Immunogen, Inc. 161,917 0.060,569 (2) Immunomedics, Inc. 1,163,530 0.2
7,474 (2) Innovate Biopharmaceuticals, Inc. 14,425 0.028,310 (2) Innoviva, Inc. 397,189 0.1
7,164 (2) Inogen, Inc. 683,231 0.128,508 (1),(2) Inovalon Holdings, Inc. 354,354 0.134,165 (1),(2) Inovio Pharmaceuticals, Inc. 127,435 0.031,333 (2) Insmed, Inc. 910,850 0.1
5,461 (2) Inspire Medical Systems, Inc. 310,076 0.012,036 (1),(2) Insys Therapeutics, Inc. 55,606 0.012,689 (2) Integer Holdings Corp. 957,004 0.114,327 (1),(2) Intellia Therapeutics, Inc. 244,705 0.0
8,839 (1),(2) Intercept Pharmaceuticals, Inc. 988,731 0.112,381 (2) Intersect ENT, Inc. 398,049 0.119,478 (2) Intra-Cellular Therapies, Inc. 237,242 0.029,639 (1),(2) Intrexon Corp. 155,901 0.0
3,383 (2) IntriCon Corp. 84,846 0.014,004 Invacare Corp. 117,213 0.028,356 (2) Invitae Corp. 664,098 0.143,295 (2) Iovance Biotherapeutics, Inc. 411,735 0.1
9,703 (2) iRhythm Technologies, Inc. 727,337 0.158,012 (1),(2) Ironwood Pharmaceuticals, Inc. 784,902 0.1
5,996 (2) Jounce Therapeutics, Inc. 37,175 0.036,998 (2) Kadmon Holdings, Inc. 97,675 0.0
5,623 (2) Kala Pharmaceuticals, Inc. 46,502 0.020,985 (2) Karyopharm Therapeutics, Inc. 122,552 0.0
4,746 (1),(2) Kezar Life Sciences, Inc. 84,194 0.012,745 (2) Kindred Biosciences, Inc. 116,872 0.0
4,588 (1),(2) Kiniksa Pharmaceuticals Ltd 82,859 0.012,168 (1),(2) Kura Oncology, Inc. 201,867 0.0
8,611 (1),(2) La Jolla Pharmaceutical Co. 55,369 0.0
Copyright © 2021 www.secdatabase.com. All Rights Reserved.Please Consider the Environment Before Printing This Document

Voya Russell™ Small Cap Index PortfolioPORTFOLIO OF INVESTMENTS
as of March 31, 2019 (Unaudited) (Continued)
Shares ValuePercentage
of NetAssets
COMMON STOCK: (continued)Health Care: (continued)
11,736 (1),(2) Lannett Co., Inc. $ 92,362 0.015,298 (2) Lantheus Holdings, Inc. 374,495 0.1
7,067 LeMaitre Vascular, Inc. 219,077 0.017,314 (1),(2) Lexicon Pharmaceuticals, Inc. 96,266 0.011,882 (2) LHC Group, Inc. 1,317,239 0.28,397 (2) Ligand Pharmaceuticals, Inc. 1,055,587 0.12,953 (2) Liquidia Technologies, Inc. 33,605 0.0
19,772 (2) LivaNova PLC 1,922,827 0.23,896 (2) LogicBio Therapeutics, Inc. 38,492 0.0
16,658 Luminex Corp. 383,301 0.116,370 (2) MacroGenics, Inc. 294,333 0.0
2,864 (1),(2) Madrigal Pharmaceuticals, Inc. 358,745 0.19,727 (2) Magellan Health, Inc. 641,204 0.15,494 (2) Magenta Therapeutics, Inc. 90,486 0.0
33,327 (2) Mallinckrodt PLC - W/I 724,529 0.164,361 (2) MannKind Corp. 126,791 0.016,863 (1),(2) Marinus Pharmaceuticals, Inc. 70,487 0.028,173 (1),(2) Medicines Co. 787,435 0.115,925 (2) MediciNova, Inc. 131,859 0.023,324 (2) Medidata Solutions, Inc. 1,708,250 0.2
8,514 (2) Medpace Holdings, Inc. 502,071 0.14,571 (2) MeiraGTx Holdings plc 78,758 0.01,990 (1),(2) Melinta Therapeutics, Inc. 7,065 0.0
17,592 Meridian Bioscience, Inc. 309,795 0.021,693 (2) Merit Medical Systems, Inc. 1,341,278 0.2
5,666 (2) Mersana Therapeutics, Inc. 29,803 0.013,586 (2) Minerva Neurosciences, Inc. 106,786 0.010,551 (2) Miragen Therapeutics, Inc. 29,437 0.0
8,542 (2) Mirati Therapeutics, Inc. 626,129 0.138,903 (2) Momenta Pharmaceuticals, Inc. 565,261 0.113,985 (2) MyoKardia, Inc. 727,080 0.128,194 (2) Myriad Genetics, Inc. 936,041 0.110,221 (2) NanoString Technologies, Inc. 244,589 0.013,481 (2) NantKwest, Inc. 21,300 0.013,499 (2) Natera, Inc. 278,349 0.0
5,096 National Healthcare Corp. 386,684 0.14,718 National Research Corp. 182,115 0.0
13,349 (2) Natus Medical, Inc. 338,798 0.120,577 (2) Neogen Corp. 1,180,914 0.229,709 (2) NeoGenomics, Inc. 607,846 0.1
6,933 (2) Neon Therapeutics, Inc. 44,787 0.018,185 (2) Neos Therapeutics, Inc. 47,463 0.0
4,174 (2) Neuronetics, Inc. 63,654 0.011,947 (2) Nevro Corp. 746,807 0.112,626 (2) NewLink Genetics Corp. 24,368 0.022,975 (2) NextGen Healthcare, Inc. 386,669 0.1
Copyright © 2021 www.secdatabase.com. All Rights Reserved.Please Consider the Environment Before Printing This Document

157,301 (2) Novavax, Inc. 86,657 0.029,850 (2) Novocure Ltd. 1,437,875 0.220,799 (2) NuVasive, Inc. 1,181,175 0.2
7,116 (2) Nuvectra Corp. 78,347 0.014,156 (1),(2) Ocular Therapeutix, Inc. 56,199 0.0
2,925 (1),(2) Odonate Therapeutics, Inc. 64,672 0.018,757 (1),(2) Omeros Corp. 325,809 0.115,505 (2) Omnicell, Inc. 1,253,424 0.2
132,313 (1),(2) Opko Health, Inc. 345,337 0.18,144 (1),(2) Optinose, Inc. 83,883 0.0
25,496 (2) OraSure Technologies, Inc. 284,280 0.039,127 (1),(2) Organovo Holdings, Inc. 38,814 0.0
7,150 (2) Orthofix Medical, Inc. 403,332 0.12,823 (2) OrthoPediatrics Corp. 124,861 0.07,825 (2) Ovid therapeutics, Inc. 13,850 0.0
24,398 Owens & Minor, Inc. 100,032 0.010,572 (2) Oxford Immunotec Global PLC 182,156 0.055,954 (1),(2) Pacific Biosciences of California, Inc. 404,547 0.116,343 (2) Pacira Pharmaceuticals, Inc. 622,015 0.182,615 (2) Palatin Technologies, Inc. 80,979 0.013,152 (1),(2) Paratek Pharmaceuticals, Inc. 70,495 0.031,328 Patterson Cos., Inc. 684,517 0.160,066 (2) PDL BioPharma, Inc. 223,446 0.0
6,218 (2) PetIQ, Inc. 195,307 0.012,888 (2) Pfenex, Inc. 79,648 0.0
8,804 Phibro Animal Health Corp. 290,532 0.022,142 (2) Pieris Pharmaceuticals, Inc. 74,176 0.0
3,814 (1),(2) PolarityTE, Inc. 40,810 0.026,405 (1),(2) Portola Pharmaceuticals, Inc. 916,254 0.120,913 (2) Prestige Consumer Healthcare, Inc. 625,508 0.1
2,478 (2) Principia Biopharma, Inc. 84,252 0.036,480 (2) Progenics Pharmaceuticals, Inc. 169,267 0.013,125 (2) Proteostasis Therapeutics, Inc. 16,538 0.016,988 (2) Prothena Corp. PLC 206,064 0.0
4,541 (2) Providence Service Corp. 302,521 0.020,109 (2) PTC Therapeutics, Inc. 756,903 0.1
4,221 (2) Pulse Biosciences, Inc. 74,247 0.012,095 (2) Puma Biotechnology, Inc. 469,165 0.1
3,159 (2) Quanterix Corp. 81,597 0.013,880 (2) Quidel Corp. 908,724 0.113,612 (2) Quorum Health Corp. 19,057 0.042,574 (2) R1 RCM, Inc. 411,691 0.1
7,517 (2) Ra Pharmaceuticals, Inc. 168,381 0.017,361 (2) Radius Health, Inc. 346,178 0.117,340 (2) RadNet, Inc. 214,843 0.0
7,578 (2) Reata Pharmaceuticals, Inc. 647,692 0.17,582 (2) Recro Pharma, Inc. 44,431 0.0
12,932 (2) REGENXBIO, Inc. 741,133 0.115,980 (2) Repligen Corp. 944,098 0.1
Copyright © 2021 www.secdatabase.com. All Rights Reserved.Please Consider the Environment Before Printing This Document

Voya Russell™ Small Cap Index PortfolioPORTFOLIO OF INVESTMENTS
as of March 31, 2019 (Unaudited) (Continued)
Shares ValuePercentage
of NetAssets
COMMON STOCK: (continued)Health Care: (continued)
4,503 (1),(2) Replimune Group, Inc. $ 68,536 0.04,210 (2) resTORbio, Inc. 28,712 0.0
17,116 (2) Retrophin, Inc. 387,335 0.113,606 (2) Revance Therapeutics, Inc. 214,431 0.0
6,382 (2) Rhythm Pharmaceuticals, Inc. 174,931 0.068,668 (2) Rigel Pharmaceuticals, Inc. 176,477 0.0
8,615 (2) Rocket Pharmaceuticals, Inc. 151,107 0.020,825 (2) Rockwell Medical, Inc. 118,494 0.027,758 (2) RTI Surgical Holdings, Inc. 166,826 0.013,497 (1),(2) Rubius Therapeutics, Inc. 244,296 0.041,959 (2) Sangamo Therapeutics, Inc. 400,289 0.110,875 (2) Savara, Inc. 80,149 0.0
5,860 (2) Scholar Rock Holding Corp. 110,109 0.05,746 (2) SeaSpine Holdings Corp. 86,650 0.0
44,266 (2) Select Medical Holdings Corp. 623,708 0.112,031 (2) Selecta Biosciences, Inc. 28,513 0.034,608 (1),(2) Senseonics Holdings, Inc. 84,790 0.010,115 (1),(2) Seres Therapeutics, Inc. 69,490 0.03,345 (2) SI-BONE, Inc. 63,020 0.06,080 (2) Sienna Biopharmaceuticals, Inc. 14,106 0.09,461 (2) Sientra, Inc. 81,175 0.0
22,040 (2) SIGA Technologies, Inc. 132,460 0.04,558 Simulations Plus, Inc. 96,219 0.05,080 (2) Solid Biosciences, Inc. 46,736 0.0
46,730 (1),(2) Sorrento Therapeutics, Inc. 221,968 0.012,830 (1),(2) Spark Therapeutics, Inc. 1,461,080 0.241,577 (2) Spectrum Pharmaceuticals, Inc. 444,458 0.1
4,498 (2) Spero Therapeutics, Inc. 57,619 0.05,371 (2) Spring Bank Pharmaceuticals, Inc. 56,342 0.0
17,749 (2) Staar Surgical Co. 606,838 0.114,522 (2) Stemline Therapeutics, Inc. 186,608 0.019,862 (2) Supernus Pharmaceuticals, Inc. 695,964 0.1
7,405 (1),(2) Surgery Partners, Inc. 83,528 0.05,553 (2) SurModics, Inc. 241,444 0.07,330 (2) Syndax Pharmaceuticals, Inc. 38,483 0.0
24,959 (2) Syneos Health, Inc. 1,291,878 0.27,207 (2) Synlogic, Inc. 54,701 0.03,199 (2) Synthorx, Inc. 65,164 0.0
10,366 (2) Syros Pharmaceuticals, Inc. 94,745 0.011,499 (1),(2) T2 Biosystems, Inc. 30,242 0.07,245 (2) Tabula Rasa HealthCare, Inc. 408,763 0.17,055 (2) Tactile Systems Technology, Inc. 371,940 0.1
20,623 (2) Tandem Diabetes Care, Inc. 1,309,561 0.227,058 (2) Teladoc Health, Inc. 1,504,425 0.217,484 (1),(2) Teligent, Inc. 20,281 0.033,757 (2) Tenet Healthcare Corp. 973,552 0.1
Copyright © 2021 www.secdatabase.com. All Rights Reserved.Please Consider the Environment Before Printing This Document

20,583 (2) Tetraphase Pharmaceuticals, Inc. 27,581 0.026,519 (1),(2) TG Therapeutics, Inc. 213,213 0.074,137 (1),(2) TherapeuticsMD, Inc. 361,047 0.117,934 (1),(2) Theravance Biopharma, Inc. 406,564 0.117,823 (2) Tivity Health, Inc. 312,972 0.0
8,527 (2) Tocagen, Inc. 92,688 0.065,616 (1),(2) TransEnterix, Inc. 156,166 0.012,044 (2) Translate Bio, Inc. 122,728 0.0
6,671 (2) Tricida, Inc. 257,634 0.09,064 (2) Triple-S Management Corp. 206,840 0.02,103 (2) Twist Bioscience Corp. 48,748 0.0
44,051 (2) Tyme Technologies, Inc. 77,530 0.021,547 (2) Ultragenyx Pharmaceutical, Inc. 1,494,500 0.210,237 (1),(2) UNITY Biotechnology, Inc. 83,022 0.011,113 (2) Unum Therapeutics, Inc. 48,786 0.05,086 US Physical Therapy, Inc. 534,183 0.11,363 Utah Medical Products, Inc. 120,285 0.0
20,968 (2) Vanda Pharmaceuticals, Inc. 385,811 0.115,503 (2) Varex Imaging Corp. 525,242 0.111,713 (2) Veracyte, Inc. 293,059 0.028,537 (1),(2) Verastem, Inc. 84,470 0.017,571 (2) Vericel Corp. 307,668 0.0
4,484 (2) Verrica Pharmaceuticals, Inc. 48,472 0.025,917 (2) ViewRay, Inc. 191,527 0.025,071 (1),(2) Viking Therapeutics, Inc. 249,206 0.012,764 (2) Vital Therapies, Inc. 2,516 0.012,086 (2) Vocera Communications, Inc. 382,280 0.1
8,740 (2) Voyager Therapeutics, Inc. 167,284 0.07,817 (1),(2) WaVe Life Sciences Ltd. 303,690 0.0
50,004 (2) Wright Medical Group NV 1,572,626 0.219,081 (2) Xencor, Inc. 592,656 0.1
7,300 (2) Xeris Pharmaceuticals, Inc. 73,292 0.03,651 (1),(2) XOMA Corp. 45,199 0.02,725 (2) Y-mAbs Therapeutics, Inc. 71,422 0.0
12,007 (2) Zafgen, Inc. 32,899 0.055,621 (1),(2) ZIOPHARM Oncology, Inc. 214,141 0.017,022 (2) Zogenix, Inc. 936,380 0.1
131,316,150 15.9
Industrials: 14.3%16,883 AAON, Inc. 779,657 0.113,554 AAR Corp. 440,641 0.126,613 ABM Industries, Inc. 967,383 0.1
Copyright © 2021 www.secdatabase.com. All Rights Reserved.Please Consider the Environment Before Printing This Document

Voya Russell™ Small Cap Index PortfolioPORTFOLIO OF INVESTMENTS
as of March 31, 2019 (Unaudited) (Continued)
Shares ValuePercentage
of NetAssets
COMMON STOCK: (continued)Industrials: (continued)
25,362 (2) Acacia Research Corp. $ 82,680 0.042,872 ACCO Brands Corp. 366,984 0.124,472 Actuant Corp. 596,383 0.128,551 (2) Advanced Disposal Services, Inc. 799,428 0.114,950 Advanced Drainage Systems, Inc. 385,261 0.113,736 (2) Aegion Corp. 241,341 0.029,127 (2) Aerojet Rocketdyne Holdings, Inc. 1,034,882 0.1
8,656 (2) Aerovironment, Inc. 592,157 0.123,668 (2) Air Transport Services Group, Inc. 545,547 0.121,234 Aircastle Ltd. 429,776 0.1
3,838 Alamo Group, Inc. 383,570 0.111,560 Albany International Corp. 827,580 0.15,241 Allegiant Travel Co. 678,552 0.12,875 Allied Motion Technologies, Inc. 98,842 0.0
24,267 Altra Industrial Motion Corp. 753,490 0.18,151 (2) Ameresco, Inc. 131,883 0.05,521 (2) American Woodmark Corp. 456,200 0.1
10,225 Apogee Enterprises, Inc. 383,335 0.115,464 Applied Industrial Technologies, Inc. 919,644 0.110,180 ArcBest Corp. 313,442 0.0
6,028 Argan, Inc. 301,099 0.09,730 (2) Armstrong Flooring, Inc. 132,328 0.0
20,413 (2) ASGN, Inc. 1,296,021 0.29,242 Astec Industries, Inc. 348,978 0.09,169 (2) Astronics Corp. 300,010 0.0
15,710 (2) Atkore International Group, Inc. 338,236 0.08,980 (2) Atlas Air Worldwide Holdings, Inc. 454,029 0.1
25,949 (2) Avis Budget Group, Inc. 904,582 0.123,246 (2) Axon Enterprise, Inc. 1,264,815 0.210,476 AZZ, Inc. 428,783 0.1
7,141 (2) Babcock & Wilcox Enterprises, Inc. 2,936 0.019,179 Barnes Group, Inc. 985,992 0.1
3,110 Barrett Business Services, Inc. 240,496 0.027,773 (2) Beacon Roofing Supply, Inc. 893,180 0.1
3,232 BG Staffing, Inc. 70,587 0.05,633 (2) Blue Bird Corp. 95,367 0.03,834 (1),(2) BlueLinx Holdings, Inc. 102,138 0.0
27,945 (2) BMC Stock Holdings, Inc. 493,788 0.118,901 Brady Corp. 877,195 0.116,769 Briggs & Stratton Corp. 198,377 0.011,926 (2) BrightView Holdings, Inc. 171,734 0.020,288 Brink's Co. 1,529,918 0.246,443 (2) Builders FirstSource, Inc. 619,550 0.1
8,923 Caesarstone Ltd. 139,288 0.06,769 (2) CAI International, Inc. 157,041 0.0
16,864 (2) Casella Waste Systems, Inc. 599,684 0.1
Copyright © 2021 www.secdatabase.com. All Rights Reserved.Please Consider the Environment Before Printing This Document

21,997 (2) CBIZ, Inc. 445,219 0.113,396 (2) Ceco Environmental Corp. 96,451 0.012,366 (2) Chart Industries, Inc. 1,119,370 0.1
8,838 (2) Cimpress NV 708,189 0.16,661 (2) CIRCOR International, Inc. 217,149 0.09,365 Columbus McKinnon Corp. 321,688 0.0
14,814 Comfort Systems USA, Inc. 776,105 0.111,545 (2) Commercial Vehicle Group, Inc. 88,550 0.014,888 (2) Continental Building Products, Inc. 369,074 0.119,931 Costamare, Inc. 103,641 0.047,971 Covanta Holding Corp. 830,378 0.1
5,396 (2) Covenant Transportation Group, Inc. 102,416 0.03,214 CRA International, Inc. 162,436 0.06,149 (2) CSW Industrials, Inc. 352,276 0.0
10,521 Cubic Corp. 591,701 0.115,103 (2) Daseke, Inc. 76,874 0.018,259 Deluxe Corp. 798,283 0.1
9,328 Douglas Dynamics, Inc. 355,117 0.04,314 (2) Ducommun, Inc. 187,745 0.06,811 (2) DXP Enterprises, Inc. 265,084 0.0
12,125 (2) Dycom Industries, Inc. 557,022 0.119,844 (2) Eagle Bulk Shipping, Inc. 92,275 0.0
3,071 Eastern Co/The 84,514 0.011,373 (2) Echo Global Logistics, Inc. 281,823 0.022,817 EMCOR Group, Inc. 1,667,466 0.2
8,208 Encore Wire Corp. 469,662 0.19,298 (2) Energous Corp. 58,949 0.0
15,355 (1),(2) Energy Recovery, Inc. 134,049 0.016,826 EnerSys 1,096,382 0.111,467 Ennis, Inc. 238,055 0.035,050 (1),(2) Enphase Energy, Inc. 323,511 0.0
8,204 EnPro Industries, Inc. 528,748 0.110,452 ESCO Technologies, Inc. 700,598 0.1
1,621 (1) EVI Industries, Inc. 61,809 0.030,730 (2) Evoqua Water Technologies Corp. 386,583 0.121,174 Exponent, Inc. 1,222,163 0.223,913 Federal Signal Corp. 621,499 0.1
4,575 Forrester Research, Inc. 221,201 0.011,257 Forward Air Corp. 728,666 0.16,801 (2) Foundation Building Materials, Inc. 66,922 0.04,124 (2) Franklin Covey Co. 104,337 0.0
18,992 Franklin Electric Co., Inc. 970,301 0.15,479 (2) Freightcar America, Inc. 33,751 0.0
15,267 (2) FTI Consulting, Inc. 1,172,811 0.115,145 GATX Corp. 1,156,624 0.124,272 (2) Generac Holdings, Inc. 1,243,455 0.212,955 (2) Gibraltar Industries, Inc. 526,103 0.1
8,897 Global Brass & Copper Holdings, Inc. 306,413 0.013,760 (2) GMS, Inc. 208,051 0.0
8,085 Gorman-Rupp Co. 274,405 0.03,826 (2) GP Strategies Corp. 46,486 0.04,947 Graham Corp. 97,110 0.0
Copyright © 2021 www.secdatabase.com. All Rights Reserved.Please Consider the Environment Before Printing This Document

Voya Russell™ Small Cap Index PortfolioPORTFOLIO OF INVESTMENTS
as of March 31, 2019 (Unaudited) (Continued)
Shares ValuePercentage
of NetAssets
COMMON STOCK: (continued)Industrials: (continued)
17,931 Granite Construction, Inc. $ 773,723 0.123,896 (2) Great Lakes Dredge & Dock Corp. 212,913 0.012,608 Greenbrier Cos., Inc. 406,356 0.114,099 Griffon Corp. 260,550 0.012,983 H&E Equipment Services, Inc. 326,003 0.032,475 (2) Harsco Corp. 654,696 0.119,797 Hawaiian Holdings, Inc. 519,671 0.120,115 (1),(2) HC2 Holdings, Inc. 49,282 0.029,896 Healthcare Services Group, Inc. 986,269 0.118,857 Heartland Express, Inc. 363,563 0.0
7,635 Heidrick & Struggles International, Inc. 292,650 0.09,713 (2) Herc Holdings, Inc. 378,613 0.16,176 (2) Heritage-Crystal Clean, Inc. 169,531 0.0
23,921 Herman Miller, Inc. 841,541 0.121,724 (2) Hertz Global Holdings, Inc. 377,346 0.124,865 Hillenbrand, Inc. 1,032,643 0.117,842 HNI Corp. 647,486 0.113,021 (2) HUB Group, Inc. 531,908 0.1
8,949 (2) Huron Consulting Group, Inc. 422,572 0.1777 Hyster-Yale Materials Handling, Inc. - A shares 48,454 0.0
3,750 (2) Hyster-Yale Materials Handling, Inc. - B shares 233,850 0.07,406 ICF International, Inc. 563,448 0.1
21,206 (2) Innerworkings, Inc. 76,766 0.015,372 Insperity, Inc. 1,900,902 0.2
7,826 Insteel Industries, Inc. 163,720 0.024,718 Interface, Inc. 378,680 0.127,747 (2) JELD-WEN Holding, Inc. 490,012 0.112,752 John Bean Technologies Corp. 1,171,781 0.1
4,413 Kadant, Inc. 388,167 0.111,175 Kaman Corp. 653,067 0.155,927 KBR, Inc. 1,067,646 0.113,127 Kelly Services, Inc. 289,582 0.032,403 Kennametal, Inc. 1,190,810 0.121,335 (2) Keyw Holding Corp. 183,908 0.0
9,508 Kforce, Inc. 333,921 0.017,197 Kimball International, Inc. 243,166 0.020,142 Knoll, Inc. 380,885 0.122,465 Korn Ferry 1,005,983 0.136,431 (2) Kratos Defense & Security Solutions, Inc. 569,417 0.1
2,891 (2) Lawson Products 90,662 0.03,868 (2) LB Foster Co. 72,796 0.04,282 Lindsay Corp. 414,455 0.1
13,819 LSC Communications, Inc. 90,238 0.07,353 (2) Lydall, Inc. 172,501 0.06,363 (2) Manitex International, Inc. 48,677 0.0
14,352 (2) Manitowoc Co., Inc./The 235,516 0.0
Copyright © 2021 www.secdatabase.com. All Rights Reserved.Please Consider the Environment Before Printing This Document
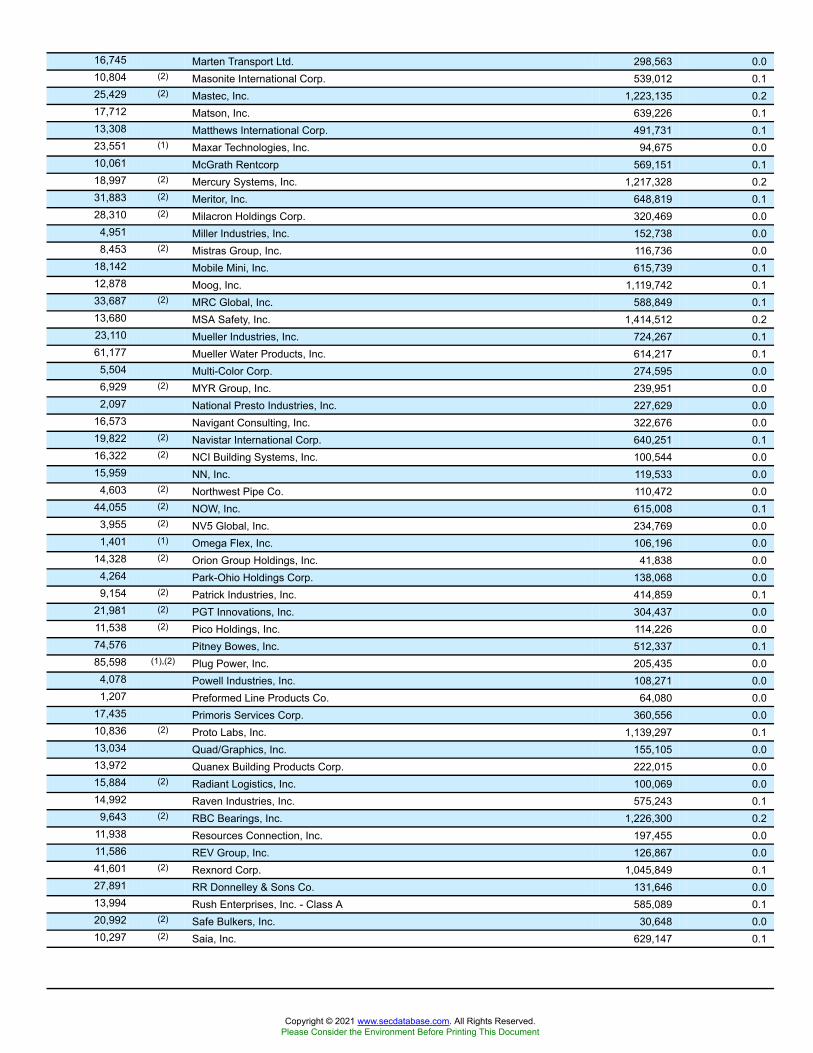
16,745 Marten Transport Ltd. 298,563 0.010,804 (2) Masonite International Corp. 539,012 0.125,429 (2) Mastec, Inc. 1,223,135 0.217,712 Matson, Inc. 639,226 0.113,308 Matthews International Corp. 491,731 0.123,551 (1) Maxar Technologies, Inc. 94,675 0.010,061 McGrath Rentcorp 569,151 0.118,997 (2) Mercury Systems, Inc. 1,217,328 0.231,883 (2) Meritor, Inc. 648,819 0.128,310 (2) Milacron Holdings Corp. 320,469 0.0
4,951 Miller Industries, Inc. 152,738 0.08,453 (2) Mistras Group, Inc. 116,736 0.0
18,142 Mobile Mini, Inc. 615,739 0.112,878 Moog, Inc. 1,119,742 0.133,687 (2) MRC Global, Inc. 588,849 0.113,680 MSA Safety, Inc. 1,414,512 0.223,110 Mueller Industries, Inc. 724,267 0.161,177 Mueller Water Products, Inc. 614,217 0.1
5,504 Multi-Color Corp. 274,595 0.06,929 (2) MYR Group, Inc. 239,951 0.02,097 National Presto Industries, Inc. 227,629 0.0
16,573 Navigant Consulting, Inc. 322,676 0.019,822 (2) Navistar International Corp. 640,251 0.116,322 (2) NCI Building Systems, Inc. 100,544 0.015,959 NN, Inc. 119,533 0.0
4,603 (2) Northwest Pipe Co. 110,472 0.044,055 (2) NOW, Inc. 615,008 0.1
3,955 (2) NV5 Global, Inc. 234,769 0.01,401 (1) Omega Flex, Inc. 106,196 0.0
14,328 (2) Orion Group Holdings, Inc. 41,838 0.04,264 Park-Ohio Holdings Corp. 138,068 0.09,154 (2) Patrick Industries, Inc. 414,859 0.1
21,981 (2) PGT Innovations, Inc. 304,437 0.011,538 (2) Pico Holdings, Inc. 114,226 0.074,576 Pitney Bowes, Inc. 512,337 0.185,598 (1),(2) Plug Power, Inc. 205,435 0.0
4,078 Powell Industries, Inc. 108,271 0.01,207 Preformed Line Products Co. 64,080 0.0
17,435 Primoris Services Corp. 360,556 0.010,836 (2) Proto Labs, Inc. 1,139,297 0.113,034 Quad/Graphics, Inc. 155,105 0.013,972 Quanex Building Products Corp. 222,015 0.015,884 (2) Radiant Logistics, Inc. 100,069 0.014,992 Raven Industries, Inc. 575,243 0.1
9,643 (2) RBC Bearings, Inc. 1,226,300 0.211,938 Resources Connection, Inc. 197,455 0.011,586 REV Group, Inc. 126,867 0.041,601 (2) Rexnord Corp. 1,045,849 0.127,891 RR Donnelley & Sons Co. 131,646 0.013,994 Rush Enterprises, Inc. - Class A 585,089 0.120,992 (2) Safe Bulkers, Inc. 30,648 0.010,297 (2) Saia, Inc. 629,147 0.1
Copyright © 2021 www.secdatabase.com. All Rights Reserved.Please Consider the Environment Before Printing This Document

Voya Russell™ Small Cap Index PortfolioPORTFOLIO OF INVESTMENTS
as of March 31, 2019 (Unaudited) (Continued)
Shares ValuePercentage
of NetAssets
COMMON STOCK: (continued)Industrials: (continued)
25,660 Scorpio Bulkers, Inc. $ 98,534 0.016,425 Simpson Manufacturing Co., Inc. 973,510 0.116,359 (2) SiteOne Landscape Supply, Inc. 934,917 0.120,783 Skywest, Inc. 1,128,309 0.1
8,882 (2) SP Plus Corp. 303,054 0.014,614 Spartan Motors, Inc. 129,042 0.027,841 (2) Spirit Airlines, Inc. 1,471,675 0.217,088 (2) SPX Corp. 594,492 0.116,898 (2) SPX FLOW, Inc. 539,046 0.1
5,248 Standex International Corp. 385,203 0.135,037 Steelcase, Inc. 509,788 0.111,002 (2) Sterling Construction Co., Inc. 137,745 0.011,633 Sun Hydraulics Corp. 541,051 0.139,406 (2) Sunrun, Inc. 554,048 0.1
5,559 Systemax, Inc. 125,856 0.012,447 (2) Team, Inc. 217,822 0.0
7,358 Tennant Co. 456,858 0.122,508 Tetra Tech, Inc. 1,341,252 0.212,101 (2) Textainer Group Holdings Ltd. 116,775 0.013,811 (2) Thermon Group Holdings, Inc. 338,508 0.020,279 Titan International, Inc. 121,066 0.0
7,764 (2) Titan Machinery, Inc. 120,808 0.05,984 (2) TPI Composites, Inc. 171,262 0.0
23,828 (2) Trex Co., Inc. 1,465,899 0.218,647 (2) Trimas Corp. 563,699 0.117,735 (2) TriNet Group, Inc. 1,059,489 0.120,730 Triton International Ltd./Bermuda 644,703 0.119,888 Triumph Group, Inc. 379,065 0.116,272 (2) TrueBlue, Inc. 384,670 0.115,635 (2) Tutor Perini Corp. 267,671 0.0
3,559 (2) Twin Disc, Inc. 59,257 0.06,045 Unifirst Corp. 927,907 0.1
24,599 Universal Forest Products, Inc. 735,264 0.13,425 Universal Logistics Holdings, Inc. 67,404 0.04,734 (1),(2) Upwork, Inc. 90,609 0.08,994 US Ecology, Inc. 503,484 0.17,753 (2) US Xpress Enterprises, Inc. 51,247 0.03,407 (2) USA Truck, Inc. 49,197 0.05,036 (2) Vectrus, Inc. 133,907 0.04,821 (2) Veritiv Corp. 126,889 0.08,881 Viad Corp. 499,911 0.16,896 (2) Vicor Corp. 213,914 0.0
13,459 (2) Vivint Solar, Inc. 66,891 0.04,277 VSE Corp. 135,068 0.0
22,264 Wabash National Corp. 301,677 0.015,916 (2) WageWorks, Inc. 600,988 0.1
Copyright © 2021 www.secdatabase.com. All Rights Reserved.Please Consider the Environment Before Printing This Document

10,797 Watts Water Technologies, Inc. 872,614 0.118,701 Werner Enterprises, Inc. 638,639 0.122,833 (2) Wesco Aircraft Holdings, Inc. 200,702 0.0
3,734 (2) Willdan Group, Inc. 138,419 0.014,937 (2) Willscot Corp. 165,651 0.021,404 Woodward, Inc. 2,031,026 0.313,882 (2) YRC Worldwide, Inc. 92,871 0.0
118,099,349 14.3
Information Technology: 15.4%43,697 (2) 3D Systems Corp. 470,180 0.137,763 (2) 8x8, Inc. 762,813 0.122,826 (2) A10 Networks, Inc. 161,836 0.010,997 (2) Acacia Communications, Inc. 630,678 0.146,998 (2) ACI Worldwide, Inc. 1,544,824 0.2
7,994 (1),(2) Adesto Technologies Corp. 48,364 0.020,148 Adtran, Inc. 276,028 0.015,575 (2) Advanced Energy Industries, Inc. 773,766 0.114,082 (2) Aerohive Networks, Inc. 63,791 0.0
7,121 (2) Agilysys, Inc. 150,752 0.012,533 (2) Alarm.com Holdings, Inc. 813,392 0.110,598 (2) Alpha & Omega Co. 121,983 0.010,505 (2) Altair Engineering, Inc. 386,689 0.111,727 (2) Alteryx, Inc. 983,543 0.112,388 (2) Ambarella, Inc. 535,162 0.1
9,970 (2) Amber Road, Inc. 86,440 0.013,516 American Software, Inc. 161,516 0.041,513 (2) Amkor Technology, Inc. 354,521 0.0
7,152 (2) Anaplan, Inc. 281,503 0.011,852 (2) Anixter International, Inc. 665,016 0.16,558 (2) Appfolio, Inc. 520,705 0.17,684 (1),(2) Applied Optoelectronics, Inc. 93,745 0.09,021 (2) Aquantia Corp. 81,730 0.0
30,611 (2) Arlo Technologies, Inc. 126,423 0.04,210 (1),(2) Asure Software, Inc. 25,723 0.0
10,628 (2) Avalara, Inc. 592,936 0.142,482 (2) Avaya Holdings Corp. 714,972 0.111,452 (2) Avid Technology, Inc. 85,317 0.018,967 AVX Corp. 328,888 0.013,646 (2) Axcelis Technologies, Inc. 274,558 0.015,801 (2) AXT, Inc. 70,314 0.011,604 Badger Meter, Inc. 645,647 0.13,625 Bel Fuse, Inc. 91,640 0.0
16,188 Belden, Inc. 869,296 0.117,501 Benchmark Electronics, Inc. 459,401 0.111,283 (1),(2) Benefitfocus, Inc. 558,734 0.119,651 Blackbaud, Inc. 1,566,774 0.215,287 (2) Blackline, Inc. 708,094 0.117,020 (2) Bottomline Technologies de, Inc. 852,532 0.150,542 (2) Box, Inc. 975,966 0.116,510 (2) Brightcove, Inc. 138,849 0.028,145 Brooks Automation, Inc. 825,493 0.111,246 Cabot Microelectronics Corp. 1,259,102 0.29,873 (2) CACI International, Inc. 1,797,083 0.2
14,900 (2) CalAmp Corp. 187,442 0.0
Copyright © 2021 www.secdatabase.com. All Rights Reserved.Please Consider the Environment Before Printing This Document

18,938 (2) Calix, Inc. 145,823 0.015,236 (2) Carbon Black, Inc. 212,542 0.012,895 (2) Carbonite, Inc. 319,925 0.0
Copyright © 2021 www.secdatabase.com. All Rights Reserved.Please Consider the Environment Before Printing This Document

Voya Russell™ Small Cap Index PortfolioPORTFOLIO OF INVESTMENTS
as of March 31, 2019 (Unaudited) (Continued)
Shares ValuePercentage
of NetAssets
COMMON STOCK: (continued)Information Technology: (continued)
16,119 (2) Cardtronics plc $ 573,514 0.111,053 (2) Casa Systems, Inc. 91,740 0.06,680 Cass Information Systems, Inc. 315,964 0.09,090 (2) Ceva, Inc. 245,066 0.0
11,742 (2) ChannelAdvisor Corp. 143,018 0.058,289 (2) Ciena Corp. 2,176,511 0.323,944 (2) Cirrus Logic, Inc. 1,007,324 0.126,567 (2) Cision Ltd. 365,828 0.1
6,231 (2) Clearfield, Inc. 91,596 0.081,110 (2) Cloudera, Inc. 887,343 0.116,142 Cohu, Inc. 238,094 0.016,154 (2) Commvault Systems, Inc. 1,045,810 0.110,447 Comtech Telecommunications Corp. 242,579 0.010,617 (2) Control4 Corp. 179,746 0.021,938 (2) Cornerstone OnDemand, Inc. 1,201,764 0.222,406 (2) Coupa Software, Inc. 2,038,498 0.316,416 (2) Cray, Inc. 427,637 0.141,129 (2) Cree, Inc. 2,353,401 0.313,844 CSG Systems International, Inc. 585,601 0.113,869 CTS Corp. 407,333 0.117,388 Daktronics, Inc. 129,541 0.030,687 Diebold Nixdorf, Inc. 339,705 0.012,694 (2) Digi International, Inc. 160,833 0.0
4,637 (1),(2) Digimarc Corp. 145,509 0.016,287 (2) Diodes, Inc. 565,159 0.1
6,352 (1),(2) Domo, Inc. 256,176 0.05,785 (1),(2) Eastman Kodak Co. 17,124 0.09,963 (1) Ebix, Inc. 491,873 0.16,586 (2) eGain Corp. 68,824 0.0
17,410 (2) Electronics for Imaging, Inc. 468,329 0.114,001 (2) Ellie Mae, Inc. 1,381,759 0.230,638 (2) Endurance International Group Holdings, Inc. 222,125 0.056,871 Entegris, Inc. 2,029,726 0.318,112 (2) Envestnet, Inc. 1,184,344 0.15,471 (2) ePlus, Inc. 484,402 0.1
10,944 (2) Everbridge, Inc. 820,909 0.127,232 (2) Everi Holdings, Inc. 286,481 0.024,889 EVERTEC, Inc. 692,163 0.1
9,457 (2) Evo Payments, Inc. 274,726 0.019,077 (2) Exela Technologies, Inc. 63,717 0.013,571 (2) ExlService Holdings, Inc. 814,531 0.147,667 (2) Extreme Networks, Inc. 357,026 0.114,348 (2) Fabrinet 751,261 0.1
6,958 (2) Faro Technologies, Inc. 305,526 0.047,214 (2) Finisar Corp. 1,093,948 0.186,291 (1),(2) Fitbit, Inc. 510,843 0.1
Copyright © 2021 www.secdatabase.com. All Rights Reserved.Please Consider the Environment Before Printing This Document

23,107 (2) Five9, Inc. 1,220,743 0.212,069 (2) ForeScout Technologies, Inc. 505,812 0.130,871 (2) Formfactor, Inc. 496,714 0.117,066 (1),(2) GTT Communications, Inc. 592,190 0.111,281 Hackett Group, Inc. 178,240 0.034,597 (2) Harmonic, Inc. 187,516 0.015,085 (2) HubSpot, Inc. 2,507,278 0.3
2,191 (2) I3 Verticals, Inc. 52,628 0.09,349 (2) Ichor Holdings Ltd. 211,100 0.0
25,123 (2) II-VI, Inc. 935,581 0.110,304 (2) Immersion Corp. 86,863 0.0
6,769 (2) Impinj, Inc. 113,415 0.062,426 (2) Infinera Corp. 270,929 0.017,564 (2) Inphi Corp. 768,249 0.114,169 (2) Insight Enterprises, Inc. 780,145 0.112,868 (2) Instructure, Inc. 606,340 0.151,995 (2) Integrated Device Technology, Inc. 2,547,235 0.313,549 InterDigital, Inc. 893,963 0.1
9,079 (1),(2) Internap Corp. 45,032 0.013,155 (2) Iteris, Inc. 54,856 0.013,801 (2) Itron, Inc. 643,817 0.118,929 j2 Global, Inc. 1,639,251 0.222,517 Kemet Corp. 382,113 0.111,588 (2) Kimball Electronics, Inc. 179,498 0.035,378 (2) Knowles Corp. 623,714 0.125,605 (1),(2) Kopin Corp. 34,311 0.047,560 (2) Lattice Semiconductor Corp. 567,391 0.147,045 (2) Limelight Networks, Inc. 151,955 0.023,866 (2) LivePerson, Inc. 692,591 0.127,442 (2) LiveRamp Holdings, Inc. 1,497,510 0.230,318 (2) Lumentum Holdings, Inc. 1,714,180 0.218,668 (2) MACOM Technology Solutions Holdings, Inc. 311,942 0.010,834 Mantech International Corp. 585,253 0.125,897 Maximus, Inc. 1,838,169 0.225,776 (2) MaxLinear, Inc. 658,061 0.117,401 (1),(2) Maxwell Technologies, Inc. 77,782 0.0
1,327 Mesa Laboratories, Inc. 305,873 0.014,424 Methode Electronics, Inc. 415,123 0.1
3,594 (2) MicroStrategy, Inc. 518,434 0.114,650 (2) Mitek Systems, Inc. 179,316 0.032,782 (2) MobileIron, Inc. 179,318 0.011,656 (2) Model N, Inc. 204,446 0.012,469 (2) MoneyGram International, Inc. 25,437 0.017,248 Monotype Imaging Holdings, Inc. 343,063 0.0
7,175 MTS Systems Corp. 390,750 0.19,266 (2) Nanometrics, Inc. 286,134 0.05,132 (2) Napco Security Technologies, Inc. 106,438 0.0
15,013 (2) NeoPhotonics Corp. 94,432 0.012,882 (2) Netgear, Inc. 426,652 0.130,903 (2) Netscout Systems, Inc. 867,447 0.118,323 (2) New Relic, Inc. 1,808,480 0.226,156 NIC, Inc. 447,006 0.1
9,039 (2) nLight, Inc. 201,389 0.013,255 (2) Novanta, Inc. 1,123,096 0.1
1,951 NVE Corp. 190,983 0.0
Copyright © 2021 www.secdatabase.com. All Rights Reserved.Please Consider the Environment Before Printing This Document
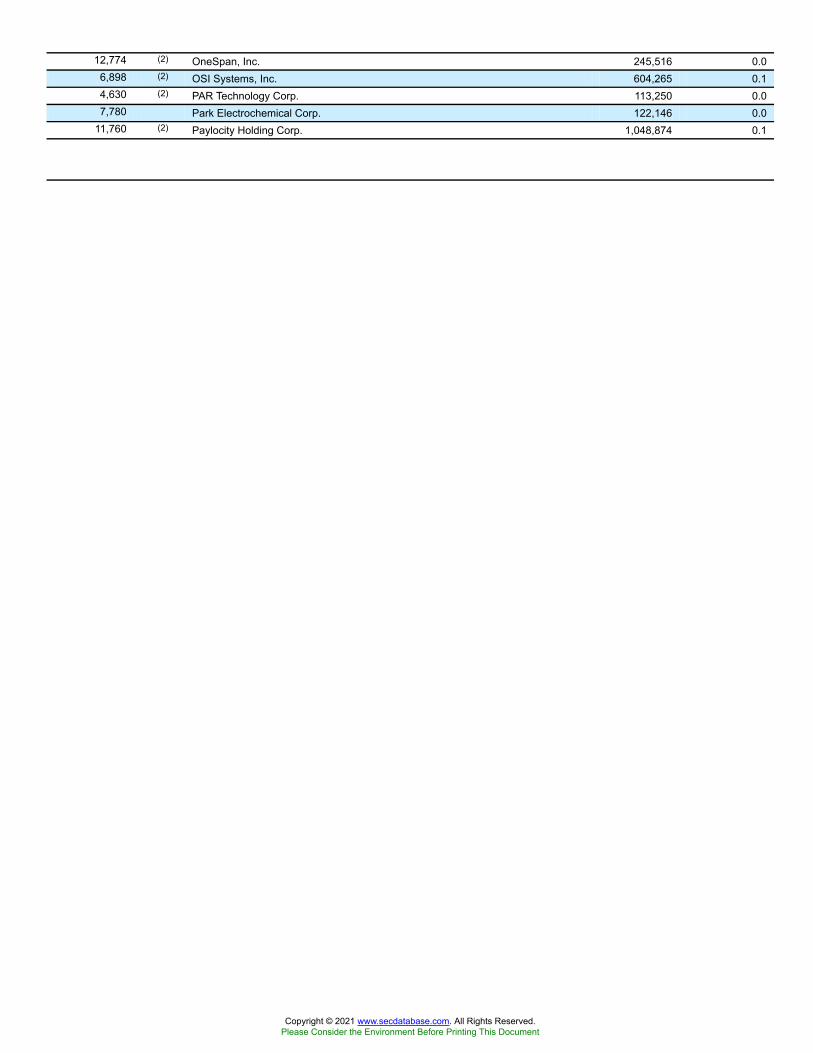
12,774 (2) OneSpan, Inc. 245,516 0.06,898 (2) OSI Systems, Inc. 604,265 0.14,630 (2) PAR Technology Corp. 113,250 0.07,780 Park Electrochemical Corp. 122,146 0.0
11,760 (2) Paylocity Holding Corp. 1,048,874 0.1
Copyright © 2021 www.secdatabase.com. All Rights Reserved.Please Consider the Environment Before Printing This Document

Voya Russell™ Small Cap Index PortfolioPORTFOLIO OF INVESTMENTS
as of March 31, 2019 (Unaudited) (Continued)
Shares ValuePercentage
of NetAssets
COMMON STOCK: (continued)Information Technology: (continued)
4,722 PC Connection, Inc. $ 173,156 0.011,682 (2) PDF Solutions, Inc. 144,273 0.013,815 (2) Perficient, Inc. 378,393 0.157,490 Perspecta, Inc. 1,162,448 0.126,357 (2) Photronics, Inc. 249,074 0.013,318 Plantronics, Inc. 614,093 0.112,479 (2) Plexus Corp. 760,595 0.111,728 Power Integrations, Inc. 820,256 0.114,635 Presidio, Inc. 216,598 0.018,208 Progress Software Corp. 807,889 0.112,642 (2) PROS Holdings, Inc. 533,998 0.114,841 (2) Q2 Holdings, Inc. 1,027,888 0.1
4,503 QAD, Inc. 193,944 0.013,743 (2) Qualys, Inc. 1,137,096 0.114,143 (2) Quantenna Communications, Inc. 344,099 0.042,750 (2) Rambus, Inc. 446,737 0.114,690 (2) Rapid7, Inc. 743,461 0.122,465 (2) Ribbon Communications, Inc. 115,695 0.0
7,410 (2) Rogers Corp. 1,177,301 0.113,317 (2) Rudolph Technologies, Inc. 303,628 0.028,502 (2) SailPoint Technologies Holding, Inc. 818,577 0.126,715 (2) Sanmina Corp. 770,728 0.110,234 (2) Scansource, Inc. 366,582 0.120,397 Science Applications International Corp. 1,569,549 0.2
3,867 (1),(2) SecureWorks Corp. 71,153 0.026,429 (2) Semtech Corp. 1,345,500 0.236,641 (2) ServiceSource International, Inc. 33,761 0.0
3,035 (2) ShotSpotter, Inc. 117,151 0.017,045 (2) Silicon Laboratories, Inc. 1,378,259 0.2
4,026 (2) SMART Global Holdings, Inc. 77,299 0.06,998 (2) SPS Commerce, Inc. 742,208 0.1
20,199 (2) Stratasys Ltd. 481,140 0.124,993 (1),(2) SunPower Corp. 162,704 0.0
7,015 (2) SVMK, Inc. 127,743 0.016,769 (2) Sykes Enterprises, Inc. 474,227 0.113,848 (2) Synaptics, Inc. 550,458 0.116,677 SYNNEX Corp. 1,590,819 0.214,855 (2) Tech Data Corp. 1,521,301 0.217,923 (2) Telaria, Inc. 113,632 0.013,648 (2) TeleNav, Inc. 82,843 0.010,250 (1),(2) Tenable Holdings, Inc. 324,515 0.050,366 TiVo Corp. 469,411 0.113,561 (2) Trade Desk, Inc./The 2,684,400 0.349,866 Travelport Worldwide Ltd. 784,392 0.1
6,267 TTEC Holdings, Inc. 227,053 0.038,296 (2) TTM Technologies, Inc. 449,212 0.1
Copyright © 2021 www.secdatabase.com. All Rights Reserved.Please Consider the Environment Before Printing This Document

3,920 (2) Tucows, Inc. 318,226 0.015,689 (2) Ultra Clean Holdings, Inc. 162,381 0.019,594 (2) Unisys Corp. 228,662 0.0
6,697 (2) Upland Software, Inc. 283,685 0.021,983 (1),(2) USA Technologies, Inc. 91,229 0.011,310 (2) Varonis Systems, Inc. 674,415 0.119,321 (2) Veeco Instruments, Inc. 209,440 0.026,019 (2) Verint Systems, Inc. 1,557,497 0.2
3,223 (1),(2) Veritone, Inc. 16,760 0.022,237 (1),(2) Viasat, Inc. 1,723,368 0.292,507 (2) Viavi Solutions, Inc. 1,145,237 0.123,678 (1),(2) VirnetX Holding Corp. 149,882 0.011,854 (2) Virtusa Corp. 633,596 0.153,169 Vishay Intertechnology, Inc. 982,031 0.1
4,455 (2) Vishay Precision Group, Inc. 152,406 0.011,915 (2) Workiva, Inc. 604,091 0.119,647 Xperi Corp. 459,740 0.133,716 (2) Yext, Inc. 737,032 0.121,847 (2) Zix Corp. 150,307 0.024,658 (2) Zscaler, Inc. 1,748,992 0.2
127,951,829 15.4
Materials: 3.8%9,298 Advanced Emissions Solutions, Inc. 107,485 0.0
12,410 (2) AdvanSix, Inc. 354,554 0.110,142 (1),(2) AgroFresh Solutions, Inc. 33,874 0.0
126,015 (1),(2) AK Steel Holding Corp. 346,541 0.150,450 (2) Allegheny Technologies, Inc. 1,290,006 0.212,456 American Vanguard Corp. 214,492 0.012,469 (1),(2) Amyris, Inc. 26,060 0.013,075 Balchem Corp. 1,213,360 0.216,069 Boise Cascade Co. 430,006 0.118,805 Carpenter Technology Corp. 862,209 0.120,189 (2) Century Aluminum Co. 179,278 0.0
3,137 Chase Corp. 290,298 0.06,909 (2) Clearwater Paper Corp. 134,587 0.0
117,948 (1) Cleveland-Cliffs, Inc. 1,178,301 0.277,863 (2) Coeur Mining, Inc. 317,681 0.046,623 Commercial Metals Co. 796,321 0.113,435 Compass Minerals International, Inc. 730,461 0.133,818 (2) Ferro Corp. 640,175 0.130,512 (2),(3),(4) Ferroglobe PLC – –22,128 (1),(2) Flotek Industries, Inc. 71,695 0.0
8,164 (1),(2) Forterra, Inc. 34,452 0.010,683 FutureFuel Corp. 143,152 0.028,792 (2) GCP Applied Technologies, Inc. 852,243 0.124,632 Gold Resource Corp. 96,804 0.0
9,478 Greif, Inc. - Class A 390,968 0.12,218 Greif, Inc. - Class B 108,438 0.04,301 Hawkins, Inc. 158,406 0.05,425 Haynes International, Inc. 178,103 0.0
20,109 HB Fuller Co. 978,102 0.1186,748 Hecla Mining Co. 429,520 0.1
17,237 (2) Ingevity Corp. 1,820,400 0.28,137 Innophos Holdings, Inc. 245,249 0.0
Copyright © 2021 www.secdatabase.com. All Rights Reserved.Please Consider the Environment Before Printing This Document

9,845 Innospec, Inc. 820,581 0.138,191 (2) Intrepid Potash, Inc. 144,744 0.0
6,506 Kaiser Aluminum Corp. 681,373 0.18,825 (2) Koppers Holdings, Inc. 229,274 0.0
12,412 (2) Kraton Corp. 399,418 0.110,603 Kronos Worldwide, Inc. 148,654 0.060,264 (2) Livent Corp. 740,042 0.1
Copyright © 2021 www.secdatabase.com. All Rights Reserved.Please Consider the Environment Before Printing This Document

Voya Russell™ Small Cap Index PortfolioPORTFOLIO OF INVESTMENTS
as of March 31, 2019 (Unaudited) (Continued)
Shares ValuePercentage
of NetAssets
COMMON STOCK: (continued)Materials: (continued)
56,843 Louisiana-Pacific Corp. $ 1,385,832 0.27,981 (1),(2) LSB Industries, Inc. 49,801 0.0
32,897 (2) Marrone Bio Innovations, Inc. 50,332 0.08,044 Materion Corp. 458,991 0.1
14,273 Minerals Technologies, Inc. 839,110 0.114,897 Myers Industries, Inc. 254,888 0.0
6,845 Neenah, Inc. 440,544 0.14,183 Olympic Steel, Inc. 66,384 0.0
20,308 (2) Omnova Solutions, Inc. 142,562 0.017,885 PH Glatfelter Co. 252,536 0.031,454 PolyOne Corp. 921,917 0.114,450 (2) PQ Group Holdings, Inc. 219,207 0.0
5,273 Quaker Chemical Corp. 1,056,340 0.121,058 Rayonier Advanced Materials, Inc. 285,546 0.0
7,499 (2) Ryerson Holding Corp. 64,191 0.010,794 Schnitzer Steel Industries, Inc. 259,056 0.012,837 Schweitzer-Mauduit International, Inc. 497,049 0.116,732 Sensient Technologies Corp. 1,134,262 0.1
8,202 Stepan Co. 717,839 0.145,151 (2) Summit Materials, Inc. 716,546 0.127,924 (2) SunCoke Energy, Inc. 237,075 0.016,742 (2) TimkenSteel Corp. 181,818 0.0
7,099 (2) Trecora Resources 64,530 0.011,114 Tredegar Corp. 179,380 0.017,241 Trinseo SA 781,017 0.137,870 (1) Tronox Holdings PLC 497,991 0.1
3,159 (2) Universal Stainless & Alloy Products, Inc. 52,345 0.06,350 (2) US Concrete, Inc. 263,017 0.0
10,533 Valhi, Inc. 24,331 0.014,154 (2) Verso Corp. 303,179 0.017,119 Warrior Met Coal, Inc. 520,418 0.116,697 Worthington Industries, Inc. 623,132 0.1
31,358,473 3.8
Real Estate: 7.5%33,611 Acadia Realty Trust 916,572 0.112,625 Agree Realty Corp. 875,418 0.127,979 Alexander & Baldwin, Inc. 711,786 0.1
1,026 Alexander's, Inc. 385,950 0.14,286 (2) Altisource Portfolio Solutions SA 101,450 0.0
17,088 American Assets Trust, Inc. 783,656 0.151,729 Americold Realty Trust 1,578,252 0.220,435 Armada Hoffler Properties, Inc. 318,582 0.036,214 Ashford Hospitality Trust, Inc. 172,017 0.0
9,480 Bluerock Residential Growth REIT, Inc. 102,194 0.012,752 Braemar Hotels & Resorts, Inc. 155,702 0.0
Copyright © 2021 www.secdatabase.com. All Rights Reserved.Please Consider the Environment Before Printing This Document

33,325 CareTrust REIT, Inc. 781,805 0.120,125 CatchMark Timber Trust, Inc. 197,628 0.071,505 (1) CBL & Associates Properties, Inc. 110,833 0.041,563 Cedar Realty Trust, Inc. 141,314 0.019,823 Chatham Lodging Trust 381,395 0.124,889 Chesapeake Lodging Trust 692,163 0.117,921 City Office REIT, Inc. 202,687 0.0
5,113 Clipper Realty, Inc. 68,463 0.08,560 Community Healthcare Trust, Inc. 307,218 0.02,106 Consolidated-Tomoka Land Co. 124,359 0.0
47,822 CoreCivic, Inc. 930,138 0.16,035 CorEnergy Infrastructure Trust, Inc. 221,786 0.0
18,097 CorePoint Lodging, Inc. 202,144 0.0168,217 Cousins Properties, Inc. 1,624,976 0.2
25,711 (2) Cushman & Wakefield PLC 457,656 0.180,511 DiamondRock Hospitality Co. 871,934 0.120,894 Easterly Government Properties, Inc. 376,301 0.113,932 EastGroup Properties, Inc. 1,555,368 0.216,818 Essential Properties Realty Trust, Inc. 328,287 0.012,170 (1) Farmland Partners, Inc. 77,888 0.048,166 First Industrial Realty Trust, Inc. 1,703,150 0.2
4,601 (2) Forestar Group, Inc. 79,551 0.029,030 Four Corners Property Trust, Inc. 859,288 0.145,639 Franklin Street Properties Corp. 328,144 0.021,422 Front Yard Residential Corp. 198,582 0.0
3,091 (2) FRP Holdings, Inc. 147,039 0.049,081 Geo Group, Inc./The 942,355 0.115,652 Getty Realty Corp. 501,334 0.113,931 Gladstone Commercial Corp. 289,347 0.030,135 Global Net Lease, Inc. 569,552 0.122,151 Hannon Armstrong Sustainable Infrastructure Capital, Inc. 567,952 0.149,837 Healthcare Realty Trust, Inc. 1,600,266 0.215,913 Hersha Hospitality Trust 272,749 0.015,074 HFF, Inc. 719,784 0.136,095 Independence Realty Trust, Inc. 389,465 0.125,414 Industrial Logistics Properties Trust 512,600 0.117,981 (2) InfraREIT, Inc. 377,062 0.1
3,680 Innovative Industrial Properties, Inc. 300,619 0.05,678 Investors Real Estate Trust 340,169 0.0
28,077 iStar, Inc. 236,408 0.0
Copyright © 2021 www.secdatabase.com. All Rights Reserved.Please Consider the Environment Before Printing This Document

Voya Russell™ Small Cap Index PortfolioPORTFOLIO OF INVESTMENTS
as of March 31, 2019 (Unaudited) (Continued)
Shares ValuePercentage
of NetAssets
COMMON STOCK: (continued)Real Estate: (continued)
9,107 Jernigan Capital, Inc. $ 191,611 0.051,658 Kennedy-Wilson Holdings, Inc. 1,104,965 0.135,390 Kite Realty Group Trust 565,886 0.188,995 Lexington Realty Trust 806,295 0.116,484 LTC Properties, Inc. 754,967 0.136,727 Mack-Cali Realty Corp. 815,339 0.1
7,544 (2) Marcus & Millichap, Inc. 307,267 0.05,411 MedEquities Realty Trust, Inc. 60,224 0.0
33,557 Monmouth Real Estate Investment Corp. 442,281 0.116,298 National Health Investors, Inc. 1,280,208 0.221,895 National Storage Affiliates Trust 624,226 0.133,684 New Senior Investment Group, Inc. 183,578 0.060,724 Newmark Group, Inc. 506,438 0.1
8,538 NexPoint Residential Trust, Inc. 327,347 0.018,563 NorthStar Realty Europe Corp. 322,254 0.019,276 Office Properties Income Trust 532,789 0.1
9,166 One Liberty Properties, Inc. 265,814 0.053,206 Pebblebrook Hotel Trust 1,652,578 0.229,832 (1) Pennsylvania Real Estate Investment Trust 187,643 0.073,819 Physicians Realty Trust 1,388,535 0.243,985 Piedmont Office Realty Trust, Inc. 917,087 0.127,074 PotlatchDeltic Corp. 1,023,126 0.117,341 Preferred Apartment Communities, Inc. 256,994 0.0
7,972 PS Business Parks, Inc. 1,250,249 0.220,780 QTS Realty Trust, Inc. 934,892 0.1
7,486 RE/MAX Holdings, Inc. 288,510 0.032,186 (1),(2) Redfin Corp. 652,410 0.145,126 Retail Opportunity Investments Corp. 782,485 0.134,623 Rexford Industrial Realty, Inc. 1,239,850 0.270,002 RLJ Lodging Trust 1,229,935 0.2
2,979 RMR Group, Inc. 181,659 0.032,899 RPT Realty 395,117 0.118,230 Ryman Hospitality Properties 1,499,235 0.272,194 Sabra Healthcare REIT, Inc. 1,405,617 0.2
4,727 Saul Centers, Inc. 242,826 0.013,033 (1) Seritage Growth Properties 579,187 0.118,766 Spirit MTA REIT 121,791 0.014,058 (1),(2) St. Joe Co. 231,816 0.039,386 STAG Industrial, Inc. 1,167,795 0.1
2,652 (2) Stratus Properties, Inc. 70,039 0.043,851 Summit Hotel Properties, Inc. 500,340 0.192,229 Sunstone Hotel Investors, Inc. 1,328,098 0.233,830 Tanger Factory Outlet Centers, Inc. 709,753 0.1
9,802 (2) Tejon Ranch Co. 172,515 0.023,206 Terreno Realty Corp. 975,580 0.122,062 Tier REIT, Inc. 632,297 0.1
Copyright © 2021 www.secdatabase.com. All Rights Reserved.Please Consider the Environment Before Printing This Document

10,870 (2) Trinity Place Holdings, Inc. 43,480 0.017,252 UMH Properties, Inc. 242,908 0.0
5,923 Universal Health Realty Income Trust 448,430 0.143,594 Urban Edge Properties 828,286 0.115,130 Urstadt Biddle Properties, Inc. 312,283 0.077,539 (1) Washington Prime Group, Inc. 438,095 0.131,844 Washington Real Estate Investment Trust 903,733 0.118,131 Whitestone REIT 217,935 0.045,271 Xenia Hotels & Resorts, Inc. 991,888 0.1
62,227,824 7.5
Utilities: 3.7%20,738 Allete, Inc. 1,705,286 0.215,035 American States Water Co. 1,071,996 0.1
5,585 (2) AquaVenture Holdings Ltd. 108,070 0.03,233 Artesian Resources Corp. 120,494 0.0
51,035 (2) Atlantic Power Corp. 128,608 0.026,106 Avista Corp. 1,060,426 0.121,747 Black Hills Corp. 1,610,800 0.2
9,351 (1),(2) Cadiz, Inc. 90,518 0.020,130 California Water Service Group 1,092,656 0.1
7,063 Chesapeake Utilities Corp. 644,216 0.119,254 Clearway Energy, Inc.-Class A 279,953 0.024,860 Clearway Energy, Inc.-Class C 375,635 0.1
5,181 Connecticut Water Service, Inc. 355,676 0.116,770 El Paso Electric Co. 986,411 0.120,164 Idacorp, Inc. 2,007,125 0.215,237 MGE Energy, Inc. 1,035,659 0.1
7,254 Middlesex Water Co. 406,151 0.135,641 New Jersey Resources Corp. 1,774,565 0.212,041 Northwest Natural Holding Co. 790,251 0.119,946 NorthWestern Corp. 1,404,398 0.221,148 ONE Gas, Inc. 1,882,806 0.216,460 Ormat Technologies, Inc. 907,769 0.117,650 Otter Tail Corp. 879,323 0.133,115 (1) Pattern Energy Group, Inc. 728,530 0.132,513 PNM Resources, Inc. 1,539,165 0.235,360 Portland General Electric Co. 1,833,062 0.2
5,952 (2) Purecycle Corp. 58,687 0.03,233 RGC Resources, Inc. 85,707 0.0
Copyright © 2021 www.secdatabase.com. All Rights Reserved.Please Consider the Environment Before Printing This Document

Voya Russell™ Small Cap Index PortfolioPORTFOLIO OF INVESTMENTS
as of March 31, 2019 (Unaudited) (Continued)
Shares ValuePercentage
of NetAssets
COMMON STOCK: (continued)Utilities: (continued)
7,549 SJW Group $ 466,075 0.134,443 South Jersey Industries, Inc. 1,104,587 0.119,801 Southwest Gas Holdings, Inc. 1,628,830 0.2
4,938 Spark Energy, Inc. 43,998 0.020,025 Spire, Inc. 1,647,857 0.227,051 TerraForm Power, Inc. 371,681 0.1
7,310 Unitil Corp. 395,983 0.16,930 York Water Co. 237,838 0.0
30,860,792 3.7
Total Common Stock(Cost $554,481,852) 820,424,819 99.0
RIGHTS: 0.0%Communication Services: –%
46,399 (2),(3),(4) Media General, Inc. - CVR – –
Materials: 0.0%11,546 (2),(3),(4) A Schulman, Inc. - CVR 23,092 0.0
Total Rights(Cost $6,039) 23,092 0.0
Total Long-Term Investments(Cost $554,487,891) 820,447,911 99.0
PrincipalAmount† Value
Percentageof NetAssets
SHORT-TERM INVESTMENTS: 5.2%Securities Lending Collateral(5): 4.3%
8,436,034 Bank of Montreal, Repurchase Agreement dated 03/29/19, 2.60%, due 04/01/19(Repurchase Amount $8,437,837, collateralized by various U.S. Government/U.S.Government Agency Obligations, 0.625%-4.500%, Market Value plus accruedinterest $8,604,763, due 03/31/19-03/01/49)
8,436,034 1.0
8,436,034 Bank of Nova Scotia, Repurchase Agreement dated 03/29/19, 2.67%, due 04/01/19(Repurchase Amount $8,437,885, collateralized by various U.S. GovernmentAgency Obligations, 3.500%-4.571%, Market Value plus accrued interest$8,606,669, due 12/01/33-02/01/49)
8,436,034 1.0
5,773,801 Citibank N.A., Repurchase Agreement dated 03/29/19, 2.65%, due 04/01/19(Repurchase Amount $5,775,059, collateralized by various U.S. Government/U.S.Government Agency Obligations, 2.960%-4.500%, Market Value plus accruedinterest $5,898,377, due 01/01/28-07/01/48)
5,773,801 0.7
8,436,034 Merrill Lynch & Co., Inc., Repurchase Agreement dated 03/29/19, 2.60%, due 04/01/19 (Repurchase Amount $8,437,837, collateralized by various U.S. GovernmentAgency Obligations, 3.500%-4.500%, Market Value plus accrued interest$8,604,755, due 03/20/47-12/20/48)
8,436,034 1.0
4,435,848 State of Wisconsin Investment Board, Repurchase Agreement dated 03/29/19,2.80%, due 04/01/19 (Repurchase Amount $4,436,869, collateralized by variousU.S. Government Securities, 0.125%-3.875%, Market Value plus accrued interest$4,532,052, due 07/15/20-02/15/47)
4,435,848 0.6
35,517,751 4.3
Copyright © 2021 www.secdatabase.com. All Rights Reserved.Please Consider the Environment Before Printing This Document

Shares ValuePercentage
of NetAssets
Mutual Funds: 0.9%7,395,000 (6) Goldman Sachs Financial Square Government Fund - Institutional Shares, 2.350%
(Cost $7,395,000) 7,395,000 0.9
Total Short-Term Investments(Cost $42,912,751) 42,912,751 5.2
Total Investments in Securities(Cost $597,400,642) $ 863,360,662 104.2
Liabilities in Excess of Other Assets (35,027,839) (4.2)Net Assets $ 828,332,823 100.0
Copyright © 2021 www.secdatabase.com. All Rights Reserved.Please Consider the Environment Before Printing This Document

Voya Russell™ Small Cap Index PortfolioPORTFOLIO OF INVESTMENTS
as of March 31, 2019 (Unaudited) (Continued)
† Unless otherwise indicated, principal amount is shown in USD.(1) Security, or a portion of the security, is on loan.(2) Non-income producing security.
(3) For fair value measurement disclosure purposes, security is categorized as Level 3, whose value was determined using significantunobservable inputs.
(4) Restricted security as to resale, excluding Rule 144A securities. As of March 31, 2019, the Portfolio held restricted securities with a fairvalue of $23,092 or 0.0% of net assets. Please refer to the table below for additional details.
(5) Represents securities purchased with cash collateral received for securities on loan.(6) Rate shown is the 7-day yield as of March 31, 2019.
Fair Value MeasurementsThe following is a summary of the fair valuations according to the inputs used as of March 31, 2019 in valuing the assets and liabilities:
Quoted Pricesin Active Markets
for IdenticalInvestments
(Level 1)
SignificantOther
ObservableInputs
(Level 2)
SignificantUnobservable
Inputs(Level 3)
Fair Valueat
March 31, 2019
Asset TableInvestments, at fair valueCommon Stock
Communication Services $ 26,796,760 $ – $ – $ 26,796,760Consumer Discretionary 98,627,037 – – 98,627,037Consumer Staples 22,693,850 – – 22,693,850Energy 30,560,653 – – 30,560,653Financials 139,932,102 – – 139,932,102Health Care 131,316,150 – – 131,316,150Industrials 118,099,349 – – 118,099,349Information Technology 127,951,829 – – 127,951,829Materials 31,358,473 – – 31,358,473Real Estate 62,227,824 – – 62,227,824Utilities 30,860,792 – – 30,860,792
Total Common Stock 820,424,819 – – 820,424,819Rights – – 23,092 23,092Short-Term Investments 7,395,000 35,517,751 – 42,912,751Total Investments, at fair value $ 827,819,819 $ 35,517,751 $ 23,092 $ 863,360,662Other Financial Instruments+Futures 159,550 – – 159,550Total Assets $ 827,979,369 $ 35,517,751 $ 23,092 $ 863,520,212
+Other Financial Instruments may include open forward foreign currency contracts, futures, centrally cleared swaps, OTC swaps and writtenoptions. Forward foreign currency contracts, futures and centrally cleared swaps are valued at the unrealized gain (loss) on the instrument. OTCswaps and written options are valued at the fair value of the instrument.
At March 31, 2019, Voya Russell™ Small Cap Index Portfolio held the following restricted securities:
Security Acquisition Date Acquisition Cost Fair ValueA Schulman, Inc. - CVR 8/22/2018 $ 6,039 $ 23,092Ferroglobe PLC 6/26/2018 – –Media General, Inc. - CVR 1/18/2017 – –
$ 6,039 $ 23,092
Copyright © 2021 www.secdatabase.com. All Rights Reserved.Please Consider the Environment Before Printing This Document

Voya Russell™ Small Cap Index PortfolioPORTFOLIO OF INVESTMENTS
as of March 31, 2019 (Unaudited) (Continued)
At March 31, 2019, the following futures contracts were outstanding for Voya Russell™ Small Cap Index Portfolio:
Description Numberof Contracts
ExpirationDate
NotionalValue
UnrealizedAppreciation/(Depreciation)
Long Contracts:Russell 2000® Mini Index 142 06/21/19 $ 10,960,980 $ 159,550
$ 10,960,980 $ 159,550
At March 31, 2019, the aggregate cost of securities and other investments and the composition of unrealized appreciation and depreciation of securitiesand other investments at period end were:
Cost for federal income tax purposes was $599,776,299.
Net unrealized appreciation consisted of:
Gross Unrealized Appreciation $342,044,558Gross Unrealized Depreciation (78,300,409)
Net Unrealized Appreciation $263,744,149
Copyright © 2021 www.secdatabase.com. All Rights Reserved.Please Consider the Environment Before Printing This Document

Voya Small Company PortfolioPORTFOLIO OF INVESTMENTSas of March 31, 2019 (Unaudited)
Shares ValuePercentage
of NetAssets
COMMON STOCK: 94.3%Communication Services: 2.4%
203,044 (1) Gray Television, Inc. $ 4,337,020 0.8208,089 (1) Imax Corp. 4,719,458 0.8479,316 (1) Vonage Holdings Corp. 4,812,333 0.8
13,868,811 2.4
Consumer Discretionary: 9.6%258,864 American Eagle Outfitters, Inc. 5,739,015 1.0169,578 (1) At Home Group, Inc. 3,028,663 0.5
39,633 (1) Boot Barn Holdings, Inc. 1,166,796 0.2316,037 Callaway Golf Co. 5,034,469 0.9
57,060 Childrens Place, Inc./The 5,550,797 1.0172,428 Dana, Inc. 3,058,873 0.5290,682 Extended Stay America, Inc. 5,217,742 0.9
44,461 (1) Five Below, Inc. 5,524,279 0.947,969 (1) Helen of Troy Ltd. 5,562,485 1.059,447 Jack in the Box, Inc. 4,818,774 0.8
126,873 La-Z-Boy, Inc. 4,185,540 0.723,501 Marriott Vacations Worldwide Corp. 2,197,343 0.4
117,367 Red Rock Resorts, Inc. 3,033,937 0.527,516 (1) TopBuild Corp. 1,783,587 0.3
55,902,300 9.6
Consumer Staples: 2.9%90,152 (1) BJ's Wholesale Club Holdings, Inc. 2,470,165 0.4
117,265 (1) Edgewell Personal Care Co. 5,146,761 0.9314,385 (1) Hostess Brands, Inc. 3,929,812 0.7140,351 (1) Performance Food Group Co. 5,563,514 0.9
17,110,252 2.9
Energy: 1.9%247,332 (1) Carrizo Oil & Gas, Inc. 3,084,230 0.5
71,780 (1) Dril-Quip, Inc. 3,291,113 0.6228,350 (1) QEP Resources, Inc. 1,778,847 0.3212,988 (1) Unit Corp. 3,032,949 0.5
11,187,139 1.9
Financials: 18.4%143,790 CenterState Bank Corp. 3,423,640 0.6166,862 Columbia Banking System, Inc. 5,454,719 0.9
67,011 (1) Eagle Bancorp, Inc. 3,363,952 0.6378,279 First BanCorp. Puerto Rico 4,335,077 0.7192,315 First Financial Bancorp. 4,627,099 0.8108,907 Hancock Whitney Corp. 4,399,843 0.8
37,429 Hanover Insurance Group, Inc. 4,273,269 0.760,112 Horace Mann Educators Corp. 2,116,544 0.499,799 Houlihan Lokey, Inc. 4,575,784 0.873,589 Independent Bank Group, Inc. 3,774,380 0.6
Copyright © 2021 www.secdatabase.com. All Rights Reserved.Please Consider the Environment Before Printing This Document

68,677 Kemper Corp. 5,229,067 0.981,118 Lakeland Financial Corp. 3,668,156 0.6
150,314 Pacific Premier Bancorp, Inc. 3,987,830 0.731,851 Primerica, Inc. 3,890,600 0.7
105,699 ProAssurance Corp. 3,658,242 0.6216,452 Radian Group, Inc. 4,489,215 0.8417,594 Redwood Trust, Inc. 6,744,143 1.2
97,993 (1) Seacoast Banking Corp. of Florida 2,582,116 0.488,748 Selective Insurance Group 5,615,973 1.0
148,295 Simmons First National Corp. 3,630,262 0.6107,861 Stifel Financial Corp. 5,690,746 1.0314,074 Two Harbors Investment Corp. 4,249,421 0.7124,120 Union Bankshares Corp. 4,012,800 0.7
74,359 Wintrust Financial Corp. 5,006,591 0.9112,064 WSFS Financial Corp. 4,325,670 0.7
107,125,139 18.4
Health Care: 13.0%35,955 (1) Aerie Pharmaceuticals, Inc. 1,707,863 0.343,195 (1) Amedisys, Inc. 5,324,216 0.9
178,831 (1) Amicus Therapeutics, Inc. 2,432,102 0.449,938 (1) Arena Pharmaceuticals, Inc. 2,238,721 0.4
112,963 (1) Array Biopharma, Inc. 2,754,038 0.528,094 (1) Blueprint Medicines Corp. 2,248,925 0.427,096 (1),(2) Clovis Oncology, Inc. 672,523 0.140,546 Conmed Corp. 3,372,616 0.633,523 (1) Emergent Biosolutions, Inc. 1,693,582 0.342,593 Encompass Health Corp. 2,487,431 0.442,355 (1) Epizyme, Inc. 524,778 0.137,597 (1) FibroGen, Inc. 2,043,397 0.437,022 (1) HealthEquity, Inc. 2,738,888 0.545,014 Hill-Rom Holdings, Inc. 4,765,182 0.8
145,490 (1) Immunogen, Inc. 394,278 0.165,366 (1),(2) Immunomedics, Inc. 1,255,681 0.234,345 (1) Insmed, Inc. 998,409 0.218,507 (1),(2) Ligand Pharmaceuticals, Inc. 2,326,515 0.428,952 (1) LivaNova PLC 2,815,582 0.551,272 (1) Medidata Solutions, Inc. 3,755,161 0.678,593 (1) Medpace Holdings, Inc. 4,634,629 0.896,446 (1) Merit Medical Systems, Inc. 5,963,256 1.019,200 (1) Puma Biotechnology, Inc. 744,768 0.135,154 (1) Repligen Corp. 2,076,898 0.436,962 (1) Supernus Pharmaceuticals, Inc. 1,295,148 0.257,686 (1) Syneos Health, Inc. 2,985,827 0.5
316,187 (1),(2) TherapeuticsMD, Inc. 1,539,831 0.387,106 (1) Tivity Health, Inc. 1,529,581 0.3
Copyright © 2021 www.secdatabase.com. All Rights Reserved.Please Consider the Environment Before Printing This Document

Voya Small Company PortfolioPORTFOLIO OF INVESTMENTS
as of March 31, 2019 (Unaudited) (Continued)
Shares ValuePercentage
of NetAssets
COMMON STOCK: (continued)Health Care: (continued)
28,561 (1) Ultragenyx Pharmaceutical, Inc. $ 1,980,991 0.3138,483 (1) Wright Medical Group NV 4,355,290 0.7
34,217 (1) Zogenix, Inc. 1,882,277 0.375,538,384 13.0
Industrials: 13.6%80,056 (1) Atlas Air Worldwide Holdings, Inc. 4,047,631 0.7
110,517 Barnes Group, Inc. 5,681,679 1.0117,313 (1) Beacon Roofing Supply, Inc. 3,772,786 0.646,053 (1) Casella Waste Systems, Inc. 1,637,645 0.343,975 Curtiss-Wright Corp. 4,984,127 0.880,250 EMCOR Group, Inc. 5,864,670 1.0
102,996 Granite Construction, Inc. 4,444,277 0.859,384 ICF International, Inc. 4,517,935 0.865,310 Regal Beloit Corp. 5,346,930 0.940,912 (1) SP Plus Corp. 1,395,917 0.2
103,761 (1) Spirit Airlines, Inc. 5,484,806 0.9150,695 (1) SPX FLOW, Inc. 4,807,171 0.8109,603 Tetra Tech, Inc. 6,531,243 1.1171,257 Universal Forest Products, Inc. 5,118,872 0.9
69,806 Watts Water Technologies, Inc. 5,641,721 1.0116,276 Werner Enterprises, Inc. 3,970,825 0.765,042 Woodward, Inc. 6,171,835 1.1
79,420,070 13.6
Information Technology: 15.9%218,661 (1) ACI Worldwide, Inc. 7,187,387 1.2
34,019 (1) CACI International, Inc. 6,192,138 1.191,695 (1) Cornerstone OnDemand, Inc. 5,023,052 0.9
155,349 Entegris, Inc. 5,544,406 1.066,090 (1) Envestnet, Inc. 4,321,625 0.742,104 (1) Everbridge, Inc. 3,158,221 0.592,632 (1) ExlService Holdings, Inc. 5,559,773 1.054,472 j2 Global, Inc. 4,717,275 0.8
122,429 Mantech International Corp. 6,613,615 1.1100,840 (1) Plexus Corp. 6,146,198 1.1193,638 (1) Rudolph Technologies, Inc. 4,414,946 0.8
87,606 (1) Semtech Corp. 4,460,021 0.861,054 (1) Silicon Laboratories, Inc. 4,936,826 0.858,751 SYNNEX Corp. 5,604,258 1.0
9,889 (1) Trade Desk, Inc./The 1,957,528 0.3219,468 (1) TTM Technologies, Inc. 2,574,360 0.4
85,489 (1) Verint Systems, Inc. 5,117,372 0.9377,291 (1) Viavi Solutions, Inc. 4,670,863 0.8
81,454 (1) Virtusa Corp. 4,353,716 0.792,553,580 15.9
Copyright © 2021 www.secdatabase.com. All Rights Reserved.Please Consider the Environment Before Printing This Document

Materials: 4.3%71,264 Carpenter Technology Corp. 3,267,454 0.6
281,200 Commercial Metals Co. 4,802,896 0.870,466 Minerals Technologies, Inc. 4,142,696 0.7
154,490 PolyOne Corp. 4,528,102 0.869,412 Sensient Technologies Corp. 4,705,439 0.895,102 Worthington Industries, Inc. 3,549,207 0.6
24,995,794 4.3
Real Estate: 8.2%201,781 Americold Realty Trust 6,156,338 1.1553,594 Cousins Properties, Inc. 5,347,718 0.9333,968 Easterly Government Properties, Inc. 6,014,764 1.0
41,279 EastGroup Properties, Inc. 4,608,388 0.8295,598 Essential Properties Realty Trust, Inc. 5,770,073 1.0180,454 First Industrial Realty Trust, Inc. 6,380,853 1.1133,079 Hudson Pacific Properties, Inc. 4,580,579 0.8377,653 Physicians Realty Trust 7,103,653 1.2
77,102 Urban Edge Properties 1,464,938 0.347,427,304 8.2
Utilities: 4.1%75,889 Black Hills Corp. 5,621,098 1.011,716 El Paso Electric Co. 689,135 0.168,983 Idacorp, Inc. 6,866,568 1.265,211 NorthWestern Corp. 4,591,507 0.8
111,531 Portland General Electric Co. 5,781,767 1.023,550,075 4.1
Total Common Stock(Cost $532,298,892) 548,678,848 94.3
EXCHANGE-TRADED FUNDS: 2.2%85,453 iShares Russell 2000 ETF 13,082,000 2.2
Total Exchange-Traded Funds(Cost $12,647,682) 13,082,000 2.2
Total Long-Term Investments(Cost $544,946,574) 561,760,848 96.5
Copyright © 2021 www.secdatabase.com. All Rights Reserved.Please Consider the Environment Before Printing This Document

Voya Small Company PortfolioPORTFOLIO OF INVESTMENTS
as of March 31, 2019 (Unaudited) (Continued)
PrincipalAmount† Value
Percentageof NetAssets
SHORT-TERM INVESTMENTS: 4.8%Securities Lending Collateral(3): 0.6%
1,000,000 Bank of Nova Scotia, Repurchase Agreement dated 03/29/19, 2.67%, due 04/01/19(Repurchase Amount $1,000,219, collateralized by various U.S. GovernmentAgency Obligations, 3.500%-4.571%, Market Value plus accrued interest$1,020,227, due 12/01/33-02/01/49)
$ 1,000,000 0.2
564,400 BNP Paribas S.A., Repurchase Agreement dated 03/29/19, 2.58%, due 04/01/19(Repurchase Amount $564,520, collateralized by various U.S. GovernmentSecurities, 0.000%-7.250%, Market Value plus accrued interest $575,688, due 05/16/19-09/09/49)
564,400 0.1
1,000,000 Citigroup, Inc., Repurchase Agreement dated 03/29/19, 2.65%, due 04/01/19(Repurchase Amount $1,000,218, collateralized by various U.S. Government/U.S.Government Agency Obligations, 0.000%-10.500%, Market Value plus accruedinterest $1,020,000, due 04/02/19-10/20/68)
1,000,000 0.1
1,000,000 Nomura Securities, Repurchase Agreement dated 03/29/19, 2.65%, due 04/01/19(Repurchase Amount $1,000,218, collateralized by various U.S. Government/U.S.Government Agency Obligations, 0.000%-8.500%, Market Value plus accruedinterest $1,020,000, due 05/01/19-01/20/69)
1,000,000 0.2
3,564,400 0.6
Shares ValuePercentage
of NetAssets
Mutual Funds: 4.2%24,553,000 (4) Goldman Sachs Financial Square Government Fund - Institutional Shares, 2.350%
(Cost $24,553,000) $ 24,553,000 4.2
Total Short-Term Investments(Cost $28,117,400) 28,117,400 4.8
Total Investments in Securities(Cost $573,063,974) $ 589,878,248 101.3
Liabilities in Excess of Other Assets (7,845,882) (1.3)Net Assets $ 582,032,366 100.0
† Unless otherwise indicated, principal amount is shown in USD.(1) Non-income producing security.(2) Security, or a portion of the security, is on loan.(3) Represents securities purchased with cash collateral received for securities on loan.(4) Rate shown is the 7-day yield as of March 31, 2019.
Copyright © 2021 www.secdatabase.com. All Rights Reserved.Please Consider the Environment Before Printing This Document
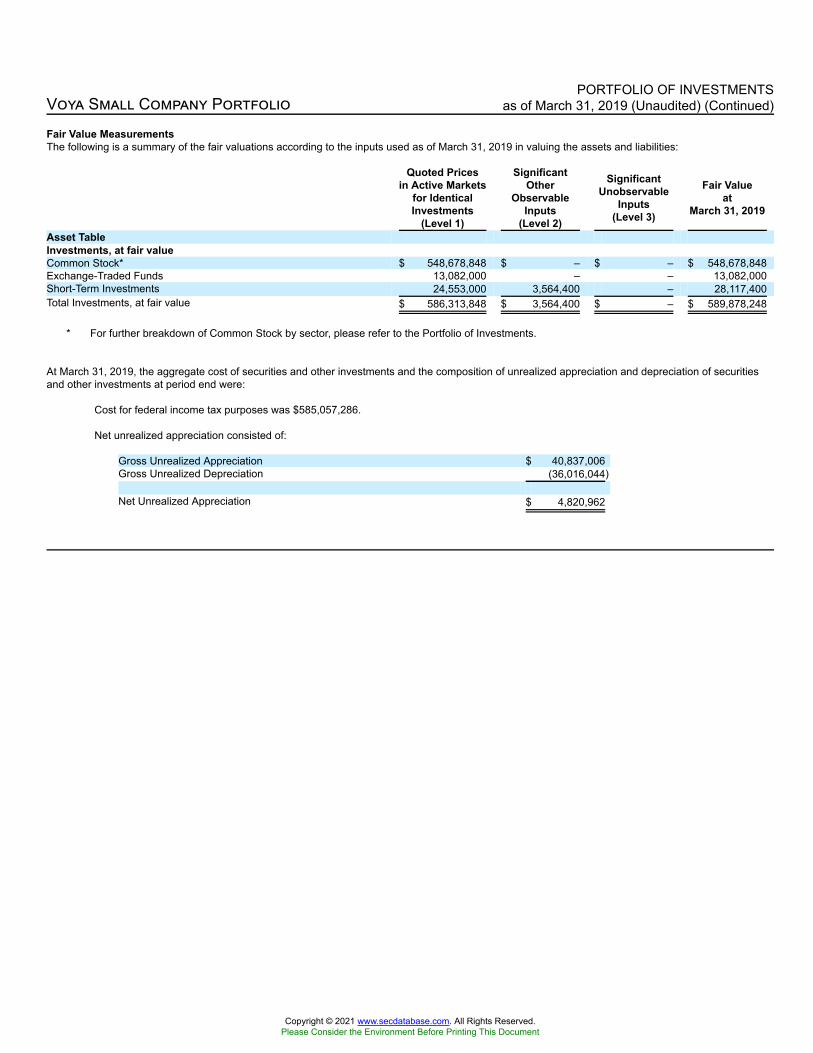
Voya Small Company PortfolioPORTFOLIO OF INVESTMENTS
as of March 31, 2019 (Unaudited) (Continued)
Fair Value MeasurementsThe following is a summary of the fair valuations according to the inputs used as of March 31, 2019 in valuing the assets and liabilities:
Quoted Pricesin Active Markets
for IdenticalInvestments
(Level 1)
SignificantOther
ObservableInputs
(Level 2)
SignificantUnobservable
Inputs(Level 3)
Fair Valueat
March 31, 2019
Asset TableInvestments, at fair valueCommon Stock* $ 548,678,848 $ – $ – $ 548,678,848Exchange-Traded Funds 13,082,000 – – 13,082,000Short-Term Investments 24,553,000 3,564,400 – 28,117,400Total Investments, at fair value $ 586,313,848 $ 3,564,400 $ – $ 589,878,248
* For further breakdown of Common Stock by sector, please refer to the Portfolio of Investments.
At March 31, 2019, the aggregate cost of securities and other investments and the composition of unrealized appreciation and depreciation of securitiesand other investments at period end were:
Cost for federal income tax purposes was $585,057,286.
Net unrealized appreciation consisted of:
Gross Unrealized Appreciation $ 40,837,006Gross Unrealized Depreciation (36,016,044)
Net Unrealized Appreciation $ 4,820,962
Copyright © 2021 www.secdatabase.com. All Rights Reserved.Please Consider the Environment Before Printing This Document

Voya U.S. Bond Index PortfolioPORTFOLIO OF INVESTMENTSas of March 31, 2019 (Unaudited)
PrincipalAmount† Value
Percentageof NetAssets
CORPORATE BONDS/NOTES: 28.1%Basic Materials: 0.6%
500,000 Airgas, Inc., 2.900%, 11/15/2022 $ 501,711 0.0800,000 Barrick Australian Finance Pty Ltd., 5.950%, 10/15/2039 937,956 0.0800,000 Cabot Corp., 3.700%, 07/15/2022 811,297 0.0
1,500,000 (1) Chevron Phillips Chemical Co. LLC / Chevron Phillips Chemical Co. L.P., 3.300%,05/01/2023 1,517,801 0.1
500,000 (1) Chevron Phillips Chemical Co. LLC / Chevron Phillips Chemical Co. L.P., 3.700%,06/01/2028 511,821 0.0
500,000 Dow Chemical Co/The, 4.250%, 10/01/2034 490,498 0.068,000 Eastman Chemical Co., 4.500%, 01/15/2021 69,478 0.0
400,000 Eastman Chemical Co., 4.650%, 10/15/2044 392,071 0.0250,000 Goldcorp, Inc., 3.625%, 06/09/2021 252,338 0.0900,000 International Paper Co., 3.000%, 02/15/2027 867,992 0.0400,000 International Paper Co., 3.650%, 06/15/2024 411,643 0.0750,000 International Paper Co., 3.800%, 01/15/2026 772,461 0.0
1,000,000 International Paper Co., 4.350%, 08/15/2048 936,721 0.0500,000 LYB International Finance BV, 4.000%, 07/15/2023 512,224 0.0
1,000,000 Mosaic Co/The, 4.250%, 11/15/2023 1,038,882 0.1250,000 Mosaic Co/The, 5.450%, 11/15/2033 269,474 0.0
1,000,000 Nutrien Ltd., 3.150%, 10/01/2022 999,480 0.11,000,000 Nutrien Ltd., 5.625%, 12/01/2040 1,098,320 0.11,000,000 Praxair, Inc., 2.200%, 08/15/2022 989,425 0.0
500,000 Rio Tinto Finance USA Ltd., 3.750%, 06/15/2025 525,390 0.0750,000 Rio Tinto Finance USA Ltd., 7.125%, 07/15/2028 975,165 0.0
1,000,000 Sherwin-Williams Co/The, 3.450%, 06/01/2027 984,276 0.02,000,000 Southern Copper Corp., 5.375%, 04/16/2020 2,053,941 0.1
250,000 Southern Copper Corp., 5.875%, 04/23/2045 282,438 0.0350,000 Southern Copper Corp., 6.750%, 04/16/2040 421,488 0.0
1,955,000 Vale Overseas Ltd., 6.875%, 11/21/2036 2,243,363 0.120,867,654 0.6
Communications: 2.7%1,000,000 Alibaba Group Holding Ltd, 2.800%, 06/06/2023 992,715 0.01,000,000 Alibaba Group Holding Ltd, 3.400%, 12/06/2027 983,508 0.0
300,000 Amazon.com, Inc., 2.500%, 11/29/2022 299,547 0.01,000,000 Amazon.com, Inc., 2.800%, 08/22/2024 1,002,685 0.01,000,000 Amazon.com, Inc., 3.150%, 08/22/2027 1,009,245 0.01,000,000 Amazon.com, Inc., 3.800%, 12/05/2024 1,052,520 0.01,000,000 Amazon.com, Inc., 4.800%, 12/05/2034 1,164,465 0.14,000,000 America Movil SAB de CV, 5.000%, 03/30/2020 4,077,846 0.1
500,000 AT&T, Inc., 3.200%, 03/01/2022 504,698 0.01,000,000 AT&T, Inc., 3.400%, 05/15/2025 991,103 0.0
500,000 AT&T, Inc., 3.800%, 03/01/2024 512,739 0.01,014,000 AT&T, Inc., 4.100%, 02/15/2028 1,025,755 0.0
500,000 AT&T, Inc., 4.125%, 02/17/2026 511,685 0.01,000,000 AT&T, Inc., 4.250%, 03/01/2027 1,030,237 0.01,000,000 AT&T, Inc., 4.500%, 05/15/2035 988,065 0.01,260,000 AT&T, Inc., 4.500%, 03/09/2048 1,188,603 0.11,500,000 AT&T, Inc., 4.750%, 05/15/2046 1,473,905 0.1
Copyright © 2021 www.secdatabase.com. All Rights Reserved.Please Consider the Environment Before Printing This Document

2,500,000 AT&T, Inc., 4.900%, 08/15/2037 2,531,644 0.1740,000 AT&T, Inc., 5.650%, 02/15/2047 811,090 0.0
1,620,000 AT&T, Inc., 6.000%, 08/15/2040 1,829,297 0.1300,000 CBS Corp., 3.700%, 08/15/2024 305,230 0.0250,000 CBS Corp., 4.000%, 01/15/2026 254,392 0.0
2,000,000 CBS Corp., 4.300%, 02/15/2021 2,043,319 0.1250,000 CBS Corp., 4.600%, 01/15/2045 239,262 0.0300,000 CBS Corp., 4.900%, 08/15/2044 296,350 0.0500,000 Charter Communications Operating LLC / Charter Communications Operating
Capital, 4.464%, 07/23/2022 517,691 0.0
Copyright © 2021 www.secdatabase.com. All Rights Reserved.Please Consider the Environment Before Printing This Document

Voya U.S. Bond Index PortfolioPORTFOLIO OF INVESTMENTS
as of March 31, 2019 (Unaudited) (Continued)
PrincipalAmount† Value
Percentageof NetAssets
CORPORATE BONDS/NOTES: (continued)Communications: (continued)
1,500,000 Charter Communications Operating LLC / Charter Communications OperatingCapital, 4.908%, 07/23/2025 $ 1,583,122 0.1
1,500,000 Charter Communications Operating LLC / Charter Communications OperatingCapital, 5.375%, 05/01/2047 1,496,773 0.1
1,000,000 Charter Communications Operating LLC / Charter Communications OperatingCapital, 6.484%, 10/23/2045 1,123,571 0.0
1,000,000 Cisco Systems, Inc., 2.200%, 02/28/2021 993,454 0.01,000,000 Cisco Systems, Inc., 2.900%, 03/04/2021 1,009,408 0.01,000,000 Cisco Systems, Inc., 3.625%, 03/04/2024 1,051,285 0.01,500,000 Cisco Systems, Inc., 5.500%, 01/15/2040 1,906,056 0.1
750,000 Comcast Corp., 3.000%, 02/01/2024 753,055 0.0500,000 Comcast Corp., 3.375%, 02/15/2025 510,058 0.0
1,250,000 Comcast Corp., 3.600%, 03/01/2024 1,286,402 0.1724,000 Comcast Corp., 3.969%, 11/01/2047 701,001 0.0750,000 Comcast Corp., 4.200%, 08/15/2034 782,554 0.0750,000 Comcast Corp., 4.250%, 01/15/2033 794,314 0.0
1,000,000 Comcast Corp., 4.500%, 01/15/2043 1,048,719 0.01,000,000 Comcast Corp., 4.600%, 08/15/2045 1,069,396 0.01,500,000 Comcast Corp., 4.700%, 10/15/2048 1,636,060 0.1
335,000 Comcast Corp., 6.500%, 11/15/2035 425,109 0.01,500,000 Deutsche Telekom International Finance BV, 8.750%, 06/15/2030 2,068,933 0.1
750,000 Discovery Communications LLC, 3.250%, 04/01/2023 747,363 0.0500,000 (1) Discovery Communications LLC, 3.500%, 06/15/2022 500,926 0.0250,000 (1) Discovery Communications LLC, 3.900%, 11/15/2024 254,466 0.0
1,800,000 Discovery Communications LLC, 4.375%, 06/15/2021 1,851,718 0.1300,000 eBay, Inc., 2.875%, 08/01/2021 300,206 0.0
1,500,000 Expedia Group, Inc., 5.950%, 08/15/2020 1,559,167 0.1500,000 Juniper Networks, Inc., 4.500%, 03/15/2024 520,924 0.0300,000 Motorola Solutions, Inc., 3.500%, 09/01/2021 303,347 0.0100,000 Motorola Solutions, Inc., 4.000%, 09/01/2024 101,988 0.0
1,500,000 (1) NBCUniversal Enterprise, Inc., 1.974%, 04/15/2019 1,499,613 0.1500,000 NBCUniversal Media LLC, 2.875%, 01/15/2023 502,334 0.0500,000 NBCUniversal Media, LLC, 4.450%, 01/15/2043 519,684 0.0
1,500,000 Omnicom Group, Inc. / Omnicom Capital, Inc., 3.625%, 05/01/2022 1,528,031 0.1500,000 Orange SA, 5.500%, 02/06/2044 578,423 0.0250,000 Rogers Communications, Inc., 5.000%, 03/15/2044 278,263 0.0500,000 Telefonica Emisiones SAU, 4.103%, 03/08/2027 507,123 0.0750,000 Telefonica Emisiones SAU, 4.665%, 03/06/2038 718,048 0.0700,000 Telefonica Emisiones SAU, 5.134%, 04/27/2020 716,370 0.0
2,000,000 Telefonica Emisiones SAU, 5.462%, 02/16/2021 2,092,139 0.11,000,000 (1) Tencent Holdings Ltd., 2.985%, 01/19/2023 996,588 0.0
750,000 Time Warner Cable LLC, 4.125%, 02/15/2021 762,056 0.01,000,000 Time Warner Cable LLC, 4.500%, 09/15/2042 879,077 0.01,000,000 Time Warner Entertainment Co. L.P., 8.375%, 03/15/2023 1,171,043 0.1
500,000 Warner Media LLC, 2.100%, 06/01/2019 499,331 0.0500,000 Warner Media LLC, 3.550%, 06/01/2024 505,162 0.0500,000 Warner Media LLC, 4.650%, 06/01/2044 484,164 0.0400,000 Warner Media LLC, 5.350%, 12/15/2043 421,594 0.0
1,425,000 Warner Media LLC, 6.500%, 11/15/2036 1,681,243 0.11,000,000 Verizon Communications, Inc., 2.625%, 08/15/2026 955,374 0.0
Copyright © 2021 www.secdatabase.com. All Rights Reserved.Please Consider the Environment Before Printing This Document

1,000,000 Verizon Communications, Inc., 3.500%, 11/01/2024 1,025,089 0.0
Copyright © 2021 www.secdatabase.com. All Rights Reserved.Please Consider the Environment Before Printing This Document

Voya U.S. Bond Index PortfolioPORTFOLIO OF INVESTMENTS
as of March 31, 2019 (Unaudited) (Continued)
PrincipalAmount† Value
Percentageof NetAssets
CORPORATE BONDS/NOTES: (continued)Communications: (continued)
1,000,000 Verizon Communications, Inc., 4.125%, 03/16/2027 $ 1,047,880 0.01,585,000 Verizon Communications, Inc., 4.329%, 09/21/2028 1,681,961 0.11,650,000 Verizon Communications, Inc., 4.400%, 11/01/2034 1,721,217 0.1
655,000 Verizon Communications, Inc., 4.522%, 09/15/2048 674,151 0.03,000,000 Verizon Communications, Inc., 4.750%, 11/01/2041 3,178,639 0.13,136,000 Verizon Communications, Inc., 4.862%, 08/21/2046 3,356,630 0.1
248,000 Viacom, Inc., 3.875%, 04/01/2024 252,791 0.0390,000 Viacom, Inc., 4.375%, 03/15/2043 350,668 0.0440,000 Viacom, Inc., 5.850%, 09/01/2043 479,326 0.0500,000 Vodafone Group PLC, 2.950%, 02/19/2023 495,925 0.0
1,500,000 Vodafone Group PLC, 3.750%, 01/16/2024 1,514,255 0.12,000,000 Vodafone Group PLC, 4.125%, 05/30/2025 2,040,407 0.11,000,000 Vodafone Group PLC, 6.150%, 02/27/2037 1,112,024 0.0
300,000 TWDC Enterprises 18 Corp., 2.350%, 12/01/2022 296,970 0.0400,000 TWDC Enterprises 18 Corp., 3.000%, 02/13/2026 402,334 0.0300,000 (2) TWDC Enterprises 18 Corp., 4.125%, 06/01/2044 320,365 0.0250,000 (1) Walt Disney Co/The, 4.750%, 09/15/2044 287,462 0.0
2,050,000 (1) Walt Disney Co/The, 6.150%, 03/01/2037 2,672,288 0.11,000,000 WPP Finance 2010, 3.625%, 09/07/2022 1,006,767 0.0
95,229,780 2.7
Consumer, Cyclical: 1.6%224,875 American Airlines 2016-2 Class AA Pass Through Trust, 3.200%, 12/15/2029 220,400 0.0922,173 American Airlines 2016-3 Class AA Pass Through Trust, 3.000%, 04/15/2030 894,778 0.0225,000 American Airlines 2017-1 Class AA Pass Through Trust, 3.650%, 08/15/2030 226,873 0.0
1,181,148 American Airlines 2017-2 Class AA Pass Through Trust, 3.350%, 04/15/2031 1,156,310 0.1500,000 American Honda Finance Corp., 2.300%, 09/09/2026 474,244 0.0750,000 AutoZone, Inc., 3.125%, 07/15/2023 752,595 0.0400,000 Tapestry, Inc., 4.250%, 04/01/2025 403,333 0.0859,281 Continental Airlines 2009-2 Class A Pass Through Trust, 7.250%, 11/10/2019 877,756 0.0300,000 Costco Wholesale Corp., 1.700%, 12/15/2019 298,140 0.0
1,000,000 (1) Daimler Finance North America LLC, 2.300%, 02/12/2021 988,376 0.0729,199 Delta Air Lines 2007-1 Class A Pass Through Trust, 6.821%, 02/10/2024 798,364 0.0500,000 Ford Motor Co., 4.346%, 12/08/2026 464,927 0.0300,000 Ford Motor Co., 4.750%, 01/15/2043 236,003 0.0500,000 Ford Motor Co., 7.450%, 07/16/2031 533,932 0.0500,000 Ford Motor Credit Co. LLC, 2.021%, 05/03/2019 499,555 0.0500,000 Ford Motor Credit Co. LLC, 3.096%, 05/04/2023 469,364 0.0500,000 Ford Motor Credit Co. LLC, 3.200%, 01/15/2021 493,086 0.0250,000 Ford Motor Credit Co. LLC, 4.134%, 08/04/2025 231,214 0.0750,000 Ford Motor Credit Co. LLC, 4.250%, 09/20/2022 745,753 0.0
1,000,000 Ford Motor Credit Co. LLC, 4.375%, 08/06/2023 980,078 0.01,300,000 Ford Motor Credit Co., LLC, 5.875%, 08/02/2021 1,347,363 0.1
750,000 General Motors Co., 6.600%, 04/01/2036 786,650 0.0500,000 General Motors Financial Co., Inc., 3.150%, 06/30/2022 495,430 0.0
1,000,000 General Motors Financial Co., Inc., 3.200%, 07/06/2021 996,173 0.01,000,000 General Motors Financial Co., Inc., 3.250%, 01/05/2023 981,396 0.0
Copyright © 2021 www.secdatabase.com. All Rights Reserved.Please Consider the Environment Before Printing This Document
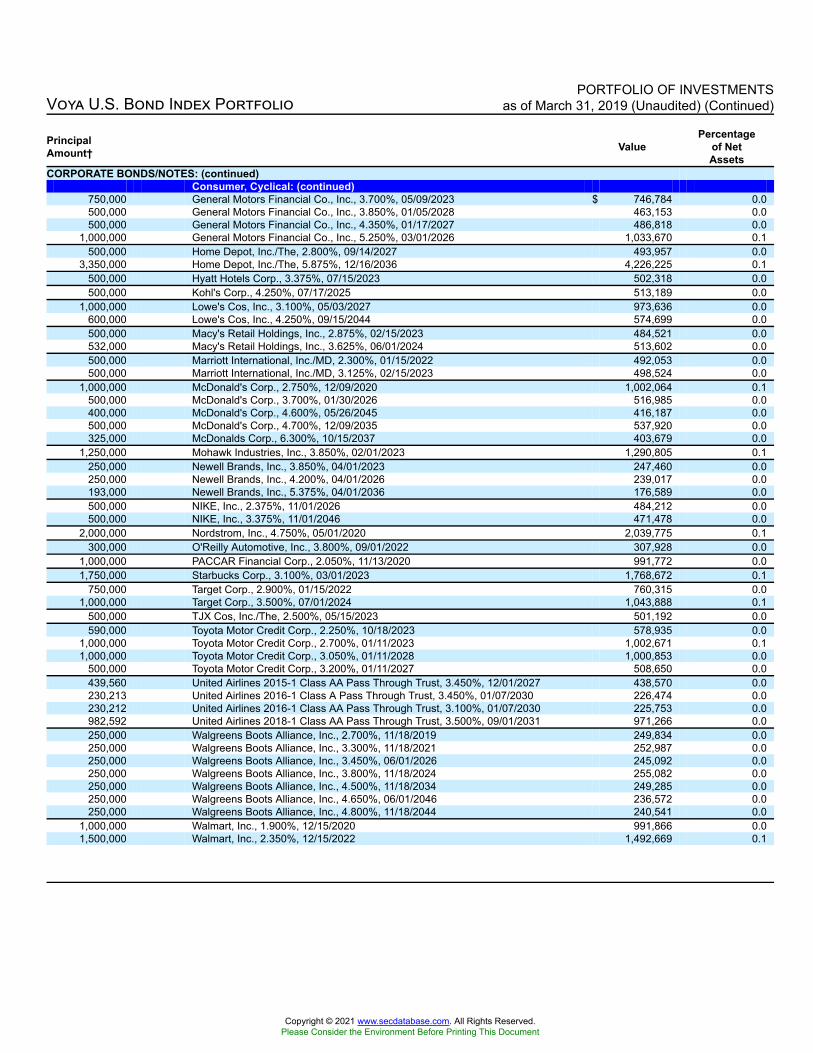
Voya U.S. Bond Index PortfolioPORTFOLIO OF INVESTMENTS
as of March 31, 2019 (Unaudited) (Continued)
PrincipalAmount† Value
Percentageof NetAssets
CORPORATE BONDS/NOTES: (continued)Consumer, Cyclical: (continued)
750,000 General Motors Financial Co., Inc., 3.700%, 05/09/2023 $ 746,784 0.0500,000 General Motors Financial Co., Inc., 3.850%, 01/05/2028 463,153 0.0500,000 General Motors Financial Co., Inc., 4.350%, 01/17/2027 486,818 0.0
1,000,000 General Motors Financial Co., Inc., 5.250%, 03/01/2026 1,033,670 0.1500,000 Home Depot, Inc./The, 2.800%, 09/14/2027 493,957 0.0
3,350,000 Home Depot, Inc./The, 5.875%, 12/16/2036 4,226,225 0.1500,000 Hyatt Hotels Corp., 3.375%, 07/15/2023 502,318 0.0500,000 Kohl's Corp., 4.250%, 07/17/2025 513,189 0.0
1,000,000 Lowe's Cos, Inc., 3.100%, 05/03/2027 973,636 0.0600,000 Lowe's Cos, Inc., 4.250%, 09/15/2044 574,699 0.0500,000 Macy's Retail Holdings, Inc., 2.875%, 02/15/2023 484,521 0.0532,000 Macy's Retail Holdings, Inc., 3.625%, 06/01/2024 513,602 0.0500,000 Marriott International, Inc./MD, 2.300%, 01/15/2022 492,053 0.0500,000 Marriott International, Inc./MD, 3.125%, 02/15/2023 498,524 0.0
1,000,000 McDonald's Corp., 2.750%, 12/09/2020 1,002,064 0.1500,000 McDonald's Corp., 3.700%, 01/30/2026 516,985 0.0400,000 McDonald's Corp., 4.600%, 05/26/2045 416,187 0.0500,000 McDonald's Corp., 4.700%, 12/09/2035 537,920 0.0325,000 McDonalds Corp., 6.300%, 10/15/2037 403,679 0.0
1,250,000 Mohawk Industries, Inc., 3.850%, 02/01/2023 1,290,805 0.1250,000 Newell Brands, Inc., 3.850%, 04/01/2023 247,460 0.0250,000 Newell Brands, Inc., 4.200%, 04/01/2026 239,017 0.0193,000 Newell Brands, Inc., 5.375%, 04/01/2036 176,589 0.0500,000 NIKE, Inc., 2.375%, 11/01/2026 484,212 0.0500,000 NIKE, Inc., 3.375%, 11/01/2046 471,478 0.0
2,000,000 Nordstrom, Inc., 4.750%, 05/01/2020 2,039,775 0.1300,000 O'Reilly Automotive, Inc., 3.800%, 09/01/2022 307,928 0.0
1,000,000 PACCAR Financial Corp., 2.050%, 11/13/2020 991,772 0.01,750,000 Starbucks Corp., 3.100%, 03/01/2023 1,768,672 0.1
750,000 Target Corp., 2.900%, 01/15/2022 760,315 0.01,000,000 Target Corp., 3.500%, 07/01/2024 1,043,888 0.1
500,000 TJX Cos, Inc./The, 2.500%, 05/15/2023 501,192 0.0590,000 Toyota Motor Credit Corp., 2.250%, 10/18/2023 578,935 0.0
1,000,000 Toyota Motor Credit Corp., 2.700%, 01/11/2023 1,002,671 0.11,000,000 Toyota Motor Credit Corp., 3.050%, 01/11/2028 1,000,853 0.0
500,000 Toyota Motor Credit Corp., 3.200%, 01/11/2027 508,650 0.0439,560 United Airlines 2015-1 Class AA Pass Through Trust, 3.450%, 12/01/2027 438,570 0.0230,213 United Airlines 2016-1 Class A Pass Through Trust, 3.450%, 01/07/2030 226,474 0.0230,212 United Airlines 2016-1 Class AA Pass Through Trust, 3.100%, 01/07/2030 225,753 0.0982,592 United Airlines 2018-1 Class AA Pass Through Trust, 3.500%, 09/01/2031 971,266 0.0250,000 Walgreens Boots Alliance, Inc., 2.700%, 11/18/2019 249,834 0.0250,000 Walgreens Boots Alliance, Inc., 3.300%, 11/18/2021 252,987 0.0250,000 Walgreens Boots Alliance, Inc., 3.450%, 06/01/2026 245,092 0.0250,000 Walgreens Boots Alliance, Inc., 3.800%, 11/18/2024 255,082 0.0250,000 Walgreens Boots Alliance, Inc., 4.500%, 11/18/2034 249,285 0.0250,000 Walgreens Boots Alliance, Inc., 4.650%, 06/01/2046 236,572 0.0250,000 Walgreens Boots Alliance, Inc., 4.800%, 11/18/2044 240,541 0.0
1,000,000 Walmart, Inc., 1.900%, 12/15/2020 991,866 0.01,500,000 Walmart, Inc., 2.350%, 12/15/2022 1,492,669 0.1
Copyright © 2021 www.secdatabase.com. All Rights Reserved.Please Consider the Environment Before Printing This Document

Voya U.S. Bond Index PortfolioPORTFOLIO OF INVESTMENTS
as of March 31, 2019 (Unaudited) (Continued)
PrincipalAmount† Value
Percentageof NetAssets
CORPORATE BONDS/NOTES: (continued)Consumer, Cyclical: (continued)
1,000,000 Walmart, Inc., 3.125%, 06/23/2021 $ 1,014,592 0.11,000,000 Walmart, Inc., 3.300%, 04/22/2024 1,030,578 0.11,000,000 Walmart, Inc., 3.400%, 06/26/2023 1,031,949 0.11,000,000 Walmart, Inc., 3.550%, 06/26/2025 1,039,596 0.11,000,000 Walmart, Inc., 3.700%, 06/26/2028 1,053,771 0.1
300,000 Whirlpool Corp., 3.700%, 05/01/2025 301,491 0.0200,000 Whirlpool Corp., 4.000%, 03/01/2024 204,562 0.0
56,398,819 1.6
Consumer, Non-cyclical: 5.4%500,000 Abbott Laboratories, 2.900%, 11/30/2021 502,413 0.0350,000 Abbott Laboratories, 3.400%, 11/30/2023 357,563 0.0284,000 Abbott Laboratories, 3.750%, 11/30/2026 295,343 0.0339,000 Abbott Laboratories, 4.750%, 11/30/2036 382,054 0.0500,000 Abbott Laboratories, 4.750%, 04/15/2043 557,783 0.0
1,500,000 Abbott Laboratories, 4.900%, 11/30/2046 1,736,683 0.1500,000 AbbVie, Inc., 2.300%, 05/14/2021 494,025 0.0500,000 AbbVie, Inc., 2.500%, 05/14/2020 498,592 0.0500,000 AbbVie, Inc., 2.850%, 05/14/2023 494,927 0.0250,000 AbbVie, Inc., 3.200%, 11/06/2022 252,400 0.0
1,500,000 AbbVie, Inc., 3.200%, 05/14/2026 1,460,986 0.11,250,000 AbbVie, Inc., 3.600%, 05/14/2025 1,254,740 0.1
500,000 AbbVie, Inc., 4.300%, 05/14/2036 477,666 0.0500,000 AbbVie, Inc., 4.450%, 05/14/2046 466,006 0.0
1,000,000 AbbVie, Inc., 4.500%, 05/14/2035 982,517 0.0250,000 AbbVie, Inc., 4.700%, 05/14/2045 241,474 0.0500,000 Allergan Finance LLC, 3.250%, 10/01/2022 500,576 0.0
1,000,000 Allergan Funding SCS, 3.000%, 03/12/2020 999,693 0.0500,000 Allergan Funding SCS, 3.450%, 03/15/2022 504,591 0.0750,000 Allergan Funding SCS, 3.800%, 03/15/2025 760,752 0.0750,000 Allergan Funding SCS, 4.550%, 03/15/2035 736,661 0.0500,000 Allergan, Inc./United States, 2.800%, 03/15/2023 490,476 0.0500,000 Aetna, Inc., 2.750%, 11/15/2022 493,775 0.0
1,283,000 Aetna, Inc., 2.800%, 06/15/2023 1,261,245 0.1250,000 Aetna, Inc., 3.500%, 11/15/2024 250,287 0.0300,000 Aetna, Inc., 4.500%, 05/15/2042 284,879 0.0500,000 Altria Group, Inc., 2.850%, 08/09/2022 499,218 0.0500,000 Altria Group, Inc., 2.950%, 05/02/2023 497,133 0.0
1,000,000 Altria Group, Inc., 4.000%, 01/31/2024 1,031,063 0.1300,000 Altria Group, Inc., 4.250%, 08/09/2042 261,905 0.0750,000 Altria Group, Inc., 4.800%, 02/14/2029 774,627 0.0500,000 Altria Group, Inc., 5.800%, 02/14/2039 530,471 0.0500,000 AmerisourceBergen Corp., 3.400%, 05/15/2024 504,235 0.0250,000 AmerisourceBergen Corp., 4.250%, 03/01/2045 226,910 0.0500,000 Amgen, Inc., 2.250%, 08/19/2023 489,079 0.0250,000 Amgen, Inc., 3.625%, 05/22/2024 257,413 0.0
4,400,000 Amgen, Inc., 3.875%, 11/15/2021 4,520,828 0.21,500,000 Amgen, Inc., 4.400%, 05/01/2045 1,481,519 0.12,000,000 (1) Anheuser-Busch Cos LLC / Anheuser-Busch InBev Worldwide, Inc., 4.700%, 02/
01/2036 2,003,735 0.1
Copyright © 2021 www.secdatabase.com. All Rights Reserved.Please Consider the Environment Before Printing This Document

3,500,000 (1) Anheuser-Busch Cos LLC / Anheuser-Busch InBev Worldwide, Inc., 4.900%, 02/01/2046 3,522,637 0.1
250,000 Anheuser-Busch InBev Worldwide, Inc., 3.750%, 07/15/2042 216,491 0.0750,000 Anheuser-Busch InBev Worldwide, Inc., 8.200%, 01/15/2039 1,045,493 0.1250,000 Anthem, Inc., 2.250%, 08/15/2019 249,556 0.0250,000 Anthem, Inc., 3.500%, 08/15/2024 253,405 0.0
1,000,000 Anthem, Inc., 3.650%, 12/01/2027 999,458 0.0750,000 Anthem, Inc., 4.101%, 03/01/2028 773,395 0.0250,000 Anthem, Inc., 4.650%, 08/15/2044 260,907 0.0750,000 AstraZeneca PLC, 1.950%, 09/18/2019 747,731 0.0100,000 AstraZeneca PLC, 3.500%, 08/17/2023 102,106 0.0
1,000,000 AstraZeneca PLC, 4.000%, 01/17/2029 1,051,975 0.11,000,000 AstraZeneca PLC, 4.375%, 08/17/2048 1,041,318 0.1
Copyright © 2021 www.secdatabase.com. All Rights Reserved.Please Consider the Environment Before Printing This Document

Voya U.S. Bond Index PortfolioPORTFOLIO OF INVESTMENTS
as of March 31, 2019 (Unaudited) (Continued)
PrincipalAmount† Value
Percentageof NetAssets
CORPORATE BONDS/NOTES: (continued)Consumer, Non-cyclical: (continued)
1,400,000 AstraZeneca PLC, 6.450%, 09/15/2037 $ 1,783,083 0.1500,000 Automatic Data Processing, Inc., 3.375%, 09/15/2025 518,492 0.0
1,000,000 BAT Capital Corp., 3.222%, 08/15/2024 978,919 0.01,000,000 BAT Capital Corp., 3.557%, 08/15/2027 948,609 0.0
224,000 Baxalta, Inc., 4.000%, 06/23/2025 230,111 0.0250,000 (1) Bayer US Finance II LLC, 2.125%, 07/15/2019 249,246 0.0
1,000,000 (1) Bayer US Finance II LLC, 2.200%, 07/15/2022 950,830 0.0400,000 (1) Bayer US Finance II LLC, 2.750%, 07/15/2021 393,532 0.0
1,000,000 (1) Bayer US Finance II LLC, 3.600%, 07/15/2042 770,425 0.0500,000 (1) Bayer US Finance II LLC, 3.950%, 04/15/2045 410,381 0.0250,000 (1) Bayer US Finance II LLC, 4.200%, 07/15/2034 227,267 0.0
4,370,000 Becton Dickinson & Co., 3.125%, 11/08/2021 4,390,652 0.11,000,000 Biogen, Inc., 2.900%, 09/15/2020 1,000,106 0.0
750,000 Biogen, Inc., 4.050%, 09/15/2025 768,394 0.0400,000 Boston Scientific Corp., 3.375%, 05/15/2022 405,685 0.0500,000 Bristol-Myers Squibb Co., 3.250%, 08/01/2042 435,761 0.0
1,000,000 Bunge Ltd. Finance Corp., 4.350%, 03/15/2024 1,013,774 0.01,000,000 Campbell Soup Co., 3.300%, 03/15/2021 1,006,780 0.0
500,000 Cardinal Health, Inc., 3.200%, 03/15/2023 497,167 0.0500,000 Cardinal Health, Inc., 4.900%, 09/15/2045 477,990 0.0250,000 Celgene Corp., 3.625%, 05/15/2024 254,446 0.0500,000 Celgene Corp., 3.875%, 08/15/2025 513,740 0.0
2,945,000 Celgene Corp., 3.950%, 10/15/2020 2,997,655 0.11,000,000 Celgene Corp., 4.000%, 08/15/2023 1,037,733 0.1
500,000 Celgene Corp., 4.625%, 05/15/2044 505,115 0.0500,000 Celgene Corp., 5.000%, 08/15/2045 526,396 0.0750,000 Cigna Holding Co., 3.250%, 04/15/2025 744,392 0.0
2,000,000 Cigna Holding Co., 4.000%, 02/15/2022 2,056,685 0.12,500,000 Cigna Holding Co., 5.125%, 06/15/2020 2,567,792 0.11,000,000 (1) Cigna Corp., 4.800%, 08/15/2038 1,029,628 0.1
500,000 (1) Cigna Corp., 4.900%, 12/15/2048 518,220 0.0750,000 Clorox Co/The, 3.050%, 09/15/2022 760,750 0.0
3,000,000 Coca-Cola Co., 3.150%, 11/15/2020 3,026,999 0.11,000,000 Coca-Cola Co., 3.200%, 11/01/2023 1,028,677 0.1
750,000 Colgate-Palmolive Co., 2.250%, 11/15/2022 746,295 0.0426,000 Conagra Brands, Inc., 3.200%, 01/25/2023 427,354 0.0
1,000,000 Constellation Brands, Inc., 3.200%, 02/15/2023 1,007,341 0.01,000,000 Constellation Brands, Inc., 3.384%, (US0003M + 0.700%), 11/15/2021 1,000,612 0.01,000,000 Constellation Brands, Inc., 3.600%, 02/15/2028 980,427 0.01,000,000 Constellation Brands, Inc., 4.400%, 11/15/2025 1,051,500 0.1
500,000 Coventry Health Care, Inc., 5.450%, 06/15/2021 522,914 0.0500,000 Covidien International Finance SA, 3.200%, 06/15/2022 508,722 0.0250,000 CVS Health Corp., 2.250%, 08/12/2019 249,447 0.0750,000 CVS Health Corp., 2.750%, 12/01/2022 740,337 0.0500,000 CVS Health Corp., 2.800%, 07/20/2020 499,638 0.0
1,000,000 CVS Health Corp., 3.125%, 03/09/2020 1,003,038 0.02,000,000 CVS Health Corp., 3.350%, 03/09/2021 2,017,047 0.1
250,000 CVS Health Corp., 3.375%, 08/12/2024 248,393 0.0
Copyright © 2021 www.secdatabase.com. All Rights Reserved.Please Consider the Environment Before Printing This Document

1,000,000 CVS Health Corp., 3.500%, 07/20/2022 1,013,626 0.01,000,000 CVS Health Corp., 3.700%, 03/09/2023 1,016,542 0.0
443,000 CVS Health Corp., 3.875%, 07/20/2025 449,010 0.01,000,000 CVS Health Corp., 4.100%, 03/25/2025 1,028,193 0.1
250,000 CVS Health Corp., 4.000%, 12/05/2023 257,155 0.01,000,000 CVS Health Corp., 4.300%, 03/25/2028 1,015,114 0.01,000,000 CVS Health Corp., 4.780%, 03/25/2038 993,209 0.01,000,000 CVS Health Corp., 5.050%, 03/25/2048 1,009,455 0.0
Copyright © 2021 www.secdatabase.com. All Rights Reserved.Please Consider the Environment Before Printing This Document

Voya U.S. Bond Index PortfolioPORTFOLIO OF INVESTMENTS
as of March 31, 2019 (Unaudited) (Continued)
PrincipalAmount† Value
Percentageof NetAssets
CORPORATE BONDS/NOTES: (continued)Consumer, Non-cyclical: (continued)
1,000,000 CVS Health Corp., 5.125%, 07/20/2045 $ 1,021,319 0.1200,000 CVS Health Corp., 5.300%, 12/05/2043 208,834 0.0750,000 Diageo Capital PLC, 2.625%, 04/29/2023 748,795 0.0
1,000,000 Diageo Capital PLC, 3.500%, 09/18/2023 1,036,871 0.11,000,000 Diageo Capital PLC, 3.875%, 05/18/2028 1,058,449 0.1
500,000 Diageo Investment Corp., 2.875%, 05/11/2022 503,230 0.0750,000 Keurig Dr Pepper, Inc., 2.000%, 01/15/2020 744,323 0.0250,000 Keurig Dr Pepper, Inc., 3.400%, 11/15/2025 244,790 0.0350,000 Keurig Dr Pepper, Inc., 4.500%, 11/15/2045 323,356 0.0591,000 Ecolab, Inc., 4.350%, 12/08/2021 617,119 0.0750,000 Eli Lilly & Co., 2.350%, 05/15/2022 746,330 0.0750,000 Eli Lilly & Co., 3.100%, 05/15/2027 754,181 0.0500,000 Eli Lilly & Co., 3.700%, 03/01/2045 499,312 0.0500,000 (1) ERAC USA Finance LLC, 2.350%, 10/15/2019 498,633 0.0500,000 (1) ERAC USA Finance LLC, 3.850%, 11/15/2024 508,365 0.0300,000 Estee Lauder Cos, Inc./The, 3.700%, 08/15/2042 293,111 0.0400,000 Express Scripts Holding Co., 2.250%, 06/15/2019 399,406 0.0500,000 Express Scripts Holding Co., 3.000%, 07/15/2023 497,462 0.0500,000 Express Scripts Holding Co., 3.400%, 03/01/2027 487,459 0.0250,000 Express Scripts Holding Co., 3.500%, 06/15/2024 252,233 0.0500,000 Express Scripts Holding Co., 4.800%, 07/15/2046 509,960 0.0350,000 Flowers Foods, Inc., 4.375%, 04/01/2022 363,032 0.0750,000 General Mills, Inc., 4.150%, 02/15/2043 685,755 0.0
1,000,000 (2) General Mills, Inc., 4.700%, 04/17/2048 1,002,973 0.0500,000 Gilead Sciences, Inc., 1.950%, 03/01/2022 490,363 0.0350,000 Gilead Sciences, Inc., 2.050%, 04/01/2019 350,000 0.0500,000 Gilead Sciences, Inc., 2.500%, 09/01/2023 495,141 0.0
1,500,000 Gilead Sciences, Inc., 2.950%, 03/01/2027 1,461,254 0.11,000,000 Gilead Sciences, Inc., 3.250%, 09/01/2022 1,019,540 0.0
750,000 Gilead Sciences, Inc., 3.500%, 02/01/2025 766,100 0.0260,000 Gilead Sciences, Inc., 3.650%, 03/01/2026 265,601 0.0150,000 Gilead Sciences, Inc., 3.700%, 04/01/2024 155,098 0.0250,000 Gilead Sciences, Inc., 4.150%, 03/01/2047 242,098 0.0200,000 Gilead Sciences, Inc., 4.500%, 02/01/2045 202,377 0.0250,000 Gilead Sciences, Inc., 4.750%, 03/01/2046 262,536 0.0350,000 Gilead Sciences, Inc., 4.800%, 04/01/2044 368,795 0.0500,000 GlaxoSmithKline Capital, Inc., 2.800%, 03/18/2023 501,366 0.0500,000 GlaxoSmithKline Capital, Inc., 6.375%, 05/15/2038 663,450 0.0750,000 Hershey Co/The, 2.300%, 08/15/2026 716,053 0.0
1,050,000 Humana, Inc., 3.150%, 12/01/2022 1,055,296 0.11,750,000 Humana, Inc., 3.850%, 10/01/2024 1,784,916 0.1
500,000 Johnson & Johnson, 2.250%, 03/03/2022 497,988 0.01,000,000 Johnson & Johnson, 2.450%, 03/01/2026 979,447 0.01,000,000 Johnson & Johnson, 2.900%, 01/15/2028 996,893 0.0
500,000 Johnson & Johnson, 2.950%, 03/03/2027 502,541 0.01,000,000 Johnson & Johnson, 3.625%, 03/03/2037 1,016,841 0.0
500,000 Johnson & Johnson, 3.750%, 03/03/2047 514,551 0.0500,000 Kellogg Co., 3.250%, 04/01/2026 486,787 0.0551,000 Kellogg Co., 4.000%, 12/15/2020 562,646 0.0
Copyright © 2021 www.secdatabase.com. All Rights Reserved.Please Consider the Environment Before Printing This Document

750,000 Kraft Heinz Foods Co., 3.000%, 06/01/2026 701,942 0.0750,000 Kraft Heinz Foods Co., 3.500%, 06/06/2022 758,771 0.0750,000 Kraft Heinz Foods Co., 3.950%, 07/15/2025 756,598 0.0250,000 Kraft Heinz Foods Co., 4.375%, 06/01/2046 217,600 0.0500,000 Kraft Heinz Foods Co., 5.000%, 07/15/2035 492,291 0.0500,000 Kraft Heinz Foods Co., 5.200%, 07/15/2045 483,145 0.0
1,000,000 Kroger Co., 2.650%, 10/15/2026 922,107 0.0400,000 Kroger Co/The, 3.300%, 01/15/2021 402,521 0.0
1,000,000 Kroger Co/The, 3.850%, 08/01/2023 1,031,504 0.1
Copyright © 2021 www.secdatabase.com. All Rights Reserved.Please Consider the Environment Before Printing This Document

Voya U.S. Bond Index PortfolioPORTFOLIO OF INVESTMENTS
as of March 31, 2019 (Unaudited) (Continued)
PrincipalAmount† Value
Percentageof NetAssets
CORPORATE BONDS/NOTES: (continued)Consumer, Non-cyclical: (continued)
879,000 Kroger Co/The, 7.500%, 04/01/2031 $ 1,103,354 0.1250,000 Laboratory Corp. of America Holdings, 2.625%, 02/01/2020 249,517 0.0250,000 Laboratory Corp. of America Holdings, 3.200%, 02/01/2022 252,003 0.0250,000 Laboratory Corp. of America Holdings, 4.700%, 02/01/2045 244,487 0.0500,000 McKesson Corp., 2.850%, 03/15/2023 494,900 0.0400,000 McKesson Corp., 3.796%, 03/15/2024 408,973 0.0350,000 Mead Johnson Nutrition Co., 3.000%, 11/15/2020 350,988 0.0250,000 Mead Johnson Nutrition Co., 4.600%, 06/01/2044 273,864 0.0
1,000,000 Medtronic, Inc., 3.150%, 03/15/2022 1,019,120 0.01,000,000 Medtronic, Inc., 3.500%, 03/15/2025 1,033,608 0.11,000,000 Medtronic, Inc., 4.375%, 03/15/2035 1,094,121 0.1
88,000 Medtronic, Inc., 4.625%, 03/15/2045 100,857 0.0250,000 Merck & Co., Inc., 1.850%, 02/10/2020 248,415 0.0
1,000,000 Merck & Co., Inc., 2.750%, 02/10/2025 1,002,921 0.0250,000 Merck & Co., Inc., 3.700%, 02/10/2045 248,378 0.0
1,000,000 Merck & Co., Inc., 3.900%, 03/07/2039 1,033,174 0.11,000,000 Merck & Co., Inc., 4.150%, 05/18/2043 1,066,982 0.11,000,000 Merck & Co., Inc., 4.000%, 03/07/2049 1,040,843 0.1
500,000 Molson Coors Brewing Co., 5.000%, 05/01/2042 491,953 0.01,000,000 Mylan NV, 3.950%, 06/15/2026 955,701 0.0
200,000 Mylan, Inc., 4.200%, 11/29/2023 203,676 0.01,000,000 Mylan, Inc., 4.550%, 04/15/2028 974,041 0.01,000,000 Mylan NV, 3.150%, 06/15/2021 998,202 0.0
500,000 Novartis Capital Corp., 2.400%, 05/17/2022 498,570 0.0500,000 Novartis Capital Corp., 3.100%, 05/17/2027 505,957 0.0500,000 Novartis Capital Corp., 3.400%, 05/06/2024 518,866 0.0500,000 PepsiCo, Inc., 4.000%, 03/05/2042 523,037 0.0500,000 PepsiCo, Inc., 2.250%, 05/02/2022 496,904 0.0
1,000,000 PepsiCo, Inc., 3.600%, 03/01/2024 1,045,793 0.1250,000 PepsiCo, Inc., 4.250%, 10/22/2044 270,303 0.0750,000 Perrigo Finance Unlimited Co., 3.900%, 12/15/2024 728,278 0.0750,000 Pfizer, Inc., 3.400%, 05/15/2024 778,445 0.0500,000 Pfizer, Inc., 3.600%, 09/15/2028 522,327 0.0
1,000,000 Pfizer, Inc., 4.100%, 09/15/2038 1,053,268 0.1500,000 Pfizer, Inc., 4.125%, 12/15/2046 528,822 0.0500,000 Pfizer, Inc., 4.000%, 12/15/2036 519,783 0.0
1,000,000 Pfizer, Inc., 4.200%, 09/15/2048 1,074,353 0.11,000,000 Pfizer, Inc., 4.300%, 06/15/2043 1,070,644 0.11,000,000 Pfizer, Inc., 3.450%, 03/15/2029 1,027,835 0.11,000,000 Pfizer, Inc., 3.900%, 03/15/2039 1,027,288 0.11,000,000 Pfizer, Inc., 4.000%, 03/15/2049 1,034,463 0.1
500,000 Philip Morris International, Inc., 1.875%, 02/25/2021 493,889 0.0500,000 Philip Morris International, Inc., 2.125%, 05/10/2023 487,347 0.0500,000 Philip Morris International, Inc., 2.000%, 02/21/2020 496,737 0.0750,000 Philip Morris International, Inc., 2.500%, 11/02/2022 744,081 0.0500,000 Philip Morris International, Inc., 2.625%, 02/18/2022 499,690 0.0500,000 Philip Morris International, Inc., 2.750%, 02/25/2026 487,770 0.0500,000 (2) Philip Morris International, Inc., 3.125%, 03/02/2028 488,000 0.0250,000 Philip Morris International, Inc., 3.250%, 11/10/2024 253,940 0.0
Copyright © 2021 www.secdatabase.com. All Rights Reserved.Please Consider the Environment Before Printing This Document

500,000 Philip Morris International, Inc., 3.875%, 08/21/2042 460,828 0.0500,000 Reynolds American, Inc., 5.700%, 08/15/2035 518,511 0.0
1,250,000 Reynolds American, Inc., 6.150%, 09/15/2043 1,308,323 0.13,000,000 Reynolds American, Inc., 8.125%, 06/23/2019 3,034,061 0.11,000,000 Sanofi, 3.375%, 06/19/2023 1,027,964 0.1
Copyright © 2021 www.secdatabase.com. All Rights Reserved.Please Consider the Environment Before Printing This Document

Voya U.S. Bond Index PortfolioPORTFOLIO OF INVESTMENTS
as of March 31, 2019 (Unaudited) (Continued)
PrincipalAmount† Value
Percentageof NetAssets
CORPORATE BONDS/NOTES: (continued)Consumer, Non-cyclical: (continued)
1,000,000 Sanofi, 3.625%, 06/19/2028 $ 1,038,316 0.13,330,000 Sanofi, 4.000%, 03/29/2021 3,418,978 0.1
750,000 Shire Acquisitions Investments Ireland DAC, 2.400%, 09/23/2021 741,786 0.0500,000 Stryker Corp., 3.500%, 03/15/2026 507,332 0.0500,000 Thermo Fisher Scientific, Inc., 3.000%, 04/15/2023 501,607 0.0400,000 Thermo Fisher Scientific, Inc., 3.300%, 02/15/2022 405,453 0.0250,000 Thermo Fisher Scientific, Inc., 4.150%, 02/01/2024 261,525 0.0150,000 Tyson Foods, Inc., 2.650%, 08/15/2019 149,884 0.0750,000 Tyson Foods, Inc., 3.550%, 06/02/2027 738,704 0.0500,000 Unilever Capital Corp., 3.250%, 03/07/2024 509,681 0.0
1,000,000 Unilever Capital Corp., 3.500%, 03/22/2028 1,029,052 0.1750,000 Unilever Capital Corp., 4.250%, 02/10/2021 773,438 0.0300,000 UnitedHealth Group, Inc., 2.300%, 12/15/2019 299,189 0.0
1,000,000 UnitedHealth Group, Inc., 2.375%, 10/15/2022 991,421 0.0500,000 UnitedHealth Group, Inc., 2.750%, 02/15/2023 500,497 0.0300,000 UnitedHealth Group, Inc., 2.875%, 12/15/2021 301,717 0.0500,000 UnitedHealth Group, Inc., 2.875%, 03/15/2023 503,581 0.0500,000 UnitedHealth Group, Inc., 2.950%, 10/15/2027 491,848 0.0500,000 UnitedHealth Group, Inc., 3.100%, 03/15/2026 500,241 0.0
1,000,000 UnitedHealth Group, Inc., 3.375%, 11/15/2021 1,016,078 0.01,000,000 UnitedHealth Group, Inc., 3.500%, 06/15/2023 1,031,513 0.11,000,000 UnitedHealth Group, Inc., 3.850%, 06/15/2028 1,048,480 0.11,000,000 UnitedHealth Group, Inc., 4.250%, 04/15/2047 1,048,783 0.1
250,000 UnitedHealth Group, Inc., 4.625%, 07/15/2035 281,192 0.0250,000 UnitedHealth Group, Inc., 4.750%, 07/15/2045 283,390 0.0400,000 Verisk Analytics, Inc., 5.500%, 06/15/2045 447,091 0.0500,000 Zoetis, Inc., 3.450%, 11/13/2020 504,793 0.0500,000 Zoetis, Inc., 4.500%, 11/13/2025 531,589 0.0
187,294,285 5.4
Energy: 2.7%1,000,000 Anadarko Petroleum Corp., 4.500%, 07/15/2044 945,588 0.0
427,000 Apache Corp., 3.250%, 04/15/2022 427,641 0.0500,000 Apache Corp., 4.250%, 01/15/2044 444,654 0.0
1,000,000 Apache Corp., 4.375%, 10/15/2028 1,009,309 0.1250,000 Boardwalk Pipelines L.P., 4.950%, 12/15/2024 259,647 0.0500,000 Boardwalk Pipelines L.P., 5.950%, 06/01/2026 532,324 0.0500,000 BP Capital Markets America, Inc., 2.112%, 09/16/2021 492,896 0.0500,000 BP Capital Markets America, Inc., 2.520%, 09/19/2022 495,648 0.0
1,000,000 BP Capital Markets America, Inc., 2.750%, 05/10/2023 997,092 0.0500,000 BP Capital Markets America, Inc., 3.017%, 01/16/2027 491,812 0.0250,000 BP Capital Markets America, Inc., 3.119%, 05/04/2026 249,346 0.0500,000 BP Capital Markets America, Inc., 3.216%, 11/28/2023 506,444 0.0
1,000,000 BP Capital Markets America, Inc., 3.937%, 09/21/2028 1,049,616 0.1500,000 BP Capital Markets PLC, 2.315%, 02/13/2020 498,825 0.0500,000 BP Capital Markets PLC, 3.062%, 03/17/2022 505,261 0.0250,000 BP Capital Markets PLC, 3.535%, 11/04/2024 257,707 0.0500,000 BP Capital Markets PLC, 3.814%, 02/10/2024 520,514 0.0
Copyright © 2021 www.secdatabase.com. All Rights Reserved.Please Consider the Environment Before Printing This Document

Voya U.S. Bond Index PortfolioPORTFOLIO OF INVESTMENTS
as of March 31, 2019 (Unaudited) (Continued)
PrincipalAmount† Value
Percentageof NetAssets
CORPORATE BONDS/NOTES: (continued)Energy: (continued)
250,000 Canadian Natural Resources Ltd., 3.800%, 04/15/2024 $ 255,414 0.0500,000 Chevron Corp., 1.561%, 05/16/2019 499,292 0.0500,000 Chevron Corp., 1.991%, 03/03/2020 497,436 0.0500,000 Chevron Corp., 2.100%, 05/16/2021 496,688 0.0300,000 Chevron Corp., 2.355%, 12/05/2022 298,104 0.0500,000 Chevron Corp., 2.498%, 03/03/2022 500,463 0.0500,000 Chevron Corp., 2.566%, 05/16/2023 501,197 0.0500,000 Chevron Corp., 2.895%, 03/03/2024 506,614 0.0500,000 Chevron Corp., 2.954%, 05/16/2026 503,835 0.0500,000 Chevron Corp., 3.326%, 11/17/2025 515,944 0.0500,000 CNOOC Finance 2013 Ltd., 3.000%, 05/09/2023 495,565 0.0750,000 CNOOC Finance 2015 USA LLC, 3.500%, 05/05/2025 759,452 0.0750,000 CNOOC Nexen Finance 2014 ULC, 4.250%, 04/30/2024 784,979 0.0250,000 CNOOC Nexen Finance 2014 ULC, 4.875%, 04/30/2044 280,125 0.0129,000 ConocoPhillips Co., 4.150%, 11/15/2034 132,632 0.0500,000 ConocoPhillips Co., 4.300%, 11/15/2044 536,176 0.0500,000 ConocoPhillips Co., 4.950%, 03/15/2026 557,922 0.0
2,000,000 ConocoPhillips, 6.500%, 02/01/2039 2,701,445 0.1400,000 Devon Energy Corp., 3.250%, 05/15/2022 403,448 0.0750,000 Devon Energy Corp., 4.000%, 07/15/2021 765,663 0.0
1,000,000 Devon Energy Corp., 5.000%, 06/15/2045 1,050,675 0.1500,000 Ecopetrol SA, 4.125%, 01/16/2025 506,255 0.0250,000 Enbridge, Inc., 3.500%, 06/10/2024 252,860 0.0250,000 Enbridge, Inc., 4.500%, 06/10/2044 253,093 0.0500,000 Energy Transfer Operating L.P., 3.600%, 02/01/2023 504,708 0.0500,000 Energy Transfer Operating L.P., 4.150%, 10/01/2020 508,271 0.0800,000 Energy Transfer Operating L.P., 6.125%, 12/15/2045 872,608 0.0
1,809,000 Energy Transfer Operating L.P., 6.500%, 02/01/2042 2,015,587 0.1500,000 Enterprise Products Operating LLC, 2.850%, 04/15/2021 500,365 0.0500,000 Enterprise Products Operating LLC, 3.700%, 02/15/2026 512,906 0.0100,000 Enterprise Products Operating LLC, 3.750%, 02/15/2025 103,104 0.0500,000 Enterprise Products Operating LLC, 3.950%, 02/15/2027 519,376 0.0300,000 Enterprise Products Operating LLC, 4.450%, 02/15/2043 302,330 0.0
1,100,000 Enterprise Products Operating LLC, 4.850%, 03/15/2044 1,171,441 0.11,750,000 Enterprise Products Operating LLC, 4.900%, 05/15/2046 1,882,919 0.1
400,000 EOG Resources, Inc., 2.450%, 04/01/2020 398,439 0.01,950,000 EOG Resources, Inc., 2.625%, 03/15/2023 1,937,779 0.1
250,000 EOG Resources, Inc., 4.150%, 01/15/2026 265,084 0.0250,000 Equinor ASA, 2.250%, 11/08/2019 249,271 0.0250,000 Equinor ASA, 2.750%, 11/10/2021 251,701 0.0500,000 Equinor ASA, 3.625%, 09/10/2028 520,848 0.0500,000 Equinor ASA, 3.950%, 05/15/2043 515,165 0.0500,000 Exxon Mobil Corp., 2.726%, 03/01/2023 503,903 0.0500,000 Exxon Mobil Corp., 3.043%, 03/01/2026 507,774 0.0500,000 Exxon Mobil Corp., 4.114%, 03/01/2046 542,367 0.0500,000 Halliburton Co., 3.500%, 08/01/2023 510,878 0.0500,000 Halliburton Co., 3.800%, 11/15/2025 511,825 0.0500,000 Halliburton Co., 4.750%, 08/01/2043 514,705 0.0500,000 Halliburton Co., 4.850%, 11/15/2035 525,525 0.0
1,000,000 Hess Corp., 5.600%, 02/15/2041 1,020,382 0.1500,000 Kinder Morgan Energy Partners L.P., 3.500%, 03/01/2021 505,028 0.0500,000 Kinder Morgan Energy Partners L.P., 3.500%, 09/01/2023 506,914 0.0167,000 Kinder Morgan Energy Partners L.P., 3.950%, 09/01/2022 171,707 0.0
Copyright © 2021 www.secdatabase.com. All Rights Reserved.Please Consider the Environment Before Printing This Document

Voya U.S. Bond Index PortfolioPORTFOLIO OF INVESTMENTS
as of March 31, 2019 (Unaudited) (Continued)
PrincipalAmount† Value
Percentageof NetAssets
CORPORATE BONDS/NOTES: (continued)Energy: (continued)
400,000 Kinder Morgan Energy Partners L.P., 4.300%, 05/01/2024 $ 418,238 0.0400,000 Kinder Morgan Energy Partners L.P., 5.400%, 09/01/2044 424,946 0.0
2,825,000 Kinder Morgan Energy Partners L.P., 6.950%, 01/15/2038 3,443,465 0.1500,000 Kinder Morgan, Inc./DE, 4.300%, 06/01/2025 522,118 0.0500,000 Kinder Morgan, Inc./DE, 5.050%, 02/15/2046 513,370 0.0500,000 Kinder Morgan, Inc./DE, 5.550%, 06/01/2045 547,998 0.0
1,500,000 Magellan Midstream Partners L.P., 4.200%, 12/01/2042 1,431,305 0.1500,000 Marathon Oil Corp., 2.800%, 11/01/2022 494,236 0.0250,000 Marathon Oil Corp., 3.850%, 06/01/2025 253,486 0.0500,000 Marathon Oil Corp., 5.200%, 06/01/2045 540,014 0.0400,000 Marathon Petroleum Corp., 4.750%, 09/15/2044 399,535 0.0
1,000,000 MPLX L.P., 4.000%, 03/15/2028 995,193 0.01,000,000 MPLX L.P., 4.875%, 12/01/2024 1,068,239 0.1
300,000 Noble Energy, Inc., 3.900%, 11/15/2024 303,152 0.0700,000 Noble Energy, Inc., 5.050%, 11/15/2044 697,811 0.0
1,000,000 Occidental Petroleum Corp., 3.400%, 04/15/2026 1,023,239 0.1500,000 Occidental Petroleum Corp., 4.100%, 02/15/2047 511,949 0.0250,000 Occidental Petroleum Corp., 4.625%, 06/15/2045 274,282 0.0
1,000,000 ONEOK Partners L.P., 6.200%, 09/15/2043 1,142,154 0.1125,000 Petroleos Mexicanos, 4.250%, 01/15/2025 118,000 0.0500,000 Petroleos Mexicanos, 4.875%, 01/18/2024 493,495 0.0
2,500,000 Petroleos Mexicanos, 5.350%, 02/12/2028 2,326,250 0.1500,000 Petroleos Mexicanos, 5.500%, 06/27/2044 410,000 0.0
3,680,000 Petroleos Mexicanos, 6.000%, 03/05/2020 3,769,056 0.12,000,000 Petroleos Mexicanos, 6.625%, 06/15/2038 1,857,000 0.11,000,000 Phillips 66, 3.246%, (US0003M + 0.600%), 02/26/2021 1,000,029 0.01,500,000 Phillips 66, 3.900%, 03/15/2028 1,528,931 0.1
250,000 Phillips 66, 4.650%, 11/15/2034 269,180 0.0500,000 Pioneer Natural Resources Co., 3.950%, 07/15/2022 514,743 0.0300,000 Plains All American Pipeline L.P. / PAA Finance Corp., 2.850%, 01/31/2023 293,004 0.0275,000 Plains All American Pipeline L.P. / PAA Finance Corp., 3.650%, 06/01/2022 276,934 0.0750,000 Plains All American Pipeline L.P. / PAA Finance Corp., 4.650%, 10/15/2025 782,576 0.0250,000 Plains All American Pipeline L.P. / PAA Finance Corp., 4.700%, 06/15/2044 232,995 0.0500,000 Shell International Finance BV, 1.750%, 09/12/2021 490,574 0.0500,000 Shell International Finance BV, 2.250%, 11/10/2020 498,036 0.0
1,040,000 Shell International Finance BV, 2.875%, 05/10/2026 1,037,510 0.11,000,000 Shell International Finance BV, 3.250%, 05/11/2025 1,020,006 0.1
500,000 Shell International Finance BV, 3.750%, 09/12/2046 501,658 0.01,500,000 Shell International Finance BV, 4.125%, 05/11/2035 1,601,922 0.1
250,000 Shell International Finance BV, 4.375%, 05/11/2045 273,996 0.0600,000 Spectra Energy Partners L.P., 4.500%, 03/15/2045 609,579 0.0
1,450,000 Suncor Energy, Inc., 6.500%, 06/15/2038 1,838,729 0.1500,000 Sunoco Logistics Partners Operations L.P., 3.450%, 01/15/2023 502,510 0.0500,000 Sunoco Logistics Partners Operations L.P., 4.400%, 04/01/2021 513,504 0.0500,000 Sunoco Logistics Partners Operations L.P., 4.950%, 01/15/2043 468,035 0.0
2,000,000 TC Pipelines L.P., 4.650%, 06/15/2021 2,051,469 0.1500,000 Total Capital Canada Ltd., 2.750%, 07/15/2023 501,388 0.0
Copyright © 2021 www.secdatabase.com. All Rights Reserved.Please Consider the Environment Before Printing This Document

Voya U.S. Bond Index PortfolioPORTFOLIO OF INVESTMENTS
as of March 31, 2019 (Unaudited) (Continued)
PrincipalAmount† Value
Percentageof NetAssets
CORPORATE BONDS/NOTES: (continued)Energy: (continued)
500,000 Total Capital International SA, 2.750%, 06/19/2021 $ 501,417 0.01,500,000 Total Capital SA, 4.450%, 06/24/2020 1,533,856 0.12,000,000 TransCanada PipeLines Ltd., 4.625%, 03/01/2034 2,114,117 0.11,000,000 TransCanada Pipelines Ltd., 7.625%, 01/15/2039 1,364,583 0.11,000,000 Valero Energy Corp., 6.625%, 06/15/2037 1,234,681 0.1
400,000 Williams Partners L.P., 3.600%, 03/15/2022 405,900 0.0400,000 Williams Partners L.P., 4.000%, 09/15/2025 411,462 0.0500,000 Williams Partners L.P., 4.300%, 03/04/2024 520,340 0.0500,000 Williams Partners L.P., 5.100%, 09/15/2045 515,462 0.0500,000 Williams Partners L.P., 5.400%, 03/04/2044 534,492 0.0
92,514,660 2.7
Financial: 9.5%1,000,000 Aflac, Inc., 3.625%, 06/15/2023 1,040,240 0.1
500,000 American International Group, Inc., 2.300%, 07/16/2019 499,231 0.0500,000 American International Group, Inc., 3.300%, 03/01/2021 503,381 0.0
1,000,000 American International Group, Inc., 3.750%, 07/10/2025 1,002,725 0.0900,000 American International Group, Inc., 4.500%, 07/16/2044 864,732 0.0250,000 American International Group, Inc., 4.700%, 07/10/2035 251,404 0.0500,000 American International Group, Inc., 4.875%, 06/01/2022 529,372 0.0500,000 Air Lease Corp., 3.000%, 09/15/2023 489,416 0.0500,000 Air Lease Corp., 3.500%, 01/15/2022 504,957 0.0400,000 Alexandria Real Estate Equities, Inc., 2.750%, 01/15/2020 399,389 0.0
1,500,000 Allstate Corp./The, 3.150%, 06/15/2023 1,519,868 0.11,000,000 Allstate Corp., 3.280%, 12/15/2026 1,015,797 0.1
750,000 American Express Co., 3.000%, 10/30/2024 747,691 0.01,000,000 American Express Co., 3.400%, 02/27/2023 1,016,224 0.1
500,000 American Express Credit Corp., 2.200%, 03/03/2020 497,806 0.0500,000 American Express Credit Corp., 2.700%, 03/03/2022 500,905 0.0
1,000,000 American Express Credit Corp., 3.300%, 05/03/2027 1,014,707 0.1500,000 American Tower Corp., 3.375%, 10/15/2026 488,173 0.0
1,000,000 American Tower Corp., 3.500%, 01/31/2023 1,015,712 0.1750,000 American Tower Corp., 3.550%, 07/15/2027 739,370 0.0667,000 American Tower Corp., 4.700%, 03/15/2022 698,342 0.0
1,000,000 Aon PLC, 4.450%, 05/24/2043 970,361 0.0500,000 Aon PLC, 4.600%, 06/14/2044 510,051 0.0500,000 Aon PLC, 4.750%, 05/15/2045 521,093 0.0400,000 (2) Assured Guaranty US Holdings, Inc., 5.000%, 07/01/2024 429,380 0.0
1,000,000 Australia & New Zealand Banking Group Ltd/New York NY, 2.625%, 11/09/2022 991,888 0.0500,000 AvalonBay Communities, Inc., 2.850%, 03/15/2023 498,770 0.0500,000 AvalonBay Communities, Inc., 2.950%, 09/15/2022 503,606 0.0600,000 Banco Santander SA, 3.125%, 02/23/2023 594,033 0.0800,000 Banco Santander SA, 3.500%, 04/11/2022 808,217 0.0600,000 Banco Santander SA, 3.800%, 02/23/2028 582,863 0.0400,000 Banco Santander SA, 4.250%, 04/11/2027 401,000 0.0400,000 Banco Santander SA, 5.179%, 11/19/2025 422,828 0.0200,000 Bank of America Corp., 2.625%, 04/19/2021 199,458 0.0500,000 Bank of America Corp., 2.650%, 04/01/2019 500,000 0.0
1,000,000 (3) Bank of America Corp., 2.738%, 01/23/2022 996,663 0.0
Copyright © 2021 www.secdatabase.com. All Rights Reserved.Please Consider the Environment Before Printing This Document

500,000 (3) Bank of America Corp., 2.881%, 04/24/2023 498,847 0.01,000,000 (3) Bank of America Corp., 3.093%, 10/01/2025 993,117 0.04,000,000 Bank of America Corp., 3.300%, 01/11/2023 4,054,757 0.11,000,000 (3) Bank of America Corp., 3.366%, 01/23/2026 1,002,185 0.02,384,000 (3) Bank of America Corp., 3.419%, 12/20/2028 2,335,435 0.11,000,000 Bank of America Corp., 3.500%, 04/19/2026 1,011,896 0.1
500,000 (3) Bank of America Corp., 3.550%, 03/05/2024 508,073 0.0
Copyright © 2021 www.secdatabase.com. All Rights Reserved.Please Consider the Environment Before Printing This Document
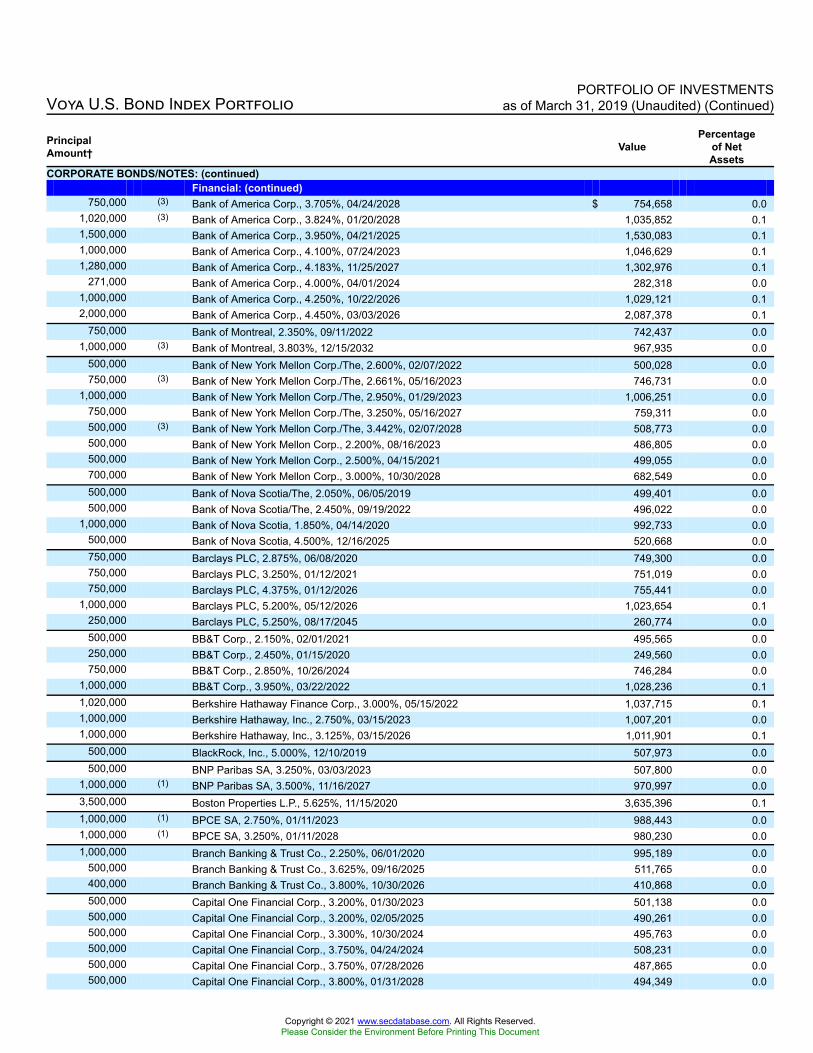
Voya U.S. Bond Index PortfolioPORTFOLIO OF INVESTMENTS
as of March 31, 2019 (Unaudited) (Continued)
PrincipalAmount† Value
Percentageof NetAssets
CORPORATE BONDS/NOTES: (continued)Financial: (continued)
750,000 (3) Bank of America Corp., 3.705%, 04/24/2028 $ 754,658 0.01,020,000 (3) Bank of America Corp., 3.824%, 01/20/2028 1,035,852 0.11,500,000 Bank of America Corp., 3.950%, 04/21/2025 1,530,083 0.11,000,000 Bank of America Corp., 4.100%, 07/24/2023 1,046,629 0.11,280,000 Bank of America Corp., 4.183%, 11/25/2027 1,302,976 0.1
271,000 Bank of America Corp., 4.000%, 04/01/2024 282,318 0.01,000,000 Bank of America Corp., 4.250%, 10/22/2026 1,029,121 0.12,000,000 Bank of America Corp., 4.450%, 03/03/2026 2,087,378 0.1
750,000 Bank of Montreal, 2.350%, 09/11/2022 742,437 0.01,000,000 (3) Bank of Montreal, 3.803%, 12/15/2032 967,935 0.0
500,000 Bank of New York Mellon Corp./The, 2.600%, 02/07/2022 500,028 0.0750,000 (3) Bank of New York Mellon Corp./The, 2.661%, 05/16/2023 746,731 0.0
1,000,000 Bank of New York Mellon Corp./The, 2.950%, 01/29/2023 1,006,251 0.0750,000 Bank of New York Mellon Corp./The, 3.250%, 05/16/2027 759,311 0.0500,000 (3) Bank of New York Mellon Corp./The, 3.442%, 02/07/2028 508,773 0.0500,000 Bank of New York Mellon Corp., 2.200%, 08/16/2023 486,805 0.0500,000 Bank of New York Mellon Corp., 2.500%, 04/15/2021 499,055 0.0700,000 Bank of New York Mellon Corp., 3.000%, 10/30/2028 682,549 0.0500,000 Bank of Nova Scotia/The, 2.050%, 06/05/2019 499,401 0.0500,000 Bank of Nova Scotia/The, 2.450%, 09/19/2022 496,022 0.0
1,000,000 Bank of Nova Scotia, 1.850%, 04/14/2020 992,733 0.0500,000 Bank of Nova Scotia, 4.500%, 12/16/2025 520,668 0.0750,000 Barclays PLC, 2.875%, 06/08/2020 749,300 0.0750,000 Barclays PLC, 3.250%, 01/12/2021 751,019 0.0750,000 Barclays PLC, 4.375%, 01/12/2026 755,441 0.0
1,000,000 Barclays PLC, 5.200%, 05/12/2026 1,023,654 0.1250,000 Barclays PLC, 5.250%, 08/17/2045 260,774 0.0500,000 BB&T Corp., 2.150%, 02/01/2021 495,565 0.0250,000 BB&T Corp., 2.450%, 01/15/2020 249,560 0.0750,000 BB&T Corp., 2.850%, 10/26/2024 746,284 0.0
1,000,000 BB&T Corp., 3.950%, 03/22/2022 1,028,236 0.11,020,000 Berkshire Hathaway Finance Corp., 3.000%, 05/15/2022 1,037,715 0.11,000,000 Berkshire Hathaway, Inc., 2.750%, 03/15/2023 1,007,201 0.01,000,000 Berkshire Hathaway, Inc., 3.125%, 03/15/2026 1,011,901 0.1
500,000 BlackRock, Inc., 5.000%, 12/10/2019 507,973 0.0500,000 BNP Paribas SA, 3.250%, 03/03/2023 507,800 0.0
1,000,000 (1) BNP Paribas SA, 3.500%, 11/16/2027 970,997 0.03,500,000 Boston Properties L.P., 5.625%, 11/15/2020 3,635,396 0.11,000,000 (1) BPCE SA, 2.750%, 01/11/2023 988,443 0.01,000,000 (1) BPCE SA, 3.250%, 01/11/2028 980,230 0.01,000,000 Branch Banking & Trust Co., 2.250%, 06/01/2020 995,189 0.0
500,000 Branch Banking & Trust Co., 3.625%, 09/16/2025 511,765 0.0400,000 Branch Banking & Trust Co., 3.800%, 10/30/2026 410,868 0.0500,000 Capital One Financial Corp., 3.200%, 01/30/2023 501,138 0.0500,000 Capital One Financial Corp., 3.200%, 02/05/2025 490,261 0.0500,000 Capital One Financial Corp., 3.300%, 10/30/2024 495,763 0.0500,000 Capital One Financial Corp., 3.750%, 04/24/2024 508,231 0.0500,000 Capital One Financial Corp., 3.750%, 07/28/2026 487,865 0.0500,000 Capital One Financial Corp., 3.800%, 01/31/2028 494,349 0.0
Copyright © 2021 www.secdatabase.com. All Rights Reserved.Please Consider the Environment Before Printing This Document

500,000 Capital One Financial Corp., 4.200%, 10/29/2025 509,252 0.01,000,000 Charles Schwab Corp./The, 2.650%, 01/25/2023 1,001,059 0.0
Copyright © 2021 www.secdatabase.com. All Rights Reserved.Please Consider the Environment Before Printing This Document

Voya U.S. Bond Index PortfolioPORTFOLIO OF INVESTMENTS
as of March 31, 2019 (Unaudited) (Continued)
PrincipalAmount† Value
Percentageof NetAssets
CORPORATE BONDS/NOTES: (continued)Financial: (continued)
1,000,000 Charles Schwab Corp./The, 3.200%, 01/25/2028 $ 1,000,202 0.01,000,000 Chubb Corp./The, 6.000%, 05/11/2037 1,288,832 0.1
750,000 Chubb INA Holdings, Inc., 2.700%, 03/13/2023 748,634 0.0500,000 Citibank NA, 2.100%, 06/12/2020 496,485 0.0500,000 Citigroup, Inc., 2.500%, 07/29/2019 499,786 0.0750,000 Citigroup, Inc., 2.700%, 10/27/2022 743,550 0.0500,000 (3) Citigroup, Inc., 2.876%, 07/24/2023 497,207 0.0
1,000,000 (3) Citigroup, Inc., 3.142%, 01/24/2023 1,004,178 0.0500,000 Citigroup, Inc., 3.400%, 05/01/2026 497,906 0.0
1,000,000 Citigroup, Inc., 3.500%, 05/15/2023 1,014,947 0.11,000,000 (3) Citigroup, Inc., 3.878%, 01/24/2039 979,991 0.01,500,000 (3) Citigroup, Inc., 3.887%, 01/10/2028 1,525,757 0.1
750,000 Citigroup, Inc., 4.050%, 07/30/2022 772,988 0.01,500,000 Citigroup, Inc., 4.125%, 07/25/2028 1,511,206 0.1
700,000 Citigroup, Inc., 4.000%, 08/05/2024 722,837 0.0500,000 Citigroup, Inc., 4.300%, 11/20/2026 509,048 0.0500,000 Citigroup, Inc., 4.400%, 06/10/2025 518,449 0.0
1,000,000 Citigroup, Inc., 4.450%, 09/29/2027 1,029,648 0.1500,000 Citigroup, Inc., 4.600%, 03/09/2026 523,162 0.0793,000 Citigroup, Inc., 5.300%, 05/06/2044 876,843 0.0615,000 Citigroup, Inc., 8.125%, 07/15/2039 925,037 0.0
1,000,000 (3) Citigroup, Inc., 3.980%, 03/20/2030 1,019,732 0.1500,000 Citizens Bank NA/Providence RI, 2.550%, 05/13/2021 496,728 0.0
1,000,000 CME Group, Inc., 3.000%, 09/15/2022 1,014,678 0.1300,000 CNA Financial Corp., 4.500%, 03/01/2026 313,636 0.0500,000 Comerica Bank, 2.500%, 06/02/2020 498,017 0.0500,000 Comerica, Inc., 2.125%, 05/23/2019 499,552 0.0250,000 Comerica, Inc., 3.800%, 07/22/2026 251,778 0.0250,000 Compass Bank, 2.750%, 09/29/2019 249,792 0.0500,000 Cooperatieve Rabobank UA/NY, 1.375%, 08/09/2019 497,717 0.0500,000 Cooperatieve Rabobank UA, 3.750%, 07/21/2026 493,948 0.0500,000 Cooperatieve Rabobank UA, 3.950%, 11/09/2022 509,640 0.0750,000 Cooperatieve Rabobank UA, 4.500%, 01/11/2021 773,096 0.0500,000 Cooperatieve Rabobank UA, 4.375%, 08/04/2025 516,211 0.0
10,000,000 (1) CPPIB Capital, Inc., 3.125%, 09/25/2023 10,281,795 0.3750,000 (1) Credit Suisse Group AG, 3.574%, 01/09/2023 753,133 0.0750,000 (1) Credit Suisse Group AG, 4.282%, 01/09/2028 759,881 0.0
1,000,000 Credit Suisse Group Funding Guernsey Ltd., 3.450%, 04/16/2021 1,010,973 0.11,000,000 Credit Suisse Group Funding Guernsey Ltd., 3.800%, 06/09/2023 1,016,623 0.11,000,000 Crown Castle International Corp., 3.150%, 07/15/2023 1,000,093 0.0
750,000 Deutsche Bank AG/New York NY, 2.950%, 08/20/2020 742,464 0.0500,000 Deutsche Bank AG/New York NY, 3.125%, 01/13/2021 494,043 0.0500,000 Deutsche Bank AG/New York NY, 3.150%, 01/22/2021 492,740 0.0500,000 Deutsche Bank AG/New York NY, 3.375%, 05/12/2021 492,565 0.0400,000 Deutsche Bank AG/New York NY, 4.100%, 01/13/2026 382,793 0.0500,000 Deutsche Bank AG, 2.850%, 05/10/2019 499,773 0.0800,000 (1) Dexia Credit Local SA, 2.500%, 01/25/2021 799,496 0.0500,000 Discover Bank, 3.100%, 06/04/2020 501,245 0.0500,000 Discover Bank, 3.200%, 08/09/2021 502,634 0.0
Copyright © 2021 www.secdatabase.com. All Rights Reserved.Please Consider the Environment Before Printing This Document

500,000 Discover Bank, 4.200%, 08/08/2023 520,358 0.0400,000 Discover Bank, 4.250%, 03/13/2026 406,822 0.0500,000 EPR Properties, 4.500%, 04/01/2025 510,066 0.0500,000 ERP Operating L.P., 4.500%, 07/01/2044 540,843 0.0750,000 Fifth Third Bancorp, 2.600%, 06/15/2022 745,551 0.0
1,000,000 Fifth Third Bancorp, 3.500%, 03/15/2022 1,017,670 0.11,000,000 Fifth Third Bancorp, 3.950%, 03/14/2028 1,034,789 0.1
400,000 Fifth Third Bancorp, 4.300%, 01/16/2024 419,391 0.0
Copyright © 2021 www.secdatabase.com. All Rights Reserved.Please Consider the Environment Before Printing This Document

Voya U.S. Bond Index PortfolioPORTFOLIO OF INVESTMENTS
as of March 31, 2019 (Unaudited) (Continued)
PrincipalAmount† Value
Percentageof NetAssets
CORPORATE BONDS/NOTES: (continued)Financial: (continued)
500,000 Fifth Third Bank/Cincinnati OH, 2.200%, 10/30/2020 $ 496,179 0.0250,000 First Tennessee Bank NA, 2.950%, 12/01/2019 249,868 0.0
5,801,000 GE Capital International Funding Co. Unlimited Co., 4.418%, 11/15/2035 5,384,140 0.2500,000 Goldman Sachs Group, Inc./The, 2.875%, 02/25/2021 500,473 0.0
1,580,000 (3) Goldman Sachs Group, Inc./The, 2.876%, 10/31/2022 1,567,676 0.1500,000 Goldman Sachs Group, Inc./The, 3.200%, 02/23/2023 501,219 0.0500,000 Goldman Sachs Group, Inc./The, 3.500%, 11/16/2026 494,204 0.0500,000 Goldman Sachs Group, Inc./The, 3.750%, 02/25/2026 502,680 0.0500,000 (3) Goldman Sachs Group, Inc./The, 3.814%, 04/23/2029 496,102 0.0500,000 Goldman Sachs Group, Inc./The, 3.850%, 01/26/2027 502,739 0.0500,000 Goldman Sachs Group, Inc., 2.550%, 10/23/2019 499,322 0.0
2,050,000 Goldman Sachs Group, Inc., 3.625%, 01/22/2023 2,087,344 0.1500,000 Goldman Sachs Group, Inc., 3.750%, 05/22/2025 505,090 0.0
1,000,000 Goldman Sachs Group, Inc., 3.850%, 07/08/2024 1,022,191 0.1750,000 Goldman Sachs Group, Inc., 5.750%, 01/24/2022 804,934 0.0
4,000,000 Goldman Sachs Group, Inc., 6.750%, 10/01/2037 4,902,377 0.2500,000 HCP, Inc., 2.625%, 02/01/2020 498,884 0.0250,000 HCP, Inc., 3.875%, 08/15/2024 255,070 0.0500,000 HCP, Inc., 4.000%, 06/01/2025 515,447 0.0500,000 Hospitality Properties Trust, 4.500%, 06/15/2023 506,657 0.0500,000 Hospitality Properties Trust, 5.000%, 08/15/2022 517,990 0.0750,000 Host Hotels & Resorts L.P., 3.750%, 10/15/2023 753,618 0.0400,000 HSBC Holdings PLC, 3.400%, 03/08/2021 403,745 0.0
1,000,000 (3) HSBC Holdings PLC, 3.803%, 03/11/2025 1,015,823 0.1750,000 (3) HSBC Holdings PLC, 4.292%, 09/12/2026 774,566 0.0300,000 HSBC Holdings PLC, 4.300%, 03/08/2026 311,806 0.0500,000 HSBC Holdings PLC, 4.375%, 11/23/2026 513,057 0.0500,000 (3) HSBC Holdings PLC, 4.583%, 06/19/2029 526,605 0.0500,000 (3) HSBC Holdings PLC, 6.000%, 12/31/2199 496,488 0.0
3,400,000 HSBC Holdings PLC, 6.500%, 09/15/2037 4,235,336 0.1250,000 HSBC USA, Inc., 2.250%, 06/23/2019 249,712 0.0250,000 HSBC USA, Inc., 3.500%, 06/23/2024 253,452 0.0
1,000,000 Huntington National Bank/The, 3.550%, 10/06/2023 1,024,857 0.1500,000 ING Groep NV, 3.150%, 03/29/2022 500,863 0.0
1,000,000 Jefferies Group LLC / Jefferies Group Capital Finance, Inc., 4.150%, 01/23/2030 917,467 0.0900,000 Jefferies Group LLC, 5.125%, 01/20/2023 955,221 0.0750,000 JPMorgan Chase & Co., 2.700%, 05/18/2023 743,256 0.0
1,000,000 JPMorgan Chase & Co., 2.750%, 06/23/2020 1,000,789 0.0500,000 JPMorgan Chase & Co., 2.950%, 10/01/2026 489,451 0.0750,000 JPMorgan Chase & Co., 3.125%, 01/23/2025 751,422 0.0750,000 (3) JPMorgan Chase & Co., 3.220%, 03/01/2025 751,786 0.0
1,500,000 JPMorgan Chase & Co., 3.375%, 05/01/2023 1,516,907 0.11,000,000 (3) JPMorgan Chase & Co., 3.509%, 01/23/2029 995,238 0.0
750,000 (3) JPMorgan Chase & Co., 3.540%, 05/01/2028 751,817 0.01,000,000 (3) JPMorgan Chase & Co., 3.782%, 02/01/2028 1,020,416 0.1
500,000 JPMorgan Chase & Co., 3.875%, 09/10/2024 513,197 0.0750,000 (3) JPMorgan Chase & Co., 3.882%, 07/24/2038 738,481 0.0
1,000,000 JPMorgan Chase & Co., 4.125%, 12/15/2026 1,034,027 0.11,000,000 JPMorgan Chase & Co., 4.250%, 10/01/2027 1,040,408 0.1
Copyright © 2021 www.secdatabase.com. All Rights Reserved.Please Consider the Environment Before Printing This Document

1,000,000 (3) JPMorgan Chase & Co., 4.260%, 02/22/2048 1,028,949 0.14,000,000 JPMorgan Chase & Co., 4.500%, 01/24/2022 4,184,999 0.12,375,000 JPMorgan Chase & Co., 5.500%, 10/15/2040 2,844,101 0.1
Copyright © 2021 www.secdatabase.com. All Rights Reserved.Please Consider the Environment Before Printing This Document

Voya U.S. Bond Index PortfolioPORTFOLIO OF INVESTMENTS
as of March 31, 2019 (Unaudited) (Continued)
PrincipalAmount† Value
Percentageof NetAssets
CORPORATE BONDS/NOTES: (continued)Financial: (continued)
1,000,000 (3) JPMorgan Chase Bank NA, 2.604%, 02/01/2021 $ 998,172 0.0500,000 Kemper Corp., 4.350%, 02/15/2025 512,388 0.0500,000 KeyBank NA/Cleveland OH, 2.300%, 09/14/2022 493,369 0.0750,000 KeyBank NA/Cleveland OH, 2.400%, 06/09/2022 743,727 0.0
1,000,000 KeyBank NA/Cleveland OH, 3.350%, 06/15/2021 1,015,611 0.1500,000 KeyBank NA/Cleveland OH, 3.400%, 05/20/2026 496,375 0.0400,000 Kilroy Realty L.P., 4.250%, 08/15/2029 408,686 0.0250,000 Kilroy Realty L.P., 4.375%, 10/01/2025 258,421 0.0
3,000,000 Kreditanstalt fuer Wiederaufbau, 1.250%, 09/30/2019 2,982,368 0.11,000,000 Kreditanstalt fuer Wiederaufbau, 1.625%, 03/15/2021 986,135 0.02,000,000 Kreditanstalt fuer Wiederaufbau, 1.875%, 11/30/2020 1,984,816 0.13,000,000 Kreditanstalt fuer Wiederaufbau, 2.125%, 03/07/2022 2,986,354 0.1
10,000,000 (2) Kreditanstalt fuer Wiederaufbau, 2.625%, 01/25/2022 10,087,905 0.3750,000 Liberty Property L.P., 3.250%, 10/01/2026 729,339 0.0750,000 Lincoln National Corp., 3.625%, 12/12/2026 754,883 0.0
1,000,000 Lincoln National Corp., 3.800%, 03/01/2028 1,015,278 0.1500,000 Lincoln National Corp., 4.200%, 03/15/2022 519,084 0.0500,000 (3) Lloyds Banking Group PLC, 2.907%, 11/07/2023 487,445 0.0750,000 Lloyds Banking Group PLC, 3.000%, 01/11/2022 745,950 0.0500,000 (3) Lloyds Banking Group PLC, 3.574%, 11/07/2028 481,000 0.0
1,000,000 Lloyds Banking Group PLC, 3.900%, 03/12/2024 1,014,198 0.1500,000 Lloyds Banking Group PLC, 4.650%, 03/24/2026 506,668 0.0250,000 Loews Corp., 3.750%, 04/01/2026 258,030 0.0250,000 Manufacturers & Traders Trust Co., 2.250%, 07/25/2019 249,686 0.0
1,000,000 Manufacturers & Traders Trust Co., 2.500%, 05/18/2022 993,950 0.01,000,000 Manufacturers & Traders Trust Co., 2.625%, 01/25/2021 1,001,217 0.0
500,000 (3) Manulife Financial Corp., 4.061%, 02/24/2032 486,782 0.0500,000 Manulife Financial Corp., 4.150%, 03/04/2026 526,922 0.0500,000 Manulife Financial Corp., 5.375%, 03/04/2046 591,716 0.0
1,000,000 Markel Corp., 3.625%, 03/30/2023 1,008,091 0.1400,000 Marsh & McLennan Cos, Inc., 3.500%, 03/10/2025 411,000 0.0
1,000,000 (1) MassMutual Global Funding II, 3.400%, 03/08/2026 1,017,498 0.11,000,000 Mastercard, Inc., 3.500%, 02/26/2028 1,046,112 0.1
500,000 MetLife, Inc., 3.048%, 12/15/2022 505,976 0.0500,000 MetLife, Inc., 3.600%, 04/10/2024 517,171 0.0
1,000,000 MetLife, Inc., 3.600%, 11/13/2025 1,033,261 0.1500,000 MetLife, Inc., 4.050%, 03/01/2045 501,202 0.0400,000 MetLife, Inc., 4.125%, 08/13/2042 404,991 0.0300,000 MetLife, Inc., 4.721%, 12/15/2044 328,443 0.0500,000 (1) Metropolitan Life Global Funding I, 1.950%, 09/15/2021 490,416 0.0750,000 (1) Metropolitan Life Global Funding I, 3.450%, 12/18/2026 765,085 0.0432,000 Mitsubishi UFJ Financial Group, Inc., 2.950%, 03/01/2021 433,013 0.0500,000 Mitsubishi UFJ Financial Group, Inc., 3.455%, 03/02/2023 507,349 0.0500,000 Mitsubishi UFJ Financial Group, Inc., 3.777%, 03/02/2025 515,762 0.0750,000 Mitsubishi UFJ Financial Group, Inc., 3.850%, 03/01/2026 777,294 0.0500,000 Mizuho Financial Group, Inc., 2.601%, 09/11/2022 494,033 0.0500,000 Mizuho Financial Group, Inc., 3.170%, 09/11/2027 494,895 0.0
1,000,000 Mizuho Financial Group, Inc., 3.549%, 03/05/2023 1,020,004 0.1
Copyright © 2021 www.secdatabase.com. All Rights Reserved.Please Consider the Environment Before Printing This Document

Copyright © 2021 www.secdatabase.com. All Rights Reserved.Please Consider the Environment Before Printing This Document

Voya U.S. Bond Index PortfolioPORTFOLIO OF INVESTMENTS
as of March 31, 2019 (Unaudited) (Continued)
PrincipalAmount† Value
Percentageof NetAssets
CORPORATE BONDS/NOTES: (continued)Financial: (continued)
500,000 (3) Mizuho Financial Group, Inc., 3.922%, 09/11/2024 $ 515,211 0.0500,000 (3) Mizuho Financial Group, Inc., 4.254%, 09/11/2029 531,249 0.0
1,000,000 Morgan Stanley, 2.500%, 04/21/2021 994,491 0.0750,000 Morgan Stanley, 2.625%, 11/17/2021 746,352 0.0
1,000,000 Morgan Stanley, 3.125%, 01/23/2023 1,004,044 0.0500,000 Morgan Stanley, 3.125%, 07/27/2026 487,858 0.0
1,750,000 (3) Morgan Stanley, 3.591%, 07/22/2028 1,739,789 0.1750,000 Morgan Stanley, 3.625%, 01/20/2027 752,520 0.0500,000 Morgan Stanley, 3.700%, 10/23/2024 509,296 0.0
1,000,000 (3) Morgan Stanley, 3.772%, 01/24/2029 1,007,496 0.1750,000 Morgan Stanley, 3.875%, 04/29/2024 772,256 0.0500,000 Morgan Stanley, 3.875%, 01/27/2026 512,077 0.0750,000 Morgan Stanley, 3.950%, 04/23/2027 752,088 0.0
1,000,000 Morgan Stanley, 4.100%, 05/22/2023 1,027,780 0.1750,000 Morgan Stanley, 4.000%, 07/23/2025 773,127 0.0500,000 Morgan Stanley, 4.350%, 09/08/2026 513,843 0.0800,000 Morgan Stanley, 4.875%, 11/01/2022 845,086 0.0
1,000,000 Morgan Stanley, 5.000%, 11/24/2025 1,073,528 0.11,000,000 MUFG Union Bank NA, 3.150%, 04/01/2022 1,009,087 0.1
500,000 MUFG Union Bank NA, 2.250%, 05/06/2019 499,607 0.0500,000 National Australia Bank Ltd./New York, 2.500%, 07/12/2026 475,382 0.0500,000 National Australia Bank Ltd./New York, 2.800%, 01/10/2022 499,909 0.0
1,000,000 National Australia Bank Ltd./New York, 2.875%, 04/12/2023 997,685 0.0300,000 National Retail Properties, Inc., 4.000%, 11/15/2025 308,049 0.0250,000 National Rural Utilities Cooperative Finance Corp., 2.300%, 11/01/2020 249,011 0.0
1,000,000 (3) National Rural Utilities Cooperative Finance Corp., 5.250%, 04/20/2046 1,004,418 0.0300,000 Northern Trust Corp., 2.375%, 08/02/2022 296,718 0.0750,000 (3) Northern Trust Corp., 3.375%, 05/08/2032 735,998 0.0250,000 Northern Trust Corp., 3.950%, 10/30/2025 264,252 0.0500,000 PNC Bank NA, 2.450%, 07/28/2022 498,356 0.0500,000 PNC Bank NA, 2.625%, 02/17/2022 500,084 0.0500,000 PNC Bank NA, 2.700%, 11/01/2022 498,048 0.0750,000 PNC Bank NA, 3.100%, 10/25/2027 749,744 0.0500,000 PNC Bank NA, 3.250%, 06/01/2025 506,866 0.0500,000 PNC Bank NA, 3.250%, 01/22/2028 504,122 0.0500,000 (3) PNC Financial Services Group, Inc./The, 2.854%, 11/09/2022 499,679 0.0500,000 PNC Financial Services Group, Inc./The, 3.300%, 03/08/2022 508,488 0.0500,000 Primerica, Inc., 4.750%, 07/15/2022 526,627 0.0300,000 Principal Financial Group, Inc., 3.125%, 05/15/2023 301,355 0.0
1,000,000 Principal Financial Group, Inc., 3.300%, 09/15/2022 1,008,027 0.11,000,000 Private Export Funding Corp., 1.450%, 08/15/2019 996,092 0.01,000,000 Private Export Funding Corp., 2.250%, 03/15/2020 997,306 0.01,000,000 Private Export Funding Corp., 2.300%, 09/15/2020 999,168 0.01,000,000 Private Export Funding Corp., 3.250%, 06/15/2025 1,034,019 0.11,000,000 Private Export Funding Corp., 3.550%, 01/15/2024 1,049,025 0.11,000,000 Progressive Corp./The, 4.000%, 03/01/2029 1,069,864 0.1
500,000 Prologis L.P., 4.250%, 08/15/2023 528,998 0.0400,000 Protective Life Corp., 7.375%, 10/15/2019 409,388 0.0
1,000,000 Prudential Financial, Inc., 3.500%, 05/15/2024 1,035,853 0.1
Copyright © 2021 www.secdatabase.com. All Rights Reserved.Please Consider the Environment Before Printing This Document

1,000,000 Prudential Financial, Inc., 3.878%, 03/27/2028 1,052,599 0.1500,000 (3) Prudential Financial, Inc., 5.375%, 05/15/2045 506,403 0.0
1,000,000 (3) Prudential Financial, Inc., 5.625%, 06/15/2043 1,041,475 0.1
Copyright © 2021 www.secdatabase.com. All Rights Reserved.Please Consider the Environment Before Printing This Document

Voya U.S. Bond Index PortfolioPORTFOLIO OF INVESTMENTS
as of March 31, 2019 (Unaudited) (Continued)
PrincipalAmount† Value
Percentageof NetAssets
CORPORATE BONDS/NOTES: (continued)Financial: (continued)
750,000 Public Storage, 2.370%, 09/15/2022 $ 742,811 0.0250,000 Public Storage, 3.094%, 09/15/2027 244,078 0.0500,000 Raymond James Financial, Inc., 3.625%, 09/15/2026 495,719 0.0400,000 Realty Income Corp., 3.875%, 07/15/2024 415,473 0.0300,000 Realty Income Corp., 4.125%, 10/15/2026 314,784 0.0
1,000,000 Regions Financial Corp., 3.200%, 02/08/2021 1,008,098 0.1500,000 Royal Bank of Canada, 2.125%, 03/02/2020 497,634 0.0
1,000,000 Royal Bank of Canada, 2.150%, 10/26/2020 993,741 0.01,000,000 (2) Royal Bank of Canada, 2.750%, 02/01/2022 1,003,566 0.0
500,000 Royal Bank of Canada, 4.650%, 01/27/2026 530,948 0.0500,000 Royal Bank of Scotland Group PLC, 4.800%, 04/05/2026 520,253 0.0500,000 Santander Holdings USA, Inc., 2.650%, 04/17/2020 498,359 0.0500,000 Santander UK Group Holdings PLC, 2.875%, 08/05/2021 496,290 0.0750,000 Santander UK Group Holdings PLC, 3.125%, 01/08/2021 750,308 0.0250,000 Senior Housing Properties Trust, 3.250%, 05/01/2019 250,033 0.0250,000 Senior Housing Properties Trust, 4.750%, 05/01/2024 247,432 0.0
1,000,000 Simon Property Group L.P., 3.375%, 03/15/2022 1,017,939 0.1500,000 Simon Property Group L.P., 3.375%, 06/15/2027 504,519 0.0500,000 (2) Simon Property Group L.P., 4.250%, 10/01/2044 519,031 0.0750,000 (3) State Street Corp., 2.653%, 05/15/2023 746,244 0.0
1,500,000 State Street Corp., 3.100%, 05/15/2023 1,522,788 0.1500,000 State Street Corp., 3.550%, 08/18/2025 519,262 0.0500,000 (2) Sumitomo Mitsui Financial Group, Inc., 2.058%, 07/14/2021 491,641 0.0500,000 Sumitomo Mitsui Financial Group, Inc., 2.442%, 10/19/2021 494,522 0.0500,000 Sumitomo Mitsui Financial Group, Inc., 2.632%, 07/14/2026 479,456 0.0750,000 Sumitomo Mitsui Financial Group, Inc., 2.778%, 10/18/2022 747,375 0.0500,000 Sumitomo Mitsui Financial Group, Inc., 2.784%, 07/12/2022 497,824 0.0500,000 Sumitomo Mitsui Financial Group, Inc., 3.364%, 07/12/2027 501,586 0.0500,000 Sumitomo Mitsui Financial Group, Inc., 3.446%, 01/11/2027 505,872 0.0500,000 Sumitomo Mitsui Financial Group, Inc., 3.544%, 01/17/2028 509,231 0.0500,000 SunTrust Bank/Atlanta GA, 2.250%, 01/31/2020 498,398 0.0500,000 SunTrust Bank/Atlanta GA, 2.750%, 05/01/2023 496,432 0.0
1,000,000 SunTrust Bank/Atlanta GA, 3.000%, 02/02/2023 1,002,447 0.0500,000 SunTrust Bank/Atlanta GA, 3.300%, 05/15/2026 496,416 0.0250,000 SunTrust Banks, Inc., 2.500%, 05/01/2019 249,948 0.0500,000 SunTrust Banks, Inc., 2.700%, 01/27/2022 498,772 0.0500,000 SunTrust Banks, Inc., 2.900%, 03/03/2021 501,496 0.0750,000 Synchrony Bank, 3.000%, 06/15/2022 740,706 0.0250,000 Synchrony Financial, 3.000%, 08/15/2019 250,080 0.0250,000 Synchrony Financial, 3.750%, 08/15/2021 252,813 0.0300,000 Synchrony Financial, 4.250%, 08/15/2024 302,143 0.0250,000 Synchrony Financial, 4.500%, 07/23/2025 251,331 0.0500,000 Tanger Properties L.P., 3.125%, 09/01/2026 463,724 0.0750,000 (1) Toronto-Dominion Bank/The, 2.500%, 01/18/2023 748,566 0.0
1,000,000 Toronto-Dominion Bank/The, 3.150%, 09/17/2020 1,009,513 0.1500,000 Toronto-Dominion Bank/The, 3.000%, 06/11/2020 502,246 0.0500,000 Toronto-Dominion Bank/The, 3.250%, 06/11/2021 506,279 0.0
1,000,000 Toronto-Dominion Bank/The, 3.250%, 03/11/2024 1,013,093 0.1750,000 Travelers Cos, Inc./The, 4.000%, 05/30/2047 767,896 0.0
Copyright © 2021 www.secdatabase.com. All Rights Reserved.Please Consider the Environment Before Printing This Document

3,000,000 Travelers Cos, Inc., 3.900%, 11/01/2020 3,062,575 0.1
Copyright © 2021 www.secdatabase.com. All Rights Reserved.Please Consider the Environment Before Printing This Document

Voya U.S. Bond Index PortfolioPORTFOLIO OF INVESTMENTS
as of March 31, 2019 (Unaudited) (Continued)
PrincipalAmount† Value
Percentageof NetAssets
CORPORATE BONDS/NOTES: (continued)Financial: (continued)
700,000 UBS AG/Stamford CT, 2.375%, 08/14/2019 $ 699,319 0.0500,000 (1) UBS Group Funding Switzerland AG, 2.950%, 09/24/2020 500,078 0.0500,000 (1) UBS Group Funding Switzerland AG, 3.000%, 04/15/2021 500,067 0.0500,000 Unum Group, 3.000%, 05/15/2021 500,111 0.0750,000 US Bancorp, 2.950%, 07/15/2022 753,021 0.0750,000 US Bancorp, 3.150%, 04/27/2027 754,431 0.0
1,000,000 US Bancorp, 3.000%, 03/15/2022 1,010,743 0.1500,000 (3) US Bancorp, 5.125%, 12/31/2199 506,560 0.0500,000 US Bank NA/Cincinnati OH, 2.000%, 01/24/2020 497,467 0.0
1,000,000 (3) US Bank NA/Cincinnati OH, 3.104%, 05/21/2021 1,004,347 0.0500,000 Ventas Realty L.P. / Ventas Capital Corp., 2.700%, 04/01/2020 499,014 0.0600,000 Ventas Realty L.P. / Ventas Capital Corp., 3.250%, 08/15/2022 605,738 0.0250,000 Ventas Realty L.P., 3.500%, 02/01/2025 250,437 0.0500,000 Ventas Realty L.P., 3.750%, 05/01/2024 512,275 0.0500,000 Ventas Realty L.P., 4.125%, 01/15/2026 514,095 0.0
1,100,000 Visa, Inc., 2.200%, 12/14/2020 1,095,479 0.1750,000 Visa, Inc., 2.750%, 09/15/2027 742,398 0.0
1,000,000 Visa, Inc., 2.800%, 12/14/2022 1,010,647 0.1500,000 Visa, Inc., 3.150%, 12/14/2025 509,266 0.0500,000 Visa, Inc., 4.300%, 12/14/2045 553,574 0.0
1,000,000 Wells Fargo & Co., 2.625%, 07/22/2022 993,370 0.01,500,000 Wells Fargo & Co., 3.069%, 01/24/2023 1,503,223 0.11,000,000 Wells Fargo & Co., 3.000%, 10/23/2026 977,194 0.01,000,000 Wells Fargo & Co., 3.450%, 02/13/2023 1,011,721 0.1
750,000 Wells Fargo & Co., 3.550%, 09/29/2025 764,126 0.01,000,000 (3) Wells Fargo & Co., 3.584%, 05/22/2028 1,005,962 0.0
500,000 Wells Fargo & Co., 4.300%, 07/22/2027 520,845 0.08,000,000 Wells Fargo & Co., 4.600%, 04/01/2021 8,267,519 0.31,000,000 Wells Fargo & Co., 4.900%, 11/17/2045 1,068,412 0.1
983,000 Wells Fargo & Co., 5.606%, 01/15/2044 1,136,206 0.11,000,000 Wells Fargo Bank NA, 2.600%, 01/15/2021 997,366 0.01,000,000 Wells Fargo Bank NA, 3.625%, 10/22/2021 1,019,406 0.1
750,000 Wells Fargo Bank NA, 6.600%, 01/15/2038 983,052 0.0500,000 Welltower, Inc., 4.000%, 06/01/2025 514,974 0.0
1,000,000 Westpac Banking Corp., 2.750%, 01/11/2023 994,493 0.0750,000 (3) Westpac Banking Corp., 4.322%, 11/23/2031 744,403 0.0
1,000,000 WR Berkley Corp., 4.625%, 03/15/2022 1,045,227 0.1333,716,432 9.5
Industrial: 2.0%500,000 3M Co., 2.000%, 06/26/2022 494,556 0.0750,000 3M Co., 2.250%, 09/19/2026 720,583 0.0
1,000,000 3M Co., 2.875%, 10/15/2027 994,855 0.0100,000 3M Co., 3.000%, 08/07/2025 101,880 0.0200,000 3M Co., 3.875%, 06/15/2044 205,392 0.0
1,000,000 3M Co., 4.000%, 09/14/2048 1,050,608 0.11,300,000 Agilent Technologies, Inc., 3.200%, 10/01/2022 1,311,220 0.11,000,000 Agilent Technologies, Inc., 3.875%, 07/15/2023 1,033,236 0.1
400,000 Arrow Electronics, Inc., 3.500%, 04/01/2022 402,668 0.0
Copyright © 2021 www.secdatabase.com. All Rights Reserved.Please Consider the Environment Before Printing This Document

750,000 Boeing Capital Corp., 4.700%, 10/27/2019 757,118 0.0500,000 Boeing Co/The, 2.125%, 03/01/2022 491,491 0.0500,000 Boeing Co/The, 2.800%, 03/01/2027 486,752 0.0500,000 Boeing Co/The, 3.300%, 03/01/2035 466,577 0.0500,000 Burlington Northern Santa Fe LLC, 3.000%, 03/15/2023 506,019 0.0
1,000,000 Burlington Northern Santa Fe LLC, 3.450%, 09/15/2021 1,017,894 0.1500,000 Burlington Northern Santa Fe LLC, 4.375%, 09/01/2042 535,194 0.0500,000 Burlington Northern Santa Fe LLC, 4.450%, 03/15/2043 541,740 0.0500,000 Burlington Northern Santa Fe LLC, 4.700%, 09/01/2045 561,461 0.0
Copyright © 2021 www.secdatabase.com. All Rights Reserved.Please Consider the Environment Before Printing This Document

Voya U.S. Bond Index PortfolioPORTFOLIO OF INVESTMENTS
as of March 31, 2019 (Unaudited) (Continued)
PrincipalAmount† Value
Percentageof NetAssets
CORPORATE BONDS/NOTES: (continued)Industrial: (continued)
400,000 Burlington Northern Santa Fe LLC, 4.900%, 04/01/2044 $ 459,522 0.01,000,000 Canadian National Railway Co., 2.250%, 11/15/2022 982,040 0.0
750,000 Canadian Pacific Railway Co., 4.800%, 09/15/2035 822,854 0.0750,000 Canadian Pacific Railway Co., 4.800%, 08/01/2045 839,295 0.0500,000 Caterpillar Financial Services Corp., 2.100%, 01/10/2020 497,906 0.0200,000 Caterpillar Financial Services Corp., 2.400%, 08/09/2026 190,622 0.0300,000 Caterpillar Financial Services Corp., 2.625%, 03/01/2023 298,591 0.0
1,000,000 Caterpillar Financial Services Corp., 3.150%, 09/07/2021 1,012,039 0.1500,000 Caterpillar Financial Services Corp., 3.750%, 11/24/2023 523,570 0.0500,000 Caterpillar, Inc., 2.600%, 06/26/2022 499,558 0.0250,000 Caterpillar, Inc., 3.400%, 05/15/2024 259,233 0.0
1,000,000 Caterpillar, Inc., 3.803%, 08/15/2042 1,020,973 0.11,250,000 Caterpillar, Inc., 4.300%, 05/15/2044 1,350,763 0.1
500,000 CSX Corp., 3.950%, 05/01/2050 474,168 0.0500,000 CSX Corp., 4.100%, 03/15/2044 496,087 0.0
1,000,000 CSX Corp., 4.400%, 03/01/2043 1,020,348 0.1830,000 Cummins, Inc., 7.125%, 03/01/2028 1,062,630 0.1500,000 Deere & Co., 3.900%, 06/09/2042 524,652 0.0
1,010,000 Dover Corp., 4.300%, 03/01/2021 1,034,457 0.1250,000 FedEx Corp., 2.300%, 02/01/2020 248,982 0.0
1,000,000 FedEx Corp., 3.400%, 02/15/2028 991,539 0.0200,000 FedEx Corp., 3.875%, 08/01/2042 177,276 0.0500,000 FedEx Corp., 4.750%, 11/15/2045 498,709 0.0500,000 General Dynamics Corp., 2.250%, 11/15/2022 495,340 0.0500,000 General Dynamics Corp., 3.600%, 11/15/2042 498,712 0.0500,000 General Electric Co., 2.700%, 10/09/2022 491,310 0.0430,000 General Electric Co., 5.875%, 01/14/2038 458,676 0.0961,000 General Electric Co., 6.750%, 03/15/2032 1,111,952 0.1
2,600,000 Honeywell International, Inc., 3.812%, 11/21/2047 2,652,121 0.1500,000 Illinois Tool Works, Inc., 3.500%, 03/01/2024 517,204 0.0500,000 Illinois Tool Works, Inc., 3.900%, 09/01/2042 526,034 0.0250,000 Ingersoll-Rand Luxembourg Finance SA, 2.625%, 05/01/2020 249,465 0.0500,000 Ingersoll-Rand Luxembourg Finance SA, 3.800%, 03/21/2029 508,611 0.0500,000 Ingersoll-Rand Luxembourg Finance SA, 4.500%, 03/21/2049 516,337 0.0250,000 Ingersoll-Rand Luxembourg Finance SA, 4.650%, 11/01/2044 257,593 0.0750,000 John Deere Capital Corp., 2.800%, 03/04/2021 752,859 0.0
1,000,000 John Deere Capital Corp., 2.800%, 03/06/2023 1,004,548 0.01,000,000 John Deere Capital Corp., 2.800%, 09/08/2027 979,304 0.0
500,000 John Deere Capital Corp., 3.350%, 06/12/2024 511,321 0.01,000,000 John Deere Capital Corp., 3.450%, 03/07/2029 1,028,444 0.1
400,000 (3) Johnson Controls International plc, 3.625%, 07/02/2024 405,068 0.0250,000 (3) Johnson Controls International plc, 4.625%, 07/02/2044 245,044 0.0250,000 Johnson Controls International plc, 5.125%, 09/14/2045 261,719 0.0800,000 L3 Technologies, Inc., 4.950%, 02/15/2021 826,870 0.0500,000 Lockheed Martin Corp., 2.500%, 11/23/2020 498,686 0.0500,000 Lockheed Martin Corp., 3.100%, 01/15/2023 505,919 0.0
1,000,000 Lockheed Martin Corp., 3.550%, 01/15/2026 1,033,350 0.11,250,000 Lockheed Martin Corp., 3.600%, 03/01/2035 1,239,089 0.1
500,000 Lockheed Martin Corp., 4.500%, 05/15/2036 543,474 0.0
Copyright © 2021 www.secdatabase.com. All Rights Reserved.Please Consider the Environment Before Printing This Document

500,000 Lockheed Martin Corp., 4.700%, 05/15/2046 561,537 0.0642,000 Norfolk Southern Corp., 3.942%, 11/01/2047 628,666 0.0
Copyright © 2021 www.secdatabase.com. All Rights Reserved.Please Consider the Environment Before Printing This Document

Voya U.S. Bond Index PortfolioPORTFOLIO OF INVESTMENTS
as of March 31, 2019 (Unaudited) (Continued)
PrincipalAmount† Value
Percentageof NetAssets
CORPORATE BONDS/NOTES: (continued)Industrial: (continued)
1,000,000 Norfolk Southern Corp., 3.950%, 10/01/2042 $ 977,113 0.0500,000 Norfolk Southern Corp., 4.450%, 06/15/2045 521,467 0.0375,000 Norfolk Southern Corp., 4.800%, 08/15/2043 404,063 0.0750,000 Northrop Grumman Corp., 2.550%, 10/15/2022 743,422 0.0750,000 Northrop Grumman Corp., 2.930%, 01/15/2025 740,595 0.0500,000 Northrop Grumman Corp., 3.850%, 04/15/2045 481,346 0.0
1,000,000 Northrop Grumman Corp., 4.030%, 10/15/2047 991,686 0.0200,000 Packaging Corp. of America, 3.650%, 09/15/2024 201,324 0.0250,000 Parker-Hannifin Corp., 4.200%, 11/21/2034 263,686 0.0
2,800,000 Raytheon Co., 3.125%, 10/15/2020 2,829,553 0.12,000,000 Republic Services, Inc., 5.250%, 11/15/2021 2,123,811 0.11,000,000 Roper Technologies, Inc., 3.650%, 09/15/2023 1,022,538 0.1
500,000 Ryder System, Inc., 2.450%, 09/03/2019 499,066 0.0500,000 Ryder System, Inc., 2.500%, 05/11/2020 498,644 0.0300,000 Stanley Black & Decker, Inc., 2.900%, 11/01/2022 302,595 0.0750,000 Textron, Inc., 3.650%, 03/01/2021 756,112 0.0500,000 Union Pacific Corp., 2.750%, 04/15/2023 497,684 0.0500,000 Union Pacific Corp., 2.750%, 03/01/2026 488,121 0.0250,000 Union Pacific Corp., 3.375%, 02/01/2035 235,089 0.0250,000 Union Pacific Corp., 3.750%, 03/15/2024 259,633 0.0250,000 Union Pacific Corp., 3.799%, 10/01/2051 235,557 0.0750,000 Union Pacific Corp., 4.050%, 11/15/2045 732,305 0.0500,000 Union Pacific Corp., 4.250%, 04/15/2043 499,792 0.0
1,000,000 United Parcel Service, Inc., 2.800%, 11/15/2024 1,006,498 0.01,000,000 United Parcel Service, Inc., 3.050%, 11/15/2027 1,001,032 0.0
750,000 United Technologies Corp., 3.100%, 06/01/2022 755,426 0.0500,000 United Technologies Corp., 3.950%, 08/16/2025 520,097 0.0500,000 United Technologies Corp., 4.125%, 11/16/2028 521,566 0.0500,000 United Technologies Corp., 4.150%, 05/15/2045 488,178 0.0
1,000,000 United Technologies Corp., 4.450%, 11/16/2038 1,037,254 0.1406,000 United Technologies Corp., 6.125%, 07/15/2038 494,511 0.0500,000 United Technologies Corp., 3.350%, 08/16/2021 507,009 0.0500,000 United Technologies Corp., 3.650%, 08/16/2023 513,628 0.0500,000 United Technologies Corp., 4.500%, 06/01/2042 517,936 0.0
1,000,000 United Technologies Corp., 4.625%, 11/16/2048 1,064,934 0.171,007,582 2.0
Technology: 1.6%500,000 Analog Devices, Inc., 3.900%, 12/15/2025 509,834 0.0500,000 Apple, Inc., 2.100%, 05/06/2019 499,761 0.0500,000 Apple, Inc., 2.150%, 02/09/2022 495,244 0.0
1,000,000 Apple, Inc., 2.250%, 02/23/2021 996,403 0.01,000,000 Apple, Inc., 2.400%, 01/13/2023 993,520 0.01,000,000 Apple, Inc., 2.400%, 05/03/2023 991,373 0.0
750,000 Apple, Inc., 2.500%, 02/09/2022 749,646 0.0500,000 Apple, Inc., 2.850%, 05/06/2021 503,397 0.0750,000 Apple, Inc., 3.000%, 02/09/2024 761,039 0.0
1,000,000 Apple, Inc., 3.000%, 11/13/2027 995,516 0.01,000,000 Apple, Inc., 3.200%, 05/13/2025 1,019,168 0.11,000,000 Apple, Inc., 3.200%, 05/11/2027 1,010,063 0.01,000,000 Apple, Inc., 3.250%, 02/23/2026 1,019,359 0.11,000,000 Apple, Inc., 3.350%, 02/09/2027 1,021,793 0.1
500,000 Apple, Inc., 3.450%, 05/06/2024 517,222 0.0500,000 Apple, Inc., 3.450%, 02/09/2045 477,692 0.0
1,000,000 Apple, Inc., 3.850%, 05/04/2043 1,013,300 0.1
Copyright © 2021 www.secdatabase.com. All Rights Reserved.Please Consider the Environment Before Printing This Document

Voya U.S. Bond Index PortfolioPORTFOLIO OF INVESTMENTS
as of March 31, 2019 (Unaudited) (Continued)
PrincipalAmount† Value
Percentageof NetAssets
CORPORATE BONDS/NOTES: (continued)Technology: (continued)
400,000 Apple, Inc., 4.375%, 05/13/2045 $ 436,583 0.0500,000 Apple, Inc., 4.450%, 05/06/2044 552,256 0.0
1,000,000 Apple, Inc., 4.650%, 02/23/2046 1,133,492 0.1500,000 Applied Materials, Inc., 3.900%, 10/01/2025 526,569 0.0400,000 Autodesk, Inc., 3.600%, 12/15/2022 406,757 0.0250,000 Autodesk, Inc., 4.375%, 06/15/2025 258,567 0.0
1,000,000 Broadcom Corp. / Broadcom Cayman Finance Ltd., 3.625%, 01/15/2024 998,527 0.01,000,000 Broadcom Corp. / Broadcom Cayman Finance Ltd., 3.875%, 01/15/2027 956,935 0.0
400,000 (1) Dell International LLC / EMC Corp., 4.420%, 06/15/2021 410,591 0.0400,000 (1) Dell International LLC / EMC Corp., 5.450%, 06/15/2023 426,502 0.0400,000 (1) Dell International LLC / EMC Corp., 6.020%, 06/15/2026 430,605 0.0400,000 (1) Dell International LLC / EMC Corp., 8.350%, 07/15/2046 484,112 0.0
1,000,000 Hewlett Packard Enterprise Co., 3.500%, 10/05/2021 1,013,762 0.1500,000 Hewlett Packard Enterprise Co., 3.600%, 10/15/2020 504,839 0.0500,000 Hewlett Packard Enterprise Co., 4.400%, 10/15/2022 523,517 0.0321,000 HP, Inc., 3.750%, 12/01/2020 326,543 0.0
1,000,000 International Business Machines Corp., 1.625%, 05/15/2020 988,521 0.0500,000 International Business Machines Corp., 1.875%, 05/15/2019 499,581 0.0
1,030,000 International Business Machines Corp., 2.250%, 02/19/2021 1,021,854 0.11,020,000 International Business Machines Corp., 2.500%, 01/27/2022 1,012,432 0.01,000,000 International Business Machines Corp., 3.375%, 08/01/2023 1,021,711 0.11,000,000 International Business Machines Corp., 3.450%, 02/19/2026 1,016,884 0.11,000,000 Intel Corp., 3.150%, 05/11/2027 1,012,658 0.11,760,000 Intel Corp., 3.700%, 07/29/2025 1,847,619 0.1
272,000 Intel Corp., 3.734%, 12/08/2047 275,223 0.0500,000 Lam Research Corp., 2.800%, 06/15/2021 500,351 0.0400,000 Lam Research Corp., 3.800%, 03/15/2025 411,616 0.0750,000 Lam Research Corp., 4.000%, 03/15/2029 766,521 0.0750,000 Microsoft Corp., 1.550%, 08/08/2021 732,509 0.0
1,000,000 Microsoft Corp., 2.375%, 05/01/2023 996,243 0.01,000,000 Microsoft Corp., 2.400%, 08/08/2026 971,305 0.01,000,000 Microsoft Corp., 2.700%, 02/12/2025 1,001,734 0.0
500,000 Microsoft Corp., 2.875%, 02/06/2024 506,566 0.0500,000 Microsoft Corp., 3.125%, 11/03/2025 512,387 0.0
1,500,000 Microsoft Corp., 3.300%, 02/06/2027 1,543,399 0.1250,000 Microsoft Corp., 3.500%, 02/12/2035 254,106 0.0750,000 Microsoft Corp., 3.625%, 12/15/2023 784,249 0.0250,000 Microsoft Corp., 3.750%, 02/12/2045 257,262 0.0500,000 Microsoft Corp., 3.950%, 08/08/2056 522,970 0.0
1,000,000 Microsoft Corp., 4.200%, 11/03/2035 1,102,436 0.11,000,000 Microsoft Corp., 4.250%, 02/06/2047 1,118,579 0.11,000,000 Microsoft Corp., 4.450%, 11/03/2045 1,141,679 0.1
250,000 Microsoft Corp., 4.875%, 12/15/2043 297,575 0.0250,000 NetApp, Inc., 3.375%, 06/15/2021 252,522 0.0
1,000,000 Oracle Corp., 1.900%, 09/15/2021 984,207 0.0500,000 Oracle Corp., 2.250%, 10/08/2019 498,970 0.0500,000 Oracle Corp., 2.500%, 10/15/2022 497,743 0.0750,000 Oracle Corp., 2.800%, 07/08/2021 753,496 0.0
1,000,000 Oracle Corp., 2.950%, 11/15/2024 1,003,644 0.0
Copyright © 2021 www.secdatabase.com. All Rights Reserved.Please Consider the Environment Before Printing This Document

750,000 Oracle Corp., 2.950%, 05/15/2025 750,228 0.01,000,000 Oracle Corp., 3.250%, 11/15/2027 1,007,080 0.0
500,000 Oracle Corp., 3.400%, 07/08/2024 512,465 0.0400,000 Oracle Corp., 3.850%, 07/15/2036 404,983 0.0750,000 Oracle Corp., 3.900%, 05/15/2035 768,914 0.0750,000 Oracle Corp., 4.125%, 05/15/2045 767,687 0.0
Copyright © 2021 www.secdatabase.com. All Rights Reserved.Please Consider the Environment Before Printing This Document

Voya U.S. Bond Index PortfolioPORTFOLIO OF INVESTMENTS
as of March 31, 2019 (Unaudited) (Continued)
PrincipalAmount† Value
Percentageof NetAssets
CORPORATE BONDS/NOTES: (continued)Technology: (continued)
180,000 Oracle Corp., 4.300%, 07/08/2034 $ 193,679 0.01,500,000 Oracle Corp., 5.375%, 07/15/2040 1,806,805 0.1
500,000 QUALCOMM, Inc., 3.000%, 05/20/2022 504,519 0.0850,000 QUALCOMM, Inc., 4.650%, 05/20/2035 878,301 0.0350,000 QUALCOMM, Inc., 4.800%, 05/20/2045 357,823 0.0
57,025,523 1.6
Utilities: 2.0%500,000 Alabama Power Co., 4.150%, 08/15/2044 517,958 0.0300,000 Ameren Illinois Co., 2.700%, 09/01/2022 300,257 0.0250,000 Ameren Illinois Co., 4.300%, 07/01/2044 261,828 0.0500,000 Appalachian Power Co., 4.400%, 05/15/2044 514,318 0.0750,000 Appalachian Power Co., 4.450%, 06/01/2045 775,103 0.0250,000 Arizona Public Service Co., 2.200%, 01/15/2020 249,067 0.0750,000 Arizona Public Service Co., 2.950%, 09/15/2027 735,690 0.0400,000 Arizona Public Service Co., 3.350%, 06/15/2024 405,291 0.0500,000 Atmos Energy Corp., 4.125%, 10/15/2044 523,395 0.0500,000 Atmos Energy Corp., 4.125%, 03/15/2049 519,902 0.0
1,000,000 Baltimore Gas & Electric Co., 3.350%, 07/01/2023 1,016,578 0.1500,000 Baltimore Gas & Electric Co., 3.500%, 08/15/2046 471,829 0.0
3,668,000 Berkshire Hathaway Energy Co., 6.125%, 04/01/2036 4,621,270 0.2750,000 CenterPoint Energy Houston Electric LLC, 3.000%, 02/01/2027 741,037 0.0250,000 CMS Energy Corp., 3.875%, 03/01/2024 256,511 0.0250,000 CMS Energy Corp., 4.875%, 03/01/2044 274,562 0.0200,000 Consolidated Edison Co. of New York, Inc., 4.300%, 12/01/2056 203,055 0.0500,000 Consolidated Edison Co. of New York, Inc., 4.450%, 03/15/2044 528,590 0.0500,000 Consolidated Edison Co. of New York, Inc., 4.500%, 12/01/2045 537,441 0.0400,000 Consolidated Edison Co. of New York, Inc., 4.625%, 12/01/2054 426,855 0.0300,000 Consumers Energy Co., 2.850%, 05/15/2022 301,921 0.0500,000 Consumers Energy Co., 3.950%, 07/15/2047 518,055 0.0200,000 Dominion Energy Gas Holdings LLC, 2.500%, 12/15/2019 199,479 0.0210,000 Dominion Energy Gas Holdings LLC, 2.800%, 11/15/2020 210,067 0.0200,000 Dominion Energy Gas Holdings LLC, 3.600%, 12/15/2024 203,237 0.0250,000 DTE Electric Co., 4.300%, 07/01/2044 267,041 0.0400,000 DTE Energy Co., 3.500%, 06/01/2024 405,396 0.0400,000 DTE Energy Co., 3.850%, 12/01/2023 413,471 0.0500,000 Duke Energy Carolinas LLC, 2.500%, 03/15/2023 497,297 0.0500,000 Duke Energy Corp., 1.800%, 09/01/2021 488,249 0.0500,000 Duke Energy Corp., 3.750%, 09/01/2046 469,371 0.0500,000 Duke Energy Corp., 3.950%, 10/15/2023 518,807 0.0500,000 Duke Energy Corp., 4.800%, 12/15/2045 543,260 0.0
1,000,000 Duke Energy Florida LLC, 3.800%, 07/15/2028 1,045,881 0.1500,000 Duke Energy Progress LLC, 3.700%, 10/15/2046 489,820 0.0150,000 Duke Energy Progress LLC, 4.150%, 12/01/2044 156,730 0.0750,000 Duke Energy Progress LLC, 4.200%, 08/15/2045 787,938 0.0
1,500,000 Duke Energy Progress LLC, 4.375%, 03/30/2044 1,623,437 0.1500,000 Enel Generacion Chile SA, 4.250%, 04/15/2024 511,925 0.0400,000 Entergy Arkansas LLC, 3.500%, 04/01/2026 408,066 0.0400,000 Entergy Arkansas LLC, 3.700%, 06/01/2024 415,541 0.0
Copyright © 2021 www.secdatabase.com. All Rights Reserved.Please Consider the Environment Before Printing This Document

500,000 Entergy Louisiana LLC, 4.950%, 01/15/2045 522,373 0.01,500,000 Exelon Corp., 4.950%, 06/15/2035 1,596,881 0.1
750,000 Exelon Corp., 5.100%, 06/15/2045 839,729 0.0760,000 Exelon Generation Co. LLC, 5.200%, 10/01/2019 768,532 0.0500,000 Florida Power & Light Co., 3.250%, 06/01/2024 512,885 0.0
Copyright © 2021 www.secdatabase.com. All Rights Reserved.Please Consider the Environment Before Printing This Document

Voya U.S. Bond Index PortfolioPORTFOLIO OF INVESTMENTS
as of March 31, 2019 (Unaudited) (Continued)
PrincipalAmount† Value
Percentageof NetAssets
CORPORATE BONDS/NOTES: (continued)Utilities: (continued)
750,000 Florida Power & Light Co., 3.800%, 12/15/2042 $ 758,853 0.01,500,000 Florida Power & Light Co., 4.050%, 06/01/2042 1,581,640 0.1
500,000 Georgia Power Co., 3.250%, 04/01/2026 490,400 0.0500,000 Indiana Michigan Power Co., 4.550%, 03/15/2046 536,118 0.0
1,000,000 (1) Israel Electric Corp. Ltd., 4.250%, 08/14/2028 1,008,405 0.11,000,000 ITC Holdings Corp., 3.350%, 11/15/2027 989,387 0.0
250,000 ITC Holdings Corp., 3.650%, 06/15/2024 251,899 0.0500,000 Jersey Central Power & Light Co., 6.150%, 06/01/2037 594,223 0.0
2,500,000 Kentucky Utilities Co., 5.125%, 11/01/2040 2,946,829 0.1500,000 MidAmerican Energy Co., 3.100%, 05/01/2027 503,552 0.0
1,000,000 MidAmerican Energy Co., 3.650%, 08/01/2048 975,134 0.0500,000 MidAmerican Energy Co., 3.950%, 08/01/2047 511,856 0.0
2,000,000 Mississippi Power Co., 4.250%, 03/15/2042 1,933,642 0.1250,000 (1) Monongahela Power Co., 5.400%, 12/15/2043 302,197 0.0
1,000,000 National Fuel Gas Co., 5.200%, 07/15/2025 1,063,374 0.11,000,000 NextEra Energy Capital Holdings, Inc., 2.300%, 04/01/2019 1,000,000 0.1
500,000 Northern States Power Co/MN, 4.125%, 05/15/2044 525,593 0.0250,000 Oklahoma Gas & Electric Co., 4.000%, 12/15/2044 245,779 0.0250,000 Oklahoma Gas & Electric Co., 4.550%, 03/15/2044 256,158 0.0750,000 Oncor Electric Delivery Co. LLC, 4.100%, 06/01/2022 780,230 0.0
1,000,000 PacifiCorp, 4.150%, 02/15/2050 1,040,632 0.1750,000 PECO Energy Co., 4.150%, 10/01/2044 781,094 0.0250,000 Piedmont Natural Gas Co., 4.100%, 09/18/2034 258,694 0.0500,000 PSEG Power LLC, 3.000%, 06/15/2021 497,943 0.0
3,410,000 Public Service Co. of Colorado, 3.200%, 11/15/2020 3,433,440 0.11,000,000 Public Service Co. of Colorado, 3.700%, 06/15/2028 1,044,200 0.1
500,000 Public Service Co. of Colorado, 4.100%, 06/15/2048 528,125 0.01,000,000 Public Service Electric & Gas Co., 2.375%, 05/15/2023 992,716 0.1
750,000 Public Service Electric & Gas Co., 3.800%, 01/01/2043 752,602 0.0250,000 Public Service Electric & Gas Co., 4.000%, 06/01/2044 250,042 0.0500,000 Sempra Energy, 2.850%, 11/15/2020 499,242 0.0750,000 Sempra Energy, 3.550%, 06/15/2024 750,798 0.0250,000 Sempra Energy, 3.750%, 11/15/2025 249,766 0.0750,000 Sierra Pacific Power Co., 2.600%, 05/01/2026 721,558 0.0250,000 South Carolina Electric & Gas Co., 5.100%, 06/01/2065 288,064 0.0
1,430,316 Southaven Combined Cycle Generation LLC, 3.846%, 08/15/2033 1,483,337 0.1500,000 Southern California Edison Co., 3.900%, 03/15/2043 462,538 0.0750,000 Southern California Edison Co., 4.000%, 04/01/2047 703,247 0.0500,000 Southern California Edison Co., 4.650%, 10/01/2043 512,082 0.0500,000 Southern California Gas Co., 4.300%, 01/15/2049 537,356 0.0
1,000,000 Southern Co. Gas Capital Corp., 4.400%, 05/30/2047 1,008,502 0.1500,000 Southern Co., 2.750%, 06/15/2020 500,090 0.0500,000 Southern Power Co., 4.150%, 12/01/2025 518,375 0.0250,000 Union Electric Co., 3.500%, 04/15/2024 257,458 0.0300,000 Union Electric Co., 3.900%, 09/15/2042 306,437 0.0500,000 Virginia Electric & Power Co., 4.450%, 02/15/2044 531,792 0.0
1,533,000 Virginia Electric & Power Co., 6.000%, 05/15/2037 1,896,842 0.1
Copyright © 2021 www.secdatabase.com. All Rights Reserved.Please Consider the Environment Before Printing This Document

1,000,000 Westar Energy, Inc., 4.125%, 03/01/2042 1,029,453 0.1
Copyright © 2021 www.secdatabase.com. All Rights Reserved.Please Consider the Environment Before Printing This Document

Voya U.S. Bond Index PortfolioPORTFOLIO OF INVESTMENTS
as of March 31, 2019 (Unaudited) (Continued)
PrincipalAmount† Value
Percentageof NetAssets
CORPORATE BONDS/NOTES: (continued)Utilities: (continued)
500,000 Westar Energy, Inc., 4.625%, 09/01/2043 $ 543,206 0.0250,000 Wisconsin Electric Power Co., 4.250%, 06/01/2044 259,614 0.0500,000 Wisconsin Power & Light Co., 4.100%, 10/15/2044 494,855 0.0
68,985,295 2.0
Total Corporate Bonds/Notes(Cost $962,630,839) 983,040,030 28.1
COLLATERALIZED MORTGAGE OBLIGATIONS: 0.1%1,567,134 Fannie Mae 2012-110 CA, 3.000%, 10/25/2042 1,563,573 0.01,418,530 Fannie Mae REMIC Trust 2006-78 BZ, 6.500%, 08/25/2036 1,568,377 0.1
Total Collateralized Mortgage Obligations(Cost $3,149,901) 3,131,950 0.1
MUNICIPAL BONDS: 0.9%California: 0.2%
4,335,000 State of California, 7.550%, 04/01/2039 6,591,671 0.2
Connecticut: 0.1%3,735,000 State of Connecticut, 5.850%, 03/15/2032 4,525,475 0.1
New Jersey: 0.2%3,425,000 New Jersey Turnpike Authority, 7.102%, 01/01/2041 4,999,952 0.12,335,000 Port Authority of New York & New Jersey, 4.926%, 10/01/2051 2,822,431 0.1
7,822,383 0.2
New York: 0.1%3,495,000 Metropolitan Transportation Authority, 6.814%, 11/15/2040 4,771,724 0.1
Ohio: 0.2%3,355,000 American Municipal Power, Inc., 7.834%, 02/15/2041 5,063,701 0.2
Washington: 0.1%3,900,000 State of Washington, 5.140%, 08/01/2040 4,739,592 0.1
Total Municipal Bonds(Cost $26,885,819) 33,514,546 0.9
CONVERTIBLE BONDS/NOTES: 0.0%Financial: 0.0%
500,000 Santander UK PLC, 3.400%, 06/01/2021 504,005 0.0
Total Convertible Bonds/Notes(Cost $500,750) 504,005 0.0
ASSET-BACKED SECURITIES: 0.5%Automobile Asset-Backed Securities: 0.3%
1,000,000 Ally Auto Receivables Trust 2017-1 A4, 1.990%, 11/15/2021 992,444 0.01,000,000 Ally Auto Receivables Trust 2017-2 A4, 2.100%, 03/15/2022 993,196 0.0
150,000 BMW Vehicle Lease Trust 2017-2 A4, 2.190%, 03/22/2021 149,268 0.0
Copyright © 2021 www.secdatabase.com. All Rights Reserved.Please Consider the Environment Before Printing This Document

1,000,000 CarMax Auto Owner Trust 2017-1 A4, 2.270%, 09/15/2022 993,746 0.01,050,000 Ford Credit Auto Owner Trust 2019-A A4, 2.850%, 08/15/2024 1,057,277 0.11,000,000 GM Financial Automobile Leasing Trust 2018-1 B, 2.870%, 12/20/2021 998,231 0.1
750,000 Honda Auto Receivables 2018-4 A4 Owner Trust, 3.300%, 07/15/2025 764,747 0.01,000,000 (1) Hyundai Auto Lease Securitization Trust 2019-A A4, 3.050%, 12/15/2022 1,006,233 0.1
450,000 Mercedes-Benz Auto Lease Trust 2019-A A2, 3.010%, 02/16/2021 451,032 0.0150,000 Mercedes-Benz Auto Lease Trust 2019-A A4, 3.250%, 10/15/2024 151,294 0.0
1,000,000 Nissan Auto Receivables 2016-C A4, 1.380%, 01/17/2023 985,209 0.0450,000 Nissan Auto Receivables 2017-B A4, 1.950%, 10/16/2023 444,923 0.0500,000 Santander Drive Auto Receivables Trust 2019-1 A3, 3.000%, 12/15/2022 502,021 0.0
1,000,000 World Omni Automobile Lease Securitization Trust 2017-A A4, 2.320%, 08/15/2022 996,934 0.010,486,555 0.3
Credit Card Asset-Backed Securities: 0.2%1,500,000 American Express Credit Account Master Trust 2017-1 B, 2.100%, 09/15/2022 1,490,177 0.1
Copyright © 2021 www.secdatabase.com. All Rights Reserved.Please Consider the Environment Before Printing This Document

Voya U.S. Bond Index PortfolioPORTFOLIO OF INVESTMENTS
as of March 31, 2019 (Unaudited) (Continued)
PrincipalAmount† Value
Percentageof NetAssets
ASSET-BACKED SECURITIES: (continued)Credit Card Asset-Backed Securities: (continued)
1,000,000 American Express Credit Account Master Trust 2017-7 A, 2.350%, 05/15/2025 $ 994,536 0.01,000,000 Capital One Multi-Asset Execution Trust 2015-A2 A2, 2.080%, 03/15/2023 994,255 0.01,000,000 Capital One Multi-Asset Execution Trust 2017-A3 A3, 2.430%, 01/15/2025 996,636 0.11,000,000 Discover Card Execution Note Trust 2017-A2 A2, 2.390%, 07/15/2024 995,919 0.0
500,000 Synchrony Credit Card Master Note Trust 2017-2 A, 2.620%, 10/15/2025 499,039 0.05,970,562 0.2
Other Asset-Backed Securities: 0.0%254,956 AEP Texas Central Transition Funding III LLC 2012-1 A2, 1.976%, 06/01/2021 253,621 0.0
1,650,000 (1) Volvo Financial Equipment LLC Series 2017-1A A4, 2.210%, 11/15/2021 1,638,196 0.01,891,817 0.0
Total Asset-Backed Securities(Cost $18,401,887) 18,348,934 0.5
SUPRANATIONAL BONDS: 1.0%4,206,000 Asian Development Bank, 1.625%, 03/16/2021 4,146,746 0.1
300,000 Asian Development Bank, 2.125%, 03/19/2025 295,546 0.02,000,000 Asian Development Bank, 2.000%, 02/16/2022 1,984,255 0.01,000,000 Corp Andina de Fomento, 2.125%, 09/27/2021 979,510 0.02,964,000 Corp Andina de Fomento, 4.375%, 06/15/2022 3,081,108 0.14,000,000 European Investment Bank, 1.125%, 08/15/2019 3,979,512 0.16,700,000 European Investment Bank, 1.625%, 06/15/2021 6,591,673 0.22,071,000 European Investment Bank, 1.750%, 05/15/2020 2,055,434 0.13,000,000 European Investment Bank, 2.250%, 03/15/2022 2,994,270 0.12,000,000 European Investment Bank, 4.000%, 02/16/2021 2,059,153 0.13,000,000 (2) Inter-American Development Bank, 1.750%, 09/14/2022 2,945,415 0.11,000,000 Inter-American Development Bank, 1.875%, 03/15/2021 991,012 0.01,000,000 Inter-American Development Bank, 3.200%, 08/07/2042 1,027,523 0.02,000,000 International Bank for Reconstruction & Development, 1.250%, 07/26/2019 1,992,175 0.1
Total Supranational Bonds(Cost $35,159,935) 35,123,332 1.0
U.S. GOVERNMENT AGENCY OBLIGATIONS: 27.8%Federal Home Loan Mortgage Corporation: 6.6%(4)
6,694,375 3.000%, 04/01/2045 6,698,883 0.26,539,434 3.000%, 04/01/2045 6,534,726 0.2
28,165,491 3.000%, 05/01/2045 28,136,488 0.89,736,868 3.000%, 11/01/2046 9,732,874 0.3
11,094,116 3.000%, 11/01/2047 11,080,973 0.3370,000 (5) 3.500%, 04/01/2033 378,845 0.0
2,076,500 3.500%, 01/01/2042 2,122,654 0.1372,854 3.500%, 01/01/2042 381,240 0.0
6,586,190 3.500%, 08/01/2042 6,711,771 0.225,066,556 3.500%, 04/01/2043 25,545,116 0.827,206,522 3.500%, 02/01/2044 27,726,115 0.8
9,675,300 3.500%, 12/01/2046 9,864,805 0.36,776,333 3.500%, 12/01/2047 6,899,207 0.2
27,956,836 3.500%, 03/01/2048 28,568,460 0.8
Copyright © 2021 www.secdatabase.com. All Rights Reserved.Please Consider the Environment Before Printing This Document

1,009,439 4.000%, 01/01/2025 1,042,544 0.1139,797 4.000%, 08/01/2040 145,179 0.0
1,670,724 4.000%, 04/01/2041 1,735,176 0.11,471,195 4.000%, 05/01/2041 1,527,998 0.1
64,238 4.000%, 08/01/2041 66,719 0.0222,834 4.000%, 12/01/2041 231,439 0.0
1,133,428 4.000%, 01/01/2042 1,171,100 0.13,054,150 4.000%, 03/01/2042 3,175,823 0.1
94,240 4.000%, 12/01/2042 97,877 0.0990,086 4.000%, 02/01/2044 1,040,824 0.0843,767 4.000%, 07/01/2045 872,155 0.0897,509 4.000%, 09/01/2045 927,641 0.0692,953 4.000%, 09/01/2045 716,236 0.0681,524 4.000%, 09/01/2045 704,411 0.0
2,254,910 4.000%, 05/01/2046 2,330,199 0.1926,205 4.000%, 11/01/2047 956,449 0.0
1,076,421 4.000%, 03/01/2048 1,111,666 0.11,517,000 (5) 4.000%, 04/01/2048 1,561,888 0.1
5,404 4.500%, 04/01/2023 5,571 0.081,237 4.500%, 03/01/2039 86,055 0.0
250,373 4.500%, 08/01/2039 265,237 0.0292,547 4.500%, 09/01/2039 309,955 0.0402,479 4.500%, 09/01/2039 426,311 0.0600,145 4.500%, 09/01/2039 635,794 0.0630,744 4.500%, 10/01/2039 668,073 0.0828,000 4.500%, 12/01/2039 877,274 0.0
Copyright © 2021 www.secdatabase.com. All Rights Reserved.Please Consider the Environment Before Printing This Document

Voya U.S. Bond Index PortfolioPORTFOLIO OF INVESTMENTS
as of March 31, 2019 (Unaudited) (Continued)
PrincipalAmount† Value
Percentageof NetAssets
U.S. GOVERNMENT AGENCY OBLIGATIONS: (continued)Federal Home Loan Mortgage Corporation: (continued)
263,348 4.500%, 03/01/2040 $ 279,013 0.0521,614 4.500%, 04/01/2040 552,646 0.0110,553 4.500%, 06/01/2040 117,131 0.0582,838 4.500%, 07/01/2040 617,490 0.0668,088 4.500%, 07/01/2040 707,755 0.0188,108 4.500%, 08/01/2040 199,300 0.0573,549 4.500%, 08/01/2040 607,673 0.0177,149 4.500%, 03/01/2041 187,688 0.0669,163 4.500%, 03/01/2041 708,978 0.0263,060 4.500%, 04/01/2041 278,711 0.0762,910 4.500%, 06/01/2041 808,109 0.0671,602 4.500%, 07/01/2041 711,563 0.0132,064 4.500%, 08/01/2041 139,515 0.0
4,114,433 4.500%, 08/01/2041 4,349,727 0.15,041,930 4.500%, 07/01/2048 5,285,676 0.2
17,759 5.000%, 03/01/2034 19,138 0.0123,906 5.000%, 12/01/2034 133,626 0.0135,150 5.000%, 08/01/2035 145,626 0.0397,288 5.000%, 08/01/2035 428,322 0.0131,178 5.000%, 10/01/2035 141,460 0.0134,678 5.000%, 10/01/2035 145,136 0.0161,291 5.000%, 10/01/2035 172,928 0.0307,777 5.000%, 12/01/2035 331,873 0.0
39,100 5.000%, 04/01/2036 42,133 0.0137,800 5.000%, 11/01/2036 148,590 0.0
97,006 5.000%, 02/01/2037 104,609 0.078,720 5.000%, 05/01/2037 84,891 0.0
1,151,760 5.000%, 10/01/2037 1,241,536 0.1670,037 5.000%, 03/01/2038 722,578 0.0204,595 5.000%, 03/01/2038 220,563 0.0593,590 5.000%, 03/01/2038 639,908 0.0202,622 5.000%, 04/01/2038 218,279 0.0
21,061 5.000%, 10/01/2038 22,700 0.083,117 5.000%, 06/01/2040 89,837 0.0
198,367 5.000%, 08/01/2040 214,405 0.0481,466 5.000%, 04/01/2041 520,397 0.0881,117 5.009%, 02/01/2042 922,249 0.055,557 5.490%, 02/01/2037 59,435 0.0
174,387 5.500%, 12/01/2024 180,168 0.0100,305 5.500%, 09/01/2034 110,357 0.0113,510 5.500%, 01/01/2035 124,692 0.050,196 5.500%, 09/01/2035 55,105 0.0
1,109,387 5.500%, 09/01/2035 1,219,902 0.1969,033 5.500%, 10/01/2035 1,064,827 0.1
78,553 5.500%, 03/01/2036 86,282 0.0333,281 5.500%, 03/01/2036 366,605 0.0
55,925 5.500%, 05/01/2036 61,443 0.0303,330 5.500%, 06/01/2036 333,734 0.0122,148 5.500%, 07/01/2036 134,357 0.0
4,930 5.500%, 07/01/2036 5,425 0.019,283 5.500%, 07/01/2036 21,312 0.025,967 5.500%, 10/01/2036 28,467 0.0
130,624 5.500%, 11/01/2036 143,610 0.011,909 5.500%, 12/01/2036 12,760 0.074,396 5.500%, 12/01/2036 81,819 0.098,896 5.500%, 12/01/2036 108,754 0.014,801 5.500%, 02/01/2037 16,258 0.088,260 5.500%, 02/01/2037 96,911 0.031,317 5.500%, 05/01/2037 34,396 0.0
4,410 5.500%, 06/01/2037 4,848 0.051,475 5.500%, 12/01/2037 56,295 0.026,897 5.500%, 03/01/2038 29,559 0.014,612 5.500%, 06/01/2038 15,976 0.0
Copyright © 2021 www.secdatabase.com. All Rights Reserved.Please Consider the Environment Before Printing This Document

6,074 5.500%, 06/01/2038 6,635 0.010,937 5.500%, 08/01/2038 11,961 0.0
2,446 5.500%, 10/01/2038 2,659 0.0881,933 5.500%, 11/01/2038 965,933 0.0
20,298 5.500%, 12/01/2038 22,194 0.014,755 5.500%, 12/01/2038 16,133 0.014,044 5.500%, 12/01/2038 15,145 0.0
148,267 5.500%, 01/01/2039 162,519 0.025,282 5.500%, 01/01/2039 27,759 0.088,085 5.500%, 01/01/2040 95,250 0.0
100,390 5.500%, 01/01/2040 109,871 0.090,387 5.500%, 03/01/2040 98,726 0.0
114,690 5.500%, 01/01/2041 122,886 0.064,656 5.750%, 05/01/2037 69,513 0.0
190,057 5.800%, 07/01/2037 204,038 0.071,461 5.800%, 08/01/2037 76,921 0.077,547 5.800%, 09/01/2037 83,494 0.040,120 5.800%, 09/01/2037 43,198 0.0
6,374 6.000%, 04/01/2028 7,025 0.057,207 6.000%, 07/01/2028 61,960 0.0
371 6.000%, 04/01/2036 402 0.012,520 6.000%, 04/01/2036 13,801 0.0
3,956 6.000%, 04/01/2036 4,359 0.039,234 6.000%, 06/01/2036 43,250 0.013,169 6.000%, 07/01/2036 14,530 0.012,772 6.000%, 08/01/2036 14,090 0.077,417 6.000%, 08/01/2036 84,782 0.0
5,155 6.000%, 08/01/2036 5,583 0.082,973 6.000%, 01/01/2037 91,457 0.060,227 6.000%, 02/01/2037 66,377 0.0
3,738 6.000%, 04/01/2037 4,125 0.01,597 6.000%, 06/01/2037 1,760 0.0
20,345 6.000%, 06/01/2037 22,420 0.0385 6.000%, 07/01/2037 425 0.0
9,832 6.000%, 07/01/2037 10,847 0.010,755 6.000%, 08/01/2037 11,869 0.0
161,138 6.000%, 08/01/2037 175,675 0.06,911 6.000%, 08/01/2037 7,485 0.0
30,730 6.000%, 08/01/2037 33,826 0.02,494 6.000%, 08/01/2037 2,748 0.04,485 6.000%, 08/01/2037 4,944 0.07,829 6.000%, 08/01/2037 8,480 0.0
19,144 6.000%, 09/01/2037 20,945 0.07,938 6.000%, 09/01/2037 8,760 0.03,646 6.000%, 09/01/2037 4,016 0.0
13,551 6.000%, 10/01/2037 14,951 0.09,500 6.000%, 10/01/2037 10,290 0.0
19,941 6.000%, 10/01/2037 21,597 0.017,813 6.000%, 10/01/2037 19,646 0.0
3,434 6.000%, 11/01/2037 3,719 0.034,478 6.000%, 11/01/2037 37,884 0.0
3,708 6.000%, 11/01/2037 4,093 0.0994 6.000%, 12/01/2037 1,076 0.0
68,650 6.000%, 12/01/2037 75,679 0.029,907 6.000%, 01/01/2038 32,954 0.024,868 6.000%, 01/01/2038 27,438 0.0
3,223 6.000%, 01/01/2038 3,552 0.020,200 6.000%, 02/01/2038 21,878 0.0
2,553 6.000%, 02/01/2038 2,765 0.018,434 6.000%, 05/01/2038 20,044 0.0
1,917 6.000%, 06/01/2038 2,113 0.038,255 6.000%, 07/01/2038 42,183 0.080,014 6.000%, 07/01/2038 88,301 0.011,732 6.000%, 09/01/2038 12,934 0.01,369 6.000%, 09/01/2038 1,509 0.0
Copyright © 2021 www.secdatabase.com. All Rights Reserved.Please Consider the Environment Before Printing This Document

Voya U.S. Bond Index PortfolioPORTFOLIO OF INVESTMENTS
as of March 31, 2019 (Unaudited) (Continued)
PrincipalAmount† Value
Percentageof NetAssets
U.S. GOVERNMENT AGENCY OBLIGATIONS: (continued)Federal Home Loan Mortgage Corporation: (continued)
290,746 6.000%, 09/01/2038 $ 320,157 0.043,008 6.000%, 09/01/2038 46,581 0.020,014 6.000%, 11/01/2038 22,041 0.0
151,985 6.000%, 01/01/2039 166,194 0.0194,196 6.000%, 04/01/2039 214,105 0.0
49,493 6.000%, 08/01/2039 53,987 0.072,657 6.000%, 10/01/2039 79,517 0.0
131,885 6.000%, 11/01/2039 143,527 0.026,119 6.000%, 11/01/2039 28,793 0.02,648 6.000%, 12/01/2039 2,918 0.0
89,016 6.000%, 05/01/2040 98,145 0.060,564 6.150%, 12/01/2037 66,166 0.075,753 6.150%, 01/01/2038 82,496 0.0
161,803 6.150%, 02/01/2038 176,026 0.086,306 6.150%, 02/01/2038 93,950 0.0
840,000 6.250%, 07/15/2032 1,161,736 0.114,362 6.500%, 06/01/2036 16,241 0.0
3,060 6.500%, 08/01/2036 3,486 0.051,726 6.500%, 10/01/2036 59,091 0.0
2,004 6.500%, 10/01/2036 2,305 0.023,626 6.500%, 07/01/2037 26,733 0.0
8,493 6.500%, 09/01/2037 9,417 0.04,330 6.500%, 10/01/2037 4,825 0.09,092 6.500%, 11/01/2037 10,076 0.0
11,359 6.500%, 04/01/2038 13,477 0.023,898 6.500%, 04/01/2038 26,713 0.0
640 6.500%, 05/01/2038 709 0.03,658 6.500%, 05/01/2038 4,053 0.02,206 6.500%, 07/01/2038 2,443 0.01,346 6.500%, 08/01/2038 1,491 0.08,287 6.500%, 09/01/2038 9,181 0.0
275 6.500%, 10/01/2038 308 0.08,717 6.500%, 11/01/2038 9,807 0.07,506 6.500%, 12/01/2038 8,315 0.0
12,711 6.500%, 12/01/2038 14,319 0.01,290 6.500%, 12/01/2038 1,429 0.0
645,337 6.500%, 12/01/2038 732,956 0.058,411 6.500%, 12/01/2038 64,703 0.03,028 6.500%, 01/01/2039 3,463 0.0
2,540,000 6.750%, 03/15/2031 3,555,774 0.1230,429,843 6.6
Federal National Mortgage Association: 12.8%(4)
2,420,000 1.500%, 06/22/2020 2,394,288 0.119,076,000 (5) 2.500%, 12/25/2026 18,965,839 0.6
5,096,975 2.500%, 09/01/2027 5,096,330 0.25,226,597 2.500%, 06/01/2030 5,203,391 0.27,637,353 2.500%, 06/01/2030 7,603,442 0.23,162,134 2.500%, 07/01/2030 3,148,092 0.12,077,484 3.000%, 06/01/2026 2,110,049 0.1
Copyright © 2021 www.secdatabase.com. All Rights Reserved.Please Consider the Environment Before Printing This Document

7,170,570 3.000%, 08/01/2030 7,252,495 0.23,202,871 3.000%, 09/01/2030 3,239,996 0.1
19,776,672 3.000%, 12/01/2042 19,799,291 0.610,965,340 3.000%, 07/01/2043 10,977,884 0.3
5,684,332 3.000%, 09/01/2043 5,690,830 0.25,754,133 3.000%, 07/01/2046 5,748,772 0.22,302,982 3.000%, 08/01/2046 2,299,912 0.15,713,490 3.000%, 09/01/2046 5,680,168 0.2
22,774,512 3.000%, 12/01/2046 22,709,098 0.75,462,121 3.500%, 05/01/2029 5,592,466 0.21,522,713 3.500%, 03/01/2041 1,556,059 0.11,640,786 3.500%, 12/01/2041 1,676,723 0.12,989,344 3.500%, 01/01/2042 3,054,819 0.16,436,708 3.500%, 10/01/2042 6,577,706 0.2
15,275,609 3.500%, 11/01/2042 15,610,270 0.55,983,896 3.500%, 01/01/2046 6,121,637 0.24,438,565 3.500%, 02/01/2046 4,540,735 0.19,047,990 3.500%, 02/01/2046 9,256,264 0.3
10,818,944 3.500%, 04/01/2046 11,026,635 0.321,926,313 3.500%, 11/01/2051 22,332,700 0.6
1,371,205 3.720%, 10/01/2029 1,454,995 0.02,481,771 4.000%, 09/01/2026 2,557,883 0.1
868,032 4.000%, 10/01/2040 907,333 0.0214,076 4.000%, 10/01/2040 222,160 0.0
16,597,571 4.000%, 11/01/2040 17,224,261 0.51,394,763 4.000%, 12/01/2040 1,447,207 0.01,849,095 4.000%, 12/01/2040 1,933,772 0.12,905,477 4.000%, 02/01/2041 3,015,200 0.1
463,241 4.000%, 03/01/2041 480,737 0.0446,925 4.000%, 04/01/2041 463,805 0.0268,236 4.000%, 08/01/2041 276,048 0.0338,142 4.000%, 09/01/2041 350,880 0.0
3,761,953 4.000%, 11/01/2041 3,904,064 0.1509,487 4.000%, 12/01/2041 528,734 0.0
1,208,374 4.000%, 01/01/2042 1,254,020 0.0743,274 4.000%, 07/01/2042 771,344 0.0
2,544,517 4.000%, 12/01/2042 2,640,560 0.12,627,384 4.000%, 07/01/2043 2,755,001 0.12,002,597 4.000%, 02/01/2044 2,093,030 0.11,199,395 4.000%, 02/01/2044 1,253,548 0.0
572,667 4.000%, 03/01/2044 591,165 0.02,035,781 4.000%, 05/01/2045 2,106,334 0.1
11,011,615 4.000%, 06/01/2045 11,440,888 0.34,010,210 4.000%, 07/01/2045 4,204,948 0.11,503,486 4.000%, 07/01/2045 1,565,811 0.12,624,991 4.000%, 07/01/2045 2,743,549 0.12,892,359 4.000%, 07/01/2045 3,022,985 0.13,758,489 4.000%, 02/01/2046 3,914,299 0.1
16,189,761 4.000%, 02/01/2048 16,714,650 0.52,590,056 4.000%, 03/01/2048 2,674,014 0.1
984,956 4.000%, 03/01/2048 1,016,378 0.062,657,000 (5) 4.000%, 04/01/2048 64,458,388 1.8
56 4.500%, 05/01/2019 57 0.02,745,154 4.500%, 07/01/2026 2,824,670 0.1
5,372 4.500%, 06/01/2034 5,678 0.020,224 4.500%, 05/01/2035 21,395 0.0
2,021 4.500%, 03/01/2038 2,137 0.04,402 4.500%, 05/01/2038 4,587 0.01,235 4.500%, 05/01/2038 1,292 0.0
Copyright © 2021 www.secdatabase.com. All Rights Reserved.Please Consider the Environment Before Printing This Document

14,892 4.500%, 06/01/2038 15,736 0.011,084 4.500%, 07/01/2038 11,547 0.09,092 4.500%, 07/01/2038 9,472 0.0
27,670 4.500%, 09/01/2038 28,826 0.0585,308 4.500%, 03/01/2039 617,831 0.0
33,552 4.500%, 04/01/2039 35,464 0.022,533 4.500%, 04/01/2039 23,821 0.0
13,029,000 (5) 4.500%, 04/25/2039 13,577,325 0.4711,054 4.500%, 07/01/2039 751,845 0.0
1,770,673 4.500%, 09/01/2039 1,871,956 0.11,232,797 4.500%, 10/01/2039 1,303,451 0.0
338,234 4.500%, 12/01/2039 357,609 0.0393,090 4.500%, 12/01/2039 415,786 0.0473,249 4.500%, 12/01/2039 500,573 0.0246,312 4.500%, 03/01/2040 260,537 0.0336,917 4.500%, 10/01/2040 356,378 0.0296,525 4.500%, 10/01/2040 313,635 0.0352,050 4.500%, 10/01/2040 372,386 0.0
Copyright © 2021 www.secdatabase.com. All Rights Reserved.Please Consider the Environment Before Printing This Document

Voya U.S. Bond Index PortfolioPORTFOLIO OF INVESTMENTS
as of March 31, 2019 (Unaudited) (Continued)
PrincipalAmount† Value
Percentageof NetAssets
U.S. GOVERNMENT AGENCY OBLIGATIONS: (continued)Federal National Mortgage Association: (continued)
706,963 4.500%, 03/01/2041 $ 747,801 0.0341,868 4.500%, 04/01/2041 356,324 0.0
3,030,495 4.500%, 06/01/2041 3,205,560 0.1196,168 4.500%, 06/01/2041 204,473 0.0287,261 4.500%, 06/01/2041 303,853 0.0281,310 4.500%, 06/01/2041 297,560 0.0129,878 4.500%, 07/01/2041 137,300 0.0223,907 4.500%, 07/01/2041 236,635 0.0
5,044,805 4.500%, 07/01/2041 5,333,127 0.21,639,026 4.500%, 08/01/2041 1,733,703 0.1
236,932 4.500%, 08/01/2041 248,607 0.01,802,374 4.500%, 08/01/2041 1,906,488 0.11,254,598 5.000%, 03/01/2027 1,288,759 0.0
102,966 5.000%, 07/01/2033 110,865 0.0108,096 5.000%, 02/01/2034 114,322 0.0
20,189 5.000%, 11/01/2034 21,722 0.02,130,188 5.000%, 02/01/2035 2,292,860 0.1
372,978 5.000%, 06/01/2035 401,486 0.027,152 5.000%, 08/01/2035 29,205 0.094,070 5.000%, 09/01/2035 101,153 0.0
238,218 5.000%, 09/01/2035 256,277 0.0376,196 5.000%, 09/01/2035 404,510 0.0
29,475 5.000%, 10/01/2035 31,713 0.0422,116 5.000%, 03/01/2036 454,479 0.0542,341 5.000%, 03/01/2036 583,997 0.0
4,464 5.000%, 05/01/2036 4,807 0.0349,935 5.000%, 05/01/2036 375,930 0.0
68,346 5.000%, 06/01/2036 73,588 0.056,988 5.000%, 12/01/2036 61,363 0.0
746,312 5.000%, 12/01/2036 803,685 0.0177,813 5.000%, 07/01/2037 191,483 0.0125,847 5.000%, 01/01/2038 135,396 0.0262,477 5.000%, 02/01/2038 282,621 0.0573,334 5.000%, 02/01/2038 617,244 0.0538,022 5.000%, 08/01/2038 579,340 0.0274,553 5.000%, 07/01/2040 296,326 0.0105,610 5.000%, 07/01/2040 113,346 0.0
159 5.500%, 07/01/2020 159 0.0329 5.500%, 04/01/2021 333 0.0
5,439 5.500%, 10/01/2021 5,500 0.025,887 5.500%, 11/01/2021 26,253 0.088,137 5.500%, 11/01/2021 89,542 0.0
1,859 5.500%, 11/01/2021 1,872 0.014,052 5.500%, 12/01/2021 14,219 0.0
137,879 5.500%, 12/01/2021 140,260 0.0112,170 5.500%, 12/01/2021 114,860 0.0
3,553 5.500%, 01/01/2022 3,611 0.03,908 5.500%, 01/01/2022 3,912 0.02,277 5.500%, 01/01/2022 2,319 0.0
18,755 5.500%, 02/01/2022 19,127 0.01,274 5.500%, 04/01/2022 1,300 0.0
13,793 5.500%, 06/01/2022 14,002 0.012,148 5.500%, 06/01/2022 12,439 0.024,554 5.500%, 07/01/2022 25,133 0.0
1,630 5.500%, 07/01/2022 1,673 0.02,074 5.500%, 08/01/2022 2,110 0.0
37,689 5.500%, 09/01/2022 38,603 0.06,206 5.500%, 09/01/2022 6,410 0.06,161 5.500%, 01/01/2023 6,346 0.03,991 5.500%, 02/01/2023 4,094 0.08,480 5.500%, 03/01/2023 8,717 0.02,586 5.500%, 04/01/2023 2,681 0.0
10,214 5.500%, 06/01/2023 10,472 0.0
Copyright © 2021 www.secdatabase.com. All Rights Reserved.Please Consider the Environment Before Printing This Document

10,692 5.500%, 08/01/2023 11,095 0.02,017 5.500%, 08/01/2023 2,085 0.03,494 5.500%, 08/01/2023 3,575 0.0
28,144 5.500%, 08/01/2023 29,138 0.026,533 5.500%, 09/01/2023 27,552 0.0
6,917 5.500%, 10/01/2023 6,945 0.015,329 5.500%, 11/01/2023 15,596 0.0
3,442 5.500%, 11/01/2023 3,533 0.01,587 5.500%, 11/01/2023 1,632 0.0
95,768 5.500%, 02/01/2024 99,454 0.01,463 5.500%, 03/01/2024 1,472 0.0
19,796 5.500%, 07/01/2024 20,125 0.08,076 5.500%, 07/01/2024 8,424 0.04,738 5.500%, 05/01/2025 4,805 0.0
36,384 5.500%, 08/01/2025 37,872 0.02,486 5.500%, 07/01/2027 2,655 0.0
636 5.500%, 08/01/2027 680 0.0122,762 5.500%, 03/01/2034 134,720 0.0109,014 5.500%, 04/01/2034 119,939 0.0
47,819 5.500%, 11/01/2034 52,631 0.045,945 5.500%, 12/01/2034 50,583 0.0
588,042 5.500%, 02/01/2035 647,334 0.083,043 5.500%, 05/01/2035 91,401 0.0
504,101 5.500%, 09/01/2035 547,912 0.087,866 5.500%, 09/01/2035 96,623 0.0
112,331 5.500%, 04/01/2036 123,621 0.066,773 5.500%, 04/01/2036 73,414 0.023,526 5.500%, 05/01/2036 25,863 0.077,370 5.500%, 06/01/2036 83,949 0.0
280,690 5.500%, 07/01/2036 308,938 0.0155,079 5.500%, 11/01/2036 170,484 0.0508,971 5.500%, 12/01/2036 559,902 0.0231,423 5.500%, 12/01/2036 254,693 0.0
77,029 5.500%, 01/01/2037 84,725 0.0331,060 5.500%, 03/01/2037 364,226 0.0
64,817 5.500%, 03/01/2037 71,277 0.0735,934 5.500%, 03/01/2037 809,673 0.0294,544 5.500%, 08/01/2037 324,130 0.0
811 5.500%, 01/01/2038 883 0.01,038 5.500%, 01/01/2038 1,121 0.02,994 5.500%, 01/01/2038 3,240 0.0
12,928 5.500%, 03/01/2038 14,101 0.017,520 5.500%, 05/01/2038 18,749 0.044,904 5.500%, 06/01/2038 49,398 0.0
1,402,498 5.500%, 09/01/2038 1,542,102 0.1324,255 5.500%, 12/01/2038 348,815 0.0
79,785 5.500%, 06/01/2039 86,700 0.014,113 5.500%, 04/01/2040 15,071 0.0
120,019 5.500%, 05/01/2040 128,168 0.0244,518 5.500%, 06/01/2040 261,121 0.0
11,142 5.500%, 07/01/2040 11,898 0.0103,593 5.700%, 07/01/2036 108,808 0.0
16,471 5.700%, 07/01/2036 16,474 0.08,424 6.000%, 01/01/2034 9,149 0.04,464 6.000%, 07/01/2034 4,830 0.0
63,109 6.000%, 12/01/2034 69,725 0.032,045 6.000%, 05/01/2035 34,566 0.033,439 6.000%, 01/01/2036 36,071 0.016,171 6.000%, 01/01/2036 17,443 0.021,942 6.000%, 02/01/2036 24,209 0.021,589 6.000%, 03/01/2036 23,811 0.032,555 6.000%, 03/01/2036 35,399 0.033,602 6.000%, 04/01/2036 37,072 0.0
7,314 6.000%, 04/01/2036 7,982 0.063,474 6.000%, 05/01/2036 70,016 0.0
Copyright © 2021 www.secdatabase.com. All Rights Reserved.Please Consider the Environment Before Printing This Document

Voya U.S. Bond Index PortfolioPORTFOLIO OF INVESTMENTS
as of March 31, 2019 (Unaudited) (Continued)
PrincipalAmount† Value
Percentageof NetAssets
U.S. GOVERNMENT AGENCY OBLIGATIONS: (continued)Federal National Mortgage Association: (continued)
463 6.000%, 06/01/2036 $ 510 0.01,817 6.000%, 08/01/2036 1,960 0.0
16,819 6.000%, 08/01/2036 18,554 0.045,396 6.000%, 09/01/2036 49,031 0.045,358 6.000%, 09/01/2036 48,982 0.021,198 6.000%, 09/01/2036 23,377 0.048,154 6.000%, 09/01/2036 53,119 0.022,575 6.000%, 10/01/2036 24,368 0.017,503 6.000%, 10/01/2036 19,095 0.0
468,675 6.000%, 12/01/2036 516,885 0.0182,137 6.000%, 12/01/2036 197,011 0.0
72,854 6.000%, 01/01/2037 78,803 0.06,871 6.000%, 02/01/2037 7,446 0.05,566 6.000%, 04/01/2037 6,003 0.0
98,253 6.000%, 07/01/2037 108,566 0.030,587 6.000%, 08/01/2037 33,714 0.0
1,122 6.000%, 08/01/2037 1,234 0.03,041 6.000%, 08/01/2037 3,349 0.0
14,313 6.000%, 09/01/2037 15,782 0.028,078 6.000%, 09/01/2037 30,607 0.0
410 6.000%, 09/01/2037 452 0.060,373 6.000%, 09/01/2037 65,121 0.0
2,049 6.000%, 09/01/2037 2,254 0.06,424 6.000%, 09/01/2037 7,077 0.02,149 6.000%, 10/01/2037 2,350 0.0
324 6.000%, 10/01/2037 354 0.03,102 6.000%, 10/01/2037 3,358 0.0
974 6.000%, 10/01/2037 1,056 0.055,438 6.000%, 11/01/2037 61,079 0.0
2,354 6.000%, 11/01/2037 2,554 0.018,297 6.000%, 11/01/2037 20,157 0.022,499 6.000%, 11/01/2037 24,269 0.0
6,239 6.000%, 11/01/2037 6,742 0.026,047 6.000%, 11/01/2037 28,609 0.0
7,302 6.000%, 11/01/2037 7,877 0.047,740 6.000%, 12/01/2037 52,622 0.0
5,946 6.000%, 12/01/2037 6,445 0.029,824 6.000%, 12/01/2037 32,872 0.014,569 6.000%, 12/01/2037 16,065 0.0
4,161 6.000%, 01/01/2038 4,488 0.012,366 6.000%, 01/01/2038 13,359 0.0
776 6.000%, 02/01/2038 837 0.084,849 6.000%, 02/01/2038 93,252 0.0
127,157 6.000%, 03/01/2038 137,185 0.06,296 6.000%, 03/01/2038 6,830 0.0
363,266 6.000%, 04/01/2038 401,218 0.019,905 6.000%, 04/01/2038 21,961 0.021,380 6.000%, 05/01/2038 23,062 0.026,792 6.000%, 05/01/2038 29,545 0.0
1,923 6.000%, 06/01/2038 2,076 0.0
Copyright © 2021 www.secdatabase.com. All Rights Reserved.Please Consider the Environment Before Printing This Document

26,432 6.000%, 07/01/2038 28,547 0.015,133 6.000%, 07/01/2038 16,361 0.0
4,063 6.000%, 08/01/2038 4,480 0.0900 6.000%, 08/01/2038 971 0.0
36,347 6.000%, 09/01/2038 39,241 0.06,979 6.000%, 09/01/2038 7,527 0.0
24,093 6.000%, 09/01/2038 26,304 0.083,732 6.000%, 10/01/2038 90,917 0.079,708 6.000%, 10/01/2038 87,788 0.022,038 6.000%, 10/01/2038 24,265 0.015,618 6.000%, 05/01/2039 16,847 0.0
701,683 6.000%, 10/01/2039 775,311 0.028,746 6.000%, 11/01/2039 31,057 0.0
915 6.500%, 04/01/2030 1,011 0.061,093 6.500%, 02/01/2034 67,498 0.0
8,554 6.500%, 11/01/2034 9,763 0.011,586 6.500%, 01/01/2036 12,984 0.033,625 6.500%, 03/01/2036 38,467 0.063,152 6.500%, 04/01/2036 71,755 0.0
604 6.500%, 05/01/2036 668 0.04,317 6.500%, 06/01/2036 4,770 0.05,428 6.500%, 07/01/2036 5,997 0.01,590 6.500%, 07/01/2036 1,845 0.0
69,702 6.500%, 07/01/2036 77,101 0.024,582 6.500%, 07/01/2036 28,536 0.049,395 6.500%, 07/01/2036 55,868 0.0
3,244 6.500%, 07/01/2036 3,660 0.03,986 6.500%, 08/01/2036 4,405 0.02,331 6.500%, 08/01/2036 2,576 0.01,419 6.500%, 09/01/2036 1,604 0.0
126,365 6.500%, 09/01/2036 146,774 0.09,179 6.500%, 09/01/2036 10,145 0.0
17,696 6.500%, 09/01/2036 20,004 0.0872 6.500%, 11/01/2036 964 0.0
4,091 6.500%, 11/01/2036 4,693 0.03,142 6.500%, 12/01/2036 3,509 0.0
13,577 6.500%, 12/01/2036 14,999 0.035,680 6.500%, 01/01/2037 39,431 0.026,938 6.500%, 01/01/2037 29,841 0.0
352 6.500%, 01/01/2037 389 0.06,696 6.500%, 01/01/2037 7,398 0.0
16,820 6.500%, 02/01/2037 18,592 0.012,391 6.500%, 03/01/2037 13,695 0.0
7,278 6.500%, 03/01/2037 8,323 0.049,106 6.500%, 03/01/2037 54,491 0.0
112,744 6.500%, 03/01/2037 129,635 0.01,752 6.500%, 04/01/2037 1,936 0.0
825 6.500%, 07/01/2037 939 0.02,254 6.500%, 08/01/2037 2,544 0.03,801 6.500%, 08/01/2037 4,200 0.02,833 6.500%, 08/01/2037 3,131 0.0
502 6.500%, 09/01/2037 568 0.018,856 6.500%, 09/01/2037 20,972 0.0
2,320 6.500%, 09/01/2037 2,577 0.08,573 6.500%, 09/01/2037 9,716 0.01,454 6.500%, 09/01/2037 1,654 0.0
111,888 6.500%, 09/01/2037 123,672 0.077,579 6.500%, 09/01/2037 88,011 0.0
989 6.500%, 10/01/2037 1,093 0.0
Copyright © 2021 www.secdatabase.com. All Rights Reserved.Please Consider the Environment Before Printing This Document

8,559 6.500%, 10/01/2037 9,887 0.02,696 6.500%, 10/01/2037 3,087 0.0
32,267 6.500%, 10/01/2037 36,573 0.030,902 6.500%, 10/01/2037 34,394 0.0
132,979 6.500%, 11/01/2037 152,507 0.02,919 6.500%, 12/01/2037 3,225 0.09,358 6.500%, 12/01/2037 10,340 0.05,514 6.500%, 12/01/2037 6,095 0.0
13,637 6.500%, 12/01/2037 15,638 0.062,941 6.500%, 12/01/2037 69,553 0.0
1,466 6.500%, 12/01/2037 1,619 0.01,353 6.500%, 12/01/2037 1,495 0.01,550 6.500%, 12/01/2037 1,713 0.0
544 6.500%, 01/01/2038 602 0.020,316 6.500%, 01/01/2038 22,732 0.081,982 6.500%, 02/01/2038 90,590 0.045,763 6.500%, 03/01/2038 52,287 0.053,095 6.500%, 04/01/2038 59,662 0.0
4,127 6.500%, 05/01/2038 4,560 0.0
Copyright © 2021 www.secdatabase.com. All Rights Reserved.Please Consider the Environment Before Printing This Document

Voya U.S. Bond Index PortfolioPORTFOLIO OF INVESTMENTS
as of March 31, 2019 (Unaudited) (Continued)
PrincipalAmount† Value
Percentageof NetAssets
U.S. GOVERNMENT AGENCY OBLIGATIONS: (continued)Federal National Mortgage Association: (continued)
70,145 6.500%, 08/01/2038 $ 77,734 0.0228,347 6.500%, 08/01/2038 252,343 0.0
86,805 6.500%, 08/01/2038 95,939 0.020,540 6.500%, 09/01/2038 22,704 0.023,571 6.500%, 09/01/2038 26,090 0.0
254,023 6.500%, 10/01/2038 290,398 0.015,537 6.500%, 10/01/2038 17,692 0.0
4,136 6.500%, 10/01/2038 4,692 0.050,679 6.500%, 10/01/2038 56,004 0.031,787 6.500%, 11/01/2038 35,688 0.059,935 6.500%, 01/01/2039 68,452 0.0
1,543 6.500%, 01/01/2039 1,785 0.015,829 6.500%, 03/01/2039 17,499 0.0
5,443 6.500%, 09/01/2039 6,014 0.0805,000 6.625%, 11/15/2030 1,110,827 0.0
3,430,000 7.125%, 01/15/2030 4,823,538 0.11,560,000 7.250%, 05/15/2030 2,227,312 0.1
446,408,141 12.8
Government National Mortgage Association: 8.0%12,709,498 3.000%, 04/15/2045 12,785,972 0.410,569,681 3.000%, 07/20/2045 10,643,196 0.3
5,089,304 3.000%, 04/20/2046 5,124,691 0.220,360,290 3.000%, 07/20/2046 20,501,917 0.6
9,409,942 3.000%, 07/20/2047 9,466,879 0.327,208,279 3.000%, 04/20/2048 27,355,355 0.825,363,583 3.500%, 03/20/2047 25,903,252 0.7
4,329,980 3.500%, 07/20/2047 4,438,849 0.114,315,563 3.500%, 09/20/2047 14,583,056 0.412,158,098 3.500%, 12/20/2047 12,433,124 0.413,277,913 3.500%, 01/20/2048 13,578,988 0.426,310,182 3.500%, 02/20/2048 26,866,569 0.8
7,018,546 4.000%, 10/20/2043 7,275,786 0.232,000,000 (5) 4.000%, 04/01/2044 33,053,750 1.0
3,635,535 4.000%, 03/20/2046 3,767,075 0.15,925,904 4.000%, 03/20/2046 6,140,692 0.21,162,168 4.500%, 02/20/2041 1,224,247 0.0
357,962 4.500%, 03/20/2041 377,079 0.01,371,598 4.500%, 05/20/2041 1,444,891 0.11,542,576 4.500%, 06/20/2041 1,624,845 0.12,856,394 4.500%, 07/20/2041 3,008,551 0.11,177,277 4.500%, 09/20/2041 1,239,890 0.03,590,111 4.500%, 10/20/2041 3,781,279 0.1
15,000,000 (5) 4.500%, 04/01/2044 15,579,126 0.512,835 5.000%, 10/15/2037 13,789 0.0
2,763 5.000%, 04/15/2038 2,942 0.070,785 5.000%, 03/15/2039 76,065 0.0
122,324 5.000%, 08/15/2039 131,433 0.0954,273 5.000%, 09/15/2039 1,024,977 0.0
1,110,035 5.000%, 09/15/2039 1,192,168 0.0
Copyright © 2021 www.secdatabase.com. All Rights Reserved.Please Consider the Environment Before Printing This Document

836,004 5.000%, 02/15/2040 878,368 0.0642,512 5.000%, 04/15/2040 679,600 0.0
1,367,554 5.000%, 06/15/2040 1,437,599 0.042,915 5.000%, 07/15/2040 46,090 0.0
535,940 5.000%, 04/15/2042 559,729 0.0845,969 5.000%, 04/20/2042 904,842 0.0
6,964,211 5.000%, 06/20/2048 7,272,930 0.237,017 5.500%, 07/20/2038 40,194 0.0
480,206 5.500%, 09/20/2039 515,569 0.034,609 5.500%, 10/20/2039 37,508 0.019,711 5.500%, 11/20/2039 21,358 0.0
799,303 5.500%, 11/20/2039 858,118 0.011,901 5.500%, 12/20/2040 12,923 0.036,587 5.500%, 01/20/2041 40,052 0.0
263,075 5.500%, 03/20/2041 286,013 0.0366,958 5.500%, 04/20/2041 400,000 0.0611,114 5.500%, 05/20/2041 663,556 0.0569,405 5.500%, 06/20/2041 617,990 0.0
18,897 6.000%, 10/15/2036 20,913 0.067,418 6.000%, 08/15/2037 74,587 0.053,876 6.000%, 11/15/2037 58,341 0.017,114 6.000%, 12/15/2037 18,900 0.024,061 6.000%, 01/15/2038 26,386 0.028,865 6.000%, 01/15/2038 31,930 0.030,138 6.000%, 02/15/2038 33,346 0.0
613 6.000%, 02/15/2038 676 0.078,760 6.000%, 02/15/2038 85,512 0.0
878 6.000%, 04/15/2038 947 0.0175,192 6.000%, 05/15/2038 193,806 0.0207,186 6.000%, 05/15/2038 229,251 0.0
29,155 6.000%, 07/15/2038 32,297 0.066,085 6.000%, 09/15/2038 73,214 0.058,095 6.000%, 11/15/2038 62,910 0.0
912,036 6.000%, 08/20/2040 980,115 0.0281,836,003 8.0
Other U.S. Agency Obligations: 0.4%1,500,000 (2) 1.875%, 08/15/2022 1,476,788 0.15,000,000 2.400%, 09/21/2026 4,945,966 0.1
10,000 6.150%, 01/15/2038 13,969 0.05,000,000 (2) 7.125%, 05/01/2030 7,038,000 0.2
13,474,723 0.4
Total U.S. Government Agency Obligations(Cost $964,933,370) 972,148,710 27.8
U.S. TREASURY OBLIGATIONS: 38.7%U.S. Treasury Bonds: 6.3%
10,659,000 2.250%, 08/15/2046 9,530,020 0.37,000,000 2.500%, 02/15/2046 6,600,098 0.29,072,000 2.500%, 05/15/2046 8,549,120 0.2
2,000 2.750%, 11/15/2042 1,995 0.09,022,000 3.000%, 11/15/2044 9,378,475 0.3
10,042,000 3.000%, 11/15/2045 10,448,387 0.32,882,000 3.125%, 02/15/2043 3,060,718 0.15,686,000 3.125%, 08/15/2044 6,042,041 0.2
74,108,600 3.375%, 11/15/2048 82,684,644 2.414,705,000 3.500%, 02/15/2039 16,697,642 0.513,888,000 3.625%, 08/15/2043 15,994,799 0.4
Copyright © 2021 www.secdatabase.com. All Rights Reserved.Please Consider the Environment Before Printing This Document

14,092,000 3.625%, 02/15/2044 16,248,186 0.513,251,000 3.750%, 11/15/2043 15,570,702 0.4
7,845,000 3.875%, 08/15/2040 9,364,509 0.36,505,000 4.375%, 05/15/2040 8,294,129 0.2
830,000 6.000%, 02/15/2026 1,023,137 0.0219,488,602 6.3
U.S. Treasury Notes: 32.4%9,004,000 (2) 0.875%, 09/15/2019 8,941,750 0.35,000,000 1.000%, 10/15/2019 4,961,426 0.14,770,000 1.000%, 11/15/2019 4,727,797 0.1
10,000,000 1.125%, 02/28/2021 9,783,594 0.38,000,000 1.125%, 08/31/2021 7,790,312 0.2
1,000 1.250%, 10/31/2019 993 0.011,755,000 1.250%, 01/31/2020 11,642,042 0.33,534,000 1.250%, 02/29/2020 3,497,625 0.1
13,040,000 1.250%, 10/31/2021 12,717,820 0.4
Copyright © 2021 www.secdatabase.com. All Rights Reserved.Please Consider the Environment Before Printing This Document

Voya U.S. Bond Index PortfolioPORTFOLIO OF INVESTMENTS
as of March 31, 2019 (Unaudited) (Continued)
PrincipalAmount† Value
Percentageof NetAssets
U.S. TREASURY OBLIGATIONS: (continued)U.S. Treasury Notes: (continued)
20,000,000 1.375%, 01/15/2020 $ 19,837,500 0.6933,000 1.375%, 01/31/2020 925,164 0.0
8,515,000 1.375%, 02/29/2020 8,435,504 0.29,022,000 1.375%, 03/31/2020 8,931,075 0.37,940,000 1.375%, 04/30/2020 7,854,862 0.2
7,000 1.375%, 08/31/2020 6,904 0.010,000,000 1.375%, 10/31/2020 9,851,758 0.337,540,000 1.375%, 04/30/2021 36,865,453 1.1
7,000,000 1.375%, 08/31/2023 6,749,534 0.25,000,000 1.375%, 09/30/2023 4,816,799 0.17,002,000 1.500%, 11/30/2019 6,959,058 0.2
752,000 1.500%, 05/31/2020 744,407 0.04,833,000 1.500%, 01/31/2022 4,736,717 0.1
10,000,000 1.500%, 02/28/2023 9,730,859 0.310,000,000 1.500%, 03/31/2023 9,724,219 0.3
4,790,000 1.625%, 12/31/2019 4,761,279 0.12,976,000 1.625%, 08/15/2022 2,918,456 0.16,480,000 1.625%, 04/30/2023 6,328,505 0.2
10,184,000 1.625%, 05/31/2023 9,940,738 0.34,046,000 1.625%, 10/31/2023 3,940,267 0.1
24,847,000 1.625%, 02/15/2026 23,759,944 0.722,705,000 1.750%, 09/30/2019 22,626,951 0.6
7,810,000 1.750%, 04/30/2022 7,700,477 0.218,000,000 1.750%, 09/30/2022 17,715,234 0.5
69,000 1.750%, 01/31/2023 67,806 0.08,000,000 1.875%, 11/30/2021 7,925,000 0.2
10,000,000 1.875%, 05/31/2022 9,895,508 0.33,003,000 1.875%, 08/31/2022 2,968,806 0.1
24,900,000 2.000%, 11/30/2020 24,768,691 0.712,097,000 2.000%, 02/28/2021 12,032,262 0.3
8,063,000 2.000%, 12/31/2021 8,017,646 0.24,000,000 2.000%, 07/31/2022 3,972,031 0.1
17,133,000 2.000%, 11/15/2026 16,730,776 0.520,498,000 2.125%, 01/31/2021 20,435,946 0.6
3,700,000 2.125%, 09/30/2021 3,689,377 0.13,774,000 2.125%, 12/31/2021 3,763,680 0.1
10,105,000 2.125%, 06/30/2022 10,075,790 0.35,000,000 2.125%, 11/30/2023 4,975,879 0.1
95,400,000 2.125%, 03/31/2024 94,924,863 2.720,000,000 2.125%, 05/15/2025 19,804,688 0.691,260,000 2.250%, 03/31/2021 91,238,610 2.6
8,794,000 2.250%, 04/30/2021 8,791,080 0.23,011,000 2.250%, 12/31/2023 3,012,823 0.1
26,457,000 2.250%, 11/15/2024 26,421,862 0.81,352,000 2.250%, 11/15/2025 1,346,772 0.0
19,590,000 2.375%, 12/31/2020 19,611,809 0.6117,870,000 2.375%, 03/15/2022 118,434,027 3.4
9,874,000 2.500%, 05/15/2024 9,993,954 0.3121,306,000 2.500%, 02/28/2026 122,765,463 3.5
77,734,000 (2) 2.625%, 02/15/2029 79,256,797 2.3
Copyright © 2021 www.secdatabase.com. All Rights Reserved.Please Consider the Environment Before Printing This Document

11,396,000 2.750%, 09/15/2021 11,534,221 0.336,569,500 2.750%, 11/15/2023 37,393,028 1.137,052,000 2.750%, 02/15/2024 37,926,919 1.116,545,000 2.875%, 10/31/2020 16,683,306 0.5
7,790,000 3.500%, 05/15/2020 7,885,853 0.21,136,270,296 32.4
Total U.S. Treasury Obligations(Cost $1,345,989,361) 1,355,758,898 38.7
COMMERCIAL MORTGAGE-BACKED SECURITIES: 2.0%2,000,000 (1) BAMLL Commercial Mortgage Securities Trust 2015-200P A, 3.218%, 04/14/2033 2,028,477 0.14,000,000 BENCHMARK 2018-B3 A5 Mortgage Trust, 4.025%, 04/10/2051 4,262,467 0.11,000,000 (3) CFCRE Commercial Mortgage Trust 2016-C7 B, 4.354%, 12/10/2054 1,054,705 0.03,000,000 Citigroup Commercial Mortgage Trust 2014-GC19 A4, 4.023%, 03/10/2047 3,157,068 0.11,000,000 (1),(3) COMM 2013-CR10 AM, 4.517%, 08/10/2046 1,053,667 0.0
650,000 COMM 2015-CR23 A3, 3.230%, 05/10/2048 658,740 0.0315,000 (3) COMM 2015-PC1 B, 4.440%, 07/10/2050 324,822 0.0
1,000,000 COMM 2016-COR1 A4, 3.091%, 10/10/2049 993,309 0.01,000,000 COMM 2016-COR1 AM, 3.494%, 10/10/2049 998,241 0.01,000,000 COMM 2016-CR28 A4, 3.762%, 02/10/2049 1,040,117 0.01,000,000 (1),(3) Core Industrial Trust 2015-TEXW D, 3.849%, 02/10/2034 1,009,180 0.0
981,425 (1) Core Industrial Trust 2015-WEST A, 3.292%, 02/10/2037 997,379 0.0500,000 DBJPM Mortgage Trust 16-C1 A4, 3.276%, 05/10/2049 506,494 0.0
2,000,000 (3) Ginnia Mae 2011-20 C, 3.562%, 04/16/2041 2,009,165 0.12,000,000 (3) Ginnie Mae 2011-127 C, 3.500%, 03/16/2047 2,027,988 0.16,000,000 (3) Ginnie Mae 2011-142 B, 3.485%, 02/16/2044 6,029,340 0.25,000,000 (3) Ginnie Mae 2011-38 D, 3.719%, 01/16/2051 5,190,404 0.2
189,325 (3) Ginnie Mae 2011-53 B, 4.397%, 05/16/2051 194,077 0.05,000,000 Ginnie Mae 2014-150 C, 3.400%, 12/16/2049 5,024,629 0.23,000,000 Ginnie Mae 2014-50 C, 3.400%, 02/16/2047 3,000,629 0.11,000,000 GS Mortgage Securities Trust 2012-GCJ7 B, 4.740%, 05/10/2045 1,033,695 0.01,000,000 (3) JP Morgan Chase Commercial Mortgage Securities Trust 2013-C13 B, 4.003%, 01/
15/2046 1,033,027 0.0
6,379,463 JP Morgan Chase Commercial Mortgage Securities Trust 2013-C16, 4.166%, 12/15/2046 6,732,250 0.2
Copyright © 2021 www.secdatabase.com. All Rights Reserved.Please Consider the Environment Before Printing This Document

Voya U.S. Bond Index PortfolioPORTFOLIO OF INVESTMENTS
as of March 31, 2019 (Unaudited) (Continued)
PrincipalAmount† Value
Percentageof NetAssets
COMMERCIAL MORTGAGE-BACKED SECURITIES: (continued)3,000,000 JPMDB Commercial Mortgage Securities Trust 2016-C2 A3A, 2.881%, 06/15/2049 $ 2,968,801 0.12,065,000 (1) Ladder Capital Commercial Mortgage 2013-GCP A2 Mortgage Trust, 3.985%, 02/
15/2036 2,157,999 0.1
3,200,000 Morgan Stanley Bank of America Merrill Lynch Trust 2013-C8 A4 A4, 3.134%, 12/15/2048 3,239,962 0.1
2,000,000 Morgan Stanley Bank of America Merrill Lynch Trust 2014 C19 A4, 3.526%, 12/15/2047 2,052,172 0.1
1,250,000 (3) Morgan Stanley Bank of America Merrill Lynch Trust 2014-C15 B, 4.565%, 04/15/2047 1,308,993 0.0
220,000 (3) Morgan Stanley Bank of America Merrill Lynch Trust 2015-C21 C, 4.159%, 03/15/2048 220,482 0.0
100,000 (1),(3) Morgan Stanley Capital I Trust 2011-C1 D, 5.376%, 09/15/2047 103,840 0.0100,000 (1),(3) Morgan Stanley Capital I Trust 2011-C1 E, 5.376%, 09/15/2047 103,920 0.0
1,000,000 (1),(3) MSCG Trust 2015-ALDR A2, 3.462%, 06/07/2035 999,526 0.01,000,000 (3) UBS Commercial Mortgage Trust 2018-C9 A4, 4.117%, 03/15/2051 1,067,080 0.02,350,000 Wells Fargo Commercial Mortgage Trust 2015-P2 A3, 3.541%, 12/15/2048 2,423,713 0.12,000,000 Wells Fargo Commercial Mortgage Trust 2016-NXS5 A4, 3.370%, 01/15/2059 2,036,227 0.1
Total Commercial Mortgage-Backed Securities(Cost $69,805,783) 69,042,585 2.0
SOVEREIGN BONDS: 2.1%3,000,000 Colombia Government International Bond, 4.000%, 02/26/2024 3,096,780 0.11,950,000 Colombia Government International Bond, 7.375%, 09/18/2037 2,556,937 0.1
500,000 Export-Import Bank of Korea, 2.625%, 12/30/2020 499,115 0.0500,000 Export-Import Bank of Korea, 3.250%, 08/12/2026 501,046 0.0
1,000,000 Export-Import Bank of Korea, 4.000%, 01/14/2024 1,047,560 0.01,000,000 Hashemite Kingdom of Jordan Government AID Bond, 2.578%, 06/30/2022 1,008,755 0.01,000,000 Japan Bank for International Cooperation, 1.750%, 05/28/2020 990,862 0.05,000,000 Japan Bank for International Cooperation, 2.125%, 11/16/2020 4,969,407 0.13,000,000 (1) Kommunalbanken AS, 2.250%, 01/25/2022 2,990,200 0.11,800,000 (1) Kommunalbanken AS, 2.500%, 01/11/2023 1,807,429 0.1
500,000 Korea International Bond, 4.125%, 06/10/2044 561,562 0.05,000,000 Mexico Government International Bond, 4.750%, 03/08/2044 4,922,500 0.11,460,000 Panama Government International Bond, 8.875%, 09/30/2027 2,027,356 0.14,000,000 Peruvian Government International Bond, 6.550%, 03/14/2037 5,405,000 0.24,000,000 Philippine Government International Bond, 6.375%, 01/15/2032 5,170,340 0.25,000,000 Province of Alberta Canada, 2.950%, 01/23/2024 5,085,641 0.13,000,000 Province of British Columbia Canada, 2.250%, 06/02/2026 2,935,067 0.11,000,000 Province of Ontario Canada, 1.875%, 05/21/2020 993,198 0.0
13,308,000 Province of Ontario Canada, 4.400%, 04/14/2020 13,557,904 0.43,405,000 Republic of Poland Government International Bond, 5.125%, 04/21/2021 3,572,662 0.15,160,000 Ukraine Government AID Bonds, 1.847%, 05/29/2020 5,157,864 0.23,000,000 Uruguay Government International Bond, 4.500%, 08/14/2024 3,157,500 0.1
Total Sovereign Bonds(Cost $70,860,461) 72,014,685 2.1
Total Long-Term Investments(Cost $3,498,318,106) 3,542,627,675 101.2
Copyright © 2021 www.secdatabase.com. All Rights Reserved.Please Consider the Environment Before Printing This Document

Voya U.S. Bond Index PortfolioPORTFOLIO OF INVESTMENTS
as of March 31, 2019 (Unaudited) (Continued)
PrincipalAmount† Value
Percentageof NetAssets
SHORT-TERM INVESTMENTS: 8.3%Commercial Paper: 5.9%
24,000,000 Autozone, Inc., 3.160%, 04/12/2019 $ 23,975,099 0.786,303,000 CVS Health Corp., 7.850%, 04/01/2019 86,284,445 2.515,000,000 Eaton Corp., 4.030%, 04/04/2019 14,993,380 0.419,000,000 Enterprise Products, 8.030%, 04/01/2019 18,995,820 0.560,000,000 Kroger Co., 7.770%, 04/01/2019 59,987,225 1.7
2,375,000 Schlumberger Ltd., 2.920%, 05/16/2019 2,366,304 0.1206,602,273 5.9
Securities Lending Collateral(6): 2.3%19,074,824 Bank of Nova Scotia, Repurchase Agreement dated 03/29/19, 2.67%, due 04/01/19
(Repurchase Amount $19,079,010, collateralized by various U.S. GovernmentAgency Obligations, 3.500%-4.571%, Market Value plus accrued interest$19,460,650, due 12/01/33-02/01/49)
19,074,824 0.5
19,074,824 Citigroup, Inc., Repurchase Agreement dated 03/29/19, 2.65%, due 04/01/19(Repurchase Amount $19,078,979, collateralized by various U.S. Government/U.S.Government Agency Obligations, 0.000%-10.500%, Market Value plus accruedinterest $19,456,320, due 04/02/19-10/20/68)
19,074,824 0.5
12,974,050 HSBC Securities USA, Repurchase Agreement dated 03/29/19, 2.58%, due 04/01/19 (Repurchase Amount $12,976,801, collateralized by various U.S. GovernmentSecurities, 0.000%-4.375%, Market Value plus accrued interest $13,233,532, due08/15/20-05/15/48)
12,974,050 0.4
19,074,824 Nomura Securities, Repurchase Agreement dated 03/29/19, 2.65%, due 04/01/19(Repurchase Amount $19,078,979, collateralized by various U.S. Government/U.S.Government Agency Obligations, 0.000%-8.500%, Market Value plus accruedinterest $19,456,321, due 05/01/19-01/20/69)
19,074,824 0.6
10,023,508 State of Wisconsin Investment Board, Repurchase Agreement dated 03/29/19,2.80%, due 04/01/19 (Repurchase Amount $10,025,815, collateralized by variousU.S. Government Securities, 0.125%-3.875%, Market Value plus accrued interest$10,240,895, due 07/15/20-02/15/47)
10,023,508 0.3
80,222,030 2.3
Shares ValuePercentage
of NetAssets
Mutual Funds: 0.1%2,898,000 (7) Goldman Sachs Financial Square Government Fund - Institutional Shares, 2.350%
(Cost $2,898,000) 2,898,000 0.1
Total Short-Term Investments(Cost $289,767,115) 289,722,303 8.3
Total Investments in Securities(Cost $3,788,085,221) $ 3,832,349,978 109.5
Liabilities in Excess of Other Assets (332,746,160) (9.5)Net Assets $ 3,499,603,818 100.0
† Unless otherwise indicated, principal amount is shown in USD.
(1) Securities with purchases pursuant to Rule 144A or section 4(a)(2), under the Securities Act of 1933 and may not be resold subject tothat rule except to qualified institutional buyers.
(2) Security, or a portion of the security, is on loan.(3) Variable rate security. Rate shown is the rate in effect as of March 31, 2019.
Copyright © 2021 www.secdatabase.com. All Rights Reserved.Please Consider the Environment Before Printing This Document

Voya U.S. Bond Index PortfolioPORTFOLIO OF INVESTMENTS
as of March 31, 2019 (Unaudited) (Continued)
(4) The Federal Housing Finance Agency (“FHFA”) placed the Federal Home Loan Mortgage Corporation and Federal National MortgageAssociation into conservatorship with FHFA as the conservator. As such, the FHFA oversees the continuing affairs of these companies.
(5) Settlement is on a when-issued or delayed-delivery basis.(6) Represents securities purchased with cash collateral received for securities on loan.(7) Rate shown is the 7-day yield as of March 31, 2019.
Reference Rate Abbreviations:US0003M 3-month LIBORUS0012M 12-month LIBOR
Fair Value MeasurementsThe following is a summary of the fair valuations according to the inputs used as of March 31, 2019 in valuing the assets and liabilities:
Quoted Pricesin Active Markets
for IdenticalInvestments
(Level 1)
SignificantOther
ObservableInputs
(Level 2)
SignificantUnobservable
Inputs(Level 3)
Fair Valueat
March 31, 2019
Asset TableInvestments, at fair valueCorporate Bonds/Notes $ – $ 983,040,030 $ – $ 983,040,030Collateralized Mortgage Obligations – 3,131,950 – 3,131,950Municipal Bonds – 33,514,546 – 33,514,546U.S. Treasury Obligations – 1,355,758,898 – 1,355,758,898Commercial Mortgage-Backed Securities – 69,042,585 – 69,042,585Convertible Bonds/Notes – 504,005 – 504,005Sovereign Bonds – 72,014,685 – 72,014,685Asset-Backed Securities – 18,348,934 – 18,348,934Supranational Bonds – 35,123,332 – 35,123,332U.S. Government Agency Obligations – 972,148,710 – 972,148,710Short-Term Investments 2,898,000 286,824,303 – 289,722,303Total Investments, at fair value $ 2,898,000 $ 3,829,451,978 $ – $ 3,832,349,978Other Financial Instruments+Futures 22,413 – – 22,413Total Assets $ 2,920,413 $ 3,829,451,978 $ – $ 3,832,372,391Liabilities TableOther Financial Instruments+Futures $ (3,070) $ – $ – $ (3,070)Total Liabilities $ (3,070) $ – $ – $ (3,070)
+Other Financial Instruments may include open forward foreign currency contracts, futures, centrally cleared swaps, OTC swaps and writtenoptions. Forward foreign currency contracts, futures and centrally cleared swaps are valued at the unrealized gain (loss) on the instrument. OTCswaps and written options are valued at the fair value of the instrument.
At March 31, 2019, the following futures contracts were outstanding for Voya U.S. Bond Index Portfolio:
Description Numberof Contracts
ExpirationDate
NotionalValue
UnrealizedAppreciation/(Depreciation)
Long Contracts:U.S. Treasury 5-Year Note 25 06/28/19 $ 2,895,703 $ 22,413
$ 2,895,703 $ 22,413Short Contracts:
U.S. Treasury 2-Year Note (4) 06/28/19 (852,375) (3,070)$ (852,375) $ (3,070)
Copyright © 2021 www.secdatabase.com. All Rights Reserved.Please Consider the Environment Before Printing This Document
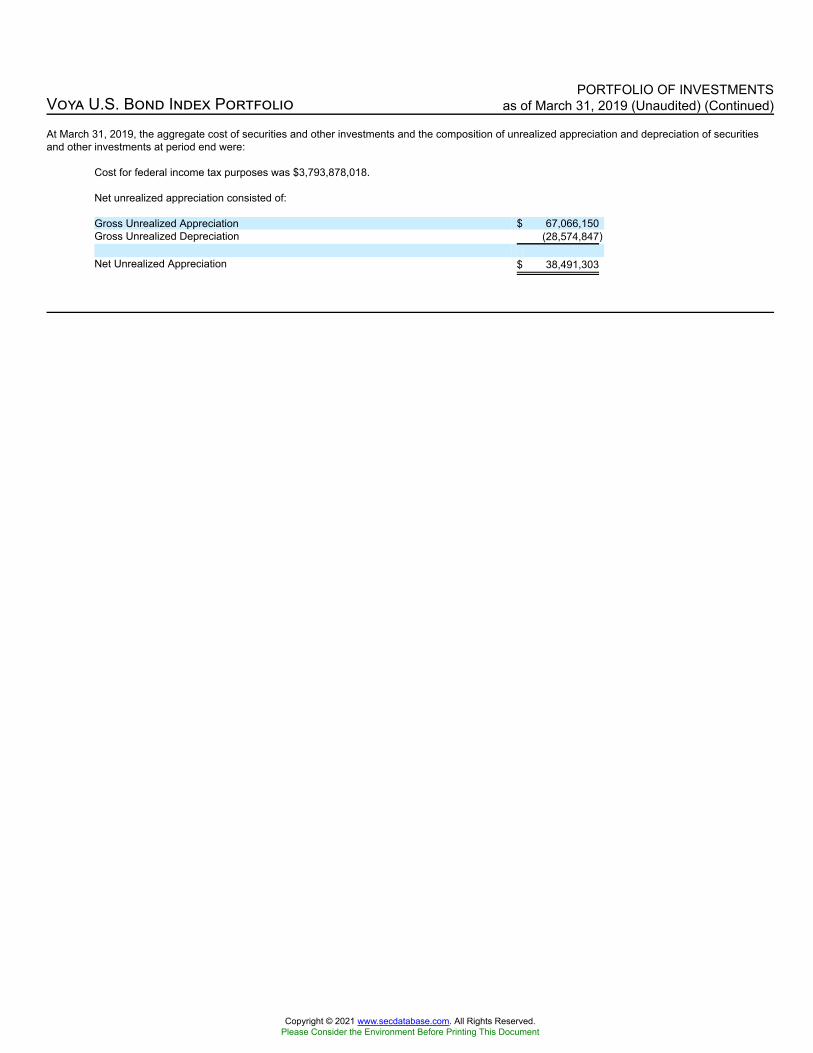
Voya U.S. Bond Index PortfolioPORTFOLIO OF INVESTMENTS
as of March 31, 2019 (Unaudited) (Continued)
At March 31, 2019, the aggregate cost of securities and other investments and the composition of unrealized appreciation and depreciation of securitiesand other investments at period end were:
Cost for federal income tax purposes was $3,793,878,018.
Net unrealized appreciation consisted of:
Gross Unrealized Appreciation $ 67,066,150Gross Unrealized Depreciation (28,574,847)
Net Unrealized Appreciation $ 38,491,303
Copyright © 2021 www.secdatabase.com. All Rights Reserved.Please Consider the Environment Before Printing This Document