lord abbett passport portfolios plc
337
LORD ABBETT PASSPORT PORTFOLIOS PLC (an open-ended investment company with variable capital constituted as an umbrella fund with segregated liability between its Funds under the laws of Ireland authorised and regulated by the Central Bank of Ireland pursuant to the European Communities (Undertakings for Collective Investment in Transferable Securities) Regulations, 2011 (as amended) ANNUAL REPORT AND AUDITED FINANCIAL STATEMENTS For the financial year ended 31 January 2020 Company Registration No. 534227
-
Upload
khangminh22 -
Category
Documents
-
view
0 -
download
0
Transcript of lord abbett passport portfolios plc

LORD ABBETT PASSPORT PORTFOLIOS PLC
(an open-ended investment company with variable capital constituted as an umbrella fund with segregated liability between its Funds under the laws of Ireland authorised and regulated by the Central Bank of Ireland
pursuant to the European Communities (Undertakings for Collective Investment in Transferable Securities) Regulations, 2011 (as amended)
ANNUAL REPORT AND
AUDITED FINANCIAL STATEMENTS
For the financial year ended 31 January 2020
Company Registration No. 534227

LORD ABBETT PASSPORT PORTFOLIOS PLC
TABLE OF CONTENTS
PAGE MANAGEMENT AND ADMINISTRATION 1 GENERAL INFORMATION 2 DIRECTORS’ REPORT 5 REPORT OF THE DEPOSITARY TO THE SHAREHOLDERS 9
INDEPENDENT AUDITORS’ REPORT 10 INVESTMENT MANAGER’S REPORT
SHORT DURATION INCOME FUND 13 HIGH YIELD FUND 15 GLOBAL MULTI-SECTOR BOND FUND 16 TOTAL RETURN FUND 18 EMERGING MARKETS CORPORATE DEBT FUND 19 MULTI-SECTOR INCOME FUND 20 U.S. GROWTH LEADERS FUND 21 GLOBAL HIGH YIELD FUND 22 GLOBAL EQUITY RESEARCH FUND 23 ULTRA SHORT BOND FUND 25 HIGH YIELD CORE FUND 26
SCHEDULE OF INVESTMENTS
SHORT DURATION INCOME FUND 27 HIGH YIELD FUND 69 GLOBAL MULTI-SECTOR BOND FUND 90 TOTAL RETURN FUND 114 EMERGING MARKETS CORPORATE DEBT FUND 127 MULTI-SECTOR INCOME FUND 133 U.S. GROWTH LEADERS FUND 158 GLOBAL HIGH YIELD FUND 161 GLOBAL EQUITY RESEARCH FUND 185 ULTRA SHORT BOND FUND 191 HIGH YIELD CORE FUND 207
STATEMENTS OF FINANCIAL POSITION 221
STATEMENTS OF COMPREHENSIVE INCOME 231
STATEMENTS OF CHANGES IN NET ASSETS ATTRIBUTABLE TO REDEEMABLE PARTICIPATING SHAREHOLDERS
237
STATEMENTS OF CASH FLOWS 243 NOTES TO THE FINANCIAL STATEMENTS 249 SCHEDULE OF PORTFOLIO CHANGES (Unaudited)
SHORT DURATION INCOME FUND 319 HIGH YIELD FUND 320 GLOBAL MULTI-SECTOR BOND FUND 321 TOTAL RETURN FUND 322 EMERGING MARKETS CORPORATE DEBT FUND 324 MULTI-SECTOR INCOME FUND 326 U.S. GROWTH LEADERS FUND 327 GLOBAL HIGH YIELD FUND 329 GLOBAL EQUITY RESEARCH FUND 330 ULTRA SHORT BOND FUND 332 HIGH YIELD CORE FUND 334
APPENDIX I – REMUNERATION DISCLOSURE (Unaudited) 335

LORD ABBETT PASSPORT PORTFOLIOS PLC
MANAGEMENT AND ADMINISTRATION Board of Directors Registered Office of the Company
Adrian Waters (Chairman, Irish Resident)* 30 Herbert Street David Conway (Irish Resident)* Dublin D02 W329 Douglas B. Sieg (U.S. Resident) Ireland Andrew D. D’Souza (U.S. Resident) Jennifer Karam (U.S. Resident) Investment Manager
* Independent Non-Executive Director Lord, Abbett & Co. LLC 90 Hudson Street
Manager Jersey City New Jersey Lord Abbett (Ireland) Ltd. 07302-3973 2nd Floor U.S.A. 5 Earlsfort Terrace Dublin 2 Depositary Ireland
Brown Brothers Harriman Trustee Services (Ireland) Board of Directors of the Manager Limited 30 Herbert Street Adrian Waters (Chairman, Irish Resident) Dublin D02 W329 David Conway (Irish Resident) Ireland Douglas B. Sieg (U.S. Resident) Andrew D. D’Souza (U.S. Resident) Distributors Jennifer Karam (U.S. Resident)
Kieran Walsh (Irish Resident) Lord Abbett Distributor LLC 90 Hudson Street Administrator, Registrar and Transfer Agent Jersey City New Jersey 07302-3973 Brown Brothers Harriman Fund Administration U.S.A. Services (Ireland) Limited 30 Herbert Street Lord Abbett (UK) Ltd. Dublin D02 W329 Tallis House Ireland 2 Tallis Street Temple Legal Advisors as to Irish Law London United Kingdom Dechert EC4Y 0AB 2nd Floor 5 Earlsfort Terrace Company Secretary Dublin 2 Ireland Dechert Secretarial Limited
2nd Floor 5 Earlsfort Terrace Dublin 2 Ireland Auditors
Deloitte Ireland LLP Deloitte & Touche House
29 Earlsfort Terrace Dublin D02 AY28 Ireland
1

LORD ABBETT PASSPORT PORTFOLIOS PLC
GENERAL INFORMATION The following information is derived from and should be read in conjunction with the full texts and definitions section of the Prospectus, a copy of which can be obtained from the Brown Brothers Harriman Fund Administration Services (Ireland) Limited (the “Administrator”) at the registered office address or available on Lord Abbett’s website at www.passportportfolios.com. Lord Abbett Passport Portfolios plc (the “Company”) was incorporated on 17 October 2013 and is an open-ended umbrella investment company with variable capital and segregated liability between its Funds and is organised under the laws of Ireland as a public limited company pursuant to the Companies Act 2014. The Company is authorised by the Central Bank of Ireland (the “Central Bank”) pursuant to the European Communities (Undertakings for Collective Investment in Transferable Securities) Regulations, 2011 as amended (the “UCITS Regulations”) and will comply with the Central Bank (Supervision and Enforcement) Act 2013 (Section 48(1)) (Undertakings for Collective Investment in Transferable Securities) Regulations 2019 (the “Central Bank UCITS Regulations”). The life of the Company is unlimited. The activities of the Company are governed by its Constitution, the Prospectus and the details concerning the Company contained herein. The Constitution provides that the Company offer separate Classes of shares, each representing interests in a Fund, with each Fund comprising a separate and distinct portfolio of investments. The assets of each Fund are invested separately on behalf of each Fund in accordance with the investment objective and policies of each Fund. The value of the shares of each Fund shall at all times equal their Net Asset Value (“NAV”). Additional Funds may be established by the Company with the prior approval of the Central Bank. At 31 January 2020, the Company comprised eleven active separate portfolios of investments, each of which is represented by a separate series of Redeemable Participating Shares. These Funds are: • Lord Abbett Short Duration Income Fund (“Short Duration Income Fund”), Lord Abbett High Yield Fund
(“High Yield Fund”) and Lord Abbett Global Multi-Sector Bond Fund (“Global Multi-Sector Bond Fund”) – all of which commenced operations on 18 February 2014.
• Lord Abbett Total Return Fund (“Total Return Fund”) – which commenced operations on 14 October 2014. • Lord Abbett Emerging Markets Corporate Debt Fund (“Emerging Markets Corporate Debt Fund”) and Lord
Abbett Multi-Sector Income Fund (“Multi-Sector Income Fund”) – both of which commenced operations on 5 January 2015.
• Lord Abbett U.S. Growth Leaders Fund (“U.S. Growth Leaders Fund”) – which commenced operations on
2 March 2016. • Lord Abbett Global High Yield Fund (“Global High Yield Fund”) – which commenced operations on
3 October 2016. • Lord Abbett Global Equity Research Fund (“Global Equity Research Fund”) – which commenced operations
on 4 October 2016. • Lord Abbett Ultra Short Bond Fund (“Ultra Short Bond Fund”) – which commenced operations on
5 December 2017. • Lord Abbett High Yield Core Fund (“High Yield Core Fund”) – which commenced operations on
5 March 2019. The Company has segregated liability between its Funds and accordingly any liability incurred on behalf of or attributable to any Fund shall be discharged solely out of the assets of that Fund.
2

LORD ABBETT PASSPORT PORTFOLIOS PLC
GENERAL INFORMATION (Continued)
The following are active share classes in each of the respective Funds at financial year end:
Short Duration Income Fund High Yield Fund Global Multi-Sector Bond Fund
Class A USD Accumulating Class A USD Accumulating Class A USD Accumulating Class A USD Distributing Class A USD Distributing Class A USD Distributing Class A CHF Accumulating (Hedged) Class A EUR Accumulating (Hedged) Class A EUR Accumulating (Hedged) Class A CHF Distributing (Hedged) Class C USD Accumulating Class C USD Distributing Class A EUR Accumulating (Hedged) Class C USD Distributing Class I USD Accumulating Class A EUR Distributing (Hedged) Class I USD Accumulating Class I EUR Accumulating (Hedged) Class A GBP Distributing (Hedged) Class I USD Distributing Class I GBP Accumulating (Hedged) Class C USD Accumulating Class I CHF Accumulating (Hedged) Class N USD Accumulating Class C USD Distributing Class I CHF Distributing (Hedged) Class N USD Distributing Class I USD Accumulating Class I EUR Accumulating Class Z USD Accumulating Class I USD Distributing Class I EUR Accumulating (Hedged) Class Z USD Distributing Class I CHF Accumulating (Hedged) Class I EUR Distributing (Hedged) Class I CHF Distributing (Hedged) Class I GBP Accumulating (Hedged) Class I EUR Accumulating Class I GBP Distributing (Hedged) Class I EUR Accumulating (Hedged) Class I JPY Accumulating Class I EUR Distributing (Hedged) Class J USD Accumulating Class I GBP Accumulating (Hedged) Class J EUR Accumulating Class I GBP Distributing (Hedged) Class J EUR Distributing (Hedged) Class J USD Accumulating Class J GBP Distributing Class J USD Distributing Class J GBP Distributing (Hedged) Class J EUR Accumulating (Hedged) Class N USD Accumulating Class J EUR Distributing (Hedged) Class N USD Distributing Class J GBP Distributing (Hedged) Class Z USD Accumulating Class N USD Accumulating Class Z USD Distributing Class N USD Distributing Class Z CHF Accumulating (Hedged) Class Z USD Accumulating Class Z CHF Distributing (Hedged) Class Z USD Distributing Class Z EUR Accumulating Class Z CHF Accumulating (Hedged) Class Z EUR Accumulating (Hedged) Class Z CHF Distributing (Hedged) Class Z EUR Accumulating (Hedged) Class Z GBP Accumulating (Hedged) Class Z GBP Distributing (Hedged) Total Return Fund Emerging Markets Corporate Debt Fund Multi-Sector Income Fund Class A USD Accumulating Class A USD Accumulating Class A USD Accumulating Class A USD Distributing Class A USD Distributing Class A USD Distributing Class C USD Distributing Class I USD Accumulating Class A EUR Accumulating (Hedged) Class N USD Accumulating Class N USD Distributing Class I USD Accumulating Class N USD Distributing Class Z USD Accumulating Class I EUR Accumulating (Hedged) Class Z USD Accumulating Class Z USD Distributing Class I EUR Distributing (Hedged) Class Z USD Distributing Class I GBP Accumulating (Hedged) Class N USD Accumulating Class N USD Distributing Class Z USD Accumulating Class Z USD Distributing
U.S. Growth Leaders Fund Global High Yield Fund Global Equity Research Fund
Class A USD Accumulating Class A USD Accumulating Class A USD Accumulating Class I USD Accumulating Class A USD Distributing Class I USD Accumulating Class N USD Accumulating Class A EUR Accumulating (Hedged) Class N USD Accumulating Class Z USD Accumulating Class I USD Accumulating Class Z USD Accumulating Class I USD Distributing Class I EUR Accumulating (Hedged) Class I EUR Distributing (Hedged) Class I GBP Accumulating (Hedged) Class IF USD Accumulating Class IF USD Distributing Class IF EUR Accumulating (Hedged) Class IF GBP Accumulating (Hedged) Class N USD Distributing Class Z USD Accumulating Class Z USD Distributing
3

LORD ABBETT PASSPORT PORTFOLIOS PLC
1Fund launched on 5 March 2019.
GENERAL INFORMATION (Continued) Ultra Short Bond Fund High Yield Core Fund1 Class A USD Accumulating Class I USD Accumulating Class A USD Distributing Class I USD Distributing Class Z USD Accumulating Class Z USD Distributing
4

LORD ABBETT PASSPORT PORTFOLIOS PLC
DIRECTORS’ REPORT The Directors present their annual report and audited financial statements for Lord Abbett Passport Portfolios plc (the “Company”) for the financial year ended 31 January 2020. Statement of Directors’ Responsibilities The Directors are responsible for preparing the annual report and the audited financial statements in accordance with applicable Irish law and International Financial Reporting Standards (“IFRS”), as adopted by the European Union. Irish company law requires the Directors to prepare financial statements for each financial year which give a true and fair view of the assets, liabilities and financial position of the Company and of the profit or loss for that financial year. In preparing the financial statements, the Directors are required to:
select suitable accounting policies and then apply them consistently; make judgements and estimates that are reasonable and prudent; state whether the financial statements have been prepared in accordance with applicable accounting standards
and identify the standards in question, subject to any material departures from those standards being disclosed and explained in the notes to the financial statements; and
prepare the financial statements on a going concern basis unless it is inappropriate to presume that the Company will continue in business.
The Directors confirm that they have complied with the above requirements in preparing the financial statements. The Directors are responsible for keeping adequate accounting records that are sufficient to:
correctly record and explain the transactions of the Company; enable, at any time, the assets, liabilities, financial position and profit or loss of the Company to be determined
with reasonable accuracy; and enable the Directors to ensure that the financial statements comply with the Companies Act 2014 and enable
those financial statements to be audited. The Directors are also responsible for safeguarding the assets of the Company and hence for taking reasonable steps for the prevention and detection of fraud and other irregularities. In carrying out this duty, the Directors have entrusted depositary of the Company’s assets to Brown Brothers Harriman Trustee Services (Ireland) Limited. Directors’ Compliance Statement It is the policy of the Company to comply with its relevant obligations (as defined in the Companies Act 2014). As required by Section 225(2) of the Companies Act 2014, the Directors acknowledge that they are responsible for securing the Company’s compliance with the relevant obligations. The Directors have drawn up a compliance policy statement as defined in Section 225(3)(a) of the Companies Act 2014 and a compliance policy which refers to the arrangements and structures that are in place and which are, in the Directors’ opinion, designed to secure material compliance with the Company’s relevant obligations. During the financial year, a review was undertaken of the arrangements and structures referred to above. In discharging their responsibilities under Section 225, the Directors relied upon, among other things, the services provided, advice and/or representations from third parties whom the Directors believe have the requisite knowledge and experience in order to secure material compliance with the Company’s relevant obligations. Accounting Records The measures taken by the Directors to secure compliance with the Company’s obligation to keep adequate accounting records are the use of appropriate systems and procedures and employment of competent persons. To achieve this, the Directors have delegated the accounting function to Brown Brothers Harriman Fund Administration Services (Ireland) Limited (the “Administrator”) to ensure that the requirements of Sections 281 to 286 of the Companies Act 2014 are complied with. The accounting records are kept at 30 Herbert Street, Dublin, D02 W329, Ireland.
5

LORD ABBETT PASSPORT PORTFOLIOS PLC
DIRECTORS’ REPORT (Continued) Directors The names of the persons who were Directors at any time during the financial year ended 31 January 2020 are set out below: Adrian Waters (Chairman, Irish Resident)* David Conway (Irish Resident)* Douglas B. Sieg (U.S. Resident) Andrew D. D’Souza (U.S. Resident) Jennifer Karam (U.S. Resident) * Independent Non-Executive Director Dividends The dividends for the financial year are set out in Note 10. Directors’ and Company Secretary’s Interests in Shares and Contracts None of the Directors nor their families, nor the Company Secretary, holds or held, at 31 January 2020 (31 January 2019: none) or during the financial year, any beneficial interest in the shares of the Company. Transactions Involving Directors There are no contracts or arrangements of any significance in relation to the business of the Company in which the Directors or Company Secretary had any interest as defined in the Companies Act 2014 at any time during the financial year ended 31 January 2020 (31 January 2019: none) other than those disclosed in Note 16 of these Financial Statements. Review of Business Activities and Future Developments A review of the business and future developments is given in the Investment Manager’s Reports, on pages 13 to 26. Risk Management - Objectives and Policies Investment in the Company carries with it a degree of risk including, but not limited to, the risks referred to in Note 11 of these financial statements. Corporate Governance Code The Board of Directors have assessed the measures included in the voluntary Corporate Governance Code for Collective Investment Schemes and Management Companies as published by Irish Funds (“IF”) in December 2011 (the “IF Code”). The Board has adopted all corporate governance practices and procedures in the IF Code for the financial year ended 31 January 2020.
6

LORD ABBETT PASSPORT PORTFOLIOS PLC
DIRECTORS’ REPORT (Continued) Connected Persons The UCITS Regulations states that, inter alia, any transaction carried out with a UCITS by the management company or depositary; and the delegates or sub-delegates of such a management company or depositary (excluding any non group company sub-custodians appointed by a depositary); and any associated or group company of these (“connected persons”) must be carried out as if negotiated at arm's length. Transactions must be in the best interests of the shareholders of the Company. The Directors of the Company are satisfied that (i) there are arrangements (evidenced by written procedures) in place, to ensure that the obligations set out in the UCITS Regulation are applied to all transactions with connected persons; and (ii) transactions with connected persons entered into during the period complied with the obligations set out in the UCITS Regulation. Results for the Financial Year and Assets, Liabilities and Financial Position as at 31 January 2020 Details of the assets, liabilities and financial position of the Company are set out in the Statement of Financial Position for the Company, the Statement of Comprehensive Income, the Statement of Changes in Net Assets Attributable to Redeemable Participating Shareholders of the Company and the Statement of Cash Flows for the Company. Political Contributions There were no political contributions made during the financial year ended 31 January 2020 (31 January 2019: none)
Material Events Affecting the Company during the Financial Year End Material Events affecting the Company during the Financial Year End are set out in Note 17. Material Events Affecting the Company after the Financial Year End The Directors have evaluated the impact of all subsequent events through 21 May 2020, the date this report was issued. They continue to monitor the global impact of the coronavirus (COVID-19) and its effect on the Sub-Funds of the Company as it evolves. They have evaluated the Business Continuity Management Program of the Investment Manager and service providers and determined each program effective in recovery and continuation of critical business activities without disruptions. Further information in regard to material events affecting the Company are set out in Note 18. Independent Auditors The Independent Auditors, Deloitte Ireland LLP, have indicated their willingness to continue in office in accordance with Section 383(2) of the Companies Act 2014. Relevant Audit Information The Directors in office at the date of this report have each confirmed that:
as far as he/she is aware, there is no relevant audit information of which the Company’s auditor is unaware; and
he/she has taken all the steps that he/she ought to have taken as a Director in order to make himself/herself aware of any relevant audit information and to establish that the Company’s auditor is aware of that information.
Audit committee The Board of Directors decided it was not necessary to constitute an audit committee given the frequency of the meetings of the Board of Directors throughout the year and given the size of the Board of Directors and the nature, scale and complexity of the Company and its activities.
7


Deloitte Ireland LLP
Chartered Accountants &
Statutory Audit Firm
INDEPENDENT AUDITOR’S REPORT TO THE SHAREHOLDERS OF
LORD ABBETT PASSPORT PORTFOLIOS PLC
Report on the audit of the financial statements
Opinion on the financial statements of Lord Abbett Passport Portfolios Plc (“the company”)
In our opinion the financial statements: give a true and fair view of the assets, liabilities and financial position of the company as at 31 January
2020 and of the profit for the financial year then ended; and have been properly prepared in accordance with the relevant financial reporting framework, the
applicable Regulations and, in particular, with the requirements of the Companies Act 2014.
The financial statements we have audited comprise:
the Statement of Comprehensive Income; the Statement of Financial Position; the Statement of Changes in Net Assets attributable to Redeemable Participating Shares; the Statement of Cash Flows; and
the related notes 1 to 19, including a summary of significant accounting policies as set out in note 1.
The relevant financial reporting framework that has been applied in their preparation is the Companies Act
2014 and International Financial Reporting Standards (IFRS) as adopted by the European Union (“the relevant
financial reporting framework”).
The applicable regulations that have been applied in their preparation is the European Communities
(Undertakings for Collective Investment in Transferable Securities) Regulations, 2011 and Central Bank
(Supervision and Enforcement) Act 2013 (Section 48(1)) (Undertakings for Collective Investment in
Transferable Securities) Regulations, 2019 (“the applicable Regulations”).
Basis for opinion
We conducted our audit in accordance with International Standards on Auditing (Ireland) (ISAs (Ireland)) and
applicable law. Our responsibilities under those standards are described below in the “Auditor's responsibilities
for the audit of the financial statements” section of our report.
We are independent of the company in accordance with the ethical requirements that are relevant to our audit
of the financial statements in Ireland, including the Ethical Standard issued by the Irish Auditing and Accounting
Supervisory Authority, and we have fulfilled our other ethical responsibilities in accordance with these
requirements. We believe that the audit evidence we have obtained is sufficient and appropriate to provide a
basis for our opinion.
Conclusions relating to going concern
We have nothing to report in respect of the following matters in relation to which ISAs (Ireland) require us to
report to you where:
the directors’ use of the going concern basis of accounting in preparation of the financial statements
is not appropriate; or the directors have not disclosed in the financial statements any identified material uncertainties that
may cast significant doubt about the company’s ability to continue to adopt the going concern basis of accounting for a period of at least twelve months from the date when the financial statements are authorised for issue.
/Continued on next page

/Continued from previous page
INDEPENDENT AUDITOR’S REPORT TO THE SHAREHOLDERS OF
LORD ABBETT PASSPORT PORTFOLIOS PLC
Other information
The directors are responsible for the other information. The other information comprises the information
included in the Annual Report and Audited Financial Statements, other than the financial statements and our
auditor’s report thereon. Our opinion on the financial statements does not cover the other information and,
except to the extent otherwise explicitly stated in our report, we do not express any form of assurance
conclusion thereon.
In connection with our audit of the financial statements, our responsibility is to read the other information and,
in doing so, consider whether the other information is materially inconsistent with the financial statements or
our knowledge obtained in the audit or otherwise appears to be materially misstated. If we identify such
material inconsistencies or apparent material misstatements, we are required to determine whether there is a
material misstatement in the financial statements or a material misstatement of the other information. If,
based on the work we have performed, we conclude that there is a material misstatement of this other
information, we are required to report that fact.
We have nothing to report in this regard.
Responsibilities of directors
As explained more fully in the Statement of Directors’ Responsibilities, the directors are responsible for the
preparation of the financial statements and for being satisfied that they give a true and fair view and otherwise
comply with the Companies Act 2014, and for such internal control as the directors determine is necessary to
enable the preparation of financial statements that are free from material misstatement, whether due to fraud
or error.
In preparing the financial statements, the directors are responsible for assessing the company’s ability to
continue as a going concern, disclosing, as applicable, matters related to going concern and using the going
concern basis of accounting unless the directors either intend to liquidate the company or to cease operations,
or have no realistic alternative but to do so.
Auditor’s responsibilities for the audit of the financial statements
Our objectives are to obtain reasonable assurance about whether the financial statements as a whole are free
from material misstatement, whether due to fraud or error, and to issue an auditor's report that includes our
opinion. Reasonable assurance is a high level of assurance, but is not a guarantee that an audit conducted in
accordance with ISAs (Ireland) will always detect a material misstatement when it exists. Misstatements can
arise from fraud or error and are considered material if, individually or in the aggregate, they could reasonably
be expected to influence the economic decisions of users taken on the basis of these financial statements.
As part of an audit in accordance with ISAs (Ireland), we exercise professional judgment and maintain
professional scepticism throughout the audit. We also:
Identify and assess the risks of material misstatement of the financial statements, whether due to fraud
or error, design and perform audit procedures responsive to those risks, and obtain audit evidence that is sufficient and appropriate to provide a basis for our opinion. The risk of not detecting a material misstatement resulting from fraud is higher than for one resulting from error, as fraud may involve collusion, forgery, intentional omissions, misrepresentations, or the override of internal control.
Obtain an understanding of internal control relevant to the audit in order to design audit procedures that are appropriate in the circumstances, but not for the purpose of expressing an opinion on the effectiveness of the company’s internal control.
Evaluate the appropriateness of accounting policies used and the reasonableness of accounting estimates
and related disclosures made by the directors.
/Continued on next page

/Continued from previous page
INDEPENDENT AUDITOR’S REPORT TO THE SHAREHOLDERS OF
LORD ABBETT PASSPORT PORTFOLIOS PLC
Conclude on the appropriateness of the directors’ use of the going concern basis of accounting and, based on the audit evidence obtained, whether a material uncertainty exists related to events or conditions that may cast significant doubt on the company’s ability to continue as a going concern. If we conclude that a material uncertainty exists, we are required to draw attention in our auditor’s report to the related disclosures in the financial statements or, if such disclosures are inadequate, to modify our opinion. Our
conclusions are based on the audit evidence obtained up to the date of the auditor’s report. However, future events or conditions may cause the entity (or where relevant, the group) to cease to continue as a going concern.
Evaluate the overall presentation, structure and content of the financial statements, including the
disclosures, and whether the financial statements represent the underlying transactions and events in a manner that achieves fair presentation.
We communicate with those charged with governance regarding, among other matters, the planned scope and
timing of the audit and significant audit findings, including any significant deficiencies in internal control that
the auditor identifies during the audit.
This report is made solely to the company’s shareholders, as a body, in accordance with Section 391 of the
Companies Act 2014. Our audit work has been undertaken so that we might state to the company’s
shareholders those matters we are required to state to them in an auditor’s report and for no other purpose.
To the fullest extent permitted by law, we do not accept or assume responsibility to anyone other than the
company and the company’s shareholders as a body, for our audit work, for this report, or for the opinions we
have formed.
Report on other legal and regulatory requirements
Opinion on other matters prescribed by the Companies Act 2014
Based solely on the work undertaken in the course of the audit, we report that:
We have obtained all the information and explanations which we consider necessary for the purposes of
our audit. In our opinion the accounting records of the company were sufficient to permit the financial statements to
be readily and properly audited.
The financial statements are in agreement with the accounting records. In our opinion the information given in the directors’ report is consistent with the financial statements and
the directors’ report has been prepared in accordance with the Companies Act 2014.
Matters on which we are required to report by exception
Based on the knowledge and understanding of the company and its environment obtained in the course of the
audit, we have not identified material misstatements in the directors' report.
We have nothing to report in respect of the provisions in the Companies Act 2014 which require us to report
to you if, in our opinion, the disclosures of directors’ remuneration and transactions specified by law are not
made.
Michael Hartwell
For and on behalf of Deloitte Ireland LLP
Chartered Accountants and Statutory Audit Firm
Deloitte & Touche House, Earlsfort Terrace, Dublin 2
27 May 2020

LORD ABBETT PASSPORT PORTFOLIOS PLC
INVESTMENT MANAGER’S REPORT SHORT DURATION INCOME FUND For the fiscal year ended 31 January 2020, the Fund returned 4.60%, reflecting performance at the net asset value (NAV) of Class A accumulating shares (USD), compared to its benchmark, the ICE BofA Merrill Lynch 1-3 Year U.S. Corporate Index1, which returned 5.29% over the same period.
The trailing 12-month period was characterized by several market-moving events. Trade tensions continued to dominate headlines, as trade negotiations between the U.S. and China remained volatile throughout early 2019. One of the more notable shifts over the year was the U.S. Federal Reserve’s (the “Fed”) transition to a more dovish policy stance, with Chairman Jerome Powell stating that the Fed would act appropriately to sustain economic growth. The combination of a dovish Fed, trade pressures, and slowing economic growth resulted in a downward shift in the U.S. Treasury yield curve. In fact, the yield on the 10-year U.S. Treasury fell below 1.5% in September to its lowest level since 2016. In August, spreads between the U.S. 10-year Treasury and the 2-year Treasury inverted for the first time in over a decade. After several months of concern, the yield curve steepened in November following a sharp shift in sentiment, with all maturities moving out of inversion territory.
Geopolitics also contributed to market volatility. Following a coordinated drone strike on Saudi Arabia in the third quarter, Brent crude oil prices increased 20% in one trading session. Despite the record increase, oil prices retracted their gains within weeks. Investor sentiment was buoyed in November as the market grew optimistic about the possibility of a “Phase One” trade deal between the U.S. and China, which was ultimately reached in December. The agreement included structural reforms to China’s trade regime in areas such as intellectual property and agriculture, as well as a commitment from China to make additional purchases of U.S. goods and services moving forward. In return, the U.S. would not proceed with tariffs that were scheduled to go into effect in December on nearly $160 billion worth of Chinese goods and would cut the tariff rate imposed on 1 September 2019 on $120 billion worth of Chinese goods from 15% to 7.5%.
Despite bouts of volatility arising from U.S.-China trade tensions, risk assets generally rallied during the 12-months ended 31 January 2020, primarily due to the dovish comments from central banks around the globe, culminating in the longest U.S. economic expansion on record. Credit sectors performed exceptionally well, with investment grade bonds benefiting from a sizeable decline in spreads along with a sharp downward shift in the yield curve. Additionally, high yield bonds produced positive returns following weakness in late 2018. High yield performance was characterized by a sharp up-in-quality bias, as the “CCC” segment underperformed. The “CCC” tier was adversely affected during the year by idiosyncratic weakness in select industries along with overall investor hesitation to enter the space, given late cycle concerns and a strong preference for perceived quality and liquidity. The energy sector dragged on high yield performance, which we believe was due largely to idiosyncratic issues within select industries.
Consistent with the Fund’s strategic design, the Fund maintained exposure to a variety of bond market sectors beyond the investment grade corporate bonds represented in the benchmark. This design provides portfolio diversification and allows for the flexibility to pursue relative value opportunities across sectors. In our view, these sector weightings were important factors affecting performance during the period.
The Fund’s allocation to high quality commercial mortgage-backed securities (“CMBS”) contributed to relative performance. On a risk-adjusted basis, CMBS exhibited resilient performance during periods of market volatility in the 12-months ended 31 January 2020. Additionally, CMBS delinquency rates remained benign and the low interest rate and competitive lending environment provided a tailwind for CMBS performance. While high yield corporate bonds experienced some volatility during the year due to U.S.-China trade tensions, mixed messaging from the Fed, and the inverted yield curve, high yield credit spreads compressed, which also aided the Fund’s relative performance during the period.
13

LORD ABBETT PASSPORT PORTFOLIOS PLC
INVESTMENT MANAGER’S REPORT SHORT DURATION INCOME FUND (Continued) The Fund’s duration positioning within its investment grade corporate bond allocation weighed on relative performance. During the period, we reduced the Fund’s corporate duration positioning, maintaining a slightly shorter duration relative to the benchmark. This created a drag on relative performance, given the significant rally in rates at the end of the second quarter and in the third quarter of 2019. Additionally, the Fund’s minor allocation to Argentinian sovereign securities detracted from relative performance, as Argentinian sovereign bonds sold-off in August following the unexpected defeat of President Mauricio Macri by Albert Fernandez during Argentina’s primary vote.
The Fund’s portfolio is actively managed and, therefore, its holdings and the weightings of a particular issuer or particular sector as a percentage of portfolio assets are subject to change. Sectors may include many industries.
1 The ICE BofA Merrill Lynch 1-3 Year U.S. Corporate Index is an unmanaged index comprised of U.S. dollar-denominated investment grade corporate debt securities publicly issued in the U.S. domestic market with between one and three years remaining to final maturity.
14

LORD ABBETT PASSPORT PORTFOLIOS PLC
INVESTMENT MANAGER’S REPORT
HIGH YIELD FUND For the fiscal year ended 31 January 2020, the Fund returned 9.91%, reflecting performance at the net asset value (NAV) of Class A accumulating shares (USD), compared to its benchmark, the ICE BofA Merrill Lynch U.S. High Yield Constrained Index1, which returned 9.39% over the same period. The trailing 12-month period was characterized by several market-moving events. Trade tensions continued to dominate headlines, as trade negotiations between the U.S. and China remained volatile throughout the year. One of the more notable shifts over the year was the U.S. Federal Reserve’s (the “Fed”) transition to a more dovish policy stance, with Chairman Jerome Powell stating that the Fed would act appropriately to sustain economic growth. The combination of a dovish Fed, trade pressures, and slowing economic growth resulted in a downward shift in the U.S. Treasury yield curve. Despite bouts of volatility arising from U.S.-China trade tensions, risk assets rallied during the 12-months ended 31 January 2020, primarily due to the dovish comments from central banks around the globe, culminating in the longest U.S. economic expansion on record. Credit sectors performed exceptionally well, with investment grade bonds benefiting from a sizeable decline in spreads along with a sharp downward shift in the yield curve. Additionally, high yield bonds produced positive returns following weakness in late 2018. High yield performance was characterized by a sharp up-in-quality bias, as the CCC segment underperformed. The CCC tier was adversely affected during the year by idiosyncratic weakness in select industries along with overall investor hesitation to enter the space given late cycle concerns and a strong preference for perceived quality and liquidity. The energy sector dragged on high yield index performance, which we believe was due largely to idiosyncratic issues within select industries. Bank loans posted positive returns, but underperformed the high yield market amidst a negative technical backdrop culminating in one of the longest and most pronounced periods of retail outflows on record. Loan performance was also characterized by an up-in-quality bias, as investors favored the largest and most liquid segment of the market. Among the largest contributors to the Fund’s relative performance during the period was security selection in the energy and basic industry sectors. Additionally, the Fund’s allocation to off-benchmark asset classes, and more specifically convertible bonds, contributed to relative performance. Convertible bonds outperformed most fixed income asset classes during the period amid the risk on sentiment that largely persisted throughout the year. Security selection within the retail sector was among the largest detractors from the Fund’s relative performance during the period. Additionally, the Fund’s modest allocation to foreign sovereign debt, and more specifically the Republic of Argentina, detracted from relative performance. The Fund’s underweight to ‘BB’ rated issues also detracted from relative performance as the credit tier rallied over the period. The Fund’s portfolio is actively managed and, therefore, its holdings and the weightings of a particular issuer or particular sector as a percentage of portfolio assets are subject to change. Sectors may include many industries. 1 The ICE BofA Merrill Lynch U.S. High Yield Constrained Index is a capitalization weighted index of all U.S. dollar denominated below investment grade corporate debt publicly issued in the U.S. domestic market.
15

LORD ABBETT PASSPORT PORTFOLIOS PLC
INVESTMENT MANAGER’S REPORT GLOBAL MULTI-SECTOR BOND FUND
For the fiscal year ended 31 January 2020, the Fund returned 9.03%, reflecting performance at the net asset value (NAV) of Class A accumulating shares (USD), compared to its benchmark, the Bloomberg Barclays Global Aggregate Bond Index (USD Hedged)1, which returned 9.01% over the same period. Over the period, the global bond market experienced positive performance, as most central banks remained accommodative, interest rates remained low, and unemployment steadily declined. In addition, corporate earnings remained strong, while global economic growth showed signs of a synchronized slowdown. Overall, European markets (as measured by the Euro Stoxx 50 Index2) rose roughly 19.3% in U.S. dollars for the period, while Japan’s Nikkei 2253 Index rose 18.3%. One of the more notable shifts over the year was the U.S. Federal Reserve’s (“Fed”) transition to a more dovish policy stance, with Chairman Jerome Powell stating that the Fed would act appropriately to sustain economic growth. Given an uncertain market outlook and muted inflation pressure, the Fed announced its decision to cut interest rates by 25 basis points on 31 July 2019 to a range of 2.00-2.25%. This was the first time that the Fed had cut interest rates since December 2008. The Fed followed that decision with two more 25 basis point rate cuts in September and October, citing “implications of global developments for the economic outlook as well as muted inflation pressures”. Chairman Powell signaled a likely pause on future interest rate cuts during the October 2019 meeting. Meanwhile, other central banks continued their accommodative policies. The European Central Bank kept its benchmark refinancing rate unchanged at 0% at its September 2019 meeting, and approved a new round of bond purchases at a monthly pace of €20 billion beginning on 1 November 2019, in an attempt to boost growth and inflation amid global trade tensions and Brexit uncertainty. The Bank of Japan also maintained its stimulative monetary policy at its October 2019 meeting, as short-term interest rates remained unchanged at -0.1%, and the bank kept its 10-year government bond yield target at around 0%. The BoJ also signaled that it may cut interest rates in the near future to support growth. The International Monetary Fund estimated that global growth will improve from 2.9% in 2019 to 3.3% in 2020 and 3.4% in 2021. This growth projection reflects the impact of substantial monetary easing across developed and emerging markets as well as the expectation that underperforming and stressed economies pick up performance, relatively healthy emerging market economies maintain their robust performance, and advanced economies continue to work towards their potential growth rates. As of the end of January, unemployment remained low in most developed countries, coming in at 7.4% in the euro area, 3.6% in the United States, 3.6% in China, and 2.4% in Japan. Gross Domestic Product growth has remained positive in most developed countries, while inflation has remained subdued, allowing central banks to continue their stimulative monetary policies with global stock markets as the beneficiaries. The Fund maintains a flexible, multi-sector approach with the ability to have exposure to sectors outside of its benchmark, the Bloomberg Barclays Global Aggregate Bond Index1. The Fund seeks to deliver total return by investing in bonds across multiple sectors in developed and emerging markets located throughout the world. Primary sector allocations include investment grade and high yield corporate bonds, sovereign debt, mortgage-backed securities ("MBS"), and asset-backed securities. The period ended 31 January 2020 was a supportive environment for global bonds. The Fund’s overweight positioning and security selection within global investment grade and high yield corporate bonds contributed to relative performance. Within high yield corporate bonds, the Fund’s allocation to both U.S. and non-U.S. high yield corporate bonds within developed markets aided performance. Domestic and global high yield bonds exhibited strong returns as spreads compressed during the period, largely due to supportive central bank policies, progress around geopolitical risks, and strong employment data.
16

LORD ABBETT PASSPORT PORTFOLIOS PLC
INVESTMENT MANAGER’S REPORT GLOBAL MULTI-SECTOR BOND FUND (Continued)
The Fund’s underweight exposure and duration positioning within developed market government bonds weighed on relative performance. Global yields generally fell during the year, benefitting sovereign securities. In particular, the Fund’s large underweight position to Japanese government bonds detracted from relative performance, as the yields on Japanese global bonds fell even further into negative territory during the year amid speculation regarding interest rate movements from the BoJ. Additionally, the Fund’s positioning within its MBS allocation detracted from relative performance during the period. Given the sharp rally in rates, the Fund’s allocation to some securities with higher coupons and to-be-announced mortgages negatively impacted performance, as these securities have more negative convexity, resulting in these positions underperforming the securities within the benchmark amid the volatility in interest rates. The Fund’s portfolio is actively managed and, therefore, its holdings and the weightings of a particular issuer or particular sector as a percentage of portfolio assets are subject to change. Sectors may include many industries.
1 The Bloomberg Barclays Global Aggregate Bond Index (USD Hedged) is a broad-based measure of the global investment-grade, fixed-income markets. The three major components of this index are the U.S. Aggregate, the Pan-European Aggregate, and the Asian-Pacific Aggregate indexes. The index also includes euro dollar and euro/yen corporate bonds, Canadian government securities, and U.S. dollar investment-grade 144A securities. 2 The EURO STOXX 50® Index represents the performance of the 50 largest companies among the 19 supersectors in terms of free-float market cap in 12 eurozone countries. These countries include Austria, Belgium, Finland, France, Germany, Greece, Ireland, Italy, Luxembourg, the Netherlands, Portugal and Spain. The Index has a fixed number of components and is part of the STOXX® blue-chip index family. The Index captures about 60% of the free-float market cap of the EURO STOXX® Total Market Index (TMI). 3 The Nikkei Stock Average, the Nikkei 225, is a price-weighted equity index, which consists of 225 stocks in the 1st section of the Tokyo Stock Exchange.
17

LORD ABBETT PASSPORT PORTFOLIOS PLC
INVESTMENT MANAGER’S REPORT TOTAL RETURN FUND For the fiscal year ended 31 January 2020, the Fund returned 8.03%, reflecting performance at the net asset value (NAV) of Class A accumulating shares (USD), compared to its benchmark, the Bloomberg Barclays U.S. Aggregate Index1, which returned 9.64% over the same period. One of the more notable shifts over the year was the U.S. Federal Reserve’s (the “Fed”) transition to a more dovish policy stance, with Chairman Jerome Powell stating that the Fed would act appropriately to sustain economic growth. The combination of a dovish Fed, trade pressures, and slowing economic growth resulted in a downward shift in the U.S. Treasury yield curve. Despite bouts of volatility arising from U.S.-China trade tensions, risk assets rallied during the trailing 12-months ended 31 January 2020, primarily due to the dovish comments from central banks around the globe, culminating in the longest U.S. economic expansion on record. Credit sectors performed exceptionally well, with investment grade bonds benefiting from a sizeable decline in spreads along with a sharp downward shift in the yield curve. Additionally, high yield bonds produced positive returns following weakness in late 2018. High yield performance was characterized by a sharp up-in-quality bias, as the CCC segment underperformed. The CCC tier was adversely affected during the year by idiosyncratic weakness in select industries along with overall investor hesitation to enter the space, given late cycle concerns and a strong preference for perceived quality and liquidity. Bank loans posted positive returns, but underperformed the high yield market amidst a negative technical backdrop culminating in one of the longest and most pronounced periods of retail outflows on record. Loan performance was also characterized by an up-in-quality bias, as investors favored the largest and most liquid segment of the market. The energy sector dragged on high yield performance, which we believe was due largely to idiosyncratic issues within select industries. For the 12-month period ended 31 January 2020, the Fund’s largest detractor from relative performance was security selection within sovereign bonds, and more specifically, selection within Argentinian and Japanese bonds hurt performance. An overweight to asset-backed securities (ABS) also detracted from performance over the period. ABS lagged the spread tightening experienced by corporate credit during the period. Security selection within investment grade corporate bonds contributed most to relative performance over the 12-month period. Specifically, selection within the financials sector contributed. We remain attracted to select securities within the financials sector due to strict regulations, strong balance sheets, more conservative management teams, and improved quality relative to the pre-crisis period. An underweight exposure to U.S. Treasury bonds also contributed to relative performance. The asset class lagged the broader market during the period, as risk assets rallied and outperformed risk-free bonds. The Fund’s portfolio is actively managed and, therefore, its holdings and the weightings of a particular issuer or particular sector as a percentage of portfolio assets are subject to change. Sectors may include many industries.
1 The Bloomberg Barclays U.S. Aggregate Bond Index an index of U.S dollar-denominated, investment-grade U.S. government and corporate securities, and mortgage pass-through securities, and asset-backed securities. Indexes are unmanaged, do not reflect the deduction of fees or expenses, and an investor cannot invest directly in an index.
18

LORD ABBETT PASSPORT PORTFOLIOS PLC
INVESTMENT MANAGER’S REPORT EMERGING MARKETS CORPORATE DEBT FUND For the fiscal year ended 31 January 2020, the Fund returned 10.41%, reflecting performance at the net asset value (NAV) of Class A accumulating shares (USD), compared to its benchmark, the J.P. Morgan Corporate Emerging Markets Bond Index Broad Diversified1, which returned 11.79% during the same period. During the period, 10-year U.S. Treasury yields decreased from 2.70% to 1.51%. During the 12-month period, U.S. dollar-denominated emerging markets corporate debt (as represented by the J.P. Morgan Corporate Emerging Markets Bond Index Broad Diversified1) outperformed U.S. fixed income markets, which returned 9.64% (as represented by the Bloomberg Barclays U.S. Aggregate Bond Index2). During the period, the asset class was influenced by emerging market central banks finding ample room to ease and support growth as major central banks kept their rates low and inflation levels remained subdued. Additionally, trade talks between the United States and China began to move in the right direction towards the end of the year, ultimately resulting in a December agreement by both parties to sign a “Phase One” trade deal. Notable events during the year included a surprise election result out of Argentina, where market-friendly incumbent President Mauricio Macri lost in a landslide election to Alberto Fernandez, and a drone attack on a major Saudi Arabian oil processing plant in mid-September, which sparked concerns of oil supply disruptions. An overweight to select corporate bonds within China contributed to relative performance. Supply and demand fundamentals were supportive for the real estate sector and high quality developers gained increased access to financing opportunities. Additionally, an overweight to Brazil’s Petrobras, a publicly-held oil and gas corporation, led to a positive impact on relative performance. In terms of detractors, underweights in Hong Kong, Macau, & Thailand negatively impacted relative performance. Finally, an overweight to Argentinian corporates led to a negative impact on relative performance following the surprise election of Alberto Fernandez. The Fund’s portfolio is actively managed and, therefore, its holdings and the weightings of a particular issuer or particular sector as a percentage of portfolio assets are subject to change. Sectors may include many industries. 1 The J.P. Morgan Corporate Emerging Markets Bond Index Broad Diversified (CEMBI BD) is a market capitalization weighted index that tracks total returns of U.S. dollar denominated debt instruments issued by corporate entities in emerging markets countries. The Index limits the current face amount allocations of the bonds in the CEMBI Broad by constraining the total face amount outstanding for countries with larger debt stocks. 2 The Bloomberg Barclays U.S. Aggregate Bond Index is an index of U.S dollar-denominated, investment-grade U.S. government and corporate securities, and mortgage pass-through securities, and asset-backed securities. Indexes are unmanaged, do not reflect the deduction of fees or expenses, and an investor cannot invest directly in an index.
19

LORD ABBETT PASSPORT PORTFOLIOS PLC
INVESTMENT MANAGER’S REPORT MULTI-SECTOR INCOME FUND
For the fiscal year ended 31 January 2020, the Fund returned 10.35%, reflecting performance at the net asset value (NAV) of Class A accumulating shares (USD), compared to its benchmark, the Bloomberg Barclays U.S. Aggregate Bond Index1, which returned 9.64% over the same period.
The trailing 12-month period was characterized by several market-moving events. Trade tensions continued to dominate headlines, as trade negotiations between the U.S. and China remained volatile throughout early 2019. One of the more notable shifts over the year was the U.S. Federal Reserve’s (the “Fed”) transition to a more dovish policy stance, with Chairman Jerome Powell stating that the Fed would act appropriately to sustain economic growth. The combination of a dovish Fed, trade pressures, and slowing economic growth resulted in a downward shift in the U.S. Treasury yield curve.
Despite bouts of volatility arising from U.S.-China trade tensions, risk assets rallied during the 12-months ended 31 January 2020, primarily due to the dovish comments from central banks around the globe, culminating in the longest U.S. economic expansion on record. Credit sectors performed exceptionally well, with investment grade bonds benefiting from a sizeable decline in spreads along with a sharp downward shift in the yield curve. Additionally, high yield bonds produced positive returns following weakness in late 2018. High yield performance was characterized by a sharp up-in-quality bias, as the CCC segment underperformed. The CCC tier was adversely affected during the year by idiosyncratic weakness in select industries along with overall investor hesitation to enter the space given late cycle concerns and a strong preference for perceived quality and liquidity. Bank loans posted positive returns, but underperformed the high yield market amidst a negative technical backdrop culminating in one of the longest and most pronounced periods of retail outflows on record. Loan performance was also characterized by an up-in-quality bias, as investors favored the largest and most liquid segment of the market. The energy sector dragged on high yield performance, which we believe was due largely to idiosyncratic issues within select industries.
As it has in the past, the Fund maintained a significant allocation to high yield bonds, as we remained positive on the high yield market from a fundamental perspective. The Fund’s exposure to high yield bonds, and more specifically the ‘CCC’ and ‘BB’ credit tiers, was accretive to relative performance over the period, as those credit tiers outperformed investment grade bonds, as represented by the Fund’s benchmark, the Bloomberg Barclays U.S. Aggregate Bond Index. Additionally, the Fund’s allocation to convertibles contributed to relative performance, as the risk-on sentiment drove the asset class to outperform other fixed income segments of the market.
The Fund’s modest allocation to mortgage backed securities detracted from relative performance. The asset class underperformed the broader fixed income market as lower rates led to a mini-refinancing boom within mortgages. Security selection within the industrial energy sector also detracted from relative performance. More specifically, the Fund’s overweight allocation to an exploration and production company based in California detracted from relative performance.
The Fund’s portfolio is actively managed and, therefore, its holdings and the weightings of a particular issuer or particular sector as a percentage of portfolio assets are subject to change. Sectors may include many industries.
1 The Bloomberg Barclays U.S. Aggregate Bond Index an index of U.S dollar-denominated, investment-grade U.S. government and corporate securities, and mortgage pass-through securities, and asset-backed securities. Indexes are unmanaged, do not reflect the deduction of fees or expenses, and an investor cannot invest directly in an index.
20

LORD ABBETT PASSPORT PORTFOLIOS PLC
INVESTMENT MANAGER’S REPORT U.S. GROWTH LEADERS FUND
For the fiscal year ended 31 January 2020, the Fund returned 25.47%, reflecting performance at the net asset value (NAV) of Class A accumulating shares (USD), compared to its benchmark, the Russell 1000® Growth Index1, which returned 27.94% over the same period.
U.S. equity returns were positive over the past year, with large cap stocks, as represented by the S&P 500® Index2, rising 21.68% during the period, while small cap stocks, as represented by the Russell 2000® Index3, were up 9.21%. Following a tumultuous fourth quarter of 2018, where trade tensions and monetary policy uncertainty sent many investors toward safety, the market staged a strong recovery. Trade tensions continued to dominate headlines, as trade negotiations between the U.S. and China remained volatile throughout the period. One of the more notable shifts over the year was the U.S. Federal Reserve’s (the “Fed”) transition to a more dovish policy stance, with Chairman Jerome Powell stating that the Fed would act appropriately to sustain economic growth. Given an uncertain market outlook and muted inflation pressures, the Fed announced its decision to cut interest rates by 25 basis points on July 31, 2019 to a range of 2.00-2.25%. This was the first time that the Fed had cut interest rates since December 2008. The Fed followed that decision with two more 25 basis point rate cuts in September and October, citing “implications of global developments for the economic outlook as well as muted inflation pressures”. After the October rate cut, Fed Chairman Powell signaled a likely pause on future rate cuts. The combination of a dovish Fed, trade pressures, and slowing economic growth, resulted in falling rates across the U.S. Treasury yield curve. In fact, in July, the yield on the 10-year U.S. Treasury fell to its lowest level since 2016.
Geopolitics also contributed to market volatility. Following a coordinated drone strike on Saudi Arabia in the third quarter, Brent crude oil prices increased 20% in one trading session. Despite the record increase, oil prices retracted their gains within weeks. Investor sentiment was buoyed in November as the market grew optimistic about the possibility of a “Phase One” trade deal between the U.S. and China, which was ultimately reached in December and officially signed in January 2020. The first month of 2020, ultimately was negative as markets sold-off on concerns of the spread of the coronavirus (COVID-19) in China and the impact it could have on global supply chains.
Security selection and positioning within the communication services sector detracted from the Fund’s relative performance during the 12-month period. Within the sector, the Fund’s underweight position in Facebook, Inc., a global social media network, detracted from relative performance. Facebook faced increased global regulatory pressure, as privacy concerns and antitrust discussions loomed. However, the company’s relatively strong fundamentals overshadowed these concerns. Shares of Twitter, Inc., a social media platform, also detracted from relative performance. Despite better-than-expected user growth, Twitter failed to meet revenue estimates as the company experienced issues with its Mobile Application Promotion, which is a suite of products that enables advertisers to promote mobile applications, sending its share price spiraling downwards.
Shares of Align Technology, Inc., a manufacturer of medical devices, specifically the Invisalign® dental product, also detracted from the Fund's performance. Align reported a second quarter Invisalign® case shipments miss, which management attributed to a slowdown in consumer spending in China and competitive pressures in North America.
Security selection within the consumer discretionary sector was the largest contributor to relative performance during the 12-month period. Shares of Tesla, Inc., a designer and developer of electric vehicles and energy related systems, contributed. Despite mixed reviews of its Cybertruck, orders outpaced expectations, as the appeal of the brand and total addressable market both expanded. The Fund’s position in Roku, Inc., a provider of a streaming platform, also contributed to relative performance as consumers continued to transition from traditional linear TV to streaming platforms.
Security selection and positioning within the industrials sector contributed during the period. Within the sector, shares of Teledyne Technologies, Inc., a producer of communications products for wireless and satellite systems, contributed to relative performance. Shares of Teledyne rose throughout the period, as the company’s organic growth accelerated and margins improved due to higher volumes and strong productivity.
The Fund’s portfolio is actively managed and, therefore, its holdings and the weightings of a particular issuer or particular sector as a percentage of portfolio assets are subject to change. Sectors may include many industries.
1 The Russell 1000® Growth Index measures the performance of those Russell 1000® Index companies with higher price-to-book ratios and higher forecasted growth values.
2 The S&P 500® Index is widely regarded as the standard for measuring large cap U.S. stock market performance and includes a representative sample of leading companies in leading industries.
3 The Russell 2000® Index measures the performance of the 2,000 smallest companies in the Russell 3000® Index, which represents approximately 10% of the total market capitalization of the Russell 3000® Index.
21

LORD ABBETT PASSPORT PORTFOLIOS PLC
INVESTMENT MANAGER’S REPORT GLOBAL HIGH YIELD FUND For the fiscal year ended 31 January 2020, the Fund returned 9.43%, reflecting performance at the net asset value (NAV) of Class A accumulating shares (USD), compared to its benchmark, the ICE BofA Merrill Lynch Global High Yield USD Hedged Index1, which returned 10.55% over the same period. The trailing 12-month period was characterized by several market-moving events. Trade tensions continued to dominate headlines, as trade negotiations between the U.S. and China remained volatile throughout 2019. One of the more notable shifts over the year was the U.S. Federal Reserve’s (the “Fed”) transition to a more dovish policy stance, with Chairman Jerome Powell stating that the Fed would act appropriately to sustain economic growth. The combination of a dovish Fed, trade pressures, and slowing economic growth resulted in a downward shift in the U.S. Treasury yield curve. Despite bouts of volatility arising from U.S.-China trade tensions, risk assets rallied during the 12-months ended 31 January 2020, primarily due to the dovish comments from central banks around the globe, culminating in the longest U.S. economic expansion on record. Credit sectors performed exceptionally well, with investment grade bonds benefiting from a sizeable decline in spreads along with a sharp downward shift in the yield curve. Additionally, high yield bonds produced positive returns following weakness in late 2018. High yield performance was characterized by a sharp up-in-quality bias, as the CCC segment underperformed. The CCC tier was adversely affected during the year by idiosyncratic weakness in select industries along with overall investor hesitation to enter the space given late cycle concerns and a strong preference for perceived quality and liquidity. Bank loans posted positive returns, but underperformed the high yield market amidst a negative technical backdrop culminating in one of the longest and most pronounced periods of retail outflows on record. Loan performance was also characterized by an up-in-quality bias, as investors favored the largest and most liquid segment of the market. The energy sector dragged on high yield performance, which we believe was due largely to idiosyncratic issues within select industries. During the 12-month period, global high yield markets performed in lockstep with the leveraged credit segments of the U.S. market, and more specifically, high yield. Security selection within the utility sector was among the largest detractors from the Fund’s relative performance during the period. Additionally, the Fund’s modest allocation to foreign sovereign, and more specifically the Republic of Argentina, detracted from relative performance. The Fund’s overweight to ‘CCC’ rated issues also detracted from relative performance, as the lower-rated segment underperformed the broader high yield market. Security selection in the basic industry sector was among the largest contributors to the Fund’s relative performance during the period. Additionally, while an underweight allocation to the ‘BB’ credit tier hurt performance, stock selection within the ‘BB’ segment contributed to relative performance. Security selection within the Fund’s U.S. high yield allocation also contributed to relative performance during the period, as the return within this segment exceeded that of the broader U.S. high yield market. The Fund’s portfolio is actively managed and, therefore, its holdings and the weightings of a particular issuer or particular sector as a percentage of portfolio assets are subject to change. Sectors may include many industries. 1 The ICE BofA Merrill Lynch Global High Yield Index tracks the performance of USD, CAD, GBP and EUR denominated below investment grade corporate debt publicly issued in the major domestic or Eurobond markets.
22

LORD ABBETT PASSPORT PORTFOLIOS PLC
INVESTMENT MANAGER’S REPORT GLOBAL EQUITY RESEARCH FUND
For the fiscal year ended 31 January 2020, the Fund returned 14.74%, reflecting performance at the net asset value (NAV) of Class A accumulating shares (USD), compared to its benchmark, the MSCI All Country World Index (Net)1, which returned 16.04% over the same period.
Over the period, global equity markets experienced significant positive performance outside the United States, as most central banks remained accommodative, interest rates remained low, unemployment steadily declined, and corporate earnings continuing to grow. Meanwhile, global economic growth was revised downwards, reflecting negative surprises to economic activity in a few emerging market economies, primarily India, which led to a reassessment of growth prospects over the next two years. Overall, European markets (as measured by the Euro Stoxx 502) rose roughly 11.5% in U.S. dollars for the period, while Japan’s Nikkei 2253 rose 12.1%.
One of the more notable shifts over the year was the U.S. Federal Reserve’s (the “Fed”) transition to a more dovish policy stance, with Chairman Jerome Powell stating that the Fed would act appropriately to sustain economic growth. Given an uncertain market outlook and muted inflation pressures, the Fed announced its decision to cut interest rates by 25 basis points on 31 July 2019, to a range of 2.00-2.25%. This was the first time that the Fed had cut interest rates since December 2008. The Fed followed that decision with two more 25 basis point rate cuts in September and October, citing “implications of global developments for the economic outlook as well as muted inflation pressures”. After the October rate cut, Fed Chairman Powell signaled a likely pause on future rate cuts. The combination of a dovish Fed, trade pressures, and slowing economic growth, resulted in falling rates across the U.S. Treasury yield curve. In fact, in July, the yield on the 10-year U.S. Treasury fell to its lowest level since 2016. Bond yields continued to fall, and in August, the spread between the U.S. 10-year Treasury and the 2-year Treasury temporarily inverted.
Meanwhile, other central banks have continued their accommodative policies as well. The European Central Bank (ECB) has kept its benchmark refinancing rate unchanged at 0% since March 2016, and held it at 0% during its January meeting, reiterating that it expects key interest rates to remain at record low levels until it has seen the inflation outlook robustly converge to a level sufficiently close to, but below, 2% within its projection horizon. The Bank of Japan (BoJ) left its key short-term interest rate unchanged at -0.1%, as was widely expected. During the January 2020 meeting, policymakers in Japan also kept the 10-year government bond yield target around 0%, while revising their growth projection higher for the 2019 fiscal year, supported by fiscal stimulus and easing trade tensions.
The International Monetary Fund cut its global growth estimates to 2.9% for 2019, and to 3.3% for 2020. Unemployment remained at or below levels from a year ago in most developed countries, falling to 7.4% in the Euro area, 3.6% in the United States, 2.4% in Japan, and 3.6% in China, all near multi-year lows. GDP growth has remained positive in most developed countries, while inflation has remained subdued, allowing central banks to continue their stimulative monetary policies.
Volatility, as measured by the VIX index, came back down in 2019, after elevating towards the tail end of 2018. Sources of tension reduction throughout the past year have come from the agreement between the U.S. and China on a phase one trade deal, the official split of the U.K. from the Eurozone, and the gradual and continuous cutting of rates by the Fed throughout 2019.
During the period, the Fund’s underperformance relative to its benchmark was driven by stock selection, particularly within the information technology and consumer staples sectors. Within the information technology sector, an overweight position in Conduent, Inc. detracted from relative performance. Shares of the business process services company fell after CEO Ashok Vemuri announced that he would be stepping down from his post. Additionally, shares of Nokia Oyj also detracted from relative performance. Shares of the network infrastructure, technology, and software services company declined as 3Q19 results and outlook were dominated by margin challenges, which, in turn, were a key driver of disappointing near-, intermediate- and longer-term outlooks.
Within the consumer staples sector, an overweight position in Coca-Cola Bottlers Japan detracted from relative performance. Shares of the beverage manufacturing company fell after 2Q19 profits came in below consensus estimates, as the company posted large impairment losses on goodwill, and most importantly made no changes to its sales and business-income guidance, but cut its operating profit and net profit forecasts on the impairment loss.
Conversely, stock selection within the industrial and materials sectors contributed to relative performance over the period. Within the industrials sector, shares of Allegion PLC contributed to relative performance. The Ireland-based security products and solutions company's shares rose after 3Q19 results topped consensus revenue and EPS estimates.
23

LORD ABBETT PASSPORT PORTFOLIOS PLC
INVESTMENT MANAGER’S REPORT GLOBAL EQUITY RESEARCH FUND (Continued)
Ametek, Inc., an electronic instruments and electromechanical devices manufacturer, also contributed to relative performance. The company benefited from another earnings beat driven by impressive margin expansion, despite a challenging macro environment.
Within the materials sector, shares of Wheaton Precious Metals Corp., a Canada-based mining company, contributed to performance. The company has continued to benefit from building a low-cost, long duration portfolio, which enables the company to generate stable long-term cash flows with reinvestment risk below that of its peers.
1 The MSCI ACWI Index is a free float-adjusted market capitalization weighted index that is designed to measure the equity market performance of developed and emerging markets. Indexes are unmanaged, do not reflect the deduction of fees or expenses, and are not available for direct investment.
2 The EURO STOXX 50® Index represents the performance of the 50 largest companies among the 19 supersectors in terms of free-float market cap in 12 eurozone countries. These countries include Austria, Belgium, Finland, France, Germany, Greece, Ireland, Italy, Luxembourg, the Netherlands, Portugal and Spain. The index has a fixed number of components and is part of the STOXX blue-chip index family. The index captures about 60% of the free-float market cap of the EURO STOXX Total Market Index (TMI).
3 The Nikkei Stock Average, the Nikkei 225 is used around the globe as the premier index of Japanese stocks. Because of the prominent nature of the index, many financial products linked to the Nikkei 225 have been created are traded worldwide while the index has been sufficiently used as the indicator of the movement of Japanese stock markets. The Nikkei 225 is a price-weighted equity index, which consists of 225 stocks in the 1st section of the Tokyo Stock Exchange.
24

LORD ABBETT PASSPORT PORTFOLIOS PLC
INVESTMENT MANAGER’S REPORT ULTRA SHORT BOND FUND For the fiscal year ended 31 January 2020, the Fund returned 2.45%, reflecting performance at the net asset value (NAV) of Class A accumulating shares (USD), compared to its benchmark, the ICE BofAML U.S. Treasury Bill Index1, which returned 2.27% over the same period. The trailing 12-month period was characterized by several market-moving events. Trade tensions continued to dominate headlines, as trade negotiations between the U.S. and China remained volatile throughout early 2019. One of the more notable shifts over the year was the U.S. Federal Reserve’s (the “Fed”) transition to a more dovish policy stance, with Chairman Jerome Powell stating that the Fed would act appropriately to sustain economic growth. The combination of a dovish Fed, trade pressures, and slowing economic growth resulted in a downward shift in the U.S. Treasury yield curve. In fact, the yield on the 10-year U.S. Treasury fell below 1.5% in September to its lowest level since 2016. In August, spreads between the U.S. 10-year Treasury and the 2-year Treasury inverted for the first time in over a decade. After several months of concern, the yield curve steepened in November following a sharp shift in sentiment, with all maturities moving out of inversion territory. Geopolitics also contributed to market volatility. Following a coordinated drone strike on Saudi Arabia in the third quarter, Brent crude oil prices increased 20% in one trading session. Despite the record increase, oil prices retracted their gains within weeks. Investor sentiment was buoyed in November as the market grew optimistic about the possibility of a “Phase One” trade deal between the U.S. and China, which was ultimately reached in December. The agreement included structural reforms to China’s trade regime in areas such as intellectual property and agriculture, as well as a commitment from China to make additional purchases of U.S. goods and services moving forward. In return, the U.S. would not proceed with tariffs that were scheduled to go into effect in December on nearly $160 billion worth of Chinese goods and would cut the tariff rate imposed on 1 September 2019 on $120 billion worth of Chinese goods, from 15% to 7.5%. Despite bouts of volatility arising from U.S.-China trade tensions, risk assets generally rallied during the 12-months ended 31 January 2020, primarily due to the dovish comments from central banks around the globe, culminating in the longest U.S. economic expansion on record. Credit sectors performed exceptionally well, with investment grade bonds benefiting from a sizeable decline in spreads along with a sharp downward shift in the yield curve. Additionally, high yield bonds produced positive returns following weakness in late 2018. High yield performance was characterized by a sharp up-in-quality bias, as the “CCC” segment underperformed. The energy sector also dragged on high yield performance, which we believe was due largely to idiosyncratic issues within select industries. Consistent with its strategic design, the Fund maintained exposure to a variety of short maturity, investment grade bond market sectors beyond the U.S. Treasury Bills represented in the benchmark. This design allows for the flexibility to take advantage of the opportunity for higher income and potential total return versus money market funds or other short term government related securities. The primary factors contributing to the Fund’s performance during the period were allocations to investment grade bonds with floating rate coupons, asset-backed securities, and commercial paper. These securities offered higher yields than U.S. Treasury Bills, and, given that they were primarily floating rate securities with very short maturities, they were able to generate positive total returns and higher yields, as short-term rates rose during the period. There were no major detractors to relative performance during the period. The Fund’s portfolio is actively managed and, therefore, its holdings and the weightings of a particular issuer or particular sector as a percentage of portfolio assets are subject to change. Sectors may include many industries. 1 The ICE BofAML Lynch U.S. Treasury Bill Index tracks the performance of US dollar denominated sovereign debt publicly issued by the U.S. government in its domestic market. Qualifying securities must have at least one year remaining term to final maturity, a fixed coupon schedule and a minimum amount outstanding of $1 billion.
25

LORD ABBETT PASSPORT PORTFOLIOS PLC
INVESTMENT MANAGER’S REPORT HIGH YIELD CORE FUND
For the period 5 March 2019 (the Fund’s inception) to 31 January 2020, the Fund returned 7.40%, reflecting performance at the net asset value (NAV) of Class I accumulating shares (USD), compared to its benchmark, the ICE BofA Merrill Lynch U.S. High Yield Constrained Index1, which returned 6.33% over the same period.
The trailing 12-month period was characterized by several market-moving events. Trade tensions continued to dominate headlines, as trade negotiations between the U.S. and China remained volatile throughout 2019. One of the more notable shifts over the year was the U.S. Federal Reserve’s (the “Fed”) transition to a more dovish policy stance, with Chairman Jerome Powell stating that the Fed would act appropriately to sustain economic growth. The combination of a dovish Fed, trade pressures, and slowing economic growth resulted in a downward shift in the U.S. Treasury yield curve.
Despite bouts of volatility arising from U.S.-China trade tensions, risk assets rallied during the 12-months ended 31 January 2020, primarily due to the dovish comments from central banks around the globe, culminating in the longest U.S. economic expansion on record. Credit sectors performed exceptionally well, with investment grade bonds benefiting from a sizeable decline in spreads along with a sharp downward shift in the yield curve. Additionally, high yield bonds produced positive returns following weakness in late 2018. High yield performance was characterized by a sharp up-in-quality bias, as the CCC segment underperformed. The CCC tier was adversely affected during the year by idiosyncratic weakness in select industries along with overall investor hesitation to enter the space given late cycle concerns and a strong preference for perceived quality and liquidity. The energy sector dragged on high yield performance, which we believe was due largely to idiosyncratic issues within select industries.
Among the largest contributors to the Fund’s relative performance during the period was security selection in the energy and basic industry sectors. While the Fund’s overweight allocation to the ‘CCC’ tier detracted from relative performance, security selection within the segment, and particularly the Fund’s allocation to select luxury automakers, contributed to relative performance. Among the largest detractors from the Fund’s relative performance during the period was the Fund’s modest allocation to foreign sovereign debt, and more specifically the Republic of Argentina. The Fund’s underweight to ‘BB’ rated issues also detracted from relative performance as the credit tier rallied over the period.
The Fund’s portfolio is actively managed and, therefore, its holdings and the weightings of a particular issuer or particular sector as a percentage of portfolio assets are subject to change. Sectors may include many industries.
1 The ICE BofA Merrill Lynch U.S. High Yield Constrained Index is a capitalization weighted index of all U.S. dollar denominated below investment grade corporate debt publicly issued in the U.S. domestic market.
26

LORD ABBETT PASSPORT PORTFOLIOS PLC SHORT DURATION INCOME FUND Schedule of Investments as at 31 January 2020
,
Interest Maturity PrincipalFair
Value % of Net Investments Rate Date (000) USD Assets Asset-Backed Securities - 44.63% (31 January 2019: 50.36%) Auto Floor Plan Ally Master Owner Trust 2017-3 Class A2 2.04% 15/06/2022 16,356 16,371,831 0.41% Ally Master Owner Trust 2018-4 Class A 3.30% 17/07/2023 9,187 9,394,147 0.23% Ford Credit Floorplan Master Owner Trust A 2017-2 Class A1 2.16% 15/09/2022 17,857 17,899,096 0.45% NextGear Floorplan Master Owner Trust 2017-1A Class A2(1) 2.54% 18/04/2022 9,100 9,111,447 0.23% NextGear Floorplan Master Owner Trust 2017-2A Class A2(1) 2.56% 17/10/2022 1,060 1,065,735 0.03% NextGear Floorplan Master Owner Trust 2018-2A Class A2(1) 3.69% 15/10/2023 11,128 11,502,159 0.29% NextGear Floorplan Master Owner Trust 2018-2A Class B(1) 4.01% 15/10/2023 951 977,287 0.02% Nissan Master Owner Trust Receivables 2017-B Class A 2.106%(2) 18/04/2022 2,179 2,180,368 0.05% 68,502,070 1.71% Automobile ACC Trust 2018-1 Class A(1) 3.70% 21/12/2020 1 1,156 0.00% American Credit Acceptance Receivables Trust 2018-2 Class B(1) 3.46% 10/08/2022 2,210 2,210,979 0.06% AmeriCredit Automobile Receivables 2016-1 Class D 3.59% 08/02/2022 1,651 1,664,643 0.04% AmeriCredit Automobile Receivables Trust 2015-3 Class D 3.34% 08/08/2021 9,382 9,383,919 0.23% AmeriCredit Automobile Receivables Trust 2016-2 Class C 2.87% 08/11/2021 2,306 2,310,932 0.06% AmeriCredit Automobile Receivables Trust 2016-2 Class D 3.65% 09/05/2022 2,877 2,906,839 0.07% AmeriCredit Automobile Receivables Trust 2016-3 Class B 1.80% 08/10/2021 729 729,276 0.02% AmeriCredit Automobile Receivables Trust 2016-3 Class D 2.71% 08/09/2022 2,493 2,512,563 0.06% Americredit Automobile Receivables Trust 2016-4 Class B 1.83% 08/12/2021 1,685 1,684,502 0.04% AmeriCredit Automobile Receivables Trust 2017-2 Class B 2.40% 18/05/2022 3,533 3,541,893 0.09% AmeriCredit Automobile Receivables Trust 2017-2 Class C 2.97% 20/03/2023 1,674 1,695,624 0.04% AmeriCredit Automobile Receivables Trust 2017-3 Class B 2.24% 19/06/2023 824 826,913 0.02% AmeriCredit Automobile Receivables Trust 2017-4 Class A3 2.04% 18/07/2022 1,556 1,557,053 0.04% AmeriCredit Automobile Receivables Trust 2017-4 Class B 2.36% 19/12/2022 1,253 1,260,095 0.03% Avid Automobile Receivables Trust 2018-1 Class A(1) 2.84% 15/08/2023 349 349,919 0.01% Avis Budget Rental Car Funding AESOP LLC 2015-2A Class A(1) 2.63% 20/12/2021 9,443 9,490,400 0.24% Bank of The West Auto Trust 2017-1 Class A3(1) 2.11% 15/01/2023 3,395 3,403,341 0.08% Bank of The West Auto Trust 2017-1 Class A4(1) 2.33% 15/09/2023 712 715,808 0.02% Bank of The West Auto Trust 2018-1 Class A4(1) 3.59% 15/12/2023 15,474 15,947,436 0.40% California Republic Auto Receivables Trust 2015-3 Class A4 2.13% 17/05/2021 8 7,620 0.00%
27

LORD ABBETT PASSPORT PORTFOLIOS PLC SHORT DURATION INCOME FUND Schedule of Investments as at 31 January 2020 (Continued)
Interest Maturity PrincipalFair
Value % of Net Investments Rate Date (000) USD Assets Asset-Backed Securities - 44.63% (31 January 2019: 50.36%) (Continued) Automobile (continued) California Republic Auto Receivables Trust 2015-4 Class A4(1) 2.58% 15/06/2021 35 35,118 0.00% California Republic Auto Receivables Trust 2015-4 Class B(1) 3.73% 15/11/2021 264 264,919 0.01% California Republic Auto Receivables Trust 2016-1 Class A4 2.24% 15/10/2021 294 294,216 0.01% California Republic Auto Receivables Trust 2016-2 Class A4 1.83% 15/12/2021 106 106,428 0.00% California Republic Auto Receivables Trust 2018-1 Class A3 3.14% 15/08/2022 2,014 2,026,490 0.05% Capital Auto Receivables Asset Trust 2017-1 Class A3(1) 2.02% 20/08/2021 175 175,074 0.00% Capital Auto Receivables Asset Trust 2017-1 Class A4(1) 2.22% 21/03/2022 489 490,092 0.01% Capital Auto Receivables Asset Trust 2018-1 Class A3(1) 2.79% 20/01/2022 2,883 2,891,642 0.07% Capital Auto Receivables Asset Trust 2018-2 Class A2(1) 3.02% 22/02/2021 1,120 1,121,332 0.03% Capital Auto Receivables Asset Trust 2018-2 Class A3(1) 3.27% 20/06/2023 2,222 2,239,404 0.06% Carmax Auto Owner Trust 2016-3 Class A3 1.39% 17/05/2021 51 51,322 0.00% Carmax Auto Owner Trust 2016-3 Class A4 1.60% 18/01/2022 412 411,607 0.01% CarMax Auto Owner Trust 2016-4 Class A3 1.40% 15/08/2021 113 112,566 0.00% CarMax Auto Owner Trust 2016-4 Class A4 1.60% 15/06/2022 397 396,794 0.01% CarMax Auto Owner Trust 2017-3 Class A4 2.22% 15/11/2022 916 923,410 0.02% CarMax Auto Owner Trust 2017-3 Class B 2.44% 15/02/2023 483 487,992 0.01% CarMax Auto Owner Trust 2017-3 Class C 2.72% 15/05/2023 589 594,439 0.01% Chesapeake Funding II LLC 2017-2A Class A1(1) 1.99% 15/05/2029 826 826,291 0.02% Chesapeake Funding II LLC 2017-3A Class A1(1) 1.91% 15/08/2029 1,931 1,931,071 0.05% Chesapeake Funding II LLC 2017-4A Class A1(1) 2.12% 15/11/2029 1,986 1,989,357 0.05% CPS Auto Receivables Trust 2016-B Class D(1) 6.58% 15/03/2022 220 227,241 0.01% CPS Auto Receivables Trust 2017-D Class B(1) 2.43% 18/01/2022 53 53,384 0.00% CPS Auto Receivables Trust 2017-D Class D(1) 3.73% 15/09/2023 326 332,147 0.01% Drive Auto Receivables Trust 2016-B Class D(1) 4.53% 15/08/2023 722 729,735 0.02% Drive Auto Receivables Trust 2016-C Class D(1) 4.18% 15/03/2024 495 501,696 0.01% Drive Auto Receivables Trust 2017-2 Class C 2.75% 15/09/2023 12 12,039 0.00% Drive Auto Receivables Trust 2017-2 Class D 3.49% 15/09/2023 4,976 5,018,350 0.13% Drive Auto Receivables Trust 2017-2 Class E 5.27% 15/11/2024 5,881 6,058,489 0.15% Drive Auto Receivables Trust 2017-3 Class D(1) 3.53% 15/12/2023 2,576 2,603,426 0.06% Drive Auto Receivables Trust 2017-A Class D(1) 4.16% 15/05/2024 596 605,203 0.02% Drive Auto Receivables Trust 2017-B Class D(1) 3.72% 17/10/2022 467 468,585 0.01% Drive Auto Receivables Trust 2017-B Class E(1) 5.30% 15/07/2024 4,000 4,120,886 0.10% Drive Auto Receivables Trust 2018-1 Class C 3.22% 15/03/2023 6,398 6,413,602 0.16% Drive Auto Receivables Trust 2018-2 Class C 3.63% 15/08/2024 8,559 8,613,978 0.22% Drive Auto Receivables Trust 2018-2 Class D 4.14% 15/08/2024 17,403 17,910,969 0.45% Drive Auto Receivables Trust 2018-3 Class B 3.37% 15/09/2022 285 285,083 0.01% Drive Auto Receivables Trust 2018-3 Class C 3.72% 16/09/2024 4,229 4,265,731 0.11% Drive Auto Receivables Trust 2018-3 Class D 4.30% 16/09/2024 8,989 9,281,364 0.23% Drive Auto Receivables Trust 2018-4 Class B 3.36% 17/10/2022 767 767,769 0.02% Drive Auto Receivables Trust 2018-4 Class C 3.66% 15/11/2024 13,838 14,004,532 0.35% Drive Auto Receivables Trust 2018-4 Class D 4.09% 15/01/2026 10,912 11,257,096 0.28% Drive Auto Receivables Trust 2018-5 Class C 3.99% 15/01/2025 2,342 2,392,486 0.06% Drive Auto Receivables Trust 2018-5 Class D 4.30% 15/04/2026 7,779 8,117,457 0.20%
28

LORD ABBETT PASSPORT PORTFOLIOS PLC SHORT DURATION INCOME FUND Schedule of Investments as at 31 January 2020 (Continued)
Interest Maturity PrincipalFair
Value % of Net Investments Rate Date (000) USD Assets Asset-Backed Securities - 44.63% (31 January 2019: 50.36%) (Continued) Automobile (continued) Exeter Automobile Receivables Trust 2017-3 Class B(1) 2.81% 15/09/2022 1,155 1,159,295 0.03% Exeter Automobile Receivables Trust 2018-3 Class C(1) 3.71% 15/06/2023 14,280 14,497,797 0.36% First Investors Auto Owner Trust 2018-1 Class B(1) 3.51% 15/05/2023 395 400,066 0.01% First Investors Auto Owner Trust 2018-2 Class C(1) 4.03% 15/01/2025 434 450,256 0.01% First Investors Auto Owner Trust 2018-2 Class D(1) 4.28% 15/01/2025 276 288,418 0.01% Flagship Credit Auto Trust 2017-3 Class A(1) 1.88% 15/10/2021 14 14,409 0.00% Flagship Credit Auto Trust 2017-3 Class B(1) 2.59% 15/07/2022 915 916,816 0.02% Flagship Credit Auto Trust 2017-4 Class A(1) 2.07% 15/04/2022 311 311,025 0.01% Ford Credit Auto Lease Trust 2017-B Class A4 2.17% 15/02/2021 5,411 5,411,739 0.14% Ford Credit Auto Owner Trust 2015-REV2 2015-2 Class A(1) 2.44% 15/01/2027 7,732 7,753,029 0.19% Ford Credit Auto Owner Trust 2016-C Class B 1.73% 15/03/2022 10,000 9,993,725 0.25% Ford Credit Auto Owner Trust 2016-REV2 2016-2 Class A(1) 2.03% 15/12/2027 1,987 2,000,323 0.05% Ford Credit Auto Owner Trust 2017-REV2 2017-2 Class A(1) 2.36% 15/03/2029 1,838 1,871,295 0.05% Ford Credit Auto Owner Trust 2018-REV2 2018-2 Class A(1) 3.47% 15/01/2030 6,806 7,233,102 0.18% Foursight Capital Automobile Receivables Trust 2016-1 Class A2(1) 2.87% 15/10/2021 83 83,085 0.00% Foursight Capital Automobile Receivables Trust 2018-1 Class D(1) 4.19% 15/11/2023 1,000 1,032,178 0.03% Foursight Capital Automobile Receivables Trust 2018-1 Class E(1) 5.56% 16/01/2024 1,000 1,045,360 0.03% GM Financial Automobile Leasing Trust 2017-2 Class B 2.43% 21/06/2021 667 667,158 0.02% Hyundai Auto Receivables Trust 2016-B Class C 2.19% 15/11/2022 2,160 2,172,525 0.05% Hyundai Auto Receivables Trust 2017-A Class C 2.53% 15/11/2023 6,167 6,224,278 0.16% Nissan Auto Lease Trust 2017-B Class A3 2.05% 15/09/2020 2 1,652 0.00% Santander Drive Auto Receivables Trust 2015-5 Class D 3.65% 15/12/2021 265 265,058 0.01% Santander Drive Auto Receivables Trust 2016-1 Class D 4.02% 15/04/2022 333 334,945 0.01% Santander Drive Auto Receivables Trust 2017-1 Class D 3.17% 17/04/2023 8,525 8,611,247 0.22% Santander Drive Auto Receivables Trust 2017-1 Class E(1) 5.05% 15/07/2024 2,735 2,814,226 0.07% Santander Drive Auto Receivables Trust 2017-2 Class C 2.79% 15/08/2022 995 996,569 0.02% Santander Drive Auto Receivables Trust 2017-2 Class D 3.49% 17/07/2023 2,368 2,401,854 0.06% Santander Drive Auto Receivables Trust 2017-3 Class C 2.76% 15/12/2022 546 547,792 0.01% Santander Drive Auto Receivables Trust 2018-2 Class C 3.35% 17/07/2023 18,660 18,882,840 0.47% Santander Drive Auto Receivables Trust 2018-3 Class B 3.29% 17/10/2022 2,025 2,031,033 0.05% Santander Drive Auto Receivables Trust 2018-3 Class C 3.51% 15/08/2023 867 877,013 0.02% Santander Drive Auto Receivables Trust 2018-4 Class C 3.56% 15/07/2024 21,811 22,177,499 0.55%
29

LORD ABBETT PASSPORT PORTFOLIOS PLC SHORT DURATION INCOME FUND Schedule of Investments as at 31 January 2020 (Continued)
Interest Maturity PrincipalFair
Value % of Net Investments Rate Date (000) USD Assets Asset-Backed Securities - 44.63% (31 January 2019: 50.36%) (Continued) Automobile (continued) Santander Drive Auto Receivables Trust 2018-5 Class B 3.52% 15/12/2022 2,354 2,367,610 0.06% Santander Drive Auto Receivables Trust 2018-5 Class C 3.81% 16/12/2024 2,181 2,217,779 0.06% TCF Auto Receivables Owner Trust 2015-2 Class B(1) 3.00% 15/09/2021 32 31,960 0.00% TCF Auto Receivables Owner Trust 2015-2 Class C(1) 3.75% 15/12/2021 84 84,047 0.00% TCF Auto Receivables Owner Trust 2015-2 Class D(1) 4.24% 15/08/2022 3,718 3,720,908 0.09% TCF Auto Receivables Owner Trust 2016-1 Class A4(1) 2.03% 15/02/2022 517 517,110 0.01% TCF Auto Receivables Owner Trust 2016-1 Class B(1) 2.32% 15/06/2022 734 735,153 0.02% TCF Auto Receivables Owner Trust 2016-1 Class C(1) 2.51% 15/09/2022 185 185,177 0.00% TCF Auto Receivables Owner Trust 2016-1 Class D(1) 3.50% 17/07/2023 6,989 7,025,569 0.18% TCF Auto Receivables Owner Trust 2016-PT1 Class A(1) 1.93% 15/06/2022 233 233,408 0.01% TCF Auto Receivables Owner Trust 2016-PT1 Class D(1) 4.20% 15/04/2024 6,989 7,093,098 0.18% Toyota Auto Receivables 2018-A Owner Trust Class A3 2.35% 16/05/2022 2,640 2,650,488 0.07% Westlake Automobile Receivables Trust 2018-1 Class C(1) 2.92% 15/05/2023 4,069 4,077,651 0.10% Westlake Automobile Receivables Trust 2018-3 Class A2A(1) 2.98% 18/01/2022 1,420 1,423,596 0.04% World Omni Auto Receivables Trust 2017-A Class A3 1.93% 15/09/2022 417 416,926 0.01% World Omni Auto Receivables Trust 2018-D Class A4 3.44% 16/12/2024 3,997 4,201,361 0.10% World Omni Auto Receivables Trust 2018-D Class B 3.67% 16/12/2024 1,350 1,428,251 0.04% World Omni Automobile Lease Securitization Trust 2017-A Class B 2.48% 15/08/2022 179 178,684 0.00% World Omni Select Auto Trust 2018-1 Class B(1) 3.68% 15/07/2023 465 473,512 0.01% World Omni Select Auto Trust 2018-1 Class D(1) 4.13% 15/01/2025 1,639 1,695,547 0.04% 347,837,165 8.69% Commercial Mortgage-Backed A10 Bridge Asset Financing 2015-A LLC Class A1(1) 3.30% 15/05/2036 978 979,477 0.02% Americold 2010 LLC 2010-ARTA Class A1(1) 3.847% 14/01/2029 72 72,570 0.00% Americold 2010 LLC 2010-ARTA Class A2FX(1) 4.954% 14/01/2029 1,170 1,185,543 0.03% AOA 2015-1177 Mortgage Trust Class A(1) 2.957% 13/12/2029 625 632,169 0.02% AREIT 2018-CRE2 Trust Class A(1) 2.65%(2) 14/11/2035 11,500 11,493,544 0.29% Atrium Hotel Portfolio Trust 2017-ATRM Class A(1) 2.606%(2) 15/12/2036 15,260 15,280,921 0.38% Atrium Hotel Portfolio Trust 2017-ATRM Class B(1) 3.176%(2) 15/12/2036 1,297 1,299,231 0.03% Aventura Mall Trust 2013-AVM Class A(1) 3.867%(2) 05/12/2032 1,165 1,172,222 0.03% Aventura Mall Trust 2013-AVM Class C(1) 3.867%(2) 05/12/2032 1,825 1,836,314 0.05% Aventura Mall Trust 2013-AVM Class D(1) 3.867%(2) 05/12/2032 500 503,100 0.01%
30

LORD ABBETT PASSPORT PORTFOLIOS PLC SHORT DURATION INCOME FUND Schedule of Investments as at 31 January 2020 (Continued)
Interest Maturity PrincipalFair
Value % of Net Investments Rate Date (000) USD Assets Asset-Backed Securities - 44.63% (31 January 2019: 50.36%) (Continued) Commercial Mortgage-Backed (continued) BAMLL Commercial Mortgage Securities Trust 2013-WBRK Class A(1) 3.652%(2) 10/03/2037 4,100 4,324,414 0.11% BAMLL Trust 2011-FSHN Class A(1) 4.42% 11/07/2033 1,830 1,869,866 0.05% Banc of America Commercial Mortgage Trust 2016-UBS10 Class XA 2.123%(2) 15/07/2049 1,532 117,977 0.00% Bancorp Commercial Mortgage 2018-CRE3 Trust Class A(1) 2.526%(2) 15/01/2033 847 847,627 0.02% BANK 2018-BNK15 Class XA 0.58%(2) 15/11/2061 61,887 1,979,809 0.05% BBCMS 2017-DELC Mortgage Trust Class A(1) 2.526%(2) 15/08/2036 1,365 1,363,259 0.03% BBCMS 2018-TALL Mortgage Trust Class A(1) 2.398%(2) 15/03/2037 1,980 1,977,738 0.05% BBCMS 2018-TALL Mortgage Trust Class E(1) 4.113%(2) 15/03/2037 2,343 2,363,228 0.06% BBCMS Trust 2013-TYSN Class A2(1) 3.756% 05/09/2032 4,717 4,744,876 0.12% BBCMS Trust 2013-TYSN Class C(1) 3.821% 05/09/2032 250 251,177 0.01% BBCMS Trust 2015-MSQ Class A(1) 3.593% 15/09/2032 713 739,372 0.02% BBCMS Trust 2015-STP Class XB(1) 0.286%(2) 10/09/2028 20,500 16,810 0.00% BBCMS Trust 2015-VFM Class A1(1) 2.466% 10/03/2036 545 552,264 0.01% BB-UBS Trust 2012-SHOW Class A(1) 3.43% 05/11/2036 21,514 22,835,317 0.57% BB-UBS Trust 2012-TFT Class A(1) 2.892% 05/06/2030 1,644 1,644,702 0.04% BB-UBS Trust 2012-TFT Class B(1) 3.584%(2) 05/06/2030 661 658,846 0.02% BB-UBS Trust 2012-TFT Class C(1) 3.584%(2) 05/06/2030 150 149,369 0.00% BDS 2018-FL1 Class A(1) 2.519%(2) 15/01/2035 6,475 6,481,131 0.16% BDS 2018-FL2 Class A(1) 2.619%(2) 15/08/2035 2,236 2,239,598 0.06% BWAY 2013-1515 Mortgage Trust Class A2(1) 3.454% 10/03/2033 5,000 5,348,473 0.13% BWAY 2015-1740 Mortgage Trust Class A(1) 2.917% 10/01/2035 175 180,282 0.00% BX Commercial Mortgage Trust 2018-BIOA Class A(1) 2.347%(2) 15/03/2037 5,836 5,838,497 0.15% BX Trust 2017-APPL Class D(1) 3.726%(2) 15/07/2034 808 809,981 0.02% BX Trust 2017-APPL Class E(1) 4.826%(2) 15/07/2034 1,180 1,186,894 0.03% BX Trust 2017-SLCT Class C(1) 3.076%(2) 15/07/2034 287 286,924 0.01% BX Trust 2017-SLCT Class D(1) 3.726%(2) 15/07/2034 2,674 2,679,629 0.07% BX Trust 2017-SLCT Class E(1) 4.826%(2) 15/07/2034 2,023 2,035,164 0.05% BX Trust 2017-SLCT Class XCP(1) ZCP(2) 15/07/2018 157,794 1,578 0.00% BX Trust 2018-BILT Class A(1) 2.476%(2) 15/05/2030 1,264 1,261,840 0.03% BX Trust 2018-BILT Class D(1) 3.446%(2) 15/05/2030 526 527,457 0.01% BX Trust 2018-GW Class A(1) 2.476%(2) 15/05/2035 972 971,555 0.02% BX Trust 2018-GW Class D(1) 3.446%(2) 15/05/2035 711 713,412 0.02% BXP Trust 2017-CQHP Class A(1) 2.526%(2) 15/11/2034 1,263 1,260,183 0.03% CCRESG Commercial Mortgage Trust 2016-HEAT Class B(1) 4.114% 10/04/2029 2,200 2,228,920 0.06% CCRESG Commercial Mortgage Trust 2016-HEAT Class C(1) 4.919% 10/04/2029 1,700 1,731,284 0.04% CD 2016-CD1 Mortgage Trust Class XA 1.541%(2) 10/08/2049 745 53,025 0.00% CFCRE Commercial Mortgage Trust 2011-C2 Class AJ(1) 5.933%(2) 15/12/2047 239 249,777 0.01% CFCRE Commercial Mortgage Trust 2016-C6 Class XA 1.302%(2) 10/11/2049 3,380 212,215 0.01% CFCRE Commercial Mortgage Trust 2016-C7 Class XA 0.882%(2) 10/12/2054 3,453 149,061 0.00% CFCRE Commercial Mortgage Trust 2018-TAN Class A(1) 4.236% 15/02/2033 14,164 14,997,636 0.37% CGRBS Commercial Mortgage Trust 2013-VN05 Class A(1) 3.369% 13/03/2035 2,610 2,726,541 0.07% Cherrywood SB Commercial Mortgage Loan Trust 2016-1 Class AFX(1) 3.73% 25/03/2049 69 69,611 0.00%
31

LORD ABBETT PASSPORT PORTFOLIOS PLC SHORT DURATION INCOME FUND Schedule of Investments as at 31 January 2020 (Continued)
Interest Maturity PrincipalFair
Value % of Net Investments Rate Date (000) USD Assets Asset-Backed Securities - 44.63% (31 January 2019: 50.36%) (Continued) Commercial Mortgage-Backed (continued) CHT 2017-COSMO Mortgage Trust Class A(1) 2.606%(2) 15/11/2036 12,437 12,461,232 0.31% CHT 2017-COSMO Mortgage Trust Class B(1) 3.076%(2) 15/11/2036 8,350 8,369,247 0.21% CHT 2017-COSMO Mortgage Trust Class C(1) 3.176%(2) 15/11/2036 10,700 10,728,060 0.27% CHT 2017-COSMO Mortgage Trust Class D(1) 3.926%(2) 15/11/2036 1,000 1,003,516 0.03% Citigroup Commercial Mortgage Trust 2012-GC8 Class A4 3.024% 10/09/2045 7,917 8,123,955 0.20% Citigroup Commercial Mortgage Trust 2013-375P Class A(1) 3.251% 10/05/2035 8,618 8,981,964 0.22% Citigroup Commercial Mortgage Trust 2013-375P Class B(1) 3.635%(2) 10/05/2035 12,932 13,431,806 0.34% Citigroup Commercial Mortgage Trust 2013-375P Class C(1) 3.635%(2) 10/05/2035 3,790 3,912,517 0.10% Citigroup Commercial Mortgage Trust 2014-GC21 Class XA 1.342%(2) 10/05/2047 3,356 144,818 0.00% Citigroup Commercial Mortgage Trust 2014-GC23 Class XB 0.309%(2) 10/07/2047 2,000 20,108 0.00% Citigroup Commercial Mortgage Trust 2015-GC27 Class AAB 2.944% 10/02/2048 179 183,419 0.00% Citigroup Commercial Mortgage Trust 2015-GC27 Class XA 1.511%(2) 10/02/2048 1,367 74,455 0.00% Citigroup Commercial Mortgage Trust 2015-GC33 Class A3 3.515% 10/09/2058 16,768 18,092,246 0.45% Citigroup Commercial Mortgage Trust 2015-GC35 Class XA 1.002%(2) 10/11/2048 4,842 159,703 0.00% Citigroup Commercial Mortgage Trust 2016-GC36 Class XA 1.431%(2) 10/02/2049 1,496 90,651 0.00% CityLine Commercial Mortgage Trust 2016-CLNE Class A(1) 2.871%(2) 10/11/2031 9,087 9,345,475 0.23% COMM 2010-C1 Mortgage Trust Class D(1) 6.264%(2) 10/07/2046 348 353,006 0.01% COMM 2012-CCRE3 Mortgage Trust Class AM(1) 3.416% 15/10/2045 251 258,176 0.01% COMM 2012-CCRE3 Mortgage Trust Class B(1) 3.922% 15/10/2045 4,600 4,730,352 0.12% COMM 2012-CCRE5 Mortgage Trust Class AM(1) 3.223% 10/12/2045 744 769,162 0.02% COMM 2013-CCRE11 Mortgage Trust Class A3 3.983% 10/08/2050 1,522 1,631,068 0.04% COMM 2013-CCRE6 Mortgage Trust Class A4 3.101% 10/03/2046 1,633 1,689,880 0.04% COMM 2013-CCRE7 Mortgage Trust Class A4 3.213% 10/03/2046 742 770,072 0.02% COMM 2013-CCRE8 Mortgage Trust Class A5 3.612%(2) 10/06/2046 511 539,742 0.01% COMM 2013-CCRE9 Mortgage Trust Class A3 4.022% 10/07/2045 903 965,472 0.02% COMM 2013-CCRE9 Mortgage Trust Class A4 4.363%(2) 10/07/2045 216 232,965 0.01% COMM 2013-GAM Class A2(1) 3.367% 10/02/2028 2,236 2,249,073 0.06% COMM 2013-SFS Mortgage Trust Class A1(1) 1.873% 12/04/2035 574 573,410 0.01% COMM 2013-WWP Mortgage Trust Class D(1) 3.898% 10/03/2031 605 642,559 0.02% COMM 2014-CCRE17 Mortgage Trust Class A4 3.70% 10/05/2047 9,719 10,387,505 0.26% COMM 2014-CCRE17 Mortgage Trust Class A5 3.977% 10/05/2047 1,600 1,734,599 0.04% COMM 2014-CCRE18 Mortgage Trust Class A5 3.828% 15/07/2047 1,928 2,079,211 0.05% COMM 2014-CCRE19 Mortgage Trust Class A4 3.532% 10/08/2047 835 886,069 0.02% COMM 2014-CCRE19 Mortgage Trust Class A5 3.796% 10/08/2047 2,000 2,158,629 0.05% COMM 2014-CCRE19 Mortgage Trust Class XA 1.19%(2) 10/08/2047 6,025 222,335 0.01% COMM 2014-CCRE21 Mortgage Trust Class XA 1.017%(2) 10/12/2047 1,199 42,487 0.00% COMM 2014-FL5 Mortgage Trust Class B(1) 3.126%(2) 15/10/2031 37 37,152 0.00% COMM 2014-LC15 Mortgage Trust Class A3 3.727% 10/04/2047 2,986 3,186,194 0.08% COMM 2014-LC15 Mortgage Trust Class A4 4.006% 10/04/2047 1,220 1,316,536 0.03% COMM 2014-LC17 Mortgage Trust Class XB(1) 0.133%(2) 10/10/2047 43,399 152,743 0.00% COMM 2014-UBS3 Mortgage Trust Class A4 3.819% 10/06/2047 3,448 3,708,928 0.09% COMM 2014-UBS5 Mortgage Trust Class A4 3.838% 10/09/2047 7,129 7,643,215 0.19%
32

LORD ABBETT PASSPORT PORTFOLIOS PLC SHORT DURATION INCOME FUND Schedule of Investments as at 31 January 2020 (Continued)
Interest Maturity PrincipalFair
Value % of Net Investments Rate Date (000) USD Assets Asset-Backed Securities - 44.63% (31 January 2019: 50.36%) (Continued) Commercial Mortgage-Backed (continued) COMM 2014-UBS5 Mortgage Trust Class XA 1.029%(2) 10/09/2047 1,950 61,068 0.00% COMM 2014-UBS5 Mortgage Trust Class XB1(1) 0.251%(2) 10/09/2047 61,736 432,294 0.01% COMM 2015-3BP Mortgage Trust Class A(1) 3.178% 10/02/2035 13,261 14,081,054 0.35% COMM 2015-CCRE23 Mortgage Trust Class CMC(1) 3.807%(2) 10/05/2048 200 200,153 0.00% COMM 2015-CCRE25 Mortgage Trust Class A3 3.505% 10/08/2048 5,596 6,001,052 0.15% COMM 2015-LC19 Mortgage Trust Class A4 3.183% 10/02/2048 16,495 17,485,960 0.44% COMM 2015-LC21 Mortgage Trust Class A3 3.445% 10/07/2048 6,856 7,363,301 0.18% COMM 2015-LC21 Mortgage Trust Class A4 3.708% 10/07/2048 8,630 9,389,040 0.23% COMM 2015-PC1 Mortgage Trust Class A5 3.902% 10/07/2050 5,000 5,483,938 0.14% COMM 2015-PC1 Mortgage Trust Class XA(1) 0.809%(2) 10/07/2050 2,233 56,048 0.00% COMM 2016-COR1 Mortgage Trust Class A2 2.499% 10/10/2049 286 288,078 0.01% COMM 2016-GCT Mortgage Trust Class D(1) 3.577%(2) 10/08/2029 200 201,873 0.01% COMM 2016-GCT Mortgage Trust Class E(1) 3.577%(2) 10/08/2029 150 150,303 0.00% COMM 2016-GCT Mortgage Trust Class XA(1) 0.784% 10/08/2029 20,000 176,500 0.00% COMM 2017-PANW Mortgage Trust Class A(1) 3.244% 10/10/2029 2,105 2,207,399 0.06% COMM 2017-PANW Mortgage Trust Class D(1) 4.343%(2) 10/10/2029 6,645 6,882,856 0.17% Commercial Mortgage Pass Through Certificates 2012-LTRT Class A1(1) 2.15% 05/10/2030 522 520,851 0.01% Commercial Mortgage Pass Through Certificates 2012-LTRT Class A2(1) 3.40% 05/10/2030 1,535 1,566,159 0.04% Commercial Mortgage Trust 2006-GG7 Class AM 5.807%(2) 10/07/2038 353 355,446 0.01% Csail 2015-C2 Commercial Mortgage Trust Class ASB 3.224% 15/06/2057 354 365,185 0.01% CSAIL 2015-C4 Commercial Mortgage Trust Class A2 3.157% 15/11/2048 130 130,409 0.00% CSAIL 2016-C5 Commercial Mortgage Trust Class XB 0.266%(2) 15/11/2048 38,965 474,204 0.01% CSAIL 2016-C6 Commercial Mortgage Trust Class XA 2.062%(2) 15/01/2049 2,860 242,795 0.01% CSAIL 2018-C14 Commercial Mortgage Trust Class A2 4.261% 15/11/2051 2,351 2,523,827 0.06% CSMC 2014-USA OA LLC Class A1(1) 3.304% 15/09/2037 18,000 18,502,214 0.46% CSMC 2014-USA OA LLC Class A2(1) 3.953% 15/09/2037 9,015 9,749,277 0.24% CSMC 2014-USA OA LLC Class X1(1) 0.697%(2) 15/09/2037 37,496 977,783 0.02% CSMC 2017-HD Trust Class A(1) 2.626%(2) 15/02/2031 1,240 1,239,569 0.03% CSMC 2017-HD Trust Class B(1) 3.026%(2) 15/02/2031 407 406,648 0.01% CSMC 2017-HD Trust Class D(1) 4.176%(2) 15/02/2031 413 412,158 0.01% CSMC 2017-HD Trust Class E(1) 5.326%(2) 15/02/2031 534 533,110 0.01% CSMC Trust 2016-NXSR Class XB 0.254%(2) 15/12/2049 18,777 288,097 0.01% CSMC Trust 2017-LSTK Class A(1) 2.761% 05/04/2033 4,530 4,549,311 0.11% CSMC Trust 2017-LSTK Class B(1) 3.03% 05/04/2033 425 426,931 0.01% CSMC Trust 2017-LSTK Class C(1) 3.229% 05/04/2033 250 250,336 0.01% CSMC Trust 2017-LSTK Class D(1) 3.442%(2) 05/04/2033 325 325,435 0.01% CSMC Trust 2017-MOON Class A(1) 3.196% 10/07/2034 1,692 1,742,138 0.04% CSMC Trust 2017-MOON Class B(1) 3.303%(2) 10/07/2034 300 306,974 0.01% CSMC Trust 2017-MOON Class C(1) 3.303%(2) 10/07/2034 3,092 3,143,380 0.08% CSMC Trust 2017-MOON Class D(1) 3.303%(2) 10/07/2034 500 506,312 0.01% CSMC Trust 2017-PFHP Class A(1) 2.626%(2) 15/12/2030 772 772,714 0.02% CSMC Trust 2017-PFHP Class C(1) 3.276%(2) 15/12/2030 616 616,822 0.02% DBGS 2018-BIOD Mortgage Trust 2018-C1 Class XA 0.336%(2) 15/10/2051 223,051 3,605,554 0.09% DBGS 2018-BIOD Mortgage Trust Class A(1) 2.479%(2) 15/05/2035 5,900 5,906,809 0.15% DBUBS 2011-LC2 Mortgage Trust Class A4(1) 4.537% 10/07/2044 895 915,133 0.02%
33

LORD ABBETT PASSPORT PORTFOLIOS PLC SHORT DURATION INCOME FUND Schedule of Investments as at 31 January 2020 (Continued)
Interest Maturity PrincipalFair
Value % of Net Investments Rate Date (000) USD Assets Asset-Backed Securities - 44.63% (31 January 2019: 50.36%) (Continued) Commercial Mortgage-Backed (continued) DBUBS 2011-LC2 Mortgage Trust Class B(1) 4.998%(2) 10/07/2044 100 102,977 0.00% DBUBS 2011-LC3 Mortgage Trust Class PM3(1) 5.268%(2) 10/05/2044 747 766,271 0.02% DBUBS 2011-LC3 Mortgage Trust Class PM4(1) 5.268%(2) 10/05/2044 300 306,616 0.01% DBWF 2016-85T Mortgage Trust Class XA(1) 0.116%(2) 10/12/2036 58,046 196,776 0.00% DBWF 2018-AMXP Mortgage Trust Class A(1) 3.873%(2) 05/05/2035 9,000 9,387,842 0.23% DBWF 2018-AMXP Mortgage Trust Class B(1) 4.122%(2) 05/05/2035 2,000 2,088,030 0.05% DBWF 2018-AMXP Mortgage Trust Class C(1) 3.956%(2) 05/05/2035 1,500 1,535,002 0.04% DBWF 2018-GLKS Mortgage Trust Class A(1) 2.688%(2) 19/11/2035 3,678 3,681,997 0.09% DBWF 2018-GLKS Mortgage Trust Class B(1) 3.008%(2) 19/11/2035 500 500,856 0.01% DBWF 2018-GLKS Mortgage Trust Class C(1) 3.408%(2) 19/11/2035 2,450 2,457,350 0.06% DBWF Mortgage Trust 2015-LCM Class A1(1) 2.998% 10/06/2034 284 289,099 0.01% DBWF Mortgage Trust 2015-LCM Class XA(1) 0.537%(2) 10/06/2034 629 9,180 0.00% Freddie Mac Multifamily Structured Pass Through Certificates K061 Class X1 0.303%(2) 25/11/2026 14,271 171,672 0.00% Freddie Mac Multifamily Structured Pass Through Certificates K722 Class X1 1.44%(2) 25/03/2023 3,688 120,795 0.00% FREMF 2011-KAIV Mortgage Trust Class B(1) 4.944% 25/06/2046 3,000 3,099,141 0.08% FREMF 2013-K713 Mortgage Trust Class B(1) 3.313%(2) 25/04/2046 1,500 1,498,410 0.04% FREMF 2015-K721 Mortgage Trust Class B(1) 3.681%(2) 25/11/2047 3,286 3,427,724 0.09% GRACE 2014-GRCE Mortgage Trust Class A(1) 3.369% 10/06/2028 1,825 1,848,122 0.05% GS Mortgage Securities Corp. II 2012-BWTR Class A(1) 2.954% 05/11/2034 915 936,122 0.02% GS Mortgage Securities Corp. II 2012-TMSQ Class A(1) 3.007% 10/12/2030 7,400 7,579,417 0.19% GS Mortgage Securities Corp. II 2012-TMSQ Class B(1) 3.409% 10/12/2030 6,050 6,229,686 0.16% GS Mortgage Securities Corp. II 2012-TMSQ Class C(1) 3.573%(2) 10/12/2030 707 725,048 0.02% GS Mortgage Securities Corp. II Series 2005-ROCK Class A(1) 5.366% 03/05/2032 7,478 8,652,727 0.22% GS Mortgage Securities Corp. Trust 2012-ALOHA Class A(1) 3.551% 10/04/2034 4,841 4,989,919 0.12% GS Mortgage Securities Corp. Trust 2012-ALOHA Class C(1) 4.267%(2) 10/04/2034 106 109,387 0.00% GS Mortgage Securities Corp. Trust 2016-RENT Class C(1) 4.202%(2) 10/02/2029 250 252,652 0.01% GS Mortgage Securities Corp. Trust 2017-485l Class XB(1) 0.244%(2) 10/02/2037 37,473 383,724 0.01% GS Mortgage Securities Corp. Trust 2017-GPTX Class A(1) 2.856% 10/05/2034 763 766,390 0.02% GS Mortgage Securities Corp. Trust 2017-GPTX Class B(1) 3.104% 10/05/2034 1,165 1,167,615 0.03% GS Mortgage Securities Corp. Trust 2017-SLP Class A(1) 3.419% 10/10/2032 15,165 15,685,293 0.39% GS Mortgage Securities Corp. Trust 2017-STAY Class A(1) 2.526%(2) 15/07/2032 3,026 3,026,854 0.08% GS Mortgage Securities Corp. Trust 2017-STAY Class B(1) 2.776%(2) 15/07/2032 396 396,746 0.01% GS Mortgage Securities Corp. Trust 2017-STAY Class C(1) 3.026%(2) 15/07/2032 286 286,202 0.01% GS Mortgage Securities Corp. Trust 2017-STAY Class D(1) 3.626%(2) 15/07/2032 735 734,484 0.02% GS Mortgage Securities Corp. Trust 2017-STAY Class XCP(1) ZCP(2) 15/07/2032 89,692 897 0.00%
34

LORD ABBETT PASSPORT PORTFOLIOS PLC SHORT DURATION INCOME FUND Schedule of Investments as at 31 January 2020 (Continued)
Interest Maturity PrincipalFair
Value % of Net Investments Rate Date (000) USD Assets Asset-Backed Securities - 44.63% (31 January 2019: 50.36%) (Continued) Commercial Mortgage-Backed (continued) GS Mortgage Securities Corp. Trust 2018-HULA Class A(1) 2.596%(2) 15/07/2025 8,879 8,870,060 0.22% GS Mortgage Securities Corp. Trust 2018-RIVR Class A(1) 2.626%(2) 15/07/2035 2,120 2,125,362 0.05% GS Mortgage Securities Trust 2010-C2 Class A1(1) 3.849% 10/12/2043 24 24,206 0.00% GS Mortgage Securities Trust 2011-GC5 Class B(1) 5.556%(2) 10/08/2044 1,166 1,211,102 0.03% GS Mortgage Securities Trust 2012-GC6 Class B(1) 5.839%(2) 10/01/2045 1,500 1,590,517 0.04% GS Mortgage Securities Trust 2012-GCJ7 Class B 4.74% 10/05/2045 268 280,195 0.01% GS Mortgage Securities Trust 2013-G1 Class A1(1) 2.059% 10/04/2031 268 268,406 0.01% GS Mortgage Securities Trust 2013-G1 Class A2(1) 3.557%(2) 10/04/2031 4,032 4,144,841 0.10% GS Mortgage Securities Trust 2013-GCJ14 Class A5 4.243% 10/08/2046 4,639 5,000,301 0.12% GS Mortgage Securities Trust 2014-GC18 Class A4 4.074% 10/01/2047 8,189 8,824,618 0.22% GS Mortgage Securities Trust 2014-GC22 Class A5 3.862% 10/06/2047 1,299 1,400,396 0.03% GS Mortgage Securities Trust 2014-GC22 Class AS 4.113% 10/06/2047 1,000 1,066,430 0.03% GS Mortgage Securities Trust 2015-GC28 Class A5 3.396% 10/02/2048 3,282 3,510,711 0.09% GS Mortgage Securities Trust 2016-GS2 Class XA 1.801%(2) 10/05/2049 3,913 288,473 0.01% GS Mortgage Securities Trust 2016-GS4 Class 225A(1) 2.636% 10/11/2029 351 354,961 0.01% GS Mortgage Securities Trust 2016-GS4 Class 225C(1) 3.778% 10/11/2029 612 623,311 0.02% GS Mortgage Securities Trust 2016-GS4 Class 225D(1) 4.766% 10/11/2029 832 856,753 0.02% Hilton Orlando Trust 2018-ORL Class A(1) 2.446%(2) 15/12/2034 1,597 1,599,656 0.04% Hilton Orlando Trust 2018-ORL Class D(1) 3.376%(2) 15/12/2034 1,028 1,029,779 0.03% Hilton USA Trust 2016-SFP Class A(1) 2.828% 05/11/2035 6,524 6,543,342 0.16% HMH Trust 2017-NSS Class A(1) 3.062% 05/07/2031 1,218 1,240,419 0.03% HMH Trust 2017-NSS Class B(1) 3.343% 05/07/2031 786 805,099 0.02% HMH Trust 2017-NSS Class C(1) 3.787% 05/07/2031 587 597,673 0.01% HMH Trust 2017-NSS Class D(1) 4.723% 05/07/2031 773 794,428 0.02% Hudsons Bay Simon JV Trust 2015-HB7 Class A7(1) 3.914% 05/08/2034 3,714 3,805,806 0.10% Hudsons Bay Simon JV Trust 2015-HB7 Class B7(1) 4.666% 05/08/2034 796 807,058 0.02% Hudsons Bay Simon JV Trust 2015-HBS Class A10(1) 4.155% 05/08/2034 7,415 7,829,141 0.20% Hudsons Bay Simon JV Trust 2015-HBS Class CFL(1) 4.504%(2) 05/08/2034 1,854 1,853,830 0.05% IMT Trust 2017-APTS Class AFX(1) 3.478% 15/06/2034 2,941 3,100,675 0.08% Irvine Core Office Trust 2013-IRV Class A1(1) 2.068% 15/05/2048 77 76,945 0.00% Irvine Core Office Trust 2013-IRV Class A2(1) 3.279%(2) 15/05/2048 644 671,258 0.02% J.P. Morgan BB Commercial Mortgage Securities Trust 2013-C14 Class A4 4.133%(2) 15/08/2046 250 268,508 0.01% J.P. Morgan BB Commercial Mortgage Securities Trust 2014-C18 Class A5 4.079% 15/02/2047 8,980 9,720,150 0.24% J.P. Morgan BB Commercial Mortgage Securities Trust 2014-C19 Class A2 3.046% 15/04/2047 11 11,059 0.00% J.P. Morgan BB Commercial Mortgage Securities Trust 2014-C19 Class A3 3.669% 15/04/2047 81 82,436 0.00% J.P. Morgan BB Commercial Mortgage Securities Trust 2014-C19 Class A4 3.997% 15/04/2047 914 987,960 0.02% J.P. Morgan BB Commercial Mortgage Securities Trust 2014-C19 Class XA 0.907%(2) 15/04/2047 499 10,408 0.00% J.P. Morgan BB Commercial Mortgage Securities Trust 2014-C19 Class XB 0.441%(2) 15/04/2047 1,000 13,889 0.00%
35

LORD ABBETT PASSPORT PORTFOLIOS PLC SHORT DURATION INCOME FUND Schedule of Investments as at 31 January 2020 (Continued)
Interest Maturity PrincipalFair
Value % of Net Investments Rate Date (000) USD Assets Asset-Backed Securities - 44.63% (31 January 2019: 50.36%) (Continued) Commercial Mortgage-Backed (continued) J.P. Morgan BB Commercial Mortgage Securities Trust 2014-C22 Class A4 3.801% 15/09/2047 3,366 3,636,272 0.09% J.P. Morgan BB Commercial Mortgage Securities Trust 2014-C24 Class XA 1.072%(2) 15/11/2047 1,085 30,470 0.00% J.P. Morgan BB Commercial Mortgage Securities Trust 2014-C25 Class XA 1.006%(2) 15/11/2047 1,956 66,529 0.00% J.P. Morgan BB Commercial Mortgage Securities Trust 2015-C27 Class A3A2(1) 2.92% 15/02/2048 2,350 2,456,573 0.06% J.P. Morgan BB Commercial Mortgage Securities Trust 2015-C28 Class A2 2.773% 15/10/2048 107 106,732 0.00% J.P. Morgan BB Commercial Mortgage Securities Trust 2015-C29 Class XA 0.90%(2) 15/05/2048 1,241 30,709 0.00% J.P. Morgan BB Commercial Mortgage Securities Trust 2015-C30 Class XA 0.659%(2) 15/07/2048 1,663 40,741 0.00% J.P. Morgan BB Commercial Mortgage Securities Trust 2015-C32 Class ASB 3.358% 15/11/2048 593 617,556 0.02% J.P. Morgan Chase Commercial Mortgage Securities Trust 2010-C2 Class B(1) 5.075%(2) 15/11/2043 500 505,647 0.01% J.P. Morgan Chase Commercial Mortgage Securities Trust 2012-C6 Class B 4.819%(2) 15/05/2045 236 247,710 0.01% J.P. Morgan Chase Commercial Mortgage Securities Trust 2012-C8 Class A3 2.829% 15/10/2045 1,167 1,193,853 0.03% J.P. Morgan Chase Commercial Mortgage Securities Trust 2012-WLDN Class A(1) 3.905% 05/05/2030 9,726 10,031,658 0.25% J.P. Morgan Chase Commercial Mortgage Securities Trust 2012-WLDN Class B(1) 4.488%(2) 05/05/2030 2,100 2,175,812 0.05% J.P. Morgan Chase Commercial Mortgage Securities Trust 2014-DSTY Class A(1) 3.429% 10/06/2027 5,000 5,012,980 0.13% J.P. Morgan Chase Commercial Mortgage Securities Trust 2014-DSTY Class B(1) 3.771% 10/06/2027 1,104 1,045,618 0.03% J.P. Morgan Chase Commercial Mortgage Securities Trust 2014-DSTY Class C(1) 3.931%(2) 10/06/2027 857 758,629 0.02% J.P. Morgan Chase Commercial Mortgage Securities Trust 2014-DSTY Class D(1) 3.931%(2) 10/06/2027 1,000 710,783 0.02% J.P. Morgan Chase Commercial Mortgage Securities Trust 2014-DSTY Class XA(1) 0.503%(2) 10/06/2027 833 25 0.00% J.P. Morgan Chase Commercial Mortgage Securities Trust 2014-DSTY Class XB(1) 0.16%(2) 10/06/2027 371 4 0.00% J.P. Morgan Chase Commercial Mortgage Securities Trust 2015-UES Class A(1) 2.933% 05/09/2032 21,539 21,572,644 0.54% J.P. Morgan Chase Commercial Mortgage Securities Trust 2015-UES Class B(1) 3.387% 05/09/2032 2,000 2,006,499 0.05% J.P. Morgan Chase Commercial Mortgage Securities Trust 2015-UES Class D(1) 3.742%(2) 05/09/2032 1,611 1,615,114 0.04% J.P. Morgan Chase Commercial Mortgage Securities Trust 2015-UES Class XB(1) 0.206%(2) 05/09/2032 25,000 6,750 0.00% J.P. Morgan Chase Commercial Mortgage Securities Trust 2016-JP4 Class XA 0.869%(2) 15/12/2049 3,815 119,425 0.00% J.P. Morgan Chase Commercial Mortgage Securities Trust 2016-WIKI Class A(1) 2.798% 05/10/2031 4,610 4,660,911 0.12% J.P. Morgan Chase Commercial Mortgage Securities Trust 2016-WIKI Class B(1) 3.201% 05/10/2031 252 255,202 0.01% J.P. Morgan Chase Commercial Mortgage Securities Trust 2016-WIKI Class C(1) 3.554% 05/10/2031 1,047 1,062,561 0.03%
36

LORD ABBETT PASSPORT PORTFOLIOS PLC SHORT DURATION INCOME FUND Schedule of Investments as at 31 January 2020 (Continued)
Interest Maturity PrincipalFair
Value % of Net Investments Rate Date (000) USD Assets Asset-Backed Securities - 44.63% (31 January 2019: 50.36%) (Continued) Commercial Mortgage-Backed (continued) J.P. Morgan Chase Commercial Mortgage Securities Trust 2016-WIKI Class D(1) 4.143%(2) 05/10/2031 810 826,191 0.02% J.P. Morgan Chase Commercial Mortgage Securities Trust 2016-WIKI Class E(1) 4.143%(2) 05/10/2031 9,572 9,701,193 0.24% J.P. Morgan Chase Commercial Mortgage Securities Trust 2016-WIKI Class XA(1) 1.345%(2) 05/10/2031 2,761 40,255 0.00% J.P. Morgan Chase Commercial Mortgage Securities Trust 2016-WIKI Class XB(1) 0.791%(2) 05/10/2031 1,671 13,802 0.00% J.P. Morgan Chase Commercial Mortgage Securities Trust 2017-FL11 Class D(1) 3.816%(2) 15/10/2032 8,314 8,337,805 0.21% J.P. Morgan Chase Commercial Mortgage Securities Trust 2017-MARK Class A(1) 3.392% 05/06/2032 1,856 1,912,532 0.05% J.P. Morgan Chase Commercial Mortgage Securities Trust 2017-MARK Class B(1) 3.795% 05/06/2032 762 780,151 0.02% J.P. Morgan Chase Commercial Mortgage Securities Trust 2017-MARK Class C(1) 4.171%(2) 05/06/2032 566 578,955 0.01% J.P. Morgan Chase Commercial Mortgage Securities Trust 2017-MARK Class X(1) 0.661%(2) 05/06/2032 40,954 481,762 0.01% J.P. Morgan Chase Commercial Mortgage Securities Trust 2018-BCON Class A(1) 3.735% 05/01/2031 4,151 4,346,408 0.11% J.P. Morgan Chase Commercial Mortgage Securities Trust 2018-BCON Class X(1) 0.146%(2) 05/01/2031 81,535 140,240 0.00% J.P. Morgan Chase Commercial Mortgage Securities Trust 2018-LAQ Class A(1) 2.676%(2) 15/06/2032 21,807 21,832,227 0.55% J.P. Morgan Chase Commercial Mortgage Securities Trust 2018-LAQ Class B(1) 2.976%(2) 15/06/2032 1,407 1,409,926 0.04% J.P. Morgan Chase Commercial Mortgage Securities Trust 2018-LAQ Class C(1) 3.276%(2) 15/06/2032 1,132 1,136,483 0.03% J.P. Morgan Chase Commercial Mortgage Securities Trust 2018-LAQ Class E(1) 4.676%(2) 15/06/2035 180 180,753 0.00% J.P. Morgan Chase Commercial Mortgage Securities Trust 2018-PTC Class A(1) 2.876%(2) 15/04/2031 2,418 2,422,159 0.06% J.P. Morgan Chase Commercial Mortgage Securities Trust 2018-PTC Class B(1) 3.576%(2) 15/04/2031 655 656,411 0.02% J.P. Morgan Chase Commercial Mortgage Securities Trust 2018-PTC Class C(1) 3.976%(2) 15/04/2031 484 485,439 0.01% J.P. Morgan Chase Commercial Mortgage Securities Trust 2018-PTC Class D(1) 4.796%(2) 15/04/2031 254 254,937 0.01% J.P. Morgan Chase Commercial Mortgage Securities Trust 2018-WPT Class AFL(1) 2.684%(2) 05/07/2033 1,428 1,429,598 0.04% J.P. Morgan Chase Commercial Mortgage Securities Trust 2018-WPT Class AFX(1) 4.248% 05/07/2033 8,005 8,604,679 0.22% J.P. Morgan Chase Commercial Mortgage Securities Trust 2018-WPT Class BFX(1) 4.549% 05/07/2033 1,154 1,242,453 0.03% J.P. Morgan Chase Commercial Mortgage Securities Trust 2018-WPT Class CFL(1) 3.384%(2) 05/07/2033 406 406,860 0.01% J.P. Morgan Chase Commercial Mortgage Securities Trust 2018-WPT Class CFX(1) 4.95% 05/07/2033 1,404 1,515,829 0.04% J.P. Morgan Chase Commercial Mortgage Securities Trust 2018-WPT Class DFL(1) 3.984%(2) 05/07/2033 406 407,532 0.01% J.P. Morgan Chase Commercial Mortgage Securities Trust 2018-WPT Class DFX(1) 5.35% 05/07/2033 1,610 1,738,713 0.04% J.P. Morgan Chase Commercial Mortgage Securities Trust 2018-WPT Class XBFX(1) 0.555%(2) 05/07/2033 119,588 1,653,902 0.04%
37

LORD ABBETT PASSPORT PORTFOLIOS PLC SHORT DURATION INCOME FUND Schedule of Investments as at 31 January 2020 (Continued)
Interest Maturity PrincipalFair
Value % of Net Investments Rate Date (000) USD Assets Asset-Backed Securities - 44.63% (31 January 2019: 50.36%) (Continued) Commercial Mortgage-Backed (continued) J.P. Morgan Chase Commercial Mortgage SecuritiesTrust 2018-MINN Class A(1) 2.76%(2) 15/11/2035 2,000 2,001,876 0.05% J.P. Morgan Chase Commercial Mortgage SecuritiesTrust 2018-MINN Class B(1) 3.09%(2) 15/11/2035 500 501,092 0.01% J.P. Morgan Chase Commercial Mortgage SecuritiesTrust 2018-MINN Class C(1) 3.44%(2) 15/11/2035 442 442,957 0.01% J.P. Morgan Chase Commercial Mortgage SecuritiesTrust 2018-MINN Class D(1) 3.74%(2) 15/11/2035 288 288,618 0.01% JPMCC Commercial Mortgage Securities Trust 2017-JP7 Class XA 1.218%(2) 15/09/2050 10,607 633,182 0.02% Ladder Capital Commercial Mortgage 2013-GCP Mortgage Trust Class A1(1) 3.575% 15/02/2036 400 426,406 0.01% LCCM 2014-909 Mortgage Trust Class B(1) 3.59% 15/05/2031 4,320 4,378,495 0.11% LCCM 2014-909 Mortgage Trust Class C(1) 4.028%(2) 15/05/2031 4,850 4,926,083 0.12% LSTAR Commercial Mortgage Trust 2016-4 Class XA(1) 1.995%(2) 10/03/2049 1,815 106,025 0.00% LSTAR Commercial Mortgage Trust 2016-4 Class XB(1) 0.756%(2) 10/03/2049 25,304 919,800 0.02% LSTAR Commercial Mortgage Trust 2017-5 Class A1(1) 2.417% 10/03/2050 285 285,807 0.01% LSTAR Commercial Mortgage Trust 2017-5 Class A2(1) 2.776% 10/03/2050 5,066 5,106,428 0.13% LSTAR Commercial Mortgage Trust 2017-5 Class A3(1) 4.50% 10/03/2050 2,300 2,443,577 0.06% Madison Avenue Trust 2013-650M Class B(1) 4.169%(2) 12/10/2032 1,397 1,406,662 0.04% Morgan Stanley Bank of America Merrill Lynch Trust 2013-C11 Class A4 4.298%(2) 15/08/2046 2,560 2,753,832 0.07% Morgan Stanley Bank of America Merrill Lynch Trust 2013-C7 Class A4 2.918% 15/02/2046 500 514,493 0.01% Morgan Stanley Bank of America Merrill Lynch Trust 2014 C19 2014-C19 Class XA 1.151%(2) 15/12/2047 1,294 49,492 0.00% Morgan Stanley Bank of America Merrill Lynch Trust 2014-C17 Class A4 3.443% 15/08/2047 3,500 3,705,794 0.09% Morgan Stanley Bank of America Merrill Lynch Trust 2015-C23 Class XA 0.794%(2) 15/07/2050 8,439 206,889 0.01% Morgan Stanley Bank of America Merrill Lynch Trust 2015-C24 Class ASB 3.479% 15/05/2048 614 639,916 0.02% Morgan Stanley Bank of America Merrill Lynch Trust 2016-C31 Class XA 1.552%(2) 15/11/2049 5,841 408,403 0.01% Morgan Stanley Capital Barclays Bank Trust 2016-MART Class B(1) 2.48% 13/09/2031 250 250,360 0.01% Morgan Stanley Capital Barclays Bank Trust 2016-MART Class C(1) 2.817% 13/09/2031 500 500,827 0.01% Morgan Stanley Capital Barclays Bank Trust 2016-MART Class XCP(1) ZCP(2) 13/09/2031 222,225 2,222 0.00% Morgan Stanley Capital I Trust 2012-C4 Class AS 3.773% 15/03/2045 1,100 1,134,563 0.03% Morgan Stanley Capital I Trust 2012-STAR Class B(1) 3.451% 05/08/2034 100 102,565 0.00% Morgan Stanley Capital I Trust 2014-150E Class A(1) 3.912% 09/09/2032 8,950 9,635,193 0.24% Morgan Stanley Capital I Trust 2014-CPT Class A(1) 3.35% 13/07/2029 250 254,642 0.01% Morgan Stanley Capital I Trust 2014-CPT Class XA(1) 0.188%(2) 13/07/2029 60,000 107,400 0.00%
38

LORD ABBETT PASSPORT PORTFOLIOS PLC SHORT DURATION INCOME FUND Schedule of Investments as at 31 January 2020 (Continued)
Interest Maturity PrincipalFair
Value % of Net Investments Rate Date (000) USD Assets Asset-Backed Securities - 44.63% (31 January 2019: 50.36%) (Continued) Commercial Mortgage-Backed (continued) Morgan Stanley Capital I Trust 2014-MP Class A(1) 3.469% 11/08/2033 1,825 1,865,221 0.05% Morgan Stanley Capital I Trust 2014-MP Class B(1) 3.693% 11/08/2033 1,841 1,885,262 0.05% Morgan Stanley Capital I Trust 2015-420 Class A(1) 3.727% 12/10/2050 6,464 6,837,458 0.17% Morgan Stanley Capital I Trust 2015-UBS8 Class ASB 3.626% 15/12/2048 361 380,355 0.01% Morgan Stanley Capital I Trust 2016-UB11 Class XB 1.132%(2) 15/08/2049 2,489 144,370 0.00% Motel 6 Trust 2017-MTL6 Class C(1) 3.076%(2) 15/08/2034 1,034 1,035,181 0.03% Motel 6 Trust 2017-MTL6 Class D(1) 3.826%(2) 15/08/2034 4,262 4,278,251 0.11% Motel 6 Trust 2017-MTL6 Class E(1) 4.926%(2) 15/08/2034 5,422 5,461,918 0.14% Motel 6 Trust 2017-MTL6 Class F(1) 5.926%(2) 15/08/2034 1,355 1,368,186 0.03% MSBAM Commercial Mortgage Securities Trust 2012-CKSV Class A1(1) 2.117% 15/10/2030 248 247,495 0.01% MSBAM Commercial Mortgage Securities Trust 2012-CKSV Class A2(1) 3.277% 15/10/2030 4,050 4,118,066 0.10% MSCG Trust 2015-ALDR Class A1(1) 2.612% 07/06/2035 273 274,998 0.01% MSCG Trust 2016-SNR Class A(1) 3.46%(2) 15/11/2034 153 153,808 0.00% MSCG Trust 2016-SNR Class B(1) 4.181% 15/11/2034 492 499,733 0.01% MSCG Trust 2016-SNR Class C(1) 5.205% 15/11/2034 316 323,764 0.01% Natixis Commercial Mortgage Securities Trust 2018-285M Class A(1) 3.917%(2) 15/11/2032 2,983 3,123,007 0.08% Natixis Commercial Mortgage Securities Trust 2018-285M Class B(1) 3.917%(2) 15/11/2032 1,138 1,185,471 0.03% One Market Plaza Trust 2017-1MKT Class A(1) 3.614% 10/02/2032 2,750 2,859,768 0.07% One Market Plaza Trust 2017-1MKT Class C(1) 4.016% 10/02/2032 4,500 4,660,370 0.12% Palisades Center Trust 2016-PLSD Class A(1) 2.713% 13/04/2033 300 299,454 0.01% Palisades Center Trust 2016-PLSD Class C(1) 3.998% 13/04/2033 5,000 4,909,629 0.12% Palisades Center Trust 2016-PLSD Class D(1) 4.737% 13/04/2033 2,969 2,889,673 0.07% RBS Commercial Funding, Inc. 2013-GSP Trust Class A(1) 3.961%(2) 15/01/2032 978 1,037,835 0.03% RBS Commercial Funding, Inc. 2013-SMV Trust Class A(1) 3.26% 11/03/2031 2,249 2,318,978 0.06% ReadyCap Commercial Mortgage Trust 2015-SBC2 2015-2 Class A(1) 3.804% 25/06/2055 271 275,183 0.01% ReadyCap Commercial Mortgage Trust 2018-4 Class A(1) 3.39% 27/02/2051 2,160 2,208,144 0.06% Shelter Growth CRE 2018-FL1 Issuer Ltd. Class A(1) 2.676%(2) 15/01/2035 8,325 8,341,011 0.21% Shops at Crystals Trust 2016-CSTL Class XB(1) 0.328%(2) 05/07/2036 16,419 230,030 0.01% SLIDE 2018-FUN Class A(1) 2.576%(2) 15/06/2031 6,470 6,480,902 0.16% SLIDE 2018-FUN Class B(1) 2.926%(2) 15/06/2031 418 418,364 0.01% SLIDE 2018-FUN Class C(1) 3.226%(2) 15/06/2031 8,779 8,808,586 0.22% SLIDE 2018-FUN Class D(1) 3.526%(2) 15/06/2031 549 551,213 0.01% SLIDE 2018-FUN Class XCP(1) 0.976%(2) 15/12/2020 44,837 377,537 0.01% UBS Commercial Mortgage Trust 2012-C1 Class A3 3.40% 10/05/2045 2,412 2,474,394 0.06% UBS Commercial Mortgage Trust 2018-C8 Class A2 3.713% 15/02/2051 5,836 6,153,761 0.15% UBS-BAMLL Trust 2012-WRM Class A(1) 3.663% 10/06/2030 1,801 1,855,169 0.05% UBS-BAMLL Trust 2012-WRM Class D(1) 4.379%(2) 10/06/2030 500 495,958 0.01% UBS-Barclays Commercial Mortgage Trust 2012-C2 Class A4 3.525% 10/05/2063 2,539 2,635,096 0.07% UBS-Barclays Commercial Mortgage Trust 2012-C3 Class A4 3.091% 10/08/2049 1,522 1,564,410 0.04%
39

LORD ABBETT PASSPORT PORTFOLIOS PLC SHORT DURATION INCOME FUND Schedule of Investments as at 31 January 2020 (Continued)
Interest Maturity PrincipalFair
Value % of Net Investments Rate Date (000) USD Assets Asset-Backed Securities - 44.63% (31 January 2019: 50.36%) (Continued) Commercial Mortgage-Backed (continued) UBS-Barclays Commercial Mortgage Trust 2012-C4 Class A4 2.792% 10/12/2045 1,197 1,216,939 0.03% UBS-Barclays Commercial Mortgage Trust 2012-C4 Class A5 2.85% 10/12/2045 1,441 1,478,213 0.04% UBS-Barclays Commercial Mortgage Trust 2013-C5 Class A4 3.185% 10/03/2046 1,442 1,496,041 0.04% UBS-Barclays Commercial Mortgage Trust 2013-C5 Class AS(1) 3.347% 10/03/2046 176 181,930 0.00% UBS-Barclays Commercial Mortgage Trust 2013-C5 Class B(1) 3.649%(2) 10/03/2046 8,134 8,376,376 0.21% UBS-Barclays Commercial Mortgage Trust 2013-C6 Class A4 3.244% 10/04/2046 3,696 3,848,090 0.10% UBS-Citigroup Commercial Mortgage Trust 2011-C1 Class A3 3.595% 10/01/2045 408 416,900 0.01% VNDO 2012-6AVE Mortgage Trust Class A(1) 2.996% 15/11/2030 12,065 12,429,567 0.31% VNDO 2012-6AVE Mortgage Trust Class C(1) 3.448%(2) 15/11/2030 3,780 3,883,417 0.10% Vornado DP LLC Trust 2010-VNO Class A1(1) 2.97% 13/09/2028 44 44,233 0.00% Vornado DP LLC Trust 2010-VNO Class A2FX(1) 4.004% 13/09/2028 213 213,461 0.01% Vornado DP LLC Trust 2010-VNO Class C(1) 5.28% 13/09/2028 100 100,340 0.00% Wells Fargo Commercial Mortgage Trust 2010-C1 Class A2(1) 4.393% 15/11/2043 771 775,731 0.02% Wells Fargo Commercial Mortgage Trust 2010-C1 Class C(1) 5.82%(2) 15/11/2043 330 335,302 0.01% Wells Fargo Commercial Mortgage Trust 2014-LC16 Class A4 3.548% 15/08/2050 155 164,746 0.00% Wells Fargo Commercial Mortgage Trust 2014-LC16 Class A5 3.817% 15/08/2050 10,351 11,164,128 0.28% Wells Fargo Commercial Mortgage Trust 2015-C26 Class AS 3.58% 15/02/2048 3,455 3,657,916 0.09% Wells Fargo Commercial Mortgage Trust 2015-C26 Class ASB 2.991% 15/02/2048 576 592,818 0.01% Wells Fargo Commercial Mortgage Trust 2015-C27 Class ASB 3.278% 15/02/2048 220 228,042 0.01% Wells Fargo Commercial Mortgage Trust 2015-C29 Class ASB 3.40% 15/06/2048 294 306,203 0.01% Wells Fargo Commercial Mortgage Trust 2015-C29 Class XA 0.782%(2) 15/06/2048 1,843 52,998 0.00% Wells Fargo Commercial Mortgage Trust 2015-SG1 Class ASB 3.556% 15/09/2048 350 365,606 0.01% Wells Fargo Commercial Mortgage Trust 2016-BNK1 Class XA 1.904%(2) 15/08/2049 1,435 133,239 0.00% Wells Fargo Commercial Mortgage Trust 2017-HSDB Class A(1) 2.534%(2) 13/12/2031 4,242 4,233,624 0.11% Wells Fargo Commercial Mortgage Trust 2017-SMP Class A(1) 2.426%(2) 15/12/2034 944 941,936 0.02% Wells Fargo Commercial Mortgage Trust 2017-SMP Class B(1) 2.676%(2) 15/12/2034 678 677,309 0.02% Wells Fargo Commercial Mortgage Trust 2018-C47 Class A2 4.361% 15/09/2061 1,134 1,232,186 0.03% Wells Fargo Commercial Mortgage Trust 2018-C48 Class A2 4.224% 15/01/2052 763 822,417 0.02% West Town Mall Trust 2017-KNOX Class A(1) 3.823% 05/07/2030 2,194 2,264,591 0.06% West Town Mall Trust 2017-KNOX Class B(1) 4.322% 05/07/2030 877 906,222 0.02% West Town Mall Trust 2017-KNOX Class C(1) 4.491%(2) 05/07/2030 650 667,912 0.02%
40

LORD ABBETT PASSPORT PORTFOLIOS PLC SHORT DURATION INCOME FUND Schedule of Investments as at 31 January 2020 (Continued)
Interest Maturity PrincipalFair
Value % of Net Investments Rate Date (000) USD Assets Asset-Backed Securities - 44.63% (31 January 2019: 50.36%) (Continued) Commercial Mortgage-Backed (continued) West Town Mall Trust 2017-KNOX Class D(1) 4.491%(2) 05/07/2030 805 821,682 0.02% West Town Mall Trust 2017-KNOX Class X(1) 0.521%(2) 05/07/2030 45,195 364,330 0.01% WFLD 2014-MONT Mortgage Trust Class C(1) 3.88%(2) 10/08/2031 2,000 2,064,710 0.05% WF-RBS Commercial Mortgage Trust 2011-C2 Class A4(1) 4.869%(2) 15/02/2044 209 213,039 0.01% WFRBS Commercial Mortgage Trust 2011-C3 Class C(1) 5.335%(2) 15/03/2044 1,075 1,105,908 0.03% WFRBS Commercial Mortgage Trust 2012-C10 Class A3 2.875% 15/12/2045 588 603,945 0.02% WFRBS Commercial Mortgage Trust 2012-C7 Class B 4.903%(2) 15/06/2045 518 541,966 0.01% WFRBS Commercial Mortgage Trust 2012-C9 Class A3 2.87% 15/11/2045 2,095 2,146,977 0.05% WFRBS Commercial Mortgage Trust 2012-C9 Class C 4.543%(2) 15/11/2045 484 502,004 0.01% WFRBS Commercial Mortgage Trust 2013-C11 Class AS 3.311% 15/03/2045 1,084 1,123,025 0.03% WFRBS Commercial Mortgage Trust 2013-C12 Class AS 3.56% 15/03/2048 785 818,742 0.02% WFRBS Commercial Mortgage Trust 2013-C13 Class XA(1) 1.333%(2) 15/05/2045 2,073 67,476 0.00% WFRBS Commercial Mortgage Trust 2013-C15 Class A3 3.881% 15/08/2046 98 103,206 0.00% WFRBS Commercial Mortgage Trust 2014-C20 Class XA 1.123%(2) 15/05/2047 327 10,745 0.00% WFRBS Commercial Mortgage Trust 2014-C20 Class XB 0.733%(2) 15/05/2047 100 2,446 0.00% WFRBS Commercial Mortgage Trust 2014-C21 Class XB 0.794%(2) 15/08/2047 10,000 282,606 0.01% WFRBS Commercial Mortgage Trust 2014-C22 Class A4 3.488% 15/09/2057 8,288 8,851,238 0.22% WFRBS Commercial Mortgage Trust 2014-C22 Class XA 0.957%(2) 15/09/2057 13,929 420,236 0.01% WFRBS Commercial Mortgage Trust 2014-C22 Class XB 0.494%(2) 15/09/2057 27,000 503,715 0.01% WFRBS Commercial Mortgage Trust 2014-C23 Class XA 0.714%(2) 15/10/2057 9,931 228,659 0.01% WFRBS Commercial Mortgage Trust 2014-C23 Class XB 0.307%(2) 15/10/2057 15,000 181,631 0.00% 932,566,734 23.31% Credit Card American Express Credit Account Master Trust 2017-3 Class A 1.77% 15/11/2022 2,655 2,655,519 0.07% American Express Credit Account Master Trust 2017-6 Class A 2.04% 15/05/2023 13,164 13,205,646 0.33% BA Credit Card Trust 2017-A2 Class A2 1.84% 17/01/2023 4,072 4,075,512 0.10% Barclays Dryrock Issuance Trust 2017-1 Class A 2.006%(2) 15/03/2023 4,858 4,862,323 0.12% Barclays Dryrock Issuance Trust 2017-2 Class A 1.976%(2) 15/05/2023 6,078 6,083,231 0.15% Barclays Dryrock Issuance Trust 2018-1 Class A 2.006%(2) 15/07/2024 1,234 1,236,652 0.03% Capital One Multi-Asset Execution Trust 2015-A2 Class A2 2.08% 15/03/2023 6,104 6,109,265 0.15% Capital One Multi-Asset Execution Trust 2015-A3 Class A3 2.076%(2) 15/03/2023 1,351 1,352,513 0.03%
41

LORD ABBETT PASSPORT PORTFOLIOS PLC SHORT DURATION INCOME FUND Schedule of Investments as at 31 January 2020 (Continued)
Interest Maturity PrincipalFair
Value % of Net Investments Rate Date (000) USD Assets Asset-Backed Securities - 44.63% (31 January 2019: 50.36%) (Continued) Credit Card (continued) Capital One Multi-Asset Execution Trust 2017-A1 Class A1 2.00% 17/01/2023 11,586 11,590,742 0.29% Capital One Multi-Asset Execution Trust 2017-A4 Class A4 1.99% 17/07/2023 10,143 10,166,558 0.25% Citibank Credit Card Issuance Trust 2014-A1 Class A1 2.88% 23/01/2023 3,101 3,139,925 0.08% Citibank Credit Card Issuance Trust 2016-A2 Class A2 2.19% 20/11/2023 3,884 3,931,716 0.10% Citibank Credit Card Issuance Trust 2017-A3 Class A3 1.92% 07/04/2022 1,612 1,612,667 0.04% Citibank Credit Card Issuance Trust 2017-A8 Class A8 1.86% 08/08/2022 5,055 5,060,098 0.13% Citibank Credit Card Issuance Trust 2018-A6 Class A6 3.21% 07/12/2024 8,635 9,058,806 0.23% Continental Credit Card 2016-1 Class C(1) 11.33% 15/01/2025 213 219,852 0.01% Discover Card Execution Note Trust 2015-A2 Class A 1.90% 17/10/2022 148 148,065 0.00% Discover Card Execution Note Trust 2017-A6 Class A6 1.88% 15/02/2023 10,706 10,730,337 0.27% First National Master Note Trust 2017-2 Class A 2.116%(2) 16/10/2023 4,868 4,875,452 0.12% Golden Credit Card Trust 2017-2A Class A(1) 1.98% 15/04/2022 1,800 1,800,653 0.04% Golden Credit Card Trust 2018-1A Class A(1) 2.62% 15/01/2023 5,030 5,077,640 0.13% Golden Credit Card Trust 2018-4A Class A(1) 3.44% 15/10/2025 2,580 2,717,755 0.07% Master Credit Card Trust II Series 2018-1 Class A(1) 2.144%(2) 21/07/2024 1,976 1,984,273 0.05% Synchrony Credit Card Master Note Trust 2015-1 Class A 2.37% 15/03/2023 18,939 18,953,301 0.47% Synchrony Credit Card Master Note Trust 2015-1 Class B 2.64% 15/03/2023 4,637 4,638,398 0.12% Synchrony Credit Card Master Note Trust 2016-2 Class A 2.21% 15/05/2024 4,837 4,873,714 0.12% Synchrony Credit Card Master Note Trust 2016-2 Class B 2.55% 15/05/2024 849 854,671 0.02% Synchrony Credit Card Master Note Trust 2017-1 Class A 1.93% 15/06/2023 2,663 2,664,403 0.07% Synchrony Credit Card Master Note Trust 2017-1 Class B 2.19% 15/06/2023 5,661 5,661,322 0.14% Synchrony Credit Card Master Note Trust 2017-2 Class B 2.82% 15/10/2025 1,467 1,495,422 0.04% World Financial Network Credit Card Master Trust 2015-B Class A 2.55% 17/06/2024 1,303 1,308,238 0.03% World Financial Network Credit Card Master Trust 2016-A Class A 2.03% 15/04/2025 10,381 10,432,189 0.26% World Financial Network Credit Card Master Trust 2017-A Class A 2.12% 15/03/2024 10,713 10,721,674 0.27% World Financial Network Credit Card Master Trust 2017-C Class A 2.31% 15/08/2024 2,302 2,310,270 0.06% World Financial Network Credit Card Master Trust 2018-B Class A 3.46% 15/07/2025 4,900 5,037,671 0.13% World Financial Network Credit Card Master Trust 2018-C Class A 3.55% 15/08/2025 4,420 4,552,193 0.11% World Financial Network Credit Card Master Trust 2018-C Class M 3.95% 15/08/2025 984 1,012,804 0.02% 186,211,470 4.65%
42

LORD ABBETT PASSPORT PORTFOLIOS PLC SHORT DURATION INCOME FUND Schedule of Investments as at 31 January 2020 (Continued)
Interest Maturity PrincipalFair
Value % of Net Investments Rate Date (000) USD Assets Asset-Backed Securities - 44.63% (31 January 2019: 50.36%) (Continued) Other ALM VIII Ltd. 2013-8A Class A1R(1) 3.321%(2) 15/10/2028 1,150 1,149,579 0.03% Amur Equipment Finance Receivables VI LLC 2018-2A Class A2(1) 3.89% 20/07/2022 1,753 1,785,248 0.04% Anchorage Capital CLO 3-R Ltd. 2014-3RA Class A(1) 2.845%(2) 28/01/2031 1,522 1,519,926 0.04% Anchorage Capital CLO 4-R Ltd. 2014-4RA Class A(1) 2.845%(2) 28/01/2031 1,902 1,898,442 0.05% Arbor Realty Collateralized Loan Obligation 2017-FL3 Ltd. Class A(1) 2.666%(2) 15/12/2027 1,964 1,965,190 0.05% Arbor Realty Commercial Real Estate Notes 2017-FL2 Ltd. Class A(1) 2.666%(2) 15/08/2027 696 696,765 0.02% Arbor Realty Commercial Real Estate Notes 2018-FL1 Ltd. Class A(1) 2.826%(2) 15/06/2028 1,475 1,476,644 0.04% Ascentium Equipment Receivables 2017-1 Trust Class A3(1) 2.29% 10/06/2021 199 199,373 0.00% Ascentium Equipment Receivables 2017-2 Trust Class A3(1) 2.31% 10/12/2021 12,152 12,178,600 0.30% Atrium IX 9A Class AR(1) 3.149%(2) 28/05/2030 8,652 8,655,179 0.22% Avery Point V CLO Ltd. 2014-5A Class AR(1) 2.816%(2) 17/07/2026 1,153 1,152,870 0.03% Bain Capital Credit CLO 2017-1 Class A1(1) 3.069%(2) 20/07/2030 1,844 1,845,813 0.05% Benefit Street Partners CLO III Ltd. 2013-IIIA Class A2R(1) 3.619%(2) 20/07/2029 1,350 1,350,123 0.03% BlueMountain CLO 2012-2 Ltd. Class AR2(1) 2.949%(2) 20/11/2028 3,137 3,136,424 0.08% Bowman Park CLO Ltd. 2014-1A Class AR(1) 3.09%(2) 23/11/2025 911 911,907 0.02% Bristol Park CLO LTD 2016-1A Class A(1) 3.251%(2) 15/04/2029 9,000 9,011,316 0.23% Carlyle Global Market Strategies CLO 2013-2 Ltd. Class AR(1) 2.709%(2) 18/01/2029 1,462 1,455,398 0.04% CCG Receivables Trust 2018-1 Class A2(1) 2.50% 16/06/2025 8,809 8,834,426 0.22% Cedar Funding IV CLO Ltd. 2014-4A Class AR(1) 3.036%(2) 23/07/2030 6,818 6,820,472 0.17% Columbia Cent CLO 27 Ltd. 2018-27A Class A2A(1) 3.394%(2) 25/10/2028 361 362,790 0.01% Conn's Receivables Funding 2018-A LLC Class A(1) 3.25% 15/01/2023 160 160,465 0.00% Diamond Resorts Owner Trust 2016-1 Class A(1) 3.08% 20/11/2028 149 149,369 0.00% Diamond Resorts Owner Trust 2018-1 Class A(1) 3.70% 21/01/2031 4,175 4,306,776 0.11% Diamond Resorts Owner Trust 2018-1 Class B(1) 4.19% 21/01/2031 1,152 1,187,055 0.03% DLL 2018-1 LLC Class A4(1) 3.27% 17/04/2026 2,927 2,998,405 0.07% DLL Securitization Trust 2017-A Class A3(1) 2.14% 15/12/2021 895 895,589 0.02% DLL Securitization Trust 2017-A Class A4(1) 2.43% 17/11/2025 1,631 1,641,870 0.04% Dryden XXV Senior Loan Fund 2012-25A Class BRR(1) 3.181%(2) 15/10/2027 1,250 1,247,023 0.03% Engs Commercial Finance Trust 2016-1 Class A2(1) 2.63% 22/02/2022 66 65,718 0.00% FREED ABS TRUST 2018-2 Class A(1) 3.99% 20/10/2025 1,404 1,414,632 0.04% Greystone Commercial Real Estate Notes 2018-HC1 Ltd. Class A(1) 3.226%(2) 15/09/2028 3,458 3,449,654 0.09% Greystone Commercial Real Estate Notes 2018-HC1 Ltd. Class AS(1) 3.826%(2) 15/09/2028 1,056 1,053,002 0.03% Halcyon Loan Advisors Funding 2015-2 Ltd. Class AR(1) 2.874%(2) 25/07/2027 1,072 1,071,368 0.03% Halcyon Loan Advisors Funding 2015-2 Ltd. Class BR(1) 3.444%(2) 25/07/2027 856 856,189 0.02% Halcyon Loan Advisors Funding 2017-2 Ltd. Class A2(1) 3.536%(2) 17/01/2030 1,448 1,445,762 0.04% Hempstead II CLO Ltd. 2017-2A Class A1(1) 3.181%(2) 10/08/2029 6,600 6,601,492 0.16% Jamestown CLO VII Ltd. 2015-7A Class A1R(1) 2.624%(2) 25/07/2027 1,486 1,486,807 0.04%
43

LORD ABBETT PASSPORT PORTFOLIOS PLC SHORT DURATION INCOME FUND Schedule of Investments as at 31 January 2020 (Continued)
Interest Maturity PrincipalFair
Value % of Net Investments Rate Date (000) USD Assets Asset-Backed Securities - 44.63% (31 January 2019: 50.36%) (Continued) Other (continued) Jamestown CLO VII Ltd. 2015-7A Class A2R(1) 3.094%(2) 25/07/2027 1,468 1,449,049 0.04% Jamestown CLO X Ltd. 2017-10A Class A2(1) 3.686%(2) 17/07/2029 6,211 6,216,939 0.16% KKR CLO 17 Ltd. Class A(1) 3.171%(2) 15/04/2029 3,000 3,003,192 0.08% KKR CLO 18 Ltd. Class A(1) 3.097%(2) 18/07/2030 5,833 5,839,406 0.15% KREF 2018-FL1 Ltd. Class A(1) 2.769%(2) 15/06/2036 669 669,936 0.02% LCM XXIV Ltd. 24A Class A(1) 3.129%(2) 20/03/2030 2,530 2,531,884 0.06% LMREC 2015-CRE1, Inc. Class AR(1) 2.641%(2) 22/02/2032 486 485,146 0.01% LMREC 2015-CRE1, Inc. Class BR(1) 3.911%(2) 22/02/2032 564 564,009 0.01% Madison Park Funding XI Ltd. 2013-11A Class AR(1) 2.966%(2) 23/07/2029 7,000 7,003,088 0.17% Madison Park Funding XVI Ltd. 2015-16A Class A2R(1) 3.719%(2) 20/04/2026 787 787,551 0.02% Magnetite XVIII Ltd. 2016-18A Class AR(1) 2.99%(2) 15/11/2028 2,195 2,195,534 0.05% Mercer Field II CLO Ltd. 2017-1A Class A1(1) 3.161%(2) 15/04/2029 968 968,156 0.02% Mountain Hawk III CLO Ltd. 2014-3A Class AR(1) 3.019%(2) 18/04/2025 772 772,280 0.02% Mountain View CLO X Ltd. 2015-10A Class AR(1) 2.668%(2) 13/10/2027 2,573 2,573,754 0.06% MVW Owner Trust 2017-1 Class A(1) 2.42% 20/12/2034 732 740,076 0.02% Newark BSL CLO 1 Ltd. 2016-1A Class A1(1) 3.314%(2) 21/12/2029 4,584 4,587,133 0.11% Oaktree CLO 2014-1 Class A1R(1) 3.195%(2) 13/05/2029 4,391 4,394,712 0.11% Oaktree CLO 2015-1 Ltd. Class A1R(1) 2.689%(2) 20/10/2027 1,198 1,198,166 0.03% OCP CLO 2015-10 Ltd. Class A2AR(1) 3.094%(2) 26/10/2027 1,004 1,001,176 0.02% OCP CLO 2015-9 Ltd. Class A1R(1) 2.631%(2) 15/07/2027 723 722,916 0.02% OCP CLO 2015-9 Ltd. Class A2R(1) 3.181%(2) 15/07/2027 1,031 1,032,014 0.03% OCP CLO 2016-12 Ltd. Class A1R(1) 2.939%(2) 18/10/2028 1,932 1,933,064 0.05% OCP CLO 2016-12 Ltd. Class A2R(1) 3.419%(2) 18/10/2028 1,421 1,421,994 0.04% OneMain Financial Issuance Trust 2016-1 Class A(1) 3.66% 20/02/2029 61 61,035 0.00% OneMain Financial Issuance Trust 2018-2 Class A(1) 3.57% 14/03/2033 392 410,941 0.01% Orec 2018-CRE1 Ltd. Class A(1) 2.856%(2) 15/06/2036 3,793 3,793,196 0.09% OZLM VIII Ltd. 2014-8A Class A1RR(1) 3.006%(2) 17/10/2029 9,222 9,226,548 0.23% Palmer Square Loan Funding 2018-1 Ltd. Class A1(1) 2.431%(2) 15/04/2026 2,305 2,296,523 0.06% Palmer Square Loan Funding 2018-1 Ltd. Class A2(1) 2.881%(2) 15/04/2026 1,404 1,401,769 0.03% Palmer Square Loan Funding 2018-5 Ltd. Class A1(1) 2.669%(2) 20/01/2027 2,790 2,788,982 0.07% Palmer Square Loan Funding 2018-5 Ltd. Class A2(1) 3.219%(2) 20/01/2027 913 911,048 0.02% Parallel 2015-1 Ltd. Class AR(1) 2.669%(2) 20/07/2027 2,770 2,771,733 0.07% PFS Financing Corp. 2018-A Class A(1) 2.076%(2) 17/02/2022 6,244 6,243,837 0.16% PFS Financing Corp. 2018-B Class A(1) 2.89% 15/02/2023 3,678 3,719,119 0.09% Planet Fitness Master Issuer LLC 2018-1A Class A2II(1) 4.666% 05/09/2048 7,809 8,242,703 0.21% Prima Capital CRE Securitization 2013-III Ltd. 2013-3A Class C(1) 5.00% 24/10/2035 1,701 1,729,129 0.04% Prima Capital CRE Securitization 2015-5A Class C(1) 4.50% 24/12/2050 3,055 3,050,092 0.08% Prima Capital CRE Securitization 2015-IV Ltd. 2015-4A Class MR-A(1) 2.55% 24/08/2049 920 920,156 0.02% Ready Capital Mortgage Financing 2018-Fl2 LLC Class A(1) 2.511%(2) 25/06/2035 1,250 1,248,056 0.03% Regatta VI Funding Ltd. 2016-1A Class AR(1) 2.899%(2) 20/07/2028 1,830 1,831,218 0.05% Salem Fields CLO Ltd. 2016-2 Class A2R(1) 3.494%(2) 25/10/2028 1,602 1,603,499 0.04%
44

LORD ABBETT PASSPORT PORTFOLIOS PLC SHORT DURATION INCOME FUND Schedule of Investments as at 31 January 2020 (Continued)
Interest Maturity PrincipalFair
Value % of Net Investments Rate Date (000) USD Assets Asset-Backed Securities - 44.63% (31 January 2019: 50.36%) (Continued) Other (continued) SCF Equipment Leasing 2017-2 LLC Class A(1) 3.41% 20/12/2023 656 658,590 0.02% SCF Equipment Leasing 2018-1 LLC Class A2(1) 3.63% 20/10/2024 2,137 2,165,991 0.05% Seneca Park CLO Ltd. 2014-1 Class AR(1) 2.956%(2) 17/07/2026 259 259,647 0.01% Sound Point Clo XV Ltd. 2017-1A Class B(1) 3.556%(2) 23/01/2029 586 586,974 0.01% Springleaf Funding Trust 2016-A Class A(1) 2.90% 15/11/2029 1,056 1,057,145 0.03% Steele Creek CLO 2015-1 Ltd. Class AR(1) 3.155%(2) 21/05/2029 4,900 4,906,583 0.12% Textainer Marine Containers VII Ltd. 2018-1A Class A(1) 4.11% 20/07/2043 2,149 2,185,314 0.05% Thacher Park CLO Ltd. 2014-1A Class AR(1) 2.979%(2) 20/10/2026 1,543 1,544,510 0.04% TPG Real Estate Finance 2018-FL2 Issuer Ltd. Class A(1) 2.799%(2) 15/11/2037 3,850 3,854,230 0.10% Venture XXIV CLO Ltd. 2016-24A Class B(1) 3.877%(2) 20/10/2028 10,000 10,012,730 0.25% West CLO 2014-2 Ltd. Class A1AR(1) 2.713%(2) 16/01/2027 2,799 2,796,872 0.07% Westgate Resorts 2016-1 LLC Class A(1) 3.50% 20/12/2028 208 209,114 0.01% Westgate Resorts 2018-1 LLC Class A(1) 3.38% 20/12/2031 712 721,318 0.02% WhiteHorse VIII Ltd. 2014-1A Class BR(1) 3.359%(2) 01/05/2026 2,171 2,174,308 0.05% 233,911,746 5.85% Student Loan DRB Prime Student Loan Trust 2015-D Class A2(1) 3.20% 25/01/2040 36 36,333 0.00% SLC Student Loan Trust 2008-1 Class A4A 3.494%(2) 15/12/2032 1,235 1,256,665 0.03% SoFi Professional Loan Program 2017-E LLC Class A2A(1) 1.86% 26/11/2040 9,300 9,298,104 0.24% SoFi Professional Loan Program 2017-F LLC Class A1FX(1) 2.05% 25/01/2041 3,672 3,672,191 0.09% Towd Point Asset Trust 2018-SL1 Class A(1) 2.308%(2) 25/01/2046 2,421 2,389,348 0.06% 16,652,641 0.42% Total Asset-Backed Securities 1,785,681,826 44.63% Convertible Bond - 0.07% (31 January 2019: 0.14%) Internet Weibo Corp. 1.25% 15/11/2022 3,057 2,923,409 0.07% Total Convertible Bond 2,923,409 0.07% Corporate Bonds - 37.60% (31 January 2019: 39.87%) Aerospace/Defense Arconic, Inc. 5.125% 01/10/2024 2,273 2,455,897 0.06% Arconic, Inc. 5.40% 15/04/2021 673 692,473 0.02% Bombardier, Inc.(1) 6.125% 15/01/2023 2,666 2,636,714 0.06% Bombardier, Inc.(1) 8.75% 01/12/2021 491 526,475 0.01% Embraer Overseas Ltd.(1) 5.696% 16/09/2023 778 860,013 0.02% Spirit AeroSystems, Inc. 2.694%(2) 15/06/2021 1,451 1,441,712 0.04% Spirit AeroSystems, Inc. 3.95% 15/06/2023 4,208 4,261,785 0.11% 12,875,069 0.32% Agriculture BAT Capital Corp. 2.499%(2) 14/08/2020 2,000 2,004,532 0.05% BAT Capital Corp. 2.789% 06/09/2024 2,931 2,994,374 0.08% BAT Capital Corp. 3.222% 15/08/2024 7,026 7,310,201 0.18% BAT International Finance PLC(1) 3.25% 07/06/2022 108 111,127 0.00% Imperial Brands Finance PLC(1) 2.95% 21/07/2020 1,000 1,004,724 0.03%
45

LORD ABBETT PASSPORT PORTFOLIOS PLC SHORT DURATION INCOME FUND Schedule of Investments as at 31 January 2020 (Continued)
Interest Maturity PrincipalFair
Value % of Net Investments Rate Date (000) USD Assets Corporate Bonds - 37.60% (31 January 2019: 39.87%) (Continued) Agriculture (continued) Imperial Brands Finance PLC(1) 3.125% 26/07/2024 13,216 13,544,149 0.34% Imperial Brands Finance PLC(1) 3.75% 21/07/2022 803 832,124 0.02% Reynolds American, Inc. 4.85% 15/09/2023 1,263 1,383,804 0.03% Viterra, Inc.(1) 5.95% 01/08/2020 1,434 1,462,225 0.04% 30,647,260 0.77% Airlines Air Canada 2013-1 Class A Pass Through Trust(1) 4.125% 15/05/2025 1,428 1,545,307 0.04% Air Canada 2015-1 Class B Pass Through Trust(1) 3.875% 15/03/2023 414 426,203 0.01% Air Canada 2015-2 Class B Pass Through Trust(1) 5.00% 15/12/2023 230 241,280 0.00% American Airlines 2013-1 Class B Pass Through Trust(1) 5.625% 15/01/2021 244 248,672 0.00% American Airlines 2013-2 Class B Pass Through Trust(1) 5.60% 15/07/2020 1,087 1,103,213 0.03% American Airlines 2014-1 Class B Pass Through Trust 4.375% 01/10/2022 647 670,914 0.02% Continental Airlines 2012-1 Class B Pass Through Trust 6.25% 11/04/2020 43 43,596 0.00% UAL 2007-1 Pass Through Trust 6.636% 02/07/2022 2,049 2,190,086 0.05% United Airlines 2014-1 Class B Pass Through Trust 4.75% 11/04/2022 251 260,662 0.01% US Airways 2012-2 Class B Pass Through Trust 6.75% 03/06/2021 259 272,386 0.01% US Airways 2013-1 Class B Pass Through Trust 5.375% 15/11/2021 1,854 1,940,655 0.05% 8,942,974 0.22% Auto Manufacturers Aston Martin Capital Holdings Ltd.(1) 6.50% 15/04/2022 831 820,172 0.02% BMW Finance NV(1) 2.691%(2) 12/08/2022 993 1,001,769 0.03% Daimler Finance North America LLC(1) 2.301%(2) 04/05/2021 1,000 1,003,935 0.03% Daimler Finance North America LLC(1) 2.56%(2) 05/11/2021 1,000 1,006,499 0.03% Daimler Finance North America LLC(1) 2.70% 14/06/2024 1,250 1,275,235 0.03% Daimler Finance North America LLC(1) 2.81%(2) 15/02/2022 500 505,586 0.01% Daimler Finance North America LLC(1) 3.35% 22/02/2023 500 519,500 0.01% Daimler Finance North America LLC(1) 3.65% 22/02/2024 1,345 1,425,206 0.04% Fiat Chrysler Automobiles NV 4.50% 15/04/2020 2,850 2,862,013 0.07% Ford Motor Credit Co. LLC 2.843%(2) 03/08/2022 1,000 990,349 0.02% Ford Motor Credit Co. LLC 2.865%(2) 24/09/2020 1,649 1,652,329 0.04% Ford Motor Credit Co. LLC 2.979% 03/08/2022 7,460 7,510,479 0.19% Ford Motor Credit Co. LLC 3.087% 09/01/2023 1,719 1,734,276 0.04% Ford Motor Credit Co. LLC 3.219% 09/01/2022 350 354,188 0.01% Ford Motor Credit Co. LLC 3.339% 28/03/2022 673 682,783 0.02% Ford Motor Credit Co. LLC 3.81% 09/01/2024 800 820,180 0.02% Ford Motor Credit Co. LLC 5.584% 18/03/2024 6,338 6,914,014 0.17% Ford Motor Credit Co. LLC 5.596% 07/01/2022 962 1,015,507 0.03% Ford Motor Credit Co. LLC 5.875% 02/08/2021 5,702 5,987,765 0.15% General Motors Financial Co., Inc. 2.90% 26/02/2025 2,040 2,061,260 0.05% General Motors Financial Co., Inc. 3.15% 30/06/2022 1,551 1,587,875 0.04% General Motors Financial Co., Inc. 3.70% 09/05/2023 4,753 4,943,353 0.12% General Motors Financial Co., Inc. 3.95% 13/04/2024 2,407 2,540,890 0.06% General Motors Financial Co., Inc. 5.10% 17/01/2024 3,952 4,339,187 0.11% Hyundai Capital America(1) 2.708%(2) 03/04/2020 1,000 1,001,115 0.02% Hyundai Capital America(1) 2.899%(2) 18/09/2020 2,000 2,008,296 0.05% Hyundai Capital America 3.00% 20/06/2022 6,800 6,932,038 0.17% Hyundai Capital America(1) 3.00% 20/06/2022 491 500,534 0.01% Hyundai Capital America(1) 3.25% 20/09/2022 881 906,448 0.02%
46

LORD ABBETT PASSPORT PORTFOLIOS PLC SHORT DURATION INCOME FUND Schedule of Investments as at 31 January 2020 (Continued)
Interest Maturity PrincipalFair
Value % of Net Investments Rate Date (000) USD Assets Corporate Bonds - 37.60% (31 January 2019: 39.87%) (Continued) Auto Manufacturers (continued) Hyundai Capital America 3.40% 20/06/2024 7,287 7,578,991 0.19% Hyundai Capital America(1) 3.45% 12/03/2021 544 552,121 0.01% Hyundai Capital Services, Inc.(1) 3.00% 29/08/2022 1,175 1,200,054 0.03% Nissan Motor Acceptance Corp.(1) 2.414%(2) 15/03/2021 2,100 2,102,435 0.05% Nissan Motor Acceptance Corp.(1) 2.558%(2) 21/09/2021 8,240 8,268,780 0.21% Nissan Motor Acceptance Corp.(1) 2.60% 28/09/2022 3,682 3,722,866 0.09% Nissan Motor Acceptance Corp.(1) 2.65% 13/07/2022 339 342,497 0.01% Nissan Motor Acceptance Corp.(1) 2.65%(2) 28/09/2022 3,936 3,937,600 0.10% Nissan Motor Acceptance Corp.(1) 2.738%(2) 13/01/2022 1,500 1,509,606 0.04% Nissan Motor Acceptance Corp.(1) 3.45% 15/03/2023 470 487,528 0.01% Volkswagen Group of America Finance LLC(1) 2.675%(2) 13/11/2020 200 200,926 0.01% Volkswagen Group of America Finance LLC(1) 2.841%(2) 12/11/2021 1,841 1,859,809 0.05% Volkswagen Group of America Finance LLC(1) 4.25% 13/11/2023 1,378 1,488,213 0.04% 98,154,207 2.45% Auto Parts & Equipment Aptiv Corp. 4.15% 15/03/2024 3,000 3,230,538 0.08% IHO Verwaltungs GmbH PIK (1) 4.75% 15/09/2026 819 847,520 0.02% Nexteer Automotive Group Ltd.(1) 5.875% 15/11/2021 2,300 2,340,623 0.06% Titan International, Inc. 6.50% 30/11/2023 217 189,965 0.00% ZF North America Capital, Inc.(1) 4.00% 29/04/2020 1,536 1,541,836 0.04% ZF North America Capital, Inc.(1) 4.50% 29/04/2022 2,006 2,087,885 0.05% ZF North America Capital, Inc.(1) 4.75% 29/04/2025 8,146 8,740,097 0.22% 18,978,464 0.47% Banks ABN AMRO Bank NV(1) 4.75% 28/07/2025 386 427,719 0.01% ABN AMRO Bank NV 6.25% 27/04/2022 2,796 3,030,436 0.08% AIB Group PLC(1) 4.263%(3) 10/04/2025 1,597 1,709,009 0.04% AIB Group PLC(1) 4.75% 12/10/2023 1,130 1,227,181 0.03% Akbank T.A.S.(1) 5.00% 24/10/2022 900 929,520 0.02% ASB Bank Ltd.(1) 3.75% 14/06/2023 1,417 1,503,564 0.04% Associated Bank N.A./Green Bay WI 3.50% 13/08/2021 1,627 1,659,842 0.04% Australia & New Zealand Banking Group Ltd.(1) 4.50% 19/03/2024 792 859,174 0.02% Banco de Credito del Peru(1) 2.70% 11/01/2025 1,121 1,124,094 0.03% Bancolombia SA 3.00% 29/01/2025 2,414 2,431,526 0.06% Bank of America Corp. 2.456%(3) 22/10/2025 2,779 2,840,196 0.07% Bank of America Corp. 2.801%(2) 24/04/2023 500 506,369 0.01% Bank of America Corp. 3.004%(3) 20/12/2023 4,891 5,043,551 0.13% Bank of America Corp. 4.00% 22/01/2025 3,041 3,292,482 0.08% Bank of America Corp. 4.20% 26/08/2024 4,422 4,812,128 0.12% Bank of Ireland Group PLC(1) 4.50% 25/11/2023 3,350 3,611,599 0.09% BankUnited, Inc. 4.875% 17/11/2025 5,391 6,028,967 0.15% Barclays Bank PLC(1) 10.179% 12/06/2021 2,672 2,958,286 0.07% BBVA Bancomer SA/Texas(1) 6.50% 10/03/2021 788 822,932 0.02% BBVA Bancomer SA/Texas(1) 6.75% 30/09/2022 3,150 3,462,732 0.09% BBVA USA 2.50% 27/08/2024 1,500 1,512,907 0.04% BBVA USA 2.875% 29/06/2022 850 869,886 0.02% Capital One N.A. 2.724%(2) 08/08/2022 970 979,844 0.02% CIT Group, Inc. 4.125% 09/03/2021 832 846,826 0.02% CIT Group, Inc. 4.75% 16/02/2024 1,355 1,444,769 0.04% CIT Group, Inc. 5.00% 15/08/2022 152 161,879 0.00% Citigroup, Inc. 2.484%(2) 27/10/2022 5,643 5,700,100 0.14% Citigroup, Inc. 2.751%(2) 24/07/2023 700 708,067 0.02%
47

LORD ABBETT PASSPORT PORTFOLIOS PLC SHORT DURATION INCOME FUND Schedule of Investments as at 31 January 2020 (Continued)
Interest Maturity PrincipalFair
Value % of Net Investments Rate Date (000) USD Assets Corporate Bonds - 37.60% (31 January 2019: 39.87%) (Continued) Banks (continued) Citigroup, Inc. 2.754%(2) 25/04/2022 2,000 2,031,515 0.05% Citigroup, Inc. 2.876%(3) 24/07/2023 1,723 1,760,019 0.04% Citigroup, Inc. 2.93%(2) 01/06/2024 3,000 3,044,463 0.08% Citigroup, Inc. 3.352%(3) 24/04/2025 4,551 4,791,147 0.12% Citigroup, Inc. 3.875% 26/03/2025 4,784 5,161,058 0.13% Citigroup, Inc. 4.40% 10/06/2025 1,572 1,734,741 0.04% Citigroup, Inc. 5.50% 13/09/2025 614 715,318 0.02% Citizens Bank N.A./Providence RI 2.629%(2) 14/02/2022 500 504,056 0.01% Citizens Bank N.A./Providence RI 2.727%(2) 26/05/2022 3,110 3,137,333 0.08% Citizens Bank N.A./Providence RI 2.91%(2) 29/03/2023 1,500 1,521,532 0.04% Citizens Financial Group, Inc.(1) 4.15% 28/09/2022 2,428 2,553,810 0.06% Credit Suisse Group Funding Guernsey Ltd. 4.109%(2) 16/04/2021 1,275 1,305,882 0.03% Danske Bank A/S(1) 2.417%(2) 02/03/2020 1,000 1,000,426 0.02% Danske Bank A/S(1) 2.75% 17/09/2020 2,759 2,773,564 0.07% Danske Bank A/S(1) 3.001%(3) 20/09/2022 2,174 2,202,394 0.05% Danske Bank A/S(1) 5.00% 12/01/2022 1,798 1,894,932 0.05% Danske Bank A/S(1) 5.375% 12/01/2024 4,289 4,774,935 0.12% Discover Bank 3.35% 06/02/2023 744 773,061 0.02% Goldman Sachs Group, Inc. 2.557%(2) 31/10/2022 7,326 7,390,646 0.18% Goldman Sachs Group, Inc. 2.904%(2) 26/04/2022 2,203 2,226,739 0.06% Goldman Sachs Group, Inc. 2.908%(3) 05/06/2023 1,815 1,855,776 0.05% Goldman Sachs Group, Inc. 3.272%(3) 29/09/2025 3,640 3,827,620 0.10% Goldman Sachs Group, Inc. 3.50% 23/01/2025 2,500 2,663,478 0.07% Goldman Sachs Group, Inc. 5.25% 27/07/2021 523 549,673 0.01% Goldman Sachs Group, Inc. 5.75% 24/01/2022 649 698,227 0.02% HSBC Holdings PLC 4.25% 14/03/2024 1,000 1,075,615 0.03% ING Bank NV(1) 5.80% 25/09/2023 841 942,679 0.02% Intesa Sanpaolo SpA(1) 6.50% 24/02/2021 3,685 3,857,710 0.10% Itau Unibanco Holding SA/Cayman Island(1) 2.90% 24/01/2023 2,993 3,003,625 0.08% JPMorgan Chase & Co. 2.536%(2) 23/04/2024 7,350 7,382,507 0.18% JPMorgan Chase & Co. 3.875% 10/09/2024 3,622 3,916,503 0.10% Lloyds Bank PLC(1) 6.50% 14/09/2020 5,213 5,356,687 0.13% M&T Bank Corp. 2.474%(2) 26/07/2023 880 886,901 0.02% Macquarie Bank Ltd.(1) 6.625% 07/04/2021 1,713 1,806,862 0.05% Macquarie Group Ltd.(1) 3.189%(3) 28/11/2023 1,399 1,444,542 0.04% Macquarie Group Ltd.(1) 4.15%(3) 27/03/2024 2,106 2,238,344 0.06% Manufacturers & Traders Trust Co. 2.875%(2) 28/12/2020 403 403,233 0.01% Morgan Stanley 2.72%(3) 22/07/2025 1,612 1,659,474 0.04% Morgan Stanley 2.999%(2) 20/01/2022 2,097 2,117,987 0.05% Morgan Stanley 3.201%(2) 24/10/2023 3,700 3,790,847 0.09% Morgan Stanley 3.70% 23/10/2024 730 787,599 0.02% Morgan Stanley 5.00% 24/11/2025 751 859,675 0.02% NBK SPC Ltd.(1) 2.75% 30/05/2022 1,130 1,141,666 0.03% Nordea Bank Abp(1) 4.25% 21/09/2022 886 935,759 0.02% Nordea Bank Abp(1) 4.875% 13/05/2021 4,863 5,043,288 0.13% People's United Bank N.A. 4.00% 15/07/2024 275 290,149 0.01% Popular, Inc. 6.125% 14/09/2023 645 694,449 0.02% Royal Bank of Scotland Group PLC 6.125% 15/12/2022 664 728,057 0.02% Santander Holdings USA, Inc. 2.65% 17/04/2020 2,000 2,002,145 0.05% Santander Holdings USA, Inc. 3.50% 07/06/2024 1,000 1,044,128 0.03% Santander UK Group Holdings PLC 3.373%(3) 05/01/2024 473 488,714 0.01% Standard Chartered Bank Hong Kong Ltd. 5.875% 24/06/2020 1,326 1,343,951 0.03% Standard Chartered PLC(1) 4.247%(3) 20/01/2023 2,584 2,684,734 0.07% Swedbank AB(1) 2.80% 14/03/2022 1,554 1,581,303 0.04%
48

LORD ABBETT PASSPORT PORTFOLIOS PLC SHORT DURATION INCOME FUND Schedule of Investments as at 31 January 2020 (Continued)
Interest Maturity PrincipalFair
Value % of Net Investments Rate Date (000) USD Assets Corporate Bonds - 37.60% (31 January 2019: 39.87%) (Continued) Banks (continued) Synovus Financial Corp. 3.125% 01/11/2022 1,750 1,782,331 0.04% Toronto-Dominion Bank 2.437%(2) 01/12/2022 2,811 2,829,339 0.07% Turkiye Vakiflar Bankasi TAO(1) 5.25% 05/02/2025 2,612 2,602,858 0.06% Turkiye Vakiflar Bankasi TAO(1) 5.625% 30/05/2022 1,624 1,675,172 0.04% Turkiye Vakiflar Bankasi TAO(1) 5.75% 30/01/2023 1,299 1,344,660 0.03% UBS AG 5.125% 15/05/2024 4,716 5,101,010 0.13% UBS AG/Stamford CT 7.625% 17/08/2022 10,211 11,533,427 0.29% UBS Group AG(1) 2.859%(3) 15/08/2023 403 411,733 0.01% UBS Group AG(1) 3.13%(2) 23/05/2023 3,137 3,188,912 0.08% Wells Fargo & Co. 2.406%(3) 30/10/2025 4,176 4,248,264 0.11% Wells Fargo & Co. 2.911%(2) 24/01/2023 5,000 5,078,402 0.13% Wells Fargo & Co. 3.007%(2) 31/10/2023 2,500 2,552,449 0.06% Wells Fargo & Co. 3.75% 24/01/2024 1,338 1,430,375 0.04% Wells Fargo & Co. 4.125% 15/08/2023 347 372,354 0.01% Wells Fargo & Co. 4.48% 16/01/2024 1,203 1,312,222 0.03% Zions Bancorp N.A. 3.35% 04/03/2022 1,828 1,879,456 0.05% 228,250,027 5.70% Beverages Constellation Brands, Inc. 2.61%(2) 15/11/2021 6,440 6,440,980 0.16% Constellation Brands, Inc. 4.75% 15/11/2024 362 404,936 0.01% 6,845,916 0.17% Building Materials Boral Finance Pty Ltd.(1) 3.00% 01/11/2022 665 673,293 0.02% CPG Merger Sub LLC(1) 8.00% 01/10/2021 1,067 1,072,762 0.03% Griffon Corp. 5.25% 01/03/2022 1,386 1,387,903 0.03% Johnson Controls International PLC 5.00% 30/03/2020 245 246,142 0.00% Martin Marietta Materials, Inc. 2.549%(2) 22/05/2020 269 269,311 0.01% Owens Corning 4.20% 01/12/2024 5,508 5,957,824 0.15% Vulcan Materials Co. 2.557%(2) 01/03/2021 4,580 4,594,612 0.11% 14,201,847 0.35% Chemicals Blue Cube Spinco LLC 9.75% 15/10/2023 280 299,253 0.01% Celanese US Holdings LLC 4.625% 15/11/2022 400 426,426 0.01% Celanese US Holdings LLC 5.875% 15/06/2021 1,683 1,769,945 0.04% CNAC HK Finbridge Co. Ltd. 3.00% 19/07/2020 1,475 1,478,710 0.04% CNAC HK Finbridge Co. Ltd. 3.50% 19/07/2022 3,800 3,882,026 0.10% CNAC HK Finbridge Co. Ltd. 4.125% 14/03/2021 2,000 2,036,370 0.05% DuPont de Nemours, Inc. 3.02%(2) 15/11/2023 930 949,816 0.02% Equate Petrochemical BV(1) 3.00% 03/03/2022 200 201,881 0.01% Mosaic Co. 3.25% 15/11/2022 905 933,335 0.02% Mosaic Co. 3.75% 15/11/2021 700 717,963 0.02% Mosaic Co. 4.25% 15/11/2023 308 330,750 0.01% NOVA Chemicals Corp.(1) 5.25% 01/08/2023 1,507 1,529,590 0.04% Nutrien Ltd. 3.375% 15/03/2025 2,400 2,540,709 0.06% SABIC Capital II BV(1) 4.00% 10/10/2023 900 950,625 0.02% Syngenta Finance NV(1) 3.698% 24/04/2020 1,035 1,037,194 0.03% Syngenta Finance NV(1) 3.933% 23/04/2021 1,420 1,449,831 0.04%
49

LORD ABBETT PASSPORT PORTFOLIOS PLC SHORT DURATION INCOME FUND Schedule of Investments as at 31 January 2020 (Continued)
Interest Maturity PrincipalFair
Value % of Net Investments Rate Date (000) USD Assets Corporate Bonds - 37.60% (31 January 2019: 39.87%) (Continued) Chemicals (continued) Syngenta Finance NV(1) 4.441% 24/04/2023 450 475,644 0.01% 21,010,068 0.53% Commercial Services Adani Ports & Special Economic Zone Ltd.(1) 3.375% 24/07/2024 1,775 1,819,484 0.05% Adani Ports & Special Economic Zone Ltd.(1) 3.95% 19/01/2022 400 411,338 0.01% Capitol Investment Merger Sub 2 LLC(1) 10.00% 01/08/2024 503 523,957 0.01% Equifax, Inc. 2.78%(2) 15/08/2021 303 304,658 0.01% IHS Markit Ltd. 4.125% 01/08/2023 1,499 1,597,859 0.04% Laureate Education, Inc.(1) 8.25% 01/05/2025 478 513,248 0.01% 5,170,544 0.13% Computers Dell International LLC/EMC Corp.(1) 4.00% 15/07/2024 232 247,742 0.01% Dell International LLC/EMC Corp.(1) 5.45% 15/06/2023 12,863 14,099,187 0.35% Dell International LLC/EMC Corp.(1) 5.875% 15/06/2021 1,062 1,073,417 0.03% Hewlett Packard Enterprise Co. 2.567%(2) 12/03/2021 3,576 3,593,388 0.09% Hewlett Packard Enterprise Co. 2.62%(2) 05/10/2021 10,175 10,176,494 0.25% HT Global IT Solutions Holdings Ltd.(1) 7.00% 14/07/2021 1,000 1,027,750 0.02% 30,217,978 0.75% Distribution/Wholesale H&E Equipment Services, Inc. 5.625% 01/09/2025 1,393 1,456,263 0.04% Diversified Financial Services AerCap Ireland Capital DAC/AerCap Global Aviation Trust 4.875% 16/01/2024 439 481,367 0.01% Air Lease Corp. 4.25% 01/02/2024 716 773,387 0.02% Aircastle Ltd. 4.40% 25/09/2023 2,102 2,256,724 0.06% Aircastle Ltd. 5.00% 01/04/2023 1,284 1,391,117 0.03% Aircastle Ltd. 5.50% 15/02/2022 1,350 1,439,092 0.04% Aircastle Ltd. 7.625% 15/04/2020 677 684,376 0.02% Ally Financial, Inc. 3.875% 21/05/2024 4,585 4,844,809 0.12% Ally Financial, Inc. 5.125% 30/09/2024 7,769 8,664,649 0.22% American Express Co. 2.569%(2) 27/02/2023 1,805 1,819,294 0.05% Avolon Holdings Funding Ltd.(1) 5.125% 01/10/2023 3,633 3,963,549 0.10% Avolon Holdings Funding Ltd.(1) 5.25% 15/05/2024 10,945 12,075,783 0.30% Avolon Holdings Funding Ltd.(1) 5.50% 15/01/2023 2,589 2,816,483 0.07% E*TRADE Financial Corp. 2.95% 24/08/2022 997 1,020,563 0.03% GE Capital International Funding Co. Unlimited Co. 2.342% 15/11/2020 158 158,568 0.00% Global Aircraft Leasing Co. Ltd. PIK (1) 6.50% 15/09/2024 1,452 1,489,099 0.04% International Lease Finance Corp. 8.25% 15/12/2020 2,427 2,558,776 0.06% International Lease Finance Corp. 8.625% 15/01/2022 7,175 8,074,904 0.20% Invesco Finance PLC 3.125% 30/11/2022 824 853,609 0.02% Jefferies Financial Group, Inc. 5.50% 18/10/2023 5,743 6,298,050 0.16% Jefferies Group LLC 6.875% 15/04/2021 836 884,136 0.02% Muthoot Finance Ltd.(1) 6.125% 31/10/2022 1,550 1,609,613 0.04% Nationstar Mortgage Holdings, Inc.(1) 8.125% 15/07/2023 2,889 3,061,141 0.08% Navient Corp. 5.00% 26/10/2020 1,493 1,515,619 0.04% Park Aerospace Holdings Ltd.(1) 3.625% 15/03/2021 566 575,435 0.01% Park Aerospace Holdings Ltd.(1) 4.50% 15/03/2023 4,634 4,927,170 0.12% Park Aerospace Holdings Ltd.(1) 5.25% 15/08/2022 1,232 1,321,359 0.03%
50

LORD ABBETT PASSPORT PORTFOLIOS PLC SHORT DURATION INCOME FUND Schedule of Investments as at 31 January 2020 (Continued)
Interest Maturity PrincipalFair
Value % of Net Investments Rate Date (000) USD Assets Corporate Bonds - 37.60% (31 January 2019: 39.87%) (Continued) Diversified Financial Services (continued) Park Aerospace Holdings Ltd.(1) 5.50% 15/02/2024 7,903 8,762,609 0.22% 84,321,281 2.11% Electric AES Corp./VA 4.875% 15/05/2023 840 852,251 0.02% Ausgrid Finance Pty Ltd.(1) 3.85% 01/05/2023 3,495 3,649,221 0.09% Calpine Corp. 5.75% 15/01/2025 2,277 2,346,494 0.06% CenterPoint Energy, Inc. 2.50% 01/09/2024 1,785 1,818,960 0.05% Comision Federal de Electricidad(1) 4.875% 26/05/2021 3,121 3,223,712 0.08% Comision Federal de Electricidad(1) 4.875% 15/01/2024 1,493 1,624,272 0.04% Dominion Energy, Inc. 3.071%(4) 15/08/2024 7,502 7,800,713 0.19% Dominion Energy, Inc. 4.104%(4) 01/04/2021 1,514 1,549,632 0.04% DPL, Inc. 7.25% 15/10/2021 2,463 2,617,923 0.06% DTE Energy Co. 2.529% 01/10/2024 5,232 5,349,352 0.13% DTE Energy Co. 3.50% 01/06/2024 650 685,748 0.02% Duquesne Light Holdings, Inc.(1) 5.90% 01/12/2021 412 438,395 0.01% Duquesne Light Holdings, Inc.(1) 6.40% 15/09/2020 703 721,602 0.02% Enel Finance International NV(1) 2.65% 10/09/2024 3,771 3,849,433 0.10% Enel Finance International NV(1) 2.75% 06/04/2023 1,420 1,445,158 0.04% Enel Finance International NV(1) 2.875% 25/05/2022 3,700 3,775,491 0.09% Enel Finance International NV(1) 4.25% 14/09/2023 4,667 5,009,578 0.12% Evergy, Inc. 2.45% 15/09/2024 2,264 2,302,903 0.06% FirstEnergy Transmission LLC(1) 4.35% 15/01/2025 1,565 1,725,681 0.04% Florida Power & Light Co. 2.308%(2) 06/05/2022 6,695 6,695,506 0.17% Jersey Central Power & Light Co.(1) 4.70% 01/04/2024 3,129 3,445,627 0.09% NextEra Energy Capital Holdings, Inc. 2.464%(2) 28/08/2021 1,285 1,285,282 0.03% NextEra Energy Capital Holdings, Inc. 2.63%(2) 25/02/2022 3,825 3,852,645 0.10% NRG Energy, Inc.(1) 3.75% 15/06/2024 4,607 4,819,666 0.12% Origin Energy Finance Ltd.(1) 5.45% 14/10/2021 3,226 3,408,563 0.08% PPL Capital Funding, Inc. 3.40% 01/06/2023 1,000 1,043,473 0.03% PPL Capital Funding, Inc. 3.50% 01/12/2022 1,052 1,091,648 0.03% PPL Capital Funding, Inc. 3.95% 15/03/2024 1,245 1,327,896 0.03% PPL WEM Ltd./Western Power Distribution Ltd.(1) 5.375% 01/05/2021 4,376 4,506,709 0.11% PSEG Power LLC 4.15% 15/09/2021 250 257,119 0.01% Puget Energy, Inc. 5.625% 15/07/2022 500 537,935 0.01% SCANA Corp. 4.125% 01/02/2022 1,285 1,323,629 0.03% SCANA Corp. 4.75% 15/05/2021 1,554 1,590,163 0.04% SCANA Corp. 6.25% 01/04/2020 740 743,696 0.02% Sempra Energy 2.331%(2) 15/01/2021 1,175 1,175,225 0.03% Sempra Energy 2.344%(2) 15/03/2021 650 651,021 0.02% Tampa Electric Co. 5.40% 15/05/2021 300 313,870 0.01% TransAlta Corp. 4.50% 15/11/2022 4,955 5,165,687 0.13% Vistra Operations Co. LLC(1) 3.55% 15/07/2024 8,579 8,861,236 0.22% 102,883,115 2.57% Electronics Trimble, Inc. 4.15% 15/06/2023 1,423 1,516,817 0.04% Trimble, Inc. 4.75% 01/12/2024 465 511,637 0.01% 2,028,454 0.05% Energy-Alternate Sources Greenko Mauritius Ltd.(1) 6.25% 21/02/2023 1,940 2,009,522 0.05%
51

LORD ABBETT PASSPORT PORTFOLIOS PLC SHORT DURATION INCOME FUND Schedule of Investments as at 31 January 2020 (Continued)
Interest Maturity PrincipalFair
Value % of Net Investments Rate Date (000) USD Assets Corporate Bonds - 37.60% (31 January 2019: 39.87%) (Continued) Entertainment Eldorado Resorts, Inc. 7.00% 01/08/2023 281 291,360 0.01% Enterprise Development Authority(1) 12.00% 15/07/2024 1,332 1,531,247 0.04% Jacobs Entertainment, Inc.(1) 7.875% 01/02/2024 219 232,734 0.00% Scientific Games International, Inc. 6.625% 15/05/2021 1,311 1,321,357 0.03% 3,376,698 0.08% Environmental Control Covanta Holding Corp. 5.875% 01/07/2025 3,305 3,437,539 0.09% Food Albertsons Cos LLC/Safeway, Inc./New Albertsons LP/Albertson's LLC 5.75% 15/03/2025 1,836 1,905,649 0.05% Campbell Soup Co. 2.394%(2) 16/03/2020 1,150 1,150,293 0.03% Campbell Soup Co. 2.524%(2) 15/03/2021 2,095 2,103,896 0.05% Conagra Brands, Inc. 2.378%(2) 09/10/2020 805 806,628 0.02% Conagra Brands, Inc. 2.552%(2) 22/10/2020 850 850,094 0.02% General Mills, Inc. 2.383%(2) 16/04/2021 468 470,403 0.01% General Mills, Inc. 2.846%(2) 17/10/2023 2,006 2,040,809 0.05% Ingles Markets, Inc. 5.75% 15/06/2023 1,504 1,533,433 0.04% JBS USA LUX SA/JBS USA Finance, Inc.(1) 5.875% 15/07/2024 1,458 1,496,273 0.04% Kraft Heinz Foods Co. 2.721%(2) 10/08/2022 276 277,385 0.01% Smithfield Foods, Inc.(1) 2.65% 03/10/2021 1,048 1,046,197 0.03% Smithfield Foods, Inc.(1) 3.35% 01/02/2022 951 959,416 0.02% 14,640,476 0.37% Gas National Fuel Gas Co. 3.75% 01/03/2023 651 677,787 0.02% National Fuel Gas Co. 4.90% 01/12/2021 2,027 2,118,465 0.05% National Fuel Gas Co. 7.395% 30/03/2023 485 556,845 0.01% Southern Star Central Corp.(1) 5.125% 15/07/2022 2,762 2,802,094 0.07% WGL Holdings, Inc. 2.437%(2) 12/03/2020 1,488 1,488,280 0.04% 7,643,471 0.19% Healthcare-Products Fresenius US Finance II, Inc.(1) 4.25% 01/02/2021 1,809 1,846,782 0.05% Kinetic Concepts, Inc./KCI USA, Inc.(1) 12.50% 01/11/2021 162 166,124 0.00% Zimmer Biomet Holdings, Inc. 2.653%(2) 19/03/2021 1,000 1,000,209 0.03% 3,013,115 0.08% Healthcare-Services Acadia Healthcare Co., Inc. 5.125% 01/07/2022 6,471 6,497,285 0.16% Acadia Healthcare Co., Inc. 5.625% 15/02/2023 2,470 2,508,075 0.06% Acadia Healthcare Co., Inc. 6.125% 15/03/2021 1,793 1,799,724 0.04% Anthem, Inc. 3.50% 15/08/2024 439 465,375 0.01% Centene Corp.(1) 5.375% 01/06/2026 901 960,106 0.02% Centene Corp. 6.125% 15/02/2024 172 177,805 0.00% CommonSpirit Health 2.76% 01/10/2024 2,235 2,310,844 0.06% Eagle Holding Co. II LLC PIK (1) 7.625% 15/05/2022 670 678,370 0.02% Fresenius Medical Care US Finance II, Inc.(1) 4.125% 15/10/2020 691 697,284 0.02% Fresenius Medical Care US Finance II, Inc.(1) 4.75% 15/10/2024 1,648 1,819,486 0.05% Fresenius Medical Care US Finance II, Inc.(1) 5.875% 31/01/2022 3,512 3,762,048 0.09% Fresenius Medical Care US Finance, Inc.(1) 5.75% 15/02/2021 1,660 1,720,055 0.04% HCA, Inc. 5.00% 15/03/2024 4,335 4,804,530 0.12%
52

LORD ABBETT PASSPORT PORTFOLIOS PLC SHORT DURATION INCOME FUND Schedule of Investments as at 31 January 2020 (Continued)
Interest Maturity PrincipalFair
Value % of Net Investments Rate Date (000) USD Assets Corporate Bonds - 37.60% (31 January 2019: 39.87%) (Continued) Healthcare-Services (continued) HCA, Inc. 5.25% 15/04/2025 2,368 2,696,129 0.07% Select Medical Corp.(1) 6.25% 15/08/2026 1,365 1,475,108 0.04% Universal Health Services, Inc.(1) 4.75% 01/08/2022 4,624 4,667,405 0.12% Universal Health Services, Inc.(1) 5.00% 01/06/2026 1,750 1,840,296 0.05% 38,879,925 0.97% Home Builders DR Horton, Inc. 4.375% 15/09/2022 468 493,396 0.01% DR Horton, Inc. 4.75% 15/02/2023 197 211,482 0.01% DR Horton, Inc. 5.75% 15/08/2023 2,997 3,349,445 0.08% M/I Homes, Inc. 5.625% 01/08/2025 3,599 3,780,443 0.09% Shea Homes LP/Shea Homes Funding Corp.(1) 5.875% 01/04/2023 265 270,410 0.01% William Lyon Homes, Inc. 7.00% 15/08/2022 326 327,019 0.01% Williams Scotsman International, Inc.(1) 7.875% 15/12/2022 1,487 1,554,379 0.04% 9,986,574 0.25% Household Products/Wares Reckitt Benckiser Treasury Services PLC(1) 2.495%(2) 24/06/2022 11,719 11,774,159 0.29% Housewares Newell Brands, Inc. 3.85% 01/04/2023 13,711 14,280,164 0.36% Newell Brands, Inc. 4.70% 15/08/2020 244 247,374 0.00% 14,527,538 0.36% Insurance Assurant, Inc. 3.197%(2) 26/03/2021 71 71,008 0.00% Assurant, Inc. 4.20% 27/09/2023 1,256 1,333,420 0.03% Brown & Brown, Inc. 4.20% 15/09/2024 500 544,882 0.01% CNA Financial Corp. 7.25% 15/11/2023 316 372,161 0.01% CNO Financial Group, Inc. 5.25% 30/05/2025 867 974,651 0.02% Equitable Holdings, Inc. 3.90% 20/04/2023 1,447 1,533,833 0.04% Kemper Corp. 4.35% 15/02/2025 1,698 1,838,004 0.05% Lincoln National Corp. 4.20% 15/03/2022 175 183,387 0.01% MGIC Investment Corp. 5.75% 15/08/2023 512 567,253 0.01% Peachtree Corners Funding Trust(1) 3.976% 15/02/2025 1,422 1,540,237 0.04% Unum Group 4.00% 15/03/2024 330 353,761 0.01% Willis North America, Inc. 3.60% 15/05/2024 324 345,092 0.01% 9,657,689 0.24% Internet Baidu, Inc. 3.875% 29/09/2023 10,514 11,085,731 0.28% Baidu, Inc. 4.125% 30/06/2025 765 827,969 0.02% Baidu, Inc. 4.375% 14/05/2024 4,548 4,912,298 0.12% Prosus NV(1) 6.00% 18/07/2020 10,153 10,311,945 0.26% Tencent Holdings Ltd.(1) 2.758%(2) 11/04/2024 3,750 3,791,370 0.09% Tencent Holdings Ltd.(1) 3.28% 11/04/2024 3,658 3,827,164 0.10% VeriSign, Inc. 4.625% 01/05/2023 206 208,630 0.01% Weibo Corp. 3.50% 05/07/2024 2,425 2,513,619 0.06% 37,478,726 0.94% Investment Companies MDGH - GMTN BV(1) 2.50% 07/11/2024 1,780 1,797,521 0.04%
53

LORD ABBETT PASSPORT PORTFOLIOS PLC SHORT DURATION INCOME FUND Schedule of Investments as at 31 January 2020 (Continued)
Interest Maturity PrincipalFair
Value % of Net Investments Rate Date (000) USD Assets Corporate Bonds - 37.60% (31 January 2019: 39.87%) (Continued) Iron/Steel POSCO(1) 2.375% 12/11/2022 1,425 1,433,690 0.04% Steel Dynamics, Inc. 4.125% 15/09/2025 1,755 1,804,967 0.04% Steel Dynamics, Inc. 5.00% 15/12/2026 1,489 1,594,993 0.04% Steel Dynamics, Inc. 5.50% 01/10/2024 3,351 3,452,368 0.09% 8,286,018 0.21% Leisure Time LTF Merger Sub, Inc.(1) 8.50% 15/06/2023 3,123 3,186,116 0.08% Royal Caribbean Cruises Ltd. 5.25% 15/11/2022 3,971 4,310,568 0.11% Silversea Cruise Finance Ltd.(1) 7.25% 01/02/2025 1,882 1,991,373 0.05% Viking Cruises Ltd.(1) 6.25% 15/05/2025 1,219 1,255,064 0.03% 10,743,121 0.27% Lodging Las Vegas Sands Corp. 2.90% 25/06/2025 5,792 5,907,999 0.15% Las Vegas Sands Corp. 3.20% 08/08/2024 8,843 9,141,387 0.23% Studio City Co. Ltd. 7.25% 30/11/2021 278 283,907 0.01% Studio City Co. Ltd.(1) 7.25% 30/11/2021 740 755,725 0.02% Wyndham Destinations, Inc. 5.625% 01/03/2021 514 532,196 0.01% 16,621,214 0.42% Machinery-Construction & Mining Caterpillar Financial Services Corp. 2.42%(2) 15/05/2023 6,858 6,896,174 0.17% Machinery-Diversified CNH Industrial Capital LLC 4.20% 15/01/2024 7,221 7,729,183 0.19% CNH Industrial Capital LLC 4.375% 05/04/2022 2,252 2,361,857 0.06% CNH Industrial Capital LLC 4.875% 01/04/2021 1,672 1,722,929 0.04% CNH Industrial NV 4.50% 15/08/2023 3,836 4,137,173 0.10% Flowserve Corp. 4.00% 15/11/2023 5,665 5,933,803 0.15% IDEX Corp. 4.20% 15/12/2021 250 257,743 0.01% Nvent Finance S.A.R.L. 3.95% 15/04/2023 1,932 1,992,579 0.05% Welbilt, Inc. 9.50% 15/02/2024 999 1,054,360 0.03% Westinghouse Air Brake Technologies Corp. 3.194%(2) 15/09/2021 899 899,189 0.02% Westinghouse Air Brake Technologies Corp. 4.375% 15/08/2023 989 1,048,573 0.03% Westinghouse Air Brake Technologies Corp. 4.40% 15/03/2024 3,302 3,576,666 0.09% 30,714,055 0.77% Media Altice Financing SA(1) 6.625% 15/02/2023 4,247 4,330,177 0.11% Cox Communications, Inc.(1) 2.95% 30/06/2023 2,156 2,215,723 0.06% Cox Communications, Inc.(1) 3.15% 15/08/2024 753 788,373 0.02% NBCUniversal Enterprise, Inc.(1) 5.25% -(5) 7,132 7,362,185 0.18% 14,696,458 0.37% Metal Fabricate/Hardware Zekelman Industries, Inc.(1) 9.875% 15/06/2023 299 315,258 0.01% Mining Anglo American Capital PLC(1) 3.625% 11/09/2024 6,600 6,959,446 0.18% Anglo American Capital PLC(1) 3.75% 10/04/2022 985 1,017,636 0.03% Anglo American Capital PLC(1) 4.125% 15/04/2021 1,623 1,661,659 0.04% Anglo American Capital PLC(1) 4.125% 27/09/2022 3,215 3,373,825 0.09%
54

LORD ABBETT PASSPORT PORTFOLIOS PLC SHORT DURATION INCOME FUND Schedule of Investments as at 31 January 2020 (Continued)
Interest Maturity PrincipalFair
Value % of Net Investments Rate Date (000) USD Assets Corporate Bonds - 37.60% (31 January 2019: 39.87%) (Continued) Mining (continued) Freeport-McMoRan, Inc. 4.55% 14/11/2024 1,999 2,113,113 0.05% Glencore Finance Canada Ltd.(1) 4.25% 25/10/2022 4,855 5,087,769 0.13% Glencore Funding LLC(1) 3.00% 27/10/2022 1,592 1,616,289 0.04% Glencore Funding LLC(1) 4.125% 30/05/2023 6,145 6,467,252 0.16% Glencore Funding LLC(1) 4.125% 12/03/2024 2,669 2,839,782 0.07% Glencore Funding LLC(1) 4.625% 29/04/2024 4,885 5,277,124 0.13% Gold Fields Orogen Holdings BVI Ltd.(1) 4.875% 07/10/2020 4,099 4,155,853 0.10% Hecla Mining Co. 6.875% 01/05/2021 1,756 1,756,439 0.05% Joseph T Ryerson & Son, Inc.(1) 11.00% 15/05/2022 1,215 1,278,779 0.03% Kinross Gold Corp. 5.125% 01/09/2021 379 393,004 0.01% Kinross Gold Corp. 5.95% 15/03/2024 1,517 1,702,056 0.04% MMC Norilsk Nickel OJSC Via MMC Finance DAC(1) 4.10% 11/04/2023 500 519,700 0.01% Southern Copper Corp. 5.375% 16/04/2020 481 484,372 0.01% 46,704,098 1.17% Miscellaneous Manufacturer General Electric Co. 2.37%(2) 28/03/2020 520 519,799 0.01% General Electric Co. 2.831%(2) 15/04/2023 92 92,642 0.00% General Electric Co. 3.375% 11/03/2024 213 224,353 0.01% General Electric Co. 3.45% 15/05/2024 1,097 1,155,926 0.03% General Electric Co. 4.65% 17/10/2021 787 822,415 0.02% Ingersoll-Rand Luxembourg Finance SA 3.55% 01/11/2024 240 256,088 0.01% Pentair Finance S.A.R.L. 3.15% 15/09/2022 800 814,099 0.02% 3,885,322 0.10% Oil & Gas American Energy- Permian Basin LLC(1) 12.00% 01/10/2024 484 333,960 0.01% Antero Resources Corp. 5.125% 01/12/2022 1,157 999,972 0.02% Callon Petroleum Co. 6.125% 01/10/2024 1,177 1,128,449 0.03% Carrizo Oil & Gas, Inc. 6.25% 15/04/2023 5,490 5,517,395 0.14% Chaparral Energy, Inc.(1) 8.75% 15/07/2023 2,018 722,948 0.02% Cimarex Energy Co. 4.375% 01/06/2024 2,947 3,134,866 0.08% CNOOC Curtis Funding No 1 Pty Ltd.(1) 4.50% 03/10/2023 5,354 5,786,458 0.14% Concho Resources, Inc. 4.375% 15/01/2025 4,717 4,877,347 0.12% Continental Resources, Inc. 3.80% 01/06/2024 2,473 2,577,997 0.06% Continental Resources, Inc. 4.50% 15/04/2023 4,045 4,273,669 0.11% Continental Resources, Inc. 5.00% 15/09/2022 12,862 12,937,378 0.32% Diamondback Energy, Inc. 2.875% 01/12/2024 1,250 1,271,916 0.03% Diamondback Energy, Inc. 5.375% 31/05/2025 8,028 8,397,856 0.21% Energen Corp. 4.625% 01/09/2021 941 969,531 0.02% ENI SpA(1) 4.00% 12/09/2023 5,701 6,077,816 0.15% ENI SpA(1) 4.15% 01/10/2020 1,846 1,870,170 0.05% EQT Corp. 2.50% 01/10/2020 500 501,285 0.01% EQT Corp. 2.679%(2) 01/10/2020 7,430 7,430,843 0.19% Equinor ASA(1) 7.875% 09/12/2022 1,000 1,168,790 0.03% Gazprom PJSC Via Gaz Capital SA(1) 6.51% 07/03/2022 1,375 1,493,910 0.04% Gulfport Energy Corp. 6.625% 01/05/2023 1,189 811,861 0.02% Harvest Operations Corp.(1) 4.20% 01/06/2023 500 534,065 0.01% Helmerich & Payne, Inc. 4.65% 15/03/2025 298 327,250 0.01% Hess Corp. 3.50% 15/07/2024 1,855 1,935,727 0.05% HighPoint Operating Corp. 7.00% 15/10/2022 564 537,036 0.01% Hilcorp Energy I LP/Hilcorp Finance Co.(1) 5.00% 01/12/2024 1,103 1,006,945 0.02% Husky Energy, Inc. 4.00% 15/04/2024 1,445 1,543,648 0.04%
55

LORD ABBETT PASSPORT PORTFOLIOS PLC SHORT DURATION INCOME FUND Schedule of Investments as at 31 January 2020 (Continued)
Interest Maturity PrincipalFair
Value % of Net Investments Rate Date (000) USD Assets Corporate Bonds - 37.60% (31 January 2019: 39.87%) (Continued) Oil & Gas (continued) KazMunayGas National Co. JSC(1) 3.875% 19/04/2022 1,150 1,190,514 0.03% Laredo Petroleum, Inc. 9.50% 15/01/2025 2,658 2,422,102 0.06% Lukoil International Finance BV(1) 6.125% 09/11/2020 1,575 1,623,075 0.04% Magnolia Oil & Gas Operating LLC/Magnolia Oil & Gas Finance Corp.(1) 6.00% 01/08/2026 150 155,302 0.00% Marathon Petroleum Corp. 5.125% 01/04/2024 1,000 1,025,350 0.03% Marathon Petroleum Corp. 5.375% 01/10/2022 1,371 1,384,906 0.03% Matador Resources Co. 5.875% 15/09/2026 5,599 5,494,439 0.14% Medco Straits Services Pte Ltd.(1) 8.50% 17/08/2022 215 227,735 0.01% Montage Resources Corp. 8.875% 15/07/2023 914 768,893 0.02% Murphy Oil Corp. 6.875% 15/08/2024 3,379 3,529,653 0.09% Oasis Petroleum, Inc. 6.875% 15/03/2022 7,523 7,240,887 0.18% Occidental Petroleum Corp. 2.60% 15/04/2022 300 303,515 0.01% Occidental Petroleum Corp. 2.70% 15/08/2022 2,421 2,461,235 0.06% Occidental Petroleum Corp. 2.90% 15/08/2024 3,913 4,001,351 0.10% Occidental Petroleum Corp. 3.36%(2) 15/08/2022 5,461 5,492,105 0.14% Occidental Petroleum Corp. 4.85% 15/03/2021 502 517,018 0.01% Occidental Petroleum Corp. 6.95% 01/07/2024 3,652 4,339,570 0.11% Parsley Energy LLC/Parsley Finance Corp.(1) 5.375% 15/01/2025 416 429,046 0.01% Parsley Energy LLC/Parsley Finance Corp.(1) 6.25% 01/06/2024 4,197 4,356,129 0.11% Petroleos Mexicanos 4.25% 15/01/2025 1,458 1,511,676 0.04% Phillips 66 2.517%(2) 26/02/2021 1,984 1,984,276 0.05% Phillips 66(1) 2.581%(2) 15/04/2020 1,145 1,145,569 0.03% QEP Resources, Inc. 6.875% 01/03/2021 2,267 2,327,416 0.06% Range Resources Corp. 5.00% 15/08/2022 2,838 2,689,573 0.07% Range Resources Corp. 5.00% 15/03/2023 800 689,992 0.02% Range Resources Corp. 5.875% 01/07/2022 273 260,118 0.01% Reliance Holding USA, Inc.(1) 5.40% 14/02/2022 4,850 5,138,845 0.13% Saudi Arabian Oil Co.(1) 2.875% 16/04/2024 1,371 1,410,161 0.03% Seven Generations Energy Ltd.(1) 6.75% 01/05/2023 2,446 2,508,165 0.06% Seven Generations Energy Ltd.(1) 6.875% 30/06/2023 3,412 3,531,164 0.09% Sinopec Group Overseas Development 2018 Ltd.(1) 2.50% 12/11/2024 2,030 2,055,888 0.05% SM Energy Co. 6.125% 15/11/2022 2,447 2,429,411 0.06% Suncor Energy Ventures Corp.(1) 9.40% 01/09/2021 1,692 1,864,720 0.05% Transocean Sentry Ltd.(1) 5.375% 15/05/2023 871 875,346 0.02% Viper Energy Partners LP(1) 5.375% 01/11/2027 4,491 4,690,176 0.12% WPX Energy, Inc. 5.25% 15/10/2027 371 388,381 0.01% 160,632,790 4.02% Oil & Gas Service National Oilwell Varco, Inc. 2.60% 01/12/2022 1,864 1,896,691 0.05% Oceaneering International, Inc. 4.65% 15/11/2024 1,133 1,096,177 0.03% SESI LLC 7.125% 15/12/2021 982 873,980 0.02% Schlumberger Holdings Corp.(1) 3.75% 01/05/2024 8,308 8,862,705 0.22% TechnipFMC PLC 3.45% 01/10/2022 91 94,142 0.00% 12,823,695 0.32% Packaging & Containers Reynolds Group Issuer, Inc./Reynolds Group Issuer LLC/Reynolds Group Issuer Lu 5.75% 15/10/2020 3,140 3,151,056 0.08% WestRock RKT LLC 4.00% 01/03/2023 685 722,753 0.02% 3,873,809 0.10%
56

LORD ABBETT PASSPORT PORTFOLIOS PLC SHORT DURATION INCOME FUND Schedule of Investments as at 31 January 2020 (Continued)
Interest Maturity PrincipalFair
Value % of Net Investments Rate Date (000) USD Assets Corporate Bonds - 37.60% (31 January 2019: 39.87%) (Continued) Pharmaceuticals AbbVie, Inc.(1) 2.545%(2) 21/11/2022 4,500 4,541,300 0.11% AbbVie, Inc.(1) 2.60% 21/11/2024 7,654 7,827,477 0.20% AbbVie, Inc. 3.60% 14/05/2025 1,248 1,334,503 0.03% AstraZeneca PLC 2.51%(2) 10/06/2022 3,033 3,051,884 0.08% AstraZeneca PLC 2.569%(2) 17/08/2023 500 504,127 0.01% Bausch Health Cos, Inc.(1) 6.50% 15/03/2022 298 303,903 0.01% Bayer US Finance II LLC(1) 2.577%(2) 25/06/2021 3,650 3,667,348 0.09% Bayer US Finance II LLC(1) 2.75% 15/07/2021 1,185 1,198,535 0.03% Bayer US Finance II LLC(1) 2.904%(2) 15/12/2023 4,521 4,565,449 0.11% Bayer US Finance II LLC(1) 3.875% 15/12/2023 7,596 8,118,662 0.20% Bayer US Finance II LLC(1) 4.25% 15/12/2025 5,000 5,522,629 0.14% Bayer US Finance LLC(1) 3.375% 08/10/2024 3,000 3,164,849 0.08% Becton Dickinson and Co. 2.836%(2) 29/12/2020 3,068 3,069,638 0.08% Becton Dickinson and Co. 2.917%(2) 06/06/2022 6,037 6,085,249 0.15% Cardinal Health, Inc. 2.664%(2) 15/06/2022 4,685 4,709,690 0.12% Cardinal Health, Inc. 3.079% 15/06/2024 6,459 6,704,672 0.17% Cardinal Health, Inc. 3.20% 15/06/2022 1,051 1,080,298 0.03% Cardinal Health, Inc. 3.50% 15/11/2024 4,373 4,627,717 0.12% Cigna Corp. 2.55%(2) 17/09/2021 5,391 5,391,630 0.13% Cigna Corp. 2.721%(2) 15/07/2023 2,550 2,582,845 0.06% Cigna Corp.(1) 3.25% 15/04/2025 2,228 2,337,151 0.06% Cigna Corp. 4.125% 15/11/2025 1,895 2,085,011 0.05% 82,474,567 2.06% Pipelines Cheniere Corpus Christi Holdings LLC 5.875% 31/03/2025 7,732 8,798,127 0.22% Cheniere Corpus Christi Holdings LLC 7.00% 30/06/2024 10,660 12,366,613 0.31% Enable Oklahoma Intrastate Transmission LLC(1) 6.25% 15/03/2020 2,984 2,997,629 0.07% Energy Transfer Operating LP 4.15% 01/10/2020 2,600 2,628,335 0.07% Energy Transfer Operating LP 4.25% 15/03/2023 2,634 2,773,719 0.07% Energy Transfer Operating LP 5.875% 15/01/2024 5,407 6,038,030 0.15% Energy Transfer Partners LP/Regency Energy Finance Corp. 4.50% 01/11/2023 516 551,644 0.01% Energy Transfer Partners LP/Regency Energy Finance Corp. 5.00% 01/10/2022 357 379,030 0.01% Energy Transfer Partners LP/Regency Energy Finance Corp. 5.75% 01/09/2020 250 252,985 0.01% Florida Gas Transmission Co. LLC(1) 3.875% 15/07/2022 386 400,784 0.01% Kinder Morgan, Inc./DE 3.111%(2) 15/01/2023 781 790,572 0.02% Midwest Connector Capital Co. LLC(1) 3.625% 01/04/2022 1,518 1,566,191 0.04% Midwest Connector Capital Co. LLC(1) 3.90% 01/04/2024 5,093 5,413,098 0.14% MPLX LP 2.785%(2) 09/09/2021 4,800 4,818,171 0.12% MPLX LP 2.985%(2) 09/09/2022 11,196 11,248,276 0.28% MPLX LP 4.50% 15/07/2023 500 536,797 0.01% MPLX LP(1) 5.25% 15/01/2025 3,862 4,059,077 0.10% MPLX LP(1) 6.25% 15/10/2022 4,824 4,918,796 0.12% MPLX LP(1) 6.375% 01/05/2024 4,348 4,525,784 0.11% NGPL PipeCo LLC(1) 4.375% 15/08/2022 6,077 6,334,736 0.16% ONEOK Partners LP 4.90% 15/03/2025 756 845,630 0.02% ONEOK, Inc. 7.50% 01/09/2023 1,717 2,015,882 0.05% Sabine Pass Liquefaction LLC 5.625% 15/04/2023 7,793 8,529,671 0.21% Sabine Pass Liquefaction LLC 5.75% 15/05/2024 12,525 14,114,560 0.35% Spectra Energy Partners LP 2.592%(2) 05/06/2020 1,000 1,002,080 0.03%
57

LORD ABBETT PASSPORT PORTFOLIOS PLC SHORT DURATION INCOME FUND Schedule of Investments as at 31 January 2020 (Continued)
Interest Maturity PrincipalFair
Value % of Net Investments Rate Date (000) USD Assets Corporate Bonds - 37.60% (31 January 2019: 39.87%) (Continued) Pipelines (continued) Spectra Energy Partners LP 4.60% 15/06/2021 1,363 1,405,104 0.04% Sunoco Logistics Partners Operations LP 3.45% 15/01/2023 200 205,472 0.01% Sunoco Logistics Partners Operations LP 4.40% 01/04/2021 793 812,347 0.02% Targa Resources Partners LP/Targa Resources Partners Finance Corp. 4.25% 15/11/2023 498 503,187 0.01% Texas Eastern Transmission LP(1) 2.80% 15/10/2022 537 545,617 0.01% Texas Eastern Transmission LP(1) 4.125% 01/12/2020 2,000 2,023,223 0.05% Texas Gas Transmission LLC(1) 4.50% 01/02/2021 1,324 1,346,509 0.03% Western Midstream Operating LP 2.698%(2) 13/01/2023 3,598 3,597,863 0.09% Williams Cos, Inc. 4.50% 15/11/2023 610 660,366 0.02% Williams Cos, Inc. 7.875% 01/09/2021 248 270,098 0.01% 119,276,003 2.98% Real Estate China Overseas Finance Cayman V Ltd. 3.95% 15/11/2022 1,700 1,762,894 0.04% REITS Brandywine Operating Partnership LP 4.10% 01/10/2024 201 216,426 0.01% Brixmor Operating Partnership LP 2.813%(2) 01/02/2022 340 340,430 0.01% Brixmor Operating Partnership LP 3.65% 15/06/2024 3,534 3,757,448 0.09% Digital Realty Trust LP 4.75% 01/10/2025 832 940,822 0.02% EPR Properties 5.25% 15/07/2023 555 602,971 0.01% Equinix, Inc. 5.375% 15/05/2027 10,240 11,117,056 0.28% Equinix, Inc. 5.875% 15/01/2026 5,436 5,772,217 0.14% Essex Portfolio LP 3.375% 15/01/2023 250 259,699 0.01% Healthcare Realty Trust, Inc. 3.75% 15/04/2023 750 782,141 0.02% Healthcare Realty Trust, Inc. 3.875% 01/05/2025 675 723,875 0.02% Healthcare Trust of America Holdings LP 3.70% 15/04/2023 1,000 1,042,891 0.03% Highwoods Realty LP 3.20% 15/06/2021 192 194,753 0.00% Highwoods Realty LP 3.625% 15/01/2023 3,308 3,440,694 0.09% Kilroy Realty LP 3.45% 15/12/2024 1,534 1,624,915 0.04% Omega Healthcare Investors, Inc. 4.375% 01/08/2023 3,234 3,461,367 0.09% SITE Centers Corp. 3.625% 01/02/2025 157 164,936 0.00% SITE Centers Corp. 4.625% 15/07/2022 304 318,785 0.01% SL Green Operating Partnership LP 3.25% 15/10/2022 3,803 3,917,552 0.10% SL Green Realty Corp. 4.50% 01/12/2022 2,155 2,281,145 0.06% VEREIT Operating Partnership LP 4.60% 06/02/2024 6,595 7,202,372 0.18% VEREIT Operating Partnership LP 4.625% 01/11/2025 2,775 3,098,062 0.08% WEA Finance LLC/Westfield UK & Europe Finance PLC(1) 3.75% 17/09/2024 3,400 3,630,762 0.09% Welltower, Inc. 4.50% 15/01/2024 181 197,192 0.00% Weyerhaeuser Co. 4.625% 15/09/2023 755 822,980 0.02% 55,911,491 1.40% Retail Asbury Automotive Group, Inc. 6.00% 15/12/2024 1,666 1,719,453 0.04% Dollar Tree, Inc. 2.536%(2) 17/04/2020 1,563 1,563,191 0.04% Dollar Tree, Inc. 4.00% 15/05/2025 851 922,274 0.02% McDonald's Corp. 2.225%(2) 28/10/2021 650 653,221 0.02% Walgreens Boots Alliance, Inc. 3.80% 18/11/2024 6,299 6,676,824 0.17% 11,534,963 0.29%
58

LORD ABBETT PASSPORT PORTFOLIOS PLC SHORT DURATION INCOME FUND Schedule of Investments as at 31 January 2020 (Continued)
Interest Maturity PrincipalFair
Value % of Net Investments Rate Date (000) USD Assets Corporate Bonds - 37.60% (31 January 2019: 39.87%) (Continued) Savings & Loans People's United Financial, Inc. 3.65% 06/12/2022 1,560 1,631,073 0.04% Semiconductors Broadcom, Inc.(1) 3.625% 15/10/2024 11,506 12,118,241 0.30% NXP BV/NXP Funding LLC(1) 3.875% 01/09/2022 3,050 3,188,323 0.08% NXP BV/NXP Funding LLC(1) 4.125% 01/06/2021 2,615 2,687,218 0.07% NXP BV/NXP Funding LLC(1) 4.625% 01/06/2023 288 310,883 0.01% 18,304,665 0.46% Shipbuilding Huntington Ingalls Industries, Inc.(1) 5.00% 15/11/2025 539 565,096 0.01% Software Genesys Telecommunications Laboratories, Inc./Greeneden Lux 3 S.A.R.L./Greeneden US Ho(1) 10.00% 30/11/2024 3,128 3,373,032 0.08% Infor US, Inc. 6.50% 15/05/2022 496 498,837 0.01% RP Crown Parent LLC(1) 7.375% 15/10/2024 801 829,367 0.02% Solera LLC/Solera Finance, Inc.(1) 10.50% 01/03/2024 5,281 5,595,457 0.14% Sophia LP/Sophia Finance, Inc.(1) 9.00% 30/09/2023 2,907 2,995,416 0.08% TIBCO Software, Inc.(1) 11.375% 01/12/2021 4,164 4,307,138 0.11% 17,599,247 0.44% Telecommunications Altice France SA/France(1) 7.375% 01/05/2026 468 498,724 0.01% AT&T, Inc. 3.067%(2) 12/06/2024 19,828 20,195,096 0.50% British Telecommunications PLC 4.50% 04/12/2023 3,350 3,653,950 0.09% CommScope, Inc.(1) 5.50% 01/03/2024 577 594,070 0.02% GTH Finance BV(1) 6.25% 26/04/2020 200 200,294 0.01% Level 3 Financing, Inc. 5.375% 15/01/2024 332 336,978 0.01% Verizon Communications, Inc. 3.01%(2) 15/05/2025 1,250 1,287,476 0.03% 26,766,588 0.67% Toys/Games/Hobbies Hasbro, Inc. 3.00% 19/11/2024 3,682 3,787,716 0.09% Transportation Pelabuhan Indonesia III Persero PT(1) 4.50% 02/05/2023 913 967,396 0.03% Ryder System, Inc. 3.65% 18/03/2024 517 550,641 0.01% Watco Cos LLC/Watco Finance Corp.(1) 6.375% 01/04/2023 1,800 1,825,497 0.05% XPO Logistics, Inc.(1) 6.50% 15/06/2022 902 919,391 0.02% 4,262,925 0.11% Trucking & Leasing Aviation Capital Group LLC(1) 2.857%(2) 01/06/2021 500 503,065 0.01% Aviation Capital Group LLC(1) 2.875% 20/01/2022 604 611,519 0.02% Aviation Capital Group LLC(1) 3.875% 01/05/2023 6,667 6,944,380 0.17% DAE Funding LLC(1) 4.00% 01/08/2020 506 510,624 0.01% GATX Corp. 3.90% 30/03/2023 1,601 1,680,389 0.04% GATX Corp. 4.35% 15/02/2024 1,081 1,164,323 0.03% Penske Truck Leasing Co. LP/PTL Finance Corp.(1) 2.70% 01/11/2024 3,021 3,096,258 0.08% Penske Truck Leasing Co. LP/PTL Finance Corp.(1) 3.45% 01/07/2024 4,677 4,939,913 0.12%
59

LORD ABBETT PASSPORT PORTFOLIOS PLC SHORT DURATION INCOME FUND Schedule of Investments as at 31 January 2020 (Continued)
Interest Maturity PrincipalFair
Value % of Net Investments Rate Date (000) USD Assets Corporate Bonds - 37.60% (31 January 2019: 39.87%) (Continued) Trucking & Leasing (continued) Penske Truck Leasing Co. LP/PTL Finance Corp.(1) 3.90% 01/02/2024 275 294,159 0.01% 19,744,630 0.49% Total Corporate Bonds 1,504,020,290 37.59% Floating Rate Loans - 3.55% (31 January 2019: 1.85%) Aerospace American Airlines, Inc. Term Loan B 3.649% 28/04/2023 3,958 3,957,895 0.10% American Airlines, Inc. Term Loan B 3.676% 14/12/2023 2,136 2,137,115 0.05% Doncasters US Finance LLC 2nd Lien Term Loan 10.195% 09/10/2020 209 25,305 0.00% United AirLines, Inc. Refinanced Term Loan 3.395% 01/04/2024 1,660 1,665,859 0.04% 7,786,174 0.19% Auto Manufacturers Ford Motor Co. Term Loan 3.160% 31/12/2022 2,500 2,443,750 0.06% Automotive Tenneco, Inc. Tranche B Term Loan TBD 01/10/2025 1,820 1,788,199 0.05% Beverages Constellation Brands, Inc. Term Loan 2.906% 14/09/2021 2,546 2,539,257 0.06% Keurig Dr Pepper, Inc. Term Loan 2.825% 08/02/2023 7,781 7,683,778 0.19% 10,223,035 0.25% Chemicals LYB Americas Finance Co. LLC Term Loan 2.830% 29/03/2022 14,947 14,918,787 0.37% Electric FirstEnergy Corp. 1st Lien Term Loan 2.420% 19/10/2020 1,825 1,823,153 0.05% FirstEnergy Corp. Term Loan 2.220% 11/09/2021 3,949 3,948,557 0.10% 5,771,710 0.15% Financial Delos Finance S.A.R.L. Term Loan 3.695% 06/10/2023 875 879,225 0.02% RPI Finance Trust Term Loan A-4 3.145% 04/05/2022 6,399 6,409,264 0.16% 7,288,489 0.18% Food and Drug Panera Bread Co. Term Loan 3.438% 18/07/2022 7,731 7,544,070 0.19% Gaming/Leisure CEOC LLC Term Loan B 3.645% 07/10/2024 3,145 3,151,692 0.08% Eldorado Resorts, Inc. Term Loan 3.938% 17/04/2024 1,022 1,022,327 0.03% GLP Capital LP Incremental Tranche A-1 Term Loan 3.281% 31/07/2020 983 981,906 0.02% MGM Growth Properties Operating Partnership LP Delayed Draw Term Loan A 3.316% 14/06/2023 1,541 1,543,225 0.04% MGM Growth Properties Operating Partnership LP Term Loan A 3.316% 14/06/2023 1,787 1,789,372 0.05% Seminole Tribe of Florida Replacement Term Loan B 3.395% 08/07/2024 1,949 1,963,176 0.05%
60

LORD ABBETT PASSPORT PORTFOLIOS PLC SHORT DURATION INCOME FUND Schedule of Investments as at 31 January 2020 (Continued)
Interest Maturity PrincipalFair
Value % of Net Investments Rate Date (000) USD Assets Floating Rate Loans - 3.55% (31 January 2019: 1.85%) (Continued) Gaming/Leisure (continued) Stars Group Holdings BV Term Loan 5.445% 10/07/2025 3,963 3,992,048 0.10% 14,443,746 0.37% Healthcare FHC Health Systems, Inc. Initial Term Loan 5.945% 23/12/2021 576 576,770 0.01% Jaguar Holding Co. I LLC Term Loan TBD 18/08/2022 519 519,356 0.01% NVA Holdings, Inc. 1st Lien Term Loan B-3 6.50% 02/02/2025 7,332 7,332,434 0.18% 8,428,560 0.20% Housing Invitation Homes Operating Partnership LP Initial Term Loan 3.361% 06/02/2022 3,853 3,833,735 0.10% Industrial Services Core & Main LP Initial Term Loan 4.572% 01/08/2024 1,377 1,378,310 0.03% Information Technology Dell International LLC Refinancing Term Loan B-1 3.650% 19/09/2025 16 15,848 0.00% Lodging Hilton Grand Vacations Borrower LLC Term Loan 3.40% 28/11/2023 938 938,672 0.02% Resorts World Las Vegas LLC Term Loan A TBD 16/04/2024 2,000 1,985,000 0.05% 2,923,672 0.07% Manufacturing Transdigm, Inc. New Tranche F Term Loan 4.145% 09/06/2023 5,503 5,506,387 0.14% Utex Industries, Inc. 1st Lien Initial Term Loan 5.645% 21/05/2021 406 348,412 0.01% Utex Industries, Inc. 2nd Lien Initial Term Loan 8.895% 20/05/2022 174 97,614 0.00% 5,952,413 0.15% Media Charter Communications Operating LLC Term Loan A-2 3.150% 31/03/2023 4,051 4,050,898 0.10% Media/Telecommunications MediArena Acquisition BV 1st Lien Dollar Term Loan B 7.659% 13/08/2021 2,828 2,840,560 0.07% MediArena Acquisition BV 2nd Lien Dollar Term Loan B 10.908% 13/08/2022 1,884 1,897,168 0.05% Uber Technologies, Inc. Refinancing Term Loan 5.145% 13/07/2023 721 722,354 0.02% 5,460,082 0.14% Pipelines Energy Transfer Operating LP Term Loan 2.658% 17/10/2022 6,000 5,977,500 0.15% Oneok, Inc. Term Loan A 2.687% 19/11/2021 3,001 3,006,475 0.08% 8,983,975 0.23% REITS Crown Castle International Corp. Term Loan 2.770% 21/06/2024 5,817 5,810,091 0.15% Hudson Pacific Properties LP Seven Year Term Loan 2.981% 01/04/2022 1,133 1,127,610 0.03%
61

LORD ABBETT PASSPORT PORTFOLIOS PLC SHORT DURATION INCOME FUND Schedule of Investments as at 31 January 2020 (Continued)
Interest Maturity PrincipalFair
Value % of Net Investments Rate Date (000) USD Assets Floating Rate Loans - 3.55% (31 January 2019: 1.85%) (Continued) REITS (continued) SL Green Realty Corp. Term Loan A 2.750% 31/03/2023 2,238 2,227,112 0.06% 9,164,813 0.24% Retail Comfort Holding LLC 1st Lien Initial Term Loan 6.150% 05/02/2024 570 567,259 0.01% Semiconductors Analog Devices, Inc. Term Loan 2.650% 10/03/2022 1,975 1,962,716 0.05% Broadcom, Inc. Term Loan A-3 2.860% 04/11/2022 10,156 10,115,400 0.25% Marvell Technology Group Ltd. Term Loan A 3.115% 04/06/2021 1,537 1,534,579 0.04% 13,612,695 0.34% Telecommunications CenturyLink, Inc. Term Loan A TBD 31/01/2025 4,003 4,014,548 0.10% Utility AES Corp. Other Term Loan 3.659% 31/05/2022 378 380,495 0.01% Stericycle, Inc. Incremental Term Loan TBD 17/11/2022 965 926,784 0.02% 1,307,279 0.03% Total Floating Rate Loans 141,902,047 3.55% Government Obligations - 5.38% (31 January 2019: 2.81%) Non-U.S. Government Obligations Costa Rica Government International Bond(1) 4.25% 26/01/2023 500 506,462 0.01% Perusahaan Penerbit SBSN Indonesia III(1) 3.40% 29/03/2022 1,853 1,901,215 0.05% Perusahaan Penerbit SBSN Indonesia III(1) 3.75% 01/03/2023 600 627,393 0.02% Republic of Bahamas(1) 5.75% 16/01/2024 2,003 2,180,786 0.06% Republic of Bermuda(1) 4.138% 03/01/2023 2,750 2,903,766 0.07% Republic of Bermuda(1) 4.854% 06/02/2024 2,318 2,553,080 0.06% Republic of Indonesia(1) 3.70% 08/01/2022 444 458,055 0.01% Republic of Indonesia 4.45% 11/02/2024 2,000 2,173,640 0.06% Republic of Indonesia(1) 5.875% 15/01/2024 1,750 1,990,209 0.05% Republic of Kenya(1) 6.875% 24/06/2024 2,805 3,046,539 0.08% Republic of Romania(1) 4.875% 22/01/2024 4,602 5,088,128 0.12% Republic of Sri Lanka(1) 5.75% 18/04/2023 920 924,595 0.02% 24,353,868 0.61% U.S. Government Obligations U.S. Treasury Note 1.375% 31/01/2022 108,492 108,602,187 2.71% U.S. Treasury Note 1.375% 31/01/2025 71,519 71,710,369 1.80% U.S. Treasury Note 1.875% 15/12/2020 3,161 3,170,755 0.08% U.S. Treasury Note 2.50% 31/01/2021 7,284 7,355,275 0.18% 190,838,586 4.77% Total Government Obligations 215,192,454 5.38% Government Sponsored Enterprises Collateralised Mortgage Obligations - 0.92% (31 January 2019: 1.83%) Federal Home Loan Mortgage Corp. 3.144% (2) 01/11/2043 457 469,758 0.01% Federal Home Loan Mortgage Corp. 4.138% (2) 01/04/2037 35 37,283 0.00% Federal Home Loan Mortgage Corp. 4.246% (2) 01/06/2041 757 800,658 0.02% Federal Home Loan Mortgage Corp. 4.71% (2) 01/06/2042 103 108,007 0.00%
62
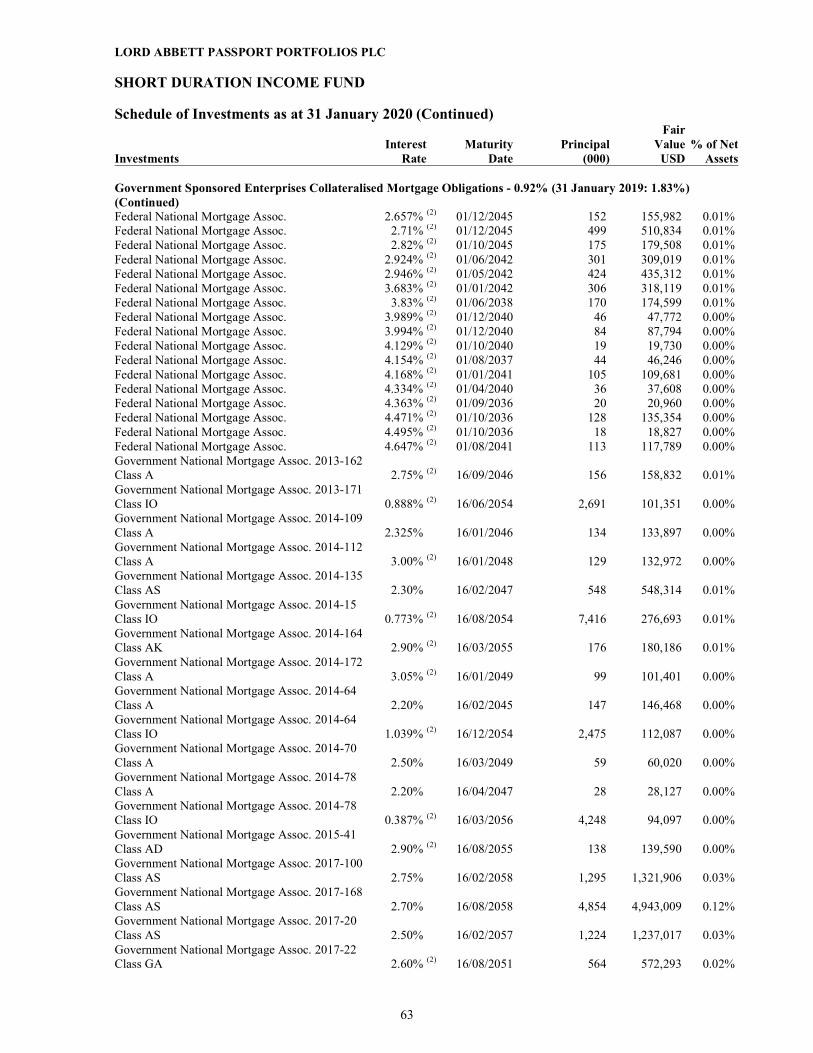
LORD ABBETT PASSPORT PORTFOLIOS PLC SHORT DURATION INCOME FUND Schedule of Investments as at 31 January 2020 (Continued)
Interest Maturity PrincipalFair
Value % of Net Investments Rate Date (000) USD Assets Government Sponsored Enterprises Collateralised Mortgage Obligations - 0.92% (31 January 2019: 1.83%) (Continued) Federal National Mortgage Assoc. 2.657% (2) 01/12/2045 152 155,982 0.01% Federal National Mortgage Assoc. 2.71% (2) 01/12/2045 499 510,834 0.01% Federal National Mortgage Assoc. 2.82% (2) 01/10/2045 175 179,508 0.01% Federal National Mortgage Assoc. 2.924% (2) 01/06/2042 301 309,019 0.01% Federal National Mortgage Assoc. 2.946% (2) 01/05/2042 424 435,312 0.01% Federal National Mortgage Assoc. 3.683% (2) 01/01/2042 306 318,119 0.01% Federal National Mortgage Assoc. 3.83% (2) 01/06/2038 170 174,599 0.01% Federal National Mortgage Assoc. 3.989% (2) 01/12/2040 46 47,772 0.00% Federal National Mortgage Assoc. 3.994% (2) 01/12/2040 84 87,794 0.00% Federal National Mortgage Assoc. 4.129% (2) 01/10/2040 19 19,730 0.00% Federal National Mortgage Assoc. 4.154% (2) 01/08/2037 44 46,246 0.00% Federal National Mortgage Assoc. 4.168% (2) 01/01/2041 105 109,681 0.00% Federal National Mortgage Assoc. 4.334% (2) 01/04/2040 36 37,608 0.00% Federal National Mortgage Assoc. 4.363% (2) 01/09/2036 20 20,960 0.00% Federal National Mortgage Assoc. 4.471% (2) 01/10/2036 128 135,354 0.00% Federal National Mortgage Assoc. 4.495% (2) 01/10/2036 18 18,827 0.00% Federal National Mortgage Assoc. 4.647% (2) 01/08/2041 113 117,789 0.00% Government National Mortgage Assoc. 2013-162 Class A 2.75% (2) 16/09/2046 156 158,832 0.01% Government National Mortgage Assoc. 2013-171 Class IO 0.888% (2) 16/06/2054 2,691 101,351 0.00% Government National Mortgage Assoc. 2014-109 Class A 2.325% 16/01/2046 134 133,897 0.00% Government National Mortgage Assoc. 2014-112 Class A 3.00% (2) 16/01/2048 129 132,972 0.00% Government National Mortgage Assoc. 2014-135 Class AS 2.30% 16/02/2047 548 548,314 0.01% Government National Mortgage Assoc. 2014-15 Class IO 0.773% (2) 16/08/2054 7,416 276,693 0.01% Government National Mortgage Assoc. 2014-164 Class AK 2.90% (2) 16/03/2055 176 180,186 0.01% Government National Mortgage Assoc. 2014-172 Class A 3.05% (2) 16/01/2049 99 101,401 0.00% Government National Mortgage Assoc. 2014-64 Class A 2.20% 16/02/2045 147 146,468 0.00% Government National Mortgage Assoc. 2014-64 Class IO 1.039% (2) 16/12/2054 2,475 112,087 0.00% Government National Mortgage Assoc. 2014-70 Class A 2.50% 16/03/2049 59 60,020 0.00% Government National Mortgage Assoc. 2014-78 Class A 2.20% 16/04/2047 28 28,127 0.00% Government National Mortgage Assoc. 2014-78 Class IO 0.387% (2) 16/03/2056 4,248 94,097 0.00% Government National Mortgage Assoc. 2015-41 Class AD 2.90% (2) 16/08/2055 138 139,590 0.00% Government National Mortgage Assoc. 2017-100 Class AS 2.75% 16/02/2058 1,295 1,321,906 0.03% Government National Mortgage Assoc. 2017-168 Class AS 2.70% 16/08/2058 4,854 4,943,009 0.12% Government National Mortgage Assoc. 2017-20 Class AS 2.50% 16/02/2057 1,224 1,237,017 0.03% Government National Mortgage Assoc. 2017-22 Class GA 2.60% (2) 16/08/2051 564 572,293 0.02%
63

LORD ABBETT PASSPORT PORTFOLIOS PLC SHORT DURATION INCOME FUND Schedule of Investments as at 31 January 2020 (Continued)
Interest Maturity PrincipalFair
Value % of Net Investments Rate Date (000) USD Assets Government Sponsored Enterprises Collateralised Mortgage Obligations - 0.92% (31 January 2019: 1.83%) (Continued) Government National Mortgage Assoc. 2017-23 Class AB 2.60% 16/12/2057 808 823,247 0.02% Government National Mortgage Assoc. 2017-28 Class AB 2.50% 16/10/2051 1,489 1,506,840 0.04% Government National Mortgage Assoc. 2017-44 Class AD 2.65% 17/11/2048 1,350 1,374,716 0.04% Government National Mortgage Assoc. 2017-51 Class AS 2.75% 16/04/2058 2,114 2,154,311 0.06% Government National Mortgage Assoc. 2017-53 Class B 2.75% 16/03/2050 2,060 2,103,083 0.05% Government National Mortgage Assoc. 2017-54 Class AD 2.75% 16/01/2057 1,954 1,993,651 0.05% Government National Mortgage Assoc. 2017-61 Class A 2.60% 16/08/2058 1,805 1,829,929 0.05% Government National Mortgage Assoc. 2017-69 Class AS 2.75% 16/02/2058 1,836 1,874,062 0.05% Government National Mortgage Assoc. 2017-71 Class AS 2.70% 16/04/2057 1,214 1,238,215 0.03% Government National Mortgage Assoc. 2017-72 Class AM 2.60% 16/09/2051 750 761,596 0.02% Government National Mortgage Assoc. 2017-74 Class AS 2.60% 16/10/2057 756 767,998 0.02% Government National Mortgage Assoc. 2017-76 Class AS 2.65% 16/11/2050 1,507 1,534,277 0.04% Government National Mortgage Assoc. 2017-89 Class AB 2.60% 16/07/2058 1,226 1,243,539 0.03% Government National Mortgage Assoc. 2017-90 Class AS 2.70% 16/07/2057 1,626 1,656,999 0.04% Government National Mortgage Assoc. 2017-92 Class AS 2.75% 16/06/2058 1,391 1,419,336 0.04% Total Government Sponsored Enterprises Collateralised Mortgage Obligations 36,710,899 0.92% Municipal Bonds - 0.11% (31 January 2019: 0.15%) New Jersey Economic Development Authority ZCP 15/02/2020 250 249,870 0.01% State of Illinois 4.95% 01/06/2023 3,165 3,329,064 0.08% State of Illinois 6.125% 01/07/2021 545 563,197 0.01% State of Illinois 6.20% 01/07/2021 200 206,812 0.01% Total Municipal Bonds 4,348,943 0.11% Shares Common Stock - 0.00% (31 January 2019: 0.00%) Oil & Gas Templar Energy LLC Class A Units 7,279 582 0.00% Total Common Stock 582 0.00%
64

LORD ABBETT PASSPORT PORTFOLIOS PLC SHORT DURATION INCOME FUND Schedule of Investments as at 31 January 2020 (Continued)
Dividend Fair
Value % of Net Investments Rate Shares USD Assets Preferred Stock - 0.00% (31 January 2019: 0.00%) Oil & Gas Templar Energy LLC ZCP 15,014 – 0.00% Total Preferred Stock – 0.00% Interest Maturity Principal Rate Date (000) Short Term Investments(6) - 6.52% (31 January 2019: 1.01%) Commercial Paper - 6.52% (31 January 2019: 1.01%) Amcor Finance USA, Inc.(1) 2.31% 28/02/2020 3,435 3,429,075 0.09% American Electric Power Co., Inc.(1) 1.72% 03/02/2020 930 929,911 0.02% AutoNation, Inc.(1) 1.87% 03/02/2020 10,000 9,998,961 0.25% Aviation Capital Group LLC(1) 1.75% 03/02/2020 10,000 9,999,028 0.25% Aviation Capital Group LLC(1) 1.853% 24/02/2020 1,153 1,151,637 0.03% Aviation Capital Group LLC(1) 2.003% 06/02/2020 10,000 9,997,222 0.25% Aviation Capital Group LLC(1) 2.004% 13/02/2020 1,531 1,529,979 0.04% B.A.T. International Finance PLC(1) 2.367% 03/04/2020 1,801 1,795,336 0.04% Barclays Bank UK PLC(1) 1.641% 05/02/2020 14,813 14,810,301 0.37% Boeing Co.(1) 2.301% 29/10/2020 5,000 4,914,849 0.11% Boeing Co.(1) 2.48% 18/02/2020 875 873,979 0.02% Broadcom, Inc.(1) 2.107% 12/03/2020 398 397,071 0.01% Broadcom, Inc.(1) 2.215% 12/02/2020 10,000 9,993,247 0.25% Broadcom, Inc.(1) 2.217% 06/02/2020 320 319,902 0.01% Broadcom, Inc.(1) 2.236% 20/02/2020 4,388 4,382,836 0.11% Broadcom, Inc.(1) 2.258% 05/03/2020 910 908,123 0.02% Canadian Natural Resources Ltd.(1) 1.70% 03/02/2020 10,000 9,999,056 0.25% CenterPoint Energy Resources Corp.(1) 1.70% 03/02/2020 6,022 6,021,431 0.15% Cigna Corp.(1) 1.903% 05/02/2020 873 872,816 0.02% Cigna Corp.(1) 2.137% 11/02/2020 2,996 2,994,227 0.07% Crown Castle International Corp.(1) 1.953% 18/02/2020 12,750 12,738,259 0.32% Crown Castle International Corp.(1) 2.003% 11/02/2020 3,059 3,057,301 0.08% Diageo Capital PLC(1) 1.70% 03/02/2020 3,419 3,418,677 0.09% Electricite de France SA(1) 1.698% 04/02/2020 37,824 37,818,649 0.95% Exelon Corp.(1) 1.71% 03/02/2020 20,000 19,998,100 0.50% Fortive Corp.(1) 1.775% 03/02/2020 453 452,955 0.01% Jabil, Inc.(1) 2.00% 03/02/2020 3,026 3,025,664 0.08% Jabil, Inc.(1) 2.03% 07/02/2020 10,000 9,996,619 0.25% Jabil, Inc.(1) 2.391% 28/02/2020 12,093 12,071,406 0.30% Kroger Co.(1) 1.70% 04/02/2020 789 788,963 0.02% Mondelez International, Inc.(1) 1.69% 05/02/2020 10,000 9,998,122 0.25% National Fuel Gas Co. 2.003% 13/02/2020 1,226 1,225,183 0.03% National Fuel Gas Co. 2.003% 14/02/2020 320 319,769 0.01% Newell Brands, Inc.(1) 2.251% 05/02/2020 1,000 999,750 0.02% Newell Brands, Inc.(1) 2.261% 04/02/2020 1,749 1,748,671 0.04% Newell Brands, Inc.(1) 2.301% 03/02/2020 2,456 2,455,686 0.06% Ovintiv Canada ULC(1) 2.001% 06/02/2020 250 249,931 0.01% Ovintiv Canada ULC(1) 2.188% 13/03/2020 320 319,206 0.01% RELX, Inc.(1) 1.711% 07/02/2020 3,829 3,827,909 0.10% Royal Caribbean Cruises Ltd.(1) 1.85% 04/02/2020 1,464 1,463,925 0.04% Royal Caribbean Cruises Ltd.(1) 1.85% 03/02/2020 1,520 1,519,844 0.04% Royal Caribbean Cruises Ltd.(1) 1.885% 17/03/2020 1,424 1,420,654 0.04% Royal Caribbean Cruises Ltd.(1) 2.056% 27/02/2020 1,814 1,811,314 0.05%
65

LORD ABBETT PASSPORT PORTFOLIOS PLC SHORT DURATION INCOME FUND Schedule of Investments as at 31 January 2020 (Continued)
Interest Maturity PrincipalFair
Value % of Net Investments Rate Date (000) USD Assets Short Term Investments(6) - 6.52% (31 January 2019: 1.01%) (Continued) Commercial Paper - 6.52% (31 January 2019: 1.01%) (Continued) Royal Caribbean Cruises Ltd.(1) 2.105% 12/02/2020 3,936 3,933,474 0.10% Smithfield Foods, Inc.(1) 1.999% 22/04/2020 307 305,126 0.00% Southern California Edison Co.(1) 1.87% 03/02/2020 20,000 19,997,922 0.50% Syngenta Wilmington, Inc.(1) 2.216% 29/05/2020 971 963,911 0.02% ViacomCBS, Inc.(1) 1.70% 04/02/2020 348 347,951 0.01%
Walgreens Boots Alliance, Inc. 2.173% 24/07/2020 3,075 3,046,599 0.07% Welltower, Inc.(1) 1.72% 06/02/2020 572 571,863 0.01% WRKCo, Inc.(1) 1.711% 07/02/2020 5,897 5,895,319 0.15% Total Commercial Paper 261,107,709 6.52% Corporate Bond – 0.01% (31 January 2019: 0.00%) Pharmaceuticals Cigna Corp. 2.25% (2) 17/03/2020 220 219,859 0.01% Total Corporate Bond 219,859 0.01% Total Short Term Investments 261,327,568 6.53% Total Investment in Securities (Cost: USD 3,917,888,042) 3,952,108,018 98.78%
PIK Payment-in-Kind. TBD To be determined. ZCP Indicates a zero coupon rate. * Non income processing security. (1) Securities exempt from registration under Rule 144A (i) of the US Securities Act of 1933. These securities may be resold in transactions exempt
from registration, normally to qualified institutional buyers. (2) Indicates a variable rate security. The interest rate shown reflects the rate as at 31 January 2020. (3) Variable Rate is Fixed to Float: Rate remains fixed until future date. The interest rate represents the rate as at 31 January 2020. (4) Indicates a multi-step security. The interest rate shown reflects the rate in effect at 31 January 2020. (5) Security is perpetual in nature and has no stated maturity date. (6) Short Term Investments are securities maturing in less than 365 days from issuance.
Open Forward Foreign Currency Exchange Contracts - 0.02% (31 January 2019: 0.05%) Unrealised Appreciation/ Depreciation % of Net Settlement Date Amount Sold Amount Bought Counterparty USD Assets Share Class Hedges Class A CHF Accumulating (Hedged) 27/02/2020 27,983 USD 27,065 CHF Brown Brothers Harriman 123 0.00% Class A CHF Distributing (Hedged) 27/02/2020 27,908 USD 26,993 CHF Brown Brothers Harriman 123 0.00% Class A EUR Accumulating (Hedged) 27/02/2020 4,055,082 USD 3,670,713 EUR Brown Brothers Harriman 18,321 0.00% Class A EUR Distributing (Hedged) 27/02/2020 27,555 USD 21,075 GBP Brown Brothers Harriman 242 0.00% Class A GBP Distributing (Hedged) 27/02/2020 1,883,256 USD 1,704,754 EUR Brown Brothers Harriman 8,514 0.00% Class I CHF Accumulating (Hedged) 27/02/2020 49,538 USD 47,913 CHF Brown Brothers Harriman 218 0.00% Class I CHF Distributing (Hedged) 27/02/2020 50,005 USD 48,365 CHF Brown Brothers Harriman 220 0.00%
66

LORD ABBETT PASSPORT PORTFOLIOS PLC SHORT DURATION INCOME FUND Schedule of Investments as at 31 January 2020 (Continued)
Open Forward Foreign Currency Exchange Contracts - 0.02% (31 January 2019: 0.05%) (Continued) Unrealised Appreciation/ Depreciation % of Net Settlement Date Amount Sold Amount Bought USD Assets Class I EUR Accumulating (Hedged) 27/02/2020 120,287,352 USD 108,887,032 EUR Brown Brothers Harriman 544,934 0.01% Class I EUR Distributing (Hedged) 27/02/2020 22,218 USD 20,112 EUR Brown Brothers Harriman 100 0.00% Class I GBP Accumulating (Hedged) 27/02/2020 36,007,809 USD 27,539,218 GBP Brown Brothers Harriman 315,806 0.01% Class I GBP Distributing (Hedged) 27/02/2020 3,743,869 USD 2,863,358 GBP Brown Brothers Harriman 32,835 0.00% Class J EUR Accumulating (Hedged) 27/02/2020 2,638,438 USD 2,388,347 EUR Brown Brothers Harriman 11,918 0.00% Class J EUR Distributing (Hedged) 27/02/2020 23,950 USD 21,680 EUR Brown Brothers Harriman 108 0.00% Class J GBP Distributing (Hedged) 27/02/2020 81,322 USD 62,196 GBP Brown Brothers Harriman 713 0.00% Class Z CHF Accumulating (Hedged) 27/02/2020 28,507 USD 27,572 CHF Brown Brothers Harriman 125 0.00% Class Z CHF Distributing (Hedged) 27/02/2020 49,142 USD 47,530 CHF Brown Brothers Harriman 216 0.00% Class Z EUR Accumulating (Hedged) 27/02/2020 15,640 USD 14,158 EUR Brown Brothers Harriman 71 0.00% Class Z GBP Accumulating (Hedged) 27/02/2020 28,429 USD 21,743 GBP Brown Brothers Harriman 249 0.00% Class Z GBP Distributing (Hedged) 27/02/2020 27,891 USD 21,331 GBP Brown Brothers Harriman 245 0.00% 935,081 0.02%
Net Unrealised Appreciation on Open Forward Foreign Currency Exchange Contracts 935,081 0.02%
Unrealised Appreciation on Open Forward Foreign Currency Exchange Contracts 935,081 0.02%
Open Futures Contracts - (0.01%) (31 January 2019: 0.03%) Unrealised Appreciation/ % of No. of Depreciation Net Type Expiration Contracts USD Assets U.S. 2 Year Treasury Note 31/03/2020 3,882 3,363,475 0.08% U.S. 5 Year Treasury Note 31/03/2020 (2,815) (3,518,481) (0.09%) Net Unrealised Depreciation on Open Futures Contracts (155,006) (0.01%) Unrealised Appreciation on Open Futures Contracts 3,363,475 0.08%Unrealised Depreciation on Open Futures Contracts (3,518,481) (0.09%)
67

LORD ABBETT PASSPORT PORTFOLIOS PLC SHORT DURATION INCOME FUND Schedule of Investments as at 31 January 2020 (Continued)
Fair
Value % of Net USD Assets
Total Financial Assets at Fair Value through Profit and Loss 3,956,406,574 98.88%Total Financial Liabilities at Fair Value through Profit and Loss (3,518,481) (0.09%) Other Net Assets 48,201,171 1.21%
Net Assets 4,001,089,264 100.00%
Analysis of Total Assets
% of Total
Assets Transferable securities admitted to an official stock exchange listing 18.16%Transferable securities traded on a regulated market 68.59%Other transferable securities including those which are unlisted 10.03%Financial derivatives dealt in on a regulated market (0.00%)OTC financial derivative instruments 0.02%
68

LORD ABBETT PASSPORT PORTFOLIOS PLC HIGH YIELD FUND Schedule of Investments as at 31 January 2020
Interest Maturity PrincipalFair
Value % of Net Investments Rate Date (000) USD Assets Asset-Backed Securities - 0.19% (31 January 2019: 0.33%) Other Benefit Street Partners CLO XII Ltd. 2017-12A Class C(1) 4.881%(2) 15/10/2030 1,500 1,498,146 0.08% CIFC Funding 2013-III-R Ltd. 2013-3RA Class C(1) 4.701%(2) 24/04/2031 429 427,422 0.02% CIFC Funding 2017-II Ltd. 2017-2A Class D(1) 5.319%(2) 20/04/2030 600 602,514 0.03% Jamestown CLO VII Ltd. 2015-7A Class CR(1) 4.394%(2) 25/07/2027 250 246,938 0.01% Madison Park Funding XXVII Ltd. 2018-27A Class C(1) 4.419%(2) 20/04/2030 1,080 1,060,520 0.05% 3,835,540 0.19% Total Asset-Backed Securities 3,835,540 0.19% Convertible Bonds - 4.72% (31 January 2019: 4.03%) Aerospace/Defense Aerojet Rocketdyne Holdings, Inc. 2.25% 15/12/2023 2,011 4,097,486 0.20% Auto Manufacturers Tesla, Inc. 2.00% 15/05/2024 3,468 7,642,998 0.38% Beverages Luckin Coffee, Inc. 0.75% 15/01/2025 2,335 2,043,690 0.10% Building Materials Patrick Industries, Inc. 1.00% 01/02/2023 1,937 1,860,779 0.09% Commercial Services Square, Inc. 0.375% 01/03/2022 648 2,101,723 0.10% Energy-Alternate Sources Enphase Energy, Inc.(1) 1.00% 01/06/2024 5,737 10,424,129 0.51% Healthcare-Products Insulet Corp. 1.375% 15/11/2024 2,252 4,793,156 0.24% Nevro Corp. 1.75% 01/06/2021 3,542 5,263,369 0.26% Repligen Corp. 0.375% 15/07/2024 2,729 3,033,350 0.15% 13,089,875 0.65% Healthcare-Services Teladoc Health, Inc. 1.375% 15/05/2025 3,440 6,988,056 0.34% Internet MercadoLibre, Inc. 2.00% 15/08/2028 1,843 3,109,409 0.15% Pinduoduo, Inc.(1) ZCP 01/10/2024 3,618 3,997,166 0.20% 7,106,575 0.35% Pharmaceuticals Canopy Growth Corp.(1) 4.25% 15/07/2023 CAD 2,426 1,689,881 0.08% DexCom, Inc. 0.75% 15/05/2022 3,315 8,086,528 0.40% 9,776,409 0.48% Semiconductors Novellus Systems, Inc. 2.625% 15/05/2041 321 2,987,171 0.15%
69

LORD ABBETT PASSPORT PORTFOLIOS PLC HIGH YIELD FUND Schedule of Investments as at 31 January 2020 (Continued)
Interest Maturity PrincipalFair
Value % of Net Investments Rate Date (000) USD Assets Convertible Bonds - 4.72% (31 January 2019: 4.03%) (Continued) Semiconductors (continued) Teradyne, Inc. 1.25% 15/12/2023 2,478 5,287,346 0.26% 8,274,517 0.41% Software Coupa Software, Inc.(1) 0.125% 15/06/2025 2,274 2,862,398 0.14% DocuSign, Inc. 0.50% 15/09/2023 4,773 6,153,840 0.30% Five9, Inc. 0.125% 01/05/2023 1,799 3,275,096 0.16% LivePerson, Inc.(1) 0.75% 01/03/2024 2,599 3,317,527 0.16% PROS Holdings, Inc.(1) 1.00% 15/05/2024 1,722 1,970,140 0.10% RingCentral, Inc. ZCP 15/03/2023 842 2,127,277 0.11% 19,706,278 0.97% Telecommunications GDS Holdings Ltd. 2.00% 01/06/2025 2,306 2,799,044 0.14% Total Convertible Bonds 95,911,559 4.72% Corporate Bonds - 82.36% (31 January 2019: 87.57%) Aerospace/Defense Arconic, Inc. 6.75% 15/01/2028 3,063 3,583,113 0.18% F-Brasile SpA/F-Brasile US LLC(1) 7.375% 15/08/2026 1,763 1,882,002 0.09% Kratos Defense & Security Solutions, Inc.(1) 6.50% 30/11/2025 2,277 2,431,642 0.12% Signature Aviation US Holdings, Inc.(1) 4.00% 01/03/2028 4,606 4,564,166 0.22% Signature Aviation US Holdings, Inc.(1) 5.375% 01/05/2026 1,146 1,187,746 0.06% TransDigm, Inc.(1) 6.25% 15/03/2026 3,296 3,560,913 0.17% TransDigm, Inc. 6.375% 15/06/2026 10,957 11,566,209 0.57% Triumph Group, Inc.(1) 6.25% 15/09/2024 741 768,017 0.04% Triumph Group, Inc. 7.75% 15/08/2025 3,015 2,954,067 0.15% 32,497,875 1.60% Agriculture Kernel Holding SA(1) 8.75% 31/01/2022 3,054 3,315,407 0.16% MHP Lux SA(1) 6.95% 03/04/2026 3,621 3,791,256 0.19% 7,106,663 0.35% Airlines Azul Investments LLP(1) 5.875% 26/10/2024 3,922 4,100,118 0.20% Hawaiian Airlines 2013-1 Class B Pass Through Certificates 4.95% 15/01/2022 613 629,139 0.03% Latam Finance Ltd.(1) 7.00% 01/03/2026 1,980 2,152,943 0.11% Transportes Aereos Portugueses SA 5.625% 02/12/2024 EUR 1,900 2,089,771 0.10% United Airlines Holdings, Inc. 4.875% 15/01/2025 7,657 8,100,455 0.40% 17,072,426 0.84% Apparel Under Armour, Inc. 3.25% 15/06/2026 1,791 1,756,456 0.09% William Carter Co.(1) 5.625% 15/03/2027 1,882 2,008,428 0.10% 3,764,884 0.19% Auto Manufacturers Aston Martin Capital Holdings Ltd.(1) 6.50% 15/04/2022 6,620 6,533,741 0.32% BCD Acquisition, Inc.(1) 9.625% 15/09/2023 4,202 4,375,290 0.21% Ford Motor Credit Co. LLC 4.389% 08/01/2026 2,000 2,063,847 0.10% Jaguar Land Rover Automotive PLC 6.875% 15/11/2026 EUR 3,445 4,073,473 0.20%
70

LORD ABBETT PASSPORT PORTFOLIOS PLC HIGH YIELD FUND Schedule of Investments as at 31 January 2020 (Continued)
Interest Maturity PrincipalFair
Value % of Net Investments Rate Date (000) USD Assets Corporate Bonds - 82.36% (31 January 2019: 87.57%) (Continued) Auto Manufacturers (continued) JB Poindexter & Co., Inc.(1) 7.125% 15/04/2026 3,361 3,622,645 0.18% Mclaren Finance PLC 5.00% 01/08/2022 GBP 6,002 7,697,402 0.38% Mclaren Finance PLC(1) 5.75% 01/08/2022 1,105 1,069,088 0.05% Tesla, Inc.(1) 5.30% 15/08/2025 12,980 13,142,380 0.65% Wabash National Corp.(1) 5.50% 01/10/2025 2,582 2,563,707 0.13% 45,141,573 2.22% Auto Parts & Equipment Adient Global Holdings Ltd.(1) 4.875% 15/08/2026 4,522 4,273,177 0.21% Adient US LLC(1) 7.00% 15/05/2026 4,128 4,517,576 0.22% American Axle & Manufacturing, Inc. 6.50% 01/04/2027 2,984 3,058,675 0.15% Garrett LX I SAR.L./Garrett Borrowing LLC(1) 5.125% 15/10/2026 EUR 1,619 1,776,234 0.09% IHO Verwaltungs GmbH PIK (1) 4.75% 15/09/2026 4,784 4,950,591 0.24% Panther BF Aggregator 2 LP/Panther Finance Co., Inc. 4.375% 15/05/2026 EUR 1,456 1,667,996 0.08% Panther BF Aggregator 2 LP/Panther Finance Co., Inc.(1) 8.50% 15/05/2027 5,003 5,387,480 0.27% Tenneco, Inc. 5.00% 15/07/2026 4,068 3,742,458 0.19% Titan International, Inc. 6.50% 30/11/2023 2,183 1,911,031 0.09% 31,285,218 1.54% Banks CIT Group, Inc. 5.25% 07/03/2025 4,497 4,944,834 0.24% CIT Group, Inc. 6.125% 09/03/2028 6,734 8,036,373 0.40% Credit Suisse Group AG(1) 5.10%(3) - (4) 2,509 2,537,226 0.13% Credit Suisse Group AG(1) 7.25%(3) - (4) 5,058 5,738,023 0.28% Freedom Mortgage Corp.(1) 8.25% 15/04/2025 2,308 2,293,552 0.11% Huntington Bancshares, Inc./OH 5.70%(3) - (4) 2,522 2,646,864 0.13% Intesa Sanpaolo SpA(1) 5.017% 26/06/2024 2,886 3,074,849 0.15% Intesa Sanpaolo SpA(1) 5.71% 15/01/2026 9,303 10,348,048 0.51% Macquarie Bank Ltd./London(1) 6.125%(3) - (4) 3,271 3,478,169 0.17% Popular, Inc. 6.125% 14/09/2023 4,332 4,664,113 0.23% Provident Funding Associates LP/PFG Finance Corp.(1) 6.375% 15/06/2025 3,797 3,770,098 0.19% Synovus Financial Corp. 5.90%(3) 07/02/2029 4,279 4,599,818 0.23% Texas Capital Bank NA 5.25% 31/01/2026 1,312 1,423,425 0.07% 57,555,392 2.84% Beverages Bacardi Ltd.(1) 5.30% 15/05/2048 4,463 5,510,656 0.27% Central American Bottling Corp.(1) 5.75% 31/01/2027 1,193 1,262,024 0.06% 6,772,680 0.33% Building Materials American Woodmark Corp.(1) 4.875% 15/03/2026 2,357 2,431,475 0.12% Cornerstone Building Brands, Inc.(1) 8.00% 15/04/2026 3,537 3,718,360 0.18% Griffon Corp. 5.25% 01/03/2022 640 640,879 0.03% Louisiana-Pacific Corp. 4.875% 15/09/2024 1,564 1,617,434 0.08% Masonite International Corp.(1) 5.375% 01/02/2028 341 359,550 0.02% Masonite International Corp.(1) 5.75% 15/09/2026 1,681 1,786,647 0.09% Norbord, Inc.(1) 5.75% 15/07/2027 150 157,927 0.01% Norbord, Inc.(1) 6.25% 15/04/2023 1,998 2,168,659 0.11% Owens Corning 4.30% 15/07/2047 1,824 1,904,597 0.09% Owens Corning 4.40% 30/01/2048 2,789 2,937,955 0.15%
71

LORD ABBETT PASSPORT PORTFOLIOS PLC HIGH YIELD FUND Schedule of Investments as at 31 January 2020 (Continued)
Interest Maturity PrincipalFair
Value % of Net Investments Rate Date (000) USD Assets Corporate Bonds - 82.36% (31 January 2019: 87.57%) (Continued) Building Materials (continued) Patrick Industries, Inc.(1) 7.50% 15/10/2027 3,696 4,039,164 0.20% PGT Innovations, Inc.(1) 6.75% 01/08/2026 3,113 3,339,774 0.16% Summit Materials LLC/Summit Materials Finance Corp.(1) 5.125% 01/06/2025 4,240 4,347,760 0.21% Summit Materials LLC/Summit Materials Finance Corp.(1) 6.50% 15/03/2027 3,095 3,359,150 0.17% 32,809,331 1.62% Chemicals Ashland LLC 6.875% 15/05/2043 2,927 3,427,327 0.17% CF Industries, Inc. 5.15% 15/03/2034 7,940 9,185,389 0.45% GCP Applied Technologies, Inc.(1) 5.50% 15/04/2026 1,125 1,173,203 0.06% Ingevity Corp.(1) 4.50% 01/02/2026 5,047 5,111,841 0.25% OCI NV(1) 6.625% 15/04/2023 2,775 2,890,163 0.14% Rain CII Carbon LLC/CII Carbon Corp.(1) 7.25% 01/04/2025 2,768 2,747,212 0.13% SPCM SA(1) 4.875% 15/09/2025 1,336 1,382,747 0.07% Starfruit Finco BV/Starfruit US Holdco LLC(1) 8.00% 01/10/2026 6,277 6,528,237 0.32% Trinseo Materials Operating SCA/Trinseo Materials Finance, Inc.(1) 5.375% 01/09/2025 3,595 3,378,581 0.17% Tronox, Inc.(1) 6.50% 15/04/2026 3,583 3,574,132 0.18% Yingde Gases Investment Ltd.(1) 6.25% 19/01/2023 4,215 4,410,101 0.22% 43,808,933 2.16% Coal CONSOL Energy, Inc.(1) 11.00% 15/11/2025 1,175 820,050 0.04% Warrior Met Coal, Inc.(1) 8.00% 01/11/2024 3,361 3,489,138 0.17% 4,309,188 0.21% Commercial Services Ahern Rentals, Inc.(1) 7.375% 15/05/2023 2,385 1,897,065 0.09% Algeco Global Finance PLC(1) 8.00% 15/02/2023 2,659 2,658,973 0.13% Autopistas del Sol SA/Costa Rica(1) 7.375% 30/12/2030 1,820 1,886,386 0.09% Brink's Co.(1) 4.625% 15/10/2027 4,458 4,557,514 0.22% Capitol Investment Merger Sub 2 LLC(1) 10.00% 01/08/2024 2,685 2,796,871 0.14% Cardtronics, Inc./Cardtronics USA, Inc.(1) 5.50% 01/05/2025 2,443 2,535,626 0.13% Garda World Security Corp.(1) 4.625% 15/02/2027 3,487 3,460,847 0.17% GW B-CR Security Corp.(1) 9.50% 01/11/2027 2,592 2,771,755 0.14% MPH Acquisition Holdings LLC(1) 7.125% 01/06/2024 3,842 3,731,005 0.18% Service Corp. International/US 4.625% 15/12/2027 1,520 1,592,918 0.08% Service Corp. International/US 5.125% 01/06/2029 1,519 1,620,393 0.08% United Rentals North America, Inc. 4.875% 15/01/2028 3,794 3,962,264 0.20% Verscend Escrow Corp.(1) 9.75% 15/08/2026 4,415 4,812,460 0.24% WW International, Inc.(1) 8.625% 01/12/2025 2,368 2,481,463 0.12% 40,765,540 2.01% Computers Banff Merger Sub, Inc.(1) 9.75% 01/09/2026 3,669 3,773,842 0.19% Booz Allen Hamilton, Inc.(1) 5.125% 01/05/2025 2,940 3,029,420 0.15% Diebold Nixdorf, Inc. 8.50% 15/04/2024 3,818 3,676,409 0.18% Everi Payments, Inc.(1) 7.50% 15/12/2025 1,640 1,755,481 0.09% MTS Systems Corp.(1) 5.75% 15/08/2027 2,945 3,100,636 0.15% Presidio Holdings, Inc.(1) 4.875% 01/02/2027 1,023 1,024,765 0.05% Presidio Holdings, Inc.(1) 8.25% 01/02/2028 1,905 1,962,150 0.10%
72

LORD ABBETT PASSPORT PORTFOLIOS PLC HIGH YIELD FUND Schedule of Investments as at 31 January 2020 (Continued)
Interest Maturity PrincipalFair
Value % of Net Investments Rate Date (000) USD Assets Corporate Bonds - 82.36% (31 January 2019: 87.57%) (Continued) Computers (continued) Tempo Acquisition LLC/Tempo Acquisition Finance Corp.(1) 6.75% 01/06/2025 2,217 2,300,115 0.11% Western Digital Corp. 4.75% 15/02/2026 6,281 6,716,744 0.33% 27,339,562 1.35% Cosmetics/Personal Care Coty, Inc.(1) 6.50% 15/04/2026 5,228 5,463,391 0.27% Revlon Consumer Products Corp. 5.75% 15/02/2021 2,082 1,836,844 0.09% 7,300,235 0.36% Distribution/Wholesale Core & Main Holdings LP PIK (1) 8.625% 15/09/2024 4,208 4,399,106 0.22% H&E Equipment Services, Inc. 5.625% 01/09/2025 1,844 1,927,745 0.09% IAA, Inc.(1) 5.50% 15/06/2027 3,690 3,922,470 0.19% Performance Food Group, Inc.(1) 5.50% 01/06/2024 1,040 1,063,832 0.05% Performance Food Group, Inc.(1) 5.50% 15/10/2027 2,836 2,992,051 0.15% Univar Solutions USA, Inc./Washington(1) 5.125% 01/12/2027 3,642 3,785,313 0.19% 18,090,517 0.89% Diversified Financial Services AG Issuer LLC(1) 6.25% 01/03/2028 1,187 1,187,000 0.06% AG Merger Sub II, Inc.(1) 10.75% 01/08/2027 2,047 2,175,649 0.11% Ally Financial, Inc. 3.875% 21/05/2024 1,984 2,096,423 0.10% Ally Financial, Inc. 8.00% 01/11/2031 5,328 7,525,320 0.37% Credit Acceptance Corp.(1) 5.125% 31/12/2024 1,873 1,961,967 0.10% CSN Islands XI Corp.(1) 6.75% 28/01/2028 1,520 1,508,600 0.07% Fairstone Financial, Inc.(1) 7.875% 15/07/2024 4,704 5,099,912 0.25% Global Aircraft Leasing Co. Ltd. PIK (1) 6.50% 15/09/2024 3,994 4,096,047 0.20% LHC3 PLC PIK 4.125% 15/08/2024 EUR 1,543 1,763,243 0.09% Muthoot Finance Ltd.(1) 6.125% 31/10/2022 2,871 2,981,419 0.15% Nationstar Mortgage Holdings, Inc.(1) 6.00% 15/01/2027 1,871 1,907,569 0.09% Navient Corp. 5.00% 15/03/2027 5,182 5,182,000 0.26% Navient Corp. 6.75% 25/06/2025 14,299 15,603,784 0.77% Navient Corp. 6.75% 15/06/2026 5,846 6,361,032 0.31% Quicken Loans, Inc.(1) 5.25% 15/01/2028 1,615 1,675,276 0.08% Springleaf Finance Corp. 5.375% 15/11/2029 2,605 2,713,759 0.13% Springleaf Finance Corp. 6.125% 15/03/2024 8,264 8,987,017 0.44% Springleaf Finance Corp. 7.125% 15/03/2026 5,640 6,481,629 0.32% 79,307,646 3.90% Electric AES Corp./VA 4.50% 15/03/2023 1,894 1,934,920 0.10% AES Corp./VA 5.125% 01/09/2027 2,235 2,363,624 0.12% AES Gener SA(1) 6.35%(3) 07/10/2079 3,161 3,306,406 0.16% Clearway Energy Operating LLC(1) 4.75% 15/03/2028 3,263 3,362,848 0.17% Clearway Energy Operating LLC 5.00% 15/09/2026 1,082 1,117,541 0.05% Clearway Energy Operating LLC 5.75% 15/10/2025 1,748 1,840,793 0.09% DPL, Inc.(1) 4.35% 15/04/2029 1,936 1,930,341 0.10% Elwood Energy LLC 8.159% 05/07/2026 1,710 1,889,150 0.09% Mong Duong Finance Holdings BV(1) 5.125% 07/05/2029 2,918 3,019,500 0.15% NextEra Energy Operating Partners LP(1) 4.50% 15/09/2027 4,285 4,478,586 0.22% NRG Energy, Inc.(1) 5.25% 15/06/2029 3,923 4,234,879 0.21% NRG Energy, Inc. 5.75% 15/01/2028 4,609 4,969,193 0.24% NSG Holdings LLC/NSG Holdings, Inc.(1) 7.75% 15/12/2025 2,015 2,258,170 0.11%
73

LORD ABBETT PASSPORT PORTFOLIOS PLC HIGH YIELD FUND Schedule of Investments as at 31 January 2020 (Continued)
Interest Maturity PrincipalFair
Value % of Net Investments Rate Date (000) USD Assets Corporate Bonds - 82.36% (31 January 2019: 87.57%) (Continued) Electric (continued) Talen Energy Supply LLC(1) 10.50% 15/01/2026 2,127 1,891,546 0.09% Terraform Global Operating LLC(1) 6.125% 01/03/2026 1,709 1,786,499 0.09% 40,383,996 1.99% Electrical Component & Equipment Energizer Holdings, Inc.(1) 6.375% 15/07/2026 2,424 2,586,166 0.13% Electronics Itron, Inc.(1) 5.00% 15/01/2026 3,038 3,168,171 0.16% Sensata Technologies BV(1) 5.625% 01/11/2024 1,012 1,121,210 0.05% 4,289,381 0.21% Energy-Alternate Sources Azure Power Solar Energy Pvt Ltd.(1) 5.65% 24/12/2024 3,630 3,755,946 0.18% Enviva Partners LP/Enviva Partners Finance Corp.(1) 6.50% 15/01/2026 3,029 3,238,819 0.16% Greenko Solar Mauritius Ltd.(1) 5.95% 29/07/2026 1,923 1,972,545 0.10% ReNew Power Pvt Ltd.(1) 5.875% 05/03/2027 1,528 1,538,324 0.08% TerraForm Power Operating LLC(1) 4.75% 15/01/2030 5,812 6,135,438 0.30% TerraForm Power Operating LLC(1) 5.00% 31/01/2028 1,023 1,106,733 0.05% YPF Energia Electrica SA(1) 10.00% 25/07/2026 2,119 1,965,102 0.10% 19,712,907 0.97% Engineering & Construction Brand Industrial Services, Inc.(1) 8.50% 15/07/2025 5,461 5,487,540 0.27% Delhi International Airport Ltd.(1) 6.45% 04/06/2029 1,225 1,320,550 0.06% Great Lakes Dredge & Dock Corp. 8.00% 15/05/2022 1,016 1,069,657 0.05% New Enterprise Stone & Lime Co., Inc.(1) 6.25% 15/03/2026 2,107 2,207,815 0.11% Promontoria Holding 264 BV 6.75% 15/08/2023 EUR 1,994 2,028,883 0.10% Promontoria Holding 264 BV(1) 6.75% 15/08/2023 EUR 1,790 1,821,314 0.09% TopBuild Corp.(1) 5.625% 01/05/2026 3,099 3,239,532 0.16% Weekley Homes LLC/Weekley Finance Corp. 6.00% 01/02/2023 1,122 1,126,673 0.06% 18,301,964 0.90% Entertainment Boyne USA, Inc.(1) 7.25% 01/05/2025 1,561 1,698,235 0.08% Buena Vista Gaming Authority(1) 13.00% 01/04/2023 3,749 3,759,928 0.19% Churchill Downs, Inc.(1) 4.75% 15/01/2028 3,292 3,396,850 0.17% Enterprise Development Authority(1) 12.00% 15/07/2024 2,985 3,431,511 0.17% Gateway Casinos & Entertainment Ltd.(1) 8.25% 01/03/2024 1,100 1,149,044 0.06% Inter Media & Communication SpA(1) 4.875% 31/12/2022 EUR 1,312 1,497,618 0.07% Jacobs Entertainment, Inc.(1) 7.875% 01/02/2024 976 1,037,205 0.05% Live Nation Entertainment, Inc.(1) 5.625% 15/03/2026 1,119 1,194,921 0.06% Merlin Entertainments PLC(1) 5.75% 15/06/2026 1,368 1,498,435 0.07% Mohegan Gaming & Entertainment(1) 7.875% 15/10/2024 3,611 3,690,749 0.18% Motion Bondco DAC(1) 6.625% 15/11/2027 1,600 1,708,000 0.08% Penn National Gaming, Inc.(1) 5.625% 15/01/2027 4,810 5,062,297 0.25% Scientific Games International, Inc.(1) 7.00% 15/05/2028 3,473 3,668,269 0.18% Scientific Games International, Inc.(1) 7.25% 15/11/2029 1,707 1,833,916 0.09% Stars Group Holdings BV/Stars Group US Co.-Borrower LLC(1) 7.00% 15/07/2026 2,876 3,129,376 0.16% Twin River Worldwide Holdings, Inc.(1) 6.75% 01/06/2027 4,340 4,591,058 0.23% 42,347,412 2.09%
74

LORD ABBETT PASSPORT PORTFOLIOS PLC HIGH YIELD FUND Schedule of Investments as at 31 January 2020 (Continued)
Interest Maturity PrincipalFair
Value % of Net Investments Rate Date (000) USD Assets Corporate Bonds - 82.36% (31 January 2019: 87.57%) (Continued) Environmental Control Covanta Holding Corp. 6.00% 01/01/2027 1,643 1,713,398 0.09% Waste Pro USA, Inc.(1) 5.50% 15/02/2026 3,231 3,326,888 0.16% 5,040,286 0.25% Food Arcor SAIC 6.00% 06/07/2023 345 338,876 0.02% Arcor SAIC(1) 6.00% 06/07/2023 1,873 1,839,754 0.09% BRF SA(1) 4.875% 24/01/2030 2,558 2,633,461 0.13% Chobani LLC/Chobani Finance Corp., Inc.(1) 7.50% 15/04/2025 5,656 5,639,654 0.28% FAGE International SA/FAGE USA Dairy Industry, Inc.(1) 5.625% 15/08/2026 2,913 2,710,102 0.13% Fresh Market, Inc.(1) 9.75% 01/05/2023 1,987 983,565 0.05% JBS USA LUX SA/JBS USA Finance, Inc.(1) 6.75% 15/02/2028 6,348 7,042,217 0.35% Lamb Weston Holdings, Inc.(1) 4.625% 01/11/2024 1,148 1,207,794 0.06% Lamb Weston Holdings, Inc.(1) 4.875% 01/11/2026 2,100 2,218,073 0.11% Minerva Luxembourg SA(1) 5.875% 19/01/2028 3,357 3,543,817 0.17% Simmons Foods, Inc.(1) 7.75% 15/01/2024 1,484 1,592,206 0.08% Tonon Luxembourg SA PIK (1) 6.50% 31/10/2024 59 623 0.00% 29,750,142 1.47% Gas Rockpoint Gas Storage Canada Ltd.(1) 7.00% 31/03/2023 213 208,695 0.01% Healthcare-Products Ortho-Clinical Diagnostics, Inc./Ortho-Clinical Diagnostics SA(1) 7.25% 01/02/2028 2,285 2,330,997 0.11% Healthcare-Services Acadia Healthcare Co., Inc. 5.625% 15/02/2023 1,242 1,261,145 0.06% AHP Health Partners, Inc.(1) 9.75% 15/07/2026 3,466 3,787,809 0.19% Air Medical Group Holdings, Inc.(1) 6.375% 15/05/2023 3,492 3,266,469 0.16% BCPE Cycle Merger Sub II, Inc.(1) 10.625% 15/07/2027 4,337 4,481,867 0.22% Catalent Pharma Solutions, Inc.(1) 5.00% 15/07/2027 2,766 2,916,747 0.14% Centene Corp.(1) 4.25% 15/12/2027 2,592 2,713,435 0.13% Centene Corp.(1) 4.625% 15/12/2029 2,314 2,494,839 0.12% Centene Corp. 4.75% 15/01/2025 2,529 2,618,565 0.13% Centene Corp.(1) 5.375% 01/06/2026 4,216 4,492,570 0.22% Encompass Health Corp. 4.50% 01/02/2028 1,840 1,898,678 0.09% Hadrian Merger Sub, Inc.(1) 8.50% 01/05/2026 6,454 6,649,863 0.33% HCA, Inc. 5.50% 15/06/2047 4,314 5,133,283 0.25% HCA, Inc. 5.875% 15/02/2026 7,706 8,857,276 0.44% HCA, Inc. 5.875% 01/02/2029 1,694 2,001,207 0.10% HCA, Inc. 7.50% 15/12/2023 445 516,756 0.03% HCA, Inc. 7.69% 15/06/2025 115 140,169 0.01% HCA, Inc. 8.36% 15/04/2024 447 541,988 0.03% MEDNAX, Inc.(1) 6.25% 15/01/2027 2,634 2,690,038 0.13% Molina Healthcare, Inc.(1) 4.875% 15/06/2025 3,473 3,552,584 0.17% Radiology Partners, Inc.(1) 9.25% 01/02/2028 4,025 4,216,188 0.21% Rede D'or Finance SAR.L.(1) 4.95% 17/01/2028 1,769 1,865,163 0.09% RegionalCare Hospital Partners Holdings, Inc./LifePoint Health, Inc.(1) 9.75% 01/12/2026 2,792 3,123,620 0.15% Select Medical Corp.(1) 6.25% 15/08/2026 2,960 3,198,768 0.16% Surgery Center Holdings, Inc.(1) 6.75% 01/07/2025 1,763 1,793,121 0.09% Surgery Center Holdings, Inc.(1) 10.00% 15/04/2027 4,788 5,359,939 0.26%
75

LORD ABBETT PASSPORT PORTFOLIOS PLC HIGH YIELD FUND Schedule of Investments as at 31 January 2020 (Continued)
Interest Maturity PrincipalFair
Value % of Net Investments Rate Date (000) USD Assets Corporate Bonds - 82.36% (31 January 2019: 87.57%) (Continued) Healthcare-Services (continued) Tenet Healthcare Corp.(1) 4.875% 01/01/2026 2,514 2,617,703 0.13% Tenet Healthcare Corp. 5.125% 01/05/2025 7,066 7,207,320 0.36% Tenet Healthcare Corp.(1) 6.25% 01/02/2027 4,712 4,989,301 0.25% Tenet Healthcare Corp. 6.75% 15/06/2023 3,636 3,961,731 0.20% West Street Merger Sub, Inc.(1) 6.375% 01/09/2025 2,760 2,725,472 0.13% 101,073,614 4.98% Holding Companies-Diversified Stena AB(1) 7.00% 01/02/2024 4,140 4,260,743 0.21% Stena International SA(1) 6.125% 01/02/2025 2,579 2,653,146 0.13% 6,913,889 0.34% Home Builders Ashton Woods USA LLC/Ashton Woods Finance Co.(1) 6.75% 01/08/2025 4,152 4,288,663 0.21% Beazer Homes USA, Inc.(1) 7.25% 15/10/2029 3,816 4,178,615 0.21% Century Communities, Inc. 5.875% 15/07/2025 983 1,035,015 0.05% Century Communities, Inc.(1) 6.75% 01/06/2027 5,863 6,374,972 0.31% Installed Building Products, Inc.(1) 5.75% 01/02/2028 1,999 2,129,630 0.10% KB Home 4.80% 15/11/2029 1,734 1,803,360 0.09% Lennar Corp. 4.75% 30/05/2025 4,782 5,231,628 0.26% LGI Homes, Inc.(1) 6.875% 15/07/2026 3,002 3,179,411 0.16% Miller Homes Group Holdings PLC 5.50% 15/10/2024 GBP 1,360 1,868,046 0.09% PulteGroup, Inc. 5.00% 15/01/2027 4,254 4,710,550 0.23% PulteGroup, Inc. 6.375% 15/05/2033 3,653 4,431,898 0.22% PulteGroup, Inc. 7.875% 15/06/2032 700 940,477 0.05% Shea Homes LP/Shea Homes Funding Corp.(1) 6.125% 01/04/2025 3,736 3,858,970 0.19% Toll Brothers Finance Corp. 4.35% 15/02/2028 6,451 6,808,047 0.33% Toll Brothers Finance Corp. 4.875% 15/03/2027 875 964,449 0.05% TRI Pointe Group, Inc. 5.25% 01/06/2027 4,789 5,101,949 0.25% William Lyon Homes, Inc.(1) 6.625% 15/07/2027 4,343 4,702,807 0.23% Williams Scotsman International, Inc.(1) 6.875% 15/08/2023 4,270 4,497,356 0.22% Williams Scotsman International, Inc.(1) 7.875% 15/12/2022 1,111 1,161,342 0.06% 67,267,185 3.31% Housewares Newell Brands, Inc. 5.375% 01/04/2036 6,626 7,297,904 0.36% Insurance Acrisure LLC/Acrisure Finance, Inc.(1) 7.00% 15/11/2025 3,047 2,993,647 0.15% Acrisure LLC/Acrisure Finance, Inc.(1) 8.125% 15/02/2024 2,956 3,164,767 0.15% Alliant Holdings Intermediate LLC/Alliant Holdings Co.-Issuer(1) 6.75% 15/10/2027 2,740 2,888,919 0.14% HUB International Ltd.(1) 7.00% 01/05/2026 3,656 3,774,729 0.18% MGIC Investment Corp. 5.75% 15/08/2023 1,030 1,141,152 0.06% Radian Group, Inc. 4.875% 15/03/2027 5,674 6,016,412 0.30% 19,979,626 0.98% Internet Cogent Communications Group, Inc.(1) 5.375% 01/03/2022 1,861 1,945,326 0.10% Go Daddy Operating Co. LLC/GD Finance Co., Inc.(1) 5.25% 01/12/2027 2,966 3,116,079 0.15% GrubHub Holdings, Inc.(1) 5.50% 01/07/2027 3,879 3,794,050 0.19% Match Group, Inc.(1) 5.00% 15/12/2027 1,622 1,707,719 0.08%
76

LORD ABBETT PASSPORT PORTFOLIOS PLC HIGH YIELD FUND Schedule of Investments as at 31 January 2020 (Continued)
Interest Maturity PrincipalFair
Value % of Net Investments Rate Date (000) USD Assets Corporate Bonds - 82.36% (31 January 2019: 87.57%) (Continued) Internet (continued) Netflix, Inc. 3.625% 15/05/2027 EUR 6,278 7,434,897 0.37% Netflix, Inc. 3.625% 15/06/2030 EUR 2,866 3,302,939 0.16% Netflix, Inc. 3.875% 15/11/2029 EUR 8,502 9,961,491 0.49% Netflix, Inc.(1) 3.875% 15/11/2029 EUR 1,000 1,171,664 0.06% Netflix, Inc. 4.625% 15/05/2029 EUR 2,805 3,472,320 0.17% Netflix, Inc. 4.875% 15/04/2028 4,757 5,102,001 0.25% Netflix, Inc. 5.50% 15/02/2022 46 48,707 0.00% Uber Technologies, Inc.(1) 8.00% 01/11/2026 5,469 5,825,456 0.29% United Group BV 3.625% 15/02/2028 EUR 2,382 2,623,366 0.13% VeriSign, Inc. 5.25% 01/04/2025 1,088 1,200,156 0.06% 50,706,171 2.50% Iron/Steel Baffinland Iron Mines Corp./Baffinland Iron Mines LP(1) 8.75% 15/07/2026 3,693 3,843,120 0.19% CSN Resources SA(1) 7.625% 17/04/2026 4,132 4,347,505 0.21% 8,190,625 0.40% Leisure Time Dometic Group AB 3.00% 08/05/2026 EUR 2,008 2,277,270 0.11% Pinnacle Bidco PLC 6.375% 15/02/2025 GBP 2,604 3,613,690 0.18% Viking Cruises Ltd.(1) 5.875% 15/09/2027 2,070 2,125,683 0.11% VOC Escrow Ltd.(1) 5.00% 15/02/2028 3,986 4,132,884 0.20% 12,149,527 0.60% Lodging Boyd Gaming Corp.(1) 4.75% 01/12/2027 1,785 1,828,465 0.09% Boyd Gaming Corp. 6.00% 15/08/2026 1,804 1,921,887 0.09% Hilton Domestic Operating Co., Inc. 4.875% 15/01/2030 1,544 1,636,366 0.08% Hilton Domestic Operating Co., Inc. 5.125% 01/05/2026 2,298 2,413,009 0.12% MGM Resorts International 4.625% 01/09/2026 8,407 8,839,351 0.43% Station Casinos LLC(1) 5.00% 01/10/2025 1,382 1,417,863 0.07% Sugarhouse HSP Gaming Prop Mezz LP/Sugarhouse HSP Gaming Finance Corp.(1) 5.875% 15/05/2025 1,796 1,805,725 0.09% Wyndham Destinations, Inc. 5.75% 01/04/2027 4,546 4,973,767 0.24% Wyndham Destinations, Inc. 6.35% 01/10/2025 1,004 1,128,034 0.06% Wyndham Hotels & Resorts, Inc.(1) 5.375% 15/04/2026 1,130 1,184,887 0.06% Wynn Las Vegas LLC/Wynn Las Vegas Capital Corp.(1) 5.50% 01/03/2025 2,457 2,567,540 0.13% Wynn Macau Ltd.(1) 5.125% 15/12/2029 1,149 1,140,383 0.06% Wynn Macau Ltd.(1) 5.50% 01/10/2027 3,058 3,119,091 0.15% 33,976,368 1.67% Machinery-Diversified Cloud Crane LLC(1) 10.125% 01/08/2024 1,731 1,848,197 0.09% Frigoglass Finance BV 6.875% 12/02/2025 EUR 3,932 4,357,442 0.21% Granite US Holdings Corp.(1) 11.00% 01/10/2027 3,636 3,819,064 0.19% Mueller Water Products, Inc.(1) 5.50% 15/06/2026 2,890 3,035,504 0.15% RBS Global, Inc./Rexnord LLC(1) 4.875% 15/12/2025 3,849 3,944,609 0.20% SPX FLOW, Inc.(1) 5.875% 15/08/2026 2,984 3,164,077 0.16% Stevens Holding Co., Inc.(1) 6.125% 01/10/2026 2,770 3,041,038 0.15% Titan Acquisition Ltd./Titan Co.-Borrower LLC(1) 7.75% 15/04/2026 3,824 3,732,903 0.18% 26,942,834 1.33%
77

LORD ABBETT PASSPORT PORTFOLIOS PLC HIGH YIELD FUND Schedule of Investments as at 31 January 2020 (Continued)
Interest Maturity PrincipalFair
Value % of Net Investments Rate Date (000) USD Assets Corporate Bonds - 82.36% (31 January 2019: 87.57%) (Continued) Media Altice Luxembourg SA(1) 10.50% 15/05/2027 1,848 2,140,261 0.11% AMC Networks, Inc. 4.75% 01/08/2025 10,057 10,174,315 0.50% Belo Corp. 7.25% 15/09/2027 2,003 2,329,184 0.12% CCO Holdings LLC/CCO Holdings Capital Corp.(1) 4.75% 01/03/2030 3,430 3,532,814 0.17% CCO Holdings LLC/CCO Holdings Capital Corp.(1) 5.00% 01/02/2028 3,950 4,144,498 0.20% CCO Holdings LLC/CCO Holdings Capital Corp.(1) 5.125% 01/05/2027 19,251 20,152,909 0.99% CCO Holdings LLC/CCO Holdings Capital Corp.(1) 5.75% 15/02/2026 6,004 6,311,345 0.31% CCO Holdings LLC/CCO Holdings Capital Corp.(1) 5.875% 01/05/2027 5,002 5,281,524 0.26% Clear Channel Worldwide Holdings, Inc.(1) 9.25% 15/02/2024 1,350 1,472,627 0.07% CSC Holdings LLC(1) 5.50% 15/04/2027 4,878 5,185,802 0.26% CSC Holdings LLC(1) 5.75% 15/01/2030 3,619 3,895,021 0.19% CSC Holdings LLC(1) 6.50% 01/02/2029 3,574 4,000,646 0.20% CSC Holdings LLC(1) 10.875% 15/10/2025 3,161 3,507,367 0.17% Diamond Sports Group LLC/Diamond Sports Finance Co.(1) 5.375% 15/08/2026 2,997 2,990,934 0.15% Diamond Sports Group LLC/Diamond Sports Finance Co.(1) 6.625% 15/08/2027 3,759 3,521,619 0.17% DISH DBS Corp. 7.75% 01/07/2026 22,546 23,715,010 1.17% EW Scripps Co.(1) 5.125% 15/05/2025 4,646 4,775,693 0.24% GCI LLC 6.875% 15/04/2025 2,980 3,119,062 0.15% Gray Television, Inc.(1) 5.875% 15/07/2026 3,400 3,563,540 0.18% Gray Television, Inc.(1) 7.00% 15/05/2027 4,124 4,497,841 0.22% LCPR Senior Secured Financing DAC(1) 6.75% 15/10/2027 1,685 1,785,072 0.09% Nexstar Broadcasting, Inc.(1) 5.625% 15/07/2027 7,163 7,561,621 0.37% Radiate Holdco LLC/Radiate Finance, Inc.(1) 6.625% 15/02/2025 1,207 1,222,588 0.06% Sinclair Television Group, Inc.(1) 5.125% 15/02/2027 11,061 11,355,195 0.56% Sirius XM Radio, Inc.(1) 4.625% 15/07/2024 1,301 1,351,687 0.07% Sirius XM Radio, Inc.(1) 5.00% 01/08/2027 5,473 5,756,775 0.28% Univision Communications, Inc.(1) 5.125% 15/02/2025 1,706 1,706,000 0.08% Virgin Media Secured Finance PLC 4.875% 15/01/2027 GBP 1,269 1,737,105 0.09% Virgin Media Secured Finance PLC(1) 5.50% 15/05/2029 3,631 3,828,345 0.19% Ziggo BV(1) 5.50% 15/01/2027 4,216 4,476,760 0.22% 159,093,160 7.84% Metal Fabricate/Hardware Hillman Group, Inc.(1) 6.375% 15/07/2022 2,958 2,774,048 0.14% TriMas Corp.(1) 4.875% 15/10/2025 1,212 1,244,572 0.06% 4,018,620 0.20% Mining Barminco Finance Pty Ltd.(1) 6.625% 15/05/2022 1,731 1,776,439 0.09% Coeur Mining, Inc. 5.875% 01/06/2024 2,867 2,867,358 0.14% Compass Minerals International, Inc.(1) 4.875% 15/07/2024 1,628 1,622,571 0.08% Compass Minerals International, Inc.(1) 6.75% 01/12/2027 2,592 2,780,905 0.14% Freeport-McMoRan, Inc. 3.875% 15/03/2023 9,164 9,366,387 0.46% Freeport-McMoRan, Inc. 5.25% 01/09/2029 3,217 3,415,971 0.17% Hecla Mining Co. 6.875% 01/05/2021 3,311 3,311,828 0.16% Industrias Penoles SAB de CV(1) 5.65% 12/09/2049 2,579 2,840,936 0.14% Joseph T Ryerson & Son, Inc.(1) 11.00% 15/05/2022 465 489,409 0.02% New Gold, Inc.(1) 6.25% 15/11/2022 4,649 4,669,309 0.23% 33,141,113 1.63% Miscellaneous Manufacturer Amsted Industries, Inc.(1) 4.625% 15/05/2030 2,615 2,654,225 0.13%
78

LORD ABBETT PASSPORT PORTFOLIOS PLC HIGH YIELD FUND Schedule of Investments as at 31 January 2020 (Continued)
Interest Maturity PrincipalFair
Value % of Net Investments Rate Date (000) USD Assets Corporate Bonds - 82.36% (31 January 2019: 87.57%) (Continued) Miscellaneous Manufacturer (continued) Amsted Industries, Inc.(1) 5.625% 01/07/2027 2,719 2,898,189 0.14% General Electric Co. 5.00%(3) - (4) 13,143 13,021,493 0.64% Koppers, Inc.(1) 6.00% 15/02/2025 3,067 3,149,778 0.16% 21,723,685 1.07% Office/Business Equip CDW LLC/CDW Finance Corp. 5.50% 01/12/2024 973 1,088,140 0.05% Oil & Gas Afren PLC(1) (5) 6.625% 09/12/2020 195 956 0.00% American Energy- Permian Basin LLC(1) 12.00% 01/10/2024 689 475,410 0.02% Berry Petroleum Co. LLC(1) 7.00% 15/02/2026 3,809 3,543,694 0.17% Callon Petroleum Co. 6.125% 01/10/2024 5,104 4,893,460 0.24% Callon Petroleum Co. 6.375% 01/07/2026 3,562 3,376,233 0.17% Carrizo Oil & Gas, Inc. 8.25% 15/07/2025 5,008 5,124,110 0.25% Centennial Resource Production LLC(1) 5.375% 15/01/2026 4,189 3,949,588 0.19% Centennial Resource Production LLC(1) 6.875% 01/04/2027 3,030 3,004,843 0.15% Chaparral Energy, Inc.(1) 8.75% 15/07/2023 3,685 1,320,151 0.07% Citgo Holding, Inc.(1) 9.25% 01/08/2024 3,039 3,259,327 0.16% Denbury Resources, Inc.(1) 7.75% 15/02/2024 2,315 1,864,536 0.09% Endeavor Energy Resources LP/EER Finance, Inc.(1) 5.50% 30/01/2026 3,566 3,667,890 0.18% Endeavor Energy Resources LP/EER Finance, Inc.(1) 5.75% 30/01/2028 1,800 1,875,330 0.09% Geopark Ltd.(1) 6.50% 21/09/2024 1,772 1,872,853 0.09% Hess Corp. 5.60% 15/02/2041 2,412 2,785,323 0.14% HighPoint Operating Corp. 7.00% 15/10/2022 2,393 2,278,595 0.11% Hilcorp Energy I LP/Hilcorp Finance Co.(1) 5.00% 01/12/2024 1,845 1,684,328 0.08% Hilcorp Energy I LP/Hilcorp Finance Co.(1) 5.75% 01/10/2025 7,319 6,638,955 0.33% Indigo Natural Resources LLC(1) 6.875% 15/02/2026 4,203 3,856,358 0.19% Jagged Peak Energy LLC 5.875% 01/05/2026 7,266 7,501,219 0.37% Jonah Energy LLC/Jonah Energy Finance Corp.(1) 7.25% 15/10/2025 2,412 669,330 0.03% Laredo Petroleum, Inc. 10.125% 15/01/2028 5,451 4,877,827 0.24% Magnolia Oil & Gas Operating LLC/Magnolia Oil & Gas Finance Corp.(1) 6.00% 01/08/2026 6,152 6,369,458 0.31% Matador Resources Co. 5.875% 15/09/2026 2,697 2,646,634 0.13% MEG Energy Corp.(1) 6.50% 15/01/2025 2,435 2,552,184 0.13% MEG Energy Corp.(1) 7.00% 31/03/2024 12,651 12,772,260 0.63% MEG Energy Corp.(1) 7.125% 01/02/2027 3,203 3,179,970 0.16% Montage Resources Corp. 8.875% 15/07/2023 2,135 1,796,047 0.09% Murphy Oil Corp. 5.875% 01/12/2027 4,700 4,823,375 0.24% Murphy Oil Corp. 6.875% 15/08/2024 1,330 1,389,298 0.07% Nabors Industries Ltd.(1) 7.25% 15/01/2026 962 965,608 0.05% Nabors Industries Ltd.(1) 7.50% 15/01/2028 986 978,605 0.05% Oasis Petroleum, Inc.(1) 6.25% 01/05/2026 7,784 5,954,955 0.29% Oasis Petroleum, Inc. 6.875% 15/03/2022 3,839 3,695,038 0.18% Pacific Drilling SA(1) 8.375% 01/10/2023 2,081 1,753,222 0.09% Parsley Energy LLC/Parsley Finance Corp.(1) 5.625% 15/10/2027 5,329 5,655,934 0.28% PBF Holding Co. LLC/PBF Finance Corp.(1) 6.00% 15/02/2028 3,394 3,479,189 0.17% PDC Energy, Inc. 6.125% 15/09/2024 2,582 2,595,982 0.13% QEP Resources, Inc. 5.25% 01/05/2023 6,600 6,352,500 0.31% QEP Resources, Inc. 5.625% 01/03/2026 1,902 1,701,149 0.08% Range Resources Corp. 5.00% 15/08/2022 1,932 1,830,956 0.09% Rio Oil Finance Trust Series 2018-1(1) 8.20% 06/04/2028 2,858 3,351,998 0.17%
79

LORD ABBETT PASSPORT PORTFOLIOS PLC HIGH YIELD FUND Schedule of Investments as at 31 January 2020 (Continued)
Interest Maturity PrincipalFair
Value % of Net Investments Rate Date (000) USD Assets Corporate Bonds - 82.36% (31 January 2019: 87.57%) (Continued) Oil & Gas (continued) SM Energy Co. 6.625% 15/01/2027 3,007 2,728,319 0.13% SM Energy Co. 6.75% 15/09/2026 4,674 4,257,558 0.21% SRC Energy, Inc. 6.25% 01/12/2025 5,178 5,229,728 0.26% Tapstone Energy LLC/Tapstone Energy Finance Corp.(1) (5) 9.75% 01/06/2022 3,336 28,356 0.00% Transocean Poseidon Ltd.(1) 6.875% 01/02/2027 10,325 10,813,605 0.53% Transocean, Inc. 6.80% 15/03/2038 3,868 2,485,577 0.12% Tullow Oil PLC(1) 7.00% 01/03/2025 2,123 1,722,305 0.09% Valaris PLC 4.50% 01/10/2024 2,402 1,303,085 0.06% Valaris PLC 8.00% 31/01/2024 567 343,979 0.02% Viper Energy Partners LP(1) 5.375% 01/11/2027 3,427 3,578,987 0.18% W&T Offshore, Inc.(1) 9.75% 01/11/2023 2,790 2,648,519 0.13% WPX Energy, Inc. 5.25% 15/09/2024 3,629 3,810,414 0.19% WPX Energy, Inc. 5.25% 15/10/2027 1,836 1,922,017 0.09% WPX Energy, Inc. 5.75% 01/06/2026 3,031 3,182,012 0.16% 186,419,139 9.18% Oil & Gas Services Apergy Corp. 6.375% 01/05/2026 4,521 4,805,134 0.24% Archrock Partners LP/Archrock Partners Finance Corp.(1) 6.25% 01/04/2028 2,770 2,856,562 0.14% Archrock Partners LP/Archrock Partners Finance Corp.(1) 6.875% 01/04/2027 1,370 1,464,568 0.07% CSI Compressco LP/CSI Compressco Finance, Inc.(1) 7.50% 01/04/2025 2,890 2,877,963 0.14% Exterran Energy Solutions LP/EES Finance Corp. 8.125% 01/05/2025 2,131 2,116,797 0.11% Nine Energy Service, Inc.(1) 8.75% 01/11/2023 3,261 2,774,296 0.14% Oceaneering International, Inc. 4.65% 15/11/2024 3,178 3,074,715 0.15% Oceaneering International, Inc. 6.00% 01/02/2028 3,422 3,286,309 0.16% 23,256,344 1.15% Packaging & Containers Ball Corp. 4.875% 15/03/2026 4,199 4,605,673 0.23% Flex Acquisition Co., Inc.(1) 7.875% 15/07/2026 1,718 1,752,665 0.09% Intertape Polymer Group, Inc.(1) 7.00% 15/10/2026 1,968 2,086,764 0.10% Mauser Packaging Solutions Holding Co.(1) 7.25% 15/04/2025 4,059 4,048,812 0.20% Pactiv LLC 7.95% 15/12/2025 2,000 2,335,830 0.11% Sealed Air Corp.(1) 6.875% 15/07/2033 1,522 1,807,904 0.09% Trident TPI Holdings, Inc.(1) 6.625% 01/11/2025 597 543,518 0.03% Trident TPI Holdings, Inc.(1) 9.25% 01/08/2024 1,513 1,540,105 0.08% Trivium Packaging Finance BV 3.75% 15/08/2026 EUR 794 923,546 0.04% Trivium Packaging Finance BV(1) 5.50% 15/08/2026 614 648,153 0.03% Trivium Packaging Finance BV(1) 8.50% 15/08/2027 1,667 1,836,784 0.09% 22,129,754 1.09% Pharmaceuticals Bausch Health Americas, Inc.(1) 8.50% 31/01/2027 11,120 12,600,072 0.62% Bausch Health Cos, Inc.(1) 5.00% 30/01/2028 1,358 1,378,370 0.07% Bausch Health Cos, Inc.(1) 5.25% 30/01/2030 3,688 3,766,370 0.19% Bausch Health Cos, Inc.(1) 6.125% 15/04/2025 1,809 1,864,545 0.09% Horizon Therapeutics USA, Inc.(1) 5.50% 01/08/2027 4,143 4,425,346 0.22% NVA Holdings, Inc.(1) 6.875% 01/04/2026 1,186 1,280,880 0.06% 25,315,583 1.25%
80

LORD ABBETT PASSPORT PORTFOLIOS PLC HIGH YIELD FUND Schedule of Investments as at 31 January 2020 (Continued)
Interest Maturity PrincipalFair
Value % of Net Investments Rate Date (000) USD Assets Corporate Bonds - 82.36% (31 January 2019: 87.57%) (Continued) Pipelines Buckeye Partners LP 3.95% 01/12/2026 2,542 2,524,439 0.12% Buckeye Partners LP 4.125% 01/12/2027 4,193 4,141,927 0.20% Buckeye Partners LP 6.375%(3) 22/01/2078 3,600 2,975,634 0.15% Cheniere Energy Partners LP(1) 4.50% 01/10/2029 4,375 4,459,656 0.22% Cheniere Energy Partners LP 5.625% 01/10/2026 5,764 6,048,603 0.30% Holly Energy Partners LP/Holly Energy Finance Corp.(1) 5.00% 01/02/2028 1,937 1,971,508 0.10% Holly Energy Partners LP/Holly Energy Finance Corp.(1) 6.00% 01/08/2024 417 436,887 0.02% NGPL PipeCo LLC(1) 4.875% 15/08/2027 2,372 2,566,535 0.13% Targa Resources Partners LP/Targa Resources Partners Finance Corp. 5.375% 01/02/2027 2,752 2,860,291 0.14% Targa Resources Partners LP/Targa Resources Partners Finance Corp. 5.875% 15/04/2026 2,284 2,413,900 0.12% Targa Resources Partners LP/Targa Resources Partners Finance Corp. 6.50% 15/07/2027 1,285 1,403,863 0.07% Transportadora de Gas del Sur SA(1) 6.75% 02/05/2025 3,155 2,927,304 0.14% 34,730,547 1.71% Real Estate Kaisa Group Holdings Ltd. 9.375% 30/06/2024 4,906 4,628,021 0.23% WeWork Cos, Inc.(1) 7.875% 01/05/2025 5,584 4,341,504 0.21% 8,969,525 0.44% REITS GEO Group, Inc. 6.00% 15/04/2026 4,534 4,046,708 0.20% HAT Holdings I LLC/HAT Holdings II LLC(1) 5.25% 15/07/2024 3,179 3,344,578 0.17% Ladder Capital Finance Holdings LLLP/Ladder Capital Finance Corp.(1) 5.25% 01/10/2025 4,229 4,357,625 0.21% MGM Growth Properties Operating Partnership LP/MGP Finance Co.-Issuer, Inc. 5.625% 01/05/2024 1,059 1,157,355 0.06% MPT Operating Partnership LP/MPT Finance Corp. 5.00% 15/10/2027 1,965 2,070,570 0.10% 14,976,836 0.74% Retail Asbury Automotive Group, Inc. 6.00% 15/12/2024 1,118 1,153,871 0.06% Carvana Co.(1) 8.875% 01/10/2023 1,807 1,902,211 0.09% Dutch Lion BV PIK (1) 11.25% 15/06/2020 EUR 951 953,450 0.05% eG Global Finance PLC(1) 8.50% 30/10/2025 4,266 4,541,520 0.22% Future Retail Ltd.(1) 5.60% 22/01/2025 4,493 4,533,194 0.22% IRB Holding Corp.(1) 6.75% 15/02/2026 6,089 6,355,683 0.31% KFC Holding Co./Pizza Hut Holdings LLC/Taco Bell of America LLC(1) 4.75% 01/06/2027 5,773 6,095,032 0.30% KGA Escrow LLC(1) 7.50% 15/08/2023 2,182 2,308,370 0.11% Lithia Motors, Inc.(1) 4.625% 15/12/2027 1,780 1,824,500 0.09% Murphy Oil USA, Inc. 4.75% 15/09/2029 6,400 6,699,840 0.33% Murphy Oil USA, Inc. 5.625% 01/05/2027 1,417 1,527,310 0.08% PetSmart, Inc.(1) 5.875% 01/06/2025 1,657 1,710,852 0.09% PetSmart, Inc.(1) 7.125% 15/03/2023 2,833 2,829,459 0.14% Rite Aid Corp.(1) 6.125% 01/04/2023 1,996 1,826,340 0.09% Sally Holdings LLC/Sally Capital, Inc. 5.625% 01/12/2025 3,316 3,438,974 0.17% Sonic Automotive, Inc. 6.125% 15/03/2027 2,752 2,923,044 0.14% SRS Distribution, Inc.(1) 8.25% 01/07/2026 3,649 3,805,351 0.19% Wendy's International LLC 7.00% 15/12/2025 1,634 1,749,605 0.09%
81

LORD ABBETT PASSPORT PORTFOLIOS PLC HIGH YIELD FUND Schedule of Investments as at 31 January 2020 (Continued)
Interest Maturity PrincipalFair
Value % of Net Investments Rate Date (000) USD Assets Corporate Bonds - 82.36% (31 January 2019: 87.57%) (Continued) Retail (continued) Yum! Brands, Inc. 5.35% 01/11/2043 1,393 1,434,790 0.07% 57,613,396 2.84% Semiconductors Micron Technology, Inc. 5.327% 06/02/2029 3,184 3,736,759 0.19% Qorvo, Inc.(1) 4.375% 15/10/2029 2,346 2,455,969 0.12% 6,192,728 0.31% Software Castle US Holding Corp.(1) 9.50% 15/02/2028 2,346 2,346,000 0.12% Fair Isaac Corp.(1) 4.00% 15/06/2028 2,622 2,674,440 0.13% Fair Isaac Corp.(1) 5.25% 15/05/2026 2,144 2,369,865 0.12% j2 Cloud Services LLC/j2 Cloud Co.-Obligor, Inc.(1) 6.00% 15/07/2025 2,597 2,745,250 0.14% PTC, Inc.(1) 3.625% 15/02/2025 817 825,170 0.04% PTC, Inc.(1) 4.00% 15/02/2028 1,283 1,299,038 0.06% Rackspace Hosting, Inc.(1) 8.625% 15/11/2024 3,783 3,754,627 0.18% 16,014,390 0.79% Storage/Warehousing LBC Tank Terminals Holding Netherlands BV(1) 6.875% 15/05/2023 1,850 1,887,768 0.09% Telecommunications Altice France SA/France 3.375% 15/01/2028 EUR 1,162 1,310,561 0.06% Altice France SA/France(1) 7.375% 01/05/2026 1,922 2,048,179 0.10% Altice France SA/France(1) 8.125% 01/02/2027 8,594 9,619,694 0.47% Connect Finco SAR.L./Connect US Finco LLC(1) 6.75% 01/10/2026 6,264 6,639,840 0.33% Consolidated Communications, Inc. 6.50% 01/10/2022 3,140 3,004,587 0.15% DKT Finance ApS(1) 9.375% 17/06/2023 4,253 4,552,624 0.22% Hughes Satellite Systems Corp. 5.25% 01/08/2026 2,733 2,972,814 0.15% Intelsat Jackson Holdings SA 5.50% 01/08/2023 9,548 7,825,398 0.38% Intelsat Jackson Holdings SA(1) 8.50% 15/10/2024 3,073 2,603,092 0.13% Millicom International Cellular SA(1) 6.625% 15/10/2026 1,752 1,932,631 0.09% Sprint Capital Corp. 6.875% 15/11/2028 25,956 26,458,249 1.30% Telecom Italia SpA/Milano 2.375% 12/10/2027 EUR 3,350 3,829,209 0.19% Telefonica Celular del Paraguay SA(1) 5.875% 15/04/2027 1,136 1,216,806 0.06% T-Mobile USA, Inc. 6.50% 15/01/2026 1,626 1,737,056 0.09% ViaSat, Inc.(1) 5.625% 15/04/2027 6,104 6,404,622 0.32% Ypso Finance Bis SA(1) 6.00% 15/02/2028 1,991 1,977,421 0.10% 84,132,783 4.14% Toys/Games/Hobbies Mattel, Inc. 5.45% 01/11/2041 2,099 1,870,072 0.09% Mattel, Inc.(1) 5.875% 15/12/2027 1,755 1,848,015 0.09% Mattel, Inc.(1) 6.75% 31/12/2025 4,608 4,951,688 0.25% 8,669,775 0.43% Transportation CMA CGM SA 5.25% 15/01/2025 EUR 3,012 2,632,767 0.13% Golar LNG Partners LP(1) 8.16%(2) 18/05/2021 1,000 990,036 0.05% Teekay Corp.(1) 9.25% 15/11/2022 1,737 1,811,365 0.09%
82

LORD ABBETT PASSPORT PORTFOLIOS PLC HIGH YIELD FUND Schedule of Investments as at 31 January 2020 (Continued)
Interest Maturity PrincipalFair
Value % of Net Investments Rate Date (000) USD Assets Corporate Bonds - 82.36% (31 January 2019: 87.57%) (Continued) Transportation (continued) XPO CNW, Inc. 6.70% 01/05/2034 2,480 2,655,389 0.13% 8,089,557 0.40% Total Corporate Bonds 1,671,840,195 82.36% Floating Rate Loans - 6.64% (31 January 2019: 4.07%) Aerospace Bleriot US Bidco, Inc. Initial Term Loan 6.695% 30/10/2026 2,450 2,485,791 0.12% Doncasters US Finance LLC Term Loan B 5.445% 09/04/2020 1,888 1,595,360 0.08% Temple Generation 1 LLC 2nd Lien Advance Term Loan 9.645% 07/02/2023 442 444,579 0.02% 4,525,730 0.22% Automotive Drive Chassis Holdco LLC 2nd Lien Term Loan B 10.084% 10/04/2026 3,246 3,091,815 0.15% Thor Industries, Inc. Initial Term Loan 5.438% 01/02/2026 3,344 3,354,616 0.17% 6,446,431 0.32% Broadcasting Univision Communications Inc. 1st Lien Replacement Repriced Term Loan 4.395% 15/03/2024 2,594 2,568,624 0.13% Chemicals Schenectady International Group, Inc. Initial Term Loan 6.625% 15/10/2025 554 551,517 0.03% Commercial Services First Advantage Corp. Term Loan B TBD 22/01/2027 695 699,646 0.03% Consumer Durables Britax US Holdings, Inc. Initial Dollar Term Loan 5.445% 15/10/2020 1,305 130,517 0.01% TGP Holdings III LLC 2nd Lien Initial Term Loan 10.277% 25/09/2025 1,519 1,416,467 0.07% Titan Acquisitionco New Zealand Ltd. 1st Lien Initial Term Loan 6.195% 01/05/2026 1,312 1,318,180 0.06% 2,865,164 0.14% Consumer Non-Durables Revlon Consumer Products Corp. Initial Term Loan B 5.409% 07/09/2023 3,402 2,684,920 0.13% Diversified Media UFC Holdings LLC 1st Lien Term Loan 4.90% 29/04/2026 805 808,145 0.04% Electric Lonestar II Generation Holdings LLC Initial Term Loan B 6.645% 20/04/2026 1,190 1,197,886 0.06% Lonestar II Generation Holdings LLC Initial Term Loan C 6.645% 20/04/2026 144 144,468 0.01% 1,342,354 0.07%
83

LORD ABBETT PASSPORT PORTFOLIOS PLC HIGH YIELD FUND Schedule of Investments as at 31 January 2020 (Continued)
Interest Maturity PrincipalFair
Value % of Net Investments Rate Date (000) USD Assets Floating Rate Loans - 6.64% (31 January 2019: 4.07%) (Continued) Energy Frontera Generation Holdings LLC Initial Term Loan 5.920% 02/05/2025 2,075 1,789,921 0.09% Medallion Midland Acquisition LLC Initial Term Loan 4.895% 30/10/2024 2,720 2,691,088 0.13% Navitas Midstream Midland Basin LLC Initial Term Loan 6.145% 13/12/2024 2,114 2,016,421 0.10% Topgolf International, Inc. Initial Term Loan 7.170% 09/02/2026 2,279 2,292,077 0.11% 8,789,507 0.43% Financial DG Investment Intermediate Holdings 2, Inc. 1st Lien Initial Term Loan 4.645% 03/02/2025 3,519 3,502,478 0.17% Hayward Industries, Inc. 1st Lien Initial Term Loan 5.145% 05/08/2024 1,791 1,777,320 0.09% Helix Gen Funding LLC Term Loan 5.395% 03/06/2024 3,286 3,244,719 0.16% Minotaur Acquisition, Inc. 1st Lien Term Loan B 6.645% 27/03/2026 1,914 1,909,832 0.09% 10,434,349 0.51% Food and Drug Fairway Group Holdings Corp. Last Out Term Loan 10.00% 24/11/2023 46 5 0.00% Fairway Group Holdings Corp. Term Loan 11.00% 24/02/2024 42 4 0.00% 9 0.00% Gaming/Leisure MND Holdings III Corp. Refinancing Term Loan TBD 19/06/2024 977 884,588 0.04% Playtika Holding Corp. Term Loan B 7.645% 10/12/2024 3,276 3,316,577 0.16% Spectacle Gary Holdings LLC Closing Date Term Loan 11.00% 23/12/2025 1,886 1,980,466 0.10% 6,181,631 0.30% Healthcare Parexel International Corp. Initial Term Loan 4.395% 27/09/2024 3,492 3,447,528 0.17% Information Technology Navicure, Inc. 1st Lien Initial Term Loan 5.645% 22/10/2026 2,065 2,083,170 0.10% Optiv, Inc. 1st Lien Initial Term Loan 4.895% 01/02/2024 3,381 2,943,585 0.15% Project Boost Purchaser LLC 1st Lien Term Loan 5.145% 01/06/2026 2,789 2,804,528 0.14% Sound Inpatient Physicians, Inc. 2nd Lien Initial Term Loan 8.395% 26/06/2026 2,651 2,666,890 0.13% Vertafore, Inc. 2nd Lien Initial Term Loan 8.895% 02/07/2026 2,795 2,806,051 0.14% 13,304,224 0.66% Machinery-Diversified MHI Holdings LLC Initial Term Loan 6.645% 21/09/2026 2,196 2,210,938 0.11% Manufacturing Airxcel, Inc. 1st Lien Initial Term Loan 6.145% 28/04/2025 2,634 2,595,478 0.13% Forming Machining Industries Holdings LLC 1st Lien Initial Term Loan 5.945% 09/10/2025 2,906 2,731,493 0.13% Forterra Finance LLC Replacement Term Loan 4.645% 25/10/2023 3,738 3,667,429 0.18% ProAmpac PG Borrower LLC 1st Lien Initial Term Loan 5.295% 20/11/2023 2,212 2,189,652 0.11%
84

LORD ABBETT PASSPORT PORTFOLIOS PLC HIGH YIELD FUND Schedule of Investments as at 31 January 2020 (Continued)
Interest Maturity PrincipalFair
Value % of Net Investments Rate Date (000) USD Assets Floating Rate Loans - 6.64% (31 January 2019: 4.07%) (Continued) Manufacturing (continued) Utex Industries, Inc. 1st Lien Initial Term Loan TBD 21/05/2021 534 458,214 0.02% Yak Access LLC 2nd Lien Initial Term Loan 11.660% 10/07/2026 3,050 2,744,621 0.14% 14,386,887 0.71% Media/Telecommunications Ancestry.com Operations, Inc. 1st Lien Extended Term Loan 5.90% 27/08/2026 1,667 1,591,811 0.08% Ancestry.com Operations, Inc. 1st Lien Non-Extended Term Loan 5.40% 19/10/2023 1,029 990,498 0.05% Montreign Operating Co. LLC Term Loan B 10.159% 24/01/2023 1,987 1,756,179 0.09% 4,338,488 0.22% Miscellaneous Manufacturer FGI Operating Co. LLC Term Loan 12.00% 16/05/2022 58 46,400 0.00% Oil & Gas BEP Ulterra Holdings, Inc. Initial Term Loan 6.895% 26/11/2025 2,261 2,136,449 0.11% Lower Cadence Holdings LLC Initial Term Loan 5.645% 22/05/2026 2,279 2,232,476 0.11% PowerTeam Services LLC 2nd Lien Initial Term Loan 9.195% 06/03/2026 1,197 873,810 0.04% 5,242,735 0.26% REITS CoreCivic, Inc. Term Loan 6.160% 12/12/2024 3,200 3,159,576 0.16% Retail Claire's Stores, Inc. Initial Term Loan 8.421% 18/12/2026 784 761,886 0.04% CWGS Group LLC Term Loan TBD 08/11/2023 4,040 3,857,916 0.19% Flynn Restaurant Group LP 1st Lien Initial Term Loan 5.145% 27/06/2025 2,829 2,752,180 0.14% Flynn Restaurant Group LP 2nd Lien Initial Term Loan 8.684% 29/06/2026 2,148 1,987,176 0.10% Froneri International PLC 2nd Lien Dollar Term Loan TBD 29/01/2028 267 272,155 0.01% J. Crew Group, Inc. Amended Term Loan 4.959% 05/03/2021 4,417 3,957,600 0.19% Mavis Tire Express Services Corp. 1st Lien Closing Date Term Loan 4.895% 20/03/2025 3,016 2,961,412 0.15% Mavis Tire Express Services Corp. 1st Lien Delayed Draw Term Loan 3.426% 20/03/2025 86 84,766 0.00% PetSmart, Inc. Amended Term Loan 5.670% 11/03/2022 3,334 3,330,958 0.16% United Natural Foods, Inc. Initial Term Loan 5.895% 22/10/2025 2,089 1,879,210 0.09% 21,845,259 1.07% Semiconductors Da Vinci Purchaser Corp. 1st Lien Initial Term Loan 5.872% 08/01/2027 1,856 1,871,384 0.09% II-VI, Inc. Term Loan B 5.145% 24/09/2026 4,853 4,892,267 0.24% 6,763,651 0.33% Service KUEHG Corp. 2nd Lien Tranche B Term Loan 10.195% 22/08/2025 2,626 2,637,082 0.13% NEP Group, Inc. 1st Lien Initial Dollar Term Loan 4.895% 20/10/2025 1,909 1,877,900 0.09% NEP Group, Inc. 2nd Lien Initial Term Loan TBD 19/10/2026 2,304 2,135,411 0.11% North American Lifting Holdings, Inc. 2nd Lien Term Loan 10.945% 26/11/2021 1,272 792,876 0.04% 7,443,269 0.37%
85

LORD ABBETT PASSPORT PORTFOLIOS PLC HIGH YIELD FUND Schedule of Investments as at 31 January 2020 (Continued)
Interest Maturity PrincipalFair
Value % of Net Investments Rate Date (000) USD Assets Floating Rate Loans - 6.64% (31 January 2019: 4.07%) (Continued) Transportation Commercial Barge Line Co. Initial Term Loan 10.528% 12/11/2020 2,147 996,417 0.05% Utility Exgen Renewables IV LLC Term Loan 4.910% 28/11/2024 2,715 2,713,383 0.13% Moxie Patriot LLC Advance Construction Term Loan B-1 7.695% 19/12/2020 321 311,110 0.02% Moxie Patriot LLC Advance Construction Term Loan B-2 7.695% 19/12/2020 708 687,125 0.03% 3,711,618 0.18% Total Floating Rate Loans 134,795,017 6.64% Government Obligations - 0.62% (31 January 2019: 1.21%) Non-U.S. Government Obligations Ciudad Autonoma de Buenos Aires/Government Bonds(1) 7.50% 01/06/2027 2,463 2,216,700 0.11% Province of Santa Fe(1) 6.90% 01/11/2027 2,433 1,946,400 0.09% Provincia de Mendoza Argentina(1) 8.375% 19/05/2024 2,648 1,999,266 0.10% Provincia de Neuquen Argentina(1) 7.50% 27/04/2025 2,478 1,982,425 0.10% Republic of Ecuador(1) 10.75% 31/01/2029 2,880 2,618,230 0.13% Ukraine Government International Bond(1) 7.375% 25/09/2032 1,600 1,773,178 0.09% 12,536,199 0.62% Total Government Obligations 12,536,199 0.62% Shares Common Stocks - 0.09% (31 January 2019: 0.21%) Gaming/Leisure Gibson Brands, Inc. 9,657 1,134,698 0.06% Miscellaneous Manufacturer Remington Outdoor Co., Inc.* 8,848 7,742 0.00% Oil & Gas Chaparral Energy, Inc. Class A* 11,840 12,195 0.00% Templar Energy LLC Class A Units 11,888 951 0.00% 13,146 0.00% Retail Claire's Stores, Inc. 1,234 678,700 0.03% Fairway Group Acquisition Co.* 587 6 0.00% 678,706 0.03%
Total Common Stocks 1,834,292 0.09%
Dividend
Rate Preferred Stocks - 0.46% (31 January 2019: 0.57%) Oil & Gas Templar Energy LLC ZCP 12,261 – 0.00%
86

LORD ABBETT PASSPORT PORTFOLIOS PLC HIGH YIELD FUND Schedule of Investments as at 31 January 2020 (Continued)
DividendRate
Maturity Fair
Value % of Net Investments Date Shares USD Assets Preferred Stocks - 0.46% (31 January 2019: 0.57%) (Continued) REITS Crown Castle International Corp. 6.875% 01/08/2020 4,000 5,323,360 0.26% Water Aqua America, Inc. 6.00% 30/04/2022 58,128 3,942,822 0.20% Total Preferred Stocks 9,266,182 0.46%
Exercise
Price Expiration USD DateWarrant - 0.00% (31 January 2019: 0.00%) Miscellaneous Manufacturer Remington Outdoor Co., Inc.* 35.05 15/05/2022 8,922 89 0.00% Total Warrant 89 0.00% Total Investment in Securities (Cost: USD 1,866,939,160) 1,930,019,073 95.08% ,
PIK Payment-in-Kind. TBD To be determined. ZCP Indicates a zero coupon rate. * Non income processing security. (1) Securities exempt from registration under Rule 144A (i) of the US Securities Act of 1933. These securities may be resold in transactions exempt
from registration, normally to qualified institutional buyers. (2) Indicates a variable rate security. The interest rate shown reflects the rate as at 31 January 2020. (3) Variable Rate is Fixed to Float: Rate remains fixed until future date. The interest rate represents the rate as at 31 January 2020. (4) Security is perpetual in nature and has no stated maturity date. (5) Default securities.
Open Forward Foreign Currency Exchange Contracts - 0.05% (31 January 2019: 0.00%) Unrealised Appreciation/ Depreciation % of Net Settlement Date Amount Sold Amount Bought Counterparty USD Assets Forward Foreign Currency Contracts 14/02/2020 3,064,965 USD 2,749,000 EUR Morgan Stanley (16,695) (0.00%) 14/02/2020 781,000 EUR 863,817 USD Morgan Stanley (2,206) (0.00%) 06/02/2020 2,702,309 USD 2,454,870 EUR Morgan Stanley 18,507 0.00% 17/04/2020 1,937,000 CAD 1,483,608 USD Morgan Stanley 19,036 0.00% 09/03/2020 31,460,000 EUR 35,120,028 USD Morgan Stanley 184,696 0.01% 09/03/2020 8,311,000 EUR 9,214,717 USD State Street Bank (14,385) (0.00%) 14/02/2020 14,465,000 EUR 16,026,809 USD State Street Bank (12,924) (0.00%) 05/03/2020 1,260,000 GBP 1,657,845 USD State Street Bank (4,378) (0.00%) 17/04/2020 335,000 CAD 252,959 USD State Street Bank (335) (0.00%) 05/03/2020 1,766,465 USD 1,344,000 GBP State Street Bank 6,573 0.00% 05/03/2020 11,610,000 GBP 15,141,866 USD Toronto-Dominion Bank (174,332) (0.01%) 14/02/2020 3,091,232 USD 2,766,000 EUR Toronto-Dominion Bank (24,111) (0.00%) 14/02/2020 2,062,000 EUR 2,284,968 USD Toronto-Dominion Bank (1,511) (0.00%) (22,065) (0.00%)
87

LORD ABBETT PASSPORT PORTFOLIOS PLC HIGH YIELD FUND Schedule of Investments as at 31 January 2020 (Continued)
Open Forward Foreign Currency Exchange Contracts - 0.05% (31 January 2019: 0.00%) (Continued) Unrealised Appreciation/ Depreciation % of Net Settlement Date Amount Sold Amount Bought USD AssetsShare Class Hedges Class A EUR Accumulating (Hedged) 27/02/2020 1,044,420 USD 945,423 EUR Brown Brothers Harriman 4,719 0.00% Class I CHF Accumulating (Hedged) 27/02/2020 20,374 USD 19,706 CHF Brown Brothers Harriman 89 0.00% Class I CHF Distributing (Hedged) 27/02/2020 20,237 USD 19,573 CHF Brown Brothers Harriman 89 0.00% Class I EUR Accumulating (Hedged) 27/02/2020 47,102,551 USD 42,637,846 EUR Brown Brothers Harriman 212,803 0.01% Class I EUR Distributing (Hedged) 27/02/2020 18,676 USD 16,906 EUR Brown Brothers Harriman 84 0.00% Class I GBP Accumulating (Hedged) 27/02/2020 469,828 USD 359,330 GBP Brown Brothers Harriman 4,121 0.00% Class I GBP Distributing (Hedged) 27/02/2020 20,252 USD 15,489 GBP Brown Brothers Harriman 178 0.00% Class J EUR Distributing (Hedged) 27/02/2020 8,757,431 USD 7,935,946 EUR Brown Brothers Harriman 49,101 0.00% Class J GBP Distributing (Hedged) 27/02/2020 74,050,288 USD 56,668,554 GBP Brown Brothers Harriman 694,247 0.04% Class Z CHF Accumulating (Hedged) 27/02/2020 26,055 USD 25,201 CHF Brown Brothers Harriman 114 0.00% Class Z CHF Distributing (Hedged) 27/02/2020 26,058 USD 25,204 CHF Brown Brothers Harriman 114 0.00% Class Z EUR Accumulating (Hedged) 27/02/2020 157,527 USD 142,595 EUR Brown Brothers Harriman 712 0.00% 966,371 0.05%
Net Unrealised Appreciation on Open Forward Foreign Currency Exchange Contracts 944,306 0.05%
Unrealised Appreciation on Open Forward Foreign Currency Exchange Contracts 1,195,183 0.06%Unrealised Depreciation on Open Forward Foreign Currency Exchange Contracts (250,877) (0.01%)
Open Futures Contracts - 0.02% (31 January 2019: 0.04%) Unrealised Appreciation/ % of No. of Depreciation Net Type Expiration Contracts USD Assets Euro-Bobl Futures 06/03/2020 (5) (3,269) (0.00%) Euro-Bund Futures 06/03/2020 (48) (107,451) (0.01%) U.S. 10 Year Treasury Note 20/03/2020 857 1,324,942 0.07% U.S. 10 Year Ultra Bond 20/03/2020 (256) (841,471) (0.04%) U.S. 2 Year Treasury Note 31/03/2020 326 255,061 0.01% U.S. 5 Year Treasury Note 31/03/2020 (426) (499,219) (0.02%) U.S. Long Treasury Bond 20/03/2020 17 61,094 0.00% U.S. Ultra Treasury Bond 20/03/2020 66 171,554 0.01% Net Unrealised Appreciation on Open Futures Contracts 361,241 0.02% Unrealised Appreciation on Open Futures Contracts 1,812,651 0.09%Unrealised Depreciation on Open Futures Contracts (1,451,410) (0.07%)
88

LORD ABBETT PASSPORT PORTFOLIOS PLC HIGH YIELD FUND Schedule of Investments as at 31 January 2020 (Continued)
Open Swap Contract – (0.00%) (31 January 2019: 0.02%) Open Centrally Cleared Credit Default Index Swap Contract – (0.00%) (31 January 2019: 0.02%)
Reference Index Counterparty
Buy/Sell Protection
Fixed Deal Receive/
(Pay)Rate
ExpirationDate
NotionalUSD
FairValue
USD
% ofNet
AssetsMarkit N.A. HY. 33 5Y Credit Suisse Sell 5.00% 20/12/2024 21,789,900 (6,937) (0.00%) Fair Value on Open Centrally Cleared Credit Default Index Swap Contract (6,937) (0.00%) Financial Liabilities on Open Swap Contract (6,937) 0.00%
Total Financial Assets at Fair Value through Profit and Loss 1,933,026,907 95.23%Total Financial Liabilities at Fair Value through Profit and Loss (1,709,224) (0.08%) Other Net Assets 98,569,296 4.85%
Net Assets 2,029,886,979 100.00%
Analysis of Total Assets
% of Total
Assets Transferable securities admitted to an official stock exchange listing 25.32%Transferable securities traded on a regulated market 59.19%Other transferable securities including those which are unlisted 6.86%Financial derivatives dealt in on a regulated market 0.02%OTC financial derivative instruments 0.04%Centrally Cleared Financial Derivative Instruments (0.00%)
89

LORD ABBETT PASSPORT PORTFOLIOS PLC GLOBAL MULTI-SECTOR BOND FUND Schedule of Investments as at 31 January 2020
Interest Maturity PrincipalFair
Value % of Net Investments Rate Date (000) USD Assets Asset-Backed Securities - 7.53% (31 January 2019: 8.58%) Cayman Islands Other Apex Credit CLO 2017 Ltd. 2017-1A Class B(1) 3.751%(2) 24/04/2029 262 262,147 0.31% Benefit Street Partners CLO XI 2017-11A Class A2A(1) 3.581%(2) 15/04/2029 250 250,119 0.30% Benefit Street Partners CLO XII Ltd. 2017-12A Class C(1) 4.881%(2) 15/10/2030 300 299,629 0.35% BlueMountain CLO 2013-2 Ltd. Class A1R(1) 2.982%(2) 22/10/2030 273 273,460 0.32% CIFC Funding 2017-II Ltd. 2017-2A Class D(1) 5.319%(2) 20/04/2030 250 251,047 0.30% Jamestown CLO X Ltd. 2017-10A Class A2(1) 3.686%(2) 17/07/2029 250 250,239 0.30% JFIN CLO 2014 Ltd. 2014-1A Class B1R(1) 3.269%(2) 21/04/2025 250 250,086 0.30% KKR CLO 17 Ltd. Class A(1) 3.171%(2) 15/04/2029 250 250,266 0.30% Mountain View CLO X Ltd. 2015-10A Class BR(1) 3.198%(2) 13/10/2027 150 149,306 0.18% Palmer Square Loan Funding 2018-1 Ltd. Class B(1) 3.231%(2) 15/04/2026 250 248,653 0.29% Tralee CLO III Ltd. 2014-3A Class AR(1) 2.849%(2) 20/10/2027 316 316,580 0.38% West CLO 2014-2 Ltd. Class A1AR(1) 2.713%(2) 16/01/2027 119 118,552 0.14% 2,920,084 3.47% Total Cayman Islands 2,920,084 3.47% United States Automobile ACC Trust 2018-1 Class B(1) 4.82% 20/05/2021 100 100,398 0.12% California Republic Auto Receivables Trust 2015-4 Class B(1) 3.73% 15/11/2021 16 16,056 0.02% Drive Auto Receivables Trust 2016-C Class D(1) 4.18% 15/03/2024 13 13,609 0.01% Exeter Automobile Receivables Trust 2016-3 Class C(1) 4.22% 15/06/2022 164 165,545 0.20% Foursight Capital Automobile Receivables Trust 2018-1 Class D(1) 4.19% 15/11/2023 665 686,398 0.81% Santander Drive Auto Receivables Trust 2016-1 Class D 4.02% 15/04/2022 14 14,563 0.02% Santander Drive Auto Receivables Trust 2018-1 Class B 2.63% 15/07/2022 66 66,147 0.08% Santander Drive Auto Receivables Trust 2018-2 Class B 3.03% 15/09/2022 49 49,224 0.06% Santander Drive Auto Receivables Trust 2018-4 Class B 3.27% 17/01/2023 27 27,090 0.03% 1,139,030 1.35% Commercial Mortgage-Backed BDS 2018-FL1 Class A(1) 2.519%(2) 15/01/2035 20 19,653 0.02% Citigroup Commercial Mortgage Trust 2014-GC25 Class XB 0.331%(2) 10/10/2047 1,000 9,994 0.01% COMM 2012-CCRE3 Mortgage Trust Class B(1) 3.922% 15/10/2045 100 102,834 0.12% COMM 2014-CCRE19 Mortgage Trust Class XA 1.19%(2) 10/08/2047 31 1,157 0.00% COMM 2014-UBS4 Mortgage Trust Class D(1) 4.863%(2) 10/08/2047 250 235,517 0.28% COMM 2015-PC1 Mortgage Trust Class C 4.582%(2) 10/07/2050 29 30,703 0.04% COMM 2015-PC1 Mortgage Trust Class D 4.582%(2) 10/07/2050 10 9,640 0.01% CSMC 2014-USA OA LLC Class E(1) 4.373% 15/09/2037 100 96,582 0.12% DBWF 2018-AMXP Mortgage Trust Class D(1) 3.917%(2) 05/05/2035 161 164,739 0.20% DBWF 2018-GLKS Mortgage Trust Class D(1) 4.058%(2) 19/11/2035 200 201,137 0.24% GS Mortgage Securities Trust 2015-GC32 Class C 4.557%(2) 10/07/2048 15 16,157 0.02% J.P. Morgan BB Commercial Mortgage Securities Trust 2014-C19 Class XA 0.907%(2) 15/04/2047 499 10,408 0.01%
90

LORD ABBETT PASSPORT PORTFOLIOS PLC GLOBAL MULTI-SECTOR BOND FUND Schedule of Investments as at 31 January 2020 (Continued)
Interest Maturity PrincipalFair
Value % of Net Investments Rate Date (000) USD Assets Asset-Backed Securities - 7.53% (31 January 2019: 8.58%) (Continued) United States (Continued) Commercial Mortgage-Backed (continued) J.P. Morgan BB Commercial Mortgage Securities Trust 2014-C19 Class XB 0.441%(2) 15/04/2047 1,000 13,889 0.02% J.P. Morgan BB Commercial Mortgage Securities Trust 2015-C30 Class C 4.412%(2) 15/07/2048 34 35,861 0.04% J.P. Morgan Chase Commercial Mortgage Securities Trust 2018-LAQ Class B(1) 2.976%(2) 15/06/2032 126 125,839 0.15% Palisades Center Trust 2016-PLSD Class C(1) 3.998% 13/04/2033 110 108,012 0.13% WFRBS Commercial Mortgage Trust 2014-C20 Class XA 1.123%(2) 15/05/2047 76 2,499 0.00% WFRBS Commercial Mortgage Trust 2014-C20 Class XB 0.733%(2) 15/05/2047 100 2,446 0.00% 1,187,067 1.41% Credit Card Synchrony Credit Card Master Note Trust 2017-2 Class B 2.82% 15/10/2025 100 101,937 0.12% World Financial Network Credit Card Master Trust 2017-C Class M 2.66% 15/08/2024 105 105,019 0.13% 206,956 0.25% Other Conn's Receivables Funding 2017-B LLC Class C(1) 5.95% 15/11/2022 90 90,722 0.11% Diamond Resorts Owner Trust 2016-1 Class A(1) 3.08% 20/11/2028 17 17,470 0.02% Hardee's Funding LLC 2018-1A Class A2II(1) 4.959% 20/06/2048 128 134,077 0.16% Hempstead II CLO Ltd. 2017-2A Class A1(1) 3.181%(2) 10/08/2029 250 250,057 0.30% OneMain Financial Issuance Trust 2016-1 Class A(1) 3.66% 20/02/2029 22 21,877 0.02% SCF Equipment Leasing 2017-2 LLC Class A(1) 3.41% 20/12/2023 44 44,439 0.05% Wingstop Funding 2018-1 LLC Class A2(1) 4.97% 05/12/2048 318 328,046 0.39% 886,688 1.05% Total United States 3,419,741 4.06% Total Asset-Backed Securities 6,339,825 7.53% Corporate Bonds - 55.22% (31 January 2019: 60.94%) Argentina Food Arcor SAIC(1) 6.00% 06/07/2023 58 56,970 0.07% Oil & Gas YPF SA(1) 6.95% 21/07/2027 98 83,824 0.10% Total Argentina 140,794 0.17% Australia Banks Macquarie Group Ltd. 1.25%(3) 05/03/2025 EUR 200 229,970 0.27% Suncorp-Metway Ltd. 3.25% 24/08/2026 AUD 200 146,929 0.17% Westpac Banking Corp. 1.375% 17/05/2032 EUR 100 127,027 0.15% 503,926 0.59%
91

LORD ABBETT PASSPORT PORTFOLIOS PLC GLOBAL MULTI-SECTOR BOND FUND Schedule of Investments as at 31 January 2020 (Continued)
Interest Maturity PrincipalFair
Value % of Net Investments Rate Date (000) USD Assets Corporate Bonds - 55.22% (31 January 2019: 60.94%) (Continued) Australia (Continued) Electric Ausgrid Finance Pty Ltd.(1) 4.35% 01/08/2028 149 166,468 0.20% Origin Energy Finance Ltd.(1) 5.45% 14/10/2021 117 123,621 0.15% 290,089 0.35% Total Australia 794,015 0.94% Bahamas Leisure Time Silversea Cruise Finance Ltd.(1) 7.25% 01/02/2025 50 52,906 0.06% Bermuda Beverages Bacardi Ltd. 2.75% 03/07/2023 EUR 100 119,803 0.14% Oil & Gas Nabors Industries Ltd.(1) 7.50% 15/01/2028 43 42,677 0.05% Tengizchevroil Finance Co. International Ltd.(1) 4.00% 15/08/2026 200 211,148 0.25% 253,825 0.30% Total Bermuda 373,628 0.44% Brazil Electric Cemig Geracao e Transmissao SA(1) 9.25% 05/12/2024 200 233,919 0.28% Food BRF SA(1) 4.875% 24/01/2030 200 205,900 0.25% Total Brazil 439,819 0.53% British Virgin Islands Electric State Grid Overseas Investment 2014 Ltd.(1) 4.125% 07/05/2024 200 216,028 0.26% Mining Chinalco Capital Holdings Ltd. 4.00% 25/08/2021 200 202,784 0.24% Total British Virgin Islands 418,812 0.50% Canada Airlines Air Canada 2015-2 Class B Pass Through Trust(1) 5.00% 15/12/2023 59 61,558 0.07% Diversified Financial Services Fairstone Financial, Inc.(1) 7.875% 15/07/2024 160 173,466 0.21% Electric Toronto Hydro Corp. 3.54% 18/11/2021 CAD 253 197,036 0.23%
92

LORD ABBETT PASSPORT PORTFOLIOS PLC GLOBAL MULTI-SECTOR BOND FUND Schedule of Investments as at 31 January 2020 (Continued)
Interest Maturity PrincipalFair
Value % of Net Investments Rate Date (000) USD Assets Corporate Bonds - 55.22% (31 January 2019: 60.94%) (Continued) Canada (Continued) Iron/Steel Baffinland Iron Mines Corp./Baffinland Iron Mines LP(1) 8.75% 15/07/2026 57 59,317 0.07% Mining New Gold, Inc.(1) 6.25% 15/11/2022 129 129,563 0.16% Oil & Gas MEG Energy Corp.(1) 7.00% 31/03/2024 196 197,879 0.24% MEG Energy Corp.(1) 7.125% 01/02/2027 69 68,504 0.08% Seven Generations Energy Ltd.(1) 6.875% 30/06/2023 71 73,480 0.09% 339,863 0.41% Pharmaceuticals Bausch Health Cos, Inc.(1) 5.00% 30/01/2028 40 40,600 0.05% Bausch Health Cos, Inc.(1) 5.25% 30/01/2030 47 47,999 0.06% Bausch Health Cos, Inc. 7.25% 30/05/2029 65 72,961 0.08% 161,560 0.19% Total Canada 1,122,363 1.34% Cayman Islands Aerospace/Defense Embraer Overseas Ltd.(1) 5.696% 16/09/2023 125 138,177 0.16% Diversified Financial Services Global Aircraft Leasing Co. Ltd. PIK(1) 6.50% 15/09/2024 139 142,552 0.17% Electric OmGrid Funding Ltd.(1) 5.196% 16/05/2027 200 207,605 0.25% Internet Alibaba Group Holding Ltd. 3.60% 28/11/2024 200 212,455 0.25% JD.com, Inc. 3.375% 14/01/2030 200 205,077 0.24% Tencent Holdings Ltd.(1) 3.80% 11/02/2025 200 215,490 0.26% 633,022 0.75% Lodging Melco Resorts Finance Ltd.(1) 5.375% 04/12/2029 200 200,538 0.24% Oil & Gas Transocean, Inc.(1) 7.25% 01/11/2025 161 152,143 0.18% Real Estate Country Garden Holdings Co. Ltd. 4.75% 17/01/2023 400 404,339 0.48% Kaisa Group Holdings Ltd. 9.375% 30/06/2024 200 188,668 0.22%
93

LORD ABBETT PASSPORT PORTFOLIOS PLC GLOBAL MULTI-SECTOR BOND FUND Schedule of Investments as at 31 January 2020 (Continued)
Interest Maturity PrincipalFair
Value % of Net Investments Rate Date (000) USD Assets Corporate Bonds - 55.22% (31 January 2019: 60.94%) (Continued) Cayman Islands (Continued) Real Estate (continued) Shimao Property Holdings Ltd. 6.375% 15/10/2021 200 209,253 0.25% 802,260 0.95% Total Cayman Islands 2,276,297 2.70% Chile Banks Banco del Estado de Chile(1) 2.704% 09/01/2025 200 201,800 0.24% Chemicals Sociedad Quimica y Minera de Chile SA(1) 4.25% 22/01/2050 200 200,510 0.24% Total Chile 402,310 0.48% Colombia Banks Bancolombia SA 3.00% 29/01/2025 200 201,452 0.24% Oil & Gas Ecopetrol SA 7.375% 18/09/2043 118 163,540 0.19% Utility Empresas Public Medellin(1) 8.375% 07/11/2027 COP 395,000 123,194 0.15% Total Colombia 488,186 0.58% Denmark Telecommunications DKT Finance ApS(1) 9.375% 17/06/2023 200 214,090 0.25% France Banks BNP Paribas SA 2.375% 17/02/2025 EUR 100 120,910 0.14% Electric Electricite de France SA 4.00%(3) -(4) EUR 100 121,518 0.14% Environmental Control Paprec Holding SA 4.00% 31/03/2025 EUR 100 101,954 0.12% Insurance AXA SA 3.375%(3) 06/07/2047 EUR 100 128,371 0.15% Software Ubisoft Entertainment SA 1.289% 30/01/2023 EUR 100 113,505 0.14% Telecommunications Altice France SA/France 5.875% 01/02/2027 EUR 100 122,859 0.15%
94

LORD ABBETT PASSPORT PORTFOLIOS PLC GLOBAL MULTI-SECTOR BOND FUND Schedule of Investments as at 31 January 2020 (Continued)
Interest Maturity PrincipalFair
Value % of Net Investments Rate Date (000) USD Assets Corporate Bonds - 55.22% (31 January 2019: 60.94%) (Continued) France (Continued) Transportation CMA CGM SA 7.75% 15/01/2021 EUR 100 105,739 0.13% Total France 814,856 0.97% Germany Auto Manufacturers Volkswagen Bank GmbH 1.25% 10/06/2024 EUR 100 114,925 0.14% Auto Parts & Equipment IHO Verwaltungs GmbH PIK 3.875% 15/05/2027 EUR 100 114,961 0.14% Banks Kreditanstalt fuer Wiederaufbau 1.625% 05/06/2020 GBP 125 165,273 0.20% Commercial Services Techem Verwaltungsgesellschaft 674 mbH 6.00% 30/07/2026 EUR 200 239,384 0.29% Total Germany 634,543 0.77% Hong Kong Chemicals CNAC HK Finbridge Co. Ltd. 4.125% 19/07/2027 250 269,586 0.32% Indonesia Oil & Gas Pertamina Persero PT(1) 4.70% 30/07/2049 200 214,706 0.26% Ireland Banks AIB Group PLC 1.50% 29/03/2023 EUR 100 115,172 0.14% Bank of Ireland Group PLC 4.125%(3) 19/09/2027 206 210,720 0.25% 325,892 0.39% Chemicals Phosagro OAO Via Phosagro Bond Funding DAC(1) 3.949% 24/04/2023 200 207,255 0.25% Electric ESB Finance DAC 6.50% 05/03/2020 GBP 200 264,783 0.31% Entertainment Motion Bondco DAC 4.50% 15/11/2027 EUR 100 116,785 0.14% Food Kerry Group Financial Services Unltd Co. 2.375% 10/09/2025 EUR 200 249,363 0.30% Telecommunications eircom Finance DAC 3.50% 15/05/2026 EUR 200 230,367 0.27% Total Ireland 1,394,445 1.66%
95

LORD ABBETT PASSPORT PORTFOLIOS PLC GLOBAL MULTI-SECTOR BOND FUND Schedule of Investments as at 31 January 2020 (Continued)
Interest Maturity PrincipalFair
Value % of Net Investments Rate Date (000) USD Assets Corporate Bonds - 55.22% (31 January 2019: 60.94%) (Continued) Israel Banks Bank Leumi Le-Israel BM(1) 3.275%(3) 29/01/2031 200 200,325 0.24% Italy Banks UniCredit SpA 5.375%(3) -(4) EUR 200 231,206 0.27% Building Materials Buzzi Unicem SpA 2.125% 28/04/2023 EUR 100 117,478 0.14% Entertainment Inter Media & Communication SpA 4.875% 31/12/2022 EUR 194 221,051 0.26% Juventus Football Club SpA 3.375% 19/02/2024 EUR 100 114,603 0.14% 335,654 0.40% Leisure Time Piaggio & C SpA 3.625% 30/04/2025 EUR 300 348,667 0.41% Oil & Gas ENI SpA(1) 5.70% 01/10/2040 325 413,349 0.49% Telecommunications Telecom Italia SpA/Milano 2.375% 12/10/2027 EUR 200 228,609 0.27% Total Italy 1,674,963 1.98% Jersey, Channel Islands Commercial Services AA Bond Co. Ltd. 2.75% 31/07/2023 GBP 100 128,962 0.15% Diversified Financial Services LHC3 PLC PIK 4.125% 15/08/2024 EUR 100 114,267 0.14% Engineering & Construction Heathrow Funding Ltd. 6.75% 03/12/2026 GBP 200 354,077 0.42% Entertainment CPUK Finance Ltd. 3.588% 28/08/2025 GBP 100 143,207 0.17% Total Jersey, Channel Islands 740,513 0.88% Kazakhstan Pipelines KazTransGas JSC(1) 4.375% 26/09/2027 200 214,262 0.25% Liberia Leisure Time Royal Caribbean Cruises Ltd. 3.70% 15/03/2028 200 210,336 0.25% Luxembourg Advertising Summer BC Holdco A S.A.R.L. 9.25% 31/10/2027 EUR 100 115,010 0.14%
96

LORD ABBETT PASSPORT PORTFOLIOS PLC GLOBAL MULTI-SECTOR BOND FUND Schedule of Investments as at 31 January 2020 (Continued)
Interest Maturity PrincipalFair
Value % of Net Investments Rate Date (000) USD Assets Corporate Bonds - 55.22% (31 January 2019: 60.94%) (Continued) Luxembourg (Continued) Agriculture Kernel Holding SA(1) 8.75% 31/01/2022 200 217,119 0.26% MHP Lux SA(1) 6.25% 19/09/2029 200 196,253 0.23% 413,372 0.49% Diversified Financial Services Lincoln Financing S.A.R.L. 3.625% 01/04/2024 EUR 200 226,767 0.27% Healthcare-Products DH Europe Finance II S.A.R.L. 0.45% 18/03/2028 EUR 100 111,213 0.13% Machinery-Diversified John Deere Cash Management SA 1.65% 13/06/2039 EUR 100 125,004 0.15% Media Altice Finco SA 4.75% 15/01/2028 EUR 100 112,175 0.13% Altice Luxembourg SA(1) 10.50% 15/05/2027 200 231,630 0.27% 343,805 0.40% Oil & Gas Gazprom PJSC Via Gaz Capital SA(1) 4.95% 06/02/2028 200 225,766 0.27% Real Estate Aroundtown SA 1.45% 09/07/2028 EUR 100 115,844 0.14% Aroundtown SA 1.875% 19/01/2026 EUR 100 119,981 0.14% 235,825 0.28% Telecommunications Crystal Almond S.A.R.L.(1) 4.25% 15/10/2024 EUR 100 114,546 0.14% Intelsat Jackson Holdings SA 5.50% 01/08/2023 140 114,742 0.14% Matterhorn Telecom SA 4.00% 15/11/2027 EUR 100 117,168 0.14% 346,456 0.42% Total Luxembourg 2,143,218 2.55% Marshall Island Transportation Navios South American Logistics, Inc./Navios Logistics Finance US, Inc.(1) 7.25% 01/05/2022 27 26,536 0.03% Mauritius Energy-Alternate Sources Greenko Solar Mauritius Ltd.(1) 5.95% 29/07/2026 200 205,153 0.24% Mexico Banks Banco Mercantil del Norte SA/Grand Cayman(1) 7.625%(3) -(4) 200 224,555 0.27% BBVA Bancomer SA/Texas(1) 5.125%(3) 18/01/2033 200 213,257 0.25% 437,812 0.52% Building Materials Cemex SAB de CV(1) 5.45% 19/11/2029 200 213,500 0.25%
97

LORD ABBETT PASSPORT PORTFOLIOS PLC GLOBAL MULTI-SECTOR BOND FUND Schedule of Investments as at 31 January 2020 (Continued)
Interest Maturity PrincipalFair
Value % of Net Investments Rate Date (000) USD Assets Corporate Bonds - 55.22% (31 January 2019: 60.94%) (Continued) Mexico (Continued) Oil & Gas Petroleos Mexicanos 5.35% 12/02/2028 240 244,139 0.29% Petroleos Mexicanos 6.75% 21/09/2047 120 121,840 0.14% 365,979 0.43% Total Mexico 1,017,291 1.20% Multinational Auto Parts & Equipment Panther BF Aggregator 2 LP/Panther Finance Co., Inc. 4.375% 15/05/2026 EUR 100 114,560 0.14% Panther BF Aggregator 2 LP/Panther Finance Co., Inc.(1) 8.50% 15/05/2027 114 122,761 0.14% 237,321 0.28% Total Multinational 237,321 0.28% Netherlands Chemicals LYB International Finance II BV 0.875% 17/09/2026 EUR 100 113,353 0.13% Electric Listrindo Capital BV(1) 4.95% 14/09/2026 200 206,483 0.24% Engineering & Construction Promontoria Holding 264 BV 6.75% 15/08/2023 EUR 100 101,749 0.12% Entertainment Stars Group Holdings BV/Stars Group US Co.-Borrower LLC(1) 7.00% 15/07/2026 126 137,101 0.16% Food Sigma Holdco BV 5.75% 15/05/2026 EUR 100 112,402 0.13% Internet Prosus NV(1) 3.68% 21/01/2030 200 205,990 0.24% Prosus NV(1) 6.00% 18/07/2020 200 203,131 0.24% United Group BV 4.875% 01/07/2024 EUR 100 115,017 0.14% 524,138 0.62% Investment Companies JAB Holdings BV 1.75% 25/06/2026 EUR 100 119,768 0.14% MDGH - GMTN BV(1) 3.70% 07/11/2049 200 209,377 0.25% 329,145 0.39% Oil & Gas Petrobras Global Finance BV(1) 5.093% 15/01/2030 200 219,720 0.26% Packaging & Containers Schoeller Packaging BV 6.375% 01/11/2024 EUR 100 117,259 0.14% Trivium Packaging Finance BV 3.75% 15/08/2026 EUR 100 116,316 0.14% 233,575 0.28%
98

LORD ABBETT PASSPORT PORTFOLIOS PLC GLOBAL MULTI-SECTOR BOND FUND Schedule of Investments as at 31 January 2020 (Continued)
Interest Maturity PrincipalFair
Value % of Net Investments Rate Date (000) USD Assets Corporate Bonds - 55.22% (31 January 2019: 60.94%) (Continued) Netherlands (Continued) Telecommunications Telefonica Europe BV 3.00%(3) -(4) EUR 100 115,398 0.14% Total Netherlands 2,093,064 2.47% Norway Leisure Time Explorer II AS 3.375% 24/02/2025 EUR 100 110,820 0.13% Pakistan Sovereign Third Pakistan International Sukuk Co. Ltd.(1) 5.625% 05/12/2022 200 207,075 0.25% Panama Media Cable Onda SA(1) 4.50% 30/01/2030 200 207,128 0.25% Portugal Airlines Transportes Aereos Portugueses SA 5.625% 02/12/2024 EUR 100 109,988 0.13% Banks Caixa Geral de Depositos SA 5.75%(3) 28/06/2028 EUR 100 127,336 0.15% Total Portugal 237,324 0.28% Puerto Rico Banks Popular, Inc. 6.125% 14/09/2023 50 53,833 0.06% Romania Telecommunications RCS & RDS SA 3.25% 05/02/2028 EUR 100 111,903 0.13% Saudi Arabia Oil & Gas Saudi Arabian Oil Co.(1) 4.375% 16/04/2049 200 226,176 0.27% Singapore Oil & Gas Medco Bell Pte Ltd.(1) 6.375% 30/01/2027 200 193,624 0.23% Spain Banks CaixaBank SA 3.50%(3) 15/02/2027 EUR 100 117,133 0.14% REITS Merlin Properties Socimi SA 2.375% 18/09/2029 EUR 100 123,771 0.15%
99

LORD ABBETT PASSPORT PORTFOLIOS PLC GLOBAL MULTI-SECTOR BOND FUND Schedule of Investments as at 31 January 2020 (Continued)
Interest Maturity PrincipalFair
Value % of Net Investments Rate Date (000) USD Assets Corporate Bonds - 55.22% (31 January 2019: 60.94%) (Continued) Spain (Continued) Water Canal de Isabel II Gestion SA 1.68% 26/02/2025 EUR 100 118,348 0.14% Total Spain 359,252 0.43% Supranational Multi-National African Development Bank 3.35% 08/08/2028 AUD 916 700,177 0.83% EUROFIMA 3.90% 19/12/2025 AUD 450 344,575 0.41% International Bank for Reconstruction & Development 2.20% 27/02/2024 AUD 370 259,320 0.31% 1,304,072 1.55% Total Supranational 1,304,072 1.55% Sweden Banks Swedbank Hypotek AB 1.00% 18/09/2024 SEK 3,400 363,168 0.43% Commercial Services Securitas AB 1.125% 20/02/2024 EUR 100 115,018 0.14% Diversified Financial Services Intrum AB 3.50% 15/07/2026 EUR 200 226,212 0.27% Leisure Time Dometic Group AB 3.00% 08/05/2026 EUR 100 113,410 0.14% Total Sweden 817,808 0.98% Switzerland Banks Credit Suisse Group AG 1.25%(3) 17/07/2025 EUR 100 115,567 0.14% UBS AG 5.125% 15/05/2024 200 216,328 0.26% UBS AG/Stamford CT 7.625% 17/08/2022 250 282,378 0.34% 614,273 0.74% Total Switzerland 614,273 0.74% Turkey Banks Turkiye Garanti Bankasi AS(1) 5.875% 16/03/2023 200 210,880 0.25% Turkiye Vakiflar Bankasi TAO(1) 5.25% 05/02/2025 200 199,300 0.24% Turkiye Vakiflar Bankasi TAO(1) 5.625% 30/05/2022 200 206,302 0.24% 616,482 0.73% Total Turkey 616,482 0.73% United Arab Emirates Banks NBK Tier 1 Financing 2 Ltd.(1) 4.50%(3) -(4) 200 200,558 0.24%
100

LORD ABBETT PASSPORT PORTFOLIOS PLC GLOBAL MULTI-SECTOR BOND FUND Schedule of Investments as at 31 January 2020 (Continued)
Interest Maturity PrincipalFair
Value % of Net Investments Rate Date (000) USD Assets Corporate Bonds - 55.22% (31 January 2019: 60.94%) (Continued) United Kingdom Auto Manufacturers Jaguar Land Rover Automotive PLC 6.875% 15/11/2026 EUR 100 118,243 0.14% Mclaren Finance PLC 5.00% 01/08/2022 GBP 200 256,494 0.30% 374,737 0.44% Banks Barclays PLC 2.00%(3) 07/02/2028 EUR 100 113,998 0.13% Lloyds Banking Group PLC 4.50% 04/11/2024 200 217,597 0.26% Santander UK PLC 5.125% 14/04/2021 GBP 150 207,461 0.25% Santander UK PLC 7.95% 26/10/2029 185 247,320 0.29% 786,376 0.93% Entertainment Pinewood Finance Co. Ltd. 3.25% 30/09/2025 GBP 100 134,735 0.16% William Hill PLC 4.75% 01/05/2026 GBP 200 275,840 0.33% 410,575 0.49% Food Tesco Corporate Treasury Services PLC 2.50% 02/05/2025 GBP 100 138,053 0.16% Leisure Time Carnival PLC 1.00% 28/10/2029 EUR 100 111,905 0.13% Pinnacle Bidco PLC 6.375% 15/02/2025 GBP 100 138,775 0.17% 250,680 0.30% Municipal Transport for London 2.125% 24/04/2025 GBP 100 139,818 0.17% Oil & Gas Valaris PLC 4.50% 01/10/2024 60 32,550 0.04% Retail Next Group PLC 3.625% 18/05/2028 GBP 100 145,777 0.17% Telecommunications Arqiva Financing PLC 5.34% 30/06/2030 GBP 100 163,871 0.20% British Telecommunications PLC 3.625% 21/11/2047 GBP 100 154,365 0.18% 318,236 0.38% Total United Kingdom 2,596,802 3.08% United States Aerospace/Defense Arconic, Inc. 6.75% 15/01/2028 65 76,037 0.09% Signature Aviation US Holdings, Inc.(1) 4.00% 01/03/2028 87 86,210 0.10% TransDigm, Inc.(1) 6.25% 15/03/2026 146 157,735 0.19% 319,982 0.38% Apparel Levi Strauss & Co. 3.375% 15/03/2027 EUR 100 117,677 0.14% PVH Corp. 3.125% 15/12/2027 EUR 100 124,436 0.15% PVH Corp. 7.75% 15/11/2023 93 108,410 0.13%
101

LORD ABBETT PASSPORT PORTFOLIOS PLC GLOBAL MULTI-SECTOR BOND FUND Schedule of Investments as at 31 January 2020 (Continued)
Interest Maturity PrincipalFair
Value % of Net Investments Rate Date (000) USD Assets Corporate Bonds - 55.22% (31 January 2019: 60.94%) (Continued) United States (Continued) Apparel (continued) William Carter Co.(1) 5.625% 15/03/2027 94 100,315 0.12% 450,838 0.54% Auto Manufacturers BCD Acquisition, Inc.(1) 9.625% 15/09/2023 75 78,093 0.09% General Motors Co. 6.75% 01/04/2046 159 195,044 0.23% JB Poindexter & Co., Inc.(1) 7.125% 15/04/2026 60 64,671 0.08% Tesla, Inc.(1) 5.30% 15/08/2025 80 81,001 0.10% 418,809 0.50% Auto Parts & Equipment Adient US LLC(1) 7.00% 15/05/2026 110 120,381 0.14% Banks Bank of America Corp. 2.369%(3) 21/07/2021 350 350,983 0.42% CIT Group, Inc. 5.80%(3) -(4) 16 16,405 0.02% Citigroup, Inc. 3.34%(2) 30/03/2021 350 355,237 0.42% Goldman Sachs Group, Inc. 2.557%(2) 31/10/2022 250 252,206 0.30% Goldman Sachs Group, Inc. 5.25% 27/07/2021 325 341,575 0.41% JPMorgan Chase & Co. 2.435%(2) 09/03/2021 350 350,183 0.42% Morgan Stanley 2.732%(2) 22/07/2022 250 252,641 0.30% Morgan Stanley 2.999%(2) 20/01/2022 350 353,503 0.42% Provident Funding Associates LP/PFG Finance Corp.(1) 6.375% 15/06/2025 35 34,752 0.04% Wells Fargo Bank N.A. 2.306%(2) 23/07/2021 350 350,683 0.42% 2,658,168 3.17% Building Materials CPG Merger Sub LLC(1) 8.00% 01/10/2021 47 47,254 0.06% Patrick Industries, Inc.(1) 7.50% 15/10/2027 175 191,248 0.23% Summit Materials LLC/Summit Materials Finance Corp.(1) 5.125% 01/06/2025 60 61,525 0.07% 300,027 0.36% Chemicals CF Industries, Inc. 5.15% 15/03/2034 94 108,744 0.13% Ingevity Corp.(1) 4.50% 01/02/2026 99 100,272 0.12% Tronox, Inc.(1) 6.50% 15/04/2026 72 71,822 0.08% 280,838 0.33% Coal Warrior Met Coal, Inc.(1) 8.00% 01/11/2024 94 97,584 0.12% Commercial Services Ahern Rentals, Inc.(1) 7.375% 15/05/2023 76 60,452 0.07% Ashtead Capital, Inc.(1) 4.25% 01/11/2029 51 52,976 0.06% Capitol Investment Merger Sub 2 LLC(1) 10.00% 01/08/2024 75 78,125 0.09% Cardtronics, Inc./Cardtronics USA, Inc.(1) 5.50% 01/05/2025 60 62,275 0.08% MPH Acquisition Holdings LLC(1) 7.125% 01/06/2024 84 81,573 0.10% Verscend Escrow Corp.(1) 9.75% 15/08/2026 80 87,202 0.10%
102
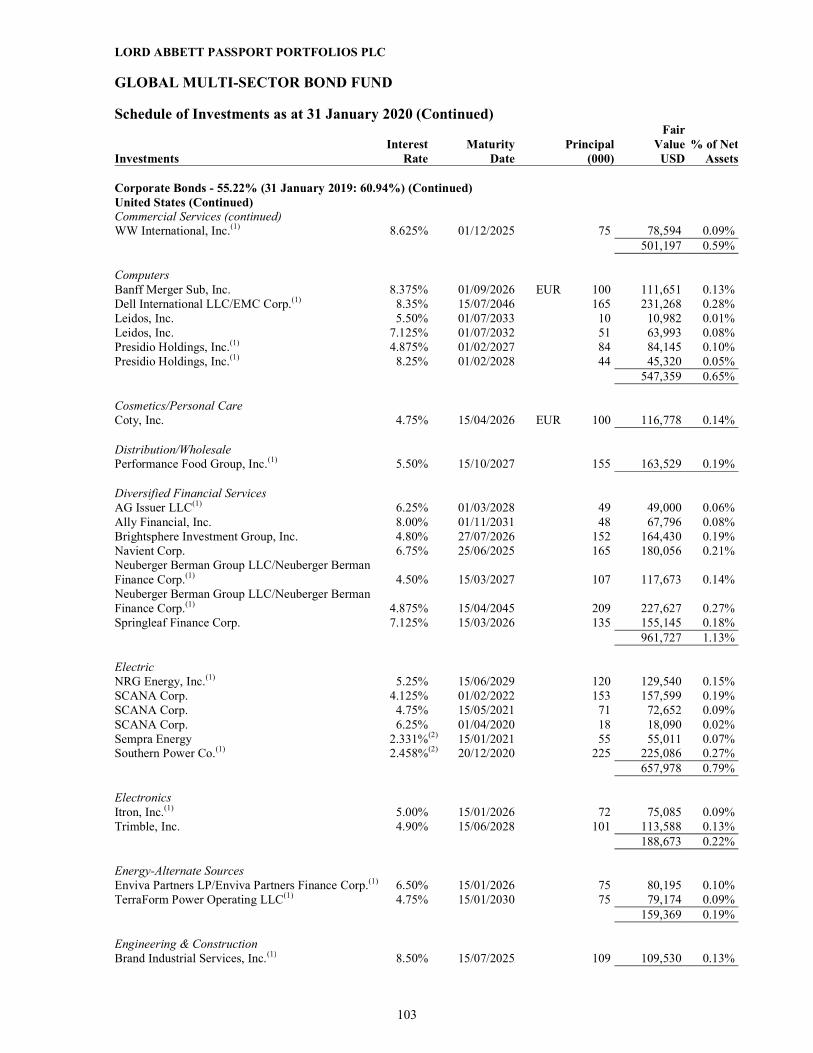
LORD ABBETT PASSPORT PORTFOLIOS PLC GLOBAL MULTI-SECTOR BOND FUND Schedule of Investments as at 31 January 2020 (Continued)
Interest Maturity PrincipalFair
Value % of Net Investments Rate Date (000) USD Assets Corporate Bonds - 55.22% (31 January 2019: 60.94%) (Continued) United States (Continued) Commercial Services (continued) WW International, Inc.(1) 8.625% 01/12/2025 75 78,594 0.09% 501,197 0.59% Computers Banff Merger Sub, Inc. 8.375% 01/09/2026 EUR 100 111,651 0.13% Dell International LLC/EMC Corp.(1) 8.35% 15/07/2046 165 231,268 0.28% Leidos, Inc. 5.50% 01/07/2033 10 10,982 0.01% Leidos, Inc. 7.125% 01/07/2032 51 63,993 0.08% Presidio Holdings, Inc.(1) 4.875% 01/02/2027 84 84,145 0.10% Presidio Holdings, Inc.(1) 8.25% 01/02/2028 44 45,320 0.05% 547,359 0.65% Cosmetics/Personal Care Coty, Inc. 4.75% 15/04/2026 EUR 100 116,778 0.14% Distribution/Wholesale Performance Food Group, Inc.(1) 5.50% 15/10/2027 155 163,529 0.19% Diversified Financial Services AG Issuer LLC(1) 6.25% 01/03/2028 49 49,000 0.06% Ally Financial, Inc. 8.00% 01/11/2031 48 67,796 0.08% Brightsphere Investment Group, Inc. 4.80% 27/07/2026 152 164,430 0.19% Navient Corp. 6.75% 25/06/2025 165 180,056 0.21% Neuberger Berman Group LLC/Neuberger Berman Finance Corp.(1) 4.50% 15/03/2027 107 117,673 0.14% Neuberger Berman Group LLC/Neuberger Berman Finance Corp.(1) 4.875% 15/04/2045 209 227,627 0.27% Springleaf Finance Corp. 7.125% 15/03/2026 135 155,145 0.18% 961,727 1.13% Electric NRG Energy, Inc.(1) 5.25% 15/06/2029 120 129,540 0.15% SCANA Corp. 4.125% 01/02/2022 153 157,599 0.19% SCANA Corp. 4.75% 15/05/2021 71 72,652 0.09% SCANA Corp. 6.25% 01/04/2020 18 18,090 0.02% Sempra Energy 2.331%(2) 15/01/2021 55 55,011 0.07% Southern Power Co.(1) 2.458%(2) 20/12/2020 225 225,086 0.27% 657,978 0.79% Electronics Itron, Inc.(1) 5.00% 15/01/2026 72 75,085 0.09% Trimble, Inc. 4.90% 15/06/2028 101 113,588 0.13% 188,673 0.22% Energy-Alternate Sources Enviva Partners LP/Enviva Partners Finance Corp.(1) 6.50% 15/01/2026 75 80,195 0.10% TerraForm Power Operating LLC(1) 4.75% 15/01/2030 75 79,174 0.09% 159,369 0.19% Engineering & Construction Brand Industrial Services, Inc.(1) 8.50% 15/07/2025 109 109,530 0.13%
103

LORD ABBETT PASSPORT PORTFOLIOS PLC GLOBAL MULTI-SECTOR BOND FUND Schedule of Investments as at 31 January 2020 (Continued)
Interest Maturity PrincipalFair
Value % of Net Investments Rate Date (000) USD Assets Corporate Bonds - 55.22% (31 January 2019: 60.94%) (Continued) United States (Continued) Entertainment Buena Vista Gaming Authority(1) 13.00% 01/04/2023 49 49,143 0.06% Enterprise Development Authority(1) 12.00% 15/07/2024 54 62,078 0.07% Penn National Gaming, Inc.(1) 5.625% 15/01/2027 95 99,983 0.12% Scientific Games International, Inc.(1) 7.25% 15/11/2029 110 118,178 0.14% Twin River Worldwide Holdings, Inc.(1) 6.75% 01/06/2027 75 79,339 0.09% 408,721 0.48% Food Chobani LLC/Chobani Finance Corp., Inc.(1) 7.50% 15/04/2025 136 135,607 0.16% Fresh Market, Inc.(1) 9.75% 01/05/2023 75 37,125 0.04% 172,732 0.20% Healthcare-Services Centene Corp.(1) 5.375% 01/06/2026 93 99,101 0.12% Fresenius Medical Care US Finance II, Inc.(1) 4.75% 15/10/2024 121 133,591 0.16% Fresenius Medical Care US Finance II, Inc.(1) 5.875% 31/01/2022 173 185,317 0.22% Hadrian Merger Sub, Inc.(1) 8.50% 01/05/2026 120 123,642 0.15% HCA, Inc. 5.25% 15/06/2026 180 206,004 0.24% MEDNAX, Inc.(1) 6.25% 15/01/2027 81 82,723 0.10% RegionalCare Hospital Partners Holdings, Inc./LifePoint Health, Inc.(1) 9.75% 01/12/2026 80 89,502 0.10% Surgery Center Holdings, Inc.(1) 10.00% 15/04/2027 65 72,764 0.09% Tenet Healthcare Corp.(1) 6.25% 01/02/2027 62 65,649 0.08% 1,058,293 1.26% Home Builders Century Communities, Inc. 5.875% 15/07/2025 60 63,175 0.07% Century Communities, Inc.(1) 6.75% 01/06/2027 90 97,859 0.12% PulteGroup, Inc. 5.00% 15/01/2027 85 94,122 0.11% Toll Brothers Finance Corp. 4.35% 15/02/2028 100 105,535 0.13% TRI Pointe Group, Inc. 5.25% 01/06/2027 70 74,574 0.09% William Lyon Homes, Inc.(1) 6.625% 15/07/2027 65 70,385 0.08% 505,650 0.60% Housewares Newell Brands, Inc. 3.75% 01/10/2021 EUR 200 232,664 0.27% Newell Brands, Inc. 5.375% 01/04/2036 75 82,606 0.10% 315,270 0.37% Insurance Assurant, Inc. 3.70% 22/02/2030 130 137,235 0.16% Chubb INA Holdings, Inc. 2.50% 15/03/2038 EUR 200 270,400 0.32% CNO Financial Group, Inc. 5.25% 30/05/2025 123 138,272 0.17% HUB International Ltd.(1) 7.00% 01/05/2026 64 66,079 0.08% Marsh & McLennan Cos, Inc. 1.349% 21/09/2026 EUR 100 118,126 0.14% Radian Group, Inc. 4.875% 15/03/2027 70 74,224 0.09% 804,336 0.96% Internet Cogent Communications Group, Inc. 4.375% 30/06/2024 EUR 100 114,469 0.13% Match Group, Inc.(1) 5.00% 15/12/2027 61 64,224 0.08% Netflix, Inc. 3.625% 15/05/2027 EUR 100 118,428 0.14% Netflix, Inc. 3.875% 15/11/2029 EUR 200 234,333 0.28%
104

LORD ABBETT PASSPORT PORTFOLIOS PLC GLOBAL MULTI-SECTOR BOND FUND Schedule of Investments as at 31 January 2020 (Continued)
Interest Maturity PrincipalFair
Value % of Net Investments Rate Date (000) USD Assets Corporate Bonds - 55.22% (31 January 2019: 60.94%) (Continued) United States (Continued) Internet (continued) Netflix, Inc.(1) 5.375% 15/11/2029 175 190,801 0.23% Uber Technologies, Inc.(1) 8.00% 01/11/2026 77 82,018 0.10% 804,273 0.96% Lodging Wyndham Destinations, Inc. 5.75% 01/04/2027 65 71,117 0.08% Machinery-Diversified RBS Global, Inc./Rexnord LLC(1) 4.875% 15/12/2025 85 87,111 0.10% Media AMC Networks, Inc. 4.75% 01/08/2025 85 85,992 0.10% CCO Holdings LLC/CCO Holdings Capital Corp.(1) 4.75% 01/03/2030 35 36,049 0.04% CCO Holdings LLC/CCO Holdings Capital Corp.(1) 5.75% 15/02/2026 65 68,327 0.08% Cox Communications, Inc.(1) 8.375% 01/03/2039 101 160,208 0.19% Diamond Sports Group LLC/Diamond Sports Finance Co.(1) 6.625% 15/08/2027 105 98,369 0.12% DISH DBS Corp. 7.75% 01/07/2026 134 140,948 0.17% EW Scripps Co.(1) 5.125% 15/05/2025 130 133,629 0.16% GCI LLC 6.875% 15/04/2025 100 104,666 0.12% Gray Television, Inc.(1) 7.00% 15/05/2027 155 169,051 0.20% NBCUniversal Enterprise, Inc.(1) 5.25% -(4) 200 206,455 0.25% Nexstar Broadcasting, Inc.(1) 5.625% 15/07/2027 60 63,339 0.08% 1,267,033 1.51% Mining Freeport-McMoRan, Inc. 3.875% 15/03/2023 140 143,092 0.17% Joseph T Ryerson & Son, Inc.(1) 11.00% 15/05/2022 24 25,260 0.03% 168,352 0.20% Miscellaneous Manufacturer General Electric Co. 6.15% 07/08/2037 100 131,982 0.16% Oil & Gas Berry Petroleum Co. LLC(1) 7.00% 15/02/2026 184 171,184 0.20% Centennial Resource Production LLC(1) 6.875% 01/04/2027 140 138,838 0.16% Continental Resources, Inc. 5.00% 15/09/2022 181 182,061 0.22% EQT Corp. 2.679%(2) 01/10/2020 200 200,023 0.24% HighPoint Operating Corp. 7.00% 15/10/2022 35 33,327 0.04% Hilcorp Energy I LP/Hilcorp Finance Co.(1) 6.25% 01/11/2028 103 91,963 0.11% Laredo Petroleum, Inc. 9.50% 15/01/2025 143 130,309 0.15% Oasis Petroleum, Inc. 6.875% 15/03/2022 168 161,700 0.19% Occidental Petroleum Corp 3.155%(2) 13/08/2021 400 402,225 0.48% Phillips 66 2.517%(2) 26/02/2021 250 250,035 0.30% Range Resources Corp. 5.00% 15/08/2022 60 56,862 0.07% Range Resources Corp. 5.875% 01/07/2022 5 4,764 0.01% SM Energy Co. 6.75% 15/09/2026 115 104,754 0.12% Tapstone Energy LLC/Tapstone Energy Finance Corp.(1) (5) 9.75% 01/06/2022 63 535 0.00% Valero Energy Corp. 10.50% 15/03/2039 79 135,548 0.16% 2,064,128 2.45%
105

LORD ABBETT PASSPORT PORTFOLIOS PLC GLOBAL MULTI-SECTOR BOND FUND Schedule of Investments as at 31 January 2020 (Continued)
Interest Maturity PrincipalFair
Value % of Net Investments Rate Date (000) USD Assets Corporate Bonds - 55.22% (31 January 2019: 60.94%) (Continued) United States (Continued) Packaging & Containers Berry Global, Inc. 1.50% 15/01/2027 EUR 100 110,586 0.13% Mauser Packaging Solutions Holding Co. 4.75% 15/04/2024 EUR 100 113,587 0.13% 224,173 0.26% Pharmaceuticals AbbVie, Inc.(1) 2.355%(2) 19/11/2021 200 200,712 0.24% Bayer Corp.(1) 6.65% 15/02/2028 75 93,073 0.11% Cardinal Health, Inc. 2.664%(2) 15/06/2022 250 251,318 0.30% Cigna Corp.(1) 6.125% 15/11/2041 26 34,660 0.04% 579,763 0.69% Pipelines Buckeye Partners LP 6.375%(3) 22/01/2078 194 160,354 0.19% Cheniere Corpus Christi Holdings LLC 5.125% 30/06/2027 100 111,609 0.13% MPLX LP 2.785%(2) 09/09/2021 400 401,514 0.48% MPLX LP 2.985%(2) 09/09/2022 308 309,438 0.37% Sabine Pass Liquefaction LLC 5.875% 30/06/2026 153 177,803 0.21% Spectra Energy Partners LP 2.592%(2) 05/06/2020 100 100,208 0.12% Texas Eastern Transmission LP(1) 4.125% 01/12/2020 50 50,581 0.06% 1,311,507 1.56% Real Estate WeWork Cos, Inc.(1) 7.875% 01/05/2025 135 104,961 0.13% REITS EPR Properties 4.95% 15/04/2028 250 280,114 0.33% GEO Group, Inc. 6.00% 15/04/2026 153 136,556 0.16% Ladder Capital Finance Holdings LLLP/Ladder Capital Finance Corp.(1) 5.25% 01/10/2025 125 128,802 0.15% VEREIT Operating Partnership LP 4.875% 01/06/2026 166 187,746 0.23% 733,218 0.87% Retail Dollar Tree, Inc. 2.536%(2) 17/04/2020 100 100,012 0.12% KFC Holding Co./Pizza Hut Holdings LLC/Taco Bell of America LLC(1) 4.75% 01/06/2027 79 83,407 0.10% Lithia Motors, Inc.(1) 4.625% 15/12/2027 35 35,875 0.04% Murphy Oil USA, Inc. 4.75% 15/09/2029 105 109,919 0.13% Sally Holdings LLC/Sally Capital, Inc. 5.625% 01/12/2025 70 72,596 0.09% Yum! Brands, Inc. 6.875% 15/11/2037 51 60,355 0.07% 462,164 0.55% Software Fidelity National Information Services, Inc. 1.50% 21/05/2027 EUR 100 118,559 0.14% Fiserv, Inc. 1.125% 01/07/2027 EUR 100 115,998 0.14% TIBCO Software, Inc.(1) 11.375% 01/12/2021 60 62,062 0.07% 296,619 0.35% Telecommunications Sprint Capital Corp. 6.875% 15/11/2028 59 60,142 0.07%
106
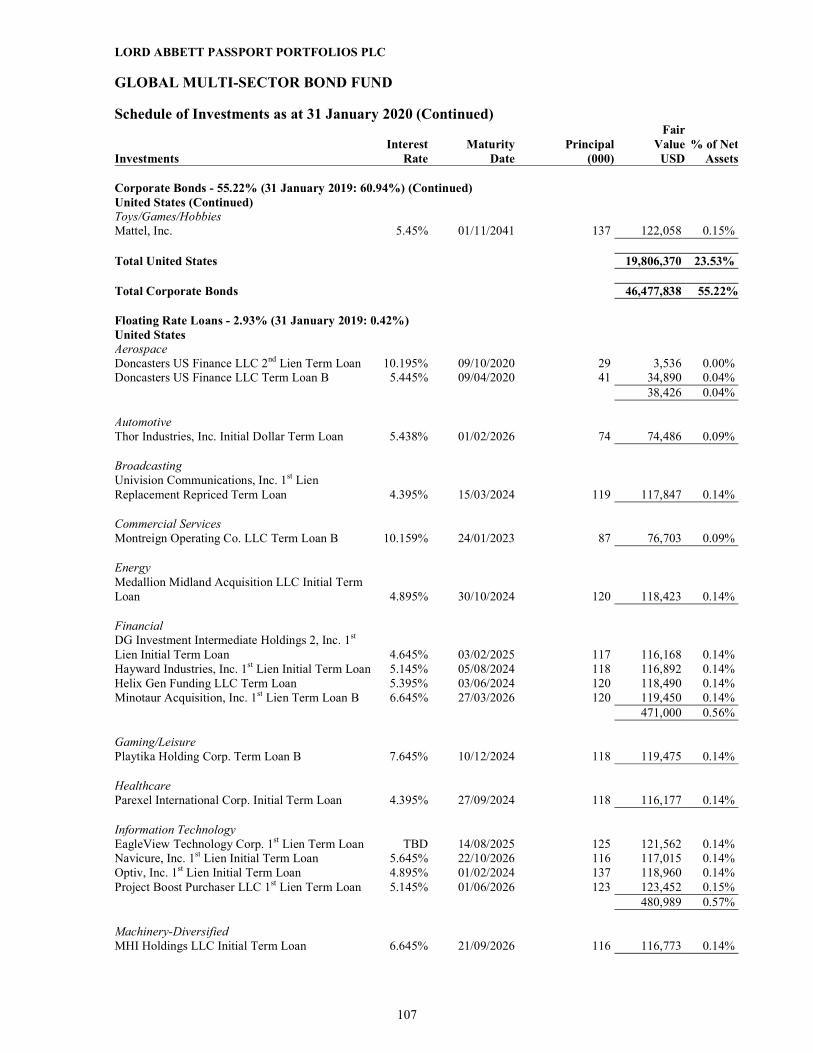
LORD ABBETT PASSPORT PORTFOLIOS PLC GLOBAL MULTI-SECTOR BOND FUND Schedule of Investments as at 31 January 2020 (Continued)
Interest Maturity PrincipalFair
Value % of Net Investments Rate Date (000) USD Assets Corporate Bonds - 55.22% (31 January 2019: 60.94%) (Continued) United States (Continued) Toys/Games/Hobbies Mattel, Inc. 5.45% 01/11/2041 137 122,058 0.15% Total United States 19,806,370 23.53% Total Corporate Bonds 46,477,838 55.22% Floating Rate Loans - 2.93% (31 January 2019: 0.42%) United States Aerospace Doncasters US Finance LLC 2nd Lien Term Loan 10.195% 09/10/2020 29 3,536 0.00% Doncasters US Finance LLC Term Loan B 5.445% 09/04/2020 41 34,890 0.04% 38,426 0.04% Automotive Thor Industries, Inc. Initial Dollar Term Loan 5.438% 01/02/2026 74 74,486 0.09% Broadcasting Univision Communications, Inc. 1st Lien Replacement Repriced Term Loan 4.395% 15/03/2024 119 117,847 0.14% Commercial Services Montreign Operating Co. LLC Term Loan B 10.159% 24/01/2023 87 76,703 0.09% Energy Medallion Midland Acquisition LLC Initial Term Loan 4.895% 30/10/2024 120 118,423 0.14% Financial DG Investment Intermediate Holdings 2, Inc. 1st Lien Initial Term Loan 4.645% 03/02/2025 117 116,168 0.14% Hayward Industries, Inc. 1st Lien Initial Term Loan 5.145% 05/08/2024 118 116,892 0.14% Helix Gen Funding LLC Term Loan 5.395% 03/06/2024 120 118,490 0.14% Minotaur Acquisition, Inc. 1st Lien Term Loan B 6.645% 27/03/2026 120 119,450 0.14% 471,000 0.56% Gaming/Leisure Playtika Holding Corp. Term Loan B 7.645% 10/12/2024 118 119,475 0.14% Healthcare Parexel International Corp. Initial Term Loan 4.395% 27/09/2024 118 116,177 0.14% Information Technology EagleView Technology Corp. 1st Lien Term Loan TBD 14/08/2025 125 121,562 0.14% Navicure, Inc. 1st Lien Initial Term Loan 5.645% 22/10/2026 116 117,015 0.14% Optiv, Inc. 1st Lien Initial Term Loan 4.895% 01/02/2024 137 118,960 0.14% Project Boost Purchaser LLC 1st Lien Term Loan 5.145% 01/06/2026 123 123,452 0.15% 480,989 0.57% Machinery-Diversified MHI Holdings LLC Initial Term Loan 6.645% 21/09/2026 116 116,773 0.14%
107

LORD ABBETT PASSPORT PORTFOLIOS PLC GLOBAL MULTI-SECTOR BOND FUND Schedule of Investments as at 31 January 2020 (Continued)
Interest Maturity PrincipalFair
Value % of Net Investments Rate Date (000) USD Assets Floating Rate Loans - 2.93% (31 January 2019: 0.42%) (Continued) United States (Continued) Manufacturing Forming Machining Industries Holdings LLC 1st Lien Initial Term Loan 5.945% 09/10/2025 112 105,313 0.13% Forterra Finance LLC Replacement Term Loan 4.645% 25/10/2023 120 117,408 0.14% ProAmpac PG Borrower LLC 1st Lien Initial Term Loan 5.295% 20/11/2023 79 77,985 0.09% 300,706 0.36% Media/Telecommunications Ancestry.com Operations, Inc. 1st Lien Non-Extended Term Loan 5.40% 19/10/2023 119 114,220 0.14% Retail PetSmart, Inc. Amended Term Loan 5.67% 11/03/2022 74 74,283 0.09% Service NEP Group, Inc. 1st Lien Initial Dollar Term Loan 4.895% 20/10/2025 126 123,953 0.15% Utility Exgen Renewables IV LLC Term Loan 4.91% 28/11/2024 121 120,950 0.14% Total United States 2,464,411 2.93% Total Floating Rate Loans 2,464,411 2.93% Government Obligations - 28.58% (31 January 2019: 28.40%) Non-U.S. Government Obligations Arab Republic of Egypt(1) 4.55% 20/11/2023 200 205,922 0.24% Bonos de la Tesoreria de la Republica en pesos 4.50% 01/03/2026 CLP 85,000 115,638 0.14% Brazil Letras do Tesouro Nacional ZCP 01/07/2022 BRL 1,000 206,886 0.25% Brazil Notas do Tesouro Nacional Serie F 10.00% 01/01/2029 BRL 1,805 512,964 0.61% Cassa Depositi e Prestiti SpA 2.125% 27/09/2023 EUR 200 236,808 0.28% City of Montreal Canada 4.25% 01/12/2032 CAD 335 308,244 0.37% City of Paris France 1.625% 02/02/2033 EUR 100 130,292 0.16% City of Toronto Canada 3.90% 29/09/2023 CAD 506 411,889 0.49% Colombian TES 7.50% 26/08/2026 COP 473,200 153,628 0.18% Dominican Republic(1) 5.95% 25/01/2027 200 220,321 0.26% Egypt Government International Bond(1) 7.903% 21/02/2048 200 216,750 0.26% Free & Hanseatic City of Hamburg 1.20% 03/06/2033 EUR 139 176,219 0.21% French Republic Government Bond OAT(1) 2.00% 25/05/2048 EUR 256 391,637 0.47% French Republic Government Bond OAT 4.50% 25/04/2041 EUR 127 261,313 0.31% Government of Qatar(1) 3.25% 02/06/2026 200 212,823 0.25% Government of Qatar(1) 5.103% 23/04/2048 200 264,784 0.31% Hungary Government Bond 3.00% 21/08/2030 HUF 42,910 153,923 0.18% Indonesia Treasury Bond 8.375% 15/03/2034 IDR 5,080,000 409,934 0.49% Italy Buoni Poliennali Del Tesoro 1.35% 01/04/2030 EUR 200 230,874 0.27% Italy Buoni Poliennali Del Tesoro 1.75% 01/07/2024 EUR 472 557,959 0.66% Italy Buoni Poliennali Del Tesoro(1) 2.45% 01/09/2033 EUR 230 293,066 0.35% Italy Buoni Poliennali Del Tesoro 2.50% 15/11/2025 EUR 296 366,739 0.44% Italy Buoni Poliennali Del Tesoro(1) 3.85% 01/09/2049 EUR 175 277,191 0.33% Japan Government Thirty Year Bond 0.40% 20/06/2049 JPY 45,950 428,585 0.51% Japan Government Twenty Year Bond 0.40% 20/03/2039 JPY 35,000 333,706 0.40% Japan Government Twenty Year Bond 1.40% 20/09/2034 JPY 32,000 351,254 0.42%
108

LORD ABBETT PASSPORT PORTFOLIOS PLC GLOBAL MULTI-SECTOR BOND FUND Schedule of Investments as at 31 January 2020 (Continued)
Interest Maturity PrincipalFair
Value % of Net Investments Rate Date (000) USD Assets Government Obligations - 28.58% (31 January 2019: 28.40%) (Continued) Non-U.S. Government Obligations (continued) Kenya Government International Bond(1) 8.25% 28/02/2048 200 216,073 0.26% Kingdom of Bahrain(1) 6.75% 20/09/2029 200 233,196 0.28% Kingdom of Saudi Arabia(1) 5.00% 17/04/2049 200 246,874 0.29% OPB Finance Trust 2.98% 25/01/2027 CAD 435 350,000 0.42% Peru Government Bond(1) 5.40% 12/08/2034 PEN 430 137,329 0.16% Province of Saskatchewan Canada 4.75% 01/06/2040 CAD 304 319,994 0.38% Queensland Treasury Corp.(1) 1.75% 21/08/2031 AUD 528 359,845 0.43% Republic of Angola(1) 8.25% 09/05/2028 200 215,939 0.26% Republic of Bahamas(1) 5.75% 16/01/2024 200 217,752 0.26% Republic of Bermuda(1) 3.717% 25/01/2027 200 213,869 0.25% Republic of Brazil 4.625% 13/01/2028 200 220,852 0.26% Republic of Columbia 3.875% 25/04/2027 200 215,469 0.26% Republic of Ghana(1) 7.875% 07/08/2023 200 224,050 0.27% Republic of Honduras(1) 6.25% 19/01/2027 200 222,370 0.26% Republic of Hungary 5.375% 25/03/2024 4 4,559 0.01% Republic of Indonesia 3.40% 18/09/2029 200 211,485 0.25% Republic of Kenya(1) 7.25% 28/02/2028 200 216,472 0.26% Republic of Nigeria(1) 6.375% 12/07/2023 200 217,668 0.26% Republic of Nigeria(1) 6.50% 28/11/2027 400 412,500 0.49% Republic of Paraguay(1) 4.70% 27/03/2027 200 221,822 0.26% Republic of South Africa 4.30% 12/10/2028 200 197,905 0.24% Republic of South Africa 8.00% 31/01/2030 ZAR 2,481 154,988 0.18% Republic of South Africa Government Bond 8.75% 28/02/2048 ZAR 3,758 219,424 0.26% Republic of Sri Lanka(1) 6.85% 03/11/2025 200 202,996 0.24% Republic of Turkey 3.25% 23/03/2023 400 396,564 0.47% Republic of Turkey 4.25% 14/04/2026 250 245,000 0.29% Republic of Turkey 6.875% 17/03/2036 228 253,905 0.30% Russian Foreign Bond - Eurobond(1) 4.25% 23/06/2027 200 221,225 0.26% Spain Government Bond(1) 1.45% 30/04/2029 EUR 235 290,487 0.35% Spain Government Bond(1) 1.85% 30/07/2035 EUR 360 470,382 0.56% Spain Government Bond(1) 2.70% 31/10/2048 EUR 109 167,306 0.20% Sultanate of Oman(1) 4.75% 15/06/2026 200 202,586 0.24% Thailand Government Bond 3.30% 17/06/2038 THB 4,050 163,040 0.19% Ukraine Government International Bond(1) 7.75% 01/09/2021 200 213,100 0.25% United Kingdom Gilt 0.75% 22/07/2023 GBP 100 133,352 0.16% United Kingdom Gilt 1.50% 22/07/2047 GBP 372 545,709 0.65% United Kingdom Gilt 1.625% 22/10/2028 GBP 210 304,540 0.36% United Kingdom Gilt 1.75% 07/09/2037 GBP 209 312,728 0.37% United Kingdom Gilt 4.25% 07/12/2027 GBP 135 230,714 0.27% 17,033,418 20.25% U.S. Government Obligations U.S. Treasury Bond 2.25% 15/08/2049 368 388,621 0.46% U.S. Treasury Bond 2.375% 15/11/2049 410 444,690 0.53% U.S. Treasury Bond 2.75% 15/11/2047 845 979,045 1.16% U.S. Treasury Bond 3.625% 15/08/2043 398 521,054 0.62% U.S. Treasury Bond 4.375% 15/05/2040 1,282 1,829,254 2.17% U.S. Treasury Inflation Indexed Note 0.50% 15/04/2024 780 801,764 0.95% U.S. Treasury Note 1.75% 15/11/2029 2,006 2,050,038 2.44% 7,014,466 8.33% Total Government Obligations 24,047,884 28.58%
109

LORD ABBETT PASSPORT PORTFOLIOS PLC GLOBAL MULTI-SECTOR BOND FUND Schedule of Investments as at 31 January 2020 (Continued)
Interest Maturity PrincipalFair
Value % of Net Investments Rate Date (000) USD Assets Government Sponsored Enterprises Collateralised Mortgage Obligations - 7.30% (31 January 2019: 10.85%) United States Federal National Mortgage Assoc. 4.00% 01/10/2049 172 188,788 0.22% Federal National Mortgage Assoc.(6) 3.50% TBA 1,950 2,013,223 2.39% Federal National Mortgage Assoc. 4.00% 01/01/2048 213 234,498 0.28% Federal National Mortgage Assoc.(6) 4.50% TBA 3,200 3,385,500 4.02% Government National Mortgage Assoc. 2013-48 Class IO 0.623% (2) 16/07/2054 654 23,353 0.03% Government National Mortgage Assoc. 2017-41 Class AS 2.60% 16/06/2057 129 130,902 0.16% Government National Mortgage Assoc. 2017-86 Class AS 2.75% 16/02/2058 53 54,487 0.07% Government National Mortgage Assoc. 2017-89 Class AB 2.60% 16/07/2058 46 46,706 0.06% Government National Mortgage Assoc. 2017-90 Class AS 2.70% 16/07/2057 62 62,870 0.07% Total Government Sponsored Enterprises Collateralised Mortgage Obligations 6,140,327 7.30% Municipal Bonds - 0.33% (31 January 2019: 0.69%) United States North Texas Tollway Authority 8.41% 01/02/2030 55 73,504 0.09% North Texas Tollway Authority 8.91% 01/02/2030 130 130,000 0.15% State of Illinois 5.10% 01/06/2033 50 56,412 0.07% State of Illinois 5.52% 01/04/2038 15 16,983 0.02% Total Municipal Bonds 276,899 0.33% Short Term Investments(7) - 2.38% (31 January 2019: 0.00%) Commercial Paper - 2.38% (31 January 2019: 0.00%) United States AutoNation Inc.(1) 1.87% 03/02/2020 500 499,948 0.59% Aviation Capital Group LLC(1) 1.75% 03/02/2020 500 499,951 0.60% Exelon Corp.(1) 1.71% 03/02/2020 500 499,953 0.59% Pentair Finance S.A.R.L.(1) 1.95% 03/02/2020 250 249,973 0.30% Southern California Edison Co.(1) 1.87% 03/02/2020 250 249,974 0.30% Total United States 1,999,799 2.38% Total Commercial Paper 1,999,799 2.38% Total Short Term Investments 1,999,799 2.38% Shares Common Stock - 0.00% (31 January 2019: 0.00%) United States Oil & Gas Templar Energy LLC Class A Units 1,213 97 0.00% Total Common Stock 97 0.00%
110

LORD ABBETT PASSPORT PORTFOLIOS PLC GLOBAL MULTI-SECTOR BOND FUND Schedule of Investments as at 31 January 2020 (Continued)
Dividend Fair
Value % of Net Investments Rate Shares USD Assets Preferred Stock - 0.00% (31 January 2019: 0.03%) United States Oil & Gas Templar Energy LLC ZCP 2,285 – 0.00% Total Preferred Stock – 0.00% Total Investment in Securities (Cost: USD 85,021,915) 87,747,080 104.27%
A zero balance of principal may reflect actual amounts rounding to less than one thousand. PIK Payment-in-Kind. TBD To be determined. ZCP Indicates a zero coupon rate. * Non income processing security. (1) Securities exempt from registration under Rule 144A (i) of the US Securities Act of 1933. These securities may be resold in transactions exempt
from registration, normally to qualified institutional buyers. (2) Indicates a variable rate security. The interest rate shown reflects the rate as at 31 January 2020. (3) Variable Rate is Fixed to Float: Rate remains fixed until future date. The interest rate represents the rate as at 31 January 2020. (4) Security is perpetual in nature and has no stated maturity date. (5) Default securities. (6) To-be-announced (“TBA”). Security purchased on a forward commitment basis with an approximate principal and maturity date. Actual principal
and maturity will be determined upon settlement when the specific mortgage pools are assigned. (7) Short Term Investments are securities maturing in less than 365 days from issuance.
Open Forward Foreign Currency Exchange Contracts - 0.13% (31 January 2019: 0.47%) Unrealised Appreciation/ Depreciation % of Net Settlement Date Amount Sold Amount Bought Counterparty USD Assets Forward Foreign Currency Contracts 30/04/2020 3,500,000 SEK 364,945 USD Bank of America 357 0.00% 09/03/2020 313,000 EUR 349,149 USD Bank of America 1,572 0.00% 11/03/2020 3,690,000 NOK 403,811 USD Bank of America 3,444 0.00% 09/04/2020 5,188,000 THB 170,923 USD Bank of America 4,243 0.01% 13/03/2020 1,914,000 CAD 1,452,101 USD Bank of America 4,948 0.01% 11/03/2020 2,552,000 ZAR 178,491 USD Bank of America 9,152 0.01% 30/04/2020 36,600,000 JPY 336,884 USD Morgan Stanley (2,429) (0.00%) 09/03/2020 118,487 USD 106,000 EUR Morgan Stanley (778) (0.00%) 05/03/2020 164,361 USD 126,000 GBP Morgan Stanley 1,862 0.00% 11/03/2020 3,190,000 ZAR 214,486 USD Morgan Stanley 2,811 0.00% 06/03/2020 1,323,000 BRL 327,824 USD Morgan Stanley 18,744 0.02% 09/03/2020 12,086,000 EUR 13,492,074 USD Morgan Stanley 70,955 0.09% 13/03/2020 5,590,000,000 IDR 397,497 USD State Street Bank (10,527) (0.01%) 09/03/2020 665,101 USD 596,000 EUR State Street Bank (3,262) (0.01%) 05/03/2020 76,000 GBP 99,303 USD State Street Bank (958) (0.00%) 06/03/2020 473,000 PEN 139,491 USD State Street Bank (494) (0.00%) 24/02/2020 6,218 USD 9,000 AUD State Street Bank (191) (0.00%) 24/02/2020 110,943 USD 100,000 EUR State Street Bank 8 0.00% 10/02/2020 82,950,000 JPY 765,626 USD State Street Bank 22 0.00% 13/03/2020 188,000 CAD 142,239 USD State Street Bank 94 0.00% 06/03/2020 93,000,000 CLP 117,580 USD State Street Bank 1,496 0.00%
111

LORD ABBETT PASSPORT PORTFOLIOS PLC GLOBAL MULTI-SECTOR BOND FUND Schedule of Investments as at 31 January 2020 (Continued)
Open Forward Foreign Currency Exchange Contracts - 0.13% (31 January 2019: 0.47%) (Continued)
Unrealised Appreciation/ Depreciation % of Net Settlement Date Amount Sold Amount Bought Counterparty USD Assets Forward Foreign Currency Contracts (Continued) 09/03/2020 1,024,000 EUR 1,139,902 USD State Street Bank 2,783 0.00% 06/03/2020 1,774,000 BRL 421,268 USD State Street Bank 6,825 0.01% 24/02/2020 2,691,000 AUD 1,833,257 USD State Street Bank 31,132 0.04% 11/03/2020 419,163 USD 3,690,000 NOK Toronto-Dominion Bank (18,796) (0.02%) 06/03/2020 990,000,000 COP 282,671 USD Toronto-Dominion Bank (5,891) (0.01%) 09/03/2020 424,791 USD 379,000 EUR Toronto-Dominion Bank (3,923) (0.01%) 05/03/2020 3,497,000 GBP 4,612,595 USD Toronto-Dominion Bank (734) (0.00%) 27/04/2020 48,000,000 HUF 157,903 USD Toronto-Dominion Bank (146) (0.00%) 112,319 0.13% Share Class Hedges Class A EUR Accumulating (Hedged) 27/02/2020 38,839 USD 35,157 EUR Brown Brothers Harriman 175 0.00% Class I EUR Accumulating (Hedged) 27/02/2020 28,768 USD 26,041 EUR Brown Brothers Harriman 130 0.00% Class I GBP Accumulating (Hedged) 27/02/2020 34,431 USD 26,333 GBP Brown Brothers Harriman 302 0.00% 607 0.00%
Net Unrealised Appreciation on Open Forward Foreign Currency Exchange Contracts 112,926 0.13%
Unrealised Appreciation on Open Forward Foreign Currency Exchange Contracts 161,055 0.19%Unrealised Depreciation on Open Forward Foreign Currency Exchange Contracts (48,129) (0.06%)
Open Futures Contracts - (0.13%) (31 January 2019: (0.13%)) Unrealised Appreciation/ % of No. of Depreciation Net Type Expiration Contracts USD Assets U.S. 10 Year Ultra Bond 20/03/2020 (25) (82,175) (0.10%) U.S. 2 Year Treasury Note 31/03/2020 5 3,828 0.00% U.S. Ultra Treasury Bond 20/03/2020 (5) (27,441) (0.03%) Net Unrealised Depreciation on Open Futures Contracts (105,788) (0.13%) Unrealised Appreciation on Open Futures Contracts 3,828 0.00%Unrealised Depreciation on Open Futures Contracts (109,616) (0.13%)
Open Swap Contracts - (0.02%) (31 January 2019: 0.00%) Open OTC Credit Default Index Swap Contract - (0.01%) (31 January 2019: (0.00%))
Reference Index
Counterparty
Buy/Sell Protection
Fixed Deal Receive/
(Pay)Rate
Expiration Date
Notional USD
Premiums Paid
UnrealisedAppreciation/Depreciation
USD
FairValueUSD
% of Net
Assets Markit CMBX.NA.AAA.8
Morgan Stanley Buy 0.50% 17/10/2057 123,000 6,090 (7,398) (1,308) (0.01%)
Fair Value on Open OTC Credit Default Index Swap Contract (1,308) (0.01%)
112

LORD ABBETT PASSPORT PORTFOLIOS PLC GLOBAL MULTI-SECTOR BOND FUND Schedule of Investments as at 31 January 2020 (Continued)
Open Centrally Cleared Credit Default Index Swap Contracts - (0.01%) (31 January 2019: 0.00%)
Reference Index Counterparty
Buy/Sell Protection
Fixed Deal Receive/
(Pay)Rate
ExpirationDate
NotionalUSD
FairValue
USD
% ofNet
AssetsMarkit EM.32 5Y Credit Suisse Sell 1.00% 20/12/2024 1,700,000 (9,589) (0.01%) Fair Value on Open Centrally Cleared Credit Default Index Swap Contracts (9,589) (0.01%) Financial Liabilities on Open Swap Contracts (10,897) (0.02%)
Total Financial Assets at Fair Value through Profit and Loss 87,911,963 104.46% Total Financial Liabilities at Fair Value through Profit and Loss (168,642) (0.21%) Other Net Liabilities (3,585,491) (4.25%)
Net Assets 84,157,830 100.00%
Analysis of Total Assets % of Total
Assets Transferable securities admitted to an official stock exchange listing 50.35% Transferable securities traded on a regulated market 34.78% Other transferable securities including those which are unlisted 8.43% Financial derivatives dealt in on a regulated market (0.11%) OTC financial derivative instruments 0.12% Centrally Cleared Financial Derivative Instruments (0.01%)
113

LORD ABBETT PASSPORT PORTFOLIOS PLC TOTAL RETURN FUND Schedule of Investments as at 31 January 2020
,
Interest Maturity PrincipalFair
Value % of Net Investments Rate Date (000) USD Assets Asset-Backed Securities - 33.52% (31 January 2019: 42.08%) Auto Floor Plan Ally Master Owner Trust 2017-3 Class A2 2.04% 15/06/2022 212 212,205 0.68% Ally Master Owner Trust 2018-2 Class A 3.29% 15/05/2023 195 199,189 0.63% Ford Credit Floorplan Master Owner Trust A 2015-5 Class A 2.39% 15/08/2022 62 62,214 0.20% NextGear Floorplan Master Owner Trust 2018-2A Class A2(1) 3.69% 15/10/2023 100 103,363 0.33% 576,971 1.84% Automobile Ally Auto Receivables Trust 2018-1 Class B 2.66% 15/05/2023 122 123,560 0.39% American Credit Acceptance Receivables Trust 2018-4 Class A(1) 3.38% 13/12/2021 7 6,548 0.02% American Credit Acceptance Receivables Trust 2018-4 Class B(1) 3.78% 12/09/2022 77 77,415 0.25% AmeriCredit Automobile Receivables 2015-4 Class D 3.72% 08/12/2021 104 104,497 0.33% AmeriCredit Automobile Receivables 2016-1 Class D 3.59% 08/02/2022 83 83,686 0.27% AmeriCredit Automobile Receivables Trust 2016-3 Class D 2.71% 08/09/2022 243 244,907 0.78% AmeriCredit Automobile Receivables Trust 2018-2 Class A2A 2.86% 18/11/2021 25 24,945 0.08% Bank of The West Auto Trust 2018-1 Class A4(1) 3.59% 15/12/2023 146 150,467 0.48% California Republic Auto Receivables Trust 2015-3 Class B 2.70% 15/09/2021 5 5,002 0.02% California Republic Auto Receivables Trust 2017-1 Class A4 2.28% 15/06/2022 90 90,137 0.29% Capital Auto Receivables Asset Trust 2018-1 Class A3(1) 2.79% 20/01/2022 157 157,817 0.50% Capital Auto Receivables Asset Trust 2018-2 Class C(1) 3.69% 20/12/2023 102 103,848 0.33% Carmax Auto Owner Trust 2016-3 Class A3 1.39% 17/05/2021 2 1,693 0.01% Carmax Auto Owner Trust 2016-3 Class A4 1.60% 18/01/2022 160 159,848 0.51% CarMax Auto Owner Trust 2017-3 Class A3 1.97% 15/04/2022 29 29,519 0.09% CarMax Auto Owner Trust 2018-3 Class A2A 2.88% 15/10/2021 9 9,333 0.03% Carmax Auto Owner Trust 2018-4 Class A4 3.48% 15/02/2024 169 177,040 0.57% Chesapeake Funding II LLC 2017-2A Class A1(1) 1.99% 15/05/2029 31 31,430 0.10% Chesapeake Funding II LLC 2017-3A Class A1(1) 1.91% 15/08/2029 36 35,511 0.11% Chrysler Capital Auto Receivables Trust 2016-A Class C(1) 3.25% 15/06/2022 1 1,273 0.00% CPS Auto Trust 2018-C Class A(1) 2.87% 15/09/2021 7 7,263 0.02% Drive Auto Receivables Trust 2016-B Class D(1) 4.53% 15/08/2023 29 29,531 0.09% Drive Auto Receivables Trust 2016-C Class D(1) 4.18% 15/03/2024 12 11,794 0.04% Drive Auto Receivables Trust 2017-3 Class C 2.80% 15/07/2022 8 8,385 0.03% Drive Auto Receivables Trust 2017-3 Class D(1) 3.53% 15/12/2023 160 161,703 0.52% Drive Auto Receivables Trust 2017-A Class D(1) 4.16% 15/05/2024 24 24,370 0.08% Drive Auto Receivables Trust 2018-2 Class C 3.63% 15/08/2024 110 111,038 0.36% Drive Auto Receivables Trust 2018-2 Class D 4.14% 15/08/2024 120 123,503 0.40% Drive Auto Receivables Trust 2018-3 Class B 3.37% 15/09/2022 4 3,990 0.01% First Investors Auto Owner Trust 2017-3A Class A2(1) 2.41% 15/12/2022 20 19,743 0.06% Flagship Credit Auto Trust 2017-3 Class A(1) 1.88% 15/10/2021 0 194 0.00% Flagship Credit Auto Trust 2017-3 Class B(1) 2.59% 15/07/2022 15 15,030 0.05%
114

LORD ABBETT PASSPORT PORTFOLIOS PLC TOTAL RETURN FUND Schedule of Investments as at 31 January 2020 (Continued)
Interest Maturity PrincipalFair
Value % of Net Investments Rate Date (000) USD Assets Asset-Backed Securities - 33.52% (31 January 2019: 42.08%) (Continued) Automobile (continued) Flagship Credit Auto Trust 2017-4 Class A(1) 2.07% 15/04/2022 5 4,511 0.02% Flagship Credit Auto Trust 2018-1 Class A(1) 2.59% 15/06/2022 9 9,477 0.03% Flagship Credit Auto Trust 2018-3 Class A(1) 3.07% 15/02/2023 43 43,039 0.14% Flagship Credit Auto Trust 2018-3 Class B(1) 3.59% 16/12/2024 28 28,599 0.09% Ford Credit Auto Owner Trust 2015-REV2 2015-2 Class A(1) 2.44% 15/01/2027 156 156,424 0.50% Ford Credit Auto Owner Trust 2017-A Class B 2.24% 15/06/2022 87 87,260 0.28% Ford Credit Auto Owner Trust 2017-B Class A3 1.69% 15/11/2021 54 53,930 0.17% Foursight Capital Automobile Receivables Trust 2016-1 Class A2(1) 2.87% 15/10/2021 3 2,791 0.01% Foursight Capital Automobile Receivables Trust 2018-1 Class A3(1) 3.24% 15/09/2022 78 78,750 0.25% Foursight Capital Automobile Receivables Trust 2018-1 Class B(1) 3.53% 17/04/2023 200 202,597 0.65% Honda Auto Receivables 2017-3 Owner Trust Class A3 1.79% 20/09/2021 107 107,397 0.34% Hyundai Auto Lease Securitization Trust 2017-C Class A3(1) 2.12% 16/02/2021 17 17,454 0.06% Hyundai Auto Receivables Trust 2018-B Class A4 3.29% 15/01/2025 109 112,862 0.36% Nissan Auto Receivables 2016-A Owner Trust Class A4 1.59% 15/07/2022 54 53,603 0.17% Nissan Auto Receivables 2017-C Owner Trust Class A3 2.12% 18/04/2022 62 62,002 0.20% Nissan Auto Receivables 2018-C Owner Trust Class A3 3.22% 15/06/2023 239 244,219 0.78% Santander Drive Auto Receivables Trust 2017-2 Class D 3.49% 17/07/2023 189 191,702 0.61% Santander Drive Auto Receivables Trust 2017-3 Class C 2.76% 15/12/2022 8 7,608 0.02% Santander Drive Auto Receivables Trust 2018-1 Class C 2.96% 15/03/2024 187 188,328 0.60% Santander Drive Auto Receivables Trust 2018-3 Class C 3.51% 15/08/2023 225 227,599 0.73% Santander Drive Auto Receivables Trust 2018-4 Class C 3.56% 15/07/2024 241 245,050 0.78% TCF Auto Receivables Owner Trust 2016-1 Class C(1) 2.51% 15/09/2022 100 100,095 0.32% TCF Auto Receivables Owner Trust 2016-PT1 Class B(1) 2.92% 17/10/2022 31 31,245 0.10% Toyota Auto Receivables 2018-A Owner Trust Class A3 2.35% 16/05/2022 79 78,910 0.25% Westlake Automobile Receivables Trust 2018-1 Class B(1) 2.67% 17/05/2021 5 5,081 0.02% World Omni Auto Receivables Trust 2018-D Class A2A 3.01% 15/04/2022 42 41,875 0.13% 4,517,428 14.43% Commercial Mortgage-Backed 1345 Avenue of the Americas & Park Avenue Plaza Trust 2005-1 Class A3(1) 5.278% 10/08/2035 25 27,885 0.09% Atrium Hotel Portfolio Trust 2018-ATRM Class A(1) 2.626%(2) 15/06/2035 100 100,116 0.32% Bancorp Commercial Mortgage 2018-CRE3 Trust Class A(1) 2.526%(2) 15/01/2033 12 11,882 0.04%
115

LORD ABBETT PASSPORT PORTFOLIOS PLC TOTAL RETURN FUND Schedule of Investments as at 31 January 2020 (Continued)
Interest Maturity PrincipalFair
Value % of Net Investments Rate Date (000) USD Assets Asset-Backed Securities - 33.52% (31 January 2019: 42.08%) (Continued) Commercial Mortgage-Backed (continued) BX Trust 2018-GW Class A(1) 2.476%(2) 15/05/2035 68 67,969 0.22% CCRESG Commercial Mortgage Trust 2016-HEAT Class B(1) 4.114% 10/04/2029 27 27,355 0.09% CCRESG Commercial Mortgage Trust 2016-HEAT Class C(1) 4.919% 10/04/2029 27 27,497 0.09% CHT 2017-COSMO Mortgage Trust Class A(1) 2.606%(2) 15/11/2036 100 100,195 0.32% Citigroup Commercial Mortgage Trust 2014-GC25 Class XB 0.331%(2) 10/10/2047 1,000 9,994 0.03% COMM 2015-LC19 Mortgage Trust Class A4 3.183% 10/02/2048 21 22,355 0.07% COMM 2015-PC1 Mortgage Trust Class AM 4.29%(2) 10/07/2050 21 23,015 0.07% COMM 2015-PC1 Mortgage Trust Class B 4.582%(2) 10/07/2050 119 129,118 0.41% COMM 2015-PC1 Mortgage Trust Class C 4.582%(2) 10/07/2050 22 23,292 0.07% COMM 2015-PC1 Mortgage Trust Class D 4.582%(2) 10/07/2050 30 28,921 0.09% COMM 2016-COR1 Mortgage Trust Class AM 3.494% 10/10/2049 15 16,060 0.05% Commercial Mortgage Pass Through Certificates 2012-LTRT Class A2(1) 3.40% 05/10/2030 100 102,030 0.32% CSMC Trust 2017-LSTK Class A(1) 2.761% 05/04/2033 204 204,451 0.65% DBWF 2018-GLKS Mortgage Trust Class A(1) 2.688%(2) 19/11/2035 100 100,109 0.32% GS Mortgage Securities Corp. Trust 2018-RIVR Class A(1) 2.626%(2) 15/07/2035 100 100,253 0.32% GS Mortgage Securities Trust 2015-GC32 Class C 4.557%(2) 10/07/2048 10 10,772 0.04% Hudsons Bay Simon JV Trust 2015-HBS Class A10(1) 4.155% 05/08/2034 100 105,585 0.34% J.P. Morgan BB Commercial Mortgage Securities Trust 2015-C30 Class C 4.412%(2) 15/07/2048 74 78,050 0.25% J.P. Morgan Chase Commercial Mortgage Securities Trust 2014-DSTY Class A(1) 3.429% 10/06/2027 100 100,259 0.32% J.P. Morgan Chase Commercial Mortgage Securities Trust 2016-NINE Class A(1) 2.949%(2) 06/09/2038 100 104,701 0.33% J.P. Morgan Chase Commercial Mortgage Securities Trust 2018-LAQ Class B(1) 2.976%(2) 15/06/2032 56 55,830 0.18% J.P. Morgan Chase Commercial Mortgage Securities Trust 2018-LAQ Class D(1) 3.776%(2) 15/06/2032 31 31,102 0.10% J.P. Morgan Chase Commercial Mortgage Securities Trust 2018-WPT Class AFL(1) 2.684%(2) 05/07/2033 16 16,018 0.05% J.P. Morgan Chase Commercial Mortgage Securities Trust 2018-WPT Class BFL(1) 2.984%(2) 05/07/2033 49 49,073 0.16% J.P. Morgan Chase Commercial Mortgage Securities Trust 2018-WPT Class BFX(1) 4.549% 05/07/2033 15 16,150 0.05% J.P. Morgan Chase Commercial Mortgage Securities Trust 2018-WPT Class CFX(1) 4.95% 05/07/2033 20 21,593 0.07% J.P. Morgan Chase Commercial Mortgage SecuritiesTrust 2018-MINN Class A(1) 2.76%(2) 15/11/2035 21 21,020 0.07% LCCM 2014-909 Mortgage Trust Class C(1) 4.028%(2) 15/05/2031 150 152,353 0.49% Morgan Stanley Bank of America Merrill Lynch Trust 2015-C23 Class XA 0.794%(2) 15/07/2050 844 20,689 0.07% VNDO 2012-6AVE Mortgage Trust Class C(1) 3.448%(2) 15/11/2030 100 102,730 0.33% Wells Fargo Commercial Mortgage Trust 2015-C28 Class D 4.25%(2) 15/05/2048 42 40,450 0.13% Wells Fargo Commercial Mortgage Trust 2016-C35 Class C 4.176%(2) 15/07/2048 10 10,559 0.03% Wells Fargo Commercial Mortgage Trust 2016-NXS5 Class E(1) 5.037%(2) 15/01/2059 20 20,407 0.06%
116

LORD ABBETT PASSPORT PORTFOLIOS PLC TOTAL RETURN FUND Schedule of Investments as at 31 January 2020 (Continued)
Interest Maturity PrincipalFair
Value % of Net Investments Rate Date (000) USD Assets Asset-Backed Securities - 33.52% (31 January 2019: 42.08%) (Continued) Commercial Mortgage-Backed (continued) Wells Fargo Commercial Mortgage Trust 2017-C41 Class AS 3.785%(2) 15/11/2050 82 89,681 0.29% 2,169,519 6.93% Credit Card American Express Credit Account Master Trust 2017-3 Class A 1.77% 15/11/2022 211 211,041 0.68% Barclays Dryrock Issuance Trust 2015-1 Class A 2.20% 15/12/2022 220 220,023 0.70% Synchrony Credit Card Master Note Trust 2015-1 Class A 2.37% 15/03/2023 150 150,114 0.48% Synchrony Credit Card Master Note Trust 2017-2 Class B 2.82% 15/10/2025 78 79,511 0.25% World Financial Network Credit Card Master Trust 2017-A Class A 2.12% 15/03/2024 142 142,115 0.45% World Financial Network Credit Card Master Trust 2017-C Class A 2.31% 15/08/2024 100 100,359 0.32% World Financial Network Credit Card Master Trust 2017-C Class M 2.66% 15/08/2024 43 43,008 0.14% 946,171 3.02% Other Ascentium Equipment Receivables 2016-2 Trust Class B(1) 2.50% 12/09/2022 1 1,099 0.00% Ascentium Equipment Receivables 2017-1 Trust Class A3(1) 2.29% 10/06/2021 6 5,934 0.02% BSPRT 2018-FL4 Issuer Ltd. Class A(1) 2.726%(2) 15/09/2035 100 99,990 0.32% CIFC Funding 2017-II Ltd. 2017-2A Class D(1) 5.319%(2) 20/04/2030 250 251,047 0.80% Diamond Resorts Owner Trust 2016-1 Class A(1) 3.08% 20/11/2028 17 17,470 0.06% DLL 2018-1 LLC Class A4(1) 3.27% 17/04/2026 221 226,703 0.72% Hardee's Funding LLC 2018-1A Class A23(1) 5.71% 20/06/2048 37 40,145 0.13% Hardee's Funding LLC 2018-1A Class A2II(1) 4.959% 20/06/2048 51 53,631 0.17% Hempstead II CLO Ltd. 2017-2A Class A1(1) 3.181%(2) 10/08/2029 250 250,057 0.80% OHA Loan Funding 2016-1 Ltd. Class B1(1) 3.619%(2) 20/01/2028 250 250,254 0.80% Orec 2018-CRE1 Ltd. Class A(1) 2.856%(2) 15/06/2036 39 39,002 0.13% Salem Fields CLO Ltd. 2016-2 Class A1R(1) 2.944%(2) 25/10/2028 250 250,676 0.80% SCF Equipment Leasing 2018-1 LLC Class A2(1) 3.63% 20/10/2024 49 49,781 0.16% Shackleton 2016-IX CLO Ltd. 2016-9A Class B(1) 3.719%(2) 20/10/2028 250 249,966 0.80% Sound Point CLO XVII 2017-3A Class A2(1) 3.419%(2) 20/10/2030 250 248,633 0.79% TPG Real Estate Finance 2018-FL2 Issuer Ltd. Class A(1) 2.799%(2) 15/11/2037 100 100,110 0.32% 2,134,498 6.82% Student Loan Pennsylvania Higher Education Assistance Agency 2006-1 Class B 2.064%(2) 25/04/2038 36 33,236 0.11% SLC Student Loan Trust 2008-1 Class A4A 3.494%(2) 15/12/2032 53 54,143 0.17% Towd Point Asset Trust 2018-SL1 Class A(1) 2.308%(2) 25/01/2046 62 61,265 0.20% 148,644 0.48% Total Asset-Backed Securities 10,493,231 33.52%
117

LORD ABBETT PASSPORT PORTFOLIOS PLC TOTAL RETURN FUND Schedule of Investments as at 31 January 2020 (Continued)
Interest Maturity PrincipalFair
Value % of Net Investments Rate Date (000) USD Assets Corporate Bonds - 33.58% (31 January 2019: 23.61%) Aerospace/Defense Kratos Defense & Security Solutions, Inc.(1) 6.50% 30/11/2025 14 14,951 0.05% Signature Aviation US Holdings, Inc.(1) 4.00% 01/03/2028 24 23,782 0.07% Spirit AeroSystems, Inc. 4.60% 15/06/2028 5 5,122 0.02% TransDigm, Inc. 6.375% 15/06/2026 27 28,501 0.09% 72,356 0.23% Agriculture BAT Capital Corp. 4.39% 15/08/2037 112 117,200 0.37% Apparel PVH Corp. 7.75% 15/11/2023 47 54,788 0.18% Auto Manufacturers BCD Acquisition, Inc.(1) 9.625% 15/09/2023 29 30,196 0.10% Ford Motor Co. 7.45% 16/07/2031 94 113,406 0.36% General Motors Co. 6.60% 01/04/2036 105 128,070 0.41% Tesla, Inc.(1) 5.30% 15/08/2025 31 31,388 0.10% 303,060 0.97% Auto Parts & Equipment Adient US LLC(1) 7.00% 15/05/2026 40 43,775 0.14% Panther BF Aggregator 2 LP/Panther Finance Co., Inc.(1) 8.50% 15/05/2027 31 33,382 0.11% 77,157 0.25% Banks Bank of America Corp. 3.593%(3) 21/07/2028 159 172,817 0.55% Bank of America Corp. 3.95% 21/04/2025 15 16,265 0.05% Bank of America Corp. 4.00% 22/01/2025 30 32,481 0.10% Bank of America Corp. 4.45% 03/03/2026 67 74,935 0.24% Citigroup, Inc. 2.666%(3) 29/01/2031 8 8,114 0.03% Citigroup, Inc. 3.887%(3) 10/01/2028 48 52,589 0.17% Citigroup, Inc. 3.98%(3) 20/03/2030 70 78,356 0.25% Citigroup, Inc. 4.45% 29/09/2027 33 37,127 0.12% Goldman Sachs Group, Inc. 6.25% 01/02/2041 26 38,181 0.12% JPMorgan Chase & Co. 3.782%(3) 01/02/2028 212 232,940 0.74% Macquarie Group Ltd.(1) 4.654%(3) 27/03/2029 83 94,995 0.30% Morgan Stanley 3.625% 20/01/2027 85 92,226 0.30% Morgan Stanley 3.875% 27/01/2026 55 60,304 0.19% Morgan Stanley 4.00% 23/07/2025 72 79,167 0.25% Morgan Stanley 7.25% 01/04/2032 3 4,422 0.02% Popular, Inc. 6.125% 14/09/2023 22 23,687 0.08% Santander UK PLC 7.95% 26/10/2029 52 69,517 0.22% Toronto-Dominion Bank 3.625%(3) 15/09/2031 140 150,587 0.48% Turkiye Garanti Bankasi AS(1) 5.875% 16/03/2023 200 210,880 0.67% UBS AG 5.125% 15/05/2024 200 216,328 0.69% Wachovia Corp. 7.574%(4) 01/08/2026 173 221,227 0.71% Wells Fargo & Co. 3.00% 23/10/2026 52 54,579 0.18% 2,021,724 6.46%
118

LORD ABBETT PASSPORT PORTFOLIOS PLC TOTAL RETURN FUND Schedule of Investments as at 31 January 2020 (Continued)
Interest Maturity PrincipalFair
Value % of Net Investments Rate Date (000) USD Assets Corporate Bonds - 33.58% (31 January 2019: 23.61%) (Continued) Beverages Anheuser-Busch Cos LLC/Anheuser-Busch InBev Worldwide, Inc. 4.70% 01/02/2036 90 108,471 0.35% Chemicals CF Industries, Inc. 4.95% 01/06/2043 32 34,323 0.11% CNAC HK Finbridge Co. Ltd. 4.125% 19/07/2027 200 215,669 0.69% Orbia Advance Corp. SAB de CV(1) 4.875% 19/09/2022 200 212,564 0.68% Rain CII Carbon LLC/CII Carbon Corp.(1) 7.25% 01/04/2025 30 29,775 0.09% Tronox, Inc.(1) 6.50% 15/04/2026 41 40,899 0.13% 533,230 1.70% Coal Warrior Met Coal, Inc.(1) 8.00% 01/11/2024 31 32,182 0.10% Commercial Services Ahern Rentals, Inc.(1) 7.375% 15/05/2023 23 18,295 0.06% Ashtead Capital, Inc.(1) 4.25% 01/11/2029 24 24,930 0.08% MPH Acquisition Holdings LLC(1) 7.125% 01/06/2024 32 31,075 0.10% PayPal Holdings, Inc. 2.85% 01/10/2029 33 33,994 0.11% Pepperdine University 3.301% 01/12/2059 14 15,004 0.05% United Rentals North America, Inc. 4.875% 15/01/2028 31 32,375 0.10% 155,673 0.50% Computers Banff Merger Sub, Inc.(1) 9.75% 01/09/2026 29 29,829 0.09% Dell International LLC/EMC Corp.(1) 5.45% 15/06/2023 11 12,057 0.04% Dell International LLC/EMC Corp.(1) 6.02% 15/06/2026 2 2,338 0.01% Dell International LLC/EMC Corp.(1) 8.35% 15/07/2046 74 103,720 0.33% Diebold Nixdorf, Inc. 8.50% 15/04/2024 46 44,294 0.14% 192,238 0.61% Cosmetics/Personal Care Coty, Inc.(1) 6.50% 15/04/2026 27 28,216 0.09% Distribution/Wholesale Performance Food Group, Inc.(1) 5.50% 15/10/2027 29 30,596 0.10% Diversified Financial Services Affiliated Managers Group, Inc. 3.50% 01/08/2025 36 38,388 0.12% Ally Financial, Inc. 8.00% 01/11/2031 22 31,073 0.10% Brightsphere Investment Group, Inc. 4.80% 27/07/2026 24 25,963 0.08% Global Aircraft Leasing Co. Ltd. PIK (1) 6.50% 15/09/2024 50 51,277 0.17% International Lease Finance Corp. 5.875% 15/08/2022 202 221,417 0.71% Navient Corp. 5.00% 15/03/2027 51 51,000 0.16% Navient Corp. 6.75% 25/06/2025 58 63,292 0.20% Neuberger Berman Group LLC/Neuberger Berman Finance Corp.(1) 4.50% 15/03/2027 28 30,793 0.10% Neuberger Berman Group LLC/Neuberger Berman Finance Corp.(1) 4.875% 15/04/2045 21 22,872 0.07% 536,075 1.71%
119

LORD ABBETT PASSPORT PORTFOLIOS PLC TOTAL RETURN FUND Schedule of Investments as at 31 January 2020 (Continued)
Interest Maturity PrincipalFair
Value % of Net Investments Rate Date (000) USD Assets Corporate Bonds - 33.58% (31 January 2019: 23.61%) (Continued) Electric Ausgrid Finance Pty Ltd.(1) 4.35% 01/08/2028 53 59,214 0.19% Berkshire Hathaway Energy Co. 3.80% 15/07/2048 55 61,885 0.20% Cleco Corporate Holdings LLC(1) 3.375% 15/09/2029 25 25,400 0.08% Cleco Corporate Holdings LLC 4.973% 01/05/2046 16 18,910 0.06% Dominion Energy South Carolina, Inc. 6.05% 15/01/2038 23 32,541 0.10% Dominion Energy South Carolina, Inc. 6.625% 01/02/2032 11 15,370 0.05% Emera US Finance LP 4.75% 15/06/2046 24 29,086 0.09% Entergy Arkansas LLC 4.20% 01/04/2049 43 52,433 0.17% Entergy Louisiana LLC 4.00% 15/03/2033 59 69,377 0.22% Exelon Generation Co. LLC 5.60% 15/06/2042 35 41,364 0.13% FirstEnergy Transmission LLC(1) 4.55% 01/04/2049 47 56,937 0.18% Massachusetts Electric Co.(1) 4.004% 15/08/2046 34 38,867 0.13% Pennsylvania Electric Co.(1) 3.60% 01/06/2029 23 25,073 0.08% Vistra Operations Co. LLC(1) 4.30% 15/07/2029 34 35,052 0.11% 561,509 1.79% Electronics Trimble, Inc. 4.90% 15/06/2028 39 43,861 0.14% Energy-Alternate Sources Enviva Partners LP/Enviva Partners Finance Corp.(1) 6.50% 15/01/2026 30 32,078 0.10% Engineering & Construction Brand Industrial Services, Inc.(1) 8.50% 15/07/2025 45 45,219 0.14% Entertainment Penn National Gaming, Inc.(1) 5.625% 15/01/2027 30 31,573 0.10% Scientific Games International, Inc.(1) 7.25% 15/11/2029 29 31,156 0.10% Stars Group Holdings BV/Stars Group US Co.-Borrower LLC(1) 7.00% 15/07/2026 47 51,141 0.16% 113,870 0.36% Food Arcor SAIC(1) 6.00% 06/07/2023 14 13,751 0.05% Chobani LLC/Chobani Finance Corp., Inc.(1) 7.50% 15/04/2025 25 24,928 0.08% JBS USA LUX SA/JBS USA Food Co./JBS USA Finance, Inc.(1) 6.50% 15/04/2029 37 41,509 0.13% 80,188 0.26% Forest Products & Paper Fibria Overseas Finance Ltd. 4.00% 14/01/2025 25 26,229 0.08% Gas Dominion Energy Gas Holdings LLC 4.60% 15/12/2044 50 58,167 0.19% Hand/Machine Tools Kennametal, Inc. 4.625% 15/06/2028 24 26,233 0.08% Healthcare-Services Adventist Health System/West 2.952% 01/03/2029 18 18,514 0.06% Advocate Health & Hospitals Corp. 3.387% 15/10/2049 32 34,489 0.11% Centene Corp.(1) 4.625% 15/12/2029 64 69,002 0.22%
120

LORD ABBETT PASSPORT PORTFOLIOS PLC TOTAL RETURN FUND Schedule of Investments as at 31 January 2020 (Continued)
Interest Maturity PrincipalFair
Value % of Net Investments Rate Date (000) USD Assets Corporate Bonds - 33.58% (31 January 2019: 23.61%) (Continued) Healthcare-Services (continued) CommonSpirit Health 3.347% 01/10/2029 99 103,131 0.33% HCA, Inc. 5.25% 15/06/2026 45 51,501 0.16% MEDNAX, Inc.(1) 6.25% 15/01/2027 45 45,957 0.15% New York & Presbyterian Hospital 3.954% 01/08/2119 10 11,014 0.04% RegionalCare Hospital Partners Holdings, Inc./LifePoint Health, Inc.(1) 9.75% 01/12/2026 21 23,494 0.07% Surgery Center Holdings, Inc.(1) 10.00% 15/04/2027 28 31,345 0.10% Tenet Healthcare Corp.(1) 6.25% 01/02/2027 15 15,883 0.05% 404,330 1.29% Home Builders Century Communities, Inc.(1) 6.75% 01/06/2027 28 30,445 0.10% Toll Brothers Finance Corp. 4.35% 15/02/2028 28 29,550 0.09% TRI Pointe Group, Inc. 5.25% 01/06/2027 23 24,503 0.08% Williams Scotsman International, Inc.(1) 6.875% 15/08/2023 21 22,118 0.07% 106,616 0.34% Housewares Newell Brands, Inc. 5.375% 01/04/2036 6 6,608 0.02% Insurance Radian Group, Inc. 4.875% 15/03/2027 32 33,931 0.11% Teachers Insurance & Annuity Association of America(1) 4.90% 15/09/2044 60 77,109 0.24% 111,040 0.35% Internet JD.com, Inc. 3.375% 14/01/2030 200 205,077 0.66% Match Group, Inc.(1) 5.625% 15/02/2029 12 12,979 0.04% Netflix, Inc. 6.375% 15/05/2029 56 65,344 0.21% Tencent Holdings Ltd.(1) 3.595% 19/01/2028 200 213,782 0.68% 497,182 1.59% Iron/Steel Baffinland Iron Mines Corp./Baffinland Iron Mines LP(1) 8.75% 15/07/2026 30 31,219 0.10% Leisure Time Carnival PLC 7.875% 01/06/2027 30 39,781 0.13% Royal Caribbean Cruises Ltd. 3.70% 15/03/2028 94 98,858 0.31% Viking Cruises Ltd.(1) 5.875% 15/09/2027 30 30,807 0.10% 169,446 0.54% Lodging Boyd Gaming Corp.(1) 4.75% 01/12/2027 46 47,120 0.15% Wyndham Destinations, Inc. 5.75% 01/04/2027 46 50,329 0.16% 97,449 0.31% Machinery-Diversified nVent Finance S.A.R.L. 4.55% 15/04/2028 110 118,418 0.38%
121
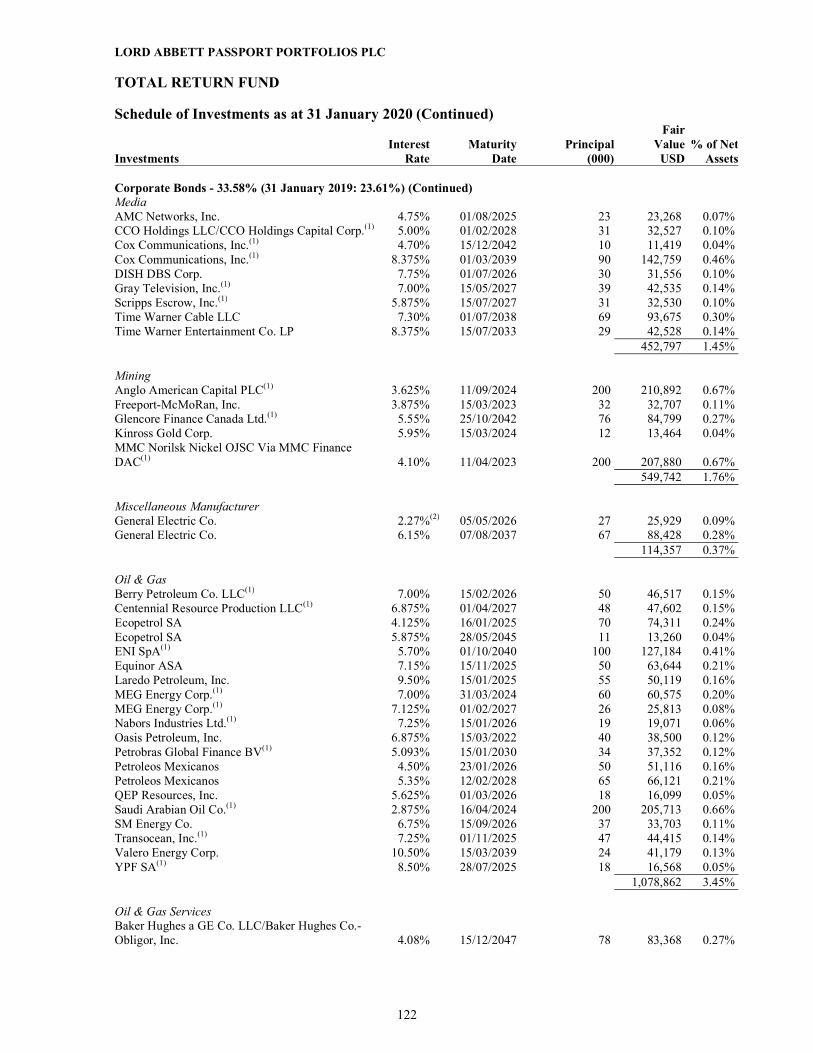
LORD ABBETT PASSPORT PORTFOLIOS PLC TOTAL RETURN FUND Schedule of Investments as at 31 January 2020 (Continued)
Interest Maturity PrincipalFair
Value % of Net Investments Rate Date (000) USD Assets Corporate Bonds - 33.58% (31 January 2019: 23.61%) (Continued) Media AMC Networks, Inc. 4.75% 01/08/2025 23 23,268 0.07% CCO Holdings LLC/CCO Holdings Capital Corp.(1) 5.00% 01/02/2028 31 32,527 0.10% Cox Communications, Inc.(1) 4.70% 15/12/2042 10 11,419 0.04% Cox Communications, Inc.(1) 8.375% 01/03/2039 90 142,759 0.46% DISH DBS Corp. 7.75% 01/07/2026 30 31,556 0.10% Gray Television, Inc.(1) 7.00% 15/05/2027 39 42,535 0.14% Scripps Escrow, Inc.(1) 5.875% 15/07/2027 31 32,530 0.10% Time Warner Cable LLC 7.30% 01/07/2038 69 93,675 0.30% Time Warner Entertainment Co. LP 8.375% 15/07/2033 29 42,528 0.14% 452,797 1.45% Mining Anglo American Capital PLC(1) 3.625% 11/09/2024 200 210,892 0.67% Freeport-McMoRan, Inc. 3.875% 15/03/2023 32 32,707 0.11% Glencore Finance Canada Ltd.(1) 5.55% 25/10/2042 76 84,799 0.27% Kinross Gold Corp. 5.95% 15/03/2024 12 13,464 0.04% MMC Norilsk Nickel OJSC Via MMC Finance DAC(1) 4.10% 11/04/2023 200 207,880 0.67% 549,742 1.76% Miscellaneous Manufacturer General Electric Co. 2.27%(2) 05/05/2026 27 25,929 0.09% General Electric Co. 6.15% 07/08/2037 67 88,428 0.28% 114,357 0.37% Oil & Gas Berry Petroleum Co. LLC(1) 7.00% 15/02/2026 50 46,517 0.15% Centennial Resource Production LLC(1) 6.875% 01/04/2027 48 47,602 0.15% Ecopetrol SA 4.125% 16/01/2025 70 74,311 0.24% Ecopetrol SA 5.875% 28/05/2045 11 13,260 0.04% ENI SpA(1) 5.70% 01/10/2040 100 127,184 0.41% Equinor ASA 7.15% 15/11/2025 50 63,644 0.21% Laredo Petroleum, Inc. 9.50% 15/01/2025 55 50,119 0.16% MEG Energy Corp.(1) 7.00% 31/03/2024 60 60,575 0.20% MEG Energy Corp.(1) 7.125% 01/02/2027 26 25,813 0.08% Nabors Industries Ltd.(1) 7.25% 15/01/2026 19 19,071 0.06% Oasis Petroleum, Inc. 6.875% 15/03/2022 40 38,500 0.12% Petrobras Global Finance BV(1) 5.093% 15/01/2030 34 37,352 0.12% Petroleos Mexicanos 4.50% 23/01/2026 50 51,116 0.16% Petroleos Mexicanos 5.35% 12/02/2028 65 66,121 0.21% QEP Resources, Inc. 5.625% 01/03/2026 18 16,099 0.05% Saudi Arabian Oil Co.(1) 2.875% 16/04/2024 200 205,713 0.66% SM Energy Co. 6.75% 15/09/2026 37 33,703 0.11% Transocean, Inc.(1) 7.25% 01/11/2025 47 44,415 0.14% Valero Energy Corp. 10.50% 15/03/2039 24 41,179 0.13% YPF SA(1) 8.50% 28/07/2025 18 16,568 0.05% 1,078,862 3.45% Oil & Gas Services Baker Hughes a GE Co. LLC/Baker Hughes Co.-Obligor, Inc. 4.08% 15/12/2047 78 83,368 0.27%
122

LORD ABBETT PASSPORT PORTFOLIOS PLC TOTAL RETURN FUND Schedule of Investments as at 31 January 2020 (Continued)
Interest Maturity PrincipalFair
Value % of Net Investments Rate Date (000) USD Assets Corporate Bonds - 33.58% (31 January 2019: 23.61%) (Continued) Oil & Gas Services (continued) Nine Energy Service, Inc.(1) 8.75% 01/11/2023 31 26,373 0.08% 109,741 0.35% Packaging & Containers Mauser Packaging Solutions Holding Co.(1) 7.25% 15/04/2025 33 32,917 0.11% Pharmaceuticals AbbVie, Inc.(1) 4.25% 21/11/2049 14 15,197 0.05% Bausch Health Americas, Inc.(1) 9.25% 01/04/2026 26 29,721 0.09% Bausch Health Cos, Inc.(1) 5.00% 30/01/2028 17 17,255 0.06% Bayer Corp.(1) 6.65% 15/02/2028 12 14,892 0.05% CVS Health Corp. 5.05% 25/03/2048 55 66,547 0.21% 143,612 0.46% Pipelines Buckeye Partners LP 6.375%(3) 22/01/2078 43 35,542 0.11% Cheniere Corpus Christi Holdings LLC(1) 3.70% 15/11/2029 20 20,795 0.07% Northern Natural Gas Co.(1) 4.30% 15/01/2049 16 18,881 0.06% Sabine Pass Liquefaction LLC 5.875% 30/06/2026 49 56,944 0.18% 132,162 0.42% Real Estate Country Garden Holdings Co. Ltd. 4.75% 28/09/2023 200 201,298 0.64% REITS EPR Properties 4.95% 15/04/2028 113 126,611 0.40% Healthcare Trust of America Holdings LP 3.10% 15/02/2030 67 69,160 0.22% Spirit Realty LP 3.40% 15/01/2030 45 46,949 0.15% VEREIT Operating Partnership LP 4.875% 01/06/2026 101 114,231 0.37% WEA Finance LLC(1) 2.875% 15/01/2027 62 63,533 0.20% 420,484 1.34% Retail Lithia Motors, Inc.(1) 4.625% 15/12/2027 48 49,200 0.16% Semiconductors Broadcom Corp./Broadcom Cayman Finance Ltd. 3.875% 15/01/2027 96 101,543 0.32% Software Oracle Corp. 6.125% 08/07/2039 42 60,983 0.20% Telecommunications AT&T, Inc. 6.25% 29/03/2041 51 68,439 0.22% Intelsat Jackson Holdings SA 5.50% 01/08/2023 32 26,227 0.08% Sprint Capital Corp. 6.875% 15/11/2028 27 27,522 0.09% Verizon Communications, Inc. 3.01%(2) 15/05/2025 27 27,809 0.09% ViaSat, Inc.(1) 5.625% 15/04/2027 30 31,478 0.10% 181,475 0.58% Toys/Games/Hobbies Mattel, Inc.(1) 6.75% 31/12/2025 48 51,580 0.17%
123

LORD ABBETT PASSPORT PORTFOLIOS PLC TOTAL RETURN FUND Schedule of Investments as at 31 January 2020 (Continued)
Interest Maturity PrincipalFair
Value % of Net Investments Rate Date (000) USD Assets Corporate Bonds - 33.58% (31 January 2019: 23.61%) (Continued) Transportation Burlington Northern Santa Fe LLC 5.75% 01/05/2040 7 9,939 0.03% Water Aqua America, Inc. 3.566% 01/05/2029 25 27,085 0.09% Total Corporate Bonds 10,510,405 33.58% Government Obligations - 20.06% (31 January 2019: 12.90%) Non-U.S. Government Obligations Arab Republic of Egypt (1) 4.55% 20/11/2023 200 205,922 0.66% Japan Bank for International Cooperation 2.50% 23/05/2024 242 250,634 0.80% Republic of Bahamas(1) 6.95% 20/11/2029 10 11,763 0.04% Republic of Indonesia 3.40% 18/09/2029 200 211,485 0.68% 679,804 2.18% U.S. Government Obligations U.S. Treasury Bond 2.25% 15/08/2049 372 392,845 1.25% U.S. Treasury Bond 2.375% 15/11/2049 359 389,375 1.24% U.S. Treasury Bond 2.75% 15/11/2047 457 529,495 1.69% U.S. Treasury Bond 3.625% 15/08/2043 750 981,885 3.14% U.S. Treasury Floating Rate Note 1.569% (2) 30/04/2020 1,873 1,873,103 5.98% U.S. Treasury Inflation Indexed Bond 1.00% 15/02/2049 133 160,502 0.51% U.S. Treasury Note 1.375% 31/01/2022 890 890,904 2.85% U.S. Treasury Note 1.375% 31/01/2025 249 249,666 0.80% U.S. Treasury Note 1.75% 15/11/2029 103 105,261 0.34% U.S. Treasury Note 2.875% 31/10/2020 26 26,249 0.08% 5,599,285 17.88% Total Government Obligations 6,279,089 20.06% Government Sponsored Enterprises Collateralised Mortgage Obligations - 24.00% (31 January 2019: 38.97%) Federal National Mortgage Assoc. 4.00% 01/10/2049 76 82,966 0.26% Federal National Mortgage Assoc.(5) 3.00% TBA 1,900 1,943,047 6.21% Federal National Mortgage Assoc.(5) 3.50% TBA 4,100 4,232,930 13.52% Federal National Mortgage Assoc. 4.00% 01/01/2048 98 107,621 0.34% Government National Mortgage Assoc.(5) 3.50% TBA 800 824,562 2.63% Government National Mortgage Assoc. 2015-47 Class AE 2.90% (2) 16/11/2055 42 42,395 0.14% Government National Mortgage Assoc. 2015-48 Class AS 2.90% (2) 16/02/2049 40 40,559 0.13% Government National Mortgage Assoc. 2015-73 Class AC 2.90% (2) 16/02/2053 5 5,407 0.02% Government National Mortgage Assoc. 2017-168 Class AS 2.70% 16/08/2058 70 71,567 0.23% Government National Mortgage Assoc. 2017-71 Class AS 2.70% 16/04/2057 36 36,390 0.12% Government National Mortgage Assoc. 2017-86 Class AS 2.75% 16/02/2058 42 42,811 0.14% Government National Mortgage Assoc. 2017-89 Class AB 2.60% 16/07/2058 35 36,002 0.11%
124

LORD ABBETT PASSPORT PORTFOLIOS PLC TOTAL RETURN FUND Schedule of Investments as at 31 January 2020 (Continued)
Interest Maturity PrincipalFair
Value % of Net Investments Rate Date (000) USD Assets Government Sponsored Enterprises Collateralised Mortgage Obligations - 24.00% (31 January 2019: 38.97%) (Continued) Government National Mortgage Assoc. 2017-90 Class AS 2.70% 16/07/2057 46 47,367 0.15% Total Government Sponsored Enterprises Collateralised Mortgage Obligations 7,513,624 24.00% Municipal Bonds - 0.82% (31 January 2019: 0.10%) California Health Facilities Financing Authority 3.034% 01/06/2034 20 20,796 0.06% Commonwealth of Pennsylvania 5.35% 01/05/2030 10 10,089 0.03% Foothill-Eastern Transportation Corridor Agency 4.094% 15/01/2049 33 34,453 0.11% Massachusetts School Building Authority 3.395% 15/10/2040 45 46,914 0.15% Michigan Finance Authority 3.084% 01/12/2034 45 47,303 0.15% North Texas Tollway Authority 8.91% 01/02/2030 11 11,000 0.04% Permanent University Fund - Texas A&M University System 3.66% 01/07/2047 35 37,210 0.12% State of California 7.30% 01/10/2039 10 16,006 0.05% State of California 7.625% 01/03/2040 20 33,691 0.11% Total Municipal Bonds 257,462 0.82% Short Term Investments(6) - 9.45% (31 January 2019: 14.66%) U.S. Government Obligations - 4.46% (31 January 2019: 0.00%) U.S. Treasury Bill ZCP 26/03/2020 0 299 0.00% U.S. Treasury Bill ZCP 07/05/2020 1,401 1,395,418 4.46% 1,395,717 4.46%
Total U.S. Government Obligations 1,395,717 4.46% Non-U.S. Government Obligation - 4.99% (31 January 2019: 0.00%) Japan Treasury Discount Bill ZCP 13/04/2020 JPY 169,400 1,563,325 4.99%
Total Non-U.S. Government Obligation 1,563,325 4.99% Total Short Term Investments 2,959,042 9.45% Total Investment in Securities (Cost: USD 37,138,788) 38,012,853 121.43%
A zero balance of principal may reflect actual amounts rounding to less than one thousand. PIK Payment-in-Kind. ZCP Indicates a zero coupon rate. (1) Securities exempt from registration under Rule 144A (i) of the US Securities Act of 1933. These securities may be resold in transactions exempt
from registration, normally to qualified institutional buyers. (2) Indicates a variable rate security. The interest rate shown reflects the rate as at 31 January 2020. (3) Variable Rate is Fixed to Float: Rate remains fixed until future date. The interest rate represents the rate as at 31 January 2020. (4) Indicates a multi-step security. The interest rate shown reflects the rate in effect at 31 January 2020. (5) To-be-announced (“TBA”). Security purchased on a forward commitment basis with an approximate principal and maturity date. Actual
principal and maturity will be determined upon settlement when the specific mortgage pools are assigned. (6) Short Term Investments are securities maturing in less than 365 days from issuance.
125

LORD ABBETT PASSPORT PORTFOLIOS PLC TOTAL RETURN FUND Schedule of Investments as at 31 January 2020 (Continued)
Open Forward Foreign Currency Exchange Contracts - (0.05%) (31 January 2019: 0.00%) Unrealised Appreciation/ Depreciation % of Net Settlement Date Amount Sold Amount Bought Counterparty USD Assets Forward Foreign Currency Contracts 13/04/2020 169,400,000 JPY 1,554,171 USD Morgan Stanley (14,850) (0.05%)
Net Unrealised Depreciation on Open Forward Foreign Currency Exchange Contracts (14,850) (0.05%)
Unrealised Depreciation on Open Forward Foreign Currency Exchange Contracts (14,850) (0.05%)
Open Futures Contracts - 0.15% (31 January 2019: 0.42%) Unrealised Appreciation/ % of No. of Depreciation Net Type Expiration Contracts USD Assets U.S. 10 Year Ultra Bond 20/03/2020 (5) (19,688) (0.06%) U.S. 2 Year Treasury Note 31/03/2020 10 7,031 0.02% U.S. 5 Year Treasury Note 31/03/2020 23 29,555 0.09% U.S. Long Treasury Bond 20/03/2020 10 35,936 0.12% U.S. Ultra Treasury Bond 20/03/2020 (1) (5,488) (0.02%) Net Unrealised Appreciation on Open Futures Contracts 47,346 0.15% Unrealised Appreciation on Open Futures Contracts 72,522 0.23%Unrealised Depreciation on Open Futures Contracts (25,176) (0.08%)
Fair
Value % of Net USD Assets
Total Financial Assets at Fair Value through Profit and Loss 38,085,375 121.66%Total Financial Liabilities at Fair Value through Profit and Loss (40,026) (0.13%) Other Net Liabilities (6,740,512) (21.53%)
Net Assets 31,304,837 100.00%
Analysis of Total Assets
% of Total
Assets Transferable securities admitted to an official stock exchange listing 28.79%Transferable securities traded on a regulated market 54.78%Other transferable securities including those which are unlisted 3.58%Financial derivatives dealt in on a regulated market 0.11%OTC financial derivative instruments (0.03%)
126

LORD ABBETT PASSPORT PORTFOLIOS PLC EMERGING MARKETS CORPORATE DEBT FUND Schedule of Investments as at 31 January 2020
Interest Maturity PrincipalFair
Value % of Net Investments Rate Date (000) USD Assets Convertible Bonds - 0.42% (31 January 2019: 0.00%) Internet Trip.com Group Ltd. 1.00% 01/07/2020 35 34,661 0.17% Weibo Corp. 1.25% 15/11/2022 35 33,470 0.16% 68,131 0.33% Telecommunications GDS Holdings Ltd. 2.00% 01/06/2025 16 19,421 0.09% Total Convertible Bonds 87,552 0.42% Corporate Bonds - 92.09% (31 January 2019: 92.02%) Agriculture JBS Investments II GmbH(1) 5.75% 15/01/2028 200 211,512 1.01% Kernel Holding SA(1) 8.75% 31/01/2022 200 217,119 1.03% MHP Lux SA(1) 6.25% 19/09/2029 200 196,253 0.94% MHP Lux SA(1) 6.95% 03/04/2026 200 209,404 1.00% 834,288 3.98% Airlines Latam Finance Ltd.(1) 7.00% 01/03/2026 200 217,469 1.04% Auto Parts & Equipment Nemak SAB de CV(1) 4.75% 23/01/2025 200 207,498 0.99% Banks Akbank T.A.S.(1) 5.00% 24/10/2022 200 206,560 0.98% Banco del Estado de Chile(1) 2.704% 09/01/2025 200 201,800 0.96% Banco do Brasil SA/Cayman(1) 6.25%(2) -(3) 200 206,450 0.98% Banco Internacional del Peru SAA Interbank(1) 3.25% 04/10/2026 200 202,476 0.97% Banco Votorantim SA(1) 4.50% 24/09/2024 200 210,250 1.00% Bancolombia SA 4.625%(2) 18/12/2029 200 206,600 0.99% Bangkok Bank PCL/Hong Kong(1) 3.733%(2) 25/09/2034 200 208,696 1.00% Banistmo SA(1) 3.65% 19/09/2022 200 205,064 0.98% Bank Leumi Le-Israel BM(1) 3.275%(2) 29/01/2031 200 200,325 0.96% BBVA Bancomer SA/Texas(1) 4.375% 10/04/2024 150 161,689 0.77% IndusInd Bank Ltd./Gift City 3.875% 15/04/2022 200 203,418 0.97% Itau Unibanco Holding SA/Cayman Island(1) 4.50%(2) 21/11/2029 200 205,600 0.98% KEB Hana Bank 4.25% 14/10/2024 200 215,109 1.03% NBK Tier 1 Financing 2 Ltd.(1) 4.50%(2) -(3) 200 200,558 0.96% Sberbank of Russia Via SB Capital SA(1) 6.125% 07/02/2022 200 214,018 1.02% Turkiye Garanti Bankasi AS(1) 5.875% 16/03/2023 200 210,880 1.01% Turkiye Vakiflar Bankasi TAO(1) 5.25% 05/02/2025 200 199,300 0.95% Turkiye Vakiflar Bankasi TAO(1) 6.00% 01/11/2022 200 205,460 0.98% Turkiye Vakiflar Bankasi TAO(1) 6.875%(2) 03/02/2025 200 200,000 0.95% Woori Bank(1) 4.75% 30/04/2024 200 217,131 1.04% 4,081,384 19.48% Building Materials Cemex SAB de CV(1) 5.45% 19/11/2029 200 213,500 1.02% Chemicals CNAC HK Finbridge Co. Ltd. 4.125% 19/07/2027 200 215,669 1.03% Orbia Advance Corp. SAB de CV(1) 4.875% 19/09/2022 200 212,564 1.01%
127

LORD ABBETT PASSPORT PORTFOLIOS PLC EMERGING MARKETS CORPORATE DEBT FUND Schedule of Investments as at 31 January 2020 (Continued)
Interest Maturity PrincipalFair
Value % of Net Investments Rate Date (000) USD Assets Corporate Bonds - 92.09% (31 January 2019: 92.02%) (Continued) Chemicals (continued) SABIC Capital II BV(1) 4.00% 10/10/2023 200 211,250 1.01% 639,483 3.05% Commercial Services Adani Ports & Special Economic Zone Ltd.(1) 4.375% 03/07/2029 200 211,697 1.01% DP World PLC(1) 6.85% 02/07/2037 200 268,246 1.28% 479,943 2.29% Diversified Financial Services Banco BTG Pactual SA/Cayman Islands(1) 4.50% 10/01/2025 200 205,750 0.98% BOC Aviation Ltd.(1) 3.00% 11/09/2029 200 200,771 0.96% SURA Asset Management SA(1) 4.875% 17/04/2024 100 108,042 0.52% 514,563 2.46% Electric Abu Dhabi National Energy Co. PJSC(1) 3.625% 12/01/2023 200 206,695 0.99% Acwa Power Management And Investments One Ltd.(1) 5.95% 15/12/2039 200 218,087 1.04% Adani Transmission Ltd.(1) 4.00% 03/08/2026 200 209,424 1.00% Celeo Redes Operacion Chile SA(1) 5.20% 22/06/2047 195 214,354 1.02% Cemig Geracao e Transmissao SA(1) 9.25% 05/12/2024 200 233,919 1.12% Centrais Eletricas Brasileiras SA(1) 3.625% 04/02/2025 200 201,450 0.96% Engie Energia Chile SA(1) 4.50% 29/01/2025 200 216,347 1.03% Eskom Holdings SOC Ltd.(1) 5.75% 26/01/2021 200 200,621 0.96% Israel Electric Corp. Ltd.(1) 4.25% 14/08/2028 200 219,933 1.05% Mong Duong Finance Holdings BV(1) 5.125% 07/05/2029 250 258,696 1.24% Terraform Global Operating LLC(1) 6.125% 01/03/2026 37 38,678 0.18% 2,218,204 10.59% Energy-Alternate Sources Greenko Solar Mauritius Ltd.(1) 5.95% 29/07/2026 200 205,153 0.98% YPF Energia Electrica SA(1) 10.00% 25/07/2026 142 131,687 0.63% 336,840 1.61% Food Arcor SAIC(1) 6.00% 06/07/2023 60 58,935 0.28% BRF SA(1) 4.875% 24/01/2030 200 205,900 0.98% NBM US Holdings, Inc.(1) 7.00% 14/05/2026 200 214,726 1.03% 479,561 2.29% Gas Gas Natural de Lima y Callao SA(1) 4.375% 01/04/2023 200 209,585 1.00% Holding Companies-Diversified CK Hutchison International 17 II Ltd.(1) 3.25% 29/09/2027 200 210,675 1.01% KOC Holding AS(1) 5.25% 15/03/2023 200 208,190 0.99% 418,865 2.00% Housewares Turkiye Sise ve Cam Fabrikalari AS(1) 6.95% 14/03/2026 200 219,978 1.05% Internet JD.com, Inc. 4.125% 14/01/2050 200 215,763 1.03%
128

LORD ABBETT PASSPORT PORTFOLIOS PLC EMERGING MARKETS CORPORATE DEBT FUND Schedule of Investments as at 31 January 2020 (Continued)
Interest Maturity PrincipalFair
Value % of Net Investments Rate Date (000) USD Assets Corporate Bonds - 92.09% (31 January 2019: 92.02%) (Continued) Internet (continued) Prosus NV(1) 3.68% 21/01/2030 200 205,990 0.98% Weibo Corp. 3.50% 05/07/2024 200 207,309 0.99% 629,062 3.00% Investment Companies Grupo de Inversiones Suramericana SA(1) 5.50% 29/04/2026 200 224,321 1.07% Huarong Finance II Co. Ltd. 4.625% 03/06/2026 200 215,641 1.03% MDGH - GMTN BV(1) 3.70% 07/11/2049 200 209,377 1.00% 649,339 3.10% Iron/Steel CSN Resources SA(1) 7.625% 13/02/2023 200 212,017 1.01% Lodging MGM China Holdings Ltd.(1) 5.875% 15/05/2026 200 207,375 0.99% Media Cable Onda SA(1) 4.50% 30/01/2030 200 207,128 0.99% Grupo Televisa SAB 6.625% 15/01/2040 50 66,065 0.31% 273,193 1.30% Mining Barminco Finance Pty Ltd.(1) 6.625% 15/05/2022 20 20,525 0.10% Chinalco Capital Holdings Ltd. 4.00% 25/08/2021 200 202,784 0.97% First Quantum Minerals Ltd.(1) 7.00% 15/02/2021 12 12,017 0.06% Industrias Penoles SAB de CV(1) 5.65% 12/09/2049 200 220,313 1.05% MMC Norilsk Nickel OJSC Via MMC Finance DAC(1) 4.10% 11/04/2023 200 207,880 0.99% Press Metal Labuan Ltd. 4.80% 30/10/2022 200 198,395 0.95% Southern Copper Corp. 5.875% 23/04/2045 44 56,417 0.27% Vedanta Resources Ltd.(1) 6.125% 09/08/2024 200 177,411 0.84% 1,095,742 5.23% Oil & Gas Ecopetrol SA 4.125% 16/01/2025 207 219,748 1.05% Ecopetrol SA 5.875% 28/05/2045 96 115,722 0.55% Gazprom PJSC Via Gaz Capital SA(1) 4.95% 06/02/2028 200 225,766 1.08% Lukoil International Finance BV(1) 4.75% 02/11/2026 200 223,371 1.07% Pertamina Persero PT(1) 4.70% 30/07/2049 200 214,706 1.02% Petrobras Global Finance BV(1) 5.093% 15/01/2030 226 248,284 1.18% Petrobras Global Finance BV 6.90% 19/03/2049 25 30,553 0.14% Petrobras Global Finance BV 7.25% 17/03/2044 63 79,849 0.38% Petroleos Mexicanos 5.35% 12/02/2028 20 20,345 0.10% Saudi Arabian Oil Co.(1) 4.375% 16/04/2049 200 226,176 1.08% Tengizchevroil Finance Co. International Ltd.(1) 4.00% 15/08/2026 200 211,148 1.01% Thaioil Treasury Center Co. Ltd.(1) 3.50% 17/10/2049 200 202,527 0.97% YPF SA(1) 6.95% 21/07/2027 262 224,101 1.07% 2,242,296 10.70% Pharmaceuticals Teva Pharmaceutical Finance Co. BV 3.65% 10/11/2021 60 59,415 0.29% Teva Pharmaceutical Finance Netherlands III BV 2.80% 21/07/2023 50 46,596 0.22%
129

LORD ABBETT PASSPORT PORTFOLIOS PLC EMERGING MARKETS CORPORATE DEBT FUND Schedule of Investments as at 31 January 2020 (Continued)
Interest Maturity PrincipalFair
Value % of Net Investments Rate Date (000) USD Assets Corporate Bonds - 92.09% (31 January 2019: 92.02%) (Continued) Pharmaceuticals (continued) Teva Pharmaceutical Finance Netherlands III BV 3.15% 01/10/2026 123 105,315 0.50% 211,326 1.01% Pipelines Abu Dhabi Crude Oil Pipeline LLC(1) 4.60% 02/11/2047 200 235,491 1.12% Real Estate China Evergrande Group 10.00% 11/04/2023 200 187,547 0.90% Country Garden Holdings Co. Ltd. 4.75% 17/01/2023 200 202,169 0.96% Pakuwon Prima Pte Ltd. 5.00% 14/02/2024 200 203,835 0.97% Ronshine China Holdings Ltd. 8.75% 25/10/2022 200 207,780 0.99% Theta Capital Pte Ltd. 6.75% 31/10/2026 200 182,002 0.87% 983,333 4.69% REITS LMIRT Capital Pte Ltd. 7.25% 19/06/2024 200 215,159 1.03% Retail Arcos Dorados Holdings, Inc.(1) 5.875% 04/04/2027 120 127,842 0.61% Telecommunications Millicom International Cellular SA(1) 6.625% 15/10/2026 200 220,620 1.05% Ooredoo International Finance Ltd.(1) 3.25% 21/02/2023 200 204,767 0.98% Oztel Holdings SPC Ltd.(1) 6.625% 24/04/2028 200 217,075 1.04% Telefonica Celular del Paraguay SA(1) 5.875% 15/04/2027 200 214,227 1.02% 856,689 4.09% Transportation Kazakhstan Temir Zholy Finance BV(1) 6.95% 10/07/2042 200 283,724 1.36% Total Corporate Bonds 19,293,749 92.09% Government Obligations - 4.04% (31 January 2019: 5.79%) Non-U.S. Government Obligations Arab Republic of Egypt(1) 4.55% 20/11/2023 200 205,922 0.98% Government of Qatar(1) 3.25% 02/06/2026 200 212,823 1.02% Republic of Nigeria(1) 7.625% 21/11/2025 200 226,368 1.08% United Arab Emirates(1) 3.125% 30/09/2049 200 200,313 0.96%
845,426 4.04% Total Government Obligations 845,426 4.04%
Shares Common Stock - 0.02% (31 January 2019: 0.05%) Mining Vedanta Ltd. 659 5,206 0.02% Total Common Stock 5,206 0.02%
130

LORD ABBETT PASSPORT PORTFOLIOS PLC EMERGING MARKETS CORPORATE DEBT FUND Schedule of Investments as at 31 January 2020 (Continued)
Interest Maturity PrincipalFair
Value % of Net Investments Rate Date (000) USD Assets
Short Term Investment(4) - 0.08% (31 January 2019: 0.00%) Non-U.S. Government Obligation- 0.08% (31 January 2019: 0.00%) Egypt Treasury Bills ZCP 24/03/2020 275 17,047 0.08%
Total Non-U.S. Government Obligation 17,047 0.08% Total Short Term Investment 17,047 0.08% Total Investment in Securities (Cost: USD 19,256,500) 20,248,980 96.65%
ZCP Indicates a zero coupon rate. (1) Securities exempt from registration under Rule 144A (i) of the US Securities Act of 1933. These securities may be resold in transactions
exempt from registration, normally to qualified institutional buyers. (2) Variable Rate is Fixed to Float: Rate remains fixed until future date. The interest rate represents the rate as at 31 January 2020. (3) Security is perpetual in nature and has no stated maturity date. (4) Short Term Investments are securities maturing in less than 365 days from issuance.
Open Futures Contracts - (0.20%) (31 January 2019: (0.15%)) Unrealised Appreciation/ % of No. of Depreciation Net Type Expiration Contracts USD Assets U.S. 10 Year Treasury Note 20/03/2020 (5) (10,547) (0.05%) U.S. 10 Year Ultra Bond 20/03/2020 (9) (15,570) (0.07%) U.S. 2 Year Treasury Note 31/03/2020 9 5,109 0.02% U.S. 5 Year Treasury Note 31/03/2020 4 1,891 0.01% U.S. Long Treasury Bond 20/03/2020 10 20,937 0.10% U.S. Ultra Treasury Bond 20/03/2020 (7) (43,774) (0.21%) Net Unrealised Depreciation on Open Futures Contracts (41,954) (0.20%) Unrealised Appreciation on Open Futures Contracts 27,937 0.13%Unrealised Depreciation on Open Futures Contracts (69,891) (0.33%)
Fair
Value USD
% of Net Assets
Total Financial Assets at Fair Value through Profit and Loss 20,276,917 96.78%Total Financial Liabilities at Fair Value through Profit and Loss (69,891) (0.33%) Other Net Assets 744,687 3.55%
Net Assets 20,951,713 100.00%
131

LORD ABBETT PASSPORT PORTFOLIOS PLC EMERGING MARKETS CORPORATE DEBT FUND Schedule of Investments as at 31 January 2020 (Continued)
Analysis of Total Assets
% of Total
Assets Transferable securities admitted to an official stock exchange listing 66.47%Transferable securities traded on a regulated market 24.73%Other transferable securities including those which are unlisted 0.08%Financial derivatives dealt in on a regulated market (0.19%)
132

LORD ABBETT PASSPORT PORTFOLIOS PLC MULTI-SECTOR INCOME FUND Schedule of Investments as at 31 January 2020
Interest Maturity Principal Fair
Value % of Net Investments Rate Date (000) USD Assets Asset-Backed Securities - 3.09% (31 January 2019: 3.67%) Automobile ACC Trust 2018-1 Class B(1) 4.82% 20/05/2021 205 205,816 0.03% ACC Trust 2018-1 Class C(1) 6.81% 21/02/2023 500 510,800 0.07% Ford Credit Auto Owner Trust 2016-C Class B 1.73% 15/03/2022 113 112,929 0.01% TCF Auto Receivables Owner Trust 2016-1 Class B(1) 2.32% 15/06/2022 52 52,082 0.01% 881,627 0.12% Commercial Mortgage-Backed Citigroup Commercial Mortgage Trust 2016-P3 Class D(1) 2.804%(2) 15/04/2049 273 247,100 0.04% CSAIL 2015-C2 Commercial Mortgage Trust Class C 4.332%(2) 15/06/2057 55 54,551 0.01% CSAIL 2016-C5 Commercial Mortgage Trust Class XB 0.266%(2) 15/11/2048 2,735 33,285 0.00% Hudsons Bay Simon JV Trust 2015-HBS Class A10(1) 4.155% 05/08/2034 100 105,585 0.02% Wells Fargo Commercial Mortgage Trust 2015-C29 Class XB 0.099%(2) 15/06/2048 8,000 19,859 0.00% Wells Fargo Commercial Mortgage Trust 2017-C41 Class AS 3.785%(2) 15/11/2050 1,112 1,217,474 0.17% 1,677,854 0.24% Other AMMC CLO XII Ltd. 2013-12A Class DR(1) 4.601%(2) 10/11/2030 250 242,477 0.03% Apex Credit CLO 2017 Ltd. 2017-1A Class B(1) 3.751%(2) 24/04/2029 2,600 2,601,460 0.37% Apex Credit CLO 2017-II LLC 2017-2A Class B(1) 3.758%(2) 20/09/2029 281 280,942 0.04% Ascentium Equipment Receivables 2016-2 Trust Class B(1) 2.50% 12/09/2022 2 2,397 0.00% BlueMountain CLO 2013-2 Ltd. Class A1R(1) 2.982%(2) 22/10/2030 2,283 2,284,353 0.32% Cedar Funding VI CLO Ltd. 2016-6A Class BR(1) 3.419%(2) 20/10/2028 500 499,887 0.07% Cedar Funding VI CLO Ltd. 2016-6A Class DR(1) 4.819%(2) 20/10/2028 250 249,357 0.04% Cent CLO 19 Ltd. 2013-19A Class C(1) 5.075%(2) 29/10/2025 800 801,259 0.11% Conn's Receivables Funding 2017-B LLC Class C(1) 5.95% 15/11/2022 374 375,848 0.05% Halcyon Loan Advisors Funding 2015-2 Ltd. Class CR(1) 3.944%(2) 25/07/2027 250 250,055 0.04% Hardee's Funding LLC 2018-1A Class A23(1) 5.71% 20/06/2048 1,975 2,135,762 0.30% Hardee's Funding LLC 2018-1A Class A2II(1) 4.959% 20/06/2048 867 905,538 0.13% Jamestown CLO VII Ltd. 2015-7A Class BR(1) 3.444%(2) 25/07/2027 250 246,562 0.03% KKR CLO 9 Ltd. Class B1R(1) 3.581%(2) 15/07/2030 3,500 3,506,860 0.49% KVK CLO 2013-1 Ltd. Class BR(1) 3.288%(2) 14/01/2028 700 698,312 0.10% Madison Park Funding XIV Ltd. 2014-14A Class DRR(1) 4.752%(2) 22/10/2030 250 250,437 0.04% Mariner CLO 2017-4 Ltd. Class D(1) 4.844%(2) 26/10/2029 500 489,416 0.07% Mountain View CLO X Ltd. 2015-10A Class BR(1) 3.198%(2) 13/10/2027 314 312,548 0.04% Octagon Investment Partners 39 Ltd. 2018-3A Class D(1) 4.769%(2) 20/10/2030 250 250,334 0.04% Palmer Square Loan Funding 2018-1 Ltd. Class A1(1) 2.431%(2) 15/04/2026 362 360,446 0.05% Palmer Square Loan Funding 2018-1 Ltd. Class A2(1) 2.881%(2) 15/04/2026 250 249,603 0.04% Palmer Square Loan Funding 2018-1 Ltd. Class B(1) 3.231%(2) 15/04/2026 250 248,653 0.04% Planet Fitness Master Issuer LLC 2018-1A Class A2I(1) 4.262% 05/09/2048 401 411,914 0.06%
133

LORD ABBETT PASSPORT PORTFOLIOS PLC MULTI-SECTOR INCOME FUND Schedule of Investments as at 31 January 2020 (Continued)
Interest Maturity Principal Fair
Value % of Net Investments Rate Date (000) USD Assets Asset-Backed Securities - 3.09% (31 January 2019: 3.67%) (Continued) Other (continued) Planet Fitness Master Issuer LLC 2018-1A Class A2II(1) 4.666% 05/09/2048 501 528,459 0.07% Regatta VI Funding Ltd. 2016-1A Class DR(1) 4.519%(2) 20/07/2028 250 248,476 0.03% THL Credit Wind River 2018-3 CLO Ltd. Class D(1) 4.769%(2) 20/01/2031 250 235,282 0.03% West CLO 2014-2 Ltd. Class BR(1) 3.593%(2) 16/01/2027 250 249,834 0.04% Wingstop Funding 2018-1 LLC Class A2(1) 4.97% 05/12/2048 438 452,088 0.06% 19,368,559 2.73% Total Asset-Backed Securities 21,928,040 3.09% Convertible Bonds - 8.09% (31 January 2019: 6.89%) Aerospace/Defense Safran SA ZCP 21/06/2023 EUR 446 588,309 0.08% Agriculture Vector Group Ltd. 1.75%(2) 15/04/2020 205 206,230 0.03% Auto Manufacturers Tesla, Inc. 2.00% 15/05/2024 880 1,939,400 0.27% Banks JPMorgan Chase Bank N.A.(1) 0.125% 01/01/2023 1,075 1,140,844 0.16% Beverages Luckin Coffee, Inc.(1) 0.75% 15/01/2025 816 714,197 0.10% Biotechnology Insmed, Inc. 1.75% 15/01/2025 1,021 966,224 0.14% Building Materials Patrick Industries, Inc.(1) 1.00% 01/02/2023 1,488 1,429,447 0.20% Commercial Services Chegg, Inc.(1) 0.125% 15/03/2025 932 997,426 0.14% Euronet Worldwide, Inc.(1) 0.75% 15/03/2049 105 125,616 0.02% FTI Consulting, Inc. 2.00% 15/08/2023 506 669,757 0.09% Macquarie Infrastructure Corp. 2.00% 01/10/2023 724 695,981 0.10% Square, Inc. 0.50% 15/05/2023 299 362,043 0.05% 2,850,823 0.40% Computers Lumentum Holdings, Inc.(1) 0.50% 15/12/2026 1,220 1,293,367 0.19% Western Digital Corp. 1.50% 01/02/2024 788 793,418 0.11% 2,086,785 0.30% Energy-Alternate Sources Enphase Energy, Inc.(1) 1.00% 01/06/2024 430 781,310 0.11% SunPower Corp. 0.875% 01/06/2021 243 232,326 0.04% SunPower Corp. 4.00% 15/01/2023 1,365 1,218,263 0.17% 2,231,899 0.32% Entertainment Live Nation Entertainment, Inc.(1) 2.00% 15/02/2025 440 446,380 0.06%
134

LORD ABBETT PASSPORT PORTFOLIOS PLC MULTI-SECTOR INCOME FUND Schedule of Investments as at 31 January 2020 (Continued)
Interest Maturity Principal Fair
Value % of Net Investments Rate Date (000) USD Assets Convertible Bonds - 8.09% (31 January 2019: 6.89%) (Continued) Entertainment (continued) Live Nation Entertainment, Inc.(1) 2.50% 15/03/2023 1,000 1,191,752 0.17% 1,638,132 0.23% Healthcare-Products CONMED Corp.(1) 2.625% 01/02/2024 511 657,913 0.09% Insulet Corp.(1) 0.375% 01/09/2026 175 197,071 0.03% Insulet Corp. 1.375% 15/11/2024 499 1,062,071 0.15% Nevro Corp. 1.75% 01/06/2021 727 1,080,313 0.15% Repligen Corp. 0.375% 15/07/2024 925 1,028,160 0.15% 4,025,528 0.57% Healthcare-Services Teladoc Health, Inc. 3.00% 15/12/2022 315 751,373 0.11% Home Builders Winnebago Industries, Inc.(1) 1.50% 01/04/2025 630 697,599 0.10% Internet FireEye, Inc. 1.625% 01/06/2035 719 698,311 0.10% IAC FinanceCo, Inc.(1) 0.875% 01/10/2022 375 630,537 0.09% MercadoLibre, Inc. 2.00% 15/08/2028 420 708,601 0.10% Okta, Inc.(1) 0.125% 01/09/2025 1,033 1,048,237 0.15% Q2 Holdings, Inc.(1) 0.75% 01/06/2026 576 693,699 0.10% Snap, Inc.(1) 0.75% 01/08/2026 944 1,053,097 0.15% Trip.com Group Ltd. 1.00% 01/07/2020 2,767 2,740,180 0.38% Twitter, Inc. 1.00% 15/09/2021 375 367,191 0.05% Weibo Corp. 1.25% 15/11/2022 3,255 3,112,757 0.44% 11,052,610 1.56% Lodging Huazhu Group Ltd. 0.375% 01/11/2022 561 593,258 0.08% Oil & Gas Oasis Petroleum, Inc. 2.625% 15/09/2023 600 427,698 0.06% SM Energy Co. 1.50% 01/07/2021 665 642,495 0.09% 1,070,193 0.15% Pharmaceuticals Canopy Growth Corp.(1) 4.25% 15/07/2023 CAD 913 635,969 0.09% DexCom, Inc.(1) 0.75% 01/12/2023 980 1,557,588 0.22% Neurocrine Biosciences, Inc. 2.25% 15/05/2024 475 689,349 0.10% Sarepta Therapeutics, Inc. 1.50% 15/11/2024 170 304,640 0.04% 3,187,546 0.45% Real Estate Redfin Corp. 1.75% 15/07/2023 520 560,147 0.08% REITS Extra Space Storage LP(1) 3.125% 01/10/2035 552 672,422 0.09% IH Merger Sub LLC 3.50% 15/01/2022 481 675,735 0.10% 1,348,157 0.19%
135

LORD ABBETT PASSPORT PORTFOLIOS PLC MULTI-SECTOR INCOME FUND Schedule of Investments as at 31 January 2020 (Continued)
Interest Maturity Principal Fair
Value % of Net Investments Rate Date (000) USD Assets Convertible Bonds - 8.09% (31 January 2019: 6.89%) (Continued) Retail RH ZCP 15/06/2023 797 995,772 0.14% Semiconductors Advanced Micro Devices, Inc. 2.125% 01/09/2026 161 953,776 0.13% Inphi Corp. 1.125% 01/12/2020 370 711,868 0.10% Microchip Technology, Inc. 1.625% 15/02/2025 875 1,752,016 0.25% Micron Technology, Inc. 3.125% 01/05/2032 50 266,457 0.04% Novellus Systems, Inc. 2.625% 15/05/2041 92 856,136 0.12% ON Semiconductor Corp. 1.00% 01/12/2020 494 645,781 0.09% Teradyne, Inc. 1.25% 15/12/2023 496 1,058,323 0.15% 6,244,357 0.88% Software Akamai Technologies, Inc.(1) 0.375% 01/09/2027 1,025 1,052,075 0.15% Alteryx, Inc.(1) 1.00% 01/08/2026 656 707,597 0.10% Coupa Software, Inc.(1) 0.125% 15/06/2025 1,000 1,258,750 0.18% DocuSign, Inc. 0.50% 15/09/2023 751 968,266 0.14% Everbridge, Inc.(1) 0.125% 15/12/2024 840 897,191 0.13% Five9, Inc.(1) 0.125% 01/05/2023 451 821,050 0.11% LivePerson, Inc.(1) 0.75% 01/03/2024 815 1,040,317 0.15% MongoDB, Inc.(1) 0.25% 15/01/2026 350 379,068 0.05% RingCentral, Inc. ZCP 15/03/2023 378 955,001 0.13% ServiceNow, Inc. ZCP 01/06/2022 309 773,852 0.11% Zynga, Inc.(1) 0.25% 01/06/2024 666 682,758 0.10% 9,535,925 1.35% Telecommunications GDS Holdings Ltd. 2.00% 01/06/2025 667 809,611 0.11% Transportation Scorpio Tankers, Inc. 3.00% 15/05/2022 631 635,654 0.09% Total Convertible Bonds 57,300,020 8.09% Corporate Bonds - 58.85% (31 January 2019: 64.71%) Aerospace/Defense Signature Aviation US Holdings, Inc.(1) 4.00% 01/03/2028 1,370 1,357,557 0.19% Signature Aviation US Holdings, Inc.(1) 5.375% 01/05/2026 319 330,621 0.05% TransDigm, Inc.(1) 6.25% 15/03/2026 787 850,254 0.12% TransDigm, Inc. 6.375% 15/06/2026 1,402 1,479,951 0.21% United Technologies Corp. 4.125% 16/11/2028 1,287 1,482,870 0.21% 5,501,253 0.78% Agriculture MHP Lux SA(1) 6.95% 03/04/2026 638 667,998 0.09% Airlines Air Canada 2013-1 Class A Pass Through Trust(1) 4.125% 15/05/2025 192 207,844 0.03% Azul Investments LLP(1) 5.875% 26/10/2024 1,461 1,527,351 0.22% British Airways 2018-1 Class A Pass Through Trust(1) 4.125% 20/09/2031 191 207,705 0.03% British Airways 2018-1 Class AA Pass Through Trust(1) 3.80% 20/09/2031 66 71,654 0.01%
136

LORD ABBETT PASSPORT PORTFOLIOS PLC MULTI-SECTOR INCOME FUND Schedule of Investments as at 31 January 2020 (Continued)
Interest Maturity Principal Fair
Value % of Net Investments Rate Date (000) USD Assets Corporate Bonds - 58.85% (31 January 2019: 64.71%) (Continued) Airlines (continued) British Airways 2019-1 Class A Pass Through Trust(1) 3.35% 15/06/2029 431 459,235 0.06% British Airways 2019-1 Class AA Pass Through Trust(1) 3.30% 15/12/2032 1,059 1,132,961 0.16% Delta Air Lines 2019-1 Class AA Pass Through Trust 3.204% 25/04/2024 521 551,127 0.08% Delta Air Lines, Inc. 3.75% 28/10/2029 953 962,930 0.14% JetBlue 2019-1 Class A Pass Through Trust 2.95% 15/05/2028 481 494,393 0.07% United Airlines 2019-2 Class AA Pass Through Trust 2.70% 01/05/2032 574 597,007 0.08% 6,212,207 0.88% Apparel Under Armour, Inc. 3.25% 15/06/2026 536 525,662 0.07% Auto Manufacturers Aston Martin Capital Holdings Ltd. 5.75% 15/04/2022 GBP 550 713,424 0.10% Aston Martin Capital Holdings Ltd.(1) 6.50% 15/04/2022 842 831,029 0.12% BCD Acquisition, Inc.(1) 9.625% 15/09/2023 838 872,559 0.12% BMW US Capital LLC(1) 3.10% 12/04/2021 321 326,418 0.05% Tesla, Inc.(1) 5.30% 15/08/2025 4,409 4,464,157 0.63% 7,207,587 1.02% Auto Parts & Equipment Adient Global Holdings Ltd.(1) 4.875% 15/08/2026 792 748,420 0.11% Adient US LLC(1) 7.00% 15/05/2026 1,102 1,206,000 0.17% Panther BF Aggregator 2 LP/Panther Finance Co., Inc.(1) 8.50% 15/05/2027 363 390,897 0.05% 2,345,317 0.33% Banks ABN AMRO Bank NV(1) 4.75% 28/07/2025 1,211 1,341,886 0.19% AIB Group PLC(1) 4.263%(3) 10/04/2025 990 1,059,436 0.15% AIB Group PLC(1) 4.75% 12/10/2023 1,465 1,590,991 0.22% ANZ New Zealand Int'l Ltd./London(1) 2.125% 28/07/2021 400 402,642 0.06% Associated Banc-Corp. 4.25% 15/01/2025 53 57,157 0.01% Australia & New Zealand Banking Group Ltd./United Kingdom(1) 6.75%(3) - (4) 400 459,834 0.06% Banco Mercantil del Norte SA/Grand Cayman(1) 7.625%(3) - (4) 655 735,418 0.10% Bancolombia SA 3.00% 29/01/2025 1,020 1,027,405 0.14% Bank Leumi Le-Israel BM(1) 3.275%(3) 29/01/2031 712 713,157 0.10% Bank of America Corp. 2.369%(3) 21/07/2021 2,245 2,251,304 0.32% Bank of America Corp. 4.45% 03/03/2026 1,050 1,174,352 0.17% Bank of Ireland Group PLC(1) 4.50% 25/11/2023 1,224 1,319,581 0.19% BankUnited, Inc. 4.875% 17/11/2025 685 766,062 0.11% BBVA Bancomer SA/Texas(1) 5.125%(3) 18/01/2033 1,377 1,468,274 0.21% BBVA USA 3.875% 10/04/2025 1,250 1,331,279 0.19% CIT Group, Inc. 5.25% 07/03/2025 247 271,597 0.04% CIT Group, Inc. 6.125% 09/03/2028 1,610 1,921,378 0.27% Citigroup, Inc. 4.45% 29/09/2027 302 339,765 0.05% Fifth Third Bancorp 8.25% 01/03/2038 81 132,180 0.02% Global Bank Corp.(1) 5.25%(3) 16/04/2029 2,164 2,368,282 0.33% Goldman Sachs Group, Inc. 3.50% 16/11/2026 853 910,764 0.13%
137

LORD ABBETT PASSPORT PORTFOLIOS PLC MULTI-SECTOR INCOME FUND Schedule of Investments as at 31 January 2020 (Continued)
Interest Maturity Principal Fair
Value % of Net Investments Rate Date (000) USD Assets Corporate Bonds - 58.85% (31 January 2019: 64.71%) (Continued) Banks (continued) Goldman Sachs Group, Inc. 4.25% 21/10/2025 875 967,433 0.14% Home BancShares, Inc./AR 5.625%(3) 15/04/2027 440 456,587 0.06% Huntington Bancshares, Inc./OH 5.70%(3) - (4) 542 568,834 0.08% Huntington National Bank 3.125% 01/04/2022 617 634,442 0.09% Intesa Sanpaolo SpA(1) 5.71% 15/01/2026 1,825 2,030,010 0.29% JPMorgan Chase & Co. 3.54%(3) 01/05/2028 675 730,831 0.10% JPMorgan Chase & Co. 3.90% 15/07/2025 151 165,638 0.02% JPMorgan Chase & Co. 6.10%(3) - (4) 330 364,355 0.05% Macquarie Bank Ltd./London(1) 6.125%(3) - (4) 1,500 1,595,002 0.22% Morgan Stanley 3.125% 27/07/2026 315 333,854 0.05% Morgan Stanley 3.625% 20/01/2027 1,031 1,118,647 0.16% Popular, Inc. 6.125% 14/09/2023 761 819,342 0.12% Santander UK Group Holdings PLC(1) 4.75% 15/09/2025 1,482 1,619,585 0.23% US Bancorp 3.00% 30/07/2029 407 429,533 0.06% Webster Financial Corp. 4.10% 25/03/2029 1,198 1,312,980 0.18% Westpac Banking Corp. 4.11%(3) 24/07/2034 580 624,812 0.09% 35,414,629 5.00% Beverages Bacardi Ltd.(1) 2.75% 15/07/2026 450 455,977 0.06% Bacardi Ltd.(1) 4.70% 15/05/2028 1,276 1,444,980 0.20% Becle SAB de CV(1) 3.75% 13/05/2025 310 324,979 0.05% Brown-Forman Corp. 3.50% 15/04/2025 208 225,777 0.03% Brown-Forman Corp. 4.50% 15/07/2045 1,026 1,330,953 0.19% PepsiCo, Inc. 3.60% 01/03/2024 827 890,994 0.13% Suntory Holdings Ltd.(1) 2.25% 16/10/2024 1,552 1,567,481 0.22% 6,241,141 0.88% Building Materials Griffon Corp. 5.25% 01/03/2022 322 322,442 0.05% Norbord, Inc.(1) 6.25% 15/04/2023 283 307,172 0.04% Owens Corning 4.30% 15/07/2047 1,443 1,506,762 0.21% Owens Corning 4.40% 30/01/2048 584 615,190 0.09% Vulcan Materials Co. 4.50% 15/06/2047 1,405 1,630,014 0.23% 4,381,580 0.62% Chemicals CF Industries, Inc.(1) 4.50% 01/12/2026 526 581,465 0.08% CF Industries, Inc. 5.15% 15/03/2034 859 993,734 0.14% CNAC HK Finbridge Co. Ltd. 4.125% 19/07/2027 1,477 1,592,717 0.23% FMC Corp. 3.45% 01/10/2029 440 469,458 0.07% OCI NV(1) 6.625% 15/04/2023 295 307,242 0.04% Rain CII Carbon LLC/CII Carbon Corp.(1) 7.25% 01/04/2025 663 658,021 0.09% Yingde Gases Investment Ltd.(1) 6.25% 19/01/2023 1,196 1,251,360 0.18% 5,853,997 0.83% Coal Warrior Met Coal, Inc.(1) 8.00% 01/11/2024 411 426,669 0.06% Commercial Services Adani Ports & Special Economic Zone Ltd.(1) 4.375% 03/07/2029 764 808,681 0.11% Ahern Rentals, Inc.(1) 7.375% 15/05/2023 816 649,059 0.09% Ashtead Capital, Inc.(1) 4.25% 01/11/2029 721 748,939 0.11%
138

LORD ABBETT PASSPORT PORTFOLIOS PLC MULTI-SECTOR INCOME FUND Schedule of Investments as at 31 January 2020 (Continued)
Interest Maturity Principal Fair
Value % of Net Investments Rate Date (000) USD Assets Corporate Bonds - 58.85% (31 January 2019: 64.71%) (Continued) Commercial Services (continued) Ashtead Capital, Inc.(1) 4.375% 15/08/2027 622 646,309 0.09% Autopistas del Sol SA/Costa Rica(1) 7.375% 30/12/2030 639 662,554 0.09% Brink's Co.(1) 4.625% 15/10/2027 1,249 1,276,881 0.18% Cleveland Clinic Foundation 4.858% 01/01/2114 40 55,514 0.01% Global Payments, Inc. 4.15% 15/08/2049 693 790,247 0.11% IHS Markit Ltd.(1) 4.00% 01/03/2026 1,454 1,566,685 0.22% IHS Markit Ltd. 4.25% 01/05/2029 571 637,236 0.09% IHS Markit Ltd. 4.75% 01/08/2028 804 924,393 0.13% ITR Concession Co. LLC(1) 5.183% 15/07/2035 157 166,736 0.02% Mersin Uluslararasi Liman Isletmeciligi AS(1) 5.375% 15/11/2024 817 863,294 0.12% Metropolitan Museum of Art 3.40% 01/07/2045 629 694,592 0.10% MPH Acquisition Holdings LLC(1) 7.125% 01/06/2024 664 644,817 0.09% Ritchie Bros Auctioneers, Inc.(1) 5.375% 15/01/2025 302 314,332 0.04% United Rentals North America, Inc. 4.625% 15/10/2025 187 191,481 0.03% United Rentals North America, Inc. 4.875% 15/01/2028 1,004 1,048,527 0.15% United Rentals North America, Inc. 5.875% 15/09/2026 42 44,784 0.01% Verscend Escrow Corp.(1) 9.75% 15/08/2026 1,098 1,196,847 0.17% WW International, Inc.(1) 8.625% 01/12/2025 534 559,587 0.08% 14,491,495 2.04% Computers Apple, Inc. 1.80% 11/09/2024 719 724,025 0.10% Apple, Inc. 3.00% 20/06/2027 908 971,696 0.13% Banff Merger Sub, Inc.(1) 9.75% 01/09/2026 610 627,431 0.09% Everi Payments, Inc.(1) 7.50% 15/12/2025 382 408,899 0.06% Western Digital Corp. 4.75% 15/02/2026 848 906,830 0.13% 3,638,881 0.51% Cosmetics/Personal Care Coty, Inc.(1) 6.50% 15/04/2026 1,256 1,312,551 0.19% Distribution/Wholesale Performance Food Group, Inc.(1) 5.50% 15/10/2027 833 878,836 0.12% Diversified Financial Services AerCap Ireland Capital DAC/AerCap Global Aviation Trust 4.45% 03/04/2026 351 383,370 0.05% AG Issuer LLC(1) 6.25% 01/03/2028 310 310,000 0.04% Aircastle Ltd. 4.25% 15/06/2026 401 430,335 0.06% Ally Financial, Inc. 4.625% 30/03/2025 1,335 1,471,524 0.21% Ally Financial, Inc. 8.00% 01/11/2031 1,435 2,026,808 0.29% CSN Islands XI Corp.(1) 6.75% 28/01/2028 1,094 1,085,795 0.15% GE Capital International Funding Co. Unlimited Co. 2.342% 15/11/2020 2,339 2,347,406 0.33% Global Aircraft Leasing Co. Ltd. PIK(1) 6.50% 15/09/2024 1,354 1,388,595 0.20% Navient Corp. 5.00% 15/03/2027 1,138 1,138,000 0.16% Navient Corp. 6.125% 25/03/2024 695 742,128 0.10% Navient Corp. 6.75% 25/06/2025 1,937 2,113,751 0.30% Navient Corp. 6.75% 15/06/2026 1,091 1,187,117 0.17% Neuberger Berman Group LLC/Neuberger Berman Finance Corp.(1) 4.875% 15/04/2045 632 688,326 0.10% Nuveen Finance LLC(1) 4.125% 01/11/2024 140 154,172 0.02% Power Finance Corp. Ltd. 3.75% 06/12/2027 515 518,548 0.07% Power Finance Corp. Ltd.(1) 6.15% 06/12/2028 1,000 1,171,114 0.17%
139

LORD ABBETT PASSPORT PORTFOLIOS PLC MULTI-SECTOR INCOME FUND Schedule of Investments as at 31 January 2020 (Continued)
Interest Maturity Principal Fair
Value % of Net Investments Rate Date (000) USD Assets Corporate Bonds - 58.85% (31 January 2019: 64.71%) (Continued) Diversified Financial Services (continued) Quicken Loans, Inc.(1) 5.25% 15/01/2028 664 688,782 0.10% Springleaf Finance Corp. 5.375% 15/11/2029 844 879,237 0.12% Visa, Inc. 3.15% 14/12/2025 339 364,528 0.05% 19,089,536 2.69% Electric Acwa Power Management And Investments One Ltd.(1) 5.95% 15/12/2039 400 436,174 0.06% Adani Renewable Energy RJ Ltd./Kodangal Solar Parks Pvt Ltd./Wardha Solar Maharash(1) 4.625% 15/10/2039 290 295,292 0.04% Adani Transmission Ltd.(1) 4.25% 21/05/2036 492 497,309 0.07% AES Corp./VA 4.50% 15/03/2023 596 608,877 0.09% AES Corp./VA 5.125% 01/09/2027 293 309,862 0.04% Arizona Public Service Co. 2.95% 15/09/2027 216 227,812 0.03% Atlantic City Electric Co. 4.00% 15/10/2028 306 349,895 0.05% Ausgrid Finance Pty Ltd.(1) 4.35% 01/08/2028 324 361,985 0.05% Avangrid, Inc. 3.80% 01/06/2029 212 231,190 0.03% Black Hills Corp. 4.35% 01/05/2033 302 351,732 0.05% Clearway Energy Operating LLC(1) 4.75% 15/03/2028 339 349,373 0.05% Clearway Energy Operating LLC 5.75% 15/10/2025 356 374,898 0.05% Dayton Power & Light Co.(1) 3.95% 15/06/2049 289 319,223 0.05% DPL, Inc.(1) 4.35% 15/04/2029 968 965,170 0.14% DTE Energy Co. 2.60% 15/06/2022 289 293,722 0.04% EL Paso Electric Co. 5.00% 01/12/2044 433 515,355 0.07% Electricite de France SA(1) 3.625% 13/10/2025 456 493,835 0.07% Electricite de France SA(1) 4.50% 21/09/2028 493 563,585 0.08% Empresa de Transmision Electrica SA(1) 5.125% 02/05/2049 420 493,372 0.07% Empresas Publicas de Medellin ESP(1) 4.25% 18/07/2029 277 291,847 0.04% Enel Finance International NV(1) 2.65% 10/09/2024 912 930,969 0.13% Enel Finance International NV(1) 3.50% 06/04/2028 1,423 1,504,172 0.21% Entergy Arkansas LLC 4.00% 01/06/2028 422 471,624 0.07% Entergy Arkansas LLC 4.95% 15/12/2044 801 868,186 0.12% Entergy Louisiana LLC 4.00% 15/03/2033 250 293,972 0.04% Entergy Mississippi LLC 2.85% 01/06/2028 388 408,117 0.06% Indianapolis Power & Light Co.(1) 4.05% 01/05/2046 549 650,756 0.09% Louisville Gas & Electric Co. 4.375% 01/10/2045 901 1,090,806 0.15% Monongahela Power Co.(1) 3.55% 15/05/2027 307 328,752 0.05% NextEra Energy Operating Partners LP(1) 3.875% 15/10/2026 1,806 1,827,444 0.26% NextEra Energy Operating Partners LP(1) 4.50% 15/09/2027 999 1,044,132 0.15% NRG Energy, Inc.(1) 3.75% 15/06/2024 965 1,009,546 0.14% NRG Energy, Inc.(1) 5.25% 15/06/2029 627 676,846 0.10% NRG Energy, Inc. 5.75% 15/01/2028 1,967 2,120,721 0.30% NSG Holdings LLC/NSG Holdings, Inc.(1) 7.75% 15/12/2025 678 759,284 0.11% Ohio Power Co. 4.00% 01/06/2049 366 433,476 0.06% Ohio Power Co. 4.15% 01/04/2048 259 313,702 0.05% Oklahoma Gas & Electric Co. 3.85% 15/08/2047 343 380,608 0.05% Oklahoma Gas & Electric Co. 4.15% 01/04/2047 197 228,533 0.03% Puget Sound Energy, Inc. 4.223% 15/06/2048 303 374,664 0.05% Rochester Gas & Electric Corp.(1) 3.10% 01/06/2027 314 331,001 0.05% Sierra Pacific Power Co. 2.60% 01/05/2026 228 236,114 0.03% State Grid Overseas Investment 2016 Ltd.(1) 3.50% 04/05/2027 1,764 1,893,325 0.27%
140

LORD ABBETT PASSPORT PORTFOLIOS PLC MULTI-SECTOR INCOME FUND Schedule of Investments as at 31 January 2020 (Continued)
Interest Maturity Principal Fair
Value % of Net Investments Rate Date (000) USD Assets Corporate Bonds - 58.85% (31 January 2019: 64.71%) (Continued) Electric (continued) Vistra Operations Co. LLC(1) 4.30% 15/07/2029 484 498,981 0.07% 27,006,239 3.81% Electrical Component & Equipment Energizer Holdings, Inc.(1) 6.375% 15/07/2026 541 577,193 0.08% Electronics Allegion PLC 3.50% 01/10/2029 390 410,650 0.06% Amphenol Corp. 2.80% 15/02/2030 1,506 1,535,070 0.21% Itron, Inc.(1) 5.00% 15/01/2026 455 474,496 0.07% Roper Technologies, Inc. 4.20% 15/09/2028 1,263 1,429,540 0.20% Trimble, Inc. 4.75% 01/12/2024 1,347 1,482,095 0.21% 5,331,851 0.75% Energy-Alternate Sources Greenko Solar Mauritius Ltd.(1) 5.95% 29/07/2026 593 608,278 0.09% TerraForm Power Operating LLC(1) 4.75% 15/01/2030 1,027 1,084,153 0.15% TerraForm Power Operating LLC(1) 5.00% 31/01/2028 862 932,555 0.13% 2,624,986 0.37% Engineering & Construction Aeropuerto Internacional de Tocumen SA(1) 6.00% 18/11/2048 515 652,281 0.09% Brand Industrial Services, Inc.(1) 8.50% 15/07/2025 757 760,679 0.11% Promontoria Holding 264 BV(1) 6.75% 15/08/2023 EUR 649 660,353 0.09% 2,073,313 0.29% Entertainment Eldorado Resorts, Inc. 6.00% 01/04/2025 164 171,956 0.02% Eldorado Resorts, Inc. 6.00% 15/09/2026 306 336,026 0.05% Jacobs Entertainment, Inc.(1) 7.875% 01/02/2024 173 183,849 0.03% Mohegan Gaming & Entertainment(1) 7.875% 15/10/2024 1,207 1,233,657 0.17% Penn National Gaming, Inc.(1) 5.625% 15/01/2027 1,658 1,744,966 0.25% Scientific Games International, Inc.(1) 7.00% 15/05/2028 1,160 1,225,221 0.17% Scientific Games International, Inc.(1) 7.25% 15/11/2029 574 616,677 0.09% Stars Group Holdings BV/Stars Group US Co.-Borrower LLC(1) 7.00% 15/07/2026 417 453,738 0.06% 5,966,090 0.84% Environmental Control Waste Pro USA, Inc.(1) 5.50% 15/02/2026 333 342,883 0.05% Food Arcor SAIC(1) 6.00% 06/07/2023 1,005 987,161 0.14% BRF SA(1) 4.875% 24/01/2030 588 605,346 0.09% Chobani LLC/Chobani Finance Corp., Inc.(1) 7.50% 15/04/2025 1,166 1,162,630 0.16% FAGE International SA/FAGE USA Dairy Industry, Inc.(1) 5.625% 15/08/2026 831 773,119 0.11% JBS USA LUX SA/JBS USA Finance, Inc.(1) 6.75% 15/02/2028 1,228 1,362,294 0.19% Lamb Weston Holdings, Inc.(1) 4.625% 01/11/2024 300 315,626 0.05% McCormick & Co., Inc./MD 4.20% 15/08/2047 993 1,168,276 0.17% Seven & i Holdings Co. Ltd.(1) 3.35% 17/09/2021 1,129 1,159,536 0.16%
141

LORD ABBETT PASSPORT PORTFOLIOS PLC MULTI-SECTOR INCOME FUND Schedule of Investments as at 31 January 2020 (Continued)
Interest Maturity Principal Fair
Value % of Net Investments Rate Date (000) USD Assets Corporate Bonds - 58.85% (31 January 2019: 64.71%) (Continued) Food (continued) Smithfield Foods, Inc.(1) 5.20% 01/04/2029 1,333 1,510,586 0.21% 9,044,574 1.28% Gas Brooklyn Union Gas Co.(1) 3.407% 10/03/2026 279 295,610 0.04% Dominion Energy Gas Holdings LLC 3.60% 15/12/2024 211 224,781 0.03% ONE Gas, Inc. 4.50% 01/11/2048 303 388,077 0.06% Southern Star Central Corp.(1) 5.125% 15/07/2022 87 88,263 0.01% 996,731 0.14% Healthcare-Products Boston Scientific Corp. 7.00% 15/11/2035 395 572,061 0.08% Edwards Lifesciences Corp. 4.30% 15/06/2028 1,554 1,767,041 0.25% 2,339,102 0.33% Healthcare-Services AHP Health Partners, Inc.(1) 9.75% 15/07/2026 707 772,643 0.11% Ascension Health 3.945% 15/11/2046 544 661,710 0.09% Centene Corp.(1) 4.25% 15/12/2027 668 699,296 0.10% Centene Corp.(1) 4.625% 15/12/2029 1,221 1,316,421 0.19% Centene Corp. 4.75% 15/01/2025 175 181,198 0.03% Centene Corp.(1) 5.375% 01/06/2026 520 554,112 0.08% DaVita, Inc. 5.00% 01/05/2025 711 730,257 0.10% Hadrian Merger Sub, Inc.(1) 8.50% 01/05/2026 1,284 1,322,966 0.19% HCA, Inc. 5.50% 15/06/2047 6,079 7,233,479 1.02% HCA, Inc. 7.05% 01/12/2027 11 12,856 0.00% HCA, Inc. 7.58% 15/09/2025 30 35,775 0.00% HCA, Inc. 7.69% 15/06/2025 61 74,351 0.01% HCA, Inc. 8.36% 15/04/2024 12 14,550 0.00% Kaiser Foundation Hospitals 4.15% 01/05/2047 224 274,565 0.04% Memorial Sloan-Kettering Cancer Center 4.20% 01/07/2055 643 809,473 0.11% Molina Healthcare, Inc.(1) 4.875% 15/06/2025 483 494,068 0.07% Montefiore Obligated Group 5.246% 01/11/2048 405 484,763 0.07% Mount Sinai Hospitals Group, Inc. 3.737% 01/07/2049 771 844,836 0.12% New York & Presbyterian Hospital 4.063% 01/08/2056 152 185,431 0.03% NYU Langone Hospitals 4.368% 01/07/2047 224 266,811 0.04% Providence St Joseph Health Obligated Group 2.532% 01/10/2029 502 511,339 0.07% RegionalCare Hospital Partners Holdings, Inc./LifePoint Health, Inc.(1) 9.75% 01/12/2026 842 942,009 0.13% Surgery Center Holdings, Inc.(1) 10.00% 15/04/2027 566 633,610 0.09% Tenet Healthcare Corp.(1) 4.875% 01/01/2026 421 438,366 0.06% Tenet Healthcare Corp. 5.125% 01/05/2025 670 683,400 0.10% Tenet Healthcare Corp.(1) 6.25% 01/02/2027 1,171 1,239,913 0.17% Tenet Healthcare Corp. 6.75% 15/06/2023 694 756,172 0.11% 22,174,370 3.13% Holding Companies-Diversified Stena AB(1) 7.00% 01/02/2024 875 900,519 0.13% Home Builders Beazer Homes USA, Inc.(1) 7.25% 15/10/2029 528 578,173 0.08% Lennar Corp. 4.75% 15/11/2022 77 81,276 0.01% Lennar Corp. 4.75% 30/05/2025 400 437,610 0.06%
142

LORD ABBETT PASSPORT PORTFOLIOS PLC MULTI-SECTOR INCOME FUND Schedule of Investments as at 31 January 2020 (Continued)
Interest Maturity Principal Fair
Value % of Net Investments Rate Date (000) USD Assets Corporate Bonds - 58.85% (31 January 2019: 64.71%) (Continued) Home Builders (continued) Lennar Corp. 4.75% 29/11/2027 173 191,918 0.03% PulteGroup, Inc. 5.00% 15/01/2027 460 509,368 0.07% PulteGroup, Inc. 6.375% 15/05/2033 1,101 1,335,757 0.19% PulteGroup, Inc. 7.875% 15/06/2032 355 476,956 0.07% Shea Homes LP/Shea Homes Funding Corp.(1) 6.125% 01/04/2025 327 337,763 0.05% Toll Brothers Finance Corp. 4.875% 15/03/2027 1,260 1,388,807 0.19% Toll Brothers Finance Corp. 5.625% 15/01/2024 319 351,830 0.05% 5,689,458 0.80% Home Furnishings Leggett & Platt, Inc. 4.40% 15/03/2029 1,273 1,423,612 0.20% Household Products/Wares SC Johnson & Son, Inc.(1) 4.75% 15/10/2046 250 318,500 0.05% Housewares Newell Brands, Inc. 4.20% 01/04/2026 3,279 3,428,770 0.48% Insurance Allstate Corp. 3.28% 15/12/2026 373 402,900 0.06% Arch Capital Finance LLC 4.011% 15/12/2026 140 157,869 0.02% Assurant, Inc. 3.70% 22/02/2030 452 477,153 0.07% AXIS Specialty Finance PLC 5.15% 01/04/2045 728 842,522 0.12% Berkshire Hathaway, Inc. 2.75% 15/03/2023 36 37,247 0.00% Berkshire Hathaway, Inc. 3.125% 15/03/2026 411 440,494 0.06% Farmers Insurance Exchange(1) 4.747%(3) 01/11/2057 360 381,007 0.05% Fidelity National Financial, Inc. 4.50% 15/08/2028 1,303 1,462,692 0.21% HUB International Ltd.(1) 7.00% 01/05/2026 637 657,687 0.09% MGIC Investment Corp. 5.75% 15/08/2023 308 341,238 0.05% Northwestern Mutual Life Insurance Co.(1) 3.85% 30/09/2047 676 754,531 0.11% PartnerRe Finance B LLC 3.70% 02/07/2029 726 794,649 0.11% Selective Insurance Group, Inc. 5.375% 01/03/2049 443 554,450 0.08% Teachers Insurance & Annuity Association of America(1) 4.27% 15/05/2047 411 491,956 0.07% Teachers Insurance & Annuity Association of America(1) 4.90% 15/09/2044 259 332,855 0.05% Transatlantic Holdings, Inc. 8.00% 30/11/2039 408 654,819 0.09% 8,784,069 1.24% Internet Amazon.com, Inc. 3.15% 22/08/2027 979 1,060,040 0.15% Amazon.com, Inc. 4.25% 22/08/2057 1,094 1,406,072 0.20% Amazon.com, Inc. 4.80% 05/12/2034 1,592 2,052,908 0.29% Amazon.com, Inc. 5.20% 03/12/2025 1,707 2,015,009 0.28% Go Daddy Operating Co. LLC/GD Finance Co., Inc.(1) 5.25% 01/12/2027 423 444,404 0.06% GrubHub Holdings, Inc.(1) 5.50% 01/07/2027 694 678,801 0.10% JD.com, Inc. 3.375% 14/01/2030 662 678,804 0.10% JD.com, Inc. 4.125% 14/01/2050 230 248,128 0.04% Match Group, Inc.(1) 5.00% 15/12/2027 812 854,912 0.12% Netflix, Inc. 3.625% 15/05/2027 EUR 1,015 1,202,042 0.17% Netflix, Inc. 3.625% 15/06/2030 EUR 476 548,569 0.08% Netflix, Inc. 3.875% 15/11/2029 EUR 924 1,082,618 0.15%
143

LORD ABBETT PASSPORT PORTFOLIOS PLC MULTI-SECTOR INCOME FUND Schedule of Investments as at 31 January 2020 (Continued)
Interest Maturity Principal Fair
Value % of Net Investments Rate Date (000) USD Assets Corporate Bonds - 58.85% (31 January 2019: 64.71%) (Continued) Internet (continued) Netflix, Inc. 4.625% 15/05/2029 EUR 554 685,799 0.10% Netflix, Inc. 4.875% 15/04/2028 1,019 1,092,903 0.15% Netflix, Inc. 5.50% 15/02/2022 30 31,765 0.00% Prosus NV(1) 3.68% 21/01/2030 1,240 1,277,136 0.18% Tencent Holdings Ltd.(1) 3.595% 19/01/2028 782 835,889 0.12% Tencent Holdings Ltd.(1) 3.925% 19/01/2038 1,026 1,154,974 0.16% Uber Technologies, Inc.(1) 8.00% 01/11/2026 610 649,758 0.09% VeriSign, Inc. 4.75% 15/07/2027 470 496,719 0.07% VeriSign, Inc. 5.25% 01/04/2025 537 592,357 0.08% 19,089,607 2.69% Investment Companies MDGH - GMTN BV(1) 3.70% 07/11/2049 927 970,461 0.14% Iron/Steel Allegheny Technologies, Inc. 7.875% 15/08/2023 355 389,536 0.05% Baffinland Iron Mines Corp./Baffinland Iron Mines LP(1) 8.75% 15/07/2026 1,216 1,265,430 0.18% CSN Resources SA(1) 7.625% 17/04/2026 650 683,901 0.10% 2,338,867 0.33% Leisure Time Royal Caribbean Cruises Ltd. 7.50% 15/10/2027 725 931,823 0.13% Silversea Cruise Finance Ltd.(1) 7.25% 01/02/2025 430 454,990 0.06% Viking Cruises Ltd.(1) 5.875% 15/09/2027 667 684,942 0.10% 2,071,755 0.29% Lodging Boyd Gaming Corp. 6.00% 15/08/2026 317 337,715 0.05% Hilton Domestic Operating Co., Inc. 4.875% 15/01/2030 530 561,706 0.08% Hilton Domestic Operating Co., Inc. 5.125% 01/05/2026 629 660,480 0.09% Las Vegas Sands Corp. 3.90% 08/08/2029 464 488,879 0.07% Station Casinos LLC(1) 5.00% 01/10/2025 960 984,912 0.14% Wyndham Destinations, Inc. 5.75% 01/04/2027 795 869,807 0.12% Wyndham Destinations, Inc. 6.35% 01/10/2025 272 305,603 0.04% Wynn Macau Ltd.(1) 5.125% 15/12/2029 396 393,030 0.06% Wynn Macau Ltd.(1) 5.50% 01/10/2027 1,213 1,237,233 0.17% 5,839,365 0.82% Machinery-Diversified Cloud Crane LLC(1) 10.125% 01/08/2024 600 640,623 0.09% Dover Corp. 2.95% 04/11/2029 643 672,394 0.10% Frigoglass Finance BV 6.875% 12/02/2025 EUR 1,373 1,521,559 0.21% SPX FLOW, Inc.(1) 5.625% 15/08/2024 172 179,381 0.03% SPX FLOW, Inc.(1) 5.875% 15/08/2026 336 356,277 0.05% Westinghouse Air Brake Technologies Corp. 3.45% 15/11/2026 423 436,949 0.06% Westinghouse Air Brake Technologies Corp. 4.95% 15/09/2028 211 239,101 0.03% Xylem, Inc./NY 3.25% 01/11/2026 56 59,460 0.01% 4,105,744 0.58% Media Altice Financing SA(1) 7.50% 15/05/2026 665 711,916 0.10% Altice Luxembourg SA(1) 10.50% 15/05/2027 706 817,654 0.12%
144

LORD ABBETT PASSPORT PORTFOLIOS PLC MULTI-SECTOR INCOME FUND Schedule of Investments as at 31 January 2020 (Continued)
Interest Maturity Principal Fair
Value % of Net Investments Rate Date (000) USD Assets Corporate Bonds - 58.85% (31 January 2019: 64.71%) (Continued) Media (continued) AMC Networks, Inc. 4.75% 01/08/2025 1,272 1,286,838 0.18% Cable Onda SA(1) 4.50% 30/01/2030 552 571,673 0.08% CCO Holdings LLC/CCO Holdings Capital Corp.(1) 5.125% 01/05/2027 2,727 2,854,760 0.40% CCO Holdings LLC/CCO Holdings Capital Corp.(1) 5.75% 15/02/2026 2,023 2,126,557 0.30% CCO Holdings LLC/CCO Holdings Capital Corp.(1) 5.875% 01/04/2024 1,926 1,991,802 0.28% Clear Channel Worldwide Holdings, Inc.(1) 9.25% 15/02/2024 319 347,976 0.05% CSC Holdings LLC(1) 5.50% 15/04/2027 1,276 1,356,516 0.19% CSC Holdings LLC(1) 5.75% 15/01/2030 448 482,169 0.07% CSC Holdings LLC(1) 6.50% 01/02/2029 432 483,570 0.07% CSC Holdings LLC(1) 10.875% 15/10/2025 380 421,639 0.06% Diamond Sports Group LLC/Diamond Sports Finance Co.(1) 5.375% 15/08/2026 1,087 1,084,800 0.15% Diamond Sports Group LLC/Diamond Sports Finance Co.(1) 6.625% 15/08/2027 1,163 1,089,557 0.15% DISH DBS Corp. 7.75% 01/07/2026 4,909 5,163,532 0.73% GCI LLC 6.875% 15/04/2025 772 808,025 0.11% Gray Television, Inc.(1) 5.875% 15/07/2026 684 716,900 0.10% LCPR Senior Secured Financing DAC(1) 6.75% 15/10/2027 590 625,040 0.09% Nexstar Broadcasting, Inc.(1) 5.625% 15/07/2027 1,645 1,736,544 0.25% Sirius XM Radio, Inc.(1) 5.00% 01/08/2027 827 869,880 0.12% TWDC Enterprises 18 Corp. 2.35% 01/12/2022 518 529,117 0.08% Univision Communications, Inc.(1) 5.125% 15/02/2025 975 975,000 0.14% Ziggo BV(1) 5.50% 15/01/2027 1,608 1,707,455 0.24% 28,758,920 4.06% Metal Fabricate/Hardware Hillman Group, Inc.(1) 6.375% 15/07/2022 536 502,667 0.07% Mining Freeport-McMoRan, Inc. 3.875% 15/03/2023 2,819 2,881,258 0.41% Freeport-McMoRan, Inc. 5.25% 01/09/2029 300 318,555 0.04% Industrias Penoles SAB de CV(1) 4.15% 12/09/2029 488 509,402 0.07% Industrias Penoles SAB de CV(1) 5.65% 12/09/2049 549 604,759 0.09% Joseph T Ryerson & Son, Inc.(1) 11.00% 15/05/2022 127 133,667 0.02% 4,447,641 0.63% Miscellaneous Manufacturer General Electric Co. 2.70% 09/10/2022 1,505 1,534,452 0.22% General Electric Co. 3.10% 09/01/2023 582 601,042 0.08% General Electric Co. 5.00%(3) - (4) 3,321 3,290,298 0.46% Siemens Financieringsmaatschappij NV(1) 3.25% 27/05/2025 574 613,996 0.09% 6,039,788 0.85% Office/Business Equipment CDW LLC/CDW Finance Corp. 5.50% 01/12/2024 358 400,364 0.06% Oil & Gas Apache Corp. 4.25% 15/01/2030 1,214 1,284,909 0.18% Berry Petroleum Co. LLC(1) 7.00% 15/02/2026 686 638,218 0.09% Callon Petroleum Co. 6.125% 01/10/2024 693 664,414 0.09% Cenovus Energy, Inc. 5.40% 15/06/2047 1,434 1,636,373 0.23% Centennial Resource Production LLC(1) 5.375% 15/01/2026 1,388 1,308,672 0.19% Centennial Resource Production LLC(1) 6.875% 01/04/2027 1,129 1,119,627 0.16%
145

LORD ABBETT PASSPORT PORTFOLIOS PLC MULTI-SECTOR INCOME FUND Schedule of Investments as at 31 January 2020 (Continued)
Interest Maturity Principal Fair
Value % of Net Investments Rate Date (000) USD Assets Corporate Bonds - 58.85% (31 January 2019: 64.71%) (Continued) Oil & Gas (continued) Citgo Holding, Inc.(1) 9.25% 01/08/2024 910 975,975 0.14% Endeavor Energy Resources LP/EER Finance, Inc.(1) 5.50% 30/01/2026 430 442,286 0.06% Endeavor Energy Resources LP/EER Finance, Inc.(1) 5.75% 30/01/2028 545 567,808 0.08% Exxon Mobil Corp. 3.043% 01/03/2026 506 538,721 0.08% Hess Corp. 5.60% 15/02/2041 1,368 1,579,735 0.22% Hess Corp. 5.80% 01/04/2047 1,363 1,623,686 0.23% HighPoint Operating Corp. 7.00% 15/10/2022 953 907,439 0.13% Hilcorp Energy I LP/Hilcorp Finance Co.(1) 5.00% 01/12/2024 417 380,686 0.05% Hilcorp Energy I LP/Hilcorp Finance Co.(1) 5.75% 01/10/2025 411 372,812 0.05% Hilcorp Energy I LP/Hilcorp Finance Co.(1) 6.25% 01/11/2028 713 636,600 0.09% Hunt Oil Co. of Peru LLC Sucursal Del Peru(1) 6.375% 01/06/2028 565 613,901 0.09% Indigo Natural Resources LLC(1) 6.875% 15/02/2026 1,218 1,117,545 0.16% Jagged Peak Energy LLC 5.875% 01/05/2026 485 500,701 0.07% Laredo Petroleum, Inc. 10.125% 15/01/2028 1,004 898,429 0.13% MEG Energy Corp.(1) 6.50% 15/01/2025 915 959,034 0.14% MEG Energy Corp.(1) 7.00% 31/03/2024 2,088 2,108,013 0.30% MEG Energy Corp.(1) 7.125% 01/02/2027 850 843,889 0.12% Murphy Oil Corp. 5.75% 15/08/2025 734 757,095 0.11% Murphy Oil Corp. 5.875% 01/12/2027 1,200 1,231,500 0.17% Murphy Oil Corp. 6.875% 15/08/2024 201 209,962 0.03% Nabors Industries Ltd.(1) 7.25% 15/01/2026 402 403,508 0.06% Nabors Industries Ltd.(1) 7.50% 15/01/2028 268 265,990 0.04% Noble Energy, Inc. 3.85% 15/01/2028 747 790,350 0.11% Oasis Petroleum, Inc.(1) 6.25% 01/05/2026 866 662,512 0.09% Oasis Petroleum, Inc. 6.875% 15/03/2022 647 622,738 0.09% Oasis Petroleum, Inc. 6.875% 15/01/2023 721 683,823 0.10% Parsley Energy LLC/Parsley Finance Corp.(1) 5.625% 15/10/2027 851 903,209 0.13% PBF Holding Co. LLC/PBF Finance Corp.(1) 6.00% 15/02/2028 907 929,766 0.13% Rio Oil Finance Trust Series 2018-1(1) 8.20% 06/04/2028 750 879,636 0.12% Saudi Arabian Oil Co.(1) 2.75% 16/04/2022 2,469 2,509,954 0.35% Saudi Arabian Oil Co.(1) 4.375% 16/04/2049 2,429 2,746,910 0.39% Shell International Finance BV 6.375% 15/12/2038 950 1,428,869 0.20% SM Energy Co. 6.625% 15/01/2027 503 456,383 0.06% SM Energy Co. 6.75% 15/09/2026 622 566,581 0.08% SRC Energy, Inc. 6.25% 01/12/2025 972 981,710 0.14% Texaco Capital, Inc. 8.625% 15/11/2031 99 161,658 0.02% Transocean Pontus Ltd.(1) 6.125% 01/08/2025 707 729,619 0.10% Transocean, Inc. 6.80% 15/03/2038 1,461 938,839 0.13% Tullow Oil PLC(1) 7.00% 01/03/2025 474 384,537 0.05% W&T Offshore, Inc.(1) 9.75% 01/11/2023 679 644,568 0.09% WPX Energy, Inc. 5.25% 15/10/2027 590 617,642 0.09% WPX Energy, Inc. 5.75% 01/06/2026 279 292,900 0.04% 42,519,732 6.00% Oil & Gas Services Oceaneering International, Inc. 4.65% 15/11/2024 380 367,650 0.05% Oceaneering International, Inc. 6.00% 01/02/2028 1,356 1,302,231 0.18% Transocean Phoenix 2 Ltd.(1) 7.75% 15/10/2024 41 43,899 0.01% Transocean Proteus Ltd.(1) 6.25% 01/12/2024 132 136,324 0.02% 1,850,104 0.26% Packaging & Containers Mauser Packaging Solutions Holding Co.(1) 7.25% 15/04/2025 1,207 1,203,970 0.17%
146

LORD ABBETT PASSPORT PORTFOLIOS PLC MULTI-SECTOR INCOME FUND Schedule of Investments as at 31 January 2020 (Continued)
Interest Maturity Principal Fair
Value % of Net Investments Rate Date (000) USD Assets Corporate Bonds - 58.85% (31 January 2019: 64.71%) (Continued) Packaging & Containers (continued) Sealed Air Corp.(1) 6.875% 15/07/2033 282 334,973 0.05% Trivium Packaging Finance BV(1) 5.50% 15/08/2026 200 211,125 0.03% 1,750,068 0.25% Pharmaceuticals AbbVie, Inc.(1) 3.20% 21/11/2029 980 1,025,774 0.14% AbbVie, Inc.(1) 4.25% 21/11/2049 516 560,135 0.08% Bausch Health Americas, Inc.(1) 8.50% 31/01/2027 1,578 1,788,032 0.25% Bausch Health Cos, Inc.(1) 5.00% 30/01/2028 328 332,920 0.05% Bausch Health Cos, Inc.(1) 5.25% 30/01/2030 404 412,585 0.06% Bausch Health Cos, Inc.(1) 6.125% 15/04/2025 318 327,764 0.05% Bausch Health Cos, Inc.(1) 7.00% 15/03/2024 246 255,541 0.03% NVA Holdings, Inc.(1) 6.875% 01/04/2026 440 475,200 0.07% Zoetis, Inc. 3.90% 20/08/2028 302 338,138 0.05% 5,516,089 0.78% Pipelines Abu Dhabi Crude Oil Pipeline LLC(1) 4.60% 02/11/2047 669 787,719 0.11% AI Candelaria Spain SLU(1) 7.50% 15/12/2028 588 672,468 0.09% Buckeye Partners LP 6.375%(3) 22/01/2078 2,128 1,758,930 0.25% Cheniere Corpus Christi Holdings LLC(1) 3.70% 15/11/2029 406 422,131 0.06% Cheniere Corpus Christi Holdings LLC 5.125% 30/06/2027 1,213 1,353,815 0.19% Cheniere Corpus Christi Holdings LLC 5.875% 31/03/2025 310 352,744 0.05% Cheniere Corpus Christi Holdings LLC 7.00% 30/06/2024 225 261,022 0.04% Cheniere Energy Partners LP(1) 4.50% 01/10/2029 2,141 2,182,429 0.31% Cheniere Energy Partners LP 5.625% 01/10/2026 530 556,169 0.08% Florida Gas Transmission Co. LLC(1) 4.35% 15/07/2025 450 493,531 0.07% Midwest Connector Capital Co. LLC(1) 4.625% 01/04/2029 1,347 1,487,485 0.21% NGPL PipeCo LLC(1) 4.875% 15/08/2027 1,363 1,474,784 0.21% Northern Natural Gas Co.(1) 4.30% 15/01/2049 468 552,274 0.08% Phillips 66 Partners LP 2.45% 15/12/2024 574 581,697 0.08% Sabal Trail Transmission LLC(1) 4.246% 01/05/2028 473 521,880 0.07% Targa Resources Partners LP/Targa Resources Partners Finance Corp. 5.875% 15/04/2026 292 308,607 0.04% Transportadora de Gas Internacional SA ESP(1) 5.55% 01/11/2028 596 692,643 0.10% 14,460,328 2.04% Real Estate Ontario Teachers' Cadillac Fairview Properties Trust(1) 3.875% 20/03/2027 936 1,026,361 0.14% WeWork Cos, Inc.(1) 7.875% 01/05/2025 1,968 1,530,101 0.22% 2,556,462 0.36% REITS Alexandria Real Estate Equities, Inc. 3.80% 15/04/2026 147 160,877 0.02% Alexandria Real Estate Equities, Inc. 3.95% 15/01/2028 137 151,721 0.02% American Tower Corp. 2.95% 15/01/2025 1,604 1,672,421 0.24% Brixmor Operating Partnership LP 4.125% 15/05/2029 625 692,443 0.10% EPR Properties 3.75% 15/08/2029 694 721,574 0.10% EPR Properties 4.50% 01/06/2027 302 332,319 0.05% Equinix, Inc. 2.875% 01/02/2026 EUR 1,246 1,430,491 0.20% GLP Capital LP/GLP Financing II, Inc. 5.75% 01/06/2028 444 519,028 0.07% Goodman US Finance Four LLC(1) 4.50% 15/10/2037 277 315,350 0.05%
147

LORD ABBETT PASSPORT PORTFOLIOS PLC MULTI-SECTOR INCOME FUND Schedule of Investments as at 31 January 2020 (Continued)
Interest Maturity Principal Fair
Value % of Net Investments Rate Date (000) USD Assets Corporate Bonds - 58.85% (31 January 2019: 64.71%) (Continued) REITS (continued) Goodman US Finance Three LLC(1) 3.70% 15/03/2028 320 339,081 0.05% Hudson Pacific Properties LP 3.25% 15/01/2030 1,454 1,495,078 0.21% Hudson Pacific Properties LP 3.95% 01/11/2027 629 680,521 0.10% Hudson Pacific Properties LP 4.65% 01/04/2029 249 283,691 0.04% Kimco Realty Corp. 3.70% 01/10/2049 1,115 1,160,255 0.16% Liberty Property LP 4.375% 01/02/2029 294 345,405 0.05% MPT Operating Partnership LP/MPT Finance Corp. 5.00% 15/10/2027 910 958,890 0.14% National Retail Properties, Inc. 4.30% 15/10/2028 455 516,299 0.07% Prologis LP 3.875% 15/09/2028 202 228,205 0.03% SBA Communications Corp.(1) 3.875% 15/02/2027 1,461 1,484,741 0.21% Spirit Realty LP 3.40% 15/01/2030 1,281 1,336,478 0.19% Spirit Realty LP 4.00% 15/07/2029 403 439,104 0.06% VEREIT Operating Partnership LP 4.875% 01/06/2026 383 433,172 0.06% 15,697,144 2.22% Retail Asbury Automotive Group, Inc. 6.00% 15/12/2024 302 311,690 0.04% Best Buy Co., Inc. 4.45% 01/10/2028 928 1,041,991 0.15% Darden Restaurants, Inc. 4.55% 15/02/2048 315 343,773 0.05% eG Global Finance PLC(1) 8.50% 30/10/2025 914 973,031 0.14% IRB Holding Corp.(1) 6.75% 15/02/2026 1,035 1,080,330 0.15% KFC Holding Co./Pizza Hut Holdings LLC/Taco Bell of America LLC(1) 4.75% 01/06/2027 1,039 1,096,958 0.16% KFC Holding Co./Pizza Hut Holdings LLC/Taco Bell of America LLC(1) 5.00% 01/06/2024 258 265,955 0.04% Murphy Oil USA, Inc. 4.75% 15/09/2029 755 790,372 0.11% PetSmart, Inc.(1) 5.875% 01/06/2025 893 922,022 0.13% PetSmart, Inc.(1) 7.125% 15/03/2023 670 669,162 0.09% Starbucks Corp. 4.45% 15/08/2049 1,326 1,577,596 0.22% Tiffany & Co. 4.90% 01/10/2044 961 1,284,967 0.18% Wendy's International LLC 7.00% 15/12/2025 150 160,613 0.02% 10,518,460 1.48% Semiconductors KLA Corp. 4.10% 15/03/2029 1,400 1,573,762 0.22% Lam Research Corp. 4.875% 15/03/2049 414 544,172 0.08% Micron Technology, Inc. 5.327% 06/02/2029 588 690,080 0.10% NVIDIA Corp. 3.20% 16/09/2026 1,013 1,090,917 0.15% Xilinx, Inc. 2.95% 01/06/2024 838 871,047 0.12% 4,769,978 0.67% Software Autodesk, Inc. 3.50% 15/06/2027 828 888,908 0.12% j2 Cloud Services LLC/j2 Cloud Co.-Obligor, Inc.(1) 6.00% 15/07/2025 147 155,391 0.02% Marble II Pte Ltd.(1) 5.30% 20/06/2022 378 384,331 0.05% Microsoft Corp. 3.125% 03/11/2025 1,461 1,571,043 0.22% Microsoft Corp. 3.30% 06/02/2027 1,266 1,387,305 0.20% PTC, Inc.(1) 3.625% 15/02/2025 334 337,340 0.05% PTC, Inc.(1) 4.00% 15/02/2028 334 338,175 0.05% salesforce.com, Inc. 3.70% 11/04/2028 424 474,792 0.07% 5,537,285 0.78%
148

LORD ABBETT PASSPORT PORTFOLIOS PLC MULTI-SECTOR INCOME FUND Schedule of Investments as at 31 January 2020 (Continued)
Interest Maturity Principal Fair
Value % of Net Investments Rate Date (000) USD Assets Corporate Bonds - 58.85% (31 January 2019: 64.71%) (Continued) Telecommunications Altice France SA/France(1) 7.375% 01/05/2026 1,292 1,376,820 0.19% Altice France SA/France(1) 8.125% 01/02/2027 2,080 2,328,248 0.33% Connect Finco S.A.R.L./Connect US Finco LLC(1) 6.75% 01/10/2026 977 1,035,620 0.15% DKT Finance ApS(1) 9.375% 17/06/2023 503 538,436 0.08% Hughes Satellite Systems Corp. 5.25% 01/08/2026 658 715,738 0.10% Intelsat Jackson Holdings SA 5.50% 01/08/2023 682 558,957 0.08% Intelsat Jackson Holdings SA(1) 8.50% 15/10/2024 1,092 925,017 0.13% Motorola Solutions, Inc. 4.60% 23/02/2028 309 343,816 0.05% Motorola Solutions, Inc. 4.60% 23/05/2029 712 801,356 0.11% Sprint Capital Corp. 6.875% 15/11/2028 3,556 3,624,808 0.51% T-Mobile USA, Inc. 6.50% 15/01/2026 374 399,544 0.06% Verizon Communications, Inc. 2.625% 15/08/2026 4,167 4,318,471 0.61% Ypso Finance Bis SA(1) 6.00% 15/02/2028 538 534,331 0.07% 17,501,162 2.47% Toys/Games/Hobbies Hasbro, Inc. 3.90% 19/11/2029 1,937 2,001,549 0.28% Hasbro, Inc. 5.10% 15/05/2044 930 984,746 0.14% Mattel, Inc.(1) 6.75% 31/12/2025 1,098 1,179,895 0.17% 4,166,190 0.59% Transportation Autoridad del Canal de Panama(1) 4.95% 29/07/2035 200 235,939 0.04% Central Japan Railway Co.(1) 4.25% 24/11/2045 400 495,145 0.07% CH Robinson Worldwide, Inc. 4.20% 15/04/2028 460 518,221 0.07% CMA CGM SA 5.25% 15/01/2025 EUR 756 660,814 0.09% Rumo Luxembourg S.A.R.L.(1) 5.875% 18/01/2025 400 429,838 0.06% Watco Cos LLC/Watco Finance Corp.(1) 6.375% 01/04/2023 153 155,167 0.02% 2,495,124 0.35% Total Corporate Bonds 417,114,904 58.85% Floating Rate Loans - 6.43% (31 January 2019: 5.81%) Aerospace Air Medical Group Holdings, Inc. Term Loan 4.91% 28/04/2022 682 669,434 0.09% American Airlines, Inc. Replacement Term Loan 3.411% 27/06/2025 1,142 1,133,141 0.16% Doncasters US Finance LLC Term Loan B 5.445% 09/04/2020 526 444,470 0.06% Kestrel Bidco, Inc. Term Loan 4.684% 11/12/2026 1,184 1,193,543 0.17% Pike Corp. Initial Term Loan 4.90% 24/07/2026 643 648,189 0.09% 4,088,777 0.57% Automotive American Axle & Manufacturing, Inc. Tranche B Term Loan 3.92% 06/04/2024 1,245 1,244,279 0.18% Broadcasting Univision Communications, Inc. 1st Lien Replacement Repriced Term Loan 4.395% 15/03/2024 1,146 1,134,979 0.16% Chemicals Nouryon Finance BV Initial Dollar Term Loan TBD 01/10/2025 1,148 1,149,789 0.16%
149

LORD ABBETT PASSPORT PORTFOLIOS PLC MULTI-SECTOR INCOME FUND Schedule of Investments as at 31 January 2020 (Continued)
Interest Maturity Principal Fair
Value % of Net Investments Rate Date (000) USD Assets Floating Rate Loans - 6.43% (31 January 2019: 5.81%) (Continued) Chemicals (continued) Schenectady International Group, Inc. Initial Term Loan 6.625% 15/10/2025 189 187,913 0.03% 1,337,702 0.19% Consumer Durables TGP Holdings III LLC 1st Lien Refinancing Term Loan 6.027% 25/09/2024 623 591,959 0.08% Consumer Non-Durables Revlon Consumer Products Corp. Initial Term Loan B 5.409% 07/09/2023 1,026 810,037 0.11% Consumer Services Azalea TopCo, Inc. 1st Lien Initial Term Loan 5.145% 24/07/2026 1,229 1,235,833 0.17% Buzz Merger Sub Ltd. Term Loan B TBD 13/01/2027 246 247,278 0.04% 1,483,111 0.21% Diversified Media Formula One Management Ltd. Facility Term Loan B3 4.145% 01/02/2024 592 592,726 0.08% Electric Pacific Gas and Electric Co. Revolving Term Loan 6.977% 27/04/2022 1,904 1,999,540 0.28% Energy Frontera Generation Holdings LLC Initial Term Loan 5.92% 02/05/2025 711 613,158 0.09% Finance Ellie Mae, Inc. 1st Lien Term Loan 5.945% 17/04/2026 1,210 1,217,642 0.17% Financial DG Investment Intermediate Holdings 2, Inc. 1st Lien Initial Term Loan 4.645% 03/02/2025 593 590,600 0.08% Hub International Ltd. Initial Term Loan 4.551% 25/04/2025 1,437 1,435,163 0.20% Kingpin Intermediate Holdings LLC 1st Lien Refinancing Term Loan 5.15% 03/07/2024 570 574,132 0.08% Trans Union LLC Replacement Term Loan B-5 3.395% 16/11/2026 675 678,499 0.10% 3,278,394 0.46% Food and Drug Panera Bread Co. Term Loan 3.438% 18/07/2022 374 364,641 0.05% Forest Product/Containers Southern Graphics, Inc. 1st Lien Refinancing Term Loan 4.895% 31/12/2022 354 222,992 0.03% Gaming/Leisure Alterra Mountain Co. Initial Bluebird Term Loan 4.395% 31/07/2024 349 350,817 0.05%
150

LORD ABBETT PASSPORT PORTFOLIOS PLC MULTI-SECTOR INCOME FUND Schedule of Investments as at 31 January 2020 (Continued)
Interest Maturity Principal Fair
Value % of Net Investments Rate Date (000) USD Assets Floating Rate Loans - 6.43% (31 January 2019: 5.81%) (Continued) Gaming/Leisure (continued) MGM Growth Properties Operating Partnership LP Term Loan B 3.566% 21/03/2025 447 448,626 0.06% PCI Gaming Authority Facility Term Loan B 4.145% 29/05/2026 262 264,125 0.04% Playtika Holding Corp. Term Loan B 7.645% 10/12/2024 1,228 1,243,629 0.18% VICI Properties 1 LLC Term Loan B 3.409% 20/12/2024 618 619,199 0.09% 2,926,396 0.42% Healthcare Parexel International Corp. Initial Term Loan 4.395% 27/09/2024 983 970,892 0.14% Regionalcare Hospital Partners Holdings, Inc. 1st Lien Term Loan B 5.395% 16/11/2025 1,064 1,071,052 0.15% 2,041,944 0.29% Healthcare-Services U.S. Renal Care, Inc. Initial Term Loan 6.645% 26/06/2026 1,783 1,773,380 0.25% Manufacturing Forterra Finance LLC Replacement Term Loan 4.645% 25/10/2023 1,789 1,755,404 0.25% Granite US Holdings Corp. Term Loan B 7.211% 30/09/2026 755 755,866 0.11% Utex Industries, Inc. 1st Lien Initial Term Loan TBD 21/05/2021 190 163,097 0.02% Yak Access LLC 1st Initial Term Loan 6.645% 11/07/2025 649 625,464 0.09% 3,299,831 0.47% Media Clear Channel Outdoor Holdings, Inc. Term Loan B 5.145% 21/08/2026 1,314 1,320,894 0.19% Media/Telecommunications Ancestry.com Operations, Inc. 1st Lien Extended Term Loan 5.90% 27/08/2026 568 542,106 0.08% Ancestry.com Operations, Inc. 1st Lien Non-Extended Term Loan 5.40% 19/10/2023 349 335,639 0.05% 877,745 0.13% Miscellaneous Manufacturer FGI Operating Co. LLC Term Loan 12.00% 16/05/2022 13 10,311 0.00% Oil & Gas Lower Cadence Holdings LLC Initial Term Loan 5.645% 22/05/2026 726 710,670 0.10% Pipelines Buckeye Partners LP Initial Term Loan 4.531% 01/11/2026 539 544,020 0.08% Retail BJ's Wholesale Club, Inc. 1st Lien Tranche B Term Loan 3.899% 03/02/2024 496 498,875 0.07% Claire's Stores, Inc. Initial Term Loan 8.421% 18/12/2026 163 158,410 0.02% CWGS Group LLC Term Loan TBD 08/11/2023 723 690,469 0.10% Froneri International PLC Dollar Term Loan TBD 29/01/2027 628 630,470 0.09% GOBP Holdings, Inc. 1st Lien Term Loan 4.409% 22/10/2025 472 473,118 0.07% IRB Holding Corp. Term Loan B 4.384% 05/02/2025 691 693,434 0.10% Mavis Tire Express Services Corp. 1st Lien Closing Date Term Loan 4.895% 20/03/2025 1,081 1,061,406 0.15%
151

LORD ABBETT PASSPORT PORTFOLIOS PLC MULTI-SECTOR INCOME FUND Schedule of Investments as at 31 January 2020 (Continued)
Interest Maturity Principal Fair
Value % of Net Investments Rate Date (000) USD Assets Floating Rate Loans - 6.43% (31 January 2019: 5.81%) (Continued) Retail (continued) Mavis Tire Express Services Corp. 1st Lien Delayed Draw Term Loan 3.426% 20/03/2025 31 30,446 0.00% PetSmart, Inc. Amended Term Loan 5.67% 11/03/2022 619 618,164 0.09% United Natural Foods, Inc. Initial Term Loan 5.895% 22/10/2025 713 641,350 0.09% 5,496,142 0.78% Semiconductors Da Vinci Purchaser Corp. 1st Lien Initial Term Loan 5.872% 08/01/2027 632 637,618 0.09% Service NEP Group, Inc. 1st Lien Initial Dollar Term Loan 4.895% 20/10/2025 1,308 1,286,893 0.18% Software TIBCO Software, Inc. Term Loan 5.74% 30/06/2026 856 861,204 0.12% Ultimate Software Group, Inc. 1st Lien Initial Term Loan 5.395% 04/05/2026 650 653,976 0.09% 1,515,180 0.21% Transportation Commercial Barge Line Co. Initial Term Loan 10.528% 12/11/2020 657 304,688 0.04% Genesee & Wyoming, Inc. Initial Term Loan 3.961% 30/12/2026 849 855,197 0.12% 1,159,885 0.16% Utility Astoria Energy LLC Advance Term Loan B 5.65% 24/12/2021 906 907,444 0.13% Edgewater Generation LLC Term Loan 5.395% 13/12/2025 956 940,703 0.13% Lightstone Holdco LLC Refinancing Term Loan B 5.395% 30/01/2024 345 325,537 0.05% Lightstone Holdco LLC Refinancing Term Loan C 5.395% 30/01/2024 19 18,361 0.00% Moxie Patriot LLC Advance Construction Term Loan B-1 7.695% 19/12/2020 151 146,839 0.02% Moxie Patriot LLC Advance Construction Term Loan B-2 7.695% 19/12/2020 233 226,563 0.03% 2,565,447 0.36% Wireless Communications Iridium Satellite LLC Initial Term Loan 5.395% 04/11/2026 452 455,513 0.06% Total Floating Rate Loans 45,601,806 6.43% Government Obligations - 14.12% (31 January 2019: 9.77%) Non-U.S. Government Obligations Arab Republic of Egypt(1) 5.577% 21/02/2023 1,290 1,356,956 0.19% Australian Government 4.25% 21/04/2026 AUD 983 796,465 0.11% Ciudad Autonoma de Buenos Aires/Government Bonds(1) 7.50% 01/06/2027 1,245 1,120,500 0.16% Development Bank of Mongolia LLC(1) 7.25% 23/10/2023 1,255 1,336,575 0.19% Dominican Republic(1) 6.40% 05/06/2049 1,014 1,097,346 0.16% Government of Jamaica 6.75% 28/04/2028 700 829,750 0.12% Government of Jamaica 8.00% 15/03/2039 1,043 1,435,111 0.20% Government of Qatar(1) 3.25% 02/06/2026 1,357 1,444,007 0.20% Japan Bank for International Cooperation 3.125% 20/07/2021 1,474 1,507,135 0.21% Kingdom of Bahrain(1) 6.75% 20/09/2029 465 542,181 0.08% Province of British Columbia Canada 2.85% 18/06/2025 CAD 850 681,632 0.10% Province of Ontario Canada 2.55% 12/02/2021 1,453 1,467,115 0.21%
152

LORD ABBETT PASSPORT PORTFOLIOS PLC MULTI-SECTOR INCOME FUND Schedule of Investments as at 31 January 2020 (Continued)
Interest Maturity Principal Fair
Value % of Net Investments Rate Date (000) USD Assets Government Obligations - 14.12% (31 January 2019: 9.77%) (Continued) Non-U.S. Government Obligations (continued) Province of Santa Fe(1) 6.90% 01/11/2027 1,236 988,800 0.14% Provincia de Cordoba(1) 7.125% 10/06/2021 940 742,609 0.11% Provincia de Cordoba(1) 7.45% 01/09/2024 1,075 778,311 0.11% Provincia de Mendoza Argentina(1) 8.375% 19/05/2024 1,114 841,081 0.12% Provincia de Neuquen Argentina(1) 7.50% 27/04/2025 216 172,802 0.02% Republic of Angola(1) 8.25% 09/05/2028 1,254 1,353,940 0.19% Republic of Angola(1) 9.375% 08/05/2048 1,352 1,469,061 0.21% Republic of Bermuda(1) 4.138% 03/01/2023 300 316,774 0.04% Republic of Bermuda(1) 4.75% 15/02/2029 296 341,243 0.05% Republic of Ecuador(1) 10.75% 31/01/2029 1,098 998,200 0.14% Republic of Honduras(1) 6.25% 19/01/2027 650 722,701 0.10% Republic of Ivory Coast(1) 5.875% 17/10/2031 EUR 497 584,483 0.08% Republic of Kenya(1) 7.25% 28/02/2028 1,306 1,413,563 0.20% Republic of Kenya(1) 8.25% 28/02/2048 904 976,650 0.14% Republic of Paraguay(1) 5.60% 13/03/2048 711 851,206 0.12% Republic of Senegal(1) 6.25% 30/07/2024 628 698,422 0.10% Republic of Surinam(1) 9.25% 26/10/2026 815 699,146 0.10% Republic of Turkey 5.75% 11/05/2047 1,490 1,441,426 0.20% Socialist Republic of Vietnam(1) 4.80% 19/11/2024 607 667,700 0.09% Ukraine Government International Bond(1) 7.375% 25/09/2032 2,241 2,483,557 0.35% United Arab Emirates(1) 3.125% 03/05/2026 2,007 2,122,152 0.30% 34,278,600 4.84% U.S. Government Obligations U.S. Treasury Bond 2.25% 15/08/2049 2,027 2,140,583 0.30% U.S. Treasury Bond 2.375% 15/11/2049 1,780 1,930,605 0.27% U.S. Treasury Inflation Indexed Note 0.50% 15/04/2024 12,544 12,891,114 1.82% U.S. Treasury Note 1.75% 15/11/2029 1,103 1,127,214 0.16% U.S. Treasury Note 2.75% 31/08/2023 45,430 47,710,373 6.73% 65,799,889 9.28% Total Government Obligations 100,078,489 14.12% Municipal Bonds - 2.28% (31 January 2019: 3.69%) California State University 3.899% 01/11/2047 745 865,943 0.12% Chicago Transit Authority 6.20% 01/12/2040 290 394,986 0.06% Chicago Transit Authority 6.899% 01/12/2040 174 244,479 0.03% City & County of Honolulu HI 5.418% 01/12/2027 55 69,325 0.01% City & County of San Francisco CA 5.45% 15/06/2025 65 76,812 0.01% City of Chicago IL 5.432% 01/01/2042 1,316 1,485,553 0.21% City of Chicago IL 6.314% 01/01/2044 731 896,886 0.13% City of Los Angeles Department of Airports 5.575% 15/05/2020 185 186,928 0.03% City of New York NY 5.985% 01/12/2036 85 114,952 0.02% City of New York NY 6.271% 01/12/2037 600 869,952 0.12% City of Portland OR 7.701% 01/06/2022 390 422,187 0.06% City of San Antonio TX Electric & Gas Systems Revenue 5.718% 01/02/2041 110 153,221 0.02% Commonwealth of Massachusetts 4.20% 01/12/2021 130 134,446 0.02% Commonwealth of Pennsylvania 5.45% 15/02/2030 119 146,902 0.02% County of Miami-Dade FL Aviation Revenue 3.982% 01/10/2041 445 482,838 0.07% County of Miami-Dade FL Aviation Revenue 4.28% 01/10/2041 410 458,261 0.06% Dallas Convention Center Hotel Development Corp. 7.088% 01/01/2042 325 469,147 0.07%
153

LORD ABBETT PASSPORT PORTFOLIOS PLC MULTI-SECTOR INCOME FUND Schedule of Investments as at 31 January 2020 (Continued)
Interest Maturity Principal Fair
Value % of Net Investments Rate Date (000) USD Assets Municipal Bonds - 2.28% (31 January 2019: 3.69%) (Continued) District of Columbia 5.591% 01/12/2034 320 409,187 0.06% Foothill-Eastern Transportation Corridor Agency 4.094% 15/01/2049 414 432,228 0.06% Los Angeles Unified School District/CA 5.75% 01/07/2034 493 663,361 0.09% Massachusetts School Building Authority 5.715% 15/08/2039 180 247,966 0.03% Memphis-Shelby County Industrial Development Board 7.00% 01/07/2045 260 287,100 0.04% New York City Industrial Development Agency(1) 11.00% 01/03/2029 540 730,939 0.10% Ohio State University 4.048% 01/12/2056 67 83,813 0.01% Ohio University 5.59% 01/12/2114 375 537,311 0.08% Pasadena Public Financing Authority 7.148% 01/03/2043 610 976,897 0.14% Permanent University Fund - Texas A&M University System 3.66% 01/07/2047 1,845 1,961,475 0.28% Port of Seattle WA 3.571% 01/05/2032 170 179,404 0.02% Port of Seattle WA 3.755% 01/05/2036 485 514,580 0.07% Regents of the University of California Medical Center Pooled Revenue 6.548% 15/05/2048 217 334,015 0.05% San Jose Redevelopment Agency Successor Agency 2.259% 01/08/2020 400 401,500 0.06% State of California 7.55% 01/04/2039 325 550,001 0.08% State of Connecticut Bradley International Airport CFC Revenue 4.282% 01/07/2045 105 114,695 0.02% State of Wisconsin 3.294% 01/05/2037 65 70,801 0.01% University of North Carolina at Chapel Hill 3.847% 01/12/2034 140 166,116 0.02% Total Municipal Bonds 16,134,207 2.28% Shares Common Stocks - 0.07% (31 January 2019: 0.21%) Gaming/Leisure Gibson Brands, Inc. 2,707 318,073 0.04% Miscellaneous Manufacturer Remington Outdoor Co., Inc.* 1,952 1,708 0.00% Oil & Gas Chaparral Energy, Inc. Class A* 10,071 10,373 0.00% Templar Energy LLC Class A Units 2,062 165 0.00% 10,538 0.00% Retail Claire's Stores, Inc. 330 181,500 0.03% Total Common Stocks 511,819 0.07%
154

LORD ABBETT PASSPORT PORTFOLIOS PLC MULTI-SECTOR INCOME FUND Schedule of Investments as at 31 January 2020 (Continued)
Dividend Fair
Value % of Net Investments Rate Shares USD Assets Preferred Stocks - 0.71% (31 January 2019: 1.31%) Banks Wells Fargo & Co. 7.50% 1,002 1,548,651 0.22% Electric NextEra Energy, Inc. 4.872% 18,250 996,998 0.14% Hand/Machine Tools Stanley Black & Decker, Inc. 5.25% 7,659 804,118 0.11% Healthcare-Products Danaher Corp. 4.75% 801 978,133 0.14% Oil & Gas Templar Energy LLC ZCP 2,974 – 0.00% Water Aqua America, Inc. 6.00% 10,161 689,221 0.10% Total Preferred Stocks 5,017,121 0.71% Exercise
PriceUSD
Expiration Date
Warrant - 0.00% (31 January 2019: 0.00%) Miscellaneous Manufacturer Remington Outdoor Co., Inc.* 35.05 15/05/2022 1,968 20 0.00% Total Warrant 20 0.00% Total Investment in Securities (Cost: USD 634,272,499) 663,686,426 93.64%
PIK Payment-in-Kind. TBD To be determined. ZCP Indicates a zero coupon rate. * Non income processing security. (1) Securities exempt from registration under Rule 144A (i) of the US Securities Act of 1933. These securities may be resold in transactions exempt
from registration, normally to qualified institutional buyers. (2) Indicates a variable rate security. The interest rate shown reflects the rate as at 31 January 2020. (3) Variable Rate is Fixed to Float: Rate remains fixed until future date. The interest rate represents the rate as at 31 January 2020. (4) Security is perpetual in nature and has no stated maturity date.
155

LORD ABBETT PASSPORT PORTFOLIOS PLC MULTI-SECTOR INCOME FUND Schedule of Investments as at 31 January 2020 (Continued)
Open Forward Foreign Currency Exchange Contracts - 0.02% (31 January 2019: (0.01%)) Unrealised Appreciation/ Depreciation % of Net Settlement Date Amount Sold Amount Bought USD Assets14/02/2020 132,829 USD 119,000 EUR Bank of America (874) (0.00%) 14/02/2020 69,000 EUR 76,317 USD Morgan Stanley (195) (0.00%) 17/04/2020 697,000 CAD 533,854 USD Morgan Stanley 6,850 0.00% 09/03/2020 6,762,000 EUR 7,548,685 USD Morgan Stanley 39,700 0.01% 17/04/2020 159,000 CAD 120,061 USD State Street Bank (159) (0.00%) 14/02/2020 50,000 EUR 55,399 USD State Street Bank (45) (0.00%) 06/02/2020 28,680 USD 26,064 EUR State Street Bank 207 0.00% 24/02/2020 1,210,000 AUD 824,319 USD State Street Bank 13,998 0.00% 05/03/2020 507,000 GBP 661,234 USD Toronto Dominion Bank (7,613) (0.00%) 51,869 0.01% Share Class Hedges Class A EUR Accumulating (Hedged) 27/02/2020 118,369 USD 107,129 EUR Brown Brothers Harriman 512 0.00% Class I EUR Accumulating (Hedged) 27/02/2020 2,860,923 USD 2,589,745 EUR Brown Brothers Harriman 12,925 0.00% Class I EUR Distributing (Hedged) 27/02/2020 5,577,676 USD 5,048,985 EUR Brown Brothers Harriman 25,198 0.01% Class I GBP Accumulating (Hedged) 27/02/2020 1,360,978 USD 1,040,892 GBP Brown Brothers Harriman 11,937 0.00% 50,572 0.01%
Net Unrealised Appreciation on Open Forward Foreign Currency Exchange Contracts 102,441 0.02%
Unrealised Appreciation on Open Forward Foreign Currency Exchange Contracts 111,327 0.02%Unrealised Depreciation on Open Forward Foreign Currency Exchange Contracts (8,886) (0.00%)
Open Futures Contracts - (0.11%) (31 January 2019: (0.25%)) Unrealised Appreciation/ % of No. of Depreciation Net Type Expiration Contracts USD Assets Euro-Bobl Futures 06/03/2020 (2) (1,308) (0.00%) U.S. 10 Year Treasury Note 20/03/2020 (56) (118,125) (0.02%) U.S. 10 Year Ultra Bond 20/03/2020 (83) (285,501) (0.04%) U.S. 2 Year Treasury Note 31/03/2020 302 233,815 0.03% U.S. 5 Year Treasury Note 31/03/2020 231 333,432 0.05% U.S. Long Treasury Bond 20/03/2020 (23) (174,524) (0.02%) U.S. Ultra Treasury Bond 20/03/2020 (137) (765,849) (0.11%) Net Unrealised Depreciation on Open Futures Contracts (778,060) (0.11%) Unrealised Appreciation on Open Futures Contracts 567,247 0.08%Unrealised Depreciation on Open Futures Contracts (1,345,307) (0.19%)
156

LORD ABBETT PASSPORT PORTFOLIOS PLC MULTI-SECTOR INCOME FUND Schedule of Investments as at 31 January 2020 (Continued)
Open Swap Contracts - (0.03%) (31 January 2019: (0.20%)) Open OTC Credit Default Index Swap Contracts – (0.02%) (31 January 2019: (0.23%))
Reference Index
Counterparty
Buy/Sell Protection
FixedDeal
Receive/ (Pay)Rate
Expiration Date
Notional USD
Premiums Received
UnrealisedAppreciation/Deppreciation
USD
FairValueUSD
% of Net
Assets Markit CMBX. N.A. BBB-S10
Morgan Stanley Sell 3.00% 17/09/2058 4,501,000 (182,334) 145,566 (36,768) (0.01%)
Markit CMBX. N.A. BBB-S11
Morgan Stanley Sell 3.00% 18/11/2054 8,258,000 (474,215) 382,504 (91,711) (0.01%)
Markit CMBX. N.A. BBB-S9
Morgan Stanley Sell 3.00% 17/11/2059 1,788,000 (72,807) 62,494 (10,312) 0.00%
Fair Value on Open OTC Credit Default Index Swap Contracts (138,791) (0.02%) Open Centrally Cleared Credit Default Index Swap Contract - (0.01%) (31 January 2019: 0.03%)
Reference Index Counterparty
Buy/Sell Protection
FixedDeal
Receive/ (Pay)Rate
ExpirationDate
NotionalUSD
FairValueUSD
% ofNet
AssetsMarkit N.A. HY. 33 5Y Credit Suisse Sell 1.00% 20/12/2024 21,500,000 (57,200) (0.01%) Fair Value on Open Centrally Cleared Credit Default Index Swap Contract (57,200) (0.01%)
Financial Liabilities on Open Swap Contract (195,991) (0.03%)
Total Financial Assets at Fair Value through Profit and Loss 664,365,000 93.74%Total Financial Liabilities at Fair Value through Profit and Loss (1,550,184) (0.22%) Other Net Assets 45,972,029 6.48%
Net Assets 708,786,845 100.00%
% of TotalAnalysis of Total Assets Assets
Transferable securities admitted to an official stock exchange listing 36.94%Transferable securities traded on a regulated market 45.54%Other transferable securities including those which are unlisted 6.76%Financial derivatives dealt in on a regulated market (0.11%)Centrally Cleared Financial Derivative Instruments (0.01%)OTC financial derivative instruments 0.00%
157

LORD ABBETT PASSPORT PORTFOLIOS PLC U.S. GROWTH LEADERS FUND Schedule of Investments as at 31 January 2020
Fair
Value % of Net Investments Shares USD Assets Common Stocks - 97.26% (31 January 2019: 97.79%) Advertising Trade Desk, Inc. Class A* 1,684 453,299 1.15% Aerospace/Defense L3Harris Technologies, Inc. 2,357 521,675 1.32% Teledyne Technologies, Inc.* 1,414 516,195 1.31% TransDigm Group, Inc. 322 207,136 0.53% 1,245,006 3.16% Apparel NIKE, Inc. Class B 6,774 652,336 1.66% Auto Manufacturers Tesla, Inc.* 753 489,879 1.24% Banks JPMorgan Chase & Co. 3,067 405,948 1.03% Biotechnology 10X Genomics, Inc. Class A* 4,029 368,210 0.93% Amarin Corp. PLC* 12,865 238,646 0.61% Argenx SE* 1,220 176,034 0.45% Mirati Therapeutics, Inc.* 2,939 255,193 0.65% Seattle Genetics, Inc.* 3,637 394,215 1.00% Vertex Pharmaceuticals, Inc.* 3,319 753,579 1.91% 2,185,877 5.55% Commercial Services Bright Horizons Family Solutions, Inc.* 1,657 271,301 0.69% MarketAxess Holdings, Inc. 999 353,826 0.90% New Oriental Education & Technology Group, Inc.* 2,338 284,184 0.72% Paylocity Holding Corp.* 2,799 397,150 1.01% Square, Inc. Class A* 4,095 305,855 0.78% StoneCo Ltd. Class A* 4,637 201,431 0.51% TransUnion 5,977 548,091 1.39% 2,361,838 6.00% Computers Apple, Inc. 8,636 2,672,928 6.79% Crowdstrike Holdings, Inc. Class A* 6,390 390,365 0.99% EPAM Systems, Inc.* 1,982 452,174 1.15% 3,515,467 8.93% Diversified Financial Services Mastercard, Inc. Class A 3,668 1,158,868 2.95% Visa, Inc. Class A 4,259 847,413 2.15% 2,006,281 5.10% Electrical Component & Equipment AMETEK, Inc. 3,895 378,399 0.96% Generac Holdings, Inc.* 4,036 418,089 1.06% Universal Display Corp. 1,316 231,840 0.59% 1,028,328 2.61%
158

LORD ABBETT PASSPORT PORTFOLIOS PLC U.S. GROWTH LEADERS FUND Schedule of Investments as at 31 January 2020 (Continued)
Fair
Value % of Net Investments Shares USD Assets Common Stocks - 97.26% (31 January 2019: 97.79%) (Continued) Entertainment Live Nation Entertainment, Inc.* 6,559 447,062 1.14% Healthcare-Products Danaher Corp. 1,885 303,240 0.77% Insulet Corp.* 2,493 483,742 1.23% Intuitive Surgical, Inc.* 933 522,275 1.33% Nevro Corp.* 1,453 193,118 0.49% Thermo Fisher Scientific, Inc. 624 195,430 0.49% 1,697,805 4.31% Home Builders Lennar Corp. Class A 5,613 372,479 0.95% Internet Alibaba Group Holding Ltd.* 2,562 529,284 1.35% Alphabet, Inc. Class A* 1,082 1,550,268 3.94% Amazon.com, Inc.* 1,003 2,014,746 5.12% Facebook, Inc. Class A* 4,285 865,184 2.20% Match Group, Inc.* 6,546 512,028 1.30% MercadoLibre, Inc.* 453 300,339 0.76% Netflix, Inc.* 856 295,397 0.75% Shopify, Inc. Class A* 1,266 589,526 1.50% Snap, Inc. Class A* 31,114 571,875 1.45% 7,228,647 18.37% Leisure Time YETI Holdings, Inc.* 13,212 480,388 1.22% Media Walt Disney Co. 2,591 358,361 0.91% Pharmaceuticals DexCom, Inc.* 1,978 476,203 1.21% Zoetis, Inc. Class A 4,608 618,440 1.57% 1,094,643 2.78% Retail Carvana Co. Class A* 3,731 295,682 0.75% Chipotle Mexican Grill, Inc. Class A* 471 408,244 1.04% Lululemon Athletica, Inc.* 2,012 481,652 1.22% 1,185,578 3.01% Semiconductors Advanced Micro Devices, Inc.* 9,489 445,983 1.13% Applied Materials, Inc. 7,219 418,630 1.07% NVIDIA Corp. 3,441 813,555 2.07% QUALCOMM, Inc. 6,793 579,511 1.47% Teradyne, Inc. 4,187 276,300 0.70% 2,533,979 6.44% Software Adobe, Inc.* 1,156 405,918 1.03%
159

LORD ABBETT PASSPORT PORTFOLIOS PLC U.S. GROWTH LEADERS FUND Schedule of Investments as at 31 January 2020 (Continued)
Fair
Value % of Net Investments Shares USD Assets Common Stocks - 97.26% (31 January 2019: 97.79%) (Continued) Software (continued) Akamai Technologies, Inc.* 4,414 412,047 1.05% Alteryx, Inc. Class A* 2,673 372,803 0.95% Atlassian Corp. PLC Class A* 2,668 392,196 1.00% DocuSign, Inc. Class A* 7,878 618,502 1.57% Fiserv, Inc.* 3,186 377,892 0.96% Five9, Inc.* 6,067 435,186 1.11% Intuit, Inc. 1,441 404,028 1.03% Microsoft Corp. 16,305 2,775,600 7.05% MSCI, Inc. Class A 1,504 429,843 1.09% Paycom Software, Inc.* 1,082 344,249 0.87% RingCentral, Inc. Class A* 2,782 571,924 1.45% salesforce.com, Inc.* 2,311 421,318 1.07% Slack Technologies, Inc. Class A* 7,921 164,202 0.42% 8,125,708 20.65% Transportation Kansas City Southern 2,447 412,785 1.05% Total Common Stocks 38,281,694 97.26% Total Investment in Securities (Cost: USD 32,933,765) 38,281,694 97.26%
* Non income processing security.
Total Financial Assets at Fair Value through Profit and Loss 38,281,694 97.26% Other Net Assets 1,076,970 2.74%
Net Assets 39,358,664 100.00%
Analysis of Total Assets
% of Total
Assets Transferable securities admitted to an official stock exchange listing 94.83%
160

LORD ABBETT PASSPORT PORTFOLIOS PLC GLOBAL HIGH YIELD FUND Schedule of Investments as at 31 January 2020
Interest Maturity PrincipalFair
Value % of Net Investments Rate Date (000) USD Assets Asset-Backed Securities - 0.94% (31 January 2019: 0.18%) Cayman Islands Other BlueMountain CLO 2018-3 Ltd. Class E(1) 7.744%(2) 25/10/2030 250 239,236 0.47% Elevation CLO 2014-2 Ltd. Class DR(1) 5.031%(2) 15/10/2029 250 244,335 0.47% 483,571 0.94% Total Cayman Islands 483,571 0.94% Total Asset-Backed Securities 483,571 0.94% Corporate Bonds - 82.45% (31 January 2019: 91.64%) Argentina Energy-Alternate Sources YPF Energia Electrica SA(1) 10.00% 25/07/2026 62 57,497 0.11% Food Arcor SAIC(1) 6.00% 06/07/2023 150 147,337 0.28% Pipelines Transportadora de Gas del Sur SA(1) 6.75% 02/05/2025 150 139,174 0.27% Telecommunications Telecom Argentina SA 8.00% 18/07/2026 35 34,375 0.07% Total Argentina 378,383 0.73% Australia Mining Barminco Finance Pty Ltd.(1) 6.625% 15/05/2022 15 15,394 0.03% Belgium Commercial Services House of Finance NV 4.375% 15/07/2026 EUR 100 111,040 0.22% Bermuda Leisure Time Viking Cruises Ltd.(1) 5.875% 15/09/2027 44 45,184 0.09% VOC Escrow Ltd.(1) 5.00% 15/02/2028 59 61,174 0.12% 106,358 0.21% Oil & Gas Geopark Ltd.(1) 6.50% 21/09/2024 200 211,383 0.41% Nabors Industries Ltd.(1) 7.25% 15/01/2026 24 24,090 0.05% Nabors Industries Ltd.(1) 7.50% 15/01/2028 24 23,820 0.05% 259,293 0.51% Total Bermuda 365,651 0.72% Brazil Banks Banco do Brasil SA/Cayman(1) 6.25%(3) -(4) 200 206,450 0.40%
161

LORD ABBETT PASSPORT PORTFOLIOS PLC GLOBAL HIGH YIELD FUND Schedule of Investments as at 31 January 2020 (Continued)
Interest Maturity PrincipalFair
Value % of Net Investments Rate Date (000) USD Assets Corporate Bonds - 82.45% (31 January 2019: 91.64%) (Continued) Brazil (Continued) Electric Cemig Geracao e Transmissao SA(1) 9.25% 05/12/2024 200 233,919 0.45% Food BRF SA(1) 4.875% 24/01/2030 200 205,900 0.40% Total Brazil 646,269 1.25% British Virgin Islands Chemicals Yingde Gases Investment Ltd.(1) 6.25% 19/01/2023 200 209,257 0.41% Canada Building Materials Masonite International Corp.(1) 5.75% 15/09/2026 39 41,451 0.08% Norbord, Inc.(1) 5.75% 15/07/2027 3 3,158 0.01% Norbord, Inc.(1) 6.25% 15/04/2023 26 28,221 0.05% 72,830 0.14% Commercial Services Garda World Security Corp.(1) 4.625% 15/02/2027 83 82,377 0.16% GW B-CR Security Corp.(1) 9.50% 01/11/2027 39 41,705 0.08% 124,082 0.24% Diversified Financial Services Fairstone Financial, Inc.(1) 7.875% 15/07/2024 149 161,541 0.31% Gas Rockpoint Gas Storage Canada Ltd.(1) 7.00% 31/03/2023 4 3,919 0.01% Iron/Steel Baffinland Iron Mines Corp./Baffinland Iron Mines LP(1) 8.75% 15/07/2026 43 44,748 0.08% Mining New Gold, Inc.(1) 6.25% 15/11/2022 37 37,161 0.07% Oil & Gas MEG Energy Corp.(1) 6.50% 15/01/2025 23 24,107 0.05% MEG Energy Corp.(1) 7.00% 31/03/2024 235 237,252 0.46% MEG Energy Corp.(1) 7.125% 01/02/2027 78 77,439 0.15% 338,798 0.66% Packaging & Containers Intertape Polymer Group, Inc.(1) 7.00% 15/10/2026 52 55,138 0.11% Pharmaceuticals Bausch Health Cos, Inc.(1) 5.00% 30/01/2028 32 32,480 0.06% Bausch Health Cos, Inc.(1) 5.25% 30/01/2030 165 168,506 0.33%
162

LORD ABBETT PASSPORT PORTFOLIOS PLC GLOBAL HIGH YIELD FUND Schedule of Investments as at 31 January 2020 (Continued)
Interest Maturity PrincipalFair
Value % of Net Investments Rate Date (000) USD Assets Corporate Bonds - 82.45% (31 January 2019: 91.64%) (Continued) Canada (Continued) Pharmaceuticals (continued) Bausch Health Cos, Inc.(1) 6.125% 15/04/2025 31 31,952 0.06% 232,938 0.45% Total Canada 1,071,155 2.07% Cayman Islands Diversified Financial Services Global Aircraft Leasing Co. Ltd. PIK (1) 6.50% 15/09/2024 170 174,343 0.34% Lodging Wynn Macau Ltd.(1) 5.125% 15/12/2029 200 198,500 0.38% Oil & Gas Transocean Pontus Ltd.(1) 6.125% 01/08/2025 107 110,270 0.21% Transocean Poseidon Ltd.(1) 6.875% 01/02/2027 65 68,076 0.13% Transocean, Inc. 6.80% 15/03/2038 55 35,343 0.07% 213,689 0.41% Oil & Gas Services Transocean Phoenix 2 Ltd.(1) 7.75% 15/10/2024 10 10,417 0.02% Transocean Proteus Ltd.(1) 6.25% 01/12/2024 7 7,213 0.01% 17,630 0.03% Real Estate China Evergrande Group 9.50% 11/04/2022 400 387,013 0.76% CIFI Holdings Group Co. Ltd. 5.375%(3) -(4) 200 194,846 0.38% Country Garden Holdings Co. Ltd. 6.50% 08/04/2024 400 425,128 0.82% Kaisa Group Holdings Ltd. 9.375% 30/06/2024 200 188,668 0.37% Kaisa Group Holdings Ltd. 10.50% 15/01/2025 200 194,642 0.38% Logan Property Holdings Co. Ltd. 5.25% 23/02/2023 200 197,856 0.38% Ronshine China Holdings Ltd. 8.75% 25/10/2022 200 207,780 0.40% Sunac China Holdings Ltd. 7.25% 14/06/2022 400 409,057 0.79% Yuzhou Properties Co. Ltd. 6.00% 25/10/2023 400 386,372 0.75% Zhenro Properties Group Ltd. 10.25%(3) -(4) 200 205,519 0.40% 2,796,881 5.43% Total Cayman Islands 3,401,043 6.59% Chile Electric AES Gener SA(1) 6.35%(3) 07/10/2079 200 209,200 0.41% Costa Rica Commercial Services Autopistas del Sol SA/Costa Rica(1) 7.375% 30/12/2030 183 189,301 0.37% France Chemicals SPCM SA(1) 4.875% 15/09/2025 12 12,420 0.02% Electric Electricite de France SA 4.00%(3) -(4) EUR 100 121,518 0.23%
163

LORD ABBETT PASSPORT PORTFOLIOS PLC GLOBAL HIGH YIELD FUND Schedule of Investments as at 31 January 2020 (Continued)
Interest Maturity PrincipalFair
Value % of Net Investments Rate Date (000) USD Assets Corporate Bonds - 82.45% (31 January 2019: 91.64%) (Continued) France (Continued) Environmental Control Paprec Holding SA 4.00% 31/03/2025 EUR 100 101,954 0.20% Telecommunications Altice France SA/France(1) 8.125% 01/02/2027 200 223,870 0.43% Transportation CMA CGM SA 5.25% 15/01/2025 EUR 200 174,819 0.34% Total France 634,581 1.22% Germany Auto Parts & Equipment IHO Verwaltungs GmbH PIK 3.875% 15/05/2027 EUR 200 229,922 0.45% Commercial Services Techem Verwaltungsgesellschaft 674 mbH 6.00% 30/07/2026 EUR 100 119,692 0.23% Forest Products & Paper WEPA Hygieneprodukte GmbH 2.875% 15/12/2027 EUR 200 226,328 0.44% Total Germany 575,942 1.12% India Diversified Financial Services Manappuram Finance Ltd. 5.90% 13/01/2023 200 201,993 0.39% Muthoot Finance Ltd.(1) 6.125% 31/10/2022 200 207,692 0.40% 409,685 0.79% Energy-Alternate Sources ReNew Power Pvt Ltd.(1) 5.875% 05/03/2027 200 201,351 0.39% Engineering & Construction GMR Hyderabad International Airport Ltd.(1) 4.25% 27/10/2027 200 192,330 0.37% Retail Future Retail Ltd.(1) 5.60% 22/01/2025 200 201,789 0.39% Total India 1,005,155 1.94% Ireland Banks AIB Group PLC 5.25%(3) -(4) EUR 200 244,650 0.47% Entertainment Motion Bondco DAC 4.50% 15/11/2027 EUR 100 116,785 0.23% Telecommunications eircom Finance DAC 3.50% 15/05/2026 EUR 100 115,183 0.22% Total Ireland 476,618 0.92%
164

LORD ABBETT PASSPORT PORTFOLIOS PLC GLOBAL HIGH YIELD FUND Schedule of Investments as at 31 January 2020 (Continued)
Interest Maturity PrincipalFair
Value % of Net Investments Rate Date (000) USD Assets Corporate Bonds - 82.45% (31 January 2019: 91.64%) (Continued) Italy Aerospace/Defense F-Brasile SpA/F-Brasile US LLC(1) 7.375% 15/08/2026 200 213,500 0.41% Banks Intesa Sanpaolo SpA(1) 5.71% 15/01/2026 200 222,467 0.43% UniCredit SpA 5.375%(3) -(4) EUR 200 231,205 0.45% 453,672 0.88% Entertainment Inter Media & Communication SpA(1) 4.875% 31/12/2022 EUR 97 110,525 0.21% Juventus Football Club SpA 3.375% 19/02/2024 EUR 200 229,206 0.44% 339,731 0.65% Telecommunications Telecom Italia SpA/Milano 2.375% 12/10/2027 EUR 100 114,305 0.22% Total Italy 1,121,208 2.16% Jersey, Channel Islands Auto Manufacturers Aston Martin Capital Holdings Ltd.(1) 6.50% 15/04/2022 300 296,091 0.57% Diversified Financial Services LHC3 PLC PIK 4.125% 15/08/2024 EUR 100 114,266 0.22% Entertainment CPUK Finance Ltd. 4.875% 28/08/2025 GBP 100 136,778 0.27% Total Jersey, Channel Islands 547,135 1.06% Luxembourg Advertising Summer BC Holdco A S.A.R.L. 9.25% 31/10/2027 EUR 100 115,010 0.22% Agriculture Kernel Holding SA(1) 8.75% 31/01/2022 200 217,119 0.42% MHP Lux SA(1) 6.25% 19/09/2029 200 196,253 0.38% 413,372 0.80% Airlines Gol Finance SA(1) 7.00% 31/01/2025 200 203,517 0.40% Chemicals Trinseo Materials Operating SCA/Trinseo Materials Finance, Inc.(1) 5.375% 01/09/2025 80 75,184 0.15% Diversified Financial Services Lincoln Financing S.A.R.L. 3.625% 01/04/2024 EUR 100 113,384 0.22% Food Minerva Luxembourg SA(1) 5.875% 19/01/2028 200 211,130 0.41%
165

LORD ABBETT PASSPORT PORTFOLIOS PLC GLOBAL HIGH YIELD FUND Schedule of Investments as at 31 January 2020 (Continued)
Interest Maturity PrincipalFair
Value % of Net Investments Rate Date (000) USD Assets Corporate Bonds - 82.45% (31 January 2019: 91.64%) (Continued) Luxembourg (Continued) Holding Companies-Diversified Stena International SA(1) 6.125% 01/02/2025 200 205,750 0.40% Iron/Steel CSN Resources SA(1) 7.625% 17/04/2026 200 210,431 0.41% Media Altice Finco SA 4.75% 15/01/2028 EUR 100 112,175 0.22% Altice Luxembourg SA 8.00% 15/05/2027 EUR 100 125,504 0.24% 237,679 0.46% Mining Nexa Resources SA(1) 5.375% 04/05/2027 200 215,622 0.42% Miscellaneous Manufacturer Pentair Finance S.A.R.L. 4.50% 01/07/2029 107 118,275 0.23% Oil & Gas Pacific Drilling SA(1) 8.375% 01/10/2023 51 42,967 0.08% Real Estate Aroundtown SA 2.125%(3) -(4) EUR 100 111,859 0.22% Sovereign Ecuador Social Bond S.A.R.L.(1) ZCP 30/01/2035 200 131,000 0.25% Telecommunications Crystal Almond S.A.R.L.(1) 4.25% 15/10/2024 EUR 100 114,546 0.22% Intelsat Jackson Holdings SA 5.50% 01/08/2023 248 203,257 0.39% Intelsat Jackson Holdings SA(1) 8.50% 15/10/2024 75 63,531 0.12% Matterhorn Telecom SA 4.00% 15/11/2027 EUR 100 117,168 0.23% Ypso Finance Bis SA(1) 6.00% 15/02/2028 200 198,636 0.39% 697,138 1.35% Total Luxembourg 3,102,318 6.02% Marshall Island Transportation Teekay Corp.(1) 9.25% 15/11/2022 30 31,284 0.06% Mauritius Electric Greenko Investment Co.(1) 4.875% 16/08/2023 200 200,344 0.39% Energy-Alternate Sources Azure Power Solar Energy Pvt Ltd.(1) 5.65% 24/12/2024 200 206,939 0.40% Total Mauritius 407,283 0.79% Mexico Mining Industrias Penoles SAB de CV(1) 5.65% 12/09/2049 200 220,313 0.43%
166

LORD ABBETT PASSPORT PORTFOLIOS PLC GLOBAL HIGH YIELD FUND Schedule of Investments as at 31 January 2020 (Continued)
Interest Maturity PrincipalFair
Value % of Net Investments Rate Date (000) USD Assets Corporate Bonds - 82.45% (31 January 2019: 91.64%) (Continued) Multinational Auto Parts & Equipment Panther BF Aggregator 2 LP/Panther Finance Co., Inc. 4.375% 15/05/2026 EUR 100 114,560 0.22% Panther BF Aggregator 2 LP/Panther Finance Co., Inc.(1) 8.50% 15/05/2027 127 136,760 0.27% 251,320 0.49% Chemicals Starfruit Finco BV/Starfruit US Holdco LLC 6.50% 01/10/2026 EUR 200 233,627 0.45% Food JBS USA LUX SA/JBS USA Finance, Inc.(1) 6.75% 15/02/2028 118 130,904 0.25% Machinery-Diversified Titan Acquisition Ltd./Titan Co.-Borrower LLC(1) 7.75% 15/04/2026 71 69,309 0.13% Telecommunications Connect Finco S.A.R.L./Connect US Finco LLC(1) 6.75% 01/10/2026 200 212,000 0.41% Total Multinational 897,160 1.73% Netherlands Beverages Ajecorp BV(1) 6.50% 14/05/2022 150 150,028 0.29% Commercial Services Intertrust Group BV 3.375% 15/11/2025 EUR 100 115,911 0.22% Engineering & Construction Promontoria Holding 264 BV 6.75% 15/08/2023 EUR 200 203,499 0.39% Entertainment Stars Group Holdings BV/Stars Group US Co.-Borrower LLC(1) 7.00% 15/07/2026 120 130,572 0.25% Food Sigma Holdco BV 5.75% 15/05/2026 EUR 100 112,402 0.22% Internet United Group BV 3.625% 15/02/2028 EUR 100 110,133 0.21% Machinery-Diversified Frigoglass Finance BV 6.875% 12/02/2025 EUR 100 110,820 0.22% Media Summer BidCo BV PIK 9.00% 15/11/2025 EUR 100 118,131 0.23% UPC Holding BV 3.875% 15/06/2029 EUR 100 116,719 0.23% 234,850 0.46% Packaging & Containers Schoeller Packaging BV 6.375% 01/11/2024 EUR 100 117,259 0.23%
167

LORD ABBETT PASSPORT PORTFOLIOS PLC GLOBAL HIGH YIELD FUND Schedule of Investments as at 31 January 2020 (Continued)
Interest Maturity PrincipalFair
Value % of Net Investments Rate Date (000) USD Assets Corporate Bonds - 82.45% (31 January 2019: 91.64%) (Continued) Netherlands (Continued) Packaging & Containers (continued) Trivium Packaging Finance BV 3.75% 15/08/2026 EUR 100 116,316 0.23% 233,575 0.46% Total Netherlands 1,401,790 2.72% Norway Leisure Time Explorer II AS 3.375% 24/02/2025 EUR 100 110,820 0.22% Portugal Airlines Transportes Aereos Portugueses SA 5.625% 02/12/2024 EUR 100 109,988 0.21% Puerto Rico Banks Popular, Inc. 6.125% 14/09/2023 126 135,660 0.26% Romania Telecommunications RCS & RDS SA 3.25% 05/02/2028 EUR 100 111,903 0.22% Singapore Oil & Gas Medco Bell Pte Ltd.(1) 6.375% 30/01/2027 200 193,624 0.38% Real Estate Theta Capital Pte Ltd. 6.75% 31/10/2026 200 182,002 0.35% Total Singapore 375,626 0.73% South Africa Electric Eskom Holdings SOC Ltd.(1) 7.125% 11/02/2025 200 203,377 0.39% Spain Pipelines AI Candelaria Spain SLU(1) 7.50% 15/12/2028 250 285,913 0.56% Sweden Diversified Financial Services Intrum AB 3.50% 15/07/2026 EUR 200 226,212 0.44% Holding Companies-Diversified Stena AB(1) 7.00% 01/02/2024 200 205,833 0.40% Leisure Time Dometic Group AB 3.00% 08/05/2026 EUR 100 113,410 0.22% Total Sweden 545,455 1.06%
168

LORD ABBETT PASSPORT PORTFOLIOS PLC GLOBAL HIGH YIELD FUND Schedule of Investments as at 31 January 2020 (Continued)
Interest Maturity PrincipalFair
Value % of Net Investments Rate Date (000) USD Assets Corporate Bonds - 82.45% (31 January 2019: 91.64%) (Continued) Switzerland Banks Credit Suisse Group AG(1) 5.10%(3) -(4) 200 202,250 0.39% Turkey Banks Akbank T.A.S.(1) 5.00% 24/10/2022 200 206,560 0.40% Turkiye Vakiflar Bankasi TAO(1) 5.25% 05/02/2025 200 199,300 0.39% 405,860 0.79% Holding Companies-Diversified KOC Holding AS(1) 5.25% 15/03/2023 200 208,190 0.40% Total Turkey 614,050 1.19% United Kingdom Auto Manufacturers Jaguar Land Rover Automotive PLC 6.875% 15/11/2026 EUR 100 118,243 0.23% Mclaren Finance PLC 5.00% 01/08/2022 GBP 200 256,495 0.50% 374,738 0.73% Commercial Services Algeco Global Finance PLC 6.50% 15/02/2023 EUR 100 110,542 0.21% Entertainment Pinewood Finance Co. Ltd. 3.25% 30/09/2025 GBP 200 269,470 0.52% William Hill PLC 4.75% 01/05/2026 GBP 200 275,840 0.53% 545,310 1.05% Home Builders Miller Homes Group Holdings PLC 5.50% 15/10/2024 GBP 100 137,356 0.27% Leisure Time Pinnacle Bidco PLC 6.375% 15/02/2025 GBP 100 138,774 0.27% Oil & Gas Valaris PLC 4.50% 01/10/2024 59 32,008 0.06% Valaris PLC 8.00% 31/01/2024 14 8,493 0.02% 40,501 0.08% Total United Kingdom 1,347,221 2.61% United States Aerospace/Defense Arconic, Inc. 6.75% 15/01/2028 44 51,471 0.10% Kratos Defense & Security Solutions, Inc.(1) 6.50% 30/11/2025 12 12,815 0.03% Signature Aviation US Holdings, Inc.(1) 4.00% 01/03/2028 53 52,519 0.10% TransDigm, Inc. 6.375% 15/06/2026 275 290,290 0.56% Triumph Group, Inc.(1) 6.25% 15/09/2024 9 9,328 0.02% Triumph Group, Inc. 7.75% 15/08/2025 59 57,808 0.11% 474,231 0.92% Airlines Azul Investments LLP(1) 5.875% 26/10/2024 200 209,083 0.41%
169
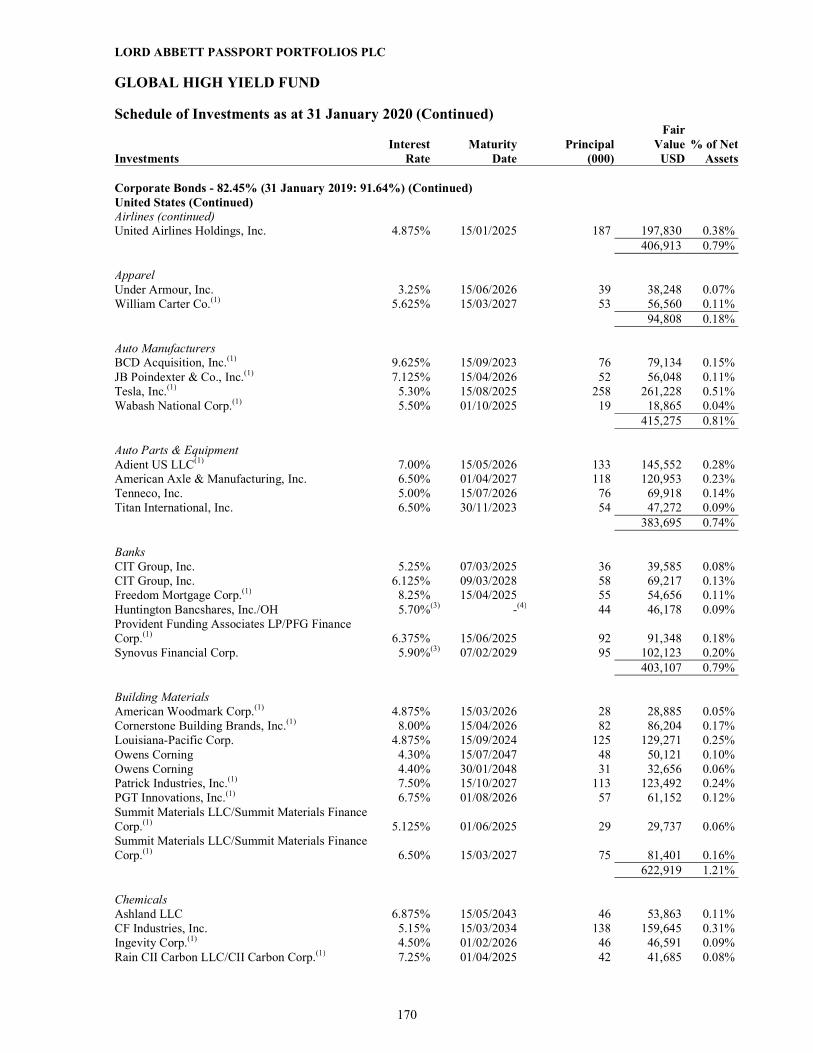
LORD ABBETT PASSPORT PORTFOLIOS PLC GLOBAL HIGH YIELD FUND Schedule of Investments as at 31 January 2020 (Continued)
Interest Maturity PrincipalFair
Value % of Net Investments Rate Date (000) USD Assets Corporate Bonds - 82.45% (31 January 2019: 91.64%) (Continued) United States (Continued) Airlines (continued) United Airlines Holdings, Inc. 4.875% 15/01/2025 187 197,830 0.38% 406,913 0.79% Apparel Under Armour, Inc. 3.25% 15/06/2026 39 38,248 0.07% William Carter Co.(1) 5.625% 15/03/2027 53 56,560 0.11% 94,808 0.18% Auto Manufacturers BCD Acquisition, Inc.(1) 9.625% 15/09/2023 76 79,134 0.15% JB Poindexter & Co., Inc.(1) 7.125% 15/04/2026 52 56,048 0.11% Tesla, Inc.(1) 5.30% 15/08/2025 258 261,228 0.51% Wabash National Corp.(1) 5.50% 01/10/2025 19 18,865 0.04% 415,275 0.81% Auto Parts & Equipment Adient US LLC(1) 7.00% 15/05/2026 133 145,552 0.28% American Axle & Manufacturing, Inc. 6.50% 01/04/2027 118 120,953 0.23% Tenneco, Inc. 5.00% 15/07/2026 76 69,918 0.14% Titan International, Inc. 6.50% 30/11/2023 54 47,272 0.09% 383,695 0.74% Banks CIT Group, Inc. 5.25% 07/03/2025 36 39,585 0.08% CIT Group, Inc. 6.125% 09/03/2028 58 69,217 0.13% Freedom Mortgage Corp.(1) 8.25% 15/04/2025 55 54,656 0.11% Huntington Bancshares, Inc./OH 5.70%(3) -(4) 44 46,178 0.09% Provident Funding Associates LP/PFG Finance Corp.(1) 6.375% 15/06/2025 92 91,348 0.18% Synovus Financial Corp. 5.90%(3) 07/02/2029 95 102,123 0.20% 403,107 0.79% Building Materials American Woodmark Corp.(1) 4.875% 15/03/2026 28 28,885 0.05% Cornerstone Building Brands, Inc.(1) 8.00% 15/04/2026 82 86,204 0.17% Louisiana-Pacific Corp. 4.875% 15/09/2024 125 129,271 0.25% Owens Corning 4.30% 15/07/2047 48 50,121 0.10% Owens Corning 4.40% 30/01/2048 31 32,656 0.06% Patrick Industries, Inc.(1) 7.50% 15/10/2027 113 123,492 0.24% PGT Innovations, Inc.(1) 6.75% 01/08/2026 57 61,152 0.12% Summit Materials LLC/Summit Materials Finance Corp.(1) 5.125% 01/06/2025 29 29,737 0.06% Summit Materials LLC/Summit Materials Finance Corp.(1) 6.50% 15/03/2027 75 81,401 0.16% 622,919 1.21% Chemicals Ashland LLC 6.875% 15/05/2043 46 53,863 0.11% CF Industries, Inc. 5.15% 15/03/2034 138 159,645 0.31% Ingevity Corp.(1) 4.50% 01/02/2026 46 46,591 0.09% Rain CII Carbon LLC/CII Carbon Corp.(1) 7.25% 01/04/2025 42 41,685 0.08%
170

LORD ABBETT PASSPORT PORTFOLIOS PLC GLOBAL HIGH YIELD FUND Schedule of Investments as at 31 January 2020 (Continued)
Interest Maturity PrincipalFair
Value % of Net Investments Rate Date (000) USD Assets Corporate Bonds - 82.45% (31 January 2019: 91.64%) (Continued) United States (Continued) Chemicals (continued) Tronox, Inc.(1) 6.50% 15/04/2026 85 84,790 0.16% 386,574 0.75% Coal CONSOL Energy, Inc.(1) 11.00% 15/11/2025 19 13,260 0.02% Warrior Met Coal, Inc.(1) 8.00% 01/11/2024 64 66,440 0.13% 79,700 0.15% Commercial Services Ahern Rentals, Inc.(1) 7.375% 15/05/2023 58 46,134 0.09% Brink's Co.(1) 4.625% 15/10/2027 58 59,295 0.12% Capitol Investment Merger Sub 2 LLC(1) 10.00% 01/08/2024 84 87,500 0.17% Cardtronics, Inc./Cardtronics USA, Inc.(1) 5.50% 01/05/2025 29 30,099 0.06% MPH Acquisition Holdings LLC(1) 7.125% 01/06/2024 71 68,949 0.13% Service Corp. International/US 4.625% 15/12/2027 12 12,576 0.02% Service Corp. International/US 5.125% 01/06/2029 56 59,738 0.12% Verscend Escrow Corp.(1) 9.75% 15/08/2026 50 54,501 0.11% WW International, Inc.(1) 8.625% 01/12/2025 25 26,198 0.05% 444,990 0.87% Computers Banff Merger Sub, Inc.(1) 9.75% 01/09/2026 53 54,514 0.11% Booz Allen Hamilton, Inc.(1) 5.125% 01/05/2025 12 12,365 0.02% Diebold Nixdorf, Inc. 8.50% 15/04/2024 72 69,330 0.14% Everi Payments, Inc.(1) 7.50% 15/12/2025 20 21,408 0.04% MTS Systems Corp.(1) 5.75% 15/08/2027 79 83,175 0.16% Presidio Holdings, Inc.(1) 4.875% 01/02/2027 25 25,043 0.05% Presidio Holdings, Inc.(1) 8.25% 01/02/2028 47 48,410 0.09% Western Digital Corp. 4.75% 15/02/2026 138 147,574 0.29% 461,819 0.90% Cosmetics/Personal Care Coty, Inc.(1) 6.50% 15/04/2026 111 115,998 0.22% Revlon Consumer Products Corp. 5.75% 15/02/2021 52 45,877 0.09% 161,875 0.31% Distribution/Wholesale Core & Main Holdings LP PIK (1) 8.625% 15/09/2024 83 86,769 0.17% IAA, Inc.(1) 5.50% 15/06/2027 29 30,827 0.06% Performance Food Group, Inc.(1) 5.50% 15/10/2027 15 15,825 0.03% Univar Solutions USA, Inc./Washington(1) 5.125% 01/12/2027 99 102,896 0.20% 236,317 0.46% Diversified Financial Services AG Issuer LLC(1) 6.25% 01/03/2028 30 30,000 0.06% AG Merger Sub II, Inc.(1) 10.75% 01/08/2027 42 44,640 0.09% Ally Financial, Inc. 8.00% 01/11/2031 69 97,456 0.19% Credit Acceptance Corp.(1) 5.125% 31/12/2024 44 46,090 0.09% Nationstar Mortgage Holdings, Inc.(1) 6.00% 15/01/2027 47 47,919 0.09% Navient Corp. 5.00% 15/03/2027 250 250,000 0.49% Navient Corp. 6.75% 25/06/2025 244 266,265 0.52% Quicken Loans, Inc.(1) 5.25% 15/01/2028 76 78,836 0.15% Springleaf Finance Corp. 5.375% 15/11/2029 68 70,839 0.14%
171

LORD ABBETT PASSPORT PORTFOLIOS PLC GLOBAL HIGH YIELD FUND Schedule of Investments as at 31 January 2020 (Continued)
Interest Maturity PrincipalFair
Value % of Net Investments Rate Date (000) USD Assets Corporate Bonds - 82.45% (31 January 2019: 91.64%) (Continued) United States (Continued) Diversified Financial Services (continued) Springleaf Finance Corp. 6.125% 15/03/2024 214 232,723 0.45% Springleaf Finance Corp. 7.125% 15/03/2026 78 89,640 0.17% 1,254,408 2.44% Electric AES Corp./VA 4.50% 15/03/2023 14 14,302 0.03% AES Corp./VA 5.125% 01/09/2027 12 12,691 0.02% Clearway Energy Operating LLC(1) 4.75% 15/03/2028 68 70,081 0.14% Clearway Energy Operating LLC 5.00% 15/09/2026 86 88,825 0.17% Clearway Energy Operating LLC 5.75% 15/10/2025 3 3,159 0.01% DPL, Inc.(1) 4.35% 15/04/2029 45 44,868 0.09% Elwood Energy LLC 8.159% 05/07/2026 59 65,522 0.13% NextEra Energy Operating Partners LP(1) 4.50% 15/09/2027 27 28,220 0.05% NRG Energy, Inc. 5.75% 15/01/2028 145 156,332 0.30% Talen Energy Supply LLC(1) 10.50% 15/01/2026 35 31,126 0.06% Terraform Global Operating LLC(1) 6.125% 01/03/2026 18 18,816 0.04% 533,942 1.04% Energy-Alternate Sources Enviva Partners LP/Enviva Partners Finance Corp.(1) 6.50% 15/01/2026 54 57,741 0.11% TerraForm Power Operating LLC(1) 4.75% 15/01/2030 44 46,449 0.09% TerraForm Power Operating LLC(1) 5.00% 31/01/2028 26 28,128 0.06% 132,318 0.26% Engineering & Construction Brand Industrial Services, Inc.(1) 8.50% 15/07/2025 113 113,549 0.22% TopBuild Corp.(1) 5.625% 01/05/2026 24 25,088 0.05% Weekley Homes LLC/Weekley Finance Corp. 6.00% 01/02/2023 18 18,075 0.04% 156,712 0.31% Entertainment Boyne USA, Inc.(1) 7.25% 01/05/2025 12 13,055 0.03% Buena Vista Gaming Authority(1) 13.00% 01/04/2023 39 39,114 0.08% Churchill Downs, Inc.(1) 4.75% 15/01/2028 42 43,338 0.08% Enterprise Development Authority(1) 12.00% 15/07/2024 67 77,022 0.15% Mohegan Gaming & Entertainment(1) 7.875% 15/10/2024 53 54,171 0.11% Penn National Gaming, Inc.(1) 5.625% 15/01/2027 92 96,826 0.19% Scientific Games International, Inc.(1) 7.00% 15/05/2028 59 62,317 0.12% Scientific Games International, Inc.(1) 7.25% 15/11/2029 27 29,007 0.06% 414,850 0.82% Environmental Control Covanta Holding Corp. 6.00% 01/01/2027 32 33,371 0.06% Waste Pro USA, Inc.(1) 5.50% 15/02/2026 28 28,831 0.06% 62,202 0.12% Food Chobani LLC/Chobani Finance Corp., Inc.(1) 7.50% 15/04/2025 74 73,786 0.14% Fresh Market, Inc.(1) 9.75% 01/05/2023 38 18,810 0.04% Lamb Weston Holdings, Inc.(1) 4.625% 01/11/2024 8 8,417 0.02% Lamb Weston Holdings, Inc.(1) 4.875% 01/11/2026 21 22,181 0.04% 123,194 0.24%
172

LORD ABBETT PASSPORT PORTFOLIOS PLC GLOBAL HIGH YIELD FUND Schedule of Investments as at 31 January 2020 (Continued)
Interest Maturity PrincipalFair
Value % of Net Investments Rate Date (000) USD Assets Corporate Bonds - 82.45% (31 January 2019: 91.64%) (Continued) United States (Continued) Healthcare-Products Ortho-Clinical Diagnostics, Inc./Ortho-Clinical Diagnostics SA(1) 7.25% 01/02/2028 56 57,127 0.11% Healthcare-Services AHP Health Partners, Inc.(1) 9.75% 15/07/2026 37 40,435 0.08% BCPE Cycle Merger Sub II, Inc.(1) 10.625% 15/07/2027 62 64,071 0.12% Centene Corp.(1) 4.25% 15/12/2027 35 36,640 0.07% Centene Corp.(1) 4.625% 15/12/2029 31 33,423 0.06% Centene Corp. 4.75% 15/01/2025 21 21,744 0.04% Centene Corp.(1) 5.375% 01/06/2026 43 45,821 0.09% Encompass Health Corp. 4.50% 01/02/2028 23 23,733 0.05% Hadrian Merger Sub, Inc.(1) 8.50% 01/05/2026 60 61,821 0.12% HCA, Inc. 5.25% 15/06/2026 33 37,767 0.07% HCA, Inc. 5.50% 15/06/2047 49 58,306 0.11% HCA, Inc. 5.875% 01/02/2029 47 55,523 0.11% HCA, Inc. 7.50% 06/11/2033 75 95,089 0.18% MEDNAX, Inc.(1) 6.25% 15/01/2027 100 102,127 0.20% Radiology Partners, Inc.(1) 9.25% 01/02/2028 92 96,370 0.19% RegionalCare Hospital Partners Holdings, Inc./LifePoint Health, Inc.(1) 9.75% 01/12/2026 40 44,751 0.09% Select Medical Corp.(1) 6.25% 15/08/2026 129 139,406 0.27% Surgery Center Holdings, Inc.(1) 10.00% 15/04/2027 144 161,201 0.31% Tenet Healthcare Corp.(1) 4.875% 01/01/2026 43 44,774 0.09% Tenet Healthcare Corp. 5.125% 01/05/2025 18 18,360 0.04% Tenet Healthcare Corp.(1) 6.25% 01/02/2027 65 68,825 0.13% West Street Merger Sub, Inc.(1) 6.375% 01/09/2025 104 102,699 0.20% 1,352,886 2.62% Home Builders Ashton Woods USA LLC/Ashton Woods Finance Co.(1) 6.75% 01/08/2025 80 82,633 0.16% Beazer Homes USA, Inc.(1) 7.25% 15/10/2029 73 79,937 0.16% Century Communities, Inc. 5.875% 15/07/2025 56 58,963 0.11% Century Communities, Inc.(1) 6.75% 01/06/2027 53 57,628 0.11% Installed Building Products, Inc.(1) 5.75% 01/02/2028 26 27,699 0.05% KB Home 4.80% 15/11/2029 23 23,920 0.05% Lennar Corp. 4.75% 30/05/2025 76 83,146 0.16% LGI Homes, Inc.(1) 6.875% 15/07/2026 174 184,283 0.36% PulteGroup, Inc. 5.00% 15/01/2027 77 85,264 0.17% Shea Homes LP/Shea Homes Funding Corp. 5.875% 01/04/2023 150 153,062 0.30% Shea Homes LP/Shea Homes Funding Corp.(1) 6.125% 01/04/2025 62 64,041 0.12% Toll Brothers Finance Corp. 4.35% 15/02/2028 180 189,963 0.37% TRI Pointe Group, Inc. 5.25% 01/06/2027 97 103,339 0.20% William Lyon Homes, Inc.(1) 6.625% 15/07/2027 102 110,451 0.21% Williams Scotsman International, Inc.(1) 6.875% 15/08/2023 22 23,171 0.04% Williams Scotsman International, Inc.(1) 7.875% 15/12/2022 13 13,589 0.03% 1,341,089 2.60% Housewares Newell Brands, Inc. 5.375% 01/04/2036 72 79,301 0.15% Insurance Acrisure LLC/Acrisure Finance, Inc.(1) 7.00% 15/11/2025 70 68,774 0.13%
173

LORD ABBETT PASSPORT PORTFOLIOS PLC GLOBAL HIGH YIELD FUND Schedule of Investments as at 31 January 2020 (Continued)
Interest Maturity PrincipalFair
Value % of Net Investments Rate Date (000) USD Assets Corporate Bonds - 82.45% (31 January 2019: 91.64%) (Continued) United States (Continued) Insurance (continued) Acrisure LLC/Acrisure Finance, Inc.(1) 8.125% 15/02/2024 50 53,531 0.10% Alliant Holdings Intermediate LLC/Alliant Holdings Co.-Issuer(1) 6.75% 15/10/2027 37 39,011 0.08% HUB International Ltd.(1) 7.00% 01/05/2026 62 64,014 0.13% Radian Group, Inc. 4.875% 15/03/2027 189 200,406 0.39% 425,736 0.83% Internet Cogent Communications Group, Inc. 4.375% 30/06/2024 EUR 300 343,407 0.67% Go Daddy Operating Co. LLC/GD Finance Co., Inc.(1) 5.25% 01/12/2027 28 29,417 0.06% GrubHub Holdings, Inc.(1) 5.50% 01/07/2027 34 33,255 0.06% Match Group, Inc.(1) 5.00% 15/12/2027 39 41,061 0.08% Netflix, Inc. 3.875% 15/11/2029 EUR 650 761,582 1.48% Uber Technologies, Inc.(1) 8.00% 01/11/2026 70 74,563 0.14% 1,283,285 2.49% Lodging Boyd Gaming Corp.(1) 4.75% 01/12/2027 25 25,609 0.05% Boyd Gaming Corp. 6.00% 15/08/2026 44 46,875 0.09% Hilton Domestic Operating Co., Inc. 4.875% 15/01/2030 28 29,675 0.06% Hilton Domestic Operating Co., Inc. 5.125% 01/05/2026 25 26,251 0.05% MGM Resorts International 4.625% 01/09/2026 246 258,651 0.50% Sugarhouse HSP Gaming Prop Mezz LP/Sugarhouse HSP Gaming Finance Corp.(1) 5.875% 15/05/2025 19 19,103 0.04% Wyndham Destinations, Inc. 5.75% 01/04/2027 107 117,069 0.23% Wyndham Destinations, Inc. 6.35% 01/10/2025 41 46,065 0.09% 569,298 1.11% Machinery-Diversified Cloud Crane LLC(1) 10.125% 01/08/2024 11 11,745 0.02% Granite US Holdings Corp.(1) 11.00% 01/10/2027 42 44,114 0.09% Mueller Water Products, Inc.(1) 5.50% 15/06/2026 28 29,410 0.06% RBS Global, Inc./Rexnord LLC(1) 4.875% 15/12/2025 45 46,118 0.09% Stevens Holding Co., Inc.(1) 6.125% 01/10/2026 26 28,544 0.06% 159,931 0.32% Media AMC Networks, Inc. 4.75% 01/08/2025 142 143,656 0.28% Belo Corp. 7.25% 15/09/2027 34 39,537 0.08% CCO Holdings LLC/CCO Holdings Capital Corp.(1) 4.75% 01/03/2030 116 119,477 0.23% CCO Holdings LLC/CCO Holdings Capital Corp.(1) 5.125% 01/05/2027 349 365,351 0.71% CCO Holdings LLC/CCO Holdings Capital Corp.(1) 5.75% 15/02/2026 70 73,583 0.14% Clear Channel Worldwide Holdings, Inc.(1) 5.125% 15/08/2027 21 21,669 0.04% Clear Channel Worldwide Holdings, Inc.(1) 9.25% 15/02/2024 9 9,817 0.02% CSC Holdings LLC(1) 5.50% 15/04/2027 50 53,155 0.10% Diamond Sports Group LLC/Diamond Sports Finance Co.(1) 5.375% 15/08/2026 42 41,915 0.08% Diamond Sports Group LLC/Diamond Sports Finance Co.(1) 6.625% 15/08/2027 95 89,001 0.17% DISH DBS Corp. 7.75% 01/07/2026 187 196,696 0.38% Gray Television, Inc.(1) 7.00% 15/05/2027 135 147,238 0.29% Nexstar Broadcasting, Inc.(1) 5.625% 15/07/2027 137 144,624 0.28%
174

LORD ABBETT PASSPORT PORTFOLIOS PLC GLOBAL HIGH YIELD FUND Schedule of Investments as at 31 January 2020 (Continued)
Interest Maturity PrincipalFair
Value % of Net Investments Rate Date (000) USD Assets Corporate Bonds - 82.45% (31 January 2019: 91.64%) (Continued) United States (Continued) Media (continued) Sinclair Television Group, Inc.(1) 5.125% 15/02/2027 143 146,803 0.28% Sirius XM Radio, Inc.(1) 4.625% 15/07/2024 62 64,416 0.13% Sirius XM Radio, Inc.(1) 5.00% 01/08/2027 80 84,148 0.16% Univision Communications, Inc.(1) 5.125% 15/02/2025 32 32,000 0.06% 1,773,086 3.43% Metal Fabricate/Hardware Hillman Group, Inc.(1) 6.375% 15/07/2022 64 60,020 0.12% Mining Coeur Mining, Inc. 5.875% 01/06/2024 126 126,016 0.24% Compass Minerals International, Inc.(1) 6.75% 01/12/2027 38 40,769 0.08% Freeport-McMoRan, Inc. 3.875% 15/03/2023 47 48,038 0.09% Freeport-McMoRan, Inc. 5.25% 01/09/2029 74 78,577 0.15% Hecla Mining Co. 6.875% 01/05/2021 44 44,011 0.09% 337,411 0.65% Miscellaneous Manufacturer Amsted Industries, Inc.(1) 4.625% 15/05/2030 60 60,900 0.12% Amsted Industries, Inc.(1) 5.625% 01/07/2027 93 99,129 0.19% General Electric Co. 5.00%(3) -(4) 271 268,495 0.52% Koppers, Inc.(1) 6.00% 15/02/2025 69 70,862 0.14% 499,386 0.97% Oil & Gas American Energy- Permian Basin LLC(1) 12.00% 01/10/2024 7 4,830 0.01% Berry Petroleum Co. LLC(1) 7.00% 15/02/2026 93 86,522 0.17% Callon Petroleum Co. 6.125% 01/10/2024 33 31,639 0.06% Callon Petroleum Co. 6.375% 01/07/2026 101 95,733 0.19% Carrizo Oil & Gas, Inc. 8.25% 15/07/2025 76 77,762 0.15% Centennial Resource Production LLC(1) 5.375% 15/01/2026 37 34,885 0.07% Centennial Resource Production LLC(1) 6.875% 01/04/2027 115 114,045 0.22% Chaparral Energy, Inc.(1) 8.75% 15/07/2023 93 33,317 0.06% Citgo Holding, Inc.(1) 9.25% 01/08/2024 45 48,262 0.09% Denbury Resources, Inc.(1) 7.75% 15/02/2024 54 43,492 0.08% Endeavor Energy Resources LP/EER Finance, Inc.(1) 5.50% 30/01/2026 111 114,172 0.22% Endeavor Energy Resources LP/EER Finance, Inc.(1) 5.75% 30/01/2028 43 44,800 0.09% Hess Corp. 5.60% 15/02/2041 53 61,203 0.12% HighPoint Operating Corp. 7.00% 15/10/2022 59 56,179 0.11% Hilcorp Energy I LP/Hilcorp Finance Co.(1) 5.00% 01/12/2024 4 3,652 0.01% Hilcorp Energy I LP/Hilcorp Finance Co.(1) 5.75% 01/10/2025 6 5,443 0.01% Hilcorp Energy I LP/Hilcorp Finance Co.(1) 6.25% 01/11/2028 165 147,320 0.29% Indigo Natural Resources LLC(1) 6.875% 15/02/2026 92 84,412 0.16% Jagged Peak Energy LLC 5.875% 01/05/2026 107 110,464 0.21% Jonah Energy LLC/Jonah Energy Finance Corp.(1) 7.25% 15/10/2025 21 5,827 0.01% Laredo Petroleum, Inc. 10.125% 15/01/2028 154 137,807 0.27% Magnolia Oil & Gas Operating LLC/Magnolia Oil & Gas Finance Corp.(1) 6.00% 01/08/2026 79 81,792 0.16% Matador Resources Co. 5.875% 15/09/2026 41 40,234 0.08% Montage Resources Corp. 8.875% 15/07/2023 35 29,443 0.06% Murphy Oil Corp. 5.875% 01/12/2027 52 53,365 0.10% Murphy Oil Corp. 6.875% 15/08/2024 19 19,847 0.04% Oasis Petroleum, Inc.(1) 6.25% 01/05/2026 60 45,902 0.09%
175

LORD ABBETT PASSPORT PORTFOLIOS PLC GLOBAL HIGH YIELD FUND Schedule of Investments as at 31 January 2020 (Continued)
Interest Maturity PrincipalFair
Value % of Net Investments Rate Date (000) USD Assets Corporate Bonds - 82.45% (31 January 2019: 91.64%) (Continued) United States (Continued) Oil & Gas (continued) Oasis Petroleum, Inc. 6.875% 15/03/2022 91 87,587 0.17% Parsley Energy LLC/Parsley Finance Corp.(1) 5.625% 15/10/2027 99 105,074 0.20% PBF Holding Co. LLC/PBF Finance Corp.(1) 6.00% 15/02/2028 83 85,083 0.17% PDC Energy, Inc. 6.125% 15/09/2024 60 60,325 0.12% QEP Resources, Inc. 5.25% 01/05/2023 181 174,213 0.34% Range Resources Corp. 5.00% 15/08/2022 68 64,444 0.12% SM Energy Co. 6.625% 15/01/2027 53 48,088 0.09% SM Energy Co. 6.75% 15/09/2026 65 59,209 0.11% SRC Energy, Inc. 6.25% 01/12/2025 63 63,629 0.12% Tapstone Energy LLC/Tapstone Energy Finance Corp.(1) (5) 9.75% 01/06/2022 36 306 0.00% Viper Energy Partners LP(1) 5.375% 01/11/2027 32 33,419 0.06% W&T Offshore, Inc.(1) 9.75% 01/11/2023 118 112,016 0.21% WPX Energy, Inc. 5.25% 15/09/2024 27 28,350 0.06% WPX Energy, Inc. 5.25% 15/10/2027 23 24,078 0.05% WPX Energy, Inc. 5.75% 01/06/2026 115 120,730 0.23% 2,678,900 5.18% Oil & Gas Services Apergy Corp. 6.375% 01/05/2026 27 28,697 0.06% Archrock Partners LP/Archrock Partners Finance Corp.(1) 6.25% 01/04/2028 65 67,031 0.13% Archrock Partners LP/Archrock Partners Finance Corp.(1) 6.875% 01/04/2027 25 26,726 0.05% CSI Compressco LP/CSI Compressco Finance, Inc.(1) 7.50% 01/04/2025 90 89,625 0.17% Exterran Energy Solutions LP/EES Finance Corp. 8.125% 01/05/2025 24 23,840 0.05% Nine Energy Service, Inc.(1) 8.75% 01/11/2023 70 59,552 0.12% Oceaneering International, Inc. 4.65% 15/11/2024 33 31,928 0.06% Oceaneering International, Inc. 6.00% 01/02/2028 130 124,845 0.23% 452,244 0.87% Packaging & Containers Flex Acquisition Co., Inc.(1) 7.875% 15/07/2026 9 9,182 0.02% Mauser Packaging Solutions Holding Co.(1) 7.25% 15/04/2025 41 40,897 0.08% Trident TPI Holdings, Inc.(1) 6.625% 01/11/2025 15 13,656 0.03% Trident TPI Holdings, Inc.(1) 9.25% 01/08/2024 37 37,663 0.07% 101,398 0.20% Pharmaceuticals Bausch Health Americas, Inc.(1) 8.50% 31/01/2027 62 70,252 0.14% NVA Holdings, Inc.(1) 6.875% 01/04/2026 12 12,960 0.02% 83,212 0.16% Pipelines Buckeye Partners LP 3.95% 01/12/2026 67 66,537 0.13% Buckeye Partners LP 4.125% 01/12/2027 95 93,843 0.18% Cheniere Energy Partners LP(1) 4.50% 01/10/2029 52 53,006 0.10% Cheniere Energy Partners LP 5.625% 01/10/2026 137 143,765 0.28% Holly Energy Partners LP/Holly Energy Finance Corp.(1) 5.00% 01/02/2028 46 46,819 0.09% NGPL PipeCo LLC(1) 4.875% 15/08/2027 52 56,265 0.11%
176
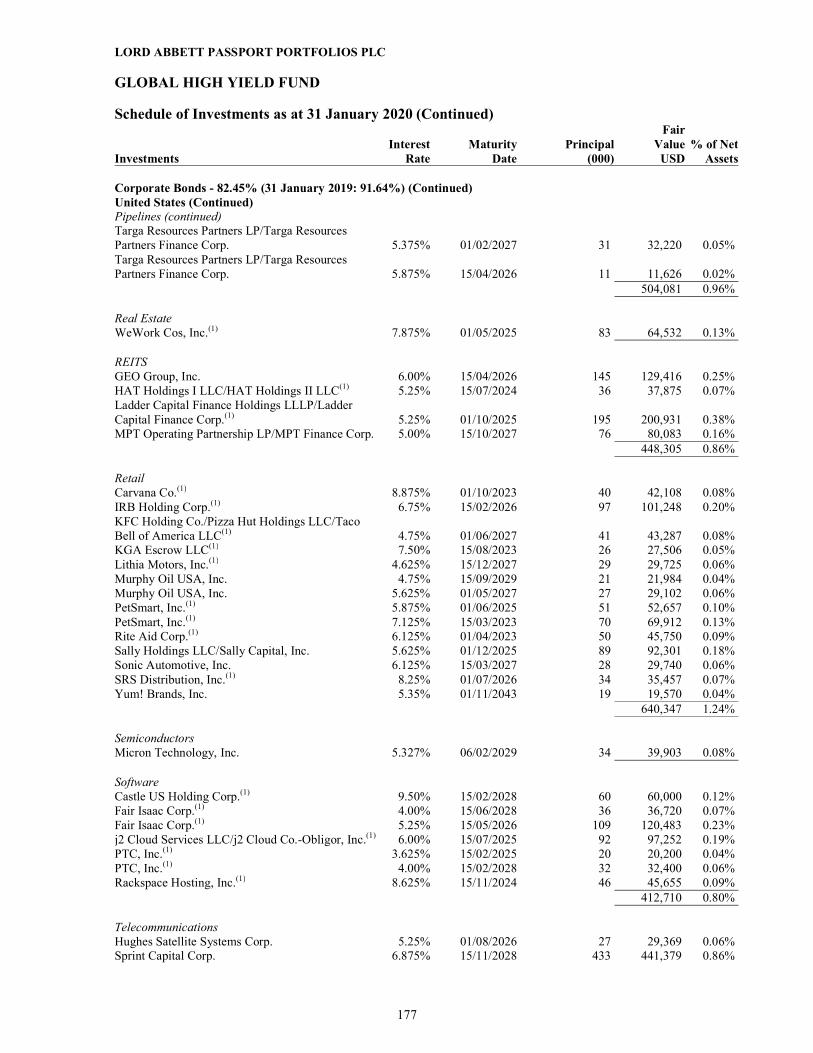
LORD ABBETT PASSPORT PORTFOLIOS PLC GLOBAL HIGH YIELD FUND Schedule of Investments as at 31 January 2020 (Continued)
Interest Maturity PrincipalFair
Value % of Net Investments Rate Date (000) USD Assets Corporate Bonds - 82.45% (31 January 2019: 91.64%) (Continued) United States (Continued) Pipelines (continued) Targa Resources Partners LP/Targa Resources Partners Finance Corp. 5.375% 01/02/2027 31 32,220 0.05% Targa Resources Partners LP/Targa Resources Partners Finance Corp. 5.875% 15/04/2026 11 11,626 0.02% 504,081 0.96% Real Estate WeWork Cos, Inc.(1) 7.875% 01/05/2025 83 64,532 0.13% REITS GEO Group, Inc. 6.00% 15/04/2026 145 129,416 0.25% HAT Holdings I LLC/HAT Holdings II LLC(1) 5.25% 15/07/2024 36 37,875 0.07% Ladder Capital Finance Holdings LLLP/Ladder Capital Finance Corp.(1) 5.25% 01/10/2025 195 200,931 0.38% MPT Operating Partnership LP/MPT Finance Corp. 5.00% 15/10/2027 76 80,083 0.16% 448,305 0.86% Retail Carvana Co.(1) 8.875% 01/10/2023 40 42,108 0.08% IRB Holding Corp.(1) 6.75% 15/02/2026 97 101,248 0.20% KFC Holding Co./Pizza Hut Holdings LLC/Taco Bell of America LLC(1) 4.75% 01/06/2027 41 43,287 0.08% KGA Escrow LLC(1) 7.50% 15/08/2023 26 27,506 0.05% Lithia Motors, Inc.(1) 4.625% 15/12/2027 29 29,725 0.06% Murphy Oil USA, Inc. 4.75% 15/09/2029 21 21,984 0.04% Murphy Oil USA, Inc. 5.625% 01/05/2027 27 29,102 0.06% PetSmart, Inc.(1) 5.875% 01/06/2025 51 52,657 0.10% PetSmart, Inc.(1) 7.125% 15/03/2023 70 69,912 0.13% Rite Aid Corp.(1) 6.125% 01/04/2023 50 45,750 0.09% Sally Holdings LLC/Sally Capital, Inc. 5.625% 01/12/2025 89 92,301 0.18% Sonic Automotive, Inc. 6.125% 15/03/2027 28 29,740 0.06% SRS Distribution, Inc.(1) 8.25% 01/07/2026 34 35,457 0.07% Yum! Brands, Inc. 5.35% 01/11/2043 19 19,570 0.04% 640,347 1.24% Semiconductors Micron Technology, Inc. 5.327% 06/02/2029 34 39,903 0.08% Software Castle US Holding Corp.(1) 9.50% 15/02/2028 60 60,000 0.12% Fair Isaac Corp.(1) 4.00% 15/06/2028 36 36,720 0.07% Fair Isaac Corp.(1) 5.25% 15/05/2026 109 120,483 0.23% j2 Cloud Services LLC/j2 Cloud Co.-Obligor, Inc.(1) 6.00% 15/07/2025 92 97,252 0.19% PTC, Inc.(1) 3.625% 15/02/2025 20 20,200 0.04% PTC, Inc.(1) 4.00% 15/02/2028 32 32,400 0.06% Rackspace Hosting, Inc.(1) 8.625% 15/11/2024 46 45,655 0.09% 412,710 0.80% Telecommunications Hughes Satellite Systems Corp. 5.25% 01/08/2026 27 29,369 0.06% Sprint Capital Corp. 6.875% 15/11/2028 433 441,379 0.86%
177

LORD ABBETT PASSPORT PORTFOLIOS PLC GLOBAL HIGH YIELD FUND Schedule of Investments as at 31 January 2020 (Continued)
Interest Maturity PrincipalFair
Value % of Net Investments Rate Date (000) USD Assets Corporate Bonds - 82.45% (31 January 2019: 91.64%) (Continued) United States (Continued) Telecommunications (continued) ViaSat, Inc.(1) 5.625% 15/04/2027 148 155,289 0.30% 626,037 1.22% Toys/Games/Hobbies Mattel, Inc. 5.45% 01/11/2041 44 39,201 0.08% Mattel, Inc.(1) 5.875% 15/12/2027 22 23,166 0.04% Mattel, Inc.(1) 6.75% 31/12/2025 112 120,354 0.23% 182,721 0.35% Transportation XPO CNW, Inc. 6.70% 01/05/2034 37 39,617 0.08% Total United States 21,462,412 41.64% Total Corporate Bonds 42,522,155 82.45% Floating Rate Loans - 5.96% (31 January 2019: 3.49%) New Zealand Consumer Services Titan Acquisitionco New Zealand Ltd. 1st Lien Initial Term Loan 6.195% 01/05/2026 28 27,983 0.05% United Kingdom Retail Froneri International PLC 2nd Lien Term Loan TBD 29/01/2028 6 6,535 0.01% United States Aerospace Bleriot US Bidco, Inc. Initial Term Loan 6.695% 30/10/2026 56 57,265 0.11% Doncasters US Finance LLC Term Loan B 5.445% 09/04/2020 29 24,505 0.05% 81,770 0.16% Automobile Drive Chassis Holdco LLC 2nd Lien Term Loan B 10.084% 10/04/2026 67 63,817 0.12% Thor Industries, Inc. Initial Dollar Term Loan 5.438% 01/02/2026 108 108,174 0.21% 171,991 0.33% Broadcasting Univision Communications, Inc. 1st Lien Replacement Repriced Term Loan 4.395% 15/03/2024 85 83,818 0.16% Chemicals Schenectady International Group, Inc. Initial Term Loan 6.625% 15/10/2025 13 12,689 0.02% Commercial Services First Advantage Corp. Term Loan B TBD 22/01/2027 16 16,578 0.03% Consumer Durables Britax US Holdings, Inc. Initial Dollar Term Loan 5.445% 15/10/2020 13 1,314 0.00%
178

LORD ABBETT PASSPORT PORTFOLIOS PLC GLOBAL HIGH YIELD FUND Schedule of Investments as at 31 January 2020 (Continued)
Interest Maturity PrincipalFair
Value % of Net Investments Rate Date (000) USD Assets Floating Rate Loans - 5.96% (31 January 2019: 3.49%) (Continued) United States (Continued) Consumer Durables (continued) TGP Holdings III LLC 2nd Lien Initial Term Loan 10.277% 25/09/2025 14 13,055 0.03% 14,369 0.03% Consumer Non-Durables Revlon Consumer Products Corp. Initial Term Loan B 5.409% 07/09/2023 66 52,012 0.10% Diversified Media UFC Holdings LLC 1st Lien Term Loan 4.90% 29/04/2026 17 17,193 0.03% Energy Frontera Generation Holdings LLC Initial Term Loan 5.92% 02/05/2025 48 41,392 0.08% Medallion Midland Acquisition LLC Initial Term Loan 4.895% 30/10/2024 63 62,170 0.12% Navitas Midstream Midland Basin LLC Initial Term Loan 6.145% 13/12/2024 48 46,202 0.09% 149,764 0.29% Financial DG Investment Intermediate Holdings 2, Inc. 1st Lien Initial Term Loan 4.645% 03/02/2025 80 79,994 0.16% Ellie Mae, Inc. 1st Lien Term Loan 5.945% 17/04/2026 90 90,364 0.18% Hayward Industries, Inc. 1st Lien Initial Term Loan 5.145% 05/08/2024 41 40,836 0.08% Helix Gen Funding LLC Term Loan 5.395% 03/06/2024 86 84,851 0.16% Minotaur Acquisition, Inc. 1st Lien Term Loan B 6.645% 27/03/2026 44 43,915 0.09% 339,960 0.67% Gaming/Leisure MND Holdings III Corp. Refinancing Term Loan TBD 19/06/2024 25 22,422 0.04% Playtika Holding Corp. Term Loan B 7.645% 10/12/2024 125 126,598 0.25% Spectacle Gary Holdings LLC Closing Date Term Loan 11.00% 23/12/2025 55 57,579 0.11% 206,599 0.40% Information Technology Optiv, Inc. 1st Lien Initial Term Loan 4.895% 01/02/2024 49 42,660 0.08% Project Boost Purchaser LLC 1st Lien Term Loan 5.145% 01/06/2026 42 42,304 0.08% Sound Inpatient Physicians, Inc. 2nd Lien Initial Term Loan 8.395% 26/06/2026 81 81,415 0.16% Vertafore, Inc. 2nd Lien Initial Term Loan 8.895% 02/07/2026 39 39,472 0.08% 205,851 0.40% Leisure Time Topgolf International, Inc. Initial Term Loan 7.17% 09/02/2026 49 49,004 0.10% Machinery-Diversified MHI Holdings LLC Initial Term Loan 6.645% 21/09/2026 69 69,594 0.14% Manufacturing Airxcel, Inc. 1st Lien Initial Term Loan 6.145% 28/04/2025 92 91,130 0.18%
179

LORD ABBETT PASSPORT PORTFOLIOS PLC GLOBAL HIGH YIELD FUND Schedule of Investments as at 31 January 2020 (Continued)
Interest Maturity PrincipalFair
Value % of Net Investments Rate Date (000) USD Assets Floating Rate Loans - 5.96% (31 January 2019: 3.49%) (Continued) United States (Continued) Manufacturing (continued) Forming Machining Industries Holdings LLC 1st Lien Initial Term Loan 5.945% 09/10/2025 69 64,470 0.13% Forterra Finance LLC Replacement Term Loan 4.645% 25/10/2023 112 109,680 0.21% ProAmpac PG Borrower LLC 1st Lien Initial Term Loan 5.295% 20/11/2023 77 75,783 0.15% Utex Industries, Inc. 1st Lien Initial Term Loan TBD 21/05/2021 13 11,296 0.02% Yak Access LLC 2nd Lien Initial Term Loan 11.66% 10/07/2026 75 67,375 0.13% 419,734 0.82% Media/Telecommunications Ancestry.com Operations, Inc. 1st Lien Extended Term Loan 5.90% 27/08/2026 39 36,818 0.07% Ancestry.com Operations, Inc. 1st Lien Non-Extended Term Loan 5.40% 19/10/2023 24 23,077 0.04% Montreign Operating Co. LLC Term Loan B 10.159% 24/01/2023 61 53,711 0.10% 113,606 0.21% Miscellaneous Manufacturer FGI Operating Co. LLC Term Loan 12.00% 16/05/2022 1 859 0.00% Oil & Gas BEP Ulterra Holdings, Inc. Initial Term Loan 6.895% 26/11/2025 25 23,382 0.05% Lower Cadence Holdings LLC Initial Term Loan 5.645% 22/05/2026 117 114,785 0.22% PowerTeam Services LLC 2nd Lien Initial Term Loan 9.195% 06/03/2026 11 8,030 0.02% 146,197 0.29% Packaging & Containers Temple Generation 1 LLC 2nd Lien Advance Term Loan 9.645% 07/02/2023 6 6,415 0.01% REITS CoreCivic, Inc. Term Loan 6.16% 12/12/2024 74 72,649 0.14% Retail Claire's Stores, Inc. Initial Term Loan 8.421% 18/12/2026 6 5,881 0.01% CWGS Group LLC Term Loan TBD 08/11/2023 50 47,743 0.09% Flynn Restaurant Group LP 1st Lien Initial Term Loan 5.145% 27/06/2025 51 49,341 0.10% Flynn Restaurant Group LP 2nd Lien Initial Term Loan 8.684% 29/06/2026 49 45,325 0.09% J. Crew Group, Inc. Amended Term Loan 4.959% 05/03/2021 101 90,650 0.18% Mavis Tire Express Services Corp. 1st Lien Closing Date Term Loan 4.895% 20/03/2025 61 60,344 0.12% Mavis Tire Express Services Corp. 1st Lien Delayed Draw Term Loan 3.426% 20/03/2025 2 1,727 0.00% United Natural Foods, Inc. Initial Term Loan 5.895% 22/10/2025 48 43,055 0.08% 344,066 0.67% Semiconductors Da Vinci Purchaser Corp. 1st Lien Initial Term Loan 5.872% 08/01/2027 43 43,057 0.08%
180

LORD ABBETT PASSPORT PORTFOLIOS PLC GLOBAL HIGH YIELD FUND Schedule of Investments as at 31 January 2020 (Continued)
Interest Maturity PrincipalFair
Value % of Net Investments Rate Date (000) USD Assets Floating Rate Loans - 5.96% (31 January 2019: 3.49%) (Continued) United States (Continued) Semiconductors (continued) II-VI, Inc. Term Loan B 5.145% 24/09/2026 106 106,594 0.21% 149,651 0.29% Service KUEHG Corp. 2nd Lien Tranche B Term Loan 10.195% 22/08/2025 48 48,203 0.09% Navicure, Inc. 1st Lien Initial Term Loan 5.645% 22/10/2026 46 46,867 0.09% NEP Group, Inc. 1st Lien Initial Dollar Term Loan 4.895% 20/10/2025 45 43,868 0.09% NEP Group, Inc. 2nd Lien Initial Term Loan TBD 19/10/2026 54 50,485 0.10% North American Lifting Holdings, Inc. 2nd Lien Term Loan 10.945% 26/11/2021 17 10,597 0.02% 200,020 0.39% Transportation Commercial Barge Line Co. Initial Term Loan 10.528% 12/11/2020 51 23,707 0.05% Utility Exgen Renewables IV LLC Term Loan 4.91% 28/11/2024 68 67,523 0.13% Lonestar II Generation Holdings LLC Initial Term Loan B 6.645% 20/04/2026 12 12,514 0.02% Lonestar II Generation Holdings LLC Initial Term Loan C 6.645% 20/04/2026 1 1,508 0.00% Moxie Patriot LLC Advance Construction Term Loan B-1 7.695% 19/12/2020 4 3,678 0.01% Moxie Patriot LLC Advance Construction Term Loan B-2 7.695% 19/12/2020 6 5,746 0.01% 90,969 0.17% Total United States 3,039,065 5.90% Total Floating Rate Loans 3,073,583 5.96% Government Obligations - 3.48% (31 January 2019: 1.03%) Non-U.S. Government Obligations Arab Republic of Egypt(1) 4.55% 20/11/2023 200 205,922 0.40% Export Credit Bank of Turkey(1) 6.125% 03/05/2024 200 209,244 0.40% Provincia de Cordoba(1) 7.125% 10/06/2021 150 118,502 0.23% Provincia de Neuquen Argentina(1) 7.50% 27/04/2025 140 112,001 0.21% Republic of Angola(1) 8.25% 09/05/2028 200 215,939 0.42% Republic of Ivory Coast(1) 5.875% 17/10/2031 EUR 100 117,602 0.23% Republic of Kenya(1) 7.25% 28/02/2028 200 216,472 0.42% Republic of Nigeria(1) 6.50% 28/11/2027 200 206,250 0.40% Republic of Senegal 4.75% 13/03/2028 EUR 100 118,339 0.23% Ukraine Government International Bond(1) 7.375% 25/09/2032 250 277,059 0.54% 1,797,330 3.48% Total Government Obligations 1,797,330 3.48%
181

LORD ABBETT PASSPORT PORTFOLIOS PLC GLOBAL HIGH YIELD FUND Schedule of Investments as at 31 January 2020 (Continued)
Fair
Value % of Net Investments Shares USD Assets Common Stocks - 0.04% (31 January 2019: 0.18%) United States Gaming/Leisure Gibson Brands, Inc. 104 12,220 0.02% Miscellaneous Manufacturer Remington Outdoor Co., Inc.* 195 171 0.00% Retail Claire's Stores, Inc. 13 7,150 0.02% Total United States 19,541 0.04% Total Common Stocks 19,541 0.04% Exercise Price Expiration USD Date Warrant - 0.00% (31 January 2019: 0.00%) United States Miscellaneous Manufacturer Remington Outdoor Co., Inc.* 35.05 15/05/2022 196 2 0.00% Total Warrant 2 0.00% Total Investment in Securities (Cost: USD 47,000,121) 47,896,182 92.87%
PIK Payment-in-Kind. TBD To be determined. ZCP Indicates a zero coupon rate. * Non income processing security. (1) Securities exempt from registration under Rule 144A (i) of the US Securities Act of 1933. These securities may be resold in transactions exempt
from registration, normally to qualified institutional buyers. (2) Indicates a variable rate security. The interest rate shown reflects the rate as at 31 January 2020. (3) Variable Rate is Fixed to Float: Rate remains fixed until future date. The interest rate represents the rate as at 31 January 2020. (4) Security is perpetual in nature and has no stated maturity date. (5) Default securities.
Open Forward Foreign Currency Exchange Contracts - 0.07% (31 January 2019: (0.07%)) Unrealised Appreciation/ Depreciation % of Net Settlement Date Amount Sold Amount Bought Counterparty USD Assets Forward Foreign Currency Contracts 14/10/2020 44,940 USD 43,000 CHF Bank of America 421 0.00% 14/02/2020 195,198 USD 175,000 EUR Morgan Stanley (1,146) (0.00%) 09/03/2020 60,000 EUR 66,184 USD Morgan Stanley (444) (0.00%) 14/10/2020 64,000 CHF 68,112 USD Morgan Stanley 598 0.00% 06/02/2020 112,374 USD 102,075 EUR Morgan Stanley 760 0.00% 05/03/2020 123,076 USD 94,000 GBP Morgan Stanley 931 0.00% 14/02/2020 5,127,000 EUR 5,715,803 USD Morgan Stanley 30,653 0.06% 09/03/2020 414,000 EUR 459,414 USD State Street Bank (319) (0.00%) 24/02/2020 110,943 USD 100,000 EUR State Street Bank 9 0.00% 14/10/2020 15,000 CHF 15,911 USD State Street Bank 87 0.00% 05/03/2020 152,557 USD 116,000 GBP State Street Bank 473 0.00%
182

LORD ABBETT PASSPORT PORTFOLIOS PLC GLOBAL HIGH YIELD FUND Schedule of Investments as at 31 January 2020 (Continued)
Open Forward Foreign Currency Exchange Contracts - 0.07% (31 January 2019: (0.07%)) (Continued) Unrealised Appreciation/ Depreciation % of Net Settlement Date Amount Sold Amount Bought Counterparty USD Assets 05/02/2020 110,336 USD 100,000 EUR State Street Bank 491 0.00% 05/03/2020 215,000 GBP 284,403 USD State Street Bank 770 0.00% 14/02/2020 420,352 USD 380,000 EUR State Street Bank 1,016 0.00% 14/02/2020 1,165,000 EUR 1,296,058 USD State Street Bank 4,230 0.01% 05/03/2020 928,000 GBP 1,210,306 USD Toronto-Dominion Bank (13,935) (0.03%) 14/10/2020 110,000 CHF 115,061 USD Toronto-Dominion Bank (979) (0.00%) 14/02/2020 80,000 EUR 88,651 USD Toronto-Dominion Bank (59) (0.00%) 14/02/2020 118,452 USD 107,000 EUR Toronto-Dominion Bank 196 0.00% 14/10/2020 151,586 USD 146,000 CHF Toronto-Dominion Bank 2,431 0.01% 26,184 0.05% Share Class Hedges Class A EUR Accumulating (Hedged) 27/02/2020 28,451 USD 25,755 EUR Brown Brothers Harriman 128 0.00% Class I EUR Accumulating (Hedged) 27/02/2020 28,983 USD 26,236 EUR Brown Brothers Harriman 131 0.00% Class I EUR Distributing (Hedged) 27/02/2020 698,798 USD 632,561 EUR Brown Brothers Harriman 3,157 0.01% Class I GBP Accumulating (Hedged) 27/02/2020 34,680 USD 26,524 GBP Brown Brothers Harriman 304 0.00% Class IF EUR Accumulating (Hedged) 27/02/2020 28,048 USD 25,390 EUR Brown Brothers Harriman 127 0.00% Class IF GBP Accumulating (Hedged) 27/02/2020 537,821 USD 411,332 GBP Brown Brothers Harriman 4,717 0.01% 8,564 0.02%
Net Unrealised Appreciation on Open Forward Foreign Currency Exchange Contracts 34,748 0.07%
Unrealised Appreciation on Open Forward Foreign Currency Exchange Contracts 51,630 0.10%Unrealised Depreciation on Open Forward Foreign Currency Exchange Contracts (16,882) (0.03%)
Open Futures Contracts - (0.00%) (31 January 2019: (0.09%)) Unrealised Appreciation/ % of No. of Depreciation Net Type Expiration Contracts USD Assets Euro-Bobl Futures 06/03/2020 1 665 0.00% Euro-Bund Futures 06/03/2020 (1) (2,239) (0.01%) Euro-Schatz Futures 06/03/2020 4 399 0.00% U.S. 10 Year Treasury Note 20/03/2020 19 23,458 0.05% U.S. 10 Year Ultra Bond 20/03/2020 3 9,563 0.02% U.S. 2 Year Treasury Note 31/03/2020 20 14,799 0.03% U.S. 5 Year Treasury Note 31/03/2020 (6) (7,031) (0.01%) U.S. Long Treasury Bond 20/03/2020 (7) (41,419) (0.08%) U.S. Ultra Treasury Bond 20/03/2020 2 (1,562) (0.00%) Net Unrealised Depreciation on Open Futures Contracts (3,367) (0.00%) Unrealised Appreciation on Open Futures Contracts 48,884 0.10%Unrealised Depreciation on Open Futures Contracts (52,251) (0.10%)
183

LORD ABBETT PASSPORT PORTFOLIOS PLC GLOBAL HIGH YIELD FUND Schedule of Investments as at 31 January 2020 (Continued)
Open Swap Contract - 0.01% (31 January 2019: 0.00%) Open Centrally Cleared Credit Default Index Swap Contract - 0.01% (31 January 2019: 0.00%)
Reference Index
Counterparty
Buy/Sell Protection
FixedDeal
Receive/ (Pay)
RateExpiration
DateNotional
USD
FairValue
USD
% ofNet
AssetsMarkit N.A. HY. 33 5Y Credit Suisse Buy 5.00% 20/12/2024 777,150 6,294 0.01% Fair Value on Open Centrally Cleared Credit Default Index Swap Contract 6,294 0.01% Financial Assets on Open Swap Contract 6,294 0.01%
Total Financial Assets at Fair Value through Profit and Loss 48,002,990 93.08%Total Financial Liabilities at Fair Value through Profit and Loss (69,133) (0.13%) Other Net Assets 3,639,397 7.05%
Net Assets 51,573,254 100.00%
Analysis of Total Assets
% of Total
Assets Transferable securities admitted to an official stock exchange listing 43.40%Transferable securities traded on a regulated market 35.42%Other transferable securities including those which are unlisted 5.87%Financial derivatives dealt in on a regulated market (0.01%)OTC financial derivative instruments 0.06%Centrally Cleared Financial Derivatives Instruments 0.01%
184

LORD ABBETT PASSPORT PORTFOLIOS PLC GLOBAL EQUITY RESEARCH FUND Schedule of Investments as at 31 January 2020
Fair
Value % of Net Investments Shares USD Assets Common Stocks – 98.65% (31 January 2019: 99.68%) Austria Banks BAWAG Group AG* (1) 1,058 45,867 0.99% Belgium Banks KBC Group NV 443 32,529 0.70% Bermuda Insurance Everest Re Group Ltd. 261 72,185 1.56% Brazil Iron/Steel Vale SA 4,031 47,420 1.02% Canada Internet Shopify, Inc. Class A* 111 51,728 1.12% China Banks China Construction Bank Corp. 51,562 39,510 0.85% Insurance Ping An Insurance Group Co. of China Ltd. 5,180 59,172 1.27% Internet Alibaba Group Holding Ltd.* 234 48,342 1.04% Tencent Holdings Ltd. 1,446 69,461 1.50% 117,803 2.54% Total China 216,485 4.66% Denmark Beverages Carlsberg A/S Class B 326 47,686 1.03% France Aerospace/Defense Airbus SE 432 63,787 1.38% Apparel LVMH Moet Hennessy Louis Vuitton SE 156 68,339 1.47% Beverages Pernod Ricard SA 288 49,949 1.08% Oil & Gas TOTAL SA 884 43,247 0.93% Total France 225,322 4.86%
185

LORD ABBETT PASSPORT PORTFOLIOS PLC GLOBAL EQUITY RESEARCH FUND Schedule of Investments as at 31 January 2020 (Continued)
Fair
Value % of Net Investments Shares USD Assets Common Stocks - 98.65% (31 January 2019: 99.68%) (Continued) Germany Miscellaneous Manufacturer Siemens AG* 503 62,231 1.34% Real Estate Vonovia SE 800 45,693 0.99% Semiconductors Infineon Technologies AG 2,238 48,552 1.05% Total Germany 156,476 3.38% Hong Kong Real Estate Kerry Properties Ltd. 19,004 53,476 1.15% India Banks ICICI Bank Ltd. 3,907 56,964 1.23% Japan Building Materials Sanwa Holdings Corp. 6,589 70,884 1.53% Cosmetics/Personal Care Shiseido Co. Ltd. 708 46,294 1.00% Electronics TDK Corp. 504 55,197 1.19% Engineering & Construction SHO-BOND Holdings Co. Ltd. 1,200 49,933 1.08% Total Japan 222,308 4.80% Mexico Banks Grupo Financiero Banorte SAB de CV 2,226 13,660 0.30% New Zealand Telecommunications Spark New Zealand Ltd. 19,233 58,002 1.25% Russia Banks Sberbank of Russia PJSC 2,141 34,256 0.74% Singapore Banks DBS Group Holdings Ltd. 2,200 40,893 0.88%
186

LORD ABBETT PASSPORT PORTFOLIOS PLC GLOBAL EQUITY RESEARCH FUND Schedule of Investments as at 31 January 2020 (Continued)
Fair
Value % of Net Investments Shares USD Assets Common Stocks - 98.65% (31 January 2019: 99.68%) (Continued) South Korea Semiconductors Samsung Electronics Co. Ltd. 2,004 94,832 2.05% Spain Banks Banco Santander SA 16,055 63,233 1.36% Sweden Oil & Gas Lundin Petroleum AB 1,357 41,335 0.89% Taiwan Semiconductors Taiwan Semiconductor Manufacturing Co. Ltd. 5,403 57,233 1.23% United Kingdom Diversified Financial Services London Stock Exchange Group PLC 636 65,695 1.42% Gas National Grid PLC 5,682 75,334 1.62% Mining Anglo American PLC 2,519 65,933 1.42% Pharmaceuticals AstraZeneca PLC 1,420 69,154 1.49% Total United Kingdom 276,116 5.95% United States Advertising Trade Desk, Inc. Class A* 185 49,798 1.07% Aerospace/Defense United Technologies Corp. 409 61,432 1.32% Agriculture Philip Morris International, Inc. 814 67,318 1.45% Auto Parts & Equipment Lear Corp. 457 56,293 1.21% Banks Citigroup, Inc. 1,127 83,860 1.81% JPMorgan Chase & Co. 527 69,754 1.50% 153,614 3.31% Beverages Coca-Cola Co. 1,620 94,608 2.04% Biotechnology Guardant Health, Inc.* 625 47,525 1.02%
187

LORD ABBETT PASSPORT PORTFOLIOS PLC GLOBAL EQUITY RESEARCH FUND Schedule of Investments as at 31 January 2020 (Continued)
Fair
Value % of Net Investments Shares USD Assets Common Stocks - 98.65% (31 January 2019: 99.68%) (Continued) United States (Continued) Biotechnology (continued) Vertex Pharmaceuticals, Inc.* 234 53,130 1.15% 100,655 2.17% Chemicals Axalta Coating Systems Ltd.* 2,379 68,539 1.48% Diversified Financial Services Mastercard, Inc. Class A 229 72,350 1.56% Electric Evergy, Inc. 808 58,305 1.26% FirstEnergy Corp. 1,169 59,374 1.28% Sempra Energy 380 61,043 1.31% 178,722 3.85% Electrical Component & Equipment AMETEK, Inc. 571 55,473 1.20% Environmental Control Waste Management, Inc. 508 61,824 1.33% Food Sysco Corp. 732 60,126 1.30% Food Service Aramark 840 37,078 0.80% Healthcare-Products Boston Scientific Corp.* 1,262 52,840 1.14% Insurance Globe Life, Inc. 608 63,390 1.37% Internet Alphabet, Inc. Class A* 73 104,593 2.26% Amazon.com, Inc.* 58 116,505 2.51% Facebook, Inc. Class A* 223 45,026 0.97% Match Group, Inc.* 636 49,748 1.07% 315,872 6.81% Media Walt Disney Co. 512 70,815 1.53% Miscellaneous Manufacturer Hillenbrand, Inc. 938 27,230 0.59% Oil & Gas Marathon Petroleum Corp. 667 36,352 0.79% Noble Energy, Inc. 2,142 42,347 0.91% 78,699 1.70%
188

LORD ABBETT PASSPORT PORTFOLIOS PLC GLOBAL EQUITY RESEARCH FUND Schedule of Investments as at 31 January 2020 (Continued)
Fair
Value % of Net Investments Shares USD Assets Common Stocks - 98.65% (31 January 2019: 99.68%) (Continued) United States (Continued) Pharmaceuticals CVS Health Corp. 841 57,036 1.23% Merck & Co., Inc. 895 76,469 1.65% Zoetis, Inc. Class A 400 53,684 1.16% 187,189 4.04% Pipelines ONEOK, Inc. 787 58,923 1.27% REITS Alexandria Real Estate Equities, Inc. 273 44,554 0.96% Duke Realty Corp. 978 35,511 0.77% 80,065 1.73% Retail Chipotle Mexican Grill, Inc. Class A* 45 39,004 0.84% Dollar Tree, Inc.* 337 29,343 0.63% TJX Cos, Inc. 986 58,213 1.26% Walmart, Inc. 740 84,723 1.83% 211,283 4.56% Semiconductors NVIDIA Corp. 265 62,654 1.35% Software Microsoft Corp. 672 114,395 2.47% RingCentral, Inc. Class A* 257 52,834 1.14% salesforce.com, Inc.* 359 65,449 1.41% 232,678 5.02% Telecommunications T-Mobile US, Inc.* 654 51,790 1.12% Transportation Saia, Inc.* 627 54,612 1.18% Total United States 2,665,870 57.50% Total Common Stocks 4,573,876 98.65% Dividend Rate Shares
Preferred Stock – 0.63% (31 January 2019: 0.45%) Germany Auto Manufacturers Volkswagen AG ZCP 162 29,152 0.63% Total Preferred Stock 29,152 0.63% Total Investment in Securities (Cost: USD 4,246,970) 4,603,028 99.28%
ZCP indicates a zero coupon rate. * Non income processing security. (1) Securities exempt from registration under Rule 144A (i) of the US Securities Act of 1933. These securities may be resold in transactions
exempt from registration, normally to qualified institutional buyers.
189

LORD ABBETT PASSPORT PORTFOLIOS PLC GLOBAL EQUITY RESEARCH FUND Schedule of Investments as at 31 January 2020 (Continued)
Fair
Value % of Net USD Assets Total Financial Assets at Fair Value through Profit and Loss 4,603,028 99.28%
Other Net Assets 33,500 0.72%
Net Assets 4,636,528 100.00%
Analysis of Total Assets
% of Total
Assets Transferable securities admitted to an official stock exchange listing 87.00%
190
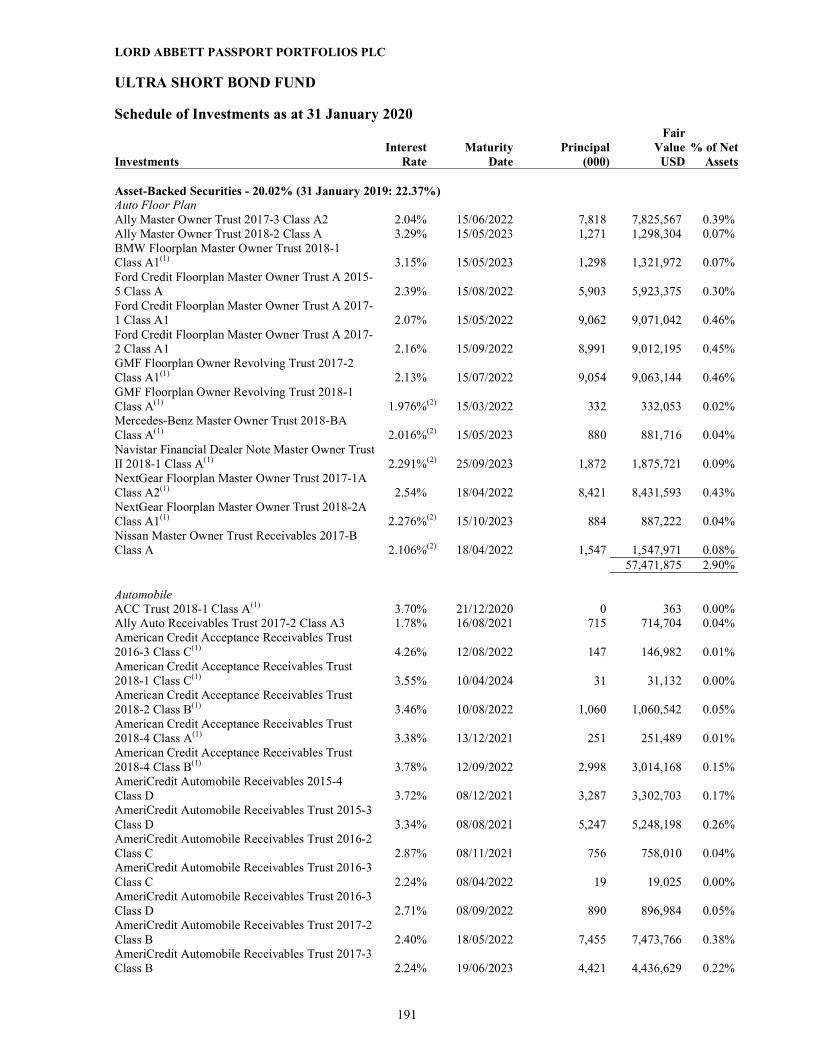
LORD ABBETT PASSPORT PORTFOLIOS PLC ULTRA SHORT BOND FUND Schedule of Investments as at 31 January 2020
Interest Maturity PrincipalFair
Value % of Net Investments Rate Date (000) USD Assets Asset-Backed Securities - 20.02% (31 January 2019: 22.37%) Auto Floor Plan Ally Master Owner Trust 2017-3 Class A2 2.04% 15/06/2022 7,818 7,825,567 0.39% Ally Master Owner Trust 2018-2 Class A 3.29% 15/05/2023 1,271 1,298,304 0.07% BMW Floorplan Master Owner Trust 2018-1 Class A1(1) 3.15% 15/05/2023 1,298 1,321,972 0.07% Ford Credit Floorplan Master Owner Trust A 2015-5 Class A 2.39% 15/08/2022 5,903 5,923,375 0.30% Ford Credit Floorplan Master Owner Trust A 2017-1 Class A1 2.07% 15/05/2022 9,062 9,071,042 0.46% Ford Credit Floorplan Master Owner Trust A 2017-2 Class A1 2.16% 15/09/2022 8,991 9,012,195 0.45% GMF Floorplan Owner Revolving Trust 2017-2 Class A1(1) 2.13% 15/07/2022 9,054 9,063,144 0.46% GMF Floorplan Owner Revolving Trust 2018-1 Class A(1) 1.976%(2) 15/03/2022 332 332,053 0.02% Mercedes-Benz Master Owner Trust 2018-BA Class A(1) 2.016%(2) 15/05/2023 880 881,716 0.04% Navistar Financial Dealer Note Master Owner Trust II 2018-1 Class A(1) 2.291%(2) 25/09/2023 1,872 1,875,721 0.09% NextGear Floorplan Master Owner Trust 2017-1A Class A2(1) 2.54% 18/04/2022 8,421 8,431,593 0.43% NextGear Floorplan Master Owner Trust 2018-2A Class A1(1) 2.276%(2) 15/10/2023 884 887,222 0.04% Nissan Master Owner Trust Receivables 2017-B Class A 2.106%(2) 18/04/2022 1,547 1,547,971 0.08% 57,471,875 2.90% Automobile ACC Trust 2018-1 Class A(1) 3.70% 21/12/2020 0 363 0.00% Ally Auto Receivables Trust 2017-2 Class A3 1.78% 16/08/2021 715 714,704 0.04% American Credit Acceptance Receivables Trust 2016-3 Class C(1) 4.26% 12/08/2022 147 146,982 0.01% American Credit Acceptance Receivables Trust 2018-1 Class C(1) 3.55% 10/04/2024 31 31,132 0.00% American Credit Acceptance Receivables Trust 2018-2 Class B(1) 3.46% 10/08/2022 1,060 1,060,542 0.05% American Credit Acceptance Receivables Trust 2018-4 Class A(1) 3.38% 13/12/2021 251 251,489 0.01% American Credit Acceptance Receivables Trust 2018-4 Class B(1) 3.78% 12/09/2022 2,998 3,014,168 0.15% AmeriCredit Automobile Receivables 2015-4 Class D 3.72% 08/12/2021 3,287 3,302,703 0.17% AmeriCredit Automobile Receivables Trust 2015-3 Class D 3.34% 08/08/2021 5,247 5,248,198 0.26% AmeriCredit Automobile Receivables Trust 2016-2 Class C 2.87% 08/11/2021 756 758,010 0.04% AmeriCredit Automobile Receivables Trust 2016-3 Class C 2.24% 08/04/2022 19 19,025 0.00% AmeriCredit Automobile Receivables Trust 2016-3 Class D 2.71% 08/09/2022 890 896,984 0.05% AmeriCredit Automobile Receivables Trust 2017-2 Class B 2.40% 18/05/2022 7,455 7,473,766 0.38% AmeriCredit Automobile Receivables Trust 2017-3 Class B 2.24% 19/06/2023 4,421 4,436,629 0.22%
191

LORD ABBETT PASSPORT PORTFOLIOS PLC ULTRA SHORT BOND FUND Schedule of Investments as at 31 January 2020 (Continued)
Interest Maturity PrincipalFair
Value % of Net Investments Rate Date (000) USD Assets Asset-Backed Securities - 20.02% (31 January 2019: 22.37%) (Continued) Automobile (continued) AmeriCredit Automobile Receivables Trust 2018-2 Class A2A 2.86% 18/11/2021 1,414 1,415,306 0.07% AmeriCredit Automobile Receivables Trust 2018-3 Class A2A 3.11% 18/01/2022 356 356,897 0.02% AmeriCredit Automobile Receivables Trust 2018-3 Class A2B 1.904%(2) 18/01/2022 356 356,167 0.02% California Republic Auto Receivables Trust 2017-1 Class A4 2.28% 15/06/2022 83 82,626 0.00% Capital Auto Receivables Asset Trust 2018-1 Class A3(1) 2.79% 20/01/2022 3,038 3,046,661 0.15% Capital Auto Receivables Asset Trust 2018-1 Class A4(1) 2.93% 20/06/2022 3,000 3,033,631 0.15% Capital Auto Receivables Asset Trust 2018-2 Class A2(1) 3.02% 22/02/2021 383 383,947 0.02% Capital Auto Receivables Asset Trust 2018-2 Class A3(1) 3.27% 20/06/2023 761 766,960 0.04% Capital Auto Receivables Asset Trust 2018-2 Class B(1) 3.48% 20/10/2023 352 357,031 0.02% CarMax Auto Owner Trust 2016-1 Class D 3.11% 15/08/2022 414 414,448 0.02% CarMax Auto Owner Trust 2016-4 Class A3 1.40% 15/08/2021 0 187 0.00% CarMax Auto Owner Trust 2016-4 Class A4 1.60% 15/06/2022 1,446 1,445,250 0.07% CarMax Auto Owner Trust 2017-2 Class A3 1.93% 15/03/2022 2,591 2,593,829 0.13% Chesapeake Funding II LLC 2017-2A Class A1(1) 1.99% 15/05/2029 286 286,326 0.01% Chesapeake Funding II LLC 2017-3A Class A1(1) 1.91% 15/08/2029 107 106,532 0.01% Chesapeake Funding II LLC 2017-3A Class A2(1) 2.016%(2) 15/08/2029 1,290 1,290,770 0.07% Chesapeake Funding II LLC 2017-4A Class A1(1) 2.12% 15/11/2029 1,429 1,431,827 0.07% Chesapeake Funding II LLC 2017-4A Class A2(1) 2.016%(2) 15/11/2029 253 252,777 0.01% Chesapeake Funding II LLC 2018-1A Class A2(1) 2.126%(2) 15/04/2030 424 424,395 0.02% Chesapeake Funding II LLC 2018-2A Class A2(1) 2.046%(2) 15/08/2030 279 282,117 0.01% Chesapeake Funding II LLC 2018-3A Class A2(1) 2.156%(2) 15/01/2031 4,215 4,218,749 0.21% CPS Auto Receivables Trust 2015-C Class D(1) 4.63% 16/08/2021 265 266,961 0.01% CPS Auto Receivables Trust 2016-C Class C(1) 3.27% 15/06/2022 20 19,962 0.00% CPS Auto Receivables Trust 2016-C Class D(1) 5.92% 15/06/2022 1,870 1,903,368 0.10% CPS Auto Receivables Trust 2018-B Class B(1) 3.23% 15/07/2022 96 96,771 0.01% CPS Auto Trust 2017-A Class C(1) 3.31% 15/12/2022 1,383 1,387,562 0.07% CPS Auto Trust 2018-C Class A(1) 2.87% 15/09/2021 33 33,339 0.00% CPS Auto Trust 2018-C Class B(1) 3.43% 15/07/2022 148 148,812 0.01% Drive Auto Receivables Trust 2016-B Class D(1) 4.53% 15/08/2023 5,328 5,384,420 0.27% Drive Auto Receivables Trust 2016-C Class D(1) 4.18% 15/03/2024 553 559,759 0.03% Drive Auto Receivables Trust 2017-2 Class E 5.27% 15/11/2024 2,869 2,955,586 0.15% Drive Auto Receivables Trust 2017-3 Class C 2.80% 15/07/2022 523 523,116 0.03% Drive Auto Receivables Trust 2017-A Class C(1) 2.98% 18/01/2022 1 1,217 0.00% Drive Auto Receivables Trust 2017-A Class D(1) 4.16% 15/05/2024 1,430 1,452,081 0.07% Drive Auto Receivables Trust 2017-B Class D(1) 3.72% 17/10/2022 2,906 2,919,038 0.15% Drive Auto Receivables Trust 2018-1 Class C 3.22% 15/03/2023 2,991 2,998,139 0.15% Drive Auto Receivables Trust 2018-2 Class C 3.63% 15/08/2024 6,188 6,228,372 0.31% Drive Auto Receivables Trust 2018-2 Class D 4.14% 15/08/2024 2,677 2,755,138 0.14% Drive Auto Receivables Trust 2018-3 Class B 3.37% 15/09/2022 429 428,954 0.02% Drive Auto Receivables Trust 2018-3 Class C 3.72% 16/09/2024 561 565,872 0.03% Drive Auto Receivables Trust 2018-3 Class D 4.30% 16/09/2024 4,190 4,326,278 0.22% Drive Auto Receivables Trust 2018-4 Class B 3.36% 17/10/2022 233 233,234 0.01% Drive Auto Receivables Trust 2018-4 Class C 3.66% 15/11/2024 303 306,646 0.02% Drive Auto Receivables Trust 2018-5 Class B 3.68% 15/07/2023 3,102 3,129,454 0.16% Enterprise Fleet Financing LLC 2017-2 Class A2(1) 1.97% 20/01/2023 1,659 1,659,460 0.08%
192

LORD ABBETT PASSPORT PORTFOLIOS PLC ULTRA SHORT BOND FUND Schedule of Investments as at 31 January 2020 (Continued)
Interest Maturity PrincipalFair
Value % of Net Investments Rate Date (000) USD Assets Asset-Backed Securities - 20.02% (31 January 2019: 22.37%) (Continued) Automobile (continued) Enterprise Fleet Financing LLC 2018-1 Class A2(1) 2.87% 20/10/2023 3,102 3,119,316 0.16% Exeter Automobile Receivables Trust 2016-2 Class D(1) 8.25% 17/04/2023 4,250 4,423,867 0.22% First Investors Auto Owner Trust 2018-2 Class A1(1) 3.23% 15/12/2022 397 399,231 0.02% Flagship Credit Auto Trust 2016-1 Class B(1) 3.91% 15/06/2022 178 177,947 0.01% Flagship Credit Auto Trust 2017-3 Class A(1) 1.88% 15/10/2021 1 1,394 0.00% Flagship Credit Auto Trust 2017-4 Class A(1) 2.07% 15/04/2022 164 164,342 0.01% Flagship Credit Auto Trust 2018-2 Class A(1) 2.97% 17/10/2022 720 722,986 0.04% Flagship Credit Auto Trust 2018-3 Class A(1) 3.07% 15/02/2023 790 794,373 0.04% Ford Credit Auto Lease Trust 2018-A Class A3 2.93% 15/06/2021 3,552 3,560,312 0.18% Ford Credit Auto Owner Trust 2016-B Class B 1.85% 15/09/2021 815 814,865 0.04% Ford Credit Auto Owner Trust 2016-REV1 2016-1 Class A(1) 2.31% 15/08/2027 1,990 2,004,302 0.10% Ford Credit Auto Owner Trust 2017-A Class B 2.24% 15/06/2022 4,123 4,135,321 0.21% Foursight Capital Automobile Receivables Trust 2016-1 Class A2(1) 2.87% 15/10/2021 28 27,909 0.00% Foursight Capital Automobile Receivables Trust 2018-1 Class A3(1) 3.24% 15/09/2022 3,698 3,716,239 0.19% Foursight Capital Automobile Receivables Trust 2018-2 Class A2(1) 3.32% 15/04/2022 530 531,563 0.03% GM Financial Automobile Leasing Trust 2017-2 Class B 2.43% 21/06/2021 4,254 4,255,010 0.21% GM Financial Consumer Automobile Receivables Trust 2017-3 Class A3(1) 1.97% 16/05/2022 1,762 1,764,335 0.09% Honda Auto Receivables 2017-3 Owner Trust Class A3 1.79% 20/09/2021 23 23,347 0.00% Hyundai Auto Lease Securitization Trust 2018-A Class A3(1) 2.81% 15/04/2021 6,602 6,618,647 0.33% Hyundai Auto Receivables Trust 2017-B Class A3 1.77% 18/01/2022 3,190 3,195,001 0.16% Mercedes-Benz Auto Lease Trust 2018-B Class A3 3.21% 15/09/2021 591 596,228 0.03% Nissan Auto Lease Trust 2017-B Class A3 2.05% 15/09/2020 1 789 0.00% Santander Drive Auto Receivables Trust 2015-4 Class D 3.53% 16/08/2021 1,225 1,225,912 0.06% Santander Drive Auto Receivables Trust 2015-4 Class E(1) 4.54% 15/11/2022 1,800 1,802,373 0.09% Santander Drive Auto Receivables Trust 2015-5 Class D 3.65% 15/12/2021 1,217 1,218,889 0.06% Santander Drive Auto Receivables Trust 2016-1 Class E 5.02% 15/06/2023 2,448 2,470,447 0.12% Santander Drive Auto Receivables Trust 2016-2 Class D 3.39% 15/04/2022 5,000 5,033,545 0.25% Santander Drive Auto Receivables Trust 2016-2 Class E 4.38% 15/09/2023 1,700 1,724,338 0.09% Santander Drive Auto Receivables Trust 2016-3 Class C 2.46% 15/03/2022 22 22,258 0.00% Santander Drive Auto Receivables Trust 2016-3 Class D 2.80% 15/08/2022 762 767,968 0.04% Santander Drive Auto Receivables Trust 2017-2 Class C 2.79% 15/08/2022 5,995 6,006,214 0.30% Santander Drive Auto Receivables Trust 2017-2 Class D 3.49% 17/07/2023 403 408,762 0.02% Santander Drive Auto Receivables Trust 2018-1 Class B 2.63% 15/07/2022 1,312 1,312,837 0.07%
193

LORD ABBETT PASSPORT PORTFOLIOS PLC ULTRA SHORT BOND FUND Schedule of Investments as at 31 January 2020 (Continued)
Interest Maturity PrincipalFair
Value % of Net Investments Rate Date (000) USD Assets Asset-Backed Securities - 20.02% (31 January 2019: 22.37%) (Continued) Automobile (continued) Santander Drive Auto Receivables Trust 2018-2 Class B 3.03% 15/09/2022 968 970,076 0.05% Santander Drive Auto Receivables Trust 2018-2 Class C 3.35% 17/07/2023 1,467 1,484,519 0.08% Santander Drive Auto Receivables Trust 2018-3 Class B 3.29% 17/10/2022 764 766,188 0.04% Santander Drive Auto Receivables Trust 2018-4 Class B 3.27% 17/01/2023 2,536 2,544,464 0.13% Santander Drive Auto Receivables Trust 2018-4 Class C 3.56% 15/07/2024 4,197 4,267,524 0.22% Santander Drive Auto Receivables Trust 2018-5 Class B 3.52% 15/12/2022 4,144 4,167,959 0.21% Toyota Auto Receivables 2018-A Owner Trust Class A3 2.35% 16/05/2022 8,942 8,977,291 0.45% Westlake Automobile Receivables Trust 2018-1 Class C(1) 2.92% 15/05/2023 2,670 2,675,677 0.14% Westlake Automobile Receivables Trust 2018-2 Class C(1) 3.50% 16/01/2024 346 349,974 0.02% Westlake Automobile Receivables Trust 2018-3 Class A2A(1) 2.98% 18/01/2022 330 330,702 0.02% Westlake Automobile Receivables Trust 2018-3 Class B(1) 3.32% 16/10/2023 1,239 1,249,981 0.06% Wheels SPV 2 LLC 2018-1A Class A2(1) 3.06% 20/04/2027 154 155,122 0.01% World Omni Automobile Lease Securitization Trust 2017-A Class B 2.48% 15/08/2022 3,191 3,191,540 0.16% World Omni Automobile Lease Securitization Trust 2018-A Class A3 2.83% 15/07/2021 8,660 8,682,396 0.44% World Omni Select Auto Trust 2018-1 Class A2(1) 3.24% 15/04/2022 19,103 19,142,164 0.97% World Omni Select Auto Trust 2018-1 Class A3(1) 3.46% 15/03/2023 2,590 2,612,671 0.13% 214,793,782 10.84% Credit Card American Express Credit Account Master Trust 2017-2 Class A 2.126%(2) 16/09/2024 1,091 1,097,037 0.06% American Express Credit Account Master Trust 2017-3 Class A 1.77% 15/11/2022 1,277 1,277,249 0.07% American Express Credit Account Master Trust 2017-6 Class A 2.04% 15/05/2023 3,934 3,946,446 0.20% American Express Credit Account Master Trust 2018-1 Class A 2.67% 17/10/2022 596 596,627 0.03% BA Credit Card Trust 2017-A2 Class A2 1.84% 17/01/2023 4,299 4,302,708 0.22% Barclays Dryrock Issuance Trust 2015-1 Class A 2.20% 15/12/2022 392 392,041 0.02% Barclays Dryrock Issuance Trust 2017-2 Class A 1.976%(2) 15/05/2023 435 435,374 0.02% Capital One Multi-Asset Execution Trust 2015-A2 Class A2 2.08% 15/03/2023 6,676 6,681,759 0.34% Capital One Multi-Asset Execution Trust 2016-A7 Class A7 2.186%(2) 16/09/2024 829 834,872 0.04% Capital One Multi-Asset Execution Trust 2017-A1 Class A1 2.00% 17/01/2023 2,241 2,241,917 0.11% Capital One Multi-Asset Execution Trust 2017-A4 Class A4 1.99% 17/07/2023 5,656 5,669,137 0.29% Citibank Credit Card Issuance Trust 2014-A1 Class A1 2.88% 23/01/2023 762 771,565 0.04%
194

LORD ABBETT PASSPORT PORTFOLIOS PLC ULTRA SHORT BOND FUND Schedule of Investments as at 31 January 2020 (Continued)
Interest Maturity PrincipalFair
Value % of Net Investments Rate Date (000) USD Assets Asset-Backed Securities - 20.02% (31 January 2019: 22.37%) (Continued) Credit Card (continued) Citibank Credit Card Issuance Trust 2017-A3 Class A3 1.92% 07/04/2022 859 859,355 0.04% Citibank Credit Card Issuance Trust 2017-A8 Class A8 1.86% 08/08/2022 13,522 13,535,637 0.68% Citibank Credit Card Issuance Trust 2018-A1 Class A1 2.49% 20/01/2023 1,265 1,276,220 0.07% Discover Card Execution Note Trust 2015-A2 Class A 1.90% 17/10/2022 911 911,402 0.05% Discover Card Execution Note Trust 2017-A1 Class A1 2.166%(2) 15/07/2024 2,974 2,995,397 0.15% Discover Card Execution Note Trust 2017-A6 Class A6 1.88% 15/02/2023 3,030 3,036,888 0.15% First National Master Note Trust 2018-1 Class A 2.136%(2) 15/10/2024 2,062 2,058,010 0.10% Golden Credit Card Trust 2018-1A Class A(1) 2.62% 15/01/2023 1,125 1,135,655 0.06% Gracechurch Card Funding PLC 2018-1A Class A(1) 2.076%(2) 15/07/2022 798 797,326 0.04% Master Credit Card Trust II 2018-3A Class B(1) 3.40% 21/01/2022 1,000 1,005,400 0.05% Synchrony Credit Card Master Note Trust 2015-1 Class A 2.37% 15/03/2023 5,369 5,373,054 0.27% Synchrony Credit Card Master Note Trust 2015-1 Class B 2.64% 15/03/2023 1,937 1,937,245 0.10% Synchrony Credit Card Master Note Trust 2015-4 Class A 2.38% 15/09/2023 1,659 1,666,153 0.08% Synchrony Credit Card Master Note Trust 2017-1 Class B 2.19% 15/06/2023 1,397 1,397,079 0.07% World Financial Network Credit Card Master Trust 2015-B Class A 2.55% 17/06/2024 131 131,527 0.01% World Financial Network Credit Card Master Trust 2016-A Class A 2.03% 15/04/2025 6,487 6,518,987 0.33% World Financial Network Credit Card Master Trust 2017-A Class A 2.12% 15/03/2024 5,580 5,584,518 0.28% World Financial Network Credit Card Master Trust 2017-C Class A 2.31% 15/08/2024 5,798 5,818,830 0.29% World Financial Network Credit Card Master Trust 2018-A Class A 3.07% 16/12/2024 6,703 6,795,798 0.34% 91,081,213 4.60% Other Amur Equipment Finance Receivables VI LLC 2018-2A Class A2(1) 3.89% 20/07/2022 575 585,411 0.03% Ascentium Equipment Receivables 2017-1 Trust Class A3(1) 2.29% 10/06/2021 248 248,425 0.01% Ascentium Equipment Receivables 2017-2 Trust Class A3(1) 2.31% 10/12/2021 5,853 5,866,341 0.30% CCG Receivables Trust 2018-1 Class A2(1) 2.50% 16/06/2025 4,227 4,239,347 0.21% Conn's Receivables Funding 2018-A LLC Class A(1) 3.25% 15/01/2023 391 392,802 0.02% Dell Equipment Finance Trust 2018-1 Class A2A(1) 2.97% 22/10/2020 547 547,331 0.03% DLL 2018-2 LLC 2018-ST2 Class A2(1) 3.14% 20/10/2020 191 190,834 0.01% FREED ABS TRUST 2018-1 Class A(1) 3.61% 18/07/2024 131 131,697 0.01% FREED ABS TRUST 2018-2 Class A(1) 3.99% 20/10/2025 1,088 1,096,308 0.05% Marlette Funding Trust 2018-3 Class A(1) 3.20% 15/09/2028 300 300,731 0.01% Marlette Funding Trust 2018-4 Class A(1) 3.71% 15/12/2028 625 630,801 0.03% MVW Owner Trust 2015-1 Class A(1) 2.52% 20/12/2032 346 347,243 0.02% OneMain Financial Issuance Trust 2016-1 Class A(1) 3.66% 20/02/2029 62 62,434 0.00%
195

LORD ABBETT PASSPORT PORTFOLIOS PLC ULTRA SHORT BOND FUND Schedule of Investments as at 31 January 2020 (Continued)
Interest Maturity PrincipalFair
Value % of Net Investments Rate Date (000) USD Assets Asset-Backed Securities - 20.02% (31 January 2019: 22.37%) (Continued) Other (continued) Orange Lake Timeshare Trust 2015-A Class A(1) 2.88% 08/09/2027 539 543,178 0.03% PFS Financing Corp. 2017-D Class A(1) 2.40% 17/10/2022 837 840,377 0.04% PFS Financing Corp. 2018-A Class A(1) 2.076%(2) 17/02/2022 2,776 2,775,927 0.14% SCF Equipment Leasing 2018-1 LLC Class A2(1) 3.63% 20/10/2024 353 357,929 0.02% Sierra Timeshare 2016-1 Receivables Funding LLC Class A(1) 3.08% 21/03/2033 2,566 2,581,845 0.13% SoFi Consumer Loan Program 2016-2 LLC Class A(1) 3.09% 27/10/2025 13 13,034 0.00% Verizon Owner Trust 2017-1 Class B(1) 2.45% 20/09/2021 4,659 4,667,253 0.24% Westgate Resorts 2018-1 LLC Class A(1) 3.38% 20/12/2031 808 818,620 0.04% 27,237,868 1.37% Student Loan SMB Private Education Loan Trust 2018-B Class A1(1) 1.996%(2) 16/12/2024 71 71,236 0.00% SoFi Professional Loan Program 2017-E LLC Class A2A(1) 1.86% 26/11/2040 4,327 4,326,429 0.22% SoFi Professional Loan Program 2017-F LLC Class A1FX(1) 2.05% 25/01/2041 1,739 1,739,191 0.09% SoFi Professional Loan Program 2018-B Trust Class A1FX(1) 2.64% 25/08/2047 57 57,116 0.00% 6,193,972 0.31% Total Asset-Backed Securities 396,778,710 20.02% Corporate Bonds - 42.92% (31 January 2019: 43.69%) Aerospace/Defense L3Harris Technologies, Inc. 2.25%(2) 30/04/2020 722 722,446 0.04% Spirit AeroSystems, Inc. 2.694%(2) 15/06/2021 243 241,444 0.01% United Technologies Corp. 2.554%(2) 16/08/2021 243 243,048 0.01% 1,206,938 0.06% Agriculture BAT Capital Corp. 2.499%(2) 14/08/2020 1,630 1,633,694 0.08% BAT Capital Corp. 2.79%(2) 15/08/2022 7,453 7,498,628 0.38% 9,132,322 0.46% Auto Manufacturers American Honda Finance Corp. 2.238%(2) 11/06/2021 1,941 1,948,057 0.10% American Honda Finance Corp. 2.487%(2) 27/06/2022 5,876 5,921,011 0.30% BMW Finance NV(1) 2.691%(2) 12/08/2022 3,913 3,947,555 0.20% BMW US Capital LLC(1) 2.258%(2) 12/04/2021 11,003 11,037,392 0.56% BMW US Capital LLC(1) 2.28%(2) 06/04/2020 151 151,132 0.01% BMW US Capital LLC(1) 2.368%(2) 14/04/2022 7,260 7,294,974 0.37% BMW US Capital LLC(1) 2.401%(2) 13/08/2021 4,022 4,040,047 0.20% BMW US Capital LLC(1) 2.54%(2) 06/04/2022 763 767,909 0.04% Daimler Finance North America LLC(1) 2.141%(2) 04/05/2020 1,658 1,659,221 0.08% Daimler Finance North America LLC(1) 2.301%(2) 04/05/2021 5,197 5,217,452 0.26% Daimler Finance North America LLC 2.331%(2) 12/02/2021 750 751,619 0.04% Daimler Finance North America LLC(1) 2.331%(2) 12/02/2021 4,364 4,373,419 0.22% Daimler Finance North America LLC(1) 2.349%(2) 22/02/2021 732 733,767 0.04% Daimler Finance North America LLC(1) 2.42%(2) 05/05/2020 2,507 2,509,882 0.13% Daimler Finance North America LLC(1) 2.56%(2) 05/11/2021 5,696 5,733,017 0.29%
196

LORD ABBETT PASSPORT PORTFOLIOS PLC ULTRA SHORT BOND FUND Schedule of Investments as at 31 January 2020 (Continued)
Interest Maturity PrincipalFair
Value % of Net Investments Rate Date (000) USD Assets Corporate Bonds - 42.92% (31 January 2019: 43.69%) (Continued) Auto Manufacturers (continued) Daimler Finance North America LLC(1) 2.779%(2) 22/02/2022 1,265 1,277,429 0.06% Daimler Finance North America LLC(1) 2.81%(2) 15/02/2022 6,144 6,212,635 0.31% Ford Motor Credit Co. LLC 2.193%(2) 02/11/2020 300 299,198 0.02% Ford Motor Credit Co. LLC 2.71%(2) 05/04/2021 200 199,695 0.01% Ford Motor Credit Co. LLC 2.728%(2) 12/10/2021 1,768 1,758,706 0.09% General Motors Financial Co., Inc. 2.778%(2) 13/04/2020 3,518 3,523,718 0.18% General Motors Financial Co., Inc. 3.388%(2) 14/01/2022 593 600,288 0.03% Harley-Davidson Financial Services, Inc.(1) 2.395%(2) 21/05/2020 217 217,255 0.01% Hyundai Capital America 2.708%(2) 03/04/2020 294 294,328 0.01% Nissan Motor Acceptance Corp.(1) 2.238%(2) 13/07/2020 558 558,426 0.03% Nissan Motor Acceptance Corp.(1) 2.35%(2) 28/09/2020 1,850 1,851,943 0.09% Nissan Motor Acceptance Corp.(1) 2.414%(2) 15/03/2021 214 214,248 0.01% Nissan Motor Acceptance Corp.(1) 2.558%(2) 21/09/2021 4,776 4,792,681 0.24% Nissan Motor Acceptance Corp.(1) 2.738%(2) 13/01/2022 1,754 1,765,233 0.09% Toyota Motor Credit Corp. 2.412%(2) 08/01/2021 1,482 1,488,036 0.08% Volkswagen Group of America Finance LLC(1) 2.675%(2) 13/11/2020 13,672 13,735,296 0.69% Volkswagen Group of America Finance LLC(1) 2.795%(2) 24/09/2021 2,339 2,359,493 0.12% Volkswagen Group of America Finance LLC(1) 2.841%(2) 12/11/2021 1,040 1,050,625 0.05% 98,285,687 4.96% Banks ABN AMRO Bank NV(1) 2.229%(2) 19/01/2021 500 501,712 0.03% ABN AMRO Bank NV(1) 2.489%(2) 27/08/2021 1,520 1,529,470 0.08% Australia & New Zealand Banking Group Ltd.(1) 2.221%(2) 09/11/2020 595 596,367 0.03% Australia & New Zealand Banking Group Ltd.(1) 2.364%(2) 17/05/2021 250 251,177 0.01% Australia & New Zealand Banking Group Ltd.(1) 2.385%(2) 21/11/2022 2,012 2,024,616 0.10% Bank of America Corp. 2.479%(2) 21/07/2021 24,255 24,321,351 1.23% Bank of America Corp. 2.559%(2) 01/10/2021 5,645 5,666,732 0.29% Bank of America Corp. 2.597%(2) 25/06/2022 1,327 1,335,784 0.07% Bank of America Corp. 2.979%(2) 20/01/2023 949 964,985 0.05% Bank of America N.A. 2.114%(2) 26/07/2021 6,649 6,654,389 0.34% Bank of America N.A. 2.26%(2) 24/05/2021 10,568 10,578,303 0.53% Bank of Montreal 2.202%(2) 22/01/2021 2,959 2,966,074 0.15% Bank of Montreal 2.29%(2) 10/09/2021 4,007 4,022,901 0.20% Bank of New York Mellon 2.18%(2) 04/06/2021 3,784 3,787,869 0.19% Bank of Nova Scotia 2.259%(2) 20/04/2021 1,790 1,797,035 0.09% Barclays PLC 3.459%(2) 10/01/2023 441 448,475 0.02% BBVA USA 2.618%(2) 11/06/2021 7,735 7,760,308 0.39% BNP Paribas SA(1) 2.284%(2) 07/08/2021 3,931 3,941,991 0.20% Canadian Imperial Bank of Commerce 2.078%(2) 02/02/2021 70 70,127 0.00% Capital One N.A. 2.724%(2) 08/08/2022 1,900 1,919,282 0.10% Citibank N.A. 2.376%(2) 23/07/2021 4,082 4,108,738 0.21% Citibank N.A. 2.433%(2) 19/02/2022 4,823 4,841,929 0.24% Citibank N.A. 2.499%(2) 20/05/2022 12,188 12,256,288 0.62% Citigroup, Inc. 2.453%(2) 04/11/2022 2,576 2,594,439 0.13% Citigroup, Inc. 2.953%(2) 02/08/2021 1,777 1,800,794 0.09% Citigroup, Inc. 2.955%(2) 08/12/2021 705 715,052 0.04% Citigroup, Inc. 3.104%(2) 26/10/2020 3,595 3,626,105 0.18% Citigroup, Inc. 3.34%(2) 30/03/2021 11,367 11,537,067 0.58% Citizens Bank N.A./Providence RI 2.447%(2) 02/03/2020 1,704 1,704,836 0.09% Citizens Bank N.A./Providence RI 2.629%(2) 14/02/2022 2,662 2,683,596 0.14% Citizens Bank N.A./Providence RI 2.727%(2) 26/05/2022 250 252,197 0.01% Credit Agricole Corporate & Investment Bank SA 2.533%(2) 03/10/2021 2,098 2,104,403 0.11% Danske Bank A/S 2.417%(2) 02/03/2020 596 596,254 0.03%
197

LORD ABBETT PASSPORT PORTFOLIOS PLC ULTRA SHORT BOND FUND Schedule of Investments as at 31 January 2020 (Continued)
Interest Maturity PrincipalFair
Value % of Net Investments Rate Date (000) USD Assets Corporate Bonds - 42.92% (31 January 2019: 43.69%) (Continued) Banks (continued) Danske Bank A/S(1) 2.417%(2) 02/03/2020 500 500,213 0.03% DNB Bank ASA(1) 2.527%(2) 02/12/2022 4,069 4,104,108 0.21% Federation des Caisses Desjardins du Quebec(1) 2.10%(2) 30/10/2020 591 592,354 0.03% Fifth Third Bank/Cincinnati OH 2.02%(2) 30/10/2020 690 690,818 0.03% Fifth Third Bank/Cincinnati OH 2.234%(2) 26/07/2021 1,113 1,117,218 0.06% Fifth Third Bank/Cincinnati OH 2.403%(2) 01/02/2022 200 201,231 0.01% Goldman Sachs Group, Inc. 2.557%(2) 31/10/2022 10,346 10,437,295 0.53% Goldman Sachs Group, Inc. 2.904%(2) 26/04/2022 12,254 12,386,044 0.62% Goldman Sachs Group, Inc. 2.966%(2) 23/04/2020 20,596 20,627,612 1.04% Goldman Sachs Group, Inc. 3.08%(2) 15/11/2021 2,001 2,017,334 0.10% Goldman Sachs Group, Inc. 3.094%(2) 15/09/2020 1,736 1,746,284 0.09% Goldman Sachs Group, Inc. 3.154%(2) 23/04/2021 8,881 9,005,319 0.45% Goldman Sachs Group, Inc. 3.68%(2) 25/02/2021 1,557 1,583,554 0.08% HSBC Holdings PLC 2.504%(2) 18/05/2021 6,933 6,942,234 0.35% HSBC Holdings PLC 2.537%(2) 11/09/2021 4,500 4,513,565 0.23% Huntington National Bank 2.44%(2) 05/02/2021 3,000 3,011,296 0.15% ING Groep NV 3.11%(2) 29/03/2022 2,575 2,613,433 0.13% JPMorgan Chase & Co. 2.435%(2) 09/03/2021 16,824 16,832,794 0.85% JPMorgan Chase & Co. 2.509%(2) 18/06/2022 10,473 10,533,984 0.53% JPMorgan Chase & Co. 2.587%(2) 01/06/2021 8,241 8,258,462 0.42% JPMorgan Chase & Co. 2.831%(2) 15/01/2023 492 498,962 0.03% JPMorgan Chase & Co. 2.985%(2) 07/06/2021 3,000 3,036,536 0.15% JPMorgan Chase & Co. 3.387%(2) 01/03/2021 3,532 3,580,030 0.18% JPMorgan Chase Bank N.A. 2.134%(2) 26/04/2021 500 500,361 0.03% JPMorgan Chase Bank N.A. 2.273%(2) 19/02/2021 6,416 6,418,569 0.32% KeyBank N.A./Cleveland OH 2.423%(2) 01/02/2022 7,543 7,603,008 0.38% KeyBank N.A./Cleveland OH 2.709%(2) 22/11/2021 377 381,324 0.02% Lloyds Bank PLC 2.384%(2) 07/05/2021 243 244,005 0.01% Lloyds Banking Group PLC 2.728%(2) 21/06/2021 508 511,908 0.03% Macquarie Bank Ltd.(1) 2.357%(2) 24/11/2021 8,145 8,180,525 0.41% Macquarie Bank Ltd.(1) 2.358%(2) 06/08/2021 5,890 5,895,980 0.30% Manufacturers & Traders Trust Co. 2.064%(2) 25/01/2021 1,053 1,054,888 0.05% Manufacturers & Traders Trust Co. 2.547%(2) 01/12/2021 3,372 3,372,407 0.17% Manufacturers & Traders Trust Co. 2.875%(2) 28/12/2020 1,449 1,449,836 0.07% Mitsubishi UFJ Financial Group, Inc. 2.444%(2) 26/07/2021 804 808,803 0.04% Morgan Stanley 2.279%(2) 20/01/2023 6,112 6,133,484 0.31% Morgan Stanley 2.451%(2) 10/02/2021 23,122 23,124,726 1.17% Morgan Stanley 2.732%(2) 22/07/2022 12,617 12,750,274 0.64% Morgan Stanley 2.874%(2) 16/06/2020 5,913 5,933,786 0.30% Morgan Stanley 2.999%(2) 20/01/2022 17,555 17,730,694 0.89% Morgan Stanley 3.219%(2) 21/04/2021 607 616,402 0.03% MUFG Union Bank N.A. 2.485%(2) 07/03/2022 3,023 3,036,325 0.15% National Australia Bank Ltd.(1) 2.198%(2) 12/01/2021 2,649 2,657,185 0.13% National Australia Bank Ltd.(1) 2.251%(2) 13/12/2022 6,070 6,087,697 0.31% National Australia Bank Ltd.(1) 2.488%(2) 20/09/2021 389 391,647 0.02% PNC Bank N.A. 2.052%(2) 22/01/2021 250 250,530 0.01% PNC Bank N.A. 2.20%(2) 10/06/2021 3,773 3,777,507 0.19% PNC Bank N.A. 2.237%(2) 12/03/2021 4,533 4,535,970 0.23% PNC Bank N.A. 2.252%(2) 22/07/2022 9,705 9,763,274 0.49% PNC Bank N.A. 2.315%(2) 09/12/2022 6,097 6,118,857 0.31% Regions Bank/Birmingham AL 2.289%(2) 01/04/2021 4,052 4,061,066 0.20% Regions Bank/Birmingham AL 2.405%(2) 13/08/2021 4,254 4,261,714 0.21% Royal Bank of Canada 2.034%(2) 26/10/2020 178 178,240 0.01% Royal Bank of Canada 2.194%(2) 25/01/2021 4,429 4,447,151 0.22%
198

LORD ABBETT PASSPORT PORTFOLIOS PLC ULTRA SHORT BOND FUND Schedule of Investments as at 31 January 2020 (Continued)
Interest Maturity PrincipalFair
Value % of Net Investments Rate Date (000) USD Assets Corporate Bonds - 42.92% (31 January 2019: 43.69%) (Continued) Banks (continued) Royal Bank of Canada 2.196%(2) 17/01/2023 8,108 8,124,996 0.41% Royal Bank of Canada 2.222%(2) 08/07/2021 3,898 3,910,466 0.20% Royal Bank of Canada 2.245%(2) 29/04/2022 6,193 6,224,850 0.31% Santander UK PLC 2.527%(2) 01/06/2021 1,150 1,156,159 0.06% Skandinaviska Enskilda Banken AB(1) 2.532%(2) 12/12/2022 5,110 5,134,030 0.26% Standard Chartered PLC(1) 3.09%(2) 10/09/2022 2,636 2,662,647 0.13% Sumitomo Mitsui Banking Corp. 2.213%(2) 16/10/2020 3,176 3,182,518 0.16% Toronto-Dominion Bank 2.034%(2) 25/01/2021 971 972,642 0.05% Toronto-Dominion Bank 2.07%(2) 30/07/2021 5,511 5,519,228 0.28% Toronto-Dominion Bank 2.17%(2) 17/03/2021 7,912 7,930,685 0.40% Toronto-Dominion Bank 2.437%(2) 01/12/2022 3,829 3,853,980 0.19% Toronto-Dominion Bank 2.824%(2) 14/12/2020 2,083 2,099,295 0.11% Truist Bank 2.294%(2) 26/10/2021 2,493 2,499,804 0.13% Truist Bank 2.494%(2) 17/05/2022 8,019 8,072,438 0.41% UBS AG/London(1) 2.387%(2) 01/12/2020 1,110 1,113,044 0.06% UBS Group AG(1) 3.293%(2) 01/02/2022 2,750 2,819,415 0.14% UBS Group AG(1) 3.375%(2) 24/09/2020 313 315,632 0.02% US Bank N.A./Cincinnati OH 2.185%(2) 21/05/2021 1,000 1,000,743 0.05% US Bank N.A./Cincinnati OH 2.285%(2) 09/12/2022 8,094 8,123,409 0.41% Wells Fargo & Co. 2.682%(2) 22/07/2020 14,502 14,562,284 0.73% Wells Fargo & Co. 2.831%(2) 11/02/2022 21,225 21,387,757 1.08% Wells Fargo & Co. 2.911%(2) 24/01/2023 1,495 1,518,442 0.08% Wells Fargo & Co. 3.24%(2) 04/03/2021 1,483 1,502,832 0.08% Wells Fargo Bank N.A. 2.306%(2) 23/07/2021 8,084 8,099,778 0.41% Wells Fargo Bank N.A. 2.312%(2) 22/10/2021 2,776 2,790,573 0.14% Wells Fargo Bank N.A. 2.539%(2) 27/05/2022 4,954 4,980,020 0.25% Wells Fargo Bank N.A. 2.545%(2) 09/09/2022 3,975 4,001,902 0.20% Westpac Banking Corp. 2.233%(2) 13/01/2023 3,667 3,674,376 0.19% 544,303,414 27.46% Beverages Constellation Brands, Inc. 2.61%(2) 15/11/2021 6,419 6,419,977 0.32% Building Materials Martin Marietta Materials, Inc. 2.549%(2) 22/05/2020 2,809 2,812,253 0.14% Vulcan Materials Co. 2.494%(2) 15/06/2020 2,551 2,554,200 0.13% Vulcan Materials Co. 2.557%(2) 01/03/2021 6,568 6,588,955 0.33% 11,955,408 0.60% Chemicals Albemarle Corp.(1) 2.941%(2) 15/11/2022 1,629 1,632,567 0.08% DuPont de Nemours, Inc. 2.62%(2) 15/11/2020 1,229 1,235,384 0.06% 2,867,951 0.14% Computers International Business Machines Corp. 2.305%(2) 13/05/2021 2,509 2,522,082 0.13% Diversified Finanancial Services AIG Global Funding(1) 2.452%(2) 22/01/2021 3,110 3,124,321 0.16% American Express Co. 2.10%(2) 30/10/2020 298 298,463 0.01% American Express Co. 2.49%(2) 05/11/2021 1,518 1,528,563 0.08% American Express Co. 2.519%(2) 20/05/2022 3,568 3,597,250 0.18% American Express Credit Corp. 2.944%(2) 14/09/2020 589 592,193 0.03%
199

LORD ABBETT PASSPORT PORTFOLIOS PLC ULTRA SHORT BOND FUND Schedule of Investments as at 31 January 2020 (Continued)
Interest Maturity PrincipalFair
Value % of Net Investments Rate Date (000) USD Assets Corporate Bonds - 42.92% (31 January 2019: 43.69%) (Continued) Diversified Finanancial Services (continued) Capital One Financial Corp. 2.661%(2) 12/05/2020 217 217,294 0.01% Capital One Financial Corp. 2.835%(2) 09/03/2022 1,135 1,148,418 0.06% GE Capital International Funding Co. Unlimited Co. 2.342% 15/11/2020 778 780,796 0.04% TD Ameritrade Holding Corp. 2.193%(2) 01/11/2021 1,518 1,523,453 0.08% 12,810,751 0.65% Electric Florida Power & Light Co. 2.308%(2) 06/05/2022 8,287 8,287,627 0.42% Mississippi Power Co. 2.597%(2) 27/03/2020 616 616,350 0.03% NextEra Energy Capital Holdings, Inc. 2.464%(2) 28/08/2021 4,054 4,054,890 0.20% Sempra Energy 2.331%(2) 15/01/2021 3,071 3,071,589 0.15% Sempra Energy 2.344%(2) 15/03/2021 700 701,100 0.04% Southern Power Co.(1) 2.458%(2) 20/12/2020 3,300 3,301,265 0.17% 20,032,821 1.01% Electronics Honeywell International, Inc. 2.274%(2) 08/08/2022 3,152 3,169,719 0.16% Tyco Electronics Group SA 2.342%(2) 05/06/2020 1,816 1,817,430 0.09% 4,987,149 0.25% Food Campbell Soup Co. 2.394%(2) 16/03/2020 1,615 1,615,411 0.08% Conagra Brands, Inc. 2.552%(2) 22/10/2020 2,838 2,838,315 0.15% General Mills, Inc. 2.383%(2) 16/04/2021 1,978 1,988,157 0.10% 6,441,883 0.33% Gas Dominion Energy Gas Holdings LLC 2.494%(2) 15/06/2021 7,164 7,201,765 0.36% WGL Holdings, Inc. 2.437%(2) 12/03/2020 3,550 3,550,668 0.18% 10,752,433 0.54% Healthcare-Products Zimmer Biomet Holdings, Inc. 2.653%(2) 19/03/2021 8,218 8,219,714 0.42% Insurance Assurant, Inc. 3.197%(2) 26/03/2021 155 155,017 0.01% Jackson National Life Global Funding(1) 2.131%(2) 15/10/2020 4,867 4,875,896 0.25% Jackson National Life Global Funding(1) 2.368%(2) 11/06/2021 205 206,115 0.01% Marsh & McLennan Cos, Inc. 3.16%(2) 29/12/2021 1,860 1,861,702 0.09% New York Life Global Funding(1) 2.228%(2) 06/08/2021 1,476 1,480,166 0.07% New York Life Global Funding(1) 2.288%(2) 12/07/2022 3,106 3,123,885 0.16% Principal Life Global Funding II(1) 2.30%(2) 06/10/2021 5,744 5,767,155 0.29% Protective Life Global Funding(1) 2.48%(2) 28/06/2021 2,033 2,042,426 0.10% 19,512,362 0.98% Lodging Marriott International, Inc./MD 2.507%(2) 01/12/2020 3,344 3,353,640 0.17% Machinery-Construction & Mining Caterpillar Financial Services Corp. 1.884%(2) 12/11/2021 4,429 4,437,120 0.23% Caterpillar Financial Services Corp. 2.185%(2) 08/03/2021 3,987 3,997,363 0.20%
200

LORD ABBETT PASSPORT PORTFOLIOS PLC ULTRA SHORT BOND FUND Schedule of Investments as at 31 January 2020 (Continued)
Interest Maturity PrincipalFair
Value % of Net Investments Rate Date (000) USD Assets Corporate Bonds - 42.92% (31 January 2019: 43.69%) (Continued) Machinery-Construction & Mining (continued) Caterpillar Financial Services Corp. 2.294%(2) 17/05/2021 3,612 3,625,313 0.18% 12,059,796 0.61% Machinery-Diversified John Deere Capital Corp. 2.285%(2) 07/06/2021 1,513 1,518,599 0.08% John Deere Capital Corp. 2.377%(2) 13/06/2022 1,980 1,990,655 0.10% Westinghouse Air Brake Technologies Corp. 3.194%(2) 15/09/2021 789 789,166 0.04% 4,298,420 0.22% Media Comcast Corp. 2.349%(2) 01/10/2021 968 973,408 0.05% NBCUniversal Enterprise, Inc.(1) 2.309%(2) 01/04/2021 5,487 5,510,281 0.28% Walt Disney Co. 2.297%(2) 01/09/2022 1,595 1,607,030 0.08% 8,090,719 0.41% Miscellaneous Manufacturer General Electric Co. 2.37%(2) 28/03/2020 1,304 1,303,497 0.07% General Electric Co. 2.50% 28/03/2020 244 244,149 0.01% General Electric Co. 2.631%(2) 15/04/2020 911 911,712 0.05% Textron, Inc. 2.451%(2) 10/11/2020 5,370 5,370,291 0.27% 7,829,649 0.40% Oil & Gas BP Capital Markets PLC 2.16%(2) 24/11/2020 2,038 2,042,015 0.10% Phillips 66 2.517%(2) 26/02/2021 1,412 1,412,197 0.07% Phillips 66(1) 2.581%(2) 15/04/2020 1,560 1,560,776 0.08% 5,014,988 0.25% Pharmaceuticals AbbVie, Inc.(1) 2.245%(2) 21/05/2021 4,783 4,794,690 0.24% AbbVie, Inc.(1) 2.355%(2) 19/11/2021 6,700 6,723,858 0.34% AbbVie, Inc.(1) 2.545%(2) 21/11/2022 4,000 4,036,711 0.20% Bayer US Finance II LLC(1) 2.577%(2) 25/06/2021 732 735,479 0.04% Becton Dickinson and Co. 2.836%(2) 29/12/2020 113 113,060 0.01% Becton Dickinson and Co. 2.917%(2) 06/06/2022 498 501,980 0.03% Bristol-Myers Squibb Co.(1) 2.104%(2) 16/11/2020 1,081 1,082,464 0.05% Cigna Corp. 2.55%(2) 17/09/2021 8,159 8,159,954 0.41% CVS Health Corp. 2.515%(2) 09/03/2020 88 88,049 0.00% CVS Health Corp. 2.605%(2) 09/03/2021 300 301,834 0.02% Express Scripts Holding Co. 2.664%(2) 30/11/2020 789 789,178 0.04% 27,327,257 1.38% Pipelines MPLX LP 2.785%(2) 09/09/2021 1,599 1,605,053 0.08% REITS AvalonBay Communities, Inc. 2.261%(2) 15/01/2021 888 888,243 0.05% SL Green Operating Partnership LP 2.884%(2) 16/08/2021 1,599 1,599,409 0.08% 2,487,652 0.13% Retail Dollar Tree, Inc. 2.536%(2) 17/04/2020 6,395 6,395,783 0.32%
201

LORD ABBETT PASSPORT PORTFOLIOS PLC ULTRA SHORT BOND FUND Schedule of Investments as at 31 January 2020 (Continued)
Interest Maturity PrincipalFair
Value % of Net Investments Rate Date (000) USD Assets Corporate Bonds - 42.92% (31 January 2019: 43.69%) (Continued) Retail (continued) McDonald's Corp. 2.225%(2) 28/10/2021 3,736 3,754,511 0.19% 10,150,294 0.51% Semiconductors QUALCOMM, Inc. 2.449%(2) 20/05/2020 2,453 2,456,549 0.12% Telecommunications AT&T, Inc. 2.657%(2) 01/06/2021 932 938,649 0.05% AT&T, Inc. 2.781%(2) 15/07/2021 400 404,334 0.02% AT&T, Inc. 2.89%(2) 30/06/2020 2,496 2,504,948 0.12% 3,847,931 0.19% Trucking & Leasing Aviation Capital Group LLC(1) 2.44%(2) 30/07/2021 805 806,686 0.04% Aviation Capital Group LLC(1) 2.857%(2) 01/06/2021 750 754,598 0.04% GATX Corp. 2.61%(2) 05/11/2021 1,252 1,258,388 0.06% 2,819,672 0.14% Total Corporate Bonds 850,792,512 42.92% Short Term Investments(3) - 36.75% (31 January 2019: 34.50%) Commercial Paper - 34.99% (31 January 2019: 32.62%) American Electric Power Co., Inc.(1) 1.813% 25/02/2020 12,291 12,276,169 0.62% American Electric Power Co., Inc.(1) 1.852% 06/02/2020 4,483 4,481,848 0.23% American Electric Power Co., Inc.(1) 1.853% 11/02/2020 1,219 1,218,374 0.06% American Electric Power Co., Inc.(1) 1.853% 12/02/2020 7,336 7,331,853 0.37% American Electric Power Co., Inc.(1) 1.853% 13/02/2020 6,520 6,515,979 0.33% Arrow Electronics, Inc.(1) 2.073% 04/02/2020 2,035 2,034,649 0.10% AutoNation, Inc.(1) 1.901% 06/02/2020 3,276 3,274,807 0.17% AutoNation, Inc.(1) 1.901% 07/02/2020 3,682 3,680,452 0.19% Aviation Capital Group LLC(1) 1.851% 07/02/2020 818 817,748 0.04% Aviation Capital Group LLC(1) 1.878% 18/02/2020 4,093 4,089,374 0.21% Aviation Capital Group LLC(1) 1.883% 28/02/2020 2,457 2,453,536 0.12% Aviation Capital Group LLC(1) 1.903% 20/02/2020 3,253 3,249,738 0.16% Aviation Capital Group LLC(1) 1.903% 27/02/2020 1,636 1,633,755 0.08% Aviation Capital Group LLC(1) 1.944% 21/02/2020 2,030 2,027,812 0.10% Aviation Capital Group LLC(1) 1.963% 12/02/2020 2,868 2,866,282 0.14% Aviation Capital Group LLC(1) 2.003% 13/02/2020 2,425 2,423,383 0.12% Aviation Capital Group LLC(1) 2.033% 06/02/2020 4,000 3,998,872 0.20% B.A.T. International Finance PLC(1) 1.953% 03/03/2020 1,500 1,497,481 0.08% B.A.T. International Finance PLC(1) 1.954% 06/03/2020 1,500 1,497,238 0.08% B.A.T. International Finance PLC(1) 1.987% 27/02/2020 3,641 3,635,785 0.18% B.A.T. International Finance PLC(1) 2.003% 20/02/2020 2,432 2,429,433 0.12% B.A.T. International Finance PLC(1) 2.054% 14/02/2020 3,216 3,213,619 0.16% B.A.T. International Finance PLC(1) 2.073% 10/02/2020 11,709 11,702,943 0.59% Bell Canada, Inc.(1) 1.833% 22/04/2020 3,272 3,257,973 0.17% Bell Canada, Inc.(1) 1.859% 15/04/2020 2,330 2,320,923 0.12% Bell Canada, Inc.(1) 2.277% 26/02/2020 3,871 3,864,952 0.19%
202

LORD ABBETT PASSPORT PORTFOLIOS PLC ULTRA SHORT BOND FUND Schedule of Investments as at 31 January 2020 (Continued)
Interest Maturity PrincipalFair
Value % of Net Investments Rate Date (000) USD Assets Short Term Investments(3) - 36.75% (31 January 2019: 34.50%) (Continued) Commercial Paper - 34.99% (31 January 2019: 32.62%) (Continued) Bemis Co., Inc.(1) 2.127% 05/02/2020 3,714 3,713,125 0.19% Berkshire Hathaway Energy Co.(1) 1.754% 12/03/2020 4,074 4,066,078 0.21% Black Hills Corp.(1) 4.205% 18/02/2020 6,631 6,624,612 0.33% Boeing Co.(1) 2.217% 26/02/2020 15,729 15,704,970 0.79% Boeing Co.(1) 2.248% 04/03/2020 1,000 998,018 0.05% Boeing Co.(1) 2.478% 04/02/2020 3,570 3,569,265 0.18% Boeing Co.(1) 2.513% 02/03/2020 976 973,967 0.05% Boston Scientific Corp.(1) 1.842% 13/02/2020 902 901,447 0.05% Boston Scientific Corp.(1) 1.842% 21/02/2020 737 736,247 0.04% Boston Scientific Corp.(1) 1.852% 19/02/2020 1,065 1,064,015 0.05% Boston Scientific Corp.(1) 1.853% 25/02/2020 1,392 1,390,283 0.07% Boston Scientific Corp.(1) 1.871% 05/02/2020 3,196 3,195,336 0.16% Boston Scientific Corp.(1) 1.872% 14/02/2020 1,889 1,887,724 0.10% Boston Scientific Corp.(1) 1.903% 11/02/2020 1,778 1,777,062 0.09% Boston Scientific Corp.(1) 1.903% 12/02/2020 2,212 2,210,716 0.11% Boston Scientific Corp.(1) 1.984% 18/02/2020 2,583 2,580,585 0.13% Boston Scientific Corp.(1) 2.024% 07/02/2020 4,839 4,837,374 0.24% Boston Scientific Corp.(1) 2.059% 04/02/2020 1,771 1,770,697 0.09% BP Capital Markets PLC(1) 1.782% 18/06/2020 1,639 1,627,970 0.09% BP Capital Markets PLC(1) 1.861% 15/05/2020 5,874 5,844,361 0.30% Broadcom, Inc.(1) 2.175% 25/02/2020 1,000 998,553 0.05% Broadcom, Inc.(1) 2.218% 06/02/2020 4,052 4,050,756 0.20% Broadcom, Inc.(1) 2.249% 12/03/2020 4,016 4,006,005 0.20% Broadcom, Inc.(1) 2.258% 05/03/2020 8,912 8,893,619 0.45% Brookfield BRP Holdings (Canada) Inc. 1.892% 19/02/2020 4,091 4,087,564 0.21% Brookfield BRP Holdings (Canada) Inc. 1.936% 25/03/2020 2,047 2,041,184 0.10% Brookfield BRP Holdings (Canada) Inc. 1.969% 23/04/2020 2,045 2,036,093 0.11% Campbell Soup Co.(1) 1.863% 02/03/2020 1,828 1,825,167 0.09% Campbell Soup Co.(1) 2.101% 06/02/2020 7,900 7,897,707 0.40% Canadian Tire Corp. Ltd. 1.751% 12/02/2020 5,926 5,922,831 0.30% Cigna Corp.(1) 1.953% 21/05/2020 2,433 2,419,227 0.13% Cigna Corp.(1) 2.145% 26/02/2020 7,468 7,456,954 0.38% Clorox Co.(1) 2.135% 04/02/2020 10,000 9,998,225 0.50% CNH Industrial Capital LLC(1) 2.277% 02/04/2020 2,427 2,419,493 0.13% CNH Industrial Capital LLC(1) 2.652% 17/04/2020 1,567 1,560,947 0.08% Constellation Brands, Inc.(1) 1.913% 12/02/2020 1,063 1,062,380 0.05% Constellation Brands, Inc.(1) 1.944% 26/02/2020 858 856,844 0.04% Constellation Brands, Inc.(1) 1.945% 28/02/2020 815 813,814 0.04% Crown Castle International Corp.(1) 1.859% 04/02/2020 3,818 3,817,409 0.19% Crown Castle International Corp.(1) 1.903% 25/02/2020 5,746 5,738,722 0.29% Crown Castle International Corp.(1) 1.953% 18/02/2020 9,000 8,991,712 0.45% Crown Castle International Corp.(1) 2.003% 11/02/2020 5,262 5,259,077 0.27% Dow Chemical Co. 1.913% 31/03/2020 8,349 8,322,937 0.42% DuPont de Nemours, Inc.(1) 1.806% 02/04/2020 1,639 1,633,981 0.09% DuPont de Nemours, Inc.(1) 1.812% 23/03/2020 11,533 11,503,474 0.58% DuPont de Nemours, Inc.(1) 1.821% 01/04/2020 12,317 12,279,934 0.62% DuPont de Nemours, Inc.(1) 1.875% 09/03/2020 2,282 2,277,614 0.11% DuPont de Nemours, Inc.(1) 1.925% 24/02/2020 1,323 1,321,377 0.07% DuPont de Nemours, Inc.(1) 1.954% 18/02/2020 2,442 2,439,751 0.12% DuPont de Nemours, Inc.(1) 2.026% 03/02/2020 3,229 3,228,638 0.16% DuPont de Nemours, Inc.(1) 4.303% 06/02/2020 2,428 2,427,292 0.12% Enbridge US, Inc.(1) 1.852% 14/02/2020 3,844 3,841,432 0.19% Enbridge US, Inc.(1) 1.954% 20/02/2020 4,076 4,071,805 0.21%
203

LORD ABBETT PASSPORT PORTFOLIOS PLC ULTRA SHORT BOND FUND Schedule of Investments as at 31 January 2020 (Continued)
Interest Maturity PrincipalFair
Value % of Net Investments Rate Date (000) USD Assets Short Term Investments(3) - 36.75% (31 January 2019: 34.50%) (Continued) Commercial Paper - 34.99% (31 January 2019: 32.62%) (Continued) Encana Corp.(1) 2.107% 10/03/2020 3,491 3,483,262 0.18% Encana Corp.(1) 2.122% 04/02/2020 6,117 6,115,919 0.31% Encana Corp.(1) 2.157% 12/03/2020 1,802 1,797,695 0.09% Encana Corp.(1) 2.188% 11/03/2020 1,467 1,463,535 0.07% Encana Corp.(1) 2.207% 26/02/2020 3,071 3,066,308 0.15% Encana Corp.(1) 2.208% 04/03/2020 9,403 9,384,612 0.47% Encana Corp.(1) 2.209% 13/03/2020 445 443,885 0.02% Eni Finance USA, Inc.(1) 2.05% 11/02/2020 2,040 2,038,616 0.10% Eni Finance USA, Inc.(1) 2.06% 18/02/2020 1,175 1,173,884 0.06% Eni Finance USA, Inc.(1) 2.061% 20/02/2020 2,072 2,070,165 0.10% Eni Finance USA, Inc.(1) 2.061% 21/02/2020 2,047 2,044,548 0.10% Eni Finance USA, Inc.(1) 2.101% 03/03/2020 5,000 4,991,001 0.25% Eni Finance USA, Inc.(1) 2.101% 06/04/2020 2,034 2,026,910 0.11% Eni Finance USA, Inc.(1) 2.152% 10/03/2020 2,010 2,005,701 0.10% Eni Finance USA, Inc.(1) 2.162% 11/03/2020 2,010 2,005,554 0.10% Entergy Corp.(1) 1.826% 06/04/2020 2,457 2,448,149 0.13% Entergy Corp.(1) 1.86% 14/05/2020 2,049 2,037,078 0.11% Entergy Corp.(1) 1.905% 27/02/2020 4,875 4,868,310 0.25% Entergy Corp.(1) 1.957% 04/03/2020 1,546 1,543,320 0.08% Entergy Corp.(1) 1.959% 03/02/2020 3,000 2,999,675 0.15% Entergy Corp.(1) 1.96% 10/02/2020 10,000 9,995,125 0.50% Entergy Corp.(1) 2.01% 14/02/2020 1,848 1,846,665 0.09% Entergy Corp.(1) 2.212% 11/03/2020 2,946 2,938,979 0.15% ERP Operating LP(1) 1.869% 20/04/2020 3,422 3,408,251 0.18% ERP Operating LP(1) 2.156% 04/02/2020 2,847 2,846,490 0.14% Exelon Generation Co. LLC(1) 1.803% 28/02/2020 3,689 3,684,020 0.19% Exelon Generation Co. LLC(1) 1.813% 21/02/2020 3,271 3,267,711 0.16% Exelon Generation Co. LLC(1) 1.853% 11/02/2020 3,260 3,258,325 0.16% Experian Finance PLC(1) 2.01% 18/02/2020 1,549 1,547,537 0.08% FMC Corp.(1) 1.953% 02/03/2020 2,006 2,002,740 0.10% FMC Corp.(1) 2.004% 24/02/2020 900 898,850 0.05% General Motors Financial Co., Inc.(1) 1.891% 07/02/2020 818 817,742 0.04% General Motors Financial Co., Inc.(1) 1.902% 13/02/2020 1,636 1,634,964 0.08% General Motors Financial Co., Inc.(1) 1.905% 17/03/2020 1,638 1,634,110 0.08% General Motors Financial Co., Inc.(1) 1.942% 06/02/2020 2,458 2,457,338 0.12% General Motors Financial Co., Inc.(1) 1.965% 09/03/2020 2,454 2,449,057 0.12% General Motors Financial Co., Inc.(1) 2.004% 10/02/2020 3,612 3,610,194 0.18% General Motors Financial Co., Inc.(1) 2.211% 12/02/2020 2,040 2,038,629 0.10% General Motors Financial Co., Inc.(1) 2.211% 24/02/2020 4,448 4,441,748 0.22% General Motors Financial Co., Inc.(1) 2.441% 28/02/2020 759 757,622 0.04% Glencore Funding LLC(1) 1.857% 21/02/2020 8,196 8,187,554 0.41% Glencore Funding LLC(1) 1.88% 20/02/2020 8,934 8,925,146 0.45% Hawaiian Electric Co. 1.932% 06/02/2020 5,409 5,407,549 0.27% Hawaiian Electric Industries, Inc.(1) 1.951% 04/02/2020 1,565 1,564,746 0.08% Hawaiian Electric Industries, Inc.(1) 1.951% 06/02/2020 2,477 2,476,329 0.12% Healthpeak Properties, Inc.(1) 1.782% 20/02/2020 10,646 10,635,999 0.54% Healthpeak Properties, Inc.(1) 1.786% 19/02/2020 8,935 8,927,031 0.45% Humana, Inc.(1) 1.876% 26/03/2020 1,663 1,658,335 0.08% Humana, Inc.(1) 1.903% 27/02/2020 3,279 3,274,500 0.17% Humana, Inc.(1) 1.909% 01/05/2020 4,074 4,052,621 0.21% Humana, Inc.(1) 1.929% 21/04/2020 2,454 2,442,626 0.13% Humana, Inc.(1) 2.009% 03/04/2020 4,068 4,053,548 0.21% Humana, Inc.(1) 2.06% 14/02/2020 3,215 3,212,620 0.16%
204

LORD ABBETT PASSPORT PORTFOLIOS PLC ULTRA SHORT BOND FUND Schedule of Investments as at 31 January 2020 (Continued)
Interest Maturity PrincipalFair
Value % of Net Investments Rate Date (000) USD Assets Short Term Investments(3) - 36.75% (31 January 2019: 34.50%) (Continued) Commercial Paper - 34.99% (31 January 2019: 32.62%) (Continued) Huntington Ingalls Industries, Inc.(1) 1.85% 04/02/2020 2,027 2,026,688 0.10% Huntington Ingalls Industries, Inc.(1) 1.851% 07/02/2020 2,045 2,044,369 0.10% Huntington Ingalls Industries, Inc.(1) 1.888% 03/02/2020 4,833 4,832,493 0.24% Jabil, Inc.(1) 2.312% 18/02/2020 6,104 6,097,370 0.31% Jabil, Inc.(1) 2.333% 24/02/2020 9,721 9,706,574 0.49% Jabil, Inc.(1) 2.406% 28/02/2020 8,402 8,386,920 0.42% Lowe's Co., Inc(1) 2.128% 20/02/2020 6,899 6,891,281 0.35% Mondelez International, Inc.(1) 1.96% 21/02/2020 2,448 2,445,348 0.12% Motiva Enterprises LLC 1.871% 04/02/2020 5,737 5,736,106 0.29% Motiva Enterprises LLC 2.108% 13/03/2020 4,045 4,035,326 0.20% Motiva Enterprises LLC 2.108% 16/03/2020 2,407 2,400,822 0.12% Mylan, Inc.(1) 2.053% 24/02/2020 4,000 3,994,761 0.20% Mylan, Inc.(1) 2.083% 14/02/2020 491 490,631 0.02% Mylan, Inc.(1) 2.086% 27/02/2020 3,355 3,349,953 0.17% Mylan, Inc.(1) 2.087% 25/02/2020 1,968 1,965,267 0.10% Mylan, Inc.(1) 2.103% 19/02/2020 736 735,227 0.04% Mylan, Inc.(1) 2.103% 28/02/2020 5,403 5,394,700 0.27% National Fuel Gas Co. 1.903% 27/02/2020 1,065 1,063,539 0.05% National Fuel Gas Co. 2.003% 20/02/2020 1,000 998,944 0.05% National Fuel Gas Co. 2.033% 06/02/2020 1,614 1,613,545 0.08% National Fuel Gas Co. 2.033% 07/02/2020 890 889,699 0.04% ONEOK, Inc.(1) 1.951% 04/02/2020 1,006 1,005,837 0.05% Pentair Finance SAR.L.(1) 2.154% 03/02/2020 2,030 2,029,758 0.10% Plains All American Pipeline LP(1) 2.001% 04/02/2020 615 614,898 0.03% Plains All American Pipeline LP(1) 2.001% 06/02/2020 2,047 2,046,431 0.10% Plains All American Pipeline LP(1) 2.001% 07/02/2020 8,177 8,174,274 0.41% Public Service Enterprise Group, Inc.(1) 2.06% 20/02/2020 1,838 1,836,011 0.09% Royal Caribbean Cruises Ltd.(1) 1.925% 09/03/2020 6,791 6,777,595 0.34% Royal Caribbean Cruises Ltd.(1) 1.955% 12/03/2020 10,051 10,029,223 0.51% Royal Caribbean Cruises Ltd.(1) 1.973% 18/02/2020 3,258 3,254,969 0.16% Royal Caribbean Cruises Ltd.(1) 2.005% 27/02/2020 2,407 2,403,523 0.12% Royal Caribbean Cruises Ltd.(1) 2.105% 12/02/2020 2,847 2,845,173 0.14% Sempra Energy(1) 1.835% 26/03/2020 6,121 6,104,820 0.31% Sherwin-Williams Co.(1) 1.871% 11/02/2020 1,556 1,555,192 0.08% Spire, Inc.(1) 2.107% 13/02/2020 4,046 4,043,168 0.20% Syngenta Wilmington, Inc.(1) 2.623% 14/02/2020 7,632 7,624,959 0.38% Telstra corp. Ltd.(1) 1.899% 30/04/2020 3,606 3,589,367 0.18% TELUS Corp.(1) 2.031% 04/02/2020 790 789,867 0.04% Thomson Reuters Corp.(1) 1.803% 28/02/2020 5,651 5,643,274 0.28% TransCanada PipeLines Ltd.(1) 1.859% 27/04/2020 2,457 2,446,235 0.13% TransCanada PipeLines Ltd.(1) 1.886% 09/03/2020 638 636,767 0.03% TransCanada PipeLines Ltd.(1) 1.938% 06/04/2020 4,649 4,633,667 0.24% TransCanada PipeLines Ltd.(1) 2.116% 23/03/2020 10,000 9,970,250 0.50% Ventas Realty LP(1) 1.855% 02/03/2020 3,251 3,245,988 0.16% Ventas Realty LP(1) 1.871% 10/03/2020 7,700 7,684,840 0.39% Viacom, Inc.(1) 1.954% 03/02/2020 4,067 4,066,559 0.21% Walgreens Boots Alliance, Inc. 2.109% 30/03/2020 2,290 2,282,289 0.12% Walgreens Boots Alliance, Inc. 2.122% 24/04/2020 3,158 3,144,655 0.16% Walgreens Boots Alliance, Inc. 2.173% 21/07/2020 2,372 2,350,501 0.12% Walgreens Boots Alliance, Inc. 2.213% 05/03/2020 3,697 3,689,544 0.19% Walgreens Boots Alliance, Inc. 2.213% 10/03/2020 4,078 4,068,530 0.21% Walgreens Boots Alliance, Inc. 2.224% 13/07/2020 3,230 3,202,204 0.17% Walgreens Boots Alliance, Inc. 2.265% 21/02/2020 318 317,603 0.02%
205

LORD ABBETT PASSPORT PORTFOLIOS PLC ULTRA SHORT BOND FUND Schedule of Investments as at 31 January 2020 (Continued)
Interest Maturity PrincipalFair
Value % of Net Investments Rate Date (000) USD Assets Short Term Investments(3) - 36.75% (31 January 2019: 34.50%) (Continued) Commercial Paper - 34.99% (31 January 2019: 32.62%) (Continued) Walgreens Boots Alliance, Inc. 2.375% 23/04/2020 5,350 5,327,674 0.27% Walgreens Boots Alliance, Inc. 2.379% 11/02/2020 3,903 3,900,452 0.20% Total Commercial Paper 693,569,836 34.99% Corporate Bond - 0.24% (31 January 2019: 0.13%) Pharmaceuticals Cigna Corp. 2.25% (2) 17/03/2020 4,742 4,739,854 0.24% Total Corporate Bond 4,739,854 0.24% U.S. Government Obligation -1.52% (31 January 2019: 1.75%) U.S. Treasury Bill ZCP 26/03/2020 30,104 30,034,911 1.52%
Total U.S. Government Obligation 30,034,911 1.52% Total Short Term Investments 728,344,601 36.75% Total Investment in Securities (Cost: USD 1,972,407,928) 1,975,915,823 99.69% A zero balance of principal may reflect actual amounts rounding to less than one thousand.
ZCP Indicates a zero coupon rate.
(1) Securities exempt from registration under Rule 144A (i) of the US Securities Act of 1933. These securities may be resold in transactions exempt from registration, normally to qualified institutional buyers.
(2) Indicates a variable rate security. The interest rate shown reflects the rate as at 31 January 2020. (3) Short Term Investments are securities maturing in less than 365 days from issuance.
Total Financial Assets at Fair Value through Profit and Loss 1,975,915,823
99.69%
Other Net Assets 6,151,647 0.31%
Net Assets 1,982,067,470 100.00%
Analysis of Total Assets
% of Total
Assets Transferable securities admitted to an official stock exchange listing 3.27%Transferable securities traded on a regulated market 60.25%Other transferable securities including those which are unlisted 34.72%
206

LORD ABBETT PASSPORT PORTFOLIOS PLC HIGH YIELD CORE FUND Schedule of Investments as at 31 January 2020
Interest Maturity PrincipalFair
Value % of Net Investments Rate Date (000) USD Assets Corporate Bonds - 97.19% Aerospace/Defense Arconic, Inc. 6.75% 15/01/2028 527 616,487 0.20% F-Brasile SpA/F-Brasile US LLC(1) 7.375% 15/08/2026 293 312,778 0.10% Kratos Defense & Security Solutions, Inc.(1) 6.50% 30/11/2025 550 587,353 0.19% Signature Aviation US Holdings, Inc.(1) 4.00% 01/03/2028 703 696,615 0.23% Signature Aviation US Holdings, Inc.(1) 5.375% 01/05/2026 550 570,035 0.19% TransDigm, Inc.(1) 6.25% 15/03/2026 350 378,131 0.12% TransDigm, Inc. 6.375% 15/06/2026 2,225 2,348,710 0.76% Triumph Group, Inc.(1) 6.25% 15/09/2024 133 137,849 0.05% Triumph Group, Inc. 7.75% 15/08/2025 295 289,038 0.09% 5,936,996 1.93% Agriculture Kernel Holding SA(1) 8.75% 31/01/2022 550 597,077 0.20% MHP Lux SA(1) 6.95% 03/04/2026 885 926,612 0.30% 1,523,689 0.50% Airlines Azul Investments LLP(1) 5.875% 26/10/2024 720 752,699 0.24% Latam Finance Ltd.(1) 7.00% 01/03/2026 290 315,330 0.10% Transportes Aereos Portugueses SA 5.625% 02/12/2024 EUR 300 329,964 0.11% United Airlines Holdings, Inc. 4.875% 15/01/2025 1,682 1,779,413 0.58% 3,177,406 1.03% Apparel Under Armour, Inc. 3.25% 15/06/2026 314 307,944 0.10% William Carter Co.(1) 5.625% 15/03/2027 575 613,627 0.20% 921,571 0.30%
Auto Manufacturers Aston Martin Capital Holdings Ltd.(1) 6.50% 15/04/2022 1,015 1,001,775 0.33% BCD Acquisition, Inc.(1) 9.625% 15/09/2023 500 520,620 0.17% Jaguar Land Rover Automotive PLC(1) 6.875% 15/11/2026 EUR 322 380,743 0.12% JB Poindexter & Co., Inc.(1) 7.125% 15/04/2026 1,200 1,293,417 0.42% Mclaren Finance PLC 5.00% 01/08/2022 GBP 1,275 1,635,153 0.53% Mclaren Finance PLC(1) 5.75% 01/08/2022 200 193,500 0.06% Tesla, Inc.(1) 5.30% 15/08/2025 2,387 2,416,861 0.79% Wabash National Corp.(1) 5.50% 01/10/2025 1,300 1,290,789 0.42% 8,732,858 2.84% Auto Parts & Equipment Adient Global Holdings Ltd.(1) 4.875% 15/08/2026 693 654,868 0.21% Adient US LLC(1) 7.00% 15/05/2026 557 609,566 0.20% American Axle & Manufacturing, Inc. 6.50% 01/04/2027 509 521,738 0.17% Garrett LX I S.A.R.L./Garrett Borrowing LLC(1) 5.125% 15/10/2026 EUR 274 300,610 0.10% Panther BF Aggregator 2 LP/Panther Finance Co., Inc. 4.375% 15/05/2026 EUR 260 297,857 0.10% Panther BF Aggregator 2 LP/Panther Finance Co., Inc.(1) 8.50% 15/05/2027 733 789,331 0.26% Tenneco, Inc. 5.00% 15/07/2026 675 620,983 0.20% Titan International, Inc. 6.50% 30/11/2023 361 316,025 0.10% 4,110,978 1.34%
207

LORD ABBETT PASSPORT PORTFOLIOS PLC HIGH YIELD CORE FUND Schedule of Investments as at 31 January 2020 (Continued)
Interest Maturity PrincipalFair
Value % of Net Investments Rate Date (000) USD Assets Corporate Bonds - 97.19% (Continued) Banks CIT Group, Inc. 5.25% 07/03/2025 271 297,988 0.10% CIT Group, Inc. 6.125% 09/03/2028 1,277 1,523,975 0.49% Credit Suisse Group AG(1) 5.10%(2) -(3) 200 202,250 0.07% Freedom Mortgage Corp.(1) 8.25% 15/04/2025 340 337,872 0.11% Huntington Bancshares, Inc./OH 5.70%(2) -(3) 450 472,279 0.15% Intesa Sanpaolo SpA(1) 5.71% 15/01/2026 883 982,191 0.32% Macquarie Bank Ltd./London(1) 6.125%(2) -(3) 800 850,668 0.28% Popular, Inc. 6.125% 14/09/2023 1,000 1,076,665 0.35% Provident Funding Associates LP/PFG Finance Corp.(1) 6.375% 15/06/2025 908 901,567 0.29% Synovus Financial Corp. 5.90%(2) 07/02/2029 700 752,482 0.24% 7,397,937 2.40% Beverages Bacardi Ltd.(1) 5.30% 15/05/2048 784 968,038 0.31% Building Materials American Woodmark Corp.(1) 4.875% 15/03/2026 439 452,871 0.15% Cornerstone Building Brands, Inc.(1) 8.00% 15/04/2026 595 625,509 0.20% Griffon Corp. 5.25% 01/03/2022 300 300,412 0.10% Louisiana-Pacific Corp. 4.875% 15/09/2024 213 220,277 0.07% Masonite International Corp.(1) 5.375% 01/02/2028 454 478,698 0.16% Masonite International Corp.(1) 5.75% 15/09/2026 1,200 1,275,417 0.41% Norbord, Inc.(1) 5.75% 15/07/2027 38 40,008 0.01% Norbord, Inc.(1) 6.25% 15/04/2023 750 814,061 0.27% Owens Corning 4.40% 30/01/2048 700 737,386 0.24% Patrick Industries, Inc.(1) 7.50% 15/10/2027 675 737,672 0.24% PGT Innovations, Inc.(1) 6.75% 01/08/2026 677 726,318 0.24% Summit Materials LLC/Summit Materials Finance Corp.(1) 5.125% 01/06/2025 750 769,061 0.25% Summit Materials LLC/Summit Materials Finance Corp.(1) 6.50% 15/03/2027 1,000 1,085,347 0.35% 8,263,037 2.69% Chemicals Ashland LLC 6.875% 15/05/2043 513 600,690 0.20% GCP Applied Technologies, Inc.(1) 5.50% 15/04/2026 275 286,783 0.09% Rain CII Carbon LLC/CII Carbon Corp.(1) 7.25% 01/04/2025 459 455,553 0.15% Starfruit Finco BV/Starfruit US Holdco LLC(1) 8.00% 01/10/2026 606 630,255 0.20% Trinseo Materials Operating SCA/Trinseo Materials Finance, Inc.(1) 5.375% 01/09/2025 620 582,676 0.19% Tronox, Inc.(1) 6.50% 15/04/2026 596 594,525 0.19% Yingde Gases Investment Ltd.(1) 6.25% 19/01/2023 875 915,501 0.30% 4,065,983 1.32% Coal CONSOL Energy, Inc.(1) 11.00% 15/11/2025 298 207,979 0.07% Warrior Met Coal, Inc.(1) 8.00% 01/11/2024 420 436,012 0.14% 643,991 0.21% Commercial Services Ahern Rentals, Inc.(1) 7.375% 15/05/2023 440 349,983 0.11% Algeco Global Finance PLC(1) 8.00% 15/02/2023 754 753,992 0.25% Brink's Co.(1) 4.625% 15/10/2027 654 668,599 0.22%
208

LORD ABBETT PASSPORT PORTFOLIOS PLC HIGH YIELD CORE FUND Schedule of Investments as at 31 January 2020 (Continued)
Interest Maturity PrincipalFair
Value % of Net Investments Rate Date (000) USD Assets Corporate Bonds - 97.19% (Continued) Commercial Services (Continued) Capitol Investment Merger Sub 2 LLC(1) 10.00% 01/08/2024 445 463,541 0.15% Cardtronics, Inc./Cardtronics USA, Inc.(1) 5.50% 01/05/2025 871 904,024 0.29% Garda World Security Corp.(1) 4.625% 15/02/2027 554 549,845 0.18% GW B-CR Security Corp.(1) 9.50% 01/11/2027 291 311,181 0.10% MPH Acquisition Holdings LLC(1) 7.125% 01/06/2024 476 462,248 0.15% Service Corp. International/US 4.625% 15/12/2027 164 171,868 0.06% Service Corp. International/US 5.125% 01/06/2029 276 294,423 0.10% United Rentals North America, Inc. 4.875% 15/01/2028 1,215 1,268,885 0.41% Verscend Escrow Corp.(1) 9.75% 15/08/2026 1,375 1,498,784 0.49% WW International, Inc.(1) 8.625% 01/12/2025 423 443,268 0.14% 8,140,641 2.65% Computers Banff Merger Sub, Inc.(1) 9.75% 01/09/2026 588 604,802 0.20% Diebold Nixdorf, Inc. 8.50% 15/04/2024 616 593,156 0.19% Everi Payments, Inc.(1) 7.50% 15/12/2025 429 459,208 0.15% MTS Systems Corp.(1) 5.75% 15/08/2027 296 311,643 0.10% Presidio Holdings, Inc.(1) 4.875% 01/02/2027 165 165,285 0.06% Presidio Holdings, Inc.(1) 8.25% 01/02/2028 307 316,210 0.10% Tempo Acquisition LLC/Tempo Acquisition Finance Corp.(1) 6.75% 01/06/2025 425 440,933 0.14% Western Digital Corp. 4.75% 15/02/2026 900 962,437 0.31% 3,853,674 1.25% Cosmetics/Personal Care Coty, Inc.(1) 6.50% 15/04/2026 615 642,690 0.21% Revlon Consumer Products Corp. 5.75% 15/02/2021 518 457,006 0.15% 1,099,696 0.36% Distribution/Wholesale Core & Main Holdings LP PIK (1) 8.625% 15/09/2024 613 640,839 0.21% H&E Equipment Services, Inc. 5.625% 01/09/2025 439 458,937 0.15% IAA, Inc.(1) 5.50% 15/06/2027 420 446,460 0.15% Performance Food Group, Inc.(1) 5.50% 01/06/2024 285 291,531 0.09% Performance Food Group, Inc.(1) 5.50% 15/10/2027 218 229,996 0.07% Univar Solutions USA, Inc./Washington(1) 5.125% 01/12/2027 301 312,844 0.10% 2,380,607 0.77% Diversified Financial Services AG Issuer LLC 6.25% 01/03/2028 180 180,000 0.06% AG Merger Sub II, Inc.(1) 10.75% 01/08/2027 310 329,483 0.11% Ally Financial, Inc. 8.00% 01/11/2031 884 1,248,570 0.41% Avolon Holdings Funding Ltd.(1) 5.25% 15/05/2024 1,400 1,544,641 0.50% Credit Acceptance Corp.(1) 5.125% 31/12/2024 317 332,058 0.11% CSN Islands XI Corp.(1) 6.75% 28/01/2028 242 240,185 0.08% Fairstone Financial, Inc.(1) 7.875% 15/07/2024 828 897,689 0.29% Global Aircraft Leasing Co. Ltd. PIK (1) 6.50% 15/09/2024 572 586,615 0.19% LHC3 PLC PIK 4.125% 15/08/2024 EUR 257 293,665 0.10% Muthoot Finance Ltd.(1) 6.125% 31/10/2022 872 905,537 0.29% Nationstar Mortgage Holdings, Inc.(1) 6.00% 15/01/2027 309 315,039 0.10% Navient Corp. 5.00% 15/03/2027 506 506,000 0.16% Navient Corp. 6.125% 25/03/2024 224 239,189 0.08% Navient Corp. 6.75% 25/06/2025 2,370 2,586,263 0.84% Navient Corp. 6.75% 15/06/2026 1,005 1,093,541 0.35%
209

LORD ABBETT PASSPORT PORTFOLIOS PLC HIGH YIELD CORE FUND Schedule of Investments as at 31 January 2020 (Continued)
Interest Maturity Principal Fair
Value % of Net Investments Rate Date (000) USD Assets Corporate Bonds - 97.19% (Continued) Diversified Financial Services (Continued) Quicken Loans, Inc.(1) 5.25% 15/01/2028 296 307,047 0.10% Springleaf Finance Corp. 5.375% 15/11/2029 443 461,495 0.15% Springleaf Finance Corp. 6.125% 15/03/2024 2,186 2,377,253 0.77% Springleaf Finance Corp. 7.125% 15/03/2026 262 301,097 0.10% 14,745,367 4.79% Electric AES Corp./VA 4.50% 15/03/2023 154 157,327 0.05% AES Corp./VA 5.125% 01/09/2027 1,375 1,454,131 0.47% AES Gener SA(1) 6.35%(2) 07/10/2079 407 425,722 0.14% Clearway Energy Operating LLC(1) 4.75% 15/03/2028 222 228,793 0.07% Clearway Energy Operating LLC 5.00% 15/09/2026 267 275,770 0.09% Clearway Energy Operating LLC 5.75% 15/10/2025 926 975,157 0.32% DPL, Inc.(1) 4.35% 15/04/2029 330 329,035 0.11% Elwood Energy LLC 8.159% 05/07/2026 334 369,512 0.12% Mong Duong Finance Holdings BV(1) 5.125% 07/05/2029 500 517,392 0.17% NextEra Energy Operating Partners LP(1) 4.50% 15/09/2027 575 600,977 0.20% NRG Energy, Inc.(1) 5.25% 15/06/2029 926 999,617 0.32% NRG Energy, Inc. 5.75% 15/01/2028 700 754,705 0.25% NSG Holdings LLC/NSG Holdings, Inc.(1) 7.75% 15/12/2025 763 854,668 0.28% Talen Energy Supply LLC(1) 10.50% 15/01/2026 352 313,035 0.10% Terraform Global Operating LLC(1) 6.125% 01/03/2026 455 475,633 0.15% 8,731,474 2.84% Electrical Component & Equipment Energizer Holdings, Inc.(1) 6.375% 15/07/2026 631 673,214 0.22% Electronics Itron, Inc.(1) 5.00% 15/01/2026 577 601,723 0.20% Energy-Alternate Sources Azure Power Solar Energy Pvt Ltd.(1) 5.65% 24/12/2024 400 413,879 0.14% Enviva Partners LP/Enviva Partners Finance Corp.(1) 6.50% 15/01/2026 516 551,743 0.18% Greenko Solar Mauritius Ltd.(1) 5.95% 29/07/2026 573 587,763 0.19% ReNew Power Pvt Ltd.(1) 5.875% 05/03/2027 245 246,655 0.08% TerraForm Power Operating LLC(1) 4.75% 15/01/2030 517 545,771 0.18% TerraForm Power Operating LLC(1) 5.00% 31/01/2028 179 193,651 0.06% YPF Energia Electrica SA(1) 10.00% 25/07/2026 377 349,620 0.11% 2,889,082 0.94% Engineering & Construction Brand Industrial Services, Inc.(1) 8.50% 15/07/2025 978 982,753 0.32% Delhi International Airport Ltd.(1) 6.45% 04/06/2029 407 438,746 0.14% Great Lakes Dredge & Dock Corp. 8.00% 15/05/2022 550 579,047 0.19% New Enterprise Stone & Lime Co., Inc.(1) 6.25% 15/03/2026 300 314,354 0.10% Promontoria Holding 264 BV(1) 6.75% 15/08/2023 EUR 292 297,108 0.09% TopBuild Corp.(1) 5.625% 01/05/2026 905 946,040 0.31% Weekley Homes LLC/Weekley Finance Corp. 6.00% 01/02/2023 207 207,862 0.07% 3,765,910 1.22% Entertainment Boyne USA, Inc.(1) 7.25% 01/05/2025 400 435,166 0.14% Buena Vista Gaming Authority(1) 13.00% 01/04/2023 548 549,597 0.18%
210

LORD ABBETT PASSPORT PORTFOLIOS PLC HIGH YIELD CORE FUND Schedule of Investments as at 31 January 2020 (Continued)
Interest Maturity Principal Fair
Value % of Net Investments Rate Date (000) USD Assets Corporate Bonds - 97.19% (Continued) Entertainment (Continued) Churchill Downs, Inc.(1) 4.75% 15/01/2028 842 868,818 0.28% Enterprise Development Authority(1) 12.00% 15/07/2024 770 885,180 0.29% Gateway Casinos & Entertainment Ltd.(1) 8.25% 01/03/2024 400 417,834 0.14% Inter Media & Communication SpA(1) 4.875% 31/12/2022 EUR 412 469,733 0.15% Jacobs Entertainment, Inc.(1) 7.875% 01/02/2024 243 258,239 0.08% Merlin Entertainments PLC(1) 5.75% 15/06/2026 275 301,221 0.10% Mohegan Gaming & Entertainment(1) 7.875% 15/10/2024 446 455,850 0.15% Motion Bondco DAC(1) 6.625% 15/11/2027 400 427,000 0.14% Penn National Gaming, Inc.(1) 5.625% 15/01/2027 600 631,471 0.21% Scientific Games International, Inc.(1) 7.00% 15/05/2028 440 464,739 0.15% Scientific Games International, Inc.(1) 7.25% 15/11/2029 294 315,859 0.10% Stars Group Holdings BV/Stars Group US Co.-Borrower LLC(1) 7.00% 15/07/2026 275 299,227 0.10% Twin River Worldwide Holdings, Inc.(1) 6.75% 01/06/2027 445 470,742 0.15% 7,250,676 2.36% Environmental Control Covanta Holding Corp. 6.00% 01/01/2027 453 472,410 0.16% Waste Pro USA, Inc.(1) 5.50% 15/02/2026 575 592,064 0.19% 1,064,474 0.35% Food Arcor SAIC 6.00% 06/07/2023 9 8,840 0.00% Arcor SAIC(1) 6.00% 06/07/2023 333 327,089 0.11% BRF SA(1) 4.875% 24/01/2030 472 485,924 0.16% Chobani LLC/Chobani Finance Corp., Inc.(1) 7.50% 15/04/2025 900 897,399 0.29% FAGE International SA/FAGE USA Dairy Industry, Inc.(1) 5.625% 15/08/2026 700 651,243 0.21% Fresh Market, Inc.(1) 9.75% 01/05/2023 550 272,250 0.09% JBS USA LUX SA/JBS USA Finance, Inc.(1) 6.75% 15/02/2028 962 1,067,204 0.35% Lamb Weston Holdings, Inc.(1) 4.875% 01/11/2026 710 749,920 0.24% Minerva Luxembourg SA(1) 5.875% 19/01/2028 549 579,552 0.19% Simmons Foods, Inc.(1) 7.75% 15/01/2024 275 295,052 0.09% 5,334,473 1.73% Gas Rockpoint Gas Storage Canada Ltd.(1) 7.00% 31/03/2023 36 35,272 0.01% Healthcare-Products Ortho-Clinical Diagnostics, Inc./Ortho-Clinical Diagnostics SA(1) 7.25% 01/02/2028 368 375,408 0.12% Healthcare-Services Acadia Healthcare Co., Inc. 5.625% 15/02/2023 850 863,103 0.28% AHP Health Partners, Inc.(1) 9.75% 15/07/2026 800 874,278 0.28% Air Medical Group Holdings, Inc.(1) 6.375% 15/05/2023 513 479,868 0.16% BCPE Cycle Merger Sub II, Inc.(1) 10.625% 15/07/2027 569 588,006 0.19% Catalent Pharma Solutions, Inc.(1) 5.00% 15/07/2027 291 306,859 0.10% Centene Corp.(1) 4.25% 15/12/2027 442 462,708 0.15% Centene Corp.(1) 4.625% 15/12/2029 395 425,869 0.14% Centene Corp.(1) 5.375% 01/06/2026 1,098 1,170,029 0.38% Encompass Health Corp. 4.50% 01/02/2028 335 345,683 0.11% Hadrian Merger Sub, Inc.(1) 8.50% 01/05/2026 1,200 1,236,417 0.40% HCA, Inc. 5.50% 15/06/2047 1,307 1,555,216 0.51%
211

LORD ABBETT PASSPORT PORTFOLIOS PLC HIGH YIELD CORE FUND Schedule of Investments as at 31 January 2020 (Continued)
Interest Maturity Principal Fair
Value % of Net Investments Rate Date (000) USD Assets Corporate Bonds - 97.19% (Continued) Healthcare-Services (Continued) MEDNAX, Inc.(1) 6.25% 15/01/2027 444 453,446 0.15% Molina Healthcare, Inc.(1) 4.875% 15/06/2025 794 812,195 0.26% Radiology Partners, Inc.(1) 9.25% 01/02/2028 617 646,307 0.21% RegionalCare Hospital Partners Holdings, Inc./LifePoint Health, Inc.(1) 9.75% 01/12/2026 667 746,223 0.24% Select Medical Corp.(1) 6.25% 15/08/2026 354 382,555 0.12% Surgery Center Holdings, Inc.(1) 6.75% 01/07/2025 475 483,115 0.16% Surgery Center Holdings, Inc.(1) 10.00% 15/04/2027 592 662,716 0.22% Tenet Healthcare Corp.(1) 4.875% 01/01/2026 429 446,696 0.15% Tenet Healthcare Corp. 5.125% 01/05/2025 575 586,500 0.19% Tenet Healthcare Corp.(1) 6.25% 01/02/2027 1,250 1,323,563 0.43% Tenet Healthcare Corp. 6.75% 15/06/2023 1,050 1,144,064 0.37% West Street Merger Sub, Inc.(1) 6.375% 01/09/2025 338 333,772 0.11% 16,329,188 5.31% Holding Companies-Diversified Stena AB(1) 7.00% 01/02/2024 891 916,986 0.30% Stena International SA(1) 6.125% 01/02/2025 410 421,788 0.14% 1,338,774 0.44% Home Builders Ashton Woods USA LLC/Ashton Woods Finance Co.(1) 6.75% 01/08/2025 735 759,192 0.25% Beazer Homes USA, Inc.(1) 7.25% 15/10/2029 498 545,322 0.18% Century Communities, Inc. 5.875% 15/07/2025 1,049 1,104,508 0.36% Century Communities, Inc.(1) 6.75% 01/06/2027 455 494,732 0.16% Installed Building Products, Inc.(1) 5.75% 01/02/2028 364 387,786 0.12% KB Home 4.80% 15/11/2029 298 309,920 0.10% Lennar Corp. 4.75% 30/05/2025 1,000 1,094,025 0.35% LGI Homes, Inc.(1) 6.875% 15/07/2026 570 603,686 0.20% Miller Homes Group Holdings PLC 5.50% 15/10/2024 GBP 320 439,540 0.14% PulteGroup, Inc. 5.00% 15/01/2027 1,698 1,880,234 0.61% Shea Homes LP/Shea Homes Funding Corp.(1) 6.125% 01/04/2025 1,150 1,187,852 0.39% Toll Brothers Finance Corp. 4.35% 15/02/2028 750 791,511 0.26% TRI Pointe Group, Inc. 5.25% 01/06/2027 603 642,405 0.21% William Lyon Homes, Inc.(1) 6.625% 15/07/2027 623 674,614 0.22% Williams Scotsman International, Inc.(1) 6.875% 15/08/2023 1,250 1,316,556 0.43% 12,231,883 3.98% Housewares Newell Brands, Inc. 5.375% 01/04/2036 564 621,192 0.20% Insurance Acrisure LLC/Acrisure Finance, Inc.(1) 7.00% 15/11/2025 467 458,823 0.15% Acrisure LLC/Acrisure Finance, Inc.(1) 8.125% 15/02/2024 652 698,048 0.23% Alliant Holdings Intermediate LLC/Alliant Holdings Co.-Issuer(1) 6.75% 15/10/2027 489 515,577 0.17% HUB International Ltd.(1) 7.00% 01/05/2026 1,000 1,032,475 0.33% MGIC Investment Corp. 5.75% 15/08/2023 280 310,216 0.10% Radian Group, Inc. 4.875% 15/03/2027 1,451 1,538,564 0.50% 4,553,703 1.48% Internet Cogent Communications Group, Inc. 4.375% 30/06/2024 EUR 1,000 1,144,691 0.37%
212

LORD ABBETT PASSPORT PORTFOLIOS PLC HIGH YIELD CORE FUND Schedule of Investments as at 31 January 2020 (Continued)
Interest Maturity Principal Fair
Value % of Net Investments Rate Date (000) USD Assets Corporate Bonds - 97.19% (Continued) Internet (Continued) Cogent Communications Group, Inc.(1) 5.375% 01/03/2022 750 783,984 0.25% Go Daddy Operating Co. LLC/GD Finance Co., Inc.(1) 5.25% 01/12/2027 288 302,573 0.10% GrubHub Holdings, Inc.(1) 5.50% 01/07/2027 318 311,036 0.10% Match Group, Inc.(1) 5.00% 15/12/2027 282 296,903 0.10% Netflix, Inc. 3.625% 15/06/2030 EUR 495 570,466 0.19% Netflix, Inc. 3.875% 15/11/2029 EUR 344 403,053 0.13% Netflix, Inc.(1) 3.875% 15/11/2029 EUR 350 410,082 0.13% Netflix, Inc. 4.625% 15/05/2029 EUR 580 717,984 0.23% Netflix, Inc. 4.875% 15/04/2028 292 313,177 0.10% Netflix, Inc. 5.875% 15/11/2028 2,351 2,651,928 0.86% Uber Technologies, Inc.(1) 8.00% 01/11/2026 576 613,542 0.20% United Group BV 3.625% 15/02/2028 EUR 379 417,404 0.14% 8,936,823 2.90% Iron/Steel Baffinland Iron Mines Corp./Baffinland Iron Mines LP(1) 8.75% 15/07/2026 615 640,000 0.21% CSN Resources SA(1) 7.625% 17/04/2026 590 620,771 0.20% 1,260,771 0.41% Leisure Time Dometic Group AB 3.00% 08/05/2026 EUR 257 291,463 0.09% Pinnacle Bidco PLC 6.375% 15/02/2025 GBP 542 752,158 0.24% Viking Cruises Ltd.(1) 5.875% 15/09/2027 294 301,909 0.10% VOC Escrow Ltd.(1) 5.00% 15/02/2028 728 754,827 0.25% 2,100,357 0.68% Lodging Boyd Gaming Corp.(1) 4.75% 01/12/2027 313 320,622 0.10% Boyd Gaming Corp. 6.00% 15/08/2026 414 441,054 0.14% Hilton Domestic Operating Co., Inc. 4.875% 15/01/2030 281 297,810 0.10% Hilton Domestic Operating Co., Inc. 5.125% 01/05/2026 586 615,328 0.20% MGM Resorts International 4.625% 01/09/2026 1,385 1,456,227 0.47% Station Casinos LLC(1) 5.00% 01/10/2025 293 300,603 0.10% Sugarhouse HSP Gaming Prop Mezz LP/Sugarhouse HSP Gaming Finance Corp.(1) 5.875% 15/05/2025 295 296,597 0.10% Wyndham Destinations, Inc. 5.75% 01/04/2027 831 909,195 0.30% Wyndham Hotels & Resorts, Inc.(1) 5.375% 15/04/2026 275 288,358 0.09% Wynn Macau Ltd.(1) 5.125% 15/12/2029 200 198,500 0.07% Wynn Macau Ltd.(1) 5.50% 01/10/2027 785 800,682 0.26% 5,924,976 1.93% Machinery-Diversified Cloud Crane LLC(1) 10.125% 01/08/2024 275 293,619 0.10% Frigoglass Finance BV 6.875% 12/02/2025 EUR 595 659,379 0.21% Granite US Holdings Corp.(1) 11.00% 01/10/2027 609 639,662 0.21% Mueller Water Products, Inc.(1) 5.50% 15/06/2026 700 735,243 0.24% RBS Global, Inc./Rexnord LLC(1) 4.875% 15/12/2025 1,033 1,058,660 0.34% SPX FLOW, Inc.(1) 5.875% 15/08/2026 850 901,295 0.29% Stevens Holding Co., Inc.(1) 6.125% 01/10/2026 413 453,411 0.15% Titan Acquisition Ltd./Titan Co.-Borrower LLC(1) 7.75% 15/04/2026 598 583,754 0.19% 5,325,023 1.73%
213

LORD ABBETT PASSPORT PORTFOLIOS PLC HIGH YIELD CORE FUND Schedule of Investments as at 31 January 2020 (Continued)
Interest Maturity Principal Fair
Value % of Net Investments Rate Date (000) USD Assets Corporate Bonds - 97.19% (Continued) Media Altice Financing SA(1) 7.50% 15/05/2026 596 638,048 0.21% Altice Luxembourg SA(1) 10.50% 15/05/2027 441 510,744 0.17% AMC Networks, Inc. 4.75% 01/08/2025 2,025 2,048,622 0.67% Belo Corp. 7.25% 15/09/2027 510 593,052 0.19% CCO Holdings LLC/CCO Holdings Capital Corp.(1) 5.125% 01/05/2027 3,478 3,640,944 1.18% CCO Holdings LLC/CCO Holdings Capital Corp.(1) 5.75% 15/02/2026 2,000 2,102,380 0.68% CCO Holdings LLC/CCO Holdings Capital Corp.(1) 5.875% 01/05/2027 92 97,141 0.03% Clear Channel Worldwide Holdings, Inc.(1) 5.125% 15/08/2027 395 407,581 0.13% Clear Channel Worldwide Holdings, Inc.(1) 9.25% 15/02/2024 340 370,884 0.12% CSC Holdings LLC(1) 5.50% 15/04/2027 1,975 2,099,623 0.68% CSC Holdings LLC(1) 5.75% 15/01/2030 603 648,991 0.21% CSC Holdings LLC(1) 6.50% 01/02/2029 575 643,641 0.21% Diamond Sports Group LLC/Diamond Sports Finance Co.(1) 5.375% 15/08/2026 855 853,269 0.28% Diamond Sports Group LLC/Diamond Sports Finance Co.(1) 6.625% 15/08/2027 621 581,784 0.19% DISH DBS Corp. 7.75% 01/07/2026 3,584 3,769,830 1.22% EW Scripps Co.(1) 5.125% 15/05/2025 1,220 1,254,056 0.41% GCI LLC 6.875% 15/04/2025 555 580,899 0.19% Gray Television, Inc.(1) 7.00% 15/05/2027 1,325 1,445,111 0.47% LCPR Senior Secured Financing DAC(1) 6.75% 15/10/2027 953 1,009,599 0.33% Nexstar Broadcasting, Inc.(1) 5.625% 15/07/2027 979 1,033,481 0.34% Radiate Holdco LLC/Radiate Finance, Inc.(1) 6.625% 15/02/2025 750 759,686 0.25% Sinclair Television Group, Inc.(1) 5.125% 15/02/2027 1,876 1,925,897 0.63% Sirius XM Radio, Inc.(1) 4.625% 15/07/2024 462 480,000 0.16% Sirius XM Radio, Inc.(1) 5.00% 01/08/2027 1,302 1,369,509 0.44% Univision Communications, Inc.(1) 5.125% 15/02/2025 920 920,000 0.30% Virgin Media Secured Finance PLC 4.875% 15/01/2027 GBP 325 444,885 0.14% Virgin Media Secured Finance PLC(1) 5.50% 15/05/2029 727 766,512 0.25% 30,996,169 10.08% Metal Fabricate/Hardware Hillman Group, Inc.(1) 6.375% 15/07/2022 487 456,714 0.15% TriMas Corp.(1) 4.875% 15/10/2025 275 282,391 0.09% 739,105 0.24% Mining Barminco Finance Pty Ltd.(1) 6.625% 15/05/2022 415 425,894 0.14% Coeur Mining, Inc. 5.875% 01/06/2024 492 492,062 0.16% Compass Minerals International, Inc.(1) 4.875% 15/07/2024 985 981,715 0.32% Compass Minerals International, Inc.(1) 6.75% 01/12/2027 442 474,213 0.15% Freeport-McMoRan, Inc. 3.875% 15/03/2023 1,500 1,533,128 0.50% Freeport-McMoRan, Inc. 5.25% 01/09/2029 453 481,018 0.16% Hecla Mining Co. 6.875% 01/05/2021 392 392,098 0.13% Industrias Penoles SAB de CV(1) 5.65% 12/09/2049 466 513,329 0.17% Joseph T Ryerson & Son, Inc.(1) 11.00% 15/05/2022 250 263,123 0.08% New Gold, Inc.(1) 6.25% 15/11/2022 744 747,250 0.24% 6,303,830 2.05% Miscellaneous Manufacturer Amsted Industries, Inc.(1) 4.625% 15/05/2030 442 448,630 0.15%
214

LORD ABBETT PASSPORT PORTFOLIOS PLC HIGH YIELD CORE FUND Schedule of Investments as at 31 January 2020 (Continued)
Interest Maturity Principal Fair
Value % of Net Investments Rate Date (000) USD Assets Corporate Bonds - 97.19% (Continued) Miscellaneous Manufacturer (Continued) Amsted Industries, Inc.(1) 5.625% 01/07/2027 305 325,100 0.10% General Electric Co. 5.00%(2) -(3) 1,901 1,883,425 0.61% Koppers, Inc.(1) 6.00% 15/02/2025 472 484,740 0.16% 3,141,895 1.02% Office/Business Equiment CDW LLC/CDW Finance Corp. 5.50% 01/12/2024 1,250 1,397,919 0.45% Oil & Gas Berry Petroleum Co. LLC(1) 7.00% 15/02/2026 647 601,935 0.20% Callon Petroleum Co. 6.125% 01/10/2024 1,099 1,053,666 0.34% Callon Petroleum Co. 6.375% 01/07/2026 614 581,978 0.19% Carrizo Oil & Gas, Inc. 8.25% 15/07/2025 844 863,568 0.28% Centennial Resource Production LLC(1) 5.375% 15/01/2026 939 885,334 0.29% Centennial Resource Production LLC(1) 6.875% 01/04/2027 660 654,520 0.21% Chaparral Energy, Inc.(1) 8.75% 15/07/2023 722 258,656 0.08% Citgo Holding, Inc.(1) 9.25% 01/08/2024 586 628,485 0.20% Denbury Resources, Inc.(1) 7.75% 15/02/2024 383 308,474 0.10% Endeavor Energy Resources LP/EER Finance, Inc.(1) 5.50% 30/01/2026 858 882,515 0.29% Endeavor Energy Resources LP/EER Finance, Inc.(1) 5.75% 30/01/2028 333 346,936 0.11% Geopark Ltd.(1) 6.50% 21/09/2024 316 333,985 0.11% Hess Corp. 5.60% 15/02/2041 392 452,673 0.15% HighPoint Operating Corp. 7.00% 15/10/2022 580 552,271 0.18% Hilcorp Energy I LP/Hilcorp Finance Co.(1) 5.00% 01/12/2024 435 397,118 0.13% Hilcorp Energy I LP/Hilcorp Finance Co.(1) 6.25% 01/11/2028 652 582,137 0.19% Indigo Natural Resources LLC(1) 6.875% 15/02/2026 825 756,958 0.25% Jagged Peak Energy LLC 5.875% 01/05/2026 917 946,686 0.31% Jonah Energy LLC/Jonah Energy Finance Corp.(1) 7.25% 15/10/2025 506 140,415 0.05% Laredo Petroleum, Inc. 10.125% 15/01/2028 656 587,022 0.19% Magnolia Oil & Gas Operating LLC/Magnolia Oil & Gas Finance Corp.(1) 6.00% 01/08/2026 1,160 1,201,003 0.39% Matador Resources Co. 5.875% 15/09/2026 455 446,503 0.15% MEG Energy Corp.(1) 6.50% 15/01/2025 455 476,897 0.16% MEG Energy Corp.(1) 7.00% 31/03/2024 1,577 1,592,116 0.52% MEG Energy Corp.(1) 7.125% 01/02/2027 515 511,297 0.17% Montage Resources Corp. 8.875% 15/07/2023 353 296,958 0.10% Murphy Oil Corp. 5.875% 01/12/2027 665 682,456 0.22% Murphy Oil Corp. 6.875% 15/08/2024 275 287,261 0.09% Nabors Industries Ltd.(1) 7.25% 15/01/2026 160 160,600 0.05% Nabors Industries Ltd.(1) 7.50% 15/01/2028 164 162,770 0.05% Oasis Petroleum, Inc.(1) 6.25% 01/05/2026 1,025 784,151 0.25% Oasis Petroleum, Inc. 6.875% 15/03/2022 326 313,775 0.10% Pacific Drilling SA(1) 8.375% 01/10/2023 347 292,344 0.10% Parsley Energy LLC/Parsley Finance Corp.(1) 5.625% 15/10/2027 564 598,601 0.19% PBF Holding Co. LLC/PBF Finance Corp.(1) 6.00% 15/02/2028 546 559,705 0.18% PDC Energy, Inc. 6.125% 15/09/2024 1,050 1,055,686 0.34% QEP Resources, Inc. 5.25% 01/05/2023 548 527,450 0.17% QEP Resources, Inc. 5.625% 01/03/2026 323 288,891 0.09% Range Resources Corp. 5.00% 15/08/2022 329 311,793 0.10% SM Energy Co. 6.625% 15/01/2027 778 705,897 0.23% SM Energy Co. 6.75% 15/09/2026 557 507,373 0.16% SRC Energy, Inc. 6.25% 01/12/2025 758 765,572 0.25%
215

LORD ABBETT PASSPORT PORTFOLIOS PLC HIGH YIELD CORE FUND Schedule of Investments as at 31 January 2020 (Continued)
Interest Maturity Principal Fair
Value % of Net Investments Rate Date (000) USD Assets Corporate Bonds - 97.19% (Continued) Oil & Gas (Continued) Tapstone Energy LLC/Tapstone Energy Finance Corp.(1) (4) 9.75% 01/06/2022 750 6,375 0.00% Transocean Pontus Ltd.(1) 6.125% 01/08/2025 890 918,916 0.30% Transocean Poseidon Ltd.(1) 6.875% 01/02/2027 1,250 1,309,153 0.43% Transocean, Inc. 6.80% 15/03/2038 397 255,112 0.08% Tullow Oil PLC(1) 7.00% 01/03/2025 352 285,564 0.09% Valaris PLC 4.50% 01/10/2024 400 217,000 0.07% Valaris PLC 8.00% 31/01/2024 95 57,633 0.02% Viper Energy Partners LP(1) 5.375% 01/11/2027 594 620,344 0.20% W&T Offshore, Inc.(1) 9.75% 01/11/2023 476 451,862 0.15% WPX Energy, Inc. 5.25% 15/10/2027 338 353,835 0.12% 28,820,225 9.37% Oil & Gas Services Apergy Corp. 6.375% 01/05/2026 1,001 1,063,910 0.34% Archrock Partners LP/Archrock Partners Finance Corp.(1) 6.25% 01/04/2028 458 472,312 0.15% Archrock Partners LP/Archrock Partners Finance Corp.(1) 6.875% 01/04/2027 375 400,885 0.13% CSI Compressco LP/CSI Compressco Finance, Inc.(1) 7.50% 01/04/2025 575 572,605 0.19% Exterran Energy Solutions LP/EES Finance Corp. 8.125% 01/05/2025 360 357,601 0.12% Nine Energy Service, Inc.(1) 8.75% 01/11/2023 542 461,107 0.15% Oceaneering International, Inc. 4.65% 15/11/2024 625 604,688 0.20% Oceaneering International, Inc. 6.00% 01/02/2028 623 598,296 0.19% 4,531,404 1.47% Packaging & Containers Ball Corp. 4.875% 15/03/2026 825 904,901 0.29% Flex Acquisition Co., Inc.(1) 7.875% 15/07/2026 327 333,598 0.11% Intertape Polymer Group, Inc.(1) 7.00% 15/10/2026 1,350 1,431,469 0.47% Mauser Packaging Solutions Holding Co.(1) 7.25% 15/04/2025 903 900,734 0.29% Pactiv LLC 7.95% 15/12/2025 425 496,364 0.16% Sealed Air Corp.(1) 6.875% 15/07/2033 254 301,713 0.10% Trident TPI Holdings, Inc.(1) 6.625% 01/11/2025 96 87,400 0.03% Trident TPI Holdings, Inc.(1) 9.25% 01/08/2024 243 247,353 0.08% Trivium Packaging Finance BV 3.75% 15/08/2026 EUR 154 179,126 0.06% Trivium Packaging Finance BV(1) 5.50% 15/08/2026 200 211,125 0.07% Trivium Packaging Finance BV(1) 8.50% 15/08/2027 400 440,740 0.14% 5,534,523 1.80% Pharmaceuticals Bausch Health Americas, Inc.(1) 8.50% 31/01/2027 1,325 1,501,358 0.49% Bausch Health Cos, Inc.(1) 5.00% 30/01/2028 225 228,375 0.07% Bausch Health Cos, Inc.(1) 5.25% 30/01/2030 728 743,470 0.24% Bausch Health Cos, Inc.(1) 6.125% 15/04/2025 309 318,488 0.10% Horizon Therapeutics USA, Inc.(1) 5.50% 01/08/2027 536 572,528 0.19% NVA Holdings, Inc.(1) 6.875% 01/04/2026 285 307,800 0.10% 3,672,019 1.19% Pipelines Buckeye Partners LP 3.95% 01/12/2026 807 801,425 0.26% Buckeye Partners LP 4.125% 01/12/2027 367 362,530 0.12% Buckeye Partners LP 6.375%(2) 22/01/2078 602 497,592 0.16%
216

LORD ABBETT PASSPORT PORTFOLIOS PLC HIGH YIELD CORE FUND Schedule of Investments as at 31 January 2020 (Continued)
Interest Maturity Principal Fair
Value % of Net Investments Rate Date (000) USD Assets Corporate Bonds - 97.19% (Continued) Pipelines (Continued) Cheniere Energy Partners LP(1) 4.50% 01/10/2029 787 802,228 0.26% Cheniere Energy Partners LP 5.625% 01/10/2026 1,220 1,280,239 0.42% Holly Energy Partners LP/Holly Energy Finance Corp.(1) 5.00% 01/02/2028 310 315,523 0.10% NGPL PipeCo LLC(1) 4.875% 15/08/2027 558 603,763 0.20% Targa Resources Partners LP/Targa Resources Partners Finance Corp. 5.375% 01/02/2027 698 725,466 0.23% Targa Resources Partners LP/Targa Resources Partners Finance Corp. 6.50% 15/07/2027 1,325 1,447,563 0.47% Transportadora de Gas del Sur SA(1) 6.75% 02/05/2025 522 484,327 0.16% 7,320,656 2.38% Real Estate Kaisa Group Holdings Ltd. 9.375% 30/06/2024 522 492,423 0.16% WeWork Cos, Inc.(1) 7.875% 01/05/2025 999 776,712 0.25% 1,269,135 0.41% REITS CoreCivic, Inc. 4.75% 15/10/2027 355 327,496 0.11% GEO Group, Inc. 6.00% 15/04/2026 1,020 910,376 0.30% HAT Holdings I LLC/HAT Holdings II LLC(1) 5.25% 15/07/2024 982 1,033,147 0.33% Ladder Capital Finance Holdings LLLP/Ladder Capital Finance Corp.(1) 5.25% 01/10/2025 1,469 1,513,680 0.49% MPT Operating Partnership LP/MPT Finance Corp. 5.00% 15/10/2027 994 1,047,403 0.34% 4,832,102 1.57% Retail Asbury Automotive Group, Inc. 6.00% 15/12/2024 285 294,144 0.09% Carvana Co.(1) 8.875% 01/10/2023 285 300,017 0.10% eG Global Finance PLC(1) 8.50% 30/10/2025 448 476,934 0.15% Future Retail Ltd.(1) 5.60% 22/01/2025 726 732,495 0.24% IRB Holding Corp.(1) 6.75% 15/02/2026 1,175 1,226,462 0.40% KFC Holding Co./Pizza Hut Holdings LLC/Taco Bell of America LLC(1) 4.75% 01/06/2027 1,565 1,652,299 0.54% KGA Escrow LLC(1) 7.50% 15/08/2023 580 613,591 0.20% Lithia Motors, Inc.(1) 4.625% 15/12/2027 300 307,500 0.10% Murphy Oil USA, Inc. 4.75% 15/09/2029 584 611,360 0.20% Murphy Oil USA, Inc. 5.625% 01/05/2027 1,350 1,455,094 0.47% PetSmart, Inc.(1) 5.875% 01/06/2025 597 616,402 0.20% PetSmart, Inc.(1) 7.125% 15/03/2023 457 456,429 0.15% Rite Aid Corp.(1) 6.125% 01/04/2023 331 302,865 0.10% Sally Holdings LLC/Sally Capital, Inc. 5.625% 01/12/2025 566 586,990 0.19% Sonic Automotive, Inc. 6.125% 15/03/2027 314 333,516 0.11% SRS Distribution, Inc.(1) 8.25% 01/07/2026 304 317,026 0.10% 10,283,124 3.34% Semiconductors Micron Technology, Inc. 5.327% 06/02/2029 850 997,564 0.32% Qorvo, Inc.(1) 4.375% 15/10/2029 402 420,844 0.14% 1,418,408 0.46% Software Castle US Holding Corp. 9.50% 15/02/2028 355 355,000 0.12%
217

LORD ABBETT PASSPORT PORTFOLIOS PLC HIGH YIELD CORE FUND Schedule of Investments as at 31 January 2020 (Continued)
Interest Maturity Principal Fair
Value % of Net Investments Rate Date (000) USD Assets Corporate Bonds - 97.19% (Continued) Software (Continued) Fair Isaac Corp.(1) 4.00% 15/06/2028 442 450,840 0.14% Fair Isaac Corp.(1) 5.25% 15/05/2026 550 607,941 0.20% j2 Cloud Services LLC/j2 Cloud Co.-Obligor, Inc.(1) 6.00% 15/07/2025 550 581,397 0.19% PTC, Inc.(1) 3.625% 15/02/2025 124 125,240 0.04% PTC, Inc.(1) 4.00% 15/02/2028 195 197,438 0.06% Rackspace Hosting, Inc.(1) 8.625% 15/11/2024 461 457,542 0.15% 2,775,398 0.90% Storage/Warehousing LBC Tank Terminals Holding Netherlands BV(1) 6.875% 15/05/2023 1,106 1,128,579 0.37% Telecommunications Altice France SA/France 3.375% 15/01/2028 EUR 211 237,976 0.08% Altice France SA/France(1) 7.375% 01/05/2026 2,676 2,851,679 0.93% Altice France SA/France(1) 8.125% 01/02/2027 266 297,747 0.10% Connect Finco S.A.R.L./Connect US Finco LLC(1) 6.75% 01/10/2026 786 833,160 0.27% Consolidated Communications, Inc. 6.50% 01/10/2022 344 329,165 0.11% DKT Finance ApS(1) 9.375% 17/06/2023 1,300 1,391,585 0.45% Hughes Satellite Systems Corp. 5.25% 01/08/2026 289 314,359 0.10% Intelsat Jackson Holdings SA 5.50% 01/08/2023 1,542 1,263,800 0.41% Intelsat Jackson Holdings SA(1) 8.50% 15/10/2024 492 416,766 0.14% Level 3 Financing, Inc. 5.25% 15/03/2026 500 520,975 0.17% Millicom International Cellular SA(1) 6.625% 15/10/2026 395 435,724 0.14% Sprint Capital Corp. 6.875% 15/11/2028 4,691 4,781,771 1.55% Telefonica Celular del Paraguay SA(1) 5.875% 15/04/2027 400 428,453 0.14% T-Mobile USA, Inc. 6.50% 15/01/2026 1,175 1,255,253 0.41% ViaSat, Inc.(1) 5.625% 15/04/2027 1,124 1,179,357 0.38% Ypso Finance Bis SA 6.00% 15/02/2028 316 313,845 0.10% 16,851,615 5.48% Toys/Games/Hobbies Mattel, Inc. 5.45% 01/11/2041 1,300 1,158,216 0.38% Mattel, Inc.(1) 5.875% 15/12/2027 299 314,847 0.10% 1,473,063 0.48% Transportation CMA CGM SA 5.25% 15/01/2025 EUR 479 418,691 0.14% Teekay Corp.(1) 9.25% 15/11/2022 301 313,886 0.10% XPO CNW, Inc. 6.70% 01/05/2034 441 472,188 0.15% 1,204,765 0.39% Total Corporate Bonds 299,000,799 97.19% Government Obligation - 0.13% Non-U.S. Government Obligation Republic of Ecuador(1) 10.75% 31/01/2029 463 420,917 0.13% Total Government Obligation 420,917 0.13% Total Investment in Securities (Cost: USD 288,919,958) 299,421,716 97.32%
218
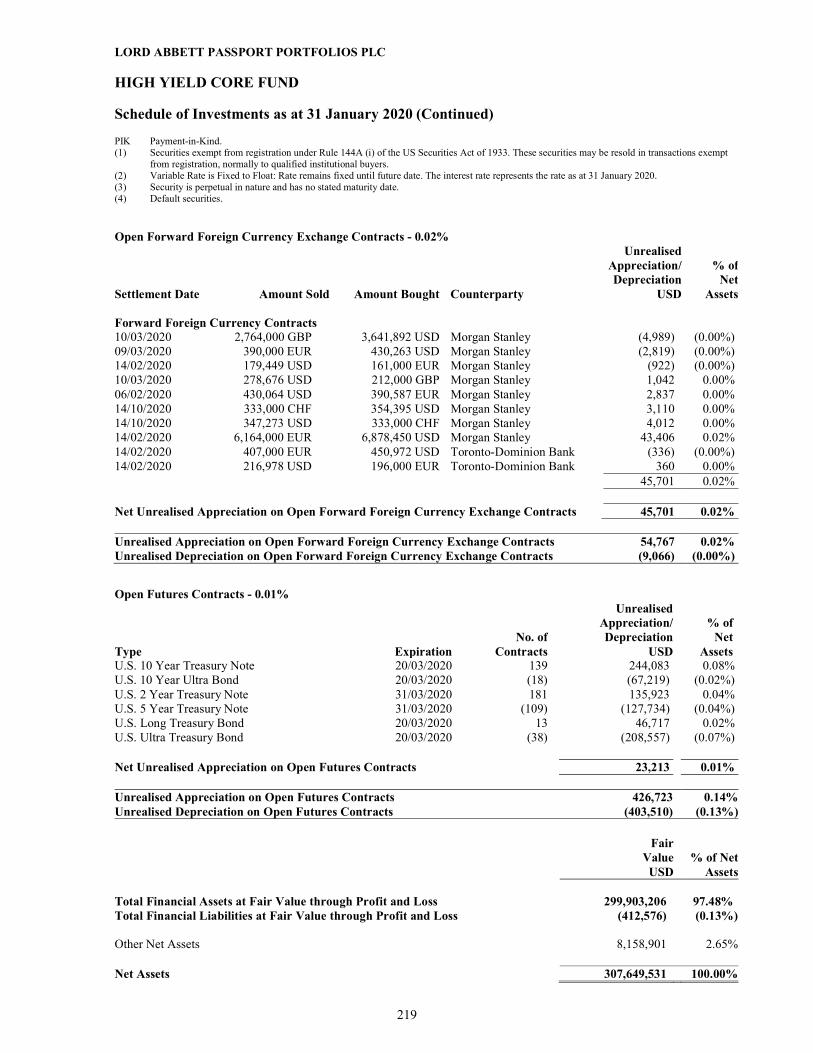
LORD ABBETT PASSPORT PORTFOLIOS PLC HIGH YIELD CORE FUND Schedule of Investments as at 31 January 2020 (Continued)
PIK Payment-in-Kind. (1) Securities exempt from registration under Rule 144A (i) of the US Securities Act of 1933. These securities may be resold in transactions exempt
from registration, normally to qualified institutional buyers. (2) Variable Rate is Fixed to Float: Rate remains fixed until future date. The interest rate represents the rate as at 31 January 2020. (3) Security is perpetual in nature and has no stated maturity date. (4) Default securities.
Open Forward Foreign Currency Exchange Contracts - 0.02% Unrealised Appreciation/ % of Depreciation Net Settlement Date Amount Sold Amount Bought Counterparty USD Assets Forward Foreign Currency Contracts 10/03/2020 2,764,000 GBP 3,641,892 USD Morgan Stanley (4,989) (0.00%) 09/03/2020 390,000 EUR 430,263 USD Morgan Stanley (2,819) (0.00%) 14/02/2020 179,449 USD 161,000 EUR Morgan Stanley (922) (0.00%) 10/03/2020 278,676 USD 212,000 GBP Morgan Stanley 1,042 0.00% 06/02/2020 430,064 USD 390,587 EUR Morgan Stanley 2,837 0.00% 14/10/2020 333,000 CHF 354,395 USD Morgan Stanley 3,110 0.00% 14/10/2020 347,273 USD 333,000 CHF Morgan Stanley 4,012 0.00% 14/02/2020 6,164,000 EUR 6,878,450 USD Morgan Stanley 43,406 0.02% 14/02/2020 407,000 EUR 450,972 USD Toronto-Dominion Bank (336) (0.00%) 14/02/2020 216,978 USD 196,000 EUR Toronto-Dominion Bank 360 0.00% 45,701 0.02% Net Unrealised Appreciation on Open Forward Foreign Currency Exchange Contracts 45,701 0.02% Unrealised Appreciation on Open Forward Foreign Currency Exchange Contracts 54,767 0.02% Unrealised Depreciation on Open Forward Foreign Currency Exchange Contracts (9,066) (0.00%)
Open Futures Contracts - 0.01% Unrealised Appreciation/ % of No. of Depreciation Net Type Expiration Contracts USD Assets U.S. 10 Year Treasury Note 20/03/2020 139 244,083 0.08% U.S. 10 Year Ultra Bond 20/03/2020 (18) (67,219) (0.02%) U.S. 2 Year Treasury Note 31/03/2020 181 135,923 0.04% U.S. 5 Year Treasury Note 31/03/2020 (109) (127,734) (0.04%) U.S. Long Treasury Bond 20/03/2020 13 46,717 0.02% U.S. Ultra Treasury Bond 20/03/2020 (38) (208,557) (0.07%) Net Unrealised Appreciation on Open Futures Contracts 23,213 0.01% Unrealised Appreciation on Open Futures Contracts 426,723 0.14%Unrealised Depreciation on Open Futures Contracts (403,510) (0.13%)
Fair Value % of Net USD Assets Total Financial Assets at Fair Value through Profit and Loss 299,903,206 97.48% Total Financial Liabilities at Fair Value through Profit and Loss (412,576) (0.13%) Other Net Assets 8,158,901 2.65% Net Assets 307,649,531 100.00%
219

LORD ABBETT PASSPORT PORTFOLIOS PLC HIGH YIELD CORE FUND Schedule of Investments as at 31 January 2020 (Continued)
Analysis of Total Assets
% of Total
Assets Transferable securities admitted to an official stock exchange listing 27.60%Transferable securities traded on a regulated market 67.95%Other transferable securities including those which are unlisted 0.10%Financial derivatives dealt in on a regulated market 0.01%OTC financial derivative instruments 0.01%
220

LORD ABBETT PASSPORT PORTFOLIOS PLC
STATEMENTS OF FINANCIAL POSITION
Short Duration
Income FundHigh Yield
Fund
Global Multi-Sector Bond
FundTotal Return
Fund
Notes 31 January 2020
USD31 January 2020
USD31 January 2020
USD31 January 2020
USDAssets
Financial Assets at Fair Value through Profit or Loss 1b, 3 3,956,406,574 1,933,026,907 87,911,963 38,085,375Cash at Bank 2 40,759,785 97,671,683 1,905,811 491,055Deposits with Broker for Derivatives Collateral 1,348,072 397,631 406,351 6,947Receivable for Investments Sold 25,540,578 34,700,793 1,642,989 4,762,109Receivable for Shares Created 39,152,676 19,507,870 1,063,337 50,582Interest Income Receivable 20,057,518 27,165,728 792,770 183,924Dividend Income Receivable – 71,423 – –Expense Reimbursement Receivable 5 21,760 629 61,766 33,343
Total Assets 4,083,286,963 2,112,542,664 93,784,987 43,613,335 Current Liabilities
Financial Liabilities at Fair Value through Profit or Loss 1b, 3 (3,518,481) (1,709,224) (168,642) (40,026)Interest Payable on Swaps 1b – – – –Payable for Investments Purchased (58,901,670) (75,462,100) (9,071,662) (12,054,003)Payable for Shares Redeemed (15,495,543) (2,756,035) (102,749) (66,308)Management Fee Payable 5 (2,607,285) (1,242,360) (112,094) (48,538)Administration Fee Payable 6 (538,344) (252,175) (58,568) (30,208)Depositary and Trustee Fees Payable 7 (197,160) (92,752) (7,302) (5,634)Audit Fee Payable (16,549) (16,451) (16,930) (16,929)Legal and Professional Fees Payable (143,446) (96,477) (42,835) (30,381)Distributions Payable (709,891) (999,687) (18,084) (738)Other Payables (69,330) (28,424) (28,291) (15,733)
Total Liabilities (82,197,699) (82,655,685) (9,627,157) (12,308,498) Net Assets Attributable to Redeemable Participating Shareholders 4,001,089,264 2,029,886,979 84,157,830 31,304,837
The accompanying notes form an integral part of these financial statements.
221

LORD ABBETT PASSPORT PORTFOLIOS PLC
STATEMENTS OF FINANCIAL POSITION (Continued)
Emerging Markets
Corporate Debt Fund
Multi-Sector Income Fund
U.S. Growth Leaders Fund
Global High Yield Fund
Notes 31 January 2020
USD31 January 2020
USD31 January 2020
USD31 January 2020
USDAssets
Financial Assets at Fair Value through Profit or Loss 1b, 3 20,276,917 664,365,000 38,281,694 48,002,990Cash at Bank 2 942,329 38,489,380 1,176,603 418,868Deposits with Broker for Derivatives Collateral 80,112 2,452,196 – 56,225Receivable for Investments Sold 623,313 15,093,648 602,954 1,561,272Receivable for Shares Created – 8,354,544 282,754 5,810,239Interest Income Receivable 231,872 6,639,951 – 655,905Dividend Income Receivable – 18 2,163 –Expense Reimbursement Receivable 5 30,820 83,540 23,196 49,331
Total Assets 22,185,363 735,478,277 40,369,364 56,554,830 Current Liabilities
Financial Liabilities at Fair Value through Profit or Loss 1b, 3 (69,891) (1,550,184) – (69,133)Interest Payable on Swaps 1b – – – (4,641)Payable for Investments Purchased (1,019,556) (22,947,701) (878,147) (4,775,131)Payable for Shares Redeemed – (900,228) (2,646) –Management Fee Payable 5 (39,415) (730,075) (64,096) (32,019)Administration Fee Payable 6 (30,996) (189,808) (22,828) (51,878)Depositary and Trustee Fees Payable 7 (4,694) (29,778) (5,272) (5,592)Audit Fee Payable (16,930) (16,930) (8,578) (16,550)Legal and Professional Fees Payable (39,644) (59,296) (9,157) (8,106)Distributions Payable (4,000) (224,848) – (7,884)Other Payables (8,524) (42,584) (19,976) (10,642)
Total Liabilities (1,233,650) (26,691,432) (1,010,700) (4,981,576) Net Assets Attributable to Redeemable Participating Shareholders 20,951,713 708,786,845 39,358,664 51,573,254
The accompanying notes form an integral part of these financial statements.
222


LORD ABBETT PASSPORT PORTFOLIOS PLC
STATEMENTS OF FINANCIAL POSITION (Continued)
Short Duration
Income FundHigh Yield
Fund
Global Multi-Sector Bond
FundTotal Return
Fund
Notes 31 January 2019
USD31 January 2019
USD31 January 2019
USD31 January 2019
USDAssets
Financial Assets at Fair Value through Profit or Loss 1b, 3 2,067,196,801 1,008,907,640 56,812,898 27,471,964Cash at Bank 2 31,300,959 7,211,344 299,129 755,461Deposits with Broker for Derivatives Collateral 64,347 919,720 151,462 –Receivable for Investments Sold 2,833,841 13,246,006 837,825 2,503,642Receivable for Shares Created 22,393,149 7,833,135 59,800 –Interest Income Receivable 14,513,678 15,392,800 623,895 111,582Dividend Income Receivable – 30,888 – –Expense Reimbursement Receivable 5 31,684 11,937 11,937 15,692
Total Assets 2,138,334,459 1,053,553,470 58,796,946 30,858,341 Current Liabilities
Financial Liabilities at Fair Value through Profit or Loss 1b, 3 (1,612,277) (2,035,146) (396,015) (14,969)Interest Payable on Swaps 1b – – – –Payable for Investments Purchased (17,621,630) (20,555,752) (6,294,023) (9,949,410)Payable for Shares Redeemed (12,608,377) (1,967,785) (207,237) –Payable to Broker due to Derivatives Collateral – – – (32,605)Management Fee Payable 5 (1,361,846) (783,658) (58,391) (21,022)Administration Fee Payable 6 (817,443) (482,542) (97,235) (65,389)Depositary and Trustee Fees Payable 7 (233,094) (131,123) (13,802) (10,103)Audit Fee Payable (10,911) (10,911) (10,911) (10,911)Legal and Professional Fees Payable (121,479) (91,368) (54,800) (42,875)Distributions Payable (601,653) (592,214) (21,890) (1,106)Other Payables (57,011) (41,715) (32,585) (25,427)
Total Liabilities (35,045,721) (26,692,214) (7,186,889) (10,173,817) Net Assets Attributable to Redeemable Participating Shareholders 2,103,288,738 1,026,861,256 51,610,057 20,684,524
Organisational Expenses Adjustment 13 865 865 856 9,827Net Assets Attributable to Redeemable Participating Shareholders 2,103,289,603 1,026,862,121 51,610,913 20,694,351
The accompanying notes form an integral part of these financial statements.
224

LORD ABBETT PASSPORT PORTFOLIOS PLC
STATEMENTS OF FINANCIAL POSITION (Continued)
Emerging Markets
Corporate Debt Fund
Multi-Sector Income Fund
U.S. Growth Leaders Fund
Global High Yield Fund
Notes 31 January 2019
USD31 January 2019
USD31 January 2019
USD31 January 2019
USDAssets
Financial Assets at Fair Value through Profit or Loss 1b, 3 14,097,077 310,390,835 24,934,425 11,547,378Cash at Bank 2 265,800 5,872,714 878,568 469,423Deposits with Broker for Derivatives Collateral 31,611 2,054,465 – 20,640Receivable for Investments Sold 204,700 3,939,627 1,590,002 418,529Receivable for Shares Created – 406,670 – –Interest Income Receivable 175,595 3,289,761 – 166,251Dividend Income Receivable – 10,006 4,847 –Expense Reimbursement Receivable 5 13,874 34,107 11,979 16,190
Total Assets 14,788,657 325,998,185 27,419,821 12,638,411 Current Liabilities
Financial Liabilities at Fair Value through Profit or Loss 1b, 3 (46,531) (2,096,371) – (50,518)Interest Payable on Swaps 1b – (14,536) – –Payable for Investments Purchased (201,281) (27,548,813) (1,788,843) (533,673)Payable for Shares Redeemed – (1,062,821) – –Payable to Broker due to Derivatives Collateral – – – –Management Fee Payable 5 (16,015) (308,523) (36,440) (14,331)Administration Fee Payable 6 (55,706) (215,945) (40,677) (69,141)Depositary and Trustee Fees Payable 7 (8,942) (38,571) (10,456) (7,056)Audit Fee Payable (10,911) (10,911) (6,942) (10,911)Legal and Professional Fees Payable (51,986) (58,283) (12,279) (1,704)Distributions Payable (3,599) (182,277) – (470)Other Payables (13,194) (43,377) (27,286) (19,292)
Total Liabilities (408,165) (31,580,428) (1,922,923) (707,096) Net Assets Attributable to Redeemable Participating Shareholders 14,380,492 294,417,757 25,496,898 11,931,315
Organisational Expenses Adjustment 13 13,009 13,009 – –Net Assets Attributable to Redeemable Participating Shareholders 14,393,501 294,430,766 25,496,898 11,931,315
The accompanying notes form an integral part of these financial statements.
225

LORD ABBETT PASSPORT PORTFOLIOS PLC
STATEMENTS OF FINANCIAL POSITION (Continued)
Global Equity
Research FundUltra Short Bond Fund Total
Notes 31 January 2019
USD31 January 2019
USD31 January 2019
USDAssets
Financial Assets at Fair Value through Profit or Loss 1b, 3 4,238,315 977,653,780 4,503,251,113Cash at Bank 2 56,146 2,763,281 49,872,825Deposits with Broker for Derivatives Collateral – – 3,242,245Receivable for Investments Sold 55,406 – 25,629,578Receivable for Shares Created – 5,391,409 36,084,163Interest Income Receivable 344 1,904,153 36,178,059Dividend Income Receivable 6,439 – 52,180Expense Reimbursement Receivable 5 7,511 45,834 200,745
Total Assets 4,364,161 987,758,457 4,654,510,908 Current Liabilities
Financial Liabilities at Fair Value through Profit or Loss 1b, 3 – – (6,251,827)Interest Payable on Swaps 1b – – (14,536)Payable for Investments Purchased (58,243) (14,104,081) (98,655,749)Payable for Shares Redeemed – (1,110,761) (16,956,981)Payable to Broker due to Derivatives Collateral – – (32,605)Management Fee Payable 5 (5,658) (348,270) (2,954,154)Administration Fee Payable 6 (33,333) (220,518) (2,097,929)Depositary and Trustee Fees Payable 7 (6,572) (80,314) (540,033)Audit Fee Payable (6,183) (10,515) (100,017)Legal and Professional Fees Payable (1,657) (6,164) (442,595)Distributions Payable – (147,017) (1,550,226)Other Payables (19,688) (45,941) (325,516)
Total Liabilities (131,334) (16,073,581) (129,922,168) Net Assets Attributable to Redeemable Participating Shareholders 4,232,827 971,684,876 4,524,588,740
Organisational Expenses Adjustment 13 – – 38,431Net Assets Attributable to Redeemable Participating Shareholders 4,232,827 971,684,876 4,524,627,171
The accompanying notes form an integral part of these financial statements.
226

LORD ABBETT PASSPORT PORTFOLIOS PLC
STATEMENTS OF FINANCIAL POSITION (Continued) NET ASSET VALUE OF REDEEMABLE PARTICIPATING SHARES
Short Duration Income Fund 31 January 2020 31 January 2019 31 January 2018
Net Assets
Net Asset Value Per
Share Net Assets
Net Asset Value Per
Share Net Assets
Net Asset Value Per
Share Class A USD Accumulating USD1,116,099,700 USD11.15 USD473,664,815 USD10.66 USD407,122,270 USD10.47 Class A USD Distributing USD330,534,647 USD9.79 USD245,468,940 USD9.59 USD248,838,587 USD9.68 Class A CHF Accumulating (Hedged) USD28,228 CHF9.74 USD27,146 CHF9.63 USD50,852 CHF9.77 Class A CHF Distributing (Hedged) USD28,249 CHF8.94 USD27,153 CHF8.96 USD50,856 CHF9.27 Class A EUR Accumulating (Hedged) USD4,113,462 EUR10.16 USD3,133,890 EUR10.00 USD25,189 EUR10.11 Class A EUR Distributing (Hedged) USD1,899,696 EUR9.44 USD2,940,831 EUR9.52 USD25,191 EUR9.86 Class A GBP Distributing (Hedged) USD27,908 GBP9.98 USD27,095 GBP9.85 USD29,270 GBP10.01 Class C USD Accumulating USD442,737 USD10.68 USD452,407 USD10.29 USD557,284 USD10.18 Class C USD Distributing USD809,634 USD9.78 USD896,153 USD9.59 USD886,820 USD9.67 Class I USD Accumulating USD1,404,128,401 USD11.56 USD704,058,808 USD10.99 USD609,233,270 USD10.74 Class I USD Distributing USD82,479,246 USD10.21 USD14,686,735 USD10.00 USD2,054,401 USD9.93 Class I CHF Accumulating (Hedged) USD50,279 CHF10.03 USD48,065 CHF9.86 USD51,787 CHF9.95 Class I CHF Distributing (Hedged) USD50,283 CHF8.87 USD48,062 CHF8.93 USD51,792 CHF9.28 Class I EUR Accumulating USD302,113 EUR11.43 USD12,048 EUR10.50 USD11,769 EUR9.45 Class I EUR Accumulating (Hedged) USD122,628,780 EUR10.43 USD83,100,158 EUR10.21 USD69,189,144 EUR10.27 Class I EUR Distributing (Hedged)1 USD22,563 EUR9.82 USD22,879 EUR9.79 – – Class I GBP Accumulating (Hedged) USD36,942,292 GBP10.99 USD15,720,497 GBP10.63 USD4,767,208 GBP10.56 Class I GBP Distributing (Hedged) USD3,788,831 GBP9.91 USD27,594 GBP9.85 USD29,654 GBP10.03 Class J USD Accumulating2 USD83,190,622 USD10.76 USD10,659,156 USD10.22 – – Class J USD Distributing2 USD1,070,138 USD10.23 USD3,518,636 USD10.01 – – Class J EUR Accumulating (Hedged)2 USD2,678,916 EUR10.24 USD51,751,576 EUR10.02 – – Class J EUR Distributing (Hedged)2 USD24,294 EUR9.73 USD2,595,542 EUR9.81 – – Class J GBP Distributing (Hedged)2 USD82,625 GBP9.94 USD2,703,680 GBP9.89 – – Class N USD Accumulating USD275,714,075 USD10.69 USD108,360,549 USD10.29 USD131,482,215 USD10.19 Class N USD Distributing USD47,935,811 USD9.79 USD36,759,060 USD9.59 USD62,903,440 USD9.68 Class Z USD Accumulating USD373,526,465 USD11.38 USD258,818,854 USD10.85 USD246,149,750 USD10.63 Class Z USD Distributing USD112,337,848 USD9.79 USD83,612,627 USD9.59 USD81,238,732 USD9.68 Class Z CHF Accumulating (Hedged) USD28,944 CHF9.89 USD27,746 CHF9.76 USD51,395 CHF9.88 Class Z CHF Distributing (Hedged) USD49,609 CHF8.86 USD47,581 CHF8.93 USD51,399 CHF9.27 Class Z EUR Accumulating (Hedged) USD15,792 EUR10.26 USD16,062 EUR10.08 USD42,590 EUR10.16 Class Z GBP Accumulating (Hedged) USD28,798 GBP10.84 USD27,876 GBP10.52 USD51,395 GBP10.48 Class Z GBP Distributing (Hedged) USD28,278 GBP9.99 USD27,382 GBP9.85 USD29,500 GBP10.02
1Share Class launched on 6 March 2018. 2Share Class launched on 1 June 2018.
The accompanying notes form an integral part of these financial statements.
227

LORD ABBETT PASSPORT PORTFOLIOS PLC
STATEMENTS OF FINANCIAL POSITION (Continued)
NET ASSET VALUE OF REDEEMABLE PARTICIPATING SHARES (Continued)
High Yield Fund 31 January 2020 31 January 2019 31 January 2018
Net Assets
Net Asset Value Per
Share Net Assets
Net Asset Value Per
Share Net Assets
Net Asset Value Per
Share Class A USD Accumulating USD199,495,419 USD13.53 USD214,955,080 USD12.31 USD192,456,615 USD12.44 Class A USD Distributing USD95,592,058 USD10.50 USD80,552,526 USD9.98 USD136,125,482 USD10.56 Class A EUR Accumulating (Hedged) USD1,048,626 EUR10.59 USD812,998 EUR9.93 USD993,991 EUR10.33 Class C USD Accumulating USD46,069 USD13.04 USD55,514 USD11.94 USD102,023 USD12.14 Class C USD Distributing USD520,317 USD10.49 USD487,179 USD9.97 USD511,544 USD10.55 Class I USD Accumulating USD1,279,939,377 USD14.18 USD478,957,444 USD12.81 USD446,017,048 USD12.84 Class I USD Distributing USD77,516,720 USD10.30 USD51,323,050 USD9.79 USD25,665,459 USD10.36 Class I CHF Accumulating (Hedged)3 USD20,389 CHF10.47 USD18,501 CHF9.78 – – Class I CHF Distributing (Hedged)3 USD20,325 CHF9.55 USD18,448 CHF9.35 – – Class I EUR Accumulating USD258,132 EUR11.96 USD29,923 EUR10.43 USD30,017 EUR9.64 Class I EUR Accumulating (Hedged) USD47,302,995 EUR12.80 USD40,987,607 EUR11.91 USD82,341,859 EUR12.31 Class I EUR Distributing (Hedged)4 USD18,761 EUR9.60 USD18,114 EUR9.39 – – Class I GBP Accumulating (Hedged)3 USD472,048 GBP10.79 USD432,954 GBP9.92 – – Class I GBP Distributing (Hedged)4 USD20,428 GBP9.85 USD18,724 GBP9.48 – – Class I JPY Accumulating6 USD36,521,346 JPY10,612.46 – – Class J USD Accumulating5 USD13,676,909 USD10.94 USD14,802 USD9.87 – – Class J EUR Accumulating5 USD113,886 EUR11.44 USD19,761 EUR9.96 – – Class J EUR Distributing (Hedged)8 USD17,223,031 EUR10.06 – – Class J GBP Distributing5 USD291,737 GBP10.10 USD19,753 GBP9.61 – – Class J GBP Distributing (Hedged)8 USD74,670,350 GBP10.14 – – Class N USD Accumulating USD34,590,089 USD13.08 USD32,777,657 USD11.96 USD54,103,599 USD12.15 Class N USD Distributing USD18,881,701 USD10.50 USD19,104,370 USD9.97 USD33,379,466 USD10.55 Class Z USD Accumulating USD98,023,076 USD13.88 USD79,774,239 USD12.56 USD72,678,560 USD12.63 Class Z USD Distributing USD33,335,898 USD10.50 USD26,353,291 USD9.98 USD24,799,703 USD10.55 Class Z CHF Accumulating (Hedged) USD26,120 CHF12.39 USD23,765 CHF11.60 USD26,366 CHF12.06 Class Z CHF Distributing (Hedged) USD26,123 CHF10.22 USD23,768 CHF10.02 USD26,368 CHF10.94 Class Z EUR Accumulating USD77,458 EUR17.20 USD26,930 EUR15.03 USD52,376 EUR13.92 Class Z EUR Accumulating (Hedged) USD157,591 EUR12.55 USD55,723 EUR11.70 USD74,726 EUR12.11
Global Multi-Sector Bond Fund 31 January 2020 31 January 2019 31 January 2018
Net Assets
Net Asset Value Per
Share Net Assets
Net Asset Value Per
Share Net Assets
Net Asset Value Per
Share Class A USD Accumulating USD31,180,527 USD12.20 USD15,451,391 USD11.19 USD17,957,499 USD11.30 Class A USD Distributing USD9,549,793 USD10.40 USD8,469,991 USD9.78 USD10,406,022 USD10.16 Class A EUR Accumulating (Hedged)9 USD39,265 EUR10.07 – – – – Class C USD Accumulating10 – – USD61,450 USD10.86 USD110,219 USD11.03 Class C USD Distributing USD695,877 USD10.40 USD1,051,874 USD9.78 USD1,195,035 USD10.16 Class I USD Accumulating7 USD16,145 USD10.76 – – – – Class I EUR Accumulating (Hedged)7 USD29,094 EUR10.50 – – – – Class I GBP Accumulating (Hedged)7 USD34,966 GBP10.61 – – – – Class N USD Accumulating USD15,815,039 USD11.77 USD9,629,780 USD10.87 USD12,439,660 USD11.03 Class N USD Distributing USD3,437,008 USD10.41 USD2,106,370 USD9.79 USD1,320,556 USD10.17 Class Z USD Accumulating USD19,901,517 USD12.50 USD12,403,270 USD11.42 USD17,629,201 USD11.48 Class Z USD Distributing USD3,458,599 USD10.40 USD2,436,787 USD9.79 USD4,422,878 USD10.17
3Share Class re-launched on 6 March 2018. 4Share Class launched on 6 March 2018. 5Share Class launched on 1 October 2018. 6Share Class launched on 6 March 2019. 7Share Class re-launched on 1 April 2019. 8Share Class launched on 7 May 2019. 9Share Class launched on 3 September 2019. 10Share Class liquidated on 3 September 2019.
The accompanying notes form an integral part of these financial statements.
228

LORD ABBETT PASSPORT PORTFOLIOS PLC
STATEMENTS OF FINANCIAL POSITION (Continued) NET ASSET VALUE OF REDEEMABLE PARTICIPATING SHARES (Continued)
Total Return Fund 31 January 2020 31 January 2019 31 January 2018
Net Assets
Net Asset Value Per
Share Net Assets
Net Asset Value Per
Share Net Assets
Net Asset Value Per
Share Class A USD Accumulating USD8,445,142 USD11.30 USD6,363,393 USD10.46 USD5,633,095 USD10.38 Class A USD Distributing USD764,317 USD10.33 USD602,963 USD9.74 USD665,107 USD9.88 Class C USD Distributing USD339,365 USD10.33 USD317,084 USD9.74 USD317,257 USD9.88 Class N USD Accumulating USD4,684,577 USD10.98 USD3,648,940 USD10.21 USD4,206,793 USD10.20 Class N USD Distributing USD932,820 USD10.32 USD952,542 USD9.73 USD604,050 USD9.88 Class Z USD Accumulating USD12,462,431 USD11.58 USD8,380,110 USD10.66 USD12,562,993 USD10.54 Class Z USD Distributing USD3,676,185 USD10.32 USD429,319 USD9.73 USD756,478 USD9.87
Emerging Markets Corporate Debt Fund 31 January 2020 31 January 2019 31 January 2018
Net Assets
Net Asset Value Per
Share Net Assets
Net Asset Value Per
Share Net Assets
Net Asset Value Per
Share Class A USD Accumulating USD13,898,766 USD12.94 USD8,747,612 USD11.72 USD8,621,689 USD11.85 Class A USD Distributing USD1,809,184 USD10.67 USD1,591,951 USD10.03 USD811,854 USD10.51 Class I USD Accumulating11 USD16,335 USD10.89 – – – – Class N USD Distributing USD1,013,989 USD10.67 USD404,624 USD10.03 USD416,753 USD10.52 Class Z USD Accumulating USD3,702,274 USD13.20 USD3,160,523 USD11.91 USD3,251,310 USD11.99 Class Z USD Distributing USD511,165 USD10.67 USD488,791 USD10.03 USD353,176 USD10.52
Multi-Sector Income Fund 31 January 2020 31 January 2019 31 January 2018
Net Assets
Net Asset Value Per
Share Net Assets
Net Asset Value Per
Share Net Assets
Net Asset Value Per
Share Class A USD Accumulating USD278,478,941 USD13.22 USD66,855,406 USD11.98 USD73,756,307 USD12.12 Class A USD Distributing USD84,538,977 USD11.21 USD57,781,956 USD10.44 USD63,570,840 USD10.92 Class A EUR Accumulating (Hedged)13 USD119,245 EUR10.19 – – – – Class C USD Distributing14 – – USD53,035 USD10.42 USD53,971 USD10.90 Class I USD Accumulating USD40,345,768 USD13.76 USD7,633,232 USD12.37 USD193,877 USD12.42 Class I EUR Accumulating (Hedged) USD2,895,566 EUR12.43 USD577,665 EUR11.51 USD998,399 EUR11.92 Class I EUR Distributing (Hedged)12 USD5,633,312 EUR10.14 – – – – Class I GBP Accumulating (Hedged)11 USD1,383,131 GBP10.69 – – – – Class N USD Accumulating USD82,963,496 USD12.82 USD40,236,486 USD11.69 USD49,654,688 USD11.89 Class N USD Distributing USD27,246,083 USD11.20 USD17,292,491 USD10.43 USD20,899,084 USD10.91 Class Z USD Accumulating USD157,083,556 USD13.50 USD89,654,484 USD12.18 USD70,512,312 USD12.27 Class Z USD Distributing USD28,098,770 USD11.20 USD14,346,011 USD10.43 USD13,773,025 USD10.92
U.S. Growth Leaders Fund 31 January 2020 31 January 2019 31 January 2018
Net Assets
Net Asset Value Per
Share Net Assets
Net Asset Value Per
Share Net Assets
Net Asset Value Per
Share Class A USD Accumulating USD28,597,378 USD18.67 USD16,363,147 USD14.88 USD5,882,305 USD14.86 Class I USD Accumulating USD37,952 USD19.27 USD2,259,779 USD15.23 USD3,017,463 USD15.09 Class N USD Accumulating USD3,685,241 USD18.24 USD4,027,999 USD14.62 USD3,675,513 USD14.69 Class Z USD Accumulating USD7,038,093 USD19.16 USD2,845,973 USD15.17 USD3,008,814 USD15.04
11Share Class re-launched on 1 April 2019. 12Share Class launched on 26 June 2019. 13Share Class launched on 3 September 2019. 14Share Class liquidated on 3 September 2019.
The accompanying notes form an integral part of these financial statements.
229

LORD ABBETT PASSPORT PORTFOLIOS PLC
STATEMENTS OF FINANCIAL POSITION (Continued) NET ASSET VALUE OF REDEEMABLE PARTICIPATING SHARES (Continued)
Global High Yield Fund 31 January 2020 31 January 2019 31 January 2018
Net Assets
Net Asset Value Per
Share Net Assets
Net Asset Value Per
Share Net Assets
Net Asset Value Per
Share Class A USD Accumulating USD2,632,977 USD11.37 USD222,131 USD10.39 USD201,061 USD10.65 Class A USD Distributing USD13,593,210 USD10.53 USD11,527,734 USD10.08 USD11,753,930 USD10.89 Class A EUR Accumulating (Hedged)17 USD28,527 EUR10.30 – – – – Class I USD Accumulating15 USD9,795,109 USD10.74 – – – – Class I USD Distributing USD142,616 USD10.52 USD57,711 USD10.07 USD58,637 USD10.88 Class I EUR Accumulating (Hedged)15 USD29,029 EUR10.48 – – – – Class I EUR Distributing (Hedged)17 USD696,886 EUR10.12 – – – – Class I GBP Accumulating (Hedged)15 USD34,881 GBP10.58 – – – – Class IF USD Accumulating16 USD22,808,078 USD10.34 – – – – Class IF USD Distributing16 USD86,807 USD10.06 – – – – Class IF EUR Accumulating (Hedged)16 USD28,236 EUR10.19 – – – – Class IF GBP Accumulating (Hedged)16 USD542,835 GBP10.25 – – – – Class N USD Distributing USD182,574 USD10.52 USD55,975 USD10.07 USD57,672 USD10.87 Class Z USD Accumulating USD908,496 USD11.51 USD10,471 USD10.47 USD10,681 USD10.68 Class Z USD Distributing USD62,993 USD10.52 USD57,293 USD10.07 USD58,443 USD10.88
Global Equity Research Fund
31 January 2020 31 January 2019 31 January 2018
Net Assets
Net Asset Value Per
Share Net Assets
Net Asset Value Per
Share Net Assets
Net Asset Value Per
Share Class A USD Accumulating USD4,395,228 USD13.47 USD3,994,522 USD11.74 USD4,168,566 USD12.99 Class I USD Accumulating USD69,170 USD13.83 USD59,804 USD11.96 USD65,643 USD13.13 Class N USD Accumulating USD103,303 USD13.21 USD118,904 USD11.58 USD132,353 USD12.89 Class Z USD Accumulating USD68,827 USD13.77 USD59,597 USD11.92 USD65,514 USD13.10
Ultra Short Bond Fund 31 January 2020 31 January 2019 31 January 2018
Net Assets
Net Asset Value Per
Share Net Assets
Net Asset Value Per
Share Net Assets
Net Asset Value Per
Share Class A USD Accumulating USD1,130,938,836 USD10.47 USD580,173,485 USD10.22 USD10,824,428 USD10.02 Class A USD Distributing USD388,328,235 USD10.02 USD198,065,939 USD9.99 USD550,562 USD10.00 Class Z USD Accumulating USD371,642,372 USD10.55 USD152,207,431 USD10.26 USD2,160,525 USD10.03 Class Z USD Distributing USD91,158,027 USD10.02 USD41,238,021 USD9.99 USD673,301 USD9.99
High Yield Core Fund18 31 January 2020
Net Assets
Net Asset Value Per
Share Class I USD Accumulating15 USD307,628,453 USD10.74 Class I USD Distributing18 USD21,078 USD10.36
15Share Class launched on 1 April 2019. 16Share Class launched on 31 July 2019. 17Share Class launched on 3 September 2019. 18Fund and Share Class launched on 5 March 2019.
The accompanying notes form an integral part of these financial statements.
230

LORD ABBETT PASSPORT PORTFOLIOS PLC
STATEMENTS OF COMPREHENSIVE INCOME
Short Duration
Income FundHigh Yield
Fund
Global Multi-Sector Bond
FundTotal Return
Fund
Notes
Year Ended31 January 2020
USD
Year Ended31 January 2020
USD
Year Ended31 January 2020
USD
Year Ended31 January 2020
USDIncome Income from Financial Assets at Fair Value through Profit or Loss
Interest Income 1b,1h 107,935,654 85,344,299 2,524,041 919,703Dividend Income 1b,1h 3,196 444,876 774 –
Other Income 630,396 603,385 14,453 5,534Net Gains on Financial Assets and Financial
Liabilities at Fair Value through Profit or Loss 3 51,986,186 67,695,238 3,974,599 1,560,783Total Investment Gain 160,555,432 154,087,798 6,513,867 2,486,020 Expenses Management Fee 5 (24,086,908) (12,124,827) (868,123) (316,567)Administration Fees 6 (2,066,551) (916,122) (217,257) (131,542)Transaction Costs 1k (177,498) (44,431) (70,107) (28,589)Depositary and Trustee Fees 7 (725,615) (349,474) (31,063) (21,085)Audit Fees 9 (20,502) (20,404) (20,882) (20,882)Legal and Professional Fees (412,069) (299,635) (27,295) (18,398)Directors Fees 8 (9,068) (9,068) (9,068) (9,068)Other Expenses (167,875) (88,238) (13,476) (6,811)Expense Reimbursement 5 60,894 574 253,915 179,937Net Operating Expenses (27,605,192) (13,851,625) (1,003,356) (373,005)Net Income from Operations before Finance Costs 132,950,240 140,236,173 5,510,511 2,113,015 Finance Costs Distributions to Redeemable Participating
Shareholders 10 (12,935,752) (9,355,690) (367,458) (103,646)Income Equalisation 1j 205,502 369,862 2,270 2,849Profit before Tax 120,219,990 131,250,345 5,145,323 2,012,218
Withholding Tax (20,202) (328,412) (6,708) (3,398)Net Increase in Net Assets Attributable to Redeemable Participating Shareholders resulting from Operations 120,199,788 130,921,933 5,138,615 2,008,820
The accompanying notes form an integral part of these financial statements.
231

LORD ABBETT PASSPORT PORTFOLIOS PLC
STATEMENTS OF COMPREHENSIVE INCOME (Continued)
Emerging Markets
Corporate Debt Fund
Multi-Sector Income Fund
U.S. Growth Leaders Fund
Global High Yield Fund
Notes
Year Ended31 January 2020
USD
Year Ended31 January 2020
USD
Year Ended31 January 2020
USD
Year Ended31 January 2020
USDIncome Income from Financial Assets at Fair Value through Profit or Loss
Interest Income 1b,1h 891,677 18,975,988 10,155 1,586,887Dividend Income 1b,1h 71 180,819 133,114 –
Other Income 2,224 267,712 – 8,217Net Gains on Financial Assets and Financial
Liabilities at Fair Value through Profit or Loss 3 1,060,584 30,688,240 7,203,294 970,012Total Investment Gain 1,954,556 50,112,759 7,346,563 2,565,116 Expenses Management Fee 5 (233,650) (5,640,707) (496,011) (258,121)Administration Fees 6 (114,258) (659,119) (104,491) (196,256)Transaction Costs 1k (6,743) (80,829) (36,813) (27,669)Depositary and Trustee Fees 7 (19,845) (109,584) (21,721) (22,486)Audit Fees 9 (20,882) (20,882) (11,998) (20,502)Legal and Professional Fees (18,273) (84,775) (13,875) (15,240)Directors Fees 8 (9,068) (9,068) (9,068) (9,068)Other Expenses (4,362) (39,674) (5,914) (21,281)Expense Reimbursement 5 175,894 195,069 125,519 256,224Net Operating Expenses (251,187) (6,449,569) (574,372) (314,399)Net Income from Operations before Finance Costs 1,703,369 43,663,190 6,772,191 2,250,717 Finance Costs Distributions to Redeemable Participating
Shareholders 10 (108,309) (2,933,261) – (602,406)Income Equalisation 1j (21) 44,207 – 249Profit before Tax 1,595,039 40,774,136 6,772,191 1,648,560
Withholding Tax (734) (93,329) (39,577) (3,174)Net Increase in Net Assets Attributable to Redeemable Participating Shareholders resulting from Operations 1,594,305 40,680,807 6,732,614 1,645,386
The accompanying notes form an integral part of these financial statements.
232

LORD ABBETT PASSPORT PORTFOLIOS PLC
STATEMENTS OF COMPREHENSIVE INCOME (Continued)
Global Equity
Research FundUltra Short Bond Fund
High Yield Core Fund1 Total
Notes
Year Ended31 January 2020
USD
Year Ended31 January 2020
USD
Period Ended31 January 2020
USD
Year/Period Ended31 January 2020
USDIncome Income from Financial Assets at Fair Value through Profit or Loss
Interest Income 1b,1h 997 40,368,680 16,203,901 274,761,982Dividend Income 1b,1h 96,089 – – 858,939
Other Income 34 23,520 106,801 1,662,276Net Gains on Financial Assets and Financial
Liabilities at Fair Value through Profit or Loss 3 610,217 3,891,931 10,175,019 179,816,103
Total Investment Gain 707,337 44,284,131 26,485,721 457,099,300 Expenses Management Fee 5 (72,512) (6,357,577) (1,621,474) (52,076,477)Administration Fees 6 (77,296) (815,633) (110,713) (5,409,238)Depositary and Trustee Fees 7 (23,571) (355,004) (54,516) (1,733,964)Legal and Professional Fees (2,716) (185,747) (37,342) (1,115,365)Transaction Costs 1k (30,103) (73,631) – (576,413)Audit Fees 9 (11,618) (20,855) (13,807) (203,214)Directors Fees 8 (9,068) (9,052) (9,099) (99,763)Other Expenses (2,674) (59,456) (20,637) (430,398)Expense Reimbursement 5 143,891 36,175 – 1,428,092Net Operating Expenses (85,667) (7,840,780) (1,867,588) (60,216,740)Net Income from Operations before Finance Costs 621,670 36,443,351 24,618,133 396,882,560 Finance Costs Distributions to Redeemable Participating
Shareholders 10 – (7,932,209) (4,968,945) (39,307,676)Income Equalisation 1j – (7,005) (474,529) 143,384Profit before Tax 621,670 28,504,137 19,174,659 357,718,268
Withholding Tax (14,100) (16,272) (31,814) (557,720)Net Increase in Net Assets Attributable to Redeemable Participating Shareholders resulting from Operations 607,570 28,487,865 19,142,845 357,160,548
1Fund launched on 5 March 2019.
The accompanying notes form an integral part of these financial statements.
233

LORD ABBETT PASSPORT PORTFOLIOS PLC
STATEMENTS OF COMPREHENSIVE INCOME (Continued)
Short Duration
Income FundHigh Yield
Fund
Global Multi-Sector Bond
FundTotal Return
Fund
Notes
Year Ended31 January 2019
USD
Year Ended31 January 2019
USD
Year Ended31 January 2019
USD
Year Ended31 January 2019
USDIncome Income from Financial Assets at Fair Value through Profit or Loss
Interest Income 1b,1h 72,339,707 66,078,537 2,531,079 820,936Dividend Income 1b,1h 50,002 277,736 575 –
Other Income 587,364 947,832 26,741 2,295Net (Losses) on Financial Assets and Financial
Liabilities at Fair Value through Profit or Loss 3 (23,815,019) (73,305,084) (2,496,985) (385,534)Total Investment Gain/(Loss) 49,162,054 (6,000,979) 61,410 437,697 Expenses Management Fee 5 (15,386,428) (10,299,534) (779,646) (273,626)Administration Fees 6 (1,494,566) (1,008,300) (207,181) (137,204)Legal and Professional Fees (459,666) (300,121) (39,501) (31,843)Depositary and Trustee Fees 7 (463,705) (280,107) (28,567) (20,435)Transaction Costs 1k (86,228) (52,732) (34,940) (30,443)Audit Fees 9 (21,091) (21,091) (21,091) (21,091)Directors Fees 8 (10,956) (10,765) (10,765) (10,765)Other Expenses (96,344) (83,985) (18,242) (19,900)Expense Reimbursement 5 127,646 41,298 255,118 230,365Net Operating Expenses (17,891,338) (12,015,337) (884,815) (314,942)Net Income/(Loss) from Operations before Finance Costs 31,270,716 (18,016,316) (823,405) 122,755 Finance Costs Distributions to Redeemable Participating
Shareholders 10 (9,890,457) (9,765,644) (461,922) (67,710)Income Equalisation 1j (1,711) (73,156) 2,013 2,383Profit/(Loss) before Tax 21,378,548 (27,855,116) (1,283,314) 57,428
Withholding Tax (96,189) (87,340) – –Net Increase/(Decrease) in Net Assets Attributable to Redeemable Participating Shareholders resulting from Operations 21,282,359 (27,942,456) (1,283,314) 57,428
The accompanying notes form an integral part of these financial statements.
234

LORD ABBETT PASSPORT PORTFOLIOS PLC
STATEMENTS OF COMPREHENSIVE INCOME (Continued)
Emerging Markets
Corporate Debt Fund
Multi-Sector Income Fund
U.S. Growth Leaders Fund
Global High Yield Fund
Notes
Year Ended31 January 2019
USD
Year Ended31 January 2019
USD
Year Ended31 January 2019
USD
Year Ended31 January 2019
USDIncome Income from Financial Assets at Fair Value through Profit or Loss
Interest Income 1b,1h 690,648 14,272,874 8,603 768,914Dividend Income 1b,1h 1,494 367,488 120,544 –
Other Income 1,700 157,190 – 9,855Net (Losses) on Financial Assets and Financial
Liabilities at Fair Value through Profit or Loss 3 (607,518) (13,763,185) (758,201) (874,135)Total Investment Gain/(Loss) 86,324 1,034,367 (629,054) (95,366) Expenses Management Fee 5 (182,958) (3,860,575) (370,659) (169,334)Administration Fees 6 (112,776) (452,014) (86,241) (147,987)Legal and Professional Fees (26,578) (124,910) (19,979) (14,207)Depositary and Trustee Fees 7 (18,190) (82,247) (20,180) (17,395)Transaction Costs 1k (6,446) (168,513) (35,861) (28,869)Audit Fees 9 (21,091) (21,091) (12,711) (21,091)Directors Fees 8 (10,765) (10,766) (10,765) (10,765)Other Expenses (18,941) (35,043) (16,944) (12,872)Expense Reimbursement 5 204,551 210,979 133,996 223,774Net Operating Expenses (193,194) (4,544,180) (439,344) (198,746)Net (Loss) from Operations before Finance Costs (106,870) (3,509,813) (1,068,398) (294,112) Finance Costs Distributions to Redeemable Participating
Shareholders 10 (76,679) (3,252,946) – (597,309)Income Equalisation 1j 1,676 2,943 – (555)(Loss) before Tax (181,873) (6,759,816) (1,068,398) (891,976)
Withholding Tax (482) (88,282) (36,028) –Net (Decrease) in Net Assets Attributable to Redeemable Participating Shareholders resulting from Operations (182,355) (6,848,098) (1,104,426) (891,976)
The accompanying notes form an integral part of these financial statements.
235

LORD ABBETT PASSPORT PORTFOLIOS PLC
STATEMENTS OF COMPREHENSIVE INCOME (Continued)
Global Equity
Research Fund Ultra Short Bond Fund Total
Notes
Year Ended31 January 2019
USD
Period Ended31 January 2019
USD
Year Ended31 January 2019
USDIncome Income from Financial Assets at Fair Value through Profit or Loss
Interest Income 1b,1h 780 11,613,358 169,125,436Dividend Income 1b,1h 86,678 – 904,517
Other Income 31 1,099 1,734,107Net (Losses)/Gains on Financial Assets and
Financial Liabilities at Fair Value through Profit or Loss 3 (436,723) 152,988 (116,289,396)
Total Investment (Loss)/Gain (349,234) 11,767,445 55,474,664 Expenses Management Fee 5 (71,853) (1,847,179) (33,241,792)Administration Fees 6 (67,249) (282,703) (3,996,221)Legal and Professional Fees (8,772) (52,515) (1,078,092)Depositary and Trustee Fees 7 (15,574) (110,299) (1,056,699)Transaction Costs 1k (38,569) (35,291) (517,892)Audit Fees 9 (11,952) (21,100) (193,400)Directors Fees 8 (10,765) (10,764) (107,841)Other Expenses (10,968) (10,283) (323,522)Expense Reimbursement 5 149,650 107,949 1,685,326Net Operating Expenses (86,052) (2,262,185) (38,830,133)Net (Loss)/Income from Operations before Finance Costs (435,286) 9,505,260 16,644,531 Finance Costs Distributions to Redeemable Participating
Shareholders 10 – (2,431,565) (26,544,232)Income Equalisation 1j – 257,335 190,928(Loss)/Profit before Tax (435,286) 7,331,030 (9,708,773)
Withholding Tax (13,099) (19,357) (340,777)Net (Decrease)/Increase in Net Assets Attributable to Redeemable Participating Shareholders resulting from Operations (448,385) 7,311,673 (10,049,550)
The accompanying notes form an integral part of these financial statements.
236

LORD ABBETT PASSPORT PORTFOLIOS PLC
STATEMENTS OF CHANGES IN NET ASSETS ATTRIBUTABLE TO REDEEMABLE PARTICIPATING SHAREHOLDERS
Short Duration
Income FundHigh Yield
Fund
Global Multi-Sector Bond
FundTotal Return
Fund
Year Ended31 January 2020
USD
Year Ended31 January 2020
USD
Year Ended31 January 2020
USD
Year Ended31 January 2020
USDNet Assets Attributable to Redeemable Participating Shareholders at beginning of Year/Period 2,103,288,738 1,026,861,256 51,610,057 20,684,524
Net Increase in Net Assets Attributable to Redeemable Participating Shareholders resulting from Operations 120,199,788 130,921,933 5,138,615 2,008,820
Share Transactions
Proceeds from Redeemable Participating Shares Issued* 2,844,902,267 1,349,723,316 42,998,263 16,589,869Proceeds from Redeemable Participating Shares Reinvested 4,363,874 2,311,042 156,698 83,644Cost of Redeemable Participating Shares Redeemed* (1,071,665,403) (479,930,568) (15,745,803) (8,062,020)
Total Increase in Net Assets resulting from Share Transactions 1,777,600,738 872,103,790 27,409,158 8,611,493 Net Assets Attributable to Redeemable Participating Shareholders at end of Year/Period 4,001,089,264 2,029,886,979 84,157,830 31,304,837
* Proceeds from Redeemable Participating Shares Issued and Cost of Redeemable Participating Shares Redeemed include income equalisation adjustments in the amount of USD 205,502 Short Duration Income Fund, USD 369,862 High Yield Fund, USD 2,270 Global Multi-Sector Bond Fund and USD 2,849 Total Return Fund.
The accompanying notes form an integral part of these financial statements.
237

LORD ABBETT PASSPORT PORTFOLIOS PLC
STATEMENTS OF CHANGES IN NET ASSETS ATTRIBUTABLE TO REDEEMABLE PARTICIPATING SHAREHOLDERS (Continued)
Emerging Markets
Corporate Debt Fund
Multi-Sector Income Fund
U.S. Growth Leaders Fund
Global High Yield Fund
Year Ended31 January 2020
USD
Year Ended31 January 2020
USD
Year Ended31 January 2020
USD
Year Ended31 January 2020
USDNet Assets Attributable to Redeemable Participating Shareholders at beginning of Year/Period 14,380,492 294,417,757 25,496,898 11,931,315
Net Increase in Net Assets Attributable to Redeemable Participating Shareholders resulting from Operations 1,594,305 40,680,807 6,732,614 1,645,386
Share Transactions
Proceeds from Redeemable Participating Shares Issued* 5,685,352 483,096,854 26,753,844 48,151,456Proceeds from Redeemable Participating Shares Reinvested 59,495 768,698 – 564,368Cost of Redeemable Participating Shares Redeemed* (767,931) (110,177,271) (19,624,692) (10,719,271)
Total Increase in Net Assets resulting from Share Transactions 4,976,916 373,688,281 7,129,152 37,996,553 Net Assets Attributable to Redeemable Participating Shareholders at end of Year/Period 20,951,713 708,786,845 39,358,664 51,573,254
* Proceeds from Redeemable Participating Shares Issued and Cost of Redeemable Participating Shares Redeemed include income equalisation adjustments in the amount of USD (21) Emerging Markets Corporate Debt Fund, USD 44,207 Multi-Sector Income Fund, USD Nil U.S. Growth Leaders Fund and USD 249 Global High Yield Fund.
The accompanying notes form an integral part of these financial statements.
238

LORD ABBETT PASSPORT PORTFOLIOS PLC
STATEMENTS OF CHANGES IN NET ASSETS ATTRIBUTABLE TO REDEEMABLE PARTICIPATING SHAREHOLDERS (Continued)
Global Equity
Research FundUltra Short Bond Fund
High Yield Core Fund1 Total
Year Ended31 January 2020
USD
Year Ended31 January 2020
USD
Period Ended31 January 2020
USD
Year/Period Ended31 January 2020
USDNet Assets Attributable to Redeemable Participating Shareholders at beginning of Year/Period 4,232,827 971,684,876 – 4,524,588,740
Net Increase in Net Assets Attributable to Redeemable Participating Shareholders resulting from Operations 607,570 28,487,865 19,142,845 357,160,548
Share Transactions
Proceeds from Redeemable Participating Shares Issued* – 2,157,179,834 582,771,215 7,557,852,270Proceeds from Redeemable Participating Shares Reinvested – 5,200,740 710 13,509,269Cost of Redeemable Participating Shares Redeemed* (203,869) (1,180,485,845) (294,265,239) (3,191,647,912)
Total (Decrease)/Increase in Net Assets resulting from Share Transactions (203,869) 981,894,729 288,506,686 4,379,713,627 Net Assets Attributable to Redeemable Participating Shareholders at end of Year/Period 4,636,528 1,982,067,470 307,649,531 9,261,462,915
* Proceeds from Redeemable Participating Shares Issued and Cost of Redeemable Participating Shares Redeemed include income equalisation adjustments in the amount of USD Nil Global Equity Research Fund, USD (7,005) Ultra Short Bond Fund and USD (474,529) High Yield Core Fund1. 1Fund launched on 5 March 2019.
The accompanying notes form an integral part of these financial statements.
239

LORD ABBETT PASSPORT PORTFOLIOS PLC
STATEMENTS OF CHANGES IN NET ASSETS ATTRIBUTABLE TO REDEEMABLE PARTICIPATING SHAREHOLDERS (Continued)
Short Duration
Income FundHigh Yield
Fund
Global Multi-Sector
Bond FundTotal Return
Fund
Year Ended31 January 2019
USD
Year Ended31 January 2019
USD
Year Ended31 January 2019
USD
Year Ended31 January 2019
USDNet Assets Attributable to Redeemable Participating Shareholders at beginning of Year 1,864,961,168 1,069,370,610 65,466,478 24,722,219
Net Increase/(Decrease) in Net Assets Attributable to Redeemable Participating Shareholders resulting from Operations 21,282,359 (27,942,456) (1,283,314) 57,428
Share Transactions
Proceeds from Redeemable Participating Shares Issued* 1,061,179,664 729,638,733 20,101,390 4,843,323Proceeds from Redeemable Participating Shares Reinvested 3,969,771 3,444,364 170,287 31,503Cost of Redeemable Participating Shares Redeemed* (848,104,224) (747,649,995) (32,844,784) (8,969,949)
Total Increase/(Decrease) in Net Assets resulting from Share Transactions 217,045,211 (14,566,898) (12,573,107) (4,095,123) Net Assets Attributable to Redeemable Participating Shareholders at end of Year 2,103,288,738 1,026,861,256 51,610,057 20,684,524
* Proceeds from Redeemable Participating Shares Issued and Cost of Redeemable Participating Shares Redeemed include income equalisation adjustments in the amount of USD (1,711) Short Duration Income Fund, USD (73,156) High Yield Fund, USD 2,013 Global Multi-Sector Bond Fund2 and USD 2,383 Total Return Fund. The accompanying notes form an integral part of these financial statements.
240

LORD ABBETT PASSPORT PORTFOLIOS PLC
STATEMENTS OF CHANGES IN NET ASSETS ATTRIBUTABLE TO REDEEMABLE PARTICIPATING SHAREHOLDERS (Continued)
Emerging Markets
Corporate Debt Fund
Multi-Sector Income Fund
U.S. Growth Leaders Fund
Global High Yield Fund
Year Ended31 January 2019
USD
Year Ended31 January 2019
USD
Year Ended31 January 2019
USD
Year Ended31 January 2019
USDNet Assets Attributable to Redeemable Participating Shareholders at beginning of Year 13,428,046 293,385,767 15,584,095 12,140,424
Net (Decrease) in Net Assets Attributable to Redeemable Participating Shareholders resulting from Operations (182,355) (6,848,098) (1,104,426) (891,976)
Share Transactions
Proceeds from Redeemable Participating Shares Issued* 1,635,884 108,516,794 19,553,985 378,371Proceeds from Redeemable Participating Shares Reinvested 59,722 1,103,048 – 592,589Cost of Redeemable Participating Shares Redeemed* (560,805) (101,739,754) (8,536,756) (288,093)
Total Increase in Net Assets resulting from Share Transactions 1,134,801 7,880,088 11,017,229 682,867 Net Assets Attributable to Redeemable Participating Shareholders at end of Year 14,380,492 294,417,757 25,496,898 11,931,315
* Proceeds from Redeemable Participating Shares Issued and Cost of Redeemable Participating Shares Redeemed include income equalisation adjustments in the amount of USD 1,676 Emerging Markets Corporate Debt Fund, USD 2,943 Multi-Sector Income Fund, Nil U.S. Growth Leaders Fund and USD (555) Global High Yield Fund. The accompanying notes form an integral part of these financial statements.
241

LORD ABBETT PASSPORT PORTFOLIOS PLC
STATEMENTS OF CHANGES IN NET ASSETS ATTRIBUTABLE TO REDEEMABLE PARTICIPATING SHAREHOLDERS (Continued)
Global Equity
Research Fund Ultra Short Bond Fund Total
Year Ended31 January 2019
USD
Period Ended31 January 2019
USD
Year Ended31 January 2019
USDNet Assets Attributable to Redeemable Participating Shareholders at beginning of Year 4,432,076 14,208,816 3,377,699,699
Net (Decrease)/Increase in Net Assets Attributable to Redeemable Participating Shareholders resulting from Operations (448,385) 7,311,673 (10,049,550)
Share Transactions
Proceeds from Redeemable Participating Shares Issued* 331,516 1,216,820,000 3,162,999,660Proceeds from Redeemable Participating Shares Reinvested – 1,853,565 11,224,849Cost of Redeemable Participating Shares Redeemed* (82,380) (268,509,178) (2,017,285,918)
Total Increase in Net Assets resulting from Share Transactions 249,136 950,164,387 1,156,938,591 Net Assets Attributable to Redeemable Participating Shareholders at end of Year 4,232,827 971,684,876 4,524,588,740
* Proceeds from Redeemable Participating Shares Issued and Cost of Redeemable Participating Shares Redeemed include income equalisation adjustments in the amount of Nil Global Equity Research Fund3 and USD 257,335 Ultra Short Bond Fund.
The accompanying notes form an integral part of these financial statements.
242

LORD ABBETT PASSPORT PORTFOLIOS PLC
STATEMENTS OF CASH FLOWS
Short Duration
Income FundHigh Yield
Fund
Global Multi-Sector Bond
FundTotal Return
Fund
Year Ended31 January 2020
USD
Year Ended31 January 2020
USD
Year Ended31 January 2020
USD
Year Ended31 January 2020
USDCash Flows from Operating Activities Notes
Purchase of Financial Assets and Settlement of Financial Liabilities at Fair Value through Profit or Loss (18,538,907,336) (2,268,628,471) (640,590,755) (263,895,349)Proceeds from Sale of Investments at Fair Value through Profit or Loss 16,722,164,592 1,445,287,843 615,213,927 254,713,916Income from Financial Assets 102,374,808 73,647,300 2,349,232 843,963Other Income Received 630,396 603,385 14,453 5,534Operating Expenses Paid (26,624,938) (13,652,995) (1,054,889) (418,960)Currency (Loss)/Gain on Investment Income (1,336) 42,238 (2,536) (12)
Net Cash (Outflow) from Operating Activities (1,740,363,814) (762,700,700) (24,070,568) (8,750,908) Cash Flows from Financing Activities
Proceeds from Issue of Redeemable Participating Shares 2,828,142,740 1,338,048,581 41,994,726 16,539,287Dividends Paid to Redeemable Participating Shareholders (8,258,138) (6,267,313) (212,296) (17,521)Payments on Redemptions of Redeemable Participating Shares (1,068,778,237) (479,142,318) (15,850,291) (7,995,712)
Cash Inflow from Financing Activities 1,751,106,365 852,638,950 25,932,139 8,526,054 Net Increase/(Decrease) in Cash at Bank and Broker for the Year/Period 10,742,551 89,938,250 1,861,571 (224,854)
Cash at Bank and Broker at beginning of Year/Period 2 31,365,306 8,131,064 450,591 722,856
Cash at Bank and Broker at end of Year/Period 2 42,107,857 98,069,314 2,312,162 498,002
The accompanying notes form an integral part of these financial statements.
243

LORD ABBETT PASSPORT PORTFOLIOS PLC
STATEMENTS OF CASH FLOWS (Continued)
Emerging Markets
Corporate Debt Fund
Multi-Sector Income Fund
U.S. Growth Leaders Fund
Global High Yield Fund
Year Ended31 January 2020
USD
Year Ended31 January 2020
USD
Year Ended31 January 2020
USD
Year Ended31 January 2020
USDCash Flows from Operating Activities Notes
Purchase of Financial Assets and Settlement of Financial Liabilities at Fair Value through Profit or Loss (23,235,979) (2,634,002,839) (56,508,225) (76,090,919)Proceeds from Sale of Investments at Fair Value through Profit or Loss 18,539,253 2,294,407,578 50,440,602 43,723,750Income from Financial Assets 834,737 15,708,740 106,376 1,098,700Other Income Received 2,224 267,712 – 8,217Operating Expenses Paid (284,684) (6,106,141) (589,762) (345,188)Currency Gain/(Loss) on Investment Income 492 8,016 – (1,101)
Net Cash (Outflow) from Operating Activities (4,143,957) (329,716,934) (6,551,009) (31,606,541) Cash Flows from Financing Activities
Proceeds from Issue of Redeemable Participating Shares 5,685,352 475,148,980 26,471,090 42,341,217Dividends Paid to Redeemable Participating Shareholders (48,434) (2,077,785) – (30,375)Payments on Redemptions of Redeemable Participating Shares (767,931) (110,339,864) (19,622,046) (10,719,271)
Cash Inflow from Financing Activities 4,868,987 362,731,331 6,849,044 31,591,571 Net Increase/(Decrease) in Cash at Bank and Broker for the Year/Period 725,030 33,014,397 298,035 (14,970)
Cash at Bank and Broker at beginning of Year/Period 2 297,411 7,927,179 878,568 490,063
Cash at Bank and Broker at end of Year/Period 2 1,022,441 40,941,576 1,176,603 475,093
The accompanying notes form an integral part of these financial statements.
244

LORD ABBETT PASSPORT PORTFOLIOS PLC
STATEMENTS OF CASH FLOWS (Continued)
Global Equity
Research FundUltra Short Bond Fund
High Yield Core Fund1 Total
Year Ended31 January 2020
USD
Year Ended31 January 2020
USD
Period Ended31 January 2020
USD
Year/Period Ended31 January 2020
USDCash Flows from Operating Activities Notes
Purchase of Financial Assets and Settlement of Financial Liabilities at Fair Value through Profit or Loss (3,930,736) (9,434,565,575) (517,956,813) (34,458,312,997)Proceeds from Sale of Investments at Fair Value through Profit or Loss 4,619,583 8,447,849,674 230,831,359 30,127,792,077Income from Financial Assets 85,194 38,899,256 11,507,504 247,455,810Other Income Received 34 23,520 106,801 1,662,276Operating Expenses Paid (126,635) (7,426,767) (1,646,597) (58,277,556)Currency (Loss)/Gain on Investment Income (548) – 3,853 49,066
Net Cash Inflow/(Outflow) from Operating Activities 646,892 (955,219,892) (277,153,893) (4,139,631,324) Cash Flows from Financing Activities
Proceeds from Issue of Redeemable Participating Shares – 2,136,532,560 582,771,215 7,493,675,748Dividends Paid to Redeemable Participating Shareholders – (2,621,431) (5,442,764) (24,976,057)Payments on Redemptions of Redeemable Participating Shares (203,869) (1,175,513,660) (294,265,239) (3,183,198,438)
Cash (Outflow)/Inflow from Financing Activities (203,869) 958,397,469 283,063,212 4,285,501,253 Net Increase in Cash at Bank and Broker for the Year/Period 443,023 3,177,577 5,909,319 145,869,929
Cash at Bank and Broker at beginning of Year/Period 2 56,146 2,763,281 – 53,082,465
Cash at Bank and Broker at end of Year/Period 2 499,169 5,940,858 5,909,319 198,952,394
1 Fund launched on 5 March 2019.
The accompanying notes form an integral part of these financial statements.
245

LORD ABBETT PASSPORT PORTFOLIOS PLC
STATEMENTS OF CASH FLOWS (Continued)
Short Duration
Income Fund High Yield Fund
Global Multi-Sector Bond
Fund Total Return
Fund
Year Ended31 January 2019
USD
Year Ended31 January 2019
USD
Year Ended31 January 2019
USD
Year Ended31 January 2019
USDCash Flows from Operating Activities Notes
Purchase of Financial Assets and Settlement of Financial Liabilities at Fair Value through Profit or Loss (5,087,130,333) (1,651,791,635) (151,480,480) (169,807,780)Proceeds from Sale of Investments at Fair Value through Profit or Loss 4,807,551,310 1,628,819,166 161,421,305 173,363,822Income from Financial Assets 70,187,594 65,624,118 2,571,934 845,976Other Income Received 587,364 947,832 26,741 2,295Operating Expenses Paid (17,130,035) (11,646,038) (801,489) (255,185)Currency Gain on Investment Income 1,368 7,939 2,693 41
Net Cash (Outflow)/Inflow from Operating Activities (225,932,732) 31,961,382 11,740,704 4,149,169 Cash Flows from Financing Activities
Proceeds from Issue of Redeemable Participating Shares 1,063,860,569 729,675,131 20,221,314 4,868,769Dividends Paid to Redeemable Participating Shareholders (5,713,941) (6,329,125) (291,875) (33,637)Payments on Redemptions of Redeemable Participating Shares (842,859,048) (770,357,635) (32,732,354) (8,969,949)
Cash Inflow/(Outflow) from Financing Activities 215,287,580 (47,011,629) (12,802,915) (4,134,817) Net (Decrease)/ Increase in Cash at Bank and Broker for the Year (10,645,152) (15,050,247) (1,062,211) 14,352
Cash at Bank and Broker at beginning of Year 2 42,010,458 23,181,311 1,512,802 708,504 Cash at Bank and Broker at end of Year 2 31,365,306 8,131,064 450,591 722,856
The accompanying notes form an integral part of these financial statements. 246

LORD ABBETT PASSPORT PORTFOLIOS PLC
STATEMENTS OF CASH FLOWS (Continued)
Emerging Markets
Corporate Debt Fund
Multi-Sector Income Fund
U.S. Growth Leaders Fund
Global High Yield Fund
Year Ended31 January 2019
USD
Year Ended31 January 2019
USD
Year Ended31 January 2019
USD
Year Ended31 January 2019
USDCash Flows from Operating Activities Notes
Purchase of Financial Assets and Settlement of Financial Liabilities at Fair Value through Profit or Loss (5,583,976) (951,677,183) (55,306,182) (20,781,214)Proceeds from Sale of Investments at Fair Value through Profit or Loss 3,842,698 924,939,465 44,873,972 19,925,298Income from Financial Assets 672,723 14,152,575 89,706 745,058Other Income Received 1,700 207,652 – 9,855Operating Expenses Paid (139,488) (4,398,516) (367,210) (129,456)Currency (Loss)/Gain on Investment Income (22) (1,214) – 3,010
Net Cash (Outflow) from Operating Activities (1,206,365) (16,777,221) (10,709,714) (227,449) Cash Flows from Financing Activities
Proceeds from Issue of Redeemable Participating Shares 1,635,884 111,765,616 19,553,985 378,371Dividends Paid to Redeemable Participating Shareholders (12,431) (2,096,985) – (5,052)Payments on Redemptions of Redeemable Participating Shares (560,805) (100,850,801) (8,536,756) (288,093)
Cash Inflow from Financing Activities 1,062,648 8,817,830 11,017,229 85,226 Net (Decrease)/Increase in Cash at Bank and Broker for the Year (143,717) (7,959,391) 307,515 (142,223)
Cash at Bank and Broker at beginning of Year 2 441,128 15,886,570 571,053 632,286 Cash at Bank and Broker at end of Year 2 297,411 7,927,179 878,568 490,063
The accompanying notes form an integral part of these financial statements.
247

LORD ABBETT PASSPORT PORTFOLIOS PLC
STATEMENTS OF CASH FLOWS (Continued)
Global Equity
Research Fund Ultra Short Bond Fund Total
Year Ended31 January 2019
USD
Year Ended31 January 2019
USD
Year Ended31 January 2019
USDCash Flows from Operating Activities Notes
Purchase of Financial Assets and Settlement of Financial Liabilities at Fair Value through Profit or Loss (4,960,635) (3,263,721,750) (11,362,241,168)Proceeds from Sale of Investments at Fair Value through Profit or Loss 4,672,659 2,314,294,956 10,083,704,651Income from Financial Assets 71,828 9,716,099 164,677,611Other Income Received 31 1,099 1,784,569Operating Expenses Paid (43,776) (1,602,163) (36,513,356)Currency (Loss)/Gain on Investment Income (1,530) (18) 12,267
Net Cash (Outflow) from Operating Activities (261,423) (941,311,777) (1,148,575,426) Cash Flows from Financing Activities
Proceeds from Issue of Redeemable Participating Shares 331,516 1,211,428,591 3,163,719,746Dividends Paid to Redeemable Participating Shareholders – (173,647) (14,656,693)Payments on Redemptions of Redeemable Participating Shares (82,380) (267,398,417) (2,032,636,238)
Cash Inflow from Financing Activities 249,136 943,856,527 1,116,426,815 Net (Decrease)/Increase in Cash at Bank and Broker for the Year (12,287) 2,544,750 (32,148,611)
Cash at Bank and Broker at beginning of Year 2 68,433 218,531 85,231,076 Cash at Bank and Broker at end of Year 2 56,146 2,763,281 53,082,465
The accompanying notes form an integral part of these financial statements.
248

LORD ABBETT PASSPORT PORTFOLIOS PLC NOTES TO THE FINANCIAL STATEMENTS AS AT 31 JANUARY 2020
1. Summary of Significant Accounting Policies The principal accounting policies applied in the preparation of these financial statements are set out below. a) Basis of Presentation The financial statements have been prepared in accordance with International Financial Reporting Standards (“IFRS”), as adopted by the European Union (EU), Irish statute comprising the Companies Act 2014 and the UCITS Regulations. The preparation of financial statements in conformity with IFRS requires the use of certain critical accounting estimates. It also requires the Board of Directors to exercise its judgement in the process of applying the Company’s accounting policies. The areas involving a higher degree of judgement or complexity, or areas where assumptions and estimates are significant to the financial statements, are disclosed in the following notes. The following amendment and interpretations to an existing standard has been applied to these financial statements. IFRIC 23, “Standard for the Uncertainty over Tax Income Treatments”. On 7 June 2017, the International Accounting Standards Board (“IASB” or the “Board”) issued IFRIC Interpretation 23 — Uncertainty over Income Tax Treatments (the “Interpretation”). The Interpretation clarifies application of recognition and measurement requirements in IAS 12 Income Taxes when there is uncertainty over income tax treatments. The Interpretation is effective for annual reporting periods beginning on or after 1 January 2019, but certain transition reliefs are available. Based on the Company's assessment, this new standard does not have a significant impact on the Company’s Financial Statements or performance. b) Financial Assets and Financial Liabilities at Fair Value through Profit or Loss
Investments are valued at the last traded price or if unavailable the probable realisation value on the principal exchange or market for such investments on the valuation day for the purpose of calculating the net asset value for subscriptions and redemptions and for various fee calculations. The valuation day in this instance is 31 January 2020.
Classification The company classifies its financial assets and liabilities at fair value through profit or loss in accordance with IFRS 9. Recognition/Derecognition The Company recognises a financial asset or a financial liability when, and only when, it becomes a party to the contractual provisions of the instrument. Purchases and sales of financial assets at fair value through profit or loss are recognised on trade date – the date on which the Company commits to purchase or sell the financial instrument. Financial assets at fair value through profit or loss are derecognised when the rights to receive cash flows from the financial assets at fair value through profit or loss have expired or the Company has transferred substantially all risks and rewards of ownership. A financial liability is derecognised when and only when the obligations are discharged, cancelled or have expired. The difference between the carrying amount of the financial liability derecognised and the consideration paid and payable is recognised in the Statement of Comprehensive Income. Measurement Financial assets and financial liabilities at fair value through profit or loss are recorded in the Statement of Financial Position at fair value.
Subsequent to initial recognition, all financial assets and liabilities at fair value through profit or loss are measured at fair value. Gains and losses arising from changes in the fair value of the financial assets and liabilities are presented in the Statement of Comprehensive Income in the period in which they arise. Determination of fair value Under IFRS 13 fair value is the amount for which an asset could be exchanged or a liability settled, between knowledgeable willing parties in an arm’s length transaction. The fair value of an investment which is quoted, listed or normally dealt in on more than one Regulated Market shall be the last traded price (or if no last traded price is available, the last mid-market price). If an asset or a liability measured at fair value has a bid price and an ask price, the standard requires valuation to be based on a price within the bid-ask spread that is most representative of fair value and allows the use of mid-market or last traded price.
249

LORD ABBETT PASSPORT PORTFOLIOS PLC NOTES TO THE FINANCIAL STATEMENTS AS AT 31 JANUARY 2020 (Continued)
1. Summary of Significant Accounting Policies (Continued) b) Financial Assets and Financial Liabilities at Fair Value through Profit or Loss (Continued) Determination of fair value (Continued) The value of any investment which is not quoted, listed or normally dealt in on a Regulated Market shall be the probable realisable value estimated with care and in good faith by a competent person, firm or association (including Lord, Abbett & Co. LLC, (the “Investment Manager”)) appointed by the Directors and approved for the purpose by the Depositary. The value of exchange traded Financial Derivative Instruments (“FDIs”) shall be based on the settlement price, as determined by the market in question, provided that where it is not the practice for the relevant market to quote a settlement price or such settlement price is not available for any reason as at the Valuation Point, such value shall be the probable realisation value thereof estimated with care and in good faith by a competent person, firm or association (including the Investment Manager) appointed by the Directors and approved for the purpose by the Depositary. Swaps are valued using independent pricing sources or quotations from brokers/dealers to the extent available. The value of open forward foreign currency exchange contracts which are dealt on a Regulated Market shall be calculated by reference to freely available market prices at which a new forward contract of the same size, currency and maturity could be effected at the Valuation Point. Open forward foreign currency exchange contracts are valued using daily forward exchange rates. Where an alternative valuation is used (i.e., a valuation that is provided by a competent person, firm of association (including the Investment Manager) appointed by the Directors and approved for that purpose by the Depositary, the valuation principals employed will follow best international practice established by bodies such as IOSCO (International Organisation for Securities Commission) and AIMA (the Alternative Investment Management Association)). Floating Rate Loans Certain Funds may invest in direct debt instruments which are interests in amounts owed by corporate, governmental, or other borrowers to lenders or lending syndicates. A Fund’s investments in loans may be in the form of participations in loans or assignments of all or a portion of loans from third parties. A loan is often administered by a bank or other financial institution (the “lender”) that acts as agent for all holders. The agent administers the terms of the loan, as specified in the loan agreement. When investing in a loan participation, a Fund has the right to receive payments of principal, interest and any fees to which it is entitled only from the lender selling the loan agreement and only upon receipt by the lender of payments from the borrower. A Fund generally has no right to enforce compliance with the terms of the loan agreement with the borrower. As a result, a Fund may be subject to the credit risk of both the borrower and the lender that is selling the loan agreement. When a Fund purchases assignments from lenders it acquires direct rights against the borrower of the loan. The Fund may have difficulty trading assignments and participations to third parties. There may be restrictions on transfers and only limited opportunities may exist to sell such securities in secondary markets. As a result, the Fund may be unable to sell assignments or participations at the desired time or may be able to sell only at a price less than fair value. The Fund may enter into a loan agreement for a certain committed amount, however the full amount of this commitment may not be drawn down by the borrower. These unfunded commitments represent the remaining obligation of the Fund to the borrower. At any point in time, up to the maturity date of issue, the borrower may demand the unfunded portion. Floating Rate Loans held by the Fund are valued on a daily basis utilising an independent third party vendor.
250

LORD ABBETT PASSPORT PORTFOLIOS PLC NOTES TO THE FINANCIAL STATEMENTS AS AT 31 JANUARY 2020 (Continued)
1. Summary of Significant Accounting Policies (Continued)
b) Financial Assets and Financial Liabilities at Fair Value through Profit or Loss (Continued) As of 31 January 2020, the Company had the following unfunded loan commitments:
Fund Name Security Name Unfunded Settled
USD Fair Value
USD High Yield Fund Bleriot U.S. Bidco, Inc. Delayed Draw Term Loan 382,781 388,404 High Yield Fund Mavis Tire Express Services Corp. 1st Lien Delayed
Draw Term Loan 298,013 377,415
High Yield Fund Spectacle Gary Holdings, LLC Delayed Draw Term Loan
177,421 143,512
Multi-Sector Income Fund Mavis Tire Express Services Corp. 1st Lien Delayed Draw Term Loan
107,037 135,556
Multi-Sector Income Fund Pacific Gas & Electric Co. Revolving Loan 8,186 2,014,753 Global High Yield Fund Bleriot U.S. Bidco, Inc. Delayed Draw Term Loan 8,818 8,948 Global High Yield Fund Mavis Tire Express Services Corp. 1st Lien Delayed
Draw Term Loan 6,072 7,690
Global High Yield Fund Spectacle Gary Holdings, LLC Delayed Draw Term Loan
3,974 4,172
As of 31 January 2019, the Company had the following unfunded loan commitments:
Fund Name Security Name Unfunded Settled
USD Fair Value
USD High Yield Fund Bulldog Purchaser, Inc. 2nd Lien Delayed Draw Term
Loan 149,356 –
High Yield Fund Claire's Stores, Inc. Revolving Term Loan 47,974 –
Multi-Sector Income Fund Claire's Stores, Inc. Revolving Term Loan 10,040 –
Multi-Sector Income Fund Mavis Tire Express Services Corp. 1st Lien Delayed Draw Term Loan
45,215 44,000
Global High Yield Fund Bulldog Purchaser, Inc. 2nd Lien Delayed Draw Term Loan
1,491 –
Global High Yield Fund Claire's Stores, Inc. Revolving Term Loan 468 – Forward Foreign Currency Exchange Contracts The Company may use forward foreign currency exchange contracts to hedge the risk to the portfolio of exchange price movements or for share class hedging purposes. Under some circumstances, the Company may commit a substantial portion or the entire value of its portfolio to the completion of forward foreign currency exchange contracts. Generally, these instruments allow the Company to lock in a specified exchange rate for a period of time. Net gains or losses on forward foreign currency exchange contracts which have been settled are included in the Statement of Comprehensive Income of each relevant Fund. Unrealised gains or losses on open forward foreign currency exchange contracts are reported as financial assets or liabilities at fair value through profit or loss as appropriate in the Statement of Financial Position of each relevant Fund. Realised and change in unrealised gains or losses during the period are included in “Net Gains/(Losses) on Financial Assets and Financial Liabilities at Fair Value through Profit or Loss” in the Statement of Comprehensive Income of each relevant Fund. Futures Contracts The Company may enter into futures contracts, which involve the purchase or sale of a contract to buy or sell a specified security, index or other financial instrument at a specific future date and price on an exchange or the Over-the-Counter (“OTC”) Market. The Company may enter into such contracts as a substitute for taking a position in an underlying asset or to increase returns. Upon entering into a futures contract, the Company is required to deposit with its futures broker, an amount of cash in accordance with the initial margin requirements of the broker or exchange. Futures contracts are valued using quoted daily settlement prices established by the exchange on which they trade. The Company and the broker agree to exchange an amount of cash equal to the daily fluctuations in the value of the futures contract (“variation margin”).
251

LORD ABBETT PASSPORT PORTFOLIOS PLC NOTES TO THE FINANCIAL STATEMENTS AS AT 31 JANUARY 2020 (Continued)
1. Summary of Significant Accounting Policies (Continued) b) Financial Assets and Financial Liabilities at Fair Value through Profit or Loss (Continued) Futures Contracts (Continued) For open futures, changes in the value of the contract are recognised as unrealised gains or losses by “marking-to-market” the value of the contract at the Statement of Financial Position date. When the contract is closed, the difference between the proceeds (or cost) of the closing transactions and the original transaction is recorded as a realised gain or loss in the Statement of Comprehensive Income. Swap Contracts The Company may enter into interest rate, equity index, credit default, currency and total return swap agreements, and swaptions (options on swaps) and similar transactions. The Company may enter into these swap transactions for hedging purposes or in an attempt to obtain a particular return when it is considered desirable to do so. A swap transaction involves an agreement between two parties to exchange different cash flows based on a specified or “notional” amount. The cash flows exchanged in a specific transaction may be, among other things, payments that are the equivalent of interest on a principal amount, payments that would compensate the purchaser for losses on a defaulted security or basket of securities, or payments reflecting the performance of one or more specified currencies, securities or indices. Unrealised gains or losses on open swap contract and initial upfront payment received or made upon entering into a swap contract are included in the fair value of the swap in the Statement of Financial Position. Investment interest payable on swap contract is recorded as “Interest Payable on Swaps” in the Statement of Financial Position. Changes in unrealised gains or losses on swap contracts at the reporting period end are reported in the Statement of Comprehensive Income. A liquidation payment received or made at the termination of the swap contract is recorded as realised gain or loss in the Statement of Comprehensive Income. Investment interest expense on swap contract is included in “Net Gains/(Losses) on Financial Assets and Financial Liabilities at Fair Value through Profit or Loss” in the Statement of Comprehensive Income. Collateral in the form of cash or securities may be required to be held with the Depositary or broker in accordance with the swap agreement. c) Foreign Currency Translation In accordance with IAS 21 “The Effects of Changes in Foreign Exchange Rates”, items included in the individual Fund’s financial statements are measured using the currency of the primary economic environment in which it operates (functional currency). This is considered to be U.S. Dollar (USD) due to the investment strategy of the individual Funds. The individual Funds have also adopted their functional currency as the presentation currency. Income and expenditure transactions are translated to the functional currency of the relevant Fund at the rate of exchange ruling on the date of the transaction. Assets and liabilities in foreign currencies are translated into USD at the rates of exchange ruling at the Statement of Financial Position date. The financial statements are presented in USD. The following exchange rates at 31 January 2020 and 31 January 2019 have been used to translate assets and liabilities held in currencies other than USD: 31 January 2020 31 January 2019
Argentine Peso 60.3348 37.0250 Australian Dollar 1.4938 1.3715 Brazilian Real 4.2733 3.6428 British Pound 0.7586 0.7602 Canadian Dollar 1.3226 1.3133 Chilean Peso 800.7350 653.1800 Colombian Peso 3,425.0500 3,106.2900 Danish Krone 6.7434 6.5069 Egyptian Pound 15.8000 17.6900 Euro 0.9024 0.8715 Hong-Kong Dollar 7.7649 7.8467 Hungarian Forint 304.7013 275.5415 Indonesian Rupiah 13,655.0000 13,972.5000 Japanese Yen 108.3850 108.8300
252

LORD ABBETT PASSPORT PORTFOLIOS PLC NOTES TO THE FINANCIAL STATEMENTS AS AT 31 JANUARY 2020 (Continued)
1. Summary of Significant Accounting Policies (Continued) c) Foreign Currency Translation (Continued) Korean Won 1,191.8500 1,112.6500 Mexican Peso 18.9180 19.0283 Norwegian Krone 9.2178 8.4235 New Zealand Dollar 1.5452 1.4418 Peruvian Nuevo Sol 3.3754 3.3285 Russian Ruble 63.9113 65.4788 Singapore Dollar 1.3649 1.3447 South African Rand 14.9995 13.2700 Swedish Krona 9.6387 9.0473 Swiss Franc 0.9645 0.9921 Taiwan New Dollar 30.2090 30.7215 Thailand Baht 31.1700 31.2425 Uruguayan Peso 37.5750 32.5450
d) Offsetting Financial Instruments Although ISDA Master netting arrangements meet the criteria for offsetting in the Statement of Financial Position, the Company does not offset financial assets and financial liabilities in the Statement of Financial Position. Note 11 provides detail of set off rights by counterparty for each Fund. e) Cash and Cash Equivalents
Cash and cash equivalents include cash in hand, deposits held on call with banks, other short-term highly liquid investments with original maturities of three months or less and bank overdrafts.
All cash at bank balances are held with Brown Brothers Harriman & Co., or with third party institutions approved by the Company on overnight deposit or directly with a sub-custodian. All deposits held on call with banks are returned to the Depositary the following day. A breakdown of the financial institutions where the cash was deposited at the financial year end is contained in Note 2. f) Accrued Expenses
All expenses, including management fees are recognised in the Statement of Comprehensive Income on an accrual basis. g) Redeemable Participating Shares
The Company issues redeemable participating shares, which are redeemable at the holder’s option and are classified as financial liabilities. Redeemable participating shares can be put back to the Company at any time for cash equal to a proportionate share of the particular Fund’s NAV. The redeemable participating share is carried at the redemption amount that is payable at the statement of financial position date if the holder exercises the right to put the share back to the Fund.
Redeemable participating shares are issued and redeemed at the holder’s option at prices based on the Fund’s NAV per share at the time of issue or redemption. The Fund’s NAV per share is calculated by dividing the net assets attributable to the holders of redeemable participating shares with the total number of outstanding redeemable participating shares. h) Investment Income Policy Dividends, investment interest income, amortisation of premium, call account interest income and term loan interest income are recognised in the Statement of Comprehensive Income within “Income from Financial Assets at Fair Value through Profit or Loss”. Investment interest income is recognised using an effective interest rate. Dividend income is recorded on the ex-dividend date. Dividends, interest and other income as well as capital gains received by the Company may be subject to withholding taxes or similar taxes imposed by the country in which such dividend, interest, other income or capital gain originated. Dividend and interest income is shown gross of any non-recoverable withholding taxes, which are disclosed separately in the Statement of Comprehensive Income net of any tax credits.
253

LORD ABBETT PASSPORT PORTFOLIOS PLC NOTES TO THE FINANCIAL STATEMENTS AS AT 31 JANUARY 2020 (Continued)
1. Summary of Significant Accounting Policies (Continued) i) Distribution Policy
Distributions to holders of Redeemable Participating Shares are recognised as Finance Costs in the Statement of Comprehensive Income. j) Equalisation The Company utilised equalisation during the period with the view of ensuring that the level of dividends payable on distributing shares was not affected by the issue and redemption of such shares during an accounting period. The subscription price of such shares will therefore be deemed to include an equalisation payment calculated by reference to the accrued income of the Fund and the first distribution in respect of any share will include a payment of capital usually equal to the amount of such equalisation payment. The redemption price of each share will also include an equalisation payment in respect of the accrued income of the Fund up to the date of redemption. Equalisation is accounted for through the Statement of Comprehensive Income as part of Finance Costs. k) Transaction Costs
Transaction costs are the costs incurred in the acquisition, issue or disposal of financial assets and liabilities. Transaction costs include fees and commissions paid to brokers and dealers, levies by regulatory agencies and securities exchanges, and transfer taxes and duties. Transaction costs do not include debt premiums or discounts, financing costs or internal administrative or holding costs. Transaction costs are accounted for as they are incurred and are recognised as an expense for financial reporting purposes in the Statement of Comprehensive Income. l) Taxation Under current law and practice, the Company qualifies as an investment undertaking as defined in Section 739B of the Taxes Consolidation Act, 1997, as amended. On that basis, it is not chargeable to Irish tax on its income or capital gains. However, Irish tax can arise on the happening of a “chargeable event”. A chargeable event includes any distribution payments to shareholders or any encashment, redemption or transfer of shares. A chargeable event can also include a deemed disposal of shares every eight years beginning from the date of acquisition of those shares. No Irish tax will arise on the Company in respect of chargeable events in respect of: a shareholder who is neither Irish resident nor ordinarily resident in Ireland for tax purposes, at the time of the
chargeable event, provided appropriate valid declarations in accordance with the provisions of the Taxes Consolidated Act, 1997 as amended, are held by the Company; and
certain exempted Irish tax resident shareholders who have provided the Company with the necessary signed
statutory declarations. Capital gains, dividends, and interest received (if any) by the Company may be subject to withholding taxes imposed by the country from which the investment income/gains are received and such taxes may not be recoverable by the Company or its shareholders.
254

LORD ABBETT PASSPORT PORTFOLIOS PLC NOTES TO THE FINANCIAL STATEMENTS AS AT 31 JANUARY 2020 (Continued)
2. Cash at Bank As at 31 January 2020, the institutions where the Fund’s cash was held are listed below:
Short Duration Income Fund
USD
High Yield Fund
USD
Global Multi-Sector Bond Fund
USD
Total Return
Fund
USD Barclays, London – – 154,721 – Brown Brothers Harriman & Co. 3,134 (65,235) 2,197 – Citibank, New York – 93,015,672 1,748,893 – Deutsche Bank, Frankfurt – 4,721,246 – – Deutsche Bank, Grand Cayman – – – – JP Morgan Chase 40,756,651 – – 491,055 40,759,785 97,671,683 1,905,811 491,055
Emerging Markets Corporate Debt
Fund
USD
Multi-Sector Income
Fund
USD
U.S. Growth Leaders
Fund
USD
Global High Yield Fund
USD Barclays, London – – – – Brown Brothers Harriman & Co. (3,693) (19,106) – 193 Citibank, New York 946,022 38,508,486 – 418,675 Deutsche Bank, Frankfurt – – – – Deutsche Bank, Grand Cayman – – – –
JP Morgan Chase – – 1,176,603 – 942,329 38,489,380 1,176,603 418,868
Global Equity Research Fund
USD
Ultra Short Bond Fund
USD
High Yield
Core Fund1
USD
Total 31 January 2020
USD Barclays, London – – – 154,721 Brown Brothers Harriman & Co. 10,634 (243) (11) (72,130) Citibank, New York 428,795 – – 135,066,543 Deutsche Bank, Frankfurt 59,740 – – 4,780,986 Deutsche Bank, Grand Cayman – – 5,718,919 5,718,919 JP Morgan Chase – 5,941,101 – 48,365,410 499,169 5,940,858 5,718,908 194,014,449 1 Fund launched on 5 March 2019.
255

LORD ABBETT PASSPORT PORTFOLIOS PLC NOTES TO THE FINANCIAL STATEMENTS AS AT 31 JANUARY 2020 (Continued)
2. Cash at Bank (Continued) As at 31 January 2019, the institutions where the Fund’s cash was held are listed below:
Short Duration Income Fund
USD
High Yield Fund
USD
Global Multi-Sector Bond Fund
USD
Total Return
Fund
USD Brown Brothers Harriman & Co. 4 (3,382) 15,172 585 Citibank, New York 31,278,384 7,076,026 114,330 754,876 Deutsche Bank, Frankfurt 22,571 138,700 169,627 – JP Morgan Chase – – – – 31,300,959 7,211,344 299,129 755,461
Emerging Markets Corporate Debt
Fund
USD
Multi-Sector Income
Fund
USD
U.S. Growth Leaders
Fund
USD
Global High Yield Fund
USD Brown Brothers Harriman & Co. 4 9,230 – (3) Citibank, New York 265,796 5,863,484 878,568 469,426 Deutsche Bank, Frankfurt – – – –
JP Morgan Chase – – – –
265,800 5,872,714 878,568 469,423
Global Equity Research Fund
USD
Ultra Short Bond Fund
USD
Total 31 January 2019
USD Brown Brothers Harriman & Co. 14,074 – 35,684 Citibank, New York – – 46,700,890 Deutsche Bank, Frankfurt – – 330,898 JP Morgan Chase 42,072 2,763,281 2,805,353 56,146 2,763,281 49,872,825 Futures variation margin cash and cash collaterals in relation to swap contracts are included within “Deposits with Broker for Derivatives Collateral” and “Payable to Broker due to Derivatives Collateral” in the Statement of Financial Position.
256

LORD ABBETT PASSPORT PORTFOLIOS PLC NOTES TO THE FINANCIAL STATEMENTS AS AT 31 JANUARY 2020 (Continued)
3. Financial Assets and Liabilities at Fair Value through Profit or Loss
Short Duration Income Fund
31 January 2020USD
High Yield Fund
31 January 2020USD
Global Multi-Sector Bond Fund
31 January 2020USD
Total Return Fund
31 January 2020USD
Investments 3,952,108,018 1,930,019,073 87,747,080 38,012,853 Net Financial Derivative Instruments 780,075 1,298,610 (3,759) 32,496 3,952,888,093 1,931,317,683 87,743,321 38,045,349 Net Gains on Financial Assets and Financial Liabilities at Fair Value through Profit and Loss Investments 60,419,225 71,788,054 3,841,071 1,318,051 Financial Derivative Instruments (8,584,407) (4,764,180) 51,336 233,906 Foreign Currencies 151,368 671,364 82,192 8,826 51,986,186 67,695,238 3,974,599 1,560,783 Net Gains on Financial Assets and Financial Liabilities at Fair Value through Profit and Loss Realised (Losses)/Gains on Financial Assets and Liabilities at Fair Value through Profit or Loss (4,414,043) (20,032,502) 1,299,817 698,860 Change in Unrealised Gains on Financial Assets and Liabilities at Fair Value through Profit or Loss 56,400,229 87,727,740 2,674,782 861,923 51,986,186 67,695,238 3,974,599 1,560,783
257

LORD ABBETT PASSPORT PORTFOLIOS PLC NOTES TO THE FINANCIAL STATEMENTS AS AT 31 JANUARY 2020 (Continued)
3. Financial Assets and Liabilities at Fair Value through Profit or Loss (Continued)
Emerging Markets Corporate Debt
Fund31 January 2020
USD
Multi-Sector Income Fund
31 January 2020USD
U.S. Growth Leaders Fund
31 January 2020USD
Global High Yield Fund
31 January 2020USD
Investments 20,248,980 663,686,426 38,281,694 47,896,182 Net Financial Derivative Instruments (41,954) (871,610) – 37,675 20,207,026 662,814,816 38,281,694 47,933,857 Net Gains on Financial Assets and Financial Liabilities at Fair Value through Profit and Loss Investments 1,167,978 33,583,156 7,203,358 774,746 Financial Derivative Instruments (108,493) (3,104,627) – 82,053 Foreign Currencies 1,099 209,711 (64) 113,213 1,060,584 30,688,240 7,203,294 970,012 Net Gains on Financial Assets and Financial Liabilities at Fair Value through Profit and Loss Realised (Losses)/Gains on Financial Assets and Liabilities at Fair Value through Profit or Loss (36,305) (1,423,094) 2,592,442 (177,256) Change in Unrealised Gains on Financial Assets and Liabilities at Fair Value through Profit or Loss 1,096,889 32,111,334 4,610,852 1,147,268 1,060,584 30,688,240 7,203,294 970,012
258

LORD ABBETT PASSPORT PORTFOLIOS PLC NOTES TO THE FINANCIAL STATEMENTS AS AT 31 JANUARY 2020 (Continued)
3. Financial Assets and Liabilities at Fair Value through Profit or Loss (Continued)
Global Equity Research Fund
31 January 2020USD
Ultra Short Bond Fund
31 January 2020USD
High Yield Core Fund1
31 January 2020USD
Total31 January 2020
USD Investments 4,603,028 1,975,915,823 299,421,716 9,057,940,873 Net Financial Derivative Instruments – – 68,914 1,300,447 4,603,028 1,975,915,823 299,490,630 9,059,241,320 Net Gains on Financial Assets and Financial Liabilities at Fair Value through Profit and Loss
Investments 619,281 3,891,438 11,078,748 195,685,106 Financial Derivative Instruments (1,269) – (1,004,064) (17,199,745) Foreign Currencies (7,795) 493 100,335 1,330,742 610,217 3,891,931 10,175,019 179,816,103 Net Gains on Financial Assets and Financial Liabilities at Fair Value through Profit and Loss Realised Gains/(Losses) on Financial Assets and Liabilities at Fair Value through Profit or Loss 287,594 479,746 (399,517) (21,124,258) Change in Unrealised Gains on Financial Assets and Liabilities at Fair Value through Profit or Loss 322,623 3,412,185 10,574,536 200,940,361 610,217 3,891,931 10,175,019 179,816,103
1Fund launched on 5 March 2019.
259

LORD ABBETT PASSPORT PORTFOLIOS PLC NOTES TO THE FINANCIAL STATEMENTS AS AT 31 JANUARY 2020 (Continued)
3. Financial Assets and Liabilities at Fair Value through Profit or Loss (Continued)
Short Duration Income Fund
31 January 2019USD
High Yield Fund31 January 2019
USD
Global Multi-Sector Bond Fund
31 January 2019USD
Total Return Fund31 January 2019
USD Investments 2,063,826,827 1,006,230,170 56,722,906 27,370,775 Net Financial Derivative Instruments 1,757,697 642,324 (306,023) 86,220 2,065,584,524 1,006,872,494 56,416,883 27,456,995 Net Gains/(Losses) on Financial Assets and Financial Liabilities at Fair Value through Profit and Loss Investments (13,805,313) (64,767,074) (2,387,924) (430,064) Financial Derivative Instruments (10,008,305) (7,410,923) (35,875) 48,873 Foreign Currencies (1,401) (1,127,087) (73,186) (4,343) (23,815,019) (73,305,084) (2,496,985) (385,534) Net (Losses) on Financial Assets and Financial Liabilities at Fair Value through Profit and Loss Realised (Losses) on Financial Assets and Liabilities at Fair Value through Profit or Loss (19,393,403) (32,125,673) (1,966,771) (494,088) Change in Unrealised Gains/(Losses) on Financial Assets and Liabilities at Fair Value through Profit or Loss (4,421,616) (41,179,411) (530,214) 108,554 (23,815,019) (73,305,084) (2,496,985) (385,534)
260

LORD ABBETT PASSPORT PORTFOLIOS PLC NOTES TO THE FINANCIAL STATEMENTS AS AT 31 JANUARY 2020 (Continued)
3. Financial Assets and Liabilities at Fair Value through Profit or Loss (Continued)
Emerging Markets Corporate Debt
Fund31 January 2019
USD
Multi-Sector Income Fund
31 January 2019USD
U.S. Growth Leaders Fund
31 January 2019USD
Global High Yield Fund
31 January 2019USD
Investments 14,073,104 309,674,854 24,934,425 11,516,607 Net Financial Derivative Instruments (22,558) (1,380,390) – (19,747) 14,050,546 308,294,464 24,934,425 11,496,860 Net Gains/(Losses) on Financial Assets and Financial Liabilities at Fair Value through Profit and Loss Investments (608,176) (13,593,887) (758,201) (640,073) Financial Derivative Instruments 1,249 357,272 – (37,083) Foreign Currencies (591) (526,570) – (196,979) (607,518) (13,763,185) (758,201) (874,135) Net Gains/(Losses) on Financial Assets and Financial Liabilities at Fair Value through Profit and Loss Realised Gains/(Losses) on Financial Assets and Liabilities at Fair Value through Profit or Loss (86,308) (3,026,769) 1,197,248 (205,046) Change in Unrealised (Losses) on Financial Assets and Liabilities at Fair Value through Profit or Loss (521,210) (10,736,416) (1,955,449) (669,089) (607,518) (13,763,185) (758,201) (874,135)
261

LORD ABBETT PASSPORT PORTFOLIOS PLC NOTES TO THE FINANCIAL STATEMENTS AS AT 31 JANUARY 2020 (Continued)
3. Financial Assets and Liabilities at Fair Value through Profit or Loss (Continued)
Global Equity Research Fund
31 January 2019USD
Ultra Short Bond Fund
31 January 2019USD
Total31 January 2019
USD Investments 4,238,315 977,653,780 4,496,241,763 Net Financial Derivative Instruments – – 757,523 4,238,315 977,653,780 4,496,999,286 Net Gains/(Losses) on Financial Assets and Financial Liabilities at Fair Value through Profit and Loss Investments (360,586) 153,096 (97,198,202) Financial Derivative Instruments – – (17,084,792) Foreign Currencies (76,137) (108) (2,006,402) (436,723) 152,988 (116,289,396) Net Gains/(Losses) on Financial Assets and Financial Liabilities at Fair Value through Profit and Loss Realised Gains/(Losses) on Financial Assets and Liabilities at Fair Value through Profit or Loss 102,545 56,556 (55,941,709) Change in Unrealised Gains/(Losses) on Financial Assets and Liabilities at Fair Value through Profit or Loss (539,268) 96,432 (60,347,687) (436,723) 152,988 (116,289,396)
262

LORD ABBETT PASSPORT PORTFOLIOS PLC NOTES TO THE FINANCIAL STATEMENTS AS AT 31 JANUARY 2020 (Continued)
4. Share Capital The authorised share capital of the Company is 500,000,000,000 shares of no par value and 300,002 redeemable Non-Participating Shares of EUR 1 each. Non-Participating Shares do not entitle holders to any dividend and on a winding up of the Company, entitles the holders thereof to receive the amount paid up thereon but do not otherwise entitle them to participate in assets of the Company. The Non-Participating Shares are held on behalf of Lord, Abbett & Co. LLC. The following tables set out the movement of shares in issue for the financial year ended 31 January 2020:
Shares in Issue at Shares Shares Shares in Issue at 1 February 2019 Issued Redeemed 31 January 2020Short Duration Income Fund Class A USD Accumulating 44,433,274 77,593,708 (21,919,131) 100,107,851Class A USD Distributing 25,591,423 17,222,642 (9,052,424) 33,761,641Class A CHF Accumulating (Hedged) 2,796 – – 2,796 Class A CHF Distributing (Hedged) 3,006 42 – 3,048 Class A EUR Accumulating (Hedged) 273,079 112,374 (20,000) 365,453 Class A EUR Distributing (Hedged) 269,278 78,026 (165,630) 181,674 Class A GBP Distributing (Hedged) 2,092 29 – 2,121 Class C USD Accumulating 43,968 – (2,516) 41,452 Class C USD Distributing 93,481 1,516 (12,253) 82,744 Class I USD Accumulating 64,052,236 87,044,076 (29,627,134) 121,469,178 Class I USD Distributing 1,468,132 8,031,122 (1,421,408) 8,077,846 Class I CHF Accumulating (Hedged) 4,837 – – 4,837 Class I CHF Distributing (Hedged) 5,337 133 – 5,470 Class I EUR Accumulating 1,000 58,364 (35,520) 23,844 Class I EUR Accumulating (Hedged) 7,091,666 5,843,062 (2,322,310) 10,612,418 Class I EUR Distributing (Hedged) 2,037 36 – 2,073 Class I GBP Accumulating (Hedged) 1,124,298 1,785,889 (359,100) 2,551,087 Class I GBP Distributing (Hedged) 2,129 312,699 (24,920) 289,908 Class J USD Accumulating 1,042,897 8,992,925 (2,306,817) 7,729,005 Class J USD Distributing 351,397 188,900 (435,730) 104,567 Class J EUR Accumulating (Hedged) 4,503,110 540,706 (4,807,755) 236,061 Class J EUR Distributing (Hedged) 230,677 1,378 (229,802) 2,253 Class J GBP Distributing (Hedged) 207,871 7,755 (209,318) 6,308 Class N USD Accumulating 10,526,779 20,746,642 (5,471,680) 25,801,741 Class N USD Distributing 3,831,129 2,575,391 (1,511,744) 4,894,776 Class Z USD Accumulating 23,843,325 23,566,754 (14,593,993) 32,816,086Class Z USD Distributing 8,718,676 6,470,091 (3,712,581) 11,476,186 Class Z CHF Accumulating (Hedged) 2,821 – – 2,821 Class Z CHF Distributing (Hedged) 5,284 117 – 5,401 Class Z EUR Accumulating (Hedged) 1,389 – – 1,389 Class Z GBP Accumulating (Hedged) 2,015 – – 2,015 Class Z GBP Distributing (Hedged) 2,112 35 – 2,147
263

LORD ABBETT PASSPORT PORTFOLIOS PLC NOTES TO THE FINANCIAL STATEMENTS AS AT 31 JANUARY 2020 (Continued)
4. Share Capital (Continued)
Shares in Issue at Shares Shares Shares in Issue at 1 February 2019 Issued Redeemed 31 January 2020High Yield Fund Class A USD Accumulating 17,464,288 6,051,750 (8,769,700) 14,746,338Class A USD Distributing 8,072,033 3,010,026 (1,979,856) 9,102,203 Class A EUR Accumulating (Hedged) 71,386 59,797 (41,850) 89,333 Class C USD Accumulating 4,650 – (1,118) 3,532 Class C USD Distributing 48,866 728 – 49,594 Class I USD Accumulating 37,400,190 70,878,239 (18,033,264) 90,245,165Class I USD Distributing 5,242,128 3,393,982 (1,112,765) 7,523,345 Class I CHF Accumulating (Hedged) 1,878 – – 1,878 Class I CHF Distributing (Hedged) 1,958 94 – 2,052 Class I EUR Accumulating 2,500 16,971 – 19,471 Class I EUR Accumulating (Hedged) 2,999,082 1,209,742 (875,396) 3,333,428 Class I EUR Distributing (Hedged) 1,682 62,064 (61,983) 1,763 Class I GBP Accumulating (Hedged) 33,186 – – 33,186 Class I GBP Distributing (Hedged) 1,502 72 – 1,574 Class I JPY Accumulating1 – 372,992 – 372,992 Class J USD Accumulating 1,500 1,394,582 (145,598) 1,250,484 Class J EUR Accumulating 1,729 7,255 – 8,984 Class J EUR Distributing (Hedged)2 – 1,548,492 (3,671) 1,544,821 Class J GBP Distributing 1,563 20,356 – 21,919 Class J GBP Distributing (Hedged)2 – 5,583,929 – 5,583,929 Class N USD Accumulating 2,740,189 874,330 (970,543) 2,643,976 Class N USD Distributing 1,915,569 368,293 (484,837) 1,799,025 Class Z USD Accumulating 6,350,341 3,992,909 (3,279,354) 7,063,896 Class Z USD Distributing 2,641,338 1,540,183 (1,006,824) 3,174,697 Class Z CHF Accumulating (Hedged) 2,032 – – 2,032 Class Z CHF Distributing (Hedged) 2,354 112 – 2,466 Class Z EUR Accumulating 1,561 2,504 – 4,065 Class Z EUR Accumulating (Hedged) 4,152 8,489 (1,306) 11,335
Shares in Issue at Shares Shares Shares in Issue at 1 February 2019 Issued Redeemed 31 January 2020Global Multi-Sector Bond Fund
Class A USD Accumulating 1,380,369 1,674,344 (499,234) 2,555,479Class A USD Distributing 865,799 279,422 (226,887) 918,334 Class A EUR Accumulating (Hedged)3 – 3,520 – 3,520 Class C USD Accumulating4 5,658 – (5,658) –Class C USD Distributing 107,518 1,195 (41,789) 66,924 Class I USD Accumulating5 – 1,500 – 1,500 Class I EUR Accumulating (Hedged)5 – 2,500 – 2,500 Class I GBP Accumulating (Hedged)5 – 2,500 – 2,500 Class N USD Accumulating 886,151 539,786 (82,747) 1,343,190 Class N USD Distributing 215,193 169,067 (53,926) 330,334 Class Z USD Accumulating 1,085,773 849,764 (343,692) 1,591,845 Class Z USD Distributing 249,031 226,265 (142,824) 332,472
1Share Class launched on 6 March 2019. 2Share Class launched on 7 May 2019. 3Share Class launched on 3 September 2019. 4Share Class liquidated on 3 September 2019. 5Share Class re-launched on 1 April 2019.
264

LORD ABBETT PASSPORT PORTFOLIOS PLC NOTES TO THE FINANCIAL STATEMENTS AS AT 31 JANUARY 2020 (Continued)
4. Share Capital (Continued)
Shares in Issue at Shares Shares Shares in Issue at 1 February 2019 Issued Redeemed 31 January 2020Total Return Fund Class A USD Accumulating 608,557 221,296 (82,650) 747,203 Class A USD Distributing 61,905 16,092 (4,033) 73,964 Class C USD Distributing 32,567 288 – 32,855 Class N USD Accumulating 357,335 78,487 (9,055) 426,767 Class N USD Distributing 97,894 21,745 (29,268) 90,371 Class Z USD Accumulating 785,812 539,501 (249,040) 1,076,273Class Z USD Distributing 44,136 699,455 (387,309) 356,282
Shares in Issue at Shares Shares Shares in Issue at 1 February 2019 Issued Redeemed 31 January 2020Emerging Markets Corporate Debt Fund Class A USD Accumulating 746,365 338,193 (10,095) 1,074,463 Class A USD Distributing 158,708 68,102 (57,220) 169,590 Class I USD Accumulating6 – 1,500 – 1,500 Class N USD Distributing 40,331 55,171 (476) 95,026 Class Z USD Accumulating 265,348 16,854 (1,689) 280,513 Class Z USD Distributing 48,729 1,142 (1,961) 47,910
Shares in Issue at Shares Shares Shares in Issue at 1 February 2019 Issued Redeemed 31 January 2020Multi-Sector Income Fund Class A USD Accumulating 5,581,708 17,359,486 (1,874,337) 21,066,857 Class A USD Distributing 5,533,957 3,866,882 (1,857,271) 7,543,568 Class A EUR Accumulating (Hedged)7 – 10,562 – 10,562 Class C USD Distributing8 5,089 71 (5,160) –Class I USD Accumulating 616,943 3,021,339 (706,695) 2,931,587 Class I EUR Accumulating (Hedged) 43,751 180,667 (14,209) 210,209 Class I EUR Distributing (Hedged)9 – 501,552 – 501,552 Class I GBP Accumulating (Hedged)6 – 98,128 – 98,128 Class N USD Accumulating 3,442,780 4,107,317 (1,080,714) 6,469,383 Class N USD Distributing 1,657,649 1,287,055 (511,060) 2,433,644 Class Z USD Accumulating 7,359,926 6,498,053 (2,222,682) 11,635,297 Class Z USD Distributing 1,374,977 1,977,322 (843,179) 2,509,120
Shares in Issue at Shares Shares Shares in Issue at 1 February 2019 Issued Redeemed 31 January 2020U.S. Growth Leaders Fund Class A USD Accumulating 1,100,233 1,024,216 (593,021) 1,531,428 Class I USD Accumulating 148,443 20,000 (166,473) 1,970 Class N USD Accumulating 275,630 163,046 (236,653) 202,023 Class Z USD Accumulating 187,751 352,347 (172,690) 367,408
6Share Class re-launched on 1 April 2019. 7Share Class launched on 3 September 2019. 8Share Class liquidated on 3 September 2019. 9Share Class launched on 26 June 2019.
265

LORD ABBETT PASSPORT PORTFOLIOS PLC NOTES TO THE FINANCIAL STATEMENTS AS AT 31 JANUARY 2020 (Continued)
4. Share Capital (Continued)
Shares in Issue at Shares Shares Shares in Issue at 1 February 2019 Issued Redeemed 31 January 2020Global High Yield Fund Class A USD Accumulating 21,384 222,424 (12,156) 231,652 Class A USD Distributing 1,143,197 194,605 (47,336) 1,290,466 Class A EUR Accumulating (Hedged)10 – 2,500 – 2,500 Class I USD Accumulating11 – 1,718,477 (806,141) 912,336 Class I USD Distributing 5,729 127,790 (119,961) 13,558 Class I EUR Accumulating (Hedged)11 – 2,500 – 2,500 Class I EUR Distributing (Hedged)10 – 62,136 – 62,136 Class I GBP Accumulating (Hedged)11 – 2,500 – 2,500 Class IF USD Accumulating12 – 2,211,582 (5,107) 2,206,475Class IF USD Distributing12 – 8,633 – 8,633 Class IF EUR Accumulating (Hedged)12 – 2,500 – 2,500 Class IF GBP Accumulating (Hedged)12 – 40,179 – 40,179 Class N USD Distributing 5,558 11,794 – 17,352 Class Z USD Accumulating 1,000 111,905 (33,989) 78,916 Class Z USD Distributing 5,688 298 – 5,986
Shares in Issue at Shares Shares Shares in Issue at 1 February 2019 Issued Redeemed 31 January 2020Global Equity Research Fund
Class A USD Accumulating 340,228 – (13,963) 326,265 Class I USD Accumulating 5,000 – – 5,000 Class N USD Accumulating 10,268 – (2,447) 7,821 Class Z USD Accumulating 5,000 – – 5,000
Shares in Issue at Shares Shares Shares in Issue at 1 February 2019 Issued Redeemed 31 January 2020Ultra Short Bond Fund Class A USD Accumulating 56,795,478 123,702,914 (72,485,535) 108,012,857 Class A USD Distributing 19,825,712 32,898,347 (13,961,725) 38,762,334 Class Z USD Accumulating 14,834,600 40,983,336 (20,581,194) 35,236,742 Class Z USD Distributing 4,127,401 12,390,872 (7,419,841) 9,098,432
Shares in Issue at Shares Shares Shares in Issue at 1 February 2019 Issued Redeemed 31 January 2020High Yield Core Fund13
Class I USD Accumulating11 – 28,642,776 – 28,642,776 Class I USD Distributing13 – 28,660,025 (28,657,989) 2,036
10Share Class launched on 3 September 2019. 11Share Class launched on 1 April 2019. 12Share Class launched on 31 July 2019. 13Fund and Share Class launched on 5 March 2019.
266

LORD ABBETT PASSPORT PORTFOLIOS PLC NOTES TO THE FINANCIAL STATEMENTS AS AT 31 JANUARY 2020 (Continued)
4. Share Capital (Continued) The following tables set out the movement of shares in issue for the financial year ended 31 January 2019:
Shares in Issue at Shares Shares Shares in Issue at 1 February 2018 Issued Redeemed 31 January 2019Short Duration Income Fund Class A USD Accumulating 38,882,080 26,360,904 (20,809,710) 44,433,274 Class A USD Distributing 25,713,068 9,071,989 (9,193,634) 25,591,423 Class A CHF Accumulating (Hedged) 4,837 – (2,041) 2,796 Class A CHF Distributing (Hedged) 5,098 72 (2,164) 3,006 Class A EUR Accumulating (Hedged) 2,000 271,079 – 273,079 Class A EUR Distributing (Hedged) 2,052 275,205 (7,979) 269,278 Class A GBP Distributing (Hedged) 2,055 37 – 2,092 Class C USD Accumulating 54,737 – (10,769) 43,968 Class C USD Distributing 91,689 1,792 – 93,481 Class I USD Accumulating 56,742,382 26,521,405 (19,211,551) 64,052,236 Class I USD Distributing 206,922 1,467,030 (205,820) 1,468,132 Class I CHF Accumulating (Hedged) 4,837 – – 4,837 Class I CHF Distributing (Hedged) 5,190 147 – 5,337 Class I EUR Accumulating 1,000 – – 1,000 Class I EUR Accumulating (Hedged) 5,408,986 3,711,991 (2,029,311) 7,091,666 Class I EUR Distributing (Hedged)1 – 2,037 – 2,037 Class I GBP Accumulating (Hedged) 317,316 880,682 (73,700) 1,124,298 Class I GBP Distributing (Hedged) 2,079 50 – 2,129 Class J USD Accumulating2 – 1,136,375 (93,478) 1,042,897 Class J USD Distributing2 – 364,602 (13,205) 351,397 Class J EUR Accumulating (Hedged)2 – 4,777,196 (274,086) 4,503,110 Class J EUR Distributing (Hedged)2 – 286,526 (55,849) 230,677 Class J GBP Distributing (Hedged)2 – 221,019 (13,148) 207,871 Class N USD Accumulating 12,907,293 4,519,925 (6,900,439) 10,526,779 Class N USD Distributing 6,498,205 951,710 (3,618,786) 3,831,129 Class Z USD Accumulating 23,154,199 15,040,914 (14,351,788) 23,843,325 Class Z USD Distributing 8,396,427 4,657,819 (4,335,570) 8,718,676 Class Z CHF Accumulating (Hedged) 4,837 – (2,016) 2,821 Class Z CHF Distributing (Hedged) 5,153 131 – 5,284 Class Z EUR Accumulating (Hedged) 3,365 59,308 (61,284) 1,389 Class Z GBP Accumulating (Hedged) 3,448 – (1,433) 2,015 Class Z GBP Distributing (Hedged) 2,069 43 – 2,112
1Share Class launched on 6 March 2018. 2Share Class launched on 1 June 2018.
267

LORD ABBETT PASSPORT PORTFOLIOS PLC NOTES TO THE FINANCIAL STATEMENTS AS AT 31 JANUARY 2020 (Continued)
4. Share Capital (Continued)
Shares in Issue at Shares Shares Shares in Issue at 1 February 2018 Issued Redeemed 31 January 2019High Yield Fund Class A USD Accumulating 15,470,654 11,062,961 (9,069,327) 17,464,288 Class A USD Distributing 12,894,749 2,013,927 (6,836,643) 8,072,033 Class A EUR Accumulating (Hedged) 77,221 40,176 (46,011) 71,386 Class C USD Accumulating 8,403 – (3,753) 4,650 Class C USD Distributing 48,506 360 – 48,866 Class I USD Accumulating 34,723,863 32,148,211 (29,471,884) 37,400,190 Class I USD Distributing 2,478,329 3,820,738 (1,056,939) 5,242,128 Class I CHF Accumulating (Hedged)3 – 1,878 – 1,878 Class I CHF Distributing (Hedged)3 – 1,958 – 1,958 Class I EUR Accumulating 2,500 – – 2,500 Class I EUR Accumulating (Hedged) 5,369,393 3,888,102 (6,258,413) 2,999,082 Class I EUR Distributing (Hedged)4 – 1,682 – 1,682 Class I GBP Accumulating (Hedged)3 – 33,186 – 33,186 Class I GBP Distributing (Hedged)4 – 1,502 – 1,502 Class J USD Accumulating5 – 1,501 (1) 1,500 Class J EUR Accumulating5 – 1,730 (1) 1,729 Class J GBP Distributing5 – 1,564 (1) 1,563 Class N USD Accumulating 4,452,352 515,123 (2,227,286) 2,740,189 Class N USD Distributing 3,164,069 747,058 (1,995,558) 1,915,569 Class Z USD Accumulating 5,752,778 3,595,438 (2,997,875) 6,350,341 Class Z USD Distributing 2,349,922 1,492,163 (1,200,747) 2,641,338 Class Z CHF Accumulating (Hedged) 2,032 – – 2,032 Class Z CHF Distributing (Hedged) 2,241 113 – 2,354 Class Z EUR Accumulating 3,020 – (1,459) 1,561 Class Z EUR Accumulating (Hedged) 4,952 16,782 (17,582) 4,152
Shares in Issue at Shares Shares Shares in Issue at 1 February 2018 Issued Redeemed 31 January 2019Global Multi-Sector Bond Fund Class A USD Accumulating 1,589,577 662,130 (871,338) 1,380,369 Class A USD Distributing 1,023,707 268,301 (426,209) 865,799 Class C USD Accumulating 9,996 – (4,338) 5,658 Class C USD Distributing 117,560 2,005 (12,047) 107,518 Class N USD Accumulating 1,127,499 125,420 (366,768) 886,151 Class N USD Distributing 129,854 126,980 (41,641) 215,193 Class Z USD Accumulating 1,535,326 583,567 (1,033,120) 1,085,773 Class Z USD Distributing 434,968 108,775 (294,712) 249,031
3Share Class re-launched on 6 March 2018. 4Share Class launched on 6 March 2018. 5Share Class launched on 1 October 2018.
268

LORD ABBETT PASSPORT PORTFOLIOS PLC NOTES TO THE FINANCIAL STATEMENTS AS AT 31 JANUARY 2020 (Continued)
4. Share Capital (Continued)
Shares in Issue at Shares Shares Shares in Issue at 1 February 2018 Issued Redeemed 31 January 2019Total Return Fund Class A USD Accumulating 542,487 139,715 (73,645) 608,557 Class A USD Distributing 67,301 165,088 (170,484) 61,905 Class C USD Distributing 32,100 467 – 32,567 Class N USD Accumulating 412,570 18,209 (73,444) 357,335 Class N USD Distributing 61,160 39,768 (3,034) 97,894 Class Z USD Accumulating 1,191,696 119,478 (525,362) 785,812 Class Z USD Distributing 76,623 1,164 (33,651) 44,136
Shares in Issue at Shares Shares Shares in Issue at 1 February 2018 Issued Redeemed 31 January 2019Emerging Markets Corporate Debt Fund Class A USD Accumulating 727,577 21,752 (2,964) 746,365 Class A USD Distributing 77,221 105,331 (23,844) 158,708 Class N USD Distributing 39,627 18,530 (17,826) 40,331 Class Z USD Accumulating 271,064 4,305 (10,021) 265,348 Class Z USD Distributing 33,583 15,146 – 48,729
Shares in Issue at Shares Shares Shares in Issue at 1 February 2018 Issued Redeemed 31 January 2019Multi-Sector Income Fund Class A USD Accumulating 6,087,298 1,843,340 (2,348,930) 5,581,708 Class A USD Distributing 5,819,779 1,526,671 (1,812,493) 5,533,957 Class C USD Distributing 4,952 137 – 5,089 Class I USD Accumulating 15,611 646,389 (45,057) 616,943 Class I EUR Accumulating (Hedged) 67,238 52,676 (76,163) 43,751 Class N USD Accumulating 4,174,748 739,712 (1,471,680) 3,442,780 Class N USD Distributing 1,914,988 334,665 (592,004) 1,657,649 Class Z USD Accumulating 5,745,063 3,408,849 (1,793,986) 7,359,926 Class Z USD Distributing 1,261,822 903,567 (790,412) 1,374,977
Shares in Issue at Shares Shares Shares in Issue at 1 February 2018 Issued Redeemed 31 January 2019U.S. Growth Leaders Fund Class A USD Accumulating 395,898 970,510 (266,175) 1,100,233 Class I USD Accumulating 200,000 50,000 (101,557) 148,443 Class N USD Accumulating 250,266 105,747 (80,383) 275,630 Class Z USD Accumulating 200,000 130,008 (142,257) 187,751
Shares in Issue at Shares Shares Shares in Issue at 1 February 2018 Issued Redeemed 31 January 2019Global High Yield Fund Class A USD Accumulating 18,882 24,634 (22,132) 21,384 Class A USD Distributing 1,079,539 69,164 (5,506) 1,143,197 Class I USD Distributing 5,392 337 – 5,729 Class N USD Distributing 5,304 254 – 5,558 Class Z USD Accumulating 1,000 – – 1,000 Class Z USD Distributing 5,374 314 – 5,688
269

LORD ABBETT PASSPORT PORTFOLIOS PLC NOTES TO THE FINANCIAL STATEMENTS AS AT 31 JANUARY 2020 (Continued)
4. Share Capital (Continued) Shares in Issue at Shares Shares Shares in Issue at 1 February 2018 Issued Redeemed 31 January 2019Global Equity Research Fund Class A USD Accumulating 320,899 26,451 (7,122) 340,228 Class I USD Accumulating 5,000 – – 5,000 Class N USD Accumulating 10,268 – – 10,268 Class Z USD Accumulating 5,000 – – 5,000
Shares in Issue at Shares Shares Shares in Issue at 1 February 2018 Issued Redeemed 31 January 2019Ultra Short Bond Fund Class A USD Accumulating 1,080,273 72,652,765 (16,937,560) 56,795,478 Class A USD Distributing 55,074 22,489,025 (2,718,387) 19,825,712 Class Z USD Accumulating 215,479 20,617,561 (5,998,440) 14,834,600 Class Z USD Distributing 67,369 4,893,693 (833,661) 4,127,401
5. Management Fee The Manager earned a fee of USD 52,076,477 for the financial year ended 31 January 2020 (31 January 2019: USD 33,241,792) of which USD 5,748,359 (31 January 2019: USD 2,954,154) was outstanding at the financial year end. Under the Management Agreement, the Company pays to the Manager a maximum fee at an annual rate equal to the percentage of the average daily NAV of the relevant Class of the Fund as set out in the table below. These fees are accrued daily and calculated and payable monthly in arrears. The Manager will remunerate the Investment Manager from its management fee, together with any reasonable vouched out of pocket expenses.
270

LORD ABBETT PASSPORT PORTFOLIOS PLC NOTES TO THE FINANCIAL STATEMENTS AS AT 31 JANUARY 2020 (Continued)
5. Management Fee (Continued)
Short Duration High Yield Global Multi-Sector Income Fund Fund Bond Fund
Class A USD Accumulating 1.00% 1.35% 1.35% Class A USD Distributing 1.00% 1.35% 1.35% Class A CHF Accumulating (Hedged) 1.00% – –
Class A CHF Distributing (Hedged) 1.00% – –
Class A EUR Accumulating (Hedged)1 1.00% 1.35% 1.35% Class A EUR Distributing (Hedged) 1.00% – –
Class A GBP Distributing (Hedged) 1.00% – –
Class C USD Accumulating2 1.75% 1.95% –
Class C USD Distributing 1.75% 1.95% 1.85% Class I USD Accumulating3 0.45% 0.60% 0.60% Class I USD Distributing 0.45% 0.60% –
Class I CHF Accumulating (Hedged) 0.45% 0.60% –
Class I CHF Distributing (Hedged) 0.45% 0.60% –
Class I EUR Accumulating 0.45% 0.60% – Class I EUR Accumulating (Hedged)3 0.45% 0.60% 0.60% Class I EUR Distributing (Hedged) 0.45% 0.60% –
Class I GBP Accumulating (Hedged)3 0.45% 0.60% 0.60% Class I GBP Distributing (Hedged) 0.45% 0.60% –
Class I JPY Accumulating4 – 0.60% –
Class J USD Accumulating 0.25% 0.52% –
Class J USD Distributing 0.25% – –
Class J EUR Accumulating – 0.52% –
Class J EUR Accumulating (Hedged) 0.25% – –
Class J EUR Distributing (Hedged)5 0.25% 0.52% –
Class J GBP Distributing – 0.52% –
Class J GBP Distributing(Hedged)5 0.25% 0.52% –
Class N USD Accumulating 1.75% 1.85% 1.85% Class N USD Distributing 1.75% 1.85% 1.85% Class Z USD Accumulating 0.75% 0.85% 0.85% Class Z USD Distributing 0.75% 0.85% 0.85% Class Z CHF Accumulating (Hedged) 0.75% 0.85% –
Class Z CHF Distributing (Hedged) 0.75% 0.85% –
Class Z EUR Accumulating – 0.85% – Class Z EUR Accumulating (Hedged) 0.75% 0.85% – Class Z GBP Accumulating (Hedged) 0.75% – – Class Z GBP Distributing (Hedged) 0.75% – –
1Share Class launched on 3 September 2019 for Global Multi-Sector Bond Fund. 2Share Class liquidated on 3 September 2019 for Global Multi-Sector Bond Fund. 3Share Class re-launched on 1 April 2019 for Global Multi-Sector Bond Fund. 4Share Class launched on 6 March 2019. 5Share Class launched on 7 May 2019 for High Yield Fund.
271

LORD ABBETT PASSPORT PORTFOLIOS PLC NOTES TO THE FINANCIAL STATEMENTS AS AT 31 JANUARY 2020 (Continued)
5. Management Fee (Continued)
Emerging Markets Total Return Corporate Debt Multi-Sector Fund Fund Income Fund
Class A USD Accumulating 1.30% 1.45% 1.35% Class A USD Distributing 1.30% 1.45% 1.35%
Class A EUR Accumulating (Hedged)6 – – 1.35%
Class C USD Distributing7 1.80% – – Class I USD Accumulating8 – 0.70% 0.60% Class I EUR Accumulating (Hedged) – – 0.60%
Class I EUR Distributing (Hedged)9 – – 0.60%
Class I GBP Accumulating (Hedged)10 – – 0.60%
Class N USD Accumulating 1.80% – 1.85% Class N USD Distributing 1.80% 1.95% 1.85% Class Z USD Accumulating 0.80% 0.95% 0.85% Class Z USD Distributing 0.80% 0.95% 0.85%
U.S. Growth Leaders
Global High Yield
Global Equity Research
Fund Fund Fund Class A USD Accumulating 1.65% 1.45% 1.65% Class A USD Distributing – 1.45% –
Class A EUR Accumulating (Hedged)6 – 1.45% – Class I USD Accumulating11 0.75% 1.45% 0.75% Class I USD Distributing – 0.65% –
Class I EUR Accumulating (Hedged)10 – 0.65% – Class I EUR Distributing (Hedged)6 – 0.65% – Class I GBP Accumulating (Hedged)10 – 0.65% – Class IF USD Accumulating12 – 0.35% – Class IF USD Distributing12 – 0.35% – Class IF EUR Accumulating (Hedged)12 – 0.35% – Class IF GBP Accumulating (Hedged)12 – 0.35% – Class N USD Accumulating 2.15% – 2.15% Class N USD Distributing – 1.95% – Class Z USD Accumulating 0.90% 0.95% 0.90% Class Z USD Distributing – 0.95% –
Ultra Short Bond
High Yield
Core Fund Fund13 Class A USD Accumulating 0.50% – Class A USD Distributing 0.50% – Class I USD Accumulating13 – 0.60% Class I USD Distributing10 – 0.60% Class Z USD Accumulating 0.20% – Class Z USD Distributing 0.20% –
6Share Class launched on 3 September 2019. 7Share Class liquidated on 3 September 2019 for Multi Sector Income Fund. 8Share Class re-launched on 1 April 2019 for Emerging Markets Corporate Debt Fund. 9Share Class launched on 26 June 2019. 10Share Class launched on 1 April 2019. 11Share Class launched on 1 April 2019 for Global High Yield Fund. 12Share Class launched on 31 July 2019. 13Fund and Share Class launched on 5 March 2019.
The Manager may from time to time at its sole discretion, use part of its management fee to remunerate the Distributor and certain other financial intermediaries and may pay reimbursements or rebates to certain institutional shareholders.
272

LORD ABBETT PASSPORT PORTFOLIOS PLC NOTES TO THE FINANCIAL STATEMENTS AS AT 31 JANUARY 2020 (Continued)
5. Management Fee (Continued) The Manager has committed to waive its management fee and, if necessary, reimburse the Funds’ operating expenses, in order to keep the Funds’ total operating expenses (including the fees of the Manager, Administrator and Depositary) from exceeding the expense limitation of the Fund as set out in the Prospectus. Operating expenses do not include the cost of buying and selling investments, withholding tax, stamp duty or other taxes on investments, commissions and brokerage fees incurred with respect to investments, and such extraordinary or exceptional costs and expenses (if any) as may arise from time to time, such as material litigation in relation to the Company as may be determined by the Directors in their discretion. The expenses subject to the expense limitation shall include the management fee. The Manager may renew or discontinue this agreement at any time upon prior notification to shareholders.
To the extent that the Manager waives its fee or reimburses the Fund’s operating expenses under the expense limitation, the Fund’s overall expense ratio will be lower than it would have been without the expense limitation. The expense ratio relevant to each Share Class can be found in the supplement for each Fund. This reduction in operating expenses may increase the Fund’s investment return and such returns may not be achieved without the benefit of the expense limitation. The Manager reimbursed an amount of USD 1,428,092 (31 January 2019: USD 1,685,326) during the financial year of which USD 371,798 (31 January 2019: USD 200,745) was receivable at the financial year end. 6. Administration Fee
Brown Brothers Harriman Fund Administration Services (Ireland) Limited (the “Administrator, Registrar, and Transfer Agent”) is entitled to receive a fee out of the assets of the Fund. This fee accrues on each Dealing Day and payable monthly in arrears. The Administrator earned a fee of USD 5,409,238 (31 January 2019: USD 3,996,221) for administration, fund accounting, and transfer agency services for the financial year ended 31 January 2020 of which USD 1,456,936 (31 January 2019: USD 2,097,929) was outstanding at the financial year end. 7. Depositary and Trustee Fees
Brown Brothers Harriman Trustee Services (Ireland) Limited (the “Depositary”) is entitled to receive a fee out of the assets of the Fund. This fee accrues and is calculated on each Dealing Day and payable monthly in arrears. The Depositary earned a fee of USD 1,733,964 (31 January 2019: USD 1,056,699) for Depositary and trustee services for the financial year ended 31 January 2020 of which USD 467,917 (31 January 2019: USD 540,033) was outstanding at financial year end.
8. Directors’ Fees and Expenses
Each Director is entitled to a fee by way of remuneration for their services at a rate to be determined from time to time by the Directors. However, Directors affiliated with the Investment Manager are not entitled to a fee. The aggregate amount of Directors’ remuneration in any one year shall not exceed EUR 100,000 without the approval of the Directors. All Directors are entitled to reimbursement by the Company of expenses properly incurred in connection with the business of the Company or discharge of their duties.
The aggregate payments to the Directors (including expenses) for the financial year ended 31 January 2020 were USD 99,763 (31 January 2019: USD 107,841) of which USD 5,136 (31 January 2019: USD 2,677) was outstanding at the financial year end.
273

LORD ABBETT PASSPORT PORTFOLIOS PLC NOTES TO THE FINANCIAL STATEMENTS AS AT 31 JANUARY 2020 (Continued)
9. Audit Fees
The tables below outline the remuneration (excluding VAT) charged by the statutory auditors firm for the financial year ended 31 January 2020 and comparative figures for the financial year ended 31 January 2019:
Short Duration Income Fund
Year Ended 31 January 2020
USD
High Yield Fund
Year Ended 31 January 2020
USD
Global Multi - Sector
Bond Fund Year Ended
31 January 2020
USD
Total Return
Fund Year Ended
31 January 2020
USD Statutory Audit Fees* 16,708 16,708 16,708 16,708 Tax services** 45,695 41,477 25,460 25,460 Other Assurance Services** 761 761 761 761 63,164 58,946 42,929 42,929
Emerging Markets Corporate Debt Fund
Year Ended 31 January 2020
USD
Multi-Sector Income Fund
Year Ended 31 January 2020
USD
U.S. Growth
Leaders Fund Year Ended
31 January 2020
USD
Global High Yield Fund
Year Ended 31 January 2020
USD Statutory Audit Fees* 16,708 16,708 9,484 16,708 Tax services** 25,460 28,428 11,095 1,025 Other Assurance Services** 761 761 761 761 42,929 45,897 21,340 18,494
Global Equity Research Fund
Year Ended 31 January 2020
USD
Ultra Short Bond Fund
Year Ended 31 January 2020
USD
High Yield Core Fund1
Period Ended 31 January 2020
USD
Total Year/Period
Ended 31 January 2020
USD Statutory Audit Fees* 9,484 16,708 11,064 163,696 Tax services** 797 1,025 – 205,922 Other Assurance Services** 761 761 559 8,169 11,042 18,494 11,623 377,787
Short Duration Income Fund
Year Ended 31 January 2019
USD
High Yield Fund
Year Ended 31 January 2019
USD
Global Multi –Sector
Bond Fund Year Ended
31 January 2019
USD
Total Return
Fund Year Ended
31 January 2019
USD Statutory Audit Fees* 17,367 17,367 17,367 17,367 Tax services** 43,575 42,688 24,700 24,700 Other Assurance Services** 750 750 750 750 61,692 60,805 42,817 42,817 1Fund launched on 5 March 2019.
274

LORD ABBETT PASSPORT PORTFOLIOS PLC NOTES TO THE FINANCIAL STATEMENTS AS AT 31 JANUARY 2020 (Continued)
9. Audit Fees (Continued)
Emerging Markets Corporate Debt Fund
Year Ended 31 January 2019
USD
Multi-Sector Income Fund
Year Ended 31 January 2019
USD
U.S. Growth
Leaders Fund Year Ended
31 January 2019
USD
Global High Yield Fund
Year Ended 31 January 2019
USD Statutory Audit Fees* 17,367 17,367 9,847 17,367 Tax services** 23,929 27,272 999 999 Other Assurance Services** 750 750 750 750 42,046 45,389 11,596 19,116
Global Equity Research Fund
Year Ended 31 January 2019
USD
Ultra Short Bond Fund
Year Ended 31 January 2019
USD
Total Year Ended
31 January 2019
USD Statutory Audit Fees* 9,847 17,367 158,630 Tax services** 999 – 189,861 Other Assurance Services** 750 750 7,500 11,596 18,117 355,991 *Statutory Audit Fees include Out of Pocket fees amounting to USD 407 (31 January 2019: USD 130). These are included in Audit Fees in the Statement
of Comprehensive Income. **Tax Services and Other Assurance Services are included within Legal and Professional Fees in the Statement of Comprehensive Income.
275

LORD ABBETT PASSPORT PORTFOLIOS PLC NOTES TO THE FINANCIAL STATEMENTS AS AT 31 JANUARY 2020 (Continued)
10. Finance Costs
For all Distributing Share Classes, dividends are declared and paid monthly with the exception of Ultra Short Bond Fund for which dividends are declared daily and paid monthly.
During the financial year ended 31 January 2020 and 31 January 2019, the Company declared and paid the following dividends:
Short Duration Income Fund
For the year ended
31 January 2020 For the year ended
31 January 2019 Cumulative Cumulative Cumulative Cumulative
Distribution
Amount Distribution
Rate Distribution
Amount Distribution
Rate USD USD USD USD Share Class Class A USD Distributing 7,464,329 0.2367995 6,373,014 0.2570760 Class A CHF Distributing (Hedged) 384 0.1270811 664 0.1761571 Class A EUR Distributing (Hedged) 75,207 0.2533805 38,915 0.2654054 Class A GBP Distributing (Hedged) 367 0.1741930 479 0.2314454 Class C USD Distributing 14,764 0.1641431 17,161 0.1855114 Class I USD Distributing 1,848,612 0.3026785 90,748 0.2354312 Class I CHF Distributing (Hedged) 1,201 0.2224184 1,349 0.2565987 Class I EUR Distributing (Hedged)1 388 0.1888458 456 0.2261039 Class I GBP Distributing (Hedged) 47,303 0.3317027 643 0.3060876 Class J USD Distributing2 17,881 0.3073306 26,708 0.2009937 Class J EUR Distributing (Hedged)2 30,510 0.3225547 39,406 0.2427352 Class J GBP Distributing (Hedged)2 18,645 0.3844366 27,555 0.2753622 Class N USD Distributing 714,109 0.1641281 867,808 0.1853270 Class Z USD Distributing 2,700,562 0.2624128 2,403,781 0.2844582 Class Z CHF Distributing (Hedged) 1,045 0.1958580 1,207 0.2315712 Class Z GBP Distributing (Hedged) 445 0.2092915 563 0.2693788 Total 12,935,752 9,890,457
High Yield Fund
For the year ended
31 January 2020 For the year ended
31 January 2019 Cumulative Cumulative Cumulative Cumulative
Distribution
Amount Distribution
Rate Distribution
Amount Distribution
Rate USD USD USD USD Share Class Class A USD Distributing 3,807,511 0.4488628 4,710,380 0.4613322 Class C USD Distributing 18,991 0.3868716 19,471 0.4000822 Class I USD Distributing 2,991,482 0.5161749 2,536,927 0.5278267 Class I CHF Distributing (Hedged)3 899 0.4494628 830 0.4344643 Class I EUR Distributing (Hedged)1 6,396 0.5006292 821 0.5001690 Class I GBP Distributing (Hedged)1 894 0.5826236 836 0.5703362 Class J EUR Distributing (Hedged)4 38,299 0.4108201 – – Class J GBP Distributing5 10,608 0.6666370 356 0.2302429 Class J GBP Distributing (Hedged)4 342,100 0.4759247 – – Class N USD Distributing 729,447 0.3971275 1,015,285 0.4099185 Class Z USD Distributing 1,407,915 0.5002888 1,479,558 0.5117274 Class Z CHF Distributing (Hedged) 1,148 0.4774401 1,180 0.5150072 Total 9,355,690 9,765,644 1Share Class launched on 6 March 2018. 2Share Class launched on 1 June 2018. 3Share Class re-launched on 6 March 2018. 4Share Class launched on 7 May 2019. 5Share Class launched on 1 October 2018.
276

LORD ABBETT PASSPORT PORTFOLIOS PLC NOTES TO THE FINANCIAL STATEMENTS AS AT 31 JANUARY 2020 (Continued)
10. Finance Costs (Continued)
Global Multi-Sector Bond Fund
For the year ended
31 January 2020 For the year ended
31 January 2019 Cumulative Cumulative Cumulative Cumulative
Distribution
Amount Distribution
Rate Distribution
Amount Distribution
Rate USD USD USD USD Share Class Class A USD Distributing 230,396 0.2546043 281,551 0.2857317 Class C USD Distributing 17,689 0.1938773 24,248 0.2268122 Class N USD Distributing 47,943 0.1940393 44,848 0.2269965 Class Z USD Distributing 71,430 0.2951448 111,275 0.3250415 Total 367,458 461,922 Total Return Fund
For the year ended
31 January 2020 For the year ended
31 January 2019 Cumulative Cumulative Cumulative Cumulative
Distribution
Amount Distribution
Rate Distribution
Amount Distribution
Rate USD USD USD USD Share Class Class A USD Distributing 12,845 0.1874127 36,330 0.2123985 Class C USD Distributing 4,328 0.1323660 5,153 0.1593726 Class N USD Distributing 11,380 0.1321856 14,270 0.1591704 Class Z USD Distributing 75,093 0.2320889 11,957 0.2555656 Total 103,646 67,710 Emerging Markets Corporate Debt Fund
For the year ended
31 January 2020 For the year ended
31 January 2019 Cumulative Cumulative Cumulative Cumulative
Distribution
Amount Distribution
Rate Distribution
Amount Distribution
Rate USD USD USD USD Share Class Class A USD Distributing 64,422 0.3845576 44,079 0.3615208 Class N USD Distributing 23,611 0.3223949 14,250 0.3016984 Class Z USD Distributing 20,276 0.4260322 18,350 0.4015094 Total 108,309 76,679 Multi-Sector Income Fund
For the year ended
31 January 2020 For the year ended
31 January 2019 Cumulative Cumulative Cumulative Cumulative
Distribution
Amount Distribution
Rate Distribution
Amount Distribution
Rate USD USD USD USD Share Class Class A USD Distributing 1,743,416 0.3034725 2,115,656 0.3533362 Class C USD Distributing6 768 0.1499415 1,445 0.2882888 Class I EUR Distributing (Hedged)7 111,482 0.2222867 – – Class N USD Distributing 442,079 0.2412997 545,441 0.2899195 Class Z USD Distributing 635,516 0.3497602 590,404 0.3951729 Total 2,933,261 3,252,946
6Share Class liquidated on 3 September 2019. 7Share Class launched on 26 June 2019.
277

LORD ABBETT PASSPORT PORTFOLIOS PLC NOTES TO THE FINANCIAL STATEMENTS AS AT 31 JANUARY 2020 (Continued)
10. Finance Costs (Continued) Global High Yield Fund
For the year ended
31 January 2020 For the year ended
31 January 2019 Cumulative Cumulative Cumulative Cumulative
Distribution
Amount Distribution
Rate Distribution
Amount Distribution
Rate USD USD USD USD Share Class Class A USD Distributing 574,667 0.4797334 588,057 0.5314310 Class I USD Distributing 4,386 0.5706781 3,447 0.6219176 Class I EUR Distributing (Hedged)8 14,642 0.2357667 – – Class IF USD Distributing9 1,750 0.2693973 – – Class N USD Distributing 3,877 0.4269862 2,599 0.4796472 Class Z USD Distributing 3,084 0.5295549 3,206 0.5813677 Total 602,406 597,309
Ultra Short Bond Fund
For the year ended
31 January 2020 For the year ended
31 January 2019 Cumulative Cumulative Cumulative Cumulative
Distribution
Amount Distribution
Rate Distribution
Amount Distribution
Rate USD USD USD USD Share Class Class A USD Distributing 6,075,934 0.2285665 2,037,740 0.2003374 Class Z USD Distributing 1,856,275 0.2600637 393,825 0.2301425 Total 7,932,209 2,431,565
High Yield Core Fund10
For the period ended
31 January 2020
Cumulative Cumulative
Distribution
Amount Distribution
Rate
USD USD Share Class Class I USD Distributing10 4,968,945 0.4873757 Total 4,968,945
8Share Class launched on 3 September 2019. 9Share Class launched on 31 July 2019. 10Fund and Share Class launched on 5 March 2019.
11. Financial Risk Management Strategy in Using Financial Instruments Each Fund aims to achieve its investment objective while spreading investment risks through investment in transferable securities or liquid financial assets or collective investment schemes or other permitted investments in accordance with the Regulations. The transferable securities and liquid financial assets in which a Fund may invest generally must be listed and/or traded on a Regulated Market except that up to 10% of the NAV of a Fund may be invested in transferable securities and liquid financial assets which are not so listed, traded or dealt.
278

LORD ABBETT PASSPORT PORTFOLIOS PLC NOTES TO THE FINANCIAL STATEMENTS AS AT 31 JANUARY 2020 (Continued)
11. Financial Risk Management (Continued) Market Price Risk Market price risk is the risk of loss for the Fund resulting from fluctuation in the market value of positions in the Fund portfolio attributable to changes in market variables, such as interest rates, foreign exchange rates, equity and commodity prices or an issuer’s credit worthiness. The market risk associated with the use of derivatives is assessed in the context of the risk profile of the total portfolio. Some of the strategies using FDIs will be risk reducing such as open forward foreign currency contracts used for hedging currency risk. Some strategies may add to market risk but at all times the regulatory limits for FDIs applying to UCITS funds will be adhered to. Common stocks and other equity securities, as well as equity-like securities such as convertible debt securities, may experience significant volatility. Such securities may fall sharply in response to adverse events affecting overall markets, a particular industry or sector, or an individual company’s financial condition. Market/leverage risk is mitigated in the Funds through the global exposure and leverage limits imposed under the UCITS rules. These are monitored by the Investment Manager on a daily basis. The Investment Manager’s internal risk management function utilises a range of systems to measure and monitor market risk. The Funds’ concentrations in market price exposures at 31 January 2020 and 31 January 2019 are detailed in their Schedules of Investments, the Statement of Financial Position and in Note 3. At 31 January 2020 and 31 January 2019, had the market price increased or decreased by 5% with all other variables held constant, the increase or decrease respectively in Net Assets Attributable to Redeemable Participating Shareholders would amount to: 31 January 2020 31 January 2019 U.S. Growth Leaders Fund 1,914,085 1,246,721 Global Equity Research Fund 230,151 211,916 There was limited exposure of market price risk in Short Duration Income Fund, High Yield Fund, Global Multi-Sector Bond Fund, Total Return Fund, Emerging Markets Corporate Debt Fund, Multi-Sector Income Fund, Global High Yield Fund, Ultra Short Bond Fund and High Yield Core Fund1 at 31 January 2020 and 31 January 2019. 1Fund launched on 5 March 2019.
Currency Risk Currency risk is the risk that the fair value or future cash flows of a financial instrument will fluctuate because of changes in foreign exchange rates. A portion of each Fund’s assets, liabilities and income may be denominated in currencies other than the Fund’s functional currency. They could, therefore be exposed to currency risk as the value of the securities denominated in other currencies will fluctuate due to changes in exchange rates. Currency exchange rates also can be affected unpredictably by intervention (or failure to intervene) by U.S. or non-U.S. governments or central banks, or by currency controls or political developments. Income denominated in foreign currencies is converted to the Fund’s functional currency on receipt. A Fund’s use of currency-related transactions involves the risk that the Investment Manager will not accurately predict currency movements, and a Fund’s returns could be reduced as a result. Investments in non-U.S. currencies are subject to the risk that those currencies will decline in value relative to the U.S. dollar, or, in the case of hedged positions, that the U.S. dollar will decline relative to the currency being hedged. If the Investment Manager is not accurate in its predictions of currency movements, a Fund will lose money, in addition to a Fund’s incurring transaction costs. Also, it may be difficult or impractical to hedge currency risk in many developing or emerging countries. The risks associated with exposure to emerging market currencies may be heightened in comparison to those associated with exposure to developed market currencies. Performance may be strongly influenced by movements in currency exchange rates because currency positions held by a Fund may not correspond with the securities positions held. In the case of unhedged Class Currencies, a currency conversion will take place on subscription, redemption, switching and payments of dividends at prevailing exchange rates. Accordingly, the value of the shares expressed in the Class Currency will be subject to exchange rate risk in relation to the Base Currency of the relevant Fund.
279

LORD ABBETT PASSPORT PORTFOLIOS PLC NOTES TO THE FINANCIAL STATEMENTS AS AT 31 JANUARY 2020 (Continued)
11. Financial Risk Management (Continued) Currency Risk (Continued) The following tables set out the Fund’s total exposure to foreign currency risk (all amounts in USD) and the effect on the Net Assets Attributable to Holders of Redeemable Participating Shares of the Fund had the exchange rate between the USD and the relevant currency increased or decreased by 5% with all other variables held constant. Short Duration Income Fund 31 January 2020 Non-USD Non-USD Forward Foreign Net Non-USD Sensitivity Currency Currency Currency Currency Analysis Assets Liabilities Contracts Asset/Liabilities +/- 5% USD USD USD USD USD British Pound 306,158 (8,496) – 297,662 14,883 Euro 1,721,320 (667,405) – 1,053,915 52,696 2,027,478 (675,901) – 1,351,577 67,579 High Yield Fund 31 January 2020 Non-USD Non-USD Forward Foreign Net Non-USD Sensitivity Currency Currency Currency Currency Analysis Assets Liabilities Contracts Asset/Liabilities +/- 5% USD USD USD USD USD British Pound 16,574,244 (330,212) (15,033,246) 1,210,786 60,539 Canadian Dollar 1,693,900 (253,622) (1,736,567) (296,289) 14,814 Euro 81,185,951 (19,415,703) (54,651,834) 7,118,414 355,921 99,454,095 (19,999,537) (71,421,647) 8,032,911 431,274 Global Multi-Sector Bond Fund
31 January 2020 Non-USD
Currency Assets
USD
Non-USD Currency Liabilities
USD
Forward Foreign Currency Contracts
USD
Net Non-USD Currency
Asset/Liabilities USD
SensitivityAnalysis
+/- 5% USD
Australian Dollar 1,829,140 (397) (1,827,039) 1,704 85 Brazilian Real 730,734 (101) (749,092) (18,459) 923 British Pound 4,554,723 – (4,547,537) 7,186 359 Canadian Dollar 1,888,667 (417,039) (1,594,340) (122,712) 6,136 Chilean Peso 117,560 (132) (117,580) (152) 8 Colombian Peso 283,430 (91) (282,671) 668 33 Euro 14,094,035 (352,225) (13,661,803) 80,007 4,000 Swedish Krona 364,483 (10) (364,945) (472) 24 South African Rand 390,374 (410) (392,977) (3,013) 151 Indonesian Rupiah 419,607 (4,446) (397,497) 17,664 883 Japanese Yen 1,116,398 (646) (1,102,510) 13,242 662 Thailand Baht 163,581 (13) (170,923) (7,355) 368 Hungarian Forint 155,816 (29) (157,903) (2,116) 106 Peruvian Nuevo Sol 141,648 (9) (139,491) 2,148 107 Norwegian Krone – – 15,352 15,352 768 26,250,196 (775,548) (25,490,956) (16,308) 14,613
280

LORD ABBETT PASSPORT PORTFOLIOS PLC NOTES TO THE FINANCIAL STATEMENTS AS AT 31 JANUARY 2020 (Continued)
11. Financial Risk Management (Continued) Currency Risk (Continued) Total Return Fund 31 January 2020 Non-USD
Currency Assets
USD
Non-USD Currency Liabilities
USD
Forward Foreign Currency Contracts
USD
Net Non-USD Currency
Asset/Liabilities USD
SensitivityAnalysis
+/- 5% USD
Japanese Yen 1,563,325 – (1,554,171) 9,154 458
1,563,325 – (1,554,171) 9,154 458
Emerging Markets Corporate Debt Fund 31 January 2020 Non-USD
Currency Assets
USD
Non-USD Currency Liabilities
USD
Forward Foreign Currency Contracts
USD
Net Non-USD Currency
Asset/Liabilities USD
Sensitivity Analysis
+/- 5% USD
Egyptian Pound 18,054 – – 18,054 903 Euro 220,864 (220,641) – 223 11
238,918 (220,641) – 18,277 914
Multi-Sector Income Fund 31 January 2020
Non-USD Currency
Assets USD
Non-USD Currency Liabilities
USD
Forward Foreign Currency Contracts
USD
Net Non-USD Currency
Asset/Liabilities USD
Sensitivity Analysis
+/- 5% USD
Australian Dollar 804,338 (195) (824,319) (20,176) 1,009 British Pound 726,012 – (661,234) 64,778 3,239 Canadian Dollar 1,321,409 (120,420) (653,915) 547,074 27,354 Euro 11,773,381 (4,283,382) (7,518,891) (28,892) 1,445
14,625,140 (4,403,997) (9,658,359) 562,784 33,047 Global High Yield Fund 31 January 2020 Non-USD
Currency Assets
USD
Non-USD Currency Liabilities
USD
Forward Foreign Currency Contracts
USD
Net Non-USD Currency
Asset/Liabilities USD
Sensitivity Analysis
+/- 5% USD
British Pound 1,233,464 (128,778) (1,219,076) (114,390) 5,720 Euro 7,294,999 (1,036,596) (6,558,456) (300,053) 15,003 Swiss Franc – (2) (2,558) (2,560) 128
8,528,463 (1,165,376) (7,780,090) (417,003) 20,851
281

LORD ABBETT PASSPORT PORTFOLIOS PLC NOTES TO THE FINANCIAL STATEMENTS AS AT 31 JANUARY 2020 (Continued)
11. Financial Risk Management (Continued) Currency Risk (Continued) Global Equity Research Fund
31 January 2020 Non-USD Currency
Assets USD
Non-USD Currency Liabilities
USD
Forward Foreign Currency Contracts
USD
Net Non-USD Currency
Asset/Liabilities USD
Sensitivity Analysis
+/- 5% USD
Brazilian Real 47,789 – – 47,789 2,389 British Pound 207,169 – – 207,169 10,358 Canadian Dollar 51,728 – – 51,728 2,586 Danish Krone 47,927 – – 47,927 2,396 Euro 614,003 (59,661) – 554,342 27,717 Hong-Kong Dollar 266,285 (189,048) – 77,237 3,862 Japanese Yen 331,949 (193,760) – 138,189 6,909 Korean Won 95,009 (61,434) – 33,575 1,679 Mexican Peso 13,660 – – 13,660 683 New Zealand Dollar 58,001 (43,674) – 14,327 716 Norwegian Krone 329 – – 329 16 Singapore Dollar 40,892 (41,800) – (908) 45 Swedish Krona 41,489 – – 41,489 2,074 Taiwan New Dollar 67,855 (9,230) – 58,625 2,931 1,884,085 (598,607) – 1,285,478 64,361
High Yield Core Fund1
31 January 2020 Non-USD Currency
Assets USD
Non-USD Currency Liabilities
USD
Forward Foreign Currency Contracts
USD
Net Non-USD Currency
Asset/Liabilities USD
Sensitivity Analysis
+/- 5% USD
British Pound 3,344,526 – (3,363,216) (18,690) 935 Euro 9,070,696 (2,273,000) (6,933,195) (135,499) 6,775 Swiss Franc – – (7,122) (7,122) 356 12,415,222 (2,273,000) (10,303,533) (161,311) 8,066 U.S. Growth Leaders Fund and Ultra Short Bond Fund do not have material currency exposure for the financial year ended 31 January 2020. 1Fund launched on 5 March 2019.
Short Duration Income Fund
31 January 2019 Non-USD Non-USD Forward Foreign Net Non-USD Sensitivity Currency Currency Currency Currency Analysis Assets Liabilities Contracts Asset/Liabilities +/- 5% USD USD USD USD USD British Pound 1,115,067 (179,031) – 936,036 46,802 Canadian Dollar 222,004 – (216,221) 5,783 289 Euro 2,913,843 (1,419,470) (415,758) 1,078,615 53,931 4,250,914 (1,598,501) (631,979) 2,020,434 101,022
282

LORD ABBETT PASSPORT PORTFOLIOS PLC NOTES TO THE FINANCIAL STATEMENTS AS AT 31 JANUARY 2020 (Continued)
11. Financial Risk Management (Continued) Currency Risk (Continued) High Yield Fund
31 January 2019 Non-USD Non-USD Forward Foreign Net Non-USD Sensitivity Currency Currency Currency Currency Analysis Assets Liabilities Contracts Asset/Liabilities +/- 5% USD USD USD USD USD British Pound 4,124,127 – (3,939,861) 184,266 9,213 Canadian Dollar 1,070,659 – (1,006,380) 64,279 3,214 Euro 32,377,472 (658,808) (31,432,284) 286,380 14,319 37,572,258 (658,808) (36,378,525) 534,925 26,746 Global Multi-Sector Bond Fund
31 January 2019 Non-USD
Currency Assets
USD
Non-USD Currency Liabilities
USD
Forward Foreign Currency Contracts
USD
Net Non-USD Currency
Asset/Liabilities USD
Sensitivity Analysis
+/- 5% USD
Brazilian Real 211,969 – (190,449) 21,520 1,076 British Pound 2,275,574 – (2,155,283) 120,291 6,014 Canadian Dollar 276,408 – (266,673) 9,735 487 Chilean Peso 135,638 – (127,143) 8,495 425 Colombian Peso 167,522 – (158,084) 9,438 472 Euro 11,206,230 (161,274) (10,871,621) 173,335 8,666 Peruvian Nuevo Sol 137,673 – (131,992) 5,681 284 Russian Ruble 164,045 – (157,661) 6,384 319 South African Rand 181,176 – (159,699) 21,477 1,074 Swedish Krona 432,313 – (432,362) (49) 2
15,188,548 (161,274) (14,650,967) 376,307 18,819
Total Return Fund
31 January 2019 Non-USD Currency
Assets USD
Non-USD Currency Liabilities
USD
Forward Foreign Currency Contracts
USD
Net Non-USD Currency
Asset/Liabilities USD
Sensitivity Analysis
+/- 5% USD
Argentine Peso 5,037 – – 5,037 252
5,037 – – 5,037 252
Emerging Markets Corporate Debt Fund
31 January 2019 Non-USD Currency
Assets USD
Non-USD Currency Liabilities
USD
Forward Foreign Currency Contracts
USD
Net Non-USD Currency
Asset/Liabilities USD
Sensitivity Analysis
+/- 5% USD
Euro – (1,580) – (1,580) 79
– (1,580) – (1,580) 79
283

LORD ABBETT PASSPORT PORTFOLIOS PLC NOTES TO THE FINANCIAL STATEMENTS AS AT 31 JANUARY 2020 (Continued)
11. Financial Risk Management (Continued) Currency Risk (Continued) Multi-Sector Income Fund
31 January 2019 Non-USD Currency
Assets USD
Non-USD Currency Liabilities
USD
Forward Foreign Currency Contracts
USD
Net Non-USD Currency
Asset/Liabilities USD
SensitivityAnalysis
+/- 5%USD
Australian Dollar 507,406 – – 507,406 25,371 Canadian Dollar 876,631 – (204,125) 672,506 33,625 Danish Krone 403 – – 403 20 Euro 7,524,725 (51,538) (7,151,809) 321,378 16,069 Japanese Yen 3,805 – – 3,805 190 Uruguay Peso 694,845 – – 694,845 34,742
9,607,815 (51,538) (7,355,934) 2,200,343 110,017
Global High Yield Fund
31 January 2019 Non-USD Currency
Assets USD
Non-USD Currency Liabilities
USD
Forward Foreign Currency Contracts
USD
Net Non-USD Currency
Asset/Liabilities USD
Sensitivity Analysis
+/- 5% USD
British Pound 390,610 – (379,552) 11,058 553 Euro 1,733,508 (8,971) (1,607,833) 116,704 5,835 Uruguay Peso 11,590 – – 11,590 580
2,135,708 (8,971) (1,987,385) 139,352 6,968
Global Equity Research Fund
31 January 2019 Non-USD
Currency Assets
USD
Non-USD Currency Liabilities
USD
Forward Foreign Currency Contracts
USD
Net Non-USD Currency
Asset/Liabilities USD
Sensitivity Analysis
+/- 5% USD
Australian Dollar 12,606 – – 12,606 630 British Pound 589,596 (12,417) – 577,179 28,859 Canadian Dollar 66,070 – – 66,070 3,304 Danish Krone 20,368 – – 20,368 1,018 Euro 595,750 (18) – 595,732 29,788 Hong-Kong Dollar 78,496 (1,592) – 76,904 3,845 Japanese Yen 160,868 – – 160,868 8,043 Mexican Peso 29,923 (37) – 29,886 1,494 Norwegian Krone 360 – – 360 18 Swedish Krona 16,675 – – 16,675 834 Swiss Franc 79,846 (1) – 79,845 3,992 Taiwan New Dollar 31,721 – – 31,721 1,586 1,682,279 (14,065) – 1,668,214 83,411
U.S. Growth Leaders Fund and Ultra Short Bond Fund do not have material currency exposure for the financial year ended 31 January 2019.
284

LORD ABBETT PASSPORT PORTFOLIOS PLC NOTES TO THE FINANCIAL STATEMENTS AS AT 31 JANUARY 2020 (Continued)
11. Financial Risk Management (Continued)
Interest Rate Risk A rise in prevailing interest rates generally will cause the price of fixed income securities to fall. Generally, the longer the maturity of a security or weighted average maturity of a Fund, the more sensitive its price is to a rise in interest rates. The interest rates on certain debt securities in which a Fund invests may adjust periodically and may not correlate to prevailing interest rates during the periods between rate adjustments. The Funds may invest in futures contracts which bear the risk of interest rates moving unexpectedly, in which case the Funds may not achieve the anticipated benefits of futures contracts and realize a loss.
The following tables present exposure to interest rate risk by duration for the financial year ended 31 January 2020 and comparative figures for the financial year ended 31 January 2019. It includes financial assets at fair value, categorised by the earlier of contractual re-pricing or maturity dates.
Short Duration Income Fund
31 January 2020 1-3 months
USD
3 months -1 year
USD1-5 years
USD> 5 years
USD
Non- interest
bearing* USD
TotalUSD
Assets Cash and cash equivalents 42,107,857 – – – – 42,107,857 Financial Assets at Fair Value through Profit and Loss Non-Interest Bearing – – – – 4,299,138 4,299,138 Fixed Interest Rate Securities 265,025,641 56,627,686 1,530,644,071 867,738,993 – 2,720,036,391 Variable Rate Securities 8,339,981 34,607,067 623,267,669 565,856,328 – 1,232,071,045 315,473,479 91,234,753 2,153,911,740 1,433,595,321 4,299,138 3,998,514,431
High Yield Fund
31 January 2020 1-3 months
USD
3 months -1 year
USD1-5 years
USD> 5 years
USD
Non- interest
bearing* USD
TotalUSD
Assets Cash and cash equivalents 98,069,314 – – – – 98,069,314 Financial Assets at Fair Value through Profit and Loss Non-Interest Bearing – – – – 14,108,308 14,108,308 Fixed Interest Rate Securities – 954,406 408,346,162 1,331,693,806 – 1,740,994,374 Variable Rate Securities 1,595,360 2,125,169 53,930,674 120,273,022 – 177,924,225 99,664,674 3,079,575 462,276,836 1,451,966,828 14,108,308 2,031,096,221
Global Multi-Sector Bond Fund
31 January 2020 1-3 months
USD
3 months -1 year
USD1-5 years
USD> 5 years
USD
Non- interest
bearing* USD
TotalUSD
Assets Cash and cash equivalents 2,312,162 – – – – 2,312,162 Financial Assets at Fair Value through Profit and Loss Non-Interest Bearing – – – – 164,980 164,980 Fixed Interest Rate Securities 2,282,671 524,725 16,776,988 54,337,366 – 73,921,750 Variable Rate Securities 134,903 583,864 5,488,490 7,617,976 – 13,825,233 4,729,736 1,108,589 22,265,478 61,955,342 164,980 90,224,125
285

LORD ABBETT PASSPORT PORTFOLIOS PLC NOTES TO THE FINANCIAL STATEMENTS AS AT 31 JANUARY 2020 (Continued)
11. Financial Risk Management (Continued)
Interest Rate Risk (Continued) Total Return Fund
31 January 2020 1-3 months
USD
3 months -1 year
USD1-5 years
USD> 5 years
USD
Non- interest
bearing* USD
TotalUSD
Assets Cash and cash equivalents 498,002 – – – – 498,002 Financial Assets at Fair Value through Profit and Loss Non-Interest Bearing – – – – 897,085 897,085 Fixed Interest Rate Securities 1,563,625 1,421,666 9,793,313 18,181,864 – 30,960,468 Variable Rate Securities 1,873,103 – – 4,354,719 – 6,227,822 3,934,730 1,421,666 9,793,313 22,536,583 897,085 38,583,377
Emerging Markets Corporate Debt Fund
31 January 2020 1-3 months
USD
3 months -1 year
USD1-5 years
USD> 5 years
USD
Non- interest
bearing* USD
TotalUSD
Assets Cash and cash equivalents 1,022,441 – – – – 1,022,441 Financial Assets at Fair Value through Profit and Loss Non-Interest Bearing – – – – 33,143 33,143 Fixed Interest Rate Securities 17,047 235,282 7,572,020 10,991,196 – 18,815,545 Variable Rate Securities – – – 1,428,229 – 1,428,229 1,039,488 235,282 7,572,020 12,419,425 33,143 21,299,358
Multi-Sector Income Fund
31 January 2020 1-3 months
USD
3 months -1 year
USD1-5 years
USD> 5 years
USD
Non- interest
bearing* USD
TotalUSD
Assets Cash and cash equivalents 40,941,576 – – – – 40,941,576 Financial Assets at Fair Value through Profit and Loss
Non-Interest Bearing – – – – 6,207,513 6,207,513Fixed Interest Rate Securities – 7,033,663 171,448,279 398,912,326 – 577,394,268Variable Rate Securities 650,700 678,091 18,963,861 60,470,567 – 80,763,219 41,592,276 7,711,754 190,412,140 459,382,893 6,207,513 705,306,576
286

LORD ABBETT PASSPORT PORTFOLIOS PLC NOTES TO THE FINANCIAL STATEMENTS AS AT 31 JANUARY 2020 (Continued)
11. Financial Risk Management (Continued) Interest Rate Risk (Continued) Global High Yield Fund
31 January 2020 1-3 months
USD
3 months -1 year
USD1-5 years
USD> 5 years
USD
Non- interest
bearing* USD
TotalUSD
Assets Cash and cash equivalents 475,093 – – – – 475,093 Financial Assets at Fair Value through Profit and Loss
Non-Interest Bearing – – – – 126,348 126,348 Fixed Interest Rate Securities – – 13,066,893 29,108,302 – 42,175,195 Variable Rate Securities 24,505 34,445 1,131,552 4,510,945 – 5,701,447 499,598 34,445 14,198,445 33,619,247 126,348 48,478,083
Ultra Short Bond Fund
31 January 2020 1-3 months
USD
3 months -1 year
USD1-5 years
USD> 5 years
USD
Non-interest
bearing*USD
TotalUSD
Assets Cash and cash equivalents 5,940,858 – – – – 5,940,858 Financial Assets at Fair Value through Profit and Loss Non-Interest Bearing – – – – – – Fixed Interest Rate Securities 702,314,933 23,054,076 345,365,183 27,259,373 – 1,097,993,565 Variable Rate Securities 48,902,639 118,228,689 704,322,122 6,468,808 – 877,922,258 757,158,430 141,282,765 1,049,687,305 33,728,181 – 1,981,856,681
High Yield Core Fund1
31 January 2020 1-3 months
USD
3 months -1 year
USD1-5 years
USD> 5 years
USD
Non-interest
bearing*USD
TotalUSD
Assets Cash and cash equivalents 5,909,319 – – – – 5,909,319 Financial Assets at Fair Value through Profit and Loss Non-Interest Bearing – – – – 481,490 481,490 Fixed Interest Rate Securities – – 64,455,643 229,881,654 – 294,337,297 Variable Rate Securities – – – 5,084,419 – 5,084,419 5,909,319 – 64,455,643 234,966,073 481,490 305,812,525 U.S. Growth Leaders Fund and Global Equity Research Fund are not materially exposed to Interest Rate Risk. * All other assets and liabilities are disclosed in the Statement of Financial Position are considered as non-interest bearing. 1Fund launched on 5 March 2019.
287

LORD ABBETT PASSPORT PORTFOLIOS PLC NOTES TO THE FINANCIAL STATEMENTS AS AT 31 JANUARY 2020 (Continued)
11. Financial Risk Management (Continued) Interest Rate Risk (Continued) Short Duration Income Fund
At 31 January 2020, had the interest rate increased or decreased by 1% with all other variables held constant, the increase or decrease respectively in the fair value of fixed rate fixed income securities of the Short Duration Income Fund would amount to approximately USD 64,464,862. High Yield Fund
At 31 January 2020, had the interest rate increased or decreased by 1% with all other variables held constant, the increase or decrease respectively in the fair value of fixed rate fixed income securities of the High Yield Fund would amount to approximately USD 78,867,045. Global Multi-Sector Bond Fund
At 31 January 2020, had the interest rate increased or decreased by 1% with all other variables held constant, the increase or decrease respectively in the fair value of fixed rate fixed income securities of the Global Multi-Sector Bond Fund would amount to approximately USD 4,339,207. Total Return Fund
At 31 January 2020, had the interest rate increased or decreased by 1% with all other variables held constant, the increase or decrease respectively in the fair value of fixed rate fixed income securities of the Total Return Fund would amount to approximately USD 1,659,481. Emerging Markets Corporate Debt Fund
At 31 January 2020, had the interest rate increased or decreased by 1% with all other variables held constant, the increase or decrease respectively in the fair value of fixed rate fixed income securities of the Emerging Markets Corporate Debt Fund would amount to approximately USD 953,948. Multi-Sector Income Fund
At 31 January 2020, had the interest rate increased or decreased by 1% with all other variables held constant, the increase or decrease respectively in the fair value of fixed rate fixed income securities of the Multi-Sector Income Fund would amount to approximately USD 30,370,938. Global High Yield Fund At 31 January 2020, had the interest rate increased or decreased by 1% with all other variables held constant, the increase or decrease respectively in the fair value of fixed rate fixed income securities of the Global High Yield Fund would amount to approximately USD 1,927,406. Ultra Short Bond Fund At 31 January 2020, had the interest rate increased or decreased by 1% with all other variables held constant, the increase or decrease respectively in the fair value of fixed rate fixed income securities of the Ultra Short Bond Fund would amount to approximately USD 2,415,586. High Yield Core Fund2
At 31 January 2020, had the interest rate increased or decreased by 1% with all other variables held constant, the increase or decrease respectively in the fair value of fixed rate fixed income securities of the High Yield Core Fund would amount to approximately USD 11,861,793. 2Fund launched on 5 March 2019.
288

LORD ABBETT PASSPORT PORTFOLIOS PLC NOTES TO THE FINANCIAL STATEMENTS AS AT 31 JANUARY 2020 (Continued)
11. Financial Risk Management (Continued) Interest Rate Risk (Continued) Short Duration Income Fund
31 January 2019 1-3 months
USD
3 months -1 year
USD1-5 years
USD> 5 years
USD
Non- interest
bearing* USD
TotalUSD
Assets Cash and cash equivalents 31,365,306 – – – – 31,365,306Financial Assets at Fair Value through Profit and Loss Non-Interest Bearing – – – – 3,374,071 3,374,071Fixed Interest Rate Securities 67,425,972 83,074,944 897,944,610 485,529,875 – 1,533,975,401Variable Rate Securities 3,308 3,450,344 102,931,189 423,462,488 – 529,847,329 98,794,586 86,525,288 1,000,875,799 908,992,363 3,374,071 2,098,562,107
High Yield Fund
31 January 2019 1-3 months
USD
3 months -1 year
USD1-5 years
USD> 5 years
USD
Non- interest
bearing* USD
TotalUSD
Assets Cash and cash equivalents 8,131,064 – – – – 8,131,064Financial Assets at Fair Value through Profit and Loss Non-Interest Bearing – – – – 4,822,999 4,822,999Fixed Interest Rate Securities 2,394,182 5,507,547 208,263,657 728,920,382 – 945,085,768Variable Rate Securities – – 19,248,525 39,750,348 – 58,998,873 10,525,246 5,507,547 227,512,182 768,670,730 4,822,999 1,017,038,704
Global Multi-Sector Bond Fund
31 January 2019 1-3 months
USD
3 months -1 year
USD1-5 years
USD> 5 years
USD
Non- interest
bearing* USD
TotalUSD
Assets Cash and cash equivalents 450,591 – – – – 450,591Financial Assets at Fair Value through Profit and Loss Non-Interest Bearing – – – – 90,675 90,675Fixed Interest Rate Securities 385,364 634,521 16,385,625 36,047,824 – 53,453,334Variable Rate Securities – – 367,736 2,901,153 – 3,268,889 835,955 634,521 16,753,361 38,948,977 90,675 57,263,489
289

LORD ABBETT PASSPORT PORTFOLIOS PLC NOTES TO THE FINANCIAL STATEMENTS AS AT 31 JANUARY 2020 (Continued)
11. Financial Risk Management (Continued) Interest Rate Risk (Continued) Total Return Fund
31 January 2019 1-3 months
USD
3 months -1 year
USD1-5 years
USD> 5 years
USD
Non- interest
bearing* USD
TotalUSD
Assets Cash and cash equivalents 755,461 – – – – 755,461Financial Assets at Fair Value through Profit and Loss Non-Interest Bearing – – – – 101,189 101,189Fixed Interest Rate Securities 3,031,763 63,381 7,004,409 14,499,220 – 24,598,773Variable Rate Securities – – – 2,772,002 – 2,772,002 3,787,224 63,381 7,004,409 17,271,222 101,189 28,227,425
Emerging Markets Corporate Debt Fund
31 January 2019 1-3 months
USD
3 months -1 year
USD1-5 years
USD> 5 years
USD
Non- interest
bearing* USD
TotalUSD
Assets Cash and cash equivalents 297,411 – – – – 297,411Financial Assets at Fair Value through Profit and Loss Non-Interest Bearing – – – – 31,334 31,334Fixed Interest Rate Securities 200,297 199,102 5,909,219 7,757,125 – 14,065,743Variable Rate Securities – – – – – – 497,708 199,102 5,909,219 7,757,125 31,334 14,394,488
Multi-Sector Income Fund
31 January 2019 1-3 months
USD
3 months -1 year
USD1-5 years
USD> 5 years
USD
Non- interest
bearing* USD
TotalUSD
Assets Cash and cash equivalents 7,927,179 – – – – 7,927,179Financial Assets at Fair Value through Profit and Loss Non-Interest Bearing – – – – 1,333,530 1,333,530Fixed Interest Rate Securities 2,816,719 3,893,799 47,715,683 226,414,233 – 280,840,434Variable Rate Securities – – 3,997,772 24,219,099 – 28,216,871 10,743,898 3,893,799 51,713,455 250,633,332 1,333,530 318,318,014
290

LORD ABBETT PASSPORT PORTFOLIOS PLC NOTES TO THE FINANCIAL STATEMENTS AS AT 31 JANUARY 2020 (Continued)
11. Financial Risk Management (Continued) Interest Rate Risk (Continued)
Global High Yield Fund
31 January 2019 1-3 months
USD
3 months -1 year
USD1-5 years
USD> 5 years
USD
Non- interest
bearing* USD
TotalUSD
Assets Cash and cash equivalents 490,063 – – – – 490,063Financial Assets at Fair Value through Profit and Loss Non-Interest Bearing – – – – 52,076 52,076Fixed Interest Rate Securities 22,006 41,793 2,443,934 8,438,198 – 10,945,931Variable Rate Securities – – 188,475 360,896 – 549,371 512,069 41,793 2,632,409 8,799,094 52,076 12,037,441
Ultra Short Bond Fund
31 January 2019 1-3 months
USD
3 months -1 year
USD1-5 years
USD> 5 years
USD
Non-interest
bearing*USD
TotalUSD
Assets Cash and cash equivalents 2,763,281 – – – – 2,763,281Financial Assets at Fair Value through Profit and Loss Non-Interest Bearing – – – – – –Fixed Interest Rate Securities 335,794,234 2,792,271 160,665,330 25,612,387 – 524,864,222Variable Rate Securities 36,807,252 120,137,143 279,090,846 16,754,317 – 452,789,558 375,364,767 122,929,414 439,756,176 42,366,704 – 980,417,061
U.S. Growth Leaders Fund and Global Equity Research Fund are not materially exposed to Interest Rate Risk.
* All other assets and liabilities are disclosed in the Statement of Financial Position are considered as non-interest bearing. Short Duration Income Fund
At 31 January 2019, had the interest rate increased or decreased by 1% with all other variables held constant, the increase or decrease respectively in the fair value of fixed rate fixed income securities of the Short Duration Income Fund would amount to approximately USD 38,349,385.
High Yield Fund
At 31 January 2019, had the interest rate increased or decreased by 1% with all other variables held constant, the increase or decrease respectively in the fair value of fixed rate fixed income securities of the High Yield Fund would amount to approximately USD 49,049,951.
Global Multi-Sector Bond Fund
At 31 January 2019, had the interest rate increased or decreased by 1% with all other variables held constant, the increase or decrease respectively in the fair value of fixed rate fixed income securities of the Global Multi-Sector Bond Fund5 would amount to approximately USD 2,656,631.
291

LORD ABBETT PASSPORT PORTFOLIOS PLC NOTES TO THE FINANCIAL STATEMENTS AS AT 31 JANUARY 2020 (Continued)
11. Financial Risk Management (Continued) Interest Rate Risk (Continued)
Total Return Fund
At 31 January 2019, had the interest rate increased or decreased by 1% with all other variables held constant, the increase or decrease respectively in the fair value of fixed rate fixed income securities of the Total Return Fund would amount to approximately USD 1,156,142.
Emerging Markets Corporate Debt Fund
At 31 January 2019, had the interest rate increased or decreased by 1% with all other variables held constant, the increase or decrease respectively in the fair value of fixed rate fixed income securities of the Emerging Markets Corporate Debt Fund would amount to approximately USD 630,145.
Multi-Sector Income Fund
At 31 January 2019, had the interest rate increased or decreased by 1% with all other variables held constant, the increase or decrease respectively in the fair value of fixed rate fixed income securities of the Multi-Sector Income Fund would amount to approximately USD 15,558,560.
Global High Yield Fund At 31 January 2019, had the interest rate increased or decreased by 1% with all other variables held constant, the increase or decrease respectively in the fair value of fixed rate fixed income securities of the Global High Yield Fund would amount to approximately USD 531,972.
Ultra Short Bond Fund At 31 January 2019, had the interest rate increased or decreased by 1% with all other variables held constant, the increase or decrease respectively in the fair value of fixed rate fixed income securities of the Ultra Short Bond Fund would amount to approximately USD 2,046,970. Credit Risk
The value of a debt security may decline based on adverse conditions of the relevant issuer, such as management performance, financial difficulties, or reduced demand for the goods and services provided by the relevant issuer. As a result, the issuer of a debt security owned by a Fund may fail to make timely payments of principal or interest, or may default on such payments. If an issuer becomes less creditworthy or is perceived to become less creditworthy, a debt security may decline in value, even when interest rates are falling. This risk is greatest for high yield debt securities, particularly those of emerging market issuers, which have lower credit ratings. Debt securities of emerging market issuers generally are subject to greater credit risk than debt securities of U.S. issuers. The risks associated with Credit Default Swaps include counterparty risk, liquidity risk (i.e., the inability to enter into closing transactions), interest-rate risk, risk of default of the underlying reference obligation and risk of disproportionate loss are the principal risks of engaging in transactions involving credit. The Depositary must ensure that there is legal separation of non-cash assets held in depositary, that such assets are held on a fiduciary basis, and that appropriate internal control systems are maintained such that records clearly identify the nature and amount of all assets under depositary. As Depositary, Brown Brothers Harriman Trustee Services (Ireland) Limited ("BBHTS") must ensure the ownership of each asset and the location of documents of title for each asset.
All securities that BBH & Co. (“BBH”) holds in depositary (as global sub-custodian for and on behalf of BBHTS for further benefit of its underlying clients) are segregated from BBH's own assets, whether they are held in BBH's vault, in segregated accounts on the books of their sub-custodians, or in an account maintained at a central securities depository. BBHTS, as Depositary to the Company, maintains segregated accounts in a manner consistent with provisions set forth in the UCITS Notices both on its own books and on the books of the global depositary including its network of sub-custodians where possible. As Depositary, BBHTS must also ensure non-cash assets are held on a fiduciary basis through BBH's network of global sub-custodians. BBH's sub-custodians are required by contract with BBH and generally by operation of law to segregate the securities of depositary clients from the general banking assets of the sub-custodian.
292

LORD ABBETT PASSPORT PORTFOLIOS PLC NOTES TO THE FINANCIAL STATEMENTS AS AT 31 JANUARY 2020 (Continued)
11. Financial Risk Management (Continued) Credit Risk (Continued) BBH performs both initial and ongoing due diligence reviews on the sub-custodians within its global depositary network through its Network Management group. Such reviews include an assessment of service level standards, management expertise, market information, depositary operations, reporting and technology capabilities at the sub-custodian, as well as reviews in relation to their reputation and standing in the market and their ongoing commitment to providing depositary services. Service level agreements are put in place with each sub-custodian, as well as the usual contractual arrangements, and these are reviewed on a regular basis through service review meetings, including on-site due diligence meetings. Regular financial analysis of all sub-custodians is carried out by BBH's Risk and Credit Group and is focused on the sub-custodian bank's capital adequacy, asset quality, earnings, liquidity and credit ratings as key indicators, amongst others. These reviews form part of BBH's routine assessment of a sub-custodian's financial strength and standing. In addition, as the Company may invest in markets where custodial and/or settlement systems are not fully developed, the assets of the Company which are traded in such markets and which have been entrusted to sub-custodians, in the circumstances where the use of such sub-custodians is necessary, may be exposed to risk in circumstances whereby the Depositary will have no liability. While cash held by the sub-custodian is identifiable as belonging to the Company, the Company will be exposed to the credit risk of the financial institution where cash is deposited. In the event of insolvency of the financial institution, the Company will be treated as a general creditor of the financial institution in relation to cash holdings of the Company. Portfolio by Rating Category The Investment Manager generally utilises well-known rating agencies for determining credit quality of the financial assets and financial liabilities.
31 January 2020
Credit Quality* Short Duration
Income Fund High Yield FundGlobal Multi-Sector
Bond FundU.S. Treasury & Agency 5.8% 0.0% 15.0%AAA 32.7% 0.0% 4.4%AA 5.8% 0.0% 8.1%A 14.4% 0.0% 9.4%BBB 32.4% 4.4% 25.1%BB 4.0% 41.3% 14.6%B 2.6% 39.2% 17.6%CCC 0.8% 9.8% 1.9%CC 0.0% 0.0% 0.0% C 0.0% 0.0% 0.0% D 0.0% 0.1% 0.0%Equity Securities and Derivatives not Subject to Credit Rating 0.0% 0.6% 0.0%Not Rated 1.5% 4.6% 3.9%Total 100.0% 100.0% 100.0%
293
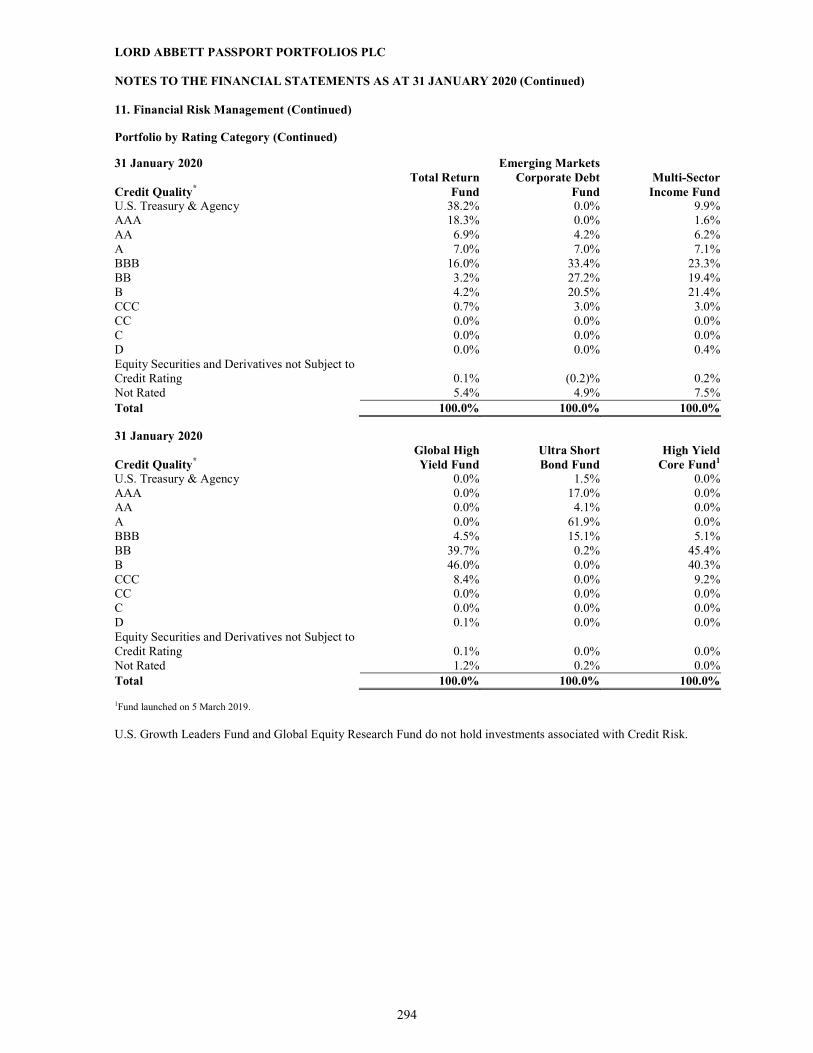
LORD ABBETT PASSPORT PORTFOLIOS PLC NOTES TO THE FINANCIAL STATEMENTS AS AT 31 JANUARY 2020 (Continued)
11. Financial Risk Management (Continued) Portfolio by Rating Category (Continued)
31 January 2020 Emerging Markets Total Return Corporate Debt Multi-Sector Credit Quality* Fund Fund Income Fund
U.S. Treasury & Agency 38.2% 0.0% 9.9% AAA 18.3% 0.0% 1.6% AA 6.9% 4.2% 6.2% A 7.0% 7.0% 7.1% BBB 16.0% 33.4% 23.3% BB 3.2% 27.2% 19.4% B 4.2% 20.5% 21.4% CCC 0.7% 3.0% 3.0% CC 0.0% 0.0% 0.0% C 0.0% 0.0% 0.0% D 0.0% 0.0% 0.4% Equity Securities and Derivatives not Subject to Credit Rating
0.1% (0.2)% 0.2%
Not Rated 5.4% 4.9% 7.5% Total 100.0% 100.0% 100.0%
31 January 2020 Global High Ultra Short High Yield Credit Quality* Yield Fund Bond Fund Core Fund1
U.S. Treasury & Agency 0.0% 1.5% 0.0% AAA 0.0% 17.0% 0.0% AA 0.0% 4.1% 0.0% A 0.0% 61.9% 0.0% BBB 4.5% 15.1% 5.1% BB 39.7% 0.2% 45.4% B 46.0% 0.0% 40.3% CCC 8.4% 0.0% 9.2% CC 0.0% 0.0% 0.0% C 0.0% 0.0% 0.0% D 0.1% 0.0% 0.0% Equity Securities and Derivatives not Subject to Credit Rating
0.1% 0.0% 0.0%
Not Rated 1.2% 0.2% 0.0% Total 100.0% 100.0% 100.0%
1Fund launched on 5 March 2019. U.S. Growth Leaders Fund and Global Equity Research Fund do not hold investments associated with Credit Risk.
294

LORD ABBETT PASSPORT PORTFOLIOS PLC NOTES TO THE FINANCIAL STATEMENTS AS AT 31 JANUARY 2020 (Continued)
11. Financial Risk Management (Continued) Portfolio by Rating Category (Continued)
31 January 2019 Short Duration High Yield Global Multi-Sector Credit Quality* Income Fund Fund Bond Fund
U.S. Treasury & Agency 4.2% 0.0% 16.5% AAA 34.6% 0.0% 5.4% AA 6.6% 0.0% 5.9% A 8.3% 0.0% 5.9% BBB 33.5% 4.1% 28.2% BB 5.3% 39.8% 16.7% B 4.9% 38.8% 17.6% CCC 1.0% 11.3% 2.7% CC 0.0% 0.3% 0.1% C 0.0% 0.0% 0.0% D 0.0% 0.5% 0.0% Equity Securities and Derivatives not Subject to Credit Rating 0.1% 0.9% (0.5)% Not Rated 1.5% 4.3% 1.5% Total 100.0% 100.0% 100.0%
31 January 2019 Emerging Markets Total Return Corporate Debt Multi-Sector Credit Quality* Fund Fund Income Fund
U.S. Treasury & Agency 47.1% 0.0% 10.8% AAA 22.3% 0.0% 2.5% AA 5.9% 2.9% 6.1% A 5.5% 13.8% 7.4% BBB 9.5% 38.3% 17.9% BB 1.9% 22.9% 22.3% B 4.0% 20.1% 22.3% CCC 0.7% 2.1% 4.2% CC 0.0% 0.0% 0.2% C 0.0% 0.0% 0.0% D 0.0% 0.0% 0.5% Equity Securities and Derivatives not Subject to Credit Rating 0.3% (0.1)% 0.3% Not Rated 2.8% 0.0% 5.5% Total 100.0% 100.0% 100.0%
31 January 2019 Global High Ultra Short Credit Quality* Yield Fund Bond Fund
U.S. Treasury & Agency 0.0% 1.7% AAA 0.0% 17.0% AA 0.0% 8.0% A 0.0% 55.3% BBB 5.4% 16.2% BB 39.7% 0.6% B 42.4% 0.0% CCC 11.4% 0.0% CC 0.3% 0.0% C 0.0% 0.0% D 0.5% 0.0% Equity Securities and Derivatives not Subject to Credit Rating 0.0% 0.0% Not Rated 0.3% 1.2% Total 100.0% 100.0%
U.S. Growth Leaders Fund and Global Equity Research Fund do not hold investments associated with Credit Risk.
295

LORD ABBETT PASSPORT PORTFOLIOS PLC NOTES TO THE FINANCIAL STATEMENTS AS AT 31 JANUARY 2020 (Continued)
11. Financial Risk Management (Continued) Portfolio by Rating Category (Continued)
All transactions in listed securities are settled/paid for upon delivery using approved brokers. The risk of default is considered minimal, as delivery of securities sold is only made once the broker has received payment. Payment is made on a purchase once the securities have been received by the broker. The trade will fail if either party fails to meet its obligation. * Ratings (other than U.S. Treasury securities or securities issued or backed by U.S. agencies) provided by Standard & Poor's, Moody's, and Fitch.
Liquidity Risk Liquidity risk is the risk that an entity will encounter difficulty in meeting obligations associated with financial liabilities. The Funds are exposed to daily cash redemptions of Redeemable Participating Shares. The Funds generally retain a certain portion of their assets in cash, which is available to satisfy redemptions. In addition, in accordance with their Prospectus, only a limited portion of the assets of each Fund is invested in transferable securities or money market instruments that are not readily tradable. The Company may invest in derivative contracts traded over-the-counter, which are not traded in an organised market and may be illiquid. As a result, the Company may not be able to liquidate quickly its investments in these instruments at an amount close to their fair value to meet its liquidity requirements or to respond to specific events such as deterioration in the creditworthiness of any particular issuer. There may be few available buyers or sellers for a security, preventing a Fund from transacting in a timely manner or at an advantageous price, and subjecting the security to greater price fluctuations. These securities may be more difficult to sell, particularly in times of market turmoil, and may be more difficult to value. If a Fund is forced to sell an illiquid security to fund redemptions or other cash needs, a Fund may be forced to sell the security at a loss. A Fund may experience heightened redemptions during periods of market turmoil. These risks are greater for a Fund’s high yield investments because the high yield market generally is less liquid than the investment grade market. The Investment Manager has determined the assets are substantially liquid and liabilities are expected to be satisfied within 90 days or less. Fair Value Estimation
The Company has classified fair value measurements using a fair value hierarchy that reflects the significance of the inputs used in making the measurements. The fair value hierarchy has the following levels:
(i) Level 1: Investments whose values are based on quoted market prices in active markets, and therefore classified within level 1, include active listed equities and futures. Quoted prices for these instruments are not adjusted.
(ii) Level 2: Financial instruments that trade in markets that are not considered to be active but are valued based on
quoted market prices, dealer quotations or alternative pricing sources supported by observable inputs are classified within level 2. These generally include investment-grade corporate bonds, U.S. government obligations and certain non-U.S. sovereign obligations, listed equities and over-the-counter derivatives. As level 2 investments include positions that are not traded in active markets and/or are subject to transfer restrictions, valuations may be adjusted to reflect illiquidity and/or non-transferability, which are generally based on available market information.
(iii) Level 3: Investments classified within level 3 have significant unobservable inputs, as they trade infrequently.
Level 3 instruments may include certain common stocks, asset backed securities, corporate debt securities and floating rate loans. As observable prices are not available for these securities, the Funds have used valuation techniques to derive the fair value.
296

LORD ABBETT PASSPORT PORTFOLIOS PLC NOTES TO THE FINANCIAL STATEMENTS AS AT 31 JANUARY 2020 (Continued)
11. Financial Risk Management (Continued) Fair Value Estimation (Continued) The level in the fair value hierarchy within which the fair value measurement is categorised in its entirety is determined on the basis of the lowest level input that is significant to the fair value measurement in its entirety. For this purpose, the significance of an input is assessed against the fair value measurement in its entirety. If a fair value measurement uses observable inputs that require significant adjustment based on unobservable inputs, that measurement is a level 3 measurement. Assessing the significance of a particular input to the fair value measurement in its entirety requires judgement, considering factors specific to the financial asset or liability. The determination of what constitutes ‘observable’ requires significant judgment by the Directors. The Directors have delegated this task to the Investment Manager. The Investment Manager, in consultation with the Administrator, considers observable data to be that market data that is readily available, regularly distributed or updated, reliable and verifiable, not proprietary, and provided by independent sources that are actively involved in the relevant market. The following tables analyse the fair value hierarchy of the Funds’ financial assets and liabilities measured at fair value at 31 January 2020:
Short Duration Income Fund 31 January 2020 Level 1 Level 2 Level 3 Total USD USD USD USDFinancial Assets at Fair Value through Profit or Loss
Fixed Income Securities − 3,546,329,538 2,548,2831 3,548,877,821
Floating Rate Loans − 88,254,788 53,647,2592 141,902,047
Common Stocks − − 5823 582
Preferred Stocks − − −4 −
Short Term Investments − 261,327,568 − 261,327,568
Forward Foreign Currency Exchange Contracts − 935,081 − 935,081
Futures Contracts 3,363,475 − − 3,363,475
Total Assets 3,363,475 3,896,846,975 56,196,124 3,956,406,574
Financial Liabilities at Fair Value through Profit or Loss
Futures Contracts (3,518,481) − − (3,518,481)
Total Liabilities (3,518,481) − − (3,518,481)
297

LORD ABBETT PASSPORT PORTFOLIOS PLC NOTES TO THE FINANCIAL STATEMENTS AS AT 31 JANUARY 2020 (Continued)
11. Financial Risk Management (Continued) Fair Value Estimation (Continued)
High Yield Fund
31 January 2020 Level 1 Level 2 Level 3 Total USD USD USD USDFinancial Assets at Fair Value through Profit or Loss
Fixed Income Securities − 1,782,146,072 1,977,4211 1,784,123,493
Floating Rate Loans − 117,606,442 17,188,5752 134,795,017 Common Stocks 12,195 686,442 1,135,6553 1,834,292 Preferred Stock 5,323,360 3,942,822 −4 9,266,182
Warrant − − 893 89
Forward Foreign Currency Exchange Contracts − 1,195,183 − 1,195,183
Futures Contracts 1,812,651 − − 1,812,651
Total Assets 7,148,206 1,905,576,961 20,301,740 1,933,026,907 Financial Liabilities at Fair Value through Profit or Loss
Forward Foreign Currency Exchange Contracts − (250,877) − (250,877)
Credit Default Index Swap Contract − (6,937) − (6,937)
Futures Contracts (1,451,410) − − (1,451,410)
Total Liabilities (1,451,410) (257,814) − (1,709,224)
Global Multi-Sector Bond Fund 31 January 2020 Level 1 Level 2 Level 3 Total USD USD USD USDFinancial Assets at Fair Value through Profit or Loss
Fixed Income Securities − 83,282,773 − 83,282,773
Floating Rate Loans − 2,359,098 105,3132 2,464,411
Common Stocks − − 973 97
Preferred Stock − − −4 −
Short Term Investments − 1,999,799 − 1,999,799
Forward Foreign Currency Exchange Contracts − 161,055 − 161,055
Futures Contracts 3,828 − − 3,828
Total Assets 3,828 87,802,725 105,410 87,911,963 Financial Liabilities at Fair Value through Profit or Loss
Forward Foreign Currency Exchange Contracts − (48,129) − (48,129)
Futures Contracts (109,616) − − (109,616)
Credit Default Index Swap Contract − (10,897) − (10,897)
Total Liabilities (109,616) (59,026) − (168,642)
298

LORD ABBETT PASSPORT PORTFOLIOS PLC NOTES TO THE FINANCIAL STATEMENTS AS AT 31 JANUARY 2020 (Continued)
11. Financial Risk Management (Continued) Fair Value Estimation (Continued) Total Return Fund 31 January 2020 Level 1 Level 2 Level 3 Total USD USD USD USDFinancial Assets at Fair Value through Profit or Loss
Fixed Income Securities − 35,053,811 − 35,053,811
Short Term Investments − 2,959,042 − 2,959,042
Futures Contracts 72,522 − − 72,522
Total Assets 72,522 38,012,853 − 38,085,375 Financial Liabilities at Fair Value through Profit or Loss Forward Foreign Currency Exchange Contracts − (14,850) − (14,850)
Futures Contracts (25,176) − − (25,176)
Total Liabilities (25,176) (14,850) − (40,026)
Emerging Markets Corporate Debt Fund 31 January 2020 Level 1 Level 2 Level 3 Total USD USD USD USDFinancial Assets at Fair Value through Profit or Loss Fixed Income Securities − 20,226,727 − 20,226,727
Common Stocks 5,206 − − 5,206
Short Term Investments − 17,047 − 17,047
Futures Contracts 27,937 − − 27,937
Total Assets 33,143 20,243,774 − 20,276,917 Financial Liabilities at Fair Value through Profit or Loss Futures Contracts (69,891) − − (69,891)
Total Liabilities (69,891) − − (69,891)
299

LORD ABBETT PASSPORT PORTFOLIOS PLC NOTES TO THE FINANCIAL STATEMENTS AS AT 31 JANUARY 2020 (Continued)
11. Financial Risk Management (Continued) Fair Value Estimation (Continued)
Multi-Sector Income Fund
31 January 2020 Level 1 Level 2 Level 3 Total USD USD USD USDFinancial Assets at Fair Value through Profit or Loss
Fixed Income Securities − 612,021,329 534,3311 612,555,660 Floating Rate Loans − 44,489,306 1,112,5002 45,601,806 Common Stocks 10,373 183,209 318,2373 511,819Preferred Stock 978,133 4,038,988 −4
5,017,121 Warrants − − 203 20 Forward Foreign Currency Exchange Contracts − 111,327 − 111,327 Futures Contracts 567,247 − 567,247Total Assets 1,555,753 660,844,159 1,965,088 664,365,000 Financial Liabilities at Fair Value through Profit or Loss
Forward Foreign Currency Exchange Contracts − (8,886) − (8,886)Futures Contracts (1,345,307) − − (1,345,307)Credit Default Index Swap Contract − (195,991) − (195,991)
Total Liabilities (1,345,307) (204,877) − (1,550,184)
U.S. Growth Leaders Fund
31 January 2020 Level 1 Level 2 Level 3 Total USD USD USD USDFinancial Assets at Fair Value through Profit or Loss Common Stocks 38,281,694 − − 38,281,694
Total Assets 38,281,694 − − 38,281,694
Global High Yield Fund
31 January 2020 Level 1 Level 2 Level 3 Total USD USD USD USDFinancial Assets at Fair Value through Profit or Loss
Fixed Income Securities − 44,604,420 198,6361 44,803,056 Floating Rate Loans − 2,703,247 370,3362 3,073,583 Common Stocks − 7,321 12,2203 19,541 Warrants − − 23 2 Forward Foreign Currency Exchange Contracts − 51,630 − 51,630 Futures Contracts 48,884 − − 48,884 Credit Default Index Swap Contract − 6,294 − 6,294 Total Assets 48,884 47,372,912 581,194 48,002,990 Financial Liabilities at Fair Value through Profit or Loss
Forward Foreign Currency Exchange Contracts − (16,882) − (16,882)Futures Contracts (52,251) − − (52,251)
Total Liabilities (52,251) (16,882) − (69,133)
300

LORD ABBETT PASSPORT PORTFOLIOS PLC NOTES TO THE FINANCIAL STATEMENTS AS AT 31 JANUARY 2020 (Continued)
11. Financial Risk Management (Continued) Fair Value Estimation (Continued)
Global Equity Research Fund 31 January 2020 Level 1 Level 2 Level 3 Total USD USD USD USDFinancial Assets at Fair Value through Profit or Loss Common Stocks 4,573,876 − − 4,573,876 Preferred Stocks 29,152 − − 29,152
Total Assets 4,603,028 − − 4,603,028
Ultra Short Bond Fund 31 January 2020 Level 1 Level 2 Level 3 Total USD USD USD USDFinancial Assets at Fair Value through Profit or Loss Fixed Income Securities − 1,247,571,222 − 1,247,571,222 Short Term Investments − 728,344,601 − 728,344,601
Total Assets − 1,975,915,823 − 1,975,915,823
High Yield Core Fund5 31 January 2020 Level 1 Level 2 Level 3 Total USD USD USD USDFinancial Assets at Fair Value through Profit or Loss Fixed Income Securities − 299,107,871 313,8451 299,421,716 Forward Foreign Currency Exchange Contracts − 54,767 − 54,767
Futures Contracts 426,723 − − 426,723 Total Assets 426,723 299,162,638 313,845 299,903,206 Financial Liabilities at Fair Value through Profit or Loss Forward Foreign Currency Exchange Contracts − (9,066) − (9,066)Futures Contracts (403,510) − − (403,510)
Total Liabilities (403,510) (9,066) − (412,576)
1Fixed Income Instruments at 31 January 2019 categorized as Level 3 are valued based on third party pricing information without adjustment. Such valuations are based on unobservable inputs. A significant change in third party information could result in significantly lower or higher value of such Level 3 Investments.
2Floating Rate loans categorized as Level 3 are valued based on a single quotation obtained from a dealer. Therefore, the Fund does not have access to unobservable inputs and cannot disclose such inputs in the valuation.
3Common Stocks, Preferred Stocks and Warrants Instruments at 31 January 2019 categorized as Level 3 are valued based on third party pricing information without adjustment. Such valuations are based on unobservable inputs. A significant change in third party information could result in significantly lower or higher value of such Level 3 Investments. For the Short Duration Income Fund the amount includes common stock of USD582, for the High Yield Fund common stocks of USD957, for the Global Multi-Sector Income Fund common stock of USD97 and for the Multi-Sector Income Fund common stock of USD165 fair valued by the Investment Manager.
4Includes securities with zero fair value. 5Fund launched on 5 March 2019.
301

LORD ABBETT PASSPORT PORTFOLIOS PLC NOTES TO THE FINANCIAL STATEMENTS AS AT 31 JANUARY 2020 (Continued)
11. Financial Risk Management (Continued) Fair Value Estimation (Continued) The tables below represent the movement in level 3 instruments for the financial year ended 31 January 2020:
Short Duration Income Fund
Fixed Income
Securities Floating Rate
Loans Common
Stocks Preferred
Stocks Total
31 January 2020 USD USD USD USD USD Opening Balance 2,226,631 5,764,214 − 31,985 8,022,830 Purchases − 56,814,650 − 3,196 56,817,846 Sales − (10,420,586) − − (10,420,586) Accrued discounts 7,895 121,932 − − 129,827 Transfers in or out of Level 3* 271,037 1,534,579 582 − 1,806,198 Gains and Losses recognised in Profit and Loss 42,720 (167,530) − (35,181) (159,991)
Closing balance as at 31 January 2020 2,548,283 53,647,259 582 −4 56,196,124 Change in Unrealised Gains and Losses at Year end and included in Net Gains/(Losses) on Financial Assets and Financial Liabilities at Fair Value through Profit or Loss 58,487 (180,466) (3,516) (35,181) (160,676)
High Yield Fund
Fixed Income
SecuritiesFloating Rate
Loans Common
Stocks Preferred
Stocks Warrants Total
31 January 2020 USD USD USD USD USD USD Opening Balance 1 12,607,446 1,010,368 26,120 89 13,644,024Purchases 1,991,000 12,115,050 1,623,110 2,610 − 15,731,770 Sales (240) (10,679,976) (1,350,998) − − (12,031,214)Accrued discounts 335 83,707 − − − 84,042 Transfers in or out of Level 3* − 3,844,859 951 − − 3,845,810 Gains and Losses recognised in Profit and Loss (13,675) (782,511) (147,776) (28,730) − (972,692)Closing balance as at 31 January 2020 1,977,421 17,188,575 1,135,655 −4
89 20,301,740Change in Unrealised Gains and Losses at Year end and included in Net Gains/(Losses) on Financial Assets and Financial Liabilities at Fair Value through Profit or Loss
(12,545) 401,806
26,700 (28,730) − 387,231
Global Multi-Sector Bond Fund
Floating Rate
Loans Common
Stocks Preferred
Stocks Total 31 January 2020 USD USD USD USD Opening Balance − − 4,868 4,868 Purchases 110,071 − 486 110,557 Sales (283) − − (283) Accrued discounts 39 − − 39 Transfers in or out of Level 3* − 97 − 97 Gains and Losses recognised in Profit and Loss (4,514) − (5,354) (9,868) Closing balance as at 31 January 2020 105,313 97 −4 105,410 Change in Unrealised Gains and Losses at Year end and included in Net Gains/(Losses) on Financial Assets and Financial Liabilities at Fair Value through Profit or Loss
(4,520)
(586)
(5,354)
(10,460)
302

LORD ABBETT PASSPORT PORTFOLIOS PLC NOTES TO THE FINANCIAL STATEMENTS AS AT 31 JANUARY 2020 (Continued)
11. Financial Risk Management (Continued) Fair Value Estimation (Continued)
Multi-Sector Income Fund
Fixed Income
Securities Floating
Rate Loans Common
Stocks Preferred
Stocks Warrants Total
31 January 2020 USD USD USD USD USD USD Opening Balance − 1,389,462 264,825 6,336 20 1,660,643 Purchases 538,000 1,388,689 423,947 633 − 2,351,269 Sales − (801,933) (332,000) − − (1,133,933) Accrued discounts − 1,150 − − − 1,150 Transfers in or out of Level 3* − (797,124) 165 − − (796,959) Gains and Losses recognised in Profit and Loss (3,669) (67,744) (38,700) (6,969) − (117,082)
Closing balance as at 31 January 2020 534,331 1,112,500 318,237 −4 20 1,965,088 Change in Unrealised Gains and Losses at Year end and included in Net Gains/(Losses) on Financial Assets and Financial Liabilities at Fair Value through Profit or Loss
(3,669)
25,916
3,862
(6,969)
−
19,140
Global High Yield Fund
Fixed Income
Securities
Floating Rate
Loans Common
Stocks Warrants Total
31 January 2020 USD USD USD USD USD Opening Balance − 130,761 9,563 2 140,326 Purchases 200,000 247,312 15,349 − 462,661 Sales − (107,882) (11,125) − (119,007) Accrued discounts − 1,132 − − 1,132 Transfers in or out of Level 3* − 101,765 − − 101,765 Gains and Losses recognised in Profit and Loss (1,364) (2,752) (1,567) − (5,683)
Closing balance as at 31 January 2020 198,636 370,336 12,220 2 581,194 Change in Unrealised Gains and Losses at Year end and included in Net Gains/(Losses) on Financial Assets and Financial Liabilities at Fair Value through Profit or Loss
(1,364)
4,639
(52)
−
3,223
Ultra Short Bond Fund
Fixed Income
Securities Total
31 January 2020 USD USD Opening Balance 3,790,816 3,790,816 Purchases − − Sales − − Accrued discounts − − Transfers in or out of Level 3* (3,808,622) (3,808,622) Gains and Losses recognised in Profit and Loss 17,806 17,806
Closing balance as at 31 January 2020 − − Change in Unrealised Gains and Losses at Year end and included in Net Gains/(Losses) on Financial Assets and Financial Liabilities at Fair Value through Profit or Loss − −
303

LORD ABBETT PASSPORT PORTFOLIOS PLC NOTES TO THE FINANCIAL STATEMENTS AS AT 31 JANUARY 2020 (Continued)
11. Financial Risk Management (Continued)
Fair Value Estimation (Continued)
High Yield Core Fund6
Fixed Income
Securities Total
31 January 2020 USD USD Opening Balance − − Purchases 316,000 316,000 Sales − − Accrued discounts − − Transfers in or out of Level 3* − − Gains and Losses recognised in Profit and Loss (2,155) (2,155)
Closing balance as at 31 January 2020 313,845 313,845 Change in Unrealised Gains and Losses at Year end and included in Net Gains/(Losses) on Financial Assets and Financial Liabilities at Fair Value through Profit or Loss
(2,155)
(2,155)
* Transfers in or out utilize the market value presented at 31 January 2020. 6Fund launched on 5 March 2019. Equity and Fixed income Instruments categorized as Level 3 are valued based on either; the probable realizable value estimated with care and in good faith by a competent person, firm or association (including the “Investment Manager”) appointed by the Directors and approved for the purposes by the Depositary, or; using third party pricing information without adjustment. Such valuations are based on unobservable inputs. A significant change in third party information could result in significantly lower or higher value of such Level 3 investments. Floating Rate Loans categorised as Level 3 are valued based on a single quotation obtained from a dealer. Therefore, the Fund does not have access to unobservable inputs and cannot disclose such inputs in the valuation. The following tables analyse the fair value hierarchy of the Funds’ financial assets and liabilities measured at fair value at 31 January 2019: Short Duration Income Fund 31 January 2019 Level 1 Level 2 Level 3 Total USD USD USD USDFinancial Assets at Fair Value through Profit or Loss
Fixed Income Securities − 1,999,571,251 2,226,6311 2,001,797,882Certificate of Deposit − 2,000,567 − 2,000,567Floating Rate Loans − 33,036,185 5,764,2142 38,800,399Common Stocks − 4,098 − 4,098Preferred Stock − − 31,9853 31,985Short Term Investments − 21,191,896 − 21,191,896Forward Foreign Currency Exchange Contracts − 1,157,956 − 1,157,956Futures Contracts 2,212,018 − − 2,212,018Total Assets 2,212,018 2,056,961,953 8,022,830 2,067,196,801 Financial Liabilities at Fair Value through Profit or Loss
Forward Foreign Currency Exchange Contracts − (3,976) − (3,976)Futures Contracts (1,608,301) − − (1,608,301)
Total Liabilities (1,608,301) (3,976) − (1,612,277)
304

LORD ABBETT PASSPORT PORTFOLIOS PLC NOTES TO THE FINANCIAL STATEMENTS AS AT 31 JANUARY 2020 (Continued)
11. Financial Risk Management (Continued) Fair Value Estimation (Continued) High Yield Fund
31 January 2019 Level 1 Level 2 Level 3 Total USD USD USD USDFinancial Assets at Fair Value through Profit or Loss
Fixed Income Securities − 956,428,696 1 4 956,428,697Floating Rate Loans − 29,167,353 12,607,446 2 41,774,799Common Stocks 91,050 1,044,111 1,010,368 3 2,145,529Preferred Stock 5,854,936 − 26,120 3 5,881,056Warrant − − 893 89Forward Foreign Currency Exchange Contracts − 346,689 − 346,689Futures Contracts 2,117,412 − − 2,117,412Credit Default Index Swap Contract − 213,369 − 213,369Total Assets 8,063,398 987,200,218 13,644,024 1,008,907,640 Financial Liabilities at Fair Value through Profit or Loss
Forward Foreign Currency Exchange Contracts − (306,054) − (306,054)Futures Contracts (1,729,092) − − (1,729,092)Total Liabilities (1,729,092) (306,054) − (2,035,146)
Global Multi-Sector Bond Fund
31 January 2019 Level 1 Level 2 Level 3 Total USD USD USD USDFinancial Assets at Fair Value through Profit or Loss
Fixed Income Securities − 56,490,586 − 56,490,586
Floating Rate Loans − 218,473 − 218,473
Common Stocks − 683 − 683
Preferred Stock 8,296 − 4,8683 13,164
Forward Foreign Currency Exchange Contracts − 781 − 781
Futures Contracts 89,211 − − 89,211
Total Assets 97,507 56,710,523 4,868 56,812,898 Financial Liabilities at Fair Value through Profit or Loss
Forward Foreign Currency Exchange Contracts − (242,375) − (242,375)Futures Contracts (152,133) − − (152,133)Credit Default Index Swap Contract − (1,507) − (1,507)Total Liabilities (152,133) (243,882) − (396,015)
305

LORD ABBETT PASSPORT PORTFOLIOS PLC NOTES TO THE FINANCIAL STATEMENTS AS AT 31 JANUARY 2020 (Continued)
11. Financial Risk Management (Continued) Fair Value Estimation (Continued) Total Return Fund
31 January 2019 Level 1 Level 2 Level 3 Total USD USD USD USDFinancial Assets at Fair Value through Profit or Loss Fixed Income Securities − 24,339,013 − 24,339,013Short Term Investments − 3,031,762 − 3,031,762Futures Contracts 101,189 − − 101,189
Total Assets 101,189 27,370,775 − 27,471,964 Financial Liabilities at Fair Value through Profit or Loss Futures Contracts (14,969) − − (14,969)
Total Liabilities (14,969) − − (14,969)
Emerging Markets Corporate Debt Fund 31 January 2019 Level 1 Level 2 Level 3 Total USD USD USD USDFinancial Assets at Fair Value through Profit or Loss Fixed Income Securities − 14,065,743 − 14,065,743Common Stocks 7,361 − − 7,361
Futures Contracts 23,973 − − 23,973
Total Assets 31,334 14,065,743 − 14,097,077 Financial Liabilities at Fair Value through Profit or Loss Futures Contracts (46,531) − − (46,531)Total Liabilities (46,531) − − (46,531)
Multi-Sector Income Fund 31 January 2019 Level 1 Level 2 Level 3 Total USD USD USD USDFinancial Assets at Fair Value through Profit or Loss
Fixed Income Securities − 286,097,463 − 286,097,463Floating Rate Loans − 15,727,019 1,389,4622 17,116,481Common Stocks 77,446 275,277 264,8253 617,548Preferred Stock 3,837,006 − 6,336
3 3,843,342
Short Term Investments − 2,000,000 − 2,000,000Warrants − − 203 20Forward Foreign Currency Exchange Contracts − 6,671 − 6,671Futures Contracts 626,746 − − 626,746Credit Default Index Swap Contract − 82,564 − 82,564Total Assets 4,541,198 304,188,994 1,660,643 310,390,835 Financial Liabilities at Fair Value through Profit or Loss
Forward Foreign Currency Exchange Contracts − (44,184) − (44,184)Futures Contracts (1,347,987) − − (1,347,987)Credit Default Index Swap Contract − (704,200) − (704,200)Total Liabilities (1,347,987) (748,384) − (2,096,371)
306

LORD ABBETT PASSPORT PORTFOLIOS PLC NOTES TO THE FINANCIAL STATEMENTS AS AT 31 JANUARY 2020 (Continued)
11. Financial Risk Management (Continued) Fair Value Estimation (Continued) U.S. Growth Leaders Fund 31 January 2019 Level 1 Level 2 Level 3 Total USD USD USD USDFinancial Assets at Fair Value through Profit or Loss Common Stocks 24,934,425 − − 24,934,425Total Assets 24,934,425 − − 24,934,425
Global High Yield Fund 31 January 2019 Level 1 Level 2 Level 3 Total USD USD USD USDFinancial Assets at Fair Value through Profit or Loss
Fixed Income Securities − 11,079,012 − 11,079,012Floating Rate Loans − 285,526 130,7612 416,287Common Stocks − 11,743 9,5633 21,306Warrants − − 23 2Forward Foreign Currency Exchange Contracts − 2,014 − 2,014Futures Contracts 28,757 − − 28,757Total Assets 28,757 11,378,295 140,326 11,547,378 Financial Liabilities at Fair Value through Profit or Loss
Forward Foreign Currency Exchange Contracts − (11,119) − (11,119)Futures Contracts (39,399) − − (39,399)Total Liabilities (39,399) (11,119) − (50,518)
Global Equity Research Fund 31 January 2019 Level 1 Level 2 Level 3 Total USD USD USD USDFinancial Assets at Fair Value through Profit or Loss Common Stocks 2,671,040 1,548,346 − 4,219,386
Preferred Stocks − 18,929 − 18,929Total Assets 2,671,040 1,567,275 − 4,238,315
307

LORD ABBETT PASSPORT PORTFOLIOS PLC NOTES TO THE FINANCIAL STATEMENTS AS AT 31 JANUARY 2020 (Continued)
11. Financial Risk Management (Continued) Fair Value Estimation (Continued) Ultra Short Bond Fund 31 January 2019 Level 1 Level 2 Level 3 Total USD USD USD USDFinancial Assets at Fair Value through Profit or Loss
Fixed Income Securities − 638,170,180 3,790,8161 641,960,996Certificate of Deposits − 480,574 − 480,574Short Term Investments − 335,212,210 − 335,212,210Total Assets − 973,862,964 3,790,816 977,653,780
1Fixed Income Instruments at 31 January 2019 categorized as Level 3 are valued based on third party pricing information without adjustment. Such
valuations are based on unobservable inputs. A significant change in third party information could result in significantly lower or higher value of such Level 3 Investments.
2Floating Rate loans categorized as Level 3 are valued based on a single quotation obtained from a dealer. Therefore, the Fund does not have access to unobservable inputs and cannot disclose such inputs in the valuation.
3Common Stocks, Preferred Stocks and Warrants Instruments at 31 January 2019 categorized as Level 3 are valued based on third party pricing information without adjustment. Such valuations are based on unobservable inputs. A significant change in third party information could result in significantly lower or higher value of such Level 3 Investments. For the High Yield Fund the amount includes common stock of USD6 fair valued by the Investment Manager.
4Fixed Income Instruments at 31 January 2019 categorized as Level 3 have been fair valued by the Investment Manager.
The tables below represent the movement in level 3 instruments for the financial year ended 31 January 2019:
Short Duration Income Fund
Fixed Income
Securities Floating Rate
Loans Preferred
Stocks Total
31 January 2019 USD USD USD USD Opening Balance 17,077,933 27,294,597 − 44,372,530 Purchases 437,724 6,423,989 − 6,861,713 Sales (7,014,632) (26,796,225) − (33,810,857) Accrued discounts (39,502) 21,799 − (17,703) Transfers in or out of Level 3* (7,601,667) (1,122,232) 31,985 (8,691,914) Gains and Losses recognised in Profit and Loss (633,225) (57,714) − (690,939)
Closing balance as at 31 January 2019 2,226,631 5,764,214 31,985 8,022,830 Change in Unrealised Gains and Losses at Year end and included in Net Gains/(Losses) on Financial Assets and Financial Liabilities at Fair Value through Profit or Loss (1,165,614) (91,577) (86,360) (1,343,551)
308

LORD ABBETT PASSPORT PORTFOLIOS PLC NOTES TO THE FINANCIAL STATEMENTS AS AT 31 JANUARY 2020 (Continued)
11. Financial Risk Management (Continued) Fair Value Estimation (Continued) High Yield Fund
Fixed Income
SecuritiesFloating
Rate Loans Common
Stocks Preferred
Stocks Warrants Total 31 January 2019 USD USD USD USD USD USD Opening Balance 37 16,279,232 6 − − 16,279,275 Purchases − 10,961,723 702,165 − 47,002 11,710,890Sales − (14,914,868) − − − (14,914,868)Accrued discounts 508 (14,985) − − − (14,477)Transfers in or out of Level 3* − 992,684 − 26,120 − 1,018,804Gains and Losses recognised in Profit and Loss (544) (696,340) 308,197 − (46,913) (435,600)
Closing balance as at 31 January 2019 1 12,607,446 1,010,368 26,120 89 13,644,024Change in Unrealised Gains and Losses at Year end and included in Net Gains/(Losses) on Financial Assets and Financial Liabilities at Fair Value through Profit or Loss 875 (736,726) 308,197 (70,525) (46,913) (545,092)
Global Multi-Sector Bond Fund
Fixed Income
Securities Floating
Rate Loans Preferred
Stocks Total 31 January 2019 USD USD USD USD Opening Balance 250,000 352,311 − 602,311 Purchases − 52,969 − 52,969 Sales (249,125) (407,173) − (656,298) Accrued discounts − 87 − 87 Transfers in or out of Level 3* − − 4,868 4,868 Gains and Losses recognised in Profit and Loss (875) 1,806 − 931 Closing balance as at 31 January 2019 − − 4,868 4,868 Change in Unrealised Gains and Losses at Year end and included in Net Gains/(Losses) on Financial Assets and Financial Liabilities at Fair Value through Profit or Loss − − (13,144) (13,618)
Multi-Sector Income Fund
Fixed Income
SecuritiesFloating
Rate Loans Common
StocksPreferred
Stocks Warrants Total 31 January 2019 USD USD USD USD USD USD Opening Balance 776,468 831,008 − − − 1,607,476Purchases − 2,403,657 184,019 − 9,527 2,597,203Sales (748,927) (1,750,777) − − − (2,499,704)Accrued discounts (315) (1,784) − − − (2,099)Transfers in or out of Level 3* (28,815) − − 6,336 − (22,479)Gains and Losses recognised in Profit and Loss 1,589 (92,642) 80,806 − (9,507) (19,754)
Closing balance as at 31 January 2019 − 1,389,462 264,825 6,336 20 1,660,643Change in Unrealised Gains and Losses at Year end and included in Net Gains/(Losses) on Financial Assets and Financial Liabilities at Fair Value through Profit or Loss − (66,743) 80,806 (17,106) (9,507) (10,817)
309

LORD ABBETT PASSPORT PORTFOLIOS PLC NOTES TO THE FINANCIAL STATEMENTS AS AT 31 JANUARY 2020 (Continued)
11. Financial Risk Management (Continued) Fair Value Estimation (Continued)
Global High Yield Fund
Floating Rate
Loans Common
Stocks Warrants Total 31 January 2019 USD USD USD USD Opening Balance 197,936 − − 197,936 Purchases 91,276 6,617 1,075 98,968 Sales (162,774) − − (162,774) Accrued discounts (301) − − (301) Transfers in or out of Level 3* 11,680 − − 11,680 Gains and Losses recognised in Profit and Loss (7,056) 2,946 (1,073) (5,183)
Closing balance as at 31 January 2019 130,761 9,563 2 140,326 Change in Unrealised Gains and Losses at Year end and included in Net Gains/(Losses) on Financial Assets and Financial Liabilities at Fair Value through Profit or Loss (8,187) 2,946 (1,073) (6,314)
Ultra Short Bond Fund
Fixed Income
Securities Total 31 January 2019 USD USD Opening Balance − − Purchases 3,798,000 3,798,000 Sales − − Accrued discounts − − Transfers in or out of Level 3* − − Gains and Losses recognised in Profit and Loss (7,184) (7,184)
Closing balance as at 31 January 2019 3,790,816 3,790,816 Change in Unrealised Gains and Losses at Year end and included in Net Gains/(Losses) on Financial Assets and Financial Liabilities at Fair Value through Profit or Loss (7,184) (7,184)
* Transfers in or out utilize the market value presented at 31 January 2019. Equity and Fixed income Instruments categorized as Level 3 are valued based on either; the probable realizable value estimated with care and in good faith by a competent person, firm or association (including the “Investment Manager”) appointed by the Directors and approved for the purposes by the Depositary, or; using third party pricing information without adjustment. Such valuations are based on unobservable inputs. A significant change in third party information could result in significantly lower or higher value of such Level 3 investments. Floating Rate Loans categorised as Level 3 are valued based on a single quotation obtained from a dealer. Therefore, the Fund does not have access to unobservable inputs and cannot disclose such inputs in the valuation. For all other financial assets and liabilities not measured at fair value, the directors consider that the carrying amount of the financial assets and financial liabilities recognised in the Statement of Financial Position approximate their fair value.
310

LORD ABBETT PASSPORT PORTFOLIOS PLC NOTES TO THE FINANCIAL STATEMENTS AS AT 31 JANUARY 2020 (Continued)
11. Financial Risk Management (Continued) Offsetting
The tables below include financial assets and financial liabilities that are subject to an enforceable master netting agreement by counterparty. A master netting agreement is an agreement between a fund and a counterparty which provides for the net settlement of amounts owed under all contracts traded under that agreement including cash collateral in the event of default or termination of any one contract. At 31 January 2020, the Funds’ derivative assets and liabilities are as follows: Short Duration Income Fund Amounts of Recognised Assets and Liabilities Amounts not offset per Statement of in the Statement of Financial Position Financial Position Net Amount* Counterparty USD USD USD Brown Brothers Harriman 935,081 − 935,081 Total 935,081 − 935,081 High Yield Fund Amounts of Recognised Assets and Liabilities Amounts not offset per Statement of in the Statement of Financial Position Financial Position Net Amount* Counterparty USD USD USD Brown Brothers Harriman 966,371 − 966,371 Morgan Stanley1 222,239 (18,901) 203,338 State Street Bank 6,573 (6,573) − Credit Suisse (6,937) − (6,937) Morgan Stanley (18,901) 18,901 − State Street Bank (32,022) 6,573 (25,449) Toronto-Dominion Bank (199,954) − (199,954) Total 937,369 − 937,369 Global Multi-Sector Bond Fund Amounts of Recognised Assets and Liabilities Amounts not offset per Statement of in the Statement of Financial Position Financial Position Net Amount* Counterparty USD USD USD Bank of America 23,716 − 23,716 Brown Brothers Harriman 607 − 607 Morgan Stanley 94,372 (4,515) 89,857 State Street Bank 42,360 (15,432) 26,928 Morgan Stanley (4,515) 4,515 − State Street Bank (15,432) 15,432 − Toronto-Dominion Bank (29,490) − (29,490) Total 111,618 − 111,618
1The High Yield Fund has received USD 320,000 from the counterparty for cash derivatives collateral.
311

LORD ABBETT PASSPORT PORTFOLIOS PLC NOTES TO THE FINANCIAL STATEMENTS AS AT 31 JANUARY 2020 (Continued)
11. Financial Risk Management (Continued) Offsetting (Continued) Total Return Fund Amounts of Recognised Assets and Liabilities Amounts not offset per Statement of in the Statement of Financial Position Financial Position Net Amount* Counterparty USD USD USD Morgan Stanley (14,850) − (14,850) Total (14,850) − (14,850) Multi-Sector Income Fund Amounts of Recognised Assets and Liabilities Amounts not offset per Statement of in the Statement of Financial Position Financial Position Net Amount* Counterparty USD USD USD Brown Brothers Harriman 50,572 − 50,572 Morgan Stanley 46,550 (46,550) − State Street Bank 14,205 (204) 14,001 Bank of America (874) − (874) Morgan Stanley2 (138,986) 46,550 (92,436) State Street Bank (204) 204 − Toronto-Dominion Bank (7,613) − (7,613) Total (36,350) − (36,350) Global High Yield Fund Amounts of Recognised Assets and Liabilities Amounts not offset per Statement of in the Statement of Financial Position Financial Position Net Amount* Counterparty USD USD USD Bank of America 421 − 421 Brown Brothers Harriman 8,564 − 8,564 Morgan Stanley 32,942 (1,590) 31,352 State Street Bank 7,076 (319) 6,757 Toronto-Dominion Bank 2,627 (2,627) − Morgan Stanley (1,590) 1,590 − State Street Bank (319) 319 − Toronto-Dominion Bank (14,973) 2,627 (12,346) Total 34,748 − 34,748
2The Multi-Sector Income Fund has pledged USD 120,000 to the counterparty for cash derivatives collateral.
312

LORD ABBETT PASSPORT PORTFOLIOS PLC NOTES TO THE FINANCIAL STATEMENTS AS AT 31 JANUARY 2020 (Continued)
11. Financial Risk Management (Continued) Offsetting (Continued) High Yield Core Fund3 Amounts of Recognised Assets and Liabilities Amounts not offset per Statement of in the Statement of Financial Position Financial Position Net Amount* Counterparty USD USD USD Morgan Stanley 54,407 (8,730) 45,677 Toronto-Dominion Bank 360 (336) 24 Morgan Stanley (8,730) 8,730 − Toronto-Dominion Bank (336) 336 − Total 45,701 − 45,701 At 31 January 2019, the Funds’ derivative assets and liabilities are as follows: Short Duration Income Fund Amounts of Recognised Assets and Liabilities Amounts not offset per Statement of in the Statement of Financial Position Financial Position Net Amount* Counterparty USD USD USD Brown Brothers Harriman 1,157,956 – 1,157,956 Goldman Sachs (3,976) – (3,976) Total 1,153,980 – 1,153,980 High Yield Fund Amounts of Recognised Assets and Liabilities Amounts not offset per Statement of in the Statement of Financial Position Financial Position Net Amount* Counterparty USD USD USD Bank of America 2,350 – 2,350 Brown Brothers Harriman 331,308 – 331,308 Goldman Sachs 1,646 (1,646) – Morgan Stanley 3,948 – 3,948 State Street Bank 7,437 (7,437) – Goldman Sachs (8,648) 1,646 (7,002) State Street Bank (297,406) 7,437 (289,969) Total 40,635 – 40,635
3Fund launched on 5 March 2019.
313

LORD ABBETT PASSPORT PORTFOLIOS PLC NOTES TO THE FINANCIAL STATEMENTS AS AT 31 JANUARY 2020 (Continued)
11. Financial Risk Management (Continued) Offsetting (Continued) Global Multi-Sector Bond Fund Amounts of Recognised Assets and Liabilities Amounts not offset per Statement of in the Statement of Financial Position Financial Position Net Amount* Counterparty USD USD USD Goldman Sachs 781 (781) – Bank of America (332) – (332) Goldman Sachs (18,653) 781 (17,872) Morgan Stanley (23,497) – (23,497) State Street Bank (201,400) – (201,400) Total (243,101) – (243,101)
Multi-Sector Income Fund Amounts of Recognised Assets and Liabilities Amounts not offset per Statement of in the Statement of Financial Position Financial Position Net Amount* Counterparty USD USD USD Bank of America 189 (189) – Brown Brothers Harriman 4,536 – 4,536 Goldman Sachs 388 (388) – Morgan Stanley 403 (403) – State Street Bank 1,155 (1,155) – Bank of America (421) 189 (232) Goldman Sachs (1,593) 388 (1,205) Morgan Stanley1 (666,162) 403 (665,759) State Street Bank (42,170) 1,155 (41,015) Total (703,675) – (703,675) Global High Yield Fund Amounts of Recognised Assets and Liabilities Amounts not offset per Statement of in the Statement of Financial Position Financial Position Net Amount* Counterparty USD USD USD Bank of America 527 (108) 419 State Street Bank 1,487 (1,487) – Bank of America (108) 108 – Goldman Sachs (6,574) – (6,574) Morgan Stanley (1,773) – (1,773) State Street Bank (2,664) 1,487 (1,177) Total (9,105) – (9,105) *Net Amount represents the amount due to/from the counterparty should settlement on a net basis occur. 1The Multi-Sector Income Fund has pledged USD 880,000 to the counterparty for cash derivatives collateral.
314

LORD ABBETT PASSPORT PORTFOLIOS PLC NOTES TO THE FINANCIAL STATEMENTS AS AT 31 JANUARY 2020 (Continued)
12. Efficient Portfolio Management
The Company may employ investment techniques and use financial derivative instruments (such as futures contracts, forward foreign currency contracts, options and swaps) for efficient portfolio management of the assets of any Fund including hedging against market movements, currency exchange or interest rate risks subject to the conditions and within the limits laid down by the Central Bank and the Prospectus. The efficient portfolio management purposes for which the Company intends to employ financial derivative instruments and such investment techniques are the reductions of risk, reduction of cost and the generation of additional capital or income for the relevant Fund with an appropriate level of risk, taking into account the risk profile of the Fund and the general UCITS Regulations. Any such investment technique or use of financial derivative instruments must be one which is reasonably believed by the Investment Adviser or Portfolio Managers to be economically appropriate in that they are realised in a cost-effective way. The Company did not employ any efficient portfolio management techniques in the form of securities lending or investment in repurchase or reverse repurchase agreements during the financial year ended 31 January 2020 (31 January 2019: none). 13. Net Asset Value per Redeemable Participating Share Reconciliation The NAV per redeemable participating share is calculated by dividing the total net assets of the Fund by the number of redeemable participating shares of that class in issue. The NAV per redeemable participating share reported in the Statement of Financial Position is that used for financial statement purposes. There were no organizational expenses during the financial year ended 31 January 2020 (31 January 2019: USD 865 for the Short Duration Income Fund, USD 865 for the High Yield Fund, USD 856 for the Global Multi-Sector Bond Fund, USD 9,827 for the Total Return Fund, USD 13,009 for the Emerging Markets Corporate Debt Fund and USD 13,009 for the Multi-Sector Income Fund). For the purpose of calculating the NAV per share for shareholder dealing, organisational expenses are being amortised over the first five financial years of the lifetime of the Fund. All organizational expenses were amortised for the financial year ended 31 January 2020 (31 January 2019: USD 82,369). 14. Swing Pricing
A Fund may experience reductions of the Net Asset Value per Share due to investors purchasing, selling and/or switching in and out of a Fund at a price that does not reflect the dealing costs associated with the trading of the underlying assets of the Fund necessary to accommodate associated cash inflows or outflows. In order to counter this dilution effect and protect Shareholders’ interests, a swing pricing mechanism has been adopted by the Company as part of its valuation policy to counter the impact of such trading. Accordingly, if the aggregate of net investor transactions in Shares of a Fund on any given Valuation Day exceed a predetermined threshold for such Fund (determined as a percentage of the net assets of that Fund from time to time by the Investment Manager), then the Net Asset Value per Share may be adjusted upwards or downwards to reflect the costs attributable to such net inflows or outflows, respectively. The relevant threshold for swing pricing shall be calculated based on objective criteria and may be adjusted from time to time. The Directors have delegated responsibility for the determination of such threshold and criteria to the Investment Manager.
The Swing Pricing Policy provides that any determination to apply swing pricing will be based on the latest available information pertaining to the aggregate level of relevant transactions at the time of calculation of the Net Asset Value. The swing pricing mechanism may be applied across all Funds. The extent of the price adjustment will be revised by the Investment Manager on a periodic basis to reflect an approximation of current dealing and other relevant costs, as well as market spreads. Such adjustment may vary from Fund to Fund and will not exceed 2% of the original Net Asset Value per Share. The Net Asset Value per Share of each Share Class in a Fund will be calculated separately but any adjustment will affect the Net Asset Value per Share of each Share Class in a Fund identically in percentage terms. Details of any such price adjustments are available on request from the Company at its registered office.
There was no swing pricing adjustment applied at the financial year ended 31 January 2020 (31 January 2019: none).
315

LORD ABBETT PASSPORT PORTFOLIOS PLC NOTES TO THE FINANCIAL STATEMENTS AS AT 31 JANUARY 2020 (Continued)
15. Soft Commissions
The Investment Manager may effect transactions with or through the agency of another person with whom it has arrangements under which that person will, from time to time, provide to or procure for the Investment Manager goods, services or other benefits such as research and advisory services, specialised computer hardware or software. No direct payment may be made for such goods or services but the Investment Manager may undertake to place business with that person provided that person has agreed to provide best execution with respect to such business and the services provided must be of a type which assists in the provision of investment services to the Fund.
There were no soft commission arrangements entered into by the Investment Manager, on behalf of the Company during the financial year ended 31 January 2020 (31 January 2019: none).
16. Related Party Transactions
Under IAS 24 “Related Party Disclosures” parties are related if one party has the ability to control the other party or exercise significant influence over the other party in making financial or operational decisions.
(i) Douglas B. Sieg is the Managing Partner of Lord, Abbett & Co. LLC. Jennifer Karam and Andrew D. D’Souza are Partners of Lord, Abbett & Co. LLC (the "Investment Manager").
(ii) Lord Abbett (Ireland) Ltd. (“the Manager”) acts as the Manager of the Company. Details of the fee paid to the Manager are listed in Note 5.
(iii) Lord Abbett Distributor LLC and Lord Abbett (UK) Ltd. act as a Distributor of the Fund. There were no distribution fees charged during the financial year ended 31 January 2020 (31 January 2019: none).
(iv) Directors who are associated with Lord, Abbett & Co. LLC are not entitled to Directors fees for the financial year ended 31 January 2020. Details of the fee paid to the Directors are listed in Note 8 (31 January 2019: none).
The Board of Directors is not aware of any other transactions with related parties during the financial year ended 31 January 2020 (31 January 2019: none).
The director fees for the financial year are set out in Note 8.
As of 31 January 2020 the Investment Manager’s holdings in the Company are as follows:
• Short Duration Income Fund – 54,693 shares. • High Yield Fund – 35,721 shares. • Global Multi-Sector Bond Fund – 14,503 shares. • Total Return Fund – 966,824 shares. • Emerging Markets Corporate Debt Fund – 957,438 shares. • Multi-Sector Income Fund – 14,043 shares. • U.S. Growth Leaders Fund – 1,970 shares. • Global High Yield Fund – 1,174,238 shares. • Global Equity Research Fund – 300,000 shares. • Ultra Short Bond Fund – 9,238 shares • High Yield Core Fund1 – 4,036 shares As of 31 January 2019 the Investment Manager’s holdings in the Company are as follows:
• Short Duration Income Fund – 53,984 shares. • High Yield Fund – 29,788 shares. • Global Multi-Sector Bond Fund – 15,189 shares. • Total Return Fund – 965,352 shares. • Emerging Markets Corporate Debt Fund – 954,602 shares. • Multi-Sector Income Fund – 13,584 shares. • U.S. Growth Leaders Fund – 604,640 shares. • Global High Yield Fund – 1,123,280 shares. • Global Equity Research Fund – 300,000 shares. • Ultra Short Bond Fund – 20,712 shares.
1Fund launched on 5 March 2019.
316

LORD ABBETT PASSPORT PORTFOLIOS PLC NOTES TO THE FINANCIAL STATEMENTS AS AT 31 JANUARY 2020 (Continued)
17. Material Events Affecting the Company during the Financial Year End Lord Abbett High Yield Core Fund commenced operations on 5 March 2019 with Class I USD Distributing Share Class. The Class I JPY Accumulating Share Class of the High Yield Fund was launched on 6 March 2019. The Class I USD Accumulating, the Class I EUR Accumulating (Hedged) and the Class I GBP Accumulating (Hedged) Share Classes of the Global Multi-Sector Bond Fund were re-launched on 1 April 2019. The Class I USD Accumulating Share Class of the Emerging Markets Corporate Debt Fund was re-launched on 1 April 2019. The Class I GBP Accumulating (Hedged) Share Class of the Multi-Sector Income Fund was re-launched on 1 April 2019. The Class I USD Accumulating, the Class I EUR Accumulating (Hedged) and the Class I GBP Accumulating (Hedged) Share Classes of the Global High Yield Fund were launched on 1 April 2019. The Class I USD Accumulating Share Class of the High Yield Core Fund was launched on 1 April 2019. The Class J EUR Distributing (Hedged) and the Class J GBP Distributing (Hedged) Share Classes of the High Yield Fund were launched on 7 May 2019. The Class I EUR Distributing (Hedged) Share Class of the Multi-Sector Income Fund was launched on 26 June 2019. The Class IF USD Accumulating, the Class IF USD Distributing, the Class IF EUR Accumulating (Hedged) and the Class IF GBP Accumulating (Hedged) Share Classes of the Global High Yield Fund were launched on 31 July 2019. A revised Prospectus and Supplement for each of the Funds was filed with the Central Bank for noting on 31 July 2019. The Prospectus and Supplements were revised to reflect recent regulatory updates and did not contain any material changes. The Supplement for the Multi-Sector Income Fund included a non-material change to the investment policy to remove reference to the expected average maturity of the Fund’s portfolio. The Class A EUR Accumulating (Hedged) Share Class of the Multi-Sector Income Fund was launched on 3 September 2019. The Class A EUR Accumulating (Hedged) Share Class of the Global Multi-Sector Bond Fund was launched on 3 September 2019. The Class A EUR Accumulating (Hedged) and the Class I EUR Distributing (Hedged) Share Classes of the Global High Yield Fund were launched on 3 September 2019. The Class C USD Distributing Share Class of the Multi-Sector Income Fund was liquidated on 3 September 2019. The Class C USD Accumulating Share Class of the Global Multi-Sector Bond Fund was liquidated on 3 September 2019. There were no other material events affecting the Company during the financial year. 18. Material Events Affecting the Company after Financial Year End Management has evaluated the impact of all subsequent events through 21 May 2020, the date these financial statements were issued, and determined there were no subsequent events that require an adjustment to the financial statements. Management continues to monitor the global impact of the coronavirus (COVID-19) which has been rapidly evolving and cannot be predicted and as a result the fund’s performance may be materially and adversely impacted due to current economic and market conditions. A revised Prospectus and Supplement for each of the Funds was filed with the Central Bank for noting on 19 February 2020. The revised Prospectus reflected a number of regulatory updates. No material changes were made to the Prospectus.
317

LORD ABBETT PASSPORT PORTFOLIOS PLC NOTES TO THE FINANCIAL STATEMENTS AS AT 31 JANUARY 2020 (Continued)
18. Material Events Affecting the Company after Financial Year End (Continued) A revised Prospectus and Supplement for each of the Funds was filed with the Central Bank for noting on 31 March 2020. The Prospectus and Supplements were updated to clarify that the Funds will not invest more than 10% of NAV in collective investment schemes. The Class AZ USD Accumulating, the Class AZ USD Distributing, the Class I USD Accumulating, the Class I USD Distributing, the Class I EUR Accumulating (Hedged), the Class I EUR Distributing (Hedged), the Class I GBP Accumulating (Hedged) and the Class I GBP Distributing (Hedged) Share Classes of the Ultra Short Bond Fund were launched on 18 March 2020. The Class J USD Distributing Share Class of the High Yield Fund was launched on 19 February 2020. There were no other material events affecting the Company after the financial year. 19. Approval of the Financial Statements The Directors approved the financial statements on 21 May 2020.
318

LORD ABBETT PASSPORT PORTFOLIOS PLC
SCHEDULE OF PORTFOLIO CHANGES (Unaudited) SHORT DURATION INCOME FUND The following Statements of Changes in Composition of Portfolio reflect the aggregate purchases of a security exceeding one percent of the total value of purchases and aggregate disposals greater than one percent of the total sales for the financial year. At a minimum, the largest twenty purchases and twenty sales are presented. Interest Maturity Nominal Cost Purchases Rate Date Amount USD U.S. Treasury Note 1.375% 31/01/2022 108,492,000 108,377,628 U.S. Treasury Note 2.50% 31/01/2024 101,175,000 101,232,805 U.S. Treasury Note 2.375% 29/02/2024 74,593,000 74,199,551 U.S. Treasury Note 1.75% 31/12/2024 71,946,000 72,179,807 U.S. Treasury Note 1.375% 31/01/2025 71,519,000 71,340,203 U.S. Treasury Note 2.50% 31/01/2021 63,191,000 63,490,743 U.S. Treasury Note 2.625% 31/12/2023 40,559,000 40,631,505 Electricite de France SA 1.698% 04/02/2020 37,824,000 37,815,082 U.S. Treasury Note 2.125% 31/03/2024 35,670,000 35,580,825 U.S. Treasury Note 2.00% 31/05/2024 34,547,000 34,460,633 U.S. Treasury Note 1.50% 30/11/2021 31,545,000 31,461,103 Great Wolf Trust 2017-WOLF Class A 3.175% 15/09/2034 31,158,000 31,167,737 U.S. Treasury Note 1.625% 31/12/2021 30,207,000 30,188,121 Energy Transfer Operating LP ZCP 27/06/2019 26,509,000 26,478,839 Energy Transfer Operating LP ZCP 17/07/2019 25,525,000 25,518,517 Energy Transfer Partners LP ZCP 16/07/2019 25,028,000 25,017,797 U.S. Treasury Note 1.50% 30/11/2024 24,596,000 24,434,147 Energy Transfer Operating LP ZCP 21/01/2020 24,428,000 24,419,783 U.S. Treasury Note 1.625% 30/06/2024 23,585,000 23,538,492 U.S. Treasury Bill ZCP 26/03/2020 23,948,000 23,395,400
Interest Maturity Nominal Proceeds Sales Rate Date Amount USD U.S. Treasury Note 2.50% 31/01/2024 115,570,000 116,214,161 U.S. Treasury Note 2.375% 29/02/2024 74,593,000 74,267,735 U.S. Treasury Note 1.75% 31/12/2024 71,946,000 73,035,958 U.S. Treasury Note 2.50% 31/01/2021 55,907,000 56,286,279 U.S. Treasury Note 2.625% 31/12/2023 40,559,000 40,794,122 U.S. Treasury Note 2.125% 31/03/2024 35,670,000 35,638,000 U.S. Treasury Note 2.00% 31/05/2024 34,547,000 34,840,179 U.S. Treasury Note 1.50% 30/11/2021 31,545,000 31,449,027 U.S. Treasury Note 1.625% 31/12/2021 30,207,000 30,303,757 U.S. Treasury Inflation Indexed Bonds 0.625% 15/04/2023 25,076,266 24,921,499 U.S. Treasury Note 1.50% 30/11/2024 24,596,000 24,408,671 U.S. Treasury Note 1.625% 30/06/2024 23,585,000 23,650,870 U.S. Treasury Bill ZCP 26/03/2020 23,948,000 23,639,508 U.S. Treasury Note 1.75% 31/07/2024 23,119,000 23,543,873 U.S. Treasury Note 1.50% 30/09/2024 22,414,000 22,378,246 Ford Credit Auto Owner Trust 2015-REV1 2015-1 Class A 2.12% 15/07/2026 20,658,000 20,658,000 Caesars Palace Las Vegas Trust 2017-VICI Class A 3.531% 15/10/2034 16,105,000 16,911,129 U.S. Treasury Note 1.50% 31/10/2024 15,566,000 15,487,829 American Airlines, Inc. Replacement Term Loan 4.379% 10/10/2021 14,559,419 14,568,521 Flying Fortress Holdings LLC Term Loan 4.08% 30/10/2020 13,255,817 13,280,832
319

LORD ABBETT PASSPORT PORTFOLIOS PLC
SCHEDULE OF PORTFOLIO CHANGES (Unaudited) (Continued) HIGH YIELD FUND Interest Maturity Nominal Cost Purchases Rate Date Amount USD DISH DBS Corp. 7.75% 01/07/2026 19,046,000 18,576,218 Sprint Capital Corp. 6.875% 15/11/2028 16,778,000 17,268,573 CCO Holdings LLC/CCO Holdings Capital Corp. 5.125% 01/05/2027 15,796,000 16,222,822 Intelsat Jackson Holdings SA 5.50% 08/01/2023 16,674,000 15,293,957 Netflix, Inc. 3.875% 15/11/2029 9,502,000 11,292,249 Intesa Sanpaolo SpA 5.71% 15/01/2026 10,303,000 10,567,633 TransDigm, Inc. 6.375% 15/06/2026 9,864,000 9,864,160 Sinclair Television Group, Inc. 5.125% 15/02/2027 9,780,000 9,565,372 Transocean Poseidon Ltd. 6.875% 02/01/2027 8,910,000 9,333,045 Pinduoduo, Inc. ZCP 01/10/2024 8,450,000 9,187,073 Bausch Health Americas, Inc. 8.50% 31/01/2027 7,853,000 8,600,569 Springleaf Finance Corp. 6.125% 15/03/2024 8,264,000 8,579,378 United Airlines Holdings, Inc. 4.875% 15/01/2025 8,119,000 8,383,033 Uber Technologies, Inc. 8.00% 01/11/2026 7,882,000 8,275,333 Navient Corp. 6.75% 25/06/2025 7,901,000 8,207,251 Altice France SA/France 8.125% 01/02/2027 7,837,000 8,198,365 Jagged Peak Energy LLC 5.875% 01/05/2026 7,918,000 7,990,742 Enphase Energy, Inc. 1.00% 06/01/2024 5,737,000 7,797,327 MGM Resorts International 4.625% 01/09/2026 7,530,000 7,558,175 Nexstar Broadcasting, Inc. 5.625% 15/07/2027 7,163,000 7,396,287 Interest Maturity Nominal Proceeds Sales Rate Date Amount USD Pacific Gas & Electric Co. 6.05% 01/03/2034 10,466,000 10,996,684 Sprint Capital Corp. 6.875% 15/11/2028 9,339,000 10,036,154 Calpine Corp. 5.75% 15/01/2025 9,302,000 9,593,553 HCA, Inc. 5.25% 15/06/2026 8,703,000 9,185,233 Cheniere Corpus Christi Holdings LLC 5.125% 30/06/2027 8,020,000 8,773,524 Intelsat Jackson Holdings SA 5.50% 01/08/2023 9,379,000 8,476,673 Delphi Technologies PLC 5.00% 01/10/2025 7,833,000 8,410,816 Altice France SA/France 7.375% 01/05/2026 7,807,000 8,324,065 Noble Holding International Ltd. 7.875% 01/02/2026 8,714,000 6,515,378 California Resources Corp. 8.00% 15/12/2022 11,810,000 6,488,192 Bombardier, Inc. 7.50% 15/03/2025 6,567,000 6,381,423 Advanced Micro Devices, Inc. 2.125% 01/09/2026 1,706,000 6,334,417 Ally Financial, Inc. 8.00% 01/11/2031 4,395,000 6,055,583 Neurocrine Biosciences, Inc. 2.25% 15/05/2024 4,125,000 6,041,093 Match Group, Inc. 5.00% 15/12/2027 5,521,000 5,748,383 Everbridge, Inc. 1.50% 01/11/2022 2,578,000 5,597,905 Republic of Argentina 6.875% 22/04/2021 9,312,000 5,501,747 Sirius XM Radio, Inc. 5.00% 01/08/2027 5,383,000 5,476,994 RegionalCare Hospital Partners Holdings, Inc./LifePoint Health, Inc. 9.75% 01/12/2026 5,036,000 5,449,184 Uniti Group LP/Uniti Group Finance, Inc./CSL Capital LLC 8.25% 15/10/2023 6,152,000 5,404,473
320

LORD ABBETT PASSPORT PORTFOLIOS PLC
SCHEDULE OF PORTFOLIO CHANGES (Unaudited) (Continued) GLOBAL MULTI-SECTOR BOND FUND Interest Maturity Nominal Cost Purchases Rate Date Amount USD U.S. Treasury Note 2.375% 15/05/2029 5,806,000 6,065,362 U.S. Treasury Note 2.625% 15/02/2029 3,980,000 4,063,446 U.S. Treasury Note 3.125% 15/11/2028 2,442,000 2,673,585 U.S. Treasury Note 1.75% 15/11/2029 2,006,000 1,976,654 U.S. Treasury Note 1.625% 15/08/2029 1,838,000 1,819,620 U.S. Treasury Bond 4.375% 15/05/2040 1,282,000 1,774,218 U.S. Treasury Bond 4.50% 15/02/2036 1,280,000 1,745,350 U.S. Treasury Bond 2.875% 15/05/2049 1,215,000 1,405,395 Federal National Mortgage Assoc. 3.50% 01/04/2049 1,300,000 1,327,574 Federal National Mortgage Assoc. 4.50% 01/10/2048 1,250,000 1,300,000 U.S. Treasury Bond 3.00% 15/02/2049 881,000 936,910 U.S. Treasury Bond 2.75% 15/11/2047 845,000 818,967 U.S. Treasury Inflation Indexed Note 0.50% 15/04/2024 779,719 791,384 U.S. Treasury Bond 3.625% 15/08/2043 621,000 789,111 U.S. Treasury Bond 3.375% 15/11/2048 720,000 775,685 Federal National Mortgage Assoc. 3.50% 01/02/2049 700,000 706,618 Societe Generale ZCP 17/09/2019 700,000 699,939 Foursight Capital Automobile Receivables Trust 2018-1 Class D 4.19% 15/11/2023 665,000 682,950 U.S. Treasury Bond 2.25% 15/08/2049 698,000 682,729 African Development Bank 3.35% 08/08/2028 916,000 682,013 Interest Maturity Nominal Proceeds Sales Rate Date Amount USD U.S. Treasury Note 2.375% 15/05/2029 5,806,000 6,040,443 U.S. Treasury Note 3.125% 15/11/2028 3,978,000 4,312,589 U.S. Treasury Note 2.625% 15/02/2029 3,980,000 4,149,904 U.S. Treasury Note 1.625% 15/08/2029 1,838,000 1,852,100 U.S. Treasury Bond 4.50% 15/02/2036 1,280,000 1,737,200 U.S. Treasury Bond 2.875% 15/05/2049 1,215,000 1,370,301 Federal National Mortgage Assoc. 3.50% 01/04/2049 1,300,000 1,325,390 Federal National Mortgage Assoc. 4.50% 01/10/2048 1,250,000 1,306,425 U.S. Treasury Bond 3.00% 15/02/2049 881,000 1,040,879 U.S. Treasury Bond 3.375% 15/11/2048 720,000 792,532 U.S. Treasury Bond 3.00% 15/08/2048 759,000 760,458 Federal National Mortgage Assoc. 4.00% 01/01/2048 700,000 713,750 U.S. Treasury Inflation Indexed Note 0.05% 15/01/2028 640,437 622,324 Italy Buoni Poliennali Del Tesoro 0.90% 08/01/2022 540,000 599,268 U.S. Treasury Note 2.125% 31/03/2024 469,000 467,867 Bundesrepublik Deutschland Bundesanleihe 1.25% 15/08/2048 280,000 429,487 GE Capital International Funding Co. Unlimited Co. 4.418% 15/11/2035 400,000 427,148 Kommuninvest I Sverige AB 1.00% 12/05/2025 3,850,000 421,908 Nordea Eiendomskreditt AS 4.25% 16/06/2021 3,500,000 410,499 U.S. Treasury Note 2.00% 31/05/2024 396,000 398,630
321

LORD ABBETT PASSPORT PORTFOLIOS PLC
SCHEDULE OF PORTFOLIO CHANGES (Unaudited) (Continued) TOTAL RETURN FUND Interest Maturity Nominal Cost Purchases Rate Date Amount USD U.S. Treasury Bill ZCP 27/08/2019 5,697,000 5,685,568 U.S. Treasury Bill ZCP 02/07/2019 4,565,000 4,553,933 U.S. Treasury Bill ZCP 30/05/2019 4,221,000 4,200,207 Japan Treasury Discount Bill ZCP 08/01/2020 331,750,000 3,106,747 U.S. Treasury Bill ZCP 21/11/2019 3,114,000 3,099,794 U.S. Treasury Note 2.375% 15/05/2029 2,826,000 2,976,632 U.S. Treasury Note 2.50% 31/01/2021 2,823,000 2,846,944 U.S. Treasury Bill ZCP 07/05/2020 2,844,000 2,826,791 U.S. Treasury Bond 2.875% 15/05/2049 2,388,000 2,746,385 U.S. Treasury Bill ZCP 03/12/2019 2,490,000 2,487,152 U.S. Treasury Floating Rate Note ZCP 30/04/2020 1,873,000 1,873,012 U.S. Treasury Note 2.625% 15/02/2029 1,623,000 1,671,627 Federal National Mortgage Assoc. 3.50% 01/02/2049 1,600,000 1,615,125 Federal Home Loan Bank Discount Notes ZCP 05/11/2019 1,613,000 1,606,968 Japan Treasury Discount Bill ZCP 13/04/2020 169,400,000 1,546,618 U.S. Treasury Bond 3.00% 15/02/2049 1,212,000 1,312,354 U.S. Treasury Bond 3.625% 15/08/2043 1,009,000 1,279,284 U.S. Treasury Bill ZCP 30/01/2020 1,260,000 1,256,874 U.S. Treasury Bond 2.25% 15/08/2049 1,246,000 1,224,000 Federal National Mortgage Assoc. 4.50% 01/10/2048 1,150,001 1,196,001 Interest Maturity Nominal Proceeds Sales Rate Date Amount USD U.S. Treasury Bill ZCP 21/11/2019 3,114,000 3,106,185 U.S. Treasury Note 2.375% 15/05/2029 2,826,000 2,938,431 U.S. Treasury Note 2.50% 31/01/2021 2,823,000 2,850,785 U.S. Treasury Bond 2.875% 15/05/2049 2,388,000 2,694,057 U.S. Treasury Bill ZCP 30/05/2019 1,704,000 1,697,865 U.S. Treasury Note 2.625% 15/02/2029 1,623,000 1,693,732 Federal National Mortgage Assoc. 3.50% 01/02/2049 1,600,000 1,631,250 Federal Home Loan Bank Discount Notes ZCP 05/11/2019 1,613,000 1,610,855 U.S. Treasury Bill ZCP 02/07/2019 1,579,000 1,578,134 U.S. Treasury Bill ZCP 27/08/2019 1,507,000 1,504,411 U.S. Treasury Bill ZCP 07/05/2020 1,443,000 1,435,862 U.S. Treasury Inflation Indexed Bonds 0.625% 15/04/2023 1,399,595 1,420,425 U.S. Treasury Bond 3.00% 15/02/2049 1,212,000 1,403,359 U.S. Treasury Bill ZCP 30/01/2020 1,260,000 1,257,553 Federal National Mortgage Assoc. 4.50% 01/10/2048 1,150,001 1,201,924 U.S. Treasury Note 1.75% 31/07/2024 1,152,000 1,171,391 U.S. Treasury Note 3.125% 15/11/2028 952,000 1,056,147 Federal National Mortgage Assoc. 4.00% 01/02/2049 1,000,000 1,032,110 Federal National Mortgage Assoc. 3.50% 01/04/2049 1,000,000 1,019,594 U.S. Treasury Bond 3.375% 15/11/2048 842,000 920,582 U.S. Treasury Note 1.625% 15/08/2029 854,000 860,588 U.S. Treasury Bond 2.25% 15/08/2049 874,000 857,173 U.S. Treasury Note 2.125% 31/03/2024 829,000 825,246 Federal National Mortgage Assoc. 3.50% 01/06/2049 750,000 764,766 U.S. Treasury Note 1.25% 31/08/2024 753,000 743,772 U.S. Treasury Bond 3.00% 15/08/2048 705,000 705,468
322

LORD ABBETT PASSPORT PORTFOLIOS PLC
SCHEDULE OF PORTFOLIO CHANGES (Unaudited) (Continued) TOTAL RETURN FUND (Continued) Interest Maturity Nominal Proceeds Sales (Continued) Rate Date Amount USD U.S. Treasury Note 1.75% 30/06/2024 696,000 696,915 U.S. Treasury Note 1.625% 31/12/2021 592,000 593,896 U.S. Treasury Note 2.375% 29/02/2024 594,000 591,604 Federal National Mortgage Assoc. 4.00% 01/10/2048 550,000 567,661 U.S. Treasury Note 2.50% 31/01/2024 546,000 553,584
323
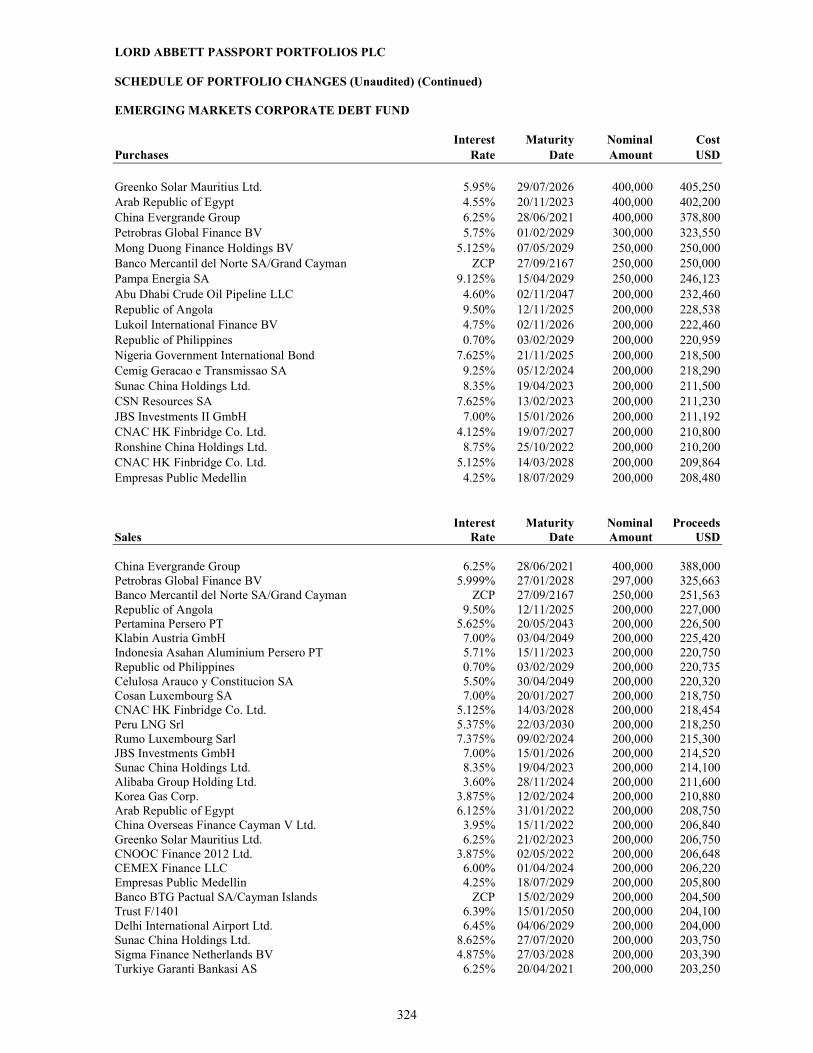
LORD ABBETT PASSPORT PORTFOLIOS PLC
SCHEDULE OF PORTFOLIO CHANGES (Unaudited) (Continued) EMERGING MARKETS CORPORATE DEBT FUND Interest Maturity Nominal Cost Purchases Rate Date Amount USD Greenko Solar Mauritius Ltd. 5.95% 29/07/2026 400,000 405,250 Arab Republic of Egypt 4.55% 20/11/2023 400,000 402,200 China Evergrande Group 6.25% 28/06/2021 400,000 378,800 Petrobras Global Finance BV 5.75% 01/02/2029 300,000 323,550 Mong Duong Finance Holdings BV 5.125% 07/05/2029 250,000 250,000 Banco Mercantil del Norte SA/Grand Cayman ZCP 27/09/2167 250,000 250,000 Pampa Energia SA 9.125% 15/04/2029 250,000 246,123 Abu Dhabi Crude Oil Pipeline LLC 4.60% 02/11/2047 200,000 232,460 Republic of Angola 9.50% 12/11/2025 200,000 228,538 Lukoil International Finance BV 4.75% 02/11/2026 200,000 222,460 Republic of Philippines 0.70% 03/02/2029 200,000 220,959 Nigeria Government International Bond 7.625% 21/11/2025 200,000 218,500 Cemig Geracao e Transmissao SA 9.25% 05/12/2024 200,000 218,290 Sunac China Holdings Ltd. 8.35% 19/04/2023 200,000 211,500 CSN Resources SA 7.625% 13/02/2023 200,000 211,230 JBS Investments II GmbH 7.00% 15/01/2026 200,000 211,192 CNAC HK Finbridge Co. Ltd. 4.125% 19/07/2027 200,000 210,800 Ronshine China Holdings Ltd. 8.75% 25/10/2022 200,000 210,200 CNAC HK Finbridge Co. Ltd. 5.125% 14/03/2028 200,000 209,864 Empresas Public Medellin 4.25% 18/07/2029 200,000 208,480 Interest Maturity Nominal Proceeds Sales Rate Date Amount USD China Evergrande Group 6.25% 28/06/2021 400,000 388,000 Petrobras Global Finance BV 5.999% 27/01/2028 297,000 325,663 Banco Mercantil del Norte SA/Grand Cayman ZCP 27/09/2167 250,000 251,563 Republic of Angola 9.50% 12/11/2025 200,000 227,000 Pertamina Persero PT 5.625% 20/05/2043 200,000 226,500 Klabin Austria GmbH 7.00% 03/04/2049 200,000 225,420 Indonesia Asahan Aluminium Persero PT 5.71% 15/11/2023 200,000 220,750 Republic od Philippines 0.70% 03/02/2029 200,000 220,735 Celulosa Arauco y Constitucion SA 5.50% 30/04/2049 200,000 220,320 Cosan Luxembourg SA 7.00% 20/01/2027 200,000 218,750 CNAC HK Finbridge Co. Ltd. 5.125% 14/03/2028 200,000 218,454 Peru LNG Srl 5.375% 22/03/2030 200,000 218,250 Rumo Luxembourg Sarl 7.375% 09/02/2024 200,000 215,300 JBS Investments GmbH 7.00% 15/01/2026 200,000 214,520 Sunac China Holdings Ltd. 8.35% 19/04/2023 200,000 214,100 Alibaba Group Holding Ltd. 3.60% 28/11/2024 200,000 211,600 Korea Gas Corp. 3.875% 12/02/2024 200,000 210,880 Arab Republic of Egypt 6.125% 31/01/2022 200,000 208,750 China Overseas Finance Cayman V Ltd. 3.95% 15/11/2022 200,000 206,840 Greenko Solar Mauritius Ltd. 6.25% 21/02/2023 200,000 206,750 CNOOC Finance 2012 Ltd. 3.875% 02/05/2022 200,000 206,648 CEMEX Finance LLC 6.00% 01/04/2024 200,000 206,220 Empresas Public Medellin 4.25% 18/07/2029 200,000 205,800 Banco BTG Pactual SA/Cayman Islands ZCP 15/02/2029 200,000 204,500 Trust F/1401 6.39% 15/01/2050 200,000 204,100 Delhi International Airport Ltd. 6.45% 04/06/2029 200,000 204,000 Sunac China Holdings Ltd. 8.625% 27/07/2020 200,000 203,750 Sigma Finance Netherlands BV 4.875% 27/03/2028 200,000 203,390 Turkiye Garanti Bankasi AS 6.25% 20/04/2021 200,000 203,250
324

LORD ABBETT PASSPORT PORTFOLIOS PLC
SCHEDULE OF PORTFOLIO CHANGES (Unaudited) (Continued) EMERGING MARKETS CORPORATE DEBT FUND (Continued) Interest Maturity Nominal Proceeds Sales (Continued) Rate Date Amount USD Centrais Eletricas Brasileiras SA 4.625% 04/02/2030 200,000 203,200 Globo Comunicacao e Participacoes SA 4.875% 22/01/2030 200,000 203,000 Republic of Sri Lanka 7.85% 14/03/2029 200,000 202,930 MV24 Capital BV 6.748% 01/06/2034 200,000 202,600 Delta Merlin Dunia Tekstil 8.625% 12/03/2024 200,000 202,600 Hyundai Capital America 3.45% 12/03/2021 200,000 202,508 Turkiye Sinai Kalkinma Class B 6.00% 23/01/2025 200,000 202,400 Muthoot Finance Ltd. 6.125% 31/10/2022 200,000 202,400 Egypt Government International Bond 4.55% 20/11/2023 200,000 202,200 Latam Finance Ltd. 6.875% 11/04/2024 200,000 202,100 Theta Capital Pte Ltd. 7.00% 11/04/2022 200,000 202,000 Shriram Transport Finance 5.95% 24/10/2022 200,000 201,750 Adaniren Kodsopar Warsom 4.625% 15/10/2039 200,000 201,520 Alpek SA de CV 4.25% 18/09/2029 200,000 201,500 Future Retail Ltd. 5.60% 22/01/2025 200,000 201,500 Greenko Solar Mauritius Ltd 5.95% 29/07/2026 200,000 201,400 AES Gener SA ZCP 26/03/2079 200,000 201,250 Renew Power PVT Ltd. 5.875% 05/03/2027 200,000 201,200 Republic of Guatemala 6.125% 01/06/2050 200,000 201,100 Evraz PLC 5.25% 02/04/2024 200,000 200,600 Turkiye Is Bankasi AS 5.00% 30/04/2020 200,000 200,500 PLA Administradora Industrial 4.962% 18/07/2029 200,000 200,200 Cosan Ltd. 5.50% 20/09/2029 200,000 200,200 CNAC HK Finbridge Co. Ltd. 3.875% 19/06/2029 200,000 200,162 Braskem Netherlands Finance BV 4.50% 10/01/2028 200,000 200,152 Industrial & Commercial Bank of China Ltd./Dubai DIFC 2.625% 26/05/2020 200,000 200,020 Export Credit Bank of Turkey 8.25% 24/01/2024 200,000 200,000 Sociedad Quimica y Miner Regd 4.25% 22/01/2050 200,000 199,800 NBM US Holdings, Inc. 6.625% 06/08/2029 200,000 199,700 Tencent Holdings Ltd. 2.875% 11/02/2020 200,000 199,700 Kaisa Group Holdings Ltd. 11.95% 22/10/2022 200,000 199,520 Republic of Indonesia 3.70% 30/10/2049 200,000 199,400 QNB Finance Ltd. 2.875% 29/04/2020 200,000 199,064 Shinhan Bank Co. Ltd. 2.25% 15/04/2020 200,000 198,800 Dominican Republic 6.40% 05/06/2049 200,000 198,800 Pampa Energia SA 9.125% 15/04/2029 250,000 198,750 America Movil SAB de CV 3.625% 22/04/2029 200,000 198,740 Bayan Resources 6.125% 24/01/2023 200,000 198,500 Minera Mexico SA de CV 4.50% 26/01/2050 200,000 198,200 CSN Islands XI Corp 6.750% 28/01/2028 200,000 198,200 Intercorp Peru Ltd. 3.875% 15/08/2029 200,000 198,100 Suzano Austria GmbH 5.00% 15/01/2030 200,000 197,940 Medco Oak Tree Pte. Ltd. 7.375% 14/05/2026 200,000 197,840 Grupo Bimbo SAB de CV 4.00% 06/09/2049 200,000 197,322 Republic of Ghan 8.95% 26/03/2051 200,000 196,800 Medco Bell Pte Ltd. 6.375% 30/01/2027 200,000 196,600 HKT Capital No 2 Ltd. 3.625% 02/04/2025 200,000 195,040 KOC Holding AS 6.50% 11/03/2025 200,000 194,000 KOC Holding AS 5.25% 15/03/2023 200,000 193,800 Republic of Sri Lanka 6.20% 11/05/2027 200,000 184,760
325

LORD ABBETT PASSPORT PORTFOLIOS PLC
SCHEDULE OF PORTFOLIO CHANGES (Unaudited) (Continued) MULTI-SECTOR INCOME FUND Interest Maturity Nominal Cost Purchases Rate Date Amount USD U.S. Treasury Note 2.75% 31/08/2023 60,791,000 62,648,084 U.S. Treasury Inflation Indexed Note 0.50% 15/04/2024 12,535,791 12,706,199 Japan Treasury Bill ZCP 08/01/2020 1,124,850,000 10,533,946 Federal National Mortgage Assoc. 4.50% 01/08/2048 8,100,000 8,424,000 Ford Motor Credit Co. LLC 5.584% 18/03/2024 6,090,000 6,513,565 U.S. Treasury Note 2.375% 15/05/2029 6,162,000 6,452,237 HCA, Inc. 5.50% 15/06/2047 5,350,000 6,177,070 DISH DBS Corp. 7.75% 01/07/2026 4,419,000 4,367,232 U.S. Treasury Note 2.625% 15/02/2029 4,187,000 4,283,600 Pacific Gas and Electric Company Revolving Term Loan ZCP 27/04/2022 4,209,900 4,073,499 U.S. Treasury Bond 2.25% 15/08/2049 3,847,000 3,913,543 Continental Resources, Inc. 4.90% 01/06/2044 3,735,000 3,836,597 Sprint Capital Corp. 6.875% 15/11/2028 3,628,000 3,814,399 KKR CLO 9 Ltd. 0.00% 15/07/2030 3,500,000 3,470,250 Newell Brands, Inc. 4.20% 01/04/2026 3,279,000 3,406,616 General Electric Co. ZCP 15/06/2168 3,321,000 3,238,578 Cenovus Energy, Inc. 5.40% 15/06/2047 2,708,000 3,107,085 Weibo Corp. 1.25% 15/11/2022 3,255,000 3,086,451 Autoliv ASP, Inc. ZCP 01/10/2019 3,000,000 2,999,817 Hitachi America Corp. ZCP 17/09/2019 3,000,000 2,999,809 Interest Maturity Nominal Proceeds Sales Rate Date Amount USD U.S. Treasury Note 2.75% 31/08/2023 15,361,000 15,932,237 Federal National Mortgage Assoc. 4.50% 01/08/2048 8,100,000 8,465,643 Ford Motor Credit Co. LLC 5.584% 18/03/2024 6,090,000 6,616,351 U.S. Treasury Note 2.375% 15/05/2029 6,162,000 6,414,836 Pacific Gas & Electric Co. ZCP 01/03/2034 4,381,000 4,637,434 U.S. Treasury Note 3.125% 15/11/2028 4,184,000 4,551,561 U.S. Treasury Note 2.625% 15/02/2029 4,187,000 4,376,209 Continental Resources, Inc./OK 4.90% 01/06/2044 3,735,000 3,805,119 U.S. Treasury Inflation Indexed Bonds 0.50% 15/01/2028 3,434,048 3,336,929 Sprint Capital Corp. 6.875% 15/11/2028 2,725,000 2,930,970 U.S. Treasury Note 2.75% 31/05/2023 2,894,000 2,923,844 Pacific Gas & Electric Co. ZCP 27/04/2022 2,291,654 2,274,151 U.S. Treasury Note 1.625% 15/08/2029 2,090,000 2,106,035 American Express Co. 3.40% 27/02/2023 1,884,000 1,951,767 Republic of South Africa Government International Bond 4.30% 12/10/2028 2,027,000 1,926,189 U.S. Treasury Bond 2.25% 15/08/2049 1,820,000 1,771,941 DexCom, Inc. 0.75% 15/05/2022 759,000 1,573,761 Ecuador Government International Bond 8.875% 23/10/2027 1,554,000 1,564,984 Bombardier, Inc. 7.50% 15/03/2025 1,591,000 1,543,774 United Group BV 3.125% 15/02/2026 1,416,000 1,538,437
326

LORD ABBETT PASSPORT PORTFOLIOS PLC
SCHEDULE OF PORTFOLIO CHANGES (Unaudited) (Continued)
U.S. GROWTH LEADERS FUND
Nominal Cost Purchases Amount USD Amazon.com, Inc. 1,360 2,576,070 Microsoft Corp. 15,176 2,080,968 Facebook, Inc. Class A 9,878 1,977,895 Apple, Inc. 8,502 1,975,709 Alphabet, Inc. Class A 1,097 1,366,835 Alibaba Group Holding Ltd. 6,564 1,211,216 Match Group, Inc. 13,971 977,445 Walt Disney Co. 6,236 851,643 QUALCOMM, Inc. 9,922 838,586 MercadoLibre, Inc. 1,569 802,782 Chipotle Mexican Grill, Inc. Class A 1,101 767,265 NVIDIA Corp 3,949 736,399 Intuitive Surgical, Inc. 1,335 736,119 Snap, Inc. Class A 43,329 727,721 Crowdstrike Holdings, Inc. Class A 10,772 721,459 DocuSign, Inc. Class A 10,634 714,200 Trade Desk, Inc. Class A 2,689 639,794 Generac Holdings, Inc. 7,095 590,567 TransUnion 7,111 590,435 MarketAxess Holdings, Inc. 2,020 570,182 Target Corp. 5,234 567,275 Amarin Corp. PLC 27,723 562,771
Nominal Proceeds Sales Amount USD Amazon.com, Inc. 1,300 2,181,194 Facebook, Inc. Class A 10,525 1,840,918 Microsoft Corp. 10,758 1,214,760 Alphabet, Inc. Class A 1,025 1,173,361 Boeing Co. 2,994 1,110,856 PayPal Holdings, Inc. 8,681 917,895 Roku, Inc. Class A 7,707 807,826 ServiceNow, Inc. 3,036 765,539 Walt Disney Co. 5,879 757,329 Trade Desk, Inc. 3,646 748,166 Alibaba Group Holding Ltd. 4,002 728,016 Intuitive Surgical, Inc. 1,380 723,077 Paycom Software, Inc. 3,384 713,932 Twilio, Inc. Class A 6,118 710,837 Keysight Technologies, Inc. 7,189 703,675 Netflix, Inc. 2,089 702,945 Starbucks Corp. 8,481 696,620 Everbridge, Inc. 9,873 695,307 Planet Fitness, Inc. Class A 10,405 677,461 Okta, Inc. Class A 6,716 675,555 HEICO Corp. 5,383 650,402 salesforce.com, Inc. 4,007 631,224 Match Group, Inc. 9,147 630,863 American Tower Corp. 2,978 625,000
327

LORD ABBETT PASSPORT PORTFOLIOS PLC
SCHEDULE OF PORTFOLIO CHANGES (Unaudited) (Continued) U.S. GROWTH LEADERS FUND (Continued) Nominal Proceeds Sales (Continued) Amount USD Target Corp. 5,234 614,906 UnitedHealth Group, Inc. 2,431 596,049 Atlassian Corp. PLC Class A 5,048 590,289 MercadoLibre, Inc. 1,116 586,149 DexCom, Inc. 3,632 548,622 Roper Technologies, Inc. 1,572 548,493 Workday, Inc. Class A 2,789 541,586 Xilinx, Inc. 5,121 532,953 Dollar General Corp. 3,434 529,541 Etsy, Inc. 8,870 526,973 Alteryx, Inc. Class A 5,146 517,730 HubSpot, Inc. 3,311 512,100
328

LORD ABBETT PASSPORT PORTFOLIOS PLC
SCHEDULE OF PORTFOLIO CHANGES (Unaudited) (Continued) GLOBAL HIGH YIELD FUND
Interest Maturity Nominal Cost Purchases Rate Date Amount USD Netflix, Inc. 3.875% 15/11/2029 650,000 769,167 Kaisa Group Holdings Ltd. 9.375% 30/06/2024 600,000 541,450 Sprint Capital Corp. 6.875% 15/11/2028 492,000 521,436 CCO Holdings LLC/CCO Holdings Capital Corp. 5.125% 01/05/2027 455,000 475,650 Country Garden Holdings Co. Ltd. 6.50% 04/08/2024 400,000 412,750 Eskom Holdings SOC Ltd. 7.125% 11/02/2025 400,000 412,100 Gol Finance SA 7.00% 31/01/2025 400,000 404,600 Sunac China Holdings Ltd. 7.25% 14/06/2022 400,000 402,610 Turkiye Vakiflar Bankasi TAO 5.25% 05/02/2025 400,000 399,290 Intesa Sanpaolo SpA 5.71% 15/01/2026 400,000 391,914 China Evergrande Group 9.50% 04/11/2022 400,000 380,400 Yuzhou Properties Co. Ltd. 6.00% 25/10/2023 400,000 380,000 Theta Capital Pte Ltd. 6.75% 31/10/2026 400,000 373,200 Autopistas del Sol SA/Costa Rica 7.375% 30/12/2030 375,562 366,467 TransDigm, Inc. 6.375% 15/06/2026 325,000 338,548 CSC Holdings LLC 5.50% 15/04/2027 300,000 300,500 AI Candelaria Spain SLU 7.50% 15/12/2028 250,000 274,063 Miller Homes Group Holdings PLC 5.50% 15/10/2024 200,000 270,586 Aston Martin Capital Holdings Ltd. 6.50% 15/04/2022 280,000 269,324 Ukraine Government International Bond 7.375% 25/09/2032 250,000 258,438
Interest Maturity Nominal Proceeds Sales Rate Date Amount USD Eskom Holdings SOC Ltd. 8.45% 08/10/2028 400,000 433,940 Turkiye Vakiflar Bankasi TAO 8.125% 28/03/2024 400,000 414,520 Kaisa Group Holdings Ltd. 9.375% 30/06/2024 400,000 375,200 CSC Holdings LLC 5.75% 15/01/2030 300,000 301,755 CSC Holdings LLC 10.875% 15/10/2025 236,000 262,845 Stoneway Capital Corp. 10.00% 03/01/2027 317,938 254,332 Mauser Packaging Solutions Holding Co. 4.75% 15/04/2024 200,000 231,535 Hunt Oil Co. of Peru LLC Sucursal Del Peru 6.375% 06/01/2028 200,000 219,000 Cemig Geracao e Transmissao SA 9.25% 05/12/2024 200,000 215,500 Delhi International Airport Ltd. 6.45% 06/04/2029 200,000 215,000 Chemours Co. 4.00% 15/05/2026 200,000 214,702 Altice Financing SA 7.50% 15/05/2026 200,000 214,066 Telefonica Celular del Paraguay SA 5.875% 15/04/2027 200,000 213,750 Suzano Austria GmbH 6.00% 15/01/2029 200,000 213,224 Rumo Luxembourg S.A.R.L. 5.875% 18/01/2025 200,000 213,200 Medco Platinum Road 6.75% 30/01/2025 200,000 209,820 Eskom Holdings SOC Ltd. 7.125% 02/11/2025 200,000 208,700 Trivium Packaging Finance BV 8.50% 15/08/2027 200,000 207,500 MHP Lux SA 6.95% 04/03/2026 200,000 206,000 IHS Netherlands Holdco 8.00% 18/09/2027 200,000 205,750
329

LORD ABBETT PASSPORT PORTFOLIOS PLC
SCHEDULE OF PORTFOLIO CHANGES (Unaudited) (Continued) GLOBAL EQUITY RESEARCH FUND
Nominal Cost Purchases Amount USD Samsung Electronics Co. Ltd. 2,019 92,881 Citigroup, Inc. 1,031 75,586 Sanwa Holdings Corp. 6,600 71,926 Walmart, Inc. 640 71,818 Everest Re Group Ltd. 261 71,676 Banco Santander SA 16,143 67,182 NVIDIA Corp. 265 65,068 AXA SA 2,428 63,609 Ping An Insurance Group Co. of China Ltd. 5,180 61,320 Airbus SE 441 60,168 London Stock Exchange Group PLC 642 59,979 Spark New Zealand Ltd. 20,005 58,132 Axalta Coating Systems Ltd. 2,057 58,109 ICICI Bank Ltd. 3,921 58,031 Saia, Inc. 627 57,439 TDK Corp. 504 56,765 Boston Scientific Corp. 1,262 55,465 KBC Group NV 778 55,440 Vertex Pharmaceuticals, Inc. 234 54,384 Kerry Properties Ltd. 19,004 54,315 Anglo American PLC 2,005 53,376 Shopify, Inc. Class A 111 52,352 Trade Desk, Inc. Class A 185 51,991 Philip Morris International, Inc. 624 51,813 Match Group, Inc. 636 51,535 Coca-Cola Co. 914 51,239 Lear Corp. 403 51,056 ONEOK, Inc. 679 50,884 Vale SA 4,046 50,404 SHO-BOND Holdings Co. Ltd. 1,200 50,186 Walt Disney Co. 367 49,601 Banco do Brasil SA 3,843 49,574 Shiseido Co. Ltd. 711 48,743 Carlsberg A/S Class B 326 48,028 BAWAG Group AG 1,058 46,150
Nominal Proceeds Sales Amount USD iShares MSCI Emerging Markets ETF 5,222 217,159 iShares MSCI Japan ETF 11,064 162,692 Apple, Inc. 304 97,874 Bank of America Corp. 2,891 86,808 AIA Group Ltd. 7,465 75,049 Wells Fargo & Co. 1,410 68,613 AXA SA 2,428 64,928 Royal Dutch Shell PLC Class B 1,981 58,393 Procter & Gamble Co. 431 52,837 Allianz SE 225 52,514 Boeing Co. 133 51,810 Novartis AG 538 51,592 Toyota Motor Corp. 714 50,114 Victory Capital Holdings, Inc. Class A 2,629 48,073
330

LORD ABBETT PASSPORT PORTFOLIOS PLC
SCHEDULE OF PORTFOLIO CHANGES (Unaudited) (Continued) GLOBAL EQUITY RESEARCH FUND (Continued) Nominal Proceeds Sales (Continued) Amount USD BNP Paribas SA 874 45,873 PepsiCo, Inc. 340 45,129 Banco do Brasil SA 3,843 45,100 Credit Agricole SA 3,298 44,770 Axis Capital Holdings Ltd. 731 44,744 Tokio Marine Holdings, Inc. 832 44,060
331

LORD ABBETT PASSPORT PORTFOLIOS PLC
SCHEDULE OF PORTFOLIO CHANGES (Unaudited) (Continued) ULTRA SHORT BOND FUND
Interest Maturity Nominal Cost Purchases Rate Date Amount USD U.S. Treasury Bill ZCP 26/03/2020 35,104,000 34,968,235 U.S. Treasury Bill ZCP 26/12/2019 34,966,000 34,862,196 U.S. Treasury Bill 2.291% 02/07/2019 28,721,000 28,657,129 Bank of America Corp. 2.479% 21/07/2021 26,197,000 26,296,731 FMC Corp. ZCP 27/12/2019 22,565,000 22,527,265 Noble Energy, Inc. ZCP 19/11/2019 22,094,000 22,085,392 U.S. Treasury Bill 2.36% 30/05/2019 22,005,000 21,911,987 Morgan Stanley 2.451% 02/10/2021 21,789,000 21,817,744 Wells Fargo & Co. 2.831% 02/11/2022 21,225,000 21,374,664 Pentair Finance S.A.R.L. ZCP 21/11/2019 21,000,000 20,998,808 U.S. Treasury Bill ZCP 27/08/2019 20,888,000 20,826,192 U.S. Treasury Note ZCP 31/10/2019 20,275,000 20,274,272 Noble Energy, Inc. ZCP 22/11/2019 20,000,000 19,998,883 Noble Energy, Inc. ZCP 12/09/2019 19,986,000 19,971,871 Keurig Dr Pepper, Inc. ZCP 13/01/2020 20,000,000 19,963,489 Noble Energy, Inc. ZCP 19/09/2019 19,017,000 19,007,645 Noble Energy, Inc. ZCP 01/10/2019 19,000,000 18,989,979 World Omni Select Auto Trust 2018-1 Class A2 3.24% 15/04/2022 18,702,062 18,743,618 Broadcom Corp./Broadcom Cayman Finance Ltd. ZCP 09/07/2019 17,790,000 17,742,730 Huntington Bancshares, Inc./OH ZCP 21/11/2019 17,411,000 17,404,615
Interest Maturity Nominal Proceeds Sales Rate Date Amount USD Ford Credit Auto Owner Trust 2015-REV1 2015-1 Class A 2.12% 15/07/2026 10,603,000 10,603,000 U.S. Treasury Bill ZCP 02/07/2019 9,000,000 8,999,527 Sumitomo Mitsui Banking Corp. 3.123% 17/01/2020 6,889,000 6,899,793 National Australia Bank Ltd. 3.187% 22/05/2020 6,559,000 6,588,778 Toronto-Dominion Bank 2.67% 17/09/2020 5,499,000 5,506,918 Comcast Corp. 2.649% 10/01/2020 5,454,000 5,465,038 Wells Fargo & Co. 3.430% 30/01/2020 5,388,000 5,393,280 Met File Global Funding ZCP 08/01/2021 4,995,000 5,002,493 U.S. Treasury Bill ZCP 26/03/2020 5,000,000 4,985,639 HSBC USA, Inc. 3.145% 13/11/2019 4,920,000 4,926,986 American Honda Finance Corp. 2.583% 19/10/2020 4,692,000 4,700,821 Verizon Communications, Inc. ZCP 22/05/2020 4,511,000 4,528,269 Bank of Montreal 3.036% 12/12/2019 4,364,000 4,368,713 Royal Bank of Canada ZCP 22/07/2020 4,237,000 4,246,618 Occidental Petroleum Corp. 3.359% 15/08/2022 3,913,000 3,937,065 Caterpillar Financial Services Corp. 2.771% 26/08/2020 3,895,000 3,900,959 IBM Credit LLC 2.994% 30/11/2020 3,634,000 3,648,427 John Deere Capital Corp. 2.76% 07/10/2020 3,123,000 3,131,432 Jackson National Life Global Funding 2.72% 16/03/2021 2,978,000 2,982,586 Jackson National Life Global Funding 3.065% 27/04/2020 2,957,000 2,964,452 National Bank of Canada 3.336% 06/12/2020 2,916,000 2,923,173 American Honda Finance Corp. ZCP 21/02/2020 2,545,000 2,547,208 Truist Financial Corp. ZCP 15/06/2020 2,534,000 2,539,321 US Bank N.A./Cincinnati OH ZCP 24/07/2020 2,400,000 2,404,152 GM Financial Consumer Automobile Receivables Trust 2019-1 Class A2 2.99% 16/03/2022 2,369,091 2,375,754 Citibank N.A. ZCP 05/01/2020 2,250,000 2,254,500 Bank of Montreal 2.643% 13/07/2020 2,181,000 2,186,217
332

LORD ABBETT PASSPORT PORTFOLIOS PLC
SCHEDULE OF PORTFOLIO CHANGES (Unaudited) (Continued) ULTRA SHORT BOND FUND (Continued)
Interest Maturity Nominal Proceeds Sales (Continued) Rate Date Amount USD Cigna Corp. 2.869% 16/07/2019 2,037,000 2,023,776 Toyota Motor Credit Corp. 2.543% 15/07/2020 2,011,000 2,013,996 Occidental Petroleum Corp. ZCP 08/02/2021 1,957,000 1,969,505 Bank of America Corp. 2.938% 21/07/2021 1,942,000 1,948,001 BMW US Capital LLC 3.122% 14/08/2020 1,932,000 1,937,468 Canadian Imperial Bank of Commerce 2.599% 10/05/2020 1,924,000 1,927,444 Bank of Nova Scotia 2.693% 14/07/2020 1,650,000 1,652,772 BP Capital Markets PLC 2.775% 24/11/2020 1,629,000 1,631,574
333

LORD ABBETT PASSPORT PORTFOLIOS PLC
SCHEDULE OF PORTFOLIO CHANGES (Unaudited) (Continued) HIGH YIELD CORE FUND1
Interest Maturity Nominal Cost Purchases Rate Date Amount USD Sprint Capital Corp. 6.875% 15/11/2028 6,282,000 6,279,920 CCO Holdings LLC/CCO Holdings Capital Corp. 5.125% 05/01/2027 4,478,000 4,503,695 Altice Financing SA 7.50% 15/05/2026 3,550,000 3,465,750 Tenet Healthcare Corp. 6.75% 15/06/2023 3,300,000 3,394,875 DISH DBS Corp. 7.75% 07/01/2026 3,584,000 3,288,710 CSC Holdings LLC 5.50% 15/04/2027 2,950,000 3,005,313 Netflix, Inc. 5.875% 15/11/2028 2,800,000 2,919,000 Cumberland Farms, Inc. 6.75% 05/01/2025 2,800,000 2,908,500 AMC Entertainment Holdings, Inc. 6.125% 15/05/2027 3,000,000 2,745,000 Pacific Gas & Electric Co. 6.05% 03/01/2034 2,713,000 2,592,618 HCA, Inc. 5.375% 09/01/2026 2,500,000 2,567,563 T-Mobile USA, Inc. 6.50% 15/01/2026 2,375,000 2,547,188 Bausch Health Cos, Inc. 5.875% 15/05/2023 2,500,000 2,500,000 Freeport-McMoRan, Inc. 3.875% 15/03/2023 2,500,000 2,456,599 FAGE International S.A. / FAGE USA Dairy Industry, Inc. 5.625% 15/08/2026 2,950,000 2,407,938 Centene Corp. 5.375% 06/01/2026 2,300,000 2,389,125 Cheniere Corpus Christi Holdings LLC 5.125% 30/06/2027 2,281,000 2,349,009 Ziggo Bond Co. BV 5.875% 15/01/2025 2,400,000 2,346,000 Ally Financial, Inc. 8.00% 11/01/2031 1,884,000 2,343,765 Navient Corp. 6.75% 25/06/2025 2,370,000 2,332,585
Interest Maturity Nominal Proceeds Sales Rate Date Amount USD CSC Holdings LLC 5.50% 15/05/2026 2,950,000 3,071,688 Pacific Gas & Electric Co. 6.05% 03/01/2034 2,713,000 2,848,531 HCA, Inc. 5.375% 09/01/2026 2,500,000 2,693,750 AMC Entertainment Holdings, Inc. 6.125% 15/05/2027 3,000,000 2,676,738 Cheniere Corpus Christi Holdings LLC 5.125% 30/06/2027 2,281,000 2,494,223 Ziggo Bond Co. BV 5.875% 15/01/2025 2,400,000 2,473,915 Cumberland Farms, Inc. 6.75% 05/01/2025 2,250,000 2,394,150 Tenet Healthcare Corp. 6.75% 15/06/2023 2,250,000 2,293,268 Grinding Media, Inc./Moly-Cop AltaSteel Ltd. 7.375% 15/12/2023 2,300,000 2,172,644 Albertsons Cos LLC/Safeway, Inc./New Albertsons LP/Albertson's LLC 5.75% 15/03/2025 2,030,000 2,069,263 HCA, Inc. 5.625% 01/09/2028 1,700,000 1,912,840 Match Group, Inc. 5.625% 15/02/2029 1,700,000 1,820,985 FAGE International SA/FAGE USA Dairy Industry, Inc. 5.625% 15/08/2026 2,250,000 1,811,250 Bausch Health Cos, Inc. 9.00% 15/12/2025 1,600,000 1,796,000 UPCB Finance IV Ltd. 5.375% 15/01/2025 1,725,000 1,773,156 Wolverine World Wide, Inc. 5.00% 09/01/2026 1,800,000 1,757,671 Sprint Capital Corp. 6.875% 15/11/2028 1,591,000 1,712,374 Calpine Corp. 5.75% 15/01/2025 1,600,000 1,649,000 DaVita, Inc. 5.00% 05/01/2025 1,450,000 1,448,718 Dell International LLC/EMC Corp. 6.02% 15/06/2026 1,325,000 1,428,284
1Fund launched on 5 March 2019.
334

LORD ABBETT PASSPORT PORTFOLIOS PLC
APPENDIX I – REMUNERATION DISCLOSURE (Unaudited) Remuneration Disclosure
Lord Abbett (Ireland) Limited (the “Manager”) has adopted a remuneration policy that is consistent with the principles outlined in the European Securities and Markets Authority guidelines on sound remuneration policies under the UCITS Directive (the “Remuneration Guidelines”). The remuneration policy is appropriate to the Manager’s size, internal organisation and the nature, scope and complexity of its activities. No material changes have been made to the remuneration policy during the financial year. The remuneration policy is available at https://www.passportportfolios.com/en.html or a paper copy is available free of charge upon request from the Investment Manager.
The Manager’s remuneration policy applies to the Manager’s management body (i.e. the Directors) and any identified staff whose professional activities have a material impact on the risk profile of the Manager. The Directors who are not affiliated with the Investment Manager receive a fixed annual fee as set out in note 5 to these financial statements which is in line with the fees paid by other Irish funds and compensates the Directors for their duties, expertise and responsibilities. Directors who are employees of the Investment Manager (or an affiliate) are not paid any fees for their services as directors. None of the Directors are entitled to receive any variable remuneration for their services as directors from the Manager.
The Manager has not paid remuneration to staff of any non-EU delegate to whom investment management functions have been delegated by the Manager. Instead, the Investment Manager receives an investment management fee as referred to in note 5 to these financial statements. The Investment Manager has appropriate arrangements in place to ensure that there is no circumvention of the remuneration rules set forth in the Remuneration Guidelines.
The Manager is required pursuant to the UCITS Regulations to provide quantitative disclosure of remuneration which is attributed to the Company. Such disclosure is made in accordance the Manager’s interpretation of currently available regulatory guidance on quantitative remuneration disclosure and in accordance with the remuneration policy as summarised above. As market or regulatory practice develops the Manager may consider it appropriate to alter the method by which the quantitative remuneration disclosure is calculated. Where such changes are made, this may result in the remuneration disclosure not being comparable to disclosure made in previous years.
Quantitative disclosures are provided in relation to (a) the staff of the Manager; (b) identified staff who are senior management; and (c) identified staff who have the ability to materially affect the risk profile of the Manager or the Company. All individuals included in the aggregated figures disclosed are rewarded in line with the Manager’s remuneration policy for their responsibilities across the relevant fund business area. As all individuals have a number of areas of responsibilities, only the portion of remuneration for those individuals’ services attributable to the Manager is included in the aggregate figures disclosed.
Certain individuals may provide both UCITS and non-UCITS related services in respect of multiple funds, clients and functions of the Manager and/or the Investment Manager. Therefore, the figures disclosed are a sum of each individual’s portion of remuneration attributable to the Manager and the Company according to an objective apportionment methodology, which takes into account the total assets under management across various funds and accounts for which such individual provides services on behalf of the Manager or Investment Manager. Accordingly, the figures are not representative of any individual’s actual remuneration or their remuneration structure.
The amount of the total remuneration awarded by the Manager to its staff which has been attributed to the Company in respect of the financial period ending 31 January 2020 is EUR 582,120. This figure is comprised entirely of fixed remuneration as no variable remuneration was paid by the Manager in respect of the Company. There were a total of 4 beneficiaries of the remuneration described above.
335