GMO TRUST Form NPORT-P Filed 2021-01-29 - SECDatabase
244
Business Address 40 ROWES WHARF BOSTON MA 02110 6173467646 Mailing Address 40 ROWES WHARF BOSTON MA 02110 SECURITIES AND EXCHANGE COMMISSION FORM NPORT-P Filing Date: 2021-01-29 | Period of Report: 2020-11-30 SEC Accession No. 0001752724-21-016587 (HTML Version on secdatabase.com) FILER GMO TRUST CIK:772129| IRS No.: 000000000 | State of Incorp.:MA | Fiscal Year End: 0831 Type: NPORT-P | Act: 40 | File No.: 811-04347 | Film No.: 21569466 Copyright © 2021 www.secdatabase.com . All Rights Reserved. Please Consider the Environment Before Printing This Document
-
Upload
khangminh22 -
Category
Documents
-
view
0 -
download
0
Transcript of GMO TRUST Form NPORT-P Filed 2021-01-29 - SECDatabase

Business Address40 ROWES WHARFBOSTON MA 021106173467646
Mailing Address40 ROWES WHARFBOSTON MA 02110
SECURITIES AND EXCHANGE COMMISSION
FORM NPORT-P
Filing Date: 2021-01-29 | Period of Report: 2020-11-30SEC Accession No. 0001752724-21-016587
(HTML Version on secdatabase.com)
FILERGMO TRUSTCIK:772129| IRS No.: 000000000 | State of Incorp.:MA | Fiscal Year End: 0831Type: NPORT-P | Act: 40 | File No.: 811-04347 | Film No.: 21569466
Copyright © 2021 www.secdatabase.com. All Rights Reserved.Please Consider the Environment Before Printing This Document

GMO Asset Allocation Bond Fund(A Series of GMO Trust)Schedule of Investments(showing percentage of total net assets)November 30, 2020 (Unaudited)
Par Value�� /Shares Description Value ($)
DEBT OBLIGATIONS �� 95.9%
U.S. Government �� 95.9%8,172,458 U.S. Treasury Inflation Indexed Bond,
0.38%, due 01/15/27 (a) 8,983,21310,403,680 U.S. Treasury Inflation Indexed Bond,
0.50%, due 01/15/28 (a) 11,636,67915,043,616 U.S. Treasury Inflation Indexed Bond,
1.75%, due 01/15/28 (a) 18,236,4676,278,187 U.S. Treasury Inflation Indexed Bond,
0.75%, due 07/15/28 (a) 7,206,10011,362,988 U.S. Treasury Inflation Indexed Bond,
0.88%, due 01/15/29 (a) 13,176,33119,549,794 U.S. Treasury Inflation Indexed Bond,
2.50%, due 01/15/29 (a) 25,388,25916,387,920 U.S. Treasury Inflation Indexed Bond,
0.13%, due 01/15/30 (a) 18,043,78314,414,704 U.S. Treasury Inflation Indexed Bond,
0.13%, due 07/15/30 (a) 15,956,965Total U.S. Government 118,627,797
TOTAL DEBT OBLIGATIONS(COST $108,468,640) 118,627,797
MUTUAL FUNDS �� 3.6%
United States �� 3.6%
Affiliated Issuers �� 3.6%894,700 GMO U.S. Treasury Fund 4,509,289
TOTAL MUTUAL FUNDS(COST $4,509,289) 4,509,289
SHORT-TERM INVESTMENTS �� 0.3%
Money Market Funds �� 0.3%411,936 State Street Institutional Treasury Money Market
Fund-Premier Class, 0.01% (b) 411,936
TOTAL SHORT-TERM INVESTMENTS (COST$411,936) 411,936
TOTAL INVESTMENTS �� 99.8%(Cost $113,389,865) 123,549,022Other Assets and Liabilities (net) � 0.2% 211,455
TOTAL NET ASSETS �� 100.0% $123,760,477
Notes to Schedule of Investments:
� Denominated in U.S. Dollar, unless otherwise indicated.(a) Indexed security in which price and/or coupon is linked to the price of a
specific instrument or financial statistic.(b) The rate disclosed is the 7 day net yield as of November 30, 2020.
Copyright © 2021 www.secdatabase.com. All Rights Reserved.Please Consider the Environment Before Printing This Document

GMO Emerging Country Debt Fund(A Series of GMO Trust)Schedule of Investments(showing percentage of total net assets)November 30, 2020 (Unaudited)
Par Value�� Description Value ($)DEBT OBLIGATIONS �� 96.7%
Albania �� 1.0%Foreign Government Obligations
49,649,849 Republic of Albania Par Bond, Zero Coupon,due 08/31/25 (a) (b) 45,757,856
Angola �� 0.6%Foreign Government Obligations
23,300,000 Angolan Government International Bond,Reg S, 9.38%, due 05/08/48 20,271,000
7,300,000 Angolan Government International Bond,Reg S, 9.13%, due 11/26/49 6,259,750Total Angola 26,530,750
Argentina �� 2.9%Foreign Government Obligations
11,490,713 Republic of Argentina, 1.00%, due 07/09/29 4,885,72723,333,493 Republic of Argentina, Step Up,
0.13%, due 07/09/30 9,100,062JPY 407,485,276 Republic of Argentina, Variable Rate,
4.33%, due 12/31/33 (c) 938,08356,547,942 Republic of Argentina, Step Up,
0.13%, due 07/09/35 19,820,05572,008,994 Republic of Argentina, Step Up,
0.13%, due 01/09/38 28,093,064JPY 323,575,000 Republic of Argentina, 0.67%, due 12/31/38
(c) 966,037141,261,240 Republic of Argentina, Step Up,
0.13%, due 07/09/41 51,281,61734,047,000 Republic of Argentina, Step Up,
0.13%, due 07/09/46 12,086,685Total Argentina 127,171,330
Armenia �� 0.5%Foreign Government Agency �� 0.4%
20,000,000 Ardshinbank CJSC Via Dilijan Finance BV,Reg S, 6.50%, due 01/28/25 18,200,000
Foreign Government Obligations �� 0.1%2,195,000 Republic of Armenia, Reg S, 7.15%, due 03/
26/25 2,456,342Total Armenia 20,656,342
Azerbaijan �� 1.4%Foreign Government Agency �� 0.9%
11,388,000 International Bank of Azerbaijan OJSC, RegS, 3.50%, due 09/01/24 10,704,720
18,950,000 Petkim Petrokimya Holding AS, Reg S,5.88%, due 01/26/23 19,145,422
8,300,000 Southern Gas Corridor CJSC, Reg S,6.88%, due 03/24/26 9,972,450
39,822,592
Par Value�� Description Value ($)Azerbaijan �� continuedForeign Government Obligations �� 0.5%
20,300,000 Republic of Azerbaijan International Bond, Reg S,5.13%, due 09/01/29 22,431,500Total Azerbaijan 62,254,092
Bahamas �� 0.7%Foreign Government Obligations
14,569,000 Bahamas Government International Bond, Reg S,6.00%, due 11/21/28 13,813,233
6,163,000 Bahamas Government International Bond, Reg S,6.95%, due 11/20/29 6,012,777
11,400,000 Bahamas Government International Bond, 144A,8.95%, due 10/15/32 12,312,000Total Bahamas 32,138,010
Bahrain �� 1.7%Foreign Government Obligations
4,100,000 Bahrain Government International Bond, Reg S,6.00%, due 09/19/44 4,157,656
61,590,000 Bahrain Government International Bond, Reg S,7.50%, due 09/20/47 70,366,575Total Bahrain 74,524,231
Barbados �� 0.5%Foreign Government Obligations
14,400,000 Barbados Government International Bond, Reg S,6.50%, due 10/01/29 13,896,000
7,600,000 Barbados Government International Bond, 144A,6.50%, due 10/01/29 7,334,000Total Barbados 21,230,000
Belarus �� 0.5%Foreign Government Agency �� 0.2%
8,304,000 Development Bank of the Republic of Belarus JSC,Reg S, 6.75%, due 05/02/24 8,259,885
Foreign Government Obligations �� 0.3%12,200,000 Republic of Belarus International Bond, Reg S,
6.20%, due 02/28/30 12,226,688Total Belarus 20,486,573
Belize �� 0.5%Foreign Government Obligations
52,833,700 Republic of Belize, Reg S, Step Up, 4.94%, due 02/20/34 23,577,039
Bermuda �� 0.2%Foreign Government Obligations
7,990,000 Bermuda Government International Bond, Reg S,4.75%, due 02/15/29 9,675,391
Copyright © 2021 www.secdatabase.com. All Rights Reserved.Please Consider the Environment Before Printing This Document

GMO Emerging Country Debt Fund(A Series of GMO Trust)Schedule of Investments �� (Continued)(showing percentage of total net assets)November 30, 2020 (Unaudited)
Par Value�� Description Value ($)Bolivia �� 0.2%Foreign Government Obligations
9,200,000 Bolivia Government International Bond, Reg S,4.50%, due 03/20/28 (d) 8,308,750
Brazil �� 2.1%Corporate Debt �� 0.5%
22,662,254 MV24 Capital BV, Reg S, 6.75%, due 06/01/34 24,457,530
Foreign Government Agency �� 1.1%40,039,000 Petrobras Global Finance BV, 6.85%, due 06/05/
2115 46,827,112
Foreign Government Obligations �� 0.5%13,397,000 Republic of Brazil, 7.13%, due 01/20/37 17,880,8084,200,000 Republic of Brazil, 4.75%, due 01/14/50 4,437,563
22,318,371Total Brazil 93,603,013
Cameroon �� 0.3%Foreign Government Obligations
10,300,000 Republic of Cameroon International Bond, Reg S,9.50%, due 11/19/25 11,188,375
Chile �� 2.8%Corporate Debt �� 1.3%
24,100,000 Empresa de Transporte de Pasajeros Metro SA,Reg S, 4.70%, due 05/07/50 30,245,500
20,411,000 Empresa Nacional de Electricidad SA,8.13%, due 02/01/97 (a) 27,599,754
57,845,254
Foreign Government Agency �� 1.5%8,800,000 Corp Nacional del Cobre de Chile, Reg S,
4.25%, due 07/17/42 10,169,50018,700,000 Corp Nacional del Cobre de Chile, 144A,
3.70%, due 01/30/50 20,435,5948,100,000 Empresa Nacional del Petroleo, Reg S,
5.25%, due 11/06/29 9,451,68723,750,000 Empresa Nacional del Petroleo, Reg S,
4.50%, due 09/14/47 26,028,51666,085,297
Total Chile 123,930,551
China �� 0.3%Corporate Debt
14,200,000 Lamar Funding Ltd., Reg S, 3.96%, due 05/07/25 13,556,563
Colombia �� 2.0%Foreign Government Agency �� 1.7%
45,411,000 Ecopetrol SA, 7.38%, due 09/18/43 60,992,6493,800,000 Ecopetrol SA, 5.88%, due 05/28/45 4,504,710
Par Value�� Description Value ($)Colombia �� continuedForeign Government Agency �� continued
COP 30,200,000,000 Empresas Publicas de Medellin ESP, RegS, 8.38%, due 11/08/27 8,644,317
74,141,676
Foreign Government Obligations �� 0.3%647,000 Colombia Government International Bond,
8.38%, due 02/15/27 802,2683,800,000 Colombia Government International Bond,
11.85%, due 03/09/28 (c) 5,559,8874,800,000 Colombia Government International Bond,
5.63%, due 02/26/44 6,118,50012,480,655
Total Colombia 86,622,331
Congo Republic (Brazzaville) �� 1.2%Foreign Government Obligations
66,264,267 Republic of Congo, Reg S, Step Up,6.00%, due 06/30/29 (c) 50,940,655
Costa Rica �� 1.2%Foreign Government Agency �� 0.1%
3,898,000 Instituto Costarricense de Electricidad,Reg S, 6.38%, due 05/15/43 2,806,560
Foreign Government Obligations �� 1.1%18,200,000 Costa Rica Government International
Bond, Reg S, 9.20%, due 08/26/26 18,916,61636,731,000 Costa Rica Government International
Bond, Reg S, 7.16%, due 03/12/45 31,944,49150,861,107
Total Costa Rica 53,667,667
Czech Republic �� 0.2%Corporate Debt
5,458,000 CEZ AS, Reg S, 5.63%, due 04/03/42 6,600,103
Dominican Republic �� 2.7%Asset-Backed Securities �� 0.3%
11,231,033 Autopistas Del Nordeste Ltd., Reg S,9.39%, due 04/15/24 11,606,570
Foreign Government Obligations �� 2.4%17,687,000 Dominican Republic International Bond,
Reg S, 8.63%, due 04/20/27 21,556,031DOP 1,500,000,000 Dominican Republic International Bond,
144A, 10.38%, due 01/11/30 28,036,55710,500,000 Dominican Republic International Bond,
144A, 6.40%, due 06/05/49 11,628,75042,000,000 Dominican Republic International Bond,
144A, 5.88%, due 01/30/60 43,771,875104,993,213
Total Dominican Republic 116,599,783
Copyright © 2021 www.secdatabase.com. All Rights Reserved.Please Consider the Environment Before Printing This Document

GMO Emerging Country Debt Fund(A Series of GMO Trust)Schedule of Investments �� (Continued)(showing percentage of total net assets)November 30, 2020 (Unaudited)
Par Value�� Description Value ($)Ecuador �� 2.6%Foreign Government Obligations
1,000,000 Ecuador Government International Bond,5.00%, due 02/28/25 (c) 891,250
9,746,892 Ecuador Government International Bond, ZeroCoupon, 144A, due 07/31/30 4,313,000
30,476,250 Ecuador Government International Bond, 144A,0.50%, due 07/31/30 19,314,323
101,887,125 Ecuador Government International Bond, 144A,0.50%, due 07/31/35 55,528,483
36,603,750 Ecuador Government International Bond, 144A,0.50%, due 07/31/40 18,027,347
19,875,364 Ecuador Social Bond Sarl, Zero Coupon, 144A,due 01/30/35 13,918,966Total Ecuador 111,993,369
Egypt �� 2.3%Foreign Government Obligations
26,800,000 Egypt Government International Bond, Reg S,7.90%, due 02/21/48 27,654,250
33,900,000 Egypt Government International Bond, Reg S,8.70%, due 03/01/49 37,173,469
21,400,000 Egypt Government International Bond, 144A,8.88%, due 05/29/50 23,787,437
11,414,000 Egypt Government International Bond, Reg S,8.15%, due 11/20/59 11,866,993Total Egypt 100,482,149
El Salvador �� 0.8%Foreign Government Obligations
17,175,000 El Salvador Government International Bond,Reg S, 7.65%, due 06/15/35 14,990,555
22,500,000 El Salvador Government International Bond,144A, 7.12%, due 01/20/50 18,745,312Total El Salvador 33,735,867
Ethiopia �� 0.2%Foreign Government Obligations
6,690,000 Ethiopia International Bond, Reg S,6.63%, due 12/11/24 6,568,744
Gabon �� 0.3%Foreign Government Obligations
1,873,667 Gabonese Republic, Reg S, 6.38%, due 12/12/24 1,883,03513,000,000 Gabonese Republic, 144A, 6.63%, due 02/06/31 12,780,625
Total Gabon 14,663,660
Ghana �� 0.9%Foreign Government Agency �� 0.3%
11,986,441 Saderea, Ltd., Reg S, 12.50%, due 11/30/26 12,376,000
Par Value�� Description Value ($)Ghana �� continuedForeign Government Obligations �� 0.6%
13,000,000 Republic of Ghana, Reg S, 8.95%, due 03/26/51 12,914,68814,300,000 Republic of Ghana, 144A, 8.75%, due 03/11/61 14,031,875
26,946,563Total Ghana 39,322,563
Grenada �� 0.2%Foreign Government Obligations
10,926,188 Grenada Government International Bond, Reg S,7.00%, due 05/12/30 7,648,332
Guatemala �� 0.8%Foreign Government Obligations
11,765,000 Republic of Guatemala, Reg S, 8.13%, due 10/06/34 16,750,41914,700,000 Republic of Guatemala, 144A, 6.13%, due 06/01/50 18,742,500
Total Guatemala 35,492,919
Honduras �� 0.1%Foreign Government Obligations
3,200,000 Honduras Government International Bond, 144A,5.63%, due 06/24/30 3,593,000
India �� 1.2%Corporate Debt �� 1.1%
29,700,000 Delhi International Airport Ltd., Reg S, 6.45%, due 06/04/29 29,477,250
21,140,000 GMR Hyderabad International Airport Ltd, Reg S,4.25%, due 10/27/27 19,699,838
49,177,088
Foreign Government Agency �� 0.1%2,500,000 Indian Railway Finance Corp., Ltd., Reg S,
3.25%, due 02/13/30 2,650,781Total India 51,827,869
Indonesia �� 5.3%Foreign Government Agency �� 3.6%
14,700,000 Hutama Karya Persero PT, Reg S, 3.75%, due 05/11/30 16,353,7503,700,000 Indonesia Asahan Aluminium Persero PT, 144A,
5.45%, due 05/15/30 4,391,43815,000,000 Indonesia Asahan Aluminium Persero PT, 144A,
5.80%, due 05/15/50 18,487,50018,400,000 Pertamina Persero PT, Reg S, 6.50%, due 05/27/41 24,742,2508,100,000 Pertamina Persero PT, Reg S, 5.63%, due 05/20/43 10,140,1079,900,000 Pertamina Persero PT, Reg S, 4.15%, due 02/25/60 10,543,5008,000,000 Perusahaan Listrik Negara PT, Reg S, 6.15%, due 05/
21/48 10,627,500
Copyright © 2021 www.secdatabase.com. All Rights Reserved.Please Consider the Environment Before Printing This Document

GMO Emerging Country Debt Fund(A Series of GMO Trust)Schedule of Investments �� (Continued)(showing percentage of total net assets)November 30, 2020 (Unaudited)
Par Value�� Description Value ($)Indonesia �� continuedForeign Government Agency �� continued
14,200,000 Perusahaan Listrik Negara PT, Reg S,6.25%, due 01/25/49 19,192,187
5,300,000 Perusahaan Penerbit SBSN Indonesia III,144A, 3.80%, due 06/23/50 5,849,875
41,500,000 Saka Energi Indonesia PT, Reg S,4.45%, due 05/05/24 39,204,531
159,532,638
Foreign Government Obligations �� 1.7%43,091,000 Indonesia Government International Bond,
Reg S, 6.63%, due 02/17/37 61,808,6537,900,000 Indonesia Government International Bond,
Reg S, 5.25%, due 01/08/47 10,657,59472,466,247
Total Indonesia 231,998,885
Israel �� 0.4%Foreign Government Agency
12,323,000 Israel Electric Corp., Ltd., Reg S,8.10%, due 12/15/96 17,836,002
Ivory Coast �� 1.0%Foreign Government Obligations
EUR 33,200,000 Ivory Coast Government International Bond,Reg S, 6.63%, due 03/22/48 42,486,205
Jamaica �� 0.8%Corporate Debt �� 0.1%
6,251,000 TransJamaican Highway Ltd, Reg S,5.75%, due 10/10/36 6,184,583
Foreign Government Agency �� 0.3%11,400,000 National Road Operating & Construction
Co., Ltd., Reg S, 9.38%, due 11/10/24 (c) 12,283,500
Foreign Government Obligations �� 0.4%11,375,000 Jamaica Government International Bond,
7.88%, due 07/28/45 15,356,250Total Jamaica 33,824,333
Jordan �� 1.4%Foreign Government Obligations
53,850,000 Jordan Government International Bond, RegS, 7.38%, due 10/10/47 59,790,328
Kazakhstan �� 0.9%Foreign Government Agency
9,000,000 Kazakhstan Temir Zholy Finance BV, Reg S,6.95%, due 07/10/42 12,760,312
19,900,000 KazMunayGas National Co JSC, Reg S,6.38%, due 10/24/48 28,337,600Total Kazakhstan 41,097,912
Par Value�� Description Value ($)Kenya �� 0.8%Foreign Government Obligations
32,600,000 Kenya Government International Bond, RegS, 8.25%, due 02/28/48 36,440,687
Kuwait �� 0.4%Corporate Debt
7,300,000 Equate Petrochemical BV, Reg S,4.25%, due 11/03/26 7,952,438
9,200,000 MEGlobal Canada ULC, 144A,5.88%, due 05/18/30 11,189,500Total Kuwait 19,141,938
Lebanon �� 0.3%Foreign Government Obligations
15,000,000 Lebanon Government International Bond,Reg S, 6.85%, due 03/23/27 (e) 1,875,000
41,605,000 Lebanon Government International Bond,Reg S, 7.15%, due 11/20/31 (e) 4,992,600
18,800,000 Lebanon Government International Bond,8.20%, due 05/17/33 (e) 2,256,000
42,944,000 Lebanon Government International Bond,8.25%, due 05/17/34 (e) 5,153,280Total Lebanon 14,276,880
Malaysia �� 0.6%Foreign Government Agency
10,700,000 1MDB Global Investments Ltd, Reg S,4.40%, due 03/09/23 10,736,781
11,700,000 Petronas Capital Ltd., 144A, 4.80%, due 04/21/60 17,078,344Total Malaysia 27,815,125
Mexico �� 6.0%Foreign Government Agency �� 3.9%
27,884,000 Petroleos Mexicanos, 6.35%, due 02/12/48 23,357,2086,400,000 Petroleos Mexicanos, Reg S, 6.63%, due 09/
29/49 5,244,800131,800,000 Petroleos Mexicanos, 7.69%, due 01/23/50 121,288,95022,986,000 Petroleos Mexicanos, 6.95%, due 01/28/60 19,710,495
169,601,453
Foreign Government Obligations �� 2.1%7,078,000 United Mexican States, 5.75%, due 10/12/
2110 8,858,117GBP 56,796,000 United Mexican States, 5.63%, due 03/19/
2114 83,289,36292,147,479
Total Mexico 261,748,932
Copyright © 2021 www.secdatabase.com. All Rights Reserved.Please Consider the Environment Before Printing This Document

GMO Emerging Country Debt Fund(A Series of GMO Trust)Schedule of Investments �� (Continued)(showing percentage of total net assets)November 30, 2020 (Unaudited)
Par Value�� Description Value ($)Mongolia �� 0.1%Foreign Government Obligations
2,400,000 Mongolia Government International Bond, 144A,5.13%, due 04/07/26 2,532,000
Morocco �� 0.4%Foreign Government Agency
14,500,000 Office Cherifien des Phosphates SA, Reg S,6.88%, due 04/25/44 18,510,156
Mozambique �� 0.2%Foreign Government Obligations
9,276,000 Mozambique International Bond, Reg S, Step Up,5.00%, due 09/15/31 8,075,918
Nigeria �� 0.9%Foreign Government Obligations
7,400,000 Nigeria Government International Bond, Reg S,8.75%, due 01/21/31 8,362,000
10,700,000 Nigeria Government International Bond, Reg S,7.70%, due 02/23/38 11,074,500
10,750,000 Nigeria Government International Bond, Reg S,7.63%, due 11/28/47 10,951,562
7,600,000 Nigeria Government International Bond, Reg S,9.25%, due 01/21/49 8,626,000Total Nigeria 39,014,062
Oman �� 2.7%Foreign Government Obligations
28,000,000 Oman Government International Bond, 144A,6.00%, due 08/01/29 27,728,750
10,000,000 Oman Government International Bond, Reg S,6.50%, due 03/08/47 9,109,375
86,900,000 Oman Government International Bond, Reg S,6.75%, due 01/17/48 80,246,719Total Oman 117,084,844
Pakistan �� 0.7%Foreign Government Obligations
28,762,000 Islamic Republic of Pakistan, Reg S, 7.88%, due 03/31/36 29,355,216
Panama �� 1.6%Foreign Government Agency �� 0.6%
24,379,199 Aeropuerto Internacional de Tocumen SA, Reg S,6.00%, due 11/18/48 27,947,704
Foreign Government Obligations �� 1.0%7,951,000 Panama Government International Bond,
8.13%, due 04/28/34 11,528,9509,000,000 Panama Government International Bond,
4.30%, due 04/29/53 11,233,12516,800,000 Panama Government International Bond,
4.50%, due 04/01/56 21,277,20044,039,275
Total Panama 71,986,979
Par Value�� Description Value ($)Papua New Guinea �� 0.0%Foreign Government Obligations
1,400,000 Papua New Guinea Government InternationalBond, Reg S, 8.38%, due 10/04/28 1,414,000
Peru �� 1.7%Foreign Government Agency �� 1.1%
9,289,451 Peru Enhanced Pass-Through Finance Ltd., RegS, Zero Coupon, due 06/02/25 (c) 8,968,036
33,395,000 Petroleos del Peru SA, Reg S, 5.63%, due 06/19/47 40,115,744
49,083,780
Foreign Government Obligations �� 0.6%26,700,000 Peruvian Government International Bond,
3.23%, due 07/28/2121 26,299,500Total Peru 75,383,280
Philippines �� 1.6%Foreign Government Agency
4,700,000 Bangko Sentral ng Pilipinas Bond,8.60%, due 06/15/97 (c) 8,689,125
40,012,000 National Power Corp., Global Bond,9.63%, due 05/15/28 59,930,474Total Philippines 68,619,599
Qatar �� 2.2%Foreign Government Agency �� 0.3%
13,378,000 QNB Finansbank AS, Reg S, 6.88%, due 09/07/24 14,084,526
Foreign Government Obligations �� 1.9%2,800,000 Qatar Government International Bond, 144A,
3.40%, due 04/16/25 3,080,87512,000,000 Qatar Government International Bond, 144A,
3.75%, due 04/16/30 14,055,00038,200,000 Qatar Government International Bond, 144A,
4.40%, due 04/16/50 50,424,00011,000,000 Qatar Government International Bond, Reg S,
5.10%, due 04/23/48 15,716,25083,276,125
Total Qatar 97,360,651
Romania �� 0.8%Foreign Government Obligations
EUR 4,000,000 Romanian Government International Bond,144A, 2.63%, due 12/02/40 4,807,187
EUR 10,900,000 Romanian Government International Bond,144A, 3.38%, due 01/28/50 14,383,541
16,100,000 Romanian Government International Bond,144A, 4.00%, due 02/14/51 17,609,375Total Romania 36,800,103
Copyright © 2021 www.secdatabase.com. All Rights Reserved.Please Consider the Environment Before Printing This Document

GMO Emerging Country Debt Fund(A Series of GMO Trust)Schedule of Investments �� (Continued)(showing percentage of total net assets)November 30, 2020 (Unaudited)
Par Value�� Description Value ($)Russia �� 2.5%Foreign Government Agency �� 0.5%
21,870,000 GTLK Europe Capital DAC, Reg S,4.65%, due 03/10/27 22,252,725
Foreign Government Obligations �� 2.0%34,000,000 Russian Foreign Bond, 144A,
5.10%, due 03/28/35 42,786,8758,800,000 Russian Foreign Bond, Reg S,
5.10%, due 03/28/35 11,074,2504,400,000 Russian Foreign Bond, Reg S,
5.88%, due 09/16/43 6,232,87520,800,000 Russian Foreign Bond, Reg S,
5.25%, due 06/23/47 28,281,50088,375,500
Total Russia 110,628,225
Saudi Arabia �� 3.0%Corporate Debt �� 1.2%
26,550,000 ACWA Power Management AndInvestments One Ltd, Reg S, 5.95%, due 12/15/39 31,196,250
21,400,000 Saudi Arabian Oil Co., 144A,3.50%, due 11/24/70 21,532,252
52,728,502
Foreign Government Obligations �� 1.8%62,300,000 Saudi Government International Bond,
144A, 4.50%, due 04/22/60 79,276,750Total Saudi Arabia 132,005,252
Senegal �� 0.3%Foreign Government Obligations
14,000,000 Senegal Government International Bond,Reg S, 6.75%, due 03/13/48 15,172,500
South Africa �� 4.0%Foreign Government Agency �� 0.7%
13,600,000 Eskom Holdings SOC, Ltd., Reg S,7.13%, due 02/11/25 13,901,750
13,600,000 Eskom Holdings SOC, Ltd., Reg S,8.45%, due 08/10/28 14,598,750
ZAR 163,000,000 Eskom Holdings SOC, Ltd., Zero Coupon,due 12/31/32 1,571,347
ZAR 27,300,000 Transnet, Ltd., 13.50%, due 04/18/28 2,124,64432,196,491
Foreign Government Obligations �� 3.3%ZAR 543,600,000 Republic of South Africa Government
International Bond, 6.50%, due 02/28/41 22,555,14313,700,000 Republic of South Africa Government
International Bond, 5.65%, due 09/27/47 13,156,28112,600,000 Republic of South Africa Government
International Bond, 6.30%, due 06/22/48 12,911,063
Par Value�� Description Value ($)South Africa �� continuedForeign Government Obligations �� continued
97,400,000 Republic of South Africa GovernmentInternational Bond, 5.75%, due 09/30/49 93,686,625
142,309,112Total South Africa 174,505,603
Sri Lanka �� 1.4%Foreign Government Obligations
9,280,000 Sri Lanka Government International Bond,Reg S, 6.83%, due 07/18/26 5,623,100
13,644,000 Sri Lanka Government International Bond,Reg S, 6.20%, due 05/11/27 8,015,850
34,500,000 Sri Lanka Government International Bond,Reg S, 6.75%, due 04/18/28 20,333,437
8,800,000 Sri Lanka Government International Bond,Reg S, 7.85%, due 03/14/29 5,192,000
35,300,000 Sri Lanka Government International Bond,144A, 7.55%, due 03/28/30 20,654,383Total Sri Lanka 59,818,770
SupraNational �� 0.3%Foreign Government Agency
TRY 263,000,000 International Finance Corp., Zero Coupon,Reg S, due 02/15/29 12,880,274
Suriname �� 0.4%Foreign Government Obligations
14,000,000 Republic of Suriname, 144A,12.88%, due 12/30/23(e) 9,108,750
19,759,000 Republic of Suriname, Reg S,9.25%, due 10/26/26(e) 9,836,277Total Suriname 18,945,027
Tajikistan �� 0.3%Foreign Government Obligations
13,874,000 Republic of Tajikistan International Bond,Reg S, 7.13%, due 09/14/27 11,155,563
Trinidad And Tobago �� 1.0%Foreign Government Agency
9,800,000 Telecommunications Services of Trinidad &Tobago Ltd, 144A, 8.88%, due 10/18/29 9,922,500
4,027,000 Trinidad Generation UnLtd, Reg S,5.25%, due 11/04/27 4,201,923
24,388,000 Trinidad Petroleum Holdings Ltd, Reg S,9.75%, due 06/15/26 27,444,121Total Trinidad And Tobago 41,568,544
Tunisia �� 1.4%Foreign Government Agency
JPY 7,340,000,000 Banque Centrale de Tunisie SA,4.30%, due 08/02/30(c) 45,023,108
Copyright © 2021 www.secdatabase.com. All Rights Reserved.Please Consider the Environment Before Printing This Document

GMO Emerging Country Debt Fund(A Series of GMO Trust)Schedule of Investments �� (Continued)(showing percentage of total net assets)November 30, 2020 (Unaudited)
Par Value�� Description Value ($)Tunisia �� continuedForeign Government Agency �� continued
JPY 2,500,000,000 Banque Centrale de Tunisie SA,4.20%, due 03/17/31 (c) 14,866,705Total Tunisia 59,889,813
Turkey �� 4.0%Foreign Government Agency �� 0.5%
10,600,000 Export Credit Bank of Turkey, Reg S,6.13%, due 05/03/24 10,653,000
3,300,000 TC Ziraat Bankasi AS, Reg S,5.13%, due 09/29/23 3,240,187
8,200,000 Turkiye Vakiflar Bankasi TAO, Reg S,5.75%, due 01/30/23 8,169,250
22,062,437
Foreign Government Obligations �� 3.5%9,500,000 Republic of Turkey, 6.88%, due 03/17/36 9,850,31316,544,000 Republic of Turkey, 6.75%, due 05/30/40 16,781,82051,802,000 Republic of Turkey, 6.00%, due 01/14/41 48,467,24623,600,000 Republic of Turkey, 6.63%, due 02/17/45 23,474,62559,013,000 Republic of Turkey, 5.75%, due 05/11/47 53,019,492
151,593,496Total Turkey 173,655,933
Ukraine �� 2.8%Foreign Government Agency �� 0.6%
EUR 3,800,000 NAK Naftogaz Ukraine via KondorFinance Plc, Reg S, 7.13%, due 07/19/24 4,624,905
15,500,000 NAK Naftogaz Ukraine via KondorFinance Plc, 144A, 7.63%, due 11/08/26 15,655,000
1,885,050 Oschadbank Via SSB #1 Plc, Reg S, StepUp, 9.63%, due 03/20/25 1,993,441
2,001,000 Ukreximbank Via Biz Finance Plc, Reg S,9.75%, due 01/22/25 2,101,050
24,374,396
Foreign Government Obligations �� 2.2%8,585,000 Ukraine Government International Bond,
Reg S, 7.75%, due 09/01/24 9,363,0166,585,000 Ukraine Government International Bond,
Reg S, 7.75%, due 09/01/25 7,236,91515,019,000 Ukraine Government International Bond,
Reg S, 7.75%, due 09/01/26 16,586,6083,869,000 Ukraine Government International Bond,
Reg S, 7.75%, due 09/01/27 4,284,91830,200,000 Ukraine Government International Bond,
Reg S, 7.38%, due 09/25/32 32,398,937
Par Value�� Description Value ($)Ukraine �� continuedForeign Government Obligations �� continued
26,500,000 Ukraine Government International Bond, 144A,7.25%, due 03/15/33 28,131,406
98,001,800Total Ukraine 122,376,196
United Arab Emirates �� 1.7%Foreign Government Agency �� 1.1%
3,100,000 DAE Sukuk Difc Ltd., 144A, 3.75%, due 02/15/26 3,123,25010,000,000 DP World Plc, Reg S, 6.85%, due 07/02/37 13,212,50014,000,000 DP World Plc, Reg S, 4.70%, due 09/30/49 15,470,00015,100,000 Finance Department Government of Sharjah, 144A,
4.00%, due 07/28/50 15,553,00047,358,750
Foreign Government Obligations �� 0.6%15,700,000 Abu Dhabi Government International Bond, 144A,
3.13%, due 09/30/49 17,034,5009,100,000 Abu Dhabi Government International Bond, Reg S,
2.70%, due 09/02/70 8,659,21825,693,718
Total United Arab Emirates 73,052,468
United States �� 6.3%Asset-Backed Securities �� 0.4%
1,929,757 Countrywide Home Equity Loan Trust, Series 05-F,Class 2A, AMBAC, Variable Rate, 1 mo. LIBOR +0.24%, 0.38%, due 12/15/35 1,835,188
874,972 Countrywide Home Equity Loan Trust, Series 05-H,Class 2A, FGIC, Variable Rate, 1 mo. LIBOR +0.24%, 0.38%, due 12/15/35 857,047
1,394,734 Countrywide Home Equity Loan Trust, Series 06-D,Class 2A, XLCA, Variable Rate, 1 mo. LIBOR +0.20%, 0.34%, due 05/15/36 1,309,105
9,216,784 Morgan Stanley IXIS Real Estate Capital Trust, Series06-2, Class A3, Variable Rate, 1 mo. LIBOR + 0.15%,0.30%, due 11/25/36 4,348,369
9,339,674 Morgan Stanley IXIS Real Estate Capital Trust, Series06-2, Class A4, Variable Rate, 1 mo. LIBOR + 0.22%,0.37%, due 11/25/36 4,465,330
4,876,405 Wamu Asset-Backed Certificates, Series 07-HE2,Class 2A4, Variable Rate, 1 mo. LIBOR + 0.36%,0.51%, due 04/25/37 2,552,829
15,367,868
Copyright © 2021 www.secdatabase.com. All Rights Reserved.Please Consider the Environment Before Printing This Document

GMO Emerging Country Debt Fund(A Series of GMO Trust)Schedule of Investments �� (Continued)(showing percentage of total net assets)November 30, 2020 (Unaudited)
Par Value�� Description Value ($)United States �� continuedCorporate Debt �� 0.0%
385,402 AMBAC Assurance Corp., 144A, 5.10%, due 06/07/2169 524,147
1,417,119 AMBAC LSNI LLC, 3 mo. LIBOR + 5.00%,6.00%, due 02/12/23 1,411,804
1,935,951
U.S. Government �� 5.9%75,000,000 U.S. Treasury Note, 1.75%, due 02/28/22 (f) 76,523,43760,000,000 U.S. Treasury Note, 0.13%, due 04/30/22 60,002,344102,000,000 U.S. Treasury Note, 0.13%, due 05/31/22 101,988,04720,000,000 U.S. Treasury Note, Variable Rate, USBM +
0.06%, 0.14%, due 07/31/22 20,002,563258,516,391
Total United States 275,820,210
Uruguay �� 1.2%Foreign Government Obligations
38,218,000 Uruguay Government International Bond,5.10%, due 06/18/50 52,406,432
Uzbekistan �� 0.5%Foreign Government Obligations
11,700,000 Republic of Uzbekistan Bond, Reg S,5.38%, due 02/20/29 13,250,250
7,600,000 Republic of Uzbekistan Bond, 144A,3.70%, due 11/25/30 7,714,000Total Uzbekistan 20,964,250
Venezuela �� 0.9%Foreign Government Agency �� 0.2%
111,465,000 Electricidad de Caracas Finance BV, Reg S,8.50%, due 04/10/49 (c) (e) 1,114,650
176,000,000 Petroleos de Venezuela SA, Reg S, 6.00%, due 05/16/24 (c) (e) 5,632,000
61,967,000 Petroleos de Venezuela SA, Reg S, 6.00%, due 11/15/26 (c) (e) 2,013,928
8,760,578
Foreign Government Obligations �� 0.7%7,000,000 Venezuela Government International Bond,
9.38%, due 01/13/34 (c) (e) 630,00019,028,000 Venezuela Government International Bond, Reg S,
7.75%, due 10/13/19 (c) (e) 1,712,52036,600,000 Venezuela Government International Bond, Reg S,
6.00%, due 12/09/20 (c) (e) 3,294,00023,750,000 Venezuela Government International Bond, Reg S,
12.75%, due 08/23/22 (c) (e) 2,137,500172,793,000 Venezuela Government International Bond, Reg S,
9.00%, due 05/07/23 (c) (e) 15,551,370
Par Value�� Description Value ($)Venezuela �� continuedForeign Government Obligations �� continued
68,700,000 Venezuela Government International Bond,Reg S, 11.95%, due 08/05/31 (c) (e) 6,183,000
29,508,390Total Venezuela 38,268,968
Vietnam �� 0.7%Foreign Government Agency �� 0.6%
28,058,000 Debt and Asset Trading Corp., Reg S,1.00%, due 10/10/25 23,533,648
Foreign Government Obligations �� 0.1%6,498,000 Socialist Republic of Vietnam, Series 30 Yr,
Variable Rate, 6 mo. LIBOR + 0.81%,1.13%, due 03/13/28 (c) 5,848,200Total Vietnam 29,381,848
Zambia �� 0.3%Foreign Government Obligations
3,600,000 Zambia Government International Bond, RegS, 5.38%, due 09/20/22 1,690,875
27,572,000 Zambia Government International Bond, RegS, 8.97%, due 07/30/27 13,122,549Total Zambia 14,813,424
TOTAL DEBT OBLIGATIONS(COST $4,364,480,089) 4,224,251,212
LOAN ASSIGNMENTS �� 0.4%
Chad �� 0.3%7,592,186 Glencore UK (Chad) Loan Agreement,
Tranche A, Variable Rate, 3 mo. LIBOR +2.00%, 2.23%, due 09/30/25 (c) 3,416,484
20,774,455 Glencore UK (Chad) Loan Agreement,Tranche B, Variable Rate, 3 mo. LIBOR +2.25%, 2.48%, due 12/31/27 (c) 9,348,505Total Chad 12,764,989
Indonesia �� 0.0%EUR 197,725 Republic of Indonesia, Indonesia Paris Club
Debt, 5.10%, due 06/01/21 (a) 232,155
Kenya �� 0.1%5,475,000 Republic of Kenya Loan Agreement,
9.17%, due 04/10/25 (a) 5,446,047
TOTAL LOAN ASSIGNMENTS(COST $24,012,721) 18,443,191
Copyright © 2021 www.secdatabase.com. All Rights Reserved.Please Consider the Environment Before Printing This Document

GMO Emerging Country Debt Fund(A Series of GMO Trust)Schedule of Investments �� (Continued)(showing percentage of total net assets)November 30, 2020 (Unaudited)
Par Value�� /Shares Description Value ($)
LOAN PARTICIPATIONS �� 0.9%
Angola �� 0.7%12,731,250 Republic of Angola Loan Agreement
(Participation with Development Bank ofSouthern Africa), 6 mo. LIBOR + 6.25%,6.51%, due 12/13/23 (c) 11,076,187
7,283,938 Republic of Angola Loan Agreement(Participation with Development Bank ofSouthern Africa), 6 mo. LIBOR + 6.25%,6.51%, due 12/20/23 (c) 6,337,026
12,666,667 Republic of Angola Loan Agreement(Participation with GE Capital EFSFinancing, Inc),7.50%, due 08/30/24 (c) 10,893,333
819,000 Republic of Angola Loan Agreement(Participation via Avenir II BV), Reg S,6 mo. LIBOR + 4.50%, 4.98%, due 12/07/23 (c) 712,530Total Angola 29,019,076
Egypt �� 0.0%CHF 14,152 Paris Club Loan Agreement (Participation
with Standard Chartered Bank), ZeroCoupon, due 01/03/24 (a) 12,689
Iraq �� 0.2%EUR 839,462 Republic of Iraq Paris Club Loan
Agreement (Participation with CreditSuisse), 4.50%, due 12/30/27 (a) 631,835
JPY 2,173,530,179 Republic of Iraq Paris Club LoanAgreement (Participation with DeutscheBank), 2.57%, due 01/01/28 (c) 9,160,168
JPY 283,992,408 Republic of Iraq Paris Club LoanAgreement (Participation with DeutscheBank), 2.57%, due 01/01/28 (c) 1,197,040
JPY 120,710,790 Republic of Iraq Paris Club LoanAgreement (Participation with DeutscheBank), 2.57%, due 01/01/28 (c) 506,027Total Iraq 11,495,070
Russia �� 0.0%EUR 76,893,500 Russian Foreign Trade Obligations
(Participation with GML InternationalLtd.) (c) (e) 3
TOTAL LOAN PARTICIPATIONS(COST $66,121,301) 40,526,838
MUTUAL FUNDS �� 1.7%
United States �� 1.7%Affiliated Issuers �� 1.7%
14,838,144 GMO U.S. Treasury Fund 74,784,247
TOTAL MUTUAL FUNDS(COST $74,296,430) 74,784,247
Par Value�� /Shares Description Value ($)
RIGHTS/WARRANTS �� 0.4%
Argentina �� 0.0%EUR 335,089,675 Republic of Argentina GDP Linked,
Variable Rate, Expires 12/15/35 (g) 799,424JPY 740,189,000 Republic of Argentina GDP Linked,
Variable Rate, Expires 12/15/35 (c) (g) 36,163Total Argentina 835,587
Ukraine �� 0.4%14,446,000 Government of Ukraine GDP Linked,
Reg S, Variable Rate, Expires 05/31/40 (g) 14,310,569
Uruguay �� 0.0%4,000,000 Banco Central Del Uruguay Value
Recovery Rights, Variable Rate,Expires 01/02/21 (a) (g) �
TOTAL RIGHTS/WARRANTS(COST $49,378,720) 15,146,156
SHORT-TERM INVESTMENTS �� 0.2%
Money Market Funds �� 0.2%8,350,363 State Street Institutional Treasury Money
Market Fund � Premier Class, 0.01% (h) 8,350,363
TOTAL SHORT-TERM INVESTMENTS(COST $8,350,363) 8,350,363
TOTAL INVESTMENTS �� 100.3%(Cost $4,586,639,624) 4,381,502,007Other Assets and Liabilities (net) � (0.3%) (13,915,614 )
TOTAL NET ASSETS �� 100.0% $4,367,586,393
Copyright © 2021 www.secdatabase.com. All Rights Reserved.Please Consider the Environment Before Printing This Document

GMO Emerging Country Debt Fund(A Series of GMO Trust)
Schedule of Investments �� (Continued)November 30, 2020 (Unaudited)
A summary of outstanding financial instruments at November 30, 2020 is as follows:
Forward Currency Contracts
Reverse Repurchase Agreements(i)
Face Value Description Value ($)USD 8,599,044 JP Morgan Securities, Inc., (0.50)%, dated 11/18/20 (collateral: Bolivia Government International Bond, Reg S,
4.50%, due 03/20/28), to be repurchased on demand at face value plus accrued interest. $(8,599,044)
Average balance outstanding $(8,719,100 )Average interest rate (net) 0.46 %Maximum balance outstanding $(10,300,000)
Average balance outstanding was calculated based on daily face value balances outstanding during the period that the Fund had enteredinto reverse repurchase agreements. Average interest rate was calculated based on interest received and/or paid during the period that theFund had entered into the reverse repurchase agreements.
Credit Linked Options
Principal /Notional Amount
ExpirationDate Description
Premiums Paid/(Received) ($) Value ($)
Put Sold USD 45,000,000 01/20/2021 Republic of Philippines Credit Linked Put Option, Fund receives premiumof 0.25% (OTC) (CP-DB) (a) (730,000 ) 28,747
Put Sold USD 46,000,000 04/13/2021 Lebanon Gap Credit Linked Put Option, Fund receives premium of 0.50%(OTC) (CP-DB) (a) (947,472 ) (194,255)
Put Sold USD 9,746,000 01/24/2024 Republic of Philippines Credit Linked Put Option, Fund receives premiumof 0.25% (OTC) (CP-DB) (a) (69,684 ) 80,085
Put Sold USD 50,797,000 04/15/2024 Banco do Brasil Credit Linked Put Option, Fund receives premium of0.30% (OTC) (CP-DB) (a) (1,055,749 ) 342,057
Put Sold USD 100,000,000 04/15/2024 Banco do Brasil Credit Linked Put Option, Fund receives premium of0.44% (OTC) (CP-DB) (a) (3,603,111 ) 187,681
$ (6,406,016 ) $444,315
Swap Contracts
Centrally Cleared Credit Default Swaps
SettlementDate
Counter-party
CurrencySold
CurrencyPurchased
NetUnrealized
Appreciation(Depreciation) ($)
01/19/2021 MSCI COP 30,200,000,000 USD 8,280,779 (99,902 )
01/19/2021 BOA EUR 49,161,600 USD 57,640,747 (1,088,873 )
01/19/2021 MSCI GBP 49,311,000 USD 63,748,028 (2,036,479 )
01/19/2021 SSB GBP 12,000,000 USD 15,644,954 (363,930 )
01/19/2021 MSCI JPY 8,000,000,000 USD 76,135,521 (570,336 )
$ (4,159,520 )
Copyright © 2021 www.secdatabase.com. All Rights Reserved.Please Consider the Environment Before Printing This Document
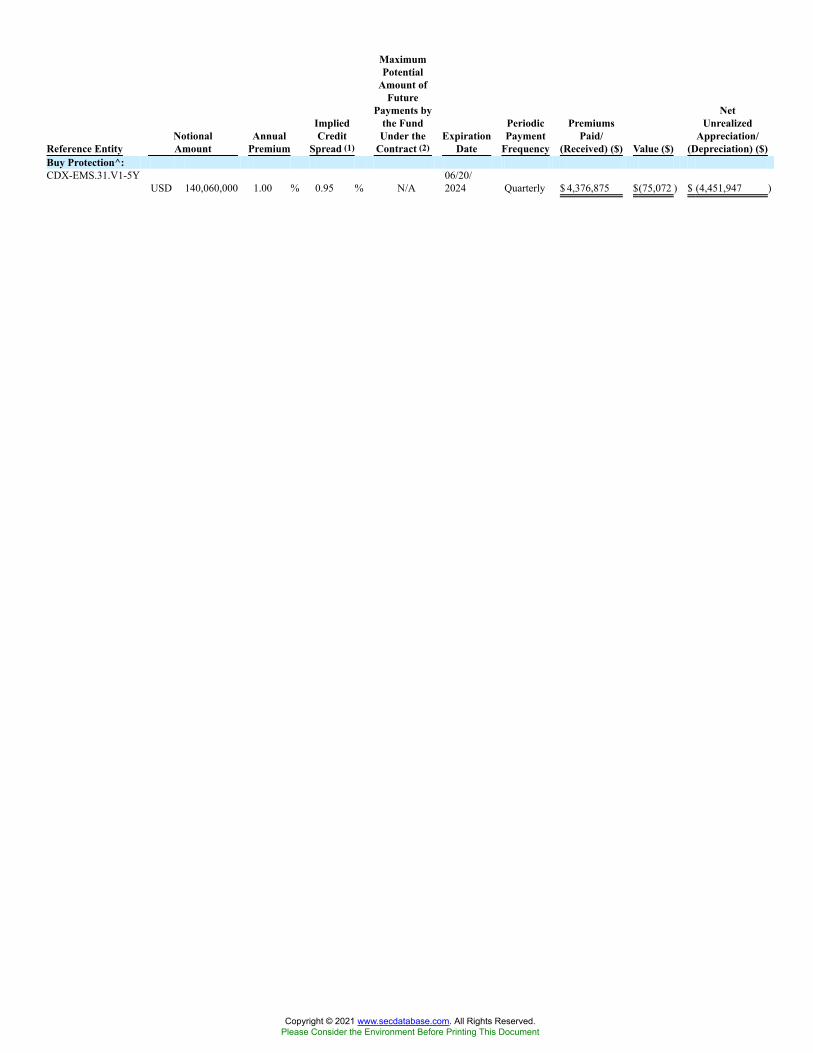
Reference EntityNotionalAmount
AnnualPremium
ImpliedCredit
Spread (1)
MaximumPotential
Amount ofFuture
Payments bythe FundUnder the
Contract (2)Expiration
Date
PeriodicPayment
Frequency
PremiumsPaid/
(Received) ($) Value ($)
NetUnrealized
Appreciation/(Depreciation) ($)
Buy Protection^:CDX-EMS.31.V1-5Y
USD 140,060,000 1.00 % 0.95 % N/A06/20/2024 Quarterly $ 4,376,875 $(75,072 ) $ (4,451,947 )
Copyright © 2021 www.secdatabase.com. All Rights Reserved.Please Consider the Environment Before Printing This Document

GMO Emerging Country Debt Fund(A Series of GMO Trust)
Schedule of Investments �� (Continued)November 30, 2020 (Unaudited)
OTC Credit Default Swaps
Reference Entity CounterpartyNotionalAmount
AnnualPremium
ImpliedCredit
Spread (1)
MaximumPotential
Amount ofFuture
Payments bythe FundUnder the
Contract (2)Expiration
Date
PeriodicPayment
Frequency
PremiumsPaid/
(Received) ($) Value ($)
NetUnrealized
Appreciation/(Depreciation)
($)Buy Protection^:Commonwealth
of Bahamas DB EUR 51,746,000 1.00% 7.08% N/A12/20/2020 Quarterly 7,730,397 208,064 (7,522,333 )
Republic of SouthAfrica CITI USD 26,200,000 1.00% 1.23% N/A
12/20/2022 Quarterly 659,930 123,499 (536,431 )
Republic of SouthAfrica GS USD 9,700,000 1.00% 1.23% N/A
12/20/2022 Quarterly 152,652 45,723 (106,929 )
Petrobras GlobalFinance BV CITI USD 37,000,000 1.00% 1.55% N/A
06/20/2024 Quarterly 1,923,458 708,277 (1,215,181 )
Commonwealthof Bahamas DB EUR 44,558,436 1.00% 5.95% N/A
06/20/2025 Quarterly 6,171,081 5,800,961 (370,120 )
Republic of SouthAfrica GS USD 41,800,000 1.00% 2.29% N/A
12/20/2025 Quarterly 4,006,975 2,579,274 (1,427,701 )
Republic ofTurkey CITI USD 15,000,000 1.00% 3.83% N/A
12/20/2025 Quarterly 2,748,570 1,923,352 (825,218 )
Republic ofTurkey GS USD 12,000,000 1.00% 3.83% N/A
12/20/2025 Quarterly 2,223,997 1,538,682 (685,315 )
Republic ofTurkey GS USD 5,000,000 1.00% 3.83% N/A
12/20/2025 Quarterly 947,400 641,117 (306,283 )
United States ofMexico GS USD 20,000,000 1.00% 1.39% N/A
06/20/2029 Quarterly 1,589,641 633,225 (956,416 )
United States ofMexico GS USD 20,000,000 1.00% 1.55% N/A
09/20/2031 Quarterly 2,640,655 1,066,765 (1,573,890 )
Sell Protection^:Commonwealth
of Bahamas DB USD 61,270,000 1.00% 7.07% 61,270,000 USD12/20/2020 Quarterly (7,515,364 ) (206,219 ) 7,309,145
Commonwealthof Bahamas DB USD 3,487,000 1.00% 6.16% 3,487,000 USD
06/20/2023 Quarterly (641,463 ) (415,337 ) 226,126
Commonwealthof Bahamas DB USD 6,975,000 1.00% 6.16% 6,975,000 USD
06/20/2023 Quarterly (1,263,915 ) (830,794 ) 433,121
Commonwealthof Bahamas DB USD 59,796,571 1.00% 5.94% 59,796,571 USD
06/20/2025 Quarterly (6,983,424 ) (6,421,255) 562,169
Republic ofMalaysia CITI USD 17,200,000 1.00% 0.62% 17,200,000 USD
12/20/2028 Quarterly (845,599 ) 514,482 1,360,081
$13,544,991 $7,909,816 $ (5,635,175 )
^ Buy Protection - Fund pays a premium and buys credit protection. If a credit event occurs the Fund will, depending on the terms of the particular swap contract,either (i) receive from the seller of protection an amount equal to the notional amount of the swap and deliver the referenced obligation or underlying securitiescomprising the referenced index or (ii) receive a net settlement amount in the form of cash or securities equal to the notional amount of the swap less the recoveryvalue of the referenced obligation or underlying securities comprising the referenced index.Sell Protection - Fund receives a premium and sells credit protection. If a credit event occurs the Fund will, depending on the terms of the particular swap contract,either (i) pay to the buyer of protection an amount equal to the notional amount of the swap and take delivery of the referenced obligation or underlying securitiescomprising the referenced index or (ii) pay a net settlement amount in the form of cash or securities equal to the notional amount of the swap less the recoveryvalue of the referenced obligation or underlying securities comprising the referenced index.
(1) As of November 30, 2020, implied credit spreads in absolute terms, calculated using a model, and utilized in determining the market value of credit default swapcontracts on the reference security, serve as an indicator of the current status of the payment/performance risk and reflect the likelihood or risk of default for thereference entity. The implied credit spread of a particular referenced entity reflects the cost of buying/selling protection. Wider (i.e. higher) credit spreads representa deterioration of the referenced entity�s credit soundness and a greater likelihood or risk of default or other credit event occurring as defined under the terms of thecontract.
(2) The maximum potential amount the Fund could be required to pay as a seller of credit protection if a credit event occurs as defined under the terms of thatparticular swap contract.
Centrally Cleared Interest Rate Swaps
Copyright © 2021 www.secdatabase.com. All Rights Reserved.Please Consider the Environment Before Printing This Document

Fund Pays Fund ReceivesNotionalAmount
ExpirationDate
PeriodicPayment
Frequency
PremiumsPaid/
(Received) ($) Value ($)
NetUnrealized
Appreciation/(Depreciation) ($)
0.53%6 Month EURIBOR EUR 30,000,000
01/24/2050 Semi-Annual (29,167 ) (5,706,889) (5,677,722 )
0.18%GBP - SONIA - COMPOUND GBP 6,410,000
04/22/2050 Annually 7,914 535,304 527,390
$ (21,253 ) $(5,171,585) $ (5,150,332 )
Copyright © 2021 www.secdatabase.com. All Rights Reserved.Please Consider the Environment Before Printing This Document

GMO Emerging Country Debt Fund(A Series of GMO Trust)
Schedule of Investments �� (Continued)November 30, 2020 (Unaudited)
As of November 30, 2020, for the above contracts and/or agreements, the Fund had sufficient cash and/or securities to covercommitments or collateral requirements, if any, of the relevant broker or exchange.
Notes to Schedule of Investments:
� Denominated in U.S. Dollar, unless otherwise indicated.(a) Investment valued at fair value using methods determined in good faith by
the Trustees of GMO Trust or persons acting at their direction pursuant toprocedures approved by the Trustees. Investment valued using significantunobservable inputs.
(b) Security is backed by U.S. Treasury Bonds.(c) Investment valued using significant unobservable inputs.(d) All or a portion of this security has been pledged to cover collateral
requirements on reverse repurchase agreements.(e) Security is in default.(f) All or a portion of this security has been pledged to cover margin
requirements on futures and/or cleared swap contracts, collateral on OTCswap contracts, forward currency contracts, and/or written options, if any.
(g) Indexed security in which price and/or coupon is linked to the price of aspecific instrument or financial statistic.
(h) The rate disclosed is the 7 day net yield as of November 30, 2020.(i) Reverse repurchase agreements have an open maturity date and can be
closed by either party on demand.
The rates shown on variable rate notes are the current interest rates atNovember 30, 2020, which are subject to change based on the terms of thesecurity.
Portfolio Abbreviations:
144A - Securities exempt from registration under Rule 144A of the Securities Actof 1933. These securities may be resold in transactions exempt from registration,normally to qualified institutional investors.AMBAC - Insured as to the payment of principal and interest by AMBACAssurance Corporation.CJSC - Closed Joint-Stock CompanyCP - CounterpartyEURIBOR - Euro Interbank Offered RateFGIC - Insured as to the payment of principal and interest by Financial GuarantyInsurance Corporation.GDP - Gross Domestic ProductJSC - Joint-Stock CompanyLIBOR - London Interbank Offered RateOJSC - Open Joint-Stock CompanyOTC - Over-the-CounterReg S - Security exempt from registration under Regulation S of the SecuritiesAct of 1933, which exempts from registration securities offered and sold outsidethe United States. Security may not be offered or sold in the United States exceptpursuant to an exemption from, or in a transaction not subject to, the registrationrequirements of the Securities Act of 1933.SONIA - Sterling Overnight Interbank Average RateUSBM - U.S. Treasury 3 Month Bill Money Market Yield.XLCA - Insured as to the payment of principal and interest by XL CapitalAssurance.
Counterparty Abbreviations:
Currency Abbreviations:
BOA - Bank of America, N.A.CITI - Citibank N.A.DB - Deutsche Bank AGGS - Goldman Sachs International
MSCI - Morgan Stanley & Co.International PLCSSB - State Street Bank and TrustCompany
CHF - Swiss FrancCOP - Colombian PesoDOP - Dominican PesoEUR - EuroGBP - British Pound
JPY - Japanese YenTRY - Turkish LiraUSD - United States DollarZAR - South African Rand
Copyright © 2021 www.secdatabase.com. All Rights Reserved.Please Consider the Environment Before Printing This Document

GMO High Yield Fund(A Series of GMO Trust)Schedule of Investments(showing percentage of total net assets)November 30, 2020 (Unaudited)
Par Value�� Description Value ($)DEBT OBLIGATIONS �� 33.6%
Corporate Debt �� 33.5%Australia �� 0.1%
180,000 North Queensland Export Terminal Pty Ltd., 144A,4.45%, due 12/15/22 170,222
Canada �� 2.3%625,000 Cenovus Energy, Inc., 5.38%, due 07/15/25 689,2301,000,000 Cenovus Energy, Inc., 5.25%, due 06/15/37 1,046,5441,125,000 Methanex Corp., 5.25%, due 12/15/29 1,178,578125,000 Mountain Province Diamonds, Inc., 144A,
8.00%, due 12/15/22 106,406500,000 Quebecor Media, Inc., 5.75%, due 01/15/23 540,500375,000 Taseko Mines Ltd., 144A, 8.75%, due 06/15/22 370,313
Total Canada 3,931,571
Germany �� 0.6%1,000,000 ZF North America Capital, Inc., 144A,
4.75%, due 04/29/25 1,057,500
Luxembourg �� 1.0%500,000 ArcelorMittal SA, 3.60%, due 07/16/24 531,945875,000 ArcelorMittal SA, 7.25%, due 10/15/39 1,160,486
Total Luxembourg 1,692,431
New Zealand �� 0.4%750,000 Trilogy International Partners LLC / Trilogy
International Finance, Inc., 144A, 8.88%, due 05/01/22 708,750
Sweden �� 0.2%375,000 Telefonaktiebolaget LM Ericsson, 4.13%, due 05/
15/22 389,531
United Kingdom �� 1.1%500,000 Avon Products, Inc., 7.00%, due 03/15/23 541,10544,000 Global Ship Lease, Inc., 144A, 9.88%, due 11/15/
22 44,990190,000 Jaguar Land Rover Automotive Plc, 144A,
5.63%, due 02/01/23 188,0061,125,000 Rolls-Royce Plc, 144A, 3.63%, due 10/14/25 1,103,906
Total United Kingdom 1,878,007
Par Value�� Description Value ($)Corporate Debt �� continuedUnited States �� 27.8%
125,000 Albertsons Cos, Inc. / Safeway, Inc. / New AlbertsonsLP / Albertsons LLC, 144A, 3.50%, due 02/15/23 128,188
375,000 Ally Financial, Inc., 5.75%, due 11/20/25 437,9141,000,000 Antero Resources Corp., 5.13%, due 12/01/22 950,0001,125,000 Apache Corp., 5.35%, due 07/01/49 1,091,250625,000 Arconic Corp., 144A, 6.00%, due 05/15/25 673,437500,000 Avis Budget Car Rental LLC / Avis Budget Finance,
Inc., 144A, 10.50%, due 05/15/25 583,665375,000 Buckeye Partners LP, 4.35%, due 10/15/24 376,875625,000 Carnival Corp., 144A, 11.50%, due 04/01/23 711,719750,000 CCO Holdings LLC / CCO Holdings Capital Corp.,
144A, 5.38%, due 06/01/29 819,375625,000 CHS/Community Health Systems, Inc., 6.25%, due 03/
31/23 638,281875,000 Cinemark USA, Inc., 5.13%, due 12/15/22 849,297375,000 Cleaver-Brooks, Inc., 144A, 7.88%, due 03/01/23 371,250250,000 Cleveland-Cliffs, Inc., 144A, 9.88%, due 10/17/25 291,5631,375,000 Continental Resources, Inc., 3.80%, due 06/01/24 1,390,826366,000 Crestwood Midstream Partners LP / Crestwood
Midstream Finance Corp., 6.25%, due 04/01/23 367,658875,000 CSC Holdings LLC, 6.75%, due 11/15/21 915,333250,000 CSC Holdings LLC, 5.88%, due 09/15/22 265,9381,125,000 Delta Air Lines, Inc., 4.38%, due 04/19/28 1,102,060625,000 DISH DBS Corp., 5.88%, due 07/15/22 656,425125,000 Downstream Development Authority of the Quapaw
Tribe of Oklahoma, 144A, 10.50%, due 02/15/23 120,0001,375,000 EQM Midstream Partners LP, 4.75%, due 07/15/23 1,402,500875,000 Fluor Corp., 3.50%, due 12/15/24 855,3121,250,000 Ford Motor Credit Co. LLC, 4.13%, due 08/04/25 1,293,750480,000 Ford Motor Credit Co. LLC, 4.39%, due 01/08/26 499,2002,627,000 Ford Motor Credit Co. LLC, 3.82%, due 11/02/27 2,646,151500,000 Gap, Inc. (The), 144A, 8.38%, due 05/15/23 566,250500,000 Gap, Inc. (The), 144A, 8.88%, due 05/15/27 580,000375,000 Genworth Holdings, Inc., 7.20%, due 02/15/21 374,531625,000 Genworth Mortgage Holdings, Inc., 144A,
6.50%, due 08/15/25 665,625181,000 HC2 Holdings, Inc., 144A, 11.50%, due 12/01/21 177,380250,000 Hillman Group, Inc. (The), 144A, 6.38%, due 07/15/22 248,113
Copyright © 2021 www.secdatabase.com. All Rights Reserved.Please Consider the Environment Before Printing This Document

GMO High Yield Fund(A Series of GMO Trust)Schedule of Investments �� (Continued)(showing percentage of total net assets)November 30, 2020 (Unaudited)
Par Value�� Description Value ($)Corporate Debt �� continuedUnited States �� continued
250,000 iStar, Inc., REIT, 5.50%, due 02/15/26 250,625500,000 KB Home, 4.80%, due 11/15/29 550,000470,000 Kraft Heinz Foods Co., 3.95%, due 07/15/25 518,401625,000 Kraft Heinz Foods Co., 144A, 3.88%, due 05/15/27 676,204500,000 Kraft Heinz Foods Co., 6.75%, due 03/15/32 667,781625,000 Ladder Capital Finance Holdings LLLP / Ladder
Capital Finance Corp., 144A, REIT, 4.25%, due 02/01/27 577,344
696,000 Macy�s Retail Holdings LLC, 3.88%, due 01/15/22 686,865898,000 Macy�s Retail Holdings LLC, 2.88%, due 02/15/23 835,1401,039,000 Michael Kors USA, Inc., 144A, 4.50%, due 11/01/24 1,049,390375,000 Netflix, Inc., 4.38%, due 11/15/26 415,781625,000 Newell Brands, Inc., 4.70%, due 04/01/26 673,3251,075,000 Nordstrom, Inc., 4.00%, due 03/15/27 1,044,700500,000 Nuance Communications, Inc., 5.63%, due 12/15/26 528,305500,000 Occidental Petroleum Corp., 2.90%, due 08/15/24 466,250500,000 Occidental Petroleum Corp., 4.30%, due 08/15/39 412,5002,375,000 Occidental Petroleum Corp., 4.40%, due 08/15/49 1,929,687375,000 OneMain Finance Corp., 6.63%, due 01/15/28 430,312250,000 OneMain Finance Corp., 7.75%, due 10/01/21 261,875375,000 Prime Security Services Borrower LLC / Prime
Finance, Inc., 144A, 5.75%, due 04/15/26 406,8751,125,000 QVC, Inc., 5.45%, due 08/15/34 1,130,625625,000 RHP Hotel Properties LP / RHP Finance Corp., REIT,
5.00%, due 04/15/23 621,875375,000 Rockies Express Pipeline LLC, 144A, 3.60%, due 05/
15/25 384,375625,000 Royal Caribbean Cruises Ltd., 144A, 10.88%, due 06/
01/23 707,031250,000 Royal Caribbean Cruises Ltd., 144A, 11.50%, due 06/
01/25 293,594525,000 RR Donnelley & Sons Co., 8.25%, due 07/01/27 551,250625,000 Sealed Air Corp., 144A, 5.25%, due 04/01/23 664,656500,000 Service Properties Trust, REIT, 4.50%, due 03/15/25 475,0001,125,000 Service Properties Trust, REIT, 4.38%, due 02/15/30 1,055,250625,000 Southwestern Energy Co., 6.45%, due 01/23/25 639,062
Par Value�� /Shares Description Value ($)
Corporate Debt �� continuedUnited States �� continued
1,000,000 Spirit AeroSystems, Inc., 3.85%, due 06/15/26 1,027,700250,000 Sprint Communications, Inc., 11.50%, due 11/
15/21 272,813750,000 Sprint Corp., 7.88%, due 09/15/23 864,375625,000 Targa Resources Partners LP / Targa
Resources Partners Finance Corp.,5.00%, due 01/15/28 651,562
375,000 Toll Brothers Finance Corp., 5.88%, due 02/15/22 389,880
250,000 Uniti Group LP / Uniti Group Finance, Inc. /CSL Capital LLC, 144A, REIT,6.00%, due 04/15/23 255,313
625,000 Urban One, Inc., 144A, 8.75%, due 12/15/22 604,687250,000 Vericast Corp., 144A, 8.38%, due 08/15/22 255,313375,000 Veritas US, Inc. / Veritas Bermuda Ltd., 144A,
7.50%, due 02/01/23 377,813375,000 Western Midstream Operating LP,
4.00%, due 07/01/22 381,563500,000 Western Midstream Operating LP,
5.05%, due 02/01/30 534,0221,125,000 Wynn Las Vegas LLC / Wynn Las Vegas
Capital Corp., 144A, 4.25%, due 05/30/23 1,130,625Total Corporate Debt 47,699,610
U.S. Government �� 0.1%150,000 U.S. Treasury Note, Variable Rate, USBM +
0.15%, 0.24%, due 01/31/22 (a) 150,186Total United States 47,849,796
TOTAL DEBT OBLIGATIONS(COST $54,173,622) 57,677,808
INVESTMENT FUNDS �� 50.4%
United States �� 50.4%1,003,674 iShares iBoxx $ High Yield Corporate Bond
ETF 86,637,140TOTAL INVESTMENT FUNDS(COST $84,041,230) 86,637,140
SHORT-TERM INVESTMENTS �� 14.2%
Foreign Government Obligations �� 8.4%JPY 1,500,000,000 Japan Treasury Discount Bill, Zero Coupon,
due 01/12/21 14,369,577
Money Market Funds �� 0.2%406,249 State Street Institutional Treasury Money
Market Fund � Premier Class, 0.01% (b) 406,249
Copyright © 2021 www.secdatabase.com. All Rights Reserved.Please Consider the Environment Before Printing This Document

GMO High Yield Fund(A Series of GMO Trust)Schedule of Investments �� (Continued)(showing percentage of total net assets)November 30, 2020 (Unaudited)
A summary of outstanding financial instruments at November 30, 2020 is as follows:
Reverse Repurchase Agreements
Average balance outstanding $(743,429)Average interest rate (net) (0.21 )%Maximum balance outstanding $(898,268)
Average balance outstanding was calculated based on daily face value balances outstanding during the period that the Fund had enteredinto reverse repurchase agreements. Average interest rate was calculated based on interest received and/or paid during the period that theFund had entered into the reverse repurchase agreements. The Fund had no reverse repurchase agreements at the end of the period.
Par Value�� Description Value ($)U.S. Government �� 5.6%
1,000,000 U.S. Treasury Bill, 0.72%, due 01/14/21 (a)(c) 999,9118,700,000 U.S. Treasury Bill, 0.01%, due 11/04/21 (c) 8,691,015
Total U.S. Government 9,690,926
TOTAL SHORT-TERM INVESTMENTS(COST $24,331,500) 24,466,752
TOTAL INVESTMENTS �� 98.2%(Cost $162,546,352) 168,781,700Other Assets and Liabilities (net) � 1.8% 3,099,857
TOTAL NET ASSETS �� 100.0% $171,881,557
Forward Currency Contracts
SettlementDate
Counter-party
CurrencySold
CurrencyPurchased
NetUnrealized
Appreciation(Depreciation) ($)
01/12/2021 DB JPY 1,500,000,000 USD 14,275,925 $ (105,147 )
Futures Contracts
Numberof
Contracts + TypeExpiration
DateNotional
Amount ($)
Value/NetUnrealized
Appreciation(Depreciation) ($)
Buys26 U.S. Treasury
Note 2 Yr. (CBT) March 2021 5,742,141 2,22848 U.S. Treasury
Note 5 Yr. (CBT) March 2021 6,049,500 7,454$11,791,641 $ 9,682
Sales7 U.S. Long Bond
(CBT) March 2021 1,224,344 (381 )13 U.S. Treasury
Note 10 Yr.(CBT) March 2021 1,796,234 (4,278 )
11 U.S. Ultra Bond(CBT) March 2021 2,376,344 7,974
$5,396,922 $ 3,315
+ Buys - Fund is long the futures contract.Sales - Fund is short the futures contract.
Copyright © 2021 www.secdatabase.com. All Rights Reserved.Please Consider the Environment Before Printing This Document

GMO High Yield Fund(A Series of GMO Trust)
Schedule of Investments �� (Continued)November 30, 2020 (Unaudited)
Swap Contracts
Centrally Cleared Credit Default Swaps
Reference EntityNotionalAmount
AnnualPremium
ImpliedCredit
Spread (1)
MaximumPotential
Amount ofFuture
Payments bythe FundUnder the
Contract (2)Expiration
Date
PeriodicPayment
Frequency
PremiumsPaid/
(Received) ($) Value ($)
NetUnrealized
Appreciation/(Depreciation) ($)
Sell Protection ^:CDX.NA.HYS.35.V1-5Y
USD 23,712,000 5.00% 3.00% 23,712,000 USD12/20/2025 Quarterly $ 851,660 $2,133,203 $ 1,281,543
^ Buy Protection - Fund pays a premium and buys credit protection. If a credit event occurs the Fund will, depending on the terms of the particular swap contract,either (i) receive from the seller of protection an amount equal to the notional amount of the swap and deliver the referenced obligation or underlying securitiescomprising the referenced index or (ii) receive a net settlement amount in the form of cash or securities equal to the notional amount of the swap less the recoveryvalue of the referenced obligation or underlying securities comprising the referenced index.Sell Protection - Fund receives a premium and sells credit protection. If a credit event occurs the Fund will, depending on the terms of the particular swap contract,either (i) pay to the buyer of protection an amount equal to the notional amount of the swap and take delivery of the referenced obligation or underlying securitiescomprising the referenced index or (ii) pay a net settlement amount in the form of cash or securities equal to the notional amount of the swap less the recoveryvalue of the referenced obligation or underlying securities comprising the referenced index.
(1) As of November 30, 2020, implied credit spreads in absolute terms, calculated using a model, and utilized in determining the market value of credit default swapcontracts on the reference security, serve as an indicator of the current status of the payment/performance risk and reflect the likelihood or risk of default for thereference entity. The implied credit spread of a particular referenced entity reflects the cost of buying/selling protection. Wider (i.e. higher) credit spreads representa deterioration of the referenced entity�s credit soundness and a greater likelihood or risk of default or other credit event occurring as defined under the terms of thecontract.
(2) The maximum potential amount the Fund could be required to pay as a seller of credit protection if a credit event occurs as defined under the terms of thatparticular swap contract.
As of November 30, 2020, for the above contracts and/or agreements, the Fund had sufficient cash and/or securities to covercommitments or collateral requirements, if any, of the relevant broker or exchange.
Notes to Schedule of Investments:
� Denominated in U.S. Dollar, unless otherwise indicated.(a) All or a portion of this security has been pledged to cover margin
requirements on futures and/or cleared swap contracts, collateral on OTCswap contracts, forward currency contracts, and/or written options, if any.
(b) The rate disclosed is the 7 day net yield as of November 30, 2020.(c) The rate shown represents yield-to-maturity.
The rates shown on variable rate notes are the current interest rates atNovember 30, 2020, which are subject to change based on the terms of thesecurity.
Portfolio Abbreviations:
144A - Securities exempt from registration under Rule 144A of the Securities Actof 1933. These securities may be resold in transactions exempt from registration,normally to qualified institutional investors.ETF - Exchange-Traded FundREIT - Real Estate Investment Trust.USBM - U.S. Treasury 3 Month Bill Money Market Yield.
Counterparty Abbreviations:
Copyright © 2021 www.secdatabase.com. All Rights Reserved.Please Consider the Environment Before Printing This Document

DB - Deutsche Bank AG
Currency Abbreviations:
JPY - Japanese YenUSD - United States Dollar
Copyright © 2021 www.secdatabase.com. All Rights Reserved.Please Consider the Environment Before Printing This Document

GMO Multi-Sector Fixed Income Fund (formerly Core Plus Bond Fund)(A Series of GMO Trust)Schedule of Investments(showing percentage of total net assets)November 30, 2020 (Unaudited)
Par Value�� Description Value ($)DEBT OBLIGATIONS �� 57.3%
Brazil �� 0.1%Corporate Debt
150,000 Suzano Austria GmbH, 3.75%, due 01/15/31 158,100
Canada �� 0.3%Corporate Debt
450,000 Bank of Nova Scotia (The), 0.55%, due 09/15/23 451,951350,000 Teck Resources Ltd, 6.25%, due 07/15/41 435,149
Total Canada 887,100
Chile �� 0.1%Corporate Debt
400,000 Enel Americas SA, 4.00%, due 10/25/26 441,250
Germany �� 0.9%Corporate Debt
450,000 Deutsche Bank AG, Variable Rate,3.55%, due 09/18/31 482,443
1,250,000 Deutsche Bank AG, 3.95%, due 02/27/23 1,326,948400,000 Deutsche Bank AG, Variable Rate,
3.96%, due 11/26/25 433,656400,000 Deutsche Bank AG, 4.25%, due 10/14/21 410,441
Total Germany 2,653,488
Japan �� 0.1%Corporate Debt
400,000 Sumitomo Mitsui Financial Group Inc,2.85%, due 01/11/22 410,990
Switzerland �� 0.4%Corporate Debt
400,000 Credit Suisse Group AG, 3.75%, due 03/26/25 443,948300,000 Credit Suisse Group AG, 4.88%, due 05/15/45 417,262400,000 Credit Suisse Group Funding Guernsey Ltd,
3.80%, due 09/15/22 423,173Total Switzerland 1,284,383
United Kingdom �� 0.3%Corporate Debt
400,000 AstraZeneca Plc, 2.38%, due 06/12/22 411,518400,000 AstraZeneca Plc, 3.13%, due 06/12/27 450,291
Total United Kingdom 861,809
Par Value�� Description Value ($)United States �� 55.1%Asset-Backed Securities �� 20.8%
1,250,000 BAMLL Commercial Mortgage Securities Trust, Series12-PARK, Class A, 144A, 2.96%, due 12/10/30 1,305,870
5,100,000 CGRBS Commercial Mortgage Trust, Series 13-VN05,Class C, 144A, Variable Rate, 3.70%, due 03/13/35 5,383,303
31,520,000 Commercial Mortgage Trust, Series 13-WWP,Class A2, 144A, 3.42%, due 03/10/31 33,404,877
2,210,000 Commercial Mortgage Trust, Series 13-WWP, Class B,144A, 3.73%, due 03/10/31 2,355,424
6,461,000 Commercial Mortgage Trust, Series 13-WWP, Class C,144A, 3.54%, due 03/10/31 6,862,796
6,310,000 Commercial Mortgage Trust, Series 13-WWP, Class D,144A, 3.90%, due 03/10/31 6,746,905
1,000,000 Morgan Stanley Capital I Trust, Series 14-CPT,Class A, 144A, 3.35%, due 07/13/29 1,009,832
490,000 Morgan Stanley Capital I Trust, Series 14-CPT,Class B, 144A, Variable Rate, 3.56%, due 07/13/29 495,021
250,000 Morgan Stanley Capital I Trust, Series 14-CPT,Class E, 144A, Variable Rate, 3.56%, due 07/13/29 252,562
300,000 Morgan Stanley Capital I Trust, Series 14-CPT,Class F, 144A, Variable Rate, 3.56%, due 07/13/29 303,074
375,000 Morgan Stanley Capital I Trust, Series 14-MP, Class A,144A, 3.47%, due 08/11/33 379,811
100,000 Morgan Stanley Capital I Trust, Series 14-MP, Class C,144A, Variable Rate, 3.82%, due 08/11/33 101,387
5,000,000 Morgan Stanley Capital I Trust, Series 14-MP, Class E,144A, Variable Rate, 3.82%, due 08/11/33 5,069,351Total Asset-Backed Securities 63,670,213
Corporate Debt �� 16.1%400,000 Abbott Laboratories, 2.55%, due 03/15/22 411,765400,000 Abbott Laboratories, 2.95%, due 03/15/25 438,534350,000 Abbott Laboratories, 3.75%, due 11/30/26 408,411400,000 Ally Financial, Inc., 4.13%, due 02/13/22 416,730400,000 Ally Financial, Inc., 5.13%, due 09/30/24 458,755450,000 Alphabet, Inc., 0.45%, due 08/15/25 449,475450,000 Alphabet, Inc., 0.80%, due 08/15/27 447,870450,000 Amazon.com, Inc., 0.40%, due 06/03/23 451,295
Copyright © 2021 www.secdatabase.com. All Rights Reserved.Please Consider the Environment Before Printing This Document

GMO Multi-Sector Fixed Income Fund (formerly Core Plus Bond Fund)(A Series of GMO Trust)Schedule of Investments �� (Continued)(showing percentage of total net assets)November 30, 2020 (Unaudited)
Par Value�� Description Value ($)United States �� continuedCorporate Debt �� continued
450,000 Amazon.com, Inc., 0.80%, due 06/03/25 456,143400,000 Amazon.com, Inc., 3.30%, due 12/05/21 410,204300,000 Amgen, Inc., 5.15%, due 11/15/41 416,637450,000 Apple, Inc., 0.75%, due 05/11/23 455,357400,000 Apple, Inc., 2.15%, due 02/09/22 409,099400,000 Apple, Inc., 2.50%, due 02/09/22 410,011100,000 Apple, Inc., 4.65%, due 02/23/46 143,871400,000 Arrow Electronics, Inc., 3.88%, due 01/12/28 451,371400,000 Bank of America Corp., Variable Rate,
2.83%, due 10/24/51 419,699300,000 Bank of America Corp., Variable Rate,
4.33%, due 03/15/50 395,812350,000 Boeing Co. (The), 5.04%, due 05/01/27 400,891200,000 Boeing Co. (The), 5.71%, due 05/01/40 252,464350,000 Bunge Ltd. Finance Corp., 3.25%, due 08/15/26 384,122400,000 Bunge Ltd. Finance Corp., 3.75%, due 09/25/27 445,616400,000 Bunge Ltd. Finance Corp., 4.35%, due 03/15/24 441,221450,000 Caterpillar Financial Services Corp.,
0.45%, due 09/14/23 450,955400,000 Caterpillar Financial Services Corp.,
1.90%, due 09/06/22 411,270400,000 Caterpillar, Inc., 3.25%, due 09/19/49 473,921300,000 Caterpillar, Inc., 4.75%, due 05/15/64 452,054400,000 Cheniere Corpus Christi Holdings LLC,
5.13%, due 06/30/27 463,898350,000 Cheniere Corpus Christi Holdings LLC,
5.88%, due 03/31/25 401,014350,000 Cheniere Corpus Christi Holdings LLC,
7.00%, due 06/30/24 403,588400,000 Coca-Cola Co. (The), 2.95%, due 03/25/25 439,919350,000 Conagra Brands, Inc., 5.30%, due 11/01/38 469,171350,000 Corning, Inc., 5.45%, due 11/15/79 486,389400,000 Crown Castle International Corp., REIT,
5.25%, due 01/15/23 438,823350,000 Deere & Co., 3.75%, due 04/15/50 456,854400,000 DH Europe Finance II Sarl, 2.60%, due 11/15/29 440,760400,000 DH Europe Finance II Sarl, 3.25%, due 11/15/39 461,084400,000 DH Europe Finance II Sarl, 3.40%, due 11/15/49 476,423200,000 Discover Bank, 2.45%, due 09/12/24 211,367450,000 DuPont de Nemours, Inc., 2.17%, due 05/01/23 457,383350,000 DuPont de Nemours, Inc., 5.32%, due 11/15/38 477,088300,000 DuPont de Nemours, Inc., 5.42%, due 11/15/48 432,214
Par Value�� Description Value ($)United States �� continuedCorporate Debt �� continued
450,000 Enable Midstream Partners LP, 4.40%, due 03/15/27 435,785450,000 Enable Midstream Partners LP, 4.95%, due 05/15/28 443,116450,000 Equinix, Inc., REIT, 1.00%, due 09/15/25 450,685400,000 Estee Lauder Cos, Inc. (The), 2.60%, due 04/15/30 443,739450,000 Expedia Group, Inc., 3.25%, due 02/15/30 456,072450,000 Expedia Group, Inc., 3.80%, due 02/15/28 472,169400,000 Expedia Group, Inc., 5.00%, due 02/15/26 436,743400,000 FedEx Corp., 4.10%, due 04/15/43 473,253350,000 FedEx Corp., 5.10%, due 01/15/44 471,902300,000 FedEx Corp., 5.25%, due 05/15/50 427,281350,000 Fortive Corp., 4.30%, due 06/15/46 423,439400,000 GLP Capital LP / GLP Financing II, Inc., REIT,
4.00%, due 01/15/31 432,440250,000 Halliburton Co., 2.92%, due 03/01/30 255,959400,000 Halliburton Co., 4.85%, due 11/15/35 453,996300,000 Halliburton Co., 5.00%, due 11/15/45 337,934400,000 Home Depot, Inc. (The), 2.50%, due 04/15/27 437,000300,000 Home Depot, Inc. (The), 5.40%, due 09/15/40 441,362350,000 International Paper Co., 4.80%, due 06/15/44 462,592400,000 John Deere Capital Corp., 2.65%, due 01/06/22 410,322400,000 John Deere Capital Corp., 3.20%, due 01/10/22 412,843350,000 Johnson & Johnson, 3.63%, due 03/03/37 430,679350,000 JPMorgan Chase & Co., Variable Rate,
3.11%, due 04/22/51 391,529400,000 Linde Inc., 2.45%, due 02/15/22 408,042400,000 Marathon Petroleum Corp., 4.75%, due 09/15/44 446,212350,000 Marathon Petroleum Corp., 6.50%, due 03/01/41 444,456450,000 Marriott International Inc/MD, 3.50%, due 10/15/32 488,849400,000 Marriott International Inc/MD, 4.63%, due 06/15/30 461,843400,000 Marriott International Inc/MD, 5.75%, due 05/01/25 463,678300,000 Morgan Stanley, Variable Rate, 5.60%, due 03/24/51 484,232300,000 Morgan Stanley, 6.38%, due 07/24/42 491,378350,000 Mosaic Co. (The), 5.45%, due 11/15/33 432,260350,000 Mosaic Co. (The), 5.63%, due 11/15/43 440,612400,000 MPLX LP, 5.25%, due 01/15/25 410,987
Copyright © 2021 www.secdatabase.com. All Rights Reserved.Please Consider the Environment Before Printing This Document

GMO Multi-Sector Fixed Income Fund (formerly Core Plus Bond Fund)(A Series of GMO Trust)Schedule of Investments �� (Continued)(showing percentage of total net assets)November 30, 2020 (Unaudited)
Par Value�� Description Value ($)United States �� continuedCorporate Debt �� continued
400,000 NextEra Energy Capital Holdings, Inc., Variable Rate,4.80%, due 12/01/77 439,531
350,000 NextEra Energy Capital Holdings, Inc., Variable Rate,5.65%, due 05/01/79 410,640
350,000 NIKE, Inc., 3.38%, due 03/27/50 422,339350,000 ONEOK, Inc., 6.35%, due 01/15/31 433,877350,000 PacifiCorp, 4.15%, due 02/15/50 457,068400,000 Procter & Gamble Co. (The), 1.70%, due 11/03/21 405,518400,000 Procter & Gamble Co. (The), 2.30%, due 02/06/22 409,843400,000 Procter & Gamble Co. (The), 3.10%, due 08/15/23 430,493400,000 Sabine Pass Liquefaction LLC, 5.00%, due 03/15/27 462,999400,000 Sherwin-Williams Co. (The), 3.80%, due 08/15/49 482,390350,000 Sherwin-Williams Co. (The), 4.50%, due 06/01/47 465,115400,000 Starbucks Corp., 3.50%, due 11/15/50 458,145350,000 Starbucks Corp., 4.45%, due 08/15/49 454,334150,000 Synchrony Bank, 3.00%, due 06/15/22 155,014400,000 Synchrony Financial, 2.85%, due 07/25/22 413,175400,000 Synchrony Financial, 4.38%, due 03/19/24 439,556350,000 Synchrony Financial, 5.15%, due 03/19/29 418,951350,000 Sysco Corp., 5.95%, due 04/01/30 462,127300,000 Sysco Corp., 6.60%, due 04/01/40 442,726300,000 Sysco Corp., 6.60%, due 04/01/50 465,221400,000 Thermo Fisher Scientific, Inc., 4.13%, due 03/25/25 454,729400,000 Thermo Fisher Scientific, Inc., 4.15%, due 02/01/24 441,731350,000 Thermo Fisher Scientific, Inc., 4.50%, due 03/25/30 438,935350,000 Union Pacific Corp., 4.10%, due 09/15/67 437,119350,000 Union Pacific Corp., 4.38%, due 11/15/65 457,036400,000 United Parcel Service, Inc., 2.35%, due 05/16/22 410,369400,000 United Parcel Service, Inc., 3.90%, due 04/01/25 451,752300,000 United Parcel Service, Inc., 5.20%, due 04/01/40 429,268400,000 Verizon Communications, Inc., 3.38%, due 02/15/25 444,208350,000 Verizon Communications, Inc., 3.88%, due 02/08/29 411,854350,000 Verizon Communications, Inc., 4.33%, due 09/21/28 424,591400,000 VMware, Inc., 4.50%, due 05/15/25 454,359
Par Value�� Description Value ($)United States �� continuedCorporate Debt �� continued
350,000 VMware, Inc., 4.65%, due 05/15/27 409,125350,000 VMware, Inc., 4.70%, due 05/15/30 426,757400,000 Walt Disney Co. (The), 1.75%, due 01/13/26 416,091400,000 Walt Disney Co. (The), 2.20%, due 01/13/28 424,748400,000 Walt Disney Co. (The), 2.65%, due 01/13/31 435,224400,000 Williams Cos, Inc. (The), 5.10%, due 09/15/45 480,577400,000 Williams Cos, Inc. (The), 5.40%, due 03/04/44 480,700350,000 Williams Cos, Inc. (The), 5.75%, due 06/24/44 439,855
49,351,007
U.S. Government �� 2.2%4,750,000 U.S. Treasury Bond, 3.38%, due 05/15/44 (a) 6,578,379
U.S. Government Agency �� 16.0%15,300,000 Federal National Mortgage Association, TBA, 3.50%,
due 12/14/50 16,139,7076,500,000 Federal National Mortgage Association, TBA, 2.50%,
due 12/16/35 6,758,98416,600,000 Federal National Mortgage Association, TBA, 3.00%,
due 12/14/50 17,341,4887,300,000 Federal National Mortgage Association, TBA, 4.00%,
due 12/14/50 7,787,760900,000 Government National Mortgage Association, TBA,
3.50%, due 12/21/50 950,27448,978,213
Total United States 168,577,812
TOTAL DEBT OBLIGATIONS(COST $170,538,976) 175,274,932
INVESTMENT FUNDS �� 3.4%
United States �� 3.4%74,912 iShares iBoxx $ Investment Grade Corporate Bond
ETF 10,373,814
TOTAL INVESTMENT FUNDS(COST $9,075,896) 10,373,814
MUTUAL FUNDS �� 27.7%
United States �� 27.7%Affiliated Issuers
627,123 GMO Emerging Country Debt Fund, Class IV 17,214,5142,523,430 GMO Opportunistic Income Fund, Class VI 66,012,920312,590 GMO U.S. Treasury Fund 1,575,452
TOTAL MUTUAL FUNDS(COST $86,489,092) 84,802,886
Copyright © 2021 www.secdatabase.com. All Rights Reserved.Please Consider the Environment Before Printing This Document

GMO Multi-Sector Fixed Income Fund (formerly Core Plus Bond Fund)(A Series of GMO Trust)Schedule of Investments �� (Continued)(showing percentage of total net assets)November 30, 2020 (Unaudited)
A summary of outstanding financial instruments at November 30, 2020 is as follows:
Forward Currency Contracts
Par Value�� Description Value ($)SHORT-TERM INVESTMENTS �� 25.4%
Foreign Government Obligations �� 24.2%JPY 3,300,000,000 Japan Treasury Discount Bill, Zero Coupon,
due 01/06/21 31,612,560JPY 4,444,000,000 Japan Treasury Discount Bill, Zero Coupon,
due 12/14/20 42,568,715Total Foreign Government Obligations 74,181,275
Shares Description Value ($)Money Market Funds �� 1.2%
3,565,840 State Street Institutional Treasury Money MarketFund � Premier Class, 0.01% (b) 3,565,840
TOTAL SHORT-TERM INVESTMENTS(COST $76,948,709) 77,747,115
TOTAL INVESTMENTS �� 113.8%(Cost $343,052,673) 348,198,747Other Assets and Liabilities(net) � (13.8%) (42,111,804 )
TOTAL NET ASSETS �� 100.0% $306,086,943
SettlementDate
Counter-party
CurrencySold
CurrencyPurchased
NetUnrealized
Appreciation(Depreciation)
($)02/08/2021 BCLY AUD 30,421,000 USD 21,916,110 (428,528)02/08/2021 DB AUD 520,000 USD 371,219 (10,728)02/02/2021 CITI BRL 2,661,043 USD 490,000 (6,148)01/13/2021 BOA CHF 1,022,103 USD 1,120,000 (6,627)01/13/2021 JPM CHF 4,090,809 USD 4,510,000 85001/13/2021 MSCI CHF 15,226,182 USD 16,608,870 (174,393)12/02/2020 MSCI CLP 447,115,000 USD 582,720 (4,123)02/03/2021 MSCI COP 8,001,071,500 USD 2,089,053 (129,889)02/16/2021 CITI CZK 19,986,000 USD 892,631 (16,439)01/27/2021 BOA EUR 1,920,000 USD 2,273,800 (20,291)01/13/2021 MSCI GBP 2,370,000 USD 3,132,323 (29,333)01/13/2021 MSCI HUF 665,626,307 USD 2,184,082 (29,280)02/16/2021 CITI IDR 3,979,472,000 USD 280,000 81202/16/2021 JPM IDR 5,971,410,000 USD 410,000 (8,936)01/29/2021 BOA ILS 1,435,832 USD 430,000 (4,240)01/22/2021 BCLY INR 26,829,000 USD 360,000 (536)01/22/2021 JPM INR 23,329,980 USD 310,000 (3,515)12/14/2020 CITI JPY 1,900,000,000 USD 18,153,729 (49,503)12/14/2020 SSB JPY 2,750,000,000 USD 25,934,591 (412,193)01/06/2021 MSCI JPY 3,300,000,000 USD 31,336,618 (299,333)02/09/2021 BOA JPY 110,252,826 USD 1,060,000 2,59602/09/2021 JPM JPY 119,377,326 USD 1,150,000 5,08601/20/2021 JPM NOK 30,858,715 USD 3,350,515 (119,197)02/05/2021 BCLY NZD 760,000 USD 507,428 (25,530)02/05/2021 JPM NZD 6,810,000 USD 4,629,684 (145,895)02/05/2021 MSCI NZD 16,520,000 USD 10,995,795 (589,018)02/02/2021 MSCI PEN 2,440,620 USD 674,288 (2,609)12/03/2020 JPM PHP 7,263,750 USD 150,000 (1,045)12/03/2020 MSCI PHP 19,059,830 USD 393,717 (2,620)01/25/2021 JPM PHP 26,323,580 USD 545,002 (834)02/16/2021 DB PLN 1,685,679 USD 450,000 65302/26/2021 BOA RON 655,962 USD 159,177 (613)02/16/2021 BCLY RUB 66,255,861 USD 850,000 (11,505)02/16/2021 MSCI RUB 18,694,608 USD 240,000 (3,080)
SettlementDate
Counter-party
CurrencySold
CurrencyPurchased
NetUnrealized
Appreciation(Depreciation)
($)02/05/2021 BCLY SEK 16,486,224 USD 1,900,000 (24,687)02/05/2021 JPM SEK 32,605,774 USD 3,780,000 (26,567)01/15/2021 BCLY SGD 334,453 USD 250,000 61712/07/2020 BCLY TWD 10,249,920 USD 360,000 91212/07/2020 CITI TWD 6,568,616 USD 230,000 (120)12/07/2020 JPM TWD 7,671,780 USD 270,000 1,23212/07/2020 MSCI TWD 11,953,664 USD 418,692 (84)02/08/2021 BOA USD 1,086,732 AUD 1,520,000 29,72902/02/2021 JPM USD 772,008 BRL 4,433,410 54,59602/03/2021 JPM USD 11,361,219 CAD 15,108,433 276,64502/03/2021 MSCI USD 11,363,740 CAD 15,108,433 274,12412/02/2020 MSCI USD 1,264,206 CLP 968,330,000 6,73502/26/2021 MSCI USD 1,252,529 CLP 968,330,000 20,77202/03/2021 MSCI USD 680,000 COP 2,470,040,000 5,01802/16/2021 BOA USD 330,000 CZK 7,344,708 4,07602/16/2021 CITI USD 180,000 CZK 3,990,942 1,52902/16/2021 DB USD 290,000 CZK 6,338,417 (1,695)01/27/2021 DB USD 14,333,929 EUR 12,069,000 86,58401/27/2021 JPM USD 7,290,687 EUR 6,130,000 33,67701/13/2021 MSCI USD 6,081,241 GBP 4,701,000 190,04501/13/2021 BOA USD 380,000 HUF 115,173,858 2,98002/16/2021 JPM USD 1,069,416 IDR 15,910,771,000 46,83601/29/2021 MSCI USD 1,196,220 ILS 4,053,751 29,75901/22/2021 JPM USD 224,364 INR 16,646,720 (661)12/14/2020 BOA USD 1,977,685 JPY 206,000,000 (4,071)02/09/2021 BOA USD 3,060,000 JPY 320,535,171 14,16302/09/2021 MSCI USD 14,009,989 JPY 1,452,100,352 (83,303)02/19/2021 MSCI USD 1,829,558 KRW 2,023,930,420 (4,589)01/21/2021 BOA USD 420,000 MXN 8,786,941 12,49701/21/2021 CITI USD 320,000 MXN 6,823,206 15,84201/21/2021 GS USD 400,000 MXN 8,568,955 21,76801/21/2021 MSCI USD 728,069 MXN 15,518,237 35,74601/20/2021 JPM USD 3,010,000 NOK 27,738,751 108,90702/05/2021 JPM USD 5,470,649 NZD 8,140,000 237,606
Copyright © 2021 www.secdatabase.com. All Rights Reserved.Please Consider the Environment Before Printing This Document

GMO Multi-Sector Fixed Income Fund (formerly Core Plus Bond Fund)(A Series of GMO Trust)
Schedule of Investments �� (Continued)November 30, 2020 (Unaudited)
Swap Contracts
Centrally Cleared Interest Rate Swaps
Fund Pays Fund ReceivesNotionalAmount
ExpirationDate
PeriodicPayment
Frequency
PremiumsPaid/
(Received) ($) Value ($)
NetUnrealized
Appreciation/(Depreciation) ($)
3 Month AUD BBSW0.15% AUD 12,290,000
12/16/2022 Quarterly 1,511 12,436 10,925
3 Month AUD BBSW0.10% AUD 16,280,000
12/16/2022 Quarterly (871 ) 4,530 5,401
0.07%3 Month AUD BBSW AUD 19,300,000
12/16/2022 Quarterly � 2,417 2,417
(0.67)%6 Month CHF LIBOR CHF 15,000,000
12/16/2022 Semi-Annually 3,637 (11,577 ) (15,214 )
6 Month CHF LIBOR(0.72)% CHF 11,120,000
12/16/2022 Semi-Annually (106 ) (1,570 ) (1,464 )
0.18%3 Month NZD Bank Bill Rate NZD 98,530,000
12/16/2022 Quarterly 18,659 90,986 72,327
(0.05)%3 Month SEK STIBOR SEK 68,830,000
12/16/2022 Annually 617 1,019 402
3 Month SEK STIBOR(0.04)% SEK 72,100,000
12/16/2022 Quarterly 187 616 429
3 Month SEK STIBOR(0.03)% SEK 72,900,000
12/16/2022 Quarterly � 1,048 1,048
0.55%3 Month CAD LIBOR CAD 10,330,000
12/19/2022 Semi-Annually � 365 365
SettlementDate
Counter-party
CurrencySold
CurrencyPurchased
NetUnrealized
Appreciation(Depreciation) ($)
02/02/2021 MSCI USD 810,000 PEN 2,907,240 (3,688 )
12/03/2020 JPM USD 546,132 PHP 26,323,580 1,249
02/16/2021 MSCI USD 656,504 PLN 2,490,431 7,364
02/16/2021 BCLY USD 102,078 RUB 7,957,729 1,394
02/05/2021 BCLY USD 20,005,651 SEK 178,044,288 780,162
02/05/2021 JPM USD 1,490,000 SEK 13,403,256 74,766
01/15/2021 GS USD 310,000 SGD 420,930 3,865
01/15/2021 MSCI USD 310,000 SGD 420,062 3,218
01/15/2021 BOA USD 720,000 THB 22,482,410 23,074
02/16/2021 BCLY USD 1,800,000 TRY 14,349,060 (16,667 )
12/07/2020 JPM USD 1,264,801 TWD 36,443,980 11,951
02/02/2021 MSCI USD 422,391 TWD 11,953,664 (149 )
01/29/2021 DB USD 500,000 ZAR 8,218,053 26,717
01/29/2021 MSCI USD 1,284,819 ZAR 21,211,465 74,679
$ (171,431 )
Futures Contracts
Number ofContracts + Type
ExpirationDate
NotionalAmount
($)
Value/NetUnrealized
Appreciation(Depreciation)
($)Buys
21 U.S. Long Bond (CBT) March 2021 3,673,031 4,69974 U.S. Treasury Note 10
Yr. (CBT) March 2021 10,224,719 16,504410 U.S. Treasury Note 5
Yr. (CBT) March 2021 51,672,813 60,60883 U.S. Treasury Ultra 10
Yr. (CBT) March 2021 13,041,375 25,77497 U.S. Ultra Bond (CBT) March 2021 20,955,031 (74,992 )
$99,566,969 $ 32,593
+ Buys - Fund is long the futures contract.Sales - Fund is short the futures contract.
Copyright © 2021 www.secdatabase.com. All Rights Reserved.Please Consider the Environment Before Printing This Document

0.56%3 Month CAD LIBOR CAD 29,750,000
12/19/2022 Semi-Annually 3,747 (3,549 ) (7,296 )
0.55%3 Month CAD LIBOR CAD 6,450,000
12/19/2022 Semi-Annually � (71 ) (71 )
6 Month EURIBOR(0.48)% EUR 10,320,000
12/21/2022 Semi-Annually 1,753 9,714 7,961
6 Month GBP LIBOR0.08% GBP 46,790,000
12/21/2022 Semi-Annually 18,659 (11,350 ) (30,009 )
3 Month USD LIBOR0.24% USD 10,940,000
12/21/2022 Quarterly (4,354 ) 1,753 6,107
3 Month USD LIBOR0.23% USD 4,480,000
12/21/2022 Quarterly 27 (634 ) (661 )
0.87%6 Month AUD BBSW AUD 2,550,000
12/16/2030 Semi-Annually (2,003 ) 4,375 6,378
0.76%6 Month AUD BBSW AUD 3,380,000
12/16/2030 Semi-Annually 2,011 31,977 29,966
0.77%6 Month AUD BBSW AUD 660,000
12/16/2030 Semi-Annually � 5,676 5,676
0.88%6 Month AUD BBSW AUD 2,000,000
12/16/2030 Semi-Annually � 2,714 2,714
6 Month AUD BBSW0.79% AUD 7,660,000
12/16/2030 Semi-Annually 795 (59,284 ) (60,079 )
0.93%6 Month AUD BBSW AUD 2,430,000
12/16/2030 Semi-Annually � (5,851 ) (5,851 )
6 Month AUD BBSW0.89% AUD 4,030,000
12/16/2030 Semi-Annually � (266 ) (266 )
3 Month CAD LIBOR1.28% CAD 14,880,000
12/16/2030 Semi-Annually (4,066 ) 88,255 92,321
3 Month CAD LIBOR1.23% CAD 3,680,000
12/16/2030 Semi-Annually 4,101 8,142 4,041
3 Month CAD LIBOR1.20% CAD 32,350,000
12/16/2030 Semi-Annually (51,130 ) (602 ) 50,528
3 Month CAD LIBOR1.11% CAD 3,920,000
12/16/2030 Semi-Annually (1,119 ) (25,145 ) (24,026 )
3 Month CAD LIBOR1.09% CAD 6,780,000
12/16/2030 Semi-Annually � (54,080 ) (54,080 )
3 Month CAD LIBOR1.09% CAD 1,240,000
12/16/2030 Semi-Annually � (10,075 ) (10,075 )
3 Month CAD LIBOR1.11% CAD 2,430,000
12/16/2030 Semi-Annually � (16,310 ) (16,310 )
3 Month CAD LIBOR1.13% CAD 3,640,000
12/16/2030 Semi-Annually � (19,018 ) (19,018 )
3 Month CAD LIBOR1.15% CAD 920,000
12/16/2030 Semi-Annually � (3,438 ) (3,438 )
6 Month CHF LIBOR(0.26)% CHF 2,500,000
12/16/2030 Semi-Annually (3,627 ) 10,215 13,842
(0.32)%6 Month CHF LIBOR CHF 1,720,000
12/16/2030 Semi-Annually � 5,631 5,631
Copyright © 2021 www.secdatabase.com. All Rights Reserved.Please Consider the Environment Before Printing This Document

GMO Multi-Sector Fixed Income Fund (formerly Core Plus Bond Fund)(A Series of GMO Trust)
Schedule of Investments �� (Continued)November 30, 2020 (Unaudited)
Swap Contracts �� continued
Centrally Cleared Interest Rate Swaps �� continued
Fund Pays Fund ReceivesNotionalAmount
ExpirationDate
PeriodicPayment
Frequency
PremiumsPaid/
(Received) ($) Value ($)
NetUnrealized
Appreciation/(Depreciation) ($)
6 Month CHF LIBOR(0.30)% CHF 29,480,000
12/16/2030 Semi-Annually (20,762 ) (29,752 ) (8,990 )
(0.27)%6 Month CHF LIBOR CHF 4,990,000
12/16/2030 Semi-Annually � (14,739 ) (14,739 )
(0.29)%6 Month CHF LIBOR CHF 2,480,000
12/16/2030 Semi-Annually � (1,709 ) (1,709 )
0.59%3 Month NZD Bank Bill Rate NZD 20,780,000
12/16/2030 Quarterly (9,197 ) 424,376 433,573
0.85%3 Month NZD Bank Bill Rate NZD 1,790,000
12/16/2030 Quarterly � 4,939 4,939
3 Month NZD Bank Bill Rate0.55% NZD 10,900,000
12/16/2030 Quarterly 20,209 (246,391) (266,600 )
3 Month NZD Bank Bill Rate0.46% NZD 5,680,000
12/16/2030 Quarterly (2,867 ) (166,743) (163,876 )
3 Month NZD Bank Bill Rate0.48% NZD 9,000,000
12/16/2030 Quarterly 225 (251,930) (252,155 )
3 Month NZD Bank Bill Rate0.74% NZD 1,820,000
12/16/2030 Quarterly � (18,364 ) (18,364 )
3 Month NZD Bank Bill Rate0.81% NZD 1,790,000
12/16/2030 Quarterly 300 (9,822 ) (10,122 )
3 Month NZD Bank Bill Rate0.78% NZD 21,540,000
12/16/2030 Quarterly (38,884 ) (154,915) (116,031 )
3 Month NZD Bank Bill Rate0.82% NZD 13,470,000
12/16/2030 Quarterly (1,235 ) (56,916 ) (55,681 )
3 Month NZD Bank Bill Rate0.86% NZD 16,150,000
12/16/2030 Quarterly (2,023 ) (28,039 ) (26,016 )
3 Month SEK STIBOR0.34% SEK 131,230,000
12/16/2030 Quarterly (34,490 ) (15,795 ) 18,695
0.30%3 Month SEK STIBOR SEK 18,400,000
12/16/2030 Quarterly � 10,304 10,304
0.31%3 Month SEK STIBOR SEK 23,500,000
12/16/2030 Quarterly � 9,897 9,897
3 Month SEK STIBOR0.30% SEK 11,700,000
12/16/2030 Quarterly � (5,807 ) (5,807 )
0.37%3 Month SEK STIBOR SEK 23,000,000
12/16/2030 Quarterly 127 (5,214 ) (5,341 )
0.39%3 Month SEK STIBOR SEK 18,810,000
12/16/2030 Quarterly � (9,922 ) (9,922 )
0.39%3 Month SEK STIBOR SEK 14,800,000
12/16/2030 Quarterly � (7,636 ) (7,636 )
(0.18)%6 Month EURIBOR EUR 37,450,000
12/18/2030 Semi-Annually 26,479 (328,975) (355,454 )
(0.21)%6 Month EURIBOR EUR 24,050,000
12/18/2030 Semi-Annually (5,926 ) (137,468) (131,542 )
(0.18)%6 Month EURIBOR EUR 2,060,000
12/18/2030 Semi-Annually (6,515 ) (19,360 ) (12,845 )
0.45%6 Month GBP LIBOR GBP 10,740,000
12/18/2030 Semi-Annually (4,081 ) 41,442 45,523
0.36%6 Month GBP LIBOR GBP 1,370,000
12/18/2030 Semi-Annually (120 ) 21,633 21,753
6 Month GBP LIBOR0.54% GBP 2,560,000
12/18/2030 Semi-Annually 4,509 18,971 14,462
6 Month GBP LIBOR0.53% GBP 2,490,000
12/18/2030 Semi-Annually 3,648 16,140 12,492
0.70%3 Month USD LIBOR USD 6,960,000
12/18/2030 Quarterly 9,119 103,184 94,065
Copyright © 2021 www.secdatabase.com. All Rights Reserved.Please Consider the Environment Before Printing This Document

0.88%3 Month USD LIBOR USD 27,730,000
12/18/2030 Quarterly (102,086 ) (80,502 ) 21,584
3 Month USD LIBOR0.82% USD 2,590,000
12/18/2030 Quarterly (2,484 ) (7,956 ) (5,472 )
3 Month USD LIBOR0.75% USD 1,270,000
12/18/2030 Quarterly 315 (12,608 ) (12,923 )
0.86%3 Month USD LIBOR USD 1,530,000
12/18/2030 Quarterly � (995 ) (995 )
0.85%3 Month USD LIBOR USD 1,530,000
12/18/2030 Quarterly � (21 ) (21 )
0.85%3 Month USD LIBOR USD 3,150,000
12/18/2030 Quarterly � (198 ) (198 )
0.86%3 Month USD LIBOR USD 3,120,000
12/18/2030 Quarterly � (3,710 ) (3,710 )
0.88%3 Month USD LIBOR USD 3,370,000
12/18/2030 Quarterly � (8,958 ) (8,958 )
$ (177,311 ) $(914,510) $ (737,199 )
As of November 30, 2020, for the above contracts and/or agreements, the Fund had sufficient cash and/or securities to covercommitments or collateral requirements, if any, of the relevant broker or exchange.
Copyright © 2021 www.secdatabase.com. All Rights Reserved.Please Consider the Environment Before Printing This Document

GMO Multi-Sector Fixed Income Fund (formerly Core Plus Bond Fund)(A Series of GMO Trust)
Schedule of Investments �� (Continued)November 30, 2020 (Unaudited)
Notes to Schedule of Investments:� Denominated in U.S. Dollar, unless otherwise indicated.(a) All or a portion of this security has been pledged to cover margin
requirements on futures and/or cleared swap contracts, collateral on OTCswap contracts, forward currency contracts, and/or written options, if any.
(b) The rate disclosed is the 7 day net yield as of November 30, 2020.
The rates shown on variable rate notes are the current interest rates atNovember 30, 2020, which are subject to change based on the terms of thesecurity.
Portfolio Abbreviations:
144A - Securities exempt from registration under Rule 144A of the Securities Actof 1933. These securities may be resold in transactions exempt from registration,normally to qualified institutional investors.AUD BBSW - Bank Bill Swap Reference Rate denominated in Australian Dollar.CAD LIBOR - London Interbank Offered Rate denominated in Canadian Dollar.CHF LIBOR - London Interbank Offered Rate denominated in Swiss Franc.ETF- Exchange-Traded FundEURIBOR - Euro Interbank Offered RateGBP LIBOR - London Interbank Offered Rate denominated in British Pound.NZD Bank Bill Rate - Bank Bill Rate denominated in New Zealand Dollar.REIT - Real Estate Investment TrustSEK STIBOR - Stockholm Interbank Offered Rate denominated in SwedishKrona.TBA - To Be Announced - Delayed Delivery SecurityUSD LIBOR - London Interbank Offered Rate denominated in United StatesDollar.
Counterparty Abbreviations:
Currency Abbreviations:
BCLY - Barclays Bank PLCBOA - Bank of America, N.A.CITI - Citibank N.A.DB - Deutsche Bank AG
GS - Goldman Sachs InternationalJPM - JPMorgan Chase Bank, N.A.MSCI - Morgan Stanley & Co.International PLCSSB - State Street Bank and TrustCompany
AUD - Australian DollarBRL - Brazilian RealCAD - Canadian DollarCHF - Swiss FrancCLP - Chilean PesoCOP - Colombian PesoCZK - Czech KorunaEUR � EuroGBP - British PoundHUF - Hungarian ForintIDR - Indonesian RupiahILS - Israeli ShekelINR - Indian RupeeJPY - Japanese Yen
MXN - Mexican PesoNOK - Norwegian KroneNZD - New Zealand DollarPEN - Peruvian SolPHP - Philippine PesoPLN - Polish ZlotyRON - Romanian LeuRUB - Russian RubleSEK - Swedish KronaSGD - Singapore DollarTHB - Thai BahtTRY - Turkish LiraTWD - Taiwan DollarUSD - United States Dollar
Copyright © 2021 www.secdatabase.com. All Rights Reserved.Please Consider the Environment Before Printing This Document

KRW - South Korean Won ZAR - South African Rand
Copyright © 2021 www.secdatabase.com. All Rights Reserved.Please Consider the Environment Before Printing This Document

GMO Opportunistic Income Fund(A Series of GMO Trust)Schedule of Investments(showing percentage of total net assets)November 30, 2020 (Unaudited)
Par Value�� Description Value ($)DEBT OBLIGATIONS �� 85.1%
Asset-Backed Securities �� 83.6%Auto Retail Subprime �� 0.0%
77,526 CPS Auto Receivables Trust, Series 15-C, Class D,144A, 4.63%, due 08/16/21 77,649
CMBS Collateralized Debt Obligations �� 0.7%477,732 ARCap 2005-1 Resecuritization Trust,
Series 05-1A, Class A, 144A, 5.45%, due 12/21/42 473,5758,586,000 ARCap 2005-1 Resecuritization Trust,
Series 05-1A, Class B, 144A, 5.55%, due 12/21/42 3,477,330336,463 Capitalsource Real Estate Loan Trust,
Series 06-1A, Class B, 144A, Variable Rate, 3 mo.LIBOR + 0.39%, 0.66%, due 01/20/37 (a) 331,416
1,623,909 GS Mortgage Securities Corp., Series 06-CC1,Class A, 144A, Variable Rate, 5.33%, due 03/21/46 1,509,435Total CMBS Collateralized Debt Obligations 5,791,756
Collateralized Loan Obligations �� 15.8%3,753,372 ACIS CLO Ltd., Series 15-6A, Class A1, 144A,
Variable Rate, 3 mo. LIBOR + 1.59%,1.80%, due 05/01/27 3,753,879
1,905,000 Apex Credit CLO II Ltd., Series 15-2A, Class CR,144A, Variable Rate, 3 mo. LIBOR + 1.90%,2.12%, due 10/17/26 1,815,305
4,222,400 Catamaran CLO Ltd., Series 13-1A, Class CR,144A, Variable Rate, 3 mo. LIBOR + 1.80%,2.02%, due 01/27/28 4,096,138
6,093,000 Crestline Denali CLO XVI Ltd., Series 18-1A,Class A, 144A, Variable Rate, 3 mo. LIBOR +1.12%, 1.34%, due 01/20/30 6,043,957
4,161,000 ECP CLO Ltd., Series 18-1A, Class A1R, 144A,Variable Rate, 3 mo. LIBOR + 1.14%,1.36%, due 04/22/30 4,112,320
1,259,600 Garrison BSL CLO Ltd., Series 18-1A, Class B,144A, Variable Rate, 3 mo. LIBOR + 1.65%,1.87%, due 07/17/28 1,237,901
6,223,860 Garrison BSL CLO Ltd., Series 18-1A, Class A1,144A, Variable Rate, 3 mo. LIBOR + 0.97%,1.19%, due 07/17/28 6,198,044
2,316,435 Halcyon Loan Advisors Funding Ltd.,Series 12-1A, Class B, 144A, Variable Rate, 3 mo.LIBOR + 3.00%, 3.22%, due 08/15/23 2,318,263
5,778,692 Loomis Sayles CLO II Ltd., Series 15-2A,Class A1R, 144A, Variable Rate, 3 mo. LIBOR +0.90%, 1.14%, due 04/15/28 5,718,241
1,465,400 Madison Park Funding XII Ltd, Series 14-12A,Class CR, 144A, Variable Rate, 3 mo. LIBOR +2.35%, 2.57%, due 07/20/26 1,465,840
15,030,900 Mountain View CLO Ltd., Series 15-9A,Class A1R, 144A, Variable Rate, 3 mo. LIBOR +1.12%, 1.36%, due 07/15/31 14,814,891
3,906,000 Northwoods Capital XVII Ltd., Series 18-17A,Class A, 144A, Variable Rate, 3 mo. LIBOR +1.06%, 1.28%, due 04/22/31 3,850,785
Par Value�� Description Value ($)Asset-Backed Securities �� continuedCollateralized Loan Obligations �� continued
1,991,642 Saranac CLO III Ltd, Series 14-3A, Class ALR,144A, Variable Rate, 3 mo. LIBOR + 1.60%,1.83%, due 06/22/30 1,991,988
7,880,500 Saratoga Investment Corp. CLO Ltd., Series 13-1A,Class BR2, 144A, Variable Rate, 3 mo. LIBOR +2.30%, 2.52%, due 01/20/30 7,881,982
2,845,600 Shackleton CLO Ltd., Series 13-4RA, Class A1A,144A, Variable Rate, 3 mo. LIBOR + 1.00%,1.22%, due 04/13/31 2,807,184
11,974,000 Sound Point CLO II Ltd., Series 13-1A, Class A1R,144A, Variable Rate, 3 mo. LIBOR + 1.07%,1.28%, due 01/26/31 11,874,975
6,235,025 Sound Point CLO XIX Ltd., Series 18-1A, Class A,144A, Variable Rate, 3 mo. LIBOR + 1.00%,1.24%, due 04/15/31 6,159,687
4,993,200 Venture CLO Ltd., Series 18-32A, Class A1, 144A,Variable Rate, 3 mo. LIBOR + 1.10%,1.32%, due 07/18/31 4,943,073
2,932,000 Venture XII CLO Ltd., Series 12-12A, Class BRR,144A, Variable Rate, 3 mo. LIBOR + 1.20%,1.46%, due 02/28/26 2,870,707
1,568,784 Voya CLO Ltd., Series 14-3A, Class A2A, 144A,Variable Rate, 3 mo. LIBOR + 1.90%,2.11%, due 07/25/26 1,569,236
460,587 WhiteHorse IX Ltd, Series 14-9A, Class AR, 144A,Variable Rate, 3 mo. LIBOR + 1.16%,1.38%, due 07/17/26 459,970
7,746,900 Whitehorse XII Ltd., Series 18-12A, Class A,144A, Variable Rate, 3 mo. LIBOR + 1.25%,1.49%, due 10/15/31 7,705,439
6,750,000 Zais CLO 1 Ltd., Series 14-1A, Class A1BR, 144A,Variable Rate, 3 mo. LIBOR + 1.50%,1.74%, due 04/15/28 6,719,071
16,471,117 Zais CLO 1 Ltd., Series 14-1A, Class A1AR, 144A,Variable Rate, 3 mo. LIBOR + 1.15%,1.39%, due 04/15/28 16,394,246
3,250,000 Zais CLO 2 Ltd., Series 14-2A, Class A2R, 144A,Variable Rate, 3 mo. LIBOR + 1.85%,2.06%, due 07/25/26 3,233,350
1,855,001 Zais CLO 8 Ltd., Series 18-1A, Class A, 144A,Variable Rate, 3 mo. LIBOR + 0.95%,1.19%, due 04/15/29 1,832,975Total Collateralized Loan Obligations 131,869,447
Commercial Mortgage-Backed Securities �� 17.6%10,000,000 BAMLL Commercial Mortgage Securities Trust,
Series 19-BPR, Class ANM, 144A, 3.11%, due 11/05/32 10,226,197
8,448,000 Barclays Commercial Mortgage Trust,Series 18-CHRS, Class E, 144A, Variable Rate,4.41%, due 08/05/38 5,830,148
4,834,200 BBCMS Mortgage Trust, Series 17-C1, Class A4,3.67%, due 02/15/50 5,498,523
2,591,000 Benchmark Mortgage Trust, Series 20-B21,Class E, 144A, 2.00%, due 12/15/53 1,800,840
Copyright © 2021 www.secdatabase.com. All Rights Reserved.Please Consider the Environment Before Printing This Document

GMO Opportunistic Income Fund(A Series of GMO Trust)Schedule of Investments �� (Continued)(showing percentage of total net assets)November 30, 2020 (Unaudited)
Par Value�� Description Value ($)Asset-Backed Securities �� continuedCommercial Mortgage-Backed Securities �� continued
4,498,000 BX Trust, Series 19-OC11, Class A, 144A,3.20%, due 12/09/41 4,800,148
1,470,000 BX Trust, Series 19-OC11, Class C, 144A,3.86%, due 12/09/41 1,468,686
5,000,000 BX Trust, Series 19-OC11, Class E, 144A, VariableRate, 4.08%, due 12/09/41 4,604,400
5,000,000 CHT Mortgage Trust, Series 17-CSMO, Class A,144A, Variable Rate, 1 mo. LIBOR + 0.93%,1.07%, due 11/15/36 4,893,754
7,000,000 Commercial Mortgage Trust, Series 15-CR24,Class A5, 3.70%, due 08/10/48 7,800,325
6,334,436 Commercial Mortgage Trust, Series 15-CR25,Class A4, 3.76%, due 08/10/48 7,060,358
224,689 Credit Suisse First Boston Mortgage SecuritiesCorp., Series 05-C2, Class AMFL, Variable Rate,1 mo. LIBOR + 0.25%, 0.39%, due 04/15/37 213,508
177,519 Credit Suisse First Boston Mortgage SecuritiesCorp., Series 05-C2, Class AMFX, 4.88%, due 04/15/37 175,744
6,372,761 CSAIL Commercial Mortgage Trust, Series 15-C3,Class A4, 3.72%, due 08/15/48 7,047,204
6,749,037 CSAIL Commercial Mortgage Trust, Series 16-C5,Class A5, 3.76%, due 11/15/48 7,506,320
10,000,000 Great Wolf Trust, Series 19-WOLF, Class A, 144A,Variable Rate, 1 mo. LIBOR + 1.03%,1.18%, due 12/15/36 9,687,353
4,454,370 GS Mortgage Securities Trust, Series 15-GC32,Class A4, 3.76%, due 07/10/48 4,944,790
2,822,831 GS Mortgage Securities Trust, Series 15-GC34,Class A4, 3.51%, due 10/10/48 3,112,220
5,618,916 GS Mortgage Securities Trust, Series 15-GS1,Class A3, 3.73%, due 11/10/48 6,243,112
276,240 JP Morgan Chase Commercial Mortgage SecuritiesTrust, Series 15-JP1, Class A5, 3.91%, due 01/15/49 313,440
805,930 JPMBB Commercial Mortgage Securities Trust,Series 15-C32, Class A5, 3.60%, due 11/15/48 895,160
1,326,589 LB-UBS Commercial Mortgage Trust, Series 04-C6,Class K, 144A, Variable Rate, 6.52%, due 08/15/36 1,363,548
1,500,000 Manhattan West, Series 20-1MW, Class C, 144A,Variable Rate, 2.41%, due 09/10/39 1,516,134
500,000 Manhattan West, Series 20-1MW, Class D, 144A,Variable Rate, 2.41%, due 09/10/39 485,444
3,302,338 Merrill Lynch Mortgage Investors Trust,Series 98-C1, Class F, Variable Rate, 6.25%, due 11/15/26 3,367,314
4,213,000 MKT Mortgage Trust, Series 20-525M, Class E,144A, Variable Rate, 3.04%, due 02/12/40 3,967,707
2,505,000 MKT Mortgage Trust, Series 20-525M, Class F,144A, Variable Rate, 3.04%, due 02/12/40 2,277,247
3,710,000 Morgan Stanley Bank of America Merrill LynchTrust, Series 13-C10, Class A4, Variable Rate,4.22%, due 07/15/46 3,965,458
1,201,206 Morgan Stanley Dean Witter Capital I Trust,Series 01-TOP3, Class F, 144A, Variable Rate,8.09%, due 07/15/33 1,111,740
Par Value�� Description Value ($)Asset-Backed Securities �� continuedCommercial Mortgage-Backed Securities �� continued
10,135,000 Union Station District of Columbia, Series2018-USDC, Class E, 144A, Variable Rate,4.64%, due 05/13/38 8,299,713
2,550,000 WaMu Commercial Mortgage Securities Trust,Series 06-SL1, Class E, 144A, Variable Rate,2.53%, due 11/23/43 2,533,829
8,270,894 WaMu Commercial Mortgage Securities Trust,Series 07-SL3, Class G, 144A, Variable Rate,3.39%, due 03/23/45 8,322,199
8,563,000 Wells Fargo Commercial Mortgage Trust,Series 13-BTC, Class F, 144A, Variable Rate,3.67%, due 04/16/35 7,789,142
1,717,000 Wells Fargo Commercial Mortgage Trust,Series 13-BTC, Class D, 144A, Variable Rate,3.67%, due 04/16/35 1,631,213
960,073 Wells Fargo Commercial Mortgage Trust,Series 15-NXS1, Class A5, 3.15%, due 05/15/48 1,043,263
4,392,094 Wells Fargo Commercial Mortgage Trust,Series 16-C32, Class A4, 3.56%, due 01/15/59 4,856,636Total Commercial Mortgage-Backed Securities 146,652,817
Residential Mortgage-Backed Securities ��Other �� 10.3%
913,513 ACE Securities Corp. Home Equity Loan Trust,Series 06-ASL1, Class A, Variable Rate, 1 mo.LIBOR + 0.28%, 0.43%, due 02/25/36 252,524
19,056,800 American Home Mortgage Investment Trust, Series06-2, Class 4A, Variable Rate, 1 mo. LIBOR +0.36%, 0.51%, due 02/25/36 1,461,367
13,743,281 BankAmerica Manufactured Housing ContractTrust, Series 98-1, Class B2, Variable Rate,8.00%, due 08/10/25 7,466,686
5,003,137 BCMSC Trust, Series 99-A, Class M1, VariableRate, 6.79%, due 03/15/29 4,651,874
8,834,023 BCMSC Trust, Series 99-B, Class A4, VariableRate, 7.30%, due 12/15/29 2,159,553
2,928,137 BCMSC Trust, Series 00-A, Class A4, VariableRate, 8.29%, due 06/15/30 926,105
437,898 Bear Stearns Mortgage Funding Trust,Series 07-SL2, Class 1A, Variable Rate, 1 mo.LIBOR + 0.32%, 0.47%, due 02/25/37 397,456
2,633,402 Conseco Finance Corp., Series 97-5, Class B1,Variable Rate, 6.97%, due 05/15/29 2,590,508
5,184,940 Conseco Finance Securitizations Corp., Series 01-3,Class M1, Variable Rate, 7.15%, due 05/01/33 5,051,763
4,955,693 Conseco Financial Corp., Series 97-6, Class M1,Variable Rate, 7.21%, due 01/15/29 5,057,425
2,998,906 Conseco Financial Corp., Series 98-6, Class M1,Variable Rate, 6.63%, due 06/01/30 2,926,520
8,041,369 Countrywide Home Equity Loan Trust, Series 07-E,Class A, FSA, Variable Rate, 1 mo. LIBOR +0.15%, 0.29%, due 06/15/37 7,701,233
322,470 GMACM Home Equity Loan Trust, Series 04-HE3,Class A3, FSA, Variable Rate, 1 mo. LIBOR +0.50%, 0.65%, due 10/25/34 304,336
Copyright © 2021 www.secdatabase.com. All Rights Reserved.Please Consider the Environment Before Printing This Document

GMO Opportunistic Income Fund(A Series of GMO Trust)Schedule of Investments �� (Continued)(showing percentage of total net assets)November 30, 2020 (Unaudited)
Par Value�� Description Value ($)Asset-Backed Securities �� continuedResidential Mortgage-Backed Securities ��Other �� continued
6,108,397 GMACM Home Equity Loan Trust, Series 07-HE3,Class 2A1, Variable Rate, 7.00%, due 09/25/37 6,138,535
4,550,496 Home Equity Loan Trust, Series 05-HS1,Class AI4, Step Up, 5.61%, due 09/25/35 903,075
29,942,942 Home Equity Mortgage Loan Asset-Backed Trust,Series 06-A, Class A, Variable Rate, 1 mo.LIBOR + 0.26%, 0.41%, due 06/25/36 2,058,487
12,441,870 Home Loan Trust, Series 06-HI4, Class A4, StepUp, 5.72%, due 09/25/36 8,155,487
11,901,546 Home Loan Trust, Series 07-HI1, Class A4, StepUp, due 03/25/37 4,824,123
3,932,267 Master Second Lien Trust, Series 06-1, Class A,Variable Rate, 1 mo. LIBOR + 0.32%,0.47%, due 03/25/36 526,024
427,129 Mellon Re-REMIC Pass-Through Trust,Series 04-TBC1, Class A, 144A, Variable Rate,1 mo. LIBOR + 0.25%, 0.39%, due 02/26/34 364,203
13,990,947 New Century Home Equity Loan Trust,Series 06-S1, Class A2A, Variable Rate, 1 mo.LIBOR + 0.20%, 0.35%, due 03/25/36 832,295
7,980,723 New Century Home Equity Loan Trust,Series 06-S1, Class A1, Variable Rate, 1 mo.LIBOR + 0.34%, 0.49%, due 03/25/36 477,167
21,277,486 New Century Home Equity Loan Trust,Series 06-S1, Class A2B, Variable Rate, 1 mo.LIBOR + 0.40%, 0.55%, due 03/25/36 1,272,004
473,691 Nomura Asset Acceptance Corp. Alternative LoanTrust, Series 05-S3, Class M1, Variable Rate, 1 mo.LIBOR + 0.90%, 1.05%, due 08/25/35 746,034
6,016,300 Oakwood Mortgage Investors, Inc., Series 99-C,Class A2, 7.48%, due 08/15/27 5,692,807
1,572,857 Oakwood Mortgage Investors, Inc., Series 98-A,Class B1, Variable Rate, 7.50%, due 05/15/28 1,616,105
1,879,162 Oakwood Mortgage Investors, Inc., Series 98-D,Class M1, 144A, 7.42%, due 01/15/29 1,931,220
4,632,451 Oakwood Mortgage Investors, Inc., Series 99-E,Class A1, Variable Rate, 7.61%, due 03/15/30 3,855,548
10,463,135 Oakwood Mortgage Investors, Inc., Series 00-D,Class A4, Variable Rate, 7.40%, due 07/15/30 3,888,063
1,125,259 Oakwood Mortgage Investors, Inc., Series 01-D,Class A4, Variable Rate, 6.93%, due 09/15/31 911,334
728,767 Oakwood Mortgage Investors, Inc., Series 01-E,Class A3, 5.69%, due 12/15/31 728,212Total Residential Mortgage-BackedSecurities � Other 85,868,073
Residential Mortgage-Backed Securities ��Prime �� 7.1%
9,627,171 American Home Mortgage Assets Trust, Series06-4, Class 1A12, Variable Rate, 1 mo. LIBOR +0.21%, 0.36%, due 10/25/46 6,406,228
1,087,566 Bear Stearns ARM Trust, Series 05-6, Class 3A1,Variable Rate, 3.09%, due 08/25/35 1,082,333
Par Value�� Description Value ($)Asset-Backed Securities �� continuedResidential Mortgage-Backed Securities ��Prime �� continued
905,937 Bear Stearns ARM Trust, Series 05-9, Class A1,Variable Rate, U.S. Treasury Yield 1 Year CMT +2.30%, 2.41%, due 10/25/35 920,928
607,837 Citigroup Mortgage Loan Trust, Series 05-3,Class 2A2, Variable Rate, 3.15%, due 08/25/35 649,518
5,245,811 CSMC Mortgage-Backed Trust, Series 07-4,Class 2A1, 6.00%, due 06/25/37 4,216,267
2,032,829 IndyMac INDA Mortgage Loan Trust,Series 06-AR3, Class 1A1, Variable Rate,3.19%, due 12/25/36 1,858,122
1,470,039 IndyMac INDA Mortgage Loan Trust,Series 07-AR1, Class 1A1, Variable Rate,3.63%, due 03/25/37 1,417,487
10,569,553 IndyMac INDX Mortgage Loan Trust,Series 06-AR2, Class 1A1A, Variable Rate, 1 mo.LIBOR + 0.44%, 0.59%, due 04/25/46 9,754,452
1,964,035 Morgan Stanley Mortgage Loan Trust, Series 06-2,Class 6A, 6.50%, due 02/25/36 1,482,779
3,092,884 RBSSP Resecuritization Trust, Series 09-6,Class 12A4, 144A, Variable Rate, 5.50%, due 05/26/35 3,085,684
1,138,711 RFMSI Trust, Series 05-SA4, Class 2A2, VariableRate, 3.39%, due 09/25/35 1,108,614
934,664 RFMSI Trust, Series 06-S6, Class A12,6.00%, due 07/25/36 932,317
302,599 RFMSI Trust, Series 06-S6, Class A9,6.00%, due 07/25/36 301,839
7,094,871 Structured Adjustable Rate Mortgage Loan Trust,Series 05-9, Class 2A2A, Variable Rate, 12 MTA+1.40%, 2.14%, due 05/25/35 5,955,673
1,302,790 WaMu Mortgage Pass-Through Certificates,Series 05-AR10, Class 1A3, Variable Rate,3.04%, due 09/25/35 1,392,413
1,457,238 WaMu Mortgage Pass-Through Certificates,Series 06-AR19, Class 2A, Variable Rate, COFI +1.25%, 1.77%, due 01/25/47 1,398,560
3,396,095 Washington Mutual Mortgage Pass-ThroughCertificates, Series 05-4, Class CB3, Variable Rate, 1mo. LIBOR + 0.45%, 0.60%, due 06/25/35 2,789,472
14,400,284 Washington Mutual Mortgage Pass-ThroughCertificates, Series 07-5, Class A6, 6.00%, due 06/25/37 14,845,191Total Residential Mortgage-BackedSecurities � Prime 59,597,877
Residential Mortgage-Backed Securities ��Subprime �� 2.5%
1,788,863 Asset Backed Funding Certificates, Series 05-AQ1,Class A5, Step Up, 4.62%, due 06/25/35 1,886,070
2,578,393 BCAP LLC, Series 14-RR2, Class 11A3, 144A,Variable Rate, 0.31%, due 05/26/37 2,469,498
1,723,153 Bear Stearns Asset Backed Securities I Trust,Series 05-TC2, Class M3, Variable Rate, 1 mo.LIBOR + 1.08%, 1.23%, due 08/25/35 1,723,039
Copyright © 2021 www.secdatabase.com. All Rights Reserved.Please Consider the Environment Before Printing This Document

GMO Opportunistic Income Fund(A Series of GMO Trust)Schedule of Investments �� (Continued)(showing percentage of total net assets)November 30, 2020 (Unaudited)
Par Value�� Description Value ($)Asset-Backed Securities �� continuedResidential Mortgage-BackedSecurities ��Subprime �� continued
3,296,075 Bear Stearns Asset Backed Securities I Trust,Series 05-TC2, Class M4, Variable Rate, 1 mo.LIBOR + 1.88%, 2.03%, due 08/25/35 3,327,416
1,897,320 Bear Stearns Asset-Backed Securities, Inc.,Series 07-AQ1, Class A1, Variable Rate, 1 mo.LIBOR + 0.11%, 0.26%, due 04/25/31 (b) 4,694,728
3,822,018 Bravo Mortgage Asset Trust, Series 06-1A,Class M1,144A, Variable Rate, 1 mo. LIBOR +0.40%, 0.55%, due 07/25/36 3,493,993
1,453,055 CHL Mortgage Pass-Through Trust,Series 04-HYB6, Class A2, Variable Rate,2.74%, due 11/20/34 1,481,049
1,550,144 GSAA Trust, Series 05-1, Class M1, Step Up,5.30%, due 11/25/34 1,582,650Total Residential Mortgage-Backed Securities �Subprime 20,658,443
Residential Mortgage-Backed Securities ��Alt-A �� 1.1%
696,136 Alternative Loan Trust, Series 04-J11, Class 1CB1,5.50%, due 11/25/34 733,607
1,980,595 Alternative Loan Trust, Series 06-7CB, Class 1A1,Variable Rate, 1 mo. LIBOR + 0.70%,0.85%, due 05/25/36 871,059
2,017,045 Alternative Loan Trust, Series 06-28CB, Class A1,Variable Rate, 1 mo. LIBOR + 0.70%,0.85%, due 10/25/36 816,294
2,916,345 Bear Stearns Asset Backed Securities I Trust,Series 04-AC5, Class A1, Step Up, 5.75%, due 10/25/34 2,981,007
4,660,043 Citigroup Mortgage Loan Trust, Inc.,Series 06-AR5, Class 2A2A, Variable Rate,3.11%, due 07/25/36 3,155,635
836,968 JP Morgan Resecuritization Trust, Series 09-10,Class 7A1, 144A, Variable Rate, 6.05%, due 02/26/37 845,865Total Residential Mortgage-BackedSecurities � Alt-A 9,403,467
Small Balance Commercial Mortgages �� 8.1%411,303 Bayview Commercial Asset Trust, Series 04-1,
Class M1, 144A, Variable Rate, 1 mo. LIBOR +0.84%, 0.99%, due 04/25/34 409,490
372,497 Bayview Commercial Asset Trust, Series 04-1,Class M2, 144A, Variable Rate, 1 mo. LIBOR +1.80%, 1.95%, due 04/25/34 371,553
413,984 Bayview Commercial Asset Trust, Series 04-1,Class B, 144A, Variable Rate, 1 mo. LIBOR +2.85%, 3.00%, due 04/25/34 413,450
4,480,486 Bayview Commercial Asset Trust, Series 05-2A,Class A1, 144A, Variable Rate, 1 mo. LIBOR +0.31%, 0.46%, due 08/25/35 4,186,336
2,252,296 Bayview Commercial Asset Trust, Series 05-4A,Class A2, 144A, Variable Rate, 1 mo. LIBOR +0.39%, 0.54%, due 01/25/36 2,121,706
Par Value�� Description Value ($)Asset-Backed Securities �� continuedSmall Balance Commercial Mortgages �� continued
1,217,759 Bayview Commercial Asset Trust, Series 06-1A,Class M1, 144A, Variable Rate, 1 mo. LIBOR +0.38%, 0.53%, due 04/25/36 1,100,328
1,791,977 Bayview Commercial Asset Trust, Series 06-2A,Class A1, 144A, Variable Rate, 1 mo. LIBOR +0.23%, 0.38%, due 07/25/36 1,664,974
3,665,511 Bayview Commercial Asset Trust, Series 06-2A,Class A2, 144A, Variable Rate, 1 mo. LIBOR +0.28%, 0.43%, due 07/25/36 3,415,384
4,543,528 Bayview Commercial Asset Trust, Series 06-3A,Class A1, 144A, Variable Rate, 1 mo. LIBOR +0.25%, 0.40%, due 10/25/36 4,225,345
2,388,293 Bayview Commercial Asset Trust, Series 07-1,Class A1, 144A, Variable Rate, 1 mo. LIBOR +0.22%, 0.37%, due 03/25/37 2,223,735
1,938,479 Bayview Commercial Asset Trust, Series 07-3,Class A1, 144A, Variable Rate, 1 mo. LIBOR +0.24%, 0.39%, due 07/25/37 1,815,859
7,878,113 Bayview Commercial Asset Trust, Series 07-2A,Class A1, 144A, Variable Rate, 1 mo. LIBOR +0.27%, 0.42%, due 07/25/37 7,299,193
947,507 Bayview Commercial Asset Trust, Series 07-6A,Class A3B, 144A, Variable Rate, 1 mo. LIBOR +0.85%, 1.00%, due 12/25/37 944,162
8,108,856 Bayview Commercial Asset Trust, Series 07-6A,Class A3A, 144A, Variable Rate, 1 mo. LIBOR +1.25%, 1.40%, due 12/25/37 8,107,900
2,326,758 Hana SBL Loan Trust, Series 19-1, Class A, 144A,Variable Rate, 1 mo. LIBOR + 2.00%, 2.15%, due 08/25/45 2,245,643
4,300,000 Lehman Brothers Small Balance Commercial,Series 07-2A, Class M1, 144A, Variable Rate, 1 mo.LIBOR + 0.40%, 0.55%, due 06/25/37 4,073,218
908,296 Lehman Brothers Small Balance CommercialMortgage Trust, Series 05-1A, Class M1,144A,Variable Rate, 1 mo. LIBOR + 0.35%, 0.50%, due 02/25/30 903,310
989,266 Lehman Brothers Small Balance CommercialMortgage Trust, Series 05-1A, Class M2,144A,Variable Rate, 1 mo. LIBOR + 0.55%, 0.70%, due 02/25/30 983,208
2,467,604 Lehman Brothers Small Balance CommercialMortgage Trust, Series 05-2A, Class B, 144A,Variable Rate, 1 mo. LIBOR + 1.00%, 1.15%, due 09/25/30 2,373,109
4,069,989 Lehman Brothers Small Balance CommercialMortgage Trust, Series 06-1A, Class M3, 144A,Variable Rate, 1 mo. LIBOR + 0.53%, 0.68%, due 04/25/31 4,002,033
2,022,599 Lehman Brothers Small Balance CommercialMortgage Trust, Series 06-1A, Class B, 144A,Variable Rate, 1 mo. LIBOR + 1.00%, 1.15%, due 04/25/31 1,903,769
1,120,306 Lehman Brothers Small Balance CommercialMortgage Trust, Series 06-2A, Class M2, 144A,Variable Rate, 1 mo. LIBOR + 0.39%, 0.54%, due 09/25/36 1,097,329
Copyright © 2021 www.secdatabase.com. All Rights Reserved.Please Consider the Environment Before Printing This Document

GMO Opportunistic Income Fund(A Series of GMO Trust)Schedule of Investments �� (Continued)(showing percentage of total net assets)November 30, 2020 (Unaudited)
Par Value�� Description Value ($)Asset-Backed Securities �� continuedSmall Balance Commercial Mortgages �� continued
5,257,410 Lehman Brothers Small Balance CommercialMortgage Trust, Series 07-3A, Class AJ, 144A,Variable Rate, 5.73%, due 10/25/37 5,311,263
3,273,722 WaMu Commercial Mortgage Securities Trust,Series 07-SL2, Class D, 144A, Variable Rate,3.31%, due 12/27/49 3,259,846
3,176,664 WaMu Commercial Mortgage Securities Trust,Series 07-SL2, Class E, 144A, Variable Rate,3.47%, due 12/27/49 3,118,448Total Small Balance Commercial Mortgages 67,570,591
Student Loans �� Federal Family Education LoanProgram �� 5.5%
4,512,866 AccessLex Institute, Series 04-2, Class A3,Variable Rate, 3 mo. LIBOR + 0.19%,0.40%, due 10/25/24 4,427,223
9,851,497 AccessLex Institute, Series 04-2, Class B, VariableRate, 3 mo. LIBOR + 0.70%, 0.91%, due 01/25/43 8,417,203
10,698,288 AccessLex Institute, Series 07-1, Class A4,Variable Rate, 3 mo. LIBOR + 0.06%,0.27%, due 01/25/23 10,520,924
4,040,551 Collegiate Funding Services Education Loan Trust,Series 05-B, Class B, Variable Rate, 3 mo. LIBOR+ 0.32%, 0.55%, due 03/28/35 (a) 3,446,336
7,479,317 SLC Student Loan Trust, Series 08-2, Class A4,Variable Rate, 3 mo. LIBOR + 0.90%,1.15%, due 06/15/21 7,252,638
11,664,895 SLM Student Loan Trust, Series 08-4, Class A4,Variable Rate, 3 mo. LIBOR + 1.65%,1.86%, due 07/25/22 11,617,702Total Student Loans � Federal Family EducationLoan Program 45,682,026
Student Loans �� Private �� 14.9%3,486,382 AccessLex Institute, Series 05-A, Class B, Variable
Rate, 3 mo. LIBOR + 0.80%, 1.01%, due 07/25/34 3,327,8062,633,376 KeyCorp Student Loan Trust, Series 05-A,
Class 2B, Variable Rate, 3 mo. LIBOR + 0.73%,0.96%, due 09/27/38 2,611,086
18,343,760 KeyCorp Student Loan Trust, Series 06-A,Class 2B, Variable Rate, 3 mo. LIBOR + 0.48%,0.71%, due 12/27/41 18,016,225
2,332,854 KeyCorp Student Loan Trust, Series 04-A,Class 2C, Variable Rate, 3 mo. LIBOR + 0.80%,1.02%, due 04/28/42 2,295,024
5,622,500 KeyCorp Student Loan Trust, Series 04-A,Class 2D, Variable Rate, 3 mo. LIBOR + 1.25%,1.47%, due 07/28/42 4,842,314
1,166,164 L2L Education Loan Trust, Series 06-1A, Class B,144A, Variable Rate, 1 mo. LIBOR + 0.50%,0.64%, due 10/15/28 1,140,829
8,775,000 National Collegiate Commutation Trust,Series 07-3, Class A3R4, 144A, Variable Rate,7-DayAuc + 0.00%, due 03/31/38 (b) 2,632,500
Par Value�� Description Value ($)Asset-Backed Securities �� continuedStudent Loans �� Private �� continued
7,625,000 National Collegiate II Commutation Trust,Series 07-4, Class A3R7, Variable Rate, 28-DayAuct+ 0.00%, due 03/25/38 (b) 2,173,125
3,275,000 National Collegiate II Commutation Trust,Series 07-4, Class A3R6, Variable Rate, 28-DayAuct+ 0.00%, due 03/25/38 (b) 933,375
2,890,310 National Collegiate Student Loan Trust, Series 05-3,Class A51, Variable Rate, 1 mo. LIBOR + 0.38%,0.53%, due 10/25/33 2,796,478
8,260,955 National Collegiate Student Loan Trust, Series 06-4,Class A4, Variable Rate, 1 mo. LIBOR + 0.31%,0.46%, due 05/25/32 7,885,121
5,426,313 National Collegiate Student Loan Trust, Series 07-2,Class A4, Variable Rate, 1 mo. LIBOR + 0.29%,0.44%, due 01/25/33 5,054,123
5,618,733 National Collegiate Student Loan Trust, Series 06-1,Class A5, Variable Rate, 1 mo. LIBOR + 0.35%,0.50%, due 03/25/33 5,341,924
8,843,105 National Collegiate Student Loan Trust, Series 05-2,Class A51, Variable Rate, 1 mo. LIBOR + 0.37%,0.52%, due 06/25/33 8,482,948
13,352,989 National Collegiate Student Loan Trust, Series 07-1,Class A4, Variable Rate, 1 mo. LIBOR + 0.31%,0.45%, due 10/25/33 12,377,529
3,256,000 National Collegiate Student Loan Trust, Series 04-2,Class B, Variable Rate, 1 mo. LIBOR + 0.54%,0.69%, due 12/26/33 3,013,493
75,000 National Collegiate Student Loan Trust, Series 07-4,Class A3A7, Variable Rate, 28-DayAuct +0.00%, due 03/25/38 (a) 60,000
25,000 National Collegiate Student Loan Trust, Series 07-3,Class A3A4, Variable Rate, 28-DayAuct +0.00%, due 03/25/38 (a) 20,000
6,156,000 SLM Private Credit Student Loan Trust, Series 03-A,Class A3, Variable Rate, 28-DayAuct +0.00%, due 06/15/32 (b) 6,112,908
3,150,000 SLM Private Credit Student Loan Trust, Series 03-C,Class A3, Variable Rate, 28-DayAuct +0.00%, due 09/15/32 (b) 3,127,950
5,400,350 SLM Private Credit Student Loan Trust, Series 03-C,Class C, Variable Rate, 3 mo. LIBOR + 1.60%,1.85%, due 09/15/32 1,612,734
9,000,000 SLM Private Credit Student Loan Trust, Series 04-B,Class A4, Variable Rate, 3 mo. LIBOR + 0.43%,0.68%, due 09/15/33 8,569,687
1,848,044 SLM Private Credit Student Loan Trust, Series 05-A,Class B, Variable Rate, 3 mo. LIBOR + 0.28%,0.53%, due 12/15/38 1,840,449
4,272,619 SLM Private Credit Student Loan Trust, Series 06-A,Class A5, Variable Rate, 3 mo. LIBOR + 0.29%,0.54%, due 06/15/39 4,095,417
3,124,231 SLM Private Credit Student Loan Trust, Series 05-B,Class A4, Variable Rate, 3 mo. LIBOR + 0.33%,0.58%, due 06/15/39 2,981,291
2,672,291 SLM Private Credit Student Loan Trust, Series 06-C,Class C, Variable Rate, 3 mo. LIBOR + 0.39%,0.64%, due 12/15/39 2,209,260
Copyright © 2021 www.secdatabase.com. All Rights Reserved.Please Consider the Environment Before Printing This Document

GMO Opportunistic Income Fund(A Series of GMO Trust)Schedule of Investments �� (Continued)(showing percentage of total net assets)November 30, 2020 (Unaudited)
PURCHASED OPTIONS �� 0.1%
Description CounterpartyExercise
RateExpiration
Date
Principal/NotionalAmount
Floating RateIndex
Pay/ReceiveFloating Rate Value ($)
Option on Credit Default Swaps �� Calls �� 0.1%CDX.NA.IGS.35.V1-5Y MSCI 55.00% 01/20/21 USD 65,527,000 Fixed Spread Receive 211,976Option on Credit Default Swaps �� Puts �� 0.0%CDX.NA.HYS.35.V1-5Y GS 106.50% 02/17/21 USD 11,825,000 Fixed Spread Pay 116,033
TOTAL PURCHASED OPTIONS(COST $389,773) 328,009
TOTAL INVESTMENTS �� 96.2%(Cost $830,572,766) 801,398,645Other Assets and Liabilities (net) � 3.8% 31,943,046
Par Value�� /Shares Description Value ($)
Asset-Backed Securities �� continuedStudent Loans �� Private �� continued
3,790,787 South Carolina Student Loan Corp., Series 15-A,Class A, Variable Rate, 1 mo. LIBOR + 1.50%,1.65%, due 01/25/36 3,801,105
6,989,400 Towd Point Asset Trust, Series 18-SL1, Class B,144A, Variable Rate, 1 mo. LIBOR + 1.05%,1.20%, due 01/25/46 6,512,437Total Student Loans � Private 123,867,138Total Asset-Backed Securities 697,039,284
U.S. Government �� 0.2%1,586,000 U.S. Treasury Note, Variable Rate, USBM +
0.12%, 0.20%, due 01/31/21 (c) 1,586,332
U.S. Government Agency �� 1.3%4,443,750 Agency for International Development Floater
(Support of Morocco), Variable Rate, 6 mo.LIBOR � 0.02%, 0.23%, due 02/01/25 (b) 4,326,688
4,500,000 Agency for International Development Floater(Support of Morocco), Variable Rate, 6 mo.LIBOR + 0.15%, 0.40%, due 10/29/26 (b) 4,351,193
2,115,000 Agency for International Development Floater(Support of Tunisia), Variable Rate, 6 mo.LIBOR + 0.00%, 0.25%, due 07/01/23 (b) 2,080,851Total U.S. Government Agency 10,758,732
TOTAL DEBT OBLIGATIONS(COST $738,501,540) 709,384,348
MUTUAL FUNDS �� 1.3%
United States �� 1.3%Affiliated Issuers �� 1.3%
2,183,242 GMO U.S. Treasury Fund 11,003,541
TOTAL MUTUAL FUNDS(COST $11,003,541) 11,003,541
Shares /Par Value�� Description Value ($)
SHORT-TERM INVESTMENTS �� 9.7%
Money Market Funds �� 0.8%6,698,595 State Street Institutional Treasury Money Market
Fund � Premier Class, 0.01% (d) 6,698,595
U.S. Government �� 8.9%34,000,000 U.S. Treasury Bill, 0.08%, due 02/04/21 (e) 33,995,07835,000,000 U.S. Treasury Bill, 0.09%, due 03/18/21 (e) 34,990,8985,000,000 U.S. Treasury Bill, 0.09%, due 04/22/21 (e) 4,998,176
Total U.S. Government 73,984,152
TOTAL SHORT-TERM INVESTMENTS(COST $80,677,912) 80,682,747
Copyright © 2021 www.secdatabase.com. All Rights Reserved.Please Consider the Environment Before Printing This Document

TOTAL NET ASSETS �� 100.0% $833,341,691
Copyright © 2021 www.secdatabase.com. All Rights Reserved.Please Consider the Environment Before Printing This Document

GMO Opportunistic Income Fund(A Series of GMO Trust)
Schedule of Investments �� (Continued)November 30, 2020 (Unaudited)
A summary of outstanding financial instruments at November 30, 2020 is as follows:
Written Options
Description CounterpartyExercise
RateExpiration
Date
Principal/NotionalAmount
FloatingRate Index
Pay/ReceiveFloating Rate Value ($)
Written Options on Credit Default Swaps �� PutsITRAXX.XOVERS.33.V3-5Y DB 500.00% 12/16/20 EUR 9,800,000 Fixed Spread Pay (2,611 )CDX.NA.IGS.35.V1-5Y GS 60.00% 12/16/20 USD 59,146,500 Fixed Spread Pay (17,232 )CDX.NA.IGS.35.V1-5Y MSCI 80.00% 01/20/21 USD 65,527,000 Fixed Spread Pay (31,648 )CDX.NA.HYS.35.V1-5Y GS 100.00% 02/17/21 USD 23,649,000 Fixed Spread Pay (73,990 )
TOTAL WRITTEN OPTIONS ON CREDIT DEFAULT SWAPS � PUTS(Premiums $542,866) $(125,481)
Swap Contracts
Centrally Cleared Credit Default Swaps
Reference EntityNotionalAmount
AnnualPremium
ImpliedCredit
Spread (1)
MaximumPotential
Amount ofFuture
Payments bythe FundUnder the
Contract (2)Expiration
Date
PeriodicPayment
Frequency
PremiumsPaid/
(Received) ($) Value ($)
Net UnrealizedAppreciation/
(Depreciation) ($)Buy Protection^:ITRAXX.XOVERS.30.V3-5Y
EUR 21,745,573 5.00% 1.83% N/A12/20/2023 Quarterly (2,273,176 ) (2,290,381) (17,205 )
CDX.NA.IGS.33.V1-5YUSD 49,070,000 1.00% 0.60% N/A
12/20/2024 Quarterly (417,805 ) (812,109 ) (394,304 )
ITRAXX.EUROPES.32.V1-5YEUR 29,470,000 1.00% 0.43% N/A
12/20/2024 Quarterly (859,948 ) (777,556 ) 82,392
CDX.NA.HYS.34.V8-5YUSD 8,213,760 5.00% 2.84% N/A
06/20/2025 Quarterly (416,438 ) (723,214 ) (306,776 )
CDX.NA.IGS.35.V1-5YUSD 59,146,500 1.00% 0.52% N/A
12/20/2025 Quarterly (1,281,546 ) (1,469,850) (188,304 )
CDX.NA.IGS.35.V1-5YUSD 65,527,000 1.00% 0.52% N/A
12/20/2025 Quarterly (1,435,777 ) (1,628,412) (192,635 )
Sell Protection^:
Forward Currency Contracts
SettlementDate
Counter-party
CurrencySold
CurrencyPurchased
NetUnrealized
Appreciation(Depreciation)
($)01/19/2021
DBEUR 39,600 USD 47,052 (255 )
01/19/2021
GSEUR 2,042,170 USD 2,394,056 (45,570 )
01/19/2021
DBUSD 333,641 EUR 280,800 1,810
01/19/2021
GSUSD 2,605,301 EUR 2,222,366 49,590
$ 5,575
Futures Contracts
Number ofContracts + Type
ExpirationDate
NotionalAmount ($)
Value/NetUnrealized
Appreciation(Depreciation)
($)Sales
33 U.S. TreasuryNote 5 Yr. (CBT) March 2021 $4,159,031 $ (5,108 )
+ Buys - Fund is long the futures contract.Sales - Fund is short the futures contract.
Copyright © 2021 www.secdatabase.com. All Rights Reserved.Please Consider the Environment Before Printing This Document

CDX.NA.IGS.28.V1-5YUSD 17,200,000 1.00% 0.49% 17,200,000 USD
06/20/2022 Quarterly 300,982 131,752 (169,230 )
CDX.NA.HYS.33.V3-5YUSD 2,300,650 5.00% 2.61% 2,300,650 USD
12/20/2024 Quarterly 78,900 204,363 125,463
$(6,304,808 ) $(7,365,407) $ (1,060,599 )
Copyright © 2021 www.secdatabase.com. All Rights Reserved.Please Consider the Environment Before Printing This Document

GMO Opportunistic Income Fund(A Series of GMO Trust)
Schedule of Investments �� (Continued)November 30, 2020 (Unaudited)
OTC Credit Default Swaps
Reference Entity CounterpartyNotionalAmount
AnnualPremium
ImpliedCredit
Spread (1)
MaximumPotentialAmount
of FuturePayments by
the FundUnder the
Contract (2)Expiration
Date
PeriodicPayment
Frequency
PremiumsPaid/
(Received) ($) Value ($)
Net UnrealizedAppreciation/
(Depreciation) ($)Buy Protection^:CDX.NA.IGS.25.V1-5Y BOA USD 4,400,000 1.00% 0.61% N/A 12/20/2020 Quarterly 710,600 (964 ) (711,564 )CDX.NA.IGS.25.V1-5Y CITI USD 4,300,000 1.00% 0.61% N/A 12/20/2020 Quarterly 547,892 (942 ) (548,834 )CDX.NA.HYS.27.V2-5Y GS USD 4,458,000 5.00% 2.70% N/A 12/20/2021 Quarterly 11,145 (108,428 ) (119,573 )CDX.NA.HYS.27.V2-5Y JPM USD 4,300,000 5.00% 2.70% N/A 12/20/2021 Quarterly (11,825 ) (104,585 ) (92,760 )D.R. Horton, Inc. BCLY USD 17,200,000 1.00% 0.14% N/A 06/20/2022 Quarterly (165,250 ) (232,422 ) (67,172 )CDX.NA.HYS.29.V1-5Y JPM USD 6,425,250 5.00% 4.45% N/A 12/20/2022 Quarterly (282,711 ) (71,158 ) 211,553CDX.NA.HYS.29.V1-5Y MORD USD 3,450,800 5.00% 4.45% N/A 12/20/2022 Quarterly (188,414 ) (38,217 ) 150,197CDX.NA.HYS.29.V1-5Y JPM USD 870,000 5.00% 4.45% N/A 12/20/2022 Quarterly (51,765 ) (9,635 ) 42,130Navient Corp. BCLY USD 2,082,800 5.00% 2.23% N/A 12/20/2022 Quarterly (160,628 ) (116,322 ) 44,306Navient Corp. BCLY USD 3,435,200 5.00% 2.23% N/A 12/20/2022 Quarterly (264,646 ) (191,850 ) 72,796Navient Corp. GS USD 4,050,000 5.00% 2.23% N/A 12/20/2022 Quarterly (421,122 ) (226,187 ) 194,935Navient Corp. GS USD 2,700,000 5.00% 2.23% N/A 12/20/2022 Quarterly (277,471 ) (150,791 ) 126,680ITRAXX.EUROPES.32.V1-5Y BOA EUR 10,000,000 1.00% 1.84% N/A 12/20/2024 Quarterly 748,704 405,343 (343,361 )CMBX.NA.A.7 CGMI USD 1,420,000 2.00% 5.24% N/A 01/17/2047 Monthly 89,177 123,025 33,848CMBX.NA.AA.7 GS USD 5,000,000 1.50% 1.37% N/A 01/17/2047 Monthly 7,975 (18,453 ) (26,428 )CMBX.NA.AS.7 DB USD 7,608,000 1.00% 0.84% N/A 01/17/2047 Monthly (119,899 ) (34,593 ) 85,306CMBX.NA.AS.7 BOA USD 4,505,000 1.00% 0.84% N/A 01/17/2047 Monthly 47,351 (20,484 ) (67,835 )CMBX.NA.AS.7 DB USD 16,677,794 1.00% 0.84% N/A 01/17/2047 Monthly 197,705 (75,832 ) (273,537 )CMBX.NA.AS.7 GS USD 4,400,000 1.00% 0.84% N/A 01/17/2047 Monthly 112,812 (20,006 ) (132,818 )CMBX.NA.AS.7 MORD USD 13,270,000 1.00% 0.84% N/A 01/17/2047 Monthly 205,782 (60,337 ) (266,119 )CMBX.NA.AA.8 CSI USD 8,892,000 1.50% 1.75% N/A 10/17/2057 Monthly 247,717 81,343 (166,374 )CMBX.NA.AS.8 MORD USD 3,384,000 1.00% 1.00% N/A 10/17/2057 Monthly 140,432 598 (139,834 )CMBX.NA.AS.8 CITI USD 8,892,000 1.00% 1.00% N/A 10/17/2057 Monthly 73,095 1,571 (71,524 )CMBX.NA.BBB-.8 GS USD 4,224,000 3.00% 9.28% N/A 10/17/2057 Monthly 400,908 859,848 458,940CMBX.NA.BBB-.8 GS USD 6,889,000 3.00% 9.28% N/A 10/17/2057 Monthly 1,034,610 1,402,342 367,732CMBX.NA.AAA.9 CGMI USD 4,000,000 0.50% 0.24% N/A 09/17/2058 Monthly (17,095 ) (49,913 ) (32,818 )CMBX.NA.AAA.9 GS USD 2,902,300 0.50% 0.24% N/A 09/17/2058 Monthly (14,187 ) (36,216 ) (22,029 )CMBX.NA.AAA.9 MSCI USD 3,328,000 0.50% 0.24% N/A 09/17/2058 Monthly (31,983 ) (41,528 ) (9,545 )CMBX.NA.AAA.9 GS USD 10,000,000 0.50% 0.24% N/A 09/17/2058 Quarterly (102,116 ) (124,784 ) (22,668 )CMBX.NA.AAA.9 MORD USD 5,000,000 0.50% 0.24% N/A 09/17/2058 Monthly (51,058 ) (62,392 ) (11,334 )CMBX.NA.BBB-.9 MORD USD 5,116,800 3.00% 7.48% N/A 09/17/2058 Monthly 584,727 934,532 349,805CMBX.NA.BBB-.9 DB USD 4,263,000 3.00% 7.48% N/A 09/17/2058 Monthly 517,160 778,594 261,434CMBX.NA.BBB-.9 MORD USD 2,585,000 3.00% 7.48% N/A 09/17/2058 Monthly 63,490 472,125 408,635CMBX.NA.BBB-.9 CGMI USD 3,425,200 3.00% 7.48% N/A 09/17/2058 Monthly 955,105 625,579 (329,526 )CMBX.NA.AAA.10 MSCI USD 9,668,400 0.50% 0.30% N/A 11/17/2059 Monthly (15,090 ) (110,639 ) (95,549 )CMBX.NA.AAA.10 MSCI USD 1,381,200 0.50% 0.30% N/A 11/17/2059 Monthly (2,156 ) (15,806 ) (13,650 )CMBX.NA.AAA.10 CGMI USD 7,079,200 0.50% 0.30% N/A 11/17/2059 Monthly (89,216 ) (81,010 ) 8,206CMBX.NA.A.6 CGMI USD 2,840,000 2.00% 7.77% N/A 05/11/2063 Monthly 340,958 266,126 (74,832 )CMBX.NA.AA.6 GS USD 5,000,000 1.50% 1.46% N/A 05/11/2063 Monthly 35,145 (3,078 ) (38,223 )CMBX.NA.BBB-.6 CGMI USD 4,274,000 3.00% 23.24% N/A 05/11/2063 Monthly 1,357,351 1,237,268 (120,083 )CMBX.NA.BBB-.13 GS USD 4,960,000 3.00% 4.17% N/A 12/16/2072 Monthly 1,011,544 423,872 (587,672 )CMBX.NA.BBB-.13 GS USD 2,000,000 3.00% 4.17% N/A 12/16/2072 Monthly 268,842 170,916 (97,926 )CMBX.NA.BBB-.13 GS USD 1,000,000 3.00% 4.17% N/A 12/16/2072 Monthly 106,533 85,458 (21,075 )CMBX.NA.BBB-.13 MORD USD 2,000,000 3.00% 4.17% N/A 12/16/2072 Monthly 408,836 170,916 (237,920 )CMBX.NA.BBB-.13 MORD USD 2,000,000 3.00% 4.17% N/A 12/16/2072 Monthly 332,412 170,916 (161,496 )Sell Protection^:CDX.NA.HYS.27.V2-5Y GS USD 2,084,000 5.00% 0.26% 2,084,000 USD 12/20/2021 Quarterly 268,315 105,247 (163,068 )CDX.NA.HYS.27.V2-5Y JPM USD 8,600,000 5.00% 0.26% 8,600,000 USD 12/20/2021 Quarterly 1,143,800 434,321 (709,479 )CDX.NA.HYS.27.V3-5Y BOA USD 8,545,000 5.00% 0.26% 8,545,000 USD 12/20/2021 Quarterly 1,369,764 431,544 (938,220 )CDX.NA.HYS.27.V3-5Y JPM USD 7,735,000 5.00% 0.26% 7,735,000 USD 12/20/2021 Quarterly 1,096,050 390,637 (705,413 )CDX.NA.HYS.29.V1-5Y MORD USD 4,264,000 5.00% 0.79% 4,264,000 USD 12/20/2022 Quarterly 644,717 371,180 (273,537 )CDX.NA.HYS.29.V1-5Y BOA USD 5,115,600 5.00% 0.79% 5,115,600 USD 12/20/2022 Quarterly 742,274 445,312 (296,962 )CDX.NA.HYS.29.V6-5Y CITI USD 5,994,100 5.00% 0.79% 5,994,100 USD 12/20/2022 Quarterly 229,274 521,785 292,511CDX.NA.HYS.31.V1-5Y JPM USD 18,156,815 5.00% 0.32% 18,156,815 USD 12/20/2023 Quarterly 3,615,022 2,563,629 (1,051,393 )
Copyright © 2021 www.secdatabase.com. All Rights Reserved.Please Consider the Environment Before Printing This Document

ITRAXX.XOVERS.30.V3-5Y JPM EUR 655,580 5.00% 35.01% 655,580 EUR 12/20/2023 Quarterly (487,841 ) (457,089 ) 30,752ITRAXX.XOVERS.30.V4-5Y JPM EUR 158,684 5.00% 35.01% 158,684 EUR 12/20/2023 Quarterly (110,801 ) (110,639 ) 162CDX.NA.HYS.33.V1-5Y GS USD 25,938,066 5.00% 0.47% 25,938,066 USD 12/20/2024 Quarterly 5,736,852 4,640,738 (1,096,114 )CDX.NA.HYS.33.V12-5Y MORD USD 2,840,000 5.00% 0.47% 2,840,000 USD 12/20/2024 Quarterly 481,871 508,122 26,251
Copyright © 2021 www.secdatabase.com. All Rights Reserved.Please Consider the Environment Before Printing This Document

GMO Opportunistic Income Fund(A Series of GMO Trust)
Schedule of Investments �� (Continued)November 30, 2020 (Unaudited)
OTC Credit Default Swaps �� continued
Reference Entity CounterpartyNotionalAmount
AnnualPremium
ImpliedCredit
Spread (1)
MaximumPotentialAmount
of FuturePayments by
the FundUnder the
Contract (2)Expiration
Date
PeriodicPayment
Frequency
PremiumsPaid/
(Received) ($) Value ($)
Net UnrealizedAppreciation/
(Depreciation) ($)CDX.NA.HYS.33.V3-5Y
CITI USD 4,185,325 5.00% 0.47% 4,185,325 USD12/20/2024 Quarterly 442,877 748,823 305,946
CDX.NA.HYS.33.V3-5YGS USD 9,506,516 5.00% 0.47% 9,506,516 USD
12/20/2024 Quarterly 1,343,307 1,700,869 357,562
CDX.NA.HYS.33.V8-5YGS USD 6,508,491 5.00% 0.47% 6,508,491 USD
12/20/2024 Quarterly 1,066,328 1,164,474 98,146
CDX.NA.IGS.33.V1-5YCITI USD 1,472,000 1.00% 13.91% 1,472,000 USD
12/20/2024 Quarterly (820,051 ) (612,867 ) 207,184
ITRAXX.EUROPES.32.V1-5YBOA EUR 25,000,000 1.00% 0.75% 25,000,000 EUR
12/20/2024 Quarterly 114,434 306,949 192,515
ITRAXX.EUROPES.32.V1-5YGS EUR 58,940,000 1.00% 0.16% 58,940,000 EUR
12/20/2024 Quarterly 2,667,689 2,424,162 (243,527 )
CMBX.NA.A.9GS USD 6,822,400 2.00% 3.04% 6,822,400 USD
09/17/2058 Monthly 89,487 (319,572 ) (409,059 )
$27,924,744 $21,461,425 $ (6,463,319 )
^ Buy Protection - Fund pays a premium and buys credit protection. If a credit event occurs the Fund will, depending on the terms of the particular swap contract,either (i) receive from the seller of protection an amount equal to the notional amount of the swap and deliver the referenced obligation or underlying securitiescomprising the referenced index or (ii) receive a net settlement amount in the form of cash or securities equal to the notional amount of the swap less the recoveryvalue of the referenced obligation or underlying securities comprising the referenced index.Sell Protection - Fund receives a premium and sells credit protection. If a credit event occurs the Fund will, depending on the terms of the particular swap contract,either (i) pay to the buyer of protection an amount equal to the notional amount of the swap and take delivery of the referenced obligation or underlying securitiescomprising the referenced index or (ii) pay a net settlement amount in the form of cash or securities equal to the notional amount of the swap less the recoveryvalue of the referenced obligation or underlying securities comprising the referenced index.
(1) As of November 30, 2020, implied credit spreads in absolute terms, calculated using a model, and utilized in determining the market value of credit default swapcontracts on the reference security, serve as an indicator of the current status of the payment/performance risk and reflect the likelihood or risk of default for thereference entity. The implied credit spread of a particular referenced entity reflects the cost of buying/selling protection. Wider (i.e. higher) credit spreads representa deterioration of the referenced entity�s credit soundness and a greater likelihood or risk of default or other credit event occurring as defined under the terms of thecontract.
(2) The maximum potential amount the Fund could be required to pay as a seller of credit protection if a credit event occurs as defined under the terms of thatparticular swap contract.
Centrally Cleared Interest Rate Swaps
Fund Pays Fund ReceivesNotionalAmount
ExpirationDate
PeriodicPayment
Frequency
PremiumsPaid/
(Received) ($) Value ($)
NetUnrealized
Appreciation/(Depreciation) ($)
0.25%3 Month USD LIBOR USD 9,700,000
11/10/2022 Quarterly (4,539 ) (4,134 ) 405
0.30%3 Month USD LIBOR USD 9,750,000
08/17/2024 Quarterly � 4,763 4,763
0.33%3 Month USD LIBOR USD 12,520,000
10/20/2024 Quarterly 3,562 (2,300 ) (5,862 )
0.35%3 Month USD LIBOR USD 48,480,000
04/19/2025 Quarterly 43 36,821 36,778
0.40%3 Month USD LIBOR USD 26,300,000
10/08/2025 Quarterly (3,685 ) 13,538 17,223
0.48%3 Month USD LIBOR USD 1,870,000
08/19/2027 Quarterly � 13,850 13,850
0.88%3 Month USD LIBOR USD 6,595,000
03/06/2028 Quarterly (15,632 ) (115,935) (100,303 )
0.65%3 Month USD LIBOR USD 7,490,000
06/04/2028 Quarterly (38,264 ) 3,882 42,146
Copyright © 2021 www.secdatabase.com. All Rights Reserved.Please Consider the Environment Before Printing This Document

0.65%3 Month USD LIBOR USD 5,790,000
07/30/2028 Quarterly (25,114 ) 8,295 33,409
0.56%3 Month USD LIBOR USD 4,790,000
09/01/2028 Quarterly � 44,301 44,301
1.30%3 Month USD LIBOR USD 10,027,000
12/19/2029 Quarterly � (466,153) (466,153 )
0.75%3 Month USD LIBOR USD 5,100,000
02/11/2030 Quarterly (22,015 ) 17,875 39,890
0.83%3 Month USD LIBOR USD 1,630,000
11/24/2030 Quarterly � 2,984 2,984
$ (105,644 ) $(442,213) $ (336,569 )
As of November 30, 2020, for the above contracts and/or agreements, the Fund had sufficient cash and/or securities to covercommitments or collateral requirements, if any, of the relevant broker or exchange.
Copyright © 2021 www.secdatabase.com. All Rights Reserved.Please Consider the Environment Before Printing This Document

GMO Opportunistic Income Fund(A Series of GMO Trust)
Schedule of Investments �� (Continued)November 30, 2020 (Unaudited)
Notes to Schedule of Investments:
� Denominated in U.S. Dollar, unless otherwise indicated.(a) Investment valued using significant unobservable inputs.(b) Investment valued at fair value using methods determined in good faith by
the Trustees of GMO Trust or persons acting at their direction pursuant toprocedures approved by the Trustees. Investment valued using significantunobservable inputs.
(c) All or a portion of this security has been pledged to cover marginrequirements on futures and/or cleared swap contracts, collateral on OTCswap contracts, forward currency contracts, and/or written options, if any.
(d) The rate disclosed is the 7 day net yield as of November 30, 2020.(e) The rate shown represents yield-to-maturity.
The rates shown on variable rate notes are the current interest rates atNovember 30, 2020, which are subject to change based on the terms of thesecurity.
Portfolio Abbreviations:
144A - Securities exempt from registration under Rule 144A of the Securities Actof 1933. These securities may be resold in transactions exempt from registration,normally to qualified institutional investors.CLO - Collateralized Loan ObligationCMT - Constant Maturity TreasuryCOFI - Cost of Funds IndexFSA - Insured as to the payment of principal and interest by Financial SecurityAssurance.LIBOR - London Interbank Offered RateMTA � Monthly Treasury Average IndexUSBM - U.S. Treasury 3 Month Bill Money Market Yield.USD LIBOR - London Interbank Offered Rate denominated in United StatesDollar.
Counterparty Abbreviations:
Currency Abbreviations:
EUR - EuroUSD - United States Dollar
BCLY - Barclays Bank PLCBOA - Bank of America, N.A.CGMI - Citigroup Global Markets Inc.CITI - Citibank N.A.CSI - Credit Suisse InternationalDB - Deutsche Bank AG
GS - Goldman Sachs InternationalJPM - JPMorgan Chase Bank, N.A.MORD - Morgan Stanley CapitalServices LLCMSCI - Morgan Stanley & Co.International PLC
Copyright © 2021 www.secdatabase.com. All Rights Reserved.Please Consider the Environment Before Printing This Document
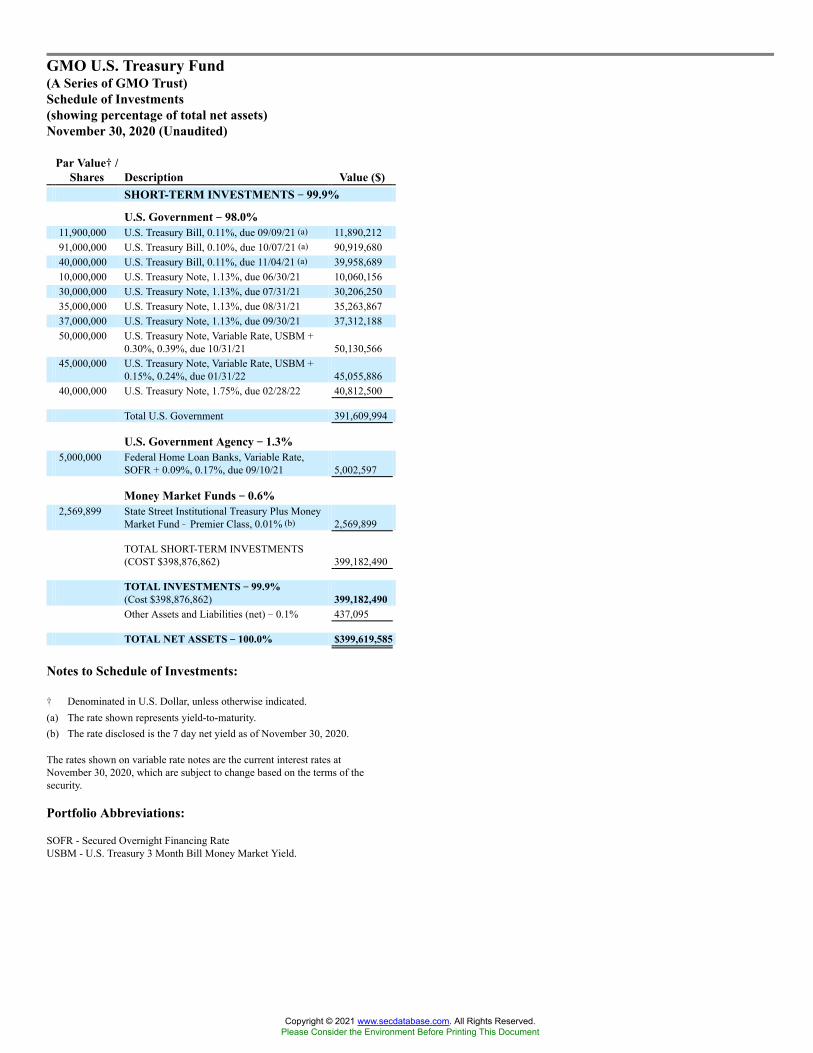
GMO U.S. Treasury Fund(A Series of GMO Trust)Schedule of Investments(showing percentage of total net assets)November 30, 2020 (Unaudited)
Par Value�� /Shares Description Value ($)
SHORT-TERM INVESTMENTS �� 99.9%
U.S. Government �� 98.0%11,900,000 U.S. Treasury Bill, 0.11%, due 09/09/21 (a) 11,890,21291,000,000 U.S. Treasury Bill, 0.10%, due 10/07/21 (a) 90,919,68040,000,000 U.S. Treasury Bill, 0.11%, due 11/04/21 (a) 39,958,68910,000,000 U.S. Treasury Note, 1.13%, due 06/30/21 10,060,15630,000,000 U.S. Treasury Note, 1.13%, due 07/31/21 30,206,25035,000,000 U.S. Treasury Note, 1.13%, due 08/31/21 35,263,86737,000,000 U.S. Treasury Note, 1.13%, due 09/30/21 37,312,18850,000,000 U.S. Treasury Note, Variable Rate, USBM +
0.30%, 0.39%, due 10/31/21 50,130,56645,000,000 U.S. Treasury Note, Variable Rate, USBM +
0.15%, 0.24%, due 01/31/22 45,055,88640,000,000 U.S. Treasury Note, 1.75%, due 02/28/22 40,812,500
Total U.S. Government 391,609,994
U.S. Government Agency �� 1.3%5,000,000 Federal Home Loan Banks, Variable Rate,
SOFR + 0.09%, 0.17%, due 09/10/21 5,002,597
Money Market Funds �� 0.6%2,569,899 State Street Institutional Treasury Plus Money
Market Fund � Premier Class, 0.01% (b) 2,569,899
TOTAL SHORT-TERM INVESTMENTS(COST $398,876,862) 399,182,490
TOTAL INVESTMENTS �� 99.9%(Cost $398,876,862) 399,182,490Other Assets and Liabilities (net) � 0.1% 437,095
TOTAL NET ASSETS �� 100.0% $399,619,585
Notes to Schedule of Investments:
� Denominated in U.S. Dollar, unless otherwise indicated.(a) The rate shown represents yield-to-maturity.(b) The rate disclosed is the 7 day net yield as of November 30, 2020.
The rates shown on variable rate notes are the current interest rates atNovember 30, 2020, which are subject to change based on the terms of thesecurity.
Portfolio Abbreviations:
SOFR - Secured Overnight Financing RateUSBM - U.S. Treasury 3 Month Bill Money Market Yield.
Copyright © 2021 www.secdatabase.com. All Rights Reserved.Please Consider the Environment Before Printing This Document

OrganizationEach of Asset Allocation Bond Fund, Emerging Country Debt Fund, High Yield Fund, Multi-Sector Fixed Income Fund (formerlyCore Plus Bond Fund), Opportunistic Income Fund and U.S. Treasury Fund (each a �Fund� and collectively the �Funds�) is aseries of GMO Trust (the �Trust�). The Trust is registered under the Investment Company Act of 1940, as amended (the �1940Act�), as an open-end management investment company. The Trust was established as a Massachusetts business trust under thelaws of The Commonwealth of Massachusetts on June 24, 1985. The Declaration of Trust permits the Trustees of the Trust(�Trustees�) to create an unlimited number of series of shares (Funds) and to subdivide Funds into classes. The Funds are advisedand managed by Grantham, Mayo, Van Otterloo & Co. LLC (�GMO�).
The Funds may invest in GMO U.S. Treasury Fund and in money market funds unaffiliated with GMO.
Many of the Funds may invest without limitation in other GMO Funds (�underlying funds�). In particular, pursuant to anexemptive order granted by the Securities and Exchange Commission (�SEC�), some of the Funds may invest in EmergingCountry Debt Fund, Opportunistic Income Fund and U.S. Treasury Fund. The financial statements of the underlying funds shouldbe read in conjunction with the Funds� financial statements. The financial statements are available without charge on the SEC�swebsite at www.sec.gov or on GMO�s website at www.gmo.com.
Each Fund has elected to be treated or intends to elect to be treated and intends to qualify each tax year as a regulated investmentcompany under Subchapter M of the Internal Revenue Code of 1986, as amended. Each Fund intends to distribute its netinvestment income, if any, and its net realized short-term and long-term capital gains, if any, after giving effect to any availablecapital loss carryforwards for U.S. federal income tax purposes. Therefore, each Fund makes no provision for U.S. federal incomeor excise taxes.
Please see the Funds� Prospectus, available on www.gmo.com, for information regarding specific risks for each Fund.
Basis of presentationThe preparation of the Schedule of Investments in accordance with accounting principles generally accepted in the United Statesof America (�U.S. GAAP�) requires GMO to make estimates and assumptions that affect the reported amounts and disclosures inthe Schedule of Investments during the reporting period. GMO believes the estimates and security valuations are appropriate;however, actual results may differ from those estimates, and the security valuations reflected in the Schedule of Investments maydiffer from the value a Fund ultimately realizes upon the sale of those securities.
Portfolio valuationTypically, the Funds and the underlying funds value fixed income securities at the most recent price supplied by a pricing sourcedetermined by GMO. GMO evaluates pricing sources on an ongoing basis and may change a pricing source at any time. GMOmonitors erratic or unusual movements (including unusual inactivity) in the prices supplied for a security and has discretion tooverride a price supplied by a source (e.g., by taking a price supplied by another source) when it believes that the price supplied isnot reliable. Alternative pricing sources are often but not always available for securities held by the Funds and the underlyingfunds.
Exchange-traded securities (other than exchange-traded options) for which market quotations are readily available are valued at(i) the last sale price or (ii) official closing price or (iii) most recent quoted price published by the exchange (if no reported last saleor official closing price) or (iv) the quoted price provided by a pricing source (in the event GMO deems the private market to be amore reliable indicator of market value than the exchange). Exchange-traded options are valued at the last sale price, provided thatprice is between the closing bid and ask prices. If the last sale price is not within that range, then they will be valued at the closingbid price for long positions and the closing ask price for short positions. Cleared derivatives are valued using the price quoted(which may be based on a model) by the relevant clearing house. If an updated quote for a cleared derivative is not available whena Fund calculates its net asset value, the derivative will generally be valued using an industry standard model, which may differfrom the model used by the relevant clearing house. Over-the-counter (�OTC�) derivatives are generally valued at the pricedetermined by an industry standard model. Unlisted securities for which market quotations are readily available are generallyvalued at the most recent quoted price. Shares of the underlying funds and other open-end registered investment companies arevalued at their most recent net asset value.
The foregoing valuation methodologies are modified for equities that trade in non-U.S. securities markets that close before theclose of the New York Stock Exchange (�NYSE�) due to time zone differences, including the value of equities that underliefutures, options and other derivatives (to the extent the market for those derivatives closes prior to the close of the NYSE). In thosecases, the price will generally be adjusted, to the extent practicable and available, based on inputs from an independent pricingservice approved by the Trustees that are intended to reflect valuation changes through the NYSE close. These securities listed onforeign exchanges (including the value of equity securities that underlie futures, options and other derivatives (to the extent themarket for such instruments closes prior to the close of the NYSE)) are classified as Level 2 (levels defined below).
Copyright © 2021 www.secdatabase.com. All Rights Reserved.Please Consider the Environment Before Printing This Document

�Quoted price� typically means the bid price for securities held long and the ask price for securities sold short. If a marketquotation for a security does not involve a bid or an ask, the �quoted price� may be the price provided by a market participant orother third-party pricing source in accordance with the market practice for that security. If an updated quoted price for a security isnot available when a Fund calculates its net asset value, the Fund will generally use the last quoted price so long as GMO believesthat the last quoted price continues to represent that security�s fair value.
In the case of derivatives, prices determined by a model may reflect an estimate of the average of bid and ask prices, regardless ofwhether a Fund has a long position or a short position.
If quotations are not readily available or circumstances make an existing valuation methodology or procedure unreliable,derivatives and other securities are valued at fair value as determined in good faith by the Trustees or persons acting at theirdirection pursuant to procedures approved by the Trustees. Because of the uncertainty inherent in fair value pricing, the pricedetermined for a particular security may be materially different from the value realized upon its sale. The Funds and/or theunderlying funds classify such securities as Level 3 (levels defined below). For the period ended November 30, 2020, the Fundsdid not reduce the value of any of their OTC derivatives contracts, if any, based on the creditworthiness of their counterparties.
U.S. GAAP requires the Funds to disclose the fair value of their investments in a three-level hierarchy (Levels 1, 2 and 3). Thevaluation hierarchy is based upon the relative observability of inputs to the valuation of the Funds� investments. The inputs ormethodologies used for valuing securities are not necessarily an indication of the risk associated with investing in those securities.
Changes in valuation techniques may result in transfers into or out of an investment�s assigned level within the fair valuehierarchy. In addition, in periods of market dislocation, the observability of prices and inputs may be reduced for manyinstruments. This condition, as well as changes related to the liquidity of investments, could cause a security to be reclassifiedbetween levels.
The three levels are defined as follows:
Level 1 � Valuations based on quoted prices for identical securities in active markets.
The types of assets and liabilities categorized in Level 1 generally include actively traded domestic and certain foreign equitysecurities; certain U.S. government obligations; derivatives actively traded on a national securities exchange (such as some futuresand options); and shares of open-end mutual funds (even if their investments are valued using Level 2 or Level 3 inputs).
Level 2 � Valuations determined using other significant direct or indirect observable inputs.
The types of assets and liabilities categorized in Level 2 generally include certain U.S. government agency securities, mortgage-backed securities, asset-backed securities, certain sovereign debt obligations, and corporate bonds valued using vendor prices orbroker quotes; cleared derivatives and certain OTC derivatives such as swaps, options, swaptions, and forward currency contractsvalued using industry standard models; certain restricted securities valued at the most recent available market or quoted price;certain debt obligations, such as collateralized loan obligations, that have yet to begin trading that are valued at cost; and certainforeign equity securities that are adjusted based on inputs from an independent pricing service approved by the Trustees, includingthe value of equity securities that underlie futures, options and other derivatives (to the extent the market for such instrumentscloses prior to the close of the NYSE) to reflect estimated valuation changes through the NYSE close.
Level 3 � Valuations based primarily on inputs that are unobservable and significant.
The types of assets and liabilities categorized in Level 3 generally include, but are not limited to, certain debt securities (such asasset-backed, mortgage-backed, loans and sovereign debt) and derivatives even though they may be valued using broker quotes;certain debt securities and derivatives adjusted by a specified discount for liquidity or other considerations; certain sovereign debtsecurities valued using comparable securities issued by the sovereign adjusted by a specified spread; securities whose trading hasbeen suspended or that have been de-listed from their current primary trading exchange valued at the most recent available marketor quoted price; securities in default or bankruptcy proceedings for which there is no current market quotation valued at the mostrecent available market or quoted price and potential litigation recoveries and interests related to bankruptcy proceedings.
Copyright © 2021 www.secdatabase.com. All Rights Reserved.Please Consider the Environment Before Printing This Document

The following is a summary of the respective levels assigned to the Funds� direct securities and derivatives, if any, as ofNovember 30, 2020:
Description Level 1 Level 2 Level 3 TotalAsset Allocation Bond FundAsset Valuation InputsDebt Obligations
U.S. Government $� $118,627,797 $� $118,627,797TOTAL DEBT OBLIGATIONS � 118,627,797 � 118,627,797Mutual Funds 4,509,289 � � 4,509,289Short-Term Investments 411,936 � � 411,936Total Investments 4,921,225 118,627,797 � 123,549,022Total $4,921,225 $118,627,797 $� $123,549,022
Emerging Country Debt FundAsset Valuation InputsDebt Obligations
Asset-Backed Securities $� $26,974,438 $� $26,974,438Corporate Debt � 204,027,758 27,599,754 231,627,512Foreign Government Agency � 1,073,868,902 98,591,052 1,172,459,954Foreign Government Obligations � 2,394,262,559 140,410,358 2,534,672,917U.S. Government 258,516,391 � � 258,516,391
TOTAL DEBT OBLIGATIONS 258,516,391 3,699,133,657 266,601,164 4,224,251,212Loan Assignments � � 18,443,191 18,443,191Loan Participations � � 40,526,838 40,526,838Mutual Funds 74,784,247 � � 74,784,247Rights/Warrants � 15,109,993 36,163 15,146,156Short-Term Investments 8,350,363 � � 8,350,363Total Investments 341,651,001 3,714,243,650 325,607,356 4,381,502,007Derivatives^
OptionsCredit Risk � � 638,570 638,570
Swap ContractsCredit Risk � 15,783,421 � 15,783,421Interest Rate Risk � 535,304 � 535,304
Total $341,651,001 $3,730,562,375 $326,245,926 $4,398,459,302Liability Valuation InputsDerivatives^
Forward Currency ContractsForeign Currency Risk $� $(4,159,520 ) $� $(4,159,520 )
OptionsCredit Risk � � (194,255 ) (194,255 )
Swap ContractsCredit Risk � (7,948,677 ) � (7,948,677 )Interest Rate Risk � (5,706,889 ) � (5,706,889 )
Total $� $(17,815,086 ) $(194,255 ) $(18,009,341 )
High Yield FundAsset Valuation InputsDebt Obligations
Corporate Debt $� $57,527,622 $� $57,527,622U.S. Government 150,186 � � 150,186
TOTAL DEBT OBLIGATIONS 150,186 57,527,622 � 57,677,808Investment Funds 86,637,140 � � 86,637,140Short-Term Investments 10,097,175 14,369,577 � 24,466,752Total Investments 96,884,501 71,897,199 � 168,781,700
Copyright © 2021 www.secdatabase.com. All Rights Reserved.Please Consider the Environment Before Printing This Document

Description Level 1 Level 2 Level 3 TotalHigh Yield Fund (continued)Asset Valuation Inputs (continued)Derivatives^
Futures ContractsInterest Rate Risk $17,656 $� $� $17,656
Swap ContractsCredit Risk � 2,133,203 � 2,133,203
Total $96,902,157 $74,030,402 $� $170,932,559Liability Valuation InputsDerivatives^
Forward Currency ContractsForeign Currency Risk $� $(105,147 ) $� $(105,147 )
Futures ContractsInterest Rate Risk (4,659 ) � � (4,659 )
Total $(4,659 ) $(105,147 ) $� $(109,806 )
Multi-Sector Fixed Income Fund (formerly Core Plus Bond Fund)Asset Valuation InputsDebt Obligations
Asset-Backed Securities $� $63,670,213 $� $63,670,213Corporate Debt � 56,048,127 � 56,048,127U.S. Government 6,578,379 � � 6,578,379U.S. Government Agency � 48,978,213 � 48,978,213
TOTAL DEBT OBLIGATIONS 6,578,379 168,696,553 � 175,274,932Investment Funds 10,373,814 � � 10,373,814Mutual Funds 84,802,886 � � 84,802,886Short-Term Investments 3,565,840 74,181,275 � 77,747,115Total Investments 105,320,919 242,877,828 � 348,198,747Derivatives^
Forward Currency ContractsForeign Currency Risk � 2,530,831 � 2,530,831
Futures ContractsInterest Rate Risk 107,585 � � 107,585
Swap ContractsInterest Rate Risk � 932,755 � 932,755
Total $105,428,504 $246,341,414 $� $351,769,918Liability Valuation InputsDerivatives^
Forward Currency ContractsForeign Currency Risk $� $(2,702,262 ) $� $(2,702,262 )
Futures ContractsInterest Rate Risk (74,992 ) � � (74,992 )
Swap ContractsInterest Rate Risk � (1,847,265 ) � (1,847,265 )
Total $(74,992 ) $(4,549,527 ) $� $(4,624,519 )
Opportunistic Income FundAsset Valuation InputsDebt Obligations
Asset-Backed Securities $� $673,506,946 $23,532,338 $697,039,284U.S. Government 1,586,332 � � 1,586,332U.S. Government Agency � � 10,758,732 10,758,732
TOTAL DEBT OBLIGATIONS 1,586,332 673,506,946 34,291,070 709,384,348Mutual Funds 11,003,541 � � 11,003,541Short-Term Investments 80,682,747 � � 80,682,747Purchased Options � 328,009 � 328,009Total Investments 93,272,620 673,834,955 34,291,070 801,398,645
Copyright © 2021 www.secdatabase.com. All Rights Reserved.Please Consider the Environment Before Printing This Document

Description Level 1 Level 2 Level 3 TotalOpportunistic Income Fund (continued)Asset Valuation Inputs (continued)Derivatives^
Forward Currency ContractsForeign Currency Risk $� $51,400 $� $51,400
Swap ContractsCredit Risk � 25,304,279 � 25,304,279Interest Rate Risk � 146,309 � 146,309
Total $93,272,620 $699,336,943 $34,291,070 $826,900,633Liability Valuation InputsDerivatives^
Forward Currency ContractsForeign Currency Risk $� $(45,825 ) $� $(45,825 )
Futures ContractsInterest Rate Risk (5,108 ) � � (5,108 )
Written OptionsCredit Risk � (125,481 ) � (125,481 )
Swap ContractsCredit Risk � (11,208,261 ) � (11,208,261 )Interest Rate Risk � (588,522 ) � (588,522 )
Total $(5,108 ) $(11,968,089 ) $� $(11,973,197 )
U.S. Treasury FundAsset Valuation InputsShort-Term Investments $399,182,490 $� $� $399,182,490Total Investments 399,182,490 � � 399,182,490Total $399,182,490 $� $� $399,182,490
The risks referenced in the tables above are not intended to be inclusive of all risks. Please see the Prospectus for moreinformation.
^ In the tables above derivatives are based on market values, rather than the notional amounts of derivatives, except for forward currencycontracts which are based on unrealized appreciation/(depreciation). The uncertainties surrounding the valuation inputs for a derivative arelikely to be more significant to the Funds� net asset values than the uncertainties surrounding inputs for a non-derivative security with thesame market value. Excludes purchased options, if any, which are included in investments.
The underlying funds held at period end are classified above as Level 1. Certain underlying funds invest in securities and/orderivatives which may have been fair valued using methods determined in good faith by or at the direction of the Trustees orwhich may have been valued using significant unobservable inputs. For a summary of the levels assigned to the underlying funds�direct securities and derivatives, if any, please refer to the underlying funds� Notes to Financial Statements which are available onthe SEC�s website at www.sec.gov or on GMO�s website at www.gmo.com.
U.S. GAAP requires additional disclosures about fair value measurements for material Level 3 securities and derivatives, if any(determined by each category of asset or liability as compared to a Fund�s total net assets). Level 3 holdings include investmentsvalued using unadjusted prices supplied by a third-party pricing source (e.g., broker quotes, vendor). Emerging Country DebtFund�s Level 3 holdings also include the Republic of Albania Par Bond, due 8/31/25, which is valued by applying a 140 basispoint spread to the yield of the U.S. Treasury Strip Principal, due 8/15/25, Empresa Nacional de Electricidad SA, due 2/01/97which is valued based on a comparable bond and applying a 200 basis point discount for liquidity considerations and a Republic ofKenya loan agreement, which is valued by applying 500 basis point yield spread to a comparable bond. Opportunistic IncomeFund�s Level 3 holdings also consists of three U.S. Agency for International Development Floater Bonds which were valued usingcurrent LIBOR yield and adjusted by 125 basis points for liquidity considerations and six asset backed securities which were eitheradjusted for additional cashflow projections discounted for timing and likelihood of receipt, valued using the latest transaction of acomparable bond, or priced in line with broker marks. There were no other Funds with classes of investments or derivatives withdirect material Level 3 holdings at November 30, 2020.
Copyright © 2021 www.secdatabase.com. All Rights Reserved.Please Consider the Environment Before Printing This Document

For Funds with material total Level 3 assets and/or liabilities, the following is a reconciliation of securities and derivatives, if any,in which significant unobservable inputs (Level 3) were used in determining value:
Balancesas of
February 29,2020 Purchases Sales
AccruedDiscounts/Premiums
TotalRealized
Gain/(Loss)
Change inUnrealized
Appreciation(Depreciation)
Transferinto
Level 3
Transferout of
Level 3
Balancesas of
November 30,2020
Net Change inUnrealized
Appreciation(Depreciation)
fromInvestmentsStill Held as
of November 30,2020
Emerging Country Debt FundDebt Obligations
Corporate Debt $29,902,115 $� $� $(1,212 ) $� $(2,301,149 ) $� $ � $27,599,754 $(2,301,149 )Foreign
GovernmentAgency 170,402,802 � (25,952,601) 12,020,817 1,595,536 (59,475,502 ) � � 98,591,052 (53,701,875 )
ForeignGovernmentObligations 173,035,182 1,826,440 (8,206,335 ) 19,730,229 812,078 (46,787,236 ) � � 140,410,358 (45,941,354 )
Loan Assignments 14,402,514 11,639,508 (2,218,039 ) 593,553 � (5,974,345 ) � � 18,443,191 (5,974,345 )Loan Participations 47,750,729 3,173,040 (7,818,233 ) 1,567,464 � (4,146,162 ) � � 40,526,838 (4,146,162 )Rights/Warrants 2,082,394 � � � (6,136,546) 4,090,315 � � 36,163 (415,503 )
TotalInvestments 437,575,736 16,638,988 (44,195,208) 33,910,851 (3,728,932) (114,594,079 ) � � 325,607,356 (112,480,388 )
DerivativesOptions 1,036,169 � � � (193,535 ) (398,319 ) � � 444,315 (39,986 )
Total $438,611,905 $16,638,988 $(44,195,208) # $33,910,851 $(3,922,467) $(114,992,398 ) $� $ � $326,051,671 $(112,520,374 )
Opportunistic Income FundDebt Obligations
Asset-BackedSecurities $25,989,481 $30 $(3,187,783 ) $147,733 $� $(1,590,248 ) $2,173,125 � $ � $23,532,338 $(1,590,248 )
U.S.GovernmentAgency 12,228,802 � (1,596,250 ) 17,284 � 108,896 � � 10,758,732 108,896
Total $38,218,283 $30 # # $(4,784,033 ) # # # $165,017 $� $(1,481,352 ) $2,173,125 $ � $34,291,070 $(1,481,352 )
# Includes $14,496,245 of proceeds received from partial calls and/or principal paydowns as applicable.## Includes $30 of purchases paid as a principal payup.### Includes $4,784,033 of proceeds received from partial calls and/or principal paydowns as applicable.� Financial assets transferred between levels were due to a change in observable and/or unobservable inputs.
Copyright © 2021 www.secdatabase.com. All Rights Reserved.Please Consider the Environment Before Printing This Document

Some Funds have material Level 3 investments. The following table summarizes the quantitative inputs used in the valuation ofinvestments classified within Level 3 of the fair value hierarchy for the period ended November 30, 2020.
Quantitative information about Level 3 Fair Value Measurements*
Investment TypeTotal FairValue ($)
ValuationMethodology Unobservable Inputs
Range (WeightedAverage)
Emerging Country Debt FundForeign Government Obligations 45,757,856 Fair Value Discount for lack of liquidity/marketabilty 1.40% (N/A)Corporate Debt 27,599,754 Fair Value Discount for lack of liquidity/marketabilty 2.00% (N/A)Loan Assignments and Participations 6,322,726 Fair Value Discount for lack of liquidity/marketabilty 5.00%-6.00% (5.16%)Options 444,315 Fair Value Probability of CDS threshold event <5% (N/A)Warrants 0 Fair Value Probability of warrant payment trigger <5% (N/A)Opportunistic Income FundAsset-Backed Securities 4,694,728 Fair Value Probability and timing of cash flow receipt 25-75% (N/A)Asset-Backed Securities 5,739,000 Fair Value Broker mark of comparable bond N/A (N/A)Asset-Backed Securities 9,240,858 Fair Value Trade correlation with observed comparable bond N/A (N/A)Government Agency 10,758,732 Fair Value Discount for lack of liquidity/marketabilty 1.25% (N/A)
* The table does not include Level 3 securities or derivatives that are valued by pricing vendors or brokers. As of November 30, 2020, thevalue of these securities and/or derivatives for Emerging Country Debt Fund and Opportunistic Income Fund was $245,927,020 and$3,857,752, respectively. The inputs for these investments are not readily available or cannot be reasonably estimated.
Investments in affiliated companies and other Funds of the TrustAn affiliated company for the purposes of this disclosure is a company in which a Fund has or had direct ownership of at least 5%of the issuer�s voting securities or an investment in other funds of GMO Trust. A summary of the Funds� transactions involvingcompanies that are or were affiliates during the period ended November 30, 2020 is set forth below:
Affiliate
Value,beginning
ofperiod Purchases
SalesProceeds
DividendIncome*
Distributionsof Realized
Gains*Net RealizedGain (Loss)
Net Increase/Decrease inUnrealized
Appreciation/Depreciation
Value,end ofperiod
Asset Allocation Bond FundGMO U.S. Treasury Fund $8,656,379 $13,843,172 $18,030,000 $13,411 $ � $59,580 $ (19,842 ) $4,509,289
Emerging Country Debt FundGMO U.S. Treasury Fund $74,487,484 $� $� $142,870 $ � $� $ 296,763 $74,784,247
High Yield FundGMO U.S. Treasury Fund $385,180 $28,755,749 $29,171,591 $7,267 $ � $30,662 $ � $�
Multi-Sector Fixed Income Fund (formerly Core Plus Bond Fund)GMO Emerging Country
Debt Fund, Class IV $29,316,657 $� $11,500,000 $285,841 $ 220,820 $(1,411,857 ) $ 809,714 $17,214,514GMO Opportunistic Income
Fund, Class VI 108,395,452 � 42,000,000 780,717 � (221,529 ) (161,003 ) 66,012,920GMO U.S. Treasury Fund 4,517,130 182,200,000 185,190,000 27,640 � 52,340 (4,018 ) 1,575,452
Totals $142,229,239 $182,200,000 $238,690,000 $1,094,198 $ 220,820 $(1,581,046 ) $ 644,693 $84,802,886
Opportunistic Income FundGMO U.S. Treasury Fund $10,256,103 $18,500,000 $17,773,000 $12,072 $ � $61,299 $ (40,861 ) $11,003,541
* The table above includes estimated sources of all distributions paid by the underlying funds during the period March 1, 2020 throughNovember 30, 2020. The actual tax characterization of distributions paid by the underlying funds will be determined at the end of the fiscalyear ending February 28, 2021.
Copyright © 2021 www.secdatabase.com. All Rights Reserved.Please Consider the Environment Before Printing This Document

Subsequent eventsSubsequent to November 30, 2020, GMO High Yield Fund and GMO Multi-Sector Fixed Income Fund received redemptionrequests in the amounts of $86,883,319 and $142,010,602, respectively.
* * *
For additional information regarding the Funds, please see the Funds� most recent annual or semiannual shareholder reportavailable on the SEC�s website, www.sec.gov, or visit GMO�s website at www.gmo.com.
Copyright © 2021 www.secdatabase.com. All Rights Reserved.Please Consider the Environment Before Printing This Document

GMO Climate Change Fund(A Series of GMO Trust)Schedule of Investments(showing percentage of total net assets)November 30, 2020 (Unaudited)
Shares Description Value ($)COMMON STOCKS �� 93.0%
Argentina �� 0.9%366,715 Adecoagro SA * 2,266,299
Australia �� 1.6%5,400,000 Clean TeQ Holdings Ltd * 1,080,206707,712 Sandfire Resources NL 2,277,786141,824 Tassal Group Ltd 376,775302,161 Western Areas Ltd (a) 498,495
Total Australia 4,233,262
Brazil �� 1.4%245,000 Duratex SA 858,831444,778 Sao Martinho SA 2,172,666139,200 SLC Agricola SA 699,196
Total Brazil 3,730,693
Canada �� 6.1%168,563 Canadian Solar Inc * (a) 7,207,754989,315 Ivanhoe Mines Ltd � Class A * 4,631,5822,322,300 Largo Resources Ltd * (a) 1,895,463107,500 Lundin Mining Corp 859,20576,100 NFI Group Inc (a) 1,150,260
Total Canada 15,744,264
China �� 6.2%647,400 CECEP Solar Energy Co Ltd � Class A 474,9261,543,000 Chaowei Power Holdings Ltd 648,3322,989,919 China High Speed Transmission Equipment Group Co
Ltd 2,148,021938,000 China Longyuan Power Group Corp Ltd � Class H 792,4612,040,000 China Suntien Green Energy Corp Ltd � Class H 539,7711,030,000 China Water Affairs Group Ltd 810,49178,100 Hollysys Automation Technologies Ltd 984,8411,944,000 Sinofert Holdings Ltd * 190,335218,822 Sungrow Power Supply Co Ltd � Class A 1,597,7221,338,000 Tianneng Power International Ltd 2,807,2541,194,000 Wasion Group Holdings Ltd 339,0901,017,400 Xinjiang Goldwind Science & Technology Co Ltd �
Class H 1,636,878555,776 Zhengzhou Yutong Bus Co Ltd � Class A 1,466,603455,285 Zhuzhou CRRC Times Electric Co Ltd � Class H 1,432,851
Total China 15,869,576
Denmark �� 1.1%1,706 Rockwool International A/S � Class B 622,13610,719 Vestas Wind Systems A/S 2,184,677
Total Denmark 2,806,813
Finland �� 3.4%60,134 Kemira Oyj 859,668117,088 Neste Oyj 7,823,851
Total Finland 8,683,519
Shares Description Value ($)France �� 7.0%
8,409 Albioma SA 426,978202,802 Electricite de France SA * 3,081,75531,420 Nexans SA * 1,979,4308,473 Schneider Electric SE 1,180,50529,713 STMicroelectronics NV 1,180,691148,665 Suez 2,843,78880,435 Valeo SA 3,103,168144,951 Veolia Environnement SA 3,325,04616,484 Vilmorin & Cie SA 980,180
Total France 18,101,541
Germany �� 3.2%19,251 CENTROTEC Sustainable AG * 344,375174,609 E.ON SE 1,889,3546,894 Infineon Technologies AG 243,227257,099 K+S AG (Registered) 2,311,113209 Knorr-Bremse AG 26,75425,095 Siemens AG (Registered) 3,349,546
Total Germany 8,164,369
India �� 0.4%854,622 Jain Irrigation Systems Ltd * 223,918267,776 Power Grid Corp of India Ltd 689,565
Total India 913,483
Israel �� 0.3%140,867 ICL Group Ltd 669,961
Italy �� 3.2%481,999 Enel SPA 4,835,810107,025 Prysmian SPA 3,522,917
Total Italy 8,358,727
Japan �� 5.8%1,300 Daikin Industries Ltd 294,43764,900 Ebara Corp 2,069,88379,000 GS Yuasa Corp 1,903,17021,500 Iseki & Co Ltd 281,71353,200 Kurita Water Industries Ltd 1,962,78615,900 METAWATER Co Ltd 360,15667,100 Osaki Electric Co Ltd 353,911292,700 Panasonic Corp 3,104,240243,200 Renesas Electronics Corp * 2,155,14319,700 Sanken Electric Co Ltd 716,46666,400 Takuma Co Ltd 1,137,12541,000 Tsukishima Kikai Co Ltd 472,055
Total Japan 14,811,085
Mexico �� 2.6%1,789,252 Grupo Mexico SAB de CV 6,507,095294,816 Grupo Rotoplas SAB de CV * (a) 316,694
Total Mexico 6,823,789
Copyright © 2021 www.secdatabase.com. All Rights Reserved.Please Consider the Environment Before Printing This Document

GMO Climate Change Fund(A Series of GMO Trust)Schedule of Investments �� (Continued)(showing percentage of total net assets)November 30, 2020 (Unaudited)
Shares Description Value ($)Netherlands �� 0.8%
68,578 Arcadis NV * (a) 2,094,587
Norway �� 1.5%354,472 Austevoll Seafood ASA 3,223,40138,208 Grieg Seafood ASA * (a) 328,2214,858 Salmar ASA * 265,553
Total Norway 3,817,175
Pakistan �� 0.3%1,088,535 Fauji Fertilizer Co Ltd 704,754
Portugal �� 1.4%651,588 EDP � Energias de Portugal SA 3,482,908
Russia �� 4.7%254,757 MMC Norilsk Nickel PJSC ADR 7,065,341297,118 PhosAgro PJSC GDR (Registered) 3,795,034116,061 Ros Agro Plc GDR (Registered) 1,235,694
Total Russia 12,096,069
Spain �� 2.4%9,324 Acciona SA (a) 1,188,9863,147 Construcciones y Auxiliar de Ferrocarriles SA * 132,29682,895 Endesa SA 2,382,61517,541 Fomento de Construcciones y Contratas SA 185,70676,226 Red Electrica Corp SA 1,558,293129,990 Talgo SA * 635,306
Total Spain 6,083,202
Sweden �� 0.3%18,234 Holmen AB � B Shares 789,657
Switzerland �� 1.3%992 Gurit Holding AG 2,496,64512,914 Landis+Gyr Group AG * 929,979
Total Switzerland 3,426,624
Taiwan �� 0.2%82,000 Delta Electronics Inc 646,454
Thailand �� 0.2%738,600 SPCG Pcl 524,822
Ukraine �� 0.7%137,904 Kernel Holding SA 1,782,972
United Kingdom �� 2.3%47,400 Abengoa Yield Plc 1,630,086300,364 Drax Group Plc 1,311,52085,071 Go-Ahead Group Plc * 921,06745,574 Polypipe Group Plc * 298,454
Shares Description Value ($)United Kingdom �� continued
2,220,793 Renewi Plc * 983,214938,643 Stagecoach Group Plc 753,268
Total United Kingdom 5,897,609
United States �� 33.7%34,000 AGCO Corp. 3,145,3408,260 Albemarle Corp. 1,123,112121,794 BorgWarner, Inc. 4,731,697193,596 Darling Ingredients, Inc. * 9,346,81525,100 Eaton Corp Plc 3,039,86114,900 Edison International 914,26424,600 EnerSys 2,012,52636,209 Enphase Energy, Inc. * 4,945,06343,700 Exelon Corp. 1,794,75950,289 First Solar, Inc. * 4,698,501241,632 Freeport-McMoRan, Inc. 5,651,77369,000 FutureFuel Corp. 827,3101,327,192 GrafTech International Ltd. 10,484,81790,500 Livent Corp. * (a) 1,372,885296,047 Mosaic Co. (The) 6,501,19220,600 MYR Group, Inc. * 1,053,27873,779 ON Semiconductor Corp. * 2,121,14647,600 Owens Corning 3,468,612145,328 Renewable Energy Group, Inc. * 8,440,65020,000 Rexnord Corp. 750,20030,344 SolarEdge Technologies, Inc. * 8,435,02510,529 TE Connectivity Ltd. 1,199,9903,900 Valmont Industries, Inc. 635,622
Total United States 86,694,438
TOTAL COMMON STOCKS(COST $193,451,496) 239,218,652
PREFERRED STOCKS (b) �� 2.0%
Chile �� 2.0%108,011 Sociedad Quimica y Minera de Chile SA Sponsored
ADR 5,084,078
TOTAL PREFERRED STOCKS(COST $3,382,757) 5,084,078
MUTUAL FUNDS �� 4.7%
United States �� 4.7%Affiliated Issuers �� 4.7%
2,418,493 GMO U.S. Treasury Fund (c) 12,189,207
TOTAL MUTUAL FUNDS(COST $12,189,207) 12,189,207
Copyright © 2021 www.secdatabase.com. All Rights Reserved.Please Consider the Environment Before Printing This Document

GMO Climate Change Fund(A Series of GMO Trust)Schedule of Investments �� (Continued)(showing percentage of total net assets)November 30, 2020 (Unaudited)
Shares Description Value ($)SHORT-TERM INVESTMENTS �� 0.2%
Money Market Funds �� 0.2%393,103 State Street Institutional Treasury Money Market
Fund � Premier Class, 0.01% (d) 393,103
TOTAL SHORT-TERM INVESTMENTS(COST $393,103) 393,103
TOTAL INVESTMENTS �� 99.9%(Cost $209,416,563) 256,885,040Other Assets and Liabilities (net) � 0.1% 227,417
TOTAL NET ASSETS �� 100.0% $257,112,457
Notes to Schedule of Investments:
* Non-income producing security.(a) All or a portion of this security is out on loan.(b) Preferred dividend rates are disclosed to the extent that a stated rate exists.(c) All or a portion of this security is purchased with collateral from securities
loaned.(d) The rate disclosed is the 7 day net yield as of November 30, 2020.
Portfolio Abbreviations:
ADR - American Depositary ReceiptGDR - Global Depositary ReceiptPJSC - Private Joint-Stock Company
Copyright © 2021 www.secdatabase.com. All Rights Reserved.Please Consider the Environment Before Printing This Document

GMO Cyclical Focus Fund(A Series of GMO Trust)Schedule of Investments(showing percentage of total net assets)November 30, 2020 (Unaudited)
Notes to Schedule of Investments:
* Non-income producing security.(a) Preferred dividend rates are disclosed to the extent that a stated rate exists.(b) The rate disclosed is the 7 day net yield as of November 30, 2020.
Portfolio Abbreviations:
Shares Description Value ($)COMMON STOCKS �� 94.5%
Canada �� 4.9%85,680 Brookfield Asset Management Inc � Class A 3,469,18362,600 Nutrien Ltd 3,084,302
Total Canada 6,553,485
Finland �� 3.5%70,072 Neste Oyj 4,682,230
France �� 8.6%4,483 Kering SA 3,236,5946,282 LVMH Moet Hennessy Louis Vuitton SE 3,608,35332,736 Safran SA * 4,772,058
Total France 11,617,005
Ireland �� 2.8%209,244 Ryanair Holdings Plc * 3,813,389
Mexico �� 5.9%449,700 Fomento Economico Mexicano SAB de CV 3,248,6591,306,800 Grupo Mexico SAB de CV Series B 4,752,529
Total Mexico 8,001,188
Russia �� 4.2%40,975 LUKOIL PJSC Sponsored ADR 2,637,77219,632 Novatek PJSC Sponsered GDR (Registered) 3,020,536
Total Russia 5,658,308
Spain �� 5.2%51,047 Amadeus IT Group SA 3,510,218107,679 Industria de Diseno Textil SA 3,574,337
Total Spain 7,084,555
United Kingdom �� 12.0%60,943 Berkeley Group Holdings Plc (The) 3,725,059244,681 Compass Group Plc 4,305,324121,417 Persimmon Plc 4,260,794248,477 Royal Dutch Shell Plc � B Shares 3,990,660
Total United Kingdom 16,281,837
United States �� 47.4%39,376 American Express Co. 4,669,6001,700 Booking Holdings, Inc. * 3,448,36598,400 BorgWarner, Inc. 3,822,84074,127 Charles Schwab Corp. (The) 3,615,91532,500 Chevron Corp. 2,833,35049,948 Coca-Cola Co. (The) 2,577,317
Shares Description Value ($)United States �� continued
73,552 EOG Resources, Inc. 3,448,11831,700 Hasbro, Inc. 2,949,05129,822 Hilton Worldwide Holdings, Inc. 3,090,45415,400 Honeywell International, Inc. 3,140,36852,463 Las Vegas Sands Corp. 2,922,71494,800 Lyft, Inc. � Class A * 3,618,5163,137 Markel Corp. * 3,054,90554,882 Raytheon Technologies Corp. 3,936,13793,287 Sensata Technologies Holding Plc * 4,555,204110,985 US Bancorp 4,795,66274,288 Verso Corp. � Class A 803,05349,423 VF Corp. 4,121,87897,579 Wells Fargo & Co. 2,668,785
Total United States 64,072,232
TOTAL COMMON STOCKS(COST $101,218,724) 127,764,229
PREFERRED STOCKS (a) �� 3.1%
Brazil �� 3.1%392,800 Bradespar SA 4,259,842
TOTAL PREFERRED STOCKS(COST $2,219,286) 4,259,842
MUTUAL FUNDS �� 2.1%
United States �� 2.1%Affiliated Issuers �� 2.1%
571,032 GMO U.S. Treasury Fund 2,878,000
TOTAL MUTUAL FUNDS(COST $2,878,000) 2,878,000
SHORT-TERM INVESTMENTS �� 0.2%
Money Market Funds �� 0.2%
251,996 State Street Institutional Treasury Money MarketFund � Premier Class, 0.01% (b) 251,996
TOTAL SHORT-TERM INVESTMENTS(COST $251,996) 251,996
TOTAL INVESTMENTS �� 99.9%(Cost $106,568,006) 135,154,067Other Assets and Liabilities (net) � 0.1% 95,055
TOTAL NET ASSETS �� 100.0% $135,249,122
Copyright © 2021 www.secdatabase.com. All Rights Reserved.Please Consider the Environment Before Printing This Document

ADR - American Depositary ReceiptGDR - Global Depositary ReceiptPJSC - Private Joint-Stock Company
Copyright © 2021 www.secdatabase.com. All Rights Reserved.Please Consider the Environment Before Printing This Document

GMO Emerging Domestic Opportunities Fund(A Series of GMO Trust)Schedule of Investments(showing percentage of total net assets)November 30, 2020 (Unaudited)
Shares Description Value ($)COMMON STOCKS �� 77.7%
Brazil �� 2.6%1,146,700 Atacadao SA 4,304,352653,000 B3 SA�Brasil Bolsa Balcao 6,841,5441,186,500 JHSF Participacoes SA 1,625,585472,300 Movida Participacoes SA 1,729,66915,968,800 Oi SA * 6,319,083521,900 Telefonica Brasil SA 4,359,396
Total Brazil 25,179,629
China �� 31.0%606,500 Alibaba Group Holding Ltd * 19,924,561145,076 Alibaba Group Holding Ltd Sponsored ADR * 38,207,215427,090 Anhui Conch Cement Co Ltd � Class H 2,729,90119,600 Autohome Inc ADR 1,850,632330,100 Bank of Ningbo Co Ltd � Class A 1,852,040434,800 Beijing Oriental Yuhong Waterproof Technology Co
Ltd � Class A 2,258,19644,000 Bilibili, Inc. Sponsored ADR * 2,765,840265,000 Chacha Food Co Ltd � Class A 2,171,4442,268,502 China Merchants Bank Co Ltd � Class H 14,378,3741,335,880 Focus Media Information Technology Co Ltd �
Class A 1,965,914380,565 Gree Electric Appliances Inc of Zhuhai � Class A 3,848,9841,834,000 Guangzhou Automobile Group Co Ltd � Class H 1,972,260299,100 Han�s Laser Technology Industry Group Co Ltd �
Class A 1,797,188284,800 JD.com Inc ADR * 24,307,680330,200 JD.com Inc � Class A * 14,170,097390,947 Jiangsu Hengli Hydraulic Co Ltd � Class A 5,446,76433,587 Kweichow Moutai Co Ltd � Class A 8,734,910455,500 Longfor Group Holdings Ltd 2,976,613241,000 Lufax Holding Ltd ADR* 3,969,270284,600 Luxshare Precision Industry Co Ltd � Class A 2,236,718300,000 Meituan � Class B * 11,218,9211,435,600 MGM China Holdings Ltd 2,089,376232,021 Midea Group Co Ltd � Class A 3,056,20128,400 NetEase Inc 528,52462,900 NetEase Inc ADR 5,684,27329,100 New Oriental Education & Technology Group Inc
Sponsored ADR * 4,797,13520,200 Pinduoduo, Inc ADR* 2,803,9621,449,246 Ping An Insurance Group Co of China Ltd � Class H 17,045,37626,300 QUALCOMM, Inc 3,870,57152,883 Shenzhen Mindray Bio-Medical Electronics Co Ltd
� Class A 2,705,181342,200 Shenzhou International Group Holdings Ltd 5,751,517515,362 Suofeiya Home Collection Co Ltd � Class A 2,137,46682,700 TAL Education Group ADR * 5,793,962
Shares Description Value ($)China �� continued
837,684 Tencent Holdings Ltd 61,065,219153,430 Wuliangye Yibin Co Ltd � Class A 5,917,400381,400 Xiaomi Corp � Class B * 1,302,15099,600 Yum China Holdings Inc 5,615,448327,000 Zhongsheng Group Holdings Ltd 2,458,617
Total China 301,405,900
France �� 0.2%5,956 L�Oreal SA 2,192,380
Greece �� 0.2%1,260,356 National Bank of Greece SA * 2,265,103
Hong Kong �� 0.9%796,400 AIA Group Ltd 8,739,998
Hungary �� 0.2%40,400 OTP Bank Plc * 1,607,887
India �� 9.2%54,337 Apollo Hospitals Enterprise Ltd 1,691,7471,492,887 Ashok Leyland Ltd 1,838,624340,804 Aurobindo Pharma Ltd 3,959,167559,310 Bandhan Bank Ltd * 2,742,800348,736 Central Depository Services India Ltd 2,304,546215,589 Cipla Ltd 2,145,0433,904,869 Gayatri Projects Ltd * 1,693,711570,610 HCL Technologies Ltd 6,306,692437,684 HDFC Bank Ltd * 8,436,304222,626 HDFC Life Insurance Co Ltd * 1,930,0841,255,876 ICICI Bank Ltd * 8,021,583204,000 ICICI Bank Ltd Sponsored ADR * 2,623,44015,137 IndiaMART InterMESH Ltd 1,034,764393,407 IndusInd Bank Ltd * 4,519,084461,034 Infosys Ltd 6,963,015162,100 Infosys Ltd Sponsored ADR 2,467,16248,168 Ipca Laboratories Ltd 1,440,096254,806 Muthoot Finance Ltd 3,927,77493,009 Reliance Industries Ltd 2,418,439368,821 SBI Cards & Payment Services Ltd 3,955,66782,767 Tata Consultancy Services Ltd 2,972,221297,873 Tata Consumer Products Ltd 2,145,263508,238 Tech Mahindra Ltd 5,907,10852,932 Torrent Pharmaceuticals Ltd 1,866,219938,532 Wipro Ltd 4,440,4528,547,592 Yes Bank Ltd * 1,696,126
Total India 89,447,131
Indonesia �� 0.6%2,647,700 Bank Central Asia Tbk PT 5,815,259
Copyright © 2021 www.secdatabase.com. All Rights Reserved.Please Consider the Environment Before Printing This Document

GMO Emerging Domestic Opportunities Fund(A Series of GMO Trust)Schedule of Investments �� (Continued)(showing percentage of total net assets)November 30, 2020 (Unaudited)
Shares Description Value ($)Japan �� 0.2%
9,500 Daikin Industries Ltd 2,151,652
Mexico �� 0.6%2,176,424 Wal-Mart de Mexico SAB de CV 5,729,061
Philippines �� 1.3%478,700 BDO Unibank Inc 1,029,796220,410 GT Capital Holdings Inc 2,657,81188,170 PLDT Inc 2,409,5392,652,480 Puregold Price Club Inc 2,324,771449,500 Security Bank Corp 1,166,3459,925,400 Semirara Mining & Power Corp 2,557,261
Total Philippines 12,145,523
Poland �� 0.2%118,225 Bank Polska Kasa Opieki SA * 1,789,467
Russia �� 2.4%1,002,290 Detsky Mir PJSC 1,843,1051,348,600 Moscow Exchange MICEX-RTS PJSC 2,706,666405,868 Sberbank of Russia PJSC Sponsored ADR 5,354,041119,850 X5 Retail Group NV GDR (Registered) 4,288,958131,500 Yandex NV � Class A * 9,068,240
Total Russia 23,261,010
South Africa �� 0.5%1,606,023 FirstRand Ltd 4,710,253
South Korea �� 10.2%17,195 E-MART Inc 2,391,0866,613 Kakao Corp 2,203,969155,570 KB Financial Group Inc 6,431,2881,893 LG Household & Health Care Ltd 2,587,6047,449 NAVER Corp 1,875,3471,200,851 Samsung Electronics Co Ltd 72,388,20473,550 Shinhan Financial Group Co Ltd 2,165,749102,891 SK Hynix Inc 9,066,581
Total South Korea 99,109,828
Taiwan �� 14.2%335,458 Advantech Co Ltd 3,607,233172,000 Airtac International Group 5,014,7993,660,000 CTBC Financial Holding Co Ltd 2,461,7671,107,000 Delta Electronics Inc 8,727,1261,455,000 E Ink Holdings Inc 2,097,3304,191,991 E.Sun Financial Holding Co Ltd 3,709,554235,000 MediaTek Inc 5,803,312765,000 Micro-Star International Co Ltd 3,350,4971,596,000 Pegatron Corp 3,651,5722,095,000 Quanta Computer Inc 5,654,897512,000 Sinbon Electronics Co Ltd 3,503,0683,162,385 Taiwan Cement Corp 4,759,300
Shares Description Value ($)Taiwan �� continued
4,729,800 Taiwan Semiconductor Manufacturing Co Ltd 80,509,8493,289,000 Wistron Corp 3,440,128142,000 Yageo Corp 2,201,735
Total Taiwan 138,492,167
Thailand �� 0.7%649,800 Advanced Info Service Pcl (Foreign Registered) 3,770,3471,579,200 CP ALL Pcl (Foreign Registered) * 3,158,335
Total Thailand 6,928,682
United States �� 1.3%30,100 Apple, Inc. 3,583,40512,450 Facebook, Inc. � Class A * 3,448,27737,900 PepsiCo, Inc. 5,466,317
Total United States 12,497,999
Vietnam �� 1.2%1,982,170 Bank for Foreign Trade of Vietnam JSC 7,973,778839,690 Vietnam Dairy Products JSC 3,923,126
Total Vietnam 11,896,904
TOTAL COMMON STOCKS(COST $634,627,412) 755,365,833
PREFERRED STOCKS (a) �� 1.9%
Brazil �� 1.9%297,900 Azul SA* 2,114,1143,040,900 Itau Unibanco Holding SA 16,210,868
Total Brazil 18,324,982
TOTAL PREFERRED STOCKS(COST $15,792,281) 18,324,982
INVESTMENT FUNDS �� 17.8%
China �� 5.4%967,500 iShares China Large-Cap ETF 45,472,50087,000 iShares MSCI China ETF 6,943,470
Total China 52,415,970
Mexico �� 1.2%277,700 iShares MSCI Mexico ETF 11,266,289
Russia �� 2.0%868,200 VanEck Vectors Russia ETF 19,794,960
South Korea �� 0.4%133,330 Samsung Kodex 200 ETF 4,181,007
United States �� 8.8%1,459,223 iShares Core MSCI Emerging Markets ETF 85,539,652
TOTAL INVESTMENT FUNDS(COST $162,610,499) 173,197,878
Copyright © 2021 www.secdatabase.com. All Rights Reserved.Please Consider the Environment Before Printing This Document

GMO Emerging Domestic Opportunities Fund(A Series of GMO Trust)Schedule of Investments �� (Continued)(showing percentage of total net assets)November 30, 2020 (Unaudited)
As of November 30, 2020, for the above contracts and/or agreements, the Fund had sufficient cash and/or securities to covercommitments or collateral requirements, if any, of the relevant broker or exchange.
Shares /Par Value�� Description Value ($)
MUTUAL FUNDS �� 1.7%
United States �� 1.7%Affiliated Issuers �� 1.7%
3,209,497 GMO U.S. Treasury Fund 16,175,866
TOTAL MUTUAL FUNDS(COST $16,175,866) 16,175,866
SHORT-TERM INVESTMENTS �� 1.0%
Money Market Funds �� 0.5%5,147,922 State Street Institutional Treasury Money
Market Fund � Premier Class, 0.01% (b) 5,147,922Total Money Market Funds 5,147,922
U.S. Government �� 0.5%5,000,000 U.S. Treasury Bill, 0.07%, due 01/14/21 (c) (d) 4,999,557
TOTAL SHORT-TERM INVESTMENTS(COST $10,147,087) 10,147,479
TOTAL INVESTMENTS �� 100.1%(Cost $839,353,145) 973,212,038Other Assets and Liabilities (net) � (0.1%) (991,814 )
TOTAL NET ASSETS �� 100.0% $972,220,224
A summary of outstanding financial instruments atNovember 30, 2020 is as follows:
Forward Currency Contracts
SettlementDate
Counter-party
CurrencySold
CurrencyPurchased
NetUnrealized
Appreciation(Depreciation)
($)02/25/2021 MSCI THB 1,537,784,049 USD 48,609,987 (2,209,109 )
02/25/2021 MSCI USD 48,894,048 THB 1,537,784,049 1,925,048
$ (284,061 )
Notes to Schedule of Investments:
� Denominated in U.S. Dollar, unless otherwise indicated.* Non-income producing security.(a) Preferred dividend rates are disclosed to the extent that a stated rate exists.(b) The rate disclosed is the 7 day net yield as of November 30, 2020.(c) All or a portion of this security has been pledged to cover margin
requirements on futures and/or cleared swap contracts, collateral on OTCswap contracts, forward currency contracts, and/or written options, if any.
(d) The rate shown represents yield-to-maturity.
Counterparty Abbreviations:
MSCI - Morgan Stanley & Co. International PLC
Currency Abbreviations:
THB - Thai BahtUSD - United States Dollar
Copyright © 2021 www.secdatabase.com. All Rights Reserved.Please Consider the Environment Before Printing This Document

Portfolio Abbreviations:ADR - American Depositary ReceiptETF - Exchange-Traded FundForeign Registered - Shares issued to foreign investors in markets that haveforeign ownership limits.GDR - Global Depositary ReceiptJSC - Joint-Stock CompanyPJSC - Private Joint-Stock Company
Copyright © 2021 www.secdatabase.com. All Rights Reserved.Please Consider the Environment Before Printing This Document

GMO Emerging Markets Fund(A Series of GMO Trust)Schedule of Investments(showing percentage of total net assets)November 30, 2020 (Unaudited)
Shares Description Value ($)COMMON STOCKS �� 91.8%
Argentina �� 0.4%228,200 Banco BBVA Argentina SA ADR * (a) 730,24016,800 Banco Macro SA ADR * 268,29647,400 Globant SA * 8,943,432351,800 Grupo Financiero Galicia SA ADR 3,028,998
Total Argentina 12,970,966
Brazil �� 0.6%3,075,000 Cielo SA 2,037,6022,364,400 Cogna Educacao * 2,069,8541,695,300 IRB Brasil Resseguros SA 2,098,002241,400 Porto Seguro SA 2,135,805688,600 WEG SA 9,456,136
Total Brazil 17,797,399
Chile �� 0.1%4,443,378 Aguas Andinas SA � Class A 1,288,865132,686 Empresa Nacional de Telecomunicaciones SA 804,58049,617 Inversiones La Construccion SA 309,877
Total Chile 2,403,322
China �� 36.8%4,972,000 361 Degrees International Ltd 622,6631,488,000 Agile Group Holdings Ltd 2,148,43697,037,590 Agricultural Bank of China Ltd � Class H 36,844,60192,000 AK Medical Holdings Ltd 144,931121,900 Alibaba Group Holding Ltd * 4,004,623657,826 Alibaba Group Holding Ltd Sponsored ADR * 173,245,0552,889,699 Anhui Conch Cement Co Ltd � Class H 18,470,5621,369,199 Anhui Expressway Co Ltd � Class H 780,176424,000 Asia Cement China Holdings Corp 423,3375,682,500 BAIC Motor Corp Ltd � Class H 2,126,06757,582,682 Bank of China Ltd � Class H 20,324,1781,696,425 Beijing North Star Co Ltd � Class H 352,194733,200 BEST Inc ADR * 2,148,276642,500 Budweiser Brewing Co APAC Ltd 2,205,705419,426 BYD Co Ltd � Class A 10,910,805389,500 BYD Electronic International Co Ltd 1,926,6509,673,878 China Communications Services Corp Ltd �
Class H 5,155,427132,088,148 China Construction Bank Corp � Class H 103,257,6033,945,000 China Dongxiang Group Co Ltd 457,9744,564,000 China Eastern Airlines Corp Ltd � Class H 2,060,8829,196,000 China Feihe Ltd 21,961,949532,300 China International Travel Service Corp Ltd �
Class A 15,597,5437,546,000 China Jinmao Holdings Group Ltd 3,888,704174,000 China Kepei Education Group Ltd 134,7572,357,000 China Lesso Group Holdings Ltd 4,213,112934,000 China Life Insurance Co Ltd � Class H 2,107,7739,465,000 China Machinery Engineering Corp � Class H 1,978,9281,104,000 China Medical System Holdings Ltd 1,127,252
Shares Description Value ($)China �� continued
115,464 China Merchants Bank Co Ltd � Class A 775,9344,636,000 China Oriental Group Co Ltd 1,389,3431,165,000 China Overseas Grand Oceans Group Ltd 694,8186,801,500 China Overseas Land & Investment Ltd 16,560,2114,783,000 China Railway Signal & Communication Corp Ltd �
Class H 1,696,96415,241,000 China Reinsurance Group Corp � Class H 1,612,3785,412,000 China Resources Cement Holdings Ltd 6,721,312356,000 China Resources Gas Group Ltd 1,715,8066,486,000 China Resources Land Ltd 28,069,382550,000 China SCE Group Holdings Ltd 251,8584,589,500 China Shenhua Energy Co Ltd � Class H 8,851,65790,781 China Vanke Co Ltd � Class H 344,80048,000 Chinasoft International Ltd * 50,8254,884,000 COSCO Shipping Energy Transportation Co Ltd �
Class H 2,148,66910,376,714 Country Garden Holdings Co Ltd 13,683,651260,000 Country Garden Services Holdings Co Ltd 1,452,7463,058,000 Dongyue Group Ltd 1,595,020300 ENN Energy Holdings Ltd 3,958163,000 Fu Shou Yuan International Group Ltd 164,0515,052,000 Geely Automobile Holdings Ltd 13,975,9962,127,000 Greenland Hong Kong Holdings Ltd 657,4877,196,000 Guangdong Investment Ltd 11,931,6718,400 Guangdong Tapai Group Co Ltd � Class A 17,4551,488,600 Guotai Junan Securities Co Ltd � Class H 2,192,838413,000 Haier Electronics Group Co Ltd 1,968,817166,000 Haitian International Holdings Ltd 449,721679,922 Hangzhou Robam Appliances Co Ltd � Class A 4,123,8671,856,500 Hebei Construction Group Corp Ltd � Class H 5,269,79936,000 Hengan International Group Co Ltd 247,6076,404,568 Hisense Home Appliances Group Co Ltd � Class A 14,538,257313,000 Hisense Home Appliances Group Co Ltd � Class H 470,450240,000 Hollysys Automation Technologies Ltd 3,026,40064,000 Hopson Development Holdings Ltd 167,19310,248,000 Hua Han Health Industry Holdings Ltd *(b) 687,5151,152,342 Huayu Automotive Systems Co Ltd � Class A 5,465,26088,472,847 Industrial & Commercial Bank of China Ltd � Class H 55,890,4972,200 KE Holdings Inc ADR * 143,7261,557,500 Kingboard Laminates Holdings Ltd 2,512,67368,707 Kweichow Moutai Co Ltd � Class A 17,868,504922,250 KWG Living Group Holdings Ltd * 713,9033,317,500 KWG Property Holding Ltd 4,538,6021,213,500 Legend Holdings Corp � Class H 1,650,136387,800 Livzon Pharmaceutical Group Inc � Class H 1,527,7203,227,000 Logan Group Co Ltd 5,402,2002,486,000 Longfor Group Holdings Ltd 16,245,5783,868,000 Lonking Holdings Ltd 1,116,873293,700 Lufax Holding Ltd ADR* 4,837,239550,506 Midea Group Co Ltd � Class A 7,251,313186,100 NetEase Inc 3,463,320783,500 NetEase Inc ADR 70,804,895
Copyright © 2021 www.secdatabase.com. All Rights Reserved.Please Consider the Environment Before Printing This Document

GMO Emerging Markets Fund(A Series of GMO Trust)Schedule of Investments �� (Continued)(showing percentage of total net assets)November 30, 2020 (Unaudited)
Shares Description Value ($)China �� continued
670,693 New China Life Insurance Co Ltd � Class A 6,251,3751,673,000 PAX Global Technology Ltd 1,039,62930,949,000 PICC Property & Casualty Co Ltd � Class H 25,536,3023,783,000 Postal Savings Bank of China Co Ltd � Class H 2,138,2865,848,400 Qingling Motors Co Ltd � Class H 1,147,310181,000 Road King Infrastructure Ltd 242,8493,606,000 Shanghai Electric Group Co Ltd � Class H * 1,037,457668,000 Shanghai Industrial Holdings Ltd 992,8151,632,000 Shenzhen Expressway Co Ltd � Class H 1,627,5683,750,789 Shenzhen Investment Ltd 1,372,8163,467,481 Shenzhen YUTO Packaging Technology Co Ltd �
Class A 13,853,7425,287,000 Shimao Group Holdings Ltd 19,705,5874,439,000 Sino-Ocean Land Holdings Ltd 933,4951,669,000 Sinopec Engineering Group Co Ltd � Class H 738,5676,434,000 Sinopec Shanghai Petrochemical Co Ltd �
Class H 1,427,7392,134,000 Sinotruk Hong Kong Ltd 5,317,7633,523,500 SOHO China Ltd * 1,095,5464,999,924 Suofeiya Home Collection Co Ltd � Class A 20,737,203893,665 Tencent Holdings Ltd 65,146,10415,900 Tencent Holdings Ltd ADR 1,160,7002,218,000 Tianneng Power International Ltd 4,653,5791,507,900 Vipshop Holdings Ltd ADR * 38,511,76611,148,676 Weifu High-Technology Group Co Ltd � Class A 43,901,58340,443 Wuhu Sanqi Interactive Entertainment Network
Technology Group Co Ltd � Class A 160,6881,472,200 Xiaomi Corp � Class B * 5,026,286220,000 Xinyi Glass Holdings Ltd 493,3921,677,500 Xtep International Holdings Ltd 713,65142,656,300 Yangzijiang Shipbuilding Holdings Ltd 27,718,8823,064,000 Yuzhou Group Holdings Co Ltd 1,217,528363,667 Zhejiang Supor Co Ltd � Class A 3,868,1541,609,500 Zhongsheng Group Holdings Ltd 12,101,3581,444,800 Zhuzhou Kibing Group Co Ltd � Class A 2,554,101
Total China 1,097,984,879
Czech Republic �� 0.1%634,781 Moneta Money Bank AS * 1,885,887
Egypt �� 0.0%42,517 Commercial International Bank Egypt SAE 169,402
Greece �� 0.0%96,241 Motor Oil Hellas Corinth Refineries SA 1,229,520
Hungary �� 0.0%15,348 Richter Gedeon Nyrt 363,719
India �� 3.3%256,987 Asian Paints Ltd 7,595,96414,229 Bosch Ltd 2,441,69811,567,064 Gayatri Projects Ltd * (c) 5,017,136
Shares Description Value ($)India �� continued
598,198 HCL Technologies Ltd 6,611,609230,960 HDFC Bank Ltd * 4,451,7252 Hero MotoCorp Ltd 83261,937 Hindustan Unilever Ltd 7,537,423252,428 Housing Development Finance Corp Ltd 7,594,8091,332,810 ICICI Bank Ltd * 8,512,979476,400 Infosys Ltd Sponsored ADR 7,250,8083,013,682 Jai Balaji Industries Ltd * 774,1911,322,083 Kiri Industries Ltd 9,209,874386,197 Kotak Mahindra Bank Ltd * 9,776,119563,047 LIC Housing Finance Ltd 2,498,33660 Muthoot Finance Ltd 925193,830 Tata Consultancy Services Ltd 6,960,572312,651 Titan Co Ltd 5,589,2311,548,435 Wipro Ltd 7,326,070
Total India 99,149,552
Indonesia �� 2.8%5,027,600 Astra International Tbk PT 1,882,4562,635,500 Bank BTPN Syariah Tbk PT 771,18310,964,900 Bank Central Asia Tbk PT 24,082,68912,813,600 Bank Mandiri Persero Tbk PT 5,747,16713,491,200 Bank Negara Indonesia Persero Tbk PT 5,721,1382,372,600 Bank Pembangunan Daerah Jawa Barat Dan Banten
Tbk PT 222,50919,718,900 Bank Pembangunan Daerah Jawa Timur Tbk PT 886,95280,204,200 Bank Rakyat Indonesia Persero Tbk PT 23,197,10518,560,300 Bank Tabungan Negara Persero Tbk PT 2,163,74621,450,700 Bukit Asam Tbk PT 3,582,67719,110,900 Hanjaya Mandala Sampoerna Tbk PT 2,064,0315,802,391 Indo Tambangraya Megah Tbk PT 5,383,0616,222,100 Matahari Department Store Tbk PT * 557,07415,171,500 Pakuwon Jati Tbk PT * 537,671203,497,200 Panin Financial Tbk PT * 3,224,63943,302,700 Ramayana Lestari Sentosa Tbk PT 2,236,819650,600 United Tractors Tbk PT 1,059,3536,344,200 XL Axiata Tbk PT 1,082,827
Total Indonesia 84,403,097
Kuwait �� 1.3%43,233 Agility Public Warehousing Co KSC 90,8681,064,784 Alimtiaz Investment Group KSC * 336,104145,962 Burgan Bank SAK 94,09390,149 Gulf Cable & Electrical Industries Co KSCP 211,843182,392 Humansoft Holding Co KSC * 2,030,0117,247,292 Kuwait Finance House KSCP 16,163,9371,457,954 Kuwait Projects Co Holding KSCP 708,327430,806 Mobile Telecommunications Co KSC 819,4106,208,958 National Bank of Kuwait SAKP 17,098,96589,823 Qurain Petrochemical Industries Co 92,345
Total Kuwait 37,645,903
Copyright © 2021 www.secdatabase.com. All Rights Reserved.Please Consider the Environment Before Printing This Document

GMO Emerging Markets Fund(A Series of GMO Trust)Schedule of Investments �� (Continued)(showing percentage of total net assets)November 30, 2020 (Unaudited)
Shares Description Value ($)Malaysia �� 0.0%
63,600 Carlsberg Brewery Malaysia Berhad � Class B 300,359205,800 Hartalega Holdings Berhad 726,5902,210,500 YTL Corp Berhad * 349,969
Total Malaysia 1,376,918
Mexico �� 2.5%1,237,800 Banco del Bajio SA * 1,543,4033,335,400 Banco Santander Mexico SA Institucion de Banca
Multiple Grupo Financiero Santand (a) 3,469,037344,200 Concentradora Fibra Danhos SA de CV (REIT) 408,2321,679,200 Credito Real SAB de CV SOFOM ER * 948,848296,400 El Puerto de Liverpool SAB de CV � Class C1 * (a) 986,1305,258,800 Fibra Uno Administracion SA de CV (REIT) 5,248,327687,100 Gentera SAB de CV * 295,779908,500 Grupo Aeroportuario del Centro Norte SAB de CV * 5,284,15910,400 Grupo Aeroportuario del Centro Norte SAB de CV
ADR * 484,2247,713,000 Grupo Financiero Banorte SAB de CV � Class O * 38,404,2351,024,300 Grupo Financiero Inbursa SAB de CV � Class O * 998,4392,441,100 Grupo Mexico SAB de CV Series B 8,877,71680,900 Industrias Bachoco SAB de CV� Series B 279,764189,000 Kimberly-Clark de Mexico SAB de CV � Class A 299,628293,427 Qualitas Controladora SAB de CV 1,425,303599,700 Regional SAB de CV * 2,557,225545,190 Unifin Financiera SAB de CV SOFOM ENR * 676,556431,800 Wal-Mart de Mexico SAB de CV 1,136,639
Total Mexico 73,323,644
Pakistan �� 0.4%461,510 Engro Corp Ltd 881,6025,359,782 Engro Fertilizers Ltd 2,037,0191,406,023 Fauji Fertilizer Co Ltd 910,307411,500 National Bank of Pakistan * 104,5974,748,084 Oil & Gas Development Co Ltd 2,917,916705,011 Pakistan Oilfields Ltd 1,738,4242,975,446 Pakistan Petroleum Ltd 1,681,038299,159 Pakistan State Oil Co Ltd * 373,502816,800 Searle Co Ltd (The) 1,193,2941,337,740 United Bank Ltd 1,012,046
Total Pakistan 12,849,745
Philippines �� 0.3%360,810 Manila Electric Co 2,109,53035,122,800 Megaworld Corp * 2,802,52119,853,000 Metro Pacific Investments Corp 1,690,609243,900 Metropolitan Bank & Trust Co 243,6031,401,400 Robinsons Land Corp 486,052251,700 Security Bank Corp 653,1016,401,200 Semirara Mining & Power Corp 1,649,257
Total Philippines 9,634,673
Shares Description Value ($)Poland �� 1.0%
46,447 Budimex SA 3,395,298234,647 Grupa Lotos SA 2,167,42551,629 Lubelski Wegiel Bogdanka SA * 256,58427,366 mBank SA * 1,103,8563,350,926 Powszechny Zaklad Ubezpieczen SA * 22,478,79113,832 Santander Bank Polska SA * 643,492
Total Poland 30,045,446
Qatar �� 0.6%1,456,860 Doha Bank QPSC * 936,206425,994 Masraf Al Rayan QSC 499,752141,417 Qatar Electricity & Water Co QSC 699,503206,002 Qatar Insurance Co SAQ 143,38522,115 Qatar Islamic Bank SAQ 101,0372,707,202 Qatar National Bank QPSC 13,140,4361,040,242 Qatar National Cement Co QSC 1,162,107
Total Qatar 16,682,426
Russia �� 13.9%27,618,810 Alrosa PJSC 31,852,9586,411,000 Credit Bank of Moscow PJSC * 503,2581,169,230 Detsky Mir PJSC 2,150,0901,049,970,000 Federal Grid Co Unified Energy System PJSC 2,753,959353,210 Gazprom Neft PJSC 1,460,7038,830 Gazprom Neft PJSC Sponsored ADR 178,331686,124 Globaltrans Investment Plc Sponsored GDR
(Registered) 3,926,38089,797,000 Inter RAO UES PJSC 6,030,55295,648 LSR Group PJSC 1,138,577696,477 LSR Group PJSC GDR (Registered) 1,636,208889,780 LUKOIL PJSC Sponsored ADR 57,279,725551,497 M.Video PJSC 5,210,1907,396 Magnit PJSC Sponsored GDR (Registered) 111,13513,172,100 Magnitogorsk Iron & Steel Works PJSC 7,251,067237,839 Magnitogorsk Iron & Steel Works PJSC Sponsored
GDR (Registered) 1,632,0722,345,590 MMC Norilsk Nickel PJSC ADR 65,051,767785,300 Mobile TeleSystems PJSC Sponsored ADR 6,777,13912,868,757 Moscow Exchange MICEX-RTS PJSC 25,827,83744,641 Novatek PJSC Sponsered GDR (Registered) 6,868,3671,053,247 Novolipetsk Steel PJSC GDR 26,056,98845,833 PhosAgro PJSC GDR (Registered) 585,4171,532,343 Polymetal International Plc 31,922,42419,505 Polyus PJSC 3,723,301182,080 Polyus PJSC GDR (Registered) 17,224,902209,315 QIWI Plc Sponsored ADR 3,047,626930,210 Raspadskaya OJSC 1,781,43282,660 Safmar Financial Investment * 508,5351,199,012 Sberbank of Russia PJSC Sponsored ADR 15,816,864556,037 Severstal PJSC GDR (Registered) 8,085,47823,335,400 Surgutneftegas PJSC 10,779,1684,762,114 Surgutneftegas PJSC Sponsored ADR 21,388,464
Copyright © 2021 www.secdatabase.com. All Rights Reserved.Please Consider the Environment Before Printing This Document

GMO Emerging Markets Fund(A Series of GMO Trust)Schedule of Investments �� (Continued)(showing percentage of total net assets)November 30, 2020 (Unaudited)
Shares Description Value ($)Russia �� continued
816,056 Tatneft PJSC Sponsored ADR 30,773,955245,436 TCS Group Holding Plc GDR (Registered) 7,529,13389,279,000 Unipro PJSC 3,241,20729,555 X5 Retail Group NV GDR (Registered) 1,057,65770,300 Yandex NV � Class A * 4,847,888
Total Russia 416,010,754
Saudi Arabia �� 0.0%46,565 Al Rajhi Bank 927,89130,520 Arriyadh Development Co 143,460
Total Saudi Arabia 1,071,351
South Africa �� 3.0%47,355 Anglo American Platinum Ltd 3,434,924220,151 Aspen Pharmacare Holdings Ltd * 1,748,41456,443 Astral Foods Ltd 489,942140,971 AVI Ltd 646,348171,697 Barloworld Ltd 771,85997,215 Clicks Group Ltd 1,467,887100,229 Discovery Ltd 793,9361,688,726 Emira Property Fund Ltd (REIT) 709,9362 Foschini Group Ltd (The) 13628,900 Gold Fields Ltd Sponsored ADR 5,477,7194,199,059 Growthpoint Properties Ltd (REIT) 3,224,392717,313 Investec Ltd 1,741,146102,212 Kumba Iron Ore Ltd 3,473,959785,177 Lewis Group Ltd 1,115,7562,121,270 Life Healthcare Group Holdings Ltd 2,168,3562,115,852 Momentum Metropolitan Holdings 2,127,295796,173 Mr Price Group Ltd 8,324,27115,662,449 Old Mutual Ltd 11,764,3051,759,420 Pepkor Holdings Ltd 1,567,84299,267 Rand Merchant Investment Holdings Ltd 194,368125,738 Remgro Ltd 742,50117,226,323 RMB Holdings Ltd * 1,417,7405,753,675 Sanlam Ltd 20,497,21644,780 Shoprite Holdings Ltd 370,32881,575 Tiger Brands Ltd 1,033,4463,176,467 Truworths International Ltd 7,328,161377,683 Vodacom Group Ltd 2,997,355386,813 Wilson Bayly Holmes-Ovcon Ltd * 2,530,514
Total South Africa 88,159,929
South Korea �� 1.3%421,556 BNK Financial Group Inc 2,144,82944,721 Daou Data Corp 507,51266,624 DB HiTek Co Ltd 2,139,572155,761 DB Insurance Co Ltd 6,193,3681,172,630 Dongwon Development Co Ltd 4,676,73719,574 Doosan Fuel Cell Co Ltd * 882,36010,663 GS Home Shopping Inc 1,323,79924,271 Hy-Lok Corp 300,859409,047 Korea Asset In Trust Co Ltd 1,464,305
Shares Description Value ($)South Korea �� continued
23,797 KT Skylife Co Ltd 193,1911,985 NCSoft Corp 1,458,56022,248 NHN KCP Corp 1,345,882118,357 Posco International Corp 1,422,57338,668 S&T Motiv Co Ltd 1,737,4947,195 Samsung Electronics Co Ltd GDR 10,899,63530,847 Sangsangin Co Ltd 180,44036,382 Soulbrain Holdings Co Ltd 1,420,097
Total South Korea 38,291,213
Sri Lanka �� 0.0%103,983,101 Anilana Hotels & Properties Ltd * (b) (c) 662,576
Taiwan �� 20.5%61,000 Acter Group Corp Ltd 414,1331,206,035 Advantech Co Ltd 12,968,6861,013,000 Alchip Technologies Ltd 23,749,620298,227 Amazing Microelectronic Corp 962,626701,689 Asustek Computer Inc 6,120,580437,000 Aten International Co Ltd 1,276,361129,200 Aurora Corp 392,5757,597,000 Catcher Technology Co Ltd 50,140,4173,776,153 Cathay Financial Holding Co Ltd 5,351,9922,992,865 Chailease Holding Co Ltd 16,419,236327,000 Chicony Electronics Co Ltd 979,1726,370,000 China Development Financial Holding Corp 1,994,929772,000 Chong Hong Construction Co Ltd 2,248,4144,541,400 Coretronic Corp 5,596,17043,151,720 CTBC Financial Holding Co Ltd 29,024,44995,000 Delta Electronics Inc 748,940654,000 Elan Microelectronics Corp 3,030,8041,609,000 Elite Material Co Ltd 8,809,3004,795,000 Eva Airways Corp 2,128,1201,758,000 Farglory Land Development Co Ltd 3,221,4945,071,000 FLEXium Interconnect Inc 21,368,174821,000 Formosa Taffeta Co Ltd 882,8583,115,075 Foxconn Technology Co Ltd 5,748,84312,666,000 Fubon Financial Holding Co Ltd 19,687,5042,435,000 Grand Pacific Petrochemical * 2,000,45120,989,532 Hon Hai Precision Industry Co Ltd 60,593,7111,966,000 Huaku Development Co Ltd 6,089,4011,431,806 IEI Integration Corp 2,419,464133,900 Innodisk Corp 766,796640,000 International Games System Co Ltd 15,258,166278,000 Kung Long Batteries Industrial Co Ltd 1,366,0023,473,000 Lite-On Technology Corp 5,852,735121,000 Lotes Co Ltd 1,890,1021,326,000 Merry Electronics Co Ltd 6,588,8142,021,000 Micro-Star International Co Ltd 8,851,44367,000 Nan Liu Enterprise Co Ltd 453,691952,000 Nantex Industry Co Ltd 2,052,4031,252,810 Novatek Microelectronics Corp 13,149,262450,000 Pegatron Corp 1,029,579
Copyright © 2021 www.secdatabase.com. All Rights Reserved.Please Consider the Environment Before Printing This Document

GMO Emerging Markets Fund(A Series of GMO Trust)Schedule of Investments �� (Continued)(showing percentage of total net assets)November 30, 2020 (Unaudited)
Shares Description Value ($)Taiwan �� continued
404,000 Quanta Computer Inc 1,090,49110,770,870 Radiant Opto-Electronics Corp 43,867,4414,000 Realtek Semiconductor Corp 51,998800,000 Shinkong Insurance Co Ltd 1,092,7121,416,068 Simplo Technology Co Ltd 16,464,7542,110,250 Syncmold Enterprise Corp 6,407,24241,300 Tah Hsin Industrial Corp 105,42477,000 Taiwan Cement Corp 115,8839,355,000 Taiwan Semiconductor Manufacturing Co Ltd 159,239,21510 Taiwan Semiconductor Manufacturing Co Ltd
Sponsored ADR 970337,000 Test Research Inc 670,07554,000 Thinking Electronic Industrial Co Ltd 276,7621,361,000 Transcend Information Inc 3,082,7261,321,160 Tripod Technology Corp 5,682,27790,000 TXC Corp 252,853785,224 United Integrated Services Co Ltd 6,299,6746,213,000 United Microelectronics Corp 8,825,815286,000 Universal Inc 1,069,77745,000 Vanguard International Semiconductor Corp 165,772121,000 Wiwynn Corp 2,897,588153,000 Yulon Nissan Motor Co Ltd 1,404,408327,000 Zeng Hsing Industrial Co Ltd 1,594,463
Total Taiwan 612,285,737
Thailand �� 0.5%141,900 Bangkok Bank Pcl (Foreign Registered) 583,94220,194,100 Beauty Community Pcl (Foreign Registered) * 1,028,06391,700 Carabao Group Pcl � Class F 365,586120,200 Hana Microelectronics Pcl (Foreign Registered) 169,77923,317,600 IRPC Pcl NVDR 2,096,657237,800 KCE Electronics Pcl (Foreign Registered) 316,199258,600 Kiatnakin Phatra Bank Pcl (Foreign Registered) 422,2871,586,600 Krung Thai Bank Pcl (Foreign Registered) 560,048841,600 Origin Property Pcl (Foreign Registered) 215,6113,787,700 Pruksa Holding Pcl (Foreign Registered) 1,565,6205,757,392 Quality Houses Pcl (Foreign Registered) 441,405146,000 Siam Commercial Bank Pcl (The) (Foreign
Registered) 411,973659,200 SPCG Pcl 468,4033,963,875 Supalai Pcl (Foreign Registered) 2,344,765465,300 Thai Vegetable Oil Pcl (Foreign Registered) 500,05158,190,900 TMB Bank Pcl NVDR 2,019,8491,248,000 TTW Pcl (Foreign Registered) 524,3021,679,500 Univentures Pcl (Foreign Registered) 168,864
Total Thailand 14,203,404
Turkey �� 1.4%573,782 Anadolu Efes Biracilik Ve Malt Sanayii AS 1,536,4447,621,394 Aselsan Elektronik Sanayi Ve Ticaret AS 16,847,040143,857 BIM Birlesik Magazalar AS 1,288,77511,246,623 Dogan Sirketler Grubu Holding AS 3,451,568
Shares Description Value ($)Turkey �� continued
39,219,839 Emlak Konut Gayrimenkul Yatirim Ortakligi AS(REIT) 10,802,443
231,519 Enerjisa Enerji AS 319,844613,677 Koza Altin Isletmeleri AS * 5,848,493817,235 Koza Anadolu Metal Madencilik Isletmeleri AS * 1,321,841
Total Turkey 41,416,448
United Arab Emirates �� 0.1%474,388 Abu Dhabi Islamic Bank PJSC 606,549114,770 Abu Dhabi National Oil Co for Distribution PJSC 107,9801,657,747 Dubai Islamic Bank PJSC 2,009,168717,123 Emaar Malls PJSC * 355,863344,396 Emirates NBD Bank PJSC 1,025,557
Total United Arab Emirates 4,105,117
United Kingdom �� 0.8%386,665 Unilever Plc 23,484,219
Vietnam �� 0.1%1,594,290 Kinh Bac City Development Share Holding Corp * 1,091,749218,620 PetroVietnam Gas JSC 787,5391,985,700 PetroVietnam Technical Services Corp 1,263,279182,980 Pha Lai Thermal Power JSC 189,033380,860 Vinh Hoan Corp 726,893
Total Vietnam 4,058,493TOTAL COMMON STOCKS(COST $2,648,656,004) 2,743,665,739
PREFERRED STOCKS (d) �� 3.3%
Brazil �� 0.1%493,300 Braskem SA � Class A* 2,080,968115,500 Cia Paranaense de Energia � Class B 1,471,83195,100 Lojas Americanas SA 407,034
Total Brazil 3,959,833
Chile �� 0.0%3,100 Sociedad Quimica y Minera de Chile SA
Sponsored ADR 145,917
Colombia �� 0.1%62,521 Banco Davivienda SA 488,5205,142,584 Grupo Aval Acciones y Valores SA 1,487,185
Total Colombia 1,975,705
Russia �� 1.9%256,245 Bashneft PJSC 4,126,427237,480 Nizhnekamskneftekhim PJSC 244,64698,683,100 Surgutneftegas PJSC 51,270,111554 Transneft PJSC 1,037,747
Total Russia 56,678,931
Copyright © 2021 www.secdatabase.com. All Rights Reserved.Please Consider the Environment Before Printing This Document

GMO Emerging Markets Fund(A Series of GMO Trust)Schedule of Investments �� (Continued)(showing percentage of total net assets)November 30, 2020 (Unaudited)
Swap Contracts
OTC Total Return Swaps
Fund Pays Fund Receives CounterpartyNotionalAmount
ExpirationDate
PeriodicPayment
Frequency
PremiumsPaid/
(Received)($) Value ($)
NetUnrealized
Appreciation/(Depreciation)
($)Depreciation of Total
Return on CSI 500Index + (1 MonthUSD LIBOR minus9.25%)
Appreciation on TotalReturn on CSI 500Index GS USD 39,327,680 12/07/2020 At Maturity $ � $(129,868) $ (129,868 )
Shares /Par Value�� Description Value ($)
South Korea �� 1.1%18,220 Amorepacific Corp 887,495596,573 Samsung Electronics Co Ltd 32,913,826
Total South Korea 33,801,321
Taiwan �� 0.1%287,798 Chailease Holding Co. Ltd. * 1,003,671605,412 CTBC Financial Holding Co Ltd 1,364,136
Total Taiwan 2,367,807
TOTAL PREFERRED STOCKS(COST $91,627,586) 98,929,514
INVESTMENT FUNDS �� 3.1%
United States �� 3.1%1,557,096 iShares Core MSCI Emerging Markets ETF 91,276,967
TOTAL INVESTMENT FUNDS(COST $92,240,542) 91,276,967
DEBT OBLIGATIONS �� 1.8%
United States �� 1.8%17,500,000 U.S. Treasury Note, Variable Rate, USBM +
0.15%, 0.24%, due 01/31/22 (e) 17,521,73435,000,000 U.S. Treasury Note, 0.13%, due 04/30/22 35,001,367
Total United States 52,523,101
TOTAL DEBT OBLIGATIONS(COST $52,506,066) 52,523,101
RIGHTS/WARRANTS �� 0.0%
Pakistan �� 0.0%106,184 Searle Co Ltd, Expires 31/12/20, Expires 12/31/
20 * (b) 42,633
TOTAL RIGHTS/WARRANTS(COST $0) 42,633
Shares /Par Value�� Description Value ($)
SHORT-TERM INVESTMENTS �� 0.4%
Money Market Funds �� 0.3%9,419,950 State Street Institutional Treasury Money
Market Fund � Premier Class, 0.01% (f) 9,419,950
U.S. Government �� 0.1%4,000,000 U.S. Treasury Bill, 0.08%, due 02/04/21 (e) (g) 3,999,421
TOTAL SHORT-TERM INVESTMENTS(COST $13,419,134) 13,419,371
TOTAL INVESTMENTS �� 100.4%(Cost $2,898,449,332) 2,999,857,325Other Assets and Liabilities (net) � (0.4%) (12,241,510 )
TOTAL NET ASSETS �� 100.0% $2,987,615,815
A summary of outstanding financial instruments at November 30,2020 is as follows:
Futures Contracts
Number ofContracts + Type
ExpirationDate
NotionalAmount ($)
Value/NetUnrealized
Appreciation(Depreciation) ($)
Buys3,357 Mini MSCI
EmergingMarkets
December2020 $201,806,055 $ 15,265,948
Sales1,157 SGX Nifty
50December
2020 $29,915,485 $ 38,666
+ Buys - Fund is long the futures contract.Sales - Fund is short the futures contract.
Copyright © 2021 www.secdatabase.com. All Rights Reserved.Please Consider the Environment Before Printing This Document

As of November 30, 2020, for the above contracts and/or agreements, the Fund had sufficient cash and/or securities to covercommitments or collateral requirements, if any, of the relevant broker or exchange.
Copyright © 2021 www.secdatabase.com. All Rights Reserved.Please Consider the Environment Before Printing This Document

GMO Emerging Markets Fund(A Series of GMO Trust)
Schedule of Investments �� (Continued)November 30, 2020 (Unaudited)
Notes to Schedule of Investments:
� Denominated in U.S. Dollar, unless otherwise indicated.* Non-income producing security.(a) All or a portion of this security is out on loan.(b) Investment valued using significant unobservable inputs.(c) Affiliated company.(d) Preferred dividend rates are disclosed to the extent that a stated rate exists.(e) All or a portion of this security has been pledged to cover margin
requirements on futures and/or cleared swap contracts, collateral on OTCswap contracts, forward currency contracts, and/or written options, if any.
(f) The rate disclosed is the 7 day net yield as of November 30, 2020.(g) The rate shown represents yield-to-maturity.
The rates shown on variable rate notes are the current interest rates atNovember 30, 2020, which are subject to change based on the terms of thesecurity.
Portfolio Abbreviations:
ADR - American Depositary ReceiptETF - Exchange-Traded FundForeign Registered - Shares issued to foreign investors in markets that haveforeign ownership limits.GDR - Global Depositary ReceiptJSC - Joint-Stock CompanyNVDR - Non-Voting Depositary ReceiptOJSC - Open Joint-Stock CompanyPJSC - Private Joint-Stock CompanyQPSC - Qatar Private Stock CompanyQSC - Qatari Shareholding CompanyREIT - Real Estate Investment TrustSOFOM - Sociedades Financieras de Objeto Multi (Multi-purposeFinancial Company)USBM - U.S. Treasury 3 Month Bill Money Market Yield.
USD LIBOR - London Interbank Offered Rate denominated in United StatesDollar.
Counterparty Abbreviations:
GS - Goldman Sachs International
Currency Abbreviations:
USD - United States Dollar
Copyright © 2021 www.secdatabase.com. All Rights Reserved.Please Consider the Environment Before Printing This Document

GMO International Equity Fund(A Series of GMO Trust)Schedule of Investments(showing percentage of total net assets)November 30, 2020 (Unaudited)
Shares Description Value ($)COMMON STOCKS �� 98.1%
Australia �� 5.0%556,139 Austal Ltd 1,192,056147,865 BHP Group Ltd 4,123,4024,487,022 Fortescue Metals Group Ltd 59,778,78816,683 JB Hi-Fi Ltd 560,381102,213 Pact Group Holdings Ltd 184,449717,032 Rio Tinto Ltd 53,497,042768,697 Sandfire Resources NL 2,474,067
Total Australia 121,810,185
Belgium �� 1.5%231,928 AGFA-Gevaert NV * 959,85655,566 Orange Belgium SA 1,072,7493,052 Sofina SA 968,808302,182 UCB SA 32,337,301
Total Belgium 35,338,714
Denmark �� 0.1%10,980 Per Aarsleff Holding A/S 465,7447,459 Schouw & Co A/S 724,538
Total Denmark 1,190,282
France �� 8.3%432,801 BNP Paribas SA * 22,030,08611,182 Christian Dior SE 5,701,84265,703 Cie de Saint-Gobain * 3,112,471274,848 Credit Agricole SA * 3,170,9923,817 Gaztransport Et Technigaz SA 377,25514,927 IPSOS 476,898107,639 L�Oreal SA 39,621,496126,188 Metropole Television SA * 1,978,510719,322 Peugeot SA * 16,876,234115 Renault SA * (a) 4,58842,362 Renault SA * (a) 1,681,849562,896 Sanofi 56,739,24463,698 Schneider Electric SE 8,874,7564,690 SEB SA 830,795171,353 Societe Generale SA * 3,397,545871,822 STMicroelectronics NV � NY Shares 34,567,74239,623 TOTAL SE (a) 1,681,81316,637 TOTAL SE (a) 710,913
Total France 201,835,029
Germany �� 4.9%109,696 ADVA Optical Networking SE * 923,38770,896 Allianz SE (Registered) 16,616,96929,479 Bayerische Motoren Werke AG 2,557,87742,541 Bechtle AG 9,286,85533,827 Brenntag AG 2,590,414930,767 CECONOMY AG * 4,585,2985,093 Cewe Stiftung & Co KGaA 551,055
Shares Description Value ($)Germany �� continued
192,634 Daimler AG (Registered Shares) 12,897,100261,839 Deutsche Pfandbriefbank AG * 2,608,1792,390 Deutsche Post AG (Registered) 115,289448,613 Dialog Semiconductor Plc * 23,941,368124,434 DWS Group GmbH & Co KGaA 4,845,8659,244 HeidelbergCement AG 653,97244,566 Henkel AG & Co KGaA 4,299,84815,329 Hornbach Holding AG & Co KGaA 1,631,9856,074 Indus Holding AG 235,30264,802 Siemens AG (Registered) 8,649,422203,966 Software AG 8,758,75465,232 Volkswagen AG 12,057,506
Total Germany 117,806,445
Hong Kong �� 2.5%495,500 BOC Hong Kong Holdings Ltd 1,612,5381,574,640 Champion (REIT) 943,268506,800 Chow Tai Fook Jewellery Group Ltd 661,566161,500 CK Asset Holdings Ltd 882,4941,505,014 Dah Sing Banking Group Ltd 1,613,467407,515 Dah Sing Financial Holdings Ltd 1,199,0534,557,096 Esprit Holdings Ltd * 595,179860,500 Johnson Electric Holdings Ltd 2,027,181794,257 Luk Fook Holdings International Ltd 2,006,7371,574,400 Man Wah Holdings Ltd 2,887,0731,405,647 Pacific Textiles Holdings Ltd 968,5631,484,000 Shun Tak Holdings Ltd 468,2041,323,173 SmarTone Telecommunications Holdings Ltd 730,582377,880 Television Broadcasts Ltd 386,81552,034,920 WH Group Ltd 42,391,376
Total Hong Kong 59,374,096
Ireland �� 0.8%70,354 CRH Plc * 2,767,245288,400 CRH Plc Sponsored ADR 11,319,7004,723 Flutter Entertainment Plc * 860,51349,273 Glanbia Plc 605,97933,861 Kingspan Group Plc * 2,954,22327,178 Smurfit Kappa Group Plc 1,140,124
Total Ireland 19,647,784
Italy �� 3.7%793,653 Anima Holding SPA 3,495,061147,282 CNH Industrial NV * 1,604,60772,194 De� Longhi SPA * 2,520,4594,679,655 Enel SPA 46,950,142377,340 EXOR NV 26,394,7102,968,848 Intesa Sanpaolo SPA * 6,877,23441,785 La Doria SPA 636,920
Total Italy 88,479,133
Copyright © 2021 www.secdatabase.com. All Rights Reserved.Please Consider the Environment Before Printing This Document

GMO International Equity Fund(A Series of GMO Trust)Schedule of Investments �� (Continued)(showing percentage of total net assets)November 30, 2020 (Unaudited)
Shares Description Value ($)Japan �� 20.5%
72,453 AOKI Holdings Inc 283,4062,121,876 Asahi Kasei Corp 19,399,1073,270,550 Astellas Pharma Inc 46,584,18551,727 Autobacs Seven Co Ltd 642,424592,121 Brother Industries Ltd 11,310,18045,036 Cawachi Ltd 1,290,43085,719 Daiwabo Holdings Co Ltd 5,349,847337,562 DCM Holdings Co Ltd 3,831,16380,385 Dexerials Corp 980,50127,100 Dip Corp 629,48061,078 Doutor Nichires Holdings Co Ltd 840,9816,566 DTS Corp 138,0646,621 Ehime Bank Ltd (The) 68,02429,300 Fuji Corp 707,911352,045 Fuji Electric Co Ltd 12,464,88659,600 Fujitsu General Ltd 1,803,117311,696 Fujitsu Ltd 43,119,43329,789 Fuyo General Lease Co Ltd 1,815,456102,812 Geo Holdings Corp 1,250,34220,135 Gunze Ltd 691,93289,500 Haseko Corp 967,258925,278 Hitachi Ltd 35,117,76641,400 Honda Motor Co Ltd 1,151,8271,336,768 ITOCHU Corp 35,276,310120,200 Itochu Techno-Solutions Corp 4,238,402101,300 Japan Post Insurance Co Ltd 1,685,29393,200 Japan Tobacco Inc 1,886,571143,900 K�s Holdings Corp 1,747,372156,611 Kanematsu Corp 1,803,4422,020,700 KDDI Corp 57,501,77541,269 Kohnan Shoji Co Ltd 1,275,64324,867 Mandom Corp 389,5299,100 MEIJI Holdings Co Ltd 644,0212,083,656 Mitsubishi Chemical Holdings Corp 11,471,2574,005,500 Mitsubishi UFJ Financial Group Inc 17,092,72737,300 Mixi Inc 1,019,230195,600 Mizuho Financial Group Inc 2,478,16445,150 Modec Inc 756,34076,266 Namura Shipbuilding Co Ltd 110,09685,200 NEC Corp 4,590,316135,200 NEC Networks & System Integration Corp 2,387,617110,457 Nichias Corp 2,568,454109,909 Nippo Corp 2,864,83667,333 Nippon Signal Co Ltd 598,6682,374,188 Nippon Telegraph & Telephone Corp 56,150,1608,400 Nitori Holdings Co Ltd 1,785,98161,000 NS Solutions Corp 1,802,104488,700 Obayashi Corp 4,301,62196,801 Okinawa Electric Power Co (The) 1,344,01397,400 Otsuka Corp 4,723,24960,600 Panasonic Corp 642,69593,902 Press Kogyo Co Ltd 272,405
Shares Description Value ($)Japan �� continued
71,896 Prima Meat Packers Ltd 1,994,079145,300 Renesas Electronics Corp * 1,287,59233,857 San-A Co Ltd 1,309,31998,887 Seiko Holdings Corp 1,271,052477,428 Sekisui Chemical Co Ltd 8,230,040262,700 Shimizu Corp 1,986,72333,600 Shinko Electric Industries Co Ltd 740,2521,907,287 Sojitz Corp 4,165,50234,800 Sony Corp 3,242,8545,971,363 Sumitomo Chemical Co Ltd 21,096,065190,200 Sumitomo Mitsui Financial Group Inc 5,468,73864,603 T-Gaia Corp 1,137,40557,900 Tokyo Electron Ltd 19,677,52142,861 Tokyo Seimitsu Co Ltd 1,885,106149,395 Tokyu Construction Co Ltd 669,61569,611 Towa Pharmaceutical Co Ltd 1,268,76723,300 Toyo Suisan Kaisha Ltd 1,146,03127,682 TPR Co Ltd 346,282113,367 TS Tech Co Ltd 3,315,90575,819 TSI Holdings Co Ltd 145,806106,514 Valor Holdings Co Ltd 2,641,32023,104 Warabeya Nichiyo Holdings Co Ltd 307,97124,646 Yahagi Construction Co Ltd 213,334
Total Japan 497,393,290
Malta �� 0.0%15,858,986 BGP Holdings Plc * (b) �
Netherlands �� 7.6%61,337 ASM International NV 10,814,430505,260 ASR Nederland NV 18,724,041110,703 Flow Traders 3,563,436133,391 Heineken Holding NV 12,289,6571,271,124 ING Groep NV * 12,363,8621,135,707 Koninklijke Ahold Delhaize NV 32,471,340142,278 Koninklijke Vopak NV 7,460,604276,623 Randstad NV * 17,108,675589,524 Signify NV * 24,849,487540,596 Wolters Kluwer NV 45,257,854
Total Netherlands 184,903,386
Norway �� 2.8%373,819 BW LPG Ltd 2,387,1902,409,657 DNB ASA * 43,449,084264,825 Gjensidige Forsikring ASA 5,766,24477,764 Norwegian Finans Holding ASA * 618,4321,722,837 Orkla ASA 16,490,77510,853 SpareBank 1 Nord Norge 89,056
Total Norway 68,800,781
Portugal �� 3.3%128,547 Altri SGPS SA 692,7173,780,423 Banco Comercial Portugues SA � Class R * 534,373
Copyright © 2021 www.secdatabase.com. All Rights Reserved.Please Consider the Environment Before Printing This Document
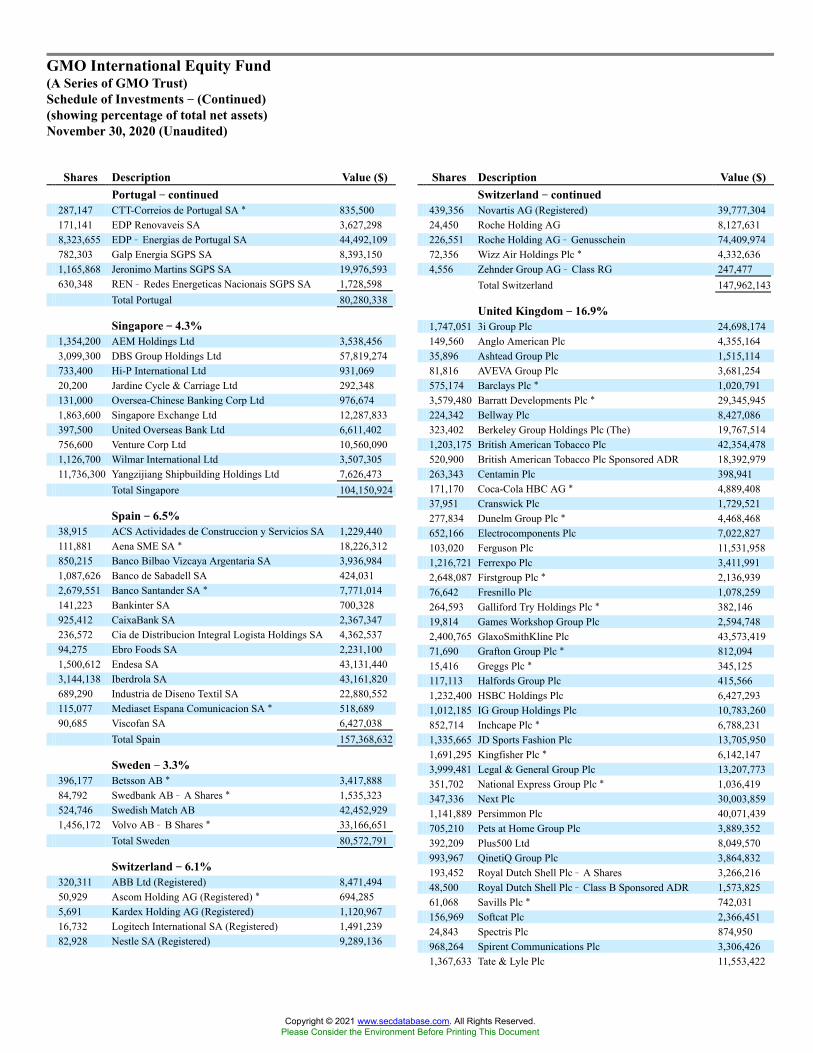
GMO International Equity Fund(A Series of GMO Trust)Schedule of Investments �� (Continued)(showing percentage of total net assets)November 30, 2020 (Unaudited)
Shares Description Value ($)Portugal �� continued
287,147 CTT-Correios de Portugal SA * 835,500171,141 EDP Renovaveis SA 3,627,2988,323,655 EDP � Energias de Portugal SA 44,492,109782,303 Galp Energia SGPS SA 8,393,1501,165,868 Jeronimo Martins SGPS SA 19,976,593630,348 REN � Redes Energeticas Nacionais SGPS SA 1,728,598
Total Portugal 80,280,338
Singapore �� 4.3%1,354,200 AEM Holdings Ltd 3,538,4563,099,300 DBS Group Holdings Ltd 57,819,274733,400 Hi-P International Ltd 931,06920,200 Jardine Cycle & Carriage Ltd 292,348131,000 Oversea-Chinese Banking Corp Ltd 976,6741,863,600 Singapore Exchange Ltd 12,287,833397,500 United Overseas Bank Ltd 6,611,402756,600 Venture Corp Ltd 10,560,0901,126,700 Wilmar International Ltd 3,507,30511,736,300 Yangzijiang Shipbuilding Holdings Ltd 7,626,473
Total Singapore 104,150,924
Spain �� 6.5%38,915 ACS Actividades de Construccion y Servicios SA 1,229,440111,881 Aena SME SA * 18,226,312850,215 Banco Bilbao Vizcaya Argentaria SA 3,936,9841,087,626 Banco de Sabadell SA 424,0312,679,551 Banco Santander SA * 7,771,014141,223 Bankinter SA 700,328925,412 CaixaBank SA 2,367,347236,572 Cia de Distribucion Integral Logista Holdings SA 4,362,53794,275 Ebro Foods SA 2,231,1001,500,612 Endesa SA 43,131,4403,144,138 Iberdrola SA 43,161,820689,290 Industria de Diseno Textil SA 22,880,552115,077 Mediaset Espana Comunicacion SA * 518,68990,685 Viscofan SA 6,427,038
Total Spain 157,368,632
Sweden �� 3.3%396,177 Betsson AB * 3,417,88884,792 Swedbank AB � A Shares * 1,535,323524,746 Swedish Match AB 42,452,9291,456,172 Volvo AB � B Shares * 33,166,651
Total Sweden 80,572,791
Switzerland �� 6.1%320,311 ABB Ltd (Registered) 8,471,49450,929 Ascom Holding AG (Registered) * 694,2855,691 Kardex Holding AG (Registered) 1,120,96716,732 Logitech International SA (Registered) 1,491,23982,928 Nestle SA (Registered) 9,289,136
Shares Description Value ($)Switzerland �� continued
439,356 Novartis AG (Registered) 39,777,30424,450 Roche Holding AG 8,127,631226,551 Roche Holding AG � Genusschein 74,409,97472,356 Wizz Air Holdings Plc * 4,332,6364,556 Zehnder Group AG � Class RG 247,477
Total Switzerland 147,962,143
United Kingdom �� 16.9%1,747,051 3i Group Plc 24,698,174149,560 Anglo American Plc 4,355,16435,896 Ashtead Group Plc 1,515,11481,816 AVEVA Group Plc 3,681,254575,174 Barclays Plc * 1,020,7913,579,480 Barratt Developments Plc * 29,345,945224,342 Bellway Plc 8,427,086323,402 Berkeley Group Holdings Plc (The) 19,767,5141,203,175 British American Tobacco Plc 42,354,478520,900 British American Tobacco Plc Sponsored ADR 18,392,979263,343 Centamin Plc 398,941171,170 Coca-Cola HBC AG * 4,889,40837,951 Cranswick Plc 1,729,521277,834 Dunelm Group Plc * 4,468,468652,166 Electrocomponents Plc 7,022,827103,020 Ferguson Plc 11,531,9581,216,721 Ferrexpo Plc 3,411,9912,648,087 Firstgroup Plc * 2,136,93976,642 Fresnillo Plc 1,078,259264,593 Galliford Try Holdings Plc * 382,14619,814 Games Workshop Group Plc 2,594,7482,400,765 GlaxoSmithKline Plc 43,573,41971,690 Grafton Group Plc * 812,09415,416 Greggs Plc * 345,125117,113 Halfords Group Plc 415,5661,232,400 HSBC Holdings Plc 6,427,2931,012,185 IG Group Holdings Plc 10,783,260852,714 Inchcape Plc * 6,788,2311,335,665 JD Sports Fashion Plc 13,705,9501,691,295 Kingfisher Plc * 6,142,1473,999,481 Legal & General Group Plc 13,207,773351,702 National Express Group Plc * 1,036,419347,336 Next Plc 30,003,8591,141,889 Persimmon Plc 40,071,439705,210 Pets at Home Group Plc 3,889,352392,209 Plus500 Ltd 8,049,570993,967 QinetiQ Group Plc 3,864,832193,452 Royal Dutch Shell Plc � A Shares 3,266,21648,500 Royal Dutch Shell Plc � Class B Sponsored ADR 1,573,82561,068 Savills Plc * 742,031156,969 Softcat Plc 2,366,45124,843 Spectris Plc 874,950968,264 Spirent Communications Plc 3,306,4261,367,633 Tate & Lyle Plc 11,553,422
Copyright © 2021 www.secdatabase.com. All Rights Reserved.Please Consider the Environment Before Printing This Document

GMO International Equity Fund(A Series of GMO Trust)Schedule of Investments �� (Continued)(showing percentage of total net assets)November 30, 2020 (Unaudited)
As of November 30, 2020, for the above contracts and/or agreements, the Fund had sufficient cash and/or securities to covercommitments or collateral requirements, if any, of the relevant broker or exchange.
Shares Description Value ($)United Kingdom �� continued
292,609 Vesuvius Plc 1,889,47327,982 Vistry Group Plc * 309,535
Total United Kingdom 408,202,363
TOTAL COMMON STOCKS(COST $2,274,578,347) 2,375,116,316
PREFERRED STOCKS (c) �� 0.9%
Germany �� 0.9%30,562 Bayerische Motoren Werke AG 2,008,08647,671 Draegerwerk AG & Co KGaA 3,735,27236,172 Henkel AG & Co KGaA 3,891,577148,175 Schaeffler AG 1,102,64267,711 Volkswagen AG 11,365,823
Total Germany 22,103,400
TOTAL PREFERRED STOCKS(COST $23,084,609) 22,103,400
RIGHTS/WARRANTS �� 0.1%
United Kingdom �� 0.1%107,672 AVEVA Group Plc, Expires 12/09/20 * 1,607,679
TOTAL RIGHTS/WARRANTS(COST $1,229,129) 1,607,679
Shares /Par Value�� Description Value ($)
SHORT-TERM INVESTMENTS �� 1.6%
Money Market Funds �� 0.7%18,425,406 State Street Institutional Treasury Money
Market Fund � Premier Class, 0.01% (d) 18,425,406
U.S. Government �� 0.9%21,000,000 U.S. Treasury Bill, 0.10%, due 10/07/21 (e)(f) 20,981,464
TOTAL SHORT-TERM INVESTMENTS(COST $39,406,927) 39,406,870
TOTAL INVESTMENTS �� 100.7%(Cost $2,338,299,012) 2,438,234,265Other Assets and Liabilities (net) � (0.7%) (17,622,891 )
TOTAL NET ASSETS �� 100.0% $2,420,611,374
A summary of outstanding financial instruments at November 30,2020 is as follows:
Futures Contracts
Number ofContracts + Type
ExpirationDate
NotionalAmount
($)
Value/NetUnrealized
Appreciation(Depreciation) ($)
Buys1
MiniMSCIEAFE December 2020 $101,650 $ 12,466
+ Buys - Fund is long the futures contract.Sales - Fund is short the futures contract.
Notes to Schedule of Investments:
* Non-income producing security.(a) Securities are traded on separate exchanges for the same entity.(b) Investment valued at fair value using methods determined in good faith by
the Trustees of GMO Trust or persons acting at their direction pursuant toprocedures approved by the Trustees. Investment valued using significantunobservable inputs.
(c) Preferred dividend rates are disclosed to the extent that a stated rate exists.(d) The rate disclosed is the 7 day net yield as of November 30, 2020.(e) All or a portion of this security has been pledged to cover margin
requirements on futures and/or cleared swap contracts, collateral on OTCswap contracts, forward currency contracts, and/or written options, if any.
(f) The rate shown represents yield-to-maturity.
Portfolio Abbreviations:
Copyright © 2021 www.secdatabase.com. All Rights Reserved.Please Consider the Environment Before Printing This Document

ADR - American Depositary ReceiptREIT - Real Estate Investment Trust
Copyright © 2021 www.secdatabase.com. All Rights Reserved.Please Consider the Environment Before Printing This Document

GMO-Usonian Japan Value Creation Fund(A Series of GMO Trust)Schedule of Investments(showing percentage of total net assets)November 30, 2020 (Unaudited)
Notes to Schedule of Investments:
(a) The rate disclosed is the 7 day net yield as of November 30, 2020.
Shares Description Value ($)COMMON STOCKS �� 97.1%
Automobiles & Components �� 3.5%75,600 Toyota Industries Corp 5,448,120
Banks �� 2.6%947,000 Mitsubishi UFJ Financial Group Inc 4,041,147
Capital Goods �� 17.1%468,300 Amada Co Ltd 4,488,937147,800 Ebara Corp 4,713,847206,200 Fuji Corp 4,981,950411,600 Hazama Ando Corp 2,703,785114,000 Kinden Corp 1,820,966158,100 Kyowa Exeo Corp 4,060,42725,900 Kyudenko Corp 739,112453,500 Penta-Ocean Construction Co Ltd 3,365,564
Total Capital Goods 26,874,588
Commercial & Professional Services �� 5.8%47,300 Secom Co Ltd 4,720,190318,800 Toppan Printing Co Ltd 4,340,280
Total Commercial & Professional Services 9,060,470
Consumer Durables & Apparel �� 8.5%295,800 Asics Corp 5,316,200325,000 Haseko Corp 3,512,389255,800 Sumitomo Forestry Co Ltd 4,631,740
Total Consumer Durables & Apparel 13,460,329
Diversified Financials �� 8.7%92,600 Jafco Co Ltd 3,962,665340,500 ORIX Corp 5,039,866103,400 Zenkoku Hosho Co Ltd 4,718,560
Total Diversified Financials 13,721,091
Food, Beverage & Tobacco �� 5.6%99,300 NH Foods Ltd 4,229,027407,800 Takara Holdings Inc 4,666,225
Total Food, Beverage & Tobacco 8,895,252
Insurance �� 2.6%138,900 MS&AD Insurance Group Holdings Inc 4,040,784
Materials �� 7.5%143,800 Denka Co Ltd 4,436,892193,700 Teijin Ltd 3,303,002263,900 Tosoh Corp 4,133,070
Total Materials 11,872,964
Shares Description Value ($)Media & Entertainment �� 2.9%
146,300 Kadokawa Corp 4,631,425
Pharmaceuticals, Biotechnology & Life Sciences �� 2.6%142,100 Tsumura & Co 4,134,964
Real Estate �� 6.3%270,700 Aeon Mall Co Ltd 4,326,337785,300 Kenedix Inc 5,654,664
Total Real Estate 9,981,001
Retailing �� 2.5%323,200 K�s Holdings Corp 3,924,604
Semiconductors & Semiconductor Equipment �� 6.1%53,100 Rohm Co Ltd 4,415,365118,500 Tokyo Seimitsu Co Ltd 5,211,849
Total Semiconductors & Semiconductor Equipment 9,627,214
Technology Hardware & Equipment �� 11.9%129,400 Amano Corp 3,035,01645,500 Daiwabo Holdings Co Ltd 2,839,721109,900 Hitachi Ltd 4,171,11780,200 Horiba Ltd 4,290,610246,000 Yokogawa Electric Corp 4,334,160
Total Technology Hardware & Equipment 18,670,624
Telecommunication Services �� 2.9%158,000 KDDI Corp 4,496,105
TOTAL COMMON STOCKS(COST $143,506,733) 152,880,682
SHORT-TERM INVESTMENTS �� 2.3%
Money Market Funds �� 2.3%3,729,257 State Street Institutional Treasury Money Market
Fund � Premier Class, 0.01% (a) 3,729,257
TOTAL SHORT-TERM INVESTMENTS(COST $3,729,257) 3,729,257
TOTAL INVESTMENTS �� 99.4%(Cost $147,235,990) 156,609,939Other Assets and Liabilities (net) � 0.6% 868,429
TOTAL NET ASSETS �� 100.0% $157,478,368
Copyright © 2021 www.secdatabase.com. All Rights Reserved.Please Consider the Environment Before Printing This Document

GMO Quality Fund(A Series of GMO Trust)Schedule of Investments(showing percentage of total net assets)November 30, 2020 (Unaudited)
Shares Description Value ($)
COMMON STOCKS �� 98.7%
Banks �� 6.2%5,867,501 US Bancorp 253,534,7186,803,401 Wells Fargo & Co. 186,073,017
Total Banks 439,607,735
Capital Goods �� 6.2%1,092,019 3M Co. 188,624,442552,674 Knorr-Bremse AG 70,748,3391,293,020 Otis Worldwide Corp. 86,554,7591,346,103 Raytheon Technologies Corp. 96,542,507
Total Capital Goods 442,470,047
Consumer Durables & Apparel �� 1.0%124,083 LVMH Moet Hennessy Louis Vuitton SE 71,272,734
Consumer Services �� 2.1%8,301,782 Compass Group Plc 146,075,341
Diversified Financials �� 4.1%1,652,051 American Express Co. 195,916,7281,952,248 Charles Schwab Corp. (The) 95,230,657
Total Diversified Financials 291,147,385
Food, Beverage & Tobacco �� 5.6%5,934,817 Coca-Cola Co. (The) 306,236,557559,822 Nestle SA (Registered) 62,708,165356,315 Philip Morris International, Inc. 26,990,861
Total Food, Beverage & Tobacco 395,935,583
Health Care Equipment & Services �� 14.7%1,257,931 Abbott Laboratories 136,133,293677,749 Anthem, Inc. 211,132,3681,958,566 Medtronic Plc 222,688,9541,011,217 Quest Diagnostics, Inc. 125,370,6841,023,218 UnitedHealth Group, Inc. 344,149,142
Total Health Care Equipment & Services 1,039,474,441
Household & Personal Products �� 2.7%2,866,860 Unilever Plc (a) 174,119,634274,530 Unilever Plc (a) 16,642,191
Total Household & Personal Products 190,761,825
Media & Entertainment �� 7.3%111,075 Alphabet, Inc. � Class A * 194,869,98072,059 Alphabet, Inc. � Class C * 126,877,164704,566 Facebook, Inc. � Class A * 195,143,645
Total Media & Entertainment 516,890,789
Pharmaceuticals, Biotechnology &Life Sciences �� 9.3%
710,702 Eli Lilly & Co. 103,513,746
Shares /Par Value�� Description Value ($)
Pharmaceuticals, Biotechnology & Life Sciences ��continued
1,531,126 Johnson & Johnson 221,523,3101,945,054 Merck & Co., Inc. 156,362,891529,833 Roche Holding AG � Genusschein 174,022,008
Total Pharmaceuticals, Biotechnology & LifeSciences 655,421,955
Retailing �� 2.9%3,228,070 TJX Cos, Inc. (The) 205,014,726
Semiconductors & Semiconductor Equipment �� 9.4%84,341 ASML Holding NV 36,644,809433,197 Lam Research Corp. 196,090,95413,703,790 Taiwan Semiconductor Manufacturing Co Ltd 233,263,5761,250,990 Texas Instruments, Inc. 201,722,138
Total Semiconductors & SemiconductorEquipment 667,721,477
Software & Services �� 19.2%1,122,093 Accenture Plc � Class A 279,502,145206,237 Adobe, Inc. * 98,678,2171,890,339 Microsoft Corp. 404,664,8704,048,493 Oracle Corp. 233,679,016264,163 salesforce.com, Inc. * 64,931,2661,371,504 SAP SE 165,562,886527,860 Visa, Inc. � Class A 111,035,351
Total Software & Services 1,358,053,751
Technology Hardware & Equipment �� 6.8%2,715,754 Apple, Inc. 323,310,5143,730,176 Cisco Systems, Inc. 160,472,171
Total Technology Hardware & Equipment 483,782,685
Transportation �� 1.2%2,137,911 Lyft, Inc. � Class A * 81,604,063
TOTAL COMMON STOCKS(COST $4,381,930,949) 6,985,234,537
MUTUAL FUNDS �� 0.1%
Affiliated Issuers �� 0.1%1,950,588 GMO U.S. Treasury Fund 9,830,961
TOTAL MUTUAL FUNDS(COST $9,752,902) 9,830,961
SHORT-TERM INVESTMENTS �� 1.3%
Money Market Funds �� 0.1%5,730,800 State Street Institutional Treasury Money Market
Fund � Premier Class, 0.01% (b) 5,730,800
U.S. Government �� 1.2%45,000,000 U.S. Treasury Bill, 0.10%, due 10/07/21 (c) 44,960,281
Copyright © 2021 www.secdatabase.com. All Rights Reserved.Please Consider the Environment Before Printing This Document

GMO Quality Fund(A Series of GMO Trust)Schedule of Investments �� (Continued)(showing percentage of total net assets)November 30, 2020 (Unaudited)
Par Value�� Description Value ($)U.S. Government �� continued
40,000,000 U.S. Treasury Bill, 0.11%, due 11/04/21 (c) 39,958,689Total U.S. Government 84,918,970TOTAL SHORT-TERM INVESTMENTS(COST $90,659,520) 90,649,770
TOTAL INVESTMENTS �� 100.1%(Cost $4,482,343,371) 7,085,715,268Other Assets and Liabilities (net) � (0.1%) (5,193,581 )
TOTAL NET ASSETS �� 100.0% $7,080,521,687
Notes to Schedule of Investments:
� Denominated in U.S. Dollar, unless otherwise indicated.* Non-income producing security.(a) Securities are traded on separate exchanges for the same entity.(b) The rate disclosed is the 7 day net yield as of November 30, 2020.(c) The rate shown represents yield-to-maturity.
Copyright © 2021 www.secdatabase.com. All Rights Reserved.Please Consider the Environment Before Printing This Document

GMO Resources Fund(A Series of GMO Trust)Schedule of Investments(showing percentage of total net assets)November 30, 2020 (Unaudited)
Shares Description Value ($)COMMON STOCKS �� 89.0%
Argentina �� 1.0%1,195,954 Adecoagro SA * 7,390,996
Australia �� 5.1%3,505,690 Beach Energy Ltd 4,476,10414,700,000 Clean TeQ Holdings Ltd * 2,940,561887,101 Fortescue Metals Group Ltd 11,818,4894,770,582 Jupiter Mines Ltd 981,592428,534 Mineral Resources Ltd (a) 10,160,3591,909,832 Sandfire Resources NL 6,146,834
Total Australia 36,523,939
Austria �� 1.4%291,983 OMV AG 9,777,070
Brazil �� 1.0%342,700 Petroleo Brasileiro SA 1,634,3721,194,657 Sao Martinho SA 5,835,699
Total Brazil 7,470,071
Canada �� 4.7%254,500 Canadian Solar Inc * (a) 10,882,420243,200 Enerflex Ltd (a) 1,288,378283,100 Frontera Energy Corp 608,1842,932,000 Ivanhoe Mines Ltd � Class A * (a) 13,726,4658,838,100 Largo Resources Ltd * 7,213,664
Total Canada 33,719,111
China �� 4.6%5,046,000 China High Speed Transmission Equipment Group
Co Ltd 3,625,1523,288,000 China Water Affairs Group Ltd 2,587,27720,888,000 CNOOC Ltd 20,784,967339,612 Sungrow Power Supply Co Ltd � Class A 2,479,6662,196,400 Xinjiang Goldwind Science & Technology Co Ltd �
Class H 3,533,752Total China 33,010,814
Colombia �� 0.9%10,530,069 Ecopetrol SA 6,093,312
Denmark �� 0.6%21,946 Vestas Wind Systems A/S 4,472,890
Finland �� 1.9%201,344 Neste Oyj 13,453,860
France �� 2.6%113,372 Suez 2,168,674248,490 TOTAL SA 10,547,251103,327 Veolia Environnement SA 2,370,229
Shares Description Value ($)France �� continued
58,741 Vilmorin & Cie SA 3,492,888Total France 18,579,042
Germany �� 0.7%554,063 K+S AG (Registered) 4,980,580
Hungary �� 1.0%1,072,359 MOL Hungarian Oil & Gas Plc * 7,152,104
India �� 2.4%6,047,822 Oil & Natural Gas Corp Ltd 6,335,3261,192,557 Oil India Ltd 1,533,3755,642,401 Vedanta Ltd 9,101,400
Total India 16,970,101
Israel �� 1.5%63,085 Equital Ltd * 1,412,398959,199 ICL Group Ltd 4,561,93725,715 Israel Corp Ltd (The) * 4,380,81694,114 Naphtha Israel Petroleum Corp Ltd * 426,981
Total Israel 10,782,132
Japan �� 1.9%122,100 Ebara Corp 3,894,186770,500 Inpex Corp 4,267,696138,800 Mitsubishi Materials Corp (a) 2,624,21653,600 Nittetsu Mining Co Ltd 2,704,130
Total Japan 13,490,228
Mexico �� 2.5%4,965,740 Grupo Mexico SAB de CV Series B 18,059,247
Norway �� 2.6%748,690 Austevoll Seafood ASA 6,808,2332,922,953 DNO ASA * (a) 1,947,552470,577 Equinor ASA 7,325,521160,538 TGS NOPEC Geophysical Co ASA 2,206,073
Total Norway 18,287,379
Pakistan �� 0.7%3,324,222 Fauji Fertilizer Co Ltd 2,152,2143,032,049 Oil & Gas Development Co Ltd 1,863,333457,975 Pakistan Oilfields Ltd 1,129,280
Total Pakistan 5,144,827
Poland �� 0.8%4,335,248 Polskie Gornictwo Naftowe i Gazownictwo SA 5,534,487
Russia �� 13.0%1,265,530 Gazprom Neft PJSC 5,233,610699,380 Gazprom PJSC 1,669,092312,865 LUKOIL PJSC Sponsored ADR 20,140,733
Copyright © 2021 www.secdatabase.com. All Rights Reserved.Please Consider the Environment Before Printing This Document

GMO Resources Fund(A Series of GMO Trust)Schedule of Investments �� (Continued)(showing percentage of total net assets)November 30, 2020 (Unaudited)
Shares Description Value ($)Russia �� continued
839,685 MMC Norilsk Nickel PJSC ADR 23,287,528131,477 Novatek PJSC Sponsered GDR (Registered) 20,228,763869,812 PhosAgro PJSC GDR (Registered) 11,109,949575,419 Ros Agro Plc GDR (Registered) 6,126,450739,296 Tatneft PJSC 4,766,946
Total Russia 92,563,071
Singapore �� 0.0%2,725,600 Ezra Holdings Ltd *(b) �
South Africa �� 0.3%139,983 African Rainbow Minerals Ltd 2,164,867
South Korea �� 0.2%2,326 Young Poong Corp 1,072,289
Spain �� 1.2%879,938 Repsol SA 8,433,984
Switzerland �� 0.6%1,745 Gurit Holding AG 4,391,779
Thailand �� 0.7%1,523,164 PTT Exploration & Production Pcl (Foreign
Registered) 4,841,672
Turkey �� 0.4%1,642,447 Koza Anadolu Metal Madencilik Isletmeleri AS * 2,656,584
Ukraine �� 0.6%325,180 Kernel Holding SA 4,204,279
United Kingdom �� 12.6%418,545 Anglo American Plc 12,187,966440,378 BHP Group Plc 9,957,233937,771 BP Plc 3,044,7821,043,459 Central Asia Metals Plc 2,999,9041,637,147 Ferrexpo Plc 4,590,9718,413,445 Glencore Plc * 23,719,6401,061,711 John Wood Group Plc * 4,153,814744,897 Petrofac Ltd *(a) 1,503,5921,657,344 Royal Dutch Shell Plc � A Shares 27,784,323
Total United Kingdom 89,942,225
United States �� 21.5%74,700 AGCO Corp. 6,910,49725,531 Albemarle Corp. 3,471,45088,800 Baker Hughes Co. 1,662,33654,100 Cactus, Inc. � Class A 1,255,120392,700 Darling Ingredients, Inc. * 18,959,55653,300 Enphase Energy, Inc. * 7,279,18164,600 First Solar, Inc. * 6,035,578818,382 Freeport-McMoRan, Inc. 19,141,955
Shares /Par Value�� Description Value ($)
United States �� continued111,700 FutureFuel Corp. 1,339,283941,924 GrafTech International Ltd. 7,441,19913,641,000 Kosmos Energy Ltd. 24,008,160139,400 Liberty Oilfield Services, Inc. � Class A 1,296,420280,500 Livent Corp. * (a) 4,255,185643,607 Mosaic Co. (The) 14,133,610323,900 NexTier Oilfield Solutions, Inc. * 906,920348,400 ProPetro Holding Corp. * 2,010,268311,354 Renewable Energy Group, Inc. * 18,083,44043,055 SolarEdge Technologies, Inc. * 11,968,429170,200 Talos Energy, Inc. * 1,456,912735,200 W&T Offshore, Inc. * (a) 1,440,992
Total United States 153,056,491TOTAL COMMON STOCKS(COST $554,526,847) 634,219,431
PREFERRED STOCKS (c) �� 9.2%
Brazil �� 5.3%3,258,599 Bradespar SA 35,338,896616,100 Petroleo Brasileiro SA 2,863,495
Total Brazil 38,202,391
Chile �� 1.8%269,012 Sociedad Quimica y Minera de Chile SA Sponsored
ADR 12,662,395
Russia �� 2.1%74,885 Bashneft PJSC 1,205,9065,091,084 Surgutneftegas PJSC 2,645,0371,830,786 Tatneft PJSC 11,221,619
Total Russia 15,072,562TOTAL PREFERRED STOCKS(COST $44,295,824) 65,937,348
DEBT OBLIGATIONS �� 0.6%
United States �� 0.6%4,250,000 U.S. Treasury Note, 1.38%, due 01/31/22 4,311,592
TOTAL DEBT OBLIGATIONS(COST $4,311,827) 4,311,592
RIGHTS/WARRANTS �� 0.0%
Singapore �� 0.0%2,117,812 Ezion Holdings Ltd, Expires 04/16/23*(a)(b) �
TOTAL RIGHTS/WARRANTS(COST $0) �
Copyright © 2021 www.secdatabase.com. All Rights Reserved.Please Consider the Environment Before Printing This Document

GMO Resources Fund(A Series of GMO Trust)Schedule of Investments �� (Continued)(showing percentage of total net assets)November 30, 2020 (Unaudited)
Shares Description Value ($)SHORT-TERM INVESTMENTS �� 1.1%
Money Market Funds �� 1.1%8,069,823 State Street Institutional Treasury Money Market
Fund � Premier Class,0.01% (d) 8,069,823
TOTAL SHORT-TERM INVESTMENTS(COST $8,069,823) 8,069,823
TOTAL INVESTMENTS �� 99.9%(Cost $611,204,321) 712,538,194Other Assets and Liabilities (net) � 0.1% 430,307
TOTAL NET ASSETS �� 100.0% $712,968,501
Notes to Schedule of Investments:
� Denominated in U.S. Dollar, unless otherwise indicated.* Non-income producing security.(a) All or a portion of this security is out on loan.(b) Investment valued at fair value using methods determined in good faith by
the Trustees of GMO Trust or persons acting at their direction pursuant toprocedures approved by the Trustees. Investment valued using significantunobservable inputs.
(c) Preferred dividend rates are disclosed to the extent that a stated rate exists.(d) The rate disclosed is the 7 day net yield as of November 30, 2020.
Portfolio Abbreviations:
ADR - American Depositary ReceiptForeign Registered - Shares issued to foreign investors in markets that haveforeign ownership limits.GDR - Global Depositary ReceiptPJSC - Private Joint-Stock Company
Copyright © 2021 www.secdatabase.com. All Rights Reserved.Please Consider the Environment Before Printing This Document

GMO Risk Premium Fund(A Series of GMO Trust)Schedule of Investments(showing percentage of total net assets)November 30, 2020 (Unaudited)
A summary of outstanding financial instruments at November 30, 2020 is as follows:
Written Options
Index Options
DescriptionExercise
PriceExpiration
DateNumber ofContracts
NotionalAmount Value ($)
Index Options �� PutsS&P 500 Index 3,570.00 12/18/20 34 USD (12,313,542) (124,780 )
TOTAL WRITTEN OPTIONS(Premiums $249,107) $(124,780 )
As of November 30, 2020, for the above contracts and/or agreements, the Fund had sufficient cash and/or securities to covercommitments or collateral requirements, if any, of the relevant broker or exchange.
Par Value�� /Shares Description Value ($)
DEBT OBLIGATIONS �� 40.7%
U.S. Government �� 40.7%5,000,000 U.S. Treasury Note, Variable Rate, USBM +
0.06%, 0.14%, due 07/31/22 5,000,641
TOTAL DEBT OBLIGATIONS(COST $5,000,000) 5,000,641
SHORT-TERM INVESTMENTS �� 57.9%
Money Market Funds �� 3.9%480,432 State Street Institutional Treasury Money Market
Fund-Premier Class, 0.01% (a) 480,432
Par Value�� Description Value ($)U.S. Government �� 54.0%
6,600,000 U.S. Treasury Note, 1.13%, due 06/30/21 (b) 6,639,703
TOTAL SHORT-TERM INVESTMENTS(COST $7,103,430) 7,120,135
TOTAL INVESTMENTS �� 98.6%(Cost $12,103,430) 12,120,776Other Assets and Liabilities (net) � 1.4% 168,064
TOTAL NET ASSETS �� 100.0% $12,288,840
Notes to Schedule of Investments:
� Denominated in U.S. Dollar, unless otherwise indicated.(a) The rate disclosed is the 7 day net yield as of November 30, 2020.(b) All or a portion of this security has been pledged to cover margin
requirements on futures and/or cleared swap contracts, collateral on OTCswap contracts, forward currency contracts, and/or written options, if any.
The rates shown on variable rate notes are the current interest rates atNovember 30, 2020, which are subject to change based on the terms of thesecurity.
Portfolio Abbreviations:
USBM - U.S. Treasury 3 Month Bill Money Market Yield.
Currency Abbreviations:
USD - United States Dollar
Copyright © 2021 www.secdatabase.com. All Rights Reserved.Please Consider the Environment Before Printing This Document

GMO Tax-Managed International Equities Fund(A Series of GMO Trust)Schedule of Investments(showing percentage of total net assets)November 30, 2020 (Unaudited)
Shares Description Value ($)COMMON STOCKS �� 95.5%
Australia �� 4.6%6,116 Accent Group Ltd 9,7011,462 Australian Pharmaceutical Industries Ltd 1,29266,782 Fortescue Metals Group Ltd 889,7103,342 JB Hi-Fi Ltd 112,2589,602 Rio Tinto Ltd 716,395
Total Australia 1,729,356
Belgium �� 1.3%79 Sofina SA 25,0774,429 UCB SA 473,959
Total Belgium 499,036
Brazil �� 0.5%24,800 Banco do Brasil SA 156,7424,100 Cia de Saneamento do Parana 19,1323,600 Qualicorp Consultoria e Corretora de Seguros SA 22,289
Total Brazil 198,163
China �� 2.0%19,000 BAIC Motor Corp Ltd � Class H 7,111423,000 Bank of China Ltd � Class H 149,301223,000 Bank of Communications Co Ltd � Class H 123,23247,000 China CITIC Bank Corp Ltd � Class H 20,329121,000 China Everbright Bank Co Ltd � Class H 47,19790,000 China Huarong Asset Management Co Ltd � Class H 10,31890,000 China Lesso Group Holdings Ltd 160,87454,000 China Medical System Holdings Ltd 55,13749,000 China Minsheng Banking Corp Ltd � Class H 27,02835,000 China Railway Group Ltd � Class H 17,2773,000 China SCE Group Holdings Ltd 1,37437,000 Chongqing Rural Commercial Bank Co Ltd � Class H 15,8654,000 IGG Inc 3,99242,300 Shanghai Pharmaceuticals Holding Co Ltd � Class H 71,53011,000 TCL Electronics Holdings Ltd * 8,66110,000 Tianneng Power International Ltd 20,981
Total China 740,207
Denmark �� 0.1%2,720 Scandinavian Tobacco Group A/S 41,856
France �� 7.9%323 APERAM SA 12,277600 ArcelorMittal SA * 10,9104,982 BNP Paribas SA * 253,59087 Christian Dior SE 44,362440 Cie de Saint-Gobain * 20,844247 Cie Generale des Etablissements Michelin SCA 30,7247,150 Credit Agricole SA * 82,4911,112 Eiffage SA * 108,71727 Faurecia SE * 1,337
Shares Description Value ($)France �� continued
246 Fnac Darty SA * 13,152432 Kaufman & Broad SA 18,3781,135 L�Oreal SA 417,789705 La Francaise des Jeux SAEM 29,486196 Legrand SA 16,597555 Nexans SA * 34,96511,162 Peugeot SA * 261,8751,207 Quadient SA 21,577770 Rexel SA * 10,4139,630 Sanofi 970,6932,562 Schneider Electric SE 356,952410 SEB SA 72,6285,712 Societe Generale SA * 113,256769 TOTAL SE 32,641361 Valeo SA 13,927
Total France 2,949,581
Germany �� 4.5%276 AIXTRON SE * 4,018362 Allianz SE (Registered) 84,847362 BASF SE 26,465889 Bayerische Motoren Werke AG 77,138753 Bechtle AG 164,383470 Brenntag AG 35,9921,901 Daimler AG (Registered) 127,2751,063 Deutsche Pfandbriefbank AG * 10,589218 Deutsche Post AG (Registered) 10,5166,286 Dialog Semiconductor Plc * 335,468909 DWS Group GmbH & Co KGaA 35,399169 Eckert & Ziegler Strahlen- und Medizintechnik AG 8,693356 Elmos Semiconductor SE 11,367144 Hannover Rueck SE 24,0651,379 HeidelbergCement AG 97,558755 Henkel AG & Co KGaA 72,845959 Merck KGaA 153,1331,747 Siemens AG (Registered) 233,1801 Siemens Healthineers AG 461,053 Software AG 45,218631 Volkswagen AG 116,634
Total Germany 1,674,829
Hong Kong �� 1.4%7,600 Chow Tai Fook Jewellery Group Ltd 9,92111,200 Dah Sing Banking Group Ltd 12,0076,000 Johnson Electric Holdings Ltd 14,1354,500 Kerry Logistics Network Ltd 9,864574,500 WH Group Ltd 468,029
Total Hong Kong 513,956
Hungary �� 0.2%3,883 Magyar Telekom Telecommunications Plc 5,0122,515 Richter Gedeon Nyrt 59,601
Total Hungary 64,613
Copyright © 2021 www.secdatabase.com. All Rights Reserved.Please Consider the Environment Before Printing This Document

GMO Tax-Managed International Equities Fund(A Series of GMO Trust)Schedule of Investments �� (Continued)(showing percentage of total net assets)November 30, 2020 (Unaudited)
Shares Description Value ($)India �� 0.4%
37,955 Power Finance Corp Ltd 55,0351,169 Rajesh Exports Ltd * 7,09860,826 REC Ltd 97,154
Total India 159,287
Ireland �� 2.1%6,765 CRH Plc 262,3064,260 CRH Plc Sponsored ADR 167,20563 Flutter Entertainment Plc * 11,478432 Kerry Group Plc � Class A 60,574110 Kingspan Group Plc * 9,5975,872 Smurfit Kappa Group Plc (a) 249,831301 Smurfit Kappa Group Plc (a) 12,627
Total Ireland 773,618
Italy �� 2.5%3,466 Arnoldo Mondadori Editore SPA * 6,177307 Banca Mediolanum SPA * 2,806807 De� Longhi SPA * 28,17448,652 Enel SPA 488,1175,591 EXOR NV 391,087235 Recordati Industria Chimica e Farmaceutica SPA 12,5691,623 Unipol Gruppo SPA * 7,828
Total Italy 936,758
Japan �� 20.4%45,500 Astellas Pharma Inc 648,0814,200 Bandai Namco Holdings Inc 382,2346,100 Brother Industries Ltd 116,5174,300 Chugai Pharmaceutical Co Ltd 207,9791,100 Daiwabo Holdings Co Ltd 68,653800 DCM Holdings Co Ltd 9,080600 Dip Corp 13,937700 Fuji Corp 16,9131,200 FUJIFILM Holdings Corp 64,5562,700 Fujitsu General Ltd 81,6854,700 Fujitsu Ltd 650,18910,900 Haseko Corp 117,8006,900 Hitachi Ltd 261,88124,400 ITOCHU Corp 643,8982,000 Itochu Techno-Solutions Corp 70,523400 Japan Post Insurance Co Ltd 6,6553,500 K�s Holdings Corp 42,50029,800 KDDI Corp 848,000800 Kohnan Shoji Co Ltd 24,7288,500 Mitsubishi Chemical Holdings Corp 46,795700 Mitsubishi Gas Chemical Co Inc 14,81638,900 Mitsubishi UFJ Financial Group Inc 165,999600 Mixi Inc 16,3952,700 Mizuho Financial Group Inc 34,2082,000 NEC Corp 107,7543,300 NEC Networks & System Integration Corp 58,278
Shares Description Value ($)Japan �� continued
1,000 Nichias Corp 23,25334,600 Nippon Telegraph & Telephone Corp 818,299100 Nitori Holdings Co Ltd 21,262100 NS Solutions Corp 2,954400 NTT DOCOMO Inc 14,8774,800 Obayashi Corp 42,250700 Otsuka Corp 33,9452,900 Recruit Holdings Co Ltd 121,5711,600 Sekisui Chemical Co Ltd 27,5812,000 Sekisui House Ltd 35,862100 Shimamura Co Ltd 10,3033,700 Shimizu Corp 27,98218,800 Sojitz Corp 41,0595,500 Sony Corp 512,520100 Sugi Holdings Co Ltd 6,6282,600 Sumitomo Mitsui Financial Group Inc 74,757400 Sushiro Global Holdings Ltd 12,7542,600 Tokyo Electron Ltd 883,6199,400 Tosoh Corp 147,218200 Toyo Suisan Kaisha Ltd 9,8372,000 Ushio Inc 25,0891,300 Wacom Co Ltd 12,035
Total Japan 7,625,709
Malaysia �� 0.0%7,400 Kossan Rubber Industries 11,383
Malta �� 0.0%1,718,063 BGP Holdings Plc * (b) �
Netherlands �� 7.5%715 Aalberts NV 30,8441,430 ASM International NV 252,1262,129 ASR Nederland NV 78,897560 Flow Traders 18,026639 Heineken Holding NV 58,87310,648 ING Groep NV * 103,57028,917 Koninklijke Ahold Delhaize NV 826,7754,081 PostNL NV * 13,8985,681 Randstad NV * 351,3609,474 Signify NV * 399,3462,754 TomTom NV * 22,4667,837 Wolters Kluwer NV 656,101
Total Netherlands 2,812,282
Norway �� 0.7%3,525 BW LPG Ltd 22,51119,143 Orkla ASA 183,23435 Salmar ASA * 1,9131,503 SpareBank 1 Nord Norge 12,3332,652 SpareBank 1 SR-Bank ASA * 26,452
Total Norway 246,443
Copyright © 2021 www.secdatabase.com. All Rights Reserved.Please Consider the Environment Before Printing This Document

GMO Tax-Managed International Equities Fund(A Series of GMO Trust)Schedule of Investments �� (Continued)(showing percentage of total net assets)November 30, 2020 (Unaudited)
Shares Description Value ($)Poland �� 0.1%
233 Asseco Poland SA 4,1191,891 Polski Koncern Naftowy ORLEN SA 27,926
Total Poland 32,045
Portugal �� 3.2%5,564 EDP Renovaveis SA 117,928143,077 EDP � Energias de Portugal SA 764,78416,923 Jeronimo Martins SGPS SA 289,9671,369 NOS SGPS SA 5,235
Total Portugal 1,177,914
Russia �� 1.2%8,367 Gazprom PJSC Sponsored ADR 38,602705,000 Inter RAO UES PJSC 47,3462,375 LUKOIL PJSC 157,2331,819 LUKOIL PJSC Sponsored ADR 117,098399,000 ROSSETI PJSC 8,8155,368 Sberbank of Russia PJSC Sponsored ADR 70,8129,800 Surgutneftegas PJSC 4,527
Total Russia 444,433
Singapore �� 4.0%17,700 AEM Holdings Ltd 46,249300 City Developments Ltd 1,72733,500 DBS Group Holdings Ltd 624,9624,000 Jardine Cycle & Carriage Ltd 57,5326,300 Mapletree Industrial Trust (REIT) 13,75620,500 Oversea-Chinese Banking Corp Ltd 152,8383,800 Riverstone Holdings Ltd/Singapore 3,73225,300 Singapore Exchange Ltd 166,81811,700 Venture Corp Ltd 163,30055,500 Wilmar International Ltd 172,766108,600 Yangzijiang Shipbuilding Holdings Ltd 70,57016,000 Yanlord Land Group Ltd 13,209
Total Singapore 1,487,459
South Africa �� 0.1%2,613 Aspen Pharmacare Holdings Ltd * 20,75211,423 Netcare Ltd 9,08115,577 Old Mutual Ltd 11,345
Total South Africa 41,178
South Korea �� 2.3%520 DongKook Pharmaceutical Co Ltd 12,079419 DoubleUGames Co Ltd 22,21310,612 Hana Financial Group Inc 322,538487 KB Financial Group Inc 20,1328,069 Kia Motors Corp 422,043293 Sebang Global Battery Co Ltd 11,6382,117 Shinhan Financial Group Co Ltd 62,337
Total South Korea 872,980
Shares Description Value ($)Spain �� 5.5%
1,171 Acerinox SA 12,1351,056 Aena SME SA * 172,03110,127 Banco Bilbao Vizcaya Argentaria SA 46,89428,444 Banco Santander SA * 82,49190 Cia de Distribucion Integral Logista Holdings SA 1,66013,151 Endesa SA 377,99351,922 Iberdrola SA 712,77015,802 Industria de Diseno Textil SA 524,5381,054 Red Electrica Corp SA 21,5471,209 Viscofan SA 85,684
Total Spain 2,037,743
Sweden �� 1.8%1,355 Betsson AB * 11,690580 Lindab International AB 10,116911 Mycronic AB 24,1171,530 Skanska AB � B Shares 36,3545,959 Swedish Match AB 482,0942,393 Volvo AB � A Shares * 55,0031,782 Volvo AB � B Shares * 40,588
Total Sweden 659,962
Switzerland �� 5.8%3,412 ABB Ltd (Registered) 90,239160 ALSO Holding AG (Registered) * 41,874363 Logitech International SA (Registered) 32,3521,182 Nestle SA (Registered) 132,4016,600 Novartis AG (Registered) 597,534207 Roche Holding AG 68,8113,593 Roche Holding AG � Genusschein 1,180,110165 Vetropack Holding AG (Registered) * 10,757
Total Switzerland 2,154,078
Taiwan �� 0.8%37,000 China Development Financial Holding Corp 11,5879,000 Fubon Financial Holding Co Ltd 13,98910,000 Hon Hai Precision Industry Co Ltd 28,86924,000 Inventec Corp 19,605104,000 Pou Chen Corp 113,91427,000 Radiant Opto-Electronics Corp 109,96511,000 Sunplus Technology Co Ltd * 6,0214,595 TOPBI International Holdings Ltd 5,082
Total Taiwan 309,032
Thailand �� 0.0%52,700 AP Thailand Pcl NVDR 12,188
Turkey �� 1.8%37,805 Akbank TAS * 29,11261,796 Eregli Demir ve Celik Fabrikalari TAS 86,87556,444 Haci Omer Sabanci Holding AS 69,474330 TAV Havalimanlari Holding AS 800
Copyright © 2021 www.secdatabase.com. All Rights Reserved.Please Consider the Environment Before Printing This Document

GMO Tax-Managed International Equities Fund(A Series of GMO Trust)Schedule of Investments �� (Continued)(showing percentage of total net assets)November 30, 2020 (Unaudited)
Shares Description Value ($)Turkey �� continued
1,488 Turk Telekomunikasyon AS 1,459174,364 Turkiye Garanti Bankasi AS * 195,321130,228 Turkiye Is Bankasi AS � Class C * 108,718112,012 Turkiye Sinai Kalkinma Bankasi AS * 32,81591,559 Turkiye Sise ve Cam Fabrikalari AS 79,547171,529 Yapi ve Kredi Bankasi AS * 62,863
Total Turkey 666,984
United Kingdom �� 12.8%24,203 3i Group Plc 342,1592,609 Anglo American Plc 75,9745,510 B&M European Value Retail SA 34,83841,931 BAE Systems Plc 279,75549,928 Barratt Developments Plc * 409,3292,561 Bellway Plc 96,2005,101 Berkeley Group Holdings Plc (The) 311,7929,844 British American Tobacco Plc 346,53111,800 British American Tobacco Plc Sponsored ADR 416,658370 Bunzl Plc 11,5242,970 Coca-Cola HBC AG * 84,8371,582 Computacenter Plc 46,638443 Cranswick Plc 20,1894,124 Dunelm Group Plc * 66,3276,773 Electrocomponents Plc 72,9352,007 Ferguson Plc 224,66217,524 Ferrexpo Plc 49,1421,057 Fresnillo Plc 14,871100 GlaxoSmithKline Plc Sponsored ADR 3,6795,217 Howden Joinery Group Plc * 43,6637,411 IG Group Holdings Plc 78,9532,037 Imperial Brands Plc 36,77212,408 Inchcape Plc * 98,7771,112 Intermediate Capital Group Plc 23,9847,940 JD Sports Fashion Plc * 81,4766,108 John Laing Group Plc 25,69634,915 Kingfisher Plc * 126,79895,214 Legal & General Group Plc 314,432610 Morgan Sindall Group Plc 11,3131,844 Next Plc 159,29014,129 Persimmon Plc 495,81881 Phoenix Group Holdings Plc 7675,371 Plus500 Ltd 110,23311,898 QinetiQ Group Plc 46,263572 Softcat Plc 8,6236,954 Spirent Communications Plc 23,74619,783 Tate & Lyle Plc 167,122
Total United Kingdom 4,761,766TOTAL COMMON STOCKS(COST $26,534,872) 35,634,839
PREFERRED STOCKS (c) �� 1.3%
Brazil �� 0.1%2,000 Cia Paranaense de Energia � Class B 25,486
Shares Description Value ($)Germany �� 1.1%
458 Bayerische Motoren Werke AG 30,093688 Draegerwerk AG & Co KGaA 53,9082,326 Henkel AG & Co KGaA 250,244689 Volkswagen AG 115,654
Total Germany 449,899
Russia �� 0.1%43,100 Surgutneftegas PJSC 22,393
TOTAL PREFERRED STOCKS(COST $440,251) 497,778
MUTUAL FUNDS �� 0.7%
United States �� 0.7%Affiliated Issuers �� 0.7%
52,612 GMO U.S. Treasury Fund 265,165
TOTAL MUTUAL FUNDS(COST $264,107) 265,165
SHORT-TERM INVESTMENTS �� 1.2%
Money Market Funds �� 1.2%442,504 State Street Institutional Treasury Money Market Fund �
Premier Class, 0.01% (d) 442,504
TOTAL SHORT-TERM INVESTMENTS(COST $442,504) 442,504
TOTAL INVESTMENTS �� 98.7%(Cost $27,681,734) 36,840,286Other Assets and Liabilities (net) � 1.3% 478,296
TOTAL NET ASSETS �� 100.0% $37,318,582
A summary of outstanding financial instruments at November 30,2020 is as follows:
Futures Contracts
Numberof
Contracts + TypeExpiration
DateNotional
Amount ($)
Value/NetUnrealized
Appreciation(Depreciation) ($)
Buys1 Mini
MSCIEAFE December 2020 $ 101,650 $ (240 )
+ Buys - Fund is long the futures contract.Sales - Fund is short the futures contract.
Copyright © 2021 www.secdatabase.com. All Rights Reserved.Please Consider the Environment Before Printing This Document

GMO Tax-Managed International Equities Fund(A Series of GMO Trust)
Schedule of Investments �� (Continued)November 30, 2020 (Unaudited)
As of November 30, 2020, for the above contracts and/or agreements, the Fund had sufficient cash and/or securities to covercommitments or collateral requirements, if any, of the relevant broker or exchange.
Notes to Schedule of Investments:
* Non-income producing security.(a) Securities are traded on separate exchanges for the same entity.(b) Investment valued at fair value using methods determined in good faith by
the Trustees of GMO Trust or persons acting at their direction pursuant toprocedures approved by the Trustees. Investment valued using significantunobservable inputs.
(c) Preferred dividend rates are disclosed to the extent that a stated rate exists.(d) The rate disclosed is the 7 day net yield as of November 30, 2020.
Portfolio Abbreviations:
ADR - American Depositary ReceiptNVDR - Non-Voting Depositary ReceiptPJSC - Private Joint-Stock CompanyREIT - Real Estate Investment Trust
Copyright © 2021 www.secdatabase.com. All Rights Reserved.Please Consider the Environment Before Printing This Document

GMO U.S. Equity Fund(A Series of GMO Trust)Schedule of Investments(showing percentage of total net assets)November 30, 2020 (Unaudited)
Shares Description Value ($)COMMON STOCKS �� 99.1%
Automobiles & Components �� 1.9%19,400 Aptiv Plc 2,302,7806,600 Autoliv, Inc. 587,73029,000 BorgWarner, Inc. 1,126,6506,500 Cooper Tire & Rubber Co. 258,24515,400 Dana, Inc. 259,33623,600 Gentex Corp. 769,3606,900 Lear Corp. 986,3554,700 Standard Motor Products, Inc. 217,5633,700 Visteon Corp. * 447,145
Total Automobiles & Components 6,955,164
Banks �� 4.5%15,700 Associated Banc-Corp. 240,52446,900 Citizens Financial Group, Inc. 1,531,7544,100 Comerica, Inc. 201,7205,900 East West Bancorp, Inc. 252,04855,300 Fifth Third Bancorp 1,401,30221,600 First Horizon National Corp. 263,9526,700 Flagstar Bancorp, Inc. 234,7687,300 Hilltop Holdings, Inc. 175,85756,800 Huntington Bancshares, Inc. 686,14444,800 JPMorgan Chase & Co. 5,281,02413,600 KeyCorp. 210,25634,000 MGIC Investment Corp. 406,64010,500 Old National Bancorp 166,2155,900 PennyMac Financial Services, Inc. 340,07610,800 PNC Financial Services Group, Inc. (The) 1,491,15661,300 Regions Financial Corp. 936,0511,900 Signature Bank/New York NY 213,161800 SVB Financial Group* 275,88838,400 US Bancorp 1,659,2644,100 Walker & Dunlop, Inc. 328,0413,400 Wintrust Financial Corp. 185,266
Total Banks 16,481,107
Capital Goods �� 9.3%2,300 3M Co. 397,2799,300 A O Smith Corp. 523,6833,600 Acuity Brands, Inc. 427,39210,900 AGCO Corp. 1,008,35913,100 Allison Transmission Holdings, Inc. 537,7557,600 BMC Stock Holdings, Inc. * 371,94416,200 Builders FirstSource, Inc. * 606,0422,100 Carlisle Cos, Inc. 304,1436,300 Crane Co. 438,03913,526 Cummins, Inc. 3,126,8056,800 Curtiss-Wright Corp. 783,76822,100 Eaton Corp Plc 2,676,5316,600 EMCOR Group, Inc. 568,78813,100 Emerson Electric Co. 1,006,342
Shares Description Value ($)Capital Goods �� continued
3,600 EnerSys 294,5169,794 Federal Signal Corp. 303,90815,900 Fortive Corp. 1,115,0674,600 Generac Holdings, Inc. * 991,7608,900 General Dynamics Corp. 1,329,2153,800 Gibraltar Industries, Inc. * 248,7483,800 Lockheed Martin Corp. 1,387,00013,500 Masco Corp. 724,5456,396 Moog, Inc. � Class A 494,79512,800 Mueller Industries, Inc. 419,3288,600 Northrop Grumman Corp. 2,599,43610,331 Oshkosh Corp. 831,6458,500 Owens Corning 619,39528,300 PACCAR, Inc. 2,463,7987,200 Parker-Hannifin Corp. 1,924,2725,900 Stanley Black & Decker, Inc. 1,087,4292,323 Teledyne Technologies, Inc. * 877,95527,991 Textron, Inc. 1,262,3948,579 Timken Co. (The) 630,0422,800 Toro Co. (The) 253,98814,696 UFP Industries, Inc. 788,440600 WW Grainger, Inc. 250,980
Total Capital Goods 33,675,526
Commercial & Professional Services �� 1.0%12,009 Brady Corp. � Class A 530,55810,200 CBIZ, Inc. * 247,0443,200 Cimpress Plc * 286,8169,700 CoreLogic Inc/United States 751,75013,704 Herman Miller, Inc. 488,41010,700 HNI Corp. 390,1227,700 ManpowerGroup, Inc. 667,20518,000 Steelcase, Inc. � Class A 218,700
Total Commercial & Professional Services 3,580,605
Consumer Durables & Apparel �� 3.7%6,000 Brunswick Corp. 447,8403,000 Deckers Outdoor Corp. * 763,77029,400 DR Horton, Inc. 2,190,30022,287 Garmin Ltd. 2,602,23030,600 Hanesbrands, Inc. 434,5202,100 Helen of Troy Ltd. * 424,17912,600 La-Z-Boy, Inc. 466,7049,100 MDC Holdings, Inc. 439,2575,600 Mohawk Industries, Inc. * 704,648190 NVR, Inc. * 759,46410,600 Polaris, Inc. 1,017,60026,600 PulteGroup, Inc. 1,160,5584,800 Ralph Lauren Corp. 411,60015,400 Skechers U.S.A., Inc. � Class A * 515,4389,500 Steven Madden Ltd. 298,96519,600 Tempur Sealy International, Inc. * 493,724
Copyright © 2021 www.secdatabase.com. All Rights Reserved.Please Consider the Environment Before Printing This Document

GMO U.S. Equity Fund(A Series of GMO Trust)Schedule of Investments �� (Continued)(showing percentage of total net assets)November 30, 2020 (Unaudited)
Shares Description Value ($)Consumer Durables & Apparel �� continued
22,600 TRI Pointe Group, Inc. * 395,048Total Consumer Durables & Apparel 13,525,845
Consumer Services �� 0.5%5,800 Brinker International, Inc. 290,6381,048 Graham Holdings Co. � Class B 468,47737,100 H&R Block, Inc. 697,48020,600 Perdoceo Education Corp. * 233,604
Total Consumer Services 1,690,199
Diversified Financials �� 3.9%4,700 Affiliated Managers Group, Inc. 409,46424,600 Ally Financial, Inc. 729,3908,900 American Express Co. 1,055,4518,014 Ameriprise Financial, Inc. 1,484,5137,800 Artisan Partners Asset Management, Inc. � Class A 351,00045,000 Bank of New York Mellon Corp. (The) 1,760,40013,200 Discover Financial Services 1,005,44410,500 Eaton Vance Corp. 703,29022,300 Federated Hermes, Inc. 598,5327,800 Franklin Resources, Inc. 171,5223,100 Nasdaq, Inc. 396,7697,200 OneMain Holdings, Inc. 280,7289,300 Raymond James Financial, Inc. 845,83514,700 SEI Investments Co. 775,42551,500 SLM Corp. 546,41525,900 State Street Corp. 1,825,43235,900 Synchrony Financial 1,093,873
Total Diversified Financials 14,033,483
Energy �� 0.4%20,804 Phillips 66 1,260,30612,900 World Fuel Services Corp. 366,618
Total Energy 1,626,924
Food & Staples Retailing �� 0.9%800 Costco Wholesale Corp. 313,41685,600 Kroger Co. (The) 2,824,80012,400 Sprouts Farmers Market, Inc. * 262,508
Total Food & Staples Retailing 3,400,724
Food, Beverage & Tobacco �� 3.7%6,600 Archer-Daniels-Midland Co. 328,4826,800 Campbell Soup Co. 340,1368,600 Conagra Brands, Inc. 314,41636,100 General Mills, Inc. 2,195,6024,300 Hershey Co. (The) 635,92716,700 Mondelez International, Inc. � Class A 959,41557,800 PepsiCo, Inc. 8,336,4943,600 Tyson Foods, Inc. � Class A 234,7205,400 Universal Corp. 245,754
Total Food, Beverage & Tobacco 13,590,946
Shares Description Value ($)Health Care Equipment & Services �� 3.3%
14,500 AmerisourceBergen Corp. 1,495,09513,400 Cardinal Health, Inc. 731,50617,800 Edwards Lifesciences Corp. * 1,493,2429,600 HCA Healthcare, Inc. 1,441,0562,200 Laboratory Corp. of America Holdings * 439,64816,178 McKesson Corp. 2,910,58416,500 Medtronic Plc 1,876,0502,000 Quest Diagnostics, Inc. 247,9601,900 STERIS Plc 368,2394,100 West Pharmaceutical Services, Inc. 1,128,156
Total Health Care Equipment & Services 12,131,536
Household & Personal Products �� 1.1%5,200 Church & Dwight Co., Inc. 456,4046,100 Clorox Co. (The) 1,238,05624,000 Colgate-Palmolive Co. 2,055,3605,300 Nu Skin Enterprises, Inc. � Class A 273,003
Total Household & Personal Products 4,022,823
Insurance �� 2.5%20,800 Aflac, Inc. 913,74431,102 Allstate Corp. (The) 3,183,28925,200 Fidelity National Financial, Inc. 906,94813,304 First American Financial Corp. 644,4463,900 Hanover Insurance Group, Inc. (The) 438,1657,800 National General Holdings Corp. 265,82411,800 Old Republic International Corp. 211,4566,000 Principal Financial Group, Inc. 298,74026,507 Progressive Corp. (The) 2,309,025
Total Insurance 9,171,637
Materials �� 4.9%70,400 Amcor Plc 797,6323,000 Ashland Global Holdings, Inc. 225,5105,900 Avery Dennison Corp. 881,10613,600 Avient Corp. 497,0807,600 Berry Global Group, Inc. * 402,8004,100 Cabot Corp. 169,7819,200 Commercial Metals Co. 183,17213,200 Corteva, Inc. 505,8244,000 Crown Holdings, Inc. * 377,0006,000 DuPont de Nemours, Inc. 380,64016,400 Eastman Chemical Co. 1,597,3607,800 FMC Corp. 904,87817,700 Graphic Packaging Holding Co. 271,1644,700 HB Fuller Co. 245,9515,200 International Paper Co. 257,2964,900 Louisiana-Pacific Corp. 167,72720,579 LyondellBasell Industries NV � Class A 1,751,2731,600 NewMarket Corp. 591,61612,800 Nucor Corp. 687,36011,300 Reliance Steel & Aluminum Co. 1,331,140
Copyright © 2021 www.secdatabase.com. All Rights Reserved.Please Consider the Environment Before Printing This Document

GMO U.S. Equity Fund(A Series of GMO Trust)Schedule of Investments �� (Continued)(showing percentage of total net assets)November 30, 2020 (Unaudited)
Shares Description Value ($)Materials �� continued
4,000 Scotts Miracle-Gro Co. (The) 703,08012,800 Sealed Air Corp. 576,7683,700 Sensient Technologies Corp. 265,3641,500 Sherwin-Williams Co. (The) 1,121,44513,900 Silgan Holdings, Inc. 469,82013,600 Steel Dynamics, Inc. 492,4563,000 Stepan Co. 348,48037,600 Valvoline, Inc. 856,90416,900 Westrock Co. 713,349
Total Materials 17,773,976
Media & Entertainment �� 6.7%63,900 Activision Blizzard, Inc. 5,078,7721,600 Alphabet, Inc. � Class C * 2,817,18487,800 Comcast Corp. � Class A 4,411,07210,100 DISH Network Corp. � Class A * 362,28762,100 Electronic Arts, Inc. * 7,933,27531,800 Interpublic Group of Cos., Inc. (The) 708,50419,489 Omnicom Group, Inc. 1,227,80735,685 TEGNA, Inc. 514,221143,900 Zynga Inc. � Class A * 1,187,175
Total Media & Entertainment 24,240,297
Pharmaceuticals, Biotechnology & LifeSciences �� 9.1%
23,900 AbbVie, Inc. 2,499,4628,300 Amgen, Inc. 1,842,9329,700 Biogen, Inc. * 2,329,64963,800 Bristol-Myers Squibb Co. 3,981,12053,300 Eli Lilly & Co. 7,763,14535,500 Gilead Sciences, Inc. 2,153,78576,631 Merck & Co., Inc. 6,160,366133,538 Pfizer, Inc. 5,115,8416,600 Prestige Consumer Healthcare, Inc. * 234,7624,500 United Therapeutics Corp. * 596,88036,469 Viatris, Inc. * 613,409
Total Pharmaceuticals, Biotechnology & Life Sciences 33,291,351
Retailing �� 9.4%3,900 Aaron�s Holdings Co., Inc. 245,4272,700 Amazon.com, Inc. * 8,553,7084,000 Asbury Automotive Group, Inc. * 451,08015,400 AutoNation, Inc. * 943,866500 AutoZone, Inc. * 568,82524,540 Best Buy Co., Inc. 2,669,9526,100 Big Lots, Inc. 315,18711,000 Core-Mark Holding Co., Inc. 343,09035,800 Designer Brands, Inc. � Class A 282,82011,500 Dick�s Sporting Goods, Inc. 653,31511,500 Dollar General Corp. 2,513,67097,055 eBay, Inc. 4,894,4849,200 Foot Locker, Inc. 344,080
Shares Description Value ($)Retailing �� continued
14,400 Gap Inc. (The) 301,82411,100 Genuine Parts Co. 1,091,9074,989 Group 1 Automotive, Inc. 592,74327,900 L Brands, Inc. 1,082,7991,000 Lithia Motors, Inc. � Class A 289,30016,800 Lowe�s Cos., Inc. 2,617,7765,800 Murphy U.S.A., Inc. 743,5604,400 Penske Automotive Group, Inc. 242,30857,200 Qurate Retail, Inc. � Series A 598,8848,600 Rent-A-Center, Inc. 290,8524,300 Sleep Number Corp. * 298,37712,300 Target Corp. 2,208,21911,200 Williams-Sonoma, Inc. 1,226,064
Total Retailing 34,364,117
Semiconductors & SemiconductorEquipment �� 9.4%
123,400 Applied Materials, Inc. 10,178,0326,400 Cirrus Logic, Inc. * 512,64012,300 Entegris, Inc. 1,139,226233,700 Intel Corp. 11,299,3958,100 KLA Corp. 2,040,9577,400 Lam Research Corp. 3,349,68410,800 Maxim Integrated Products, Inc. 896,83237,800 Micron Technology, Inc. * 2,422,6023,100 Skyworks Solutions, Inc. 437,6272,800 Synaptics, Inc. * 217,75614,200 Teradyne, Inc. 1,566,828
Total Semiconductors & Semiconductor Equipment 34,061,579
Software & Services �� 10.6%3,700 Akamai Technologies, Inc. * 382,98717,420 Amdocs Ltd. 1,146,41010,600 Booz Allen Hamilton Holding Corp. 919,9741,300 CACI International, Inc. � Class A * 308,47744,205 Cadence Design Systems, Inc. * 5,141,0429,127 Citrix Systems, Inc. 1,131,01812,695 Intuit, Inc. 4,468,8945,800 j2 Global, Inc. * 519,73852,353 Microsoft Corp. 11,207,20730,500 NortonLifeLock, Inc. 556,015105,200 Oracle Corp. 6,072,1447,448 Progress Software Corp. 298,6657,810 Sykes Enterprises, Inc. * 293,89023,919 Synopsys, Inc. * 5,441,57225,400 Western Union Co. (The) 573,024
Total Software & Services 38,461,057
Technology Hardware & Equipment �� 11.9%130,520 Apple, Inc. 15,538,4069,833 Arrow Electronics, Inc. * 901,1949,000 Avnet, Inc. 273,150
Copyright © 2021 www.secdatabase.com. All Rights Reserved.Please Consider the Environment Before Printing This Document

GMO U.S. Equity Fund(A Series of GMO Trust)Schedule of Investments �� (Continued)(showing percentage of total net assets)November 30, 2020 (Unaudited)
As of November 30, 2020, for the above contracts and/or agreements, the Fund had sufficient cash and/or securities to covercommitments or collateral requirements, if any, of the relevant broker or exchange.
Shares Description Value ($)Technology Hardware & Equipment �� continued
127,100 Cisco Systems, Inc. 5,467,84215,100 Corning, Inc. 565,0425,100 F5 Networks, Inc. * 830,33148,200 Flex Ltd. * 782,286151,614 Hewlett Packard Enterprise Co. 1,673,819143,640 HP, Inc. 3,150,0255,200 II-VI, Inc. * 351,7805,120 Insight Enterprises, Inc. * 365,97815,400 Jabil, Inc. 588,58851,900 Juniper Networks, Inc. 1,129,8638,407 Motorola Solutions, Inc. 1,442,05310,300 National Instruments Corp. 385,52919,200 NetApp, Inc. 1,023,55213,400 Sanmina Corp. * 426,32135,300 Seagate Technology Plc 2,075,9935,400 Sensata Technologies Holding Plc * 263,6825,000 SYNNEX Corp. 801,55040,400 TE Connectivity Ltd. 4,604,38827,500 Xerox Holdings Corp. 601,975
Total Technology Hardware & Equipment 43,243,347
Telecommunication Services �� 0.3%23,700 Telephone & Data Systems, Inc. 449,82612,400 Verizon Communications, Inc. 749,084
Total Telecommunication Services 1,198,910
Transportation �� 0.1%6,400 Werner Enterprises, Inc. 255,936
TOTAL COMMON STOCKS(COST $303,224,958) 360,777,089
Shares Description Value ($)MUTUAL FUNDS �� 0.6%
Affiliated Issuers �� 0.6%426,646 GMO U.S. Treasury Fund 2,150,296
TOTAL MUTUAL FUNDS(COST $2,150,296) 2,150,296
SHORT-TERM INVESTMENTS �� 0.1%
Money Market Funds �� 0.1%490,860 State Street Institutional Treasury Money Market
Fund � Premier Class, 0.01% (a) 490,860
TOTAL SHORT-TERM INVESTMENTS(COST $490,860) 490,860
TOTAL INVESTMENTS �� 99.8%(Cost $305,866,114) 363,418,245Other Assets and Liabilities (net) � 0.2% 571,670
TOTAL NET ASSETS �� 100.0% $363,989,915
A summary of outstanding financial instruments at November 30,2020 is as follows:
Futures Contracts
Numberof
Contracts + TypeExpiration
Date
NotionalAmount
($)
Value/NetUnrealized
Appreciation(Depreciation)
($)Buys
6 S&P 500E-Mini December 2020 $1,086,960 $ 106,861
+ Buys - Fund is long the futures contract.Sales - Fund is short the futures contract.
Notes to Schedule of Investments:
* Non-income producing security.(a) The rate disclosed is the 7 day net yield as of November 30, 2020.
Copyright © 2021 www.secdatabase.com. All Rights Reserved.Please Consider the Environment Before Printing This Document

GMO U.S. Small Cap Value Fund(A Series of GMO Trust)Schedule of Investments(showing percentage of total net assets)November 30, 2020 (Unaudited)
Shares Description Value ($)COMMON STOCKS �� 98.6%
Automobiles & Components �� 1.6%44,600 Cooper Tire & Rubber Co. 1,771,95845,200 Dana, Inc. 761,16822,100 Garrett Motion, Inc. * 107,18518,800 Modine Manufacturing Co. * 205,29611,700 Patrick Industries, Inc. 737,56817,000 Standard Motor Products, Inc. 786,93079,100 Stoneridge, Inc. * 2,124,626
Total Automobiles & Components 6,494,731
Banks �� 12.9%12,800 1st Source Corp. 477,69624,500 Amalgamated Bank � Class A 311,6403,193 Arrow Financial Corp. 95,024182,700 Associated Banc-Corp. 2,798,9641,800 Bancorp, Inc. (The) * 21,2404,600 Bar Harbor Bankshares 106,03080,200 Boston Private Financial Holdings, Inc. 574,23217,000 Bridge Bancorp, Inc. 379,44046,900 Brookline Bancorp, Inc. 533,25335,300 Cathay General Bancorp 997,2252,900 Century Bancorp, Inc. � Class A 214,3105,800 Civista Bancshares, Inc. 97,6141,200 CNB Financial Corp. 23,6167,695 Community Trust Bancorp, Inc. 260,47681,800 Dime Community Bancshares, Inc. 1,182,0101,200 Federal Agricultural Mortgage Corp. � Class C 81,24016,400 Financial Institutions, Inc. 328,1648,576 First Community Bankshares, Inc. 180,69610,900 First Financial Corp. 412,78318,200 First Foundation, Inc. 323,232182,600 Flagstar Bancorp, Inc. 6,398,30419,600 Flushing Financial Corp. 278,3206,100 Great Southern Bancorp, Inc. 279,9907,800 Heritage Financial Corp. 181,506216,400 Hilltop Holdings, Inc. 5,213,07613,900 Independent Bank Corp. 236,43984,400 International Bancshares Corp. 2,735,404432,700 Investors Bancorp, Inc. 4,188,53622,000 Lakeland Financial Corp. 1,117,3807,000 Mercantile Bank Corp. 173,8105,400 Merchants Bancorp 143,85625,000 Meridian Bancorp, Inc. 341,125246,200 MGIC Investment Corp. 2,944,55225,100 Northfield Bancorp, Inc. 279,3634,500 Northrim BanCorp, Inc. 142,96530,400 Northwest Bancshares, Inc. 359,632129,400 OFG Bancorp 2,167,45025,300 Old National Bancorp 400,49992,300 PennyMac Financial Services, Inc. 5,320,17253,444 Premier Financial Corp. 1,106,8255,700 Sierra Bancorp 125,400
Shares Description Value ($)Banks �� continued
3,000 Territorial Bancorp, Inc. 66,93034,400 Towne Bank/Portsmouth VA 748,20024,700 TriCo Bancshares 809,17279,000 TrustCo Bank Corp. 479,5303,500 Trustmark Corp. 86,87085,800 Walker & Dunlop, Inc. 6,864,85847,903 Waterstone Financial, Inc. 841,4162,700 Wintrust Financial Corp. 147,123
Total Banks 53,577,588
Capital Goods �� 11.0%8,900 Allied Motion Technologies, Inc. 361,0735,800 Apogee Enterprises, Inc. 152,1924,900 Applied Industrial Technologies, Inc. 384,3072,800 Arcosa, Inc. 145,29231,900 AZZ, Inc. 1,422,4217,100 Comfort Systems USA, Inc. 357,76947,100 Cornerstone Building Brands, Inc. * 411,65423,700 Ducommun, Inc. * 1,178,3644,200 EMCOR Group, Inc. 361,9565,500 EnerSys 449,9555,100 EnPro Industries, Inc. 361,13189,400 Federal Signal Corp. 2,774,08227,225 Gorman-Rupp Co. (The) 895,703107,900 Griffon Corp. 2,249,7155,400 Hurco Cos, Inc. 160,97429,100 Hyster-Yale Materials Handling, Inc. 1,601,66413,100 Insteel Industries, Inc. 303,0031,900 Masonite International Corp. * 190,09588,500 Meritor, Inc. * 2,336,4009,400 Miller Industries, Inc. 313,86680,900 Moog, Inc. � Class A 6,258,42469,500 Mueller Industries, Inc. 2,276,8207,700 National Presto Industries, Inc. 654,88564,500 nVent Electric Plc 1,483,50014,100 Park-Ohio Holdings Corp. 396,0693,100 Preformed Line Products Co. 188,015222,500 Resideo Technologies, Inc. * 4,114,02522,000 Systemax, Inc. 676,9409,600 Tennant Co. 644,73686,600 Terex Corp. 2,684,6006,500 Tutor Perini Corp. * 87,880125,100 UFP Industries, Inc. 6,711,61552,700 Vectrus, Inc. * 2,512,20922,400 Veritiv Corp. * 416,1924,900 WESCO International, Inc. * 319,578
Total Capital Goods 45,837,104
Commercial & Professional Services �� 6.5%320,929 ACCO Brands Corp. 2,458,316125,900 Brady Corp. � Class A 5,562,26253,500 CBIZ, Inc. * 1,295,770
Copyright © 2021 www.secdatabase.com. All Rights Reserved.Please Consider the Environment Before Printing This Document

GMO U.S. Small Cap Value Fund(A Series of GMO Trust)Schedule of Investments �� (Continued)(showing percentage of total net assets)November 30, 2020 (Unaudited)
Shares Description Value ($)Commercial & Professional Services �� continued
15,500 CRA International, Inc. 710,67556,100 Deluxe Corp. 1,444,0148,400 Ennis, Inc. 137,50817,600 Heidrick & Struggles International, Inc. 459,360187,100 Herman Miller, Inc. 6,668,24441,900 HNI Corp. 1,527,67458,400 Interface, Inc. 487,34854,900 Kelly Services, Inc. � Class A 1,123,25419,000 Kforce, Inc. 779,95096,600 Kimball International, Inc. � Class B 1,055,83860,600 Resources Connection, Inc. 733,866198,600 Steelcase, Inc. � Class A 2,412,99010,300 TrueBlue, Inc. * 196,730
Total Commercial & Professional Services 27,053,799
Consumer Durables & Apparel �� 5.7%17,000 Acushnet Holdings Corp. 640,9006,026 Clarus Corp. 86,774136,600 Ethan Allen Interiors, Inc. 2,495,682103,200 G-III Apparel Group Ltd. * 2,102,18416,700 Hooker Furniture Corp. 505,50919,900 Johnson Outdoors, Inc. � Class A 1,663,64076,500 La-Z-Boy, Inc. 2,833,5607,500 Levi Strauss & Co. � Class A 137,92550,000 MDC Holdings, Inc. 2,413,50057,800 Movado Group, Inc. 978,554172,400 Nautilus, Inc. * 3,637,6406,500 Polaris, Inc. 624,00018,000 Rocky Brands, Inc. 522,000132,000 TRI Pointe Group, Inc. * 2,307,36015,800 Universal Electronics, Inc. * 832,028119,800 Vera Bradley, Inc. * 1,015,90448,100 Vista Outdoor, Inc. * 992,303
Total Consumer Durables & Apparel 23,789,463
Consumer Services �� 2.5%84,700 Adtalem Global Education, Inc. * 2,424,9617,700 American Public Education, Inc. * 239,00867,100 Brinker International, Inc. 3,362,38121,300 Carriage Services, Inc. 579,5732,300 Graham Holdings Co. � Class B 1,028,14669,200 H&R Block, Inc. 1,300,960120,500 Perdoceo Education Corp. * 1,366,470
Total Consumer Services 10,301,499
Diversified Financials �� 5.2%104,100 Brightsphere Investment Group, Inc. 1,842,57046,100 Curo Group Holdings Corp. 398,3041,500 Diamond Hill Investment Group, Inc. 205,230124,800 Donnelley Financial Solutions, Inc. * 2,032,99229,100 Encore Capital Group, Inc. * 993,474189,317 Enova International, Inc. * 3,958,618
Shares Description Value ($)Diversified Financials �� continued
94,700 Federated Hermes, Inc. 2,541,74833,900 Oppenheimer Holdings, Inc. � Class A 999,711280,500 SLM Corp. 2,976,10534,300 StoneX Group, Inc. * 2,113,566202,500 Waddell & Reed Financial, Inc. � Class A 3,333,15018,400 Westwood Holdings Group, Inc. 219,328
Total Diversified Financials 21,614,796
Energy �� 3.2%58,700 Evolution Petroleum Corp. 178,44825,500 Geospace Technologies Corp. * 158,35512,780 Matrix Service Co. * 122,43276,100 Penn Virginia Corp. * 686,422258,500 QEP Resources, Inc. 416,18519,300 Renewable Energy Group, Inc. * 1,120,9444,200 REX American Resources Corp. * 329,7001,181,000 Southwestern Energy Co. * 3,672,910226,800 World Fuel Services Corp. 6,445,656
Total Energy 13,131,052
Food & Staples Retailing �� 0.8%16,900 Ingles Markets, Inc. � Class A 635,27191,800 SpartanNash Co. 1,733,1848,800 Village Super Market, Inc. � Class A 203,80815,200 Weis Markets, Inc. 723,976
Total Food & Staples Retailing 3,296,239
Food, Beverage & Tobacco �� 1.1%6,016 Seneca Foods Corp. � Class A * 251,95092,100 Universal Corp. 4,191,471
Total Food, Beverage & Tobacco 4,443,421
Health Care Equipment & Services �� 4.5%40,900 AngioDynamics, Inc. * 581,59848,100 Computer Programs & Systems, Inc. 1,367,48310,900 Covetrus, Inc. * 294,46415,300 FONAR Corp. * 293,91325,500 Integer Holdings Corp. * 1,838,2957,300 Lantheus Holdings, Inc. * 96,06812,990 LENSAR, Inc. * 111,32417,000 Mednax, Inc. * 343,570120,900 Meridian Bioscience, Inc. * 2,285,0108,600 Natus Medical, Inc. * 179,91245,900 NextGen Healthcare, Inc. * 814,266220,000 Owens & Minor, Inc. 5,667,20017,000 Patterson Cos., Inc. 471,92012,000 Providence Service Corp. (The) * 1,629,4809,500 SeaSpine Holdings Corp. * 135,09079,800 Select Medical Holdings Corp. * 1,923,18071,500 Surgalign Holdings, Inc. * 161,59011,200 Surmodics, Inc. * 419,328
Copyright © 2021 www.secdatabase.com. All Rights Reserved.Please Consider the Environment Before Printing This Document

GMO U.S. Small Cap Value Fund(A Series of GMO Trust)Schedule of Investments �� (Continued)(showing percentage of total net assets)November 30, 2020 (Unaudited)
Shares Description Value ($)Health Care Equipment & Services �� continued
2,100 Triple-S Management Corp. � Class B * 47,061Total Health Care Equipment & Services 18,660,752
Household & Personal Products �� 0.7%4,900 Central Garden & Pet Co. * 196,1968,000 Central Garden & Pet Co. � Class A * 295,12016,300 Inter Parfums, Inc. 885,25316,200 Lifevantage Corp. * 172,2062,900 Nu Skin Enterprises, Inc. � Class A 149,37914,600 USANA Health Sciences, Inc. * 1,097,628
Total Household & Personal Products 2,795,782
Insurance �� 0.6%17,200 Employers Holdings, Inc. 524,77241,500 National General Holdings Corp. 1,414,3207,800 Stewart Information Services Corp. 326,58611,500 Universal Insurance Holdings, Inc. 160,540
Total Insurance 2,426,218
Materials �� 7.9%5,400 AdvanSix, Inc. * 95,95821,000 American Vanguard Corp. 318,36068,700 Avient Corp. 2,510,98511,200 Cabot Corp. 463,79210,000 Commercial Metals Co. 199,10011,200 Domtar Corp. 337,12030,500 FutureFuel Corp. 365,69573,900 Greif, Inc. � Class A 3,592,2794,500 Hawkins, Inc. 225,81019,400 HB Fuller Co. 1,015,20236,500 Innospec, Inc. 3,003,58520,200 Koppers Holdings, Inc. * 546,8145,900 Kronos Worldwide, Inc. 81,12566,000 Materion Corp. 3,847,80023,300 Neenah, Inc. 1,130,283106,600 Schweitzer-Mauduit International, Inc. 3,707,54873,900 Silgan Holdings, Inc. 2,497,82018,029 Stepan Co. 2,094,24965,900 Tredegar Corp. 1,041,879184,100 Valvoline, Inc. 4,195,63945,100 Verso Corp. � Class A 487,53118,100 Worthington Industries, Inc. 936,132
Total Materials 32,694,706
Media & Entertainment �� 3.5%45,400 AMC Networks, Inc. � Class A * 1,496,838122,800 Cars.com, Inc. * 1,371,67686,100 DHI Group, Inc. * 165,312378,200 Liberty TripAdvisor Holdings, Inc. � Class A * 1,040,05079,400 Marchex, Inc. � Class B * 171,50441,100 Scholastic Corp. 974,892
Shares Description Value ($)Media & Entertainment �� continued
124,802 Sciplay Corp. � Class A * 1,858,302458,900 TEGNA, Inc. 6,612,74966,000 Tribune Publishing Co. 797,28065,200 TrueCar, Inc. * 266,016
Total Media & Entertainment 14,754,619
Pharmaceuticals, Biotechnology & Life Sciences �� 2.6%41,900 Amneal Pharmaceuticals, Inc. * 165,50558,500 CytomX Therapeutics, Inc. * 439,920579,000 Endo International Plc * 2,941,32093,800 Kezar Life Sciences, Inc. * 617,20441,900 Luminex Corp. 994,287141,300 Prestige Consumer Healthcare, Inc. * 5,026,04143,300 Surface Oncology, Inc. * 391,4323,300 United Therapeutics Corp. * 437,712
Total Pharmaceuticals, Biotechnology & Life Sciences 11,013,421
Real Estate �� 5.7%454,100 CoreCivic, Inc. (REIT) 3,219,569170,100 CorePoint Lodging, Inc. (REIT) 1,107,35118,000 Cushman & Wakefield Plc * 268,200404,700 GEO Group, Inc. (REIT) 3,824,415483,200 Newmark Group, Inc. � Class A 3,392,064321,800 Realogy Holdings Corp. * 3,961,358213,500 Summit Hotel Properties, Inc. (REIT) 1,855,315233,900 Sunstone Hotel Investors, Inc. (REIT) 2,455,95044,300 Urban Edge Properties (REIT) 575,014224,100 Xenia Hotels & Resorts, Inc. (REIT) 3,157,569
Total Real Estate 23,816,805
Retailing �� 10.6%98,700 AutoNation, Inc. * 6,049,323160,000 Big Lots, Inc. 8,267,20023,500 Cato Corp. (The) � Class A 189,41076,600 Core-Mark Holding Co., Inc. 2,389,15429,800 Designer Brands, Inc. � Class A 235,42037,400 Dick�s Sporting Goods, Inc. 2,124,6948,000 Duluth Holdings Inc. � Class B * 117,60048,300 Genesco, Inc. * 1,515,17184,800 Group 1 Automotive, Inc. 10,075,08879,113 Haverty Furniture Cos, Inc. 2,153,45696,900 Michaels Cos., Inc. (The) * 958,3419,800 Penske Automotive Group, Inc. 539,686131,700 Qurate Retail, Inc. � Series A 1,378,89916,800 Sally Beauty Holdings, Inc. * 193,20060,300 Shoe Carnival, Inc. 2,205,1717,300 Sleep Number Corp. * 506,54774,900 Sonic Automotive, Inc. � Class A 3,024,4622,600 Weyco Group, Inc. 46,59262,200 Zumiez, Inc. * 2,306,998
Total Retailing 44,276,412
Copyright © 2021 www.secdatabase.com. All Rights Reserved.Please Consider the Environment Before Printing This Document

GMO U.S. Small Cap Value Fund(A Series of GMO Trust)Schedule of Investments �� (Continued)(showing percentage of total net assets)November 30, 2020 (Unaudited)
Shares Description Value ($)Semiconductors & Semiconductor Equipment �� 0.7%
35,600 Alpha & Omega Semiconductor Ltd. * 884,30422,200 Amkor Technology, Inc. * 327,22889,000 DSP Group, Inc. * 1,497,87033,600 Photronics, Inc. * 389,424
Total Semiconductors & Semiconductor Equipment 3,098,826
Software & Services �� 1.9%11,400 Alliance Data Systems Corp. 833,79610,500 Cerence, Inc. * 952,87533,100 CSG Systems International, Inc. 1,435,87821,700 Endurance International Group Holdings, Inc. * 205,71649,800 Progress Software Corp. 1,996,98069,000 Sykes Enterprises, Inc. * 2,596,470
Total Software & Services 8,021,715
Technology Hardware & Equipment �� 7.1%104,446 ADTRAN, Inc. 1,319,675196,700 Arlo Technologies, Inc. * 1,034,64258,200 Avnet, Inc. 1,766,370115,400 Benchmark Electronics, Inc. 2,806,52841,500 Calix, Inc. * 982,72094,900 Comtech Telecommunications Corp. 1,808,79443,300 CTS Corp. 1,318,9182,100 ePlus, Inc. * 177,05184,500 Insight Enterprises, Inc. * 6,040,06030,900 Kimball Electronics, Inc. * 476,16936,900 Methode Electronics, Inc. 1,292,238235,700 Sanmina Corp. * 7,498,7956,400 ScanSource, Inc. * 160,6408,500 Super Micro Computer, Inc. * 239,7854,526 Vishay Precision Group, Inc. * 132,386119,800 Xerox Holdings Corp. 2,622,422
Total Technology Hardware & Equipment 29,677,193
Telecommunication Services �� 1.7%1,200 ATN International, Inc. 58,72883,600 Consolidated Communications Holdings, Inc. * 468,16052,000 IDT Corp. � Class B * 619,84011,400 Ooma, Inc. * 177,954106,378 Spok Holdings, Inc. 1,045,696186,600 Telephone & Data Systems, Inc. 3,541,66833,600 United States Cellular Corp. * 1,053,360
Total Telecommunication Services 6,965,406
Transportation �� 0.6%31,700 ArcBest Corp. 1,328,54721,500 Atlas Air Worldwide Holdings, Inc. * 1,199,915
Total Transportation 2,528,462
Shares Description Value ($)Utilities �� 0.0%
9,500 Genie Energy Ltd. � Class B 78,850
TOTAL COMMON STOCKS(COST $392,644,665) 410,348,859
MUTUAL FUNDS �� 0.9%
Affiliated Issuers �� 0.9%736,130 GMO U.S. Treasury Fund 3,710,097
TOTAL MUTUAL FUNDS(COST $3,710,097) 3,710,097
RIGHTS/WARRANTS �� 0.0%
Pharmaceuticals, Biotechnology & Life Sciences �� 0.0%72,700 Achillion Pharmaceuticals, Inc. CVR * (a) 36,350
TOTAL RIGHTS/WARRANTS(COST $33,442) 36,350
SHORT-TERM INVESTMENTS �� 0.0%
Money Market Funds �� 0.0%107,069 State Street Institutional Treasury Money Market Fund
� Premier Class, 0.01% (b) 107,069
TOTAL SHORT-TERM INVESTMENTS(COST $107,069) 107,069TOTAL INVESTMENTS �� 99.5%(Cost $396,495,273) 414,202,375Other Assets and Liabilities (net) � 0.5% 1,897,780
TOTAL NET ASSETS �� 100.0% $416,100,155
A summary of outstanding financial instruments at November 30,2020 is as follows:
Futures Contracts
Number ofContracts + Type
ExpirationDate
NotionalAmount
($)
Value/NetUnrealized
Appreciation(Depreciation) ($)
Buys36 E-mini
Russell2000Index December 2020 $3,276,180 $ 80,753
+ Buys - Fund is long the futures contract.Sales - Fund is short the futures contract.
Copyright © 2021 www.secdatabase.com. All Rights Reserved.Please Consider the Environment Before Printing This Document

GMO U.S. Small Cap Value Fund(A Series of GMO Trust)
Schedule of Investments �� (Continued)November 30, 2020 (Unaudited)
As of November 30, 2020, for the above contracts and/or agreements, the Fund had sufficient cash and/or securities to covercommitments or collateral requirements, if any, of the relevant broker or exchange.
Notes to Schedule of Investments:
* Non-income producing security.(a) Investment valued using significant unobservable inputs.(b) The rate disclosed is the 7 day net yield as of November 30, 2020.
Portfolio Abbreviations:
CVR - Contingent Value RightREIT - Real Estate Investment Trust
Copyright © 2021 www.secdatabase.com. All Rights Reserved.Please Consider the Environment Before Printing This Document
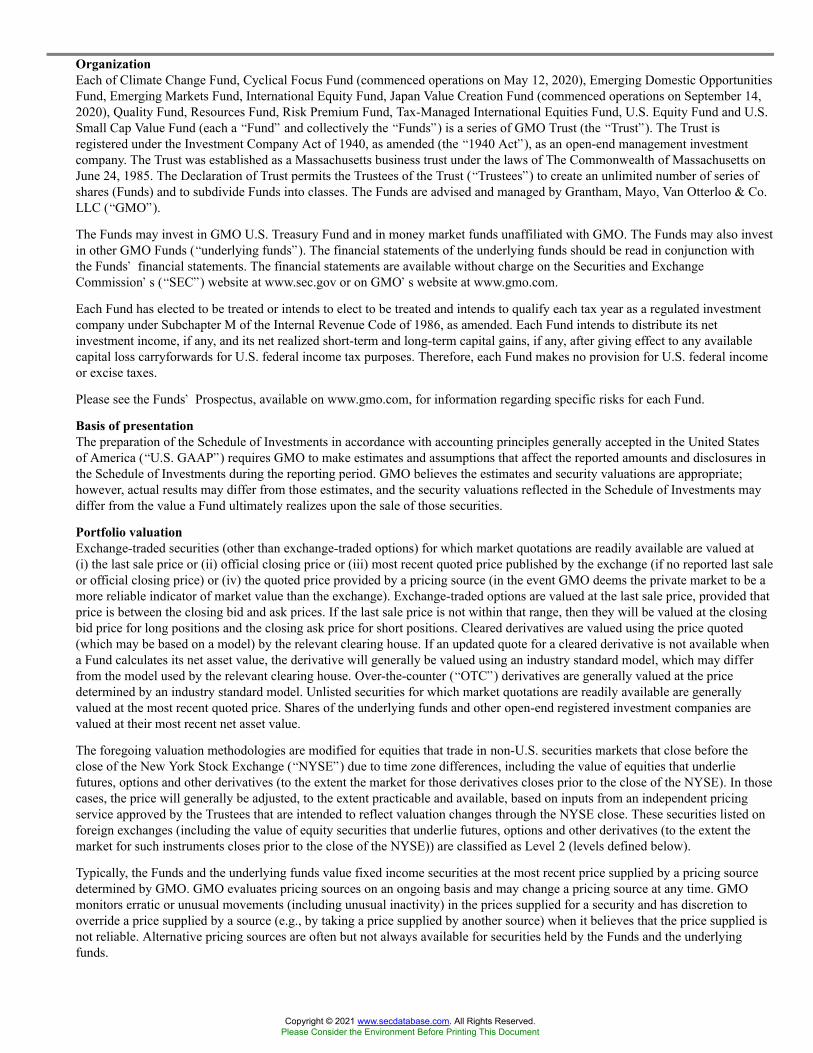
OrganizationEach of Climate Change Fund, Cyclical Focus Fund (commenced operations on May 12, 2020), Emerging Domestic OpportunitiesFund, Emerging Markets Fund, International Equity Fund, Japan Value Creation Fund (commenced operations on September 14,2020), Quality Fund, Resources Fund, Risk Premium Fund, Tax-Managed International Equities Fund, U.S. Equity Fund and U.S.Small Cap Value Fund (each a �Fund� and collectively the �Funds�) is a series of GMO Trust (the �Trust�). The Trust isregistered under the Investment Company Act of 1940, as amended (the �1940 Act�), as an open-end management investmentcompany. The Trust was established as a Massachusetts business trust under the laws of The Commonwealth of Massachusetts onJune 24, 1985. The Declaration of Trust permits the Trustees of the Trust (�Trustees�) to create an unlimited number of series ofshares (Funds) and to subdivide Funds into classes. The Funds are advised and managed by Grantham, Mayo, Van Otterloo & Co.LLC (�GMO�).
The Funds may invest in GMO U.S. Treasury Fund and in money market funds unaffiliated with GMO. The Funds may also investin other GMO Funds (�underlying funds�). The financial statements of the underlying funds should be read in conjunction withthe Funds� financial statements. The financial statements are available without charge on the Securities and ExchangeCommission�s (�SEC�) website at www.sec.gov or on GMO�s website at www.gmo.com.
Each Fund has elected to be treated or intends to elect to be treated and intends to qualify each tax year as a regulated investmentcompany under Subchapter M of the Internal Revenue Code of 1986, as amended. Each Fund intends to distribute its netinvestment income, if any, and its net realized short-term and long-term capital gains, if any, after giving effect to any availablecapital loss carryforwards for U.S. federal income tax purposes. Therefore, each Fund makes no provision for U.S. federal incomeor excise taxes.
Please see the Funds� Prospectus, available on www.gmo.com, for information regarding specific risks for each Fund.
Basis of presentationThe preparation of the Schedule of Investments in accordance with accounting principles generally accepted in the United Statesof America (�U.S. GAAP�) requires GMO to make estimates and assumptions that affect the reported amounts and disclosures inthe Schedule of Investments during the reporting period. GMO believes the estimates and security valuations are appropriate;however, actual results may differ from those estimates, and the security valuations reflected in the Schedule of Investments maydiffer from the value a Fund ultimately realizes upon the sale of those securities.
Portfolio valuationExchange-traded securities (other than exchange-traded options) for which market quotations are readily available are valued at(i) the last sale price or (ii) official closing price or (iii) most recent quoted price published by the exchange (if no reported last saleor official closing price) or (iv) the quoted price provided by a pricing source (in the event GMO deems the private market to be amore reliable indicator of market value than the exchange). Exchange-traded options are valued at the last sale price, provided thatprice is between the closing bid and ask prices. If the last sale price is not within that range, then they will be valued at the closingbid price for long positions and the closing ask price for short positions. Cleared derivatives are valued using the price quoted(which may be based on a model) by the relevant clearing house. If an updated quote for a cleared derivative is not available whena Fund calculates its net asset value, the derivative will generally be valued using an industry standard model, which may differfrom the model used by the relevant clearing house. Over-the-counter (�OTC�) derivatives are generally valued at the pricedetermined by an industry standard model. Unlisted securities for which market quotations are readily available are generallyvalued at the most recent quoted price. Shares of the underlying funds and other open-end registered investment companies arevalued at their most recent net asset value.
The foregoing valuation methodologies are modified for equities that trade in non-U.S. securities markets that close before theclose of the New York Stock Exchange (�NYSE�) due to time zone differences, including the value of equities that underliefutures, options and other derivatives (to the extent the market for those derivatives closes prior to the close of the NYSE). In thosecases, the price will generally be adjusted, to the extent practicable and available, based on inputs from an independent pricingservice approved by the Trustees that are intended to reflect valuation changes through the NYSE close. These securities listed onforeign exchanges (including the value of equity securities that underlie futures, options and other derivatives (to the extent themarket for such instruments closes prior to the close of the NYSE)) are classified as Level 2 (levels defined below).
Typically, the Funds and the underlying funds value fixed income securities at the most recent price supplied by a pricing sourcedetermined by GMO. GMO evaluates pricing sources on an ongoing basis and may change a pricing source at any time. GMOmonitors erratic or unusual movements (including unusual inactivity) in the prices supplied for a security and has discretion tooverride a price supplied by a source (e.g., by taking a price supplied by another source) when it believes that the price supplied isnot reliable. Alternative pricing sources are often but not always available for securities held by the Funds and the underlyingfunds.
Copyright © 2021 www.secdatabase.com. All Rights Reserved.Please Consider the Environment Before Printing This Document

�Quoted price� typically means the bid price for securities held long and the ask price for securities sold short. If a marketquotation for a security does not involve a bid or an ask, the �quoted price� may be the price provided by a market participant orother third-party pricing source in accordance with the market practice for that security. If an updated quoted price for a security isnot available when a Fund calculates its net asset value, the Fund will generally use the last quoted price so long as GMO believesthat the last quoted price continues to represent that security�s fair value.
Copyright © 2021 www.secdatabase.com. All Rights Reserved.Please Consider the Environment Before Printing This Document

In the case of derivatives, prices determined by a model may reflect an estimate of the average of bid and ask prices, regardless ofwhether a Fund has a long position or a short position.
If quotations are not readily available or circumstances make an existing valuation methodology or procedure unreliable,derivatives and other securities are valued at fair value as determined in good faith by the Trustees or persons acting at theirdirection pursuant to procedures approved by the Trustees. Because of the uncertainty inherent in fair value pricing, the pricedetermined for a particular security may be materially different from the value realized upon its sale. The Funds and/or theunderlying funds classify such securities as Level 3 (levels defined below). For the period ended November 30, 2020, the Fundsdid not reduce the value of any of their OTC derivatives contracts, if any, based on the creditworthiness of their counterparties.
U.S. GAAP requires the Funds to disclose the fair value of their investments in a three-level hierarchy (Levels 1, 2 and 3). Thevaluation hierarchy is based upon the relative observability of inputs to the valuation of the Funds� investments. The inputs ormethodologies used for valuing securities are not necessarily an indication of the risk associated with investing in those securities.
Changes in valuation techniques may result in transfers into or out of an investment�s assigned level within the fair valuehierarchy. In addition, in periods of market dislocation, the observability of prices and inputs may be reduced for manyinstruments. This condition, as well as changes related to the liquidity of investments, could cause a security to be reclassifiedbetween levels.
The three levels are defined as follows:
Level 1 � Valuations based on quoted prices for identical securities in active markets.
The types of assets and liabilities categorized in Level 1 generally include actively traded domestic and certain foreign equitysecurities; certain U.S. government obligations; derivatives actively traded on a national securities exchange (such as some futuresand options); and shares of open-end mutual funds (even if their investments are valued using Level 2 or Level 3 inputs).
Level 2 � Valuations determined using other significant direct or indirect observable inputs.
The types of assets and liabilities categorized in Level 2 generally include cleared derivatives and certain OTC derivatives such asswaps, options, swaptions, and forward currency contracts valued using industry standard models; certain restricted securitiesvalued at the most recent available market or quoted price; certain securities that are valued at the local price; and certain foreignequity securities that are adjusted based on inputs from an independent pricing service approved by the Trustees, including thevalue of equity securities that underlie futures, options and other derivatives (to the extent the market for such instruments closesprior to the close of the NYSE) to reflect estimated valuation changes through the NYSE close.
Level 3 � Valuations based primarily on inputs that are unobservable and significant.
The types of assets and liabilities categorized in Level 3 generally include, but are not limited to, securities whose trading has beensuspended or that have been de-listed from their current primary trading exchange valued at the most recent available market orquoted price; securities in default or bankruptcy proceedings for which there is no current market quotation valued at the mostrecent available market or quoted price; certain equity securities valued based on the last traded exchange price adjusted for themovement in a relevant index and/or a security type conversion discount; certain securities that are valued using a price from acomparable security related to the same issuer; and certain recently acquired equity securities that have yet to begin trading that arevalued at cost.
The following is a summary of the respective levels assigned to the Funds� direct securities and derivatives, if any, as ofNovember 30, 2020:
Description Level 1 Level 2 Level 3 TotalClimate Change FundAsset Valuation InputsCommon Stocks
Argentina $2,266,299 $� $ � $2,266,299Australia � 4,233,262 � 4,233,262Brazil � 3,730,693 � 3,730,693Canada 15,744,264 � � 15,744,264China 984,841 14,884,735 � 15,869,576Denmark � 2,806,813 � 2,806,813Finland � 8,683,519 � 8,683,519France � 18,101,541 � 18,101,541Germany � 8,164,369 � 8,164,369India � 913,483 � 913,483
Copyright © 2021 www.secdatabase.com. All Rights Reserved.Please Consider the Environment Before Printing This Document

Israel � 669,961 � 669,961Italy � 8,358,727 � 8,358,727
Copyright © 2021 www.secdatabase.com. All Rights Reserved.Please Consider the Environment Before Printing This Document

Description Level 1 Level 2 Level 3 TotalClimate Change Fund (continued)Asset Valuation Inputs (continued)Common Stocks (continued)
Japan $� $14,811,085 $ � $14,811,085Mexico 6,823,789 � � 6,823,789Netherlands � 2,094,587 � 2,094,587Norway � 3,817,175 � 3,817,175Pakistan � 704,754 � 704,754Portugal � 3,482,908 � 3,482,908Russia � 12,096,069 � 12,096,069Spain � 6,083,202 � 6,083,202Sweden � 789,657 � 789,657Switzerland � 3,426,624 � 3,426,624Taiwan � 646,454 � 646,454Thailand � 524,822 � 524,822Ukraine � 1,782,972 � 1,782,972United Kingdom 1,630,086 4,267,523 � 5,897,609United States 86,694,438 � � 86,694,438
TOTAL COMMON STOCKS 114,143,717 125,074,935 � 239,218,652Preferred Stocks
Chile 5,084,078 � � 5,084,078TOTAL PREFERRED STOCKS 5,084,078 � � 5,084,078Mutual Funds
United States 12,189,207 � � 12,189,207TOTAL MUTUAL FUNDS 12,189,207 � � 12,189,207Short-Term Investments 393,103 � � 393,103Total Investments 131,810,105 125,074,935 � 256,885,040Total $131,810,105 $125,074,935 $ � $256,885,040
Cyclical Focus FundAsset Valuation InputsCommon Stocks
Canada $6,553,485 $� $ � $6,553,485Finland � 4,682,230 � 4,682,230France � 11,617,005 � 11,617,005Ireland � 3,813,389 � 3,813,389Mexico 8,001,188 � � 8,001,188Russia � 5,658,308 � 5,658,308Spain � 7,084,555 � 7,084,555United Kingdom � 16,281,837 � 16,281,837United States 64,072,232 � � 64,072,232
TOTAL COMMON STOCKS 78,626,905 49,137,324 � 127,764,229Preferred Stocks
Brazil � 4,259,842 � 4,259,842TOTAL PREFERRED STOCKS � 4,259,842 � 4,259,842Mutual Funds
United States 2,878,000 � � 2,878,000TOTAL MUTUAL FUNDS 2,878,000 � � 2,878,000Short-Term Investments 251,996 � � 251,996Total Investments 81,756,901 53,397,166 � 135,154,067Total $81,756,901 $53,397,166 $ � $135,154,067
Emerging Domestic Opportunities FundAsset Valuation InputsCommon Stocks
Brazil $� $25,179,629 $ � $25,179,629China 99,665,988 201,739,912 � 301,405,900France � 2,192,380 � 2,192,380
Copyright © 2021 www.secdatabase.com. All Rights Reserved.Please Consider the Environment Before Printing This Document

Description Level 1 Level 2 Level 3 TotalEmerging Domestic Opportunities Fund (continued)Asset Valuation Inputs (continued)Common Stocks (continued)
Greece $� $2,265,103 $� $2,265,103Hong Kong � 8,739,998 � 8,739,998Hungary � 1,607,887 � 1,607,887India 5,090,602 84,356,529 � 89,447,131Indonesia � 5,815,259 � 5,815,259Japan � 2,151,652 � 2,151,652Mexico 5,729,061 � � 5,729,061Philippines � 12,145,523 � 12,145,523Poland � 1,789,467 � 1,789,467Russia 9,068,240 14,192,770 � 23,261,010South Africa � 4,710,253 � 4,710,253South Korea � 99,109,828 � 99,109,828Taiwan � 138,492,167 � 138,492,167Thailand � 6,928,682 � 6,928,682United States 12,497,999 � � 12,497,999Vietnam � 11,896,904 � 11,896,904
TOTAL COMMON STOCKS 132,051,890 623,313,943 � 755,365,833Preferred Stocks
Brazil � 18,324,982 � 18,324,982TOTAL PREFERRED STOCKS � 18,324,982 � 18,324,982Investment Funds
China 52,415,970 � � 52,415,970Mexico 11,266,289 � � 11,266,289Russia 19,794,960 � � 19,794,960South Korea � 4,181,007 � 4,181,007United States 85,539,652 � � 85,539,652
TOTAL INVESTMENT FUNDS 169,016,871 4,181,007 � 173,197,878Mutual Funds
United States 16,175,866 � � 16,175,866TOTAL MUTUAL FUNDS 16,175,866 � � 16,175,866Short-Term Investments 10,147,479 � � 10,147,479Total Investments 327,392,106 645,819,932 � 973,212,038Derivatives^
Forward Currency ContractsForeign Currency Risk � 1,925,048 � 1,925,048
Total $327,392,106 $647,744,980 $� $975,137,086Liability Valuation InputsDerivatives^
Forward Currency ContractsForeign Currency Risk $� $(2,209,109 ) $� $(2,209,109 )
Emerging Markets FundAsset Valuation InputsCommon Stocks
Argentina $12,970,966 $� $� $12,970,966Brazil � 17,797,399 � 17,797,399Chile � 2,403,322 � 2,403,322China 293,878,057 803,419,307 687,515 1,097,984,879Czech Republic � 1,885,887 � 1,885,887Egypt � 169,402 � 169,402Greece � 1,229,520 � 1,229,520Hungary � 363,719 � 363,719India 7,250,808 91,898,744 � 99,149,552Indonesia � 84,403,097 � 84,403,097Kuwait � 37,645,903 � 37,645,903Malaysia � 1,376,918 � 1,376,918Mexico 73,323,644 � � 73,323,644
Copyright © 2021 www.secdatabase.com. All Rights Reserved.Please Consider the Environment Before Printing This Document

Description Level 1 Level 2 Level 3 TotalEmerging Markets Fund (continued)Asset Valuation Inputs (continued)Common Stocks (continued)
Pakistan $� $12,849,745 $� $12,849,745Philippines � 9,634,673 � 9,634,673Poland � 30,045,446 � 30,045,446Qatar � 16,682,426 � 16,682,426Russia 14,672,653 401,338,101 � 416,010,754Saudi Arabia � 1,071,351 � 1,071,351South Africa 5,477,719 82,682,210 � 88,159,929South Korea � 38,291,213 � 38,291,213Sri Lanka � � 662,576 662,576Taiwan 970 612,284,767 � 612,285,737Thailand � 14,203,404 � 14,203,404Turkey � 41,416,448 � 41,416,448United Arab Emirates � 4,105,117 � 4,105,117United Kingdom � 23,484,219 � 23,484,219Vietnam � 4,058,493 � 4,058,493
TOTAL COMMON STOCKS 407,574,817 2,334,740,831 1,350,091 2,743,665,739Preferred Stocks
Brazil � 3,959,833 � 3,959,833Chile 145,917 � � 145,917Colombia 1,975,705 � � 1,975,705Russia � 56,678,931 � 56,678,931South Korea � 33,801,321 � 33,801,321Taiwan � 2,367,807 � 2,367,807
TOTAL PREFERRED STOCKS 2,121,622 96,807,892 � 98,929,514Investment Funds
United States 91,276,967 � � 91,276,967TOTAL INVESTMENT FUNDS 91,276,967 � � 91,276,967Debt Obligations
United States 52,523,101 � � 52,523,101TOTAL DEBT OBLIGATIONS 52,523,101 � � 52,523,101Rights/Warrants
Pakistan � � 42,633 42,633TOTAL RIGHTS/WARRANTS � � 42,633 42,633Short-Term Investments 13,419,371 � � 13,419,371Total Investments 566,915,878 2,431,548,723 1,392,724 2,999,857,325Derivatives^
Futures ContractsEquity Risk 15,265,948 38,666 � 15,304,614
Total $582,181,826 $2,431,587,389 $1,392,724 $3,015,161,939Liability Valuation InputsDerivatives^
Swap ContractsEquity Risk $� $(129,868 ) $� $(129,868 )
International Equity FundAsset Valuation InputsCommon Stocks
Australia $� $121,810,185 $� $121,810,185Belgium � 35,338,714 � 35,338,714Denmark � 1,190,282 � 1,190,282France 34,567,742 167,267,287 � 201,835,029Germany � 117,806,445 � 117,806,445Hong Kong � 59,374,096 � 59,374,096Ireland 11,319,700 8,328,084 � 19,647,784Italy � 88,479,133 � 88,479,133Japan � 497,393,290 � 497,393,290Malta � � 0 § 0 §
Copyright © 2021 www.secdatabase.com. All Rights Reserved.Please Consider the Environment Before Printing This Document

Description Level 1 Level 2 Level 3 TotalInternational Equity Fund (continued)Asset Valuation Inputs (continued)Common Stocks (continued)
Netherlands $� $184,903,386 $ � $184,903,386Norway � 68,800,781 � 68,800,781Portugal � 80,280,338 � 80,280,338Singapore � 104,150,924 � 104,150,924Spain � 157,368,632 � 157,368,632Sweden � 80,572,791 � 80,572,791Switzerland � 147,962,143 � 147,962,143United Kingdom 19,966,804 388,235,559 � 408,202,363
TOTAL COMMON STOCKS 65,854,246 2,309,262,070 0 § 2,375,116,316Preferred Stocks
Germany � 22,103,400 � 22,103,400TOTAL PREFERRED STOCKS � 22,103,400 � 22,103,400Rights/Warrants
United Kingdom 1,607,679 � � 1,607,679TOTAL RIGHTS/WARRANTS 1,607,679 � � 1,607,679Short-Term Investments 39,406,870 � � 39,406,870Total Investments 106,868,795 2,331,365,470 0 § 2,438,234,265Derivatives^
Futures ContractsEquity Risk 12,466 � � 12,466
Total $106,881,261 $2,331,365,470 $ 0 § $2,438,246,731
Japan Value Creation FundAsset Valuation InputsCommon Stocks $� $152,880,682 $ � $152,880,682Short-Term Investments 3,729,257 � � 3,729,257Total Investments 3,729,257 152,880,682 � 156,609,939Total $3,729,257 $152,880,682 $ � $156,609,939
Quality FundAsset Valuation InputsCommon Stocks
France $� $71,272,734 $ � $71,272,734Germany � 236,311,225 � 236,311,225Netherlands � 36,644,809 � 36,644,809Switzerland � 236,730,173 � 236,730,173Taiwan � 233,263,576 � 233,263,576United Kingdom � 336,837,166 � 336,837,166United States 5,834,174,854 � � 5,834,174,854
TOTAL COMMON STOCKS 5,834,174,854 1,151,059,683 � 6,985,234,537Mutual Funds
United States 9,830,961 � � 9,830,961TOTAL MUTUAL FUNDS 9,830,961 � � 9,830,961Short-Term Investments 90,649,770 � � 90,649,770Total Investments 5,934,655,585 1,151,059,683 � 7,085,715,268Total $5,934,655,585 $1,151,059,683 $ � $7,085,715,268
Resources FundAsset Valuation InputsCommon Stocks
Argentina $7,390,996 $� $ � $7,390,996Australia � 36,523,939 � 36,523,939Austria � 9,777,070 � 9,777,070Brazil � 7,470,071 � 7,470,071
Copyright © 2021 www.secdatabase.com. All Rights Reserved.Please Consider the Environment Before Printing This Document

Description Level 1 Level 2 Level 3 TotalResources Fund (continued)Asset Valuation Inputs (continued)Common Stocks (continued)
Canada $33,719,111 $� $ � $33,719,111China � 33,010,814 � 33,010,814Colombia 6,093,312 � � 6,093,312Denmark � 4,472,890 � 4,472,890Finland � 13,453,860 � 13,453,860France � 18,579,042 � 18,579,042Germany � 4,980,580 � 4,980,580Hungary � 7,152,104 � 7,152,104India � 16,970,101 � 16,970,101Israel � 10,782,132 � 10,782,132Japan � 13,490,228 � 13,490,228Mexico 18,059,247 � � 18,059,247Norway � 18,287,379 � 18,287,379Pakistan � 5,144,827 � 5,144,827Poland � 5,534,487 � 5,534,487Russia � 92,563,071 � 92,563,071Singapore � � 0 § 0 §South Africa � 2,164,867 � 2,164,867South Korea � 1,072,289 � 1,072,289Spain � 8,433,984 � 8,433,984Switzerland � 4,391,779 � 4,391,779Thailand � 4,841,672 � 4,841,672Turkey � 2,656,584 � 2,656,584Ukraine � 4,204,279 � 4,204,279United Kingdom � 89,942,225 � 89,942,225United States 153,056,491 � � 153,056,491
TOTAL COMMON STOCKS 218,319,157 415,900,274 0 § 634,219,431Preferred Stocks
Brazil � 38,202,391 � 38,202,391Chile 12,662,395 � � 12,662,395Russia � 15,072,562 � 15,072,562
TOTAL PREFERRED STOCKS 12,662,395 53,274,953 � 65,937,348Debt Obligations
United States 4,311,592 � � 4,311,592TOTAL DEBT OBLIGATIONS 4,311,592 � � 4,311,592Rights/Warrants
Singapore � � 0 § 0 §TOTAL RIGHTS/WARRANTS � � 0 § 0 §Short-Term Investments 8,069,823 � � 8,069,823Total Investments 243,362,967 469,175,227 � 712,538,194Total $243,362,967 $469,175,227 $ 0 § $712,538,194
Risk Premium FundAsset Valuation InputsDebt Obligations
United States $5,000,641 $� $ � $5,000,641TOTAL DEBT OBLIGATIONS 5,000,641 � � 5,000,641Short-Term Investments 7,120,135 � � 7,120,135Total Investments 12,120,776 � � 12,120,776Total $12,120,776 $� $ � $12,120,776Liability Valuation InputsDerivatives^
Written OptionsEquity Risk $(124,780 ) $� $ � $(124,780 )
Copyright © 2021 www.secdatabase.com. All Rights Reserved.Please Consider the Environment Before Printing This Document

Description Level 1 Level 2 Level 3 TotalTax-Managed International Equities FundAsset Valuation InputsCommon Stocks
Australia $� $1,729,356 $ � $1,729,356Belgium � 499,036 � 499,036Brazil � 198,163 � 198,163China � 740,207 � 740,207Denmark � 41,856 � 41,856France � 2,949,581 � 2,949,581Germany � 1,674,829 � 1,674,829Hong Kong � 513,956 � 513,956Hungary � 64,613 � 64,613India � 159,287 � 159,287Ireland 167,205 606,413 � 773,618Italy � 936,758 � 936,758Japan � 7,625,709 � 7,625,709Malaysia � 11,383 � 11,383Malta � � 0 § 0 §Netherlands � 2,812,282 � 2,812,282Norway � 246,443 � 246,443Poland � 32,045 � 32,045Portugal � 1,177,914 � 1,177,914Russia � 444,433 � 444,433Singapore � 1,487,459 � 1,487,459South Africa � 41,178 � 41,178South Korea � 872,980 � 872,980Spain � 2,037,743 � 2,037,743Sweden � 659,962 � 659,962Switzerland � 2,154,078 � 2,154,078Taiwan � 309,032 � 309,032Thailand � 12,188 � 12,188Turkey � 666,984 � 666,984United Kingdom 420,337 4,341,429 � 4,761,766
TOTAL COMMON STOCKS 587,542 35,047,297 0 § 35,634,839Preferred Stocks
Brazil � 25,486 � 25,486Germany � 449,899 � 449,899Russia � 22,393 � 22,393
TOTAL PREFERRED STOCKS � 497,778 � 497,778Mutual Funds
United States 265,165 � � 265,165TOTAL MUTUAL FUNDS 265,165 � � 265,165Short-Term Investments 442,504 � � 442,504Total Investments $1,295,211 $35,545,075 $ 0 § $36,840,286Liability Valuation InputsDerivatives^
Futures ContractsEquity Risk $(240 ) $� $ � $(240 )
U.S. Equity FundAsset Valuation InputsCommon Stocks $360,777,089 $� $ � $360,777,089Mutual Funds 2,150,296 � � 2,150,296Short-Term Investments 490,860 � � 490,860Total Investments 363,418,245 � � 363,418,245Derivatives^
Futures ContractsEquity Risk 106,861 � � 106,861
Total $363,525,106 $� $ � $363,525,106
Copyright © 2021 www.secdatabase.com. All Rights Reserved.Please Consider the Environment Before Printing This Document

Description Level 1 Level 2 Level 3 TotalU.S. Small Cap Value FundAsset Valuation InputsCommon Stocks $410,348,859 $ � $� $410,348,859Mutual Funds 3,710,097 � � 3,710,097Rights/Warrants � � 36,350 36,350Short-Term Investments 107,069 � � 107,069Total Investments 414,166,025 � 36,350 414,202,375Derivatives^
Futures ContractsEquity Risk 80,753 � � 80,753
Total $414,246,778 $ � $36,350 $414,283,128
The risks referenced in the tables above are not intended to be inclusive of all risks. Please see the Prospectus for moreinformation.
^ In the tables above derivatives are based on market values, rather than the notional amounts of derivatives, except for forward currencycontracts which are based on unrealized appreciation/(depreciation). The uncertainties surrounding the valuation inputs for a derivative arelikely to be more significant to the Funds� net asset values than the uncertainties surrounding inputs for a non-derivative security with thesame market value. Excludes purchased options and fully funded total return swaps, if any, which are included in investments.
§ Represents the interest in securities that were determined to have a value of zero at November 30, 2020.
The underlying funds held at period end are classified above as Level 1. Certain underlying funds invest in securities and/orderivatives which may have been fair valued using methods determined in good faith by or at the direction of the Trustees orwhich may have been valued using significant unobservable inputs. For a summary of the levels assigned to the underlying funds�direct securities and derivatives, if any, please refer to the underlying funds� Notes to Financial Statements which are available onthe SEC�s website at www.sec.gov or on GMO�s website at www.gmo.com.
U.S. GAAP requires additional disclosures about fair value measurements for material Level 3 securities and derivatives, if any(determined by each category of asset or liability as compared to a Fund�s total net assets). Emerging Markets Fund�s Level 3holdings includes a common stock whose trading has been suspended and is valued at the last available price. At November 30,2020, there were no other Funds with material Level 3 classes of investments or derivatives with significant unobservable inputssubject to this additional disclosure.
For Funds with material total Level 3 assets and/or liabilities, the following is a reconciliation of securities and derivatives, if any,in which significant unobservable inputs (Level 3) were used in determining value:
Balancesas of
February 29,2020 Purchases Sales
AccruedDiscounts/Premiums
TotalRealized
Gain/(Loss)
Change inUnrealized
Appreciation(Depreciation)
Transferinto
Level 3
Transferout of
Level 3
Balancesas of
November 30,2020
Net Change inUnrealized
Appreciation(Depreciation)
fromInvestments
Still Held as ofNovember 30,
2020EmergingMarkets FundCommon Stocks
China $ 683,638 $ � $ � $ � $ � $ 3,877 $� $ � $ 687,515 $ 3,877Sri Lanka � � � � � � 662,576� � 662,576 �
Rights/WarrantsPakistan � 0 � � � 42,633 � � 42,633 42,633
TotalInvestments $ 683,638 $ 0 $� $ � $� $ 46,510 $662,576 $� $ 1,392,724 $ 46,510
� Financial assets transferred between levels were due to a change in observable and/or unobservable inputs.
For Funds with material Level 3 investments, the following table summarizes the quantitative inputs used in the valuation ofinvestments classified within Level 3 of the fair value hierarchy for the period ended November 30, 2020.
Copyright © 2021 www.secdatabase.com. All Rights Reserved.Please Consider the Environment Before Printing This Document

Quantitative information about Level 3 Fair Value Measurements
Investment TypeTotal FairValue ($)
ValuationMethodology Unobservable Inputs
Range(WeightedAverage)
Emerging Markets FundCommon Stock 1,350,091 Stale Price Unadjusted Last Exchange Price N/ARights/Warrants 42,633 Intrinsic Value Exchange Traded Price N/A
Investments in affiliated companies and other Funds of the TrustAn affiliated company for the purposes of this disclosure is a company in which a Fund has or had direct ownership of at least 5%of the issuer�s voting securities or an investment in other funds of GMO Trust. A summary of the Funds� transactions involvingcompanies that are or were affiliates during the period ended November 30, 2020 is set forth below:
Affiliate
Value,beginning of
period PurchasesSales
ProceedsDividendIncome*
NetRealized
Gain (Loss)
Net Increase/Decrease inUnrealized
Appreciation/Depreciation
Value, end ofperiod
Climate Change FundGMO U.S. Treasury Fund $8,545,006 $98,282,744 $94,649,074 $6,705 ** $25,397 $ (14,866 ) $12,189,207
Cyclical Focus FundGMO U.S. Treasury Fund $� $3,528,000 $650,000 $638 $� $ � $2,878,000
Emerging Domestic Opportunities FundCMI Ltd $325,809 $� $326,513 $� $(3,310,713) $ 3,311,417 $� #Gayatri Projects Ltd 3,380,455 � 1,436,828 � (1,485,323 ) 1,235,407 � #GMO U.S. Treasury Fund 18,615,329 199,542,300 202,050,001 36,594 85,327 (17,089 ) 16,175,866
Totals $22,321,593 $199,542,300 $203,813,342 $36,594 $(4,710,709 ) $ 4,529,735 $16,175,866
Emerging Markets FundAnilana Hotels & Properties Ltd $485,306 $� $� $� $� $ 177,270 $662,576Gayatri Highways Ltd 49,629 � 53,333 � (1,353,564 ) 1,357,268 � #Gayatri Projects Ltd 5,130,069 � 1,223,719 � (2,099,960 ) 3,210,746 5,017,136
Totals $5,665,004 $� $1,277,052 $� $(3,453,524 ) $ 4,745,284 $5,679,712
Quality FundGMO U.S. Treasury Fund $15,768,140 $� $6,000,000 $29,436 $47,619 $ 15,202 $9,830,961
Resources FundGMO U.S. Treasury Fund $1,832,863 $12,190,500 $14,026,825 $� $10,764 $ (7,302 ) $�
Tax-Managed International Equities FundGMO U.S. Treasury Fund $368,696 $1,055,000 $1,160,000 $757 $1,310 $ 159 $265,165
U.S. Equity FundGMO U.S. Treasury Fund $1,469,983 $43,200,000 $42,530,000 $6,635 $13,242 $ (2,929 ) $2,150,296
U.S. Small Cap Value FundGMO U.S. Treasury Fund $6,280,467 $40,500,000 $43,083,000 $4,842 $28,629 $ (15,999 ) $3,710,097
* The table above includes estimated sources of all distributions paid by the underlying funds during the period March 1, 2020 throughNovember 30, 2020. The actual tax characterization of distributions paid by the underlying funds will be determined at the end of the fiscalyear ending February 28, 2021.
** Excludes income from investment of cash collateral from securities lending in GMO U.S. Treasury Fund. Income (net of fee rebates paid tothe borrower and fees paid to the lending agent) from investment of cash collateral from securities lending in GMO U.S. Treasury Fund was$12,230 in Climate Change Fund during the period.
# Security is no longer an affiliate at period end.
Copyright © 2021 www.secdatabase.com. All Rights Reserved.Please Consider the Environment Before Printing This Document

Subsequent eventsAs of close of business on January 22, 2021, pursuant to approval by shareholders of Climate Change Series Fund, EmergingDomestic Opportunities Series Fund, Emerging Markets Series Fund, Quality Series Fund and Resources Series Fund (each, a�Selling Fund�), each Selling Fund was reorganized with and into the corresponding series of GMO Trust (each, an �AcquiringFund�). As part of the reorganization, each Selling Fund shareholder received shares of the corresponding Acquiring Fund inexchange for Selling Fund shares. Following the reorganization, the Selling Funds were terminated.
In January 2021, the Board of Trustees approved the termination of GMO Risk Premium Fund. The Fund is expected to liquidateon or about February 16, 2021.
* * *
For additional information regarding the Funds, please see the Funds� most recent annual or semiannual shareholder reportavailable on the SEC�s website, www.sec.gov, or visit GMO�s website at www.gmo.com.
Copyright © 2021 www.secdatabase.com. All Rights Reserved.Please Consider the Environment Before Printing This Document

GMO Alternative Allocation Fund(A Series of GMO Trust)Consolidated Schedule of Investments(showing percentage of total net assets)November 30, 2020 (Unaudited)
Shares Description Value ($)COMMON STOCKS �� 43.6%
Australia �� 1.2%8,694 BlueScope Steel Ltd 108,783355,669 Coca-Cola Amatil Ltd 3,293,5952,078 Computershare Ltd 21,77313,196 Dexus (REIT) 94,5451,800 Fortescue Metals Group Ltd 23,98140,985 GPT Group (The) (REIT) 141,65432,933 Mirvac Group (REIT) 62,223765 Rio Tinto Ltd 57,07671,868 Scentre Group (REIT) 147,01214,245 Stockland (REIT) 47,310
Total Australia 3,997,952
Belgium �� 0.1%2,973 Ageas SA/NV 145,560140 UCB SA 14,982
Total Belgium 160,542
Canada �� 0.2%1,400 Canadian Apartment Properties (REIT) 55,150100 Canadian Tire Corp Ltd � Class A 12,7803,900 Imperial Oil Ltd 67,5071,200 Linamar Corp 55,2742,400 Magna International Inc 147,1754,400 Manulife Financial Corp 74,9766,600 Power Corp of Canada 148,5982,900 RioCan Real Estate Investment Trust 39,1678,900 TELUS Corp 171,668
Total Canada 772,295
China �� 0.5%30,000 Agile Group Holdings Ltd 43,31571,500 BAIC Motor Corp Ltd � Class H 26,761188,000 Bank of Communications Co Ltd � Class H 103,8904,500 Beijing Enterprises Holdings Ltd 14,58263,000 China Communications Construction Co Ltd � Class H 32,65580,000 China Communications Services Corp Ltd � Class H 42,6341,241,000 China Huarong Asset Management Co Ltd � Class H 142,2676,000 China Overseas Land & Investment Ltd 14,60921,000 China Railway Construction Corp Ltd � Class H 13,877340,000 China Railway Group Ltd � Class H 167,831159,600 China Zhongwang Holdings Ltd * 34,76150,000 Chongqing Rural Commercial Bank Co Ltd � Class H 21,439136,000 Dongfeng Motor Group Co Ltd � Class H 139,92218,000 Fosun International Ltd 25,974125,200 Guangzhou R&F Properties Co Ltd � Class H 163,3759,000 Kingboard Holdings Ltd 34,386
Shares Description Value ($)China �� continued
86,400 Legend Holdings Corp � Class H 117,6438,600 Momo Inc Sponsored ADR 123,66816,000 Seazen Group Ltd * 14,16015,900 Shanghai Pharmaceuticals Holding Co Ltd � Class H 26,88733,000 Shimao Group Holdings Ltd 122,99731,600 Sinopharm Group Co Ltd � Class H 78,218122,000 Skyworth Group Ltd * 33,299195,000 Yuzhou Group Holdings Co Ltd 77,503
Total China 1,616,653
Denmark �� 0.1%8,639 Danske Bank A/S * 142,2233,698 Demant A/S * 139,5041,754 Pandora A/S 175,864
Total Denmark 457,591
Finland �� 0.0%25,051 Nokia Oyj * 99,903135 UPM-Kymmene Oyj 4,430
Total Finland 104,333
France �� 0.3%1,789 Atos SE * 163,3015,786 Peugeot SA * 135,7472,040 Publicis Groupe SA 91,9274,032 Renault SA * 160,0786,562 Societe Generale SA * 130,110984 Unibail-Rodamco-Westfield (REIT) 69,2382,497 Valeo SA 96,334
Total France 846,735
Germany �� 0.1%12,508 Aroundtown SA * 86,5682,180 Bayer AG (Registered) 125,598301 Bayerische Motoren Werke AG 26,1182,311 Daimler AG (Registered) 154,7248,916 Deutsche Lufthansa AG (Registered) * 102,792
Total Germany 495,800
Hong Kong �� 0.2%20,500 CK Hutchison Holdings Ltd 148,699432,000 First Pacific Co Ltd 131,88524,000 Hongkong Land Holdings Ltd 97,42745,500 Kerry Properties Ltd 116,572255,000 PCCW Ltd 154,7473,000 Swire Pacific Ltd � Class A 17,1915,000 Wharf Holdings Ltd (The) 12,369
Total Hong Kong 678,890
Copyright © 2021 www.secdatabase.com. All Rights Reserved.Please Consider the Environment Before Printing This Document

GMO Alternative Allocation Fund(A Series of GMO Trust)Consolidated Schedule of Investments �� (Continued)(showing percentage of total net assets)November 30, 2020 (Unaudited)
Shares Description Value ($)Israel �� 0.1%
17,000 Teva Pharmaceutical Industries Ltd Sponsored ADR * 161,670
Italy �� 0.1%2,131 EXOR NV 149,06212,435 Leonardo SPA 90,268180,790 Telecom Italia SPA 85,203303,877 Telecom Italia SPA-RSP 155,430
Total Italy 479,963
Japan �� 1.7%17,900 Asahi Kasei Corp 163,6493,300 Astellas Pharma Inc 47,0041,200 Central Japan Railway Co 152,5092,200 Daiwa House Industry Co Ltd 67,2324,800 Electric Power Development Co Ltd 64,4245,000 Honda Motor Co Ltd 139,11031,000 Inpex Corp 171,7056,700 ITOCHU Corp 176,8084,900 KDDI Corp 139,4366,100 Nippon Telegraph & Telephone Corp 144,26786,248 NTT DOCOMO Inc 3,207,67217,800 Obayashi Corp 156,6799,900 ORIX Corp 146,5338,800 Sekisui House Ltd 157,79411,700 Shimizu Corp 88,48412,300 Sumitomo Chemical Co Ltd 43,45412,600 Sumitomo Dainippon Pharma Co Ltd 158,894700 Suzuki Motor Corp 37,5402,600 Taisei Corp 91,4685,400 TIS Inc 107,24155,300 Tokyo Electric Power Co Holdings Inc * 143,9332,200 Tosoh Corp 34,455
Total Japan 5,640,291
Netherlands �� 0.2%5,996 ABN AMRO Bank NV CVA * 61,38327,935 Aegon NV 103,3403,600 AerCap Holdings NV * 132,33616,207 ING Groep NV * 157,6414,784 Koninklijke Ahold Delhaize NV 136,781676 NN Group NV 27,3201,763 Randstad NV * 109,038
Total Netherlands 727,839
New Zealand �� 0.0%32,678 Meridian Energy Ltd 147,413
Singapore �� 0.0%44,600 Yangzijiang Shipbuilding Holdings Ltd 28,982
Shares Description Value ($)South Africa �� 0.1%
16,824 Bidvest Group Ltd (The) 176,37319,557 Old Mutual Ltd 14,690
Total South Africa 191,063
Spain �� 0.1%27,772 Banco Bilbao Vizcaya Argentaria SA 128,60052,704 Banco Santander SA * 152,848
Total Spain 281,448
Sweden �� 0.0%18,350 Nordea Bank Abp * 156,827
Switzerland �� 0.1%2,402 Adecco Group AG (Registered) 145,2061,177 Banque Cantonale Vaudoise (Registered) 121,202
Total Switzerland 266,408
United Kingdom �� 4.0%4,312 Aviva Plc 18,2562,465 Berkeley Group Holdings Plc (The) 150,67085,428 BT Group Plc 132,2351,851 Carnival Plc 32,0862,454 Coca-Cola HBC AG * 70,09837,366 ITV Plc * 46,50019,642 Kingfisher Plc * 71,33251,490 M&G Plc 127,75935,082 Micro Focus International Plc * 161,57928 National Grid Plc 313338,900 Royal Dutch Shell Plc � Class B Sponsored ADR 10,997,305170,433 RSA Insurance Group Plc 1,531,414751 Smiths Group Plc 14,43026,886 Taylor Wimpey Plc * 54,71813,152 WPP Plc 126,729
Total United Kingdom 13,535,424
United States �� 34.5%900 Alexion Pharmaceuticals, Inc. * 109,8992,000 Alliance Data Systems Corp. 146,2801,600 Ally Financial, Inc. (a) 47,4401,700 Arrow Electronics, Inc. * 155,8053,300 Athene Holding Ltd. � Class A * (a) 146,3554,200 Bed Bath & Beyond, Inc. 88,032500 Biogen, Inc. * 120,08539,000 Bristol-Myers Squibb Co. 2,433,6001,600 Capital One Financial Corp. (a) 137,0242,600 Capri Holdings Ltd. * 91,9883,900 Carnival Corp. (a) 77,9222,400 Carrier Global Corp. 91,3682,400 CBRE Group, Inc. � Class A * 146,7361,900 Centene Corp. * (a) 117,13517,000 CenturyLink, Inc. (a) 177,650800 Cigna Corp. 167,312
Copyright © 2021 www.secdatabase.com. All Rights Reserved.Please Consider the Environment Before Printing This Document

GMO Alternative Allocation Fund(A Series of GMO Trust)Consolidated Schedule of Investments �� (Continued)(showing percentage of total net assets)November 30, 2020 (Unaudited)
Shares Description Value ($)United States �� continued
3,000 Citigroup, Inc. 165,2102,400 Citizens Financial Group, Inc. (a) 78,3841,500 Cognizant Technology Solutions Corp. � Class A 117,1953,100 Comcast Corp. � Class A (a) 155,744109,856 Concho Resources, Inc. (b) 6,314,5233,800 Corteva, Inc. (a) 145,61625,600 Coty Inc. � Class A (a) 184,0642,200 CVS Health Corp. (a) 149,138414,700 Discovery, Inc. � Class C * (a) (b) 9,961,0944,300 DISH Network Corp. � Class A * 154,2411,900 DR Horton, Inc. 141,5501,500 Edwards Lifesciences Corp. * (a) 125,8351,100 Exelon Corp. (a) 45,1771,400 Expedia Group, Inc. (a) 174,2863,700 Exxon Mobil Corp. (a) 141,081702 First Horizon Corp. (a) 8,578101,584 FirstEnergy Corp. (a) (c) 2,698,071200 FleetCor Technologies, Inc. * (a) 53,04216,500 Ford Motor Co. (a) 149,8203,400 Fox Corp. � Class A (a) 98,0564,000 Fox Corp. � Class B * 113,52079,300 GCI Liberty, Inc. � Class A * (a) (b) 7,225,8163,500 General Motors Co. 153,440800 Goldman Sachs Group, Inc. (The) (a) 184,46464,035 Grubhub, Inc. * (b) 4,504,22255,107 HD Supply Holdings, Inc. * 3,075,52220,576 HEICO Corp. (a) 2,542,7821,700 HP, Inc. (a) 37,28151,200 Inphi Corp. * (a) 7,942,6562,700 Intel Corp. (a) 130,5451,500 International Business Machines Corp. (a) 185,2806,500 Invesco Ltd. (a) 105,495800 Jazz Pharmaceuticals Plc * (a) 112,56810,600 Kinder Morgan, Inc. 152,4285,000 Kohl�s Corp. 161,000600 Kraft Heinz Co. (The) (a) 19,764800 Kroger Co. (The) (a) 26,400100 Laboratory Corp. of America Holdings * 19,984500 Leidos Holdings, Inc. 50,3501,800 Lennar Corp. � Class A (a) 136,54838,800 Liberty Broadband Corp. � Class C * 6,105,18094,887 Liberty Media Corp.-Liberty SiriusXM � Class C * (b) 3,891,3164,100 Lincoln National Corp. (a) 193,602900 LKQ Corp. * 31,6982,000 LyondellBasell Industries NV � Class A (a) 170,200113,000 Maxim Integrated Products, Inc. (b) 9,383,5203,500 MetLife, Inc. 161,5952,400 Micron Technology, Inc. * 153,816400 Mohawk Industries, Inc. * (a) 50,3323,200 Molson Coors Brewing Co. � Class B (a) 147,2001,300 Morgan Stanley 80,37976,509 National General Holdings Corp. (b) 2,607,4272,800 Occidental Petroleum Corp. (a) 44,128
Shares Description Value ($)United States �� continued
31,300 PNM Resources, Inc. 1,537,143400 Principal Financial Group, Inc. (a) 19,9161,900 Prudential Financial, Inc. (a) 143,6789,900 Qurate Retail, Inc. � Series A 103,6532,200 Raytheon Technologies Corp. (a) 157,784300 Regeneron Pharmaceuticals, Inc. * (a) 154,809600 SS&C Technologies Holdings, Inc. 41,3344,600 Synchrony Financial 140,16221,075 Teladoc Health, Inc. * 4,189,1171,000 Textron, Inc. (a) 45,1001,900 Tyson Foods, Inc. � Class A 123,880400 United Rentals, Inc. * (a) 90,7921,100 Universal Health Services, Inc. � Class B 143,63848,700 Varian Medical Systems, Inc. * (b) 8,472,8264,500 ViacomCBS, Inc. � Class B (a) 158,7603,100 Viatris, Inc. * 52,14230,700 Virtusa Corp. * 1,537,456800 VMware, Inc. � Class A * (a) 111,9122,300 Walgreens Boots Alliance, Inc. (a) 87,4235,300 Wells Fargo & Co. 144,9555,200 Western Union Co. (The) (a) 117,3122,500 Western Digital Corp. (a) 112,20077,232 Willis Towers Watson Plc (b) 16,078,9301,700 WPX Energy, Inc. * 12,76757,600 Xilinx, Inc. (b) 8,383,680
Total United States 117,655,311
TOTAL COMMON STOCKS(COST $135,807,550) 148,403,430
PREFERRED STOCKS (d) �� 0.0%
Germany �� 0.0%2,548 Bayerische Motoren Werke AG 167,417
TOTAL PREFERRED STOCKS(COST $139,483) 167,417
RIGHTS/WARRANTS �� 0.1%
Spain �� 0.0%84,396 Banco Santander SA, Expires 12/03/20 * 10,540
United States �� 0.1%291,300 Bristol-Myers Squibb Co., Expires 03/31/21 * 343,734
TOTAL RIGHTS/WARRANTS(COST $526,434) 354,274
INVESTMENT FUNDS �� 2.5%
United States �� 2.5%587,100 Altaba, Inc. (e) 8,454,240
TOTAL INVESTMENT FUNDS(COST $7,476,745) 8,454,240
Copyright © 2021 www.secdatabase.com. All Rights Reserved.Please Consider the Environment Before Printing This Document

2,300 Oracle Corp. (a) 132,7562,400 Phillips 66 (a) 145,392
Copyright © 2021 www.secdatabase.com. All Rights Reserved.Please Consider the Environment Before Printing This Document

GMO Alternative Allocation Fund(A Series of GMO Trust)Consolidated Schedule of Investments �� (Continued)(showing percentage of total net assets)November 30, 2020 (Unaudited)
PURCHASED OPTIONS �� 0.1%
DescriptionExercise
PriceExpiration
DateNumber ofContracts
NotionalAmount Value ($)
Equity Options �� Calls �� 0.0%FirstEnergy Corp. (c) 35.00 04/16/21 313 USD 831,328 9,390Equity Options �� Puts �� 0.1%FirstEnergy Corp. (c) 24.00 04/16/21 1,310 USD 3,479,360 203,050
Description CounterpartyExercise
RateExpiration
Date
Principal/NotionalAmount
Floating RateIndex
Pay/ReceiveFloating Rate Value ($)
Option on Credit Default Swaps �� Calls �� 0.0%CDX.NA.IGS.35.V1-5Y MSCI 55.00 01/20/21 USD 25,000,000 Fixed Spread Receive 80,874Option on Credit Default Swaps �� Puts �� 0.0%CDX.NA.HYS.35.VI JPM 107.00 02/17/21 USD 6,600,000 Fixed Spread Pay 73,313
TOTAL PURCHASED OPTIONS(COST $319,793) 366,627
Par Value�� Description Value ($)DEBT OBLIGATIONS �� 73.6%
United States �� 72.5%Asset-Backed Securities �� 16.4%
9,866,545 Canyon CLO Ltd., Series 20-1A, Class A, 144A,Variable Rate, 3 mo. LIBOR + 1.92%, 2.16%, due07/15/28 9,905,157
953,288 Catamaran CLO Ltd., Series 13-1A, Class AR,144A, Variable Rate, 3 mo. LIBOR + 0.85%,1.07%, due 01/27/28 948,908
6,469,420 MP CLO VIII Ltd., Series 15-2A, Class AR, 144A,Variable Rate, 3 mo. LIBOR + 0.91%, 1.13%, due10/28/27 6,428,430
8,960,392 Neuberger Berman CLO XIX Ltd., Series 15-19A,Class A1R2, 144A, Variable Rate, 3 mo. LIBOR +0.80%, 1.04%, due 07/15/27 8,925,115
4,049,123 Oaktree CLO Ltd., Series 15-1A, Class A1R,144A, Variable Rate, 3 mo. LIBOR + 0.87%,1.09%, due 10/20/27 4,033,882
2,261,020 Ocean Trails CLO VI, Series 16-6A, Class AR,144A, Variable Rate, 3 mo. LIBOR + 1.15%,1.39%, due 07/15/28 2,249,636
1,797,513 Octagon Investment Partners XXIII Ltd.,Series 15-1A, Class A1R, 144A, Variable Rate, 3mo. LIBOR + 0.85%, 1.09%, due 07/15/27 1,789,442
2,229,722 Palmer Square Loan Funding Ltd., Series 18-4A,Class A1, 144A, Variable Rate, 3 mo. LIBOR +0.90%, 1.12%, due 11/15/26 2,228,408
4,736,969 Palmer Square Loan Funding Ltd., Series 19-3A,Class A1, 144A, Variable Rate, 3 mo. LIBOR +0.85%, 1.07%, due 08/20/27 4,726,543
10,047,737 Venture XX CLO Ltd., Series 15-20A, Class AR,144A, Variable Rate, 3 mo. LIBOR + 0.82%,1.06%, due 04/15/27 10,013,564
4,835,266 Zais CLO 8 Ltd., Series 18-1A, Class A, 144A,Variable Rate, 3 mo. LIBOR + 0.95%, 1.19%, due04/15/29 4,777,852Total Asset-Backed Securities 56,026,937
Par Value�� /Shares Description Value ($)
U.S. Government �� 56.1%4,500,000 U.S. Treasury Note, 1.38%, due 01/31/21 4,509,20517,500,000 U.S. Treasury Note, Variable Rate, USBM +
0.14%, 0.22%, due 04/30/21 (b) 17,510,24227,500,000 U.S. Treasury Note, 1.75%, due 11/30/21 (b) 27,943,65265,000,000 U.S. Treasury Note, 1.50%, due 01/31/22 (b) 66,046,09415,000,000 U.S. Treasury Note, 0.13%, due 04/30/22 (b) 15,000,58620,000,000 U.S. Treasury Note, 0.13%, due 05/31/22 (b) 19,997,65620,000,000 U.S. Treasury Note, 0.13%, due 07/31/22 19,993,75020,000,000 U.S. Treasury Note, 0.13%, due 08/31/22 (b) 19,992,969
Total U.S. Government 190,994,154Total United States 247,021,091
United States Virgin Islands �� 1.1%
Asset-Backed Securities �� 1.1%3,921,227 Denali Capital CLO X LLC, Series 13-1A,
Class A1LR, 144A, Variable Rate, 3 mo. LIBOR+ 1.05%, 1.26%, due 10/26/27 3,919,552
TOTAL DEBT OBLIGATIONS(COST $250,801,335) 250,940,643
MUTUAL FUNDS �� 10.6%
United States �� 10.6%Affiliated Issuers �� 10.6%
607,025 GMO Emerging Markets Fund, Class VI 20,614,557683,846 GMO Resources Fund, Class IV 15,639,568
TOTAL MUTUAL FUNDS(COST $30,706,393) 36,254,125
Copyright © 2021 www.secdatabase.com. All Rights Reserved.Please Consider the Environment Before Printing This Document

GMO Alternative Allocation Fund(A Series of GMO Trust)Consolidated Schedule of Investments �� (Continued)(showing percentage of total net assets)November 30, 2020 (Unaudited)
Shares Description Value ($)SHORT-TERM INVESTMENTS �� 0.3%
Money Market Funds �� 0.3%699,258 State Street Institutional Treasury Money Market
Fund � Premier Class, 0.01% (f) 699,258154,242 State Street U.S. Treasury Liquidity Fund � Class D
Shares, 0.01% (g) 154,242TOTAL SHORT-TERM INVESTMENTS(COST $853,500) 853,500
TOTAL INVESTMENTS �� 130.8%(Cost $426,631,233) 445,794,256
SECURITIES SOLD SHORT �� (35.1)%
Common Stocks �� (35.1)%Australia �� (0.2)%
(1,588 ) Afterpay Ltd * (110,644 )(21,965 ) APA Group (166,480 )(688 ) ASX Ltd (38,909 )(306 ) Cochlear Ltd (49,587 )(76 ) Ramsay Health Care Ltd (3,520 )(26,551 ) Sydney Airport (131,009 )(4,490 ) TPG Telecom Ltd * (25,348 )(13,932 ) Transurban Group (143,761 )
Total Australia (669,258 )
Austria �� (0.0)%(1,733 ) Verbund AG (121,797 )
Canada �� (0.0)%(8,300 ) AltaGas Ltd (119,128 )
China �� (0.1)%(24,200 ) BEST Inc ADR * (70,906 )(2,100 ) Yum China Holdings Inc (118,398 )
Total China (189,304 )
France �� (0.3)%(2,771 ) Edenred (158,349 )(8,942 ) Getlink SE * (148,189 )(180 ) Hermes International (175,132 )(287 ) Sartorius Stedim Biotech (103,484 )(1,188 ) Ubisoft Entertainment SA * (112,655 )(5,370 ) Vivendi SA (160,984 )(1,347 ) Wendel SA (152,191 )
Total France (1,010,984 )
Germany �� (0.4)%(1,512 ) Delivery Hero SE * (183,840 )(1,751 ) Puma SE * (173,512 )(671 ) QIAGEN NV * (32,337 )(4,348 ) RWE AG (179,844 )(373 ) Sartorius AG (170,072 )
Shares Description Value ($)Germany �� continued
(1,310 ) Scout24 AG (99,823 )(52,779) Telefonica Deutschland Holding AG (145,684 )(6,481 ) thyssenkrupp AG * (43,217 )(4,521 ) Uniper SE (153,030 )(1,717 ) Zalando SE * (174,408 )
Total Germany (1,355,767)
Italy �� (0.1)%(786 ) Ferrari NV (166,538 )(10,370) FinecoBank Banca Fineco SPA * (163,719 )
Total Italy (330,257 )
Japan �� (0.9)%(6,700 ) Acom Co Ltd (32,163 )(4,400 ) Asahi Intecc Co Ltd (161,200 )(24,500) ENEOS Holdings Inc (83,687 )(1,300 ) GMO Payment Gateway Inc (182,311 )(1,100 ) Hitachi Metals Ltd (16,087 )(5,300 ) Idemitsu Kosan Co Ltd (109,880 )(10,200) Isetan Mitsukoshi Holdings Ltd (54,746 )(2,300 ) Japan Airport Terminal Co Ltd (133,223 )(2,500 ) Japan Exchange Group Inc (61,849 )(30 ) Japan Real Estate Investment Corp (155,396 )(18,200) JGC Holding Corp (162,037 )(8,900 ) Keikyu Corp (152,236 )(300 ) Kintetsu Group Holdings Co Ltd (13,287 )(8,000 ) Kyushu Electric Power Co Inc (67,406 )(2,300 ) LINE Corp * (118,519 )(4,700 ) LIXIL Group Corp (112,470 )(2,000 ) M3 Inc (184,043 )(3,400 ) McDonald�s Holdings Co Japan Ltd (164,917 )(2,200 ) Mercari Inc * (100,468 )(2,400 ) Mitsubishi Materials Corp (45,376 )(3,000 ) MonotaRO Co Ltd (182,481 )(1,400 ) Nihon M&A Center Inc (97,823 )(1,700 ) Nippon Paint Holdings Co Ltd (217,816 )(8,300 ) Nippon Yusen KK (180,288 )(1,000 ) Odakyu Electric Railway Co Ltd (30,271 )(100 ) ORIENTAL LAND CO LTD (16,985 )(10,300) Sharp Corp (137,714 )(400 ) Yaskawa Electric Corp (19,192 )
Total Japan (2,993,871)
Netherlands �� (1.5)%(91 ) Adyen NV * (173,824 )(33,258) Altice Europe NV * (174,960 )(44,336) Just Eat Takeaway.com NV * (4,718,322)
Total Netherlands (5,067,106)
Norway �� (0.0)%(428 ) Schibsted ASA � B Shares * (15,566 )
Copyright © 2021 www.secdatabase.com. All Rights Reserved.Please Consider the Environment Before Printing This Document

GMO Alternative Allocation Fund(A Series of GMO Trust)Consolidated Schedule of Investments �� (Continued)(showing percentage of total net assets)November 30, 2020 (Unaudited)
Shares Description Value ($)Peru �� (0.0)%
(2,300 ) Southern Copper Corp (136,551 )
Singapore �� (0.1)%(25,200 ) Singapore Exchange Ltd (166,159 )
Spain �� (0.2)%(84,793 ) Bankia SA (145,842 )(2,760 ) Cellnex Telecom SA (174,836 )(5,976 ) Endesa SA (171,766 )(5,385 ) Ferrovial SA (150,378 )(4,710 ) Siemens Gamesa Renewable Energy SA (168,919 )
Total Spain (811,741 )
Sweden �� (0.1)%(1,145 ) Evolution Gaming Group AB (97,425 )(6,153 ) Lundin Energy AB (146,998 )
Total Sweden (244,423 )
Switzerland �� (0.1)%(128 ) Straumann Holding AG (Registered) (147,750 )(1,734 ) Swiss Re AG (158,428 )
Total Switzerland (306,178 )
United Kingdom �� (3.6)%(2,396 ) Admiral Group Plc (90,250 )(4,221 ) Antofagasta Plc (69,701 )(21,799 ) Auto Trader Group Plc (162,138 )(56,601 ) ConvaTec Group Plc (155,688 )(3,535 ) Experian Plc (125,245 )(13,165 ) GVC Holdings Plc * (180,897 )(1,945 ) Halma Plc (57,231 )(7,226 ) Hargreaves Lansdown Plc (136,858 )(20,048 ) Informa Plc * (140,432 )(1,528 ) London Stock Exchange Group Plc (164,797 )(5,310 ) Ocado Group Plc * (156,120 )(1,984 ) Prudential Plc (30,509 )(321,997) Royal Dutch Shell Plc � Class A Sponsored ADR (10,896,379)(310 ) Spirax-Sarco Engineering Plc (45,666 )
Total United Kingdom (12,411,911)
United States �� (27.5)%(100,770) Advanced Micro Devices, Inc. * (9,337,348 )(1,400 ) AES Corp. (The) (28,616 )(700 ) American Tower Corp. (REIT) (161,840 )(71,231 ) Analog Devices, Inc. (9,906,807 )(83,527 ) Aon Plc � Class A (17,113,847)(13,300 ) Apache Corp. (171,437 )(300 ) Arthur J Gallagher & Co. (34,623 )(600 ) Autodesk, Inc. * (168,138 )(800 ) Avalara, Inc. * (137,400 )(500 ) Ball Corp. (48,005 )
Shares Description Value ($)United States �� continued
(200 ) Black Knight, Inc. * (18,324 )(2,700 ) Blackstone Group , Inc. (The) � Class A (160,785 )(39,001 ) Bristol-Myers Squibb Co. (2,433,662 )(600 ) Burlington Stores, Inc. * (131,124 )(1 ) Charles Schwab Corp. (The) (49 )(9,424 ) Charter Communications, Inc. � Class A * (6,144,354 )(2,900 ) Cheniere Energy, Inc. * (164,401 )(100 ) Chipotle Mexican Grill, Inc. * (128,943 )(1,100 ) Cognex Corp. (82,654 )(160,526) ConocoPhillips (6,350,409 )(100 ) CoStar Group, Inc. * (91,057 )(500 ) Coupa Software, Inc. * (164,455 )(1,000 ) Crowdstrike Holdings, Inc. � Class A * (153,280 )(1,300 ) Datadog, Inc. � Class A * (128,596 )(900 ) Devon Energy Corp. (13,302 )(400 ) DexCom, Inc. * (127,872 )(600 ) Digital Realty Trust, Inc. (REIT) (80,850 )(376,328) Discovery, Inc. � Class A * (10,126,986)(800 ) DocuSign, Inc. * (182,304 )(30,200 ) Endo International Plc * (153,416 )(700 ) Equifax, Inc. (116,830 )(200 ) Equinix, Inc. (REIT) (139,558 )(2,700 ) Equity LifeStyle Properties, Inc. (REIT) (158,193 )(100 ) Erie Indemnity Co. � Class A (22,561 )(1,400 ) Exact Sciences Corp. * (169,484 )(1 ) Fidelity National Financial, Inc. (36 )(1,600 ) Guidewire Software, Inc. * (195,968 )(23,225 ) HEICO Corp. � Class A (2,572,169 )(200 ) IDEXX Laboratories, Inc. * (92,196 )(1,000 ) IHS Markit Ltd. (99,460 )(1,600 ) Ingersoll Rand, Inc. * (70,832 )(700 ) Insulet Corp. * (180,397 )(900 ) IQVIA Holdings, Inc. * (152,091 )(2,100 ) Lamb Weston Holdings, Inc. (151,998 )(500 ) Liberty Broadband Corp. � Class A * (78,385 )(46,470 ) Liberty Broadband Corp. � Class C * (7,312,055 )(3,600 ) Liberty Media Corp-Liberty Formula One � Class C * (150,408 )(13,000 ) Live Nation Entertainment, Inc. * (853,450 )(300 ) MarketAxess Holdings, Inc. (161,754 )(118,939) Marvell Technology Group Ltd. (5,505,686 )(700 ) MongoDB, Inc. * (201,117 )(400 ) MSCI, Inc. (163,768 )(1,000 ) NIKE Inc. � Class B (134,700 )(3,300 ) Nuance Communications, Inc. * (142,329 )(800 ) Okta, Inc. * (196,032 )(300 ) Paycom Software, Inc. * (125,124 )(300 ) Pinterest, Inc. � Class A * (21,006 )(400 ) Public Storage (REIT) (89,784 )(600 ) RingCentral, Inc. � Class A * (178,230 )(100 ) Rockwell Automation, Inc. (25,556 )(600 ) Roku, Inc. * (176,142 )(2,000 ) Rollins, Inc. (114,360 )
Copyright © 2021 www.secdatabase.com. All Rights Reserved.Please Consider the Environment Before Printing This Document
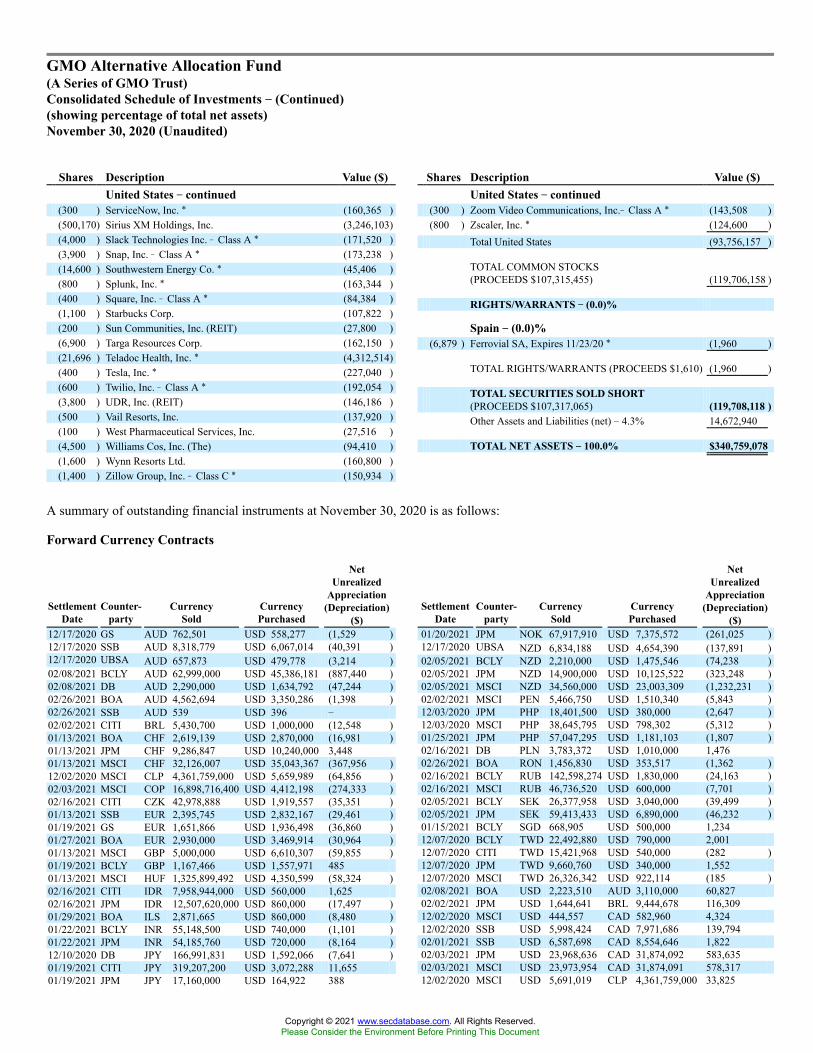
GMO Alternative Allocation Fund(A Series of GMO Trust)Consolidated Schedule of Investments �� (Continued)(showing percentage of total net assets)November 30, 2020 (Unaudited)
A summary of outstanding financial instruments at November 30, 2020 is as follows:
Forward Currency Contracts
Shares Description Value ($)United States �� continued
(300 ) ServiceNow, Inc. * (160,365 )(500,170) Sirius XM Holdings, Inc. (3,246,103)(4,000 ) Slack Technologies Inc. � Class A * (171,520 )(3,900 ) Snap, Inc. � Class A * (173,238 )(14,600 ) Southwestern Energy Co. * (45,406 )(800 ) Splunk, Inc. * (163,344 )(400 ) Square, Inc. � Class A * (84,384 )(1,100 ) Starbucks Corp. (107,822 )(200 ) Sun Communities, Inc. (REIT) (27,800 )(6,900 ) Targa Resources Corp. (162,150 )(21,696 ) Teladoc Health, Inc. * (4,312,514)(400 ) Tesla, Inc. * (227,040 )(600 ) Twilio, Inc. � Class A * (192,054 )(3,800 ) UDR, Inc. (REIT) (146,186 )(500 ) Vail Resorts, Inc. (137,920 )(100 ) West Pharmaceutical Services, Inc. (27,516 )(4,500 ) Williams Cos, Inc. (The) (94,410 )(1,600 ) Wynn Resorts Ltd. (160,800 )(1,400 ) Zillow Group, Inc. � Class C * (150,934 )
Shares Description Value ($)United States �� continued
(300 ) Zoom Video Communications, Inc.� Class A * (143,508 )(800 ) Zscaler, Inc. * (124,600 )
Total United States (93,756,157 )
TOTAL COMMON STOCKS(PROCEEDS $107,315,455) (119,706,158 )
RIGHTS/WARRANTS �� (0.0)%
Spain �� (0.0)%(6,879 ) Ferrovial SA, Expires 11/23/20 * (1,960 )
TOTAL RIGHTS/WARRANTS (PROCEEDS $1,610) (1,960 )
TOTAL SECURITIES SOLD SHORT(PROCEEDS $107,317,065) (119,708,118 )Other Assets and Liabilities (net) � 4.3% 14,672,940
TOTAL NET ASSETS �� 100.0% $340,759,078
SettlementDate
Counter-party
CurrencySold
CurrencyPurchased
NetUnrealized
Appreciation(Depreciation)
($)12/17/2020 GS AUD 762,501 USD 558,277 (1,529 )12/17/2020 SSB AUD 8,318,779 USD 6,067,014 (40,391 )12/17/2020 UBSA AUD 657,873 USD 479,778 (3,214 )02/08/2021 BCLY AUD 62,999,000 USD 45,386,181 (887,440 )02/08/2021 DB AUD 2,290,000 USD 1,634,792 (47,244 )02/26/2021 BOA AUD 4,562,694 USD 3,350,286 (1,398 )02/26/2021 SSB AUD 539 USD 396 �02/02/2021 CITI BRL 5,430,700 USD 1,000,000 (12,548 )01/13/2021 BOA CHF 2,619,139 USD 2,870,000 (16,981 )01/13/2021 JPM CHF 9,286,847 USD 10,240,000 3,44801/13/2021 MSCI CHF 32,126,007 USD 35,043,367 (367,956 )12/02/2020 MSCI CLP 4,361,759,000 USD 5,659,989 (64,856 )02/03/2021 MSCI COP 16,898,716,400 USD 4,412,198 (274,333 )02/16/2021 CITI CZK 42,978,888 USD 1,919,557 (35,351 )01/13/2021 SSB EUR 2,395,745 USD 2,832,167 (29,461 )01/19/2021 GS EUR 1,651,866 USD 1,936,498 (36,860 )01/27/2021 BOA EUR 2,930,000 USD 3,469,914 (30,964 )01/13/2021 MSCI GBP 5,000,000 USD 6,610,307 (59,855 )01/19/2021 BCLY GBP 1,167,466 USD 1,557,971 48501/13/2021 MSCI HUF 1,325,899,492 USD 4,350,599 (58,324 )02/16/2021 CITI IDR 7,958,944,000 USD 560,000 1,62502/16/2021 JPM IDR 12,507,620,000 USD 860,000 (17,497 )01/29/2021 BOA ILS 2,871,665 USD 860,000 (8,480 )01/22/2021 BCLY INR 55,148,500 USD 740,000 (1,101 )01/22/2021 JPM INR 54,185,760 USD 720,000 (8,164 )12/10/2020 DB JPY 166,991,831 USD 1,592,066 (7,641 )01/19/2021 CITI JPY 319,207,200 USD 3,072,288 11,65501/19/2021 JPM JPY 17,160,000 USD 164,922 388
SettlementDate
Counter-party
CurrencySold
CurrencyPurchased
NetUnrealized
Appreciation(Depreciation)
($)01/20/2021 JPM NOK 67,917,910 USD 7,375,572 (261,025 )12/17/2020 UBSA NZD 6,834,188 USD 4,654,390 (137,891 )02/05/2021 BCLY NZD 2,210,000 USD 1,475,546 (74,238 )02/05/2021 JPM NZD 14,900,000 USD 10,125,522 (323,248 )02/05/2021 MSCI NZD 34,560,000 USD 23,003,309 (1,232,231 )02/02/2021 MSCI PEN 5,466,750 USD 1,510,340 (5,843 )12/03/2020 JPM PHP 18,401,500 USD 380,000 (2,647 )12/03/2020 MSCI PHP 38,645,795 USD 798,302 (5,312 )01/25/2021 JPM PHP 57,047,295 USD 1,181,103 (1,807 )02/16/2021 DB PLN 3,783,372 USD 1,010,000 1,47602/26/2021 BOA RON 1,456,830 USD 353,517 (1,362 )02/16/2021 BCLY RUB 142,598,274 USD 1,830,000 (24,163 )02/16/2021 MSCI RUB 46,736,520 USD 600,000 (7,701 )02/05/2021 BCLY SEK 26,377,958 USD 3,040,000 (39,499 )02/05/2021 JPM SEK 59,413,433 USD 6,890,000 (46,232 )01/15/2021 BCLY SGD 668,905 USD 500,000 1,23412/07/2020 BCLY TWD 22,492,880 USD 790,000 2,00112/07/2020 CITI TWD 15,421,968 USD 540,000 (282 )12/07/2020 JPM TWD 9,660,760 USD 340,000 1,55212/07/2020 MSCI TWD 26,326,342 USD 922,114 (185 )02/08/2021 BOA USD 2,223,510 AUD 3,110,000 60,82702/02/2021 JPM USD 1,644,641 BRL 9,444,678 116,30912/02/2020 MSCI USD 444,557 CAD 582,960 4,32412/02/2020 SSB USD 5,998,424 CAD 7,971,686 139,79402/01/2021 SSB USD 6,587,698 CAD 8,554,646 1,82202/03/2021 JPM USD 23,968,636 CAD 31,874,092 583,63502/03/2021 MSCI USD 23,973,954 CAD 31,874,091 578,31712/02/2020 MSCI USD 5,691,019 CLP 4,361,759,000 33,825
Copyright © 2021 www.secdatabase.com. All Rights Reserved.Please Consider the Environment Before Printing This Document

01/19/2021 MSCI JPY 531,858,600 USD 5,061,666 (37,917 )02/09/2021 BOA JPY 260,030,250 USD 2,500,000 6,12302/09/2021 JPM JPY 275,086,881 USD 2,650,000 11,719
02/26/2021 MSCI USD 2,820,954 CLP 2,180,879,500 46,78302/03/2021 MSCI USD 1,280,000 COP 4,641,640,000 7,26902/16/2021 BOA USD 660,000 CZK 14,689,415 8,153
Copyright © 2021 www.secdatabase.com. All Rights Reserved.Please Consider the Environment Before Printing This Document

GMO Alternative Allocation Fund(A Series of GMO Trust)
Consolidated Schedule of Investments �� (Continued)November 30, 2020 (Unaudited)
Forward Currency Contracts �� continued
Futures Contracts
SettlementDate
Counter-party
CurrencySold
CurrencyPurchased
NetUnrealized
Appreciation(Depreciation)
($)02/16/2021 CITI USD 400,000 CZK 8,868,760 3,398
02/16/2021 DB USD 640,000 CZK 13,988,230 (3,741 )
01/13/2021 UBSA USD 23,554,115 EUR 19,915,545 234,256
01/19/2021 BOA USD 1,250,667 EUR 1,070,830 28,572
01/19/2021 DB USD 14,021 EUR 11,800 76
01/27/2021 DB USD 30,285,458 EUR 25,500,000 182,939
01/27/2021 JPM USD 16,436,667 EUR 13,820,000 76,009
02/16/2021 BCLY USD 776,330 EUR 653,823 5,228
02/16/2021 GS USD 23,639,560 EUR 20,000,000 267,748
02/16/2021 JPM USD 362,186 EUR 305,148 2,577
01/13/2021 MSCI USD 13,178,592 GBP 10,186,000 409,861
01/13/2021 BOA USD 320,000 HUF 96,988,512 2,509
02/16/2021 JPM USD 2,260,322 IDR 33,629,064,000 98,992
01/29/2021 MSCI USD 2,564,807 ILS 8,691,619 63,807
01/22/2021 JPM USD 451,271 INR 33,482,018 (1,330 )
12/10/2020 MSCI USD 7,397,708 JPY 774,521,220 21,859
12/10/2020 SSB USD 11,905,570 JPY 1,259,096,844 156,014
02/09/2021 BOA USD 8,310,000 JPY 870,584,961 39,535
02/09/2021 MSCI USD 30,042,865 JPY 3,113,867,801 (178,635 )
02/10/2021 MSCI USD 1,545,260 JPY 160,250,771 (8,322 )
02/10/2021 SSB USD 6,907,435 JPY 715,321,476 (46,908 )
02/19/2021 MSCI USD 4,095,683 KRW 4,530,807,850 (10,273 )
01/21/2021 BOA USD 1,000,000 MXN 20,907,425 29,074
SettlementDate
Counter-party
CurrencySold
CurrencyPurchased
NetUnrealized
Appreciation(Depreciation)
($)01/21/2021 CITI USD 800,000 MXN 17,058,016 39,60401/21/2021 GS USD 760,000 MXN 16,281,015 41,35901/21/2021 MSCI USD 1,527,501 MXN 32,557,530 74,99601/20/2021 JPM USD 6,620,000 NOK 60,975,624 236,01712/17/2020 BOA USD 466,486 NZD 683,267 12,63612/17/2020 UBSA USD 157,867 NZD 228,666 2,47802/05/2021 JPM USD 10,860,744 NZD 16,170,000 478,62802/02/2021 MSCI USD 1,800,000 PEN 6,460,080 (8,320 )12/03/2020 JPM USD 1,183,554 PHP 57,047,295 2,70702/16/2021 MSCI USD 1,462,967 PLN 5,549,729 16,41002/16/2021 BCLY USD 208,378 RUB 16,244,616 2,84602/05/2021 BCLY USD 41,451,927 SEK 368,909,714 1,616,50302/05/2021 JPM USD 3,890,000 SEK 34,992,394 195,19301/15/2021 GS USD 660,000 SGD 896,174 8,22801/15/2021 MSCI USD 670,000 SGD 907,875 6,95401/15/2021 BOA USD 1,550,000 THB 48,398,710 49,64302/16/2021 BCLY USD 4,050,000 TRY 32,285,385 (37,502 )12/07/2020 JPM USD 2,564,793 TWD 73,901,950 24,23502/02/2021 MSCI USD 930,259 TWD 26,326,342 (329 )01/29/2021 DB USD 1,120,000 ZAR 18,415,137 60,27401/29/2021 MSCI USD 2,718,637 ZAR 44,882,790 158,019
$ 1,763,417
Numberof
Contracts + TypeExpiration
DateNotional
Amount ($)
Value/NetUnrealized
Appreciation(Depreciation)
($)
Numberof
Contracts + TypeExpiration
DateNotional
Amount ($)
Value/NetUnrealized
Appreciation(Depreciation)
($)
Copyright © 2021 www.secdatabase.com. All Rights Reserved.Please Consider the Environment Before Printing This Document

Buys32 CAC40 10
Euro December 2020 2,099,554 6,71257 Canadian
GovernmentBond 10 Yr. March 2021 6,532,594 6,190
19 Hang SengIndex December 2020 3,235,119 (25,529 )
342 Mini MSCIEmergingMarkets December 2020 20,559,330 1,746,027
13 S&P/TSX 60 December 2020 2,046,046 113,753164 U.S.
TreasuryNote 10 Yr.(CBT) March 2021 22,660,188 38,651
$57,132,831 $ 1,885,804
Sales6 DAX Index December 2020 2,380,420 (70,241 )54 E-mini
Russell 2000Index December 2020 4,914,270 (455,633 )
138 Euro Bund December 2020 28,848,494 26,17180 FTSE/JSE
TOP 40 December 2020 2,704,253 (28,996 )11 Gilt Long
Bond March 2021 1,967,850 (2,404 )9 Japanese
GovernmentBond 10 Yr.(OSE) December 2020 13,106,034 3,209
42 S&P 500E-Mini December 2020 7,608,720 (619,212 )
28 SPI 200 December 2020 3,349,132 (190,480 )6 TOPIX Index December 2020 1,007,335 (18,419 )
$65,886,508 $ (1,356,005 )
+ Buys - Fund is long the futures contract.Sales - Fund is short the futures contract.
Copyright © 2021 www.secdatabase.com. All Rights Reserved.Please Consider the Environment Before Printing This Document

GMO Alternative Allocation Fund(A Series of GMO Trust)
Consolidated Schedule of Investments �� (Continued)November 30, 2020 (Unaudited)
Written Options
DescriptionExercise
PriceExpiration
DateNumber ofContracts
NotionalAmount Value ($)
Equity Options �� CallsFirstEnergy Corp. (c) 30.00 04/16/21 (1,374 ) USD (3,649,344) (151,140)Equity Options �� PutsFirstEnergy Corp. (c) 28.00 04/16/21 (1,374 ) USD (3,649,344) (439,680)Index Options �� PutsS&P/ASX 200 Index 6,525.00 12/03/20 (49 ) AUD (3,193,727) (17,874)S&P 500 Index 3,585.00 12/04/20 (10 ) USD (3,621,630) (12,700)S&P 500 Index 3,560.00 12/11/20 (16 ) USD (5,794,608) (33,600)S&P 500 Index 3,635.00 12/18/20 (16 ) USD (5,794,608) (95,360)
Total Index Options � Puts (159,534)
Description CounterpartyExercise
RateExpiration
Date
Principal/NotionalAmount
Floating RateIndex
Pay/ReceiveFloating Rate Value ($)
Written Options on Credit Default Swaps �� PutsCDX.NA.IGS.35.V1-5Y MSCI 80.00 01/20/21 USD (25,000,000) Fixed Spread Pay (12,074 )CDX. NA.HYS.35.V1 JPM 101.00 02/17/21 USD (13,200,000) Fixed Spread Pay (47,353 )
Total Written Options on Credit DefaultSwaps - Puts (59,427 )
TOTAL WRITTEN OPTIONS(Premiums $980,190) $(809,781)
Swap Contracts
Centrally Cleared Credit Default Swaps
Reference EntityNotionalAmount
AnnualPremium
ImpliedCredit
Spread (1)
MaximumPotential
Amount ofFuture
Payments bythe FundUnder the
Contract (2)Expiration
Date
PeriodicPayment
Frequency
PremiumsPaid/
(Received) ($) Value ($)
NetUnrealized
Appreciation/(Depreciation) ($)
Buy Protection^:CDX.NA.IGS.35.V1-5Y
USD 25,000,000 1.00% 0.52% N/A12/20/2025 Quarterly $ (547,781 ) $(621,275) $ (73,494 )
OTC Credit Default Swaps
Reference Entity CounterpartyNotionalAmount
AnnualPremium
ImpliedCredit
Spread (1)
MaximumPotential
Amount ofFuture
Payments bythe FundUnder the
Contract (2)Expiration
Date
PeriodicPayment
Frequency
PremiumsPaid/
(Received) ($) Value ($)
NetUnrealized
Appreciation/(Depreciation) ($)
Buy Protection^:ITRAXX.EUROPES.32.V1-5Y
JPM EUR 9,600,000 1.00% 1.84% N/A12/20/2024 Quarterly 572,808 389,129 (183,679 )
Sell Protection^:ITRAXX.EUROPES.32.V1-5Y
JPM EUR 20,000,000 1.00% 0.75% 20,000,000 EUR12/20/2024 Quarterly 116,938 245,559 128,621
$ 689,746 $634,688 $ (55,058 )
Copyright © 2021 www.secdatabase.com. All Rights Reserved.Please Consider the Environment Before Printing This Document

GMO Alternative Allocation Fund(A Series of GMO Trust)
Consolidated Schedule of Investments �� (Continued)November 30, 2020 (Unaudited)
^ Buy Protection - Fund pays a premium and buys credit protection. If a credit event occurs the Fund will, depending on the terms of the particular swap contract,either (i) receive from the seller of protection an amount equal to the notional amount of the swap and deliver the referenced obligation or underlying securitiescomprising the referenced index or (ii) receive a net settlement amount in the form of cash or securities equal to the notional amount of the swap less the recoveryvalue of the referenced obligation or underlying securities comprising the referenced index.Sell Protection - Fund receives a premium and sells credit protection. If a credit event occurs the Fund will, depending on the terms of the particular swap contract,either (i) pay to the buyer of protection an amount equal to the notional amount of the swap and take delivery of the referenced obligation or underlying securitiescomprising the referenced index or (ii) pay a net settlement amount in the form of cash or securities equal to the notional amount of the swap less the recoveryvalue of the referenced obligation or underlying securities comprising the referenced index.
(1) As of November 30, 2020, implied credit spreads in absolute terms, calculated using a model, and utilized in determining the market value of credit default swapcontracts on the reference security, serve as an indicator of the current status of the payment/performance risk and reflect the likelihood or risk of default for thereference entity. The implied credit spread of a particular referenced entity reflects the cost of buying/selling protection. Wider (i.e. higher) credit spreads representa deterioration of the referenced entity�s credit soundness and a greater likelihood or risk of default or other credit event occurring as defined under the terms of thecontract.
(2) The maximum potential amount the Fund could be required to pay as a seller of credit protection if a credit event occurs as defined under the terms of thatparticular swap contract.
Centrally Cleared Interest Rate Swaps
Fund Pays Fund ReceivesNotionalAmount
ExpirationDate
PeriodicPayment
Frequency
PremiumsPaid/
(Received) ($) Value ($)
NetUnrealized
Appreciation/(Depreciation) ($)
3 Month AUD BBSW0.15% AUD 24,780,000
12/16/2022 Quarterly 3,046 25,073 22,027
3 Month AUD BBSW0.10% AUD 36,530,000
12/16/2022 Quarterly (1,770 ) 10,164 11,934
0.07%3 Month AUD BBSW AUD 40,650,000
12/16/2022 Quarterly � 5,091 5,091
(0.67)%6 Month CHF LIBOR CHF 30,330,000
12/16/2022 Semi-Annually 7,353 (23,408 ) (30,761 )
6 Month CHF LIBOR(0.72)% CHF 21,630,000
12/16/2022 Semi-Annually (172 ) (3,054 ) (2,882 )
0.18%3 Month NZD Bank Bill Rate NZD 220,230,000
12/16/2022 Quarterly 42,020 203,369 161,349
(0.05)%3 Month SEK STIBOR SEK 150,890,000
12/16/2022 Quarterly 1,392 2,234 842
3 Month SEK STIBOR(0.04)% SEK 158,100,000
12/16/2022 Quarterly 395 1,350 955
3 Month SEK STIBOR(0.03)% SEK 166,000,000
12/16/2022 Quarterly � 2,386 2,386
0.55%3 Month CAD LIBOR CAD 22,480,000
12/19/2022 Semi-Annually � 794 794
0.56%3 Month CAD LIBOR CAD 63,670,000
12/19/2022 Semi-Annually 8,005 (7,595 ) (15,600 )
0.55%3 Month CAD LIBOR CAD 17,650,000
12/19/2022 Semi-Annually � (195 ) (195 )
6 Month EURIBOR(0.48)% EUR 23,040,000
12/21/2022 Semi-Annually 5,571 21,688 16,117
6 Month GBP LIBOR0.08% GBP 104,780,000
12/21/2022 Semi-Annually 40,853 (25,416 ) (66,269 )
3 Month USD LIBOR0.24% USD 24,380,000
12/21/2022 Quarterly (9,706 ) 3,906 13,612
3 Month USD LIBOR0.23% USD 9,850,000
12/21/2022 Quarterly 59 (1,394 ) (1,453 )
0.87%6 Month AUD BBSW AUD 5,160,000
12/16/2030 Semi-Annually (4,054 ) 8,852 12,906
0.76%6 Month AUD BBSW AUD 7,580,000
12/16/2030 Semi-Annually 4,084 71,711 67,627
0.77%6 Month AUD BBSW AUD 1,460,000
12/16/2030 Semi-Annually � 12,556 12,556
0.88%6 Month AUD BBSW AUD 4,210,000
12/16/2030 Semi-Annually � 5,713 5,713
6 Month AUD BBSW0.79% AUD 16,610,000
12/16/2030 Semi-Annually 1,718 (128,553) (130,271 )
0.93%6 Month AUD BBSW AUD 5,160,000
12/16/2030 Semi-Annually � (12,425 ) (12,425 )
Copyright © 2021 www.secdatabase.com. All Rights Reserved.Please Consider the Environment Before Printing This Document

6 Month AUD BBSW0.89% AUD 8,490,000
12/16/2030 Semi-Annually � (561 ) (561 )
3 Month CAD LIBOR1.28% CAD 39,930,000
12/16/2030 Semi-Annually (10,911 ) 236,830 247,741
3 Month CAD LIBOR1.23% CAD 8,780,000
12/16/2030 Semi-Annually 8,945 19,426 10,481
3 Month CAD LIBOR1.20% CAD 66,370,000
12/16/2030 Semi-Annually (104,361 ) (1,235 ) 103,126
3 Month CAD LIBOR1.11% CAD 8,330,000
12/16/2030 Semi-Annually (2,368 ) (53,433 ) (51,065 )
3 Month CAD LIBOR1.09% CAD 14,870,000
12/16/2030 Semi-Annually � (118,609) (118,609 )
3 Month CAD LIBOR1.09% CAD 2,640,000
12/16/2030 Semi-Annually � (21,450 ) (21,450 )
3 Month CAD LIBOR1.11% CAD 5,090,000
12/16/2030 Semi-Annually � (34,164 ) (34,164 )
3 Month CAD LIBOR1.13% CAD 8,130,000
12/16/2030 Semi-Annually � (42,476 ) (42,476 )
3 Month CAD LIBOR1.15% CAD 2,060,000
12/16/2030 Semi-Annually � (7,699 ) (7,699 )
6 Month CHF LIBOR(0.26)% CHF 5,240,000
12/16/2030 Semi-Annually (7,603 ) 21,411 29,014
(0.32)%6 Month CHF LIBOR CHF 3,490,000
12/16/2030 Semi-Annually � 11,425 11,425
6 Month CHF LIBOR(0.30)% CHF 62,040,000
12/16/2030 Semi-Annually (25,072 ) (62,612 ) (37,540 )
(0.27)%6 Month CHF LIBOR CHF 6,890,000
12/16/2030 Semi-Annually � (20,351 ) (20,351 )
(0.29)%6 Month CHF LIBOR CHF 5,920,000
12/16/2030 Semi-Annually � (4,080 ) (4,080 )
0.59%3 Month NZD Bank Bill Rate NZD 41,980,000
12/16/2030 Quarterly (19,391 ) 857,329 876,720
0.85%3 Month NZD Bank Bill Rate NZD 4,320,000
12/16/2030 Quarterly � 11,919 11,919
3 Month NZD Bank Bill Rate0.55% NZD 22,000,000
12/16/2030 Quarterly 40,790 (497,302) (538,092 )
3 Month NZD Bank Bill Rate0.46% NZD 11,010,000
12/16/2030 Quarterly (6,086 ) (323,212) (317,126 )
3 Month NZD Bank Bill Rate0.48% NZD 19,180,000
12/16/2030 Quarterly 478 (536,891) (537,369 )
3 Month NZD Bank Bill Rate0.74% NZD 4,230,000
12/16/2030 Quarterly � (42,682 ) (42,682 )
3 Month NZD Bank Bill Rate0.81% NZD 4,470,000
12/16/2030 Quarterly 749 (24,527 ) (25,276 )
Copyright © 2021 www.secdatabase.com. All Rights Reserved.Please Consider the Environment Before Printing This Document
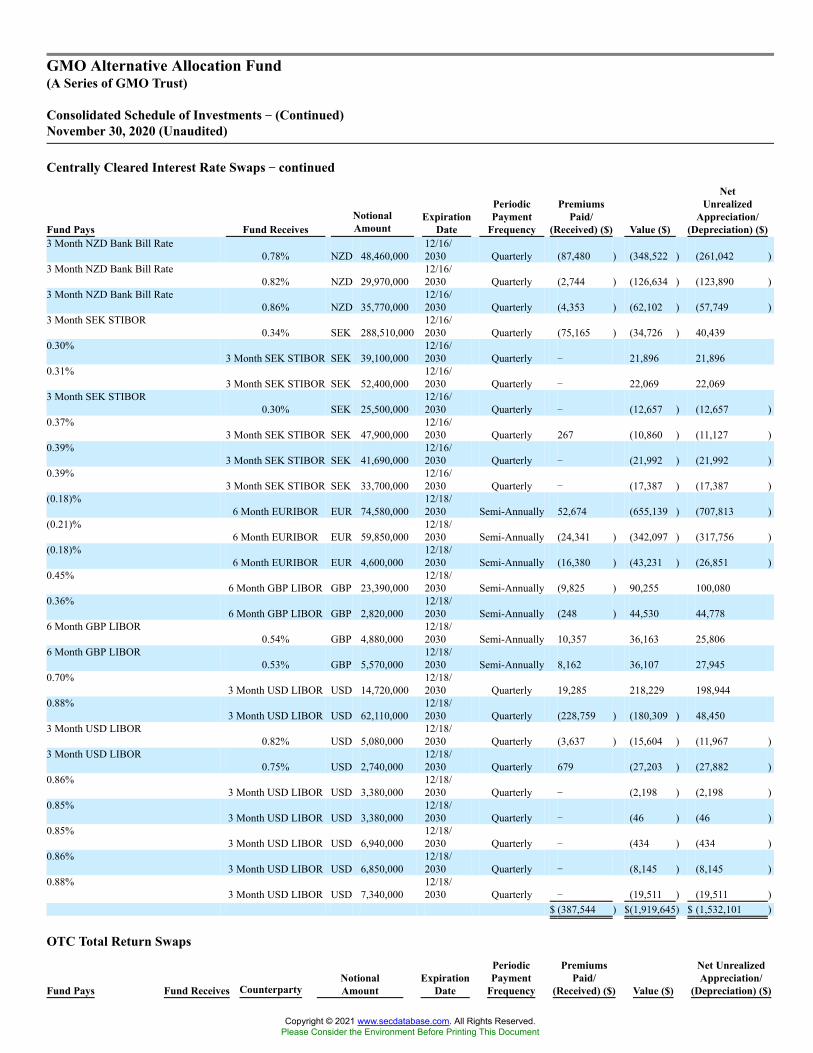
GMO Alternative Allocation Fund(A Series of GMO Trust)
Consolidated Schedule of Investments �� (Continued)November 30, 2020 (Unaudited)
Centrally Cleared Interest Rate Swaps �� continued
Fund Pays Fund ReceivesNotionalAmount
ExpirationDate
PeriodicPayment
Frequency
PremiumsPaid/
(Received) ($) Value ($)
NetUnrealized
Appreciation/(Depreciation) ($)
3 Month NZD Bank Bill Rate0.78% NZD 48,460,000
12/16/2030 Quarterly (87,480 ) (348,522 ) (261,042 )
3 Month NZD Bank Bill Rate0.82% NZD 29,970,000
12/16/2030 Quarterly (2,744 ) (126,634 ) (123,890 )
3 Month NZD Bank Bill Rate0.86% NZD 35,770,000
12/16/2030 Quarterly (4,353 ) (62,102 ) (57,749 )
3 Month SEK STIBOR0.34% SEK 288,510,000
12/16/2030 Quarterly (75,165 ) (34,726 ) 40,439
0.30%3 Month SEK STIBOR SEK 39,100,000
12/16/2030 Quarterly � 21,896 21,896
0.31%3 Month SEK STIBOR SEK 52,400,000
12/16/2030 Quarterly � 22,069 22,069
3 Month SEK STIBOR0.30% SEK 25,500,000
12/16/2030 Quarterly � (12,657 ) (12,657 )
0.37%3 Month SEK STIBOR SEK 47,900,000
12/16/2030 Quarterly 267 (10,860 ) (11,127 )
0.39%3 Month SEK STIBOR SEK 41,690,000
12/16/2030 Quarterly � (21,992 ) (21,992 )
0.39%3 Month SEK STIBOR SEK 33,700,000
12/16/2030 Quarterly � (17,387 ) (17,387 )
(0.18)%6 Month EURIBOR EUR 74,580,000
12/18/2030 Semi-Annually 52,674 (655,139 ) (707,813 )
(0.21)%6 Month EURIBOR EUR 59,850,000
12/18/2030 Semi-Annually (24,341 ) (342,097 ) (317,756 )
(0.18)%6 Month EURIBOR EUR 4,600,000
12/18/2030 Semi-Annually (16,380 ) (43,231 ) (26,851 )
0.45%6 Month GBP LIBOR GBP 23,390,000
12/18/2030 Semi-Annually (9,825 ) 90,255 100,080
0.36%6 Month GBP LIBOR GBP 2,820,000
12/18/2030 Semi-Annually (248 ) 44,530 44,778
6 Month GBP LIBOR0.54% GBP 4,880,000
12/18/2030 Semi-Annually 10,357 36,163 25,806
6 Month GBP LIBOR0.53% GBP 5,570,000
12/18/2030 Semi-Annually 8,162 36,107 27,945
0.70%3 Month USD LIBOR USD 14,720,000
12/18/2030 Quarterly 19,285 218,229 198,944
0.88%3 Month USD LIBOR USD 62,110,000
12/18/2030 Quarterly (228,759 ) (180,309 ) 48,450
3 Month USD LIBOR0.82% USD 5,080,000
12/18/2030 Quarterly (3,637 ) (15,604 ) (11,967 )
3 Month USD LIBOR0.75% USD 2,740,000
12/18/2030 Quarterly 679 (27,203 ) (27,882 )
0.86%3 Month USD LIBOR USD 3,380,000
12/18/2030 Quarterly � (2,198 ) (2,198 )
0.85%3 Month USD LIBOR USD 3,380,000
12/18/2030 Quarterly � (46 ) (46 )
0.85%3 Month USD LIBOR USD 6,940,000
12/18/2030 Quarterly � (434 ) (434 )
0.86%3 Month USD LIBOR USD 6,850,000
12/18/2030 Quarterly � (8,145 ) (8,145 )
0.88%3 Month USD LIBOR USD 7,340,000
12/18/2030 Quarterly � (19,511 ) (19,511 )
$ (387,544 ) $(1,919,645) $ (1,532,101 )
OTC Total Return Swaps
Fund Pays Fund Receives CounterpartyNotionalAmount
ExpirationDate
PeriodicPayment
Frequency
PremiumsPaid/
(Received) ($) Value ($)
Net UnrealizedAppreciation/
(Depreciation) ($)
Copyright © 2021 www.secdatabase.com. All Rights Reserved.Please Consider the Environment Before Printing This Document

Total Return on MSCIACWI CommodityProducers Index
3 Month USDLIBOR plus aspread of(0.35)% MSCI USD 2,383,206
02/25/2021 Quarterly � 79,406 79,406
Total Return on MSCIACWI CommodityProducers Index
3 Month USDLIBOR plus aspread of(0.35)% MSCI USD 6,887,089
02/25/2021 Quarterly � 229,470 229,470
Total Return on MSCIACWI CommodityProducers Index
3 Month USDLIBOR plus aspread of(0.35)% MSCI USD 6,341,577
02/25/2021 Quarterly � 211,294 211,294
1 Month FED FundsRate plus 0.15% (g)
Total Returnon BloombergCommodityIndex MSCI USD 2,456,470
08/20/2021 Monthly 3,334 7,386 4,052
Total Return on EquityBasket (h)
1 Month FEDFunds Rateminus 0.50% GS USD 90,215
05/24/2022 Monthly � 9,993 9,993
Total Return on EquityBasket (h)
1 Month FEDFunds Rateminus 0.75% GS USD 88,444
05/24/2022 Monthly � 721 721
1 Month FED FundsRate plus 0.60%
Total Returnon EquityBasket(h) GS USD 97,754
05/24/2022 Monthly � 404 404
Copyright © 2021 www.secdatabase.com. All Rights Reserved.Please Consider the Environment Before Printing This Document

GMO Alternative Allocation Fund(A Series of GMO Trust)
Consolidated Schedule of Investments �� (Continued)November 30, 2020 (Unaudited)
OTC Total Return Swaps �� continued
Fund Pays Fund Receives CounterpartyNotionalAmount
ExpirationDate
PeriodicPayment
Frequency
PremiumsPaid/
(Received) ($) Value ($)
Net UnrealizedAppreciation/
(Depreciation) ($)Total Return on Equity
Basket (h)1 Month FEDFunds Rateminus 0.40% MORD USD 1,540,173
10/18/2022 Monthly � (32,829 ) (32,829 )
1 Month FED Funds Rateplus 0.95%
Total Returnon EquityBasket (h) MORD USD 51,891
10/18/2022 Monthly � 1,078 1,078
$ 3,334 $506,923 $ 503,589
As of November 30, 2020, for the above contracts and/or agreements, the Fund had sufficient cash and/or securities to covercommitments or collateral requirements, if any, of the relevant broker or exchange.
Counterparty Abbreviations:
Notes to Schedule of Investments:
� Denominated in U.S. Dollar, unless otherwise indicated.* Non-income producing security.(a) All or a portion of this security is out on loan.(b) All or a portion of this security has been pledged to cover margin
requirements on futures and/or cleared swap contracts, collateral onsecurities sold short, OTC swap contracts, forward currency contracts, and/or written options, if any.
(c) All or a portion of this investment is held in connection with one or moreholdings within the Fund.
(d) Preferred dividend rates are disclosed to the extent that a stated rate exists.(e) Investment valued using significant unobservable inputs.(f) The rate disclosed is the 7 day net yield as of November 30, 2020.(g) All or a portion of this security or derivative is owned by GMO Alternative
Allocation SPC Ltd., which is a 100% owned subsidiary of GMOAlternative Allocation Fund.
(h) Periodic payments made/received are based on the total return of thereferenced entity. Custom equity basket swap which has a notional amountof less than 1% of the Fund�s total net assets.
The rates shown on variable rate notes are the current interest rates atNovember 30, 2020, which are subject to change based on the terms of thesecurity.
Portfolio Abbreviations:
144A - Securities exempt from registration under Rule 144A of the Securities Actof 1933. These securities may be resold in transactions exempt from registration,normally to qualified institutional investors.ADR - American Depositary ReceiptAUD BBSW - Bank Bill Swap Reference Rate denominated in Australian Dollar.CAD LIBOR - London Interbank Offered Rate denominated in Canadian Dollar.CHF LIBOR - London Interbank Offered Rate denominated in Swiss Franc.CLO - Collateralized Loan ObligationCVA - Certificaaten van aandelen (Share Certificates)EURIBOR - Euro Interbank Offered RateGBP LIBOR - London Interbank Offered Rate denominated in British Pound.NZD Bank Bill Rate - Bank Bill Rate denominated in New Zealand Dollar.REIT - Real Estate Investment TrustSEK STIBOR - Stockholm Interbank Offered Rate denominated in Swedish Krona.USBM - U.S. Treasury 3 Month Bill Money Market Yield.USD LIBOR - London Interbank Offered Rate denominated in United StatesDollar.
BCLY - Barclays Bank PLCBOA - Bank of America, N.A.CITI - Citibank N.A.DB - Deutsche Bank AGGS - Goldman Sachs International
JPM - JPMorgan Chase Bank, N.A.MORD - Morgan Stanley Capital Services LLCMSCI - Morgan Stanley & Co. International PLCSSB - State Street Bank and Trust CompanyUBSA - UBS AG
Copyright © 2021 www.secdatabase.com. All Rights Reserved.Please Consider the Environment Before Printing This Document

GMO Alternative Allocation Fund(A Series of GMO Trust)
Consolidated Schedule of Investments �� (Continued)November 30, 2020 (Unaudited)
Currency Abbreviations:
AUD - Australian DollarBRL - Brazilian RealCAD - Canadian DollarCHF - Swiss FrancCLP - Chilean PesoCOP - Colombian PesoCZK - Czech KorunaEUR - EuroGBP - British PoundHUF - Hungarian ForintIDR - Indonesian RupiahILS - Israeli ShekelINR - Indian RupeeJPY - Japanese YenKRW - South Korean Won
MXN - Mexican PesoNOK - Norwegian KroneNZD - New Zealand DollarPEN - Peruvian SolPHP - Philippine PesoPLN - Polish ZlotyRON - Romanian LeuRUB - Russian RubleSEK - Swedish KronaSGD - Singapore DollarTHB - Thai BahtTRY - Turkish LiraTWD - Taiwan DollarUSD - United States DollarZAR - South African Rand
Copyright © 2021 www.secdatabase.com. All Rights Reserved.Please Consider the Environment Before Printing This Document

GMO Benchmark-Free Allocation Fund(A Series of GMO Trust)Schedule of Investments(showing percentage of total net assets)November 30, 2020 (Unaudited)
Shares Description Value ($)MUTUAL FUNDS �� 100.0%
Affiliated Issuers �� 100.0%7,650,737 GMO Emerging Country Debt Fund, Class IV 210,012,7243,803,989 GMO High Yield Fund, Class VI 79,122,969456,670,191 GMO Implementation Fund 5,662,710,36612,850,716 GMO Opportunistic Income Fund, Class VI 336,174,7275,590,398 GMO SGM Major Markets Fund, Class VI 184,650,8585,713,838 GMO Special Opportunities Fund, Class VI 181,414,366
TOTAL MUTUAL FUNDS(COST $6,958,992,770) 6,654,086,010
SHORT-TERM INVESTMENTS �� 0.1%
Money Market Funds �� 0.1%3,796,402 State Street Institutional Treasury Money
Market Fund � Premier Class, 0.01% (a) 3,796,402
TOTAL SHORT-TERM INVESTMENTS(COST $3,796,402) 3,796,402
TOTAL INVESTMENTS �� 100.1%(Cost $6,962,789,172) 6,657,882,412Other Assets and Liabilities (net) � (0.1%) (3,369,446 )
TOTAL NET ASSETS �� 100.0% $6,654,512,966
Notes to Schedule of Investments:
(a) The rate disclosed is the 7 day net yield as of November 30, 2020.
Copyright © 2021 www.secdatabase.com. All Rights Reserved.Please Consider the Environment Before Printing This Document
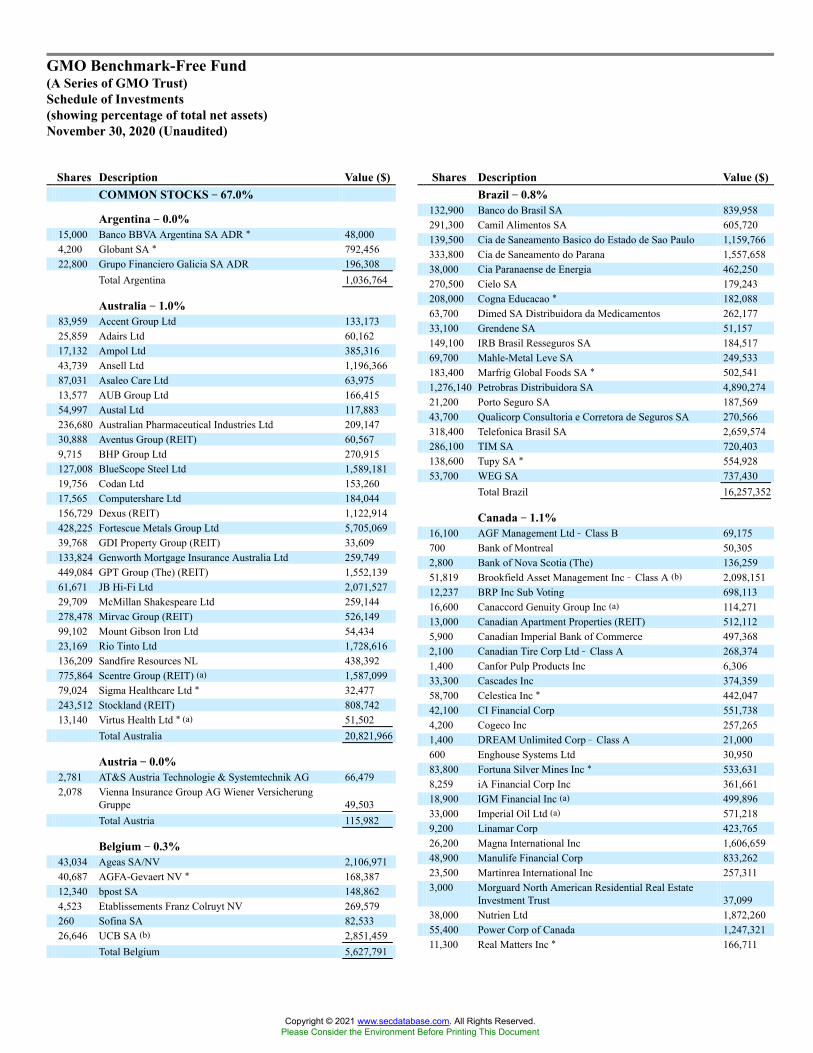
GMO Benchmark-Free Fund(A Series of GMO Trust)Schedule of Investments(showing percentage of total net assets)November 30, 2020 (Unaudited)
Shares Description Value ($)COMMON STOCKS �� 67.0%
Argentina �� 0.0%15,000 Banco BBVA Argentina SA ADR * 48,0004,200 Globant SA * 792,45622,800 Grupo Financiero Galicia SA ADR 196,308
Total Argentina 1,036,764
Australia �� 1.0%83,959 Accent Group Ltd 133,17325,859 Adairs Ltd 60,16217,132 Ampol Ltd 385,31643,739 Ansell Ltd 1,196,36687,031 Asaleo Care Ltd 63,97513,577 AUB Group Ltd 166,41554,997 Austal Ltd 117,883236,680 Australian Pharmaceutical Industries Ltd 209,14730,888 Aventus Group (REIT) 60,5679,715 BHP Group Ltd 270,915127,008 BlueScope Steel Ltd 1,589,18119,756 Codan Ltd 153,26017,565 Computershare Ltd 184,044156,729 Dexus (REIT) 1,122,914428,225 Fortescue Metals Group Ltd 5,705,06939,768 GDI Property Group (REIT) 33,609133,824 Genworth Mortgage Insurance Australia Ltd 259,749449,084 GPT Group (The) (REIT) 1,552,13961,671 JB Hi-Fi Ltd 2,071,52729,709 McMillan Shakespeare Ltd 259,144278,478 Mirvac Group (REIT) 526,14999,102 Mount Gibson Iron Ltd 54,43423,169 Rio Tinto Ltd 1,728,616136,209 Sandfire Resources NL 438,392775,864 Scentre Group (REIT) (a) 1,587,09979,024 Sigma Healthcare Ltd * 32,477243,512 Stockland (REIT) 808,74213,140 Virtus Health Ltd * (a) 51,502
Total Australia 20,821,966
Austria �� 0.0%2,781 AT&S Austria Technologie & Systemtechnik AG 66,4792,078 Vienna Insurance Group AG Wiener Versicherung
Gruppe 49,503Total Austria 115,982
Belgium �� 0.3%43,034 Ageas SA/NV 2,106,97140,687 AGFA-Gevaert NV * 168,38712,340 bpost SA 148,8624,523 Etablissements Franz Colruyt NV 269,579260 Sofina SA 82,53326,646 UCB SA (b) 2,851,459
Total Belgium 5,627,791
Shares Description Value ($)Brazil �� 0.8%
132,900 Banco do Brasil SA 839,958291,300 Camil Alimentos SA 605,720139,500 Cia de Saneamento Basico do Estado de Sao Paulo 1,159,766333,800 Cia de Saneamento do Parana 1,557,65838,000 Cia Paranaense de Energia 462,250270,500 Cielo SA 179,243208,000 Cogna Educacao * 182,08863,700 Dimed SA Distribuidora da Medicamentos 262,17733,100 Grendene SA 51,157149,100 IRB Brasil Resseguros SA 184,51769,700 Mahle-Metal Leve SA 249,533183,400 Marfrig Global Foods SA * 502,5411,276,140 Petrobras Distribuidora SA 4,890,27421,200 Porto Seguro SA 187,56943,700 Qualicorp Consultoria e Corretora de Seguros SA 270,566318,400 Telefonica Brasil SA 2,659,574286,100 TIM SA 720,403138,600 Tupy SA * 554,92853,700 WEG SA 737,430
Total Brazil 16,257,352
Canada �� 1.1%16,100 AGF Management Ltd � Class B 69,175700 Bank of Montreal 50,3052,800 Bank of Nova Scotia (The) 136,25951,819 Brookfield Asset Management Inc � Class A (b) 2,098,15112,237 BRP Inc Sub Voting 698,11316,600 Canaccord Genuity Group Inc (a) 114,27113,000 Canadian Apartment Properties (REIT) 512,1125,900 Canadian Imperial Bank of Commerce 497,3682,100 Canadian Tire Corp Ltd � Class A 268,3741,400 Canfor Pulp Products Inc 6,30633,300 Cascades Inc 374,35958,700 Celestica Inc * 442,04742,100 CI Financial Corp 551,7384,200 Cogeco Inc 257,2651,400 DREAM Unlimited Corp � Class A 21,000600 Enghouse Systems Ltd 30,95083,800 Fortuna Silver Mines Inc * 533,6318,259 iA Financial Corp Inc 361,66118,900 IGM Financial Inc (a) 499,89633,000 Imperial Oil Ltd (a) 571,2189,200 Linamar Corp 423,76526,200 Magna International Inc 1,606,65948,900 Manulife Financial Corp 833,26223,500 Martinrea International Inc 257,3113,000 Morguard North American Residential Real Estate
Investment Trust 37,09938,000 Nutrien Ltd 1,872,26055,400 Power Corp of Canada 1,247,32111,300 Real Matters Inc * 166,711
Copyright © 2021 www.secdatabase.com. All Rights Reserved.Please Consider the Environment Before Printing This Document

GMO Benchmark-Free Fund(A Series of GMO Trust)Schedule of Investments �� (Continued)(showing percentage of total net assets)November 30, 2020 (Unaudited)
Shares Description Value ($)Canada �� continued
24,900 RioCan Real Estate Investment Trust 336,29553,300 Royal Bank of Canada 4,352,81320,200 Sun Life Financial Inc (b) 897,0006,000 Teekay Tankers Ltd � Class A * (a) 69,84075,600 TELUS Corp (a) 1,458,21210,600 TFI International Inc 537,87624,600 Toronto-Dominion Bank (The) 1,312,30318,600 Tourmaline Oil Corp 258,94233,900 Transcontinental Inc � Class A (a) 503,2665,500 Wajax Corp 71,9958,900 Westshore Terminals Investment Corp (a) 113,486
Total Canada 24,450,615
Chile �� 0.0%390,826 Aguas Andinas SA � Class A 113,36511,671 Empresa Nacional de Telecomunicaciones SA 70,7702,700 Enel Americas SA ADR 19,6025,354 Inversiones La Construccion SA 33,438
Total Chile 237,175
China �� 12.4%44,000 7Road Holdings Ltd * 15,0633,381,668 Agile Group Holdings Ltd 4,882,59218,411,800 Agricultural Bank of China Ltd � Class H 6,990,8526,000 AK Medical Holdings Ltd 9,45220,200 Alibaba Group Holding Ltd * 663,60461,900 Alibaba Group Holding Ltd Sponsored ADR * 16,301,9841,517,084 Anhui Conch Cement Co Ltd � Class H (b) 9,696,994180,500 Anhui Expressway Co Ltd � Class H 102,85046,000 Asia Cement China Holdings Corp 45,928100 Autohome Inc ADR 9,4425,576,000 BAIC Motor Corp Ltd � Class H 2,086,97215,900 Baidu Inc Sponsored ADR * (b) 2,209,94133,833,000 Bank of China Ltd � Class H 11,941,57517,563,000 Bank of Communications Co Ltd � Class H 9,705,44936,000 Beijing Enterprises Holdings Ltd 116,653314,300 Beijing North Star Co Ltd � Class H 65,25264,500 BEST Inc ADR * 188,98538,100 BYD Co Ltd � Class A 991,12037,000 BYD Electronic International Co Ltd 183,01910,606,000 China Cinda Asset Management Co Ltd � Class H 2,065,256531,000 China Communications Construction Co Ltd �
Class H 275,2333,527,357 China Communications Services Corp Ltd � Class H 1,879,80812,853,000 China Construction Bank Corp � Class H 10,047,608460,000 China Dongxiang Group Co Ltd 53,401402,000 China Eastern Airlines Corp Ltd � Class H 181,5243,195,000 China Everbright Bank Co Ltd � Class H 1,246,246816,000 China Feihe Ltd 1,948,7771,058,000 China Greenfresh Group Co Ltd * (c) 11,056
Shares Description Value ($)China �� continued
161,000 China Hongqiao Group Ltd 140,59210,488,000 China Huarong Asset Management Co Ltd � Class H 1,202,336616,000 China Jinmao Holdings Group Ltd 317,44526,000 China Kepei Education Group Ltd 20,1363,225,000 China Lesso Group Holdings Ltd 5,764,65384,000 China Life Insurance Co Ltd � Class H 189,564508,000 China Lilang Ltd 348,5061,817,000 China Machinery Engineering Corp � Class H 379,8963,579,645 China Medical System Holdings Ltd 3,655,0371,566,000 China Mobile Ltd (b) 9,341,5064,500 China Mobile Ltd Sponsored ADR 134,3256,468,000 China National Building Material Co Ltd � Class H 8,479,742712,000 China Oriental Group Co Ltd 213,376423,000 China Overseas Grand Oceans Group Ltd 252,281690,000 China Overseas Land & Investment Ltd 1,680,004105,000 China Overseas Property Holdings Ltd 68,6564,638 China Petroleum & Chemical Corp ADR 209,08115,300,000 China Petroleum & Chemical Corp � Class H 6,873,363162,000 China Pioneer Pharma Holdings Ltd 20,7045,648,500 China Railway Construction Corp Ltd � Class H 3,732,63713,237,042 China Railway Group Ltd � Class H 6,534,070421,000 China Railway Signal & Communication Corp Ltd �
Class H 149,3671,628,000 China Reinsurance Group Corp � Class H 172,141482,000 China Resources Cement Holdings Ltd 598,60942,000 China Resources Gas Group Ltd 202,427530,000 China Resources Land Ltd 2,293,6744,167,000 China Resources Pharmaceutical Group Ltd 2,253,128199,000 China SCE Group Holdings Ltd 91,127408,979 China Shenhua Energy Co Ltd � Class H 788,788725,000 China Shineway Pharmaceutical Group Ltd 495,95013,800 China Taiping Insurance Holdings Co Ltd 24,40313,242,000 China Telecom Corp Ltd � Class H 3,984,839412,000 China Traditional Chinese Medicine Holdings Co Ltd 193,630372,525 China Vanke Co Ltd � Class H 1,414,90515,400 China Yuchai International Ltd 259,3361,348,800 China Zhongwang Holdings Ltd * 293,769229,000 Chongqing Rural Commercial Bank Co Ltd � Class H 98,191430,000 COSCO Shipping Energy Transportation Co Ltd �
Class H 189,1743,480,604 Country Garden Holdings Co Ltd 4,589,83225,000 Country Garden Services Holdings Co Ltd 139,68743,500 Dali Foods Group Co Ltd 26,9401,746,000 Dongfeng Motor Group Co Ltd � Class H 1,796,3541,966,000 Dongyue Group Ltd 1,025,444130,000 Edvantage Group Holdings Ltd 134,2261,015,500 Fantasia Holdings Group Co Ltd * 197,703363,500 Fosun International Ltd 524,54257,000 Fu Shou Yuan International Group Ltd 57,368
Copyright © 2021 www.secdatabase.com. All Rights Reserved.Please Consider the Environment Before Printing This Document

GMO Benchmark-Free Fund(A Series of GMO Trust)Schedule of Investments �� (Continued)(showing percentage of total net assets)November 30, 2020 (Unaudited)
Shares Description Value ($)China �� continued
687,000 Geely Automobile Holdings Ltd 1,900,5361,550,500 Great Wall Motor Co Ltd � Class H 3,135,343157,000 Greenland Hong Kong Holdings Ltd 48,531708,000 Guangdong Investment Ltd 1,173,93311,800 Guangdong Tapai Group Co Ltd � Class A 24,520350,000 Guangzhou Baiyunshan Pharmaceutical Holdings Co
Ltd � Class H 899,8571,059,600 Guangzhou R&F Properties Co Ltd � Class H 1,382,683131,000 Guotai Junan Securities Co Ltd � Class H 192,975323,000 Haier Electronics Group Co Ltd 1,539,77743,000 Haitian International Holdings Ltd 116,494125,500 Hebei Construction Group Corp Ltd � Class H 356,2408,500 Hengan International Group Co Ltd 58,463238,987 Hisense Home Appliances Group Co Ltd � Class A 542,496368,000 Hisense Home Appliances Group Co Ltd � Class H 553,11720,700 Hollysys Automation Technologies Ltd 261,027434,000 Hopson Development Holdings Ltd 1,133,7791,598,000 Huabao International Holdings Ltd 2,174,7362,372,000 IGG Inc 2,367,3818,326,000 Industrial & Commercial Bank of China Ltd � Class H 5,259,7411,000 JOYY Inc ADR 89,0701,100 KE Holdings Inc ADR * 71,86385,500 Kingboard Holdings Ltd 326,671113,000 Kingboard Laminates Holdings Ltd 182,300205,000 KWG Living Group Holdings Ltd * 158,688295,500 KWG Property Holding Ltd 404,2676,389 Lao Feng Xiang Co Ltd � Class A 45,831837,000 Legend Holdings Corp � Class H 1,139,665473,481 Livzon Pharmaceutical Group Inc � Class H 1,865,256258,000 Logan Group Co Ltd 431,908232,000 Longfor Group Holdings Ltd 1,516,0803,488,000 Lonking Holdings Ltd 1,007,14924,000 Lufax Holding Ltd * 395,2801,704,000 Metallurgical Corp of China Ltd � Class H 309,85258,900 Momo Inc Sponsored ADR 846,98248,000 NetEase Inc 893,28095,300 NetEase Inc ADR (b) 8,612,26151,300 New China Life Insurance Co Ltd � Class A 478,156833,000 Nexteer Automotive Group Ltd 882,9792,235,000 Nine Dragons Paper Holdings Ltd 2,936,639908,000 PAX Global Technology Ltd 564,2467,640,000 PICC Property & Casualty Co Ltd � Class H 6,303,834765,000 Poly Property Group Co Ltd 236,8994,215,000 Postal Savings Bank of China Co Ltd � Class H 2,382,4681,668,000 Powerlong Real Estate Holdings Ltd 1,204,065144,000 Qingling Motors Co Ltd � Class H 28,249244,000 Road King Infrastructure Ltd 327,376144,000 Seazen Group Ltd * 127,440318,000 Shanghai Electric Group Co Ltd � Class H * 91,49059,000 Shanghai Industrial Holdings Ltd 87,689
Shares Description Value ($)China �� continued
298,000 Shanghai Jin Jiang Capital Co Ltd � Class H 48,7272,281,900 Shanghai Pharmaceuticals Holding Co Ltd � Class H 3,858,727144,000 Shenzhen Expressway Co Ltd � Class H 143,609420,858 Shenzhen Investment Ltd 154,03710,500 Shenzhou International Group Holdings Ltd 176,4782,136,500 Shimao Group Holdings Ltd 7,963,114390,500 Sino-Ocean Land Holdings Ltd 82,120147,000 Sinopec Engineering Group Co Ltd � Class H 65,0514,130,000 Sinopec Shanghai Petrochemical Co Ltd � Class H 915,0952,332,000 Sinopharm Group Co Ltd � Class H 5,772,2841,314,000 Sinotruk Hong Kong Ltd 3,274,3861,030,000 Skyworth Group Ltd * 281,131310,000 SOHO China Ltd * 96,3871,689,000 TCL Electronics Holdings Ltd * 1,329,89165,500 Tencent Holdings Ltd 4,774,7989,200 Tencent Holdings Ltd ADR 671,600231,500 Texhong Textile Group Ltd 213,723610,000 Tianjin Port Development Holdings Ltd 47,1322,070,000 Tianneng Power International Ltd 4,343,061136,300 Vipshop Holdings Ltd ADR * 3,481,10251,000 Weichai Power Co Ltd � Class H 104,156975,485 Weifu High-Technology Group Co Ltd � Class A 3,841,2934,382,000 West China Cement Ltd 682,95812,100 Wuhu Sanqi Interactive Entertainment Network
Technology Group Co Ltd � Class A 48,076173,600 Xiaomi Corp � Class B * 592,693435,000 Xinhua Winshare Publishing and Media Co Ltd �
Class H 264,745194,500 Xtep International Holdings Ltd 82,745730,000 Yuexiu Property Co Ltd 151,742100 Yum China Holdings Inc (a) 5,6381,924,000 Yuzhou Group Holdings Co Ltd 764,696686,000 Zhongsheng Group Holdings Ltd (b) 5,157,833127,000 Zhuzhou Kibing Group Co Ltd � Class A 224,509264,400 Zoomlion Heavy Industry Science and Technology Co
Ltd � Class H 276,032Total China 262,429,231
Cyprus �� 0.0%16,500 QIWI Plc Sponsored ADR 240,240
Czech Republic �� 0.0%34,220 Moneta Money Bank AS * 101,665
Denmark �� 0.2%93,579 Danske Bank A/S * 1,540,58231,272 Demant A/S * 1,179,7097,316 Matas A/S * 94,43914,843 Pandora A/S 1,488,22820,726 Scandinavian Tobacco Group A/S 318,936
Total Denmark 4,621,894
Copyright © 2021 www.secdatabase.com. All Rights Reserved.Please Consider the Environment Before Printing This Document

GMO Benchmark-Free Fund(A Series of GMO Trust)Schedule of Investments �� (Continued)(showing percentage of total net assets)November 30, 2020 (Unaudited)
Shares Description Value ($)Egypt �� 0.0%
3,031 Commercial International Bank Egypt SAE 12,077
Finland �� 0.2%2,416 Aktia Bank Oyj * 28,8053,798 Kesko Oyj � B Shares 99,43142,507 Neste Oyj 2,840,329211,793 Nokia Oyj * 844,6316,736 Tokmanni Group Corp 122,5047,932 UPM-Kymmene Oyj 260,2673,342 Uponor Oyj 67,948
Total Finland 4,263,915
France �� 1.5%1,553 AKWEL 38,2041,984 ALD SA 25,38630,243 APERAM SA (a) 1,149,47114,301 Arkema SA 1,665,447902 Assystem SA 26,82615,147 Atos SE * 1,382,629839 Axway Software SA * 23,41453,501 BNP Paribas SA * 2,723,265721 Boiron SA 32,899680 Bonduelle SCA 16,004683 Christian Dior SE 348,2703,673 Cie de Saint-Gobain * 173,9976,934 Credit Agricole SA * 79,99945,243 Derichebourg SA 177,3813,312 Eiffage SA * 323,806917 Fnac Darty SA * 49,0274,282 Gaztransport Et Technigaz SA 423,2141,371 GL Events * (a) 16,396337 Groupe Crit * 24,373389 HEXAOM * 16,19118,204 IPSOS 581,5942,769 Kaufman & Broad SA 117,7962,720 Kering SA 1,963,7601,757 L�Oreal SA (b) 646,7453,811 LVMH Moet Hennessy Louis Vuitton SE 2,189,02221,950 Metropole Television SA * 344,1561,298 Nexans SA * 81,773149,169 Peugeot SA * (b) 3,499,70038,383 Publicis Groupe SA 1,729,62121,953 Quadient SA 392,4366 Renault SA * (d) 23945,739 Renault SA * (d) 1,815,9221,204 Rothschild & Co * 37,57719,858 Safran SA * (b) 2,894,78025,594 Sanofi 2,579,845355 SEB SA 62,885393 Societe BIC SA 23,26255,482 Societe Generale SA * 1,100,083193 Sopra Steria Group * 29,262
Shares Description Value ($)France �� continued
17,197 STMicroelectronics NV � NY Shares 681,861695 Synergie SA * 23,5455,603 Television Francaise 1 * (a) 43,304797 TOTAL SE 33,8298,338 Unibail-Rodamco-Westfield (REIT) 586,69430,451 Valeo SA 1,174,7944,488 Vicat SA 182,778369 Vilmorin & Cie SA 21,942
Total France 31,555,404
Germany �� 1.2%2,523 Allianz SE (Registered) 591,354732 Amadeus Fire AG * 103,707108,343 Aroundtown SA * 749,8489,076 Aurubis AG 689,79128,401 Bayer AG (Registered) 1,636,2877,085 Bayerische Motoren Werke AG 614,7621,204 Bechtle AG 262,838327 bet-at-home.com AG 12,5888,894 Borussia Dortmund GmbH & Co KGaA * 60,2655,606 Brenntag AG 429,2981,732 Carl Zeiss Meditec AG 230,30158,557 CECONOMY AG * 288,473478 Cewe Stiftung & Co KGaA 51,71917,584 CropEnergies AG 291,11832,511 Daimler AG (Registered) 2,176,654113,782 Deutsche Lufthansa AG (Registered) * (a) 1,311,782128,948 Deutsche Pfandbriefbank AG * 1,284,45125,191 Deutz AG * 144,39978,753 Dialog Semiconductor Plc * 4,202,8531,823 Draegerwerk AG & Co KGaA 131,7785,016 DWS Group GmbH & Co KGaA 195,3392,691 Eckert & Ziegler Strahlen- und Medizintechnik AG 138,4192,334 Elmos Semiconductor SE 74,5265,375 Fresenius SE & Co KGaA 240,3124,682 Hamburger Hafen und Logistik AG 102,16241,278 HeidelbergCement AG (b) 2,920,2383,876 Henkel AG & Co KGaA 373,9675,262 Hornbach Baumarkt AG 241,4526,389 Hornbach Holding AG & Co KGaA 680,1981,882 KWS Saat SE & Co KGaA * 142,6513,130 Merck KGaA 499,7996,324 Siemens AG (Registered) 844,09332,517 Software AG (b) 1,396,35222,716 Takkt AG * 292,3801,082 Talanx AG * 39,65217,222 VERBIO Vereinigte BioEnergie AG 534,4544,192 Volkswagen AG 774,851
Total Germany 24,755,111
Copyright © 2021 www.secdatabase.com. All Rights Reserved.Please Consider the Environment Before Printing This Document

GMO Benchmark-Free Fund(A Series of GMO Trust)Schedule of Investments �� (Continued)(showing percentage of total net assets)November 30, 2020 (Unaudited)
Shares Description Value ($)Greece �� 0.0%
12,055 FF Group (e) �
15,736 JUMBO SA 279,0358,465 Motor Oil Hellas Corinth Refineries SA 108,144
Total Greece 387,179
Hong Kong �� 0.8%112,500 BOC Hong Kong Holdings Ltd 366,11628,700 Budweiser Brewing Co APAC Ltd 98,527158,400 Champion (REIT) 94,888142,000 Chow Sang Sang Holdings International Ltd 171,95567,800 Chow Tai Fook Jewellery Group Ltd 88,5051,108,000 CITIC Telecom International Holdings Ltd 368,567218,500 CK Hutchison Holdings Ltd 1,584,916550,000 CSI Properties Ltd 15,445100,500 Dah Sing Banking Group Ltd 107,742133,200 Dah Sing Financial Holdings Ltd 391,9213,736,000 First Pacific Co Ltd 1,140,565730,000 Giordano International Ltd 110,398226,000 HKT Trust & HKT Ltd � Class SS 295,384202,700 Hongkong Land Holdings Ltd 822,850389,000 Johnson Electric Holdings Ltd 916,413113,000 K Wah International Holdings Ltd 56,21134,500 Kerry Logistics Network Ltd 75,625386,500 Kerry Properties Ltd 990,22236,800 Luk Fook Holdings International Ltd 92,977179,000 Pacific Textiles Holdings Ltd 123,3402,151,000 PCCW Ltd 1,305,340848,000 Shun Tak Holdings Ltd 267,54560,500 SmarTone Telecommunications Holdings Ltd 33,485130,000 Sun Hung Kai & Co Ltd 58,1543,000 Sun Hung Kai Properties Ltd 39,87725,000 Swire Pacific Ltd � Class A 143,255180,000 Texwinca Holdings Ltd 35,916132,000 VSTECS Holdings Ltd 110,963252,800 VTech Holdings Ltd 1,947,3283,376,500 WH Group Ltd 2,750,73984,000 Wharf Holdings Ltd (The) 207,792120,000 Xinyi Glass Holdings Ltd 269,123536,500 Yue Yuen Industrial Holdings Ltd 1,101,317
Total Hong Kong 16,183,401
Hungary �� 0.1%160,693 Magyar Telekom Telecommunications Plc 207,43841,523 Richter Gedeon Nyrt 984,019
Total Hungary 1,191,457
India �� 1.8%20,481 Asian Paints Ltd 605,373116,190 Aurobindo Pharma Ltd 1,349,79557,974 Bajaj Auto Ltd 2,474,35582,729 Balrampur Chini Mills Ltd 182,613
Shares Description Value ($)India �� continued
1,269 Bosch Ltd 217,761263,490 Cadila Healthcare Ltd 1,588,9346,868 Cochin Shipyard Ltd 34,29149,305 Dr Reddy�s Laboratories Ltd 3,202,18055,300 Dr Reddy�s Laboratories Ltd ADR 3,627,12769,750 Gujarat Narmada Valley Fertilizers & Chemicals Ltd 196,385740,521 HCL Technologies Ltd 8,184,64017,815 HDFC Bank Ltd * 343,38264,671 Hindalco Industries Ltd 194,72127,502 Hindustan Petroleum Corp Ltd 77,29821,163 Hindustan Unilever Ltd 608,98020,265 Housing Development Finance Corp Ltd 609,714107,289 ICICI Bank Ltd * 685,281459,145 Indiabulls Housing Finance Ltd 1,145,192402,779 Indian Oil Corp Ltd 455,59037,700 Infosys Ltd Sponsored ADR 573,79430,989 Kotak Mahindra Bank Ltd * 784,45050,233 LIC Housing Finance Ltd 222,8934 Muthoot Finance Ltd 6297,804 NTPC Ltd 122,4321,441,278 Oil & Natural Gas Corp Ltd 1,509,7941,724,845 Power Finance Corp Ltd 2,501,041356,414 PTC India Ltd 262,16421,371 Rajesh Exports Ltd * 129,7702,864,952 REC Ltd 4,576,00413,180 Sonata Software Ltd 60,6402 Sun TV Network Ltd 1215,326 Tata Consultancy Services Ltd 550,36822,937 Tata Motors Ltd * 54,55625,137 Titan Co Ltd 449,372124,503 Wipro Ltd 589,058
Total India 38,170,022
Indonesia �� 0.4%614,300 Astra International Tbk PT 230,00962,700 Bank BTPN Syariah Tbk PT 18,3471,020,400 Bank Central Asia Tbk PT 2,241,1491,602,100 Bank Mandiri Persero Tbk PT 718,5751,384,700 Bank Negara Indonesia Persero Tbk PT 587,2022,588,500 Bank Pembangunan Daerah Jawa Timur Tbk PT 116,4308,108,300 Bank Rakyat Indonesia Persero Tbk PT 2,345,1281,977,600 Bank Tabungan Negara Persero Tbk PT 230,5472,415,700 Bukit Asam Tbk PT 403,4681,680,900 Hanjaya Mandala Sampoerna Tbk PT 181,542223,000 Indah Kiat Pulp & Paper Corp Tbk PT 136,917260,200 Indo Tambangraya Megah Tbk PT 241,396595,800 Matahari Department Store Tbk PT * 53,3431,593,100 Pakuwon Jati Tbk PT * 56,4591,417,500 Panin Financial Tbk PT * 22,4622,660,100 Ramayana Lestari Sentosa Tbk PT 137,409254,000 Unilever Indonesia Tbk PT 138,864
Copyright © 2021 www.secdatabase.com. All Rights Reserved.Please Consider the Environment Before Printing This Document

GMO Benchmark-Free Fund(A Series of GMO Trust)Schedule of Investments �� (Continued)(showing percentage of total net assets)November 30, 2020 (Unaudited)
Shares Description Value ($)Indonesia �� continued
57,200 United Tractors Tbk PT 93,137558,000 XL Axiata Tbk PT 95,239
Total Indonesia 8,047,623
Ireland �� 0.3%119,693 AIB Group Plc * (a) 214,959179,315 Bank of Ireland Group Plc * 561,8133,941 CRH Plc * 155,01219,400 CRH Plc Sponsored ADR 761,450556 Flutter Entertainment Plc * 101,3019,518 Glanbia Plc 117,056307,199 Hibernia REIT Plc 419,469155,047 Irish Residential Properties REIT Plc 258,1032,732 Kingspan Group Plc * 238,35554,941 Origin Enterprises Plc 234,85432,738 Permanent TSB Group Holdings Plc * 24,375126,930 Ryanair Holdings Plc * 2,313,24941,834 Smurfit Kappa Group Plc (d) 1,779,8722,166 Smurfit Kappa Group Plc (d) 90,86428,153 Total Produce Plc * 47,479
Total Ireland 7,318,211
Israel �� 0.1%530 Fox Wizel Ltd 45,61023,322 Isracard Ltd 76,038458 Israel Corp Ltd (The) * 78,025477,592 Oil Refineries Ltd * 103,405143,900 Teva Pharmaceutical Industries Ltd Sponsored ADR * 1,368,489
Total Israel 1,671,567
Italy �� 0.9%63,827 A2A SPA 97,6496,500 ACEA SPA 137,793191,783 Anima Holding SPA 844,5675,369 Biesse SPA * 108,15986,897 Buzzi Unicem SPA (a) (b) 2,126,4145,071 Buzzi Unicem SPA � RSP 83,00815,485 Cementir Holding NV 127,44549,102 CNH Industrial NV * 534,95655,960 Cofide SPA * 31,75422,116 Credito Emiliano SPA * 123,0483,140 De� Longhi SPA * 109,6251,622 El.En. SPA * 47,94848,977 Enav SPA 215,602303,350 Enel SPA (b) 3,043,45685,106 EXOR NV 5,953,114290,223 Hera SPA 1,057,93793,876 Intesa Sanpaolo SPA * 217,4619,031 La Doria SPA 137,658107,222 Leonardo SPA 778,3471,923 MARR SPA * 36,175
Shares Description Value ($)Italy �� continued
49,751 Saras SPA * (a) 32,2051,481 Sesa SPA * 148,7571,986,541 Telecom Italia SPA 936,2142,899,579 Telecom Italia SPA � RSP 1,483,1012,463 Unieuro SPA * 37,11497,890 Unipol Gruppo SPA * 472,112
Total Italy 18,921,619
Japan �� 8.8%12,400 ADEKA Corp 196,075137,500 Aeon Mall Co Ltd 2,197,5306,100 Aichi Corp 54,12514,800 Aida Engineering Ltd 124,8156,000 Altech Corp 119,772264,800 Amada Co Ltd (b) 2,538,26734,700 Amano Corp 813,8726,600 AOKI Holdings Inc 25,8164,600 Arata Corp 218,29321,800 Arcland Sakamoto Co Ltd 373,25461,000 Arcs Co Ltd 1,273,939242,800 Asahi Kasei Corp (b) 2,219,782176,800 Asics Corp (b) 3,177,499214,500 Astellas Pharma Inc (b) 3,055,2383,600 Bando Chemical Industries Ltd 19,7844,400 BeNEXT Group Inc (a) 47,87191,900 Brother Industries Ltd 1,755,39410,800 Bunka Shutter Co Ltd 94,1121,600 Cawachi Ltd 45,8453,400 Central Glass Co Ltd 72,14810,400 Central Japan Railway Co 1,321,7461,600 Chiyoda Integre Co Ltd 23,303149,600 Chugoku Marine Paints Ltd 1,422,0021,200 Cleanup Corp 5,2984,300 CONEXIO Corp 50,6613,700 Credit Saison Co Ltd 42,2995,400 Dai Nippon Toryo Co Ltd 47,7551,500 Dai-Dan Co Ltd 39,85441,900 Daihen Corp 1,814,8601,900 Daiichi Jitsugyo Co Ltd 73,2721,900 Dainichiseika Color & Chemicals Manufacturing Co
Ltd 43,4081,600 Daishi Hokuetsu Financial Group Inc 36,05518,700 Daiwa House Industry Co Ltd 571,4715,200 Daiwa Industries Ltd 50,99153,400 Daiwabo Holdings Co Ltd (b) 3,332,77187,000 Denka Co Ltd (b) 2,684,35139,900 Doshisha Co Ltd 765,8934,600 DTS Corp 96,72565,600 Ebara Corp 2,092,2083,200 Ehime Bank Ltd (The) 32,8776,400 Elecom Co Ltd 293,10640,300 Electric Power Development Co Ltd 540,890
Copyright © 2021 www.secdatabase.com. All Rights Reserved.Please Consider the Environment Before Printing This Document

GMO Benchmark-Free Fund(A Series of GMO Trust)Schedule of Investments �� (Continued)(showing percentage of total net assets)November 30, 2020 (Unaudited)
Shares Description Value ($)Japan �� continued
8,500 FAN Communications Inc 33,92459,400 Fuji Corp 1,435,15011,600 Fuji Electric Co Ltd 410,7225,900 Fujimi Inc 205,4701,500 Fujimori Kogyo Co Ltd 67,7285,700 Fujitec Co Ltd 115,97916,400 Fujitsu Ltd 2,268,7452,600 Furuno Electric Co Ltd 29,5073,000 G-7 Holdings Inc 69,77617,200 Geo Holdings Corp 209,17728,900 GungHo Online Entertainment Inc (a) 732,85111,600 Gunma Bank Ltd (The) 35,93623,200 Gunze Ltd 797,2603,600 Hakuto Co Ltd 36,3512,000 Hanwa Co Ltd 47,678275,700 Haseko Corp (b) 2,979,587352,500 Hazama Ando Corp 2,315,5601,800 Heiwado Co Ltd 36,53414,600 Hisamitsu Pharmaceutical Co Inc 856,77089,600 Hitachi Ltd 3,400,65645,100 Hogy Medical Co Ltd 1,363,34767,200 Honda Motor Co Ltd 1,869,63350,100 Horiba Ltd (b) 2,680,2946,500 Inaba Denki Sangyo Co Ltd 148,77293,600 Inabata & Co Ltd 1,232,294262,000 Inpex Corp 1,451,183121,100 ITOCHU Corp 3,195,73916,400 Itochu Enex Co Ltd 157,3925,100 Itochu Techno-Solutions Corp 179,832600 Itochu-Shokuhin Co Ltd 32,32711,600 Itoki Corp 37,5281,600 Jaccs Co Ltd 27,79153,300 JAFCO Group Co Ltd 2,280,88627,800 Japan Post Insurance Co Ltd 462,4997,400 Japan Tobacco Inc (a) 149,792159,300 JVCKenwood Corp 214,981274,300 K�s Holdings Corp (b) 3,330,813104,500 Kadokawa Corp (b) 3,308,1616,800 Kajima Corp 89,2121,700 Kaken Pharmaceutical Co Ltd 62,1143,500 Kamei Corp 39,27647,700 Kanamoto Co Ltd 991,584156,700 Kanematsu Corp 1,804,4672,100 Kanematsu Electronics Ltd 81,3062,600 Kato Sangyo Co Ltd 86,086207,100 KDDI Corp (b) 5,893,3136,200 Keiyo Bank Ltd (The) 27,071390,300 Kenedix Inc (a) 2,810,41064,500 Kinden Corp 1,030,2834,500 Kissei Pharmaceutical Co Ltd 89,9311,600 Kiyo Bank Ltd (The) 24,2278,501 Kohnan Shoji Co Ltd 262,770
Shares Description Value ($)Japan �� continued
16,201 Komeri Co Ltd 440,435115,074 Konica Minolta Inc 367,51898,600 Konoike Transport Co Ltd 975,9593,700 Kureha Corp 186,980100,100 Kyowa Exeo Corp (b) 2,570,83322,400 Kyudenko Corp 639,23290,300 Macromill Inc 562,3671,000 Makino Milling Machine Co Ltd 40,10065,200 Mandom Corp 1,021,32557,400 Maruichi Steel Tube Ltd 1,206,7092,100 Maruzen Showa Unyu Co Ltd 67,25815,700 Marvelous Inc 136,4332,000 Matsuda Sangyo Co Ltd 32,892127,500 Maxell Holdings Ltd * 1,465,16423,900 MCJ Co Ltd 220,18822,700 Mebuki Financial Group Inc 46,49021,100 Meidensha Corp 365,627300 MEIJI Holdings Co Ltd 21,2319,000 METAWATER Co Ltd 203,86230,100 Mitsubishi Chemical Holdings Corp 165,7112,200 Mitsubishi Electric Corp 32,23366,200 Mitsubishi Gas Chemical Co Inc 1,401,1882,000 Mitsubishi Research Institute Inc 79,567840,200 Mitsubishi UFJ Financial Group Inc 3,585,3974,400 Mitsuboshi Belting Ltd 68,6052,600 Mitsui & Co Ltd 44,1777,700 Mitsui Chemicals Inc 215,2656,200 Mitsui Sugar Co Ltd 105,95528,800 Mixi Inc 786,9664,300 Mizuho Financial Group Inc 54,4796,100 Mizuno Corp 105,4301,400 Mochida Pharmaceutical Co Ltd 53,84988,400 MS&AD Insurance Group Holdings Inc (b) 2,571,6725,100 MTI Ltd 41,1278,800 NEC Corp 474,11719,300 NEC Networks & System Integration Corp 340,83672,900 NH Foods Ltd (b) 3,104,6944,700 Nichias Corp 109,2895,500 Nichiha Corp 171,49046,700 Nikkon Holdings Co Ltd 906,23116,500 Nippo Corp 430,0813,000 Nippon Flour Mills Co Ltd 46,7023,100 Nippon Kayaku Co Ltd 27,06721,500 Nippon Light Metal Holdings Co Ltd 367,1254,700 Nippon Soda Co Ltd 123,150213,100 Nippon Telegraph & Telephone Corp 5,039,8702,600 Nishimatsu Construction Co Ltd 48,3001,500 Nishio Rent All Co Ltd 29,1501,500 Nissin Corp 17,45521,400 Nissin Electric Co Ltd 238,935600 Nitori Holdings Co Ltd 127,5709,000 Nojima Corp 234,877
Copyright © 2021 www.secdatabase.com. All Rights Reserved.Please Consider the Environment Before Printing This Document

GMO Benchmark-Free Fund(A Series of GMO Trust)Schedule of Investments �� (Continued)(showing percentage of total net assets)November 30, 2020 (Unaudited)
Shares Description Value ($)Japan �� continued
35,900 Nomura Real Estate Holdings Inc 771,6434,000 NS Solutions Corp 118,1712,800 Obara Group Inc (a) 90,694422,000 Obayashi Corp (b) 3,714,51611,900 Okamura Corp 106,323600 Okinawa Cellular Telephone Co 24,9373,900 Organo Corp (a) 220,979334,400 ORIX Corp (b) 4,949,5784,200 Osaka Soda Co Ltd 98,290800 Otsuka Corp 38,795111,000 Pacific Industrial Co Ltd 1,136,0176,100 Panasonic Corp 64,694200 Paramount Bed Holdings Co Ltd 8,136123,800 Penta-Ocean Construction Co Ltd 918,7584,300 Prima Meat Packers Ltd 119,2635,700 Proto Corp 57,33680,300 Raiznext Corp 855,34713,700 Resona Holdings Inc 47,7533,500 Rinnai Corp 408,353900 Rion Co Ltd 27,56213,700 Rohm Co Ltd 1,139,1813,200 Roland DG Corp 52,2251,300 Ryobi Ltd 15,09723,500 San-A Co Ltd 908,7939,200 San-Ai Oil Co Ltd 101,63411,200 San-In Godo Bank Ltd (The) 58,29315,300 Sanki Engineering Co Ltd 168,1708,300 Sanwa Holdings Corp 100,8183,800 Sanyo Chemical Industries Ltd 163,06429,200 Secom Co Ltd (b) 2,913,9444,900 Seiko Holdings Corp 62,98330,400 Sekisui Chemical Co Ltd (b) 524,04474,100 Sekisui House Ltd 1,328,6974,300 Sekisui Jushi Corp 90,444384,500 Shimizu Corp (b) 2,907,8601,300 Shindengen Electric Manufacturing Co Ltd 29,0486,600 Shizuoka Gas Co Ltd 62,573800 Sinanen Holdings Co Ltd 22,6749,100 Sinko Industries Ltd 149,2517,400 Sintokogio Ltd 50,411348,700 SKY Perfect JSAT Holdings Inc 1,577,598147,200 Sojitz Corp 321,484482,500 Sumitomo Chemical Co Ltd 1,704,611164,700 Sumitomo Dainippon Pharma Co Ltd (a) 2,076,978164,200 Sumitomo Forestry Co Ltd (b) 2,973,1503,500 Sumitomo Mitsui Financial Group Inc 100,6342,300 Sumitomo Seika Chemicals Co Ltd 91,2531,200 Sushiro Global Holdings Ltd 38,2625,700 Suzuki Motor Corp 305,68064,600 T Hasegawa Co Ltd 1,241,7672,700 T&D Holdings Inc 31,4334,000 T-Gaia Corp 70,424
Shares Description Value ($)Japan �� continued
77,800 Tachi-S Co Ltd 835,86322,300 Taisei Corp 784,510109,500 Takara Holdings Inc 1,252,94649,700 Takara Leben Co Ltd 140,19816,500 Takasago Thermal Engineering Co Ltd 226,53415,200 Takeuchi Manufacturing Co Ltd 356,60973,900 Takuma Co Ltd 1,265,5669,000 Tamron Co Ltd 137,3325,100 Tanseisha Co Ltd 36,98365,400 Teijin Ltd 1,115,21145,800 TIS Inc 909,5662,100 TKC Corp 139,40992,100 Toho Holdings Co Ltd 1,679,677522,800 Tokyo Electric Power Co Holdings Inc * 1,360,73263,600 Tokyo Seimitsu Co Ltd 2,797,24642,100 Tokyu Construction Co Ltd 188,7009,100 TOMONY Holdings Inc 29,05619,100 Toppan Forms Co Ltd 181,857262,000 Toppan Printing Co Ltd (b) 3,566,9801,300 Torii Pharmaceutical Co Ltd 39,328115,200 Tosei Corp (a) 1,277,310182,400 Tosoh Corp (b) 2,856,6582,200 Towa Pharmaceutical Co Ltd 40,09840,300 Toyo Construction Co Ltd 153,40428,300 Toyo Suisan Kaisha Ltd 1,391,96150,600 Toyota Industries Corp (b) 3,646,4922,200 TPR Co Ltd 27,5209,500 TS Tech Co Ltd (b) 277,86837,600 Tsumura & Co 1,094,1212,500 UKC Holdings Corp 53,74710,800 Ushio Inc 135,4801,600 Valqua Ltd 28,5555,300 Wacoal Holdings Corp 101,34116,500 YAMABIKO Corp 223,07719,700 Yamaguchi Financial Group Inc 122,1694,800 Yamazen Corp 45,63714,000 Yellow Hat Ltd 215,553173,200 Yokogawa Electric Corp (b) 3,051,5315,500 Yuasa Trading Co Ltd 172,33559,100 Zenkoku Hosho Co Ltd (b) 2,696,972
Total Japan 186,840,820
Kuwait �� 0.1%7,476 Gulf Cable & Electrical Industries Co KSCP 17,5687,969 Humansoft Holding Co KSC * 88,695494,218 Kuwait Finance House KSCP 1,102,27538,023 Kuwait Projects Co Holding KSCP 18,47335,730 Mobile Telecommunications Co KSC 67,960234,620 National Bank of Kuwait SAKP 646,124
Total Kuwait 1,941,095
Copyright © 2021 www.secdatabase.com. All Rights Reserved.Please Consider the Environment Before Printing This Document

GMO Benchmark-Free Fund(A Series of GMO Trust)Schedule of Investments �� (Continued)(showing percentage of total net assets)November 30, 2020 (Unaudited)
Shares Description Value ($)Malaysia �� 0.1%
5,600 Carlsberg Brewery Malaysia Berhad 26,4471,025,100 DRB-Hicom Berhad 500,35018,000 Hartalega Holdings Berhad 63,550227,700 Kossan Rubber Industries 350,244299,946 Magnum Berhad 159,81985,000 Pharmaniaga Berhad 114,71887,300 Syarikat Takaful Malaysia Keluarga Berhad 100,71498,700 Westports Holdings Berhad 104,116194,400 YTL Corp Berhad * 30,778
Total Malaysia 1,450,736
Mexico �� 1.1%822,500 America Movil SAB de CV � Series L 614,120162,100 Arca Continental SAB de CV 796,37487,100 Banco del Bajio SA * 108,604206,600 Banco Santander Mexico SA Institucion de Banca
Multiple Grupo Financiero Santander Mexico 214,87895,800 Cemex SAB de CV Sponsored ADR 440,68027,500 Corp Inmobiliaria Vesta SAB de CV 49,257122,700 Credito Real SAB de CV SOFOM ER * 69,33381,100 El Puerto de Liverpool SAB de CV � Class C1 * 269,822407,700 Fibra Uno Administracion SA de CV (REIT) 406,888259,800 Fomento Economico Mexicano SAB de CV 1,876,810421,300 Gentera SAB de CV * 181,359100,600 Grupo Aeroportuario del Centro Norte SAB de CV * 585,1251,500 Grupo Aeroportuario del Centro Norte SAB de CV
ADR * 69,840600 Grupo Aeroportuario del Sureste SAB de CV ADR * 89,700662,700 Grupo Financiero Banorte SAB de CV � Class O * 3,299,68795,800 Grupo Financiero Inbursa SAB de CV � Class O * 93,38195,842 Grupo Herdez SAB de CV 187,9831,365,200 Grupo Mexico SAB de CV � Series B 4,964,91634,500 Kimberly-Clark de Mexico SAB de CV � Class A 54,694199,000 Nemak SAB de CV 64,2983,820 Promotora y Operadora de Infraestructura SAB de CV 30,56236,100 Qualitas Controladora SAB de CV 175,35438,100 Regional SAB de CV * 162,46524,649 Unifin Financiera SAB de CV SOFOM ENR * 30,5883,296,138 Wal-Mart de Mexico SAB de CV 8,676,515
Total Mexico 23,513,233
Netherlands �� 1.2%72,248 ABN AMRO Bank NV CVA * 739,625240,495 Aegon NV 889,66139,000 AerCap Holdings NV * 1,433,640427 ASM International NV 75,28582,297 ASR Nederland NV (b) 3,049,7811,624 Flow Traders 52,27511,846 ForFarmers NV 75,9786,778 Heineken Holding NV 624,475
Shares Description Value ($)Netherlands �� continued
282 Hunter Douglas NV * 18,260185,082 ING Groep NV * 1,800,240118,308 Koninklijke Ahold Delhaize NV 3,382,58019,817 Koninklijke Vopak NV 1,039,14044,556 NIBC Holding NV * 395,0695,733 NN Group NV 231,69947,613 PostNL NV * 162,15473,208 Randstad NV * (b) 4,527,794110,707 Signify NV * (b) 4,666,49726,280 Wolters Kluwer NV 2,200,120
Total Netherlands 25,364,273
New Zealand �� 0.1%20,285 Air New Zealand Ltd * 25,883346,877 Meridian Energy Ltd 1,564,787
Total New Zealand 1,590,670
Norway �� 0.5%17,705 Austevoll Seafood ASA 161,00110,158 Avance Gas Holding Ltd (a) 45,87417,334 Borregaard ASA 254,958194,136 BW LPG Ltd 1,239,743109,879 DNB ASA * 1,981,254198,295 Elkem ASA 637,5677,536 Entra ASA (a) 150,18871,926 Europris ASA 388,78913,785 Gjensidige Forsikring ASA 300,15250,979 Kvaerner ASA * 83,09440,869 Norsk Hydro ASA 165,48970,121 Norwegian Finans Holding ASA * 557,649169,186 Orkla ASA 1,619,42776 Salmar ASA * 4,15419,122 Sbanken ASA * 152,92020,680 Selvaag Bolig ASA 120,56426,396 SpareBank 1 Nord Norge 216,59619,287 SpareBank 1 SMN 206,47058,375 SpareBank 1 SR-Bank ASA * 582,26015,202 Wallenius Wilhelmsen ASA * 36,32629,786 Yara International ASA 1,207,336
Total Norway 10,111,811
Pakistan �� 0.0%34,810 Engro Corp Ltd 66,496387,294 Engro Fertilizers Ltd 147,19437,019 Fauji Fertilizer Co Ltd 23,967337,928 Oil & Gas Development Co Ltd 207,67245,809 Pakistan Oilfields Ltd 112,956236,209 Pakistan Petroleum Ltd 133,45123,700 Pakistan State Oil Co Ltd * 29,59047,700 Searle Co Ltd (The) 69,68767,270 United Bank Ltd 50,892
Total Pakistan 841,905
Copyright © 2021 www.secdatabase.com. All Rights Reserved.Please Consider the Environment Before Printing This Document

GMO Benchmark-Free Fund(A Series of GMO Trust)Schedule of Investments �� (Continued)(showing percentage of total net assets)November 30, 2020 (Unaudited)
Shares Description Value ($)Philippines �� 0.0%
10,240 Globe Telecom Inc 414,40214,660 Manila Electric Co 85,7122,369,000 Megaworld Corp * 189,0282,145,000 Metro Pacific Investments Corp 182,660125,000 Robinsons Land Corp 43,35415,810 Security Bank Corp 41,023135,050 Semirara Mining & Power Corp 34,795
Total Philippines 990,974
Poland �� 0.4%20,978 Asseco Poland SA 370,8663,461 Budimex SA 253,001109,530 Cyfrowy Polsat SA 780,12420,639 Grupa Lotos SA 190,6422,883 KGHM Polska Miedz SA * 114,7832,407 mBank SA * 97,091209,920 Polski Koncern Naftowy ORLEN SA 3,100,042843,681 Polskie Gornictwo Naftowe i Gazownictwo SA 1,077,064272,864 Powszechny Zaklad Ubezpieczen SA * 1,830,4351,911 Santander Bank Polska SA * 88,904
Total Poland 7,902,952
Portugal �� 0.5%113,141 Altri SGPS SA 609,6976,453,793 Banco Comercial Portugues SA � Class R * (a) 913,447113,256 CTT-Correios de Portugal SA * (a) 329,53625,308 EDP Renovaveis SA 536,398420,138 EDP � Energias de Portugal SA 2,245,747200,351 Galp Energia SGPS SA 2,149,52056,156 Jeronimo Martins SGPS SA 962,206118,662 Mota-Engil SGPS SA * (a) 206,410172,750 Navigator Co SA (The) * 515,08670,621 NOS SGPS SA 270,053140,247 REN � Redes Energeticas Nacionais SGPS SA 384,59811,271 Semapa-Sociedade de Investimento e Gestao 120,667598,195 Sonae SGPS SA 481,803
Total Portugal 9,725,168
Qatar �� 0.0%114,022 Doha Bank QPSC * 73,27334,104 Masraf Al Rayan QSC 40,00952,125 Ooredoo QPSC 96,6858,101 Qatar Electricity & Water Co QSC 40,07031,879 Qatar Insurance Co SAQ 22,189142,157 Qatar National Bank QPSC 690,01345,376 Qatar National Cement Co QSC 50,692
Total Qatar 1,012,931
Russia �� 3.1%2,078,850 Alrosa PJSC 2,397,552931,600 Credit Bank of Moscow PJSC * 73,130
Shares Description Value ($)Russia �� continued
72,810 Detsky Mir PJSC 133,89068,070,000 Federal Grid Co Unified Energy System PJSC 178,54030,390 Gazprom Neft PJSC 125,6782,752 Gazprom Neft PJSC Sponsored ADR 55,5801,040,380 Gazprom PJSC 2,482,89925,637 Globaltrans Investment Plc Sponsored GDR
(Registered) 146,70971,237,001 Inter RAO UES PJSC 4,784,1062,687 LSR Group PJSC 31,98666,217 LSR Group PJSC GDR (Registered) 155,561119,488 LUKOIL PJSC 7,910,484161,136 LUKOIL PJSC Sponsored ADR 10,373,15525,860 M.Video PJSC 244,309922,400 Magnitogorsk Iron & Steel Works PJSC 507,76934,180 Magnitogorsk Iron & Steel Works PJSC Sponsored
GDR (Registered) 234,546211,785 MMC Norilsk Nickel PJSC ADR 5,873,571103,100 Mobile TeleSystems PJSC Sponsored ADR 889,753978,010 Moscow Exchange MICEX-RTS PJSC 1,962,88415,595 Novatek PJSC Sponsered GDR (Registered) 2,399,412105,010 Novolipetsk Steel PJSC 264,747117,261 Novolipetsk Steel PJSC GDR 2,900,99914,642 PhosAgro PJSC GDR (Registered) 187,020140,017 Polymetal International Plc 2,916,8941,692 Polyus PJSC 322,98516,490 Polyus PJSC GDR (Registered) 1,559,96681,350 Raspadskaya OJSC 155,79254,687,000 ROSSETI PJSC 1,208,13313,580 Safmar Financial Investment * 83,5461,345,390 Sberbank of Russia PJSC 4,378,908285,446 Sberbank of Russia PJSC Sponsored ADR 3,765,48450,205 Severstal PJSC GDR (Registered) 730,0443,081,600 Surgutneftegas PJSC 1,423,463283,564 Surgutneftegas PJSC Sponsored ADR 1,273,59471,676 Tatneft PJSC Sponsored ADR 2,702,94418,944 TCS Group Holding Plc GDR (Registered) 581,1373,313,000 Unipro PJSC 120,276345,563 VTB Bank PJSC GDR (Registered) 316,6352,667 X5 Retail Group NV GDR (Registered) 95,4414,400 Yandex NV � Class A * (a) 303,424
Total Russia 66,252,946
Saudi Arabia �� 0.0%7,743 Al Rajhi Bank 154,2932,781 Arriyadh Development Co 13,072
Total Saudi Arabia 167,365
Singapore �� 0.7%85,000 AEM Holdings Ltd 222,101243,500 Asian Pay Television Trust 21,78317,856 CapitaLand Integrated Commercial Trust (REIT) 25,72628,400 CapitaLand Ltd 65,747
Copyright © 2021 www.secdatabase.com. All Rights Reserved.Please Consider the Environment Before Printing This Document

GMO Benchmark-Free Fund(A Series of GMO Trust)Schedule of Investments �� (Continued)(showing percentage of total net assets)November 30, 2020 (Unaudited)
Shares Description Value ($)Singapore �� continued
68,200 City Developments Ltd 392,526554,800 ComfortDelGro Corp Ltd 678,723200,200 DBS Group Holdings Ltd 3,734,849187,200 First Real Estate Investment Trust 59,137291,940 Japfa Ltd 161,57257,500 Jardine Cycle & Carriage Ltd 827,01478,000 Lendlease Global Commercial (REIT) 39,400516,800 Mapletree Industrial Trust (REIT) 1,128,384166,600 Mapletree Logistics Trust (REIT) 243,761601,300 Mapletree North Asia Commercial Trust (REIT) 401,1655,600 Oversea-Chinese Banking Corp Ltd 41,751200,900 Sasseur Real Estate Investment Trust 121,028349,500 Silverlake Axis Ltd 68,88565,200 Singapore Exchange Ltd 429,903242,400 StarHub Ltd 232,8447,200 United Overseas Bank Ltd 119,75446,900 Venture Corp Ltd 654,59750,800 Wilmar International Ltd 158,1356,426,099 Yangzijiang Shipbuilding Holdings Ltd 4,175,802338,000 Yanlord Land Group Ltd 279,041
Total Singapore 14,283,628
South Africa �� 1.7%680,401 Absa Group Ltd 4,812,0765,100 Anglo American Platinum Ltd 369,9323,528 AngloGold Ashanti Ltd 75,65911,100 AngloGold Ashanti Ltd Sponsored ADR 240,537145,089 Aspen Pharmacare Holdings Ltd * 1,152,28051,903 Astral Foods Ltd 450,53416,003 AVI Ltd 73,373186,538 Barloworld Ltd 838,576134,447 Bidvest Group Ltd (The) 1,409,464357,441 Blue Label Telecoms Ltd * 90,78714,823 Clicks Group Ltd 223,81827,759 Discovery Ltd 219,88570,429 Emira Property Fund Ltd (REIT) 29,608183,332 FirstRand Ltd 537,6889,641 Foschini Group Ltd (The) 61,0166,046 Gold Fields Ltd 52,42554,900 Gold Fields Ltd Sponsored ADR 478,179420,210 Growthpoint Properties Ltd (REIT) 322,67314,493 Hyprop Investments Ltd (REIT) * 26,349110,996 Imperial Logistics Ltd 276,88774,376 Investec Ltd 180,534114,604 Kumba Iron Ore Ltd 3,895,13657,204 Lewis Group Ltd 81,2883,831 Liberty Holdings Ltd 14,712186,581 Life Healthcare Group Holdings Ltd 190,72331,586 Metair Investments Ltd * 35,280186,104 Momentum Metropolitan Holdings 187,110194,551 Motus Holdings Ltd * 722,50861,453 Mr Price Group Ltd 642,513
Shares Description Value ($)South Africa �� continued
51,205 Naspers Ltd � N Shares 10,294,097220,717 Netcare Ltd 175,4622,075,278 Old Mutual Ltd 1,558,773154,753 Pepkor Holdings Ltd 137,90223,027 Rand Merchant Investment Holdings Ltd 45,08830,943 Raubex Group Ltd 49,40621,911 Remgro Ltd 129,388153,824 Reunert Ltd 357,5891,640,950 RMB Holdings Ltd * 135,051583,478 Sanlam Ltd 2,078,615118,057 Sappi Ltd * 220,26115,419 Shoprite Holdings Ltd 127,514790,096 Telkom SA SOC Ltd 1,605,3286,843 Tiger Brands Ltd 86,692245,509 Truworths International Ltd 566,39390,743 Tsogo Sun Gaming Ltd 30,11588,185 Vodacom Group Ltd 699,85131,788 Wilson Bayly Holmes-Ovcon Ltd * 207,956
Total South Africa 36,197,031
South Korea �� 2.7%26,266 Aekyung Petrochemical Co Ltd 224,0279,409 Aju Capital Co Ltd 107,97637,079 BNK Financial Group Inc 188,6544,207 Com2uSCorp 510,6545,533 Daou Data Corp 62,79136,872 DB HiTek Co Ltd 1,184,1126,974 DB Insurance Co Ltd 277,30034,093 Dongwon Development Co Ltd 135,9711,186 Doosan Fuel Cell Co Ltd * 53,4637,678 DoubleUGames Co Ltd 407,0386,093 GS Home Shopping Inc 756,439333,719 Hana Financial Group Inc 10,142,96320,338 Hankook Tire & Technology Co Ltd 602,0185,598 HDC Hyundai Development Co-Engineering &
Construction 101,5252,310 Huons Co Ltd 130,9142,997 Hy-Lok Corp 37,1509,888 Hyundai Home Shopping Network Corp 652,3528,888 Hyundai Mobis Co Ltd 1,962,0162,924 JNTC Co Ltd * 29,80365,124 KB Financial Group Inc 2,692,2365,900 KB Financial Group Inc ADR 245,3817,907 KC Co Ltd 178,195915 KEPCO Plant Service & Engineering Co Ltd 24,008205,125 Kia Motors Corp 10,728,91117,594 Korea Asset In Trust Co Ltd 62,98317,380 Korea Autoglass Corp 259,21216,811 Korean Reinsurance Co 117,6395,306 KT Skylife Co Ltd 43,07657,381 KT&G Corp 4,281,93433,545 LF Corp 446,282
Copyright © 2021 www.secdatabase.com. All Rights Reserved.Please Consider the Environment Before Printing This Document
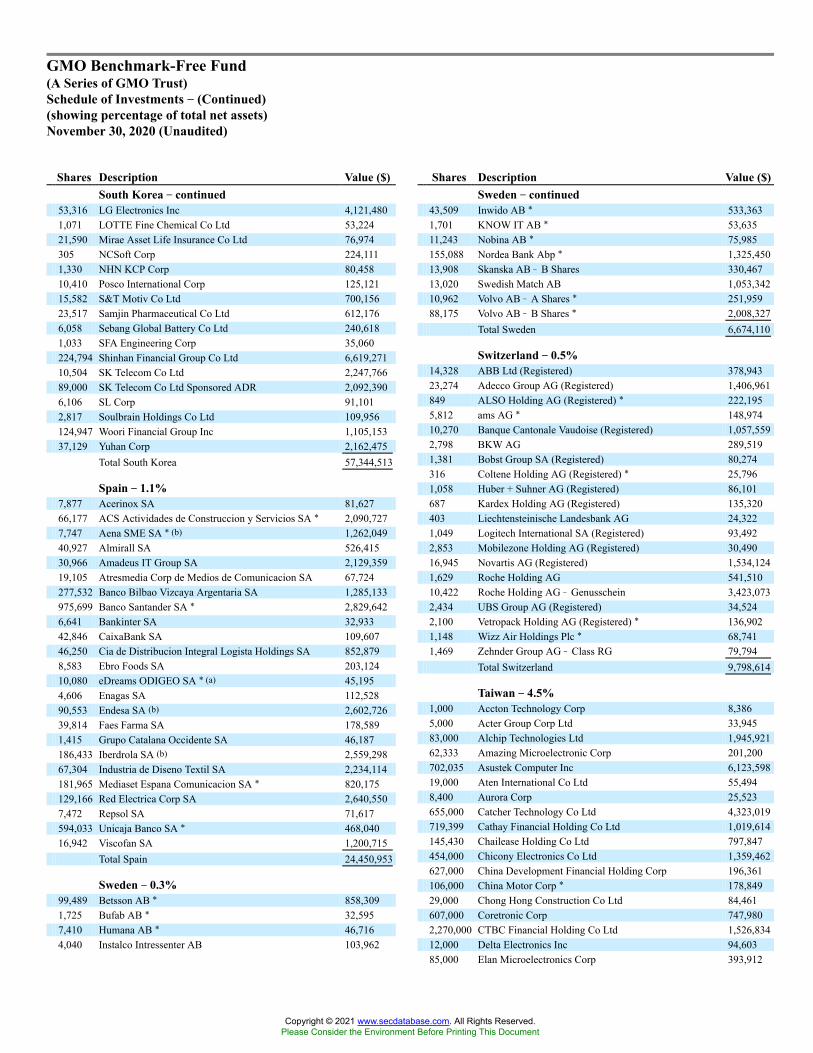
GMO Benchmark-Free Fund(A Series of GMO Trust)Schedule of Investments �� (Continued)(showing percentage of total net assets)November 30, 2020 (Unaudited)
Shares Description Value ($)South Korea �� continued
53,316 LG Electronics Inc 4,121,4801,071 LOTTE Fine Chemical Co Ltd 53,22421,590 Mirae Asset Life Insurance Co Ltd 76,974305 NCSoft Corp 224,1111,330 NHN KCP Corp 80,45810,410 Posco International Corp 125,12115,582 S&T Motiv Co Ltd 700,15623,517 Samjin Pharmaceutical Co Ltd 612,1766,058 Sebang Global Battery Co Ltd 240,6181,033 SFA Engineering Corp 35,060224,794 Shinhan Financial Group Co Ltd 6,619,27110,504 SK Telecom Co Ltd 2,247,76689,000 SK Telecom Co Ltd Sponsored ADR 2,092,3906,106 SL Corp 91,1012,817 Soulbrain Holdings Co Ltd 109,956124,947 Woori Financial Group Inc 1,105,15337,129 Yuhan Corp 2,162,475
Total South Korea 57,344,513
Spain �� 1.1%7,877 Acerinox SA 81,62766,177 ACS Actividades de Construccion y Servicios SA * 2,090,7277,747 Aena SME SA * (b) 1,262,04940,927 Almirall SA 526,41530,966 Amadeus IT Group SA 2,129,35919,105 Atresmedia Corp de Medios de Comunicacion SA 67,724277,532 Banco Bilbao Vizcaya Argentaria SA 1,285,133975,699 Banco Santander SA * 2,829,6426,641 Bankinter SA 32,93342,846 CaixaBank SA 109,60746,250 Cia de Distribucion Integral Logista Holdings SA 852,8798,583 Ebro Foods SA 203,12410,080 eDreams ODIGEO SA * (a) 45,1954,606 Enagas SA 112,52890,553 Endesa SA (b) 2,602,72639,814 Faes Farma SA 178,5891,415 Grupo Catalana Occidente SA 46,187186,433 Iberdrola SA (b) 2,559,29867,304 Industria de Diseno Textil SA 2,234,114181,965 Mediaset Espana Comunicacion SA * 820,175129,166 Red Electrica Corp SA 2,640,5507,472 Repsol SA 71,617594,033 Unicaja Banco SA * 468,04016,942 Viscofan SA 1,200,715
Total Spain 24,450,953
Sweden �� 0.3%99,489 Betsson AB * 858,3091,725 Bufab AB * 32,5957,410 Humana AB * 46,7164,040 Instalco Intressenter AB 103,962
Shares Description Value ($)Sweden �� continued
43,509 Inwido AB * 533,3631,701 KNOW IT AB * 53,63511,243 Nobina AB * 75,985155,088 Nordea Bank Abp * 1,325,45013,908 Skanska AB � B Shares 330,46713,020 Swedish Match AB 1,053,34210,962 Volvo AB � A Shares * 251,95988,175 Volvo AB � B Shares * 2,008,327
Total Sweden 6,674,110
Switzerland �� 0.5%14,328 ABB Ltd (Registered) 378,94323,274 Adecco Group AG (Registered) 1,406,961849 ALSO Holding AG (Registered) * 222,1955,812 ams AG * 148,97410,270 Banque Cantonale Vaudoise (Registered) 1,057,5592,798 BKW AG 289,5191,381 Bobst Group SA (Registered) 80,274316 Coltene Holding AG (Registered) * 25,7961,058 Huber + Suhner AG (Registered) 86,101687 Kardex Holding AG (Registered) 135,320403 Liechtensteinische Landesbank AG 24,3221,049 Logitech International SA (Registered) 93,4922,853 Mobilezone Holding AG (Registered) 30,49016,945 Novartis AG (Registered) 1,534,1241,629 Roche Holding AG 541,51010,422 Roche Holding AG � Genusschein 3,423,0732,434 UBS Group AG (Registered) 34,5242,100 Vetropack Holding AG (Registered) * 136,9021,148 Wizz Air Holdings Plc * 68,7411,469 Zehnder Group AG � Class RG 79,794
Total Switzerland 9,798,614
Taiwan �� 4.5%1,000 Accton Technology Corp 8,3865,000 Acter Group Corp Ltd 33,94583,000 Alchip Technologies Ltd 1,945,92162,333 Amazing Microelectronic Corp 201,200702,035 Asustek Computer Inc 6,123,59819,000 Aten International Co Ltd 55,4948,400 Aurora Corp 25,523655,000 Catcher Technology Co Ltd 4,323,019719,399 Cathay Financial Holding Co Ltd 1,019,614145,430 Chailease Holding Co Ltd 797,847454,000 Chicony Electronics Co Ltd 1,359,462627,000 China Development Financial Holding Corp 196,361106,000 China Motor Corp * 178,84929,000 Chong Hong Construction Co Ltd 84,461607,000 Coretronic Corp 747,9802,270,000 CTBC Financial Holding Co Ltd 1,526,83412,000 Delta Electronics Inc 94,60385,000 Elan Microelectronics Corp 393,912
Copyright © 2021 www.secdatabase.com. All Rights Reserved.Please Consider the Environment Before Printing This Document

GMO Benchmark-Free Fund(A Series of GMO Trust)Schedule of Investments �� (Continued)(showing percentage of total net assets)November 30, 2020 (Unaudited)
Shares Description Value ($)Taiwan �� continued
8,000 Elite Advanced Laser Corp 19,605149,000 Elite Material Co Ltd 815,777422,000 Eva Airways Corp 187,29297,000 Farglory Land Development Co Ltd 177,750429,000 FLEXium Interconnect Inc 1,807,720320,000 Formosa Taffeta Co Ltd 344,015251,000 Foxconn Technology Co Ltd 463,2181,288,000 Fubon Financial Holding Co Ltd 2,002,01419,000 Fusheng Precision Co Ltd 114,00925,000 Getac Technology Corp 42,225388,000 Gigabyte Technology Co Ltd 1,068,5666,000 Globalwafers Co Ltd 117,3531,522,000 Grand Pacific Petrochemical * 1,250,38510,303 Great Wall Enterprise Co Ltd 16,74866,000 Holiday Entertainment Co Ltd 146,6816,537,318 Hon Hai Precision Industry Co Ltd 18,872,28278,000 Huaku Development Co Ltd 241,59459,439 IBF Financial Holdings Co Ltd 25,04262,820 IEI Integration Corp 106,15332,721 Innodisk Corp 187,38156,000 International Games System Co Ltd 1,335,090294,000 Lite-On Technology Corp 495,45212,000 Lotes Co Ltd 187,44826,300 Makalot Industrial Co Ltd 170,428135,000 Merry Electronics Co Ltd 670,807172,000 Micro-Star International Co Ltd 753,3141,519,817 Mitac Holdings Corp 1,572,4995,000 Nan Liu Enterprise Co Ltd 33,85848,000 Nantex Industry Co Ltd 103,48342,000 Nichidenbo Corp 70,48717,000 Nien Made Enterprise Co Ltd 200,658366,000 Novatek Microelectronics Corp 3,841,4681,000 Parade Technologies Ltd 36,3451,889,000 Pegatron Corp 4,321,94210,000 Phison Electronics Corp 113,3113,000 Pixart Imaging Inc 20,7793,027,000 Pou Chen Corp 3,315,5591,120,000 Qisda Corp 922,872412,000 Quanta Computer Inc 1,112,0851,282,000 Radiant Opto-Electronics Corp 5,221,3111,000 Realtek Semiconductor Corp 12,999203,000 Ruentex Development Co Ltd 299,67072,000 Sampo Corp 67,84187,000 Shinkong Insurance Co Ltd 118,832101,800 Simplo Technology Co Ltd 1,183,63825,945 Sinmag Equipment Corp 79,23211,000 Sitronix Technology Corp 54,06419,000 Soft-World International Corp 60,214146,000 Sunplus Technology Co Ltd * 79,909128,500 Syncmold Enterprise Corp 390,15819,000 Taiwan Cement Corp 28,594467,000 Taiwan PCB Techvest Co Ltd 747,637
Shares Description Value ($)Taiwan �� continued
75,000 Taiwan Sakura Corp 133,239903,000 Taiwan Semiconductor Manufacturing Co Ltd 15,370,71223,685 Taiwan Semiconductor Manufacturing Co Ltd
Sponsored ADR (a) 2,297,91970,000 Teco Electric and Machinery Co Ltd 72,58023,000 Test Research Inc 45,7327,000 Thinking Electronic Industrial Co Ltd 35,877152,246 TOPBI International Holdings Ltd 168,37862,419 Topco Scientific Co Ltd 266,13958,000 Transcend Information Inc 131,373111,000 Tripod Technology Corp 477,4089,000 TXC Corp 25,28564,624 United Integrated Services Co Ltd 518,464551,000 United Microelectronics Corp 782,71827,000 Universal Inc 100,9937,000 Vanguard International Semiconductor Corp 25,78727,000 Wah Lee Industrial Corp 73,236354,000 Wistron Corp 370,26611,000 Wiwynn Corp 263,4176,000 Yulon Nissan Motor Co Ltd 55,07533,000 Zeng Hsing Industrial Co Ltd 160,909
Total Taiwan 96,120,310
Thailand �� 0.1%1,284,900 AP Thailand Pcl NVDR 297,160104,500 Bangkok Bank Pcl NVDR 407,7231,661,100 Beauty Community Pcl NVDR * 84,53711,200 Carabao Group Pcl NVDR 44,65230,500 Hana Microelectronics Pcl NVDR 43,0802,050,900 IRPC Pcl NVDR 184,41221,300 KCE Electronics Pcl NVDR 28,32249,600 Kiatnakin Phatra Bank Pcl NVDR 80,995148,900 Krung Thai Bank Pcl NVDR 52,560108,100 Land & Houses Pcl NVDR 28,051193,900 Origin Property Pcl NVDR 49,676167,600 Pruksa Holding Pcl NVDR 69,276909,500 Quality Houses Pcl NVDR 69,72983,400 Siam Commercial Bank Pcl NVDR (The) 235,332141,300 Somboon Advance Technology Pcl NVDR 67,10560,200 SPCG Pcl NVDR 42,77674,250 Supalai Pcl (Foreign Registered) 43,921344,875 Supalai Pcl NVDR 204,0051,480,300 Thai Beverage Pcl (a) 814,85552,000 Thai Vegetable Oil Pcl NVDR 55,8845,118,300 TMB Bank Pcl NVDR 177,660106,000 TTW Pcl NVDR 44,532204,300 Univentures Pcl NVDR 20,541
Total Thailand 3,146,784
Turkey �� 0.8%404,011 Aksa Akrilik Kimya Sanayii AS 553,031148,561 Alkim Alkali Kimya AS 259,272
Copyright © 2021 www.secdatabase.com. All Rights Reserved.Please Consider the Environment Before Printing This Document

GMO Benchmark-Free Fund(A Series of GMO Trust)Schedule of Investments �� (Continued)(showing percentage of total net assets)November 30, 2020 (Unaudited)
Shares Description Value ($)Turkey �� continued
50,468 Anadolu Efes Biracilik Ve Malt Sanayii AS 135,141157,704 Arcelik AS * 550,233638,576 Aselsan Elektronik Sanayi Ve Ticaret AS 1,411,56815,920 BIM Birlesik Magazalar AS 142,6231,381,782 Dogan Sirketler Grubu Holding AS 424,06645,393 Dogus Otomotiv Servis ve Ticaret AS 154,6693,541,191 Emlak Konut Gayrimenkul Yatirim Ortakligi AS
(REIT) 975,361703,585 Enerjisa Enerji AS 972,0031,391,192 Eregli Demir ve Celik Fabrikalari TAS 1,955,783190,179 Goodyear Lastikleri TAS * 181,99657,625 Koza Altin Isletmeleri AS * 549,18079,123 Koza Anadolu Metal Madencilik Isletmeleri AS * 127,978143,941 Ozak Gayrimenkul Yatirim Ortakligi (REIT) * 77,926288,243 Selcuk Ecza Deposu Ticaret ve Sanayi AS 461,86134,618 Tofas Turk Otomobil Fabrikasi AS 125,822291,107 Torunlar Gayrimenkul Yatirim Ortakligi AS (REIT) * 134,7171,080 Turkcell Iletisim Hizmetleri AS 2,0413,309,651 Turkiye Garanti Bankasi AS * 3,707,4354,367,658 Turkiye Is Bankasi AS � Class C * 3,646,248470,763 Turkiye Sinai Kalkinma Bankasi AS * 137,917790,017 Turkiye Sise ve Cam Fabrikalari AS 686,37029,636 Vestel Beyaz Esya Sanayi ve Ticaret AS 130,237
Total Turkey 17,503,478
United Arab Emirates �� 0.1%26,248 Abu Dhabi Commercial Bank PJSC 43,27231,478 Abu Dhabi Islamic Bank PJSC 40,248143,156 Dubai Islamic Bank PJSC 173,50375,698 Emaar Malls PJSC * 37,5643,105,633 Emaar Properties PJSC * 2,679,41417,277 Emirates NBD Bank PJSC 51,448
Total United Arab Emirates 3,025,449
United Kingdom �� 3.4%132,968 3i Group Plc 1,879,77788,449 888 Holdings Plc 320,5731,007 Admiral Group Plc 37,93122,447 Aggreko Plc 166,3925,944 Alliance Pharma Plc 5,91012,288 Anglo American Plc 357,8258,191 AVEVA Group Plc (a) 368,54848,991 Aviva Plc 207,41828,506 B&M European Value Retail SA 180,23314,675 Bank of Georgia Group Plc * 220,252454,736 Barratt Developments Plc * 3,728,09952,499 Bellway Plc 1,972,05088,468 Berkeley Group Holdings Plc (The) 5,407,48848,498 British American Tobacco Plc 1,707,23962,200 British American Tobacco Plc Sponsored ADR 2,196,282922,249 BT Group Plc 1,427,559
Shares Description Value ($)United Kingdom �� continued
5,587 Bunzl Plc 174,01515,764 Carnival Plc 273,259725,585 Centamin Plc 1,099,19730,246 Central Asia Metals Plc 86,95626,485 CMC Markets Plc 137,23834,017 Coca-Cola HBC AG * 971,683148,427 Compass Group Plc 2,611,67117,757 Computacenter Plc 523,4813,158 Cranswick Plc 143,9186,278 Daily Mail & General Trust Plc � Class A 56,6882,893 Dart Group Plc 53,65544,239 Dixons Carphone Plc 64,85215,846 Dunelm Group Plc * 254,85544,911 Electrocomponents Plc 483,6236,836 EMIS Group Plc 88,74711,088 Evraz Plc 55,71934,363 Ferguson Plc 3,846,561347,095 Ferrexpo Plc 973,34180,475 Frasers Group Plc * 449,1096,581 Fresnillo Plc 92,58711,710 Galliford Try Holdings Plc * 16,9123,308 Games Workshop Group Plc 433,20019,604 Go-Ahead Group Plc (The) * 212,2537,895 Greggs Plc * 176,74966,636 Halfords Group Plc 236,4537,340 Howden Joinery Group Plc * 61,432150,800 HSBC Holdings Plc * 786,462180,919 IG Group Holdings Plc 1,927,41118,917 IMI Plc 280,34257,918 Inchcape Plc * 461,070127,082 Indivior Plc * 171,79932,655 International Personal Finance Plc * (a) 38,38864,396 Investec Plc 158,552375,454 ITV Plc * 467,234216,158 J Sainsbury Plc 603,373107,581 JD Sports Fashion Plc * 1,103,94438,826 John Laing Group Plc 163,3385,306 Johnson Matthey Plc 156,35039,590 Jupiter Fund Management Plc 127,871667,614 Kingfisher Plc * 2,424,523477,935 Legal & General Group Plc 1,578,31951,972 Lookers Plc (c) 14,550536,309 M&G Plc 1,330,707413,172 Micro Focus International Plc * 1,902,96453,437 Mitchells & Butlers Plc * 150,4541,093 Mondi Plc 23,91676,026 Morgan Advanced Materials Plc 284,90917,371 Morgan Sindall Group Plc 322,153144,583 National Express Group Plc * 426,06728,190 National Grid Plc 315,6874,029 Next Plc 348,03621,681 Numis Corp Plc 99,522
Copyright © 2021 www.secdatabase.com. All Rights Reserved.Please Consider the Environment Before Printing This Document

GMO Benchmark-Free Fund(A Series of GMO Trust)Schedule of Investments �� (Continued)(showing percentage of total net assets)November 30, 2020 (Unaudited)
Shares Description Value ($)United Kingdom �� continued
13,128 OSB Group Plc * 68,00269,279 Paragon Banking Group Plc 372,077203,898 Persimmon Plc 7,155,237128,677 Pets at Home Group Plc 709,67543,645 Phoenix Group Holdings Plc 413,35143,894 Playtech Plc * 224,05489,601 Plus500 Ltd 1,838,942216,530 Premier Foods Plc * 253,517232,899 QinetiQ Group Plc 905,57954,135 Redde Northgate Plc 174,13715,424 Redrow Plc * 106,08750,388 Royal Dutch Shell Plc � A Shares 850,744188,788 Royal Dutch Shell Plc � B Shares 3,032,0262,700 Royal Dutch Shell Plc � Class B Sponsored ADR 87,61517,271 Royal Mail Plc 69,992400 Smith & Nephew Plc Sponsored ADR 15,74034,529 Smiths Group Plc 663,44912,899 Softcat Plc 194,464162,504 Spirent Communications Plc 554,91857,445 Stock Spirits Group Plc 180,166289,144 Tate & Lyle Plc 2,442,616226,660 Taylor Wimpey Plc * 461,2941,688 TI Fluid Systems Plc * 4,96112,980 Vesuvius Plc 83,81629,633 Vistry Group Plc * 327,798201,671 WPP Plc 1,943,251
Total United Kingdom 72,563,179
United States �� 12.1%3,300 1st Source Corp. 123,156112,203 ACCO Brands Corp. 859,47531,300 Acushnet Holdings Corp. (a) 1,180,01021,900 Adtalem Global Education, Inc. * (a) 626,99731,000 ADTRAN, Inc. 391,6851,700 AdvanSix, Inc. * (a) 30,2098,200 Alexion Pharmaceuticals, Inc. * 1,001,30223,500 Alliance Data Systems Corp. 1,718,7903,300 Allied Motion Technologies, Inc. 133,8815,200 Allscripts Healthcare Solutions, Inc. * (a) 71,13620,800 Ally Financial, Inc. (a) 616,72013,400 Alpha & Omega Semiconductor Ltd. * 332,8566,400 Amalgamated Bank � Class A 81,40813,000 AMC Networks, Inc. � Class A * (a) 428,61023,856 American Express Co. (a) 2,829,0835,200 American Public Education, Inc. * 161,4085,900 American Vanguard Corp. 89,4446,300 Amkor Technology, Inc. * 92,86219,900 Amneal Pharmaceuticals, Inc. * (a) 78,60518,300 AngioDynamics, Inc. * 260,226400 Anthem, Inc. 124,6082,100 Apogee Enterprises, Inc. (a) 55,1042,300 Applied Industrial Technologies, Inc. 180,389
Shares Description Value ($)United States �� continued
10,000 ArcBest Corp. 419,1003,600 Arcosa, Inc. 186,804200 Ares Commercial Real Estate Corp. (REIT) 2,22864,400 Arlo Technologies, Inc. * 338,74413,900 Arrow Electronics, Inc. * 1,273,9351,030 Arrow Financial Corp. 30,65347,100 Associated Banc-Corp. (a) 721,57239,800 AT&T, Inc. (a) 1,144,25035,700 Athene Holding Ltd. � Class A * (a) 1,583,29511,700 Atlas Air Worldwide Holdings, Inc. * (a) 652,97730,800 AutoNation, Inc. * (b) 1,887,73226,100 Avient Corp. 953,95514,400 Avnet, Inc. 437,0401,500 Axos Financial, Inc. * (a) 50,25010,500 AZZ, Inc. 468,1952,400 Bancorp, Inc. (The) * 28,3205,400 BankFinancial Corp. 43,5782,800 BankUnited, Inc. (a) 79,8281,300 Bar Harbor Bankshares 29,96524,400 Bed Bath & Beyond, Inc. 511,42439,900 Benchmark Electronics, Inc. 970,36851,800 Big Lots, Inc. (b) 2,676,5064,300 Biogen, Inc. * 1,032,731400 BOK Financial Corp. 26,7801,000 Booking Holdings, Inc. * (a) 2,028,45066,400 BorgWarner, Inc. (b) 2,579,64030,600 Boston Private Financial Holdings, Inc. 219,09639,400 Brady Corp. � Class A (b) 1,740,6924,400 Bridge Bancorp, Inc. 98,20833,800 Brightsphere Investment Group, Inc. 598,26018,800 Brinker International, Inc. 942,0685,500 Brookline Bancorp, Inc. 62,5351,600 Cabot Corp. 66,25610,100 Calix, Inc. * 239,1683,100 Camden National Corp. 106,48517,800 Capital One Financial Corp. (a) 1,524,39219,900 Capri Holdings Ltd. * 704,06232,900 Carnival Corp. (a) 657,3423,100 Carriage Services, Inc. 84,35126,400 Carrier Global Corp. 1,005,04856,700 Cars.com, Inc. * (a) 633,3399,700 Cathay General Bancorp 274,0254,600 Cato Corp. (The) � Class A 37,07613,900 CBIZ, Inc. * 336,65826,000 CBRE Group, Inc. � Class A * 1,589,64016,400 Centene Corp. * (a) 1,011,0602,200 Central Garden & Pet Co. * 88,0888,500 Central Garden & Pet Co. � Class A * 313,5651,800 Century Bancorp, Inc. � Class A 133,020143,500 CenturyLink, Inc. (a) 1,499,57544,929 Charles Schwab Corp. (The) (a) (b) 2,191,63719,700 Chevron Corp. (a) 1,717,446
Copyright © 2021 www.secdatabase.com. All Rights Reserved.Please Consider the Environment Before Printing This Document

GMO Benchmark-Free Fund(A Series of GMO Trust)Schedule of Investments �� (Continued)(showing percentage of total net assets)November 30, 2020 (Unaudited)
Shares Description Value ($)United States �� continued
6,400 Cigna Corp. 1,338,4967,300 Cisco Systems, Inc. 314,04632,100 Citigroup, Inc. 1,767,74720,200 Citizens Financial Group, Inc. (a) 659,7322,700 Civista Bancshares, Inc. 45,4419,240 Clarus Corp. 133,0562,000 CNB Financial Corp. 39,36024,563 Coca-Cola Co. (The) 1,267,45112,400 Cognizant Technology Solutions Corp. � Class A 968,81226,500 Comcast Corp. � Class A (a) 1,331,3602,700 Comfort Systems USA, Inc. 136,0532,500 Commercial Metals Co. (a) 49,7751,900 Community Trust Bancorp, Inc. 64,31514,900 Computer Programs & Systems, Inc. 423,60734,600 Comtech Telecommunications Corp. 659,47623,200 Consolidated Communications Holdings, Inc. * 129,9206,700 Cooper Tire & Rubber Co. 266,19121,200 Core-Mark Holding Co., Inc. 661,228146,100 CoreCivic, Inc. (REIT) (b) 1,035,84960,100 CorePoint Lodging, Inc. (REIT) 391,25113,496 Cornerstone Building Brands, Inc. * (a) 117,95532,300 Corteva, Inc. (a) 1,237,736155,000 Coty Inc. � Class A (a) 1,114,4501,800 Covetrus, Inc. * (a) 48,6276,215 CRA International, Inc. 284,9588,400 CSG Systems International, Inc. 364,3926,100 CTS Corp. 185,80613,400 Curo Group Holdings Corp. 115,77618,900 CVS Health Corp. (a) 1,281,23119,300 CytomX Therapeutics, Inc.* 145,13611,100 Deluxe Corp. (a) 285,71444,400 Designer Brands, Inc. � Class A (a) 350,76026,800 DHI Group, Inc.* 51,456600 Diamond Hill Investment Group, Inc. 82,0928,500 Dick�s Sporting Goods, Inc. (a) 482,8857,700 Digi International, Inc. * (a) 132,13214,440 Dime Community Bancshares, Inc. 208,65846,700 DISH Network Corp. � Class A * 1,675,1293,500 Domtar Corp. (a) 105,35039,200 Donnelley Financial Solutions, Inc. * 638,56816,400 DR Horton, Inc. 1,221,8008,900 DSP Group, Inc. * 149,7876,900 Ducommun, Inc. * 343,0682,000 Duluth Holdings Inc. � Class A * (a) 29,40013,100 Edwards Lifesciences Corp. * (a) 1,098,9591,800 EMCOR Group, Inc. (a) 155,1243,000 Employers Holdings, Inc. 91,53012,900 Encore Capital Group, Inc. * (a) 440,4061,600 Encore Wire Corp. 82,672157,000 Endo International Plc * (a) 797,5606,300 Endurance International Group Holdings, Inc. * 59,7242,200 EnerSys (a) 179,982
Shares Description Value ($)United States �� continued
9,200 Ennis, Inc. 150,60453,834 Enova International, Inc. * 1,125,669700 EnPro Industries, Inc. 49,56744,657 EOG Resources, Inc. (a) 2,093,5201,000 ePlus, Inc. * 84,3101,800 Escalade, Inc. 34,6861,900 ESSA Bancorp, Inc. (a) 30,05842,600 Ethan Allen Interiors, Inc. 778,30212,700 Evolution Petroleum Corp. 38,60824,800 Exelon Corp. (a) 1,018,53612,100 Expedia Group, Inc. (a) 1,506,32931,600 Exxon Mobil Corp. (a) 1,204,908800 Federal Agricultural Mortgage Corp. � Class C 54,16029,600 Federal Signal Corp. (b) 918,48832,200 Federated Hermes, Inc. 864,2485,550 FedNat Holding Co. 31,3022,200 Ferro Corp. * 31,4824,400 Financial Institutions, Inc. 88,0442,600 First Community Bankshares, Inc. 54,7823,535 First Financial Corp. 133,8701,800 First Financial Northwest, Inc. 19,8725,100 First Foundation, Inc. 90,57653,600 Flagstar Bancorp, Inc. (b) 1,878,1441,500 FleetCor Technologies, Inc. * (a) 397,8154,700 Flushing Financial Corp. 66,74012,500 FNB Corp (a) 110,3752,600 FONAR Corp. * 49,946179,100 Ford Motor Co. (a) 1,626,22828,600 Fox Corp. � Class A (a) 824,82433,700 Fox Corp. � Class B * 956,4068,400 FutureFuel Corp. 100,7166,800 G-III Apparel Group Ltd. * (a) 138,51617,000 GameStop Corp. � Class A * 281,52024,700 Garrett Motion, Inc. * 119,79537,700 General Motors Co. 1,652,76815,200 Genesco, Inc. * (a) 476,82414,844 Genie Energy Ltd. � Class B (a) 123,205131,100 GEO Group, Inc. (The) (REIT) 1,238,8955,200 Gilead Sciences, Inc. 315,4847,100 Goldman Sachs Group, Inc. (The) 1,637,1189,300 Gorman-Rupp Co. (The) 305,970700 Graham Holdings Co. � Class B 312,914685 Great Southern Bancorp, Inc. 31,44225,700 Greif, Inc. � Class A 1,249,27734,400 Griffon Corp. 717,24027,400 Group 1 Automotive, Inc. (a) (b) 3,255,39416,100 H&R Block, Inc. (a) 302,68019,300 Hasbro, Inc. (a) 1,795,47926,300 Haverty Furniture Cos, Inc. 715,886300 Hawkins, Inc. 15,0545,000 HB Fuller Co. (a) 261,6503,700 HealthStream, Inc. * 69,116
Copyright © 2021 www.secdatabase.com. All Rights Reserved.Please Consider the Environment Before Printing This Document

GMO Benchmark-Free Fund(A Series of GMO Trust)Schedule of Investments �� (Continued)(showing percentage of total net assets)November 30, 2020 (Unaudited)
Shares Description Value ($)United States �� continued
7,000 Heidrick & Struggles International, Inc. 182,7003,500 Heritage Financial Corp. 81,44554,530 Herman Miller, Inc. (b) 1,943,44924,300 Hilltop Holdings, Inc. 585,38718,028 Hilton Worldwide Holdings, Inc. (b) 1,868,24213,400 HNI Corp. 488,5649,361 Honeywell International, Inc. (a) 1,908,89533,400 HP, Inc. (a) 732,4621,600 Hurco Cos, Inc. 47,6969,800 Hyster-Yale Materials Handling, Inc. 539,39212,500 IDT Corp. � Class B * 149,0005,646 Independent Bank Corp. 96,03812,200 Information Services Group, Inc. * 36,8445,000 Ingles Markets, Inc. � Class A 187,95014,405 Innospec, Inc. 1,185,38728,400 Insight Enterprises, Inc. * (a) (b) 2,030,0323,200 Insteel Industries, Inc. 74,0167,500 Integer Holdings Corp. * (a) 540,67525,100 Intel Corp. (a) 1,213,5854,700 Inter Parfums, Inc. (a) 255,2578,200 Interface, Inc. 68,42923,900 International Bancshares Corp. (b) 774,59912,700 International Business Machines Corp. (a) 1,568,70458,100 Invesco Ltd. (a) 942,963156,600 Investors Bancorp, Inc. 1,515,8887,100 Jazz Pharmaceuticals Plc * (a) 999,0416,300 Johnson Outdoors, Inc. � Class A 526,6801,100 Jones Lang LaSalle, Inc. * (a) 145,51912,700 Kelly Services, Inc. � Class A 259,84212,600 Kezar Life Sciences, Inc. * 82,9085,800 Kforce, Inc. 238,09010,100 Kimball Electronics, Inc. * 155,64132,900 Kimball International, Inc. � Class B 359,597112,300 Kinder Morgan, Inc. 1,614,87410,600 Knoll, Inc. 144,79641,900 Kohl�s Corp. 1,349,180800 Kontoor Brands, Inc. * 33,3365,200 Koppers Holdings, Inc. * 140,76418,800 Kraft Heinz Co. (The) (a) 619,27229,200 Kroger Co. (The) (a) 963,6005,600 Kronos Worldwide, Inc. 77,00027,300 La-Z-Boy, Inc. 1,011,1922,400 Laboratory Corp. of America Holdings * 479,6165,700 Lakeland Financial Corp. (a) 289,5032,500 Lantheus Holdings, Inc. * 32,90031,884 Las Vegas Sands Corp. (a) 1,776,2583,000 LCNB Corp. 44,4004,000 Leidos Holdings, Inc. 402,80015,200 Lennar Corp. � Class A (a) 1,153,0723,953 LENSAR, Inc. * 33,8774,100 Levi Strauss & Co. � Class A 75,399105,600 Liberty TripAdvisor Holdings, Inc. � Class A * 290,400
Shares Description Value ($)United States �� continued
4,200 Lifevantage Corp. * 44,64635,100 Lincoln National Corp. (a) 1,657,4227,400 LKQ Corp. * (a) 260,62826,800 Luminex Corp. 635,96457,500 Lyft, Inc. � Class A * (a) (b) 2,194,77516,700 LyondellBasell Industries NV � Class A (a) 1,421,1704,800 Macatawa Bank Corp. 37,24815,400 Marchex, Inc. � Class B * 33,2641,898 Markel Corp. * (a) 1,848,329800 Masonite International Corp. * 80,04015,700 Materion Corp. (b) 915,31014,677 Matrix Service Co. * 140,60615,300 MDC Holdings, Inc. 738,53133,400 MDC Partners Inc � Class A * 76,8203,100 Mednax, Inc. * (a) 62,6511,600 Mercantile Bank Corp. 39,7286,300 Meridian Bancorp, Inc. 85,96339,200 Meridian Bioscience, Inc. * (a) 740,88049,400 Meritor, Inc.* (b) 1,304,1606,100 Methode Electronics, Inc. 213,62229,500 MetLife, Inc. 1,362,01564,700 MGIC Investment Corp. (a) 773,81222,000 Michaels Cos., Inc. (The) * 217,58025,800 Micron Technology, Inc. * (b) 1,653,5221,400 MicroStrategy, Inc. � Class A * (a) 479,8782,100 Miller Industries, Inc. 70,11930,800 Modine Manufacturing Co. * 336,3363,500 Mohawk Industries, Inc. * (a) 440,40534,300 Molson Coors Brewing Co. � Class B (a) 1,577,80024,900 Moog, Inc. � Class A (b) 1,926,26416,700 Morgan Stanley 1,032,56125,000 Movado Group, Inc. 423,2501,000 MSC Industrial Direct Co., Inc. � Class A (a) 83,32011,800 Mueller Industries, Inc. 386,5686,400 National General Holdings Corp. 218,1122,200 National Presto Industries, Inc. 187,1101,800 Natus Medical, Inc. * 37,65653,300 Nautilus, Inc. * 1,124,6301,000 NBT Bancorp, Inc. 29,9507,700 Neenah, Inc. 373,5279,000 NETGEAR, Inc. * 286,290164,300 Newmark Group, Inc. � Class A 1,153,38611,500 NextGen Healthcare, Inc. * 204,0108,500 Northfield Bancorp, Inc. 94,605942 Northrim BanCorp, Inc. 29,927600 Northwest Bancshares, Inc. (a) 7,0982,100 Nu Skin Enterprises, Inc. � Class A (a) 108,17126,700 nVent Electric Plc 614,10037,300 Occidental Petroleum Corp. (a) 587,84837,900 OFG Bancorp 634,8259,700 Old National Bancorp 153,5517,200 Olympic Steel, Inc. (a) 106,848
Copyright © 2021 www.secdatabase.com. All Rights Reserved.Please Consider the Environment Before Printing This Document

GMO Benchmark-Free Fund(A Series of GMO Trust)Schedule of Investments �� (Continued)(showing percentage of total net assets)November 30, 2020 (Unaudited)
Shares Description Value ($)United States �� continued
7,906 Oppenheimer Holdings, Inc. � Class A 233,14819,200 Oracle Corp. (a) 1,108,22444,600 Owens & Minor, Inc. 1,148,8962,300 PacWest Bancorp 53,4981,400 Park National Corp. 141,5544,600 Park-Ohio Holdings Corp. (a) 129,2142,600 Patrick Industries, Inc. (a) 163,90440,100 Patterson Cos., Inc. (a) 1,113,1765,700 PC Connection, Inc. (a) 260,20527,300 Penn Virginia Corp. * (a) 246,246600 Penns Woods Bancorp, Inc. 15,33637,100 PennyMac Financial Services, Inc. (a) 2,138,44440,400 PennyMac Mortgage Investment Trust (REIT) (a) 690,8403,700 Penske Automotive Group, Inc. (a) 203,75938,900 Perdoceo Education Corp. * (a) 441,126900 Phibro Animal Health Corp. � Class A 17,00119,900 Phillips 66 (a) 1,205,54214,500 Photronics, Inc. * 168,0552,500 Polaris, Inc. (a) 240,000400 Preformed Line Products Co. 24,2602,900 Premier Financial Bancorp, Inc. 38,59918,000 Premier Financial Corp. 372,78042,900 Prestige Consumer Healthcare, Inc. * 1,525,9531,800 Primoris Services Corp. 43,6503,200 Principal Financial Group, Inc. (a) 159,3288,900 Progress Software Corp. 356,8902,800 Protective Insurance Corp. � Class B 40,0123,300 Providence Service Corp. (The) * 448,10720,700 Prudential Financial, Inc. 1,565,3345,700 PulteGroup, Inc. 248,69156,500 QEP Resources, Inc. (a) 90,9652,600 Quanex Building Products Corp. 53,560114,900 Qurate Retail, Inc. � Series A 1,203,00352,065 Raytheon Technologies Corp. 3,734,10279,900 Realogy Holdings Corp. * 983,5692,200 Regeneron Pharmaceuticals, Inc. * (a) 1,135,2665,300 Renewable Energy Group, Inc. * (a) 307,8241,800 Republic Bancorp, Inc. � Class A 63,54061,700 Resideo Technologies, Inc. * 1,140,83326,200 Resources Connection, Inc. 317,2823,665 Riverview Bancorp, Inc. 19,3515,800 Rocky Brands, Inc. 168,20077,600 Sanmina Corp. * (b) 2,468,84412,700 Scholastic Corp. 301,24432,700 Schweitzer-Mauduit International, Inc. (a) 1,137,30636,700 Sciplay Corp. � Class A * 546,46321,200 Select Medical Holdings Corp. * 510,9203,700 Seneca Foods Corp. � Class A * 154,95656,560 Sensata Technologies Holding Plc * (b) 2,761,82517,000 Shoe Carnival, Inc. 621,6907,100 Sierra Bancorp 156,20022,200 Silgan Holdings, Inc. (a) 750,360
Shares Description Value ($)United States �� continued
2,700 Simmons First National Corp-Class A (a) 52,6501,700 Sleep Number Corp. * 117,96398,600 SLM Corp. (a) 1,046,14629,800 Sonic Automotive, Inc. � Class A (b) 1,203,324206,700 Southwestern Energy Co. * (a) 642,83727,900 SpartanNash Co. 526,75233,100 Spok Holdings, Inc. 325,3734,100 Sprouts Farmers Market, Inc. * 86,7975,400 SS&C Technologies Holdings, Inc. 372,0063,400 Standard Motor Products, Inc. 157,38660,400 Steelcase, Inc. � Class A 733,8605,000 Stepan Co. 580,8004,400 Stewart Information Services Corp. (a) 184,22826,100 Stoneridge, Inc. * 701,04612,300 StoneX Group, Inc. * (a) 757,92693,200 Summit Hotel Properties, Inc. (REIT) 809,90821,600 Sunstone Hotel Investors, Inc. (REIT) (b) 226,8002,800 Super Micro Computer, Inc. * 78,98813,600 Surface Oncology, Inc. * 122,94421,000 Surgalign Holdings, Inc. * (a) 47,4603,000 Surmodics, Inc. * 112,3202,900 Sutro Biopharma, Inc. * (a) 49,59029,200 Sykes Enterprises, Inc. * (a) 1,098,79649,900 Synchrony Financial 1,520,45310,500 Systemax, Inc. 323,085144,336 TEGNA, Inc. (b) 2,079,88257,400 Telephone & Data Systems, Inc. (b) 1,089,4521,500 Tennant Co. 100,74028,500 Terex Corp. 883,5003,800 Territorial Bancorp, Inc. 84,7781,000 Texas Capital Bancshares, Inc. * (a) 55,90012,400 Textron, Inc. (a) 559,240700 Timberland Bancorp, Inc. 16,6819,200 Towne Bank/Portsmouth VA 200,10020,900 Tredegar Corp. 330,42935,700 TRI Pointe Group, Inc. * 624,03622,000 Tribune Publishing Co. 265,7606,500 TriCo Bancshares 212,9402,000 TrueBlue, Inc. * 38,20025,100 TrustCo Bank Corp. 152,3573,900 Trustmark Corp. 96,7982,100 Tutor Perini Corp. * (a) 28,39216,300 Tyson Foods, Inc. � Class A 1,062,76031,800 UFP Industries, Inc. (b) 1,706,0702,700 United Natural Foods, Inc. * (a) 46,5753,200 United Rentals, Inc. * (a) 726,33610,900 United States Cellular Corp. * 341,7152,900 United Therapeutics Corp. * (a) 384,6561,100 Uniti Group, Inc. (REIT) 11,30831,500 Universal Corp. (b) 1,433,5651,500 Universal Electronics, Inc. * 78,99011,600 Universal Health Services, Inc. � Class B 1,514,728
Copyright © 2021 www.secdatabase.com. All Rights Reserved.Please Consider the Environment Before Printing This Document

GMO Benchmark-Free Fund(A Series of GMO Trust)Schedule of Investments �� (Continued)(showing percentage of total net assets)November 30, 2020 (Unaudited)
Shares Description Value ($)United States �� continued
2,600 Universal Insurance Holdings, Inc. 36,2961,200 Universal Logistics Holdings, Inc. 25,81210,000 Urban Edge Properties (REIT) 129,80067,309 US Bancorp (b) 2,908,4223,600 USANA Health Sciences, Inc. * 270,64856,400 Valvoline, Inc. 1,285,35617,300 Vectrus, Inc. * 824,69141,800 Vera Bradley, Inc. * 354,46411,000 Veritiv Corp. * 204,38055,925 Verso Corp. � Class A 604,54929,949 VF Corp. (a) 2,497,74747,800 ViacomCBS, Inc. � Class B (a) 1,686,38433,600 Viatris, Inc.* 565,1523,200 Village Super Market, Inc. � Class A 74,11216,700 Vista Outdoor, Inc. * 344,5216,800 VMware, Inc. � Class A * (a) 951,25264,800 Waddell & Reed Financial, Inc. � Class A (a) 1,066,60826,000 Walgreens Boots Alliance, Inc. (a) 988,26026,800 Walker & Dunlop, Inc. (b) 2,144,26816,200 Waterstone Financial, Inc. 284,5534,900 Weis Markets, Inc. 233,387103,956 Wells Fargo & Co. (b) 2,843,1971,900 WESCO International, Inc. * (a) 123,91847,600 Western Union Co. (The) (a) 1,073,85632,300 Western Digital Corp. (a) 1,449,6242,300 Westwood Holdings Group, Inc. 27,4163,900 Wintrust Financial Corp. 212,51179,900 World Fuel Services Corp. (b) 2,270,7589,900 Worthington Industries, Inc. 512,0281,700 WW International, Inc. * (a) 50,167120,004 Xenia Hotels & Resorts, Inc. (REIT) 1,690,85632,500 Xerox Holdings Corp. (a) 711,42510,400 Xperi Holding Corp. (a) 198,43219,600 Zumiez, Inc. * 726,964
Total United States 256,280,909
Vietnam �� 0.0%71,230 Kinh Bac City Development Share Holding Corp * 48,77713,660 PetroVietnam Gas JSC 49,208142,000 PetroVietnam Technical Services Corp 90,33920,810 Vinh Hoan Corp 39,717
Total Vietnam 228,041
TOTAL COMMON STOCKS(COST $1,328,817,017) 1,423,742,139
PREFERRED STOCKS (f) �� 1.2%
Brazil �� 0.3%32,800 Banco do Estado do Rio Grande do Sul SA �
Class B 80,815239,221 Bradespar SA 2,594,30743,400 Braskem SA � Class A * 183,081
Shares Description Value ($)Brazil �� continued
437,800 Cia de Saneamento do Parana 407,777237,000 Cia Paranaense de Energia � Class B 3,020,12014,900 Lojas Americanas SA 63,773
Total Brazil 6,349,873
Chile �� 0.0%1,000 Sociedad Quimica y Minera de Chile SA Sponsored
ADR 47,070
Colombia �� 0.0%2,263 Banco Davivienda SA 17,683443,291 Grupo Aval Acciones y Valores SA 128,195
Total Colombia 145,878
Germany �� 0.1%22,726 Bayerische Motoren Werke AG 1,493,2198,749 Draegerwerk AG & Co KGaA 685,5304,294 Henkel AG & Co KGaA 461,97212,237 Schaeffler AG 91,0611,243 Sixt SE 89,8751,897 Villeroy & Boch AG 30,0162,280 Volkswagen AG 382,716
Total Germany 3,234,389
Russia �� 0.3%43,754 Bashneft PJSC 704,59056,000 Nizhnekamskneftekhim PJSC 57,69010,116,100 Surgutneftegas PJSC 5,255,74842 Transneft PJSC 78,674
Total Russia 6,096,702
South Korea �� 0.5%1,603 Amorepacific Corp 78,0823,733 Hyundai Motor Co Ltd Prf 283,7691,110 Hyundai Motor Co Ltd-2nd Prf 86,97322,177 LG Electronics Inc 659,342160,494 Samsung Electronics Co Ltd 8,854,694392 Samsung Electronics Co Ltd GDR (Registered) 531,556
Total South Korea 10,494,416
Taiwan �� 0.0%13,589 Chailease Holding Co. Ltd. * 47,39020,463 CTBC Financial Holding Co Ltd 46,108
Total Taiwan 93,498
TOTAL PREFERRED STOCKS(COST $22,184,819) 26,461,826
RIGHTS/WARRANTS �� 0.0%
Pakistan �� 0.0%6,201 Searle Co Ltd, Expires 12/31/20 * (c) 2,490
Copyright © 2021 www.secdatabase.com. All Rights Reserved.Please Consider the Environment Before Printing This Document

GMO Benchmark-Free Fund(A Series of GMO Trust)Schedule of Investments �� (Continued)(showing percentage of total net assets)November 30, 2020 (Unaudited)
Shares /Par Value�� Description Value ($)
Spain �� 0.0%997,534 Banco Santander SA, Expires 12/03/20 * 124,583
United Kingdom �� 0.0%10,277 AVEVA Group Plc, Expires 12/09/20 * 153,446
TOTAL RIGHTS/WARRANTS(COST $221,959) 280,519
INVESTMENT FUNDS �� 0.3%
United States �� 0.3%90,754 iShares Core MSCI Emerging Markets ETF 5,319,999
TOTAL INVESTMENT FUNDS(COST $5,454,542) 5,319,999
DEBT OBLIGATIONS �� 16.7%
United States �� 16.7%Asset-Backed Securities �� 0.1%
114,742 Atlas Senior Loan Fund XI Ltd., Series 18-11A,Class X, 144A, Variable Rate, 3 mo. LIBOR +0.75%, 0.96%, due 07/26/31 114,734
67,143 Avery Point IV CLO Ltd., Series 14-1A, Class AR,144A, Variable Rate, 3 mo. LIBOR + 1.10%,1.31%, due 04/25/26 67,143
14,839 Babson CLO Ltd., Series 14-IA, Class A1R, 144A,Variable Rate, 3 mo. LIBOR + 1.15%,1.37%, due 07/20/25 14,846
273,492 Bayview Commercial Asset Trust, Series 07-5A,Class A3, 144A, Variable Rate, 1 mo. LIBOR +1.00%, 1.15%, due 10/25/37 272,729
54,453 Bayview Commercial Mortgage Pass-ThroughTrust, Series 06-SP1, Class M3, 144A, VariableRate, 1 mo. LIBOR + 0.86%, 1.01%, due 04/25/36 54,443
140,198 Canyon Capital CLO Ltd., Series 16-1A, Class X,144A, Variable Rate, 3 mo. LIBOR + 0.70%,0.94%, due 07/15/31 140,197
2,571,735 Crest G-Star LP, Series 01-1A, Class D, 144A,9.00%, due 11/28/35 3
285,333 Elevation CLO Ltd, Series 16-5A, Class X, 144A,Variable Rate, 3 mo. LIBOR + 0.80%,1.01%, due 10/25/31 283,745
104,811 Galaxy XXVII CLO Ltd., Series 18-27A, Class X,144A, Variable Rate, 3 mo. LIBOR + 0.60%,0.82%, due 05/16/31 104,419
341,869 KeyCorp Student Loan Trust, Series 00-B, Class A2,Variable Rate, 3 mo. LIBOR + 0.31%,0.52%, due 07/25/29 338,569
113,582 LCM XVIII LP, Series 18A, Class XR, 144A,Variable Rate, 3 mo. LIBOR + 0.60%,0.82%, due 04/20/31 113,266
44,024 LCM XXV Ltd., Series 25,A, Class X, 144A,Variable Rate, 3 mo. LIBOR + 0.95%,1.17%, due 07/20/30 43,983
Par Value�� /Shares Description Value ($)
United States �� continuedAsset-Backed Securities �� continued
453,141 Lehman Brothers Small Balance CommercialMortgage Trust, Series 07-2A, Class 1A3, 144A,Variable Rate, 1 mo. LIBOR + 0.27%,0.42%, due 06/25/37 446,605
199,640 Madison Park Funding XIII Ltd., Series 14-13A,Class XR, 144A, Variable Rate, 3 mo. LIBOR +0.60%, 0.82%, due 04/19/30 199,141
61,959 Mountain View CLO LLC, Series 17-2A, Class X,144A, Variable Rate, 3 mo. LIBOR + 0.65%,0.88%, due 01/16/31 61,856
95,731 Silvermore CLO Ltd., Series 14-1A, Class A1R,144A, Variable Rate, 3 mo. LIBOR + 1.17%,1.39%, due 05/15/26 95,474
289,333 Telos CLO Ltd., Series 14-5A, Class X, 144A,Variable Rate, 3 mo. LIBOR + 0.75%,0.97%, due 04/17/28 289,297
228,595 Telos CLO Ltd., Series 13-4A, Class XR, 144A,Variable Rate, 3 mo. LIBOR + 0.75%,0.97%, due 01/17/30 227,290
70,956 Velocity Commercial Capital Loan Trust,Series 17-1, Class AFL, 144A, Variable Rate, 1mo. LIBOR + 1.25%, 1.40%, due 05/25/47 70,732
41,106 Velocity Commercial Capital Loan Trust,Series 17-1, Class AFX, 144A, Variable Rate,3.00%, due 05/25/47 41,086Total Asset-Backed Securities 2,979,558
U.S. Government �� 16.6%34,000,000 U.S. Treasury Note, 1.50%, due 10/31/21 34,430,31327,000,000 U.S. Treasury Note, 1.63%, due 12/31/21 27,440,85921,000,000 U.S. Treasury Note, Variable Rate, USBM +
0.15%, 0.24%, due 01/31/22 21,026,0806,000,000 U.S. Treasury Note, 1.38%, due 01/31/22 6,086,95322,000,000 U.S. Treasury Note, 1.88%, due 05/31/22 22,573,20360,000,000 U.S. Treasury Note, 0.13%, due 06/30/22 59,990,62560,000,000 U.S. Treasury Note, 0.13%, due 07/31/22 59,981,25060,000,000 U.S. Treasury Note, 0.13%, due 08/31/22 (b) 59,978,90760,000,000 U.S. Treasury Note, 0.13%, due 10/31/22 (b) 59,976,563
Total U.S. Government 351,484,753Total United States 354,464,311
TOTAL DEBT OBLIGATIONS(COST $355,609,544) 354,464,311
MUTUAL FUNDS �� 22.5%
United States �� 22.5%Affiliated Issuers �� 22.5%
2,492,451 GMO Emerging Country Debt Fund, Class IV 68,417,7784,210,292 GMO Emerging Markets Fund, Class VI 142,981,5085,213,891 GMO Opportunistic Income Fund, Class VI 136,395,3981,626,141 GMO SGM Major Markets Fund, Class VI 53,711,4452,267,763 GMO Special Opportunities Fund, Class VI 72,001,487
Copyright © 2021 www.secdatabase.com. All Rights Reserved.Please Consider the Environment Before Printing This Document

GMO Benchmark-Free Fund(A Series of GMO Trust)Schedule of Investments �� (Continued)(showing percentage of total net assets)November 30, 2020 (Unaudited)
Shares Description Value ($)United States �� continuedAffiliated Issuers �� continued
913,248 GMO U.S. Treasury Fund (g) 4,602,767
TOTAL MUTUAL FUNDS(COST $435,149,743) 478,110,383
SHORT-TERM INVESTMENTS �� 1.1%
Money Market Funds �� 1.1%22,813,777 State Street Institutional Treasury Money
Market Fund � Premier Class, 0.01% (h) 22,813,777TOTAL SHORT-TERM INVESTMENTS(COST $22,813,777) 22,813,777
TOTAL INVESTMENTS �� 108.8%(Cost $2,170,251,401) 2,311,192,954
SECURITIES SOLD SHORT �� (8.9)%
Common Stocks �� (8.9)%Australia �� (0.3)%
(13,948 ) Afterpay Ltd * (971,833 )(192,684 ) APA Group (1,460,415 )(8,846 ) ASX Ltd (500,273 )(3,300 ) Cochlear Ltd (534,765 )(8,073 ) Ramsay Health Care Ltd (373,885 )(233,087 ) Sydney Airport (1,150,107 )(48,012 ) TPG Telecom Ltd * (271,053 )(142,308 ) Transurban Group (1,468,440 )
Total Australia (6,730,771 )
Austria �� (0.0)%(15,206 ) Verbund AG (1,068,695 )
Canada �� (0.0)%(73,300 ) AltaGas Ltd (1,052,061 )
China �� (0.1)%(211,900 ) BEST Inc ADR * (620,867 )(18,800 ) Yum China Holdings Inc (1,059,944 )
Total China (1,680,811 )
France �� (0.5)%(28,305 ) Edenred (1,617,493 )(91,341 ) Getlink SE * (1,513,722 )(1,583 ) Hermes International (1,540,191 )(2,518 ) Sartorius Stedim Biotech (907,920 )(10,953 ) Ubisoft Entertainment SA * (1,038,647 )(47,131 ) Vivendi SA (1,412,916 )(13,763 ) Wendel SA (1,555,010 )
Total France (9,585,899 )
Germany �� (0.6)%(13,270 ) Delivery Hero SE * (1,613,463 )
Shares Description Value ($)Germany �� continued
(378 ) Deutsche Boerse AG (62,964 )(15,383 ) Puma SE * (1,524,346 )(13,196 ) QIAGEN NV * (635,949 )(38,165 ) RWE AG (1,578,594 )(3,272 ) Sartorius AG (1,491,892 )(13,699 ) Scout24 AG (1,043,870 )(2,588 ) TeamViewer AG * (123,378 )(539,107) Telefonica Deutschland Holding AG (1,488,082 )(55,370 ) thyssenkrupp AG * (369,225 )(46,760 ) Uniper SE (1,582,765 )(15,084 ) Zalando SE * (1,532,190 )
Total Germany (13,046,718)
Italy �� (0.2)%(6,907 ) Ferrari NV (1,463,461 )(107,698) FinecoBank Banca Fineco SPA * (1,700,306 )(14,740 ) Infrastrutture Wireless Italiane SPA (189,798 )
Total Italy (3,353,565 )
Japan �� (1.3)%(60,700 ) Acom Co Ltd (291,391 )(38,700 ) Asahi Intecc Co Ltd (1,417,831 )(294,800) ENEOS Holdings Inc (1,006,978 )(100 ) Fast Retailing Co Ltd (81,936 )(11,700 ) GMO Payment Gateway Inc (1,640,796 )(19,000 ) Hitachi Metals Ltd (277,858 )(47,400 ) Idemitsu Kosan Co Ltd (982,700 )(106,200) Isetan Mitsukoshi Holdings Ltd (569,999 )(20,700 ) Japan Airport Terminal Co Ltd (1,199,010 )(23,700 ) Japan Exchange Group Inc (586,328 )(264 ) Japan Real Estate Investment Corp (1,367,484 )(159,700) JGC Holding Corp (1,421,828 )(91,200 ) Keikyu Corp (1,559,988 )(2,900 ) Kintetsu Group Holdings Co Ltd (128,444 )(72,300 ) Kyushu Electric Power Co Inc (609,184 )(19,900 ) LINE Corp * (1,025,447 )(43,900 ) LIXIL Group Corp (1,050,515 )(20,400 ) M3 Inc (1,877,243 )(30,200 ) McDonald�s Holdings Co Japan Ltd (1,464,851 )(18,900 ) Mercari Inc * (863,111 )(21,700 ) Mitsubishi Materials Corp (410,270 )(40,400 ) Mitsubishi Motors Corp * (72,686 )(26,300 ) MonotaRO Co Ltd (1,599,746 )(15,500 ) Nihon M&A Center Inc (1,083,042 )(15,000 ) Nippon Paint Holdings Co Ltd (1,921,903 )(72,600 ) Nippon Yusen KK (1,576,981 )(1,300 ) Nissin Foods Holdings Co Ltd (107,294 )(14,400 ) Odakyu Electric Railway Co Ltd (435,910 )(2,900 ) ORIENTAL LAND CO LTD (492,580 )(90,500 ) Sharp Corp (1,210,009 )(4,300 ) Yaskawa Electric Corp (206,309 )
Total Japan (28,539,652)
Copyright © 2021 www.secdatabase.com. All Rights Reserved.Please Consider the Environment Before Printing This Document

GMO Benchmark-Free Fund(A Series of GMO Trust)Schedule of Investments �� (Continued)(showing percentage of total net assets)November 30, 2020 (Unaudited)
Shares Description Value ($)Netherlands �� (0.2)%
(798 ) Adyen NV * (1,524,303)(292,002) Altice Europe NV * (1,536,128)(12,058 ) Just Eat Takeaway.com NV * (1,283,236)
Total Netherlands (4,343,667)
Norway �� (0.0)%(3,729 ) Schibsted ASA � B Shares * (135,619 )
Peru �� (0.0)%(19,800 ) Southern Copper Corp (1,175,526)
Russia �� (0.0)%(26,941 ) Magnit PJSC Sponsored GDR (Registered) (404,824 )
Singapore �� (0.1)%(221,000) Singapore Exchange Ltd (1,457,186)
Spain �� (0.4)%(866,121) Bankia SA (1,489,703)(24,218 ) Cellnex Telecom SA (1,534,126)(52,488 ) Endesa SA (1,508,640)(55,008 ) Ferrovial SA (1,536,120)(49,223 ) Siemens Gamesa Renewable Energy SA (1,765,326)
Total Spain (7,833,915)
Sweden �� (0.1)%(13,767 ) Evolution Gaming Group AB (1,171,395)(62,853 ) Lundin Energy AB (1,501,590)
Total Sweden (2,672,985)
Switzerland �� (0.2)%(1 ) Chocoladefabriken Lindt & Spruengli AG
(Registered) (89,487 )(261 ) Partners Group Holding AG (281,405 )(1,306 ) Straumann Holding AG (Registered) (1,507,508)(17,712 ) Swiss Re AG (1,618,269)
Total Switzerland (3,496,669)
United Kingdom �� (0.7)%(21,024 ) Admiral Group Plc (791,909 )(37,051 ) Antofagasta Plc (611,824 )(191,455) Auto Trader Group Plc (1,424,019)(496,619) ConvaTec Group Plc (1,366,015)(31,050 ) Experian Plc (1,100,098)(115,622) GVC Holdings Plc * (1,588,735)(17,061 ) Halma Plc (502,011 )(73,810 ) Hargreaves Lansdown Plc (1,397,939)(204,775) Informa Plc * (1,434,407)(20,192 ) Land Securities Group Plc (REIT) (176,588 )(13,413 ) London Stock Exchange Group Plc (1,446,614)(46,654 ) Ocado Group Plc * (1,371,684)(17,376 ) Prudential Plc (267,203 )
Shares Description Value ($)
United Kingdom �� continued(2,953 ) Spirax-Sarco Engineering Plc (434,992 )
Total United Kingdom (13,914,038)
United States �� (4.2)%(13,600 ) Advanced Micro Devices, Inc. * (1,260,176 )(24,700 ) AES Corp. (The) (504,868 )(500 ) Align Technology, Inc. * (240,645 )(6,500 ) American Tower Corp. (REIT) (1,502,800 )(135,600) Apache Corp. (1,747,884 )(7,500 ) Arthur J Gallagher & Co. (865,575 )(5,100 ) Autodesk, Inc. * (1,429,173 )(6,800 ) Avalara, Inc. * (1,167,900 )(5,800 ) Ball Corp. (556,858 )(5,000 ) Black Knight, Inc. * (458,100 )(27,700 ) Blackstone Group , Inc. (The) � Class A (1,649,535 )(5,500 ) Burlington Stores, Inc. * (1,201,970 )(1,600 ) Catalent, Inc. * (153,824 )(29,900 ) Cheniere Energy, Inc. * (1,695,031 )(1,200 ) Chipotle Mexican Grill, Inc. * (1,547,316 )(11,400 ) Cognex Corp. (856,596 )(600 ) CoStar Group, Inc. * (546,342 )(4,000 ) Coupa Software, Inc. * (1,315,640 )(8,700 ) Crowdstrike Holdings, Inc. � Class A * (1,333,536 )(12,100 ) Datadog, Inc. � Class A * (1,196,932 )(3,900 ) DexCom, Inc. * (1,246,752 )(7,600 ) Digital Realty Trust, Inc. (REIT) (1,024,100 )(6,900 ) DocuSign, Inc. * (1,572,372 )(264,600) Endo International Plc * (1,344,168 )(6,200 ) Equifax, Inc. (1,034,780 )(1,900 ) Equinix, Inc. (REIT) (1,325,801 )(23,800 ) Equity LifeStyle Properties, Inc. (REIT) (1,394,442 )(700 ) Erie Indemnity Co. � Class A (157,927 )(12,300 ) Exact Sciences Corp. * (1,489,038 )(2,300 ) Extra Space Storage, Inc. (REIT) (259,279 )(4,100 ) Fastenal Co. (202,745 )(14,300 ) Guidewire Software, Inc. * (1,751,464 )(2,400 ) Hologic, Inc. * (165,912 )(2,100 ) IDEXX Laboratories, Inc. * (968,058 )(11,600 ) IHS Markit Ltd. (1,153,736 )(15,900 ) Ingersoll Rand, Inc. * (703,893 )(6,200 ) Insulet Corp. * (1,597,802 )(7,500 ) IQVIA Holdings, Inc. * (1,267,425 )(18,600 ) Lamb Weston Holdings, Inc. (1,346,268 )(4,300 ) Liberty Broadband Corp. � Class A * (674,111 )(5,600 ) Liberty Broadband Corp. � Class C * (881,160 )(36,800 ) Liberty Media Corp-Liberty Formula One � Class C * (1,537,504 )(21,800 ) Live Nation Entertainment, Inc. * (1,431,170 )(900 ) Lululemon Athletica, Inc. * (333,198 )(2,700 ) MarketAxess Holdings, Inc. (1,455,786 )(5,900 ) MongoDB, Inc. * (1,695,129 )(4,000 ) MSCI, Inc. (1,637,680 )
Copyright © 2021 www.secdatabase.com. All Rights Reserved.Please Consider the Environment Before Printing This Document

GMO Benchmark-Free Fund(A Series of GMO Trust)Schedule of Investments �� (Continued)(showing percentage of total net assets)November 30, 2020 (Unaudited)
A summary of outstanding financial instruments at November 30, 2020 is as follows:
Forward Currency Contracts
Shares Description Value ($)United States �� continued
(8,500 ) NIKE Inc. � Class B (1,144,950)(28,800 ) Nuance Communications, Inc. * (1,242,144)(6,800 ) Okta, Inc. * (1,666,272)(3,000 ) Paycom Software, Inc. * (1,251,240)(7,800 ) Pinterest, Inc. � Class A * (546,156 )(4,600 ) Public Storage (REIT) (1,032,516)(5,100 ) RingCentral, Inc. � Class A * (1,514,955)(1,700 ) Rockwell Automation, Inc. (434,452 )(5,200 ) Roku, Inc. * (1,526,564)(17,500 ) Rollins, Inc. (1,000,650)(3,000 ) ServiceNow, Inc. * (1,603,650)(40,000 ) Slack Technologies Inc. � Class A * (1,715,200)(41,000 ) Snap, Inc. � Class A* (1,821,220)(128,300) Southwestern Energy Co. * (399,013 )(7,100 ) Splunk, Inc. * (1,449,678)(6,100 ) Square, Inc. � Class A * (1,286,856)(11,500 ) Starbucks Corp. (1,127,230)(3,100 ) Sun Communities, Inc. (REIT) (430,900 )(3,400 ) Sunrun, Inc. * (217,872 )(70,000 ) Targa Resources Corp. (1,645,000)(6,000 ) Teladoc Health, Inc. * (1,192,620)(3,900 ) Tesla, Inc. * (2,213,640)(5,100 ) Twilio, Inc. � Class A * (1,632,459)(38,500 ) UDR, Inc. (REIT) (1,481,095)(4,300 ) Vail Resorts, Inc. (1,186,112)
Shares Description Value ($)United States �� continued
(1,300 ) West Pharmaceutical Services, Inc. (357,708 )(52,600) Williams Cos, Inc. (The) (1,103,548 )(1,800 ) Workday, Inc. � Class A * (404,622 )(16,300) Wynn Resorts Ltd. (1,638,150 )(400 ) XPO Logistics, Inc. * (42,672 )(14,700) Zillow Group, Inc. � Class C * (1,584,807 )(800 ) Zoetis, Inc. (128,304 )(2,700 ) Zoom Video Communications, Inc. � Class A * (1,291,572 )(7,800) Zscaler, Inc. * (1,214,850 )
Total United States (89,411,078 )
TOTAL COMMON STOCKS(PROCEEDS $176,004,844) (189,903,679 )
RIGHTS/WARRANTS �� (0.0)%
Spain �� (0.0)%(41,811) Ferrovial SA, Expires 11/23/20 * (11,914 )
TOTAL RIGHTS/WARRANTS(PROCEEDS $9,790) (11,914 )
TOTAL SECURITIES SOLD SHORT(PROCEEDS $176,014,634) (189,915,593 )Other Assets and Liabilities (net) � 0.1% 2,804,977
TOTAL NET ASSETS �� 100.0% $2,124,082,338
SettlementDate
Counter-party
CurrencySold
CurrencyPurchased
NetUnrealized
Appreciation(Depreciation)
($)01/19/2021 MSCI AUD 34,183,300 USD 24,408,747 (695,905 )02/08/2021 BCLY AUD 26,050,000 USD 18,767,123 (366,955 )02/08/2021 DB AUD 950,000 USD 678,189 (19,599 )02/02/2021 CITI BRL 2,117,973 USD 390,000 (4,894 )01/13/2021 BOA CHF 1,651,792 USD 1,810,000 (10,709 )01/13/2021 JPM CHF 3,845,361 USD 4,240,000 1,39901/13/2021 MSCI CHF 13,280,108 USD 14,486,074 (152,104 )12/02/2020 MSCI CLP 1,719,676,000 USD 2,230,234 (26,854 )12/02/2020 MSCI. CLP 227,250,000 USD 296,172 (2,095 )02/03/2021 MSCI COP 6,992,625,000 USD 1,825,751 (113,518 )02/16/2021 CITI CZK 18,356,684 USD 819,861 (15,099 )01/19/2021 DB EUR 6,685,900 USD 7,846,358 (140,777 )01/19/2021 GS EUR 73,506,550 USD 86,585,675 (1,227,003 )01/19/2021 MSCI EUR 32,557,600 USD 38,584,705 (309,380 )01/19/2021 SSB EUR 40,948,950 USD 48,010,773 (907,820 )01/27/2021 BOA EUR 370,000 USD 438,180 (3,910 )01/13/2021 MSCI GBP 2,040,000 USD 2,697,957 (23,469 )01/19/2021 JPM GBP 11,756,500 USD 15,213,758 (470,280 )01/19/2021 MSCI GBP 11,756,500 USD 15,198,509 (485,528 )01/19/2021 SSB GBP 16,748,900 USD 22,154,534 (189,733 )01/19/2021 SSB HKD 134,689,400 USD 17,371,935 (6,311 )01/13/2021 MSCI HUF 547,093,860 USD 1,795,148 (24,066 )
SettlementDate
Counter-party
CurrencySold
CurrencyPurchased
NetUnrealized
Appreciation(Depreciation)
($)01/29/2021 BOA ILS 1,035,135 USD 310,000 (3,057 )01/22/2021 BCLY INR 23,102,750 USD 310,000 (461 )01/22/2021 JPM INR 24,835,140 USD 330,000 (3,742 )01/19/2021 BOA JPY 6,970,876,867 USD 66,363,718 (474,667 )01/19/2021 DB JPY 3,370,746,033 USD 32,085,964 (233,531 )01/19/2021 JPM JPY 1,345,354,900 USD 12,948,104 48,52901/19/2021 MSCI JPY 3,015,104,700 USD 29,022,733 113,21002/09/2021 BOA JPY 115,453,431 USD 1,110,000 2,71902/09/2021 JPM JPY 122,491,517 USD 1,180,000 5,21802/24/2021 GS JPY 1,875,151,766 USD 18,064,750 77,54602/24/2021 MSCI JPY 3,750,303,534 USD 36,132,734 158,32601/20/2021 JPM NOK 29,288,943 USD 3,181,599 (111,611 )02/05/2021 BCLY NZD 1,350,000 USD 901,352 (45,349 )02/05/2021 JPM NZD 6,460,000 USD 4,393,683 (136,455 )02/05/2021 MSCI NZD 14,290,000 USD 9,511,495 (509,507 )02/02/2021 MSCI PEN 2,268,770 USD 626,810 (2,425 )12/03/2020 JPM PHP 8,232,250 USD 170,000 (1,184 )12/03/2020 MSCI PHP 16,135,830 USD 333,316 (2,218 )01/25/2021 JPM PHP 24,368,080 USD 504,515 (772 )02/16/2021 DB PLN 1,685,679 USD 450,000 65302/26/2021 BOA RON 668,386 USD 162,192 (625 )02/16/2021 BCLY RUB 60,785,762 USD 780,000 (10,379 )
Copyright © 2021 www.secdatabase.com. All Rights Reserved.Please Consider the Environment Before Printing This Document

02/16/2021 CITI IDR 2,700,356,000 USD 190,000 55102/16/2021 JPM IDR 5,231,160,000 USD 360,000 (7,002 )
02/16/2021 MSCI RUB 23,368,260 USD 300,000 (3,850 )02/05/2021 BCLY SEK 4,685,558 USD 540,000 (7,016 )
Copyright © 2021 www.secdatabase.com. All Rights Reserved.Please Consider the Environment Before Printing This Document

GMO Benchmark-Free Fund(A Series of GMO Trust)
Schedule of Investments �� (Continued)November 30, 2020 (Unaudited)
Forward Currency Contracts �� continued
SettlementDate
Counter-party
CurrencySold
CurrencyPurchased
NetUnrealized
Appreciation(Depreciation)
($)02/05/2021 JPM SEK 20,515,735 USD 2,380,000 (15,113 )
01/15/2021 BCLY SGD 240,806 USD 180,000 444
12/07/2020 BCLY TWD 7,972,160 USD 280,000 709
12/07/2020 CITI TWD 6,854,208 USD 240,000 (125 )
12/07/2020 JPM TWD 3,977,960 USD 140,000 639
12/07/2020 MSCI TWD 11,736,192 USD 411,075 (82 )
01/19/2021 DB USD 3,445,569 AUD 4,866,400 128,377
02/08/2021 BOA USD 922,292 AUD 1,290,000 25,231
02/02/2021 JPM USD 683,173 BRL 3,923,256 48,314
02/03/2021 JPM USD 9,908,468 CAD 13,176,528 241,271
02/03/2021 MSCI USD 9,910,665 CAD 13,176,527 239,072
12/02/2020 MSCI USD 2,171,167 CLP 1,666,466,000 16,082
12/02/2020 MSCI. USD 370,000 CLP 280,460,000 (1,894 )
02/26/2021 MSCI USD 1,259,168 CLP 973,463,000 20,882
02/03/2021 MSCI USD 420,000 COP 1,518,380,000 1,093
02/16/2021 BOA USD 260,000 CZK 5,786,739 3,212
02/16/2021 CITI USD 180,000 CZK 3,990,942 1,529
02/16/2021 DB USD 280,000 CZK 6,119,851 (1,637 )
01/19/2021 BOA USD 16,112,076 EUR 13,792,826 365,163
01/19/2021 DB USD 8,912,054 EUR 7,532,200 86,092
01/19/2021 MSCI USD 8,391,554 EUR 7,187,774 195,132
01/27/2021 DB USD 12,523,927 EUR 10,545,000 75,651
01/27/2021 JPM USD 7,183,628 EUR 6,040,000 33,200
01/13/2021 MSCI USD 5,622,479 GBP 4,345,000 173,892
01/19/2021 DB USD 7,423,528 GBP 5,745,100 240,859
01/19/2021 MSCI USD 3,192,064 GBP 2,441,700 65,344
01/19/2021 SSB USD 1,900,011 GBP 1,444,900 27,592
01/19/2021 SSB USD 3,844,236 HKD 29,802,500 1,019
02/16/2021 JPM USD 931,705 IDR 13,861,913,000 40,804
SettlementDate
Counter-party
CurrencySold
CurrencyPurchased
NetUnrealized
Appreciation(Depreciation)
($)01/22/2021 JPM USD 186,672 INR 13,850,098 (550 )01/19/2021 BOA USD 3,854,745 JPY 405,167,200 30,09201/19/2021 BONY USD 2,594,085 JPY 270,788,000 2,29301/19/2021 CITI USD 2,445,363 JPY 255,333,600 2,83502/09/2021 BOA USD 4,650,000 JPY 487,210,785 22,70202/09/2021 MSCI USD 12,425,895 JPY 1,287,912,940 (73,884 )02/19/2021 MSCI USD 1,688,951 KRW 1,868,385,160 (4,236 )01/21/2021 BOA USD 420,000 MXN 8,780,009 12,15601/21/2021 CITI USD 330,000 MXN 7,036,432 16,33601/21/2021 GS USD 360,000 MXN 7,712,060 19,59101/21/2021 MSCI USD 631,335 MXN 13,456,437 30,99701/20/2021 JPM USD 2,850,000 NOK 26,230,670 99,34102/05/2021 JPM USD 4,213,079 NZD 6,280,000 190,83202/02/2021 MSCI USD 760,000 PEN 2,728,000 (3,399 )12/03/2020 JPM USD 505,562 PHP 24,368,080 1,15602/16/2021 MSCI USD 651,964 PLN 2,473,211 7,31302/16/2021 BCLY USD 85,248 RUB 6,645,694 1,16402/05/2021 BCLY USD 17,139,423 SEK 152,535,720 668,38702/05/2021 JPM USD 1,610,000 SEK 14,482,713 80,78701/15/2021 GS USD 270,000 SGD 366,616 3,36601/15/2021 MSCI USD 280,000 SGD 379,411 2,90601/15/2021 BOA USD 660,000 THB 20,607,939 21,12002/16/2021 BCLY USD 1,810,000 TRY 14,428,777 (16,759 )12/07/2020 JPM USD 1,059,919 TWD 30,540,520 10,01502/02/2021 MSCI USD 414,706 TWD 11,736,192 (146 )01/29/2021 DB USD 510,000 ZAR 8,384,318 27,37301/29/2021 MSCI USD 1,123,904 ZAR 18,554,870 65,326
$ (3,085,332 )
Copyright © 2021 www.secdatabase.com. All Rights Reserved.Please Consider the Environment Before Printing This Document

Futures Contracts
Reverse Repurchase AgreementsAverage balance outstanding $(20,500,000)Average interest rate (net) (0.65 )%Maximum balance outstanding $(20,500,000)Average balance outstanding was calculated based on daily face value balances outstanding during the period that the Fund had enteredinto reverse repurchase agreements. Average interest rate was calculated based on interest received and/or paid during the period that theFund had entered into the reverse repurchase agreements. The Fund had no reverse repurchase agreements at the end of the period.
01/29/2021 MSCI USD 1,065,657 ILS 3,611,297 26,511
Numberof
Contracts + TypeExpiration
DateNotional
Amount ($)
Value/NetUnrealized
Appreciation(Depreciation)
($)Buys214 Mini MSCI
EmergingMarkets December 2020 12,864,610 456,630
Sales1,490 E-mini
Russell2000 Index December 2020 135,597,450 (24,074,439 )
3,586 EuroSTOXX 50 December 2020 149,783,388 (8,531,253 )
481 FTSE 100Index December 2020 40,125,038 (1,589,820 )
Numberof
Contracts + TypeExpiration
DateNotional
Amount ($)
Value/NetUnrealized
Appreciation(Depreciation)
($)79 Hang
SengIndex December 2020 13,451,283 94,099
1,619 S&P 500E-Mini December 2020 293,298,040 (21,625,443)
76 SGXNifty 50 December 2020 1,965,062 2,566
180 SPI 200 December 2020 21,530,134 (2,054,563 )1,122 TOPIX
Index December 2020 188,371,580 (14,714,612)$844,121,975 $(72,493,465)
+ Buys - Fund is long the futures contract.Sales - Fund is short the futures contract.
Copyright © 2021 www.secdatabase.com. All Rights Reserved.Please Consider the Environment Before Printing This Document

GMO Benchmark-Free Fund(A Series of GMO Trust)
Schedule of Investments �� (Continued)November 30, 2020 (Unaudited)
Swap Contracts
Centrally Cleared Interest Rate Swaps
Fund Pays Fund ReceivesNotionalAmount
ExpirationDate
PeriodicPayment
Frequency
PremiumsPaid/
(Received) ($) Value ($)
Net UnrealizedAppreciation/
(Depreciation) ($)3 Month AUD BBSW
0.15% AUD 10,276,00012/16/2022 Quarterly 1,263 10,398 9,135
3 Month AUD BBSW0.10% AUD 15,130,000
12/16/2022 Quarterly (731 ) 4,210 4,941
0.07%3 Month AUD BBSW AUD 16,180,000
12/16/2022 Quarterly � 2,027 2,027
(0.67)%6 Month CHF LIBOR CHF 12,560,000
12/16/2022 Semi-Annually 3,045 (9,694 ) (12,739 )
6 Month CHF LIBOR(0.72)% CHF 8,670,000
12/16/2022 Semi-Annually (59 ) (1,224 ) (1,165 )
0.18%3 Month NZD Bank Bill Rate NZD 97,930,000
12/16/2022 Quarterly 19,063 90,433 71,370
(0.05)%3 Month SEK STIBOR SEK 63,000,000
12/16/2022 Quarterly 615 932 317
3 Month SEK STIBOR(0.04)% SEK 61,900,000
12/16/2022 Quarterly 179 529 350
3 Month SEK STIBOR(0.03)% SEK 77,300,000
12/16/2022 Quarterly � 1,111 1,111
0.56%3 Month CAD LIBOR CAD 27,170,000
12/19/2022 Semi-Annually 3,401 (3,241 ) (6,642 )
0.55%3 Month CAD LIBOR CAD 9,820,000
12/19/2022 Semi-Annually � (109 ) (109 )
0.55%3 Month CAD LIBOR CAD 9,280,000
12/19/2022 Semi-Annually � 328 328
6 Month EURIBOR(0.48)% EUR 10,270,000
12/21/2022 Semi-Annually 3,004 9,667 6,663
6 Month GBP LIBOR0.08% GBP 46,660,000
12/21/2022 Semi-Annually 18,561 (11,318 ) (29,879 )
3 Month USD LIBOR0.23% USD 4,085,000
12/21/2022 Quarterly 24 (579 ) (603 )
3 Month USD LIBOR0.24% USD 11,090,000
12/21/2022 Quarterly (4,423 ) 1,777 6,200
6 Month AUD BBSW0.79% AUD 7,060,000
12/16/2030 Semi-Annually 733 (54,640 ) (55,373 )
0.93%6 Month AUD BBSW AUD 2,200,000
12/16/2030 Semi-Annually � (5,298 ) (5,298 )
6 Month AUD BBSW0.89% AUD 3,380,000
12/16/2030 Semi-Annually � (224 ) (224 )
0.87%6 Month AUD BBSW AUD 2,130,000
12/16/2030 Semi-Annually (1,673 ) 3,655 5,328
0.76%6 Month AUD BBSW AUD 3,140,000
12/16/2030 Semi-Annually 1,688 29,706 28,018
0.77%6 Month AUD BBSW AUD 600,000
12/16/2030 Semi-Annually � 5,160 5,160
0.88%6 Month AUD BBSW AUD 1,690,000
12/16/2030 Semi-Annually � 2,293 2,293
3 Month CAD LIBOR1.11% CAD 3,450,000
12/16/2030 Semi-Annually (982 ) (22,130 ) (21,148 )
3 Month CAD LIBOR1.09% CAD 6,150,000
12/16/2030 Semi-Annually � (49,055 ) (49,055 )
3 Month CAD LIBOR1.09% CAD 1,090,000
12/16/2030 Semi-Annually � (8,856 ) (8,856 )
3 Month CAD LIBOR1.11% CAD 2,100,000
12/16/2030 Semi-Annually � (14,095 ) (14,095 )
3 Month CAD LIBOR1.13% CAD 3,360,000
12/16/2030 Semi-Annually � (17,555 ) (17,555 )
3 Month CAD LIBOR1.15% CAD 850,000
12/16/2030 Semi-Annually � (3,177 ) (3,177 )
Copyright © 2021 www.secdatabase.com. All Rights Reserved.Please Consider the Environment Before Printing This Document

3 Month CAD LIBOR1.28% CAD 16,700,000
12/16/2030 Semi-Annually (4,563 ) 99,050 103,613
3 Month CAD LIBOR1.23% CAD 4,330,000
12/16/2030 Semi-Annually 3,995 9,580 5,585
3 Month CAD LIBOR1.20% CAD 31,580,000
12/16/2030 Semi-Annually (53,455 ) (588 ) 52,867
6 Month CHF LIBOR(0.30)% CHF 26,200,000
12/16/2030 Semi-Annually (10,370 ) (26,442 ) (16,072 )
(0.27)%6 Month CHF LIBOR CHF 1,620,000
12/16/2030 Semi-Annually � (4,785 ) (4,785 )
(0.29)%6 Month CHF LIBOR CHF 2,640,000
12/16/2030 Semi-Annually � (1,819 ) (1,819 )
6 Month CHF LIBOR(0.26)% CHF 2,220,000
12/16/2030 Semi-Annually (3,221 ) 9,071 12,292
(0.32)%6 Month CHF LIBOR CHF 1,440,000
12/16/2030 Semi-Annually � 4,714 4,714
3 Month NZD Bank Bill Rate0.55% NZD 9,100,000
12/16/2030 Quarterly 16,857 (205,702) (222,559 )
3 Month NZD Bank Bill Rate0.46% NZD 4,550,000
12/16/2030 Quarterly (2,514 ) (133,570) (131,056 )
3 Month NZD Bank Bill Rate0.48% NZD 7,930,000
12/16/2030 Quarterly 197 (221,979) (222,176 )
3 Month NZD Bank Bill Rate0.74% NZD 1,930,000
12/16/2030 Quarterly � (19,474 ) (19,474 )
3 Month NZD Bank Bill Rate0.81% NZD 2,260,000
12/16/2030 Quarterly 379 (12,400 ) (12,779 )
3 Month NZD Bank Bill Rate0.78% NZD 21,590,000
12/16/2030 Quarterly (38,974 ) (155,274) (116,300 )
3 Month NZD Bank Bill Rate0.82% NZD 13,370,000
12/16/2030 Quarterly (1,225 ) (56,493 ) (55,268 )
3 Month NZD Bank Bill Rate0.86% NZD 15,930,000
12/16/2030 Quarterly (1,940 ) (27,657 ) (25,717 )
0.59%3 Month NZD Bank Bill Rate NZD 17,360,000
12/16/2030 Quarterly (8,024 ) 354,531 362,555
0.85%3 Month NZD Bank Bill Rate NZD 1,920,000
12/16/2030 Quarterly � 5,298 5,298
3 Month SEK STIBOR0.30% SEK 10,500,000
12/16/2030 Quarterly � (5,212 ) (5,212 )
0.37%3 Month SEK STIBOR SEK 20,200,000
12/16/2030 Quarterly 120 (4,580 ) (4,700 )
0.39%3 Month SEK STIBOR SEK 18,320,000
12/16/2030 Quarterly � (9,664 ) (9,664 )
0.39%3 Month SEK STIBOR SEK 15,700,000
12/16/2030 Quarterly � (8,100 ) (8,100 )
3 Month SEK STIBOR0.34% SEK 125,570,000
12/16/2030 Quarterly (32,265 ) (15,114 ) 17,151
0.30%3 Month SEK STIBOR SEK 16,100,000
12/16/2030 Quarterly � 9,016 9,016
0.31%3 Month SEK STIBOR SEK 21,600,000
12/16/2030 Quarterly � 9,097 9,097
(0.18)%6 Month EURIBOR EUR 30,830,000
12/18/2030 Semi-Annually 21,772 (270,823) (292,595 )
(0.21)%6 Month EURIBOR EUR 26,530,000
12/18/2030 Semi-Annually (12,833 ) (151,643) (138,810 )
Copyright © 2021 www.secdatabase.com. All Rights Reserved.Please Consider the Environment Before Printing This Document

GMO Benchmark-Free Fund(A Series of GMO Trust)
Schedule of Investments �� (Continued)November 30, 2020 (Unaudited)
Centrally Cleared Interest Rate Swaps �� continued
Fund Pays Fund ReceivesNotionalAmount
ExpirationDate
PeriodicPayment
Frequency
PremiumsPaid/
(Received) ($) Value ($)
Net UnrealizedAppreciation/
(Depreciation) ($)(0.18)%
6 Month EURIBOR EUR 2,050,00012/18/2030 Semi-Annually (7,655 ) (19,266 ) (11,611 )
0.45%6 Month GBP LIBOR GBP 10,010,000
12/18/2030 Semi-Annually (3,889 ) 38,625 42,514
0.36%6 Month GBP LIBOR GBP 1,170,000
12/18/2030 Semi-Annually (103 ) 18,475 18,578
6 Month GBP LIBOR0.54% GBP 1,680,000
12/18/2030 Semi-Annually 4,286 12,450 8,164
6 Month GBP LIBOR0.53% GBP 2,480,000
12/18/2030 Semi-Annually 3,634 16,077 12,443
3 Month USD LIBOR0.82% USD 1,880,000
12/18/2030 Quarterly (874 ) (5,775 ) (4,901 )
3 Month USD LIBOR0.75% USD 1,130,000
12/18/2030 Quarterly 280 (11,219 ) (11,499 )
0.86%3 Month USD LIBOR USD 1,500,000
12/18/2030 Quarterly � (975 ) (975 )
0.85%3 Month USD LIBOR USD 1,500,000
12/18/2030 Quarterly � (20 ) (20 )
0.85%3 Month USD LIBOR USD 3,090,000
12/18/2030 Quarterly � (193 ) (193 )
0.86%3 Month USD LIBOR USD 3,060,000
12/18/2030 Quarterly � (3,638 ) (3,638 )
0.88%3 Month USD LIBOR USD 3,270,000
12/18/2030 Quarterly � (8,692 ) (8,692 )
0.70%3 Month USD LIBOR USD 6,080,000
12/18/2030 Quarterly 7,966 90,137 82,171
0.88%3 Month USD LIBOR USD 27,690,000
12/18/2030 Quarterly (101,961 ) (80,387 ) 21,574
$ (180,672 ) $(824,332) $ (643,660 )
OTC Total Return Swaps
Fund Pays Fund Receives Counterparty Notional AmountExpiration
Date
PeriodicPayment
Frequency
PremiumsPaid/
(Received) ($) Value ($)
Net UnrealizedAppreciation/
(Depreciation) ($)Depreciation of
Total Return onCSI 500 Index +(1 Month USDLIBOR minus9.25%)
Appreciation on Total Returnon CSI 500 Index GS USD 2,245,935 12/07/2020 Monthly � (7,417 ) (7,417 )
Total Return onEquity Basket (i)
1 Month Federal Funds Rateminus 0.75% GS USD 845,043 05/24/2022 Monthly � 10,552 10,552
Total Return onEquity Basket (i)
1 Month Federal Funds Rateminus 0.75% GS USD 187,066 05/24/2022 Monthly � 6,869 6,869
Total Return onEquity Basket (i)
1 Month Federal Funds Rateminus 0.50% GS USD 541,292 05/24/2022 Monthly � 59,962 59,962
Total Return onEquity Basket (i)
1 Month Federal Funds Rateminus 0.75% GS USD 89,803 05/24/2022 Monthly � (1,534 ) (1,534 )
Total Return onEquity Basket (i)
1 Month Federal Funds Rateminus 0.50% GS USD 35,053 05/24/2022 Monthly � 676 676
Total Return onEquity Basket (i)
1 Month Federal Funds Rateminus 0.75% GS USD 107,922 05/24/2022 Monthly � 575 575
Total Return onEquity Basket (i)
1 Month Federal Funds Rateminus 1.00% MORD USD 1 06/20/2022 Monthly � � �
Total Return onEquity Basket (i)
1 Month Federal Funds Rateminus 1.00% MORD USD 329,064 10/18/2022 Monthly � 19,331 19,331
Total Return onEquity Basket (i)
1 Month Federal Funds Rateminus 0.40% MORD USD 15,904,466 10/18/2022 Monthly � (333,636) (333,636 )
Copyright © 2021 www.secdatabase.com. All Rights Reserved.Please Consider the Environment Before Printing This Document

Total Return onEquity Basket (i)
1 Month Federal Funds Rateminus0.50% MORD USD 77,076 10/18/2022 Monthly � 6 6
Total Return onEquity Basket (i)
1 Month Federal Funds Rateminus 0.40% MORD USD 249,253 10/18/2022 Monthly � 660 660
$ � $(243,956) $ (243,956 )
As of November 30, 2020, for the above contracts and/or agreements, the Fund had sufficient cash and/or securities to covercommitments or collateral requirements, if any, of the relevant broker or exchange.
Copyright © 2021 www.secdatabase.com. All Rights Reserved.Please Consider the Environment Before Printing This Document
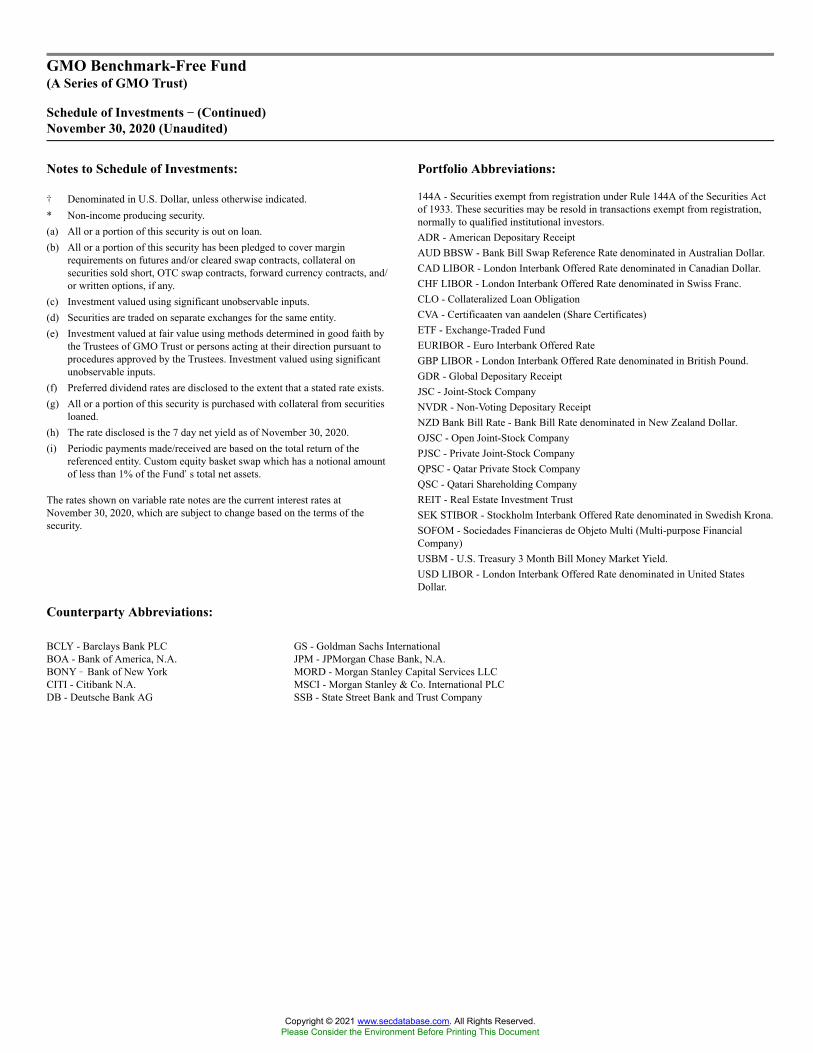
GMO Benchmark-Free Fund(A Series of GMO Trust)
Schedule of Investments �� (Continued)November 30, 2020 (Unaudited)
Counterparty Abbreviations:
Notes to Schedule of Investments:
� Denominated in U.S. Dollar, unless otherwise indicated.* Non-income producing security.(a) All or a portion of this security is out on loan.(b) All or a portion of this security has been pledged to cover margin
requirements on futures and/or cleared swap contracts, collateral onsecurities sold short, OTC swap contracts, forward currency contracts, and/or written options, if any.
(c) Investment valued using significant unobservable inputs.(d) Securities are traded on separate exchanges for the same entity.(e) Investment valued at fair value using methods determined in good faith by
the Trustees of GMO Trust or persons acting at their direction pursuant toprocedures approved by the Trustees. Investment valued using significantunobservable inputs.
(f) Preferred dividend rates are disclosed to the extent that a stated rate exists.(g) All or a portion of this security is purchased with collateral from securities
loaned.(h) The rate disclosed is the 7 day net yield as of November 30, 2020.(i) Periodic payments made/received are based on the total return of the
referenced entity. Custom equity basket swap which has a notional amountof less than 1% of the Fund�s total net assets.
The rates shown on variable rate notes are the current interest rates atNovember 30, 2020, which are subject to change based on the terms of thesecurity.
Portfolio Abbreviations:
144A - Securities exempt from registration under Rule 144A of the Securities Actof 1933. These securities may be resold in transactions exempt from registration,normally to qualified institutional investors.ADR - American Depositary ReceiptAUD BBSW - Bank Bill Swap Reference Rate denominated in Australian Dollar.CAD LIBOR - London Interbank Offered Rate denominated in Canadian Dollar.CHF LIBOR - London Interbank Offered Rate denominated in Swiss Franc.CLO - Collateralized Loan ObligationCVA - Certificaaten van aandelen (Share Certificates)ETF - Exchange-Traded FundEURIBOR - Euro Interbank Offered RateGBP LIBOR - London Interbank Offered Rate denominated in British Pound.GDR - Global Depositary ReceiptJSC - Joint-Stock CompanyNVDR - Non-Voting Depositary ReceiptNZD Bank Bill Rate - Bank Bill Rate denominated in New Zealand Dollar.OJSC - Open Joint-Stock CompanyPJSC - Private Joint-Stock CompanyQPSC - Qatar Private Stock CompanyQSC - Qatari Shareholding CompanyREIT - Real Estate Investment TrustSEK STIBOR - Stockholm Interbank Offered Rate denominated in Swedish Krona.SOFOM - Sociedades Financieras de Objeto Multi (Multi-purpose FinancialCompany)USBM - U.S. Treasury 3 Month Bill Money Market Yield.USD LIBOR - London Interbank Offered Rate denominated in United StatesDollar.
BCLY - Barclays Bank PLCBOA - Bank of America, N.A.BONY � Bank of New YorkCITI - Citibank N.A.DB - Deutsche Bank AG
GS - Goldman Sachs InternationalJPM - JPMorgan Chase Bank, N.A.MORD - Morgan Stanley Capital Services LLCMSCI - Morgan Stanley & Co. International PLCSSB - State Street Bank and Trust Company
Copyright © 2021 www.secdatabase.com. All Rights Reserved.Please Consider the Environment Before Printing This Document

GMO Benchmark-Free Fund(A Series of GMO Trust)
Schedule of Investments �� (Continued)November 30, 2020 (Unaudited)
Currency Abbreviations:
AUD - Australian DollarBRL - Brazilian RealCAD - Canadian DollarCHF - Swiss FrancCLP - Chilean PesoCOP - Colombian PesoCZK - Czech KorunaEUR - EuroGBP - British PoundHKD - Hong Kong DollarHUF - Hungarian ForintIDR - Indonesian RupiahILS - Israeli ShekelINR - Indian RupeeJPY - Japanese Yen
KRW - South Korean WonMXN - Mexican PesoNOK - Norwegian KroneNZD - New Zealand DollarPEN - Peruvian SolPHP - Philippine PesoPLN - Polish ZlotyRON - Romanian LeuRUB - Russian RubleSEK - Swedish KronaSGD - Singapore DollarTHB - Thai BahtTWD - Taiwan DollarUSD - United States DollarZAR - South African Rand
Copyright © 2021 www.secdatabase.com. All Rights Reserved.Please Consider the Environment Before Printing This Document

GMO Global Asset Allocation Fund(A Series of GMO Trust)Schedule of Investments(showing percentage of total net assets)November 30, 2020 (Unaudited)
As of November 30, 2020, for the above contracts and/or agreements, the Fund had sufficient cash and/or securities to covercommitments or collateral requirements, if any, of the relevant broker or exchange.
Counterparty Abbreviations:
Shares /Par Value�� Description Value ($)
MUTUAL FUNDS �� 99.0%
Affiliated Issuers �� 99.0%4,711,974 GMO Alternative Allocation Fund, Class VI 93,202,8542,551,459 GMO Asset Allocation Bond Fund, Class VI 61,617,7361,156,435 GMO Cyclical Focus Fund, Class IV 32,229,8421,211,213 GMO Emerging Country Debt Fund, Class IV 33,247,7945,442,744 GMO Emerging Markets Fund, Class VI 184,835,5877,537,169 GMO International Equity Fund, Class IV 168,003,5071,813,768 GMO-Usonian Japan Value Creation Fund,
Class VI 39,086,6935,854,275 GMO Multi-Sector Fixed Income Fund (formerly
GMO Core Plus Bond Fund), Class IV 131,018,672717,569 GMO Opportunistic Income Fund, Class VI 18,771,610709,061 GMO Quality Fund, Class VI 19,080,841437,224 GMO Risk Premium Fund, Class VI 11,822,5365,791,171 GMO U.S. Equity Fund, Class VI 75,922,2482,756,108 GMO U.S. Small Cap Value Fund, Class VI 56,720,710377,597 GMO U.S. Treasury Fund 1,903,090
TOTAL MUTUAL FUNDS(COST $912,499,519) 927,463,720
DEBT OBLIGATIONS �� 0.0%
Asset-Backed Securities �� 0.0%20,807 ACE Securities Corp Home Equity Loan Trust,
Series 06-ASL1, Class A,Variable Rate, 1 mo.LIBOR + 0.28%, 0.43%, due 02/25/36 5,752
Par Value�� /Shares Description Value ($)
Asset-Backed Securities �� continued10,749 GMACM Home Equity Loan Trust,
Series 04-HE3, Class A3, FSA, Variable Rate,1 mo. LIBOR + 0.50%, 0.65%, due 10/25/34 10,144
11,360 Mellon Re-REMIC Pass-Through Trust,Series 04-TBC1, Class A, 144A, Variable Rate,1 mo. LIBOR + 0.25%, 0.39%, due 02/26/34 9,686
TOTAL DEBT OBLIGATIONS(COST $28,956) 25,582
SHORT-TERM INVESTMENTS �� 0.0%
Money Market Funds �� 0.0%285,577 State Street Institutional Treasury Money Market
Fund � Premier Class, 0.01% (a) 285,577
TOTAL SHORT-TERM INVESTMENTS(COST $285,577) 285,577
TOTAL INVESTMENTS �� 99.0%(Cost $912,814,052) 927,774,879Other Assets and Liabilities (net) � 1.0% 9,492,402
TOTAL NET ASSETS �� 100.0% $937,267,281
A summary of outstanding financial instruments atNovember 30, 2020 is as follows:
Forward Currency Contracts
SettlementDate
Counter-party
CurrencySold
CurrencyPurchased
Net UnrealizedAppreciation
(Depreciation)($)
1/19/21 SSB JPY 2,269,278,600 USD 21,770,812 12,4422/24/21 SSB JPY 1,843,558,600 USD 17,761,185 77,035
$ 89,477
Futures Contracts
Numberof
Contracts + TypeExpiration
Date
NotionalAmount
($)
Value/NetUnrealized
Appreciation(Depreciation)
($)Sales287 MSCI EAFE December 2020 29,173,550 (1,593,404 )237 TOPIX Index December 2020 39,789,719 (2,682,310 )
$68,963,269 $ (4,275,714 )
+ Buys - Fund is long the futures contract.Sales - Fund is short the futures contract.
Notes to Schedule of Investments:� Denominated in U.S. Dollar, unless otherwise indicated.(a) The rate disclosed is the 7 day net yield as of November 30, 2020.
The rates shown on variable rate notes are the current interest rates atNovember 30, 2020, which are subject to change based on the terms of thesecurity.
Portfolio Abbreviations:144A - Securities exempt from registration under Rule 144A of the Securities Actof 1933. These securities may be resold in transactions exempt from registration,normally to qualified institutional investors.FSA - Insured as to the payment of principal and interest by Financial SecurityAssurance.LIBOR - London Interbank Offered Rate
Copyright © 2021 www.secdatabase.com. All Rights Reserved.Please Consider the Environment Before Printing This Document

SSB - State Street Bank and Trust Company
Currency Abbreviations:JPY - Japanese YenUSD - United States Dollar
Copyright © 2021 www.secdatabase.com. All Rights Reserved.Please Consider the Environment Before Printing This Document

GMO Global Developed Equity Allocation Fund(A Series of GMO Trust)Schedule of Investments(showing percentage of total net assets)November 30, 2020 (Unaudited)
Shares Description Value ($)MUTUAL FUNDS �� 99.9%
Affiliated Issuers �� 99.9%155,500 GMO Cyclical Focus Fund, Class IV 4,333,785229,957 GMO Emerging Markets Fund, Class VI 7,809,3371,492,348 GMO International Equity Fund, Class IV 33,264,445145,092 GMO-Usonian Japan Value Creation Fund, Class VI 3,126,725366,350 GMO Quality Fund, Class VI 9,858,481969,980 GMO U.S. Equity Fund, Class VI 12,716,436384,765 GMO U.S. Small Cap Value Fund, Class VI 7,918,466
TOTAL MUTUAL FUNDS(COST $69,309,706) 79,027,675
SHORT-TERM INVESTMENTS �� 0.1%
Money Market Funds �� 0.1%58,155 State Street Institutional Treasury Money Market
Fund � Premier Class, 0.01% (a) 58,155
TOTAL SHORT-TERM INVESTMENTS(COST $58,155) 58,155
TOTAL INVESTMENTS �� 100.0%(Cost $69,367,861) 79,085,830Other Assets and Liabilities (net) � (0.0%) (34,712 )
TOTAL NET ASSETS �� 100.0% $79,051,118
Notes to Schedule of Investments:
(a) The rate disclosed is the 7 day net yield as of November 30, 2020.
Copyright © 2021 www.secdatabase.com. All Rights Reserved.Please Consider the Environment Before Printing This Document

GMO Global Equity Allocation Fund(A Series of GMO Trust)Schedule of Investments(showing percentage of total net assets)November 30, 2020 (Unaudited)
Shares Description Value ($)MUTUAL FUNDS �� 100.0%
Affiliated Issuers �� 100.0%2,969,717 GMO Cyclical Focus Fund, Class VI 82,766,00812,745,018 GMO Emerging Markets Fund, Class VI 432,820,81024,008,750 GMO International Equity Fund, Class IV 535,155,0332,940,296 GMO-Usonian Japan Value Creation Fund,
Class VI 63,363,3788,083,794 GMO Quality Fund, Class VI 217,534,8907,522,862 GMO U.S. Equity Fund, Class VI 98,624,7257,672,549 GMO U.S. Small Cap Value Fund, Class VI 157,901,052
TOTAL MUTUAL FUNDS(COST $1,517,014,675) 1,588,165,896
SHORT-TERM INVESTMENTS �� 0.0%
Money Market Funds �� 0.0%539,758 State Street Institutional Treasury Money
Market Fund � Premier Class, 0.01% (a) 539,758
TOTAL SHORT-TERM INVESTMENTS(COST $539,758) 539,758
TOTAL INVESTMENTS �� 100.0%(Cost $1,517,554,433) 1,588,705,654Other Assets and Liabilities (net) � (0.0%) (62,506 )
TOTAL NET ASSETS �� 100.0% $1,588,643,148
Notes to Schedule of Investments:
(a) The rate disclosed is the 7 day net yield as of November 30, 2020.
Copyright © 2021 www.secdatabase.com. All Rights Reserved.Please Consider the Environment Before Printing This Document

GMO Implementation Fund(A Series of GMO Trust)Consolidated Schedule of Investments(showing percentage of total net assets)November 30, 2020 (Unaudited)
Shares Description Value ($)COMMON STOCKS �� 78.9%
Argentina �� 0.1%74,700 Banco BBVA Argentina SA ADR * 239,04017,400 Globant SA * 3,283,03297,300 Grupo Financiero Galicia SA ADR 837,753
Total Argentina 4,359,825
Australia �� 1.1%237,711 Accent Group Ltd 377,049120,256 Adairs Ltd 279,78146,846 Ampol Ltd 1,053,614109,822 Ansell Ltd 3,003,892216,982 Asaleo Care Ltd 159,50139,708 AUB Group Ltd 486,706639,040 Australian Pharmaceutical Industries Ltd 564,70148,776 Aventus Group (REIT) 95,64223,659 BHP Group Ltd 659,761335,871 BlueScope Steel Ltd 4,202,5703,612 Brickworks Ltd 51,211893,605 Coca-Cola Amatil Ltd 8,275,03350,760 Codan Ltd (a) 393,77745,930 Computershare Ltd 481,250192,226 Coronado Global Resources Inc 148,801409,817 Dexus (REIT) 2,936,2091,148,987 Fortescue Metals Group Ltd 15,307,491139,743 G8 Education Ltd (a) 120,40582,845 GDI Property Group (REIT) 70,014350,053 Genworth Mortgage Insurance Australia Ltd 679,4451,174,271 GPT Group (The) (REIT) 4,058,555155,490 JB Hi-Fi Ltd (a) 5,222,90474,492 McMillan Shakespeare Ltd 649,776728,166 Mirvac Group (REIT) 1,375,778276,889 Mount Gibson Iron Ltd 152,08756,042 Rio Tinto Ltd 4,181,238358,390 Sandfire Resources NL 1,153,4862,025,490 Scentre Group (REIT) 4,143,320357,735 Sigma Healthcare Ltd * (a) 147,020636,738 Stockland (REIT) 2,114,70950,535 Tassal Group Ltd (a) 134,25333,424 Virtus Health Ltd * 131,004
Total Australia 62,810,983
Austria �� 0.0%6,988 AT&S Austria Technologie & Systemtechnik AG 167,0451,959 Vienna Insurance Group AG Wiener Versicherung
Gruppe 46,669Total Austria 213,714
Shares Description Value ($)Belgium �� 0.3%
105,627 Ageas SA/NV 5,171,564134,536 AGFA-Gevaert NV * 556,79035,018 bpost SA 422,43423,298 Econocom Group SA/NV (a) 65,69111,129 Etablissements Franz Colruyt NV 663,3082,978 Orange Belgium SA 57,493792 Sofina SA 251,40871,201 UCB SA 7,619,409
Total Belgium 14,808,097
Brazil �� 0.8%106,700 Banco Bradesco SA 431,190423,800 Banco do Brasil SA 2,678,513805,500 Camil Alimentos SA 1,674,930523,120 Cia de Saneamento Basico do Estado de Sao Paulo 4,349,081578,200 Cia de Saneamento do Parana 2,698,13791,900 Cia Paranaense de Energia 1,117,9161,097,800 Cielo SA 727,440844,100 Cogna Educacao * 738,946127,500 Dimed SA Distribuidora da Medicamentos 524,765605,200 IRB Brasil Resseguros SA 748,960136,600 Mahle-Metal Leve SA 489,041233,100 Marfrig Global Foods SA * 638,7253,664,100 Petrobras Distribuidora SA 14,041,13486,200 Porto Seguro SA 762,661284,200 Qualicorp Consultoria e Corretora de Seguros SA 1,759,606568,000 Telefonica Brasil SA 4,744,466217,300 TIM SA 547,164394,600 Tupy SA * 1,579,903296,600 WEG SA 4,073,032
Total Brazil 44,325,610
Canada �� 1.1%50,300 AGF Management Ltd � Class B 216,1191,300 Bank of Montreal 93,423140,142 Brookfield Asset Management Inc � Class A (a) 5,674,35030,848 BRP Inc 1,759,85940,000 Canaccord Genuity Group Inc (a) 275,35233,800 Canadian Apartment Properties (REIT) 1,331,4919,400 Canadian Imperial Bank of Commerce 792,4175,100 Canadian Tire Corp Ltd � Class A 651,7658,800 Canfor Pulp Products Inc 39,64083,100 Cascades Inc 934,211138,800 Celestica Inc * 1,045,248114,100 CI Financial Corp 1,495,32810,600 Cogeco Inc 649,288214,500 Fortuna Silver Mines Inc * (a) 1,365,916
Copyright © 2021 www.secdatabase.com. All Rights Reserved.Please Consider the Environment Before Printing This Document

GMO Implementation Fund(A Series of GMO Trust)Consolidated Schedule of Investments �� (Continued)(showing percentage of total net assets)November 30, 2020 (Unaudited)
Shares Description Value ($)Canada �� continued
27,600 iA Financial Corp Inc 1,208,60260,300 IGM Financial Inc 1,594,90686,300 Imperial Oil Ltd (a) 1,493,82024,200 Linamar Corp 1,114,68765,500 Magna International Inc (a) 4,016,647128,400 Manulife Financial Corp 2,187,95135,800 Martinrea International Inc 391,9896,100 Morguard North American Residential Real Estate
Investment Trust 75,434102,743 Nutrien Ltd 5,062,148145,000 Power Corp of Canada 3,264,64925,100 Real Matters Inc * 370,30665,100 RioCan Real Estate Investment Trust 879,228139,600 Royal Bank of Canada 11,400,61315,900 Teekay Tankers Ltd � Class A * (a) 185,076197,600 TELUS Corp (a) 3,811,41123,200 TFI International Inc 1,177,239134,700 Toronto-Dominion Bank (The) (a) 7,185,66041,900 Tourmaline Oil Corp 583,31611,800 Transat AT Inc * (a) 53,33576,620 Transcontinental Inc � Class A 1,137,47111,900 Wajax Corp 155,7712,200 West Fraser Timber Co Ltd 121,816
Total Canada 63,796,482
Chile �� 0.1%1,586,260 Aguas Andinas SA � Class A 460,11747,368 Empresa Nacional de Telecomunicaciones SA 287,229288,600 Enel Americas SA ADR 2,095,23614,339 Inversiones La Construccion SA 89,553
Total Chile 2,932,135
China �� 14.0%5,276,000 361 Degrees International Ltd 660,735270,000 7Road Holdings Ltd * 92,4299,263,000 Agile Group Holdings Ltd 13,374,30259,867,000 Agricultural Bank of China Ltd � Class H 22,731,14746,000 AK Medical Holdings Ltd 72,466210,300 Alibaba Group Holding Ltd Sponsored ADR * 55,384,6084,341,832 Anhui Conch Cement Co Ltd � Class H 27,752,398463,372 Anhui Expressway Co Ltd � Class H 264,031139,500 Asia Cement China Holdings Corp 139,28216,565,500 BAIC Motor Corp Ltd � Class H 6,200,09545,000 Baidu Inc Sponsored ADR * (b) 6,254,55096,628,000 Bank of China Ltd � Class H 34,105,47545,993,000 Bank of Communications Co Ltd � Class H 25,416,08794,000 Beijing Enterprises Holdings Ltd 304,595701,675 Beijing North Star Co Ltd � Class H 145,674261,700 BEST Inc ADR * 766,781
Shares Description Value ($)China �� continued
152,600 BYD Co Ltd � Class A 3,969,684147,000 BYD Electronic International Co Ltd 727,13118,389,000 China Cinda Asset Management Co Ltd � Class H 3,580,8024,209,000 China CITIC Bank Corp Ltd � Class H 1,820,5651,934,000 China Communications Construction Co Ltd � Class H 1,002,4518,546,485 China Communications Services Corp Ltd � Class H 4,554,61444,202,803 China Construction Bank Corp � Class H 34,554,7691,472,000 China Dongxiang Group Co Ltd 170,8841,630,000 China Eastern Airlines Corp Ltd � Class H 736,0296,245,000 China Everbright Bank Co Ltd � Class H 2,435,9333,370,000 China Feihe Ltd 8,048,2573,659,000 China Greenfresh Group Co Ltd * (c) 38,237551,500 China Hongqiao Group Ltd 481,59429,298,000 China Huarong Asset Management Co Ltd � Class H 3,358,6993,066,000 China Jinmao Holdings Group Ltd 1,580,0119,013,000 China Lesso Group Holdings Ltd 16,110,6411,627,000 China Lilang Ltd 1,116,1787,858,000 China Machinery Engineering Corp � Class H 1,642,9399,350,925 China Medical System Holdings Ltd 9,547,8674,101,500 China Mobile Ltd (b) 24,466,27618,700 China Mobile Ltd Sponsored ADR 558,19516,716,000 China National Building Material Co Ltd � Class H 21,915,1773,174,000 China Oriental Group Co Ltd 951,203246,000 China Overseas Grand Oceans Group Ltd 146,7172,527,000 China Overseas Land & Investment Ltd 6,152,70950,630,000 China Petroleum & Chemical Corp � Class H 22,744,99115,768,700 China Railway Construction Corp Ltd � Class H 10,420,25834,578,000 China Railway Group Ltd � Class H 17,068,3961,707,000 China Railway Signal & Communication Corp Ltd �
Class H 605,6285,441,000 China Reinsurance Group Corp � Class H 575,6151,918,000 China Resources Cement Holdings Ltd 2,382,01756,000 China Resources Gas Group Ltd 269,9022,550,000 China Resources Land Ltd 11,035,60311,664,000 China Resources Pharmaceutical Group Ltd 6,306,8131,627,000 China Shenhua Energy Co Ltd � Class H 3,137,9552,203,000 China Shineway Pharmaceutical Group Ltd 1,507,005229,000 China Taiping Insurance Holdings Co Ltd 404,94432,112,000 China Telecom Corp Ltd � Class H 9,663,2801,490,000 China Traditional Chinese Medicine Holdings Co Ltd 700,262140,700 China Vanke Co Ltd � Class H 534,39936,200 China Yuchai International Ltd 609,608
Copyright © 2021 www.secdatabase.com. All Rights Reserved.Please Consider the Environment Before Printing This Document

GMO Implementation Fund(A Series of GMO Trust)Consolidated Schedule of Investments �� (Continued)(showing percentage of total net assets)November 30, 2020 (Unaudited)
Shares Description Value ($)China �� continued
3,526,800 China Zhongwang Holdings Ltd * 768,137648,000 Chongqing Rural Commercial Bank Co Ltd �
Class H 277,8511,744,000 COSCO Shipping Energy Transportation Co Ltd �
Class H 767,2568,777,506 Country Garden Holdings Co Ltd 11,574,79592,000 Country Garden Services Holdings Co Ltd 514,0484,960,000 Dongfeng Motor Group Co Ltd � Class H 5,103,0464,953,000 Dongyue Group Ltd 2,583,4312,878,500 Fantasia Holdings Group Co Ltd * 560,401404,000 Fosun International Ltd 582,9841,300 G-bits Network Technology Xiamen Co Ltd �
Class A 74,3061,405,000 Geely Automobile Holdings Ltd 3,886,8323,421,500 Great Wall Motor Co Ltd � Class H 6,918,784822,000 Greenland Hong Kong Holdings Ltd 254,0922,550,000 Guangdong Investment Ltd 4,228,1491,334,000 Guangzhou Baiyunshan Pharmaceutical Holdings Co
Ltd � Class H 3,429,7422,770,800 Guangzhou R&F Properties Co Ltd � Class H 3,615,644531,400 Guotai Junan Securities Co Ltd � Class H 782,799680,000 Haier Electronics Group Co Ltd 3,241,635885,000 Hebei Construction Group Corp Ltd � Class H 2,512,1311,000 Hengan International Group Co Ltd 6,8782,675,044 Hisense Home Appliances Group Co Ltd � Class A 6,072,3031,529,000 Hisense Home Appliances Group Co Ltd � Class H 2,298,14081,900 Hollysys Automation Technologies Ltd 1,032,759898,000 Hopson Development Holdings Ltd 2,345,9314,468,000 Huabao International Holdings Ltd 6,080,5506,295,000 IGG Inc 6,282,74229,812,400 Industrial & Commercial Bank of China Ltd �
Class H 18,833,234172,000 Jingrui Holdings Ltd 45,95736,000 JNBY Design Ltd 40,7042,700 JOYY Inc ADR (a) 240,489149,500 Kingboard Holdings Ltd 571,197810,500 Kingboard Laminates Holdings Ltd 1,307,558386,250 KWG Living Group Holdings Ltd * 298,9921,196,500 KWG Property Holding Ltd 1,636,9072,342,900 Legend Holdings Corp � Class H 3,190,1081,348,000 Livzon Pharmaceutical Group Inc � Class H 5,310,3821,184,000 Logan Group Co Ltd 1,982,0901,062,000 Longfor Group Holdings Ltd 6,939,98610,134,000 Lonking Holdings Ltd 2,926,160109,800 Lufax Holding Ltd * (a) 1,808,4062,785,000 Metallurgical Corp of China Ltd � Class H 506,419153,000 Momo Inc Sponsored ADR (a) 2,200,140
Shares Description Value ($)China �� continued
340,900 NetEase Inc ADR (a) (b) 30,807,1331,705,000 Nexteer Automotive Group Ltd 1,807,2995,278,000 Nine Dragons Paper Holdings Ltd 6,934,9362,047,000 PAX Global Technology Ltd 1,272,03823,587,000 PICC Property & Casualty Co Ltd � Class H 19,461,849597,000 Poly Property Group Co Ltd 184,87413,673,000 Postal Savings Bank of China Co Ltd � Class H 7,728,4662,748,000 Powerlong Real Estate Holdings Ltd 1,983,675354,000 Road King Infrastructure Ltd 474,964380,000 Seazen Group Ltd * 336,3011,288,000 Shanghai Electric Group Co Ltd � Class H * 370,561238,000 Shanghai Industrial Holdings Ltd 353,7281,108,000 Shanghai Jin Jiang Capital Co Ltd � Class H 181,1726,296,900 Shanghai Pharmaceuticals Holding Co Ltd � Class H 10,648,153582,000 Shenzhen Expressway Co Ltd � Class H 580,419571,228 Shenzhen Investment Ltd 209,0747,533,076 Shimao Group Holdings Ltd 28,077,1101,585,000 Sino-Ocean Land Holdings Ltd 333,316596,000 Sinopec Engineering Group Co Ltd � Class H 263,74212,828,000 Sinopec Shanghai Petrochemical Co Ltd � Class H 2,842,3355,248,400 Sinopharm Group Co Ltd � Class H 12,991,1042,035,000 Sinotruk Hong Kong Ltd 5,071,0622,694,000 Skyworth Group Ltd * 735,3081,258,000 SOHO China Ltd * 391,1443,519,000 TCL Electronics Holdings Ltd * 2,770,803328,500 Tencent Holdings Ltd 23,946,88840,300 Tencent Holdings Ltd ADR 2,941,900994,500 Texhong Textile Group Ltd 918,131588,000 Tianjin Development Holdings Ltd 113,669914,000 Tianjin Port Development Holdings Ltd 70,6206,256,000 Tianneng Power International Ltd 13,125,695462,500 Vipshop Holdings Ltd ADR * 11,812,2505,666,000 Weichai Power Co Ltd � Class H 11,571,5664,186,968 Weifu High-Technology Group Co Ltd � Class A 16,487,56510,398,000 West China Cement Ltd 1,620,58365,800 Wuhu Sanqi Interactive Entertainment Network
Technology Group Co Ltd � Class A 261,437702,600 Xiaomi Corp � Class B * 2,398,770498,500 XTEP International Holdings Ltd 212,0755,420,000 Yuzhou Group Holdings Co Ltd 2,154,1861,811,500 Zhongsheng Group Holdings Ltd 13,620,137613,900 Zhuzhou Kibing Group Co Ltd � Class A 1,085,245326,200 Zoomlion Heavy Industry Science and Technology Co
Ltd � Class H 340,550Total China 794,424,821
Copyright © 2021 www.secdatabase.com. All Rights Reserved.Please Consider the Environment Before Printing This Document

GMO Implementation Fund(A Series of GMO Trust)Consolidated Schedule of Investments �� (Continued)(showing percentage of total net assets)November 30, 2020 (Unaudited)
Shares Description Value ($)Cyprus �� 0.0%
73,892 QIWI Plc Sponsored ADR 1,075,867
Czech Republic �� 0.0%223,295 Moneta Money Bank AS * 663,393
Denmark �� 0.2%244,691 Danske Bank A/S * 4,028,32581,771 Demant A/S * 3,084,73919,286 Matas A/S * 248,95438,813 Pandora A/S 3,891,57144,396 Scandinavian Tobacco Group A/S 683,175
Total Denmark 11,936,764
Egypt �� 0.0%23,151 Commercial International Bank Egypt SAE 92,241
Finland �� 0.2%18,077 Kesko Oyj � B Shares 473,251114,981 Neste Oyj 7,683,061553,800 Nokia Oyj * 2,208,5565,821 Sanoma Oyj 84,27322,187 Tokmanni Group Corp 403,50220,743 UPM-Kymmene Oyj 680,6259,515 Uponor Oyj 193,455
Total Finland 11,726,723
France �� 1.4%5,078 Akka Technologies * (a) 152,67835,197 ALD SA 450,36283,547 APERAM SA (a) 3,175,44117,798 Arkema SA 2,072,6972,294 Assystem SA 68,22639,608 Atos SE * 3,615,4472,133 Axway Software SA * 59,52789,621 BNP Paribas SA * 4,561,8151,836 Boiron SA 83,777909 Caisse Regionale de Credit Agricole Mutuel Nord de
France * 23,056190 Capgemini SE 26,4341,786 Christian Dior SE 910,7049,849 Cie de Saint-Gobain * 466,56523,831 Credit Agricole SA * 274,94494,715 Derichebourg SA 371,3438,477 Eiffage SA * 828,775148 Euronext NV 15,75418,662 Fnac Darty SA * 997,76311,188 Gaztransport Et Technigaz SA 1,105,772857 Groupe Crit * 61,980989 HEXAOM * 41,16347,287 IPSOS 1,510,7577,231 Kaufman & Broad SA 307,615
Shares Description Value ($)France �� continued
7,357 Kering SA 5,311,53713,035 L�Oreal SA 4,798,13310,309 LVMH Moet Hennessy Louis Vuitton SE 5,921,4451,885 Mersen SA * 54,92962,001 Metropole Television SA * 972,1181,778 Nexans SA * 112,012443,303 Peugeot SA * (a) 10,400,46793,213 Publicis Groupe SA 4,200,37854,948 Quadient SA 982,26015 Renault SA * (d) 598118,991 Renault SA * (d) 4,724,1602,190 Rothschild & Co * 68,35053,716 Safran SA * 7,830,39757,762 Sanofi 5,822,3401,100 SEB SA 194,856755 Societe BIC SA 44,689151,794 Societe Generale SA * 3,009,734585 Sopra Steria Group * 88,6967,600 STMicroelectronics NV � NY Shares 301,3401,769 Synergie SA * 59,9292,003 TOTAL SE (d) 85,5901,211 TOTAL SE (d) 51,40121,803 Unibail-Rodamco-Westfield (REIT) (a) 1,534,14384,732 Valeo SA 3,268,9458,295 Vicat SA 337,8221,584 Vilmorin & Cie SA 94,189
Total France 81,453,053
Germany �� 1.1%2,480 Allianz SE (Registered) 581,2752,359 Amadeus Fire AG * 334,214283,296 Aroundtown SA * 1,960,70830,008 Aurubis AG 2,280,65874,264 Bayer AG (Registered) 4,278,62619,405 Bayerische Motoren Werke AG 1,683,7612,200 Bechtle AG 480,26817,067 Borussia Dortmund GmbH & Co KGaA * 115,64617,176 Brenntag AG 1,315,309152,975 CECONOMY AG * 753,611933 Cewe Stiftung & Co KGaA 100,94940,854 CropEnergies AG 676,37383,610 Daimler AG (Registered) 5,597,799304,552 Deutsche Lufthansa AG (Registered) * (a) 3,511,150362,716 Deutsche Pfandbriefbank AG * 3,613,01456,960 Deutz AG * 326,505199,824 Dialog Semiconductor Plc * 10,664,1144,603 Draegerwerk AG & Co KGaA 332,73416,805 DWS Group GmbH & Co KGaA 654,4415,884 Eckert & Ziegler Strahlen- und Medizintechnik AG 302,65914,055 Fresenius SE & Co KGaA 628,3871,775 Gesco AG 31,472
Copyright © 2021 www.secdatabase.com. All Rights Reserved.Please Consider the Environment Before Printing This Document

GMO Implementation Fund(A Series of GMO Trust)Consolidated Schedule of Investments �� (Continued)(showing percentage of total net assets)November 30, 2020 (Unaudited)
Shares Description Value ($)Germany �� continued
1,061 Grammer AG * 22,35214,470 Hamburger Hafen und Logistik AG 315,739106,700 HeidelbergCement AG 7,548,55710,611 Henkel AG & Co KGaA 1,023,77810,989 Hornbach Baumarkt AG 504,24016,058 Hornbach Holding AG & Co KGaA 1,709,5972,774 KWS Saat SE & Co KGaA * 210,26312,143 Merck KGaA 1,938,9961,852 OHB SE * 90,57718,385 Siemens AG (Registered) 2,453,93180,993 Software AG 3,478,02043,724 Takkt AG * 562,77710,122 Talanx AG * 370,93744,963 VERBIO Vereinigte BioEnergie AG 1,395,34710,978 Volkswagen AG 2,029,1777,291 Wuestenrot & Wuerttembergische AG 149,143
Total Germany 64,027,104
Greece �� 0.0%40,910 JUMBO SA 725,42634,357 Motor Oil Hellas Corinth Refineries SA 438,925
Total Greece 1,164,351
Hong Kong �� 0.7%339,500 BOC Hong Kong Holdings Ltd 1,104,857279,800 Budweiser Brewing Co APAC Ltd 960,554488,000 Chow Sang Sang Holdings International Ltd 590,944215,600 Chow Tai Fook Jewellery Group Ltd 281,4402,818,000 CITIC Telecom International Holdings Ltd 937,38518,000 CK Asset Holdings Ltd 98,359571,000 CK Hutchison Holdings Ltd 4,141,8171,400,000 CSI Properties Ltd 39,314413,200 Dah Sing Banking Group Ltd 442,976393,600 Dah Sing Financial Holdings Ltd 1,158,1106,792,000 First Pacific Co Ltd 2,073,5321,610,000 Giordano International Ltd 243,479430,000 HKT Trust & HKT Ltd � Class SS 562,014529,900 Hongkong Land Holdings Ltd 2,151,1001,040,213 I-CABLE Communications Ltd * 8,693926,000 Johnson Electric Holdings Ltd 2,181,487443,000 K Wah International Holdings Ltd 220,36599,500 Kerry Logistics Network Ltd 218,1081,010,000 Kerry Properties Ltd 2,587,644258,800 Man Wah Holdings Ltd 474,5771,494,000 Pacific Textiles Holdings Ltd 1,029,4425,624,000 PCCW Ltd 3,412,939201,000 Regal Real Estate Investment Trust 33,4291,772,000 Shun Tak Holdings Ltd 559,069350,000 Singamas Container Holdings Ltd 21,626
Shares Description Value ($)Hong Kong �� continued
139,500 SmarTone Telecommunications Holdings Ltd 77,024522,000 Sun Hung Kai & Co Ltd 233,51111,500 Sun Hung Kai Properties Ltd 152,86366,000 Swire Pacific Ltd � Class A 378,19340,000 TAI Cheung Holdings Ltd 24,309614,000 VSTECS Holdings Ltd 516,147553,700 VTech Holdings Ltd 4,265,1727,703,000 WH Group Ltd 6,275,416222,000 Wharf Holdings Ltd (The) 549,163146,000 Xinyi Glass Holdings Ltd 327,4331,085,000 Yue Yuen Industrial Holdings Ltd 2,227,268
Total Hong Kong 40,559,759
Hungary �� 0.1%409,121 Magyar Telekom Telecommunications Plc 528,134143,077 Richter Gedeon Nyrt 3,390,660
Total Hungary 3,918,794
India �� 2.1%11,303 Alkem Laboratories Ltd 431,171104,228 Asian Paints Ltd 3,080,748173,004 Aurobindo Pharma Ltd 2,009,811130,090 Bajaj Auto Ltd 5,552,296332,913 Balrampur Chini Mills Ltd 734,8605,039 Bosch Ltd 864,693493,293 Cadila Healthcare Ltd 2,974,724109,549 Dr Reddy�s Laboratories Ltd 7,114,808153,600 Dr Reddy�s Laboratories Ltd ADR 10,074,624762,659 Firstsource Solutions Ltd 808,370192,124 Gujarat Narmada Valley Fertilizers & Chemicals Ltd 540,9362,204,825 HCL Technologies Ltd 24,368,92491,213 HDFC Bank Ltd * 1,758,1192 Hero MotoCorp Ltd 83129,606 Hindalco Industries Ltd 390,23766,902 Hindustan Petroleum Corp Ltd 188,038108,665 Hindustan Unilever Ltd 3,126,913102,379 Housing Development Finance Corp Ltd 3,080,280542,577 ICICI Bank Ltd * 3,465,5701,200,578 Indiabulls Housing Finance Ltd 2,994,462797,676 Indian Oil Corp Ltd 902,264188,800 Infosys Ltd Sponsored ADR (a) 2,873,536155,879 Kotak Mahindra Bank Ltd * 3,945,892199,406 LIC Housing Finance Ltd 884,79940,408 Mphasis Ltd 719,11016 Muthoot Finance Ltd 24756,133 Narayana Hrudayalaya Ltd 286,387255,738 NTPC Ltd 320,1363,768,673 Oil & Natural Gas Corp Ltd 3,947,8304,935,078 Power Finance Corp Ltd 7,155,909
Copyright © 2021 www.secdatabase.com. All Rights Reserved.Please Consider the Environment Before Printing This Document

GMO Implementation Fund(A Series of GMO Trust)Consolidated Schedule of Investments �� (Continued)(showing percentage of total net assets)November 30, 2020 (Unaudited)
Shares Description Value ($)India �� continued
809,264 PTC India Ltd 595,26355,410 Rajesh Exports Ltd * 336,4647,830,974 REC Ltd 12,507,913120,182 Sonata Software Ltd 552,94876,805 Tata Consultancy Services Ltd 2,758,12263,055 Tata Motors Ltd * 149,978126,805 Titan Co Ltd 2,266,880623,604 Wipro Ltd 2,950,441
Total India 116,713,786
Indonesia �� 0.6%1,353,800 Astra International Tbk PT 506,896898,500 Bank BTPN Syariah Tbk PT 262,9133,768,600 Bank Central Asia Tbk PT 8,277,1416,518,200 Bank Mandiri Persero Tbk PT 2,923,5496,358,400 Bank Negara Indonesia Persero Tbk PT 2,696,371871,200 Bank Pembangunan Daerah Jawa Barat Dan Banten
Tbk PT 81,7036,794,200 Bank Pembangunan Daerah Jawa Timur Tbk PT 305,60231,402,300 Bank Rakyat Indonesia Persero Tbk PT 9,082,3486,481,600 Bank Tabungan Negara Persero Tbk PT 755,6206,690,000 Bukit Asam Tbk PT 1,117,3582,540,600 Gajah Tunggal Tbk PT * 92,5656,822,500 Hanjaya Mandala Sampoerna Tbk PT 736,849579,700 Indah Kiat Pulp & Paper Corp Tbk PT 355,9242,330,400 Indo Tambangraya Megah Tbk PT 2,161,9852,014,100 Matahari Department Store Tbk PT * 180,3256,026,000 Pakuwon Jati Tbk PT * 213,55956,399,000 Panin Financial Tbk PT * 893,70515,651,700 Ramayana Lestari Sentosa Tbk PT 808,495496,100 Unilever Indonesia Tbk PT 271,223211,600 United Tractors Tbk PT 344,5422,264,800 XL Axiata Tbk PT 386,556
Total Indonesia 32,455,229
Ireland �� 0.3%111,432 AIB Group Plc * 200,123440,553 Bank of Ireland Group Plc * 1,380,2984,381 CRH Plc * 172,31952,100 CRH Plc Sponsored ADR 2,044,9251,956 Flutter Entertainment Plc * 356,37628,431 Glanbia Plc 349,655636,023 Hibernia REIT Plc 868,466377,562 Irish Residential Properties REIT Plc (a) 628,5197,556 Kingspan Group Plc * 659,228131,178 Origin Enterprises Plc 560,74183,277 Permanent TSB Group Holdings Plc * 62,005343,345 Ryanair Holdings Plc * 6,257,32710,215 Smurfit Kappa Group Plc (d) 428,522106,416 Smurfit Kappa Group Plc (d) 4,527,581
Shares Description Value ($)Ireland �� continued
71,613 Total Produce Plc * 120,773Total Ireland 18,616,858
Israel �� 0.1%58,412 Isracard Ltd 190,443836,336 Oil Refineries Ltd * 181,078376,100 Teva Pharmaceutical Industries Ltd Sponsored
ADR * (a) 3,576,711Total Israel 3,948,232
Italy �� 0.9%167,430 A2A SPA 256,1511,295 ACEA SPA 27,452417,563 Anima Holding SPA 1,838,84972,048 Arnoldo Mondadori Editore SPA * 128,39368,263 Banca Popolare di Sondrio SCPA * 184,58817,925 Biesse SPA * 361,102223,690 Buzzi Unicem SPA 5,473,80939,390 Cementir Holding NV 324,189143,233 CNH Industrial NV * 1,560,49460,403 Credito Emiliano SPA * 336,0678,160 De� Longhi SPA * 284,88480,777 Enav SPA 355,5901,002,854 Enel SPA 10,061,455207,085 EXOR NV 14,485,473792,183 Hera SPA 2,887,711100,916 IMMSI SPA * 52,078387,571 Intesa Sanpaolo SPA * 897,79527,785 La Doria SPA 423,521296,902 Leonardo SPA (a) 2,155,27439,568 Piaggio & C SPA 125,4241,351 Prima Industrie SPA * (a) 22,5561,433 Recordati Industria Chimica e Farmaceutica SPA 76,6451,858 Sabaf SPA 29,181451,734 Saras SPA * (a) 292,4203,768 Sesa SPA * 378,47036,755 Societa Cattolica di Assicurazioni SC * (a) 219,9375,608,746 Telecom Italia SPA 2,643,2827,993,418 Telecom Italia SPA-RSP 4,088,540245,613 Unipol Gruppo SPA * 1,184,562
Total Italy 51,155,892
Japan �� 8.9%34,300 ADEKA Corp 542,369371,700 Aeon Mall Co Ltd 5,940,52215,500 Aichi Corp 137,53111,000 Aida Engineering Ltd 92,7689,000 Altech Corp 179,658717,000 Amada Co Ltd 6,872,87593,500 Amano Corp 2,192,998
Copyright © 2021 www.secdatabase.com. All Rights Reserved.Please Consider the Environment Before Printing This Document

GMO Implementation Fund(A Series of GMO Trust)Consolidated Schedule of Investments �� (Continued)(showing percentage of total net assets)November 30, 2020 (Unaudited)
Shares Description Value ($)Japan �� continued
29,500 AOKI Holdings Inc 115,39210,500 Arata Corp 498,27852,900 Arcland Sakamoto Co Ltd 905,739164,500 Arcs Co Ltd 3,435,459586,800 Asahi Kasei Corp (b) 5,364,779477,900 Asics Corp (a) 8,588,952575,800 Astellas Pharma Inc 8,201,4269,100 Bando Chemical Industries Ltd 50,01010,000 BeNEXT Group Inc (a) 108,799243,000 Brother Industries Ltd 4,641,57523,300 Bunka Shutter Co Ltd 203,0384,800 Central Glass Co Ltd 101,85727,300 Central Japan Railway Co 3,469,5824,000 Chiyoda Integre Co Ltd 58,257403,100 Chugoku Marine Paints Ltd 3,831,6123,000 Cleanup Corp 13,2459,600 CONEXIO Corp 113,1039,200 Credit Saison Co Ltd 105,17513,700 Dai Nippon Toryo Co Ltd 121,1564,000 Dai-Dan Co Ltd 106,277113,400 Daihen Corp 4,911,8174,800 Daiichi Jitsugyo Co Ltd 185,1084,700 Dainichiseika Color & Chemicals Manufacturing Co Ltd 107,3778,500 Daishi Hokuetsu Financial Group Inc 191,5402,800 Daito Pharmaceutical Co Ltd 96,92348,700 Daiwa House Industry Co Ltd 1,488,27013,300 Daiwa Industries Ltd 130,420135,800 Daiwabo Holdings Co Ltd 8,475,475234,200 Denka Co Ltd 7,226,149100,400 Doshisha Co Ltd 1,927,2081,900 DTS Corp 39,952177,200 Ebara Corp 5,651,513105,400 Electric Power Development Co Ltd 1,414,63610,300 FJ Next Co Ltd 96,730159,100 Fuji Corp 3,843,97834,200 Fuji Electric Co Ltd 1,210,9224,300 Fuji Pharma Co Ltd 51,40214,200 Fujimi Inc 494,5214,700 Fujimori Kogyo Co Ltd 212,21414,800 Fujitec Co Ltd 301,1375,800 Fujitsu General Ltd 175,47150,300 Fujitsu Ltd 6,958,4076,800 Furuno Electric Co Ltd 77,1737,800 Furyu Corp 87,9017,400 G-7 Holdings Inc 172,11334,400 Geo Holdings Corp 418,35416,000 Glory Ltd 320,84775,500 GungHo Online Entertainment Inc (a) 1,914,54162,900 Gunze Ltd 2,161,53738,600 Gurunavi Inc 191,0979,100 Hakuto Co Ltd 91,887
Shares Description Value ($)Japan �� continued
4,900 Hanwa Co Ltd 116,810709,194 Haseko Corp 7,664,510938,200 Hazama Ando Corp 6,163,0015,900 Heiwado Co Ltd 119,75134,100 Hisamitsu Pharmaceutical Co Inc 2,001,086269,300 Hitachi Ltd 10,220,9442,900 Hochiki Corp 34,484122,000 Hogy Medical Co Ltd 3,687,990202,800 Honda Motor Co Ltd 5,642,285135,600 Horiba Ltd 7,254,4481,900 Hosokawa Micron Corp 114,97219,400 Inaba Denki Sangyo Co Ltd 444,028253,400 Inabata & Co Ltd 3,336,1476,700 Information Services International-Dentsu Ltd 446,031684,900 Inpex Corp 3,793,569329,600 ITOCHU Corp 8,697,89832,300 Itochu Enex Co Ltd 309,9855,900 Itochu Techno-Solutions Corp 208,0411,600 Itochu-Shokuhin Co Ltd 86,20429,400 Itoki Corp 95,1154,200 Jaccs Co Ltd 72,951144,000 JAFCO Group Co Ltd 6,162,24368,800 Japan Post Insurance Co Ltd 1,144,60222,100 Japan Tobacco Inc (a) 447,3525,600 Jeol Ltd 218,745490,100 JVCKenwood Corp 661,407737,700 K�s Holdings Corp 8,957,860282,500 Kadokawa Corp 8,943,11514,300 Kajima Corp 187,6085,700 Kaken Pharmaceutical Co Ltd 208,26513,800 Kamei Corp 154,860132,000 Kanamoto Co Ltd 2,744,007408,200 Kanematsu Corp 4,700,5974,300 Kanematsu Electronics Ltd 166,48520,100 Kasai Kogyo Co Ltd 66,9044,400 Kato Sangyo Co Ltd 145,684548,200 KDDI Corp (b) 15,599,77913,700 Keiyo Bank Ltd (The) 59,8191,055,300 Kenedix Inc (a) 7,598,837170,600 Kinden Corp 2,725,05911,300 Kissei Pharmaceutical Co Ltd 225,82619,400 Kitz Corp 104,2382,900 Kiyo Bank Ltd (The) 43,91118,400 Kohnan Shoji Co Ltd 568,75238,800 Komeri Co Ltd 1,054,803488,731 Konica Minolta Inc 1,560,885266,200 Konoike Transport Co Ltd 2,634,8911,700 Krosaki Harima Corp 58,3664,800 Kumagai Gumi Co Ltd 108,5358,900 Kureha Corp 449,76313,600 Kyosan Electric Manufacturing Co Ltd 54,916
Copyright © 2021 www.secdatabase.com. All Rights Reserved.Please Consider the Environment Before Printing This Document

GMO Implementation Fund(A Series of GMO Trust)Consolidated Schedule of Investments �� (Continued)(showing percentage of total net assets)November 30, 2020 (Unaudited)
Shares Description Value ($)Japan �� continued
270,600 Kyowa Exeo Corp 6,949,72560,500 Kyudenko Corp 1,726,497244,100 Macromill Inc 1,520,196176,200 Mandom Corp 2,760,083155,300 Maruichi Steel Tube Ltd 3,264,8425,400 Maruzen Showa Unyu Co Ltd 172,95036,500 Marvelous Inc 317,1865,000 Matsuda Sangyo Co Ltd 82,231344,700 Maxell Holdings Ltd * 3,961,11448,500 MCJ Co Ltd 446,82454,700 Mebuki Financial Group Inc 112,02645,100 Meidensha Corp 781,50620,600 METAWATER Co Ltd 466,618222,500 Mitsubishi Chemical Holdings Corp 1,224,940151,000 Mitsubishi Gas Chemical Co Inc 3,196,0645,100 Mitsubishi Research Institute Inc 202,8952,341,800 Mitsubishi UFJ Financial Group Inc 9,993,19611,100 Mitsuboshi Belting Ltd 173,07218,500 Mitsui Chemicals Inc 517,19612,600 Mitsui Sugar Co Ltd 215,32875,400 Mixi Inc 2,060,32015,300 Mizuho Financial Group Inc 193,84410,700 Mizuno Corp 184,9343,000 Mochida Pharmaceutical Co Ltd 115,39117,400 Modec Inc (a) 291,480238,700 MS&AD Insurance Group Holdings Inc 6,944,09826,900 MTI Ltd 216,92518,100 NEC Corp (b) 975,17338,400 NEC Networks & System Integration Corp 678,140197,000 NH Foods Ltd 8,389,91312,400 Nichias Corp 288,33716,400 Nichiha Corp 511,353126,200 Nikkon Holdings Co Ltd 2,448,96048,600 Nippo Corp 1,266,7845,300 Nippon Flour Mills Co Ltd 82,50611,300 Nippon Kayaku Co Ltd 98,66457,680 Nippon Light Metal Holdings Co Ltd 984,91814,000 Nippon Soda Co Ltd 366,829557,900 Nippon Telegraph & Telephone Corp 13,194,4799,800 Nishimatsu Construction Co Ltd 182,0553,700 Nishio Rent All Co Ltd 71,9037,100 Nisshin Oillio Group Ltd (The) 198,0933,800 Nissin Corp 44,22055,100 Nissin Electric Co Ltd 615,2011,400 Nitori Holdings Co Ltd 297,66320,600 Nojima Corp 537,60786,600 Nomura Real Estate Holdings Inc 1,861,4027,300 NS Solutions Corp 215,662230,200 NTT DOCOMO Inc (a) 8,561,4287,500 Obara Group Inc (a) 242,931943,200 Obayashi Corp 8,302,207
Shares Description Value ($)Japan �� continued
15,100 Okamura Corp 134,9141,500 Okinawa Cellular Telephone Co 62,34311,300 Organo Corp 640,272894,700 ORIX Corp (b) 13,242,7859,800 Osaka Soda Co Ltd 229,3427,700 Osaki Electric Co Ltd 40,6131,000 Otsuka Corp 48,493297,500 Pacific Industrial Co Ltd 3,044,730333,600 Penta-Ocean Construction Co Ltd 2,475,7499,100 Prima Meat Packers Ltd 252,3948,000 Proto Corp 80,471217,100 Raiznext Corp 2,312,52646,400 Resona Holdings Inc 161,7338,700 Rinnai Corp 1,015,04837,000 Rohm Co Ltd 3,076,6205,700 Ryoden Corp 82,3577,100 Sakata INX Corp 78,54563,500 San-A Co Ltd 2,455,67423,400 San-Ai Oil Co Ltd 258,50323,000 San-In Godo Bank Ltd (The) 119,71035,200 Sanki Engineering Co Ltd 386,90119,000 Sanwa Holdings Corp 230,7899,600 Sanyo Chemical Industries Ltd 411,95179,000 Secom Co Ltd 7,883,61510,500 Seikitokyu Kogyo Co Ltd 81,14186,100 Sekisui Chemical Co Ltd 1,484,216193,700 Sekisui House Ltd 3,473,2627,500 Sekisui Jushi Corp 157,751879,000 Shimizu Corp 6,647,6186,900 Shin-Etsu Polymer Co Ltd 61,8533,800 Shindengen Electric Manufacturing Co Ltd 84,9107,100 Shinnihon Corp 57,64616,900 Shizuoka Gas Co Ltd 160,2262,000 Sinanen Holdings Co Ltd 56,68616,100 Sinko Industries Ltd 264,05918,900 Sintokogio Ltd 128,752942,600 SKY Perfect JSAT Holdings Inc 4,264,536478,000 Sojitz Corp 1,043,949961,100 Sumitomo Chemical Co Ltd 3,395,444425,100 Sumitomo Dainippon Pharma Co Ltd 5,360,797443,900 Sumitomo Forestry Co Ltd 8,037,64413,300 Sumitomo Mitsui Financial Group Inc 382,4093,400 Sumitomo Seika Chemicals Co Ltd 134,89614,700 Suzuki Motor Corp 788,333174,700 T Hasegawa Co Ltd 3,358,154210,500 Tachi-S Co Ltd 2,261,55768,800 Taisei Corp 2,420,373293,600 Takara Holdings Inc 3,359,49975,800 Takara Leben Co Ltd 213,82432,900 Takasago Thermal Engineering Co Ltd 451,69636,300 Takeuchi Manufacturing Co Ltd 851,639
Copyright © 2021 www.secdatabase.com. All Rights Reserved.Please Consider the Environment Before Printing This Document

GMO Implementation Fund(A Series of GMO Trust)Consolidated Schedule of Investments �� (Continued)(showing percentage of total net assets)November 30, 2020 (Unaudited)
Shares Description Value ($)Japan �� continued
199,600 Takuma Co Ltd 3,418,22620,700 Tamron Co Ltd 315,86410,900 Tanseisha Co Ltd 79,043204,600 Teijin Ltd 3,488,870119,700 TIS Inc 2,377,183249,100 Toho Holdings Co Ltd 4,542,9712,500 Token Corp 193,4711,352,200 Tokyo Electric Power Co Holdings Inc * 3,519,475179,600 Tokyo Seimitsu Co Ltd 7,899,14194,800 Tokyu Construction Co Ltd 424,9109,800 Toli Corp 23,95744,200 Toppan Forms Co Ltd 420,843673,800 Toppan Printing Co Ltd (b) 9,173,4022,300 Torii Pharmaceutical Co Ltd 69,580314,400 Tosei Corp (a) 3,485,9913,300 Toshiba TEC Corp 118,519468,300 Tosoh Corp 7,334,2815,300 Towa Pharmaceutical Co Ltd 96,60193,000 Toyo Construction Co Ltd 354,0102,500 Toyo Ink SC Holdings Co Ltd (a) 46,75067,700 Toyo Suisan Kaisha Ltd 3,329,885136,800 Toyota Industries Corp (b) 9,858,50127,300 TS Tech Co Ltd 798,506100,900 Tsumura & Co 2,936,08610,600 Unipres Corp 90,66522,700 Ushio Inc 284,7608,000 Vital KSK Holdings Inc 65,9568,900 Wacoal Holdings Corp 170,1769,100 Warabeya Nichiyo Holdings Co Ltd 121,30133,000 YAMABIKO Corp 446,15464,500 Yamaguchi Financial Group Inc 399,99423,300 Yamazen Corp 221,53138,300 Yellow Hat Ltd 589,690468,400 Yokogawa Electric Corp 8,252,5235,500 Yondoshi Holdings Inc 98,0867,200 Yuasa Trading Co Ltd 225,602159,900 Zenkoku Hosho Co Ltd 7,296,884
Total Japan 503,673,661
Kuwait �� 0.2%19,127 Agility Public Warehousing Co KSC 40,20172,399 Burgan Bank SAK 46,67187,243 Gulf Bank KSCP 59,92434,795 Gulf Cable & Electrical Industries Co KSCP 81,76531,884 Humansoft Holding Co KSC * 354,8672,163,736 Kuwait Finance House KSCP 4,825,871340,709 Kuwait Projects Co Holding KSCP 165,529166,320 Mobile Telecommunications Co KSC 316,347974,907 National Bank of Kuwait SAKP 2,684,81534,283 Qurain Petrochemical Industries Co 35,246
Total Kuwait 8,611,236
Shares Description Value ($)Malaysia �� 0.1%
22,700 Carlsberg Brewery Malaysia Berhad 107,2042,706,400 DRB-Hicom Berhad 1,320,991143,900 Hartalega Holdings Berhad 508,048303,000 Kossan Rubber Industries 466,070233,200 Pharmaniaga Berhad 314,732309,300 Ta Ann Holdings Berhad 234,230757,100 Top Glove Corp Berhad 1,324,160258,300 Westports Holdings Berhad 272,474789,100 YTL Corp Berhad * 124,931
Total Malaysia 4,672,840
Mexico �� 1.2%2,238,600 America Movil SAB de CV � Series L 1,671,453216,500 Arca Continental SAB de CV 1,063,633438,200 Banco del Bajio SA * 546,3881,238,200 Banco Santander Mexico SA Institucion de Banca
Multiple Grupo Financiero Santander Mexico 1,287,810283,200 Cemex SAB de CV Sponsored ADR 1,302,72080,400 Concentradora Fibra Danhos SA de CV (REIT) 95,357777,700 Credito Real SAB de CV SOFOM ER * 439,447198,700 El Puerto de Liverpool SAB de CV � Class C1 * 661,0801,976,400 Fibra Uno Administracion SA de CV (REIT) 1,972,464689,600 Fomento Economico Mexicano SAB de CV 4,981,710498,700 Gentera SAB de CV * 214,678304,100 Grupo Aeroportuario del Centro Norte SAB de CV * 1,768,7543,100 Grupo Aeroportuario del Centro Norte SAB de CV
ADR * 144,3362,983,100 Grupo Financiero Banorte SAB de CV � Class O * 14,853,322438,600 Grupo Financiero Inbursa SAB de CV � Class O * 427,527222,213 Grupo Herdez SAB de CV 435,8443,661,400 Grupo Mexico SAB de CV � Series B 13,315,66447,300 Kimberly-Clark de Mexico SAB de CV � Class A 74,986129,100 Qualitas Controladora SAB de CV 627,095214,600 Regional SAB de CV * 915,091310,869 Unifin Financiera SAB de CV SOFOM ENR * 385,7748,652,500 Wal-Mart de Mexico SAB de CV 22,776,215
Total Mexico 69,961,348
Netherlands �� 1.2%188,913 ABN AMRO Bank NV CVA * 1,933,960628,849 Aegon NV 2,326,297101,800 AerCap Holdings NV * (a) 3,742,1681,148 ASM International NV 202,406
Copyright © 2021 www.secdatabase.com. All Rights Reserved.Please Consider the Environment Before Printing This Document

GMO Implementation Fund(A Series of GMO Trust)Consolidated Schedule of Investments �� (Continued)(showing percentage of total net assets)November 30, 2020 (Unaudited)
Shares Description Value ($)Netherlands �� continued
237,051 ASR Nederland NV (b) 8,784,69073,710 Evander Gold Mines Ltd (c) 8794,163 Flow Traders 134,00346,377 ForFarmers NV 297,45420,612 Heineken Holding NV 1,899,037717 Hunter Douglas NV * 46,427494,672 ING Groep NV * 4,811,534259,189 Koninklijke Ahold Delhaize NV 7,410,55141,245 Koninklijke Vopak NV 2,162,756111,502 NIBC Holding NV * 988,66514,989 NN Group NV 605,779133,134 PostNL NV * 453,411167,436 Randstad NV * 10,355,639280,758 Signify NV * 11,834,45084,136 Wolters Kluwer NV 7,043,734
Total Netherlands 65,033,840
New Zealand �� 0.1%83,450 Air New Zealand Ltd * (a) 106,477905,530 Meridian Energy Ltd 4,084,911
Total New Zealand 4,191,388
Norway �� 0.4%67,379 Austevoll Seafood ASA 612,71327,001 Avance Gas Holding Ltd (a) 121,9378,019 Borregaard ASA 117,948461,545 BW LPG Ltd 2,947,404132,713 DNB ASA * 2,392,979495,668 Elkem ASA 1,593,69415,810 Entra ASA (a) 315,085167,113 Europris ASA 903,31467,400 Gjensidige Forsikring ASA 1,467,553211 Kongsberg Gruppen ASA 4,005110,019 Norsk Hydro ASA 445,495152,181 Norwegian Finans Holding ASA * 1,210,246444,616 Orkla ASA 4,255,8074,827 Salmar ASA * (a) 263,85836,490 Sbanken ASA * 291,81251,692 Selvaag Bolig ASA 301,36463,395 SpareBank 1 Nord Norge 520,19748,515 SpareBank 1 SMN 519,359149,960 SpareBank 1 SR-Bank ASA * 1,495,77337,813 Wallenius Wilhelmsen ASA * 90,35682,923 Yara International ASA (a) 3,361,175
Total Norway 23,232,074
Pakistan �� 0.1%174,523 Engro Corp Ltd 333,3842,006,673 Engro Fertilizers Ltd 762,649499,103 Fauji Fertilizer Co Ltd 323,136169,500 National Bank of Pakistan * 43,084
Shares Description Value ($)Pakistan �� continued
125,900 Nishat Mills Ltd 72,1761,781,180 Oil & Gas Development Co Ltd 1,094,617259,338 Pakistan Oilfields Ltd 639,4781,082,377 Pakistan Petroleum Ltd 611,511127,351 Pakistan State Oil Co Ltd * 158,999355,000 Searle Co Ltd (The) 518,633477,847 United Bank Ltd 361,507
Total Pakistan 4,919,174
Philippines �� 0.1%19,645 Globe Telecom Inc 795,011227,640 Manila Electric Co 1,330,93119,338,600 Megaworld Corp * 1,543,0678,576,000 Metro Pacific Investments Corp 730,30140,400 Metropolitan Bank & Trust Co 40,351496,300 Robinsons Land Corp 172,13482,010 Security Bank Corp 212,7961,367,225 Semirara Mining & Power Corp 352,263
Total Philippines 5,176,854
Poland �� 0.5%60,074 Asseco Poland SA 1,062,03817,459 Bank Polska Kasa Opieki SA * 264,26133,987 Budimex SA 2,484,466261,698 Cyfrowy Polsat SA 1,863,93683,767 Grupa Lotos SA 773,75213,010 KGHM Polska Miedz SA * 517,97828,081 Lubelski Wegiel Bogdanka SA * 139,5569,769 mBank SA * 394,050345,482 Polski Koncern Naftowy ORLEN SA 5,101,9861,187,126 Polskie Gornictwo Naftowe i Gazownictwo SA 1,515,5151,688,268 Powszechny Zaklad Ubezpieczen SA * 11,325,2946,660 Santander Bank Polska SA * 309,837
Total Poland 25,752,669
Portugal �� 0.4%251,608 Altri SGPS SA (a) 1,355,87113,907,352 Banco Comercial Portugues SA � Class R * (a) 1,968,398262,349 CTT-Correios de Portugal SA * (a) 763,34641,741 EDP Renovaveis SA 884,6921,137,001 EDP � Energias de Portugal SA 6,077,567585,532 Galp Energia SGPS SA 6,282,039127,972 Jeronimo Martins SGPS SA 2,192,739277,317 Mota-Engil SGPS SA * (a) 482,386400,162 Navigator Co SA (The) * 1,193,157186,201 NOS SGPS SA 712,028298,901 REN � Redes Energeticas Nacionais SGPS SA 819,67426,453 Semapa-Sociedade de Investimento e Gestao 283,205
Copyright © 2021 www.secdatabase.com. All Rights Reserved.Please Consider the Environment Before Printing This Document

GMO Implementation Fund(A Series of GMO Trust)Consolidated Schedule of Investments �� (Continued)(showing percentage of total net assets)November 30, 2020 (Unaudited)
Shares Description Value ($)Portugal �� continued
1,206,437 Sonae SGPS SA 971,697Total Portugal 23,986,799
Qatar �� 0.1%614,884 Doha Bank QPSC * 395,136178,264 Masraf Al Rayan QSC 209,129116,204 Ooredoo QPSC 215,543107,783 Qatar Electricity & Water Co QSC 533,137167,330 Qatar Insurance Co SAQ 116,46812,249 Qatar Islamic Bank SAQ 55,9621,270,052 Qatar National Bank QPSC 6,164,681456,982 Qatar National Cement Co QSC 510,518
Total Qatar 8,200,574
Russia �� 3.9%11,068,410 Alrosa PJSC 12,765,2711,093,600 Credit Bank of Moscow PJSC * 85,847392,020 Detsky Mir PJSC 720,88345,315 Etalon Group Plc GDR (Registered) 72,414331,590,000 Federal Grid Co Unified Energy System PJSC 869,72580,700 Gazprom Neft PJSC 333,7361,449 Gazprom Neft PJSC Sponsored ADR 29,2642,296,340 Gazprom PJSC 5,480,286293,235 Globaltrans Investment Plc Sponsored GDR
(Registered) 1,678,052208,915,000 Inter RAO UES PJSC 14,030,23142,811 LSR Group PJSC 509,615224,290 LSR Group PJSC GDR (Registered) 526,916239,146 LUKOIL PJSC 15,832,223518,871 LUKOIL PJSC Sponsored ADR 33,402,401173,600 M.Video PJSC 1,640,0613,677,600 Magnitogorsk Iron & Steel Works PJSC 2,024,470158,695 Magnitogorsk Iron & Steel Works PJSC Sponsored
GDR (Registered) 1,088,979775,859 MMC Norilsk Nickel PJSC ADR 21,517,400209,035 Mobile TeleSystems PJSC Sponsored ADR 1,803,9725,139,930 Moscow Exchange MICEX-RTS PJSC 10,315,93644,012 Novatek PJSC Sponsered GDR (Registered) 6,771,590480,848 Novolipetsk Steel PJSC GDR 11,896,02385,680 PhosAgro PJSC GDR (Registered) 1,094,375515,007 Polymetal International Plc 10,728,8467,629 Polyus PJSC 1,456,29762,936 Polyus PJSC GDR (Registered) 5,953,792324,950 Raspadskaya OJSC 622,307149,202,000 ROSSETI PJSC 3,296,1364,283,000 RusHydro PJSC 43,81530,090 Safmar Financial Investment * 185,1182,621,830 Sberbank of Russia PJSC 8,533,4011,076,721 Sberbank of Russia PJSC Sponsored ADR 14,203,652
Shares Description Value ($)Russia �� continued
198,464 Severstal PJSC GDR (Registered) 2,885,9172,110,100 Surgutneftegas PJSC 974,7052,733,683 Surgutneftegas PJSC Sponsored ADR 12,278,009351,065 Tatneft PJSC Sponsored ADR 13,238,86992,306 TCS Group Holding Plc GDR (Registered) 2,831,63128,395,000 Unipro PJSC 1,030,859376,156 VTB Bank PJSC GDR (Registered) 344,6673,313 X5 Retail Group NV GDR (Registered) 118,559
Total Russia 223,216,250
Saudi Arabia �� 0.0%48,386 Al Rajhi Bank 964,17714,148 Arriyadh Development Co 66,5036,028 Samba Financial Group 49,687
Total Saudi Arabia 1,080,367
Singapore �� 0.8%249,100 AEM Holdings Ltd 650,886648,700 Asian Pay Television Trust 58,032406,888 CapitaLand Integrated Commercial Trust (REIT) 586,221267,500 CapitaLand Ltd 619,268170,800 City Developments Ltd 983,0411,662,100 ComfortDelGro Corp Ltd 2,033,354523,000 DBS Group Holdings Ltd 9,756,874512,600 First Real Estate Investment Trust 161,932693,999 Japfa Ltd 384,089142,700 Jardine Cycle & Carriage Ltd 2,052,433107,300 Keppel DC (REIT) 224,5881,156,300 Mapletree Industrial Trust (REIT) 2,524,672330,700 Mapletree Logistics Trust (REIT) 483,8651,759,900 Mapletree North Asia Commercial Trust (REIT) 1,174,14121,300 Oversea-Chinese Banking Corp Ltd 158,803545,900 Sasseur Real Estate Investment Trust 328,866954,100 Silverlake Axis Ltd 188,04999,800 Singapore Exchange Ltd 658,041479,400 StarHub Ltd 460,50048,700 United Overseas Bank Ltd 810,00187,900 Venture Corp Ltd 1,226,846122,400 Wilmar International Ltd 381,01925,307,177 Yangzijiang Shipbuilding Holdings Ltd 16,445,089866,500 Yanlord Land Group Ltd 715,351
Total Singapore 43,065,961
South Africa �� 1.9%2,215,032 Absa Group Ltd 15,665,61839,768 AECI Ltd 218,77716,868 Anglo American Platinum Ltd 1,223,53142,400 AngloGold Ashanti Ltd Sponsored ADR 918,808244,123 Aspen Pharmacare Holdings Ltd * 1,938,797
Copyright © 2021 www.secdatabase.com. All Rights Reserved.Please Consider the Environment Before Printing This Document

GMO Implementation Fund(A Series of GMO Trust)Consolidated Schedule of Investments �� (Continued)(showing percentage of total net assets)November 30, 2020 (Unaudited)
Shares Description Value ($)South Africa �� continued
207,964 Astral Foods Ltd 1,805,19145,152 AVI Ltd 207,021533,661 Barloworld Ltd 2,399,057351,369 Bidvest Group Ltd (The) 3,683,5471,352,911 Blue Label Telecoms Ltd * 343,62837,473 Clicks Group Ltd 565,81947,413 Discovery Ltd 375,569896,766 Emira Property Fund Ltd (REIT) 376,9981,793 Gold Fields Ltd 15,547352,000 Gold Fields Ltd Sponsored ADR 3,065,9202,440,707 Growthpoint Properties Ltd (REIT) 1,874,181315,643 Imperial Logistics Ltd 787,393316,507 Investec Ltd 768,263339,709 Kumba Iron Ore Ltd 11,545,956350,319 Lewis Group Ltd 497,812146,808 Liberty Holdings Ltd 563,770757,281 Life Healthcare Group Holdings Ltd 774,090755,346 Momentum Metropolitan Holdings 759,431435,928 Motus Holdings Ltd * 1,618,915299,433 Mr Price Group Ltd 3,130,678133,026 Naspers Ltd � N Shares 26,743,141989,609 Netcare Ltd 786,7044,536,827 Old Mutual Ltd 3,407,680628,102 Pepkor Holdings Ltd 559,71096,661 Rand Merchant Investment Holdings Ltd 189,26531,582 Remgro Ltd 186,496329,396 Reunert Ltd 765,7353,356,794 RMB Holdings Ltd * 276,2672,054,215 Sanlam Ltd 7,318,05138,934 Santam Ltd 617,98888,670 Sappi Ltd * 165,4334,383 Shoprite Holdings Ltd 36,2472,273,278 Telkom SA SOC Ltd 4,618,87825,373 Tiger Brands Ltd 321,4421,190,440 Truworths International Ltd 2,746,364267,529 Tsogo Sun Gaming Ltd 88,786160,482 Vodacom Group Ltd 1,273,612244,310 Wilson Bayly Holmes-Ovcon Ltd * 1,598,265
Total South Africa 106,824,381
South Korea �� 2.8%79,547 Aekyung Petrochemical Co Ltd 678,47126,575 Aju Capital Co Ltd 304,970150,493 BNK Financial Group Inc 765,6915,522 Com2uSCorp 670,27211,121 Daou Data Corp 126,206128,520 DB HiTek Co Ltd 4,127,30942,996 DB Insurance Co Ltd 1,709,60713,945 DongKook Pharmaceutical Co Ltd 323,928520,896 Dongwon Development Co Ltd 2,077,46116,927 Doosan Fuel Cell Co Ltd * 763,03813,356 DoubleUGames Co Ltd 708,049
Shares Description Value ($)South Korea �� continued
17,652 GS Home Shopping Inc 2,191,475879,071 Hana Financial Group Inc 26,718,24166,170 Hankook Tire & Technology Co Ltd 1,958,67635,827 Huons Co Ltd 2,030,41311,634 Hy-Lok Corp 144,21330,038 Hyundai Home Shopping Network Corp 1,981,73116,334 Hyundai Mobis Co Ltd 3,605,71120,533 Hyundai Motor Co 3,373,5291,299 Ilyang Pharmaceutical Co Ltd 75,781194,899 Industrial Bank of Korea 1,634,184145,130 JB Financial Group Co Ltd 715,7568,933 JNTC Co Ltd * 91,051168,733 KB Financial Group Inc 6,975,44910,174 KC Co Ltd 229,2843,159 KEPCO Plant Service & Engineering Co Ltd 82,886540,333 Kia Motors Corp 28,261,71877,111 Korea Asset In Trust Co Ltd 276,04245,196 Korea Autoglass Corp 674,07053,855 Korean Reinsurance Co 376,8636,488 KT Skylife Co Ltd 52,671173,324 KT&G Corp 12,933,93295,874 LF Corp 1,275,505102,771 LG Electronics Inc 7,944,49420,004 LOTTE Himart Co Ltd 568,21428,523 Mirae Asset Life Insurance Co Ltd 101,6911,081 NCSoft Corp 794,30914,116 NHN KCP Corp 853,94042,253 Posco International Corp 507,85337,051 S&T Motiv Co Ltd 1,664,83660,458 Samjin Pharmaceutical Co Ltd 1,573,79512,344 Sangsangin Co Ltd 72,2068,508 Sebang Global Battery Co Ltd 337,930658,940 Shinhan Financial Group Co Ltd 19,403,10814,759 SK Telecom Co Ltd 3,158,300295,441 SK Telecom Co Ltd Sponsored ADR 6,945,81833,965 SL Corp 506,75413,952 Soulbrain Holdings Co Ltd 544,588180 Taekwang Industrial Co Ltd 124,947234,972 Woori Financial Group Inc 2,078,32187,833 Yuhan Corp 5,115,588
Total South Korea 160,210,875
Spain �� 1.1%31,977 Acerinox SA 331,370166,901 ACS Actividades de Construccion y Servicios SA * 5,272,89628,578 Aena SME SA * 4,655,58572,164 Almirall SA (a) 928,19483,763 Amadeus IT Group SA 5,759,91544,710 Atresmedia Corp de Medios de Comunicacion SA (a) 158,489
Copyright © 2021 www.secdatabase.com. All Rights Reserved.Please Consider the Environment Before Printing This Document

GMO Implementation Fund(A Series of GMO Trust)Consolidated Schedule of Investments �� (Continued)(showing percentage of total net assets)November 30, 2020 (Unaudited)
Shares Description Value ($)Spain �� continued
805,450 Banco Bilbao Vizcaya Argentaria SA 3,729,6962,540,439 Banco Santander SA * 7,367,57217,035 Bankinter SA 84,47796,025 CaixaBank SA 245,647111,319 Cia de Distribucion Integral Logista Holdings SA 2,052,79328,843 Ebro Foods SA 682,59527,069 eDreams ODIGEO SA * (a) 121,3684,863 Enagas SA 118,807251,639 Endesa SA 7,232,75188,667 Faes Farma SA 397,7232,450 Grupo Catalana Occidente SA 79,971304,505 Iberdrola SA 4,180,157176,689 Industria de Diseno Textil SA 5,865,081467,142 Mediaset Espana Comunicacion SA * 2,105,559334,336 Red Electrica Corp SA 6,834,85413,586 Repsol SA 130,2181,305,014 Unicaja Banco SA * 1,028,22338,623 Viscofan SA 2,737,294
Total Spain 62,101,235
Sweden �� 0.4%255,829 Betsson AB * 2,207,0816,757 Bufab AB * 127,67818,848 Humana AB * 118,827101,076 Inwido AB * 1,239,0589,787 Lindab International AB 170,70212,999 New Wave Group AB � B Shares * 76,404405,527 Nordea Bank Abp * 3,465,81133,824 Skanska AB � B Shares 803,6907,268 Swedbank AB � A Shares * 131,60143,536 Swedish Match AB 3,522,14425,117 Volvo AB � A Shares * 577,310313,867 Volvo AB � B Shares * 7,148,824
Total Sweden 19,589,130
Switzerland �� 0.4%25,743 ABB Ltd (Registered) 680,84357,545 Adecco Group AG (Registered) 3,478,7142,225 ALSO Holding AG (Registered) * 582,31215,402 ams AG * 394,78627,742 Banque Cantonale Vaudoise (Registered) 2,856,7486,642 BKW AG 687,2722,433 Bobst Group SA (Registered) 141,4252,568 Huber + Suhner AG (Registered) 208,9851,531 Kardex Holding AG (Registered) 301,5642,185 Logitech International SA (Registered) 194,7385,037 Mobilezone Holding AG (Registered) 53,83040,375 Novartis AG (Registered) 3,655,3704,260 Roche Holding AG 1,416,10327,959 Roche Holding AG � Genusschein 9,183,047
Shares Description Value ($)Switzerland �� continued
5,011 Vetropack Holding AG (Registered) * 326,6746,132 Zehnder Group AG � Class RG 333,083
Total Switzerland 24,495,494
Taiwan �� 6.2%302,000 Ability Enterprise Co Ltd 146,59221,000 Acter Group Corp Ltd 142,570358,000 Alchip Technologies Ltd 8,393,25246,678 Amazing Microelectronic Corp 150,6692,037,672 Asustek Computer Inc 17,773,87965,000 Aten International Co Ltd 189,8483,042,000 Catcher Technology Co Ltd 20,077,2871,300,000 Cathay Financial Holding Co Ltd 1,842,5071,000,525 Chailease Holding Co Ltd 5,489,0071,494,660 Chicony Electronics Co Ltd 4,475,624120,000 Chicony Power Technology Co Ltd 283,1653,495,000 China Development Financial Holding Corp 1,094,549226,400 China Motor Corp * 381,995390,000 Chong Hong Construction Co Ltd 1,135,8572,135,000 Coretronic Corp 2,630,86813,579,000 CTBC Financial Holding Co Ltd 9,133,42561,000 Depo Auto Parts Ind Co Ltd 111,672232,000 Elan Microelectronics Corp 1,075,148608,000 Elite Material Co Ltd 3,328,810241,000 Elitegroup Computer Systems Co Ltd * 145,8861,712,000 Eva Airways Corp 759,821496,000 Farglory Land Development Co Ltd 908,90845,080 Feng TAY Enterprise Co Ltd 289,8672,163,000 FLEXium Interconnect Inc 9,114,447244,000 Formosa Advanced Technologies Co Ltd 316,8091,415,000 Formosa Taffeta Co Ltd 1,521,1921,188,000 Foxconn Technology Co Ltd 2,192,4434,263,000 Fubon Financial Holding Co Ltd 6,626,2301,875,000 Gigabyte Technology Co Ltd 5,163,81961,000 Gold Circuit Electronics Ltd * 110,3555,493,000 Grand Pacific Petrochemical * 4,512,722730,580 Great Wall Enterprise Co Ltd 1,187,574121,000 Holiday Entertainment Co Ltd 268,915364,000 Holtek Semiconductor Inc 917,72519,351,406 Hon Hai Precision Industry Co Ltd 55,864,681462,000 Huaku Development Co Ltd 1,430,978389,980 IEI Integration Corp 658,98827,660 Innodisk Corp 158,399242,000 International Games System Co Ltd 5,769,494161,000 Kung Long Batteries Industrial Co Ltd 791,1021,374,000 Lite-On Technology Corp 2,315,47931,000 Lotes Co Ltd 484,2411,973,992 Mercuries Life Insurance Co Ltd * 601,787455,000 Merry Electronics Co Ltd 2,260,868760,000 Micro-Star International Co Ltd 3,328,5982,083,368 Mitac Holdings Corp 2,155,585
Copyright © 2021 www.secdatabase.com. All Rights Reserved.Please Consider the Environment Before Printing This Document

GMO Implementation Fund(A Series of GMO Trust)Consolidated Schedule of Investments �� (Continued)(showing percentage of total net assets)November 30, 2020 (Unaudited)
Shares Description Value ($)Taiwan �� continued
19,000 Nan Liu Enterprise Co Ltd 128,659391,000 Nantex Industry Co Ltd 842,9512,027,000 Novatek Microelectronics Corp 21,275,0183,000 Parade Technologies Ltd 109,0343,021,000 Pegatron Corp 6,911,905217,000 Phison Electronics Corp 2,458,8577,929,566 Pou Chen Corp 8,685,4772,372,000 Qisda Corp 1,954,5111,476,000 Quanta Computer Inc 3,984,0707,637,020 Radiant Opto-Electronics Corp 31,103,943530,000 Ruentex Development Co Ltd 782,39029,000 Sheng Yu Steel Co Ltd 20,470200,000 Shinkong Insurance Co Ltd 273,1783,000 Silergy Corp. 233,730615,400 Simplo Technology Co Ltd 7,155,313136,000 Soft-World International Corp 431,005141,000 Standard Chemical & Pharmaceutical Co Ltd 192,912802,000 Sunplus Technology Co Ltd * 438,952610,000 Syncmold Enterprise Corp 1,852,11115,400 Tah Hsin Industrial Corp 39,3111,123,000 Taiwan PCB Techvest Co Ltd 1,797,8512,214,000 Taiwan Semiconductor Manufacturing Co Ltd 37,686,330192,550 Taiwan Semiconductor Manufacturing Co Ltd
Sponsored ADR (a) 18,681,20122,000 Thinking Electronic Industrial Co Ltd 112,755516,264 TOPBI International Holdings Ltd 570,966432,064 Topco Scientific Co Ltd 1,842,21529,000 Topkey Corp 170,112652,000 Transcend Information Inc 1,476,809516,000 Tripod Technology Corp 2,219,304301,681 United Integrated Services Co Ltd 2,420,3181,122,000 United Microelectronics Corp 1,593,846114,000 Universal Inc 426,4158,000 Universal Vision Biotechnology Co Ltd 83,378176,000 Wah Lee Industrial Corp 477,390446,000 Wistron Corp 466,49338,000 Wiwynn Corp 909,986493,000 Youngtek Electronics Corp 1,083,44020,000 Yulon Nissan Motor Co Ltd 183,583
Total Taiwan 348,789,826
Thailand �� 0.1%669,000 AP Thailand Pcl NVDR 154,720258,600 Bangkok Bank Pcl NVDR 1,008,9697,548,600 Beauty Community Pcl NVDR * 384,16665,900 Hana Microelectronics Pcl NVDR 93,0828,324,200 IRPC Pcl NVDR 748,49070,500 KCE Electronics Pcl NVDR 93,74382,900 Kiatnakin Phatra Bank Pcl NVDR 135,373708,900 Krung Thai Bank Pcl NVDR 250,232
Shares Description Value ($)Thailand �� continued
274,300 Origin Property Pcl NVDR 70,273363,200 Pruksa Holding Pcl (Foreign Registered) 150,1261,515,300 Pruksa Holding Pcl NVDR 626,339849,700 SC Asset Corp Pcl (Foreign Registered) 76,9692,100 Siam Commercial Bank Pcl NVDR (The) 5,926207,800 Somboon Advance Technology Pcl NVDR 98,686222,500 SPCG Pcl NVDR 158,1001,073,525 Supalai Pcl (Foreign Registered) 635,026583,000 Supalai Pcl NVDR 344,864201,500 Thai Vegetable Oil Pcl NVDR 216,54920,773,800 TMB Bank Pcl NVDR 721,074453,300 TTW Pcl NVDR 190,438985,600 Univentures Pcl NVDR 99,096
Total Thailand 6,262,241
Turkey �� 0.8%970,171 Aksa Akrilik Kimya Sanayii AS 1,328,020413,025 Alkim Alkali Kimya AS 720,822204,837 Anadolu Efes Biracilik Ve Malt Sanayii AS 548,502426,031 Arcelik AS * 1,486,4312,961,632 Aselsan Elektronik Sanayi Ve Ticaret AS 6,546,66761,656 BIM Birlesik Magazalar AS 552,3594,070,023 Dogan Sirketler Grubu Holding AS 1,249,083220,674 Dogus Otomotiv Servis ve Ticaret AS 751,90813,998,623 Emlak Konut Gayrimenkul Yatirim Ortakligi AS
(REIT) 3,855,6841,821,359 Enerjisa Enerji AS 2,516,2093,280,733 Eregli Demir ve Celik Fabrikalari TAS 4,612,16119,144 Ford Otomotiv Sanayi AS 263,381389,210 Goodyear Lastikleri TAS * 372,4641,052,357 KOC Holding AS 2,368,371228,571 Koza Altin Isletmeleri AS * 2,178,338318,983 Koza Anadolu Metal Madencilik Isletmeleri AS * 515,941338,429 Ozak Gayrimenkul Yatirim Ortakligi (REIT) * 183,216653,505 Selcuk Ecza Deposu Ticaret ve Sanayi AS 1,047,13244,633 Tofas Turk Otomobil Fabrikasi AS 162,222843,363 Torunlar Gayrimenkul Yatirim Ortakligi AS (REIT) * 390,2892,740,297 Turkiye Garanti Bankasi AS * 3,069,65111,505,129 Turkiye Is Bankasi � Class C * 9,604,8171,210,974 Turkiye Sise ve Cam Fabrikalari AS 1,052,09945,765 Vestel Beyaz Esya Sanayi ve Ticaret AS 201,116
Total Turkey 45,576,883
United Arab Emirates �� 0.1%196,980 Abu Dhabi Islamic Bank PJSC 251,85753,315 Abu Dhabi National Oil Co for Distribution PJSC 50,161
Copyright © 2021 www.secdatabase.com. All Rights Reserved.Please Consider the Environment Before Printing This Document

GMO Implementation Fund(A Series of GMO Trust)Consolidated Schedule of Investments �� (Continued)(showing percentage of total net assets)November 30, 2020 (Unaudited)
Shares Description Value ($)United Arab Emirates �� continued
723,427 Dubai Islamic Bank PJSC 876,784264,256 Emaar Malls PJSC * 131,1346,655,008 Emaar Properties PJSC * 5,741,669150,839 Emirates NBD Bank PJSC 449,175
Total United Arab Emirates 7,500,780
United Kingdom �� 3.9%360,410 3i Group Plc 5,095,140105,452 888 Holdings Plc 382,198839 Admiral Group Plc 31,603131,352 Aggreko Plc 973,66836,501 Alliance Pharma Plc 36,29432,323 Anglo American Plc 941,24121,411 AVEVA Group Plc (a) 963,37394,298 Aviva Plc 399,23866,509 B&M European Value Retail SA 420,51232,351 Bank of Georgia Group Plc * 485,5451,188,785 Barratt Developments Plc * 9,746,114131,393 Bellway Plc 4,935,590220,702 Berkeley Group Holdings Plc (The) 13,490,1144,300 BP Plc Sponsored ADR (a) 84,10872,829 British American Tobacco Plc 2,563,745201,700 British American Tobacco Plc Sponsored ADR 7,122,0272,407,646 BT Group Plc 3,726,82028,219 Bunzl Plc 878,92341,219 Carnival Plc 714,5061,823,655 Centamin Plc 2,762,67776,903 Central Asia Metals Plc 221,09339,959 CMC Markets Plc 207,056100,547 Coca-Cola HBC AG * 2,872,088401,494 Compass Group Plc 7,064,55242,827 Computacenter Plc 1,262,5525,531 Cranswick Plc 252,06129,293 Daily Mail & General Trust Plc � Class A 264,5061,199 Diploma Plc 33,6683,669 Dixons Carphone Plc 5,37941,521 Dunelm Group Plc * 667,79287,406 Electrocomponents Plc 941,22815,495 EMIS Group Plc 201,16130,214 Evraz Plc 151,82983,932 Ferguson Plc 9,395,266824,323 Ferrexpo Plc 2,311,608200,635 Frasers Group Plc * 1,119,68917,273 Fresnillo Plc 243,0107,548 Games Workshop Group Plc 988,45156,840 Go-Ahead Group Plc (The) * 615,4083,708 Greggs Plc * 83,013143,158 Halfords Group Plc 507,9852,454 Hikma Pharmaceuticals Plc 84,766346,000 HSBC Holdings Plc * 1,804,482310,097 IG Group Holdings Plc 3,303,602
Shares Description Value ($)United Kingdom �� continued
52,415 IMI Plc 776,769215,363 Inchcape Plc * 1,714,448323,262 Indivior Plc * 437,00983,066 International Personal Finance Plc * (a) 97,649184,324 Investec Plc 453,831984,482 ITV Plc * 1,225,139611,010 J Sainsbury Plc 1,705,545281,776 JD Sports Fashion Plc * 2,891,449109,177 John Laing Group Plc 459,30015,984 Johnson Matthey Plc 470,99422,942 Jupiter Fund Management Plc 74,1001,703,064 Kingfisher Plc * 6,184,8882,055,070 Legal & General Group Plc 6,786,6051,370,326 M&G Plc 3,400,0961,076,064 Micro Focus International Plc * 4,956,073172,056 Mitchells & Butlers Plc * 484,43235,607 Mondi Plc 779,123100,325 Morgan Advanced Materials Plc 375,97050,417 Morgan Sindall Group Plc 935,007331,118 National Express Group Plc * 975,76073,712 National Grid Plc 825,46734,415 Next Plc 2,972,86423,905 Numis Corp Plc 109,73194,460 OSB Group Plc * 489,299161,298 Paragon Banking Group Plc 866,284516,093 Persimmon Plc 18,110,858254,514 Pets at Home Group Plc 1,403,687102,236 Phoenix Group Holdings Plc 968,251148,588 Playtech Plc * 758,459209,481 Plus500 Ltd 4,299,320543,697 Premier Foods Plc * 636,569619,774 QinetiQ Group Plc 2,409,861104,630 Redde Northgate Plc 336,566156,273 Royal Dutch Shell Plc � A Shares 2,638,491479,527 Royal Dutch Shell Plc � B Shares 7,701,433904,500 Royal Dutch Shell Plc � Class B Sponsored ADR 29,351,02579,395 Royal Mail Plc 321,753448,818 RSA Insurance Group Plc 4,032,8247,500 Smith & Nephew Plc Sponsored ADR 295,12571,920 Smiths Group Plc 1,381,88933,891 Softcat Plc 510,938394,953 Spirent Communications Plc 1,348,685110,403 Stock Spirits Group Plc 346,259697,734 Tate & Lyle Plc 5,894,283592,676 Taylor Wimpey Plc * 1,206,20375,433 TI Fluid Systems Plc * 221,70243,380 Vesuvius Plc 280,119152,686 WM Morrison Supermarkets Plc 363,362520,993 WPP Plc 5,020,157
Total United Kingdom 220,641,332
Copyright © 2021 www.secdatabase.com. All Rights Reserved.Please Consider the Environment Before Printing This Document

GMO Implementation Fund(A Series of GMO Trust)Consolidated Schedule of Investments �� (Continued)(showing percentage of total net assets)November 30, 2020 (Unaudited)
Shares Description Value ($)United States �� 18.0%
11,100 1st Source Corp. 414,252303,600 ACCO Brands Corp. (a) 2,325,576116,400 Acushnet Holdings Corp. (a) (b) 4,388,28046,600 Adtalem Global Education, Inc. * (a) 1,334,15893,700 ADTRAN, Inc. 1,183,89946,900 AgroFresh Solutions, Inc. * 107,87021,600 Alexion Pharmaceuticals, Inc. * 2,637,57656,300 Alliance Data Systems Corp. 4,117,78254,300 Ally Financial, Inc. (a) 1,609,99546,500 Alpha & Omega Semiconductor Ltd. * 1,155,06019,400 Amalgamated Bank � Class A 246,7687,800 AMC Networks, Inc. � Class A * (a) 257,16664,594 American Express Co. (a) 7,660,20214,700 American Public Education, Inc. * 456,2887,300 American Vanguard Corp. 110,66854,200 Amneal Pharmaceuticals, Inc. * (a) 214,09039,500 AngioDynamics, Inc. * 561,6901,000 Anthem, Inc. (a) 311,5202,200 Applied Industrial Technologies, Inc. 172,54624,600 ArcBest Corp. 1,030,9869,700 Arcosa, Inc. 503,333152,100 Arlo Technologies, Inc. * 800,04636,500 Arrow Electronics, Inc. * 3,345,2252,987 Arrow Financial Corp. 88,893116,600 Associated Banc-Corp. (a) 1,786,312104,100 AT&T, Inc. (a) 2,992,87593,100 Athene Holding Ltd. � Class A * (a) 4,128,98531,000 Atlas Air Worldwide Holdings, Inc. * (a) 1,730,11081,600 AutoNation, Inc. * (a) 5,001,26481,100 Avient Corp. (a) 2,964,20533,100 Avnet, Inc. 1,004,58522,800 AZZ, Inc. 1,016,65212,900 BankFinancial Corp. 104,1034,100 Bar Harbor Bankshares 94,50511,700 Bassett Furniture Industries, Inc. 183,69063,800 Bed Bath & Beyond, Inc. 1,337,2489,830 Bel Fuse, Inc. � Class B 144,108109,300 Benchmark Electronics, Inc. 2,658,176137,300 Big Lots, Inc. (a) (b) 7,094,29111,200 Biogen, Inc. * 2,689,90417,400 Bloomin� Brands, Inc. (a) 304,5002,800 Booking Holdings, Inc. * (a) 5,679,660178,100 BorgWarner, Inc. (a) (b) 6,919,18548,200 Boston Private Financial Holdings, Inc. 345,112108,700 Brady Corp. � Class A 4,802,36613,700 Bridge Bancorp, Inc. 305,78473,200 Brightsphere Investment Group, Inc. 1,295,64041,600 Brinker International, Inc. (a) 2,084,57678 Bristol-Myers Squibb Co. 4,86715,300 Brookline Bancorp, Inc. 173,9612,500 Cabot Corp. 103,52531,000 Calix, Inc. * (a) 734,080
Shares Description Value ($)United States �� continued
13,300 Camden National Corp. 456,85546,500 Capital One Financial Corp. (a) 3,982,26058,200 Capri Holdings Ltd. * 2,059,11697,360 Carnival Corp. (a) 1,945,2533,100 Carriage Services, Inc. 84,35168,900 Carrier Global Corp. (a) 2,623,02379,700 Cars.com, Inc. * 890,24922,300 Cathay General Bancorp 629,97542,500 CBIZ, Inc. * 1,029,35067,800 CBRE Group, Inc. � Class A * 4,145,29243,000 Centene Corp. * (a) 2,650,9508,700 Central Garden & Pet Co. * 348,34825,800 Central Garden & Pet Co. � Class A * 951,7624,815 Century Bancorp, Inc. � Class A 355,828375,100 CenturyLink, Inc. (a) 3,919,795537,182 Charles Schwab Corp. (The) (a) 26,203,73853,300 Chevron Corp. (a) 4,646,69416,700 Cigna Corp. (a) 3,492,63816,000 Cisco Systems, Inc. (a) 688,32083,900 Citigroup, Inc. 4,620,37352,600 Citizens Financial Group, Inc. (a) 1,717,91611,860 Civista Bancshares, Inc. 199,60438,771 Clarus Corp. 558,3028,600 CNB Financial Corp. 169,24866,483 Coca-Cola Co. (The) (a) 3,430,52332,500 Cognizant Technology Solutions Corp. � Class A (a) 2,539,22569,200 Comcast Corp. � Class A (a) 3,476,6088,500 Community Trust Bancorp, Inc. 287,72538,600 Computer Programs & Systems, Inc. 1,097,39897,300 Comtech Telecommunications Corp. 1,854,538288,191 Concho Resources, Inc. (a) (b) 16,565,21957,300 Consolidated Communications Holdings, Inc.* 320,88027,800 Cooper Tire & Rubber Co. 1,104,49443,300 Core-Mark Holding Co., Inc. 1,350,527445,500 CoreCivic, Inc. (REIT) 3,158,595162,400 CorePoint Lodging, Inc. (REIT) 1,057,22424,300 Cornerstone Building Brands, Inc. * (a) 212,38284,700 Corteva, Inc. (a) 3,245,704405,300 Coty Inc. � Class A (a) 2,914,107100 Covetrus, Inc. * (a) 2,70216,400 CRA International, Inc. 751,94029,000 CSG Systems International, Inc. (a) 1,258,02022,600 CTS Corp. 688,39647,200 Curo Group Holdings Corp. 407,80849,700 CVS Health Corp. (a) 3,369,16335,799 CytomX Therapeutics, Inc. * 269,2081,100 Deluxe Corp. (a) 28,314191,200 Designer Brands, Inc. � Class A (a) 1,510,48075,100 DHI Group, Inc. * 144,1922,600 Diamond Hill Investment Group, Inc. 355,732
Copyright © 2021 www.secdatabase.com. All Rights Reserved.Please Consider the Environment Before Printing This Document

GMO Implementation Fund(A Series of GMO Trust)Consolidated Schedule of Investments �� (Continued)(showing percentage of total net assets)November 30, 2020 (Unaudited)
Shares Description Value ($)United States �� continued
29,000 Dick�s Sporting Goods, Inc. (a) 1,647,49015,800 Digi International, Inc. * (a) 271,12857,800 Dime Community Bancshares, Inc. 835,2101,082,700 Discovery, Inc. � Class C * (b) 26,006,454121,900 DISH Network Corp. � Class A * (a) 4,372,5534,047 Donegal Group, Inc. � Class A 56,577118,200 Donnelley Financial Solutions, Inc. * 1,925,47842,900 DR Horton, Inc. 3,196,05043,900 DSP Group, Inc. * 738,83723,000 Ducommun, Inc. * 1,143,5607,800 Duluth Holdings Inc. � Class A * (a) 114,66034,100 Edwards Lifesciences Corp. * (a) 2,860,64925,600 Ellington Financial, Inc. (REIT) 368,6403,000 Employers Holdings, Inc. 91,53030,100 Encore Capital Group, Inc. * (a) 1,027,614300 Encore Wire Corp. 15,501433,400 Endo International Plc * (a) 2,201,67222,100 Endurance International Group Holdings, Inc. * 209,508500 EnerSys (a) 40,90530,200 Ennis, Inc. 494,374169,425 Enova International, Inc. * (a) 3,542,677400 EnPro Industries, Inc. 28,324120,718 EOG Resources, Inc. (a) 5,659,2604,000 ePlus, Inc. * 337,2401,288,200 ESC NII Holdings, Inc. (c) 2,705,2207,400 Escalade, Inc. 142,5987,300 ESSA Bancorp, Inc. (a) 115,486129,000 Ethan Allen Interiors, Inc. 2,356,83051,300 Evolution Petroleum Corp. 155,95264,300 Exelon Corp. (a) 2,640,80131,500 Expedia Group, Inc. (a) 3,921,43582,600 Exxon Mobil Corp. (a) 3,149,5381,200 Federal Agricultural Mortgage Corp. � Class C 81,240102,700 Federal Signal Corp. (b) 3,186,78199,000 Federated Hermes, Inc. (a) 2,657,16027,100 FedNat Holding Co. 152,84420,130 Financial Institutions, Inc. 402,80112,826 First Community Bankshares, Inc. 270,2449,900 First Financial Corp. 374,9137,900 First Financial Northwest, Inc. 87,21612,800 First Foundation, Inc. (a) 227,328276,000 FirstEnergy Corp. (a) (e) 7,330,560166,800 Flagstar Bancorp, Inc. (b) 5,844,6724,100 FleetCor Technologies, Inc. * (a) 1,087,3618,000 Flushing Financial Corp. 113,60013,100 FONAR Corp.* 251,651468,200 Ford Motor Co. (a) 4,251,25674,500 Fox Corp. � Class A (a) 2,148,58088,300 Fox Corp. � Class B * 2,505,95427,000 FutureFuel Corp. 323,730
Shares Description Value ($)United States �� continued
15,400 G-III Apparel Group Ltd. * (a) 313,69851,600 GameStop Corp. � Class A * 854,496201,500 GCI Liberty, Inc. � Class A * (b) 18,360,68098,400 General Motors Co. (a) 4,313,85615,100 Genesco, Inc. * (a) 473,68738,000 Genie Energy Ltd. � Class B 315,400230,700 GEO Group, Inc. (The) (REIT) 2,180,11512,400 Gilead Sciences, Inc. (a) 752,30818,500 Goldman Sachs Group, Inc. (The) 4,265,73028,900 Gorman-Rupp Co. (The) 950,8101,500 Graham Holdings Co. � Class B 670,5305,600 Great Southern Bancorp, Inc. 257,04062,200 Greif, Inc. � Class A (a) 3,023,542103,300 Griffon Corp. (a) 2,153,80511,000 Gritstone Oncology, Inc. * (a) 33,55072,600 Group 1 Automotive, Inc. (b) 8,625,606160,388 Grubhub, Inc. * (b) 11,281,6928,500 H&R Block, Inc. (a) 159,80052,100 Hasbro, Inc. (a) 4,846,86369,600 Haverty Furniture Cos, Inc. 1,894,5122,700 Hawkins, Inc. 135,4866,700 HB Fuller Co. (a) 350,611145,120 HD Supply Holdings, Inc. * 8,099,14710,200 HealthStream, Inc. * 190,53651,681 HEICO Corp. (a) 6,386,73822,500 Heidrick & Struggles International, Inc. 587,25013,500 Heritage Financial Corp. 314,145188,736 Herman Miller, Inc. (b) 6,726,55154,775 Hilltop Holdings, Inc. 1,319,53068,800 Hilton Grand Vacations, Inc. * 1,908,51248,872 Hilton Worldwide Holdings, Inc. (a) 5,064,60541,200 HNI Corp. 1,502,15225,300 Honeywell International, Inc. (a) 5,159,17686,200 HP, Inc. (a) 1,890,3665,700 Hurco Cos, Inc. 169,91711,320 Hyatt Hotels Corp. � Class A (a) 814,70026,000 Hyster-Yale Materials Handling, Inc. 1,431,04027,100 IDT Corp. � Class B * 323,032309,050 iHeartMedia, Inc. � Class A * (a) 3,694,6931,200 Independence Holding Co. 47,31623,163 Independent Bank Corp. 394,00319,800 Information Services Group, Inc. * 59,79615,562 Ingles Markets, Inc. � Class A 584,97647,100 Innospec, Inc. 3,875,8591,200 Inogen, Inc. * (a) 42,084135,900 Inphi Corp. * (a) 21,082,16793,500 Insight Enterprises, Inc. * (a) (b) 6,683,38013,000 Insteel Industries, Inc. 300,6909,100 Integer Holdings Corp. * (a) 656,01965,500 Intel Corp. (a) 3,166,92523,900 Inter Parfums, Inc. (a) 1,298,009
Copyright © 2021 www.secdatabase.com. All Rights Reserved.Please Consider the Environment Before Printing This Document

GMO Implementation Fund(A Series of GMO Trust)Consolidated Schedule of Investments �� (Continued)(showing percentage of total net assets)November 30, 2020 (Unaudited)
Shares Description Value ($)United States �� continued
35,000 Interface, Inc. 292,07551,675 International Bancshares Corp. (b) 1,674,78733,100 International Business Machines Corp. (a) 4,088,512152,100 Invesco Ltd. (a) 2,468,583415,500 Investors Bancorp, Inc. (a) 4,022,04018,700 Jazz Pharmaceuticals Plc * (a) 2,631,277118,473 JELD-WEN Holding, Inc. * 2,865,86217,800 Johnson Outdoors, Inc. � Class A (b) 1,488,0802,800 Jones Lang LaSalle, Inc. * (a) 370,41230,400 Kelly Services, Inc. � Class A 621,98431,900 Kezar Life Sciences, Inc. * 209,9028,500 Kforce, Inc. 348,92534,700 Kimball Electronics, Inc. * 534,72789,400 Kimball International, Inc. � Class B 977,142293,400 Kinder Morgan, Inc. (a) 4,219,0928,400 Knoll, Inc. 114,744109,500 Kohl�s Corp. (a) 3,525,90018,800 Koppers Holdings, Inc. * 508,91649,200 Kraft Heinz Co. (The) (a) 1,620,64876,500 Kroger Co. (The) (a) 2,524,5005,000 Kronos Worldwide, Inc. (a) 68,7505,400 L B Foster Co. � Class A * 78,62473,400 La-Z-Boy, Inc. (a) 2,718,7366,100 Laboratory Corp. of America Holdings * (a) 1,219,02418,200 Lakeland Financial Corp. 924,37886,104 Las Vegas Sands Corp. (a) 4,796,85411,000 LCNB Corp. 162,8004,000 Leaf Group Ltd. * 22,56010,500 Leidos Holdings, Inc. (a) 1,057,35039,700 Lennar Corp. � Class A (a) 3,011,64222,035 LENSAR, Inc. * (a) 188,840103,700 Liberty Broadband Corp. � Class C * (a) 16,317,19521,660 Liberty Media Corp-Liberty Formula One � Class C * (a) 904,955244,711 Liberty Media Corp.-Liberty SiriusXM � Class C * (b) 10,035,598345,900 Liberty TripAdvisor Holdings, Inc. � Class A * (a) 951,22591,700 Lincoln National Corp. (a) 4,330,0748,752 Live Nation Entertainment, Inc.* 574,56919,400 LKQ Corp. * (a) 683,26865,300 Luminex Corp. (a) 1,549,569155,500 Lyft, Inc. � Class A * (a) 5,935,43543,700 LyondellBasell Industries NV � Class A (a) 3,718,87023,355 Macatawa Bank Corp. 181,235103,980 Macquarie Infrastructure Corp. (a) 3,363,75352,600 Marchex, Inc. � Class B * 113,6165,131 Markel Corp. * (a) 4,996,7225,700 Marlin Business Services Corp. (a) 59,22336,430 Masonite International Corp. * 3,644,82160,100 Materion Corp. (a) (b) 3,503,83031,000 Matrix Service Co. * 296,980
Shares Description Value ($)United States �� continued
299,900 Maxim Integrated Products, Inc. (b) 24,903,69654,800 MDC Holdings, Inc. (a) (b) 2,645,1961,000 Mercantile Bank Corp. 24,83018,300 Meridian Bancorp, Inc. 249,703117,500 Meridian Bioscience, Inc. * (a) 2,220,750102,700 Meritor, Inc. * (a) 2,711,28015,500 Methode Electronics, Inc. (a) 542,81077,100 MetLife, Inc. 3,559,707131,900 MGIC Investment Corp. (a) 1,577,524114,350 MGM Growth Properties LLC � Class A (REIT) (a) 3,495,67964,600 Michaels Cos., Inc. (The) * 638,89467,400 Micron Technology, Inc. * (a) (b) 4,319,6661,600 MicroStrategy, Inc. � Class A * (a) 548,43268,300 Modine Manufacturing Co. * (a) 745,8369,100 Mohawk Industries, Inc. * (a) 1,145,05389,400 Molson Coors Brewing Co. � Class B (a) 4,112,40077,200 Moog, Inc. � Class A (a) (b) 5,972,19243,600 Morgan Stanley (a) 2,695,78851,600 Movado Group, Inc. 873,58833,000 Mueller Industries, Inc. (a) 1,081,08012,521 Murray Energy Corp. (c) 81,387231,214 National General Holdings Corp. 7,879,7736,300 National Presto Industries, Inc. 535,81517,700 Natus Medical, Inc. * (a) 370,284150,500 Nautilus, Inc. * 3,175,55021,000 Neenah, Inc. 1,018,71019,500 NETGEAR, Inc. * (a) 620,295458,700 Newmark Group, Inc. � Class A(a) 3,220,07429,100 NextGen Healthcare, Inc. * (a) 516,234840 NexTier Oilfield Solutions, Inc. * 2,35217,400 Northfield Bancorp, Inc. 193,6624,737 Northrim BanCorp, Inc. 150,49429,040 Northwest Bancshares, Inc. 343,54368,900 nVent Electric Plc 1,584,70097,600 Occidental Petroleum Corp. (a) 1,538,176129,300 OFG Bancorp 2,165,77513,000 Old National Bancorp 205,79016,800 Olympic Steel, Inc. (a) 249,31225,642 Oppenheimer Holdings, Inc. � Class A 756,18350,400 Oracle Corp. (a) 2,909,088163,000 Owens & Minor, Inc. 4,198,8807,300 Park-Ohio Holdings Corp. (a) 205,0572,400 Patrick Industries, Inc. (a) 151,29682,500 Patterson Cos., Inc. (a) 2,290,20027,100 PC Connection, Inc. (a) (b) 1,237,115106,700 PDL BioPharma, Inc. * (a) 269,95164,400 Penn Virginia Corp. * (a) 580,8881,650 Penns Woods Bancorp, Inc. 42,174101,900 PennyMac Financial Services, Inc. (a) 5,873,516139,500 PennyMac Mortgage Investment Trust (REIT) (a) 2,385,450
Copyright © 2021 www.secdatabase.com. All Rights Reserved.Please Consider the Environment Before Printing This Document

GMO Implementation Fund(A Series of GMO Trust)Consolidated Schedule of Investments �� (Continued)(showing percentage of total net assets)November 30, 2020 (Unaudited)
Shares Description Value ($)United States �� continued
8,300 Penske Automotive Group, Inc. (a) 457,081110,900 Perdoceo Education Corp. * (a) 1,257,606280,321 PG&E Corp. * (a) 3,560,0773,400 Phibro Animal Health Corp. � Class A 64,22652,200 Phillips 66 (a) 3,162,27624,200 Photronics, Inc. * 280,47883,000 PNM Resources, Inc. 4,076,1301,900 Preformed Line Products Co. 115,23512,500 Premier Financial Bancorp, Inc. 166,37566,106 Premier Financial Corp. 1,369,055142,200 Prestige Consumer Healthcare, Inc. * (a) 5,058,0548,200 Principal Financial Group, Inc. (a) 408,27812,900 Progress Software Corp. (a) 517,2908,300 Protective Insurance Corp. � Class B (a) 118,60710,500 Providence Service Corp. (The) * (a) 1,425,79554,100 Prudential Financial, Inc. (a) 4,091,04214,300 PulteGroup, Inc. 623,90981,600 QEP Resources, Inc. 131,376333,400 Qurate Retail, Inc. � Series A 3,490,6981,700 Radian Group, Inc. 32,096138,923 Raytheon Technologies Corp. (a) 9,963,558243,400 Realogy Holdings Corp. * (a) 2,996,2545,700 Regeneron Pharmaceuticals, Inc. * (a) 2,941,3714,900 Renewable Energy Group, Inc. * (a) 284,5927,233 Republic Bancorp, Inc. � Class A 255,325181,800 Resideo Technologies, Inc. * (a) 3,361,48243,000 Resources Connection, Inc. 520,73015,400 Riverview Bancorp, Inc. 81,31214,097 Rocky Brands, Inc. 408,8138,000 Royal Caribbean Cruises Ltd. 630,4807,200 Sally Beauty Holdings, Inc. * (a) 82,800151,800 SandRidge Energy, Inc.* 405,306205,700 Sanmina Corp. * (b) 6,544,3451,200 Scholar Rock Holding Corp. * (a) 59,78437,400 Scholastic Corp. 887,12886,600 Schweitzer-Mauduit International, Inc. (a) 3,011,948103,715 Sciplay Corp. � Class A * 1,544,3165,200 SeaSpine Holdings Corp.* 73,94453,700 Select Medical Holdings Corp. * (a) 1,294,17013,876 Seneca Foods Corp. � Class A * (a) 581,127152,995 Sensata Technologies Holding Plc * (a) 7,470,74649,600 Shoe Carnival, Inc. (a) 1,813,87220,600 Sierra Bancorp 453,20031,700 Silgan Holdings, Inc. (a) 1,071,46018,296 SkillSoft Corp. (c) 3,110,3201,800 Sleep Number Corp. * 124,902115,200 SLM Corp. (a) 1,222,27291,200 Sonic Automotive, Inc. � Class A (a) 3,682,65638,300 Southeastern Grocers (c) 2,661,850684,600 Southwestern Energy Co. * (a) 2,129,10677,300 SpartanNash Co. 1,459,42497,800 Spok Holdings, Inc. 961,374
Shares Description Value ($)United States �� continued
14,000 SS&C Technologies Holdings, Inc. 964,4609,400 Standard Motor Products, Inc. 435,126160,700 Steelcase, Inc. � Class A 1,952,50521,400 Stepan Co. (a) 2,485,8243,000 Stewart Information Services Corp. (a) 125,61075,400 Stoneridge, Inc. * 2,025,24432,457 StoneX Group, Inc. * (a) (b) 2,000,000247,600 Summit Hotel Properties, Inc. (REIT) (a) 2,151,64416,400 Sunstone Hotel Investors, Inc. (REIT) 172,2002,400 Super Micro Computer, Inc. * 67,70439,500 Surface Oncology, Inc. * 357,08087,400 Surgalign Holdings, Inc. * (a) 197,5247,600 Surmodics, Inc. * 284,5449,500 Sutro Biopharma, Inc. * (a) 162,45082,200 Sykes Enterprises, Inc. * 3,093,186130,200 Synchrony Financial 3,967,1941,507,100 Syncora Holdings Ltd. 437,05933,900 Systemax, Inc. (a) 1,043,10395,040 Taylor Morrison Home Corp. * (a) 2,402,611467,100 TEGNA, Inc. (a) (b) 6,730,91142 Teladoc Health, Inc. * 8,388137,100 Telephone & Data Systems, Inc. 2,602,158176,920 Tempur Sealy International, Inc. * (a) 4,456,61551,620 Tenet Healthcare Corp. * (a) 1,622,4175,500 Tennant Co. 369,38067,100 Terex Corp. (a) 2,080,10010,900 Territorial Bancorp, Inc. 243,17932,400 Textron, Inc. (a) 1,461,2401,888,723 The Oneida Group (f) 3,324,1523,300 Timberland Bancorp, Inc. 78,63928,300 Towne Bank/Portsmouth VA 615,52557,700 Tredegar Corp. 912,23795,300 TRI Pointe Group, Inc. * 1,665,84461,000 Tribune Publishing Co. 736,88033,600 TriCo Bancshares 1,100,73610,600 Triple-S Management Corp. � Class B * (a) 237,546446,524 TRU TAJ (f) 1,562,8345,869 TRU TAJ Liquidation Unit Trust (c) 88,03516,200 TrueBlue, Inc. * 309,42079,600 TrustCo Bank Corp. 483,1723,000 Trustmark Corp. 74,46042,600 Tyson Foods, Inc. � Class A 2,777,520114,800 UFP Industries, Inc. (b) 6,159,0208,300 United Rentals, Inc. * (a) 1,883,9345,421 United Security Bancshares 38,21830,900 United States Cellular Corp. * 968,7151,100 United Therapeutics Corp. * (a) 145,90485,200 Universal Corp. (a) (b) 3,877,45217,500 Universal Electronics, Inc. * 921,55030,300 Universal Health Services, Inc. � Class B 3,956,57418,700 Urban Edge Properties (REIT) 242,726182,108 US Bancorp (b) 7,868,887
Copyright © 2021 www.secdatabase.com. All Rights Reserved.Please Consider the Environment Before Printing This Document

GMO Implementation Fund(A Series of GMO Trust)Consolidated Schedule of Investments �� (Continued)(showing percentage of total net assets)November 30, 2020 (Unaudited)
Shares Description Value ($)United States �� continued
5,000 USANA Health Sciences, Inc. * 375,90087,800 Valvoline, Inc. 2,000,9623,400 Vanda Pharmaceuticals, Inc. * 41,514129,100 Varian Medical Systems, Inc. * (b) 22,460,81845,957 Vectrus, Inc. * 2,190,770126,300 Vera Bradley, Inc. * 1,071,02432,700 Veritiv Corp. * 607,566148,871 Verso Corp. � Class A 1,609,29681,101 VF Corp. (a) 6,763,823124,800 ViacomCBS, Inc. � Class B (a) 4,402,94487,800 Viatris, Inc. * (a) 1,476,79612,700 Village Super Market, Inc. � Class A 294,13281,500 Virtusa Corp. * 4,081,52019,000 Vista Outdoor, Inc. * 391,97017,300 VMware, Inc. � Class A * (a) 2,420,097186,200 Waddell & Reed Financial, Inc. � Class A (a) 3,064,85268,200 Walgreens Boots Alliance, Inc. (a) 2,592,28267,000 Walker & Dunlop, Inc. (a) (b) 5,360,67040,325 Waterstone Financial, Inc. 708,3099,700 Weis Markets, Inc. 462,011277,453 Wells Fargo & Co. (a) (b) 7,588,3405,770 West BanCorp, Inc. 111,246124,300 Western Union Co. (The) (a) 2,804,20884,700 Western Digital Corp. (a) 3,801,336107,060 Westmoreland Mining Holdings LLC (f) 579,94416,600 Westwood Holdings Group, Inc. 197,872193,200 Willis Towers Watson Plc (b) 40,222,3084,200 Wintrust Financial Corp. 228,858215,500 World Fuel Services Corp. (b) 6,124,51028,000 Worthington Industries, Inc. (a) 1,448,1604,732 WPX Energy, Inc. * 35,53724,230 Wyndham Destinations Corp. 1,019,114404,400 Xenia Hotels & Resorts, Inc. (REIT) (a) 5,697,99629,500 Xerox Holdings Corp. (a) 645,755152,900 Xilinx, Inc. (b) 22,254,59529,600 Xperi Holding Corp. (a) 564,76843,500 Zumiez, Inc. * (a) 1,613,415
Total United States 1,019,221,992
Vietnam �� 0.0%580,610 Kinh Bac City Development Share Holding Corp * 397,59485,710 PetroVietnam Gas JSC 308,755769,000 PetroVietnam Technical Services Corp 489,22953,480 Pha Lai Thermal Power JSC 55,249188,440 Vinh Hoan Corp 359,648
Total Vietnam 1,610,475
TOTAL COMMON STOCKS(COST $4,474,311,831) 4,464,779,392
Shares Description Value ($)PREFERRED STOCKS (g) �� 1.5%
Brazil �� 0.3%450,100 Banco do Estado do Rio Grande do Sul SA � Class B 1,108,993647,451 Bradespar SA 7,021,485176,100 Braskem SA � Class A * 742,871816,000 Cia de Saneamento do Parana 760,04013,500 Cia de Transmissao de Energia Eletrica Paulista 68,541619,900 Cia Paranaense de Energia � Class B 7,899,46193,600 Lojas Americanas SA 400,614
Total Brazil 18,002,005
Colombia �� 0.0%22,832 Banco Davivienda SA 178,4021,845,309 Grupo Aval Acciones y Valores SA 533,645
Total Colombia 712,047
Germany �� 0.2%61,062 Bayerische Motoren Werke AG 4,012,09823,067 Draegerwerk AG & Co KGaA (a) 1,807,42013,298 Henkel AG & Co KGaA 1,430,6702,037 Jungheinrich AG 88,71824,407 Schaeffler AG 181,6244,825 Villeroy & Boch AG 76,3455,115 Volkswagen AG 858,593
Total Germany 8,455,468
Russia �� 0.4%163,829 Bashneft PJSC 2,638,21293,450 Nizhnekamskneftekhim PJSC 96,27040,767,000 Surgutneftegas PJSC 21,180,208191 Transneft PJSC 357,779
Total Russia 24,272,469
South Korea �� 0.6%6,504 Amorepacific Corp 316,80919,960 Hyundai Motor Co Ltd Prf 1,517,28716,860 Hyundai Motor Co Ltd-2nd Prf 1,321,04648,658 LG Electronics Inc 1,446,644394,823 Samsung Electronics Co Ltd 21,782,9763,543 Samsung Electronics Co Ltd GDR (Registered) 4,804,345
Total South Korea 31,189,107
Taiwan �� 0.0%97,864 Chailease Holding Co. Ltd. * 341,292216,277 CTBC Financial Holding Co Ltd 487,324
Total Taiwan 828,616
United States �� 0.0%11,013 Murray Energy Corp. (c) 479,066
TOTAL PREFERRED STOCKS(COST $78,434,877) 83,938,778
Copyright © 2021 www.secdatabase.com. All Rights Reserved.Please Consider the Environment Before Printing This Document

GMO Implementation Fund(A Series of GMO Trust)Consolidated Schedule of Investments �� (Continued)(showing percentage of total net assets)November 30, 2020 (Unaudited)
Shares /Par Value�� Description Value ($)
RIGHTS/WARRANTS �� 0.0%
Pakistan �� 0.0%46,150 Searle Co Ltd, Expires 12/31/20 * (c) 18,530
Spain �� 0.0%2,630,374 Banco Santander SA, Expires 12/03/20 * 328,511
United Kingdom �� 0.0%26,934 AVEVA Group Plc, Expires 12/09/20 * 402,154
United States �� 0.0%730,200 Bristol-Myers Squibb Co., Expires 03/31/21* 861,636222,285 Contra Clementia Pharma CVR * (c) 300,0852,616,810 Media General, Inc. CVR * (c) 130,841
Total United States 1,292,562
TOTAL RIGHTS/WARRANTS(COST $2,147,081) 2,041,757
INVESTMENT FUNDS �� 0.8%
United States �� 0.8%1,546,000 Altaba, Inc. (c) 22,262,400423,470 iShares Core MSCI Emerging Markets ETF 24,823,811
Total United States 47,086,211
TOTAL INVESTMENT FUNDS(COST $44,609,814) 47,086,211
DEBT OBLIGATIONS �� 23.0%
Brazil �� 0.2%Corporate Debt �� 0.2%
9,170,000 Oi SA, 10.00%, due 07/27/25 9,536,800
Israel �� 0.1%Corporate Debt �� 0.1%
570,000 Teva Pharmaceutical Finance Co BV,3.65%, due 11/10/21 569,822
6,996,000 Teva Pharmaceutical Finance Co. LLC,6.15%, due 02/01/36 7,345,800Total Israel 7,915,622
Jamaica �� 0.2%Bank Loans �� 0.1%
5,496,051 Digicel International Finance Ltd, 2017 Term LoanB, Variable Rate, 3 mo. LIBOR plus 3.25%,3.51%, due 05/28/24 (c) 4,850,266
Par Value�� Description Value ($)Jamaica �� continuedCorporate Debt �� 0.1%
1,024,878 Digicel Group 0.5 Ltd., 10.00%, due 04/01/24 812,5361,954,000 Digicel International Finance Ltd / Digicel
Holdings Bermuda Ltd, Reg. S,8.75%, due 05/25/24 1,993,080
2,530,000 Digicel International Finance Ltd / DigicelHoldings Bermuda Ltd, 144A,8.75%, due 05/25/24 2,580,600Total Corporate Debt 5,386,216Total Jamaica 10,236,482
Netherlands �� 0.2%Corporate Debt �� 0.2%
EUR 2,948,400 Evander Gold Mines Ltd, 1.00%, due 04/19/26 (c) 1,406,800
EUR 6,405,620 Hema Bondco, 7.50%, due 10/19/21 (c) 7,717,357EUR 1,114,874 Hema BV, 144A, 10.00%, due 04/19/25 (c) 1,383,073
Total Netherlands 10,507,230
Puerto Rico �� 0.2%Municipal Obligations �� 0.2%
1,500,000 Puerto Rico Commonwealth Aqueduct &Sewer Authority, (Senior Lien), Series A,6.05%, due 07/01/28 1,485,000
3,320,000 Puerto Rico Commonwealth Aqueduct &Sewer Authority, (Senior Lien), Series A,6.10%, due 07/01/34 3,286,800
524,834 Puerto Rico Commonwealth Aqueduct &Sewer Authority, (Senior Lien) � Class A,6.00%, due 07/01/44 531,394
6,320,000 Puerto Rico Commonwealth Aqueduct &Sewer Authority, (Senior Lien) � Class B,5.35%, due 07/01/27 6,272,600
1,518,000 Puerto Rico Commonwealth Aqueduct &Sewer Authority, Class B, 6.05%, due 07/01/28 1,502,820Total Puerto Rico 13,078,614
United States �� 22.1%Asset-Backed Securities �� 0.3%
570,000 Alaska Airlines Pass-Through Trust, Reg. S,4.80%, due 02/15/29 615,658
2,288,000 Alaska Airlines Pass-Through Trust � Class A,144A, 4.80%, due 02/15/29 2,471,271
2,420,000 Alaska Airlines Pass-Through Trust � Class B,144A, 8.00%, due 02/15/27 2,558,863
315,144 Atlas Senior Loan Fund XI Ltd., Series18-11A, Class X, 144A, Variable Rate, 3 mo.LIBOR + 0.75%, 0.96%, due 07/26/31 315,121
184,411 Avery Point IV CLO Ltd., Series 14-1A,Class AR, 144A, Variable Rate, 3 mo. LIBOR+ 1.10%, 1.31%, due 04/25/26 184,411
44,955 Babson CLO Ltd., Series 14-IA, Class A1R,144A, Variable Rate, 3 mo. LIBOR + 1.15%,1.37%, due 07/20/25 44,974
Copyright © 2021 www.secdatabase.com. All Rights Reserved.Please Consider the Environment Before Printing This Document

GMO Implementation Fund(A Series of GMO Trust)Consolidated Schedule of Investments �� (Continued)(showing percentage of total net assets)November 30, 2020 (Unaudited)
Par Value�� Description Value ($)United States �� continuedAsset-Backed Securities �� continued
825,824 Bayview Commercial Asset Trust, Series 07-5A,Class A3, 144A, Variable Rate, 1 mo. LIBOR +1.00%, 1.15%, due 10/25/37 823,520
149,557 Bayview Commercial Mortgage Pass-ThroughTrust, Series 06-SP1, Class M3, 144A, VariableRate, 1 mo. LIBOR + 0.86%, 1.01%, due 04/25/36 149,532
385,059 Canyon Capital CLO Ltd., Series 16-1A, Class X,144A, Variable Rate, 3 mo. LIBOR + 0.70%, 0.94%,due 07/15/31 385,058
7,063,382 Crest G-Star LP, Series 01-1A, Class D, 144A,9.00%, due 11/28/35 (h) 7
1,134,300 Delta Air Lines Pass-Through Trust, Series 19-1,Class AA, 3.20%, due 10/25/25 1,158,207
287,868 Galaxy XXVII CLO Ltd., Series 18-27A, Class X,144A, Variable Rate, 3 mo. LIBOR + 0.60%, 0.82%,due 05/16/31 286,792
286,300 JetBlue Pass-Through Trust � Class A,4.00%, due 11/15/32 304,205
1,574,500 JetBlue Pass-Through Trust � Class B, Series 20-1,Class B, 7.75%, due 05/15/30 1,701,091
1,032,294 KeyCorp Student Loan Trust, Series 00-B, Class A2,Variable Rate, 3 mo. LIBOR + 0.31%,0.52%, due 07/25/29 1,022,330
311,175 LCM XVIII LP, Series 18A, Class XR, 144A,Variable Rate, 3 mo. LIBOR +0.60%, 0.82%, due 04/20/31 310,310
120,609 LCM XXV Ltd., Series 25,A, Class X, 144A,Variable Rate, 3 mo. LIBOR +0.95%, 1.17%, due 07/20/30 120,499
1,244,572 Lehman Brothers Small Balance CommercialMortgage Trust, Series 07-2A, Class 1A3, 144A,Variable Rate, 1 mo. LIBOR + 0.27%,0.42%, due 06/25/37 1,226,619
548,320 Madison Park Funding XIII Ltd., Series 14-13A,Class XR, 144A, Variable Rate, 3 mo. LIBOR +0.60%, 0.82%, due 04/19/30 546,950
400,000 Morgan Stanley Capital I Trust, Series 14-CPT,Class B, 144A, Variable Rate, 3.56%, due 07/13/29 404,099
550,000 Morgan Stanley Capital I Trust, Series 14-MP,Class A, 144A, 3.47%, due 08/11/33 557,056
169,746 Mountain View CLO LLC, Series 17-2A, Class X,144A, Variable Rate, 3 mo. LIBOR + 0.65%, 0.88%,due 01/16/31 169,463
262,930 Silvermore CLO Ltd., Series 14-1A, Class A1R,144A, Variable Rate, 3 mo. LIBOR + 1.17%, 1.39%,due 05/15/26 262,224
794,667 Telos CLO Ltd., Series 14-5A, Class X, 144A,Variable Rate, 3 mo. LIBOR +0.75%, 0.97%, due 04/17/28 794,568
Par Value�� Description Value ($)United States �� continuedAsset-Backed Securities �� continued
626,269 Telos CLO Ltd., Series 13-4A, Class XR, 144A,Variable Rate, 3 mo. LIBOR +0.75%, 0.97%, due 01/17/30 622,695
353,374 Velocity Commercial Capital Loan Trust,Series 17-1, Class AFL, 144A, Variable Rate, 1 mo.LIBOR + 1.25%, 1.40%, due 05/25/47 352,257
124,123 Velocity Commercial Capital Loan Trust,Series 17-1, Class AFX, 144A, Variable Rate,3.00%, due 05/25/47 124,060Total Asset-Backed Securities 17,511,840
Bank Loans �� 0.8%5,208,085 American Consolidated Natural Resources, Inc.,
2020 Exit Term Loan, PIK, 1 mo. LIBOR plus13.00%, 3.00%, due 09/16/25 (c) 4,973,721
652,519 Envision Healthcare Corp., 2018 1st Lien TermLoan, Variable Rate, 3.75%, due 10/10/25 (c) 533,434
4,058,092 Flexential Intermediate Corp., 2017 1st Lien TermLoan, Variable Rate, 3 mo. LIBOR plus 3.50%,3.72%, due 08/01/24 (c) 3,601,557
4,138,249 Owens & Minor Distribution, Inc., Term Loan B,Variable Rate, 3 mo. LIBOR plus 4.50%, 4.65%, due04/30/25 (c) 4,082,631
6,318,314 Quorum Health Corporation, 2020 Term Loan, 3 mo.LIBOR plus 8.25%, 9.25%, due 04/29/25 (c) 6,033,990
13,589,577 SeaWorld Parks & Entertainment, Inc., Term LoanB5, Variable Rate, 3 mo. LIBOR plus 3.00%,3.75%, due 03/31/24 (c) 13,045,994
2,158,700 Serta Simmons Bedding, LLC, 2020 Super PrioritySecond Out Term Loan, 8.50%, due 08/10/23 (c) 1,942,830
521,009 SkillSoft Corp., 2020 DIP Term Loan, 3 mo. LIBORplus 7.50%, 8.50%, due 12/27/24 (c) 523,614
1,953,493 SkillSoft Corp., 2020 Take Back 2nd Out Term Loan,3 mo. LIBOR plus 7.50%, 8.50%, due 04/27/25(c) 1,933,958
2,073,964 Surgery Center Holdings, Inc., 2017 Term Loan B,Variable Rate, 3 mo. LIBOR plus 3.25%, 4.25%, due09/03/24 (c) 2,029,892
2,780,000 VICI Properties 1 LLC, Replacement Term Loan B1,Variable Rate, 1 mo. LIBOR plus 1.75%, 1.90%, due12/20/24 (c) 2,708,193
10,163,768 Westmoreland Coal Co., PIK Term Loan, VariableRate, 3 mo. LIBOR plus 12.50%, due 03/15/29 (c) 4,065,507
2,363,466 WP CPP Holdings LLC, 2018 Term Loan, VariableRate, 3 mo. LIBOR plus 3.75%, 4.75%, due 04/30/25 (c) 2,186,206Total Bank Loans 47,661,527
Copyright © 2021 www.secdatabase.com. All Rights Reserved.Please Consider the Environment Before Printing This Document

GMO Implementation Fund(A Series of GMO Trust)Consolidated Schedule of Investments �� (Continued)(showing percentage of total net assets)November 30, 2020 (Unaudited)
Par Value�� Description Value ($)United States �� continuedConvertible Debt �� 0.2%
5,270,000 Guess?, Inc., 2.00%, due 04/15/24 5,059,2002,117,300 Live Nation Entertainment, Inc., 144A,
2.00%, due 02/15/25 2,073,2862,140,000 Twitter, Inc., 0.25%, due 06/15/24 2,410,764
Total Convertible Debt 9,543,250
Corporate Debt �� 2.7%2,147,000 Ahern Rentals, Inc., 144A, 7.38%, due 05/15/23 1,486,7984,680,000 American Airlines Group, Inc., 144A,
3.75%, due 03/01/25 3,077,1002,565,000 Antero Midstream Partners LP / Antero Midstream
Finance Corp., 5.38%, due 09/15/24 2,419,7701,140,000 Antero Midstream Partners LP / Antero Midstream
Finance Corp., 144A, 5.75%, due 01/15/28 1,026,0001,445,000 Boeing Co. (The), 5.15%, due 05/01/30 1,696,3042,271,900 Boeing Co. (The), 8.75%, due 09/15/31 3,331,732748,600 Boeing Co. (The), 8.63%, due 11/15/31 1,092,7341,430,000 Boeing Co. (The), 5.71%, due 05/01/40 1,805,116572,000 Boeing Co. (The), 3.63%, due 03/01/48 543,9681,244,000 Boeing Co. (The), 5.81%, due 05/01/50 1,643,4293,270,000 Boeing Co. (The), 5.93%, due 05/01/60 4,442,1652,280,000 Bruce Mansfield, 8.88%, due 08/01/23 (h) 4,5603,600,000 Carnival Corp, 144A, 7.63%, due 03/01/26 3,819,3125,340,000 Cedar Fair LP / Canada�s Wonderland Co. /
Magnum Management Corp. / Millennium Op,144A, 6.50%, due 10/01/28 5,633,700
768,000 Cumulus Media New Holdings, Inc., 144A,6.75%, due 07/01/26 748,800
7,150,000 Dave & Buster�s, Inc., 144A, 7.63%, due 11/01/25 7,418,1251,140,000 EnLink Midstream Partners LP, 5.60%, due 04/01/
44 843,6002,118,000 EnLink Midstream Partners LP, 5.05%, due 04/01/
45 1,554,082290,000 Ferrellgas LP / Ferrellgas Finance Corp., 144A,
10.00%, due 04/15/25 319,0001,740,000 Ford Motor Credit Co. LLC, 5.58%, due 03/18/24 1,868,3251,770,000 Ford Motor Credit Co. LLC, 4.13%, due 08/04/25 1,831,9502,280,000 Ford Motor Credit Co. LLC, 4.39%, due 01/08/26 2,371,200290,000 Ford Motor Credit Co. LLC, 4.27%, due 01/09/27 300,18312,280,000 Ford Motor Credit Co. LLC, 5.11%, due 05/03/29 13,250,1201,140,000 Frontier Communications Corp., 10.50%, due 09/
15/22 (h) 560,025
Par Value�� Description Value ($)United States �� continuedCorporate Debt �� continued
1,791,000 Frontier Communications Corp., 7.13%, due 01/15/23 (h) 823,860
1,894,000 Frontier Communications Corp., 11.00%, due 09/15/25 (h) 932,795
5,977,000 FS KKR Capital Corp., 4.13%, due 02/01/25 6,119,25411,003,000 FS KKR Capital Corp. II, 144A, 4.25%, due 02/14/
25 10,695,5991,160,000 Goldman Sachs Group, Inc. (The), Variable Rate,
5 year CMT + 3.22%, 4.95%, due 12/31/99 1,212,2001,400,000 Gulfport Energy Corp., 6.38%, due 01/15/26 (h) 843,5002,400,000 Hyatt Hotels Corp., 5.75%, due 04/23/30 2,854,7873,300,000 iHeartCommunications, Inc., 144A, 4.75%, due 01/
15/28 3,335,0463,134,100 JPMorgan Chase & Co., Variable Rate, SOFR +
2.75%, 4.00%, due 12/31/99 3,131,9841,464,000 Live Nation Entertainment, Inc., 144A,
4.88%, due 11/01/24 1,453,0202,485,000 Live Nation Entertainment, Inc., 144A,
5.63%, due 03/15/26 2,512,9567,613,000 Marriott Ownership Resorts, Inc., 4.75%, due 01/15/
28 7,670,0972,420,000 Marriott Ownership Resorts, Inc. / ILG LLC,
6.50%, due 09/15/26 2,541,00014,661,000 Murray Energy Corp., 144A, 11.25%, due 04/15/
21 (h) 1471,640,000 NGL Energy Partners LP / NGL Energy Finance
Corp., 7.50%, due 04/15/26 672,4002,200,000 OneMain Finance Corp., 6.63%, due 01/15/28 2,524,5001,572,000 Outfront Media Capital LLC / Outfront Media
Capital Corp., 144A, 4.63%, due 03/15/30 1,556,2801,854,000 Owens & Minor, Inc., 4.38%, due 12/15/24 1,886,4454,780,000 Royal Caribbean Cruises Ltd, 7.50%, due 10/15/27 5,114,6001,200,000 Royal Caribbean Cruises Ltd, 3.70%, due 03/15/28 1,059,0942,967,000 SeaWorld Parks & Entertainment, Inc., 144A,
8.75%, due 05/01/25 3,174,6901,780,000 SEG Holding LLC / SEG Finance Corp., 144A,
5.63%, due 10/15/28 1,864,5502,860,000 Six Flags Entertainment Corp., 144A, 4.88%, due 07/
31/24 2,849,2461,710,000 Tenet Healthcare Corp., 4.63%, due 07/15/24 1,739,9251,700,000 Uber Technologies, Inc., 144A, 8.00%, due 11/01/26 1,831,7504,560,000 Uniti Group LP / Uniti Fiber Holdings, Inc. / CSL
Capital LLC, 144A, REIT, 7.13%, due 12/15/24 4,457,4006,561,000 Uniti Group LP / Uniti Group Finance, Inc. / CSL
Capital LLC, 144A, REIT, 6.00%, due 04/15/23 6,700,421
Copyright © 2021 www.secdatabase.com. All Rights Reserved.Please Consider the Environment Before Printing This Document

GMO Implementation Fund(A Series of GMO Trust)Consolidated Schedule of Investments �� (Continued)(showing percentage of total net assets)November 30, 2020 (Unaudited)
PURCHASED OPTIONS �� 0.0%
DescriptionExercise
PriceExpiration
DateNumber ofContracts
NotionalAmount
Value($)
Equity Options �� Calls �� 0.0%FirstEnergy Corp. (e) 35.00 04/16/21 800 USD 2,124,800 24,000Equity Options �� Puts �� 0.0%FirstEnergy Corp. (e) 24.00 04/16/21 3,500 USD 9,296,000 542,500
TOTAL PURCHASED OPTIONS(COST $420,743) 566,500
Par Value�� Description Value ($)United States �� continuedCorporate Debt �� continued
3,300,000 Uniti Group LP / Uniti Group Finance, Inc. / CSLCapital LLC, REIT, 8.25%, due 10/15/23 3,304,125
1,450,000 Western Midstream Operating LP, 5.38%, due 06/01/21 1,460,875
2,860,000 Wyndham Destinations, Inc., 6.60%, due 10/01/25 3,210,3502,780,000 Wyndham Destinations, Inc., 144A,
6.63%, due 07/31/26 3,120,5501,287,000 Wyndham Destinations, Inc., 6.00%, due 04/01/27 1,406,048909,000 Wyndham Destinations, Inc., 144A,
4.63%, due 03/01/30 939,960Total Corporate Debt 156,087,552
U.S. Government �� 18.1%10,000,000 U.S. Treasury Note, 1.75%, due 07/31/21 (b) (i) 10,109,76615,000,000 U.S. Treasury Note, 1.38%, due 01/31/22 15,217,38329,000,000 U.S. Treasury Note, 1.13%, due 02/28/22 29,367,031210,000,000 U.S. Treasury Note, 1.75%, due 02/28/22 214,265,625100,000,000 U.S. Treasury Note, 1.88%, due 04/30/22 102,460,938100,000,000 U.S. Treasury Note, 1.88%, due 05/31/22 102,605,469
Par Value�� /Shares Description Value ($)
United States �� continuedU.S. Government �� continued
100,000,000 U.S. Treasury Note, 0.13%, due 06/30/22 99,984,375100,000,000 U.S. Treasury Note, 0.13%, due 07/31/22 99,968,750145,000,000 U.S. Treasury Note, 1.63%, due 08/31/22 (b) 148,726,952100,000,000 U.S. Treasury Note, 0.13%, due 09/30/22 (b) 99,972,656100,000,000 U.S. Treasury Note, 0.13%, due 10/31/22 (b) 99,958,503
Total U.S. Government 1,022,637,448Total United States 1,253,441,617
TOTAL DEBT OBLIGATIONS(COST $1,302,954,671) 1,304,716,365
MUTUAL FUNDS �� 0.4%
United States �� 0.4%Affiliated Issuers �� 0.4%
4,044,429 GMO U.S. Treasury Fund (j) 20,383,922
TOTAL MUTUAL FUNDS(COST $20,383,922) 20,383,922
Shares Description Value ($)SHORT-TERM INVESTMENTS �� 4.2%
Foreign Government Obligations �� 2.1%JPY 2,400,000,000 Japan Treasury Discount Bill, Zero
Coupon, due 12/10/20 22,989,142JPY 2,600,000,000 Japan Treasury Discount Bill, Zero
Coupon, due 12/14/20 24,905,189JPY 5,500,000,000 Japan Treasury Discount Bill, Zero
Coupon, due 02/08/21 52,691,895JPY 1,700,000,000 Japan Treasury Discount Bill, Zero
Coupon, due 02/22/21 16,287,086Total Foreign Government Obligations 116,873,312
Shares Description Value ($)Money Market Funds �� 0.5%
25,355,216 State Street Institutional Treasury Money MarketFund � Premier Class, 0.01% (k) 25,355,216
186,142 State Street U.S. Treasury Liquidity Fund � Class DShares, 0.01% (i) 186,142Total Money Market Funds 25,541,358
U.S. Government �� 1.6%47,000,000 U.S. Treasury Bill, 0.09%, due 07/15/21 (i) (l) 46,973,81445,900,000 U.S. Treasury Bill, 0.11%, due 09/09/21 (i) (l) 45,862,247
Total U.S. Government 92,836,061
TOTAL SHORT-TERM INVESTMENTS(COST $234,881,075) 235,250,731TOTAL INVESTMENTS �� 108.8%(Cost $6,158,144,014) 6,158,763,656
Copyright © 2021 www.secdatabase.com. All Rights Reserved.Please Consider the Environment Before Printing This Document

GMO Implementation Fund(A Series of GMO Trust)Consolidated Schedule of Investments �� (Continued)(showing percentage of total net assets)November 30, 2020 (Unaudited)
Shares Description Value ($)SECURITIES SOLD SHORT �� (13.5)%
Common Stocks �� (13.4)%Australia �� (0.3)%
(36,394 ) Afterpay Ltd * (2,535,767 )(502,774 ) APA Group (3,810,689 )(23,081 ) ASX Ltd (1,305,313 )(8,610 ) Cochlear Ltd (1,395,251 )(21,067 ) Ramsay Health Care Ltd (975,676 )(608,198 ) Sydney Airport (3,000,994 )(114,098 ) TPG Telecom Ltd * (644,142 )(370,353 ) Transurban Group (3,821,578 )
Total Australia (17,489,410)
Austria �� (0.0)%(39,678 ) Verbund AG (2,788,614 )
Canada �� (0.0)%(191,000 ) AltaGas Ltd (2,741,388 )(48,500 ) Westshore Terminals Investment Corp (618,434 )
Total Canada (3,359,822 )
China �� (0.1)%(552,900 ) BEST Inc ADR * (1,619,997 )(49,200 ) Yum China Holdings Inc (2,773,896 )
Total China (4,393,893 )
France �� (0.4)%(73,663 ) Edenred (4,209,482 )(237,712 ) Getlink SE * (3,939,412 )(4,131 ) Hermes International (4,019,286 )(6,569 ) Sartorius Stedim Biotech (2,368,595 )(28,504 ) Ubisoft Entertainment SA * (2,702,966 )(122,983 ) Vivendi SA (3,686,844 )(35,817 ) Wendel SA (4,046,778 )
Total France (24,973,363)
Germany �� (0.6)%(34,628 ) Delivery Hero SE * (4,210,323 )(40,138 ) Puma SE * (3,977,389 )(34,206 ) QIAGEN NV * (1,648,474 )(99,587 ) RWE AG (4,119,152 )(8,539 ) Sartorius AG (3,893,420 )(35,651 ) Scout24 AG (2,716,622 )(6,667 ) TeamViewer AG * (317,838 )(1,403,011) Telefonica Deutschland Holding AG (3,872,691 )(140,394 ) thyssenkrupp AG * (936,192 )(122,011 ) Uniper SE (4,129,914 )(39,359 ) Zalando SE * (3,997,975 )
Total Germany (33,819,990)
Shares Description Value ($)Italy �� (0.2)%
(18,022 ) Ferrari NV (3,818,517 )(281,019) FinecoBank Banca Fineco SPA * (4,436,648 )(38,390 ) Infrastrutture Wireless Italiane SPA (494,325 )
Total Italy (8,749,490 )
Japan �� (1.3)%(158,300) Acom Co Ltd (759,921 )(100,900) Asahi Intecc Co Ltd (3,696,619 )(767,200) ENEOS Holdings Inc (2,620,603 )(300 ) Fast Retailing Co Ltd (245,808 )(30,600 ) GMO Payment Gateway Inc (4,291,313 )(46,500 ) Hitachi Metals Ltd (680,022 )(123,600) Idemitsu Kosan Co Ltd (2,562,484 )(273,800) Isetan Mitsukoshi Holdings Ltd (1,469,546 )(53,800 ) Japan Airport Terminal Co Ltd (3,116,267 )(62,000 ) Japan Exchange Group Inc (1,533,853 )(688 ) Japan Real Estate Investment Corp (3,563,746 )(416,600) JGC Holding Corp (3,709,038 )(237,500) Keikyu Corp (4,062,469 )(7,600 ) Kintetsu Group Holdings Co Ltd (336,613 )(188,400) Kyushu Electric Power Co Inc (1,587,418 )(52,000 ) LINE Corp * (2,679,560 )(114,500) LIXIL Group Corp (2,739,954 )(53,000 ) M3 Inc (4,877,151 )(78,800 ) McDonald�s Holdings Co Japan Ltd (3,822,193 )(49,500 ) Mercari Inc * (2,260,530 )(56,400 ) Mitsubishi Materials Corp (1,066,324 )(95,300 ) Mitsubishi Motors Corp * (171,463 )(68,500 ) MonotaRO Co Ltd (4,166,639 )(40,500 ) Nihon M&A Center Inc (2,829,883 )(39,100 ) Nippon Paint Holdings Co Ltd (5,009,760 )(189,500) Nippon Yusen KK (4,116,224 )(3,200 ) Nissin Foods Holdings Co Ltd (264,109 )(37,700 ) Odakyu Electric Railway Co Ltd (1,141,235 )(7,600 ) ORIENTAL LAND CO LTD (1,290,898 )(236,100) Sharp Corp (3,156,720 )(11,600 ) Yaskawa Electric Corp (556,554 )
Total Japan (74,384,917)
Netherlands �� (0.4)%(2,083 ) Adyen NV * (3,978,850 )(761,925) Altice Europe NV * (4,008,240 )(139,095) Just Eat Takeaway.com NV * (14,802,757)
Total Netherlands (22,789,847)
Norway �� (0.0)%(9,730 ) Schibsted ASA � B Shares * (353,868 )
Peru �� (0.0)%(51,700 ) Southern Copper Corp (3,069,429 )
Copyright © 2021 www.secdatabase.com. All Rights Reserved.Please Consider the Environment Before Printing This Document

GMO Implementation Fund(A Series of GMO Trust)Consolidated Schedule of Investments �� (Continued)(showing percentage of total net assets)November 30, 2020 (Unaudited)
Shares Description Value ($)Russia �� (0.0)%
(69,362 ) Magnit PJSC Sponsored GDR (Registered) (1,042,256 )
Singapore �� (0.1)%(576,700 ) Singapore Exchange Ltd (3,802,529 )
Spain �� (0.4)%(2,254,057) Bankia SA (3,876,913 )(63,193 ) Cellnex Telecom SA (4,003,057 )(136,958 ) Endesa SA (3,936,524 )(143,157 ) Ferrovial SA (3,997,716 )(128,438 ) Siemens Gamesa Renewable Energy SA (4,606,282 )
Total Spain (20,420,492)
Sweden �� (0.1)%(35,829 ) Evolution Gaming Group AB (3,048,588 )(163,572 ) Lundin Energy AB (3,907,817 )
Total Sweden (6,956,405 )
Switzerland �� (0.2)%(4 ) Chocoladefabriken Lindt & Spruengli AG
(Registered) (357,947 )(449 ) Partners Group Holding AG (484,103 )(3,400 ) Straumann Holding AG (Registered) (3,924,600 )(46,095 ) Swiss Re AG (4,211,500 )
Total Switzerland (8,978,150 )
United Kingdom �� (1.2)%(54,859 ) Admiral Group Plc (2,066,368 )(96,677 ) Antofagasta Plc (1,596,428 )(499,568 ) Auto Trader Group Plc (3,715,726 )(1,295,838) ConvaTec Group Plc (3,564,371 )(81,019 ) Experian Plc (2,870,493 )(301,696 ) GVC Holdings Plc * (4,145,536 )(44,518 ) Halma Plc (1,309,920 )(192,090 ) Hargreaves Lansdown Plc (3,638,126 )(532,923 ) Informa Plc * (3,733,017 )(49,697 ) Land Securities Group Plc (REIT) (434,623 )(34,998 ) London Stock Exchange Group Plc (3,774,591 )(121,734 ) Ocado Group Plc * (3,579,126 )(45,341 ) Prudential Plc (697,241 )(855,964 ) Royal Dutch Shell Plc � Class A Sponsored ADR (28,965,822)(7,703 ) Spirax-Sarco Engineering Plc (1,134,692 )
Total United Kingdom (65,226,080)
United States �� (8.1)%(57 ) AbbVie, Inc. (5,961 )(298,809 ) Advanced Micro Devices, Inc. * (27,687,642)(65,700 ) AES Corp. (The) (1,342,908 )(1,300 ) Align Technology, Inc. * (625,677 )(109,040 ) American Airlines Group, Inc. (1,540,735 )(16,800 ) American Tower Corp. (REIT) (3,884,160 )
Shares Description Value ($)
United States �� continued(188,868) Analog Devices, Inc. (26,267,761)(208,581) Aon Plc � Class A (42,736,161)(352,900) Apache Corp. (4,548,881 )(17,200 ) Arthur J Gallagher & Co. (1,985,052 )(13,000 ) Autodesk, Inc. * (3,642,990 )(17,700 ) Avalara, Inc.* (3,039,975 )(15,400 ) Ball Corp. (1,478,554 )(13,100 ) Black Knight, Inc. * (1,200,222 )(72,500 ) Blackstone Group , Inc. (The) � Class A (4,317,375 )(14,500 ) Burlington Stores, Inc. * (3,168,830 )(4,300 ) Catalent, Inc. * (413,402 )(415,600) Charles Schwab Corp. (The) (20,272,968)(25,665 ) Charter Communications, Inc. � Class A * (16,733,323)(78,100 ) Cheniere Energy, Inc. * (4,427,489 )(2,900 ) Chipotle Mexican Grill, Inc. * (3,739,347 )(30,100 ) Cognex Corp. (2,261,714 )(420,548) ConocoPhillips (16,636,879)(1,300 ) CoStar Group, Inc. * (1,183,741 )(10,500 ) Coupa Software, Inc. * (3,453,555 )(22,600 ) Crowdstrike Holdings, Inc. � Class A * (3,464,128 )(31,500 ) Datadog, Inc. � Class A * (3,115,980 )(2,400 ) Devon Energy Corp. (35,472 )(10,300 ) DexCom, Inc. * (3,292,704 )(19,700 ) Digital Realty Trust, Inc. (REIT) (2,654,575 )(982,398) Discovery, Inc. � Class A * (26,436,330)(18,200 ) DocuSign, Inc. * (4,147,416 )(690,500) Endo International Plc * (3,507,740 )(16,400 ) Equifax, Inc. (2,737,160 )(5,000 ) Equinix, Inc. (REIT) (3,488,950 )(62,400 ) Equity LifeStyle Properties, Inc. (REIT) (3,656,016 )(1,900 ) Erie Indemnity Co. � Class A (428,659 )(31,900 ) Exact Sciences Corp. * (3,861,814 )(6,300 ) Extra Space Storage, Inc. (REIT) (710,199 )(11,200 ) Fastenal Co. (553,840 )(4 ) Fidelity National Financial, Inc. (144 )(207 ) First Horizon Corp. (2,531 )(36,400 ) Guidewire Software, Inc. * (4,458,272 )(58,333 ) HEICO Corp. � Class A (6,460,380 )(6,400 ) Hologic, Inc. * (442,432 )(5,800 ) IDEXX Laboratories, Inc. * (2,673,684 )(30,200 ) IHS Markit Ltd. (3,003,692 )(41,300 ) Ingersoll Rand, Inc. * (1,828,351 )(16,100 ) Insulet Corp. * (4,149,131 )(19,600 ) IQVIA Holdings, Inc. * (3,312,204 )(48,600 ) Lamb Weston Holdings, Inc. (3,517,668 )(11,300 ) Liberty Broadband Corp. � Class A * (1,771,501 )(131,434) Liberty Broadband Corp. � Class C * (20,681,140)(95,800 ) Liberty Media Corp-Liberty Formula One � Class C * (4,002,524 )(85,372 ) Live Nation Entertainment, Inc. * (5,604,672 )(2,600 ) Lululemon Athletica, Inc. * (962,572 )(7,000 ) MarketAxess Holdings, Inc. (3,774,260 )(315,697) Marvell Technology Group Ltd. (14,613,614)
Copyright © 2021 www.secdatabase.com. All Rights Reserved.Please Consider the Environment Before Printing This Document

GMO Implementation Fund(A Series of GMO Trust)Consolidated Schedule of Investments �� (Continued)(showing percentage of total net assets)November 30, 2020 (Unaudited)
A summary of outstanding financial instruments at November 30, 2020 is as follows:Forward Currency Contracts
Shares Description Value ($)
United States �� continued(15,500 ) MongoDB, Inc. * (4,453,305)(10,300 ) MSCI, Inc. (4,217,026)(22,900 ) NIKE Inc. � Class B (3,084,630)(75,100 ) Nuance Communications, Inc. * (3,239,063)(17,700 ) Okta, Inc. * (4,337,208)(8,100 ) Paycom Software, Inc. * (3,378,348)(1,200 ) Peloton Interactive, Inc. � Class A * (139,620 )(21,000 ) Pinterest, Inc. � Class A * (1,470,420)(12,000 ) Public Storage (REIT) (2,693,520)(13,300 ) RingCentral, Inc. � Class A * (3,950,765)(4,800 ) Rockwell Automation, Inc. (1,226,688)(13,800 ) Roku, Inc. * (4,051,266)(45,600 ) Rollins, Inc. (2,607,408)(7,900 ) ServiceNow, Inc. * (4,222,945)(1,289,551) Sirius XM Holdings, Inc. (8,369,186)(104,000 ) Slack Technologies Inc. � Class A * (4,459,520)(107,200 ) Snap, Inc. � Class A * (4,761,824)(335,000 ) Southwestern Energy Co. * (1,041,850)(18,600 ) Splunk, Inc. * (3,797,748)(15,900 ) Square, Inc. � Class A * (3,354,264)(29,900 ) Starbucks Corp. (2,930,798)(8,400 ) Sun Communities, Inc. (REIT) (1,167,600)(9,300 ) Sunrun, Inc. * (595,944 )(182,200 ) Targa Resources Corp. (4,281,700)(15,500 ) Teladoc Health, Inc. * (3,080,935)(10,100 ) Tesla, Inc. * (5,732,760)(13,200 ) Twilio, Inc. � Class A * (4,225,188)(100,100 ) UDR, Inc. (REIT) (3,850,847)(11,300 ) Vail Resorts, Inc. (3,116,992)(3,400 ) West Pharmaceutical Services, Inc. (935,544 )(4,100 ) Weyerhaeuser Co. (REIT) (119,065 )
Shares /Par Value�� Description Value ($)
United States �� continued(137,400 ) Williams Cos, Inc. (The) (2,882,653 )(4,800 ) Workday, Inc. � Class A * (1,078,991 )(42,400 ) Wynn Resorts Ltd. (4,261,200 )(1,400 ) XPO Logistics, Inc. * (149,352 )(38,500 ) Zillow Group, Inc. � Class C * (4,150,685 )(2,500 ) Zoetis, Inc. (400,950 )(7,100 ) Zoom Video Communications, Inc. � Class A * (3,396,357 )(20,300 ) Zscaler, Inc. * (3,161,726 )
Total United States (458,320,948 )
TOTAL COMMON STOCKS(PROCEEDS $685,638,680) (760,919,503 )
RIGHTS/WARRANTS �� (0.0)%
Spain �� (0.0)%(107,649 ) Ferrovial SA, Expires 11/23/20 * (30,677 )
TOTAL RIGHTS/WARRANTS(PROCEEDS $25,204) (30,677 )
DEBT OBLIGATIONS �� (0.1)%
Corporate Debt �� (0.1)%United States �� (0.1)%
(3,015,000 ) U.S. Concrete, Inc., 6.38%, due 06/01/24 (3,121,859 )
TOTAL DEBT OBLIGATIONS(PROCEEDS $2,766,478) (3,121,859 )
TOTAL SECURITIES SOLD SHORT(PROCEEDS $688,430,362) (764,072,039 )Other Assets and Liabilities (net) � 4.7% 265,854,524
TOTAL NET ASSETS �� 100.0% $5,660,546,141
SettlementDate
Counter-party
CurrencySold
CurrencyPurchased
NetUnrealized
Appreciation(Depreciation)
($)12/17/2020 GS AUD 2,745,588 USD 2,010,226 (5,504 )
12/17/2020 SSB AUD 29,111,560 USD 21,231,548 (141,308 )
12/17/2020 UBSA AUD 4,131,852 USD 3,013,302 (20,183 )
01/19/2021 MSCI AUD 90,533,900 USD 64,660,544 (1,828,708 )
02/08/2021 BCLY AUD 159,690,050 USD 115,045,024 (2,249,487 )
02/08/2021 DB AUD 5,840,000 USD 4,169,077 (120,483 )
SettlementDate
Counter-party
CurrencySold
CurrencyPurchased
NetUnrealized
Appreciation(Depreciation)
($)02/16/2021 CITI CZK 102,412,570 USD 4,574,032 (84,237 )01/19/2021 DB EUR 18,253,200 USD 21,421,371 (384,337 )01/19/2021 GS EUR 198,149,210 USD 233,275,987 (3,437,786 )01/19/2021 MSCI EUR 77,507,000 USD 91,855,197 (736,514 )01/19/2021 SSB EUR 120,642,209 USD 141,447,477 (2,674,584 )01/27/2021 BOA EUR 2,110,000 USD 2,498,812 (22,299 )01/27/2021 DB EUR 6,500,000 USD 7,708,220 (58,234 )01/13/2021 DB GBP 1,900,000 USD 2,479,719 (54,943 )01/13/2021 MSCI GBP 11,360,000 USD 15,024,131 (130,476 )01/19/2021 BCLY GBP 3,074,403 USD 4,102,758 1,27801/19/2021 JPM GBP 41,169,850 USD 53,276,750 (1,646,863 )01/19/2021 MSCI GBP 41,169,850 USD 53,223,353 (1,700,261 )01/19/2021 SSB GBP 20,214,100 USD 26,738,112 (228,987 )
Copyright © 2021 www.secdatabase.com. All Rights Reserved.Please Consider the Environment Before Printing This Document

02/26/2021 BOA AUD 11,463,105 USD 8,417,106 (3,511 )
02/26/2021 SSB AUD 1,848 USD 1,357 �
02/02/2021 CITI BRL 20,007,154 USD 3,666,000 (64,311 )
02/02/2021 JPM BRL 20,303,726 USD 3,535,571 (250,036 )
12/02/2020 MSCI CAD 2,826,817 USD 2,151,085 (25,571 )
01/13/2021 BOA CHF 9,271,935 USD 10,160,000 (60,115 )
01/13/2021 JPM CHF 23,570,760 USD 25,990,000 8,813
01/13/2021 MSCI CHF 81,450,494 USD 88,847,007 (932,894 )
12/02/2020 MSCI CLP 10,825,554,000 USD 14,047,660 (160,968 )
02/03/2021 MSCI COP 42,798,245,300 USD 11,174,477 (694,785 )
01/19/2021 SSB HKD 346,267,200 USD 44,660,749 (16,238 )01/13/2021 MSCI HUF 3,367,271,618 USD 11,048,838 (148,120 )02/16/2021 CITI IDR 20,607,980,000 USD 1,450,000 4,20602/16/2021 JPM IDR 31,567,890,000 USD 2,170,000 (44,708 )
Copyright © 2021 www.secdatabase.com. All Rights Reserved.Please Consider the Environment Before Printing This Document

GMO Implementation Fund(A Series of GMO Trust)
Consolidated Schedule of Investments �� (Continued)November 30, 2020 (Unaudited)
Forward Currency Contracts �� continued
SettlementDate
Counter-party
CurrencySold
CurrencyPurchased
NetUnrealized
Appreciation(Depreciation)
($)01/29/2021 BOA ILS 7,579,859 USD 2,270,000 (22,383 )01/22/2021 BCLY INR 135,635,500 USD 1,820,000 (2,709 )01/22/2021 JPM INR 137,722,140 USD 1,830,000 (20,750 )12/10/2020 CITI JPY 2,400,000,000 USD 22,661,441 (329,484 )12/14/2020 SSB JPY 2,600,000,000 USD 24,519,977 (389,710 )01/19/2021 BOA JPY 21,401,038,734 USD 203,729,198 (1,468,926 )01/19/2021 CITI JPY 852,540,000 USD 8,205,481 31,12901/19/2021 DB JPY 10,390,728,966 USD 98,908,833 (719,888 )01/19/2021 JPM JPY 2,995,141,800 USD 28,825,546 107,43101/19/2021 MSCI JPY 5,980,247,500 USD 57,564,544 224,54302/08/2021 JPM JPY 5,500,000,000 USD 53,266,036 517,70102/09/2021 BOA JPY 643,834,899 USD 6,190,000 15,16102/09/2021 JPM JPY 683,045,915 USD 6,580,000 29,09902/22/2021 JPM JPY 1,700,000,000 USD 16,236,625 (70,072 )02/24/2021 GS JPY 4,888,633,333 USD 47,095,889 202,16702/24/2021 MSCI JPY 9,777,266,667 USD 94,200,208 412,76501/20/2021 JPM NOK 168,678,841 USD 18,315,331 (650,689 )12/17/2020 UBSA NZD 23,961,855 USD 16,319,102 (483,471 )02/05/2021 BCLY NZD 7,550,000 USD 5,040,893 (253,618 )02/05/2021 JPM NZD 37,300,000 USD 25,342,111 (814,880 )02/05/2021 MSCI NZD 87,615,000 USD 58,316,982 (3,123,897 )02/02/2021 MSCI PEN 13,824,065 USD 3,819,277 (14,777 )12/03/2020 JPM PHP 36,318,750 USD 750,000 (5,225 )12/03/2020 MSCI PHP 98,241,115 USD 2,029,356 (13,504 )01/25/2021 JPM PHP 134,559,865 USD 2,785,919 (4,263 )02/01/2021 SSB CAD 31,611,905 USD 24,343,459 6,73202/16/2021 DB PLN 9,439,307 USD 2,520,000 3,78802/26/2021 BOA RON 3,642,947 USD 884,003 (3,405 )02/16/2021 BCLY RUB 342,539,865 USD 4,400,000 (53,943 )02/16/2021 MSCI RUB 130,862,256 USD 1,680,000 (21,563 )02/05/2021 BCLY SEK 26,377,958 USD 3,040,000 (39,499 )02/05/2021 DB SEK 90,465,024 USD 10,400,000 (161,355 )02/05/2021 JPM SEK 114,645,473 USD 13,300,000 (84,307 )01/15/2021 BCLY SGD 1,739,153 USD 1,300,000 3,20712/07/2020 BCLY TWD 60,360,640 USD 2,120,000 5,36912/07/2020 CITI TWD 37,698,144 USD 1,320,000 (690 )12/07/2020 JPM TWD 23,299,480 USD 820,000 3,74312/07/2020 MSCI TWD 65,783,466 USD 2,304,149 (461 )01/19/2021 DB USD 10,939,597 AUD 15,425,400 389,01402/08/2021 BOA USD 5,648,145 AUD 7,900,000 154,51302/08/2021 DB USD 9,991,884 AUD 14,000,000 291,30602/02/2021 JPM USD 4,167,724 BRL 23,933,986 294,74212/02/2020 GS USD 1,555,554 CAD 2,035,746 11,97512/02/2020 MSCI USD 1,982,368 CAD 2,597,323 17,57712/02/2020 SSB USD 22,427,746 CAD 29,805,653 522,68102/01/2021 SSB USD 24,343,459 CAD 31,611,905 6,73202/03/2021 JPM USD 55,362,563 CAD 73,622,520 1,348,07502/03/2021 MSCI USD 55,374,847 CAD 73,622,520 1,335,79102/12/2021 DB USD 628,956 CAD 818,658 1,66201/13/2021 DB USD 10,300,000 CHF 9,317,936 (29,180 )12/02/2020 MSCI USD 14,122,981 CLP 10,825,554,000 85,64802/26/2021 MSCI USD 7,001,393 CLP 5,412,777,000 116,11302/03/2021 MSCI USD 3,370,000 COP 12,227,120,000 20,95402/16/2021 BOA USD 1,430,000 CZK 31,827,067 17,66402/16/2021 CITI USD 1,010,000 CZK 22,393,619 8,58102/16/2021 DB USD 1,590,000 CZK 34,752,010 (9,294 )01/13/2021 UBSA USD 82,415,762 EUR 69,684,419 819,662
SettlementDate
Counter-party
CurrencySold
CurrencyPurchased
NetUnrealized
Appreciation(Depreciation)
($)01/19/2021 DB USD 31,745,336 EUR 26,820,545 295,12701/19/2021 JPM USD 1,375,020 EUR 1,160,250 11,04301/19/2021 MSCI USD 23,821,006 EUR 20,399,190 548,35301/27/2021 DB USD 76,795,607 EUR 64,661,000 463,88201/27/2021 JPM USD 41,139,203 EUR 34,590,000 190,28102/16/2021 BCLY USD 2,508,345 EUR 2,112,522 16,89102/16/2021 GS USD 82,738,460 EUR 70,000,000 937,11902/16/2021 JPM USD 471,807 EUR 397,505 3,35701/13/2021 MSCI USD 33,864,576 GBP 26,172,700 1,050,65101/19/2021 DB USD 20,733,707 GBP 16,047,000 674,17401/19/2021 MSCI USD 9,516,316 GBP 7,279,300 194,80601/19/2021 SSB USD 6,525,969 GBP 4,962,800 94,77201/19/2021 SSB USD 9,728,335 HKD 75,419,900 2,68701/13/2021 BOA USD 1,000,000 HUF 303,089,100 7,84202/16/2021 JPM USD 5,716,143 IDR 85,044,771,400 250,34101/29/2021 MSCI USD 6,509,832 ILS 22,060,518 161,95001/22/2021 JPM USD 1,142,500 INR 84,767,769 (3,366 )12/10/2020 MSCI USD 27,923,780 JPY 2,922,522,465 72,67712/10/2020 SSB USD 39,738,376 JPY 4,209,073,772 582,66601/19/2021 BOA USD 13,234,042 JPY 1,391,012,900 103,31301/19/2021 BONY USD 6,376,194 JPY 665,589,900 5,63601/19/2021 CITI USD 6,453,330 JPY 673,827,200 7,48102/09/2021 BOA USD 25,990,000 JPY 2,723,152,109 126,98502/09/2021 MSCI USD 69,427,841 JPY 7,196,022,133 (412,818 )02/10/2021 MSCI USD 5,164,160 JPY 535,547,692 (27,813 )02/10/2021 SSB USD 24,030,637 JPY 2,488,335,316 (165,435 )02/19/2021 MSCI USD 10,381,290 KRW 11,484,198,110 (26,040 )01/21/2021 BOA USD 2,460,000 MXN 51,459,438 72,85801/21/2021 CITI USD 2,030,000 MXN 43,284,716 100,49401/21/2021 GS USD 1,400,000 MXN 29,991,343 76,18801/21/2021 MSCI USD 3,861,796 MXN 82,311,289 189,60501/20/2021 JPM USD 16,450,000 NOK 151,505,129 585,03112/17/2020 UBSA USD 1,401,377 NZD 2,029,854 22,00102/05/2021 DB USD 4,694,648 NZD 7,000,000 214,17102/05/2021 JPM USD 24,851,586 NZD 37,070,000 1,144,11602/02/2021 MSCI USD 4,560,000 PEN 16,365,600 (21,060 )12/03/2020 JPM USD 2,791,698 PHP 134,559,865 6,38602/16/2021 MSCI USD 3,655,865 PLN 13,868,432 41,00802/16/2021 BCLY USD 520,721 RUB 40,594,099 7,11202/05/2021 BCLY USD 105,082,336 SEK 935,201,265 4,097,90202/05/2021 JPM USD 9,850,000 SEK 88,605,420 494,25601/15/2021 GS USD 1,650,000 SGD 2,240,434 20,57101/15/2021 MSCI USD 1,720,000 SGD 2,330,665 17,85201/15/2021 BOA USD 3,680,000 THB 114,914,581 118,08202/16/2021 BCLY USD 10,100,000 TRY 80,514,170 (93,523 )12/07/2020 JPM USD 6,494,820 TWD 187,141,730 61,36902/02/2021 MSCI USD 2,324,504 TWD 65,783,466 (821 )01/29/2021 DB USD 2,260,000 ZAR 37,175,554 122,67801/29/2021 MSCI USD 6,885,153 ZAR 113,669,052 400,194
$(5,829,288 )
Copyright © 2021 www.secdatabase.com. All Rights Reserved.Please Consider the Environment Before Printing This Document

01/19/2021 BOA USD 45,279,028 EUR 38,761,389 1,026,252
Copyright © 2021 www.secdatabase.com. All Rights Reserved.Please Consider the Environment Before Printing This Document

GMO Implementation Fund(A Series of GMO Trust)
Consolidated Schedule of Investments �� (Continued)November 30, 2020 (Unaudited)
Futures Contracts
Reverse Repurchase Agreements
Average balance outstanding $(7,449,132)Average interest rate (net) (0.21 )%Maximum balance outstanding $(91,591,373)
Average balance outstanding was calculated based on daily face value balances outstanding during the period that the Fund had enteredinto reverse repurchase agreements. Average interest rate was calculated based on interest received and/or paid during the period that theFund had entered into the reverse repurchase agreements. The Fund had no reverse repurchase agreements at the end of the period.
Written Options
Equity Options
DescriptionExercise
PriceExpiration
DateNumber ofContracts
NotionalAmount Value ($)
Equity Options �� CallsFirstEnergy Corp. (e) 30.00 04/16/21 (3,500 ) USD (9,296,000) (385,000 )Equity Options �� PutsFirstEnergy Corp. (e) 28.00 04/16/21 (3,500 ) USD (9,296,000) (1,120,000 )
TOTAL WRITTEN OPTIONS(Premiums $1,431,533) $(1,505,000)
Numberof
Contracts + TypeExpiration
DateNotional
Amount ($)
Value/NetUnrealized
Appreciation(Depreciation)
($)Buys116 CAC40 10
Euro December 2020 7,610,885 23,945213 Canadian
GovernmentBond 10 Yr. March 2021 24,411,273 22,793
152 Gold 100OZ (i) February 2021 27,069,680 (1,961,748 )
71 Hang SengIndex December 2020 12,089,128 (94,478 )
2,330 Mini MSCIEmergingMarkets December 2020 140,067,950 11,122,558
72 S&P 500E-Mini December 2020 13,043,520 205,794
49 S&P/TSX60 December 2020 7,712,019 428,763
126 Silver (i) March 2021 14,233,590 (1,339,027 )607 U.S.
TreasuryNote 10 Yr.(CBT) March 2021 83,870,328 142,512
281 WTICrude (i) December 2020 12,740,540 1,183,955
$342,848,913 $9,735,067
Numberof
Contracts + TypeExpiration
DateNotional
Amount ($)
Value/NetUnrealized
Appreciation(Depreciation)
($)Sales1,047 Corn (i) March 2021 22,301,100 (320,688 )
22 DAX Index December 2020 8,728,208 (214,960 )4,137 E-mini Russell
2000 Index December 2020 376,487,685 (64,562,659 )513 Euro Bund December 2020 107,241,139 52,933
9,214 Euro STOXX 50 December 2020 384,858,932 (21,964,078 )1,167 FTSE 100 Index December 2020 97,351,184 (3,857,215 )296 FTSE/JSE TOP
40 December 2020 10,005,735 (67,102 )43 Gilt Long Bond March 2021 7,692,504 (7,134 )204 Hang Seng
Index December 2020 34,734,959 242,99033 Japanese
GovernmentBond 10 Yr.(OSE) December 2020 48,055,460 4,031
4,317 S&P 500E-Mini December 2020 782,067,720 (55,007,239 )
162 SGX Nifty 50 December 2020 4,188,685 5,403203 Soybean (i) January 2021 11,860,275 (1,039,624 )562 SPI 200 December 2020 67,221,862 (6,025,599 )
2,990 TOPIX Index December 2020 501,988,436 (39,601,163 )$2,464,783,884 $(192,362,104 )
+ Buys - Fund is long the futures contract.Sales - Fund is short the futures contract.
Copyright © 2021 www.secdatabase.com. All Rights Reserved.Please Consider the Environment Before Printing This Document

GMO Implementation Fund(A Series of GMO Trust)
Consolidated Schedule of Investments �� (Continued)November 30, 2020 (Unaudited)
Swap Contracts
OTC Credit Default Swaps
Reference Entity CounterpartyNotionalAmount
AnnualPremium
ImpliedCredit
Spread (1)
MaximumPotential
Amount ofFuture
Payments bythe FundUnder the
Contract (2)Expiration
Date
PeriodicPayment
Frequency
PremiumsPaid/
(Received) ($) Value ($)
Net UnrealizedAppreciation/
(Depreciation) ($)Buy Protection^:Halliburton Co.
BOA USD 1,140,000 1.00% 0.97% N/A12/20/2024 Quarterly 96,637 (1,577 ) (98,214 )
HCA, Inc.BCLY USD 1,140,000 5.00% 0.89% N/A
12/20/2024 Quarterly (139,584 ) (187,467) (47,883 )
Tenet Healthcare Corp.JPM USD 570,000 5.00% 3.17% N/A
12/20/2024 Quarterly 14,842 (39,507 ) (54,349 )
Tenet Healthcare Corp.JPM USD 1,140,000 5.00% 3.17% N/A
12/20/2024 Quarterly 142,500 (79,014 ) (221,514 )
United Rentals NorthAmerica, Inc. CSI USD 1,140,000 5.00% 0.86% N/A
12/20/2024 Quarterly (96,605 ) (189,377) (92,772 )
United Rentals NorthAmerica, Inc. JPM USD 1,140,000 5.00% 0.86% N/A
12/20/2024 Quarterly (51,323 ) (189,378) (138,055 )
$ (33,533 ) $(686,320) $ (652,787 )
^ Buy Protection - Fund pays a premium and buys credit protection. If a credit event occurs the Fund will, depending on the terms of the particular swap contract,either (i) receive from the seller of protection an amount equal to the notional amount of the swap and deliver the referenced obligation or underlying securitiescomprising the referenced index or (ii) receive a net settlement amount in the form of cash or securities equal to the notional amount of the swap less the recoveryvalue of the referenced obligation or underlying securities comprising the referenced index.Sell Protection - Fund receives a premium and sells credit protection. If a credit event occurs the Fund will, depending on the terms of the particular swap contract,either (i) pay to the buyer of protection an amount equal to the notional amount of the swap and take delivery of the referenced obligation or underlying securitiescomprising the referenced index or (ii) pay a net settlement amount in the form of cash or securities equal to the notional amount of the swap less the recoveryvalue of the referenced obligation or underlying securities comprising the referenced index.
(1) As of November 30, 2020, implied credit spreads in absolute terms, calculated using a model, and utilized in determining the market value of credit default swapcontracts on the reference security, serve as an indicator of the current status of the payment/performance risk and reflect the likelihood or risk of default for thereference entity. The implied credit spread of a particular referenced entity reflects the cost of buying/selling protection. Wider (i.e. higher) credit spreads representa deterioration of the referenced entity�s credit soundness and a greater likelihood or risk of default or other credit event occurring as defined under the terms of thecontract.
(2) The maximum potential amount the Fund could be required to pay as a seller of credit protection if a credit event occurs as defined under the terms of thatparticular swap contract.
Centrally Cleared Interest Rate Swaps
Fund Pays Fund ReceivesNotionalAmount
ExpirationDate
PeriodicPayment
Frequency
PremiumsPaid/
(Received) ($) Value ($)
NetUnrealized
Appreciation/(Depreciation) ($)
3 Month AUD BBSW0.15% AUD 62,864,000
12/16/2022 Quarterly 7,727 63,608 55,881
3 Month AUD BBSW0.10% AUD 92,610,000
12/16/2022 Quarterly (4,503 ) 25,767 30,270
0.07%3 Month AUD BBSW AUD 103,960,000
12/16/2022 Quarterly � 13,021 13,021
(0.67)%6 Month CHF LIBOR CHF 76,920,000
12/16/2022 Semi-Annually 18,648 (59,365 ) (78,013 )
6 Month CHF LIBOR(0.72)% CHF 55,220,000
12/16/2022 Semi-Annually (456 ) (7,797 ) (7,341 )
0.18%3 Month NZD Bank Bill Rate NZD 547,530,000
12/16/2022 Quarterly 106,071 505,611 399,540
(0.05)%3 Month SEK STIBOR SEK 387,130,000
12/16/2022 Quarterly 3,796 5,730 1,934
3 Month SEK STIBOR(0.04)% SEK 382,100,000
12/16/2022 Quarterly 991 3,263 2,272
3 Month SEK STIBOR(0.03)% SEK 431,300,000
12/16/2022 Quarterly � 6,200 6,200
Copyright © 2021 www.secdatabase.com. All Rights Reserved.Please Consider the Environment Before Printing This Document

0.55%3 Month CAD LIBOR CAD 56,870,000
12/19/2022 Semi-Annually � 2,008 2,008
0.56%3 Month CAD LIBOR CAD 160,700,000
12/19/2022 Semi-Annually 20,224 (19,169 ) (39,393 )
0.55%3 Month CAD LIBOR CAD 41,230,000
12/19/2022 Semi-Annually � (457 ) (457 )
6 Month EURIBOR(0.48)% EUR 57,530,000
12/21/2022 Semi-Annually 13,007 54,154 41,147
6 Month GBP LIBOR0.08% GBP 260,380,000
12/21/2022 Semi-Annually 103,713 (63,159 ) (166,872 )
3 Month USD LIBOR0.24% USD 60,360,000
12/21/2022 Quarterly (24,015 ) 9,671 33,686
3 Month USD LIBOR0.23% USD 25,310,000
12/21/2022 Quarterly 151 (3,583 ) (3,734 )
0.87%6 Month AUD BBSW AUD 13,070,000
12/16/2030 Semi-Annually (10,268 ) 22,422 32,690
0.76%6 Month AUD BBSW AUD 19,220,000
12/16/2030 Semi-Annually 10,389 181,833 171,444
0.77%6 Month AUD BBSW AUD 3,350,000
12/16/2030 Semi-Annually � 28,810 28,810
0.88%6 Month AUD BBSW AUD 9,440,000
12/16/2030 Semi-Annually � 12,810 12,810
6 Month AUD BBSW0.79% AUD 39,480,000
12/16/2030 Semi-Annually 4,097 (305,554) (309,651 )
Copyright © 2021 www.secdatabase.com. All Rights Reserved.Please Consider the Environment Before Printing This Document

GMO Implementation Fund(A Series of GMO Trust)
Consolidated Schedule of Investments �� (Continued)November 30, 2020 (Unaudited)
Centrally Cleared Interest Rate Swaps �� continued
Fund Pays Fund ReceivesNotionalAmount
ExpirationDate
PeriodicPayment
Frequency
PremiumsPaid/
(Received) ($) Value ($)
NetUnrealized
Appreciation/(Depreciation) ($)
0.93%6 Month AUD BBSW AUD 12,310,000
12/16/2030 Semi-Annually � (29,642 ) (29,642 )
6 Month AUD BBSW0.89% AUD 21,710,000
12/16/2030 Semi-Annually � (1,436 ) (1,436 )
3 Month CAD LIBOR1.28% CAD 74,200,000
12/16/2030 Semi-Annually (20,276 ) 440,090 460,366
3 Month CAD LIBOR1.23% CAD 21,320,000
12/16/2030 Semi-Annually 22,326 47,171 24,845
3 Month CAD LIBOR1.20% CAD 189,350,000
12/16/2030 Semi-Annually (323,545 ) (3,524 ) 320,021
3 Month CAD LIBOR1.11% CAD 21,140,000
12/16/2030 Semi-Annually (6,008 ) (135,604 ) (129,596 )
3 Month CAD LIBOR1.09% CAD 37,730,000
12/16/2030 Semi-Annually � (300,949 ) (300,949 )
3 Month CAD LIBOR1.09% CAD 6,690,000
12/16/2030 Semi-Annually � (54,357 ) (54,357 )
3 Month CAD LIBOR1.11% CAD 12,870,000
12/16/2030 Semi-Annually � (86,384 ) (86,384 )
3 Month CAD LIBOR1.13% CAD 20,650,000
12/16/2030 Semi-Annually � (107,889 ) (107,889 )
3 Month CAD LIBOR1.15% CAD 5,200,000
12/16/2030 Semi-Annually � (19,433 ) (19,433 )
6 Month CHF LIBOR(0.26)% CHF 13,200,000
12/16/2030 Semi-Annually (19,153 ) 53,935 73,088
(0.32)%6 Month CHF LIBOR CHF 8,840,000
12/16/2030 Semi-Annually � 28,940 28,940
6 Month CHF LIBOR(0.30)% CHF 146,140,000
12/16/2030 Semi-Annually (63,913 ) (147,486 ) (83,573 )
(0.27)%6 Month CHF LIBOR CHF 8,730,000
12/16/2030 Semi-Annually � (25,786 ) (25,786 )
(0.29)%6 Month CHF LIBOR CHF 14,790,000
12/16/2030 Semi-Annually � (10,193 ) (10,193 )
0.59% 3 Month NZD BankBill Rate NZD 106,400,000
12/16/2030 Quarterly (49,127 ) 2,172,934 2,222,061
0.85% 3 Month NZD BankBill Rate NZD 10,690,000
12/16/2030 Quarterly � 29,495 29,495
3 Month NZD Bank Bill Rate0.55% NZD 55,750,000
12/16/2030 Quarterly 103,372 (1,260,208) (1,363,580 )
3 Month NZD Bank Bill Rate0.46% NZD 27,940,000
12/16/2030 Quarterly (15,439 ) (820,212 ) (804,773 )
3 Month NZD Bank Bill Rate0.48% NZD 48,590,000
12/16/2030 Quarterly 1,211 (1,360,143) (1,361,354 )
3 Month NZD Bank Bill Rate0.74% NZD 8,620,000
12/16/2030 Quarterly � (86,980 ) (86,980 )
3 Month NZD Bank Bill Rate0.81% NZD 12,580,000
12/16/2030 Quarterly 2,108 (69,027 ) (71,135 )
3 Month NZD Bank Bill Rate0.78% NZD 120,640,000
12/16/2030 Quarterly (217,780 ) (867,638 ) (649,858 )
3 Month NZD Bank Bill Rate0.82% NZD 74,630,000
12/16/2030 Quarterly (6,833 ) (315,339 ) (308,506 )
3 Month NZD Bank Bill Rate0.86% NZD 89,140,000
12/16/2030 Quarterly (10,759 ) (154,760 ) (144,001 )
3 Month SEK STIBOR0.34% SEK 721,220,000
12/16/2030 Quarterly (188,184 ) (86,807 ) 101,377
0.30%3 Month SEK STIBOR SEK 99,400,000
12/16/2030 Quarterly � 55,663 55,663
0.31%3 Month SEK STIBOR SEK 128,300,000
12/16/2030 Quarterly � 54,035 54,035
Copyright © 2021 www.secdatabase.com. All Rights Reserved.Please Consider the Environment Before Printing This Document

3 Month SEK STIBOR0.30% SEK 64,500,000
12/16/2030 Quarterly � (32,015 ) (32,015 )
0.37%3 Month SEK STIBOR SEK 121,000,000
12/16/2030 Quarterly 669 (27,432 ) (28,101 )
0.39%3 Month SEK STIBOR SEK 102,240,000
12/16/2030 Quarterly � (53,933 ) (53,933 )
0.39%3 Month SEK STIBOR SEK 87,600,000
12/16/2030 Quarterly � (45,196 ) (45,196 )
(0.18)%6 Month EURIBOR EUR 189,020,000
12/18/2030 Semi-Annually 133,513 (1,660,424) (1,793,937 )
(0.21)%6 Month EURIBOR EUR 131,550,000
12/18/2030 Semi-Annually (30,173 ) (751,928 ) (721,755 )
(0.18)%6 Month EURIBOR EUR 11,490,000
12/18/2030 Semi-Annually (39,512 ) (107,984 ) (68,472 )
0.45%6 Month GBP LIBOR GBP 55,330,000
12/18/2030 Semi-Annually (22,555 ) 213,501 236,056
0.36%6 Month GBP LIBOR GBP 7,170,000
12/18/2030 Semi-Annually (630 ) 113,220 113,850
6 Month GBP LIBOR0.54% GBP 9,400,000
12/18/2030 Semi-Annually 24,084 69,659 45,575
6 Month GBP LIBOR0.53% GBP 13,890,000
12/18/2030 Semi-Annually 20,353 90,041 69,688
0.70%3 Month USD LIBOR USD 37,310,000
12/18/2030 Quarterly 48,881 553,133 504,252
0.88%3 Month USD LIBOR USD 154,720,000
12/18/2030 Quarterly (569,787 ) (449,162 ) 120,625
3 Month USD LIBOR0.82% USD 13,190,000
12/18/2030 Quarterly (11,009 ) (40,517 ) (29,508 )
3 Month USD LIBOR0.75% USD 6,930,000
12/18/2030 Quarterly 1,718 (68,803 ) (70,521 )
0.86%3 Month USD LIBOR USD 8,420,000
12/18/2030 Quarterly � (5,475 ) (5,475 )
0.85%3 Month USD LIBOR USD 8,420,000
12/18/2030 Quarterly � (115 ) (115 )
0.85%3 Month USD LIBOR USD 17,290,000
12/18/2030 Quarterly � (1,082 ) (1,082 )
0.86%3 Month USD LIBOR USD 17,070,000
12/18/2030 Quarterly � (20,296 ) (20,296 )
0.88%3 Month USD LIBOR USD 18,250,000
12/18/2030 Quarterly � (48,512 ) (48,512 )
$ (986,876 ) $(4,859,030) $ (3,872,154 )
Copyright © 2021 www.secdatabase.com. All Rights Reserved.Please Consider the Environment Before Printing This Document

GMO Implementation Fund(A Series of GMO Trust)
Consolidated Schedule of Investments �� (Continued)November 30, 2020 (Unaudited)
OTC Total Return Swaps
Fund Pays Fund Receives CounterpartyNotionalAmount
ExpirationDate
PeriodicPayment
Frequency
PremiumsPaid/
(Received) ($) Value ($)
Net UnrealizedAppreciation/
(Depreciation) ($)Depreciation of Total Return on CSI 500
Index + (1 Month USD LIBOR minus9.25%)
Appreciation onTotal Return onCSI 500 Index GS USD 11,114,886
12/07/2020 Monthly � (36,704 ) (36,704 )
Total Return on Equity Basket (m) 1 Month FederalFunds Rateminus 0.75% GS USD 2,248,032
05/24/2022 Monthly � 28,810 28,810
Total Return on Equity Basket (m) 1 Month FederalFunds Rateminus 0.75% GS USD 488,114
05/24/2022 Monthly � 17,923 17,923
Total Return on Equity Basket (m) 1 Month FederalFunds Rateminus 0.50% GS USD 1,404,782
05/24/2022 Monthly � 155,617 155,617
Total Return on Equity Basket (m) 1 Month FederalFunds Rateminus 0.75% GS USD 243,965
05/24/2022 Monthly � (4,169 ) (4,169 )
Total Return on Equity Basket (m) 1 Month FederalFunds Rateminus 0.50% GS USD 94,227
05/24/2022 Monthly � 1,818 1,818
Total Return on Equity Basket (m) 1 Month FederalFunds Rateminus 0.75% GS USD 286,294
05/24/2022 Monthly � 1,526 1,526
Total Return on Equity Basket (m) 1 Month FederalFunds Rateminus 1.00% MORD USD 846,889
10/18/2022 Monthly � 49,750 49,750
Total Return on Equity Basket (m) 1 Month FederalFunds Rateminus 0.40% MORD USD 41,578,142
10/18/2022 Monthly � (872,863) (872,863 )
Total Return on Equity Basket (m) 1 Month FederalFunds Rateminus 0.50% MORD USD 198,455
10/18/2022 Monthly � 16 16
Total Return on Equity Basket (m) 1 Month FederalFunds Rateminus 0.40% MORD USD 646,167
10/18/2022 Monthly � 1,845 1,845
$ � $(656,431) $ (656,431 )
Copyright © 2021 www.secdatabase.com. All Rights Reserved.Please Consider the Environment Before Printing This Document

GMO Implementation Fund(A Series of GMO Trust)
Consolidated Schedule of Investments �� (Continued)November 30, 2020 (Unaudited)
As of November 30, 2020, for the above contracts and/or agreements, the Fund had sufficient cash and/or securities to covercommitments or collateral requirements, if any, of the relevant broker or exchange.
Counterparty Abbreviations:
Notes to Schedule of Investments:
� Denominated in U.S. Dollar, unless otherwise indicated.* Non-income producing security.(a) All or a portion of this security is out on loan.(b) All or a portion of this security has been pledged to cover margin
requirements on futures and/or cleared swap contracts, collateral onsecurities sold short, OTC swap contracts, forward currency contracts, and/or written options, if any.
(c) Investment valued using significant unobservable inputs.(d) Securities are traded on separate exchanges for the same entity.(e) All or a portion of this investment is held in connection with one or more
holdings within the Fund.(f) Investment valued at fair value using methods determined in good faith by
the Trustees of GMO Trust or persons acting at their direction pursuant toprocedures approved by the Trustees. Investment valued using significantunobservable inputs.
(g) Preferred dividend rates are disclosed to the extent that a stated rate exists.(h) Security is in default.(i) All or a portion of this security or derivative is owned by GMO
Implementation SPC Ltd., which is a 100% owned subsidiary of GMOImplementation Fund.
(j) All or a portion of this security is purchased with collateral from securitiesloaned.
(k) The rate disclosed is the 7 day net yield as of November 30, 2020.(l) The rate shown represents yield-to-maturity.(m) Periodic payments made/received are based on the total return of the
referenced entity. Custom equity basket swap which has a notional amountof less than 1% of the Fund�s total net assets.
The rates shown on variable rate notes are the current interest rates atNovember 30, 2020, which are subject to change based on the terms of thesecurity.
Portfolio Abbreviations:
144A - Securities exempt from registration under Rule 144A of the Securities Actof 1933. These securities may be resold in transactions exempt from registration,normally to qualified institutional investors.ADR - American Depositary ReceiptAUD BBSW - Bank Bill Swap Reference Rate denominated in Australian Dollar.CAD LIBOR - London Interbank Offered Rate denominated in Canadian Dollar.CHF LIBOR - London Interbank Offered Rate denominated in Swiss Franc.CLO - Collateralized Loan ObligationCMT - Constant Maturity TreasuryCVA - Certificaaten van aandelen (Share Certificates)CVR - Contingent Value RightETF - Exchange-Traded FundEURIBOR - Euro Interbank Offered RateForeign Registered - Shares issued to foreign investors in markets that have foreignownership limits.GBP LIBOR - London Interbank Offered Rate denominated in British Pound.GDR - Global Depositary ReceiptJSC - Joint-Stock CompanyLIBOR - London Interbank Offered RateNVDR - Non-Voting Depositary ReceiptNZD Bank Bill Rate - Bank Bill Rate denominated in New Zealand Dollar.OJSC - Open Joint-Stock CompanyPIK - Payment In KindPJSC - Private Joint-Stock CompanyQPSC - Qatar Private Stock CompanyQSC - Qatari Shareholding CompanyReg S - Security exempt from registration under Regulation S of the Securities Actof 1933, which exempts from registration securities offered and sold outside theUnited States. Security may not be offered or sold in the United States exceptpursuant to an exemption from, or in a transaction not subject to, the registrationrequirements of the Securities Act of 1933.REIT - Real Estate Investment TrustSEK STIBOR - Stockholm Interbank Offered Rate denominated in Swedish Krona.SOFOM - Sociedades Financieras de Objeto Multi (Multi-purpose FinancialCompanySOFR - Secured Overnight Financing RateUSD LIBOR - London Interbank Offered Rate denominated in United StatesDollar.
BCLY - Barclays Bank PLCBOA - Bank of America, N.A.BONY - Bank of New YorkCITI - Citibank N.A.CSI - Credit Suisse InternationalDB - Deutsche Bank AGGS - Goldman Sachs International
JPM - JPMorgan Chase Bank, N.A.MORD - Morgan Stanley Capital Services LLCMSCI - Morgan Stanley & Co. International PLCSSB - State Street Bank and Trust CompanyUBSA - UBS AG
Copyright © 2021 www.secdatabase.com. All Rights Reserved.Please Consider the Environment Before Printing This Document

GMO Implementation Fund(A Series of GMO Trust)
Consolidated Schedule of Investments �� (Continued)November 30, 2020 (Unaudited)
Currency Abbreviations:
AUD - Australian DollarBRL - Brazilian RealCAD - Canadian DollarCHF - Swiss FrancCLP - Chilean PesoCOP - Colombian PesoCZK - Czech KorunaEUR - EuroGBP - British PoundHKD - Hong Kong DollarHUF - Hungarian ForintIDR - Indonesian RupiahILS - Israeli ShekelINR - Indian RupeeJPY - Japanese YenKRW - South Korean Won
MXN - Mexican PesoNOK - Norwegian KroneNZD - New Zealand DollarPEN - Peruvian SolPHP - Philippine PesoPLN - Polish ZlotyRON - Romanian LeuRUB - Russian RubleSEK - Swedish KronaSGD - Singapore DollarTHB - Thai BahtTRY - Turkish LiraTWD - Taiwan DollarUSD - United States DollarZAR - South African Rand
Copyright © 2021 www.secdatabase.com. All Rights Reserved.Please Consider the Environment Before Printing This Document

GMO International Developed Equity Allocation Fund(A Series of GMO Trust)Schedule of Investments(showing percentage of total net assets)November 30, 2020 (Unaudited)
Shares Description Value ($)MUTUAL FUNDS �� 100.0%
Affiliated Issuers �� 100.0%614,798 GMO Emerging Markets Fund, Class VI 20,878,5268,105,955 GMO International Equity Fund, Class IV 180,681,741387,104 GMO-Usonian Japan Value Creation Fund,
Class VI 8,342,097
TOTAL MUTUAL FUNDS(COST $213,978,447) 209,902,364
SHORT-TERM INVESTMENTS �� 0.0%
Money Market Funds �� 0.0%92,137 State Street Institutional Treasury Money Market
Fund � Premier Class, 0.01% (a) 92,137
TOTAL SHORT-TERM INVESTMENTS(COST $92,137) 92,137
TOTAL INVESTMENTS �� 100.0%(Cost $214,070,584) 209,994,501Other Assets and Liabilities (net) � (0.0%) (41,300 )
TOTAL NET ASSETS �� 100.0% $209,953,201
Notes to Schedule of Investments:
(a) The rate disclosed is the 7 day net yield as of November 30, 2020.
Copyright © 2021 www.secdatabase.com. All Rights Reserved.Please Consider the Environment Before Printing This Document

GMO International Equity Allocation Fund(A Series of GMO Trust)Schedule of Investments(showing percentage of total net assets)November 30, 2020 (Unaudited)
Shares Description Value ($)MUTUAL FUNDS �� 100.0%
Affiliated Issuers �� 100.0%9,683,715 GMO Emerging Markets Fund, Class VI 328,858,94819,784,816 GMO International Equity Fund, Class IV 441,003,5421,497,142 GMO-Usonian Japan Value Creation Fund,
Class VI 32,263,417
TOTAL MUTUAL FUNDS(COST $785,760,815) 802,125,907
SHORT-TERM INVESTMENTS �� 0.0%175,252 State Street Institutional Treasury Money Market
Fund � Premier Class, 0.01% (a) 175,252
TOTAL SHORT-TERM INVESTMENTS(COST $175,252) 175,252
TOTAL INVESTMENTS �� 100.0%(Cost $785,936,067) 802,301,159Other Assets and Liabilities (net) � (0.0%) (57,024 )
TOTAL NET ASSETS �� 100.0% $802,244,135
Notes to Schedule of Investments:
(a) The rate disclosed is the 7 day net yield as of November 30, 2020.
Copyright © 2021 www.secdatabase.com. All Rights Reserved.Please Consider the Environment Before Printing This Document
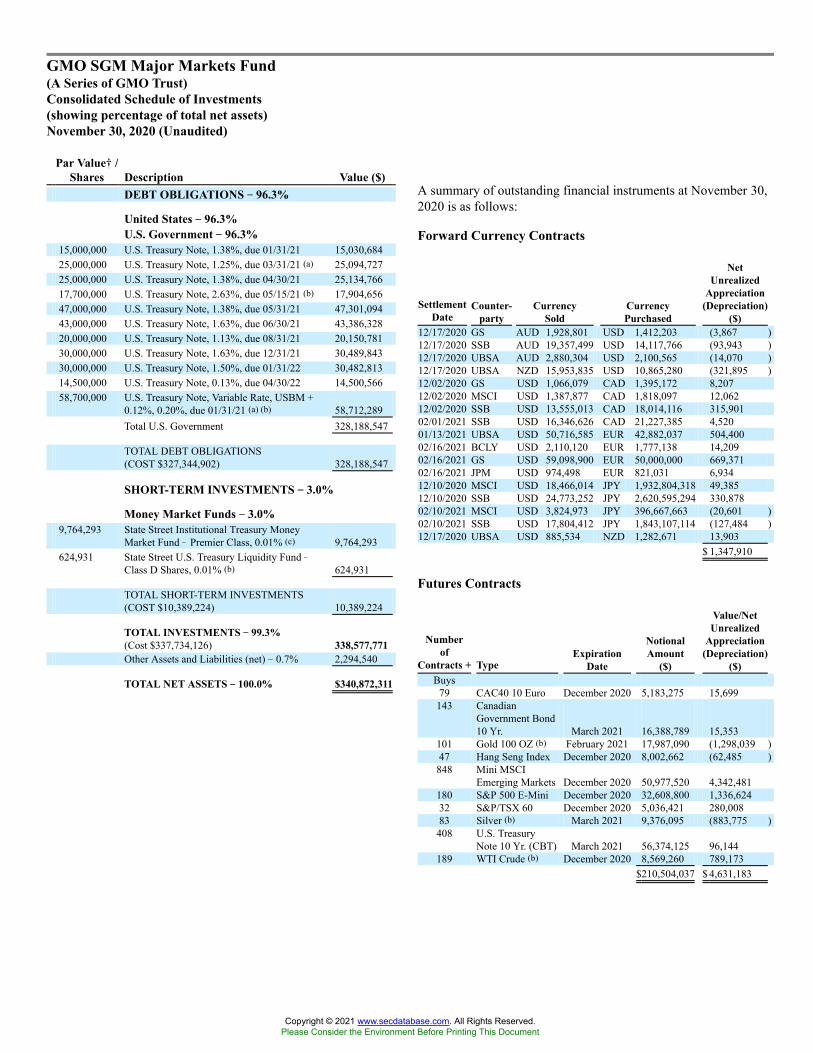
GMO SGM Major Markets Fund(A Series of GMO Trust)Consolidated Schedule of Investments(showing percentage of total net assets)November 30, 2020 (Unaudited)
Par Value�� /Shares Description Value ($)
DEBT OBLIGATIONS �� 96.3%
United States �� 96.3%U.S. Government �� 96.3%
15,000,000 U.S. Treasury Note, 1.38%, due 01/31/21 15,030,68425,000,000 U.S. Treasury Note, 1.25%, due 03/31/21 (a) 25,094,72725,000,000 U.S. Treasury Note, 1.38%, due 04/30/21 25,134,76617,700,000 U.S. Treasury Note, 2.63%, due 05/15/21 (b) 17,904,65647,000,000 U.S. Treasury Note, 1.38%, due 05/31/21 47,301,09443,000,000 U.S. Treasury Note, 1.63%, due 06/30/21 43,386,32820,000,000 U.S. Treasury Note, 1.13%, due 08/31/21 20,150,78130,000,000 U.S. Treasury Note, 1.63%, due 12/31/21 30,489,84330,000,000 U.S. Treasury Note, 1.50%, due 01/31/22 30,482,81314,500,000 U.S. Treasury Note, 0.13%, due 04/30/22 14,500,56658,700,000 U.S. Treasury Note, Variable Rate, USBM +
0.12%, 0.20%, due 01/31/21 (a) (b) 58,712,289Total U.S. Government 328,188,547
TOTAL DEBT OBLIGATIONS(COST $327,344,902) 328,188,547
SHORT-TERM INVESTMENTS �� 3.0%
Money Market Funds �� 3.0%9,764,293 State Street Institutional Treasury Money
Market Fund � Premier Class, 0.01% (c) 9,764,293624,931 State Street U.S. Treasury Liquidity Fund �
Class D Shares, 0.01% (b) 624,931
TOTAL SHORT-TERM INVESTMENTS(COST $10,389,224) 10,389,224
TOTAL INVESTMENTS �� 99.3%(Cost $337,734,126) 338,577,771Other Assets and Liabilities (net) � 0.7% 2,294,540
TOTAL NET ASSETS �� 100.0% $340,872,311
A summary of outstanding financial instruments at November 30,2020 is as follows:
Forward Currency Contracts
SettlementDate
Counter-party
CurrencySold
CurrencyPurchased
NetUnrealized
Appreciation(Depreciation)
($)12/17/2020 GS AUD 1,928,801 USD 1,412,203 (3,867 )12/17/2020 SSB AUD 19,357,499 USD 14,117,766 (93,943 )12/17/2020 UBSA AUD 2,880,304 USD 2,100,565 (14,070 )12/17/2020 UBSA NZD 15,953,835 USD 10,865,280 (321,895 )12/02/2020 GS USD 1,066,079 CAD 1,395,172 8,20712/02/2020 MSCI USD 1,387,877 CAD 1,818,097 12,06212/02/2020 SSB USD 13,555,013 CAD 18,014,116 315,90102/01/2021 SSB USD 16,346,626 CAD 21,227,385 4,52001/13/2021 UBSA USD 50,716,585 EUR 42,882,037 504,40002/16/2021 BCLY USD 2,110,120 EUR 1,777,138 14,20902/16/2021 GS USD 59,098,900 EUR 50,000,000 669,37102/16/2021 JPM USD 974,498 EUR 821,031 6,93412/10/2020 MSCI USD 18,466,014 JPY 1,932,804,318 49,38512/10/2020 SSB USD 24,773,252 JPY 2,620,595,294 330,87802/10/2021 MSCI USD 3,824,973 JPY 396,667,663 (20,601 )02/10/2021 SSB USD 17,804,412 JPY 1,843,107,114 (127,484 )12/17/2020 UBSA USD 885,534 NZD 1,282,671 13,903
$ 1,347,910
Futures Contracts
Numberof
Contracts + TypeExpiration
Date
NotionalAmount
($)
Value/NetUnrealized
Appreciation(Depreciation)
($)Buys
79 CAC40 10 Euro December 2020 5,183,275 15,699143 Canadian
Government Bond10 Yr. March 2021 16,388,789 15,353
101 Gold 100 OZ (b) February 2021 17,987,090 (1,298,039 )47 Hang Seng Index December 2020 8,002,662 (62,485 )848 Mini MSCI
Emerging Markets December 2020 50,977,520 4,342,481180 S&P 500 E-Mini December 2020 32,608,800 1,336,62432 S&P/TSX 60 December 2020 5,036,421 280,00883 Silver (b) March 2021 9,376,095 (883,775 )408 U.S. Treasury
Note 10 Yr. (CBT) March 2021 56,374,125 96,144189 WTI Crude (b) December 2020 8,569,260 789,173
$210,504,037 $ 4,631,183
Copyright © 2021 www.secdatabase.com. All Rights Reserved.Please Consider the Environment Before Printing This Document

GMO SGM Major Markets Fund(A Series of GMO Trust)
Consolidated Schedule of Investments �� (Continued)November 30, 2020 (Unaudited)
As of November 30, 2020, for the above contracts and/or agreements, the Fund had sufficient cash and/or securities to covercommitments or collateral requirements, if any, of the relevant broker or exchange.
Portfolio Abbreviations:USBM - U.S. Treasury 3 Month Bill Money Market Yield.
Counterparty Abbreviations:
Currency Abbreviations:
Futures Contracts �� continued
Numberof
Contracts + TypeExpiration
Date
NotionalAmount
($)
Value/NetUnrealized
Appreciation(Depreciation)
($)Sales704 Corn (b) March 2021 14,995,200 (213,453 )15 DAX Index December 2020 5,951,051 (158,234 )134 E-mini Russell
2000 Index December 2020 12,194,670 (1,122,082 )344 Euro Bund December 2020 71,912,187 52,768198 FTSE/JSE TOP
40 December 2020 6,693,026 (69,596 )28 Gilt Long Bond March 2021 5,009,072 (4,583 )22 Japanese
GovernmentBond 10 Yr.(OSE) December 2020 32,036,973 (1,565 )
137 Soybean (b) January 2021 8,004,225 (692,391 )68 SPI 200 December 2020 8,133,606 (473,645 )15 TOPIX Index December 2020 2,518,337 (46,080 )
$167,448,347 $ (2,728,861 )
+ Buys - Fund is long the futures contract.Sales - Fund is short the futures contract.
Notes to Schedule of Investments:
� Denominated in U.S. Dollar, unless otherwise indicated.(a) All or a portion of this security has been pledged to cover margin
requirements on futures and/or cleared swap contracts, collateral on OTCswap contracts, forward currency contracts, and/or written options, if any.
(b) All or a portion of this security or derivative is owned by GMO AlternativeAsset SPC Ltd., which is a 100% owned subsidiary of GMO SGM MajorMarkets Fund.
(c) The rate disclosed is the 7 day net yield as of November 30, 2020.
The rates shown on variable rate notes are the current interest rates atNovember 30, 2020, which are subject to change based on the terms of thesecurity.
BCLY - Barclays Bank PLCGS - Goldman Sachs InternationalJPM - JPMorgan Chase Bank, N.A.MSCI - Morgan Stanley & Co.International PLC
SSB - State Street Bank and TrustCompanyUBSA - UBS AG
AUD - Australian Dollar JPY - Japanese Yen
Copyright © 2021 www.secdatabase.com. All Rights Reserved.Please Consider the Environment Before Printing This Document

CAD - Canadian DollarEUR - Euro
NZD - New Zealand DollarUSD - United States Dollar
Copyright © 2021 www.secdatabase.com. All Rights Reserved.Please Consider the Environment Before Printing This Document

GMO Special Opportunities Fund(A Series of GMO Trust)Consolidated Schedule of Investments(showing percentage of total net assets)November 30, 2020 (Unaudited)
Shares Description Value ($)COMMON STOCKS �� 80.4%
Germany �� 1.3%79,180 GRENKE AG 3,459,546
Israel �� 3.7%38,000 Wix.com Ltd * 9,706,340
New Zealand �� 4.7%1,220,000 Ryman Healthcare Ltd 12,602,858
United Kingdom �� 5.6%1,960,000 boohoo Group Plc * 8,223,485640,000 Burford Capital Ltd 6,521,600
Total United Kingdom 14,745,085
United States �� 65.1%675,300 At Home Group, Inc. * 12,790,182346,830 Cardlytics, Inc. * 41,161,785177,514 Carvana Co. * 44,415,77895,684 Fastly, Inc. � Class A * 8,111,133207,920 Interactive Brokers Group, Inc. � Class A 10,969,859891,944 Redfin Corp. * 42,715,19848,953 Wayfair, Inc. � Class A * 12,451,685
Total United States 172,615,620
TOTAL COMMON STOCKS(COST $95,168,604) 213,129,449
SHORT-TERM INVESTMENTS �� 4.8%
Money Market Funds �� 4.8%12,795,746 State Street Institutional Treasury Money Market
Fund � Premier Class, 0.01% (a) 12,795,74610 State Street U.S. Treasury Liquidity Fund �
Class D Shares, 0.01% (b) 10
TOTAL SHORT-TERM INVESTMENTS(COST $12,795,756) 12,795,756
TOTAL INVESTMENTS �� 85.2%(Cost $107,964,360) 225,925,205Other Assets and Liabilities (net) � 14.8% 39,372,078
TOTAL NET ASSETS �� 100.0% $265,297,283
Notes to Schedule of Investments:
* Non-income producing security.(a) The rate disclosed is the 7 day net yield as of November 30, 2020.(b) All or a portion of this security is owned by GMO Special Opportunities
SPC Ltd., which is a 100% owned subsidiary of GMO Special OpportunitiesFund.
Copyright © 2021 www.secdatabase.com. All Rights Reserved.Please Consider the Environment Before Printing This Document

GMO Strategic Opportunities Allocation Fund(A Series of GMO Trust)Schedule of Investments(showing percentage of total net assets)November 30, 2020 (Unaudited)
Shares Description Value ($)COMMON STOCKS �� 30.4%
Australia �� 0.8%25,635 Accent Group Ltd 40,66117,346 Ansell Ltd 474,45426,425 Asaleo Care Ltd 19,4259,288 AUB Group Ltd 113,84448,596 Australian Pharmaceutical Industries Ltd 42,94346,248 BlueScope Steel Ltd 578,6764,615 Computershare Ltd 48,35625,239 Coronado Global Resources Inc 19,53718,346 CSR Ltd 65,11841,178 Dexus (REIT) 295,02741,990 Fortescue Metals Group Ltd 559,41634,199 G8 Education Ltd 29,46731,008 Genworth Mortgage Insurance Australia Ltd 60,186117,986 GPT Group (The) (REIT) 407,78710,503 GWA Group Ltd 22,24218,720 JB Hi-Fi Ltd 628,80413,003 McMillan Shakespeare Ltd 113,42273,163 Mirvac Group (REIT) 138,232976 Rio Tinto Ltd 72,81834,636 Sandfire Resources NL 111,477201,264 Scentre Group (REIT) 411,70463,977 Stockland (REIT) 212,4786,747 Super Retail Group Ltd 48,819
Total Australia 4,514,893
Austria �� 0.0%1,110 AT&S Austria Technologie & Systemtechnik AG 26,534
Belgium �� 0.3%16,078 Ageas SA/NV 787,1899,099 AGFA-Gevaert NV * 37,6579,467 bpost SA 114,2045,747 Etablissements Franz Colruyt NV 342,53196 Melexis NV 9,209938 Orange Belgium SA 18,109542 UCB SA 58,001
Total Belgium 1,366,900
Canada �� 0.9%16,476 Brookfield Asset Management Inc � Class A (a) (b) 667,1133,400 Canadian Apartment Properties (REIT) 133,937700 Canadian Tire Corp Ltd � Class A 89,4583,100 Canadian Western Bank 72,04012,500 Cascades Inc 140,52518,258 Celestica Inc * 137,49424,700 CI Financial Corp 323,704900 Cogeco Inc 55,12837,100 Fortuna Silver Mines Inc * 236,249600 goeasy Ltd 39,261200 iA Financial Corp Inc 8,758
Shares Description Value ($)Canada �� continued
8,300 IGM Financial Inc 219,5318,600 Imperial Oil Ltd 148,8633,175 Labrador Iron Ore Royalty Corp 64,2723,100 Linamar Corp 142,7906,500 Magna International Inc 398,59913,700 Manulife Financial Corp 233,4506,400 Martinrea International Inc 70,076800 Norbord Inc 29,99312,017 Nutrien Ltd 592,07814,600 Power Corp of Canada 328,7166,500 RioCan Real Estate Investment Trust 87,7881,600 Stella-Jones Inc 54,43019,800 TELUS Corp 381,9132,800 TFI International Inc 142,0809,600 Tourmaline Oil Corp 133,6478,900 Transcontinental Inc � Class A 132,1261,000 West Fraser Timber Co Ltd 55,371
Total Canada 5,119,390
China �� 0.6%66,000 Agile Group Holdings Ltd 95,294158,500 BAIC Motor Corp Ltd � Class H 59,323418,000 Bank of Communications Co Ltd � Class H 230,9909,500 Beijing Enterprises Holdings Ltd 30,783140,000 China Communications Construction Co Ltd � Class H 72,566124,000 China Communications Services Corp Ltd � Class H 66,0822,756,000 China Huarong Asset Management Co Ltd � Class H 315,94612,500 China Overseas Land & Investment Ltd 30,43547,000 China Railway Construction Corp Ltd � Class H 31,058754,000 China Railway Group Ltd � Class H 372,190354,000 China Zhongwang Holdings Ltd * 77,10159,000 Chongqing Rural Commercial Bank Co Ltd � Class H 25,298382,000 Dongfeng Motor Group Co Ltd � Class H 393,01741,000 Fosun International Ltd 59,164278,400 Guangzhou R&F Properties Co Ltd � Class H 363,287200 JOYY Inc ADR 17,81420,000 Kingboard Holdings Ltd 76,414191,800 Legend Holdings Corp � Class H 261,15615,300 Momo Inc Sponsored ADR 220,01438,000 Seazen Group Ltd * 33,63035,300 Shanghai Pharmaceuticals Holding Co Ltd � Class H 59,69373,500 Shimao Group Holdings Ltd 273,94870,400 Sinopharm Group Co Ltd � Class H 174,258270,000 Skyworth Group Ltd * 73,695435,000 Yuzhou Group Holdings Co Ltd 172,891
Total China 3,586,047
Copyright © 2021 www.secdatabase.com. All Rights Reserved.Please Consider the Environment Before Printing This Document

GMO Strategic Opportunities Allocation Fund(A Series of GMO Trust)Schedule of Investments �� (Continued)(showing percentage of total net assets)November 30, 2020 (Unaudited)
Shares Description Value ($)Denmark �� 0.2%
24,585 Danske Bank A/S * 404,7418,216 Demant A/S * 309,9411,699 Matas A/S * 21,9323,900 Pandora A/S 391,0326,502 Scandinavian Tobacco Group A/S 100,054
Total Denmark 1,227,700
Finland �� 0.3%8,939 Kesko Oyj � B Shares 234,02113,504 Neste Oyj (b) 902,34155,643 Nokia Oyj * 221,9042,085 UPM-Kymmene Oyj 68,4141,122 Uponor Oyj 22,812
Total Finland 1,449,492
France �� 1.2%1,608 Akka Technologies * 48,3477,508 ALD SA 96,06810,399 APERAM SA 395,2441,656 Arkema SA 192,8523,979 Atos SE * 363,206801 Capgemini SE 111,4402,325 Eiffage SA * 227,3091,832 Fnac Darty SA * 97,9482,665 IPSOS 85,143864 Kering SA (b) 623,7831,211 LVMH Moet Hennessy Louis Vuitton SE (b) 695,5934,329 Metropole Television SA * 67,87512,844 Peugeot SA * 301,33717,145 Publicis Groupe SA 772,5913,784 Quadient SA 67,64411,291 Renault SA * 448,2732,206 Rexel SA * 29,8326,309 Safran SA * (b) 919,6881,129 Societe BIC SA 66,82614,576 Societe Generale SA * 289,009592 Sopra Steria Group * 89,7571,723 Tarkett SA * 29,8098,216 Television Francaise 1 * 63,4982,191 Unibail-Rodamco-Westfield (REIT) 154,1679,678 Valeo SA 373,376566 Vicat SA 23,051
Total France 6,633,666
Germany �� 1.1%28,465 Aroundtown SA * 197,0084,614 Aurubis AG 350,6727,461 Bayer AG (Registered) 429,8561,205 Bayerische Motoren Werke AG 104,5573,474 Brenntag AG 266,0334,936 CECONOMY AG * 24,317
Shares Description Value ($)Germany �� continued
5,269 CropEnergies AG 87,2336,543 Daimler AG (Registered) 438,06228,942 Deutsche Lufthansa AG (Registered) * 333,67042,232 Deutsche Pfandbriefbank AG * 420,67317,356 Dialog Semiconductor Plc * 926,247387 Draegerwerk AG & Co KGaA 27,9751,412 Fresenius SE & Co KGaA 63,12917,177 HeidelbergCement AG (b) 1,215,1972,041 Hornbach Baumarkt AG 93,6532,348 Hornbach Holding AG & Co KGaA 249,9775,491 ProSiebenSat.1 Media SE * 79,61912,464 Software AG 535,2324,351 Takkt AG * 56,0024,699 VERBIO Vereinigte BioEnergie AG 145,825
Total Germany 6,044,937
Greece �� 0.0%4,080 JUMBO SA 72,347
Hong Kong �� 0.6%19,000 Chow Sang Sang Holdings International Ltd 23,008260,000 CITIC Telecom International Holdings Ltd 86,48756,500 CK Hutchison Holdings Ltd 409,83021,200 Dah Sing Financial Holdings Ltd 62,3781,268,000 First Pacific Co. Ltd. 387,10811,000 Hang Lung Group Ltd 27,72394,000 HKT Trust & HKT Ltd � Class SS 122,85953,300 Hongkong Land Holdings Ltd 216,36878,500 Johnson Electric Holdings Ltd 184,932102,000 K Wah International Holdings Ltd 50,739115,500 Kerry Properties Ltd 295,91432,000 NWS Holdings Ltd 30,598191,000 Pacific Textiles Holdings Ltd 131,609565,000 PCCW Ltd 342,872298,000 Shun Tak Holdings Ltd 94,02060,000 Sun Hung Kai & Co Ltd 26,84017,000 Swire Pacific Ltd � Class A 97,41364,900 VTech Holdings Ltd 499,92720,000 Wharf Holdings Ltd (The) 49,474128,000 Yue Yuen Industrial Holdings Ltd 262,756
Total Hong Kong 3,402,855
India �� 0.2%7,204 Hindustan Petroleum Corp Ltd 20,248120,629 Indiabulls Housing Finance Ltd 300,87173,906 Indian Oil Corp Ltd 83,59625,695 NTPC Ltd 32,165378,662 Oil & Natural Gas Corp Ltd 396,663257,228 REC Ltd 410,8544,771 Tata Motors Ltd * 11,348
Total India 1,255,745
Copyright © 2021 www.secdatabase.com. All Rights Reserved.Please Consider the Environment Before Printing This Document

GMO Strategic Opportunities Allocation Fund(A Series of GMO Trust)Schedule of Investments �� (Continued)(showing percentage of total net assets)November 30, 2020 (Unaudited)
Shares Description Value ($)Indonesia �� 0.0%
83,200 Indah Kiat Pulp & Paper Corp Tbk PT 51,083
Ireland �� 0.3%52,329 AIB Group Plc * 93,97949,545 Bank of Ireland Group Plc * 155,2302,237 Glanbia Plc 27,51171,600 Hibernia REIT Plc 97,76736,837 Irish Residential Properties REIT Plc 61,3229,692 Origin Enterprises Plc 41,43040,326 Ryanair Holdings Plc * (b) 734,9259,904 Smurfit Kappa Group Plc 421,376
Total Ireland 1,633,540
Israel �� 0.1%11,916 Isracard Ltd 38,85037,800 Teva Pharmaceutical Industries Ltd Sponsored ADR * 359,478
Total Israel 398,328
Italy �� 0.8%106,434 A2A SPA 162,83331,325 Anima Holding SPA 137,9483,839 Ascopiave SPA 16,22510,009 Banca Mediolanum SPA * 91,49321,973 Banca Popolare di Sondrio SCPA * 59,4171,474 Biesse SPA * 29,69426,498 Buzzi Unicem SPA 648,4202,513 Buzzi Unicem SpA � RSP 41,1363,639 Cementir Holding NV 29,95017,950 CNH Industrial NV * 195,56120,024 Enav SPA 88,14819,944 EXOR NV 1,395,07168,966 Hera SPA 251,39912,720 Italgas SpA 81,8081,690 La Doria SPA 25,76028,170 Leonardo SPA 204,492348 Sesa SPA * 34,954836,207 Telecom Italia SPA 394,086956,421 Telecom Italia SPA-RSP 489,19844,163 Unipol Gruppo SPA * 212,993
Total Italy 4,590,586
Japan �� 10.1%1,700 77 Bank Ltd (The) 23,7024,100 ADEKA Corp 64,83149,200 Aeon Mall Co Ltd (b) 786,3164,400 Alps Alpine Co Ltd 55,09594,700 Amada Co Ltd (b) 907,75612,300 Amano Corp 288,491600 Arata Corp 28,4736,400 Arcland Sakamoto Co Ltd 109,579
Shares Description Value ($)Japan �� continued
23,900 Arcs Co Ltd 499,13439,700 Asahi Kasei Corp 362,95563,300 Asics Corp (b) 1,137,6459,900 Astellas Pharma Inc 141,0112,900 Belluna Co Ltd 26,55023,300 Brother Industries Ltd 445,0562,700 Central Japan Railway Co 343,14553,300 Chugoku Marine Paints Ltd 506,6362,100 Credit Saison Co Ltd 24,007200 Dai Nippon Toryo Co Ltd 1,76915,000 Daihen Corp (b) 649,711400 Daiichi Jitsugyo Co Ltd 15,426900 Daishi Hokuetsu Financial Group Inc 20,2814,900 Daiwa House Industry Co Ltd 149,74415,700 Daiwabo Holdings Co Ltd (b) 979,86032,700 Denka Co Ltd (b) 1,008,9463,100 Dexerials Corp 37,81213,300 Doshisha Co Ltd 255,298800 DTS Corp 16,822700 Earth Corp 41,28323,500 Ebara Corp (b) 749,4953,700 EDION Corp 34,584800 Eizo Corp 27,67610,600 Electric Power Development Co Ltd 142,2691,000 ESPEC Corp 18,5444,800 Financial Products Group Co Ltd 22,76421,000 Fuji Corp 507,3761,600 Fuji Electric Co Ltd 56,6511,900 Fujimi Inc 66,1683,400 Fujitec Co Ltd 69,1801,500 Fujitsu General Ltd 45,3804,600 Geo Holdings Corp 55,9433,600 Glory Ltd 72,19117,500 GungHo Online Entertainment Inc 443,76822,900 Gunma Bank Ltd (The) 70,9438,100 Gunze Ltd 278,3546,900 Gurunavi Inc 34,1601,200 Hanwa Co Ltd 28,60792,100 Haseko Corp (b) 995,357127,800 Hazama Ando Corp (b) 839,5131,000 Heiwado Co Ltd 20,2975,600 Hirogin Holdings Inc 31,039200 Hirose Electric Co Ltd 28,2123,400 Hisamitsu Pharmaceutical Co Inc 199,52211,200 Hitachi Ltd 425,08216,200 Hogy Medical Co Ltd 489,7172,500 Hokuhoku Financial Group Inc 24,68614,900 Honda Motor Co Ltd 414,54717,900 Horiba Ltd (b) 957,6303,300 Inaba Denki Sangyo Co Ltd 75,53033,500 Inabata & Co Ltd 441,04568,800 Inpex Corp 381,074
Copyright © 2021 www.secdatabase.com. All Rights Reserved.Please Consider the Environment Before Printing This Document

GMO Strategic Opportunities Allocation Fund(A Series of GMO Trust)Schedule of Investments �� (Continued)(showing percentage of total net assets)November 30, 2020 (Unaudited)
Shares Description Value ($)Japan �� continued
15,000 ITOCHU Corp 395,8393,000 Itochu Enex Co Ltd 28,7914,200 Iyo Bank Ltd (The) 27,71719,100 JAFCO Group Co Ltd (b) 817,35313,600 Japan Post Insurance Co Ltd 226,25840,400 JVCKenwood Corp 54,521102,500 K�s Holdings Corp (b) 1,244,65337,400 Kadokawa Corp (b) 1,183,97310,900 Kajima Corp 143,002100 Kaken Pharmaceutical Co Ltd 3,65419,200 Kanamoto Co Ltd 399,1283,400 Kandenko Co Ltd 25,898900 Kaneka Corp 27,02452,900 Kanematsu Corp 609,166700 Kanematsu Electronics Ltd 27,10226,400 KDDI Corp (b) 751,248139,900 Kenedix Inc (b) 1,007,37025,700 Kinden Corp (b) 410,5161,800 Kissei Pharmaceutical Co Ltd 35,9723,500 Kohnan Shoji Co Ltd 108,1873,600 Kokuyo Co Ltd 46,2635,900 Komeri Co Ltd 160,39585,100 Konica Minolta Inc 271,78835,300 Konoike Transport Co Ltd 349,4051,200 Kumagai Gumi Co Ltd 27,1341,100 Kureha Corp 55,58935,900 Kyowa Exeo Corp (b) 922,0079,200 Kyudenko Corp 262,54232,300 Macromill Inc 201,1571,800 Makino Milling Machine Co Ltd 72,18023,300 Mandom Corp 364,98320,500 Maruichi Steel Tube Ltd 430,968500 Maruzen Showa Unyu Co Ltd 16,01445,600 Maxell Holdings Ltd * 524,012700 Medipal Holdings Corp 13,1284,900 Meidensha Corp 84,9091,400 METAWATER Co Ltd 31,71225,100 Mitsubishi Gas Chemical Co Inc 531,266223,200 Mitsubishi UFJ Financial Group Inc 952,4651,000 Mitsuboshi Belting Ltd 15,5924,300 Mitsui Chemicals Inc 120,2131,200 Mitsui Sugar Co Ltd 20,50711,700 Mixi Inc 319,7051,200 Mizuho Leasing Co Ltd 31,75831,600 MS&AD Insurance Group Holdings Inc (b) 919,2864,200 NEC Networks & System Integration Corp 74,17226,200 NH Foods Ltd (b) 1,115,8163,700 Nichias Corp 86,0361,500 Nichiha Corp 46,77016,700 Nikkon Holdings Co Ltd 324,0705,000 Nippo Corp 130,328300 Nippon Flour Mills Co Ltd 4,670
Shares Description Value ($)Japan �� continued
7,550 Nippon Light Metal Holdings Co Ltd 128,9202,200 Nippon Soda Co Ltd 57,644900 Nippon Steel Trading Corp 30,48517,100 Nippon Telegraph & Telephone Corp 404,4194,000 Nishimatsu Construction Co Ltd 74,3081,300 Nishio Rent All Co Ltd 25,2631,200 Nisshin Oillio Group Ltd (The) 33,4815,700 Nissin Electric Co Ltd 63,6412,700 Nitto Denko Corp 222,6262,600 Nojima Corp 67,8539,200 Nomura Real Estate Holdings Inc 197,747800 Obara Group Inc 25,913113,500 Obayashi Corp (b) 999,046800 Organo Corp 45,329109,300 ORIX Corp (b) 1,617,790600 Osaka Soda Co Ltd 14,04139,300 Pacific Industrial Co Ltd 402,211200 Paramount Bed Holdings Co Ltd 8,13644,200 Penta-Ocean Construction Co Ltd 328,0221,600 Pressance Corp 26,7792,000 Proto Corp 20,11830,700 Raiznext Corp 327,01316,400 Resona Holdings Inc 57,1641,500 Rinnai Corp 175,0084,900 Rohm Co Ltd 407,4448,400 San-A Co Ltd 324,8452,200 San-Ai Oil Co Ltd 24,3044,100 Sanki Engineering Co Ltd 45,0654,000 Sanwa Holdings Corp 48,5871,500 Sanyo Chemical Industries Ltd 64,36710,400 Secom Co Ltd (b) 1,037,8432,400 Seiko Holdings Corp 30,8494,800 Sekisui Chemical Co Ltd 82,74419,500 Sekisui House Ltd 349,657600 Sekisui Jushi Corp 12,620600 Shimamura Co Ltd 61,82195,100 Shimizu Corp (b) 719,2134,700 Shizuoka Bank Ltd (The) 33,2131,600 Shizuoka Gas Co Ltd 15,1691,500 Sinko Industries Ltd 24,602124,800 SKY Perfect JSAT Holdings Inc 564,62384,000 Sumitomo Chemical Co Ltd 296,76141,900 Sumitomo Dainippon Pharma Co Ltd 528,38760,700 Sumitomo Forestry Co Ltd (b) 1,099,088600 Sumitomo Heavy Industries Ltd 12,971500 Sumitomo Seika Chemicals Co Ltd 19,838500 Suzuken Co Ltd 19,0761,500 Suzuki Motor Corp 80,44223,100 T Hasegawa Co Ltd 444,0389,800 T&D Holdings Inc 114,089400 T-Gaia Corp 7,04227,800 Tachi-S Co Ltd 298,676
Copyright © 2021 www.secdatabase.com. All Rights Reserved.Please Consider the Environment Before Printing This Document

GMO Strategic Opportunities Allocation Fund(A Series of GMO Trust)Schedule of Investments �� (Continued)(showing percentage of total net assets)November 30, 2020 (Unaudited)
Shares Description Value ($)Japan �� continued
10,200 Taisei Corp 358,834400 Taisho Pharmaceutical Holdings Co Ltd 25,39838,800 Takara Holdings Inc 443,9667,900 Takara Leben Co Ltd 22,2854,100 Takasago Thermal Engineering Co Ltd 56,2905,300 Takeuchi Manufacturing Co Ltd 124,34426,400 Takuma Co Ltd 452,1102,600 Tamron Co Ltd 39,674900 TDK Corp 126,40126,000 Teijin Ltd 443,35612,100 TIS Inc 240,30033,000 Toho Holdings Co Ltd (b) 601,8392,100 Tokai Rika Co Ltd 32,113139,800 Tokyo Electric Power Co Holdings Inc * 363,8681,300 Tokyo Ohka Kogyo Co Ltd 82,03724,200 Tokyo Seimitsu Co Ltd (b) 1,064,3617,600 Tokyu Construction Co Ltd 34,0653,500 Toppan Forms Co Ltd 33,32588,400 Toppan Printing Co Ltd (b) 1,203,51528,400 Toray Industries Inc 153,251800 Torii Pharmaceutical Co Ltd 24,20244,000 Tosei Corp 487,86164,400 Tosoh Corp (b) 1,008,60111,800 Toyo Suisan Kaisha Ltd 580,39318,100 Toyota Industries Corp (b) 1,304,3782,700 TS Tech Co Ltd 78,97313,300 Tsumura & Co 387,0164,500 Ushio Inc 56,4502,800 YAMABIKO Corp 37,8557,500 Yamaguchi Financial Group Inc 46,5112,800 Yamazen Corp 26,6223,100 Yellow Hat Ltd 47,72962,100 Yokogawa Electric Corp (b) 1,094,111900 Yuasa Trading Co Ltd 28,20021,200 Zenkoku Hosho Co Ltd (b) 967,442
Total Japan 57,226,857
Malta �� 0.0%125,500 BGP Holdings Plc * (c) �
Mexico �� 0.3%80,741 Fomento Economico Mexicano SAB de CV 583,277251,900 Grupo Mexico SAB de CV � Series B 916,102
Total Mexico 1,499,379
Netherlands �� 0.9%18,981 ABN AMRO Bank NV CVA * 194,31463,184 Aegon NV 233,73610,100 AerCap Holdings NV * 371,27619,636 ASR Nederland NV 727,676414 Corbion NV 21,323
Shares Description Value ($)Netherlands �� continued
48,057 ING Groep NV * 467,43710,628 Koninklijke Ahold Delhaize NV 303,86815,767 NIBC Holding NV * 139,8031,506 NN Group NV 60,86574,496 PostNL NV * 253,70921,438 Randstad NV * (b) 1,325,90527,296 Signify NV * (b) 1,150,5755,528 TomTom NV * 45,095
Total Netherlands 5,295,582
New Zealand �� 0.1%90,509 Meridian Energy Ltd 408,293
Norway �� 0.4%6,382 Austevoll Seafood ASA 58,03546,695 BW LPG Ltd 298,19252,704 Elkem ASA 169,4566,662 Entra ASA 132,77025,472 Europris ASA 137,686402 Gjensidige Forsikring ASA 8,7531,208 Kongsberg Gruppen ASA 22,9287,891 Norsk Hydro ASA 31,95315,100 Norwegian Finans Holding ASA * 120,08549,715 Orkla ASA 475,8662,664 SpareBank 1 Nord Norge 21,8604,533 SpareBank 1 SMN 48,52611,251 SpareBank 1 SR-Bank ASA * 112,22318,197 Yara International ASA 737,592
Total Norway 2,375,925
Portugal �� 0.3%25,316 Altri SGPS SA 136,4241,956,817 Banco Comercial Portugues SA � Class R * 276,96126,397 CTT-Correios de Portugal SA * 76,80641,967 Galp Energia SGPS SA 450,25449,113 Mota-Engil SGPS SA * 85,43140,264 Navigator Co SA (The) * 120,05519,427 NOS SGPS SA 74,28832,571 REN � Redes Energeticas Nacionais SGPS SA 89,319110,844 Sonae SGPS SA 89,277
Total Portugal 1,398,815
Russia �� 0.2%7,897 LUKOIL PJSC Sponsored ADR 508,3703,784 Novatek PJSC Sponsered GDR (Registered) 582,198
Total Russia 1,090,568
Singapore �� 0.4%26,100 CapitaLand Integrated Commercial Trust (REIT) 37,60364,000 City Developments Ltd 368,353222,900 ComfortDelGro Corp Ltd 272,688
Copyright © 2021 www.secdatabase.com. All Rights Reserved.Please Consider the Environment Before Printing This Document

GMO Strategic Opportunities Allocation Fund(A Series of GMO Trust)Schedule of Investments �� (Continued)(showing percentage of total net assets)November 30, 2020 (Unaudited)
Shares Description Value ($)Singapore �� continued
21,500 Jardine Cycle & Carriage Ltd 309,2319,800 Keppel DC (REIT) 20,512201,300 Mapletree Industrial Trust (REIT) 439,52016,400 Mapletree Logistics Trust (REIT) 23,996166,900 Mapletree North Asia Commercial Trust (REIT) 111,35018,300 Sembcorp Industries Ltd 24,79477,100 SPH (REIT) 47,60768,000 StarHub Ltd 65,319724,100 Yangzijiang Shipbuilding Holdings Ltd 470,53458,400 Yanlord Land Group Ltd 48,213
Total Singapore 2,239,720
South Africa �� 0.1%34,834 Bidvest Group Ltd (The) 365,17943,825 Old Mutual Ltd 32,918
Total South Africa 398,097
South Korea �� 0.0%1,115 Yuhan Corp 64,940
Spain �� 0.9%15,146 Acerinox SA 156,95422,221 ACS Actividades de Construccion y Servicios SA * 702,0277,033 Almirall SA 90,4619,838 Amadeus IT Group SA (b) 676,5046,242 Atresmedia Corp de Medios de Comunicacion SA 22,12761,749 Banco Bilbao Vizcaya Argentaria SA 285,933147,596 Banco Santander SA * 428,0464,585 Bankinter SA 22,73711,235 Cia de Distribucion Integral Logista Holdings SA 207,1813,351 Ebro Foods SA 79,3043,369 Enagas SA 82,3074,487 Faes Farma SA 20,1271,007 Grupo Catalana Occidente SA 32,87020,752 Industria de Diseno Textil SA (b) 688,85011,200 Mapfre SA 21,49140,863 Mediaset Espana Comunicacion SA * 184,1838,839 Prosegur Cia de Seguridad SA 24,97950,196 Red Electrica Corp SA (b) 1,026,160123,203 Unicaja Banco SA * 97,0724,040 Viscofan SA 286,323
Total Spain 5,135,636
Sweden �� 0.1%2,305 AcadeMedia AB 22,66423,235 Betsson AB * 200,45311,030 Inwido AB * 135,21340,746 Nordea Bank Abp * 348,233167 Resurs Holding AB 839363 Skanska AB � B Shares 8,625
Total Sweden 716,027
Shares Description Value ($)Switzerland �� 0.1%
6,235 Adecco Group AG (Registered) 376,9192,608 ams AG * 66,8482,652 Banque Cantonale Vaudoise (Registered) 273,091316 BKW AG 32,698
Total Switzerland 749,556
Taiwan �� 0.1%126,000 Hon Hai Precision Industry Co Ltd 363,74436,000 Pou Chen Corp 39,43254,000 Ruentex Development Co Ltd 79,715
Total Taiwan 482,891
United Kingdom �� 2.9%13,929 Aggreko Plc 103,2513,454 Antofagasta Plc 57,0369,475 Aviva Plc 40,1153,420 Bank of Georgia Group Plc * 51,33097,494 Barratt Developments Plc * 799,2938,576 Bellway Plc 322,14521,703 Berkeley Group Holdings Plc (The) 1,326,567239,237 BT Group Plc 370,31713,167 Bunzl Plc 410,1064,141 Carnival Plc 71,782207,784 Centamin Plc 314,7748,037 CMC Markets Plc 41,6455,448 Coca-Cola HBC AG * 155,62047,156 Compass Group Plc 829,7412,345 Computacenter Plc 69,1312,268 Daily Mail & General Trust Plc � Class A 20,47927,087 Diversified Gas & Oil Plc 38,99812,201 Dixons Carphone Plc 17,8861,271 EMIS Group Plc 16,50115,281 Evraz Plc 76,78911,219 Ferguson Plc 1,255,84470,067 Ferrexpo Plc 196,48526,408 Frasers Group Plc * 147,3764,488 Go-Ahead Group Plc (The) * 48,59217,806 Halfords Group Plc 63,18325,459 Hays Plc * 44,20241,617 IG Group Holdings Plc 443,36513,671 IMI Plc 202,59916,923 Inchcape Plc * 134,72029,866 Indivior Plc * 40,37517,324 Investec Plc 42,654191,501 ITV Plc * 238,31357,099 J Sainsbury Plc 159,3844,574 Johnson Matthey Plc 134,78022,201 Jupiter Fund Management Plc 71,706244,593 Kingfisher Plc * 888,27012,214 Lookers Plc (d) 3,419192,861 M&G Plc 478,533122,201 Micro Focus International Plc * 562,826
Copyright © 2021 www.secdatabase.com. All Rights Reserved.Please Consider the Environment Before Printing This Document

GMO Strategic Opportunities Allocation Fund(A Series of GMO Trust)Schedule of Investments �� (Continued)(showing percentage of total net assets)November 30, 2020 (Unaudited)
Shares Description Value ($)United Kingdom �� continued
12,455 Mitchells & Butlers Plc * 35,0689,278 Mondi Plc 203,01416,910 Morgan Advanced Materials Plc 63,3714,384 Morgan Sindall Group Plc 81,30324,289 National Express Group Plc * 71,5767,406 National Grid Plc 82,9364,545 Numis Corp Plc 20,86326,353 OSB Group Plc * 136,50716,757 Paragon Banking Group Plc 89,99749,219 Persimmon Plc 1,727,20533,819 Pets at Home Group Plc 186,51725,696 Phoenix Group Holdings Plc 243,36035,626 Playtech Plc * 181,85115,849 Plus500 Ltd 325,28084,671 Premier Foods Plc * 99,13444,498 QinetiQ Group Plc 173,0219,678 Redde Northgate Plc 31,1317,218 Redrow Plc * 49,646578 RHI Magnesita NV 25,01147,864 Royal Dutch Shell Plc � B Shares 768,7193,584 Smiths Group Plc 68,86423,843 Spirent Communications Plc 81,4197,940 Stock Spirits Group Plc 24,90257,145 Tate & Lyle Plc 482,747128,527 Taylor Wimpey Plc * 261,5765,131 Vistry Group Plc * 56,75970,420 WPP Plc 678,549
Total United Kingdom 16,540,458
United States �� 6.1%2,200 Alexion Pharmaceuticals, Inc. * 268,6425,600 Alliance Data Systems Corp. (b) 409,5845,500 Ally Financial, Inc. (a) 163,0757,547 American Express Co. (a) 894,999100 Anthem, Inc. 31,1523,700 Arrow Electronics, Inc. * 339,10510,400 AT&T, Inc. (a) 299,0009,300 Athene Holding Ltd. � Class A * (a) 412,4556,400 Bed Bath & Beyond, Inc. 134,1441,100 Biogen, Inc. * 264,187300 Booking Holdings, Inc. * (a) 608,53520,800 BorgWarner, Inc. (b) 808,0804,600 Capital One Financial Corp. (a) 393,9444,500 Capri Holdings Ltd. * 159,2108,600 Carnival Corp. (a) 171,8286,800 Carrier Global Corp. 258,8767,100 CBRE Group, Inc. � Class A * 434,0944,300 Centene Corp. * (a) 265,09537,600 CenturyLink, Inc. (a) 392,92014,273 Charles Schwab Corp. (The) (a) 696,2376,300 Chevron Corp. (a) 549,2341,600 Cigna Corp. 334,6242,500 Cisco Systems, Inc. 107,550
Shares Description Value ($)United States �� continued
8,300 Citigroup, Inc. (a) 457,0815,400 Citizens Financial Group, Inc. (a) 176,3647,787 Coca-Cola Co. (The) 401,8093,300 Cognizant Technology Solutions Corp. � Class A 257,8297,000 Comcast Corp. � Class A (a) 351,6808,500 Corteva, Inc. (a) 325,72040,800 Coty Inc. � Class A (a) 293,3525,100 CVS Health Corp. (a) 345,72912,100 DISH Network Corp. � Class A * (b) 434,0274,300 DR Horton, Inc. 320,3503,400 Edwards Lifesciences Corp. * (a) 285,22614,157 EOG Resources, Inc. (a) 663,6806,100 Exelon Corp. (a) 250,5273,100 Expedia Group, Inc. (a) 385,9198,300 Exxon Mobil Corp. (a) 316,479400 FleetCor Technologies, Inc. * (a) 106,08447,000 Ford Motor Co. (a) 426,7607,400 Fox Corp. � Class A (a) 213,4168,900 Fox Corp. � Class B * 252,5824,200 GameStop Corp. � Class A * 69,5529,800 General Motors Co. 429,6321,600 Gilead Sciences, Inc. 97,0721,800 Goldman Sachs Group, Inc. (The) 415,0446,100 Hasbro, Inc. (a) 567,4835,701 Hilton Worldwide Holdings, Inc. (b) 590,7952,951 Honeywell International, Inc. (a) 601,7689,000 HP, Inc. (a) 197,3706,500 Intel Corp. (a) 314,2753,300 International Business Machines Corp. (a) 407,61615,300 Invesco Ltd. (a) 248,3191,900 Jazz Pharmaceuticals Plc * (a) 267,349300 Jones Lang LaSalle, Inc. * (a) 39,68729,500 Kinder Morgan, Inc. (b) 424,21011,000 Kohl�s Corp. 354,2004,900 Kraft Heinz Co. (The) (a) 161,4067,700 Kroger Co. (The) (a) 254,100600 Laboratory Corp. of America Holdings * 119,90410,095 Las Vegas Sands Corp. (a) 562,3921,000 Leidos Holdings, Inc. 100,7004,000 Lennar Corp. � Class A (a) 303,4409,200 Lincoln National Corp. (a) 434,4241,900 LKQ Corp. * (a) 66,91818,300 Lyft, Inc. � Class A * (a) 698,5114,300 LyondellBasell Industries NV � Class A (a) 365,930606 Markel Corp. * (a) 590,1417,700 MetLife, Inc. 355,5097,000 Micron Technology, Inc. * (b) 448,630900 Mohawk Industries, Inc. * (a) 113,2478,900 Molson Coors Brewing Co. � Class B (a) 409,4004,300 Morgan Stanley 265,8699,800 Occidental Petroleum Corp. (a) 154,4485,100 Oracle Corp. (a) 294,372
Copyright © 2021 www.secdatabase.com. All Rights Reserved.Please Consider the Environment Before Printing This Document

GMO Strategic Opportunities Allocation Fund(A Series of GMO Trust)Schedule of Investments �� (Continued)(showing percentage of total net assets)November 30, 2020 (Unaudited)
Shares Description Value ($)United States �� continued
5,200 Phillips 66 (a) 315,016900 Principal Financial Group, Inc. (a) 44,8115,700 Prudential Financial, Inc. (a) 431,0341,600 PulteGroup, Inc. 69,80819,800 Qurate Retail, Inc. � Series A 207,30615,445 Raytheon Technologies Corp. (a) 1,107,715600 Regeneron Pharmaceuticals, Inc. * (a) 309,61817,966 Sensata Technologies Holding Plc * (b) 877,2801,300 SS&C Technologies Holdings, Inc. 89,55713,500 Synchrony Financial 411,3453,300 Textron, Inc. (a) 148,8304,300 Tyson Foods, Inc. � Class A 280,360900 United Rentals, Inc. * (a) 204,2823,000 Universal Health Services, Inc. � Class B (b) 391,74021,360 US Bancorp (b) 922,96613,047 Verso Corp. � Class A 141,0389,548 VF Corp. (a) 796,30312,500 ViacomCBS, Inc. � Class B (a) 441,0008,800 Viatris, Inc. * 148,0161,800 VMware, Inc. � Class A * (a) 251,8026,800 Walgreens Boots Alliance, Inc. (a) 258,46830,624 Wells Fargo & Co. (b) 837,56611,600 Western Union Co. (The) (a) 261,6968,500 Western Digital Corp. (a) 381,480
Total United States 34,713,934
TOTAL COMMON STOCKS(COST $156,452,082) 171,710,721
PREFERRED STOCKS (e) �� 0.3%
Brazil �� 0.2%75,732 Bradespar SA 821,300
Germany �� 0.1%5,677 Bayerische Motoren Werke AG 373,0092,963 Draegerwerk AG & Co KGaA 232,1661,373 Jungheinrich AG 59,799
Total Germany 664,974
TOTAL PREFERRED STOCKS(COST $1,176,862) 1,486,274
RIGHTS/WARRANTS �� 0.0%
Spain �� 0.0%187,382 Banco Santander SA, Expires 12/03/20 * 23,403
United Kingdom �� 0.0%884 AVEVA Group Plc, Expires 12/09/20 * 13,204
TOTAL RIGHTS/WARRANTS(COST $30,255) 36,607
Shares Description Value ($)MUTUAL FUNDS �� 74.4%
United States �� 74.4%Affiliated Issuers �� 74.4%
772,320 GMO Emerging Country Debt Fund, Class IV 21,200,1954,018,525 GMO Emerging Markets Fund, Class VI 136,469,0933,152,713 GMO International Equity Fund, Class IV 70,273,9761,884,096 GMO Multi-Sector Fixed Income Fund (formerly
GMO Core Plus Bond Fund), Class IV 42,166,071609,566 GMO Opportunistic Income Fund, Class VI 15,946,2491,181,492 GMO Quality Fund, Class VI 31,793,9441,998,638 GMO U.S. Equity Fund, Class VI 26,202,1411,931,999 GMO U.S. Small Cap Value Fund, Class VI 39,760,5437,342,678 GMO U.S. Treasury Fund 37,007,096
TOTAL MUTUAL FUNDS(COST $398,884,961) 420,819,308
SHORT-TERM INVESTMENTS �� 4.6%
Money Market Funds �� 4.6%26,270,217 State Street Institutional Treasury Money Market
Fund � Premier Class, 0.01% (f) 26,270,217
TOTAL SHORT-TERM INVESTMENTS(COST $26,270,217) 26,270,217
TOTAL INVESTMENTS �� 109.7%(Cost $582,814,377) 620,323,127
SECURITIES SOLD SHORT �� (8.8)%
Common Stocks �� (8.8)%Australia �� (0.3)%
(3,669 ) Afterpay Ltd * (255,639 )(50,686 ) APA Group (384,166 )(2,327 ) ASX Ltd (131,600 )(867 ) Cochlear Ltd (140,499 )(2,124 ) Ramsay Health Care Ltd (98,369 )(61,316 ) Sydney Airport (302,548 )(13,188 ) TPG Telecom Ltd * (74,453 )(37,478 ) Transurban Group (386,726 )
Total Australia (1,774,000 )
Austria �� (0.0)%(4,000 ) Verbund AG (281,124 )
Canada �� (0.0)%(19,300 ) AltaGas Ltd (277,009 )
China �� (0.1)%(55,800 ) BEST Inc ADR * (163,494 )(4,900 ) Yum China Holdings Inc (276,262 )
Total China (439,756 )
Copyright © 2021 www.secdatabase.com. All Rights Reserved.Please Consider the Environment Before Printing This Document

GMO Strategic Opportunities Allocation Fund(A Series of GMO Trust)Schedule of Investments �� (Continued)(showing percentage of total net assets)November 30, 2020 (Unaudited)
Shares Description Value ($)France �� (0.4)%
(7,454 ) Edenred (425,960 )(24,055 ) Getlink SE * (398,644 )(416 ) Hermes International (404,750 )(662 ) Sartorius Stedim Biotech (238,699 )(2,744 ) Ubisoft Entertainment SA * (260,207 )(12,398 ) Vivendi SA (371,673 )(3,624 ) Wendel SA (409,457 )
Total France (2,509,390)
Germany �� (0.6)%(3,491 ) Delivery Hero SE * (424,461 )(126 ) Deutsche Boerse AG (20,988 )(4,046 ) Puma SE * (400,930 )(3,515 ) QIAGEN NV * (169,397 )(10,040 ) RWE AG (415,278 )(861 ) Sartorius AG (392,579 )(3,608 ) Scout24 AG (274,931 )(537 ) TeamViewer AG * (25,601 )(148,330) Telefonica Deutschland Holding AG (409,431 )(14,850 ) thyssenkrupp AG * (99,025 )(12,301 ) Uniper SE (416,373 )(3,967 ) Zalando SE * (402,958 )
Total Germany (3,451,952)
Italy �� (0.2)%(1,817 ) Ferrari NV (384,988 )(28,330 ) FinecoBank Banca Fineco SPA * (447,266 )(2,794 ) Infrastrutture Wireless Italiane SPA (35,977 )
Total Italy (868,231 )
Japan �� (1.3)%(15,900 ) Acom Co Ltd (76,328 )(10,200 ) Asahi Intecc Co Ltd (373,692 )(77,600 ) ENEOS Holdings Inc (265,066 )(3,100 ) GMO Payment Gateway Inc (434,741 )(5,200 ) Hitachi Metals Ltd (76,045 )(12,500 ) Idemitsu Kosan Co Ltd (259,151 )(28,100 ) Isetan Mitsukoshi Holdings Ltd (150,819 )(5,400 ) Japan Airport Terminal Co Ltd (312,785 )(6,200 ) Japan Exchange Group Inc (153,385 )(70 ) Japan Real Estate Investment Corp (362,590 )(42,100 ) JGC Holding Corp (374,821 )(24,000 ) Keikyu Corp (410,523 )(800 ) Kintetsu Group Holdings Co Ltd (35,433 )(19,000 ) Kyushu Electric Power Co Inc (160,090 )(5,300 ) LINE Corp * (273,109 )(11,600 ) LIXIL Group Corp (277,585 )(5,400 ) M3 Inc (496,917 )(7,900 ) McDonald�s Holdings Co Japan Ltd (383,189 )(4,900 ) Mercari Inc * (223,770 )(5,700 ) Mitsubishi Materials Corp (107,767 )(11,300 ) Mitsubishi Motors Corp * (20,331 )(7,000 ) MonotaRO Co Ltd (425,788 )
Shares Description Value ($)Japan �� continued
(4,100 ) Nihon M&A Center Inc (286,482 )(4,000 ) Nippon Paint Holdings Co Ltd (512,507 )(19,200 ) Nippon Yusen KK (417,053 )(300 ) Nissin Foods Holdings Co Ltd (24,760 )(3,700 ) Odakyu Electric Railway Co Ltd (112,005 )(700 ) ORIENTAL LAND CO LTD (118,899 )(23,800 ) Sharp Corp (318,212 )(1,100 ) Yaskawa Electric Corp (52,777 )
Total Japan (7,496,620)
Netherlands �� (0.2)%(210 ) Adyen NV * (401,132 )(76,814 ) Altice Europe NV * (404,093 )(3,173 ) Just Eat Takeaway.com NV * (337,677 )
Total Netherlands (1,142,902)
Norway �� (0.0)%(980 ) Schibsted ASA � B Shares * (35,641 )
Peru �� (0.1)%(5,300 ) Southern Copper Corp (314,661 )
Russia �� (0.0)%(6,625 ) Magnit PJSC Sponsored GDR (Registered) (99,549 )
Singapore �� (0.1)%(58,100 ) Singapore Exchange Ltd (383,088 )
Spain �� (0.4)%(228,100) Bankia SA (392,325 )(6,371 ) Cellnex Telecom SA (403,581 )(13,808 ) Endesa SA (396,877 )(14,487 ) Ferrovial SA (404,555 )(12,948 ) Siemens Gamesa Renewable Energy SA (464,365 )
Total Spain (2,061,703)
Sweden �� (0.1)%(3,626 ) Evolution Gaming Group AB (308,526 )(16,553 ) Lundin Energy AB (395,459 )
Total Sweden (703,985 )
Switzerland �� (0.2)%(71 ) Partners Group Holding AG (76,551 )(344 ) Straumann Holding AG (Registered) (397,077 )(4,665 ) Swiss Re AG (426,221 )
Total Switzerland (899,849 )
United Kingdom �� (0.6)%(5,530 ) Admiral Group Plc (208,298 )(9,746 ) Antofagasta Plc (160,936 )(50,363 ) Auto Trader Group Plc (374,594 )(130,640) ConvaTec Group Plc (359,342 )
Copyright © 2021 www.secdatabase.com. All Rights Reserved.Please Consider the Environment Before Printing This Document

GMO Strategic Opportunities Allocation Fund(A Series of GMO Trust)Schedule of Investments �� (Continued)(showing percentage of total net assets)November 30, 2020 (Unaudited)
Shares Description Value ($)United Kingdom �� continued
(8,168 ) Experian Plc (289,391 )(30,416) GVC Holdings Plc * (417,939 )(4,488 ) Halma Plc (132,057 )(19,439) Hargreaves Lansdown Plc (368,169 )(53,929) Informa Plc * (377,762 )(3,650 ) Land Securities Group Plc (REIT) (31,921 )(3,528 ) London Stock Exchange Group Plc (380,500 )(12,273) Ocado Group Plc * (360,841 )(4,572 ) Prudential Plc (70,307 )(776 ) Spirax-Sarco Engineering Plc (114,309 )
Total United Kingdom (3,646,366)
United States �� (4.2)%(3,600 ) Advanced Micro Devices, Inc. * (333,576 )(6,300 ) AES Corp. (The) (128,772 )(100 ) Align Technology, Inc. * (48,129 )(1,700 ) American Tower Corp. (REIT) (393,040 )(35,700) Apache Corp. (460,173 )(1,900 ) Arthur J Gallagher & Co. (219,279 )(1,400 ) Autodesk, Inc. * (392,322 )(1,900 ) Avalara, Inc. * (326,325 )(1,400 ) Ball Corp. (134,414 )(1,200 ) Black Knight, Inc. * (109,944 )(7,300 ) Blackstone Group , Inc. (The) � Class A (434,715 )(1,400 ) Burlington Stores, Inc. * (305,956 )(400 ) Catalent, Inc. * (38,456 )(7,900 ) Cheniere Energy, Inc. * (447,851 )(300 ) Chipotle Mexican Grill, Inc. * (386,829 )(2,900 ) Cognex Corp. (217,906 )(200 ) CoStar Group, Inc. * (182,114 )(1,100 ) Coupa Software, Inc. * (361,801 )(2,300 ) Crowdstrike Holdings, Inc. � Class A * (352,544 )(3,200 ) Datadog, Inc. � Class A * (316,544 )(1,100 ) DexCom, Inc. * (351,648 )(1,900 ) Digital Realty Trust, Inc. (REIT) (256,025 )(1,900 ) DocuSign, Inc. * (432,972 )(69,600) Endo International Plc * (353,568 )(1,700 ) Equifax, Inc. (283,730 )(500 ) Equinix, Inc. (REIT) (348,895 )(6,300 ) Equity LifeStyle Properties, Inc. (REIT) (369,117 )(200 ) Erie Indemnity Co. � Class A (45,122 )(3,200 ) Exact Sciences Corp. * (387,392 )(600 ) Extra Space Storage, Inc. (REIT) (67,638 )(1,000 ) Fastenal Co. (49,450 )(3,700 ) Guidewire Software, Inc. * (453,176 )(600 ) Hologic, Inc. * (41,478 )(600 ) IDEXX Laboratories, Inc. * (276,588 )(3,100 ) IHS Markit Ltd. (308,326 )(4,200 ) Ingersoll Rand, Inc. * (185,934 )(1,600 ) Insulet Corp. * (412,336 )(2,000 ) IQVIA Holdings, Inc. * (337,980 )(4,900 ) Lamb Weston Holdings, Inc. (354,662 )(1,100 ) Liberty Broadband Corp. � Class A * (172,447 )
Shares Description Value ($)United States �� continued
(9,700 ) Liberty Media Corp-Liberty Formula One � Class C * (405,266 )(5,700 ) Live Nation Entertainment, Inc. * (374,205 )(200 ) Lululemon Athletica, Inc. * (74,044 )(800 ) MarketAxess Holdings, Inc. (431,344 )(1,500 ) MongoDB, Inc. * (430,965 )(1,000 ) MSCI, Inc. (409,420 )(2,200 ) NIKE Inc. � Class B (296,340 )(7,600 ) Nuance Communications, Inc. * (327,788 )(1,900 ) Okta, Inc. * (465,576 )(800 ) Paycom Software, Inc. * (333,664 )(1,800 ) Pinterest, Inc. � Class A * (126,036 )(1,200 ) Public Storage (REIT) (269,352 )(1,400 ) RingCentral, Inc. � Class A * (415,870 )(400 ) Rockwell Automation, Inc. (102,224 )(1,400 ) Roku, Inc. * (410,998 )(4,600 ) Rollins, Inc. (263,028 )(800 ) ServiceNow, Inc. * (427,640 )(10,500) Slack Technologies Inc. � Class A * (450,240 )(10,800) Snap, Inc. � Class A * (479,736 )(33,700) Southwestern Energy Co. * (104,807 )(1,900 ) Splunk, Inc. * (387,942 )(1,500 ) Square, Inc. � Class A * (316,440 )(3,000 ) Starbucks Corp. (294,060 )(800 ) Sun Communities, Inc. (REIT) (111,200 )(800 ) Sunrun, Inc. * (51,264 )(18,400) Targa Resources Corp. (432,400 )(1,600 ) Teladoc Health, Inc. * (318,032 )(1,100 ) Tesla, Inc. * (624,360 )(1,400 ) Twilio, Inc. � Class A * (448,126 )(10,100) UDR, Inc. (REIT) (388,547 )(1,100 ) Vail Resorts, Inc. (303,424 )(400 ) West Pharmaceutical Services, Inc. (110,064 )(13,900) Williams Cos, Inc. (The) (291,622 )(300 ) Workday, Inc. � Class A * (67,437 )(4,300 ) Wynn Resorts Ltd. (432,150 )(3,900 ) Zillow Group, Inc. � Class C * (420,459 )(700 ) Zoom Video Communications, Inc.� Class A * (334,852 )(1,900 ) Zscaler, Inc. * (295,925 )
Total United States (23,542,046 )
TOTAL COMMON STOCKS(PROCEEDS $46,441,981) (49,927,872 )
RIGHTS/WARRANTS �� (0.0)%
Spain �� (0.0)%(10,282) Ferrovial SA, Expires 11/23/20 * (2,930 )
TOTAL RIGHTS/WARRANTS (PROCEEDS $2,407) (2,930 )
TOTAL SECURITIES SOLD SHORT(PROCEEDS $46,444,388) (49,930,802 )Other Assets and Liabilities (net) � (0.9%) (5,046,665 )
TOTAL NET ASSETS �� 100.0% $565,345,660
Copyright © 2021 www.secdatabase.com. All Rights Reserved.Please Consider the Environment Before Printing This Document

(1,500 ) Liberty Broadband Corp. � Class C * (236,025 )
Copyright © 2021 www.secdatabase.com. All Rights Reserved.Please Consider the Environment Before Printing This Document

GMO Strategic Opportunities Allocation Fund(A Series of GMO Trust)
Schedule of Investments �� (Continued)November 30, 2020 (Unaudited)
A summary of outstanding financial instruments at November 30, 2020 is as follows:
Reverse Repurchase Agreements
Average balance outstanding $(4,560,000)Average interest rate (net) (0.09 )%Maximum balance outstanding $(4,560,000)
Average balance outstanding was calculated based on daily face value balances outstanding during the period that the Fund had enteredinto reverse repurchase agreements. Average interest rate was calculated based on interest received and/or paid during the period that theFund had entered into the reverse repurchase agreements. The Fund had no reverse repurchase agreements at the end of the period.
Swap Contracts
OTC Total Return Swaps
Fund Pays Fund Receives CounterpartyNotionalAmount
ExpirationDate
PeriodicPayment
Frequency
PremiumsPaid/
(Received) ($) Value ($)
Net UnrealizedAppreciation/
(Depreciation) ($)Total Return on Equity
Basket (g)1 Month Federal FundsRate minus 0.75% GS USD 226,674
05/24/2022 Monthly � 2,772 2,772
Total Return on EquityBasket (g)
1 Month Federal FundsRate minus 0.75% GS USD 49,208
05/24/2022 Monthly � 1,807 1,807
Total Return on EquityBasket (g)
1 Month Federal FundsRate minus 0.50% GS USD 128,879
05/24/2022 Monthly � 14,277 14,277
Total Return on EquityBasket (g)
1 Month Federal FundsRate minus 0.75% GS USD 36,070
05/24/2022 Monthly � (616 ) (616 )
Forward Currency Contracts
SettlementDate
Counter-party
CurrencySold
CurrencyPurchased
NetUnrealized
Appreciation(Depreciation)
($)01/19/2021 BOA JPY 1,484,774,767 USD 14,144,857 (91,508 )
01/19/2021 DB JPY 810,408,933 USD 7,712,067 (58,322 )
02/24/2021 GS JPY 1,904,385,700 USD 18,346,383 78,755
01/19/2021 BOA USD 3,782,608 JPY 396,794,800 21,953
01/19/2021 CITI USD 852,937 JPY 89,059,800 989
$ (48,133 )
Futures Contracts
Numberof
Contracts + TypeExpiration
Date
NotionalAmount
($)
Value/NetUnrealized
Appreciation(Depreciation)
($)Sales214 TOPIX Index December 2020 $35,928,269 $ (2,921,080 )
+ Buys - Fund is long the futures contract.Sales - Fund is short the futures contract.
Copyright © 2021 www.secdatabase.com. All Rights Reserved.Please Consider the Environment Before Printing This Document

Total Return on EquityBasket (g)
1 Month Federal FundsRate minus 0.50% GS USD 10,595
05/24/2022 Monthly � 204 204
Total Return on EquityBasket (g)
1 Month Federal FundsRate minus 0.75% GS USD 19,486
05/24/2022 Monthly � 104 104
Total Return on EquityBasket (g)
1 Month Federal FundsRate minus 1.00% MORD USD 80,766
10/18/2022 Monthly � 4,374 4,374
Total Return on EquityBasket (g)
1 Month Federal FundsRate minus 0.40% MORD USD 4,184,111
10/18/2022 Monthly � (87,834 ) (87,834 )
Total Return on EquityBasket (g)
1 Month Federal FundsRate minus 0.50% MORD USD 18,979
10/18/2022 Monthly � 2 2
Total Return on EquityBasket (g)
1 Month Federal FundsRate minus 0.40% MORD USD 74,150
10/18/2022 Monthly � (94 ) (94 )
$ � $(65,004 ) $ (65,004 )
Copyright © 2021 www.secdatabase.com. All Rights Reserved.Please Consider the Environment Before Printing This Document

GMO Strategic Opportunities Allocation Fund(A Series of GMO Trust)
Schedule of Investments �� (Continued)November 30, 2020 (Unaudited)
As of November 30, 2020, for the above contracts and/or agreements, the Fund had sufficient cash and/or securities to covercommitments or collateral requirements, if any, of the relevant broker or exchange.
Notes to Schedule of Investments:
� Denominated in U.S. Dollar, unless otherwise indicated.* Non-income producing security.(a) All or a portion of this security is out on loan.(b) All or a portion of this security has been pledged to cover margin
requirements on futures and/or cleared swap contracts, collateral onsecurities sold short, OTC swap contracts, forward currency contracts, and/or written options, if any.
(c) Investment valued at fair value using methods determined in good faith bythe Trustees of GMO Trust or persons acting at their direction pursuant toprocedures approved by the Trustees. Investment valued using significantunobservable inputs.
(d) Investment valued using significant unobservable inputs.(e) Preferred dividend rates are disclosed to the extent that a stated rate exists.(f) The rate disclosed is the 7 day net yield as of November 30, 2020.(g) Periodic payments made/received are based on the total return of the
referenced entity. Custom equity basket swap which has a notional amountof less than 1% of the Fund�s total net assets.
Portfolio Abbreviations:
Counterparty Abbreviations:
Currency Abbreviations:
JPY - Japanese YenUSD - United States Dollar
ADR - American Depositary ReceiptCVA - Certificaaten van aandelen(Share Certificates)GDR - Global Depositary Receipt
PJSC - Private Joint-Stock CompanyREIT - Real Estate Investment Trust
BOA - Bank of America, N.A.CITI - Citibank N.A.DB - Deutsche Bank AG
GS - Goldman Sachs InternationalMORD - Morgan Stanley CapitalServices LLC
Copyright © 2021 www.secdatabase.com. All Rights Reserved.Please Consider the Environment Before Printing This Document

OrganizationEach of Alternative Allocation Fund, Benchmark-Free Allocation Fund, Benchmark-Free Fund, Global Asset Allocation Fund,Global Developed Equity Allocation Fund, Global Equity Allocation Fund, Implementation Fund, International Developed EquityAllocation Fund, International Equity Allocation Fund, SGM Major Markets Fund, Special Opportunities Fund and StrategicOpportunities Allocation Fund, (each a �Fund� and collectively the �Funds�) is a series of GMO Trust (the �Trust�). The Trust isregistered under the Investment Company Act of 1940, as amended (the �1940 Act�), as an open-end management investmentcompany. The Trust was established as a Massachusetts business trust under the laws of The Commonwealth of Massachusetts onJune 24, 1985. The Declaration of Trust permits the Trustees of the Trust (�Trustees�) to create an unlimited number of series ofshares (Funds) and to subdivide Funds into classes. The Funds are advised and managed by Grantham, Mayo, Van Otterloo & Co.LLC (�GMO�).
The Funds may invest in GMO U.S. Treasury Fund and in money market funds unaffiliated with GMO.
Many of the Funds may invest primarily in other GMO Funds and Alternative Allocation Fund, Implementation Fund, SpecialOpportunities Fund, and SGM Major Markets Fund may also invest in GMO Alternative Allocation SPC Ltd., GMOImplementation SPC Ltd., GMO Special Opportunities SPC Ltd. and GMO Alternative Asset SPC Ltd., (each a �wholly-ownedsubsidiary�) respectively. These GMO Funds and wholly owned subsidiaries are referenced herein as �underlying funds�. As aresult, the Funds are exposed to all of the risks of the underlying funds in which they invest. Several of the underlying fundsthemselves invest a substantial portion of their assets in other GMO Funds. The financial statements of the underlying fundsshould be read in conjunction with the Funds� financial statements. The financial statements are available without charge on theSecurities and Exchange Commission�s (�SEC�) website at www.sec.gov or on GMO�s website at www.gmo.com.
Each Fund has elected to be treated or intends to elect to be treated and intends to qualify each tax year as a regulated investmentcompany under Subchapter M of the Internal Revenue Code of 1986, as amended. Each Fund intends to distribute its netinvestment income, if any, and its net realized short-term and long-term capital gains, if any, after giving effect to any availablecapital loss carryforwards for U.S. federal income tax purposes. Therefore, each Fund makes no provision for U.S. federal incomeor excise taxes.
Please see the Funds� Prospectus, available on www.gmo.com, for information regarding specific risks for each Fund.
Basis of presentationThe preparation of the Schedule of Investments in accordance with accounting principles generally accepted in the United Statesof America (�U.S. GAAP�) requires GMO to make estimates and assumptions that affect the reported amounts and disclosures inthe Schedule of Investments during the reporting period. GMO believes the estimates and security valuations are appropriate;however, actual results may differ from those estimates, and the security valuations reflected in the Schedule of Investments maydiffer from the value a Fund ultimately realizes upon the sale of those securities.
Basis of presentation and principles of consolidation: Alternative Allocation Fund, Implementation Fund, SpecialOpportunities Fund and SGM Major Markets FundAlternative Allocation Fund, Implementation Fund, Special Opportunities Fund and SGM Major Markets Fund include theaccounts of their wholly-owned subsidiaries and the accompanying schedules of investments have been consolidated for thoseaccounts. The consolidated schedules of investments include all of the assets and liabilities of each wholly-owned subsidiary.
Portfolio valuationShares of the underlying funds and other open-end registered investment companies are valued at their most recent net asset value.Direct investments held by the Funds and underlying funds are valued as follows: Exchange-traded securities (other thanexchange-traded options) for which market quotations are readily available are valued at (i) the last sale price or (ii) officialclosing price or (iii) most recent quoted price published by the exchange (if no reported last sale or official closing price) or(iv) the quoted price provided by a pricing source (in the event GMO deems the private market to be a more reliable indicator ofmarket value than the exchange). Exchange-traded options are valued at the last sale price, provided that price is between theclosing bid and ask prices. If the last sale price is not within that range, then they will be valued at the closing bid price for longpositions and the closing ask price for short positions. Cleared derivatives are valued using the price quoted (which may be basedon a model) by the relevant clearing house. If an updated quote for a cleared derivative is not available when a Fund calculates itsnet asset value, the derivative will generally be valued using an industry standard model, which may differ from the model used bythe relevant clearing house. Over-the-counter (�OTC�) derivatives are generally valued at the price determined by an industrystandard model. Unlisted securities for which market quotations are readily available are generally valued at the most recentquoted price.
The foregoing valuation methodologies are modified for equities that trade in non-U.S. securities markets that close before theclose of the New York Stock Exchange (�NYSE�) due to time zone differences, including the value of equities that underlie
Copyright © 2021 www.secdatabase.com. All Rights Reserved.Please Consider the Environment Before Printing This Document

futures, options and other derivatives (to the extent the market for those derivatives closes prior to the close of the NYSE). In thosecases, the price will generally be adjusted, to the extent practicable and available, based on inputs from an independent pricingservice approved by
Copyright © 2021 www.secdatabase.com. All Rights Reserved.Please Consider the Environment Before Printing This Document

the Trustees that are intended to reflect valuation changes through the NYSE close. These securities listed on foreign exchanges(including the value of equity securities that underlie futures, options and other derivatives (to the extent the market for suchinstruments closes prior to the close of the NYSE)) are classified as Level 2 (levels defined below) and are described in thedisclosures of the underlying funds.
Typically, the Funds and the underlying funds value fixed income securities at the most recent price supplied by a pricing sourcedetermined by GMO. GMO evaluates pricing sources on an ongoing basis and may change a pricing source at any time. GMOmonitors erratic or unusual movements (including unusual inactivity) in the prices supplied for a security and has discretion tooverride a price supplied by a source (e.g., by taking a price supplied by another source) when it believes that the price supplied isnot reliable. Alternative pricing sources are often but not always available for securities held by the Funds and the underlyingfunds.
�Quoted price� typically means the bid price for securities held long and the ask price for securities sold short. If a marketquotation for a security does not involve a bid or an ask, the �quoted price� may be the price provided by a market participant orother third-party pricing source in accordance with the market practice for that security. If an updated quoted price for a security isnot available when a Fund calculates its net asset value, the Fund will generally use the last quoted price so long as GMO believesthat the last quoted price continues to represent that security�s fair value.
In the case of derivatives, prices determined by a model may reflect an estimate of the average of bid and ask prices, regardless ofwhether a Fund has a long position or a short position.
If quotations are not readily available or circumstances make an existing valuation methodology or procedure unreliable,derivatives and other securities are valued at fair value as determined in good faith by the Trustees or persons acting at theirdirection pursuant to procedures approved by the Trustees. Because of the uncertainty inherent in fair value pricing, the pricedetermined for a particular security may be materially different from the value realized upon its sale. The Funds and/or theunderlying funds classify such securities as Level 3 (levels defined below). For the period ended November 30, 2020, the Fundsdid not reduce the value of any of their OTC derivatives contracts, if any, based on the creditworthiness of their counterparties.
U.S. GAAP requires the Funds to disclose the fair value of their investments in a three-level hierarchy (Levels 1, 2 and 3). Thevaluation hierarchy is based upon the relative observability of inputs to the valuation of the Funds� investments. The inputs ormethodologies used for valuing securities are not necessarily an indication of the risk associated with investing in those securities.
Changes in valuation techniques may result in transfers into or out of an investment�s assigned level within the fair valuehierarchy. In addition, in periods of market dislocation, the observability of prices and inputs may be reduced for manyinstruments. This condition, as well as changes related to the liquidity of investments, could cause a security to be reclassifiedbetween levels.
The three levels are defined as follows:
Level 1 � Valuations based on quoted prices for identical securities in active markets.
The types of assets and liabilities categorized in Level 1 generally include actively traded domestic and certain foreign equitysecurities; certain U.S. government obligations; derivatives actively traded on a national securities exchange (such as some futuresand options); and shares of open-end mutual funds (even if their investments are valued using Level 2 or Level 3 inputs).
Level 2 � Valuations determined using other significant direct or indirect observable inputs.
The types of assets and liabilities categorized in Level 2 generally include certain U.S. government agency securities, mortgage-backed securities, asset-backed securities, certain sovereign debt obligations, and corporate bonds valued using vendor prices orbroker quotes; cleared derivatives and certain OTC derivatives such as swaps, options, swaptions, and forward currency contractsvalued using industry standard models; certain restricted securities valued at the most recent available market or quoted price;certain securities that are valued at the local price; certain debt obligations, such as collateralized loan obligations, that have yet tobegin trading that are valued at cost; and certain foreign equity securities that are adjusted based on inputs from an independentpricing service approved by the Trustees, including the value of equity securities that underlie futures, options and otherderivatives (to the extent the market for such instruments closes prior to the close of the NYSE) to reflect estimated valuationchanges through the NYSE close.
Level 3 � Valuations based primarily on inputs that are unobservable and significant.
The types of assets and liabilities categorized in Level 3 generally include, but are not limited to, certain debt securities (such asasset-backed, mortgage-backed, loans and sovereign debt) and derivatives even though they may be valued using broker quotes;certain debt securities and derivatives adjusted by a specified discount for liquidity or other considerations; securities whosetrading has been suspended or that have been de-listed from their current primary trading exchange valued at the most recentavailable market or quoted price; securities in default or bankruptcy proceedings for which there is no current market quotation
Copyright © 2021 www.secdatabase.com. All Rights Reserved.Please Consider the Environment Before Printing This Document

valued at the most recent available market or quoted price; potential litigation recoveries and interests related to bankruptcyproceedings; certain equity
Copyright © 2021 www.secdatabase.com. All Rights Reserved.Please Consider the Environment Before Printing This Document

securities valued based on the last traded exchange price adjusted for the movement in a relevant index; certain securities that arevalued using a price from a comparable security related to the same issuer; and certain recently acquired equity securities that haveyet to begin trading that are valued at cost.
The following is a summary of the respective levels assigned to the Funds� direct securities and derivatives, if any, as ofNovember 30, 2020:
Description Level 1 Level 2 Level 3 TotalConsolidated Alternative Allocation FundAsset Valuation InputsCommon Stocks
Australia $� $3,997,952 $� $3,997,952Belgium � 160,542 � 160,542Canada 772,295 � � 772,295China 123,668 1,492,985 � 1,616,653Denmark � 457,591 � 457,591Finland � 104,333 � 104,333France � 846,735 � 846,735Germany � 495,800 � 495,800Hong Kong � 678,890 � 678,890Israel 161,670 � � 161,670Italy � 479,963 � 479,963Japan � 5,640,291 � 5,640,291Netherlands 132,336 595,503 � 727,839New Zealand � 147,413 � 147,413Singapore � 28,982 � 28,982South Africa � 191,063 � 191,063Spain � 281,448 � 281,448Sweden � 156,827 � 156,827Switzerland � 266,408 � 266,408United Kingdom 10,997,305 2,538,119 � 13,535,424United States 117,655,311 � � 117,655,311
TOTAL COMMON STOCKS 129,842,585 18,560,845 � 148,403,430Preferred Stocks
Germany � 167,417 � 167,417TOTAL PREFERRED STOCKS � 167,417 � 167,417Rights/Warrants
Spain 10,540 � � 10,540United States 343,734 � � 343,734
TOTAL RIGHTS/WARRANTS 354,274 � � 354,274Investment Funds
United States � � 8,454,240 8,454,240TOTAL INVESTMENT FUNDS � � 8,454,240 8,454,240Debt Obligations
United States 190,994,154 56,026,937 � 247,021,091United States Virgin Islands � 3,919,552 � 3,919,552
TOTAL DEBT OBLIGATIONS 190,994,154 59,946,489 � 250,940,643Mutual Funds
United States 36,254,125 � � 36,254,125TOTAL MUTUAL FUNDS 36,254,125 � � 36,254,125Purchased Options 212,440 154,187 � 366,627Short-Term Investments 699,258 154,242 � 853,500Total Investments 358,356,836 78,983,180 8,454,240 445,794,256Derivatives^
Forward Currency ContractsForeign Currency Risk � 6,271,948 � 6,271,948
Futures ContractsEquity Risk 1,859,780 6,712 � 1,866,492Interest Rate Risk 74,221 � � 74,221
Copyright © 2021 www.secdatabase.com. All Rights Reserved.Please Consider the Environment Before Printing This Document

Description Level 1 Level 2 Level 3 TotalConsolidated Alternative Allocation Fund (continued)Asset Valuation Inputs (continued)
Swap ContractsCredit Risk $� $634,688 $� $634,688Equity Risk � 12,196 � 12,196Interest Rate Risk � 2,002,476 � 2,002,476Physical Commodity Contract Risk � 527,556 � 527,556
Total $360,290,837 $88,438,756 $8,454,240 $457,183,833Liability Valuation InputsCommon Stocks
Australia $� $(669,258 ) $� $(669,258 )Austria � (121,797 ) � (121,797 )Canada (119,128 ) � � (119,128 )China (189,304 ) � � (189,304 )France � (1,010,984 ) � (1,010,984 )Germany � (1,355,767 ) � (1,355,767 )Italy � (330,257 ) � (330,257 )Japan � (2,993,871 ) � (2,993,871 )Netherlands � (5,067,106 ) � (5,067,106 )Norway � (15,566 ) � (15,566 )Peru (136,551 ) � � (136,551 )Singapore � (166,159 ) � (166,159 )Spain � (811,741 ) � (811,741 )Sweden � (244,423 ) � (244,423 )Switzerland � (306,178 ) � (306,178 )United Kingdom (10,896,378 ) (1,515,533 ) � (12,411,911 )United States (93,756,157 ) � � (93,756,157 )
TOTAL COMMON STOCKS (105,097,518 ) (14,608,640) � (119,706,158 )Rights/Warrants
Spain (1,960 ) � � (1,960 )TOTAL RIGHTS/WARRANTS (1,960 ) � � (1,960 )Derivatives^
Forward Currency ContractsForeign Currency Risk � (4,508,531 ) � (4,508,531 )
Futures ContractsEquity Risk (1,074,845 ) (333,665 ) � (1,408,510 )Interest Rate Risk (2,404 ) � � (2,404 )
Written OptionsCredit Risk � (59,427 ) � (59,427 )Equity Risk (732,480 ) (17,874 ) � (750,354 )
Swap ContractsCredit Risk � (621,275 ) � (621,275 )Equity Risk � (32,829 ) � (32,829 )Interest Rate Risk � (3,922,121 ) � (3,922,121 )
Total $(106,909,207 ) $(24,104,362) $� $(131,013,569 )
Benchmark-Free Allocation FundAsset Valuation InputsMutual Funds $6,654,086,010 $� $� $6,654,086,010Short-Term Investments 3,796,402 � � 3,796,402Total Investments 6,657,882,412 � � 6,657,882,412Total $6,657,882,412 $� $� $6,657,882,412
Benchmark-Free FundAsset Valuation InputsCommon Stocks
Argentina $1,036,764 $� $� $1,036,764Australia � 20,821,966 � 20,821,966Austria � 115,982 � 115,982Belgium � 5,627,791 � 5,627,791Brazil � 16,257,352 � 16,257,352Canada 24,450,615 � � 24,450,615
Copyright © 2021 www.secdatabase.com. All Rights Reserved.Please Consider the Environment Before Printing This Document

Chile 19,602 217,573 � 237,175
Copyright © 2021 www.secdatabase.com. All Rights Reserved.Please Consider the Environment Before Printing This Document

Description Level 1 Level 2 Level 3 TotalBenchmark-Free Fund (continued)Asset Valuation Inputs (continued)Common Stocks (continued)
China $33,747,917 $228,670,258 $11,056 $262,429,231Cyprus 240,240 � � 240,240Czech Republic � 101,665 � 101,665Denmark � 4,621,894 � 4,621,894Egypt � 12,077 � 12,077Finland � 4,263,915 � 4,263,915France 681,861 30,873,543 � 31,555,404Germany � 24,755,111 � 24,755,111Greece � 387,179 � 387,179Hong Kong � 16,183,401 � 16,183,401Hungary � 1,191,457 � 1,191,457India 4,200,921 33,969,101 � 38,170,022Indonesia � 8,047,623 � 8,047,623Ireland 761,450 6,556,761 � 7,318,211Israel 1,368,489 303,078 � 1,671,567Italy � 18,921,619 � 18,921,619Japan � 186,840,820 � 186,840,820Kuwait � 1,941,095 � 1,941,095Malaysia � 1,450,736 � 1,450,736Mexico 23,513,233 � � 23,513,233Netherlands 1,433,640 23,930,633 � 25,364,273New Zealand � 1,590,670 � 1,590,670Norway � 10,111,811 � 10,111,811Pakistan � 841,905 � 841,905Philippines � 990,974 � 990,974Poland � 7,902,952 � 7,902,952Portugal � 9,725,168 � 9,725,168Qatar � 1,012,931 � 1,012,931Russia 1,193,177 65,059,769 � 66,252,946Saudi Arabia � 167,365 � 167,365Singapore � 14,283,628 � 14,283,628South Africa 718,716 35,478,315 � 36,197,031South Korea 2,337,771 55,006,742 � 57,344,513Spain � 24,450,953 � 24,450,953Sweden � 6,674,110 � 6,674,110Switzerland � 9,798,614 � 9,798,614Taiwan 2,297,919 93,822,391 � 96,120,310Thailand � 3,146,784 � 3,146,784Turkey � 17,503,478 � 17,503,478United Arab Emirates � 3,025,449 � 3,025,449United Kingdom 2,299,637 70,248,992 14,550 72,563,179United States 256,280,909 � � 256,280,909Vietnam � 228,041 � 228,041
TOTAL COMMON STOCKS 356,582,861 1,067,133,672 25,606 1,423,742,139Preferred Stocks
Brazil � 6,349,873 � 6,349,873Chile 47,070 � � 47,070Colombia 145,878 � � 145,878Germany � 3,234,389 � 3,234,389Russia � 6,096,702 � 6,096,702South Korea � 10,494,416 � 10,494,416Taiwan � 93,498 � 93,498
TOTAL PREFERRED STOCKS 192,948 26,268,878 � 26,461,826Rights/Warrants
Pakistan � � 2,490 2,490Spain 124,583 � � 124,583United Kingdom 153,446 � � 153,446
TOTAL RIGHTS/WARRANTS 278,029 � 2,490 280,519
Copyright © 2021 www.secdatabase.com. All Rights Reserved.Please Consider the Environment Before Printing This Document

Description Level 1 Level 2 Level 3 TotalBenchmark-Free Fund (continued)Asset Valuation Inputs (continued)Investment Funds
United States $5,319,999 $� $� $5,319,999TOTAL INVESTMENT FUNDS 5,319,999 � � 5,319,999Debt Obligations
United States 351,484,753 2,979,558 � 354,464,311TOTAL DEBT OBLIGATIONS 351,484,753 2,979,558 � 354,464,311Mutual Funds
United States 478,110,383 � � 478,110,383TOTAL MUTUAL FUNDS 478,110,383 � � 478,110,383Short-Term Investments 22,813,777 � � 22,813,777Total Investments 1,214,782,750 1,096,382,108 28,096 2,311,192,954Derivatives^
Forward Currency ContractsForeign Currency Risk � 3,782,353 � 3,782,353
Futures ContractsEquity Risk 456,630 96,665 � 553,295
Swap ContractsEquity Risk � 98,631 � 98,631Interest Rate Risk � 838,347 � 838,347
Total $1,215,239,380 $1,101,198,104 $28,096 $2,316,465,580Liability Valuation InputsCommon Stocks
Australia $� $(6,730,771 ) $� $(6,730,771 )Austria � (1,068,695 ) � (1,068,695 )Canada (1,052,061 ) � � (1,052,061 )China (1,680,811 ) � � (1,680,811 )France � (9,585,899 ) � (9,585,899 )Germany � (13,046,718 ) � (13,046,718 )Italy � (3,353,565 ) � (3,353,565 )Japan � (28,539,652 ) � (28,539,652 )Netherlands � (4,343,667 ) � (4,343,667 )Norway � (135,619 ) � (135,619 )Peru (1,175,526 ) � � (1,175,526 )Russia � (404,824 ) � (404,824 )Singapore � (1,457,186 ) � (1,457,186 )Spain � (7,833,915 ) � (7,833,915 )Sweden � (2,672,985 ) � (2,672,985 )Switzerland � (3,496,669 ) � (3,496,669 )United Kingdom � (13,914,038 ) � (13,914,038 )United States (89,411,078 ) � � (89,411,078 )
TOTAL COMMON STOCKS (93,319,476 ) (96,584,203 ) � (189,903,679 )Rights/Warrants
Spain (11,914 ) � � (11,914 )TOTAL RIGHTS/WARRANTS (11,914 ) � � (11,914 )Derivatives^
Forward Currency ContractsForeign Currency Risk � (6,867,685 ) � (6,867,685 )
Futures ContractsEquity Risk (45,699,882 ) (26,890,248 ) � (72,590,130 )
Swap ContractsEquity Risk � (342,587 ) � (342,587 )Interest Rate Risk � (1,662,679 ) � (1,662,679 )
Total $(139,031,272 ) $(132,347,402 ) $� $(271,378,674 )
Copyright © 2021 www.secdatabase.com. All Rights Reserved.Please Consider the Environment Before Printing This Document

Description Level 1 Level 2 Level 3 TotalGlobal Asset Allocation FundAsset Valuation InputsMutual Funds $927,463,720 $� $� $927,463,720Debt Obligations
Asset-Backed Securities � 25,582 � 25,582TOTAL DEBT OBLIGATIONS � 25,582 � 25,582Short-Term Investments 285,577 � � 285,577Total Investments 927,749,297 25,582 � 927,774,879Derivatives^
Forward Currency ContractsForeign Currency Risk � 89,477 � 89,477
Total $927,749,297 $115,059 $� $927,864,356Liability Valuation InputsDerivatives^
Futures ContractsEquity Risk $(1,593,404 ) $(2,682,310 ) $� $(4,275,714 )
Global Developed Equity Allocation FundAsset Valuation InputsMutual Funds $79,027,675 $� $� $79,027,675Short-Term Investments 58,155 � � 58,155Total Investments 79,085,830 � � 79,085,830Total $79,085,830 $� $� $79,085,830
Global Equity Allocation FundAsset Valuation InputsMutual Funds $1,588,165,896 $� $� $1,588,165,896Short-Term Investments 539,758 � � 539,758Total Investments 1,588,705,654 � � 1,588,705,654Total $1,588,705,654 $� $� $1,588,705,654
Consolidated Implementation FundAsset Valuation InputsCommon Stocks
Argentina $4,359,825 $� $� $4,359,825Australia � 62,810,983 � 62,810,983Austria � 213,714 � 213,714Belgium � 14,808,097 � 14,808,097Brazil � 44,325,610 � 44,325,610Canada 63,796,482 � � 63,796,482Chile 2,095,236 836,899 � 2,932,135China 114,416,819 679,969,765 38,237 794,424,821Cyprus 1,075,867 � � 1,075,867Czech Republic � 663,393 � 663,393Denmark � 11,936,764 � 11,936,764Egypt � 92,241 � 92,241Finland � 11,726,723 � 11,726,723France 301,340 81,151,713 � 81,453,053Germany � 64,027,104 � 64,027,104Greece � 1,164,351 � 1,164,351Hong Kong � 40,559,759 � 40,559,759Hungary � 3,918,794 � 3,918,794India 12,948,160 103,765,626 � 116,713,786Indonesia � 32,455,229 � 32,455,229Ireland 2,044,925 16,571,933 � 18,616,858Israel 3,576,711 371,521 � 3,948,232Italy � 51,155,892 � 51,155,892Japan � 503,673,661 � 503,673,661Kuwait � 8,611,236 � 8,611,236Malaysia � 4,672,840 � 4,672,840Mexico 69,961,348 � � 69,961,348
Copyright © 2021 www.secdatabase.com. All Rights Reserved.Please Consider the Environment Before Printing This Document

Description Level 1 Level 2 Level 3 TotalConsolidated Implementation Fund (continued)Asset Valuation Inputs (continued)Common Stocks (continued)
Netherlands $3,742,168 $61,290,793 $879 $65,033,840New Zealand � 4,191,388 � 4,191,388Norway � 23,232,074 � 23,232,074Pakistan � 4,919,174 � 4,919,174Philippines � 5,176,854 � 5,176,854Poland � 25,752,669 � 25,752,669Portugal � 23,986,799 � 23,986,799Qatar � 8,200,574 � 8,200,574Russia 1,803,972 221,412,278 � 223,216,250Saudi Arabia � 1,080,367 � 1,080,367Singapore � 43,065,961 � 43,065,961South Africa 3,984,728 102,839,653 � 106,824,381South Korea 6,945,818 153,265,057 � 160,210,875Spain � 62,101,235 � 62,101,235Sweden � 19,589,130 � 19,589,130Switzerland � 24,495,494 � 24,495,494Taiwan 18,681,201 330,108,625 � 348,789,826Thailand � 6,262,241 � 6,262,241Turkey � 45,576,883 � 45,576,883United Arab Emirates � 7,500,780 � 7,500,780United Kingdom 36,852,285 183,789,047 � 220,641,332United States 1,005,108,250 � 14,113,742 1,019,221,992Vietnam � 1,610,475 � 1,610,475
TOTAL COMMON STOCKS 1,351,695,135 3,098,931,399 14,152,858 4,464,779,392Preferred Stocks
Brazil � 18,002,005 � 18,002,005Colombia 712,047 � � 712,047Germany � 8,455,468 � 8,455,468Russia � 24,272,469 � 24,272,469South Korea � 31,189,107 � 31,189,107Taiwan � 828,616 � 828,616United States � � 479,066 479,066
TOTAL PREFERRED STOCKS 712,047 82,747,665 479,066 83,938,778Rights/Warrants
Pakistan � � 18,530 18,530Spain 328,511 � � 328,511United Kingdom 402,154 � � 402,154United States 861,636 � 430,926 1,292,562
TOTAL RIGHTS/WARRANTS 1,592,301 � 449,456 2,041,757Investment Funds
United States 24,823,811 � 22,262,400 47,086,211TOTAL INVESTMENT FUNDS 24,823,811 � 22,262,400 47,086,211Debt Obligations
Brazil � 9,536,800 � 9,536,800Israel � 7,915,622 � 7,915,622Jamaica � 5,386,216 4,850,266 10,236,482Netherlands � � 10,507,230 10,507,230Puerto Rico � 13,078,614 � 13,078,614United States 1,022,637,448 183,142,642 47,661,527 1,253,441,617
TOTAL DEBT OBLIGATIONS 1,022,637,448 219,059,894 63,019,023 1,304,716,365Mutual Funds
United States 20,383,922 � � 20,383,922TOTAL MUTUAL FUNDS 20,383,922 � � 20,383,922Purchased Options 566,500 � � 566,500Short-Term Investments 118,191,277 117,059,454 � 235,250,731Total Investments 2,540,602,441 3,517,798,412 100,362,803 6,158,763,656
Copyright © 2021 www.secdatabase.com. All Rights Reserved.Please Consider the Environment Before Printing This Document

Description Level 1 Level 2 Level 3 TotalConsolidated Implementation Fund (continued)Asset Valuation Inputs (continued)Derivatives^
Forward Currency ContractsForeign Currency Risk $� $21,639,982 $� $21,639,982
Futures ContractsEquity Risk 11,757,115 272,338 � 12,029,453Interest Rate Risk 222,269 � � 222,269Physical Commodity Contract Risk 1,183,955 � � 1,183,955
Swap ContractsEquity Risk � 257,305 � 257,305Interest Rate Risk � 4,856,725 � 4,856,725
Total $2,553,765,780 $3,544,824,762 $100,362,803 $6,198,953,345Liability Valuation InputsCommon Stocks
Australia $� $(17,489,410 ) $� $(17,489,410 )Austria � (2,788,614 ) � (2,788,614 )Canada (3,359,822 ) � � (3,359,822 )China (4,393,893 ) � � (4,393,893 )France � (24,973,363 ) � (24,973,363 )Germany � (33,819,990 ) � (33,819,990 )Italy � (8,749,490 ) � (8,749,490 )Japan � (74,384,917 ) � (74,384,917 )Netherlands � (22,789,847 ) � (22,789,847 )Norway � (353,868 ) � (353,868 )Peru (3,069,429 ) � � (3,069,429 )Russia � (1,042,256 ) � (1,042,256 )Singapore � (3,802,529 ) � (3,802,529 )Spain � (20,420,492 ) � (20,420,492 )Sweden � (6,956,405 ) � (6,956,405 )Switzerland � (8,978,150 ) � (8,978,150 )United Kingdom (28,965,822 ) (36,260,258 ) � (65,226,080 )United States (458,320,948 ) � � (458,320,948 )
TOTAL COMMON STOCKS (498,109,914 ) (262,809,589 ) � (760,919,503 )Rights/Warrants
Spain (30,677 ) � � (30,677 )TOTAL RIGHTS/WARRANTS (30,677 ) � � (30,677 )Debt Obligations
United States � (3,121,859 ) � (3,121,859 )TOTAL DEBT OBLIGATIONS � (3,121,859 ) � (3,121,859 )Derivatives^
Forward Currency ContractsForeign Currency Risk � (27,469,270 ) � (27,469,270 )
Futures ContractsEquity Risk (119,569,898 ) (71,824,595 ) � (191,394,493 )Interest Rate Risk (7,134 ) � � (7,134 )Physical Commodity Contract Risk (4,661,087 ) � � (4,661,087 )
Written OptionsEquity Risk (1,505,000 ) � � (1,505,000 )
Swap ContractsCredit Risk � (686,320 ) � (686,320 )Equity Risk � (913,736 ) � (913,736 )Interest Rate Risk � (9,715,755 ) � (9,715,755 )
Total $(623,883,710 ) $(376,541,124 ) $� $(1,000,424,834)
International Developed Equity Allocation FundAsset Valuation InputsMutual Funds $209,902,364 $� $� $209,902,364Short-Term Investments 92,137 � � 92,137Total Investments 209,994,501 � � 209,994,501Total $209,994,501 $� $� $209,994,501
Copyright © 2021 www.secdatabase.com. All Rights Reserved.Please Consider the Environment Before Printing This Document

Copyright © 2021 www.secdatabase.com. All Rights Reserved.Please Consider the Environment Before Printing This Document

Description Level 1 Level 2 Level 3 TotalInternational Equity Allocation FundAsset Valuation InputsMutual Funds $802,125,907 $� $ � $802,125,907Short-Term Investments 175,252 � � 175,252Total Investments 802,301,159 � � 802,301,159Total $802,301,159 $� $ � $802,301,159
Consolidated SGM Major Markets FundAsset Valuation InputsDebt Obligations
U.S. Government $328,188,547 $� $ � $328,188,547TOTAL DEBT OBLIGATIONS 328,188,547 � � 328,188,547Short-Term Investments 9,764,293 624,931 � 10,389,224Total Investments 337,952,840 624,931 � 338,577,771Derivatives^
Forward Currency ContractsForeign Currency Risk � 1,929,770 � 1,929,770
Futures ContractsEquity Risk 5,959,113 15,699 � 5,974,812Interest Rate Risk 164,265 � � 164,265Physical Commodity Contract Risk 789,173 � � 789,173
Total $344,865,391 $2,570,400 $ � $347,435,791Liability Valuation InputsDerivatives^
Forward Currency ContractsForeign Currency Risk $� $(581,860 ) $ � $(581,860 )
Futures ContractsEquity Risk (1,122,082 ) (810,040 ) � (1,932,122 )Interest Rate Risk (6,148 ) � � (6,148 )Physical Commodity Contract Risk (3,087,658 ) � � (3,087,658 )
Total $(4,215,888 ) $(1,391,900 ) $ � $(5,607,788 )
Consolidated Special Opportunities FundAsset Valuation InputsCommon Stocks
Germany $� $3,459,546 $ � $3,459,546Israel 9,706,340 � � 9,706,340New Zealand � 12,602,858 � 12,602,858United Kingdom 6,521,600 8,223,485 � 14,745,085United States 172,615,620 � � 172,615,620
TOTAL COMMON STOCKS 188,843,560 24,285,889 � 213,129,449Short-Term Investments 12,795,746 10 � 12,795,756Total Investments 201,639,306 24,285,899 � 225,925,205Total $201,639,306 $24,285,899 $ � $225,925,205
Strategic Opportunities Allocation FundAsset Valuation InputsCommon Stocks
Australia $� $4,514,893 $ � $4,514,893Austria � 26,534 � 26,534Belgium � 1,366,900 � 1,366,900Canada 5,119,390 � � 5,119,390China 237,828 3,348,219 � 3,586,047Denmark � 1,227,700 � 1,227,700Finland � 1,449,492 � 1,449,492France � 6,633,666 � 6,633,666
Copyright © 2021 www.secdatabase.com. All Rights Reserved.Please Consider the Environment Before Printing This Document

Description Level 1 Level 2 Level 3 TotalStrategic Opportunities Allocation Fund (continued)Asset Valuation Inputs (continued)Common Stocks (continued)
Germany $� $6,044,937 $� $6,044,937Greece � 72,347 � 72,347Hong Kong � 3,402,855 � 3,402,855India � 1,255,745 � 1,255,745Indonesia � 51,083 � 51,083Ireland � 1,633,540 � 1,633,540Israel 359,478 38,850 � 398,328Italy � 4,590,586 � 4,590,586Japan � 57,226,857 � 57,226,857Malta � � 0 § 0 §Mexico 1,499,379 � � 1,499,379Netherlands 371,276 4,924,306 � 5,295,582New Zealand � 408,293 � 408,293Norway � 2,375,925 � 2,375,925Portugal � 1,398,815 � 1,398,815Russia � 1,090,568 � 1,090,568Singapore � 2,239,720 � 2,239,720South Africa � 398,097 � 398,097South Korea � 64,940 � 64,940Spain � 5,135,636 � 5,135,636Sweden � 716,027 � 716,027Switzerland � 749,556 � 749,556Taiwan � 482,891 � 482,891United Kingdom � 16,537,039 3,419 16,540,458United States 34,713,934 � � 34,713,934
TOTAL COMMON STOCKS 42,301,285 129,406,017 3,419 171,710,721Preferred Stocks
Brazil � 821,300 � 821,300Germany � 664,974 � 664,974
TOTAL PREFERRED STOCKS � 1,486,274 � 1,486,274Rights/Warrants
Spain 23,403 � � 23,403United Kingdom 13,204 � � 13,204
TOTAL RIGHTS/WARRANTS 36,607 � � 36,607Mutual Funds
United States 420,819,308 � � 420,819,308TOTAL MUTUAL FUNDS 420,819,308 � � 420,819,308Short-Term Investments 26,270,217 � � 26,270,217Total Investments 489,427,417 130,892,291 3,419 620,323,127Derivatives^
Forward Currency ContractsForeign Currency Risk � 101,697 � 101,697
Swap ContractsEquity Risk � 23,540 � 23,540
Total $489,427,417 $131,017,528 $3,419 $620,448,364Liability Valuation InputsCommon Stocks
Australia $� $(1,774,000 ) $� $(1,774,000 )Austria � (281,124 ) � (281,124 )Canada (277,009 ) � � (277,009 )China (439,756 ) � � (439,756 )France � (2,509,390 ) � (2,509,390 )Germany � (3,451,952 ) � (3,451,952 )Italy � (868,231 ) � (868,231 )Japan � (7,496,620 ) � (7,496,620 )Netherlands � (1,142,902 ) � (1,142,902 )Norway � (35,641 ) � (35,641 )
Copyright © 2021 www.secdatabase.com. All Rights Reserved.Please Consider the Environment Before Printing This Document

Description Level 1 Level 2 Level 3 TotalStrategic Opportunities Allocation Fund (continued)Liability Valuation Inputs (continued)Common Stocks (continued)
Peru $(314,661 ) $� $ � $(314,661 )Russia � (99,549 ) � (99,549 )Singapore � (383,088 ) � (383,088 )Spain � (2,061,703 ) � (2,061,703 )Sweden � (703,985 ) � (703,985 )Switzerland � (899,849 ) � (899,849 )United Kingdom � (3,646,366 ) � (3,646,366 )United States (23,542,046) � � (23,542,046)
TOTAL COMMON STOCKS (24,573,472) (25,354,400) � (49,927,872)Rights/Warrants
Spain (2,930 ) � � (2,930 )TOTAL RIGHTS/WARRANTS (2,930 ) � � (2,930 )Derivatives^
Forward Currency ContractsForeign Currency Risk � (149,830 ) � (149,830 )
Futures ContractsEquity Risk � (2,921,080 ) � (2,921,080 )
Swap ContractsEquity Risk � (88,544 ) � (88,544 )
Total $(24,576,402) $(28,513,854) $ � $(53,090,256)
The risks referenced in the tables above are not intended to be inclusive of all risks. Please see the Prospectus for moreinformation.
^ In the tables above derivatives are based on market values, rather than the notional amounts of derivatives, except for forward currencycontracts which are based on unrealized appreciation/(depreciation). The uncertainties surrounding the valuation inputs for a derivative arelikely to be more significant to the Funds� net asset values than the uncertainties surrounding inputs for a non-derivative security with thesame market value. Excludes purchased options, if any, which are included in investments.
§ Represents the interest in securities that were determined to have a value of zero at November 30, 2020.
The underlying funds held at period end are classified above as Level 1. Certain underlying funds invest in securities and/orderivatives which may have been fair valued using methods determined in good faith by or at the direction of the Trustees orwhich may have been valued using significant unobservable inputs. For a summary of the levels assigned to the underlying funds�direct securities and derivatives, if any, please refer to the underlying funds� Notes to Financial Statements which are available onthe SEC�s website at www.sec.gov or on GMO�s website at www.gmo.com.
U.S. GAAP requires additional disclosures about fair value measurements for material Level 3 securities and derivatives, if any(determined by each category of asset or liability as compared to a Fund�s total net assets). Level 3 holdings include investmentsvalued using unadjusted prices supplied by a third-party pricing source (e.g., broker quotes, vendor). Implementation Fund�sLevel 3 holdings also includes two common stocks which are priced at the average of broker bids and a common stock priced witha 2,000 basis point discount to a comparable stock and an additional 1,000 basis point discount for liquidity considerations. Otherthan described above, there were no other Funds with classes of investments or derivatives with direct material Level 3 holdings atNovember 30, 2020.
For Funds with material total Level 3 assets and/or liabilities, the following is a reconciliation of securities and derivatives, if any,in which significant unobservable inputs (Level 3) were used in determining value:
Balancesas of
February 29,2020 Purchases Sales
AccruedDiscounts/Premiums
TotalRealized
Gain/(Loss)
Change inUnrealized
Appreciation(Depreciation)
Transferinto
Level 3
Transferout of
Level 3
Balancesas of
November 30,2020
Net Change inUnrealized
Appreciation(Depreciation)
from InvestmentsStill Held as of
November 30, 2020Consolidated Alternative Allocation FundInvestment Funds
United States $2,667,600 $9,620,271 $(4,424,896) $ � $ � $ 591,265 $ � $ � $ 8,454,240 $ 591,265Total
Investments $2,667,600 $9,620,271 $(4,424,896) $ � $ � $ 591,265 $ � $ � $ 8,454,240 $ 591,265
Copyright © 2021 www.secdatabase.com. All Rights Reserved.Please Consider the Environment Before Printing This Document

Balancesas of
February 29,2020 Purchases Sales
AccruedDiscounts/Premiums
TotalRealized
Gain/(Loss)
Change inUnrealized
Appreciation(Depreciation)
Transferinto
Level 3
Transferout of
Level 3
Balancesas of
November 30,2020
Net Change inUnrealized
Appreciation(Depreciation)
from InvestmentsStill Held as of
November 30, 2020Consolidated Implementation FundCommon Stocks
China $� $� $� $� $� $ � $38,237 � $ � $38,237 $ �Netherlands � 867 � � � 12 � � 879 12United States 9,521,813 5,041,256 (302,137 ) � � (147,190 ) � � 14,113,742 (147,190 )
Preferred StocksUnited States � 110,130 � � � 368,936 � � 479,066 368,936
Rights/WarrantsPakistan � � � � � 18,530 � � 18,530 18,530United States 430,926 � � � � � � � 430,926 �
Investment FundsUnited States 29,566,080 7,679,409 (16,120,764) � 1,495,949 (358,274 ) � � 22,262,400 (358,274 )
Debt ObligationsBank Loans
Luxembourg 7,763,747 � (6,906,643 ) 43,520 (2,263,375 ) 1,362,751 � � � �Jamaica 1,925,000 2,790,550 (33,948 ) 96,554 � 72,110 � � 4,850,266 72,110United States 67,533,991 38,255,972 (51,647,123) (952,365 ) (18,584,745) 7,268,034 5,787,763 � � 47,661,527 173,041
Corporate DebtNetherlands � 12,326,783 (1,364,354 ) 23,346 18,426 (496,971 ) � � 10,507,230 (496,971 )
Total Investments $116,741,557 $66,204,967 $(76,374,969)# (788,945) $(19,333,745) $ 8,087,938 $5,826,000 $ � $100,362,803 $ (369,806 )
� Financial assets transferred between levels were due to a change in observable and/or unobservable inputs.# Includes $12,238,178 of proceeds received from partial calls and/or principal paydowns as applicable.
Some Funds have material Level 3 investments. The following table summarizes the quantitative inputs used in the valuation ofinvestments classified within Level 3 of the fair value hierarchy for the period ended November 30, 2020.
Quantitative information about Level 3 Fair Value Measurements*
Investment TypeTotal FairValue ($)
ValuationMethodology Unobservable Inputs
Range(WeightedAverage)
Consolidated Alternative Allocation FundN/A � N/A N/A N/AConsolidated Implementation FundCommon Stock 3,324,152 Fair Value Discount Rate 30% (N/A)Common Stock 2,142,778 Fair Value Most Relevant Broker Quote $3.5-$5.417 ($4.02)
* The table does not include Level 3 securities or derivatives that are valued by pricing vendors or brokers. As of November 30, 2020, thevalue of these securities and/or derivatives for Consolidated Alternative Allocation Fund and Consolidated Implementation Fund was$8,454,240 and $94,895,873, respectively. The inputs for these investments are not readily available or cannot be reasonably estimated.
Copyright © 2021 www.secdatabase.com. All Rights Reserved.Please Consider the Environment Before Printing This Document

Investments in affiliated companies and other Funds of the TrustAn affiliated company for the purposes of this disclosure is a company in which a Fund has or had direct ownership of at least 5%of the issuer�s voting securities or an investment in other funds of GMO Trust. A summary of the Funds� transactions involvingcompanies that are or were affiliates during the period ended November 30, 2020 is set forth below:
Affiliate
Value,beginning of
period PurchasesSales
ProceedsDividendIncome*
Distributionsof Realized
Gains*Net RealizedGain (Loss)
Net Increase/Decrease inUnrealized
Appreciation/Depreciation
Value, end ofperiod
Consolidated Alternative Allocation FundGMO Emerging Markets
Fund, Class VI $13,595,699 $9,450,000 $4,855,000 $114,884 $� $52,583 $2,371,275 $20,614,557GMO International Equity
Fund, Class IV 9,097,096 6,110,000 15,842,055 40,733 � (267,945 ) 902,904 �GMO Resources Fund,
Class IV 6,568,271 5,483,583 1,300,000 4,007 � (124,773 ) 5,012,487 15,639,568GMO U.S. Treasury Fund � 3,000,000 3,000,000 346 � � � �
Totals $29,261,066 $24,043,583 $24,997,055 $159,970 $� $(340,135 ) $8,286,666 $36,254,125
Benchmark-Free Allocation FundGMO Emerging Country
Debt Fund, Class IV $264,983,913 $6,689,062 $60,499,003 $3,773,746 $2,915,316 $651,844 $(1,813,092 ) $210,012,724GMO High Yield Fund,
Class VI 110,184,438 670,111 34,400,000 608,301 61,810 (532,087 ) 3,200,507 79,122,969GMO Implementation Fund 7,114,226,325 615,325,717 1,826,526,463 15,205,271 � (75,656,995) (164,658,218) 5,662,710,366GMO Opportunistic Income
Fund, Class VI 446,590,600 3,984,656 112,388,843 3,984,656 � 3,939,243 (5,950,929 ) 336,174,727GMO SGM Major Markets
Fund, Class VI 664,643,917 207,992 503,632,844 207,991 � (43,213,564) 66,645,357 184,650,858GMO Special Opportunities
Fund, Class VI 195,830,895 128,540,064 272,711,511 � 78,540,064 45,100,795 84,654,123 181,414,366Totals $8,796,460,088 $755,417,602 $2,810,158,664 $23,779,965 $81,517,190 $(69,710,764) $(17,922,252 ) $6,654,086,010
Benchmark-Free FundGMO Emerging Country
Debt Fund, Class IV $88,839,361 $2,339,588 $22,240,602 $1,319,918 $1,019,670 $(644,583 ) $124,014 $68,417,778GMO Emerging Markets
Fund, Class VI 277,719,859 1,315,877 155,415,000 1,315,877 � 24,691,274 (5,330,502 ) 142,981,508GMO Opportunistic Income
Fund, Class VI 174,387,661 1,667,064 38,700,000 1,667,064 � 1,314,501 (2,273,828 ) 136,395,398GMO SGM Major Markets
Fund, Class VI 119,656,426 59,062,349 131,599,924 62,349 � 3,726,904 2,865,690 53,711,445GMO Special Opportunities
Fund, Class VI 81,623,064 44,787,474 111,531,765 � 32,687,474 13,223,694 43,899,020 72,001,487GMO U.S. Treasury Fund 1,849,041 104,119,118 101,408,488 � ** � 46,769 (3,673 ) 4,602,767
Totals $744,075,412 $213,291,470 $560,895,779 $4,365,208 $33,707,144 $42,358,559 $39,280,721 $478,110,383
Global Asset Allocation FundGMO Alternative Allocation
Fund, Class VI $162,822,665 $7,538,183 $78,425,730 $273,248 $� $(2,143,804 ) $3,411,540 $93,202,854GMO Asset Allocation Bond
Fund, Class VI 122,351,825 4,671,342 69,500,257 193,289 � 2,203,514 1,891,312 61,617,736GMO Cyclical Focus Fund
Class IV � 38,860,000 18,900,000 � � 3,168,699 9,101,143 32,229,842GMO Emerging Country
Debt Fund, Class IV 57,278,855 2,520,534 26,251,559 756,837 584,677 576,729 (876,765 ) 33,247,794GMO Emerging Markets
Fund, Class VI 306,807,240 8,629,698 154,816,851 1,504,007 � 22,354,867 1,860,633 184,835,587GMO International Equity
Fund, Class IV 375,344,309 59,395,592 287,334,867 836,506 � (1,744,165 ) 22,342,638 168,003,507GMO-Usonian Japan Value
Creation Fund, Class VI � 49,952,048 14,000,000 � � 547,028 2,587,617 39,086,693GMO Multi-Sector Fixed
Income Fund (formerlyGMO Core Plus BondFund), Class IV 234,253,275 13,904,081 117,899,884 � 5,908,863 7,060,292 (6,299,092 ) 131,018,672
GMO Opportunistic IncomeFund, Class VI 33,470,164 291,017 14,922,935 291,017 � 596,515 (663,151 ) 18,771,610
GMO Quality Fund, Class VI 29,476,103 949,285 15,455,714 79,376 869,909 2,234,701 1,876,466 19,080,841
Copyright © 2021 www.secdatabase.com. All Rights Reserved.Please Consider the Environment Before Printing This Document

GMO Risk Premium Fund,Class VI 31,514,461 639,164 17,572,747 90,479 548,686 (3,567,153 ) 808,811 11,822,536
GMO U.S. Equity Fund,Class VI 116,800,239 13,993,882 64,627,349 533,897 6,835,412 (3,003,343 ) 12,758,819 75,922,248
GMO U.S. Small Cap ValueFund, Class VI 86,440,407 9,339,144 47,841,238 161,901 � (2,012,078 ) 10,794,475 56,720,710
GMO U.S. Treasury Fund 725,851 75,731,474 74,598,958 11,521 � 47,541 (2,818 ) 1,903,090Totals $1,557,285,394 $286,415,444 $1,002,148,089 $4,732,078 $14,747,547 $26,319,343 $59,591,628 $927,463,720
Copyright © 2021 www.secdatabase.com. All Rights Reserved.Please Consider the Environment Before Printing This Document

Affiliate
Value,beginning of
period PurchasesSales
ProceedsDividendIncome*
Distributionsof Realized
Gains*Net RealizedGain (Loss)
Net Increase/Decrease inUnrealized
Appreciation/Depreciation
Value, end ofperiod
Global Developed Equity Allocation FundGMO Cyclical Focus Fund,
Class IV $� $3,110,000 $� $� $� $� $1,223,785 $4,333,785GMO Emerging Markets Fund,
Class VI 7,608,658 249,793 701,371 38,586 � 53,925 598,332 7,809,337GMO International Equity Fund,
Class IV 36,181,574 478,106 6,407,140 94,542 � (319,264 ) 3,331,169 33,264,445GMO-Usonian Japan Value
Creation Fund, Class VI � 2,909,413 � � � � 217,312 3,126,725GMO Quality Fund, Class VI 9,214,489 629,461 1,312,995 25,149 275,618 (28,093 ) 1,355,619 9,858,481GMO U.S. Equity Fund,
Class VI 13,571,810 1,882,874 3,731,676 51,158 654,971 (1,082,392 ) 2,075,820 12,716,436GMO U.S. Small Cap Value
Fund, Class VI 6,770,087 1,047,226 1,316,074 15,306 � (42,978 ) 1,460,205 7,918,466Totals $73,346,618 $10,306,873 $13,469,256 $224,741 $930,589 $(1,418,802 ) $10,262,242 $79,027,675
Global Equity Allocation FundGMO Cyclical Focus Fund,
Class VI $� $66,600,000 $9,670,000 $� $� $2,464,336 $23,371,672 $82,766,008GMO Emerging Markets Fund,
Class VI 405,390,168 24,609,663 37,005,355 2,146,686 � 7,367,760 32,458,574 432,820,810GMO International Equity Fund,
Class IV 608,303,007 23,792,925 150,664,006 1,633,486 � 4,778,904 48,944,203 535,155,033GMO-Usonian Japan Value
Creation Fund, Class VI � 58,890,450 � � � � 4,472,928 63,363,378GMO Quality Fund, Class VI 197,661,153 10,042,175 22,756,634 588,626 6,450,933 1,218,191 31,370,005 217,534,890GMO U.S. Equity Fund,
Class VI 107,094,199 8,516,450 26,433,930 441,378 5,650,895 (986,361 ) 10,434,367 98,624,725GMO U.S. Small Cap Value
Fund, Class VI 137,186,837 24,336,672 31,443,522 317,694 � 8,524,272 19,296,793 157,901,052Totals $1,455,635,364 $216,788,335 $277,973,447 $5,127,870 $12,101,828 $23,367,102 $170,348,542 $1,588,165,896
Consolidated Implementation FundGMO U.S. Treasury Fund $6,103,201 $302,904,276 $288,733,529 $� ** $� $121,961 $(11,987 ) $20,383,922
International Developed Equity Allocation FundGMO Emerging Markets Fund,
Class VI $30,679,613 $1,924,781 $13,908,456 $161,609 $� $1,371,579 $811,009 $20,878,526GMO International Equity Fund,
Class IV 266,698,094 7,875,416 112,928,865 734,291 � 252,406 18,784,690 180,681,741GMO-Usonian Japan Value
Creation Fund, Class VI � 7,757,903 � � � � 584,194 8,342,097Totals $297,377,707 $17,558,100 $126,837,321 $895,900 $� $1,623,985 $20,179,893 $209,902,364
International Equity Allocation FundGMO Emerging Markets Fund,
Class VI $306,462,975 $52,846,228 $54,641,882 $1,428,821 $� $5,449,755 $18,741,872 $328,858,948GMO International Equity Fund,
Class IV 550,104,514 10,100,114 157,673,962 1,367,771 � (26,019,871) 64,492,747 441,003,542GMO-Usonian Japan Value
Creation Fund, Class VI � 30,000,259 � � � � 2,263,158 32,263,417Totals $856,567,489 $92,946,601 $212,315,844 $2,796,592 $� $(20,570,116) $85,497,777 $802,125,907
Copyright © 2021 www.secdatabase.com. All Rights Reserved.Please Consider the Environment Before Printing This Document

Affiliate
Value,beginning of
period PurchasesSales
ProceedsDividendIncome*
Distributionsof Realized
Gains*Net RealizedGain (Loss)
Net Increase/Decrease inUnrealized
Appreciation/Depreciation
Value, end ofperiod
Strategic Opportunities Allocation FundGMO Emerging Country
Debt Fund, Class IV $27,054,909 $712,493 $6,411,557 $401,964 $310,528 $(74,536 ) $(81,114 ) $21,200,195GMO Emerging Markets
Fund, Class VI 182,753,835 973,913 63,045,000 973,913 � 11,567,199 4,219,146 136,469,093GMO International Equity
Fund, Class IV 198,303,123 17,284,319 156,604,771 492,668 � 3,325,083 7,966,222 70,273,976GMO Multi-Sector Fixed
Income Fund (formerlyGMO Core Plus BondFund), Class IV 67,321,337 1,689,789 26,886,119 � 1,689,789 731,838 (690,774 ) 42,166,071
GMO Opportunistic IncomeFund, Class VI 21,226,892 195,626 5,453,377 195,627 � 255,543 (278,435 ) 15,946,249
GMO Quality Fund, Class VI 57,387,212 1,480,564 31,545,000 123,801 1,356,763 378,769 4,092,399 31,793,944GMO U.S. Equity Fund,
Class VI 28,351,515 5,788,676 10,675,000 129,587 1,659,089 (2,082,383 ) 4,819,333 26,202,141GMO U.S. Small Cap Value
Fund, Class VI 53,392,571 5,428,680 24,650,000 108,627 � (1,228,176 ) 6,817,468 39,760,543GMO U.S. Treasury Fund 5,804,477 116,618,087 85,454,059 22,128 � 50,141 (11,550 ) 37,007,096
Totals $641,595,871 $150,172,147 $410,724,883 $2,448,315 $5,016,169 $12,923,478 $26,852,695 $420,819,308
* The table above includes estimated sources of all distributions paid by the underlying funds during the period March 1, 2020 throughNovember 30, 2020. The actual tax characterization of distributions paid by the underlying funds will be determined at the end of the fiscalyear ending February 28, 2021.
** Excludes income from investment of cash collateral from securities lending in GMO U.S. Treasury Fund. Income (net of fee rebates paid tothe borrower and fees paid to the lending agent) from investment of cash collateral from securities lending in GMO U.S. Treasury Fund was$53,982 and $167,056 in Benchmark-Free Fund and Consolidated Implementation Fund, respectively, during the period.
Subsequent eventsAs of close of business on January 22, 2021, pursuant to approval by shareholders of Benchmark-Free Allocation Series Fund,Global Asset Allocation Series Fund, International Developed Equity Allocation Series Fund and International Equity AllocationSeries Fund (each, a �Selling Fund�), each Selling Fund was reorganized with and into the corresponding series of GMO Trust(each, an �Acquiring Fund�). As part of the reorganization, each Selling Fund shareholder received shares of the correspondingAcquiring Fund in exchange for Selling Fund shares. Following the reorganization, the Selling Funds were terminated.
In January 2021, the Board of Trustees approved the termination of GMO Special Opportunities Fund. The Fund is expected toliquidate on or about January 27, 2021.
* * *
For additional information regarding the Funds, please see the Funds� most recent annual or semiannual shareholder reportavailable on the SEC�s website, www.sec.gov, or visit GMO�s website at www.gmo.com.
Copyright © 2021 www.secdatabase.com. All Rights Reserved.Please Consider the Environment Before Printing This Document