The Postmodern Simulacrum-A critique of the work of Allen Weiss and Barbara Kruger
Upload
khangminh22Category
view
3download
0
Business Address320 PARK AVENUE20TH FLOORNEW YORK NY 100222124154500
Mailing Address320 PARK AVENUE20TH FLOORNEW YORK NY 10022
SECURITIES AND EXCHANGE COMMISSION
FORM NPORT-P
Filing Date: 2021-11-23 | Period of Report: 2021-09-30SEC Accession No. 0001752724-21-250832
(HTML Version on secdatabase.com)
FILERWeiss Strategic Interval FundCIK:1717976| IRS No.: 822853585 | State of Incorp.:DE | Fiscal Year End: 1231Type: NPORT-P | Act: 40 | File No.: 811-23298 | Film No.: 211435482
Copyright © 2021 www.secdatabase.com. All Rights Reserved.Please Consider the Environment Before Printing This Document
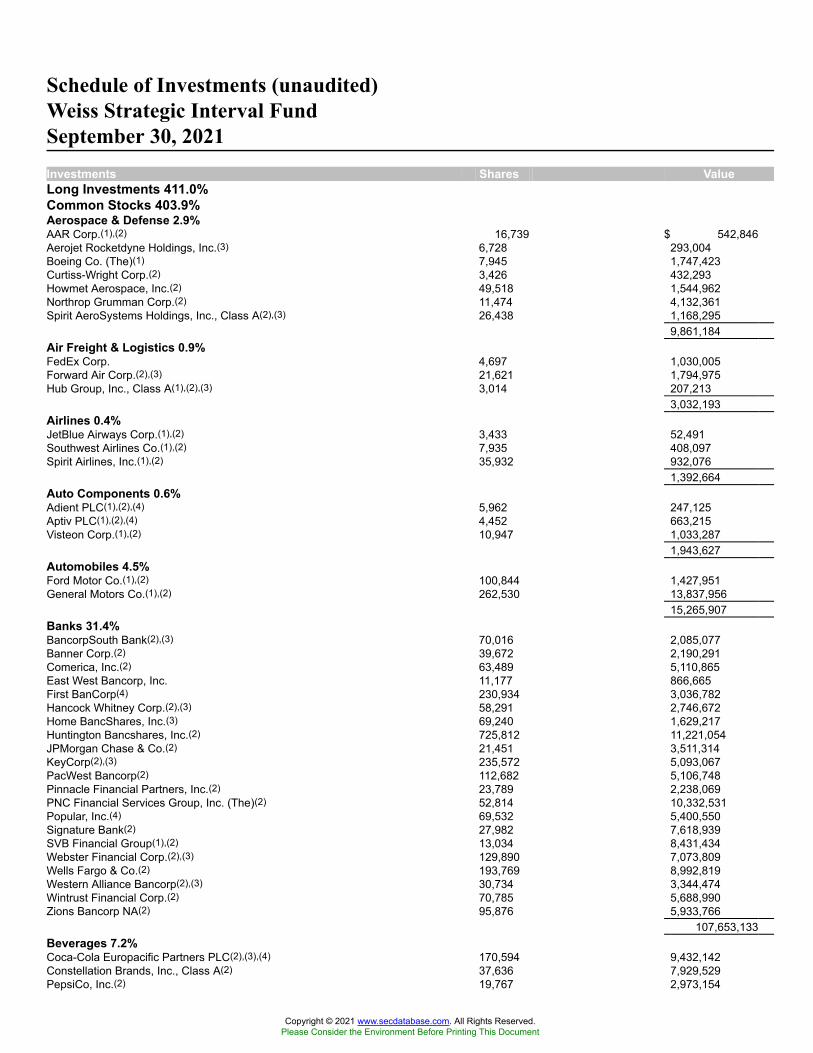
Schedule of Investments (unaudited)Weiss Strategic Interval FundSeptember 30, 2021Investments Shares ValueLong Investments 411.0%Common Stocks 403.9%Aerospace & Defense 2.9%AAR Corp.(1),(2) 16,739 $ 542,846Aerojet Rocketdyne Holdings, Inc.(3) 6,728 293,004Boeing Co. (The)(1) 7,945 1,747,423Curtiss-Wright Corp.(2) 3,426 432,293Howmet Aerospace, Inc.(2) 49,518 1,544,962Northrop Grumman Corp.(2) 11,474 4,132,361Spirit AeroSystems Holdings, Inc., Class A(2),(3) 26,438 1,168,295
9,861,184Air Freight & Logistics 0.9%FedEx Corp. 4,697 1,030,005Forward Air Corp.(2),(3) 21,621 1,794,975Hub Group, Inc., Class A(1),(2),(3) 3,014 207,213
3,032,193Airlines 0.4%JetBlue Airways Corp.(1),(2) 3,433 52,491Southwest Airlines Co.(1),(2) 7,935 408,097Spirit Airlines, Inc.(1),(2) 35,932 932,076
1,392,664Auto Components 0.6%Adient PLC(1),(2),(4) 5,962 247,125Aptiv PLC(1),(2),(4) 4,452 663,215Visteon Corp.(1),(2) 10,947 1,033,287
1,943,627Automobiles 4.5%Ford Motor Co.(1),(2) 100,844 1,427,951General Motors Co.(1),(2) 262,530 13,837,956
15,265,907Banks 31.4%BancorpSouth Bank(2),(3) 70,016 2,085,077Banner Corp.(2) 39,672 2,190,291Comerica, Inc.(2) 63,489 5,110,865East West Bancorp, Inc. 11,177 866,665First BanCorp(4) 230,934 3,036,782Hancock Whitney Corp.(2),(3) 58,291 2,746,672Home BancShares, Inc.(3) 69,240 1,629,217Huntington Bancshares, Inc.(2) 725,812 11,221,054JPMorgan Chase & Co.(2) 21,451 3,511,314KeyCorp(2),(3) 235,572 5,093,067PacWest Bancorp(2) 112,682 5,106,748Pinnacle Financial Partners, Inc.(2) 23,789 2,238,069PNC Financial Services Group, Inc. (The)(2) 52,814 10,332,531Popular, Inc.(4) 69,532 5,400,550Signature Bank(2) 27,982 7,618,939SVB Financial Group(1),(2) 13,034 8,431,434Webster Financial Corp.(2),(3) 129,890 7,073,809Wells Fargo & Co.(2) 193,769 8,992,819Western Alliance Bancorp(2),(3) 30,734 3,344,474Wintrust Financial Corp.(2) 70,785 5,688,990Zions Bancorp NA(2) 95,876 5,933,766
107,653,133Beverages 7.2%Coca-Cola Europacific Partners PLC(2),(3),(4) 170,594 9,432,142Constellation Brands, Inc., Class A(2) 37,636 7,929,529PepsiCo, Inc.(2) 19,767 2,973,154
Copyright © 2021 www.secdatabase.com. All Rights Reserved.Please Consider the Environment Before Printing This Document

See Notes to Schedule of Investments.
Copyright © 2021 www.secdatabase.com. All Rights Reserved.Please Consider the Environment Before Printing This Document

Schedule of Investments (unaudited)Weiss Strategic Interval FundSeptember 30, 2021Investments Shares ValueCommon StocksBeveragesVintage Wine Estates, Inc.(1),(2) 438,589 4,477,994
24,812,819Biotechnology 6.2%AbbVie, Inc.(2) 10,661 1,150,002ACADIA Pharmaceuticals, Inc.(1),(2) 11,148 185,168Acceleron Pharma, Inc.(1),(2),(3) 17,500 3,011,750Albireo Pharma, Inc.(1),(2) 642 20,030Alder Biopharmaceuticals, Inc.(1),(3) 6,157 5,541Aldeyra Therapeutics, Inc.(1),(2),(3) 45,021 395,284Applied Genetic Technologies Corp.(1),(3) 1,271 3,826Arena Pharmaceuticals, Inc.(1),(2) 5,139 306,028Argenx SE, ADR(1),(2),(4) 252 76,104Arrowhead Pharmaceuticals, Inc.(1),(3) 3,148 196,530Ascendis Pharma A/S, ADR(1),(2),(4) 102 16,258Aurinia Pharmaceuticals, Inc.(1),(2),(4) 11,529 255,137Autolus Therapeutics PLC(1),(4) 1,781 11,666AVEO Pharmaceuticals, Inc.(1),(3) 17,832 110,202BELLUS Health, Inc.(1),(3),(4) 1,451 8,909Biohaven Pharmaceutical Holding Co., Ltd.(1),(3),(4) 25,745 3,576,238BioMarin Pharmaceutical, Inc.(1),(2) 611 47,224Bioxcel Therapeutics, Inc.(1),(3) 7,897 239,674ChemoCentryx, Inc.(1),(2),(3) 8,597 147,009Deciphera Pharmaceuticals, Inc.(1),(3) 1,480 50,290Dynavax Technologies Corp.(1),(3) 7,098 136,353Eiger BioPharmaceuticals, Inc.(1),(3) 32,855 219,471Elevation Oncology, Inc.(1) 4,943 38,506Epizyme, Inc.(1),(3) 2,029 10,389Exact Sciences Corp.(1),(3) 5,386 514,094Exelixis, Inc.(1),(2),(3) 14,930 315,620Fate Therapeutics, Inc.(1),(2),(3) 3,043 180,359FibroGen, Inc.(1),(3) 997 10,189Global Blood Therapeutics, Inc.(1),(2) 8,757 223,128Heron Therapeutics, Inc.(1),(3) 1,089 11,641Horizon Therapeutics PLC(1),(2),(3),(4) 7,540 825,932Incyte Corp.(1),(2) 812 55,849Insmed, Inc.(1),(2),(3) 13,829 380,851Ionis Pharmaceuticals, Inc.(1),(3) 1,780 59,701Iovance Biotherapeutics, Inc.(1),(2),(3) 25,770 635,488Karyopharm Therapeutics, Inc.(1),(3) 7,915 46,065Legend Biotech Corp., ADR(1),(2),(4) 1,032 52,178Merus N.V.(1),(2),(4) 519 11,418Mirati Therapeutics, Inc.(1),(2) 3,422 605,386Molecular Templates, Inc.(1) 15,430 103,535Natera, Inc.(1),(2) 5,335 594,532Neurocrine Biosciences, Inc.(1),(3) 2,375 227,786Regeneron Pharmaceuticals, Inc.(1),(2),(3) 1,548 936,819Rigel Pharmaceuticals, Inc.(1),(3) 24,899 90,383Rocket Pharmaceuticals, Inc.(1),(2),(3) 5,741 171,599Sage Therapeutics, Inc.(1),(2) 886 39,259Seagen, Inc.(1),(2) 2,000 339,600TG Therapeutics, Inc.(1),(2),(3) 4,364 145,234Trillium Therapeutics, Inc.(1),(2),(4) 103,607 1,819,339Turning Point Therapeutics, Inc.(1),(2),(3) 4,465 296,610Twist Bioscience Corp.(1),(2),(3) 361 38,616United Therapeutics Corp.(1),(2) 4,876 900,012Vertex Pharmaceuticals, Inc.(1),(2) 7,665 1,390,354
See Notes to Schedule of Investments.
Copyright © 2021 www.secdatabase.com. All Rights Reserved.Please Consider the Environment Before Printing This Document

Schedule of Investments (unaudited)Weiss Strategic Interval FundSeptember 30, 2021Investments Shares ValueCommon StocksBiotechnologyZymeworks, Inc.(1),(2),(4) 103 2,991
21,242,157Building Products 0.9%Armstrong World Industries, Inc.(2) 3,426 327,080AZEK Co., Inc. (The)(1),(2) 19,269 703,897Builders FirstSource, Inc.(1),(2),(3) 34,012 1,759,781Carlisle Cos., Inc.(2) 2,057 408,911
3,199,669Capital Markets 4.3%BlackRock, Inc.(2),(3) 2,438 2,044,653Blucora, Inc.(1),(2) 131,654 2,052,486Coinbase Global, Inc., Class A(1) 1,425 324,159Goldman Sachs Group, Inc. (The)(2),(3) 27,415 10,363,693KKR & Co., Inc., Class A(2) 2,257 137,406
14,922,397Chemicals 3.5%Atotech Ltd.(1),(4) 8,878 214,404Axalta Coating Systems Ltd.(1),(2),(4) 17,168 501,134CF Industries Holdings, Inc.(2) 3,350 186,997Huntsman Corp.(2) 77,045 2,279,762Sherwin-Williams Co. (The)(2),(3) 3,862 1,080,317Sociedad Quimica y Minera de Chile S.A., ADR(3),(4) 117,116 6,291,471Tronox Holdings PLC, Class A(2),(4) 53,988 1,330,804
11,884,889Commercial Services & Supplies 1.3%Clean Harbors, Inc.(1),(2) 12,676 1,316,656Covanta Holding Corp.(2) 33,764 679,332Republic Services, Inc.(2) 6,926 831,536Waste Connections, Inc.(4) 13,708 1,726,248
4,553,772Communications Equipment 8.4%Arista Networks, Inc.(1),(2),(3) 3,506 1,204,802Calix, Inc.(1),(2) 68,267 3,374,438Ciena Corp.(1),(2) 113,151 5,810,304CommScope Holding Co., Inc.(1),(2),(3) 981,134 13,333,611F5 Networks, Inc.(1),(2) 5,119 1,017,555Nokia Oyj, ADR(1),(2),(4) 9,306 50,718Radware Ltd.(1),(4) 25,793 869,740Telefonaktiebolaget LM Ericsson, ADR(2),(4) 277,778 3,111,113
28,772,281Construction & Engineering 3.1%MasTec, Inc.(1),(2) 9,773 843,215Quanta Services, Inc.(2) 20,770 2,364,041WillScot Mobile Mini Holdings Corp.(1),(2) 235,744 7,477,800
10,685,056Construction Materials 0.1%Martin Marietta Materials, Inc.(3) 1,147 391,907Consumer Finance 4.2%Ally Financial, Inc. 51,585 2,633,414Capital One Financial Corp.(2) 30,976 5,017,183Curo Group Holdings Corp.(2) 4,258 73,791Encore Capital Group, Inc.(1),(2),(3) 34,346 1,692,228
See Notes to Schedule of Investments.
Copyright © 2021 www.secdatabase.com. All Rights Reserved.Please Consider the Environment Before Printing This Document
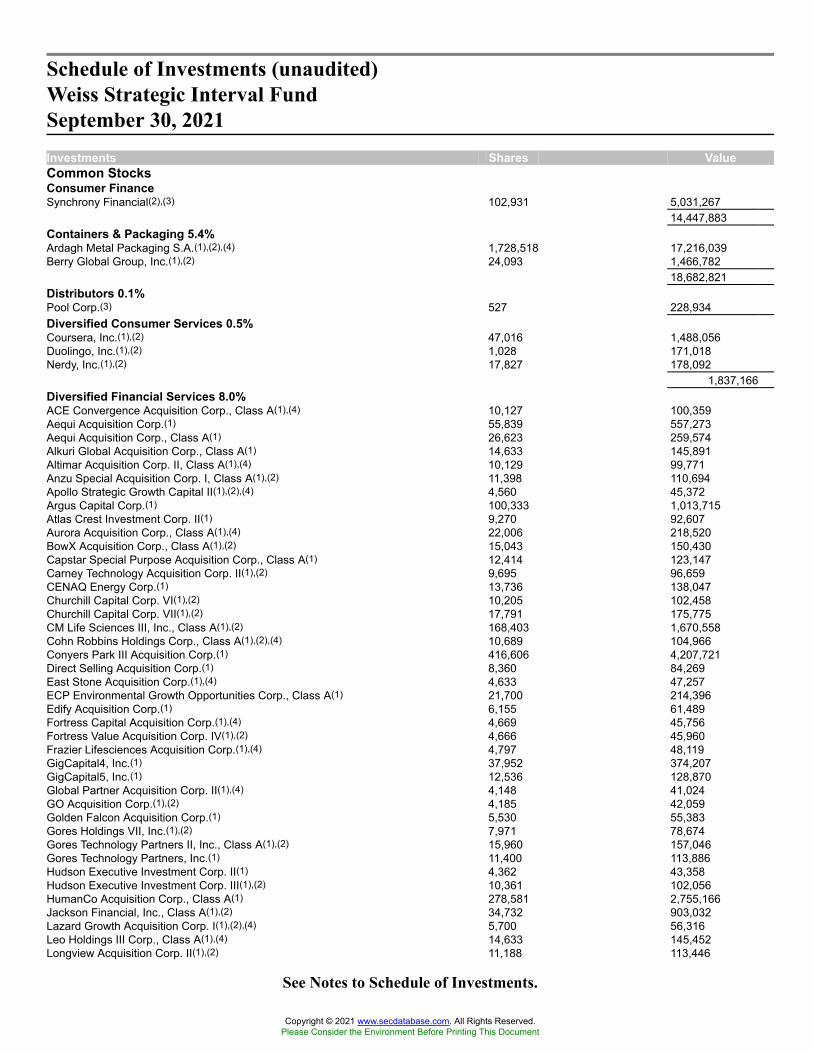
Schedule of Investments (unaudited)Weiss Strategic Interval FundSeptember 30, 2021Investments Shares ValueCommon StocksConsumer FinanceSynchrony Financial(2),(3) 102,931 5,031,267
14,447,883Containers & Packaging 5.4%Ardagh Metal Packaging S.A.(1),(2),(4) 1,728,518 17,216,039Berry Global Group, Inc.(1),(2) 24,093 1,466,782
18,682,821Distributors 0.1%Pool Corp.(3) 527 228,934Diversified Consumer Services 0.5%Coursera, Inc.(1),(2) 47,016 1,488,056Duolingo, Inc.(1),(2) 1,028 171,018Nerdy, Inc.(1),(2) 17,827 178,092
1,837,166Diversified Financial Services 8.0%ACE Convergence Acquisition Corp., Class A(1),(4) 10,127 100,359Aequi Acquisition Corp.(1) 55,839 557,273Aequi Acquisition Corp., Class A(1) 26,623 259,574Alkuri Global Acquisition Corp., Class A(1) 14,633 145,891Altimar Acquisition Corp. II, Class A(1),(4) 10,129 99,771Anzu Special Acquisition Corp. I, Class A(1),(2) 11,398 110,694Apollo Strategic Growth Capital II(1),(2),(4) 4,560 45,372Argus Capital Corp.(1) 100,333 1,013,715Atlas Crest Investment Corp. II(1) 9,270 92,607Aurora Acquisition Corp., Class A(1),(4) 22,006 218,520BowX Acquisition Corp., Class A(1),(2) 15,043 150,430Capstar Special Purpose Acquisition Corp., Class A(1) 12,414 123,147Carney Technology Acquisition Corp. II(1),(2) 9,695 96,659CENAQ Energy Corp.(1) 13,736 138,047Churchill Capital Corp. VI(1),(2) 10,205 102,458Churchill Capital Corp. VII(1),(2) 17,791 175,775CM Life Sciences III, Inc., Class A(1),(2) 168,403 1,670,558Cohn Robbins Holdings Corp., Class A(1),(2),(4) 10,689 104,966Conyers Park III Acquisition Corp.(1) 416,606 4,207,721Direct Selling Acquisition Corp.(1) 8,360 84,269East Stone Acquisition Corp.(1),(4) 4,633 47,257ECP Environmental Growth Opportunities Corp., Class A(1) 21,700 214,396Edify Acquisition Corp.(1) 6,155 61,489Fortress Capital Acquisition Corp.(1),(4) 4,669 45,756Fortress Value Acquisition Corp. IV(1),(2) 4,666 45,960Frazier Lifesciences Acquisition Corp.(1),(4) 4,797 48,119GigCapital4, Inc.(1) 37,952 374,207GigCapital5, Inc.(1) 12,536 128,870Global Partner Acquisition Corp. II(1),(4) 4,148 41,024GO Acquisition Corp.(1),(2) 4,185 42,059Golden Falcon Acquisition Corp.(1) 5,530 55,383Gores Holdings VII, Inc.(1),(2) 7,971 78,674Gores Technology Partners II, Inc., Class A(1),(2) 15,960 157,046Gores Technology Partners, Inc.(1) 11,400 113,886Hudson Executive Investment Corp. II(1) 4,362 43,358Hudson Executive Investment Corp. III(1),(2) 10,361 102,056HumanCo Acquisition Corp., Class A(1) 278,581 2,755,166Jackson Financial, Inc., Class A(1),(2) 34,732 903,032Lazard Growth Acquisition Corp. I(1),(2),(4) 5,700 56,316Leo Holdings III Corp., Class A(1),(4) 14,633 145,452Longview Acquisition Corp. II(1),(2) 11,188 113,446
See Notes to Schedule of Investments.
Copyright © 2021 www.secdatabase.com. All Rights Reserved.Please Consider the Environment Before Printing This Document

Schedule of Investments (unaudited)Weiss Strategic Interval FundSeptember 30, 2021Investments Shares ValueCommon StocksDiversified Financial ServicesM3-Brigade Acquisition II Corp., Class A(1) 14,731 145,984Magnum Opus Acquisition Ltd., Class A(1),(4) 5,407 53,475MCAP Acquisition Corp., Class A(1) 5,146 50,791MDH Acquisition Corp., Class A(1) 21,005 206,899MedTech Acquisition Corp.(1) 2,089 21,193Northern Star Investment Corp. III(1) 11,398 112,384Omnichannel Acquisition Corp., Class A(1) 4,485 44,402Pontem Corp.(1),(2),(4) 4,781 47,571Primavera Capital Acquisition Corp.(1),(2),(4) 2,521 25,084Priveterra Acquisition Corp.(1) 5,669 56,293PropTech Investment Corp. II(1) 7,044 69,665Queen�s Gambit Growth Capital, Class A(1),(4) 13,661 134,834Revolution Healthcare Acquisition Corp.(1),(2) 5,698 56,125RMG Acquisition Corp. III(1),(2),(4) 4,165 41,150ScION Tech Growth I(1),(2),(4) 6,940 69,192ScION Tech Growth II(1),(4) 8,034 79,938Senior Connect Acquisition Corp. I, Class A(1),(2) 7,744 75,659Simon Property Group Acquisition Holdings, Inc., Class A(1) 218,580 2,131,155Simon Property Group Acquisition Holdings, Inc.(1) 641,326 6,381,194Supernova Partners Acquisition Co. II Ltd.(1),(4) 6,656 66,227SVF Investment Corp. 3, Class A(1),(4) 2,280 22,412Tishman Speyer Innovation Corp. II, Class A(1) 29,639 290,462Tishman Speyer Innovation Corp. II(1) 118,055 1,180,550TLG Acquisition One Corp.(1) 4,852 48,156Turmeric Acquisition Corp.(1),(4) 6,073 60,305Vector Acquisition Corp. II, Class A(1),(2),(4) 10,946 106,724Velocity Acquisition Corp., Class A(1) 14,633 144,281Virtuoso Acquisition Corp., Class A(1) 43,898 435,029Viveon Health Acquisition Corp.(1) 7,014 70,070Warburg Pincus Capital Corp. I-A(1),(4) 11,400 114,000Williams Rowland Acquisition Corp.(1) 13,602 138,060
27,550,022Diversified Telecommunication Services 1.2%AT&T, Inc.(2) 104,130 2,812,551Verizon Communications, Inc.(2) 24,783 1,338,530
4,151,081Electric Utilities 2.9%NextEra Energy, Inc. 17,780 1,396,086PNM Resources, Inc.(2) 169,411 8,382,456
9,778,542Electrical Equipment 5.1%ABB Ltd., ADR(2),(4) 5,159 172,104AMETEK, Inc.(2) 43,602 5,407,084Generac Holdings, Inc.(1),(2) 3,323 1,358,011nVent Electric PLC(2),(4) 52,898 1,710,192Regal Beloit Corp.(2) 24,953 3,751,434Rockwell Automation, Inc.(2) 431 126,731Sensata Technologies Holding PLC(1),(2),(4) 27,460 1,502,611Vertiv Holdings Co.(2) 140,676 3,388,885
17,417,052Electronic Equipment, Instruments & Components 1.3%908 Devices, Inc.(1),(2) 6,280 204,226Coherent, Inc.(1),(2) 13,580 3,396,222II-VI, Inc.(1),(3) 4,512 267,832
See Notes to Schedule of Investments.
Copyright © 2021 www.secdatabase.com. All Rights Reserved.Please Consider the Environment Before Printing This Document

Schedule of Investments (unaudited)Weiss Strategic Interval FundSeptember 30, 2021Investments Shares ValueCommon StocksElectronic Equipment, Instruments & ComponentsVontier Corp.(2) 15,066 506,218
4,374,498Energy Equipment & Services 1.5%Baker Hughes Co.(2),(3) 85,579 2,116,369ChampionX Corp.(1),(2),(3) 91,768 2,051,932Halliburton Co.(2) 51,325 1,109,647
5,277,948Entertainment 5.7%Activision Blizzard, Inc.(2) 63,873 4,943,132Chicken Soup For The Soul Entertainment, Inc.(1),(3) 22,229 508,377Cinemark Holdings, Inc.(1),(2),(3) 5,458 104,848Electronic Arts, Inc. 171 24,325Netflix, Inc.(1) 2,933 1,790,127ROBLOX Corp., Class A(1),(2) 44,236 3,342,030Sciplay Corp., Class A(1),(2) 122,960 2,544,042Score Media and Gaming, Inc.(1),(2),(4) 29,118 996,709Take-Two Interactive Software, Inc.(1),(2) 1,370 211,076Walt Disney Co. (The)(1),(2),(3) 3,769 637,602World Wrestling Entertainment, Inc., Class A(3) 22,540 1,268,100Zynga, Inc., Class A(1),(2),(3) 433,668 3,265,520
19,635,888Food & Staples Retailing 1.0%Casey�s General Stores, Inc.(2) 3,446 649,398Performance Food Group Co.(1),(2) 56,791 2,638,510Walgreens Boots Alliance, Inc.(3) 3,434 161,570
3,449,478Food Products 10.5%Bunge Ltd.(2),(4) 68,448 5,566,192Cal-Maine Foods, Inc.(3) 40,288 1,456,814Freshpet, Inc.(1),(2) 8,196 1,169,487Hershey Co. (The)(2),(3) 29,943 5,067,853Hostess Brands, Inc.(1),(2) 238,582 4,144,170Ingredion, Inc.(2),(3) 16,297 1,450,596Kellogg Co.(2) 29,009 1,854,255Nomad Foods Ltd.(1),(3),(4) 89,736 2,473,124Oatly Group AB, ADR(1),(2),(4) 80,173 1,212,216Pilgrim�s Pride Corp.(1),(2) 85,703 2,492,243Sanderson Farms, Inc.(2) 12,370 2,328,034Simply Good Foods Co. (The)(1),(2),(3) 167,519 5,777,730Sovos Brands, Inc.(1),(2) 74,578 1,040,363
36,033,077Health Care Equipment & Supplies 3.4%Abbott Laboratories(3) 3,560 420,543ABIOMED, Inc.(1),(3) 1,070 348,306Boston Scientific Corp.(1),(2) 9,626 417,672Cardiovascular Systems, Inc.(1),(2) 266 8,733CVRX, Inc.(1) 16,365 270,677Danaher Corp.(2) 1,270 386,639DexCom, Inc.(1),(2),(3) 3,358 1,836,356Edwards Lifesciences Corp.(1),(2),(3) 11,172 1,264,782Envista Holdings Corp.(1),(2) 4,919 205,663Haemonetics Corp.(1),(2) 5,924 418,175Hill-Rom Holdings, Inc.(2) 24,494 3,674,100Inari Medical, Inc.(1),(2),(3) 3,458 280,444Intersect ENT, Inc.(1),(2) 15,830 430,576
See Notes to Schedule of Investments.
Copyright © 2021 www.secdatabase.com. All Rights Reserved.Please Consider the Environment Before Printing This Document
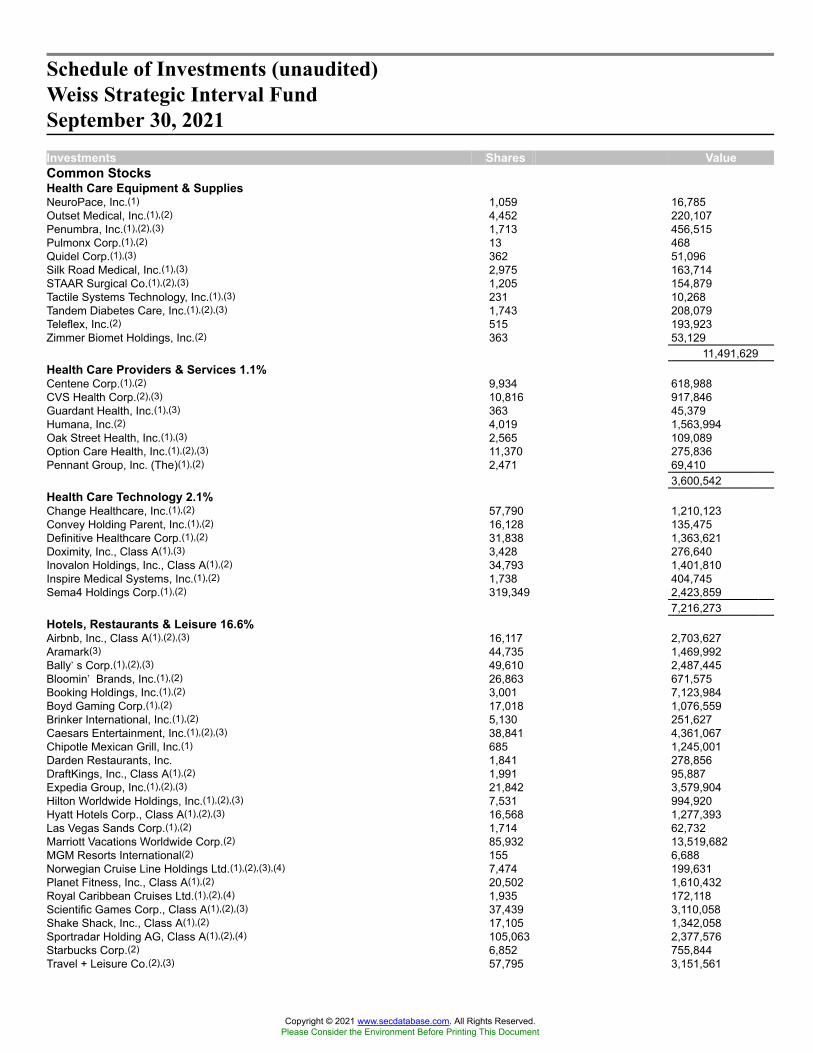
Schedule of Investments (unaudited)Weiss Strategic Interval FundSeptember 30, 2021Investments Shares ValueCommon StocksHealth Care Equipment & SuppliesNeuroPace, Inc.(1) 1,059 16,785Outset Medical, Inc.(1),(2) 4,452 220,107Penumbra, Inc.(1),(2),(3) 1,713 456,515Pulmonx Corp.(1),(2) 13 468Quidel Corp.(1),(3) 362 51,096Silk Road Medical, Inc.(1),(3) 2,975 163,714STAAR Surgical Co.(1),(2),(3) 1,205 154,879Tactile Systems Technology, Inc.(1),(3) 231 10,268Tandem Diabetes Care, Inc.(1),(2),(3) 1,743 208,079Teleflex, Inc.(2) 515 193,923Zimmer Biomet Holdings, Inc.(2) 363 53,129
11,491,629Health Care Providers & Services 1.1%Centene Corp.(1),(2) 9,934 618,988CVS Health Corp.(2),(3) 10,816 917,846Guardant Health, Inc.(1),(3) 363 45,379Humana, Inc.(2) 4,019 1,563,994Oak Street Health, Inc.(1),(3) 2,565 109,089Option Care Health, Inc.(1),(2),(3) 11,370 275,836Pennant Group, Inc. (The)(1),(2) 2,471 69,410
3,600,542Health Care Technology 2.1%Change Healthcare, Inc.(1),(2) 57,790 1,210,123Convey Holding Parent, Inc.(1),(2) 16,128 135,475Definitive Healthcare Corp.(1),(2) 31,838 1,363,621Doximity, Inc., Class A(1),(3) 3,428 276,640Inovalon Holdings, Inc., Class A(1),(2) 34,793 1,401,810Inspire Medical Systems, Inc.(1),(2) 1,738 404,745Sema4 Holdings Corp.(1),(2) 319,349 2,423,859
7,216,273Hotels, Restaurants & Leisure 16.6%Airbnb, Inc., Class A(1),(2),(3) 16,117 2,703,627Aramark(3) 44,735 1,469,992Bally�s Corp.(1),(2),(3) 49,610 2,487,445Bloomin� Brands, Inc.(1),(2) 26,863 671,575Booking Holdings, Inc.(1),(2) 3,001 7,123,984Boyd Gaming Corp.(1),(2) 17,018 1,076,559Brinker International, Inc.(1),(2) 5,130 251,627Caesars Entertainment, Inc.(1),(2),(3) 38,841 4,361,067Chipotle Mexican Grill, Inc.(1) 685 1,245,001Darden Restaurants, Inc. 1,841 278,856DraftKings, Inc., Class A(1),(2) 1,991 95,887Expedia Group, Inc.(1),(2),(3) 21,842 3,579,904Hilton Worldwide Holdings, Inc.(1),(2),(3) 7,531 994,920Hyatt Hotels Corp., Class A(1),(2),(3) 16,568 1,277,393Las Vegas Sands Corp.(1),(2) 1,714 62,732Marriott Vacations Worldwide Corp.(2) 85,932 13,519,682MGM Resorts International(2) 155 6,688Norwegian Cruise Line Holdings Ltd.(1),(2),(3),(4) 7,474 199,631Planet Fitness, Inc., Class A(1),(2) 20,502 1,610,432Royal Caribbean Cruises Ltd.(1),(2),(4) 1,935 172,118Scientific Games Corp., Class A(1),(2),(3) 37,439 3,110,058Shake Shack, Inc., Class A(1),(2) 17,105 1,342,058Sportradar Holding AG, Class A(1),(2),(4) 105,063 2,377,576Starbucks Corp.(2) 6,852 755,844Travel + Leisure Co.(2),(3) 57,795 3,151,561
Copyright © 2021 www.secdatabase.com. All Rights Reserved.Please Consider the Environment Before Printing This Document

See Notes to Schedule of Investments.
Copyright © 2021 www.secdatabase.com. All Rights Reserved.Please Consider the Environment Before Printing This Document

Schedule of Investments (unaudited)Weiss Strategic Interval FundSeptember 30, 2021Investments Shares ValueCommon StocksHotels, Restaurants & LeisureWendy�s Co. (The) 137,560 2,982,301
56,908,518Household Durables 1.5%DR Horton, Inc.(2) 7,684 645,225Lennar Corp., Class A(2),(3) 9,287 870,006Newell Brands, Inc.(2),(3) 106,414 2,356,006Tri Pointe Homes, Inc.(1),(3) 38,485 808,955Vizio Holding Corp., Class A(1) 25,792 547,822
5,228,014Household Products 5.1%Colgate-Palmolive Co.(2) 467 35,296Procter & Gamble Co. (The)(2),(3) 85,875 12,005,325Spectrum Brands Holdings, Inc.(2),(3) 58,338 5,581,196
17,621,817Industrial Conglomerates 0.3%General Electric Co.(2) 6,153 633,944Raven Industries, Inc.(1),(2) 4,581 263,911Roper Technologies, Inc.(2) 98 43,721
941,576Insurance 0.9%American National Group, Inc.(2) 2,461 465,203Athene Holding Ltd., Class A(1),(2),(4) 17,413 1,199,233Syncora Holdings Ltd.(1),(4) 56,504 2,825Willis Towers Watson PLC(3),(4) 5,908 1,373,374
3,040,635Interactive Media & Services 5.8%Alphabet, Inc., Class C(1),(2) 1 2,665Alphabet, Inc., Class A(1),(2) 2,237 5,980,664Bumble, Inc., Class A(1),(2) 24,475 1,223,260Facebook, Inc., Class A(1),(2) 10,412 3,533,729Match Group, Inc.(1),(2),(3) 33,748 5,298,099QuinStreet, Inc.(1),(2),(3) 50,206 881,617TripAdvisor, Inc.(1),(2) 37,620 1,273,437Vimeo, Inc.(1),(3) 12,007 352,646ZoomInfo Technologies, Inc., Class A(1),(2) 19,917 1,218,721
19,764,838Internet & Direct Marketing Retail 0.4%Altaba, Inc.(1) 148,076 962,494Global-e Online Ltd.(1),(4) 3,424 245,843Xometry, Inc., Class A(1),(2) 4,112 237,139
1,445,476IT Services 12.4%Accenture PLC, Class A(2),(4) 17,195 5,501,024Affirm Holdings, Inc.(1),(2),(3) 11,136 1,326,632Afterpay Ltd., ADR(1),(2),(4) 2,133 187,128Akamai Technologies, Inc.(1),(2) 25,404 2,657,004BigCommerce Holdings, Inc., Series 1(1),(3) 11,541 584,436Cognizant Technology Solutions Corp., Class A(2) 51,513 3,822,780Concentrix Corp.(1) 24,407 4,320,039DXC Technology Co.(1),(2),(3) 272,001 9,141,954Flywire Corp.(1) 12,712 557,294Global Payments, Inc.(2) 512 80,681LiveRamp Holdings, Inc.(1),(3) 91,771 4,334,344Marqeta, Inc., Class A(1),(2) 76,348 1,688,818
See Notes to Schedule of Investments.
Copyright © 2021 www.secdatabase.com. All Rights Reserved.Please Consider the Environment Before Printing This Document

Schedule of Investments (unaudited)Weiss Strategic Interval FundSeptember 30, 2021Investments Shares ValueCommon StocksIT ServicesMastercard, Inc., Class A(2) 5,154 1,791,943MongoDB, Inc.(1),(2),(3) 2,746 1,294,767Okta, Inc.(1),(2),(3) 13,895 3,297,839PayPal Holdings, Inc.(1),(2),(3) 4,097 1,066,080Sabre Corp.(1),(3) 9,253 109,556Shift4 Payments, Inc., Class A(1),(3) 10,591 821,014
42,583,333Leisure Products 0.6%Callaway Golf Co.(1),(2),(3) 73,624 2,034,231Life Sciences Tools & Services 2.8%Adaptive Biotechnologies Corp.(1),(2),(3) 144 4,895Berkeley Lights, Inc.(1),(2),(3) 7,895 154,426Fluidigm Corp.(1) 344 2,267NanoString Technologies, Inc.(1),(3) 5,452 261,750Pacific Biosciences of California, Inc.(1),(2) 8,942 228,468Repligen Corp.(1),(2),(3) 5,836 1,686,546SomaLogic, Inc.(1),(2) 577,270 7,152,375
9,490,727Machinery 8.1%AGCO Corp.(2) 19,766 2,421,928Allison Transmission Holdings, Inc.(2) 13,109 463,010Chart Industries, Inc.(1),(2),(3) 7,027 1,342,930Deere & Co.(2),(3) 13,201 4,423,259Dover Corp.(2) 16,098 2,503,239Evoqua Water Technologies Corp.(1),(2) 14,061 528,131IDEX Corp.(2),(3) 4,730 978,874Ingersoll Rand, Inc.(1),(2),(3) 66,096 3,331,899Lydall, Inc.(1),(2) 2,572 159,695Meritor, Inc.(1),(2),(3) 18,821 401,076PACCAR, Inc.(2),(3) 19,189 1,514,396Parker-Hannifin Corp.(2),(3) 14,042 3,926,424Rexnord Corp. 31,914 2,051,751SPX FLOW, Inc.(2),(3) 17,113 1,250,960Welbilt, Inc.(1),(2) 76,102 1,768,610Woodward, Inc.(2) 6,248 707,274
27,773,456Marine 1.0%Kirby Corp.(1),(2),(3) 74,379 3,567,217Media 5.8%Altice USA, Inc., Class A(1) 34,778 720,600Clear Channel Outdoor Holdings, Inc.(1),(3) 29,148 78,991comScore, Inc.(1),(3) 1,852,413 7,224,411Criteo S.A., ADR(1),(2),(4) 29,835 1,093,453Discovery, Inc., Class A(1),(2) 34,412 873,377DISH Network Corp., Class A(1),(3) 35,242 1,531,617Gray Television, Inc.(2) 28,736 655,755iHeartMedia, Inc., Class A(1),(2) 121,195 3,032,299Liberty Broadband Corp.(1),(2) 2,547 439,867Meredith Corp.(1),(2) 4,906 273,264Shaw Communications, Inc., Class B(2),(4) 8,812 255,900TEGNA, Inc.(2) 184,205 3,632,523
19,812,057Metals & Mining 3.5%Alcoa Corp.(1),(2),(3) 116,593 5,706,061Allegheny Technologies, Inc.(1),(3) 40,117 667,146
Copyright © 2021 www.secdatabase.com. All Rights Reserved.Please Consider the Environment Before Printing This Document

See Notes to Schedule of Investments.
Copyright © 2021 www.secdatabase.com. All Rights Reserved.Please Consider the Environment Before Printing This Document

Schedule of Investments (unaudited)Weiss Strategic Interval FundSeptember 30, 2021Investments Shares ValueCommon StocksMetals & MiningBHP Group PLC, ADR(2),(4) 40,201 2,037,789Freeport-McMoRan, Inc. 6,802 221,269Hudbay Minerals, Inc.(2),(4) 136,012 847,355MP Materials Corp.(1),(3) 2,851 91,888Teck Resources Ltd., Class B(2),(4) 86,549 2,155,935United States Steel Corp.(2) 18,843 413,981
12,141,424Mortgage Real Estate Investment 1.0%AFC Gamma, Inc. 159,811 3,448,721Multiline Retail 0.7%Dollar General Corp. 3,426 726,792Dollar Tree, Inc.(1),(2),(3) 17,195 1,645,905
2,372,697Oil, Gas & Consumable Fuels 32.2%Antero Resources Corp.(1),(2) 347,581 6,537,999Arch Resources, Inc.(1),(2),(3) 72,675 6,740,606Bonanza Creek Energy, Inc. 15,671 750,641Cabot Oil & Gas Corp.(2) 280,160 6,096,281Cimarex Energy Co.(2) 56,998 4,970,226ConocoPhillips(2),(3) 117,348 7,952,674Continental Resources, Inc.(2) 169,064 7,802,303Devon Energy Corp.(2),(3) 250,104 8,881,193Marathon Oil Corp.(2),(3) 525,901 7,189,067Marathon Petroleum Corp.(2),(3) 91,742 5,670,573Matador Resources Co.(2) 212,118 8,068,969Northern Oil and Gas, Inc.(2) 306,933 6,568,366Occidental Petroleum Corp.(2),(3) 311,417 9,211,715Ovintiv, Inc.(2),(3) 224,161 7,370,414PDC Energy, Inc.(2),(3) 93,275 4,420,302Peabody Energy Corp.(1),(2) 54,954 812,770Pioneer Natural Resources Co.(2) 36,653 6,103,091Range Resources Corp.(1),(2) 145,886 3,301,400Southwestern Energy Co.(1),(2) 361,095 2,000,466
110,449,056Paper & Forest Products 1.3%Domtar Corp.(1),(2),(3) 17,094 932,307Louisiana-Pacific Corp.(2) 50,376 3,091,575West Fraser Timber Co., Ltd.(2),(4) 4,487 377,940
4,401,822Personal Products 1.8%BellRing Brands, Inc., Class A(1),(2),(3) 44,641 1,372,711Coty, Inc., Class A(1),(2),(3) 261,164 2,052,749elf Beauty, Inc.(1),(2),(3) 98,940 2,874,207
6,299,667Pharmaceuticals 2.9%Aerie Pharmaceuticals, Inc.(1),(2) 268 3,055AstraZeneca PLC, ADR(2),(3),(4) 28,916 1,736,695Axsome Therapeutics, Inc.(1),(2),(3) 5,820 191,827Bristol-Myers Squibb Co.(2) 36,141 2,138,463Catalent, Inc.(1),(2) 3,357 446,716Cresco Labs, Inc.(1),(2),(4) 53,055 492,351Curaleaf Holdings, Inc.(1),(2),(4) 54,473 656,400Eli Lilly & Co.(2) 8,578 1,981,947Green Thumb Industries, Inc.(1),(2),(4) 74,551 2,070,281
See Notes to Schedule of Investments.
Copyright © 2021 www.secdatabase.com. All Rights Reserved.Please Consider the Environment Before Printing This Document

Schedule of Investments (unaudited)Weiss Strategic Interval FundSeptember 30, 2021Investments Shares ValueCommon StocksPharmaceuticalsIntra-Cellular Therapies, Inc.(1),(2),(3) 419 15,620Relmada Therapeutics, Inc.(1) 1,738 45,553TherapeuticsMD, Inc.(1),(3) 14,934 11,072Zogenix, Inc.(1),(3) 1,420 21,570
9,811,550Professional Services 1.7%IHS Markit Ltd.(2),(4) 50,692 5,911,701Real Estate Investment Trusts 81.9%Acadia Realty Trust(2) 606,353 12,375,665Alexandria Real Estate Equities, Inc.(2) 62,569 11,955,059American Campus Communities, Inc.(2),(3) 197,199 9,554,292Americold Realty Trust(2),(3) 674,477 19,593,557AvalonBay Communities, Inc.(2),(3) 12,209 2,706,003Brixmor Property Group, Inc.(2) 29,944 662,062CareTrust REIT, Inc.(2),(3) 363,064 7,377,460Columbia Property Trust, Inc.(2) 63,580 1,209,292CyrusOne, Inc. 4,301 332,940Duke Realty Corp.(2) 191,393 9,161,983Equity LifeStyle Properties, Inc.(2),(3) 60,263 4,706,540Equity Residential(2),(3) 187,802 15,196,938Essex Property Trust, Inc.(2),(3) 22,783 7,284,636Federal Realty Investment Trust(3) 88,458 10,437,159First Industrial Realty Trust, Inc.(2) 169,802 8,843,288Healthcare Trust of America, Inc., Class A(2),(3) 90,789 2,692,802Invitation Homes, Inc.(2) 76,732 2,941,138Kilroy Realty Corp.(2) 144,834 9,589,459Kimco Realty Corp.(2),(3) 381,594 7,918,076Medical Properties Trust, Inc.(2) 125,809 2,524,987MGM Growth Properties LLC, Class A(2) 13,034 499,202Mid-America Apartment Communities, Inc.(2),(3) 66,550 12,428,212National Storage Affiliates Trust(2) 169,084 8,925,944NETSTREIT Corp.(2) 607,999 14,379,176Newlake Capital Partners, Inc.(2) 32,894 967,413Paramount Group, Inc.(2) 483,506 4,346,719Piedmont Office Realty Trust, Inc., Class A(2) 949,808 16,555,153Plymouth Industrial REIT, Inc.(2) 232,743 5,294,903RPT Realty(2),(3) 421,091 5,373,121Sabra Health Care REIT, Inc.(2),(3) 118,490 1,744,173Simon Property Group, Inc.(2),(3) 4,628 601,501Spirit Realty Capital, Inc.(2) 70,920 3,265,157Terreno Realty Corp.(2) 185,933 11,756,544Urban Edge Properties(2) 103,012 1,886,150Ventas, Inc.(2),(3) 252,506 13,940,856VEREIT, Inc.(2) 265,500 12,008,565VICI Properties, Inc.(2) 119,910 3,406,643WP Carey, Inc.(2) 228,986 16,725,137
281,167,905Road & Rail 14.8%ArcBest Corp.(2) 6,878 562,414Canadian Pacific Railway Ltd.(2),(3),(4) 160,016 10,412,241Heartland Express, Inc.(2),(3) 32,585 522,012Hertz Global Holdings, Inc.(1),(2) 13,969 273,094JB Hunt Transport Services, Inc. 95 15,886Kansas City Southern(2) 27,931 7,559,246Knight-Swift Transportation Holdings, Inc.(2) 101,543 5,193,924Landstar System, Inc.(3) 34,350 5,421,117
Copyright © 2021 www.secdatabase.com. All Rights Reserved.Please Consider the Environment Before Printing This Document

See Notes to Schedule of Investments.
Copyright © 2021 www.secdatabase.com. All Rights Reserved.Please Consider the Environment Before Printing This Document

Schedule of Investments (unaudited)Weiss Strategic Interval FundSeptember 30, 2021Investments Shares ValueCommon StocksRoad & RailLyft, Inc., Class A(1),(2),(3) 64,513 3,457,252Norfolk Southern Corp.(2) 13,390 3,203,558Saia, Inc.(1),(2) 20,010 4,762,980Schneider National, Inc., Class B(2) 4,446 101,102TFI International, Inc.(4) 6,190 632,494Uber Technologies, Inc.(1),(2) 5,532 247,834Union Pacific Corp.(2) 6,749 1,322,871XPO Logistics, Inc.(1),(2) 89,683 7,136,973Yellow Corp.(1) 17,124 96,751
50,921,749Semiconductors & Semiconductor Equipment 16.2%Ambarella, Inc.(1),(2),(4) 12,629 1,966,841Analog Devices, Inc.(2) 3,255 545,147Applied Materials, Inc.(2) 8,795 1,132,180ASML Holding N.V.(2),(4) 5,675 4,228,499Broadcom, Inc.(2),(3) 2,058 997,986Brooks Automation, Inc.(2) 30,811 3,153,506Ichor Holdings Ltd.(1),(2),(3),(4) 12,534 515,022Kulicke & Soffa Industries, Inc.(3) 9,579 558,264Lam Research Corp.(2),(3) 1,713 974,954Magnachip Semiconductor Corp.(1) 3 53Marvell Technology, Inc.(3) 77,170 4,654,123Microchip Technology, Inc.(2) 6,534 1,002,904Micron Technology, Inc.(2) 10,301 731,165MKS Instruments, Inc.(2) 6,753 1,019,095NVIDIA Corp.(2),(3) 10,263 2,126,083NXP Semiconductors N.V.(4) 27,502 5,386,817ON Semiconductor Corp.(1),(2) 28,221 1,291,675QUALCOMM, Inc.(2) 110,061 14,195,668Ultra Clean Holdings, Inc.(1),(2) 23,195 988,107Xilinx, Inc.(2) 66,364 10,020,300
55,488,389Software 40.0%Adobe, Inc.(1),(2) 4,318 2,485,959Alteryx, Inc., Class A(1),(3) 8,552 625,151Anaplan, Inc.(1),(2),(3) 8,565 521,523AppLovin Corp., Class A(1) 133 9,625Asana, Inc., Class A(1),(2),(3) 8,227 854,292Aspen Technology, Inc.(1),(2),(3) 1,772 217,602Atlassian Corp. PLC, Class A(1),(2),(3),(4) 5,144 2,013,464Avalara, Inc.(1),(2),(3) 5,298 925,931Bill.com Holdings, Inc.(1),(2),(3) 6,848 1,828,074BlackBerry Ltd.(1),(4) 17,105 166,432Cadence Design Systems, Inc.(1),(2) 8,570 1,297,841Citrix Systems, Inc.(2) 33,853 3,634,797Cloudera, Inc.(1) 62,174 992,919Cognyte Software Ltd.(1),(4) 83,927 1,724,700CommVault Systems, Inc.(1) 42,825 3,225,151Cornerstone OnDemand, Inc.(1) 293 16,777Coupa Software, Inc.(1),(2),(3) 2,301 504,333Crowdstrike Holdings, Inc., Class A(1),(3) 6,842 1,681,627CyberArk Software Ltd.(1),(3),(4) 10,257 1,618,760Datadog, Inc., Class A(1),(2) 10,281 1,453,219Descartes Systems Group, Inc. (The)(1),(4) 3,224 261,982DocuSign, Inc.(1),(2),(3) 4,450 1,145,564Domo, Inc., Class B(1) 49,520 4,181,469
See Notes to Schedule of Investments.
Copyright © 2021 www.secdatabase.com. All Rights Reserved.Please Consider the Environment Before Printing This Document

Schedule of Investments (unaudited)Weiss Strategic Interval FundSeptember 30, 2021Investments Shares ValueCommon StocksSoftwareDynatrace, Inc.(1),(2) 20,638 1,464,679Elastic N.V.(1),(2),(4) 7,051 1,050,528EngageSmart, Inc.(1) 50,569 1,722,380Everbridge, Inc.(1) 685 103,462Five9, Inc.(1),(2) 51,438 8,216,706Fortinet, Inc.(1),(2),(3) 16,851 4,921,166HubSpot, Inc.(1),(2),(3) 3,485 2,356,174ironSource Ltd., Class A(1),(4) 85,700 931,559Lightspeed Commerce, Inc.(1),(2),(3),(4) 6,179 595,841Mandiant, Inc.(1) 114,334 2,035,145Manhattan Associates, Inc.(1),(2),(3) 36,732 5,621,098McAfee Corp., Class A(2) 7,236 159,988Medallia, Inc.(1) 22,424 759,501Microsoft Corp.(2) 39,248 11,064,796Mimecast Ltd.(1),(3),(4) 15,106 960,742Monday.com Ltd.(1),(2),(4) 7,713 2,515,981NCR Corp.(1),(3) 108,972 4,223,755Nice Ltd., ADR(1),(3),(4) 1,719 488,265Nuance Communications, Inc.(1),(2) 86,879 4,781,820Nutanix, Inc., Class A(1),(2),(3) 37,829 1,426,153Oracle Corp.(2),(3) 60,182 5,243,658Palo Alto Networks, Inc.(1),(2) 9,599 4,597,921Ping Identity Holding Corp.(1) 48,428 1,189,876Riskified Ltd., Class A(1),(4) 17,140 390,963Sailpoint Technologies Holdings, Inc.(1),(3) 840 36,019salesforce.com, Inc.(1),(2) 58,625 15,900,272SentinelOne, Inc., Class A(1),(2) 3,424 183,424ServiceNow, Inc.(1),(2),(3) 6,495 4,041,644Smartsheet, Inc., Class A(1),(2),(3) 12,009 826,459Splunk, Inc.(1),(2),(3) 9,293 1,344,790Synopsys, Inc.(1),(2) 3,410 1,020,988Tenable Holdings, Inc.(1) 103,950 4,796,253Tufin Software Technologies Ltd.(1),(4) 108,254 1,064,137Varonis Systems, Inc.(1),(3) 17,678 1,075,706Verint Systems, Inc.(1) 34,210 1,532,266Workday, Inc., Class A(1),(2) 7,046 1,760,725Zendesk, Inc.(1),(2) 5,134 597,546Zeta Global Holdings Corp., Class A(1) 154,997 908,282Zscaler, Inc.(1),(2),(3) 15,369 4,030,059
137,327,919Specialty Retail 3.2%AKA Brands Holding Corp.(1) 14,921 127,724AutoNation, Inc.(1),(2) 88 10,715Bath & Body Works, Inc.(3) 6,929 436,735Best Buy Co., Inc.(2) 154 16,279Brilliant Earth Group, Inc., Class A(1),(2) 35,813 479,894Carvana Co.(1),(2),(3) 527 158,912Citi Trends, Inc.(1),(2) 21,359 1,558,353Home Depot, Inc. (The)(3) 4,299 1,411,190Lithia Motors, Inc., Class A(2) 327 103,672Lowe�s Cos., Inc.(2) 11,846 2,403,080Sonic Automotive, Inc., Class A(2) 2,137 112,278TJX Cos., Inc. (The)(2),(3) 49,031 3,235,065Tractor Supply Co.(2),(3) 4,109 832,524
See Notes to Schedule of Investments.
Copyright © 2021 www.secdatabase.com. All Rights Reserved.Please Consider the Environment Before Printing This Document

Schedule of Investments (unaudited)Weiss Strategic Interval FundSeptember 30, 2021Investments Shares ValueCommon StocksSpecialty RetailVictoria�s Secret & Co.(1),(2) 3,436 189,873
11,076,294Technology Hardware, Storage & Peripherals 3.1%3D Systems Corp.(1),(3) 10,266 283,034Dell Technologies, Inc., Class C(1),(2) 7,350 764,694NetApp, Inc.(2),(3) 65,470 5,876,587Pure Storage, Inc., Class A(1),(2) 111,540 2,806,346Turtle Beach Corp.(1) 34,040 946,993Western Digital Corp.(1),(2) 1,880 106,107
10,783,761Textiles, Apparel & Luxury Goods 0.7%Capri Holdings Ltd.(1),(2),(3),(4) 11,463 554,924NIKE, Inc., Class B 4,788 695,361Under Armour, Inc., Class A(1),(2),(3) 57,933 1,169,088
2,419,373Thrifts & Mortgage Finance 3.2%MGIC Investment Corp.(2),(3) 112,252 1,679,290Mr. Cooper Group, Inc.(1),(2) 52,074 2,143,886New York Community Bancorp, Inc.(2) 318,107 4,094,037PennyMac Financial Services, Inc.(2),(3) 50,130 3,064,447
10,981,660Trading Companies & Distributors 4.7%Air Lease Corp.(2),(3) 154,215 6,066,818Fortress Transportation and Infrastructure Investors LLC(2) 22,595 573,461GATX Corp.(2) 8,597 769,947Rush Enterprises, Inc., Class A(2) 3,420 154,447Triton International Ltd.(4) 17,949 934,066United Rentals, Inc.(1),(2) 11,131 3,906,202Watsco, Inc.(2) 2,402 635,617WESCO International, Inc.(1),(2) 28,176 3,249,257
16,289,815Wireless Telecommunication Services 0.0%NII Holdings, Inc.(1) 174,048 60,917
Total Common Stocks (Cost $1,362,557,375) 1,386,352,804Exchange-Traded Funds 6.7%Energy Select Sector SPDR Fund(2),(3) 111,050 5,784,594Financial Select Sector SPDR Fund(2) 61,524 2,308,996Invesco S&P 500 Equal Weight ETF(2) 34,730 5,203,249iShares Russell 1000 Value ETF(2) 2,919 456,853ProShares VIX Short-Term Futures ETF(1) 80,800 1,842,240SPDR S&P Oil & Gas Exploration & Production ETF(2) 27,367 2,646,936SPDR S&P Regional Banking ETF 10,177 689,492United States Oil Fund L.P.(1) 43,908 2,307,804US Global Jets ETF(2) 73,550 1,737,986
Total Exchange-Traded Funds (Cost $23,050,544) 22,978,150Warrants 0.4%Diversified Financial Services 0.1%Aequi Acquisition Corp., Class A(1) 8,874 5,242CM Life Sciences III, Inc.(1) 33,681 67,699Gores Technology Partners II, Inc.(1) 3,192 3,559
See Notes to Schedule of Investments.
Copyright © 2021 www.secdatabase.com. All Rights Reserved.Please Consider the Environment Before Printing This Document

Schedule of Investments (unaudited)Weiss Strategic Interval FundSeptember 30, 2021Investments Shares ValueWarrantsDiversified Financial ServicesHumanCo Acquisition Corp., Class A(1) 150,043 158,296
234,796Health Care Technology 0.2%Multiplan Corp.(1) 4,362 5,147Sema4 Holdings Corp.(1) 304,201 650,990
656,137Life Sciences Tools & Services 0.1%SomaLogic, Inc.(1) 120,844 389,722
Total Warrants (Cost $1,355,727) 1,280,655Total Long Investments (Cost $1,386,963,646) 1,410,611,609
Securities Sold Short (5)(347.9)%Common Stocks (258.7)%Aerospace & Defense (1.1)%Lockheed Martin Corp. 808 (278,841 )Virgin Galactic Holdings, Inc. 137,315 (3,474,069 )
(3,752,910 )Air Freight & Logistics (1.7)%Atlas Air Worldwide Holdings, Inc. 3,439 (280,898 )C.H. Robinson Worldwide, Inc. 19,621 (1,707,027 )Expeditors International of Washington, Inc. 28,101 (3,347,672 )United Parcel Service, Inc., Class B 3,280 (597,288 )
(5,932,885 )Airlines (0.3)%American Airlines Group, Inc. 8,700 (178,524 )Delta Air Lines, Inc. 23,304 (992,983 )
(1,171,507 )Auto Components (0.9)%American Axle & Manufacturing Holdings, Inc. 17,401 (153,303 )Autoliv, Inc. 2,523 (216,271 )BorgWarner, Inc. 38,633 (1,669,332 )Lear Corp. 7,547 (1,180,955 )
(3,219,861 )Automobiles (0.8)%Stellantis N.V.(4) 71,120 (1,358,392 )Tesla, Inc. 1,574 (1,220,606 )
(2,578,998 )Banks (26.3)%Associated Banc-Corp 161,522 (3,459,801 )Bank of America Corp. 22,302 (946,720 )Bank OZK 46,006 (1,977,338 )BankUnited, Inc. 46,426 (1,941,535 )BOK Financial Corp. 19,933 (1,785,000 )CIT Group, Inc. 41,970 (2,180,342 )Citigroup, Inc. 147,677 (10,363,972 )Citizens Financial Group, Inc. 76,247 (3,582,084 )Columbia Banking System, Inc. 31,957 (1,214,046 )Cullen/Frost Bankers, Inc. 26,904 (3,191,352 )Fifth Third Bancorp 101,136 (4,292,212 )First Citizens BancShares, Inc., Class A 79 (66,610 )First Horizon Corp. 413,496 (6,735,850 )First Republic Bank 17,934 (3,459,110 )FNB Corp. 196,964 (2,288,722 )
See Notes to Schedule of Investments.
Copyright © 2021 www.secdatabase.com. All Rights Reserved.Please Consider the Environment Before Printing This Document

Schedule of Investments (unaudited)Weiss Strategic Interval FundSeptember 30, 2021Investments Shares ValueCommon StocksBanksGreat Western Bancorp, Inc. 26,330 (862,044)Hilltop Holdings, Inc. 49,287 (1,610,206)M&T Bank Corp. 51,585 (7,703,704)Old National Bancorp 73,533 (1,246,384)Regions Financial Corp. 441,438 (9,407,044)Renasant Corp. 46,041 (1,659,778)Simmons First National Corp., Class A 49,805 (1,472,236)Synovus Financial Corp. 70,311 (3,085,950)Texas Capital Bancshares, Inc. 32,671 (1,960,913)Truist Financial Corp. 159,638 (9,362,769)United Community Banks, Inc. 50,078 (1,643,560)US Bancorp 43,847 (2,606,266)
(90,105,548)Beverages (5.0)%Anheuser-Busch InBev S.A., ADR(4) 21,723 (1,224,743)Boston Beer Co., Inc. (The), Class A 5,817 (2,965,216)Coca-Cola Co. (The) 125,187 (6,568,562)Keurig Dr Pepper, Inc. 52,406 (1,790,189)Monster Beverage Corp. 5,246 (466,002)National Beverage Corp. 75,831 (3,980,369)
(16,995,081)Biotechnology (0.4)%Amgen, Inc. 1,718 (365,333)Biogen, Inc. 343 (97,066)Biomea Fusion, Inc. 1,370 (16,399)Cerevel Therapeutics Holdings, Inc. 350 (10,325)Connect Biopharma Holdings Ltd.(4) 3,173 (76,882)Evelo Biosciences, Inc. 343 (2,415)Kodiak Sciences, Inc. 1,072 (102,890)Krystal Biotech, Inc. 1,409 (73,564)Moderna, Inc. 1,363 (524,564)Sana Biotechnology, Inc. 1,027 (23,128)VectivBio Holding AG(4) 714 (5,516)Werewolf Therapeutics, Inc. 722 (12,389)
(1,310,471)Building Products (3.6)%Allegion PLC(4) 9,234 (1,220,550)American Woodmark Corp. 9,341 (610,621)Carrier Global Corp. 8,074 (417,910)Johnson Controls International PLC(4) 10,272 (699,318)Lennox International, Inc. 7,855 (2,310,705)Masco Corp. 27,573 (1,531,680)Owens Corning 31,880 (2,725,740)Trane Technologies PLC(4) 15,253 (2,633,431)Trex Co., Inc. 1,556 (158,603)
(12,308,558)Capital Markets (6.6)%Apollo Global Management, Inc. 20,302 (1,250,400)Bank of New York Mellon Corp. (The) 199,381 (10,335,911)Charles Schwab Corp. (The) 27,316 (1,989,698)Morgan Stanley 9,062 (881,823)S&P Global, Inc. 13,443 (5,711,796)
See Notes to Schedule of Investments.
Copyright © 2021 www.secdatabase.com. All Rights Reserved.Please Consider the Environment Before Printing This Document

Schedule of Investments (unaudited)Weiss Strategic Interval FundSeptember 30, 2021Investments Shares ValueCommon StocksCapital MarketsState Street Corp. 30,785 (2,608,105)
(22,777,733)Chemicals (5.5)%Albemarle Corp. 14,345 (3,141,125)Dow, Inc. 78,101 (4,495,494)DuPont de Nemours, Inc. 18,483 (1,256,659)Ecolab, Inc. 4,119 (859,306)HB Fuller Co. 6,876 (443,914)LyondellBasell Industries N.V., Class A(4) 42,922 (4,028,230)PPG Industries, Inc. 15,398 (2,202,068)RPM International, Inc. 19,947 (1,548,884)Scotts Miracle-Gro Co. (The) 6,959 (1,018,519)
(18,994,199)Communications Equipment (2.0)%Cisco Systems, Inc. 57,271 (3,117,260)Juniper Networks, Inc. 137,667 (3,788,596)
(6,905,856)Construction Materials (0.2)%Vulcan Materials Co. 3,016 (510,187)Consumer Finance (4.2)%American Express Co. 10,317 (1,728,407)Discover Financial Services 56,703 (6,965,964)FirstCash, Inc. 9,997 (874,737)OneMain Holdings, Inc. 87,694 (4,852,109)
(14,421,217)Containers & Packaging (2.2)%Amcor PLC(4) 79,101 (916,781)Ball Corp. 29,695 (2,671,659)Crown Holdings, Inc. 21,812 (2,198,213)Packaging Corp. of America 4,736 (650,916)Pactiv Evergreen, Inc. 8,073 (101,074)Sealed Air Corp. 4,530 (248,199)Westrock Co. 15,476 (771,169)
(7,558,011)Diversified Consumer Services (0.2)%Chegg, Inc. 7,656 (520,761)frontdoor, Inc. 6,842 (286,680)
(807,441)Diversified Financial Services (0.1)%Berkshire Hathaway, Inc., Class B 1,369 (373,655)Electrical Equipment (1.9)%Bloom Energy Corp., Class A 92,718 (1,735,681)Eaton Corp. PLC(4) 7,853 (1,172,531)Emerson Electric Co. 6,545 (616,539)GrafTech International Ltd. 68,780 (709,810)Hubbell, Inc. 11,479 (2,073,911)Shoals Technologies Group, Inc., Class A 12,140 (338,463)
(6,646,935)Electronic Equipment, Instruments & Components (0.9)%Amphenol Corp., Class A 2,741 (200,724)Corning, Inc. 27,512 (1,003,913)Keysight Technologies, Inc. 8,907 (1,463,331)
See Notes to Schedule of Investments.
Copyright © 2021 www.secdatabase.com. All Rights Reserved.Please Consider the Environment Before Printing This Document

Schedule of Investments (unaudited)Weiss Strategic Interval FundSeptember 30, 2021Investments Shares ValueCommon StocksElectronic Equipment, Instruments & ComponentsZebra Technologies Corp., Class A 617 (318,014)
(2,985,982)Energy Equipment & Services (0.4)%Helmerich & Payne, Inc. 40,534 (1,111,037)Patterson-UTI Energy, Inc. 33,107 (297,963)ProPetro Holding Corp. 13,188 (114,076)
(1,523,076)Entertainment (1.3)%Roku, Inc. 5,767 (1,807,090)Spotify Technology S.A.(4) 12,053 (2,716,023)
(4,523,113)Food & Staples Retailing (1.4)%Sysco Corp. 47,002 (3,689,657)Walmart, Inc. 8,184 (1,140,686)
(4,830,343)Food Products (10.5)%Archer-Daniels-Midland Co. 77,303 (4,638,953)B&G Foods, Inc. 98,778 (2,952,474)Beyond Meat, Inc. 13,242 (1,393,853)Campbell Soup Co. 108,691 (4,544,371)Conagra Brands, Inc. 14,147 (479,159)Flowers Foods, Inc. 117,401 (2,774,186)General Mills, Inc. 45,409 (2,716,366)Hormel Foods Corp. 38,185 (1,565,585)JM Smucker Co. (The) 6,082 (730,023)McCormick & Co., Inc. 32,581 (2,640,039)Mondelez International, Inc., Class A 151,424 (8,809,848)Post Holdings, Inc. 14,732 (1,622,877)Tattooed Chef, Inc. 54,752 (1,009,079)
(35,876,813)Health Care Equipment & Supplies (1.0)%Baxter International, Inc. 8,604 (692,020)Becton Dickinson and Co. 3,302 (811,698)Medtronic PLC(4) 6,878 (862,157)Novocure Ltd.(4) 344 (39,962)Pulse Biosciences, Inc. 1,566 (33,826)STERIS PLC(4) 3,959 (808,744)
(3,248,407)Health Care Providers & Services (1.7)%HCA Healthcare, Inc. 13,080 (3,174,778)Quest Diagnostics, Inc. 6,885 (1,000,459)UnitedHealth Group, Inc. 3,823 (1,493,799)
(5,669,036)Hotels, Restaurants & Leisure (8.8)%Carnival Corp.(4) 33,551 (839,111)Cheesecake Factory, Inc. (The) 17,811 (837,117)Choice Hotels International, Inc. 16,507 (2,085,990)Hilton Grand Vacations, Inc. 208,683 (9,927,050)Marriott International, Inc., Class A 28,438 (4,211,383)Papa John�s International, Inc. 3,426 (435,068)Penn National Gaming, Inc. 52,370 (3,794,730)SeaWorld Entertainment, Inc. 41,798 (2,312,265)Vail Resorts, Inc. 5,158 (1,723,030)Wyndham Hotels & Resorts, Inc. 3,325 (256,657)
See Notes to Schedule of Investments.
Copyright © 2021 www.secdatabase.com. All Rights Reserved.Please Consider the Environment Before Printing This Document

Schedule of Investments (unaudited)Weiss Strategic Interval FundSeptember 30, 2021Investments Shares ValueCommon StocksHotels, Restaurants & LeisureWynn Resorts Ltd. 26,276 (2,226,891)Yum! Brands, Inc. 11,991 (1,466,619)
(30,115,911)Household Durables (2.6)%Helen of Troy Ltd.(4) 14,214 (3,193,602)Installed Building Products, Inc. 3,129 (335,272)KB Home 17,562 (683,513)Leggett & Platt, Inc. 6,007 (269,354)MDC Holdings, Inc. 2,431 (113,576)Mohawk Industries, Inc. 13,195 (2,340,793)PulteGroup, Inc. 5,663 (260,045)TopBuild Corp. 3,763 (770,700)Vizio Holding Corp., Class A 31,035 (659,184)Whirlpool Corp. 2,227 (453,996)
(9,080,035)Household Products (4.8)%Church & Dwight Co., Inc. 52,295 (4,317,998)Clorox Co. (The) 40,064 (6,634,999)Kimberly-Clark Corp. 14,360 (1,901,838)Reynolds Consumer Products, Inc. 136,190 (3,723,435)
(16,578,270)Industrial Conglomerates (5.2)%3M Co. 76,997 (13,506,814)General Electric Co. 24,056 (2,478,489)Honeywell International, Inc. 8,903 (1,889,929)
(17,875,232)Insurance (1.1)%American International Group, Inc. 9,285 (509,654)Aon PLC, Class A(4) 3,951 (1,129,077)First American Financial Corp. 29,210 (1,958,530)
(3,597,261)Interactive Media & Services (2.4)%Genius Sports Ltd.(4) 87,350 (1,629,951)IAC/InterActiveCorp 9,505 (1,238,406)Pinterest, Inc., Class A 28,220 (1,437,809)Snap, Inc., Class A 17,804 (1,315,182)Taboola.com Ltd.(4) 28,787 (243,538)Twitter, Inc. 37,464 (2,262,451)
(8,127,337)Internet & Direct Marketing Retail (5.7)%Amazon.com, Inc. 2,080 (6,832,883)DoorDash, Inc., Class A 12,809 (2,638,398)eBay, Inc. 29,188 (2,033,528)Etsy, Inc. 6,713 (1,396,035)Farfetch Ltd., Class A(4) 21,020 (787,830)Fiverr International Ltd.(4) 6,878 (1,256,473)Just Eat Takeaway.com N.V., ADR(4) 40,239 (584,673)Wayfair, Inc., Class A 16,007 (4,089,948)
(19,619,768)IT Services (5.4)%Automatic Data Processing, Inc. 12,537 (2,506,397)Broadridge Financial Solutions, Inc. 6,682 (1,113,488)Fastly, Inc., Class A 25,793 (1,043,069)Fiserv, Inc. 15,063 (1,634,336)
See Notes to Schedule of Investments.
Copyright © 2021 www.secdatabase.com. All Rights Reserved.Please Consider the Environment Before Printing This Document

Schedule of Investments (unaudited)Weiss Strategic Interval FundSeptember 30, 2021Investments Shares ValueCommon StocksIT ServicesFleetCor Technologies, Inc. 5,230 (1,366,442)International Business Machines Corp. 8,777 (1,219,389)Jack Henry & Associates, Inc. 6,114 (1,003,063)Shopify, Inc., Class A(4) 1,936 (2,624,790)Snowflake, Inc., Class A 7,646 (2,312,380)Square, Inc., Class A 4,608 (1,105,183)Squarespace, Inc., Class A 20,067 (775,389)Toast, Inc., Class A 4,651 (232,317)Twilio, Inc., Class A 1,350 (430,717)Wix.com Ltd.(4) 5,154 (1,010,029)
(18,376,989)Leisure Products (0.8)%Acushnet Holdings Corp. 26,514 (1,238,204)Peloton Interactive, Inc., Class A 16,650 (1,449,382)
(2,687,586)Life Sciences Tools & Services (0.3)%PPD, Inc. 1,626 (76,081)Rapid Micro Biosystems, Inc., Class A 1,634 (30,180)Thermo Fisher Scientific, Inc. 1,715 (979,831)
(1,086,092)Machinery (8.4)%Caterpillar, Inc. 25,298 (4,856,457)Colfax Corp. 12,880 (591,192)Cummins, Inc. 15,130 (3,397,593)Donaldson Co., Inc. 5,866 (336,767)Flowserve Corp. 28,405 (984,801)Fortive Corp. 8,287 (584,814)Hydrofarm Holdings Group, Inc. 26,886 (1,017,635)Illinois Tool Works, Inc. 33,280 (6,876,646)ITT, Inc. 1,826 (156,744)Kennametal, Inc. 48,730 (1,668,028)Lincoln Electric Holdings, Inc. 7,015 (903,462)Pentair PLC(4) 55,370 (4,021,523)Proto Labs, Inc. 8,555 (569,763)Stanley Black & Decker, Inc. 4,523 (792,927)Timken Co. (The) 7,274 (475,865)Toro Co. (The) 3,429 (334,019)Trinity Industries, Inc. 12,063 (327,752)Westinghouse Air Brake Technologies Corp. 6,336 (546,226)Xylem, Inc. 3,428 (423,975)
(28,866,189)Marine 0.0%Matson, Inc. 1,714 (138,337)Media (3.6)%Charter Communications, Inc., Class A 8,687 (6,320,314)Comcast Corp., Class A 39,913 (2,232,334)Nexstar Media Group, Inc., Class A 1,379 (209,553)Omnicom Group, Inc. 30,640 (2,220,175)PubMatic, Inc., Class A 11,789 (310,640)Sinclair Broadcast Group, Inc., Class A 7,575 (239,976)ViacomCBS, Inc., Class B 22,487 (888,461)
(12,421,453)Metals & Mining (4.0)%BHP Group Ltd., ADR(4) 7,319 (391,713)
See Notes to Schedule of Investments.
Copyright © 2021 www.secdatabase.com. All Rights Reserved.Please Consider the Environment Before Printing This Document
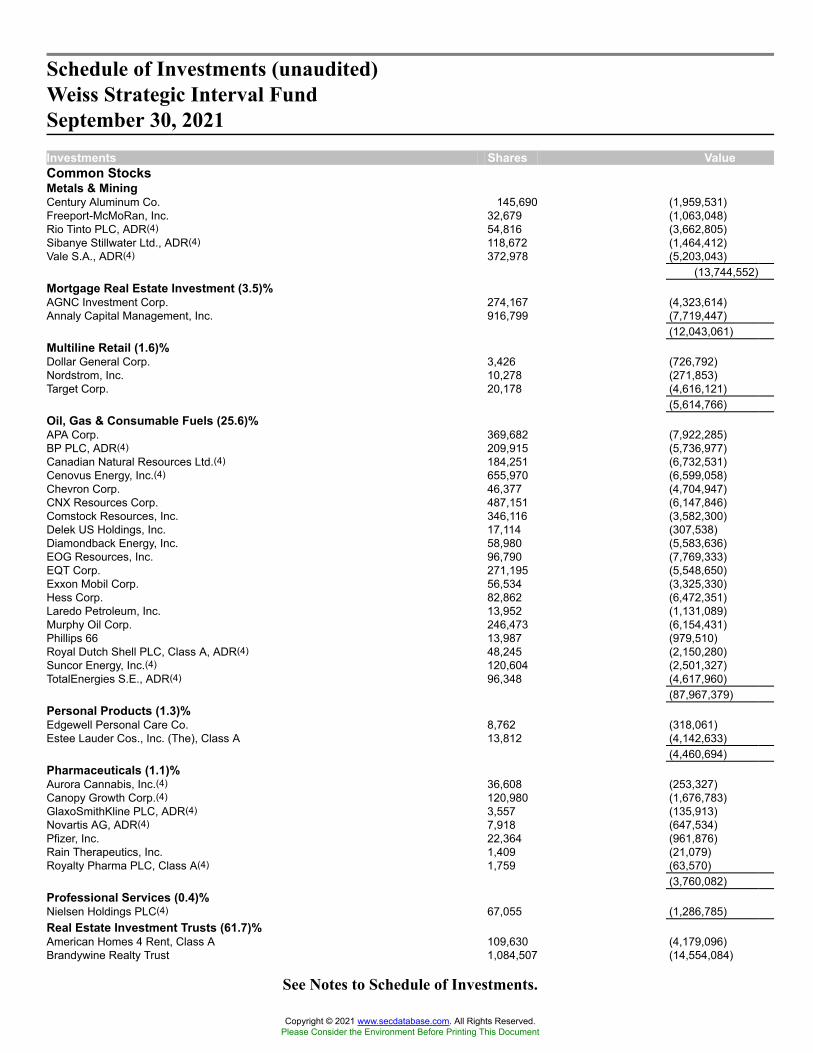
Schedule of Investments (unaudited)Weiss Strategic Interval FundSeptember 30, 2021Investments Shares ValueCommon StocksMetals & MiningCentury Aluminum Co. 145,690 (1,959,531)Freeport-McMoRan, Inc. 32,679 (1,063,048)Rio Tinto PLC, ADR(4) 54,816 (3,662,805)Sibanye Stillwater Ltd., ADR(4) 118,672 (1,464,412)Vale S.A., ADR(4) 372,978 (5,203,043)
(13,744,552)Mortgage Real Estate Investment (3.5)%AGNC Investment Corp. 274,167 (4,323,614)Annaly Capital Management, Inc. 916,799 (7,719,447)
(12,043,061)Multiline Retail (1.6)%Dollar General Corp. 3,426 (726,792)Nordstrom, Inc. 10,278 (271,853)Target Corp. 20,178 (4,616,121)
(5,614,766)Oil, Gas & Consumable Fuels (25.6)%APA Corp. 369,682 (7,922,285)BP PLC, ADR(4) 209,915 (5,736,977)Canadian Natural Resources Ltd.(4) 184,251 (6,732,531)Cenovus Energy, Inc.(4) 655,970 (6,599,058)Chevron Corp. 46,377 (4,704,947)CNX Resources Corp. 487,151 (6,147,846)Comstock Resources, Inc. 346,116 (3,582,300)Delek US Holdings, Inc. 17,114 (307,538)Diamondback Energy, Inc. 58,980 (5,583,636)EOG Resources, Inc. 96,790 (7,769,333)EQT Corp. 271,195 (5,548,650)Exxon Mobil Corp. 56,534 (3,325,330)Hess Corp. 82,862 (6,472,351)Laredo Petroleum, Inc. 13,952 (1,131,089)Murphy Oil Corp. 246,473 (6,154,431)Phillips 66 13,987 (979,510)Royal Dutch Shell PLC, Class A, ADR(4) 48,245 (2,150,280)Suncor Energy, Inc.(4) 120,604 (2,501,327)TotalEnergies S.E., ADR(4) 96,348 (4,617,960)
(87,967,379)Personal Products (1.3)%Edgewell Personal Care Co. 8,762 (318,061)Estee Lauder Cos., Inc. (The), Class A 13,812 (4,142,633)
(4,460,694)Pharmaceuticals (1.1)%Aurora Cannabis, Inc.(4) 36,608 (253,327)Canopy Growth Corp.(4) 120,980 (1,676,783)GlaxoSmithKline PLC, ADR(4) 3,557 (135,913)Novartis AG, ADR(4) 7,918 (647,534)Pfizer, Inc. 22,364 (961,876)Rain Therapeutics, Inc. 1,409 (21,079)Royalty Pharma PLC, Class A(4) 1,759 (63,570)
(3,760,082)Professional Services (0.4)%Nielsen Holdings PLC(4) 67,055 (1,286,785)Real Estate Investment Trusts (61.7)%American Homes 4 Rent, Class A 109,630 (4,179,096)Brandywine Realty Trust 1,084,507 (14,554,084)
See Notes to Schedule of Investments.
Copyright © 2021 www.secdatabase.com. All Rights Reserved.Please Consider the Environment Before Printing This Document

Schedule of Investments (unaudited)Weiss Strategic Interval FundSeptember 30, 2021Investments Shares ValueCommon StocksReal Estate Investment TrustsBroadstone Net Lease, Inc. 564,337 (14,001,201)Camden Property Trust 95,838 (14,133,230)Douglas Emmett, Inc. 204,247 (6,456,248)EastGroup Properties, Inc. 46,871 (7,810,115)Empire State Realty Trust, Inc., Class A 127,541 (1,279,236)Essential Properties Realty Trust, Inc. 378,516 (10,568,167)Extra Space Storage, Inc. 28,563 (4,798,298)Healthcare Realty Trust, Inc. 238,487 (7,102,143)Healthpeak Properties, Inc. 275,674 (9,229,565)Host Hotels & Resorts, Inc. 84,100 (1,373,353)Hudson Pacific Properties, Inc. 124,924 (3,281,753)Innovative Industrial Properties, Inc. 17,130 (3,959,942)Kite Realty Group Trust 204,007 (4,153,582)LTC Properties, Inc. 226,189 (7,167,929)National Health Investors, Inc. 66,590 (3,562,565)National Retail Properties, Inc. 171,440 (7,404,494)Park Hotels & Resorts, Inc. 53,697 (1,027,761)Physicians Realty Trust 46,349 (816,669)Prologis, Inc. 136,555 (17,128,094)Public Storage 11,041 (3,280,281)Realty Income Corp. 6,809 (441,632)Regency Centers Corp. 199,664 (13,443,377)Rexford Industrial Realty, Inc. 183,288 (10,401,594)SITE Centers Corp. 555,727 (8,580,425)SL Green Realty Corp. 62,683 (4,440,464)STORE Capital Corp. 126,016 (4,036,292)UDR, Inc. 164,203 (8,699,475)Washington Real Estate Investment Trust 242,587 (6,004,028)Welltower, Inc. 87,304 (7,193,850)Weyerhaeuser Co. 36,173 (1,286,674)
(211,795,617)Real Estate Management & Development (0.7)%Opendoor Technologies, Inc. 122,618 (2,517,348)Rafael Holdings, Inc., Class B 363 (11,155)
(2,528,503)Road & Rail (2.3)%Canadian National Railway Co.(4) 3,313 (383,148)Covenant Logistics Group, Inc. 51,929 (1,435,837)CSX Corp. 12,487 (371,363)Old Dominion Freight Line, Inc. 13,505 (3,862,160)Ryder System, Inc. 1,711 (141,517)Uber Technologies, Inc. 24,646 (1,104,141)Werner Enterprises, Inc. 12,456 (551,427)
(7,849,593)Semiconductors & Semiconductor Equipment (7.2)%Advanced Micro Devices, Inc. 74,723 (7,688,997)Intel Corp. 11,967 (637,602)Lattice Semiconductor Corp. 12,867 (831,851)Onto Innovation, Inc. 4,436 (320,501)Skyworks Solutions, Inc. 23,247 (3,830,641)Taiwan Semiconductor Manufacturing Co., Ltd., ADR(4) 15,752 (1,758,711)Texas Instruments, Inc. 44,873 (8,625,039)
See Notes to Schedule of Investments.
Copyright © 2021 www.secdatabase.com. All Rights Reserved.Please Consider the Environment Before Printing This Document

Schedule of Investments (unaudited)Weiss Strategic Interval FundSeptember 30, 2021Investments Shares ValueCommon StocksSemiconductors & Semiconductor EquipmentWolfspeed, Inc. 10,558 (852,347)
(24,545,689)Software (6.6)%Autodesk, Inc. 10,666 (3,041,623)Avaya Holdings Corp. 48,333 (956,510)DoubleVerify Holdings, Inc. 11,293 (385,769)ForgeRock, Inc., Class A 5,867 (228,402)Intuit, Inc. 2,249 (1,213,358)JFrog Ltd.(4) 10,136 (339,556)nCino, Inc. 5,144 (365,378)NortonLifeLock, Inc. 34,270 (867,031)Palantir Technologies, Inc., Class A 75,280 (1,809,731)Qualys, Inc. 34 (3,784)RingCentral, Inc., Class A 8,120 (1,766,100)Trade Desk, Inc. (The), Class A 19,595 (1,377,529)UiPath, Inc., Class A 25,194 (1,325,457)Unity Software, Inc. 3,625 (457,656)VMware, Inc., Class A 32,809 (4,878,698)Zoom Video Communications, Inc., Class A 13,672 (3,575,228)
(22,591,810)Specialty Retail (1.6)%Caleres, Inc. 25,756 (572,298)CarMax, Inc. 3,439 (440,055)GrowGeneration Corp. 32,909 (811,865)RH 2,170 (1,447,195)Ross Stores, Inc. 17,313 (1,884,520)Williams-Sonoma, Inc. 1,185 (210,136)
(5,366,069)Technology Hardware, Storage & Peripherals (7.6)%Apple, Inc. 55,120 (7,799,480)Hewlett Packard Enterprise Co. 247,365 (3,524,951)HP, Inc. 315,226 (8,624,583)Logitech International S.A.(4) 51,390 (4,530,029)Seagate Technology Holdings PLC(4) 20,568 (1,697,271)
(26,176,314)Textiles, Apparel & Luxury Goods (0.5)%Ralph Lauren Corp. 16,621 (1,845,596)Thrifts & Mortgage Finance (1.4)%Rocket Cos., Inc., Class A 145,229 (2,329,473)UWM Holdings Corp. 368,198 (2,558,976)
(4,888,449)Trading Companies & Distributors (1.8)%AerCap Holdings N.V.(4) 8,171 (472,365)Beacon Roofing Supply, Inc. 3,439 (164,247)Fastenal Co. 81,072 (4,184,126)MSC Industrial Direct Co., Inc., Class A 2,885 (231,348)WW Grainger, Inc. 3,136 (1,232,636)
(6,284,722)Wireless Telecommunication Services (0.5)%T-Mobile U.S., Inc. 13,122 (1,676,467)
Total Common Stocks (Proceeds $888,849,520) (888,024,431)Exchange-Traded Funds (89.2)%ARK Genomic Revolution ETF 40,475 (3,024,292)
See Notes to Schedule of Investments.
Copyright © 2021 www.secdatabase.com. All Rights Reserved.Please Consider the Environment Before Printing This Document

Schedule of Investments (unaudited)Weiss Strategic Interval FundSeptember 30, 2021Investments Shares ValueExchange-Traded FundsARK Innovation ETF 21,642 (2,392,090)Communication Services Select Sector SPDR Fund 69,016 (5,528,872)Consumer Discretionary Select Sector SPDR Fund 15,781 (2,831,900)Consumer Staples Select Sector SPDR Fund 337,051 (23,202,591)ETFMG Alternative Harvest ETF 46,806 (673,538)Health Care Select Sector SPDR Fund 41,608 (5,296,698)Industrial Select Sector SPDR Fund 67,728 (6,626,508)Invesco QQQ Trust, Series 1 126,965 (45,448,391)iShares 20+ Year Treasury Bond ETF 6,286 (907,196)iShares Biotechnology ETF 15,946 (2,578,149)iShares China Large-Cap ETF 6,918 (269,318)iShares Cohen & Steers REIT ETF 160,909 (10,526,667)iShares Expanded Tech-Software Sector ETF 39,978 (15,956,819)iShares MSCI Emerging Markets ETF 34,143 (1,720,124)iShares MSCI Eurozone ETF 33,272 (1,601,049)iShares MSCI Germany ETF 43,315 (1,425,930)iShares MSCI India ETF 5,244 (255,330)iShares MSCI Taiwan ETF 19,703 (1,221,783)iShares Russell 1000 Growth ETF 1,631 (446,959)iShares Russell 2000 ETF 55,556 (12,152,875)iShares S&P 500 Value ETF 3,449 (501,554)iShares U.S. Home Construction ETF 70,434 (4,661,322)iShares U.S. Medical Devices ETF 9,881 (620,329)iShares U.S. Real Estate ETF 88,514 (9,062,948)iShares U.S. Technology ETF 122,511 (12,405,464)iShares U.S. Transportation ETF 2,428 (590,441)Materials Select Sector SPDR Fund 4,743 (375,219)ProShares UltraShort 20+ Year Treasury 217,754 (3,995,786)SPDR S&P 500 ETF Trust 137,264 (58,905,473)SPDR S&P Biotech ETF 19,837 (2,493,709)SPDR S&P Homebuilders ETF 10,653 (764,459)SPDR S&P Metals & Mining ETF 78,741 (3,286,649)SPDR S&P Retail ETF 34,630 (3,127,782)SPDR S&P Semiconductor ETF 13,622 (2,696,747)Utilities Select Sector SPDR Fund 39,679 (2,534,695)VanEck Semiconductor ETF 54,447 (13,953,133)Vanguard Real Estate ETF 412,091 (41,942,622)
Total Exchange-Traded Funds (Proceeds $304,883,490) (306,005,411)Total Securities Sold Short (Proceeds $1,193,733,010) (1,194,029,842)
Total Investments, net of securities sold short (Cost $193,230,636) 63.1% 216,581,767Other assets, less liabilities 36.9% 126,675,180Net Assets 100.0% $343,256,947
The Global Industry Classification Standard (GICS®) was developed by and/or is the exclusive property of MSCI, Inc. and Standard & Poor�s.
(1)Non-income producing.(2)All or a portion of this security has been committed as collateral for open securities sold short. The total value of assets committed as collateral
as of September 30, 2021, is $1,075,435,013.(3)All or a portion of this security is on loan.(4)Foreign security.(5)Securities sold short are not owned by the Fund and cannot produce income.
ADR American Depository Receipt
ETF Exchange-Traded Fund
REIT Real Estate Investment Trust
Copyright © 2021 www.secdatabase.com. All Rights Reserved.Please Consider the Environment Before Printing This Document

See Notes to Schedule of Investments.
Copyright © 2021 www.secdatabase.com. All Rights Reserved.Please Consider the Environment Before Printing This Document
Schedule of Investments (unaudited)Weiss Strategic Interval FundSeptember 30, 2021
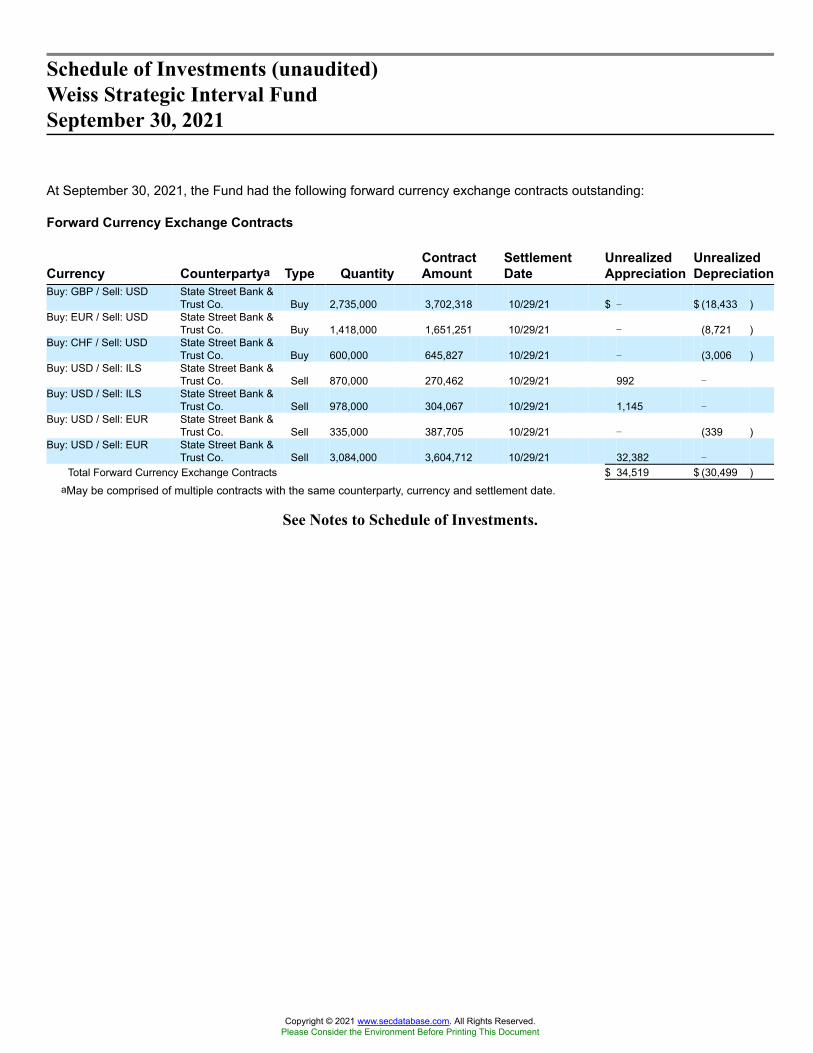
At September 30, 2021, the Fund had the following forward currency exchange contracts outstanding:
Forward Currency Exchange Contracts
Currency Counterpartya Type QuantityContractAmount
SettlementDate
UnrealizedAppreciation
UnrealizedDepreciation
Buy: GBP / Sell: USD State Street Bank &Trust Co. Buy 2,735,000 3,702,318 10/29/21 $ � $ (18,433 )
Buy: EUR / Sell: USD State Street Bank &Trust Co. Buy 1,418,000 1,651,251 10/29/21 � (8,721 )
Buy: CHF / Sell: USD State Street Bank &Trust Co. Buy 600,000 645,827 10/29/21 � (3,006 )
Buy: USD / Sell: ILS State Street Bank &Trust Co. Sell 870,000 270,462 10/29/21 992 �
Buy: USD / Sell: ILS State Street Bank &Trust Co. Sell 978,000 304,067 10/29/21 1,145 �
Buy: USD / Sell: EUR State Street Bank &Trust Co. Sell 335,000 387,705 10/29/21 � (339 )
Buy: USD / Sell: EUR State Street Bank &Trust Co. Sell 3,084,000 3,604,712 10/29/21 32,382 �
Total Forward Currency Exchange Contracts $ 34,519 $ (30,499 )aMay be comprised of multiple contracts with the same counterparty, currency and settlement date.
See Notes to Schedule of Investments.
Copyright © 2021 www.secdatabase.com. All Rights Reserved.Please Consider the Environment Before Printing This Document

Notes to Schedule of InvestmentsSeptember 30, 2021 (unaudited)
1. Organization
Weiss Strategic Interval Fund (the �Fund�) was organized as a Delaware statutory trust on September 5, 2017 pursuant to an Agreement and Declarationof Trust (�Declaration of Trust�). The Fund is registered with the Securities and Exchange Commission as a closed-end, diversified managementinvestment company under the Investment Company Act of 1940, as amended (the �1940 Act�). Weiss Multi-Strategy Advisers LLC (the �Adviser�)serves as the Fund�s investment adviser.
The Fund�s investment objective is to provide returns with moderate volatility and reduced correlation to the overall performance of the equity market.The Fund pursues its investment objective by establishing long and short positions in a diversified portfolio of equity securities. The equity securitiesin which the Fund takes long and short positions include domestically traded large and mid-capitalization equity securities, including master limitedpartnerships or other entities that offer economic exposure to master limited partnerships and shares of real estate investment trusts. The Fund operatesas an interval fund under Rule 23c-3 of the 1940 Act.
2. Significant Accounting Policies
The accompanying financial statements of the Fund are prepared in accordance with accounting principles generally accepted in the United States(�U.S. GAAP�). The Fund is an investment company and follows the accounting and reporting guidance in the Financial Accounting Standards Board(�FASB�) Accounting Standards Codification (�ASC�) Topic 946, Financial Services � Investment Companies. The Fund maintains its financial recordsin U.S. dollars and follows the accrual basis of accounting.
Use of Estimates
The preparation of financial statements in conformity with GAAP requires management to make estimates and assumptions that affect the reportedamounts of assets and liabilities and disclosure of contingent assets and liabilities at the date of the financial statements and the reported amounts ofrevenues and expenses during the reporting period. Actual results could differ from those estimates.
Organization and Offering Costs
Under an agreement with the Fund�s sole shareholder, Somerset Reinsurance Ltd. (�Somerset�), a Bermuda-based reinsurance company, Somerset willpay all expenses incurred by the Fund in connection with the organization and offering of shares of the Fund. The sole shareholder is not entitled to thereimbursement of these costs from the Fund. During the period ended September 30, 2021, the Fund did not incur any organization or offering costs.
Federal Income Taxes
It is the Fund�s policy to comply with the requirements of Subchapter M of the Internal Revenue Code applicable to regulated investment companiesand to distribute substantially all of its taxable income to its shareholders. Therefore, no provision for federal income taxes is required.
Guarantees and Indemnifications
In the normal course of business, the Fund enters into contracts with service providers that contain general indemnification clauses. The Fund�smaximum exposure under these arrangements is unknown, as this would involve future claims that may be made against the Fund that have not yetoccurred. However, based on experience, management expects the risk of loss to be remote.
Security Transactions, Investment Income and Expenses
The Fund records security transactions on the trade date. Realized gains and losses on sales of securities are determined using cost calculated on thebasis of specific identification. Dividend income and expense are recorded on the ex-dividend date, or when the Fund first learns of the ex-date dividendnotification, and interest income is recorded on an accrual basis. Withholding taxes on foreign dividends have been provided for in accordance withthe Fund�s understanding of the applicable country�s tax rules and regulations. The Fund invests in real estate investment trusts (REITs) which reportinformation on the source of their distributions annually. The Fund�s policy is to record all REIT distributions initially as dividend income on theex-dividend date and then re-designate them as return of capital and/or capital gain distributions at the end of the reporting period based on informationprovided annually by each REIT, and management estimates such re-designations when actual information has not yet been reported.
Offsetting of Amounts Related to Certain Contracts
Amounts due from and to brokers are presented on a gross basis, by counterparty, even if the Fund has the legal right to offset. The Fund presents ona gross basis the fair value amounts recognized for OTC derivatives executed with the same counterparty under the same master netting agreement,even though such positions may qualify for net presentation. Fair value amounts recognized for exchange traded future contracts executed with the samebroker are presented on a gross basis even if the Fund has the legal right to offset. The Fund has elected not to offset fair value amounts recognized forcash collateral receivables and payables against fair value amounts recognized for net derivative positions executed with the same counterparty underthe same master netting arrangement.
Copyright © 2021 www.secdatabase.com. All Rights Reserved.Please Consider the Environment Before Printing This Document

Transactions with Brokers
The Fund�s receivables from brokers for proceeds on securities sold short and deposits at brokers for securities sold short are with one securities dealer.The Fund does not require the brokers to maintain collateral in support of the receivables from the brokers for proceeds on securities sold short. TheFund is required by the brokers to maintain collateral at the brokers or in a segregated account at the Fund�s custodian for securities sold short. Thedeposit at broker for shorts on the Statement of Assets and Liabilities represents the collateral for securities sold short. The Fund may maintain cashdeposits at brokers beyond the receivables for securities sold short.
Restricted cash is subject to a legal or contractual restriction by third parties as well as a restriction as to withdrawal or use, including restrictions thatrequire the funds to be used for a specified purpose and restrictions that limit the purpose for which the funds can be used. The Fund considers depositsat broker for shorts to be restricted cash.
The Fund�s foreign currency exchange contracts� cash deposits are monitored daily by the Adviser and counterparty. Cash deposits beyond the shortsale proceeds by the Fund would be presented as deposits at brokers on the Statement of Assets and Liabilities. These transactions may involve marketrisk in excess of the amounts receivable or payable reflected on the Statement of Assets and Liabilities.
Share Valuation
The NAV per share of the Fund is calculated by dividing the sum of the value of the securities held by the Fund, plus cash or other assets, minus allliabilities (including estimated accrued expenses) by the total number of shares outstanding for the Fund, rounded to the nearest cent. The Fund�s shareswill not be priced on days which the New York Stock Exchange is closed for trading.
Distributions
The Fund intends to declare income dividends and distribute them to the sole shareholder monthly at rates that reflect the past and projected net incomeof the Fund. Subject to applicable law, the Fund may fund a portion of its distributions with gains from the sale of portfolio securities and other sources.The Fund will pay the sole shareholder at least annually all or substantially all of its net investment income after the payment of interest, fees ordividends, if any, owed with respect to any forms of leverage utilized by the Fund. The Fund intends to pay any capital gains distributions at leastannually. Distributions received from real estate investment trusts may be classified as dividends, capital gains, and/or return of capital.
Fair Value �� Definition and Hierarchy
Fair value is defined as the price that would be received to sell an asset or paid to transfer a liability (i.e., the �exit price�) in an orderly transactionbetween market participants at the measurement date.
In determining fair value, the Fund uses various valuation approaches. A fair value hierarchy for inputs is used in measuring fair value that maximizesthe use of observable inputs and minimizes the use of unobservable inputs by requiring that the most observable inputs are to be used when available.The fair value hierarchy is categorized into three levels based on the inputs as follows:
Level 1 - Valuations based on unadjusted quoted prices in active markets for identical assets or liabilities that the Fund has the ability to access.
Level 2 - Valuations based on inputs, other than quoted prices included in Level 1 that are observable either directly or indirectly.
Level 3 - Valuations based on inputs that are unobservable and significant to the overall fair value measurement.
Fair value is a market-based measure, based on assumptions of prices and inputs considered from the perspective of a market participant that are currentas of the measurement date, rather than an entity-specific measure. Therefore, even when market assumptions are not readily available, the Fund�s ownassumptions are set to reflect those that market participants would use in pricing the asset or liability at the measurement date.
The availability of valuation techniques and observable inputs can vary from investment to investment and is affected by a wide variety of factors,including the type of investment, whether the investment is new and not yet established in the marketplace, the liquidity of markets, and othercharacteristics particular to the transaction. To the extent that valuation is based on models or inputs that are less observable or unobservable in themarket, the determination of fair value requires more judgment. Because of the inherent uncertainty of valuation, those estimated values may bematerially higher or lower than the values that would have been used had a ready market for the investments existed. Accordingly, the degree of judgmentexercised by the Fund in determining fair value is greatest for investments categorized in Level 3. In certain cases, the inputs used to measure fair valuemay fall into different levels of the fair value hierarchy. In such cases, the level in the fair value hierarchy which the fair value measurement falls in itsentirety is determined based on the lowest level input that is significant to the fair value measurement.
Copyright © 2021 www.secdatabase.com. All Rights Reserved.Please Consider the Environment Before Printing This Document

3. Fair Value Measurements
The Fund�s assets and liabilities recorded at fair value have been categorized based upon a fair value hierarchy as described in the Fund�s significantaccounting policies in Note 2. The inputs or methodology used for valuing securities may not be an indication of the risk associated with investing inthose securities. The following is a summary of the fair valuations according to the inputs used as of September 30, 2021, for valuing the Fund�s assetsand liabilities.
Level 1 Level 2 Level 3 TotalAssets:
Investments in Securities:Common Stocks(1) $1,385,323,852 $1,023,411 $5,541 $1,386,352,804Exchange-Traded Funds 22,978,150 � � 22,978,150Warrants � 1,280,655 � 1,280,655
Total Investments in Securities $ 1,408,302,002 $ 2,304,066 $ 5,541 $ 1,410,611,609Derivative Contracts:
Forward Exchange Contracts(2) � 34,519 � 34,519Total $1,408,302,002 $2,338,585 $5,541 $1,410,646,128
Liabilities:Securities Sold Short:
Common Stocks(1) $(888,024,431 ) $� $� $(888,024,431 )Exchange-Traded Funds (306,005,411 ) � � (306,005,411 )
Total Securities Sold Short $(1,194,029,842 ) $� $� $(1,194,029,842 )
Derivative Contracts:Forward Exchange Contracts(2) $� $(30,499 ) $� $(30,499 )
Total $(1,194,029,842 ) $(30,499 ) $� $(1,194,060,341 )(1) Please refer to the Schedule of Investments to view long and short common stocks segregated by industry type.(2) Forward currency exchange contracts are valued at the net unrealized appreciation (depreciation) on the instrument.
The average notional value of forward currency exchange contracts purchased and sold for the period ended September 30, 2021 was 46,079,646 and50,142,203, respectively.
Equity Securities
Equity securities listed on a U.S. securities exchange generally are valued at the last sale or closing price as reported by an independent pricing service onthe primary market or exchange on which they are traded and are categorized as Level 1 in the hierarchy. Equity securities listed on the NASDAQ Globalor Global Select Market are valued at the NASDAQ official closing price and are categorized as Level 1 in the hierarchy. Unlisted or listed securitiesfor which closing sales prices or closing quotations are not available are valued using indicative broker quotations and are categorized as Level 2 in thehierarchy. The daily valuation of exchange-traded foreign securities generally is determined as of the close of trading on the principal exchange on whichsuch securities trade. Events occurring after the close of trading on foreign exchanges may result in adjustments to the valuation of foreign securities tomore accurately reflect their fair value as of the close of regular trading on the New York Stock Exchange. When valuing foreign equity securities thatmeet certain criteria, the Fund�s Board has approved the use of a fair value service that values such securities to reflect market trading that occurs afterthe close of the applicable foreign markets of comparable securities or other instruments that have a strong correlation to the fair-valued securities. Suchsecurities are categorized as Level 2 in the hierarchy.
Exchange-Traded Funds
Exchange-traded funds are valued at the official closing price as reported by an independent pricing service on the primary market or exchange on whichthey are traded and are categorized as Level 1 in the hierarchy. Investments in registered investment companies (such as money market funds and mutualfunds) that do not trade on an exchange are valued at the net asset value per share on the valuation day and are categorized as Level 1 in the hierarchy.
Securities Sold Short
The Fund sells securities or currencies short for investment purposes. For financial statement purposes, an amount equal to the settlement amount isinitially included in the Statement of Assets and Liabilities as an asset and an equivalent liability. The amount of the liability is subsequently priced toreflect the current value of the short position. Subsequent fluctuations in the market prices of securities or currencies sold, but not yet purchased, mayrequire purchasing the securities or currencies at prices which may differ from the fair value reflected on the Statement of Assets and Liabilities. Shortsale transactions result in off balance sheet risk because the ultimate obligation may exceed the related amounts shown in the Statement of Assets andLiabilities. The Fund will incur losses if the price of the security increases between the date of the short sale and the date on which the Fund purchasesthe securities to replace the borrowed securities. The Fund�s losses on short sales are potentially unlimited because there is no upward limit on the pricea borrowed security could attain.
The Fund is liable for any dividends payable on securities while those securities are sold short. Until the security is replaced, the Fund is required to payto the lender any income earned, which is recorded as an expense by the Fund. The Fund�s policy is to segregate liquid assets in an amount equal
Copyright © 2021 www.secdatabase.com. All Rights Reserved.Please Consider the Environment Before Printing This Document

to the fair value of securities sold short (not including proceeds received), which is reflected in the Schedule of Investments. These assets are required tobe adjusted daily to reflect changes in the value of the securities or currencies sold short.
Foreign Securities and Currency Translation
Investment securities and other assets and liabilities denominated in foreign currencies are translated into U.S. dollar amounts at the date of valuation.Purchases and sales of investment securities and income and expense items denominated in foreign currencies are translated into U.S. dollar amounts onthe respective dates of such transactions. The Fund does not isolate the portion of the results of operations from changes in foreign exchange rates oninvestments from the fluctuations arising from changes in market prices of securities held. Reported net realized foreign exchange gains or losses arisefrom sales of foreign currencies, currency gains or losses realized between the trade and settlement dates on securities transactions, and the differencebetween the amounts of dividends, interest, and foreign withholding taxes recorded on the Fund�s books and the U.S. dollar equivalent of the amountsactually received or paid. Net unrealized foreign exchange gains and losses arise from changes in the fair values of assets and liabilities, other thaninvestments in securities at fiscal year-end, resulting from changes in exchange rates.
Investments in foreign securities entail certain risks. There may be a possibility of nationalization or expropriation of assets, confiscatory taxation,political or financial instability, and diplomatic developments that could affect the value of the Fund�s investments in certain foreign countries. Sinceforeign securities normally are denominated and traded in foreign currencies, the value of the Fund�s assets may be affected favorably or unfavorably bycurrency exchange rates, currency exchange control regulations, foreign withholding taxes, and restrictions or prohibitions on the repatriation of foreigncurrencies. There may be less information publicly available about a foreign issuer than about a U.S. issuer, and foreign issuers are not generally subjectto accounting, auditing, and financial reporting standards and practices comparable to those in the United States. The securities of some foreign issuersare less liquid and at times more volatile than securities of comparable U.S. issuers.
Derivatives
The Fund may utilize derivative instruments such as options, swaps, futures, forward contracts and other instruments with similar characteristics to theextent that they are consistent with the Fund�s respective investment objectives and limitations. The use of these instruments may involve additionalinvestment risks, including the possibility of illiquid markets or imperfect correlation between the value of the instruments and the underlying securities.Derivatives also may create leverage which will amplify the effect of their performance on the Fund and may produce significant losses.
Forward Currency Exchange Contracts
The Fund is subject to foreign currency exchange rate risk in the normal course of pursuing its investment objectives. The Fund may enter into forwardcontracts for foreign currency hedging purposes, volatility management purposes or otherwise to gain, or reduce, long or short exposure to one or moreasset classes or issuers. The Fund may enter into forward currency exchange contracts obligating the Fund to deliver and receive a currency at a specifiedfuture date. Forward contracts are valued daily, and unrealized appreciation or depreciation is recorded daily as the difference between the contractexchange rate and the closing forward rate applied to the face amount of the contract. A realized gain or loss is recorded at the time the forward contractexpires. Credit risk may arise as a result of the failure of the counterparty to comply with the terms of the contract.
The use of forward currency exchange contracts does not eliminate fluctuations in the underlying prices of the Fund�s investment securities. The useof forward currency exchange contracts involves the risk that anticipated currency movements will not be accurately predicted. A forward currencyexchange contract would limit the risk of loss due to a decline in the value of a particular currency; however, it would also limit any potential gain thatmight result should the value of the currency increase instead of decrease. These contracts may involve market risk in excess of the amounts receivableor payable reflected on the Statement of Assets and Liabilities.
The Fund values forward contracts based on the terms of the contract (including the notional amount and contract duration) and using observable inputs,such as currency exchange rates or commodity prices. The Fund also considers counterparty credit risk in its valuation of forward contracts. Forwardcontracts are generally categorized in Level 2 of the fair value hierarchy.
4. Fund Fees and Expenses
Under the terms of the Investment Advisory Agreement between the Fund and the Adviser amended effective July 1, 2020, the Fund pays the Advisera monthly management fee at the annual rate of 2.00%. The management fee will be applied to the Fund�s net asset value (before the deduction of anyincentive fee and the repurchase of any shares pursuant to a periodic repurchase offer). The management fee will be accrued at least weekly and paidmonthly in arrears. The Fund also pays to the Adviser a performance-based incentive fee, quarterly in arrears, generally accrued as of the end of eachbusiness day, equal to 20.00% of the investment profits, as defined in the Investment Advisory Agreement, attributable to each share for such calendarquarter; provided, however, that an incentive fee with respect to a share will be paid only with respect to investment profits for the applicable calendarquarter in excess of unrecouped investment losses as defined in the Investment Advisory Agreement as of the end of the previous calendar quarter.
Previously, in the Investment Advisory Agreement effective September 1, 2019, the Fund paid the Adviser a monthly management fee at the annual rateof 1.50%. The management fee was applied to the Fund�s net asset value (before the deduction of any incentive fee and the repurchase of any sharespursuant to a periodic repurchase offer). In addition, the Fund paid the Adviser a performance-based incentive fee, quarterly in arrears, generally accruedas of the end of each business day, equal to 20.00% of the investment profits, as defined in the Investment Advisory Agreement effective September 1,2019, attributable to each share for such calendar quarter; provided, however, that an incentive fee with respect to a share will be paid only with respectto investment profits for the applicable calendar quarter in excess of unrecouped investment losses as defined in the Investment Advisory Agreement asof the end of the previous calendar quarter.
Copyright © 2021 www.secdatabase.com. All Rights Reserved.Please Consider the Environment Before Printing This Document

The Adviser in addition agreed that it would attempt to manage the Fund�s aggregate leverage to be 1.5x per side of that of Weiss Multi-Strategy PartnersLLC (the �Flagship Fund�) as measured by the Adviser�s risk metrics, unless otherwise agreed with Somerset in writing. In the event that Somerset,in its sole discretion, wanted to increase the Fund�s aggregate leverage by an additional 0.5x per side that of the Flagship Fund, it could have doneso (subject to the US $1.2 billion in aggregate AUM capacity); provided, however, that the management fee associated with the incremental leverageapplicable to Somerset for any quarter (or portion thereof) would have been 0.4375% (i.e., 1.75% per annum) and the incentive fee associated with theincremental leverage applicable to Somerset for any such quarter (or portion thereof) would have been an amount equal to an annual rate of 25% of theprofits derived from the incremental leverage (including net unrealized gains and losses on investments).
In addition to the fees paid to the Adviser, the Fund pays all other costs and expenses of its operations, including compensation of its trustees (otherthan those affiliated with the Adviser), custodian, leveraging expenses, transfer and dividend disbursing agent expenses, legal fees, rating agency fees,listing fees and expenses, expenses of independent auditors, expenses of repurchasing shares, expenses of preparing, printing and distributing shareholderreports, notices, proxy statements and reports to governmental agencies and taxes, if any.
For purposes of determining the fee calculations of the Fund, the value of the loans outstanding are included in the NAV of the Fund. See Note 5 below.
5. Loans Receivable from Sole Shareholder
The Fund provides financial support to its sole shareholder in the normal course of executing its investment strategies. The loans have a stated maturitydate of May 2, 2022, with the interest accrued at the London Interbank Offered Rate (�LIBOR�) plus 0.50% reset every 90 days and payable quarterly.As the loans began to reset in 2021, they were reset using the Secured Overnight Financing Rate (�SOFR�) plus 0.50%. The following table summarizesfinancial support provided to the Fund�s sole shareholder during the period from January 1, 2021 through September 30, 2021.
As of September 30, 2021, the loans receivable and related interest are recorded as deductions to net assets on the Statement of Assets and Liabilities.
Type Amount Reasons for providing supportThe Fund agrees to make revolving loans toSomerset in an aggregate amount at any one timeoutstanding not to exceed the MaximumRevolver Amount equal to the lesser of (i) U.S.$1,500,000,000, (ii) 60% of Lender�s Net AssetValue and that of Weiss Insurance Partners(Cayman) Ltd. (as determined by Lender withrespect to each Loan related to a BorrowingRequest) and (iii) the amount that the Borroweris permitted to borrow in accordance with itsorganizational documents.
$298,339,134 (principal) and $130,739(accrued interest)
The proceeds of the loans shall be used bySomerset to provide cash collateral insupport of its reinsurance obligations underreinsurance arrangements entered into bySomerset.
The Fund collected $50,000,000 in principal loan payments from the sole shareholder during the period ended September 30, 2021.
On July 27, 2017, the Financial Conduct Authority (�FCA�) announced that it would phase out LIBOR as a benchmark by the end of 2021 and the FCAhas indicated that market participants should not rely on LIBOR being available after 2021. As an alternative to LIBOR, the U.S. Federal Reserve, inconjunction with the Alternative Reference Rates Committee, a steering committee comprised of large U.S. financial institutions, is replacing U.S.-dollarLIBOR with the SOFR, a new index calculated by short-term repurchase agreements, backed by Treasury securities. The Fund has amended its existingloan agreements with the Fund�s sole shareholder to reference SOFR as its preferred rate.
6. Administration Agreement
The Fund has entered into an Administration and Operating Services Agreement with the State Street Bank & Trust Company (�SSB&T�). Under theterms of this agreement, the Fund pays SSB&T a fee, to provide administrative services to the Fund, including custody, accounting, fund administrationand transfer agency services for the Fund.
7. Related Party Transactions
The managing member and chief executive officer of the Adviser is also an investor and director of the Fund�s sole shareholder. A decision by the soleshareholder to withdraw capital from the Fund could have a material negative impact on the Fund.
8. Securities Lending
The Fund participates in State Street�s enhanced custody program. Through this program, State Street is capable of facilitating the Fund�s short sellingactivity and reducing its cost of such activity. The Fund participates in the enhanced custody program which permits self-borrow transactions that doesnot require any collateral for the securities on loan under those transactions. The Fund could experience a delay in recovering its securities and a possibleloss of income or value if the borrower fails to return the securities when due. At September 30, 2021, the Fund had securities on loan with a total valueof $229,276,533.
Copyright © 2021 www.secdatabase.com. All Rights Reserved.Please Consider the Environment Before Printing This Document

9. Subsequent Events
The Fund has evaluated subsequent events through November 18, 2021, the date the form N-PORT was filed. From October 25, 2021 to October 28,2021, the Fund entered into additional loans with the sole shareholder with a total principal amount of $14,000,000.
Copyright © 2021 www.secdatabase.com. All Rights Reserved.Please Consider the Environment Before Printing This Document
Copyright © 2022 FDOKUMEN