Brighthouse Funds Trust II Form NPORT-P Filed 2022-05-26
616
Business Address BRIGHTHOUSE INVESTMENT ADVISERS, LLC 125 HIGH STREET, SUITE 732 BOSTON MA 02110 980-949-5121 Mailing Address BRIGHTHOUSE INVESTMENT ADVISERS, LLC 125 HIGH STREET, SUITE 732 BOSTON MA 02110 SECURITIES AND EXCHANGE COMMISSION FORM NPORT-P Filing Date: 2022-05-26 | Period of Report: 2022-03-31 SEC Accession No. 0001752724-22-124554 (HTML Version on secdatabase.com) FILER Brighthouse Funds Trust II CIK:710826| IRS No.: 833164113 | State of Incorp.:DE | Fiscal Year End: 1231 Type: NPORT-P | Act: 40 | File No.: 811-03618 | Film No.: 22968993 Copyright © 2022 www.secdatabase.com . All Rights Reserved. Please Consider the Environment Before Printing This Document
-
Upload
khangminh22 -
Category
Documents
-
view
1 -
download
0
Transcript of Brighthouse Funds Trust II Form NPORT-P Filed 2022-05-26

Business AddressBRIGHTHOUSEINVESTMENT ADVISERS,LLC125 HIGH STREET, SUITE732BOSTON MA 02110980-949-5121
Mailing AddressBRIGHTHOUSEINVESTMENT ADVISERS,LLC125 HIGH STREET, SUITE732BOSTON MA 02110
SECURITIES AND EXCHANGE COMMISSION
FORM NPORT-P
Filing Date: 2022-05-26 | Period of Report: 2022-03-31SEC Accession No. 0001752724-22-124554
(HTML Version on secdatabase.com)
FILERBrighthouse Funds Trust IICIK:710826| IRS No.: 833164113 | State of Incorp.:DE | Fiscal Year End: 1231Type: NPORT-P | Act: 40 | File No.: 811-03618 | Film No.: 22968993
Copyright © 2022 www.secdatabase.com. All Rights Reserved.Please Consider the Environment Before Printing This Document

Table of Contents
Brighthouse Funds Trust II
Schedule of InvestmentsMarch 31, 2022
Copyright © 2022 www.secdatabase.com. All Rights Reserved.Please Consider the Environment Before Printing This Document

Table of ContentsBrighthouse Funds Trust II
Table of Contents
Schedule of Investments as of March 31, 2022Baillie Gifford International Stock Portfolio BHFTII-1BlackRock Bond Income Portfolio BHFTII-5BlackRock Capital Appreciation Portfolio BHFTII-54BlackRock Ultra-Short Term Bond Portfolio BHFTII-58Brighthouse Asset Allocation 20 Portfolio BHFTII-61Brighthouse Asset Allocation 40 Portfolio BHFTII-62Brighthouse Asset Allocation 60 Portfolio BHFTII-63Brighthouse Asset Allocation 80 Portfolio BHFTII-64Brighthouse/Artisan Mid Cap Value Portfolio BHFTII-65Brighthouse/Dimensional International Small Company Portfolio BHFTII-69Brighthouse/Wellington Balanced Portfolio BHFTII-108Brighthouse/Wellington Core Equity Opportunities Portfolio BHFTII-139Frontier Mid Cap Growth Portfolio BHFTII-142Jennison Growth Portfolio BHFTII-147Loomis Sayles Small Cap Core Portfolio BHFTII-151Loomis Sayles Small Cap Growth Portfolio BHFTII-157MetLife Aggregate Bond Index Portfolio BHFTII-161MetLife Mid Cap Stock index Portfolio BHFTII-181MetLife MSCI EAFE® Index Portfolio BHFTII-189MetLife Russell 2000® Index Portfolio BHFTII-201MetLife Stock Index Portfolio BHFTII-222MFS® Total Return Portfolio BHFTII-231MFS® Value Portfolio BHFTII-246Neuberger Berman Genesis Portfolio BHFTII-250T. Rowe Price Large Cap Growth Portfolio BHFTII-253T. Rowe Price Small Cap Growth Portfolio BHFTII-259VanEck Global Natural Resources Portfolio BHFTII-266Western Asset Management Strategic Bond Opportunities Portfolio BHFTII-270Western Asset Management U.S. Government Portfolio BHFTII-297
Not all Portfolios are available under every product.Refer to your prospectus for information on the Portfolios that are available.
MSCI sponsors the MSCI EAFE® Index, Bloomberg sponsors the Bloomberg U.S. Aggregate Bond Index, Standard & Poor�s sponsors the S&P 500®Index and the S&P 400 MidCap Index, and FTSE Russell sponsors the Russell 2000® Index (together referred to as the �index sponsors�). Directinvestment in the indexes is not possible. The index sponsors do not sponsor, endorse, sell or promote any of the Brighthouse Funds Trust II (the�Fund�s�) Portfolios (the �Portfolios�) or make any representation regarding the advisability of investing in the Portfolios. The index sponsors have noresponsibility for and do not participate in the management of the Portfolio assets or sale of the Portfolio shares. Each index and its associated servicemarks are the exclusive property of the respective index sponsors, and references thereto have been made with permission. The Brighthouse Funds TrustII Statement of Additional Information contains a more detailed description of the limited relationship the index sponsors have with the Fund.
Copyright © 2022 www.secdatabase.com. All Rights Reserved.Please Consider the Environment Before Printing This Document

Table of ContentsBrighthouse Funds Trust II
Baillie Gifford International Stock Portfolio
Schedule of Investments as of March 31, 2022 (Unaudited)Common Stocks��98.4% of Net Assets
Security Description Shares Value
Argentina��4.0%MercadoLibre, Inc. (a) 55,635 $66,176,720
Australia��1.0%Cochlear, Ltd. 105,108 17,510,875
Belgium��0.8%Umicore S.A. 308,141 13,310,809
Canada��3.2%Constellation Software, Inc. 11,879 20,305,902Ritchie Bros. Auctioneers, Inc. 250,649 14,795,810Topicus.com, Inc. (a) 241,047 17,979,949
53,081,661
China��8.4%Alibaba Group Holding, Ltd. (a) 1,518,072 20,778,280Futu Holdings, Ltd. (ADR) (a) (b) 93,000 3,028,080Hangzhou Tigermed Consulting Co., Ltd. -
Class H 556,300 6,702,953JD.com, Inc. - Class A (a) 34,242 1,002,874Meituan - Class B (a) 824,800 16,253,194Ping An Healthcare and Technology Co., Ltd.
(a) (b) 1,991,400 5,193,655Ping An Insurance Group Co. of China, Ltd. -
Class H 3,083,500 21,755,876Prosus NV (a) 169,475 8,971,557Tencent Holdings, Ltd. 719,100 33,923,821Tencent Music Entertainment Group (ADR)
(a) 1,867,617 9,095,295Wuxi Biologics Cayman, Inc. (a) 686,500 5,569,039Zai Lab, Ltd. (ADR) (a) (b) 1,672,750 7,595,436
139,870,060
Denmark��4.4%Ambu A/S - Class B 449,794 6,605,626Chr Hansen Holding A/S 196,416 14,433,982DSV A/S 142,354 27,220,461Novozymes A/S - B Shares 362,242 24,792,419
73,052,488
Finland��1.2%Kone Oyj - Class B 395,927 20,736,857
France��4.2%Danone S.A. 413,904 22,801,092Dassault Systemes SE 493,008 24,292,954Edenred 471,369 23,302,399
70,396,445
Germany��7.8%BioNTech SE (ADR) (a) 53,855 9,185,509Deutsche Boerse AG 222,586 39,985,066Rational AG 27,669 19,198,834SAP SE 306,517 34,202,181Scout24 SE 490,149 28,117,007
130,688,597
Hong Kong��4.2%AIA Group, Ltd. 4,776,600 $50,008,295Hong Kong Exchanges & Clearing, Ltd. 447,900 21,108,171
71,116,466
Copyright © 2022 www.secdatabase.com. All Rights Reserved.Please Consider the Environment Before Printing This Document

India��3.0%Housing Development Finance Corp., Ltd. 1,155,231 36,091,492ICICI Lombard General Insurance Co., Ltd. 856,061 14,916,176
51,007,668
Ireland��5.6%CRH plc 718,859 28,839,697Kingspan Group plc 334,788 32,538,648Ryanair Holdings plc (ADR) (a) 363,605 31,677,268
93,055,613
Italy��1.1%FinecoBank Banca Fineco S.p.A. 1,170,661 17,779,740
Japan��14.1%Denso Corp. (b) 408,700 26,079,718FANUC Corp. 136,800 24,057,432Japan Exchange Group, Inc. 1,026,200 19,120,899MonotaRO Co., Ltd. 1,158,900 24,834,743Nidec Corp. 305,100 24,171,780Nintendo Co., Ltd. 34,800 17,558,786Shimano, Inc. 100,400 22,965,015Shiseido Co., Ltd. 340,900 17,277,150SMC Corp. 47,200 26,361,826Sony Group Corp. 321,300 33,161,688
235,589,037
Netherlands��6.0%Adyen NV (a) 8,592 16,974,101ASML Holding NV 49,574 33,065,827Heineken Holding NV 144,728 11,327,390IMCD NV 211,556 35,970,369Just Eat Takeaway (a) 114,249 3,858,574
101,196,261
Norway��1.1%Aker Carbon Capture ASA (a) 7,094,507 18,233,547
Panama��0.9%Copa Holdings S.A. - Class A (a) 171,410 14,336,732
Russia��0.0%Magnit PJSC (GDR) (c) (d) 624,163 0MMC Norilsk Nickel PJSC (ADR) (c) (d) 392,107 0
0
South Africa��1.8%Discovery, Ltd. (a) 2,423,322 30,094,060
BHFTII-1
Copyright © 2022 www.secdatabase.com. All Rights Reserved.Please Consider the Environment Before Printing This Document

Table of ContentsBrighthouse Funds Trust IIBaillie Gifford International Stock Portfolio
Schedule of Investments as of March 31, 2022 (Unaudited)Common Stocks��(Continued)
Security Description
Shares/PrincipalAmount* Value
South Korea��3.2%Coupang, Inc. (a) 778,174 $13,758,116Samsung Electronics Co., Ltd. 697,369 39,839,048
53,597,164
Spain��1.5%Amadeus IT Group S.A. (a) 396,025 25,795,486
Sweden��3.5%Atlas Copco AB - B Shares 701,579 31,816,749Epiroc AB - B Shares 1,460,262 26,285,385
58,102,134
Switzerland��7.3%Cie Financiere Richemont S.A. - Class A 227,269 28,828,732Kuehne & Nagel International AG 82,269 23,310,586Nestle S.A. 347,651 45,132,335Temenos AG 177,379 16,995,854Wizz Air Holdings plc (a) 202,269 7,603,234
121,870,741
Taiwan��4.3%Sea, Ltd. (ADR) (a) 109,595 13,128,385Taiwan Semiconductor Manufacturing Co.,
Ltd. 2,870,000 59,335,62672,464,011
United Kingdom��5.0%Experian plc 635,784 24,519,006Oxford Nanopore Technologies plc (a) 1,494,316 7,740,775Prudential plc 1,067,177 15,764,095Rio Tinto plc 444,077 35,226,820
83,250,696
United States��0.8%Spotify Technology S.A. (a) 92,119 13,911,811Total Common Stocks
(Cost $1,359,815,718) 1,646,225,679
Short-Term Investment��1.1%Repurchase Agreement��1.1%Fixed Income Clearing Corp.
Repurchase Agreement dated 03/31/22at 0.000%, due on 04/01/22 with amaturity value of $17,467,976;collateralized by U.S. Treasury Note at2.500%, maturing 03/31/27, with amarket value of $17,817,380. 17,467,976 17,467,976
Total Short-Term Investments(Cost $17,467,976) 17,467,976
Securities Lending Reinvestments (e)��1.4%
Security DescriptionPrincipalAmount* Value
Repurchase Agreements��0.8%
Copyright © 2022 www.secdatabase.com. All Rights Reserved.Please Consider the Environment Before Printing This Document

Cantor Fitzgerald & Co.Repurchase Agreement dated 03/31/22at 0.290%, due on 04/01/22 with amaturity value of $4,000,032;collateralized by U.S. Treasury and U.S.Government Agency Obligations withrates ranging from 0.125% - 8.000%,maturity dates ranging from 09/15/22 -07/20/71, and an aggregate marketvalue of $4,080,000. 4,000,000 $4,000,000
Citigroup Global Markets, Ltd.Repurchase Agreement dated 03/31/22at 0.300%, due on 04/01/22 with amaturity value of $400,003;collateralized by U.S. Treasury andForeign Obligations with rates rangingfrom 0.125% - 2.875%, maturity datesranging from 08/15/23 - 02/15/51, andan aggregate market value of $408,000. 400,000 400,000
ING Financial Markets LLCRepurchase Agreement dated 03/31/22at 0.260%, due on 04/01/22 with amaturity value of $3,928,660;collateralized by U.S. GovernmentAgency Obligations with rates rangingfrom 0.350% - 6.625%, maturity datesranging from 04/05/22 - 11/15/30, andan aggregate market value of$4,007,230. 3,928,632 3,928,632
National Bank Financial Inc.Repurchase Agreement dated 03/31/22at 0.320%, due on 04/01/22 with amaturity value of $20,000; collateralizedby U.S. Treasury Obligations with ratesranging from 0.125% - 3.000%, maturitydates ranging from 06/30/22 - 02/15/49,and an aggregate market value of$20,411. 20,000 20,000
National Bank of CanadaRepurchase Agreement dated 03/31/22at 0.320%, due on 04/07/22 with amaturity value of $50,003; collateralizedby U.S. Treasury Obligations with ratesranging from 0.000% - 4.500%, maturitydates ranging from 04/14/22 - 08/15/51,and an aggregate market value of$51,028. 50,000 50,000
NBC Global Finance, Ltd.Repurchase Agreement dated 03/31/22at 0.440%, due on 04/01/22 with amaturity value of $2,300,028;collateralized by U.S. TreasuryObligations with rates ranging from0.125% - 4.750%, maturity datesranging from 05/15/24 - 02/15/50, andvarious Common Stock with anaggregate market value of $2,553,866. 2,300,000 2,300,000
Societe GeneraleRepurchase Agreement dated 03/31/22at 0.360%, due on 04/01/22 with amaturity value of $1,800,018;collateralized by various Common Stockwith an aggregate market value of$2,000,165. 1,800,000 1,800,000Repurchase Agreement dated 03/31/22at 0.410%, due on 04/01/22 with amaturity value of $800,009;collateralized by various Common Stockwith an aggregate market value of$889,032. 800,000 800,000
Copyright © 2022 www.secdatabase.com. All Rights Reserved.Please Consider the Environment Before Printing This Document

Repurchase Agreement dated 03/31/22at 0.420%, due on 04/07/22 with amaturity value of $400,033;collateralized by various Common Stockwith an aggregate market value of$444,516. 400,000 400,000
TD Prime Services LLCRepurchase Agreement dated 03/31/22at 0.400%, due on 04/01/22 with amaturity value of $20,000; collateralizedby various Common Stock with anaggregate market value of $23,164. 20,000 20,000
13,718,632
BHFTII-2
Copyright © 2022 www.secdatabase.com. All Rights Reserved.Please Consider the Environment Before Printing This Document

Table of ContentsBrighthouse Funds Trust IIBaillie Gifford International Stock Portfolio
Schedule of Investments as of March 31, 2022 (Unaudited)Securities Lending Reinvestments (e)��(Continued)
Security Description
Shares/PrincipalAmount* Value
Time Deposits��0.1%DZ Bank AG (NY)
0.300%, 04/01/22 1,000,000 $1,000,000Svenska (NY)
0.260%, 04/01/22 1,000,000 1,000,0002,000,000
Mutual Funds��0.5%BlackRock Liquidity Funds FedFund,
Institutional Shares0.230% (f) 3,000,000 3,000,000
Fidelity Government Portfolio, Class I0.120% (f) 2,000,000 2,000,000
Fidelity Government Portfolio, InstitutionalClass0.160% (f) 50,000 50,000
Morgan Stanley Liquidity Funds GovernmentPortfolio, Institutional Shares0.230% (f) 3,000,000 3,000,000
8,050,000Total Securities Lending Reinvestments
(Cost $23,768,632) 23,768,632Total Investments�100.9%
(Cost $1,401,052,326) 1,687,462,287Other assets and liabilities (net)�(0.9)% (14,573,331 )Net Assets��100.0% $1,672,888,956
* Principal amount stated in U.S. dollars unless otherwise noted.(a) Non-income producing security.(b) All or a portion of the security was held on loan. As of March 31, 2022, the market value of securities loaned was $23,015,452 and the collateral
received consisted of cash in the amount of $23,768,632 and non-cash collateral with a value of $2,102,715. The cash collateral investments aredisclosed in the Schedule of Investments and categorized as Securities Lending Reinvestments. The non-cash collateral received consists of U.S.government securities that are held in safe-keeping by the lending agent, or a third- party custodian, and cannot be sold or repledged by thePortfolio.
(c) Significant unobservable inputs were used in the valuation of this portfolio security; i.e. Level 3.(d) Security was valued in good faith under procedures approved by the Board of Trustees. As of March 31, 2022, these securities represent less than
0.05% of net assets.(e) Represents investment of cash collateral received from securities on loan as of March 31, 2022.(f) The rate shown represents the annualized seven-day yield as of March 31, 2022.
Ten Largest Industries as ofMarch 31, 2022 (Unaudited)
% ofNet Assets
Machinery 8.9Insurance 7.9Internet & Direct Marketing Retail 7.8Software 6.8Semiconductors & Semiconductor Equipment 5.5Capital Markets 5.0Food Products 4.1IT Services 4.0Interactive Media & Services 3.7Trading Companies & Distributors 3.6
Glossary of Abbreviations
Other Abbreviations
Copyright © 2022 www.secdatabase.com. All Rights Reserved.Please Consider the Environment Before Printing This Document

(ADR)� American Depositary Receipt(GDR)� Global Depositary Receipt
Fair Value HierarchyAccounting principles generally accepted in the United States of America (�GAAP�) define fair market value as the price that the Portfolio would receive tosell an asset or pay to transfer a liability in an orderly transaction between market participants at the measurement date. It establishes a fair valuehierarchy that prioritizes inputs to valuation methods and requires disclosure of the fair value hierarchy, separately for each major category of assets andliabilities, that segregates fair value measurements into three levels. Levels 1, 2 and 3 of the fair value hierarchy are defined as follows:
Level 1 - unadjusted quoted prices in active markets for identical investmentsLevel 2 - other significant observable inputs (including, but not limited to, quoted prices for similar assets or liabilities in markets that are either activeor inactive; inputs other than quoted prices that are observable such as interest rates, yield curves, volatilities, prepayment speeds, loss severities,credit risks, default rates, or other market corroborated inputs)Level 3 - significant unobservable inputs based on the best information available in the circumstances, to the extent observable inputs areunavailable (including the Portfolio�s own assumptions used in determining the fair value of investments and derivative financial instruments)
The inputs or methodologies used for valuing investments are not necessarily an indication of the risk associated with investing in them. Changes to theinputs or methodologies used may result in transfers between levels. A reconciliation of Level 3 securities, if any, will be disclosed following the fair valuehierarchy table. For more information about the Portfolio�s policy regarding the valuation of investments, please refer to the Notes to Schedule ofInvestments.
BHFTII-3
Copyright © 2022 www.secdatabase.com. All Rights Reserved.Please Consider the Environment Before Printing This Document

Table of ContentsBrighthouse Funds Trust IIBaillie Gifford International Stock Portfolio
Schedule of Investments as of March 31, 2022 (Unaudited)Fair Value Hierarchy��(Continued)
The following table summarizes the fair value hierarchy of the Portfolio�s investments as of March 31, 2022:
Description Level 1 Level 2 Level 3 TotalCommon Stocks
Argentina $66,176,720 $� $ � $66,176,720Australia � 17,510,875 � 17,510,875Belgium � 13,310,809 � 13,310,809Canada 53,081,661 � � 53,081,661China 12,123,375 127,746,685 � 139,870,060Denmark � 73,052,488 � 73,052,488Finland � 20,736,857 � 20,736,857France � 70,396,445 � 70,396,445Germany 9,185,509 121,503,088 � 130,688,597Hong Kong � 71,116,466 � 71,116,466India � 51,007,668 � 51,007,668Ireland 31,677,268 61,378,345 � 93,055,613Italy � 17,779,740 � 17,779,740Japan � 235,589,037 � 235,589,037Netherlands � 101,196,261 � 101,196,261Norway � 18,233,547 � 18,233,547Panama 14,336,732 � � 14,336,732Russia � � 0 0South Africa � 30,094,060 � 30,094,060South Korea � 39,839,047 � 39,839,047Spain � 25,795,486 � 25,795,486Sweden � 58,102,134 � 58,102,134Switzerland � 121,870,741 � 121,870,741Taiwan 13,128,385 59,335,626 � 72,464,011United Kingdom � 83,250,696 � 83,250,696United States 27,669,928 � � 27,669,928
Total Common Stocks 227,379,578 1,418,846,101 0 1,646,225,679Total Short-Term Investment* � 17,467,976 � 17,467,976Securities Lending Reinvestments
Repurchase Agreements � 13,718,632 � 13,718,632Time Deposits � 2,000,000 � 2,000,000Mutual Funds 8,050,000 � � 8,050,000
Total Securities Lending Reinvestments 8,050,000 15,718,632 � 23,768,632Total Investments $235,429,578 $1,452,032,709 $ 0 $1,687,462,287Collateral for Securities Loaned (Liability) $� $(23,768,632 ) $ � $(23,768,632 )
* See Schedule of Investments for additional detailed categorizations.
Level 3 investments at the beginning and/or end of the period in relation to net assets were not significant and accordingly, a reconciliation of Level 3assets for the period ended March 31, 2022 is not presented.
During the period ended March 31, 2022, transfers into Level 3 in the amount of $21,833,902 were due to trading halts on the securities� respectiveexchanges which resulted in the lack of observable inputs.
BHFTII-4
Copyright © 2022 www.secdatabase.com. All Rights Reserved.Please Consider the Environment Before Printing This Document

Table of ContentsBrighthouse Funds Trust II
BlackRock Bond Income Portfolio
Schedule of Investments as of March 31, 2022 (Unaudited)U.S. Treasury & Government Agencies��49.5% of Net Assets
Security DescriptionPrincipalAmount* Value
Agency Sponsored Mortgage - Backed��32.8%Connecticut Avenue Securities Trust
(CMO)3.199%, SOFR30A + 3.100%, 10/25/41(144A) (a) 2,090,448 $1,923,3695.599%, SOFR30A + 5.500%, 12/25/41(144a) (a) 267,000 237,003
Fannie Mae 15 Yr. Pool2.000%, 10/01/31 107,673 104,9872.000%, 11/01/31 1,362,399 1,328,5422.000%, 12/01/31 148,796 145,0802.000%, 03/01/32 966,342 942,4652.500%, 09/01/27 104,787 103,8232.500%, 02/01/28 13,135 13,0142.500%, 04/01/28 37,015 36,6812.500%, 08/01/28 103,971 103,0322.500%, 01/01/30 562,529 557,1352.500%, 02/01/30 60,646 60,0972.500%, 03/01/30 103,867 102,9102.500%, 07/01/30 386,291 382,5392.500%, 08/01/30 1,243,054 1,231,4042.500%, 09/01/30 691,958 685,5272.500%, 11/01/30 1,338,613 1,326,0002.500%, 03/01/31 66,383 65,7892.500%, 06/01/31 399,910 396,3122.500%, 07/01/31 230,311 228,2392.500%, 08/01/31 32,065 31,7772.500%, 10/01/31 1,938,295 1,920,6902.500%, 11/01/31 1,231,477 1,220,4812.500%, 02/01/32 56,999 56,4672.500%, 03/01/32 214,316 212,4632.500%, 08/01/32 1,323,863 1,311,5332.500%, 02/01/33 2,380,982 2,356,7253.000%, 04/01/28 78,200 79,0123.000%, 05/01/28 85,584 86,4723.000%, 10/01/28 181,811 183,7003.000%, 11/01/28 1,292,322 1,304,7023.000%, 12/01/28 332,183 334,8633.000%, 01/01/29 133,425 134,4973.000%, 04/01/29 590,022 595,5503.000%, 05/01/29 878,444 886,2823.000%, 08/01/29 834,402 842,9023.000%, 10/01/29 237,675 240,1493.000%, 03/01/30 489,285 494,3783.000%, 04/01/30 398,083 402,2293.000%, 05/01/30 649,644 656,4073.000%, 07/01/30 477,820 482,6583.000%, 08/01/30 2,116,095 2,138,1263.000%, 09/01/30 570,418 576,1863.000%, 08/01/31 1,989,955 2,005,9473.000%, 09/01/31 241,595 244,1153.000%, 03/01/32 422,799 427,2223.500%, 08/01/28 155,157 158,4023.500%, 10/01/28 1,436,571 1,479,7533.500%, 11/01/28 1,415,474 1,455,1383.500%, 02/01/29 1,616,589 1,658,4093.500%, 04/01/29 411,435 421,3273.500%, 05/01/29 1,251,693 1,281,2853.500%, 07/01/29 421,002 430,967
Copyright © 2022 www.secdatabase.com. All Rights Reserved.Please Consider the Environment Before Printing This Document

3.500%, 09/01/29 85,121 87,4003.500%, 08/01/30 335,821 347,754
Agency Sponsored Mortgage - Backed��(Continued)Fannie Mae 15 Yr. Pool
3.500%, 11/01/32 127,458 132,1383.500%, 01/01/33 80,839 83,8064.000%, 10/01/33 3,142,649 3,290,8804.500%, 02/01/25 67,711 69,5554.500%, 04/01/25 16,933 17,5144.500%, 07/01/25 47,658 48,9824.500%, 06/01/26 393,677 404,384
Fannie Mae 20 Yr. Pool1.500%, 11/01/41 21,240,205 19,254,9331.500%, 12/01/41 10,845,340 9,829,8792.000%, 02/01/42 788,014 736,3632.000%, 03/01/42 7,553,076 7,057,9882.000%, 04/01/42 1,160,506 1,089,1103.000%, 10/01/36 54,023 53,9793.000%, 11/01/36 621,693 622,1043.000%, 12/01/36 979,714 981,560
Fannie Mae 30 Yr. Pool2.000%, 09/01/50 528,667 492,5712.000%, 11/01/50 420,876 391,9342.000%, 12/01/50 2,414,002 2,248,2622.000%, 03/01/51 1,855,180 1,727,3102.000%, 04/01/51 2,333,863 2,172,8422.000%, 11/01/51 3,121,781 2,901,2422.000%, 12/01/51 7,106,461 6,613,2622.000%, 01/01/52 7,743,982 7,215,4842.000%, 02/01/52 9,330,431 8,690,7412.500%, 11/01/51 1,249,267 1,200,2642.500%, 01/01/52 25,478,596 24,462,3432.500%, 02/01/52 6,852,923 6,583,0263.000%, 03/01/43 5,010,522 4,998,8833.000%, 04/01/43 2,915,719 2,907,2593.000%, 05/01/43 1,544,088 1,539,7973.000%, 06/01/43 55,015 54,9243.000%, 06/01/46 29,384 29,2123.000%, 08/01/46 42,359 42,1113.000%, 11/01/46 1,674,909 1,664,0863.000%, 02/01/47 415,266 411,8403.000%, 03/01/47 1,736,301 1,723,1383.000%, 03/01/50 620,828 611,8793.000%, 08/01/50 2,393,128 2,350,1483.500%, 01/01/42 255,021 260,1393.500%, 04/01/42 170,311 173,4923.500%, 05/01/42 25,447 25,9113.500%, 06/01/42 48,788 49,7623.500%, 07/01/42 59,579 60,7663.500%, 02/01/45 1,771,994 1,807,2043.500%, 05/01/47 883,857 898,2623.500%, 11/01/47 568,382 574,6893.500%, 12/01/47 567,682 572,5983.500%, 01/01/48 1,720,742 1,746,0493.500%, 02/01/48 262,342 265,1743.500%, 03/01/48 1,455,452 1,470,7193.500%, 04/01/48 999,597 1,018,8273.500%, 06/01/49 9,644,378 9,761,9303.500%, 01/01/51 24,138,903 24,203,015
BHFTII-5
Copyright © 2022 www.secdatabase.com. All Rights Reserved.Please Consider the Environment Before Printing This Document

Table of ContentsBrighthouse Funds Trust IIBlackRock Bond Income Portfolio
Schedule of Investments as of March 31, 2022 (Unaudited)U.S. Treasury & Government Agencies��(Continued)
Security DescriptionPrincipalAmount* Value
Agency Sponsored Mortgage - Backed��(Continued)Fannie Mae 30 Yr. Pool
4.000%, 08/01/33 420,575 $439,7254.000%, 01/01/41 112,953 117,8994.000%, 01/01/42 518,479 542,4164.000%, 02/01/42 863,278 899,8574.000%, 05/01/42 195,879 203,4584.000%, 11/01/46 180,061 185,5264.000%, 06/01/47 587,403 604,9374.000%, 08/01/47 383,547 396,4624.000%, 09/01/47 34,461 35,5044.000%, 10/01/47 272,472 280,5074.000%, 01/01/48 270,166 278,8504.000%, 04/01/48 61,058 62,4274.000%, 05/01/48 72,352 74,4594.000%, 06/01/48 50,519 51,7894.000%, 07/01/48 51,158 52,3224.000%, 08/01/48 716,688 743,3774.000%, 09/01/48 337,741 345,6874.000%, 10/01/48 152,360 155,8284.000%, 09/01/49 1,401,433 1,432,0034.000%, 03/01/50 667,795 681,9764.000%, 04/01/50 356,288 364,5694.000%, 05/01/50 564,907 576,8514.000%, 06/01/50 800,000 818,4664.000%, 11/01/50 59,506 60,8024.000%, 01/01/51 4,201,608 4,319,8844.000%, 03/01/51 5,889,364 6,011,8634.000%, 10/01/51 7,911,439 8,087,8184.500%, 08/01/39 482,888 513,6284.500%, 11/01/39 334,586 355,8854.500%, 01/01/40 17,753 18,8904.500%, 04/01/40 33,057 35,0764.500%, 05/01/40 81,263 86,4584.500%, 06/01/40 72,848 77,5094.500%, 07/01/40 156,947 166,9584.500%, 11/01/40 308,369 328,0484.500%, 07/01/41 77,245 82,1774.500%, 09/01/41 296,143 315,1034.500%, 10/01/41 88,724 94,4304.500%, 01/01/42 69,083 73,4484.500%, 08/01/42 381,160 405,6334.500%, 09/01/43 386,440 407,6614.500%, 10/01/43 649,936 690,3754.500%, 11/01/43 1,711,894 1,809,9604.500%, 12/01/43 724,182 771,7684.500%, 01/01/44 576,566 614,2544.500%, 06/01/44 2,378,677 2,533,1224.500%, 07/01/45 665,925 702,9134.500%, 09/01/45 340,548 362,4004.500%, 11/01/45 1,148,995 1,220,7384.500%, 12/01/45 490,947 522,8604.500%, 07/01/46 2,226,406 2,371,3764.500%, 09/01/46 368,687 390,5174.500%, 09/01/47 43,738 45,9524.500%, 10/01/47 285,683 299,9034.500%, 11/01/47 1,448,019 1,518,212
Agency Sponsored Mortgage - Backed��(Continued)Fannie Mae 30 Yr. Pool
4.500%, 12/01/47 49,721 52,084
Copyright © 2022 www.secdatabase.com. All Rights Reserved.Please Consider the Environment Before Printing This Document

4.500%, 01/01/48 1,452,025 1,522,7854.500%, 02/01/48 78,215 82,0434.500%, 03/01/48 120,432 126,1714.500%, 04/01/48 753,077 799,4174.500%, 05/01/48 6,532,624 6,886,8284.500%, 07/01/48 116,043 121,8314.500%, 08/01/48 1,350,022 1,424,3914.500%, 11/01/48 859,641 901,0224.500%, 02/01/49 7,176,583 7,617,6454.500%, 05/01/49 6,584,961 6,989,6805.000%, 11/01/32 2,201 2,3355.000%, 09/01/35 97,817 105,2485.000%, 06/01/39 4,133,798 4,451,0565.000%, 04/01/41 5,535 5,8265.000%, 07/01/41 130,874 141,1255.000%, 08/01/41 130,627 141,3355.000%, 01/01/42 46,720 49,1775.500%, 11/01/32 472,120 516,1475.500%, 12/01/32 79,184 86,7025.500%, 01/01/33 266,379 291,3885.500%, 12/01/33 104,371 114,1465.500%, 05/01/34 883,843 958,1085.500%, 08/01/37 912,147 998,7055.500%, 02/01/38 148,454 163,0175.500%, 03/01/38 90,165 99,3775.500%, 06/01/38 94,367 100,3565.500%, 12/01/38 81,536 86,7195.500%, 01/01/39 149,847 165,1165.500%, 08/01/39 111,901 121,5315.500%, 12/01/39 200,107 219,4775.500%, 04/01/40 20,262 21,9755.500%, 04/01/41 111,467 119,3976.000%, 02/01/34 106,614 115,2606.000%, 08/01/34 76,895 84,4926.000%, 04/01/35 1,235,483 1,365,5326.000%, 06/01/36 159,988 178,5296.000%, 02/01/38 228,391 254,7956.000%, 03/01/38 89,179 99,6176.000%, 05/01/38 254,182 283,9346.000%, 10/01/38 283,318 312,9806.000%, 12/01/38 104,485 116,7166.000%, 04/01/40 952,977 1,063,7216.000%, 09/01/40 103,291 115,2146.000%, 06/01/41 218,868 244,2986.500%, 05/01/40 1,382,733 1,525,439
Fannie Mae REMICS (CMO)5.000%, 04/25/35 7,872 8,030
Freddie Mac 15 Yr. Gold Pool2.500%, 04/01/27 33,106 32,8042.500%, 10/01/28 163,020 161,6292.500%, 08/01/29 414,093 410,2722.500%, 12/01/29 146,850 145,4532.500%, 05/01/30 478,433 474,1812.500%, 07/01/30 294,275 291,710
BHFTII-6
Copyright © 2022 www.secdatabase.com. All Rights Reserved.Please Consider the Environment Before Printing This Document

Table of ContentsBrighthouse Funds Trust IIBlackRock Bond Income Portfolio
Schedule of Investments as of March 31, 2022 (Unaudited)U.S. Treasury & Government Agencies��(Continued)
Security DescriptionPrincipalAmount* Value
Agency Sponsored Mortgage - Backed��(Continued)Freddie Mac 15 Yr. Gold Pool
2.500%, 08/01/30 1,142,467 $1,132,6642.500%, 09/01/30 1,212,722 1,202,0162.500%, 04/01/31 917,123 908,9923.000%, 01/01/30 328,947 332,6123.000%, 04/01/30 1,944,323 1,965,9723.000%, 05/01/30 330,034 333,7053.000%, 06/01/30 12,030 12,1643.000%, 07/01/30 701,949 708,6623.000%, 08/01/30 219,960 222,413
Freddie Mac 20 Yr. Pool2.000%, 02/01/42 479,396 448,9302.000%, 03/01/42 941,804 883,8622.000%, 04/01/42 494,699 464,2643.000%, 09/01/37 68,340 68,5883.000%, 06/01/38 1,402,808 1,398,5813.500%, 01/01/34 631,492 649,5723.500%, 05/01/35 2,409,039 2,439,356
Freddie Mac 30 Yr. Gold Pool3.000%, 01/01/43 900,659 900,3403.000%, 03/01/43 1,547,639 1,544,1863.000%, 12/01/46 942,213 936,4803.500%, 04/01/42 1,068,872 1,091,1043.500%, 05/01/42 33,557 34,2553.500%, 08/01/42 912,174 931,1063.500%, 10/01/42 43,071 43,6643.500%, 06/01/43 169,926 173,0063.500%, 01/01/44 287,442 292,7713.500%, 05/01/44 67,534 68,9343.500%, 06/01/44 140,357 143,2793.500%, 07/01/44 55,802 56,9253.500%, 09/01/44 107,631 109,6503.500%, 09/01/45 101,918 103,8553.500%, 03/01/47 906,500 914,9403.500%, 10/01/47 750,916 767,7093.500%, 12/01/47 938,976 959,9753.500%, 01/01/48 320,135 326,0194.000%, 08/01/40 102,670 107,4724.000%, 09/01/40 138,613 145,1104.000%, 10/01/40 83,146 87,0494.000%, 11/01/40 256,118 268,1334.000%, 04/01/41 6,440 6,7414.000%, 10/01/41 223,372 233,8554.000%, 09/01/43 224,174 233,8944.000%, 04/01/44 519,128 542,1744.000%, 07/01/44 102,722 107,2974.000%, 02/01/45 137,230 142,2484.000%, 09/01/45 630,363 656,3604.000%, 12/01/45 4,256,360 4,428,9834.500%, 02/01/39 490,749 522,1514.500%, 08/01/39 368,378 392,3634.500%, 12/01/39 99,548 106,0044.500%, 07/01/40 34,004 36,2104.500%, 05/01/41 520,861 553,9624.500%, 05/01/42 566,916 603,4854.500%, 10/01/43 156,085 162,344
Agency Sponsored Mortgage - Backed��(Continued)Freddie Mac 30 Yr. Gold Pool
4.500%, 12/01/43 681,074 726,075
Copyright © 2022 www.secdatabase.com. All Rights Reserved.Please Consider the Environment Before Printing This Document

4.500%, 04/01/47 1,208,456 1,276,9114.500%, 05/01/47 433,703 457,7164.500%, 07/01/47 997,227 1,050,5224.500%, 02/01/49 1,299,135 1,370,9644.500%, 04/01/49 698,759 734,5765.000%, 10/01/41 269,650 291,7195.000%, 11/01/41 2,009,124 2,173,8445.500%, 02/01/35 73,672 80,7265.500%, 09/01/39 69,305 75,3325.500%, 01/01/40 81,809 87,1185.500%, 06/01/41 1,037,361 1,144,037
Freddie Mac 30 Yr. Pool2.000%, 08/01/50 378,040 352,0542.000%, 11/01/50 707,929 659,2672.000%, 05/01/51 1,246,374 1,160,6332.000%, 07/01/51 4,856,426 4,526,8492.000%, 09/01/51 1,647,372 1,531,8612.000%, 10/01/51 4,590,794 4,264,8512.000%, 12/01/51 3,444,172 3,207,8802.000%, 01/01/52 16,932,671 15,772,3922.000%, 02/01/52 1,919,238 1,786,7152.500%, 02/01/51 1,409,337 1,354,2032.500%, 05/01/51 11,804,886 11,330,8662.500%, 11/01/51 10,243,888 9,832,6982.500%, 12/01/51 6,299,865 6,046,8752.500%, 01/01/52 15,582,088 14,937,2913.000%, 06/01/44 8,044,831 8,034,7943.000%, 02/01/47 669,214 665,2983.000%, 08/01/50 5,603,408 5,520,3083.500%, 09/01/44 19,197 19,5813.500%, 03/01/46 3,019,307 3,079,2533.500%, 09/01/46 725,066 732,1793.500%, 01/01/48 4,271,588 4,338,4043.500%, 06/01/48 1,217,335 1,238,4293.500%, 08/01/50 386,116 389,8404.000%, 01/01/45 6,308,291 6,594,8484.000%, 07/01/47 1,479,645 1,540,8464.000%, 04/01/48 3,197,716 3,342,7884.000%, 06/01/48 1,434,041 1,493,8564.000%, 05/01/49 144,383 148,7674.000%, 06/01/50 1,605,977 1,657,626
Freddie Mac Gold Pool3.000%, 09/01/27 194,913 197,0573.000%, 07/01/28 113,524 114,771
Freddie Mac Multifamily Structured Pass-Through Certificates0.802%, 05/25/29 (a) (b) 6,286,790 286,8990.882%, 11/25/30 (a) (b) 1,299,579 79,815
Freddie Mac STACR REMIC Trust2.749%, SOFR30A + 2.650%, 01/25/51(144A) (a) 1,400,000 1,239,7183.099%, SOFR30A + 3.000%, 08/25/33(144A) (a) 1,444,344 1,257,6523.099%, SOFR30A + 3.000%, 12/25/50(144A) (a) 610,000 570,3213.499%, SOFR30A + 3.400%, 08/25/33(144A) (a) 1,160,000 1,080,1013.449%, SOFR30A + 3.350%, 09/25/41(144A) (a) 809,072 721,9323.499%, SOFR30A + 3.400%, 10/25/41(144A) (a) 3,541,000 3,266,7983.599%, SOFR30A + 3.500%, 10/25/33(144A) (a) 1,148,271 1,074,354
BHFTII-7
Copyright © 2022 www.secdatabase.com. All Rights Reserved.Please Consider the Environment Before Printing This Document

Table of ContentsBrighthouse Funds Trust IIBlackRock Bond Income Portfolio
Schedule of Investments as of March 31, 2022 (Unaudited)U.S. Treasury & Government Agencies��(Continued)
Security DescriptionPrincipalAmount* Value
Agency Sponsored Mortgage - Backed��(Continued)Freddie Mac STACR REMIC Trust
4.849%, SOFR30A + 4.750%, 01/25/51(144A) (a) 860,000 $748,0565.099%, SOFR30A + 5.000%, 08/25/33(144A) (a) 866,467 769,9597.099%, SOFR30A + 7.000%, 12/25/41(144A) (a) 377,000 332,941
Freddie Mac Structured Agency Credit Risk Debt Notes (CMO)3.749%, SOFR30A + 3.650%, 11/25/41(144A) (a) 2,111,699 1,999,1954.099%, SOFR30A + 4.000%, 11/25/50(144A) (a) 410,000 399,7434.907%, 1M LIBOR + 4.450%, 03/25/30 (a) 682,210 711,2206.099%, SOFR30A + 6.000%, 08/25/33(144A) (a) 1,050,000 998,1627.899%, SOFR30A + 7.800%, 11/25/41(144A) (a) 1,046,708 976,568
FREMF Mortgage Trust0.100%, 01/25/29 (144A) (b) 25,318,087 130,6064.229%, 08/25/50 (144A) (a) 440,000 441,576
FRESB Mortgage Trust3.625%, 06/25/28 (a) 339,620 343,125
Ginnie Mae I 30 Yr. Pool3.000%, 02/15/45 541,651 538,2643.500%, 01/15/42 143,975 148,2773.500%, 02/15/42 80,711 81,5923.500%, 04/15/42 174,072 176,2273.500%, 05/15/42 212,182 215,7183.500%, 08/15/42 221,215 223,8293.500%, 11/15/42 111,519 112,6923.500%, 12/15/42 597,718 613,9313.500%, 01/15/43 198,574 201,2573.500%, 02/15/43 352,565 359,0883.500%, 03/15/43 260,899 264,8093.500%, 04/15/43 886,499 907,4603.500%, 05/15/43 1,321,161 1,353,2463.500%, 06/15/43 373,202 382,3593.500%, 07/15/43 1,085,746 1,113,6514.000%, 03/15/41 294,314 311,5504.000%, 12/15/41 23,118 23,8214.500%, 02/15/42 3,780,981 4,074,8384.500%, 03/15/47 83,033 89,1394.500%, 04/15/47 197,632 213,4824.500%, 05/15/47 61,633 67,0395.000%, 12/15/38 126,199 139,1785.000%, 07/15/39 204,979 226,0765.000%, 10/15/39 138,548 152,0515.000%, 09/15/40 10,374 11,4055.000%, 12/15/40 399,574 440,6995.500%, 04/15/33 12,689 14,0336.500%, 04/15/33 36,196 39,109
Ginnie Mae II 30 Yr. Pool2.000%, 08/20/50 8,359,287 7,984,2752.000%, 11/20/50 5,645,618 5,397,3322.000%, TBA (c) 39,839,200 37,896,6222.500%, 10/20/51 8,311,253 8,071,9442.500%, 12/20/51 15,581,731 15,133,0802.500%, TBA (c) 28,509,000 27,636,9943.000%, 12/20/44 46,985 46,861
Copyright © 2022 www.secdatabase.com. All Rights Reserved.Please Consider the Environment Before Printing This Document

3.000%, 09/20/47 973,776 969,7113.000%, 03/20/49 26,094 25,9713.000%, 05/20/50 382,496 379,6183.000%, 01/20/51 26,920,859 26,718,1803.000%, TBA (c) 9,491,470 9,367,5683.500%, 04/20/43 858,316 881,267
Agency Sponsored Mortgage - Backed��(Continued)Ginnie Mae II 30 Yr. Pool
3.500%, 05/20/43 469,085 481,5023.500%, 07/20/43 36,397 37,3713.500%, 02/20/44 932,012 956,8803.500%, 03/20/45 33,841 34,6063.500%, 04/20/45 50,573 51,7633.500%, 05/20/45 207,216 211,8893.500%, 07/20/45 37,420 38,4073.500%, 08/20/45 49,766 50,8583.500%, 10/20/45 94,146 96,1763.500%, 11/20/45 34,805 35,6223.500%, 12/20/45 524,613 536,0383.500%, 01/20/46 105,384 107,6553.500%, 05/20/46 442,204 450,5473.500%, 09/20/46 168,355 171,1993.500%, 10/20/46 955,663 973,8223.500%, 03/20/48 41,672 42,2713.500%, 04/20/48 16,908 17,1523.500%, TBA (c) 18,100,496 18,199,4834.000%, 04/20/39 18,938 19,8974.000%, 07/20/39 129,694 136,2624.000%, 09/20/40 34,178 35,9104.000%, 10/20/40 396,832 416,9374.000%, 11/20/40 221,651 232,8814.000%, 12/20/40 832,796 874,9884.000%, 01/20/41 750,275 784,6174.000%, 02/20/41 13,444 14,1264.000%, 07/20/43 77,671 81,6054.000%, 08/20/44 299,761 311,0144.000%, 10/20/46 51,182 52,8304.000%, 05/20/47 210,358 217,4884.000%, 06/20/47 537,821 554,1114.000%, 11/20/47 625,683 647,9224.000%, 12/20/47 302,717 313,4714.000%, 05/20/50 619,810 634,1104.000%, TBA (c) 7,606,500 7,742,3774.500%, 12/20/39 30,577 32,5554.500%, 01/20/40 37,146 39,5494.500%, 02/20/40 30,572 32,5494.500%, 05/20/40 1,928 2,0534.500%, 09/20/48 347,509 365,9774.500%, 03/20/49 1,349,382 1,403,0374.500%, 04/20/49 290,724 302,3314.500%, 05/20/49 1,141,485 1,183,2244.500%, 04/20/50 32,126 33,3964.500%, TBA (c) 175,000 180,9065.000%, 10/20/33 385,631 409,3165.000%, 10/20/39 113,249 124,2095.000%, 07/20/42 156,276 171,4845.000%, TBA (c) 2,597,000 2,708,793
Government National MortgageAssociation
0.540%, 03/16/55 (a) (b) 1,308,108 28,1500.670%, 09/16/55 (a) (b) 1,255,623 37,5530.685%, 02/16/50 (a) (b) 357,541 9,9850.822%, 12/16/57 (a) (b) 1,759,885 75,711
Uniform Mortgage-Backed Securities 15Yr. Pool
1.500%, TBA (c) 15,081,000 14,298,084
BHFTII-8
Copyright © 2022 www.secdatabase.com. All Rights Reserved.Please Consider the Environment Before Printing This Document

Table of ContentsBrighthouse Funds Trust IIBlackRock Bond Income Portfolio
Schedule of Investments as of March 31, 2022 (Unaudited)U.S. Treasury & Government Agencies��(Continued)
Security DescriptionPrincipalAmount* Value
Agency Sponsored Mortgage - Backed��(Continued)Uniform Mortgage-Backed Securities 15Yr. Pool
2.000%, TBA (c) 39,280,000 $38,149,1662.500%, TBA (c) 7,163,800 7,079,569
Uniform Mortgage-Backed Securities 30Yr. Pool1.500%, TBA (c) 14,550,400 12,985,4442.000%, TBA (c) 138,727,635 128,661,7232.500%, TBA (c) 63,110,335 60,147,0593.000%, TBA (c) 12,820,174 12,527,8273.500%, TBA (c) 85,345,006 85,430,9924.000%, TBA (c) 79,600,906 81,138,572
1,102,326,459
U.S. Treasury��16.7%U.S. Treasury Bonds
1.125%, 05/15/40 10,822,000 8,527,3981.125%, 08/15/40 10,822,000 8,483,8561.375%, 11/15/40 10,822,000 8,847,4081.750%, 08/15/41 340,600 295,2042.250%, 08/15/49 4,760,000 4,526,0912.500%, 02/15/45 (d) 20,100,000 19,577,0862.750%, 11/15/47 (d) 20,100,000 20,855,3202.875%, 05/15/43 3,865,000 4,001,1812.875%, 11/15/46 3,706,000 3,896,3673.000%, 02/15/48 (d) 23,806,000 25,936,4513.125%, 02/15/43 3,865,000 4,159,7063.625%, 08/15/43 3,865,000 4,484,0043.750%, 11/15/43 3,865,000 4,571,2684.250%, 05/15/39 1,010,000 1,264,7494.375%, 11/15/39 1,010,000 1,283,9234.500%, 08/15/39 1,010,000 1,303,650
U.S. Treasury Notes0.125%, 03/31/23 10,482,000 10,318,6280.125%, 04/30/23 10,482,000 10,296,9270.125%, 05/31/23 10,482,000 10,267,8560.250%, 04/15/23 27,956,000 27,526,8320.375%, 04/30/25 41,246,000 38,621,4010.375%, 11/30/25 12,344,000 11,412,4140.375%, 12/31/25 12,344,000 11,398,4300.500%, 03/15/23 27,956,000 27,650,2310.500%, 05/31/27 15,364,000 13,904,4200.750%, 05/31/26 12,344,000 11,480,8841.125%, 02/15/31 1,989,000 1,795,9271.250%, 03/31/28 5,324,000 4,965,8781.250%, 04/30/28 5,324,000 4,959,6391.250%, 05/31/28 5,324,000 4,956,5191.500%, 10/31/24 41,246,000 40,240,6291.500%, 08/15/26 10,766,000 10,317,2761.500%, 02/15/30 (e) 5,471,000 5,129,0631.625%, 11/30/26 15,364,000 14,787,8501.625%, 08/15/29 2,246,000 2,129,9271.625%, 05/15/31 1,989,000 1,872,6121.750%, 04/30/22 14,119,000 14,136,0561.750%, 07/15/22 27,956,000 28,041,1791.750%, 07/31/24 14,357,000 14,132,6721.750%, 12/31/24 (e) 41,246,000 40,417,858
U.S. Treasury��(Continued)U.S. Treasury Notes
Copyright © 2022 www.secdatabase.com. All Rights Reserved.Please Consider the Environment Before Printing This Document

2.000%, 02/15/25 9,276,000 9,145,5562.125%, 12/31/22 7,432,000 7,469,7412.125%, 07/31/24 7,432,000 7,379,1632.125%, 05/15/25 8,178,000 8,078,3312.250%, 08/15/27 22,796,000 22,550,2312.375%, 05/15/29 5,471,000 5,455,1852.625%, 02/15/29 5,471,000 5,536,8232.750%, 05/31/23 7,432,000 7,503,9982.875%, 08/15/28 2,236,000 2,291,1143.125%, 11/15/28 4,225,000 4,399,116
562,584,028Total U.S. Treasury & Government Agencies
(Cost $1,721,686,427) 1,664,910,487
Corporate Bonds & Notes��33.4%Advertising��0.1%Clear Channel Outdoor Holdings, Inc.
5.125%, 08/15/27 (144A) 640,000 633,082Interpublic Group of Cos., Inc. (The)
4.750%, 03/30/30 738,000 792,363Lamar Media Corp.
3.750%, 02/15/28 54,000 51,275Omnicom Group, Inc.
4.200%, 06/01/30 738,000 770,457Outfront Media Capital LLC / Outfront
Media Capital Corp.4.625%, 03/15/30 (144A) 42,000 39,5335.000%, 08/15/27 (144A) 583,000 569,929
2,856,639
Aerospace/Defense��1.0%BAE Systems Holdings, Inc.
3.850%, 12/15/25 (144A) 1,474,000 1,478,999BAE Systems plc
3.400%, 04/15/30 (144A) 3,360,000 3,310,833Embraer Netherlands Finance B.V.
5.050%, 06/15/25 303,000 306,0335.400%, 02/01/27 174,000 176,8296.950%, 01/17/28 (144A) 205,000 216,788
General Dynamics Corp.3.625%, 04/01/30 834,000 858,935
L3Harris Technologies, Inc.1.800%, 01/15/31 2,595,000 2,254,7304.400%, 06/15/28 3,389,000 3,524,365
Lockheed Martin Corp.2.800%, 06/15/50 633,000 554,0763.600%, 03/01/35 1,732,000 1,750,0033.800%, 03/01/45 280,000 285,9094.070%, 12/15/42 514,000 548,6964.090%, 09/15/52 287,000 315,290
Northrop Grumman Corp.3.250%, 01/15/28 3,173,000 3,173,1444.030%, 10/15/47 700,000 736,524
BHFTII-9
Copyright © 2022 www.secdatabase.com. All Rights Reserved.Please Consider the Environment Before Printing This Document

Table of ContentsBrighthouse Funds Trust IIBlackRock Bond Income Portfolio
Schedule of Investments as of March 31, 2022 (Unaudited)Corporate Bonds & Notes��(Continued)
Security DescriptionPrincipalAmount* Value
Aerospace/Defense��(Continued)Northrop Grumman Corp.
5.250%, 05/01/50 1,371,000 $1,708,463Raytheon Technologies Corp.
2.150%, 05/18/30 (EUR) 906,000 1,002,3532.375%, 03/15/32 1,119,000 1,027,2742.820%, 09/01/51 1,750,000 1,471,7343.030%, 03/15/52 1,766,000 1,547,2423.150%, 12/15/24 775,000 778,3914.125%, 11/16/28 3,031,000 3,168,3124.200%, 12/15/44 425,000 425,4624.500%, 06/01/42 108,000 119,0917.000%, 11/01/28 1,810,000 2,169,9077.200%, 08/15/27 525,000 624,877
33,534,260
Agriculture��0.3%Altria Group, Inc.
3.125%, 06/15/31 (EUR) 2,110,000 2,334,7613.400%, 02/04/41 829,000 680,3155.800%, 02/14/39 1,943,000 2,094,169
BAT Capital Corp.4.906%, 04/02/30 426,000 438,801
Darling Ingredients, Inc.5.250%, 04/15/27 (144A) 216,000 220,320
Philip Morris International, Inc.1.450%, 08/01/39 (EUR) 2,000,000 1,680,438
Reynolds American, Inc.5.850%, 08/15/45 1,045,000 1,075,228
8,524,032
Airlines��0.6%Air Canada Pass-Through Trust
3.300%, 01/15/30 (144A) 495,763 472,9123.700%, 01/15/26 (144A) 6,574 6,276
Allegiant Travel Co.8.500%, 02/05/24 (144A) 892,000 932,140
American Airlines Pass-Through Trust3.000%, 10/15/28 1,650,174 1,533,3293.150%, 02/15/32 1,074,345 1,009,1803.200%, 06/15/28 420,475 399,0243.575%, 01/15/28 132,863 126,2353.600%, 09/22/27 231,915 225,3793.650%, 02/15/29 305,273 295,6723.850%, 02/15/28 668,647 593,6624.400%, 09/22/23 1,376,658 1,340,2624.950%, 02/15/25 263,553 252,6445.250%, 01/15/24 765,060 746,354
Avianca Midco 2 Ltd9.000%, 12/01/28 (144A) 526,316 505,263
Azul Investments LLP5.875%, 10/26/24 (144A) 455,000 400,4057.250%, 06/15/26 (144A) (e) 315,000 265,388
Delta Air Lines Pass-Through Trust3.204%, 10/25/25 2,258,000 2,259,923
Airlines��(Continued)Gol Finance S.A.
7.000%, 01/31/25 (144A) 800,000 664,000Latam Finance, Ltd.
6.875%, 04/11/24 (f) 200,000 179,000
Copyright © 2022 www.secdatabase.com. All Rights Reserved.Please Consider the Environment Before Printing This Document

Turkish Airlines Pass-Through Trust4.200%, 03/15/27 (144A) 796,076 653,189
United Airlines Pass-Through Trust2.700%, 05/01/32 542,635 496,7432.875%, 10/07/28 420,298 398,3103.100%, 07/07/28 127,346 123,3373.450%, 12/01/27 168,834 166,7263.500%, 05/01/28 652,593 589,5783.500%, 03/01/30 225,152 217,5873.650%, 10/07/25 55,880 52,3784.000%, 04/11/26 192,753 193,4534.150%, 08/25/31 208,639 210,5684.625%, 09/03/22 80,332 80,7744.750%, 04/11/22 191,032 191,1694.875%, 01/15/26 548,640 541,4785.875%, 10/15/27 3,075,874 3,183,795
19,306,133
Apparel��0.0%William Carter Co. (The)
5.625%, 03/15/27 (144A) 42,000 42,620
Auto Manufacturers��0.5%Ford Motor Co.
3.250%, 02/12/32 (e) 397,000 354,573General Motors Co.
4.000%, 04/01/25 514,000 518,7615.400%, 10/02/23 338,000 349,721
General Motors Financial Co., Inc.2.400%, 10/15/28 1,163,000 1,040,7722.700%, 06/10/31 75,000 66,0392.750%, 06/20/25 1,117,000 1,084,8963.700%, 05/09/23 3,188,000 3,219,8334.000%, 01/15/25 2,190,000 2,216,9114.350%, 04/09/25 (e) 1,754,000 1,783,8935.100%, 01/17/24 1,344,000 1,389,509
Hyundai Capital Services, Inc.3.000%, 08/29/22 (144A) 1,220,000 1,223,311
Nissan Motor Co., Ltd.4.810%, 09/17/30 (144A) 5,041,000 4,997,421
18,245,640
Auto Parts & Equipment��0.0%Dana, Inc.
4.250%, 09/01/30 (e) 143,000 130,874Metalsa S A P I De C.V.
3.750%, 05/04/31 209,000 181,606Nemak S.A.B. de C.V.
3.625%, 06/28/31 209,000 182,386494,866
BHFTII-10
Copyright © 2022 www.secdatabase.com. All Rights Reserved.Please Consider the Environment Before Printing This Document

Table of ContentsBrighthouse Funds Trust IIBlackRock Bond Income Portfolio
Schedule of Investments as of March 31, 2022 (Unaudited)Corporate Bonds & Notes��(Continued)
Security DescriptionPrincipalAmount* Value
Banks��8.7%Banco Davivienda S.A.
6.650%, 10Y H15 + 5.097%, 04/22/31(144A) (a) 200,000 $184,352
Banco Espirito Santo S.A.4.000%, 01/21/19 (EUR) (f) 200,000 32,081
Banco GNB Sudameris S.A.7.500%, 5Y H15 + 6.660%, 04/16/31(144A) (a) 150,000 139,632
Banco Mercantil del Norte S.A.5.875%, 5Y H15 + 4.643%, 01/24/27(144A) (a) 300,000 277,5006.625%, 10Y H15 + 5.034%, 01/24/32(144A) (a) 270,000 249,075
Banco Santander S.A.1.849%, 03/25/26 1,600,000 1,495,4582.706%, 06/27/24 (e) 2,000,000 1,978,7813.306%, 06/27/29 1,000,000 968,379
Banco Votorantim S.A.4.000%, 09/24/22 (144A) 276,000 278,349
Bank of America Corp.0.976%, SOFR + 0.690%, 04/22/25 (a) 2,731,000 2,617,5041.197%, SOFR + 1.010%, 10/24/26 (a) 1,121,000 1,036,0111.319%, SOFR + 1.150%, 06/19/26 (a) 3,517,000 3,296,0301.658%, SOFR + 0.910%, 03/11/27 (a) 4,792,000 4,466,9691.734%, SOFR + 0.960%, 07/22/27 (a) 5,800,000 5,386,3731.922%, SOFR + 1.370%, 10/24/31 (a) 1,613,000 1,401,1772.299%, SOFR + 1.220%, 07/21/32 (a) 2,800,000 2,492,0422.456%, 3M LIBOR + 0.870%, 10/22/25 (a) 11,120,000 10,926,5182.551%, SOFR + 1.050%, 02/04/28 (a) 1,680,000 1,605,2112.572%, SOFR + 1.210%, 10/20/32 (a)(e) 2,269,000 2,061,7572.592%, SOFR + 2.150%, 04/29/31 (a) 650,000 599,6682.676%, SOFR + 1.930%, 06/19/41 (a) 1,008,000 851,1132.816%, 3M LIBOR + 0.930%, 07/21/23 (a) 515,000 515,4212.884%, 3M LIBOR + 1.190%, 10/22/30 (a) 579,000 549,0552.972%, SOFR + 1.330%, 02/04/33 (a) 3,383,000 3,169,8473.194%, 3M LIBOR + 1.180%, 07/23/30 (a) 2,381,000 2,303,9143.384%, SOFR + 1.330%, 04/02/26 (a) 4,201,000 4,195,3443.550%, 3M LIBOR + 0.780%, 03/05/24 (a) 3,369,000 3,388,2353.559%, 3M LIBOR + 1.060%, 04/23/27 (a) 3,494,000 3,503,9493.705%, 3M LIBOR + 1.512%, 04/24/28 (a) 4,306,000 4,333,5383.824%, 3M LIBOR + 1.575%, 01/20/28 (a) 1,466,000 1,482,9113.974%, 3M LIBOR + 1.210%, 02/07/30 (a) 1,307,000 1,328,0954.000%, 01/22/25 658,000 670,0484.271%, 3M LIBOR + 1.310%, 07/23/29 (a) 3,058,000 3,154,9485.875%, 3M LIBOR + 2.931%, 03/15/28 (a) 1,765,000 1,782,297
Bank of New York Mellon Corp. (The)3.700%, 5Y H15 + 3.352%, 03/20/26(a) 255,000 242,250
Copyright © 2022 www.secdatabase.com. All Rights Reserved.Please Consider the Environment Before Printing This Document

4.625%, 3M LIBOR + 3.131%, 09/20/26 (a) 1,770,000 1,743,450
Barclays plc3.811%, 1Y H15 + 1.700%, 03/10/42(a) 359,000 321,043
BNP Paribas S.A.2.591%, SOFR + 1.228%, 01/20/28(144A) (a) 2,335,000 2,197,480
BPCE S.A.2.700%, 10/01/29 (144A) 1,572,000 1,492,806
Burgan Bank SAK5.749%, 5Y H15 + 4.007%, 07/09/24(a) 292,000 283,240
Citigroup, Inc.2.014%, SOFR + 0.694%, 01/25/26 (a) 3,903,000 3,757,3362.976%, SOFR + 1.422%, 11/05/30 (a) 6,582,000 6,243,0843.057%, SOFR + 1.351%, 01/25/33 (a) 366,000 341,966
Banks��(Continued)Citigroup, Inc.
3.070%, SOFR + 1.280%, 02/24/28 (a) 6,450,000 6,282,0343.290%, SOFR + 1.528%, 03/17/26 (a) 5,839,000 5,819,2983.668%, 3M LIBOR + 1.390%, 07/24/28 (a) 3,224,000 3,224,7133.875%, 5Y H15 + 3.417%, 02/18/26(a) 2,981,000 2,809,5924.000%, 5Y H15 + 3.597%, 12/10/25(a) 657,000 630,720
Citizens Financial Group, Inc.3.250%, 04/30/30 680,000 664,592
Credit Suisse AG1.250%, 08/07/26 2,569,000 2,342,6603.625%, 09/09/24 1,166,000 1,179,375
Credit Suisse Group AG3.800%, 06/09/23 955,000 963,756
Credit Suisse Group Funding Guernsey,Ltd.3.800%, 09/15/22 1,397,000 1,411,392
Danske Bank A/S1.171%, 1Y H15 + 1.030%, 12/08/23(144A) (a) 610,000 602,1301.549%, 1Y H15 + 0.730%, 09/10/27(144A) (a) (e) 419,000 381,5351.621%, 1Y H15 + 1.350%, 09/11/26(144A) (a) 544,000 503,0305.375%, 01/12/24 (144A) 2,078,000 2,142,500
Deutsche Bank AG1.447%, SOFR + 1.131%, 04/01/25 (a) 1,650,000 1,575,8581.686%, 03/19/26 4,651,000 4,362,3422.552%, SOFR + 1.318%, 01/07/28 (a) 1,639,000 1,512,049
Discover Bank3.450%, 07/27/26 621,000 617,394
Emirates NBD Bank PJSC6.125%, 6Y USD Swap + 3.656%, 03/20/25 (a) 477,000 478,586
Freedom Mortgage Corp.8.125%, 11/15/24 (144A) 425,000 423,4068.250%, 04/15/25 (144A) 333,000 331,994
Goldman Sachs Group, Inc. (The)0.657%, SOFR + 0.505%, 09/10/24 (a) 4,073,000 3,939,3360.855%, SOFR + 0.609%, 02/12/26 (a) 1,751,000 1,631,2711.431%, SOFR + 0.798%, 03/09/27 (a) 3,151,000 2,903,6491.676%, 3M LIBOR + 1.170%, 05/15/26 (a) 1,602,000 1,610,2162.615%, SOFR + 1.281%, 04/22/32 (a) 1,323,000 1,202,4232.640%, SOFR + 1.114%, 02/24/28 (a) 3,293,000 3,148,5262.650%, SOFR + 1.264%, 10/21/32 (a) 1,490,000 1,347,0543.000%, 03/15/24 7,038,000 7,029,0823.102%, SOFR + 1.410%, 02/24/33 (a) 6,979,000 6,578,3183.272%, 3M LIBOR + 1.201%, 09/29/25 (a) 502,000 502,9503.500%, 04/01/25 16,903,000 17,029,0633.500%, 11/16/26 (e) 2,975,000 2,987,371
Copyright © 2022 www.secdatabase.com. All Rights Reserved.Please Consider the Environment Before Printing This Document

3.615%, SOFR + 1.846%, 03/15/28 (a)(e) 5,426,000 5,418,4033.691%, 3M LIBOR + 1.510%, 06/05/28 (a) 685,000 685,7863.750%, 05/22/25 (e) 1,485,000 1,507,3503.750%, 02/25/26 1,568,000 1,592,7303.850%, 01/26/27 583,000 588,234
Grupo Aval, Ltd.4.375%, 02/04/30 (144A) 1,055,000 913,6094.750%, 09/26/22 204,000 205,314
HSBC Holdings plc2.206%, SOFR + 1.285%, 08/17/29 (a) 1,186,000 1,066,7662.251%, SOFR + 1.100%, 11/22/27 (a) 2,586,000 2,409,4712.804%, SOFR + 1.187%, 05/24/32 (a) 333,000 302,577
BHFTII-11
Copyright © 2022 www.secdatabase.com. All Rights Reserved.Please Consider the Environment Before Printing This Document

Table of ContentsBrighthouse Funds Trust IIBlackRock Bond Income Portfolio
Schedule of Investments as of March 31, 2022 (Unaudited)Corporate Bonds & Notes��(Continued)
Security DescriptionPrincipalAmount* Value
Banks��(Continued)HSBC Holdings plc
4.583%, 3M LIBOR + 1.535%, 06/19/29(a) 2,495,000 $2,567,112
ING Groep NV4.100%, 10/02/23 754,000 766,6974.625%, 01/06/26 (144A) 915,000 945,676
JPMorgan Chase & Co.0.653%, 3M TSFR + 0.600%, 09/16/24(a) 375,000 364,6381.578%, SOFR + 0.885%, 04/22/27 (a) 1,300,000 1,210,7912.005%, 3M TSFR + 1.585%, 03/13/26(a) 3,385,000 3,263,3682.083%, SOFR + 1.850%, 04/22/26 (a) 2,995,000 2,890,1922.301%, SOFR + 1.160%, 10/15/25 (a) 4,906,000 4,804,8712.947%, SOFR + 1.170%, 02/24/28 (a) 2,567,000 2,505,0742.963%, SOFR + 1.260%, 01/25/33 (a) 2,840,000 2,677,4193.200%, 06/15/26 60,000 60,3233.509%, 3M LIBOR + 0.945%, 01/23/29(a) 564,000 561,3953.540%, 3M LIBOR + 1.380%, 05/01/28(a) 6,521,000 6,538,0633.702%, 3M LIBOR + 1.160%, 05/06/30(a) (e) 652,000 655,4533.782%, 3M LIBOR + 1.337%, 02/01/28(a) 1,672,000 1,693,3953.960%, 3M LIBOR + 1.245%, 01/29/27(a) 3,085,000 3,148,9013.964%, 3M LIBOR + 1.380%, 11/15/48(a) 405,000 413,7004.005%, 3M LIBOR + 1.120%, 04/23/29(a) 2,500,000 2,555,9994.023%, 3M LIBOR + 1.000%, 12/05/24(a) 1,580,000 1,605,2934.032%, 3M LIBOR + 1.460%, 07/24/48(a) 2,266,000 2,329,0834.260%, 3M LIBOR + 1.580%, 02/22/48(a) 330,000 352,6654.452%, 3M LIBOR + 1.330%, 12/05/29(a) 389,000 405,479
Lloyds Banking Group plc1.627%, 1Y H15 + 0.850%, 05/11/27 (a) 1,496,000 1,371,7603.574%, 3M LIBOR + 1.205%, 11/07/28(a) 846,000 826,3753.750%, 01/11/27 579,000 577,421
Mitsubishi UFJ Financial Group, Inc.0.848%, 1Y H15 + 0.680%, 09/15/24 (a) 1,419,000 1,375,2362.193%, 02/25/25 1,767,000 1,708,3253.455%, 03/02/23 665,000 671,951
Mizuho Financial Group, Inc.2.201%, SOFR + 1.772%, 07/10/31 (a) 851,000 755,776
Morgan Stanley1.512%, SOFR + 0.858%, 07/20/27 (a) 1,560,000 1,433,9581.593%, SOFR + 0.879%, 05/04/27 (a) 3,437,000 3,193,2541.928%, SOFR + 1.020%, 04/28/32 (a) 342,000 295,6042.188%, SOFR + 1.990%, 04/28/26 (a) 528,000 510,0312.239%, SOFR + 1.178%, 07/21/32 (a) 2,455,000 2,175,4482.511%, SOFR + 1.200%, 10/20/32 (a) 451,000 406,5042.699%, SOFR + 1.143%, 01/22/31 (a) 6,493,000 6,092,8132.943%, SOFR + 1.290%, 01/21/33 (a) 1,355,000 1,270,6353.217%, SOFR + 1.485%, 04/22/42 (a) 938,000 862,879
Copyright © 2022 www.secdatabase.com. All Rights Reserved.Please Consider the Environment Before Printing This Document

3.591%, 3M LIBOR + 1.340%, 07/22/28(a) 3,066,000 3,074,5263.622%, SOFR + 3.120%, 04/01/31 (a) 410,000 407,8673.625%, 01/20/27 3,448,000 3,477,6403.772%, 3M LIBOR + 1.140%, 01/24/29(a) 1,405,000 1,415,9633.875%, 01/27/26 388,000 395,3814.000%, 07/23/25 (e) 259,000 265,0964.431%, 3M LIBOR + 1.628%, 01/23/30(a) 9,249,000 9,670,613
NBK Tier 1, Ltd.3.625%, 6Y USD Swap + 2.875%, 08/24/26 (144A) (a) 637,000 594,194
Standard Chartered plc2.608%, 1Y H15 + 1.180%, 01/12/28(144A) (a) 3,753,000 3,508,668
Banks��(Continued)State Street Corp.
4.423%, 3M LIBOR + 3.597%, 06/15/22(a) 280,000 279,9205.625%, 3M LIBOR + 2.539%, 12/15/23(a) (e) 2,815,000 2,781,220
Sumitomo Mitsui Financial Group, Inc.1.474%, 07/08/25 200,000 188,1822.348%, 01/15/25 2,905,000 2,822,8882.696%, 07/16/24 1,916,000 1,897,441
Toronto-Dominion Bank (The)3.200%, 03/10/32 720,000 708,584
UBS Group AG2.859%, 3M LIBOR + 0.954%, 08/15/23(144A) (a) 759,000 760,140
Wells Fargo & Co.2.879%, SOFR + 1.432%, 10/30/30 (a) 221,000 210,0473.526%, SOFR + 1.510%, 03/24/28 (a) 1,238,000 1,235,514
291,740,133
Beverages��0.4%Anheuser-Busch Cos. LLC / Anheuser-Busch InBev Worldwide, Inc.
4.700%, 02/01/36 5,022,000 5,386,173Anheuser-Busch InBev Finance, Inc.
4.000%, 01/17/43 717,000 705,554Anheuser-Busch InBev Worldwide, Inc.
4.000%, 04/13/28 4,844,000 5,019,1644.600%, 04/15/48 1,886,000 2,035,5104.750%, 01/23/29 792,000 858,667
14,005,068
Biotechnology��0.2%Amgen, Inc.
2.450%, 02/21/30 452,000 426,1594.200%, 02/22/52 (e) 372,000 384,7204.400%, 05/01/45 1,565,000 1,643,374
Biogen, Inc.2.250%, 05/01/30 1,791,000 1,611,4453.150%, 05/01/50 821,000 672,311
Gilead Sciences, Inc.2.800%, 10/01/50 407,000 333,0584.150%, 03/01/47 790,000 812,3104.500%, 02/01/45 420,000 447,5114.800%, 04/01/44 1,258,000 1,382,912
7,713,800
Building Materials��0.0%Carrier Global Corp.
2.242%, 02/15/25 132,000 128,504Cemex S.A.B. de C.V.
5.200%, 09/17/30 (144A) 288,000 286,560Johnson Controls International plc
5.125%, 09/14/45 11,000 12,542Masonite International Corp.
5.375%, 02/01/28 (144A) 219,000 220,643Standard Industries, Inc.
4.750%, 01/15/28 (144A) 90,000 86,063
Copyright © 2022 www.secdatabase.com. All Rights Reserved.Please Consider the Environment Before Printing This Document

5.000%, 02/15/27 (144A) 215,000 213,125947,437
BHFTII-12
Copyright © 2022 www.secdatabase.com. All Rights Reserved.Please Consider the Environment Before Printing This Document

Table of ContentsBrighthouse Funds Trust IIBlackRock Bond Income Portfolio
Schedule of Investments as of March 31, 2022 (Unaudited)Corporate Bonds & Notes��(Continued)
Security DescriptionPrincipalAmount* Value
Chemicals��0.4%Braskem Idesa SAPI
6.990%, 02/20/32 (144A) 385,000 $377,323Braskem Netherlands Finance B.V.
5.875%, 01/31/50 (144A) (e) 479,000 475,1688.500%, 5Y H15 + 8.220%, 01/23/81(144A) (a) (e) 491,000 538,089
Dow Chemical Co. (The)1.125%, 03/15/32 (EUR) 859,000 855,352
DuPont de Nemours, Inc.4.493%, 11/15/25 2,562,000 2,664,604
Ecolab, Inc.2.750%, 08/18/55 1,494,000 1,235,413
Equate Petrochemical B.V.2.625%, 04/28/28 (144A) 263,000 243,604
LYB International Finance III LLC4.200%, 05/01/50 813,000 802,961
MEGlobal Canada ULC5.000%, 05/18/25 (144A) 555,000 572,133
OCP S.A.3.750%, 06/23/31 308,000 278,740
SASOL Financing USA LLC4.375%, 09/18/26 (e) 800,000 764,0005.500%, 03/18/31 465,000 434,1245.875%, 03/27/24 289,000 292,8446.500%, 09/27/28 207,000 210,146
Sherwin-Williams Co. (The)2.300%, 05/15/30 1,400,000 1,280,123
Westlake Corp.3.375%, 08/15/61 916,000 745,074
11,769,698
Commercial Services��0.6%AMN Healthcare, Inc.
4.625%, 10/01/27 (144A) 350,000 340,308Atento Luxco 1 S.A.
8.000%, 02/10/26 (144A) (e) 200,000 202,049Global Payments, Inc.
1.200%, 03/01/26 3,897,000 3,590,1932.150%, 01/15/27 327,000 306,9142.900%, 05/15/30 831,000 766,9653.200%, 08/15/29 3,085,000 2,930,7904.800%, 04/01/26 2,735,000 2,871,128
GXO Logistics, Inc.1.650%, 07/15/26 (144A) 160,000 144,4482.650%, 07/15/31 (144A) 819,000 710,155
Herc Holdings, Inc.5.500%, 07/15/27 (144A) 553,000 560,742
Moody�s Corp.3.100%, 11/29/61 831,000 694,9303.250%, 01/15/28 399,000 398,3623.750%, 02/25/52 126,000 124,182
Movida Europe S.A.5.250%, 02/08/31 200,000 179,258
RELX Capital, Inc.3.000%, 05/22/30 2,389,000 2,282,5323.500%, 03/16/23 355,000 358,0424.000%, 03/18/29 2,546,000 2,611,544
Commercial Services��(Continued)S&P Global, Inc.
Copyright © 2022 www.secdatabase.com. All Rights Reserved.Please Consider the Environment Before Printing This Document

3.900%, 03/01/62 (144A) 48,000 49,3744.750%, 08/01/28 (144A) 1,737,000 1,866,139
20,988,055
Computers��0.4%Apple, Inc.
2.375%, 02/08/41 385,000 335,3692.550%, 08/20/60 (e) 1,221,000 1,000,6362.800%, 02/08/61 1,783,000 1,533,0503.850%, 05/04/43 1,138,000 1,196,992
Dell International LLC / EMC Corp.3.450%, 12/15/51 (144A) 565,000 459,0004.900%, 10/01/26 1,374,000 1,441,1818.350%, 07/15/46 91,000 132,987
HP, Inc.2.650%, 06/17/31 466,000 416,9316.000%, 09/15/41 243,000 283,197
International Business Machines Corp.3.430%, 02/09/52 581,000 553,4904.250%, 05/15/49 1,050,000 1,118,222
Leidos, Inc.2.300%, 02/15/31 1,565,000 1,356,6204.375%, 05/15/30 2,712,000 2,742,252
Western Digital Corp.2.850%, 02/01/29 293,000 267,682
12,837,609
Distribution/Wholesale��0.0%KAR Auction Services, Inc.
5.125%, 06/01/25 (144A) 438,000 443,475
Diversified Financial Services��0.5%American Express Co.
2.550%, 03/04/27 1,818,000 1,767,685ASG Finance Designated Activity Co.
7.875%, 12/03/24 (144A) (e) 1,018,000 962,010Capital One Financial Corp.
3.273%, SOFR + 1.790%, 03/01/30 (a) 1,151,000 1,111,3543.900%, 01/29/24 874,000 887,651
Charles Schwab Corp. (The)4.000%, 10Y H15 + 3.079%, 12/01/30 (a) 2,100,000 1,886,052
Discover Financial Services4.500%, 01/30/26 62,000 63,874
Intercontinental Exchange, Inc.1.850%, 09/15/32 1,362,000 1,176,2823.750%, 09/21/28 610,000 620,957
Nationstar Mortgage Holdings, Inc.5.500%, 08/15/28 (144A) 425,000 408,5536.000%, 01/15/27 (144A) 128,000 130,253
Navient Corp.5.875%, 10/25/24 223,000 227,4916.750%, 06/25/25 236,000 242,4496.750%, 06/15/26 (e) 233,000 237,6607.250%, 09/25/23 143,000 148,541
BHFTII-13
Copyright © 2022 www.secdatabase.com. All Rights Reserved.Please Consider the Environment Before Printing This Document

Table of ContentsBrighthouse Funds Trust IIBlackRock Bond Income Portfolio
Schedule of Investments as of March 31, 2022 (Unaudited)Corporate Bonds & Notes��(Continued)
Security DescriptionPrincipalAmount* Value
Diversified Financial Services��(Continued)Nomura Holdings, Inc.
2.608%, 07/14/31 2,722,000 $2,446,5592.999%, 01/22/32 1,358,000 1,250,938
Operadora de Servicios Mega S.A. de C.V.Sofom ER8.250%, 02/11/25 (144A) (e) 892,000 682,380
ORIX Corp.2.900%, 07/18/22 22,000 22,083
Rocket Mortgage LLC / Rocket Mortgage Co-Issuer, Inc.3.625%, 03/01/29 (144A) 564,000 515,411
Synchrony Financial3.700%, 08/04/26 396,000 393,6754.500%, 07/23/25 24,000 24,481
United Wholesale Mortgage LLC5.500%, 11/15/25 (144A) 1,640,000 1,590,800
16,797,139
Electric��2.6%AEP Texas, Inc.
3.450%, 01/15/50 480,000 426,0203.450%, 05/15/51 (e) 982,000 869,8093.950%, 06/01/28 1,018,000 1,038,713
AEP Transmission Co. LLC3.150%, 09/15/49 730,000 646,3733.650%, 04/01/50 1,032,000 995,3443.800%, 06/15/49 840,000 829,229
Alabama Power Co.3.125%, 07/15/51 (e) 315,000 273,8973.450%, 10/01/49 637,000 590,9453.750%, 03/01/45 554,000 531,1264.150%, 08/15/44 10,000 10,1526.000%, 03/01/39 34,000 42,010
Ameren Illinois Co.3.250%, 03/15/50 775,000 709,6123.800%, 05/15/28 800,000 820,941
American Transmission Systems, Inc.2.650%, 01/15/32 (144A) 1,120,000 1,035,101
Baltimore Gas & Electric Co.3.200%, 09/15/49 625,000 563,4393.500%, 08/15/46 980,000 946,9693.750%, 08/15/47 699,000 688,384
Calpine Corp.4.500%, 02/15/28 (144A) 3,173,000 3,095,198
Capex S.A.6.875%, 05/15/24 (144A) 96,000 90,721
CenterPoint Energy Houston Electric LLC2.350%, 04/01/31 1,250,000 1,160,3823.350%, 04/01/51 530,000 504,6893.600%, 03/01/52 352,000 352,4863.950%, 03/01/48 406,000 421,923
Commonwealth Edison Co.3.125%, 03/15/51 775,000 702,4683.850%, 03/15/52 215,000 222,2504.000%, 03/01/48 694,000 737,233
Consumers Energy Co.2.650%, 08/15/52 97,000 80,5153.100%, 08/15/50 445,000 407,369
Electric��(Continued)
Copyright © 2022 www.secdatabase.com. All Rights Reserved.Please Consider the Environment Before Printing This Document

Consumers Energy Co.3.500%, 08/01/51 615,000 600,6943.750%, 02/15/50 1,357,000 1,363,1913.950%, 07/15/47 337,000 351,082
DTE Electric Co.3.950%, 03/01/49 355,000 366,5714.050%, 05/15/48 1,373,000 1,447,450
Duke Energy Carolinas LLC3.450%, 04/15/51 (f) 1,481,000 1,435,5323.550%, 03/15/52 (e) 309,000 305,2483.950%, 11/15/28 321,000 333,2743.950%, 03/15/48 9,000 9,233
Duke Energy Florida LLC1.750%, 06/15/30 456,000 405,9242.500%, 12/01/29 (e) 3,592,000 3,378,3033.800%, 07/15/28 328,000 334,920
Duke Energy Progress LLC2.500%, 08/15/50 640,000 519,8353.450%, 03/15/29 1,992,000 1,995,921
Edison International2.400%, 09/15/22 1,991,000 1,992,7653.125%, 11/15/22 9,000 9,0464.950%, 04/15/25 608,000 622,037
Empresas Publicas de Medellin E.S.P.4.250%, 07/18/29 (144A) 323,000 287,5354.375%, 02/15/31 (144A) 253,000 217,909
Entergy Louisiana LLC4.200%, 09/01/48 1,310,000 1,372,029
Eskom Holdings SOC, Ltd.7.125%, 02/11/25 370,000 356,599
Exelon Corp.2.750%, 03/15/27 (144A) 317,000 308,8764.100%, 03/15/52 (144A) 107,000 108,6774.700%, 04/15/50 731,000 803,9345.100%, 06/15/45 166,000 184,481
FEL Energy VI Sarl5.750%, 12/01/40 462,145 414,780
FirstEnergy Corp.2.050%, 03/01/25 (e) 272,000 259,0802.250%, 09/01/30 849,000 751,3652.650%, 03/01/30 972,000 882,4743.400%, 03/01/50 850,000 715,9464.400%, 07/15/27 1,223,000 1,230,766
FirstEnergy Transmission LLC4.350%, 01/15/25 (144A) 3,191,000 3,206,3744.550%, 04/01/49 (144A) 2,814,000 2,688,466
Florida Power & Light Co.2.875%, 12/04/51 1,300,000 1,165,4103.150%, 10/01/49 1,708,000 1,592,0363.700%, 12/01/47 410,000 417,5083.950%, 03/01/48 1,403,000 1,492,719
Generacion Mediterranea S.A./CentralTermica Roca S.A.9.625%, 12/01/27 (144A) 1,022,591 802,734
Genneia S.A.8.750%, 09/02/27 (144A) 169,340 159,391
Mid-Atlantic Interstate Transmission LLC4.100%, 05/15/28 (144A) 240,000 242,152
BHFTII-14
Copyright © 2022 www.secdatabase.com. All Rights Reserved.Please Consider the Environment Before Printing This Document

Table of ContentsBrighthouse Funds Trust IIBlackRock Bond Income Portfolio
Schedule of Investments as of March 31, 2022 (Unaudited)Corporate Bonds & Notes��(Continued)
Security DescriptionPrincipalAmount* Value
Electric��(Continued)MidAmerican Energy Co.
2.700%, 08/01/52 281,000 $240,1953.100%, 05/01/27 70,000 69,9683.150%, 04/15/50 680,000 624,5273.650%, 04/15/29 2,047,000 2,104,0124.250%, 07/15/49 687,000 749,565
Northern States Power Co.2.250%, 04/01/31 10,000 9,2132.600%, 06/01/51 536,000 453,3262.900%, 03/01/50 356,000 314,0614.000%, 08/15/45 471,000 485,429
NPC Ukrenergo6.875%, 11/09/26 (144A) 257,000 97,660
NRG Energy, Inc.2.450%, 12/02/27 (144A) 1,791,000 1,651,8464.450%, 06/15/29 (144A) (e) 1,196,000 1,196,4905.250%, 06/15/29 (144A) 320,000 312,7145.750%, 01/15/28 357,000 362,857
NSTAR Electric Co.3.950%, 04/01/30 442,000 458,791
Ohio Power Co.1.625%, 01/15/31 1,525,000 1,304,6132.900%, 10/01/51 383,000 317,3884.000%, 06/01/49 386,000 384,569
Oncor Electric Delivery Co. LLC2.700%, 11/15/51 (144A) 73,000 62,4623.100%, 09/15/49 937,000 858,5083.700%, 11/15/28 1,155,000 1,187,9683.800%, 06/01/49 243,000 247,8625.750%, 03/15/29 10,000 11,396
Pacific Gas & Electric Co.2.500%, 02/01/31 125,000 107,8174.950%, 07/01/50 1,236,000 1,164,188
PECO Energy Co.3.050%, 03/15/51 1,079,000 972,039
Public Service Electric & Gas Co3.000%, 03/01/51 394,000 348,7663.650%, 09/01/28 1,343,000 1,363,594
Southern California Edison Co.2.250%, 06/01/30 1,858,000 1,679,6672.500%, 06/01/31 777,000 707,0763.700%, 08/01/25 1,227,000 1,247,3834.200%, 03/01/29 324,000 335,179
Southwestern Public Service Co.3.150%, 05/01/50 1,333,000 1,193,449
Star Energy Geothermal Darajat II / Star Energy Geothermal Salak4.850%, 10/14/38 (144A) 505,000 499,950
Tampa Electric Co.4.450%, 06/15/49 828,000 887,826
Trans-Allegheny Interstate Line Co.3.850%, 06/01/25 (144A) 3,450,000 3,473,501
Virginia Electric & Power Co.3.500%, 03/15/27 703,000 714,6954.000%, 01/15/43 1,226,000 1,248,648
Vistra Corp.7.000%, 5Y H15 + 5.740%, 12/15/26(144A) (a) 420,000 408,975
Electric��(Continued)Vistra Operations Co. LLC
Copyright © 2022 www.secdatabase.com. All Rights Reserved.Please Consider the Environment Before Printing This Document

4.300%, 07/15/29 (144A) 2,473,000 2,387,0345.000%, 07/31/27 (144A) 561,000 551,9175.500%, 09/01/26 (144A) 435,000 437,3795.625%, 02/15/27 (144A) 563,000 562,524
87,722,592
Electronics��0.1%Agilent Technologies, Inc.
2.100%, 06/04/30 1,723,000 1,546,4652.300%, 03/12/31 428,000 386,6433.050%, 09/22/26 680,000 675,242
2,608,350
Energy-Alternate Sources��0.0%Continuum Energy Levanter Pte, Ltd.
4.500%, 02/09/27 (144A) 369,844 355,605Renewable Energy Group, Inc.
5.875%, 06/01/28 (144A) 130,000 139,637495,242
Engineering & Construction��0.1%Aeropuerto Internacional de Tocumen S.A.
5.125%, 08/11/61 (144A) 210,000 191,100HTA Group, Ltd.
7.000%, 12/18/25 (144A) 410,000 405,408IHS Holding, Ltd.
5.625%, 11/29/26 (144A) 330,000 312,345Mexico City Airport Trust
5.500%, 07/31/47 1,034,000 911,223Stoneway Capital Corp.
10.000%, 03/01/27 (f) 1,193,766 332,76210.000%, 03/01/27 (144A) (f) 1,137,974 317,211
Weekley Homes LLC / Weekley FinanceCorp.
4.875%, 09/15/28 (144A) 318,000 293,0862,763,135
Entertainment��0.4%Affinity Gaming
6.875%, 12/15/27 (144A) 353,000 343,293Caesars Entertainment, Inc.
4.625%, 10/15/29 (144A) (e) 210,000 196,3506.250%, 07/01/25 (144A) 2,452,000 2,531,5438.125%, 07/01/27 (144A) (e) 761,000 815,377
Caesars Resort Collection LLC / CRCFinco, Inc.
5.750%, 07/01/25 (144A) 460,000 469,469CDI Escrow Issuer, Inc.
5.750%, 04/01/30 (144A) 305,000 308,050Cedar Fair L.P.
5.250%, 07/15/29 451,000 444,244Cedar Fair L.P. / Canada�s Wonderland Co. / Magnum Management Corp.
5.375%, 04/15/27 (e) 451,000 446,490Churchill Downs, Inc.
4.750%, 01/15/28 (144A) (e) 272,000 263,840
BHFTII-15
Copyright © 2022 www.secdatabase.com. All Rights Reserved.Please Consider the Environment Before Printing This Document

Table of ContentsBrighthouse Funds Trust IIBlackRock Bond Income Portfolio
Schedule of Investments as of March 31, 2022 (Unaudited)Corporate Bonds & Notes��(Continued)
Security DescriptionPrincipalAmount* Value
Entertainment��(Continued)Churchill Downs, Inc.
5.500%, 04/01/27 (144A) 537,000 $543,090Magallanes, Inc.
3.428%, 03/15/24 (144A) 2,038,000 2,049,172Midwest Gaming Borrower LLC / Midwest Gaming Finance Corp.
4.875%, 05/01/29 (144A) 609,000 561,413Peninsula Pacific Entertainment LLC / Peninsula Pacific EntertainmentFinance, Inc.
8.500%, 11/15/27 (144A) 1,550,000 1,714,687Scientific Games International, Inc.
5.000%, 10/15/25 (144A) 142,000 145,550Wynn Resorts Finance LLC / Wynn ResortsCapital Corp.
5.125%, 10/01/29 (144A) 931,000 876,3047.750%, 04/15/25 (144A) 1,027,000 1,065,677
12,774,549
Environmental Control��0.1%Clean Harbors, Inc.
4.875%, 07/15/27 (144A) 142,000 141,645Covanta Holding Corp.
4.875%, 12/01/29 (144A) 265,000 252,996Republic Services, Inc.
2.375%, 03/15/33 245,000 219,9553.950%, 05/15/28 584,000 600,310
Waste Management, Inc.1.150%, 03/15/28 (e) 1,795,000 1,604,1992.000%, 06/01/29 (e) 415,000 385,981
Waste Pro USA, Inc.5.500%, 02/15/26 (144A) 227,000 214,533
3,419,619
Food��0.1%Albertsons Cos., Inc. / Safeway, Inc. / New Albertsons L.P. / Albertsons LLC
4.875%, 02/15/30 (144A) 90,000 87,6375.875%, 02/15/28 (144A) 557,000 555,115
BRF GmbH4.350%, 09/29/26 (144A) 580,000 564,926
BRF S.A.5.750%, 09/21/50 (144A) (e) 450,000 396,000
Cydsa S.A.B. de C.V.6.250%, 10/04/27 (144A) 509,000 493,730
Frigorifico Concepcion S.A.7.700%, 07/21/28 (144A) 220,000 195,800
JBS USA LUX S.A. / JBS USA Finance, Inc.6.750%, 02/15/28 (144A) (e) 537,000 566,132
Performance Food Group, Inc.5.500%, 10/15/27 (144A) 490,000 487,648
Post Holdings, Inc.5.500%, 12/15/29 (144A) 349,000 335,8015.625%, 01/15/28 (144A) 443,000 434,833
4,117,622
Food Service��0.0%Aramark Services, Inc.
5.000%, 02/01/28 (144A) (e) 496,000 481,120
Forest Products & Paper��0.0%International Paper Co.
4.800%, 06/15/44 261,000 278,289
Copyright © 2022 www.secdatabase.com. All Rights Reserved.Please Consider the Environment Before Printing This Document

6.000%, 11/15/41 367,000 436,959Suzano Austria GmbH
3.125%, 01/15/32 (e) 400,000 354,1523.750%, 01/15/31 135,000 127,1025.750%, 07/14/26 (144A) 200,000 214,500
1,411,002
Gas��0.1%Atmos Energy Corp.
4.125%, 03/15/49 368,000 387,506CenterPoint Energy Resources Corp.
1.750%, 10/01/30 2,530,000 2,217,938ONE Gas, Inc.
2.000%, 05/15/30 370,000 331,022Piedmont Natural Gas Co., Inc.
2.500%, 03/15/31 810,000 743,692Promigas S.A. ESP / Gases del PacificoSAC
3.750%, 10/16/29 266,000 240,8663.750%, 10/16/29 (144A) 407,000 368,542
4,289,566
Healthcare-Products��0.2%Boston Scientific Corp.
2.650%, 06/01/30 1,187,000 1,113,781Medtronic Global Holdings SCA
1.750%, 07/02/49 (EUR) 700,000 694,241Mozart Debt Merger Sub, Inc.
3.875%, 04/01/29 (144A) 3,719,000 3,440,075Thermo Fisher Scientific, Inc.
1.875%, 10/01/49 (EUR) 1,500,000 1,487,6292.800%, 10/15/41 540,000 483,650
7,219,376
Healthcare-Services��1.1%Aetna, Inc.
4.500%, 05/15/42 639,000 665,153Anthem, Inc.
3.125%, 05/15/50 372,000 327,5903.600%, 03/15/51 778,000 743,789
Centene Corp.2.450%, 07/15/28 1,230,000 1,123,8512.625%, 08/01/31 836,000 744,040
Charles River Laboratories International,Inc.
4.250%, 05/01/28 (144A) 135,000 131,962DaVita, Inc.
4.625%, 06/01/30 (144A) 1,206,000 1,126,163HCA, Inc.
2.375%, 07/15/31 3,612,000 3,228,0703.500%, 09/01/30 351,000 339,0883.625%, 03/15/32 (144A) 4,808,000 4,711,6234.625%, 03/15/52 (144A) 1,530,000 1,541,8894.750%, 05/01/23 1,737,000 1,780,363
BHFTII-16
Copyright © 2022 www.secdatabase.com. All Rights Reserved.Please Consider the Environment Before Printing This Document

Table of ContentsBrighthouse Funds Trust IIBlackRock Bond Income Portfolio
Schedule of Investments as of March 31, 2022 (Unaudited)Corporate Bonds & Notes��(Continued)
Security DescriptionPrincipalAmount* Value
Healthcare-Services��(Continued)HCA, Inc.
5.250%, 04/15/25 5,229,000 $5,505,1515.250%, 06/15/26 1,156,000 1,220,1645.375%, 02/01/25 453,000 471,3465.875%, 02/01/29 68,000 74,338
Humana, Inc.4.875%, 04/01/30 713,000 768,337
Roche Holdings, Inc.2.607%, 12/13/51 (144A) 960,000 831,530
Select Medical Corp.6.250%, 08/15/26 (144A) (e) 2,969,000 3,073,628
Tenet Healthcare Corp.4.250%, 06/01/29 (144A) 857,000 821,6494.375%, 01/15/30 (144A) 1,496,000 1,436,0554.625%, 06/15/28 (144A) 92,000 90,2754.875%, 01/01/26 (144A) 885,000 892,7445.125%, 11/01/27 (144A) 135,000 135,6356.250%, 02/01/27 (144A) (e) 1,353,000 1,388,983
UnitedHealth Group, Inc.3.250%, 05/15/51 358,000 336,2574.250%, 06/15/48 348,000 380,6304.450%, 12/15/48 351,000 395,4654.625%, 07/15/35 386,000 431,3744.625%, 11/15/41 807,000 916,3914.750%, 07/15/45 424,000 491,987
36,125,520
Home Builders��0.2%Ashton Woods USA LLC / Ashton WoodsFinance Co.
4.625%, 08/01/29 (144A) 202,000 178,1304.625%, 04/01/30 (144A) 496,000 432,1006.625%, 01/15/28 (144A) 1,207,000 1,236,632
Beazer Homes USA, Inc.7.250%, 10/15/29 (e) 1,030,000 1,035,510
Brookfield Residential Properties, Inc. / Brookfield Residential U.S. Corp.5.000%, 06/15/29 (144A) 265,000 240,6236.250%, 09/15/27 (144A) 533,000 521,842
Forestar Group, Inc.3.850%, 05/15/26 (144A) 242,000 225,6655.000%, 03/01/28 (144A) 659,000 617,813
Homes By West Bay LLC9.500%, 04/30/27 (g) (h) 1,259,000 1,236,967
M/I Homes, Inc.4.950%, 02/01/28 1,010,000 951,925
Mattamy Group Corp.4.625%, 03/01/30 (144A) 662,000 621,8235.250%, 12/15/27 (144A) 604,000 596,202
New Home Co., Inc. (The)7.250%, 10/15/25 (144A) 215,000 207,866
Tri Pointe Homes, Inc.5.700%, 06/15/28 60,000 59,897
8,162,995
Insurance��0.4%Ambac Assurance Corp.
5.100%, (144A) (i) 162,922 184,102
Insurance��(Continued)American International Group, Inc.
Copyright © 2022 www.secdatabase.com. All Rights Reserved.Please Consider the Environment Before Printing This Document

4.375%, 01/15/55 393,000 419,8624.500%, 07/16/44 820,000 884,8504.750%, 04/01/48 651,000 745,890
Aon Corp.2.800%, 05/15/30 1,253,000 1,193,5523.750%, 05/02/29 2,463,000 2,518,3853.900%, 02/28/52 157,000 154,9454.500%, 12/15/28 1,072,000 1,123,007
Berkshire Hathaway Finance Corp.3.850%, 03/15/52 471,000 481,629
Hartford Financial Services Group, Inc. (The)4.300%, 04/15/43 325,000 326,594
Marsh & McLennan Cos., Inc.1.349%, 09/21/26 (EUR) 830,000 910,7681.979%, 03/21/30 (EUR) 1,046,000 1,150,6692.250%, 11/15/30 (e) 1,712,000 1,562,771
Sitka Holdings LLC5.506%, 3M LIBOR + 4.500%, 07/06/26(144A) (a) 920,000 877,455
Trinity Acquisition plc4.400%, 03/15/26 190,000 196,284
12,730,763
Internet��0.1%Amazon.com, Inc.
2.500%, 06/03/50 (e) 3,129,000 2,612,280Expedia Group, Inc.
2.950%, 03/15/31 403,000 373,1162,985,396
Investment Companies��0.1%Blackstone Private Credit Fund
3.250%, 03/15/27 (144A) 1,872,000 1,715,6274.000%, 01/15/29 (144A) 1,558,000 1,442,423
3,158,050
Iron/Steel��0.0%Commercial Metals Co.
4.375%, 03/15/32 614,000 570,252Nucor Corp.
3.950%, 05/01/28 341,000 348,763919,015
Lodging��0.1%Boyd Gaming Corp.
8.625%, 06/01/25 (144A) (e) 151,000 158,604Full House Resorts, Inc.
8.250%, 02/15/28 (144A) 253,000 258,693Marriott International, Inc.
4.625%, 06/15/30 373,000 386,313Marriott Ownership Resorts, Inc.
6.125%, 09/15/25 (144A) 353,000 361,825MGM Resorts International
4.625%, 09/01/26 (e) 35,000 34,475
BHFTII-17
Copyright © 2022 www.secdatabase.com. All Rights Reserved.Please Consider the Environment Before Printing This Document

Table of ContentsBrighthouse Funds Trust IIBlackRock Bond Income Portfolio
Schedule of Investments as of March 31, 2022 (Unaudited)Corporate Bonds & Notes��(Continued)
Security DescriptionPrincipalAmount* Value
Lodging��(Continued)MGM Resorts International
5.500%, 04/15/27 59,000 $59,5905.750%, 06/15/25 59,000 60,476
Sonder Holdings, Inc.10.000%, SOFR + 9.000%, 01/19/27 � (a)(g) (h) (j) 1,388,000 1,301,250
Wynn Las Vegas LLC / Wynn Las VegasCapital Corp.
5.250%, 05/15/27 (144A) (e) 498,000 481,8155.500%, 03/01/25 (144A) 998,000 998,020
4,101,061
Machinery-Diversified��0.1%CNH Industrial Capital LLC
4.200%, 01/15/24 2,941,000 2,999,385Otis Worldwide Corp.
2.565%, 02/15/30 939,000 877,582TK Elevator U.S. Newco, Inc.
5.250%, 07/15/27 (144A) 926,000 915,8424,792,809
Media��1.1%CCO Holdings LLC / CCO Holdings CapitalCorp.
4.750%, 03/01/30 (144A) 658,000 631,8385.375%, 06/01/29 (144A) 569,000 569,000
Charter Communications Operating LLC / Charter CommunicationsOperating Capital Corp.
2.250%, 01/15/29 203,000 182,6733.850%, 04/01/61 (e) 903,000 725,9763.950%, 06/30/62 1,859,000 1,503,3034.400%, 04/01/33 1,670,000 1,665,0614.400%, 12/01/61 849,000 739,0335.125%, 07/01/49 2,120,000 2,103,2065.375%, 05/01/47 745,000 762,7995.750%, 04/01/48 929,000 987,6536.484%, 10/23/45 3,637,000 4,140,3006.834%, 10/23/55 994,000 1,178,553
Comcast Corp.2.450%, 08/15/52 (e) 420,000 333,1342.650%, 02/01/30 2,934,000 2,816,3252.887%, 11/01/51 (144A) 1,312,000 1,106,0623.400%, 07/15/46 1,411,000 1,324,7623.969%, 11/01/47 780,000 792,4103.999%, 11/01/49 2,672,000 2,694,876
COX Communications, Inc.3.150%, 08/15/24 (144A) 1,381,000 1,383,2623.600%, 06/15/51 (144A) 1,330,000 1,183,439
CSC Holdings LLC5.750%, 01/15/30 (144A) 845,000 752,0507.500%, 04/01/28 (144A) (e) 387,000 380,228
Discovery Communications LLC1.900%, 03/19/27 (EUR) 1,804,000 1,955,186
FactSet Research Systems, Inc.3.450%, 03/01/32 1,093,000 1,055,802
iHeartCommunications, Inc.4.750%, 01/15/28 (144A) (e) 45,000 42,9755.250%, 08/15/27 (144A) 324,000 320,3556.375%, 05/01/26 (e) 362,706 372,680
Copyright © 2022 www.secdatabase.com. All Rights Reserved.Please Consider the Environment Before Printing This Document

Media��(Continued)Nexstar Media, Inc.
4.750%, 11/01/28 (144A) 433,000 419,4695.625%, 07/15/27 (144A) 523,000 529,381
Paramount Global4.375%, 03/15/43 336,000 319,7885.850%, 09/01/43 608,000 700,520
Sirius XM Radio, Inc.5.500%, 07/01/29 (144A) 544,000 552,160
TEGNA, Inc.4.625%, 03/15/28 (e) 832,000 827,6075.000%, 09/15/29 (e) 99,000 99,242
VTR Comunicaciones S.p.A.4.375%, 04/15/29 (144A) 430,000 392,917
Walt Disney Co. (The)2.750%, 09/01/49 2,280,000 1,940,0174.700%, 03/23/50 506,000 586,826
Ziggo Bond Co. B.V.6.000%, 01/15/27 (144A) 178,000 179,113
38,249,981
Mining��0.4%Anglo American Capital plc
2.625%, 09/10/30 (144A) (e) 482,000 437,0342.875%, 03/17/31 (144A) (e) 617,000 568,6285.625%, 04/01/30 (144A) 802,000 883,958
AngloGold Ashanti Holdings plc3.750%, 10/01/30 200,000 187,100
Glencore Funding LLC1.625%, 04/27/26 (144A) 2,050,000 1,893,1152.500%, 09/01/30 (144A) (e) 3,240,000 2,899,2902.625%, 09/23/31 (144A) (e) 875,000 782,6952.850%, 04/27/31 (144A) (e) 1,050,000 958,8393.375%, 09/23/51 (144A) 941,000 791,208
Newmont Corp.2.250%, 10/01/30 1,311,000 1,198,163
Vedanta Resources Finance II plc8.950%, 03/11/25 (144A) 900,000 875,250
Vedanta Resources, Ltd.6.125%, 08/09/24 (144A) 225,000 196,875
11,672,155
Miscellaneous Manufacturing��0.2%GE Capital Funding LLC
4.550%, 05/15/32 535,000 574,523GE Capital International Funding Co.
4.418%, 11/15/35 2,524,000 2,710,242Parker-Hannifin Corp.
3.250%, 03/01/27 435,000 434,914Textron, Inc.
2.450%, 03/15/31 446,000 403,7913.900%, 09/17/29 1,540,000 1,567,181
5,690,651
Oil & Gas��1.4%BP Capital Markets America, Inc.
3.001%, 03/17/52 870,000 749,456
BHFTII-18
Copyright © 2022 www.secdatabase.com. All Rights Reserved.Please Consider the Environment Before Printing This Document

Table of ContentsBrighthouse Funds Trust IIBlackRock Bond Income Portfolio
Schedule of Investments as of March 31, 2022 (Unaudited)Corporate Bonds & Notes��(Continued)
Security DescriptionPrincipalAmount* Value
Oil & Gas��(Continued)BP Capital Markets America, Inc.
3.790%, 02/06/24 1,243,000 $1,264,562BP Capital Markets plc
3.814%, 02/10/24 2,178,000 2,223,409California Resources Corp.
7.125%, 02/01/26 (144A) 278,000 289,056Cenovus Energy, Inc.
3.750%, 02/15/52 131,000 117,151Centennial Resource Production LLC
5.375%, 01/15/26 (144A) (e) 75,000 72,750Chesapeake Energy Corp.
5.500%, 02/01/26 (144A) 276,000 282,647Chevron USA, Inc.
2.343%, 08/12/50 672,000 544,077Citgo Holding, Inc.
9.250%, 08/01/24 (144A) (e) 375,000 378,750Colgate Energy Partners III LLC
5.875%, 07/01/29 (144A) 240,000 247,4287.750%, 02/15/26 (144A) 126,000 134,317
CrownRock L.P. / CrownRock Finance, Inc.5.625%, 10/15/25 (144A) 230,000 234,424
Devon Energy Corp.4.500%, 01/15/30 268,000 276,5594.750%, 05/15/42 (e) 854,000 902,4365.000%, 06/15/45 (e) 560,000 609,6895.850%, 12/15/25 250,000 270,5625.875%, 06/15/28 73,000 77,2848.250%, 08/01/23 334,000 353,755
Diamondback Energy, Inc.3.125%, 03/24/31 4,361,000 4,164,9803.250%, 12/01/26 2,528,000 2,524,2443.500%, 12/01/29 7,968,000 7,892,8324.250%, 03/15/52 900,000 889,5084.400%, 03/24/51 1,637,000 1,660,651
Ecopetrol S.A.6.875%, 04/29/30 1,287,000 1,350,475
Frontera Energy Corp.7.875%, 06/21/28 (144A) 395,000 369,365
Geopark, Ltd.5.500%, 01/17/27 (144A) 200,000 190,452
Great Western Petroleum LLC / GreatWestern Finance Corp.12.000%, 09/01/25 (144A) 449,000 500,635
Marathon Petroleum Corp.4.500%, 04/01/48 50,000 50,1255.850%, 12/15/45 360,000 400,414
Matador Resources Co.5.875%, 09/15/26 94,000 95,720
MC Brazil Downstream Trading S.a.r.l.7.250%, 06/30/31(144A) 430,000 395,600
Odebrecht Offshore Drilling Finance, Ltd.7.720%, 12/01/26 (144A) (j) 245 55
Oil and Gas Holding Co. BSCC (The)7.625%, 11/07/24 379,000 397,950
OQ SAOC5.125%, 05/06/28 (144A) 205,000 202,445
Oil & Gas��(Continued)Ovintiv Exploration, Inc.
5.625%, 07/01/24 (e) 1,588,000 1,669,563
Copyright © 2022 www.secdatabase.com. All Rights Reserved.Please Consider the Environment Before Printing This Document

Petroleos Mexicanos5.500%, 06/27/44 226,000 170,3506.700%, 02/16/32 4,644,000 4,411,8006.750%, 09/21/47 331,000 269,0706.840%, 01/23/30 1,226,000 1,219,9806.875%, 10/16/25 472,000 494,8456.950%, 01/28/60 176,000 142,8437.190%, 09/12/24 (MXN) 10,225,600 483,2617.690%, 01/23/50 452,000 394,935
Pioneer Natural Resources Co.2.150%, 01/15/31 781,000 703,821
Puma International Financing S.A.5.125%, 10/06/24 (144A) 258,000 245,745
Qatar Energy3.125%, 07/12/41 (144A) 291,000 264,767
Shelf Drilling Holdings Ltd.8.875%, 11/15/24 (144A) 72,000 73,440
Shell International Finance B.V.2.375%, 11/07/29 262,000 248,162
SM Energy Co.10.000%, 01/15/25 (144A) 1,129,000 1,232,484
Suncor Energy, Inc.6.500%, 06/15/38 417,000 525,6526.850%, 06/01/39 89,000 115,103
Sunoco L.P. / Sunoco Finance Corp.4.500%, 04/30/30 (144A) 1,029,000 948,002
Tap Rock Resouces LLC7.000%, 10/01/26 (144A) 1,447,000 1,497,819
YPF S.A.7.000%, 12/15/47 (144A) 509,000 327,669
45,553,074
Packaging & Containers��0.1%Ardagh Metal Packaging Finance U.S.A.
LLC3.250%, 09/01/28 (144A) (e) 738,000 669,735
Ardagh Packaging Finance plc / ArdaghHoldings USA, Inc.
5.250%, 04/30/25 (144A) 738,000 736,9855.250%, 08/15/27 (144A) 210,000 194,119
Klabin Austria GmbH3.200%, 01/12/31 (144A) 340,000 296,228
Trivium Packaging Finance B.V.5.500%, 08/15/26 (144A) 317,000 315,694
2,212,761
Pharmaceuticals��1.1%AbbVie, Inc.
2.600%, 11/21/24 7,269,000 7,218,7203.800%, 03/15/25 1,369,000 1,394,4394.250%, 11/21/49 (e) 330,000 342,4464.450%, 05/14/46 1,480,000 1,572,6244.500%, 05/14/35 1,765,000 1,894,3694.550%, 03/15/35 883,000 947,9064.850%, 06/15/44 49,000 54,319
BHFTII-19
Copyright © 2022 www.secdatabase.com. All Rights Reserved.Please Consider the Environment Before Printing This Document

Table of ContentsBrighthouse Funds Trust IIBlackRock Bond Income Portfolio
Schedule of Investments as of March 31, 2022 (Unaudited)Corporate Bonds & Notes��(Continued)
Security DescriptionPrincipalAmount* Value
Pharmaceuticals��(Continued)Bausch Health Americas, Inc.
8.500%, 01/31/27 (144A) (e) 745,000 $742,9669.250%, 04/01/26 (144A) 639,000 654,438
Bausch Health Cos., Inc.4.875%, 06/01/28 (144A) 235,000 225,0125.750%, 08/15/27 (144A) 183,000 180,3196.125%, 02/01/27 (144A) 1,125,000 1,132,1327.000%, 01/15/28 (144A) 308,000 275,7467.250%, 05/30/29 (144A) 318,000 271,2329.000%, 12/15/25 (144A) 647,000 670,340
Cigna Corp.3.400%, 03/01/27 1,374,000 1,386,7003.750%, 07/15/23 16,000 16,2344.375%, 10/15/28 3,882,000 4,083,557
CVS Health Corp.3.750%, 04/01/30 3,917,000 3,985,5075.125%, 07/20/45 3,030,000 3,420,296
Merck & Co., Inc.2.450%, 06/24/50 408,000 339,1902.750%, 12/10/51 221,000 192,5004.000%, 03/07/49 345,000 373,797
Takeda Pharmaceutical Co., Ltd.2.000%, 07/09/40 (EUR) 1,790,000 1,870,9402.050%, 03/31/30 1,982,000 1,789,0245.000%, 11/26/28 607,000 658,214
Teva Pharmaceutical Finance NetherlandsIII B.V.5.125%, 05/09/29 (e) 260,000 249,917
35,942,884
Pipelines��2.2%Blue Racer Midstream LLC / Blue Racer
Finance Corp.7.625%, 12/15/25 (144A) 160,000 167,298
Boardwalk Pipelines L.P.4.800%, 05/03/29 275,000 284,402
Buckeye Partners L.P.3.950%, 12/01/26 54,000 52,7714.125%, 03/01/25 (144A) (e) 219,000 215,9764.150%, 07/01/23 391,000 392,3614.350%, 10/15/24 500,000 502,495
Cameron LNG LLC3.302%, 01/15/35 (144A) 1,320,000 1,240,5693.402%, 01/15/38 (144A) 1,690,000 1,574,020
Cheniere Corpus Christi Holdings LLC3.700%, 11/15/29 1,050,000 1,046,7245.125%, 06/30/27 5,408,000 5,764,5355.875%, 03/31/25 3,742,000 3,949,4297.000%, 06/30/24 2,373,000 2,524,958
Cheniere Energy, Inc.4.625%, 10/15/28 426,000 427,427
EIG Pearl Holdings Sarl3.545%, 08/31/36 (144A) 1,678,000 1,598,4364.387%, 11/30/46 (144A) 1,440,000 1,346,400
Energy Transfer L.P.2.900%, 05/15/25 5,037,000 4,926,948
Pipelines��(Continued)Energy Transfer L.P.
3.600%, 02/01/23 1,617,000 1,626,317
Copyright © 2022 www.secdatabase.com. All Rights Reserved.Please Consider the Environment Before Printing This Document

3.900%, 05/15/24 1,506,000 1,514,8994.000%, 10/01/27 168,000 169,0814.250%, 04/01/24 1,343,000 1,369,0664.950%, 06/15/28 520,000 546,1245.000%, 05/15/50 2,541,000 2,571,0835.950%, 12/01/25 1,310,000 1,402,9136.100%, 02/15/42 353,000 384,4566.250%, 04/15/49 200,000 229,4956.500%, 02/01/42 1,104,000 1,268,866
Enterprise Products Operating LLC2.800%, 01/31/30 (e) 878,000 843,9453.125%, 07/31/29 1,155,000 1,134,1693.300%, 02/15/53 326,000 278,1315.950%, 02/01/41 910,000 1,078,816
Galaxy Pipeline Assets Bidco, Ltd.2.160%, 03/31/34 (144A) 451,623 415,4252.940%, 09/30/40 (144A) 525,696 474,006
MPLX L.P.1.750%, 03/01/26 952,000 892,0524.875%, 12/01/24 492,000 509,545
NGPL PipeCo LLC3.250%, 07/15/31 (144A) 1,957,000 1,827,1364.875%, 08/15/27 (144A) 990,000 1,027,580
Northwest Pipeline LLC4.000%, 04/01/27 2,329,000 2,388,473
Rattler Midstream L.P.5.625%, 07/15/25 (144A) 225,000 228,375
Sabine Pass Liquefaction LLC5.000%, 03/15/27 860,000 909,5055.625%, 04/15/23 1,735,000 1,775,1615.625%, 03/01/25 10,394,000 10,989,5605.750%, 05/15/24 3,483,000 3,645,440
Texas Eastern Transmission L.P.3.500%, 01/15/28 (144A) 1,732,000 1,721,218
TransCanada PipeLines, Ltd.4.625%, 03/01/34 509,000 543,130
Transcontinental Gas Pipe Line Co. LLC3.950%, 05/15/50 686,000 667,0614.000%, 03/15/28 2,280,000 2,332,2167.850%, 02/01/26 3,110,000 3,565,167
Venture Global Calcasieu Pass LLC3.875%, 11/01/33 (144A) 454,000 434,138
74,777,298
Real Estate��0.1%Arabian Centres Sukuk II, Ltd.
5.625%, 10/07/26 (144A) 515,000 487,025Arabian Centres Sukuk, Ltd.
5.375%, 11/26/24 285,000 274,683Five Point Operating Co. L.P. / Five Point
Capital Corp.7.875%, 11/15/25 (144A) 794,000 812,500
Freed Hotels & Resorts10.000%, 12/02/23 (144A) � (g) (h) 1,192,000 1,160,770
BHFTII-20
Copyright © 2022 www.secdatabase.com. All Rights Reserved.Please Consider the Environment Before Printing This Document
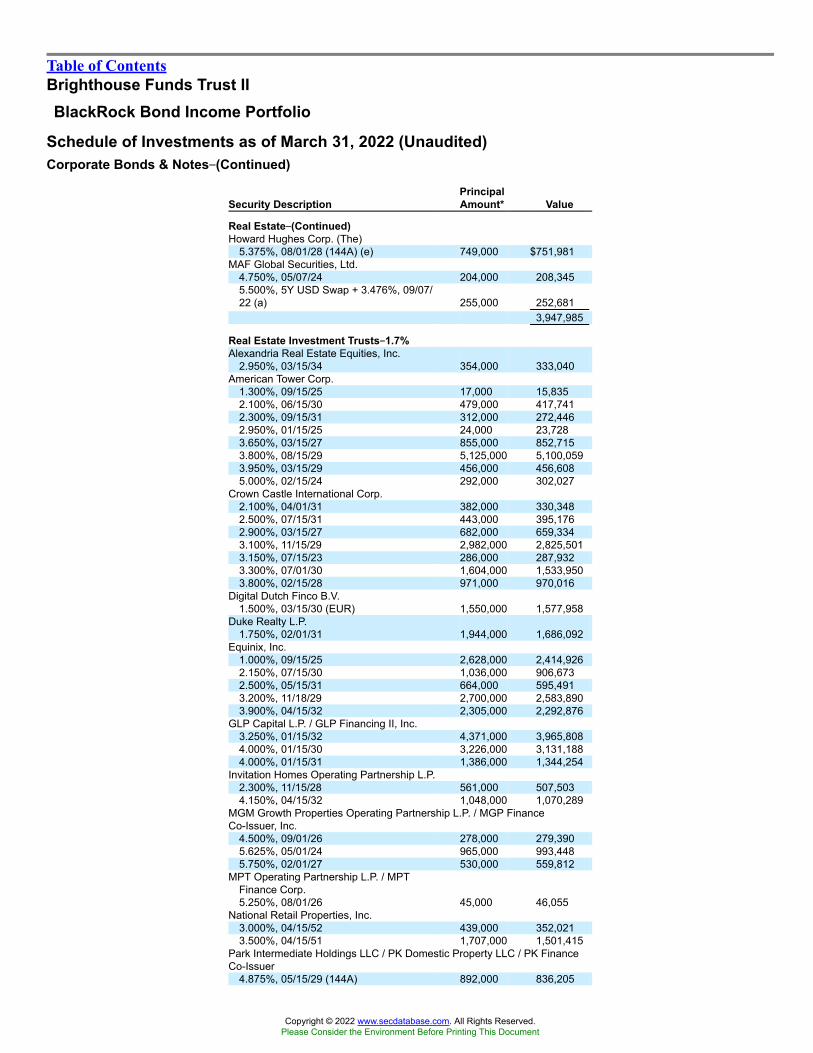
Table of ContentsBrighthouse Funds Trust IIBlackRock Bond Income Portfolio
Schedule of Investments as of March 31, 2022 (Unaudited)Corporate Bonds & Notes��(Continued)
Security DescriptionPrincipalAmount* Value
Real Estate��(Continued)Howard Hughes Corp. (The)
5.375%, 08/01/28 (144A) (e) 749,000 $751,981MAF Global Securities, Ltd.
4.750%, 05/07/24 204,000 208,3455.500%, 5Y USD Swap + 3.476%, 09/07/22 (a) 255,000 252,681
3,947,985
Real Estate Investment Trusts��1.7%Alexandria Real Estate Equities, Inc.
2.950%, 03/15/34 354,000 333,040American Tower Corp.
1.300%, 09/15/25 17,000 15,8352.100%, 06/15/30 479,000 417,7412.300%, 09/15/31 312,000 272,4462.950%, 01/15/25 24,000 23,7283.650%, 03/15/27 855,000 852,7153.800%, 08/15/29 5,125,000 5,100,0593.950%, 03/15/29 456,000 456,6085.000%, 02/15/24 292,000 302,027
Crown Castle International Corp.2.100%, 04/01/31 382,000 330,3482.500%, 07/15/31 443,000 395,1762.900%, 03/15/27 682,000 659,3343.100%, 11/15/29 2,982,000 2,825,5013.150%, 07/15/23 286,000 287,9323.300%, 07/01/30 1,604,000 1,533,9503.800%, 02/15/28 971,000 970,016
Digital Dutch Finco B.V.1.500%, 03/15/30 (EUR) 1,550,000 1,577,958
Duke Realty L.P.1.750%, 02/01/31 1,944,000 1,686,092
Equinix, Inc.1.000%, 09/15/25 2,628,000 2,414,9262.150%, 07/15/30 1,036,000 906,6732.500%, 05/15/31 664,000 595,4913.200%, 11/18/29 2,700,000 2,583,8903.900%, 04/15/32 2,305,000 2,292,876
GLP Capital L.P. / GLP Financing II, Inc.3.250%, 01/15/32 4,371,000 3,965,8084.000%, 01/15/30 3,226,000 3,131,1884.000%, 01/15/31 1,386,000 1,344,254
Invitation Homes Operating Partnership L.P.2.300%, 11/15/28 561,000 507,5034.150%, 04/15/32 1,048,000 1,070,289
MGM Growth Properties Operating Partnership L.P. / MGP FinanceCo-Issuer, Inc.
4.500%, 09/01/26 278,000 279,3905.625%, 05/01/24 965,000 993,4485.750%, 02/01/27 530,000 559,812
MPT Operating Partnership L.P. / MPTFinance Corp.5.250%, 08/01/26 45,000 46,055
National Retail Properties, Inc.3.000%, 04/15/52 439,000 352,0213.500%, 04/15/51 1,707,000 1,501,415
Park Intermediate Holdings LLC / PK Domestic Property LLC / PK FinanceCo-Issuer
4.875%, 05/15/29 (144A) 892,000 836,205
Copyright © 2022 www.secdatabase.com. All Rights Reserved.Please Consider the Environment Before Printing This Document

Real Estate InvestmentTrusts��(Continued)Realty Income Corp.
3.250%, 01/15/31 920,000 903,447RHP Hotel Properties L.P. / RHP Finance
Corp.4.750%, 10/15/27 (e) 377,000 362,783
Service Properties Trust4.350%, 10/01/24 233,000 224,2634.500%, 06/15/23 1,350,000 1,334,5425.000%, 08/15/22 789,000 785,0555.500%, 12/15/27 135,000 130,2087.500%, 09/15/25 264,000 276,949
VICI Properties L.P. / VICI Note Co., Inc.3.500%, 02/15/25 (144A) (e) 4,832,000 4,760,7283.750%, 02/15/27 (144A) (e) 736,000 715,7604.125%, 08/15/30 (144A) 868,000 837,9324.250%, 12/01/26 (144A) 2,732,000 2,720,526
WP Carey, Inc.2.400%, 02/01/31 612,000 551,528
XHR L.P.4.875%, 06/01/29 (144A) 137,000 133,0866.375%, 08/15/25 (144A) 236,000 243,216
55,401,773
Retail��0.2%1011778 BC ULC / New Red Finance, Inc.
3.875%, 01/15/28 (144A) 68,000 64,432InRetail Consumer
3.250%, 03/22/28 (144A) 330,000 309,375JSM Global S.a.r.l.
4.750%, 10/20/30 (144A) 448,000 392,565Lowe�s Cos., Inc.
1.300%, 04/15/28 503,000 447,9481.700%, 09/15/28 1,378,000 1,247,1352.800%, 09/15/41 1,606,000 1,375,5413.650%, 04/05/29 931,000 946,0854.250%, 04/01/52 284,000 293,751
SRS Distribution, Inc.4.625%, 07/01/28 (144A) 147,000 140,416
5,217,248
Semiconductors��1.0%Analog Devices, Inc.
2.800%, 10/01/41 458,000 410,942Applied Materials, Inc.
2.750%, 06/01/50 659,000 586,028Broadcom Corp. / Broadcom Cayman
Finance, Ltd.3.875%, 01/15/27 1,941,000 1,953,976
Broadcom, Inc.2.600%, 02/15/33 (144A) 334,000 289,9673.150%, 11/15/25 383,000 379,8953.419%, 04/15/33 (144A) 1,929,000 1,800,3773.469%, 04/15/34 (144A) 2,539,000 2,351,4474.110%, 09/15/28 374,000 378,4434.150%, 11/15/30 1,137,000 1,152,3374.150%, 04/15/32 905,000 903,0184.300%, 11/15/32 1,386,000 1,406,466
BHFTII-21
Copyright © 2022 www.secdatabase.com. All Rights Reserved.Please Consider the Environment Before Printing This Document

Table of ContentsBrighthouse Funds Trust IIBlackRock Bond Income Portfolio
Schedule of Investments as of March 31, 2022 (Unaudited)Corporate Bonds & Notes��(Continued)
Security DescriptionPrincipalAmount* Value
Semiconductors��(Continued)Broadcom, Inc.
4.750%, 04/15/29 2,448,000 $2,572,190Intel Corp.
3.200%, 08/12/61 796,000 703,9343.734%, 12/08/47 1,228,000 1,226,472
KLA Corp.3.300%, 03/01/50 2,136,000 2,011,9424.100%, 03/15/29 1,866,000 1,958,404
Lam Research Corp.2.875%, 06/15/50 480,000 424,5853.750%, 03/15/26 638,000 655,5764.875%, 03/15/49 1,285,000 1,530,673
NVIDIA Corp.3.500%, 04/01/50 (e) 1,113,000 1,124,809
NXP B.V. / NXP Funding LLC / NXP USA,Inc.
2.500%, 05/11/31 (144A) 3,527,000 3,167,4033.400%, 05/01/30 (144A) 2,069,000 2,005,3914.300%, 06/18/29 (144A) 4,553,000 4,700,053
QUALCOMM, Inc.4.300%, 05/20/47 1,824,000 2,052,517
35,746,845
Shipbuilding��0.1%Huntington Ingalls Industries, Inc.
2.043%, 08/16/28 (144A) 654,000 591,2053.844%, 05/01/25 995,000 1,005,6284.200%, 05/01/30 1,224,000 1,273,018
2,869,851
Software��1.2%Autodesk, Inc.
3.500%, 06/15/27 2,478,000 2,490,805Citrix Systems, Inc.
3.300%, 03/01/30 998,000 987,139Electronic Arts, Inc.
1.850%, 02/15/31 1,029,000 903,7352.950%, 02/15/51 373,000 310,953
Fidelity National Information Services, Inc.1.000%, 12/03/28 (EUR) 1,750,000 1,843,2641.500%, 05/21/27 (EUR) 470,000 516,7482.250%, 03/01/31 2,456,000 2,171,7432.950%, 05/21/39 (EUR) 900,000 1,053,082
Fiserv, Inc.3.500%, 07/01/29 3,972,000 3,909,609
Microsoft Corp.2.921%, 03/17/52 1,911,000 1,793,262
Oracle Corp.3.600%, 04/01/40 7,614,000 6,605,0413.600%, 04/01/50 1,146,000 950,4493.650%, 03/25/41 3,308,000 2,889,3263.900%, 05/15/35 2,705,000 2,543,7354.000%, 07/15/46 3,603,000 3,197,0954.000%, 11/15/47 1,699,000 1,502,5444.125%, 05/15/45 41,000 36,819
Software��(Continued)Playtika Holding Corp.
4.250%, 03/15/29 (144A) 161,000 148,523
Copyright © 2022 www.secdatabase.com. All Rights Reserved.Please Consider the Environment Before Printing This Document

Roper Technologies, Inc.2.950%, 09/15/29 411,000 396,161
salesforce.com, Inc.3.050%, 07/15/61 (e) 1,365,000 1,197,374
ServiceNow, Inc.1.400%, 09/01/30 1,948,000 1,655,557
VMware, Inc.1.800%, 08/15/28 625,000 554,3172.200%, 08/15/31 1,931,000 1,700,116
Workday, Inc.3.800%, 04/01/32 725,000 723,620
40,081,017
Telecommunications��2.4%Altice France S.A.
5.500%, 01/15/28 (144A) 356,000 329,905AT&T, Inc.
Zero Coupon, 11/27/22 (144A) 8,000,000 7,870,8171.650%, 02/01/28 (e) 1,444,000 1,315,6402.550%, 12/01/33 2,570,000 2,283,3022.600%, 05/19/38 (EUR) 850,000 967,9613.500%, 09/15/53 2,373,000 2,082,1753.500%, 02/01/61 374,000 317,8883.550%, 09/15/55 1,403,000 1,237,3993.650%, 09/15/59 2,832,000 2,483,4733.800%, 12/01/57 738,000 673,3073.850%, 06/01/60 270,000 241,6804.300%, 02/15/30 1,411,000 1,490,8294.350%, 03/01/29 2,248,000 2,378,8754.500%, 05/15/35 3,354,000 3,553,0625.150%, 02/15/50 2,074,000 2,363,549
Axtel S.A.B. de CV6.375%, 11/14/24 (144A) 451,000 460,020
Connect Finco S.a.r.l. / Connect U.S. FincoLLC6.750%, 10/01/26 (144A) 756,000 769,147
Deutsche Telekom International Finance B.V.3.600%, 01/19/27 (144A) 348,000 351,282
Digicel Group Holdings, Ltd.8.000%, 04/01/25 (144A) (j) 286,930 251,067
Digicel International Finance, Ltd. / Digicel Holdings Bermuda, Ltd.8.000%, 12/31/26 (144A) 97,061 90,0258.750%, 05/25/24 (144A) 243,135 241,91913.000%, 12/31/25 (144A) (j) 138,075 137,039
Juniper Networks, Inc.2.000%, 12/10/30 723,000 625,366
Kenbourne Invest S.A.4.700%, 01/22/28 (144A) 210,000 184,4986.875%, 11/26/24 (144A) 733,000 719,058
Level 3 Financing, Inc.4.625%, 09/15/27 (144A) 90,000 84,720
Liquid Telecommunications Financing plc5.500%, 09/04/26 (144A) 231,000 220,790
BHFTII-22
Copyright © 2022 www.secdatabase.com. All Rights Reserved.Please Consider the Environment Before Printing This Document

Table of ContentsBrighthouse Funds Trust IIBlackRock Bond Income Portfolio
Schedule of Investments as of March 31, 2022 (Unaudited)Corporate Bonds & Notes��(Continued)
Security DescriptionPrincipalAmount* Value
Telecommunications��(Continued)Millicom International Cellular S.A.
6.625%, 10/15/26 (144A) 270,000 $276,750Motorola Solutions, Inc.
2.750%, 05/24/31 2,975,000 2,691,7254.600%, 05/23/29 2,555,000 2,656,9015.500%, 09/01/44 1,369,000 1,505,341
Oi S.A.10.000%, 07/27/25 (j) 706,000 534,795
Rogers Communications, Inc.3.800%, 03/15/32 (144A) 2,590,000 2,569,9454.550%, 03/15/52 (144A) 2,200,000 2,187,148
T-Mobile USA, Inc.2.050%, 02/15/28 599,000 547,0753.875%, 04/15/30 7,297,000 7,325,014
Verizon Communications, Inc.1.500%, 09/18/30 (e) 3,276,000 2,844,8531.750%, 01/20/31 2,558,000 2,230,2442.100%, 03/22/28 3,296,000 3,072,1152.355%, 03/15/32 (144A) 3,427,000 3,095,3182.550%, 03/21/31 401,000 372,5492.650%, 11/20/40 1,350,000 1,148,3892.850%, 09/03/41 3,740,000 3,292,1432.875%, 11/20/50 2,711,000 2,265,1043.000%, 11/20/60 402,000 327,8193.150%, 03/22/30 3,892,000 3,827,6863.400%, 03/22/41 351,000 329,0333.550%, 03/22/51 95,000 89,2713.700%, 03/22/61 1,868,000 1,730,2833.875%, 02/08/29 1,715,000 1,784,1834.016%, 12/03/29 929,000 964,1644.329%, 09/21/28 302,000 318,572
VTR Comunicaciones S.p.A.5.125%, 01/15/28 (144A) 201,000 191,591
81,902,804
Transportation��0.6%Burlington Northern Santa Fe LLC
2.875%, 06/15/52 398,000 352,5723.300%, 09/15/51 1,950,000 1,843,9895.400%, 06/01/41 269,000 324,7155.750%, 05/01/40 656,000 817,477
CSX Corp.2.500%, 05/15/51 431,000 348,2873.350%, 09/15/49 309,000 287,6184.300%, 03/01/48 1,116,000 1,198,9354.650%, 03/01/68 407,000 445,497
Norfolk Southern Corp.2.900%, 06/15/26 709,000 700,2013.000%, 03/15/32 1,562,000 1,522,1633.400%, 11/01/49 863,000 805,4204.050%, 08/15/52 451,000 473,600
Ryder System, Inc.4.625%, 06/01/25 3,580,000 3,705,910
Simpar Europe S.A.5.200%, 01/26/31 (144A) 520,000 465,920
Transportation��(Continued)Union Pacific Corp.
2.750%, 03/01/26 992,000 985,6432.950%, 03/10/52 186,000 164,627
Copyright © 2022 www.secdatabase.com. All Rights Reserved.Please Consider the Environment Before Printing This Document

2.973%, 09/16/62 748,000 632,9653.799%, 04/06/71 724,000 717,4723.839%, 03/20/60 1,513,000 1,518,2603.950%, 08/15/59 311,000 315,748
Union Pacific Railroad Co. Pass-ThroughTrust3.227%, 05/14/26 632,416 631,040
18,258,059
Trucking & Leasing��0.1%Penske Truck Leasing Co. L.P. / PTLFinance Corp.
1.200%, 11/15/25 (144A) 863,000 792,0701.700%, 06/15/26 (144A) 1,452,000 1,347,2833.950%, 03/10/25 (144A) 337,000 340,6364.000%, 07/15/25 (144A) 1,003,000 1,012,746
3,492,735Total Corporate Bonds & Notes
(Cost $1,193,259,392) 1,121,541,507
Asset-BackedSecurities��13.2%Asset-Backed - Credit Card��0.0%Brex Commercial Charge Card Master
Trust2.090%, 07/15/24 (144A) 850,000 840,331
Asset-Backed - Home Equity��0.6%ACE Securities Corp. Home Equity LoanTrust
Zero Coupon, 08/15/30 614,343 509,9040.717%, 1M LIBOR + 0.260%, 05/25/37 (a) 1,059,632 245,557
Bayview Financial Revolving Asset Trust1.447%, 1M LIBOR + 1.000%, 05/28/39 (144A) (a) 4,292,487 3,770,7221.447%, 1M LIBOR + 1.000%, 12/28/40 (144A) (a) 225,158 218,355
Bear Stearns Asset-Backed SecuritiesTrust
0.807%, 1M LIBOR + 0.350%, 04/25/37 (a) 2,509,591 2,486,7592.182%, 1M LIBOR + 1.725%, 08/25/34 (a) 28,567 28,305
Citigroup Mortgage Loan Trust0.657%, 1M LIBOR + 0.200%, 05/25/37 (a) 1,849,098 1,464,0480.727%, 1M LIBOR + 0.270%, 05/25/37 (a) 839,941 669,895
Countrywide Home Equity Loan Trust6.155%, 06/25/35 64,274 80,489
Credit Suisse Mortgage CapitalCertificates2.465%, 09/27/66 (144A) (a) 5,725,385 5,497,878
Home Equity Mortgage Loan Asset-Backed Trust2.482%, 1M LIBOR + 2.025%, 07/25/34 (a) 157,288 156,404
Home Equity Mortgage Trust5.867%, 07/25/36 (k) 525,469 69,129
Home Loan Mortgage Loan Trust1.117%, 1M LIBOR + 0.720%, 04/15/36 (a) 475,235 451,443
Irwin Home Equity Loan Trust6.530%, 09/25/37 (144A) (k) 70,647 67,704
MASTR Asset-Backed Securities Trust0.737%, 1M LIBOR + 0.280%, 05/25/37 (a) 621,846 559,240
BHFTII-23
Copyright © 2022 www.secdatabase.com. All Rights Reserved.Please Consider the Environment Before Printing This Document

Table of ContentsBrighthouse Funds Trust IIBlackRock Bond Income Portfolio
Schedule of Investments as of March 31, 2022 (Unaudited)Asset-Backed Securities��(Continued)
Security DescriptionPrincipalAmount* Value
Asset-Backed - HomeEquity��(Continued)MASTR Asset-Backed Securities Trust
0.977%, 1M LIBOR + 0.520%, 06/25/36(144A) (a) 391,542 $372,867
Option One Mortgage Loan Trust0.667%, 1M LIBOR + 0.210%, 03/25/37(a) 930,000 769,9145.820%, 03/25/37 (k) 963,226 891,8285.866%, 01/25/37 (k) 2,761,379 2,533,667
Security National Mortgage Loan Trust0.807%, 1M LIBOR + 0.350%, 04/25/37(144A) (a) 12,028 12,021
Yale Mortgage Loan Trust0.857%, 1M LIBOR + 0.400%, 06/25/37(144A) (a) 767,857 301,335
21,157,464
Asset-Backed - ManufacturedHousing��0.3%Bank of America Manufactured HousingContract Trust
7.070%, 02/10/22 (a) 470,000 178,1537.397%, 12/10/25 (a) 4,000,000 1,283,218
BCMSC Trust7.575%, 06/15/30 (a) 1,270,292 245,6927.830%, 06/15/30 (a) 1,178,847 235,6808.290%, 06/15/30 (a) 850,435 180,011
Cascade MH Asset Trust4.000%, 11/25/44 (144A) (a) 2,040,103 2,040,997
Conseco Finance Corp.6.280%, 09/01/30 109,241 111,0186.830%, 04/01/30 (a) 128,926 121,0346.980%, 09/01/30 (a) 974,629 944,4187.500%, 03/01/30 (a) 385,376 187,6827.860%, 03/01/30 (a) 359,854 181,992
Conseco Finance Securitizations Corp.7.960%, 05/01/31 891,002 344,5638.060%, 09/01/29 (a) 649,273 179,9968.200%, 05/01/31 1,628,102 648,158
Credit Suisse First Boston MortgageSecurities Corp.8.100%, 09/25/31 (a) 499,550 491,593
Credit-Based Asset Servicing &Securitization LLC6.250%, 10/25/36 (144A) (k) 344,000 338,659
Greenpoint Manufactured Housing8.290%, 12/15/29 (a) 360,514 368,6999.230%, 12/15/29 (a) 373,493 338,631
Lehman ABS Manufactured HousingContract Trust6.630%, 04/15/40 (a) 1,220,916 1,238,139
Oakwood Mortgage Investors, Inc.6.930%, 09/15/31 (a) 186,306 130,5037.620%, 06/15/32 (a) 817,867 687,395
Origen Manufactured Housing ContractTrust
1.597%, 1M LIBOR + 1.200%, 10/15/37(144A) (a) 350,702 344,2597.820%, 03/15/32 (a) 264,821 254,346
Copyright © 2022 www.secdatabase.com. All Rights Reserved.Please Consider the Environment Before Printing This Document

11,074,836
Asset-Backed - Other��11.3%510 Loan Acquisition Trust
5.107%, 09/25/60 (144A) (k) 988,185 960,341522 Funding CLO, Ltd.
2.654%, 3M LIBOR + 2.400%, 04/20/30(144A) (a) 625,000 612,6873.904%, 3M LIBOR + 3.650%, 04/20/30(144A) (a) 360,000 359,998
Asset-Backed - Other��(Continued)AGL CLO, Ltd.
1.267%, 3M LIBOR + 1.150%, 12/02/34(144A) (a) 1,330,000 1,319,9861.414%, 3M LIBOR + 1.160%, 07/20/34(144A) (a) 1,310,000 1,301,201
AGL Core CLO, Ltd.1.267%, 3M LIBOR + 1.150%, 01/20/35(144A) (a) 250,000 247,5111.324%, 3M LIBOR + 1.070%, 04/20/33(144A) (a) 860,000 851,016
AIG CLO, Ltd.1.374%, 3M LIBOR + 1.120%, 04/20/32(144A) (a) 250,000 249,367
AIMCO CLO1.341%, 3M LIBOR + 1.100%, 01/15/32(144A) (a) 940,000 936,6331.841%, 3M LIBOR + 1.600%, 10/17/34(144A) (a) 250,000 249,043
Ajax Mortgage Loan TrustZero Coupon, 02/26/57 (144A) 61,248 36,561Zero Coupon, 06/25/57 (144A) 1,451,031 1,437,129Zero Coupon, 08/25/57 (144A) 1,105,348 1,318,835Zero Coupon, 12/25/57 (144A) (a) 40,563 35,460Zero Coupon, 04/25/58 (144A) 22,230 21,281Zero Coupon, 06/25/58 (144A) (a) 24,909 24,093Zero Coupon, 08/25/58 (144A) (a) 814,621 575,448Zero Coupon, 11/25/58 (144A) 79,904 53,523Zero Coupon, 09/25/59 (144A) 2,316,751 2,096,166Zero Coupon, 11/25/59 (144A) 980,027 1,011,421Zero Coupon, 12/25/59 (144A) 1,743,235 1,093,0081.740%, 12/25/60 (144A) (a) 4,666,636 4,304,8981.875%, 06/25/61 (144A) (a) 16,969,563 16,071,1012.000%, 03/25/60 (144A) (k) 5,932,404 5,619,2382.115%, 01/25/61 (144A) (k) 2,579,533 2,463,4982.250%, 06/25/60 (144A) (k) 947,066 915,4782.250%, 09/27/60 (144A) (k) 327,222 324,6212.375%, 12/25/59 (144A) (k) 4,043,554 3,963,1172.693%, 12/25/60 (144A) (a) 744,000 676,9052.940%, 12/25/60 (144A) (a) 293,000 255,6383.000%, 09/25/59 (144A) (k) 5,151,468 5,103,4313.000%, 11/25/59 (144A) (k) 1,377,160 1,372,3023.500%, 12/25/59 (144A) (k) 732,499 715,2373.729%, 12/25/60 (144A) (a) 449,000 401,1553.750%, 08/25/57 (144A) (a) 1,661,305 1,658,2773.750%, 08/25/58 (144A) (a) 2,226,825 2,231,4784.250%, 09/25/59 (144A) (k) 432,000 422,7374.250%, 11/25/59 (144A) (k) 400,000 391,4234.375%, 06/25/57 (144A) (a) 1,936,032 1,937,3694.875%, 09/25/59 (144A) (k) 570,000 562,0945.250%, 06/25/57 (144A) (a) 567,000 559,6185.250%, 08/25/57 (144A) (a) 440,000 436,170
Allegro CLO, Ltd.1.335%, 3M LIBOR + 1.080%, 10/21/28(144A) (a) 1,160,310 1,158,651
ALM, Ltd.2.091%, 3M LIBOR + 1.850%, 10/15/29(144A) (a) 1,220,000 1,216,876
ALME Loan Funding V B.V.5.410%, 3M EURIBOR + 5.410%, 07/15/31 (144A) (EUR) (a) 270,000 285,623
AMMC CLO, Ltd.
Copyright © 2022 www.secdatabase.com. All Rights Reserved.Please Consider the Environment Before Printing This Document

1.317%, 3M LIBOR + 1.050%, 07/24/29(144A) (a) 470,000 468,864
Anchorage Capital CLO, Ltd.1.291%, 3M LIBOR + 1.050%, 07/15/30(144A) (a) 890,000 886,3311.368%, 3M LIBOR + 1.090%, 01/28/31(144A) (a) 830,000 828,320
BHFTII-24
Copyright © 2022 www.secdatabase.com. All Rights Reserved.Please Consider the Environment Before Printing This Document

Table of ContentsBrighthouse Funds Trust IIBlackRock Bond Income Portfolio
Schedule of Investments as of March 31, 2022 (Unaudited)Asset-Backed Securities��(Continued)
Security DescriptionPrincipalAmount* Value
Asset-Backed - Other��(Continued)Anchorage Capital CLO, Ltd.
1.411%, 3M LIBOR + 1.170%, 07/15/34(144A) (a) 1,890,000 $1,875,4171.494%, 3M LIBOR + 1.250%, 10/13/30(144A) (a) 835,000 833,0551.691%, 3M LIBOR + 1.450%, 01/15/30(144A) (a) 2,410,000 2,409,9931.778%, 3M LIBOR + 1.500%, 01/28/31(144A) (a) 1,270,000 1,257,0661.927%, 3M LIBOR + 1.800%, 10/27/34(144A) (a) 1,050,000 1,042,5072.028%, 3M LIBOR + 1.750%, 01/28/31(144A) (a) 1,480,000 1,467,5212.091%, 3M LIBOR + 1.850%, 01/15/30(144A) (a) 1,010,000 1,003,1932.128%, 3M LIBOR + 1.850%, 01/28/31(144A) (a) 1,740,000 1,719,1892.394%, 3M LIBOR + 2.150%, 10/13/30(144A) (a) 590,000 587,2383.778%, 3M LIBOR + 3.500%, 01/28/31(144A) (a) 250,000 247,655
Anchorage Capital Europe CLO 2 DAC2.400%, 3M EURIBOR + 2.400%, 04/15/34(144A) (EUR) (a) 264,000 283,9453.550%, 3M EURIBOR + 3.550%, 04/15/34(144A) (EUR) (a) 350,000 380,326
Antares CLO Trust1.788%, 3M LIBOR + 1.530%, 07/25/33(144A) (a) 1,820,000 1,800,992
Apidos CLO1.259%, 3M LIBOR + 1.130%, 10/22/34(144A) (a) 270,000 268,6541.754%, 3M LIBOR + 1.500%, 04/20/31(144A) (a) 250,000 247,6202.191%, 3M LIBOR + 1.950%, 07/18/29(144A) (a) 250,000 247,4026.429%, 3M LIBOR + 6.300%, 10/22/34(144A) (a) 250,000 245,433
Aqua Finance Trust2.400%, 07/17/46 (144A) 430,000 395,202
Ares CLO, Ltd.1.411%, 3M LIBOR + 1.170%, 10/15/30(144A) (a) 390,000 388,468
Ares European CLO XII DAC1.700%, 3M EURIBOR + 1.700%, 04/20/32(144A) (EUR) (a) 297,000 322,374
Ares LII CLO, Ltd.1.309%, 3M LIBOR + 1.050%, 04/22/31(144A) (a) 1,330,000 1,323,418
Ares LIX CLO, Ltd.1.288%, 3M LIBOR + 1.030%, 04/25/34(144A) (a) 250,000 246,578
Ares LVI CLO, Ltd.1.418%, 3M LIBOR + 1.160%, 10/25/34(144A) (a) 350,000 346,0196.758%, 3M LIBOR + 6.500%, 10/25/34(144A) (a) 280,000 274,058
ARM Master Trust Corp.2.430%, 11/15/27 (144A) 370,000 353,977
Armada Euro CLO IV DAC
Copyright © 2022 www.secdatabase.com. All Rights Reserved.Please Consider the Environment Before Printing This Document

2.350%, 3M EURIBOR + 2.350%, 07/15/31(144A) (EUR) (a) 440,000 480,5463.300%, 3M EURIBOR + 3.300%, 07/15/31(144A) (EUR) (a) 250,000 272,319
Assurant CLO, Ltd.1.294%, 3M LIBOR + 1.040%, 04/20/31(144A) (a) 500,000 497,348
Atrium1.909%, 3M LIBOR + 1.650%, 04/22/27(144A) (a) 1,119,000 1,110,306
Avoca CLO1.300%, 3M EURIBOR + 1.300%, 04/15/35(EUR) (a) 150,000 160,5512.900%, 3M EURIBOR + 2.900%, 04/15/35(144A) (EUR) (a) 250,000 265,3755.750%, 3M EURIBOR + 5.750%, 07/15/32(EUR) (a) 160,000 169,246
Babson CLO, Ltd.1.654%, 3M LIBOR + 1.400%, 01/20/31(144A) (a) 250,000 246,980
Asset-Backed - Other��(Continued)Bain Capital Credit CLO
1.754%, 3M LIBOR + 1.500%, 07/20/30(144A) (a) 250,000 247,2101.848%, 3M LIBOR + 1.600%, 07/19/31(144A) (a) 250,000 249,0843.359%, 3M LIBOR + 3.100%, 07/24/34(144A) (a) 250,000 248,600
Bain Capital Euro CLO DAC6.810%, 3M EURIBOR + 6.810%, 04/15/32(EUR) (a) 250,000 265,046
Bankers Healthcare Group SecuritizationTrust5.170%, 09/17/31 (144A) 100,000 98,401
Bardot CLO, Ltd.3.259%, 3M LIBOR + 3.000%, 10/22/32(144A) (a) 250,000 243,787
Barings CLO, Ltd.1.324%, 3M LIBOR + 1.070%, 04/20/31(144A) (a) 250,000 249,2351.444%, 3M LIBOR + 1.190%, 10/20/30(144A) (a) 870,000 867,894
Battalion CLO, Ltd.1.311%, 3M LIBOR + 1.070%, 07/18/30(144A) (a) 1,285,000 1,281,7851.421%, 3M LIBOR + 1.180%, 07/15/34(144A) (a) 730,000 723,1631.429%, 3M LIBOR + 1.170%, 01/25/35(144A) (a) 6,220,000 6,156,4071.791%, 3M LIBOR + 1.550%, 07/18/30(144A) (a) 642,000 640,4641.809%, 3M LIBOR + 1.550%, 01/25/35(144A) (a) 480,000 476,8681.979%, 3M LIBOR + 1.720%, 04/24/34(144A) (a) 250,000 248,4981.991%, 3M LIBOR + 1.750%, 10/15/36(144A) (a) 298,000 295,1616.404%, 3M LIBOR + 6.150%, 10/20/31(144A) (a) 250,000 245,724
Benefit Street Partners CLO, Ltd.1.344%, 3M LIBOR + 1.090%, 04/20/31(144A) (a) 1,030,000 1,023,4931.354%, 3M LIBOR + 1.100%, 01/20/31(144A) (a) 2,000,000 1,984,6641.444%, 3M LIBOR + 1.190%, 07/20/34(144A) (a) 3,800,000 3,764,1361.904%, 3M LIBOR + 1.650%, 07/20/29(144A) (a) 290,000 288,9352.241%, 3M LIBOR + 2.000%, 10/15/30(144A) (a) 270,000 268,2746.991%, 3M LIBOR + 6.750%, 07/15/34(144A) (a) 250,000 240,365
Copyright © 2022 www.secdatabase.com. All Rights Reserved.Please Consider the Environment Before Printing This Document

BHG Securitization Trust2.240%, 10/17/34 (144A) 130,000 119,050
Bilbao CLO III DAC5.960%, 3M EURIBOR + 5.960%, 05/17/34(EUR) (a) 370,000 381,812
BlueMountain CLO, Ltd.1.439%, 3M LIBOR + 1.180%, 10/22/30(144A) (a) 745,093 742,1851.501%, 3M LIBOR + 1.260%, 04/15/34(144A) (a) 100,000 99,7321.739%, 3M LIBOR + 1.500%, 07/15/31(144A) (a) 660,000 653,9192.730%, 3M LIBOR + 2.250%, 08/20/32(144A) (a) 260,000 258,420
BlueMountain EUR CLO DAC1.750%, 3M EURIBOR + 1.750%, 10/15/35(144A) (EUR) (a) 560,000 604,997
Bridge Street CLO II, Ltd.1.484%, 3M LIBOR + 1.230%, 07/20/34(144A) (a) 250,000 247,195
Buttermilk Park CLO, Ltd.1.341%, 3M LIBOR + 1.100%, 10/15/31(144A) (a) 250,000 249,221
C-BASS Trust0.777%, 1M LIBOR + 0.160%, 10/25/36 (a) 179,959 144,796
Canyon Capital CLO, Ltd.1.341%, 3M LIBOR + 1.100%, 04/15/32(144A) (a) 460,000 457,2371.941%, 3M LIBOR + 1.700%, 01/15/34(144A) (a) 290,000 288,129
Capital Four CLO I DAC6.470%, 3M EURIBOR + 6.470%, 01/15/33(EUR) (a) 100,000 107,166
Carlyle Euro CLO DAC3.300%, 3M EURIBOR + 3.300%, 10/15/35(144A) (EUR) (a) 450,000 473,030
BHFTII-25
Copyright © 2022 www.secdatabase.com. All Rights Reserved.Please Consider the Environment Before Printing This Document

Table of ContentsBrighthouse Funds Trust IIBlackRock Bond Income Portfolio
Schedule of Investments as of March 31, 2022 (Unaudited)Asset-Backed Securities��(Continued)
Security DescriptionPrincipalAmount* Value
Asset-Backed - Other��(Continued)Carlyle Global Market Strategies CLO, Ltd.
1.211%, 3M LIBOR + 0.970%, 04/17/31(144A) (a) 967,060 $957,1841.318%, 3M LIBOR + 1.050%, 07/27/31(144A) (a) 4,066,514 4,033,791
Carlyle U.S. CLO, Ltd.1.272%, 3M LIBOR + 1.150%, 10/20/34(144A) (a) 710,000 701,9221.401%, 3M LIBOR + 1.160%, 07/15/34(144A) (a) 610,000 606,8441.421%, 3M LIBOR + 1.180%, 01/15/30(144A) (a) 1,550,000 1,546,319
Carrington Mortgage Loan Trust0.617%, 1M LIBOR + 0.160%, 10/25/36(a) 203,665 198,761
CarVal CLO, Ltd.3.454%, 3M LIBOR + 3.200%, 04/20/32(144A) (a) 870,000 860,257
CBAM, Ltd.1.504%, 3M LIBOR + 1.250%, 07/20/30(144A) (a) 2,000,000 1,997,060
Cedar Funding CLO, Ltd.1.234%, 3M LIBOR + 0.980%, 04/20/31(144A) (a) 380,000 376,5241.304%, 3M LIBOR + 1.050%, 04/20/34(144A) (a) 3,020,000 2,987,4231.334%, 3M LIBOR + 1.080%, 04/20/34(144A) (a) 535,000 528,7161.341%, 3M LIBOR + 1.100%, 07/17/31(144A) (a) 770,000 768,2341.604%, 3M LIBOR + 1.350%, 04/20/34(144A) (a) 510,000 494,0931.858%, 3M LIBOR + 1.350%, 05/29/32(144A) (a) 250,000 248,118
Chase Funding Trust6.333%, 04/25/32 (k) 88,991 89,373
CIFC European Funding CLO DAC5.970%, 3M EURIBOR + 5.970%, 08/18/35 (EUR) (a) 250,000 258,602
CIFC Funding, Ltd.1.241%, 3M LIBOR + 1.000%, 04/18/31(144A) (a) 1,289,000 1,279,3131.265%, 3M LIBOR + 1.010%, 04/23/29(144A) (a) 1,129,791 1,126,5051.291%, 3M LIBOR + 1.050%, 07/15/33(144A) (a) 1,100,000 1,094,9061.381%, 3M LIBOR + 1.140%, 07/15/34(144A) (a) 280,000 276,9481.384%, 3M LIBOR + 1.130%, 10/20/34(144A) (a) 1,190,000 1,178,4761.391%, 3M LIBOR + 1.150%, 07/15/36(144A) (a) 250,000 248,4421.868%, 3M LIBOR + 1.600%, 04/27/31(144A) (a) 250,000 248,9171.991%, 3M LIBOR + 1.750%, 07/16/30(144A) (a) 250,000 248,4492.241%, 3M LIBOR + 2.000%, 04/15/30(144A) (a) 571,000 571,005
Copyright © 2022 www.secdatabase.com. All Rights Reserved.Please Consider the Environment Before Printing This Document

Citigroup Mortgage Loan Trust0.627%, 1M LIBOR + 0.170%, 07/25/45(a) 650,950 512,941
Clear Creek CLO1.454%, 3M LIBOR + 1.200%, 10/20/30(144A) (a) 250,000 249,387
Clontarf Park CLO DAC3.050%, 3M EURIBOR + 3.050%, 08/05/30 (EUR) (a) 310,000 339,996
Contego CLO VIII DAC3.200%, 3M EURIBOR + 3.200%, 01/25/34 (144A) (EUR) (a) 250,000 266,330
Countrywide Asset-Backed Certificates0.617%, 1M LIBOR + 0.160%, 09/25/46(a) 23,948 23,8450.677%, 1M LIBOR + 0.220%, 12/25/25(a) 1,547 9,3710.717%, 1M LIBOR + 0.260%, 12/25/36(a) 306,794 298,8844.517%, 04/25/36 (a) 880,581 813,073
Countrywide Revolving Home Equity Loan Resecuritization Trust0.697%, 1M LIBOR + 0.300%, 12/15/33(144A) (a) 232,106 222,957
Countrywide Revolving Home Equity LoanTrust
0.547%, 1M LIBOR + 0.150%, 11/15/36 (a) 258,046 236,5040.577%, 1M LIBOR + 0.180%, 05/15/35(a) 97,677 96,097
Credit-Based Asset Servicing &Securitization LLC3.004%, 12/25/36 (k) 157,192 152,866
Asset-Backed - Other��(Continued)Crown Point CLO 10, Ltd.
1.424%, 3M LIBOR + 1.170%, 07/20/34(144A) (a) 620,000 612,637
CVC Cordatus Loan Fund DAC1.300%, 3M EURIBOR + 1.300%, 02/22/34 (EUR) (a) 250,000 270,1605.930%, 3M EURIBOR + 5.930%, 09/22/34 (EUR) (a) 250,000 254,7596.060%, 3M EURIBOR + 6.060%, 07/29/34 (144A) (EUR) (a) 250,000 261,8306.120%, 3M EURIBOR + 6.120%, 11/18/33(144A) (EUR) (a) 260,000 267,632
Diameter Capital CLO, Ltd.1.481%, 3M LIBOR + 1.240%, 07/15/36(144A) (a) 250,000 249,4246.183%, 3M LIBOR + 6.060%, 10/15/36(144A) (a) 250,000 227,566
Dryden 45 Senior Loan Fund1.941%, 3M LIBOR + 1.700%, 10/15/30(144A) (a) 540,000 537,954
Dryden 87 CLO, Ltd.1.580%, 3M LIBOR + 1.100%, 05/20/34(144A) (a) 400,000 397,550
Dryden CLO, Ltd.1.361%, 3M LIBOR + 1.120%, 01/15/31(144A) (a) 6,020,000 5,994,7641.600%, 3M LIBOR + 1.120%, 05/20/34(144A) (a) 610,000 605,9421.841%, 3M LIBOR + 1.600%, 07/18/30(144A) (a) 250,000 249,762
Dryden Senior Loan Fund1.294%, 3M LIBOR + 1.040%, 04/20/34(144A) (a) 910,000 898,9431.706%, 3M LIBOR + 1.200%, 08/15/30(144A) (a) 2,205,000 2,199,946
Eaton Vance CLO, Ltd.2.441%, 3M LIBOR + 2.200%, 10/15/30(144A) (a) 710,000 704,4796.741%, 3M LIBOR + 6.500%, 04/15/31(144A) (a) 500,000 493,183
Elmwood CLO II, Ltd.
Copyright © 2022 www.secdatabase.com. All Rights Reserved.Please Consider the Environment Before Printing This Document

1.404%, 3M LIBOR + 1.150%, 04/20/34(144A) (a) 750,000 741,7241.904%, 3M LIBOR + 1.650%, 04/20/34(144A) (a) 250,000 248,2027.054%, 3M LIBOR + 6.800%, 04/20/34(144A) (a) 250,000 243,291
Elmwood CLO X, Ltd.1.294%, 3M LIBOR + 1.040%, 10/20/34(144A) (a) 1,220,000 1,212,133
Elmwood CLO, Ltd.1.271%, 3M LIBOR + 1.150%, 01/20/35(144A) (a) 250,000 247,1632.204%, 3M LIBOR + 1.950%, 10/20/34(144A) (a) 250,000 248,461
Euro-Galaxy CLO2.400%, 3M EURIBOR + 2.400%, 07/25/35 (144A) (EUR) (a) 250,000 272,4603.250%, 3M EURIBOR + 3.250%, 04/24/34 (144A) (EUR) (a) 290,000 312,1603.500%, 3M EURIBOR + 3.500%, 07/25/35 (144A) (EUR) (a) 250,000 265,846
Fairstone Financial Issuance Trust3.735%, 10/20/39 (144A) (CAD) 323,000 253,607
Fidelity Grand Harbour CLO DAC3.600%, 3M EURIBOR + 3.600%, 10/15/34 (144A) (EUR) (a) 250,000 269,565
First Franklin Mortgage Loan Trust0.607%, 1M LIBOR + 0.150%, 12/25/36(a) 1,814,375 1,738,2590.737%, 1M LIBOR + 0.280%, 12/25/36(a) 4,082,494 2,149,1950.877%, 1M LIBOR + 0.420%, 12/25/36(a) 7,510,003 3,997,005
Flatiron CLO, Ltd.1.191%, 3M LIBOR + 0.950%, 04/17/31(144A) (a) 270,000 267,7001.358%, 3M LIBOR + 1.110%, 07/19/34(144A) (a) 2,390,000 2,370,149
Foundation Finance Trust2.190%, 01/15/42 (144A) 1,091,203 1,050,448
BHFTII-26
Copyright © 2022 www.secdatabase.com. All Rights Reserved.Please Consider the Environment Before Printing This Document

Table of ContentsBrighthouse Funds Trust IIBlackRock Bond Income Portfolio
Schedule of Investments as of March 31, 2022 (Unaudited)Asset-Backed Securities��(Continued)
Security DescriptionPrincipalAmount* Value
Asset-Backed - Other��(Continued)Fremont Home Loan Trust
0.737%, 1M LIBOR + 0.280%, 02/25/37(a) 765,177 $621,421
FS Rialto1.681%, 1M LIBOR + 1.250%, 11/16/36(144A) (a) 566,000 556,892
Galaxy CLO, Ltd.1.341%, 3M LIBOR + 1.100%, 07/15/31(144A) (a) 250,000 249,2081.441%, 3M LIBOR + 1.200%, 04/16/34(144A) (a) 660,000 654,590
Generate CLO, Ltd.1.504%, 3M LIBOR + 1.250%, 10/20/29(144A) (a) 624,032 622,9062.004%, 3M LIBOR + 1.750%, 10/20/29(144A) (a) 850,000 847,3912.699%, 3M LIBOR + 2.450%, 01/22/35(144A) (a) 250,000 244,3363.749%, 3M LIBOR + 3.500%, 01/22/35(144A) (a) 250,000 249,8106.976%, 3M LIBOR + 6.850%, 10/20/34(144A) (a) 500,000 477,475
Gilbert Park CLO, Ltd.3.191%, 3M LIBOR + 2.950%, 10/15/30(144A) (a) 861,000 852,141
GoldentTree Loan Management U.S. CLO,Ltd.1.384%, 3M LIBOR + 1.130%, 10/20/34(144A) (a) 910,000 904,154
Goldman Home Improvement Trust IssuerTrust1.970%, 06/25/51 (144A) 403,000 370,036
Golub Capital BDC CLO LLC3.041%, 3M LIBOR + 2.800%, 04/15/33(144A) (a) 250,000 247,204
Golub Capital Partners CLO 58B, Ltd.1.424%, 3M LIBOR + 1.180%, 01/25/35(144A) (a) 270,000 265,782
Gracie Point International Funding1.631%, 1M LIBOR + 1.400%, 11/01/23(144A) (a) 120,000 119,2242.631%, 1M LIBOR + 2.400%, 11/01/23(144A) (a) 160,000 158,084
Great Lakes CLO, Ltd.1.801%, 3M LIBOR + 1.560%, 07/15/31(144A) (a) 730,000 725,8301.941%, 3M LIBOR + 1.700%, 04/15/33(144A) (a) 420,000 420,260
Grippen Park CLO, Ltd.3.554%, 3M LIBOR + 3.300%, 01/20/30(144A) (a) 250,000 248,500
Gulf Stream Meridian, Ltd.1.441%, 3M LIBOR + 1.200%, 07/15/34(144A) (a) 1,860,000 1,841,0042.041%, 3M LIBOR + 1.800%, 07/15/34(144A) (a) 250,000 247,5886.591%, 3M LIBOR + 6.350%, 07/15/34(144A) (a) 250,000 238,069
Harvest CLO2.050%, 10/20/32 (144A) (EUR) 250,000 270,782
Copyright © 2022 www.secdatabase.com. All Rights Reserved.Please Consider the Environment Before Printing This Document

Henley CLO DAC1.350%, 3M EURIBOR + 1.350%, 04/25/34 (EUR) (a) 100,000 107,7112.100%, 3M EURIBOR + 2.100%, 04/25/34 (144A) (EUR) (a) 250,000 271,598
Highbridge Loan Management, Ltd.1.394%, 3M LIBOR + 1.140%, 04/20/34(144A) (a) 1,160,000 1,151,2691.421%, 3M LIBOR + 1.180%, 07/18/29(144A) (a) 500,000 498,855
Home Partners of America Trust3.799%, 12/17/26 (144A) 1,406,412 1,289,343
HPS Loan Management, Ltd.1.315%, 3M LIBOR + 1.000%, 02/05/31(144A) (a) 1,380,565 1,377,166
ICG U.S. CLO, Ltd.1.388%, 3M LIBOR + 1.140%, 10/19/28(144A) (a) 1,052,302 1,051,605
Invesco Euro CLO V DAC3.800%, 3M EURIBOR + 3.800%, 01/15/34 (EUR) (a) 100,000 108,521
Jamestown CLO XII, Ltd.2.404%, 3M LIBOR + 2.150%, 04/20/32(144A) (a) 260,000 259,235
Knollwood CDO, Ltd.3.431%, 3M LIBOR + 3.200%, 01/10/39(144A) � (a) 1,041,547 104
Asset-Backed - Other��(Continued)LCM, Ltd.
1.294%, 3M LIBOR + 1.040%, 10/20/27(144A) (a) 435,544 434,0881.311%, 3M LIBOR + 1.070%, 04/15/31(144A) (a) 250,000 248,4201.324%, 3M LIBOR + 1.070%, 01/20/31(144A) (a) 2,590,000 2,570,922
Legacy Mortgage Asset Trust3.375%, 02/25/59 (144A) (a) 1,228,214 1,221,410
Lehman ABS Mortgage Loan Trust0.547%, 1M LIBOR + 0.090%, 06/25/37(144A) (a) 144,875 110,905
Lendmark Funding Trust2.470%, 11/20/31 (144A) 290,000 264,7693.090%, 04/20/32 (144A) 170,000 153,9493.410%, 11/20/31 (144A) 220,000 201,7045.050%, 11/20/31 (144A) 450,000 405,453
Litigation Fee Residual Funding LLC4.000%, 10/30/27 (144A) � 102,480 97,860
LoanCore Issuer, Ltd.1.527%, 1M LIBOR + 1.130%, 05/15/28(144A) (a) 138,970 138,7831.697%, 1M LIBOR + 1.300%, 11/15/38(144A) (a) 580,000 577,113
Loanpal Solar Loan, Ltd.2.290%, 01/20/48 (144A) 988,052 902,8062.750%, 07/20/47 (144A) 1,020,042 967,135
Logan CLO, Ltd.1.414%, 3M LIBOR + 1.160%, 07/20/34(144A) (a) 730,000 729,066
Long Beach Mortgage Loan Trust0.617%, 1M LIBOR + 0.160%, 08/25/36(a) 550,873 263,6270.757%, 1M LIBOR + 0.300%, 06/25/36(a) 494,385 303,821
Longfellow Place CLO, Ltd.1.991%, 3M LIBOR + 1.750%, 04/15/29(144A) (a) 250,000 248,225
Madison Park Euro Funding DAC3.200%, 3M EURIBOR + 3.200%, 05/25/34 (144A) (EUR) (a) 250,000 268,4223.600%, 3M EURIBOR + 3.600%, 07/15/32 (144A) (EUR) (a) 250,000 270,8266.020%, 3M EURIBOR + 6.020%, 05/25/34 (144A) (EUR) (a) 250,000 260,304
Copyright © 2022 www.secdatabase.com. All Rights Reserved.Please Consider the Environment Before Printing This Document

Madison Park Funding, Ltd.1.179%, 3M LIBOR + 0.920%, 01/22/28(144A) (a) 1,022,376 1,017,0361.195%, 3M LIBOR + 0.940%, 10/21/30(144A) (a) 5,000,000 4,981,8601.198%, 3M LIBOR + 0.950%, 04/19/30(144A) (a) 1,303,022 1,296,1401.244%, 3M LIBOR + 0.990%, 04/20/32(144A) (a) 550,000 547,7501.311%, 3M LIBOR + 1.070%, 07/15/33(144A) (a) 350,000 348,8211.361%, 3M LIBOR + 1.120%, 07/15/34(144A) (a) 790,000 786,3411.361%, 3M LIBOR + 1.120%, 07/17/34(144A) (a) 860,000 853,7051.499%, 3M LIBOR + 1.200%, 07/29/30(144A) (a) 2,030,000 2,022,9521.908%, 3M LIBOR + 1.650%, 04/25/29(144A) (a) 250,000 249,9102.268%, 3M LIBOR + 2.000%, 07/27/31(144A) (a) 250,000 248,2536.369%, 3M LIBOR + 6.250%, 10/19/34(144A) (a) 250,000 245,202
Marble Point CLO, Ltd.1.421%, 3M LIBOR + 1.180%, 12/18/30(144A) (a) 580,000 575,801
Mariner CLO LLC1.249%, 3M LIBOR + 0.990%, 07/23/29(144A) (a) 271,913 270,5341.759%, 3M LIBOR + 1.500%, 07/23/29(144A) (a) 522,000 517,7162.309%, 3M LIBOR + 2.050%, 07/23/29(144A) (a) 1,015,000 1,010,012
Mariner Finance Issuance Trust3.420%, 11/20/36 (144A) 100,000 91,4863.510%, 07/20/32 (144A) 560,000 549,074
BHFTII-27
Copyright © 2022 www.secdatabase.com. All Rights Reserved.Please Consider the Environment Before Printing This Document

Table of ContentsBrighthouse Funds Trust IIBlackRock Bond Income Portfolio
Schedule of Investments as of March 31, 2022 (Unaudited)Asset-Backed Securities��(Continued)
Security DescriptionPrincipalAmount* Value
Asset-Backed - Other��(Continued)Mariner Finance Issuance Trust
4.010%, 07/20/32 (144A) 490,000 $477,6404.680%, 11/20/36 (144A) 400,000 365,755
Merrill Lynch First Franklin Mortgage LoanTrust0.697%, 1M LIBOR + 0.240%, 05/25/37(a) 8,259,826 6,851,177
Mill City Solar Loan, Ltd.3.690%, 07/20/43 (144A) 1,204,712 1,196,221
Mosaic Solar Loan Trust2.100%, 04/20/46 (144A) 179,429 169,5122.880%, 09/20/40 (144A) 138,339 134,146
MP CLO, Ltd.1.504%, 3M LIBOR + 1.250%, 10/20/30(144A) (a) 1,010,000 1,003,517
Neuberger Berman Loan Advisers CLO,Ltd.
1.161%, 3M LIBOR + 0.920%, 10/18/30(144A) (a) 1,770,000 1,755,8881.281%, 3M LIBOR + 1.040%, 04/15/34(144A) (a) 440,000 433,7741.341%, 3M LIBOR + 1.100%, 07/16/35(144A) (a) 680,000 673,3671.704%, 3M LIBOR + 1.450%, 07/20/31(144A) (a) 250,000 247,855
Nomura Asset Acceptance Corp.Alternative Loan Trust0.857%, 1M LIBOR + 0.400%, 10/25/36(144A) (a) 95,748 119,484
OAK Hill European Credit Partners VDesignated Activity Co.1.900%, 3M EURIBOR + 1.900%, 01/21/35 (144A) (EUR) (a) 250,000 268,440
OCP CLO, Ltd.1.231%, 3M LIBOR + 1.000%, 04/10/33(144A) (a) 250,000 247,7051.296%, 3M LIBOR + 1.180%, 12/02/34(144A) (a) 330,000 326,2871.344%, 3M LIBOR + 1.090%, 07/20/32(144A) (a) 500,000 495,5111.347%, 3M LIBOR + 1.080%, 04/26/31(144A) (a) 160,000 158,7061.667%, 3M LIBOR + 1.400%, 04/26/31(144A) (a) 180,000 179,5282.159%, 3M LIBOR + 1.900%, 04/24/29(144A) (a) 911,000 899,0492.430%, 3M LIBOR + 1.950%, 11/20/30(144A) (a) 250,000 246,408
OCP Euro CLO DAC1.700%, 3M EURIBOR + 1.700%, 09/22/34 (144A) (EUR) (a) 570,000 617,6805.940%, 3M EURIBOR + 5.940%, 09/22/34 (144A) (EUR) (a) 400,000 418,1085.940%, 3M EURIBOR + 5.940%, 09/22/34 (EUR) (a) 250,000 261,317
Octagon 54, Ltd.3.291%, 3M LIBOR + 3.050%, 07/15/34(144A) (a) 250,000 248,617
Octagon Investment Partners, Ltd.
Copyright © 2022 www.secdatabase.com. All Rights Reserved.Please Consider the Environment Before Printing This Document

1.201%, 3M LIBOR + 0.960%, 04/16/31(144A) (a) 2,210,000 2,187,1571.258%, 3M LIBOR + 1.000%, 01/25/31(144A) (a) 3,670,000 3,648,8311.261%, 3M LIBOR + 1.020%, 07/17/30(144A) (a) 3,370,000 3,361,0661.404%, 3M LIBOR + 1.150%, 07/20/34(144A) (a) 1,920,000 1,899,3501.444%, 3M LIBOR + 1.190%, 01/20/31(144A) (a) 250,000 248,8191.598%, 3M LIBOR + 1.350%, 07/19/30(144A) (a) 250,000 248,7761.838%, 3M LIBOR + 1.580%, 07/25/30(144A) (a) 250,000 247,9351.955%, 3M LIBOR + 1.700%, 04/21/31(144A) (a) 560,000 557,494
OHA Credit Funding, Ltd.1.394%, 3M LIBOR + 1.140%, 07/02/35(144A) (a) 550,000 546,4311.405%, 3M LIBOR + 1.150%, 04/21/34(144A) (a) 2,340,000 2,327,2311.409%, 3M LIBOR + 1.150%, 10/22/36(144A) (a) 250,000 247,0331.904%, 3M LIBOR + 1.650%, 07/02/35(144A) (a) 343,000 339,892
OHA Loan Funding, Ltd.1.360%, 3M LIBOR + 1.150%, 01/19/37(144A) (a) 500,000 496,6441.504%, 3M LIBOR + 1.040%, 05/23/31(144A) (a) 5,670,000 5,650,042
Asset-Backed - Other��(Continued)OneMain Financial Issuance Trust
2.220%, 06/16/36 (144A) 100,000 90,7942.470%, 06/16/36 (144A) 150,000 132,6243.140%, 10/14/36 (144A) 3,280,000 3,205,3683.840%, 05/14/32 (144A) 2,332,000 2,350,034
Oportun Issuance Trust1.960%, 05/08/31 (144A) 170,000 161,8642.180%, 10/08/31 (144A) 2,500,000 2,354,2142.670%, 10/08/31 (144A) 1,191,000 1,124,3673.610%, 10/08/31 (144A) 383,000 365,3233.650%, 05/08/31 (144A) 100,000 97,284
Owl Rock CLO VI, Ltd.1.572%, 3M LIBOR + 1.450%, 06/21/32(144A) (a) 250,000 248,002
OZLM Funding, Ltd.1.509%, 3M LIBOR + 1.250%, 10/22/30(144A) (a) 10,503,398 10,450,251
OZLM XXII, Ltd.1.311%, 3M LIBOR + 1.070%, 01/17/31(144A) (a) 249,683 248,134
OZLM, Ltd.1.259%, 3M LIBOR + 1.020%, 04/15/31(144A) (a) 520,000 515,8352.154%, 3M LIBOR + 1.900%, 01/20/31(144A) (a) 320,000 313,380
Palmer Square CLO, Ltd.1.248%, 3M LIBOR + 1.000%, 10/17/31(144A) (a) 560,000 557,1511.271%, 3M LIBOR + 1.030%, 04/18/31(144A) (a) 1,040,000 1,037,6821.341%, 3M LIBOR + 1.100%, 07/16/31(144A) (a) 1,240,000 1,234,0831.371%, 3M LIBOR + 1.130%, 01/17/31(144A) (a) 1,312,000 1,307,8791.383%, 3M LIBOR + 1.150%, 01/15/35(144A) (a) 250,000 248,7531.586%, 3M LIBOR + 1.080%, 11/15/31(144A) (a) 250,000 248,9511.610%, 3M LIBOR + 1.130%, 05/21/34(144A) (a) 4,195,000 4,175,8792.180%, 3M LIBOR + 1.700%, 05/21/34(144A) (a) 250,000 246,866
Copyright © 2022 www.secdatabase.com. All Rights Reserved.Please Consider the Environment Before Printing This Document

5.839%, 3M LIBOR + 5.600%, 07/16/31(144A) (a) 250,000 241,744
Palmer Square Loan Funding, Ltd.1.804%, 3M LIBOR + 1.550%, 04/20/28(144A) (a) 1,120,000 1,117,8991.830%, 3M LIBOR + 1.350%, 02/20/28(144A) (a) 980,000 971,6515.128%, 3M LIBOR + 5.000%, 10/15/29(144A) (a) 270,000 261,9705.830%, 3M LIBOR + 5.350%, 08/20/27(144A) (a) 250,000 246,8426.159%, 3M LIBOR + 5.900%, 10/24/27(144A) (a) 262,000 258,0797.004%, 3M LIBOR + 6.750%, 04/20/27(144A) (a) 250,000 249,906
Parallel, td.2.004%, 3M LIBOR + 1.750%, 07/20/27(144A) (a) 350,000 347,859
Park Avenue Institutional Advisers CLO,Ltd.
1.635%, 3M LIBOR + 1.240%, 02/14/34(144A) (a) 1,050,000 1,047,7051.945%, 3M LIBOR + 1.550%, 02/14/34(144A) (a) 730,000 716,2827.554%, 3M LIBOR + 7.300%, 01/20/34(144A) (a) 250,000 238,191
Penta CLO DAC5.930%, 3M EURIBOR + 5.930%, 01/15/34 (144A) (EUR) (a) 250,000 260,713
Pikes Peak CLO1.424%, 3M LIBOR + 1.170%, 07/20/34(144A) (a) 1,180,000 1,173,1091.439%, 3M LIBOR + 1.180%, 07/24/31(144A) (a) 250,000 249,417
Post CLO, Ltd.3.191%, 3M LIBOR + 2.950%, 04/16/31(144A) (a) 250,000 248,100
Preston Ridge Partners Mortgage LLC2.951%, 10/25/25 (144A) (k) 1,225,544 1,194,164
Pretium Mortgage Credit Partners I LLC2.487%, 07/25/51 (144A) (k) 2,492,352 2,417,195
BHFTII-28
Copyright © 2022 www.secdatabase.com. All Rights Reserved.Please Consider the Environment Before Printing This Document

Table of ContentsBrighthouse Funds Trust IIBlackRock Bond Income Portfolio
Schedule of Investments as of March 31, 2022 (Unaudited)Asset-Backed Securities��(Continued)
Security DescriptionPrincipalAmount* Value
Asset-Backed - Other��(Continued)Prima Capital CRE Securitization, Ltd.
4.000%, 08/24/40 (144A) 1,740,000 $1,664,6604.000%, 08/24/49 (144A) 260,000 249,870
Progress Residential Trust2.757%, 04/17/38 (144A) 500,000 430,5853.395%, 04/19/38 (144A) 967,000 881,8113.407%, 05/17/38 (144A) 1,340,000 1,227,5663.436%, 05/17/26 (144A) 1,070,000 965,7083.666%, 12/17/40 (144A) 348,000 316,8394.053%, 11/17/40 (144A) 221,000 189,1724.608%, 12/17/40 (144A) 1,406,000 1,296,389
Race Point CLO, Ltd.1.181%, 3M LIBOR + 0.940%, 10/15/30(144A) (a) 789,000 787,513
Rad CLO, Ltd.1.321%, 3M LIBOR + 1.080%, 10/15/31(144A) (a) 540,000 536,2281.337%, 3M LIBOR + 1.090%, 01/20/34(144A) (a) 250,000 249,5261.791%, 3M LIBOR + 1.550%, 04/15/32(144A) (a) 250,000 248,5172.991%, 3M LIBOR + 2.750%, 04/15/32(144A) (a) 250,000 245,6363.058%, 3M LIBOR + 2.800%, 04/25/32(144A) (a) 250,000 250,1386.447%, 3M LIBOR + 6.200%, 01/20/34(144A) (a) 250,000 242,362
Regatta VI Funding, Ltd.1.414%, 3M LIBOR + 1.160%, 04/20/34(144A) (a) 760,000 751,980
Regatta VII Funding, Ltd.2.078%, 3M LIBOR + 1.150%, 06/20/34(144A) (a) 280,000 278,226
Regatta XVI Funding, Ltd.2.291%, 3M LIBOR + 2.050%, 01/15/33(144A) (a) 250,000 249,915
Regional Management Issuance Trust3.875%, 10/17/33 (g) (h) 3,710,000 3,533,775
Republic Finance Issuance Trust2.300%, 12/22/31 (144A) 2,250,000 2,135,0612.800%, 12/22/31 (144A) 500,000 470,3683.530%, 12/22/31 (144A) 170,000 159,937
Riserva CLO, Ltd.1.301%, 3M LIBOR + 1.060%, 01/18/34(144A) (a) 940,000 928,122
Rockfield Park CLO DAC5.950%, 3M EURIBOR + 5.950%, 07/16/34(EUR) (a) 250,000 256,434
Rockford Tower CLO, Ltd.1.354%, 3M LIBOR + 1.100%, 04/20/34(144A) (a) 1,856,000 1,829,6871.424%, 3M LIBOR + 1.170%, 07/20/34(144A) (a) 1,260,000 1,252,1311.444%, 3M LIBOR + 1.190%, 10/20/30(144A) (a) 3,405,000 3,396,2931.741%, 3M LIBOR + 1.500%, 10/15/29(144A) (a) 1,781,000 1,766,4581.904%, 3M LIBOR + 1.650%, 04/20/34(144A) (a) 1,160,000 1,141,742
Copyright © 2022 www.secdatabase.com. All Rights Reserved.Please Consider the Environment Before Printing This Document

2.130%, 3M LIBOR + 1.650%, 08/20/32(144A) (a) 250,000 247,5743.091%, 3M LIBOR + 2.850%, 10/15/29(144A) (a) 939,000 918,169
Rockford Tower Europe CLO DAC1.850%, 3M EURIBOR + 1.850%, 12/20/31(EUR) (a) 407,000 446,0215.360%, 3M EURIBOR + 5.360%, 12/20/31(144A) (EUR) (a) 270,000 283,156
Romark CLO, Ltd.3.431%, 3M LIBOR + 3.200%, 07/10/34(144A) (a) 310,000 299,4005.231%, 3M LIBOR + 5.000%, 07/10/34(144A) (a) 250,000 248,276
Romark WM-R, Ltd.1.284%, 3M LIBOR + 1.030%, 04/20/31(144A) (a) 247,404 246,681
RR 1 LLC1.391%, 3M LIBOR + 1.150%, 07/15/35(144A) (a) 1,620,000 1,611,898
Asset-Backed - Other��(Continued)RR, Ltd.
1.331%, 3M LIBOR + 1.090%, 01/15/30(144A) (a) 860,000 858,0551.891%, 3M LIBOR + 1.650%, 10/15/31(144A) (a) 250,000 248,807
RRE 5 Loan Management DAC1.750%, 3M EURIBOR + 1.750%, 01/15/37(144A) (EUR) (a) 390,000 423,810
RRE 9 Loan Management DAC1.700%, 3M EURIBOR + 1.700%, 10/15/36(144A) (EUR) (a) 560,000 605,093
Service Experts Issuer LLC2.670%, 02/02/32 (144A) 1,182,213 1,131,242
SG Mortgage Securities Trust0.667%, 1M LIBOR + 0.210%, 10/25/36 (a) 570,000 462,991
Signal Peak CLO LLC1.754%, 3M LIBOR + 1.500%, 04/20/29(144A) (a) 1,412,000 1,405,068
Signal Peak CLO, Ltd.1.401%, 3M LIBOR + 1.160%, 04/17/34(144A) (a) 3,750,000 3,721,1472.041%, 3M LIBOR + 1.800%, 04/17/34(144A) (a) 490,000 486,697
Silver Creek CLO, Ltd.1.494%, 3M LIBOR + 1.240%, 07/20/30(144A) (a) 1,682,893 1,678,443
Sixth Street CLO, Ltd1.354%, 3M LIBOR + 1.100%, 07/20/34(144A) (a) 2,890,000 2,864,423
Sound Point CLO, Ltd.1.159%, 3M LIBOR + 0.900%, 01/23/29(144A) (a) 234,757 233,4381.337%, 3M LIBOR + 1.070%, 01/26/31(144A) (a) 500,000 496,2131.411%, 3M LIBOR + 1.170%, 07/15/34(144A) (a) 4,840,000 4,776,5231.538%, 3M LIBOR + 1.280%, 01/25/32(144A) (a) 350,000 349,2452.304%, 3M LIBOR + 2.050%, 10/20/28(144A) (a) 780,000 768,0183.604%, 3M LIBOR + 3.350%, 07/20/34(144A) (a) 250,000 247,938
Soundview Home Loan Trust1.252%, 1M LIBOR + 0.795%, 01/25/35 (a) 15,736 14,287
St Paul�s CLO VI DAC3.300%, 3M EURIBOR + 3.300%, 05/20/34(144A) (EUR) (a) 500,000 538,739
Steele Creek CLO, Ltd.1.491%, 3M LIBOR + 1.250%, 10/15/30(144A) (a) 670,000 668,259
Copyright © 2022 www.secdatabase.com. All Rights Reserved.Please Consider the Environment Before Printing This Document

Symphony CLO, Ltd.1.334%, 3M LIBOR + 1.080%, 04/20/33(144A) (a) 398,000 396,7201.841%, 3M LIBOR + 1.600%, 01/15/34(144A) (a) 250,000 248,305
TCI-Flatiron CLO, Ltd.1.429%, 3M LIBOR + 0.960%, 11/18/30(144A) (a) 680,000 678,201
TCW CLO AMR, Ltd.1.679%, 3M LIBOR + 1.220%, 08/16/34(144A) (a) 250,000 248,710
TIAA CLO, Ltd.1.391%, 3M LIBOR + 1.150%, 01/16/31(144A) (a) 571,000 569,638
TICP CLO, Ltd.1.361%, 3M LIBOR + 1.120%, 01/15/34(144A) (a) 820,000 810,6081.411%, 3M LIBOR + 1.170%, 07/15/34(144A) (a) 250,000 248,4431.741%, 3M LIBOR + 1.500%, 01/15/34(144A) (a) 1,050,000 1,037,4007.291%, 3M LIBOR + 7.050%, 04/15/33(144A) (a) 500,000 485,984
Trestles CLO, Ltd.1.425%, 3M LIBOR + 1.170%, 07/21/34(144A) (a) 1,170,000 1,159,1131.425%, 3M LIBOR + 1.170%, 10/20/34(144A) (a) 1,190,000 1,183,0111.584%, 3M LIBOR + 1.330%, 01/20/33(144A) (a) 1,170,000 1,167,8982.104%, 3M LIBOR + 1.850%, 01/20/33(144A) (a) 520,000 515,2123.158%, 3M LIBOR + 2.900%, 04/25/32(144A) (a) 250,000 245,795
BHFTII-29
Copyright © 2022 www.secdatabase.com. All Rights Reserved.Please Consider the Environment Before Printing This Document

Table of ContentsBrighthouse Funds Trust IIBlackRock Bond Income Portfolio
Schedule of Investments as of March 31, 2022 (Unaudited)Asset-Backed Securities��(Continued)
Security DescriptionPrincipalAmount* Value
Asset-Backed - Other��(Continued)Tricon American Homes Trust
4.564%, 05/17/37 (144A) 260,000 $250,3844.960%, 05/17/37 (144A) 180,000 175,745
Tricon Residential Trust3.692%, 07/17/38 (144A) 795,000 734,8254.133%, 07/17/38 (144A) 639,000 579,159
Trinitas CLO, Ltd.1.641%, 3M LIBOR + 1.400%, 10/18/31(144A) (a) 160,000 158,2282.258%, 3M LIBOR + 2.000%, 01/25/34(144A) (a) 560,000 548,5793.258%, 3M LIBOR + 3.000%, 01/25/34(144A) (a) 400,000 397,085
Upstart Pass-Through Trust2.000%, 07/20/27 (144A) 273,262 263,903
Venture CLO, Ltd.1.311%, 3M LIBOR + 1.070%, 07/18/31(144A) (a) 420,000 415,494
VOLT CVI LLC2.734%, 12/26/51 (144A) (k) 2,410,040 2,342,101
Voya CLO, Ltd.1.294%, 3M LIBOR + 1.040%, 04/20/34(144A) (a) 357,000 353,0141.301%, 3M LIBOR + 1.060%, 04/15/31(144A) (a) 1,989,000 1,984,4911.371%, 3M LIBOR + 1.130%, 10/15/30(144A) (a) 1,020,000 1,016,889
Voya Euro CLO DAC0.960%, 3M EURIBOR + 0.960%, 07/15/35 (144A) (EUR) (a) 1,030,000 1,123,4951.750%, 3M EURIBOR + 1.750%, 04/15/35 (144A) (EUR) (a) 340,000 368,6303.100%, 3M EURIBOR + 3.100%, 04/15/35 (144A) (EUR) (a) 250,000 265,6895.810%, 3M EURIBOR + 5.810%, 04/15/35 (144A) (EUR) (a) 250,000 255,500
Washington Mutual Asset-BackedCertificates Trust
0.612%, 1M LIBOR + 0.155%, 10/25/36(a) 592,787 495,7710.817%, 1M LIBOR + 0.360%, 09/25/36(a) 1,827,152 677,725
Whitebox CLO, Ltd.3.309%, 3M LIBOR + 3.050%, 07/24/32(144A) (a) 500,000 493,6333.471%, 3M LIBOR + 3.350%, 10/15/34(144A) (a) 250,000 244,4556.659%, 3M LIBOR + 6.400%, 07/24/32(144A) (a) 250,000 241,7306.971%, 3M LIBOR + 6.850%, 10/15/34(144A) (a) 250,000 240,477
Woodmont Trust1.924%, 3M LIBOR + 1.670%, 04/20/33(144A) (a) 1,570,000 1,554,066
377,934,142
Asset-Backed - Student Loan��1.0%College Avenue Student Loans LLC
2.420%, 06/25/52 (144A) 190,000 176,7512.720%, 06/25/52 (144A) 100,000 92,963
Copyright © 2022 www.secdatabase.com. All Rights Reserved.Please Consider the Environment Before Printing This Document

4.110%, 07/26/55 (144A) 100,000 94,559Navient Private Education Refi Loan Trust
1.297%, 1M LIBOR + 0.900%, 11/15/68(144A) (a) 441,961 438,9522.610%, 04/15/60(144A) 280,000 262,3222.690%, 07/15/69(144A) 450,000 430,3453.480%, 04/15/60(144A) 710,000 664,3124.000%, 04/15/60(144A) 230,000 214,311
Nelnet Student Loan Trust2.530%, 04/20/62(144A) 2,830,000 2,564,2042.680%, 04/20/62(144A) 3,120,000 2,855,254
Asset-Backed - StudentLoan��(Continued)Nelnet Student Loan Trust
2.850%, 04/20/62(144A) 3,661,000 3,404,7992.900%, 04/20/62(144A) 1,640,000 1,533,4993.360%, 04/20/62(144A) 110,000 103,6023.500%, 04/20/62(144A) 170,000 159,0093.570%, 04/20/62(144A) 870,000 802,5273.750%, 04/20/62(144A) 2,130,000 2,068,0094.380%, 04/20/62(144A) 100,000 94,8954.440%, 04/20/62(144A) 160,000 152,0334.750%, 04/20/62(144A) 260,000 242,4434.930%, 04/20/62(144A) 860,000 810,494
Prodigy Finance DAC1.707%, 1M LIBOR + 1.250%, 07/25/51(144A) (a) 1,027,131 1,024,9882.957%, 1M LIBOR + 2.500%, 07/25/51(144A) (a) 250,000 249,953
Scholar Funding Trust1.097%, 1M LIBOR + 0.650%, 01/30/45(144A) (a) 3,253,818 3,216,354
SLM Private Credit Student Loan Trust1.156%, 3M LIBOR + 0.330%, 03/15/24(a) 602,385 599,610
SLM Private Education Loan Trust5.147%, 1M LIBOR + 4.750%, 10/15/41(144A) (a) 3,271,464 3,626,162
SMB Private Education Loan Trust2.300%, 01/15/53(144A) 150,000 140,0282.310%, 01/15/53(144A) 760,000 709,7742.990%, 01/15/53(144A) 2,040,000 1,902,1563.000%, 01/15/53(144A) 120,000 113,6783.500%, 12/17/40(144A) 1,340,000 1,297,0453.860%, 01/15/53(144A) 1,560,000 1,489,8633.930%, 01/15/53(144A) 100,000 94,444
31,629,338Total Asset-Backed Securities
(Cost $450,669,061) 442,636,111
Mortgage-Backed Securities��5.7%Collateralized Mortgage Obligations��1.7%Agate Bay Mortgage Trust
3.535%, 06/25/45 (144A) (a) 104,000 99,6193.567%, 04/25/45 (144A) (a) 150,000 145,5333.703%, 01/25/45 (144A) (a) 130,000 126,726
Alternative Loan Trust0.639%, 1M LIBOR + 0.190%, 03/20/47(a) 1,054,940 892,8900.649%, 1M LIBOR + 0.200%, 07/20/46(a) 1,812,297 1,387,4410.737%, 1M LIBOR + 0.280%, 04/25/47(a) 497,593 447,8250.807%, 1M LIBOR + 0.350%, 06/25/35(a) 997,452 858,4750.837%, 1M LIBOR + 0.380%, 10/25/46(a) 648,936 617,7940.917%, 1M LIBOR + 0.460%, 11/25/36(a) 529,825 510,7641.057%, 1M LIBOR + 0.600%, 01/25/36(a) 336,072 296,130
Copyright © 2022 www.secdatabase.com. All Rights Reserved.Please Consider the Environment Before Printing This Document

1.871%, 12M MTA + 1.730%, 11/25/46(a) 1,813,472 1,537,9235.500%, 04/25/37 585,889 394,4866.000%, 04/25/37 95,981 56,8516.000%, 05/25/37 2,174,492 1,347,287
American Home Mortgage Assets Trust1.061%, 12M MTA + 0.920%, 11/25/46(a) 245,483 86,9771.081%, 12M MTA + 0.940%, 10/25/46(a) 358,035 286,613
BHFTII-30
Copyright © 2022 www.secdatabase.com. All Rights Reserved.Please Consider the Environment Before Printing This Document

Table of ContentsBrighthouse Funds Trust IIBlackRock Bond Income Portfolio
Schedule of Investments as of March 31, 2022 (Unaudited)Mortgage-Backed Securities��(Continued)
Security DescriptionPrincipalAmount* Value
Collateralized Mortgage Obligations��(Continued)APS Resecuritization Trust
3.307%, 1M LIBOR + 2.850%, 09/27/46(144A) (a) 879,470 $877,792
Ari Investments LLC2.986%, 01/06/25 686,928 686,928
Barclays Mortgage Trust2.000%, 11/25/51 (144A) (k) 4,584,747 4,418,491
Bear Stearns Asset-Backed Securities Trust6.250%, 12/25/35 (k) 1,369,413 1,163,5446.250%, 02/25/36 (k) 2,081,529 1,738,861
Chase Mortgage Finance Trust6.000%, 12/25/37 6,498,179 3,676,843
CHL Mortgage Pass-Through Trust1.101%, 12M MTA + 0.960%, 04/25/46(a) 3,278,418 1,229,404
Credit Suisse Mortgage Capital Certificates2.436%, 02/25/61 (144A) (a) 2,044,333 1,943,5676.500%, 10/27/37 (144A) 2,614,726 1,330,004
CSFB Mortgage-Backed Pass-ThroughCertificates1.807%, 1M LIBOR + 1.350%, 11/25/35(a) 420,482 76,527
Deutsche ALT-A Securities Mortgage LoanTrust0.627%, 1M LIBOR + 0.170%, 08/25/47(a) 309,980 341,999
Deutsche ALT-A Securities, Inc. AlternateLoan Trust0.709%, 1M LIBOR + 0.500%, 01/27/37(144A) (a) 5,568 5,600
GreenPoint Mortgage Funding Trust2.141%, 12M MTA + 2.000%, 03/25/36(a) 124,832 122,913
GS Mortgage-Backed Securities Corp.4.374%, 11/25/49 (144A) (a) 255,896 256,282
GSR Mortgage Loan Trust6.000%, 07/25/37 384,289 315,834
HarborView Mortgage Loan Trust0.654%, 1M LIBOR + 0.205%, 12/19/36(a) 2,367,153 2,186,036
Impac Secured Assets Trust0.797%, 1M LIBOR + 0.340%, 11/25/36(a) 195,269 176,972
IndyMac INDX Mortgage Loan Trust2.967%, 09/25/37 (a) 685,733 523,583
JPMorgan Alternative Loan Trust0.877%, 1M LIBOR + 0.420%, 03/25/37(a) 802,803 816,7983.250%, 05/25/37 (a) 160,344 146,397
JPMorgan Mortgage Trust0.272%, 02/25/52 (144A) (a) (b) 9,878,917 111,8310.500%, 02/25/52 (144A) (a) (b) 9,879,773 252,6412.500%, 02/25/52 (144A) (a) 7,709,624 7,125,4393.220%, 02/25/52 (144A) (a) 130,743 60,0423.272%, 02/25/52 (144A) (a) 1,001,446 900,7086.500%, 08/25/36 185,543 93,866
Legacy Mortgage Asset Trust1.750%, 04/25/61 (144A) (k) 3,483,436 3,321,0702.734%, 01/25/60 (144A) (k) 359,675 357,302
Copyright © 2022 www.secdatabase.com. All Rights Reserved.Please Consider the Environment Before Printing This Document

MASTR Resecuritization Trust0.621%, 08/25/37 (144A) (a) 258,856 143,572
Merrill Lynch Mortgage Investors Trust2.735%, 05/25/36 (a) 615,847 513,865
MFA Trust3.514%, 04/25/65 (144A) (a) 540,000 525,281
Mortgage Loan Resecuritization Trust0.571%, 1M LIBOR + 0.340%, 04/16/36(144A) (a) 1,056,072 1,000,034
Collateralized Mortgage Obligations��(Continued)New Residential Mortgage Loan Trust
4.250%, 12/25/57 (144A) (a) 283,657 287,192New York Mortgage Trust, Inc.
2.944%, 10/25/60 (144A) (a) 2,373,814 2,323,971Nomura Asset Acceptance Corp. Alternative
Loan Trust7.134%, 05/25/36 (k) 226,892 65,520
Provident Funding Mortgage Trust4.687%, 1M LIBOR + 4.500%, 02/25/55(144A) (a) 211,111 208,074
RFMSI Trust4.446%, 08/25/36 (a) 917,529 695,129
RMF Buyout Issuance Trust3.690%, 11/25/31 (144A) (a) 509,000 480,408
Seasoned Credit Risk Transfer TrustZero Coupon, 07/25/56 (144A) (l) 793,973 233,4942.127%, 07/25/56 (144A) (a) (b) 1,064,201 98,8954.266%, 05/25/57 (a) 160,717 88,219
Seasoned Loans Structured TransactionTrust4.750%, 09/25/60 (144A) (a) 2,550,000 2,479,248
Sequoia Mortgage Trust2.649%, 07/20/37 (a) 191,514 167,760
Structured Adjustable Rate Mortgage LoanTrust
3.020%, 04/25/36 (a) 200,820 141,6093.107%, 04/25/47 (a) 629,612 374,088
Structured Asset Mortgage InvestmentsTrust
0.837%, 1M LIBOR + 0.380%, 06/25/36(a) 846,299 783,4180.877%, 1M LIBOR + 0.420%, 05/25/46(a) 148,354 105,5480.917%, 1M LIBOR + 0.460%, 02/25/36(a) 1,144,592 1,008,106
TVC Mortgage Trust3.474%, 09/25/24 (144A) 306,492 306,285
Verus Securitization Trust2.601%, 05/25/65 (144A) (a) 391,000 372,451
VISIO Trust3.910%, 11/25/54 (144A) (a) 169,000 162,063
Vista Point Securitization Trust4.900%, 04/25/65 (144A) (a) 100,000 97,673
Voyager OPTONE Delaware Trust9.198%, 02/25/38 (144A) (a) (b) 3,112,019 930,385
WaMu Mortgage Pass-Through CertificatesTrust0.891%, 12M MTA + 0.750%, 06/25/47(a) 461,629 435,659
57,378,555
Commercial Mortgage-Backed Securities��4.0%1211 Avenue of the Americas Trust
4.142%, 08/10/35 (144A) (a) 230,000 212,899ACEN Mortgage Trust
3.497%, 1M LIBOR + 3.100%, 04/15/34(144A) (a) 453,000 442,624
Arbor Multifamily Mortgage Securities Trust1.750%, 05/15/53 (144A) 126,000 94,519
Ashford Hospitality Trust, Inc.2.497%, 1M LIBOR + 2.100%, 04/15/35(144A) (a) 138,000 133,510
Atrium Hotel Portfolio Trust
Copyright © 2022 www.secdatabase.com. All Rights Reserved.Please Consider the Environment Before Printing This Document

2.347%, 1M LIBOR + 1.950%, 12/15/36(144A) (a) 1,540,000 1,493,4993.447%, 1M LIBOR + 3.050%, 12/15/36(144A) (a) 178,038 167,292
BHFTII-31
Copyright © 2022 www.secdatabase.com. All Rights Reserved.Please Consider the Environment Before Printing This Document

Table of ContentsBrighthouse Funds Trust IIBlackRock Bond Income Portfolio
Schedule of Investments as of March 31, 2022 (Unaudited)Mortgage-Backed Securities��(Continued)
Security DescriptionPrincipalAmount* Value
Commercial Mortgage-Backed Securities��(Continued)BAMLL Commercial Mortgage SecuritiesTrust
1.797%, 1M LIBOR + 1.400%, 11/15/33(144A) (a) 510,000 $488,8091.897%, 1M LIBOR + 1.500%, 11/15/32(144A) (a) 300,000 263,0732.397%, 1M LIBOR + 2.000%, 11/15/32(144A) (a) 630,000 521,0793.596%, 04/14/33 (144A) (a) 250,000 234,220
Banc of America Commercial MortgageTrust
0.599%, 02/15/50 (a) (b) 4,070,000 109,9851.256%, 02/15/50 (144A) (a) (b) 2,000,000 106,420
BANK0.379%, 09/15/62 (a) (b) 8,619,000 210,789
Barclays Commercial Mortgage Trust1.119%, 1M LIBOR + 0.722%, 03/15/37(144A) (a) 280,000 273,120
Bayview Commercial Asset Trust0.707%, 1M LIBOR + 0.250%, 10/25/36(144A) (a) 111,071 105,2190.727%, 1M LIBOR + 0.270%, 03/25/37(144A) (a) 165,323 155,3210.757%, 1M LIBOR + 0.300%, 10/25/36(144A) (a) 113,020 107,2540.907%, 1M LIBOR + 0.450%, 01/25/36(144A) (a) 76,791 72,4380.997%, 1M LIBOR + 0.540%, 04/25/36(144A) (a) 85,971 80,3921.132%, 1M LIBOR + 0.675%, 01/25/36(144A) (a) 57,167 52,6651.957%, 1M LIBOR + 1.500%, 12/25/37(144A) (a) 1,259,785 1,222,060
BB-UBS Trust0.596%, 11/05/36 (144A) (a) (b) 85,480,000 1,270,3104.026%, 11/05/36 (144A) (a) 330,000 305,104
BBCMS Mortgage Trust3.897%, 1M LIBOR + 3.500%, 08/15/36(144A) (a) 297,000 288,821
Beast Mortgage Trust1.497%, 1M LIBOR + 1.100%, 04/15/36(144A) (a) 604,000 585,7961.747%, 1M LIBOR + 1.350%, 04/15/36(144A) (a) 751,000 728,5901.997%, 1M LIBOR + 1.600%, 04/15/36(144A) (a) 697,000 676,2122.497%, 1M LIBOR + 2.100%, 04/15/36(144A) (a) 589,000 571,6193.297%, 1M LIBOR + 2.900%, 04/15/36(144A) (a) 576,000 561,6504.197%, 1M LIBOR + 3.800%, 04/15/36(144A) (a) 641,000 628,5875.299%, 1M LIBOR + 4.902%, 04/15/36(144A) (a) 454,000 445,264
Benchmark Mortgage Trust1.037%, 03/15/52 (a) (b) 3,575,177 204,4991.276%, 02/15/54 (a) (b) 5,119,595 422,624
BFLD Trust4.097%, 1M LIBOR + 3.700%, 10/15/35(144A) (a) 980,000 964,106
Copyright © 2022 www.secdatabase.com. All Rights Reserved.Please Consider the Environment Before Printing This Document

BHMS Mortgage Trust1.647%, 1M LIBOR + 1.250%, 07/15/35(144A) (a) 260,000 257,305
BPR Trust3.997%, 1M LIBOR + 3.600%, 09/15/38(144A) (a) 492,000 483,353
BWAY Mortgage Trust3.446%, 03/10/33 (144A) 1,495,000 1,437,0713.454%, 03/10/33 (144A) 1,847,304 1,833,6093.633%, 03/10/33 (144A) 600,000 574,129
BX Commercial Mortgage Trust1.307%, 1M LIBOR + 0.910%, 02/15/33(144A) (a) 2,861,000 2,824,8252.348%, 1M LIBOR + 1.951%, 03/15/37(144A) (a) 181,760 178,7972.447%, 1M LIBOR + 2.050%, 11/15/35(144A) (a) 399,000 395,9902.547%, 1M LIBOR + 2.150%, 02/15/33(144A) (a) 1,754,000 1,731,8242.568%, 1M LIBOR + 2.171%, 10/15/36(144A) (a) 936,000 902,8152.647%, 1M LIBOR + 2.250%, 01/15/34(144A) (a) 280,000 271,8152.697%, 1M LIBOR + 2.300%, 10/15/36(144A) (a) 3,944,000 3,859,9632.843%, 03/09/44 (144A) (a) 1,167,000 1,095,1512.868%, 1M LIBOR + 2.471%, 03/15/37(144A) (a) 418,047 410,508
Commercial Mortgage-Backed Securities��(Continued)BX Commercial Mortgage Trust
3.047%, 1M LIBOR + 2.650%, 10/15/36(144A) (a) 3,802,050 3,712,4833.197%, 1M LIBOR + 2.800%, 06/15/38(144A) (a) 2,050,354 1,984,6723.217%, 1M LIBOR + 2.820%, 12/15/38(144A) (a) 1,443,000 1,399,5263.397%, 1M LIBOR + 3.000%, 01/15/34(144A) (a) 430,000 422,3513.397%, 1M LIBOR + 3.000%, 11/15/35(144A) (a) 3,101,000 3,062,6363.997%, 1M LIBOR + 3.600%, 11/15/32(144A) (a) 1,061,347 1,052,0144.647%, 1M LIBOR + 4.250%, 02/15/33(144A) (a) 1,171,000 1,156,193
BX Trust2.292%, 1M LIBOR + 1.895%, 10/15/36(144A) (a) 344,000 336,2262.797%, 1M LIBOR + 2.400%, 02/15/36(144A) (a) 1,920,000 1,837,0513.202%, 12/09/41 (144A) 168,000 162,1813.397%, 1M LIBOR + 3.000%, 02/15/36(144A) (a) 2,520,000 2,408,4603.539%, 1M LIBOR + 3.142%, 10/15/36(144A) (a) 1,087,000 1,046,1744.076%, 12/09/41 (144A) (a) 3,534,000 3,170,6344.147%, 1M LIBOR + 3.750%, 06/15/38(144A) (a) 1,810,000 1,743,0194.430%, 1M LIBOR + 4.033%, 09/15/34(144A) (a) 276,000 266,835
BXP Trust2.776%, 01/15/44 (144A) (a) 454,000 364,4483.552%, 08/13/37 (144A) (a) 760,000 698,452
Cassia SRL2.500%, 3M EURIBOR + 2.500%, 05/22/34 (EUR) (a) 1,277,000 1,412,681
CD Commercial Mortgage Trust3.631%, 02/10/50 350,000 353,0443.956%, 08/15/50 (a) 363,000 356,519
CFCRE Commercial Mortgage Trust0.703%, 05/10/58 (a) (b) 2,370,000 61,6964.690%, 02/15/33 (144A) 220,000 220,486
CFK Trust4.637%, 01/15/39 (144A) (a) 728,000 708,190
Copyright © 2022 www.secdatabase.com. All Rights Reserved.Please Consider the Environment Before Printing This Document

CHC Commercial Mortgage Trust1.897%, 1M LIBOR + 1.500%, 06/15/34(144A) (a) 1,685,696 1,660,240
Citigroup Commercial Mortgage Trust0.890%, 11/10/42 (144A) (a) (b) 7,730,000 443,7154.731%, 05/10/36 (144A) (a) 1,107,000 1,085,2974.888%, 04/15/49 (a) 10,000 9,673
Cold Storage Trust3.162%, 1M LIBOR + 2.766%, 11/15/37(144A) (a) 1,582,615 1,564,815
Commercial Mortgage Pass-ThroughCertificates MortgageTrust
0.060%, 02/10/35 (144A) (a) (b) 60,958,000 158,4910.998%, 03/10/46 (a) (b) 19,145,595 56,6253.179%, 10/10/36 (144A) (a) 270,000 237,0373.550%, 07/15/47 463,567 460,3814.334%, 07/10/48 (a) 1,600,000 1,574,5224.690%, 02/10/47 (a) 635,000 641,012
Credit Suisse Mortgage Capital CertificatesTrust
1.347%, 1M LIBOR + 0.950%, 12/15/30(144A) (a) 280,000 278,0713.778%, 11/10/32 (144A) (a) 301,000 293,1205.259%, 1M LIBOR + 4.862%, 10/15/37(144A) (a) 750,000 750,901
Credit Suisse Mortgage Trust3.897%, 1M LIBOR + 3.500%, 11/15/38(144A) (a) 191,000 190,725
CSAIL Commercial Mortgage Trust0.131%, 11/15/50 (a) (b) 3,940,000 50,2720.558%, 09/15/52 (a) (b) 4,150,000 148,4071.359%, 09/15/52 (a) (b) 3,119,618 231,079
BHFTII-32
Copyright © 2022 www.secdatabase.com. All Rights Reserved.Please Consider the Environment Before Printing This Document

Table of ContentsBrighthouse Funds Trust IIBlackRock Bond Income Portfolio
Schedule of Investments as of March 31, 2022 (Unaudited)Mortgage-Backed Securities��(Continued)
Security DescriptionPrincipalAmount* Value
Commercial Mortgage-Backed Securities��(Continued)CSAIL Commercial Mortgage Trust
1.557%, 06/15/52 (a) (b) 7,112,261 $625,1303.504%, 06/15/57 320,000 320,0914.237%, 06/15/52 (a) 130,000 123,020
DBJPM Mortgage Trust1.000%, 06/10/50 (a) (b) 2,060,000 87,9683.276%, 05/10/49 240,000 239,262
DBUBS Mortgage Trust3.452%, 10/10/34 (144A) 850,000 845,5473.530%, 10/10/34 (144A) (a) 1,511,000 1,424,933
ELP Commercial Mortgage Trust3.513%, 1M LIBOR + 3.116%, 11/15/38(144A) (a) 994,000 971,4344.012%, 1M LIBOR + 3.615%, 11/15/38(144A) (a) 385,000 376,340
Extended Stay America Trust2.647%, 1M LIBOR + 2.250%, 07/15/38(144A) (a) 844,801 832,0733.247%, 1M LIBOR + 2.850%, 07/15/38(144A) (a) 1,341,742 1,319,0004.097%, 1M LIBOR + 3.700%, 07/15/38(144A) (a) 1,401,375 1,369,623
GCT Commercial Mortgage Trust1.197%, 1M LIBOR + 0.800%, 02/15/38(144A) (a) 310,000 304,7222.747%, 1M LIBOR + 2.350%, 02/15/38(144A) (a) 100,000 97,698
GS Mortgage Securities Corp. II3.458%, 12/10/30 (144A) (a) 250,000 239,7325.366%, 05/03/32 (144A) 840,000 877,821
GS Mortgage Securities Corp. Trust1.597%, 1M LIBOR + 1.200%, 06/15/38(144A) (a) 332,000 331,9061.733%, 12/12/53 (144A) (a) (b) 3,130,349 346,3862.856%, 05/10/34 (144A) 710,000 707,9582.897%, 1M LIBOR + 2.500%, 11/15/37(144A) (a) 160,000 159,8073.832%, 1M LIBOR + 3.435%, 11/15/36(144A) (a) 301,000 293,238
GS Mortgage Securities Trust3.000%, 08/10/50 (144A) 180,000 158,9403.804%, 11/10/52 (a) 110,000 103,4763.805%, 10/10/35 (144A) (a) 340,000 312,4754.422%, 07/10/48 (a) 110,000 108,0094.529%, 04/10/47 (a) 50,000 48,906
GSCG Trust3.985%, 09/06/34 (144A) (a) 620,000 573,557
HMH Trust3.062%, 07/05/31 (144A) 1,210,000 1,182,025
HONO Mortgage Trust3.747%, 1M LIBOR + 3.350%, 10/15/36(144A) (a) 387,000 379,7234.797%, 1M LIBOR + 4.400%, 10/15/36(144A) (a) 263,000 257,863
Hudson Yards Mortgage Trust2.943%, 12/10/41 (144A) (a) 930,000 778,0203.443%, 07/10/39 (144A) (a) 511,000 471,480
IMT Trust3.478%, 06/15/34 (144A) 540,000 538,2573.497%, 06/15/34 (144A) (a) 570,000 552,188
Copyright © 2022 www.secdatabase.com. All Rights Reserved.Please Consider the Environment Before Printing This Document

JPMBB Commercial Mortgage SecuritiesTrust
0.603%, 05/15/48 (a) (b) 626,799 9,3370.818%, 09/15/47 (a) (b) 1,285,445 19,9344.112%, 12/15/48 (144A) (a) 300,000 273,573
JPMCC Commercial Mortgage SecuritiesTrust3.490%, 07/15/50 320,000 321,907
JPMDB Commercial Mortgage SecuritiesTrust0.750%, 12/15/49 (144A) (a) (b) 2,067,000 58,815
Commercial Mortgage-Backed Securities��(Continued)JPMorgan Chase Commercial MortgageSecurities Corp.
2.847%, 1M LIBOR + 2.450%, 04/15/38(144A) (a) 1,030,000 998,9453.347%, 1M LIBOR + 2.950%, 04/15/38(144A) (a) 1,080,000 1,039,303
JPMorgan Chase Commercial MortgageSecurities Trust
0.510%, 04/15/46 (a) (b) 4,900,000 25,9070.750%, 08/15/49 (144A) (a) (b) 5,300,000 148,0601.741%, 1M LIBOR + 1.300%, 06/15/45(144A) (a) 14,615 14,6222.097%, 1M LIBOR + 1.700%, 04/15/38(144A) (a) 787,000 766,2742.557%, 1M LIBOR + 2.160%, 07/15/36(144A) (a) 570,000 554,3732.560%, 1M LIBOR + 1.060%, 06/15/35(144A) (a) 310,107 305,1052.854%, 09/06/38 (144A) (a) 238,000 230,2573.167%, 1M LIBOR + 2.770%, 10/15/33(144A) (a) 180,000 174,2403.397%, 1M LIBOR + 3.000%, 07/15/36(144A) (a) 774,000 749,8713.750%, 06/13/52 232,000 216,7964.050%, 09/15/50 110,000 108,9784.219%, 01/15/49 (a) 970,000 872,722
KKR Industrial Portfolio Trust 2021-KDIP2.447%, 1M LIBOR + 2.050%, 12/15/37(144A) (a) 420,000 406,293
KNDL Mortgage Trust2.197%, 1M LIBOR + 1.800%, 05/15/36(144A) (a) 2,728,000 2,688,541
LB-UBS Commercial Mortgage Trust1.031%, 12/15/52 (a) (b) 7,244,370 403,315
Lehman Brothers Small Balance CommercialMortgage Trust
0.707%, 1M LIBOR + 0.250%, 03/25/37(144A) (a) 108,273 107,6820.907%, 1M LIBOR + 0.450%, 09/25/36(144A) (a) 374,136 361,587
Life Mortgage Trust2.747%, 1M LIBOR + 2.350%, 03/15/38(144A) (a) 1,287,691 1,232,891
LSTAR Commercial Mortgage Trust0.790%, 03/10/50 (144A) (a) (b) 654,809 16,8853.165%, 04/20/48 (144A) (a) 68,952 68,059
LUXE Trust3.147%, 1M LIBOR + 2.750%, 10/15/38(144A) (a) 100,000 97,974
Med Trust5.647%, 1M LIBOR + 5.250%, 11/15/38(144A) (a) 5,601,839 5,469,648
MF14.521%, 1M TSFR + 4.220%, 12/15/34(144A) (a) 163,000 162,796
MFT Trust3.477%, 02/10/42 (144A) (a) 1,752,000 1,511,550
MHC Commercial Mortgage Trust2.498%, 1M LIBOR + 2.101%, 04/15/38(144A) (a) 2,540,000 2,479,416
Copyright © 2022 www.secdatabase.com. All Rights Reserved.Please Consider the Environment Before Printing This Document

2.998%, 1M LIBOR + 2.601%, 04/15/38(144A) (a) 1,040,000 1,013,888
Morgan Stanley Bank of America MerrillLynch Trust1.180%, 12/15/47 (144A) (a) (b) 1,810,000 53,425
Morgan Stanley Bank of America MerrillLynch Trust
3.060%, 10/15/48 (144A) 85,000 75,9964.526%, 10/15/48 (a) 170,000 167,6894.558%, 05/15/50 (a) 300,000 288,232
Morgan Stanley Capital Trust1.021%, 03/15/52 (a) (b) 2,372,152 134,7032.161%, 06/15/50 (144A) (a) (b) 1,190,000 113,1462.546%, 06/15/50 (144A) 1,510,000 1,201,7752.947%, 1M LIBOR + 2.550%, 07/15/35(144A) (a) 120,000 116,3822.997%, 1M LIBOR + 2.600%, 11/15/34(144A) (a) 1,977,000 1,952,2433.744%, 1M LIBOR + 2.244%, 12/15/36(144A) (a) 220,000 216,5324.040%, 05/15/48 (a) 180,000 170,2644.071%, 03/15/52 403,000 414,920
BHFTII-33
Copyright © 2022 www.secdatabase.com. All Rights Reserved.Please Consider the Environment Before Printing This Document

Table of ContentsBrighthouse Funds Trust IIBlackRock Bond Income Portfolio
Schedule of Investments as of March 31, 2022 (Unaudited)Mortgage-Backed Securities��(Continued)
Security DescriptionPrincipalAmount* Value
Commercial Mortgage-Backed Securities��(Continued)Morgan Stanley Capital Trust
4.177%, 07/15/51 38,000 $39,2614.295%, 09/09/32 (144A) (a) 527,000 498,931
Motel Trust3.947%, 1M LIBOR + 3.550%, 09/15/38(144A) (a) 387,702 378,162
MSCG Trust2.547%, 1M LIBOR + 2.150%, 10/15/37(144A) (a) 122,000 119,934
Natixis Commercial Mortgage SecuritiesTrust
1.347%, 1M LIBOR + 0.950%, 06/15/35(144A) (a) 126,023 121,2793.018%, 1M LIBOR + 2.550%, 08/18/25(144A) (a) 3,373,433 3,330,2974.404%, 06/17/38 (144A) 265,000 270,482
Olympic Tower Mortgage Trust0.379%, 05/10/39 (144A) (a) (b) 13,300,000 244,0953.945%, 05/10/39 (144A) (a) 1,049,000 871,579
One Market Plaza TrustZero Coupon, 02/10/32 (144A) (a) (b) 21,110,000 6330.090%, 02/10/32 (144A) (a) (b) 4,222,000 4
One New York Plaza Trust3.147%, 1M LIBOR + 2.750%, 01/15/36(144A) (a) 160,000 157,597
Park Avenue Mortgage Trust1.844%, 1M LIBOR + 1.536%, 09/15/34 (144A) � (a) 500,000 494,5312.426%, 1M LIBOR + 2.119%, 09/15/34 (144A) � (a) 1,750,000 1,726,484
Park Avenue Trust0.149%, 06/05/37 (144A) (a) (b) 5,000,000 43,1333.657%, 06/05/37 (144A) (a) 207,000 181,198
PFP, Ltd.1.851%, 1M LIBOR + 1.420%, 04/14/36(144A) (a) 188,856 186,094
SREIT Trust3.015%, 1M LIBOR + 2.618%, 11/15/36(144A) (a) 672,700 655,8103.022%, 1M LIBOR + 2.625%, 11/15/38(144A) (a) 890,000 857,6434.313%, 1M LIBOR + 3.916%, 11/15/36(144A) (a) 226,000 221,046
TPGI Trust3.400%, 1M LIBOR + 3.000%, 06/15/26(144A) (a) 315,000 306,1044.250%, 1M LIBOR + 3.850%, 06/15/26(144A) (a) 215,000 208,642
UBS Commercial Mortgage Trust1.477%, 10/15/52 (a) (b) 6,909,096 581,067
Velocity Commercial Capital Loan Trust2.520%, 12/26/51 (144A) (a) 3,245,496 3,092,0532.980%, 02/25/50 (144A) (a) 172,680 163,9874.240%, 11/25/47 (144A) (a) 102,030 99,0914.480%, 12/26/51 (144A) (a) 296,484 256,4075.000%, 11/25/47 (144A) (a) 60,040 58,449
Wells Fargo Commercial Mortgage Trust0.512%, 12/15/48 (a) (b) 932,014 28,5101.237%, 1M LIBOR + 0.850%, 12/13/31(144A) (a) 490,000 484,065
Copyright © 2022 www.secdatabase.com. All Rights Reserved.Please Consider the Environment Before Printing This Document

1.254%, 08/15/49 (144A) (a) (b) 1,430,000 64,3361.408%, 05/15/52 (a) (b) 5,079,534 379,9152.487%, 1M LIBOR + 2.090%, 02/15/37(144A) (a) 300,000 287,9862.600%, 11/15/50 (144A) (a) 305,000 228,7813.137%, 1M LIBOR + 2.740%, 02/15/37(144A) (a) 260,000 246,2113.241%, 12/15/48 (144A) 283,000 234,2973.561%, 08/15/52 92,000 85,9103.749%, 06/15/36 (144A) (a) 270,000 269,4514.341%, 09/15/50 (144A) (a) 150,000 133,9324.904%, 01/15/52 (a) 622,000 637,618
Commercial Mortgage-Backed Securities��(Continued)WF-RBS Commercial Mortgage Trust
3.759%, 09/15/57 (a) 1,540,000 1,495,086133,141,428
Total Mortgage-Backed Securities(Cost $206,900,329) 190,519,983
Floating Rate Loans (m)��2.4%Advertising��0.0%Lamar Media Corp.
Term Loan B, 1.968%, 1M LIBOR +1.500%, 02/05/27 104,734 104,472
Aerospace/Defense��0.0%Cobham Ultra U.S. Co-Borrower LLC
Term Loan B, 11/16/28 (n) 322,000 318,981
Airlines��0.1%Allegiant Travel Co.
Term Loan, 3.469%, 3M LIBOR +3.000%, 02/05/24 1,140,056 1,128,656
Kestrel Bidco, Inc.Term Loan B, 4.000%, 6M LIBOR +3.000%, 12/11/26 1,683,036 1,625,182
2,753,838
Apparel��0.0%Fanatics Commerce Intermediate HoldcoLLC
Term Loan B, 3.695%, 1M LIBOR +3.250%, 11/24/28 877,800 871,490
Auto Parts & Equipment��0.0%Emerald Technologies (U.S.)Acquisitionco, Inc
Term Loan, 7.250%, TSFR + 6.250%,12/29/27 613,000 603,805
Beverages��0.0%City Brewing Co. LLC
Term Loan, 4.250%, 3M LIBOR +3.500%, 04/05/28 349,245 321,305
Naked Juice LLC2nd Lien Term Loan, 6.751%, TSFR +6.000%, 01/24/30 75,000 75,062
Triton Water Holdings, Inc.Term Loan, 4.506%, 3M LIBOR +3.500%, 03/31/28 374,173 365,871
762,238
Building Materials��0.1%ACProducts, Inc.
Term Loan B, 4.750%, 6M LIBOR +4.250%, 05/17/28 753,308 685,301
IPS Corp.Delayed Draw Term Loan, 10/02/28 (o) 58,544 57,373Term Loan, 4.000%, 1M LIBOR +3.500%, 10/02/28 146,361 143,433
BHFTII-34
Copyright © 2022 www.secdatabase.com. All Rights Reserved.Please Consider the Environment Before Printing This Document

Table of ContentsBrighthouse Funds Trust IIBlackRock Bond Income Portfolio
Schedule of Investments as of March 31, 2022 (Unaudited)Floating Rate Loans (m)��(Continued)
Security DescriptionPrincipalAmount* Value
Building Materials��(Continued)Jeld-Wen Inc.
Term Loan B, 2.707%, 1M LIBOR +2.250%, 07/28/28 753,308 $749,070
MI Windows and Doors, LLCTerm Loan, 4.000%, TSFR + 3.500%, 12/18/27 328,571 325,593
Zurn Holdings, Inc.Term Loan B, 2.750%, 1M LIBOR +2.250%, 10/04/28 150,623 149,964
2,110,734
Chemicals��0.1%Aruba Investments, Inc.
USD Term Loan, 4.500%, 6M LIBOR +3.750%, 11/24/27 412,925 408,280
Eastman Chemical Co.Term Loan B, 6.000%, 3M LIBOR +5.250%, 11/01/28 402,000 398,482
LSF11 A5 Holdco LLCTerm Loan, 4.000%, TSFR + 3.500%, 10/15/28 1,619,000 1,597,414
SCIH Salt Holdings, Inc.Incremental Term Loan B, 4.750%, 6MLIBOR + 4.000%, 03/16/27 829,160 817,345
U.S. Holdco Vad, IncTerm Loan, 02/02/29 (n) 1,201,000 1,173,977
4,395,498
Commercial Services��0.4%AEA International Holdings (Lux) S.a.r.l.
Term Loan B, 4.250%, 3M LIBOR +3.750%, 09/07/28 659,846 659,021
Allied Universal Holdco LLCUSD Incremental Term Loan B, 4.250%,1M LIBOR + 3.750%, 05/12/28 615,905 607,949
American Auto Auction Group, LLCTerm Loan B, 5.250%, TSFR + 4.500%,12/30/27 1,610,963 1,588,8122nd Lien Term Loan, 9.250%, SOFR +8.500%, 01/02/29 859,000 846,115
Caliber Home Loans, Inc.Revolver, 2.951%, 3M LIBOR + 2.875%,07/24/25 (o) 5,430,250 5,416,674
Digital Room Holdings, Inc.Term Loan, 5.750%, 1M LIBOR +5.250%, 12/21/28 517,000 509,460
DS Parent, Inc.Term Loan, 6.756%, 3M LIBOR +5.750%, 12/10/28 824,563 803,949
Interface Security Systems LLCTerm Loan, 0.826%, 08/07/23 (g) (h) 1,222,448 1,178,195
Signal Parent, Inc.Term Loan B, 4.250%, 1M LIBOR +3.500%, 04/03/28 555,800 500,452
Vaco Holdings LLCTerm Loan, 5.750%, TSFR + 5.000%, 01/21/29 616,455 613,758
12,724,385
Cosmetics/Personal Care��0.0%
Copyright © 2022 www.secdatabase.com. All Rights Reserved.Please Consider the Environment Before Printing This Document

Conair Holdings LLCTerm Loan B, 4.756%, 3M LIBOR +3.750%, 05/17/28 212,930 209,896
Distribution/Wholesale��0.0%KAR Auction Services, Inc.
Term Loan B6, 2.750%, 1M LIBOR +2.250%, 09/19/26 231,193 229,314
Electric��0.1%Pacific Gas & Electric Co.
Term Loan, 3.500%, 1M LIBOR +3.000%, 06/23/25 1,352,903 1,338,247
Entertainment��0.4%ECL Entertainment LLC
Term Loan, 8.250%, 1M LIBOR +7.500%, 03/31/28 853,550 864,753
Everi Holdings, Inc.Term Loan B, 3.008%, 3M LIBOR +2.500%, 08/03/28 279,300 277,903
GVC Holdings (Gibraltar), Ltd.USD Term Loan B4, 3.743%, 6M LIBOR+ 2.500%, 03/16/27 853,550 844,125
Herschend Entertainment Company LLCTerm Loan, 4.250%, 1M LIBOR +3.750%, 08/27/28 332,330 331,084
J&J Ventures Gaming LLCTerm Loan, 4.750%, 1M LIBOR +4.000%, 04/26/28 712,420 708,413
Maverick Gaming LLCTerm Loan B, 8.500%, 3M LIBOR +7.500%, 09/03/26 487,550 482,065
Raptor Acquisition Corp.Term Loan, 4.934%, 3M LIBOR +4.000%, 11/01/26 138,653 138,098
Scientific Games Holdings L.P.USD Term Loan B, 04/04/29 (n) 1,603,000 1,590,309
SeaWorld Parks & Entertainment, Inc.Term Loan B, 3.500%, 1M LIBOR +3.000%, 08/25/28 3,715,330 3,681,662
Stars Group Holdings B.V. (The)Incremental Term Loan, 3.256%, 3MLIBOR + 2.250%, 07/21/26 2,305,995 2,288,700
The Enterprise Development AuthorityTerm Loan B, 5.000%, 1M LIBOR +4.250%, 02/28/28 571,900 568,683
Twin River Worldwide Holdings, Inc.Term Loan B, 3.750%, 6M LIBOR +3.250%, 10/02/28 2,721,180 2,708,423
14,484,218
Environmental Control��0.0%MIP V Waste Holdings LLC
Term Loan B, 3.750%, 1M LIBOR +3.250%, 12/08/28 445,000 441,477
WIN Waste Innovations Holdings, Inc.Term Loan B, 3.756%, 3M LIBOR +2.750%, 03/24/28 131,010 129,904
571,381
BHFTII-35
Copyright © 2022 www.secdatabase.com. All Rights Reserved.Please Consider the Environment Before Printing This Document

Table of ContentsBrighthouse Funds Trust IIBlackRock Bond Income Portfolio
Schedule of Investments as of March 31, 2022 (Unaudited)Floating Rate Loans (m)��(Continued)
Security DescriptionPrincipalAmount* Value
Food��0.0%BCPE North Star U.S. HoldCo 2, Inc.
Term Loan, 5.006%, 3M LIBOR + 4.000%,06/09/28 798,992 $784,511
Shearer�s Foods, Inc.Term Loan, 4.250%, 1M LIBOR + 3.500%,09/23/27 164,500 160,131
Sovos Brands Intermediate, Inc.Term Loan, 4.500%, 3M LIBOR + 3.750%,06/08/28 139,317 138,167
1,082,809
Hand/Machine Tools��0.0%Apex Tool Group LLC
Term Loan, 5.750%, TSFR + 5.250%, 02/08/29 1,074,609 1,049,759
Healthcare-Products��0.1%Medline Borrower L.P.
Term Loan B, 3.750%, 1M LIBOR +3.250%, 10/23/28 3,583,000 3,549,399
Healthcare-Services��0.0%Medical Solutions LLC
2nd Lien Term Loan, 7.500%, 3M LIBOR +7.000%, 11/01/29 274,000 265,780
Select Medical Corp.Term Loan B, 2.710%, 1M LIBOR +2.250%, 03/06/25 242,054 239,784
505,564
Household Products/Wares��0.0%Kronos Acquisition Holdings, Inc.
1st Lien Term Loan, 7.000%, TSFR +6.000%, 12/22/26 274,313 273,055
Housewares��0.0%Springs Windows Fashions LLC
Term Loan B, 4.750%, 1M LIBOR +4.000%, 10/06/28 343,000 333,139
Internet��0.1%Cablevision Lightpath LLC
Term Loan B, 3.750%, 3M LIBOR +3.250%, 11/30/27 203,425 201,213
Olaplex, IncTerm Loan, 4.250%, TSFR + 3.750%, 02/23/29 1,949,000 1,946,564
2,147,777
Lodging��0.2%Aimbridge Acquisition Co., Inc.
Incremental Term Loan B, 5.500%, 1MLIBOR + 4.750%, 02/02/26 336,880 335,617Term Loan B, 4.199%, 1M LIBOR +3.750%, 02/02/26 829,548 816,068
Caesars Resort Collection LLCTerm Loan B1, 3.957%, 1M LIBOR +3.500%, 07/21/25 385,135 383,530
Lodging��(Continued)Fertitta Entertainment LLC
Copyright © 2022 www.secdatabase.com. All Rights Reserved.Please Consider the Environment Before Printing This Document

Term Loan B, 4.500%, TSFR + 4.000%,01/27/29 1,557,655 1,551,018
Hilton Grand Vacations Borrower LLCTerm Loan B, 3.500%, 1M LIBOR +3.000%, 08/02/28 1,156,190 1,150,951
HRNI Holdings LLCTerm Loan B, 5.256%, 3M LIBOR +4.250%, 11/19/28 3,312,075 3,299,655
Jack Ohio Finance LLCTerm Loan, 5.500%, 1M LIBOR + 4.750%,10/04/28 519,698 514,501
8,051,340
Machinery-Diversified��0.0%Columbus McKinnon Corp.
Term Loan B, 3.813%, 3M LIBOR +2.750%, 05/14/28 87,894 86,796
Hydrofarm Holdings LLCTerm Loan, 6.500%, 1M LIBOR + 5.500%,09/27/28 378,053 362,930
449,726
Media��0.1%CSC Holdings LLC
Term Loan B5, 2.897%, 1M LIBOR +2.500%, 04/15/27 964,302 949,596
DirecTV Financing LLCTerm Loan, 5.750%, 1M LIBOR + 5.000%,08/02/27 841,355 841,443
Gray Television, Inc.Term Loan D, 3.231%, 1M LIBOR +3.000%, 12/01/28 1,003,485 999,826
2,790,865
Metal Fabricate/Hardware��0.0%Advanced Drainage Systems, Inc.
Term Loan B, 2.481%, 1M LIBOR +2.250%, 07/31/26 161,913 161,508
Zekelman Industries, Inc.Term Loan, 2.457%, 1M LIBOR + 2.000%,01/24/27 267,874 263,856
425,364
Mining��0.0%American Rock Salt Co. LLC
Term Loan, 4.750%, 1M LIBOR + 4.000%,06/09/28 216,365 214,742
Oil & Gas��0.0%Southwestern Energy Co.
Term Loan, 3.301%, TSFR + 2.500%, 06/22/27 692,265 687,938
Packaging & Containers��0.0%Valcour Packaging LLC
1st Lien Term Loan, 4.250%, 3M LIBOR +3.750%, 10/04/28 352,000 344,960
BHFTII-36
Copyright © 2022 www.secdatabase.com. All Rights Reserved.Please Consider the Environment Before Printing This Document

Table of ContentsBrighthouse Funds Trust IIBlackRock Bond Income Portfolio
Schedule of Investments as of March 31, 2022 (Unaudited)Floating Rate Loans (m)��(Continued)
Security DescriptionPrincipalAmount* Value
Pharmaceuticals��0.1%Grifols Worldwide Operations USA, Inc.
Term Loan B, 2.457%, 1M LIBOR +2.000%, 11/15/27 1,440,393 $1,415,686
Pipelines��0.1%Buckeye Partners L.P.
Term Loan B, 2.707%, 1M LIBOR +2.250%, 11/01/26 2,472,776 2,458,647
DT Midstream, Inc.Term Loan B, 2.500%, 6M LIBOR +2.000%, 06/26/28 711,623 711,511
ITT Holdings LLCTerm Loan, 3.250%, 1M LIBOR +2.750%, 07/10/28 349,245 345,644
3,515,802
Real Estate Investment Trusts��0.0%OVG Business Services LLC
Initial Term Loan, 7.250%, 3M LIBOR+ 6.250%, 10/13/28 508,000 492,760
Retail��0.2%Foundation Building Materials HoldingCo. LLC
Term Loan, 3.750%, 3M LIBOR +3.250%, 02/03/28 1,176,167 1,155,584
Jo-Ann Stores, Inc.Term Loan B1, 5.500%, 3M LIBOR +4.750%, 07/07/28 283,575 249,546
LBM Acquisition LLCTerm Loan B, 4.500%, 1M LIBOR +3.750%, 12/17/27 1,840,778 1,801,088
Leslie�s Poolmart, Inc.Term Loan B, 3.019%, 3M LIBOR +2.500%, 03/09/28 195,806 193,568
Michaels Companies, Inc.Term Loan B, 5.256%, 3M LIBOR +4.250%, 04/15/28 185,598 173,998
Park River Holdings, Inc.Term Loan, 4.000%, 3M LIBOR +3.250%, 12/28/27 200,484 196,428
SRS Distribution, Inc.Term Loan B, 4.250%, 3M LIBOR +3.500%, 06/02/28 945,250 932,489
Tory Burch LLCTerm Loan B, 3.500%, 1M LIBOR +3.000%, 04/16/28 603,440 588,606
White Cap Buyer LLCTerm Loan B, 6.250%, TSFR +3.750%, 10/19/27 1,372,625 1,358,470
WOOF Holdings, Inc.1st Lien Term Loan, 4.678%, 3MLIBOR + 3.750%, 12/21/27 315,810 313,836
6,963,613
Software��0.1%ConnectWise, LLC
Term Loan B, 4.000%, 1M LIBOR +3.500%, 09/29/28 1,097,250 1,091,490
Copyright © 2022 www.secdatabase.com. All Rights Reserved.Please Consider the Environment Before Printing This Document

Software��(Continued)Playtika Holding Corp.
Term Loan, 3.207%, 1M LIBOR +2.750%, 03/13/28 1,065,240 1,052,590
2,144,080
Telecommunications��0.1%Connect Finco Sarl
Term Loan B, 4.500%, 1M LIBOR +3.500%, 12/11/26 1,447,516 1,437,263
Intelsat Jackson Holdings S.A.Term Loan B4, 9.000%, PRIME +5.500%, 01/02/24 1,178 1,161
1,438,424
Transportation��0.1%Genesee & Wyoming, Inc.
Term Loan, 3.006%, 3M LIBOR +2.000%, 12/30/26 899,640 891,318
XPO Logistics, Inc.Term Loan B, 1.992%, 1M LIBOR +1.750%, 02/24/25 1,462,420 1,449,754
2,341,072Total Floating Rate Loans
(Cost $82,315,198) 81,696,371
Foreign Government��1.0%Sovereign��1.0%Argentine Republic GovernmentInternational Bond
1.125%, 07/09/35 (k) 1,948,000 593,965Chile Government International Bond
4.340%, 03/07/42 665,000 682,669Colombia Government InternationalBond
4.500%, 03/15/29 (e) 2,089,000 2,017,849Dominican Republic International Bond
5.500%, 02/22/29 (144A) 1,100,000 1,086,250Ghana Government International Bond
7.625%, 05/16/29 488,000 353,312Hungary Government InternationalBond
5.375%, 03/25/24 2,054,000 2,150,998Indonesia Government InternationalBonds
2.850%, 02/14/30 (e) 662,000 650,6223.050%, 03/12/51 (e) 1,965,000 1,775,562
Indonesia Treasury Bonds7.500%, 06/15/35 (IDR) 14,862,000,000 1,061,4868.375%, 03/15/34 (IDR) 14,950,000,000 1,140,280
Ivory Coast Government InternationalBond
6.625%, 03/22/48 (EUR) 323,000 311,254Mexico Government International Bonds
2.659%, 05/24/31 2,105,000 1,915,9714.400%, 02/12/52 (e) 2,580,000 2,367,0724.500%, 01/31/50 (e) 4,504,000 4,234,345
Nigeria Government International Bond8.375%, 03/24/29 640,000 646,170
Panama Government InternationalBonds
3.875%, 03/17/28 1,279,000 1,306,0514.500%, 04/01/56 1,811,000 1,769,945
BHFTII-37
Copyright © 2022 www.secdatabase.com. All Rights Reserved.Please Consider the Environment Before Printing This Document

Table of ContentsBrighthouse Funds Trust IIBlackRock Bond Income Portfolio
Schedule of Investments as of March 31, 2022 (Unaudited)Foreign Government��(Continued)
Security DescriptionPrincipalAmount* Value
Sovereign��(Continued)Peruvian Government International Bonds
3.550%, 03/10/51 1,587,000 $1,477,8944.125%, 08/25/27 1,009,000 1,046,736
Philippine Government International Bonds3.000%, 02/01/28 1,834,000 1,841,3463.200%, 07/06/46 2,044,000 1,824,592
Russian Federal Bond - OFZ6.100%, 07/18/35 (RUB) 147,607,000 54,501
Ukraine Government International Bonds7.253%, 03/15/33 (144A) 200,000 82,9507.375%, 09/25/32 (144A) 274,000 113,433
Uruguay Government International Bond4.375%, 10/27/27 1,266,587 1,342,5955.100%, 06/18/50 1,118,733 1,317,375
Total Foreign Government(Cost $38,075,670) 33,165,223
Municipals��0.7%American Municipal Power, Inc., BuildAmerica Bond
8.084%, 02/15/50 510,000 844,884Bay Area Toll Bridge Authority, BuildAmerica Bond
7.043%, 04/01/50 1,215,000 1,867,463Los Angeles, CA Community College District, Build America Bond
6.600%, 08/01/42 785,000 1,101,628Los Angeles, CA Unified School District,Build America Bond
6.758%, 07/01/34 2,020,000 2,564,997Massachusetts Housing Finance Agency
4.500%, 12/01/48 275,000 281,810Metropolitan Transportation Authority, BuildAmerica Bonds
6.668%, 11/15/39 170,000 213,9936.814%, 11/15/40 330,000 423,352
Municipal Electric Authority of Georgia,Build America Bond
6.637%, 04/01/57 466,000 621,922New Jersey Turnpike Authority
7.414%, 01/01/40 492,000 716,657New York City Water & Sewer System
5.882%, 06/15/44 270,000 365,384New York State Dormitory Authority, BuildAmerica Bond
5.389%, 03/15/40 355,000 427,946Port Authority of New York & New Jersey
4.960%, 08/01/46 1,350,000 1,576,260San Antonio, TX Electric & Gas Systems Revenue, Build America Bond
5.808%, 02/01/41 875,000 1,088,228State of California
4.600%, 04/01/38 3,765,000 4,118,918State of California General Obligation Unlimited, Build America Bond
7.550%, 04/01/39 780,000 1,156,621State of Illinois, General ObligationUnlimited
5.100%, 06/01/33 3,010,000 3,200,856State of Texas
5.517%, 04/01/39 820,000 1,038,580University of California
Copyright © 2022 www.secdatabase.com. All Rights Reserved.Please Consider the Environment Before Printing This Document

4.858%, 05/15/2112 239,000 266,743Total Municipals
(Cost $21,738,460) 21,876,242Common Stocks��0.4%
Security Description Shares Value
Chemicals��0.1%CF Industries Holdings, Inc. 7,032 724,718Element Solutions, Inc. 25,267 553,347Mosaic Co. (The) 5,745 382,043
1,660,108
Equity Real Estate InvestmentTrusts��0.1%DiamondRock Hospitality Co. (p) 76,361 771,246Park Hotels & Resorts, Inc. (q) 36,027 703,607Service Properties Trust 77,719 686,259Sunstone Hotel Investors, Inc. (p) (q) 32,871 387,220Xenia Hotels & Resorts, Inc. (p) 42,097 812,051
3,360,383
Health Care Providers & Services��0.1%HCA Healthcare, Inc. (q) 3,654 915,766Tenet Healthcare Corp. (p) 4,138 355,702
1,271,468
Hotels, Restaurants & Leisure��0.0%Caesars Entertainment, Inc. (p) 4,625 357,790
Household Durables��0.0%Taylor Morrison Home Corp. (p) 18,564 505,312
Interactive Media & Services��0.0%Genius Sports, Ltd. (p) 101,806 468,307
Machinery��0.0%Sarcos Technology and Robotics Corp. (e)
(p) 6,978 46,404
Media��0.0%Altice USA, Inc. - Class A (p) 11,862 148,038
Oil, Gas & Consumable Fuels��0.1%California Resources Corp. (q) 43,177 1,931,307Chesapeake Energy Corp. (e) 4,216 366,792Green Plains, Inc. (e) (p) (q) 28,483 883,258
3,181,357
Real Estate Management &Development��0.0%Forestar Group, Inc. (p) 12,122 215,287
Special Purpose AcquisitionCompanies��0.0%Pivotal Investment Corp. III (p) 26,099 254,987Tishman Speyer Innovation Corp. II -
Class A (p) 16,712 163,778418,765
Total Common Stocks(Cost $10,585,325) 11,633,219
Preferred Stock��0.1%Home Builders��0.1%Dream Finders Homes, Inc.,
9.000%, 09/08/26 � (g) (h)(Cost $2,601,720) 2,628 2,605,005
BHFTII-38
Copyright © 2022 www.secdatabase.com. All Rights Reserved.Please Consider the Environment Before Printing This Document

Table of ContentsBrighthouse Funds Trust IIBlackRock Bond Income Portfolio
Schedule of Investments as of March 31, 2022 (Unaudited)Warrants��0.0%
Security Description Shares Value
Commercial Services &Supplies��0.0%Aurora Innovation, Inc. (p) 4,108 $6,203
Health Care Providers &Services��0.0%Cano Health, Inc. (p) 36,440 57,575
Health Care Technology��0.0%Pear Therapeutics, Inc. � (p) 10,748 8,513
Hotels, Restaurants & Leisure��0.0%HomeToGo SE (p) 3,040 1,682Sonder Holdings, Inc. (g) (h) (p) 20,820 8,328
10,010
Independent Power and Renewable Electricity Producers��0.0%Altus Power, Inc. (p) 9,486 15,367
Interactive Media & Services��0.0%Genius Sports, Ltd. (p) 76,133 79,940
Machinery��0.0%Hyzon Motors, Inc. (p) 32,814 55,784Sarcos Technology and Robotics Corp.
(p) 102,425 108,570164,354
Oil, Gas & Consumable Fuels��0.0%Chesapeake Energy Corp. (p) 411 22,880
Real Estate Management &Development��0.0%Offerpad Solutions, Inc. (p) 31,569 25,571
Software��0.0%Embark Technology, Inc. (p) 3,005 3,366Latch, Inc. (p) 43,584 28,765
32,131
Special Purpose AcquisitionCompanies��0.0%ArcLight Clean Transition Corp. II (p) 4,354 5,791Climate Real Impact Solutions II
Acquisition Corp. (p) 1,816 835Gores Holdings VIII, Inc. (p) 6,990 9,157Science Strategic Acquisition Corp.
Alpha (p) 9,181 2,023Tishman Speyer Innovation Corp. II (p) 3,342 1,270TPG Pace Beneficial Finance Corp. (p) 8,740 5,594
24,670
Specialty Retail��0.0%EVgo, Inc. (p) 19,550 76,832Volta, Inc. (p) 20,140 19,133
95,965Total Warrants
(Cost $1,220,890) 543,179Convertible Bonds��0.0%
Security DescriptionPrincipalAmount* Value
Copyright © 2022 www.secdatabase.com. All Rights Reserved.Please Consider the Environment Before Printing This Document

Airlines��0.0%GOL Equity Finance S.A.
3.750%, 07/15/24 100,000 81,625
Energy-Alternate Sources��0.0%Stem, Inc.
0.500%, 12/01/28 102,000 75,653Total Convertible Bonds
(Cost $176,536) 157,278
Escrow Shares��0.0%Oil & Gas��0.0%Chesapeake Energy Corp. (f) (g) (h) 100,000 0
Savings & Loans��0.0%Washington Mutual Bank (g) (h) 5,027,000 1Washington Mutual Bank (g) (h) 1,310,000 0Washington Mutual Bank (g) (h) 2,440,000 0
1Total Escrow Shares
(Cost $0) 1
Short-Term Investment��10.5%Repurchase Agreement��10.5%Fixed Income Clearing Corp.
Repurchase Agreement dated 03/31/22 at 0.000%, due on 04/01/22 with amaturity value of $353,430,673;collateralized by U.S. Treasury Noteat 2.500%, maturing 03/31/27, with amarket value of $360,499,318. 353,430,673 353,430,673
Total Short-Term Investments(Cost $353,430,673) 353,430,673
Securities Lending Reinvestments (r)��0.8%Certificate of Deposit��0.0%Oversea-Chinese Banking Corp., Ltd.
Zero Coupon, 04/14/22 300,000 299,949
Repurchase Agreements��0.6%Cantor Fitzgerald & Co.
Repurchase Agreement dated 03/31/22 at 0.290%, due on 04/01/22 with amaturity value of $1,000,008;collateralized by U.S. Treasury andU.S. Government Agency Obligationswith rates ranging from 0.125% -8.000%, maturity dates ranging from09/15/22 - 07/20/71, and anaggregate market value of$1,020,000. 1,000,000 1,000,000
BHFTII-39
Copyright © 2022 www.secdatabase.com. All Rights Reserved.Please Consider the Environment Before Printing This Document

Table of ContentsBrighthouse Funds Trust IIBlackRock Bond Income Portfolio
Schedule of Investments as of March 31, 2022 (Unaudited)Securities Lending Reinvestments (r)��(Continued)
Security DescriptionPrincipalAmount* Value
Repurchase Agreements��(Continued)Citigroup Global Markets, Ltd.
Repurchase Agreement dated 03/31/22 at 0.300%, due on 04/01/22 with amaturity value of $300,003;collateralized by U.S. Treasury andForeign Obligations with rates rangingfrom 0.125% - 2.875%, maturity datesranging from 08/15/23 - 02/15/51, andan aggregate market value of$306,000. 300,000 $300,000
ING Financial Markets LLCRepurchase Agreement dated 03/31/22 at 0.260%, due on 04/01/22 with amaturity value of $2,106,393;collateralized by U.S. GovernmentAgency Obligations with rates rangingfrom 0.350% - 6.625%, maturity datesranging from 04/05/22 - 11/15/30, andan aggregate market value of$2,148,519. 2,106,378 2,106,378
National Bank Financial Inc.Repurchase Agreement dated 03/31/22 at 0.320%, due on 04/01/22 with amaturity value of $1,900,017;collateralized by U.S. TreasuryObligations with rates ranging from0.125% - 3.000%, maturity datesranging from 06/30/22 - 02/15/49, andan aggregate market value of$1,939,081. 1,900,000 1,900,000
National Bank of CanadaRepurchase Agreement dated 03/31/22 at 0.320%, due on 04/07/22 with amaturity value of $3,200,199;collateralized by U.S. TreasuryObligations with rates ranging from0.000% - 4.500%, maturity datesranging from 04/14/22 - 08/15/51, andan aggregate market value of$3,265,820. 3,200,000 3,200,000Repurchase Agreement dated 03/31/22 at 0.450%, due on 04/07/22 with amaturity value of $2,000,175;collateralized by U.S. TreasuryObligations with rates ranging from0.500% - 3.000%, maturity datesranging from 11/30/23 - 08/15/48, andvarious Common Stock with anaggregate market value of $2,211,597. 2,000,000 2,000,000
NBC Global Finance, Ltd.Repurchase Agreement dated 03/31/22 at 0.440%, due on 04/01/22 with amaturity value of $4,000,049;collateralized by U.S. TreasuryObligations with rates ranging from0.125% - 4.750%, maturity datesranging from 05/15/24 - 02/15/50, andvarious Common Stock with anaggregate market value of$4,441,506. 4,000,000 4,000,000
Copyright © 2022 www.secdatabase.com. All Rights Reserved.Please Consider the Environment Before Printing This Document

Repurchase Agreement dated 03/31/22 at 0.485%, due on 04/07/22 with amaturity value of $1,300,123;collateralized by U.S. TreasuryObligations with rates ranging from0.125% - 4.750%, maturity datesranging from 05/15/24 - 02/15/50, andvarious Common Stock with anaggregate market value of$1,443,490. 1,300,000 1,300,000
Societe GeneraleRepurchase Agreement dated 03/31/22 at 0.360%, due on 04/01/22 with amaturity value of $1,000,010;collateralized by various CommonStock with an aggregate market valueof $1,111,203. 1,000,000 1,000,000Repurchase Agreement dated 03/31/22 at 0.420%, due on 04/07/22 with amaturity value of $600,049;collateralized by various CommonStock with an aggregate market valueof $666,774. 600,000 600,000
Repurchase Agreements��(Continued)TD Prime Services LLC
Repurchase Agreement dated 03/31/22 at 0.400%, due on 04/01/22 with amaturity value of $3,000,033;collateralized by various CommonStock with an aggregate market valueof $3,474,565. 3,000,000 3,000,000
20,406,378
Time Deposit��0.0%Skandi (NY)
0.300%, 04/01/22 1,000,000 1,000,000
Mutual Funds��0.2%Allspring Government Money Market
Fund, Select Class 0.180% (s) 794,560 794,560Fidelity Government Portfolio,
Institutional Class 0.160% (s) 1,000,000 1,000,000Morgan Stanley Liquidity Funds
Government Portfolio, InstitutionalShares 0.230% (s) 2,000,000 2,000,000
STIT-Government & Agency Portfolio,Institutional Class 0.250% (s) 2,000,000 2,000,000
5,794,560Total Securities Lending Reinvestments
(Cost $27,500,921) 27,500,887Total Purchased Options�0.1% (t)
(Cost $2,579,121) 3,245,234Total Investments�117.8%
(Cost $4,112,739,723) 3,955,461,400Unfunded Loan Commitments�(0.0)%
(Cost $(109,522)) (109,522 )Net Investments�117.8%
(Cost $4,112,630,201) 3,955,351,878Other assets and liabilities (net)�(17.8)% (598,459,616 )Net Assets��100.0% $3,356,892,262
* Principal and notional amounts stated in U.S. dollars unless otherwise noted.� Restricted securities are not registered under the Securities Act of 1933 and are subject to legal restrictions on resale. These securities
generally may be resold in transactions exempt from registration or to the public if the securities are subsequently registered. Disposal ofthese securities may involve time-consuming negotiations and prompt sale at an acceptable price may be difficult. As of March 31, 2022,the market value of restricted securities was $7,402,845, which is 0.2% of net assets. See details shown in the Restricted Securities tablethat follows.
(a) Variable or floating rate security. The stated rate represents the rate at March 31, 2022. Maturity date shown for callable securities reflectsthe earliest possible call date. For securities based on a published reference index and spread, the index and spread are indicated in thedescription above. For certain variable rate securities, the coupon rate is determined by the issuer/agent based on current marketconditions. For certain asset- and mortgage-backed securities, the coupon rate may fluctuate based on changes of the underlyingcollateral or prepayments of principal. These securities do not indicate a reference index and spread in their description above.
Copyright © 2022 www.secdatabase.com. All Rights Reserved.Please Consider the Environment Before Printing This Document

(b) Interest only security.(c) TBA (To Be Announced) Securities are purchased on a forward commitment basis with an approximate principal amount and no defined
maturity date. The actual principal and maturity date will be determined upon settlement date.
BHFTII-40
Copyright © 2022 www.secdatabase.com. All Rights Reserved.Please Consider the Environment Before Printing This Document

Table of ContentsBrighthouse Funds Trust IIBlackRock Bond Income Portfolio
Schedule of Investments as of March 31, 2022 (Unaudited)(d) All or a portion of the security was pledged as collateral against open futures contracts. As of March 31, 2022, the market value of
securities pledged was $11,156,590.(e) All or a portion of the security was held on loan. As of March 31, 2022, the market value of securities loaned was $47,956,341 and the
collateral received consisted of cash in the amount of $27,500,703 and non-cash collateral with a value of $21,918,785. The cashcollateral investments are disclosed in the Schedule of Investments and categorized as Securities Lending Reinvestments. The non-cash collateral received consists of U.S. government securities that are held in safe-keeping by the lending agent, or a third-partycustodian, and cannot be sold or repledged by the Portfolio.
(f) Non-income producing; security is in default and/or issuer is in bankruptcy.(g) Significant unobservable inputs were used in the valuation of this portfolio security; i.e. Level 3.(h) Security was valued in good faith under procedures approved by the Board of Trustees. As of March 31, 2022, these securities
represent 0.3% of net assets.(i) Perpetual bond with no specified maturity date.(j) Payment-in-kind security for which part of the income earned may be paid as additional principal.(k) Security is a �step-up� bond where coupon increases or steps up at a predetermined date. Rate shown is current coupon rate.(l) Principal only security.(m) Floating rate loans (�Senior Loans�) often require prepayments from excess cash flows or permit the borrowers to repay at their
election. The degree to which borrowers repay, whether as a contractual requirement or at their election, cannot be predicted withaccuracy. As a result, the actual remaining maturity may be substantially less than the stated maturities shown. However, Senior Loanswill generally have an expected average life of approximately two to four years. Senior Loans typically have rates of interest which aredetermined periodically by reference to a base lending rate, plus a spread. These base rates are primarily the London Interbank OfferedRate and secondarily, the prime rate offered by one or more major United States banks. Base lending rates may be subject to a floor, ora minimum rate.
(n) This loan will settle after March 31, 2022, at which time the interest rate will be determined.(o) Unfunded or partially unfunded loan commitments. The Portfolio may enter into certain credit agreements for which all or a portion may
be unfunded. The Portfolio is obligated to fund these commitments at the borrower�s discretion.(p) Non-income producing security.(q) All or a portion of the security was pledged as collateral against open option contracts. As of March 31, 2022, the market value of
securities pledged was $2,611,236.(r) Represents investment of cash collateral received from securities on loan as of March 31, 2022.(s) The rate shown represents the annualized seven-day yield as of March 31, 2022.(t) For a breakout of open positions, see details shown in the Purchased Options table that follows.(144A)� Securities exempt from registration under Rule 144A of the Securities Act of 1933. These securities may be resold in transactions
exempt from registration, normally to qualified institutional buyers. As of March 31, 2022, the market value of 144A securities was$783,834,861, which is 23.4% of net assets.
Restricted SecuritiesAcquisition
Date
Shares/PrincipalAmount Cost Value
Dream Finders Homes, Inc. 09/29/21 2,628 $2,601,720 $2,605,005Freed Corp., 10.000%, 12/02/23 12/06/21 1,192,000 1,166,555 1,160,770Knollwood CDO, Ltd., 3.431%, 01/10/39 02/10/04 1,041,547 1,041,547 104Litigation Fee Residual Funding LLC, 4.000%, 10/30/27 04/24/15 102,480 102,480 97,860Park Avenue Mortgage Trust, 1.844%, 09/15/34 04/23/19 500,000 500,938 494,531Park Avenue Mortgage Trust, 2.426%, 09/15/34 01/26/18 1,750,000 1,750,547 1,726,484Pear Therapeutics, Inc. 02/02/21 10,748 12,027 8,513Sonder Holdings, Inc., 10.000%, 01/19/27 01/19/22 1,388,000 1,340,923 1,301,250Sonder Holdings, Inc. 01/19/22 20,820 � 8,328
$7,402,845
TBA Forward Sale Commitments
Security Description Interest Rate MaturityFace
Amount Cost ValueGinnie Mae II 30 Yr. Pool 3.500% TBA $(788,000 ) $(789,262 ) $(789,847 )Ginnie Mae II 30 Yr. Pool 4.500% TBA (3,233,000) (3,377,339 ) (3,342,114 )Uniform Mortgage-Backed Securities 15 Yr. Pool 3.000% TBA (2,068,000) (2,097,191 ) (2,082,218 )Uniform Mortgage-Backed Securities 15 Yr. Pool 3.500% TBA (7,292,000) (7,502,215 ) (7,437,840 )Uniform Mortgage-Backed Securities 15 Yr. Pool 4.500% TBA (664,000 ) (685,788 ) (685,413 )Uniform Mortgage-Backed Securities 30 Yr. Pool 4.500% TBA (5,872,000) (6,192,666 ) (6,084,860 )Totals $(20,644,461) $(20,422,292)
BHFTII-41
Copyright © 2022 www.secdatabase.com. All Rights Reserved.Please Consider the Environment Before Printing This Document

Table of ContentsBrighthouse Funds Trust IIBlackRock Bond Income Portfolio
Schedule of Investments as of March 31, 2022 (Unaudited)Forward Foreign Currency Exchange Contracts
Contracts to Buy CounterpartySettlement
DateIn Exchange
for
UnrealizedAppreciation/(Depreciation)
BRL 1,723,081 CBNA 04/04/22 USD 337,000 $ 24,912BRL 1,723,081 CBNA 04/04/22 USD 337,000 24,912BRL 2,642,229 CBNA 04/04/22 USD 557,691 (2,723 )BRL 2,642,229 CBNA 04/04/22 USD 557,691 (2,723 )BRL 1,689,604 DBAG 04/04/22 USD 356,622 (1,741 )BRL 1,689,604 DBAG 04/04/22 USD 356,622 (1,741 )BRL 1,672,154 GSI 04/04/22 USD 352,939 (1,723 )BRL 1,672,154 GSI 04/04/22 USD 352,939 (1,723 )BRL 1,796,817 GSI 04/04/22 USD 346,742 30,657BRL 1,796,817 GSI 04/04/22 USD 346,742 30,657BRL 2,704,172 GSI 04/04/22 USD 523,000 44,978BRL 2,704,172 GSI 04/04/22 USD 523,000 44,978CAD 628,178 HSBC 04/20/22 USD 502,000 441CLP 386,475,500 CBNA 04/20/22 USD 499,000 (9,186 )CLP 386,475,500 CBNA 04/20/22 USD 499,000 (9,186 )COP 1,950,750,000 CBNA 04/20/22 USD 510,000 5,914COP 1,950,750,000 CBNA 04/20/22 USD 510,000 5,914COP 1,871,250,000 GSI 04/20/22 USD 499,000 (4,111 )COP 1,871,250,000 GSI 04/20/22 USD 499,000 (4,111 )EUR 224,605 DBAG 04/01/22 USD 252,738 (4,269 )EUR 224,605 DBAG 04/01/22 USD 252,738 (4,269 )EUR 657,613 HSBC 04/01/22 USD 739,754 (12,270 )EUR 657,613 HSBC 04/01/22 USD 739,754 (12,270 )EUR 42,782 JPMC 04/01/22 USD 48,143 (816 )EUR 42,782 JPMC 04/01/22 USD 48,143 (816 )EUR 925,000 BOA 04/20/22 USD 1,027,654 (3,901 )EUR 925,000 BOA 04/20/22 USD 1,027,654 (3,901 )EUR 613,000 DBAG 04/20/22 USD 677,140 1,304EUR 613,000 DBAG 04/20/22 USD 677,140 1,304JPY 60,131,310 HSBC 04/18/22 USD 510,000 (15,947 )JPY 60,131,310 HSBC 04/18/22 USD 510,000 (15,947 )MXN 10,723,960 CBNA 04/01/22 USD 520,000 19,163MXN 10,723,960 CBNA 04/01/22 USD 520,000 19,163MXN 10,898,738 CBNA 04/01/22 USD 525,000 22,951MXN 10,898,738 CBNA 04/01/22 USD 525,000 22,951MXN 3,588,205 BNP 04/20/22 USD 179,000 899MXN 3,588,205 BNP 04/20/22 USD 179,000 899MXN 10,104,192 HSBC 04/20/22 USD 504,000 2,587MXN 10,104,192 HSBC 04/20/22 USD 504,000 2,587MXN 20,489,973 HSBC 04/20/22 USD 973,742 53,549MXN 25,245,999 HSBC 04/20/22 USD 1,199,742 65,999RUB 17,580,135 GSI 05/24/22 USD 199,774 5,851RUB 40,093,290 HSBC 05/24/22 USD 337,628 131,322RUB 4,741,920 CBNA 05/25/22 USD 42,624 12,798RUB 4,912,416 CBNA 05/25/22 USD 42,624 14,791RUB 6,905,088 JPMC 05/25/22 USD 63,936 16,768RUB 20,570,000 JPMC 05/25/22 USD 170,000 70,415RUB 7,000,992 MSIP 05/25/22 USD 63,936 17,889TRY 171,164 BBP 06/08/22 USD 10,753 325TRY 171,164 BBP 06/08/22 USD 10,753 325TRY 5,383,649 UBSA 06/08/22 USD 337,246 11,207TRY 5,383,649 UBSA 06/08/22 USD 337,247 11,207ZAR 8,067,885 BOA 04/01/22 USD 525,000 27,122ZAR 8,067,885 BOA 04/01/22 USD 525,000 27,122ZAR 7,657,367 UBSA 04/20/22 USD 525,000 (2,036 )ZAR 7,658,920 UBSA 04/20/22 USD 525,000 (1,930 )
BHFTII-42
Copyright © 2022 www.secdatabase.com. All Rights Reserved.Please Consider the Environment Before Printing This Document

Table of ContentsBrighthouse Funds Trust IIBlackRock Bond Income Portfolio
Schedule of Investments as of March 31, 2022 (Unaudited)Forward Foreign Currency Exchange Contracts�(Continued)
Contracts to Deliver CounterpartySettlement
DateIn Exchange
for
UnrealizedAppreciation/(Depreciation)
AUD 1,599,000 UBSA 06/15/22 USD 1,157,714 $ (40,260 )BRL 2,642,229 CBNA 04/04/22 USD 519,000 (35,968 )BRL 2,642,229 CBNA 04/04/22 USD 519,000 (35,968 )BRL 1,723,081 CBNA 04/04/22 USD 363,688 1,776BRL 1,723,081 CBNA 04/04/22 USD 363,688 1,776BRL 1,689,604 DBAG 04/04/22 USD 349,742 (5,138 )BRL 1,689,604 DBAG 04/04/22 USD 349,742 (5,138 )BRL 2,704,172 GSI 04/04/22 USD 570,765 2,787BRL 2,704,172 GSI 04/04/22 USD 570,765 2,787BRL 1,796,817 GSI 04/04/22 USD 379,251 1,852BRL 1,796,817 GSI 04/04/22 USD 379,251 1,852BRL 1,672,154 GSI 04/04/22 USD 338,000 (13,215 )BRL 1,672,154 GSI 04/04/22 USD 338,000 (13,215 )CAD 1,603,000 MSIP 06/15/22 USD 1,257,373 (24,635 )CLP 395,827,000 CBNA 04/20/22 USD 502,000 334CLP 395,827,000 CBNA 04/20/22 USD 502,000 334COP 4,192,931,343 CBNA 04/20/22 USD 1,098,647 (10,256 )COP 4,013,558,193 CBNA 04/20/22 USD 1,051,647 (9,818 )COP 1,917,891,000 CBNA 04/20/22 USD 502,000 (5,224 )COP 1,917,891,000 CBNA 04/20/22 USD 502,000 (5,224 )EUR 925,000 BOA 04/01/22 USD 1,027,074 3,793EUR 925,000 BOA 04/01/22 USD 1,027,074 3,793EUR 622,000 RBC 04/20/22 USD 681,905 (6,499 )EUR 622,000 RBC 04/20/22 USD 681,837 (6,568 )EUR 297,000 BOA 05/24/22 USD 325,079 (4,040 )EUR 40,084,000 BNP 06/15/22 USD 44,107,351 (355,336 )IDR 13,097,553,756 BNP 04/18/22 USD 907,787 (3,628 )IDR 4,139,504,508 BNP 04/18/22 USD 286,908 (1,147 )IDR 15,775,254,816 BBP 04/18/22 USD 1,094,060 (3,687 )JPY 60,041,696 CBNA 04/18/22 USD 514,000 20,683JPY 60,041,696 CBNA 04/18/22 USD 514,000 20,683MXN 3,576,587 BNP 04/01/22 USD 179,000 (818 )MXN 3,576,587 BNP 04/01/22 USD 179,000 (818 )MXN 4,433,068 BBP 04/01/22 USD 214,272 (8,608 )MXN 4,433,068 BBP 04/01/22 USD 214,271 (8,608 )MXN 9,056,720 CBNA 04/01/22 USD 437,457 (17,884 )MXN 9,056,720 CBNA 04/01/22 USD 437,457 (17,884 )MXN 2,218,294 CBNA 04/01/22 USD 107,136 (4,392 )MXN 2,218,294 CBNA 04/01/22 USD 107,136 (4,392 )MXN 1,107,848 DBAG 04/01/22 USD 53,568 (2,131 )MXN 1,107,848 DBAG 04/01/22 USD 53,568 (2,131 )MXN 1,108,447 GSI 04/01/22 USD 53,568 (2,161 )MXN 1,108,447 GSI 04/01/22 USD 53,568 (2,161 )MXN 10,378,186 HSBC 04/20/22 USD 508,000 (12,324 )MXN 9,823,215 BNP 05/24/22 USD 474,562 (14,973 )RUB 120,280,000 HSBC 05/24/22 USD 1,557,688 150,837RUB 48,812,699 CBNA 05/25/22 USD 520,114 (50,391 )TRY 8,051,400 UBSA 04/29/22 USD 525,000 (13,008 )TRY 8,051,400 UBSA 04/29/22 USD 525,000 (13,008 )TRY 5,568,000 CBNA 06/08/22 USD 348,000 (12,385 )TRY 5,568,000 CBNA 06/08/22 USD 348,000 (12,385 )ZAR 7,638,974 UBSA 04/01/22 USD 525,000 2,230ZAR 7,637,441 UBSA 04/01/22 USD 525,000 2,335ZAR 7,725,998 CBNA 04/19/22 USD 510,000 (17,719 )ZAR 17,093,626 BBP 04/20/22 USD 1,126,000 (41,417 )ZAR 15,727,350 BBP 04/20/22 USD 1,036,000 (38,107 )
Cross Currency Contracts to BuyAUD 705,000 RBC 04/20/22 CAD 650,358 7,468EUR 460,000 DBAG 04/20/22 SEK 4,777,461 855
Copyright © 2022 www.secdatabase.com. All Rights Reserved.Please Consider the Environment Before Printing This Document

Net Unrealized Appreciation $ 27
BHFTII-43
Copyright © 2022 www.secdatabase.com. All Rights Reserved.Please Consider the Environment Before Printing This Document

Table of ContentsBrighthouse Funds Trust IIBlackRock Bond Income Portfolio
Schedule of Investments as of March 31, 2022 (Unaudited)Futures Contracts
Futures Contracts��LongExpiration
DateNumber ofContracts
NotionalValue
Value/Unrealized
Appreciation/(Depreciation)
Euro-Bund Futures 06/08/22 79 EUR 12,534,140 $ (62,984 )U.S. Treasury Long Bond Futures 06/21/22 752 USD 112,847,000 (3,083,221 )U.S. Treasury Note 2 Year Futures 06/30/22 762 USD 161,484,470 (1,700,172 )U.S. Treasury Note 5 Year Futures 06/30/22 1,184 USD 135,790,000 (3,352,971 )U.S. Treasury Note 10 Year Futures 06/21/22 438 USD 53,819,250 581,579U.S. Treasury Ultra Long Bond Futures 06/21/22 721 USD 127,707,125 (4,797,177 )
Futures Contracts - ShortEuro-BTP Futures 06/08/22 (126 ) EUR (17,427,060 ) 769,338Euro-Buxl 30 Year Bond Futures 06/08/22 (54 ) EUR (10,054,800 ) 827,908U.S. Treasury Note Ultra 10 Year Futures 06/21/22 (380 ) USD (51,478,125 ) 1,445,621Net Unrealized Depreciation $ (9,372,079 )
Purchased Options
Exchange-Traded Equity Options Strike PriceExpiration
DateNumber ofContracts Notional Amount
PremiumsPaid
MarketValue
UnrealizedAppreciation/(Depreciation)
Call - CF Industries Holdings, Inc. USD 115.000 05/20/22 27,200 USD 312,800,000 $176,800 $114,308 $ (62,492 )Call - Devon Energy Corp. USD 60.000 04/14/22 1,036 USD 6,216,000 251,985 199,948 (52,037 )Call - Diamondback Energy, Inc. USD 135.000 04/14/22 91 USD 1,228,500 55,878 61,880 6,002Call - Diamondback Energy, Inc. USD 150.000 05/20/22 86 USD 1,290,000 57,075 48,590 (8,485 )Call - Diamondback Energy, Inc. USD 155.000 05/20/22 105 USD 1,627,500 59,034 45,150 (13,884 )Call - Marathon Oil Corp. USD 24.000 04/14/22 341 USD 818,400 49,527 57,629 8,102Call - Marathon Oil Corp. USD 25.000 04/14/22 342 USD 855,000 40,628 36,936 (3,692 )Call - Marathon Oil Corp. USD 25.000 07/15/22 341 USD 852,500 78,077 101,959 23,882Call - Marathon Oil Corp. USD 26.000 07/15/22 342 USD 889,200 73,495 85,500 12,005Call - Mosaic Co. (The) USD 75.000 05/20/22 48,000 USD 360,000,000 204,000 137,060 (66,940 )Call - Occidental Petroleum Corp. USD 60.000 04/14/22 242 USD 1,452,000 122,749 31,218 (91,531 )Call - Occidental Petroleum Corp. USD 55.000 05/20/22 242 USD 1,331,000 60,203 142,780 82,577Call - Occidental Petroleum Corp. USD 60.000 05/20/22 242 USD 1,452,000 52,569 88,330 35,761Call - Occidental Petroleum Corp. USD 65.000 05/20/22 242 USD 1,573,000 102,932 53,240 (49,692 )Call - Ovintiv, Inc. USD 55.000 05/20/22 546 USD 3,003,000 197,777 229,320 31,543Totals $1,582,729 $1,433,848 $ (148,881 )
Foreign Currency OptionsStrikePrice Counterparty
ExpirationDate
Number ofContracts
NotionalAmount
PremiumsPaid
MarketValue
UnrealizedAppreciation/(Depreciation)
EUR Call/CZK Put CZK 24.850 BOA 04/13/22 1,230,000 EUR 1,230,000 $9,171 $2,603 $ (6,568 )EUR Put/SEK Call SEK 9.950 UBSA 04/11/22 224,000 EUR 224,000 28,898 154 (28,744 )EUR Put/SEK Call SEK 10.500 UBSA 04/28/22 1,233,000 EUR 1,233,000 11,187 19,297 8,110USD Call/COP Put COP 4,100.000 MSIP 05/19/22 174,000 USD 174,000 21,837 16,497 (5,340 )USD Call/MXN Put MXN 20.300 GSI 05/27/22 2,018,000 USD 2,018,000 34,270 26,402 (7,868 )USD Call/ZAR Put ZAR 15.500 BOA 04/12/22 2,452,000 USD 2,452,000 43,780 1,184 (42,596 )USD Call/ZAR Put ZAR 15.000 BOA 05/27/22 1,338,000 USD 1,338,000 23,790 21,325 (2,465 )USD Put/CLP Call CLP 815.000 BBP 05/06/22 2,782,000 USD 2,782,000 72,527 106,662 34,135Totals $245,460 $194,124 $ (51,336 )
BHFTII-44
Copyright © 2022 www.secdatabase.com. All Rights Reserved.Please Consider the Environment Before Printing This Document

Table of ContentsBrighthouse Funds Trust IIBlackRock Bond Income Portfolio
Schedule of Investments as of March 31, 2022 (Unaudited)Purchased Options��(Continued)
Interest Rate SwaptionsStrikeRate Counterparty
Floating RateIndex
Pay/ReceiveFloating
RateExpiration
DateNumber ofContracts
NotionalAmount
PremiumsPaid
MarketValue
UnrealizedAppreciation/(Depreciation)
Put - OTC - 10 Year IRS 2.020% BOA SOFR Receive 05/04/22 613,000,000 USD 613,000,000 $674,300 $1,299,309 $ 625,009
Options on Exchange-Traded Futures ContractsStrikePrice
ExpirationDate
Number ofContracts
NotionalAmount
PremiumsPaid
MarketValue
UnrealizedAppreciation/(Depreciation)
Put - U.S. Treasury Note 10 Year Futures USD 119.000 05/20/22 1,197 USD 1,197,000 $ 76,632 $317,953 $ 241,321
Written Options
Foreign Currency OptionsStrikePrice Counterparty
ExpirationDate
Number ofContracts
NotionalAmount
PremiumsReceived
MarketValue
UnrealizedAppreciation/(Depreciation)
EUR Call/SEK Put SEK 10.800 UBSA 04/28/22 (617,000 ) EUR (617,000 ) $(5,010 ) $(700 ) $ 4,310USD Call/CLP Put CLP 855.000 BBP 05/06/22 (1,392,000) USD (1,392,000) (20,031 ) (3,378 ) 16,653USD Call/MXN Put MXN 20.700 GSI 05/27/22 (3,026,000) USD (3,026,000) (31,589 ) (23,694 ) 7,895USD Call/TRY Put TRY 15.000 GSI 04/28/22 (1,050,000) USD (1,050,000) (53,088 ) (30,320 ) 22,768USD Call/ZAR Put ZAR 16.250 BOA 04/12/22 (3,504,000) USD (3,504,000) (24,108 ) (98 ) 24,010USD Call/ZAR Put ZAR 15.700 BOA 05/27/22 (2,008,000) USD (2,008,000) (14,458 ) (12,375 ) 2,083USD Put/CLP Call CLP 795.000 BBP 05/06/22 (2,782,000) USD (2,782,000) (40,116 ) (58,775 ) (18,659 )USD Put/RUB Call RUB 72.000 BOA 04/08/22 (1,092,000) USD (1,092,000) (5,279 ) $(3,750 ) 1,529USD Put/RUB Call RUB 72.000 CBNA 04/08/22 (3,513,000) USD (3,513,000) (16,485 ) (12,064 ) 4,421Totals $(210,164 ) $(145,154) $ 65,010
Interest Rate SwaptionsStrikeRate Counterparty
FloatingRate Index
Pay/ReceiveFloating
RateExpiration
DateNumber ofContracts Notional Amount
PremiumsReceived
MarketValue
UnrealizedAppreciation/(Depreciation)
Put - OTC - 10 Year IRS 2.320% BOA SOFR Pay 05/04/22 (613,000,000) USD (613,000,000) $(245,200 ) $(490,578) $ (245,378 )
Options on Exchange-Traded Futures ContractsStrikePrice
ExpirationDate
Number ofContracts
NotionalAmount
PremiumsReceived
MarketValue
UnrealizedAppreciation/(Depreciation)
Put - U.S. Treasury Note 10 Year Futures USD 121.500 04/22/22 (6 ) USD (6,000 ) $ (7,116 ) $(2,250 ) $ 4,866Put - U.S. Treasury Note 10 Year Futures USD 123.000 04/22/22 (22 ) USD (22,000) (20,935 ) (20,281) 654Totals $ (28,051 ) $(22,531) $ 5,520
Swap AgreementsCentrally Cleared Interest Rate Swaps
Pay/ReceiveFloating Rate
FloatingRate Index
PaymentFrequency
FixedRate
PaymentFrequency
MaturityDate
NotionalAmount
MarketValue
UpfrontPremiums
Paid/(Received)
UnrealizedAppreciation/(Depreciation)
Pay 12M CPURNSA Maturity 2.337% Annually 02/02/31
USD 797,000 $(105,154 ) $ 15 $ (105,169 )
Pay 12M CPURNSA Maturity 2.474% Maturity 04/26/31
USD 19,740,210 (2,265,876) 372 (2,266,248 )
Pay 12M CPURNSA Maturity 2.628% Maturity 05/11/31
USD 4,752,000 (464,752 ) 90 (464,842 )
Pay 12M CPURNSA Maturity 2.639% Maturity 05/21/31
USD 16,320,000 (1,562,457) 310 (1,562,767 )
Pay 12M CPURNSA Maturity 2.763% Maturity 11/05/31
USD 8,399,000 (483,186 ) 168 (483,354 )
Copyright © 2022 www.secdatabase.com. All Rights Reserved.Please Consider the Environment Before Printing This Document

Pay 12M CPURNSA Maturity 2.765% Maturity 11/05/31
USD 8,399,000 (480,992 ) 168 (481,160 )
Pay 12M CPURNSA Maturity 2.798% Maturity 11/08/31
USD 3,509,234 (188,596 ) 70 (188,666 )
Pay 12M CPURNSA Maturity 2.823% Maturity 11/10/31
USD 4,889,766 (249,766 ) 98 (249,864 )
Pay 12M CPURNSA Maturity 2.878% Maturity 11/01/31
USD 8,003,000 (364,582 ) 159 (364,741 )
Pay 12M CPURNSA Maturity 2.888% Maturity 10/29/31
USD 8,000,000 (355,681 ) 159 (355,840 )
Pay 12M CPURNSA Maturity 2.888% Maturity 02/28/32
USD 8,284,000 (206,799 ) 171 (206,970 )
BHFTII-45
Copyright © 2022 www.secdatabase.com. All Rights Reserved.Please Consider the Environment Before Printing This Document

Table of ContentsBrighthouse Funds Trust IIBlackRock Bond Income Portfolio
Schedule of Investments as of March 31, 2022 (Unaudited)Swap Agreements��(Continued)
Pay/ReceiveFloating Rate
FloatingRate Index
PaymentFrequency
FixedRate
PaymentFrequency
MaturityDate
NotionalAmount
MarketValue
UpfrontPremiums
Paid/(Received)
UnrealizedAppreciation/(Depreciation)
Pay 12M CPURNSA Maturity 2.893% Maturity 11/15/31
USD 4,199,500 $(182,737 ) $ 84 $ (182,821 )
Pay 12M CPURNSA Maturity 2.925% Maturity 11/15/31
USD 4,199,500 (168,295 ) 84 (168,379 )
Pay 12M CPURNSA Maturity 3.059% Maturity 04/04/32
USD 6,093,000 (14,928 ) 127 (15,055 )
Pay 12M CPURNSA Maturity 3.498% Maturity 03/31/27
USD 15,778,000 40,051 186 39,865
Pay 12M CPURNSA Maturity 3.519% Maturity 03/31/27
USD 15,778,000 57,298 186 57,112
Pay 12M FEDL Maturity 1.175% Annually 09/21/22
USD 1,174,790,000 (714,413 ) 1,205 (715,618 )
Pay 12M FEDL Maturity 1.197% Annually 09/21/22
USD 1,132,835,000 (650,327 ) 1,180 (651,507 )
Pay 12M FEDL Maturity 1.239% Annually 09/21/22
USD 179,388,000 (91,318 ) 189 (91,507 )
Pay 1M TIIE Monthly 7.530% Monthly 01/23/32
MXN 26,050,000 (56,207 ) 20 (56,227 )
Pay 1M TIIE Monthly 7.565% Monthly 01/12/32
MXN 44,332,000 (89,503 ) 14 (89,517 )
Pay 1M TIIE Monthly 7.600% Monthly 01/01/32
MXN 38,940,000 (73,945 ) 13 (73,958 )
Pay 1M TIIE Monthly 8.290% Monthly 03/30/32
MXN 23,026,000 11,578 19 11,559
Receive 3M LIBOR Semi-Annually 2.915% Quarterly 08/23/26
USD 110,000 (1,861 ) 2 (1,863 )
Receive 3M LIBOR Semi-Annually 3.156% Quarterly 10/03/28
USD 1,279,000 (55,773 ) 17 (55,790 )
Totals $(8,718,221) $ 5,106 $ (8,723,327 )
OTC Interest Rate Swaps
Pay/ReceiveFloating Rate
Floating RateIndex
PaymentFrequency
FixedRate
PaymentFrequency
MaturityDate Counterparty
NotionalAmount
MarketValue
UpfrontPremium
Paid/(Received)
UnrealizedAppreciation/
(Depreciation)(1)Pay 1 Day CDI Maturity 11.470% Maturity 01/02/
24GSI BRL 12,128,867 $(18,902 ) $ � $ (18,902 )
Pay 3M CLOIS Semi-Annually 1.650% Semi-Annually 05/28/23
BOA CLP 3,163,924,000 (256,877) � (256,877 )
Receive 3M CLOIS Semi-Annually 1.420% Semi-Annually 04/01/23
BOA CLP 3,163,924,000 246,348 � 246,348
Totals $(29,431 ) $ � $ (29,431 )
Centrally Cleared Credit Default Swaps on Credit Indices��Buy Protection (a)
Reference ObligationFixed Deal(Pay) Rate
PaymentFrequency
MaturityDate
ImpliedCredit Spreadat March 31,
2022 (b)Notional
Amount (c)MarketValue
UpfrontPremiums
Paid/(Received)
UnrealizedAppreciation/(Depreciation)
CDX.NA.HY.33.V12(5.000 %) Quarterly
12/20/24 0.000 % USD 4,786,420 $(277,014) $53,168 $ (330,182 )
CDX.NA.HY.37V1(5.000 %) Quarterly
12/20/26 0.000 % USD 4,853,000 (308,235) (208,982 ) (99,253 )
ITRX.EUR.XOVER.37.V1(5.000 %) Quarterly
06/20/27 0.000 % EUR 3,653,000 (291,677) (246,604 ) (45,073 )
Copyright © 2022 www.secdatabase.com. All Rights Reserved.Please Consider the Environment Before Printing This Document

ITRX.FINSR.37.V1(1.000 %) Quarterly
06/20/27 0.809 % EUR 7,277,000 (76,742 ) (60,803 ) (15,939 )
ITRX.FINSUB.37.V1(1.000 %) Quarterly
06/20/27 1.534 % EUR 3,639,000 105,629 118,800 (13,171 )
Totals $(848,039) $(344,421 ) $ (503,618 )
OTC Credit Default Swaps on Corporate and Sovereign Issues��Buy Protection (a)
Reference ObligationFixed Deal(Pay) Rate
PaymentFrequency
MaturityDate Counterparty
ImpliedCredit Spreadat March 31,
2022(b)Notional
Amount (c)MarketValue
UpfrontPremium
Paid/(Received)
UnrealizedAppreciation/(Depreciation)
Abbott Laboratories3.400%, due 11/30/23 (1.000 %) Quarterly
06/20/27 JPMC 0.000 % USD 1,237,909 $(35,829) $ (30,164 ) $ (5,665 )
Avis Budget Group,Inc.5.250%, due 03/15/25 (5.000 %) Quarterly
12/20/24 JPMC 1.684 % USD 460,000 (39,828) 21,047 (60,875 )
Avis Budget Group,Inc.5.250%, due 03/15/25 (5.000 %) Quarterly
06/20/25 JPMC 1.907 % USD 480,000 (45,152) 38,481 (83,633 )
BHFTII-46
Copyright © 2022 www.secdatabase.com. All Rights Reserved.Please Consider the Environment Before Printing This Document

Table of ContentsBrighthouse Funds Trust IIBlackRock Bond Income Portfolio
Schedule of Investments as of March 31, 2022 (Unaudited)OTC Credit Default Swaps on Corporate and Sovereign Issues��Buy Protection (a) ��(Continued)
Reference ObligationFixed Deal(Pay) Rate
PaymentFrequency
MaturityDate Counterparty
ImpliedCredit Spreadat March 31,
2022(b)Notional
Amount (c)MarketValue
UpfrontPremium
Paid/(Received)
UnrealizedAppreciation/(Depreciation)
Beazer Homes USA,Inc.6.750%, due 03/15/25 (5.000 %) Quarterly
06/20/24 BNP 2.501 % USD 250,000 $(13,281 ) $(6,561 ) $ (6,720 )
Beazer Homes USA,Inc.6.750%, due 03/15/25 (5.000 %) Quarterly
06/20/24 BNP 2.501 % USD 250,000 (13,281 ) (7,080 ) (6,201 )
Beazer Homes USA,Inc.6.750%, due 03/15/25 (5.000 %) Quarterly
06/20/24 BBP 2.501 % USD 250,000 (13,281 ) (7,430 ) (5,851 )
Boeing Co.8.750%, due 08/15/21 (1.000 %) Quarterly
12/20/24 BNP 1.132 % USD 460,000 1,591 (5,004 ) 6,595
Boeing Co.8.750%, due 08/15/21 (1.000 %) Quarterly
12/20/24 MSIP 1.132 % USD 1,185,000 4,099 (7,638 ) 11,737
Brazil GovernmentInternational Bond4.250%, due 01/07/25 (1.000 %) Quarterly
12/20/24 BBP 1.231 % USD 740,000 4,496 10,003 (5,507 )
Brazil GovernmentInternational Bond4.250%, due 01/07/25 (1.000 %) Quarterly
12/20/24 BBP 1.231 % USD 526,000 3,196 7,110 (3,914 )
Brazil GovernmentInternational Bond4.250%, due 01/07/25 (1.000 %) Quarterly
12/20/24 BBP 1.231 % USD 525,000 3,190 7,234 (4,044 )
Brazil GovernmentInternational Bond4.250%, due 01/07/25 (1.000 %) Quarterly
12/20/24 BBP 1.231 % USD 524,000 3,183 7,220 (4,037 )
Brazil GovernmentInternational Bond4.250%, due 01/07/25 (1.000 %) Quarterly
12/20/24 BBP 1.231 % USD 520,000 3,159 7,165 (4,006 )
Brazil GovernmentInternational Bond4.250%, due 01/07/25 (1.000 %) Quarterly
12/20/24 BBP 1.231 % USD 314,000 1,908 4,244 (2,336 )
Brazil GovernmentInternational Bond4.250%, due 01/07/25 (1.000 %) Quarterly
06/20/27 BBP 2.069 % USD 8,620,600 436,811 526,295 (89,484 )
Chile GovernmentInternational Bond3.240%, due 02/06/28 (1.000 %) Quarterly
06/20/27 GSI 0.700 % USD 1,098,000 (16,167 ) (6,394 ) (9,773 )
Colombia GovernmentInternational Bond10.375%, due 01/28/33 (1.000 %) Quarterly
06/20/27 GSI 1.918 % USD 6,435,000 281,173 358,120 (76,947 )
IndonesiaGovernmentInternational Bond3.700%, due 03/16/25 (1.000 %) Quarterly
06/20/27 GSI 0.842 % USD 5,397,000 (41,475 ) 66,621 (108,096 )
Copyright © 2022 www.secdatabase.com. All Rights Reserved.Please Consider the Environment Before Printing This Document

Mexico GovernmentInternational Bond4.150%, due 03/28/27 (1.000 %) Quarterly
06/20/27 GSI 1.002 % USD 950,000 98 (2,047 ) 2,145
Mexico GovernmentInternational Bond4.150%, due 03/28/27 (1.000 %) Quarterly
06/20/27 GSI 1.002 % USD 760,000 79 (1,091 ) 1,170
Mexico GovernmentInternational Bond4.150%, due 03/28/27 (1.000 %) Quarterly
06/20/27 MSIP 1.002 % USD 10,567,060 1,094 67,108 (66,014 )
Occidental PetroleumCorp.5.550%, due 03/15/26 (1.000 %) Quarterly
12/20/24 BBP 0.868 % USD 970,000 (3,372 ) 277,643 (281,015 )
PhilippinesGovernmentInternational Bond10.625%, due 03/16/25 (1.000 %) Quarterly
06/20/27 GSI 0.790 % USD 3,913,035 (40,198 ) 21,080 (61,278 )
Republic of SouthAfrica GovernmentInternational Bond5.875%, due 09/16/25 (1.000 %) Quarterly
06/20/27 MSIP 2.091 % USD 3,898,191 201,336 241,825 (40,489 )
Republic of SouthAfrica GovernmentInternational Bond5.875%, due 09/16/25 (1.000 %) Quarterly
06/20/27 MSIP 2.091 % USD 978,694 50,548 60,713 (10,165 )
Republic of SouthAfrica GovernmentInternational Bond5.875%, due 09/16/25 (1.000 %) Quarterly
06/20/27 MSIP 2.091 % USD 878,613 45,379 54,505 (9,126 )
Tenet HealthcareCorp.6.875%, due 11/15/31 (5.000 %) Quarterly
06/20/24 BBP 1.414 % USD 499,000 (38,654 ) (2,613 ) (36,041 )
Totals $740,822 $1,700,392 $ (959,570 )
BHFTII-47
Copyright © 2022 www.secdatabase.com. All Rights Reserved.Please Consider the Environment Before Printing This Document

Table of ContentsBrighthouse Funds Trust IIBlackRock Bond Income Portfolio
Schedule of Investments as of March 31, 2022 (Unaudited)OTC Credit Default Swaps on Credit Indices��Buy Protection (a)
Reference ObligationFixed Deal(Pay) Rate
PaymentFrequency
MaturityDate Counterparty
ImpliedCredit Spreadat March 31,
2022 (b)Notional
Amount (c)MarketValue
UpfrontPremium
Paid/(Received)
UnrealizedAppreciation/(Depreciation)
CMBX.NA.AAA.V6(0.500 %) Monthly
05/11/63 DBAG 0.305 % USD 1,001,000 $(796 ) $145 $ (941 )
CMBX.NA.AAA.V6(0.500 %) Monthly
05/11/63 DBAG 0.305 % USD 2,340,000 (1,861 ) (883 ) (978 )
CMBX.NA.AAA.V9(0.500 %) Monthly
09/17/58 CSI 0.323 % USD 1,610,000 (9,450 ) 19,805 (29,255 )
CMBX.NA.AAA.V9(0.500 %) Monthly
09/17/58 DBAG 0.323 % USD 1,280,000 (7,513 ) 15,972 (23,485 )
CMBX.NA.AAA.V9(0.500 %) Monthly
09/17/58 MSIP 0.323 % USD 900,000 (5,283 ) 11,071 (16,354 )
CMBX.NA.AAA.V9(0.500 %) Monthly
09/17/58 MSIP 0.323 % USD 1,090,000 (6,398 ) 13,409 (19,807 )
CMBX.NA.AAA.V9(0.500 %) Monthly
09/17/58 MSIP 0.323 % USD 1,960,000 (11,504 ) 26,423 (37,927 )
CMBX.NA.BBB-.V6(3.000 %) Monthly
05/11/63 JPMC 66.736 % USD 340,000 82,982 34,298 48,684
CMBX.NA.BBB-.V9(3.000 %) Monthly
09/17/58 CGM 6.352 % USD 500,000 51,046 16,330 34,716
CMBX.NA.BBB-.V9(3.000 %) Monthly
09/17/58 MSIP 6.352 % USD 105,000 10,720 5,615 5,105
Totals $101,943 $142,185 $ (40,242 )
OTC Credit Default Swaps on Credit Indices��Sell Protection (d)
Reference ObligationFixed Deal
Receive RatePayment
FrequencyMaturity
Date Counterparty
ImpliedCredit Spreadat March 31,
2022 (b)Notional
Amount (c)MarketValue
UpfrontPremium
Paid/(Received)
UnrealizedAppreciation/(Depreciation)
CMBX.NA.A.V102.000 % Monthly
11/17/59 DBAG 2.212 % USD 660,000 $(5,770 ) $(30,601 ) $ 24,831
CMBX.NA.A.V102.000 % Monthly
11/17/59 DBAG 2.212 % USD 1,310,000 (11,453 ) (59,736 ) 48,283
CMBX.NA.AAA.V70.500 % Monthly
01/17/47 CSI 0.244 % USD 5,000,000 18,392 (156,398 ) 174,790
CMBX.NA.BBB-.V103.000 % Monthly
11/17/59 JPMC 5.926 % USD 40,000 (4,457 ) (3,575 ) (882 )
CMBX.NA.BBB-.V63.000 % Monthly
05/11/63 CSI 66.736 % USD 340,000 (82,982 ) (28,925 ) (54,057 )
CMBX.NA.BBB-.V93.000 % Monthly
09/17/58 DBAG 6.352 % USD 467,000 (47,677 ) (57,312 ) 9,635
CMBX.NA.BBB-.V93.000 % Monthly
09/17/58 GSI 6.352 % USD 210,000 (21,439 ) (22,600 ) 1,161
CMBX.NA.BBB-.V93.000 % Monthly
09/17/58 JPMC 6.352 % USD 130,000 (13,272 ) (28,330 ) 15,058
CMBX.NA.BBB-.V93.000 % Monthly
09/17/58 MSIP 6.352 % USD 236,000 (24,094 ) (11,077 ) (13,017 )
CMBX.NA.BBB-.V93.000 % Monthly
09/17/58 MSIP 6.352 % USD 240,000 (24,502 ) (307 ) (24,195 )
Totals $(217,254) $(398,861 ) $ 181,607
OTC Total Return Swaps
Pay/Receive Floating RateFloating Rate
IndexPayment
FrequencyMaturity
Date CounterpartyUnderlying Reference
InstrumentNotionalAmount
MarketValue
UpfrontPremium
Paid
UnrealizedAppreciation/
(Depreciation)(1)
Copyright © 2022 www.secdatabase.com. All Rights Reserved.Please Consider the Environment Before Printing This Document

Receive 12M SOFR Quarterly 06/10/22
BNP Universal HealthServices, Inc
USD 355,285 $(47,531 ) $ � $ (47,531 )
Receive 12M SOFR Quarterly 08/10/22
BNP Universal HealthServices, Inc
USD 332,709 (28,506 ) � (28,506 )
Receive 12M SOFR Quarterly 09/02/22
BNP Sherwin-Williams Co. USD 353,113 11,883 � 11,883
Receive 12M SOFR Quarterly 09/02/22
BNP PPG Industries, Inc. USD 349,012 (9,334 ) � (9,334 )
Receive 12M SOFR Quarterly 09/02/22
BNP Sherwin-Williams Co. USD 353,455 (19,477 ) � (19,477 )
Receive 12M SOFR Quarterly 09/02/22
BNP PPG Industries, Inc. USD 343,951 (32,613 ) � (32,613 )
Receive 12M SOFR Quarterly 09/09/22
CBNA TreeHouse Foods, Inc. USD 41,360 712 � 712
Receive 12M SOFR Quarterly 09/09/22
CBNA TreeHouse Foods, Inc. USD 6,826 245 � 245
Receive 12M SOFR Quarterly 09/09/22
CBNA TreeHouse Foods, Inc. USD 126,696 2,141 � 2,141
Receive 12M SOFR Quarterly 09/09/22
CBNA TreeHouse Foods, Inc. USD 95,500 1,914 � 1,914
Receive 12M SOFR Quarterly 09/09/22
CBNA TreeHouse Foods, Inc. USD 26,616 711 � 711
Receive 12M SOFR Quarterly 09/09/22
CBNA TreeHouse Foods, Inc. USD 49,820 1,333 � 1,333
Totals $(118,522) $ � $ (118,522 )
BHFTII-48
Copyright © 2022 www.secdatabase.com. All Rights Reserved.Please Consider the Environment Before Printing This Document

Table of ContentsBrighthouse Funds Trust IIBlackRock Bond Income Portfolio
Schedule of Investments as of March 31, 2022 (Unaudited)OTC Total Return Swaps��(Continued)
(a) If the Portfolio is a buyer of protection and a credit event occurs, as defined under the terms of that particular swap agreement, the Portfolio will either(i) receive from the seller of protection an amount equal to the notional amount of the swap and deliver the referenced obligation or underlyingsecurities comprising the referenced index or (ii) receive a net settlement amount in the form of cash or securities equal to the notional amount of theswap less the recovery value of the referenced obligation or underlying securities comprising the referenced index.
(b) Implied credit spreads, represented in absolute terms, utilized in determining the market value of credit default swap agreements on corporate issuesor indices as of period end serve as an indicator of the current status of the payment/performance risk and represent the likelihood or risk of default forthe credit derivative. The implied credit spread of a particular referenced entity reflects the cost of buying/selling protection and may include upfrontpayments required to be made to enter into the agreement. Wider credit spreads represent a deterioration of the referenced entity�s credit soundnessand a greater likelihood or risk of default or other credit event occurring as defined under the terms of the agreement. A credit spread identified as�Defaulted� indicates a credit event has occurred for the referenced entity or obligation.
(c) The maximum potential amount of future undiscounted payments that the Portfolio could be required to make under a credit default swap contractwould be the notional amount of the contract. These potential amounts would be partially offset by any recovery values of the referenced debtobligation or net amounts received from the settlement of purchased protection credit default swap contracts entered into by the Portfolio for the samereferenced debt obligation.
(d) If the Portfolio is a seller of protection and a credit event occurs, as defined under the terms of that particular swap agreement, the Portfolio will either(i) pay to the buyer of protection an amount equal to the notional amount of the swap and take delivery of the referenced obligation or underlyingsecurities comprising the referenced index or (ii) pay a net settlement amount in the form of cash or securities equal to the notional amount of theswap less the recovery value of the referenced obligation or underlying securities comprising the referenced index.
(1) There were no upfront premiums paid or (received), therefore Market Value equals Unrealized Appreciation/(Depreciation).
Securities in the amount of $1,507,008 have been received at the custodian bank as collateral for OTC swap contracts, OTC option contracts and forwardforeign currency exchange contracts.
Glossary of Abbreviations
Counterparties
(BBP)� Barclays Bank plc(BNP)� BNP Paribas S.A.(BOA)� Bank of America N.A.(CBNA)� Citibank N.A.(CGM)� Citigroup Global Markets, Inc.(DBAG)� Deutsche Bank AG(GSI)� Goldman Sachs International(HSBC)� HSBC Bank plc(JPMC)� JPMorgan Chase Bank N.A.(MSIP)� Morgan Stanley & Co. International plc(RBC)� Royal Bank of Canada(UBSA)� UBS AG
Currencies
(AUD)� Australian Dollar(BRL)� Brazilian Real(CAD)� Canadian Dollar(CLP)� Chilean Peso(COP)� Colombian Peso(CZK)� Czech Koruna(EUR)� Euro(IDR)� Indonesian Rupiah(JPY)� Japanese Yen(MXN)� Mexican Peso(RUB)� Russian Ruble(SEK)� Swedish Krona(TRY)� Turkish Lira(USD)� United States Dollar(ZAR)� South African Rand
Index Abbreviations
(CDI)� Brazil Interbank Deposit Rate(CDX.NA.HY)� Markit North America High Yield CDS Index(CLOIS)� Sinacofi Chile Interbank Rate Average(CMBX.NA.A)� Markit North America A Rated CMBS Index
Copyright © 2022 www.secdatabase.com. All Rights Reserved.Please Consider the Environment Before Printing This Document

(CMBX.NA.AAA)� Markit North America AAA Rated CMBS Index(CMBX.NA.BBB-)� Markit North America BBB- Rated CMBS Index(CPURNSA)� U.S. Consumer Price Index for All Urban
Consumers Non-Seasonally Adjusted(EURIBOR)� Euro InterBank Offered Rate(FEDL)� Federal Funds Rate(H15)� U.S. Treasury Yield Curve Rate T-Note
Constant Maturity Index(ITRX.EUR.XOVER)� Markit iTraxx Europe Crossover CDS Index(ITRX.FINSR)� Markit iTraxx Europe Senior Financials CDS Index(ITRX.FINSUB)� Markit iTraxx Europe Sub Financials CDS Index(LIBOR)� London Interbank Offered Rate(MTA)� Monthly Treasury Average Index(PRIME)� U.S. Federal Reserve Prime Rate(SOFR)� Secured Overnight Financing Rate(SOFR30A)� Secured Overnight Financing Rate 30-Day Average(TIIE)� Mexican Interbank Equilibrium Interest Rate(TSFR)� Term Secured Financing Rate
Other Abbreviations
(ARM)� Adjustable-Rate Mortgage(CDO)� Collateralized Debt Obligation(CLO)� Collateralized Loan Obligation(CMO)� Collateralized Mortgage Obligation(DAC)� Designated Activity Company(ICE)� Intercontinental Exchange, Inc.(IRS)� Interest Rate Swap(REIT)� Real Estate Investment Trust(REMIC)� Real Estate Mortgage Investment Conduit(STACR)� Structured Agency Credit Risk
BHFTII-49
Copyright © 2022 www.secdatabase.com. All Rights Reserved.Please Consider the Environment Before Printing This Document

Table of ContentsBrighthouse Funds Trust IIBlackRock Bond Income Portfolio
Schedule of Investments as of March 31, 2022 (Unaudited)
Fair Value HierarchyAccounting principles generally accepted in the United States of America (�GAAP�) define fair market value as the price that the Portfolio would receive tosell an asset or pay to transfer a liability in an orderly transaction between market participants at the measurement date. It establishes a fair valuehierarchy that prioritizes inputs to valuation methods and requires disclosure of the fair value hierarchy, separately for each major category of assets andliabilities, that segregates fair value measurements into three levels. Levels 1, 2 and 3 of the fair value hierarchy are defined as follows:
Level 1 - unadjusted quoted prices in active markets for identical investmentsLevel 2 - other significant observable inputs (including, but not limited to, quoted prices for similar assets or liabilities in markets that are either activeor inactive; inputs other than quoted prices that are observable such as interest rates, yield curves, volatilities, prepayment speeds, loss severities,credit risks, default rates, or other market corroborated inputs)Level 3 - significant unobservable inputs based on the best information available in the circumstances, to the extent observable inputs areunavailable (including the Portfolio�s own assumptions used in determining the fair value of investments and derivative financial instruments)
The inputs or methodologies used for valuing investments are not necessarily an indication of the risk associated with investing in them. Changes to theinputs or methodologies used may result in transfers between levels. A reconciliation of Level 3 securities, if any, will be disclosed following the fair valuehierarchy table. For more information about the Portfolio�s policy regarding the valuation of investments, please refer to the Notes to Schedule ofInvestments.
The following table summarizes the fair value hierarchy of the Portfolio�s investments as of March 31, 2022:Description Level 1 Level 2 Level 3 TotalTotal U.S. Treasury & Government Agencies* $ � $1,664,910,487 $� $1,664,910,487Corporate Bonds & Notes
Advertising � 2,856,639 � 2,856,639Aerospace/Defense � 33,534,260 � 33,534,260Agriculture � 8,524,032 � 8,524,032Airlines � 19,306,133 � 19,306,133Apparel � 42,620 � 42,620Auto Manufacturers � 18,245,640 � 18,245,640Auto Parts & Equipment � 494,866 � 494,866Banks � 291,740,133 � 291,740,133Beverages � 14,005,068 � 14,005,068Biotechnology � 7,713,800 � 7,713,800Building Materials � 947,437 � 947,437Chemicals � 11,769,698 � 11,769,698Commercial Services � 20,988,055 � 20,988,055Computers � 12,837,609 � 12,837,609Distribution/Wholesale � 443,475 � 443,475Diversified Financial Services � 16,797,139 � 16,797,139Electric � 87,722,592 � 87,722,592Electronics � 2,608,350 � 2,608,350Energy-Alternate Sources � 495,242 � 495,242Engineering & Construction � 2,763,135 � 2,763,135Entertainment � 12,774,549 � 12,774,549Environmental Control � 3,419,619 � 3,419,619Food � 4,117,622 � 4,117,622Food Service � 481,120 � 481,120Forest Products & Paper � 1,411,002 � 1,411,002Gas � 4,289,566 � 4,289,566Healthcare-Products � 7,219,376 � 7,219,376Healthcare-Services � 36,125,520 � 36,125,520Home Builders � 6,926,028 1,236,967 8,162,995Insurance � 12,730,763 � 12,730,763Internet � 2,985,396 � 2,985,396Investment Companies � 3,158,050 � 3,158,050Iron/Steel � 919,015 � 919,015Lodging � 2,799,811 1,301,250 4,101,061Machinery-Diversified � 4,792,809 � 4,792,809Media � 38,249,981 � 38,249,981Mining � 11,672,155 � 11,672,155Miscellaneous Manufacturing � 5,690,651 � 5,690,651Oil & Gas � 45,553,074 � 45,553,074Packaging & Containers � 2,212,761 � 2,212,761
Copyright © 2022 www.secdatabase.com. All Rights Reserved.Please Consider the Environment Before Printing This Document

BHFTII-50
Copyright © 2022 www.secdatabase.com. All Rights Reserved.Please Consider the Environment Before Printing This Document

Table of ContentsBrighthouse Funds Trust IIBlackRock Bond Income Portfolio
Schedule of Investments as of March 31, 2022 (Unaudited)Fair Value Hierarchy��(Continued)
Description Level 1 Level 2 Level 3 TotalPharmaceuticals $ � $35,942,884 $� $35,942,884Pipelines � 74,777,298 � 74,777,298Real Estate � 2,787,215 1,160,770 3,947,985Real Estate Investment Trusts � 55,401,773 � 55,401,773Retail � 5,217,248 � 5,217,248Semiconductors � 35,746,845 � 35,746,845Shipbuilding � 2,869,851 � 2,869,851Software � 40,081,017 � 40,081,017Telecommunications � 81,902,804 � 81,902,804Transportation � 18,258,059 � 18,258,059Trucking & Leasing � 3,492,735 � 3,492,735
Total Corporate Bonds & Notes � 1,117,842,520 3,698,987 1,121,541,507Asset-Backed Securities
Asset-Backed - Credit Card � 840,331 � 840,331Asset-Backed - Home Equity � 21,157,464 � 21,157,464Asset-Backed - Manufactured Housing � 11,074,836 � 11,074,836Asset-Backed - Other � 374,400,367 3,533,775 377,934,142Asset-Backed - Student Loan � 31,629,338 � 31,629,338
Total Asset-Backed Securities � 439,102,336 3,533,775 442,636,111Total Mortgage-Backed Securities* � 190,519,983 � 190,519,983Floating Rate Loans
Advertising � 104,472 � 104,472Aerospace/Defense � 318,981 � 318,981Airlines � 2,753,838 � 2,753,838Apparel � 871,490 � 871,490Auto Parts & Equipment � 603,805 � 603,805Beverages � 762,238 � 762,238Building Materials (Less Unfunded Loan Commitments of $29,272) � 2,081,462 � 2,081,462Chemicals � 4,395,498 � 4,395,498Commercial Services (Less Unfunded Loan Commitments of $80,250) � 11,465,940 1,178,195 12,644,135Cosmetics/Personal Care � 209,896 � 209,896Distribution/Wholesale � 229,314 � 229,314Electric � 1,338,247 � 1,338,247Entertainment � 14,484,218 � 14,484,218Environmental Control � 571,381 � 571,381Food � 1,082,809 � 1,082,809Hand/Machine Tools � 1,049,759 � 1,049,759Healthcare-Products � 3,549,399 � 3,549,399Healthcare-Services � 505,564 � 505,564Household Products/Wares � 273,055 � 273,055Housewares � 333,139 � 333,139Internet � 2,147,777 � 2,147,777Lodging � 8,051,340 � 8,051,340Machinery-Diversified � 449,726 � 449,726Media � 2,790,865 � 2,790,865Metal Fabricate/Hardware � 425,364 � 425,364Mining � 214,742 � 214,742Oil & Gas � 687,938 � 687,938Packaging & Containers � 344,960 � 344,960Pharmaceuticals � 1,415,686 � 1,415,686Pipelines � 3,515,802 � 3,515,802Real Estate Investment Trusts � 492,760 � 492,760Retail � 6,963,613 � 6,963,613Software � 2,144,080 � 2,144,080Telecommunications � 1,438,424 � 1,438,424Transportation � 2,341,072 � 2,341,072
BHFTII-51
Copyright © 2022 www.secdatabase.com. All Rights Reserved.Please Consider the Environment Before Printing This Document

Table of ContentsBrighthouse Funds Trust IIBlackRock Bond Income Portfolio
Schedule of Investments as of March 31, 2022 (Unaudited)Fair Value Hierarchy��(Continued)
Description Level 1 Level 2 Level 3 TotalTotal Floating Rate Loans (Less Unfunded Loan Commitments of $109,522) $� $80,408,654 $1,178,195 $81,586,849Total Foreign Government* � 33,165,223 � 33,165,223Total Municipals* � 21,876,242 � 21,876,242Total Common Stocks* 11,633,219 � � 11,633,219Total Preferred Stock* � � 2,605,005 2,605,005Warrants
Commercial Services & Supplies 6,203 � � 6,203Health Care Providers & Services 57,575 � � 57,575Health Care Technology 8,513 � � 8,513Hotels, Restaurants & Leisure 1,682 � 8,328 10,010Independent Power and Renewable Electricity Producers 15,367 � � 15,367Interactive Media & Services 79,940 � � 79,940Machinery 164,354 � � 164,354Oil, Gas & Consumable Fuels 22,880 � � 22,880Real Estate Management & Development 25,571 � � 25,571Software 32,131 � � 32,131Special Purpose Acquisition Companies 24,670 � � 24,670Specialty Retail 95,965 � � 95,965
Total Warrants* 534,851 � 8,328 543,179Total Convertible Bonds* � 157,278 � 157,278Total Escrow Shares* � � 1 1Total Short-Term Investment* � 353,430,673 � 353,430,673Securities Lending Reinvestments
Certificate of Deposit � 299,949 � 299,949Repurchase Agreements � 20,406,378 � 20,406,378Time Deposit � 1,000,000 � 1,000,000Mutual Funds 5,794,560 � � 5,794,560
Total Securities Lending Reinvestments 5,794,560 21,706,327 � 27,500,887Purchased Options
Exchange Traded Equity Options at Value 1,433,848 � � 1,433,848Foreign Currency Options at Value � 194,124 � 194,124Interest Rate Swaptions at Value � 1,299,309 � 1,299,309Options on Exchange-Traded Futures Contracts at Value 317,953 � � 317,953
Total Purchased Options $1,751,801 $1,493,433 $� $3,245,234Total Net Investments $19,714,431 $3,924,613,156 $11,024,291 $3,955,351,878Collateral for Securities Loaned (Liability) $� $(27,500,703 ) $� $(27,500,703 )TBA Forward Sales Commitments $� $(20,422,292 ) $� $(20,422,292 )Forward Contracts
Forward Foreign Currency Exchange Contracts (Unrealized Appreciation) $� $1,000,036 $� $1,000,036Forward Foreign Currency Exchange Contracts (Unrealized Depreciation) � (1,000,009 ) � (1,000,009 )
Total Forward Contracts $� $27 $� $27Futures Contracts
Futures Contracts (Unrealized Appreciation) $3,624,446 $� $� $3,624,446Futures Contracts (Unrealized Depreciation) (12,996,525) � � (12,996,525 )
Total Futures Contracts $(9,372,079 ) $� $� $(9,372,079 )Written Options
Foreign Currency Options at Value $� $(145,154 ) $� $(145,154 )Interest Rate Swaptions at Value � (490,578 ) � (490,578 )Options on Exchange-Traded Futures Contracts at Value (22,531 ) � � (22,531 )
Total Written Options $(22,531 ) $(635,732 ) $� $(658,263 )Centrally Cleared Swap Contracts
Centrally Cleared Swap Contracts (Unrealized Appreciation) $� $108,536 $� $108,536Centrally Cleared Swap Contracts (Unrealized Depreciation) � (9,335,481 ) � (9,335,481 )
Total Centrally Cleared Swap Contracts $� $(9,226,945 ) $� $(9,226,945 )
BHFTII-52
Copyright © 2022 www.secdatabase.com. All Rights Reserved.Please Consider the Environment Before Printing This Document

Table of ContentsBrighthouse Funds Trust IIBlackRock Bond Income Portfolio
Schedule of Investments as of March 31, 2022 (Unaudited)Fair Value Hierarchy��(Continued)
Description Level 1 Level 2 Level 3 TotalOTC Swap Contracts
OTC Swap Contracts at Value (Assets) $ � $1,469,767 $ � $1,469,767OTC Swap Contracts at Value (Liabilities) � (992,209 ) � (992,209 )
Total OTC Swap Contracts $ � $477,558 $ � $477,558
* See Schedule of Investments for additional detailed categorizations.
Level 3 investments at the beginning and/or end of the period in relation to net assets were not significant and accordingly, a reconciliation of Level 3assets for the period ended March 31, 2022 is not presented.
BHFTII-53
Copyright © 2022 www.secdatabase.com. All Rights Reserved.Please Consider the Environment Before Printing This Document

Table of ContentsBrighthouse Funds Trust II
BlackRock Capital Appreciation Portfolio
Schedule of Investments as of March 31, 2022 (Unaudited)Common Stocks��99.0% of Net Assets
Security Description Shares Value
Aerospace & Defense��2.2%TransDigm Group, Inc. (a) (b) 61,140 $ 39,835,156
Automobiles��2.6%Tesla, Inc. (a) (b) 44,312 47,750,611
Capital Markets��4.8%KKR & Co., Inc. 464,526 27,160,835S&P Global, Inc. (b) 145,975 59,876,026
87,036,861
Chemicals��2.5%Linde plc 80,448 25,697,505Sherwin-Williams Co. (The) 75,357 18,810,614
44,508,119
Containers & Packaging��0.5%Ball Corp. (b) 99,828 8,984,520
Electronic Equipment, Instruments & Components��1.4%Zebra Technologies Corp. - Class A (a) 62,713 25,944,368
Entertainment��1.1%Netflix, Inc. (a) 53,427 20,013,220
Health Care Equipment & Supplies��2.3%Align Technology, Inc. (a) 68,915 30,046,940Intuitive Surgical, Inc. (a) 41,723 12,586,995
42,633,935
Health Care Providers & Services��1.1%UnitedHealth Group, Inc. 40,143 20,471,726
Hotels, Restaurants & Leisure��4.0%Chipotle Mexican Grill, Inc. (a) 24,990 39,534,930Domino�s Pizza, Inc. (b) 40,745 16,583,622Evolution AB 167,279 17,071,596
73,190,148
Industrial Conglomerates��0.9%Roper Technologies, Inc. 33,682 15,905,651
Interactive Media & Services��10.0%Alphabet, Inc. - Class A (a) 35,574 98,943,745Match Group, Inc. (a) 244,007 26,533,321Meta Platforms, Inc. - Class A (a) 82,003 18,234,187Snap, Inc. - Class A (a) (b) 1,021,845 36,776,202
180,487,455
Internet & Direct Marketing Retail��10.5%Amazon.com, Inc. (a) 51,327 167,323,454Etsy, Inc. (a) (b) 184,384 22,915,243
190,238,697
IT Services��7.2%MasterCard, Inc. - Class A 93,076 33,263,501
IT Services ��(Continued)MongoDB, Inc. (a) (b) 50,514 22,407,505Snowflake, Inc. - Class A (a) 101,016 23,145,796Visa, Inc. - Class A 235,951 52,326,853
131,143,655
Life Sciences Tools & Services��4.2%
Copyright © 2022 www.secdatabase.com. All Rights Reserved.Please Consider the Environment Before Printing This Document

10X Genomics, Inc. - Class A (a) 38,831 2,953,874Danaher Corp. 115,619 33,914,521Lonza Group AG 26,419 19,140,124Thermo Fisher Scientific, Inc. 32,700 19,314,255
75,322,774
Oil, Gas & Consumable Fuels��2.7%EQT Corp. 409,135 14,078,335Pioneer Natural Resources Co. 137,193 34,302,366
48,380,701
Personal Products��0.6%Olaplex Holdings, Inc. (a) (b) 658,984 10,299,920
Pharmaceuticals��2.3%Eli Lilly and Co. 41,504 11,885,500Zoetis, Inc. 161,108 30,383,358
42,268,858
Professional Services��0.6%TransUnion 100,293 10,364,279
Semiconductors & Semiconductor Equipment��9.4%Applied Materials, Inc. 79,363 10,460,043ASML Holding NV 75,696 50,559,629Marvell Technology, Inc. 613,950 44,026,355NVIDIA Corp. 242,644 66,207,842
171,253,869
Software��19.8%Adobe, Inc. (a) 60,739 27,673,903Bill.com Holdings, Inc. (a) (b) 68,040 15,430,792Crowdstrike Holdings, Inc. - Class A (a) 51,490 11,692,349Intuit, Inc. 145,715 70,065,601Microsoft Corp. 617,552 190,397,457ServiceNow, Inc. (a) 76,652 42,686,732
357,946,834
Technology Hardware, Storage & Peripherals��3.9%Apple, Inc. 405,118 70,737,654
Textiles, Apparel & Luxury Goods��4.4%LVMH Moet Hennessy Louis Vuitton SE 50,431 35,910,377NIKE, Inc. - Class B 319,333 42,969,448
78,879,825Total Common Stocks
(Cost $1,228,480,630) 1,793,598,836
BHFTII-54
Copyright © 2022 www.secdatabase.com. All Rights Reserved.Please Consider the Environment Before Printing This Document

Table of ContentsBrighthouse Funds Trust IIBlackRock Capital Appreciation Portfolio
Schedule of Investments as of March 31, 2022 (Unaudited)Preferred Stock��0.4%
Security Description
Shares/PrincipalAmount* Value
Interactive Media & Services��0.4%Bytedance, Ltd. - Series E � (a) (c) (d)
(Cost $5,566,369) 50,800 $ 8,184,265
Short-Term Investment��0.1%Repurchase Agreement��0.1%Fixed Income Clearing Corp.
Repurchase Agreement dated 03/31/22 at 0.000%, due on 04/01/22 with a maturity value of$1,855,762; collateralized by U.S. Treasury Note at 2.500%, maturing 03/31/27, with a marketvalue of $1,892,961. 1,855,762 1,855,762
Total Short-Term Investments(Cost $1,855,762) 1,855,762
Securities Lending Reinvestments (e)��4.5%Certificates of Deposit��1.6%Bank of Montreal
0.300%, 06/02/22 2,000,000 1,998,532Bank of Nova Scotia
0.520%, SOFR + 0.250%, 02/17/23 (f) 3,000,000 2,993,332Barclays Bank plc
0.180%, 04/07/22 2,000,000 1,999,926BNP Paribas S.A.
0.490%, SOFR + 0.220%, 11/17/22 (f) 4,000,000 3,994,368Canadian Imperial Bank of Commerce (NY)
0.770%, SOFR + 0.500%, 03/03/23 (f) 3,000,000 3,001,906Cooperatieve Rabobank UA
0.840%, SOFR + 0.570%, 09/19/22 (f) 1,000,000 1,000,000Nordea Bank Abp.
0.720%, SOFR + 0.450%, 08/30/22 (f) 1,000,000 999,998Oversea-Chinese Banking Corp., Ltd.
Zero Coupon, 04/14/22 700,000 699,881Royal Bank of Canada
0.520%, SOFR + 0.250%, 01/11/23 (f) 1,000,000 997,6620.850%, FEDEFF PRV + 0.520%, 09/21/22 (f) 3,000,000 2,999,565
Standard Chartered Bank (NY)0.460%, SOFR + 0.190%, 08/25/22 (f) 1,000,000 999,183
Toronto-Dominion Bank (The)0.530%, SOFR + 0.250%, 02/09/23 (f) 1,000,000 1,000,0000.820%, FEDEFF PRV + 0.490%, 12/23/22 (f) 2,000,000 1,999,408
Westpac Banking Corp.0.500%, SOFR + 0.230%, 02/17/23 (f) 4,000,000 3,987,492
28,671,253
Repurchase Agreements��2.8%Cantor Fitzgerald & Co.
Repurchase Agreement dated 03/31/22 at 0.290%, due on 04/01/22 with a maturity value of$2,000,016; collateralized by U.S. Treasury and U.S. Government Agency Obligations with ratesranging from 0.125% - 8.000%, maturity dates ranging from 09/15/22 - 07/20/71, and anaggregate market value of $2,040,000. 2,000,000 2,000,000
Repurchase Agreements��(Continued)Citigroup Global Markets, Inc.
Repurchase Agreement dated 03/31/22 at 0.620%, due on 05/05/22 with a maturity value of$7,004,219; collateralized by U.S. Treasury Obligations with rates ranging from 1.375% -4.375%, maturity dates ranging from 02/15/39 - 05/15/47, and various Common Stock with anaggregate market value of $7,140,942. 7,000,000 $ 7,000,000
Copyright © 2022 www.secdatabase.com. All Rights Reserved.Please Consider the Environment Before Printing This Document

Citigroup Global Markets, Ltd.Repurchase Agreement dated 03/31/22 at 0.300%, due on 04/01/22 with a maturity value of$1,800,015; collateralized by U.S. Treasury and Foreign Obligations with rates ranging from0.125% - 2.875%, maturity dates ranging from 08/15/23 - 02/15/51, and an aggregate marketvalue of $1,836,001. 1,800,000 1,800,000
ING Financial Markets LLCRepurchase Agreement dated 03/31/22 at 0.260%, due on 04/01/22 with a maturity value of$7,058,974; collateralized by U.S. Government Agency Obligations with rates ranging from0.350% - 6.625%, maturity dates ranging from 04/05/22 - 11/15/30, and an aggregate marketvalue of $7,200,149. 7,058,923 7,058,923
National Bank of CanadaRepurchase Agreement dated 03/31/22 at 0.320%, due on 04/07/22 with a maturity value of$4,200,261; collateralized by U.S. Treasury Obligations with rates ranging from 0.000% -4.500%, maturity dates ranging from 04/14/22 - 08/15/51, and an aggregate market value of$4,286,389. 4,200,000 4,200,000Repurchase Agreement dated 03/31/22 at 0.450%, due on 04/07/22 with a maturity value of$6,300,551; collateralized by U.S. Treasury Obligations with rates ranging from 0.500% -3.000%, maturity dates ranging from 11/30/23 - 08/15/48, and various Common Stock with anaggregate market value of $6,966,532. 6,300,000 6,300,000
NBC Global Finance, Ltd.Repurchase Agreement dated 03/31/22 at 0.440%, due on 04/01/22 with a maturity value of$17,000,208; collateralized by U.S. Treasury Obligations with rates ranging from 0.125% -4.750%, maturity dates ranging from 05/15/24 - 02/15/50, and various Common Stock with anaggregate market value of $18,876,402. 17,000,000 17,000,000
Societe GeneraleRepurchase Agreement dated 03/31/22 at 0.360%, due on 04/01/22 with a maturity value of$1,000,010; collateralized by various Common Stock with an aggregate market value of$1,111,203. 1,000,000 1,000,000Repurchase Agreement dated 03/31/22 at 0.420%, due on 04/07/22 with a maturity value of$2,700,221; collateralized by various Common Stock with an aggregate market value of$3,000,482. 2,700,000 2,700,000
TD Prime Services LLCRepurchase Agreement dated 03/31/22 at 0.400%, due on 04/01/22 with a maturity value of$1,000,011; collateralized by various Common Stock with an aggregate market value of$1,126,665. 1,000,000 1,000,000
50,058,923
BHFTII-55
Copyright © 2022 www.secdatabase.com. All Rights Reserved.Please Consider the Environment Before Printing This Document

Table of ContentsBrighthouse Funds Trust IIBlackRock Capital Appreciation Portfolio
Schedule of Investments as of March 31, 2022 (Unaudited)Securities Lending Reinvestments (e)��(Continued)
Security DescriptionPrincipalAmount* Value
Time Deposit��0.1%National Bank of Canada
0.370%, OBFR + 0.050%, 04/07/22 (f) 2,000,000 $ 2,000,000Total Securities Lending Reinvestments
(Cost $80,758,884) 80,730,176Total Investments�104.0%
(Cost $1,316,661,645) 1,884,369,039Other assets and liabilities (net)�(4.0)% (72,602,132 )Net Assets��100.0% $ 1,811,766,907
* Principal amount stated in U.S. dollars unless otherwise noted.� Restricted securities are not registered under the Securities Act of 1933 and are subject to legal restrictions on resale. These securities generally
may be resold in transactions exempt from registration or to the public if the securities are subsequently registered. Disposal of these securitiesmay involve time-consuming negotiations and prompt sale at an acceptable price may be difficult. As of March 31, 2022, the market value ofrestricted securities was $8,184,265, which is 0.5% of net assets. See details shown in the Restricted Securities table that follows.
(a) Non-income producing security.(b) All or a portion of the security was held on loan. As of March 31, 2022, the market value of securities loaned was $78,749,847 and the collateral
received consisted of cash in the amount of $80,758,375. The cash collateral investments are disclosed in the Schedule of Investments andcategorized as Securities Lending Reinvestments.
(c) Security was valued in good faith under procedures approved by the Board of Trustees. As of March 31, 2022, these securities represent 0.5% ofnet assets.
(d) Significant unobservable inputs were used in the valuation of this portfolio security; i.e. Level 3.(e) Represents investment of cash collateral received from securities on loan as of March 31, 2022.(f) Variable or floating rate security. The stated rate represents the rate at March 31, 2022. Maturity date shown for callable securities reflects the
earliest possible call date. For securities based on a published reference index and spread, the index and spread are indicated in the descriptionabove. For certain variable rate securities, the coupon rate is determined by the issuer/agent based on current market conditions. For certainasset- and mortgage-backed securities, the coupon rate may fluctuate based on changes of the underlying collateral or prepayments of principal.These securities do not indicate a reference index and spread in their description above.
Restricted SecuritiesAcquisition
Date Shares Cost ValueBytedance, Ltd. Series E 12/10/20 50,800 $5,566,369 $8,184,265
Glossary of Abbreviations
Index Abbreviations
(FEDEFF PRV)� Effective Federal Funds Rate(OBFR)� U.S. Overnight Bank Funding Rate(SOFR)� Secured Overnight Financing Rate
BHFTII-56
Copyright © 2022 www.secdatabase.com. All Rights Reserved.Please Consider the Environment Before Printing This Document

Table of ContentsBrighthouse Funds Trust IIBlackRock Capital Appreciation Portfolio
Schedule of Investments as of March 31, 2022 (Unaudited)
Fair Value HierarchyAccounting principles generally accepted in the United States of America (�GAAP�) define fair market value as the price that the Portfolio would receive tosell an asset or pay to transfer a liability in an orderly transaction between market participants at the measurement date. It establishes a fair valuehierarchy that prioritizes inputs to valuation methods and requires disclosure of the fair value hierarchy, separately for each major category of assets andliabilities, that segregates fair value measurements into three levels. Levels 1, 2 and 3 of the fair value hierarchy are defined as follows:
Level 1 - unadjusted quoted prices in active markets for identical investmentsLevel 2 - other significant observable inputs (including, but not limited to, quoted prices for similar assets or liabilities in markets that are either activeor inactive; inputs other than quoted prices that are observable such as interest rates, yield curves, volatilities, prepayment speeds, loss severities,credit risks, default rates, or other market corroborated inputs)Level 3 - significant unobservable inputs based on the best information available in the circumstances, to the extent observable inputs areunavailable (including the Portfolio�s own assumptions used in determining the fair value of investments and derivative financial instruments)
The inputs or methodologies used for valuing investments are not necessarily an indication of the risk associated with investing in them. Changes to theinputs or methodologies used may result in transfers between levels. A reconciliation of Level 3 securities, if any, will be disclosed following the fair valuehierarchy table. For more information about the Portfolio�s policy regarding the valuation of investments, please refer to the Notes to Schedule ofInvestments.
The following table summarizes the fair value hierarchy of the Portfolio�s investments as of March 31, 2022:
Description Level 1 Level 2 Level 3 TotalCommon Stocks
Aerospace & Defense $39,835,156 $� $� $39,835,156Automobiles 47,750,611 � � 47,750,611Capital Markets 87,036,861 � � 87,036,861Chemicals 44,508,119 � � 44,508,119Containers & Packaging 8,984,520 � � 8,984,520Electronic Equipment, Instruments & Components 25,944,368 � � 25,944,368Entertainment 20,013,220 � � 20,013,220Health Care Equipment & Supplies 42,633,935 � � 42,633,935Health Care Providers & Services 20,471,726 � � 20,471,726Hotels, Restaurants & Leisure 56,118,552 17,071,596 � 73,190,148Industrial Conglomerates 15,905,651 � � 15,905,651Interactive Media & Services 180,487,455 � � 180,487,455Internet & Direct Marketing Retail 190,238,697 � � 190,238,697IT Services 131,143,655 � � 131,143,655Life Sciences Tools & Services 56,182,650 19,140,124 � 75,322,774Oil, Gas & Consumable Fuels 48,380,701 � � 48,380,701Personal Products 10,299,920 � � 10,299,920Pharmaceuticals 42,268,858 � � 42,268,858Professional Services 10,364,279 � � 10,364,279Semiconductors & Semiconductor Equipment 171,253,869 � � 171,253,869Software 357,946,834 � � 357,946,834Technology Hardware, Storage & Peripherals 70,737,654 � � 70,737,654Textiles, Apparel & Luxury Goods 42,969,448 35,910,377 � 78,879,825
Total Common Stocks 1,721,476,739 72,122,097 � 1,793,598,836Total Preferred Stock* � � 8,184,265 8,184,265Total Short-Term Investment* � 1,855,762 � 1,855,762Total Securities Lending Reinvestments* � 80,730,176 � 80,730,176Total Investments $1,721,476,739 $154,708,035 $8,184,265 $1,884,369,039Collateral for Securities Loaned (Liability) $� $(80,758,375 ) $� $(80,758,375 )
* See Schedule of Investments for additional detailed categorizations.
Level 3 investments at the beginning and/or end of the period in relation to net assets were not significant and accordingly, a reconciliation of Level 3assets for the period ended March 31, 2022 is not presented.
BHFTII-57
Copyright © 2022 www.secdatabase.com. All Rights Reserved.Please Consider the Environment Before Printing This Document

Table of ContentsBrighthouse Funds Trust II
BlackRock Ultra-Short Term Bond Portfolio
Schedule of Investments as of March 31, 2022 (Unaudited)Corporate Bonds & Notes��0.8% of Net Assets
Security DescriptionPrincipalAmount* Value
Auto Manufacturers��0.8%Toyota Motor Credit Corp.
0.420%, SOFR + 0.150%, 08/15/22 (a) 6,132,000 $6,125,3270.550%, SOFR + 0.280%, 12/14/22 (a) 1,928,000 1,927,047
Total Corporate Bonds & Notes(Cost $8,060,000) 8,052,374
Short-Term Investments��99.4%Certificate of Deposit��28.9%Bank of Montreal (Chicago)
0.430%, SOFR + 0.150%, 09/21/22 (a) 7,000,000 6,992,6400.509%, 3M LIBOR + 0.050%, 05/16/22(a) 4,000,000 4,001,0950.546%, 3M LIBOR + 0.040%, 08/15/22(a) 5,000,000 5,000,9720.633%, 3M LIBOR + 0.050%, 06/06/22(a) 6,000,000 6,001,461
Bank of Nova Scotia (Houston)0.309%, SOFR + 0.160%, 06/03/22 (a) 7,000,000 6,998,1210.353%, SOFR + 0.200%, 05/04/22 (a) 5,000,000 5,000,0320.440%, SOFR + 0.160%, 07/08/22 (a) 4,000,000 3,998,0450.480%, SOFR + 0.200%, 06/17/22 (a) 7,000,000 6,998,240
BNP Paribas S.A. (NY)0.327%, SOFR + 0.160%, 08/05/22(144A) (a) 2,000,000 1,998,880
Canadian Imperial Bank of Commerce(NY)0.240%, 04/06/22 8,500,000 8,499,8710.311%, 1M FEDL + 0.100%, 06/08/22(a) 7,000,000 6,996,7230.430%, SOFR + 0.150%, 07/01/22 (a) 10,000,000 9,995,6090.580%, SOFR + 0.300%, 01/06/23 (a) 3,500,000 3,498,1470.633%, 3M LIBOR + 0.050%, 06/07/22(a) 6,000,000 6,000,540
Credit Industriel Et Commercial (NY)0.365%, 3M LIBOR + 0.050%, 05/06/22(a) 7,000,000 7,000,357
Credit Suisse AG (NY)0.300%, 06/01/22 5,500,000 5,496,0280.465%, SOFR + 0.280%, 02/10/23 (a) 7,000,000 6,983,7800.482%, SOFR + 0.200%, 07/15/22 (a) 5,000,000 4,997,044
Goldman Sachs Bank USA0.251%, SOFR + 0.170%, 07/26/22 (a) 5,000,000 4,996,2520.456%, SOFR + 0.300%, 03/09/23 (a) 5,500,000 5,487,637
Korea Development Bank0.878%, SOFR + 0.600%, 09/22/22 (a) 2,800,000 2,801,492
Landesbank Baden-Wuettertemberg (NY)0.350%, 04/01/22 30,000,000 30,000,013
Lloyds Bank Corporate Markets plc0.348%, SOFR + 0.270%, 01/24/23 (a) 3,400,000 3,394,401
Mitsubishi UFJ Trust & Banking Corp.0.300%, 04/22/22 8,000,000 7,999,534
MUFG Bank Ltd. (NY)0.300%, 10/31/22 3,000,000 2,980,0540.330%, 11/01/22 7,000,000 6,954,3610.360%, SOFR + 0.280%, 01/23/23 (a) 6,000,000 5,987,8320.454%, SOFR + 0.300%, 03/10/23 (a) 4,000,000 3,990,564
Natixis S.A. (New York)0.337%, SOFR + 0.170%, 08/05/22 (a) 5,000,000 4,997,4980.447%, SOFR + 0.280%, 02/07/23 (a) 6,000,000 5,991,681
Copyright © 2022 www.secdatabase.com. All Rights Reserved.Please Consider the Environment Before Printing This Document

Nordea Bank ABP (NY)0.230%, 04/07/22 16,900,000 16,899,6360.460%, SOFR + 0.190%, 10/27/22 (a) 4,000,000 3,994,647
Certificate of Deposit��(Continued)Oversea-Chinese Banking Corp., Ltd.
0.380%, 05/09/22 15,000,000 14,996,650Standard Chartered Bank (NY)
0.335%, SOFR + 0.190%, 09/02/22 (a) 5,500,000 5,495,2720.521%, SOFR + 0.300%, 03/13/23 (a) 4,500,000 4,491,794
Sumitomo Mitsui Banking Corp. (NY)0.394%, SOFR + 0.170%, 09/14/22 (a) 5,000,000 4,994,5130.444%, SOFR + 0.170%, 06/22/22 (a) 6,000,000 5,997,9540.550%, SOFR + 0.270%, 01/19/23 (a) 5,500,000 5,491,3140.730%, SOFR + 0.450%, 07/22/22 (a) 10,000,000 10,003,354
Sumitomo Mitsui Trust Bank, Ltd. (NY)0.320%, 04/01/22 25,000,000 25,000,000
Svenska Handelsbanken0.470%, SOFR + 0.190%, 10/27/22 (a) 5,000,000 4,993,307
Toronto-Dominion Bank (NY)0.300%, 10/25/22 4,000,000 3,971,025
298,368,370
Commercial Paper��60.6%Alinghi Funding Co. LLC
0.209%, 05/24/22 (b) 4,000,000 3,995,260Antalis S.A.
0.266%, 04/04/22 (b) 8,000,000 7,999,7190.478%, 04/07/22 (b) 8,000,000 7,999,5020.659%, 04/14/22 (b) 10,000,000 9,998,4831.054%, 06/21/22 (b) 5,000,000 4,986,664
ANZ New Zealand International, Ltd.(London)0.175%, 04/04/22 (b) 14,660,000 14,659,4790.244%, 04/26/22 (b) 4,000,000 3,998,7660.246%, 05/03/22 (b) 11,815,000 11,809,845
ASB Bank, Ltd.0.550%, SOFR + 0.500%, 09/08/22 (a) 3,000,000 3,000,625
ASB Finance, Ltd.0.152%, 04/06/22 (b) 13,000,000 12,999,3520.159%, 04/20/22 (b) 7,000,000 6,998,6580.185%, 06/21/22 (b) 6,000,000 5,988,452
Australia & New Zealand Banking Group,Ltd.0.541%, 05/02/22 (b) 5,000,000 4,997,924
Autobahn Funding Co. LLC0.409%, 04/25/22 (b) 20,000,000 19,992,681
Bank of Nova Scotia (The)0.203%, 04/05/22 (b) 4,000,000 3,999,822
Barclays Bank plcZero Coupon, 04/01/22 (b) 25,000,000 24,999,777
Bayerische Landesbank (NY)Zero Coupon, 04/01/22 (b) 22,000,000 21,999,8030.325%, 04/05/22 (b) 20,000,000 19,999,072
Bedford Row Funding Corp.0.279%, 04/06/22 (b) 32,000,000 31,998,352
BNG Bank N.V.0.243%, 04/04/22 (b) 15,000,000 14,999,507
BNP Paribas S.A. (NY)0.963%, 06/15/22 (b) 8,000,000 7,987,148
BPCE S.A.1.433%, 02/22/23 (b) 7,000,000 6,873,274
BHFTII-58
Copyright © 2022 www.secdatabase.com. All Rights Reserved.Please Consider the Environment Before Printing This Document

Table of ContentsBrighthouse Funds Trust IIBlackRock Ultra-Short Term Bond Portfolio
Schedule of Investments as of March 31, 2022 (Unaudited)Short-Term Investments��(Continued)
Security DescriptionPrincipalAmount* Value
Commercial Paper��(Continued)Caisse des Depots et Consignations
Zero Coupon, 04/01/22 (b) 20,000,000 $19,999,828Caisse D�Amortissement De La Dette
Sociale0.155%, 04/14/22 (b) 8,000,000 7,998,983
Cancara Asset Securitisation LLC0.389%, 04/25/22 (b) 5,000,000 4,998,132
CDP Financial, Inc.0.433%, 05/03/22 (b) 5,000,000 4,997,9740.689%, 06/02/22 (b) 12,500,000 12,485,366
Citigroup Global Markets, Inc.0.190%, 06/03/22 (b) 5,000,000 4,992,951
Collateralized Commercial Paper FLEX Co.LLC0.242%, 08/10/22 (b) 6,000,000 5,971,840
Columbia Funding Co. LLC0.284%, 04/05/22 (b) 20,000,000 19,999,119
Crown Point Capital Co. LLC0.299%, 06/01/22 (b) 5,000,000 4,992,5600.300%, 10/04/22 8,000,000 7,951,5840.320%, 10/07/22 5,000,000 4,969,251
DBS Bank, Ltd.0.315%, 06/03/22 (b) 10,400,000 10,386,8910.323%, 04/28/22 (b) 7,000,000 6,997,675
DZ Bank AG (NY)Zero Coupon, 04/01/22 (b) 15,000,000 14,999,870
Federation des Caisses Desjardins duQuebec0.492%, 05/03/22 (b) 5,000,000 4,997,928
Goldman Sachs International Co.0.252%, 09/23/22 (b) 4,000,000 3,972,5240.901%, 06/07/22 (b) 5,000,000 4,992,964
Great Bear Funding LLC0.259%, 04/04/22 (b) 10,000,000 9,999,649
Ionic Capital III Trust0.478%, 04/07/22 (b) 8,000,000 7,999,502
Landesbank Baden-Wuettertemberg (NY)0.443%, 04/07/22 (b) 5,000,000 4,999,660
Lloyds Bank plc0.363%, 04/06/22 (b) 14,000,000 13,999,279
Macquarie Bank, Ltd.0.400%, SOFR + 0.350%, 01/04/23 (a) 4,000,000 3,993,7860.650%, SOFR + 0.600%, 03/03/23 (a) 4,000,000 3,998,136
Mitsubishi UFJ Trust & Banking Corp.0.710%, 05/06/22 (144A) (b) 5,000,000 4,997,650
Mizuho Bank, Ltd. (NY)0.522%, 04/18/22 (b) 21,000,000 20,995,233
National Australia Bank, Ltd.0.170%, SOFR + 0.120%, 06/16/22 (a) 6,000,000 5,997,213
National Bank of Canada0.200%, SOFR + 0.160%, 07/28/22 (a) 5,000,000 4,996,402
Nieuw Amsterdam Receivables Corp.0.532%, 04/08/22 (b) 12,000,000 11,999,0720.626%, 04/20/22 (b) 10,000,000 9,997,278
Nordea Bank ABP0.308%, 10/21/22 (b) 4,000,000 3,966,771
NRW Bank0.351%, 04/06/22 (b) 5,500,000 5,499,734
Commercial Paper��(Continued)
Copyright © 2022 www.secdatabase.com. All Rights Reserved.Please Consider the Environment Before Printing This Document

OMERS Finance Trust0.432%, 04/19/22 (b) 6,283,000 6,281,839
PSP Capital, Inc.0.312%, 04/04/22 (b) 4,000,000 3,999,868
Ridgefield Funding Co. LLC0.197%, 05/02/22 (b) 5,000,000 4,997,2760.246%, 05/04/22 (b) 3,000,000 2,998,224
Sheffield Receivables Co. LLCZero Coupon, 04/01/22 (b) 12,000,000 11,999,896
Skandinaviska Enskilda Banken AB0.177%, 05/02/22 (b) 8,000,000 7,996,8780.220%, SOFR + 0.170%, 09/09/22 (a) 4,000,000 3,996,515
Starbird Funding Corp.0.295%, 05/04/22 (b) 9,000,000 8,994,6710.351%, 06/17/22 (b) 4,800,000 4,790,3700.720%, SOFR + 0.450%, 07/08/22 (a) 5,000,000 4,999,998
Swedbank AB0.169%, 04/20/22 (b) 5,000,000 4,999,214
Toronto-Dominion Bank (NY)1.361%, 02/17/23 (b) 7,000,000 6,877,215
UBS AG0.220%, SOFR + 0.170%, 09/22/22(144A) (a) 5,000,000 4,995,0770.230%, SOFR + 0.180%, 06/17/22 (a) 9,000,000 8,996,3070.251%, 07/12/22 (b) 6,000,000 5,980,9790.350%, SOFR + 0.300%, 12/08/22 (a) 5,000,000 4,991,442
Versailles Commercial Paper LLC1.052%, 06/09/22 (b) 5,000,000 4,991,474
Washington Morgan Capital Co. LLC0.500%, 09/01/22 3,000,000 2,989,020
Westpac Banking Corp.1.260%, SOFR + 0.480%, 03/24/23 (a) 5,000,000 4,999,9600.273%, 10/14/22 (b) 4,000,000 3,967,364
626,270,557
Repurchase Agreements��8.4%BofA Securities, Inc.
Repurchase Agreement dated 03/31/22 at0.300%, due on 04/01/22 with a maturityvalue of $47,000,392; collateralized byU.S. Government Agency Obligations withrates ranging from 2.500% - 5.000%, withmaturity dates ranging from 10/20/51 - 03/20/52, and an aggregate market value of$47,940,001. 47,000,000 47,000,000
JPMorgan Securities LLCRepurchase Agreement dated 03/31/22 at0.300%, due on 04/01/22 with a maturityvalue of $40,000,333; collateralized byU.S. Treasury Bonds with rates rangingfrom 1.250% - 5.000%, with maturitydates ranging from 05/15/37 - 05/15/50,and an aggregate market value of$40,800,011. 40,000,000 40,000,000
87,000,000
Time Deposit��0.5%Royal Bank of Canada (Toronto)
0.310%, 04/01/22 5,000,000 5,000,000
BHFTII-59
Copyright © 2022 www.secdatabase.com. All Rights Reserved.Please Consider the Environment Before Printing This Document

Table of ContentsBrighthouse Funds Trust IIBlackRock Ultra-Short Term Bond Portfolio
Schedule of Investments as of March 31, 2022 (Unaudited)Short-Term Investments��(Continued)
Security DescriptionPrincipalAmount* Value
U.S. Treasury��1.0%U.S. Treasury Cash Management Bill
0.110%, 04/26/22 (b) 10,107,000 $10,106,079Total Short-Term Investments
(Cost $1,027,333,468) 1,026,745,006Total Investments� 100.2%
(Cost $1,035,393,468) 1,034,797,380Other assets and liabilities (net)�(0.2)% (2,428,907 )Net Assets��100.0% $1,032,368,473
* Principal amount stated in U.S. dollars unless otherwise noted.(a) Variable or floating rate security. The stated rate represents the rate at March 31, 2022. Maturity date shown for callable securities reflects the
earliest possible call date. For securities based on a published reference index and spread, the index and spread are indicated in the descriptionabove. For certain variable rate securities, the coupon rate is determined by the issuer/agent based on current market conditions. For certainasset- and mortgage-backed securities, the coupon rate may fluctuate based on changes of the underlying collateral or prepayments of principal.These securities do not indicate a reference index and spread in their description above.
(b) The rate shown represents current yield to maturity.(144A)� Securities exempt from registration under Rule 144A of the Securities Act of 1933. These securities may be resold in transactions exempt from
registration, normally to qualified institutional buyers. As of March 31, 2022, the market value of 144A securities was $11,991,607, which is 1.2%of net assets.
Glossary of Abbreviations
Index Abbreviations
(FEDL)� Federal Funds Rate(LIBOR)� London Interbank Offered Rate(SOFR)� Secured Overnight Financing Rate
Fair Value HierarchyAccounting principles generally accepted in the United States of America (�GAAP�) define fair market value as the price that the Portfolio would receive tosell an asset or pay to transfer a liability in an orderly transaction between market participants at the measurement date. It establishes a fair valuehierarchy that prioritizes inputs to valuation methods and requires disclosure of the fair value hierarchy, separately for each major category of assets andliabilities, that segregates fair value measurements into three levels. Levels 1, 2 and 3 of the fair value hierarchy are defined as follows:
Level 1 - unadjusted quoted prices in active markets for identical investmentsLevel 2 - other significant observable inputs (including, but not limited to, quoted prices for similar assets or liabilities in markets that are either activeor inactive; inputs other than quoted prices that are observable such as interest rates, yield curves, volatilities, prepayment speeds, loss severities,credit risks, default rates, or other market corroborated inputs)Level 3 - significant unobservable inputs based on the best information available in the circumstances, to the extent observable inputs areunavailable (including the Portfolio�s own assumptions used in determining the fair value of investments and derivative financial instruments)
The inputs or methodologies used for valuing investments are not necessarily an indication of the risk associated with investing in them. Changes to theinputs or methodologies used may result in transfers between levels. A reconciliation of Level 3 securities, if any, will be disclosed following the fair valuehierarchy table. For more information about the Portfolio�s policy regarding the valuation of investments, please refer to the Notes to Schedule ofInvestments.
The following table summarizes the fair value hierarchy of the Portfolio�s investments as of March 31, 2022:
Description Level 1 Level 2 Level 3 TotalTotal Corporate Bonds & Notes* $ � $8,052,374 $ � $8,052,374Total Short-Term Investments* � 1,026,745,006 � 1,026,745,006Total Investments $ � $1,034,797,380 $ � $1,034,797,380
* See Schedule of Investments for additional detailed categorizations.
Copyright © 2022 www.secdatabase.com. All Rights Reserved.Please Consider the Environment Before Printing This Document

BHFTII-60
Copyright © 2022 www.secdatabase.com. All Rights Reserved.Please Consider the Environment Before Printing This Document

Table of ContentsBrighthouse Funds Trust II
Brighthouse Asset Allocation 20 Portfolio
Schedule of Investments as of March 31, 2022 (Unaudited)Mutual Funds��100.1% of Net Assets
Security Description Shares Value
Affiliated Investment Companies��100.1%AB International Bond Portfolio (Class A) (a) 1,028,247 $9,932,869Baillie Gifford International Stock Portfolio
(Class A) (b) 528,007 6,262,164BlackRock Bond Income Portfolio (Class A)
(b) 599,792 60,830,907BlackRock Capital Appreciation Portfolio
(Class A) (b) 78,749 3,820,134BlackRock High Yield Portfolio (Class A) (a) 326,461 2,533,341Brighthouse Small Cap Value Portfolio
(Class A) (a) 268,293 4,976,842Brighthouse/abrdn Emerging Markets Equity
Portfolio (Class A) (a) 107,278 1,241,209Brighthouse/Artisan International Portfolio
(Class A) (a) 309,417 3,781,080Brighthouse/Artisan Mid Cap Value Portfolio
(Class A) (b) 4,420 1,259,147Brighthouse/Eaton Vance Floating Rate
Portfolio (Class A) (a) 1,015,382 10,113,200Brighthouse/Franklin Low Duration Total
Return Portfolio (Class A) (a) 2,761,798 24,994,270Brighthouse/Templeton International Bond
Portfolio (Class A) (a) (c) 944,618 7,575,837Brighthouse/Wellington Core Equity
Opportunities Portfolio (Class A) (b) 227,529 8,905,481Brighthouse/Wellington Large Cap Research
Portfolio (Class A) (a) 280,481 5,079,514CBRE Global Real Estate Portfolio (Class A)
(a) 181,195 2,551,227Harris Oakmark International Portfolio (Class
A) (a) 374,282 4,955,493Invesco Comstock Portfolio (Class A) (a) 576,173 10,059,972Invesco Global Equity Portfolio (Class A) (a) 45,959 1,260,186Jennison Growth Portfolio (Class A) (b) 214,652 3,855,156JPMorgan Core Bond Portfolio (Class A) (a) 3,912,589 38,421,626JPMorgan Small Cap Value Portfolio (Class
A) (a) 129,002 2,507,803Loomis Sayles Small Cap Growth Portfolio
(Class A) (b) 88,992 1,258,352
Affiliated InvestmentCompanies��(Continued)MFS Research International Portfolio (Class
A) (a) 281,341 3,772,780MFS Value Portfolio (Class A) (b) 617,092 11,366,842Neuberger Berman Genesis Portfolio (Class
A) (b) 105,632 2,498,208PIMCO Inflation Protected Bond Portfolio
(Class A) (a) 4,035,126 44,547,791PIMCO Total Return Portfolio (Class A) (a) 5,434,834 59,294,036T. Rowe Price Large Cap Growth Portfolio
(Class A) (b) 146,683 3,822,564T. Rowe Price Large Cap Value Portfolio
(Class A) (a) 211,268 7,563,378T. Rowe Price Mid Cap Growth Portfolio
(Class A) (a) 109,026 1,269,057T. Rowe Price Small Cap Growth Portfolio
(Class A) (b) 210,305 5,026,286TCW Core Fixed Income Portfolio (Class A)
(a) 4,872,618 47,020,767VanEck Global Natural Resources Portfolio
(Class A) (b) 434,809 6,413,440
Copyright © 2022 www.secdatabase.com. All Rights Reserved.Please Consider the Environment Before Printing This Document

Western Asset Management Strategic BondOpportunities Portfolio (Class A) (b) 1,933,524 24,903,784
Western Asset Management U.S.Government Portfolio (Class A) (b) 5,800,802 64,446,912
Total Mutual Funds(Cost $495,853,518) 498,121,655
Total Investments�100.1%(Cost $495,853,518) 498,121,655
Other assets and liabilities (net)�(0.1)% (373,668 )Net Assets��100.0% $497,747,987
(a) A Portfolio of Brighthouse Funds Trust I.(b) A Portfolio of Brighthouse Funds Trust II.(c) Non-income producing security.
Fair Value HierarchyAccounting principles generally accepted in the United States of America (�GAAP�) define fair market value as the price that the Portfolio would receive tosell an asset or pay to transfer a liability in an orderly transaction between market participants at the measurement date. It establishes a fair valuehierarchy that prioritizes inputs to valuation methods and requires disclosure of the fair value hierarchy, separately for each major category of assets andliabilities, that segregates fair value measurements into three levels. Levels 1, 2 and 3 of the fair value hierarchy are defined as follows:
Level 1 - unadjusted quoted prices in active markets for identical investmentsLevel 2 - other significant observable inputs (including, but not limited to, quoted prices for similar assets or liabilities in markets that are either activeor inactive; inputs other than quoted prices that are observable such as interest rates, yield curves, volatilities, prepayment speeds, loss severities,credit risks, default rates, or other market corroborated inputs)Level 3 - significant unobservable inputs based on the best information available in the circumstances, to the extent observable inputs areunavailable (including the Portfolio�s own assumptions used in determining the fair value of investments and derivative financial instruments)
The inputs or methodologies used for valuing investments are not necessarily an indication of the risk associated with investing in them. Changes to theinputs or methodologies used may result in transfers between levels. A reconciliation of Level 3 securities, if any, will be disclosed following the fair valuehierarchy table. For more information about the Portfolio�s policy regarding the valuation of investments, please refer to the Notes to Schedule ofInvestments.
The following table summarizes the fair value hierarchy of the Portfolio�s investments as of March 31, 2022:
Description Level 1 Level 2 Level 3 TotalMutual Funds
Affiliated Investment Companies $498,121,655 $ � $ � $498,121,655Total Investments $498,121,655 $ � $ � $498,121,655
BHFTII-61
Copyright © 2022 www.secdatabase.com. All Rights Reserved.Please Consider the Environment Before Printing This Document

Table of ContentsBrighthouse Funds Trust II
Brighthouse Asset Allocation 40 Portfolio
Schedule of Investments as of March 31, 2022 (Unaudited)Mutual Funds��100.0% of Net Assets
Security Description Shares Value
Affiliated Investment Companies��100.0%AB International Bond Portfolio (Class A)
(a) 16,677,947 $161,108,971Allspring Mid Cap Value Portfolio (Class A)
(a) 758,181 11,713,891Baillie Gifford International Stock Portfolio
(Class A) (b) 9,492,554 112,581,693BlackRock Bond Income Portfolio (Class A)
(b) 4,312,436 437,367,258BlackRock Capital Appreciation Portfolio
(Class A) (b) 1,629,188 79,031,907BlackRock High Yield Portfolio (Class A)
(a) 3,024,207 23,467,843Brighthouse Small Cap Value Portfolio
(Class A) (a) 3,129,977 58,061,068Brighthouse/abrdn Emerging Markets
Equity Portfolio (Class A) (a) 2,605,040 30,140,311Brighthouse/Artisan International Portfolio
(Class A) (a) 6,273,653 76,664,039Brighthouse/Artisan Mid Cap Value
Portfolio (Class A) (b) 41,093 11,706,456Brighthouse/Eaton Vance Floating Rate
Portfolio (Class A) (a) 9,428,634 93,909,190Brighthouse/Franklin Low Duration Total
Return Portfolio (Class A) (a) 15,424,200 139,589,011Brighthouse/Templeton International Bond
Portfolio (Class A) (a) (c) 14,668,752 117,643,392Brighthouse/Wellington Core Equity
Opportunities Portfolio (Class A) (b) 3,951,891 154,677,028Brighthouse/Wellington Large Cap
Research Portfolio (Class A) (a) 5,864,043 106,197,817CBRE Global Real Estate Portfolio (Class
A) (a) 2,516,133 35,427,148Harris Oakmark International Portfolio
(Class A) (a) 8,831,233 116,925,519Invesco Comstock Portfolio (Class A) (a) 8,736,963 152,547,380Invesco Global Equity Portfolio (Class A)
(a) 1,539,464 42,212,100Invesco Small Cap Growth Portfolio (Class
A) (a) 1,656,644 22,530,360Jennison Growth Portfolio (Class A) (b) 3,182,987 57,166,455JPMorgan Core Bond Portfolio (Class A)
(a) 17,580,062 172,636,212JPMorgan Small Cap Value Portfolio
(Class A) (a) 1,809,322 35,173,220Loomis Sayles Growth Portfolio (Class A)
(a) 3,019,809 46,203,072
Affiliated Investment Companies��(Continued)Loomis Sayles Small Cap Growth Portfolio
(Class A) (b) 821,513 11,616,188MFS Research International Portfolio
(Class A) (a) 5,104,089 68,445,828MFS Value Portfolio (Class A) (b) 9,598,758 176,809,129Neuberger Berman Genesis Portfolio
(Class A) (b) 970,382 22,949,541PIMCO Inflation Protected Bond Portfolio
(Class A) (a) 25,303,212 279,347,464PIMCO Total Return Portfolio (Class A) (a) 37,799,434 412,391,821SSGA Emerging Markets Enhanced Index
Portfolio (Class A) (a) 3,083,773 33,181,403
Copyright © 2022 www.secdatabase.com. All Rights Reserved.Please Consider the Environment Before Printing This Document

T. Rowe Price Large Cap Growth Portfolio(Class A) (b) 2,574,612 67,094,377
T. Rowe Price Large Cap Value Portfolio(Class A) (a) 4,589,049 164,287,951
T. Rowe Price Mid Cap Growth Portfolio(Class A) (a) 1,973,566 22,972,308
T. Rowe Price Small Cap Growth Portfolio(Class A) (b) 2,422,301 57,892,986
TCW Core Fixed Income Portfolio (ClassA) (a) 34,529,507 333,209,744
VanEck Global Natural Resources Portfolio(Class A) (b) 6,727,203 99,226,239
Western Asset Management StrategicBond Opportunities Portfolio (Class A)(b) 14,356,325 184,909,470
Western Asset Management U.S.Government Portfolio (Class A) (b) 33,243,076 369,330,580
Total Mutual Funds(Cost $4,431,654,728) 4,598,346,370
Total Investments�100.0%(Cost $4,431,654,728) 4,598,346,370
Other assets and liabilities (net)�0.0% (1,510,450 )Net Assets��100.0% $4,596,835,920
(a) A Portfolio of Brighthouse Funds Trust I.(b) A Portfolio of Brighthouse Funds Trust II.(c) Non-income producing security.
Fair Value HierarchyAccounting principles generally accepted in the United States of America (�GAAP�) define fair market value as the price that the Portfolio would receive tosell an asset or pay to transfer a liability in an orderly transaction between market participants at the measurement date. It establishes a fair valuehierarchy that prioritizes inputs to valuation methods and requires disclosure of the fair value hierarchy, separately for each major category of assets andliabilities, that segregates fair value measurements into three levels. Levels 1, 2 and 3 of the fair value hierarchy are defined as follows:
Level 1 - unadjusted quoted prices in active markets for identical investmentsLevel 2 - other significant observable inputs (including, but not limited to, quoted prices for similar assets or liabilities in markets that are either activeor inactive; inputs other than quoted prices that are observable such as interest rates, yield curves, volatilities, prepayment speeds, loss severities,credit risks, default rates, or other market corroborated inputs)Level 3 - significant unobservable inputs based on the best information available in the circumstances, to the extent observable inputs areunavailable (including the Portfolio�s own assumptions used in determining the fair value of investments and derivative financial instruments)
The inputs or methodologies used for valuing investments are not necessarily an indication of the risk associated with investing in them. Changes to theinputs or methodologies used may result in transfers between levels. A reconciliation of Level 3 securities, if any, will be disclosed following the fair valuehierarchy table. For more information about the Portfolio�s policy regarding the valuation of investments, please refer to the Notes to Schedule ofInvestments.
The following table summarizes the fair value hierarchy of the Portfolio�s investments as of March 31, 2022:
Description Level 1 Level 2 Level 3 TotalMutual Funds
Affiliated Investment Companies $4,598,346,370 $ � $ � $4,598,346,370Total Investments $4,598,346,370 $ � $ � $4,598,346,370
BHFTII-62
Copyright © 2022 www.secdatabase.com. All Rights Reserved.Please Consider the Environment Before Printing This Document

Table of ContentsBrighthouse Funds Trust II
Brighthouse Asset Allocation 60 Portfolio
Schedule of Investments as of March 31, 2022 (Unaudited)Mutual Funds��100.0% of Net Assets
Security Description Shares Value
Affiliated InvestmentCompanies��100.0%AB International Bond Portfolio (Class A)
(a) 35,275,780 $340,764,038Allspring Mid Cap Value Portfolio (Class
A) (a) 1,901,343 29,375,756Baillie Gifford International Stock
Portfolio (Class A) (b) 31,932,235 378,716,306BlackRock Bond Income Portfolio (Class
A) (b) 7,579,333 768,695,902BlackRock Capital Appreciation Portfolio
(Class A) (b) 5,735,941 278,250,509BlackRock High Yield Portfolio (Class A)
(a) 9,010,839 69,924,107Brighthouse Small Cap Value Portfolio
(Class A) (a) 10,983,299 203,740,204Brighthouse/abrdn Emerging Markets
Equity Portfolio (Class A) (a) 12,748,662 147,502,020Brighthouse/Artisan International
Portfolio (Class A) (a) 26,754,243 326,936,844Brighthouse/Artisan Mid Cap Value
Portfolio (Class A) (b) 103,217 29,404,501Brighthouse/Dimensional International
Small Company Portfolio (Class A) (b) 9,358,882 114,646,298Brighthouse/Eaton Vance Floating Rate
Portfolio (Class A) (a) 23,505,588 234,115,655Brighthouse/Franklin Low Duration Total
Return Portfolio (Class A) (a) 25,536,852 231,108,508Brighthouse/Templeton International
Bond Portfolio (Class A) (a) (c) 36,732,332 294,593,306Brighthouse/Wellington Core Equity
Opportunities Portfolio (Class A) (b) 12,988,361 508,364,449Brighthouse/Wellington Large Cap
Research Portfolio (Class A) (a) 19,685,339 356,501,498CBRE Global Real Estate Portfolio
(Class A) (a) 12,661,903 178,279,596Harris Oakmark International Portfolio
(Class A) (a) 32,209,491 426,453,661Invesco Comstock Portfolio (Class A) (a) 27,038,862 472,098,535Invesco Global Equity Portfolio (Class A)
(a) 3,827,244 104,943,037Invesco Small Cap Growth Portfolio
(Class A) (a) 10,203,314 138,765,072Jennison Growth Portfolio (Class A) (b) 17,249,919 309,808,544JPMorgan Core Bond Portfolio (Class A)
(a) 23,231,064 228,129,047JPMorgan Small Cap Value Portfolio
(Class A) (a) 4,549,954 88,451,103Loomis Sayles Growth Portfolio (Class A)
(a) 20,786,304 318,030,446
Affiliated InvestmentCompanies��(Continued)Loomis Sayles Small Cap Growth
Portfolio (Class A) (b) 6,085,929 86,055,033MFS Research International Portfolio
(Class A) (a) 19,016,569 255,012,196MFS Value Portfolio (Class A) (b) 32,077,864 590,874,257Neuberger Berman Genesis Portfolio
(Class A) (b) 3,598,522 85,105,056PIMCO Inflation Protected Bond Portfolio
(Class A) (a) 31,663,911 349,569,573
Copyright © 2022 www.secdatabase.com. All Rights Reserved.Please Consider the Environment Before Printing This Document

PIMCO Total Return Portfolio (Class A)(a) 62,417,865 680,978,911
SSGA Emerging Markets EnhancedIndex Portfolio (Class A) (a) 10,179,979 109,536,574
T. Rowe Price Large Cap GrowthPortfolio (Class A) (b) 9,505,935 247,724,660
T. Rowe Price Large Cap Value Portfolio(Class A) (a) 14,782,287 529,205,859
T. Rowe Price Mid Cap Growth Portfolio(Class A) (a) 4,866,184 56,642,384
T. Rowe Price Small Cap GrowthPortfolio (Class A) (b) 8,387,487 200,460,929
TCW Core Fixed Income Portfolio (ClassA) (a) 60,732,943 586,072,896
VanEck Global Natural ResourcesPortfolio (Class A) (b) 26,411,848 389,574,751
Western Asset Management StrategicBond Opportunities Portfolio (Class A)(b) 17,726,043 228,311,431
Western Asset Management U.S.Government Portfolio (Class A) (b) 41,276,141 458,577,923
Total Mutual Funds(Cost $10,634,834,050) 11,431,301,375
Total Investments�100.0%(Cost $10,634,834,050) 11,431,301,375
Other assets and liabilities (net)�0.0% (3,134,079 )Net Assets��100.0% $11,428,167,296
(a) A Portfolio of Brighthouse Funds Trust I.(b) A Portfolio of Brighthouse Funds Trust II.(c) Non-income producing security.
Fair Value HierarchyAccounting principles generally accepted in the United States of America (�GAAP�) define fair market value as the price that the Portfolio would receive tosell an asset or pay to transfer a liability in an orderly transaction between market participants at the measurement date. It establishes a fair valuehierarchy that prioritizes inputs to valuation methods and requires disclosure of the fair value hierarchy, separately for each major category of assets andliabilities, that segregates fair value measurements into three levels. Levels 1, 2 and 3 of the fair value hierarchy are defined as follows:
Level 1 - unadjusted quoted prices in active markets for identical investmentsLevel 2 - other significant observable inputs (including, but not limited to, quoted prices for similar assets or liabilities in markets that are either activeor inactive; inputs other than quoted prices that are observable such as interest rates, yield curves, volatilities, prepayment speeds, loss severities,credit risks, default rates, or other market corroborated inputs)Level 3 - significant unobservable inputs based on the best information available in the circumstances, to the extent observable inputs areunavailable (including the Portfolio�s own assumptions used in determining the fair value of investments and derivative financial instruments)
The inputs or methodologies used for valuing investments are not necessarily an indication of the risk associated with investing in them. Changes to theinputs or methodologies used may result in transfers between levels. A reconciliation of Level 3 securities, if any, will be disclosed following the fair valuehierarchy table. For more information about the Portfolio�s policy regarding the valuation of investments, please refer to the Notes to Schedule ofInvestments.
The following table summarizes the fair value hierarchy of the Portfolio�s investments as of March 31, 2022:
Description Level 1 Level 2 Level 3 TotalMutual Funds
Affiliated Investment Companies $11,431,301,375 $ � $ � $11,431,301,375Total Investments $11,431,301,375 $ � $ � $11,431,301,375
BHFTII-63
Copyright © 2022 www.secdatabase.com. All Rights Reserved.Please Consider the Environment Before Printing This Document

Table of ContentsBrighthouse Funds Trust II
Brighthouse Asset Allocation 80 Portfolio
Schedule of Investments as of March 31, 2022 (Unaudited)Mutual Funds��100.0% of Net Assets
Security Description Shares Value
Affiliated InvestmentCompanies��100.0%AB International Bond Portfolio (Class A)
(a) 10,129,711 $97,853,011Allspring Mid Cap Value Portfolio (Class
A) (a) 6,598,188 101,942,000Baillie Gifford International Stock Portfolio
(Class A) (b) 33,021,301 391,632,631BlackRock Bond Income Portfolio (Class
A) (b) 3,146,354 319,103,208BlackRock Capital Appreciation Portfolio
(Class A) (b) 5,930,601 287,693,430BlackRock High Yield Portfolio (Class A)
(a) 6,480,496 50,288,652Brighthouse Small Cap Value Portfolio
(Class A) (a) 13,608,616 252,439,833Brighthouse/abrdn Emerging Markets
Equity Portfolio (Class A) (a) 14,815,403 171,414,217Brighthouse/Artisan International Portfolio
(Class A) (a) 30,941,170 378,101,094Brighthouse/Artisan Mid Cap Value
Portfolio (Class A) (b) 89,533 25,506,101Brighthouse/Dimensional International
Small Company Portfolio (Class A) (b) 16,168,450 198,063,513Brighthouse/Eaton Vance Floating Rate
Portfolio (Class A) (a) 10,178,724 101,380,094Brighthouse/Templeton International Bond
Portfolio (Class A) (a) (c) 31,857,442 255,496,685Brighthouse/Wellington Core Equity
Opportunities Portfolio (Class A) (b) 11,920,755 466,578,353Brighthouse/Wellington Large Cap
Research Portfolio (Class A) (a) 19,932,756 360,982,205CBRE Global Real Estate Portfolio (Class
A) (a) 18,298,955 257,649,283Frontier Mid Cap Growth Portfolio (Class
A) (b) 1,280,030 49,601,173Harris Oakmark International Portfolio
(Class A) (a) 34,886,879 461,902,277Invesco Comstock Portfolio (Class A) (a) 29,394,255 513,223,700Invesco Global Equity Portfolio (Class A)
(a) 4,973,001 136,359,674Invesco Small Cap Growth Portfolio
(Class A) (a) 15,822,363 215,184,140Jennison Growth Portfolio (Class A) (b) 24,310,847 436,622,810JPMorgan Core Bond Portfolio (Class A)
(a) 10,019,893 98,395,346JPMorgan Small Cap Value Portfolio
(Class A) (a) 7,905,796 153,688,666
Affiliated InvestmentCompanies��(Continued)Loomis Sayles Growth Portfolio (Class A)
(a) 29,650,525 453,653,040Loomis Sayles Small Cap Growth Portfolio
(Class A) (b) 12,237,439 173,037,390MFS Research International Portfolio
(Class A) (a) 23,791,130 319,039,056MFS Value Portfolio (Class A) (b) 31,955,126 588,613,429Morgan Stanley Discovery Portfolio (Class
A) (a) 1,446,212 23,385,254Neuberger Berman Genesis Portfolio
(Class A) (b) 1,044,099 24,692,951
Copyright © 2022 www.secdatabase.com. All Rights Reserved.Please Consider the Environment Before Printing This Document

PIMCO Inflation Protected Bond Portfolio(Class A) (a) 13,711,744 151,377,658
PIMCO Total Return Portfolio (Class A) (a) 26,916,838 293,662,701SSGA Emerging Markets Enhanced Index
Portfolio (Class A) (a) 13,199,653 142,028,269T. Rowe Price Large Cap Growth Portfolio
(Class A) (b) 14,559,729 379,426,539T. Rowe Price Large Cap Value Portfolio
(Class A) (a) 14,250,704 510,175,220T. Rowe Price Mid Cap Growth Portfolio
(Class A) (a) 4,221,688 49,140,445T. Rowe Price Small Cap Growth Portfolio
(Class A) (b) 7,228,151 172,752,811TCW Core Fixed Income Portfolio (Class
A) (a) 27,966,704 269,878,697VanEck Global Natural Resources
Portfolio (Class A) (b) 23,351,495 344,434,550Western Asset Management Strategic
Bond Opportunities Portfolio (Class A)(b) 15,278,343 196,785,052
Total Mutual Funds(Cost $8,805,602,897) 9,873,185,158
Total Investments�100.0%(Cost $8,805,602,897) 9,873,185,158
Other assets and liabilities (net)�0.0% (2,717,012 )Net Assets�100.0% $9,870,468,146
(a) A Portfolio of Brighthouse Funds Trust I.(b) A Portfolio of Brighthouse Funds Trust II.(c) Non-income producing security.
Fair Value HierarchyAccounting principles generally accepted in the United States of America (�GAAP�) define fair market value as the price that the Portfolio would receive tosell an asset or pay to transfer a liability in an orderly transaction between market participants at the measurement date. It establishes a fair valuehierarchy that prioritizes inputs to valuation methods and requires disclosure of the fair value hierarchy, separately for each major category of assets andliabilities, that segregates fair value measurements into three levels. Levels 1, 2 and 3 of the fair value hierarchy are defined as follows:
Level 1 - unadjusted quoted prices in active markets for identical investmentsLevel 2 - other significant observable inputs (including, but not limited to, quoted prices for similar assets or liabilities in markets that are either activeor inactive; inputs other than quoted prices that are observable such as interest rates, yield curves, volatilities, prepayment speeds, loss severities,credit risks, default rates, or other market corroborated inputs)Level 3 - significant unobservable inputs based on the best information available in the circumstances, to the extent observable inputs areunavailable (including the Portfolio�s own assumptions used in determining the fair value of investments and derivative financial instruments)
The inputs or methodologies used for valuing investments are not necessarily an indication of the risk associated with investing in them. Changes to theinputs or methodologies used may result in transfers between levels. A reconciliation of Level 3 securities, if any, will be disclosed following the fair valuehierarchy table. For more information about the Portfolio�s policy regarding the valuation of investments, please refer to the Notes to Schedule ofInvestments.
The following table summarizes the fair value hierarchy of the Portfolio�s investments as of March 31, 2022:
Description Level 1 Level 2 Level 3 TotalMutual Funds
Affiliated Investment Companies $9,873,185,158 $ � $ � $9,873,185,158Total Investments $9,873,185,158 $ � $ � $9,873,185,158
BHFTII-64
Copyright © 2022 www.secdatabase.com. All Rights Reserved.Please Consider the Environment Before Printing This Document

Table of ContentsBrighthouse Funds Trust II
Brighthouse/Artisan Mid Cap Value Portfolio
Schedule of Investments as of March 31, 2022 (Unaudited)Common Stocks��95.9% of Net Assets
Security Description Shares Value
Air Freight & Logistics��0.8%Expeditors International of Washington, Inc. 69,066 $7,124,849
Auto Components��3.9%BorgWarner, Inc. (a) 466,451 18,144,944Gentex Corp. (a) 614,186 17,915,805
36,060,749
Banks��1.7%M&T Bank Corp. (a) 94,921 16,089,109
Capital Markets��5.7%Carlyle Group, Inc. (The) 315,341 15,423,328Moelis & Co. - Class A (a) 375,399 17,624,983Northern Trust Corp. (a) 171,986 20,027,770
53,076,081
Chemicals��4.2%Celanese Corp. 104,841 14,978,634Corteva, Inc. 422,493 24,284,897
39,263,531
Consumer Finance��2.1%Synchrony Financial 570,228 19,849,637
Diversified Consumer Services��1.8%H&R Block, Inc. (a) 645,891 16,819,002
Electric Utilities��2.6%OGE Energy Corp. 594,116 24,228,050
Electrical Equipment��2.6%nVent Electric plc (a) 706,977 24,588,660
Energy Equipment & Services��2.7%NOV, Inc. (a) 1,263,199 24,771,332
Entertainment��3.0%Electronic Arts, Inc. 126,533 16,007,690Lions Gate Entertainment Corp. - Class A (b) 236,732 3,846,895Lions Gate Entertainment Corp. - Class B
(a) (b) 517,093 7,771,90827,626,493
Equity Real Estate Investment Trusts��6.6%Lamar Advertising Co. - Class A (a) 239,529 27,828,479PS Business Parks, Inc. (a) 61,787 10,385,159Public Storage 40,053 15,631,885STORE Capital Corp. 259,455 7,583,870
61,429,393
Food & Staples Retailing��3.9%Kroger Co. (The) 380,322 21,819,073Sysco Corp. (a) 179,237 14,634,701
36,453,774
Food Products��2.5%Tyson Foods, Inc. - Class A 265,547 23,800,978
Health Care Equipment & Supplies��2.0%Dentsply Sirona, Inc. 372,256 18,322,440
Health Care Providers & Services��4.5%AmerisourceBergen Corp. 123,942 19,175,067
Copyright © 2022 www.secdatabase.com. All Rights Reserved.Please Consider the Environment Before Printing This Document

Centene Corp. (b) 273,330 23,011,65242,186,719
Hotels, Restaurants & Leisure��8.7%Expedia Group, Inc. (b) 192,377 37,642,408Marriott International, Inc. - Class A (b) 142,470 25,039,102Vail Resorts, Inc. 72,596 18,894,561
81,576,071
Insurance��7.3%Arch Capital Group, Ltd. (b) 533,898 25,851,341Globe Life, Inc. 242,157 24,360,994Progressive Corp. (The) 158,163 18,029,001
68,241,336
Interactive Media & Services��2.0%IAC/InterActiveCorp. (a) (b) 170,594 17,107,166Vimeo, Inc. (a) (b) 94,220 1,119,334
18,226,500
Machinery��1.3%Otis Worldwide Corp. 161,601 12,435,197
Marine��1.8%Kirby Corp. (b) 232,110 16,756,021
Media��7.2%Liberty Broadband Corp. - Class C (a) (b) 53,861 7,288,471Liberty Media Corp. - Class A (b) 199,771 9,131,532Liberty Media Corp. - Class C (a) (b) 198,571 9,080,652News Corp. - Class A 993,228 22,000,000Omnicom Group, Inc. 229,313 19,464,087
66,964,742
Real Estate Management &Development��1.8%Jones Lang LaSalle, Inc. (a) (b) 69,671 16,683,418
Road & Rail��3.3%AMERCO 52,399 31,279,059
Semiconductors & SemiconductorEquipment��3.7%Analog Devices, Inc. 209,548 34,613,139
Software��2.1%Check Point Software Technologies, Ltd. (b) 139,107 19,232,934
Specialty Retail��2.5%AutoNation, Inc. (b) 232,676 23,169,876
BHFTII-65
Copyright © 2022 www.secdatabase.com. All Rights Reserved.Please Consider the Environment Before Printing This Document

Table of ContentsBrighthouse Funds Trust IIBrighthouse/Artisan Mid Cap Value Portfolio
Schedule of Investments as of March 31, 2022 (Unaudited)Common Stocks��(Continued)
Security Description
Shares/PrincipalAmount* Value
Technology Hardware, Storage &Peripherals��1.7%NetApp, Inc. 191,980 $15,934,340
Trading Companies & Distributors��1.9%Air Lease Corp. (a) 399,138 17,821,512Total Common Stocks
(Cost $549,310,320) 894,624,942
Short-Term Investment��4.2%Repurchase Agreement��4.2%Fixed Income Clearing Corp.
Repurchase Agreement dated 03/31/22 at0.000%, due on 04/01/22 with a maturityvalue of $39,532,530; collateralized by U.S.Treasury Note at 2.500%, maturing 03/31/27, with a market value of $40,323,243. 39,532,530 39,532,530
Total Short-Term Investments(Cost $39,532,530) 39,532,530
Securities Lending Reinvestments (c)��7.9%Certificates of Deposit��2.1%Bank of Montreal
0.300%, 06/02/22 4,000,000 3,997,064Barclays Bank plc
0.180%, 04/07/22 2,000,000 1,999,926BNP Paribas S.A.
0.490%, SOFR + 0.220%, 11/17/22 (d) 1,000,000 998,592Canadian Imperial Bank of Commerce (NY)
0.520%, SOFR + 0.250%, 02/03/23 (d) 1,000,000 998,5150.770%, SOFR + 0.500%, 03/03/23 (d) 3,000,000 3,001,906
Cooperatieve Rabobank UA0.840%, SOFR + 0.570%, 09/19/22 (d) 2,000,000 2,000,000
Goldman Sachs Bank USA0.470%, SOFR + 0.190%, 09/02/22 (d) 1,000,000 998,726
Nordea Bank Abp.0.720%, SOFR + 0.450%, 08/30/22 (d) 1,000,000 999,998
Oversea-Chinese Banking Corp., Ltd.Zero Coupon, 04/14/22 500,000 499,9150.720%, SOFR + 0.440%, 09/26/22 (d) 1,000,000 1,000,199
Royal Bank of Canada0.520%, SOFR + 0.250%, 01/11/23 (d) 1,000,000 997,662
Westpac Banking Corp.0.500%, SOFR + 0.230%, 02/17/23 (d) 2,000,000 1,993,746
19,486,249
Commercial Paper��0.3%Macquarie Bank Ltd.
0.510%, SOFR + 0.230%, 08/04/22 (d) 1,000,000 999,231Societe Generale
0.460%, SOFR + 0.190%, 08/18/22 (d) 2,000,000 1,997,9822,997,213
Repurchase Agreements��4.1%
Copyright © 2022 www.secdatabase.com. All Rights Reserved.Please Consider the Environment Before Printing This Document

BofA Securities, Inc.Repurchase Agreement dated 03/31/22 at0.270%, due on 04/01/22 with a maturityvalue of $1,165,159; collateralized by U.S.Treasury Obligations with rates rangingfrom 2.000% - 5.000%, maturity datesranging from 05/15/37 - 02/15/50, and anaggregate market value of $1,188,454. 1,165,150 1,165,150
Cantor Fitzgerald & Co.Repurchase Agreement dated 03/31/22 at0.290%, due on 04/01/22 with a maturityvalue of $2,000,016; collateralized by U.S.Treasury and U.S. Government AgencyObligations with rates ranging from 0.125%- 8.000%, maturity dates ranging from 09/15/22 - 07/20/71, and an aggregate marketvalue of $2,040,000. 2,000,000 2,000,000
Citigroup Global Markets, Inc.Repurchase Agreement dated 03/31/22 at0.620%, due on 05/05/22 with a maturityvalue of $4,002,411; collateralized by U.S.Treasury Obligations with rates rangingfrom 1.375% - 4.375%, maturity datesranging from 02/15/39 - 05/15/47, andvarious Common Stock with an aggregatemarket value of $4,080,538. 4,000,000 4,000,000Repurchase Agreement dated 03/31/22 at0.620%, due on 05/05/22 with a maturityvalue of $3,001,808; collateralized by U.S.Treasury Obligations with rates rangingfrom 0.000% - 3.875%, maturity datesranging from 04/21/22 - 05/15/51, andvarious Common Stock with an aggregatemarket value of $3,210,183. 3,000,000 3,000,000
Citigroup Global Markets, Ltd.Repurchase Agreement dated 03/31/22 at0.300%, due on 04/01/22 with a maturityvalue of $600,005; collateralized by U.S.Treasury and Foreign Obligations with ratesranging from 0.125% - 2.875%, maturitydates ranging from 08/15/23 - 02/15/51,and an aggregate market value of$612,000. 600,000 600,000
ING Financial Markets LLCRepurchase Agreement dated 03/31/22 at0.260%, due on 04/01/22 with a maturityvalue of $5,000; collateralized by U.S.Government Agency Obligations with ratesranging from 0.350% - 6.625%, maturitydates ranging from 04/05/22 - 11/15/30,and an aggregate market value of $5,100. 5,000 5,000
National Bank Financial, Inc.Repurchase Agreement dated 03/31/22 at0.320%, due on 04/01/22 with a maturityvalue of $2,000,018; collateralized by U.S.Treasury Obligations with rates rangingfrom 0.125% - 3.000%, maturity datesranging from 06/30/22 - 02/15/49, and anaggregate market value of $2,041,138. 2,000,000 2,000,000
National Bank of CanadaRepurchase Agreement dated 03/31/22 at0.320%, due on 04/07/22 with a maturityvalue of $5,600,348; collateralized by U.S.Treasury Obligations with rates rangingfrom 0.000% - 4.500%, maturity datesranging from 04/14/22 - 08/15/51, and anaggregate market value of $5,715,186. 5,600,000 5,600,000
Copyright © 2022 www.secdatabase.com. All Rights Reserved.Please Consider the Environment Before Printing This Document

Repurchase Agreement dated 03/31/22 at0.450%, due on 04/07/22 with a maturityvalue of $2,000,175; collateralized by U.S.Treasury Obligations with rates rangingfrom 0.500% - 3.000%, maturity datesranging from 11/30/23 - 08/15/48, andvarious Common Stock with an aggregatemarket value of $2,211,597. 2,000,000 2,000,000
BHFTII-66
Copyright © 2022 www.secdatabase.com. All Rights Reserved.Please Consider the Environment Before Printing This Document

Table of ContentsBrighthouse Funds Trust IIBrighthouse/Artisan Mid Cap Value Portfolio
Schedule of Investments as of March 31, 2022 (Unaudited)Securities Lending Reinvestments (c)��(Continued)
Security DescriptionPrincipalAmount* Value
Repurchase Agreements ��(Continued)NBC Global Finance, Ltd.
Repurchase Agreement dated 03/31/22at 0.440%, due on 04/01/22 with amaturity value of $2,000,024;collateralized by U.S. TreasuryObligations with rates ranging from0.125% - 4.750%, maturity dates rangingfrom 05/15/24 - 02/15/50, and variousCommon Stock with an aggregate marketvalue of $2,220,753. 2,000,000 $2,000,000Repurchase Agreement dated 03/31/22at 0.485%, due on 04/07/22 with amaturity value of $1,300,123;collateralized by U.S. TreasuryObligations with rates ranging from0.125% - 4.750%, maturity dates rangingfrom 05/15/24 - 02/15/50, and variousCommon Stock with an aggregate marketvalue of $1,443,490. 1,300,000 1,300,000
Societe GeneraleRepurchase Agreement dated 03/31/22at 0.360%, due on 04/01/22 with amaturity value of $7,600,076;collateralized by various Common Stockwith an aggregate market value of$8,445,143. 7,600,000 7,600,000Repurchase Agreement dated 03/31/22at 0.380%, due on 04/01/22 with amaturity value of $2,900,031;collateralized by various Common Stockwith an aggregate market value of$3,222,488. 2,900,000 2,900,000Repurchase Agreement dated 03/31/22at 0.410%, due on 04/01/22 with amaturity value of $75,992; collateralizedby various Common Stock with anaggregate market value of $84,448. 75,991 75,991Repurchase Agreement dated 03/31/22at 0.420%, due on 04/07/22 with amaturity value of $2,300,188;collateralized by various Common Stockwith an aggregate market value of$2,555,966. 2,300,000 2,300,000
TD Prime Services LLCRepurchase Agreement dated 03/31/22at 0.400%, due on 04/01/22 with amaturity value of $2,000,022;collateralized by various Common Stockwith an aggregate market value of$2,316,377. 2,000,000 2,000,000
38,546,141
Time Deposits��0.8%DZ Bank AG (NY)
0.300%, 04/01/22 1,000,000 1,000,000Jyske Bank A/S
0.750%, 04/11/22 3,000,000 3,000,000
Time Deposits��(Continued)
Copyright © 2022 www.secdatabase.com. All Rights Reserved.Please Consider the Environment Before Printing This Document

Rabobank (New York)0.310%, 04/01/22 1,000,000 1,000,000
Skandi (NY)0.300%, 04/01/22 1,000,000 1,000,000
Svenska (NY)0.260%, 04/01/22 1,000,000 1,000,000
7,000,000
Mutual Funds��0.6%AB Government Money Market Portfolio,
Institutional Class0.190%, 04/01/22 (e) 4,000,000 4,000,000
BlackRock Liquidity Funds FedFund,Institutional Shares0.230%, 04/01/22 (e) 2,000,000 2,000,000
6,000,000Total Securities Lending Reinvestments
(Cost $74,046,114) 74,029,603Total Investments�108.0%
(Cost $662,888,964) 1,008,187,075Other assets and liabilities (net)�(8.0)% (74,893,245 )Net Assets��100.0% $933,293,830
* Principal amount stated in U.S. dollars unless otherwise noted.(a) All or a portion of the security was held on loan. As of March 31, 2022, the market value of securities loaned was $71,268,143 and the collateral
received consisted of cash in the amount of $74,045,750. The cash collateral investments are disclosed in the Schedule of Investments andcategorized as Securities Lending Reinvestments.
(b) Non-income producing security.(c) Represents investment of cash collateral received from securities on loan as of March 31, 2022.(d) Variable or floating rate security. The stated rate represents the rate at March 31, 2022. Maturity date shown for callable securities reflects the
earliest possible call date. For securities based on a published reference index and spread, the index and spread are indicated in the descriptionabove. For certain variable rate securities, the coupon rate is determined by the issuer/agent based on current market conditions. For certain asset-and mortgage-backed securities, the coupon rate may fluctuate based on changes of the underlying collateral or prepayments of principal. Thesesecurities do not indicate a reference index and spread in their description above.
(e) The rate shown represents the annualized seven-day yield as of March 31, 2022.
Glossary of Abbreviations
Index Abbreviations
(SOFR)� Secured Overnight Financing Rate
BHFTII-67
Copyright © 2022 www.secdatabase.com. All Rights Reserved.Please Consider the Environment Before Printing This Document

Table of ContentsBrighthouse Funds Trust IIBrighthouse/Artisan Mid Cap Value Portfolio
Schedule of Investments as of March 31, 2022 (Unaudited)
Fair Value HierarchyAccounting principles generally accepted in the United States of America (�GAAP�) define fair market value as the price that the Portfolio would receive tosell an asset or pay to transfer a liability in an orderly transaction between market participants at the measurement date. It establishes a fair valuehierarchy that prioritizes inputs to valuation methods and requires disclosure of the fair value hierarchy, separately for each major category of assets andliabilities, that segregates fair value measurements into three levels. Levels 1, 2 and 3 of the fair value hierarchy are defined as follows:
Level 1 - unadjusted quoted prices in active markets for identical investmentsLevel 2 - other significant observable inputs (including, but not limited to, quoted prices for similar assets or liabilities in markets that are either activeor inactive; inputs other than quoted prices that are observable such as interest rates, yield curves, volatilities, prepayment speeds, loss severities,credit risks, default rates, or other market corroborated inputs)Level 3 - significant unobservable inputs based on the best information available in the circumstances, to the extent observable inputs areunavailable (including the Portfolio�s own assumptions used in determining the fair value of investments and derivative financial instruments)
The inputs or methodologies used for valuing investments are not necessarily an indication of the risk associated with investing in them. Changes to theinputs or methodologies used may result in transfers between levels. A reconciliation of Level 3 securities, if any, will be disclosed following the fair valuehierarchy table. For more information about the Portfolio�s policy regarding the valuation of investments, please refer to the Notes to Schedule ofInvestments.
The following table summarizes the fair value hierarchy of the Portfolio�s investments as of March 31, 2022:
Description Level 1 Level 2 Level 3 TotalTotal Common Stocks* $894,624,942 $� $ � $894,624,942Total Short-Term Investment* � 39,532,530 � 39,532,530Securities Lending Reinvestments
Certificates of Deposit � 19,486,249 � 19,486,249Commercial Paper � 2,997,213 � 2,997,213Repurchase Agreements � 38,546,141 � 38,546,141Time Deposits � 7,000,000 � 7,000,000Mutual Funds 6,000,000 � � 6,000,000
Total Securities Lending Reinvestments 6,000,000 68,029,603 � 74,029,603Total Investments $900,624,942 $107,562,133 $ � $1,008,187,075Collateral for Securities Loaned (Liability) $� $(74,045,750 ) $ � $(74,045,750 )
* See Schedule of Investments for additional detailed categorizations.
BHFTII-68
Copyright © 2022 www.secdatabase.com. All Rights Reserved.Please Consider the Environment Before Printing This Document

Table of ContentsBrighthouse Funds Trust II
Brighthouse/Dimensional International Small Company Portfolio
Schedule of Investments as of March 31, 2022 (Unaudited)Common Stocks��98.7% of Net Assets
Security Description Shares Value
Australia��6.8%A2B Australia, Ltd. (a) 55,813 $59,142Accent Group, Ltd. 97,699 123,830Adairs, Ltd. 37,038 82,593Adbri, Ltd. 108,171 242,597Ainsworth Game Technology, Ltd. (a) 51,616 44,125Alkane Resources, Ltd. (a) 145,570 124,099Alliance Aviation Services, Ltd. (a) 6,026 16,960AMA Group, Ltd. (a) 197,423 52,097AMP, Ltd. (a) 713,315 509,801Ansell, Ltd. 12,494 239,939Appen, Ltd. 12,693 64,871Arafura Resources, Ltd. (a) 268,675 72,104ARB Corp., Ltd. 21,345 654,752Ardent Leisure Group, Ltd. (a) 113,950 113,335AUB Group, Ltd. 28,168 474,779Audinate Group, Ltd. (a) 1,536 7,600Aurelia Metals, Ltd. (a) 300,118 109,687Aussie Broadband, Ltd. (a) 4,282 16,922Austal, Ltd. 105,389 148,927Australian Agricultural Co., Ltd. (a) 114,933 140,202Australian Ethical Investment, Ltd. 3,755 20,052Australian Finance Group, Ltd. 54,872 87,526Australian Strategic Materials, Ltd. (a) 32,427 181,679Auswide Bank, Ltd. 10,195 54,617AVJennings, Ltd. 10,332 4,143AVZ Minerals, Ltd. (a) 95,221 85,351Baby Bunting Group, Ltd. 24,951 95,969Bapcor, Ltd. 85,877 407,641Beach Energy, Ltd. 411,793 476,411Bega Cheese, Ltd. 99,511 355,245Bellevue Gold, Ltd. (a) 187,966 134,442Black Rock Mining, Ltd. (a) 70,006 13,203Blackmores, Ltd. 4,626 257,999Boral, Ltd. 27,298 70,184Bravura Solutions, Ltd. 79,636 105,392Breville Group, Ltd. 25,536 516,118Brickworks, Ltd. 16,435 298,150BSA, Ltd. 28,058 2,615BWX, Ltd. 28,740 47,895Calix, Ltd. (a) 3,136 17,211Capitol Health, Ltd. 260,324 66,993Capral, Ltd. 5,292 36,071Capricorn Metals, Ltd. (a) 59,339 180,720Cardno, Ltd. 2,541 3,192Carnarvon Energy Ltd. (a) 17,807 4,191Carnarvon Energy, Ltd. (a) 118,720 27,943Cash Converters International, Ltd. 152,939 28,582Catapult Group International, Ltd. (a) 33,605 36,348Cedar Woods Properties, Ltd. 22,776 79,007Chalice Mining Ltd. (a) 50,322 263,304Challenger, Ltd. 70,132 349,252Champion Iron, Ltd. 56,704 327,690City Chic Collective, Ltd. (a) 43,372 108,773Clinuvel Pharmaceuticals, Ltd. 9,453 129,082Clover Corp., Ltd. 39,945 41,045Codan, Ltd. 31,190 169,248Collection House, Ltd. (a) 40,783 3,691
Australia��(Continued)Collins Foods, Ltd. 30,579 239,346Cooper Energy, Ltd. (a) 552,999 119,643
Copyright © 2022 www.secdatabase.com. All Rights Reserved.Please Consider the Environment Before Printing This Document

Corporate Travel Management, Ltd. (a) 28,366 494,628Costa Group Holdings, Ltd. 138,722 328,804Credit Corp. Group, Ltd. 20,160 449,997CSR, Ltd. 156,422 714,760Dacian Gold, Ltd. (a) 86,371 14,125Data #3, Ltd. 49,016 215,192De Grey Mining, Ltd. (a) 214,618 184,951Decmil Group, Ltd. (a) 48,903 7,631Deterra Royalties, Ltd. 95,438 341,778Dicker Data, Ltd. 8,492 92,033Domain Holdings Australia, Ltd. 78,081 231,226Downer EDI, Ltd. 126,601 505,954Eagers Automotive, Ltd. 35,943 379,078Earlypay, Ltd. 50,451 18,095Eclipx Group, Ltd. (a) 82,973 156,276Elanor Investor Group 5,934 9,153Elders, Ltd. 45,511 450,568Elixir Energy, Ltd. (a) 29,923 3,911Emeco Holdings, Ltd. 147,781 95,612EML Payments, Ltd. (a) 62,760 138,065Energy World Corp., Ltd. (a) 472,609 26,756EQT Holdings, Ltd. 3,341 68,597Estia Health, Ltd. 52,899 91,890Euroz Hartleys Group, Ltd. 27,855 34,335Event Hospitality and Entertainment, Ltd. (a) 33,773 361,619Fiducian Group, Ltd. 3,121 20,040Finbar Group, Ltd. 6,909 4,080Fleetwood, Ltd. 35,042 46,968Flight Centre Travel Group, Ltd. (a) 26,693 387,467Frontier Digital Ventures, Ltd. (a) 10,067 9,845G8 Education, Ltd. 300,520 256,916Galan Lithium, Ltd. (a) 27,489 40,180Genworth Mortgage Insurance Australia, Ltd. 81,806 175,582Gold Road Resources, Ltd. 215,895 260,211GR Engineering Services, Ltd. 5,075 8,349GrainCorp, Ltd. - Class A 83,590 528,497Grange Resources, Ltd. 120,000 98,493Greenland Minerals Ltd. (a) 349,524 18,440GUD Holdings, Ltd. 52,411 451,683GWA Group, Ltd. 81,814 151,767Hansen Technologies, Ltd. 57,391 246,297Hastings Technology Metals, Ltd. (a) 124,937 26,048Healius, Ltd. 153,195 498,829HT&E, Ltd. 82,651 117,329HUB24, Ltd. 15,573 312,336Humm Group, Ltd. 107,580 68,578IDM International, Ltd. (a) (b) (c) 1,969 0Iluka Resources, Ltd. 76,879 645,210Imdex, Ltd. 110,358 222,696Immutep, Ltd. (ADR) (a) 3,886 10,648Imugene, Ltd. (a) 470,807 86,290Infomedia, Ltd. 133,597 135,475Inghams Group, Ltd. 86,621 196,957Insignia Financial, Ltd. 179,673 489,460Integral Diagnostics, Ltd. 38,552 113,351
BHFTII-69
Copyright © 2022 www.secdatabase.com. All Rights Reserved.Please Consider the Environment Before Printing This Document

Table of ContentsBrighthouse Funds Trust IIBrighthouse/Dimensional International Small Company Portfolio
Schedule of Investments as of March 31, 2022 (Unaudited)Common Stocks��(Continued)
Security Description Shares Value
Australia��(Continued)Integrated Research, Ltd. (a) 28,972 $15,826Invocare, Ltd. 44,413 395,289ioneer, Ltd. (a) 304,527 154,671IPH, Ltd. 59,961 354,087Iress, Ltd. 58,472 516,458IVE Group, Ltd. 19,754 31,390Johns Lyng Group, Ltd. 37,701 243,157Jumbo Interactive, Ltd. 12,118 168,295Jupiter Mines, Ltd. 439,415 85,441Karoon Energy, Ltd. (a) 168,923 269,775Kelsian Group, Ltd. 6,268 32,651Kogan.com, Ltd. (a) 16,956 71,761Lifestyle Communities, Ltd. 20,891 262,386Link Administration Holdings, Ltd. 158,207 611,645Lovisa Holdings, Ltd. 11,216 155,039Lycopodium, Ltd. 6,179 25,355MA Financial Group, Ltd. 11,341 67,826MACA, Ltd. 71,850 47,181Macmahon Holdings, Ltd. 380,170 55,330Macquarie Telecom Group, Ltd. (a) 436 22,147Mayne Pharma Group, Ltd. (a) 452,144 84,593McMillan Shakespeare, Ltd. 26,993 241,129McPherson�s, Ltd. 39,600 27,744Medusa Mining, Ltd. 60,972 39,619Megaport, Ltd. (a) 30,907 315,575Mesoblast, Ltd. (a) 42,929 36,495Metals X, Ltd. (a) 104,677 53,659Metcash, Ltd. 261,795 884,281Mincor Resources NL (a) 38,790 62,263MMA Offshore, Ltd. (a) 78,350 35,675Monadelphous Group, Ltd. 35,445 289,134Monash IVF Group, Ltd. 36,262 32,073Money3 Corp., Ltd. 47,676 108,792Morning Star Gold NL (a) (b) (c) 33,455 0Mount Gibson Iron, Ltd. 158,334 73,092Myer Holdings, Ltd. 275,411 109,686MyState, Ltd. 24,019 89,698Nanosonics, Ltd. (a) 37,175 108,885Navigator Global Investments, Ltd. 45,623 55,297Nearmap, Ltd. (a) 109,995 120,452Netwealth Group, Ltd. 24,001 265,469New Energy Solar, Ltd. 2,827 1,786New Hope Corp., Ltd. 137,727 347,153Newcrest Mining, Ltd. (a) 16,507 332,345Newcrest Mining, Ltd. 369 7,454nib holdings, Ltd. 142,740 675,187Nick Scali, Ltd. 21,771 183,605Nickel Mines, Ltd. 186,202 175,136Noumi, Ltd. (a) 35,888 5,342Novonix, Ltd. (a) 53,945 245,493NRW Holdings, Ltd. 134,771 215,752Nufarm, Ltd. 102,823 482,846Objective Corp., Ltd. 2,117 30,076OceanaGold Corp. (a) 212,111 469,982OFX Group, Ltd. (a) 99,303 179,715OM Holdings, Ltd. (a) 21,506 14,487Omni Bridgeway, Ltd. (a) 75,128 210,984
Australia��(Continued)oOh!media, Ltd. 130,777 156,885Opthea, Ltd. (a) 15,431 13,246
Copyright © 2022 www.secdatabase.com. All Rights Reserved.Please Consider the Environment Before Printing This Document

Orora, Ltd. 248,793 666,228OZ Minerals, Ltd. 13,173 260,962Pacific Current Group, Ltd. 12,733 72,334Pacific Smiles Group, Ltd. (a) 13,431 21,794Pact Group Holdings, Ltd. 50,886 88,207Paladin Energy, Ltd. (a) (b) (c) 524,142 302,059Panoramic Resources, Ltd. (a) 200,216 44,548Pantoro, Ltd. (a) 98,978 20,672Peet, Ltd. 88,199 76,983Pendal Group, Ltd. 88,324 303,220PeopleIN, Ltd. 4,093 12,287Perenti Global, Ltd. 204,417 114,142Perpetual, Ltd. 19,757 506,926Perseus Mining, Ltd. 340,886 494,408Pinnacle Investment Management Group,
Ltd. 16,945 131,718Platinum Asset Management, Ltd. 71,195 116,562Poseidon Nickel, Ltd. (a) 225,248 15,223Praemium, Ltd. (a) 98,955 50,607Premier Investments, Ltd. 20,232 411,195Propel Funeral Partners, Ltd. 8,061 27,870PSC Insurance Group, Ltd. 7,056 23,788PWR Holdings, Ltd. 13,903 97,678PYC Therapeutics, Ltd. (a) 83,719 5,535QANTM Intellectual Property, Ltd. 14,173 11,608Ramelius Resources, Ltd. 229,213 244,322Reckon, Ltd. 36,898 24,657Red 5, Ltd. (a) 362,960 101,507Redbubble, Ltd. (a) 43,202 49,480Regis Healthcare, Ltd. 26,109 42,118Regis Resources, Ltd. 236,656 370,019Reject Shop, Ltd. (The) (a) 12,421 52,707Resolute Mining, Ltd. (a) 357,444 87,528Retail Food Group, Ltd. (a) 190,378 9,941Ridley Corp., Ltd. 113,689 143,032RPMGlobal Holdings, Ltd. (a) 24,415 33,370Sandfire Resources, Ltd. 121,005 510,927Select Harvests, Ltd. 44,322 176,745Servcorp, Ltd. 21,215 58,469Service Stream, Ltd. (a) 154,571 120,411Seven West Media, Ltd. (a) 345,244 174,806SG Fleet Group, Ltd. 27,529 48,676Shaver Shop Group, Ltd. 18,090 15,551Sigma Healthcare, Ltd. 347,766 133,726Silver Lake Resources, Ltd. (a) 202,549 322,579Silver Mines, Ltd. (a) 74,163 13,133SmartGroup Corp., Ltd. 33,331 211,922SolGold plc (a) 15,118 7,185Southern Cross Media Group, Ltd. 76,997 98,601SpeedCast International, Ltd. (a) (b) (c) 65,225 0SRG Global, Ltd. 9,380 4,523St. Barbara, Ltd. 208,312 217,254Star Entertainment Group, Ltd. (The) (a) 208,130 501,361Sunland Group, Ltd. 40,150 80,061Super Retail Group, Ltd. 52,166 399,713Superloop, Ltd. (a) 59,252 41,461
BHFTII-70
Copyright © 2022 www.secdatabase.com. All Rights Reserved.Please Consider the Environment Before Printing This Document

Table of ContentsBrighthouse Funds Trust IIBrighthouse/Dimensional International Small Company Portfolio
Schedule of Investments as of March 31, 2022 (Unaudited)Common Stocks��(Continued)
Security Description Shares Value
Australia��(Continued)Symbio Holdings, Ltd. 4,332 $17,810Syrah Resources, Ltd. (a) 144,723 173,033Tassal Group, Ltd. 70,236 188,585Technology One, Ltd. 69,846 591,755Temple & Webster Group, Ltd. (a) 8,536 42,212Tribune Resources, Ltd. 2,377 8,563Tyro Payments, Ltd. (a) 54,611 70,479United Malt Group, Ltd. 95,694 269,685Uniti Group, Ltd. (a) 101,440 353,603Virgin Australia International Holding, Ltd.
(a) (b) (c) 968,773 0Virtus Health, Ltd. 30,029 180,494Vista Group International, Ltd. (a) 33,201 42,619Vita Group, Ltd. 34,096 8,889Viva Energy Group, Ltd. 164,478 286,785Webjet, Ltd. (a) 84,765 348,638West African Resources, Ltd. (a) 238,805 221,690Western Areas, Ltd. (a) 108,846 295,276Westgold Resources, Ltd. 123,130 175,732Whitehaven Coal, Ltd. 259,853 799,343Zip Co., Ltd. (a) 37,474 40,250
42,441,957
Austria��1.5%A-TEC Industries AG (a) (b) (c) 1 0Agrana Beteiligungs AG 4,073 73,730ams-OSRAM AG (a) 58,625 896,232Andritz AG 20,093 927,540Austria Technologie & Systemtechnik AG 11,814 653,586BAWAG Group AG (a) 15,608 787,402DO & Co. AG (a) (d) 2,435 204,037EVN AG 9,993 256,324FACC AG (a) (d) 6,291 55,267Flughafen Wien AG (a) 900 25,927Kapsch TrafficCom AG (a) (d) 1,870 29,504Lenzing AG (a) (d) 3,209 324,928Mayr Melnhof Karton AG 2,669 475,134Oberbank AG 198 20,907Oesterreichische Post AG (d) 9,304 330,544Palfinger AG 5,204 130,063POLYTEC Holding AG (d) 6,228 45,672Porr AG (a) 2,768 35,890Raiffeisen Bank International AG 6,631 93,736Rosenbauer International AG (d) 1,414 66,492S IMMO AG 17,333 424,986S&T AG (d) 15,588 291,244Schoeller-Bleckmann Oilfield Equipment
AG (a) 3,509 189,094Semperit AG Holding 4,892 122,733Strabag SE 2,729 109,286Telekom Austria AG (a) 40,133 309,871UBM Development AG 1,459 66,291UNIQA Insurance Group AG 32,519 257,049Vienna Insurance Group AG Wiener
Versicherung Gruppe 9,511 245,781voestalpine AG 25,972 771,513Wienerberger AG 33,409 1,004,453Zumtobel Group AG 8,536 68,857
9,294,073
Belgium��1.7%
Copyright © 2022 www.secdatabase.com. All Rights Reserved.Please Consider the Environment Before Printing This Document

Ackermans & van Haaren NV 7,319 1,365,804AGFA-Gevaert NV (a) 50,218 201,062Atenor (d) 1,361 88,140Banque Nationale de Belgique 37 71,168Barco NV 20,718 455,958Bekaert S.A. 10,571 412,891Biocartis Group NV (a) (d) 10,340 24,820bpost S.A. (a) (d) 18,928 125,277Cie d�Entreprises CFE 2,249 315,633D�ieteren Group 4,990 835,471Deceuninck NV 27,313 82,176Econocom Group S.A. 39,556 175,630Elia Group S.A. 6,438 982,650Etablissements Franz Colruyt NV 2,029 84,135Euronav NV 53,441 570,469EVS Broadcast Equipment S.A. 4,312 96,985Exmar NV (d) 10,339 67,765Fagron 13,001 237,050Galapagos NV (a) 737 45,731GIMV NV 4,793 288,931Greenyard NV (a) 5,819 51,542Immobel S.A. (d) 1,276 102,288Ion Beam Applications 6,507 125,089Jensen-Group NV 1,035 36,138Kinepolis Group NV (a) 4,307 259,850Lotus Bakeries NV 92 482,257MDxHealth S.A. (a) 8,434 7,020Melexis NV 5,164 475,308Mithra Pharmaceuticals S.A. (a) (d) 506 6,948Ontex Group NV (a) (d) 16,729 122,144Orange Belgium S.A. 5,071 107,656Oxurion NV (a) 12,685 21,449Picanol (a) 467 34,985Proximus SADP (d) 19,363 360,386Recticel S.A. 15,533 369,428Resilux NV (d) 229 59,528Roularta Media Group NV 1,629 33,919Shurgard Self Storage S.A. 5,118 317,787Sipef NV 1,958 142,416Telenet Group Holding NV 8,880 286,384TER Beke S.A. 144 17,190Tessenderlo Group S.A. (a) 5,516 199,514Van de Velde NV 1,970 84,053VGP NV 1,291 331,280Viohalco S.A. 35,458 173,728X-Fab Silicon Foundries SE (a) 14,349 109,980
10,846,013
Cambodia��0.0%NagaCorp, Ltd. (d) 236,000 209,745
Canada��11.7%5N Plus, Inc. (a) 33,732 64,758Absolute Software Corp. 1,711 14,439Acadian Timber Corp. (d) 3,800 57,905Aclara Resources, Inc. (a) (d) 13,185 7,699
BHFTII-71
Copyright © 2022 www.secdatabase.com. All Rights Reserved.Please Consider the Environment Before Printing This Document

Table of ContentsBrighthouse Funds Trust IIBrighthouse/Dimensional International Small Company Portfolio
Schedule of Investments as of March 31, 2022 (Unaudited)Common Stocks��(Continued)
Security Description Shares Value
Canada��(Continued)Advantage Energy, Ltd. (a) 91,030 $634,221Aecon Group, Inc. 19,646 266,682AG Growth International, Inc. 5,820 201,022AGF Management, Ltd. - Class B 19,644 122,250Aimia, Inc. (a) 24,635 99,316AirBoss of America Corp. (d) 3,761 107,100Alamos Gold, Inc. - Class A 114,193 959,106Alaris Equity Partners Income 12,754 206,182Alcanna, Inc. (a) 12,660 92,761Alexco Resource Corp. (a) (d) 22,734 35,824Algoma Central Corp. 6,110 84,552Altius Minerals Corp. 12,660 244,056Altus Group, Ltd. 12,988 524,652Americas Gold And Silver Corp. (a) (d) 4,400 4,822Amerigo Resources, Ltd. 35,000 51,514Andlauer Healthcare Group, Inc. 1,569 62,464Andrew Peller, Ltd. - Class A (d) 11,417 66,485Aritzia, Inc. (a) 23,394 954,922Ascot Resources, Ltd. (a) 16,500 13,990Atco, Ltd. - Class I 15,669 538,072Athabasca Oil Corp. (a) 144,824 235,166ATS Automation Tooling Systems, Inc. (a) 25,733 928,335Aurora Cannabis, Inc. (a) 8,729 34,916AutoCanada, Inc. (a) 8,428 244,248B2Gold Corp. 79,520 364,997B2Gold Corp. 39,204 180,003Badger Infrastructure Solutions, Ltd. 11,262 283,408Birchcliff Energy, Ltd. 80,388 537,570Bird Construction, Inc. 18,612 135,926Black Diamond Group, Ltd. 19,812 77,812BMTC Group, Inc. (d) 5,387 64,550Bombardier, Inc. - Class A (a) (d) 14,600 17,751Bombardier, Inc. - Class B (a) 442,238 509,397Boralex, Inc. - Class A (d) 25,118 814,127Bridgemarq Real Estate Services (d) 3,500 44,599Brookfield Infrastructure Corp. - Class A 8,728 658,641Calian Group, Ltd. 2,846 157,331Canaccord Genuity Group, Inc. 30,012 296,483Canacol Energy, Ltd. (d) 40,661 101,803Canada Goose Holdings, Inc. (a) (d) 9,656 254,242Canada Goose Holdings, Inc. (a) 4,869 127,942Canadian Western Bank 25,085 729,184Canfor Corp. (a) 20,141 415,016Canfor Pulp Products, Inc. (a) 11,097 47,578Capital Power Corp. 36,075 1,174,750Capstone Copper Corp. (a) 117,839 666,417Cardinal Energy, Ltd. (a) 32,459 198,366Cascades, Inc. 28,626 293,553Celestica, Inc. (a) 35,793 425,742Centerra Gold, Inc. 66,685 655,568CES Energy Solutions Corp. 90,181 173,127CI Financial Corp. (d) 51,912 824,679Clairvest Group, Inc. 200 10,058Cogeco Communications, Inc. 3,980 329,441Cogeco, Inc. 2,109 130,034Colliers International Group, Inc. 7,038 917,307Computer Modelling Group, Ltd. 28,920 123,994
Canada��(Continued)Copper Mountain Mining Corp. (a) (d) 63,622 191,352Corby Spirit and Wine, Ltd. 3,957 55,012
Copyright © 2022 www.secdatabase.com. All Rights Reserved.Please Consider the Environment Before Printing This Document

Corus Entertainment, Inc. - B Shares 69,390 273,086Crescent Point Energy Corp. 89,477 648,451Crescent Point Energy Corp. (d) 60,196 436,421Crew Energy, Inc. (a) 69,029 286,022Cronos Group, Inc. (a) 7,801 30,346Denison Mines Corp. (a) (d) 231,048 377,025Dexterra Group, Inc. (d) 11,442 71,939DIRTT Environmental Solutions (a) (d) 17,310 24,231Doman Building Materials Group, Ltd. (d) 19,304 123,376Dorel Industries, Inc. - Class B 8,626 66,792DREAM Unlimited Corp. - Class A 8,735 347,961Dundee Precious Metals, Inc. 45,872 273,731E-L Financial Corp., Ltd. 677 478,175ECN Capital Corp. 87,631 467,543EcoSynthetix, Inc. (a) (d) 8,700 42,312Eldorado Gold Corp. (a) 51,016 571,311Element Fleet Management Corp. 83,382 807,041Endeavour Silver Corp. (a) (d) 34,348 159,356Enerflex, Ltd. 29,289 187,661Enerplus Corp. 56,230 712,461Enerplus Corp. 8,452 107,340Enghouse Systems, Ltd. 12,678 400,780Ensign Energy Services, Inc. (a) 51,526 142,195Equinox Gold Corp. (a) 28,628 236,324Equinox Gold Corp. (a) (d) 27,871 230,493Equitable Group, Inc. (d) 8,098 464,705ERO Copper Corp. (a) 16,890 247,375Evertz Technologies, Ltd. 9,349 113,969Exchange Income Corp. 2,651 90,717Exco Technologies, Ltd. 7,732 59,313Extendicare, Inc. (d) 29,162 183,115Fiera Capital Corp. (d) 22,157 185,033Finning International, Inc. 39,388 1,185,909Firm Capital Mortgage Investment Corp. (d) 9,574 108,901First Majestic Silver Corp. 45,160 593,512First Majestic Silver Corp. (d) 6,000 78,960First Mining Gold Corp. (a) 50,000 10,999First National Financial Corp. (d) 4,907 159,085Fission Uranium Corp. (a) 114,725 86,263Fortuna Silver Mines, Inc. (a) 4,200 16,002Fortuna Silver Mines, Inc. (a) 82,364 312,946Freehold Royalties, Ltd. 35,012 400,769Galiano Gold, Inc. (a) (d) 23,027 12,894Gamehost, Inc. 4,952 34,858GDI Integrated Facility Services, Inc. (a) 3,200 138,223Gibson Energy, Inc. (d) 42,525 850,738Goeasy, Ltd. 3,895 437,060GoGold Resources, Inc. (a) (d) 18,500 43,359GoldMoney, Inc. (a) (d) 11,000 17,158Goodfood Market Corp. (a) (d) 8,500 19,038Gran Tierra Energy, Inc. (a) (d) 112,213 175,929Guardian Capital Group, Ltd. - Class A 5,600 179,178Hanfeng Evergreen, Inc. (a) (b) (c) 12,100 0Hardwoods Distribution, Inc. 3,502 102,246Headwater Exploration, Inc. (a) 31,956 169,474
BHFTII-72
Copyright © 2022 www.secdatabase.com. All Rights Reserved.Please Consider the Environment Before Printing This Document

Table of ContentsBrighthouse Funds Trust IIBrighthouse/Dimensional International Small Company Portfolio
Schedule of Investments as of March 31, 2022 (Unaudited)Common Stocks��(Continued)
Security Description Shares Value
Canada��(Continued)Heroux-Devtek, Inc. (a) 12,653 $172,971High Liner Foods, Inc. 6,007 65,541Home Capital Group, Inc. 14,784 449,380HudBay Minerals, Inc. (d) 64,983 510,445i-80 Gold Corp. (a) (d) 19,147 52,686IAMGOLD Corp. (a) 118,555 411,574IAMGOLD Corp. (a) 5,500 19,140IBI Group, Inc. (a) 5,900 66,686Imperial Metals Corp. (a) (d) 19,966 60,051Information Services Corp. (d) 2,900 57,645Innergex Renewable Energy, Inc. 35,108 558,291Interfor Corp. 23,632 657,269International Petroleum Corp. (a) (d) 25,919 247,341International Tower Hill Mines, Ltd. (a) (d) 21,604 21,601Intertape Polymer Group, Inc. 23,413 743,133Invesque, Inc. (a) (d) 9,800 13,916Jamieson Wellness, Inc. 12,957 361,198K-Bro Linen, Inc. 3,219 87,006Karora Resources, Inc. (a) (d) 10,330 52,553Kelt Exploration, Ltd. (a) 58,951 317,826Keyera Corp. 21,560 546,524Kinaxis, Inc. (a) 5,523 722,852Kingsway Financial Services, Inc. (a) 8,765 48,208Knight Therapeutics, Inc. (a) 36,815 153,721KP Tissue, Inc. 1,400 12,375Labrador Iron Ore Royalty Corp. (d) 17,800 598,151Largo, Inc. (a) (d) 8,317 105,314Lassonde Industries, Inc. - Class A (d) 900 102,667Laurentian Bank of Canada 12,879 428,150Leon�s Furniture, Ltd. 9,639 171,862LifeWorks, Inc. 21,185 366,372Lightstream Resources, Ltd. (a) (b) (c) 108,373 0Linamar Corp. 12,044 535,364Logistec Corp. - Class B 600 21,237Lucara Diamond Corp. (a) 110,136 59,026Lundin Gold, Inc. (a) 11,400 95,293MAG Silver Corp. (a) 2,438 39,422Magellan Aerospace Corp. (d) 5,794 45,651Mainstreet Equity Corp. (a) (d) 2,261 258,645Major Drilling Group International, Inc. (a) 28,577 278,192Manitok Energy, Inc. (a) (b) (c) 122 0Maple Leaf Foods, Inc. (d) 26,200 628,725Martinrea International, Inc. 25,209 181,080Maverix Metals, Inc. 7,686 36,893Maxim Power Corp. (a) 2,800 8,175MDF Commerce, Inc. (a) (d) 4,176 10,522Medical Facilities Corp. (d) 12,861 116,455MEG Energy Corp. (a) 87,454 1,194,129Melcor Developments, Ltd. 3,120 43,650Methanex Corp. 1,300 70,888Methanex Corp. 12,518 682,982Morguard Corp. 1,400 154,362Mountain Province Diamonds, Inc. (a) 1,600 1,126MTY Food Group, Inc. 6,320 275,468Mullen Group, Ltd. (d) 29,854 319,041Neo Performance Materials, Inc. 4,300 52,351New Gold, Inc. (a) 172,247 312,763
Canada��(Continued)NFI Group, Inc. (d) 13,975 178,188Nighthawk Gold Corp. (a) (d) 4,900 3,410
Copyright © 2022 www.secdatabase.com. All Rights Reserved.Please Consider the Environment Before Printing This Document

North American Construction Group, Ltd. (d) 10,441 151,168North West Co., Inc. (The) 15,571 477,038NuVista Energy, Ltd. (a) 59,117 499,833Opsens, Inc. (a) (d) 6,700 10,236Organigram Holdings, Inc. (a) 36,998 61,417Osisko Gold Royalties, Ltd. 36,950 487,386Osisko Gold Royalties, Ltd. (d) 3,800 50,122Osisko Mining, Inc. (a) 42,179 134,619Paramount Resources, Ltd. - Class A (d) 19,290 481,575Parex Resources, Inc. 39,859 817,809Park Lawn Corp. 8,556 236,665Parkland Corp. 34,684 1,025,691Pason Systems, Inc. 24,116 295,337Peyto Exploration & Development Corp. (d) 67,791 687,589PHX Energy Services Corp. (d) 12,350 65,299Pizza Pizza Royalty Corp. (d) 6,998 78,928Points.com, Inc. (a) 5,320 97,749Polaris Infrastructure, Inc. 5,300 71,647Pollard Banknote, Ltd. (d) 2,690 57,946PolyMet Mining Corp. (a) 3,835 15,860PrairieSky Royalty, Ltd. (d) 56,452 780,750Precision Drilling Corp. (a) 4,794 355,480Premium Brands Holdings Corp. 8,708 761,824Primo Water Corp. (d) 45,705 650,761Pulse Seismic, Inc. (d) 13,500 23,757Quarterhill, Inc. 44,645 86,779Questerre Energy Corp. - Class A (a) (d) 83,569 19,386Real Matters, Inc. (a) 25,451 108,306Recipe Unlimited Corp. (a) 4,150 48,665RF Capital Group ,Inc. (a) (d) 1,730 23,944Richelieu Hardware, Ltd. 16,390 597,049Rogers Sugar, Inc. (d) 35,106 176,913Russel Metals, Inc. 23,322 617,866Sabina Gold & Silver Corp. (a) (d) 64,606 78,035Sandstorm Gold, Ltd. 58,462 471,381Savaria Corp. (d) 10,600 148,552Seabridge Gold, Inc. (a) (d) 11,279 208,661Secure Energy Services, Inc. (d) 65,264 278,774Shawcor, Ltd. (a) 21,791 87,851Sienna Senior Living, Inc. (d) 22,176 271,579Sierra Wireless, Inc. (a) 12,710 229,464SilverCrest Metals, Inc. (a) (d) 11,567 103,062SilverCrest Metals, Inc. (a) 8,003 71,314Sleep Country Canada Holdings, Inc. 12,404 289,822SNC-Lavalin Group, Inc. 29,545 711,358Spin Master Corp. (a) 7,348 253,035Sprott, Inc. (d) 6,042 302,934SSR Mining, Inc. (d) 53,145 1,155,446Stantec, Inc. 5,877 294,802Stelco Holdings, Inc. 5,227 217,375Stella-Jones, Inc. 16,794 504,700Steppe Gold, Ltd. (a) 6,300 7,509SunOpta, Inc. (a) (d) 26,392 132,577Superior Plus Corp. 54,086 496,666Surge Energy, Inc. (a) 9,000 63,784
BHFTII-73
Copyright © 2022 www.secdatabase.com. All Rights Reserved.Please Consider the Environment Before Printing This Document

Table of ContentsBrighthouse Funds Trust IIBrighthouse/Dimensional International Small Company Portfolio
Schedule of Investments as of March 31, 2022 (Unaudited)Common Stocks��(Continued)
Security Description Shares Value
Canada��(Continued)Tamarack Valley Energy, Ltd. 82,978 $329,217Taseko Mines, Ltd. (a) (d) 108,786 250,613TECSYS, Inc. 172 4,397TeraGo, Inc. (a) 4,100 18,825TerraVest Industries, Inc. 1,600 32,188Tidewater Midstream and Infrastructure, Ltd.
(d) 79,200 82,358Timbercreek Financial Corp. (d) 29,251 222,047Torex Gold Resources, Inc. (a) 27,594 346,539Total Energy Services, Inc. (a) 17,786 110,971TransAlta Corp. 83,943 868,874TransAlta Renewables, Inc. 28,608 422,890Transcontinental, Inc. - Class A 21,120 295,138TransGlobe Energy Corp. (a) (d) 4,500 16,378TransGlobe Energy Corp. (a) (d) 3,814 13,883Treasury Metals, Inc. (a) (d) 1,668 907Trevali Mining Corp. (a) 9,060 10,508Trican Well Service, Ltd. (a) 92,913 276,476Tricon Residential, Inc. (d) 50,696 805,767Trisura Group, Ltd. (a) 8,800 241,936Turquoise Hill Resources, Ltd. (a) 21,279 638,974Uni-Select, Inc. (a) 13,271 323,774Vecima Networks, Inc. 2,500 32,056Vermilion Energy, Inc. 33,426 701,862Vermilion Energy, Inc. (d) 5,708 119,982VersaBank 2,000 23,197Wajax Corp. 7,885 124,631Waterloo Brewing, Ltd. (d) 2,600 9,962Wesdome Gold Mines, Ltd. (a) 54,507 684,090Western Forest Products, Inc. 145,247 233,529Westshore Terminals Investment Corp. (d) 17,388 460,796Whitecap Resources, Inc. 152,919 1,264,794WildBrain, Ltd. (a) (d) 53,045 141,295Winpak, Ltd. 9,852 302,617Yamana Gold, Inc. 169,409 945,866Yamana Gold, Inc. (d) 54,613 304,741Yellow Pages, Ltd. (d) 6,975 73,870Zenith Capital Corp. (a) (b) (c) 12,830 1,184
73,782,014
China��0.2%BOE Varitronix, Ltd. (d) 137,000 161,148Bund Center Investment, Ltd. 107,700 41,718China Display Optoelectronics Technology
Holdings, Ltd. (a) 136,000 7,613China Gold International Resources Corp.,
Ltd. (d) 79,013 281,885China Sunsine Chemical Holdings, Ltd. 70,000 24,013CITIC Telecom International Holdings, Ltd. 467,000 171,551First Sponsor Group, Ltd. 9,490 9,453Fountain SET Holdings, Ltd. 280,000 49,587GDH Guangnan Holdings, Ltd. 264,000 22,008Goodbaby International Holdings, Ltd. (a) 193,000 25,038Guotai Junan International Holdings, Ltd. (d) 806,600 90,238Neo-Neon Holdings, Ltd. (a) 322,500 19,556TI Fluid Systems plc 7,903 19,701
923,509
Colombia��0.0%Frontera Energy Corp. (a) 8,353 96,816
Copyright © 2022 www.secdatabase.com. All Rights Reserved.Please Consider the Environment Before Printing This Document

Denmark��2.2%ALK Abello A/S (a) 35,460 780,806Alm Brand A/S 262,490 446,309Bang & Olufsen A/S (a) (d) 30,627 87,054Bavarian Nordic A/S (a) (d) 20,257 508,851Better Collective A/S (a) (d) 3,925 70,336Brodrene Hartmann A/S (a) 653 27,537cBrain A/S 511 15,836Chemometec A/S 3,762 455,710Columbus A/S 20,865 29,146D/S Norden A/S 8,013 279,902DFDS A/S 10,724 457,077Drilling Co of 1972 A/S (The) (a) 2,524 138,056FLSmidth & Co. A/S 12,789 333,457H Lundbeck A/S 13,450 310,110H+H International A/S - Class B (a) 5,958 163,199Harboes Bryggeri A/S - Class B (a) 1,454 16,587ISS A/S (a) 33,398 591,052Jeudan A/S 2,360 96,397Jyske Bank A/S (a) (d) 16,358 885,948Matas A/S 10,988 156,685Netcompany Group A/S (a) 7,500 494,618Nilfisk Holding A/S (a) 7,976 237,436NKT A/S (a) 9,092 410,209NNIT A/S (a) 2,656 37,382North Media A/S 679 8,386NTG Nordic Transport Group A/S (a) 2,706 163,197Parken Sport & Entertainment A/S (a) 2,351 29,709PER Aarsleff Holding A/S 5,304 204,649Ringkjoebing Landbobank A/S 8,462 1,067,906Royal Unibrew A/S 13,170 1,224,161RTX A/S (a) 2,486 64,071Scandinavian Tobacco Group A/S - Class A 18,965 403,780Schouw & Co. A/S 3,973 343,337SimCorp A/S 10,560 769,132Solar A/S - B Shares 1,807 199,252SP Group A/S 468 24,542Spar Nord Bank A/S 26,418 348,295Sparekassen Sjaelland-Fyn A/S 452 13,856Sydbank A/S 17,865 609,968TCM Group A/S 502 9,396Tivoli A/S (a) 844 108,254Topdanmark A/S 11,821 661,388United International Enterprises, Ltd. 606 180,135Zealand Pharma A/S (a) 8,489 129,685
13,592,799
Faeroe Islands��0.0%BankNordik P/F (d) 1,109 21,012
Finland��2.1%Aktia Bank Oyj 15,788 189,460Alma Media Oyj 11,899 127,792Anora Group Oyj 1,398 13,562
BHFTII-74
Copyright © 2022 www.secdatabase.com. All Rights Reserved.Please Consider the Environment Before Printing This Document

Table of ContentsBrighthouse Funds Trust IIBrighthouse/Dimensional International Small Company Portfolio
Schedule of Investments as of March 31, 2022 (Unaudited)Common Stocks��(Continued)
Security Description Shares Value
Finland��(Continued)Apetit Oyj (d) 1,205 $16,789Aspo Oyj 7,386 57,639Atria Oyj (d) 3,290 37,900BasWare Oyj (a) 2,744 64,774Bittium Oyj (d) 8,034 50,880Cargotec Oyj - B Shares 10,991 416,285Caverion Oyj (d) 25,551 146,440Citycon Oyj (a) (d) 21,486 162,696Digia Oyj 6,625 55,597Enento Group Oyj (a) (d) 3,892 116,533Finnair Oyj (a) (d) 272,008 149,862Fiskars Oyj Abp 6,971 165,359Harvia Oyj (d) 2,955 118,142HKScan Oyj - A Shares 6,704 10,822Huhtamaki Oyj 26,983 936,952Ilkka-Yhtyma Oyj 5,725 29,118Kamux Corp. (d) 4,328 53,482Kemira Oyj 28,960 378,407Kojamo Oyj 26,601 638,329Konecranes Oyj (a) 16,247 498,925Lassila & Tikanoja Oyj 8,464 101,058Marimekko Oyj 378 31,583Metsa Board Oyj - Class B 52,211 527,131Multitude SE (a) 2,093 8,507Musti Group Oyj (a) 5,196 137,235Neles Oyj 31,578 321,272Nokian Renkaat Oyj 35,666 577,712Olvi Oyj - A Shares 5,028 198,011Oriola Oyj - A Shares (d) 4,196 8,866Oriola-KD Oyj - B Shares 38,525 80,176Orion Oyj - Class A 7,619 344,452Orion Oyj - Class B 26,553 1,204,892Outokumpu Oyj (a) (d) 102,277 544,676Ponsse Oyj (d) 3,208 116,012QT Group Oyj (a) 3,066 423,833Raisio Oyj - V Shares 35,039 103,031Rapala VMC Oyj 8,902 67,969Raute Oyj - A Shares 72 1,369Revenio Group Oyj 5,309 278,853Sanoma Oyj 25,537 362,233Stockmann Oyj Abp - B Shares (a) 3,752 7,662Talenom Oyj 1,064 11,503Teleste Oyj 2,149 11,473Terveystalo Oyj 14,772 182,671TietoEVRY Oyj 22,579 600,491Tokmanni Group Corp. 13,877 229,816Uponor Oyj 17,933 361,316Vaisala Oyj - A Shares 5,709 272,223Valmet Oyj 38,018 1,180,163Wartsila Oyj Abp 38,693 353,398WithSecure Oyj (a) 26,373 132,359YIT Oyj (d) 39,980 150,862
13,368,553
France��4.6%ABC Arbitrage 2,865 23,535Akka Technologies S.A. (a) 2,270 122,982AKWEL 3,301 72,849Albioma S.A. 10,475 508,567ALD S.A. (d) 19,331 256,775Altamir 9,152 266,921
Copyright © 2022 www.secdatabase.com. All Rights Reserved.Please Consider the Environment Before Printing This Document

Alten S.A. 6,377 962,175Assystem S.A. (d) 2,720 127,798Atos SE 2,603 70,776Aubay 2,423 160,248Axway Software S.A. 2,132 39,667Bastide le Confort Medical (d) 1,345 59,842Beneteau S.A. (a) 15,076 235,491Bigben Interactive (d) 4,507 73,681Boiron S.A. 1,869 79,824Bonduelle SCA 6,411 116,833Burelle S.A. (d) 101 66,404Casino Guichard Perrachon S.A. (a) (d) 6,946 128,212Catering International Services (a) 541 6,467CBo Territoria 2,864 12,060Cegedim S.A. (a) 2,295 64,490CGG S.A. (a) 189,243 215,710Chargeurs S.A. 6,857 153,366Cie des Alpes (a) (d) 8,244 121,753Cie Plastic Omnium S.A. 18,690 338,495Coface S.A. 31,535 377,918Delta Plus Group 91 9,034Derichebourg S.A. 33,761 351,614Electricite de Strasbourg S.A. 329 38,727Elior Group S.A. (a) 35,740 119,400Elis S.A. (a) 48,236 709,543Eramet S.A. (a) 3,022 497,971ESI Group (a) (d) 468 35,466Esso S.A. Francaise (a) (d) 1,341 42,659Etablissements Maurel et Prom (a) 12,067 53,536Eurazeo S.E. 7,611 639,645Eutelsat Communications S.A. 57,002 618,808Exel Industries - A Shares 618 50,514Faurecia SE (d) 29,253 756,741Fnac Darty S.A. 6,777 347,484Gaztransport Et Technigaz S.A. 5,603 627,771GEA (d) 165 16,960GL Events (a) (d) 4,217 77,575Groupe Crit 1,062 77,674Groupe Gorge S.A. 395 8,159Guerbet 2,188 63,732Guillemot Corp. (d) 770 12,470Haulotte Group S.A. (a) 5,337 24,319HEXAOM (d) 1,526 52,325ID Logistics Group (a) 796 282,601Imerys S.A. 7,588 325,163Infotel S.A. 342 20,424Interparfums S.A. 3,123 187,510IPSOS 13,160 652,573Jacquet Metals S.A. 5,978 129,165JCDecaux S.A. (a) 13,978 331,184Kaufman & Broad S.A. 5,175 170,975
BHFTII-75
Copyright © 2022 www.secdatabase.com. All Rights Reserved.Please Consider the Environment Before Printing This Document

Table of ContentsBrighthouse Funds Trust IIBrighthouse/Dimensional International Small Company Portfolio
Schedule of Investments as of March 31, 2022 (Unaudited)Common Stocks��(Continued)
Security Description Shares Value
France��(Continued)Korian S.A. 24,916 $573,507Lagardere SA (a) 10,027 280,942Laurent-Perrier 1,255 132,715Lectra 7,396 351,289Linedata Services 1,348 62,161LISI 7,422 176,837LNA Sante S.A. 1,534 62,706Maisons du Monde S.A. (d) 13,951 267,127Manitou BF S.A. 3,893 108,651Manutan International (d) 589 43,867Mersen S.A. 6,354 234,287Metropole Television S.A. 8,342 164,315Nacon S.A. (a) (d) 901 5,434Nexans S.A. 10,012 935,667Nexity S.A. 12,995 456,498Nicox (a) (d) 1,834 3,972NRJ Group 9,690 70,184Oeneo S.A. (d) 3,143 47,004OL Groupe S.A. (a) (d) 3,273 7,092Onxeo S.A. (a) (d) 4,566 1,809Orpea S.A. 4,040 174,349Pharmagest Interactive 448 42,837Plastiques Du Val De Loire (d) 1,576 10,302Prodways Group S.A. (a) 592 1,770Quadient S.A. 15,239 286,260Rallye S.A. (a) 9,791 38,370Recylex S.A. (a) (b) (c) (d) 3,335 1,278Rexel S.A. 81,149 1,728,716Robertet S.A. 143 138,929Rothschild & Co. 8,416 331,807Rubis SCA 22,815 670,585Samse S.A. (d) 107 25,109Savencia S.A. 1,728 115,981SCOR SE 40,311 1,295,638Seche Environnement S.A. 1,380 108,244Societe BIC S.A. 7,557 381,658Societe LDC S.A. 95 8,930Societe pour l�Informatique Industrielle 1,887 93,472Soitec (a) 5,617 1,053,848Solocal Group (a) (d) 33,527 44,820Somfy S.A. 2,415 388,679Sopra Steria Group SACA 4,903 910,017SPIE S.A. 34,853 823,676STEF S.A. 1,145 126,429Sword Group (d) 1,364 73,674Synergie SE (d) 3,366 142,105Technicolor S.A. (a) 14,511 54,429Technip Energies NV (a) 24,641 300,157Television Francaise 1 (d) 17,932 173,956Thermador Groupe 2,148 224,236Tikehau Capital SCA 7,508 201,671Totalenergies EP Gabon 324 63,646Trigano S.A. 2,956 428,228Ubisoft Entertainment S.A. (a) 1,908 83,997Union Financiere de France BQE S.A. 1,257 26,320Valeo 37,724 693,096Vallourec S.A. (a) 29,203 372,807
France��(Continued)Verallia S.A. 11,136 263,968Vetoquinol S.A. 1,341 196,885
Copyright © 2022 www.secdatabase.com. All Rights Reserved.Please Consider the Environment Before Printing This Document

Vicat S.A. 7,909 267,239VIEL & Cie S.A. 4,205 27,544Vilmorin & Cie S.A. 2,655 129,527Virbac S.A. 1,006 401,421Vranken-Pommery Monopole S.A. (a) 958 18,886Wavestone 1,052 53,340
28,979,461
Georgia��0.0%Bank of Georgia Group plc 13,336 207,687
Germany��6.5%1&1 AG 13,083 293,2127C Solarparken AG 12,140 59,481Aareal Bank AG (d) 21,487 675,173Adesso SE 230 47,107ADVA Optical Networking SE (a) 17,098 256,750All for One Steeb AG 498 36,407Allgeier SE 2,942 146,670Amadeus Fire AG 779 124,386Atoss Software AG 1,110 219,298Aurubis AG 10,200 1,219,176Basler AG 1,220 134,642Bauer AG (a) 4,513 45,991BayWa AG (d) 305 23,433BayWa AG 5,509 257,449Bechtle AG 360 20,316Bertrandt AG 2,127 104,315bet-at-home.com AG (d) 1,222 21,107Bijou Brigitte AG (a) 1,603 43,152Bilfinger SE 10,033 382,676Borussia Dortmund GmbH & Co. KGaA (a) 26,685 119,708CANCOM SE 10,426 650,021CECONOMY AG 47,148 178,673CENIT AG 3,413 48,542Cewe Stiftung & Co. KGaA 1,828 184,560Commerzbank AG (a) 55,806 426,103CompuGroup Medical SE & Co KgaA 7,186 439,077Corestate Capital Holding S.A. (a) (d) 4,473 41,627CropEnergies AG 9,235 121,785CTS Eventim AG & Co. KGaA (a) 2,006 137,644Data Modul AG (d) 138 8,774Dermapharm Holding SE 2,745 175,462Deutsche Beteiligungs AG 4,577 144,955Deutsche Euroshop AG 14,792 273,246Deutsche Lufthansa AG (a) (d) 9,110 73,855Deutsche Pfandbriefbank AG 45,896 558,346Deutz AG (a) 40,985 212,209DIC Asset AG 15,921 254,397DMG Mori AG (d) 595 27,484Dr. Hoenle AG (d) 2,084 75,769Draegerwerk AG & Co. KGaA 1,062 57,204Duerr AG 15,842 468,618Eckert & Ziegler AG 4,645 298,892
BHFTII-76
Copyright © 2022 www.secdatabase.com. All Rights Reserved.Please Consider the Environment Before Printing This Document

Table of ContentsBrighthouse Funds Trust IIBrighthouse/Dimensional International Small Company Portfolio
Schedule of Investments as of March 31, 2022 (Unaudited)Common Stocks��(Continued)
Security Description Shares Value
Germany��(Continued)Elmos Semiconductor SE 398 $23,078ElringKlinger AG (a) 8,918 84,854Encavis AG (d) 23,338 487,858Energiekontor AG (d) 1,621 156,074EuroEyes International Eye Clinic, Ltd. 10,000 8,863Fielmann AG 6,684 365,306First Sensor AG 1,405 75,669Flatexdegiro AG (a) (d) 3,496 70,813FORTEC Elektronik AG 253 5,733Francotyp-Postalia Holding AG (a) 3,300 9,813Fraport AG Frankfurt Airport Services
Worldwide (a) 7,897 439,366Freenet AG 42,208 1,131,428Fuchs Petrolub SE 7,604 216,244GEA Group AG 35,535 1,468,181Gerresheimer AG 9,767 714,589Gesco AG (a) 2,953 77,884GFT Technologies SE 5,130 235,050Grammer AG (a) 706 12,981Grand City Properties S.A. 31,748 635,495GRENKE AG (d) 659 18,379H&R GmbH & Co. KGaA (a) 4,195 28,770Hamburger Hafen und Logistik AG 8,624 153,799Hawesko Holding AG 223 12,072Heidelberger Druckmaschinen AG (a) 100,140 263,913Hensoldt AG 5,664 165,940Hornbach Holding AG & Co. KGaA (d) 3,220 405,337Hugo Boss AG 20,336 1,183,803Hypoport SE (a) 804 305,364Indus Holding AG 6,490 193,190Instone Real Estate Group SE 9,568 179,179IVU Traffic Technologies AG 2,709 56,145Jenoptik AG 16,935 512,865JOST Werke AG 2,840 114,220K&S AG (a) 61,757 1,873,168Kloeckner & Co. SE (a) 28,642 386,774Koenig & Bauer AG (a) (d) 4,373 101,979Krones AG 4,960 412,816KSB SE & Co. KGaA 82 39,452KWS Saat SE & Co. KGaA 3,725 270,257LANXESS AG 22,664 1,002,308Leifheit AG (d) 2,964 87,065Leoni AG (a) (d) 12,471 126,675Manz AG (a) (d) 1,272 56,233Medigene AG (a) 2,446 8,746METRO AG (a) 25,342 225,626MLP SE 22,156 177,253Nagarro SE (a) 2,942 467,563New Work SE 895 183,054Nexus AG 5,374 321,556Nordex SE (a) (d) 31,718 555,100Norma Group SE 10,781 310,085OHB SE 1,607 65,506Patrizia AG 16,379 308,893Pfeiffer Vacuum Technology AG 1,559 299,119PNE Wind AG (d) 13,868 160,814Progress-Werk Oberkirch AG (a) 822 28,075ProSiebenSat.1 Media SE 59,262 757,984
Germany��(Continued)PSI Software AG 4,019 171,680
Copyright © 2022 www.secdatabase.com. All Rights Reserved.Please Consider the Environment Before Printing This Document

PVA TePla AG (a) (d) 2,716 79,429q.beyond AG (a) 42,643 78,619R Stahl AG (a) 1,594 26,078Rheinmetall AG 12,901 2,738,405SAF-Holland SE (a) 18,418 155,491Salzgitter AG (a) 14,950 695,907Scout24 SE 15,735 902,626Secunet Security Networks AG 391 183,141SGL Carbon SE (a) 8,945 55,917Siltronic AG 6,867 705,669Sirius Real Estate, Ltd. 194,501 318,952Sixt SE (a) (d) 4,289 579,196SMA Solar Technology AG (d) 3,992 167,308Softing AG 3,104 21,015Software AG 17,469 601,300Softwareone Holding AG (a) 11,301 158,849Stabilus S.A. 6,982 346,920STRATEC SE (d) 1,553 173,871Stroeer SE & Co. KGaA 8,363 577,663Suedzucker AG 21,506 278,369Surteco Group SE 2,209 73,464Suss Microtec SE (a) (d) 6,216 109,523TAG Immobilien AG 43,726 993,205Takkt AG (d) 11,656 211,348Technotrans SE (d) 2,573 64,896ThyssenKrupp AG (a) 82,356 709,452Traffic Systems SE 1,794 72,670United Internet AG 1,869 64,280Varta AG (d) 2,851 282,038VERBIO Vereinigte BioEnergie AG 9,187 710,698Vossloh AG 3,384 140,999Wacker Chemie AG 2,043 350,711Wacker Neuson SE 10,321 231,316Washtec AG 3,673 194,583Westwing Group SE (a) 1,155 14,255Wuestenrot & Wuerttembergische AG 4,932 99,538Zeal Network SE (d) 2,680 106,867
40,572,296
Ghana��0.1%Tullow Oil plc (a) 488,272 343,439
Greenland��0.0%Gronlandsbanken A/S 140 12,863
Guernsey, Channel Islands��0.0%Raven Property Group, Ltd. (a) (b) (c) 112,611 0
Hong Kong��2.3%Aceso Life Science Group, Ltd. (a) 1,001,000 8,403Aeon Credit Service Asia Co., Ltd. 44,000 28,342Aidigong Maternal & Child Health, Ltd.
(a) 180,000 11,335Allied Group, Ltd. 382,000 133,787APAC Resources, Ltd. 84,990 12,572Apollo Future Mobility Group, Ltd. (a) 348,000 16,401
BHFTII-77
Copyright © 2022 www.secdatabase.com. All Rights Reserved.Please Consider the Environment Before Printing This Document

Table of ContentsBrighthouse Funds Trust IIBrighthouse/Dimensional International Small Company Portfolio
Schedule of Investments as of March 31, 2022 (Unaudited)Common Stocks��(Continued)
Security Description Shares Value
Hong Kong��(Continued)Applied Development Holdings, Ltd. (a) 390,000 $4,862Asia Financial Holdings, Ltd. 88,000 40,443Asia Standard International Group, Ltd. 296,000 26,982Asiasec Properties, Ltd. 88,000 5,593ASM Pacific Technology, Ltd. 54,200 548,177Associated International Hotels, Ltd. 14,000 20,553Bank of East Asia, Ltd. (The) 49,600 77,647Bel Global Resources Holdings, Ltd.
(a) (b) (c) 520,000 0BOCOM International Holdings Co., Ltd. 117,000 17,030Brightoil Petroleum Holdings, Ltd. (a) (b) (c) 591,000 21,223Build King Holdings, Ltd. 160,000 17,096Burwill Holdings, Ltd. (a) (b) (c) 1,566,000 2,659C-Mer Eye Care Holdings, Ltd. 56,000 32,777Cafe de Coral Holdings, Ltd. 106,000 176,428Cathay Pacific Airways, Ltd. (a) (d) 257,000 252,212Century City International Holdings, Ltd. (a) 616,000 26,674Chen Hsong Holdings 150,000 44,306Cheuk Nang Holdings, Ltd. 108,566 32,293Chevalier International Holdings, Ltd. 75,139 89,688China Baoli Technologies Holdings, Ltd. (a) 28,500 1,200China Best Group Holding, Ltd. (a) 45,000 4,640China Energy Development Holdings, Ltd.
(a) 3,376,000 69,641China Motor Bus Co., Ltd. 4,800 54,390China Solar Energy Holdings, Ltd. (a) (b) (c) 162,000 698China Star Entertainment, Ltd. (a) 378,000 41,017China Strategic Holdings, Ltd. (a) (d) 4,927,500 22,512China Tonghai International Financial, Ltd. 180,000 3,700Chinese Estates Holdings, Ltd. 151,000 43,236Chinney Investment, Ltd. 8,000 1,552Chow Sang Sang Holdings International,
Ltd. 111,000 128,316Chuang�s China Investments, Ltd. 511,500 25,327Chuang�s Consortium International, Ltd. 382,357 44,727CK Life Sciences International Holdings,
Inc. (d) 304,000 23,964CMBC Capital Holdings, Ltd. 19,000 4,119CNT Group, Ltd. 246,000 11,463Convenience Retail Asia, Ltd. 36,000 4,586Convoy Global Holdings (a) (b) (c) 1,314,000 5,250Cowell e Holdings, Inc. (a) 24,000 23,427Crystal International Group, Ltd. 29,500 11,731CSI Properties, Ltd. 2,274,023 56,423Dah Sing Banking Group, Ltd. 139,071 122,754Dah Sing Financial Holdings, Ltd. 45,460 147,192Dickson Concepts International, Ltd. 87,500 44,586DMX Technologies Group, Ltd. (a) (b) (c) 186,000 0DTXS Silk Road Investment Holdings Co.,
Ltd. (a) 24,000 5,642Dynamic Holdings, Ltd. 20,000 27,817Eagle Nice International Holdings, Ltd. 80,000 45,269EC Healthcare 48,000 50,826EcoGreen International Group, Ltd. 118,800 28,766Emperor Capital Group, Ltd. (a) 984,000 7,916Emperor Entertainment Hotel, Ltd. 235,000 20,629Emperor International Holdings, Ltd. 529,250 54,529Emperor Watch & Jewellery, Ltd. 1,520,000 34,956Energy Development (b) (c) 92,000 284Energy International Investments Holdings,
Ltd. (a) 580,000 3,628
Copyright © 2022 www.secdatabase.com. All Rights Reserved.Please Consider the Environment Before Printing This Document

ENM Holdings, Ltd. (a) 412,000 30,898Esprit Holdings, Ltd. (a) (d) 889,275 100,558Fairwood Holdings, Ltd. 26,500 51,371
Hong Kong��(Continued)Far East Consortium International, Ltd. 396,766 134,392First Pacific Co., Ltd. 674,000 272,060Fosun Tourism Group (a) 14,400 20,183G-Resources Group, Ltd. (a) 123,180 41,308Genting Hong Kong, Ltd. (a) (b) (c) 327,000 17,324Get Nice Financial Group, Ltd. 104,000 9,630Giordano International, Ltd. (d) 446,000 90,309Glorious Sun Enterprises, Ltd. 393,000 38,555Gold Finance Holdings, Ltd. (a) (b) (c) 214,000 0Gold Peak Technology Group Ltd. (a) 277,714 23,373Golden Resources Development
International, Ltd. 370,000 21,462Good Resources Holdings, Ltd. (a) (b) (c) 420,000 853GR Properties, Ltd. (a) 82,000 11,935Great Eagle Holdings, Ltd. 57,687 139,972Guoco Group, Ltd. 1,000 10,621Haitong International Securities Group, Ltd.
(d) 735,562 132,059Hang Lung Group, Ltd. 209,000 442,834Hanison Construction Holdings, Ltd. 148,009 23,043Harbour Centre Development, Ltd. (a) 88,000 75,268HKBN, Ltd. 167,500 192,055HKR International, Ltd. 343,680 125,479Hon Kwok Land Investment Co., Ltd. 140,000 46,290Hong Kong Economic Times Holdings, Ltd. 50,000 7,213Hong Kong Ferry Holdings Co., Ltd. 39,000 34,632Hong Kong Technology Venture Co., Ltd,
(d) 96,000 85,075Hongkong & Shanghai Hotels (The) (a) 110,902 118,083Hongkong Chinese, Ltd. 510,000 41,008Hsin Chong Group Holdings, Ltd. (a) (b) (c) 918,000 7,688Hung Hing Printing Group, Ltd. 252,000 40,667Huobi Technology Holdings, Ltd. (a) 10,500 8,540Hutchison Port Holdings Trust - Class U 1,123,200 273,783Hutchison Telecommunications Hong Kong
Holdings, Ltd. 526,000 84,460Hypebeast, Ltd. (a) 127,500 12,810Hysan Development Co., Ltd. 153,000 445,873Imagi International Holdings, Ltd. (a) 90,112 5,951International Housewares Retail Co., Ltd. 134,000 44,418IPE Group, Ltd. (a) 285,000 27,614IRC, Ltd. (a) 936,000 24,974ITC Properties Group, Ltd. 182,746 23,992Jacobson Pharma Corp., Ltd. 90,000 7,457Johnson Electric Holdings, Ltd. 108,873 149,693JS Global Lifestyle Co., Ltd. 89,500 104,304K Wah International Holdings, Ltd. 172,000 64,808Kader Holdings Co., Ltd. (a) 224,000 12,868Kam Hing International Holdings, Ltd. (a) 32,000 1,226Karrie International Holdings, Ltd. 140,000 26,395Keck Seng Investments Hong Kong, Ltd. (a) 72,000 25,980Kerry Logistics Network, Ltd. (d) 147,500 336,649Kerry Properties, Ltd. 148,000 417,062Kingmaker Footwear Holdings, Ltd. 102,000 13,412Kingston Financial Group, Ltd. (a) 162,000 5,229Kowloon Development Co., Ltd. 124,000 165,966Lai Sun Development Co., Ltd. (a) 111,919 52,301Lai Sun Garment International, Ltd. (a) 129,756 60,958Lam Soon Hong Kong, Ltd. 15,000 26,905Landing International Development, Ltd. (a) 310,800 8,957
BHFTII-78
Copyright © 2022 www.secdatabase.com. All Rights Reserved.Please Consider the Environment Before Printing This Document

Table of ContentsBrighthouse Funds Trust IIBrighthouse/Dimensional International Small Company Portfolio
Schedule of Investments as of March 31, 2022 (Unaudited)Common Stocks��(Continued)
Security Description Shares Value
Hong Kong��(Continued)Landsea Green Group Co., Ltd. (a) 268,000 $8,927Langham Hospitality Investments and
Langham Hospitality Investments, Ltd.(a) 207,000 24,002
Lerthai Group, Ltd. (a) (b) (c) 18,000 384Lifestyle International Holdings, Ltd.
(a) (d) 134,500 64,742Lippo China Resources, Ltd. 2,106,000 38,399Lippo, Ltd. 122,000 43,297Liu Chong Hing Investment, Ltd. 78,000 73,461Luk Fook Holdings International, Ltd. 118,000 287,016Lung Kee Bermuda Holdings 90,000 42,721Magnificent Hotel Investment, Ltd. (a) 1,310,000 19,901Man Wah Holdings, Ltd. 242,000 263,604Mandarin Oriental International, Ltd. (a) 67,000 134,158Mason Group Holdings, Ltd. (a) 7,685,000 17,595Matrix Holdings, Ltd. 36,000 11,949Melco International Development, Ltd.
(a) (d) 165,000 151,188MH Development, Ltd. (a) (b) (c) 124,000 3,443Midland Holdings, Ltd. (a) 178,010 18,975Miramar Hotel & Investment 51,000 81,312Modern Dental Group, Ltd. 79,000 30,016Nameson Holdings, Ltd. 130,000 7,485National Electronic Holdings, Ltd. 182,600 23,777Newocean Energy Holdings, Ltd. (a) 398,000 1,990Nissin Foods Co., Ltd. 47,000 32,882NWS Holdings, Ltd. (d) 279,000 255,585Oriental Watch Holdings 120,484 63,939Oshidori International Holdings, Ltd. (a) 1,068,000 67,969Pacific Andes International Holdings, Ltd.
(a) (b) (c) 1,819,984 6,366Pacific Basin Shipping, Ltd. 1,337,000 721,954Pacific Century Premium Developments,
Ltd. (a) 49,788 3,133Pacific Textiles Holdings, Ltd. 266,000 123,099Paliburg Holdings, Ltd. (a) 208,000 56,027Paradise Entertainment, Ltd. (a) 168,000 18,649PC Partner Group, Ltd. (d) 54,000 78,418PCCW, Ltd. 825,582 464,942Perfect Medical Health Management, Ltd. 108,000 66,541Pico Far East Holdings, Ltd. 318,000 44,154Playmates Holdings, Ltd. 460,000 42,326PT International Development Co., Ltd.
(a) 186,000 5,107Public Financial Holdings, Ltd. 166,000 51,394Regal Hotels International Holdings, Ltd.
(a) 126,000 51,575Regina Miracle International Holdings,
Ltd. 71,000 42,942Sa Sa International Holdings, Ltd. (a) 96,000 16,972Samson Holding, Ltd. (a) 146,000 7,049SAS Dragon Holdings, Ltd. 140,000 87,244SEA Holdings, Ltd. 63,896 47,388Shangri-La Asia, Ltd. (a) 234,000 183,403Shun Ho Property Investments, Ltd. (a) 21,615 3,201Shun Tak Holdings, Ltd. (a) 379,500 83,005Sing Tao News Corp., Ltd. 212,000 10,673Singamas Container Holdings, Ltd. 506,000 74,057SmarTone Telecommunications Holdings,
Ltd. 124,888 66,551
Copyright © 2022 www.secdatabase.com. All Rights Reserved.Please Consider the Environment Before Printing This Document

Soundwill Holdings, Ltd. 41,500 37,670South China Holdings Co., Ltd. (a) 1,240,000 11,556Stella International Holdings, Ltd. 141,000 136,807Sun Hung Kai & Co., Ltd. 153,440 77,989SUNeVision Holdings, Ltd. (d) 176,000 149,703
Hong Kong��(Continued)TAI Cheung Holdings, Ltd. (d) 192,000 118,396Tan Chong International, Ltd. 63,000 16,085Tao Heung Holdings, Ltd. 204,000 24,672Television Broadcasts, Ltd. (a) 97,700 55,894Texwinca Holdings, Ltd. 300,000 55,638Tradelink Electronic Commerce, Ltd. 256,000 38,572Transport International Holdings, Ltd. 62,602 101,881United Laboratories International
Holdings, Ltd. (The) 241,000 126,037Upbest Group, Ltd. 16,000 1,357Value Partners Group, Ltd. (d) 215,000 92,331Valuetronics Holdings, Ltd. 89,790 35,407Vedan International Holdings, Ltd. 296,000 23,050Vitasoy International Holdings, Ltd. (d) 162,000 306,970VPower Group International Holdings,
Ltd. 53,251 6,500VSTECS Holdings, Ltd. 231,200 216,953VTech Holdings, Ltd. (d) 42,200 306,380Wai Kee Holdings, Ltd. 54,000 23,118Wang On Group, Ltd. 2,200,000 19,618Wealthking Investments, Ltd. (a) 284,000 21,696Wing On Co. International, Ltd. 46,000 104,293Wing Tai Properties, Ltd. 210,000 109,915Yue Yuen Industrial Holdings, Ltd. (a) 164,000 263,794Yunfeng Financial Group, Ltd. (a) 34,000 6,218Zhaobangji Properties Holdings, Ltd.
(a) (d) 184,000 11,45314,267,819
India��0.0%Rhi Magnesita NV 3,120 99,389
Ireland��0.6%AIB Group plc 22,853 50,148Bank of Ireland Group plc (a) 249,385 1,584,257C&C Group plc (a) 120,783 310,422Cairn Homes plc (a) 135,193 184,840COSMO Pharmaceuticals NV (a) (d) 515 33,933Dalata Hotel Group plc (a) 19,956 87,185Datalex plc (a) 5,495 5,095FBD Holdings plc (a) 10,350 113,426Glanbia plc 51,475 594,517Glenveagh Properties plc (a) 89,923 116,384Greencore Group plc (a) 159,206 268,087Hostelworld Group plc (a) 16,696 16,788Irish Continental Group plc (a) 33,406 142,848Keywords Studios plc 5,158 176,998Permanent TSB Group Holdings plc (a) 15,086 27,836
3,712,764
Isle of Man��0.0%Hansard Global plc 2,566 1,604Strix Group plc 23,629 62,605
64,209
Israel��2.0%Abra Information Technologies Ltd. 7,868 10,807Adgar Investment and Development, Ltd. 11,788 27,812
BHFTII-79
Copyright © 2022 www.secdatabase.com. All Rights Reserved.Please Consider the Environment Before Printing This Document

Table of ContentsBrighthouse Funds Trust IIBrighthouse/Dimensional International Small Company Portfolio
Schedule of Investments as of March 31, 2022 (Unaudited)Common Stocks��(Continued)
Security Description Shares Value
Israel��(Continued)Afcon Holdings, Ltd. 771 $54,126AFI Properties, Ltd. 4,055 241,023Africa Israel Residences, Ltd. 880 60,768Airport City, Ltd. (a) 1 11Allot, Ltd. (a) 10,216 86,786Alrov Properties and Lodgings, Ltd. (a) 2,780 187,157Arad, Ltd. 2,224 33,364Ashtrom Group, Ltd. 10,987 323,959Atreyu Capital Markets, Ltd. 2,021 43,464AudioCodes, Ltd. 5,713 145,967AudioCodes, Ltd. 1 16Aura Investments, Ltd. 3,293 7,634Avgol Industries 1953, Ltd. (a) 27,883 21,697Azorim-Investment Development &
Construction Co., Ltd. (a) 31,528 174,003Bet Shemesh Engines Holdings, Ltd. (a) 2,139 57,972BioLine RX, Ltd. (a) 1 0Blue Square Real Estate, Ltd. 1,940 165,939Camtek, Ltd. (a) 2,060 63,649Carasso Motors, Ltd. 5,984 43,048Cellcom Israel, Ltd. (a) 24,928 143,492Ceragon Networks, Ltd. (a) (d) 14,799 31,522Clal Insurance Enterprises Holdings, Ltd.
(a) 10,623 248,139Compugen, Ltd. (a) 1,588 5,321Danel Adir Yeoshua, Ltd. 1,759 323,915Delek Automotive Systems, Ltd. 12,832 197,500Delek Group, Ltd. (a) 1,931 279,018Delta-Galil Industries, Ltd. 3,185 217,441Dor Alon Energy in Israel, Ltd. 2,364 90,255Duniec Brothers, Ltd. 915 60,279Electra Consumer Products 1970, Ltd. 3,029 179,481Electra Real Estate, Ltd. 6,750 127,856Electra, Ltd. 483 359,220Energix-Renewable Energies, Ltd. 35,157 134,475Enlight Renewable Energy, Ltd. (a) 205,209 481,112Equital, Ltd. (a) 8,196 348,893Fattal Holdings 1998, Ltd. (a) 570 81,506FMS Enterprises Migun, Ltd. 1,295 47,439Formula Systems 1985, Ltd. 3,277 328,116Fox Wizel, Ltd. 2,684 429,105Gav-Yam Lands Corp., Ltd. 18,811 220,714Gilat Satellite Networks, Ltd. (a) 9,844 86,791Globrands, Ltd. 93 12,194Harel Insurance Investments & Financial
Services, Ltd. 31,928 387,922Hilan, Ltd. 4,492 277,297IDI Insurance Co., Ltd. 2,662 90,193IES Holdings, Ltd. 569 58,030Ilex Medical, Ltd. 659 30,717Infinya Ltd. 1,104 93,064Inrom Construction Industries, Ltd. 22,474 104,576Isracard, Ltd. 22,812 112,180Israel Canada T.R., Ltd. 36,696 200,520Israel Land Development Co., Ltd. (The) 3,950 63,617Isras Investment Co., Ltd. 541 134,854Issta Lines, Ltd. (a) 1,175 42,667Kamada, Ltd. (a) 11,729 65,187Kerur Holdings, Ltd. 2,088 55,567
Israel��(Continued)
Copyright © 2022 www.secdatabase.com. All Rights Reserved.Please Consider the Environment Before Printing This Document

Klil Industries, Ltd. 315 27,400Levinstein Properties, Ltd. 1,208 44,400M Yochananof & Sons, Ltd. 586 38,491Magic Software Enterprises, Ltd. 9,462 165,636Malam - Team, Ltd. 3,350 99,308Matrix IT, Ltd. 10,787 281,066Maytronics, Ltd. 1 10Mediterranean Towers, Ltd. 28,011 94,758Mega Or Holdings, Ltd. 4,941 192,572Mehadrin, Ltd. (a) 108 6,211Meitav Dash Investments, Ltd. 8,613 46,635Menora Mivtachim Holdings, Ltd. (a) 8,846 218,137Migdal Insurance & Financial Holding, Ltd. 94,179 167,213Mivtach Shamir Holdings, Ltd. 1,966 66,277Mizrahi Tefahot Bank, Ltd. 1 36Naphtha Israel Petroleum Corp., Ltd. (a) 14,775 118,609Nawi Brothers, Ltd. 4,888 46,968Neto ME Holdings, Ltd. 788 55,809Novolog, Ltd. 32,840 31,808NR Spuntech Industries, Ltd. (a) 3,848 7,148Oil Refineries, Ltd. (a) 418,554 166,266One Software Technologies, Ltd. 9,000 155,845OPC Energy, Ltd. (a) 15,415 175,721Partner Communications Co., Ltd. (a) 36,424 302,012Paz Oil Co., Ltd. (a) 2,185 320,597Perion Network, Ltd. (a) 6,230 141,760Plasson Industries, Ltd. 1,078 66,330Plus500, Ltd. 25,321 468,992Priortech, Ltd. (a) 2,244 67,953Rami Levi Chain Stores Hashikma
Marketing, Ltd. 2,198 175,309Sano-Brunos Enterprises, Ltd. 46 5,204Scope Metals Group, Ltd. 1,844 93,535Shikun & Binui, Ltd. (a) 5,657 33,828Shufersal, Ltd. 16,784 152,053Summit Real Estate Holdings, Ltd. (a) 8,001 182,708Suny Cellular Communication, Ltd. 16,495 9,286Tadiran Group, Ltd. 855 138,914Tel Aviv Stock Exchange, Ltd. 1,780 9,112Telsys, Ltd. 297 15,640Tera Light, Ltd. (a) 8,846 19,681Tremor International, Ltd. (ADR) (a) 7,429 112,995Victory Supermarket Chain, Ltd. 589 10,844YH Dimri Construction & Development,
Ltd. 1,750 161,90012,594,354
Italy��3.4%A2A S.p.A. 472,680 809,933ACEA S.p.A. 15,403 283,368Aeffe S.p.A. (a) 11,359 24,153Anima Holding S.p.A. 92,515 415,025Aquafil S.p.A. (a) 3,537 25,596Arnoldo Mondadori Editore S.p.A. (a) 54,123 119,300Ascopiave S.p.A. 19,908 75,574Autostrade Meridionali S.p.A. (d) 777 33,573Avio S.p.A. (d) 6,077 71,423Azimut Holding S.p.A. 33,841 785,413
BHFTII-80
Copyright © 2022 www.secdatabase.com. All Rights Reserved.Please Consider the Environment Before Printing This Document

Table of ContentsBrighthouse Funds Trust IIBrighthouse/Dimensional International Small Company Portfolio
Schedule of Investments as of March 31, 2022 (Unaudited)Common Stocks��(Continued)
Security Description Shares Value
Italy��(Continued)Banca Carige S.p.A. (a) 156 $135Banca Farmafactoring S.p.A. 40,885 303,437Banca Generali S.p.A. 19,702 730,213Banca IFIS S.p.A. 7,714 158,068Banca Mediolanum S.p.A. 40,974 348,974Banca Popolare dell�Emilia Romagna SC 310,312 540,921Banca Popolare di Sondrio SPA 161,515 659,483Banca Profilo S.p.A. (d) 117,883 28,633Banca Sistema S.p.A. 13,168 29,401Banco BPM S.p.A. 456,529 1,347,726Banco di Desio e della Brianza S.p.A. 20,306 68,763Be Shaping The Future S.p.A 29,207 105,534BF S.p.A. 2,916 11,325Brembo S.p.A. 28,489 317,410Brunello Cucinelli S.p.A. (a) 9,914 578,682Buzzi Unicem S.p.A. 30,531 565,790Cairo Communication S.p.A. 25,255 62,647Carel Industries S.p.A. 5,874 149,969Cementir Holding NV 18,579 140,248CIR SpA-Compagnie Industriali (a) 315,684 142,054Credito Emiliano S.p.A. 23,832 156,709d�Amico International Shipping S.A. (a) 115,150 14,115Danieli & C Officine Meccaniche S.p.A.
(d) 4,407 96,169Danieli & C Officine Meccaniche S.p.A.
(Savings Shares) 3,745 59,580De�Longhi S.p.A. 17,430 473,946DeA Capital S.p.A. 32,300 48,368doValue S.p.A. 2,051 17,311Elica S.p.A. (a) 11,044 38,560Emak S.p.A. 23,063 35,743Enav S.p.A. (a) 13,326 61,627ERG S.p.A. 16,018 532,922Esprinet S.p.A. 12,105 127,902Eurotech S.p.A. (a) (d) 13,076 55,162Fila S.p.A. 3,057 31,750Fincantieri S.p.A. (a) (d) 93,136 64,046FNM S.p.A. (a) 55,327 32,739Geox S.p.A. (a) (d) 34,378 33,939Gruppo MutuiOnline S.p.A. 8,426 301,112Hera S.p.A. 272,570 1,005,679Illimity Bank S.p.A. (a) 12,140 158,665IMMSI S.p.A. (a) (d) 51,196 25,150Intek Group S.p.A. (a) (d) 80,757 47,000Interpump Group S.p.A. 1,597 80,300Iren S.p.A. 217,068 575,217Italgas S.p.A. 151,950 975,626Italmobiliare S.p.A. 4,207 134,060IVS Group S.A. (a) 3,278 17,556Juventus Football Club S.p.A. (a) (d) 259,477 93,837La Doria S.p.A. 3,877 70,570Leonardo S.p.A. (a) 98,520 981,768LU-VE S.p.A. 1,991 42,769Maire Tecnimont S.p.A. 42,334 146,097Openjobmetis S.p.A. agenzia per il lavoro 1,209 15,198OVS S.p.A. (a) 72,276 156,174Pharmanutra S.p.A. 826 57,371Piaggio & C S.p.A. 60,717 171,523Pirelli & C S.p.A. 101,331 548,896
Italy��(Continued)
Copyright © 2022 www.secdatabase.com. All Rights Reserved.Please Consider the Environment Before Printing This Document

Prima Industrie S.p.A. (a) (d) 1,853 34,807RAI Way S.p.A. 24,727 154,976Reply S.p.A. 6,087 1,002,029Rizzoli Corriere Della Sera Mediagroup
S.p.A. 39,016 33,325Sabaf S.p.A. 3,059 75,479SAES Getters S.p.A. 1,024 25,110Safilo Group S.p.A. (a) 12,212 20,380Saipem S.p.A. (a) (d) 197,655 249,792Salvatore Ferragamo S.p.A. (a) (d) 10,353 195,502Saras S.p.A. (a) 169,450 130,094Servizi Italia S.p.A. (a) 1,701 3,433Sesa S.p.A. 2,065 337,804Sogefi S.p.A. (a) 24,822 23,642SOL S.p.A. 11,001 200,100Tamburi Investment Partners S.p.A. 38,251 377,650Technogym S.p.A. 31,905 252,726Tinexta S.p.A. 6,919 201,460Tod�s S.p.A. (a) (d) 3,369 150,812TXT e-solutions S.p.A. 2,997 32,335Uni Land S.p.A. (a) (b) (c) 4,937 0Unieuro S.p.A. (d) 3,192 61,592Unipol Gruppo S.p.A. 133,549 730,898UnipolSai Assicurazioni S.p.A. (d) 33,327 98,616Webuild S.p.A. (d) 70,140 124,373Zignago Vetro S.p.A. 6,769 88,511
21,023,373
Japan��21.7%&Do Holdings Co., Ltd. 1,400 10,98477 Bank, Ltd. (The) 17,700 221,950A&A Material Corp. 1,200 8,705A&D Co., Ltd. (d) 6,000 47,124A/S One Corp. 3,200 188,859Access Co., Ltd. (a) 7,300 34,356Achilles Corp. 4,800 49,719Ad-sol Nissin Corp. (d) 1,900 25,593Adastria Co., Ltd. (d) 8,040 125,531ADEKA Corp. 25,700 565,426Adtec Plasma Technology Co., Ltd. 600 12,931Advan Group Co., Ltd. 6,700 49,266Advance Create Co., Ltd. 1,600 12,458Advanced Media, Inc. (a) 2,500 12,222Advantage Risk Management Co., Ltd. 1,300 6,575Adventure, Inc. 600 42,730Adways, Inc. 2,000 12,298Aeon Delight Co., Ltd. 6,200 154,082Aeon Fantasy Co., Ltd. 2,400 37,715AEON Financial Service Co., Ltd. 7,200 71,379Aeon Hokkaido Corp. (d) 4,800 44,151Aeon Kyushu Co. Ltd. (d) 600 10,323Aeria, Inc. (d) 2,200 6,816AFC-HD AMS Life Science Co., Ltd. 1,900 11,567Agro-Kanesho Co., Ltd. 1,000 9,502Ahresty Corp. 9,200 28,307Ai Holdings Corp. 10,200 142,233AI inside, Inc. (a) (d) 300 12,661
BHFTII-81
Copyright © 2022 www.secdatabase.com. All Rights Reserved.Please Consider the Environment Before Printing This Document

Table of ContentsBrighthouse Funds Trust IIBrighthouse/Dimensional International Small Company Portfolio
Schedule of Investments as of March 31, 2022 (Unaudited)Common Stocks��(Continued)
Security Description Shares Value
Japan��(Continued)Aica Kogyo Co., Ltd. 8,300 $202,301Aichi Bank, Ltd. (The) 2,600 96,228Aichi Corp. 10,800 77,788Aichi Steel Corp. 3,200 62,893Aichi Tokei Denki Co., Ltd. (d) 3,000 38,167Aida Engineering, Ltd. 16,900 145,477Aiful Corp. (d) 106,300 311,222Aiming, Inc. 4,500 12,016Ain Holdings, Inc. 5,800 301,817Ainavo Holdings Co., Ltd. 1,100 8,422Aiphone Co., Ltd. (d) 3,800 63,801Airport Facilities Co., Ltd. 7,500 33,311Aisan Industry Co., Ltd. 10,400 61,826AIT Corp. 600 7,480Aizawa Securities Group Co., Ltd. (d) 11,000 65,923Ajis Co., Ltd. 500 9,834Akatsuki Corp. 8,100 21,437Akatsuki, Inc. 2,100 49,604Akebono Brake Industry Co., Ltd. (a) 17,400 22,281Akita Bank, Ltd. (The) 4,100 56,296Albis Co., Ltd. 1,600 29,267Alconix Corp. 6,400 73,076Alinco, Inc. 4,600 32,629Alleanza Holdings Co., Ltd. 1,400 11,156Alpen Co., Ltd. 4,800 80,265Alpha Corp. (d) 2,200 18,384AlphaPolis Co., Ltd. (a) 400 11,331Alps Alpine Co., Ltd. (d) 55,800 549,187Alps Logistics Co., Ltd. 6,000 52,649Altech Corp. 4,520 69,449Amano Corp. 14,400 257,804Amiyaki Tei Co., Ltd. 1,100 26,620Amuse, Inc. (d) 2,800 44,770Anabuki Kosan, Inc. 800 14,668Anest Iwata Corp. (d) 10,400 70,546Anicom Holdings, Inc. 8,800 46,717Anritsu Corp. (d) 33,000 418,623Aohata Corp. 500 9,921AOI Electronics Co., Ltd. 1,100 18,101AOKI Holdings, Inc. 12,500 59,402Aomori Bank Ltd (The) (a) (b) (c) (d) 6,100 94,451Aoyama Trading Co., Ltd. 14,500 79,694Aoyama Zaisan Networks Co., Ltd. 2,800 28,232Aozora Bank, Ltd. (d) 6,100 128,719Apaman Co., Ltd. 2,100 8,426Arakawa Chemical Industries, Ltd. 4,600 40,144Arata Corp. 4,200 124,926Arcland Service Holdings Co., Ltd. 4,000 71,389Arcs Co., Ltd. 13,364 231,838Arealink Co., Ltd. 3,100 34,117Argo Graphics, Inc. 4,800 119,868Arisawa Manufacturing Co., Ltd. 10,600 82,864ARTERIA Networks Corp. 4,700 50,360Artiza Networks, Inc. 1,800 20,076Artnature, Inc. 5,000 29,400ArtSpark Holdings, Inc. (d) 6,900 47,157Aruhi Corp. (d) 7,100 57,922
Japan��(Continued)Asahi Broadcasting Group Holdings Corp. 2,400 13,991Asahi Co., Ltd. (d) 4,500 48,930
Copyright © 2022 www.secdatabase.com. All Rights Reserved.Please Consider the Environment Before Printing This Document

Asahi Diamond Industrial Co., Ltd. 17,700 85,329Asahi Holdings, Inc. (d) 19,200 356,434Asahi Intelligence Service Co., Ltd. (d) 100 976Asahi Kogyosha Co., Ltd. 2,400 31,558Asahi Net, Inc. 5,000 24,017Asahi Printing Co., Ltd. 400 2,702ASAHI YUKIZAI Corp. 5,000 81,618Asahipen Corp. (d) 400 6,258Asante, Inc. (d) 2,300 27,478Asanuma Corp. (d) 2,400 98,055Asax Co., Ltd. 5,400 28,692Ascentech K.K. 1,400 9,452Ashimori Industry Co., Ltd. 1,600 11,789Asia Pile Holdings Corp. 3,800 13,287ASKA Pharmaceutical Holdings Co., Ltd. 7,500 77,188ASKUL Corp. 7,500 98,361Astena Holdings Co., Ltd. 9,000 32,664Asteria Corp. (d) 2,100 16,430Atrae, Inc. (a) 3,200 50,154Atsugi Co., Ltd. (a) 6,100 30,337Aucnet, Inc. 2,700 35,166Autobacs Seven Co., Ltd. (d) 20,400 224,602Aval Data Corp. 500 12,691Avant Corp. (d) 5,800 63,807Avantia Co., Ltd. 3,000 20,768Avex, Inc. 7,600 82,719Awa Bank, Ltd. (The) 10,300 182,356Axell Corp. 3,800 32,895Axial Retailing, Inc. 5,100 133,452Axyz Co., Ltd. 500 13,491Bando Chemical Industries, Ltd. (d) 12,000 86,484Bank of Iwate, Ltd. (The) 5,400 81,668Bank of Kochi, Ltd. (The) (d) 1,600 9,910Bank of Nagoya, Ltd. (The) (d) 4,200 98,641Bank of Saga, Ltd. (The) (d) 5,100 60,921Bank of the Ryukyus, Ltd. 15,800 102,517Baroque Japan, Ltd. 3,100 19,795Beauty Garage, Inc. (d) 800 15,387Beenos, Inc. (d) 1,900 36,178Belc Co., Ltd. 2,800 124,459Bell System24 Holdings, Inc. 8,200 91,955Belluna Co., Ltd. (d) 16,800 99,531Benesse Holdings, Inc. 14,300 262,514Bengo4.com, Inc. (a) (d) 1,400 44,452Bic Camera, Inc. (d) 18,000 159,579Bike O & Co., Ltd. (d) 1,600 14,941BML, Inc. (d) 7,200 181,750Bookoff Group Holdings, Ltd. (d) 3,500 31,682Bourbon Corp. 2,100 38,813BP Castrol KK (d) 2,600 26,265Br Holdings Corp. (d) 7,400 19,356BrainPad, Inc. (a) 3,300 35,039Broadleaf Co., Ltd. 24,600 74,224Bull-Dog Sauce Co., Ltd. (d) 1,200 21,003Bunka Shutter Co., Ltd. 19,000 152,830
BHFTII-82
Copyright © 2022 www.secdatabase.com. All Rights Reserved.Please Consider the Environment Before Printing This Document

Table of ContentsBrighthouse Funds Trust IIBrighthouse/Dimensional International Small Company Portfolio
Schedule of Investments as of March 31, 2022 (Unaudited)Common Stocks��(Continued)
Security Description Shares Value
Japan��(Continued)Business Brain Showa-Ota, Inc. 2,600 $31,560Business Engineering Corp. 400 12,678BuySell Technologies Co., Ltd. (d) 400 12,358C Uyemura & Co., Ltd. 4,800 224,062C.I. Takiron Corp. 16,300 72,518CAC Holdings Corp. 4,400 50,707Can Do Co., Ltd. 200 3,662Canare Electric Co., Ltd. 800 10,373Canon Electronics, Inc. 6,000 78,621Careerlink Co., Ltd. (d) 1,000 11,895Carenet, Inc. (d) 3,600 25,164Carlit Holdings Co., Ltd. 7,300 39,465Carta Holdings, Inc. 900 17,581Casa, Inc. 1,000 6,868Cawachi, Ltd. 4,000 73,689CDS Co., Ltd. 700 9,452CellSource Co., Ltd. (a) (d) 600 14,452Central Automotive Products, Ltd. 3,000 61,479Central Glass Co., Ltd. (d) 10,900 185,573Central Security Patrols Co., Ltd. (d) 2,300 47,048Central Sports Co., Ltd. (d) 2,400 45,980Ceres, Inc. 1,600 21,057Charm Care Corp. (d) 3,800 34,302Chiba Kogyo Bank, Ltd. (The) 16,000 34,359Chilled & Frozen Logistics Holdings Co., Ltd. 2,800 27,546Chino Corp. (d) 2,700 35,841Chiyoda Co., Ltd. (d) 5,800 34,892Chiyoda Corp. (a) 38,700 148,640Chiyoda Integre Co., Ltd. 3,900 67,290Chofu Seisakusho Co., Ltd. 5,700 92,773Chori Co., Ltd. (d) 4,300 61,844Chubu Shiryo Co., Ltd. (d) 6,800 54,909Chudenko Corp. 8,200 138,703Chuetsu Pulp & Paper Co., Ltd. (d) 1,900 14,749Chugai Ro Co., Ltd. 1,400 18,388Chugoku Bank, Ltd. (The) (d) 36,700 261,910Chugoku Marine Paints, Ltd. (d) 13,000 96,338Chukyo Bank, Ltd. (The) 3,900 51,038Chuo Gyorui Co., Ltd. (d) 200 4,896Chuo Spring Co., Ltd. 4,300 26,842Citizen Watch Co., Ltd. (d) 83,700 356,608CKD Corp. (d) 8,900 136,134Cleanup Corp. 7,300 31,652CMIC Holdings Co., Ltd. 3,900 48,642CMK Corp. (d) 15,500 77,481COLOPL, Inc. 7,200 37,470Colowide Co., Ltd. (d) 7,500 108,811Como Co., Ltd. (d) 400 8,645Computer Engineering & Consulting, Ltd. 8,200 85,656Computer Institute of Japan, Ltd. 4,080 25,298Comture Corp. (d) 5,900 148,858CONEXIO Corp. 4,600 52,799Core Corp. 2,500 32,412Corona Corp. 4,400 30,666Cosel Co., Ltd. 8,100 53,278Cosmo Energy Holdings Co., Ltd. (d) 18,100 390,621Cosmos Initia Co., Ltd. (d) 3,500 12,229
Japan��(Continued)Cota Co., Ltd. (d) 4,977 57,853CRE, Inc. 800 11,705
Copyright © 2022 www.secdatabase.com. All Rights Reserved.Please Consider the Environment Before Printing This Document

Create Medic Co., Ltd. 1,800 14,653Create Restaurants Holdings, Inc. (d) 13,300 78,629Create SD Holdings Co., Ltd. 5,000 131,219Credit Saison Co., Ltd. (d) 38,200 404,675Creek & River Co., Ltd. 3,900 65,052Cresco, Ltd. 4,000 63,927CROOZ, Inc. (a) 1,300 8,028Cross Cat Co., Ltd. (d) 1,400 13,606CTI Engineering Co., Ltd. 3,900 72,482CTS Co., Ltd. 7,700 52,838Cube System, Inc. 2,500 18,995Curves Holdings Co., Ltd. 9,400 54,097Cyber Com Co., Ltd. (d) 1,100 10,277Cybernet Systems Co., Ltd. 2,200 13,320Cybozu, Inc. (d) 5,300 59,767Dai Nippon Toryo Co., Ltd. 7,800 50,089Dai-Dan Co., Ltd. (d) 4,600 78,919Daibiru Corp. (a) (d) 4,200 75,654Daicel Corp. (d) 40,500 270,320Daido Kogyo Co., Ltd. 2,000 15,222Daido Metal Co., Ltd. 13,400 62,382Daido Steel Co., Ltd. 7,600 229,161Daidoh, Ltd. (a) 10,800 12,405Daihatsu Diesel Manufacturing Co., Ltd. 6,700 27,800Daihen Corp. 5,600 192,964Daiho Corp. 4,200 155,282Daiichi Jitsugyo Co., Ltd. 2,800 97,956Daiichi Kigenso Kagaku-Kogyo Co., Ltd. (d) 5,000 41,125Daiken Corp. 4,100 72,722Daiken Medical Co., Ltd. (d) 4,400 18,344Daiki Aluminium Industry Co., Ltd. (d) 9,000 115,067Daiki Axis Co., Ltd. (d) 1,300 8,053Daiko Denshi Tsushin, Ltd. 1,300 4,280Daikoku Denki Co., Ltd. 2,700 26,773Daikokutenbussan Co., Ltd. 1,300 55,178Daikyonishikawa Corp. (d) 11,600 51,113Dainichi Co., Ltd. 4,100 22,275Dainichiseika Color & Chemicals
Manufacturing Co., Ltd. 4,000 67,292Daiohs Corp. 900 7,537Daiseki Co., Ltd. 12,839 482,483Daishi Hokuetsu Financial Group, Inc. (d) 10,300 209,924Daishinku Corp. (d) 10,400 101,713Daisue Construction Co., Ltd. 2,300 23,538Daito Bank, Ltd. (The) 5,200 29,143Daito Pharmaceutical Co., Ltd. 3,960 92,617Daitron Co., Ltd. 2,400 37,031Daiwa Industries, Ltd. 11,000 97,752Daiwabo Holdings Co., Ltd. 26,000 348,888DATA HORIZON Co., Ltd. 900 14,548DCM Holdings Co., Ltd. 33,100 285,787Dear Life Co., Ltd. (d) 7,500 32,496Delica Foods Holdings Co., Ltd. (d) 600 2,662DeNA Co., Ltd. (a) (d) 19,200 291,860Densan System Holdings Co., Ltd. 1,700 35,870Denyo Co., Ltd. (d) 4,800 64,230
BHFTII-83
Copyright © 2022 www.secdatabase.com. All Rights Reserved.Please Consider the Environment Before Printing This Document

Table of ContentsBrighthouse Funds Trust IIBrighthouse/Dimensional International Small Company Portfolio
Schedule of Investments as of March 31, 2022 (Unaudited)Common Stocks��(Continued)
Security Description Shares Value
Japan��(Continued)Dexerials Corp. 15,300 $415,319DIC Corp. 10,900 222,609Digital Arts, Inc. 2,900 174,722Digital Garage, Inc. (d) 7,400 276,483Digital Holdings, Inc. 2,100 23,915Digital Information Technologies Corp. 2,100 21,932Dip Corp. (d) 7,700 209,718Direct Marketing MiX, Inc. 1,700 25,287DKK Co., Ltd. 3,300 60,876DKS Co., Ltd. 2,800 63,120DMG Mori Co., Ltd. 28,400 385,483DMW Corp. (d) 700 19,036Doshisha Co., Ltd. 7,400 90,524Double Standard, Inc. 1,400 24,438Doutor Nichires Holdings Co., Ltd. 7,600 94,659Dowa Holdings Co., Ltd. 1,500 68,870Drecom Co., Ltd. (a) (d) 2,700 12,072DTS Corp. 11,700 255,535Duskin Co., Ltd. (d) 12,500 274,956DyDo Group Holdings, Inc. 3,200 123,592Dynic Corp. (d) 3,200 19,357E-Guardian, Inc. 2,400 59,746Eagle Industry Co., Ltd. (d) 7,800 62,154Earth Corp. 3,100 141,327EAT&Holdings Co., Ltd. 1,400 24,265Ebara Foods Industry, Inc. (d) 700 16,157Ebara Jitsugyo Co., Ltd. (d) 3,000 60,238Ebase Co., Ltd. 4,800 22,283Eco�s Co., Ltd. (d) 2,100 35,055EDION Corp. (d) 22,500 209,142EF-ON, Inc. 6,100 29,447eGuarantee, Inc. (d) 8,200 136,844Ehime Bank, Ltd. (The) (d) 11,400 86,680Eidai Co., Ltd. (d) 10,000 23,808Eiken Chemical Co., Ltd. 7,500 105,829Eizo Corp. (d) 4,400 129,325Elan Corp. 8,200 72,337Elecom Co., Ltd. 11,700 140,612Elematec Corp. 6,800 57,912en-japan, Inc. 7,300 175,409Endo Lighting Corp. 2,600 19,876Enigmo, Inc. 6,400 33,786Enplas Corp. (d) 2,500 55,521Enshu, Ltd. (d) 2,300 13,524Entrust, Inc. (d) 1,500 6,962eRex Co., Ltd. (d) 8,000 113,464ES-Con Japan, Ltd. (d) 6,700 44,745Escrow Agent Japan, Inc. (a) 5,100 7,732Eslead Corp. 2,700 37,019ESPEC Corp. (d) 6,500 104,195Exedy Corp. (d) 9,100 116,963Ezaki Glico Co., Ltd. 6,600 201,482F&M Co., Ltd. (d) 1,600 21,265F-Tech, Inc. (d) 6,000 26,676Faith, Inc. 2,680 15,120FALCO HOLDINGS Co., Ltd. 3,100 50,989FAN Communications, Inc. 11,700 41,500
Japan��(Continued)FCC Co., Ltd. 10,500 115,020FDK Corp. (a) (d) 3,600 25,425
Copyright © 2022 www.secdatabase.com. All Rights Reserved.Please Consider the Environment Before Printing This Document

Feed One Co., Ltd. (d) 8,276 45,392Ferrotec Holdings Corp. (d) 10,400 229,551FFRI Security, Inc. (a) (d) 1,000 9,383Fibergate, Inc. 1,800 19,132FIDEA Holdings Co., Ltd. 6,250 65,127Fields Corp. 6,000 44,020Financial Products Group Co., Ltd. 4,400 30,798FINDEX, Inc. 3,900 22,545First Bank of Toyama, Ltd. (The) 10,700 27,664First Brothers Co., Ltd. 900 6,202First Juken Co., Ltd. 1,600 16,191First-corp, Inc. 1,600 10,280Fixstars Corp. (d) 4,100 27,772FJ Next Holdings Co., Ltd. (d) 3,800 30,740Focus Systems Corp. 2,900 22,394Forval Corp. 1,900 13,936Foster Electric Co., Ltd. 7,400 43,626France Bed Holdings Co., Ltd. 9,300 65,915FreakOut Holdings, Inc. (a) 800 12,625Freebit Co., Ltd. 2,100 15,052Freund Corp. 2,400 15,457FTGroup Co., Ltd. 1,500 12,877Fudo Tetra Corp. 6,030 75,000Fuji Co., Ltd. (d) 6,700 127,266Fuji Corp. (d) 15,100 273,068Fuji Corp., Ltd. 8,600 43,398Fuji Corp/Miyagi 2,300 22,399Fuji Kyuko Co., Ltd. (d) 4,000 127,442Fuji Media Holdings, Inc. 6,900 66,106Fuji Oil Co., Ltd. (a) 21,100 45,973Fuji Oil Holdings, Inc. 10,600 172,166Fuji Pharma Co., Ltd. 4,600 36,986Fuji Seal International, Inc. (d) 12,100 166,248Fuji Soft, Inc. 4,900 246,312Fujibo Holdings, Inc. 3,300 93,211Fujicco Co., Ltd. (d) 6,500 102,862Fujikura Composites, Inc. (d) 5,800 34,180Fujikura Kasei Co., Ltd. 9,500 35,524Fujikura, Ltd. (a) 76,500 387,999Fujimi, Inc. 2,500 136,559Fujimori Kogyo Co., Ltd. 4,900 149,581Fujisash Co., Ltd. (d) 24,500 14,444Fujishoji Co., Ltd. 1,300 9,354Fujitec Co., Ltd. (d) 9,600 246,903Fujitsu General, Ltd. 5,800 112,818Fujiya Co., Ltd. 3,300 65,855FuKoKu Co., Ltd. (d) 5,100 38,590Fukuda Corp. (d) 2,100 77,479Fukuda Denshi Co., Ltd. 2,100 134,185Fukui Bank, Ltd. (The) 5,400 62,053Fukui Computer Holdings, Inc. 2,700 71,662Fukushima Bank, Ltd. (The) 11,200 20,881Fukushima Galilei Co., Ltd. (d) 3,800 119,194Fukuyama Transporting Co., Ltd. (d) 3,200 95,267FULLCAST Holdings Co., Ltd. 5,400 115,093
BHFTII-84
Copyright © 2022 www.secdatabase.com. All Rights Reserved.Please Consider the Environment Before Printing This Document

Table of ContentsBrighthouse Funds Trust IIBrighthouse/Dimensional International Small Company Portfolio
Schedule of Investments as of March 31, 2022 (Unaudited)Common Stocks��(Continued)
Security Description Shares Value
Japan��(Continued)Funai Soken Holdings, Inc. 10,370 $186,465Furukawa Battery Co., Ltd. (The) (d) 5,000 52,318Furukawa Co., Ltd. (d) 10,500 110,619Furukawa Electric Co., Ltd. (d) 20,900 370,494Furuno Electric Co., Ltd. 8,400 69,471Furuya Metal Co., Ltd. (d) 1,100 92,501Furyu Corp. (d) 4,300 38,685Fuso Chemical Co., Ltd. 4,600 168,526Fuso Pharmaceutical Industries, Ltd. 2,600 46,503Futaba Corp. 10,200 54,822Futaba Industrial Co., Ltd. 19,600 58,271Future Corp. 11,200 158,117Fuyo General Lease Co., Ltd. 5,100 290,238G-7 Holdings, Inc. 5,800 78,333G-Tekt Corp. (d) 7,700 80,239Gakken Holdings Co., Ltd. 6,400 50,000Gakkyusha Co., Ltd. 2,800 35,481Gecoss Corp. 4,600 30,210geechs, Inc. 1,100 12,241Genki Sushi Co., Ltd. (d) 1,600 33,379Genky DrugStores Co., Ltd. 2,400 88,942Geo Holdings Corp. (d) 8,100 82,969Gift Holdings, Inc. 800 15,565GL Sciences, Inc. 1,300 26,948GLOBERIDE, Inc. 5,200 122,619Glory, Ltd. 13,000 219,868GMO Financial Gate, Inc. (d) 200 24,993GMO Financial Holdings, Inc. 8,000 53,803GMO GlobalSign Holdings K.K. (d) 1,000 50,444GMO Pepabo, Inc. 700 13,041GNI Group, Ltd. (a) (d) 6,000 67,178Godo Steel, Ltd. (a) 3,500 37,920Goldcrest Co., Ltd. 6,230 85,725Golf Digest Online, Inc. 900 7,280Good Com Asset Co., Ltd. 1,600 13,636Grandy House Corp. 3,600 15,364gremz, Inc. 900 16,462GS Yuasa Corp. (d) 15,900 302,730GSI Creos Corp. (d) 3,600 33,465Gun-Ei Chemical Industry Co., Ltd. 1,800 44,055GungHo Online Entertainment, Inc. 10,500 223,274Gunma Bank, Ltd. (The) 84,300 243,517Gunze, Ltd. (d) 4,800 146,807H-One Co., Ltd. (d) 6,000 29,769H.U. Group Holdings, Inc. (d) 14,400 342,112H2O Retailing Corp. (d) 24,100 166,641HABA Laboratories, Inc. 700 12,382Hachijuni Bank, Ltd. (The) (d) 67,100 222,674Hagihara Industries, Inc. 4,000 36,898Hagiwara Electric Holdings Co., Ltd. 2,400 39,664Hakudo Co., Ltd. 2,400 50,452Hakuto Co., Ltd. (d) 4,900 97,801Halows Co., Ltd. 1,600 39,659Hamakyorex Co., Ltd. 5,600 131,058Hamee Corp. (d) 1,800 17,170Handsman Co., Ltd. 800 7,401Hanwa Co., Ltd. 10,000 264,455
Japan��(Continued)Happinet Corp. 5,000 61,766Hard Off Corp. Co., Ltd. 3,700 23,435
Copyright © 2022 www.secdatabase.com. All Rights Reserved.Please Consider the Environment Before Printing This Document

Harima Chemicals Group, Inc. (d) 4,300 28,041Haruyama Holdings, Inc. (a) (d) 5,400 23,465Hashimoto Sogyo Holdings Co. Ltd. (d) 700 10,911Hazama Ando Corp. (d) 54,490 403,451Hearts United Group Co., Ltd. (d) 2,600 37,815Heiwa Corp. (d) 11,400 169,931Heiwa Real Estate Co., Ltd. (d) 9,700 314,328Heiwado Co., Ltd. 8,700 135,060Helios Techno Holding Co., Ltd. 2,900 6,946Hennge KK (a) 600 4,562HI-LEX Corp. 5,500 53,825Hibiya Engineering, Ltd. 5,800 87,033Himaraya Co., Ltd. (d) 2,600 21,014Hinokiya Group Co., Ltd. 600 11,566Hioki EE Corp. 3,000 172,149Hirakawa Hewtech Corp. 2,000 18,993Hirano Tecseed Co., Ltd. 1,300 21,869Hirata Corp. (d) 1,000 43,955Hirogin Holdings, Inc. (d) 64,700 342,544Hirose Tusyo, Inc. (a) (d) 300 5,442Hiroshima Electric Railway Co., Ltd. (a) 1,500 10,467Hiroshima Gas Co., Ltd. 7,000 19,257Hisaka Works, Ltd. 7,000 45,378Hitachi Zosen Corp. 50,600 307,559Hito Communications Holdings, Inc. (d) 1,700 25,025Hochiki Corp. 4,600 46,408Hodogaya Chemical Co., Ltd. (d) 1,800 64,426Hogy Medical Co., Ltd. (d) 6,000 158,717Hokkaido Electric Power Co., Inc. 53,500 212,564Hokkaido Gas Co., Ltd. 5,400 65,195Hokkan Holdings, Ltd. (d) 3,300 35,226Hokko Chemical Industry Co., Ltd. 7,000 53,458Hokkoku Financial Holdings, Inc. (d) 7,200 180,007Hokuetsu Corp. (d) 29,900 169,750Hokuetsu Industries Co., Ltd. 7,000 50,017Hokuhoku Financial Group, Inc. (d) 37,300 271,888Hokuriku Electric Industry Co., Ltd. 2,800 27,112Hokuriku Electric Power Co. (d) 47,000 204,901Hokuriku Electrical Construction Co., Ltd. (d) 3,600 23,185Hokuriku Gas Co., Ltd. 1,000 23,793Hokuto Corp. (d) 7,100 110,866Honda Tsushin Kogyo Co., Ltd. (d) 6,100 23,931Honeys Holdings Co., Ltd. (d) 6,930 59,273Honma Golf, Ltd. 27,000 10,776Hoosiers Holdings Co., Ltd. 8,000 42,579Horiba, Ltd. 1,600 87,450Hoshi Iryo-Sanki Co., Ltd. 300 8,151Hosiden Corp. (d) 16,400 154,855Hosokawa Micron Corp. 4,400 96,167Hotland Co., Ltd. 3,200 34,688Hotto Link, Inc. (a) (d) 800 3,073Howa Machinery, Ltd. 4,400 29,205HPC Systems, Inc. (a) 500 8,628HS Holdings Co., Ltd. (a) 10,300 109,580Hyakugo Bank, Ltd. (The) 68,600 187,386
BHFTII-85
Copyright © 2022 www.secdatabase.com. All Rights Reserved.Please Consider the Environment Before Printing This Document

Table of ContentsBrighthouse Funds Trust IIBrighthouse/Dimensional International Small Company Portfolio
Schedule of Investments as of March 31, 2022 (Unaudited)Common Stocks��(Continued)
Security Description Shares Value
Japan��(Continued)Hyakujushi Bank, Ltd. (The) 5,800 $78,409I�ll, Inc. 900 11,381I�rom Group Co., Ltd. 2,700 42,098i-mobile Co., Ltd. 1,800 18,460I-NE Co., Ltd. (a) (d) 400 10,449I-Net Corp. 3,520 36,687I-PEX, Inc. 3,100 37,033IBJ, Inc. (d) 4,900 31,961Ichigo, Inc. 68,700 176,586Ichiken Co., Ltd. 1,800 27,392Ichikoh Industries, Ltd. 9,000 30,182Ichimasa Kamaboko Co., Ltd. 1,100 7,621ICHINEN HOLDINGS Co., Ltd. 7,400 78,743Ichiyoshi Securities Co., Ltd. 12,600 63,511Icom, Inc. (d) 2,600 52,623ID Holdings Corp. 3,899 27,011Idec Corp. 7,500 156,755IDOM, Inc. 20,400 121,321Ihara Science Corp. 1,800 29,405Iino Kaiun Kaisha, Ltd. 23,200 156,277IJTT Co., Ltd. 9,000 39,287Ikegami Tsushinki Co., Ltd. 2,600 13,407Imagica Group, Inc. 4,500 26,103Imasen Electric Industrial (d) 2,000 9,809Imuraya Group Co., Ltd. (d) 2,900 53,720Inaba Denki Sangyo Co., Ltd. 15,300 310,402Inaba Seisakusho Co., Ltd. 3,200 34,621Inabata & Co., Ltd. (d) 13,000 219,045Inageya Co., Ltd. (d) 2,000 22,092Ines Corp. 7,300 97,465Infocom Corp. 4,500 77,386Infomart Corp. (d) 44,600 238,840Information Services International-Dentsu,
Ltd. 4,800 152,542INFRONEER Holdings, Inc. (d) 48,775 416,702Innotech Corp. 3,900 43,969Insource Co., Ltd. (d) 5,600 106,046Intage Holdings, Inc. (d) 11,600 162,215Intelligent Wave, Inc. 3,400 16,099Inter Action Corp. (d) 2,700 47,568Inui Global Logistics Co., Ltd. (d) 1,300 21,247IR Japan Holdings, Ltd. (d) 2,000 69,661Iriso Electronics Co., Ltd. (d) 5,500 149,622ISB Corp. 400 3,688Ise Chemicals Corp. (d) 1,000 34,977Iseki & Co., Ltd. 5,700 60,499Ishihara Chemical Co., Ltd. 1,200 12,251Ishihara Sangyo Kaisha, Ltd. 12,200 106,595Ishii Iron Works Co., Ltd. (d) 900 21,679Ishizuka Glass Co., Ltd. 500 8,267Itfor, Inc. 7,800 50,174ITmedia, Inc. 1,500 21,963Itochu Enex Co., Ltd. 17,400 146,489Itochu-Shokuhin Co., Ltd. (d) 2,000 79,731Itoham Yonekyu Holdings, Inc. (d) 29,500 157,061Itoki Corp. 15,600 44,304Itokuro, Inc. (a) (d) 1,900 7,992IwaiCosmo Holdings, Inc. (d) 6,200 67,448
Japan��(Continued)Iwaki Co., Ltd. 1,300 11,633
Copyright © 2022 www.secdatabase.com. All Rights Reserved.Please Consider the Environment Before Printing This Document

Iwasaki Electric Co., Ltd. 2,500 46,708Iwatsuka Confectionery Co., Ltd. 1,000 32,067Iyo Bank, Ltd. (The) (d) 61,000 297,799Izumi Co., Ltd. 7,400 194,534J Front Retailing Co., Ltd. (d) 22,700 184,597J Trust Co., Ltd. 21,200 60,815J-Lease Co., Ltd. (d) 600 8,456J-Oil Mills, Inc. (d) 6,600 86,832J-Stream, Inc. 1,000 6,281JAC Recruitment Co., Ltd. 3,900 58,959Jaccs Co., Ltd. 6,100 153,293JAFCO Group Co., Ltd. (a) 27,900 425,775JANOME Corp. (d) 7,099 42,683Japan Aviation Electronics Industry, Ltd. (d) 15,200 246,371Japan Cash Machine Co., Ltd. 4,300 23,615Japan Communications, Inc. (a) (d) 22,400 38,801Japan Electronic Materials Corp. (d) 2,400 40,981Japan Elevator Service Holdings Co., Ltd. (d) 11,700 151,777Japan Foundation Engineering Co., Ltd. (d) 7,900 47,199Japan Investment Adviser Co., Ltd. (d) 3,200 32,066Japan Lifeline Co., Ltd. 15,500 129,760Japan Material Co., Ltd. (d) 14,400 203,690Japan Medical Dynamic Marketing, Inc. 4,400 58,746Japan Oil Transportation Co., Ltd. 700 15,220Japan Petroleum Exploration Co., Ltd. 11,400 241,284Japan Property Management Center Co., Ltd. 4,100 34,423Japan Pulp & Paper Co., Ltd. 3,700 117,754Japan Pure Chemical Co., Ltd. (d) 500 9,838Japan Securities Finance Co., Ltd. 24,000 180,490Japan Steel Works, Ltd. (The) (d) 7,400 229,726Japan Transcity Corp. (d) 12,000 59,353Japan Wool Textile Co., Ltd. (The) 17,100 124,760Jastec Co., Ltd. (d) 4,300 38,829JBCC Holdings, Inc. 5,300 67,280JCR Pharmaceuticals Co., Ltd. (d) 1,900 34,842JCU Corp. (d) 5,700 192,390JFE Systems, Inc. 700 14,392JGC Holdings Corp. (d) 38,400 459,641JIG-SAW, Inc. (a) (d) 900 47,692Jimoto Holdings, Inc. 6,790 34,455JINS Holdings, Inc. (d) 3,200 150,797JINUSHI Co., Ltd. 3,500 54,029JK Holdings Co., Ltd. (d) 5,600 54,925JM Holdings Co., Ltd. 3,200 45,768JMS Co., Ltd. 6,400 31,902Joban Kosan Co., Ltd. (a) 1,700 19,152Joshin Denki Co., Ltd. 5,700 89,420Joyful Honda Co., Ltd. 7,500 91,885JP-Holdings, Inc. (d) 17,900 31,746JSB Co., Ltd. 1,000 28,030JSP Corp. 3,900 48,982Juki Corp. 7,200 49,119Juroku Financial Group, Inc. (d) 9,700 172,318JVC Kenwood Corp. (d) 53,300 77,467K&O Energy Group, Inc. 5,400 74,322K�s Holdings Corp. (d) 39,000 402,808
BHFTII-86
Copyright © 2022 www.secdatabase.com. All Rights Reserved.Please Consider the Environment Before Printing This Document

Table of ContentsBrighthouse Funds Trust IIBrighthouse/Dimensional International Small Company Portfolio
Schedule of Investments as of March 31, 2022 (Unaudited)Common Stocks��(Continued)
Security Description Shares Value
Japan��(Continued)Kadoya Sesame Mills, Inc. (d) 800 $24,473Kaga Electronics Co., Ltd. 5,900 156,305Kagome Co., Ltd. 6,700 171,196Kaken Pharmaceutical Co., Ltd. (d) 6,800 216,221Kakiyasu Honten Co., Ltd. 2,500 49,792Kamakura Shinsho, Ltd. (d) 3,700 19,002Kameda Seika Co., Ltd. (d) 3,500 114,218Kamei Corp. (d) 7,700 63,514Kanaden Corp. 6,300 51,142Kanagawa Chuo Kotsu Co., Ltd. 2,400 68,362Kanamic Network Co., Ltd. 4,200 17,910Kanamoto Co., Ltd. 9,900 161,919Kandenko Co., Ltd. 21,900 149,424Kaneka Corp. 5,500 158,974Kaneko Seeds Co., Ltd. (d) 1,300 17,030Kanematsu Corp. 24,900 272,974Kanematsu Electronics, Ltd. 3,100 97,113Kanemi Co., Ltd. 100 2,235Kanto Denka Kogyo Co., Ltd. 15,000 131,753Kasai Kogyo Co., Ltd. (a) 8,600 19,549Katakura & Co-op Agri Corp. 1,600 16,630Katakura Industries Co., Ltd. (d) 7,800 142,382Katitas Co., Ltd. 400 11,004Kato Sangyo Co., Ltd. 7,100 184,037Kato Works Co., Ltd. 3,800 24,293Kawada Technologies, Inc. 1,500 44,299Kawai Musical Instruments Manufacturing
Co., Ltd. 1,600 42,630Kawasaki Kinkai Kisen Kaisha, Ltd. (d) 700 26,474KeePer Technical Laboratory Co., Ltd. 3,000 60,462Keihanshin Building Co., Ltd. 10,600 129,752Keihin Co., Ltd./Minato-Ku Tokyo Japan 2,300 27,949Keiyo Bank, Ltd. (The) 33,200 133,502Keiyo Co., Ltd. 10,600 77,209Kenko Mayonnaise Co., Ltd. 4,100 46,564KFC Holdings Japan, Ltd. 4,000 93,155KH Neochem Co., Ltd. 9,400 210,573Ki-Star Real Estate Co., Ltd. (d) 3,000 127,387Kimoto Co., Ltd. (d) 14,900 26,449Kimura Chemical Plants Co., Ltd. (d) 3,300 23,326King Jim Co., Ltd. (d) 1,400 10,497Kinki Sharyo Co., Ltd. (The) 1,200 11,710Kintetsu World Express, Inc. 11,200 287,278Kissei Pharmaceutical Co., Ltd. 8,100 168,878Kita-Nippon Bank, Ltd. (The) 2,900 37,404Kitagawa Corp. 3,100 33,895Kitano Construction Corp. 1,400 24,463Kitanotatsujin Corp. 14,100 25,791Kito Corp. 5,900 85,556Kitz Corp. 19,100 107,383Kiyo Bank, Ltd. (The) (d) 18,700 209,542KLab, Inc. (a) 10,600 38,167Koa Corp. (d) 8,400 98,087Koatsu Gas Kogyo Co., Ltd. 11,100 60,012Kobe Electric Railway Co., Ltd. (a) (d) 1,400 37,748Kobe Steel, Ltd. (d) 63,920 308,689Kohnan Shoji Co., Ltd. 7,600 216,961Kohsoku Corp. (d) 4,000 52,258
Japan��(Continued)Koike Sanso Kogyo Co., Ltd. (d) 700 11,657
Copyright © 2022 www.secdatabase.com. All Rights Reserved.Please Consider the Environment Before Printing This Document

Kojima Co., Ltd. 7,800 36,651Kokusai Pulp & Paper Co., Ltd. (d) 3,700 9,594Kokuyo Co., Ltd. 21,700 286,164KOMAIHALTEC, Inc. (d) 1,800 31,955Komatsu Seiren Co., Ltd. 6,700 77,101Komatsu Wall Industry Co., Ltd. 2,700 40,564KOMEDA Holdings Co., Ltd. 10,500 175,024Komehyo Holdings Co., Ltd. (d) 1,300 19,752Komeri Co., Ltd. 11,000 236,519Komori Corp. 14,100 83,859Konaka Co., Ltd. (d) 7,300 20,124Kondotec, Inc. 6,900 57,453Konica Minolta, Inc. (d) 115,700 488,028Konishi Co., Ltd. 9,900 126,354Konoike Transport Co., Ltd. 6,900 64,940Konoshima Chemical Co., Ltd. 600 8,632Kosaido Holdings Co., Ltd. (a) 3,700 24,236Kotobukiya Co., Ltd. 500 22,238Kozo Keikaku Engineering, Inc. 1,200 24,708Krosaki Harima Corp. 1,600 53,980KRS Corp. (d) 4,400 36,036KU Holdings Co., Ltd. (d) 6,700 58,994Kumagai Gumi Co., Ltd. 11,000 243,538Kumiai Chemical Industry Co., Ltd. 10,995 79,318Kunimine Industries Co., Ltd. 1,200 9,821Kurabo Industries, Ltd. 5,600 80,398Kureha Corp. (d) 4,700 375,545Kurimoto, Ltd. 2,800 36,016Kuriyama Holdings Corp. 2,300 18,066Kusuri no. Aoki Holdings Co., Ltd. (d) 3,400 189,153KYB Corp. (d) 6,400 154,850Kyoden Co., Ltd. (d) 6,500 30,966Kyodo Printing Co., Ltd. (d) 2,600 58,872Kyoei Steel, Ltd. 6,700 73,182Kyokuto Boeki Kaisha, Ltd. (d) 1,800 32,329Kyokuto Kaihatsu Kogyo Co., Ltd. 9,800 111,033Kyokuto Securities Co., Ltd. (d) 7,600 45,452Kyokuyo Co., Ltd. 3,500 95,490KYORIN Holdings, Inc. 12,800 186,019Kyoritsu Printing Co., Ltd. 6,800 7,993Kyosan Electric Manufacturing Co., Ltd. 16,000 57,098Kyowa Electronic Instruments Co., Ltd. (d) 8,000 23,954Kyowa Leather Cloth Co., Ltd. 3,300 17,606Kyudenko Corp. (d) 7,500 175,548Kyushu Financial Group, Inc. 80,900 264,828LAC Co., Ltd. 5,900 44,278Lacto Japan Co., Ltd. 1,400 23,943LEC, Inc. (d) 8,800 63,326Life Corp. 2,800 72,126LIFULL Co., Ltd. (d) 17,000 34,187Like, Inc. 2,100 35,140Linical Co., Ltd. 2,600 19,375Link And Motivation, Inc. 8,900 39,382Lintec Corp. 10,500 208,769LITALICO, Inc. 4,000 91,935Look Holdings, Inc. (d) 2,200 27,430
BHFTII-87
Copyright © 2022 www.secdatabase.com. All Rights Reserved.Please Consider the Environment Before Printing This Document

Table of ContentsBrighthouse Funds Trust IIBrighthouse/Dimensional International Small Company Portfolio
Schedule of Investments as of March 31, 2022 (Unaudited)Common Stocks��(Continued)
Security Description Shares Value
Japan��(Continued)M&A Capital Partners Co., Ltd. (a) 3,600 $127,623m-up Holdings, Inc. 3,600 30,160Mabuchi Motor Co., Ltd. 10,900 339,786Macnica Fuji Electronics Holdings, Inc. 14,550 312,197Macromill, Inc. 13,700 130,391Maeda Kosen Co., Ltd. 5,100 133,630Maezawa Kasei Industries Co., Ltd. 4,300 44,952Maezawa Kyuso Industries Co., Ltd. 5,800 46,137Makino Milling Machine Co., Ltd. (d) 7,000 220,875Management Solutions Co., Ltd. (a) 1,800 54,779Mandom Corp. 8,900 95,346Mani, Inc. 17,100 204,202MarkLines Co., Ltd. (d) 3,000 70,160Mars Group Holdings Corp. 3,600 50,102Marubun Corp. (d) 6,100 35,456Marudai Food Co., Ltd. (d) 6,700 81,258Marufuji Sheet Piling Co., Ltd. 1,300 20,669Maruha Nichiro Corp. (d) 12,000 235,209Maruichi Steel Tube, Ltd. (d) 5,700 128,646MARUKA FURUSATO Corp. 5,893 142,706Marumae Co., Ltd. (d) 2,500 48,402Marusan Securities Co., Ltd. (d) 19,700 80,099Maruwa Co., Ltd. 2,600 346,223Maruwa Unyu Kikan Co., Ltd. (d) 4,900 45,001Maruyama Manufacturing Co., Inc. 1,500 19,156Maruzen CHI Holdings Co., Ltd. 11,900 37,213Maruzen Co. Ltd/Taito ward 900 13,094Maruzen Showa Unyu Co., Ltd. 3,600 93,125Marvelous, Inc. 9,500 56,022Matching Service Japan Co., Ltd. (d) 1,200 8,324Matsuda Sangyo Co., Ltd. (d) 5,000 101,003Matsui Construction Co., Ltd. 6,400 34,628Matsui Securities Co., Ltd. (d) 24,900 164,154Max Co., Ltd. 8,400 116,783Maxel,l Ltd. 15,300 150,301Maxvalu Tokai Co., Ltd. 3,500 73,855MCJ Co., Ltd. (d) 17,300 131,386Mebuki Financial Group, Inc. (d) 74,200 154,946MEC Co., Ltd. 4,200 113,465Media Do Co., Ltd. (d) 2,100 43,362Medical Data Vision Co., Ltd. 6,800 65,621Medical System Network Co., Ltd. 7,000 31,231Medikit Co., Ltd. 1,300 24,823Medius Holdings Co., Ltd. (d) 1,800 14,211MedPeer, Inc. (a) (d) 2,600 83,306Megachips Corp. (a) 4,800 147,094Megmilk Snow Brand Co., Ltd. 14,000 227,398Meidensha Corp. (d) 10,100 208,662Meiji Electric Industries Co., Ltd. 1,000 8,433Meiji Shipping Co., Ltd. (d) 4,300 30,534Meiko Electronics Co., Ltd. 6,300 207,114Meisei Industrial Co., Ltd. 11,600 65,391Meitec Corp. (d) 6,300 342,143Meito Sangyo Co., Ltd. 3,000 39,138Meiwa Corp. (d) 8,100 60,720Meiwa Estate Co., Ltd. 5,200 25,704Melco Holdings, Inc. 1,500 47,866
Japan��(Continued)Members Co., Ltd. 1,800 46,716Menicon Co., Ltd. (d) 10,300 246,209
Copyright © 2022 www.secdatabase.com. All Rights Reserved.Please Consider the Environment Before Printing This Document

Mercuria Holdings Co., Ltd. 2,100 8,608Metaps, Inc. (a) 1,300 8,293MetaReal Corp. (a) (d) 1,400 11,486METAWATER Co., Ltd. 3,600 58,735Michinoku Bank Ltd. (The) (a) (b) (c) (d) 5,700 41,296Micronics Japan Co., Ltd. 6,300 85,221Mie Kotsu Group Holdings, Inc. (d) 8,600 32,098Mikuni Corp. (d) 7,300 24,029Milbon Co., Ltd. 6,720 301,254MIMAKI ENGINEERING Co., Ltd. 1,700 9,480Mimasu Semiconductor Industry Co., Ltd. 4,400 91,394Ministop Co., Ltd. 5,400 64,167Miraial Co., Ltd. 2,900 41,325Mirait Holdings Corp. 24,080 383,558Miroku Jyoho Service Co., Ltd. 5,500 63,839Mitani Corp. 22,700 344,060Mitani Sekisan Co., Ltd. (d) 2,100 114,259Mito Securities Co., Ltd. (d) 19,600 43,958Mitsuba Corp. 12,300 37,007Mitsubishi Kakoki Kaisha, Ltd. (d) 800 13,143Mitsubishi Logisnext Co., Ltd. (d) 8,400 63,834Mitsubishi Logistics Corp. (d) 4,800 118,987Mitsubishi Materials Corp. (d) 3,900 68,406Mitsubishi Paper Mills, Ltd. 8,800 22,498Mitsubishi Pencil Co., Ltd. 8,200 84,772Mitsubishi Research Institute, Inc. 2,000 65,458Mitsubishi Shokuhin Co., Ltd. 4,800 118,461Mitsubishi Steel Manufacturing Co., Ltd. (d) 4,400 40,661Mitsuboshi Belting, Ltd. 6,700 110,834Mitsui DM Sugar Holdings Co., Ltd. 6,100 96,195Mitsui Engineering & Shipbuilding Co., Ltd.
(a) (d) 24,900 74,550Mitsui Matsushima Co., Ltd. (d) 5,200 81,571Mitsui Mining & Smelting Co., Ltd. (d) 17,000 466,014Mitsui-Soko Holdings Co., Ltd. 6,100 125,077Mitsumura Printing Co., Ltd. 500 6,075Mitsuuroko Group Holdings Co., Ltd. (d) 10,100 85,268Mixi, Inc. 11,700 210,024Miyaji Engineering Group, Inc. 1,800 50,849Miyazaki Bank, Ltd. (The) 5,400 90,794Miyoshi Oil & Fat Co., Ltd. (d) 2,800 26,564Mizuho Leasing Co., Ltd. 8,700 211,693Mizuho Medy Co., Ltd. 500 8,183Mizuno Corp. 5,800 100,067Mochida Pharmaceutical Co., Ltd. 4,700 143,672Modec, Inc. 6,100 63,816Monex Group, Inc. (d) 45,500 238,405Money Partners Group Co., Ltd. 7,100 17,199Monogatari Corp. (The) 2,600 123,230MORESCO Corp. (d) 2,500 23,265Morinaga & Co., Ltd. (d) 7,600 237,194Morinaga Milk Industry Co., Ltd. 2,100 89,835Moriroku Holdings Co., Ltd. 800 11,821Morita Holdings Corp. 11,200 113,299Morito Co., Ltd. 3,400 21,603Morozoff, Ltd. 1,800 44,460
BHFTII-88
Copyright © 2022 www.secdatabase.com. All Rights Reserved.Please Consider the Environment Before Printing This Document

Table of ContentsBrighthouse Funds Trust IIBrighthouse/Dimensional International Small Company Portfolio
Schedule of Investments as of March 31, 2022 (Unaudited)Common Stocks��(Continued)
Security Description Shares Value
Japan��(Continued)Mortgage Service Japan, Ltd. (d) 1,200 $9,275Mory Industries, Inc. 1,600 33,609Mr. Max Holdings, Ltd. 10,500 50,052MRK Holdings, Inc. (d) 15,600 15,114MTI, Ltd. (d) 6,800 25,312Mugen Estate Co., Ltd. 3,300 13,673Murakami Corp. 2,500 49,617Musashi Seimitsu Industry Co., Ltd. (d) 13,400 164,706Musashino Bank, Ltd. (The) (d) 9,500 135,923Mutoh Holdings Co., Ltd. (d) 900 15,612NAC Co., Ltd. (d) 3,600 28,090Nachi-Fujikoshi Corp. 4,200 143,540Nafco Co., Ltd. 2,600 36,240Nagano Bank, Ltd. (The) (d) 3,500 36,614Nagano Keiki Co., Ltd. 4,200 43,063Nagase & Co., Ltd. 30,600 454,292Nagatanien Holdings Co., Ltd. 4,000 63,424Nagawa Co., Ltd. (d) 2,000 164,108Naigai Trans Line, Ltd. (d) 2,100 32,842Nakabayashi Co., Ltd. (d) 5,500 22,296Nakamuraya Co., Ltd. (d) 1,600 41,243Nakanishi, Inc. 15,100 278,468Nakano Corp. 4,000 10,948Nakayama Steel Works, Ltd. 6,300 22,938Nakayamafuku Co., Ltd. 2,000 5,817Namura Shipbuilding Co., Ltd. (a) (d) 18,956 50,546Nankai Electric Railway Co., Ltd. (d) 21,700 418,942Nanto Bank, Ltd. (The) 9,200 148,149Narasaki Sangyo Co., Ltd. 800 13,576Natori Co., Ltd. 2,600 41,562NEC Capital Solutions, Ltd. 3,800 64,498NEC Networks & System Integration Corp. 5,200 75,658NET One Systems Co., Ltd. 13,100 304,979Neturen Co., Ltd. 9,800 47,274New Art Holdings Co., Ltd. 1,235 12,750New Japan Chemical Co., Ltd. (d) 9,900 19,559Nextage Co., Ltd. (d) 9,800 177,083NexTone, Inc. (a) (d) 700 16,304NF Holdings Corp. 1,600 16,169NHK Spring Co., Ltd. (d) 49,600 357,805Nicca Chemical Co., Ltd. 1,400 8,611Nice Corp. 2,300 36,850Nichi-iko Pharmaceutical Co., Ltd. (a) (d) 14,900 94,773Nichia Steel Works, Ltd. 9,100 20,021Nichias Corp. 16,500 340,025Nichiban Co., Ltd. 4,000 55,654Nichicon Corp. 17,900 171,055Nichiden Corp. (d) 5,200 91,582Nichiha Corp. 7,900 161,795Nichimo Co., Ltd. 1,600 37,795Nichireki Co., Ltd. 8,200 82,652Nichirin Co., Ltd. 1,400 17,751Nihon Chouzai Co., Ltd. 3,320 36,084Nihon Dengi Co., Ltd. 400 12,290Nihon Flush Co., Ltd. 6,000 48,375Nihon House Holdings Co., Ltd. 15,000 55,589Nihon Kagaku Sangyo Co., Ltd. 3,000 28,936
Japan��(Continued)Nihon Kohden Corp. 1,300 31,244Nihon Nohyaku Co., Ltd. (d) 14,000 69,840
Copyright © 2022 www.secdatabase.com. All Rights Reserved.Please Consider the Environment Before Printing This Document

Nihon Parkerizing Co., Ltd. (d) 24,500 186,400Nihon Plast Co., Ltd. (d) 4,500 18,522Nihon Tokushu Toryo Co., Ltd. 2,900 19,859Nihon Yamamura Glass Co., Ltd. (a) 3,800 25,469Nikkato Corp. 1,700 7,492Nikkiso Co., Ltd. 16,800 125,701Nikko Co., Ltd. (d) 9,000 44,708Nikkon Holdings Co., Ltd. (d) 17,700 295,911Nippn Corp. 14,300 194,862Nippon Air Conditioning Services Co., Ltd. 9,600 62,360Nippon Aqua Co., Ltd. 3,000 16,075Nippon Beet Sugar Manufacturing Co., Ltd. 3,800 50,162Nippon Carbide Industries Co., Inc. 2,300 26,073Nippon Carbon Co., Ltd. 3,000 102,722Nippon Chemi-Con Corp. (a) 5,900 90,952Nippon Chemical Industrial Co., Ltd. 2,400 47,246Nippon Chemiphar Co., Ltd. 800 13,668Nippon Coke & Engineering Co., Ltd. 61,100 71,920Nippon Computer Dynamics Co., Ltd. (d) 1,700 9,600Nippon Concept Corp. 1,500 18,765Nippon Concrete Industries Co., Ltd. 14,000 33,327Nippon Denko Co., Ltd. (d) 38,165 105,482Nippon Densetsu Kogyo Co., Ltd. 10,300 133,053Nippon Dry-Chemical Co., Ltd. (d) 1,000 14,224Nippon Electric Glass Co., Ltd. 19,600 434,191Nippon Felt Co., Ltd. 8,600 36,461Nippon Filcon Co., Ltd. 5,200 22,264Nippon Fine Chemical Co., Ltd. (d) 4,300 77,946Nippon Gas Co., Ltd. (d) 28,200 342,976Nippon Hume Corp. 6,700 37,836Nippon Kayaku Co., Ltd. (d) 21,700 205,508Nippon Kodoshi Corp. (d) 1,600 28,952Nippon Koei Co., Ltd. 4,200 102,851Nippon Light Metal Holdings Co., Ltd. (d) 16,500 231,019Nippon Paper Industries Co., Ltd. (d) 26,600 226,581Nippon Parking Development Co., Ltd. 65,100 82,040Nippon Pillar Packing Co., Ltd. 6,500 162,273Nippon Piston Ring Co., Ltd. 3,200 34,199Nippon Rietec Co., Ltd. (d) 3,700 38,943Nippon Road Co., Ltd. (The) (d) 969 65,934Nippon Seiki Co., Ltd. 15,000 104,763Nippon Seisen Co., Ltd. (d) 700 25,438Nippon Sharyo, Ltd. 2,600 46,293Nippon Sheet Glass Co., Ltd. (a) 10,700 37,241Nippon Shokubai Co., Ltd. 2,600 113,186Nippon Signal Co., Ltd. (d) 17,500 126,080Nippon Soda Co., Ltd. 6,700 184,604Nippon Steel Trading Corp. 4,596 199,347Nippon Suisan Kaisha, Ltd. 80,800 362,489Nippon Systemware Co., Ltd. 1,900 33,966Nippon Thompson Co., Ltd. 15,700 68,837Nippon Yakin Kogyo Co., Ltd. 4,100 94,029Nipro Corp. 34,200 286,183Nishi-Nippon Financial Holdings, Inc. 35,700 220,118Nishi-Nippon Railroad Co., Ltd. 13,600 298,029
BHFTII-89
Copyright © 2022 www.secdatabase.com. All Rights Reserved.Please Consider the Environment Before Printing This Document

Table of ContentsBrighthouse Funds Trust IIBrighthouse/Dimensional International Small Company Portfolio
Schedule of Investments as of March 31, 2022 (Unaudited)Common Stocks��(Continued)
Security Description Shares Value
Japan��(Continued)Nishikawa Rubber Co., Ltd. 1,200 $13,273Nishimatsu Construction Co., Ltd. (d) 15,600 467,883Nishimatsuya Chain Co., Ltd. (d) 12,500 161,055Nishimoto Co., Ltd. (d) 1,400 32,485Nishio Rent All Co., Ltd. 6,000 136,807Nissan Shatai Co., Ltd. 12,600 57,195Nissan Tokyo Sales Holdings Co., Ltd. 11,000 20,419Nissei ASB Machine Co., Ltd. 2,300 58,446Nissei Plastic Industrial Co., Ltd. 6,000 49,439Nissha Co., Ltd. (d) 14,100 166,646Nisshin Group Holdings Co., Ltd. (d) 12,300 46,541Nisshin Oillio Group, Ltd. (The) 7,400 172,968Nisshinbo Holdings, Inc. (d) 39,820 345,402Nissin Corp. 4,300 57,336Nissin Electric Co., Ltd. 14,800 177,784Nissin Sugar Co., Ltd. (d) 2,400 33,170Nisso Corp. 1,400 8,628Nissui Pharmaceutical Co., Ltd. 4,000 32,040Nitta Corp. 6,800 153,642Nitta Gelatin, Inc. (d) 4,500 24,496Nittan Valve Co., Ltd. (d) 6,300 14,556Nittetsu Mining Co., Ltd. (d) 1,700 98,312Nitto Boseki Co., Ltd. 4,100 94,017Nitto Fuji Flour Milling Co., Ltd. 800 29,618Nitto Kogyo Corp. 9,000 115,860Nitto Kohki Co., Ltd. 4,100 52,193Nitto Seiko Co., Ltd. 8,900 36,608Nittoc Construction Co., Ltd. (d) 7,450 42,845NJS Co., Ltd. 2,200 36,355Noevir Holdings Co., Ltd. 3,200 129,339Nohmi Bosai, Ltd. 7,000 111,662Nojima Corp. 9,000 169,809NOK Corp. (d) 17,100 159,497Nomura Co., Ltd. 1,200 8,978Nomura Micro Science Co., Ltd. (d) 1,300 44,372Noritake Co., Ltd. (d) 2,800 101,959Noritsu Koki Co., Ltd. 5,200 99,002Noritz Corp. (d) 10,600 126,897North Pacific Bank, Ltd. 74,900 146,081NS Tool Co., Ltd. (d) 4,800 56,861NS United Kaiun Kaisha, Ltd. (d) 3,300 113,216NSD Co., Ltd. (d) 18,540 331,209NTN Corp. (a) (d) 124,600 216,798OAK Capital Corp. (a) (d) 15,500 9,891Oat Agrio Co., Ltd. 400 3,734Obara Group, Inc. (d) 3,800 92,874Oenon Holdings, Inc. (d) 12,300 32,490Ogaki Kyoritsu Bank, Ltd. (The) 10,900 168,988Ohara, Inc. 1,600 16,629Ohashi Technica, Inc. (d) 3,800 40,236Ohba Co., Ltd. (d) 4,600 28,612Ohsho Food Service Corp. 3,600 177,011OIE Sangyo Co., Ltd. (a) (d) 800 6,360Oiles Corp. (d) 8,000 99,038Oisix ra daichi, Inc. (a) (d) 5,600 137,584Oita Bank, Ltd. (The) 5,000 78,193Okabe Co., Ltd. (d) 12,500 70,446
Japan��(Continued)Okada Aiyon Corp. 1,900 22,312Okamoto Industries, Inc. 3,200 102,174
Copyright © 2022 www.secdatabase.com. All Rights Reserved.Please Consider the Environment Before Printing This Document

Okamoto Machine Tool Works, Ltd. (d) 1,400 51,227Okamura Corp. (d) 17,500 172,965Okasan Securities Group, Inc. (d) 39,200 118,309Okaya Electric Industries Co., Ltd. (a) (d) 5,800 14,206Oki Electric Industry Co., Ltd. 25,700 177,390Okinawa Cellular Telephone Co. 4,000 161,870Okinawa Electric Power Co., Inc. (The) (d) 14,827 167,831Okinawa Financial Group, Inc. 7,360 123,572OKUMA Corp. (d) 7,800 323,443Okumura Corp. 8,200 199,347Okura Industrial Co., Ltd. (d) 3,000 44,600Okuwa Co., Ltd. 7,400 55,853Olympic Group Corp. (d) 2,600 15,196ONO Sokki Co., Ltd. 4,200 16,229Onoken Co., Ltd. (d) 4,300 54,212Onward Holdings Co., Ltd. 31,800 66,359Optex Group Co., Ltd. (d) 6,000 84,667Optim Corp. (a) 4,200 34,885Optorun Co., Ltd. 5,500 94,300Organo Corp. 2,300 189,555Oricon, Inc. 1,200 8,850Orient Corp. (d) 116,700 118,300Oriental Shiraishi Corp. 39,400 76,319Origin Co., Ltd. 3,400 33,807Oro Co., Ltd. (d) 2,100 39,760Osaka Organic Chemical Industry, Ltd. (d) 4,100 101,861Osaka Soda Co., Ltd. 5,000 127,326Osaka Steel Co., Ltd. 5,000 63,285Osaki Electric Co., Ltd. 14,400 55,074OSG Corp. 19,400 297,265OUG Holdings, Inc. 700 15,706Outsourcing, Inc. 32,100 331,122Oyo Corp. (d) 6,400 120,515Ozu Corp. 600 10,447Pacific Industrial Co., Ltd. 13,700 105,604Pacific Metals Co., Ltd. (d) 5,100 172,672Pack Corp. (The) (d) 4,600 96,612Pal Group Holdings Co., Ltd. 4,300 54,486PALTAC Corp. 100 3,708PAPYLESS Co., Ltd. (d) 700 7,999Paraca, Inc. 300 4,201Paramount Bed Holdings Co., Ltd. 12,000 195,293Paris Miki Holdings, Inc. (d) 10,600 23,179Park24 Co., Ltd. (a) 16,400 268,373Pasona Group, Inc. 6,200 124,201PC Depot Corp. (d) 7,000 17,343PCA Corp. (d) 800 10,034PCI Holdings, Inc. (d) 1,800 16,045Pegasus Sewing Machine Manufacturing
Co., Ltd. 5,400 26,149Penta-Ocean Construction Co., Ltd. 62,000 310,139People Dreams & Technologies Group Co.,
Ltd. 1,400 23,524PeptiDream, Inc. (a) 3,300 58,554Phil Co., Inc. (d) 700 7,215Pickles Corp. 2,600 34,520Pigeon Corp. 8,300 146,155
BHFTII-90
Copyright © 2022 www.secdatabase.com. All Rights Reserved.Please Consider the Environment Before Printing This Document

Table of ContentsBrighthouse Funds Trust IIBrighthouse/Dimensional International Small Company Portfolio
Schedule of Investments as of March 31, 2022 (Unaudited)Common Stocks��(Continued)
Security Description Shares Value
Japan��(Continued)Pilot Corp. 4,400 $189,076Piolax, Inc. 9,700 123,202Pipedo HD, Inc. (d) 700 15,721Plenus Co., Ltd. 2,500 41,147Poletowin Pitcrew Holdings, Inc. (d) 7,900 72,916PR Times, Inc. (a) (d) 700 18,426Premier Anti-Aging Co., Ltd. (a) (d) 500 15,216Premium Group Co., Ltd. 2,600 85,475Premium Water Holdings, Inc. 500 9,901Press Kogyo Co., Ltd. (d) 29,900 92,091Pressance Corp. 4,000 59,739Prestige International, Inc. 27,100 159,296Prima Meat Packers, Ltd. 7,500 135,103Pro-Ship, Inc. (d) 2,300 26,886Pronexus, Inc. 5,100 44,224Proto Corp. 8,800 74,207PS Mitsubishi Construction Co., Ltd. (d) 8,800 42,119Punch Industry Co., Ltd. 2,700 10,980QB Net Holdings Co., Ltd. (a) 1,400 17,158Qol Holdings Co., Ltd. 7,400 70,366Quick Co., Ltd. 4,000 51,600Raccoon Holdings, Inc. (d) 4,100 42,159Raito Kogyo Co., Ltd. 13,400 213,948Raiznext Corp. (d) 11,000 96,484Rasa Industries, Ltd. (d) 2,600 33,483Raysum Co., Ltd. 5,300 40,059Relia, Inc. 11,500 99,747Relo Group, Inc. 2,900 43,199Rengo Co., Ltd. (d) 35,200 225,048RENOVA, Inc. (a) (d) 5,100 71,027Resorttrust, Inc. 25,500 435,333Restar Holdings Corp. 6,900 111,369Retail Partners Co., Ltd. 4,300 50,568Rheon Automatic Machinery Co., Ltd. 5,000 41,524Rhythm Co., Ltd. 2,500 30,454Riberesute Corp. 4,300 28,508Ricoh Leasing Co., Ltd. 4,500 122,154Ride On Express Holdings Co., Ltd. 1,700 17,214Right On Co., Ltd. (a) 5,900 35,068Riken Corp. 2,500 49,927Riken Keiki Co., Ltd. (d) 4,600 184,042Riken Technos Corp. 9,900 36,926Riken Vitamin Co., Ltd. 5,400 74,312Rion Co., Ltd. 2,200 41,903Riso Kyoiku Co., Ltd. 34,770 107,997Rock Field Co., Ltd. (d) 6,600 80,143Rokko Butter Co., Ltd. (d) 3,600 44,399Roland Corp. 2,400 79,316Roland DG Corp. 3,600 98,815Rorze Corp. 2,200 218,487Round One Corp. 1,500 16,496Ryobi, Ltd. (d) 6,200 54,126Ryoden Corp. 4,500 62,694Ryosan Co., Ltd. 7,000 125,391S Foods, Inc. 4,500 120,797S&B Foods, Inc. (d) 1,500 45,340S-Pool, Inc. 15,000 152,080
Japan��(Continued)Sac�s Bar Holdings, Inc. (d) 6,850 27,958Sagami Rubber Industries Co., Ltd. 1,800 11,046
Copyright © 2022 www.secdatabase.com. All Rights Reserved.Please Consider the Environment Before Printing This Document

Saibu Gas Holdings Co., Ltd. (d) 8,000 130,581Saison Information Systems Co., Ltd. 600 9,377Sakai Chemical Industry Co., Ltd. 4,700 74,425Sakai Heavy Industries, Ltd. 1,400 36,637Sakai Moving Service Co., Ltd. 2,800 96,875Sakata INX Corp. (d) 13,000 102,765Sakura Internet, Inc. 4,400 20,453Sala Corp. 15,800 82,574SAMTY Co., Ltd. 10,000 179,536San Holdings, Inc. 2,800 35,873San ju San Financial Group, Inc. (d) 7,870 94,881San-A Co., Ltd. 5,700 192,882San-Ai Oil Co., Ltd. 20,000 154,130San-In Godo Bank, Ltd. (The) (d) 46,900 239,556Sanden Corp. (a) (d) 4,400 7,129Sanei Architecture Planning Co., Ltd. (d) 2,800 36,410Sangetsu Corp. 12,600 157,525Sanix, Inc. (a) (d) 7,800 16,174Sanken Electric Co., Ltd. 2,600 109,864Sanki Engineering Co., Ltd. 13,000 148,924Sanko Metal Industrial Co., Ltd. 1,000 20,744Sankyo Co., Ltd. (d) 9,800 271,882Sankyo Frontier Co., Ltd. 1,000 40,802Sankyo Seiko Co., Ltd. 13,400 57,247Sankyo Tateyama, Inc. 8,200 42,957Sankyu, Inc. 2,200 71,808Sanoh Industrial Co., Ltd. (d) 6,300 35,850Sansei Technologies, Inc. 800 4,802Sansha Electric Manufacturing Co., Ltd. (d) 2,700 17,578Sanshin Electronics Co., Ltd. (d) 4,000 52,647Sanyo Chemical Industries, Ltd. 3,700 152,069Sanyo Denki Co., Ltd. 2,500 100,187Sanyo Electric Railway Co., Ltd. (d) 4,800 80,171Sanyo Industries, Ltd. 1,300 19,785Sanyo Shokai, Ltd. (a) 2,500 15,596Sanyo Special Steel Co., Ltd. 6,400 110,831Sanyo Trading Co., Ltd. 5,300 42,731Sapporo Holdings, Ltd. 17,500 329,726Sata Construction Co., Ltd. 2,600 9,843Sato Holdings Corp. 8,100 113,292Sato Shoji Corp. 4,100 38,680Satori Electric Co., Ltd. (d) 5,500 44,253Sawai Group Holdings Co., Ltd. 6,700 244,984Saxa Holdings, Inc. 2,400 30,213SB Technology, Corp. (d) 3,000 61,732SBI Insurance Group Co., Ltd. (a) (d) 1,400 11,806SBS Holdings, Inc. (d) 6,200 169,437Scala, Inc. (d) 3,200 19,709Scroll Corp. (d) 8,000 54,352SEC Carbon, Ltd. 200 9,579Seed Co., Ltd. 1,700 7,244Seika Corp. 3,300 43,115Seikagaku Corp. 9,800 70,091Seikitokyu Kogyo Co., Ltd. (d) 10,900 66,526Seiko Holdings Corp. (d) 8,800 164,291
BHFTII-91
Copyright © 2022 www.secdatabase.com. All Rights Reserved.Please Consider the Environment Before Printing This Document

Table of ContentsBrighthouse Funds Trust IIBrighthouse/Dimensional International Small Company Portfolio
Schedule of Investments as of March 31, 2022 (Unaudited)Common Stocks��(Continued)
Security Description Shares Value
Japan��(Continued)Seiko PMC Corp. 3,500 $16,946Seikoh Giken Co. Ltd. 700 10,158Seino Holdings Co., Ltd. 1,800 16,385Seiren Co., Ltd. (d) 13,300 240,914Sekisui Jushi Corp. 9,100 131,622Sekisui Kasei Co., Ltd. 8,100 28,885SEMITEC Corp. (d) 400 24,609Senko Group Holdings Co., Ltd. (d) 31,000 227,318Senshu Electric Co., Ltd. 2,400 114,731Senshu Ikeda Holdings, Inc. (d) 72,800 103,185Senshukai Co., Ltd. 11,000 35,098Septeni Holdings Co., Ltd. 13,900 72,495SERAKU Co., Ltd. (d) 700 8,110Seria Co., Ltd. 8,800 199,436Seven Bank, Ltd. (d) 70,500 137,925Shibaura Electronics Co., Ltd. (d) 2,800 173,666Shibaura Machine Co., Ltd. 7,200 200,208Shibaura Mechatronics Corp. 900 62,930Shibusawa Warehouse Co., Ltd. (The) (d) 3,500 66,179Shibuya Corp. 4,400 87,650Shidax Corp. 3,000 9,546Shiga Bank, Ltd. (The) 12,100 217,737Shikibo, Ltd. 4,700 34,309Shikoku Bank, Ltd. (The) 12,000 73,251Shikoku Chemicals Corp. 10,900 119,105Shikoku Electric Power Co., Inc. (d) 40,900 264,575Shima Seiki Manufacturing, Ltd. (d) 8,700 132,382Shimizu Bank, Ltd. (The) (d) 3,400 43,818Shimojima Co., Ltd. (d) 4,200 32,568Shin Nippon Air Technologies Co., Ltd. (d) 2,100 33,087Shin Nippon Biomedical Laboratories, Ltd. 5,300 72,918Shin-Etsu Polymer Co., Ltd. 13,200 121,694Shin-Keisei Electric Railway Co., Ltd. (d) 2,400 40,324Shinagawa Refractories Co., Ltd. 2,000 62,079Shindengen Electric Manufacturing Co., Ltd. 2,800 71,017Shinki Bus Co., Ltd. 900 24,010Shinko Shoji Co., Ltd. 9,800 73,063Shinmaywa Industries, Ltd. 16,400 121,423Shinnihon Corp. 8,300 49,458Shinnihonseiyaku Co., Ltd. 1,100 12,989Shinoken Group Co., Ltd. 7,100 59,630Shinsho Corp. 1,400 40,782Shinwa Co., Ltd. 2,200 14,160Shinwa Co., Ltd. 3,900 62,455Ship Healthcare Holdings, Inc. (d) 15,800 256,398Shizuki Electric Co., Inc. (d) 8,000 29,674Shizuoka Gas Co., Ltd. 17,600 122,852SHO-BOND Holdings Co., Ltd. 6,000 261,298Shobunsha Holdings, Inc. (a) 1,700 5,988Shoei Co., Ltd. 6,300 234,614Shoei Foods Corp. (d) 3,400 113,656Shofu, Inc. (d) 3,500 44,705Showa Sangyo Co., Ltd. 5,700 122,420SIGMAXYZ Holdings, Inc. (d) 7,200 67,118Siix Corp. (d) 9,600 83,114Silver Life Co., Ltd. (a) (d) 900 11,193Sinanen Holdings Co., Ltd. 2,900 78,258
Japan��(Continued)Sinfonia Technology Co., Ltd. 7,400 80,390Sinko Industries, Ltd. 6,400 90,381
Copyright © 2022 www.secdatabase.com. All Rights Reserved.Please Consider the Environment Before Printing This Document

Sintokogio, Ltd. 13,500 75,961SK-Electronics Co., Ltd. 2,700 18,209SKY Perfect JSAT Holdings, Inc. 43,700 148,009Smaregi, Inc. (a) 1,200 13,613SMK Corp. 1,700 30,982Snow Peak, Inc. (d) 5,400 144,604SNT Corp. 7,300 13,372Soda Nikka Co., Ltd. 7,000 36,991Sodick Co., Ltd. 14,500 92,662Soft99 Corp. 5,100 51,444Softcreate Holdings Corp. 2,300 87,713Software Service, Inc. 1,100 56,134Soiken Holdings, Inc. 2,100 5,668Soken Chemical & Engineering Co. Ltd. 700 9,575Solasto Corp. 12,800 103,178Soliton Systems KK 2,500 33,218Solxyz Co., Ltd. 1,400 4,651Sotetsu Holdings, Inc. (d) 10,200 190,957Sotoh Co., Ltd. 3,100 21,641Space Co., Ltd. (d) 5,060 39,818Sparx Group Co., Ltd. (d) 29,200 65,326SPK Corp. 3,400 37,151Sprix, Ltd. 1,300 14,123SRA Holdings 3,100 70,361SRE Holdings Corp. (a) (d) 1,200 33,085ST Corp. 4,100 51,331St-Care Holding Corp. (d) 2,300 15,618St. Marc Holdings Co., Ltd. 5,100 64,811Star Mica Holdings Co., Ltd. 3,000 32,383Star Micronics Co., Ltd. 9,200 115,504Starts Corp., Inc. 8,700 170,444Starzen Co., Ltd. 4,400 72,014Stella Chemifa Corp. 3,600 76,265Step Co., Ltd. 3,300 47,338Strike Co., Ltd. 2,200 84,062Studio Alice Co., Ltd. (d) 2,900 51,796Subaru Enterprise Co., Ltd. 100 7,005Sugimoto & Co., Ltd. 3,000 51,036Sumida Corp. (d) 8,600 65,535Suminoe Textile Co., Ltd. (d) 2,300 35,803Sumitomo Bakelite Co., Ltd. 7,200 291,951Sumitomo Densetsu Co., Ltd. 5,400 98,074Sumitomo Mitsui Construction Co., Ltd. 48,760 166,329Sumitomo Osaka Cement Co., Ltd. (d) 9,900 272,095Sumitomo Precision Products Co., Ltd. 1,200 22,789Sumitomo Riko Co., Ltd. 11,500 56,351Sumitomo Seika Chemicals Co., Ltd. 2,700 68,358Sumitomo Warehouse Co., Ltd. (The) (d) 16,500 310,109Sun Frontier Fudousan Co., Ltd. 10,100 86,548Sun-Wa Technos Corp. 3,900 42,827Suncall Corp. 8,300 33,386Suruga Bank, Ltd. 39,500 131,388Suzuki Co., Ltd. 3,300 21,456SWCC Showa Holdings Co., Ltd. (d) 7,600 116,056System Information Co., Ltd. 2,800 20,669
BHFTII-92
Copyright © 2022 www.secdatabase.com. All Rights Reserved.Please Consider the Environment Before Printing This Document

Table of ContentsBrighthouse Funds Trust IIBrighthouse/Dimensional International Small Company Portfolio
Schedule of Investments as of March 31, 2022 (Unaudited)Common Stocks��(Continued)
Security Description Shares Value
Japan��(Continued)System Research Co., Ltd. 1,200 $18,399Systems Engineering Consultants Co., Ltd. 600 11,089Systena Corp. (d) 63,200 221,283Syuppin Co., Ltd. 6,100 65,231T Hasegawa Co., Ltd. 8,400 178,311T RAD Co., Ltd. 1,900 38,675T&K Toka Co., Ltd. 7,200 52,277T-Gaia Corp. 6,000 80,413Tachi-S Co., Ltd. 10,300 83,661Tachibana Eletech Co., Ltd. 5,640 76,079Tachikawa Corp. (d) 3,100 27,011Tadano, Ltd. (d) 31,400 263,291Taihei Dengyo Kaisha, Ltd. (d) 4,500 97,324Taiheiyo Kouhatsu, Inc. 2,100 11,028Taiho Kogyo Co., Ltd. 6,400 36,824Taikisha, Ltd. 8,100 201,543Taiko Bank, Ltd. (The) (d) 3,100 35,156Taiko Pharmaceutical Co., Ltd. (a) (d) 5,600 27,223Taisei Lamick Co., Ltd. 2,200 48,257Taiyo Holdings Co., Ltd. 9,800 259,131Takachiho Koheki Co., Ltd. (d) 400 4,859Takamatsu Construction Group Co., Ltd. 5,400 91,080Takamiya Co., Ltd. (d) 5,200 15,827Takano Co., Ltd. (d) 4,600 27,343Takaoka Toko Co., Ltd. 4,365 52,603Takara & Co., Ltd. 1,300 20,931Takara Holdings, Inc. (d) 19,400 174,063Takara Leben Co., Ltd. (d) 28,600 69,937Takara Standard Co., Ltd. 9,300 96,466Takasago International Corp. 4,200 94,303Takasago Thermal Engineering Co., Ltd. (d) 11,100 157,409Takashima & Co., Ltd. 2,500 46,274Takashimaya Co., Ltd. 38,500 365,209Takemoto Yohki Co., Ltd. 1,200 8,329Takeuchi Manufacturing Co., Ltd. 10,400 223,981Takihyo Co., Ltd. (d) 2,000 19,768Takisawa Machine Tool Co., Ltd. 2,200 21,322Takuma Co., Ltd. 15,700 183,008Tama Home Co., Ltd. (d) 4,800 100,098Tamagawa Holdings Co., Ltd. (d) 1,100 7,898Tamron Co., Ltd. (d) 6,000 116,592Tamura Corp. (d) 26,000 130,569Tanseisha Co., Ltd. (d) 11,750 76,625Tatsuta Electric Wire and Cable Co., Ltd. 14,200 53,607Tayca Corp. (d) 5,200 54,854TBK Co., Ltd. 8,000 24,348TDC Soft, Inc. 4,900 46,658TechMatrix Corp. (d) 9,800 170,213TECHNO ASSOCIE Co., Ltd. (d) 300 2,873Techno Medica Co., Ltd. 2,400 30,671Techno Ryowa, Ltd. 4,800 33,539Teijin, Ltd. 5,100 56,819Teikoku Electric Manufacturing Co., Ltd. 6,000 77,136Teikoku Sen-I Co., Ltd. 4,900 69,273Teikoku Tsushin Kogyo Co., Ltd. 3,000 35,337Tekken Corp. 2,700 40,675Temairazu, Inc. 700 27,084
Japan��(Continued)Tenma Corp. 5,700 112,718Teraoka Seisakusho Co., Ltd. 200 582
Copyright © 2022 www.secdatabase.com. All Rights Reserved.Please Consider the Environment Before Printing This Document

Terilogy Co., Ltd. 1,600 5,332Tigers Polymer Corp. 2,200 8,241TKC Corp. (d) 7,400 201,151Toa Corp. 9,600 53,279Toa Corp. (d) 5,200 106,046Toa Oil Co., Ltd. 2,300 57,076TOA ROAD Corp. (d) 1,400 55,215Toabo Corp. 3,400 10,934Toagosei Co., Ltd. 30,800 271,122Tobishima Corp. 5,560 46,917TOC Co., Ltd. (d) 14,300 77,691Tocalo Co., Ltd. 17,400 192,094Tochigi Bank, Ltd. (The) 38,200 68,831Toda Corp. (d) 33,100 200,781Toda Kogyo Corp. (a) 600 14,066Toei Co., Ltd. 400 55,521Toell Co., Ltd. (d) 3,100 23,214Toenec Corp. 2,400 64,457Toho Bank, Ltd. (The) 57,800 96,829Toho Co., Ltd. (d) 2,700 25,121Toho Holdings Co., Ltd. (d) 13,700 207,245Toho Titanium Co., Ltd. 11,300 134,660Toho Zinc Co., Ltd. (d) 5,000 120,062Tohoku Bank, Ltd. (The) (d) 4,700 39,086Tohokushinsha Film Corp. 4,800 24,436Tokai Carbon Co., Ltd. 20,300 190,022Tokai Corp. 7,400 104,254TOKAI Holdings Corp. 24,700 174,284Tokai Lease Co., Ltd. (d) 1,600 20,421Tokai Rika Co., Ltd. (d) 15,500 189,888Tokai Tokyo Financial Holdings, Inc. (d) 64,500 211,581Token Corp. 2,460 181,565Tokushu Tokai Paper Co., Ltd. (d) 3,000 77,982Tokuyama Corp. (d) 19,200 269,241Tokyo Base Co., Ltd. (a) (d) 4,100 14,188Tokyo Electron Device, Ltd. 2,400 101,341Tokyo Energy & Systems, Inc. (d) 8,000 63,581Tokyo Keiki, Inc. (d) 4,200 40,888Tokyo Kiraboshi Financial Group, Inc. 9,724 138,583Tokyo Rakutenchi Co., Ltd. 1,000 33,972Tokyo Rope Manufacturing Co., Ltd. (d) 2,800 20,657Tokyo Sangyo Co., Ltd. (d) 7,300 43,173Tokyo Seimitsu Co., Ltd. 11,900 472,526Tokyo Steel Manufacturing Co., Ltd. (d) 21,400 203,092Tokyo Tekko Co., Ltd. 3,400 37,119Tokyo Theatres Co., Inc. (d) 2,900 29,456Tokyotokeiba Co., Ltd. 4,200 149,350Tokyu Construction Co., Ltd. (d) 21,400 117,679Tokyu Recreation Co., Ltd. (a) 1,200 48,816Toli Corp. 15,600 28,230Tomato Bank, Ltd. 4,200 35,916Tomen Devices Corp. (d) 800 41,488Tomoe Corp. 9,800 38,901Tomoe Engineering Co., Ltd. (d) 2,100 41,551Tomoegawa Co., Ltd. 1,000 6,934
BHFTII-93
Copyright © 2022 www.secdatabase.com. All Rights Reserved.Please Consider the Environment Before Printing This Document

Table of ContentsBrighthouse Funds Trust IIBrighthouse/Dimensional International Small Company Portfolio
Schedule of Investments as of March 31, 2022 (Unaudited)Common Stocks��(Continued)
Security Description Shares Value
Japan��(Continued)Tomoku Co., Ltd. (d) 3,900 $50,749TOMONY Holdings, Inc. 47,700 127,855Tomy Co., Ltd. 25,100 250,102Tonami Holdings Co., Ltd. 1,800 55,270Topcon Corp. 28,800 365,858Topre Corp. 9,800 93,814Topy Industries, Ltd. 5,700 48,915Torex Semiconductor, Ltd. 500 10,846Toridolll Holdings Corp. (d) 11,600 240,121Torigoe Co., Ltd. (The) (d) 6,000 32,371Torii Pharmaceutical Co., Ltd. 4,500 115,425Torishima Pump Manufacturing Co., Ltd. 7,700 64,510Tosei Corp. 11,700 111,443Toshiba TEC Corp. 5,000 200,779Totech Corp. 700 13,040Totetsu Kogyo Co., Ltd. (d) 8,000 148,501Tottori Bank, Ltd. (The) 3,700 36,060Toukei Computer Co., Ltd. (d) 300 12,502Tow Co., Ltd. 11,000 28,533Towa Bank, Ltd. (The) 11,500 50,484Towa Corp. (d) 6,300 125,116Towa Pharmaceutical Co., Ltd. 8,400 188,533Toyo Construction Co., Ltd. (a) 25,499 161,429Toyo Corp. 7,900 68,725Toyo Denki Seizo KK 3,200 26,214Toyo Engineering Corp. (a) 10,800 56,072Toyo Gosei Co., Ltd. 800 70,727Toyo Ink SC Holdings Co., Ltd. 10,300 160,134Toyo Kanetsu KK 2,400 48,130Toyo Machinery & Metal Co., Ltd. 6,000 30,994Toyo Securities Co., Ltd. (d) 23,000 28,115Toyo Seikan Group Holdings, Ltd. 4,600 52,719Toyo Sugar Refining Co., Ltd. 900 7,491Toyo Tanso Co., Ltd. (d) 3,600 92,447Toyo Tire Corp. 18,200 231,605Toyo Wharf & Warehouse Co., Ltd. (d) 2,500 30,752Toyobo Co., Ltd. 23,600 210,456TPR Co., Ltd. 7,300 77,527Traders Holdings Co., Ltd. 2,800 7,877Trancom Co., Ltd. (d) 2,300 132,654Trans Genic, Inc. (d) 2,700 9,395Transaction Co., Ltd. 1,400 11,385Transcosmos, Inc. (a) 2,800 72,603TRE Holdings Corp. 10,168 164,836Tri Chemical Laboratories, Inc. 6,000 139,623Trusco Nakayama Corp. 9,600 187,811TS Tech Co., Ltd. 20,700 231,872TSI Holdings Co., Ltd. 14,405 39,422Tsubaki Nakashima Co., Ltd. 13,000 101,856Tsubakimoto Chain Co. 7,900 196,769Tsubakimoto Kogyo Co., Ltd. (d) 1,600 47,947Tsugami Corp. (d) 10,600 114,361Tsukamoto Corp. Co., Ltd. (d) 1,100 11,663Tsukishima Kikai Co., Ltd. 9,000 79,635Tsukuba Bank, Ltd. 34,500 57,033Tsumura & Co. 10,200 266,707Tsurumi Manufacturing Co., Ltd. (d) 6,100 90,740
Japan��(Continued)Tsutsumi Jewelry Co., Ltd. (d) 2,100 32,399TV Asahi Holdings Corp. 6,300 77,517
Copyright © 2022 www.secdatabase.com. All Rights Reserved.Please Consider the Environment Before Printing This Document

TV Tokyo Holdings Corp. 1,800 29,286TYK Corp. 6,000 14,402UACJ Corp. (d) 9,185 174,527Ube Industries, Ltd. (d) 24,700 402,620Ubicom Holdings, Inc. (d) 500 10,078Uchida Yoko Co., Ltd. 2,600 103,325Ueki Corp. (d) 2,200 26,574ULS Group, Inc. 600 21,590Uniden Holdings Corp. 1,100 30,995Union Tool Co. 3,400 105,707Unipres Corp. 10,600 60,875United Super Markets Holdings, Inc. 18,100 156,536UNITED, Inc. (d) 3,000 45,560Unitika, Ltd. (a) (d) 15,600 37,016Universal Entertainment Corp. (a) 7,300 163,374Urbanet Corp. Co., Ltd. 4,500 11,184Usen-Next Holdings Co., Ltd. 2,700 55,548Ushio, Inc. 30,500 451,895UT Group Co., Ltd. (d) 6,600 166,297Uzabase, Inc. (a) 3,700 32,105V Technology Co., Ltd. (d) 2,700 72,530V-Cube, Inc. 2,100 15,463Valor Holdings Co., Ltd. 11,800 203,856Valqua, Ltd. 6,000 130,077Value HR Co., Ltd. 2,000 22,446ValueCommerce Co., Ltd. 4,300 129,722Vector, Inc. 8,200 83,518Vertex Corp. 1,000 23,621Village Vanguard Co., Ltd. (a) 2,300 18,882VINX Corp. 1,000 9,443Vital KSK Holdings, Inc. 14,200 85,336VT Holdings Co., Ltd. 24,300 88,632Wacoal Holdings Corp. 12,400 186,678Wacom Co., Ltd. (d) 39,500 303,298Wakachiku Construction Co., Ltd. (d) 4,600 73,527Wakamoto Pharmaceutical Co., Ltd. (a) (d) 9,000 21,232Wakita & Co., Ltd. 11,200 91,522Warabeya Nichiyo Holdings Co., Ltd. (d) 4,200 61,275Waseda Academy Co., Ltd. (d) 1,400 11,659Watahan & Co., Ltd. (d) 3,200 35,041Watts Co., Ltd. 1,900 11,708WDB Holdings Co., Ltd. 2,700 59,814Weathernews, Inc. 1,500 110,566Welbe, Inc. (d) 2,300 19,398Wellnet Corp. (d) 4,400 19,949West Holdings Corp. (d) 5,629 220,593Will Group, Inc. (d) 4,200 43,651WIN-Partners Co., Ltd. (d) 5,000 40,912Wood One Co., Ltd. (d) 2,600 28,904World Co., Ltd. (d) 5,000 50,479World Holdings Co., Ltd. 2,500 48,059Wow World, Inc. 1,500 14,346Wowow, Inc. 2,200 28,935Writeup Co., Ltd. (a) (d) 400 8,698Xebio Holdings Co., Ltd. 8,700 67,269
BHFTII-94
Copyright © 2022 www.secdatabase.com. All Rights Reserved.Please Consider the Environment Before Printing This Document

Table of ContentsBrighthouse Funds Trust IIBrighthouse/Dimensional International Small Company Portfolio
Schedule of Investments as of March 31, 2022 (Unaudited)Common Stocks��(Continued)
Security Description Shares Value
Japan��(Continued)Y.A.C. Holdings Co., Ltd. (d) 1,800 $24,587YA-MAN, Ltd. (d) 8,800 82,405Yachiyo Industry Co., Ltd. 3,900 22,423Yahagi Construction Co., Ltd. 9,500 62,341Yaizu Suisankagaku Industry Co., Ltd. (d) 4,400 32,875YAKUODO Holdings Co., Ltd. (d) 2,900 53,706YAMABIKO Corp. 11,500 140,313YAMADA Consulting Group Co., Ltd. 3,100 29,918Yamagata Bank, Ltd. (The) 9,300 65,748Yamaguchi Financial Group, Inc. (d) 57,500 318,844Yamaichi Electronics Co., Ltd. 7,500 114,204Yamanashi Chuo Bank, Ltd. (The) 10,400 80,934Yamatane Corp. 3,400 47,118Yamato Corp. 6,600 40,771Yamato Kogyo Co., Ltd. (d) 12,200 370,180Yamaura Corp. (d) 2,800 21,828Yamaya Corp. (d) 1,150 23,501Yamazawa Co., Ltd. 1,000 13,427Yamazen Corp. 19,500 150,352Yaoko Co., Ltd. (d) 3,700 201,512Yashima Denki Co., Ltd. 7,500 57,409Yasuda Logistics Corp. (d) 4,900 38,856Yasunaga Corp. (d) 1,700 11,563Yellow Hat, Ltd. 10,300 132,218Yodogawa Steel Works, Ltd. 6,800 146,059Yokogawa Bridge Holdings Corp. 10,500 166,832Yokorei Co., Ltd. 15,500 108,980Yokowo Co., Ltd. (d) 4,300 90,804Yomeishu Seizo Co., Ltd. 2,400 34,580Yondenko Corp. (d) 3,200 45,126Yondoshi Holdings, Inc. 4,600 61,673Yorozu Corp. 6,500 47,166Yoshimura Food Holdings KK (a) 2,000 8,960Yoshinoya Holdings Co., Ltd. 9,100 175,794Yotai Refractories Co., Ltd. 4,100 42,282Yuasa Funashoku Co., Ltd. (a) (d) 1,300 28,666Yuasa Trading Co., Ltd. 5,800 137,300Yuken Kogyo Co., Ltd. 1,700 24,457Yukiguni Maitake Co., Ltd. 2,100 19,648Yurtec Corp. 12,000 67,785Yushin Precision Equipment Co., Ltd. 2,900 15,942Yushiro Chemical Industry Co., Ltd. (d) 3,700 31,255Yutaka Giken Co., Ltd. 600 8,718Zaoh Co., Ltd. 800 12,671Zenrin Co., Ltd. 9,750 79,289ZERIA Pharmaceutical Co., Ltd. (d) 600 9,340ZIGExN Co., Ltd. (d) 8,400 20,574Zojirushi Corp. 800 9,485Zuiko Corp. 4,000 27,000
136,374,182
Jersey, Channel Islands��0.1%Centamin plc 366,127 437,942JTC plc 22,852 252,042
689,984
Liechtenstein��0.1%Liechtensteinische Landesbank AG 3,540 211,644VP Bank AG - Class A 1,049 108,152
319,796
Copyright © 2022 www.secdatabase.com. All Rights Reserved.Please Consider the Environment Before Printing This Document

Luxembourg��0.3%ADLER Group S.A. 1,495 19,811APERAM S.A. (d) 14,570 643,084Befesa S.A. 5,095 402,015L�Occitane International S.A. 87,500 281,956SES S.A. 69,043 628,500
1,975,366
Macau��0.0%Huasheng International Holding, Ltd.
(a) (d) 76,000 1,235MECOM Power and Construction, Ltd. 46,000 21,093SJM Holdings, Ltd. (a) 389,000 191,888
214,216
Malta��0.0%Gaming Innovation Group, Inc. (a) 5,882 13,082
Mongolia��0.0%Mongolian Mining Corp. (a) 33,000 12,374Turquoise Hill Resources, Ltd. (a) (d) 3,153 94,716
107,090
Netherlands��2.7%Aalberts NV 31,181 1,611,536Accell Group NV (a) 6,628 420,396Alfen Beheer B.V. (a) (d) 4,130 418,900AMG Advanced Metallurgical Group NV 10,120 434,147Amsterdam Commodities NV (a) 2,850 76,924Arcadis NV (d) 26,950 1,211,106ASR Nederland NV 40,042 1,860,556Basic-Fit NV (a) (d) 8,733 387,714BE Semiconductor Industries NV 15,564 1,324,918Beter Bed Holding NV (a) (d) 5,373 29,077Boskalis Westminster 22,517 805,636Brack Capital Properties NV (a) 856 142,349Brunel International NV 8,065 97,744Corbion NV 16,447 563,068Flow Traders 10,451 354,409ForFarmers NV 10,101 37,921Fugro NV (a) 20,885 250,996Heijmans NV 7,961 130,348Hunter Douglas NV (a) 392 74,772IMCD NV 2,564 435,951Intertrust NV (a) 15,775 342,549Kendrion NV 4,279 92,176Koninklijke BAM Groep NV (a) 99,485 299,311Koninklijke Vopak NV 7,916 256,123Lucas Bols B.V. (a) 1,325 15,728MFE-MediaForEurope NV - Class A
(a) (d) 120,075 83,787MFE-MediaForEurope NV - Class B (d) 95,311 109,977Nedap NV 1,849 130,632
BHFTII-95
Copyright © 2022 www.secdatabase.com. All Rights Reserved.Please Consider the Environment Before Printing This Document

Table of ContentsBrighthouse Funds Trust IIBrighthouse/Dimensional International Small Company Portfolio
Schedule of Investments as of March 31, 2022 (Unaudited)Common Stocks��(Continued)
Security Description Shares Value
Netherlands��(Continued)New World Resources plc (a) (b) (c) 11,898 $0OCI NV (a) 19,201 676,029Ordina NV 33,735 173,118PostNL NV 140,500 535,406Rhi Magnesita NV (d) 4,696 152,876SBM Offshore NV (d) 44,193 702,308SIF Holding NV 1,259 16,308Signify NV 31,954 1,489,963Sligro Food Group NV (a) 8,989 217,641SNS REAAL NV (a) (b) (c) 105,329 0TKH Group NV 11,770 656,561TomTom NV (a) 22,362 206,581Van Lanschot Kempen NV 6,057 160,150
16,985,692
New Zealand��0.6%Air New Zealand, Ltd. (a) (d) 72,013 64,092Arvida Group, Ltd. (d) 91,546 108,896Briscoe Group, Ltd. 13,123 52,183Chorus, Ltd. 90,567 464,249Delegat Group, Ltd. 6,671 60,945Eroad, Ltd. (a) 4,808 14,546Freightways, Ltd. 28,712 245,247Gentrack Group, Ltd. (a) 7,810 9,577Hallenstein Glasson Holdings, Ltd. 13,182 59,246Heartland Group Holdings, Ltd. 104,855 163,022Investore Property, Ltd. (REIT) 46,089 54,952KMD Brands Ltd. 106,864 100,492Michael Hill International, Ltd. 82,929 73,386NEW Zealand King Salmon
Investments, Ltd. (a) 8,061 5,143New Zealand Refining Co., Ltd. (The)
(a) 39,302 28,289NZME, Ltd. 71,247 85,496NZX, Ltd. 74,928 73,939Oceania Healthcare, Ltd. 106,494 77,220Pacific Edge, Ltd. (a) (d) 89,677 59,359PGG Wrightson, Ltd. 5,854 17,971Pushpay Holdings, Ltd. (a) (d) 101,573 79,660Restaurant Brands New Zealand, Ltd.
(a) (d) 7,507 71,934Sanford, Ltd. (a) (d) 17,782 57,902Scales Corp., Ltd. 25,709 91,570Serko, Ltd. (a) 5,880 18,967Skellerup Holdings, Ltd. 44,588 183,939SKY Network Television, Ltd. (a) (d) 45,879 91,857SKYCITY Entertainment Group, Ltd. 180,796 359,267Steel & Tube Holdings, Ltd. 51,732 56,223Summerset Group Holdings, Ltd. 28,760 233,395Synlait Milk, Ltd. (a) (d) 17,226 39,475Tourism Holdings, Ltd. (a) (d) 26,255 51,928TOWER, Ltd. 53,852 26,152Trustpower, Ltd. (d) 13,980 68,272Turners Automotive Group, Ltd. 8,394 23,564Warehouse Group, Ltd. (The) 26,369 60,583Z Energy, Ltd. 89,671 232,973
3,565,911
Nigeria��0.0%Airtel Africa plc 121,080 220,203
Copyright © 2022 www.secdatabase.com. All Rights Reserved.Please Consider the Environment Before Printing This Document

Norway��0.9%2020 Bulkers, Ltd. 1,029 14,076ABG Sundal Collier Holding ASA 134,443 129,917Akastor ASA (a) (d) 47,184 43,730Aker Solutions ASA (a) 65,910 226,493American Shipping Co. ASA (a) 16,816 61,925Arcticzymes Technologies ASA (a) 3,275 28,549Atea ASA (a) 18,057 270,056Axactor SE (a) (d) 50,628 38,233B2Holding ASA 54,575 57,223Bonheur ASA 8,017 324,957Borregaard ASA 841 16,603Bouvet ASA 4,324 34,222BW Energy, Ltd. (a) 25,058 76,217BW Offshore, Ltd. 24,958 82,255Crayon Group Holding ASA (a) 8,386 157,842DNO ASA 137,884 201,246Europris ASA 48,402 310,259Fjordkraft Holding ASA 15,787 60,098Frontline, Ltd. (a) 24,578 213,134Golden Ocean Group, Ltd. 20,211 248,523Grieg Seafood ASA (a) 13,378 181,830Hexagon Composites ASA (a) 36,341 130,091IDEX Biometrics ASA (a) 200,592 42,595Itera ASA 17,553 23,871Kid ASA 2,707 31,637Kitron ASA (d) 28,832 65,841Kongsberg Automotive ASA (a) (d) 222,670 63,546Magnora ASA (a) (d) 5,982 13,459Medistim ASA 1,357 40,555MPC Container Ships ASA 39,419 131,662Multiconsult ASA 727 11,629Nekkar ASA (a) 8,927 8,263Next Biometrics Group A/S (a) 16,529 11,609Nordic Nanovector ASA (a) 17,091 29,021Norske Skog ASA (a) 3,303 18,573Norway Royal Salmon ASA 3,997 95,062Norwegian Energy Co. ASA (a) 1,276 40,450Odfjell Drilling, Ltd. (a) 25,648 70,163Odfjell SE - A Shares (a) 1,949 8,377Olav Thon Eiendomsselskap ASA 1,025 21,941Otello Corp. ASA (a) 150 462PGS ASA (a) 106,228 35,222Protector Forsikring ASA 25,433 350,619REC Silicon ASA (a) 64,361 106,213Selvaag Bolig ASA 14,928 84,314Sparebank 1 Oestlandet 1,802 28,621SpareBank 1 Sorost-Norge 3,854 26,941Sparebanken More 490 24,494Stolt-Nielsen, Ltd. 6,538 123,030TGS ASA 32,320 480,171Treasure ASA 21,003 37,876Ultimovacs ASA (a) 1,682 15,463Veidekke ASA 28,524 395,578Wallenius Wilhelmsen ASA (a) 14,567 106,954
BHFTII-96
Copyright © 2022 www.secdatabase.com. All Rights Reserved.Please Consider the Environment Before Printing This Document

Table of ContentsBrighthouse Funds Trust IIBrighthouse/Dimensional International Small Company Portfolio
Schedule of Investments as of March 31, 2022 (Unaudited)Common Stocks��(Continued)
Security Description Shares Value
Norway��(Continued)Wilh Wilhelmsen Holding ASA - Class A 3,078 $84,385XXL ASA 45,078 57,049
5,593,125
Peru��0.0%Hochschild Mining plc 95,965 161,974
Philippines��0.0%Del Monte Pacific, Ltd. 77,636 21,696
Portugal��0.4%Altri SGPS S.A. 27,747 184,831Banco Comercial Portugues S.A. -
Class R (a) (d) 2,143,248 407,126Banco Espirito Santo S.A. (a) (b) (c) 89,078 0Corticeira Amorim SGPS S.A. 2,047 22,732CTT-Correios de Portugal S.A. 47,697 236,701Greenvolt-Energias Renovaveis S.A. (a) 504 4,153Mota-Engil SGPS S.A. (a) (d) 25,385 37,714Navigator Co. S.A. (The) 71,289 265,326NOS SGPS S.A. 74,998 315,929Novabase SGPS S.A. (a) 7,827 42,092REN - Redes Energeticas Nacionais
SGPS S.A. 122,322 385,444Sonae SGPS S.A. 309,228 355,005
2,257,053
Singapore��1.3%Abterra, Ltd. (a) (b) (c) 51,720 279AEM Holdings, Ltd. 38,400 133,012Ascendas India Trust 242,700 212,387Avarga, Ltd. 46,000 8,488Banyan Tree Holdings, Ltd. (a) 97,700 21,580Best World International, Ltd. (a) (b) (c) 43,144 8,047BOC Aviation, Ltd. 23,400 183,849Bonvests Holdings, Ltd. 18,000 12,351Boustead Projects, Ltd. 24,607 17,482Boustead Singapore, Ltd. 82,025 59,193Bukit Sembawang Estates, Ltd. 56,100 207,194BW LPG, Ltd. 21,752 148,263Centurion Corp., Ltd. (a) 98,400 25,721China Aviation Oil Singapore Corp., Ltd. 83,000 56,020Chip Eng Seng Corp., Ltd. 136,300 45,209Chuan Hup Holdings, Ltd. 125,000 20,789ComfortDelGro Corp., Ltd. 427,500 468,136COSCO Shipping International Singapore
Co., Ltd. (a) 332,100 62,422Creative Technology, Ltd. (a) 16,300 29,982CSE Global, Ltd. 114,300 39,953CW Group Holdings, Ltd. (a) (b) (c) 106,000 0Delfi, Ltd. 80,600 45,422Ezion Holdings, Ltd. (a) (b) (c) 753,729 4,504Ezra Holdings, Ltd. (a) (b) (c) 1,000,703 1,521Far East Orchard, Ltd. 74,044 60,368First Resources, Ltd. 141,400 213,181Food Empire Holdings, Ltd. 54,000 20,605Fraser and Neave, Ltd. 36,400 36,455Frencken Group, Ltd. 57,600 69,926Fu Yu Corp., Ltd. 98,800 20,056
Singapore��(Continued)
Copyright © 2022 www.secdatabase.com. All Rights Reserved.Please Consider the Environment Before Printing This Document

Gallant Venture, Ltd. (a) 257,900 24,547Geo Energy Resources, Ltd. 155,000 53,509GK Goh Holdings, Ltd. 12,000 10,054Golden Agri-Resources, Ltd. 1,606,500 359,135Golden Energy & Resources, Ltd. (a) 69,000 26,248GuocoLand, Ltd. 68,800 77,462Halcyon Agri Corp., Ltd. (a) 155,813 28,113Hanwell Holdings, Ltd. 19,000 5,676Haw Par Corp., Ltd. 29,700 253,803Hiap Hoe, Ltd. 58,000 31,826Ho Bee Land, Ltd. 49,800 107,065Hong Fok Corp., Ltd. 107,140 68,048Hong Leong Asia, Ltd. 52,600 31,896Hong Leong Finance, Ltd. 43,900 83,537Hotel Grand Central, Ltd. 26,435 20,417Hour Glass, Ltd. (The) 75,300 129,196Hrnet Group, Ltd. 67,700 38,389Hwa Hong Corp., Ltd. 138,000 30,036Hyflux, Ltd. (a) (b) (c) 179,500 5,553iFAST Corp., Ltd. 25,500 113,416IGG, Inc. 227,000 107,702Indofood Agri Resources, Ltd. (a) 152,000 44,024InnoTek, Ltd. 17,400 8,133Japfa, Ltd. 98,670 50,495k1 Ventures, Ltd. (a) (b) (c) 80,800 0Kenon Holdings, Ltd. 5,886 386,549Keppel Infrastructure Trust 849,718 350,591KSH Holdings, Ltd. 25,700 6,654Low Keng Huat Singapore, Ltd. 122,600 42,967Metro Holdings, Ltd. 141,600 78,453Mewah International, Inc. 110,000 34,765Midas Holdings, Ltd. (a) (b) (c) 452,000 12,006mm2 Asia, Ltd. (a) 299,600 14,356Nanofilm Technologies International, Ltd. 20,000 39,757NetLink NBN Trust 185,600 133,449NSL, Ltd. 15,000 9,719Overseas Union Enterprise, Ltd. 70,300 68,445Oxley Holdings, Ltd. 268,718 36,044Pan-United Corp., Ltd. 53,750 16,578Propnex, Ltd. 7,700 10,662Q&M Dental Group Singapore, Ltd. 50,160 19,588QAF, Ltd. 74,167 47,056Raffles Education Corp., Ltd. (a) 335,506 16,506Raffles Medical Group, Ltd. 229,411 197,580Rickmers Maritime (a) (b) (c) 110,000 0SBS Transit, Ltd. 25,600 56,310Sembcorp Industries, Ltd. 234,400 459,702Sembcorp Marine, Ltd. (a) 407,000 29,345Sheng Siong Group, Ltd. 146,100 163,713SHS Holdings, Ltd. (a) 47,000 5,375SIA Engineering Co., Ltd. (a) 55,200 103,322SIIC Environment Holdings, Ltd. 220,300 35,645Sinarmas Land, Ltd. 618,500 104,823Sing Holdings, Ltd. 82,000 23,898Singapore Land Group, Ltd. 20,800 39,135Singapore Post, Ltd. 414,200 197,923Singapore Press Holdings, Ltd. 360,400 624,693
BHFTII-97
Copyright © 2022 www.secdatabase.com. All Rights Reserved.Please Consider the Environment Before Printing This Document

Table of ContentsBrighthouse Funds Trust IIBrighthouse/Dimensional International Small Company Portfolio
Schedule of Investments as of March 31, 2022 (Unaudited)Common Stocks��(Continued)
Security Description Shares Value
Singapore��(Continued)Stamford Land Corp., Ltd. 300,200 $88,504StarHub, Ltd. 117,100 111,216Straits Trading Co., Ltd. 6,800 15,983Swiber Holdings, Ltd. (a) (b) (c) 117,749 1,772Thomson Medical Group, Ltd. 328,600 19,816Tuan Sing Holdings, Ltd. 181,205 54,825UMS Holdings, Ltd. 145,312 130,980United Overseas Insurance, Ltd. 4,000 20,305UOB-Kay Hian Holdings, Ltd. 121,277 146,395Vicom, Ltd. 26,000 40,255Wee Hur Holdings, Ltd. 85,000 12,088Wing Tai Holdings, Ltd. 119,321 157,252XP Power, Ltd. 4,868 221,071Yeo Hiap Seng, Ltd. 20,155 12,977
8,339,723
South Africa��0.2%Investec plc 65,010 426,985Mediclinic International plc (a) 122,923 572,735
999,720
Spain��2.2%Acerinox S.A. 66,512 728,767Alantra Partners S.A. 6,139 112,911Almirall S.A. 21,750 275,781Amper S.A. (a) (d) 224,339 61,550Applus Services S.A. 33,014 272,477Atresmedia Corp. de Medios de
Comunicacion S.A. 31,355 132,616Azkoyen S.A. 3,142 19,052Banco de Sabadell S.A. (d) 1,450,527 1,180,624Bankinter S.A. 186,237 1,086,024Caja de Ahorros del Mediterraneo
(a) (b) (c) (d) 14,621 0Cia de Distribucion Integral Logista
Holdings S.A. 12,772 233,398Cie Automotive S.A. (d) 13,586 308,455Construcciones y Auxiliar de
Ferrocarriles S.A. 5,880 192,784Distribuidora Internacional de
Alimentacion S.A. (a) 2,455,491 37,831Ebro Foods S.A. 20,251 356,702eDreams ODIGEO S.A. (a) 17,603 155,526Elecnor S.A. 11,262 135,222Enagas S.A. 57,504 1,277,808Ence Energia y Celulosa S.A (a) 57,034 199,503Ercros S.A. (a) 30,406 101,462Faes Farma S.A. 100,057 404,911Fluidra S.A. 14,698 421,724Fomento de Construcciones y Contratas
S.A. 12,522 149,987Gestamp Automocion S.A. 18,173 63,466Global Dominion Access S.A. 25,444 113,345Grupo Catalana Occidente S.A. 14,264 435,715Grupo Empresarial San Jose S.A. (d) 8,320 40,382Grupo Ezentis S.A. (a) (d) 78,251 12,486Iberpapel Gestion S.A. 1,128 19,568Indra Sistemas S.A. (a) 42,149 468,201Laboratorios Farmaceuticos Rovi S.A. 4,330 319,855Linea Directa Aseguradora S.A. Cia de
Seguros y Reaseguros (d) 186,237 286,033
Copyright © 2022 www.secdatabase.com. All Rights Reserved.Please Consider the Environment Before Printing This Document

Mapfre S.A. 167,272 350,064
Spain��(Continued)Mediaset Espana Comunicacion S.A. (a) 49,361 249,116Melia Hotels International S.A. (a) 31,617 236,289Metrovacesa S.A. 2,919 24,702Miquel y Costas & Miquel S.A. 8,748 120,841Neinor Homes S.A. (a) 4,237 55,631Obrascon Huarte Lain S.A. (a) 47,913 48,929Prim S.A. (d) 3,013 48,513Promotora de Informaciones S.A. -
Class A (a) 83,921 59,871Prosegur Cash S.A. 11,698 7,620Prosegur Cia de Seguridad S.A. 54,905 119,332Realia Business S.A. (a) 143,011 132,247Sacyr S.A. (d) 128,006 308,962Solaria Energia y Medio Ambiente S.A.
(a) 19,439 436,709Talgo S.A. (a) 22,161 94,834Tecnicas Reunidas S.A. (a) 11,115 94,792Tubacex S.A. (a) (d) 32,455 65,877Unicaja Banco S.A. 267,421 277,855Vidrala S.A. 5,416 380,612Viscofan S.A. 10,515 623,460Vocento S.A. (a) 18,128 20,709Zardoya Otis S.A. 14,196 110,693
13,471,824
Sweden��3.0%AcadeMedia AB 21,250 116,815AddNode Group AB (d) 7,307 296,464AFRY AB 5,236 105,017Alimak Group AB 10,425 116,770Alligo AB - Class B 8,890 130,739Ambea AB 4,741 24,086Annehem Fastigheter AB - Class B (a) 7,859 25,025Arise AB (a) 4,852 24,568Arjo AB - B Shares 55,404 467,753Atrium Ljungberg AB - B Shares 8,077 164,365Attendo AB (a) (d) 28,610 90,358Beijer Alma AB 13,962 321,653Beijer Electronics Group AB (a) 7,843 56,346Bergman & Beving AB 10,176 151,963Besqab AB 1,061 18,587Betsson AB - Class B (a) 39,536 239,448BHG Group AB (a) (d) 13,680 90,428Bilia AB - A Shares 27,610 393,297BioGaia AB - B Shares 1,519 90,174Biotage AB 20,199 468,649Bonava AB - B Shares 18,068 112,824Boozt AB (a) (d) 4,572 58,527Bravida Holding AB 44,355 509,724Bufab AB (d) 11,463 405,915Bulten AB 4,294 29,506Bure Equity AB 5,995 194,011Byggmax Group AB 18,326 135,386Calliditas Therapeutics AB - Class B
(a) (d) 1,493 14,042Careium AB (a) 3,391 5,995Catella AB 2,281 11,121Catena AB (d) 7,656 463,063Cellavision AB 2,146 71,318
BHFTII-98
Copyright © 2022 www.secdatabase.com. All Rights Reserved.Please Consider the Environment Before Printing This Document

Table of ContentsBrighthouse Funds Trust IIBrighthouse/Dimensional International Small Company Portfolio
Schedule of Investments as of March 31, 2022 (Unaudited)Common Stocks��(Continued)
Security Description Shares Value
Sweden��(Continued)Clas Ohlson AB - B Shares 15,608 $177,462Cloetta AB - B Shares 79,517 216,943Collector AB (a) 5,059 21,012Coor Service Management Holding AB 24,209 193,876Corem Property Group AB - B Shares 182,923 474,261Dios Fastigheter AB 26,164 282,975Doro AB (a) 3,391 9,714Duni AB (a) 13,288 144,861Dustin Group AB 21,864 186,572Eastnine AB 7,088 80,148Elanders AB - B Shares 1,453 21,087Electrolux Professional AB - Class B (a) 42,587 261,334Eltel AB (a) 18,428 24,449Enea AB (a) 4,082 79,043Eolus Vind AB - B Shares 935 9,615eWork Group AB 2,864 32,812Fagerhult AB 19,392 103,443Fastighets AB Trianon 997 21,644FastPartner AB - Class A 10,644 116,806FastPartner AB - D Shares 332 2,940Ferronordic AB 275 1,680Fingerprint Cards AB - Class B (a) (d) 28,890 45,266FormPipe Software AB 2,450 9,431G5 Entertainment AB 208 4,590GARO AB 4,784 78,116GHP Specialty Care AB 7,172 26,248Granges AB 31,689 311,061Haldex AB (a) 16,480 71,499Heba Fastighets AB - Class B 9,527 153,287Hexatronic Group AB (d) 4,912 195,513HMS Networks AB 5,072 237,576Hoist Finance AB (a) (d) 12,983 39,611Humana AB (a) 6,890 44,060Instalco AB 38,975 291,486INVISIO AB 1,473 26,748Inwido AB 16,291 257,346ITAB Shop Concept AB (a) 1,944 2,555JM AB 17,370 550,273John Mattson Fastighetsforetagen AB (a) 2,402 41,975Karnov Group AB 12,337 78,241Know It AB 7,992 264,557Lagercrantz Group AB - B Shares (d) 64,002 723,803LeoVegas AB 5,910 23,747Lime Technologies AB 808 23,451Lindab International AB 25,702 654,252Loomis AB 14,627 399,931Mekonomen AB (a) 11,543 135,593MIPS AB 5,892 548,186Modern Times Group MTG AB - B Shares
(a) 20,045 291,811Momentum Group (a) 8,890 75,640Munters Group AB 7,077 43,434Mycronic AB 17,551 326,484NCAB Group AB 15,993 111,376NCC AB - B Shares 14,914 211,357Nederman Holding AB 7,692 156,285Nelly Group AB (a) 2,434 6,203Net Insight AB - Class B (a) 74,697 31,819
Sweden��(Continued)New Wave Group AB - B Shares 19,643 317,698
Copyright © 2022 www.secdatabase.com. All Rights Reserved.Please Consider the Environment Before Printing This Document

Nobia AB 40,224 176,539Nolato AB - B Shares 52,647 390,084Nordic Waterproofing Holding AB 6,754 120,567Note AB (a) 1,027 20,286NP3 Fastigheter AB 11,449 376,836Nyfosa AB 50,630 721,583OEM International AB - B Shares 11,400 197,683Pandox AB (a) 8,038 120,847Peab AB - Class B 13,694 137,213Platzer Fastigheter Holding AB - Class B (d) 15,422 190,228Pricer AB - B Shares 32,212 66,504Proact IT Group AB 8,496 61,733Ratos AB - B Shares 61,820 317,829RaySearch Laboratories AB (a) 7,859 43,015Rejlers AB 804 11,337Rottneros AB 26,936 31,979Scandi Standard AB 18,069 68,390Scandic Hotels Group AB (a) 23,341 106,866Sdiptech AB - Class B (a) 1,095 42,000Semcon AB 5,540 68,613Sensys Gatso Group AB (a) 223,283 23,904SkiStar AB 13,849 256,055Softronic AB - B Shares 3,875 10,585Solid Forsakring AB (a) 2,708 13,995Stendorren Fastigheter AB (a) 1,576 45,296Systemair AB 22,572 166,633Tethys Oil AB 2,076 17,256TF Bank AB 690 13,100Troax Group AB 11,680 302,593VBG Group AB - B Shares 2,387 35,344Vitec Software Group AB - B Shares 4,122 212,279
19,044,295
Switzerland��7.2%Aevis Victoria S.A. (a) 892 17,568Allreal Holding AG 4,342 929,900ALSO Holding AG (a) 2,049 497,010APG SGA S.A. (a) 390 82,178Arbonia AG 14,726 288,893Aryzta AG (a) 230,151 235,409Ascom Holding AG (a) 3,201 35,864Autoneum Holding AG (d) 1,187 164,080Bachem Holding AG - Class B 603 330,897Baloise Holding AG 3,602 641,856Banque Cantonale de Geneve 750 132,704Banque Cantonale Vaudoise 5,441 470,087Belimo Holding AG 2,560 1,358,033Bell Food Group AG 693 203,602Bellevue Group AG 3,322 138,716Berner Kantonalbank AG 1,494 361,807BKW AG 6,201 776,213Bobst Group S.A. (a) 3,214 314,415Bossard Holding AG - Class A 2,139 500,359Bucher Industries AG 2,031 820,619Burckhardt Compression Holding AG 660 348,055
BHFTII-99
Copyright © 2022 www.secdatabase.com. All Rights Reserved.Please Consider the Environment Before Printing This Document

Table of ContentsBrighthouse Funds Trust IIBrighthouse/Dimensional International Small Company Portfolio
Schedule of Investments as of March 31, 2022 (Unaudited)Common Stocks��(Continued)
Security Description Shares Value
Switzerland��(Continued)Burkhalter Holding AG 1,499 $117,034Bystronic AG 452 465,286Calida Holding AG 1,703 93,777Carlo Gavazzi Holding AG 124 37,383Cembra Money Bank AG 9,521 698,357Cicor Technologies, Ltd. (a) (d) 644 34,424Cie Financiere Tradition S.A. 597 69,701Clariant AG (a) 59,367 1,027,999Coltene Holding AG (a) 1,490 167,166Comet Holding AG 1,621 467,455Daetwyler Holding AG 810 266,862DKSH Holding AG 11,314 949,780dormakaba Holding AG 835 427,659Dufry AG (a) 14,576 611,111EDAG Engineering Group AG (a) 3,171 43,078EFG International AG (a) 30,423 234,690Emmi AG 657 716,559Energiedienst Holding AG 4,654 231,400Evolva Holding S.A. (a) (d) 84,327 10,187Feintool International Holding AG (a) 588 30,868Fenix Outdoor International AG 1,091 122,346Ferrexpo plc 101,799 245,441Flughafen Zurich AG (a) 5,491 985,451Forbo Holding AG 343 583,512Fundamenta Real Estate AG 3,326 71,281Galenica AG 13,396 1,029,033GAM Holding AG (a) (d) 62,659 76,847Georg Fischer AG 1,273 1,518,948Gurit Holding AG (d) 143 229,802Helvetia Holding AG 10,528 1,370,542Hiag Immobilien Holding AG 1,881 211,815Highlight Communications AG (a) 7,829 32,898HOCHDORF Holding AG (a) (d) 174 7,702Huber & Suhner AG 5,184 484,374Hypothekarbank Lenzburg AG 3 13,701Implenia AG (a) (d) 4,729 115,400Ina Invest Holding AG (a) 1,388 28,880Inficon Holding AG 501 573,786Interroll Holding AG 220 724,132Intershop Holding AG 466 322,240Investis Holding S.A. 322 39,183IWG plc (a) 194,505 664,077Jungfraubahn Holding AG (a) 890 137,598Kardex Holding AG 2,137 489,146Komax Holding AG (a) 974 271,400Kudelski S.A. (d) 13,221 47,160Landis & Gyr Group AG (a) 4,126 260,974LEM Holding S.A. 166 401,239Luzerner Kantonalbank AG 1,001 469,249Medacta Group S.A. (a) 1,064 126,766Medartis Holding AG (a) 614 82,881Medmix AG (a) 5,258 182,911Meier Tobler Group AG (a) 1,744 39,385Metall Zug AG - B Shares 78 179,045Mikron Holding AG (a) 2,145 17,980Mobilezone Holding AG 13,629 240,685Mobimo Holding AG (a) 2,123 676,534
Switzerland��(Continued)OC Oerlikon Corp. AG 62,425 497,892Orascom Development Holding AG (a) 4,230 42,597
Copyright © 2022 www.secdatabase.com. All Rights Reserved.Please Consider the Environment Before Printing This Document

Orell Fuessli AG 331 31,369Orior AG 1,947 190,002Phoenix Mecano AG 274 115,813Plazza AG - Class A 191 72,113PSP Swiss Property AG 13,459 1,766,344Resurs Holding AB 27,086 79,443Rieter Holding AG (a) 1,344 216,897Romande Energie Holding S.A. 111 147,140Schaffner Holding AG 238 81,283Schweiter Technologies AG 354 432,879Schweizerische Nationalbank (d) 5 41,634Sensirion Holding AG (a) 1,981 244,163SFS Group AG 5,311 734,672Siegfried Holding AG (a) 1,427 1,174,595SIG Combibloc Group AG (a) 6,995 176,652St. Galler Kantonalbank AG 970 483,769Sulzer AG 5,258 435,052Swiss Prime Site AG 13,836 1,363,935Swiss Steel Holding AG (a) 161,565 48,076Swissquote Group Holding S.A. 3,768 682,357Tecan Group AG 2,185 861,134TX Group AG (a) 1,079 179,089U-Blox Holding AG (a) 2,199 212,879V-ZUG Holding AG (a) 780 93,949Valiant Holding AG 5,102 527,210Valora Holding AG (a) 1,153 215,285VAT Group AG 5,052 1,926,325Vaudoise Assurances Holding S.A. 306 151,187Vetropack Holding AG 4,400 205,409Vifor Pharma AG (a) 5,691 1,014,655Von Roll Holding AG (a) 16,704 19,544Vontobel Holding AG 9,439 793,286VZ Holding AG 4,180 395,353Walliser Kantonalbank 1,345 162,987Warteck Invest AG 53 135,820Ypsomed Holding AG (d) 621 108,887Zehnder Group AG 4,202 363,261Zug Estates Holding AG - B Shares 83 181,349Zuger Kantonalbank AG 57 453,049
45,482,720
Taiwan��0.0%FIT Hon Teng, Ltd. (a) 80,000 11,830
Tanzania��0.0%Helios Towers plc (a) 110,176 166,840
United Arab Emirates��0.0%Lamprell plc (a) 100,553 38,200
United Kingdom��11.9%4imprint Group plc 7,046 258,682888 Holdings plc 95,449 230,108A.G. Barr plc 34,817 244,424
BHFTII-100
Copyright © 2022 www.secdatabase.com. All Rights Reserved.Please Consider the Environment Before Printing This Document

Table of ContentsBrighthouse Funds Trust IIBrighthouse/Dimensional International Small Company Portfolio
Schedule of Investments as of March 31, 2022 (Unaudited)Common Stocks��(Continued)
Security Description Shares Value
United Kingdom��(Continued)Advanced Medical Solutions Group plc 28,754 $112,097Air Partner plc 4,960 8,103AJ Bell plc 46,708 185,619Alfa Financial Software Holdings plc 5,160 10,706Alliance Pharma plc 87,282 131,990Anglo Pacific Group plc 51,447 119,200Anglo-Eastern Plantations plc 5,782 58,004Appreciate Group plc 23,099 7,112Aptitude Software Group plc 1,319 5,319Ascential plc (a) 74,373 338,097Ashmore Group plc 97,994 297,490Avon Protection plc 8,677 148,106Babcock International Group plc (a) 152,440 647,249Bakkavor Group plc 12,493 18,425Balfour Beatty plc 201,378 677,891Beazley plc 163,069 895,781Begbies Traynor Group plc (d) 20,686 31,426Bellway plc 19,119 607,503Biffa plc 44,517 186,024Bloomsbury Publishing plc 28,218 156,423Bodycote plc 64,772 533,948boohoo Group plc (a) 12,408 14,347Braemar Shipping Services plc (d) 7,120 21,347Brewin Dolphin Holdings plc 98,930 664,428Britvic plc 74,790 789,878Bytes Technology Group plc 40,288 262,486Capita plc (a) 344,633 93,595Capricorn Energy plc (a) 170,133 490,911Card Factory plc (a) 103,756 61,675CareTech Holdings plc 15,279 138,759Carr�s Group plc 19,239 38,552Castings plc 2,870 11,260Cazoo Group, Ltd. (a) 27,925 77,073Centaur Media plc 92,526 58,342Central Asia Metals plc 20,359 63,161Centrica plc (a) 925,921 969,209Chemring Group plc 102,749 438,827Chesnara plc 50,709 201,594Cineworld Group plc (a) (d) 28,804 12,233Clarkson plc 8,219 396,777Clinigen Group plc 18,679 226,353Clipper Logistics plc 12,531 144,794Close Brothers Group plc 45,801 710,918CLS Holdings plc 16,645 43,621CMC Markets plc 42,124 140,046Coats Group plc 273,031 273,937Computacenter plc 22,674 871,084Concentric AB 11,928 258,889ContourGlobal plc 28,299 70,877Costain Group plc (a) 35,950 18,628Countryside Partnerships plc (a) 139,641 494,471Cranswick plc 15,732 726,133Crest Nicholson Holdings plc 83,456 291,285Currys plc 250,394 297,858CVS Group plc 15,668 367,493De La Rue plc (a) (d) 52,440 74,504Devro plc 56,716 155,188
United Kingdom��(Continued)DFS Furniture plc 51,390 140,215Dialight plc (a) (d) 5,140 24,365
Copyright © 2022 www.secdatabase.com. All Rights Reserved.Please Consider the Environment Before Printing This Document

Dignity plc (a) (d) 19,579 129,879Diploma plc 24,018 825,954DiscoverIE Group plc 22,813 234,616Domino�s Pizza Group plc 134,943 669,621dotdigital group plc 41,626 45,238Drax Group plc 123,481 1,271,106Dunelm Group plc 27,630 393,629DWF Group plc 20,571 30,908EKF Diagnostics Holdings plc 38,020 21,532Elementis plc (a) 202,330 313,766EMIS Group plc 13,707 239,529Energean plc (a) 19,818 309,342EnQuest plc (a) 515,849 207,760Epwin Group plc 14,369 16,977Ergomed plc (a) 4,933 87,283Essentra plc 94,236 388,969Euromoney Institutional Investor plc 32,940 426,294FD Technologies plc (a) 482 12,163FDM Group Holdings plc 18,975 263,514Fevertree Drinks plc 28,738 673,198Firstgroup plc (a) 136,404 198,231Flex LNG, Ltd. 8,311 230,255Flowtech Fluidpower plc (a) 6,703 12,100Forterra plc 58,426 178,292Foxtons Group plc 74,860 42,015Frasers Group plc (a) 60,772 502,840Frontier Developments plc (a) 1,358 22,250Fuller Smith & Turner plc - Class A 9,279 74,272Funding Circle Holdings plc (a) 10,326 9,955Future plc 3,296 112,158FW Thorpe plc 6,310 37,847Galliford Try Holdings plc 49,848 116,021Games Workshop Group plc 6,981 664,045Gamma Communications plc 10,934 194,330Gem Diamonds, Ltd. 44,142 32,694Genel Energy plc 14,530 35,350Genuit Group plc 68,299 439,125Genus plc 1,201 44,318Georgia Capital plc (a) 7,105 58,513Go-Ahead Group plc (The) (a) 14,801 157,422Gooch & Housego plc 2,212 29,088Goodwin plc 188 8,365Grafton Group plc 67,734 870,754Grainger plc 208,838 797,876Greggs plc 29,520 950,214Gulf Keystone Petroleum, Ltd. 64,377 200,958Gym Group plc (The) (a) 49,004 124,669H&T Group plc 1,027 4,664Halfords Group plc 72,677 234,323Harworth Group plc 4,382 10,240Hays plc 457,753 733,174Headlam Group plc 31,939 159,215Helical plc 38,476 207,054Henry Boot plc 14,477 60,012Hill & Smith Holdings plc 26,057 500,873
BHFTII-101
Copyright © 2022 www.secdatabase.com. All Rights Reserved.Please Consider the Environment Before Printing This Document

Table of ContentsBrighthouse Funds Trust IIBrighthouse/Dimensional International Small Company Portfolio
Schedule of Investments as of March 31, 2022 (Unaudited)Common Stocks��(Continued)
Security Description Shares Value
United Kingdom��(Continued)Hilton Food Group plc 19,243 $312,974Hiscox, Ltd. 68,213 879,413Hollywood Bowl Group plc (a) 35,798 113,014HomeServe plc 4,134 45,552Hunting plc 52,837 207,693Hyve Group plc (a) 76,414 70,758Ibstock plc 123,730 283,251IDOX plc (d) 75,537 62,396IG Group Holdings plc 88,761 952,542IMI plc 51,741 922,141Impax Asset Management Group plc 13,684 176,634Inchcape plc 117,929 1,029,452Indivior plc (a) 153,822 564,981IntegraFin Holdings plc 46,352 256,057International Personal Finance plc 79,366 106,963iomart Group plc (d) 16,833 35,884IP Group plc 225,731 263,222IQE plc (a) (d) 33,849 14,990J.D. Wetherspoon plc (a) 24,696 251,929James Fisher & Sons plc (a) 17,856 81,104James Halstead plc 41,749 126,641Jet2 plc (a) 22,038 330,254John Menzies plc (a) 23,155 180,320John Wood Group plc (a) 195,202 412,197Johnson Service Group plc (a) 61,047 93,900Joules Group plc (a) 4,111 3,006Jupiter Fund Management plc 156,485 423,215Just Group plc (a) 211,144 242,229Kainos Group plc 20,314 351,148Keller Group plc 23,721 258,569Kier Group plc (a) 94,700 105,592Kin & Carta plc (a) 51,298 170,970Lancashire Holdings, Ltd. 72,054 405,942Learning Technologies Group plc 112,961 240,262Liontrust Asset Management plc 12,072 201,168Lookers plc (a) 131,372 158,854LSL Property Services plc 25,826 131,189Luceco plc 31,684 84,714M&C Saatchi plc (a) 3,677 7,917Man Group plc 461,786 1,407,559Marks & Spencer Group plc (a) 324,090 655,948Marshalls plc 60,744 539,974Marston�s plc (a) 258,409 275,229McBride plc (a) 63,975 35,618Mears Group plc 41,542 112,202Medica Group plc 4,619 9,364Meggitt plc (a) 117,808 1,175,009Metro Bank plc (a) 2,816 3,332Micro Focus International plc 44,529 236,025Midwich Group plc (d) 2,103 17,356Mitchells & Butlers plc (a) 103,172 315,698Mitie Group plc 406,977 291,860MJ Gleeson plc 13,112 101,443Moneysupermarket.com Group plc 146,027 363,834Morgan Advanced Materials plc 95,467 387,258Morgan Sindall Group plc 14,642 461,500Mortgage Advice Bureau Holdings, Ltd. 6,665 100,022
United Kingdom��(Continued)Motorpoint group plc (a) 14,323 52,568MP Evans Group plc 1,196 16,470
Copyright © 2022 www.secdatabase.com. All Rights Reserved.Please Consider the Environment Before Printing This Document

N Brown Group plc (a) 62,840 24,781Naked Wines plc (a) 1,427 6,736National Express Group plc (a) 190,696 581,999NCC Group plc 88,729 211,617Next Fifteen Communications Group plc 16,972 297,377Ninety One plc 48,829 163,452Norcros plc 11,343 38,329Numis Corp. plc 16,141 54,264Odfjell Technology Ltd. (a) 4,275 9,852On the Beach Group plc (a) 32,313 99,233OSB Group plc 67,797 499,958Oxford Biomedica plc (a) 11,450 101,274Oxford Instruments plc 18,083 499,155Pagegroup plc 102,025 657,141Pan African Resources plc 368,191 107,715Paragon Banking Group plc 81,611 532,531Parkmead Group plc (The) (a) 28,991 19,205PayPoint plc 20,570 156,922Pendragon plc (a) 345,188 127,393Pennon Group plc 54,352 766,162Petrofac, Ltd. (a) 95,267 129,571Pets at Home Group plc 171,293 810,575Pharos Energy plc (a) 50,968 18,263Photo-Me International plc (a) 89,030 83,364Playtech plc (a) 90,374 697,721Polar Capital Holdings plc 16,568 134,976Porvair plc 8,570 70,631PPHE Hotel Group, Ltd. (a) 3,290 62,578Premier Foods plc 241,797 361,183Provident Financial plc (a) 52,029 209,115PZ Cussons plc 74,104 190,337QinetiQ Group plc 170,380 679,635Quilter plc 517,517 961,182Rank Group plc (a) 54,017 94,717Rathbones Group plc 17,130 443,844Reach plc 159,041 382,128Redde Northgate plc 57,053 322,431Redrow plc 89,477 611,397Renew Holdings plc 8,917 79,863Renewi plc (a) 25,541 221,147Renishaw plc 2,766 139,681Renold plc (a) 238 64Restaurant Group plc (The) (a) 92,660 73,893Ricardo plc 13,452 69,177River & Mercantile Group plc 112 388RM plc 43,283 84,943Robert Walters plc 16,356 149,451Rotork plc 249,530 1,062,751RPS Group plc 100,537 137,608RWS Holdings plc 12,286 59,688S&U plc 1,188 37,734Sabre Insurance Group plc 44,771 136,310Saga plc (a) 8,514 25,908Savills plc 45,458 660,753Secure Trust Bank plc 458 7,673
BHFTII-102
Copyright © 2022 www.secdatabase.com. All Rights Reserved.Please Consider the Environment Before Printing This Document

Table of ContentsBrighthouse Funds Trust IIBrighthouse/Dimensional International Small Company Portfolio
Schedule of Investments as of March 31, 2022 (Unaudited)Common Stocks��(Continued)
Security Description Shares Value
United Kingdom��(Continued)Senior plc (a) 166,890 $277,491Serco Group plc 51,037 96,046Serica Energy plc 20,470 106,994Severfield plc 100,890 88,723SIG plc (a) 255,262 144,122Smart Metering Systems plc 19,388 200,473Smiths News plc 20,535 9,224Softcat plc 30,324 676,144Spectris plc 6,489 220,384Speedy Hire plc 177,240 125,393Spire Healthcare Group plc (a) 58,762 188,300Spirent Communications plc 181,575 566,219Sportech plc (a) 8,446 3,857SSP Group plc (a) 177,745 528,307Stagecoach Group plc (a) 144,489 201,675SThree plc 41,761 225,474Stobart Group, Ltd. (a) 102,535 14,731Studio Retail Group plc (a) (b) (c) 17,439 26,345STV Group plc 7,194 29,403Superdry plc (a) 18,185 38,118Synthomer plc 101,465 406,045T. Clarke plc 15,381 29,483Tate & Lyle plc 116,405 1,118,214TBC Bank Group plc 4,639 66,842Ted Baker plc (a) 15,673 26,295Telecom Plus plc 18,238 364,563Topps Tiles plc 61,961 45,431TORM plc - Class A (a) 8,003 68,741TP ICAP Group plc 235,823 458,566Travis Perkins plc 50,576 816,709Treatt plc 8,866 131,553Trellus Health Ltd. (a) 2,339 0Trifast plc 20,432 30,710TT electronics plc 60,814 163,382Tyman plc 21,078 87,371Ultra Electronics Holdings plc 22,478 977,312Vertu Motors plc 46,012 39,072Vesuvius plc 68,585 306,394Victrex plc 25,139 601,112Virgin Money UK plc 194,812 435,198Vistry Group plc 65,780 810,464Vitec Group plc (The) 10,351 183,205Vivo Energy plc 53,383 95,612Volex plc 20,438 70,762Volution Group plc 31,181 170,541Vp plc 4,147 45,790Watches of Switzerland Group plc (a) 32,275 478,566Watkin Jones plc 36,280 121,929WH Smith plc (a) 19,684 368,458Wickes Group plc 76,029 183,368Wincanton plc 40,925 207,069Xaar plc (a) 18,088 61,069Young & Co�s Brewery plc - Class A 4,640 86,076Young & Co�s Brewery plc (Non-Voting
Shares) 1,744 15,259Zotefoams plc 7,268 31,335
74,812,631
United States��0.4%Argonaut Gold, Inc. (a) 80,499 157,759Arko Corp. (d) 9,286 84,503
Copyright © 2022 www.secdatabase.com. All Rights Reserved.Please Consider the Environment Before Printing This Document

Burford Capital, Ltd. 33,018 300,469Diversified Energy Co., plc 107,722 167,255Energy Fuels, Inc. (a) (d) 14,915 137,321Frontage Holdings Corp. (a) 58,000 21,222Ormat Technologies, Inc. 1 45Primo Water Corp. 2,400 34,200PureTech Health plc (a) 45,320 117,838Razer, Inc. (a) 666,000 216,622Reliance Worldwide Corp., Ltd. 151,455 475,548Sims, Ltd. 51,085 819,010Varia US Properties AG (a) 1,203 73,891Viemed Healthcare, Inc. (a) 3,244 16,155Vobile Group, Ltd. (a) (d) 163,000 98,828
2,720,666Total Common Stocks
(Cost $551,366,877) 620,041,964
Preferred Stocks��0.3%Germany��0.3%Biotest AG (a) 5,357 219,269Draegerwerk AG & Co. KGaA 3,031 167,733Fuchs Petrolub SE 17,122 622,011Jungheinrich AG 16,854 491,552Sixt SE 4,716 354,170Sto SE & Co. KGaA 618 141,147Villeroy & Boch AG 505 13,366Total Preferred Stocks
(Cost $1,839,524) 2,009,248
Warrants��0.0%Australia��0.0%Decmil Group, Ltd., Expires 09/15/22 (a) 4,018 0
Canada��0.0%Cenovus Energy, Inc. (a) 807 9,360
Italy��0.0%Webuild S.p.A (a) (d) 6,346 0
Singapore��0.0%Ezion Holdings, Ltd., Expires 04/16/23 (a) 309,737 0Total Warrants
(Cost $3,005) 9,360
Rights��0.0%Australia��0.0%Centrebet International, Ltd. (Litigation
Units) (a) 9,600 0
BHFTII-103
Copyright © 2022 www.secdatabase.com. All Rights Reserved.Please Consider the Environment Before Printing This Document

Table of ContentsBrighthouse Funds Trust IIBrighthouse/Dimensional International Small Company Portfolio
Schedule of Investments as of March 31, 2022 (Unaudited)Rights��(Continued)
Security Description
Shares/PrincipalAmount* Value
Austria��0.0%CA Immobilien Anlagen AG (a) 21,414 $0IMMOFINANZ AG (a) (d) 28,505 0Intercell AG (a) (b) (c) 24,163 0
0
Hong Kong��0.0%Fortune Oil CVR (a) (b) (c) 575,627 0
Sweden��0.0%Karo Pharma AB (a) 4,962 94Total Rights
(Cost $0) 94
Short-Term Investment��0.2%Repurchase Agreement��0.2%Fixed Income Clearing Corp.
Repurchase Agreement dated 03/31/22 at 0.000%, due on 04/01/22with a maturity value of $1,130,632;collateralized by U.S. Treasury Noteat 2.500%, maturing 03/31/27, witha market value of $1,153,345. 1,130,632 1,130,632
Total Short-Term Investments(Cost $1,130,632) 1,130,632
Securities Lending Reinvestments (e)��8.6%Certificate of Deposit��0.0%Oversea-Chinese Banking Corp., Ltd.
Zero Coupon, 04/14/22 200,000 199,966
Commercial Paper��0.2%DNB Bank ASA
0.830%, SOFR + 0.550%, 09/07/22(f) 1,000,000 1,000,399
Repurchase Agreements��4.1%BofA Securities, Inc.
Repurchase Agreement dated 03/31/22 at 0.270%, due on 04/01/22with a maturity value of $2,036,006;collateralized by U.S. TreasuryObligations with rates ranging from2.000% - 5.000%, maturity datesranging from 05/15/37 - 02/15/50,and an aggregate market value of$2,076,710. 2,035,990 2,035,990
Citigroup Global Markets, Ltd.Repurchase Agreement dated 03/31/22 at 0.300%, due on 04/01/22with a maturity value of $800,007;collateralized by U.S. Treasury andForeign Obligations with ratesranging from 0.125% - 2.875%,maturity dates ranging from 08/15/23 - 02/15/51, and an aggregatemarket value of $816,000. 800,000 800,000
Repurchase Agreements��(Continued)
Copyright © 2022 www.secdatabase.com. All Rights Reserved.Please Consider the Environment Before Printing This Document

National Bank Financial, Inc.Repurchase Agreement dated 03/31/22 at 0.320%, due on 04/01/22with a maturity value of $800,007;collateralized by U.S. TreasuryObligations with rates ranging from0.125% - 3.000%, maturity datesranging from 06/30/22 - 02/15/49,and an aggregate market value of$816,455. 800,000 800,000
National Bank of CanadaRepurchase Agreement dated 03/31/22 at 0.320%, due on 04/07/22with a maturity value of $3,500,218;collateralized by U.S. TreasuryObligations with rates ranging from0.000% - 4.500%, maturity datesranging from 04/14/22 - 08/15/51,and an aggregate market value of$3,571,991. 3,500,000 3,500,000Repurchase Agreement dated 03/31/22 at 0.450%, due on 04/07/22with a maturity value of $3,300,289;collateralized by U.S. TreasuryObligations with rates ranging from0.500% - 3.000%, maturity datesranging from 11/30/23 - 08/15/48,and various Common Stock with anaggregate market value of$3,649,136. 3,300,000 3,300,000
NBC Global Finance, Ltd.Repurchase Agreement dated 03/31/22 at 0.440%, due on 04/01/22with a maturity value of $6,000,073;collateralized by U.S. TreasuryObligations with rates ranging from0.125% - 4.750%, maturity datesranging from 05/15/24 - 02/15/50,and various Common Stock with anaggregate market value of$6,662,259. 6,000,000 6,000,000Repurchase Agreement dated 03/31/22 at 0.485%, due on 04/07/22with a maturity value of $1,100,104;collateralized by U.S. TreasuryObligations with rates ranging from0.125% - 4.750%, maturity datesranging from 05/15/24 - 02/15/50,and various Common Stock with anaggregate market value of$1,221,414. 1,100,000 1,100,000
Societe GeneraleRepurchase Agreement dated 03/31/22 at 0.360%, due on 04/01/22with a maturity value of $2,300,023;collateralized by various CommonStock with an aggregate marketvalue of $2,555,766. 2,300,000 2,300,000Repurchase Agreement dated 03/31/22 at 0.380%, due on 04/01/22with a maturity value of $1,300,014;collateralized by various CommonStock with an aggregate marketvalue of $1,444,564. 1,300,000 1,300,000Repurchase Agreement dated 03/31/22 at 0.410%, due on 04/01/22with a maturity value of $4,000,046;collateralized by various CommonStock with an aggregate marketvalue of $4,445,159. 4,000,000 4,000,000
Copyright © 2022 www.secdatabase.com. All Rights Reserved.Please Consider the Environment Before Printing This Document

Repurchase Agreement dated 03/31/22 at 0.420%, due on 04/07/22with a maturity value of $800,065;collateralized by various CommonStock with an aggregate marketvalue of $889,032. 800,000 800,000
25,935,990
BHFTII-104
Copyright © 2022 www.secdatabase.com. All Rights Reserved.Please Consider the Environment Before Printing This Document

Table of ContentsBrighthouse Funds Trust IIBrighthouse/Dimensional International Small Company Portfolio
Schedule of Investments as of March 31, 2022 (Unaudited)Securities Lending Reinvestments (e)��(Continued)
Security Description
Shares/PrincipalAmount* Value
Time Deposits��1.6%Canadian Imperial Bank of Commerce
0.320%, 04/01/22 2,000,000 $2,000,000DZ Bank AG (NY)
0.300%, 04/01/22 2,000,000 2,000,000Rabobank (New York)
0.310%, 04/01/22 2,000,000 2,000,000Skandi (NY) 0.300%,
04/01/22 2,000,000 2,000,000Svenska (NY) 0.260%,
04/01/22 2,000,000 2,000,00010,000,000
Mutual Funds��2.7%BlackRock Liquidity Funds FedFund,
Institutional Shares0.230% (g) 5,000,000 5,000,000
Morgan Stanley Liquidity FundsGovernment Portfolio, InstitutionalShares0.230% (g) 5,000,000 5,000,000
STIT-Government & Agency Portfolio,Institutional Class0.250% (g) 7,000,000 7,000,000
17,000,000Total Securities Lending Reinvestments
(Cost $54,135,979) 54,136,355Total Investments�107.8%
(Cost $608,476,017) 677,327,653Other assets and liabilities (net)�(7.8)% (48,931,324 )Net Assets��100.0% $628,396,329
* Principal amount stated in U.S. dollars unless otherwise noted.(a) Non-income producing security.(b) Security was valued in good faith under procedures approved by the Board of Trustees. As of March 31, 2022, these securities represent 0.1% of
net assets.(c) Significant unobservable inputs were used in the valuation of this portfolio security; i.e. Level 3.(d) All or a portion of the security was held on loan. As of March 31, 2022, the market value of securities loaned was $67,671,248 and the collateral
received consisted of cash in the amount of $54,135,834 and non-cash collateral with a value of $20,493,977. The cash collateral investments aredisclosed in the Schedule of Investments and categorized as Securities Lending Reinvestments. The non-cash collateral received consists of U.S.government securities that are held in safe-keeping by the lending agent, or a third-party custodian, and cannot be sold or repledged by thePortfolio.
(e) Represents investment of cash collateral received from securities on loan as of March 31, 2022.(f) Variable or floating rate security. The stated rate represents the rate at March 31, 2022. Maturity date shown for callable securities reflects the
earliest possible call date. For securities based on a published reference index and spread, the index and spread are indicated in the descriptionabove. For certain variable rate securities, the coupon rate is determined by the issuer/agent based on current market conditions. For certain asset-and mortgage-backed securities, the coupon rate may fluctuate based on changes of the underlying collateral or prepayments of principal. Thesesecurities do not indicate a reference index and spread in their description above.
(g) The rate shown represents the annualized seven-day yield as of March 31, 2022.
Ten Largest Industries as ofMarch 31, 2022 (Unaudited)
% ofNet Assets
Machinery 6.3Metals & Mining 6.0Real Estate Management & Development 4.9Banks 4.3Oil, Gas & Consumable Fuels 4.3Capital Markets 3.7
Copyright © 2022 www.secdatabase.com. All Rights Reserved.Please Consider the Environment Before Printing This Document

Chemicals 3.5Food Products 3.2Electronic Equipment, Instruments & Components 3.1Construction & Engineering 3.0
Glossary of Abbreviations
Index Abbreviations
(SOFR)� Secured Overnight Financing Rate
Other Abbreviations
(REIT)� Real Estate Investment Trust(ADR)� American Depositary Receipt
BHFTII-105
Copyright © 2022 www.secdatabase.com. All Rights Reserved.Please Consider the Environment Before Printing This Document

Table of ContentsBrighthouse Funds Trust IIBrighthouse/Dimensional International Small Company Portfolio
Schedule of Investments as of March 31, 2022 (Unaudited)
Fair Value HierarchyAccounting principles generally accepted in the United States of America (�GAAP�) define fair market value as the price that the Portfolio would receive tosell an asset or pay to transfer a liability in an orderly transaction between market participants at the measurement date. It establishes a fair valuehierarchy that prioritizes inputs to valuation methods and requires disclosure of the fair value hierarchy, separately for each major category of assets andliabilities, that segregates fair value measurements into three levels. Levels 1, 2 and 3 of the fair value hierarchy are defined as follows:
Level 1 - unadjusted quoted prices in active markets for identical investmentsLevel 2 - other significant observable inputs (including, but not limited to, quoted prices for similar assets or liabilities in markets that are either activeor inactive; inputs other than quoted prices that are observable such as interest rates, yield curves, volatilities, prepayment speeds, loss severities,credit risks, default rates, or other market corroborated inputs)Level 3 - significant unobservable inputs based on the best information available in the circumstances, to the extent observable inputs areunavailable (including the Portfolio�s own assumptions used in determining the fair value of investments and derivative financial instruments)
The inputs or methodologies used for valuing investments are not necessarily an indication of the risk associated with investing in them. Changes to theinputs or methodologies used may result in transfers between levels. A reconciliation of Level 3 securities, if any, will be disclosed following the fair valuehierarchy table. For more information about the Portfolio�s policy regarding the valuation of investments, please refer to the Notes to Schedule ofInvestments.
The following table summarizes the fair value hierarchy of the Portfolio�s investments as of March 31, 2022:
Description Level 1 Level 2 Level 3 TotalCommon Stocks
Australia $820,429 $41,319,469 $302,059 $42,441,957Austria � 9,294,073 0 9,294,073Belgium � 10,846,013 � 10,846,013Cambodia � 209,745 � 209,745Canada 73,574,648 206,182 1,184 73,782,014China 352,612 570,897 � 923,509Colombia 96,816 � � 96,816Denmark � 13,592,799 � 13,592,799Faeroe Islands � 21,012 � 21,012Finland � 13,368,553 � 13,368,553France � 28,978,183 1,278 28,979,461Georgia � 207,687 � 207,687Germany � 40,572,296 � 40,572,296Ghana � 343,439 � 343,439Greenland � 12,863 � 12,863Guernsey, Channel Islands � � 0 0Hong Kong 888,031 13,313,616 66,172 14,267,819India � 99,389 � 99,389Ireland � 3,712,764 � 3,712,764Isle of Man � 64,209 � 64,209Israel 290,484 12,303,870 � 12,594,354Italy � 21,023,373 � 21,023,373Japan � 136,238,435 135,747 136,374,182Jersey, Channel Islands � 689,984 � 689,984Liechtenstein � 319,796 � 319,796Luxembourg � 1,975,366 � 1,975,366Macau � 214,216 � 214,216Malta � 13,082 � 13,082Mongolia 94,716 12,374 � 107,090Netherlands � 16,985,692 0 16,985,692New Zealand � 3,565,911 � 3,565,911Nigeria � 220,203 � 220,203Norway � 5,593,125 � 5,593,125Peru � 161,974 � 161,974Philippines � 21,696 � 21,696Portugal � 2,257,053 0 2,257,053Singapore 134,932 8,171,109 33,682 8,339,723South Africa � 999,720 � 999,720Spain � 13,471,824 0 13,471,824Sweden 75,640 18,968,655 � 19,044,295
Copyright © 2022 www.secdatabase.com. All Rights Reserved.Please Consider the Environment Before Printing This Document

Switzerland 1,014,655 44,468,065 � 45,482,720
BHFTII-106
Copyright © 2022 www.secdatabase.com. All Rights Reserved.Please Consider the Environment Before Printing This Document

Table of ContentsBrighthouse Funds Trust IIBrighthouse/Dimensional International Small Company Portfolio
Schedule of Investments as of March 31, 2022 (Unaudited)
Fair Value Hierarchy��(Continued)
Description Level 1 Level 2 Level 3 TotalTaiwan $� $11,830 $� $11,830Tanzania � 166,840 � 166,840United Arab Emirates � 38,200 � 38,200United Kingdom 145,267 74,641,019 26,345 74,812,631United States 429,938 2,290,728 � 2,720,666
Total Common Stocks 77,918,168 541,557,329 566,467 620,041,964Preferred Stocks
Germany 219,269 1,789,979 � 2,009,248Warrants
Australia � 0 � 0Canada 9,360 � � 9,360Italy � 0 � 0Singapore � 0 � 0
Total Warrants 9,360 0 � 9,360Rights
Australia � 0 � 0Austria � 0 0 0Hong Kong � � 0 0Sweden 94 � � 94
Total Rights 94 0 0 94Total Short-Term Investment* � 1,130,632 � 1,130,632Securities Lending Reinvestments
Certificate of Deposit � 199,966 � 199,966Commercial Paper � 1,000,399 � 1,000,399Repurchase Agreements � 25,935,990 � 25,935,990Time Deposits � 10,000,000 � 10,000,000Mutual Funds 17,000,000 � � 17,000,000
Total Securities Lending Reinvestments 17,000,000 37,136,355 � 54,136,355Total Investments $95,146,891 $581,614,295 $566,467 $677,327,653Collateral for Securities Loaned (Liability) $� $(54,135,834 ) $� $(54,135,834 )
* See Schedule of Investments for additional detailed categorizations.
Level 3 investments at the beginning and/or end of the period in relation to net assets were not significant and accordingly, a reconciliation of Level 3assets for the period ended March 31, 2022 is not presented.
During the period ended March 31, 2022, transfers into Level 3 in the amount of $556,989 were due to trading halts on the securities� respectiveexchanges which resulted in the lack of observable inputs.
During the period ended March 31, 2022, transfers out of Level 3 in the amount of $27,255 were due to the resumption of trading activity which resulted inthe availability of significant observable inputs.
BHFTII-107
Copyright © 2022 www.secdatabase.com. All Rights Reserved.Please Consider the Environment Before Printing This Document

Table of ContentsBrighthouse Funds Trust II
Brighthouse/Wellington Balanced Portfolio
Schedule of Investments as of March 31, 2022 (Unaudited)Common Stocks��61.0% of Net Assets
Security Description Shares Value
Aerospace & Defense��1.3%Boeing Co. (The) (a) 13,943 $2,670,084General Dynamics Corp. 20,432 4,927,790L3Harris Technologies, Inc. 10,836 2,692,421Raytheon Technologies Corp. 71,724 7,105,697
17,395,992
Air Freight & Logistics��0.2%FedEx Corp. 10,148 2,348,146
Airlines��0.2%JetBlue Airways Corp. (a) (b) 110,847 1,657,162Southwest Airlines Co. (a) 11,631 532,700
2,189,862
Automobiles��0.6%Tesla, Inc. (a)(b) 7,694 8,291,054
Banks��0.3%PNC Financial Services Group, Inc. (The) 22,431 4,137,398
Beverages��0.7%Constellation Brands, Inc. - Class A 32,893 7,575,916Monster Beverage Corp. (a) 27,428 2,191,497
9,767,413
Biotechnology��1.1%Alnylam Pharmaceuticals, Inc. (a) 2,823 460,968Apellis Pharmaceuticals, Inc. (a) 5,006 254,355Ascendis Pharma A/S (ADR) (a) (b) 4,134 485,166Biogen, Inc. (a) 4,848 1,020,989Blueprint Medicines Corp. (a) 2,763 176,500Celldex Therapeutics, Inc. (a) 4,714 160,559Exact Sciences Corp. (a) (b) 20,221 1,413,852Genmab A/S (ADR) (a) 12,223 442,228Horizon Therapeutics plc (a) 3,832 403,165Incyte Corp. (a) 6,842 543,392Kymera Therapeutics, Inc. (a) (b) 4,104 173,681Mirati Therapeutics, Inc. (a) 1,740 143,063Moderna, Inc. (a) 1,792 308,690Myovant Sciences, Ltd. (a)(b) 73,499 979,007Neurocrine Biosciences, Inc. (a) 2,592 243,000Regeneron Pharmaceuticals, Inc. (a) 3,068 2,142,752REVOLUTION Medicines, Inc. (a) (b) 5,811 148,238Sarepta Therapeutics, Inc. (a) 2,689 210,065Seagen, Inc. (a) 5,194 748,196United Therapeutics Corp. (a) 1,534 275,215Veracyte, Inc. (a)(b) 29,431 811,413Vertex Pharmaceuticals, Inc. (a) 10,251 2,675,203
14,219,697
Building Products��0.6%Johnson Controls International plc 78,171 5,125,673Trane Technologies plc 13,639 2,082,675Zurn Water Solutions Corp. 38,663 1,368,670
8,577,018
Capital Markets��3.4%Ares Management Corp. - Class A 97,643 7,931,541Charles Schwab Corp. (The) 220,031 18,550,814Hamilton Lane, Inc. - Class A (b) 28,948 2,237,391Morgan Stanley 64,229 5,613,614
Copyright © 2022 www.secdatabase.com. All Rights Reserved.Please Consider the Environment Before Printing This Document

S&P Global, Inc. (b) 27,225 11,167,15045,500,510
Chemicals��1.7%Cabot Corp. (b) 45,069 3,083,170Celanese Corp. 22,594 3,228,005FMC Corp. (b) 32,411 4,264,315Ingevity Corp. (a) 17,291 1,107,834Linde plc 18,683 5,967,911Livent Corp. (a) (b) 41,310 1,076,952PPG Industries, Inc. 26,139 3,426,039
22,154,226
Communications Equipment��0.4%Arista Networks, Inc. (a) 33,186 4,612,190
Construction & Engineering��0.0%Fluor Corp. (a) (b) 14,902 427,538
Consumer Finance��1.0%American Express Co. 64,434 12,049,158OneMain Holdings, Inc. 26,600 1,261,106
13,310,264
Containers & Packaging��0.1%Ball Corp. 15,649 1,408,410
Diversified Financial Services��0.4%Equitable Holdings, Inc. 151,957 4,696,991Voya Financial, Inc. (b) 14,360 952,786
5,649,777
Electric Utilities��2.0%Constellation Energy Corp. 37,483 2,108,419Duke Energy Corp. 66,033 7,373,245Edison International (b) 76,760 5,380,876Exelon Corp. 108,615 5,173,332FirstEnergy Corp. (b) 138,174 6,336,660
26,372,532
Electrical Equipment��0.1%Emerson Electric Co. 12,264 1,202,485Regal Rexnord Corp. 1,204 179,131
1,381,616
Energy Equipment & Services��0.2%Schlumberger NV 73,093 3,019,472
Entertainment��0.6%Electronic Arts, Inc. 24,058 3,043,577Netflix, Inc. (a) 1,859 696,363
BHFTII-108
Copyright © 2022 www.secdatabase.com. All Rights Reserved.Please Consider the Environment Before Printing This Document

Table of ContentsBrighthouse Funds Trust IIBrighthouse/Wellington Balanced Portfolio
Schedule of Investments as of March 31, 2022 (Unaudited)Common Stocks��(Continued)
Security Description Shares Value
Entertainment��(Continued)Roku, Inc. (a) 34,552 $4,328,329
8,068,269
Equity Real Estate Investment Trusts��1.4%American Tower Corp. 12,263 3,080,711AvalonBay Communities, Inc. 13,046 3,240,235Rexford Industrial Realty, Inc. 59,157 4,412,521Ryman Hospitality Properties, Inc. (a) 32,266 2,993,317Welltower, Inc. 50,240 4,830,073
18,556,857
Food & Staples Retailing��1.5%Performance Food Group Co. (a) 272,200 13,857,702Sysco Corp. 77,807 6,352,942
20,210,644
Food Products��1.1%Hershey Co. (The) 21,477 4,652,562Mondelez International, Inc. - Class A 151,391 9,504,327
14,156,889
Health Care Equipment & Supplies��1.9%Align Technology, Inc. (a) 4,263 1,858,668Baxter International, Inc. 41,953 3,253,036Boston Scientific Corp. (a) 103,099 4,566,255Edwards Lifesciences Corp. (a) 36,093 4,248,868Inari Medical, Inc. (a) 15,443 1,399,753Insulet Corp. (a) 8,264 2,201,447Stryker Corp. 18,549 4,959,075Teleflex, Inc. 9,075 3,220,082
25,707,184
Health Care Providers & Services��2.2%Agilon Health, Inc. (a) (b) 110,691 2,806,017Anthem, Inc. 10,590 5,202,020Centene Corp. (a) 52,473 4,417,702HCA Healthcare, Inc. 8,468 2,122,250Humana, Inc. 16,670 7,254,284Laboratory Corp. of America Holdings (a) 4,667 1,230,501McKesson Corp. 6,974 2,134,951UnitedHealth Group, Inc. 9,061 4,620,838
29,788,563
Hotels, Restaurants & Leisure��1.2%Airbnb, Inc. - Class A (a) 46,425 7,973,958Hyatt Hotels Corp. - Class A (a) 23,264 2,220,549Starbucks Corp. 65,005 5,913,505
16,108,012
Industrial Conglomerates��0.4%Honeywell International, Inc. 24,543 4,775,577
Insurance��1.9%American International Group, Inc. 77,597 4,870,764Assurant, Inc. 9,210 1,674,654Assured Guaranty, Ltd. 39,236 2,497,764Chubb, Ltd. 26,344 5,634,982Hartford Financial Services Group, Inc. (The) 37,900 2,721,599Marsh & McLennan Cos., Inc. 23,408 3,989,191Oscar Health, Inc. - Class A (a) (b) 63,960 637,681Trupanion, Inc. (a) (b) 31,174 2,778,227
Copyright © 2022 www.secdatabase.com. All Rights Reserved.Please Consider the Environment Before Printing This Document

24,804,862
Interactive Media & Services��4.5%Alphabet, Inc. - Class A (a) 13,798 38,377,067Bumble, Inc. - Class A (a) 44,808 1,298,536Cargurus, Inc. (a) 78,901 3,350,137Match Group, Inc. (a) 25,135 2,733,180Meta Platforms, Inc. - Class A (a) 51,323 11,412,182Snap, Inc. - Class A (a) (b) 84,605 3,044,934
60,216,036
Internet & Direct Marketing Retail��3.6%Amazon.com, Inc. (a) 12,919 42,115,294Etsy, Inc. (a) (b) 47,215 5,867,880
47,983,174
IT Services��2.1%Block, Inc. (a) 16,019 2,172,176FleetCor Technologies, Inc. (a) 10,110 2,517,997Genpact, Ltd. 36,233 1,576,498Global Payments, Inc. 54,504 7,458,327GoDaddy, Inc. - Class A (a) 44,343 3,711,509Nuvei Corp. (a) 27,018 2,036,887Okta, Inc. (a) 2,982 450,163PayPal Holdings, Inc. (a) 6,568 759,589Snowflake, Inc. - Class A (a) 1,502 344,153Visa, Inc. - Class A 23,762 5,269,699WEX, Inc. (a) 10,637 1,898,173
28,195,171
Life Sciences Tools & Services��1.5%Agilent Technologies, Inc. 33,631 4,450,390Danaher Corp. 30,826 9,042,191ICON plc (a) 4,070 989,905NanoString Technologies, Inc. (a) 39,883 1,385,934Syneos Health, Inc. (a) 28,920 2,341,074Waters Corp. (a) (b) 6,966 2,162,177
20,371,671
Machinery��1.3%Fortive Corp. 59,294 3,612,783Ingersoll Rand, Inc. 61,414 3,092,195Kennametal, Inc. (b) 50,639 1,448,782PACCAR, Inc. 30,306 2,669,049Parker-Hannifin Corp. 8,193 2,324,846
BHFTII-109
Copyright © 2022 www.secdatabase.com. All Rights Reserved.Please Consider the Environment Before Printing This Document

Table of ContentsBrighthouse Funds Trust IIBrighthouse/Wellington Balanced Portfolio
Schedule of Investments as of March 31, 2022 (Unaudited)Common Stocks��(Continued)
Security Description Shares Value
Machinery��(Continued)Westinghouse Air Brake Technologies Corp. 44,586 $4,287,836
17,435,491
Media��1.8%Charter Communications, Inc. - Class A (a) 12,628 6,888,827DISH Network Corp. - Class A (a) 90,169 2,853,849New York Times Co. (The) - Class A (b) 68,033 3,118,633Omnicom Group, Inc. (b) 126,905 10,771,696
23,633,005
Metals & Mining��0.0%Foresight Energy LLC 1,359 23,101
Oil, Gas & Consumable Fuels��2.5%ConocoPhillips 72,019 7,201,900Marathon Petroleum Corp. 38,258 3,271,059Pioneer Natural Resources Co. 12,772 3,193,383Shell plc (ADR) 358,454 19,689,878
33,356,220
Pharmaceuticals��3.2%Aclaris Therapeutics, Inc. (a) 9,585 165,245AstraZeneca plc (ADR) (b) 67,095 4,451,082Bristol-Myers Squibb Co. 89,650 6,547,140Elanco Animal Health, Inc. (a) 66,319 1,730,263Eli Lilly and Co. 39,703 11,369,748Intra-Cellular Therapies, Inc. (a) (b) 19,607 1,199,752Novartis AG (ADR) 28,244 2,478,411Pfizer, Inc. 207,146 10,723,949Zoetis, Inc. 21,900 4,130,121
42,795,711
Professional Services��0.4%CACI International, Inc. 3,057 920,952Science Applications International Corp. 11,753 1,083,274TriNet Group, Inc. (a) 26,471 2,603,687
4,607,913
Road & Rail��0.4%Canadian Pacific Railway, Ltd. 25,793 2,128,954Uber Technologies, Inc. (a) 101,247 3,612,493
5,741,447
Semiconductors & Semiconductor Equipment��2.9%Advanced Micro Devices, Inc. (a) 70,434 7,701,254KLA Corp. 10,330 3,781,400Marvell Technology, Inc. 58,439 4,190,661Micron Technology, Inc. 67,971 5,294,261NVIDIA Corp. 14,720 4,016,499Taiwan Semiconductor Manufacturing Co.,
Ltd. (ADR) 8,070 841,378Teradyne, Inc. (b) 32,990 3,900,408Texas Instruments, Inc. 48,609 8,918,779
38,644,640
Software��5.7%Adobe, Inc. (a) 5,869 $2,674,034Avalara, Inc. (a) 3,923 390,378Ceridian HCM Holding, Inc. (a) 19,671 1,344,709
Copyright © 2022 www.secdatabase.com. All Rights Reserved.Please Consider the Environment Before Printing This Document

Confluent, Inc. - Class A (a) 3,795 155,595Gitlab, Inc. - Class A (a) 2,939 160,028Guidewire Software, Inc. (a) 9,466 895,673Hashicorp, Inc. - Class A (a) (b) 17,392 939,168Microsoft Corp. 174,547 53,814,586Palo Alto Networks, Inc. (a) 1,379 858,441Qualtrics International, Inc. - Class A (a) 27,191 776,303Rapid7, Inc. (a) (b) 7,657 851,765Salesforce.com, Inc. (a) 28,511 6,053,455SentinelOne, Inc. - Class A (a) 12,636 489,519ServiceNow, Inc. (a) 5,503 3,064,566UiPath, Inc. - Class A (a) 21,181 457,298Varonis Systems, Inc. (a) 14,920 709,297Workday, Inc. - Class A (a) 10,753 2,574,913
76,209,728
Specialty Retail��1.1%TJX Cos., Inc. (The) 117,399 7,112,031Ulta Beauty, Inc. (a) 18,908 7,529,544
14,641,575
Technology Hardware, Storage & Peripherals��2.4%Apple, Inc. 181,318 31,659,936
Tobacco��0.6%Philip Morris International, Inc. 83,739 7,866,442
Wireless TelecommunicationServices��0.5%T-Mobile U.S., Inc. (a) 52,524 6,741,455Total Common Stocks
(Cost $643,856,567) 813,062,688
U.S. Treasury & Government Agencies��23.6%Agency Sponsored Mortgage - Backed��15.2%Fannie Mae 15 Yr. Pool
3.000%, 07/01/28 574,892 580,8623.000%, 02/01/31 73,933 74,7033.000%, 08/01/33 191,433 193,4114.000%, 04/01/26 10,606 10,9154.000%, 02/01/29 226,364 232,6644.500%, 06/01/24 30,132 30,8614.500%, 02/01/25 9,659 9,9234.500%, 04/01/25 1,881 1,9464.500%, 07/01/25 6,950 7,1434.500%, 06/01/26 188,604 193,733
Fannie Mae 20 Yr. Pool2.000%, 12/01/40 1,221,018 1,147,1692.000%, 04/01/41 361,535 339,312
BHFTII-110
Copyright © 2022 www.secdatabase.com. All Rights Reserved.Please Consider the Environment Before Printing This Document

Table of ContentsBrighthouse Funds Trust IIBrighthouse/Wellington Balanced Portfolio
Schedule of Investments as of March 31, 2022 (Unaudited)U.S. Treasury & Government Agencies��(Continued)
Security DescriptionPrincipalAmount* Value
Agency Sponsored Mortgage - Backed��(Continued)Fannie Mae 20 Yr. Pool
2.000%, 05/01/41 116,856 $110,2622.000%, 10/01/41 436,088 409,2342.000%, 02/01/42 273,686 256,9833.000%, 03/01/37 365,071 364,283
Fannie Mae 30 Yr. Pool2.000%, 08/01/50 245,623 228,8372.000%, 01/01/51 410,157 382,3442.000%, 02/01/51 1,564,957 1,456,6022.000%, 03/01/51 3,740,225 3,480,3422.500%, 11/01/51 3,192,021 3,062,6062.500%, 12/01/51 987,774 943,7142.500%, 01/01/52 497,472 475,3532.500%, 02/01/52 2,174,289 2,077,4873.000%, 02/01/43 410,392 410,0063.000%, 03/01/43 511,880 510,7993.000%, 04/01/43 497,749 497,1573.000%, 05/01/43 1,313,886 1,310,2893.000%, 06/01/43 167,425 167,1593.000%, 08/01/50 205,038 201,3033.000%, 05/01/51 465,718 457,6623.000%, 12/01/51 412,327 404,2163.500%, 03/01/43 16,556 16,7943.500%, 05/01/43 40,063 40,8633.500%, 07/01/43 98,323 100,2863.500%, 08/01/43 139,877 142,4253.500%, 10/01/44 158,846 161,7383.500%, 02/01/45 156,906 159,7963.500%, 01/01/46 177,925 181,0513.500%, 03/01/46 135,093 137,3073.500%, 09/01/46 266,313 270,5843.500%, 10/01/46 99,655 101,1413.500%, 11/01/46 121,763 123,2603.500%, 12/01/46 654,071 667,0383.500%, 05/01/47 236,285 239,6733.500%, 09/01/47 509,332 516,2973.500%, 12/01/47 70,229 71,2903.500%, 01/01/48 273,466 276,0023.500%, 02/01/48 318,593 322,4203.500%, 07/01/48 356,152 361,8013.500%, 11/01/48 73,314 74,1524.000%, 10/01/40 337,966 353,4494.000%, 11/01/40 126,402 132,0894.000%, 12/01/40 88,017 92,0744.000%, 02/01/41 45,454 47,5344.000%, 03/01/41 127,860 133,7384.000%, 08/01/42 75,990 79,4434.000%, 09/01/42 122,728 128,3794.000%, 03/01/45 14,088 14,7014.000%, 07/01/45 102,307 106,5334.000%, 05/01/46 30,148 31,1744.000%, 06/01/46 121,166 125,9014.000%, 04/01/47 135,182 140,1384.000%, 10/01/47 503,649 519,634
Agency Sponsored Mortgage - Backed��(Continued)Fannie Mae 30 Yr. Pool
4.000%, 09/01/48 192,946 197,4354.000%, 01/01/49 388,340 397,7974.500%, 10/01/40 262,720 279,262
Copyright © 2022 www.secdatabase.com. All Rights Reserved.Please Consider the Environment Before Printing This Document

4.500%, 09/01/41 28,248 30,0574.500%, 10/01/41 122,200 129,9254.500%, 08/01/42 39,430 41,9624.500%, 09/01/43 658,612 698,0534.500%, 10/01/43 93,215 98,6784.500%, 12/01/43 84,207 89,7404.500%, 01/01/44 221,967 236,1364.500%, 04/01/49 176,031 182,8675.000%, 04/01/33 1,228 1,3005.000%, 07/01/33 4,016 4,3425.000%, 09/01/33 72,942 78,5985.000%, 11/01/33 19,451 21,0385.000%, 12/01/33 7,439 8,0375.000%, 02/01/34 3,476 3,6865.000%, 03/01/34 1,654 1,7875.000%, 04/01/34 1,541 1,6645.000%, 06/01/34 1,593 1,7185.000%, 07/01/34 21,919 23,6985.000%, 10/01/34 52,304 56,5145.000%, 07/01/35 38,787 41,5165.000%, 10/01/35 43,203 46,2835.000%, 12/01/35 33,353 36,0525.000%, 08/01/36 29,611 31,9865.000%, 07/01/37 16,953 18,3245.000%, 07/01/41 21,812 23,5215.000%, 08/01/41 12,441 13,4605.500%, 08/01/28 17,051 18,1135.500%, 04/01/33 21,713 23,7745.500%, 08/01/37 125,525 137,4365.500%, 04/01/41 8,574 9,1846.000%, 03/01/28 655 6986.000%, 02/01/34 90,461 97,7966.000%, 08/01/34 46,381 50,9636.000%, 04/01/35 399,348 441,3846.000%, 02/01/38 28,549 31,8496.000%, 03/01/38 11,147 12,4526.000%, 05/01/38 31,771 35,4906.000%, 10/01/38 7,764 8,4966.000%, 12/01/38 12,794 14,2926.500%, 05/01/40 214,961 237,146
Fannie Mae ARM Pool2.032%, 12M LIBOR + 1.769%, 06/01/41 (c) 36,451 37,8682.070%, 12M LIBOR + 1.820%, 09/01/41 (c) 35,431 36,8602.219%, 12M LIBOR + 1.969%, 12/01/40 (c) 9,550 9,7482.250%, 12M LIBOR + 1.750%, 03/01/41 (c) 4,338 4,335
Fannie Mae Connecticut Avenue Securities (CMO)4.007%, 1M LIBOR + 3.550%, 07/25/29 (c) 234,404 238,6144.807%, 1M LIBOR + 4.350%, 05/25/29 (c) 412,798 430,1055.357%, 1M LIBOR + 4.900%, 11/25/24 (c) 90,800 93,481
BHFTII-111
Copyright © 2022 www.secdatabase.com. All Rights Reserved.Please Consider the Environment Before Printing This Document

Table of ContentsBrighthouse Funds Trust IIBrighthouse/Wellington Balanced Portfolio
Schedule of Investments as of March 31, 2022 (Unaudited)U.S. Treasury & Government Agencies��(Continued)
Security DescriptionPrincipalAmount* Value
Agency Sponsored Mortgage - Backed��(Continued)Fannie Mae Connecticut Avenue Securities (CMO)
6.157%, 1M LIBOR + 5.700%, 04/25/28 (c) 74,538 $79,7316.457%, 1M LIBOR + 6.000%, 09/25/28 (c) 39,490 41,628
Fannie Mae Interest Strip (CMO)2.000%, 09/25/39 169,996 164,0464.000%, 05/25/27 (d) 87,898 4,256
Fannie Mae Pool2.500%, 01/01/57 620,406 592,6243.240%, 12/01/26 76,004 77,2863.410%, 08/01/27 447,616 458,5313.500%, 09/01/57 1,149,745 1,165,5563.500%, 05/01/58 679,847 689,2564.000%, 06/01/41 395,367 408,7354.500%, 01/01/51 729,260 779,041
Fannie Mae REMICS (CMO)Zero Coupon, 03/25/36 (e) 13,991 12,355Zero Coupon, 06/25/36 (e) 118,704 107,105Zero Coupon, 06/25/41 (e) 107,082 92,4071.433%, 05/25/46 (c) (d) 285,583 13,4971.615%, 06/25/55 (c) (d) 234,315 11,0881.630%, 08/25/44 (c) (d) 215,224 11,0121.694%, 04/25/55 (c) (d) 306,826 12,9741.750%, 12/25/42 291,656 273,9852.000%, 08/25/43 4,845 4,8412.500%, 06/25/28 (d) 67,157 3,3353.000%, 02/25/27 (d) 127,065 4,4083.000%, 09/25/27 (d) 56,113 3,1253.000%, 01/25/28 (d) 355,902 18,8473.000%, 03/25/43 396,987 390,1903.000%, 05/25/47 109,640 108,5643.000%, 08/25/49 378,919 371,9183.500%, 05/25/27 (d) 157,948 9,4733.500%, 10/25/27 (d) 101,388 6,7243.500%, 05/25/30 (d) 125,884 10,4783.500%, 08/25/30 (d) 36,292 2,5483.500%, 02/25/31 (d) 63,456 3,3353.500%, 03/25/34 (d) 1,285,862 77,2853.500%, 09/25/35 (d) 84,943 8,6723.500%, 11/25/39 (d) 686,744 77,7903.500%, 04/25/46 161,730 160,6823.500%, 10/25/46 (d) 85,277 14,8343.500%, 02/25/48 81,271 81,3373.500%, 12/25/58 690,714 702,8554.000%, 03/25/42 (d) 51,888 5,7944.000%, 11/25/42 (d) 33,590 4,3374.500%, 07/25/27 (d) 33,076 1,3225.000%, 12/25/43 (d) 373,316 68,6535.000%, 06/25/48 (d) 424,527 69,5415.500%, 04/25/35 210,036 228,5495.500%, 04/25/37 60,609 65,5025.500%, 11/25/40 (d) 422,334 63,1475.500%, 09/25/44 (d) 288,991 57,1895.500%, 06/25/48 (d) 299,945 56,6465.508%, 05/25/42 (c) (d) 15,174 1,522
Agency Sponsored Mortgage - Backed��(Continued)Fannie Mae REMICS (CMO)
6.000%, 01/25/42 (d) 265,513 31,9486.000%, 09/25/47 (d) 200,747 41,069
Copyright © 2022 www.secdatabase.com. All Rights Reserved.Please Consider the Environment Before Printing This Document

Fannie Mae-ACES0.329%, 01/25/30 (c) (d) 1,910,506 34,7731.202%, 06/25/34 (c) (d) 4,179,221 432,2531.438%, 05/25/29 (c) (d) 2,648,272 222,3033.329%, 10/25/23 (c) 268,217 269,563
Freddie Mac 15 Yr. Gold Pool3.000%, 07/01/28 238,319 240,9713.000%, 08/01/29 148,396 150,0463.000%, 04/01/33 276,524 279,529
Freddie Mac 15 Yr. Pool3.000%, 10/01/32 275,190 278,057
Freddie Mac 20 Yr. Gold Pool2.000%, 12/01/40 86,864 82,3872.000%, 12/01/41 592,583 556,6423.000%, 11/01/36 465,591 463,6243.000%, 01/01/37 311,475 310,1553.500%, 08/01/34 271,802 275,4025.000%, 05/01/30 170,459 181,187
Freddie Mac 20 Yr. Pool2.000%, 05/01/41 549,570 515,733
Freddie Mac 30 Yr. Gold Pool3.000%, 12/01/44 5,716 5,6873.000%, 08/01/46 509,263 506,4233.000%, 10/01/46 518,868 516,8913.000%, 11/01/46 1,159,411 1,152,4763.000%, 12/01/46 348,938 346,7293.000%, 01/01/47 316,462 314,3033.500%, 08/01/42 63,626 64,9463.500%, 11/01/42 80,872 82,5473.500%, 06/01/46 77,749 79,0683.500%, 10/01/47 325,783 329,7303.500%, 03/01/48 302,118 306,5154.000%, 05/01/42 276,313 289,1624.000%, 08/01/42 86,277 90,2114.000%, 09/01/42 144,949 151,4494.000%, 07/01/44 5,963 6,0954.000%, 02/01/46 106,450 111,1384.000%, 09/01/48 43,691 44,8484.500%, 09/01/43 42,840 45,6114.500%, 11/01/43 390,935 414,7025.000%, 03/01/38 31,356 33,9595.000%, 05/01/39 3,817 4,1355.000%, 06/01/41 213,771 230,6105.500%, 07/01/33 50,942 54,1825.500%, 04/01/39 22,609 24,9345.500%, 06/01/41 82,167 90,617
Freddie Mac 30 Yr. Pool2.000%, 02/01/51 771,395 718,1162.000%, 03/01/51 2,353,106 2,189,8852.500%, 05/01/50 269,716 258,4232.500%, 06/01/50 332,535 318,045
BHFTII-112
Copyright © 2022 www.secdatabase.com. All Rights Reserved.Please Consider the Environment Before Printing This Document

Table of ContentsBrighthouse Funds Trust IIBrighthouse/Wellington Balanced Portfolio
Schedule of Investments as of March 31, 2022 (Unaudited)U.S. Treasury & Government Agencies��(Continued)
Security DescriptionPrincipalAmount* Value
Agency Sponsored Mortgage - Backed��(Continued)Freddie Mac 30 Yr. Pool
3.500%, 12/01/47 127,981 $129,7503.500%, 12/01/48 204,121 206,103
Freddie Mac ARM Non-Gold Pool2.400%, 12M LIBOR + 1.900%, 02/01/41 (c) 22,806 23,236
Freddie Mac Multifamily Structured Pass-ThroughCertificates
0.605%, 03/25/27 (c) (d) 4,116,941 106,7470.636%, 10/25/26 (c) (d) 1,147,240 27,2830.750%, 06/25/27 (c) (d) 2,429,872 80,3690.882%, 11/25/30 (c) (d) 963,206 59,1561.025%, 10/25/30 (c) (d) 1,659,797 116,4141.117%, 06/25/30 (c) (d) 3,041,794 230,4231.125%, 01/25/30 (c) (d) 2,488,033 179,0361.384%, 06/25/22 (c) (d) 1,262,794 131.432%, 05/25/30 (c) (d) 2,360,924 227,5701.571%, 05/25/30 (c) (d) 1,486,312 155,400
Freddie Mac REMICS (CMO)Zero Coupon, 11/15/36 (e) 11,720 10,2581.750%, 10/15/42 162,732 152,1062.500%, 05/15/28 (d) 75,837 3,8833.000%, 03/15/28 (d) 163,445 9,5383.000%, 05/15/32 (d) 78,233 3,0813.000%, 03/15/33 (d) 83,000 7,4923.000%, 08/15/43 1,047,925 1,039,5553.000%, 05/15/46 301,300 297,1023.250%, 11/15/41 98,793 99,5053.500%, 06/15/26 (d) 12,584 483.500%, 09/15/26 (d) 33,137 1,6483.500%, 03/15/27 (d) 43,497 2,0773.500%, 03/15/41 (d) 86,487 4,5993.500%, 10/15/45 93,854 96,2814.000%, 07/15/27 (d) 155,787 6,5344.000%, 03/15/28 (d) 82,792 3,9964.000%, 06/15/28 (d) 45,191 2,4674.000%, 07/15/30 (d) 117,778 10,6724.000%, 05/25/40 (d) 404,794 52,3324.750%, 07/15/39 259,228 273,2725.000%, 09/15/33 (d) 108,953 18,2495.000%, 02/15/48 (d) 155,566 32,2615.500%, 08/15/33 30,382 32,7455.500%, 07/15/36 63,812 69,3695.500%, 06/15/46 85,689 93,4786.500%, 07/15/36 80,474 86,6206.500%, 04/15/39 (d) 396,045 81,314
Freddie Mac STACR Trust (CMO)2.307%, 1M LIBOR + 1.850%, 09/25/49 (144A)(c) 343,975 343,4372.507%, 1M LIBOR + 2.050%, 07/25/49 (144A)(c) 385,205 385,2042.807%, 1M LIBOR + 2.350%, 02/25/49 (144A)(c) 846,986 846,9862.907%, 1M LIBOR + 2.450%, 03/25/49 (144A)(c) 520,223 520,866
Ginnie Mae I 30 Yr. Pool3.000%, 12/15/44 20,540 20,6353.000%, 02/15/45 25,430 25,2033.000%, 04/15/45 217,238 215,244
Copyright © 2022 www.secdatabase.com. All Rights Reserved.Please Consider the Environment Before Printing This Document

3.000%, 05/15/45 822,366 815,033
Agency Sponsored Mortgage - Backed��(Continued)Ginnie Mae I 30 Yr. Pool
3.000%, 07/15/45 7,965 7,8883.875%, 08/15/42 276,060 289,6924.000%, 09/15/42 352,589 372,9284.500%, 04/15/41 225,816 243,4674.500%, 02/15/42 471,856 508,5285.000%, 12/15/38 19,309 21,2955.000%, 04/15/39 366,522 404,2805.000%, 07/15/39 24,210 26,7025.000%, 12/15/40 51,669 56,9875.500%, 12/15/40 193,555 216,309
Ginnie Mae II 30 Yr. Pool2.000%, TBA (f) 1,160,000 1,103,4502.500%, 09/20/51 634,244 615,9822.500%, 10/20/51 2,089,580 2,029,4142.500%, TBA (f) 5,235,000 5,075,9943.000%, 12/20/51 2,041,519 2,021,0143.000%, TBA (f) 2,860,000 2,822,6993.500%, 06/20/46 406,338 413,6333.500%, 07/20/46 96,534 98,2433.500%, 10/20/46 102,307 104,1893.500%, 02/20/47 465,904 473,0003.500%, 08/20/47 84,677 85,8983.500%, 11/20/47 95,943 97,3263.500%, 03/20/48 123,777 125,5583.500%, 07/20/49 365,862 368,8513.500%, 01/20/51 96,029 96,8203.500%, TBA (f) 9,445,000 9,496,6524.000%, 08/20/45 351,931 369,8664.000%, 11/20/47 124,129 127,3824.000%, 03/20/48 288,947 296,3804.000%, 07/20/48 982,257 1,012,5514.500%, 01/20/46 45,040 48,0594.500%, TBA (f) 700,000 723,6255.000%, 10/20/39 7,927 8,6955.000%, 11/20/49 403,884 423,604
Government National Mortgage Association(CMO)
0.644%, 02/16/53 (c) (d) 924,828 17,5381.750%, 09/20/43 131,745 128,6912.000%, 01/20/42 107,253 106,4782.500%, 12/16/39 124,977 122,1882.500%, 07/20/41 242,315 233,4303.000%, 09/20/28 (d) 65,710 3,5973.000%, 05/20/35 (d) 864,636 52,1463.000%, 02/16/43 (d) 71,006 9,1963.000%, 10/20/47 147,586 147,6613.500%, 02/16/27 (d) 26,667 1,4843.500%, 03/20/27 (d) 69,703 3,9363.500%, 10/20/29 (d) 417,188 35,3613.500%, 07/20/40 (d) 59,249 3,0453.500%, 02/20/41 (d) 79,768 2,3203.500%, 04/20/42 (d) 181,747 11,4023.500%, 10/20/42 (d) 391,801 58,3483.500%, 05/20/43 (d) 48,265 6,862
BHFTII-113
Copyright © 2022 www.secdatabase.com. All Rights Reserved.Please Consider the Environment Before Printing This Document

Table of ContentsBrighthouse Funds Trust IIBrighthouse/Wellington Balanced Portfolio
Schedule of Investments as of March 31, 2022 (Unaudited)U.S. Treasury & Government Agencies��(Continued)
Security DescriptionPrincipalAmount* Value
Agency Sponsored Mortgage - Backed��(Continued)Government National Mortgage Association(CMO)
3.500%, 07/20/43 (d) 154,762 $20,1534.000%, 12/16/26 (d) 16,117 7094.000%, 05/20/29 (d) 268,385 13,7244.000%, 05/16/42 (d) 43,992 5,0764.000%, 09/16/42 (d) 622,039 133,3694.000%, 03/20/43 (d) 71,874 11,5694.000%, 01/20/44 (d) 32,709 5,4224.000%, 11/20/44 (d) 568,793 81,5274.000%, 03/20/47 (d) 231,789 31,0314.500%, 04/20/45 (d) 111,556 20,1604.500%, 08/20/45 (d) 435,635 76,3974.500%, 05/20/48 (d) 354,202 52,9155.000%, 02/16/40 (d) 282,132 58,2055.000%, 10/16/41 (d) 147,721 23,6255.000%, 12/20/43 (d) 324,011 62,8095.000%, 01/16/47 (d) 65,566 13,2155.500%, 03/20/39 (d) 174,620 29,0035.500%, 02/16/47 (d) 197,924 32,7925.500%, 02/20/47 (d) 124,841 21,1596.000%, 09/20/40 (d) 242,853 45,3106.000%, 02/20/46 (d) 196,454 28,276
Uniform Mortgage-Backed Securities 15 Yr.Pool
1.500%, TBA (f) 2,101,000 1,991,9292.500%, TBA (f) 3,840,000 3,794,850
Uniform Mortgage-Backed Securities 30 Yr.Pool
1.500%, TBA (f) 595,000 531,0142.000%, TBA (f) 49,199,000 45,607,3602.500%, TBA (f) 45,313,000 43,186,5403.000%, TBA (f) 15,655,000 15,312,5474.000%, TBA (f) 630,000 642,994
201,658,054
U.S. Treasury��8.4%U.S. Treasury Bonds
1.250%, 05/15/50 11,030,000 8,226,8291.375%, 11/15/40 3,040,000 2,485,3191.625%, 11/15/50 3,460,000 2,835,3082.250%, 08/15/46 910,000 851,1342.875%, 08/15/45 (g) 19,040,000 19,846,2252.875%, 11/15/46 1,200,000 1,261,6413.000%, 02/15/47 6,040,000 6,498,8983.125%, 02/15/43 4,470,000 4,810,8383.125%, 08/15/44 (h) 6,010,000 6,496,9043.125%, 05/15/48 2,465,000 2,752,1345.000%, 05/15/37 4,660,000 6,234,570
U.S. Treasury Inflation Indexed Bonds0.125%, 02/15/51 (i) 404,846 414,0030.875%, 02/15/47 (i) 2,142,459 2,562,0801.000%, 02/15/48 (i) 290,652 360,414
U.S. Treasury Inflation Indexed Notes0.125%, 07/15/30 (i) 1,743,053 1,848,386
U.S. Treasury Notes0.625%, 08/15/30 12,245,000 10,635,930
U.S. Treasury��(Continued)
Copyright © 2022 www.secdatabase.com. All Rights Reserved.Please Consider the Environment Before Printing This Document

U.S. Treasury Notes0.875%, 11/15/30 6,205,000 5,494,5761.250%, 08/15/31 (b) 12,020,000 10,926,9311.375%, 11/15/31 6,620,000 6,073,8501.625%, 05/15/31 10,550,000 9,932,6601.875%, 02/15/32 (b) 1,755,000 1,685,348
112,233,978Total U.S. Treasury & Government Agencies
(Cost $330,687,001) 313,892,032
Corporate Bonds & Notes��11.3%Advertising��0.0%Lamar Media Corp.
3.625%, 01/15/31 130,000 119,3573.750%, 02/15/28 398,000 377,919
497,276
Aerospace/Defense��0.2%Boeing Co. (The)
5.040%, 05/01/27 425,000 447,5305.150%, 05/01/30 300,000 319,937
L3Harris Technologies, Inc.3.850%, 06/15/23 650,000 659,105
Northrop Grumman Corp.5.150%, 05/01/40 175,000 203,652
Raytheon Technologies Corp.2.375%, 03/15/32 110,000 100,9833.650%, 08/16/23 7,000 7,0913.950%, 08/16/25 345,000 355,8784.450%, 11/16/38 190,000 206,060
2,300,236
Agriculture��0.2%BAT Capital Corp.
2.259%, 03/25/28 170,000 152,5362.789%, 09/06/24 565,000 557,5774.742%, 03/16/32 520,000 523,074
BAT International Finance plc1.668%, 03/25/26 (b) 530,000 486,3324.448%, 03/16/28 780,000 781,659
Kernel Holding S.A.6.500%, 10/17/24 520,000 263,442
2,764,620
Airlines��0.0%United Airlines, Inc.
4.625%, 04/15/29 (144A) 95,000 90,340
Apparel��0.1%Hanesbrands, Inc.
4.875%, 05/15/26 (144A) 140,000 140,802
BHFTII-114
Copyright © 2022 www.secdatabase.com. All Rights Reserved.Please Consider the Environment Before Printing This Document

Table of ContentsBrighthouse Funds Trust IIBrighthouse/Wellington Balanced Portfolio
Schedule of Investments as of March 31, 2022 (Unaudited)Corporate Bonds & Notes��(Continued)
Security DescriptionPrincipalAmount* Value
Apparel��(Continued)William Carter Co. (The)
5.625%, 03/15/27 (144A) 765,000 $776,291917,093
Auto Manufacturers��0.1%Ford Motor Co.
3.250%, 02/12/32 100,000 89,313General Motors Financial Co., Inc.
1.500%, 06/10/26 (b) 800,000 730,955820,268
Auto Parts & Equipment��0.0%Clarios Global L.P. / Clarios U.S. Finance Co.
6.250%, 05/15/26 (144A) 81,000 83,329
Banks��2.0%Bangkok Bank PCL
3.466%, 5Y H15 + 2.150%, 09/23/36 (144A)(c) 840,000 757,027
Bank of America Corp.1.658%, SOFR + 0.910%, 03/11/27 (c) 120,000 111,8612.456%, 3M LIBOR + 0.870%, 10/22/25 (c) 485,000 476,5612.572%, SOFR + 1.210%, 10/20/32 (b) (c) 230,000 208,9933.194%, 3M LIBOR + 1.180%, 07/23/30 (c) 45,000 43,5433.311%, SOFR + 1.580%, 04/22/42 (b) (c) 580,000 536,9454.083%, 3M LIBOR + 3.150%, 03/20/51 (c) 1,110,000 1,148,6617.750%, 05/14/38 365,000 509,354
Bank of New York Mellon Corp. (The)2.050%, 01/26/27 (b) 815,000 785,235
BNP Paribas S.A.1.323%, SOFR + 1.004%, 01/13/27 (144A) (c) 235,000 213,9832.219%, SOFR + 2.074%, 06/09/26 (144A) (c) 465,000 442,1712.591%, SOFR + 1.228%, 01/20/28 (144A) (c) 455,000 428,203
Citigroup, Inc.2.520%, SOFR + 1.177%, 11/03/32 (c) 425,000 381,2912.561%, SOFR + 1.167%, 05/01/32 (c) 100,000 90,1773.200%, 10/21/26 210,000 208,3443.352%, 3M LIBOR + 0.897%, 04/24/25 (c) 495,000 496,1773.700%, 01/12/26 640,000 647,8763.980%, 3M LIBOR + 1.338%, 03/20/30 (c) 425,000 431,4814.412%, SOFR + 3.914%, 03/31/31 (c) 425,000 441,2164.450%, 09/29/27 55,000 56,729
Credit Suisse Group AG3.091%, SOFR + 1.730%, 05/14/32 (144A) (c) 250,000 225,474
Danske Bank A/S5.375%, 01/12/24 (144A) 450,000 463,968
Deutsche Bank AG2.311%, SOFR + 1.219%, 11/16/27 (c) 370,000 339,074
Goldman Sachs Group, Inc. (The)0.925%, SOFR + 0.486%, 10/21/24 (c) 365,000 353,7952.383%, SOFR + 1.248%, 07/21/32 (c) 660,000 584,5642.615%, SOFR + 1.281%, 04/22/32 (c) 910,000 827,0632.650%, SOFR + 1.264%, 10/21/32 (c) 75,000 67,8052.905%, 3M LIBOR + 0.990%, 07/24/23 (c) 1,085,000 1,086,1953.102%, SOFR + 1.410%, 02/24/33 (c) 105,000 98,972
Banks��(Continued)Goldman Sachs Group, Inc. (The)
4.223%, 3M LIBOR + 1.301%, 05/01/29 (c) 485,000 496,588
Copyright © 2022 www.secdatabase.com. All Rights Reserved.Please Consider the Environment Before Printing This Document

6.250%, 02/01/41 110,000 142,0086.750%, 10/01/37 290,000 365,441
HSBC Holdings plc0.976%, SOFR + 0.708%, 05/24/25 (c) 600,000 569,6041.589%, SOFR + 1.290%, 05/24/27 (c) 340,000 310,3254.583%, 3M LIBOR + 1.535%, 06/19/29 (c) 620,000 637,9194.762%, SOFR + 2.530%, 03/29/33 (c) 630,000 647,437
JPMorgan Chase & Co.1.470%, SOFR + 0.765%, 09/22/27 (c) 40,000 36,8632.545%, SOFR + 1.180%, 11/08/32 (c) 535,000 488,8542.580%, SOFR + 1.250%, 04/22/32 (c) 225,000 206,1342.956%, SOFR + 2.515%, 05/13/31 (c) 85,000 79,5343.109%, SOFR + 2.460%, 04/22/41 (c) 205,000 185,2663.109%, SOFR + 2.440%, 04/22/51 (c) 185,000 163,8403.157%, SOFR + 1.460%, 04/22/42 (b) (c) 915,000 829,5103.509%, 3M LIBOR + 0.945%, 01/23/29 (c) 525,000 522,5763.702%, 3M LIBOR + 1.160%, 05/06/30 (c) 390,000 392,0663.960%, 3M LIBOR + 1.245%, 01/29/27 (c) 1,360,000 1,388,1704.005%, 3M LIBOR + 1.120%, 04/23/29 (c) 410,000 419,184
Landsbanki IslandsZero Coupon, 08/25/49 (j)(k)(l) 320,000 0
Morgan Stanley1.593%, SOFR + 0.879%, 05/04/27 (c) 335,000 311,2421.794%, SOFR + 1.034%, 02/13/32 (c) 880,000 756,7351.928%, SOFR + 1.020%, 04/28/32 (c) 635,000 548,8552.239%, SOFR + 1.178%, 07/21/32 (c) 490,000 434,2032.475%, SOFR + 1.000%, 01/21/28 (c) 455,000 433,7622.511%, SOFR + 1.200%, 10/20/32 (c) 55,000 49,5743.125%, 07/27/26 180,000 178,4473.591%, 3M LIBOR + 1.340%, 07/22/28 (b) (c) 550,000 551,5303.625%, 01/20/27 400,000 403,4394.000%, 07/23/25 (b) 180,000 184,237
Truist Bank2.250%, 03/11/30 375,000 343,724
Wells Fargo & Co.3.000%, 04/22/26 175,000 173,3003.000%, 10/23/26 600,000 591,6543.350%, SOFR + 1.500%, 03/02/33 (c) 565,000 549,0914.900%, 11/17/45 290,000 320,059
26,173,909
Beverages��0.1%Anheuser-Busch InBev Worldwide, Inc.
3.750%, 07/15/42 504,000 479,7834.750%, 04/15/58 45,000 48,7975.450%, 01/23/39 443,000 517,324
Constellation Brands, Inc.3.150%, 08/01/29 283,000 273,270
1,319,174
BHFTII-115
Copyright © 2022 www.secdatabase.com. All Rights Reserved.Please Consider the Environment Before Printing This Document

Table of ContentsBrighthouse Funds Trust IIBrighthouse/Wellington Balanced Portfolio
Schedule of Investments as of March 31, 2022 (Unaudited)Corporate Bonds & Notes��(Continued)
Security DescriptionPrincipalAmount* Value
Biotechnology��0.1%Amgen, Inc.
3.350%, 02/22/32 140,000 $138,6904.200%, 02/22/52 (b) 30,000 31,026
Baxalta, Inc.3.600%, 06/23/22 17,000 17,017
Royalty Pharma plc1.750%, 09/02/27 50,000 45,3782.150%, 09/02/31 (b) 840,000 720,1872.200%, 09/02/30 395,000 345,346
1,297,644
Building Materials��0.1%Builders FirstSource, Inc.
5.000%, 03/01/30 (144A) 785,000 772,142Standard Industries, Inc.
3.375%, 01/15/31 (144A) 175,000 153,1254.375%, 07/15/30 (144A) 720,000 659,4875.000%, 02/15/27 (144A) 10,000 9,913
1,594,667
Chemicals��0.1%Chemours Co. (The)
5.375%, 05/15/27 60,000 59,850DuPont de Nemours, Inc.
4.205%, 11/15/23 625,000 639,552International Flavors & Fragrances, Inc.
2.300%, 11/01/30 (144A) 275,000 245,483LYB International Finance III LLC
1.250%, 10/01/25 157,000 145,3181,090,203
Commercial Services��0.4%Ashtead Capital, Inc.
4.375%, 08/15/27 (144A) 1,000,000 1,012,520Gartner, Inc.
3.625%, 06/15/29 (144A) 155,000 145,3123.750%, 10/01/30 (144A) (b) 420,000 394,2754.500%, 07/01/28 (144A) (b) 386,000 384,551
Global Payments, Inc.2.150%, 01/15/27 115,000 107,9363.200%, 08/15/29 470,000 446,506
Howard University2.291%, 10/01/26 100,000 93,2472.701%, 10/01/29 260,000 242,1492.801%, 10/01/30 100,000 93,8252.901%, 10/01/31 100,000 92,5093.476%, 10/01/41 115,000 103,075
Nielsen Finance LLC / Nielsen Finance Co.4.500%, 07/15/29 (144A) 578,000 576,555
S&P Global, Inc.2.450%, 03/01/27 (144A) 150,000 145,9442.700%, 03/01/29 (144A) 255,000 247,1752.900%, 03/01/32 (144A) 190,000 184,196
Commercial Services��(Continued)Service Corp. International
3.375%, 08/15/30 785,000 707,1915.125%, 06/01/29 (b) 858,000 873,092
United Rentals North America, Inc.
Copyright © 2022 www.secdatabase.com. All Rights Reserved.Please Consider the Environment Before Printing This Document

4.000%, 07/15/30 85,000 81,2884.875%, 01/15/28 65,000 66,027
5,997,373
Computers��0.3%Apple, Inc.
1.400%, 08/05/28 940,000 859,4812.200%, 09/11/29 195,000 185,8472.650%, 02/08/51 465,000 401,1013.450%, 02/09/45 185,000 183,772
Booz Allen Hamilton, Inc.3.875%, 09/01/28 (144A) 1,530,000 1,476,894
International Business Machines Corp.2.720%, 02/09/32 270,000 256,387
Kyndryl Holdings, Inc.3.150%, 10/15/31 (144A) 350,000 294,890
Leidos, Inc.3.625%, 05/15/25 235,000 234,941
3,893,313
Diversified Financial Services��0.3%AerCap Ireland Capital DAC / AerCap Global
Aviation Trust3.300%, 01/30/32 555,000 500,310
Capital One Financial Corp.3.900%, 01/29/24 390,000 396,092
GTP Acquisition Partners I LLC3.482%, 06/15/50 (144A) 1,355,000 1,359,248
Mastercard, Inc.2.950%, 03/15/51 225,000 205,860
OneMain Finance Corp.6.125%, 03/15/24 155,000 158,875
Power Finance Corp., Ltd.3.950%, 04/23/30 (144A) 970,000 925,341
3,545,726
Electric��0.9%AES Corp. (The)
3.300%, 07/15/25 (144A) 335,000 328,669Alabama Power Co.
3.450%, 10/01/49 245,000 227,2874.150%, 08/15/44 225,000 228,409
Berkshire Hathaway Energy Co.1.650%, 05/15/31 165,000 143,684
Cleco Corporate Holdings LLC3.375%, 09/15/29 255,000 243,7024.973%, 05/01/46 20,000 21,104
Commonwealth Edison Co.3.650%, 06/15/46 325,000 321,338
BHFTII-116
Copyright © 2022 www.secdatabase.com. All Rights Reserved.Please Consider the Environment Before Printing This Document

Table of ContentsBrighthouse Funds Trust IIBrighthouse/Wellington Balanced Portfolio
Schedule of Investments as of March 31, 2022 (Unaudited)Corporate Bonds & Notes��(Continued)
Security DescriptionPrincipalAmount* Value
Electric��(Continued)Consolidated Edison Co. of New York, Inc.
3.200%, 12/01/51 (b) 250,000 $221,038Duke Energy Carolinas LLC
3.450%, 04/15/51 5,000 4,8474.250%, 12/15/41 275,000 287,600
Duke Energy Corp.2.550%, 06/15/31 635,000 580,578
Duke Energy Indiana LLC2.750%, 04/01/50 (b) 335,000 282,121
Duke Energy Progress LLC4.000%, 04/01/52 130,000 137,7794.375%, 03/30/44 320,000 339,002
Duquesne Light Holdings, Inc.2.775%, 01/07/32 (144A) 260,000 232,376
Enel Finance International NV1.375%, 07/12/26 (144A) 440,000 403,874
Evergy Metro, Inc.2.250%, 06/01/30 10,000 9,170
Evergy, Inc.2.450%, 09/15/24 165,000 161,8962.900%, 09/15/29 345,000 329,744
Exelon Corp.3.950%, 06/15/25 (b) 585,000 596,4214.100%, 03/15/52 (144A) 60,000 60,940
FirstEnergy Corp.1.600%, 01/15/26 65,000 60,4502.250%, 09/01/30 150,000 132,750
Georgia Power Co.4.300%, 03/15/42 365,000 369,045
IPALCO Enterprises, Inc.3.700%, 09/01/24 335,000 335,868
ITC Holdings Corp.2.950%, 05/14/30 (144A) 290,000 274,728
Jersey Central Power & Light Co.2.750%, 03/01/32 (144A) 140,000 130,367
MidAmerican Energy Co.3.150%, 04/15/50 140,000 128,5793.650%, 08/01/48 45,000 44,585
NRG Energy, Inc.2.450%, 12/02/27 (144A) 360,000 332,029
Oglethorpe Power Corp.5.050%, 10/01/48 115,000 128,678
Pacific Gas & Electric Co.2.500%, 02/01/31 840,000 724,5324.400%, 03/01/32 155,000 152,3784.950%, 07/01/50 795,000 748,8105.250%, 03/01/52 125,000 127,295
PacifiCorp.4.125%, 01/15/49 63,000 65,1484.150%, 02/15/50 80,000 83,310
Puget Energy, Inc.3.650%, 05/15/25 270,000 270,5904.100%, 06/15/30 360,000 359,311
Electric��(Continued)Sempra Energy
3.400%, 02/01/28 365,000 363,7803.800%, 02/01/38 165,000 161,8224.000%, 02/01/48 50,000 49,598
Copyright © 2022 www.secdatabase.com. All Rights Reserved.Please Consider the Environment Before Printing This Document

Southern California Edison Co.2.250%, 06/01/30 150,000 135,6032.750%, 02/01/32 415,000 385,1632.850%, 08/01/29 315,000 299,7584.125%, 03/01/48 69,000 67,883
Southern Co. (The)2.950%, 07/01/23 130,000 130,6823.250%, 07/01/26 335,000 335,031
11,559,352
Electronics��0.0%Imola Merger Corp.
4.750%, 05/15/29 (144A) 160,000 154,074Sensata Technologies B.V.
5.000%, 10/01/25 (144A) 120,000 121,650275,724
Energy-Alternate Sources��0.1%Energo-Pro A.S.
8.500%, 02/04/27 (144A) 645,000 606,300FS Luxembourg Sarl
10.000%, 12/15/25 (144A) 245,000 257,250Investment Energy Resources, Ltd.
6.250%, 04/26/29 (144A) 200,000 202,0021,065,552
Engineering & Construction��0.1%IHS Holding, Ltd.
6.250%, 11/29/28 (144A) 390,000 365,820International Airport Finance S.A.
12.000%, 03/15/33 (144A) 928,940 960,2911,326,111
Entertainment��0.2%Magallanes, Inc.
4.279%, 03/15/32 (144A) 535,000 537,3805.141%, 03/15/52 (144A) 1,460,000 1,493,718
WMG Acquisition Corp.3.875%, 07/15/30 (144A) 855,000 814,388
2,845,486
Environmental Control��0.1%Clean Harbors, Inc.
4.875%, 07/15/27 (144A) 1,290,000 1,286,7755.125%, 07/15/29 (144A) 25,000 25,094
1,311,869
BHFTII-117
Copyright © 2022 www.secdatabase.com. All Rights Reserved.Please Consider the Environment Before Printing This Document

Table of ContentsBrighthouse Funds Trust IIBrighthouse/Wellington Balanced Portfolio
Schedule of Investments as of March 31, 2022 (Unaudited)Corporate Bonds & Notes��(Continued)
Security DescriptionPrincipalAmount* Value
Food��0.2%Conagra Brands, Inc.
1.375%, 11/01/27 255,000 $226,2974.300%, 05/01/24 145,000 148,9915.400%, 11/01/48 55,000 63,150
JBS Finance Luxembourg Sarl2.500%, 01/15/27 (144A) 410,000 380,791
Kellogg Co.3.400%, 11/15/27 270,000 269,446
Mondelez International, Inc.2.625%, 03/17/27 220,000 214,6633.000%, 03/17/32 170,000 164,064
NBM U.S. Holdings, Inc.7.000%, 05/14/26 (144A) 635,000 659,054
2,126,456
Food Service��0.0%Aramark Services, Inc.
5.000%, 02/01/28 (144A) (b) 60,000 58,200
Gas��0.0%NiSource, Inc.
3.490%, 05/15/27 425,000 423,642
Healthcare-Products��0.3%Alcon Finance Corp.
2.750%, 09/23/26 (144A) 200,000 193,6473.000%, 09/23/29 (144A) 265,000 253,372
Avantor Funding, Inc.4.625%, 07/15/28 (144A) 780,000 771,420
Baxter International, Inc.2.539%, 02/01/32 (144A) 1,485,000 1,356,011
Boston Scientific Corp.1.900%, 06/01/25 225,000 215,950
Hologic, Inc.4.625%, 02/01/28 (144A) 1,035,000 1,047,938
Teleflex, Inc.4.250%, 06/01/28 (144A) 125,000 121,719
3,960,057
Healthcare-Services��0.3%Anthem, Inc.
3.500%, 08/15/24 225,000 228,347Centene Corp.
3.375%, 02/15/30 20,000 18,8194.250%, 12/15/27 110,000 110,4124.625%, 12/15/29 1,185,000 1,194,587
CommonSpirit Health3.347%, 10/01/29 80,000 77,672
HCA, Inc.3.625%, 03/15/32 (144A) (b) 130,000 127,3944.625%, 03/15/52 (144A) 115,000 115,894
Humana, Inc.2.150%, 02/03/32 220,000 192,7583.700%, 03/23/29 465,000 466,535
Healthcare-Services��(Continued)Kaiser Foundation Hospitals
2.810%, 06/01/41 205,000 179,0063.002%, 06/01/51 335,000 295,109
Copyright © 2022 www.secdatabase.com. All Rights Reserved.Please Consider the Environment Before Printing This Document

Sutter Health3.361%, 08/15/50 210,000 187,266
UnitedHealth Group, Inc.2.750%, 05/15/40 315,000 282,9123.500%, 08/15/39 (b) 60,000 59,518
3,536,229
Home Builders��0.1%PulteGroup, Inc.
5.500%, 03/01/26 583,000 620,231Taylor Morrison Communities, Inc.
5.125%, 08/01/30 (144A) 120,000 117,3005.750%, 01/15/28 (144A) 623,000 641,690
Toll Brothers Finance Corp.4.875%, 11/15/25 130,000 133,868
1,513,089
Insurance��0.4%American International Group, Inc.
2.500%, 06/30/25 885,000 865,276Aon Corp.
2.200%, 11/15/22 350,000 350,6412.850%, 05/28/27 55,000 53,8053.900%, 02/28/52 160,000 157,906
Athene Global Funding2.646%, 10/04/31 (144A) 445,000 392,7032.717%, 01/07/29 (144A) 735,000 675,583
Corebridge Financial, Inc.3.850%, 04/05/29 (144A) 160,000 159,8543.900%, 04/05/32 (144A) 70,000 69,896
Equitable Financial Life Global Funding1.800%, 03/08/28 (144A) 755,000 679,062
Marsh & McLennan Cos., Inc.3.875%, 03/15/24 330,000 336,9134.750%, 03/15/39 245,000 269,015
MGIC Investment Corp.5.750%, 08/15/23 90,000 92,250
New York Life Global Funding2.000%, 01/22/25 (144A) 485,000 470,370
Unum Group4.125%, 06/15/51 (b) 45,000 39,288
Willis North America, Inc.3.600%, 05/15/24 335,000 336,929
4,949,491
Internet��0.2%Alibaba Group Holding, Ltd.
3.400%, 12/06/27 (b) 225,000 220,763Amazon.com, Inc.
3.875%, 08/22/37 320,000 338,701
BHFTII-118
Copyright © 2022 www.secdatabase.com. All Rights Reserved.Please Consider the Environment Before Printing This Document

Table of ContentsBrighthouse Funds Trust IIBrighthouse/Wellington Balanced Portfolio
Schedule of Investments as of March 31, 2022 (Unaudited)Corporate Bonds & Notes��(Continued)
Security DescriptionPrincipalAmount* Value
Internet��(Continued)Go Daddy Operating Co. LLC / GD Finance Co.,
Inc.3.500%, 03/01/29 (144A) 170,000 $156,3105.250%, 12/01/27 (144A) 798,000 801,635
NortonLifeLock, Inc.5.000%, 04/15/25 (144A) 905,000 903,633
2,421,042
Iron/Steel��0.0%Metinvest B.V.
5.625%, 06/17/25 (144A) (EUR) 355,000 170,361Vale Overseas, Ltd.
3.750%, 07/08/30 (b) 280,000 270,2006.250%, 08/10/26 135,000 148,190
588,751
Leisure Time��0.0%Carnival Corp.
4.000%, 08/01/28 (144A) 130,000 120,900
Lodging��0.0%Las Vegas Sands Corp.
3.500%, 08/18/26 295,000 277,915
Machinery-Construction & Mining��0.0%BWX Technologies, Inc.
4.125%, 04/15/29 (144A) (b) 160,000 154,000
Machinery-Diversified��0.0%Otis Worldwide Corp.
2.565%, 02/15/30 330,000 308,415
Media��0.6%CCO Holdings LLC / CCO Holdings Capital Corp.
4.500%, 08/15/30 (144A) (b) 175,000 164,2015.125%, 05/01/27 (144A) 15,000 15,022
Charter Communications Operating LLC / CharterCommunications Operating Capital Corp.4.400%, 04/01/33 505,000 503,5065.050%, 03/30/29 200,000 211,7655.125%, 07/01/49 305,000 302,5845.750%, 04/01/48 5,000 5,3166.484%, 10/23/45 1,290,000 1,468,5146.834%, 10/23/55 90,000 106,710
Comcast Corp.2.937%, 11/01/56 (144A) 139,000 114,7482.987%, 11/01/63 (144A) (b) 377,000 308,5093.250%, 11/01/39 30,000 28,4463.750%, 04/01/40 460,000 463,042
COX Communications, Inc.2.600%, 06/15/31 (144A) 350,000 316,229
CSC Holdings LLC3.375%, 02/15/31 (144A) 1,035,000 871,9874.125%, 12/01/30 (144A) 200,000 175,373
Media��(Continued)Discovery Communications LLC
3.800%, 03/13/24 99,000 99,7083.950%, 06/15/25 2,000 2,0203.950%, 03/20/28 261,000 260,699
Copyright © 2022 www.secdatabase.com. All Rights Reserved.Please Consider the Environment Before Printing This Document

4.000%, 09/15/55 (b) 516,000 445,1944.125%, 05/15/29 44,000 44,3955.200%, 09/20/47 190,000 197,6435.300%, 05/15/49 517,000 540,702
DISH DBS Corp.5.875%, 11/15/24 130,000 129,675
Sirius XM Radio, Inc.3.125%, 09/01/26 (144A) 835,000 789,4704.000%, 07/15/28 (144A) 70,000 66,5004.125%, 07/01/30 (144A) (b) 100,000 93,617
Time Warner Cable LLC4.500%, 09/15/42 200,000 184,984
Videotron, Ltd.5.375%, 06/15/24 (144A) 145,000 149,031
8,059,590
Miscellaneous Manufacturing��0.0%Trane Technologies Luxembourg Finance S.A.
4.500%, 03/21/49 80,000 85,216
Office/Business Equipment��0.1%CDW LLC / CDW Finance Corp.
2.670%, 12/01/26 120,000 113,1033.250%, 02/15/29 1,304,000 1,198,1283.276%, 12/01/28 110,000 103,6093.569%, 12/01/31 105,000 97,277
Xerox Holdings Corp.5.500%, 08/15/28 (144A) (b) 90,000 87,774
1,599,891
Oil & Gas��0.6%Apache Corp.
4.875%, 11/15/27 60,000 61,500BP Capital Markets America, Inc.
2.939%, 06/04/51 245,000 209,1183.000%, 02/24/50 85,000 73,4183.060%, 06/17/41 110,000 98,5683.379%, 02/08/61 200,000 177,8043.633%, 04/06/30 470,000 478,583
ConocoPhillips Co.3.800%, 03/15/52 50,000 50,8764.025%, 03/15/62 (144A) 90,000 91,244
Continental Resources, Inc.5.750%, 01/15/31 (144A) 125,000 136,725
Diamondback Energy, Inc.3.500%, 12/01/29 111,000 109,953
Ecopetrol S.A.4.625%, 11/02/31 785,000 710,425
BHFTII-119
Copyright © 2022 www.secdatabase.com. All Rights Reserved.Please Consider the Environment Before Printing This Document

Table of ContentsBrighthouse Funds Trust IIBrighthouse/Wellington Balanced Portfolio
Schedule of Investments as of March 31, 2022 (Unaudited)Corporate Bonds & Notes��(Continued)
Security DescriptionPrincipalAmount* Value
Oil & Gas��(Continued)Energean Israel Finance, Ltd.
4.500%, 03/30/24 (144A) 180,000 $177,7954.875%, 03/30/26 (144A) 155,000 149,5755.875%, 03/30/31 (144A) 155,000 147,599
Equinor ASA1.750%, 01/22/26 (b) 275,000 263,3223.625%, 04/06/40 170,000 170,9703.700%, 04/06/50 180,000 182,081
Exxon Mobil Corp.4.227%, 03/19/40 355,000 381,7274.327%, 03/19/50 10,000 11,149
Hess Corp.7.125%, 03/15/33 127,000 156,7117.300%, 08/15/31 285,000 349,040
Leviathan Bond, Ltd.6.500%, 06/30/27 (144A) 480,000 491,121
Lundin Energy Finance B.V.2.000%, 07/15/26 (144A) 200,000 186,2343.100%, 07/15/31 (144A) 580,000 537,127
Marathon Petroleum Corp.4.700%, 05/01/25 400,000 415,669
Occidental Petroleum Corp.3.400%, 04/15/26 5,000 4,9693.500%, 08/15/29 (144A) (b) 10,000 9,8504.100%, 02/15/47 145,000 134,1256.125%, 01/01/31 5,000 5,625
Ovintiv, Inc.6.625%, 08/15/37 340,000 402,242
Shell International Finance B.V.2.875%, 11/26/41 120,000 107,7923.000%, 11/26/51 155,000 138,7323.250%, 04/06/50 165,000 154,781
Sunoco L.P. / Sunoco Finance Corp.4.500%, 04/30/30 (144A) 50,000 46,0645.875%, 03/15/28 60,000 60,600
Tullow Oil plc7.000%, 03/01/25 (144A) 500,000 412,500
Viper Energy Partners L.P.5.375%, 11/01/27 (144A) (b) 535,000 544,956
7,840,570
Packaging & Containers��0.1%Ball Corp.
4.000%, 11/15/23 (b) 1,060,000 1,070,600Owens-Brockway Glass Container, Inc.
5.875%, 08/15/23 (144A) 100,000 102,1641,172,764
Pharmaceuticals��0.3%AbbVie, Inc.
3.200%, 11/21/29 50,000 49,4064.625%, 10/01/42 205,000 217,796
Pharmaceuticals��(Continued)Astrazeneca Finance LLC
1.750%, 05/28/28 610,000 562,069Bausch Health Cos., Inc.
5.750%, 08/15/27 (144A) 150,000 147,803Bayer U.S. Finance LLC
Copyright © 2022 www.secdatabase.com. All Rights Reserved.Please Consider the Environment Before Printing This Document

4.250%, 12/15/25 (144A) 535,000 543,980Bristol-Myers Squibb Co.
0.750%, 11/13/25 (b) 745,000 689,9272.550%, 11/13/50 180,000 149,4152.950%, 03/15/32 130,000 127,1693.550%, 03/15/42 590,000 583,543
Cigna Corp.1.250%, 03/15/26 (b) 735,000 686,301
CVS Health Corp.4.125%, 04/01/40 155,000 157,6925.125%, 07/20/45 210,000 237,050
Teva Pharmaceutical Finance Netherlands III B.V.4.750%, 05/09/27 300,000 287,985
4,440,136
Pipelines��0.4%DCP Midstream Operating L.P.
3.875%, 03/15/23 20,000 20,0015.600%, 04/01/44 50,000 52,538
Energy Transfer L.P.5.250%, 04/15/29 265,000 282,7835.300%, 04/01/44 35,000 35,9575.350%, 05/15/45 35,000 36,0245.950%, 10/01/43 20,000 21,3456.125%, 12/15/45 570,000 628,5696.250%, 04/15/49 60,000 68,849
Enterprise Products Operating LLC3.300%, 02/15/53 40,000 34,1264.250%, 02/15/48 135,000 135,5404.950%, 10/15/54 155,000 168,492
EQM Midstream Partners L.P.6.500%, 07/01/27 (144A) 30,000 31,336
Galaxy Pipeline Assets Bidco, Ltd.2.160%, 03/31/34 (144A) 530,000 487,5202.625%, 03/31/36 (144A) 1,195,000 1,071,1802.940%, 09/30/40 (144A) 250,000 225,418
MPLX L.P.1.750%, 03/01/26 30,000 28,1114.950%, 03/14/52 405,000 421,637
NGPL PipeCo LLC3.250%, 07/15/31 (144A) 210,000 196,065
ONEOK, Inc.3.100%, 03/15/30 170,000 159,3324.550%, 07/15/28 95,000 97,6135.850%, 01/15/26 125,000 134,3476.350%, 01/15/31 57,000 65,919
Sabine Pass Liquefaction LLC4.500%, 05/15/30 345,000 360,790
BHFTII-120
Copyright © 2022 www.secdatabase.com. All Rights Reserved.Please Consider the Environment Before Printing This Document

Table of ContentsBrighthouse Funds Trust IIBrighthouse/Wellington Balanced Portfolio
Schedule of Investments as of March 31, 2022 (Unaudited)Corporate Bonds & Notes��(Continued)
Security DescriptionPrincipalAmount* Value
Pipelines��(Continued)Targa Resources Corp.
4.200%, 02/01/33 290,000 $292,6464.950%, 04/15/52 30,000 30,564
Targa Resources Partners L.P. / TargaResources Partners Finance Corp.4.875%, 02/01/31 65,000 65,650
Transcontinental Gas Pipe Line Co. LLC3.250%, 05/15/30 125,000 121,902
Venture Global Calcasieu Pass LLC3.875%, 08/15/29 (144A) 95,000 92,3524.125%, 08/15/31 (144A) 35,000 34,340
Western Midstream Operating L.P.4.550%, 02/01/30 150,000 149,250
5,550,196
Real Estate Investment Trusts��0.3%American Tower Corp.
1.450%, 09/15/26 180,000 164,2321.500%, 01/31/28 105,000 92,7782.400%, 03/15/25 255,000 248,1563.650%, 03/15/27 280,000 279,252
EPR Properties3.600%, 11/15/31 175,000 158,6553.750%, 08/15/29 240,000 224,6544.950%, 04/15/28 470,000 470,197
Equinix, Inc.2.000%, 05/15/28 210,000 189,219
GLP Capital L.P. / GLP Financing II, Inc.3.250%, 01/15/32 215,000 195,0694.000%, 01/15/31 195,000 189,1275.300%, 01/15/29 235,000 246,8845.750%, 06/01/28 270,000 290,594
Realty Income Corp.2.200%, 06/15/28 25,000 23,0622.850%, 12/15/32 (b) 30,000 28,3433.400%, 01/15/28 110,000 109,687
SBA Tower Trust2.836%, 01/15/50 (144A) 545,000 536,123
3,446,032
Retail��0.3%1011778 BC ULC / New Red Finance, Inc.
3.500%, 02/15/29 (144A) 170,000 156,987Asbury Automotive Group, Inc.
4.500%, 03/01/28 (b) 130,000 124,878FirstCash, Inc.
4.625%, 09/01/28 (144A) 758,000 704,8345.625%, 01/01/30 (144A) 585,000 562,092
Gap, Inc. (The)3.625%, 10/01/29 (144A) 627,000 558,6573.875%, 10/01/31 (144A) 913,000 795,314
Home Depot, Inc. (The)3.300%, 04/15/40 380,000 365,992
KFC Holding Co. / Pizza Hut Holdings LLC /Taco Bell of America LLC4.750%, 06/01/27 (144A) 60,000 60,900
Retail��(Continued)Lithia Motors, Inc.
Copyright © 2022 www.secdatabase.com. All Rights Reserved.Please Consider the Environment Before Printing This Document

4.625%, 12/15/27 (144A) 120,000 119,100Lowe�s Cos., Inc.
3.350%, 04/01/27 85,000 85,4973.750%, 04/01/32 55,000 55,605
McDonald�s Corp.3.350%, 04/01/23 330,000 334,0903.625%, 09/01/49 245,000 234,580
Suburban Propane Partners L.P. / SuburbanEnergy Finance Corp.5.875%, 03/01/27 75,000 76,031
Yum! Brands, Inc.3.625%, 03/15/31 100,000 91,184
4,325,741
Semiconductors��0.4%Broadcom, Inc.
2.600%, 02/15/33 (144A) 10,000 8,6823.137%, 11/15/35 (144A) 31,000 27,3143.419%, 04/15/33 (144A) 410,000 382,6624.000%, 04/15/29 (144A) 1,555,000 1,554,2384.300%, 11/15/32 95,000 96,403
Entegris, Inc.3.625%, 05/01/29 (144A) 65,000 60,8184.375%, 04/15/28 (144A) 90,000 87,075
Intel Corp.3.100%, 02/15/60 275,000 236,309
Marvell Technology, Inc.2.450%, 04/15/28 380,000 349,4022.950%, 04/15/31 375,000 346,628
Microchip Technology, Inc.2.670%, 09/01/23 715,000 712,605
NVIDIA Corp.3.500%, 04/01/40 385,000 387,806
NXP B.V. / NXP Funding LLC4.875%, 03/01/24 (144A) 659,000 677,1455.350%, 03/01/26 (144A) 200,000 210,5085.550%, 12/01/28 (144A) 165,000 180,860
NXP B.V. / NXP Funding LLC / NXP USA, Inc.4.300%, 06/18/29 (144A) 116,000 119,746
5,438,201
Software��0.6%Black Knight InfoServ LLC
3.625%, 09/01/28 (144A) 1,658,000 1,571,287CDK Global, Inc.
5.250%, 05/15/29 (144A) 975,000 980,655Fair Isaac Corp.
4.000%, 06/15/28 (144A) 853,000 825,806Microsoft Corp.
2.675%, 06/01/60 42,000 36,2172.921%, 03/17/52 40,000 37,5363.041%, 03/17/62 (b) 203,000 189,571
Open Text Corp.3.875%, 12/01/29 (144A) 740,000 703,000
BHFTII-121
Copyright © 2022 www.secdatabase.com. All Rights Reserved.Please Consider the Environment Before Printing This Document

Table of ContentsBrighthouse Funds Trust IIBrighthouse/Wellington Balanced Portfolio
Schedule of Investments as of March 31, 2022 (Unaudited)Corporate Bonds & Notes��(Continued)
Security DescriptionPrincipalAmount* Value
Software��(Continued)Open Text Holdings, Inc.
4.125%, 12/01/31 (144A) 130,000 $121,713Oracle Corp.
2.300%, 03/25/28 330,000 301,4132.875%, 03/25/31 130,000 118,5333.600%, 04/01/40 163,000 141,4003.600%, 04/01/50 267,000 221,4403.850%, 04/01/60 885,000 726,2903.950%, 03/25/51 296,000 258,7684.000%, 07/15/46 225,000 199,6524.000%, 11/15/47 135,000 119,3904.100%, 03/25/61 225,000 191,8034.125%, 05/15/45 15,000 13,470
SS&C Technologies, Inc.5.500%, 09/30/27 (144A) 735,000 740,524
7,498,468
Telecommunications��0.5%AT&T, Inc.
3.500%, 02/01/61 565,000 480,2313.550%, 09/15/55 1,039,000 916,3633.650%, 06/01/51 355,000 323,0413.650%, 09/15/59 31,000 27,1853.800%, 12/01/57 251,000 228,997
Lumen Technologies, Inc.4.000%, 02/15/27 (144A) 130,000 121,074
Nokia Oyj4.375%, 06/12/27 (b) 720,000 730,3466.625%, 05/15/39 100,000 119,125
NTT Finance Corp.1.162%, 04/03/26 (144A) 640,000 590,074
Rogers Communications, Inc.3.800%, 03/15/32 (144A) 310,000 307,5994.550%, 03/15/52 (144A) (b) 310,000 308,189
Sprint Corp.7.125%, 06/15/24 100,000 107,255
T-Mobile USA, Inc.2.050%, 02/15/28 545,000 497,7562.700%, 03/15/32 (144A) 25,000 22,7423.500%, 04/15/25 580,000 583,8383.875%, 04/15/30 150,000 150,5764.500%, 04/15/50 190,000 192,215
Telecom Italia Capital S.A.6.000%, 09/30/34 45,000 42,3037.721%, 06/04/38 50,000 50,990
Telefonica Celular del Paraguay S.A.5.875%, 04/15/27 (144A) 730,000 739,125
Verizon Communications, Inc.3.850%, 11/01/42 85,000 84,7352.650%, 11/20/40 65,000 55,2932.850%, 09/03/41 180,000 158,4453.400%, 03/22/41 105,000 98,4293.550%, 03/22/51 80,000 75,176
Telecommunications��(Continued)Verizon Communications, Inc.
4.000%, 03/22/50 30,000 30,4417,041,543
Copyright © 2022 www.secdatabase.com. All Rights Reserved.Please Consider the Environment Before Printing This Document

Transportation��0.1%Union Pacific Corp.
2.375%, 05/20/31 (b) 595,000 556,7172.800%, 02/14/32 170,000 163,2212.973%, 09/16/62 10,000 8,462
728,400
Trucking & Leasing��0.1%DAE Funding LLC
1.550%, 08/01/24 (144A) 885,000 835,886Penske Truck Leasing Co. L.P. / PTL Finance
Corp.2.700%, 11/01/24 (144A) 455,000 448,0934.000%, 07/15/25 (144A) 405,000 408,935
1,692,914
Water �� 0.0%American Water Capital Corp.
4.150%, 06/01/49 140,000 145,125Total Corporate Bonds & Notes
(Cost $158,992,618) 150,272,239
Mortgage-Backed Securities��5.9%Collateralized Mortgage Obligations��3.8%Adjustable Rate Mortgage Trust
0.957%, 1M LIBOR + 0.500%, 01/25/36 (c) 90,805 88,6590.997%, 1M LIBOR + 0.540%, 11/25/35 (c) 57,777 58,123
Angel Oak Mortgage Trust LLC0.951%, 07/25/66 (144A) (c) 896,166 845,8790.985%, 04/25/66 (144A) (c) 375,095 357,8020.990%, 04/25/53 (144A) (c) 417,368 410,3381.068%, 05/25/66 (144A) (c) 730,819 689,9241.820%, 11/25/66 (144A) (c) 610,753 571,8903.628%, 03/25/49 (144A) (c) 31,905 31,8783.920%, 11/25/48 (144A) (c) 114,154 114,201
Arroyo Mortgage Trust3.347%, 04/25/49 (144A) (c) 502,578 490,386
Bear Stearns Adjustable Rate Mortgage Trust2.988%, 07/25/36 (c) 162,057 153,666
Bear Stearns ALT-A Trust0.937%, 1M LIBOR + 0.480%, 02/25/36 (c) 339,871 341,967
Bear Stearns Mortgage Funding Trust0.637%, 1M LIBOR + 0.180%, 10/25/36 (c) 85,472 80,5100.657%, 1M LIBOR + 0.200%, 02/25/37 (c) 331,256 315,618
BINOM Securitization Trust2.034%, 06/25/56 (144A) (c) 409,442 390,117
BRAVO Residential Funding Trust0.941%, 02/25/49 (144A) (c) 277,286 269,0800.970%, 03/25/60 (144A) (c) 354,316 345,839
BHFTII-122
Copyright © 2022 www.secdatabase.com. All Rights Reserved.Please Consider the Environment Before Printing This Document

Table of ContentsBrighthouse Funds Trust IIBrighthouse/Wellington Balanced Portfolio
Schedule of Investments as of March 31, 2022 (Unaudited)Mortgage-Backed Securities��(Continued)
Security DescriptionPrincipalAmount* Value
Collateralized Mortgage Obligations��(Continued)CIM Trust
3.000%, 04/25/57 (144A) (c) 197,647 $198,309Citigroup Mortgage Loan Trust
2.720%, 07/25/49 (144A) (c) 79,811 78,9993.228%, 11/25/70 (144A) (m) 391,428 391,290
COLT Mortgage Loan Trust0.910%, 06/25/66 (144A) (c) 568,437 523,0670.956%, 09/27/66 (144A) (c) 944,775 875,097
Connecticut Avenue Securities Trust2.557%, 1M LIBOR + 2.100%, 06/25/39 (144A)(c) 9,623 9,6232.607%, 1M LIBOR + 2.150%, 09/25/31 (144A)(c) 56,813 56,8132.607%, 1M LIBOR + 2.150%, 11/25/39 (144A)(c) 234,050 230,687
Countrywide Alternative Loan Trust0.907%, 1M LIBOR + 0.450%, 03/01/38 (c) 148,151 122,9540.997%, 1M LIBOR + 0.540%, 01/25/36 (c) 78,280 76,9191.257%, 1M LIBOR + 0.800%, 12/25/35 (c) 84,601 73,6331.491%, 12M MTA + 1.350%, 08/25/35 (c) 187,985 170,9785.500%, 11/25/35 366,290 260,616
Countrywide Home Loan Mortgage Pass-ThroughTrust0.857%, 1M LIBOR + 0.400%, 04/25/46 (c) 200,852 172,3641.137%, 1M LIBOR + 0.680%, 02/25/35 (c) 73,149 67,3602.577%, 06/20/35 (c) 5,830 5,7852.887%, 09/25/47 (c) 200,521 189,558
Credit Suisse Mortgage Capital Certificates Trust0.938%, 05/25/66 (144A) (c) 499,407 471,3671.179%, 02/25/66 (144A) (c) 776,677 749,0781.841%, 10/25/66 (144A) (c) 586,151 559,5312.265%, 11/25/66 (144A) (c) 1,331,808 1,280,9623.250%, 04/25/47 (144A) (c) 330,491 320,972
CSMC Trust1.796%, 12/27/60 (144A) (c) 337,770 321,496
Deephaven Residential Mortgage Trust0.899%, 04/25/66 (144A) (c) 265,216 249,455
Deutsche ALT-A Securities Mortgage Loan Trust0.607%, 1M LIBOR + 0.150%, 12/25/36 (c) 204,486 201,256
Ellington Financial Mortgage Trust0.931%, 06/25/66 (144A) (c) 226,837 212,1362.206%, 01/25/67 (144A) (c) 638,765 604,453
GCAT LLC1.036%, 05/25/66 (144A) (c) 493,877 467,0761.091%, 05/25/66 (144A) (c) 689,807 652,8441.262%, 07/25/66 (144A) (c) 1,198,579 1,133,7321.915%, 08/25/66 (144A) (c) 514,052 499,260
GreenPoint Mortgage Funding Trust1.541%, 12M MTA + 1.400%, 10/25/45 (c) 153,657 128,035
GSR Mortgage Loan Trust0.757%, 1M LIBOR + 0.300%, 01/25/37 (c) 457,854 104,9262.871%, 01/25/36 (c) 197,250 199,6446.000%, 07/25/37 141,283 116,115
Home Re, Ltd.2.057%, 1M LIBOR + 1.600%, 10/25/28 (144A)(c) 204,195 203,851
Imperial Fund Mortgage Trust3.638%, 03/25/67 (144A) (m) 1,320,000 1,304,798
Copyright © 2022 www.secdatabase.com. All Rights Reserved.Please Consider the Environment Before Printing This Document

Collateralized Mortgage Obligations��(Continued)IndyMac INDX Mortgage Loan Trust
3.011%, 10/25/35 (c) 13,976 13,020JPMorgan Mortgage Trust
3.067%, 05/25/36 (c) 13,326 11,753Legacy Mortgage Asset Trust
1.650%, 11/25/60 (144A) (m) 224,816 212,1331.750%, 04/25/61 (144A) (m) 337,107 321,3941.750%, 07/25/61 (144A) (m) 429,980 409,2853.000%, 06/25/59 (144A) (m) 575,670 574,5013.250%, 11/25/59 (144A) (m) 808,853 805,190
LSTAR Securities Investment, Ltd.1.931%, 1M LIBOR + 1.700%, 03/02/26 (144A)(c) 846,898 835,8382.255%, 1M LIBOR + 1.800%, 02/01/26 (144A)(c) 533,413 533,0772.955%, 1M LIBOR + 2.500%, 04/01/24 (144A)(c) 267,765 269,7252.955%, 1M LIBOR + 2.500%, 05/01/24 (144A)(c) 550,342 542,179
MASTR Adjustable Rate Mortgages Trust2.759%, 11/21/34 (c) 45,353 45,2182.764%, 09/25/33 (c) 49,938 49,328
Metlife Securitization Trust3.750%, 03/25/57 (144A) (c) 362,844 363,973
MFA Trust1.029%, 11/25/64 (144A) (c) 401,774 380,0211.153%, 04/25/65 (144A) (c) 355,722 349,527
Mill City Mortgage Loan Trust3.497%, 04/25/66 (144A) (c) 903,167 902,9593.500%, 08/25/58 (144A) (c) 431,090 429,488
Morgan Stanley Mortgage Loan Trust3.327%, 05/25/36 (c) 152,436 93,501
New Residential Mortgage Loan Trust0.941%, 10/25/58 (144A) (c) 307,180 299,4391.207%, 1M LIBOR + 0.750%, 01/25/48 (144A)(c) 528,839 525,4022.492%, 09/25/59 (144A) (c) 110,011 109,3363.500%, 08/25/59 (144A) (c) 404,330 402,8013.750%, 11/26/35 (144A) (c) 373,545 373,3663.985%, 09/25/57 (144A) (c) 555,474 557,8824.000%, 02/25/57 (144A) (c) 662,603 663,8974.000%, 03/25/57 (144A) (c) 700,164 701,8034.000%, 04/25/57 (144A) (c) 555,606 557,1864.000%, 05/25/57 (144A) (c) 385,147 385,693
NMLT Trust1.185%, 05/25/56 (144A) (c) 994,763 934,037
Oaktown Re III, Ltd.1.857%, 1M LIBOR + 1.400%, 07/25/29 (144A)(c) 61,246 61,244
OBX Trust1.054%, 07/25/61 (144A) (c) 595,752 558,8391.072%, 02/25/66 (144A) (c) 707,936 685,4592.305%, 11/25/61 (144A) (c) 1,160,134 1,121,867
Preston Ridge Partners Mortgage LLC1.793%, 06/25/26 (144A) (m) 620,191 587,7901.793%, 07/25/26 (144A) (m) 620,242 588,1841.867%, 04/25/26 (144A) (m) 1,141,162 1,087,8772.363%, 11/25/25 (144A) (m) 166,042 161,5492.363%, 10/25/26 (144A) (m) 1,207,785 1,154,3952.487%, 10/25/26 (144A) (m) 516,675 495,489
BHFTII-123
Copyright © 2022 www.secdatabase.com. All Rights Reserved.Please Consider the Environment Before Printing This Document

Table of ContentsBrighthouse Funds Trust IIBrighthouse/Wellington Balanced Portfolio
Schedule of Investments as of March 31, 2022 (Unaudited)Mortgage-Backed Securities��(Continued)
Security DescriptionPrincipalAmount* Value
Collateralized Mortgage Obligations��(Continued)RALI Series Trust
1.057%, 1M LIBOR + 0.600%, 04/25/36 (c) 508,844 $468,8066.000%, 12/25/35 141,634 136,827
RFMSI Trust2.805%, 08/25/35 (c) 53,230 29,809
Seasoned Credit Risk Transfer Trust2.500%, 08/25/59 546,603 529,6483.500%, 11/25/57 428,320 434,5353.500%, 03/25/58 881,463 885,2363.500%, 07/25/58 1,174,242 1,194,0453.500%, 08/25/58 230,051 234,2253.500%, 10/25/58 955,446 962,192
Starwood Mortgage Residential Trust0.943%, 05/25/65 (144A) (c) 240,005 234,5251.219%, 05/25/65 (144A) (c) 650,867 637,5411.920%, 11/25/66 (144A) (c) 921,169 868,166
Structured Adjustable Rate Mortgage LoanTrust0.757%, 1M LIBOR + 0.300%, 09/25/34 (c) 40,410 38,044
Toorak Mortgage Corp., Ltd.2.240%, 06/25/24 (144A) (m) 670,000 634,085
Towd Point Mortgage Trust2.750%, 08/25/55 (144A) (c) 23,533 23,5112.750%, 10/25/56 (144A) (c) 428,829 428,8232.750%, 04/25/57 (144A) (c) 83,591 83,6382.750%, 06/25/57 (144A) (c) 431,922 428,7952.918%, 11/30/60 (144A) (c) 1,279,071 1,244,448
Verus Securitization Trust0.918%, 02/25/64 (144A) (c) 360,309 352,8290.938%, 07/25/66 (144A) (c) 417,567 391,8101.031%, 02/25/66 (144A) (c) 308,791 297,2461.824%, 11/25/66 (144A) (c) 657,156 628,8241.829%, 10/25/66 (144A) (c) 1,278,166 1,207,447
WaMu Mortgage Pass-Through CertificatesTrust1.021%, 12M MTA + 0.880%, 10/25/46 (c) 133,980 125,6672.811%, 06/25/37 (c) 73,114 69,933
Washington Mutual Mortgage Pass-ThroughCertificates1.057%, 1M LIBOR + 0.600%, 07/25/36 (c) 61,875 41,879
Wells Fargo Mortgage-Backed SecuritiesTrust2.240%, 10/25/36 (c) 52,419 49,8952.514%, 09/25/36 (c) 53,931 52,663
50,711,653
Commercial Mortgage-Backed Securities��2.1%BANK
0.598%, 11/15/62 (c)(d) 4,567,308 173,4050.644%, 11/15/62 (c)(d) 2,256,582 95,8270.695%, 12/15/52 (c)(d) 3,646,698 161,8120.725%, 11/15/50 (c)(d) 8,160,445 272,9200.770%, 11/15/54 (c)(d) 949,883 33,3260.854%, 09/15/62 (c)(d) 4,448,357 222,1400.897%, 05/15/62 (c)(d) 2,888,947 150,4031.782%, 03/15/63 (c)(d) 4,999,996 582,2852.036%, 02/15/54 565,000 508,7953.688%, 02/15/61 1,700,000 1,727,742
Copyright © 2022 www.secdatabase.com. All Rights Reserved.Please Consider the Environment Before Printing This Document

Commercial Mortgage-Backed Securities��(Continued)Barclays Commercial Mortgage Trust
0.988%, 04/15/53 (c)(d) 1,280,000 91,0841.247%, 1M LIBOR + 0.850%, 08/15/36(144A) (c) 1,802,000 1,783,8451.437%, 02/15/50 (c)(d) 5,245,421 288,1454.969%, 12/15/51 (c) 475,000 480,943
Benchmark Mortgage Trust0.492%, 01/15/51 (c)(d) 2,396,669 54,3960.508%, 07/15/51 (c)(d) 4,273,265 92,5791.061%, 08/15/52 (c)(d) 2,038,554 107,1061.225%, 03/15/62 (c)(d) 6,101,476 385,6761.519%, 01/15/54 (c)(d) 2,363,080 247,4571.792%, 07/15/53 (c)(d) 1,326,819 127,9333.882%, 02/15/51 (c) 795,000 814,6674.016%, 03/15/52 1,600,000 1,656,247
BX Commercial Mortgage Trust1.317%, 1M LIBOR + 0.920%, 10/15/36(144A) (c) 1,009,427 1,005,032
CAMB Commercial Mortgage Trust2.947%, 1M LIBOR + 2.550%, 12/15/37(144A) (c) 665,000 653,617
Century Plaza Towers2.865%, 11/13/39 (144A) 585,000 552,027
Citigroup Commercial Mortgage Trust0.911%, 07/10/47 (c)(d) 3,143,923 56,4871.022%, 04/10/48 (c)(d) 3,794,950 96,643
Commercial Mortgage Pass-ThroughCertificates Mortgage Trust0.536%, 02/10/47 (c)(d) 2,620,871 21,9960.706%, 08/10/46 (c)(d) 686,047 5,3261.685%, 10/15/45 (c)(d) 340,289 1,2112.819%, 01/10/39 (144A) 205,000 196,7122.853%, 10/15/45 178,907 179,1983.101%, 03/10/46 145,000 145,2183.213%, 03/10/46 171,029 171,4793.424%, 03/10/31 (144A) 1,065,000 1,074,6113.612%, 06/10/46 (c) 260,000 261,6693.796%, 08/10/47 225,000 227,2203.896%, 01/10/39 (144A) (c) 210,000 202,7273.961%, 03/10/47 235,125 237,8134.074%, 02/10/47 (c) 115,000 116,5904.205%, 08/10/46 97,229 98,5764.210%, 08/10/46 (c) 175,000 177,4714.236%, 02/10/47 (c) 190,000 193,1644.750%, 10/15/45 (144A) (c) 355,000 190,884
Credit Suisse First Boston MortgageSecurities Corp.4.877%, 04/15/37 967 951
CSAIL Commercial Mortgage Trust0.742%, 06/15/57 (c)(d) 11,612,481 208,2710.925%, 11/15/48 (c)(d) 734,699 19,4921.866%, 01/15/49 (c)(d) 1,518,424 92,152
DBJPM Mortgage Trust1.712%, 09/15/53 (c)(d) 1,010,517 86,690
GS Mortgage Securities Corp.2.954%, 11/05/34 (144A) 1,200,000 1,198,140
GS Mortgage Securities Trust0.063%, 07/10/46 (c)(d) 10,073,670 6,6630.093%, 08/10/44 (144A) (c)(d) 163,882 25.031%, 04/10/47 (144A) (c) 465,000 268,783
BHFTII-124
Copyright © 2022 www.secdatabase.com. All Rights Reserved.Please Consider the Environment Before Printing This Document

Table of ContentsBrighthouse Funds Trust IIBrighthouse/Wellington Balanced Portfolio
Schedule of Investments as of March 31, 2022 (Unaudited)Mortgage-Backed Securities��(Continued)
Security DescriptionPrincipalAmount* Value
Commercial Mortgage-Backed Securities��(Continued)JPMBB Commercial Mortgage Securities Trust
0.598%, 09/15/47 (c)(d) 2,781,213 $33,3903.363%, 07/15/45 350,575 351,228
JPMorgan Chase Commercial MortgageSecurities Trust2.733%, 10/15/45 (144A) (c) 400,000 213,5972.812%, 01/16/37 (144A) 305,000 296,0124.364%, 12/15/47 (144A) (c) 130,000 107,971
Morgan Stanley Bank of America Merrill LynchTrust0.959%, 12/15/47 (c)(d) 1,793,367 35,5530.980%, 10/15/48 (c)(d) 757,651 18,4092.918%, 02/15/46 130,000 129,9763.134%, 12/15/48 480,000 481,0603.176%, 08/15/45 110,033 110,0203.766%, 11/15/46 160,061 160,2714.259%, 10/15/46 (c) 115,000 116,561
Morgan Stanley Capital Trust1.341%, 06/15/50 (c)(d) 1,542,469 73,0943.912%, 09/09/32 (144A) 1,140,000 1,131,2165.086%, 07/15/49 (144A) (c) 265,000 140,8835.658%, 10/12/52 (144A) (c) 12,137 4,248
MTRO Commercial Mortgage Trust2.197%, 1M LIBOR + 1.800%, 12/15/33(144A) (c) 565,000 547,871
SFAVE Commercial Mortgage Securities Trust3.872%, 01/05/43 (144A) (c) 150,000 143,571
SG Commercial Mortgage Securities Trust2.632%, 03/15/37 (144A) 1,230,000 1,193,665
UBS Commercial Mortgage Trust1.049%, 08/15/50 (c)(d) 888,904 36,025
UBS-Barclays Commercial Mortgage Trust2.850%, 12/10/45 325,000 325,7423.091%, 08/10/49 421,076 421,6823.185%, 03/10/46 240,000 240,6203.244%, 04/10/46 300,119 301,117
VNDO Mortgage Trust2.996%, 11/15/30 (144A) 1,105,000 1,109,435
Wells Fargo Commercial Mortgage Trust0.900%, 09/15/57 (c)(d) 4,680,101 120,2471.084%, 05/15/48 (c)(d) 2,772,128 71,1092.918%, 10/15/45 256,094 256,3972.942%, 10/15/49 890,000 874,4974.152%, 05/15/48 (c) 80,000 75,999
WF-RBS Commercial Mortgage Trust1.246%, 03/15/47 (c)(d) 1,472,756 26,0022.870%, 11/15/45 319,991 320,1152.875%, 12/15/45 175,000 174,9413.016%, 11/15/47 (144A) 86,806 5,2093.071%, 03/15/45 180,010 180,2053.345%, 05/15/45 100,000 100,1523.723%, 05/15/47 93,339 92,2003.995%, 05/15/47 160,281 161,5994.045%, 03/15/47 40,000 40,465
Commercial Mortgage-Backed Securities��(Continued)WF-RBS Commercial Mortgage Trust
4.101%, 03/15/47 335,000 340,3754.888%, 06/15/44 (144A) (c) 105,000 67,438
Copyright © 2022 www.secdatabase.com. All Rights Reserved.Please Consider the Environment Before Printing This Document

28,435,715Total Mortgage-Backed Securities
(Cost $85,388,973) 79,147,368
Asset-Backed Securities��3.3%Asset-Backed - Automobile��0.3%AmeriCredit Automobile Receivables Trust
2.580%, 09/18/25 535,000 532,712Credit Acceptance Auto Loan Trust
1.000%, 05/15/30 (144A) 370,000 357,054Drive Auto Receivables Trust
2.700%, 02/16/27 465,000 464,612Exeter Automobile Receivables Trust
2.580%, 09/15/25 (144A) 1,045,000 1,041,2482.730%, 12/15/25 (144A) 315,000 313,759
Santander Drive Auto Receivables Trust1.480%, 01/15/27 140,000 136,233
Westlake Automobile Receivables Trust1.650%, 02/17/26 (144A) 415,000 402,0942.720%, 11/15/24 (144A) 765,000 766,362
4,014,074
Asset-Backed - Credit Card��0.0%Mercury Financial Credit Card Master Trust
1.540%, 03/20/26 (144A) 495,000 480,336
Asset-Backed - Home Equity��0.1%GSAA Home Equity Trust
0.557%, 1M LIBOR + 0.100%, 12/25/46 (c) 50,656 29,6791.057%, 1M LIBOR + 0.600%, 03/25/36 (c) 582,058 365,9675.985%, 06/25/36 (c) 445,499 155,255
Renaissance Home Equity Loan Trust6.120%, 11/25/36 (m) 239,267 117,120
Soundview Home Loan Trust0.957%, 1M LIBOR + 0.500%, 11/25/36 (c) 440,884 425,581
1,093,602
Asset-Backed - Other��2.9%510 Asset Backed Trust
2.116%, 06/25/61 (144A) (m) 1,028,836 984,000Affirm Asset Securitization Trust
1.900%, 01/15/25 (144A) 262,896 260,2603.460%, 10/15/24 (144A) 119,607 120,027
Apex Credit CLO, Ltd.1.259%, 3M LIBOR + 1.000%, 04/24/29(144A) (c) 1,096,501 1,092,852
Apollo Aviation Securitization Trust3.351%, 01/16/40 (144A) 196,201 172,531
BHFTII-125
Copyright © 2022 www.secdatabase.com. All Rights Reserved.Please Consider the Environment Before Printing This Document

Table of ContentsBrighthouse Funds Trust IIBrighthouse/Wellington Balanced Portfolio
Schedule of Investments as of March 31, 2022 (Unaudited)Asset-Backed Securities��(Continued)
Security DescriptionPrincipalAmount* Value
Asset-Backed - Other��(Continued)Arbor Realty Commercial Real Estate Notes,
Ltd.1.497%, 1M LIBOR + 1.100%, 05/15/36(144A) (c) 210,000 $207,776
Avant Loans Funding Trust1.210%, 07/15/30 (144A) 455,000 439,697
Bain Capital Credit CLO, Ltd.1.438%, 3M LIBOR + 1.180%, 07/25/34(144A) (c) 1,325,000 1,311,789
Bayview Koitere Fund Trust3.500%, 07/28/57 (144A) (c) 522,051 518,6874.000%, 11/28/53 (144A) (c) 202,042 200,532
Bayview Mortgage Fund Trust3.500%, 01/28/58 (144A) (c) 334,596 329,610
Bayview Opportunity Master Fund Trust3.500%, 01/28/55 (144A) (c) 222,595 221,1533.500%, 06/28/57 (144A) (c) 261,043 259,7713.500%, 10/28/57 (144A) (c) 508,822 497,6404.000%, 10/28/64 (144A) (c) 421,648 417,120
BlueMountain CLO, Ltd.1.354%, 3M LIBOR + 1.100%, 04/20/34(144A) (c) 825,000 815,0211.398%, 3M LIBOR + 1.150%, 04/19/34(144A) (c) 1,560,000 1,551,147
Buckhorn Park CLO, Ltd.1.361%, 3M LIBOR + 1.120%, 07/18/34(144A) (c) 555,000 551,842
CF Hippolyta LLC1.990%, 07/15/60 (144A) 250,746 230,426
Cirrus Funding, Ltd.4.800%, 01/25/37 (144A) 940,000 952,151
Domino�s Pizza Master Issuer LLC2.662%, 04/25/51 (144A) 516,100 478,4853.668%, 10/25/49 (144A) 323,400 310,0364.116%, 07/25/48 (144A) 677,250 680,440
Finance America Mortgage Loan Trust1.507%, 1M LIBOR + 1.050%, 09/25/33 (c) 47,677 46,500
GMACM Home Equity Loan Trust0.957%, 1M LIBOR + 0.500%, 10/25/34(144A) (c) 14,041 13,903
Harriman Park CLO, Ltd.1.374%, 3M LIBOR + 1.120%, 04/20/34(144A) (c) 1,655,000 1,647,606
KKR CLO, Ltd.1.241%, 3M LIBOR + 1.000%, 04/15/31(144A) (c) 1,230,000 1,218,573
Knollwood CDO, Ltd.3.431%, 3M LIBOR + 3.200%, 01/10/39(144A) (c) 764,301 77
LCM, Ltd.1.294%, 3M LIBOR + 1.040%, 10/20/27(144A) (c) 463,574 462,025
Madison Park Funding, Ltd.1.361%, 3M LIBOR + 1.120%, 07/17/34(144A) (c) 1,330,000 1,320,265
MF1, Ltd.1.800%, SOFR30A + 1.750%, 02/19/37(144A) (c) 685,000 676,878
Copyright © 2022 www.secdatabase.com. All Rights Reserved.Please Consider the Environment Before Printing This Document

MFA LLC2.363%, 03/25/60 (144A) (m) 910,096 889,246
Morgan Stanley ABS Capital I, Inc. Trust0.757%, 1M LIBOR + 0.300%, 06/25/36 (c) 8,696 7,869
NRZ Excess Spread-Collateralized Notes3.844%, 12/25/25 (144A) 133,530 129,968
Octagon Investment Partners 45, Ltd.1.584%, 3M TSFR + 1.340%, 04/15/35 (144A)(c) 1,155,000 1,152,296
Asset-Backed - Other��(Continued)OZLM, Ltd.
1.251%, 3M LIBOR + 1.010%, 07/17/29(144A) (c) 287,029 285,4941.259%, 3M LIBOR + 1.020%, 04/15/31(144A) (c) 900,000 892,7911.349%, 3M LIBOR + 1.050%, 04/30/27(144A) (c) 175,576 175,495
Pretium Mortgage Credit Partners LLC1.992%, 06/27/60 (144A) (m) 610,175 583,9381.992%, 02/25/61 (144A) (m) 1,193,257 1,136,4502.487%, 07/25/51 (144A) (m) 594,316 576,3942.981%, 01/25/52 (144A) (m) 1,322,126 1,279,113
RCO Mortgage LLC1.868%, 05/26/26 (144A) (m) 441,142 428,701
Regatta VI Funding, Ltd.1.414%, 3M LIBOR + 1.160%, 04/20/34(144A) (c) 1,200,000 1,187,336
RR 1 LLC1.391%, 3M LIBOR + 1.150%, 07/15/35(144A) (c) 1,365,000 1,358,174
RR 16, Ltd.1.351%, 3M LIBOR + 1.110%, 07/15/36(144A) (c) 1,175,000 1,167,129
Sapphire Aviation Finance II, Ltd.3.228%, 03/15/40 (144A) 200,201 180,550
Sound Point CLO XXIX, Ltd.1.328%, 3M LIBOR + 1.070%, 04/25/34(144A) (c) 1,300,000 1,290,619
Summit Issuer LLC2.290%, 12/20/50 (144A) 320,000 301,574
Symphony CLO, Ltd.1.188%, 3M LIBOR + 0.950%, 07/14/26(144A) (c) 267,946 267,852
Upstart Securitization Trust0.830%, 07/20/31 (144A) 250,730 246,224
VCAT Asset Securitization LLC1.743%, 05/25/51 (144A) (m) 599,331 570,5332.115%, 03/27/51 (144A) (m) 183,466 177,749
Venture CLO, Ltd.1.371%, 3M LIBOR + 1.130%, 04/15/34(144A) (c) 1,300,000 1,283,1531.481%, 3M LIBOR + 1.240%, 04/15/34(144A) (c) 500,000 498,502
VOLT XCIV LLC2.240%, 02/27/51 (144A) (m) 587,689 564,599
Voya CLO, Ltd.1.141%, 3M LIBOR + 0.900%, 01/18/29(144A) (c) 1,246,384 1,238,917
Wellfleet CLO X, Ltd.1.424%, 3M LIBOR + 1.170%, 07/20/32(144A) (c) 1,065,000 1,058,248
Wendy�s Funding LLC2.370%, 06/15/51 (144A) 1,176,113 1,046,0493.884%, 03/15/48 (144A) 416,513 411,940
Wingstop Funding LLC2.841%, 12/05/50 (144A) 164,175 152,268
38,527,991Total Asset-Backed Securities
(Cost $45,793,106) 44,116,003
BHFTII-126
Copyright © 2022 www.secdatabase.com. All Rights Reserved.Please Consider the Environment Before Printing This Document

Table of ContentsBrighthouse Funds Trust IIBrighthouse/Wellington Balanced Portfolio
Schedule of Investments as of March 31, 2022 (Unaudited)Foreign Government��2.1%
Security DescriptionPrincipalAmount* Value
Sovereign��2.1%Angolan Government International Bonds
8.000%, 11/26/29 400,000 $401,4488.250%, 05/09/28 205,000 208,587
Benin Government International Bond4.950%, 01/22/35 (144A) (EUR) 620,000 558,302
Bermuda Government International Bond2.375%, 08/20/30 (144A) 200,000 183,000
Brazil Notas do Tesouro Nacional10.000%, 01/01/31 (BRL) 11,104,000 2,193,053
Chile Government International Bonds1.250%, 01/22/51 (EUR) 1,100,000 902,1473.100%, 05/07/41 285,000 250,7323.250%, 09/21/71 200,000 161,8623.500%, 01/31/34 200,000 197,2984.000%, 01/31/52 220,000 217,155
Colombia Government International Bonds3.875%, 04/25/27 325,000 311,5715.000%, 06/15/45 800,000 673,2885.200%, 05/15/49 200,000 170,4545.625%, 02/26/44 225,000 203,956
Croatia Government International Bond1.500%, 06/17/31 (EUR) 1,025,000 1,063,037
Dominican Republic International Bond6.400%, 06/05/49 (144A) 1,110,000 1,037,861
Egypt Government International Bonds7.300%, 09/30/33 (144A) 200,000 174,4267.625%, 05/29/32 (144A) 255,000 230,7098.500%, 01/31/47 200,000 170,156
Finance Department Government of Sharjah3.625%, 03/10/33 (144A) 550,000 506,715
Hungary Government International Bond1.625%, 04/28/32 (EUR) 1,320,000 1,384,171
Indonesia Government International Bonds1.100%, 03/12/33 (EUR) 1,170,000 1,126,0002.150%, 07/18/24 (EUR) 100,000 112,4502.625%, 06/14/23 (EUR) 100,000 112,694
Ivory Coast Government International Bond4.875%, 01/30/32 (EUR) 460,000 447,382
Jordan Government International Bond5.850%, 07/07/30 430,000 400,141
Mexican Bonos7.750%, 05/29/31 (MXN) 72,152,300 3,494,979
Mexico Government International Bonds1.125%, 01/17/30 (EUR) 200,000 197,4541.450%, 10/25/33 (EUR) 1,330,000 1,238,8453.771%, 05/24/61 335,000 270,7844.280%, 08/14/41 340,000 316,938
Morocco Government International Bond2.000%, 09/30/30 (EUR) 640,000 618,064
North Macedonia Government InternationalBonds2.750%, 01/18/25 (EUR) 425,000 457,3303.675%, 06/03/26 (144A) (EUR) 515,000 568,340
Oman Government International Bond6.750%, 01/17/48 (144A) 895,000 892,870
Sovereign��(Continued)Panama Government International Bonds
3.870%, 07/23/60 1,170,000 1,023,469
Copyright © 2022 www.secdatabase.com. All Rights Reserved.Please Consider the Environment Before Printing This Document

4.300%, 04/29/53 400,000 383,9924.500%, 01/19/63 200,000 191,852
Philippine Government International Bonds1.200%, 04/28/33 (EUR) 1,135,000 1,115,8461.750%, 04/28/41 (EUR) 300,000 281,679
Romanian Government International Bonds2.625%, 12/02/40 (144A) (EUR) 635,000 533,6162.750%, 04/14/41 (EUR) 305,000 257,6343.375%, 02/08/38 (EUR) 310,000 296,1664.625%, 04/03/49 (EUR) 738,000 800,411
Russian Federal Bond - OFZ5.900%, 03/12/31 (RUB) (l) 148,955,000 54,999
Saudi Government International Bond2.000%, 07/09/39 (EUR) 820,000 835,925
Senegal Government International Bonds4.750%, 03/13/28 (EUR) 245,000 262,9006.250%, 05/23/33 485,000 457,326
Total Foreign Government(Cost $34,589,066) 27,950,014
Floating Rate Loans (n)��1.3%Advertising��0.0%Clear Channel Outdoor Holdings, Inc.
Term Loan B, 3.799%, 3M LIBOR +3.500%, 08/21/26 136,500 134,427
CMG Media Corp.Term Loan, 3.957%, 1M LIBOR + 3.500%,12/17/26 117,315 115,712
250,139
Aerospace/Defense��0.0%TransDigm, Inc.
Term Loan E, 2.707%, 1M LIBOR +2.250%, 05/30/25 145,025 142,618
Agriculture��0.0%Lorca Finco plc
Term Loan B1, 4.250%, 6M EURIBOR +4.250%, 09/17/27 (EUR) 180,000 198,805
Airlines��0.0%Kestrel Bidco, Inc.
Term Loan B, 4.000%, 6M LIBOR +3.000%, 12/11/26 97,750 94,390
SkyMiles IP, Ltd.Term Loan B, 4.750%, 3M LIBOR +3.750%, 10/20/27 100,000 103,531
United Airlines, Inc.Term Loan B, 4.500%, 3M LIBOR +3.750%, 04/21/28 99,000 98,010
295,931
Apparel��0.0%Birkenstock GmbH & Co. KG
USD Term Loan B, 3.750%, 6M LIBOR +3.250%, 04/28/28 99,250 98,340
BHFTII-127
Copyright © 2022 www.secdatabase.com. All Rights Reserved.Please Consider the Environment Before Printing This Document

Table of ContentsBrighthouse Funds Trust IIBrighthouse/Wellington Balanced Portfolio
Schedule of Investments as of March 31, 2022 (Unaudited)Floating Rate Loans (n)��(Continued)
Security DescriptionPrincipalAmount* Value
Auto Parts & Equipment��0.0%Clarios Global L.P.
EUR Term Loan B, 3.250%, 1M EURIBOR +3.250%, 04/30/26 (EUR) 145,013 $157,312USD Term Loan B, 3.707%, 1M LIBOR +3.250%, 04/30/26 97,199 96,166
253,478
Building Materials��0.0%Cornerstone Building Brands, Inc.
Term Loan B, 3.750%, 1M LIBOR + 3.250%,04/12/28 195,277 189,541
Ingersoll-Rand Services Co.USD Term Loan, 2.207%, 1M LIBOR + 1.750%,03/01/27 456 450
Quikrete Holdings, Inc.1st Lien Term Loan, 2.957%, 1M LIBOR +2.500%, 02/01/27 122,188 119,395
309,386
Chemicals��0.1%Axalta Coating Systems U.S. Holdings, Inc.
Term Loan B3, 2.756%, 3M LIBOR + 1.750%,06/01/24 791,591 786,479
Diamond (BC) B.V.Term Loan B, 3.250%, 1M LIBOR + 2.750%,09/29/28 149,625 146,866
933,345
Commercial Services��0.2%Allied Universal Holdco LLCUSD Incremental Term Loan B, 4.250%, 1MLIBOR + 3.750%,05/12/28 111,655 110,212APX Group, Inc.
Term Loan B, 6.000%, 1M LIBOR + 3.500%,07/10/28 99,500 98,360
AVSC Holding Corp.Term Loan B1, 4.250%, 3M LIBOR + 3.250%,03/03/25 168,614 159,586
BrightView Landscapes LLC1st Lien Term Loan B, 3.000%, 1M LIBOR +2.500%, 08/15/25 209,781 207,421
MPH Acquisition Holdings LLCTerm Loan B, 4.758%, 3M LIBOR + 4.250%,09/01/28 149,250 145,379
Techem Verwaltungsgesellschaft 675 mbHTerm Loan B4, 2.625%, 3M EURIBOR +2.625%, 07/15/25 (EUR) 49,291 53,721
Verisure Holding ABTerm Loan B, 3.250%, 3M EURIBOR +3.250%, 07/20/26 (EUR) 185,000 201,330
Wex, Inc.Term Loan, 2.707%, 1M LIBOR + 2.250%, 03/31/28 1,019,700 1,009,078
WW International, Inc.Term Loan B, 3.957%, 1M LIBOR + 3.500%,04/13/28 94,500 86,397
Copyright © 2022 www.secdatabase.com. All Rights Reserved.Please Consider the Environment Before Printing This Document

2,071,484
Computers��0.0%McAfee LLC
USD Term Loan B, 4.500%, TSFR + 4.000%,03/01/29 145,000 144,057
Peraton Holding Corp.Term Loan B, 4.500%, 1M LIBOR + 3.750%,02/01/28 106,932 106,207
Tempo Acquisition LLCTerm Loan B, 3.500%, TSFR + 3.000%, 08/31/28 176,188 175,307
425,571
Cosmetics/Personal Care��0.0%Sunshine Luxembourg ViII S.a.r.l
Term Loan B3, 4.756%, 3M LIBOR + 3.750%,10/01/26 201,663 200,592
Distribution/Wholesale��0.1%American Builders & Contractors Supply Co., Inc.
Term Loan, 2.457%, 1M LIBOR + 2.000%, 01/15/27 587,727 581,336
Diversified Financial Services��0.1%Blackhawk Network Holdings, Inc.
1st Lien Term Loan, 3.457%, 1M LIBOR +3.000%, 06/15/25 192,984 189,751
Deerfield Dakota Holding LLCTerm Loan B, 4.750%, 1M LIBOR + 3.750%,04/09/27 216,150 215,529
Fleetcor Technologies Operating Co. LLCTerm Loan B4, 2.195%, 1M LIBOR + 1.750%,04/28/28 198,750 195,875
601,155
Electronics��0.0%II-VI, Inc.
Bridge Term Loan B, 12/01/28 (o) 100,000 98,917
Engineering & Construction��0.0%Artera Services LLC
Incremental Term Loan, 4.506%, 3M LIBOR +3.500%, 03/06/25 99,250 93,760
Brand Energy & Infrastructure Services, Inc.Term Loan, 5.256%, 3M LIBOR + 4.250%, 06/21/24 142,875 136,882
Brown Group Holding LLCTerm Loan B, 3.506%, 3M LIBOR + 2.500%,06/07/28 174,064 $171,362
402,004
Entertainment��0.0%Crown Finance U.S., Inc.
Incremental Term Loan B1, 9.250%, 3M LIBOR+ 8.250%, 02/28/25 3,492 3,727Term Loan, 3.506%, 3M LIBOR + 2.500%, 02/28/25 80,221 62,146
Delta 2 (LUX) S.a.r.l.Term Loan, 3.500%, 1M LIBOR + 2.500%, 02/01/24 241,686 240,448
Golden Entertainment, Inc.1st Lien Term Loan, 4.000%, 1M LIBOR +3.000%, 10/21/24 132,813 131,692
438,013
Food��0.0%Froneri International, Ltd.
Term Loan, 2.707%, 1M LIBOR + 2.250%, 01/29/27 98,250 96,703
Hostess Brands LLCTerm Loan, 3.000%, 3M LIBOR + 2.250%, 08/03/25 104,317 103,170
Copyright © 2022 www.secdatabase.com. All Rights Reserved.Please Consider the Environment Before Printing This Document

U.S. Foods, Inc.Term Loan B, 2.508%, 3M LIBOR + 2.000%,09/13/26 121,875 119,725
319,598
Food Service��0.0%Aramark Services, Inc.
Term Loan B4, 2.207%, 1M LIBOR + 1.750%,01/15/27 93,250 91,667
BHFTII-128
Copyright © 2022 www.secdatabase.com. All Rights Reserved.Please Consider the Environment Before Printing This Document

Table of ContentsBrighthouse Funds Trust IIBrighthouse/Wellington Balanced Portfolio
Schedule of Investments as of March 31, 2022 (Unaudited)Floating Rate Loans (n)��(continued)
Security DescriptionPrincipalAmount* Value
Gas��0.0%UGI Energy Services LLC
Term Loan B, 4.207%, 1M LIBOR + 3.750%, 08/13/26 145,875 $145,784
Healthcare-Products��0.0%Avantor Funding, Inc.
Term Loan B5, 2.750%, 1M LIBOR + 2.250%, 11/08/27 222,756 221,409
Medline Borrower L.P.Term Loan B, 3.750%, 1M LIBOR + 3.250%, 10/23/28 220,000 217,937
439,346
Healthcare-Services��0.0%ADMI Corp.
Term Loan B2, 3.875%, 1M LIBOR + 3.375%, 12/23/27 123,750 121,829
Envision Healthcare Corp.1st Lien Term Loan, 4.207%, 1M LIBOR +3.750%, 10/10/25 111,263 74,864
Surgery Center Holdings, Inc.Term Loan, 4.500%, 1M LIBOR + 3.750%, 08/31/26 188,100 186,872
383,565
Insurance��0.1%Acrisure LLC
Term Loan B, 3.957%, 1M LIBOR + 3.500%, 02/15/27 133,300 131,500
Asurion LLC Second LienTerm Loan B4, 5.707%, 1M LIBOR + 5.250%, 01/20/29 100,000 98,000Term Loan B8, 3.707%, 1M LIBOR + 3.250%, 12/23/26 247,752 242,731
HUB International, Ltd.Term Loan B, 3.267%, 3M LIBOR + 3.000%, 04/25/25 115,500 114,338
Sedgwick Claims Management Services, Inc.Term Loan B, 3.707%, 1M LIBOR + 3.250%, 12/31/25 96,750 95,921Term Loan B, 4.207%, 1M LIBOR + 3.750%, 09/03/26 131,288 130,702
USI, Inc.Repriced Term Loan, 4.006%, 3M LIBOR +3.000%, 05/16/24 100,275 99,796
912,988
Internet��0.1%Go Daddy Operating Co. LLC
Term Loan B, 2.207%, 1M LIBOR + 1.750%, 02/15/24 783,475 779,978Term Loan B4, 2.449%, 1M LIBOR + 2.000%, 08/10/27 112,988 112,038
892,016
Leisure Time��0.0%Carnival Corp.
Incremental Term Loan B, 4.000%, 3M LIBOR +3.250%, 10/18/28 124,688 122,090
Copyright © 2022 www.secdatabase.com. All Rights Reserved.Please Consider the Environment Before Printing This Document

MajorDrive Holdings LLCTerm Loan B, 4.563%, 3M LIBOR + 4.000%, 06/01/28 99,250 97,947
220,037
Lodging��0.0%Caesars Resort Collection LLC
1st Lien Term Loan B, 3.207%, 1M LIBOR +2.750%, 12/23/24 106,560 106,161Term Loan B1, 3.957%, 1M LIBOR + 3.500%, 07/21/25 128,050 127,516
233,677
Machinery-Construction & Mining��0.0%Brookfield WEC Holdings, Inc.
Term Loan, 3.250%, 1M LIBOR + 2.750%, 08/01/25 96,775 95,197
Machinery-Diversified��0.1%Gardner Denver, Inc.
Term Loan B2, 2.207%, 1M LIBOR + 1.750%, 03/01/27 171,408 168,933
Vertical U.S. Newco, Inc.Term Loan B, 4.000%, 6M LIBOR + 3.500%, 07/30/27 345,457 342,952
511,885
Media��0.1%Adevinta ASA
Term Loan B, 3.000%, 3M EURIBOR + 3.000%,06/26/28 (EUR) 100,000 109,657
CSC Holdings LLCTerm Loan B1, 2.647%, 1M LIBOR + 2.250%, 07/17/25 103,138 101,720
E.W. Scripps Co. (The)Term Loan B3, 3.750%, 1M LIBOR + 3.000%, 01/07/28 83,125 82,830
Gray Television, Inc.Term Loan C, 2.731%, 1M LIBOR + 2.500%, 01/02/26 84,964 84,557
Telenet Financing USD LLCTerm Loan AR, 2.397%, 1M LIBOR + 2.000%, 04/30/28 100,000 97,875
UPC Financing PartnershipUSD Term Loan AX, 3.397%, 1M LIBOR +3.000%, 01/31/29 200,000 198,350
674,989
Miscellaneous Manufacturing��0.0%CeramTec AcquiCo GmbH
EUR Term Loan B, 3.750%, 3M EURIBOR +3.750%, 01/19/29 (EUR) 92,993 102,102
Oil & Gas��0.0%Paragon Offshore Finance Co.
Term Loan B, 07/18/22 (j) (k) (l) 587 0
Packaging & Containers��0.0%Clydesdale Acquisition Holdings, Inc.
Term Loan, 03/30/29 (o) 100,000 98,429Flex Acquisition Co., Inc.
Term Loan, 4.000%, 3M LIBOR + 3.500%, 03/02/28 82,989 82,846
Proampac PG Borrower LLCTerm Loan, 4.500%, 3M LIBOR + 3.750%, 11/03/25 99,003 97,105
278,380
Pharmaceuticals��0.1%Bausch Health Companies, Inc.
Term Loan B, 3.457%, 1M LIBOR + 3.000%, 06/02/25 98,590 97,943
Change Healthcare Holdings LLC
Copyright © 2022 www.secdatabase.com. All Rights Reserved.Please Consider the Environment Before Printing This Document

Term Loan B, 3.500%, 1M LIBOR + 2.500%, 03/01/24 113,690 113,223
Endo Luxembourg Finance Co. I S.a.r.l.Term Loan, 5.750%, 1M LIBOR + 5.000%, 03/27/28 162,915 152,835
Gainwell Acquisition Corp.Term Loan B, 5.006%, 3M LIBOR + 4.000%, 10/01/27 98,997 98,626
BHFTII-129
Copyright © 2022 www.secdatabase.com. All Rights Reserved.Please Consider the Environment Before Printing This Document

Table of ContentsBrighthouse Funds Trust IIBrighthouse/Wellington Balanced Portfolio
Schedule of Investments as of March 31, 2022 (Unaudited)Floating Rate Loans (n)��(continued)
Security DescriptionPrincipalAmount* Value
Pharmaceuticals��(Continued)Horizon Therapeutics USA, Inc.
Term Loan B2, 2.250%, 1M LIBOR +1.750%, 03/15/28 99,000 $98,183
Jazz Financing Lux S.a.r.l.Term Loan, 4.000%, 1M LIBOR + 3.500%,05/05/28 124,063 123,796
Organon & Co.USD Term Loan, 3.563%, 3M LIBOR +3.000%, 06/02/28 120,521 120,012
Pathway Vet Alliance LLCTerm Loan, 4.207%, 1M LIBOR + 3.750%,03/31/27 245,116 243,125
1,047,743
Retail��0.1%1011778 B.C. Unlimited Liability Co.
Term Loan B4, 2.207%, 1M LIBOR +1.750%, 11/19/26 1,071 1,050
Great Outdoors Group LLCTerm Loan B1, 4.500%, 1M LIBOR +3.750%, 03/06/28 128,380 128,079
Harbor Freight Tools USA, Inc.Term Loan B, 3.250%, 1M LIBOR +2.750%, 10/19/27 113,128 110,984
IRB Holding Corp.Term Loan B, 3.750%, TSFR + 3.000%,12/15/27 98,750 97,824
LBM Acquisition LLCTerm Loan B, 4.500%, 1M LIBOR +3.750%, 12/17/27 198,379 194,101
Michaels Companies, Inc.Term Loan B, 5.256%, 3M LIBOR +4.250%, 04/15/28 99,250 93,047
PetSmart, Inc.Term Loan B, 4.500%, 3M LIBOR +3.750%, 02/11/28 99,500 99,202
SRS Distribution, Inc.Term Loan B, 4.250%, 3M LIBOR +3.500%, 06/02/28 109,450 107,972
Staples, Inc.Term Loan, 5.317%, 3M LIBOR + 5.000%,04/16/26 124,845 118,228
White Cap Buyer LLCTerm Loan B, 6.250%, TSFR + 3.750%,10/19/27 103,688 102,618
1,053,105
Software��0.2%DCert Buyer, Inc.
Term Loan B, 4.457%, 1M LIBOR +4.000%, 10/16/26 206,541 205,416
Dun & Bradstreet Corp. (The)Term Loan, 3.697%, 1M LIBOR + 3.250%,02/06/26 294,769 292,595
Finastra USA, Inc.1st Lien Term Loan, 4.500%, 3M LIBOR +3.500%, 06/13/24 113,256 111,946
Polaris Newco LLC
Copyright © 2022 www.secdatabase.com. All Rights Reserved.Please Consider the Environment Before Printing This Document

Term Loan B, 4.500%, 1M LIBOR +4.000%, 06/02/28 104,475 103,861
Realpage, Inc.1st Lien Term Loan, 3.750%, 1M LIBOR +3.250%, 04/24/28 99,500 98,530
SS&C Technologies, Inc.Term Loan B3, 2.207%, 1M LIBOR +1.750%, 04/16/25 259,779 256,369Term Loan B4, 2.207%, 1M LIBOR +1.750%, 04/16/25 210,883 208,115Term Loan B5, 2.207%, 1M LIBOR +1.750%, 04/16/25 289,725 286,067
Ultimate Software Group, Inc.Term Loan, 3.750%, 3M LIBOR + 3.250%,05/04/26 182,696 181,440
Zelis Healthcare Corp.Term Loan, 3.731%, 1M LIBOR + 3.500%,09/30/26 220,953 219,158
1,963,497
Telecommunications��0.0%Altice France S.A.
Term Loan B12, 3.927%, 3M LIBOR +3.687%, 01/31/26 95,750 93,865
CenturyLink, Inc.Term Loan B, 2.707%, 1M LIBOR +2.250%, 03/15/27 97,750 95,321
189,186Total Floating Rate Loans
(Cost $17,088,354) 16,855,876
Municipal��0.6%Chicago Board of Education, General Obligation Unlimited,Build America Bonds
6.038%, 12/01/29 85,000 89,6676.138%, 12/01/39 325,000 355,3586.319%, 11/01/29 480,000 523,318
Chicago Transit Authority Sale Tax ReceiptsFund
3.912%, 12/01/40 170,000 169,643Metropolitan Transportation Authority
4.750%, 11/15/45 505,000 544,1915.175%, 11/15/49 1,390,000 1,590,412
Municipal Electric Authority of Georgia, BuildAmerica Bond
6.637%, 04/01/57 193,000 257,577New York Transportation Development Corp
4.248%, 09/01/35 1,280,000 1,323,678Philadelphia, Authority for IndustrialDevelopment
6.550%, 10/15/28 1,235,000 1,458,829State Board of Administration Finance Corp.
1.258%, 07/01/25 975,000 926,177State of California General ObligationUnlimited, Build America Bond
7.300%, 10/01/39 180,000 253,350State of Illinois
4.950%, 06/01/23 453,091 461,1665.000%, 01/01/23 70,000 71,3845.947%, 04/01/22 220,000 220,000
Total Municipals(Cost $8,108,954) 8,244,750
Short-Term Investment��0.9%Repurchase Agreement��0.9%Fixed Income Clearing Corp. Repurchase
Agreement dated 03/31/22 at 0.000%, dueon 04/01/22 with a maturity value of$12,585,039; collateralized by U.S.Treasury Note at 2.500%, maturing 03/31/27, with a market value of $12,836,800. 12,585,039 12,585,039
Copyright © 2022 www.secdatabase.com. All Rights Reserved.Please Consider the Environment Before Printing This Document

Total Short-Term Investments(Cost $12,585,039) 12,585,039
Securities Lending Reinvestments (p)��5.0%Certificate of Deposit��0.0%Oversea-Chinese Banking Corp., Ltd.
Zero Coupon, 04/14/22 300,000 299,949
BHFTII-130
Copyright © 2022 www.secdatabase.com. All Rights Reserved.Please Consider the Environment Before Printing This Document

Table of ContentsBrighthouse Funds Trust IIBrighthouse/Wellington Balanced Portfolio
Schedule of Investments as of March 31, 2022 (Unaudited)Securities Lending Reinvestments (p)��(continued)
Security DescriptionPrincipalAmount* Value
Commercial Paper��0.2%DNB Bank ASA
0.830%, SOFR + 0.550%, 09/07/22 (c) 2,000,000 $2,000,798
Repurchase Agreements��3.0%BofA Securities, Inc.
Repurchase Agreement dated 03/31/22at 0.270%, due on 04/01/22 with amaturity value of $3,564,232;collateralized by U.S. TreasuryObligations with rates ranging from2.000% - 5.000%, maturity dates rangingfrom 05/15/37 - 02/15/50, and anaggregate market value of $3,635,490. 3,564,205 3,564,205
Citigroup Global Markets, Ltd.Repurchase Agreement dated 03/31/22at 0.300%, due on 04/01/22 with amaturity value of $900,008; collateralizedby U.S. Treasury and Foreign Obligationswith rates ranging from 0.125% - 2.875%,maturity dates ranging from 08/15/23 -02/15/51, and an aggregate market valueof $918,000. 900,000 900,000
National Bank Financial, Inc.Repurchase Agreement dated 03/31/22at 0.320%, due on 04/01/22 with amaturity value of $5,000,044;collateralized by U.S. TreasuryObligations with rates ranging from0.125% - 3.000%, maturity dates rangingfrom 06/30/22 - 02/15/49, and anaggregate market value of $5,102,844. 5,000,000 5,000,000
National Bank of CanadaRepurchase Agreement dated 03/31/22at 0.320%, due on 04/07/22 with amaturity value of $2,500,156;collateralized by U.S. TreasuryObligations with rates ranging from0.000% - 4.500%, maturity dates rangingfrom 04/14/22 - 08/15/51, and anaggregate market value of $2,551,422. 2,500,000 2,500,000Repurchase Agreement dated 03/31/22at 0.450%, due on 04/07/22 with amaturity value of $2,700,236;collateralized by U.S. TreasuryObligations with rates ranging from0.500% - 3.000%, maturity dates rangingfrom 11/30/23 - 08/15/48, and variousCommon Stock with an aggregate marketvalue of $2,985,656. 2,700,000 2,700,000
NBC Global Finance, Ltd.Repurchase Agreement dated 03/31/22at 0.440%, due on 04/01/22 with amaturity value of $10,000,122;collateralized by U.S. TreasuryObligations with rates ranging from0.125% - 4.750%, maturity dates rangingfrom 05/15/24 - 02/15/50, and variousCommon Stock with an aggregate marketvalue of $11,103,766. 10,000,000 10,000,000
Copyright © 2022 www.secdatabase.com. All Rights Reserved.Please Consider the Environment Before Printing This Document

Repurchase Agreement dated 03/31/22at 0.485%, due on 04/07/22 with amaturity value of $2,010,190;collateralized by U.S. TreasuryObligations with rates ranging from0.125% - 4.750%, maturity dates rangingfrom 05/15/24 - 02/15/50, and variousCommon Stock with an aggregate marketvalue of $2,231,857. 2,010,000 2,010,000
Societe GeneraleRepurchase Agreement dated 03/31/22at 0.410%, due on 04/01/22 with amaturity value of $10,000,114;collateralized by various Common Stockwith an aggregate market value of$11,112,897. 10,000,000 10,000,000
Repurchase Agreements��(Continued)Societe Generale
Repurchase Agreement dated 03/31/22at 0.420%, due on 04/07/22 with amaturity value of $900,074; collateralizedby various Common Stock with anaggregate market value of $1,000,161. 900,000 900,000
TD Prime Services LLC RepurchaseAgreement dated 03/31/22 at 0.400%,due on 04/01/22 with a maturity value of$3,000,033; collateralized by variousCommon Stock with an aggregate marketvalue of $3,474,565. 3,000,000 3,000,000
40,574,205
Time Deposits��0.8%Canadian Imperial Bank of Commerce
0.320%, 04/01/22 2,000,000 2,000,000DZ Bank AG (NY)
0.300%, 04/01/22 2,000,000 2,000,000Rabobank (New York)
0.310%, 04/01/22 2,000,000 2,000,000Skandi (NY)
0.300%, 04/01/22 2,000,000 2,000,000Svenska (NY)
0.260%, 04/01/22 2,000,000 2,000,00010,000,000
Mutual Funds��1.0%BlackRock Liquidity Funds FedFund,
Institutional Shares0.230% (q) 4,000,000 4,000,000
Fidelity Government Portfolio, Class I0.120% (q) 100,000 100,000
Morgan Stanley Liquidity FundsGovernment Portfolio, InstitutionalShares 0.230% (q) 5,000,000 5,000,000
STIT-Government & Agency Portfolio,Institutional Class 0.250% (q) 4,000,000 4,000,000
13,100,000Total Securities Lending Reinvestments
(Cost $65,974,188) 65,974,952Total Investments�115.0%
(Cost $1,403,063,866) 1,532,100,961Other assets and liabilities (net) �(15.0)% (199,303,101 )Net Assets�100.0% $1,332,797,860
* Principal amount stated in U.S. dollars unless otherwise noted.(a) Non-income producing security.(b) All or a portion of the security was held on loan. As of March 31, 2022, the market value of securities loaned was $70,605,183 and the collateral
received consisted of cash in the amount of $65,973,970 and non-cash collateral with a value of $7,502,356. The cash collateral investments aredisclosed in the Schedule of Investments and categorized as Securities Lending Reinvestments. The non-cash collateral received consists of U.S.government securities that are held in safe-keeping by the lending agent, or a third- party custodian, and cannot be sold or repledged by thePortfolio.
See accompanying notes to financial statements.
Copyright © 2022 www.secdatabase.com. All Rights Reserved.Please Consider the Environment Before Printing This Document

BHFTII-131
Copyright © 2022 www.secdatabase.com. All Rights Reserved.Please Consider the Environment Before Printing This Document

Table of ContentsBrighthouse Funds Trust IIBrighthouse/Wellington Balanced Portfolio
Schedule of Investments as of March 31, 2022 (Unaudited)(c) Variable or floating rate security. The stated rate represents the rate at March 31, 2022. Maturity date shown for callable securities reflects the
earliest possible call date. For securities based on a published reference index and spread, the index and spread are indicated in thedescription above. For certain variable rate securities, the coupon rate is determined by the issuer/agent based on current market conditions.For certain asset- and mortgage-backed securities, the coupon rate may fluctuate based on changes of the underlying collateral orprepayments of principal. These securities do not indicate a reference index and spread in their description above.
(d) Interest only security.(e) Principal only security.(f) TBA (To Be Announced) Securities are purchased on a forward commitment basis with an approximate principal amount and no defined
maturity date. The actual principal and maturity date will be determined upon settlement date.(g) All or a portion of the security was pledged as collateral against open centrally cleared swap contracts. As of March 31, 2022, the market
value of securities pledged was $3,079,083.(h) All or a portion of the security was pledged as collateral against open futures contracts. As of March 31, 2022, the market value of securities
pledged was $1,044,261.(i) Principal amount of security is adjusted for inflation.(j) Significant unobservable inputs were used in the valuation of this portfolio security; i.e. Level 3.(k) Security was valued in good faith under procedures approved by the Board of Trustees. As of March 31, 2022, these securities represent less
than 0.05% of net assets.(l) Non-income producing; security is in default and/or issuer is in bankruptcy.(m) Security is a �step-up� bond where coupon increases or steps up at a predetermined date. Rate shown is current coupon rate.(n) Floating rate loans (�Senior Loans�) often require prepayments from excess cash flows or permit the borrowers to repay at their election. The
degree to which borrowers repay, whether as a contractual requirement or at their election, cannot be predicted with accuracy. As a result, theactual remaining maturity may be substantially less than the stated maturities shown. However, Senior Loans will generally have an expectedaverage life of approximately two to four years. Senior Loans typically have rates of interest which are determined periodically by reference toa base lending rate, plus a spread. These base rates are primarily the London Interbank Offered Rate and secondarily, the prime rate offeredby one or more major United States banks. Base lending rates may be subject to a floor, or a minimum rate.
(o) This loan will settle after March 31, 2022, at which time the interest rate will be determined.(p) Represents investment of cash collateral received from securities on loan as of March 31, 2022.(q) The rate shown represents the annualized seven-day yield as of March 31, 2022.(144A)� Securities exempt from registration under Rule 144A of the Securities Act of 1933. These securities may be resold in transactions exempt
from registration, normally to qualified institutional buyers. As of March 31, 2022, the market value of 144A securities was $159,359,313,which is 12.0% of net assets.
TBA Forward Sale Commitments
Security DescriptionInterest
Rate MaturityFace
Amount Cost ValueGinnie Mae II 30 Yr. Pool 4.000 % TBA $(618,000) $(636,250 ) $(630,167 )Uniform Mortgage-Backed Securities 30 Yr. Pool 3.500 % TBA (216,000) (218,006 ) (216,371 )Uniform Mortgage-Backed Securities 30 Yr. Pool 5.000 % TBA (726,000) (782,492 ) (763,803 )Totals $(1,636,748) $(1,610,341)
Forward Foreign Currency Exchange Contracts
Contracts to Buy CounterpartySettlement
DateIn Exchange
for
UnrealizedAppreciation/(Depreciation)
EUR 122,000 BOA 06/15/22 USD 134,042 $ 1,285EUR 346,000 MSIP 06/15/22 USD 381,626 2,171EUR 339,000 NWM 06/15/22 USD 371,663 4,368EUR 380,000 SCB 06/15/22 USD 421,795 (284 )
Contracts to DeliverBRL 10,470,000 GSI 06/15/22 USD 2,018,664 (135,987 )EUR 599,334 DBAG 04/29/22 USD 663,718 219EUR 13,117,000 DBAG 06/15/22 USD 14,699,173 149,301EUR 582,000 MSIP 06/15/22 USD 640,114 (5,462 )MXN 47,600,000 CBNA 06/15/22 USD 2,242,131 (120,674 )Net Unrealized Depreciation $ (105,063 )
BHFTII-132
Copyright © 2022 www.secdatabase.com. All Rights Reserved.Please Consider the Environment Before Printing This Document

Table of ContentsBrighthouse Funds Trust IIBrighthouse/Wellington Balanced Portfolio
Schedule of Investments as of March 31, 2022 (Unaudited)Futures Contracts
Futures Contracts - LongExpiration
DateNumber ofContracts
NotionalValue
Value/Unrealized
Appreciation/(Depreciation)
U.S. Treasury Note 2 Year Futures 06/30/22 93 USD 19,708,734 $ (211,701 )U.S. Treasury Note 5 Year Futures 06/30/22 374 USD 42,893,125 (1,199,983 )
Futures Contracts - ShortEuro-Bund Futures 06/08/22 (104 ) EUR (16,500,640) 675,536Euro-Buxl 30 Year Bond Futures 06/08/22 (14 ) EUR (2,606,800 ) 211,076U.S. Treasury Long Bond Futures 06/21/22 (60 ) USD (9,003,750 ) 215,836U.S. Treasury Note 10 Year Futures 06/21/22 (129 ) USD (15,850,875) (32,455 )U.S. Treasury Note Ultra 10 Year Futures 06/21/22 (206 ) USD (27,906,563) 814,971U.S. Treasury Ultra Long Bond Futures 06/21/22 (151 ) USD (26,745,875) 793,949Net Unrealized Appreciation $ 1,267,229
Written Options
Credit Default SwaptionsStrikePrice Counterparty
ReferenceObligation
Buy/SellProtection
ExpirationDate
Number ofContracts
NotionalAmount
PremiumsReceived
MarketValue
UnrealizedAppreciation/(Depreciation)
Call - OTC-5 Yr. CDS USD 65.000 GSI CDX.NA.IG.37 Buy 04/20/22 (39,370,000) USD (39,370,000) $(55,118 ) $(84,208 ) $ (29,090 )Call - OTC-5 Yr. CDS USD 75.000 GSI CDX.NA.IG.37 Buy 04/20/22 (39,370,000) USD (39,370,000) (108,268 ) (234,409) (126,141 )Put - OTC-5 Yr. CDS USD 65.000 GSI CDX.NA.IG.37 Sell 04/20/22 (39,370,000) USD (39,370,000) (77,165 ) (35,985 ) 41,180Put - OTC-5 Yr. CDS USD 75.000 GSI CDX.NA.IG.37 Sell 04/20/22 (39,370,000) USD (39,370,000) (167,323 ) (12,405 ) 154,918Totals $(407,874 ) $(367,007) $ 40,867
Swap Agreements
Centrally Cleared Credit Default Swaps on Credit Indices - Buy Protection (a)
Reference ObligationFixed Deal(Pay) Rate
PaymentFrequency
MaturityDate
ImpliedCredit Spreadat March 31,
2022 (b)Notional
Amount (c)MarketValue
UpfrontPremiums
Paid/(Received)
UnrealizedAppreciation/(Depreciation)
CDX.EM.35.V1(1.000 %) Quarterly
06/20/26 3.030 % USD 4,005,000 $303,126 $103,715 $ 199,411
OTC Credit Default Swaps on Credit Indices - Buy Protection (a)
Reference ObligationFixed Deal(Pay) Rate
PaymentFrequency
MaturityDate Counterparty
ImpliedCredit Spreadat March 31,
2022(b)Notional
Amount (c)MarketValue
UpfrontPremiums
Paid/(Received)
UnrealizedAppreciation/(Depreciation)
ABX.HE.PEN.AAA.06-2(0.110 %) Monthly
05/25/46 JPMC 70.818 % USD 78,577 $5,762 $ 10,216 $ (4,454 )
PRIMEX.ARM.2 (e)(4.580 %) Monthly
12/25/37 MSIP 0.000 % USD 133,688 0 (271 ) 271
Totals $5,762 $ 9,945 $ (4,183 )
OTC Credit Default Swaps on Credit Indices - Sell Protection (d)
Reference ObligationFixed Deal
Receive RatePayment
FrequencyMaturity
Date Counterparty
ImpliedCredit Spreadat March 31,
2022 (b)Notional
Amount (c)MarketValue
UpfrontPremiums
Paid/(Received)
UnrealizedAppreciation/(Depreciation)
ABX.HE.PEN.AAA.06-20.110 % Monthly
05/25/46 BBP 70.818 % USD 78,577 $(5,762) $ (2,005 ) $ (3,757 )
PRIMEX.ARM.2 (e)4.580 % Monthly
12/25/37 JPMC 0.000 % USD 133,688 0 3,765 (3,765 )
Copyright © 2022 www.secdatabase.com. All Rights Reserved.Please Consider the Environment Before Printing This Document

Totals $(5,762) $ 1,760 $ (7,522 )
BHFTII-133
Copyright © 2022 www.secdatabase.com. All Rights Reserved.Please Consider the Environment Before Printing This Document

Table of ContentsBrighthouse Funds Trust IIBrighthouse/Wellington Balanced Portfolio
Schedule of Investments as of March 31, 2022 (Unaudited)(a) If the Portfolio is a buyer of protection and a credit event occurs, as defined under the terms of that particular swap agreement, the Portfolio will either
(i) receive from the seller of protection an amount equal to the notional amount of the swap and deliver the referenced obligation or underlyingsecurities comprising the referenced index or (ii) receive a net settlement amount in the form of cash or securities equal to the notional amount of theswap less the recovery value of the referenced obligation or underlying securities comprising the referenced index.
(b) Implied credit spreads, represented in absolute terms, utilized in determining the market value of credit default swap agreements on corporate issuesor indices as of period end serve as an indicator of the current status of the payment/performance risk and represent the likelihood or risk of default forthe credit derivative. The implied credit spread of a particular referenced entity reflects the cost of buying/selling protection and may include upfrontpayments required to be made to enter into the agreement. Wider credit spreads represent a deterioration of the referenced entity�s credit soundnessand a greater likelihood or risk of default or other credit event occurring as defined under the terms of the agreement. A credit spread identified as�Defaulted� indicates a credit event has occurred for the referenced entity or obligation.
(c) The maximum potential amount of future undiscounted payments that the Portfolio could be required to make under a credit default swap contractwould be the notional amount of the contract. These potential amounts would be partially offset by any recovery values of the referenced debtobligation or net amounts received from the settlement of purchased protection credit default swap contracts entered into by the Portfolio for the samereferenced debt obligation.
(d) If the Portfolio is a seller of protection and a credit event occurs, as defined under the terms of that particular swap agreement, the Portfolio will either(i) pay to the buyer of protection an amount equal to the notional amount of the swap and take delivery of the referenced obligation or underlyingsecurities comprising the referenced index or (ii) pay a net settlement amount in the form of cash or securities equal to the notional amount of theswap less the recovery value of the referenced obligation or underlying securities comprising the referenced index.
(e) Significant unobservable inputs were used in the valuation of this position; i.e. Level 3.
Glossary of Abbreviations
Counterparties
(BBP)� Barclays Bank plc(BOA)� Bank of America N.A.(CBNA)� Citibank N.A.(DBAG)� Deutsche Bank AG(GSI)� Goldman Sachs International(JPMC)� JPMorgan Chase Bank N.A.(MSIP)� Morgan Stanley & Co. International plc(NWM)� NatWest Markets plc(SCB)� Standard Chartered Bank
Currencies
(BRL)� Brazilian Real(EUR)� Euro(MXN)� Mexican Peso(RUB)� Russian Ruble(USD)� United States Dollar
Index Abbreviations
(ABX.HE.PEN.AAA)� Markit Asset-Backed Home EquityPenultimate AAA Rated Index
(CDX.EM)� Markit Emerging Market CDS Index(CDX.NA.IG)� Markit North America Investment Grade
CDS Index(EURIBOR)� Euro InterBank Offered Rate(H15)� U.S. Treasury Yield Curve Rate T-Note Constant
Maturity Index(LIBOR)� London Interbank Offered Rate(MTA)� Monthly Treasury Average Index(PRIMEX.ARM)� Markit PrimeX Adjustable Rate Mortgage Index(SOFR)� Secured Overnight Financing Rate(SOFR30A)� Secured Overnight Financing Rate 30-Day Average(TSFR)� Term Secured Financing Rate
Other Abbreviations
(ARM)� Adjustable-Rate Mortgage(ACES)� Alternative Credit Enhancement Securities(ADR)� American Depositary Receipt(CDO)� Collateralized Debt Obligation
Copyright © 2022 www.secdatabase.com. All Rights Reserved.Please Consider the Environment Before Printing This Document

(CLO)� Collateralized Loan Obligation(CMO)� Collateralized Mortgage Obligation(CDS)� Credit Default Swap(DAC)� Designated Activity Company(REMIC)� Real Estate Mortgage Investment Conduit(STACR)� Structured Agency Credit Risk
BHFTII-134
Copyright © 2022 www.secdatabase.com. All Rights Reserved.Please Consider the Environment Before Printing This Document

Table of ContentsBrighthouse Funds Trust IIBrighthouse/Wellington Balanced Portfolio
Schedule of Investments as of March 31, 2022 (Unaudited)
Fair Value HierarchyAccounting principles generally accepted in the United States of America (�GAAP�) define fair market value as the price that the Portfolio would receive tosell an asset or pay to transfer a liability in an orderly transaction between market participants at the measurement date. It establishes a fair valuehierarchy that prioritizes inputs to valuation methods and requires disclosure of the fair value hierarchy, separately for each major category of assets andliabilities, that segregates fair value measurements into three levels. Levels 1, 2 and 3 of the fair value hierarchy are defined as follows:
Level 1 - unadjusted quoted prices in active markets for identical investmentsLevel 2 - other significant observable inputs (including, but not limited to, quoted prices for similar assets or liabilities in markets that are either activeor inactive; inputs other than quoted prices that are observable such as interest rates, yield curves, volatilities, prepayment speeds, loss severities,credit risks, default rates, or other market corroborated inputs)Level 3 - significant unobservable inputs based on the best information available in the circumstances, to the extent observable inputs areunavailable (including the Portfolio�s own assumptions used in determining the fair value of investments and derivative financial instruments)
The inputs or methodologies used for valuing investments are not necessarily an indication of the risk associated with investing in them. Changes to theinputs or methodologies used may result in transfers between levels. A reconciliation of Level 3 securities, if any, will be disclosed following the fair valuehierarchy table. For more information about the Portfolio�s policy regarding the valuation of investments, please refer to the Notes to Schedule ofInvestments.
The following table summarizes the fair value hierarchy of the Portfolio�s investments as of March 31, 2022:Description Level 1 Level 2 Level 3 TotalCommon Stocks
Aerospace & Defense $17,395,992 $� $ � $17,395,992Air Freight & Logistics 2,348,146 � � 2,348,146Airlines 2,189,862 � � 2,189,862Automobiles 8,291,054 � � 8,291,054Banks 4,137,398 � � 4,137,398Beverages 9,767,413 � � 9,767,413Biotechnology 14,219,697 � � 14,219,697Building Products 8,577,018 � � 8,577,018Capital Markets 45,500,510 � � 45,500,510Chemicals 22,154,226 � � 22,154,226Communications Equipment 4,612,190 � � 4,612,190Construction & Engineering 427,538 � � 427,538Consumer Finance 13,310,264 � � 13,310,264Containers & Packaging 1,408,410 � � 1,408,410Diversified Financial Services 5,649,777 � � 5,649,777Electric Utilities 26,372,532 � � 26,372,532Electrical Equipment 1,381,616 � � 1,381,616Energy Equipment & Services 3,019,472 � � 3,019,472Entertainment 8,068,269 � � 8,068,269Equity Real Estate Investment Trusts 18,556,857 � � 18,556,857Food & Staples Retailing 20,210,644 � � 20,210,644Food Products 14,156,889 � � 14,156,889Health Care Equipment & Supplies 25,707,184 � � 25,707,184Health Care Providers & Services 29,788,563 � � 29,788,563Hotels, Restaurants & Leisure 16,108,012 � � 16,108,012Industrial Conglomerates 4,775,577 � � 4,775,577Insurance 24,804,862 � � 24,804,862Interactive Media & Services 60,216,036 � � 60,216,036Internet & Direct Marketing Retail 47,983,174 � � 47,983,174IT Services 28,195,171 � � 28,195,171Life Sciences Tools & Services 20,371,671 � � 20,371,671Machinery 17,435,491 � � 17,435,491Media 23,633,005 � � 23,633,005Metals & Mining � 23,101 � 23,101Oil, Gas & Consumable Fuels 33,356,220 � � 33,356,220Pharmaceuticals 42,795,711 � � 42,795,711Professional Services 4,607,913 � � 4,607,913Road & Rail 5,741,447 � � 5,741,447Semiconductors & Semiconductor Equipment 38,644,640 � � 38,644,640Software 76,209,728 � � 76,209,728Specialty Retail 14,641,575 � � 14,641,575
BHFTII-135
Copyright © 2022 www.secdatabase.com. All Rights Reserved.Please Consider the Environment Before Printing This Document

Table of ContentsBrighthouse Funds Trust IIBrighthouse/Wellington Balanced Portfolio
Schedule of Investments as of March 31, 2022 (Unaudited)Fair Value Hierarchy��(Continued)
Description Level 1 Level 2 Level 3 TotalTechnology Hardware, Storage & Peripherals $31,659,936 $� $ � $31,659,936Tobacco 7,866,442 � � 7,866,442Wireless Telecommunication Services 6,741,455 � � 6,741,455
Total Common Stocks 813,039,587 23,101 � 813,062,688Total U.S. Treasury & Government Agencies* � 313,892,032 � 313,892,032Corporate Bonds & Notes
Advertising � 497,276 � 497,276Aerospace/Defense � 2,300,236 � 2,300,236Agriculture � 2,764,620 � 2,764,620Airlines � 90,340 � 90,340Apparel � 917,093 � 917,093Auto Manufacturers � 820,268 � 820,268Auto Parts & Equipment � 83,329 � 83,329Banks � 26,173,909 0 26,173,909Beverages � 1,319,174 � 1,319,174Biotechnology � 1,297,644 � 1,297,644Building Materials � 1,594,667 � 1,594,667Chemicals � 1,090,203 � 1,090,203Commercial Services � 5,997,373 � 5,997,373Computers � 3,893,313 � 3,893,313Diversified Financial Services � 3,545,726 � 3,545,726Electric � 11,559,352 � 11,559,352Electronics � 275,724 � 275,724Energy-Alternate Sources � 1,065,552 � 1,065,552Engineering & Construction � 1,326,111 � 1,326,111Entertainment � 2,845,486 � 2,845,486Environmental Control � 1,311,869 � 1,311,869Food � 2,126,456 � 2,126,456Food Service � 58,200 � 58,200Gas � 423,642 � 423,642Healthcare-Products � 3,960,057 � 3,960,057Healthcare-Services � 3,536,229 � 3,536,229Home Builders � 1,513,089 � 1,513,089Insurance � 4,949,491 � 4,949,491Internet � 2,421,042 � 2,421,042Iron/Steel � 588,751 � 588,751Leisure Time � 120,900 � 120,900Lodging � 277,915 � 277,915Machinery-Construction & Mining � 154,000 � 154,000Machinery-Diversified � 308,415 � 308,415Media � 8,059,590 � 8,059,590Miscellaneous Manufacturing � 85,216 � 85,216Office/Business Equipment � 1,599,891 � 1,599,891Oil & Gas � 7,840,570 � 7,840,570Packaging & Containers � 1,172,764 � 1,172,764Pharmaceuticals � 4,440,136 � 4,440,136Pipelines � 5,550,196 � 5,550,196Real Estate Investment Trusts � 3,446,032 � 3,446,032Retail � 4,325,741 � 4,325,741Semiconductors � 5,438,201 � 5,438,201Software � 7,498,468 � 7,498,468Telecommunications � 7,041,543 � 7,041,543Transportation � 728,400 � 728,400Trucking & Leasing � 1,692,914 � 1,692,914Water � 145,125 � 145,125
Total Corporate Bonds & Notes � 150,272,239 0 150,272,239Total Mortgage-Backed Securities* � 79,147,368 � 79,147,368
BHFTII-136
Copyright © 2022 www.secdatabase.com. All Rights Reserved.Please Consider the Environment Before Printing This Document
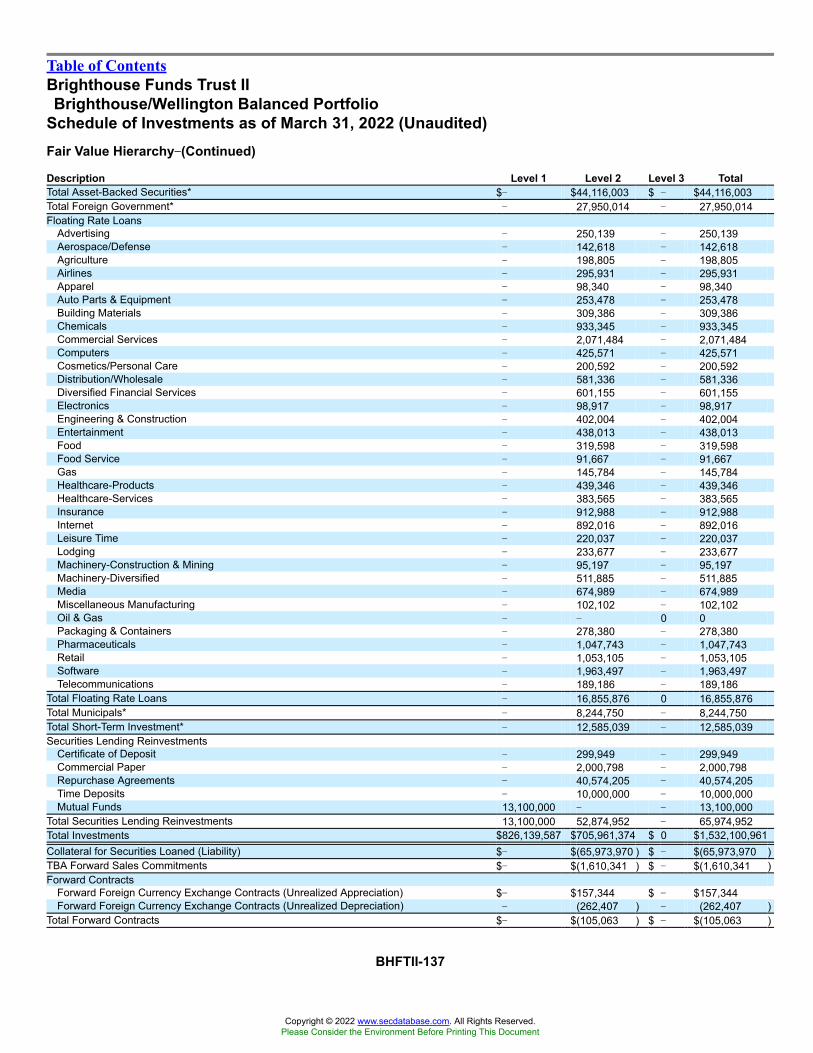
Table of ContentsBrighthouse Funds Trust IIBrighthouse/Wellington Balanced Portfolio
Schedule of Investments as of March 31, 2022 (Unaudited)Fair Value Hierarchy��(Continued)
Description Level 1 Level 2 Level 3 TotalTotal Asset-Backed Securities* $� $44,116,003 $ � $44,116,003Total Foreign Government* � 27,950,014 � 27,950,014Floating Rate Loans
Advertising � 250,139 � 250,139Aerospace/Defense � 142,618 � 142,618Agriculture � 198,805 � 198,805Airlines � 295,931 � 295,931Apparel � 98,340 � 98,340Auto Parts & Equipment � 253,478 � 253,478Building Materials � 309,386 � 309,386Chemicals � 933,345 � 933,345Commercial Services � 2,071,484 � 2,071,484Computers � 425,571 � 425,571Cosmetics/Personal Care � 200,592 � 200,592Distribution/Wholesale � 581,336 � 581,336Diversified Financial Services � 601,155 � 601,155Electronics � 98,917 � 98,917Engineering & Construction � 402,004 � 402,004Entertainment � 438,013 � 438,013Food � 319,598 � 319,598Food Service � 91,667 � 91,667Gas � 145,784 � 145,784Healthcare-Products � 439,346 � 439,346Healthcare-Services � 383,565 � 383,565Insurance � 912,988 � 912,988Internet � 892,016 � 892,016Leisure Time � 220,037 � 220,037Lodging � 233,677 � 233,677Machinery-Construction & Mining � 95,197 � 95,197Machinery-Diversified � 511,885 � 511,885Media � 674,989 � 674,989Miscellaneous Manufacturing � 102,102 � 102,102Oil & Gas � � 0 0Packaging & Containers � 278,380 � 278,380Pharmaceuticals � 1,047,743 � 1,047,743Retail � 1,053,105 � 1,053,105Software � 1,963,497 � 1,963,497Telecommunications � 189,186 � 189,186
Total Floating Rate Loans � 16,855,876 0 16,855,876Total Municipals* � 8,244,750 � 8,244,750Total Short-Term Investment* � 12,585,039 � 12,585,039Securities Lending Reinvestments
Certificate of Deposit � 299,949 � 299,949Commercial Paper � 2,000,798 � 2,000,798Repurchase Agreements � 40,574,205 � 40,574,205Time Deposits � 10,000,000 � 10,000,000Mutual Funds 13,100,000 � � 13,100,000
Total Securities Lending Reinvestments 13,100,000 52,874,952 � 65,974,952Total Investments $826,139,587 $705,961,374 $ 0 $1,532,100,961Collateral for Securities Loaned (Liability) $� $(65,973,970 ) $ � $(65,973,970 )TBA Forward Sales Commitments $� $(1,610,341 ) $ � $(1,610,341 )Forward Contracts
Forward Foreign Currency Exchange Contracts (Unrealized Appreciation) $� $157,344 $ � $157,344Forward Foreign Currency Exchange Contracts (Unrealized Depreciation) � (262,407 ) � (262,407 )
Total Forward Contracts $� $(105,063 ) $ � $(105,063 )
BHFTII-137
Copyright © 2022 www.secdatabase.com. All Rights Reserved.Please Consider the Environment Before Printing This Document

Table of ContentsBrighthouse Funds Trust IIBrighthouse/Wellington Balanced Portfolio
Schedule of Investments as of March 31, 2022 (Unaudited)Fair Value Hierarchy��(Continued)
Description Level 1 Level 2 Level 3 TotalFutures Contracts
Futures Contracts (Unrealized Appreciation) $2,711,368 $� $ � $2,711,368Futures Contracts (Unrealized Depreciation) (1,444,139) � � (1,444,139)
Total Futures Contracts $1,267,229 $� $ � $1,267,229Total Written Options at Value $� $(367,007) $ � $(367,007 )Centrally Cleared Swap Contracts
Centrally Cleared Swap Contracts (Unrealized Appreciation) $� $199,411 $ � $199,411OTC Swap Contracts
OTC Swap Contracts at Value (Assets) $� $5,762 $ 0 $5,762OTC Swap Contracts at Value (Liabilities) � (5,762 ) 0 (5,762 )
Total OTC Swap Contracts $� $0 $ 0 $0
* See Schedule of Investments for additional detailed categorizations.Level 3 investments at the beginning and/or end of the period in relation to net assets were not significant and accordingly, a reconciliation of Level 3assets for the period ended March 31, 2022 is not presented.
BHFTII-138
Copyright © 2022 www.secdatabase.com. All Rights Reserved.Please Consider the Environment Before Printing This Document

Table of ContentsBrighthouse Funds Trust II
Brighthouse/Wellington Core Equity Opportunities Portfolio
Schedule of Investments as of March 31, 2022 (Unaudited)Common Stocks��98.0% of Net Assets
Security Description Shares Value
Aerospace & Defense��10.0%General Dynamics Corp. 401,628 $96,864,641Lockheed Martin Corp. 151,854 67,028,356Northrop Grumman Corp. 263,736 117,948,014Raytheon Technologies Corp. (a) 912,358 90,387,307
372,228,318
Air Freight & Logistics��2.2%United Parcel Service, Inc. - Class B 380,430 81,587,018
Banks��1.3%PNC Financial Services Group, Inc. (The) 254,628 46,966,135
Beverages��7.5%Coca-Cola Co. (The) 1,976,357 122,534,134Diageo plc 1,260,328 63,700,999PepsiCo, Inc. 559,428 93,637,059
279,872,192
Chemicals��4.6%Ecolab, Inc. 409,118 72,233,874Linde plc 312,794 99,915,787
172,149,661
Consumer Finance��2.3%American Express Co. 465,645 87,075,615
Equity Real Estate Investment Trusts��2.9%American Tower Corp. 189,374 47,574,536Public Storage (a) 155,938 60,859,483
108,434,019
Food & Staples Retailing��2.2%Costco Wholesale Corp. 142,544 82,083,962
Health Care Equipment & Supplies��7.1%Baxter International, Inc. 984,707 76,354,180Medtronic plc 820,124 90,992,758Stryker Corp. 360,277 96,320,056
263,666,994
Health Care Providers & Services��3.8%UnitedHealth Group, Inc. 277,932 141,736,982
Hotels, Restaurants & Leisure��2.7%McDonald�s Corp. 410,646 101,544,543
Household Products��6.5%Colgate-Palmolive Co. 1,646,471 124,851,896Procter & Gamble Co. (The) 760,430 116,193,704
241,045,600
Industrial Conglomerates��2.8%Honeywell International, Inc. 528,613 102,857,518
Insurance��5.3%Chubb, Ltd. 442,262 94,599,842Marsh & McLennan Cos., Inc. 593,946 101,220,277
195,820,119
IT Services��9.2%Accenture plc - Class A 228,369 77,012,878Automatic Data Processing, Inc. 283,889 64,596,103
Copyright © 2022 www.secdatabase.com. All Rights Reserved.Please Consider the Environment Before Printing This Document

MasterCard, Inc. - Class A 253,636 90,644,434Visa, Inc. - Class A (a) 490,259 108,724,738
340,978,153
Life Sciences Tools & Services��1.6%Danaher Corp. 207,803 60,954,854
Machinery��1.2%Deere & Co. 103,421 42,967,289
Media��1.7%Comcast Corp. - Class A 1,393,679 65,252,051
Pharmaceuticals��7.0%Johnson & Johnson 722,124 127,982,037Merck & Co., Inc. (a) 1,044,653 85,713,779Pfizer, Inc. 935,033 48,406,658
262,102,474
Road & Rail��5.1%Canadian National Railway Co. 610,375 81,878,084Union Pacific Corp. 399,670 109,193,841
191,071,925
Semiconductors & Semiconductor Equipment��1.5%Texas Instruments, Inc. 299,973 55,039,046
Software��2.3%Microsoft Corp. 278,759 85,944,187
Specialty Retail��4.6%Home Depot, Inc. (The) 177,041 52,993,683TJX Cos., Inc. (The) 1,941,425 117,611,526
170,605,209
Textiles, Apparel & Luxury Goods��2.6%NIKE, Inc. - Class B 721,806 97,126,215Total Common Stocks
(Cost $2,463,039,895) 3,649,110,079
Escrow Shares��0.0%Forest Products & Paper��0.0%Sino-Forest Corp. (b) (c) (d)
(Cost $0) 5,844,000 0
BHFTII-139
Copyright © 2022 www.secdatabase.com. All Rights Reserved.Please Consider the Environment Before Printing This Document

Table of ContentsBrighthouse Funds Trust IIBrighthouse/Wellington Core Equity Opportunities Portfolio
Schedule of Investments as of March 31, 2022 (Unaudited)Short-Term Investments��1.9%
Security DescriptionPrincipalAmount* Value
Repurchase Agreement��1.0%Fixed Income Clearing Corp.
Repurchase Agreement dated 03/31/22 at 0.000%, due on 04/01/22 with amaturity value of $37,686,382;collateralized by U.S. Treasury Noteat 2.500%, maturing 03/31/27, with amarket value of $38,440,209. $37,686,382 $37,686,382
U.S. Treasury��0.9%U.S. Treasury Bill
0.292%, 05/24/22 (e) 31,855,000 31,841,165Total Short-Term Investments
(Cost $69,527,641) 69,527,547
Securities Lending Reinvestments (f)��0.3%Certificates of Deposit��0.2%Bank of Montreal
0.300%, 06/02/22 4,000,000 3,997,064Oversea-Chinese Banking Corp., Ltd.
Zero Coupon, 04/14/22 300,000 299,949Sumitomo Mitsui Banking Corp.
0.450%, SOFR + 0.180%, 08/09/22(g) 2,000,000 1,998,046
6,295,059
Repurchase Agreements��0.1%BofA Securities, Inc.
Repurchase Agreement dated 03/31/22 at 0.270%, due on 04/01/22 with amaturity value of $2,500,019;collateralized by U.S. TreasuryObligations with rates ranging from2.000% - 5.000%, maturity datesranging from 05/15/37 - 02/15/50,and an aggregate market value of$2,550,001. 2,500,000 2,500,000
Citigroup Global Markets, Ltd.Repurchase Agreement dated 03/31/22 at 0.300%, due on 04/01/22 with amaturity value of $300,003;collateralized by U.S. Treasury andForeign Obligations with rates rangingfrom 0.125% - 2.875%, maturity datesranging from 08/15/23 - 02/15/51, andan aggregate market valueof $306,000. 300,000 300,000
HSBC Securities, Inc.Repurchase Agreement dated 03/31/22 at 0.300%, due on 04/01/22 with amaturity value of $2,000,017;collateralized by U.S. TreasuryObligations with rates ranging from1.000% - 2.250%, maturity datesranging from 10/15/22 - 02/15/48,and an aggregate market value of$2,040,017. 2,000,000 2,000,000
Repurchase Agreements��(Continued)
Copyright © 2022 www.secdatabase.com. All Rights Reserved.Please Consider the Environment Before Printing This Document
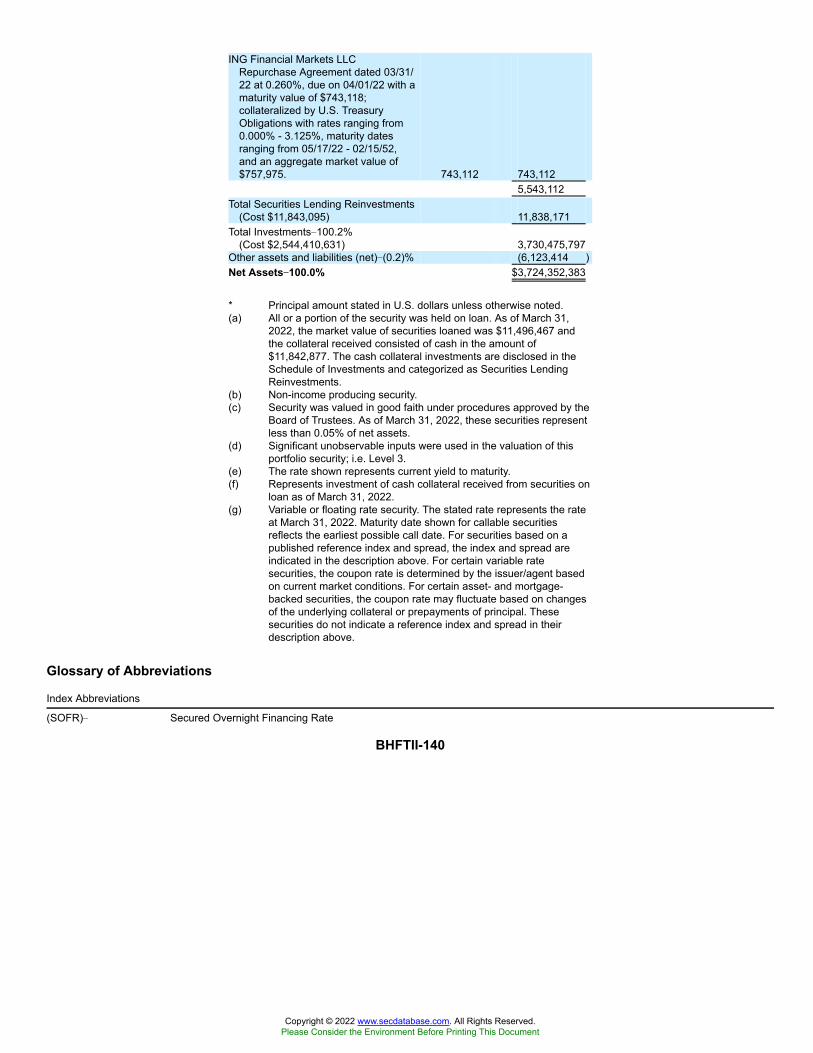
ING Financial Markets LLCRepurchase Agreement dated 03/31/22 at 0.260%, due on 04/01/22 with amaturity value of $743,118;collateralized by U.S. TreasuryObligations with rates ranging from0.000% - 3.125%, maturity datesranging from 05/17/22 - 02/15/52,and an aggregate market value of$757,975. 743,112 743,112
5,543,112Total Securities Lending Reinvestments
(Cost $11,843,095) 11,838,171Total Investments�100.2%
(Cost $2,544,410,631) 3,730,475,797Other assets and liabilities (net)�(0.2)% (6,123,414 )Net Assets��100.0% $3,724,352,383
* Principal amount stated in U.S. dollars unless otherwise noted.(a) All or a portion of the security was held on loan. As of March 31,
2022, the market value of securities loaned was $11,496,467 andthe collateral received consisted of cash in the amount of$11,842,877. The cash collateral investments are disclosed in theSchedule of Investments and categorized as Securities LendingReinvestments.
(b) Non-income producing security.(c) Security was valued in good faith under procedures approved by the
Board of Trustees. As of March 31, 2022, these securities representless than 0.05% of net assets.
(d) Significant unobservable inputs were used in the valuation of thisportfolio security; i.e. Level 3.
(e) The rate shown represents current yield to maturity.(f) Represents investment of cash collateral received from securities on
loan as of March 31, 2022.(g) Variable or floating rate security. The stated rate represents the rate
at March 31, 2022. Maturity date shown for callable securitiesreflects the earliest possible call date. For securities based on apublished reference index and spread, the index and spread areindicated in the description above. For certain variable ratesecurities, the coupon rate is determined by the issuer/agent basedon current market conditions. For certain asset- and mortgage-backed securities, the coupon rate may fluctuate based on changesof the underlying collateral or prepayments of principal. Thesesecurities do not indicate a reference index and spread in theirdescription above.
Glossary of Abbreviations
Index Abbreviations
(SOFR)� Secured Overnight Financing Rate
BHFTII-140
Copyright © 2022 www.secdatabase.com. All Rights Reserved.Please Consider the Environment Before Printing This Document

Table of ContentsBrighthouse Funds Trust IIBrighthouse/Wellington Core Equity Opportunities Portfolio
Schedule of Investments as of March 31, 2022 (Unaudited)
Fair Value HierarchyAccounting principles generally accepted in the United States of America (�GAAP�) define fair market value as the price that the Portfolio would receive tosell an asset or pay to transfer a liability in an orderly transaction between market participants at the measurement date. It establishes a fair valuehierarchy that prioritizes inputs to valuation methods and requires disclosure of the fair value hierarchy, separately for each major category of assets andliabilities, that segregates fair value measurements into three levels. Levels 1, 2 and 3 of the fair value hierarchy are defined as follows:
Level 1 - unadjusted quoted prices in active markets for identical investmentsLevel 2 - other significant observable inputs (including, but not limited to, quoted prices for similar assets or liabilities in markets that are either activeor inactive; inputs other than quoted prices that are observable such as interest rates, yield curves, volatilities, prepayment speeds, loss severities,credit risks, default rates, or other market corroborated inputs)Level 3 - significant unobservable inputs based on the best information available in the circumstances, to the extent observable inputs areunavailable (including the Portfolio�s own assumptions used in determining the fair value of investments and derivative financial instruments)
The inputs or methodologies used for valuing investments are not necessarily an indication of the risk associated with investing in them. Changes to theinputs or methodologies used may result in transfers between levels. A reconciliation of Level 3 securities, if any, will be disclosed following the fair valuehierarchy table. For more information about the Portfolio�s policy regarding the valuation of investments, please refer to the Notes to Schedule ofInvestments.
The following table summarizes the fair value hierarchy of the Portfolio�s investments as of March 31, 2022:
Description Level 1 Level 2 Level 3 TotalCommon Stocks
Aerospace & Defense $372,228,318 $� $ � $372,228,318Air Freight & Logistics 81,587,018 � � 81,587,018Banks 46,966,135 � � 46,966,135Beverages 216,171,193 63,700,999 � 279,872,192Chemicals 172,149,661 � � 172,149,661Consumer Finance 87,075,615 � � 87,075,615Equity Real Estate Investment Trusts 108,434,019 � � 108,434,019Food & Staples Retailing 82,083,962 � � 82,083,962Health Care Equipment & Supplies 263,666,994 � � 263,666,994Health Care Providers & Services 141,736,982 � � 141,736,982Hotels, Restaurants & Leisure 101,544,543 � � 101,544,543Household Products 241,045,600 � � 241,045,600Industrial Conglomerates 102,857,518 � � 102,857,518Insurance 195,820,119 � � 195,820,119IT Services 340,978,153 � � 340,978,153Life Sciences Tools & Services 60,954,854 � � 60,954,854Machinery 42,967,289 � � 42,967,289Media 65,252,051 � � 65,252,051Pharmaceuticals 262,102,474 � � 262,102,474Road & Rail 191,071,925 � � 191,071,925Semiconductors & Semiconductor Equipment 55,039,046 � � 55,039,046Software 85,944,187 � � 85,944,187Specialty Retail 170,605,209 � � 170,605,209Textiles, Apparel & Luxury Goods 97,126,215 � � 97,126,215
Total Common Stocks 3,585,409,080 63,700,999 � 3,649,110,079Total Escrow Shares* � � 0 0Total Short-Term Investments* � 69,527,547 � 69,527,547Total Securities Lending Reinvestments* � 11,838,171 � 11,838,171Total Investments $3,585,409,080 $145,066,717 $ 0 $3,730,475,797Collateral for Securities Loaned (Liability) $� $(11,842,877 ) $ � $(11,842,877 )
* See Schedule of Investments for additional detailed categorizations.
Level 3 investments at the beginning and/or end of the period in relation to net assets were not significant and accordingly, a reconciliation of Level 3assets for the period ended March 31, 2022 is not presented.
BHFTII-141
Copyright © 2022 www.secdatabase.com. All Rights Reserved.Please Consider the Environment Before Printing This Document

Table of ContentsBrighthouse Funds Trust II
Frontier Mid Cap Growth Portfolio
Schedule of Investments as of March 31, 2022 (Unaudited)Common Stocks��98.9% of Net Assets
Security Description Shares Value
Air Freight & Logistics��0.5%GXO Logistics, Inc. (a) (b) 89,284 $6,369,521
Airlines��0.9%Azul S.A. (ADR) (a) (b) 786,401 11,835,335
Auto Components��0.4%BorgWarner, Inc. 123,296 4,796,214
Banks��3.0%SVB Financial Group (a) 67,921 37,998,403
Biotechnology��2.4%BioMarin Pharmaceutical, Inc. (a) 55,116 4,249,444Exact Sciences Corp. (a) (b) 96,235 6,728,751Horizon Therapeutics plc (a) 79,278 8,340,838Moderna, Inc. (a) (b) 33,077 5,697,844Sarepta Therapeutics, Inc. (a) 66,289 5,178,497
30,195,374
Building Products��0.8%Builders FirstSource, Inc. (a) 149,710 9,662,283
Capital Markets��6.3%KKR & Co., Inc. 460,009 26,896,726LPL Financial Holdings, Inc. 146,270 26,720,604Moody�s Corp. 23,915 8,069,160MSCI, Inc. (b) 37,948 19,083,290
80,769,780
Chemicals��0.8%Sherwin-Williams Co. (The) 39,101 9,760,392
Commercial Services & Supplies��3.4%Cintas Corp. 66,042 28,093,606Waste Connections, Inc. 104,610 14,614,017
42,707,623
Communications Equipment��1.4%Arista Networks, Inc. (a) 127,725 17,751,221
Construction & Engineering��2.5%MasTec, Inc. (a) (b) 114,664 9,987,234Quanta Services, Inc. (b) 164,616 21,665,112
31,652,346
Containers & Packaging��1.5%Ball Corp. 218,377 19,653,930
Diversified Consumer Services��1.3%Bright Horizons Family Solutions, Inc. (a) 125,044 16,592,088
Electronic Equipment, Instruments &Components��1.7%Amphenol Corp. - Class A 130,594 9,840,258II-VI, Inc. (a) (b) 171,242 12,413,333
22,253,591
Entertainment��3.2%Live Nation Entertainment, Inc. (a) (b) 261,047 30,709,569Roku, Inc. (a) (b) 83,005 10,398,036
41,107,605
Health Care Equipment & Supplies��8.4%
Copyright © 2022 www.secdatabase.com. All Rights Reserved.Please Consider the Environment Before Printing This Document

Alcon, Inc. (b) 134,099 10,638,074Align Technology, Inc. (a) 27,110 11,819,960DexCom, Inc. (a) (b) 38,528 19,710,925Edwards Lifesciences Corp. (a) 57,115 6,723,578Hologic, Inc. (a) (b) 92,318 7,091,869IDEXX Laboratories, Inc. (a) 24,834 13,585,688Insulet Corp. (a) (b) 52,637 14,021,970Novocure, Ltd. (a) (b) 61,959 5,133,303ResMed, Inc. (b) 17,969 4,357,662Teleflex, Inc. 37,605 13,343,382
106,426,411
Health Care Providers & Services��3.2%Amedisys, Inc. (a) (b) 76,004 13,094,729Guardant Health, Inc. (a) (b) 84,981 5,629,142Molina Healthcare, Inc. (a) 45,343 15,125,971Signify Health, Inc. - Class A (a) (b) 378,599 6,871,572
40,721,414
Health Care Technology��0.6%Veeva Systems, Inc. - Class A (a) 34,663 7,364,501
Hotels, Restaurants & Leisure��7.4%Caesars Entertainment, Inc. (a) (b) 517,907 40,065,286Chipotle Mexican Grill, Inc. (a) 12,368 19,566,547Darden Restaurants, Inc. (b) 78,576 10,446,679Planet Fitness, Inc. - Class A (a) 281,484 23,779,768
93,858,280
Insurance��2.3%Aon plc - Class A 90,787 29,562,971
Interactive Media & Services��1.0%Twitter, Inc. (a) (b) 196,443 7,600,380Vimeo, Inc. (a) (b) 472,808 5,616,959
13,217,339
Internet & Direct Marketing Retail��0.5%Chewy, Inc. - Class A (a) (b) 142,639 5,816,818
IT Services��7.6%Block, Inc. (a) (b) 162,452 22,028,491Dlocal, Ltd. (a) (b) 272,035 8,503,814EPAM Systems, Inc. (a) (b) 44,143 13,093,255Genpact, Ltd. 270,967 11,789,774Global Payments, Inc. 110,753 15,155,441MongoDB, Inc. (a) (b) 32,552 14,439,742Okta, Inc. (a) 79,544 12,007,962
97,018,479
BHFTII-142
Copyright © 2022 www.secdatabase.com. All Rights Reserved.Please Consider the Environment Before Printing This Document

Table of ContentsBrighthouse Funds Trust IIFrontier Mid Cap Growth Portfolio
Schedule of Investments as of March 31, 2022 (Unaudited)Common Stocks��(Continued)
Security Description Shares Value
Leisure Products��4.1%Mattel, Inc. (a) 2,375,330 $52,756,079
Life Sciences Tools & Services��1.6%Agilent Technologies, Inc. 117,155 15,503,121Illumina, Inc. (a) 14,841 5,185,446
20,688,567
Multiline Retail��0.8%Dollar General Corp. 48,318 10,757,036
Oil, Gas & Consumable Fuels��1.1%Coterra Energy, Inc. 521,975 14,077,666
Professional Services��1.8%KBR, Inc. (b) 408,693 22,367,768
Road & Rail��1.4%Knight-Swift Transportation Holdings, Inc.
(b) 195,600 9,869,976XPO Logistics, Inc. (a) (b) 101,711 7,404,561
17,274,537
Semiconductors & SemiconductorEquipment��9.1%Advanced Micro Devices, Inc. (a) 214,659 23,470,815KLA Corp. 48,229 17,654,708Lam Research Corp. 20,489 11,015,091Marvell Technology, Inc. 279,804 20,064,745Microchip Technology, Inc. 269,081 20,218,746Wolfspeed, Inc. (a) (b) 205,097 23,352,345
115,776,450
Software��11.8%Atlassian Corp. plc - Class A (a) 33,705 9,903,540Autodesk, Inc. (a) 31,995 6,858,128Coupa Software, Inc. (a) (b) 61,869 6,287,747Fair Isaac Corp. (a) 41,700 19,451,382HubSpot, Inc. (a) (b) 20,848 9,901,549Palo Alto Networks, Inc. (a) (b) 84,262 52,453,938Paycom Software, Inc. (a) 64,998 22,514,007Trade Desk, Inc. (The) - Class A (a) 191,476 13,259,713Workday, Inc. - Class A (a) 42,631 10,208,419
150,838,423
Specialty Retail��6.1%Advance Auto Parts, Inc. 91,409 18,918,007Burlington Stores, Inc. (a) (b) 67,581 12,311,231Carvana Co. (a) (b) 25,020 2,984,636Floor & Decor Holdings, Inc. - Class A
(a) (b) 106,527 8,628,687Leslie�s, Inc. (a) (b) 501,918 9,717,132O�Reilly Automotive, Inc. (a) 16,681 11,425,818Ross Stores, Inc. 156,855 14,189,103
78,174,614Total Common Stocks
(Cost $1,108,173,303) 1,259,803,059Short-Term Investment��1.0%
Security DescriptionPrincipalAmount* Value
Copyright © 2022 www.secdatabase.com. All Rights Reserved.Please Consider the Environment Before Printing This Document

Repurchase Agreement��1.0%Fixed Income Clearing Corp. Repurchase
Agreement dated 03/31/22 at 0.000%,due on 04/01/22 with a maturity value of$12,723,479; collateralized by U.S.Treasury Note at 2.500%, maturing 03/31/27, with a market value of$12,977,985. 12,723,479 $12,723,479
Total Short-Term Investments(Cost $12,723,479) 12,723,479
Securities Lending Reinvestments (c)��23.9%Certificates of Deposit��7.8%Bank of Montreal
0.300%, 06/02/22 10,000,000 9,992,660Barclays Bank plc
0.180%, 04/07/22 2,000,000 1,999,926BNP Paribas S.A.
0.490%, SOFR + 0.220%, 11/17/22 (d) 4,000,000 3,994,368Canadian Imperial Bank of Commerce
(NY)0.520%, SOFR + 0.250%, 02/03/23 (d) 6,000,000 5,991,0910.770%, SOFR + 0.500%, 03/03/23 (d) 6,000,000 6,003,811
Cooperatieve Rabobank UA0.840%, SOFR + 0.570%, 09/19/22 (d) 5,000,000 5,000,000
Credit Agricole S.A.0.590%, 05/24/22 2,000,000 1,999,760
Credit Suisse Group AG0.830%, 06/03/22 5,000,000 5,000,920
Goldman Sachs Bank USA0.470%, SOFR + 0.190%, 09/02/22 (d) 4,000,000 3,994,904
Mitsubishi UFJ Trust and Banking Corp.0.430%, SOFR + 0.160%, 07/22/22 (d) 5,000,000 4,996,795
MUFG Bank Ltd.0.250%, 05/04/22 5,000,000 4,998,530
National Australia Bank, Ltd.Zero Coupon, 04/25/22 2,000,000 1,999,280
Natixis S.A. (New York)0.330%, 06/09/22 2,000,000 1,998,3080.450%, SOFR + 0.180%, 06/17/22 (d) 3,000,000 2,999,230
Nordea Bank Abp.0.720%, SOFR + 0.450%, 08/30/22 (d) 4,000,000 3,999,992
Oversea-Chinese Banking Corp., Ltd.Zero Coupon, 04/14/22 1,800,000 1,799,6940.720%, SOFR + 0.440%, 09/26/22 (d) 4,000,000 4,000,797
Royal Bank of Canada0.520%, SOFR + 0.250%, 01/11/23 (d) 5,000,000 4,988,310
Standard Chartered Bank (NY)0.460%, SOFR + 0.190%, 08/25/22 (d) 5,000,000 4,995,917
Sumitomo Mitsui Banking Corp.0.450%, SOFR + 0.180%, 08/09/22 (d) 5,000,000 4,995,115
Toronto-Dominion Bank (The)0.530%, SOFR + 0.250%, 02/09/23 (d) 3,000,000 2,999,9990.820%, FEDEFF PRV + 0.490%, 12/23/22 (d) 5,000,000 4,998,520
Westpac Banking Corp.0.500%, SOFR + 0.230%, 02/17/23 (d) 5,000,000 4,984,365
98,732,292
BHFTII-143
Copyright © 2022 www.secdatabase.com. All Rights Reserved.Please Consider the Environment Before Printing This Document

Table of ContentsBrighthouse Funds Trust IIFrontier Mid Cap Growth Portfolio
Schedule of Investments as of March 31, 2022 (Unaudited)Securities Lending Reinvestments (c)��(Continued)
Security DescriptionPrincipalAmount* Value
Commercial Paper��1.5%Macquarie Bank Ltd.
0.510%, SOFR + 0.230%, 08/04/22 (d) 2,000,000 $1,998,462Skandinaviska Enskilda Banken AB
0.200%, 04/28/22 5,000,000 4,998,100Societe Generale
0.460%, SOFR + 0.190%, 08/18/22 (d) 5,000,000 4,994,955UBS AG
0.350%, 06/08/22 7,000,000 6,989,47218,980,989
Repurchase Agreements��12.4%Barclays Bank plc
Repurchase Agreement dated 03/31/22at 0.600%, due on 05/05/22 with amaturity value of $5,002,917;collateralized by various Common Stockwith an aggregate market value of$5,557,284. 5,000,000 5,000,000
Barclays Capital, Inc.Repurchase Agreement dated 03/31/22at 0.240%, due on 04/01/22 with amaturity value of $25,000,167;collateralized by U.S. TreasuryObligations at 0.125%, maturing 01/15/30, and an aggregate market value of$25,500,053. 25,000,000 25,000,000
Cantor Fitzgerald & Co.Repurchase Agreement dated 03/31/22at 0.290%, due on 04/01/22 with amaturity value of $2,000,016;collateralized by U.S. Treasury and U.S.Government Agency Obligations withrates ranging from 0.125% - 8.000%,maturity dates ranging from 09/15/22 -07/20/71, and an aggregate market valueof $2,040,000. 2,000,000 2,000,000
Citigroup Global Markets, Inc.Repurchase Agreement dated 03/31/22at 0.620%, due on 05/05/22 with amaturity value of $5,003,014;collateralized by U.S. TreasuryObligations with rates ranging from0.000% - 3.875%, maturity dates rangingfrom 04/21/22 - 05/15/51, and variousCommon Stock with an aggregatemarket value of $5,350,305. 5,000,000 5,000,000
Citigroup Global Markets, Ltd.Repurchase Agreement dated 03/31/22at 0.300%, due on 04/01/22 with amaturity value of $4,000,033;collateralized by U.S. Treasury andForeign Obligations with rates rangingfrom 0.125% - 2.875%, maturity datesranging from 08/15/23 - 02/15/51, and anaggregate market value of $4,080,001. 4,000,000 4,000,000
Copyright © 2022 www.secdatabase.com. All Rights Reserved.Please Consider the Environment Before Printing This Document

ING Financial Markets LLCRepurchase Agreement dated 03/31/22at 0.260%, due on 04/01/22 with amaturity value of $1,986,359;collateralized by U.S. GovernmentAgency Obligations with rates rangingfrom 0.350% - 6.625%, maturity datesranging from 04/05/22 - 11/15/30, and anaggregate market value of $2,026,085. 1,986,345 1,986,345
National Bank Financial, Inc.Repurchase Agreement dated 03/31/22at 0.320%, due on 04/01/22 with amaturity value of $2,000,018;collateralized by U.S. TreasuryObligations with rates ranging from0.125% - 3.000%, maturity dates rangingfrom 06/30/22 - 02/15/49, and anaggregate market value of $2,041,138. 2,000,000 2,000,000
Repurchase Agreements��(Continued)National Bank of Canada
Repurchase Agreement dated 03/31/22at 0.320%, due on 04/07/22 with amaturity value of $30,001,867;collateralized by U.S. TreasuryObligations with rates ranging from0.000% - 4.500%, maturity dates rangingfrom 04/14/22 - 08/15/51, and anaggregate market value of $30,617,067. 30,000,000 $30,000,000Repurchase Agreement dated 03/31/22at 0.450%, due on 04/07/22 with amaturity value of $25,202,205;collateralized by U.S. TreasuryObligations with rates ranging from0.500% - 3.000%, maturity dates rangingfrom 11/30/23 - 08/15/48, and variousCommon Stock with an aggregatemarket value of $27,866,127. 25,200,000 25,200,000
NBC Global Finance, Ltd.Repurchase Agreement dated 03/31/22at 0.440%, due on 04/01/22 with amaturity value of $9,300,114;collateralized by U.S. TreasuryObligations with rates ranging from0.125% - 4.750%, maturity dates rangingfrom 05/15/24 - 02/15/50, and variousCommon Stock with an aggregatemarket value of $10,326,502. 9,300,000 9,300,000Repurchase Agreement dated 03/31/22at 0.485%, due on 04/07/22 with amaturity value of $2,200,207;collateralized by U.S. TreasuryObligations with rates ranging from0.125% - 4.750%, maturity dates rangingfrom 05/15/24 - 02/15/50, and variousCommon Stock with an aggregatemarket value of $2,442,828. 2,200,000 2,200,000
Societe GeneraleRepurchase Agreement dated 03/31/22at 0.360%, due on 04/01/22 with amaturity value of $7,500,075;collateralized by various Common Stockwith an aggregate market value of$8,334,022. 7,500,000 7,500,000Repurchase Agreement dated 03/31/22at 0.360%, due on 04/01/22 with amaturity value of $10,000,100;collateralized by various Common Stockwith an aggregate market value of$11,112,029. 10,000,000 10,000,000
Copyright © 2022 www.secdatabase.com. All Rights Reserved.Please Consider the Environment Before Printing This Document

Repurchase Agreement dated 03/31/22at 0.380%, due on 04/01/22 with amaturity value of $7,200,076;collateralized by various Common Stockwith an aggregate market value of$8,000,661. 7,200,000 7,200,000Repurchase Agreement dated 03/31/22at 0.410%, due on 04/01/22 with amaturity value of $10,000,114;collateralized by various Common Stockwith an aggregate market value of$11,112,897. 10,000,000 10,000,000Repurchase Agreement dated 03/31/22at 0.420%, due on 04/07/22 with amaturity value of $2,000,163;collateralized by various Common Stockwith an aggregate market value of$2,222,579. 2,000,000 2,000,000
TD Prime Services LLCRepurchase Agreement dated 03/31/22at 0.400%, due on 04/01/22 with amaturity value of $5,000,056;collateralized by various Common Stockwith an aggregate market value of$5,790,942. 5,000,000 5,000,000Repurchase Agreement dated 03/31/22at 0.400%, due on 04/01/22 with amaturity value of $5,000,056;collateralized by various Common Stockwith an aggregate market value of$5,633,327. 5,000,000 5,000,000
158,386,345
BHFTII-144
Copyright © 2022 www.secdatabase.com. All Rights Reserved.Please Consider the Environment Before Printing This Document

Table of ContentsBrighthouse Funds Trust IIFrontier Mid Cap Growth Portfolio
Schedule of Investments as of March 31, 2022 (Unaudited)Securities Lending Reinvestments (c)��(Continued)
Security Description
Shares/PrincipalAmount* Value
Time Deposits��1.6%National Bank of Canada
0.370%, OBFR + 0.050%, 04/07/22 (d) 14,000,000 $14,000,000Skandi (NY)
0.300%, 04/01/22 7,000,000 7,000,00021,000,000
Mutual Funds��0.6%AB Government Money Market Portfolio,
Institutional Class 0.190% (e) 2,000,000 2,000,000Allspring Government Money Market Fund,
Select Class 0.180% (e) 100,000 100,000BlackRock Liquidity Funds FedFund,
Institutional Shares 0.230% (e) 1,000,000 1,000,000Goldman Sachs Financial Square
Government Fund, Institutional Shares0.250% (e) 5,000,000 5,000,000
8,100,000Total Securities Lending Reinvestments
(Cost $305,280,791) 305,199,626Total Investments� 123.8%
(Cost $1,426,177,573) 1,577,726,164Other assets and liabilities (net)�(23.8)% (303,755,919 )Net Assets��100.0% $1,273,970,245
* Principal amount stated in U.S. dollars unless otherwise noted.(a) Non-income producing security.(b) All or a portion of the security was held on loan. As of March 31, 2022, the market value of securities loaned was $295,646,221 and the collateral
received consisted of cash in the amount of $305,265,706 and non-cash collateral with a value of $66,259. The cash collateral investments aredisclosed in the Schedule of Investments and categorized as Securities Lending Reinvestments. The non-cash collateral received consists of U.S.government securities that are held in safe-keeping by the lending agent, or a third-party custodian, and cannot be sold or repledged by thePortfolio.
(c) Represents investment of cash collateral received from securities on loan as of March 31, 2022.(d) Variable or floating rate security. The stated rate represents the rate at March 31, 2022. Maturity date shown for callable securities reflects the
earliest possible call date. For securities based on a published reference index and spread, the index and spread are indicated in the descriptionabove. For certain variable rate securities, the coupon rate is determined by the issuer/agent based on current market conditions. For certain asset-and mortgage-backed securities, the coupon rate may fluctuate based on changes of the underlying collateral or prepayments of principal. Thesesecurities do not indicate a reference index and spread in their description above.
(e) The rate shown represents the annualized seven-day yield as of March 31, 2022.
Glossary of Abbreviations
Index Abbreviations
(FEDEFF PRV)� Effective Federal Funds Rate(OBFR)� U.S. Overnight Bank Funding Rate(SOFR)� Secured Overnight Financing Rate
Other Abbreviations
(ADR)� American Depositary Receipt
BHFTII-145
Copyright © 2022 www.secdatabase.com. All Rights Reserved.Please Consider the Environment Before Printing This Document

Table of ContentsBrighthouse Funds Trust IIFrontier Mid Cap Growth Portfolio
Schedule of Investments as of March 31, 2022 (Unaudited)
Fair Value HierarchyAccounting principles generally accepted in the United States of America (�GAAP�) define fair market value as the price that the Portfolio would receive tosell an asset or pay to transfer a liability in an orderly transaction between market participants at the measurement date. It establishes a fair valuehierarchy that prioritizes inputs to valuation methods and requires disclosure of the fair value hierarchy, separately for each major category of assets andliabilities, that segregates fair value measurements into three levels. Levels 1, 2 and 3 of the fair value hierarchy are defined as follows:
Level 1 - unadjusted quoted prices in active markets for identical investmentsLevel 2 - other significant observable inputs (including, but not limited to, quoted prices for similar assets or liabilities in markets that are either activeor inactive; inputs other than quoted prices that are observable such as interest rates, yield curves, volatilities, prepayment speeds, loss severities,credit risks, default rates, or other market corroborated inputs)Level 3 - significant unobservable inputs based on the best information available in the circumstances, to the extent observable inputs areunavailable (including the Portfolio�s own assumptions used in determining the fair value of investments and derivative financial instruments)
The inputs or methodologies used for valuing investments are not necessarily an indication of the risk associated with investing in them. Changes to theinputs or methodologies used may result in transfers between levels. A reconciliation of Level 3 securities, if any, will be disclosed following the fair valuehierarchy table. For more information about the Portfolio�s policy regarding the valuation of investments, please refer to the Notes to Schedule ofInvestments.
The following table summarizes the fair value hierarchy of the Portfolio�s investments as of March 31, 2022:
Description Level 1 Level 2 Level 3 TotalTotal Common Stocks* $1,259,803,059 $� $ � $1,259,803,059Total Short-Term Investment* � 12,723,479 � 12,723,479Securities Lending Reinvestments
Certificates of Deposit � 98,732,292 � 98,732,292Commercial Paper � 18,980,989 � 18,980,989Repurchase Agreements � 158,386,345 � 158,386,345Time Deposits � 21,000,000 � 21,000,000Mutual Funds 8,100,000 � � 8,100,000
Total Securities Lending Reinvestments 8,100,000 297,099,626 � 305,199,626Total Investments $1,267,903,059 $309,823,105 $ � $1,577,726,164Collateral for Securities Loaned (Liability) $� $(305,265,706) $ � $(305,265,706 )
* See Schedule of Investments for additional detailed categorizations.
BHFTII-146
Copyright © 2022 www.secdatabase.com. All Rights Reserved.Please Consider the Environment Before Printing This Document

Table of ContentsBrighthouse Funds Trust II
Jennison Growth Portfolio
Schedule of Investments as of March 31, 2022 (Unaudited)Common Stocks��99.6% of Net Assets
Security Description Shares Value
Automobiles��10.1%Tesla, Inc. (a) (b) 278,128 $299,710,733
Capital Markets��1.0%Goldman Sachs Group, Inc. (The) 47,930 15,821,693KKR & Co., Inc. 227,829 13,321,162
29,142,855
Energy Equipment & Services��0.6%Schlumberger NV 413,731 17,091,228
Entertainment��3.2%Netflix, Inc. (a) 188,755 70,705,735ROBLOX Corp. - Class A (a) (b) 232,100 10,732,304Spotify Technology S.A. (a) 94,723 14,305,068
95,743,107
Equity Real Estate Investment Trusts��0.2%American Tower Corp. 26,479 6,652,054
Food & Staples Retailing��2.5%Costco Wholesale Corp. 128,328 73,897,679
Health Care Equipment & Supplies��2.7%Abbott Laboratories 114,350 13,534,466DexCom, Inc. (a) (b) 65,151 33,331,251Intuitive Surgical, Inc. (a) 106,188 32,034,796
78,900,513
Health Care Providers & Services��1.5%UnitedHealth Group, Inc. 85,345 43,523,390
Hotels, Restaurants & Leisure��3.3%Airbnb, Inc. - Class A (a) 318,335 54,677,220Chipotle Mexican Grill, Inc. (a) (b) 26,438 41,825,709
96,502,929
Interactive Media & Services��9.4%Alphabet, Inc. - Class A (a) 34,535 96,053,922Alphabet, Inc. - Class C (a) 33,403 93,294,245Match Group, Inc. (a) (b) 206,829 22,490,585Meta Platforms, Inc. - Class A (a) 156,877 34,883,170Snap, Inc. - Class A (a) (b) 886,716 31,912,909
278,634,831
Internet & Direct Marketing Retail��8.8%Amazon.com, Inc. (a) 63,399 206,677,570MercadoLibre, Inc. (a) 43,598 51,858,949
258,536,519
IT Services��10.4%Adyen NV (a) 21,641 42,753,318MasterCard, Inc. - Class A 177,816 63,547,882Okta, Inc. (a) (b) 80,507 12,153,337Shopify, Inc. - Class A (a) (b) 91,871 62,101,121Snowflake, Inc. - Class A (a) 114,670 26,274,337
IT Services��(Continued)Twilio, Inc. - Class A (a) 102,842 16,949,390Visa, Inc. - Class A (b) 378,296 83,894,704
307,674,089
Life Sciences Tools & Services��1.6%
Copyright © 2022 www.secdatabase.com. All Rights Reserved.Please Consider the Environment Before Printing This Document

Danaher Corp. 165,420 48,522,649
Multiline Retail��1.3%Target Corp. 184,989 39,258,365
Personal Products��1.6%Estee Lauder Cos., Inc. (The) - Class A 176,584 48,087,355
Pharmaceuticals��2.2%Eli Lilly and Co. 172,691 49,453,522Novo Nordisk A/S (ADR) 127,060 14,110,013
63,563,535
Road & Rail��1.8%Uber Technologies, Inc. (a) 1,483,967 52,947,942
Semiconductors & Semiconductor Equipment��5.8%Broadcom, Inc. 44,386 27,948,977NVIDIA Corp. 521,105 142,188,710
170,137,687
Software��16.5%Adobe, Inc. (a) 155,248 70,734,094Atlassian Corp. plc - Class A (a) (b) 166,091 48,802,519Crowdstrike Holdings, Inc. - Class A (a) 217,651 49,424,189HubSpot, Inc. (a) (b) 25,899 12,300,471Microsoft Corp. 541,598 166,980,079Salesforce.com, Inc. (a) 373,104 79,217,441Trade Desk, Inc. (The) - Class A (a) (b) 350,775 24,291,169Workday, Inc. - Class A (a) 144,231 34,537,555
486,287,517
Specialty Retail��2.7%Home Depot, Inc. (The) 103,267 30,910,911O�Reilly Automotive, Inc. (a) 20,634 14,133,465TJX Cos., Inc. (The) 596,021 36,106,952
81,151,328
Technology Hardware, Storage & Peripherals��7.0%Apple, Inc. 1,184,118 206,758,844
Textiles, Apparel & Luxury Goods��5.4%Kering S.A. 40,979 25,886,348Lululemon Athletica, Inc. (a) 99,894 36,484,286LVMH Moet Hennessy Louis Vuitton SE 87,484 62,294,688NIKE, Inc. - Class B 254,276 34,215,378
158,880,700Total Common Stocks
(Cost $1,589,795,916) 2,941,605,849
BHFTII-147
Copyright © 2022 www.secdatabase.com. All Rights Reserved.Please Consider the Environment Before Printing This Document

Table of ContentsBrighthouse Funds Trust IIJennison Growth Portfolio
Schedule of Investments as of March 31, 2022 (Unaudited)Short-Term Investment��0.0%
Security DescriptionPrincipalAmount* Value
Repurchase Agreement��0.0%Fixed Income Clearing Corp.
Repurchase Agreement dated 03/31/22 at0.000%, due on 04/01/22 with a maturityvalue of $1,475,010; collateralized by U.S.Treasury Note at 2.500%, maturing 03/31/27, with a market value of $1,504,602. 1,475,010 $1,475,010
Total Short-Term Investments(Cost $1,475,010) 1,475,010
Securities Lending Reinvestments (c)��13.4%Certificates of Deposit��2.9%Bank of Montreal
0.300%, 06/02/22 6,000,000 5,995,596Bank of Nova Scotia
0.520%, SOFR + 0.250%, 02/17/23 (d) 2,000,000 1,995,555BNP Paribas S.A.
0.490%, SOFR + 0.220%, 11/17/22 (d) 4,000,000 3,994,368Canadian Imperial Bank of Commerce (NY)
0.520%, SOFR + 0.250%, 02/03/23 (d) 5,000,000 4,992,5760.770%, SOFR + 0.500%, 03/03/23 (d) 6,000,000 6,003,811
Cooperatieve Rabobank UA0.840%, SOFR + 0.570%, 09/19/22 (d) 5,000,000 5,000,000
Credit Agricole S.A.0.590%, 05/24/22 3,000,000 2,999,640
Credit Industriel et CommercialZero Coupon, 04/14/22 6,000,000 5,998,980
Credit Suisse Group AG0.830%, 06/03/22 (d) 5,000,000 5,000,920
Goldman Sachs Bank USA0.470%, SOFR + 0.190%, 09/02/22 (d) 4,000,000 3,994,904
MUFG Bank Ltd.0.250%, 05/04/22 5,000,000 4,998,530
Natixis S.A. (New York)0.450%, SOFR + 0.180%, 06/17/22 (d) 3,000,000 2,999,230
Nordea Bank Abp.0.720%, SOFR + 0.450%, 08/30/22 (d) 4,000,000 3,999,992
Oversea-Chinese Banking Corp., Ltd.Zero Coupon, 04/14/22 1,500,000 1,499,745
Standard Chartered Bank (NY)0.460%, SOFR + 0.190%, 08/25/22 (d) 5,000,000 4,995,917
Sumitomo Mitsui Banking Corp.0.450%, SOFR + 0.180%, 08/09/22 (d) 5,000,000 4,995,115
Toronto-Dominion Bank (The)0.530%, SOFR + 0.250%, 02/09/23 (d) 3,000,000 2,999,9990.820%, FEDEFF PRV + 0.490%, 12/23/22 (d) 5,000,000 4,998,520
Westpac Banking Corp.0.500%, SOFR + 0.230%, 02/17/23 (d) 7,000,000 6,978,111
84,441,509
Commercial Paper��0.6%DNB Bank ASA
0.830%, SOFR + 0.550%, 09/07/22 (d) 5,000,000 5,001,995Macquarie Bank Ltd.
0.510%, SOFR + 0.230%, 08/04/22 (d) 2,000,000 1,998,462
Commercial Paper��(Continued)Skandinaviska Enskilda Banken AB
0.200%, 04/28/22 5,000,000 4,998,100
Copyright © 2022 www.secdatabase.com. All Rights Reserved.Please Consider the Environment Before Printing This Document

Societe Generale0.460%, SOFR + 0.190%, 08/18/22 (d) 5,000,000 4,994,955
16,993,512
Repurchase Agreements��8.3%BofA Securities, Inc.
Repurchase Agreement dated 03/31/22 at0.600%, due on 04/18/22 with a maturityvalue of $2,000,600; collateralized by U.S.Treasury Obligations with rates rangingfrom 0.000% - 2.250%, maturity datesranging from 07/21/22 - 08/15/49, andvarious Common Stock with an aggregatemarket value of $2,116,839. 2,000,000 2,000,000Repurchase Agreement dated 03/31/22 at0.600%, due on 05/05/22 with a maturityvalue of $3,001,750; collateralized by U.S.Treasury Obligations with rates rangingfrom 0.000% - 7.500%, maturity datesranging from 04/21/22 - 08/15/51, andvarious Common Stock with an aggregatemarket value of $3,155,671. 3,000,000 3,000,000
Cantor Fitzgerald & Co.Repurchase Agreement dated 03/31/22 at0.290%, due on 04/01/22 with a maturityvalue of $6,000,048; collateralized by U.S.Treasury and U.S. Government AgencyObligations with rates ranging from0.125% - 8.000%, maturity dates rangingfrom 09/15/22 - 07/20/71, and anaggregate market value of $6,120,000. 6,000,000 6,000,000
Citigroup Global Markets, Inc.Repurchase Agreement dated 03/31/22 at0.620%, due on 05/05/22 with a maturityvalue of $7,004,219; collateralized by U.S.Treasury Obligations with rates rangingfrom 0.000% - 3.875%, maturity datesranging from 04/21/22 - 05/15/51, andvarious Common Stock with an aggregatemarket value of $7,490,426. 7,000,000 7,000,000
Citigroup Global Markets, Ltd.Repurchase Agreement dated 03/31/22 at0.300%, due on 04/01/22 with a maturityvalue of $6,500,054; collateralized by U.S.Treasury and Foreign Obligations withrates ranging from 0.125% - 2.875%,maturity dates ranging from 08/15/23 - 02/15/51, and an aggregate market value of$6,630,002. 6,500,000 6,500,000
ING Financial Markets LLCRepurchase Agreement dated 03/31/22 at0.260%, due on 04/01/22 with a maturityvalue of $25,999,872; collateralized byU.S. Government Agency Obligations withrates ranging from 0.350% - 6.625%,maturity dates ranging from 04/05/22 - 11/15/30, and an aggregate market value of$26,519,850. 25,999,684 25,999,684
National Bank Financial, Inc.Repurchase Agreement dated 03/31/22 at0.320%, due on 04/01/22 with a maturityvalue of $17,000,151; collateralized byU.S. Treasury Obligations with ratesranging from 0.125% - 3.000%, maturitydates ranging from 06/30/22 - 02/15/49,and an aggregate market value of$17,349,671. 17,000,000 17,000,000
BHFTII-148
Copyright © 2022 www.secdatabase.com. All Rights Reserved.Please Consider the Environment Before Printing This Document

Table of ContentsBrighthouse Funds Trust IIJennison Growth Portfolio
Schedule of Investments as of March 31, 2022 (Unaudited)Securities Lending Reinvestments (c)��(Continued)
Security DescriptionPrincipalAmount* Value
Repurchase Agreements��(Continued)National Bank of Canada
Repurchase Agreement dated 03/31/22at 0.450%, due on 04/07/22 with amaturity value of $26,002,275;collateralized by U.S. TreasuryObligations with rates ranging from0.500% - 3.000%, maturity datesranging from 11/30/23 - 08/15/48, andvarious Common Stock with anaggregate market value of $28,750,766. 26,000,000 $26,000,000
NBC Global Finance, Ltd.Repurchase Agreement dated 03/31/22at 0.440%, due on 04/01/22 with amaturity value of $20,000,244;collateralized by U.S. TreasuryObligations with rates ranging from0.125% - 4.750%, maturity datesranging from 05/15/24 - 02/15/50, andvarious Common Stock with anaggregate market value of $22,207,531. 20,000,000 20,000,000Repurchase Agreement dated 03/31/22at 0.485%, due on 04/07/22 with amaturity value of $3,200,302;collateralized by U.S. TreasuryObligations with rates ranging from0.125% - 4.750%, maturity datesranging from 05/15/24 - 02/15/50, andvarious Common Stock with anaggregate market value of $3,553,205. 3,200,000 3,200,000
Royal Bank of Canada TorontoRepurchase Agreement dated 03/31/22at 0.570%, due on 05/05/22 with amaturity value of $5,002,771;collateralized by various Common Stockwith an aggregate market value of$5,555,644. 5,000,000 5,000,000
Societe GeneraleRepurchase Agreement dated 03/31/22at 0.360%, due on 04/01/22 with amaturity value of $30,000,300;collateralized by various Common Stockwith an aggregate market value of$33,336,088. 30,000,000 30,000,000Repurchase Agreement dated 03/31/22at 0.410%, due on 04/01/22 with amaturity value of $50,000,569;collateralized by various Common Stockwith an aggregate market value of$55,564,486. 50,000,000 50,000,000Repurchase Agreement dated 03/31/22at 0.420%, due on 04/07/22 with amaturity value of $2,000,163;collateralized by various Common Stockwith an aggregate market value of$2,222,579. 2,000,000 2,000,000
Copyright © 2022 www.secdatabase.com. All Rights Reserved.Please Consider the Environment Before Printing This Document

TD Prime Services LLCRepurchase Agreement dated 03/31/22at 0.400%, due on 04/01/22 with amaturity value of $40,000,444;collateralized by various Common Stockwith an aggregate market value of$45,539,460. 40,000,000 40,000,000
243,699,684
Time Deposits��1.3%Australia New Zealand Banking Group,
Ltd0.310%, 04/01/22 10,000,000 10,000,000
First Abu Dhabi Bank USA NV0.310%, 04/01/22 7,000,000 7,000,000
Jyske Bank A/S0.750%, 04/11/22 5,000,000 5,000,000
National Bank of Canada0.370%, OBFR + 0.050%, 04/07/22 (d) 7,000,000 7,000,000
Skandi (NY)0.300%, 04/01/22 10,000,000 10,000,000
39,000,000
Mutual Funds��0.3%Fidelity Government Portfolio, Institutional
Class0.160% (e) 1,000,000 1,000,000
Goldman Sachs Financial SquareGovernment Fund, Institutional Shares0.250% (e) 8,000,000 8,000,000
9,000,000Total Securities Lending Reinvestments
(Cost $393,198,695) 393,134,705Total Investments�113.0%
(Cost $1,984,469,621) 3,336,215,564Other assets and liabilities (net)�(13.0)% (384,122,779 )Net Assets��100.0% $2,952,092,785
* Principal amount stated in U.S. dollars unless otherwise noted.(a) Non-income producing security.(b) All or a portion of the security was held on loan. As of March 31, 2022, the market value of securities loaned was $378,641,641 and the collateral
received consisted of cash in the amount of $393,188,837. The cash collateral investments are disclosed in the Schedule of Investments andcategorized as Securities Lending Reinvestments.
(c) Represents investment of cash collateral received from securities on loan as of March 31, 2022.(d) Variable or floating rate security. The stated rate represents the rate at March 31, 2022. Maturity date shown for callable securities reflects the
earliest possible call date. For securities based on a published reference index and spread, the index and spread are indicated in the descriptionabove. For certain variable rate securities, the coupon rate is determined by the issuer/agent based on current market conditions. For certain asset-and mortgage-backed securities, the coupon rate may fluctuate based on changes of the underlying collateral or prepayments of principal. Thesesecurities do not indicate a reference index and spread in their description above.
(e) The rate shown represents the annualized seven-day yield as of March 31, 2022.
Glossary of Abbreviations
Index Abbreviations
(FEDEFF PRV)� Effective Federal Funds Rate(OBFR)� U.S. Overnight Bank Funding Rate(SOFR)� Secured Overnight Financing Rate
Other Abbreviations
(ADR)� American Depositary Receipt
BHFTII-149
Copyright © 2022 www.secdatabase.com. All Rights Reserved.Please Consider the Environment Before Printing This Document

Table of ContentsBrighthouse Funds Trust IIJennison Growth Portfolio
Schedule of Investments as of March 31, 2022 (Unaudited)Fair Value HierarchyAccounting principles generally accepted in the United States of America (�GAAP�) define fair market value as the price that the Portfolio would receive tosell an asset or pay to transfer a liability in an orderly transaction between market participants at the measurement date. It establishes a fair valuehierarchy that prioritizes inputs to valuation methods and requires disclosure of the fair value hierarchy, separately for each major category of assets andliabilities, that segregates fair value measurements into three levels. Levels 1, 2 and 3 of the fair value hierarchy are defined as follows:
Level 1 - unadjusted quoted prices in active markets for identical investmentsLevel 2 - other significant observable inputs (including, but not limited to, quoted prices for similar assets or liabilities in markets that are either activeor inactive; inputs other than quoted prices that are observable such as interest rates, yield curves, volatilities, prepayment speeds, loss severities,credit risks, default rates, or other market corroborated inputs)Level 3 - significant unobservable inputs based on the best information available in the circumstances, to the extent observable inputs areunavailable (including the Portfolio�s own assumptions used in determining the fair value of investments and derivative financial instruments)
The inputs or methodologies used for valuing investments are not necessarily an indication of the risk associated with investing in them. Changes to theinputs or methodologies used may result in transfers between levels. A reconciliation of Level 3 securities, if any, will be disclosed following the fair valuehierarchy table. For more information about the Portfolio�s policy regarding the valuation of investments, please refer to the Notes to Schedule ofInvestments.
The following table summarizes the fair value hierarchy of the Portfolio�s investments as of March 31, 2022:
Description Level 1 Level 2 Level 3 TotalCommon Stocks
Automobiles $299,710,733 $� $ � $299,710,733Capital Markets 29,142,855 � � 29,142,855Energy Equipment & Services 17,091,228 � � 17,091,228Entertainment 95,743,107 � � 95,743,107Equity Real Estate Investment Trusts 6,652,054 � � 6,652,054Food & Staples Retailing 73,897,679 � � 73,897,679Health Care Equipment & Supplies 78,900,513 � � 78,900,513Health Care Providers & Services 43,523,390 � � 43,523,390Hotels, Restaurants & Leisure 96,502,929 � � 96,502,929Interactive Media & Services 278,634,831 � � 278,634,831Internet & Direct Marketing Retail 258,536,519 � � 258,536,519IT Services 264,920,771 42,753,318 � 307,674,089Life Sciences Tools & Services 48,522,649 � � 48,522,649Multiline Retail 39,258,365 � � 39,258,365Personal Products 48,087,355 � � 48,087,355Pharmaceuticals 63,563,535 � � 63,563,535Road & Rail 52,947,942 � � 52,947,942Semiconductors & Semiconductor Equipment 170,137,687 � � 170,137,687Software 486,287,517 � � 486,287,517Specialty Retail 81,151,328 � � 81,151,328Technology Hardware, Storage & Peripherals 206,758,844 � � 206,758,844Textiles, Apparel & Luxury Goods 70,699,664 88,181,036 � 158,880,700
Total Common Stocks 2,810,671,495 130,934,354 � 2,941,605,849Total Short-Term Investment* � 1,475,010 � 1,475,010Securities Lending Reinvestments
Certificates of Deposit � 84,441,509 � 84,441,509Commercial Paper � 16,993,512 � 16,993,512Repurchase Agreements � 243,699,684 � 243,699,684Time Deposits � 39,000,000 � 39,000,000Mutual Funds 9,000,000 � � 9,000,000
Total Securities Lending Reinvestments 9,000,000 384,134,705 � 393,134,705Total Investments $2,819,671,495 $516,544,069 $ � $3,336,215,564Collateral for Securities Loaned (Liability) $� $(393,188,837) $ � $(393,188,837 )
* See Schedule of Investments for additional detailed categorizations.
BHFTII-150
Copyright © 2022 www.secdatabase.com. All Rights Reserved.Please Consider the Environment Before Printing This Document

Table of ContentsBrighthouse Funds Trust II
Loomis Sayles Small Cap Core Portfolio
Schedule of Investments as of March 31, 2022 (Unaudited)Common Stocks��97.8% of Net Assets
Security Description Shares Value
Air Freight & Logistics��0.4%Hub Group, Inc. - Class A (a) 21,392 $1,651,676
Auto Components��2.2%Dana, Inc. 165,143 2,901,562Dorman Products, Inc. (a) 13,560 1,288,607Fox Factory Holding Corp. (a) 9,026 884,097Gentherm, Inc. (a) 16,328 1,192,597LCI Industries (b) 16,570 1,720,132Patrick Industries, Inc. 17,240 1,039,572
9,026,567
Banks��11.4%Ameris Bancorp 91,430 4,011,948Atlantic Union Bankshares Corp. 75,173 2,758,097Bancorp, Inc. (The) (a) (b) 43,723 1,238,673Cadence Bank 102,092 2,987,212CVB Financial Corp. (b) 106,316 2,467,594Home BancShares, Inc. 134,959 3,050,073Lakeland Financial Corp. (b) 15,691 1,145,443Meta Financial Group, Inc. (b) 75,405 4,141,243OceanFirst Financial Corp. 154,145 3,098,315Pinnacle Financial Partners, Inc. (b) 40,236 3,704,931Popular, Inc. 52,865 4,321,185Prosperity Bancshares, Inc. 32,715 2,269,767SouthState Corp. (b) 28,515 2,326,539Triumph Bancorp, Inc. (a) 49,299 4,635,092Wintrust Financial Corp. 49,415 4,592,136
46,748,248
Beverages��0.2%Primo Water Corp. 62,553 891,380
Biotechnology��2.8%Bicycle Therapeutics plc (ADR) (a) 17,839 782,775BioCryst Pharmaceuticals, Inc. (a) (b) 65,306 1,061,876Blueprint Medicines Corp. (a) 12,138 775,375Halozyme Therapeutics, Inc. (a) (b) 39,963 1,593,724Inhibrx, Inc. (a) 28,885 643,558Insmed, Inc. (a) (b) 35,418 832,323PTC Therapeutics, Inc. (a) (b) 26,737 997,557SpringWorks Therapeutics, Inc. (a) (b) 14,747 832,321United Therapeutics Corp. (a) 14,821 2,659,036Vericel Corp. (a) 18,110 692,164Xencor, Inc. (a) 30,370 810,272
11,680,981
Building Products��2.5%Advanced Drainage Systems, Inc. (b) 17,060 2,026,899Janus International Group Inc. (a) 146,201 1,315,809Quanex Building Products Corp. (b) 92,117 1,933,536Simpson Manufacturing Co., Inc. 9,863 1,075,461UFP Industries, Inc. 47,870 3,693,649
10,045,354
Capital Markets��1.8%Focus Financial Partners, Inc. - Class A (a) 24,436 1,117,703Hamilton Lane, Inc. - Class A 17,945 1,386,969PJT Partners, Inc. - Class A 18,730 1,182,237Stifel Financial Corp. 53,493 3,632,175
7,319,084
Copyright © 2022 www.secdatabase.com. All Rights Reserved.Please Consider the Environment Before Printing This Document

Chemicals��2.5%Ashland Global Holdings, Inc. (b) 18,318 1,802,674Cabot Corp. 40,908 2,798,516Ingevity Corp. (a) 24,979 1,600,405Scotts Miracle-Gro Co. (The) (b) 11,287 1,387,850Valvoline, Inc. 86,267 2,722,586
10,312,031
Commercial Services & Supplies��2.4%Casella Waste Systems, Inc. - Class A (a) 26,387 2,312,821Clean Harbors, Inc. (a) 28,913 3,227,847Driven Brands Holdings, Inc. (a) 25,231 663,071IAA, Inc. (a) 46,005 1,759,691KAR Auction Services, Inc. (a) (b) 56,542 1,020,583VSE Corp. (b) 22,816 1,051,589
10,035,602
Communications Equipment��1.3%Calix, Inc. (a) 23,534 1,009,844Radware, Ltd. (a) 34,527 1,103,828Viavi Solutions, Inc. (a) 192,881 3,101,527
5,215,199
Construction & Engineering��2.9%AECOM 48,905 3,756,393Arcosa, Inc. 57,624 3,298,974MDU Resources Group, Inc. 109,120 2,908,048WillScot Mobile Mini Holdings Corp. (a) 47,323 1,851,749
11,815,164
Containers & Packaging��0.6%Ranpak Holdings, Corp. (a) (b) 38,447 785,472TriMas Corp. 55,822 1,791,328
2,576,800
Diversified Consumer Services �� 0.8%Frontdoor, Inc. (a) 22,172 661,834Houghton Mifflin Harcourt Co. (a) 123,537 2,595,513
3,257,347
Diversified Financial Services��0.4%Cannae Holdings, Inc. (a) 77,064 1,843,371
Electric Utilities��0.5%ALLETE, Inc. 33,428 2,239,007
BHFTII-151
Copyright © 2022 www.secdatabase.com. All Rights Reserved.Please Consider the Environment Before Printing This Document

Table of ContentsBrighthouse Funds Trust IILoomis Sayles Small Cap Core Portfolio
Schedule of Investments as of March 31, 2022 (Unaudited)Common Stocks��(Continued)
Security Description Shares Value
Electrical Equipment��0.7%Atkore, Inc. (a) 20,817 $2,049,226AZZ, Inc. 15,135 730,112
2,779,338
Electronic Equipment, Instruments & Components��4.8%Advanced Energy Industries, Inc. 31,715 2,730,027Itron, Inc. (a) 15,988 842,248Kimball Electronics, Inc. (a) 73,011 1,459,490Littelfuse, Inc. 6,391 1,593,979Methode Electronics, Inc. 72,575 3,138,869nLight, Inc. (a) 34,029 590,063Novanta, Inc. (a) 10,054 1,430,584TD SYNNEX Corp. 21,066 2,174,222TTM Technologies, Inc. (a) 167,994 2,489,671Vontier Corp. 127,385 3,234,305
19,683,458
Energy Equipment & Services��1.5%Cactus, Inc. - Class A 32,804 1,861,299ChampionX Corp. (a) 183,501 4,492,104
6,353,403
Entertainment��0.4%Liberty Braves Group - Class C (a) 56,744 1,583,725
Equity Real Estate Investment Trusts��3.1%Agree Realty Corp. 34,862 2,313,442CubeSmart 48,247 2,510,291Orion Office REIT, Inc. 69,442 972,188PotlatchDeltic Corp. 32,924 1,736,083Rexford Industrial Realty, Inc. 28,878 2,154,010STAG Industrial, Inc. 69,390 2,869,277
12,555,291
Food & Staples Retailing��0.3%Andersons, Inc. (The) 25,802 1,296,808
Food Products��1.9%Dole plc (b) 142,009 1,760,911J & J Snack Foods Corp. 8,603 1,334,325Nomad Foods, Ltd. (a) 69,309 1,564,997Simply Good Foods Co. (The) (a) 39,687 1,506,122Whole Earth Brands, Inc. (a) (b) 211,017 1,510,882
7,677,237
Health Care Equipment & Supplies��4.4%AtriCure, Inc. (a) 25,634 1,683,385Axonics, Inc. (a) (b) 28,429 1,779,656CONMED Corp. 26,365 3,916,521Inmode, Ltd. (a) 61,864 2,283,400Lantheus Holdings, Inc. (a) 59,746 3,304,551LivaNova plc (a) 1,277 104,497Merit Medical Systems, Inc. (a) 23,656 1,573,597NuVasive, Inc. (a) 21,042 1,193,081STAAR Surgical Co. (a) (b) 9,609 767,855
Health Care Equipment & Supplies��(Continued)UFP Technologies, Inc. (a) (b) 21,270 1,407,436
18,013,979
Health Care Providers & Services��2.0%Acadia Healthcare Co., Inc. (a) 8,702 570,242
Copyright © 2022 www.secdatabase.com. All Rights Reserved.Please Consider the Environment Before Printing This Document

AMN Healthcare Services, Inc. (a) 13,617 1,420,661Ensign Group, Inc. (The) (b) 13,682 1,231,517ModivCare, Inc. (a) 5,520 636,953Option Care Health, Inc. (a) (b) 147,077 4,200,519
8,059,892
Health Care Technology��2.1%Allscripts Healthcare Solutions, Inc. (a) (b) 180,180 4,057,654Evolent Health, Inc. - Class A (a) 70,020 2,261,646Inspire Medical Systems, Inc. (a) 8,209 2,107,168
8,426,468
Hotels, Restaurants & Leisure��2.6%Churchill Downs, Inc. 12,559 2,785,335Cracker Barrel Old Country Store, Inc. 6,920 821,612Life Time Group Holdings, Inc. (a) (b) 44,624 648,833Marriott Vacations Worldwide Corp. 19,962 3,148,007Papa John�s International, Inc. 10,277 1,081,963Texas Roadhouse, Inc. 11,163 934,678Wingstop, Inc. (b) 10,229 1,200,373
10,620,801
Household Durables��1.0%Installed Building Products, Inc. 10,860 917,561KB Home 62,670 2,029,255Skyline Champion Corp. (a) 22,428 1,230,849
4,177,665
Household Products��0.7%Spectrum Brands Holdings, Inc. (b) 31,296 2,776,581
Independent Power and Renewable Electricity Producers��0.7%NextEra Energy Partners L.P. (b) 32,445 2,704,615
Insurance��1.6%BRP Group, Inc. - Class A (a) 30,407 815,820Employers Holdings, Inc. 58,245 2,389,210First American Financial Corp. 39,472 2,558,575Kinsale Capital Group, Inc. (b) 3,076 701,389
6,464,994
Interactive Media & Services��0.3%Cargurus, Inc. (a) 30,354 1,288,831
Internet & Direct Marketing Retail��0.4%Shutterstock, Inc. 19,419 1,807,520
IT Services��4.2%Concentrix Corp. 19,113 3,183,461
BHFTII-152
Copyright © 2022 www.secdatabase.com. All Rights Reserved.Please Consider the Environment Before Printing This Document

Table of ContentsBrighthouse Funds Trust IILoomis Sayles Small Cap Core Portfolio
Schedule of Investments as of March 31, 2022 (Unaudited)Common Stocks��(Continued)
Security Description Shares Value
IT Services��(Continued)CSG Systems International, Inc. 38,705 $2,460,477Euronet Worldwide, Inc. (a) 15,515 2,019,277EVERTEC, Inc. 33,759 1,381,756International Money Express, Inc. (a) 102,567 2,113,906Perficient, Inc. (a) 8,633 950,407Unisys Corp. (a) (b) 105,844 2,287,289WEX, Inc. (a) 4,857 866,732WNS Holdings, Ltd. (ADR) (a) 22,882 1,956,182
17,219,487
Leisure Products��0.8%Brunswick Corp. 28,364 2,294,364Malibu Boats, Inc. - Class A (a) 16,455 954,554
3,248,918
Life Sciences Tools & Services��0.9%Charles River Laboratories International, Inc. (a) 5,694 1,616,925Inotiv, Inc. (a) (b) 29,871 782,023Medpace Holdings, Inc. (a) 7,180 1,174,576
3,573,524
Machinery��4.9%Albany International Corp. - Class A 43,817 3,694,649Altra Industrial Motion Corp. 57,215 2,227,380Columbus McKinnon Corp. (b) 71,565 3,034,356Helios Technologies, Inc. 16,757 1,344,749Kadant, Inc. 20,124 3,907,880Kornit Digital, Ltd. (a) (b) 12,955 1,071,249Miller Industries, Inc. 52,115 1,467,558RBC Bearings, Inc. (a) 6,745 1,307,721Shyft Group, Inc. (The) 28,296 1,021,769Wabash National Corp. (b) 78,132 1,159,479
20,236,790
Marine��1.1%Genco Shipping & Trading, Ltd. 194,173 4,586,366
Media��1.9%Gray Television, Inc. (b) 107,130 2,364,359John Wiley & Sons, Inc. - Class A (b) 31,060 1,647,112Scholastic Corp. 32,198 1,296,935TechTarget, Inc. (a) (b) 19,531 1,587,480Thryv Holdings, Inc. (a) 35,411 995,757
7,891,643
Metals & Mining��0.6%Arconic Corp. (a) 99,167 2,540,659
Multi-Utilities��0.4%NorthWestern Corp. (b) 27,004 1,633,472
Oil, Gas & Consumable Fuels��2.5%Antero Resources Corp. (a) 109,278 3,336,257California Resources Corp. 38,149 1,706,405EQT Corp. 60,085 2,067,525
Oil, Gas & Consumable Fuels��(Continued)Northern Oil and Gas, Inc. (b) 108,267 3,052,047
10,162,234
Personal Products��0.4%elf Beauty, Inc. (a) 35,333 912,651
Copyright © 2022 www.secdatabase.com. All Rights Reserved.Please Consider the Environment Before Printing This Document

Inter Parfums, Inc. 6,296 554,3631,467,014
Pharmaceuticals��1.9%Jazz Pharmaceuticals plc (a) (b) 15,142 2,357,155Pacira BioSciences, Inc. (a) 22,225 1,696,212Supernus Pharmaceuticals, Inc. (a) 113,239 3,659,885
7,713,252
Professional Services��3.0%FTI Consulting, Inc. (a) 5,865 922,095Insperity, Inc. 24,772 2,487,604KBR, Inc. 42,561 2,329,364Korn Ferry 53,134 3,450,522Science Applications International Corp. 31,888 2,939,117
12,128,702
Semiconductors & Semiconductor Equipment��4.2%MACOM Technology Solutions Holdings, Inc. (a) 30,678 1,836,692MaxLinear, Inc. (a) 34,156 1,993,003Rambus, Inc. (a) 199,105 6,349,458Silicon Laboratories, Inc. (a) 10,622 1,595,424Silicon Motion Technology Corp. (ADR) 18,894 1,262,497Tower Semiconductor, Ltd. (U.S. Listed Shares)
(a) 82,654 4,000,45417,037,528
Software��2.1%Blackline, Inc. (a) 10,855 794,803Envestnet, Inc. (a) 18,210 1,355,552Q2 Holdings, Inc. (a) (b) 16,471 1,015,437Rapid7, Inc. (a) 21,631 2,406,233Tenable Holdings, Inc. (a) 25,231 1,458,100Varonis Systems, Inc. (a) 36,145 1,718,333
8,748,458
Specialty Retail��1.2%Aaron�s, Inc. (The) 86,154 1,729,972Boot Barn Holdings, Inc. (a) 12,271 1,163,168Urban Outfitters, Inc. (a) (b) 77,751 1,952,328
4,845,468
Technology Hardware, Storage & Peripherals��0.9%Pure Storage, Inc. - Class A (a) 57,224 2,020,580Super Micro Computer, Inc. (a) 46,131 1,756,207
3,776,787
Textiles, Apparel & Luxury Goods��0.5%Columbia Sportswear Co. 10,966 992,752
BHFTII-153
Copyright © 2022 www.secdatabase.com. All Rights Reserved.Please Consider the Environment Before Printing This Document

Table of ContentsBrighthouse Funds Trust IILoomis Sayles Small Cap Core Portfolio
Schedule of Investments as of March 31, 2022 (Unaudited)Common Stocks��(Continued)
Security Description
Shares/PrincipalAmount* Value
Textiles, Apparel & Luxury Goods��(Continued)Oxford Industries, Inc. (b) 10,516 $951,698
1,944,450
Thrifts & Mortgage Finance��1.2%Federal Agricultural Mortgage Corp. -
Class C 21,842 2,369,420WSFS Financial Corp. 53,803 2,508,296
4,877,716
Trading Companies & Distributors��3.1%Alta Equipment Group, Inc. (a) 105,054 1,298,468Applied Industrial Technologies, Inc. 2,319 238,069Herc Holdings, Inc. 38,499 6,432,798McGrath RentCorp 39,732 3,376,425SiteOne Landscape Supply, Inc. (a) 8,018 1,296,430
12,642,190
Water Utilities��0.3%Pure Cycle Corp. (a) 101,388 1,218,684
Wireless TelecommunicationServices��0.5%United States Cellular Corp. (a) 70,061 2,117,944Total Common Stocks
(Cost $286,549,943) 400,539,703
Short-Term Investment��2.4%Repurchase Agreement��2.4%Fixed Income Clearing Corp.
Repurchase Agreement dated 03/31/22 at0.000%, due on 04/01/22 with a maturityvalue of $9,938,836; collateralized by U.S.Treasury Note at 2.500%, maturing 03/31/27, with a market value of $10,137,641. 9,938,836 9,938,836
Total Short-Term Investments(Cost $9,938,836) 9,938,836
Securities Lending Reinvestments (c)��6.7%Certificate of Deposit��0.0%Oversea-Chinese Banking Corp., Ltd.
Zero Coupon, 04/14/22 100,000 99,983
Repurchase Agreements��4.6%Barclays Bank plc
Repurchase Agreement dated 03/31/22 at0.600%, due on 05/05/22 with a maturityvalue of $3,001,750; collateralized byvarious Common Stock with an aggregatemarket value of $3,334,370. 3,000,000 3,000,000
Repurchase Agreements��(Continued)
Copyright © 2022 www.secdatabase.com. All Rights Reserved.Please Consider the Environment Before Printing This Document

Citigroup Global Markets, Ltd.Repurchase Agreement dated 03/31/22 at0.300%, due on 04/01/22 with a maturityvalue of $500,004; collateralized by U.S.Treasury and Foreign Obligations withrates ranging from 0.125% - 2.875%,maturity dates ranging from 08/15/23 - 02/15/51, and an aggregate market value of$510,000. 500,000 500,000
ING Financial Markets LLCRepurchase Agreement dated 03/31/22 at0.260%, due on 04/01/22 with a maturityvalue of $1,488,980; collateralized by U.S.Government Agency Obligations withrates ranging from 0.350% - 6.625%,maturity dates ranging from 04/05/22 - 11/15/30, and an aggregate market value of$1,518,758. 1,488,969 1,488,969
National Bank Financial, Inc.Repurchase Agreement dated 03/31/22 at0.320%, due on 04/01/22 with a maturityvalue of $1,000,009; collateralized by U.S.Treasury Obligations with rates rangingfrom 0.125% - 3.000%, maturity datesranging from 06/30/22 - 02/15/49, and anaggregate market value of $1,020,569. 1,000,000 1,000,000
National Bank of CanadaRepurchase Agreement dated 03/31/22 at0.320%, due on 04/07/22 with a maturityvalue of $1,400,087; collateralized by U.S.Treasury Obligations with rates rangingfrom 0.000% - 4.500%, maturity datesranging from 04/14/22 - 08/15/51, and anaggregate market value of $1,428,796. 1,400,000 1,400,000Repurchase Agreement dated 03/31/22 at0.450%, due on 04/07/22 with a maturityvalue of $1,000,088; collateralized by U.S.Treasury Obligations with rates rangingfrom 0.500% - 3.000%, maturity datesranging from 11/30/23 - 08/15/48, andvarious Common Stock with an aggregatemarket value of $1,105,799. 1,000,000 1,000,000
NBC Global Finance, Ltd.Repurchase Agreement dated 03/31/22 at0.440%, due on 04/01/22 with a maturityvalue of $3,000,037; collateralized by U.S.Treasury Obligations with rates rangingfrom 0.125% - 4.750%, maturity datesranging from 05/15/24 - 02/15/50, andvarious Common Stock with an aggregatemarket value of $3,331,130. 3,000,000 3,000,000Repurchase Agreement dated 03/31/22 at0.485%, due on 04/07/22 with a maturityvalue of $2,000,189; collateralized by U.S.Treasury Obligations with rates rangingfrom 0.125% - 4.750%, maturity datesranging from 05/15/24 - 02/15/50, andvarious Common Stock with an aggregatemarket value of $2,220,753. 2,000,000 2,000,000
Societe GeneraleRepurchase Agreement dated 03/31/22 at0.360%, due on 04/01/22 with a maturityvalue of $4,300,043; collateralized byvarious Common Stock with an aggregatemarket value of $4,778,173. 4,300,000 4,300,000Repurchase Agreement dated 03/31/22 at0.380%, due on 04/01/22 with a maturityvalue of $300,003; collateralized byvarious Common Stock with an aggregatemarket value of $333,361. 300,000 300,000
BHFTII-154
Copyright © 2022 www.secdatabase.com. All Rights Reserved.Please Consider the Environment Before Printing This Document

Table of ContentsBrighthouse Funds Trust IILoomis Sayles Small Cap Core Portfolio
Schedule of Investments as of March 31, 2022 (Unaudited)Securities Lending Reinvestments (c)��(Continued)
Security Description
Shares/PrincipalAmount* Value
Repurchase Agreements��(Continued)Societe Generale
Repurchase Agreement dated 03/31/22 at0.420%, due on 04/07/22 with a maturityvalue of $400,033; collateralized byvarious Common Stock with an aggregatemarket value of $444,516. 400,000 $400,000
TD Prime Services LLCRepurchase Agreement dated 03/31/22 at0.400%, due on 04/01/22 with a maturityvalue of $500,006; collateralized byvarious Common Stock with an aggregatemarket value of $579,094. 500,000 500,000
18,888,969
Time Deposits��1.0%DZ Bank AG (NY)
0.300%, 04/01/22 1,000,000 1,000,000Rabobank (New York)
0.310%, 04/01/22 1,000,000 1,000,000Skandi (NY)
0.300%, 04/01/22 1,000,000 1,000,000Svenska (NY)
0.260%, 04/01/22 1,000,000 1,000,0004,000,000
Mutual Funds��1.1%Allspring Government Money Market Fund,
Select Class0.180% (d) 300,000 300,000
Mutual Funds��(Continued)BlackRock Liquidity Funds FedFund,
Institutional Shares0.230% (d) 2,000,000 2,000,000
Morgan Stanley Liquidity FundsGovernment Portfolio, Institutional Shares0.230% (d) 2,000,000 2,000,000
STIT-Government & Agency Portfolio,Institutional Class0.250% (d) 200,000 200,000
4,500,000Total Securities Lending Reinvestments
(Cost $27,488,963) 27,488,952Total Investments�106.9%
(Cost $323,977,742) 437,967,491Other assets and liabilities (net)�(6.9)% (28,199,445 )Net Assets��100.0% $409,768,046
* Principal amount stated in U.S. dollars unless otherwise noted.(a) Non-income producing security.(b) All or a portion of the security was held on loan. As of March 31, 2022, the market value of securities loaned was $26,548,160 and the collateral
received consisted of cash in the amount of $27,488,891. The cash collateral investments are disclosed in the Schedule of Investments andcategorized as Securities Lending Reinvestments.
(c) Represents investment of cash collateral received from securities on loan as of March 31, 2022.(d) The rate shown represents the annualized seven-day yield as of March 31, 2022.
Glossary of Abbreviations
Copyright © 2022 www.secdatabase.com. All Rights Reserved.Please Consider the Environment Before Printing This Document

Other Abbreviations
(ADR)� American Depositary Receipt(REIT)� Real Estate Investment Trust
BHFTII-155
Copyright © 2022 www.secdatabase.com. All Rights Reserved.Please Consider the Environment Before Printing This Document

Table of ContentsBrighthouse Funds Trust IILoomis Sayles Small Cap Core Portfolio
Schedule of Investments as of March 31, 2022 (Unaudited)
Fair Value HierarchyAccounting principles generally accepted in the United States of America (�GAAP�) define fair market value as the price that the Portfolio would receive tosell an asset or pay to transfer a liability in an orderly transaction between market participants at the measurement date. It establishes a fair valuehierarchy that prioritizes inputs to valuation methods and requires disclosure of the fair value hierarchy, separately for each major category of assets andliabilities, that segregates fair value measurements into three levels. Levels 1, 2 and 3 of the fair value hierarchy are defined as follows:
Level 1 - unadjusted quoted prices in active markets for identical investmentsLevel 2 - other significant observable inputs (including, but not limited to, quoted prices for similar assets or liabilities in markets that are either activeor inactive; inputs other than quoted prices that are observable such as interest rates, yield curves, volatilities, prepayment speeds, loss severities,credit risks, default rates, or other market corroborated inputs)Level 3 - significant unobservable inputs based on the best information available in the circumstances, to the extent observable inputs areunavailable (including the Portfolio�s own assumptions used in determining the fair value of investments and derivative financial instruments)
The inputs or methodologies used for valuing investments are not necessarily an indication of the risk associated with investing in them. Changes to theinputs or methodologies used may result in transfers between levels. A reconciliation of Level 3 securities, if any, will be disclosed following the fair valuehierarchy table. For more information about the Portfolio�s policy regarding the valuation of investments, please refer to the Notes to Schedule ofInvestments.
The following table summarizes the fair value hierarchy of the Portfolio�s investments as of March 31, 2022:
Description Level 1 Level 2 Level 3 TotalTotal Common Stocks* $400,539,703 $� $ � $400,539,703Total Short-Term Investment* � 9,938,836 � 9,938,836Securities Lending Reinvestments
Certificate of Deposit � 99,983 � 99,983Repurchase Agreements � 18,888,969 � 18,888,969Time Deposits � 4,000,000 � 4,000,000Mutual Funds 4,500,000 � � 4,500,000
Total Securities Lending Reinvestments 4,500,000 22,988,952 � 27,488,952Total Investments $405,039,703 $32,927,788 $ � $437,967,491Collateral for Securities Loaned (Liability) $� $(27,488,891) $ � $(27,488,891 )
* See Schedule of Investments for additional detailed categorizations.
BHFTII-156
Copyright © 2022 www.secdatabase.com. All Rights Reserved.Please Consider the Environment Before Printing This Document

Table of ContentsBrighthouse Funds Trust II
Loomis Sayles Small Cap Growth Portfolio
Schedule of Investments as of March 31, 2022 (Unaudited)Common Stocks��96.9% of Net Assets
Security Description Shares Value
Air Freight & Logistics��1.4%Hub Group, Inc. - Class A (a) 78,926 $6,093,876
Auto Components��3.7%Dorman Products, Inc. (a) 50,027 4,754,066Fox Factory Holding Corp. (a) 33,294 3,261,147Gentherm, Inc. (a) 60,241 4,400,003Patrick Industries, Inc. 63,606 3,835,442
16,250,658
Banks��2.8%Ameris Bancorp 78,344 3,437,735Bancorp, Inc. (The) (a) (b) 161,318 4,570,139Lakeland Financial Corp. (b) 57,889 4,225,897
12,233,771
Beverages��0.7%Primo Water Corp. 230,789 3,288,743
Biotechnology��7.5%Bicycle Therapeutics plc (ADR) (a) (b) 65,818 2,888,094BioCryst Pharmaceuticals, Inc. (a) 240,987 3,918,449Blueprint Medicines Corp. (a) 44,785 2,860,866Halozyme Therapeutics, Inc. (a) (b) 147,447 5,880,186Inhibrx, Inc. (a) (b) 106,260 2,367,473Insmed, Inc. (a) (b) 130,679 3,070,957PTC Therapeutics, Inc. (a) 98,643 3,680,370SpringWorks Therapeutics, Inc. (a) (b) 54,410 3,070,900Vericel Corp. (a) 66,814 2,553,631Xencor, Inc. (a) 112,056 2,989,654
33,280,580
Building Products��3.4%Advanced Drainage Systems, Inc. (b) 62,941 7,478,020Simpson Manufacturing Co., Inc. 36,389 3,967,856UFP Industries, Inc. 48,529 3,744,498
15,190,374
Capital Markets��3.1%Focus Financial Partners, Inc. - Class A (a) 90,155 4,123,690Hamilton Lane, Inc. - Class A 66,206 5,117,062PJT Partners, Inc. - Class A 69,104 4,361,844
13,602,596
Commercial Services & Supplies��2.5%Casella Waste Systems, Inc. - Class A (a) 97,355 8,533,166Driven Brands Holdings, Inc. (a) 92,892 2,441,202
10,974,368
Communications Equipment��1.8%Calix, Inc. (a) 86,833 3,726,004Radware, Ltd. (a) 127,378 4,072,275
7,798,279
Construction & Engineering��1.5%WillScot Mobile Mini Holdings Corp. (a) 174,596 6,831,942
Containers & Packaging��0.7%Ranpak Holdings, Corp. (a) 141,849 2,897,975
Diversified Consumer Services��0.5%Frontdoor, Inc. (a) 81,800 2,441,730
Copyright © 2022 www.secdatabase.com. All Rights Reserved.Please Consider the Environment Before Printing This Document

Electronic Equipment, Instruments & Components��3.2%Advanced Energy Industries, Inc. 41,791 3,597,369Itron, Inc. (a) 58,988 3,107,488nLight, Inc. (a) (b) 125,548 2,177,002Novanta, Inc. (a) (b) 37,092 5,277,821
14,159,680
Energy Equipment & Services��1.5%Cactus, Inc. - Class A 121,029 6,867,185
Food Products��1.3%Simply Good Foods Co. (The) (a) 146,424 5,556,791
Health Care Equipment & Supplies��7.3%AtriCure, Inc. (a) 94,580 6,211,069Axonics, Inc. (a) 104,894 6,566,364CONMED Corp. (b) 42,257 6,277,277LivaNova plc (a) 4,694 384,110Merit Medical Systems, Inc. (a) 87,278 5,805,733NuVasive, Inc. (a) 77,633 4,401,791STAAR Surgical Co. (a) (b) 35,452 2,832,969
32,479,313
Health Care Providers & Services��3.5%Acadia Healthcare Co., Inc. (a) 31,989 2,096,239Ensign Group, Inc. (The) 50,478 4,543,525ModivCare, Inc. (a) 20,377 2,351,302Option Care Health, Inc. (a) 230,072 6,570,856
15,561,922
Health Care Technology��3.6%Evolent Health, Inc. - Class A (a) 258,333 8,344,156Inspire Medical Systems, Inc. (a) 30,296 7,776,680
16,120,836
Hotels, Restaurants & Leisure��3.2%Life Time Group Holdings, Inc. (a) (b) 164,639 2,393,851Papa John�s International, Inc. 37,916 3,991,797Texas Roadhouse, Inc. 41,178 3,447,834Wingstop, Inc. 37,741 4,428,906
14,262,388
Household Durables��0.8%Installed Building Products, Inc. 40,069 3,385,430
BHFTII-157
Copyright © 2022 www.secdatabase.com. All Rights Reserved.Please Consider the Environment Before Printing This Document

Table of ContentsBrighthouse Funds Trust IILoomis Sayles Small Cap Growth Portfolio
Schedule of Investments as of March 31, 2022 (Unaudited)Common Stocks��(Continued)
Security Description Shares Value
Insurance��1.3%BRP Group, Inc. - Class A (a) 112,186 $3,009,950Kinsale Capital Group, Inc. (b) 11,348 2,587,571
5,597,521
Interactive Media & Services��1.1%Cargurus, Inc. (a) 111,994 4,755,265
Internet & Direct Marketing Retail��1.5%Shutterstock, Inc. 71,646 6,668,810
IT Services��3.6%EVERTEC, Inc. 124,551 5,097,872Perficient, Inc. (a) 31,851 3,506,477WNS Holdings, Ltd. (ADR) (a) 84,423 7,217,322
15,821,671
Leisure Products��0.8%Malibu Boats, Inc. - Class A (a) 60,710 3,521,787
Life Sciences Tools & Services��1.0%Medpace Holdings, Inc. (a) 26,499 4,334,971
Machinery��5.1%Albany International Corp. - Class A (b) 57,619 4,858,434Helios Technologies, Inc. 61,835 4,962,259Kornit Digital, Ltd. (a) 47,809 3,953,326RBC Bearings, Inc. (a) 24,887 4,825,091Shyft Group, Inc. (The) 104,398 3,769,812
22,368,922
Media��1.3%TechTarget, Inc. (a) (b) 72,058 5,856,874
Personal Products��1.2%elf Beauty, Inc. (a) 130,362 3,367,250Inter Parfums, Inc. 23,077 2,031,930
5,399,180
Pharmaceuticals��2.3%Pacira BioSciences, Inc. (a) (b) 81,997 6,258,011Supernus Pharmaceuticals, Inc. (a) 124,816 4,034,053
10,292,064
Professional Services��2.7%FTI Consulting, Inc. (a) (b) 21,614 3,398,153KBR, Inc. (b) 157,028 8,594,143
11,992,296
Semiconductors & Semiconductor Equipment��7.3%MACOM Technology Solutions Holdings,
Inc. (a) 113,183 6,776,266MaxLinear, Inc. (a) 126,020 7,353,267Rambus, Inc. (a) (b) 243,134 7,753,543
Semiconductors & Semiconductor Equipment��(Continued)Silicon Laboratories, Inc. (a) 39,188 5,886,038Silicon Motion Technology Corp. (ADR) 69,710 4,658,022
32,427,136
Software��7.3%
Copyright © 2022 www.secdatabase.com. All Rights Reserved.Please Consider the Environment Before Printing This Document

Blackline, Inc. (a) 40,055 2,932,827Envestnet, Inc. (a) (b) 67,186 5,001,326Q2 Holdings, Inc. (a) 60,774 3,746,717Rapid7, Inc. (a) 79,805 8,877,508Tenable Holdings, Inc. (a) 93,085 5,379,382Varonis Systems, Inc. (a) 133,362 6,340,030
32,277,790
Specialty Retail��1.0%Boot Barn Holdings, Inc. (a) 45,273 4,291,428
Technology Hardware, Storage &Peripherals��1.7%Pure Storage, Inc. - Class A (a) 211,121 7,454,683
Textiles, Apparel & Luxury Goods��1.6%Columbia Sportswear Co. 40,454 3,662,301Oxford Industries, Inc. (b) 38,798 3,511,219
7,173,520
Trading Companies & Distributors��2.1%Applied Industrial Technologies, Inc. 8,522 874,868McGrath RentCorp 44,667 3,795,802SiteOne Landscape Supply, Inc. (a) 29,575 4,781,982
9,452,652Total Common Stocks
(Cost $343,942,482) 428,965,007
Short-Term Investment��3.2%Repurchase Agreement��3.2%Fixed Income Clearing Corp.
Repurchase Agreement dated 03/31/22 at0.000%, due on 04/01/22 with a maturityvalue of $13,996,262; collateralized byU.S. Treasury Note at 2.500%, maturing03/31/27, with a market value of$14,276,225. 13,996,262 13,996,262
Total Short-Term Investments(Cost $13,996,262) 13,996,262
Securities Lending Reinvestments (c)��3.5%Certificate of Deposit��0.1%Oversea-Chinese Banking Corp., Ltd.
Zero Coupon, 04/14/22 200,000 199,966
BHFTII-158
Copyright © 2022 www.secdatabase.com. All Rights Reserved.Please Consider the Environment Before Printing This Document

Table of ContentsBrighthouse Funds Trust IILoomis Sayles Small Cap Growth Portfolio
Schedule of Investments as of March 31, 2022 (Unaudited)Securities Lending Reinvestments (c)��(Continued)
Security DescriptionPrincipalAmount* Value
Repurchase Agreements��2.5%Barclays Bank plc
Repurchase Agreement dated 03/31/22 at0.600%, due on 05/05/22 with a maturityvalue of $2,001,167; collateralized byvarious Common Stock with an aggregatemarket value of $2,222,914. 2,000,000 $2,000,000
ING Financial Markets LLCRepurchase Agreement dated 03/31/22 at0.260%, due on 04/01/22 with a maturityvalue of $1,895,999; collateralized by U.S.Government Agency Obligations with ratesranging from 0.350% - 6.625%, maturitydates ranging from 04/05/22 - 11/15/30,and an aggregate market value of$1,933,917. 1,895,985 1,895,985
National Bank of CanadaRepurchase Agreement dated 03/31/22 at0.320%, due on 04/07/22 with a maturityvalue of $1,400,087; collateralized by U.S.Treasury Obligations with rates rangingfrom 0.000% - 4.500%, maturity datesranging from 04/14/22 - 08/15/51, and anaggregate market value of $1,428,796. 1,400,000 1,400,000Repurchase Agreement dated 03/31/22 at0.450%, due on 04/07/22 with a maturityvalue of $900,079; collateralized by U.S.Treasury Obligations with rates rangingfrom 0.500% - 3.000%, maturity datesranging from 11/30/23 - 08/15/48, andvarious Common Stock with an aggregatemarket value of $995,219. 900,000 900,000
NBC Global Finance, Ltd.Repurchase Agreement dated 03/31/22 at0.440%, due on 04/01/22 with a maturityvalue of $1,900,023; collateralized by U.S.Treasury Obligations with rates rangingfrom 0.125% - 4.750%, maturity datesranging from 05/15/24 - 02/15/50, andvarious Common Stock with an aggregatemarket value of $2,109,715. 1,900,000 1,900,000
Societe GeneraleRepurchase Agreement dated 03/31/22 at0.360%, due on 04/01/22 with a maturityvalue of $2,100,021; collateralized byvarious Common Stock with an aggregatemarket value of $2,333,526. 2,100,000 2,100,000Repurchase Agreement dated 03/31/22 at0.380%, due on 04/01/22 with a maturityvalue of $400,004; collateralized byvarious Common Stock with an aggregatemarket value of $444,481. 400,000 400,000
Repurchase Agreements��(Continued)Societe Generale
Repurchase Agreement dated 03/31/22 at0.410%, due on 04/01/22 with a maturityvalue of $348,805; collateralized byvarious Common Stock with an aggregatemarket value of $387,618. 348,801 348,801
Copyright © 2022 www.secdatabase.com. All Rights Reserved.Please Consider the Environment Before Printing This Document

Repurchase Agreement dated 03/31/22 at0.420%, due on 04/07/22 with a maturityvalue of $300,025; collateralized byvarious Common Stock with an aggregatemarket value of $333,387. 300,000 300,000
11,244,786
Mutual Funds��0.9%Fidelity Government Portfolio, Institutional
Class 0.160% (d) 2,000,000 2,000,000Morgan Stanley Liquidity Funds Government
Portfolio, Institutional Shares 0.230% (d) 2,000,000 2,000,0004,000,000
Total Securities Lending Reinvestments(Cost $15,444,775) 15,444,752
Total Investments�103.6%(Cost $373,383,519) 458,406,021
Other assets and liabilities (net)�(3.6)% (15,830,712 )Net Assets��100.0% $442,575,309
* Principal amount stated in U.S. dollars unless otherwise noted.(a) Non-income producing security.(b) All or a portion of the security was held on loan. As of March 31, 2022, the market value of securities loaned was $16,261,446 and the collateral
received consisted of cash in the amount of $15,444,629 and non-cash collateral with a value of $1,430,598. The cash collateral investments aredisclosed in the Schedule of Investments and categorized as Securities Lending Reinvestments. The non-cash collateral received consists of U.S.government securities that are held in safe-keeping by the lending agent, or a third- party custodian, and cannot be sold or repledged by thePortfolio
(c) Represents investment of cash collateral received from securities on loan as of March 31, 2022.(d) The rate shown represents the annualized seven-day yield as of March 31, 2022.
Glossary of Abbreviations
Other Abbreviations
(ADR)� American Depositary Receipt
BHFTII-159
Copyright © 2022 www.secdatabase.com. All Rights Reserved.Please Consider the Environment Before Printing This Document

Table of ContentsBrighthouse Funds Trust IILoomis Sayles Small Cap Growth Portfolio
Schedule of Investments as of March 31, 2022 (Unaudited)
Fair Value HierarchyAccounting principles generally accepted in the United States of America (�GAAP�) define fair market value as the price that the Portfolio would receive tosell an asset or pay to transfer a liability in an orderly transaction between market participants at the measurement date. It establishes a fair valuehierarchy that prioritizes inputs to valuation methods and requires disclosure of the fair value hierarchy, separately for each major category of assets andliabilities, that segregates fair value measurements into three levels. Levels 1, 2 and 3 of the fair value hierarchy are defined as follows:
Level 1 - unadjusted quoted prices in active markets for identical investmentsLevel 2 - other significant observable inputs (including, but not limited to, quoted prices for similar assets or liabilities in markets that are either activeor inactive; inputs other than quoted prices that are observable such as interest rates, yield curves, volatilities, prepayment speeds, loss severities,credit risks, default rates, or other market corroborated inputs)Level 3 - significant unobservable inputs based on the best information available in the circumstances, to the extent observable inputs areunavailable (including the Portfolio�s own assumptions used in determining the fair value of investments and derivative financial instruments)
The inputs or methodologies used for valuing investments are not necessarily an indication of the risk associated with investing in them. Changes to theinputs or methodologies used may result in transfers between levels. A reconciliation of Level 3 securities, if any, will be disclosed following the fair valuehierarchy table. For more information about the Portfolio�s policy regarding the valuation of investments, please refer to the Notes to Schedule ofInvestments.
The following table summarizes the fair value hierarchy of the Portfolio�s investments as of March 31, 2022:
Description Level 1 Level 2 Level 3 TotalTotal Common Stocks* $428,965,007 $� $ � $428,965,007Total Short-Term Investment* � 13,996,262 � 13,996,262Securities Lending Reinvestments
Certificate of Deposit � 199,966 � 199,966Repurchase Agreements � 11,244,786 � 11,244,786Mutual Funds 4,000,000 � � 4,000,000
Total Securities Lending Reinvestments 4,000,000 11,444,752 � 15,444,752Total Investments $432,965,007 $25,441,014 $ � $458,406,021Collateral for Securities Loaned (Liability) $� $(15,444,629) $ � $(15,444,629 )
* See Schedule of Investments for additional detailed categorizations.
BHFTII-160
Copyright © 2022 www.secdatabase.com. All Rights Reserved.Please Consider the Environment Before Printing This Document

Table of ContentsBrighthouse Funds Trust II
MetLife Aggregate Bond Index Portfolio
Schedule of Investments as of March 31, 2022 (Unaudited)U.S. Treasury & Government Agencies��69.2% of Net Assets
Security DescriptionPrincipalAmount* Value
Agency Sponsored Mortgage - Backed��28.5%Fannie Mae 15 Yr. Pool
1.500%, 04/01/36 1,743,716 $1,653,4991.500%, 05/01/36 4,438,872 4,209,2111.500%, 09/01/36 1,889,272 1,791,5241.500%, 11/01/36 2,900,325 2,750,2581.500%, 02/01/37 2,470,194 2,342,3892.000%, 11/01/35 9,528,390 9,271,3482.000%, 12/01/35 3,725,856 3,625,3462.000%, 09/01/36 4,646,808 4,517,3552.000%, 12/01/36 2,901,852 2,821,0112.000%, 02/01/37 985,368 957,9132.500%, 12/01/27 945,356 941,3462.500%, 02/01/28 828,575 825,0612.500%, 07/01/28 1,481,619 1,476,6412.500%, 10/01/28 958,132 954,9122.500%, 03/01/30 964,915 962,8682.500%, 09/01/31 1,593,079 1,588,9812.500%, 01/01/32 499,481 498,1962.500%, 04/01/32 1,156,658 1,152,6032.500%, 09/01/32 284,197 283,2012.500%, 12/01/34 882,726 876,6122.500%, 09/01/35 828,077 819,8833.000%, 01/01/27 290,283 293,2813.000%, 02/01/27 489,844 494,9023.000%, 03/01/27 227,827 230,2443.000%, 01/01/29 1,665,020 1,684,4943.000%, 10/01/29 635,656 642,8973.000%, 06/01/30 747,883 756,9653.000%, 02/01/33 1,329,714 1,346,0203.000%, 01/01/36 923,646 930,5873.500%, 02/01/26 345,839 353,4483.500%, 03/01/26 252,875 258,2323.500%, 05/01/29 636,737 650,8743.500%, 08/01/32 215,948 221,4593.500%, 03/01/34 316,653 325,2784.000%, 06/01/24 30,835 31,7244.000%, 11/01/24 200,982 206,7764.500%, 08/01/24 64,534 66,1084.500%, 06/01/25 138,390 142,2285.000%, 02/01/24 11,156 11,323
Fannie Mae 20 Yr. Pool2.000%, 02/01/41 2,585,099 2,435,0092.000%, 06/01/41 2,312,379 2,177,5692.500%, 02/01/41 1,970,394 1,908,2663.000%, 02/01/33 621,994 623,8393.000%, 08/01/35 719,369 720,1513.000%, 05/01/36 837,574 838,3073.500%, 04/01/32 495,260 506,0323.500%, 09/01/35 665,472 679,9423.500%, 07/01/38 471,466 481,5654.000%, 02/01/31 221,770 229,4174.000%, 03/01/38 463,601 477,4214.500%, 08/01/30 127,426 133,6755.000%, 02/01/24 17,054 17,2705.000%, 09/01/25 30,488 32,0565.500%, 07/01/23 8,688 8,790
Agency Sponsored Mortgage - Backed��(Continued)Fannie Mae 20 Yr. Pool
5.500%, 01/01/24 8,773 8,912
Copyright © 2022 www.secdatabase.com. All Rights Reserved.Please Consider the Environment Before Printing This Document

5.500%, 07/01/24 27,728 28,6255.500%, 07/01/25 35,383 36,903
Fannie Mae 30 Yr. Pool1.500%, 03/01/51 3,689,411 3,295,4391.500%, 04/01/51 4,670,698 4,171,4601.500%, 10/01/51 979,634 874,3212.000%, 10/01/50 10,507,619 9,796,3922.000%, 11/01/50 8,278,414 7,718,0752.000%, 12/01/50 4,221,559 3,935,8152.000%, 01/01/51 10,370,506 9,668,5602.000%, 02/01/51 4,372,561 4,076,5972.000%, 04/01/51 9,124,825 8,489,1122.000%, 05/01/51 4,640,405 4,316,3952.000%, 06/01/51 8,434,953 7,844,6842.000%, 08/01/51 2,387,421 2,219,6102.000%, 09/01/51 4,823,547 4,483,7532.000%, 10/01/51 6,815,582 6,334,4022.000%, 11/01/51 1,961,092 1,822,3342.000%, 12/01/51 4,928,369 4,578,8962.000%, 01/01/52 2,970,465 2,759,3672.000%, 02/01/52 3,974,928 3,691,8302.000%, 03/01/52 1,960,038 1,819,3072.000%, 04/01/52 2,000,000 1,856,3992.500%, 01/01/50 1,090,929 1,049,1532.500%, 03/01/50 1,002,701 962,4142.500%, 05/01/50 2,427,203 2,328,7472.500%, 07/01/50 3,917,705 3,757,2802.500%, 08/01/50 7,007,027 6,718,7482.500%, 09/01/50 5,642,563 5,409,3332.500%, 11/01/50 1,393,225 1,335,1002.500%, 12/01/50 2,166,181 2,075,3922.500%, 01/01/51 2,232,953 2,138,9362.500%, 02/01/51 1,117,403 1,070,1402.500%, 05/01/51 3,465,030 3,314,6382.500%, 07/01/51 4,572,115 4,372,2552.500%, 08/01/51 2,323,533 2,221,6042.500%, 09/01/51 7,583,675 7,249,8182.500%, 10/01/51 5,765,558 5,510,8462.500%, 12/01/51 6,866,465 6,560,9892.500%, 01/01/52 2,961,818 2,829,5932.500%, 02/01/52 7,915,384 7,560,9812.500%, 03/01/52 996,917 951,7322.500%, 04/01/52 8,500,000 8,114,1433.000%, 08/01/42 769,407 767,7293.000%, 09/01/42 652,491 651,0683.000%, 11/01/42 1,076,000 1,073,6543.000%, 12/01/42 692,244 690,7353.000%, 01/01/43 479,162 478,1173.000%, 03/01/43 1,030,043 1,027,3813.000%, 05/01/43 1,176,272 1,173,2323.000%, 07/01/43 2,277,895 2,272,0083.000%, 09/01/43 622,591 620,9823.000%, 05/01/45 1,492,644 1,484,1593.000%, 05/01/46 822,747 816,944
BHFTII-161
Copyright © 2022 www.secdatabase.com. All Rights Reserved.Please Consider the Environment Before Printing This Document

Table of ContentsBrighthouse Funds Trust IIMetLife Aggregate Bond Index Portfolio
Schedule of Investments as of March 31, 2022 (Unaudited)U.S. Treasury & Government Agencies��(Continued)
Security DescriptionPrincipalAmount* Value
Agency Sponsored Mortgage - Backed��(Continued)Fannie Mae 30 Yr. Pool
3.000%, 06/01/46 1,123,287 $1,115,3643.000%, 08/01/46 1,208,290 1,199,7673.000%, 02/01/47 1,642,621 1,631,0343.000%, 11/01/49 760,405 747,9823.000%, 12/01/49 1,359,451 1,337,2413.000%, 01/01/50 1,423,202 1,399,9503.000%, 02/01/50 687,588 676,3543.000%, 04/01/50 1,572,128 1,543,8613.000%, 05/01/50 2,845,317 2,794,0493.000%, 07/01/50 1,044,933 1,026,0253.000%, 08/01/50 4,291,797 4,213,9743.000%, 11/01/51 2,846,741 2,788,5423.000%, 12/01/51 2,426,854 2,377,0513.000%, 04/01/52 4,000,000 3,917,1823.500%, 12/01/40 485,622 496,1063.500%, 03/01/42 517,561 529,2853.500%, 04/01/42 688,053 703,6393.500%, 05/01/42 851,843 871,1393.500%, 06/01/42 600,485 614,0873.500%, 08/01/42 352,055 360,0303.500%, 09/01/42 1,590,466 1,626,4933.500%, 10/01/42 836,768 855,7223.500%, 01/01/43 558,392 571,0403.500%, 02/01/43 1,158,560 1,184,8033.500%, 06/01/43 737,241 746,4543.500%, 08/01/44 734,728 748,9143.500%, 02/01/45 860,767 877,3873.500%, 03/01/45 1,410,748 1,436,2573.500%, 04/01/45 1,394,221 1,418,4823.500%, 09/01/45 2,307,111 2,347,2593.500%, 11/01/45 774,079 787,5493.500%, 01/01/46 894,516 910,0823.500%, 03/01/46 843,001 854,0753.500%, 05/01/46 610,421 618,4403.500%, 11/01/47 1,415,483 1,428,1653.500%, 03/01/48 1,155,741 1,170,4213.500%, 02/01/49 281,312 284,8863.500%, 08/01/49 341,065 342,7503.500%, 10/01/49 717,694 721,2413.500%, 01/01/50 480,842 483,2183.500%, 02/01/50 235,779 236,9443.500%, 05/01/50 1,053,475 1,057,9163.500%, 02/01/51 1,790,155 1,797,7014.000%, 08/01/39 402,656 419,7004.000%, 09/01/39 269,027 280,4154.000%, 12/01/39 340,777 355,2024.000%, 06/01/40 300,322 313,0354.000%, 09/01/40 212,260 221,2464.000%, 12/01/40 1,898,868 1,979,2514.000%, 01/01/41 792,951 826,5194.000%, 12/01/41 348,895 363,6494.000%, 02/01/42 461,894 481,4264.000%, 09/01/43 591,350 615,1224.000%, 05/01/44 644,590 670,6304.000%, 08/01/44 1,119,332 1,164,550
Agency Sponsored Mortgage - Backed��(Continued)Fannie Mae 30 Yr. Pool
4.000%, 10/01/44 383,701 399,202
Copyright © 2022 www.secdatabase.com. All Rights Reserved.Please Consider the Environment Before Printing This Document

4.000%, 11/01/44 860,900 890,9044.000%, 01/01/45 775,946 807,2924.000%, 03/01/45 511,874 531,5934.000%, 10/01/45 686,400 712,8424.000%, 03/01/47 224,141 230,5524.000%, 05/01/47 235,040 241,7634.000%, 06/01/47 1,592,521 1,638,0724.000%, 07/01/47 381,208 392,1124.000%, 10/01/47 576,822 593,3214.000%, 05/01/48 652,694 668,3054.000%, 06/01/48 546,061 559,1224.000%, 07/01/48 414,730 424,6504.000%, 09/01/48 199,385 204,1544.000%, 10/01/48 315,891 323,4464.000%, 11/01/48 386,050 395,2834.000%, 04/01/49 656,325 670,4384.000%, 02/01/50 725,996 741,6074.000%, 03/01/50 778,873 795,6204.000%, 09/01/50 605,053 617,5814.500%, 08/01/33 64,861 68,6724.500%, 10/01/33 74,306 78,6714.500%, 04/01/34 52,211 55,3234.500%, 01/01/39 19,177 20,3804.500%, 07/01/39 493,108 523,6894.500%, 09/01/39 614,690 652,8114.500%, 10/01/39 354,238 376,2064.500%, 05/01/40 469,940 498,9504.500%, 08/01/40 546,547 580,2864.500%, 11/01/40 311,870 331,1234.500%, 12/01/40 724,223 768,9314.500%, 04/01/41 1,823,938 1,935,9604.500%, 05/01/41 369,317 391,9354.500%, 03/01/44 268,605 284,5734.500%, 08/01/47 569,360 594,2734.500%, 08/01/48 929,828 965,5584.500%, 10/01/48 308,515 320,3704.500%, 12/01/48 393,615 408,7404.500%, 09/01/50 1,058,912 1,099,6025.000%, 07/01/33 38,353 40,9945.000%, 08/01/33 193,524 206,8515.000%, 09/01/33 66,083 70,6335.000%, 10/01/33 713,375 762,5005.000%, 03/01/34 81,710 87,3375.000%, 04/01/34 169,042 181,2445.000%, 05/01/34 25,928 27,8775.000%, 09/01/34 112,991 121,4875.000%, 02/01/35 48,122 51,7405.000%, 04/01/35 25,732 27,6795.000%, 05/01/35 15,671 16,8575.000%, 11/01/35 48,321 51,9765.000%, 03/01/36 177,935 191,3985.000%, 07/01/37 130,028 140,1665.000%, 01/01/39 135,152 145,6905.000%, 04/01/40 389,078 419,735
BHFTII-162
Copyright © 2022 www.secdatabase.com. All Rights Reserved.Please Consider the Environment Before Printing This Document

Table of ContentsBrighthouse Funds Trust IIMetLife Aggregate Bond Index Portfolio
Schedule of Investments as of March 31, 2022 (Unaudited)U.S. Treasury & Government Agencies��(Continued)
Security DescriptionPrincipalAmount* Value
Agency Sponsored Mortgage - Backed��(Continued)Fannie Mae 30 Yr. Pool
5.000%, 07/01/41 260,794 $281,6965.000%, 04/01/49 567,448 596,8095.500%, 10/01/32 10,616 11,1555.500%, 02/01/33 34,106 36,9215.500%, 03/01/33 70,389 74,0045.500%, 08/01/33 297,005 323,3805.500%, 10/01/33 41,789 45,5495.500%, 12/01/33 212,119 228,1155.500%, 02/01/34 40,995 43,3075.500%, 03/01/34 31,663 34,3725.500%, 04/01/34 16,274 17,6095.500%, 06/01/34 72,381 78,6605.500%, 09/01/34 68,098 73,9725.500%, 12/01/34 49,905 54,3875.500%, 01/01/35 43,528 47,2815.500%, 04/01/35 8,183 8,5985.500%, 06/01/35 63,005 67,8695.500%, 01/01/37 66,997 73,1205.500%, 05/01/37 44,654 48,6905.500%, 05/01/38 28,426 30,9605.500%, 06/01/38 30,394 33,2596.000%, 08/01/28 570 5716.000%, 11/01/28 178 1886.000%, 12/01/28 280 2996.000%, 06/01/31 25,500 27,1026.000%, 09/01/32 30,308 33,1516.000%, 01/01/33 7,517 8,1216.000%, 02/01/33 32,502 35,2106.000%, 03/01/33 38,184 39,1186.000%, 04/01/33 71,398 75,0606.000%, 05/01/33 68,030 72,3556.000%, 05/01/34 59,359 62,3956.000%, 09/01/34 56,117 60,5516.000%, 11/01/34 97,605 107,4996.000%, 01/01/35 37,267 40,0336.000%, 07/01/36 15,524 16,9296.000%, 09/01/36 47,204 52,0526.000%, 07/01/37 41,430 44,3296.000%, 08/01/37 72,813 80,4696.000%, 09/01/37 122,561 135,4656.000%, 10/01/37 42,183 46,6216.000%, 05/01/38 186,926 207,1276.000%, 12/01/38 45,022 49,7866.500%, 05/01/28 12,457 13,3796.500%, 12/01/28 42,198 43,8226.500%, 03/01/29 1,136 1,2176.500%, 04/01/29 9,672 10,4516.500%, 05/01/29 1,079 1,1506.500%, 08/01/29 382 4066.500%, 05/01/30 9,943 10,2866.500%, 09/01/31 3,023 3,1786.500%, 06/01/32 7,079 7,8716.500%, 10/01/33 16,183 16,6256.500%, 10/01/34 100,584 111,7606.500%, 10/01/37 18,016 19,731
Agency Sponsored Mortgage - Backed��(Continued)Fannie Mae 30 Yr. Pool
7.000%, 06/01/26 172 177
Copyright © 2022 www.secdatabase.com. All Rights Reserved.Please Consider the Environment Before Printing This Document

7.000%, 06/01/28 4,489 4,6227.000%, 10/01/29 2,232 2,4547.000%, 06/01/32 21,491 23,7807.000%, 10/01/37 59,866 68,2127.500%, 09/01/25 949 9957.500%, 06/01/26 1,020 1,0747.500%, 07/01/29 3,324 3,6457.500%, 10/01/29 1,820 1,8968.000%, 11/01/29 44 508.000%, 05/01/30 12,172 13,0558.000%, 11/01/30 559 6088.000%, 01/01/31 657 7098.000%, 02/01/31 1,785 2,014
Fannie Mae-ACES1.610%, 03/25/31 1,523,000 1,435,3232.190%, 01/25/30 1,435,000 1,370,404
Freddie Mac 15 Yr. Gold Pool2.500%, 12/01/27 325,435 324,2692.500%, 02/01/28 846,231 843,9442.500%, 04/01/28 640,394 638,6632.500%, 12/01/29 873,666 872,1502.500%, 01/01/31 1,234,024 1,232,2162.500%, 01/01/32 2,085,105 2,081,1113.000%, 03/01/27 273,267 276,2773.000%, 05/01/27 383,758 388,0993.000%, 11/01/28 532,341 538,9413.000%, 12/01/29 955,818 967,3643.000%, 05/01/31 1,108,225 1,124,2743.500%, 12/01/25 256,197 262,0293.500%, 05/01/26 91,293 93,2923.500%, 09/01/30 826,356 848,3264.000%, 05/01/25 102,651 105,7214.000%, 08/01/25 54,526 56,1574.000%, 10/01/25 102,399 105,4625.500%, 01/01/24 22,477 22,932
Freddie Mac 15 Yr. Pool1.500%, 03/01/36 1,697,118 1,609,3701.500%, 05/01/36 4,465,221 4,234,3482.000%, 10/01/35 2,712,093 2,638,9292.000%, 11/01/35 2,128,931 2,071,4992.000%, 06/01/36 2,650,526 2,576,6962.500%, 08/01/35 1,427,056 1,412,9463.000%, 10/01/32 552,788 559,5673.000%, 03/01/35 875,369 884,124
Freddie Mac 20 Yr. Gold Pool3.000%, 04/01/33 986,600 990,2843.000%, 02/01/37 1,021,060 1,022,6883.500%, 04/01/32 600,264 613,7564.000%, 01/01/31 242,784 251,3284.000%, 08/01/31 259,679 268,8274.500%, 05/01/29 61,082 64,1245.000%, 03/01/27 26,938 28,553
Freddie Mac 20 Yr. Pool1.500%, 01/01/42 2,963,593 2,681,320
BHFTII-163
Copyright © 2022 www.secdatabase.com. All Rights Reserved.Please Consider the Environment Before Printing This Document

Table of ContentsBrighthouse Funds Trust IIMetLife Aggregate Bond Index Portfolio
Schedule of Investments as of March 31, 2022 (Unaudited)U.S. Treasury & Government Agencies��(Continued)
Security DescriptionPrincipalAmount* Value
Agency Sponsored Mortgage - Backed��(Continued)Freddie Mac 20 Yr. Pool
2.000%, 03/01/41 2,196,029 $2,067,9762.000%, 12/01/41 2,945,648 2,773,8832.500%, 02/01/41 1,665,712 1,613,157
Freddie Mac 30 Yr. Gold Pool3.000%, 10/01/42 1,044,380 1,042,8533.000%, 01/01/43 786,398 785,2493.000%, 03/01/43 693,698 692,6843.000%, 04/01/43 1,614,071 1,611,0573.000%, 06/01/43 986,503 984,6613.000%, 06/01/45 1,141,332 1,135,6663.000%, 06/01/46 1,142,723 1,135,4853.000%, 11/01/46 1,266,379 1,258,3583.000%, 01/01/47 2,224,340 2,210,2533.500%, 01/01/42 360,985 369,0383.500%, 03/01/42 329,220 336,9283.500%, 02/01/43 568,534 581,8453.500%, 05/01/43 862,081 879,6463.500%, 06/01/43 512,907 523,3583.500%, 06/01/44 424,534 433,0693.500%, 10/01/44 529,785 540,4363.500%, 11/01/44 999,812 1,019,9133.500%, 12/01/44 633,543 646,2803.500%, 05/01/45 815,619 830,4263.500%, 08/01/45 1,452,311 1,478,6773.500%, 11/01/45 799,461 813,9753.500%, 12/01/45 496,539 505,5533.500%, 03/01/46 1,428,999 1,452,1653.500%, 06/01/47 652,867 659,2103.500%, 08/01/47 429,422 433,5943.500%, 11/01/47 565,908 571,4064.000%, 06/01/39 214,143 223,3884.000%, 12/01/39 477,965 498,5994.000%, 11/01/40 292,313 304,9144.000%, 04/01/41 354,682 369,9574.000%, 09/01/41 304,635 317,7554.000%, 10/01/41 907,290 946,3654.000%, 11/01/41 253,864 264,7974.000%, 07/01/44 694,634 723,1924.000%, 10/01/44 540,100 562,3044.000%, 07/01/45 856,505 890,1814.000%, 01/01/46 796,075 827,3764.000%, 02/01/46 449,524 467,1994.000%, 06/01/47 715,603 736,6074.000%, 10/01/47 381,092 392,2784.000%, 11/01/47 366,211 376,9604.000%, 03/01/48 583,896 601,0354.000%, 05/01/48 264,459 270,9854.000%, 10/01/48 297,564 304,9074.000%, 11/01/48 355,396 364,1674.000%, 01/01/49 210,619 215,8164.500%, 10/01/35 122,054 130,7634.500%, 06/01/38 185,563 198,8044.500%, 02/01/39 116,223 123,6524.500%, 03/01/39 128,303 136,3714.500%, 04/01/39 174,726 185,714
Agency Sponsored Mortgage - Backed��(Continued)Freddie Mac 30 Yr. Gold Pool
4.500%, 09/01/39 186,556 198,288
Copyright © 2022 www.secdatabase.com. All Rights Reserved.Please Consider the Environment Before Printing This Document

4.500%, 10/01/39 471,274 500,9104.500%, 11/01/39 131,624 139,9014.500%, 01/01/40 126,732 134,7024.500%, 05/01/40 192,511 204,5504.500%, 11/01/40 313,195 332,7824.500%, 02/01/41 49,860 52,9634.500%, 05/01/41 181,513 192,8104.500%, 06/01/41 114,414 121,5354.500%, 12/01/43 221,474 235,0274.500%, 12/01/45 339,255 359,6804.500%, 08/01/47 536,514 560,4574.500%, 08/01/48 223,836 232,6204.500%, 10/01/48 403,624 419,4644.500%, 12/01/48 247,889 257,6185.000%, 10/01/33 204,533 218,9165.000%, 03/01/34 32,079 34,5175.000%, 08/01/35 159,753 171,9645.000%, 09/01/35 52,231 56,2245.000%, 10/01/35 18,386 19,7915.000%, 01/01/36 156,079 168,0105.000%, 04/01/38 87,544 94,5555.000%, 11/01/39 434,220 468,6085.000%, 05/01/40 465,604 502,5825.500%, 06/01/34 75,615 80,1795.500%, 10/01/35 78,883 83,3535.500%, 12/01/35 176,657 192,6855.500%, 01/01/36 136,408 148,4675.500%, 12/01/37 115,990 126,3145.500%, 04/01/38 479,563 523,6355.500%, 07/01/38 60,707 66,5125.500%, 08/01/38 173,869 189,9196.000%, 11/01/28 2,178 2,3116.000%, 12/01/28 1,613 1,7296.000%, 04/01/29 726 7616.000%, 06/01/31 1,051 1,1176.000%, 07/01/31 226 2476.000%, 09/01/31 37,097 38,5716.000%, 11/01/32 7,037 7,5876.000%, 06/01/34 35,924 37,0726.000%, 11/01/35 32,250 35,2196.000%, 02/01/36 38,942 41,7276.000%, 08/01/36 19,451 21,4876.000%, 10/01/36 51,945 57,4106.000%, 01/01/37 21,981 23,7916.000%, 02/01/38 49,887 55,4576.000%, 11/01/39 447,840 496,4196.000%, 04/01/40 134,502 150,7336.500%, 02/01/30 3,596 3,8536.500%, 08/01/31 2,929 3,2366.500%, 10/01/31 5,124 5,4026.500%, 11/01/31 6,740 7,4776.500%, 03/01/32 103,153 113,4926.500%, 04/01/32 100,405 110,933
BHFTII-164
Copyright © 2022 www.secdatabase.com. All Rights Reserved.Please Consider the Environment Before Printing This Document

Table of ContentsBrighthouse Funds Trust IIMetLife Aggregate Bond Index Portfolio
Schedule of Investments as of March 31, 2022 (Unaudited)U.S. Treasury & Government Agencies��(Continued)
Security DescriptionPrincipalAmount* Value
Agency Sponsored Mortgage - Backed��(Continued)Freddie Mac 30 Yr. Gold Pool
6.500%, 09/01/36 147,106 $165,5606.500%, 11/01/37 30,785 34,3387.000%, 12/01/27 418 4527.000%, 11/01/28 797 8727.000%, 04/01/29 1,156 1,2747.000%, 05/01/29 429 4597.000%, 07/01/29 162 1677.000%, 01/01/31 32,375 34,0127.500%, 10/01/27 2,627 2,8447.500%, 10/01/29 3,906 4,3377.500%, 05/01/30 6,219 6,7998.000%, 02/01/27 976 1,0438.000%, 10/01/28 1,672 1,825
Freddie Mac 30 Yr. Pool1.500%, 03/01/51 3,692,386 3,298,1581.500%, 04/01/51 4,668,673 4,169,7311.500%, 05/01/51 2,349,983 2,098,5992.000%, 10/01/50 8,874,466 8,273,7002.000%, 11/01/50 4,159,843 3,878,2382.000%, 12/01/50 6,799,585 6,339,2812.000%, 01/01/51 10,374,475 9,672,1652.000%, 02/01/51 4,367,508 4,071,8452.000%, 05/01/51 8,297,876 7,718,5212.000%, 06/01/51 4,680,831 4,353,2902.000%, 07/01/51 5,676,063 5,278,0002.000%, 08/01/51 4,659,241 4,331,7652.000%, 12/01/51 6,886,579 6,393,8722.500%, 03/01/50 1,811,507 1,738,7212.500%, 07/01/50 7,199,850 6,905,0152.500%, 09/01/50 3,225,877 3,092,5342.500%, 10/01/50 2,606,491 2,498,2482.500%, 12/01/50 3,614,004 3,462,5292.500%, 04/01/51 4,736,143 4,531,3122.500%, 07/01/51 6,406,989 6,126,9172.500%, 08/01/51 4,477,353 4,280,9382.500%, 12/01/51 2,450,255 2,341,2463.000%, 01/01/48 476,526 472,3933.000%, 09/01/49 1,088,124 1,070,3283.000%, 12/01/49 1,404,312 1,381,3463.000%, 02/01/50 712,383 700,7323.000%, 04/01/50 1,262,288 1,239,5943.000%, 05/01/50 1,215,085 1,193,1923.000%, 07/01/50 1,082,235 1,062,6533.000%, 11/01/50 1,190,512 1,168,7893.500%, 10/01/47 584,691 589,9333.500%, 04/01/49 399,872 401,8503.500%, 05/01/49 258,920 260,2013.500%, 10/01/49 554,377 557,1193.500%, 03/01/50 763,228 767,0033.500%, 06/01/50 1,437,018 1,443,0843.500%, 08/01/50 1,953,465 1,961,7104.000%, 02/01/49 204,741 209,6464.000%, 06/01/49 416,300 425,2644.500%, 01/01/49 218,035 226,4304.500%, 09/01/49 619,617 643,123
Agency Sponsored Mortgage - Backed��(Continued)Freddie Mac Multifamily Structured Pass-Through Certificates
2.519%, 07/25/29 2,250,000 2,207,644
Copyright © 2022 www.secdatabase.com. All Rights Reserved.Please Consider the Environment Before Printing This Document

2.785%, 06/25/29 1,800,000 1,796,8013.117%, 06/25/27 1,000,000 1,013,9393.171%, 10/25/24 975,000 981,8773.187%, 09/25/27 (a) 1,265,000 1,287,6763.194%, 07/25/27 685,000 697,4123.780%, 10/25/28 (a) 4,000,000 4,189,5113.920%, 09/25/28 (a) 2,900,000 3,082,6053.926%, 07/25/28 (a) 2,500,000 2,655,378
Ginnie Mae I 15 Yr. Pool3.000%, 08/15/28 615,000 621,360
Ginnie Mae I 30 Yr. Pool3.000%, 11/15/42 745,288 751,7833.000%, 12/15/42 792,707 799,6143.000%, 02/15/43 560,258 565,1403.000%, 03/15/43 580,858 585,9143.000%, 05/15/43 837,139 844,4253.000%, 07/15/43 529,356 533,9633.500%, 02/15/42 208,811 215,3564.000%, 07/15/39 461,295 484,1584.000%, 07/15/40 248,996 261,2914.500%, 01/15/39 91,842 99,1874.500%, 04/15/39 244,156 264,1014.500%, 05/15/39 499,459 540,2604.500%, 08/15/39 194,810 210,7244.500%, 01/15/40 215,147 232,7224.500%, 04/15/40 98,836 106,9044.500%, 02/15/41 75,376 81,5294.500%, 04/15/41 71,063 76,7955.000%, 12/15/35 95,743 102,5195.000%, 12/15/36 19,611 20,1815.000%, 01/15/39 284,449 305,4755.000%, 02/15/39 52,395 56,6705.000%, 08/15/39 307,344 330,6315.000%, 09/15/39 56,392 60,6115.000%, 12/15/39 193,834 208,4765.000%, 05/15/40 236,511 250,8855.500%, 03/15/36 50,162 53,1335.500%, 09/15/38 18,913 19,8145.500%, 08/15/39 60,199 66,5056.000%, 01/15/29 1,039 1,0886.000%, 01/15/33 76,248 83,5606.000%, 03/15/35 56,900 62,9716.000%, 12/15/35 47,027 50,9966.000%, 09/15/36 39,924 43,4536.000%, 07/15/38 107,187 118,6086.500%, 05/15/23 170 1706.500%, 02/15/27 6,696 6,9816.500%, 07/15/28 3,566 3,7496.500%, 08/15/28 3,902 4,1336.500%, 11/15/28 1,830 1,9696.500%, 12/15/28 4,201 4,3876.500%, 07/15/29 1,385 1,4366.500%, 05/15/36 84,516 94,3577.000%, 01/15/28 631 673
BHFTII-165
Copyright © 2022 www.secdatabase.com. All Rights Reserved.Please Consider the Environment Before Printing This Document

Table of ContentsBrighthouse Funds Trust IIMetLife Aggregate Bond Index Portfolio
Schedule of Investments as of March 31, 2022 (Unaudited)U.S. Treasury & Government Agencies��(Continued)
Security DescriptionPrincipalAmount* Value
Agency Sponsored Mortgage - Backed��(Continued)Ginnie Mae I 30 Yr. Pool
7.000%, 05/15/28 3,139 $3,2647.000%, 06/15/28 3,415 3,6697.000%, 10/15/28 4,105 4,3757.000%, 09/15/29 615 6187.000%, 01/15/31 966 1,0087.000%, 03/15/31 507 5417.000%, 08/15/31 29,204 32,6527.000%, 07/15/32 10,812 12,1288.000%, 08/15/26 757 8068.000%, 09/15/26 788 815
Ginnie Mae II 30 Yr. Pool2.000%, 11/20/50 4,927,636 4,705,6962.000%, 01/20/51 2,553,413 2,438,4072.000%, 03/20/51 4,407,094 4,197,5892.000%, 04/20/51 4,500,064 4,286,1392.000%, 05/20/51 10,055,966 9,593,6942.000%, 06/20/51 2,327,484 2,220,2602.000%, 10/20/51 2,941,093 2,801,2792.000%, 12/20/51 4,951,602 4,716,2122.500%, 02/20/50 1,077,883 1,048,6662.500%, 06/20/50 3,878,303 3,773,1792.500%, 07/20/50 2,772,576 2,697,4222.500%, 09/20/50 4,553,392 4,429,9682.500%, 10/20/50 1,338,623 1,302,3392.500%, 11/20/50 2,042,526 1,987,1612.500%, 12/20/50 2,121,763 2,064,2512.500%, 04/20/51 2,578,673 2,502,8702.500%, 06/20/51 2,739,780 2,659,2422.500%, 08/20/51 2,865,603 2,781,3662.500%, 09/20/51 4,834,645 4,692,5252.500%, 12/20/51 4,936,496 4,791,3833.000%, 12/20/42 754,161 759,1693.000%, 03/20/43 1,288,448 1,297,6273.000%, 12/20/44 653,710 654,8703.000%, 04/20/45 596,769 596,6373.000%, 08/20/45 1,059,330 1,059,0953.000%, 11/20/45 570,658 570,5313.000%, 01/20/46 947,521 947,3113.000%, 09/20/46 1,042,064 1,039,7233.000%, 10/20/46 1,059,231 1,056,8513.000%, 11/20/46 1,115,665 1,113,1583.000%, 01/20/47 1,152,906 1,150,3153.000%, 04/20/47 504,649 502,9423.000%, 02/20/48 737,101 734,6073.000%, 10/20/49 812,981 806,7153.000%, 12/20/49 1,490,985 1,480,5533.000%, 01/20/50 2,127,547 2,108,5883.000%, 05/20/50 1,681,303 1,667,8323.000%, 07/20/50 1,080,181 1,071,6443.000%, 11/20/50 2,405,908 2,387,1533.000%, 05/20/51 (b) 2,103,588 2,081,6243.500%, 12/20/41 441,150 452,5783.500%, 08/20/42 410,430 420,2503.500%, 01/20/43 582,739 596,6823.500%, 05/20/43 889,588 910,442
Agency Sponsored Mortgage - Backed��(Continued)Ginnie Mae II 30 Yr. Pool
3.500%, 07/20/44 877,848 895,924
Copyright © 2022 www.secdatabase.com. All Rights Reserved.Please Consider the Environment Before Printing This Document

3.500%, 02/20/45 895,916 914,3653.500%, 06/20/45 564,091 575,5603.500%, 08/20/45 1,319,781 1,346,6133.500%, 09/20/45 1,503,163 1,533,7243.500%, 10/20/45 872,844 890,5903.500%, 12/20/45 811,140 827,6313.500%, 01/20/46 770,055 785,7113.500%, 02/20/46 631,969 644,8183.500%, 06/20/46 698,735 712,4413.500%, 02/20/47 1,102,007 1,121,5693.500%, 03/20/47 935,175 950,0813.500%, 09/20/47 391,737 397,0913.500%, 10/20/48 190,124 192,4763.500%, 05/20/49 347,351 351,6413.500%, 07/20/49 385,118 390,0013.500%, 09/20/49 1,016,343 1,027,8793.500%, 10/20/49 637,418 644,6533.500%, 11/20/49 879,719 889,3133.500%, 12/20/49 579,540 585,6033.500%, 02/20/50 750,662 758,5163.500%, 06/20/50 834,857 840,5843.500%, 02/20/51 1,302,160 1,311,2924.000%, 11/20/40 388,824 407,0074.000%, 12/20/40 554,766 580,7104.000%, 05/20/43 1,170,336 1,228,3874.000%, 11/20/43 260,201 273,1084.000%, 04/20/44 370,155 386,8004.000%, 05/20/44 445,009 465,0214.000%, 09/20/44 726,221 758,8794.000%, 10/20/44 1,029,095 1,075,3734.000%, 11/20/44 193,766 202,4794.000%, 10/20/45 676,538 703,5974.000%, 11/20/45 367,712 382,4194.000%, 02/20/47 737,052 764,3454.000%, 03/20/47 145,203 150,5804.000%, 04/20/47 587,231 605,0724.000%, 09/20/47 535,897 552,1784.000%, 07/20/48 374,193 384,1274.000%, 08/20/48 270,102 277,2724.000%, 09/20/48 479,818 492,5564.000%, 07/20/49 501,028 511,7614.000%, 05/20/50 706,279 721,4094.500%, 08/20/40 317,328 341,6764.500%, 12/20/40 234,725 252,7354.500%, 04/20/41 179,716 193,5274.500%, 03/20/42 187,793 202,2244.500%, 10/20/43 228,875 245,3624.500%, 03/20/47 372,115 392,0364.500%, 03/20/49 267,326 277,0745.000%, 08/20/40 164,069 178,5565.000%, 10/20/40 183,749 199,9735.000%, 06/20/44 391,208 425,7505.000%, 10/20/48 304,064 320,2985.000%, 01/20/49 213,492 224,890
BHFTII-166
Copyright © 2022 www.secdatabase.com. All Rights Reserved.Please Consider the Environment Before Printing This Document

Table of ContentsBrighthouse Funds Trust IIMetLife Aggregate Bond Index Portfolio
Schedule of Investments as of March 31, 2022 (Unaudited)U.S. Treasury & Government Agencies��(Continued)
Security DescriptionPrincipalAmount* Value
Agency Sponsored Mortgage - Backed��(Continued)Ginnie Mae II 30 Yr. Pool
6.500%, 06/20/31 8,099 $8,8757.500%, 02/20/28 830 896
692,934,054
Federal Agencies��1.4%Federal Farm Credit Banks Funding
Corp.0.125%, 05/10/23 6,000,000 5,874,000
Federal Home Loan Banks2.875%, 09/13/24 4,600,000 4,638,8243.250%, 11/16/28 (b) 2,700,000 2,823,795
Federal Home Loan Mortgage Corp.0.250%, 08/24/23 1,500,000 1,461,9300.375%, 09/23/25 1,000,000 927,8401.500%, 02/12/25 (b) 2,500,000 2,430,5506.250%, 07/15/32 1,600,000 2,121,7446.750%, 03/15/31 900,000 1,196,478
Federal National Mortgage Association0.750%, 10/08/27 (b) 1,500,000 1,365,4952.125%, 04/24/26 (b) 3,500,000 3,449,8802.625%, 09/06/24 (b) 2,800,000 2,815,4566.625%, 11/15/30 (b) 1,450,000 1,901,327
Tennessee Valley Authority3.500%, 12/15/42 (b) 1,600,000 1,634,384
32,641,703
U.S. Treasury��39.3%U.S. Treasury Bonds
1.125%, 05/15/40 7,100,000 5,592,3591.125%, 08/15/40 3,200,000 2,507,0001.250%, 05/15/50 6,200,000 4,627,7191.375%, 11/15/40 7,500,000 6,130,0781.375%, 08/15/50 8,400,000 6,468,0001.625%, 11/15/50 (b) 6,500,000 5,332,0311.750%, 08/15/41 4,300,000 3,724,2031.875%, 02/15/41 5,200,000 4,627,1881.875%, 02/15/51 (b) 6,100,000 5,326,0631.875%, 11/15/51 (b) 6,500,000 5,691,5622.000%, 02/15/50 8,600,000 7,737,3122.000%, 08/15/51 7,500,000 6,760,5472.250%, 05/15/41 3,700,000 3,491,2972.250%, 08/15/46 3,000,000 2,805,0002.250%, 08/15/49 8,000,000 7,597,5002.250%, 02/15/52 2,100,000 2,014,0312.375%, 05/15/51 (b) 5,100,000 4,996,4062.500%, 05/15/46 4,800,000 4,702,5002.750%, 08/15/42 4,820,000 4,897,5722.750%, 11/15/42 1,200,000 1,218,0002.750%, 08/15/47 (b) 3,000,000 3,107,8132.750%, 11/15/47 800,000 828,8752.875%, 05/15/43 3,260,000 3,371,0442.875%, 08/15/45 5,200,000 5,419,3752.875%, 11/15/46 (b) 4,600,000 4,840,0632.875%, 05/15/49 (b) 2,300,000 2,470,3443.000%, 11/15/44 2,600,000 2,753,969
U.S. Treasury��(Continued)U.S. Treasury Bonds
3.000%, 05/15/45 3,100,000 3,292,781
Copyright © 2022 www.secdatabase.com. All Rights Reserved.Please Consider the Environment Before Printing This Document

3.000%, 02/15/47 3,000,000 3,228,7503.000%, 05/15/47 2,800,000 3,019,1883.000%, 08/15/48 9,700,000 10,574,5163.000%, 02/15/49 7,300,000 8,014,0313.125%, 11/15/41 3,000,000 3,233,4383.125%, 02/15/43 3,270,000 3,515,7613.125%, 08/15/44 4,700,000 5,075,2663.375%, 05/15/44 3,000,000 3,365,6253.375%, 11/15/48 5,000,000 5,847,6563.500%, 02/15/39 (b) 1,872,000 2,143,4403.625%, 08/15/43 2,600,000 3,014,3753.625%, 02/15/44 2,420,000 2,813,2503.750%, 08/15/41 2,800,000 3,290,8753.750%, 11/15/43 2,600,000 3,072,8754.250%, 05/15/39 2,200,000 2,753,4384.250%, 11/15/40 1,780,000 2,223,3314.375%, 11/15/39 1,900,000 2,409,7344.375%, 05/15/40 1,220,000 1,550,7344.375%, 05/15/41 (b) 1,350,000 1,714,7114.500%, 02/15/36 (b) 600,000 759,0004.500%, 05/15/38 2,000,000 2,565,0004.625%, 02/15/40 1,300,000 1,702,7975.000%, 05/15/37 (b) 1,560,000 2,086,9885.250%, 02/15/29 750,000 882,6566.250%, 08/15/23 7,700,000 8,127,7116.250%, 05/15/30 2,500,000 3,212,891
U.S. Treasury Notes0.125%, 07/15/23 13,500,000 13,174,6290.125%, 08/15/23 8,000,000 7,789,3750.125%, 08/31/23 7,000,000 6,809,1410.125%, 09/15/23 12,000,000 11,659,2190.125%, 10/15/23 (b) 15,000,000 14,538,2810.250%, 06/15/23 15,000,000 14,705,2730.250%, 09/30/23 (b) 7,000,000 6,806,1330.250%, 03/15/24 (b) 14,000,000 13,448,7500.250%, 06/15/24 7,000,000 6,675,7030.250%, 06/30/25 6,100,000 5,667,2810.250%, 07/31/25 7,000,000 6,489,2190.250%, 08/31/25 5,100,000 4,718,6950.250%, 09/30/25 9,000,000 8,313,0470.375%, 04/15/24 4,000,000 3,842,5000.375%, 07/15/24 13,000,000 12,407,8910.375%, 08/15/24 (b) 7,000,000 6,666,4060.375%, 09/15/24 (b) 10,100,000 9,595,7890.375%, 04/30/25 7,200,000 6,742,6880.375%, 11/30/25 6,100,000 5,639,1640.375%, 12/31/25 12,200,000 11,264,9840.375%, 01/31/26 11,200,000 10,319,7500.375%, 07/31/27 (b) 3,100,000 2,779,5860.375%, 09/30/27 6,300,000 5,623,2420.500%, 03/31/25 (b) 4,000,000 3,768,7500.500%, 02/28/26 6,100,000 5,639,6410.500%, 04/30/27 (b) 8,000,000 7,254,3750.500%, 10/31/27 (b) 7,600,000 6,822,781
BHFTII-167
Copyright © 2022 www.secdatabase.com. All Rights Reserved.Please Consider the Environment Before Printing This Document

Table of ContentsBrighthouse Funds Trust IIMetLife Aggregate Bond Index Portfolio
Schedule of Investments as of March 31, 2022 (Unaudited)U.S. Treasury & Government Agencies��(Continued)
Security DescriptionPrincipalAmount* Value
U.S. Treasury��(Continued)U.S. Treasury Notes
0.625%, 07/31/26 (b) 6,100,000 $5,629,1560.625%, 11/30/27 (b) 7,000,000 6,318,0470.625%, 12/31/27 7,200,000 6,490,6880.625%, 05/15/30 10,000,000 8,720,3120.625%, 08/15/30 11,100,000 9,643,1250.750%, 03/31/26 13,100,000 12,215,7500.750%, 01/31/28 (b) 13,100,000 11,881,0860.875%, 06/30/26 (b) 6,000,000 5,603,9060.875%, 11/15/30 (b) 12,700,000 11,251,4061.000%, 07/31/28 (b) 4,000,000 3,660,3131.125%, 02/28/25 3,800,000 3,653,0471.125%, 08/31/28 6,000,000 5,528,4381.125%, 02/15/31 (b) 11,500,000 10,385,9371.250%, 07/31/23 8,600,000 8,509,2971.250%, 11/30/26 2,100,000 1,986,6331.250%, 03/31/28 (b) 10,100,000 9,419,8281.250%, 04/30/28 6,000,000 5,589,8441.250%, 06/30/28 5,900,000 5,488,3831.250%, 09/30/28 6,000,000 5,567,8121.250%, 08/15/31 (b) 10,300,000 9,364,9531.375%, 11/15/31 10,200,000 9,360,0941.500%, 10/31/24 8,100,000 7,901,2971.500%, 11/30/24 7,600,000 7,402,8751.500%, 08/15/26 5,600,000 5,365,9381.500%, 01/31/27 (b) 8,000,000 7,646,2501.500%, 11/30/28 10,000,000 9,420,3121.500%, 02/15/30 (b) 8,300,000 7,781,2501.625%, 05/31/23 7,900,000 7,873,4611.625%, 02/15/26 6,400,000 6,185,5001.625%, 05/15/26 10,900,000 10,516,7971.625%, 09/30/26 (b) 6,000,000 5,776,4061.625%, 08/15/29 4,500,000 4,267,2661.625%, 05/15/31 (b) 9,800,000 9,230,3751.750%, 05/15/23 12,720,000 12,701,6161.750%, 06/30/24 7,600,000 7,490,1561.750%, 01/31/29 (b) 5,000,000 4,788,2811.875%, 08/31/24 (b) 10,200,000 10,057,3591.875%, 06/30/26 6,900,000 6,725,3441.875%, 02/15/32 (b) 4,100,000 3,937,9222.000%, 05/31/24 (b) 8,400,000 8,329,1252.000%, 02/15/25 7,600,000 7,492,5312.000%, 08/15/25 5,100,000 5,009,9532.000%, 11/15/26 7,300,000 7,140,3122.125%, 02/29/24 12,000,000 11,956,8752.125%, 03/31/24 13,100,000 13,045,2462.125%, 05/15/25 (b) 5,500,000 5,432,9692.125%, 05/31/26 6,800,000 6,693,7502.250%, 11/15/24 6,700,000 6,657,0782.250%, 11/15/25 10,800,000 10,690,3122.250%, 02/15/27 7,800,000 7,718,3442.250%, 08/15/27 6,100,000 6,032,3282.250%, 11/15/27 5,600,000 5,534,3752.375%, 08/15/24 9,600,000 9,579,0002.375%, 05/15/27 8,000,000 7,963,7502.375%, 05/15/29 6,800,000 6,780,875
U.S. Treasury��(Continued)U.S. Treasury Notes
2.500%, 01/31/24 3,900,000 3,913,102
Copyright © 2022 www.secdatabase.com. All Rights Reserved.Please Consider the Environment Before Printing This Document

2.500%, 02/28/26 6,700,000 6,689,5312.625%, 12/31/23 (b) 6,900,000 6,942,3162.625%, 02/15/29 8,300,000 8,399,8592.750%, 04/30/23 7,500,000 7,576,1722.750%, 08/31/23 4,800,000 4,843,5002.750%, 11/15/23 6,335,000 6,386,9672.750%, 02/15/24 12,400,000 12,495,4222.750%, 02/28/25 (b) 6,900,000 6,944,7422.750%, 02/15/28 (b) 6,000,000 6,092,3442.875%, 04/30/25 8,400,000 8,486,6252.875%, 07/31/25 6,600,000 6,671,6722.875%, 05/15/28 5,900,000 6,037,3592.875%, 08/15/28 6,000,000 6,146,7193.125%, 11/15/28 8,000,000 8,327,500
955,038,075Total U.S. Treasury & Government
Agencies(Cost $1,757,233,729) 1,680,613,832
Corporate Bonds &Notes��26.6%Aerospace/Defense��0.6%Boeing Co. (The)
5.150%, 05/01/30 (b) 3,800,000 4,047,2285.930%, 05/01/60 (b) 1,100,000 1,273,3277.250%, 06/15/25 (b) 460,000 511,037
Lockheed Martin Corp.3.550%, 01/15/26 (b) 1,000,000 1,024,8104.090%, 09/15/52 954,000 1,047,015
Northrop Grumman Corp.3.250%, 01/15/28 (b) 1,100,000 1,100,341
Northrop Grumman Systems Corp.7.750%, 02/15/31 515,000 669,927
Raytheon Technologies Corp.3.125%, 05/04/27 (b) 2,000,000 2,005,4204.500%, 06/01/42 (b) 1,645,000 1,810,8337.500%, 09/15/29 200,000 253,018
13,742,956
Agriculture��0.3%Altria Group, Inc.
4.000%, 01/31/24 (b) 1,000,000 1,019,6205.950%, 02/14/49 1,200,000 1,305,732
Philip Morris International, Inc.3.250%, 11/10/24 (b) 2,000,000 2,015,960
Reynolds American, Inc.4.450%, 06/12/25 2,800,000 2,858,576
7,199,888
Airlines��0.1%Southwest Airlines Co.
5.125%, 06/15/27 (b) 1,900,000 2,031,252
BHFTII-168
Copyright © 2022 www.secdatabase.com. All Rights Reserved.Please Consider the Environment Before Printing This Document

Table of ContentsBrighthouse Funds Trust IIMetLife Aggregate Bond Index Portfolio
Schedule of Investments as of March 31, 2022 (Unaudited)Corporate Bonds & Notes��(Continued)
Security DescriptionPrincipalAmount* Value
Apparel��0.1%NIKE, Inc.
2.750%, 03/27/27 (b) 2,000,000 $1,991,220
Auto Manufacturers��0.4%American Honda Finance Corp.
2.250%, 01/12/29 1,000,000 932,6402.300%, 09/09/26 (b) 1,100,000 1,062,028
Daimler Finance North America LLC8.500%, 01/18/31 (b) 1,050,000 1,414,150
General Motors Financial Co., Inc.1.250%, 01/08/26 (b) 1,200,000 1,096,4404.350%, 01/17/27 3,200,000 3,257,792
Toyota Motor Credit Corp.3.375%, 04/01/30 (b) 2,600,000 2,608,944
10,371,994
Banks��5.6%Banco Santander S.A.
4.379%, 04/12/28 (b) 2,200,000 2,230,316Bank of America Corp.
2.676%, SOFR + 1.930%, 06/19/41 (a) 3,000,000 2,542,5902.687%, SOFR + 1.320%, 04/22/32 (a) 2,000,000 1,838,2803.300%, 01/11/23 (b) 4,075,000 4,120,7214.100%, 07/24/23 (b) 2,905,000 2,977,0444.200%, 08/26/24 3,000,000 3,074,3405.875%, 02/07/42 (b) 3,000,000 3,778,560
Bank of New York Mellon Corp. (The)3.442%, 3M LIBOR + 1.069%, 02/07/28(a) 1,800,000 1,823,076
Barclays plc4.375%, 01/12/26 (b) 3,500,000 3,577,525
Canadian Imperial Bank of Commerce2.250%, 01/28/25 (b) 1,000,000 977,010
Citigroup, Inc.2.572%, SOFR + 2.107%, 06/03/31 (a) (b) 2,500,000 2,287,5253.200%, 10/21/26 (b) 1,700,000 1,686,9444.000%, 08/05/24 (b) 900,000 920,9344.412%, SOFR + 3.914%, 03/31/31 (a) (b) 2,900,000 3,019,7124.650%, 07/23/48 (b) 1,300,000 1,470,209
Cooperatieve Rabobank UA5.750%, 12/01/43 (b) 1,200,000 1,457,508
Credit Suisse Group AG4.550%, 04/17/26 (b) 2,700,000 2,746,953
Deutsche Bank AG2.129%, SOFR + 1.870%, 11/24/26 (a) 2,000,000 1,857,120
Discover Bank2.450%, 09/12/24 (b) 1,400,000 1,376,214
Fifth Third Bancorp8.250%, 03/01/38 1,175,000 1,735,287
Goldman Sachs Group, Inc. (The)3.210%, SOFR + 1.513%, 04/22/42 (a) 1,600,000 1,436,8643.850%, 01/26/27 (b) 1,900,000 1,922,2684.000%, 03/03/24 (b) 2,000,000 2,041,1804.223%, 3M LIBOR + 1.301%, 05/01/29(a) (b) 1,900,000 1,946,2466.125%, 02/15/33 (b) 2,075,000 2,481,140
HSBC Holdings plc3.973%, 3M LIBOR + 1.610%, 05/22/30(a) (b) 3,500,000 3,508,050
Copyright © 2022 www.secdatabase.com. All Rights Reserved.Please Consider the Environment Before Printing This Document

Banks��(Continued)HSBC Holdings plc
4.250%, 03/14/24 1,400,000 1,420,9446.500%, 09/15/37 (b) 1,205,000 1,472,064
JPMorgan Chase & Co.1.953%, SOFR + 1.065%, 02/04/32 (a) 2,100,000 1,834,7912.522%, SOFR + 2.040%, 04/22/31 (a) (b) 2,000,000 1,851,9802.950%, 10/01/26 (b) 2,000,000 1,987,1803.882%, 3M LIBOR + 1.360%, 07/24/38(a) 1,000,000 1,016,0403.900%, 07/15/25 4,700,000 4,830,5663.964%, 3M LIBOR + 1.380%, 11/15/48(a) 2,400,000 2,454,096
KeyBank N.A.3.300%, 06/01/25 (b) 3,800,000 3,822,382
KFW0.250%, 10/19/23 (b) 3,000,000 2,909,7900.500%, 09/20/24 1,000,000 952,9101.750%, 09/14/29 (b) 2,000,000 1,900,820
Landwirtschaftliche Rentenbank2.000%, 01/13/25 (b) 1,500,000 1,477,665
Lloyds Banking Group plc3.574%, 3M LIBOR + 1.205%, 11/07/28(a) 1,800,000 1,760,2564.650%, 03/24/26 (b) 1,700,000 1,738,947
Mitsubishi UFJ Financial Group, Inc.0.953%, 1Y H15 + 0.550%, 07/19/25 (a)(b) 2,000,000 1,898,0803.850%, 03/01/26 (b) 1,000,000 1,012,990
Mizuho Financial Group, Inc.4.018%, 03/05/28 (b) 1,800,000 1,826,694
Morgan Stanley4.100%, 05/22/23 2,400,000 2,442,9844.300%, 01/27/45 (b) 1,900,000 1,998,5724.350%, 09/08/26 3,800,000 3,919,9667.250%, 04/01/32 (b) 1,850,000 2,390,367
Natwest Group plc3.875%, 09/12/23 1,000,000 1,009,920
Oesterreichische Kontrollbank AG2.875%, 03/13/23 1,300,000 1,312,701
PNC Bank N.A.2.950%, 02/23/25 4,100,000 4,106,314
Royal Bank of Canada1.600%, 01/21/25 2,100,000 2,024,127
Sumitomo Mitsui Financial Group, Inc.2.632%, 07/14/26 (b) 4,700,000 4,561,021
Toronto-Dominion Bank (The)3.500%, 07/19/23 (b) 3,000,000 3,049,530
Truist Financial Corp.1.267%, SOFR + 0.609%, 03/02/27 (a) (b) 2,000,000 1,857,080
U.S. Bancorp3.600%, 09/11/24 (b) 3,000,000 3,049,080
Wells Fargo & Co.2.879%, SOFR + 1.432%, 10/30/30 (a) 2,400,000 2,284,3923.000%, 10/23/26 (b) 2,000,000 1,972,9405.013%, SOFR + 4.502%, 04/04/51 (a) 1,000,000 1,184,4705.606%, 01/15/44 (b) 2,200,000 2,632,718
Westpac Banking Corp.2.668%, 5Y H15 + 1.750%, 11/15/35 (a) 1,700,000 1,484,746
136,282,739
BHFTII-169
Copyright © 2022 www.secdatabase.com. All Rights Reserved.Please Consider the Environment Before Printing This Document

Table of ContentsBrighthouse Funds Trust IIMetLife Aggregate Bond Index Portfolio
Schedule of Investments as of March 31, 2022 (Unaudited)Corporate Bonds & Notes��(Continued)
Security DescriptionPrincipalAmount* Value
Beverages��0.6%Anheuser-Busch InBev Worldwide, Inc.
4.439%, 10/06/48 (b) 1,165,000 $1,219,5224.600%, 06/01/60 (b) 1,600,000 1,697,4085.550%, 01/23/49 (b) 1,900,000 2,307,303
Coca-Cola Co. (The)1.650%, 06/01/30 2,400,000 2,152,296
Constellation Brands, Inc.3.150%, 08/01/29 1,900,000 1,834,431
Diageo Capital plc2.375%, 10/24/29 (b) 1,400,000 1,324,876
Keurig Dr Pepper, Inc.4.057%, 05/25/23 503,000 511,6474.597%, 05/25/28 (b) 1,200,000 1,268,976
PepsiCo, Inc.2.750%, 03/19/30 (b) 800,000 784,1844.450%, 04/14/46 (b) 2,300,000 2,657,190
15,757,833
Biotechnology��0.3%Amgen, Inc.
2.000%, 01/15/32 (b) 1,600,000 1,420,4802.600%, 08/19/26 (b) 1,200,000 1,184,3284.663%, 06/15/51 1,000,000 1,106,570
Biogen, Inc.4.050%, 09/15/25 (b) 1,300,000 1,336,023
Gilead Sciences, Inc.3.650%, 03/01/26 (b) 3,000,000 3,055,680
8,103,081
Building Materials��0.1%Carrier Global Corp.
2.493%, 02/15/27 (b) 2,000,000 1,909,320
Chemicals��0.4%Dow Chemical Co. (The)
4.375%, 11/15/42 (b) 1,000,000 1,039,3909.400%, 05/15/39 650,000 1,038,668
DuPont de Nemours, Inc.5.419%, 11/15/48 (b) 1,600,000 1,936,608
LyondellBasell Industries NV4.625%, 02/26/55 1,400,000 1,427,146
Nutrien, Ltd.4.200%, 04/01/29 1,000,000 1,045,100
Sherwin-Williams Co. (The)3.450%, 06/01/27 (b) 1,800,000 1,806,498
Westlake Corp.3.125%, 08/15/51 (b) 500,000 414,675
8,708,085
Commercial Services��0.3%Global Payments, Inc.
2.900%, 05/15/30 (b) 900,000 832,833Massachusetts Institute of Technology
2.294%, 07/01/51 (b) 1,200,000 972,612
Commercial Services��(Continued)PayPal Holdings, Inc.
2.850%, 10/01/29 (b) 3,000,000 2,935,380Yale University
2.402%, 04/15/50 2,000,000 1,662,580
Copyright © 2022 www.secdatabase.com. All Rights Reserved.Please Consider the Environment Before Printing This Document

6,403,405
Computers��0.7%Apple, Inc.
2.400%, 05/03/23 (b) 4,072,000 4,093,9482.550%, 08/20/60 (b) 1,000,000 819,3002.650%, 02/08/51 1,500,000 1,296,9004.650%, 02/23/46 2,700,000 3,182,976
Dell International LLC / EMC Corp.5.300%, 10/01/29 (b) 1,800,000 1,960,668
Hewlett Packard Enterprise Co.4.900%, 10/15/25 (b) 1,400,000 1,465,716
International Business Machines Corp.3.300%, 05/15/26 (b) 1,900,000 1,920,0644.000%, 06/20/42 (b) 1,200,000 1,227,084
15,966,656
Cosmetics/Personal Care��0.1%Estee Lauder Cos., Inc. (The)
1.950%, 03/15/31 (b) 1,100,000 998,910Procter & Gamble Co. (The)
3.550%, 03/25/40 (b) 900,000 927,027Unilever Capital Corp.
2.900%, 05/05/27 1,500,000 1,490,9403,416,877
Diversified Financial Services��0.9%AerCap Ireland Capital DAC / AerCap Global
Aviation Trust3.300%, 01/30/32 1,000,000 903,9003.650%, 07/21/27 (b) 1,900,000 1,843,171
Air Lease Corp.2.875%, 01/15/26 (b) 900,000 868,7794.250%, 02/01/24 900,000 911,709
American Express Co.3.300%, 05/03/27 (144A) (b) 3,000,000 3,014,760
BlackRock, Inc.3.500%, 03/18/24 (b) 3,800,000 3,876,988
Capital One Financial Corp.3.800%, 01/31/28 (b) 1,800,000 1,815,552
Charles Schwab Corp. (The)4.625%, 03/22/30 (b) 900,000 979,875
Intercontinental Exchange, Inc.3.000%, 06/15/50 (b) 1,000,000 875,9103.750%, 12/01/25 (b) 1,000,000 1,024,470
Mastercard, Inc.3.350%, 03/26/30 1,700,000 1,735,275
Nomura Holdings, Inc.2.679%, 07/16/30 1,000,000 909,380
Visa, Inc.1.100%, 02/15/31 (b) 3,100,000 2,654,902
21,414,671
BHFTII-170
Copyright © 2022 www.secdatabase.com. All Rights Reserved.Please Consider the Environment Before Printing This Document

Table of ContentsBrighthouse Funds Trust IIMetLife Aggregate Bond Index Portfolio
Schedule of Investments as of March 31, 2022 (Unaudited)Corporate Bonds & Notes��(Continued)
Security DescriptionPrincipalAmount* Value
Electric��2.0%Appalachian Power Co.
3.700%, 05/01/50 (b) 900,000 $841,671CenterPoint Energy Houston Electric LLC
4.500%, 04/01/44 1,300,000 1,430,598CMS Energy Corp.
4.750%, 5Y H15 + 4.116%, 06/01/50 (a)(b) 1,500,000 1,479,345
Commonwealth Edison Co.3.000%, 03/01/50 900,000 804,051
Connecticut Light & Power Co. (The)4.000%, 04/01/48 (b) 1,000,000 1,049,870
Consolidated Edison Co. of New York, Inc.3.950%, 03/01/43 2,070,000 2,019,326
Dominion Energy, Inc.3.900%, 10/01/25 (b) 1,900,000 1,944,6314.600%, 03/15/49 (b) 800,000 871,168
DTE Electric Co.3.700%, 03/15/45 1,000,000 984,510
Duke Energy Carolinas LLC3.550%, 03/15/52 1,000,000 989,6905.300%, 02/15/40 2,000,000 2,368,200
Duke Energy Corp.2.650%, 09/01/26 (b) 2,300,000 2,242,385
Entergy Louisiana LLC4.000%, 03/15/33 (b) 1,000,000 1,042,830
Evergy, Inc.2.900%, 09/15/29 1,500,000 1,433,715
Exelon Corp.3.400%, 04/15/26 (b) 1,000,000 1,004,7205.625%, 06/15/35 (b) 1,500,000 1,710,525
Florida Power & Light Co.5.950%, 02/01/38 (b) 1,700,000 2,142,170
Georgia Power Co.4.300%, 03/15/42 (b) 2,000,000 2,022,280
Louisville Gas and Electric Co.4.250%, 04/01/49 800,000 834,888
MidAmerican Energy Co.3.650%, 04/15/29 (b) 1,700,000 1,752,5474.250%, 07/15/49 (b) 1,500,000 1,641,000
National Rural Utilities Cooperative FinanceCorp.2.400%, 03/15/30 (b) 1,800,000 1,683,378
Northern States Power Co.6.250%, 06/01/36 (b) 2,200,000 2,778,930
Oncor Electric Delivery Co. LLC3.100%, 09/15/49 (b) 900,000 825,354
Pacific Gas & Electric Co.2.500%, 02/01/31 3,000,000 2,581,320
Public Service Electric and Gas Co.1.900%, 08/15/31 (b) 1,600,000 1,427,248
Sempra Energy3.400%, 02/01/28 (b) 1,100,000 1,096,568
Southern California Edison Co.3.650%, 03/01/28 (b) 1,900,000 1,906,6884.000%, 04/01/47 (b) 1,000,000 963,640
Southwestern Electric Power Co.4.100%, 09/15/28 (b) 1,800,000 1,841,040
Electric��(Continued)
Copyright © 2022 www.secdatabase.com. All Rights Reserved.Please Consider the Environment Before Printing This Document

Union Electric Co.3.500%, 03/15/29 (b) 1,800,000 1,829,970
47,544,256
Electrical Components &Equipment��0.0%Emerson Electric Co.
2.200%, 12/21/31 (b) 500,000 461,340
Electronics��0.1%Honeywell International, Inc.
2.500%, 11/01/26 (b) 1,800,000 1,775,862
Environmental Control��0.1%Waste Connections, Inc.
2.200%, 01/15/32 (b) 500,000 447,555Waste Management, Inc.
3.150%, 11/15/27 (b) 1,800,000 1,805,8682,253,423
Food��0.3%Conagra Brands, Inc.
4.850%, 11/01/28 (b) 1,300,000 1,378,468General Mills, Inc.
4.200%, 04/17/28 (b) 1,500,000 1,566,330Kraft Heinz Foods Co.
5.000%, 07/15/35 1,600,000 1,713,904Kroger Co. (The)
2.200%, 05/01/30 (b) 1,900,000 1,738,348Tyson Foods, Inc.
3.550%, 06/02/27 (b) 1,200,000 1,211,6167,608,666
Forest Products & Paper��0.1%Georgia-Pacific LLC
8.000%, 01/15/24 (b) 1,800,000 1,965,330International Paper Co.
4.400%, 08/15/47 800,000 839,5682,804,898
Gas��0.1%Atmos Energy Corp.
1.500%, 01/15/31 (b) 1,100,000 948,101NiSource, Inc.
4.800%, 02/15/44 (b) 1,500,000 1,562,0252,510,126
Hand/Machine Tools��0.1%Stanley Black & Decker, Inc.
4.000%, 5Y H15 + 2.657%, 03/15/60 (a)(b) 2,500,000 2,462,525
Healthcare-Products��0.2%Abbott Laboratories
4.750%, 11/30/36 (b) 1,300,000 1,514,227
BHFTII-171
Copyright © 2022 www.secdatabase.com. All Rights Reserved.Please Consider the Environment Before Printing This Document

Table of ContentsBrighthouse Funds Trust IIMetLife Aggregate Bond Index Portfolio
Schedule of Investments as of March 31, 2022 (Unaudited)Corporate Bonds & Notes��(Continued)
Security DescriptionPrincipalAmount* Value
Healthcare-Products��(Continued)Boston Scientific Corp.
1.900%, 06/01/25 (b) 1,900,000 $1,823,335DH Europe Finance II Sarl
3.250%, 11/15/39 900,000 856,737Medtronic, Inc.
4.625%, 03/15/45 (b) 933,000 1,084,594Stryker Corp.
1.150%, 06/15/25 (b) 1,000,000 942,1606,221,053
Healthcare-Services��0.6%Anthem, Inc.
5.850%, 01/15/36 (b) 1,800,000 2,173,734CommonSpirit Health
3.910%, 10/01/50 1,500,000 1,434,285HCA, Inc.
4.125%, 06/15/29 1,800,000 1,833,102Humana, Inc.
4.875%, 04/01/30 800,000 864,168Kaiser Foundation Hospitals
3.002%, 06/01/51 (b) 1,000,000 881,740Laboratory Corp. of America Holdings
3.600%, 02/01/25 (b) 1,800,000 1,819,098UnitedHealth Group, Inc.
3.500%, 08/15/39 (b) 900,000 894,4653.750%, 07/15/25 (b) 2,600,000 2,673,9184.250%, 06/15/48 1,000,000 1,098,130
13,672,640
Home Builders��0.1%Lennar Corp.
4.750%, 11/29/27 (b) 1,300,000 1,355,523
Household Products/Wares��0.0%Kimberly-Clark Corp.
3.100%, 03/26/30 1,100,000 1,101,518
Insurance��0.8%Allstate Corp. (The)
1.450%, 12/15/30 1,100,000 950,224American International Group, Inc.
3.400%, 06/30/30 (b) 1,800,000 1,797,5884.500%, 07/16/44 1,100,000 1,189,980
AXA S.A.8.600%, 12/15/30 1,165,000 1,543,310
Berkshire Hathaway Finance Corp.4.200%, 08/15/48 (b) 1,700,000 1,827,976
Berkshire Hathaway, Inc.3.125%, 03/15/26 (b) 1,500,000 1,516,635
Chubb Corp. (The)6.000%, 05/11/37 (b) 865,000 1,083,906
Chubb INA Holdings, Inc.3.350%, 05/15/24 (b) 1,000,000 1,014,700
Hartford Financial Services Group, Inc. (The)6.100%, 10/01/41 (b) 780,000 967,356
Insurance��(Continued)Marsh & McLennan Cos., Inc.
3.750%, 03/14/26 (b) 2,000,000 2,043,560
Copyright © 2022 www.secdatabase.com. All Rights Reserved.Please Consider the Environment Before Printing This Document

Principal Financial Group, Inc.3.100%, 11/15/26 (b) 1,000,000 986,260
Prudential Financial, Inc.2.100%, 03/10/30 (b) 2,000,000 1,849,9005.700%, 12/14/36 (b) 1,525,000 1,833,706
Travelers Cos., Inc. (The)3.050%, 06/08/51 (b) 800,000 717,312
19,322,413
Internet��0.3%Alibaba Group Holding, Ltd.
4.200%, 12/06/47 1,400,000 1,295,798Alphabet, Inc.
2.050%, 08/15/50 (b) 1,100,000 870,265Amazon.com, Inc.
3.100%, 05/12/51 1,000,000 939,3203.800%, 12/05/24 (b) 1,800,000 1,854,7203.875%, 08/22/37 1,900,000 2,002,429
eBay, Inc.3.600%, 06/05/27 (b) 1,500,000 1,523,295
8,485,827
Investment Companies��0.1%Ares Capital Corp.
4.250%, 03/01/25 (b) 900,000 899,316Owl Rock Capital Corp.
3.400%, 07/15/26 1,600,000 1,507,2482,406,564
Iron/Steel��0.0%Vale Overseas, Ltd.
6.875%, 11/21/36 528,000 637,713
Lodging��0.1%Marriott International, Inc.
2.850%, 04/15/31 1,100,000 1,005,455Sands China, Ltd.
5.400%, 08/08/28 900,000 886,1581,891,613
Machinery-Construction & Mining��0.1%Caterpillar Financial Services Corp.
3.750%, 11/24/23 (b) 1,000,000 1,024,740Caterpillar, Inc.
3.803%, 08/15/42 (b) 1,500,000 1,555,5152,580,255
Machinery-Diversified��0.0%John Deere Capital Corp.
2.000%, 06/17/31 (b) 1,000,000 918,170
BHFTII-172
Copyright © 2022 www.secdatabase.com. All Rights Reserved.Please Consider the Environment Before Printing This Document

Table of ContentsBrighthouse Funds Trust IIMetLife Aggregate Bond Index Portfolio
Schedule of Investments as of March 31, 2022 (Unaudited)Corporate Bonds & Notes��(Continued)
Security DescriptionPrincipalAmount* Value
Media��0.9%Charter Communications Operating LLC /
Charter Communications Operating CapitalCorp.3.850%, 04/01/61 3,300,000 $2,650,0656.484%, 10/23/45 900,000 1,025,766
Comcast Corp.3.150%, 03/01/26 (b) 2,000,000 2,018,2603.969%, 11/01/47 2,900,000 2,963,5974.650%, 07/15/42 1,670,000 1,838,5365.650%, 06/15/35 (b) 1,500,000 1,797,825
Discovery Communications LLC4.000%, 09/15/55 (b) 1,481,000 1,279,777
Fox Corp.5.576%, 01/25/49 (b) 1,000,000 1,165,370
Paramount Global4.375%, 03/15/43 1,500,000 1,426,305
Time Warner Cable LLC6.550%, 05/01/37 100,000 115,138
Time Warner Entertainment Co. L.P.8.375%, 03/15/23 380,000 400,862
TWDC Enterprises 18 Corp.2.950%, 06/15/27 (b) 2,000,000 1,994,280
Walt Disney Co. (The)3.500%, 05/13/40 (b) 900,000 877,0773.600%, 01/13/51 (b) 1,000,000 988,0506.550%, 03/15/33 (b) 950,000 1,201,569
21,742,477
Mining��0.2%Newmont Corp.
6.250%, 10/01/39 (b) 1,800,000 2,276,928Rio Tinto Alcan, Inc.
6.125%, 12/15/33 (b) 1,751,000 2,211,6364,488,564
Miscellaneous Manufacturing��0.3%3M Co.
3.625%, 10/15/47 1,000,000 990,4604.000%, 09/14/48 (b) 900,000 954,054
GE Capital International Funding Co.4.418%, 11/15/35 1,459,000 1,573,152
General Electric Co.6.750%, 03/15/32 1,250,000 1,574,8507.500%, 08/21/35 100,000 129,231
Parker-Hannifin Corp.3.250%, 06/14/29 (b) 1,900,000 1,874,673
Trane Technologies Luxembourg FinanceS.A.3.800%, 03/21/29 (b) 1,000,000 1,017,060
8,113,480
Multi-National��1.4%Asian Development Bank
1.500%, 03/04/31 2,000,000 1,847,7401.750%, 09/19/29 900,000 852,6872.625%, 01/30/24 3,700,000 3,720,128
Multi-National��(Continued)Asian Infrastructure Investment Bank (The)
0.500%, 05/28/25 1,000,000 932,170
Copyright © 2022 www.secdatabase.com. All Rights Reserved.Please Consider the Environment Before Printing This Document

European Bank for Reconstruction &Development0.500%, 05/19/25 (b) 2,000,000 1,873,700
European Investment Bank0.375%, 03/26/26 (b) 2,000,000 1,833,5801.875%, 02/10/25 2,500,000 2,455,3502.500%, 10/15/24 (b) 2,800,000 2,801,5124.875%, 02/15/36 (b) 1,100,000 1,383,976
Inter-American Development Bank2.125%, 01/15/25 (b) 4,000,000 3,954,2402.250%, 06/18/29 1,400,000 1,373,9742.375%, 07/07/27 1,500,000 1,486,2457.000%, 06/15/25 200,000 226,224
International Bank for Reconstruction &Development0.500%, 10/28/25 2,000,000 1,858,1801.625%, 11/03/31 2,600,000 2,404,6622.125%, 03/03/25 3,000,000 2,965,6502.500%, 07/29/25 2,000,000 1,993,140
33,963,158
Oil & Gas��1.0%BP Capital Markets America, Inc.
2.721%, 01/12/32 (b) 1,000,000 942,3903.000%, 02/24/50 (b) 1,000,000 865,990
BP Capital Markets plc3.814%, 02/10/24 (b) 1,800,000 1,836,288
Burlington Resources LLC5.950%, 10/15/36 1,550,000 1,878,383
Canadian Natural Resources, Ltd.6.250%, 03/15/38 (b) 1,800,000 2,140,974
Chevron Corp.3.191%, 06/24/23 (b) 2,025,000 2,046,465
ConocoPhillips Co.6.950%, 04/15/29 700,000 864,486
Equinor ASA3.250%, 11/10/24 (b) 2,100,000 2,119,971
Exxon Mobil Corp.3.176%, 03/15/24 (b) 1,900,000 1,926,9044.114%, 03/01/46 (b) 1,600,000 1,720,832
Marathon Oil Corp.6.600%, 10/01/37 (b) 1,000,000 1,218,570
Marathon Petroleum Corp.4.700%, 05/01/25 (b) 600,000 624,270
Phillips66 4.875%, 11/15/44 1,000,000 1,107,410
Shell International Finance B.V.2.375%, 11/07/29 (b) 3,000,000 2,843,7903.250%, 04/06/50 (b) 900,000 846,792
TotalEnergies Capital International S.A.2.700%, 01/25/23 (b) 500,000 502,0653.127%, 05/29/50 900,000 821,817
Valero Energy Corp.3.400%, 09/15/26 (b) 1,000,000 996,520
25,303,917
BHFTII-173
Copyright © 2022 www.secdatabase.com. All Rights Reserved.Please Consider the Environment Before Printing This Document

Table of ContentsBrighthouse Funds Trust IIMetLife Aggregate Bond Index Portfolio
Schedule of Investments as of March 31, 2022 (Unaudited)Corporate Bonds & Notes��(Continued)
Security DescriptionPrincipalAmount* Value
Oil & Gas Services��0.1%Halliburton Co.
3.500%, 08/01/23 (b) 209,000 $211,1175.000%, 11/15/45 (b) 1,200,000 1,302,360
1,513,477
Pharmaceuticals��1.6%AbbVie, Inc.
3.800%, 03/15/25 400,000 408,2444.050%, 11/21/39 1,300,000 1,341,0414.400%, 11/06/42 3,200,000 3,392,032
AstraZeneca plc4.000%, 09/18/42 1,200,000 1,268,856
Becton Dickinson & Co.4.669%, 06/06/47 (b) 2,000,000 2,186,800
Bristol-Myers Squibb Co.3.400%, 07/26/29 (b) 1,000,000 1,017,4304.625%, 05/15/44 2,000,000 2,274,600
Cardinal Health, Inc.3.410%, 06/15/27 (b) 1,800,000 1,808,334
Cigna Corp.2.375%, 03/15/31 1,500,000 1,374,2704.500%, 02/25/26 1,200,000 1,255,2366.125%, 11/15/41 (b) 313,000 392,559
CVS Health Corp.4.300%, 03/25/28 544,000 570,2754.780%, 03/25/38 2,500,000 2,729,1505.050%, 03/25/48 1,500,000 1,699,5455.125%, 07/20/45 1,900,000 2,150,078
Eli Lilly and Co.2.250%, 05/15/50 (b) 1,100,000 895,323
GlaxoSmithKline Capital, Inc.3.875%, 05/15/28 (b) 2,000,000 2,089,760
Johnson & Johnson3.700%, 03/01/46 (b) 1,000,000 1,050,9305.950%, 08/15/37 (b) 910,000 1,190,653
Merck & Co., Inc.6.550%, 09/15/37 (b) 1,000,000 1,342,690
Merck Sharp & Dohme Corp.5.950%, 12/01/28 300,000 347,853
Novartis Capital Corp.2.200%, 08/14/30 (b) 1,900,000 1,784,917
Shire Acquisitions Investments Ireland DAC3.200%, 09/23/26 (b) 2,000,000 2,003,080
Utah Acquisition Sub, Inc.3.950%, 06/15/26 1,800,000 1,788,552
Wyeth LLC5.950%, 04/01/37 1,800,000 2,284,596
38,646,804
Pipelines��0.9%El Paso Natural Gas Co. LLC
8.375%, 06/15/32 220,000 286,999Enbridge Energy Partners L.P.
5.875%, 10/15/25 (b) 3,000,000 3,233,760Energy Transfer L.P.
5.150%, 03/15/45 (b) 2,600,000 2,630,888
Pipelines��(Continued)Enterprise Products Operating LLC
3.200%, 02/15/52 1,100,000 934,659
Copyright © 2022 www.secdatabase.com. All Rights Reserved.Please Consider the Environment Before Printing This Document

3.950%, 02/15/27 (b) 2,300,000 2,358,696Kinder Morgan Energy Partners L.P.
6.500%, 02/01/37 2,000,000 2,344,500MPLX L.P.
5.200%, 03/01/47 (b) 1,000,000 1,078,020ONEOK, Inc.
3.100%, 03/15/30 (b) 2,100,000 1,967,091Sabine Pass Liquefaction LLC
5.875%, 06/30/26 1,600,000 1,731,168TransCanada PipeLines, Ltd.
6.200%, 10/15/37 1,800,000 2,201,040Williams Cos., Inc. (The)
3.750%, 06/15/27 (b) 2,500,000 2,531,55021,298,371
Real Estate Investment Trusts��0.9%Alexandria Real Estate Equities, Inc.
3.375%, 08/15/31 (b) 1,000,000 985,4203.550%, 03/15/52 1,100,000 1,023,220
American Tower Corp.3.000%, 06/15/23 2,100,000 2,108,337
AvalonBay Communities, Inc.2.300%, 03/01/30 (b) 1,000,000 930,800
Boston Properties L.P.3.200%, 01/15/25 (b) 1,400,000 1,399,524
Brixmor Operating Partnership L.P.4.050%, 07/01/30 900,000 902,772
Crown Castle International Corp.3.800%, 02/15/28 (b) 1,500,000 1,498,590
Digital Realty Trust L.P.3.700%, 08/15/27 (b) 2,500,000 2,518,925
Duke Realty L.P.3.375%, 12/15/27 (b) 500,000 495,340
Equinix, Inc.3.200%, 11/18/29 (b) 700,000 672,525
ERP Operating L.P.3.000%, 07/01/29 (b) 1,000,000 981,580
Essex Portfolio L.P.3.000%, 01/15/30 (b) 1,000,000 962,340
Healthpeak Properties, Inc.3.500%, 07/15/29 (b) 900,000 899,118
National Retail Properties, Inc.2.500%, 04/15/30 (b) 1,000,000 920,410
Public Storage3.094%, 09/15/27 500,000 499,905
Simon Property Group L.P.3.300%, 01/15/26 (b) 3,800,000 3,825,802
Welltower, Inc.4.000%, 06/01/25 1,500,000 1,524,960
22,149,568
BHFTII-174
Copyright © 2022 www.secdatabase.com. All Rights Reserved.Please Consider the Environment Before Printing This Document

Table of ContentsBrighthouse Funds Trust IIMetLife Aggregate Bond Index Portfolio
Schedule of Investments as of March 31, 2022 (Unaudited)Corporate Bonds & Notes��(Continued)
Security DescriptionPrincipalAmount* Value
Retail��0.6%Home Depot, Inc. (The)
3.000%, 04/01/26 (b) 1,800,000 $1,815,1924.250%, 04/01/46 2,000,000 2,175,600
Lowe�s Cos., Inc.4.050%, 05/03/47 (b) 1,500,000 1,499,340
McDonald�s Corp.3.700%, 01/30/26 (b) 1,000,000 1,024,9204.875%, 12/09/45 (b) 1,500,000 1,677,225
Starbucks Corp.3.550%, 08/15/29 (b) 1,000,000 1,007,030
Target Corp.2.650%, 09/15/30 (b) 1,400,000 1,359,4564.000%, 07/01/42 (b) 1,000,000 1,076,000
Walmart, Inc.4.050%, 06/29/48 (b) 900,000 1,020,3395.250%, 09/01/35 (b) 935,000 1,134,781
13,789,883
Semiconductors��0.5%Broadcom, Inc.
3.137%, 11/15/35 (144A) 3,600,000 3,173,9044.300%, 11/15/32 (b) 1,700,000 1,723,715
Intel Corp.3.734%, 12/08/47 1,000,000 1,005,9704.750%, 03/25/50 (b) 1,800,000 2,097,198
QUALCOMM, Inc.1.650%, 05/20/32 (b) 4,533,000 3,945,569
11,946,356
Software��0.8%Fidelity National Information Services, Inc.
1.150%, 03/01/26 (b) 1,000,000 918,920Fiserv, Inc.
2.750%, 07/01/24 (b) 2,000,000 1,988,900Microsoft Corp.
3.125%, 11/03/25 (b) 5,100,000 5,180,2744.250%, 02/06/47 (b) 3,000,000 3,442,140
Oracle Corp.2.875%, 03/25/31 (b) 3,000,000 2,737,6802.950%, 11/15/24 (b) 2,300,000 2,287,7642.950%, 04/01/30 1,200,000 1,110,5883.850%, 04/01/60 2,100,000 1,721,958
Salesforce.com, Inc.2.900%, 07/15/51 (b) 1,000,000 892,770
20,280,994
Telecommunications��1.2%America Movil S.A.B. de C.V.
2.875%, 05/07/30 (b) 1,000,000 955,440AT&T, Inc.
3.500%, 09/15/53 (b) 1,221,000 1,079,5713.650%, 09/15/59 (b) 2,686,000 2,360,1084.100%, 02/15/28 (b) 2,687,000 2,791,8204.125%, 02/17/26 (b) 2,000,000 2,078,260
Telecommunications��(Continued)AT&T, Inc.
5.150%, 11/15/46 (b) 1,308,000 1,491,9317.125%, 12/15/31 100,000 124,100
Copyright © 2022 www.secdatabase.com. All Rights Reserved.Please Consider the Environment Before Printing This Document

Cisco Systems, Inc.5.500%, 01/15/40 (b) 1,000,000 1,264,560
Deutsche Telekom International FinanceB.V.8.750%, 06/15/30 1,000,000 1,344,070
Orange S.A.5.500%, 02/06/44 (b) 500,000 600,485
T-Mobile USA, Inc.2.550%, 02/15/31 2,200,000 1,995,0483.300%, 02/15/51 (b) 1,500,000 1,266,960
Telefonica Emisiones S.A.4.103%, 03/08/27 (b) 900,000 922,680
Verizon Communications, Inc.2.875%, 11/20/50 (b) 1,900,000 1,587,2413.376%, 02/15/25 (b) 2,078,000 2,103,3723.550%, 03/22/51 (b) 2,000,000 1,886,4004.812%, 03/15/39 (b) 1,927,000 2,177,375
Vodafone Group plc6.150%, 02/27/37 2,170,000 2,598,315
28,627,736
Transportation��0.6%Burlington Northern Santa Fe LLC
4.150%, 04/01/45 1,900,000 2,013,563Canadian National Railway Co.
4.450%, 01/20/49 400,000 452,492Canadian Pacific Railway Co.
2.450%, 12/02/31 (b) 1,100,000 1,020,151CSX Corp.
6.150%, 05/01/37 1,600,000 2,007,056FedEx Corp.
4.250%, 05/15/30 (b) 1,000,000 1,048,9504.550%, 04/01/46 1,000,000 1,050,950
Norfolk Southern Corp.2.550%, 11/01/29 (b) 1,900,000 1,820,7135.590%, 05/17/25 28,000 29,828
Union Pacific Corp.2.891%, 04/06/36 (b) 1,200,000 1,121,5323.250%, 02/05/50 (b) 1,300,000 1,214,356
United Parcel Service, Inc.4.450%, 04/01/30 (b) 1,600,000 1,746,160
13,525,751
Water��0.0%American Water Capital Corp.
3.750%, 09/01/28 (b) 900,000 916,416Total Corporate Bonds & Notes
(Cost $668,271,014) 645,621,314
Foreign Government��1.5%Provincial��0.2%Province of Alberta Canada
1.000%, 05/20/25 1,500,000 1,423,635
BHFTII-175
Copyright © 2022 www.secdatabase.com. All Rights Reserved.Please Consider the Environment Before Printing This Document

Table of ContentsBrighthouse Funds Trust IIMetLife Aggregate Bond Index Portfolio
Schedule of Investments as of March 31, 2022 (Unaudited)Foreign Government��(Continued)
Security DescriptionPrincipalAmount* Value
Provincial��(Continued)Province of British Columbia Canada
1.300%, 01/29/31 (b) 1,000,000 $894,950Province of Ontario Canada
3.050%, 01/29/24 (b) 1,000,000 1,011,690Province of Quebec Canada
2.500%, 04/20/26 2,000,000 1,985,0407.500%, 07/15/23 350,000 373,233
5,688,548
Sovereign��1.3%Canada Government International Bond
1.625%, 01/22/25 (b) 1,000,000 975,550Chile Government International Bonds
3.100%, 01/22/61 (b) 1,200,000 987,5523.500%, 01/25/50 (b) 1,000,000 916,290
Export-Import Bank of Korea2.875%, 01/21/25 (b) 2,400,000 2,401,320
Indonesia Government International Bonds3.050%, 03/12/51 (b) 1,100,000 998,4153.850%, 10/15/30 (b) 700,000 736,393
Israel Government International Bond4.125%, 01/17/48 (b) 1,500,000 1,601,370
Italy Government International Bond2.875%, 10/17/29 (b) 2,000,000 1,890,420
Japan Bank for International Cooperation2.500%, 05/23/24 3,900,000 3,897,114
Mexico Government International Bonds4.600%, 01/23/46 1,100,000 1,056,4294.750%, 03/08/44 (b) 900,000 887,4635.750%, 10/12/10 2,000,000 2,034,7406.750%, 09/27/34 (b) 1,050,000 1,285,883
Panama Government International Bonds3.875%, 03/17/28 900,000 920,0614.500%, 05/15/47 1,400,000 1,397,298
Peruvian Government International Bond8.750%, 11/21/33 (b) 1,450,000 2,105,037
Philippine Government International Bonds3.950%, 01/20/40 2,100,000 2,100,1475.000%, 01/13/37 (b) 1,740,000 1,953,498
Poland Government International Bond3.250%, 04/06/26 1,000,000 1,018,260
Svensk Exportkredit AB0.625%, 05/14/25 1,000,000 939,340
Uruguay Government International Bond4.375%, 10/27/27 1,900,000 2,016,451
32,119,031Total Foreign Government
(Cost $38,786,898) 37,807,579
Mortgage-Backed Securities��1.2%Commercial Mortgage-Backed Securities��1.2%BANK
2.556%, 05/15/64 2,000,000 1,876,2582.758%, 09/15/62 455,000 435,218
Commercial Mortgage-Backed Securities ��(Continued)BANK
4.407%, 11/15/61 (a) 881,000 933,465
Copyright © 2022 www.secdatabase.com. All Rights Reserved.Please Consider the Environment Before Printing This Document

Benchmark Mortgage Trust3.049%, 12/15/62 1,430,000 1,397,218
CD Commercial Mortgage Trust3.631%, 02/10/50 950,000 957,874
CFCRE Commercial Mortgage Trust3.585%, 12/10/54 1,825,361 1,822,232
Commercial Mortgage Pass-ThroughCertificates Mortgage Trust3.765%, 02/10/49 1,539,000 1,554,5763.838%, 09/10/47 1,000,000 1,000,7603.902%, 07/10/50 1,835,000 1,854,886
GS Mortgage Securities Trust3.382%, 05/10/50 1,835,000 1,828,479
JPMBB Commercial Mortgage SecuritiesTrust3.598%, 11/15/48 2,900,000 2,897,7113.801%, 08/15/48 1,499,204 1,506,164
Morgan Stanley Bank of America MerrillLynch Trust3.544%, 01/15/49 3,850,000 3,850,3453.635%, 10/15/48 1,547,000 1,552,1553.732%, 05/15/48 1,750,000 1,763,775
UBS Commercial Mortgage Trust3.035%, 12/15/52 2,250,000 2,170,759
WF-RBS Commercial Mortgage Trust3.488%, 06/15/46 1,054,000 1,057,777
Total Mortgage-Backed Securities(Cost $29,965,027) 28,459,652
Municipals��0.6%Chicago O�Hare International Airport
4.572%, 01/01/54 395,000 469,538Grand Parkway Transportation Corp.
3.236%, 10/01/52 1,000,000 903,074Los Angeles, CA Unified School District,
Build America Bond 6.758%, 07/01/34 660,000 838,068Municipal Electric Authority of Georgia, Build
America Bond 6.637%, 04/01/57 1,947,000 2,598,457New Jersey Turnpike Authority
7.414%, 01/01/40 1,700,000 2,476,255New York City Water & Sewer System
5.440%, 06/15/43 300,000 384,486Oregon School Boards Association
5.680%, 06/30/28 1,900,000 2,082,987Port Authority of New York & New Jersey
4.458%, 10/01/62 1,500,000 1,666,489Regents of the University of California
Medical Center Pooled Revenue3.006%, 05/15/50 1,000,000 875,099
State of California General ObligationUnlimited, Build America Bond7.300%, 10/01/39 1,200,000 1,688,998
State of Illinois, General ObligationUnlimited5.100%, 06/01/33 1,230,000 1,307,991
Total Municipals(Cost $14,988,906) 15,291,442
BHFTII-176
Copyright © 2022 www.secdatabase.com. All Rights Reserved.Please Consider the Environment Before Printing This Document

Table of ContentsBrighthouse Funds Trust IIMetLife Aggregate Bond Index Portfolio
Schedule of Investments as of March 31, 2022 (Unaudited)Asset-Backed Securities��0.2%
Security DescriptionPrincipalAmount* Value
Asset-Backed - Automobile��0.1%Carmax Auto Owner Trust
2.030%, 06/16/25 903,000 $894,173GM Financial Consumer Automobile
Receivables Trust2.210%, 11/18/24 1,000,000 1,001,395
Honda Auto Receivables Owner Trust1.090%, 10/15/26 1,500,000 1,467,068
3,362,636
Asset-Backed - Credit Card��0.1%Capital One Multi-Asset Execution Trust
2.060%, 08/15/28 1,865,000 1,796,861
Asset-Backed - Other��0.0%CNH Equipment Trust
1.160%, 06/16/25 195,551 194,103John Deere Owner Trust
0.510%, 11/15/24 124,454 123,0183.000%, 01/15/26 350,000 351,600
668,721Total Asset-Backed Securities
(Cost $6,165,302) 5,828,218
Short-Term Investments��0.5%U.S. Treasury��0.5%U.S. Treasury Bills
0.215%, 05/10/22 (c) 8,300,000 8,298,2010.276%, 05/24/22 (c) 5,100,000 5,097,804
Total Short-Term Investments(Cost $13,395,996) 13,396,005
Securities Lending Reinvestments (d)��16.5%Certificates of Deposit��6.0%Bank of Montreal
0.300%, 06/02/22 10,000,000 9,992,660Bank of Nova Scotia
0.320%, 06/07/22 8,000,000 7,993,4720.520%, SOFR + 0.250%, 02/17/23 (a) 4,000,000 3,991,110
Barclays Bank plc0.180%, 04/07/22 10,000,000 9,999,630
BNP Paribas S.A.0.490%, SOFR + 0.220%, 11/17/22 (a) 7,000,000 6,990,144
Canadian Imperial Bank of Commerce(NY)0.770%, SOFR + 0.500%, 03/03/23 (a) 4,000,000 4,002,540
Cooperatieve Rabobank UA0.840%, SOFR + 0.570%, 09/19/22 (a) 7,000,000 7,000,000
Credit Agricole S.A.0.590%, 05/24/22 5,000,000 4,999,400
Credit Industriel et CommercialZero Coupon, 04/14/22 10,000,000 9,998,300
Certificates of Deposit��(Continued)Credit Industriel et Commercial (NY)
0.480%, SOFR + 0.210%, 11/08/22 (a) 5,000,000 4,990,775Credit Suisse Group AG
0.830%, 06/03/22 10,000,000 10,001,840
Copyright © 2022 www.secdatabase.com. All Rights Reserved.Please Consider the Environment Before Printing This Document

Goldman Sachs Bank USA0.470%, SOFR + 0.190%, 09/02/22 (a) 5,000,000 4,993,630
Mitsubishi UFJ Trust and Banking Corp.0.430%, SOFR + 0.160%, 07/22/22 (a) 5,000,000 4,996,795
National Australia Bank, Ltd.Zero Coupon, 04/25/22 2,000,000 1,999,280
National Westminster Bank plc0.440%, 05/11/22 5,000,000 4,999,100
Natixis S.A. (New York)0.330%, 06/09/22 2,000,000 1,998,308
Nordea Bank Abp.0.720%, SOFR + 0.450%, 08/30/22 (a) 5,000,000 4,999,990
Oversea-Chinese Banking Corp., Ltd.Zero Coupon, 04/14/22 1,200,000 1,199,7960.720%, SOFR + 0.440%, 09/26/22 (a) 5,000,000 5,000,997
Royal Bank of Canada0.520%, SOFR + 0.250%, 01/11/23 (a) 10,000,000 9,976,620
Standard Chartered Bank (NY)0.460%, SOFR + 0.190%, 08/25/22 (a) 5,000,000 4,995,916
Sumitomo Mitsui Banking Corp.0.450%, SOFR + 0.180%, 08/09/22 (a) 5,000,000 4,995,115
Sumitomo Mitsui Trust Bank, Ltd.Zero Coupon, 04/19/22 5,000,000 4,998,750
Toronto-Dominion Bank (The)0.530%, SOFR + 0.250%, 02/09/23 (a) 5,000,000 4,999,999
Westpac Banking Corp.0.500%, SOFR + 0.230%, 02/17/23 (a) 5,000,000 4,984,365
145,098,532
Commercial Paper��1.4%Antalis S.A.
0.800%, 06/01/22 5,000,000 4,991,965DNB Bank ASA
0.830%, SOFR + 0.550%, 09/07/22 (a) 5,000,000 5,001,995Macquarie Bank Ltd.
0.510%, SOFR + 0.230%, 08/04/22 (a) 3,000,000 2,997,693Skandinaviska Enskilda Banken AB
0.200%, 04/28/22 10,000,000 9,996,200Societe Generale
0.460%, SOFR + 0.190%, 08/18/22 (a) 5,000,000 4,994,955UBS AG
0.350%, 06/08/22 5,000,000 4,992,48032,975,288
Master Demand Notes��0.2%Natixis Financial Products LLC
0.670%, OBFR + 0.350%, 05/05/22 (a) 5,000,000 5,000,000
BHFTII-177
Copyright © 2022 www.secdatabase.com. All Rights Reserved.Please Consider the Environment Before Printing This Document

Table of ContentsBrighthouse Funds Trust IIMetLife Aggregate Bond Index Portfolio
Schedule of Investments as of March 31, 2022 (Unaudited)Securities Lending Reinvestments (d)��(Continued)
Security DescriptionPrincipalAmount* Value
Repurchase Agreements��7.3%Barclays Bank plc
Repurchase Agreement dated 03/31/22at 0.600%, due on 05/05/22 with amaturity value of $8,004,667;collateralized by various Common Stockwith an aggregate market value of$8,891,654. 8,000,000 $8,000,000
Barclays Capital, Inc.Repurchase Agreement dated 03/31/22at 0.240%, due on 04/01/22 with amaturity value of $4,278,078;collateralized by U.S. TreasuryObligations at 0.000%, maturity datesranging from 02/15/37 - 11/15/48, and anaggregate market value of $4,363,610. 4,278,049 4,278,049
BofA Securities, Inc.Repurchase Agreement dated 03/31/22at 0.600%, due on 04/18/22 with amaturity value of $800,240; collateralizedby U.S. Treasury Obligations with ratesranging from 0.000% - 2.250%, maturitydates ranging from 07/21/22 - 08/15/49,and various Common Stock with anaggregate market value of $846,736. 800,000 800,000Repurchase Agreement dated 03/31/22at 0.600%, due on 05/05/22 with amaturity value of $1,200,700;collateralized by U.S. TreasuryObligations with rates ranging from0.000% - 7.500%, maturity dates rangingfrom 04/21/22 - 08/15/51, and variousCommon Stock with an aggregatemarket value of $1,262,268. 1,200,000 1,200,000
Cantor Fitzgerald & Co.Repurchase Agreement dated 03/31/22at 0.290%, due on 04/01/22 with amaturity value of $5,000,040;collateralized by U.S. Treasury and U.S.Government Agency Obligations withrates ranging from 0.125% - 8.000%,maturity dates ranging from 09/15/22 -07/20/71, and an aggregate market valueof $5,100,000. 5,000,000 5,000,000
Citigroup Global Markets, Ltd.Repurchase Agreement dated 03/31/22at 0.300%, due on 04/01/22 with amaturity value of $4,800,040;collateralized by U.S. Treasury andForeign Obligations with rates rangingfrom 0.125% - 2.875%, maturity datesranging from 08/15/23 - 02/15/51, and anaggregate market value of $4,896,002. 4,800,000 4,800,000
Copyright © 2022 www.secdatabase.com. All Rights Reserved.Please Consider the Environment Before Printing This Document

ING Financial Markets LLCRepurchase Agreement dated 03/31/22at 0.260%, due on 04/01/22 with amaturity value of $22,743,808;collateralized by U.S. GovernmentAgency Obligations with rates rangingfrom 0.350% - 6.625%, maturity datesranging from 04/05/22 - 11/15/30, and anaggregate market value of $23,198,668. 22,743,644 22,743,644
National Bank Financial, Inc.Repurchase Agreement dated 03/31/22at 0.320%, due on 04/01/22 with amaturity value of $5,000,044;collateralized by U.S. TreasuryObligations with rates ranging from0.125% - 3.000%, maturity dates rangingfrom 06/30/22 - 02/15/49, and anaggregate market value of $5,102,844. 5,000,000 5,000,000
National Bank of CanadaRepurchase Agreement dated 03/31/22at 0.320%, due on 04/07/22 with amaturity value of $25,001,556;collateralized by U.S. TreasuryObligations with rates ranging from0.000% - 4.500%, maturity dates rangingfrom 04/14/22 - 08/15/51, and anaggregate market value of $25,514,222. 25,000,000 25,000,000
Repurchase Agreements��(Continued)Repurchase Agreement dated 03/31/22at 0.450%, due on 04/07/22 with amaturity value of $38,303,351;collateralized by U.S. TreasuryObligations with rates ranging from0.500% - 3.000%, maturity dates rangingfrom 11/30/23 - 08/15/48, and variousCommon Stock with an aggregatemarket value of $42,352,090. 38,300,000 38,300,000
NBC Global Finance, Ltd.Repurchase Agreement dated 03/31/22at 0.440%, due on 04/01/22 with amaturity value of $8,800,108;collateralized by U.S. TreasuryObligations with rates ranging from0.125% - 4.750%, maturity dates rangingfrom 05/15/24 - 02/15/50, and variousCommon Stock with an aggregatemarket value of $9,771,314. 8,800,000 8,800,000Repurchase Agreement dated 03/31/22at 0.485%, due on 04/07/22 with amaturity value of $1,800,170;collateralized by U.S. TreasuryObligations with rates ranging from0.125% - 4.750%, maturity dates rangingfrom 05/15/24 - 02/15/50, and variousCommon Stock with an aggregatemarket value of $1,998,678. 1,800,000 1,800,000
Societe GeneraleRepurchase Agreement dated 03/31/22at 0.360%, due on 04/01/22 with amaturity value of $14,900,149;collateralized by various Common Stockwith an aggregate market value of$16,556,924. 14,900,000 14,900,000Repurchase Agreement dated 03/31/22at 0.380%, due on 04/01/22 with amaturity value of $5,000,053;collateralized by various Common Stockwith an aggregate market value of$5,556,015. 5,000,000 5,000,000
Copyright © 2022 www.secdatabase.com. All Rights Reserved.Please Consider the Environment Before Printing This Document

Repurchase Agreement dated 03/31/22at 0.410%, due on 04/01/22 with amaturity value of $15,000,171;collateralized by various Common Stockwith an aggregate market value of$16,669,346. 15,000,000 15,000,000Repurchase Agreement dated 03/31/22at 0.420%, due on 04/07/22 with amaturity value of $8,300,678;collateralized by various Common Stockwith an aggregate market value of$9,223,705. 8,300,000 8,300,000
TD Prime Services LLCRepurchase Agreement dated 03/31/22at 0.400%, due on 04/01/22 with amaturity value of $9,000,100;collateralized by various Common Stockwith an aggregate market value of$10,266,080. 9,000,000 9,000,000
177,921,693
Time Deposits��1.0%Australia New Zealand Banking Group, Ltd
0.310%, 04/01/22 10,000,000 10,000,000Jyske Bank A/S
0.750%, 04/11/22 4,000,000 4,000,000National Bank of Canada
0.370%, OBFR + 0.050%, 04/07/22 (a) 5,000,000 5,000,000Skandi (NY)
0.300%, 04/01/22 5,000,000 5,000,00024,000,000
BHFTII-178
Copyright © 2022 www.secdatabase.com. All Rights Reserved.Please Consider the Environment Before Printing This Document

Table of ContentsBrighthouse Funds Trust IIMetLife Aggregate Bond Index Portfolio
Schedule of Investments as of March 31, 2022 (Unaudited)Securities Lending Reinvestments (d)��(Continued)
Security Description Shares Value
Mutual Funds��0.6%Allspring Government Money Market Fund,
Select Class0.180% (e) 728,751 $728,751
Fidelity Government Portfolio, InstitutionalClass0.160% (e) 1,000,000 1,000,000
Goldman Sachs Financial SquareGovernment Fund, Institutional Shares0.250% (e) 8,000,000 8,000,000
STIT-Government & Agency Portfolio,Institutional Class0.250% (e) 5,000,000 5,000,000
14,728,751Total Securities Lending Reinvestments
(Cost $399,837,475) 399,724,264Total Investments�116.3%
(Cost $2,928,644,347) 2,826,742,306Other assets and liabilities (net)�(16.3)% (397,066,575 )Net Assets��100.0% $2,429,675,731
* Principal amount stated in U.S. dollars unless otherwise noted.(a) Variable or floating rate security. The stated rate represents the rate at March 31, 2022. Maturity date shown for callable securities reflects the
earliest possible call date. For securities based on a published reference index and spread, the index and spread are indicated in the descriptionabove. For certain variable rate securities, the coupon rate is determined by the issuer/agent based on current market conditions. For certainasset- and mortgage-backed securities, the coupon rate may fluctuate based on changes of the underlying collateral or prepayments of principal.These securities do not indicate a reference index and spread in their description above.
(b) All or a portion of the security was held on loan. As of March 31, 2022, the market value of securities loaned was $421,368,648 and the collateralreceived consisted of cash in the amount of $399,805,328 and non-cash collateral with a value of $35,241,642. The cash collateral investmentsare disclosed in the Schedule of Investments and categorized as Securities Lending Reinvestments. The non-cash collateral received consists ofU.S. government securities that are held in safe-keeping by the lending agent, or a third-party custodian, and cannot be sold or repledged by thePortfolio.
(c) The rate shown represents current yield to maturity.(d) Represents investment of cash collateral received from securities on loan as of March 31, 2022.(e) The rate shown represents the annualized seven-day yield as of March 31, 2022.(144A)� Securities exempt from registration under Rule 144A of the Securities Act of 1933. These securities may be resold in transactions exempt from
registration, normally to qualified institutional buyers. As of March 31, 2022, the market value of 144A securities was $6,188,664, which is 0.3%of net assets.
Glossary of Abbreviations
Index Abbreviations
(H15)� U.S. Treasury Yield Curve Rate T-Note Constant Maturity Index(LIBOR)� London Interbank Offered Rate(OBFR)� U.S. Overnight Bank Funding Rate(SOFR)� Secured Overnight Financing Rate
Other Abbreviations
(ACES)� Alternative Credit Enhancement Securities(DAC)� Designated Activity Company
Fair Value HierarchyAccounting principles generally accepted in the United States of America (�GAAP�) define fair market value as the price that the Portfolio would receive tosell an asset or pay to transfer a liability in an orderly transaction between market participants at the measurement date. It establishes a fair valuehierarchy that prioritizes inputs to valuation methods and requires disclosure of the fair value hierarchy, separately for each major category of assets andliabilities, that segregates fair value measurements into three levels. Levels 1, 2 and 3 of the fair value hierarchy are defined as follows:
Copyright © 2022 www.secdatabase.com. All Rights Reserved.Please Consider the Environment Before Printing This Document

Level 1 - unadjusted quoted prices in active markets for identical investmentsLevel 2 - other significant observable inputs (including, but not limited to, quoted prices for similar assets or liabilities in markets that are either activeor inactive; inputs other than quoted prices that are observable such as interest rates, yield curves, volatilities, prepayment speeds, loss severities,credit risks, default rates, or other market corroborated inputs)Level 3 - significant unobservable inputs based on the best information available in the circumstances, to the extent observable inputs areunavailable (including the Portfolio�s own assumptions used in determining the fair value of investments and derivative financial instruments)
The inputs or methodologies used for valuing investments are not necessarily an indication of the risk associated with investing in them. Changes to theinputs or methodologies used may result in transfers between levels. A reconciliation of Level 3 securities, if any, will be disclosed following the fair valuehierarchy table. For more information about the Portfolio�s policy regarding the valuation of investments, please refer to the Notes to Schedule ofInvestments.
BHFTII-179
Copyright © 2022 www.secdatabase.com. All Rights Reserved.Please Consider the Environment Before Printing This Document

Table of ContentsBrighthouse Funds Trust IIMetLife Aggregate Bond Index Portfolio
Schedule of Investments as of March 31, 2022 (Unaudited)Fair Value Hierarchy��(Continued)
The following table summarizes the fair value hierarchy of the Portfolio�s investments as of March 31, 2022:
Description Level 1 Level 2 Level 3 TotalTotal U.S. Treasury & Government Agencies* $� $1,680,613,832 $ � $1,680,613,832Total Corporate Bonds & Notes* � 645,621,314 � 645,621,314Total Foreign Government* � 37,807,579 � 37,807,579Total Mortgage-Backed Securities* � 28,459,652 � 28,459,652Total Municipals* � 15,291,442 � 15,291,442Total Asset-Backed Securities* � 5,828,218 � 5,828,218Total Short-Term Investments* � 13,396,005 � 13,396,005Securities Lending Reinvestments
Certificates of Deposit � 145,098,532 � 145,098,532Commercial Paper � 32,975,288 � 32,975,288Master Demand Notes � 5,000,000 � 5,000,000Repurchase Agreements � 177,921,693 � 177,921,693Time Deposits � 24,000,000 � 24,000,000Mutual Funds 14,728,751 � � 14,728,751
Total Securities Lending Reinvestments 14,728,751 384,995,513 � 399,724,264Total Investments $14,728,751 $2,812,013,555 $ � $2,826,742,306Collateral for Securities Loaned (Liability) $� $(399,805,328 ) $ � $(399,805,328 )
* See Schedule of Investments for additional detailed categorizations.
BHFTII-180
Copyright © 2022 www.secdatabase.com. All Rights Reserved.Please Consider the Environment Before Printing This Document
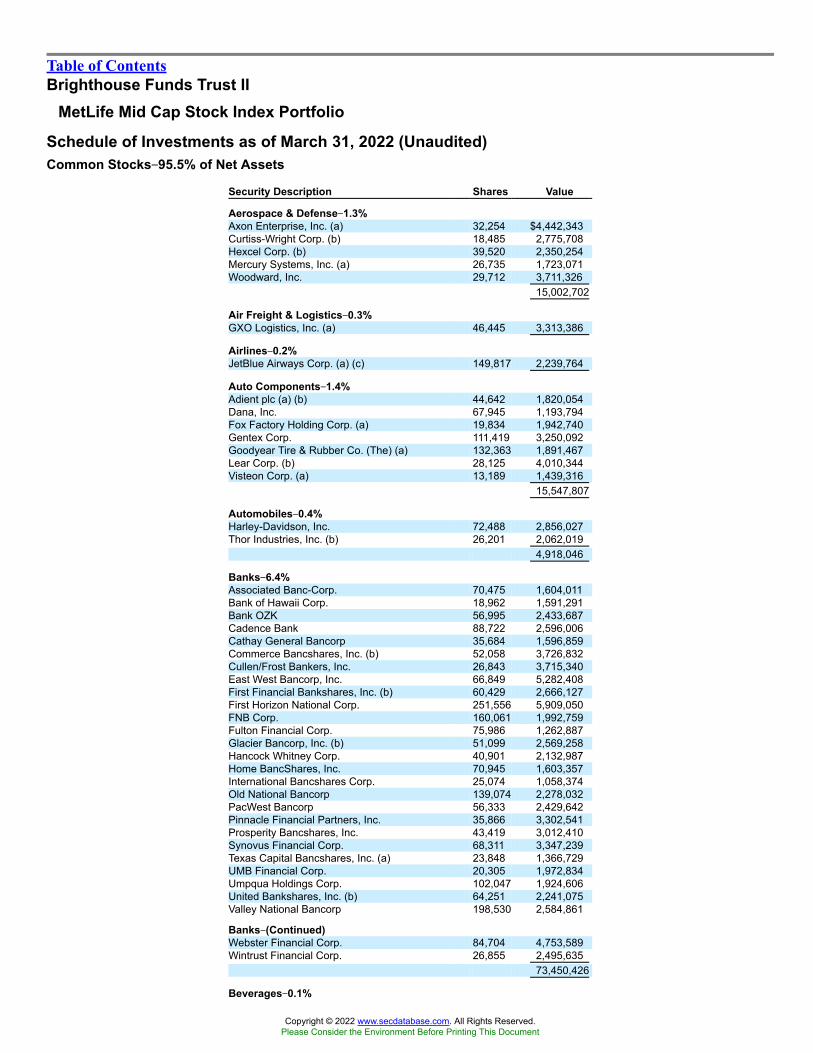
Table of ContentsBrighthouse Funds Trust II
MetLife Mid Cap Stock Index Portfolio
Schedule of Investments as of March 31, 2022 (Unaudited)Common Stocks��95.5% of Net Assets
Security Description Shares Value
Aerospace & Defense��1.3%Axon Enterprise, Inc. (a) 32,254 $4,442,343Curtiss-Wright Corp. (b) 18,485 2,775,708Hexcel Corp. (b) 39,520 2,350,254Mercury Systems, Inc. (a) 26,735 1,723,071Woodward, Inc. 29,712 3,711,326
15,002,702
Air Freight & Logistics��0.3%GXO Logistics, Inc. (a) 46,445 3,313,386
Airlines��0.2%JetBlue Airways Corp. (a) (c) 149,817 2,239,764
Auto Components��1.4%Adient plc (a) (b) 44,642 1,820,054Dana, Inc. 67,945 1,193,794Fox Factory Holding Corp. (a) 19,834 1,942,740Gentex Corp. 111,419 3,250,092Goodyear Tire & Rubber Co. (The) (a) 132,363 1,891,467Lear Corp. (b) 28,125 4,010,344Visteon Corp. (a) 13,189 1,439,316
15,547,807
Automobiles��0.4%Harley-Davidson, Inc. 72,488 2,856,027Thor Industries, Inc. (b) 26,201 2,062,019
4,918,046
Banks��6.4%Associated Banc-Corp. 70,475 1,604,011Bank of Hawaii Corp. 18,962 1,591,291Bank OZK 56,995 2,433,687Cadence Bank 88,722 2,596,006Cathay General Bancorp 35,684 1,596,859Commerce Bancshares, Inc. (b) 52,058 3,726,832Cullen/Frost Bankers, Inc. 26,843 3,715,340East West Bancorp, Inc. 66,849 5,282,408First Financial Bankshares, Inc. (b) 60,429 2,666,127First Horizon National Corp. 251,556 5,909,050FNB Corp. 160,061 1,992,759Fulton Financial Corp. 75,986 1,262,887Glacier Bancorp, Inc. (b) 51,099 2,569,258Hancock Whitney Corp. 40,901 2,132,987Home BancShares, Inc. 70,945 1,603,357International Bancshares Corp. 25,074 1,058,374Old National Bancorp 139,074 2,278,032PacWest Bancorp 56,333 2,429,642Pinnacle Financial Partners, Inc. 35,866 3,302,541Prosperity Bancshares, Inc. 43,419 3,012,410Synovus Financial Corp. 68,311 3,347,239Texas Capital Bancshares, Inc. (a) 23,848 1,366,729UMB Financial Corp. 20,305 1,972,834Umpqua Holdings Corp. 102,047 1,924,606United Bankshares, Inc. (b) 64,251 2,241,075Valley National Bancorp 198,530 2,584,861
Banks��(Continued)Webster Financial Corp. 84,704 4,753,589Wintrust Financial Corp. 26,855 2,495,635
73,450,426
Beverages��0.1%
Copyright © 2022 www.secdatabase.com. All Rights Reserved.Please Consider the Environment Before Printing This Document

Boston Beer Co., Inc. (The) - Class A (a) 4,423 1,718,203
Biotechnology��1.4%Arrowhead Pharmaceuticals, Inc. (a) 49,679 2,284,737Exelixis, Inc. (a) 149,047 3,378,895Halozyme Therapeutics, Inc. (a) 66,321 2,644,881Neurocrine Biosciences, Inc. (a) 44,690 4,189,688United Therapeutics Corp. (a) 21,216 3,806,363
16,304,564
Building Products��2.3%Builders FirstSource, Inc. (a) 90,212 5,822,282Carlisle Cos., Inc. 24,631 6,057,256Lennox International, Inc. 15,861 4,089,917Owens Corning 47,337 4,331,335Simpson Manufacturing Co., Inc. (b) 20,464 2,231,395Trex Co., Inc. (a) 54,229 3,542,781
26,074,966
Capital Markets��1.8%Affiliated Managers Group, Inc. 19,150 2,699,192Evercore, Inc. - Class A 18,381 2,046,173Federated Hermes, Inc. (b) 45,621 1,553,851Interactive Brokers Group, Inc. - Class A 41,160 2,712,856Janus Henderson Group plc (b) 79,633 2,788,748Jefferies Financial Group, Inc. 91,146 2,994,146SEI Investments Co. 49,567 2,984,429Stifel Financial Corp. (b) 49,227 3,342,513
21,121,908
Chemicals��2.4%Ashland Global Holdings, Inc. 24,938 2,454,149Avient Corp. 43,099 2,068,752Cabot Corp. (b) 26,657 1,823,605Chemours Co. (The) 75,381 2,372,994Ingevity Corp. (a) 18,506 1,185,680Minerals Technologies, Inc. 15,683 1,037,431NewMarket Corp. 3,222 1,045,152Olin Corp. 66,478 3,475,470RPM International, Inc. 61,087 4,974,925Scotts Miracle-Gro Co. (The) (b) 19,115 2,350,380Sensient Technologies Corp. 19,797 1,661,958Valvoline, Inc. 84,490 2,666,504
27,117,000
Commercial Services & Supplies��1.5%Brink�s Co. (The) 23,155 1,574,540Clean Harbors, Inc. (a) 23,582 2,632,694IAA, Inc. (a) 63,523 2,429,755MillerKnoll, Inc. 35,681 1,233,135
BHFTII-181
Copyright © 2022 www.secdatabase.com. All Rights Reserved.Please Consider the Environment Before Printing This Document

Table of ContentsBrighthouse Funds Trust IIMetLife Mid Cap Stock Index Portfolio
Schedule of Investments as of March 31, 2022 (Unaudited)Common Stocks��(Continued)
Security Description Shares Value
Commercial Services & Supplies��(Continued)MSA Safety, Inc. (b) 17,177 $2,279,388Stericycle, Inc. (a) (b) 43,274 2,549,704Tetra Tech, Inc. (b) 25,438 4,195,744
16,894,960
Communications Equipment��0.9%Calix, Inc. (a) 25,829 1,108,323Ciena Corp. (a) 72,962 4,423,686Lumentum Holdings, Inc. (a) (b) 34,012 3,319,571ViaSat, Inc. (a) (b) 35,044 1,710,147
10,561,727
Construction & Engineering��1.6%AECOM 66,583 5,114,240Dycom Industries, Inc. (a) 14,218 1,354,407EMCOR Group, Inc. 25,143 2,831,856Fluor Corp. (a) (b) 66,616 1,911,213MasTec, Inc. (a) (b) 27,723 2,414,673MDU Resources Group, Inc. 95,794 2,552,910Valmont Industries, Inc. 9,998 2,385,523
18,564,822
Construction Materials��0.2%Eagle Materials, Inc. 18,610 2,388,780
Consumer Finance��0.5%FirstCash Holdings, Inc. (b) 18,955 1,333,294Navient Corp. 72,546 1,236,184PROG Holdings, Inc. (a) (b) 26,718 768,677SLM Corp. (b) 131,383 2,412,192
5,750,347
Containers & Packaging��0.8%AptarGroup, Inc. 31,010 3,643,675Greif, Inc. - Class A 12,507 813,705Silgan Holdings, Inc. 39,528 1,827,380Sonoco Products Co. 46,319 2,897,717
9,182,477
Diversified Consumer Services��0.9%Graham Holdings Co. - Class B (b) 1,880 1,149,564Grand Canyon Education, Inc. (a) 18,665 1,812,558H&R Block, Inc. (b) 77,510 2,018,360Service Corp. International 77,686 5,113,293
10,093,775
Diversified Financial Services��0.3%Voya Financial, Inc. (b) 50,876 3,375,623
Diversified TelecommunicationServices��0.2%Iridium Communications, Inc. (a) 62,277 2,511,009
Electric Utilities��1.1%ALLETE, Inc. 24,765 1,658,760
Electric Utilities��(Continued)Hawaiian Electric Industries, Inc. 51,494 2,178,711IDACORP, Inc. 23,797 2,745,222OGE Energy Corp. 94,298 3,845,472PNM Resources, Inc. 40,435 1,927,537
12,355,702
Copyright © 2022 www.secdatabase.com. All Rights Reserved.Please Consider the Environment Before Printing This Document

Electrical Equipment��1.8%Acuity Brands, Inc. 16,496 3,122,693EnerSys 19,432 1,449,044Hubbell, Inc. 25,631 4,710,209nVent Electric plc 79,252 2,756,384Regal Rexnord Corp. (b) 31,920 4,749,058Sunrun, Inc. (a) (b) 97,515 2,961,530Vicor Corp. (a) 10,103 712,767
20,461,685
Electronic Equipment, Instruments & Components��3.1%Arrow Electronics, Inc. (a) 32,065 3,803,871Avnet, Inc. 46,619 1,892,265Belden, Inc. 21,150 1,171,710Cognex Corp. 83,286 6,425,515Coherent, Inc. (a) 11,670 3,190,111II-VI, Inc. (a) (b) 50,091 3,631,097Jabil, Inc. 67,592 4,172,454Littelfuse, Inc. (b) 11,604 2,894,154National Instruments Corp. 62,126 2,521,694TD SYNNEX Corp. 19,526 2,015,278Vishay Intertechnology, Inc. 62,517 1,225,333Vontier Corp. 79,640 2,022,060
34,965,542
Energy Equipment & Services��0.5%ChampionX Corp. (a) 95,190 2,330,251NOV, Inc. 184,976 3,627,380
5,957,631
Entertainment��0.1%World Wrestling Entertainment, Inc. - Class A
(b) 20,617 1,287,325
Equity Real Estate Investment Trusts��9.1%American Campus Communities, Inc. 65,553 3,669,001Apartment Income REIT Corp. 73,952 3,953,474Brixmor Property Group, Inc. 140,307 3,621,324Camden Property Trust 48,143 8,001,367Corporate Office Properties Trust 52,913 1,510,137Cousins Properties, Inc. (b) 70,043 2,822,032Douglas Emmett, Inc. 82,667 2,762,731EastGroup Properties, Inc. 19,166 3,896,065EPR Properties (b) 35,239 1,927,926First Industrial Realty Trust, Inc. 61,376 3,799,788Healthcare Realty Trust, Inc. (b) 69,503 1,909,942Highwoods Properties, Inc. 49,412 2,260,105Hudson Pacific Properties, Inc. 71,829 1,993,255JBG SMITH Properties 53,777 1,571,364Kilroy Realty Corp. (b) 49,484 3,781,567
BHFTII-182
Copyright © 2022 www.secdatabase.com. All Rights Reserved.Please Consider the Environment Before Printing This Document

Table of ContentsBrighthouse Funds Trust IIMetLife Mid Cap Stock Index Portfolio
Schedule of Investments as of March 31, 2022 (Unaudited)Common Stocks��(Continued)
Security Description Shares Value
Equity Real Estate Investment Trusts��(Continued)Kite Realty Group Trust 103,171 $2,349,204Lamar Advertising Co. - Class A 40,899 4,751,646Life Storage, Inc. 38,638 5,425,934Macerich Co. (The) (b) 100,357 1,569,583Medical Properties Trust, Inc. (b) 281,146 5,943,426National Retail Properties, Inc. (b) 82,737 3,718,201National Storage Affiliates Trust 38,601 2,422,599Omega Healthcare Investors, Inc. (b) 112,575 3,507,837Park Hotels & Resorts, Inc. 111,400 2,175,642Pebblebrook Hotel Trust (b) 61,891 1,515,092Physicians Realty Trust 103,773 1,820,178PotlatchDeltic Corp. 32,534 1,715,518PS Business Parks, Inc. (b) 9,475 1,592,558Rayonier, Inc. (b) 68,482 2,815,980Rexford Industrial Realty, Inc. 75,495 5,631,172Sabra Health Care REIT, Inc. 107,725 1,604,025SL Green Realty Corp. (b) 30,198 2,451,474Spirit Realty Capital, Inc. 60,156 2,768,379STORE Capital Corp. 115,605 3,379,134
104,637,660
Food & Staples Retailing��1.3%BJ�s Wholesale Club Holdings, Inc. (a) (b) 64,050 4,330,420Casey�s General Stores, Inc. 17,481 3,464,210Grocery Outlet Holding Corp. (a) (b) 41,160 1,349,225Performance Food Group Co. (a) 72,923 3,712,510Sprouts Farmers Market, Inc. (a) (b) 52,882 1,691,166
14,547,531
Food Products��1.6%Darling Ingredients, Inc. (a) 76,224 6,126,885Flowers Foods, Inc. 93,608 2,406,662Hain Celestial Group, Inc. (The) (a) (b) 43,022 1,479,957Ingredion, Inc. 31,344 2,731,630Lancaster Colony Corp. 9,339 1,392,912Pilgrim�s Pride Corp. (a) 22,958 576,246Post Holdings, Inc. (a) 26,809 1,856,791Sanderson Farms, Inc. 9,993 1,873,587
18,444,670
Gas Utilities��1.3%National Fuel Gas Co. 43,077 2,959,390New Jersey Resources Corp. (b) 45,252 2,075,257ONE Gas, Inc. (b) 25,244 2,227,531Southwest Gas Holdings, Inc. (a) 31,037 2,429,887Spire, Inc. (b) 24,378 1,749,365UGI Corp. 98,834 3,579,767
15,021,197
Health Care Equipment & Supplies��2.8%Envista Holdings Corp. (a) (b) 76,017 3,702,788Globus Medical, Inc. - Class A (a) 37,229 2,746,756Haemonetics Corp. (a) 24,077 1,522,148ICU Medical, Inc. (a) 9,394 2,091,480Integra LifeSciences Holdings Corp. (a) 34,314 2,205,018
Health Care Equipment & Supplies��(Continued)LivaNova plc (a) 25,073 2,051,724Masimo Corp. (a) 23,933 3,483,209Neogen Corp. (a) 50,760 1,565,438NuVasive, Inc. (a) 24,371 1,381,836
Copyright © 2022 www.secdatabase.com. All Rights Reserved.Please Consider the Environment Before Printing This Document

Penumbra, Inc. (a) (b) 16,543 3,674,696Quidel Corp. (a) 17,865 2,009,098STAAR Surgical Co. (a) (b) 22,423 1,791,822Tandem Diabetes Care, Inc. (a) 29,929 3,480,443
31,706,456
Health Care Providers & Services��2.5%Acadia Healthcare Co., Inc. (a) (b) 42,367 2,776,310Amedisys, Inc. (a) 15,358 2,646,030Chemed Corp. 7,253 3,674,007Encompass Health Corp. 46,868 3,332,784HealthEquity, Inc. (a) (b) 39,382 2,655,922LHC Group, Inc. (a) 14,920 2,515,512Option Care Health, Inc. (a) 65,246 1,863,426Patterson Cos., Inc. 40,876 1,323,156Progyny, Inc. (a) (b) 32,801 1,685,971R1 RCM, Inc. (a) 62,911 1,683,498Tenet Healthcare Corp. (a) 50,465 4,337,971
28,494,587
Hotels, Restaurants & Leisure��2.7%Boyd Gaming Corp. 38,634 2,541,345Choice Hotels International, Inc. (b) 15,461 2,191,751Churchill Downs, Inc. 16,217 3,596,606Cracker Barrel Old Country Store, Inc. 11,081 1,315,647Marriott Vacations Worldwide Corp. 20,066 3,164,408Papa John�s International, Inc. 15,246 1,605,099Scientific Games Corp. - Class A (a) 45,464 2,671,010Six Flags Entertainment Corp. (a) 36,454 1,585,749Texas Roadhouse, Inc. 32,808 2,747,014Travel and Leisure Co. 40,653 2,355,435Wendy�s Co. (The) 83,148 1,826,762Wingstop, Inc. (b) 14,050 1,648,767Wyndham Hotels & Resorts, Inc. 43,894 3,717,383
30,966,976
Household Durables��1.4%Helen of Troy, Ltd. (a) (b) 11,371 2,226,897KB Home 40,374 1,307,310Leggett & Platt, Inc. (b) 62,831 2,186,519Taylor Morrison Home Corp. (a) 57,891 1,575,793Tempur Sealy International, Inc. 90,687 2,531,981Toll Brothers, Inc. 52,935 2,489,004TopBuild Corp. (a) 15,511 2,813,540TRI Pointe Group, Inc. (a) 52,354 1,051,268
16,182,312
Household Products��0.1%Energizer Holdings, Inc. (b) 30,879 949,838
BHFTII-183
Copyright © 2022 www.secdatabase.com. All Rights Reserved.Please Consider the Environment Before Printing This Document

Table of ContentsBrighthouse Funds Trust IIMetLife Mid Cap Stock Index Portfolio
Schedule of Investments as of March 31, 2022 (Unaudited)Common Stocks��(Continued)
Security Description Shares Value
Insurance��3.9%Alleghany Corp. (a) 6,454 $5,466,538American Financial Group, Inc. 31,196 4,542,761Brighthouse Financial, Inc. (a) (d) 36,682 1,894,992CNO Financial Group, Inc. 56,717 1,423,030First American Financial Corp. 51,709 3,351,777Hanover Insurance Group, Inc. (The) 16,761 2,506,105Kemper Corp. 28,200 1,594,428Kinsale Capital Group, Inc. 10,105 2,304,142Mercury General Corp. 12,520 688,600Old Republic International Corp. 134,501 3,479,541Primerica, Inc. 18,603 2,545,262Reinsurance Group of America, Inc. 31,643 3,463,643RenaissanceRe Holdings, Ltd. 20,719 3,284,169RLI Corp. 18,775 2,077,078Selective Insurance Group, Inc. (b) 28,359 2,534,160Unum Group 96,313 3,034,823
44,191,049
Interactive Media & Services��0.4%TripAdvisor, Inc. (a) (b) 46,660 1,265,419Yelp, Inc. (a) 32,332 1,102,845Ziff Davis, Inc. (a) 22,716 2,198,454
4,566,718
IT Services��2.2%Alliance Data Systems Corp. 23,452 1,316,830Concentrix Corp. 20,210 3,366,178Euronet Worldwide, Inc. (a) (b) 24,899 3,240,605Genpact, Ltd. 80,323 3,494,854Kyndryl Holdings, Inc. (a) (b) 84,468 1,108,220LiveRamp Holdings, Inc. (a) 32,077 1,199,359Maximus, Inc. 29,170 2,186,291Sabre Corp. (a) (b) 152,364 1,741,520Western Union Co. (The) (b) 185,510 3,476,457WEX, Inc. (a) 21,113 3,767,615
24,897,929
Leisure Products��1.2%Brunswick Corp. 36,318 2,937,763Callaway Golf Co. (a) 55,205 1,292,901Mattel, Inc. (a) 165,038 3,665,494Polaris, Inc. (b) 26,871 2,830,054YETI Holdings, Inc. (a) (b) 41,286 2,476,334
13,202,546
Life Sciences Tools & Services��1.5%Azenta, Inc. (b) 35,291 2,924,918Bruker Corp. 47,865 3,077,719Medpace Holdings, Inc. (a) 13,544 2,215,663Repligen Corp. (a) 24,222 4,555,916Syneos Health, Inc. (a) 48,847 3,954,165
16,728,381
Machinery��4.3%AGCO Corp. 28,907 4,221,289
Machinery��(Continued)Chart Industries, Inc. (a) 16,781 2,882,472Colfax Corp. (a) 64,036 2,547,993Crane Co. 23,515 2,546,204Donaldson Co., Inc. 58,193 3,021,963
Copyright © 2022 www.secdatabase.com. All Rights Reserved.Please Consider the Environment Before Printing This Document

Flowserve Corp. 61,366 2,203,039Graco, Inc. 80,067 5,582,271ITT, Inc. 40,324 3,032,768Kennametal, Inc. 39,142 1,119,853Lincoln Electric Holdings, Inc. 27,816 3,833,323Middleby Corp. (The) (a) (b) 26,204 4,295,884Oshkosh Corp. (b) 31,376 3,157,994Terex Corp. 32,881 1,172,537Timken Co. (The) 32,519 1,973,903Toro Co. (The) (b) 49,420 4,224,916Trinity Industries, Inc. 38,530 1,323,891Watts Water Technologies, Inc. - Class A 12,982 1,812,157
48,952,457
Marine��0.2%Kirby Corp. (a) 28,317 2,044,204
Media��0.9%Cable One, Inc. (b) 2,336 3,420,465John Wiley & Sons, Inc. - Class A 20,510 1,087,645New York Times Co. (The) - Class A (b) 78,714 3,608,250TEGNA, Inc. 104,240 2,334,976
10,451,336
Metals & Mining��3.5%Alcoa Corp. 86,725 7,807,852Cleveland-Cliffs, Inc. (a) (b) 225,233 7,254,755Commercial Metals Co. 57,227 2,381,788Reliance Steel & Aluminum Co. 29,516 5,411,758Royal Gold, Inc. (b) 30,920 4,368,378Steel Dynamics, Inc. (b) 88,812 7,409,585United States Steel Corp. 122,919 4,638,963Worthington Industries, Inc. (b) 15,356 789,452
40,062,531
Multi-Utilities��0.3%Black Hills Corp. 30,064 2,315,530NorthWestern Corp. 25,476 1,541,043
3,856,573
Multiline Retail��0.9%Kohl�s Corp. 65,554 3,963,395Macy�s, Inc. 140,979 3,434,248Nordstrom, Inc. (b) 52,534 1,424,197Ollie�s Bargain Outlet Holdings, Inc. (a) (b) 27,655 1,188,059
10,009,899
Oil, Gas & Consumable Fuels��2.9%Antero Midstream Corp. (b) 152,960 1,662,675CNX Resources Corp. (a) 95,388 1,976,439DT Midstream, Inc. (a) 45,568 2,472,520
BHFTII-184
Copyright © 2022 www.secdatabase.com. All Rights Reserved.Please Consider the Environment Before Printing This Document

Table of ContentsBrighthouse Funds Trust IIMetLife Mid Cap Stock Index Portfolio
Schedule of Investments as of March 31, 2022 (Unaudited)Common Stocks��(Continued)
Security Description Shares Value
Oil, Gas & Consumable Fuels��(Continued)EQT Corp. 141,709 $4,876,207Equitrans Midstream Corp. 191,517 1,616,404HF Sinclair Corp. (a) (b) 70,424 2,806,396Murphy Oil Corp. (b) 68,398 2,762,595PDC Energy, Inc. 45,874 3,334,122Range Resources Corp. (a) 117,671 3,574,845Targa Resources Corp. 107,864 8,140,496
33,222,699
Paper & Forest Products��0.2%Louisiana-Pacific Corp. (b) 41,449 2,574,812
Personal Products��0.3%BellRing Brands, Inc. (a) (b) 52,601 1,214,031Coty, Inc. - Class A (a) 162,003 1,456,407Nu Skin Enterprises, Inc. - Class A 23,470 1,123,744
3,794,182
Pharmaceuticals��0.6%Jazz Pharmaceuticals plc (a) (b) 28,957 4,507,736Perrigo Co. plc 63,018 2,421,782
6,929,518
Professional Services��1.6%ASGN, Inc. (a) 24,543 2,864,414CACI International, Inc. - Class A (a) 10,989 3,310,546FTI Consulting, Inc. (a) (b) 16,152 2,539,417Insperity, Inc. (b) 16,795 1,686,554KBR, Inc. 66,085 3,616,832ManpowerGroup, Inc. 25,551 2,399,750Science Applications International Corp. 26,824 2,472,368
18,889,881
Real Estate Management & Development��0.5%Jones Lang LaSalle, Inc. (a) 23,775 5,693,162
Road & Rail��1.8%Avis Budget Group, Inc. (a) (b) 18,880 4,971,104Knight-Swift Transportation Holdings, Inc. 78,178 3,944,862Landstar System, Inc. 17,757 2,678,288Ryder System, Inc. (b) 25,293 2,006,494Saia, Inc. (a) 12,407 3,025,075Werner Enterprises, Inc. 28,202 1,156,282XPO Logistics, Inc. (a) 46,472 3,383,161
21,165,266
Semiconductors & Semiconductor Equipment��3.6%Amkor Technology, Inc. 47,228 1,025,792Cirrus Logic, Inc. (a) 26,985 2,288,058CMC Materials, Inc. 13,463 2,496,040First Solar, Inc. (a) (b) 46,582 3,900,777Lattice Semiconductor Corp. (a) 64,509 3,931,824MKS Instruments, Inc. (b) 26,126 3,918,900Power Integrations, Inc. (b) 27,868 2,582,806Semtech Corp. (a) 30,355 2,104,816
Semiconductors & Semiconductor Equipment��(Continued)Silicon Laboratories, Inc. (a) (b) 17,994 2,702,699SiTime Corp. (a) 7,061 1,749,857SunPower Corp. (a) (b) 39,115 840,190Synaptics, Inc. (a) (b) 18,619 3,714,490Universal Display Corp. 20,424 3,409,787
Copyright © 2022 www.secdatabase.com. All Rights Reserved.Please Consider the Environment Before Printing This Document

Wolfspeed, Inc. (a) (b) 58,214 6,628,24641,294,282
Software��3.6%ACI Worldwide, Inc. (a) 55,382 1,743,979Aspen Technology, Inc. (a) 31,403 5,193,114Blackbaud, Inc. (a) 21,060 1,260,862CDK Global, Inc. 55,014 2,678,081CommVault Systems, Inc. (a) 20,991 1,392,753Digital Turbine, Inc. (a) 41,565 1,820,963Envestnet, Inc. (a) (b) 25,741 1,916,160Fair Isaac Corp. (a) 12,380 5,774,775Manhattan Associates, Inc. (a) 29,751 4,126,761Mimecast, Ltd. (a) 29,330 2,333,495NCR Corp. (a) (b) 62,182 2,499,095Paylocity Holding Corp. (a) 18,692 3,846,253Qualys, Inc. (a) (b) 15,729 2,239,967SailPoint Technologies Holding, Inc. (a) (b) 43,934 2,248,542Teradata Corp. (a) (b) 51,112 2,519,310
41,594,110
Specialty Retail��3.0%American Eagle Outfitters, Inc. (b) 72,285 1,214,388AutoNation, Inc. (a) 18,833 1,875,390Dick�s Sporting Goods, Inc. (b) 29,636 2,964,193Five Below, Inc. (a) (b) 26,392 4,179,701Foot Locker, Inc. (b) 41,134 1,220,035GameStop Corp. - Class A (a) (b) 29,133 4,852,975Gap, Inc. (The) (b) 100,264 1,411,717Lithia Motors, Inc. 14,265 4,281,212Murphy USA, Inc. 10,807 2,160,968RH (a) (b) 8,192 2,671,329Urban Outfitters, Inc. (a) 30,894 775,748Victoria�s Secret & Co. (a) (b) 34,222 1,757,642Williams-Sonoma, Inc. (b) 34,368 4,983,360
34,348,658
Technology Hardware, Storage & Peripherals��0.1%Xerox Holdings Corp. 57,817 1,166,169
Textiles, Apparel & Luxury Goods��1.5%Capri Holdings, Ltd. (a) 69,538 3,573,558Carter�s, Inc. 19,911 1,831,613Columbia Sportswear Co. 16,283 1,474,100Crocs, Inc. (a) 27,721 2,117,884Deckers Outdoor Corp. (a) (c) 12,833 3,513,290Hanesbrands, Inc. (b) 164,503 2,449,450Skechers USA, Inc. - Class A (a) 63,549 2,590,257
17,550,152
BHFTII-185
Copyright © 2022 www.secdatabase.com. All Rights Reserved.Please Consider the Environment Before Printing This Document

Table of ContentsBrighthouse Funds Trust IIMetLife Mid Cap Stock Index Portfolio
Schedule of Investments as of March 31, 2022 (Unaudited)Common Stocks��(Continued)
Security Description
Shares/PrincipalAmount* Value
Thrifts & Mortgage Finance��0.7%Essent Group, Ltd. 52,022 $2,143,827MGIC Investment Corp. 150,903 2,044,736New York Community Bancorp, Inc. (b) 219,059 2,348,312Washington Federal, Inc. (b) 30,725 1,008,394
7,545,269
Trading Companies & Distributors��1.0%GATX Corp. (b) 16,723 2,062,448MSC Industrial Direct Co., Inc. - Class A 22,205 1,892,088Univar Solutions, Inc. (a) 80,534 2,588,363Watsco, Inc. 15,558 4,739,589
11,282,488
Water Utilities��0.5%Essential Utilities, Inc. (b) 108,346 5,539,731Total Common Stocks
(Cost $756,905,330) 1,093,665,406
Mutual Funds��3.1%Investment Companies��3.1%SPDR S&P MidCap 400 ETF Trust
(Cost $34,648,865) 71,300 34,969,085
Short-Term Investment��1.4%U.S. Treasury��1.4%U.S. Treasury Bill
0.149%, 05/10/22 (e) 16,400,000 16,396,736Total Short-Term Investments
(Cost $16,397,317) 16,396,736
Securities Lending Reinvestments (f)��13.0%Certificates of Deposit��4.0%Bank of Montreal
0.300%, 06/02/22 4,000,000 3,997,064Bank of Nova Scotia
0.320%, 06/07/22 2,000,000 1,998,368Barclays Bank plc
0.180%, 04/07/22 5,000,000 4,999,815BNP Paribas S.A.
0.490%, SOFR + 0.220%, 11/17/22 (g) 2,000,000 1,997,184Canadian Imperial Bank of Commerce
(NY)0.520%, SOFR + 0.250%, 02/03/23 (g) 3,000,000 2,995,5460.770%, SOFR + 0.500%, 03/03/23 (g) 2,000,000 2,001,270
Cooperatieve Rabobank UA0.840%, SOFR + 0.570%, 09/19/22 (g) 5,000,000 5,000,000
Credit Agricole S.A.0.590%, 05/24/22 3,000,000 2,999,640
Certificates of Deposit��(Continued)Credit Industriel et Commercial
Zero Coupon, 04/14/22 3,000,000 2,999,490Credit Suisse Group AG
0.830%, 06/03/22 5,000,000 5,000,920Goldman Sachs Bank USA
0.470%, SOFR + 0.190%, 09/02/22 (g) 2,000,000 1,997,452
Copyright © 2022 www.secdatabase.com. All Rights Reserved.Please Consider the Environment Before Printing This Document

Oversea-Chinese Banking Corp., Ltd.Zero Coupon, 04/14/22 700,000 699,881
Sumitomo Mitsui Banking Corp.0.450%, SOFR + 0.180%, 08/09/22 (g) 4,000,000 3,996,092
Sumitomo Mitsui Trust Bank, Ltd.Zero Coupon, 04/19/22 3,000,000 2,999,250
Westpac Banking Corp.0.500%, SOFR + 0.230%, 02/17/23 (g) 2,000,000 1,993,746
45,675,718
Commercial Paper��0.4%DNB Bank ASA
0.830%, SOFR + 0.550%, 09/07/22 (g) 3,000,000 3,001,197Macquarie Bank Ltd.
0.510%, SOFR + 0.230%, 08/04/22 (g) 1,000,000 999,2314,000,428
Repurchase Agreements��7.6%Barclays Bank plc
Repurchase Agreement dated 03/31/22at 0.600%, due on 05/05/22 with amaturity value of $5,002,917;collateralized by various CommonStock with an aggregate market valueof $5,557,284. 5,000,000 5,000,000
BofA Securities, Inc.Repurchase Agreement dated 03/31/22at 0.270%, due on 04/01/22 with amaturity value of $2,947,441;collateralized by U.S. TreasuryObligations with rates ranging from2.000% - 5.000%, maturity datesranging from 05/15/37 - 02/15/50, andan aggregate market value of$3,006,368. 2,947,419 2,947,419Repurchase Agreement dated 03/31/22at 0.600%, due on 04/18/22 with amaturity value of $2,000,600;collateralized by U.S. TreasuryObligations with rates ranging from0.000% - 2.250%, maturity datesranging from 07/21/22 - 08/15/49, andvarious Common Stock with anaggregate market value of $2,116,839. 2,000,000 2,000,000Repurchase Agreement dated 03/31/22at 0.600%, due on 05/05/22 with amaturity value of $3,001,750;collateralized by U.S. TreasuryObligations with rates ranging from0.000% - 7.500%, maturity datesranging from 04/21/22 - 08/15/51, andvarious Common Stock with anaggregate market value of $3,155,671. 3,000,000 3,000,000
Citigroup Global Markets, Inc.Repurchase Agreement dated 03/31/22at 0.620%, due on 05/05/22 with amaturity value of $5,003,014;collateralized by U.S. TreasuryObligations with rates ranging from0.000% - 3.875%, maturity datesranging from 04/21/22 - 05/15/51, andvarious Common Stock with anaggregate market value of $5,350,305. 5,000,000 5,000,000
BHFTII-186
Copyright © 2022 www.secdatabase.com. All Rights Reserved.Please Consider the Environment Before Printing This Document
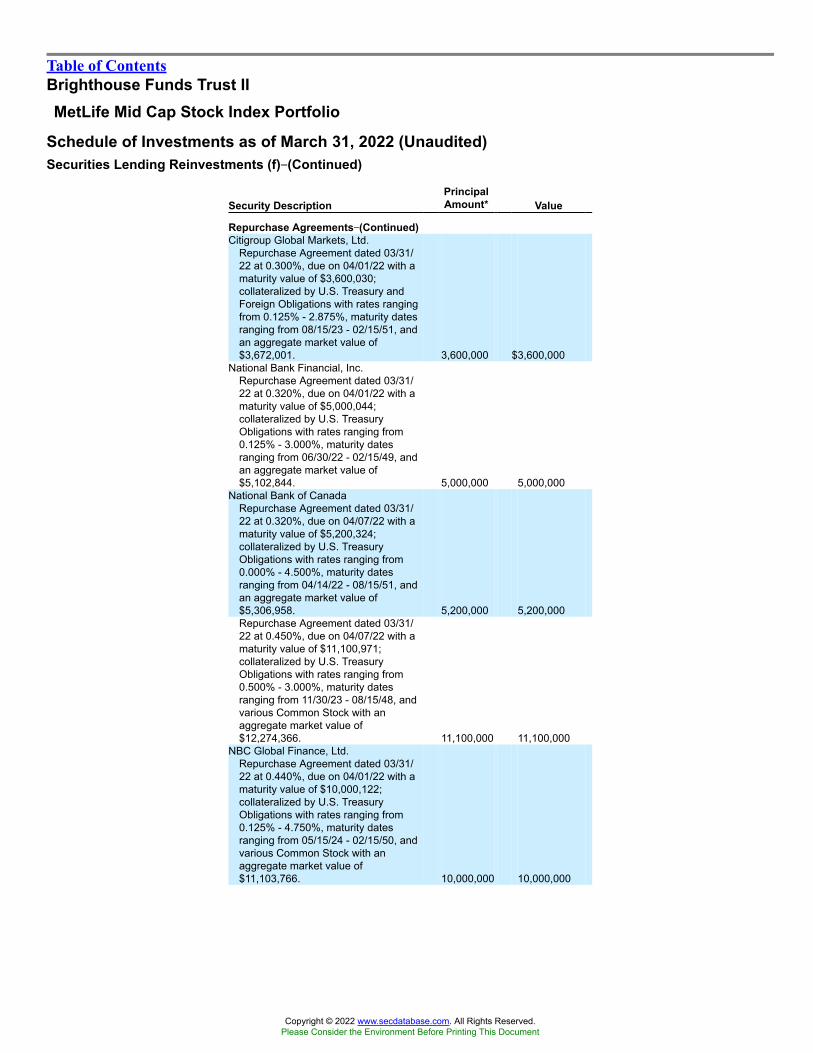
Table of ContentsBrighthouse Funds Trust IIMetLife Mid Cap Stock Index Portfolio
Schedule of Investments as of March 31, 2022 (Unaudited)Securities Lending Reinvestments (f)��(Continued)
Security DescriptionPrincipalAmount* Value
Repurchase Agreements��(Continued)Citigroup Global Markets, Ltd.
Repurchase Agreement dated 03/31/22 at 0.300%, due on 04/01/22 with amaturity value of $3,600,030;collateralized by U.S. Treasury andForeign Obligations with rates rangingfrom 0.125% - 2.875%, maturity datesranging from 08/15/23 - 02/15/51, andan aggregate market value of$3,672,001. 3,600,000 $3,600,000
National Bank Financial, Inc.Repurchase Agreement dated 03/31/22 at 0.320%, due on 04/01/22 with amaturity value of $5,000,044;collateralized by U.S. TreasuryObligations with rates ranging from0.125% - 3.000%, maturity datesranging from 06/30/22 - 02/15/49, andan aggregate market value of$5,102,844. 5,000,000 5,000,000
National Bank of CanadaRepurchase Agreement dated 03/31/22 at 0.320%, due on 04/07/22 with amaturity value of $5,200,324;collateralized by U.S. TreasuryObligations with rates ranging from0.000% - 4.500%, maturity datesranging from 04/14/22 - 08/15/51, andan aggregate market value of$5,306,958. 5,200,000 5,200,000Repurchase Agreement dated 03/31/22 at 0.450%, due on 04/07/22 with amaturity value of $11,100,971;collateralized by U.S. TreasuryObligations with rates ranging from0.500% - 3.000%, maturity datesranging from 11/30/23 - 08/15/48, andvarious Common Stock with anaggregate market value of$12,274,366. 11,100,000 11,100,000
NBC Global Finance, Ltd.Repurchase Agreement dated 03/31/22 at 0.440%, due on 04/01/22 with amaturity value of $10,000,122;collateralized by U.S. TreasuryObligations with rates ranging from0.125% - 4.750%, maturity datesranging from 05/15/24 - 02/15/50, andvarious Common Stock with anaggregate market value of$11,103,766. 10,000,000 10,000,000
Copyright © 2022 www.secdatabase.com. All Rights Reserved.Please Consider the Environment Before Printing This Document

Repurchase Agreement dated 03/31/22 at 0.485%, due on 04/07/22 with amaturity value of $2,000,189;collateralized by U.S. TreasuryObligations with rates ranging from0.125% - 4.750%, maturity datesranging from 05/15/24 - 02/15/50, andvarious Common Stock with anaggregate market value of $2,220,753. 2,000,000 2,000,000
Societe GeneraleRepurchase Agreement dated 03/31/22 at 0.360%, due on 04/01/22 with amaturity value of $6,200,062;collateralized by various CommonStock with an aggregate market valueof $6,889,458. 6,200,000 6,200,000Repurchase Agreement dated 03/31/22 at 0.380%, due on 04/01/22 with amaturity value of $3,300,035;collateralized by various CommonStock with an aggregate market valueof $3,666,970. 3,300,000 3,300,000Repurchase Agreement dated 03/31/22 at 0.410%, due on 04/01/22 with amaturity value of $10,000,114;collateralized by various CommonStock with an aggregate market valueof $11,112,897. 10,000,000 10,000,000
Repurchase Agreements��(Continued)Societe Generale
Repurchase Agreement dated 03/31/22 at 0.420%, due on 04/07/22 with amaturity value of $2,500,204;collateralized by various CommonStock with an aggregate market valueof $2,778,224. 2,500,000 2,500,000
TD Prime Services LLCRepurchase Agreement dated 03/31/22 at 0.400%, due on 04/01/22 with amaturity value of $10,000,111;collateralized by various CommonStock with an aggregate market valueof $11,424,269. 10,000,000 10,000,000
86,847,419
Time Deposit��0.4%Skandi (NY)
0.300%, 04/01/22 5,000,000 5,000,000
Mutual Funds��0.6%AB Government Money Market Portfolio,
Institutional Class0.190%, 04/01/22 (h) 5,000,000 5,000,000
Fidelity Government Portfolio, Class I0.120%, 04/01/22 (h) 2,000,000 2,000,000
7,000,000Total Securities Lending Reinvestments
(Cost $148,546,922) 148,523,565Total Investments�113.0%
(Cost $956,498,434) 1,293,554,792Other assets and liabilities (net)�(13.0)% (148,867,242 )Net Assets��100.0% $1,144,687,550
* Principal amount stated in U.S. dollars unless otherwise noted.(a) Non-income producing security.(b) All or a portion of the security was held on loan. As of March 31, 2022, the market value of securities loaned was $144,683,170 and the collateral
received consisted of cash in the amount of $148,541,504 and non-cash collateral with a value of $1,509,049. The cash collateral investments aredisclosed in the Schedule of Investments and categorized as Securities Lending Reinvestments. The non-cash collateral received consists of U.S.government securities that are held in safe-keeping by the lending agent, or a third-party custodian, and cannot be sold or repledged by thePortfolio.
(c) All or a portion of the security was pledged as collateral against open futures contracts. As of March 31, 2022, the market value of securitiespledged was $3,037,640.
Copyright © 2022 www.secdatabase.com. All Rights Reserved.Please Consider the Environment Before Printing This Document

(d) Affiliated Issuer.(e) The rate shown represents current yield to maturity.(f) Represents investment of cash collateral received from securities on loan as of March 31, 2022.(g) Variable or floating rate security. The stated rate represents the rate at March 31, 2022. Maturity date shown for callable securities reflects the
earliest possible call date. For securities based on a published reference index and spread, the index and spread are indicated in the descriptionabove. For certain variable rate securities, the coupon rate is determined by the issuer/agent based on current market conditions. For certain asset-and mortgage-backed securities, the coupon rate may fluctuate based on changes of the underlying collateral or prepayments of principal. Thesesecurities do not indicate a reference index and spread in their description above.
(h) The rate shown represents the annualized seven-day yield as of March 31, 2022.
BHFTII-187
Copyright © 2022 www.secdatabase.com. All Rights Reserved.Please Consider the Environment Before Printing This Document

Table of ContentsBrighthouse Funds Trust IIMetLife Mid Cap Stock Index Portfolio
Schedule of Investments as of March 31, 2022 (Unaudited)
Futures Contracts
Futures Contracts��LongExpiration
DateNumber ofContracts
NotionalAmount
Value/Unrealized
Appreciation/(Depreciation)
S&P Midcap 400 Index E-Mini Futures 06/17/22 57 USD 15,328,440 $ 578,462
Glossary of Abbreviations
Currencies
(USD)� United States Dollar
Index Abbreviations
(SOFR)� Secured Overnight Financing Rate
Other Abbreviations
(ETF)� Exchange-Traded Fund(REIT)� Real Estate Investment Trust
Fair Value HierarchyAccounting principles generally accepted in the United States of America (�GAAP�) define fair market value as the price that the Portfolio would receive tosell an asset or pay to transfer a liability in an orderly transaction between market participants at the measurement date. It establishes a fair valuehierarchy that prioritizes inputs to valuation methods and requires disclosure of the fair value hierarchy, separately for each major category of assets andliabilities, that segregates fair value measurements into three levels. Levels 1, 2 and 3 of the fair value hierarchy are defined as follows:
Level 1 - unadjusted quoted prices in active markets for identical investmentsLevel 2 - other significant observable inputs (including, but not limited to, quoted prices for similar assets or liabilities in markets that are either activeor inactive; inputs other than quoted prices that are observable such as interest rates, yield curves, volatilities, prepayment speeds, loss severities,credit risks, default rates, or other market corroborated inputs)Level 3 - significant unobservable inputs based on the best information available in the circumstances, to the extent observable inputs areunavailable (including the Portfolio�s own assumptions used in determining the fair value of investments and derivative financial instruments)
The inputs or methodologies used for valuing investments are not necessarily an indication of the risk associated with investing in them. Changes to theinputs or methodologies used may result in transfers between levels. A reconciliation of Level 3 securities, if any, will be disclosed following the fair valuehierarchy table. For more information about the Portfolio�s policy regarding the valuation of investments, please refer to the Notes to Schedule ofInvestments.
The following table summarizes the fair value hierarchy of the Portfolio�s investments as of March 31, 2022:
Description Level 1 Level 2 Level 3 TotalTotal Common Stocks* $1,093,665,406 $� $ � $1,093,665,406Total Mutual Funds* 34,969,085 � � 34,969,085Total Short-Term Investment* � 16,396,736 � 16,396,736Securities Lending Reinvestments
Certificates of Deposit � 45,675,718 � 45,675,718Commercial Paper � 4,000,428 � 4,000,428Repurchase Agreements � 86,847,419 � 86,847,419Time Deposit � 5,000,000 � 5,000,000Mutual Funds 7,000,000 � � 7,000,000
Total Securities Lending Reinvestments 7,000,000 141,523,565 � 148,523,565Total Investments $1,135,634,491 $157,920,301 $ � $1,293,554,792Collateral for Securities Loaned (Liability) $� $(148,541,504) $ � $(148,541,504 )Futures Contracts
Futures Contracts (Unrealized Appreciation) $578,462 $� $ � $578,462
* See Schedule of Investments for additional detailed categorizations.
Copyright © 2022 www.secdatabase.com. All Rights Reserved.Please Consider the Environment Before Printing This Document

BHFTII-188
Copyright © 2022 www.secdatabase.com. All Rights Reserved.Please Consider the Environment Before Printing This Document

Table of ContentsBrighthouse Funds Trust II
MetLife MSCI EAFE Index Portfolio
Schedule of Investments as of March 31, 2022 (Unaudited)Common Stocks��94.9% of Net Assets
Security Description Shares Value
Australia��7.6%Ampol, Ltd. 18,604 $424,264APA Group 77,620 617,711Aristocrat Leisure, Ltd. 38,272 1,041,279ASX, Ltd. 13,079 796,704Aurizon Holdings, Ltd. 132,266 364,475Australia & New Zealand Banking Group, Ltd. 190,145 3,910,313BGP Holdings plc (a) (b) (c) 713,624 0BHP Group, Ltd. 335,049 13,096,350BlueScope Steel, Ltd. 33,509 519,634Brambles, Ltd. 91,149 674,519Cochlear, Ltd. 4,353 727,773Coles Group, Ltd. 88,152 1,179,116Commonwealth Bank of Australia 112,937 8,899,516Computershare, Ltd. 39,599 727,031Crown Resorts, Ltd. (b) 29,464 281,038CSL, Ltd. 31,480 6,273,969Dexus (REIT) 77,269 631,058Domino�s Pizza Enterprises, Ltd. 4,255 278,215Endeavour Group, Ltd. 89,555 488,957Evolution Mining, Ltd. 118,939 387,839Fortescue Metals Group, Ltd. 115,617 1,780,522Goodman Group (REIT) 115,041 1,960,862GPT Group (The) (REIT) 137,557 530,995IDP Education, Ltd. 14,103 330,079Insurance Australia Group, Ltd. 171,814 561,496LendLease Corp,Ltd. (REIT) 48,652 405,786Macquarie Group, Ltd. 22,430 3,386,061Medibank Private, Ltd. 194,632 447,249Mineral Resources, Ltd. 11,249 441,288Mirvac Group (REIT) 198,413 368,604National Australia Bank, Ltd. 216,578 5,221,050Newcrest Mining, Ltd. 53,581 1,067,435Northern Star Resources, Ltd. 79,868 635,231Orica, Ltd. 24,591 292,252Origin Energy, Ltd. 123,597 573,960Qantas Airways, Ltd. (b) 58,443 225,334QBE Insurance Group, Ltd. 90,383 773,034Ramsay Health Care, Ltd. 13,525 657,344REA Group, Ltd. 2,790 279,945Reece, Ltd. 20,424 289,151Rio Tinto, Ltd. 24,091 2,141,619Santos, Ltd. 208,207 1,201,471Scentre Group (REIT) 297,059 675,121Seek, Ltd. 23,745 524,339Sonic Healthcare, Ltd. 27,367 723,183South32, Ltd. 315,794 1,180,121Stockland (REIT) 162,137 513,622Suncorp Group, Ltd. 92,883 770,760Tabcorp Holdings, Ltd. 153,298 610,057Telstra Corp., Ltd. 240,920 713,014Transurban Group 196,741 1,989,110Treasury Wine Estates, Ltd. 53,467 459,607Vicinity Centres (REIT) 150,225 208,448Washington H Soul Pattinson & Co., Ltd. 14,627 311,713Wesfarmers, Ltd. 76,356 2,879,201Westpac Banking Corp. 239,905 4,335,492
Australia��(Continued)WiseTech Global, Ltd. 10,682 403,851Woodside Petroleum, Ltd. 61,175 1,464,761
Copyright © 2022 www.secdatabase.com. All Rights Reserved.Please Consider the Environment Before Printing This Document

Woolworths Group, Ltd. 78,303 2,182,57784,835,506
Austria��0.2%Erste Group Bank AG 21,338 778,371OMV AG 9,828 471,349Raiffeisen Bank International AG 9,390 133,505Verbund AG 4,951 524,319voestalpine AG 7,917 236,540
2,144,084
Belgium��0.8%Ageas SA 12,505 632,962Anheuser-Busch InBev S.A. 57,689 3,480,166Elia Group S.A. 2,253 345,871Groupe Bruxelles Lambert S.A. 6,450 672,766KBC Group NV 17,056 1,233,757Proximus SADP 11,920 223,140Sofina S.A. 1,124 409,974Solvay S.A. 5,192 514,134UCB S.A. 8,488 1,021,998Umicore S.A. 13,317 578,585
9,113,353
Chile��0.1%Antofagasta plc 26,957 589,984
China��0.5%BOC Hong Kong Holdings, Ltd. 230,965 869,291Budweiser Brewing Co. APAC, Ltd. 120,500 319,876Chow Tai Fook Jewellery Group, Ltd. 143,000 259,063ESR Cayman, Ltd. (b) 122,000 377,780Prosus NV 60,480 3,220,175SITC International Holdings Co., Ltd. 93,000 328,369
5,374,554
Denmark��2.6%Ambu A/S - Class B (d) 11,908 175,893AP Moller - Maersk A/S - Class A 226 671,733AP Moller - Maersk A/S - Class B 398 1,206,585Carlsberg AS - Class B 6,055 743,566Chr Hansen Holding A/S 7,473 552,350Coloplast A/S - Class B 7,704 1,173,553Danske Bank A/S 48,462 805,549Demant A/S (b) 7,349 334,370DSV A/S 13,653 2,625,814Genmab A/S (b) 4,091 1,490,601GN Store Nord AS 8,231 404,007Novo Nordisk A/S - Class B 111,451 12,414,370Novozymes A/S - B Shares 13,878 955,338Orsted A/S 12,362 1,565,667Pandora A/S 7,026 668,582
BHFTII-189
Copyright © 2022 www.secdatabase.com. All Rights Reserved.Please Consider the Environment Before Printing This Document

Table of ContentsBrighthouse Funds Trust IIMetLife MSCI EAFE Index Portfolio
Schedule of Investments as of March 31, 2022 (Unaudited)Common Stocks��(Continued)
Security Description Shares Value
Denmark��(Continued)Rockwool International A/S - B Shares 585 $194,340Tryg A/S 25,298 616,898Vestas Wind Systems A/S 63,552 1,887,257
28,486,473
Finland��1.1%Elisa Oyj 8,457 512,650Fortum Oyj (d) 30,377 554,634Kesko Oyj - B Shares 19,815 550,078Kone Oyj - Class B 22,998 1,211,500Neste Oyj (d) 28,819 1,320,499Nokia Oyj (b) 361,104 1,999,339Nordea Bank Abp 213,731 2,220,545Orion Oyj - Class B (d) 8,084 368,949Sampo Oyj - A Shares 31,188 1,531,154Stora Enso Oyj - R Shares 40,497 796,962UPM-Kymmene Oyj 33,433 1,097,251Wartsila Oyj Abp 31,392 288,374
12,451,935
France��10.5%Accor S.A. (b) 12,886 415,341Adevinta ASA (b) 17,802 163,310Aeroports de Paris (b) 2,209 332,737Air Liquide S.A. 31,087 5,469,800Airbus SE (b) 38,780 4,714,596Alstom S.A. 21,565 505,611Amundi S.A. 4,463 306,287Arkema S.A. 3,712 445,414AXA S.A. 127,528 3,745,864BioMerieux 3,058 327,828BNP Paribas S.A. 73,625 4,216,259Bollore SE 61,874 325,059Bouygues S.A. 15,150 531,197Bureau Veritas S.A. 19,740 567,102Capgemini SE 10,405 2,327,913Carrefour S.A. 42,889 935,805Cie de Saint-Gobain 33,751 2,020,146Cie Generale des Etablissements Michelin 11,638 1,581,307CNP Assurances 10,520 255,113Covivio (REIT) 3,163 252,403Credit Agricole S.A. 81,913 984,288Danone S.A. 43,567 2,413,899Dassault Aviation S.A. 1,830 292,621Dassault Systemes SE 42,518 2,107,195Edenred 17,436 866,946Eiffage S.A. 5,728 590,503Electricite de France S.A. (d) 31,130 294,983Engie S.A. 116,940 1,541,766EssilorLuxottica S.A. 19,181 3,521,655Eurazeo S.E. 2,867 242,343Faurecia SE (d) 8,085 210,360Gecina S.A. (REIT) 3,288 416,104Getlink SE 32,808 594,267Hermes International 2,091 2,982,996
France��(Continued)Ipsen S.A. 2,947 370,265Kering S.A. 5,036 3,199,637Klepierre S.A. (REIT) 12,682 339,141
Copyright © 2022 www.secdatabase.com. All Rights Reserved.Please Consider the Environment Before Printing This Document

L�Oreal S.A. 16,571 6,671,180La Francaise des Jeux SAEM 6,363 253,671Legrand S.A. 17,126 1,637,537LVMH Moet Hennessy Louis Vuitton SE 18,377 13,161,412Orange S.A. 128,034 1,522,726Pernod Ricard S.A. 13,684 3,018,567Publicis Groupe S.A. 15,420 942,130Remy Cointreau S.A. 1,206 249,915Renault S.A. (b) 14,189 373,041Safran S.A. 22,701 2,683,489Sanofi 75,284 7,722,204Sartorius Stedim Biotech 1,739 716,848Schneider Electric SE 36,097 6,061,496SEB S.A. 1,989 279,051Societe Generale S.A. 53,796 1,447,461Sodexo S.A. (d) 6,495 530,334Teleperformance 3,877 1,486,933Thales S.A. 7,807 991,532TotalEnergies SE 165,648 8,453,398UBISOFT Entertainment S.A. (b) 7,194 318,538Unibail-Rodamco-Westfield (REIT) (b) 7,986 600,910Valeo 15,665 289,476Veolia Environnement S.A. 42,002 1,348,011Vinci S.A. 35,857 3,687,145Vivendi SE 49,997 656,309Wendel S.E. 1,813 185,535Worldline S.A. (b) 15,808 689,292
116,386,202
Germany��7.4%Adidas AG 12,880 3,025,092Allianz SE 26,818 6,441,041Aroundtown S.A. 63,611 367,508BASF SE 60,446 3,466,863Bayer AG 64,288 4,423,853Bayerische Motoren Werke AG 21,740 1,893,889Bechtle AG 5,943 337,327Beiersdorf AG 7,042 744,264Brenntag SE 9,778 795,214Carl Zeiss Meditec AG 2,898 472,622Commerzbank AG (b) 70,392 540,583Continental AG 7,262 526,847Covestro AG 13,256 673,677Daimler Truck Holding AG (b) 28,970 809,473Delivery Hero SE (b) 11,033 488,799Deutsche Bank AG 133,660 1,716,590Deutsche Boerse AG 12,471 2,253,236Deutsche Lufthansa AG (b) (d) 35,564 289,985Deutsche Post AG 65,921 3,183,744Deutsche Telekom AG 214,518 4,029,762E.ON SE 144,559 1,690,903Evonik Industries AG 12,954 362,241
BHFTII-190
Copyright © 2022 www.secdatabase.com. All Rights Reserved.Please Consider the Environment Before Printing This Document

Table of ContentsBrighthouse Funds Trust IIMetLife MSCI EAFE Index Portfolio
Schedule of Investments as of March 31, 2022 (Unaudited)Common Stocks��(Continued)
Security Description Shares Value
Germany��(Continued)Fresenius Medical Care AG & Co. KGaA 13,633 $919,554Fresenius SE & Co. KGaA 27,953 1,034,514GEA Group AG 11,736 487,696Hannover Rueck SE 4,237 725,800HeidelbergCement AG 10,711 616,119HelloFresh SE (b) 10,721 487,252Henkel AG & Co. KGaA 6,878 458,535Infineon Technologies AG 84,294 2,896,433KION Group AG 5,070 339,112Knorr-Bremse AG 5,273 407,455LANXESS AG 5,571 247,801LEG Immobilien SE 5,050 580,057Mercedes-Benz Group AG 56,049 3,959,470Merck KGaA 8,617 1,815,090MTU Aero Engines AG 3,171 741,034Muenchener Rueckversicherungs-
Gesellschaft AG 9,297 2,504,761Nemetschek SE 4,238 413,490Puma SE 7,160 614,677Rational AG 371 258,917RWE AG 41,461 1,818,923SAP SE 69,112 7,756,364Scout24 SE 5,930 342,138Siemens AG 50,180 6,993,280Siemens Energy AG (b) 28,411 652,909Siemens Healthineers AG 19,718 1,229,760Symrise AG 8,326 1,005,343Telefonica Deutschland Holding AG 73,147 200,948Uniper SE 6,428 166,277United Internet AG 4,835 167,251Volkswagen AG 1,994 499,693Vonovia SE 49,461 2,326,039Zalando SE (b) 15,086 770,214
81,970,419
Hong Kong��2.5%AIA Group, Ltd. 801,400 8,392,239CK Asset Holdings, Ltd. 126,940 867,810CK Hutchison Holdings, Ltd. 176,440 1,293,912CK Infrastructure Holdings, Ltd. 49,500 331,305CLP Holdings, Ltd. 111,377 1,085,619Galaxy Entertainment Group, Ltd. 152,000 903,598Hang Lung Properties, Ltd. 142,000 285,764Hang Seng Bank, Ltd. 54,200 1,042,815Henderson Land Development Co., Ltd. 100,311 416,545HK Electric Investments & HK Electric
Investments, Ltd. 39,000 38,080HKT Trust & HKT, Ltd. 163,980 225,100Hong Kong & China Gas Co., Ltd. 759,531 918,962Hong Kong Exchanges & Clearing, Ltd. 78,700 3,709,793Hongkong Land Holdings, Ltd. 86,500 421,960Jardine Matheson Holdings, Ltd. 14,300 784,329Link REIT (REIT) 148,541 1,266,381MTR Corp., Ltd. 110,500 596,491New World Development Co., Ltd. 115,926 470,834Power Assets Holdings, Ltd. 93,049 606,244Sino Land Co., Ltd. 233,600 301,668
Hong Kong��(Continued)Sun Hung Kai Properties, Ltd. 83,250 991,928
Copyright © 2022 www.secdatabase.com. All Rights Reserved.Please Consider the Environment Before Printing This Document

Swire Pacific, Ltd. - Class A 36,817 224,720Swire Properties, Ltd. 83,600 207,325Techtronic Industries Co., Ltd. 94,500 1,522,744WH Group, Ltd. 564,000 354,898Wharf Real Estate Investment Co., Ltd. 117,976 583,137Xinyi Glass Holdings, Ltd. 128,000 307,568
28,151,769
Ireland��0.7%AerCap Holdings NV (b) 9,000 452,520CRH plc 52,050 2,096,118Flutter Entertainment plc (b) 11,454 1,321,440James Hardie Industries plc 30,071 908,155Kerry Group plc - Class A 10,420 1,171,000Kingspan Group plc 9,603 938,733Smurfit Kappa Group plc 16,402 731,188
7,619,154
Israel��0.7%Azrieli Group, Ltd. 3,090 271,094Bank Hapoalim B.M. 79,475 783,542Bank Leumi Le-Israel B.M. 98,212 1,054,262Check Point Software Technologies, Ltd. (b) 7,600 1,050,776CyberArk Software, Ltd. (b) (d) 2,700 455,625Elbit Systems, Ltd. 1,811 396,436ICL Group, Ltd. 48,759 579,653Israel Discount Bank, Ltd. - Class A 83,247 517,226Kornit Digital, Ltd. (b) 3,100 256,339Mizrahi Tefahot Bank, Ltd. 9,874 384,078Nice, Ltd. (b) 4,264 933,391Teva Pharmaceutical Industries, Ltd. (ADR)
(b) 75,753 711,321Wix.com, Ltd. (b) 3,600 376,056
7,769,799
Italy��1.9%Amplifon S.p.A. 9,033 405,675Assicurazioni Generali S.p.A. 74,881 1,723,308Atlantia S.p.A. 36,067 754,378Davide Campari-Milano NV 36,167 423,125DiaSorin S.p.A. 1,857 292,455Enel S.p.A. 530,048 3,560,164Eni S.p.A. 165,402 2,439,003Ferrari NV 8,221 1,808,263FinecoBank Banca Fineco S.p.A. 42,655 651,583Infrastrutture Wireless Italiane S.p.A. 24,381 275,004Intesa Sanpaolo S.p.A. 1,101,259 2,531,720Mediobanca Banca di Credito Finanziario
S.p.A. 44,816 456,704Moncler S.p.A. 13,551 759,018Nexi S.p.A. (b) 32,431 376,780Poste Italiane S.p.A. 29,264 333,897Prysmian S.p.A. 17,303 592,811Recordati Industria Chimica e Farmaceutica
S.p.A. 5,644 285,379Snam S.p.A. 137,424 798,213
BHFTII-191
Copyright © 2022 www.secdatabase.com. All Rights Reserved.Please Consider the Environment Before Printing This Document

Table of ContentsBrighthouse Funds Trust IIMetLife MSCI EAFE Index Portfolio
Schedule of Investments as of March 31, 2022 (Unaudited)Common Stocks��(Continued)
Security Description Shares Value
Italy��(Continued)Telecom Italia S.p.A. 331,993 $122,609Terna - Rete Elettrica Nazionale 98,855 855,134UniCredit S.p.A. 142,045 1,542,528
20,987,751
Japan��21.2%Advantest Corp. 13,500 1,062,079Aeon Co., Ltd. 43,500 930,810AGC, Inc. 12,900 517,120Aisin Corp. (d) 11,100 380,401Ajinomoto Co., Inc. 33,000 939,920ANA Holdings, Inc. (b) (d) 8,400 175,897Asahi Group Holdings, Ltd. 30,500 1,110,589Asahi Intecc Co., Ltd. 14,200 278,681Asahi Kasei Corp. 85,900 745,812Astellas Pharma, Inc. 120,300 1,891,533Azbil Corp. (d) 9,100 304,012Bandai Namco Holdings, Inc. 13,500 1,025,765Bridgestone Corp. 36,400 1,412,969Brother Industries, Ltd. (d) 16,400 299,546Canon, Inc. 68,400 1,670,044Capcom Co., Ltd. 13,000 315,320Central Japan Railway Co. (d) 9,800 1,281,152Chiba Bank, Ltd. (The) (d) 39,400 232,940Chubu Electric Power Co., Inc. (d) 45,700 474,904Chugai Pharmaceutical Co., Ltd. 42,700 1,432,324Concordia Financial Group, Ltd. (d) 73,300 274,271Cosmos Pharmaceutical Corp. 1,500 182,748CyberAgent, Inc. 29,600 368,106Dai Nippon Printing Co., Ltd. (d) 13,000 306,251Dai-ichi Life Holdings, Inc. 65,300 1,332,458Daifuku Co., Ltd. (d) 7,400 530,226Daiichi Sankyo Co., Ltd. 113,100 2,488,700Daikin Industries, Ltd. 16,700 3,049,795Daito Trust Construction Co., Ltd. 4,600 489,525Daiwa House Industry Co., Ltd. 37,400 980,041Daiwa House REIT Investment Corp. (REIT) 136 367,064Daiwa Securities Group, Inc. (d) 102,200 580,421Denso Corp. (d) 27,700 1,772,891Dentsu Group, Inc. 14,400 590,628Disco Corp. 1,900 531,582East Japan Railway Co. 20,100 1,170,112Eisai Co., Ltd. 14,000 650,753ENEOS Holdings, Inc. (d) 179,800 677,814FANUC Corp. 12,700 2,240,118Fast Retailing Co., Ltd. 3,700 1,906,504Fuji Electric Co., Ltd. 8,600 430,209FUJIFILM Holdings Corp. 23,700 1,454,250Fujitsu, Ltd. 12,500 1,869,132GLP J-REIT 268 409,143GMO Payment Gateway, Inc. 3,000 307,193Hakuhodo DY Holdings, Inc. (d) 17,600 221,831Hamamatsu Photonics KK 9,600 512,464Hankyu Hanshin Holdings, Inc. 16,400 475,801Hikari Tsushin, Inc. 1,500 171,366Hino Motors, Ltd. (d) 19,600 115,023
Japan��(Continued)Hirose Electric Co., Ltd. (d) 2,415 351,968Hitachi Construction Machinery Co., Ltd. (d) 8,900 231,320
Copyright © 2022 www.secdatabase.com. All Rights Reserved.Please Consider the Environment Before Printing This Document

Hitachi Metals, Ltd. (b) 13,800 231,594Hitachi, Ltd. 64,400 3,236,690Honda Motor Co., Ltd. (d) 106,900 3,046,828Hoshizaki Corp. 4,100 282,057Hoya Corp. 24,800 2,838,481Hulic Co., Ltd. 25,800 232,346Ibiden Co., Ltd. 7,800 383,761Idemitsu Kosan Co., Ltd. 14,768 408,656Iida Group Holdings Co., Ltd. 12,700 220,496Inpex Corp. 71,100 846,816Isuzu Motors, Ltd. 39,100 506,661Ito En, Ltd. 4,000 196,853ITOCHU Corp. (d) 78,000 2,653,877Itochu Techno-Solutions Corp. 7,100 181,889Japan Airlines Co., Ltd. (b) 8,400 156,813Japan Exchange Group, Inc. 31,100 581,220Japan Metropolitan Fund Invest (REIT) 494 418,687Japan Post Bank Co., Ltd. (d) 30,800 248,809Japan Post Holdings Co., Ltd. 152,600 1,124,282Japan Post Insurance Co., Ltd. 16,000 280,727Japan Real Estate Investment Corp. (REIT) 85 446,740Japan Tobacco, Inc. 82,800 1,421,645JFE Holdings, Inc. 35,100 495,439JSR Corp. (d) 14,400 425,865Kajima Corp. (d) 32,000 390,884Kakaku.com, Inc. 10,700 240,030Kansai Electric Power Co., Inc. (The) (d) 49,800 471,265Kansai Paint Co., Ltd. 11,900 191,770Kao Corp. 31,800 1,309,371KDDI Corp. (d) 104,900 3,455,938Keio Corp. (d) 6,700 262,356Keisei Electric Railway Co., Ltd. 10,000 279,151Keyence Corp. 12,800 5,968,974Kikkoman Corp. (d) 10,200 677,588Kintetsu Group Holdings Co., Ltd. (d) 12,612 361,908Kirin Holdings Co., Ltd. 51,100 766,535Kobayashi Pharmaceutical Co., Ltd. 3,600 289,475Kobe Bussan Co., Ltd. 9,200 283,458Koito Manufacturing Co., Ltd. 7,700 312,666Komatsu, Ltd. 55,400 1,333,358Konami Holdings Corp. (d) 4,800 304,308Kose Corp. 2,300 241,277Kubota Corp. 67,200 1,263,653Kurita Water Industries, Ltd. 7,100 262,851Kyocera Corp. 21,800 1,229,035Kyowa Kirin Co., Ltd. 15,200 353,706Lasertec Corp. 5,100 860,005Lion Corp. 15,900 177,777Lixil Corp. (d) 19,000 354,635M3, Inc. 29,000 1,052,710Makita Corp. (d) 15,900 510,788Marubeni Corp. (d) 105,900 1,239,203Mazda Motor Corp. 43,000 319,054McDonald�s Holdings Co. Japan, Ltd. 5,400 225,592
BHFTII-192
Copyright © 2022 www.secdatabase.com. All Rights Reserved.Please Consider the Environment Before Printing This Document

Table of ContentsBrighthouse Funds Trust IIMetLife MSCI EAFE Index Portfolio
Schedule of Investments as of March 31, 2022 (Unaudited)Common Stocks��(Continued)
Security Description Shares Value
Japan��(Continued)Medipal Holdings Corp. (d) 9,400 $155,375MEIJI Holdings Co., Ltd. (d) 7,300 397,093Mercari, Inc. (b) 5,800 150,859MINEBEA MITSUMI, Inc. (d) 26,300 574,639MISUMI Group, Inc. 19,300 575,973Mitsubishi Chemical Holdings Corp. (d) 90,400 603,317Mitsubishi Corp. (d) 82,700 3,125,348Mitsubishi Electric Corp. 115,900 1,337,996Mitsubishi Estate Co., Ltd. 75,800 1,130,726Mitsubishi Gas Chemical Co., Inc. (d) 11,500 195,837Mitsubishi HC Capital, Inc. 36,000 168,060Mitsubishi Heavy Industries, Ltd. (d) 23,100 763,038Mitsubishi UFJ Financial Group, Inc. (d) 791,788 4,929,546Mitsui & Co., Ltd. 105,517 2,882,896Mitsui Chemicals, Inc. 12,700 320,883Mitsui Fudosan Co., Ltd. 61,200 1,313,311Mitsui OSK Lines, Ltd. (d) 22,800 634,846Miura Co., Ltd. (d) 6,500 160,792Mizuho Financial Group, Inc. 156,550 2,009,854MonotaRO Co., Ltd. 18,400 395,490MS&AD Insurance Group Holdings, Inc. 28,400 925,501Murata Manufacturing Co., Ltd. 37,700 2,499,679NEC Corp. 15,600 656,412Nexon Co., Ltd. 31,800 763,240NGK Insulators, Ltd. (d) 19,300 276,373Nidec Corp. 30,000 2,383,920Nihon M&A Center Holdings, Inc. 22,000 306,643Nintendo Co., Ltd. 7,400 3,744,993Nippon Building Fund, Inc. (REIT) 102 580,972Nippon Express Holdings, Inc. 5,900 406,771Nippon Paint Holdings Co., Ltd. 54,000 475,282Nippon Prologis REIT, Inc. 143 419,507Nippon Sanso Holdings Corp. 9,600 182,963Nippon Shinyaku Co., Ltd. 3,200 218,233Nippon Steel Corp. (d) 56,300 1,001,068Nippon Telegraph & Telephone Corp. 79,200 2,308,224Nippon Yusen KK 11,100 972,975Nissan Chemical Corp. (d) 7,300 429,734Nissan Motor Co., Ltd. (b) 133,900 597,865Nisshin Seifun Group, Inc. (d) 15,700 219,840Nissin Foods Holdings Co., Ltd. (d) 4,700 331,038Nitori Holdings Co., Ltd. 4,800 604,605Nitto Denko Corp. 9,300 668,510Nomura Holdings, Inc. (d) 184,800 776,730Nomura Real Estate Holdings, Inc. 9,500 228,191Nomura Real Estate Master Fund, Inc. (REIT) 296 392,543Nomura Research Institute, Ltd. 20,800 682,315NTT Data Corp. 43,680 859,300Obayashi Corp. 45,500 335,570Obic Co., Ltd. 4,200 631,214Odakyu Electric Railway Co., Ltd. (d) 20,800 346,419Oji Holdings Corp. (d) 61,700 307,664Olympus Corp. (d) 71,400 1,360,564Omron Corp. 12,600 842,603Ono Pharmaceutical Co., Ltd. 26,000 654,942Open House Group Co., Ltd. (d) 5,600 248,549
Japan��(Continued)Oracle Corp. Japan 3,000 208,963Oriental Land Co., Ltd. (d) 13,000 2,489,444
Copyright © 2022 www.secdatabase.com. All Rights Reserved.Please Consider the Environment Before Printing This Document

ORIX Corp. 81,700 1,635,553Orix JREIT, Inc. 185 251,556Osaka Gas Co., Ltd. 21,200 365,057Otsuka Corp. 7,400 263,570Otsuka Holdings Co., Ltd. 23,800 825,775Pan Pacific International Holdings Corp. 26,000 418,260Panasonic Corp. 140,000 1,359,856Persol Holdings Co., Ltd. 13,400 301,272Rakuten Group, Inc. 61,500 486,290Recruit Holdings Co., Ltd. 88,400 3,881,548Renesas Electronics Corp. (b) 82,000 951,689Resona Holdings, Inc. (d) 143,200 615,060Ricoh Co., Ltd. (d) 48,600 422,913Rinnai Corp. 2,800 210,268Rohm Co., Ltd. 5,000 389,777Ryohin Keikaku Co., Ltd. 18,000 210,553Santen Pharmaceutical Co., Ltd. 27,500 276,116SBI Holdings, Inc. (d) 16,511 418,519SCSK Corp. 11,700 201,102Secom Co., Ltd. 14,200 1,031,979Seiko Epson Corp. (d) 20,000 300,757Sekisui Chemical Co., Ltd. 25,900 372,068Sekisui House, Ltd. 37,700 733,184Seven & i Holdings Co., Ltd. 49,000 2,338,442SG Holdings Co., Ltd. (d) 23,200 438,541Shimadzu Corp. 15,600 538,798Shimano, Inc. 5,100 1,170,058Shimizu Corp. (d) 39,000 235,096Shin-Etsu Chemical Co., Ltd. 23,800 3,637,676Shionogi & Co., Ltd. (d) 18,100 1,114,933Shiseido Co., Ltd. 25,500 1,296,252Shizuoka Bank, Ltd. (The) (d) 25,000 177,084SMC Corp. 3,800 2,128,733SoftBank Corp. (d) 188,100 2,205,085SoftBank Group Corp. 78,900 3,559,367Sohgo Security Services Co., Ltd. 4,800 157,220Sompo Holdings, Inc. (d) 21,699 957,348Sony Group Corp. 83,500 8,644,033Square Enix Holdings Co., Ltd. 6,500 288,601Stanley Electric Co., Ltd. 9,700 183,734Subaru Corp. (d) 37,600 599,108SUMCO Corp. 22,600 371,929Sumitomo Chemical Co., Ltd. (d) 105,400 484,615Sumitomo Corp. (d) 70,200 1,220,958Sumitomo Electric Industries, Ltd. (d) 45,834 546,747Sumitomo Metal Mining Co., Ltd. (d) 16,600 840,700Sumitomo Mitsui Financial Group, Inc. (d) 87,000 2,784,887Sumitomo Mitsui Trust Holdings, Inc. 23,126 757,786Sumitomo Realty & Development Co., Ltd. (d) 22,600 626,566Suntory Beverage & Food, Ltd. 10,400 397,765Suzuki Motor Corp. (d) 23,000 790,771Sysmex Corp. 10,800 786,594T&D Holdings, Inc. 39,400 536,139Taisei Corp. 14,500 420,428
BHFTII-193
Copyright © 2022 www.secdatabase.com. All Rights Reserved.Please Consider the Environment Before Printing This Document

Table of ContentsBrighthouse Funds Trust IIMetLife MSCI EAFE Index Portfolio
Schedule of Investments as of March 31, 2022 (Unaudited)Common Stocks��(Continued)
Security Description Shares Value
Japan��(Continued)Takeda Pharmaceutical Co., Ltd. (d) 104,048 $2,986,792TDK Corp. 26,300 952,441Terumo Corp. 41,500 1,260,638TIS, Inc. 16,500 387,081Tobu Railway Co., Ltd. 14,600 356,286Toho Co., Ltd. 8,500 322,336Tokio Marine Holdings, Inc. (d) 40,900 2,385,987Tokyo Electric Power Co. Holdings, Inc. (b) 108,500 359,797Tokyo Electron, Ltd. 10,000 5,150,184Tokyo Gas Co., Ltd. 26,000 477,710Tokyu Corp. 37,500 488,539TOPPAN, Inc. (d) 20,500 363,252Toray Industries, Inc. 74,300 388,421Toshiba Corp. (d) 25,100 955,301Tosoh Corp. 18,900 280,339TOTO, Ltd. 10,400 419,006Toyo Suisan Kaisha, Ltd. 6,000 215,208Toyota Industries Corp. 10,200 704,177Toyota Motor Corp. 702,100 12,614,895Toyota Tsusho Corp. 15,500 639,692Trend Micro, Inc. 8,900 521,092Tsuruha Holdings, Inc. 2,900 184,733Unicharm Corp. 25,800 920,280USS Co., Ltd. 16,600 280,049Welcia Holdings Co., Ltd. 7,000 172,751West Japan Railway Co. 14,600 607,810Yakult Honsha Co., Ltd. 9,100 487,171Yamaha Corp. (d) 9,100 398,027Yamaha Motor Co., Ltd. 18,700 420,346Yamato Holdings Co., Ltd. 21,800 409,330Yaskawa Electric Corp. 14,600 571,936Yokogawa Electric Corp. (d) 16,300 278,914Z Holdings Corp. 155,600 677,627ZOZO, Inc. 8,400 223,828
236,564,009
Jordan��0.0%Hikma Pharmaceuticals plc 11,270 303,904
Luxembourg��0.2%ArcelorMittal S.A. 42,356 1,369,335Eurofins Scientific SE 8,661 863,557Tenaris S.A. 35,513 538,330
2,771,222
Macau��0.0%Sands China, Ltd. (b) 176,400 423,475
Netherlands��5.4%ABN AMRO Bank NV 29,995 385,947Adyen NV (b) 1,334 2,650,659Aegon NV 119,047 631,902Akzo Nobel NV 12,124 1,047,674Argenx SE (b) 2,698 853,287ASM International NV 3,312 1,207,547
Netherlands��(Continued)ASML Holding NV 27,361 18,355,359Euronext NV 5,789 528,706EXOR NV 7,620 584,556
Copyright © 2022 www.secdatabase.com. All Rights Reserved.Please Consider the Environment Before Printing This Document

Heineken Holding NV 7,046 554,658Heineken NV (d) 16,675 1,598,974IMCD NV 3,850 658,394ING Groep NV 261,518 2,748,878JDE Peet�s NV 5,438 156,476Just Eat Takeaway.com NV (b) 13,092 441,988Koninklijke Ahold Delhaize NV 69,743 2,254,946Koninklijke DSM NV 11,244 2,021,147Koninklijke KPN NV 229,375 801,232Koninklijke Philips NV 60,898 1,873,831NN Group NV 17,632 893,808Randstad NV (d) 8,273 499,438Shell plc 509,578 14,016,680Stellantis NV (Milan-Traded Shares) 136,818 2,231,544Universal Music Group NV 49,997 1,334,980Wolters Kluwer NV 17,273 1,849,340
60,181,951
New Zealand��0.2%Auckland International Airport, Ltd. (b) 89,204 484,118Fisher & Paykel Healthcare Corp., Ltd. 38,953 656,904Mercury NZ, Ltd. 47,715 196,734Meridian Energy, Ltd. 89,813 314,210Ryman Healthcare, Ltd. 29,900 194,479Spark New Zealand, Ltd. 83,726 266,226Xero, Ltd. (b) 8,809 669,571
2,782,242
Norway��0.7%Aker BP ASA (d) 8,515 319,451DNB Bank ASA 60,120 1,370,458Equinor ASA 68,665 2,594,163Gjensidige Forsikring ASA 14,357 358,608Mowi ASA 29,767 807,958Norsk Hydro ASA 91,188 894,636Orkla ASA 54,509 488,085Telenor ASA 48,193 697,404Yara International ASA 10,920 548,277
8,079,040
Portugal��0.2%Banco Espirito Santo S.A. (a) (b) (c) 199,038 0EDP�Energias de Portugal S.A. 189,377 938,156Galp Energia SGPS S.A. 23,389 297,698Jeronimo Martins SGPS S.A. 18,255 439,861
1,675,715
Singapore��1.2%Ascendas Real Estate Investment Trust
(REIT) 228,844 494,211CapitaLand Integrated Commercial Trust
(REIT) 348,942 578,725CapitaLand Investment, Ltd. (b) 170,600 500,869DBS Group Holdings, Ltd. 120,967 3,184,963
BHFTII-194
Copyright © 2022 www.secdatabase.com. All Rights Reserved.Please Consider the Environment Before Printing This Document

Table of ContentsBrighthouse Funds Trust IIMetLife MSCI EAFE Index Portfolio
Schedule of Investments as of March 31, 2022 (Unaudited)Common Stocks��(Continued)
Security Description Shares Value
Singapore��(Continued)Genting Singapore, Ltd. 186,200 $111,701Grab Holdings, Ltd Class A (b) (d) 73,200 256,200Keppel Corp., Ltd. 113,900 538,592Mapletree Commercial Trust (REIT) 147,200 205,029Mapletree Logistics Trust (REIT) 103,749 141,359Oversea-Chinese Banking Corp., Ltd. 227,364 2,069,574Singapore Airlines, Ltd. (b) 102,940 416,123Singapore Exchange, Ltd. 54,400 399,516Singapore Technologies Engineering, Ltd. 106,000 321,788Singapore Telecommunications, Ltd. 576,320 1,120,952United Overseas Bank, Ltd. 80,792 1,897,862UOL Group, Ltd. 32,900 170,792Venture Corp., Ltd. 20,500 264,842Wilmar International, Ltd. 144,000 500,058
13,173,156
South Africa��0.4%Anglo American plc 84,044 4,344,595
Spain��2.2%ACS Actividades de Construccion y
Servicios S.A. (d) 16,502 446,149Aena SME S.A. (b) 5,006 834,073Amadeus IT Group S.A. (b) 29,027 1,901,642Banco Bilbao Vizcaya Argentaria S.A. (d) 446,318 2,566,708Banco Santander S.A. 1,130,082 3,856,513CaixaBank S.A. (d) 267,729 907,573Cellnex Telecom S.A. 35,254 1,699,573EDP Renovaveis S.A. 20,247 524,499Enagas S.A. 15,136 338,286Endesa S.A. 23,384 513,258Ferrovial S.A. 31,045 826,637Grifols S.A. 21,632 393,576Iberdrola S.A. (d) 393,512 4,307,904Industria de Diseno Textil S.A. 69,851 1,528,671Naturgy Energy Group S.A. 14,280 428,905Red Electrica Corp. S.A. 29,209 603,353Repsol S.A. 95,651 1,264,998Siemens Gamesa Renewable Energy S.A.
(b) 12,710 224,414Telefonica S.A. 347,763 1,697,774
24,864,506
Sweden��3.2%Alfa Laval AB 21,114 732,549Assa Abloy AB - Class B 63,945 1,739,538Atlas Copco AB - A Shares 44,265 2,317,747Atlas Copco AB - B Shares 25,535 1,168,331Boliden AB 16,516 844,999Electrolux AB - Series B (d) 17,118 261,308Embracer Group AB (b) 36,038 304,696Epiroc AB - A Shares 42,693 921,709Epiroc AB - B Shares 28,433 516,365EQT AB 18,476 729,975Essity AB - Class B (d) 38,912 924,989Evolution AB 11,608 1,195,201Fastighets AB Balder - B Shares (b) 7,346 484,980Getinge AB - B Shares 15,453 620,585
Sweden��(Continued)
Copyright © 2022 www.secdatabase.com. All Rights Reserved.Please Consider the Environment Before Printing This Document

H & M Hennes & Mauritz AB - B Shares (d) 51,313 691,374Hexagon AB - B Shares 133,449 1,888,922Husqvarna AB - B Shares 25,677 270,015Industrivarden AB - A Shares 9,265 265,668Industrivarden AB - C Shares 10,214 287,570Investment AB Latour - B Shares 10,798 346,068Investor AB - A Shares 33,691 789,702Investor AB - B Shares 119,478 2,617,695Kinnevik AB - B Shares (b) 17,515 459,903L E Lundbergforetagen AB - B Shares 6,090 312,114Lifco AB - B Shares 15,748 403,204Lundin Energy AB 13,010 556,465Nibe Industrier AB - B Shares 100,180 1,113,910Sagax AB - Class B 10,880 332,063Sandvik AB 72,746 1,558,182Securitas AB - B Shares 21,462 243,963Sinch AB (b) 31,980 218,468Skandinaviska Enskilda Banken AB -
Class A 101,386 1,107,590Skanska AB - B Shares (d) 24,008 541,880SKF AB - B Shares (d) 25,976 425,998Svenska Cellulosa AB SCA - Class B 35,237 690,280Svenska Handelsbanken AB - A Shares 98,487 914,465Swedbank AB - A Shares (d) 57,325 863,129Swedish Match AB 109,190 828,647Tele2 AB - B Shares 34,110 519,537Telefonaktiebolaget LM Ericsson - B Shares
(d) 194,193 1,792,687Telia Co. AB (d) 146,704 592,725Volvo AB - A Shares 14,069 271,314Volvo AB - B Shares (d) 97,294 1,830,841
35,497,351
Switzerland��10.7%ABB, Ltd. 106,483 3,459,329Adecco Group AG 10,992 499,561Alcon, Inc. 32,764 2,598,818Bachem Holding AG - Class B 419 230,876Baloise Holding AG 2,719 486,511Barry Callebaut AG 251 590,179Chocoladefabriken Lindt & Spruengli AG 7 849,050Chocoladefabriken Lindt & Spruengli AG
(Participation Certificate) 72 857,361Cie Financiere Richemont S.A. - Class A 34,924 4,448,350Clariant AG 13,958 242,695Coca-Cola HBC AG 13,800 288,443Credit Suisse Group AG 171,578 1,359,360EMS-Chemie Holding AG 423 410,910Ferguson plc 14,600 1,986,330Geberit AG 2,335 1,443,382Givaudan S.A. 625 2,583,399Glencore plc 665,854 4,337,117Holcim, Ltd. 35,449 1,737,823Julius Baer Group, Ltd. 15,725 915,922Kuehne & Nagel International AG 3,794 1,079,454Logitech International S.A. 11,995 892,637Lonza Group AG 4,907 3,569,719Nestle S.A. 186,310 24,286,791
BHFTII-195
Copyright © 2022 www.secdatabase.com. All Rights Reserved.Please Consider the Environment Before Printing This Document

Table of ContentsBrighthouse Funds Trust IIMetLife MSCI EAFE Index Portfolio
Schedule of Investments as of March 31, 2022 (Unaudited)Common Stocks��(Continued)
Security Description Shares Value
Switzerland��(Continued)Novartis AG 145,010 $12,770,104Partners Group Holding AG 1,502 1,873,741Roche Holding AG 46,499 18,465,141Roche Holding AG 2,240 983,418Schindler Holding AG 1,428 304,030Schindler Holding AG (Participation
Certificate) 2,909 622,768SGS S.A. 404 1,127,196Sika AG 9,430 3,119,606Sonova Holding AG 3,655 1,530,799STMicroelectronics NV 44,652 1,950,959Straumann Holding AG 661 1,062,062Swatch Group AG (The) 4,374 238,477Swatch Group AG (The) - Bearer Shares 1,701 485,350Swiss Life Holding AG 2,117 1,356,833Swiss Prime Site AG 4,615 456,819Swiss Re AG 19,152 1,829,995Swisscom AG (d) 1,603 966,396Temenos AG 4,465 429,588UBS Group AG 235,479 4,619,551VAT Group AG 1,824 698,362Vifor Pharma AG 2,821 502,494Zurich Insurance Group AG 9,834 4,868,464
119,416,170
Taiwan��0.2%Sea, Ltd. (ADR) (b) (d) 21,200 2,539,548
United Arab Emirates��0.0%NMC Health plc (a) (b) (c) 7,569 0
United Kingdom��12.4%3i Group plc 62,170 1,127,157abrdn plc 153,329 430,127Admiral Group plc 11,968 401,831Ashtead Group plc 30,486 1,926,170Associated British Foods plc 23,588 513,440AstraZeneca plc 102,530 13,627,683Auto Trader Group plc 59,168 490,920AVEVA Group plc 8,176 261,629Aviva plc 248,294 1,469,007BAE Systems plc 204,680 1,933,815Barclays plc 1,089,369 2,121,053Barratt Developments plc 69,622 476,097Berkeley Group Holdings plc 7,129 347,790BP plc 1,306,837 6,401,144British American Tobacco plc 144,278 6,048,413British Land Co. plc (The) (REIT) 61,629 427,843BT Group plc 603,043 1,440,579Bunzl plc 23,720 924,347Burberry Group plc 29,504 645,755CNH Industrial NV 62,091 988,842Coca-Cola Europacific Partners plc 13,100 636,791Compass Group plc 116,912 2,525,333Croda International plc 8,925 919,336DCC plc 7,008 544,395Diageo plc 154,068 7,804,877Entain plc (b) 39,400 847,001
United Kingdom��(Continued)
Copyright © 2022 www.secdatabase.com. All Rights Reserved.Please Consider the Environment Before Printing This Document

Experian plc 60,725 2,347,209GlaxoSmithKline plc 331,583 7,166,568Halma plc 27,211 890,242Hargreaves Lansdown plc 27,409 361,943HSBC Holdings plc (Hong Kong-Traded
Shares) 1,346,719 9,248,862Imperial Brands plc 64,428 1,359,698Informa plc (b) 90,924 715,224InterContinental Hotels Group plc 11,718 795,319Intertek Group plc 11,659 798,016J Sainsbury plc 120,106 398,613JD Sports Fashion plc 153,395 297,728Johnson Matthey plc 11,701 287,375Kingfisher plc 148,300 496,060Land Securities Group plc (REIT) 46,621 479,707Legal & General Group plc 407,374 1,447,798Lloyds Banking Group plc 4,561,127 2,798,689London Stock Exchange Group plc 22,513 2,357,434M&G plc 182,005 528,391Melrose Industries plc 229,987 373,130Mondi plc 29,085 565,136National Grid plc 244,344 3,761,622NatWest Group plc 346,684 977,734Next plc 8,268 653,467Ocado Group plc (b) 33,748 517,041Pearson plc 51,825 507,482Persimmon plc 22,805 642,885Phoenix Group Holdings plc 39,867 320,375Prudential plc 178,490 2,642,637Reckitt Benckiser Group plc 46,647 3,573,701RELX plc 128,122 3,999,880Rentokil Initial plc 132,544 914,997Rio Tinto plc 73,860 5,872,397Rolls-Royce Holdings plc (b) 464,491 612,107Sage Group plc (The) 62,616 575,521Schroders plc 7,869 332,365Segro plc (REIT) 79,379 1,401,542Severn Trent plc 17,094 691,558Smith & Nephew plc 58,520 934,916Smiths Group plc 25,708 488,430Spirax-Sarco Engineering plc 5,277 866,731SSE plc 70,245 1,612,101St. James�s Place plc 38,927 735,627Standard Chartered plc 165,924 1,102,813Taylor Wimpey plc 255,125 436,338Tesco plc 522,325 1,892,696Unilever plc 169,974 7,712,253United Utilities Group plc 48,927 722,803Vodafone Group plc 1,805,966 2,969,757Whitbread plc (b) 13,755 513,034WPP plc 80,473 1,055,494
138,034,821
United States��0.1%QIAGEN NV (b) 15,184 749,631Total Common Stocks
(Cost $796,540,444) 1,057,282,319
BHFTII-196
Copyright © 2022 www.secdatabase.com. All Rights Reserved.Please Consider the Environment Before Printing This Document

Table of ContentsBrighthouse Funds Trust IIMetLife MSCI EAFE Index Portfolio
Schedule of Investments as of March 31, 2022 (Unaudited)Mutual Funds��2.7%
Security Description
Shares/PrincipalAmount* Value
United States��2.7%iShares MSCI EAFE ETF (d) (e)
(Cost $30,328,926) 404,000 $29,734,400
Preferred Stocks��0.5%Germany��0.5%Bayerische Motoren Werke (BMW) AG 3,581 279,097Fuchs Petrolub SE 4,900 179,038Henkel AG & Co. KGaA 11,026 742,706Porsche Automobil Holding SE 9,628 938,154Sartorius AG 1,841 822,336Volkswagen AG 12,059 2,097,263Total Preferred Stocks
(Cost $3,927,983) 5,058,594
Warrants��0.0%Switzerland��0.0%Cie Financiere Richemont S.A. Expires 11/22/
23 (b)(Cost $0) 78,908 62,595
Rights��0.0%France��0.0%Electricite de France S.A. Expires 04/04/22
(b) (d)(Cost $0) 31,130 45,475
Short-Term Investment��1.2%U.S. Treasury��1.2%U.S. Treasury Bill
0.149%, 05/10/22 (f) 13,275,000 13,272,357Total Short-Term Investments
(Cost $13,272,828) 13,272,357
Securities Lending Reinvestments(g)��6.8%Repurchase Agreements��5.4%BofA Securities, Inc.
Repurchase Agreement dated 03/31/22 at0.270%, due on 04/01/22 with a maturityvalue of $8,282,515; collateralized by U.S.Treasury Obligations with rates rangingfrom 2.000% - 5.000%, maturity datesranging from 05/15/37 - 02/15/50, and anaggregate market value of $8,448,104. 8,282,453 8,282,453
Cantor Fitzgerald & Co.Repurchase Agreement dated 03/31/22 at0.290%, due on 04/01/22 with a maturityvalue of $12,000,097; collateralized by U.S.Treasury and U.S. Government AgencyObligations with rates ranging from 0.125%- 8.000%, maturity dates ranging from 09/15/22 - 07/20/71, and an aggregate marketvalue of $12,240,000. 12,000,000 12,000,000
Copyright © 2022 www.secdatabase.com. All Rights Reserved.Please Consider the Environment Before Printing This Document

Citigroup Global Markets, Ltd.Repurchase Agreement dated 03/31/22 at0.300%, due on 04/01/22 with a maturityvalue of $2,700,023; collateralized by U.S.Treasury and Foreign Obligations withrates ranging from 0.125% - 2.875%,maturity dates ranging from 08/15/23 - 02/15/51, and an aggregate market value of$2,754,001. 2,700,000 2,700,000
National Bank Financial, Inc.Repurchase Agreement dated 03/31/22 at0.320%, due on 04/01/22 with a maturityvalue of $10,000,089; collateralized by U.S.Treasury Obligations with rates rangingfrom 0.125% - 3.000%, maturity datesranging from 06/30/22 - 02/15/49, and anaggregate market value of $10,205,689. 10,000,000 10,000,000
National Bank of CanadaRepurchase Agreement dated 03/31/22 at0.450%, due on 04/07/22 with a maturityvalue of $1,200,105; collateralized by U.S.Treasury Obligations with rates rangingfrom 0.500% - 3.000%, maturity datesranging from 11/30/23 - 08/15/48, andvarious Common Stock with an aggregatemarket value of $1,326,958. 1,200,000 1,200,000
NBC Global Finance, Ltd.Repurchase Agreement dated 03/31/22 at0.440%, due on 04/01/22 with a maturityvalue of $10,300,126; collateralized by U.S.Treasury Obligations with rates rangingfrom 0.125% - 4.750%, maturity datesranging from 05/15/24 - 02/15/50, andvarious Common Stock with an aggregatemarket value of $11,436,879. 10,300,000 10,300,000Repurchase Agreement dated 03/31/22 at0.485%, due on 04/07/22 with a maturityvalue of $20,002; collateralized by U.S.Treasury Obligations with rates rangingfrom 0.125% - 4.750%, maturity datesranging from 05/15/24 - 02/15/50, andvarious Common Stock with an aggregatemarket value of $22,208. 20,000 20,000
Societe GeneraleRepurchase Agreement dated 03/31/22 at0.360%, due on 04/01/22 with a maturityvalue of $4,700,047; collateralized byvarious Common Stock with an aggregatemarket value of $5,222,654. 4,700,000 4,700,000Repurchase Agreement dated 03/31/22 at0.380%, due on 04/01/22 with a maturityvalue of $1,500,016; collateralized byvarious Common Stock with an aggregatemarket value of $1,666,804. 1,500,000 1,500,000Repurchase Agreement dated 03/31/22 at0.410%, due on 04/01/22 with a maturityvalue of $1,800,021; collateralized byvarious Common Stock with an aggregatemarket value of $2,000,321. 1,800,000 1,800,000Repurchase Agreement dated 03/31/22 at0.420%, due on 04/07/22 with a maturityvalue of $300,025; collateralized by variousCommon Stock with an aggregate marketvalue of $333,387. 300,000 300,000
BHFTII-197
Copyright © 2022 www.secdatabase.com. All Rights Reserved.Please Consider the Environment Before Printing This Document

Table of ContentsBrighthouse Funds Trust IIMetLife MSCI EAFE Index Portfolio
Schedule of Investments as of March 31, 2022 (Unaudited)Securities Lending Reinvestments (g)��(Continued)
Security Description
Shares/PrincipalAmount* Value
Repurchase Agreements��(Continued)TD Prime Services LLC
Repurchase Agreement dated 03/31/22 at0.400%, due on 04/01/22 with a maturityvalue of $7,000,078; collateralized byvarious Common Stock with an aggregatemarket value of $8,107,318. 7,000,000 $7,000,000
59,802,453
Time Deposits��0.9%Canadian Imperial Bank of Commerce
0.320%, 04/01/22 2,000,000 2,000,000DZ Bank AG (NY)
0.300%, 04/01/22 2,000,000 2,000,000Rabobank (New York)
0.310%, 04/01/22 2,000,000 2,000,000Skandi (NY)
0.300%, 04/01/22 2,000,000 2,000,000Svenska (NY)
0.260%, 04/01/22 2,000,000 2,000,00010,000,000
Mutual Funds��0.5%Morgan Stanley Liquidity Funds Government
Portfolio, Institutional Shares0.230% (h) 6,000,000 6,000,000
Total Securities Lending Reinvestments(Cost $75,802,453) 75,802,453
Total Investments�106.1%(Cost $919,872,634) 1,181,258,193
Other assets and liabilities (net)�(6.1)% (67,657,992 )Net Assets��100.0% $1,113,600,201
* Principal amount stated in U.S. dollars unless otherwise noted.(a) Significant unobservable inputs were used in the valuation of this portfolio security; i.e. Level 3.(b) Non-income producing security.(c) Security was valued in good faith under procedures approved by the Board of Trustees. As of March 31, 2022, these securities represent less than
0.05% of net assets.(d) All or a portion of the security was held on loan. As of March 31, 2022, the market value of securities loaned was $86,944,328 and the collateral
received consisted of cash in the amount of $75,802,453 and non-cash collateral with a value of $16,723,569. The cash collateral investments aredisclosed in the Schedule of Investments and categorized as Securities Lending Reinvestments. The non-cash collateral received consists of U.S.government securities that are held in safe-keeping by the lending agent, or a third-party custodian, and cannot be sold or repledged by thePortfolio.
(e) All or a portion of the security was pledged as collateral against open futures contracts. As of March 31, 2022, the market value of securitiespledged was $5,888,000.
(f) The rate shown represents current yield to maturity.(g) Represents investment of cash collateral received from securities on loan as of March 31, 2022.(h) The rate shown represents the annualized seven-day yield as of March 31, 2022.
Ten Largest Industries as ofMarch 31, 2022 (Unaudited)
% ofNet Assets
Pharmaceuticals 8.6Banks 8.5Insurance 4.8Oil, Gas & Consumable Fuels 3.9Metals & Mining 3.8Food Products 3.3Chemicals 3.2
Copyright © 2022 www.secdatabase.com. All Rights Reserved.Please Consider the Environment Before Printing This Document

Textiles, Apparel & Luxury Goods 3.0Semiconductors & Semiconductor Equipment 3.0Automobiles 3.0
Futures Contracts
Futures Contracts��LongExpiration
DateNumber ofContracts
NotionalAmount
Value/Unrealized
Appreciation/(Depreciation)
MSCI EAFE Index Mini Futures 06/17/22 115 USD 12,330,300 $ 742,316
Glossary of Abbreviations
Currencies
(USD)� United States Dollar
Other Abbreviations
(REIT)� Real Estate Investment Trust(ADR)� American Depositary Receipt(ETF)� Exchange-Traded Fund
BHFTII-198
Copyright © 2022 www.secdatabase.com. All Rights Reserved.Please Consider the Environment Before Printing This Document

Table of ContentsBrighthouse Funds Trust IIMetLife MSCI EAFE Index Portfolio
Schedule of Investments as of March 31, 2022 (Unaudited)
Fair Value HierarchyAccounting principles generally accepted in the United States of America (�GAAP�) define fair market value as the price that the Portfolio would receive tosell an asset or pay to transfer a liability in an orderly transaction between market participants at the measurement date. It establishes a fair valuehierarchy that prioritizes inputs to valuation methods and requires disclosure of the fair value hierarchy, separately for each major category of assets andliabilities, that segregates fair value measurements into three levels. Levels 1, 2 and 3 of the fair value hierarchy are defined as follows:
Level 1 - unadjusted quoted prices in active markets for identical investmentsLevel 2 - other significant observable inputs (including, but not limited to, quoted prices for similar assets or liabilities in markets that are either activeor inactive; inputs other than quoted prices that are observable such as interest rates, yield curves, volatilities, prepayment speeds, loss severities,credit risks, default rates, or other market corroborated inputs)Level 3 - significant unobservable inputs based on the best information available in the circumstances, to the extent observable inputs areunavailable (including the Portfolio�s own assumptions used in determining the fair value of investments and derivative financial instruments)
The inputs or methodologies used for valuing investments are not necessarily an indication of the risk associated with investing in them. Changes to theinputs or methodologies used may result in transfers between levels. A reconciliation of Level 3 securities, if any, will be disclosed following the fair valuehierarchy table. For more information about the Portfolio�s policy regarding the valuation of investments, please refer to the Notes to Schedule ofInvestments.
The following table summarizes the fair value hierarchy of the Portfolio�s investments as of March 31, 2022:
Description Level 1 Level 2 Level 3 TotalCommon Stocks
Australia $� $84,835,506 $ 0 $84,835,506Austria � 2,144,084 � 2,144,084Belgium � 9,113,353 � 9,113,353Chile � 589,984 � 589,984China � 5,374,554 � 5,374,554Denmark � 28,486,473 � 28,486,473Finland � 12,451,935 � 12,451,935France � 116,386,202 � 116,386,202Germany � 81,970,419 � 81,970,419Hong Kong � 28,151,769 � 28,151,769Ireland 452,520 7,166,634 � 7,619,154Israel 2,850,117 4,919,682 � 7,769,799Italy � 20,987,751 � 20,987,751Japan � 236,564,009 � 236,564,009Jordan � 303,904 � 303,904Luxembourg � 2,771,222 � 2,771,222Macau � 423,475 � 423,475Netherlands � 60,181,951 � 60,181,951New Zealand � 2,782,242 � 2,782,242Norway � 8,079,040 � 8,079,040Portugal � 1,675,715 0 1,675,715Singapore 256,200 12,916,956 � 13,173,156South Africa � 4,344,595 � 4,344,595Spain � 24,864,506 � 24,864,506Sweden � 35,497,351 � 35,497,351Switzerland � 119,416,170 � 119,416,170Taiwan 2,539,548 � � 2,539,548United Arab Emirates � � 0 0United Kingdom 636,791 137,398,030 � 138,034,821United States � 749,631 � 749,631
Total Common Stocks 6,735,176 1,050,547,143 0 1,057,282,319Total Mutual Funds* 29,734,400 � � 29,734,400Total Preferred Stocks* � 5,058,594 � 5,058,594Total Warrants* 62,595 � � 62,595Total Rights* 45,475 � � 45,475Total Short-Term Investment* � 13,272,357 � 13,272,357Securities Lending Reinvestments
Repurchase Agreements � 59,802,453 � 59,802,453Time Deposits � 10,000,000 � 10,000,000
Copyright © 2022 www.secdatabase.com. All Rights Reserved.Please Consider the Environment Before Printing This Document

BHFTII-199
Copyright © 2022 www.secdatabase.com. All Rights Reserved.Please Consider the Environment Before Printing This Document

Table of ContentsBrighthouse Funds Trust IIMetLife MSCI EAFE Index Portfolio
Schedule of Investments as of March 31, 2022 (Unaudited)
Fair Value Hierarchy��(Continued)
Description Level 1 Level 2 Level 3 TotalMutual Funds $6,000,000 $� $ � $6,000,000
Total Securities Lending Reinvestments 6,000,000 69,802,453 � 75,802,453Total Investments $42,577,646 $1,138,680,547 $ 0 $1,181,258,193Collateral for Securities Loaned (Liability) $� $(75,802,453 ) $ � $(75,802,453 )Futures Contracts
Futures Contracts (Unrealized Appreciation) $742,316 $� $ � $742,316
* See Schedule of Investments for additional detailed categorizations.
Level 3 investments at the beginning and/or end of the period in relation to net assets were not significant and accordingly, a reconciliation of Level 3assets for the period ended March 31, 2022 is not presented.
During the period ended March 31, 2022, a transfer out of Level 3 in the amount of $219,021 was due to the resumption of trading activity which resultedin the availability of significant observable inputs.
BHFTII-200
Copyright © 2022 www.secdatabase.com. All Rights Reserved.Please Consider the Environment Before Printing This Document

Table of ContentsBrighthouse Funds Trust II
MetLife Russell 2000 Index Portfolio
Schedule of Investments as of March 31, 2022 (Unaudited)Common Stocks��95.4% of Net Assets
Security Description Shares Value
Aerospace & Defense��0.7%AAR Corp. (a) 11,635 $563,483Aerojet Rocketdyne Holdings, Inc. (a) (b) 26,460 1,041,201AeroVironment, Inc. (a) (b) 7,571 712,734AerSale Corp. (a) 6,969 109,553Astronics Corp. (a) 9,068 117,249Ducommun, Inc. (a) 3,227 169,062Kaman Corp. 8,733 379,711Kratos Defense & Security Solutions, Inc. (a) 42,530 871,014Maxar Technologies, Inc. 25,404 1,002,442Moog, Inc. - Class A 9,540 837,612National Presto Industries, Inc. (b) 1,408 108,346Park Aerospace Corp. (b) 7,125 92,981Parsons Corp. (a) 10,160 393,192Triumph Group, Inc. (a) 22,281 563,264Vectrus, Inc. (a) 3,920 140,571
7,102,415
Air Freight & Logistics��0.3%Air Transport Services Group, Inc. (a) 20,568 688,000Atlas Air Worldwide Holdings, Inc. (a) (b) 10,161 877,605Forward Air Corp. 8,967 876,793Hub Group, Inc. - Class A (a) 11,249 868,535Radiant Logistics, Inc. (a) 14,094 89,779
3,400,712
Airlines��0.3%Allegiant Travel Co. (a) 5,412 878,855Frontier Group Holdings, Inc. (a) (b) 14,756 167,185Hawaiian Holdings, Inc. (a) 18,138 357,319SkyWest, Inc. (a) 16,673 481,016Spirit Airlines, Inc. (a) 34,929 763,897Sun Country Airlines Holdings, Inc. (a) (b) 12,318 322,485
2,970,757
Auto Components��1.1%Adient plc (a) (b) 32,641 1,330,774American Axle & Manufacturing Holdings, Inc.
(a) 39,293 304,914Dana, Inc. 49,995 878,412Dorman Products, Inc. (a) 9,015 856,695Fox Factory Holding Corp. (a) 14,677 1,437,612Gentherm, Inc. (a) 11,505 840,325Goodyear Tire & Rubber Co. (The) (a) (b) 95,413 1,363,452LCI Industries (b) 8,570 889,652Modine Manufacturing Co. (a) 17,537 158,008Motorcar Parts of America, Inc. (a) (b) 6,814 121,494Patrick Industries, Inc. 8,089 487,767Standard Motor Products, Inc. 6,921 298,572Stoneridge, Inc. (a) (b) 9,252 192,071Tenneco, Inc. - Class A (a) 23,943 438,636Visteon Corp. (a) 9,437 1,029,860XL Fleet Corp. (a) 51,400 102,286XPEL, Inc. (a) (b) 5,781 304,138
11,034,668
Automobiles��0.2%Canoo, Inc. (a) (b) 40,499 223,554Fisker, Inc. (a) (b) 58,292 751,967Lordstown Motors Corp. - Class A (a) (b) 33,536 114,358Winnebago Industries, Inc. (b) 10,945 591,358
Copyright © 2022 www.secdatabase.com. All Rights Reserved.Please Consider the Environment Before Printing This Document

Workhorse Group, Inc. (a) (b) 53,589 267,9451,949,182
Banks��8.5%1st Source Corp. 5,951 275,234Allegiance Bancshares, Inc. 6,717 300,116Amalgamated Financial Corp. (b) 4,801 86,274Amerant Bancorp, Inc. 9,340 295,051American National Bankshares, Inc. 4,311 162,438Ameris Bancorp (b) 23,061 1,011,917Arrow Financial Corp. (b) 4,764 154,449Associated Banc-Corp. 50,625 1,152,225Atlantic Union Bankshares Corp. 26,629 977,018Banc of California, Inc. (b) 18,927 366,427BancFirst Corp. (b) 5,725 476,377Bancorp, Inc. (The) (a) (b) 17,243 488,494Bank First Corp. (b) 2,663 191,709Bank of Marin Bancorp (b) 5,192 182,083Bank of NT Butterfield & Son, Ltd. (The) 17,296 620,580BankUnited, Inc. (b) 28,662 1,259,982Banner Corp. 12,017 703,355Bar Harbor Bankshares 5,292 151,457Berkshire Hills Bancorp, Inc. (b) 16,851 488,173Blue Ridge Bankshares, Inc. (b) 7,472 113,350Brookline Bancorp, Inc. (b) 26,855 424,846Business First Bancshares, Inc. 6,674 162,378Byline Bancorp, Inc. 8,821 235,344Cadence Bank 60,872 1,781,115Cambridge Bancorp (b) 2,648 225,080Camden National Corp. 4,522 212,715Capital City Bank Group, Inc. 5,769 152,071Capstar Financial Holdings, Inc. (b) 7,899 166,511Carter Bankshares, Inc. (a) (b) 9,102 158,102Cathay General Bancorp 25,431 1,138,037CBTX, Inc. (b) 6,171 191,301Central Pacific Financial Corp. 8,164 227,776Citizens & Northern Corp. 6,038 147,206City Holding Co. (b) 4,757 374,376Civista Bancshares, Inc. 5,230 126,043CNB Financial Corp. (b) 6,782 178,502Coastal Financial Corp. (a) 3,437 157,243Columbia Banking System, Inc. (b) 27,046 872,774Community Bank System, Inc. 17,961 1,259,964Community Trust Bancorp, Inc. 5,081 209,337ConnectOne Bancorp, Inc. 13,780 441,098CrossFirst Bankshares, Inc. (a) (b) 16,519 260,339Customers Bancorp, Inc. (a) 10,596 552,475CVB Financial Corp. (b) 46,665 1,083,095Dime Community Bancshares, Inc. 11,336 391,886Eagle Bancorp, Inc. (b) 11,013 627,851Eastern Bankshares, Inc. 60,633 1,306,035
BHFTII-201
Copyright © 2022 www.secdatabase.com. All Rights Reserved.Please Consider the Environment Before Printing This Document

Table of ContentsBrighthouse Funds Trust IIMetLife Russell 2000 Index Portfolio
Schedule of Investments as of March 31, 2022 (Unaudited)Common Stocks��(Continued)
Security Description Shares Value
Banks��(Continued)Enterprise Bancorp, Inc. (b) 3,354 $134,562Enterprise Financial Services Corp. 11,710 554,000Equity Bancshares, Inc. - Class A 4,632 149,660Farmers National Banc Corp. 11,007 187,779FB Financial Corp. 10,920 485,066Financial Institutions, Inc. 6,461 194,670First Bancorp 12,219 510,388First Bancorp, Inc. (The) 3,758 113,041First BanCorp/Puerto Rico 64,035 840,139First Bancshares, Inc. (The) (b) 6,912 232,658First Bank/Hamilton NJ (b) 5,582 79,376First Busey Corp. 18,478 468,233First Commonwealth Financial Corp. 32,439 491,775First Community Bankshares, Inc. 5,650 159,387First Financial Bancorp 32,896 758,253First Financial Bankshares, Inc. (b) 44,473 1,962,149First Financial Corp. 3,977 172,125First Foundation, Inc. 17,120 415,845First Internet Bancorp (b) 3,385 145,589First Interstate BancSystem, Inc. - Class A 30,314 1,114,646First Merchants Corp. 18,811 782,538First Mid Bancshares, Inc. 6,036 232,326First of Long Island Corp. (The) 7,996 155,602Five Star Bancorp 5,331 150,867Flushing Financial Corp. 10,410 232,664Fulton Financial Corp. 52,704 875,940German American Bancorp, Inc. 8,481 322,193Glacier Bancorp, Inc. 37,735 1,897,316Great Southern Bancorp, Inc. (b) 3,405 200,929Guaranty Bancshares, Inc. (b) 2,906 101,710Hancock Whitney Corp. 29,980 1,563,457Hanmi Financial Corp. 11,484 282,621HarborOne Bancrop, Inc. (b) 16,612 232,900Heartland Financial USA, Inc. 13,012 622,364Heritage Commerce Corp. 20,117 226,316Heritage Financial Corp. 12,295 308,113Hilltop Holdings, Inc. 22,119 650,299Home BancShares, Inc. (b) 52,868 1,194,817HomeStreet, Inc. 6,963 329,907HomeTrust Bancshares, Inc. 5,432 160,407Hope Bancorp, Inc. 39,512 635,353Horizon Bancorp 14,700 274,449Independent Bank Corp. (b) 15,765 1,287,843Independent Bank Corp. 7,375 162,250Independent Bank Group, Inc. 13,038 927,784International Bancshares Corp. 19,040 803,678Investors Bancorp, Inc. 78,461 1,171,423Lakeland Bancorp, Inc. 21,117 352,654Lakeland Financial Corp. 8,350 609,550Live Oak Bancshares, Inc. (b) 11,266 573,327Macatawa Bank Corp. (b) 1,358 12,236Mercantile Bank Corp. 5,350 189,497Meta Financial Group, Inc. 10,648 584,788Metrocity Bankshares, Inc. (b) 7,472 175,443Metropolitan Bank Holding Corp. (a) 3,249 330,651Mid Penn Bancorp, Inc. 5,091 136,490
Banks��(Continued)Midland States Bancorp, Inc. 6,845 197,547MidWestOne Financial Group, Inc. 4,031 133,426
Copyright © 2022 www.secdatabase.com. All Rights Reserved.Please Consider the Environment Before Printing This Document

MVB Financial Corp. 3,791 157,327National Bank Holdings Corp. - Class A 10,343 416,616NBT Bancorp, Inc. 14,003 505,928Nicolet Bankshares, Inc. (a) 4,330 405,158Northrim BanCorp, Inc. 2,219 96,682Northwest Bancshares, Inc. 42,112 568,933OceanFirst Financial Corp. 20,664 415,346OFG Bancorp 17,884 476,430Old National Bancorp 99,968 1,637,476Old Second Bancorp, Inc. 9,998 145,071Origin Bancorp, Inc. 7,487 316,625Orrstown Financial Services, Inc. (b) 3,982 91,307Pacific Premier Bancorp, Inc. 31,410 1,110,343Park National Corp. (b) 4,856 637,981Peapack Gladstone Financial Corp. 6,072 211,002Peoples Bancorp, Inc. 8,443 264,350Peoples Financial Services Corp. (b) 2,533 127,866Preferred Bank 4,747 351,705Premier Financial Corp. 11,932 361,898Primis Financial Corp. 8,503 118,872QCR Holdings, Inc. 5,055 286,062RBB Bancorp (b) 4,676 109,839Red River Bancshares, Inc. (b) 1,618 85,608Renasant Corp. 19,074 638,025Republic Bancorp, Inc. - Class A 3,075 138,191Republic First Bancorp, Inc. (a) (b) 15,769 81,368S&T Bancorp, Inc. 14,575 431,129Sandy Spring Bancorp, Inc. (b) 14,383 646,084Seacoast Banking Corp. of Florida 18,712 655,294ServisFirst Bancshares, Inc. (b) 17,302 1,648,708Sierra Bancorp 5,841 145,908Silvergate Capital Corp. - Class A (a) 9,265 1,395,031Simmons First National Corp. - Class A 38,358 1,005,747SmartFinancial, Inc. 5,462 139,718South Plains Financial, Inc. 3,888 103,343Southern First Bancshares, Inc. (a) (b) 2,130 108,289Southside Bancshares, Inc. (b) 11,347 463,298SouthState Corp. (b) 26,157 2,134,150Spirit of Texas Bancshares, Inc. 4,640 121,939Stock Yards Bancorp, Inc. (b) 8,157 431,505Summit Financial Group, Inc. (b) 4,159 106,429Texas Capital Bancshares, Inc. (a) 17,594 1,008,312Tompkins Financial Corp. (b) 5,099 399,099Towne Bank 23,282 697,063TriCo Bancshares 9,639 385,849TriState Capital Holdings, Inc. (a) 9,101 302,426Triumph Bancorp, Inc. (a) (b) 8,184 769,460Trustmark Corp. 21,627 657,245UMB Financial Corp. 15,172 1,474,112United Bankshares, Inc. 44,339 1,546,544United Community Banks, Inc. 34,770 1,209,996Univest Financial Corp. (b) 9,428 252,293Valley National Bancorp 131,804 1,716,088Veritex Holdings, Inc. 16,326 623,163
BHFTII-202
Copyright © 2022 www.secdatabase.com. All Rights Reserved.Please Consider the Environment Before Printing This Document

Table of ContentsBrighthouse Funds Trust IIMetLife Russell 2000 Index Portfolio
Schedule of Investments as of March 31, 2022 (Unaudited)Common Stocks��(Continued)
Security Description Shares Value
Banks��(Continued)Washington Trust Bancorp, Inc. (b) 5,542 $290,955WesBanco, Inc. 21,083 724,412West Bancorp, Inc. (b) 7,090 192,919Westamerica Bancorp 8,503 514,431
82,828,173
Beverages��0.4%Celsius Holdings, Inc. (a) (b) 18,716 1,032,749Coca-Cola Consolidated, Inc. 1,600 794,960Duckhorn Portfolio, Inc. (The) (a) (b) 13,689 249,003MGP Ingredients, Inc. (b) 4,809 411,602National Beverage Corp. 8,223 357,700Primo Water Corp. 54,035 769,999
3,616,013
Biotechnology��6.4%2seventy bio, Inc. (a) (b) 8,165 139,2954D Molecular Therapeutics, Inc. (a) (b) 11,182 169,072ACADIA Pharmaceuticals, Inc. (a) 43,086 1,043,543Adagio Therapeutics, Inc. (a) (b) 25,083 114,378Adicet Bio, Inc. (a) 8,160 162,955Affimed NV (a) 42,830 187,167Agenus, Inc. (a) 53,584 131,817Agios Pharmaceuticals, Inc. (a) (b) 20,321 591,544Akebia Therapeutics, Inc. (a) (b) 65,356 46,919Akero Therapeutics, Inc. (a) 9,830 139,488Albireo Pharma, Inc. (a) (b) 6,398 190,852Aldeyra Therapeutics, Inc. (a) 3,450 15,335Alector, Inc. (a) 20,549 292,823Alkermes plc (a) 54,605 1,436,658Allogene Therapeutics, Inc. (a) (b) 22,907 208,683Allovir, Inc. (a) (b) 11,916 80,433Altimmune, Inc. (a) 12,799 77,946ALX Oncology Holdings, Inc. (a) (b) 6,780 114,582Amicus Therapeutics, Inc. (a) (b) 94,876 898,476AnaptysBio, Inc. (a) 7,034 174,021Anavex Life Sciences Corp. (a) (b) 23,292 286,725Anika Therapeutics, Inc. (a) 4,948 124,244Apellis Pharmaceuticals, Inc. (a) 26,614 1,352,257Arbutus Biopharma Corp. (a) 35,967 107,182Arcturus Therapeutics Holdings, Inc. (a) (b) 7,412 199,828Arcus Biosciences, Inc. (a) (b) 15,912 502,183Arcutis Biotherapeutics, Inc. (a) (b) 10,548 203,154Arrowhead Pharmaceuticals, Inc. (a) 34,801 1,600,498Atara Biotherapeutics, Inc. (a) 29,753 276,405Avid Bioservices, Inc. (a) (b) 23,713 483,034Avidity Biosciences, Inc. (a) (b) 12,243 226,128Beam Therapeutics, Inc. (a) (b) 17,300 991,290BioCryst Pharmaceuticals, Inc. (a) (b) 62,014 1,008,348Biohaven Pharmaceutical Holding Co., Ltd. (a) 19,281 2,286,148Bioxcel Therapeutics, Inc. (a) 6,276 131,231Bluebird Bio, Inc. (a) 9,658 46,841Blueprint Medicines Corp. (a) 20,651 1,319,186Bridgebio Pharma, Inc. (a) (b) 38,327 389,019C4 Therapeutics, Inc. (a) (b) 13,320 323,143CareDx, Inc. (a) 17,647 652,763
Biotechnology��(Continued)Caribou Biosciences, Inc. (a) 19,951 183,150Catalyst Pharmaceuticals, Inc. (a) 35,330 292,886
Copyright © 2022 www.secdatabase.com. All Rights Reserved.Please Consider the Environment Before Printing This Document

Celldex Therapeutics, Inc. (a) 16,056 546,867Century Therapeutics, Inc. (a) (b) 7,830 98,580Cerevel Therapeutics Holdings, Inc. (a) (b) 15,873 555,714ChemoCentryx, Inc. (a) (b) 19,189 481,068Chimerix, Inc. (a) 27,379 125,396Chinook Therapeutics, Inc. (a) 12,517 204,778Cogent Biosciences, Inc. (a) (b) 15,075 112,912Coherus Biosciences, Inc. (a) (b) 21,324 275,293Crinetics Pharmaceuticals, Inc. (a) 16,354 358,970Cullinan Oncology, Inc. (a) (b) 9,808 102,690Curis, Inc. (a) 6,513 15,501Cytokinetics, Inc. (a) (b) 26,826 987,465CytomX Therapeutics, Inc. (a) 3,066 8,186Day One Biopharmaceuticals, Inc. (a) 10,021 99,408Deciphera Pharmaceuticals, Inc. (a) (b) 15,140 140,348Denali Therapeutics, Inc. (a) 32,389 1,041,954DermTech, Inc. (a) (b) 8,843 129,815Design Therapeutics, Inc. (a) 10,864 175,454Dynavax Technologies Corp. (a) (b) 36,559 396,300Dyne Therapeutics, Inc. (a) (b) 12,586 121,329Eagle Pharmaceuticals, Inc. (a) 4,988 246,856Editas Medicine, Inc. (a) (b) 23,602 448,910Eiger BioPharmaceuticals, Inc. (a) 12,775 106,032Emergent BioSolutions, Inc. (a) 17,598 722,574Enanta Pharmaceuticals, Inc. (a) 6,820 485,448Erasca, Inc. (a) (b) 23,988 206,297Fate Therapeutics, Inc. (a) 28,366 1,099,750FibroGen, Inc. (a) (b) 30,460 366,129Foghorn Therapeutics, Inc. (a) (b) 8,683 132,242Forma Therapeutics Holdings, Inc. (a) (b) 11,944 111,079G1 Therapeutics, Inc. (a) (b) 14,959 113,688Generation Bio Co. (a) 17,596 129,155Geron Corp. (a) (b) 115,159 156,616Global Blood Therapeutics, Inc. (a) (b) 21,706 751,896Gossamer Bio, Inc. (a) (b) 22,675 196,819Graphite Bio, Inc. (a) 12,964 66,116Halozyme Therapeutics, Inc. (a) 47,729 1,903,433Heron Therapeutics, Inc. (a) (b) 32,773 187,462Icosavax, Inc. (a) (b) 9,862 69,428Ideaya Biosciences, Inc. (a) (b) 10,897 121,937Imago Biosciences, Inc. (a) (b) 8,089 155,875Immunic, Inc. (a) (b) 7,644 86,377Immunitybio, Inc. (a) (b) 25,881 145,192ImmunoGen, Inc. (a) 69,797 332,234Immunovant, Inc. (a) 16,206 89,295Inhibrx, Inc. (a) 11,523 256,732Inovio Pharmaceuticals, Inc. (a) (b) 73,073 262,332Insmed, Inc. (a) (b) 40,053 941,245Instil Bio, Inc. (a) (b) 20,414 219,450Intellia Therapeutics, Inc. (a) (b) 24,153 1,755,198Intercept Pharmaceuticals, Inc. (a) (b) 11,215 182,468Ironwood Pharmaceuticals, Inc. (a) (b) 50,961 641,089iTeos Therapeutics, Inc. (a) 7,999 257,408IVERIC bio, Inc. (a) 40,293 678,131Janux Therapeutics, Inc. (a) 7,592 108,869
BHFTII-203
Copyright © 2022 www.secdatabase.com. All Rights Reserved.Please Consider the Environment Before Printing This Document

Table of ContentsBrighthouse Funds Trust IIMetLife Russell 2000 Index Portfolio
Schedule of Investments as of March 31, 2022 (Unaudited)Common Stocks��(Continued)
Security Description Shares Value
Biotechnology��(Continued)KalVista Pharmaceuticals, Inc. (a) (b) 8,595 $126,690Karuna Therapeutics, Inc. (a) (b) 8,002 1,014,574Karyopharm Therapeutics, Inc. (a) 27,007 199,042Keros Therapeutics, Inc. (a) (b) 5,456 296,697Kezar Life Sciences, Inc. (a) 12,936 214,996Kiniksa Pharmaceuticals, Ltd. - Class A (a) (b) 11,087 110,205Kinnate Biopharma, Inc. (a) (b) 9,927 111,778Kodiak Sciences, Inc. (a) 11,661 90,023Kronos Bio, Inc. (a) (b) 15,479 111,913Krystal Biotech, Inc. (a) (b) 6,648 442,358Kura Oncology, Inc. (a) 23,723 381,466Kymera Therapeutics, Inc. (a) 12,247 518,293Ligand Pharmaceuticals, Inc. (a) 5,564 625,894Lyell Immunopharma, Inc. (a) 54,385 274,644MacroGenics, Inc. (a) (b) 21,059 185,530Madrigal Pharmaceuticals, Inc. (a) (b) 4,214 413,478MannKind Corp. (a) (b) 88,067 324,087MEI Pharma, Inc. (a) (b) 51,459 31,004MeiraGTx Holdings plc (a) (b) 10,435 144,525Mersana Therapeutics, Inc. (a) (b) 9,525 38,005MiMedx Group, Inc. (a) (b) 40,218 189,427Monte Rosa Therapeutics, Inc. (a) (b) 11,684 163,810Morphic Holding, Inc. (a) (b) 7,677 308,232Myriad Genetics, Inc. (a) 27,414 690,833Nurix Therapeutics, Inc. (a) (b) 11,779 165,024Nuvalent, Inc. - Class A (a) (b) 8,339 115,829Ocugen, Inc. (a) (b) 43,433 143,329Opko Health, Inc. (a) (b) 139,872 481,160Organogenesis Holdings, Inc. (a) (b) 25,508 194,371PMV Pharmaceuticals, Inc. (a) (b) 10,611 220,921Praxis Precision Medicines, Inc. (a) (b) 13,093 133,680Prometheus Biosciences, Inc. (a) (b) 11,237 424,309Protagonist Therapeutics, Inc. (a) 15,088 357,284Prothena Corp. plc (a) (b) 12,610 461,148PTC Therapeutics, Inc. (a) 24,991 932,414Radius Health, Inc. (a) (b) 18,090 159,735Rapt Therapeutics, Inc. (a) (b) 6,958 153,006Recursion Pharmaceuticals, Inc. - Class A (a)
(b) 41,202 295,006REGENXBIO, Inc. (a) 15,197 504,388Relay Therapeutics, Inc. (a) (b) 24,426 731,070Replimune Group, Inc. (a) 9,865 167,508REVOLUTION Medicines, Inc. (a) (b) 21,613 551,348Rhythm Pharmaceuticals, Inc. (a) 15,372 177,085Rigel Pharmaceuticals, Inc. (a) 62,685 187,428Rocket Pharmaceuticals, Inc. (a) (b) 14,674 232,730Rubius Therapeutics, Inc. (a) (b) 16,756 92,326Sana Biotechnology, Inc. (a) (b) 30,778 254,226Sangamo Therapeutics, Inc. (a) 44,571 258,957Scholar Rock Holding Corp. (a) (b) 10,772 138,851Seres Therapeutics, Inc. (a) 25,540 181,845Sorrento Therapeutics, Inc. (a) (b) 75,890 176,824SpringWorks Therapeutics, Inc. (a) (b) 10,552 595,555Stoke Therapeutics, Inc. (a) 7,332 154,339Sutro Biopharma, Inc. (a) 16,423 134,997Syndax Pharmaceuticals, Inc. (a) 17,053 296,381Tenaya Therapeutics, Inc. (a) (b) 12,048 141,925TG Therapeutics, Inc. (a) (b) 44,826 426,295
Biotechnology��(Continued)
Copyright © 2022 www.secdatabase.com. All Rights Reserved.Please Consider the Environment Before Printing This Document

Travere Therapeutics, Inc. (a) 21,324 549,519Turning Point Therapeutics, Inc. (a) 16,488 442,703Twist Bioscience Corp. (a) 19,106 943,454Vanda Pharmaceuticals, Inc. (a) (b) 19,612 221,812Vaxart, Inc. (a) (b) 44,017 221,846Vaxcyte, Inc. (a) (b) 14,946 360,946VBI Vaccines, Inc. (a) (b) 70,444 116,937Vera Therapeutics, Inc. (a) (b) 5,715 134,245Veracyte, Inc. (a) (b) 24,557 677,036Verastem, Inc. (a) (b) 9,838 13,872Vericel Corp. (a) 16,730 639,421Verve Therapeutics, Inc. (a) (b) 13,474 307,477Viking Therapeutics, Inc. (a) (b) 4,527 13,581Vir Biotechnology, Inc. (a) (b) 21,642 556,632VistaGen Therapeutics, Inc. (a) (b) 84,097 104,280Xencor, Inc. (a) 19,810 528,531Y-mAbs Therapeutics, Inc. (a) (b) 13,415 159,370Zentalis Pharmaceuticals, Inc. (a) (b) 12,526 577,950
62,131,830
Building Products��1.2%AAON, Inc. (b) 14,309 797,441American Woodmark Corp. (a) 6,243 305,595Apogee Enterprises, Inc. 8,397 398,522Caesarstone, Ltd. (b) 8,108 85,296Cornerstone Building Brands, Inc. (a) 18,962 461,156CSW Industrials, Inc. 5,399 634,868Gibraltar Industries, Inc. (a) 11,164 479,494Griffon Corp. 17,255 345,618Insteel Industries, Inc. 7,079 261,852JELD-WEN Holding, Inc. (a) 31,425 637,299Masonite International Corp. (a) 8,366 744,072PGT Innovations, Inc. (a) (b) 20,640 371,107Quanex Building Products Corp. (b) 12,585 264,159Resideo Technologies, Inc. (a) 50,093 1,193,716Simpson Manufacturing Co., Inc. 15,108 1,647,376UFP Industries, Inc. 20,840 1,608,014Zurn Water Solutions Corp. 40,537 1,435,010
11,670,595
Capital Markets��1.4%Artisan Partners Asset Management, Inc. -
Class A 20,001 787,039AssetMark Financial Holdings, Inc. (a) 6,422 142,890B. Riley Financial, Inc. 6,563 459,147BGC Partners, Inc. - Class A 108,126 475,754Blucora, Inc. (a) 17,555 343,200Brightsphere Investment Group, Inc. 11,092 268,981Cohen & Steers, Inc. 8,580 736,936Cowen, Inc. - Class A (b) 10,078 273,114Diamond Hill Investment Group, Inc. 1,057 197,976Donnelley Financial Solutions, Inc. (a) 10,141 337,290Federated Hermes, Inc. 31,681 1,079,055Focus Financial Partners, Inc. - Class A (a) 22,152 1,013,233GCM Grosvenor, Inc. - Class A (b) 15,754 152,971Greenhill & Co., Inc. 4,969 76,870Hamilton Lane, Inc. - Class A (b) 11,802 912,177
BHFTII-204
Copyright © 2022 www.secdatabase.com. All Rights Reserved.Please Consider the Environment Before Printing This Document
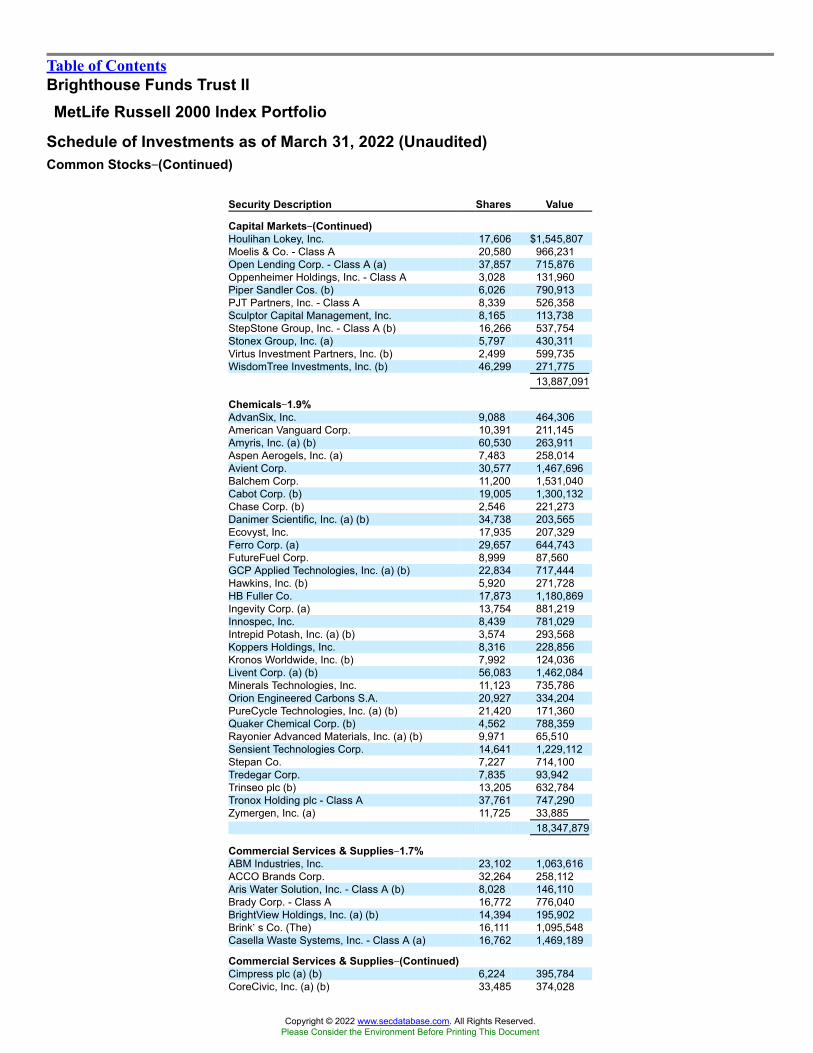
Table of ContentsBrighthouse Funds Trust IIMetLife Russell 2000 Index Portfolio
Schedule of Investments as of March 31, 2022 (Unaudited)Common Stocks��(Continued)
Security Description Shares Value
Capital Markets��(Continued)Houlihan Lokey, Inc. 17,606 $1,545,807Moelis & Co. - Class A 20,580 966,231Open Lending Corp. - Class A (a) 37,857 715,876Oppenheimer Holdings, Inc. - Class A 3,028 131,960Piper Sandler Cos. (b) 6,026 790,913PJT Partners, Inc. - Class A 8,339 526,358Sculptor Capital Management, Inc. 8,165 113,738StepStone Group, Inc. - Class A (b) 16,266 537,754Stonex Group, Inc. (a) 5,797 430,311Virtus Investment Partners, Inc. (b) 2,499 599,735WisdomTree Investments, Inc. (b) 46,299 271,775
13,887,091
Chemicals��1.9%AdvanSix, Inc. 9,088 464,306American Vanguard Corp. 10,391 211,145Amyris, Inc. (a) (b) 60,530 263,911Aspen Aerogels, Inc. (a) 7,483 258,014Avient Corp. 30,577 1,467,696Balchem Corp. 11,200 1,531,040Cabot Corp. (b) 19,005 1,300,132Chase Corp. (b) 2,546 221,273Danimer Scientific, Inc. (a) (b) 34,738 203,565Ecovyst, Inc. 17,935 207,329Ferro Corp. (a) 29,657 644,743FutureFuel Corp. 8,999 87,560GCP Applied Technologies, Inc. (a) (b) 22,834 717,444Hawkins, Inc. (b) 5,920 271,728HB Fuller Co. 17,873 1,180,869Ingevity Corp. (a) 13,754 881,219Innospec, Inc. 8,439 781,029Intrepid Potash, Inc. (a) (b) 3,574 293,568Koppers Holdings, Inc. 8,316 228,856Kronos Worldwide, Inc. (b) 7,992 124,036Livent Corp. (a) (b) 56,083 1,462,084Minerals Technologies, Inc. 11,123 735,786Orion Engineered Carbons S.A. 20,927 334,204PureCycle Technologies, Inc. (a) (b) 21,420 171,360Quaker Chemical Corp. (b) 4,562 788,359Rayonier Advanced Materials, Inc. (a) (b) 9,971 65,510Sensient Technologies Corp. 14,641 1,229,112Stepan Co. 7,227 714,100Tredegar Corp. 7,835 93,942Trinseo plc (b) 13,205 632,784Tronox Holding plc - Class A 37,761 747,290Zymergen, Inc. (a) 11,725 33,885
18,347,879
Commercial Services & Supplies��1.7%ABM Industries, Inc. 23,102 1,063,616ACCO Brands Corp. 32,264 258,112Aris Water Solution, Inc. - Class A (b) 8,028 146,110Brady Corp. - Class A 16,772 776,040BrightView Holdings, Inc. (a) (b) 14,394 195,902Brink�s Co. (The) 16,111 1,095,548Casella Waste Systems, Inc. - Class A (a) 16,762 1,469,189
Commercial Services & Supplies��(Continued)Cimpress plc (a) (b) 6,224 395,784CoreCivic, Inc. (a) (b) 33,485 374,028
Copyright © 2022 www.secdatabase.com. All Rights Reserved.Please Consider the Environment Before Printing This Document

Deluxe Corp. (b) 14,396 435,335Ennis, Inc. 9,011 166,433Harsco Corp. (a) (b) 27,344 334,691Healthcare Services Group, Inc. (b) 27,110 503,433Heritage-Crystal Clean, Inc. (a) (b) 6,299 186,513HNI Corp. (b) 15,112 559,900Interface, Inc. 20,528 278,565KAR Auction Services, Inc. (a) (b) 41,784 754,201Kimball International, Inc. - Class B 12,880 108,836Matthews International Corp. - Class A 11,034 357,060MillerKnoll, Inc. 25,792 891,372Montrose Environmental Group, Inc. (a) (b) 9,033 478,117Pitney Bowes, Inc. 60,718 315,734SP Plus Corp. (a) (b) 8,026 251,695Steelcase, Inc. - Class A 30,212 361,033Tetra Tech, Inc. 18,124 2,989,373U.S. Ecology, Inc. (a) 11,349 543,390UniFirst Corp. 5,229 963,600Viad Corp. (a) 6,618 235,866VSE Corp. 4,405 203,026
16,692,502
Communications Equipment��0.7%ADTRAN, Inc. (b) 16,670 307,561Aviat Networks, Inc. (a) (b) 3,608 111,018CalAmp Corp. (a) (b) 12,551 91,748Calix, Inc. (a) 18,967 813,874Cambium Networks Corp. (a) 3,242 76,641Clearfield, Inc. (a) (b) 3,951 257,684Comtech Telecommunications Corp. 9,651 151,424Digi International, Inc. (a) 11,390 245,113DZS, Inc. (a) 6,096 84,551Extreme Networks, Inc. (a) 43,045 525,579Harmonic, Inc. (a) (b) 31,330 291,056Infinera Corp. (a) (b) 62,963 545,889Inseego Corp. (a) (b) 12,591 50,994NETGEAR, Inc. (a) 10,251 252,995NetScout Systems, Inc. (a) 23,746 761,772Plantronics, Inc. (a) (b) 14,059 553,925Ribbon Communications, Inc. (a) 25,034 77,355Viavi Solutions, Inc. (a) (b) 77,528 1,246,650
6,445,829
Construction & Engineering��1.6%Ameresco, Inc. - Class A (a) (b) 10,064 800,088API Group Corp. (a) (b) 68,630 1,443,289Arcosa, Inc. (b) 16,643 952,812Argan, Inc. 6,140 249,222Comfort Systems USA, Inc. 12,500 1,112,625Construction Partners, Inc. - Class A (a) (b) 13,715 359,059Dycom Industries, Inc. (a) 9,730 926,880EMCOR Group, Inc. 17,812 2,006,165Fluor Corp. (a) (b) 49,349 1,415,823Granite Construction, Inc. (b) 16,882 553,729
BHFTII-205
Copyright © 2022 www.secdatabase.com. All Rights Reserved.Please Consider the Environment Before Printing This Document

Table of ContentsBrighthouse Funds Trust IIMetLife Russell 2000 Index Portfolio
Schedule of Investments as of March 31, 2022 (Unaudited)Common Stocks��(Continued)
Security Description Shares Value
Construction & Engineering��(Continued)Great Lakes Dredge & Dock Corp. (a) 22,694 $318,397IES Holdings, Inc. (a) (b) 3,768 151,474Infrastructure and Energy Alternatives, Inc. (a) 9,694 114,874Matrix Service Co. (a) 9,107 74,859MYR Group, Inc. (a) 5,521 519,195Northwest Pipe Co. (a) (b) 3,497 88,999NV5 Global, Inc. (a) (b) 4,636 617,979Primoris Services Corp. 18,341 436,883Sterling Construction Co., Inc. (a) (b) 10,373 277,996Tutor Perini Corp. (a) 14,544 157,075WillScot Mobile Mini Holdings Corp. (a) 70,434 2,756,082
15,333,505
Construction Materials��0.1%Summit Materials, Inc. - Class A (a) 40,690 1,263,831United States Lime & Minerals, Inc. 743 86,218
1,350,049
Consumer Finance��0.7%Atlanticus Holdings Corp. (a) (b) 1,946 100,783Curo Group Holdings Corp. (b) 8,266 107,871Encore Capital Group, Inc. (a) 8,441 529,504Enova International, Inc. (a) 13,516 513,202EZCORP, Inc. - Class A (a) (b) 17,468 105,507FirstCash Holdings, Inc. (b) 13,449 946,003Green Dot Corp. - Class A (a) 18,477 507,748LendingClub Corp. (a) 34,752 548,387LendingTree, Inc. (a) (b) 4,163 498,186Navient Corp. 54,266 924,693Nelnet, Inc. - Class A 5,967 507,135Oportun Financial Corp. (a) 7,407 106,364PRA Group, Inc. (a) (b) 14,698 662,586PROG Holdings, Inc. (a) 19,480 560,440Regional Management Corp. 3,196 155,230World Acceptance Corp. (a) 1,519 291,405
7,065,044
Containers & Packaging��0.3%Greif, Inc. - Class A 8,697 565,827Greif, Inc. - Class B (b) 2,362 150,601Myers Industries, Inc. (b) 13,639 294,602O-I Glass, Inc. (a) (b) 51,183 674,592Pactiv Evergreen, Inc. 17,273 173,766Ranpak Holdings, Corp. (a) (b) 12,914 263,833TriMas Corp. 15,686 503,364
2,626,585
Distributors��0.0%Funko, Inc. - Class A (a) (b) 9,888 170,568
Diversified Consumer Services��0.7%2U, Inc. (a) (b) 25,600 339,968Adtalem Global Education, Inc. (a) (b) 16,606 493,364American Public Education, Inc. (a) 6,422 136,403Carriage Services, Inc. (b) 5,721 305,101
Diversified ConsumerServices��(Continued)Coursera, Inc. (a) (b) 26,293 605,791European Wax Center, Inc. - Class A (a) 4,374 129,295
Copyright © 2022 www.secdatabase.com. All Rights Reserved.Please Consider the Environment Before Printing This Document

Graham Holdings Co. - Class B (b) 1,262 771,675Houghton Mifflin Harcourt Co. (a) 44,358 931,962Laureate Education, Inc. - Class A 34,397 407,605OneSpaWorld Holdings, Ltd. (a) (b) 18,970 193,494Perdoceo Education Corp. (a) 24,654 283,028PowerSchool Holdings, Inc. - Class A (a) (b) 15,984 263,896Strategic Education, Inc. (b) 8,893 590,317Stride, Inc. (a) (b) 15,318 556,503Vivint Smart Home, Inc. (a) (b) 21,379 144,522WW International, Inc. (a) (b) 18,914 193,490
6,346,414
Diversified Financial Services��0.1%A-Mark Precious Metals, Inc. (b) 3,327 257,310Alerus Financial Corp. (b) 4,862 134,386Banco Latinoamericano de Comercio Exterior
S.A. - Class E (b) 11,004 171,442Cannae Holdings, Inc. (a) 28,533 682,510
1,245,648
Diversified TelecommunicationServices��0.5%Anterix, Inc. (a) 4,083 236,406ATN International, Inc. 4,754 189,589Bandwidth, Inc. - Class A (a) (b) 8,108 262,618Cogent Communications Holdings, Inc. 13,896 922,000Consolidated Communications Holdings, Inc.
(a) 11,965 70,593EchoStar Corp. - Class A (a) (b) 11,847 288,356Globalstar, Inc. (a) (b) 150,074 220,609IDT Corp. - Class B (a) 5,006 170,654Iridium Communications, Inc. (a) 40,552 1,635,057Liberty Latin America, Ltd. - Class A (a) 14,620 141,814Liberty Latin America, Ltd. - Class C (a) 53,354 511,665Ooma, Inc. (a) 8,609 129,049Radius Global Infrastructure, Inc. - Class A (a)
(b) 26,242 374,7365,153,146
Electric Utilities��0.6%ALLETE, Inc. 18,161 1,216,424MGE Energy, Inc. 11,834 944,235Otter Tail Corp. 13,456 841,000PNM Resources, Inc. 29,601 1,411,080Portland General Electric Co. 30,482 1,681,082
6,093,821
Electrical Equipment��0.9%Allied Motion Technologies, Inc. 4,130 123,239American Superconductor Corp. (a) (b) 10,830 82,416Array Technologies, Inc. (a) (b) 47,853 539,303Atkore, Inc. (a) 15,073 1,483,786AZZ, Inc. 8,063 388,959Babcock & Wilcox Enterprises, Inc. (a) 11,168 91,131Blink Charging Co. (a) (b) 13,174 348,584Bloom Energy Corp. - Class A (a) (b) 49,578 1,197,309Encore Wire Corp. (b) 6,794 774,992
BHFTII-206
Copyright © 2022 www.secdatabase.com. All Rights Reserved.Please Consider the Environment Before Printing This Document

Table of ContentsBrighthouse Funds Trust IIMetLife Russell 2000 Index Portfolio
Schedule of Investments as of March 31, 2022 (Unaudited)Common Stocks��(Continued)
Security Description Shares Value
Electrical Equipment��(Continued)EnerSys 14,034 $1,046,515FTC Solar, Inc. (a) (b) 17,724 87,379FuelCell Energy, Inc. (a) 127,052 731,820GrafTech International, Ltd. 68,311 657,152Stem, Inc. (a) (b) 40,734 448,481Thermon Group Holdings, Inc. (a) 11,598 187,888TPI Composites, Inc. (a) (b) 11,883 167,075Vicor Corp. (a) 7,241 510,853
8,866,882
Electronic Equipment, Instruments &Components��2.2%908 Devices, Inc. (a) (b) 7,715 146,662Advanced Energy Industries, Inc. 12,905 1,110,862Aeva Technologies, Inc. (a) (b) 39,886 172,706Akoustis Technologies, Inc. (a) (b) 4,998 32,487Arlo Technologies, Inc. (a) 29,089 257,729Badger Meter, Inc. (b) 10,136 1,010,661Belden, Inc. 15,359 850,889Benchmark Electronics, Inc. 12,513 313,326CTS Corp. (b) 10,302 364,073ePlus, Inc. (a) 8,628 483,686Fabrinet (a) 12,442 1,308,027FARO Technologies, Inc. (a) 6,602 342,776Identiv, Inc. (a) 7,717 124,784II-VI, Inc. (a) (b) 35,726 2,589,778Insight Enterprises, Inc. (a) (b) (c) 11,745 1,260,473Itron, Inc. (a) 15,613 822,493Kimball Electronics, Inc. (a) 9,543 190,765Knowles Corp. (a) 30,951 666,375Luna Innovations, Inc. (a) (b) 1,647 12,698Methode Electronics, Inc. (b) 12,930 559,222MicroVision, Inc. (a) (b) 56,736 264,957Napco Security Technologies, Inc. (a) (b) 11,304 231,958nLight, Inc. (a) (b) 14,866 257,776Novanta, Inc. (a) 11,869 1,688,840OSI Systems, Inc. (a) (b) 5,771 491,228Ouster, Inc. (a) (b) 38,329 172,481PAR Technology Corp. (a) (b) 8,465 341,478PC Connection, Inc. 3,547 185,827Plexus Corp. (a) (c) 9,599 785,294Rogers Corp. (a) 6,411 1,741,869Sanmina Corp. (a) 20,646 834,511ScanSource, Inc. (a) 8,101 281,834TTM Technologies, Inc. (a) 35,927 532,438Vishay Intertechnology, Inc. 45,367 889,193Vishay Precision Group, Inc. (a) 5,267 169,334
21,489,490
Energy Equipment & Services��1.2%Archrock, Inc. 49,321 455,233Bristow Group, Inc. (a) (b) 8,308 308,061Cactus, Inc. - Class A 19,577 1,110,799ChampionX Corp. (a) 70,110 1,716,293DMC Global, Inc. (a) (b) 6,765 206,333Dril-Quip, Inc. (a) (b) 12,726 475,316Expro Group Holdings NV (a) 16,177 287,627
Energy Equipment & Services��(Continued)Helix Energy Solutions Group, Inc. (a) 40,373 192,983
Copyright © 2022 www.secdatabase.com. All Rights Reserved.Please Consider the Environment Before Printing This Document

Helmerich & Payne, Inc. 35,014 1,497,899Liberty Oilfield Services, Inc. - Class A (a) (b) 31,566 467,808Nabors Industries, Ltd. (a) 2,206 336,900National Energy Services Reunited Corp. (a)
(b) 11,331 95,180Newpark Resources, Inc. (a) 32,358 118,430NexTier Oilfield Solutions, Inc. (a) 51,835 478,955Oceaneering International, Inc. (a) 35,840 543,335Oil States International, Inc. (a) 24,658 171,373Patterson-UTI Energy, Inc. 63,440 982,051ProPetro Holding Corp. (a) 29,421 409,835RPC, Inc. (a) (b) 26,045 277,900Select Energy Services, Inc. - Class A (a) 22,065 189,097Solaris Oilfield Infrastructure, Inc. - Class A 10,753 121,401TETRA Technologies, Inc. (a) 21,874 89,902Tidewater, Inc. (a) 13,616 296,012U.S. Silica Holdings, Inc. (a) 25,504 475,905
11,304,628
Entertainment��0.8%AMC Entertainment Holdings, Inc. - Class A (a)
(b) 178,303 4,393,386Cinemark Holdings, Inc. (a) (b) 37,384 645,996IMAX Corp. (a) 18,129 343,182Liberty Media Corp-Liberty Braves - Class C (a) 12,842 358,420Liberty Media Corp. Liberty Braves - Class A
(a) 3,713 106,860Lions Gate Entertainment Corp. - Class A (a)
(b) 20,369 330,996Lions Gate Entertainment Corp. - Class B (a) 40,868 614,246Madison Square Garden Entertainment Corp.
(a) (b) 9,098 757,954Marcus Corp. (The) (a) (b) 8,228 145,636
7,696,676
Equity Real Estate Investment Trusts��6.7%Acadia Realty Trust 30,219 654,846Agree Realty Corp. 23,549 1,562,712Alexander & Baldwin, Inc. (a) 23,869 553,522Alexander�s, Inc. 759 194,479American Assets Trust, Inc. 17,223 652,580Apartment Investment & Management Co. -
Class A (a) 42,325 309,819Apple Hospitality REIT, Inc. 73,539 1,321,496Armada Hoffler Properties, Inc. 20,899 305,125Braemar Hotels & Resorts, Inc. (b) 19,907 123,025Brandywine Realty Trust 58,289 824,207Broadstone Net Lease, Inc. 54,358 1,183,917BRT Apartments Corp. 3,996 95,784CareTrust REIT, Inc. 33,166 640,104CatchMark Timber Trust, Inc. - Class A 8,201 67,248Centerspace 4,565 447,918Chatham Lodging Trust (a) 16,628 229,300City Office REIT, Inc. 15,043 265,659Community Healthcare Trust, Inc. 8,030 338,946Corporate Office Properties Trust 37,695 1,075,815CTO Realty Growth, Inc. (b) 2,109 139,869DiamondRock Hospitality Co. (a) 71,359 720,726DigitalBridge Group, Inc. (a) 155,671 1,120,831Diversified Healthcare Trust 81,599 261,117Easterly Government Properties, Inc. 28,209 596,338
BHFTII-207
Copyright © 2022 www.secdatabase.com. All Rights Reserved.Please Consider the Environment Before Printing This Document

Table of ContentsBrighthouse Funds Trust IIMetLife Russell 2000 Index Portfolio
Schedule of Investments as of March 31, 2022 (Unaudited)Common Stocks��(Continued)
Security Description Shares Value
Equity Real Estate InvestmentTrusts��(Continued)EastGroup Properties, Inc. 13,811 $2,807,500Empire State Realty Trust, Inc. - Class A (b) 41,789 410,368Equity Commonwealth (a) 37,069 1,045,717Essential Properties Realty Trust, Inc. 42,553 1,076,591Farmland Partners, Inc. (b) 10,095 138,806Four Corners Property Trust, Inc. 27,333 739,084Franklin Street Properties Corp. (b) 35,022 206,630Geo Group, Inc. (The) (a) (b) 28,018 185,199Getty Realty Corp. 14,042 401,882Gladstone Commercial Corp. 12,023 264,747Gladstone Land Corp. 10,827 394,319Global Medical REIT, Inc. 18,398 300,255Global Net Lease, Inc. (b) 34,451 541,914Healthcare Realty Trust, Inc. (b) 49,577 1,362,376Hersha Hospitality Trust (a) 3,422 31,072Independence Realty Trust, Inc. (b) 75,182 1,987,812Indus Realty Trust, Inc. 1,581 115,555Industrial Logistics Properties Trust (b) 23,274 527,622Innovative Industrial Properties, Inc. 8,095 1,662,713iStar, Inc. (b) 24,106 564,322Kite Realty Group Trust 73,033 1,662,962LTC Properties, Inc. (b) 13,090 503,572LXP Industrial Trust (b) 93,318 1,465,093Macerich Co. (The) (b) 69,127 1,081,146National Health Investors, Inc. 15,012 885,858National Storage Affiliates Trust 27,642 1,734,812Necessity Retail REIT, Inc. (The) (b) 33,171 262,383NETSTREIT Corp. (b) 14,605 327,736NexPoint Residential Trust, Inc. 7,849 708,843Office Properties Income Trust 16,817 432,701One Liberty Properties, Inc. (b) 6,483 199,612Outfront Media, Inc. 49,314 1,401,997Paramount Group, Inc. 57,322 625,383Pebblebrook Hotel Trust (b) 43,364 1,061,551Phillips Edison & Co., Inc. (b) 39,518 1,359,024Physicians Realty Trust 75,576 1,325,603Piedmont Office Realty Trust, Inc. - Class A 41,047 706,829Plymouth Industrial REIT, Inc. 10,839 293,737Postal Realty Trust, Inc. - Class A (b) 5,867 98,683PotlatchDeltic Corp. 22,893 1,207,148Preferred Apartment Communities, Inc. - Class A 18,248 455,105PS Business Parks, Inc. 6,725 1,130,338Retail Opportunity Investments Corp. 41,820 810,890RLJ Lodging Trust 56,512 795,689RPT Realty 28,918 398,201Ryman Hospitality Properties, Inc. (a) 18,140 1,682,848Sabra Health Care REIT, Inc. 76,862 1,144,475Safehold, Inc. (b) 7,154 396,689Saul Centers, Inc. 3,884 204,687Seritage Growth Properties - Class A (a) (b) 12,941 163,833Service Properties Trust 53,587 473,173SITE Centers Corp. 58,444 976,599STAG Industrial, Inc. 60,378 2,496,630Summit Hotel Properties, Inc. (a) (b) 35,542 353,998Sunstone Hotel Investors, Inc. (a) 74,226 874,382Tanger Factory Outlet Centers, Inc. (b) 34,992 601,513Terreno Realty Corp. 25,258 1,870,355
Copyright © 2022 www.secdatabase.com. All Rights Reserved.Please Consider the Environment Before Printing This Document

Equity Real Estate InvestmentTrusts��(Continued)UMH Properties, Inc. 14,925 367,006Uniti Group, Inc. (b) 64,587 888,717Universal Health Realty Income Trust 4,263 248,831Urban Edge Properties 39,794 760,065Urstadt Biddle Properties, Inc. - Class A 11,225 211,142Veris Residential, Inc. (a) 30,231 525,717Washington Real Estate Investment Trust 28,554 728,127Whitestone REIT 15,859 210,132Xenia Hotels & Resorts, Inc. (a) 37,927 731,612
65,295,294
Food & Staples Retailing��1.1%Andersons, Inc. (The) 11,198 562,811BJ�s Wholesale Club Holdings, Inc. (a) 47,225 3,192,882Chefs� Warehouse, Inc. (The) (a) 11,522 375,617HF Foods Group, Inc. (a) 1,552 10,336Ingles Markets, Inc. - Class A 4,911 437,325Performance Food Group Co. (a) 52,048 2,649,764PriceSmart, Inc. 8,002 631,118Rite Aid Corp. (a) (b) 17,917 156,774SpartanNash Co. 12,524 413,167Sprouts Farmers Market, Inc. (a) 39,087 1,250,002United Natural Foods, Inc. (a) (b) 19,108 790,116Weis Markets, Inc. (b) 5,226 373,241
10,843,153
Food Products��1.0%AppHarvest, Inc. (a) (b) 27,468 147,640B&G Foods, Inc. (b) 21,670 584,657Cal-Maine Foods, Inc. (b) 13,890 767,006Calavo Growers, Inc. 5,820 212,139Fresh Del Monte Produce, Inc. 11,729 303,898Hostess Brands, Inc. (a) 47,613 1,044,629J & J Snack Foods Corp. 5,253 814,740John B Sanfilippo & Son, Inc. 2,849 237,721Lancaster Colony Corp. 6,596 983,793Landec Corp. (a) (b) 9,681 112,106Mission Produce, Inc. (a) (b) 15,099 191,002Sanderson Farms, Inc. 6,797 1,274,370Seneca Foods Corp. - Class A (a) 2,395 123,438Simply Good Foods Co. (The) (a) 30,224 1,147,001Sovos Brands, Inc. (a) 10,886 154,363Tattooed Chef, Inc. (a) 18,663 234,781Tootsie Roll Industries, Inc. (b) 6,405 223,903TreeHouse Foods, Inc. (a) (b) 18,804 606,617UTZ Brands, Inc. (b) 22,721 335,816Vital Farms, Inc. (a) 9,557 118,125Whole Earth Brands, Inc. (a) 16,393 117,374
9,735,119
Gas Utilities��1.1%Brookfield Infrastructure Corp. - Class A 21,642 1,632,673Chesapeake Utilities Corp. 5,971 822,565New Jersey Resources Corp. 33,368 1,530,256Northwest Natural Holding Co. 10,881 562,765ONE Gas, Inc. (b) 17,702 1,562,024
BHFTII-208
Copyright © 2022 www.secdatabase.com. All Rights Reserved.Please Consider the Environment Before Printing This Document

Table of ContentsBrighthouse Funds Trust IIMetLife Russell 2000 Index Portfolio
Schedule of Investments as of March 31, 2022 (Unaudited)Common Stocks��(Continued)
Security Description Shares Value
Gas Utilities��(Continued)South Jersey Industries, Inc. 35,356 $1,221,550Southwest Gas Holdings, Inc. (a) 22,576 1,767,475Spire, Inc. (b) 17,502 1,255,944
10,355,252
Health Care Equipment & Supplies��3.3%Accuray, Inc. (a) (b) 35,553 117,680Alphatec Holdings, Inc. (a) (b) 25,663 295,124AngioDynamics, Inc. (a) 12,161 261,948Apyx Medical Corp. (a) (b) 11,665 76,172Artivion, Inc. (a) (b) 12,730 272,167AtriCure, Inc. (a) 15,592 1,023,927Atrion Corp. (b) 495 352,935Avanos Medical, Inc. (a) 18,331 614,088AxoGen, Inc. (a) (b) 14,840 117,830Axonics, Inc. (a) (b) 15,955 998,783BioLife Solutions, Inc. (a) (b) 3,986 90,602Bioventus, Inc. - Class A (a) 12,058 170,018Butterfly Network, Inc. (a) (b) 47,336 225,319Cardiovascular Systems, Inc. (a) 13,837 312,716Cerus Corp. (a) (b) 59,814 328,379CONMED Corp. (b) 9,867 1,465,743CryoPort, Inc. (a) (b) 13,680 477,569Cutera, Inc. (a) 6,744 465,336Glaukos Corp. (a) 16,191 936,164Haemonetics Corp. (a) 18,130 1,146,179Heska Corp. (a) 3,474 480,385Inari Medical, Inc. (a) 12,217 1,107,349Inogen, Inc. (a) 6,732 218,251Integer Holdings Corp. (a) (b) 11,577 932,759Intersect ENT, Inc. (a) 13,971 391,328iRadimed Corp. 2,491 111,696iRhythm Technologies, Inc. (a) 10,038 1,580,684Lantheus Holdings, Inc. (a) 23,157 1,280,814LeMaitre Vascular, Inc. (b) 7,651 355,542LivaNova plc (a) 18,448 1,509,600Meridian Bioscience, Inc. (a) (b) 14,711 381,897Merit Medical Systems, Inc. (a) 18,450 1,227,294Mesa Laboratories, Inc. (b) 1,730 440,942Natus Medical, Inc. (a) (b) 12,046 316,569Neogen Corp. (a) 38,451 1,185,829Nevro Corp. (a) 12,102 875,338NuVasive, Inc. (a) (c) 18,483 1,047,986OraSure Technologies, Inc. (a) (b) 28,635 194,145Ortho Clinical Diagnostics Holdings plc (a) 42,875 800,047Orthofix Medical, Inc. (a) (b) 7,567 247,441OrthoPediatrics Corp. (a) (b) 5,617 303,262Outset Medical, Inc. (a) 16,994 771,528PROCEPT BioRobotics Corp. (a) (b) 3,223 112,773Pulmonx Corp. (a) (b) 9,963 247,182SeaSpine Holdings Corp. (a) (b) 10,839 131,802Senseonics Holdings, Inc. (a) (b) 112,551 221,725Shockwave Medical, Inc. (a) 11,661 2,418,025SI-BONE, Inc. (a) (b) 12,210 275,946Sight Sciences, Inc. (a) 9,243 106,849Silk Road Medical, Inc. (a) (b) 11,451 472,812STAAR Surgical Co. (a) 16,470 1,316,118
Health Care Equipment &Supplies��(Continued)
Copyright © 2022 www.secdatabase.com. All Rights Reserved.Please Consider the Environment Before Printing This Document

SurModics, Inc. (a) 4,747 $215,181Tactile Systems Technology, Inc. (a) 8,238 166,078TransMedics Group, Inc. (a) (b) 9,254 249,303Treace Medical Concepts, Inc. (a) 12,249 231,628UFP Technologies, Inc. (a) (b) 2,028 134,193Utah Medical Products, Inc. 1,293 116,189Vapotherm, Inc. (a) (b) 8,810 122,459Varex Imaging Corp. (a) (b) 15,292 325,567ViewRay, Inc. (a) (b) 54,916 215,271
32,588,466
Health Care Providers & Services��3.0%1Life Healthcare, Inc. (a) (b) 41,767 462,778Accolade, Inc. (a) 18,167 319,013AdaptHealth Corp. (a) 28,311 453,825Addus HomeCare Corp. (a) 5,248 489,586Agiliti, Inc. (a) (b) 9,835 207,519Alignment Healthcare, Inc. (a) (b) 29,558 331,936AMN Healthcare Services, Inc. (a) 16,179 1,687,955Apollo Medical Holdings, Inc. (a) (b) 13,155 637,623Aveanna Healthcare Holdings, Inc. (a) (b) 18,668 63,658Brookdale Senior Living, Inc. (a) 65,085 458,849Castle Biosciences, Inc. (a) 7,804 350,087Community Health Systems, Inc. (a) 45,180 536,287Corvel Corp. (a) 3,162 532,607Covetrus, Inc. (a) 36,775 617,452Cross Country Healthcare, Inc. (a) 12,489 270,637Ensign Group, Inc. (The) 18,227 1,640,612Fulgent Genetics, Inc. (a) 7,417 462,895Hanger, Inc. (a) 14,755 270,459HealthEquity, Inc. (a) 28,395 1,914,959Invitae Corp. (a) (b) 71,322 568,436Joint Corp. (The) (a) 5,088 180,064LHC Group, Inc. (a) 10,373 1,748,888Lifestance Health Group, Inc. (a) (b) 27,070 273,678MEDNAX, Inc. (a) (b) 26,848 630,391ModivCare, Inc. (a) 4,229 487,984National HealthCare Corp. (b) 4,199 294,896National Research Corp. (b) 6,206 246,068Option Care Health, Inc. (a) 54,896 1,567,830Owens & Minor, Inc. (b) 24,511 1,078,974Patterson Cos., Inc. 30,828 997,902Pennant Group Inc. (The) (a) 11,360 211,637PetIQ, Inc. (a) (b) 9,493 231,629Privia Health Group, Inc. (a) (b) 15,278 408,381Progyny, Inc. (a) (b) 22,620 1,162,668R1 RCM, Inc. (a) 41,477 1,109,925RadNet, Inc. (a) (b) 16,412 367,136Select Medical Holdings Corp. 37,643 903,056Surgery Partners, Inc. (a) (b) 11,767 647,773Tenet Healthcare Corp. (a) 36,664 3,151,638Tivity Health, Inc. (a) 17,194 553,131U.S. Physical Therapy, Inc. (b) 4,409 438,475
28,969,297
BHFTII-209
Copyright © 2022 www.secdatabase.com. All Rights Reserved.Please Consider the Environment Before Printing This Document

Table of ContentsBrighthouse Funds Trust IIMetLife Russell 2000 Index Portfolio
Schedule of Investments as of March 31, 2022 (Unaudited)Common Stocks��(Continued)
Security Description Shares Value
Health Care Technology��1.0%Allscripts Healthcare Solutions, Inc. (a) 43,500 $979,620American Well Corp. - Class A (a) 64,199 270,278Computer Programs & Systems, Inc. (a) (b) 5,856 201,739Evolent Health, Inc. - Class A (a) 29,029 937,637Health Catalyst, Inc. (a) (b) 17,486 456,909HealthStream, Inc. (a) 9,080 180,874Inspire Medical Systems, Inc. (a) 9,323 2,393,121Multiplan Corp. (a) (b) 137,915 645,442NextGen Healthcare, Inc. (a) 21,901 457,950Omnicell, Inc. (a) (b) 14,912 1,930,955OptimizeRx Corp. (a) (b) 5,787 218,228Phreesia, Inc. (a) 17,014 448,489Schrodinger, Inc. (a) 16,079 548,615Simulations Plus, Inc. (b) 5,451 277,892
9,947,749
Hotels, Restaurants & Leisure��2.3%Accel Entertainment, Inc. (a) 19,825 241,468Bally�s Corp. (a) 11,742 360,949BJ�s Restaurants, Inc. (a) 9,083 257,049Bloomin� Brands, Inc. (b) 32,263 707,850Bluegreen Vacations Holding Corp. (a) (b) 5,418 160,210Brinker International, Inc. (a) 15,862 605,294Century Casinos, Inc. (a) 9,899 118,293Cheesecake Factory, Inc. (The) (a) (b) 16,135 642,012Chuy�s Holdings, Inc. (a) (b) 8,272 223,344Cracker Barrel Old Country Store, Inc. 8,206 974,298Dave & Buster�s Entertainment, Inc. (a) 14,842 728,742Denny�s Corp. (a) 21,650 309,811Dine Brands Global, Inc. 5,429 423,191El Pollo Loco Holdings, Inc. (a) 7,185 83,490Everi Holdings, Inc. (a) 31,005 651,105F45 Training Holdings, Inc. (a) 12,664 135,505Full House Resorts, Inc. (a) (b) 11,840 113,782GAN, Ltd. (a) (b) 14,337 69,104Golden Entertainment, Inc. (a) 6,242 362,473Golden Nugget Online Gaming, Inc. (a) 14,609 103,870Hilton Grand Vacations, Inc. (a) 29,511 1,534,867International Game Technology plc (b) 35,785 883,174Jack in the Box, Inc. (b) 7,171 669,843Krispy Kreme, Inc. (b) 30,666 455,390Kura Sushi USA, Inc. - Class A (a) (b) 1,484 81,843Life Time Group Holdings, Inc. (a) (b) 15,138 220,106Lindblad Expeditions Holdings, Inc. (a) (b) 10,934 164,885Monarch Casino & Resort, Inc. (a) 4,396 383,463Noodles & Co. (a) (b) 12,647 75,503ONE Group Hospitality, Inc. (a) (b) 7,689 80,811Papa John�s International, Inc. 11,469 1,207,456Portillo�s, Inc. - Class A (a) (b) 9,053 222,342RCI Hospitality Holdings, Inc. (b) 2,630 161,640Red Robin Gourmet Burgers, Inc. (a) 5,755 97,029Red Rock Resorts, Inc. - Class A (b) 18,412 894,087Rush Street Interactive, Inc. (a) (b) 21,900 159,213Ruth�s Hospitality Group, Inc. (b) 12,375 283,140Scientific Games Corp. - Class A (a) 33,049 1,941,629SeaWorld Entertainment, Inc. (a) 17,225 1,282,229Shake Shack, Inc. - Class A (a) 13,241 899,064
Hotels, Restaurants & Leisure��(Continued)Sweetgreen, Inc. - Class A (a) (b) 4,844 154,960
Copyright © 2022 www.secdatabase.com. All Rights Reserved.Please Consider the Environment Before Printing This Document

Texas Roadhouse, Inc. 23,614 1,977,200Wingstop, Inc. (b) 10,306 1,209,409Xponential Fitness, Inc. - Class A (a) 5,274 123,623
22,434,746
Household Durables��1.5%Beazer Homes USA, Inc. (a) 10,935 166,431Cavco Industries, Inc. (a) 3,093 744,949Century Communities, Inc. (b) 10,341 553,967Ethan Allen Interiors, Inc. (b) 9,100 237,237GoPro, Inc. - Class A (a) (b) 44,776 381,939Green Brick Partners, Inc. (a) 10,016 197,916Helen of Troy, Ltd. (a) (b) 8,363 1,637,810Hooker Furnishings Corp. (b) 6,029 114,189Hovnanian Enterprises, Inc. - Class A (a) 1,923 113,649Installed Building Products, Inc. (b) 8,305 701,690iRobot Corp. (a) (b) 8,888 563,499KB Home 27,244 882,161La-Z-Boy, Inc. 16,250 428,513LGI Homes, Inc. (a) (b) 7,603 742,661Lovesac Co. (The) (a) (b) 4,517 244,189M/I Homes, Inc. (a) 9,907 439,375MDC Holdings, Inc. 19,668 744,237Meritage Homes Corp. (a) (c) 12,250 970,568Purple Innovation, Inc. (a) (b) 20,685 121,007Skyline Champion Corp. (a) 18,238 1,000,901Snap One Holdings Corp. (a) (b) 5,851 86,302Sonos, Inc. (a) (b) 43,889 1,238,548Taylor Morrison Home Corp. (a) 40,039 1,089,862Traeger, Inc. (a) 13,375 99,510TRI Pointe Group, Inc. (a) 38,423 771,534Tupperware Brands Corp. (a) (b) 15,525 301,961Universal Electronics, Inc. (a) 4,412 137,831Vuzix Corp. (a) (b) 9,656 63,730Weber, Inc. - Class A (b) 9,376 92,166
14,868,332
Household Products��0.2%Central Garden and Pet Co. (Non-Voting
Shares) - Class A (a) 13,396 546,289Central Garden and Pet Co. (Voting Shares)
(a) 2,845 125,066Energizer Holdings, Inc. (b) 22,082 679,242WD-40 Co. (b) 4,703 861,731
2,212,328
Independent Power and Renewable Electricity Producers��0.3%Clearway Energy, Inc. - Class A 12,687 422,731Clearway Energy, Inc. - Class C 27,115 989,969Ormat Technologies, Inc. (b) 15,283 1,250,608Sunnova Energy International, Inc. (a) (b) 30,639 706,535
3,369,843
Insurance��1.8%Ambac Financial Group, Inc. (a) 15,807 164,393American Equity Investment Life Holding Co. 28,381 1,132,686
BHFTII-210
Copyright © 2022 www.secdatabase.com. All Rights Reserved.Please Consider the Environment Before Printing This Document

Table of ContentsBrighthouse Funds Trust IIMetLife Russell 2000 Index Portfolio
Schedule of Investments as of March 31, 2022 (Unaudited)Common Stocks��(Continued)
Security Description Shares Value
Insurance��(Continued)American National Group, Inc. 2,332 $440,958AMERISAFE, Inc. 6,927 344,064Argo Group International Holdings, Ltd. 10,670 440,458Bright Health Group, Inc. (a) (b) 99,081 191,226BRP Group, Inc. - Class A (a) 16,072 431,212CNO Financial Group, Inc. 42,230 1,059,551eHealth, Inc. (a) 8,196 101,712Employers Holdings, Inc. 10,200 418,404Enstar Group, Ltd. (a) 4,306 1,124,512Genworth Financial, Inc. - Class A (a) 154,927 585,624Goosehead Insurance, Inc. - Class A 6,359 499,627HCI Group, Inc. 1,899 129,474Horace Mann Educators Corp. 13,604 569,055Investors Title Co. 476 96,728James River Group Holdings, Ltd. (b) 13,003 321,694Kinsale Capital Group, Inc. 7,402 1,687,804MBIA, Inc. (a) 16,483 253,673National Western Life Group, Inc. - Class A (b) 1,039 218,606Palomar Holdings, Inc. (a) 8,685 555,753ProAssurance Corp. 19,097 513,327RLI Corp. 13,582 1,502,577Safety Insurance Group, Inc. 5,238 475,872Selective Insurance Group, Inc. 19,974 1,784,877Selectquote, Inc. (a) (b) 17,000 47,430Siriuspoint, Ltd. (a) (b) 30,477 227,968Stewart Information Services Corp. 9,296 563,431Tiptree, Inc. - Class A (b) 8,311 106,796Trupanion, Inc. (a) (b) 12,959 1,154,906United Fire Group, Inc. 7,479 232,372Universal Insurance Holdings, Inc. 9,488 127,993
17,504,763
Interactive Media & Services��0.6%Cargurus, Inc. (a) 33,031 1,402,496Cars.com, Inc. (a) 23,858 344,271Eventbrite, Inc. - Class A (a) (b) 24,116 356,193EverQuote, Inc. - Class A (a) 6,305 102,015fuboTV, Inc. (a) (b) 48,212 316,753MediaAlpha, Inc. - Class A (a) (b) 7,846 129,851Outbrain, Inc. (a) 10,498 112,644QuinStreet, Inc. (a) 18,173 210,807TrueCar, Inc. (a) (b) 33,426 132,033Yelp, Inc. (a) 24,475 834,842Ziff Davis, Inc. (a) 14,633 1,416,182
5,358,087
Internet & Direct Marketing Retail��0.4%1-800-Flowers.com, Inc. - Class A (a) 10,044 128,161CarParts.com, Inc. (a) (b) 7,401 49,587Groupon, Inc. (a) (b) 9,992 192,146Lands� End, Inc. (a) (b) 4,859 82,214Liquidity Services, Inc. (a) 10,346 177,123Overstock.com, Inc. (a) (b) 15,298 673,188PetMed Express, Inc. (b) 6,446 166,307Porch Group, Inc. (a) (b) 27,929 193,967
Internet & Direct MarketingRetail��(Continued)Quotient Technology, Inc. (a) (b) 31,794 202,846RealReal, Inc. (The) (a) 18,368 133,352
Copyright © 2022 www.secdatabase.com. All Rights Reserved.Please Consider the Environment Before Printing This Document
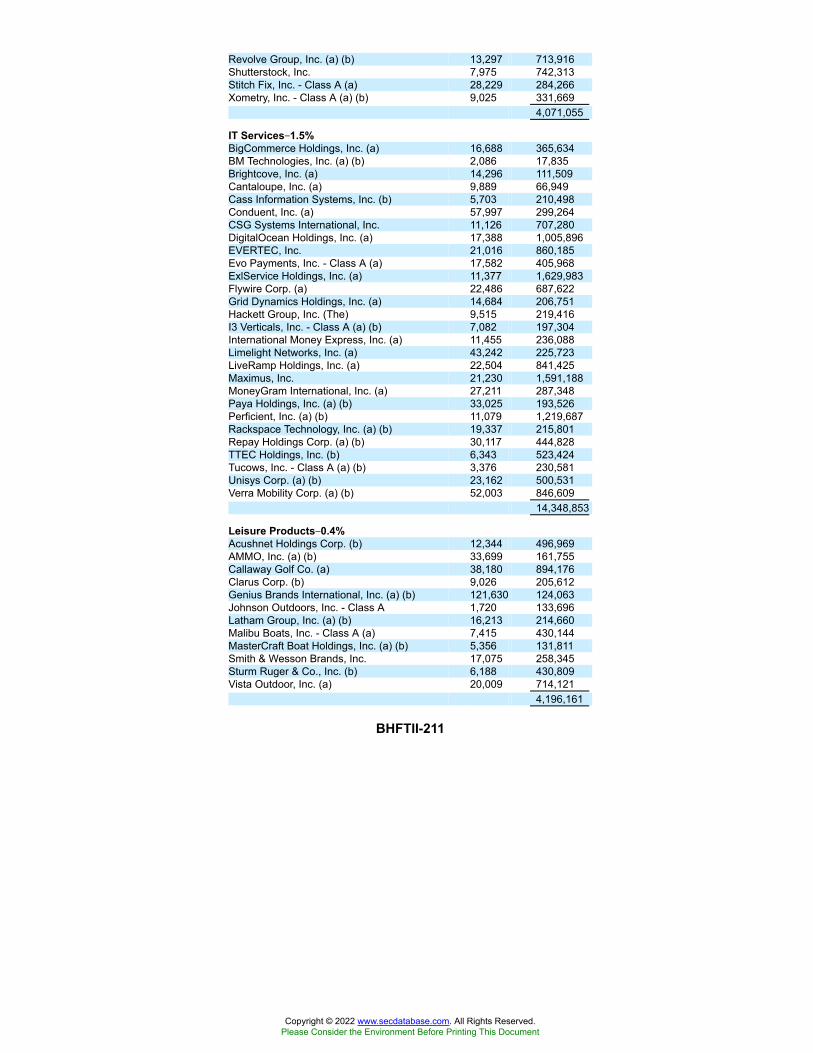
Revolve Group, Inc. (a) (b) 13,297 713,916Shutterstock, Inc. 7,975 742,313Stitch Fix, Inc. - Class A (a) 28,229 284,266Xometry, Inc. - Class A (a) (b) 9,025 331,669
4,071,055
IT Services��1.5%BigCommerce Holdings, Inc. (a) 16,688 365,634BM Technologies, Inc. (a) (b) 2,086 17,835Brightcove, Inc. (a) 14,296 111,509Cantaloupe, Inc. (a) 9,889 66,949Cass Information Systems, Inc. (b) 5,703 210,498Conduent, Inc. (a) 57,997 299,264CSG Systems International, Inc. 11,126 707,280DigitalOcean Holdings, Inc. (a) 17,388 1,005,896EVERTEC, Inc. 21,016 860,185Evo Payments, Inc. - Class A (a) 17,582 405,968ExlService Holdings, Inc. (a) 11,377 1,629,983Flywire Corp. (a) 22,486 687,622Grid Dynamics Holdings, Inc. (a) 14,684 206,751Hackett Group, Inc. (The) 9,515 219,416I3 Verticals, Inc. - Class A (a) (b) 7,082 197,304International Money Express, Inc. (a) 11,455 236,088Limelight Networks, Inc. (a) 43,242 225,723LiveRamp Holdings, Inc. (a) 22,504 841,425Maximus, Inc. 21,230 1,591,188MoneyGram International, Inc. (a) 27,211 287,348Paya Holdings, Inc. (a) (b) 33,025 193,526Perficient, Inc. (a) (b) 11,079 1,219,687Rackspace Technology, Inc. (a) (b) 19,337 215,801Repay Holdings Corp. (a) (b) 30,117 444,828TTEC Holdings, Inc. (b) 6,343 523,424Tucows, Inc. - Class A (a) (b) 3,376 230,581Unisys Corp. (a) (b) 23,162 500,531Verra Mobility Corp. (a) (b) 52,003 846,609
14,348,853
Leisure Products��0.4%Acushnet Holdings Corp. (b) 12,344 496,969AMMO, Inc. (a) (b) 33,699 161,755Callaway Golf Co. (a) 38,180 894,176Clarus Corp. (b) 9,026 205,612Genius Brands International, Inc. (a) (b) 121,630 124,063Johnson Outdoors, Inc. - Class A 1,720 133,696Latham Group, Inc. (a) (b) 16,213 214,660Malibu Boats, Inc. - Class A (a) 7,415 430,144MasterCraft Boat Holdings, Inc. (a) (b) 5,356 131,811Smith & Wesson Brands, Inc. 17,075 258,345Sturm Ruger & Co., Inc. (b) 6,188 430,809Vista Outdoor, Inc. (a) 20,009 714,121
4,196,161
BHFTII-211
Copyright © 2022 www.secdatabase.com. All Rights Reserved.Please Consider the Environment Before Printing This Document

Table of ContentsBrighthouse Funds Trust IIMetLife Russell 2000 Index Portfolio
Schedule of Investments as of March 31, 2022 (Unaudited)Common Stocks��(Continued)
Security Description Shares Value
Life Sciences Tools & Services��0.6%Absci Corp. (a) (b) 21,745 $183,310Berkeley Lights, Inc. (a) 17,360 123,430Bionano Genomics, Inc. (a) (b) 69,435 179,142Codexis, Inc. (a) 21,179 436,711Cytek Biosciences, Inc. (a) (b) 35,235 379,833Fluidigm Corp. (a) (b) 29,945 107,503Harvard Bioscience, Inc. (a) (b) 14,825 92,063Inotiv, Inc. (a) (b) 5,305 138,885MaxCyte, Inc. (a) 36,112 252,423Medpace Holdings, Inc. (a) 9,953 1,628,211NanoString Technologies, Inc. (a) 15,548 540,293NeoGenomics, Inc. (a) 39,085 474,883Pacific Biosciences of California, Inc. (a) (b) 69,267 630,330Personalis, Inc. (a) 13,385 109,623Quanterix Corp. (a) 11,230 327,804Seer, Inc. (a) (b) 15,060 229,514Singular Genomics Systems, Inc. (a) 19,700 124,307
5,958,265
Machinery��3.5%Alamo Group, Inc. 3,584 515,343Albany International Corp. - Class A 10,575 891,684Altra Industrial Motion Corp. 22,753 885,774Astec Industries, Inc. 8,361 359,523Barnes Group, Inc. 16,460 661,527Blue Bird Corp. (a) (b) 5,762 108,441Chart Industries, Inc. (a) (b) 12,192 2,094,220CIRCOR International, Inc. (a) 6,280 167,174Columbus McKinnon Corp. (b) 10,074 427,138Commercial Vehicle Group, Inc. (a) 2,854 24,116Desktop Metal, Inc. - Class A (a) (b) 66,572 315,551Douglas Dynamics, Inc. 7,665 265,132Energy Recovery, Inc. (a) (b) 15,479 311,747Enerpac Tool Group Corp. (b) 20,140 440,865EnPro Industries, Inc. 6,833 667,789ESCO Technologies, Inc. 8,855 619,142Evoqua Water Technologies Corp. (a) 40,010 1,879,670Federal Signal Corp. 20,932 706,455Franklin Electric Co., Inc. 16,069 1,334,370Gorman-Rupp Co. (The) (b) 7,300 261,924Greenbrier Cos., Inc. (The) (b) 10,684 550,333Helios Technologies, Inc. 11,222 900,565Hillenbrand, Inc. 25,057 1,106,768Hydrofarm Holdings Group, Inc. (a) (b) 13,979 211,782Hyliion Holdings Corp. (a) (b) 44,983 199,275Hyster-Yale Materials Handling, Inc. 3,777 125,434Ideanomics, Inc. (a) (b) 79,525 89,068John Bean Technologies Corp. 10,810 1,280,661Kadant, Inc. 3,991 775,012Kennametal, Inc. 28,533 816,329Lindsay Corp. (b) 3,909 613,752Luxfer Holdings plc (b) 10,353 173,930Manitowoc Co., Inc. (The) (a) 9,971 150,363Meritor, Inc. (a) 22,702 807,510Miller Industries, Inc. 3,305 93,069
Machinery��(Continued)Mueller Industries, Inc. 19,487 1,055,611Mueller Water Products, Inc. - Class A 48,875 631,465Nikola Corp. (a) (b) 80,110 857,978
Copyright © 2022 www.secdatabase.com. All Rights Reserved.Please Consider the Environment Before Printing This Document

Omega Flex, Inc. (b) 819 106,364Proto Labs, Inc. (a) (b) 8,980 475,042RBC Bearings, Inc. (a) 9,667 1,874,238REV Group, Inc. (b) 10,161 136,157Shyft Group, Inc. (The) 12,528 452,386SPX Corp. (a) 15,612 771,389SPX FLOW, Inc. 14,413 1,242,689Standex International Corp. 3,775 377,198Tennant Co. 5,981 471,303Terex Corp. 23,730 846,212Titan International, Inc. (a) 18,172 267,674Trinity Industries, Inc. 27,391 941,155Wabash National Corp. (b) 17,203 255,292Watts Water Technologies, Inc. - Class A 9,526 1,329,734Welbilt, Inc. (a) 43,878 1,042,102
33,965,425
Marine��0.3%Costamare, Inc. 18,240 310,992Eagle Bulk Shipping, Inc. (b) 3,177 216,385Genco Shipping & Trading, Ltd. 11,163 263,670Matson, Inc. 14,126 1,703,878Safe Bulkers, Inc. 22,656 107,843
2,602,768
Media��1.0%Advantage Solutions, Inc. (a) (b) 30,307 193,359AMC Networks, Inc. - Class A (a) (b) 10,133 411,704Audacy, Inc. (a) (b) 42,881 123,926Boston Omaha Corp. - Class A (a) (b) 5,973 151,535Cardlytics, Inc. (a) (b) 11,016 605,660Clear Channel Outdoor Holdings, Inc. (a) 106,135 367,227Daily Journal Corp. (a) 342 106,700Entravision Communications Corp. - Class A
(b) 10,395 66,632EW Scripps Co. (The) - Class A (a) 19,856 412,806Gannett Co., Inc. (a) (b) 33,774 152,321Gray Television, Inc. (b) 29,805 657,796iHeartMedia, Inc. - Class A (a) 39,947 756,197Integral Ad Science Holding Corp. (a) (b) 12,716 175,481John Wiley & Sons, Inc. - Class A 15,436 818,571Magnite, Inc. (a) 44,965 593,988Scholastic Corp. 9,213 371,100Sinclair Broadcast Group, Inc. - Class A 15,766 441,763Stagwell, Inc. (a) (b) 12,414 89,877TechTarget, Inc. (a) 9,094 739,160TEGNA, Inc. 75,982 1,701,997Thryv Holdings, Inc. (a) 3,516 98,870WideOpenWest, Inc. (a) (b) 18,090 315,489
9,352,159
BHFTII-212
Copyright © 2022 www.secdatabase.com. All Rights Reserved.Please Consider the Environment Before Printing This Document

Table of ContentsBrighthouse Funds Trust IIMetLife Russell 2000 Index Portfolio
Schedule of Investments as of March 31, 2022 (Unaudited)Common Stocks��(Continued)
Security Description Shares Value
Metals & Mining��1.5%Allegheny Technologies, Inc. (a) 43,466 $1,166,627Arconic Corp. (a) (b) 36,643 938,794Carpenter Technology Corp. (b) 16,114 676,466Century Aluminum Co. (a) 17,836 469,265Coeur Mining, Inc. (a) (b) 87,354 388,725Commercial Metals Co. 41,165 1,713,287Compass Minerals International, Inc. (b) 11,864 744,941Constellium SE (a) 44,037 792,666Gatos Silver, Inc. (a) (b) 17,907 77,358Haynes International, Inc. (b) 3,793 161,582Hecla Mining Co. (b) 180,876 1,188,355Kaiser Aluminum Corp. (b) 5,296 498,671Materion Corp. 7,321 627,703MP Materials Corp. (a) (b) 26,988 1,547,492Novagold Resources, Inc. (a) 72,235 558,377Olympic Steel, Inc. 3,243 124,726Ryerson Holding Corp. 5,848 204,797Schnitzer Steel Industries, Inc. - Class A 8,757 454,839SunCoke Energy, Inc. (b) 29,072 259,031TimkenSteel Corp. (a) (b) 16,152 353,406Warrior Met Coal, Inc. 17,236 639,628Worthington Industries, Inc. (b) 11,415 586,845
14,173,581
Mortgage Real Estate InvestmentTrusts��1.2%AFC Gamma, Inc. (b) 5,786 110,628Apollo Commercial Real Estate Finance, Inc. 46,637 649,653Arbor Realty Trust, Inc. (b) 49,413 842,986Ares Commercial Real Estate Corp. 13,470 209,054ARMOUR Residential REIT, Inc. (b) 28,940 243,096Blackstone Mortgage Trust, Inc. - Class A (b) 52,735 1,676,446BrightSpire Capital, Inc. 29,006 268,306Broadmark Realty Capital, Inc. (b) 35,510 307,162Chimera Investment Corp. (b) 80,284 966,619Dynex Capital, Inc. (b) 12,043 195,097Ellington Financial, Inc. (b) 18,630 330,683Franklin BSP Realty Trust, Inc. 14,388 201,144Granite Point Mortgage Trust, Inc. 18,427 204,908Great Ajax Corp. (b) 7,860 92,198Hannon Armstrong Sustainable Infrastructure
Capital, Inc. (b) 26,080 1,236,974Invesco Mortgage Capital, Inc. (b) 108,033 246,315KKR Real Estate Finance Trust, Inc. (b) 12,092 249,216Ladder Capital Corp. 39,172 464,972MFA Financial, Inc. 134,536 542,180New York Mortgage Trust, Inc. 129,785 473,715Orchid Island Capital, Inc. (b) 47,085 153,026PennyMac Mortgage Investment Trust (b) 32,587 550,395Ready Capital Corp. (b) 23,050 347,133Redwood Trust, Inc. (b) 39,416 415,051TPG RE Finance Trust, Inc. 20,840 246,120Two Harbors Investment Corp. (b) 104,632 578,615
11,801,692
Multi-Utilities��0.4%Avista Corp. (b) 23,487 1,060,438
Multi-Utilities��(Continued)Black Hills Corp. 21,363 1,645,379
Copyright © 2022 www.secdatabase.com. All Rights Reserved.Please Consider the Environment Before Printing This Document

NorthWestern Corp. 18,082 1,093,780Unitil Corp. 5,823 290,451
4,090,048
Multiline Retail��0.4%Big Lots, Inc. (b) 10,588 366,345Dillard�s, Inc. - Class A (b) 1,759 472,098Franchise Group, Inc. 9,820 406,843Macy�s, Inc. (b) 102,765 2,503,355
3,748,641
Oil, Gas & Consumable Fuels��5.2%Aemetis, Inc. (a) (b) 9,652 122,291Alto Ingredients, Inc. (a) 27,235 185,743Antero Resources Corp. (a) 97,262 2,969,409Arch Resources, Inc. 5,183 712,041Berry Corp. 23,561 243,149Brigham Minerals, Inc. - Class A (b) 15,907 406,424California Resources Corp. 29,042 1,299,049Callon Petroleum Co. (a) (b) 16,341 965,426Centennial Resource Development, Inc. -
Class A (a) 62,766 506,522Centrus Energy Corp. - Class A (a) 3,474 117,074Chesapeake Energy Corp. (b) 36,862 3,206,994Civitas Resources, Inc. (b) 14,940 892,067Clean Energy Fuels Corp. (a) (b) 54,120 429,713CNX Resources Corp. (a) 68,399 1,417,227Comstock Resources, Inc. (a) (b) 34,163 445,827CONSOL Energy, Inc. (a) 12,747 479,670Crescent Energy, Inc. - Class A (b) 12,363 214,374CVR Energy, Inc. (b) 10,082 257,494Delek U.S. Holdings, Inc. (a) 23,703 502,978Denbury, Inc. (a) (b) 18,340 1,440,974DHT Holdings, Inc. (b) 36,631 212,460Dorian LPG, Ltd. 11,086 160,636Earthstone Energy, Inc. - Class A (a) (b) 9,068 114,529Energy Fuels, Inc. (a) (b) 45,519 416,499Equitrans Midstream Corp. 137,245 1,158,348Falcon Minerals Corp. (b) 13,606 91,704Frontline, Ltd. (a) (b) 42,361 372,777Gevo, Inc. (a) (b) 52,204 244,315Golar LNG, Ltd. (a) (b) 34,450 853,671Green Plains, Inc. (a) (b) 15,498 480,593International Seaways, Inc. (b) 16,560 298,742Kosmos Energy, Ltd. (a) (b) 142,959 1,027,875Laredo Petroleum, Inc. (a) 4,581 362,540Magnolia Oil & Gas Corp. - Class A 49,911 1,180,395Matador Resources Co. (b) 38,374 2,033,054Murphy Oil Corp. (b) 49,818 2,012,149Nordic American Tankers, Ltd. (b) 59,722 127,208Northern Oil and Gas, Inc. (b) 20,818 586,859Oasis Petroleum, Inc. 6,905 1,010,201Ovintiv, Inc. 88,533 4,786,979Par Pacific Holdings, Inc. (a) 16,282 211,992PBF Energy, Inc. - Class A (a) 33,227 809,742
BHFTII-213
Copyright © 2022 www.secdatabase.com. All Rights Reserved.Please Consider the Environment Before Printing This Document

Table of ContentsBrighthouse Funds Trust IIMetLife Russell 2000 Index Portfolio
Schedule of Investments as of March 31, 2022 (Unaudited)Common Stocks��(Continued)
Security Description Shares Value
Oil, Gas & Consumable Fuels��(Continued)PDC Energy, Inc. 33,416 $2,428,675Peabody Energy Corp. (a) (b) 30,857 756,922Range Resources Corp. (a) 81,520 2,476,578Ranger Oil Corp. - Class A (a) 7,251 250,377Renewable Energy Group, Inc. (a) 14,844 900,289REX American Resources Corp. (a) (b) 1,752 174,499Riley Exploration Permian, Inc. 4,606 115,518Scorpio Tankers, Inc. (b) 17,121 366,047SFL Corp., Ltd. (b) 35,518 361,573SM Energy Co. (b) 40,989 1,596,522Southwestern Energy Co. (a) (b) 348,317 2,497,433Talos Energy, Inc. (a) 13,717 216,591Teekay Corp. (a) 25,174 79,802Teekay Tankers, Ltd. - Class A (a) (b) 8,653 119,758Tellurian, Inc. (a) (b) 109,799 581,935Ur-Energy, Inc. (a) (b) 75,333 120,533Uranium Energy Corp. (a) (b) 72,621 333,330W&T Offshore, Inc. (a) 32,205 123,023Whiting Petroleum Corp. 13,398 1,092,071World Fuel Services Corp. (b) 21,674 586,065
50,545,255
Paper & Forest Products��0.1%Clearwater Paper Corp. (a) 5,381 150,829Glatfelter Corp. (b) 14,914 184,635Neenah, Inc. (b) 5,481 217,377Schweitzer-Mauduit International, Inc. 11,101 305,278
858,119
Personal Products��0.5%Beauty Health Co. (The) (a) (b) 31,070 524,462BellRing Brands, Inc. (a) 40,445 933,471Edgewell Personal Care Co. (b) 19,017 697,353elf Beauty, Inc. (a) 17,235 445,180Honest Co. Inc. (The) (a) (b) 33,335 173,675Inter Parfums, Inc. (b) 6,560 577,608Medifast, Inc. (b) 3,943 673,385Nu Skin Enterprises, Inc. - Class A 17,901 857,100USANA Health Sciences, Inc. (a) 4,527 359,670Veru, Inc. (a) (b) 8,379 40,471
5,282,375
Pharmaceuticals��1.5%Aclaris Therapeutics, Inc. (a) 16,582 285,874Aerie Pharmaceuticals, Inc. (a) 15,265 138,911Amneal Pharmaceuticals, Inc. (a) 37,525 156,479Amphastar Pharmaceuticals, Inc. (a) (b) 13,014 467,203Amylyx Pharmaceuticals, Inc. (a) 4,366 56,103ANI Pharmaceuticals, Inc. (a) 3,731 104,878Antares Pharma, Inc. (a) 60,537 248,202Arvinas, Inc. (a) (b) 16,311 1,097,730Atea Pharmaceuticals, Inc. (a) 24,648 177,959Athira Pharma, Inc. (a) (b) 13,703 184,990Axsome Therapeutics, Inc. (a) (b) 10,909 451,524Cara Therapeutics, Inc. (a) (b) 18,209 221,239
Pharmaceuticals��(Continued)Cassava Sciences, Inc. (a) (b) 13,762 511,121CinCor Pharma, Inc. (a) 5,206 91,313Collegium Pharmaceutical, Inc. (a) (b) 14,032 285,692
Copyright © 2022 www.secdatabase.com. All Rights Reserved.Please Consider the Environment Before Printing This Document

Corcept Therapeutics, Inc. (a) (b) 30,309 682,559Cymabay Therapeutics, Inc. (a) (b) 33,680 104,745DICE Therapeutics, Inc. (a) (b) 6,094 116,578Edgewise Therapeutics, Inc. (a) (b) 15,027 145,762Endo International plc (a) (b) 50,790 117,325Esperion Therapeutics, Inc. (a) (b) 22,594 104,836Evolus, Inc. (a) 12,622 141,619EyePoint Pharmaceuticals, Inc. (a) (b) 8,253 100,274Fulcrum Therapeutics, Inc. (a) (b) 9,555 225,976Harmony Biosciences Holdings, Inc. (a) (b) 9,337 454,245Innoviva, Inc. (a) (b) 15,620 302,247Intra-Cellular Therapies, Inc. (a) 27,188 1,663,634Marinus Pharmaceuticals, Inc. (a) (b) 12,435 116,267Mind Medicine MindMed, Inc. (a) (b) 73,240 81,296NGM Biopharmaceuticals, Inc. (a) (b) 11,665 177,891Nuvation Bio, Inc. (a) (b) 57,700 303,502Ocular Therapeutix, Inc. (a) 14,742 72,973Omeros Corp. (a) (b) 22,858 137,377Oramed Pharmaceuticals, Inc. (a) (b) 10,953 94,743Pacira BioSciences, Inc. (a) 15,246 1,163,575Phathom Pharmaceuticals, Inc. (a) (b) 7,762 105,641Phibro Animal Health Corp. - Class A 9,993 199,360Prestige Consumer Healthcare, Inc. (a) 17,473 925,021Provention Bio, Inc. (a) (b) 20,860 152,695Reata Pharmaceuticals, Inc. - Class A (a) (b) 9,837 322,260Relmada Therapeutics, Inc. (a) (b) 9,068 244,745Revance Therapeutics, Inc. (a) 25,433 495,943SIGA Technologies, Inc. (a) (b) 18,339 130,024Supernus Pharmaceuticals, Inc. (a) (b) 17,997 581,663Theravance Biopharma, Inc. (a) 21,852 208,905
14,152,899
Professional Services��1.8%ASGN, Inc. (a) 17,332 2,022,818Barrett Business Services, Inc. 2,279 176,554CBIZ, Inc. (a) 16,340 685,790CRA International, Inc. 2,895 243,933Exponent, Inc. 17,969 1,941,550First Advantage Corp. (a) (b) 20,718 418,296Forrester Research, Inc. (a) 3,344 188,668Franklin Covey Co. (a) 3,849 174,052Heidrick & Struggles International, Inc. 7,497 296,731HireRight Holdings Corp. (a) (b) 9,930 169,803Huron Consulting Group, Inc. (a) 6,931 317,509ICF International, Inc. 5,914 556,744Insperity, Inc. 12,555 1,260,773KBR, Inc. 48,462 2,652,325Kelly Services, Inc. - Class A (b) 12,354 267,958Kforce, Inc. 7,178 530,957Korn Ferry 18,493 1,200,935ManTech International Corp. - Class A 9,366 807,256
BHFTII-214
Copyright © 2022 www.secdatabase.com. All Rights Reserved.Please Consider the Environment Before Printing This Document

Table of ContentsBrighthouse Funds Trust IIMetLife Russell 2000 Index Portfolio
Schedule of Investments as of March 31, 2022 (Unaudited)Common Stocks��(Continued)
Security Description Shares Value
Professional Services��(Continued)Resources Connection, Inc. 11,231 $192,499Sterling Check Corp. (a) 7,285 192,543TriNet Group, Inc. (a) (b) 14,046 1,381,565TrueBlue, Inc. (a) 10,956 316,519Upwork, Inc. (a) (b) 41,273 959,185Willdan Group, Inc. (a) (b) 4,570 140,253
17,095,216
Real Estate Management &Development��0.7%Cushman & Wakefield plc (a) (b) 48,167 987,905Douglas Elliman, Inc. (b) 27,436 200,283eXp World Holdings, Inc. (b) 22,252 471,075Forestar Group, Inc. (a) 6,983 124,018FRP Holdings, Inc. (a) (b) 1,723 99,589Kennedy-Wilson Holdings, Inc. (b) 41,685 1,016,697Marcus & Millichap, Inc. 8,728 459,791Newmark Group, Inc. - Class A 57,288 912,025RE/MAX Holdings, Inc. - Class A 6,249 173,285Realogy Holdings Corp. (a) (b) 39,613 621,132Redfin Corp. (a) (b) 35,715 644,298RMR Group, Inc. (The) - Class A (b) 4,706 146,357St. Joe Co. (The) (b) 11,618 688,250Tejon Ranch Co. (a) 7,461 136,238
6,680,943
Road & Rail��0.9%ArcBest Corp. (b) 8,807 708,964Avis Budget Group, Inc. (a) (b) 14,161 3,728,591Covenant Logistics Group, Inc. 4,410 94,947Daseke, Inc. (a) (b) 14,084 141,826Heartland Express, Inc. 16,789 236,221Marten Transport, Ltd. 20,880 370,829PAM Transportation Services, Inc. (a) (b) 2,592 90,072Saia, Inc. (a) 8,916 2,173,899Werner Enterprises, Inc. 20,609 844,969Yellow Corp. (a) (b) 8,681 60,854
8,451,172
Semiconductors & SemiconductorEquipment��3.2%Alpha & Omega Semiconductor, Ltd. (a) 7,372 402,880Ambarella, Inc. (a) 12,092 1,268,693Amkor Technology, Inc. (b) 35,047 761,221Atomera, Inc. (a) (b) 7,526 98,289Axcelis Technologies, Inc. (a) 11,583 874,864AXT, Inc. (a) (b) 3,880 27,238Ceva, Inc. (a) 8,407 341,744CMC Materials, Inc. 9,616 1,782,806Cohu, Inc. (a) 17,431 515,958Credo Technology Group Holding, Ltd. (a) (b) 9,288 141,456Diodes, Inc. (a) 14,701 1,278,840FormFactor, Inc. (a) (b) (c) 26,288 1,104,885Ichor Holdings, Ltd. (a) (b) 10,143 361,294Impinj, Inc. (a) 6,522 414,408Kulicke & Soffa Industries, Inc. (b) 20,492 1,147,962
Semiconductors & SemiconductorEquipment��(Continued)Lattice Semiconductor Corp. (a) 45,551 2,776,333
Copyright © 2022 www.secdatabase.com. All Rights Reserved.Please Consider the Environment Before Printing This Document

MACOM Technology Solutions Holdings, Inc.(a) 16,748 1,002,703
MaxLinear, Inc. (a) 24,378 1,422,456Meta Materials, Inc. (a) (b) 49,625 82,874NeoPhotonics Corp. (a) 17,783 270,479NVE Corp. (b) 2,070 112,753Onto Innovation, Inc. (a) (b) 16,863 1,465,226PDF Solutions, Inc. (a) (b) 11,347 316,241Photronics, Inc. (a) 21,105 358,152Power Integrations, Inc. 19,971 1,850,912Rambus, Inc. (a) 37,951 1,210,257Semtech Corp. (a) 22,379 1,551,760Silicon Laboratories, Inc. (a) 12,903 1,938,031SiTime Corp. (a) 5,459 1,352,849SMART Global Holdings, Inc. (a) (b) 16,723 431,955SunPower Corp. (a) (b) 27,543 591,624Synaptics, Inc. (a) 13,413 2,675,893Ultra Clean Holdings, Inc. (a) 14,573 617,749Veeco Instruments, Inc. (a) (b) 18,456 501,819
31,052,604
Software��5.3%8x8, Inc. (a) 38,837 488,958A10 Networks, Inc. 21,038 293,480ACI Worldwide, Inc. (a) 41,015 1,291,562Agilysys, Inc. (a) (b) 7,295 290,925Alarm.com Holdings, Inc. (a) 16,373 1,088,150Alkami Technology, Inc. (a) 11,437 163,663Altair Engineering, Inc. - Class A (a) (b) 15,558 1,001,935American Software, Inc. - Class A 11,730 244,453Appfolio, Inc. - Class A (a) (b) 6,290 712,091Appian Corp. (a) (b) 13,931 847,283Asana, Inc. - Class A (a) (b) 25,738 1,028,748Avaya Holdings Corp. (a) (b) 26,988 341,938Benefitfocus, Inc. (a) (b) 8,909 112,432Blackbaud, Inc. (a) 16,076 962,470Blackline, Inc. (a) (b) 18,486 1,353,545Bottomline Technologies de, Inc. (a) 15,184 860,629Box, Inc. - Class A (a) 47,867 1,391,015BTRS Holdings, Inc. - Class A (a) 36,214 270,881Cerence, Inc. (a) 13,068 471,755ChannelAdvisor Corp. (a) 10,981 181,955Cleanspark, Inc. (a) (b) 14,178 175,382CommVault Systems, Inc. (a) 14,725 977,004Consensus Cloud Solutions, Inc. (a) (b) 6,079 365,530Couchbase, Inc. (a) (b) 9,433 164,323CS Disco, Inc. (a) (b) 4,923 167,234Digimarc Corp. (a) (b) 5,494 144,877Digital Turbine, Inc. (a) 31,408 1,375,984Domo, Inc. - Class B (a) 9,814 496,294E2open Parent Holdings, Inc. (a) (b) 71,031 625,783Ebix, Inc. (b) 8,704 288,538eGain Corp. (a) 7,336 84,951Enfusion, Inc. - Class A (a) (b) 9,141 116,273EngageSmart, Inc. (a) (b) 6,984 148,829
BHFTII-215
Copyright © 2022 www.secdatabase.com. All Rights Reserved.Please Consider the Environment Before Printing This Document

Table of ContentsBrighthouse Funds Trust IIMetLife Russell 2000 Index Portfolio
Schedule of Investments as of March 31, 2022 (Unaudited)Common Stocks��(Continued)
Security Description Shares Value
Software��(Continued)Envestnet, Inc. (a) (b) 18,271 $1,360,093EverCommerce, Inc. (a) (b) 12,206 161,119Instructure Holdings, Inc. (a) 5,336 107,040Intapp, Inc. (a) (b) 4,245 101,922Intelligent Systems Corp. (a) (b) 2,617 71,706InterDigital, Inc. 10,312 657,906JFrog, Ltd. (a) 19,085 514,341LivePerson, Inc. (a) (b) 22,272 543,882Marathon Digital Holdings, Inc. (a) (b) 34,158 954,716MeridianLink, Inc. (a) 8,983 162,592MicroStrategy, Inc. - Class A (a) (b) 3,203 1,557,683Mimecast, Ltd. (a) 21,116 1,679,989Mitek Systems, Inc. (a) (b) 15,147 222,206Model N, Inc. (a) (b) 11,531 310,184Momentive Global, Inc. (a) 45,741 743,749ON24, Inc. (a) 10,517 138,298OneSpan, Inc. (a) (b) 13,014 187,922PagerDuty, Inc. (a) (b) 28,642 979,270Ping Identity Holding Corp. (a) (b) 20,946 574,549Progress Software Corp. (b) 14,833 698,486PROS Holdings, Inc. (a) (b) 13,018 433,630Q2 Holdings, Inc. (a) (b) 18,911 1,165,863Qualys, Inc. (a) 11,383 1,621,053Rapid7, Inc. (a) (b) 19,454 2,164,063Rimini Street, Inc. (a) (b) 15,883 92,121Riot Blockchain, Inc. (a) (b) 36,729 777,553SailPoint Technologies Holding, Inc. (a) (b) 31,710 1,622,918Sapiens International Corp. NV (b) 11,177 283,784ShotSpotter, Inc. (a) 3,138 86,985Sprout Social, Inc. - Class A (a) 15,663 1,254,920SPS Commerce, Inc. (a) (b) 12,481 1,637,507Sumo Logic, Inc. (a) 30,840 359,903Telos Corp. (a) (b) 14,532 144,884Tenable Holdings, Inc. (a) 32,177 1,859,509Upland Software, Inc. (a) (b) 10,139 178,548Varonis Systems, Inc. (a) (b) 36,305 1,725,940Verint Systems, Inc. (a) 22,599 1,168,368Veritone, Inc. (a) (b) 10,577 193,348Vonage Holdings Corp. (a) 86,332 1,751,676Workiva, Inc. (a) (b) 14,808 1,747,344Xperi Holding Corp. 35,163 609,023Yext, Inc. (a) (b) 37,994 261,779Zuora, Inc. - Class A (a) 37,412 560,432
51,957,674
Specialty Retail��2.1%Aaron�s, Inc. (The) (b) 13,892 278,951Abercrombie & Fitch Co. - Class A (a) 18,745 599,653Academy Sports & Outdoors, Inc. (b) 27,368 1,078,299America�s Car-Mart, Inc. (a) 2,086 168,048American Eagle Outfitters, Inc. (b) 53,012 890,602Arko Corp. (b) 31,060 282,646Asbury Automotive Group, Inc. (a) (b) 7,960 1,275,192Bed Bath & Beyond, Inc. (a) 32,237 726,300Big 5 Sporting Goods Corp. 7,812 133,976
Specialty Retail��(Continued)Boot Barn Holdings, Inc. (a) 10,047 952,355Buckle, Inc. (The) (b) 11,227 370,940Caleres, Inc. 13,428 259,563
Copyright © 2022 www.secdatabase.com. All Rights Reserved.Please Consider the Environment Before Printing This Document

Camping World Holdings, Inc. - Class A (b) 15,369 429,564Cato Corp. (The) - Class A (b) 7,694 112,794Chico�s FAS, Inc. (a) 42,742 205,162Children�s Place, Inc. (The) (a) (b) 5,422 267,305Citi Trends, Inc. (a) (b) 3,442 105,411Conn�s, Inc. (a) (b) 6,760 104,172Container Store Group, Inc. (The) (a) (b) 11,779 96,235Designer Brands, Inc. - Class A (a) (b) 21,072 284,683Genesco, Inc. (a) (b) 4,989 317,350Group 1 Automotive, Inc. (b) 5,853 982,309GrowGeneration Corp. (a) (b) 19,559 180,138Guess?, Inc. (b) 15,106 330,066Haverty Furniture Cos., Inc. (b) 6,403 175,570Hibbett Sports, Inc. 4,141 183,612LL Flooring Holdings, Inc. (a) (b) 11,017 154,458MarineMax, Inc. (a) 8,159 328,481Monro, Inc. 11,236 498,204Murphy USA, Inc. 7,968 1,593,281National Vision Holdings, Inc. (a) (b) 28,077 1,223,315ODP Corp. (The) (a) 15,623 716,002OneWater Marine, Inc. - Class A 3,644 125,536Party City Holdco, Inc. (a) 18,735 67,071Rent-A-Center, Inc. (b) 23,490 591,713Sally Beauty Holdings, Inc. (a) (b) 38,900 608,007Shoe Carnival, Inc. (b) 6,132 178,809Signet Jewelers, Ltd. (b) 18,324 1,332,155Sleep Number Corp. (a) (b) 7,502 380,426Sonic Automotive, Inc. - Class A (b) 7,055 299,908Sportsman�s Warehouse Holdings, Inc. (a) 15,500 165,695TravelCenters of America, Inc. (a) (b) 4,817 206,938Urban Outfitters, Inc. (a) 23,786 597,267Winmark Corp. 1,140 250,800Zumiez, Inc. (a) (b) 7,350 280,844
20,389,806
Technology Hardware, Storage &Peripherals��0.2%3D Systems Corp. (a) (b) 42,023 700,944Avid Technology, Inc. (a) 12,231 426,495Corsair Gaming, Inc. (a) (b) 9,907 209,632Diebold Nixdorf, Inc. (a) (b) 14,896 100,250Super Micro Computer, Inc. (a) 16,120 613,688Turtle Beach Corp. (a) (b) 6,636 141,281
2,192,290
Textiles, Apparel & Luxury Goods��0.6%Crocs, Inc. (a) (c) 19,971 1,525,784Fossil Group, Inc. (a) (b) 17,060 164,458G-III Apparel Group, Ltd. (a) (b) 15,756 426,200Kontoor Brands, Inc. (b) 18,511 765,430Movado Group, Inc. 6,616 258,355Oxford Industries, Inc. 5,314 480,917PLBY Group, Inc. (a) (b) 11,027 144,343
BHFTII-216
Copyright © 2022 www.secdatabase.com. All Rights Reserved.Please Consider the Environment Before Printing This Document

Table of ContentsBrighthouse Funds Trust IIMetLife Russell 2000 Index Portfolio
Schedule of Investments as of March 31, 2022 (Unaudited)Common Stocks��(Continued)
Security Description Shares Value
Textiles, Apparel & LuxuryGoods��(Continued)Rocky Brands, Inc. (b) 2,801 $116,494Steven Madden, Ltd. 28,518 1,101,936Unifi, Inc. (a) 4,765 86,247Wolverine World Wide, Inc. 28,133 634,680
5,704,844
Thrifts & Mortgage Finance��1.4%Axos Financial, Inc. (a) 19,507 904,930Blue Foundry Bancorp (a) (b) 11,482 155,581Bridgewater Bancshares, Inc. (a) 8,285 138,194Capitol Federal Financial, Inc. 44,416 483,246Columbia Financial, Inc. (a) (b) 13,860 298,129Enact Holdings, Inc. 6,603 146,917Essent Group, Ltd. 36,784 1,515,869Federal Agricultural Mortgage Corp. - Class C 3,118 338,241Flagstar Bancorp, Inc. 17,902 759,045FS Bancorp, Inc. (b) 2,552 79,112Hingham Institution for Savings (The) 473 162,334Home Bancorp, Inc. (b) 2,776 113,233Kearny Financial Corp. (b) 18,064 232,664Merchants Bancorp 5,967 163,376Mr Cooper Group, Inc. (a) 21,242 970,122NMI Holdings, Inc. - Class A (a) 30,237 623,487Northfield Bancorp, Inc. 15,870 227,893PCSB Financial Corp. (b) 4,598 87,868PennyMac Financial Services, Inc. (b) 10,067 535,564Provident Bancorp, Inc. 5,626 91,254Provident Financial Services, Inc. 27,348 639,943Radian Group, Inc. 60,439 1,342,350Southern Missouri Bancorp, Inc. 3,031 151,398TrustCo Bank Corp. 7,756 247,649Walker & Dunlop, Inc. 9,747 1,261,457Washington Federal, Inc. (b) 22,314 732,345Waterstone Financial, Inc. (b) 8,351 161,508WSFS Financial Corp. 22,255 1,037,528
13,601,237
Tobacco��0.1%22nd Century Group, Inc. (a) (b) 24,919 57,812Turning Point Brands, Inc. (b) 5,617 191,034Universal Corp. 9,114 529,250Vector Group, Ltd. 49,588 597,040
1,375,136
Trading Companies & Distributors��1.6%Alta Equipment Group, Inc. (a) 7,040 87,014Applied Industrial Technologies, Inc. (b) 13,282 1,363,530Beacon Roofing Supply, Inc. (a) (b) 19,126 1,133,789BlueLinx Holdings, Inc. (a) (b) 3,473 249,639Boise Cascade Co. 13,372 928,953Custom Truck One Source, Inc. (a) (b) 20,451 171,584DXP Enterprises, Inc. (a) 6,978 189,034GATX Corp. (b) 12,037 1,484,523Global Industrial Co. (b) 3,989 128,566GMS, Inc. (a) 14,713 732,266H&E Equipment Services, Inc. 10,452 454,871Herc Holdings, Inc. 8,653 1,445,830
Copyright © 2022 www.secdatabase.com. All Rights Reserved.Please Consider the Environment Before Printing This Document

Trading Companies &Distributors��(Continued)McGrath RentCorp 8,030 682,389MRC Global, Inc. (a) 28,411 338,375NOW, Inc. (a) 35,404 390,506Rush Enterprises, Inc. - Class A (b) 14,047 715,133Rush Enterprises, Inc. - Class B 2,388 115,460Textainer Group Holdings, Ltd. (b) 15,539 591,570Titan Machinery, Inc. (a) (b) 5,742 162,269Transcat, Inc. (a) (b) 2,858 231,898Triton International, Ltd. 22,889 1,606,350Veritiv Corp. (a) 4,784 639,095WESCO International, Inc. (a) 15,121 1,967,847
15,810,491
Water Utilities��0.4%American States Water Co. (b) 12,645 1,125,658Artesian Resources Corp. - Class A (b) 2,874 139,533California Water Service Group 17,574 1,041,787Middlesex Water Co. (b) 5,991 630,073Pure Cycle Corp. (a) 6,829 82,084SJW Group 9,760 679,101York Water Co. (The) 5,110 229,797
3,928,033
Wireless TelecommunicationServices��0.2%Gogo, Inc. (a) (b) 20,238 385,736Shenandoah Telecommunications Co. (b) 16,904 398,596Telephone & Data Systems, Inc. (b) 34,718 655,476United States Cellular Corp. (a) 5,651 170,830
1,610,638Total Common Stocks
(Cost $640,686,959) 929,299,911
Mutual Funds��3.4%Investment Company Securities��3.4%iShares Russell 2000 Index Fund (b)
(Cost $34,974,549) 160,600 32,966,362
Rights��0.0%Biotechnology��0.0%Tobira Therapeutics, Inc. Expires 12/31/28 (a)
(d) (e) 4,660 37,094
Pharmaceuticals��0.0%Zogenix, Inc., Expires 12/31/23 (a) 24,868 16,910Total Rights
(Cost $17,190) 54,004
Warrants��0.0%Energy Equipment & Services��0.0%Nabors Industries, Ltd. Expires 06/11/26 (a)
(Cost $0) 882 20,286
BHFTII-217
Copyright © 2022 www.secdatabase.com. All Rights Reserved.Please Consider the Environment Before Printing This Document

Table of ContentsBrighthouse Funds Trust IIMetLife Russell 2000 Index Portfolio
Schedule of Investments as of March 31, 2022 (Unaudited)Short-Term Investment��1.2%
Security DescriptionPrincipalAmount* Value
U.S. Treasury��1.2%U.S. Treasury Bill
0.158%, 05/10/22 (f) 11,275,000 $11,272,755Total Short-Term Investments
(Cost $11,273,070) 11,272,755
Securities Lending Reinvestments (g)��21.8%Certificates of Deposit��7.6%Bank of Montreal
0.300%, 06/02/22 4,000,000 3,997,064Bank of Nova Scotia
0.520%, SOFR + 0.250%, 02/17/23 (h) 2,000,000 1,995,555Barclays Bank plc
0.180%, 04/07/22 5,000,000 4,999,815BNP Paribas S.A.
0.490%, SOFR + 0.220%, 11/17/22 (h) 4,000,000 3,994,368Canadian Imperial Bank of Commerce (NY)
0.520%, SOFR + 0.250%, 02/03/23 (h) 2,000,000 1,997,0300.770%, SOFR + 0.500%, 03/03/23 (h) 4,000,000 4,002,541
Cooperatieve Rabobank UA0.840%, SOFR + 0.570%, 09/19/22 (h) 4,000,000 4,000,000
Credit Agricole S.A.0.590%, 05/24/22 3,000,000 2,999,640
Credit Industriel et CommercialZero Coupon, 04/14/22 4,000,000 3,999,320
Credit Suisse Group AG0.830%, 06/03/22 5,000,000 5,000,920
Goldman Sachs Bank USA0.470%, SOFR + 0.190%, 09/02/22 (h) 2,000,000 1,997,452
Mitsubishi UFJ Trust and Banking Corp.0.430%, SOFR + 0.160%, 07/22/22 (h) 2,000,000 1,998,718
National Australia Bank, Ltd.Zero Coupon, 04/25/22 2,000,000 1,999,280
Natixis S.A. (New York)0.450%, SOFR + 0.180%, 06/17/22 (h) 5,000,000 4,998,717
Oversea-Chinese Banking Corp., Ltd.Zero Coupon, 04/14/22 900,000 899,8470.720%, SOFR + 0.440%, 09/26/22 (h) 3,000,000 3,000,598
Royal Bank of Canada0.520%, SOFR + 0.250%, 01/11/23 (h) 3,000,000 2,992,986
Standard Chartered Bank (NY)0.460%, SOFR + 0.190%, 08/25/22 (h) 3,000,000 2,997,550
Sumitomo Mitsui Banking Corp.0.200%, 04/26/22 3,000,000 2,999,3220.450%, SOFR + 0.180%, 08/09/22 (h) 2,000,000 1,998,046
Sumitomo Mitsui Trust Bank, Ltd.Zero Coupon, 04/19/22 5,000,000 4,998,750
Toronto-Dominion Bank (The)0.530%, SOFR + 0.250%, 02/09/23 (h) 4,000,000 3,999,999
Westpac Banking Corp.0.500%, SOFR + 0.230%, 02/17/23 (h) 2,000,000 1,993,746
73,861,264
Commercial Paper��1.4%DNB Bank ASA
0.830%, SOFR + 0.550%, 09/07/22 (h) 4,000,000 4,001,596
Commercial Paper��(Continued)Macquarie Bank Ltd.
0.510%, SOFR + 0.230%, 08/04/22 (h) 2,000,000 1,998,462
Copyright © 2022 www.secdatabase.com. All Rights Reserved.Please Consider the Environment Before Printing This Document

Skandinaviska Enskilda Banken AB0.200%, 04/28/22 3,000,000 2,998,860
Societe Generale0.460%, SOFR + 0.190%, 08/18/22 (h) 5,000,000 4,994,955
13,993,873
Repurchase Agreements��10.5%Barclays Bank plc
Repurchase Agreement dated 03/31/22 at0.600%, due on 05/05/22 with a maturityvalue of $5,002,917; collateralized byvarious Common Stock with an aggregatemarket value of $5,557,284. 5,000,000 5,000,000
BofA Securities, Inc.Repurchase Agreement dated 03/31/22 at0.270%, due on 04/01/22 with a maturityvalue of $16,958,130; collateralized by U.S.Treasury Obligations with rates rangingfrom 2.000% - 5.000%, maturity datesranging from 05/15/37 - 02/15/50, and anaggregate market value of $17,297,166. 16,958,003 16,958,003Repurchase Agreement dated 03/31/22 at0.600%, due on 04/18/22 with a maturityvalue of $1,600,480; collateralized by U.S.Treasury Obligations with rates rangingfrom 0.000% - 2.250%, maturity datesranging from 07/21/22 - 08/15/49, andvarious Common Stock with an aggregatemarket value of $1,693,471. 1,600,000 1,600,000Repurchase Agreement dated 03/31/22 at0.600%, due on 05/05/22 with a maturityvalue of $2,401,400; collateralized by U.S.Treasury Obligations with rates rangingfrom 0.000% - 7.500%, maturity datesranging from 04/21/22 - 08/15/51, andvarious Common Stock with an aggregatemarket value of $2,524,537. 2,400,000 2,400,000
Cantor Fitzgerald & Co.Repurchase Agreement dated 03/31/22 at0.290%, due on 04/01/22 with a maturityvalue of $10,000,081; collateralized by U.S.Treasury and U.S. Government AgencyObligations with rates ranging from 0.125%- 8.000%, maturity dates ranging from 09/15/22 - 07/20/71, and an aggregate marketvalue of $10,200,000. 10,000,000 10,000,000
Citigroup Global Markets, Inc.Repurchase Agreement dated 03/31/22 at0.620%, due on 05/05/22 with a maturityvalue of $2,001,206; collateralized by U.S.Treasury Obligations with rates rangingfrom 1.375% - 4.375%, maturity datesranging from 02/15/39 - 05/15/47, andvarious Common Stock with an aggregatemarket value of $2,040,269. 2,000,000 2,000,000Repurchase Agreement dated 03/31/22 at0.620%, due on 05/05/22 with a maturityvalue of $5,003,014; collateralized by U.S.Treasury Obligations with rates rangingfrom 0.000% - 3.875%, maturity datesranging from 04/21/22 - 05/15/51, andvarious Common Stock with an aggregatemarket value of $5,350,305. 5,000,000 5,000,000
BHFTII-218
Copyright © 2022 www.secdatabase.com. All Rights Reserved.Please Consider the Environment Before Printing This Document

Table of ContentsBrighthouse Funds Trust IIMetLife Russell 2000 Index Portfolio
Schedule of Investments as of March 31, 2022 (Unaudited)Securities Lending Reinvestments (g)��(Continued)
Security DescriptionPrincipalAmount* Value
Repurchase Agreements��(Continued)Citigroup Global Markets, Ltd.
Repurchase Agreement dated 03/31/22 at 0.300%, due on 04/01/22 with amaturity value of $3,000,025;collateralized by U.S. Treasury andForeign Obligations with rates rangingfrom 0.125% - 2.875%, maturity datesranging from 08/15/23 - 02/15/51, andan aggregate market value of$3,060,001. 3,000,000 $3,000,000
National Bank Financial, Inc.Repurchase Agreement dated 03/31/22 at 0.320%, due on 04/01/22 with amaturity value of $4,030,036;collateralized by U.S. TreasuryObligations with rates ranging from0.125% - 3.000%, maturity datesranging from 06/30/22 - 02/15/49, andan aggregate market value of$4,112,893. 4,030,000 4,030,000
National Bank of CanadaRepurchase Agreement dated 03/31/22 at 0.320%, due on 04/07/22 with amaturity value of $3,700,230;collateralized by U.S. TreasuryObligations with rates ranging from0.000% - 4.500%, maturity datesranging from 04/14/22 - 08/15/51, andan aggregate market value of$3,776,105. 3,700,000 3,700,000Repurchase Agreement dated 03/31/22 at 0.450%, due on 04/07/22 with amaturity value of $15,401,348;collateralized by U.S. TreasuryObligations with rates ranging from0.500% - 3.000%, maturity datesranging from 11/30/23 - 08/15/48, andvarious Common Stock with anaggregate market value of$17,029,300. 15,400,000 15,400,000
NBC Global Finance, Ltd.Repurchase Agreement dated 03/31/22 at 0.440%, due on 04/01/22 with amaturity value of $10,000,122;collateralized by U.S. TreasuryObligations with rates ranging from0.125% - 4.750%, maturity datesranging from 05/15/24 - 02/15/50, andvarious Common Stock with anaggregate market value of$11,103,766. 10,000,000 10,000,000
Copyright © 2022 www.secdatabase.com. All Rights Reserved.Please Consider the Environment Before Printing This Document

Repurchase Agreement dated 03/31/22 at 0.485%, due on 04/07/22 with amaturity value of $1,000,094;collateralized by U.S. TreasuryObligations with rates ranging from0.125% - 4.750%, maturity datesranging from 05/15/24 - 02/15/50, andvarious Common Stock with anaggregate market value of $1,110,377. 1,000,000 1,000,000
Societe GeneraleRepurchase Agreement dated 03/31/22 at 0.360%, due on 04/01/22 with amaturity value of $7,800,078;collateralized by various CommonStock with an aggregate market valueof $ 8,667,382. 7,800,000 7,800,000Repurchase Agreement dated 03/31/22 at 0.380%, due on 04/01/22 with amaturity value of $2,000,021;collateralized by various CommonStock with an aggregate market valueof $2,222,406. 2,000,000 2,000,000Repurchase Agreement dated 03/31/22 at 0.410%, due on 04/01/22 with amaturity value of $5,900,067;collateralized by various CommonStock with an aggregate market valueof $6,556,609. 5,900,000 5,900,000
Repurchase Agreements��(Continued)Societe Generale
Repurchase Agreement dated 03/31/22 at 0.420%, due on 04/07/22 with amaturity value of $3,900,319;collateralized by various CommonStock with an aggregate market valueof $4,334,030. 3,900,000 3,900,000
TD Prime Services LLCRepurchase Agreement dated 03/31/22 at 0.400%, due on 04/01/22 with amaturity value of $3,000,033;collateralized by various CommonStock with an aggregate market valueof $3,474,565. 3,000,000 3,000,000
102,688,003
Time Deposits��1.6%Canadian Imperial Bank of Commerce
0.320%, 04/01/22 3,000,000 3,000,000Jyske Bank A/S
0.750%, 04/11/22 2,000,000 2,000,000National Bank of Canada
0.370%, OBFR + 0.050%, 04/07/22 (h) 5,000,000 5,000,000Rabobank (New York)
0.310%, 04/01/22 3,000,000 3,000,000Skandi (NY)
0.300%, 04/01/22 3,000,000 3,000,00016,000,000
Mutual Funds��0.7%BlackRock Liquidity Funds FedFund,
Institutional Shares0.230% (i) 7,000,000 7,000,000
Total Securities Lending Reinvestments(Cost $213,586,848) 213,543,140
Total Investments�121.8%(Cost $900,538,616) 1,187,156,458
Other assets and liabilities (net)�(21.8)% (212,784,663 )Net Assets��100.0% $974,371,795
* Principal amount stated in U.S. dollars unless otherwise noted.(a) Non-income producing security.
Copyright © 2022 www.secdatabase.com. All Rights Reserved.Please Consider the Environment Before Printing This Document

(b) All or a portion of the security was held on loan. As of March 31, 2022, the market value of securities loaned was $207,172,542 and thecollateral received consisted of cash in the amount of $213,574,490 and non-cash collateral with a value of $1,695,651. The cash collateralinvestments are disclosed in the Schedule of Investments and categorized as Securities Lending Reinvestments. The non-cash collateralreceived consists of U.S. government securities that are held in safe-keeping by the lending agent, or a third-party custodian, and cannot besold or repledged by the Portfolio.
(c) All or a portion of the security was pledged as collateral against open futures contracts. As of March 31, 2022, the market value of securitiespledged was $3,745,334.
(d) Significant unobservable inputs were used in the valuation of this portfolio security; i.e. Level 3.(e) Security was valued in good faith under procedures approved by the Board of Trustees. As of March 31, 2022, these securities represent
less than 0.05% of net assets.(f) The rate shown represents current yield to maturity.
BHFTII-219
Copyright © 2022 www.secdatabase.com. All Rights Reserved.Please Consider the Environment Before Printing This Document

Table of ContentsBrighthouse Funds Trust IIMetLife Russell 2000 Index Portfolio
Schedule of Investments as of March 31, 2022 (Unaudited)(g) Represents investment of cash collateral received from securities on loan as of March 31, 2022.(h) Variable or floating rate security. The stated rate represents the rate at March 31, 2022. Maturity date shown for callable securities reflects the
earliest possible call date. For securities based on a published reference index and spread, the index and spread are indicated in the descriptionabove. For certain variable rate securities, the coupon rate is determined by the issuer/agent based on current market conditions. For certainasset- and mortgage-backed securities, the coupon rate may fluctuate based on changes of the underlying collateral or prepayments of principal.These securities do not indicate a reference index and spread in their description above.
(i) The rate shown represents the annualized seven-day yield as of March 31, 2022.
Futures Contracts
Futures Contracts��LongExpiration
DateNumber ofContracts
NotionalAmount
Value/Unrealized
Appreciation/(Depreciation)
Russell 2000 Index E-Mini Futures 06/17/22 100 USD 10,332,000 $ 276,845
Glossary of Abbreviations
Currencies
(USD)� United States Dollar
Index Abbreviations
(OBFR)� U.S. Overnight Bank Funding Rate(SOFR)� Secured Overnight Financing Rate
Other Abbreviations
(REIT)� Real Estate Investment Trust
BHFTII-220
Copyright © 2022 www.secdatabase.com. All Rights Reserved.Please Consider the Environment Before Printing This Document

Table of ContentsBrighthouse Funds Trust IIMetLife Russell 2000 Index Portfolio
Schedule of Investments as of March 31, 2022 (Unaudited)
Fair Value HierarchyAccounting principles generally accepted in the United States of America (�GAAP�) define fair market value as the price that the Portfolio would receive tosell an asset or pay to transfer a liability in an orderly transaction between market participants at the measurement date. It establishes a fair valuehierarchy that prioritizes inputs to valuation methods and requires disclosure of the fair value hierarchy, separately for each major category of assets andliabilities, that segregates fair value measurements into three levels. Levels 1, 2 and 3 of the fair value hierarchy are defined as follows:
Level 1 - unadjusted quoted prices in active markets for identical investmentsLevel 2 - other significant observable inputs (including, but not limited to, quoted prices for similar assets or liabilities in markets that are either activeor inactive; inputs other than quoted prices that are observable such as interest rates, yield curves, volatilities, prepayment speeds, loss severities,credit risks, default rates, or other market corroborated inputs)Level 3 - significant unobservable inputs based on the best information available in the circumstances, to the extent observable inputs areunavailable (including the Portfolio�s own assumptions used in determining the fair value of investments and derivative financial instruments)
The inputs or methodologies used for valuing investments are not necessarily an indication of the risk associated with investing in them. Changes to theinputs or methodologies used may result in transfers between levels. A reconciliation of Level 3 securities, if any, will be disclosed following the fair valuehierarchy table. For more information about the Portfolio�s policy regarding the valuation of investments, please refer to the Notes to Schedule ofInvestments.
The following table summarizes the fair value hierarchy of the Portfolio�s investments as of March 31, 2022:
Description Level 1 Level 2 Level 3 TotalTotal Common Stocks* $929,299,911 $� $� $929,299,911Total Mutual Funds* 32,966,362 � � 32,966,362Rights
Biotechnology � � 37,094 37,094Pharmaceuticals � 16,910 � 16,910
Total Rights � 16,910 37,094 54,004Total Warrants* 20,286 � � 20,286Total Short-Term Investment* � 11,272,755 � 11,272,755Securities Lending Reinvestments
Certificates of Deposit � 73,861,264 � 73,861,264Commercial Paper � 13,993,873 � 13,993,873Repurchase Agreements � 102,688,003 � 102,688,003Time Deposits � 16,000,000 � 16,000,000Mutual Funds 7,000,000 � � 7,000,000
Total Securities Lending Reinvestments 7,000,000 206,543,140 � 213,543,140Total Investments $969,286,559 $217,832,805 $37,094 $1,187,156,458Collateral for Securities Loaned (Liability) $� $(213,574,490) $� $(213,574,490 )Futures Contracts
Futures Contracts (Unrealized Appreciation) $276,845 $� $� $276,845
* See Schedule of Investments for additional detailed categorizations.
Level 3 investments at the beginning and/or end of the period in relation to net assets were not significant and accordingly, a reconciliation of Level 3assets for the period ended March 31, 2022 is not presented.
BHFTII-221
Copyright © 2022 www.secdatabase.com. All Rights Reserved.Please Consider the Environment Before Printing This Document

Table of ContentsBrighthouse Funds Trust II
MetLife Stock Index Portfolio
Schedule of Investments as of March 31, 2022 (Unaudited)Common Stocks��99.1% of Net Assets
Security Description Shares Value
Aerospace & Defense��1.6%Boeing Co. (The) (a) 116,361 $22,283,131General Dynamics Corp. 48,940 11,803,349Howmet Aerospace, Inc. 80,584 2,896,189Huntington Ingalls Industries, Inc. 8,506 1,696,437L3Harris Technologies, Inc. 41,664 10,352,254Lockheed Martin Corp. 51,462 22,715,327Northrop Grumman Corp. 31,156 13,933,586Raytheon Technologies Corp. 316,865 31,391,816Textron, Inc. 46,803 3,481,207TransDigm Group, Inc. (a) 11,187 7,288,778
127,842,074
Air Freight & Logistics��0.6%C.H. Robinson Worldwide, Inc. (b) 27,600 2,972,796Expeditors International of Washington, Inc. 35,969 3,710,562FedEx Corp. 51,760 11,976,746United Parcel Service, Inc. - Class B 154,821 33,202,912
51,863,016
Airlines��0.2%Alaska Air Group, Inc. (a) (b) 26,733 1,550,781American Airlines Group, Inc. (a) (b) 137,531 2,509,941Delta Air Lines, Inc. (a) 135,893 5,377,286Southwest Airlines Co. (a) 125,771 5,760,312United Airlines Holdings, Inc. (a) (b) 68,754 3,187,435
18,385,755
Auto Components��0.1%Aptiv plc (a) 57,438 6,875,903BorgWarner, Inc. (b) 50,910 1,980,399
8,856,302
Automobiles��2.7%Ford Motor Co. 835,174 14,122,792General Motors Co. (a) 308,518 13,494,577Tesla, Inc. (a) (b) 177,749 191,542,323
219,159,692
Banks��3.8%Bank of America Corp. 1,509,333 62,214,706Citigroup, Inc. 421,346 22,499,877Citizens Financial Group, Inc. (b) 90,495 4,102,138Comerica, Inc. 27,749 2,509,342Fifth Third Bancorp 145,181 6,248,590First Republic Bank 38,062 6,169,850Huntington Bancshares, Inc. (b) 305,274 4,463,106JPMorgan Chase & Co. 627,488 85,539,164KeyCorp 197,222 4,413,828M&T Bank Corp. (b) 27,328 4,632,096People�s United Financial, Inc. (b) 90,860 1,816,292PNC Financial Services Group, Inc. (The) 89,178 16,448,882Regions Financial Corp. (b) 200,014 4,452,312Signature Bank 13,320 3,909,287SVB Financial Group (a) 12,474 6,978,579Truist Financial Corp. 283,436 16,070,821
Banks��(Continued)U.S. Bancorp 286,737 15,240,072Wells Fargo & Co. 825,068 39,982,795Zions Bancorp N.A. (b) 32,194 2,110,639
309,802,376
Copyright © 2022 www.secdatabase.com. All Rights Reserved.Please Consider the Environment Before Printing This Document

Beverages��1.5%Brown-Forman Corp. - Class B (b) 38,803 2,600,577Coca-Cola Co. (The) 825,424 51,176,288Constellation Brands, Inc. - Class A 34,894 8,036,786Molson Coors Beverage Co. - Class B (b) 40,004 2,135,414Monster Beverage Corp. (a) 79,770 6,373,623PepsiCo, Inc. 293,747 49,167,373
119,490,061
Biotechnology��1.9%AbbVie, Inc. 375,372 60,851,555Amgen, Inc. 119,598 28,921,188Biogen, Inc. (a) 31,190 6,568,614Gilead Sciences, Inc. 266,342 15,834,032Incyte Corp. (a) 39,945 3,172,432Moderna, Inc. (a) (b) 74,897 12,901,757Regeneron Pharmaceuticals, Inc. (a) 22,659 15,825,499Vertex Pharmaceuticals, Inc. (a) 54,054 14,106,472
158,181,549
Building Products��0.4%A.O. Smith Corp. (b) 27,903 1,782,723Allegion plc (b) 19,045 2,090,760Carrier Global Corp. (b) 181,650 8,332,285Fortune Brands Home & Security, Inc. 28,820 2,140,750Johnson Controls International plc (b) 149,188 9,782,257Masco Corp. 50,943 2,598,093Trane Technologies plc 49,587 7,571,935
34,298,803
Capital Markets��2.9%Ameriprise Financial, Inc. 23,547 7,072,577Bank of New York Mellon Corp. (The) 157,084 7,796,079BlackRock, Inc. 30,275 23,135,247Cboe Global Markets, Inc. 22,643 2,590,812Charles Schwab Corp. (The) 319,212 26,912,764CME Group, Inc. 76,310 18,151,096FactSet Research Systems, Inc. 8,025 3,484,054Franklin Resources, Inc. (b) 59,705 1,666,964Goldman Sachs Group, Inc. (The) 72,077 23,792,618Intercontinental Exchange, Inc. 119,297 15,761,520Invesco, Ltd. (b) 72,465 1,671,043MarketAxess Holdings, Inc. (b) 8,074 2,746,775Moody�s Corp. 34,341 11,586,997Morgan Stanley 300,998 26,307,225MSCI, Inc. 17,256 8,677,697Nasdaq, Inc. (b) 24,854 4,428,983Northern Trust Corp. (b) 44,114 5,137,075Raymond James Financial, Inc. (b) 39,672 4,360,349S&P Global, Inc. 75,205 30,847,587
BHFTII-222
Copyright © 2022 www.secdatabase.com. All Rights Reserved.Please Consider the Environment Before Printing This Document

Table of ContentsBrighthouse Funds Trust IIMetLife Stock Index Portfolio
Schedule of Investments as of March 31, 2022 (Unaudited)Common Stocks��(Continued)
Security Description Shares Value
Capital Markets��(Continued)State Street Corp. (b) 77,709 $6,770,008T. Rowe Price Group, Inc. (b) 48,666 7,357,812
240,255,282
Chemicals��1.7%Air Products & Chemicals, Inc. 47,077 11,765,013Albemarle Corp. 24,837 5,492,703Celanese Corp. 22,938 3,277,152CF Industries Holdings, Inc. 45,539 4,693,249Corteva, Inc. 154,368 8,873,073Dow, Inc. 156,220 9,954,338DuPont de Nemours, Inc. 108,905 8,013,230Eastman Chemical Co. 27,390 3,069,323Ecolab, Inc. 52,936 9,346,380FMC Corp. 26,913 3,540,943International Flavors & Fragrances, Inc. 54,048 7,098,124Linde plc 108,830 34,763,567LyondellBasell Industries NV - Class A (b) 55,821 5,739,515Mosaic Co. (The) 78,649 5,230,159PPG Industries, Inc. 50,407 6,606,846Sherwin-Williams Co. (The) 51,218 12,785,037
140,248,652
Commercial Services & Supplies��0.4%Cintas Corp. 18,722 7,964,152Copart, Inc. (a) 45,326 5,687,053Republic Services, Inc. 44,344 5,875,580Rollins, Inc. (b) 48,059 1,684,468Waste Management, Inc. 81,715 12,951,827
34,163,080
Communications Equipment��0.9%Arista Networks, Inc. (a) 47,629 6,619,479Cisco Systems, Inc. 895,520 49,934,195F5, Inc. (a) 12,896 2,694,619Juniper Networks, Inc. 69,045 2,565,712Motorola Solutions, Inc. 35,862 8,685,776
70,499,781
Construction & Engineering��0.1%Quanta Services, Inc. 30,257 3,982,124
Construction Materials��0.1%Martin Marietta Materials, Inc. 13,246 5,098,253Vulcan Materials Co. 28,177 5,176,115
10,274,368
Consumer Finance��0.6%American Express Co. 130,599 24,422,013Capital One Financial Corp. 87,883 11,538,159Discover Financial Services 61,151 6,738,229Synchrony Financial 110,681 3,852,805
46,551,206
Containers & Packaging��0.3%AMCOR plc (b) 321,408 3,641,553Avery Dennison Corp. 17,580 3,058,392Ball Corp. 68,772 6,189,480International Paper Co. 82,227 3,794,776Packaging Corp. of America 20,169 3,148,582Sealed Air Corp. (b) 31,458 2,106,428
Copyright © 2022 www.secdatabase.com. All Rights Reserved.Please Consider the Environment Before Printing This Document

WestRock Co. 55,888 2,628,41324,567,624
Distributors��0.1%Genuine Parts Co. 30,240 3,810,845LKQ Corp. 56,941 2,585,691Pool Corp. (b) 8,512 3,599,299
9,995,835
Diversified Financial Services��1.7%Berkshire Hathaway, Inc. - Class B (a) 388,854 137,230,465
Diversified TelecommunicationServices��1.0%AT&T, Inc. 1,516,241 35,828,775Lumen Technologies, Inc. (b) 195,662 2,205,111Verizon Communications, Inc. 891,357 45,405,725
83,439,611
Electric Utilities��1.7%Alliant Energy Corp. (b) 53,159 3,321,374American Electric Power Co., Inc. 106,940 10,669,404Constellation Energy Corp. 69,325 3,899,531Duke Energy Corp. 163,327 18,237,093Edison International 80,665 5,654,616Entergy Corp. 42,674 4,982,189Evergy, Inc. 48,688 3,327,338Eversource Energy 73,000 6,437,870Exelon Corp. 207,976 9,905,897FirstEnergy Corp. (b) 121,067 5,552,133NextEra Energy, Inc. 416,618 35,291,711NRG Energy, Inc. 51,986 1,994,183Pinnacle West Capital Corp. 23,955 1,870,886PPL Corp. 159,399 4,552,435Southern Co. (The) 225,027 16,316,708Xcel Energy, Inc. 114,377 8,254,588
140,267,956
Electrical Equipment��0.5%AMETEK, Inc. 49,117 6,541,402Eaton Corp. plc 84,634 12,844,056Emerson Electric Co. 126,123 12,366,360Generac Holdings, Inc. (a) 13,396 3,982,095Rockwell Automation, Inc. (b) 24,672 6,908,900
42,642,813
Electronic Equipment, Instruments & Components��0.6%Amphenol Corp. - Class A 127,172 9,582,410CDW Corp. 28,818 5,155,252Corning, Inc. 158,610 5,854,295
BHFTII-223
Copyright © 2022 www.secdatabase.com. All Rights Reserved.Please Consider the Environment Before Printing This Document

Table of ContentsBrighthouse Funds Trust IIMetLife Stock Index Portfolio
Schedule of Investments as of March 31, 2022 (Unaudited)Common Stocks��(Continued)
Security Description Shares Value
Electronic Equipment, Instruments & Components��(Continued)IPG Photonics Corp. (a) (b) 7,584 $832,420Keysight Technologies, Inc. (a) 38,865 6,139,504TE Connectivity, Ltd. (b) 69,129 9,054,516Teledyne Technologies, Inc. (a) 9,906 4,681,873Trimble, Inc. (a) 53,296 3,844,774Zebra Technologies Corp. - Class A (a) 11,270 4,662,399
49,807,443
Energy Equipment & Services��0.3%Baker Hughes Co. (b) 192,301 7,001,679Halliburton Co. 190,793 7,225,331Schlumberger NV 297,979 12,309,513
26,536,523
Entertainment��1.4%Activision Blizzard, Inc. 165,416 13,251,476Electronic Arts, Inc. 59,712 7,554,165Live Nation Entertainment, Inc. (a) (b) 28,682 3,374,150Netflix, Inc. (a) 94,266 35,311,101Take-Two Interactive Software, Inc. (a) 24,506 3,767,552Walt Disney Co. (The) (a) 386,573 53,022,353
116,280,797
Equity Real Estate InvestmentTrusts��2.6%Alexandria Real Estate Equities, Inc. 30,904 6,219,430American Tower Corp. 96,698 24,292,472AvalonBay Communities, Inc. 29,675 7,370,380Boston Properties, Inc. (b) 30,182 3,887,442Crown Castle International Corp. 91,769 16,940,557Digital Realty Trust, Inc. (b) 60,256 8,544,301Duke Realty Corp. 80,865 4,695,022Equinix, Inc. 19,118 14,178,291Equity Residential 72,559 6,524,505Essex Property Trust, Inc. 13,854 4,786,280Extra Space Storage, Inc. 28,429 5,845,002Federal Realty Investment Trust (b) 15,023 1,833,858Healthpeak Properties, Inc. 114,510 3,931,128Host Hotels & Resorts, Inc. (b) 151,610 2,945,782Iron Mountain, Inc. (b) 61,480 3,406,607Kimco Realty Corp. 130,935 3,234,094Mid-America Apartment Communities, Inc. 24,489 5,129,221Prologis, Inc. 157,123 25,372,222Public Storage 32,393 12,642,340Realty Income Corp. 120,127 8,324,801Regency Centers Corp. (b) 32,718 2,334,102SBA Communications Corp. 23,097 7,947,678Simon Property Group, Inc. 69,774 9,179,467UDR, Inc. (b) 63,499 3,642,938Ventas, Inc. (b) 84,757 5,234,592Vornado Realty Trust (b) 33,759 1,529,958Welltower, Inc. (b) 92,421 8,885,355Weyerhaeuser Co. 158,674 6,013,745
214,871,570
Food & Staples Retailing��1.5%Costco Wholesale Corp. 94,154 54,218,581Kroger Co. (The) 142,066 8,150,326Sysco Corp. 107,746 8,797,461Walgreens Boots Alliance, Inc. (b) 152,137 6,811,174Walmart, Inc. 300,377 44,732,143
Copyright © 2022 www.secdatabase.com. All Rights Reserved.Please Consider the Environment Before Printing This Document

122,709,685
Food Products��1.0%Archer-Daniels-Midland Co. 118,809 10,723,700Campbell Soup Co. (b) 42,925 1,913,167Conagra Brands, Inc. (b) 101,854 3,419,239General Mills, Inc. 128,078 8,673,442Hershey Co. (The) 30,871 6,687,585Hormel Foods Corp. (b) 59,906 3,087,555J.M. Smucker Co. (The) (b) 23,009 3,115,649Kellogg Co. (b) 54,323 3,503,290Kraft Heinz Co. (The) 150,742 5,937,728Lamb Weston Holdings, Inc. (b) 30,831 1,847,085McCormick & Co., Inc. (b) 53,028 5,292,195Mondelez International, Inc. - Class A 294,782 18,506,414Tyson Foods, Inc. - Class A 62,097 5,565,754
78,272,803
Gas Utilities��0.0%Atmos Energy Corp. (b) 28,756 3,436,054
Health Care Equipment & Supplies��2.9%Abbott Laboratories 375,459 44,439,327ABIOMED, Inc. (a) 9,664 3,201,103Align Technology, Inc. (a) 15,571 6,788,956Baxter International, Inc. 106,312 8,243,433Becton Dickinson & Co. 60,465 16,083,690Boston Scientific Corp. (a) 302,567 13,400,692Cooper Cos., Inc. (The) (b) 10,467 4,370,915Dentsply Sirona, Inc. 46,417 2,284,645DexCom, Inc. (a) 20,579 10,528,216Edwards Lifesciences Corp. (a) 132,564 15,605,434Hologic, Inc. (a) 53,079 4,077,529IDEXX Laboratories, Inc. (a) 18,004 9,849,268Intuitive Surgical, Inc. (a) 75,959 22,915,311Medtronic plc 285,489 31,675,005ResMed, Inc. 31,050 7,529,936STERIS plc (b) 21,260 5,140,030Stryker Corp. 71,288 19,058,847Teleflex, Inc. 9,947 3,529,494Zimmer Biomet Holdings, Inc. 44,357 5,673,260
234,395,091
Health Care Providers & Services��3.0%AmerisourceBergen Corp. (b) 31,972 4,946,388Anthem, Inc. 51,535 25,315,023Cardinal Health, Inc. 58,828 3,335,548Centene Corp. (a) 123,895 10,430,720Cigna Corp. 68,571 16,430,297CVS Health Corp. 278,684 28,205,608
BHFTII-224
Copyright © 2022 www.secdatabase.com. All Rights Reserved.Please Consider the Environment Before Printing This Document

Table of ContentsBrighthouse Funds Trust IIMetLife Stock Index Portfolio
Schedule of Investments as of March 31, 2022 (Unaudited)Common Stocks��(Continued)
Security Description Shares Value
Health Care Providers &Services��(Continued)DaVita, Inc. (a) (b) 13,086 $1,480,157HCA Healthcare, Inc. 50,850 12,744,027Henry Schein, Inc. (a) 29,445 2,567,310Humana, Inc. 27,291 11,876,224Laboratory Corp. of America Holdings (a) 19,768 5,212,031McKesson Corp. (b) 31,806 9,736,771Molina Healthcare, Inc. (a) 12,400 4,136,516Quest Diagnostics, Inc. 25,267 3,458,042UnitedHealth Group, Inc. 199,982 101,984,820Universal Health Services, Inc. - Class B 15,525 2,250,349
244,109,831
Health Care Technology��0.1%Cerner Corp. 62,472 5,844,880
Hotels, Restaurants & Leisure��1.9%Booking Holdings, Inc. (a) 8,719 20,476,136Caesars Entertainment, Inc. (a) 45,390 3,511,370Carnival Corp. (a) (b) 171,736 3,472,502Chipotle Mexican Grill, Inc. (a) 5,974 9,451,047Darden Restaurants, Inc. 27,120 3,605,604Domino�s Pizza, Inc. (b) 7,726 3,144,559Expedia Group, Inc. (a) 31,898 6,241,482Hilton Worldwide Holdings, Inc. (a) 59,181 8,980,125Las Vegas Sands Corp. (a) (b) 72,998 2,837,432Marriott International, Inc. - Class A (a) 58,088 10,208,966McDonald�s Corp. 158,662 39,233,939MGM Resorts International 79,975 3,354,152Norwegian Cruise Line Holdings, Ltd. (a) (b) 88,518 1,936,774Penn National Gaming, Inc. (a) (b) 35,273 1,496,281Royal Caribbean Cruises, Ltd. (a) (b) 47,613 3,989,017Starbucks Corp. 244,242 22,218,695Wynn Resorts, Ltd. (a) (b) 22,347 1,781,950Yum! Brands, Inc. 61,363 7,273,356
153,213,387
Household Durables��0.3%DR Horton, Inc. 68,469 5,101,625Garmin, Ltd. 32,260 3,826,359Lennar Corp. - Class A 55,497 4,504,692Mohawk Industries, Inc. (a) (b) 11,649 1,446,806Newell Brands, Inc. 80,389 1,721,128NVR, Inc. (a) 695 3,104,753PulteGroup, Inc. (b) 52,796 2,212,152Whirlpool Corp. (b) 12,527 2,164,415
24,081,930
Household Products��1.3%Church & Dwight Co., Inc. 51,384 5,106,542Clorox Co. (The) 26,129 3,632,715Colgate-Palmolive Co. 178,961 13,570,612Kimberly-Clark Corp. 71,512 8,807,418Procter & Gamble Co. (The) 508,966 77,770,005
108,887,292
Independent Power and Renewable Electricity Producers��0.0%AES Corp. (The) 141,563 3,642,416
Industrial Conglomerates��1.0%3M Co. 121,261 18,053,338
Copyright © 2022 www.secdatabase.com. All Rights Reserved.Please Consider the Environment Before Printing This Document

General Electric Co. 233,418 21,357,747Honeywell International, Inc. 145,619 28,334,545Roper Technologies, Inc. 22,398 10,577,007
78,322,637
Insurance��2.1%Aflac, Inc. 127,389 8,202,578Allstate Corp. (The) 59,580 8,252,426American International Group, Inc. 176,296 11,066,100Aon plc - Class A (b) 45,608 14,851,333Arthur J. Gallagher & Co. 44,261 7,727,971Assurant, Inc. 12,098 2,199,779Brown & Brown, Inc. 49,785 3,597,962Chubb, Ltd. 91,459 19,563,080Cincinnati Financial Corp. 31,820 4,326,247Everest Re Group, Ltd. 8,359 2,519,235Globe Life, Inc. 19,726 1,984,436Hartford Financial Services Group, Inc. (The) 71,109 5,106,337Lincoln National Corp. 35,367 2,311,587Loews Corp. 41,633 2,698,651Marsh & McLennan Cos., Inc. 107,204 18,269,706MetLife, Inc. (c) 148,986 10,470,736Principal Financial Group, Inc. (b) 51,584 3,786,781Progressive Corp. (The) 124,085 14,144,449Prudential Financial, Inc. (b) 80,260 9,484,324Travelers Cos., Inc. (The) 51,214 9,358,334W.R. Berkley Corp. 44,480 2,961,890Willis Towers Watson plc (b) 25,916 6,121,878
169,005,820
Interactive Media & Services��5.7%Alphabet, Inc. - Class A (a) 63,859 177,614,230Alphabet, Inc. - Class C (a) (d) 58,977 164,722,171Match Group, Inc. (a) (b) 60,107 6,536,035Meta Platforms, Inc. - Class A (a) 490,285 109,019,773Twitter, Inc. (a) (b) 169,780 6,568,788
464,460,997
Internet & Direct Marketing Retail��3.8%Amazon.com, Inc. (a) 92,916 302,901,514eBay, Inc. 132,919 7,610,942Etsy, Inc. (a) (b) 26,919 3,345,493
313,857,949
IT Services��4.2%Accenture plc - Class A 134,192 45,253,568Akamai Technologies, Inc. (a) (b) 34,499 4,118,836Automatic Data Processing, Inc. 89,188 20,293,838Broadridge Financial Solutions, Inc. 24,794 3,860,674Cognizant Technology Solutions Corp. -
Class A 111,526 10,000,536DXC Technology Co. (a) 51,910 1,693,823
BHFTII-225
Copyright © 2022 www.secdatabase.com. All Rights Reserved.Please Consider the Environment Before Printing This Document
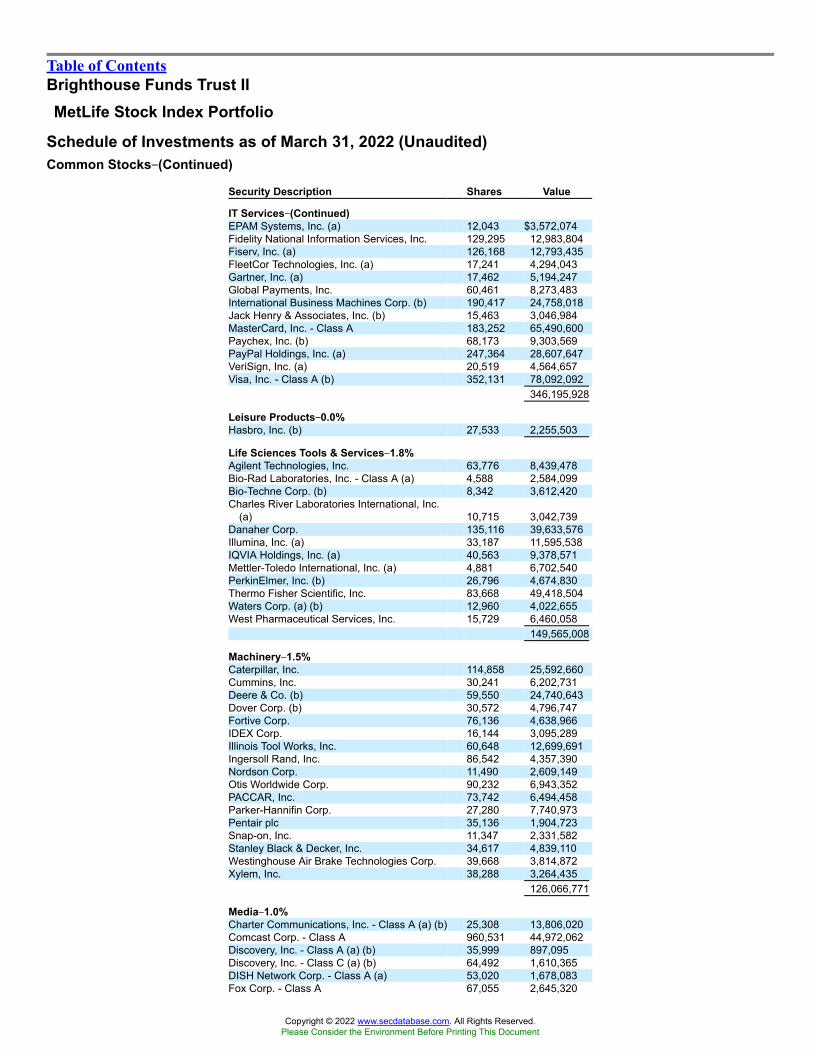
Table of ContentsBrighthouse Funds Trust IIMetLife Stock Index Portfolio
Schedule of Investments as of March 31, 2022 (Unaudited)Common Stocks��(Continued)
Security Description Shares Value
IT Services��(Continued)EPAM Systems, Inc. (a) 12,043 $3,572,074Fidelity National Information Services, Inc. 129,295 12,983,804Fiserv, Inc. (a) 126,168 12,793,435FleetCor Technologies, Inc. (a) 17,241 4,294,043Gartner, Inc. (a) 17,462 5,194,247Global Payments, Inc. 60,461 8,273,483International Business Machines Corp. (b) 190,417 24,758,018Jack Henry & Associates, Inc. (b) 15,463 3,046,984MasterCard, Inc. - Class A 183,252 65,490,600Paychex, Inc. (b) 68,173 9,303,569PayPal Holdings, Inc. (a) 247,364 28,607,647VeriSign, Inc. (a) 20,519 4,564,657Visa, Inc. - Class A (b) 352,131 78,092,092
346,195,928
Leisure Products��0.0%Hasbro, Inc. (b) 27,533 2,255,503
Life Sciences Tools & Services��1.8%Agilent Technologies, Inc. 63,776 8,439,478Bio-Rad Laboratories, Inc. - Class A (a) 4,588 2,584,099Bio-Techne Corp. (b) 8,342 3,612,420Charles River Laboratories International, Inc.
(a) 10,715 3,042,739Danaher Corp. 135,116 39,633,576Illumina, Inc. (a) 33,187 11,595,538IQVIA Holdings, Inc. (a) 40,563 9,378,571Mettler-Toledo International, Inc. (a) 4,881 6,702,540PerkinElmer, Inc. (b) 26,796 4,674,830Thermo Fisher Scientific, Inc. 83,668 49,418,504Waters Corp. (a) (b) 12,960 4,022,655West Pharmaceutical Services, Inc. 15,729 6,460,058
149,565,008
Machinery��1.5%Caterpillar, Inc. 114,858 25,592,660Cummins, Inc. 30,241 6,202,731Deere & Co. (b) 59,550 24,740,643Dover Corp. (b) 30,572 4,796,747Fortive Corp. 76,136 4,638,966IDEX Corp. 16,144 3,095,289Illinois Tool Works, Inc. 60,648 12,699,691Ingersoll Rand, Inc. 86,542 4,357,390Nordson Corp. 11,490 2,609,149Otis Worldwide Corp. 90,232 6,943,352PACCAR, Inc. 73,742 6,494,458Parker-Hannifin Corp. 27,280 7,740,973Pentair plc 35,136 1,904,723Snap-on, Inc. 11,347 2,331,582Stanley Black & Decker, Inc. 34,617 4,839,110Westinghouse Air Brake Technologies Corp. 39,668 3,814,872Xylem, Inc. 38,288 3,264,435
126,066,771
Media��1.0%Charter Communications, Inc. - Class A (a) (b) 25,308 13,806,020Comcast Corp. - Class A 960,531 44,972,062Discovery, Inc. - Class A (a) (b) 35,999 897,095Discovery, Inc. - Class C (a) (b) 64,492 1,610,365DISH Network Corp. - Class A (a) 53,020 1,678,083Fox Corp. - Class A 67,055 2,645,320
Copyright © 2022 www.secdatabase.com. All Rights Reserved.Please Consider the Environment Before Printing This Document

Fox Corp. - Class B 30,955 1,123,047Interpublic Group of Cos., Inc. (The) (b) 83,577 2,962,805News Corp. - Class A 82,994 1,838,317News Corp. - Class B 25,708 578,944Omnicom Group, Inc. 44,375 3,766,550Paramount Global - Class B (b) 128,821 4,870,722
80,749,330
Metals & Mining��0.5%Freeport-McMoRan, Inc. 311,712 15,504,555Newmont Corp. (b) 169,319 13,452,395Nucor Corp. (b) 57,753 8,584,983
37,541,933
Multi-Utilities��0.8%Ameren Corp. 54,697 5,128,391CenterPoint Energy, Inc. (b) 133,526 4,091,237CMS Energy Corp. 61,524 4,302,989Consolidated Edison, Inc. 75,111 7,111,509Dominion Energy, Inc. 171,986 14,613,650DTE Energy Co. 41,138 5,438,855NiSource, Inc. 83,383 2,651,579Public Service Enterprise Group, Inc. 107,367 7,515,690Sempra Energy 67,804 11,399,208WEC Energy Group, Inc. 66,976 6,684,875
68,937,983
Multiline Retail��0.5%Dollar General Corp. 49,198 10,952,951Dollar Tree, Inc. (a) (b) 47,765 7,649,565Target Corp. 101,732 21,589,565
40,192,081
Oil, Gas & Consumable Fuels��3.5%APA Corp. 77,134 3,187,948Chevron Corp. 409,304 66,646,970ConocoPhillips 276,504 27,650,400Coterra Energy, Inc. 172,746 4,658,960Devon Energy Corp. 133,684 7,904,735Diamondback Energy, Inc. 36,161 4,956,950EOG Resources, Inc. 124,232 14,812,182Exxon Mobil Corp. 898,909 74,240,894Hess Corp. 58,530 6,265,051Kinder Morgan, Inc. 414,049 7,829,667Marathon Oil Corp. 165,306 4,150,834Marathon Petroleum Corp. (b) 122,938 10,511,199Occidental Petroleum Corp. 188,396 10,689,589ONEOK, Inc. (b) 94,685 6,687,602Phillips 66 99,339 8,581,896
BHFTII-226
Copyright © 2022 www.secdatabase.com. All Rights Reserved.Please Consider the Environment Before Printing This Document

Table of ContentsBrighthouse Funds Trust IIMetLife Stock Index Portfolio
Schedule of Investments as of March 31, 2022 (Unaudited)Common Stocks��(Continued)
Security Description Shares Value
Oil, Gas & Consumable Fuels��(Continued)Pioneer Natural Resources Co. 48,208 $12,053,446Valero Energy Corp. 86,808 8,814,484Williams Cos., Inc. (The) (b) 257,986 8,619,312
288,262,119
Personal Products��0.2%Estee Lauder Cos., Inc. (The) - Class A 49,350 13,438,992
Pharmaceuticals��3.8%Bristol-Myers Squibb Co. 462,816 33,799,453Catalent, Inc. (a) (b) 38,029 4,217,416Eli Lilly and Co. 168,583 48,277,114Johnson & Johnson 558,977 99,067,494Merck & Co., Inc. 536,331 44,005,959Organon & Co. (b) 53,836 1,880,491Pfizer, Inc. 1,191,774 61,698,140Viatris, Inc. 256,789 2,793,864Zoetis, Inc. 100,458 18,945,374
314,685,305
Professional Services��0.3%Equifax, Inc. 25,905 6,142,076Jacobs Engineering Group, Inc. 27,437 3,781,093Leidos Holdings, Inc. 29,798 3,218,780Nielsen Holdings plc (b) 76,184 2,075,252Robert Half International, Inc. 23,247 2,654,342Verisk Analytics, Inc. (b) 34,219 7,344,424
25,215,967
Real Estate Management &Development��0.1%CBRE Group, Inc. - Class A (a) 71,059 6,503,320
Road & Rail��1.0%CSX Corp. 470,942 17,636,778J.B. Hunt Transport Services, Inc. 17,838 3,581,692Norfolk Southern Corp. 50,912 14,521,121Old Dominion Freight Line, Inc. (b) 19,780 5,907,890Union Pacific Corp. 135,232 36,946,735
78,594,216
Semiconductors & Semiconductor Equipment��5.9%Advanced Micro Devices, Inc. (a) (b) 347,117 37,953,773Analog Devices, Inc. 111,543 18,424,673Applied Materials, Inc. 188,546 24,850,363Broadcom, Inc. 87,665 55,200,897Enphase Energy, Inc. (a) (b) 28,438 5,738,220Intel Corp. 864,603 42,849,725KLA Corp. 32,001 11,714,286Lam Research Corp. 29,620 15,924,008Microchip Technology, Inc. 118,053 8,870,502Micron Technology, Inc. 237,761 18,519,204Monolithic Power Systems, Inc. 9,200 4,468,256NVIDIA Corp. 530,822 144,840,091NXP Semiconductors NV 56,465 10,450,542Qorvo, Inc. (a) 23,023 2,857,154
Semiconductors & Semiconductor Equipment��(Continued)QUALCOMM, Inc. 239,295 36,569,062Skyworks Solutions, Inc. 34,823 4,641,210SolarEdge Technologies, Inc. (a) (b) 11,152 3,595,070Teradyne, Inc. (b) 34,610 4,091,940
Copyright © 2022 www.secdatabase.com. All Rights Reserved.Please Consider the Environment Before Printing This Document

Texas Instruments, Inc. 196,096 35,979,694487,538,670
Software��8.8%Adobe, Inc. (a) 100,156 45,633,077ANSYS, Inc. (a) 18,526 5,884,784Autodesk, Inc. (a) 46,707 10,011,645Cadence Design Systems, Inc. (a) 58,845 9,677,649Ceridian HCM Holding, Inc. (a) (b) 29,046 1,985,584Citrix Systems, Inc. 26,482 2,672,034Fortinet, Inc. (a) 28,814 9,846,896Intuit, Inc. 60,125 28,910,505Microsoft Corp. 1,591,802 490,768,475NortonLifeLock, Inc. (b) 123,546 3,276,440Oracle Corp. 334,538 27,676,329Paycom Software, Inc. (a) 10,224 3,541,389PTC, Inc. (a) (b) 22,349 2,407,434Salesforce.com, Inc. (a) 209,144 44,405,454ServiceNow, Inc. (a) 42,466 23,648,891Synopsys, Inc. (a) 32,579 10,857,603Tyler Technologies, Inc. (a) 8,700 3,870,543
725,074,732
Specialty Retail��1.9%Advance Auto Parts, Inc. 13,240 2,740,150AutoZone, Inc. (a) 4,381 8,957,305Bath & Body Works, Inc. 54,722 2,615,712Best Buy Co., Inc. (b) 45,970 4,178,673CarMax, Inc. (a) 34,329 3,312,062Home Depot, Inc. (The) 221,722 66,368,046Lowe�s Cos., Inc. 143,056 28,924,493O�Reilly Automotive, Inc. (a) 14,306 9,799,038Ross Stores, Inc. 75,022 6,786,490TJX Cos., Inc. (The) 253,283 15,343,884Tractor Supply Co. 24,166 5,639,619Ulta Beauty, Inc. (a) 11,491 4,575,946
159,241,418
Technology Hardware, Storage &Peripherals��7.3%Apple, Inc. 3,291,835 574,787,309Hewlett Packard Enterprise Co. 274,635 4,589,151HP, Inc. (b) 229,893 8,345,116NetApp, Inc. 47,196 3,917,268Seagate Technology Holdings plc 42,760 3,844,124Western Digital Corp. (a) 66,442 3,298,845
598,781,813
Textiles, Apparel & Luxury Goods��0.6%NIKE, Inc. - Class B 270,993 36,464,818PVH Corp. 14,858 1,138,271Ralph Lauren Corp. (b) 9,828 1,114,888
BHFTII-227
Copyright © 2022 www.secdatabase.com. All Rights Reserved.Please Consider the Environment Before Printing This Document

Table of ContentsBrighthouse Funds Trust IIMetLife Stock Index Portfolio
Schedule of Investments as of March 31, 2022 (Unaudited)Common Stocks��(Continued)
Security Description
Shares/PrincipalAmount* Value
Textiles, Apparel & LuxuryGoods��(Continued)Tapestry, Inc. (b) 56,053 $2,082,369Under Armour, Inc. - Class A (a) (b) 40,055 681,736Under Armour, Inc. - Class C (a) (b) 45,665 710,548VF Corp. 68,537 3,897,014
46,089,644
Tobacco��0.6%Altria Group, Inc. 387,113 20,226,654Philip Morris International, Inc. 329,073 30,913,118
51,139,772
Trading Companies &Distributors��0.2%Fastenal Co. 122,206 7,259,037United Rentals, Inc. (a) 15,377 5,462,064WW Grainger, Inc. 9,189 4,739,594
17,460,695
Water Utilities��0.1%American Water Works Co., Inc. 38,546 6,380,519
Wireless TelecommunicationServices��0.2%T-Mobile U.S., Inc. (a) 124,665 16,000,753Total Common Stocks
(Cost $2,778,927,328) 8,129,648,002
Mutual Funds��0.6%Investment Company Securities��0.6%SPDR S&P 500 ETF Trust
(Cost $44,017,449) 99,000 44,712,360
Short-Term Investment��0.3%U.S. Treasury��0.3%U.S. Treasury Bill
0.033%, 05/10/22 (e) 23,150,000 23,145,392Total Short-Term Investments
(Cost $23,146,039) 23,145,392
Securities Lending Reinvestments (f)��6.7%Certificates of Deposit��3.0%Bank of Montreal
0.300%, 06/02/22 25,000,000 24,981,650Bank of Nova Scotia
0.320%, 06/07/22 10,000,000 9,991,8400.520%, SOFR + 0.250%, 02/17/23 (g) 5,000,000 4,988,887
Barclays Bank plc0.180%, 04/07/22 23,000,000 22,999,149
BNP Paribas S.A.0.490%, SOFR + 0.220%, 11/17/22 (g) 15,000,000 14,978,880
Certificates of Deposit��(Continued)Canadian Imperial Bank of Commerce
(NY)0.770%, SOFR + 0.500%, 03/03/23 (g) 15,000,000 15,009,527
Copyright © 2022 www.secdatabase.com. All Rights Reserved.Please Consider the Environment Before Printing This Document

Credit Agricole Corp. & Investment Bank(NY)0.410%, SOFR + 0.140%, 05/16/22 (g) 9,000,000 8,997,012
Credit Agricole S.A.0.590%, 05/24/22 5,000,000 4,999,400
Credit Industriel et CommercialZero Coupon, 04/14/22 15,000,000 14,997,450
Credit Suisse Group AG0.830%, 06/03/22 20,000,000 20,003,680
Mizuho Bank, Ltd.0.250%, 05/05/22 10,000,000 9,996,910
MUFG Bank Ltd.0.780%, SOFR + 0.500%, 05/09/22 (g) 10,000,000 10,003,107
National Australia Bank, Ltd.Zero Coupon, 04/25/22 4,000,000 3,998,560
National Westminster Bank plc0.440%, 05/11/22 10,000,000 9,998,200
Natixis S.A. (New York)0.330%, 06/09/22 5,000,000 4,995,7700.450%, SOFR + 0.180%, 06/17/22 (g) 10,150,000 10,147,395
Oversea-Chinese Banking Corp., Ltd.Zero Coupon, 04/14/22 4,400,000 4,399,252
Standard Chartered Bank (NY)0.460%, SOFR + 0.190%, 08/25/22 (g) 10,000,000 9,991,834
Sumitomo Mitsui Banking Corp.0.450%, SOFR + 0.180%, 08/09/22 (g) 10,000,000 9,990,230
Sumitomo Mitsui Trust Bank, Ltd.Zero Coupon, 04/19/22 13,000,000 12,996,750
Toronto-Dominion Bank (The)0.820%, FEDEFF PRV + 0.490%, 12/23/22 (g) 10,000,000 9,997,040
Westpac Banking Corp.0.500%, SOFR + 0.230%, 02/17/23 (g) 10,000,000 9,968,730
248,431,253
Commercial Paper��0.6%Antalis S.A.
0.800%, 06/01/22 10,000,000 9,983,930DNB Bank ASA
0.830%, SOFR + 0.550%, 09/07/22 (g) 14,000,000 14,005,586Skandinaviska Enskilda Banken AB
0.200%, 04/28/22 10,000,000 9,996,200Societe Generale
0.460%, SOFR + 0.190%, 08/18/22 (g) 10,000,000 9,989,910UBS AG
0.350%, 06/08/22 5,000,000 4,992,48048,968,106
Master Demand Notes��0.1%Natixis Financial Products LLC
0.550%, OBFR + 0.230%, 04/01/22 (g) 9,000,000 9,000,0000.570%, OBFR + 0.250%, 04/01/22 (g) 1,000,000 1,000,000
10,000,000
BHFTII-228
Copyright © 2022 www.secdatabase.com. All Rights Reserved.Please Consider the Environment Before Printing This Document

Table of ContentsBrighthouse Funds Trust IIMetLife Stock Index Portfolio
Schedule of Investments as of March 31, 2022 (Unaudited)Securities Lending Reinvestments (f)��(Continued)
Security DescriptionPrincipalAmount* Value
Repurchase Agreements��2.7%Barclays Bank plc
Repurchase Agreement dated 03/31/22 at 0.600%, due on 05/05/22 with amaturity value of $8,004,667;collateralized by various CommonStock with an aggregate market valueof $8,891,654. 8,000,000 $8,000,000
Cantor Fitzgerald & Co.Repurchase Agreement dated 03/31/22 at 0.290%, due on 04/01/22 with amaturity value of $1,396,641;collateralized by U.S. Treasury andU.S. Government Agency Obligationswith rates ranging from 0.125% -8.000%, maturity dates ranging from09/15/22 - 07/20/71, and an aggregatemarket value of $1,424,562. 1,396,630 1,396,630
Citigroup Global Markets, Inc.Repurchase Agreement dated 03/31/22 at 0.620%, due on 05/05/22 with amaturity value of $16,009,644;collateralized by U.S. TreasuryObligations with rates ranging from1.375% - 4.375%, maturity datesranging from 02/15/39 - 05/15/47, andvarious Common Stock with anaggregate market value of$16,322,154. 16,000,000 16,000,000Repurchase Agreement dated 03/31/22 at 0.620%, due on 05/05/22 with amaturity value of $25,015,069;collateralized by U.S. TreasuryObligations with rates ranging from0.000% - 3.875%, maturity datesranging from 04/21/22 - 05/15/51, andvarious Common Stock with anaggregate market value of$26,751,523. 25,000,000 25,000,000
Citigroup Global Markets, Ltd.Repurchase Agreement dated 03/31/22 at 0.300%, due on 04/01/22 with amaturity value of $7,300,061;collateralized by U.S. Treasury andForeign Obligations with rates rangingfrom 0.125% - 2.875%, maturity datesranging from 08/15/23 - 02/15/51, andan aggregate market value of$7,446,002. 7,300,000 7,300,000
National Bank of CanadaRepurchase Agreement dated 03/31/22 at 0.320%, due on 04/07/22 with amaturity value of $29,001,804;collateralized by U.S. TreasuryObligations with rates ranging from0.000% - 4.500%, maturity datesranging from 04/14/22 - 08/15/51, andan aggregate market value of$29,596,498. 29,000,000 29,000,000
Copyright © 2022 www.secdatabase.com. All Rights Reserved.Please Consider the Environment Before Printing This Document

Repurchase Agreement dated 03/31/22 at 0.450%, due on 04/07/22 with amaturity value of $48,004,200;collateralized by U.S. TreasuryObligations with rates ranging from0.500% - 3.000%, maturity datesranging from 11/30/23 - 08/15/48, andvarious Common Stock with anaggregate market value of$53,078,337. 48,000,000 48,000,000
NBC Global Finance, Ltd.Repurchase Agreement dated 03/31/22 at 0.440%, due on 04/01/22 with amaturity value of $20,000,244;collateralized by U.S. TreasuryObligations with rates ranging from0.125% - 4.750%, maturity datesranging from 05/15/24 - 02/15/50, andvarious Common Stock with anaggregate market value of$22,207,531. 20,000,000 20,000,000
Repurchase Agreements��(Continued)NBC Global Finance, Ltd.
Repurchase Agreement dated 03/31/22 at 0.485%, due on 04/07/22 with amaturity value of $900,085;collateralized by U.S. TreasuryObligations with rates ranging from0.125% - 4.750%, maturity datesranging from 05/15/24 - 02/15/50, andvarious Common Stock with anaggregate market value of $999,339. 900,000 900,000
Societe GeneraleRepurchase Agreement dated 03/31/22 at 0.360%, due on 04/01/22 with amaturity value of $10,000,100;collateralized by various CommonStock with an aggregate market valueof $11,112,029. 10,000,000 10,000,000Repurchase Agreement dated 03/31/22 at 0.410%, due on 04/01/22 with amaturity value of $10,000,114;collateralized by various CommonStock with an aggregate market valueof $11,112,897. 10,000,000 10,000,000Repurchase Agreement dated 03/31/22 at 0.420%, due on 04/07/22 with amaturity value of $14,401,176;collateralized by various CommonStock with an aggregate market valueof $16,002,572. 14,400,000 14,400,000
TD Prime Services LLCRepurchase Agreement dated 03/31/22 at 0.400%, due on 04/01/22 with amaturity value of $30,000,334;collateralized by various CommonStock with an aggregate market valueof $33,957,578. 30,000,000 30,000,000
219,996,630
Time Deposits��0.3%Jyske Bank A/S
0.750%, 04/11/22 3,000,000 3,000,000National Bank of Canada
0.370%, OBFR + 0.050%, 04/07/22 (g) 21,000,000 21,000,00024,000,000
Total Securities Lending Reinvestments(Cost $551,526,035) 551,395,989
Total Investments�106.7%(Cost $3,397,616,851) 8,748,901,743
Other assets and liabilities (net)�(6.7)% (548,996,867 )Net Assets��100.0% $8,199,904,876
Copyright © 2022 www.secdatabase.com. All Rights Reserved.Please Consider the Environment Before Printing This Document

* Principal amount stated in U.S. dollars unless otherwise noted.(a) Non-income producing security.(b) All or a portion of the security was held on loan. As of March 31, 2022, the market value of securities loaned was $532,544,936 and the collateral
received consisted of cash in the amount of $551,475,648 and non-cash collateral with a value of $95,161. The cash collateral investments aredisclosed in the Schedule of Investments and categorized as Securities Lending Reinvestments. The non-cash collateral received consists of U.S.government securities that are held in safe-keeping by the lending agent, or a third-party custodian, and cannot be sold or repledged by thePortfolio.
(c) Affiliated Issuer.(d) All or a portion of the security was pledged as collateral against open futures contracts. As of March 31, 2022, the market value of securities
pledged was $16,757,940.(e) The rate shown represents current yield to maturity.
BHFTII-229
Copyright © 2022 www.secdatabase.com. All Rights Reserved.Please Consider the Environment Before Printing This Document

Table of ContentsBrighthouse Funds Trust IIMetLife Stock Index Portfolio
Schedule of Investments as of March 31, 2022 (Unaudited)(f) Represents investment of cash collateral received from securities on loan as of March 31, 2022.(g) Variable or floating rate security. The stated rate represents the rate at March 31, 2022. Maturity date shown for callable securities reflects the
earliest possible call date. For securities based on a published reference index and spread, the index and spread areindicated in the description above. For certain variable rate securities, the coupon rate is determined by the issuer/agent based on current marketconditions. For certain asset- and mortgage-backed securities, the coupon rate may fluctuate based on changes of the underlying collateral orprepayments of principal. These securities do not indicate a reference index and spread in their description above.
Futures Contracts
Futures Contracts��LongExpiration
DateNumber ofContracts
NotionalAmount
Value/Unrealized
Appreciation/(Depreciation)
S&P 500 Index E-Mini Futures 06/17/22 101 USD 22,880,288 $ 1,336,326
Glossary of Abbreviations
Currencies
(USD)� United States Dollar
Index Abbreviations
(FEDEFF PRV)� Effective Federal Funds Rate(OBFR)� U.S. Overnight Bank Funding Rate(SOFR)� Secured Overnight Financing Rate
Other Abbreviations
(ETF)� Exchange-Traded Fund
Fair Value HierarchyAccounting principles generally accepted in the United States of America (�GAAP�) define fair market value as the price that the Portfolio would receive tosell an asset or pay to transfer a liability in an orderly transaction between market participants at the measurement date. It establishes a fair valuehierarchy that prioritizes inputs to valuation methods and requires disclosure of the fair value hierarchy, separately for each major category of assets andliabilities, that segregates fair value measurements into three levels. Levels 1, 2 and 3 of the fair value hierarchy are defined as follows:
Level 1 - unadjusted quoted prices in active markets for identical investmentsLevel 2 - other significant observable inputs (including, but not limited to, quoted prices for similar assets or liabilities in markets that are either activeor inactive; inputs other than quoted prices that are observable such as interest rates, yield curves, volatilities, prepayment speeds, loss severities,credit risks, default rates, or other market corroborated inputs)Level 3 - significant unobservable inputs based on the best information available in the circumstances, to the extent observable inputs areunavailable (including the Portfolio�s own assumptions used in determining the fair value of investments and derivative financial instruments)
The inputs or methodologies used for valuing investments are not necessarily an indication of the risk associated with investing in them. Changes to theinputs or methodologies used may result in transfers between levels. A reconciliation of Level 3 securities, if any, will be disclosed following the fair valuehierarchy table. For more information about the Portfolio�s policy regarding the valuation of investments, please refer to the Notes to Schedule ofInvestments.
The following table summarizes the fair value hierarchy of the Portfolio�s investments as of March 31, 2022:
Description Level 1 Level 2 Level 3 TotalTotal Common Stocks* $8,129,648,002 $� $ � $8,129,648,002Total Mutual Funds* 44,712,360 � � 44,712,360Total Short-Term Investment* � 23,145,392 � 23,145,392Total Securities Lending Reinvestments* � 551,395,989 � 551,395,989Total Investments $8,174,360,362 $574,541,381 $ � $8,748,901,743Collateral for Securities Loaned (Liability) $� $(551,475,648) $ � $(551,475,648 )Futures Contracts
Futures Contracts (Unrealized Appreciation) $1,336,326 $� $ � $1,336,326
Copyright © 2022 www.secdatabase.com. All Rights Reserved.Please Consider the Environment Before Printing This Document

* See Schedule of Investments for additional detailed categorizations.
BHFTII-230
Copyright © 2022 www.secdatabase.com. All Rights Reserved.Please Consider the Environment Before Printing This Document

Table of ContentsBrighthouse Funds Trust II
MFS Total Return Portfolio
Schedule of Investments as of March 31, 2022 (Unaudited)Common Stocks��58.2% of Net Assets
Security Description Shares Value
Aerospace & Defense��1.4%Howmet Aerospace, Inc. 79,471 $2,856,188L3Harris Technologies, Inc. 20,233 5,027,293Northrop Grumman Corp. 5,590 2,499,960
10,383,441
Auto Components��0.8%Aptiv plc (a) 19,176 2,295,559Lear Corp. 22,354 3,187,457
5,483,016
Banks��5.2%Bank of America Corp. 249,262 10,274,579JPMorgan Chase & Co. 79,215 10,798,589PNC Financial Services Group, Inc. (The) 25,195 4,647,218Truist Financial Corp. 170,094 9,644,330U.S. Bancorp 39,951 2,123,396
37,488,112
Beverages��0.6%Constellation Brands, Inc. - Class A 10,526 2,424,348PepsiCo, Inc. 13,236 2,215,442
4,639,790
Biotechnology��0.4%Vertex Pharmaceuticals, Inc. (a) 11,607 3,029,079
Building Products��1.9%Johnson Controls International plc 123,058 8,068,913Masco Corp. (b) 107,682 5,491,782
13,560,695
Capital Markets��5.9%Cboe Global Markets, Inc. 20,576 2,354,306Charles Schwab Corp. (The) 150,733 12,708,299Goldman Sachs Group, Inc. (The) 44,994 14,852,520Invesco, Ltd. (b) 119,940 2,765,816Morgan Stanley 51,442 4,496,031Nasdaq, Inc. (b) 14,432 2,571,782Northern Trust Corp. (b) 24,391 2,840,332
42,589,086
Chemicals��1.5%Axalta Coating Systems, Ltd. (a) 136,936 3,365,887DuPont de Nemours, Inc. 47,903 3,524,703PPG Industries, Inc. 30,032 3,936,294
10,826,884
Construction Materials��0.3%Vulcan Materials Co. 13,046 2,396,550
Distributors��0.5%LKQ Corp. 78,388 3,559,599
Electric Utilities��2.2%Duke Energy Corp. 42,324 $4,725,898Exelon Corp. 74,910 3,567,963PG&E Corp. (a) (b) 231,854 2,768,337Southern Co. (The) 67,722 4,910,522
15,972,720
Electrical Equipment��1.7%
Copyright © 2022 www.secdatabase.com. All Rights Reserved.Please Consider the Environment Before Printing This Document

Eaton Corp. plc 63,737 9,672,727Regal Rexnord Corp. (b) 14,606 2,173,081
11,845,808
Electronic Equipment, Instruments &Components��0.1%TE Connectivity, Ltd. 5,561 728,380
Entertainment��0.3%Electronic Arts, Inc. 16,064 2,032,257
Equity Real Estate Investment Trusts��0.3%STORE Capital Corp. 68,191 1,993,223
Food & Staples Retailing��0.7%Walmart, Inc. 31,537 4,696,490
Food Products��1.7%Archer-Daniels-Midland Co. 29,854 2,694,622Danone S.A. 31,216 1,719,623General Mills, Inc. 33,917 2,296,859J.M. Smucker Co. (The) (b) 9,666 1,308,873Mondelez International, Inc. - Class A 27,976 1,756,333Nestle S.A. 16,350 2,122,571
11,898,881
Health Care Equipment & Supplies��1.2%Becton Dickinson & Co. 8,423 2,240,518Medtronic plc 58,716 6,514,540
8,755,058
Health Care Providers & Services��2.7%Cigna Corp. 45,916 11,001,933McKesson Corp. 16,235 4,970,020Quest Diagnostics, Inc. 23,779 3,254,394
19,226,347
Hotels, Restaurants & Leisure��0.4%Booking Holdings, Inc. (a) 563 1,322,177Wendy�s Co. (The) 74,150 1,629,076
2,951,253
Household Products��0.6%Colgate-Palmolive Co. 31,679 2,402,219Kimberly-Clark Corp. 15,483 1,906,886
4,309,105
BHFTII-231
Copyright © 2022 www.secdatabase.com. All Rights Reserved.Please Consider the Environment Before Printing This Document

Table of ContentsBrighthouse Funds Trust IIMFS Total Return Portfolio
Schedule of Investments as of March 31, 2022 (Unaudited)Common Stocks��(Continued)
Security Description Shares Value
Industrial Conglomerates��0.9%Honeywell International, Inc. 33,347 $6,488,659
Insurance��3.6%Aon plc - Class A 24,121 7,854,521Chubb, Ltd. 36,747 7,860,183Travelers Cos., Inc. (The) 25,032 4,574,097Willis Towers Watson plc (b) 23,634 5,582,824
25,871,625
Interactive Media & Services��0.5%Alphabet, Inc. - Class A (a) 1,350 3,754,822
IT Services��2.6%Accenture plc - Class A 12,188 4,110,159Amdocs, Ltd. 46,721 3,840,933Cognizant Technology Solutions Corp. -
Class A 36,442 3,267,754Fidelity National Information Services, Inc. 39,922 4,008,967Fiserv, Inc. (a) 30,994 3,142,792
18,370,605
Life Sciences Tools & Services��1.6%Danaher Corp. 20,571 6,034,091ICON plc (a) (b) 7,796 1,896,143Thermo Fisher Scientific, Inc. 6,098 3,601,784
11,532,018
Machinery��1.5%Ingersoll Rand, Inc. 82,125 4,134,994PACCAR, Inc. (b) 27,265 2,401,228Stanley Black & Decker, Inc. 30,257 4,229,626
10,765,848
Media��1.9%Comcast Corp. - Class A 244,419 11,443,698Discovery, Inc. - Class C (a) (b) 56,741 1,416,823Omnicom Group, Inc. 8,821 748,726
13,609,247
Metals & Mining��0.2%Rio Tinto plc 17,970 1,425,487
Multiline Retail��0.1%Dollar Tree, Inc. (a) 6,359 1,018,394
Oil, Gas & Consumable Fuels��2.1%ConocoPhillips (b) 64,644 6,464,400Hess Corp. 43,607 4,667,693Pioneer Natural Resources Co. 16,686 4,172,001
15,304,094
Pharmaceuticals��4.0%Bayer AG 18,300 1,252,035Johnson & Johnson 71,568 12,683,997
Pharmaceuticals��(Continued)Merck & Co., Inc. 113,652 $9,325,146Organon & Co. (b) 49,930 1,744,055Roche Holding AG 9,014 3,564,814
28,570,047
Copyright © 2022 www.secdatabase.com. All Rights Reserved.Please Consider the Environment Before Printing This Document

Professional Services��0.2%Equifax, Inc. 4,779 1,133,101
Road & Rail��1.3%Union Pacific Corp. 32,966 9,006,641
Semiconductors & SemiconductorEquipment��2.8%Applied Materials, Inc. 31,025 4,089,095Intel Corp. 104,730 5,190,419NXP Semiconductors NV 16,239 3,005,514Taiwan Semiconductor Manufacturing Co., Ltd.
(ADR) 27,557 2,873,093Texas Instruments, Inc. 24,875 4,564,065
19,722,186
Software��2.6%Microsoft Corp. 53,927 16,626,234Oracle Corp. 23,873 1,975,013
18,601,247
Specialty Retail��0.2%Home Depot, Inc. (The) 2,887 864,166Ross Stores, Inc. 9,270 838,564
1,702,730
Tobacco��1.0%Philip Morris International, Inc. 74,071 6,958,230
Wireless Telecommunication Services��0.7%T-Mobile U.S., Inc. (a) 40,717 5,226,027Total Common Stocks
(Cost $288,178,126) 417,426,782
U.S. Treasury & Government Agencies��18.2%Agency Sponsored Mortgage��Backed��10.5%Fannie Mae 15 Yr. Pool
2.500%, 11/01/31 23,969 23,7253.000%, 11/01/28 64,095 64,7613.000%, 09/01/30 40,153 40,5703.000%, 12/01/31 588,261 594,4083.000%, 08/01/33 25,154 25,4083.000%, 10/01/33 483,612 488,6503.000%, 12/01/33 42,717 43,142
Fannie Mae 20 Yr. Pool1.500%, 02/01/42 34,756 31,5042.000%, 02/01/42 769,184 718,7672.000%, 03/01/42 476,671 445,4262.000%, 04/01/42 788,906 740,3712.500%, 03/01/42 373,918 361,472
BHFTII-232
Copyright © 2022 www.secdatabase.com. All Rights Reserved.Please Consider the Environment Before Printing This Document

Table of ContentsBrighthouse Funds Trust IIMFS Total Return Portfolio
Schedule of Investments as of March 31, 2022 (Unaudited)U.S. Treasury & Government Agencies��(Continued)
Security DescriptionPrincipalAmount* Value
Agency Sponsored Mortgage��Backed��(Continued)Fannie Mae 20 Yr. Pool
2.500%, 04/01/42 574,422 $553,7103.000%, 07/01/37 72,058 71,8383.000%, 11/01/37 121,765 121,3923.500%, 04/01/38 116,359 117,648
Fannie Mae 30 Yr. Pool1.000%, 04/01/52 (c) (d) 1,754,070 1,763,3082.000%, 01/01/51 60,001 55,8432.000%, 02/01/51 93,095 86,7002.000%, 12/01/51 4,374,997 4,065,8222.000%, 03/01/52 2,116,298 1,966,2412.500%, 02/01/50 228,002 217,9212.500%, 06/01/50 44,501 42,7572.500%, 07/01/50 426,294 409,2562.500%, 10/01/50 381,832 366,0032.500%, 08/01/51 141,427 135,2412.500%, 12/01/51 786,026 752,2982.500%, 01/01/52 1,314,173 1,257,3922.500%, 03/01/52 716,642 686,7183.000%, 09/01/46 104,994 104,3363.000%, 06/01/51 130,199 128,4373.000%, 12/01/51 394,645 387,2333.000%, 01/01/52 347,229 341,8733.000%, 04/01/52 (c) (d) 265,000 270,5383.070%, 04/01/52 (c) (d) 391,934 398,0733.100%, 04/01/52 (c) (d) 309,242 314,7743.500%, 11/01/41 32,799 33,4323.500%, 01/01/42 304,933 310,5463.500%, 01/01/43 101,269 103,3013.500%, 04/01/43 331,776 338,4303.500%, 05/01/43 300,962 306,9533.500%, 07/01/43 399,185 407,1783.500%, 08/01/43 157,059 160,2063.500%, 09/01/43 587,811 596,5423.500%, 02/01/45 482,048 491,3693.500%, 09/01/45 400,267 407,8453.500%, 10/01/45 340,714 346,7593.500%, 01/01/46 121,949 124,2303.500%, 05/01/46 121,579 123,6543.500%, 07/01/46 460,476 468,7814.000%, 09/01/40 304,920 318,9434.000%, 11/01/40 89,645 93,5474.000%, 12/01/40 202,231 211,3234.000%, 02/01/41 110,373 115,4574.000%, 06/01/41 217,746 227,2144.000%, 11/01/41 92,626 96,8574.000%, 01/01/42 587,972 615,0004.000%, 04/01/42 56,705 58,8524.000%, 10/01/42 71,479 74,7674.000%, 12/01/42 74,735 78,0764.000%, 01/01/43 96,198 100,3814.000%, 04/01/43 19,972 20,8794.000%, 05/01/43 164,816 172,4514.000%, 06/01/43 94,775 98,8444.000%, 07/01/43 64,414 67,2124.000%, 04/01/44 51,443 53,823
Agency Sponsored Mortgage��Backed��(Continued)Fannie Mae 30 Yr. Pool
4.000%, 05/01/44 173,229 181,241
Copyright © 2022 www.secdatabase.com. All Rights Reserved.Please Consider the Environment Before Printing This Document

4.000%, 11/01/44 60,275 62,8204.000%, 06/01/47 202,832 208,8874.500%, 08/01/33 61,927 65,8684.500%, 03/01/34 175,458 186,7014.500%, 01/01/40 45,606 48,4684.500%, 08/01/40 12,417 13,1434.500%, 02/01/41 79,089 83,7214.500%, 04/01/41 166,933 176,8334.500%, 11/01/42 43,903 46,6864.500%, 01/01/43 109,953 116,7504.500%, 04/01/44 673,280 715,8724.500%, 06/01/44 61,643 63,8965.000%, 11/01/33 36,983 40,0025.000%, 03/01/34 30,641 33,1065.000%, 05/01/34 9,998 10,8045.000%, 08/01/34 11,665 12,6115.000%, 09/01/34 47,115 50,9015.000%, 06/01/35 30,124 32,5805.000%, 07/01/35 94,122 101,4605.000%, 08/01/35 28,024 30,3265.000%, 09/01/35 21,242 22,9905.000%, 10/01/35 77,538 83,8965.000%, 07/01/39 45,771 48,6765.000%, 10/01/39 36,719 39,7225.000%, 11/01/39 23,610 25,4875.000%, 11/01/40 35,741 37,9255.000%, 03/01/41 24,781 26,7215.500%, 02/01/33 4,534 4,8225.500%, 05/01/33 1,874 1,9935.500%, 06/01/33 70,415 77,0245.500%, 07/01/33 58,147 63,6715.500%, 11/01/33 35,279 38,2805.500%, 01/01/34 47,919 51,4385.500%, 02/01/34 50,798 55,1335.500%, 03/01/34 19,068 20,4355.500%, 04/01/34 19,177 20,3895.500%, 05/01/34 124,436 134,7225.500%, 06/01/34 155,361 169,5885.500%, 07/01/34 40,918 43,9125.500%, 09/01/34 158,669 169,8135.500%, 10/01/34 154,730 166,1615.500%, 11/01/34 200,812 217,0065.500%, 12/01/34 87,055 93,6425.500%, 01/01/35 131,694 144,1335.500%, 04/01/35 30,684 33,5425.500%, 07/01/35 7,725 8,2115.500%, 09/01/35 97,721 106,9586.000%, 02/01/32 37,263 39,8186.000%, 03/01/34 11,209 12,1206.000%, 04/01/34 101,666 109,9796.000%, 06/01/34 100,947 110,5836.000%, 07/01/34 67,342 73,4196.000%, 08/01/34 104,229 113,3526.000%, 10/01/34 55,481 59,958
BHFTII-233
Copyright © 2022 www.secdatabase.com. All Rights Reserved.Please Consider the Environment Before Printing This Document

Table of ContentsBrighthouse Funds Trust IIMFS Total Return Portfolio
Schedule of Investments as of March 31, 2022 (Unaudited)U.S. Treasury & Government Agencies��(Continued)
Security DescriptionPrincipalAmount* Value
Agency Sponsored Mortgage��Backed��(Continued)Fannie Mae 30 Yr. Pool
6.000%, 11/01/34 24,416 $26,3376.000%, 12/01/34 7,257 7,7506.000%, 08/01/35 5,411 5,7746.000%, 09/01/35 17,617 19,3016.000%, 10/01/35 36,251 39,5636.000%, 11/01/35 7,813 8,3446.000%, 12/01/35 33,166 35,9626.000%, 02/01/36 45,385 48,5346.000%, 04/01/36 18,244 19,4866.000%, 06/01/36 4,636 5,1736.000%, 07/01/37 44,934 48,7826.500%, 06/01/31 13,831 15,0556.500%, 09/01/31 17,984 19,3066.500%, 02/01/32 6,926 7,4896.500%, 07/01/32 34,501 37,6826.500%, 08/01/32 23,475 25,4846.500%, 01/01/33 14,170 15,2546.500%, 04/01/34 34,315 37,0226.500%, 06/01/34 10,033 10,8456.500%, 04/01/36 10,327 11,0866.500%, 05/01/36 16,065 17,2466.500%, 02/01/37 36,317 39,1956.500%, 05/01/37 15,713 16,8686.500%, 07/01/37 31,042 33,868
Fannie Mae Pool2.410%, 05/01/23 82,546 82,7122.550%, 05/01/23 132,274 132,6642.700%, 07/01/25 121,000 120,5553.000%, 12/01/51 375,000 367,9293.410%, 04/01/29 300,000 310,7455.000%, 03/01/26 76,976 81,044
Fannie Mae REMICS (CMO)2.000%, 10/25/40 10,905 10,8432.000%, 05/25/44 28,386 28,0392.000%, 04/25/46 73,858 70,7993.000%, 02/25/33 (e) 86,737 8,4873.250%, 05/25/40 36,225 36,3344.000%, 10/25/40 49,981 51,2454.000%, 07/25/46 (e) 104,768 19,1195.000%, 03/25/25 11,097 11,367
Fannie Mae-ACES2.572%, 12/25/26 (f) 415,198 411,821
Freddie Mac 15 Yr. Gold Pool4.500%, 08/01/24 28,417 29,172
Freddie Mac 20 Yr. Gold Pool3.000%, 01/01/38 239,868 240,9093.500%, 11/01/37 167,042 169,2354.000%, 08/01/37 43,977 45,591
Freddie Mac 20 Yr. Pool2.000%, 02/01/42 520,690 487,600
Freddie Mac 30 Yr. Gold Pool3.000%, 10/01/42 270,948 270,5603.000%, 04/01/43 685,204 684,6403.000%, 05/01/43 581,868 581,2413.000%, 05/01/46 241,543 239,936
Agency Sponsored Mortgage��Backed��(Continued)Freddie Mac 30 Yr. Gold Pool
3.000%, 10/01/46 531,397 528,204
Copyright © 2022 www.secdatabase.com. All Rights Reserved.Please Consider the Environment Before Printing This Document

3.000%, 11/01/46 557,447 554,0143.000%, 03/01/48 47,731 47,1043.500%, 02/01/42 219,323 223,8703.500%, 04/01/42 167,846 171,3283.500%, 12/01/42 401,026 409,3563.500%, 04/01/43 88,666 90,1223.500%, 07/01/43 19,286 19,6883.500%, 08/01/43 232,655 237,4683.500%, 12/01/45 134,358 136,6413.500%, 12/01/46 649,196 659,1664.000%, 11/01/40 201,152 210,5714.000%, 01/01/41 413,865 432,2214.000%, 04/01/44 161,347 168,4874.000%, 08/01/47 251,898 258,9354.500%, 04/01/35 16,377 17,4324.500%, 07/01/39 74,756 79,6084.500%, 09/01/39 42,841 45,6324.500%, 10/01/39 23,445 24,9724.500%, 12/01/39 35,566 37,8844.500%, 05/01/42 67,882 72,2245.000%, 09/01/33 69,076 74,8185.000%, 03/01/34 18,914 20,2775.000%, 04/01/34 12,814 13,8795.000%, 08/01/35 14,656 15,8725.000%, 11/01/35 23,329 25,1265.000%, 12/01/36 18,070 19,5585.000%, 07/01/39 123,424 133,7125.500%, 12/01/33 95,654 104,3805.500%, 01/01/34 60,056 65,8255.500%, 04/01/34 9,140 9,7265.500%, 11/01/34 11,287 12,2185.500%, 12/01/34 6,057 6,4415.500%, 05/01/35 14,712 15,6635.500%, 09/01/35 13,900 14,7935.500%, 10/01/35 17,600 18,7536.000%, 04/01/34 38,138 40,8866.000%, 07/01/34 18,993 20,5006.000%, 08/01/34 115,231 126,9936.000%, 09/01/34 2,147 2,2946.000%, 07/01/35 16,155 18,0546.000%, 08/01/35 19,813 22,1426.000%, 11/01/35 19,864 22,1986.000%, 10/01/36 10,099 10,8276.000%, 05/01/37 34,336 37,5126.000%, 06/01/37 17,095 18,7606.500%, 05/01/34 8,266 8,8806.500%, 06/01/34 33,393 35,8756.500%, 08/01/34 21,483 23,0806.500%, 11/01/34 36,430 39,1386.500%, 05/01/37 14,983 16,0976.500%, 07/01/37 25,492 27,609
Freddie Mac 30 Yr. Pool2.000%, 02/01/52 573,053 532,8462.500%, 04/01/48 73,671 70,7612.500%, 10/01/51 292,263 279,801
BHFTII-234
Copyright © 2022 www.secdatabase.com. All Rights Reserved.Please Consider the Environment Before Printing This Document

Table of ContentsBrighthouse Funds Trust IIMFS Total Return Portfolio
Schedule of Investments as of March 31, 2022 (Unaudited)U.S. Treasury & Government Agencies��(Continued)
Security DescriptionPrincipalAmount* Value
Agency Sponsored Mortgage��Backed��(Continued)Freddie Mac 30 Yr. Pool
2.500%, 12/01/51 392,662 $375,2192.500%, 03/01/52 191,578 183,8873.000%, 07/01/50 24,723 24,3283.000%, 01/01/52 348,657 342,7285.000%, 10/01/35 44,898 48,4596.000%, 03/01/36 13,754 14,6956.500%, 10/01/34 29,103 31,403
Freddie Mac Multifamily Structured Pass-Through Certificates
0.196%, 11/25/27 (e) (f) 5,207,000 60,8470.244%, 12/25/27 (e) (f) 3,235,000 46,6750.273%, 11/25/24 (e) (f) 4,908,000 35,0800.288%, 09/25/27 (e) (f) 3,341,000 52,5980.289%, 11/25/27 (e) (f) 3,644,802 51,7160.289%, 12/25/27 (e) (f) 3,579,000 60,5090.300%, 11/25/32 (e) (f) 2,680,945 65,4390.316%, 08/25/24 (e) (f) 4,897,000 45,3130.328%, 11/25/27 (e) (f) 3,310,249 55,4120.329%, 08/25/27 (e) (f) 3,107,000 56,0110.331%, 01/25/31 (e) (f) 1,571,778 37,3220.345%, 10/25/24 (e) (f) 5,804,586 41,8940.350%, 11/25/31 (e) (f) 2,325,421 70,8890.368%, 12/25/27 (e) (f) 5,635,765 105,0390.385%, 08/25/24 (e) (f) 7,964,337 68,7700.399%, 12/25/31 (e) (f) 2,074,891 85,7950.429%, 08/25/27 (e) (f) 2,091,928 43,0100.508%, 07/25/24 (e) (f) 4,483,000 50,8790.508%, 08/25/31 (e) (f) 484,286 19,6590.529%, 03/25/31 (e) (f) 1,261,018 48,0980.536%, 09/25/31 (e) (f) 1,578,796 72,8600.567%, 12/25/31 (e) (f) 3,517,256 163,4380.577%, 07/25/27 (e) (f) 3,833,229 102,1570.604%, 07/25/24 (e) (f) 1,573,525 14,5350.637%, 06/25/27 (e) (f) 4,356,000 139,5010.740%, 03/25/31 (e) (f) 539,591 30,9120.750%, 06/25/27 (e) (f) 1,459,883 48,2860.782%, 01/25/31 (e) (f) 658,188 39,4410.856%, 09/25/31 (e) (f) 453,515 31,3600.895%, 04/25/24 (e) (f) 1,545,546 23,4660.936%, 01/25/31 (e) (f) 441,180 31,0500.938%, 07/25/31 (e) (f) 361,575 27,2311.081%, 11/25/30 (e) (f) 400,945 32,1001.090%, 07/25/29 (e) (f) 256,304 17,3891.144%, 08/25/29 (e) (f) 1,589,746 113,1851.170%, 09/25/30 (e) (f) 229,735 19,6401.225%, 05/25/31 (e) (f) 240,722 22,5961.342%, 06/25/30 (e) (f) 396,103 37,3561.600%, 08/25/30 (e) (f) 357,560 40,9991.663%, 05/25/30 (e) (f) 384,386 44,8291.797%, 05/25/30 (e) (f) 1,002,928 125,9851.798%, 04/25/30 (e) (f) 300,000 37,3321.868%, 04/25/30 (e) (f) 808,011 104,1582.120%, 06/25/29 344,908 328,0292.510%, 11/25/22 488,421 490,2042.670%, 12/25/24 507,000 506,5713.010%, 07/25/25 134,000 134,9353.060%, 07/25/23 (f) 59,000 59,571
Agency Sponsored Mortgage��Backed��(Continued)
Copyright © 2022 www.secdatabase.com. All Rights Reserved.Please Consider the Environment Before Printing This Document

Freddie Mac Multifamily Structured Pass-Through Certificates
3.064%, 08/25/24 (f) 251,436 252,2033.111%, 02/25/23 684,988 690,8343.117%, 06/25/27 354,000 359,5793.151%, 11/25/25 317,000 320,9343.171%, 10/25/24 424,000 428,5903.187%, 09/25/27 (f) 242,000 246,6263.250%, 04/25/23 (f) 793,541 801,3823.320%, 02/25/23 (f) 218,884 221,0533.458%, 08/25/23 (f) 566,000 573,6713.650%, 02/25/28 (f) 285,000 297,7063.900%, 04/25/28 528,000 558,931
Freddie Mac REMICS (CMO)3.000%, 07/15/39 45,555 45,2094.500%, 12/15/40 (e) 17,633 1,6455.000%, 01/15/40 59,634 63,4535.500%, 02/15/36 (e) 20,474 3,534
Ginnie Mae I 30 Yr. Pool3.500%, 12/15/41 227,028 236,9223.500%, 02/15/42 38,845 40,0084.500%, 09/15/33 31,029 33,3434.500%, 11/15/39 69,681 75,0154.500%, 03/15/40 105,687 114,7874.500%, 04/15/40 105,805 112,8174.500%, 06/15/40 35,894 38,5975.000%, 03/15/34 10,735 11,8005.000%, 06/15/34 28,031 30,8305.000%, 12/15/34 8,156 8,9115.000%, 06/15/35 6,080 6,5695.500%, 11/15/32 47,504 50,7735.500%, 08/15/33 84,259 91,2415.500%, 12/15/33 51,091 56,8465.500%, 09/15/34 42,309 46,9985.500%, 10/15/35 7,949 8,5916.000%, 12/15/28 14,967 16,1526.000%, 12/15/31 7,938 8,5776.000%, 03/15/32 890 9506.000%, 10/15/32 74,339 83,3876.000%, 01/15/33 712 7836.000%, 02/15/33 1,069 1,1526.000%, 04/15/33 70,749 79,2986.000%, 08/15/33 466 4986.000%, 07/15/34 37,668 41,5066.000%, 09/15/34 19,775 21,1266.000%, 01/15/38 50,511 56,022
Ginnie Mae II 30 Yr. Pool2.000%, 01/20/52 1,292,316 1,233,6892.500%, 08/20/51 310,440 301,5022.500%, 09/20/51 1,257,008 1,220,8142.500%, 11/20/51 1,154,240 1,121,0053.000%, 04/20/45 100,855 100,5873.000%, 04/20/46 45,745 45,5703.000%, 08/20/46 49,939 49,7453.000%, 09/20/46 114,787 114,6223.000%, 11/20/47 539,524 537,2173.000%, 01/20/48 752,904 749,6473.000%, 02/20/48 45,199 44,999
BHFTII-235
Copyright © 2022 www.secdatabase.com. All Rights Reserved.Please Consider the Environment Before Printing This Document

Table of ContentsBrighthouse Funds Trust IIMFS Total Return Portfolio
Schedule of Investments as of March 31, 2022 (Unaudited)U.S. Treasury & Government Agencies��(Continued)
Security DescriptionPrincipalAmount* Value
Agency Sponsored Mortgage��Backed��(Continued)Ginnie Mae II 30 Yr. Pool
3.000%, 04/20/48 15,604 $15,5363.000%, 11/20/51 195,531 193,6903.000%, 02/20/52 174,374 172,6183.000%, TBA (g) 1,625,000 1,605,8943.500%, 06/20/43 254,056 260,8543.500%, 07/20/43 315,865 324,3223.500%, 11/20/47 44,871 45,5183.500%, 03/20/48 528,243 535,8413.500%, TBA (g) 1,825,000 1,832,2464.000%, 01/20/41 280,440 293,2774.000%, 02/20/41 70,843 74,4324.000%, 04/20/41 57,190 60,0884.000%, 02/20/42 72,987 77,1554.000%, TBA (g) 25,000 25,4924.500%, 07/20/33 5,063 5,3924.500%, 09/20/33 3,751 3,9934.500%, 12/20/34 1,964 2,0874.500%, 03/20/35 17,329 18,4524.500%, 01/20/41 78,829 84,6105.000%, 07/20/33 13,296 14,4116.000%, 01/20/35 17,292 19,1876.000%, 02/20/35 8,703 9,6626.000%, 04/20/35 15,338 17,014
Government National Mortgage Association (CMO)0.584%, 02/16/59 (e) (f) 851,691 33,8904.000%, 07/20/41 57,602 59,1924.500%, 09/20/41 37,983 39,028
Uniform Mortgage-Backed Securities 15 Yr. Pool2.000%, TBA (g) 2,725,000 2,644,382
Uniform Mortgage-Backed Securities 30 Yr. Pool2.000%, TBA (g) 2,175,000 2,018,9272.500%, TBA (g) 6,165,000 5,877,7413.000%, TBA (g) 650,000 635,7813.500%, TBA (g) 300,000 298,7084.000%, TBA (g) 300,000 304,021
75,121,294
U.S. Treasury��7.7%U.S. Treasury Bonds
1.375%, 11/15/40 2,500,000 2,043,8471.750%, 08/15/41 2,600,000 2,253,4691.875%, 11/15/51 650,000 570,1722.375%, 11/15/49 11,245,000 10,999,8942.500%, 02/15/45 68,000 66,2312.875%, 05/15/43 2,550,000 2,639,8482.875%, 11/15/46 2,439,000 2,564,2843.000%, 02/15/48 2,332,000 2,540,696
U.S. Treasury Notes0.375%, 11/30/25 (h) 10,500,000 9,707,5780.500%, 11/30/23 6,700,000 6,512,3481.375%, 01/31/25 16,000,000 15,507,500
55,405,867Total U.S. Treasury & Government
Agencies(Cost $136,336,268) 130,527,161
Corporate Bonds & Notes��14.8%
Security DescriptionPrincipalAmount* Value
Copyright © 2022 www.secdatabase.com. All Rights Reserved.Please Consider the Environment Before Printing This Document

Aerospace/Defense��0.1%BAE Systems plc
3.400%, 04/15/30 (144A) 336,000 331,083Raytheon Technologies Corp.
4.125%, 11/16/28 502,000 524,742855,825
Agriculture��0.2%BAT International Finance plc
4.448%, 03/16/28 (b) 1,224,000 1,226,603
Auto Manufacturers��0.3%General Motors Co.
6.750%, 04/01/46 333,000 401,050Hyundai Capital America
2.650%, 02/10/25 (144A) (b) 287,000 278,0663.000%, 02/10/27 (144A) 597,000 570,167
Stellantis Finance U.S., Inc.2.691%, 09/15/31 (144A) (b) 1,012,000 888,295
Volkswagen Group of America Finance LLC3.350%, 05/13/25 (144A) (b) 305,000 304,043
2,441,621
Auto Parts & Equipment��0.2%Lear Corp.
3.800%, 09/15/27 (b) 293,000 293,2434.250%, 05/15/29 244,000 247,018
Magna International, Inc.2.450%, 06/15/30 685,000 631,084
1,171,345
Banks��3.5%Bank of America Corp.
2.572%, SOFR + 1.210%, 10/20/32 (b) (f) 961,000 873,2263.004%, 3M LIBOR + 0.790%, 12/20/23(f) 455,000 456,1493.366%, 3M LIBOR + 0.810%, 01/23/26(b) (f) 527,000 527,2663.500%, 04/19/26 (b) 441,000 446,466
Barclays plc2.894%, 1Y H15 + 1.300%, 11/24/32 (b)(f) 905,000 820,864
BBVA Bancomer S.A.6.750%, 09/30/22 (144A) 810,000 823,252
Citigroup, Inc.2.666%, SOFR + 1.146%, 01/29/31 (f) 875,000 810,680
Credit Suisse Group AG3.091%, SOFR + 1.730%, 05/14/32(144A) (b) (f) 500,000 450,949
Deutsche Bank AG2.311%, SOFR + 1.219%, 11/16/27 (f) 258,000 236,435
Goldman Sachs Group, Inc. (The)2.383%, SOFR + 1.248%, 07/21/32 (f) 981,000 868,8742.600%, 02/07/30 (b) 1,755,000 1,627,956
HSBC Holdings plc4.000%, 5Y H15 + 3.222%, 03/09/26 (f) 200,000 189,6004.700%, 5Y H15 + 3.250%, 03/09/31 (b)(f) 332,000 297,555
JPMorgan Chase & Co.2.545%, SOFR + 1.180%, 11/08/32 (f) 1,591,000 1,453,7702.956%, SOFR + 2.515%, 05/13/31 (b) (f) 169,000 158,1333.109%, SOFR + 2.460%, 04/22/41 (b) (f) 879,000 794,386
BHFTII-236
Copyright © 2022 www.secdatabase.com. All Rights Reserved.Please Consider the Environment Before Printing This Document

Table of ContentsBrighthouse Funds Trust IIMFS Total Return Portfolio
Schedule of Investments as of March 31, 2022 (Unaudited)Corporate Bonds & Notes��(Continued)
Security DescriptionPrincipalAmount* Value
Banks��(Continued)JPMorgan Chase & Co.
2.739%, SOFR + 1.510%, 10/15/30 (b) (f) 310,000 $292,9252.963%, SOFR + 1.260%, 01/25/33 (b) (f) 613,000 577,9083.782%, 3M LIBOR + 1.337%, 02/01/28 (f) 1,220,000 1,235,6113.897%, 3M LIBOR + 1.220%, 01/23/49 (f) 357,000 361,080
Macquarie Group, Ltd.4.442%, SOFR + 2.405%, 06/21/33 (144A)(b) (f) 1,713,000 1,729,018
Mitsubishi UFJ Financial Group, Inc.2.852%, 1Y H15 + 1.100%, 01/19/33 (b) (f) 920,000 857,254
Morgan Stanley2.699%, SOFR + 1.143%, 01/22/31 (b) (f) 1,780,000 1,670,2922.943%, SOFR + 1.290%, 01/21/33 (b) (f) 919,000 861,7813.875%, 04/29/24 (b) 496,000 505,9714.000%, 07/23/25 (b) 352,000 360,285
PNC Bank N.A.2.700%, 10/22/29 (b) 250,000 240,032
Royal Bank of Canada1.150%, 06/10/25 (b) 850,000 802,179
State Street Corp.2.901%, SOFR + 2.600%, 03/30/26 (f) 125,000 123,942
Sumitomo Mitsui Financial Group, Inc.2.472%, 01/14/29 (b) 1,536,000 1,428,519
UBS Group AG2.095%, 1Y H15 + 1.000%, 02/11/32(144A) (f) 1,883,000 1,646,378
Wells Fargo & Co.3.350%, SOFR + 1.500%, 03/02/33 (f) 1,499,000 1,456,792
24,985,528
Beverages��0.4%Anheuser-Busch InBev Worldwide, Inc.
4.375%, 04/15/38 (b) 208,000 218,5618.000%, 11/15/39 868,000 1,265,277
Constellation Brands, Inc.3.500%, 05/09/27 (b) 687,000 688,309
Diageo Capital plc2.375%, 10/24/29 (b) 835,000 790,496
Keurig Dr Pepper, Inc.3.200%, 05/01/30 (b) 108,000 104,679
3,067,322
Building Materials��0.3%Carrier Global Corp.
3.377%, 04/05/40 665,000 604,461Martin Marietta Materials, Inc.
2.500%, 03/15/30 67,000 61,1723.500%, 12/15/27 (b) 263,000 264,171
Masco Corp.2.000%, 02/15/31 (b) 1,257,000 1,090,369
Vulcan Materials Co.3.500%, 06/01/30 (b) 115,000 114,058
2,134,231
Chemicals��0.1%RPM International, Inc.
2.950%, 01/15/32 (b) 491,000 450,080
Chemicals��(Continued)Sherwin-Williams Co. (The)
Copyright © 2022 www.secdatabase.com. All Rights Reserved.Please Consider the Environment Before Printing This Document

2.300%, 05/15/30 470,000 429,756879,836
Commercial Services��0.4%ERAC USA Finance LLC
7.000%, 10/15/37 (144A) 602,000 785,838Experian Finance plc
4.250%, 02/01/29 (144A) 533,000 556,778Global Payments, Inc.
1.200%, 03/01/26 (b) 644,000 593,298RELX Capital, Inc.
3.000%, 05/22/30 174,000 166,246S&P Global, Inc.
4.250%, 05/01/29 (144A) 243,000 255,895Verisk Analytics, Inc.
4.125%, 03/15/29 (b) 630,000 649,6063,007,661
Computers��0.1%Dell International LLC / EMC Corp.
4.900%, 10/01/26 (b) 481,000 504,518
Diversified Financial Services��1.0%AerCap Ireland Capital DAC / AerCap GlobalAviation Trust
2.450%, 10/29/26 1,700,000 1,572,4193.650%, 07/21/27 (b) 320,000 310,0544.875%, 01/16/24 (b) 150,000 152,026
Air Lease Corp.2.200%, 01/15/27 (b) 410,000 379,4432.875%, 01/15/32 (b) 538,000 481,691
Avolon Holdings Funding, Ltd.3.250%, 02/15/27 (144A) 640,000 602,0064.375%, 05/01/26 (144A) 215,000 212,099
Capital One Financial Corp.3.273%, SOFR + 1.790%, 03/01/30 (f) 1,091,000 1,053,4213.750%, 03/09/27 (b) 554,000 558,363
Intercontinental Exchange, Inc.1.850%, 09/15/32 (b) 193,000 166,6832.100%, 06/15/30 (b) 657,000 600,018
Morgan Stanley Domestic Holdings, Inc.4.500%, 06/20/28 310,000 321,652
Raymond James Financial, Inc.4.950%, 07/15/46 (b) 696,000 779,339
Western Union Co. (The)2.850%, 01/10/25 (b) 161,000 159,145
7,348,359
Electric��0.6%Duke Energy Corp.
2.650%, 09/01/26 (b) 114,000 110,952Enel Finance International NV
2.650%, 09/10/24 (144A) 334,000 328,988Evergy, Inc.
2.900%, 09/15/29 (b) 505,000 482,669
BHFTII-237
Copyright © 2022 www.secdatabase.com. All Rights Reserved.Please Consider the Environment Before Printing This Document

Table of ContentsBrighthouse Funds Trust IIMFS Total Return Portfolio
Schedule of Investments as of March 31, 2022 (Unaudited)Corporate Bonds & Notes��(Continued)
Security DescriptionPrincipalAmount* Value
Electric��(Continued)Exelon Corp.
4.050%, 04/15/30 590,000 $609,019FirstEnergy Corp.
3.400%, 03/01/50 330,000 277,956Georgia Power Co.
3.700%, 01/30/50 44,000 40,880Jersey Central Power & Light Co.
2.750%, 03/01/32 (144A) (b) 275,000 256,0774.300%, 01/15/26 (144A) 422,000 430,783
Oncor Electric Delivery Co. LLC5.750%, 03/15/29 713,000 812,567
Pacific Gas and Electric Co.2.100%, 08/01/27 145,000 130,2883.000%, 06/15/28 (b) 418,000 388,8023.300%, 08/01/40 (b) 283,000 231,609
Xcel Energy, Inc.3.400%, 06/01/30 (b) 297,000 296,504
4,397,094
Electronics��0.0%Arrow Electronics, Inc.
2.950%, 02/15/32 (b) 245,000 225,000
Entertainment��0.2%Magallanes, Inc.
5.050%, 03/15/42 (144A) 564,000 575,2975.141%, 03/15/52 (144A) 493,000 504,386
1,079,683
Environmental Control��0.1%Republic Services, Inc.
1.450%, 02/15/31 (b) 304,000 258,2303.950%, 05/15/28 (b) 397,000 408,088
666,318
Food��0.1%General Mills, Inc.
2.875%, 04/15/30 (b) 134,000 128,7254.000%, 04/17/25 (b) 651,000 664,499
793,224
Gas��0.2%APT Pipelines, Ltd.
4.200%, 03/23/25 (144A) 1,100,000 1,115,2414.250%, 07/15/27 (144A) 84,000 86,152
East Ohio Gas Co. (The)2.000%, 06/15/30 (144A) (b) 406,000 362,087
NiSource, Inc.5.650%, 02/01/45 156,000 176,810
1,740,290
Healthcare-Products��0.1%Alcon Finance Corp.
2.600%, 05/27/30 (144A) (b) 200,000 184,1493.800%, 09/23/49 (144A) (b) 462,000 430,519
Healthcare-Products��(Continued)Boston Scientific Corp.
2.650%, 06/01/30 (b) 470,000 441,0081,055,676
Copyright © 2022 www.secdatabase.com. All Rights Reserved.Please Consider the Environment Before Printing This Document

Healthcare-Services��0.4%HCA, Inc.
4.125%, 06/15/29 627,000 639,1035.125%, 06/15/39 577,000 622,210
Humana, Inc.3.700%, 03/23/29 543,000 544,793
Laboratory Corp. of America Holdings4.700%, 02/01/45 209,000 222,536
Northwell Healthcare, Inc.3.979%, 11/01/46 (b) 51,000 50,1164.260%, 11/01/47 (b) 407,000 410,412
UnitedHealth Group, Inc.3.500%, 08/15/39 (b) 222,000 220,217
2,709,387
Insurance��0.7%AIA Group, Ltd.
3.375%, 04/07/30 (144A) (b) 804,000 799,625American International Group, Inc.
4.125%, 02/15/24 (b) 610,000 623,735Aon Corp.
3.750%, 05/02/29 (b) 1,126,000 1,151,320Brown & Brown, Inc.
4.200%, 03/17/32 618,000 627,925Corebridge Financial, Inc.
3.900%, 04/05/32 (144A) 1,051,000 1,049,445Hartford Financial Services Group, Inc. (The)
3.600%, 08/19/49 (b) 108,000 101,271Liberty Mutual Group, Inc.
3.951%, 10/15/50 (144A) 331,000 313,083Marsh & McLennan Cos., Inc.
4.750%, 03/15/39 242,000 265,7204,932,124
Internet��0.1%Booking Holdings, Inc.
4.625%, 04/13/30 424,000 459,864Tencent Holdings, Ltd.
2.390%, 06/03/30 (144A) (b) 548,000 487,393947,257
Investment Companies��0.3%Temasek Financial I, Ltd.
2.375%, 01/23/23 (144A) 1,790,000 1,793,277
Lodging��0.3%Las Vegas Sands Corp.
3.900%, 08/08/29 (b) 288,000 264,096Marriott International, Inc.
2.750%, 10/15/33 (b) 475,000 419,1992.850%, 04/15/31 2,000 1,825
BHFTII-238
Copyright © 2022 www.secdatabase.com. All Rights Reserved.Please Consider the Environment Before Printing This Document

Table of ContentsBrighthouse Funds Trust IIMFS Total Return Portfolio
Schedule of Investments as of March 31, 2022 (Unaudited)Corporate Bonds & Notes��(Continued)
Security DescriptionPrincipalAmount* Value
Lodging��(Continued)Marriott International, Inc.
4.000%, 04/15/28 (b) 623,000 $623,9954.625%, 06/15/30 (b) 582,000 602,772
1,911,887
Machinery-Diversified��0.2%CNH Industrial Capital LLC
1.875%, 01/15/26 135,000 127,8074.200%, 01/15/24 (b) 540,000 550,720
Westinghouse Air Brake Technologies Corp.3.200%, 06/15/25 248,000 242,1074.950%, 09/15/28 660,000 694,621
1,615,255
Media��0.6%Charter Communications Operating LLC /Charter CommunicationsOperating Capital Corp.
3.500%, 06/01/41 (b) 628,000 521,9504.908%, 07/23/25 466,000 483,2475.250%, 04/01/53 (b) 505,000 508,4065.375%, 05/01/47 132,000 135,1546.384%, 10/23/35 310,000 350,217
COX Communications, Inc.1.800%, 10/01/30 (144A) (b) 404,000 346,436
Time Warner Entertainment Co. L.P.8.375%, 07/15/33 592,000 772,880
Walt Disney Co. (The)3.500%, 05/13/40 1,021,000 994,444
4,112,734
Mining��0.4%Anglo American Capital plc
2.625%, 09/10/30 (144A) (b) 1,340,000 1,214,9923.875%, 03/16/29 (144A) 200,000 200,0925.625%, 04/01/30 (144A) 524,000 577,549
Glencore Funding LLC2.500%, 09/01/30 (144A) (b) 502,000 449,2112.850%, 04/27/31 (144A) (b) 208,000 189,9414.125%, 05/30/23 (144A) (b) 416,000 422,623
3,054,408
Oil & Gas��0.7%BP Capital Markets America, Inc.
2.721%, 01/12/32 (b) 1,226,000 1,153,791Cenovus Energy, Inc.
5.375%, 07/15/25 (b) 149,000 157,117Diamondback Energy, Inc.
4.400%, 03/24/51 (b) 106,000 107,531Eni S.p.A.
4.750%, 09/12/28 (144A) 1,046,000 1,092,107Equinor ASA
7.750%, 06/15/23 100,000 106,054Marathon Petroleum Corp.
4.750%, 09/15/44 (b) 340,000 345,714
Oil & Gas��(Continued)Phillips 66
2.150%, 12/15/30 (b) 995,000 883,779Valero Energy Corp.
Copyright © 2022 www.secdatabase.com. All Rights Reserved.Please Consider the Environment Before Printing This Document

3.650%, 12/01/51 176,000 155,3236.625%, 06/15/37 596,000 737,257
4,738,673
Pharmaceuticals��0.2%Becton Dickinson & Co.
4.669%, 06/06/47 587,000 639,375Cigna Corp.
3.200%, 03/15/40 169,000 153,616GSK Consumer Healthcare Capital US LLC
3.375%, 03/24/29 (144A) (b) 542,000 536,4761,329,467
Pipelines��0.7%Cheniere Corpus Christi Holdings LLC
3.700%, 11/15/29 514,000 512,396Enbridge, Inc.
2.500%, 01/15/25 (b) 273,000 268,230Enterprise Products Operating LLC
4.200%, 01/31/50 234,000 232,192Galaxy Pipeline Assets Bidco, Ltd.
2.160%, 03/31/34 (144A) (b) 736,000 677,009Kinder Morgan Energy Partners L.P.
4.150%, 02/01/24 (b) 577,000 587,615ONEOK, Inc.
4.950%, 07/13/47 729,000 734,020Plains All American Pipeline L.P. / PAAFinance Corp.
3.800%, 09/15/30 (b) 538,000 527,714Sabine Pass Liquefaction LLC
4.500%, 05/15/30 147,000 153,7285.000%, 03/15/27 (b) 485,000 512,919
Spectra Energy Partners L.P.3.375%, 10/15/26 236,000 236,089
Targa Resources Corp.4.200%, 02/01/33 217,000 218,980
4,660,892
Real Estate Investment Trusts��0.6%American Tower Corp.
3.000%, 06/15/23 (b) 303,000 303,9653.600%, 01/15/28 369,000 365,464
Boston Properties L.P.2.550%, 04/01/32 (b) 389,000 350,820
Brixmor Operating Partnership L.P.4.050%, 07/01/30 512,000 513,7094.125%, 05/15/29 (b) 51,000 52,310
Crown Castle International Corp.1.350%, 07/15/25 (b) 213,000 198,5733.650%, 09/01/27 843,000 836,881
Equinix, Inc.1.800%, 07/15/27 517,000 470,0522.625%, 11/18/24 (b) 800,000 788,561
BHFTII-239
Copyright © 2022 www.secdatabase.com. All Rights Reserved.Please Consider the Environment Before Printing This Document

Table of ContentsBrighthouse Funds Trust IIMFS Total Return Portfolio
Schedule of Investments as of March 31, 2022 (Unaudited)Corporate Bonds & Notes��(Continued)
Security DescriptionPrincipalAmount* Value
Real Estate InvestmentTrusts��(Continued)GLP Capital L.P. / GLP Financing II, Inc.
5.300%, 01/15/29 513,000 $538,943Realty Income Corp.
3.250%, 01/15/31 (b) 174,000 170,8694,590,147
Retail��0.4%Alimentation Couche-Tard, Inc.
3.439%, 05/13/41 (144A) (b) 619,000 555,854Best Buy Co., Inc.
4.450%, 10/01/28 (b) 648,000 675,758Genuine Parts Co.
2.750%, 02/01/32 (b) 814,000 746,981Home Depot, Inc. (The)
3.900%, 06/15/47 (b) 359,000 373,937TJX Cos., Inc. (The)
3.875%, 04/15/30 139,000 144,7242,497,254
Semiconductors��0.5%Broadcom, Inc.
3.187%, 11/15/36 (144A) (b) 889,000 771,7313.469%, 04/15/34 (144A) 351,000 325,0724.150%, 11/15/30 409,000 414,5174.300%, 11/15/32 439,000 445,482
Intel Corp.4.750%, 03/25/50 308,000 358,677
NXP B.V. / NXP Funding LLC / NXP USA,Inc.
2.500%, 05/11/31 (144A) 651,000 584,6273.250%, 05/11/41 (144A) (b) 558,000 492,057
3,392,163
Shipbuilding��0.0%Huntington Ingalls Industries, Inc.
3.844%, 05/01/25 180,000 181,923
Software��0.1%Fiserv, Inc.
2.650%, 06/01/30 (b) 198,000 182,742Roper Technologies, Inc.
2.000%, 06/30/30 (b) 468,000 415,4702.950%, 09/15/29 (b) 147,000 141,6934.200%, 09/15/28 250,000 258,765
998,670
Telecommunications��0.7%AT&T, Inc.
2.750%, 06/01/31 (b) 620,000 581,3613.650%, 09/15/59 (b) 616,000 540,190
Rogers Communications, Inc.3.800%, 03/15/32 (144A) (b) 1,514,000 1,502,277
T-Mobile USA, Inc.2.050%, 02/15/28 557,000 508,7164.500%, 04/15/50 57,000 57,664
Telecommunications��(Continued)Verizon Communications, Inc.
2.100%, 03/22/28 (b) 81,000 75,498
Copyright © 2022 www.secdatabase.com. All Rights Reserved.Please Consider the Environment Before Printing This Document

2.550%, 03/21/31 (b) 381,000 353,9683.150%, 03/22/30 310,000 304,8774.272%, 01/15/36 459,000 483,5514.812%, 03/15/39 573,000 647,992
5,056,094Total Corporate Bonds & Notes
(Cost $110,609,049) 106,101,746
Asset-Backed Securities��4.4%Asset-Backed��Automobile��0.1%Credit Acceptance Auto Loan Trust
1.380%, 07/15/30 (144A) 328,000 310,825Santander Retail Auto Lease Trust
1.880%, 03/20/24 (144A) 487,000 486,332797,157
Asset-Backed��Home Equity��0.1%Bayview Financial Revolving Asset Trust
2.047%, 1M LIBOR + 1.600%, 12/28/40(144A) (f) 208,582 256,178
GMAC Home Equity Loan Trust5.805%, 10/25/36 (f) 38,011 40,435
Home Equity Loan Trust4.435%, 12/25/35 (f) 20,613 20,582
317,195
Asset-Backed��Other��4.2%ACRES Commercial Realty, Ltd.
2.191%, 1M LIBOR + 1.750%, 01/15/37(144A) � (f) 535,500 528,117
Allegro CLO IV, Ltd.1.791%, 3M LIBOR + 1.550%, 01/15/30(144A) (f) 702,748 698,726
American Tower Trust I3.070%, 03/15/48 (144A) 876,000 870,747
Arbor Realty Commercial Real Estate Notes,Ltd.
1.597%, 1M LIBOR + 1.200%, 12/15/35(144A) (f) 625,000 612,6011.997%, 1M LIBOR + 1.600%, 08/15/34(144A) (f) 522,000 516,2372.150%, SOFR30A + 2.100%, 01/15/37(144A) (f) 1,466,500 1,459,920
BDS, Ltd.1.541%, 1M LIBOR + 1.100%, 08/15/36(144A) (f) 472,557 471,397
BSPRT Issuer, Ltd.1.697%, 1M LIBOR + 1.300%, 03/15/36(144A) (f) 1,463,000 1,442,7752.100%, SOFR30A + 2.050%, 02/15/37(144A) (f) 524,000 521,6282.447%, 1M LIBOR + 2.050%, 12/15/38(144A) (f) 245,000 240,753
Business Jet Securities LLC2.162%, 04/15/36 (144A) 362,139 336,763
CHCP FL1, Ltd.1.464%, SOFR30A + 1.414%, 02/15/38(144A) (f) 650,500 642,547
Columbia Cent CLO 28, Ltd.2.015%, 3M LIBOR + 1.700%, 11/07/30(144A) (f) 1,026,773 1,010,864
Cutwater, Ltd.1.461%, 3M LIBOR + 1.220%, 01/15/29(144A) (f) 735,940 735,369
Dryden 55 CLO, Ltd.1.261%, 3M LIBOR + 1.020%, 04/15/31(144A) (f) 1,430,000 1,416,198
BHFTII-240
Copyright © 2022 www.secdatabase.com. All Rights Reserved.Please Consider the Environment Before Printing This Document

Table of ContentsBrighthouse Funds Trust IIMFS Total Return Portfolio
Schedule of Investments as of March 31, 2022 (Unaudited)Asset-Backed Securities��(Continued)
Security DescriptionPrincipalAmount* Value
Asset-Backed��Other��(Continued)Dryden Senior Loan Fund
1.141%, 3M LIBOR + 0.900%, 04/15/29(144A) (f) 635,777 $632,138
Ladder Capital Commercial Mortgage Trust2.297%, 1M LIBOR + 1.900%, 12/13/38(144A) (f) 682,500 676,622
Loancore Issuer, Ltd.2.147%, 1M LIBOR + 1.750%, 07/15/36(144A) (f) 1,547,500 1,518,5902.297%, 1M LIBOR + 1.900%, 11/15/38(144A) (f) 3,913,500 3,880,916
MF1, Ltd.2.000%, SOFR30A + 1.950%, 02/19/37(144A) (f) 650,507 648,4312.143%, SOFR + 1.814%, 11/15/35 (144A)(f) 502,000 496,875
MidOcean Credit CLO II1.949%, 3M LIBOR + 1.650%, 01/29/30(144A) (f) 1,156,232 1,142,205
Neuberger Berman CLO XX, Ltd.1.401%, 3M LIBOR + 1.160%, 07/15/34(144A) (f) 600,000 596,213
Neuberger Berman CLO, Ltd.1.591%, 3M LIBOR + 1.350%, 10/15/29(144A) (f) 508,944 503,358
Oaktree CLO, Ltd.1.604%, 3M LIBOR + 1.350%, 10/20/27(144A) (f) 254,518 254,0842.009%, 3M LIBOR + 1.750%, 04/22/30(144A) (f) 1,503,087 1,478,092
OCP CLO, Ltd.1.783%, 3M LIBOR + 1.650%, 01/26/34(144A) (f) 4,041,128 3,989,511
Small Business Administration ParticipationCertificates
4.350%, 07/01/23 19,076 19,2634.770%, 04/01/24 1,884 1,9034.950%, 03/01/25 11,431 11,4414.990%, 09/01/24 5,711 5,7345.110%, 08/01/25 15,448 15,6625.180%, 05/01/24 2,448 2,4925.520%, 06/01/24 6,847 6,944
STWD, Ltd.1.850%, SOFR30A + 1.800%, 11/15/38(144A) (f) 1,507,000 1,492,220
Verizon Owner Trust1.980%, 07/22/24 782,000 779,991
Voya, Ltd.1.691%, 3M LIBOR + 1.450%, 10/15/30(144A) (f) 584,168 579,323
30,236,650Total Asset-Backed Securities
(Cost $31,646,558) 31,351,002
Mortgage-Backed Securities��2.1%Collateralized Mortgage Obligations��0.1%Seasoned Credit Risk Transfer Trust
3.000%, 02/25/59 256,508 254,246
Copyright © 2022 www.secdatabase.com. All Rights Reserved.Please Consider the Environment Before Printing This Document

3.500%, 08/25/58 79,873 81,2023.500%, 10/25/58 201,373 203,540
538,988
Commercial Mortgage-Backed Securities��2.0%AREIT Trust
1.464%, SOFR30A + 1.414%, 09/14/36(144A) (f) 1,953,000 1,952,0751.900%, SOFR30A + 1.850%, 11/17/24(144A) (f) 892,000 887,987
Commercial Mortgage-Backed Securities��(Continued)BPCRE, Ltd.
1.291%, 1M LIBOR + 0.850%, 02/15/37(144A) (f) 4,284 4,234
BXMT, Ltd.1.697%, 1M LIBOR + 1.300%, 05/15/38(144A) (f) 1,532,500 1,508,103
Commercial Mortgage Trust3.708%, 07/10/48 1,300,833 1,312,451
CSAIL Commercial Mortgage Trust3.504%, 06/15/57 738,578 738,787
GS Mortgage Securities Trust3.382%, 05/10/50 1,387,991 1,379,540
JPMBB Commercial Mortgage SecuritiesTrust
3.227%, 10/15/48 1,036,740 1,029,7293.494%, 01/15/48 1,590,000 1,594,132
Morgan Stanley Bank of America MerrillLynch Trust
3.536%, 11/15/52 519,442 521,980Morgan Stanley Capital Trust
3.530%, 06/15/50 470,148 473,115Ready Capital Mortgage Financing LLC
1.457%, 1M LIBOR + 1.000%, 04/25/38(144A) � (f) 886,739 883,7652.257%, 1M LIBOR + 1.800%, 11/25/36(144A) � (f) 320,000 317,655
UBS Commercial Mortgage Trust2.921%, 10/15/52 743,153 714,418
Wells Fargo Commercial Mortgage Trust3.540%, 05/15/48 1,410,327 1,415,426
14,733,397Total Mortgage-Backed Securities
(Cost $15,601,961) 15,272,385
Convertible Preferred Stocks��0.9%Auto Components��0.2%Aptiv plc
5.500%, 06/15/23 11,000 1,501,170
Health Care Equipment & Supplies��0.4%Boston Scientific Corp.
5.500%, 06/01/23 (b) 19,658 2,288,978Danaher Corp.
4.750%, 04/15/22 418 846,3453,135,323
Wireless Telecommunication Services��0.3%T-Mobile U.S., Inc.
5.250%, 06/01/23 (b) 1,603 1,787,345Total Convertible Preferred Stocks
(Cost $5,104,735) 6,423,838
Preferred Stocks��0.7%Household Products��0.5%Henkel AG & Co. KGaA 47,110 3,155,052
BHFTII-241
Copyright © 2022 www.secdatabase.com. All Rights Reserved.Please Consider the Environment Before Printing This Document

Table of ContentsBrighthouse Funds Trust IIMFS Total Return Portfolio
Schedule of Investments as of March 31, 2022 (Unaudited)Preferred Stocks��(Continued)
Security Description
Shares/PrincipalAmount* Value
Technology Hardware, Storage & Peripherals��0.2%Samsung Electronics Co., Ltd. 28,863 $1,492,905Total Preferred Stocks
(Cost $5,208,412) 4,647,957
Municipals��0.4%New Jersey Economic Development Authority
7.425%, 02/15/29 800,000 940,115New Jersey Turnpike Authority
7.414%, 01/01/40 1,050,000 1,529,452State Board of Administration Finance Corp.
2.154%, 07/01/30 436,000 397,988Total Municipals
(Cost $2,552,005) 2,867,555
Short-Term Investment��3.2%Repurchase Agreement��3.2%Fixed Income Clearing Corp.
Repurchase Agreement dated 03/31/22 at0.000%, due on 04/01/22 with a maturityvalue of $22,846,075; collateralized by U.S.Treasury Note at 2.500%, maturing 03/31/27, with a market value of $23,303,037. 22,846,075 22,846,075
Total Short-Term Investments(Cost $22,846,075) 22,846,075
Securities Lending Reinvestments (i)��5.5%Certificate of Deposit��0.0%Oversea-Chinese Banking Corp., Ltd.
Zero Coupon, 04/14/22 100,000 99,983
Commercial Paper��0.1%DNB Bank ASA
0.830%, SOFR + 0.550%, 09/07/22 (f) 1,000,000 1,000,399
Repurchase Agreements��4.4%BofA Securities, Inc.
Repurchase Agreement dated 03/31/22 at0.270%, due on 04/01/22 with a maturityvalue of $8,221,319; collateralized by U.S.Treasury Obligations with rates rangingfrom 2.000% - 5.000%, maturity datesranging from 05/15/37 - 02/15/50, and anaggregate market value of $8,385,684. 8,221,257 8,221,257
Cantor Fitzgerald & Co.Repurchase Agreement dated 03/31/22 at0.290%, due on 04/01/22 with a maturityvalue of $5,000,040; collateralized by U.S.Treasury and U.S. Government AgencyObligations with rates ranging from 0.125%- 8.000%, maturity dates ranging from 09/15/22 - 07/20/71, and an aggregate marketvalue of $5,100,000. 5,000,000 5,000,000
Copyright © 2022 www.secdatabase.com. All Rights Reserved.Please Consider the Environment Before Printing This Document

Citigroup Global Markets, Ltd.Repurchase Agreement dated 03/31/22 at0.300%, due on 04/01/22 with a maturityvalue of $800,007; collateralized by U.S.Treasury and Foreign Obligations with ratesranging from 0.125% - 2.875%, maturitydates ranging from 08/15/23 - 02/15/51,and an aggregate market value of$816,000. 800,000 800,000
Repurchase Agreements��(Continued)National Bank Financial, Inc.
Repurchase Agreement dated 03/31/22 at0.320%, due on 04/01/22 with a maturityvalue of $5,000,044; collateralized by U.S.Treasury Obligations with rates rangingfrom 0.125% - 3.000%, maturity datesranging from 06/30/22 - 02/15/49, and anaggregate market value of $5,102,844. 5,000,000 5,000,000
National Bank of CanadaRepurchase Agreement dated 03/31/22 at0.320%, due on 04/07/22 with a maturityvalue of $1,800,112; collateralized by U.S.Treasury Obligations with rates rangingfrom 0.000% - 4.500%, maturity datesranging from 04/14/22 - 08/15/51, and anaggregate market value of $1,837,024. 1,800,000 1,800,000Repurchase Agreement dated 03/31/22 at0.450%, due on 04/07/22 with a maturityvalue of $2,600,228; collateralized by U.S.Treasury Obligations with rates rangingfrom 0.500% - 3.000%, maturity datesranging from 11/30/23 - 08/15/48, andvarious Common Stock with an aggregatemarket value of $2,875,077. 2,600,000 2,600,000
NBC Global Finance, Ltd.Repurchase Agreement dated 03/31/22 at0.440%, due on 04/01/22 with a maturityvalue of $4,000,049; collateralized by U.S.Treasury Obligations with rates rangingfrom 0.125% - 4.750%, maturity datesranging from 05/15/24 - 02/15/50, andvarious Common Stock with an aggregatemarket value of $4,441,506. 4,000,000 4,000,000Repurchase Agreement dated 03/31/22 at0.485%, due on 04/07/22 with a maturityvalue of $700,066; collateralized by U.S.Treasury Obligations with rates rangingfrom 0.125% - 4.750%, maturity datesranging from 05/15/24 - 02/15/50, andvarious Common Stock with an aggregatemarket value of $777,264. 700,000 700,000
Societe GeneraleRepurchase Agreement dated 03/31/22 at0.410%, due on 04/01/22 with a maturityvalue of $3,000,034; collateralized byvarious Common Stock with an aggregatemarket value of $3,333,869. 3,000,000 3,000,000Repurchase Agreement dated 03/31/22 at0.420%, due on 04/07/22 with a maturityvalue of $600,049; collateralized by variousCommon Stock with an aggregate marketvalue of $666,774. 600,000 600,000
31,721,257
Time Deposits��0.7%Canadian Imperial Bank of Commerce
0.320%, 04/01/22 1,000,000 1,000,000DZ Bank AG (NY)
0.300%, 04/01/22 1,000,000 1,000,000Rabobank (New York)
0.310%, 04/01/22 1,000,000 1,000,000Skandi (NY)
0.300%, 04/01/22 1,000,000 1,000,000
Copyright © 2022 www.secdatabase.com. All Rights Reserved.Please Consider the Environment Before Printing This Document

Svenska (NY)0.260%, 04/01/22 1,000,000 1,000,000
5,000,000
BHFTII-242
Copyright © 2022 www.secdatabase.com. All Rights Reserved.Please Consider the Environment Before Printing This Document

Table of ContentsBrighthouse Funds Trust IIMFS Total Return Portfolio
Schedule of Investments as of March 31, 2022 (Unaudited)Securities Lending Reinvestments (i)��(Continued)
Security Description Shares Value
Mutual Funds��0.3%BlackRock Liquidity Funds FedFund,
Institutional Shares0.230% (j) 1,000,000 $1,000,000
Morgan Stanley Liquidity Funds GovernmentPortfolio, Institutional Shares0.230% (j) 1,000,000 1,000,000
2,000,000Total Securities Lending Reinvestments
(Cost $39,821,251) 39,821,639Total Investments�108.4%
(Cost $657,904,440) 777,286,140Other assets and liabilities (net)�(8.4)% (60,073,143 )Net Assets��100.0% $717,212,997
* Principal amount stated in U.S. dollars unless otherwise noted.� Restricted securities are not registered under the Securities Act of 1933 and are subject to legal restrictions on resale. These securities generally
may be resold in transactions exempt from registration or to the public if the securities are subsequently registered. Disposal of these securitiesmay involve time-consuming negotiations and prompt sale at an acceptable price may be difficult. As of March 31, 2022, the market value ofrestricted securities was $1,729,537, which is 0.2% of net assets. See details shown in the Restricted Securities table that follows.
(a) Non-income producing security.(b) All or a portion of the security was held on loan. As of March 31, 2022, the market value of securities loaned was $51,468,496 and the collateral
received consisted of cash in the amount of $39,821,179 and non-cash collateral with a value of $13,469,402. The cash collateral investmentsare disclosed in the Schedule of Investments and categorized as Securities Lending Reinvestments. The non-cash collateral received consists ofU.S. government securities that are held in safe-keeping by the lending agent, or a third-party custodian, and cannot be sold or repledged by thePortfolio.
(c) Security was valued in good faith under procedures approved by the Board of Trustees. As of March 31, 2022, these securities represent 0.4% ofnet assets.
(d) Significant unobservable inputs were used in the valuation of this portfolio security; i.e. Level 3.(e) Interest only security.(f) Variable or floating rate security. The stated rate represents the rate at March 31, 2022. Maturity date shown for callable securities reflects the
earliest possible call date. For securities based on a published reference index and spread, the index and spread are indicated in the descriptionabove. For certain variable rate securities, the coupon rate is determined by the issuer/agent based on current market conditions. For certainasset- and mortgage-backed securities, the coupon rate may fluctuate based on changes of the underlying collateral or prepayments of principal.These securities do not indicate a reference index and spread in their description above.
(g) TBA (To Be Announced) Securities are purchased on a forward commitment basis with an approximate principal amount and no defined maturitydate. The actual principal and maturity date will be determined upon settlement date.
(h) All or a portion of the security was pledged as collateral against open futures contracts. As of March 31, 2022, the market value of securitiespledged was $259,793.
(i) Represents investment of cash collateral received from securities on loan as of March 31, 2022.(j) The rate shown represents the annualized seven-day yield as of March 31, 2022.(144A)� Securities exempt from registration under Rule 144A of the Securities Act of 1933. These securities may be resold in transactions exempt from
registration, normally to qualified institutional buyers. As of March 31, 2022, the market value of 144A securities was $65,876,142, which is 9.2%of net assets.
Restricted SecuritiesAcquisition
DatePrincipalAmount Cost Value
ACRES Commercial Realty, Ltd., 2.191%, 01/15/37 12/07/21 $535,500 $535,500 $528,117Ready Capital Mortgage Financing LLC, 1.457%, 04/25/38 03/19/21 886,739 886,739 883,765Ready Capital Mortgage Financing LLC, 2.257%, 11/25/36 11/12/21 320,000 320,000 317,655
$1,729,537
Futures Contracts
Futures Contracts��LongExpiration
DateNumber ofContracts
NotionalValue
Value/Unrealized
Appreciation/(Depreciation)
U.S. Treasury Note 2 Year Futures 06/30/22 52 USD 11,019,938 $ (135,058 )
Copyright © 2022 www.secdatabase.com. All Rights Reserved.Please Consider the Environment Before Printing This Document

U.S. Treasury Note 5 Year Futures 06/30/22 197 USD 22,593,438 (308,017 )U.S. Treasury Ultra Long Bond Futures 06/21/22 38 USD 6,730,750 (255,117 )
Futures Contracts��ShortU.S. Treasury Note Ultra 10 Year Futures 06/21/22 (159 ) USD (21,539,531) 217,770Net Unrealized Depreciation $ (480,422 )
BHFTII-243
Copyright © 2022 www.secdatabase.com. All Rights Reserved.Please Consider the Environment Before Printing This Document

Table of ContentsBrighthouse Funds Trust IIMFS Total Return Portfolio
Schedule of Investments as of March 31, 2022 (Unaudited)Glossary of Abbreviations
Currencies
(USD)� United States Dollar
Index Abbreviations
(H15)� U.S. Treasury Yield Curve Rate T-Note Constant Maturity Index(LIBOR)� London Interbank Offered Rate(OBFR)� U.S. Overnight Bank Funding Rate(SOFR)� Secured Overnight Financing Rate(SOFR30A)� Secured Overnight Financing Rate 30-Day Average
Other Abbreviations
(ACES)� Alternative Credit Enhancement Securities(ADR)� American Depositary Receipt(CLO)� Collateralized Loan Obligation(CMO)� Collateralized Mortgage Obligation(DAC)� Designated Activity Company(REMIC)� Real Estate Mortgage Investment Conduit
Fair Value HierarchyAccounting principles generally accepted in the United States of America (�GAAP�) define fair market value as the price that the Portfolio would receive tosell an asset or pay to transfer a liability in an orderly transaction between market participants at the measurement date. It establishes a fair valuehierarchy that prioritizes inputs to valuation methods and requires disclosure of the fair value hierarchy, separately for each major category of assets andliabilities, that segregates fair value measurements into three levels. Levels 1, 2 and 3 of the fair value hierarchy are defined as follows:
Level 1 - unadjusted quoted prices in active markets for identical investmentsLevel 2 - other significant observable inputs (including, but not limited to, quoted prices for similar assets or liabilities in markets that are either activeor inactive; inputs other than quoted prices that are observable such as interest rates, yield curves, volatilities, prepayment speeds, loss severities,credit risks, default rates, or other market corroborated inputs)Level 3 - significant unobservable inputs based on the best information available in the circumstances, to the extent observable inputs areunavailable (including the Portfolio�s own assumptions used in determining the fair value of investments and derivative financial instruments)
The inputs or methodologies used for valuing investments are not necessarily an indication of the risk associated with investing in them. Changes to theinputs or methodologies used may result in transfers between levels. A reconciliation of Level 3 securities, if any, will be disclosed following the fair valuehierarchy table. For more information about the Portfolio�s policy regarding the valuation of investments, please refer to the Notes to Schedule ofInvestments.
The following table summarizes the fair value hierarchy of the Portfolio�s investments as of March 31, 2022:Description Level 1 Level 2 Level 3 TotalCommon Stocks
Aerospace & Defense $10,383,441 $� $ � $10,383,441Auto Components 5,483,016 � � 5,483,016Banks 37,488,112 � � 37,488,112Beverages 4,639,790 � � 4,639,790Biotechnology 3,029,079 � � 3,029,079Building Products 13,560,695 � � 13,560,695Capital Markets 42,589,086 � � 42,589,086Chemicals 10,826,884 � � 10,826,884Construction Materials 2,396,550 � � 2,396,550Distributors 3,559,599 � � 3,559,599Electric Utilities 15,972,720 � � 15,972,720Electrical Equipment 11,845,808 � � 11,845,808Electronic Equipment, Instruments & Components 728,380 � � 728,380Entertainment 2,032,257 � � 2,032,257Equity Real Estate Investment Trusts 1,993,223 � � 1,993,223Food & Staples Retailing 4,696,490 � � 4,696,490Food Products 8,056,687 3,842,194 � 11,898,881Health Care Equipment & Supplies 8,755,058 � � 8,755,058Health Care Providers & Services 19,226,347 � � 19,226,347Hotels, Restaurants & Leisure 2,951,253 � � 2,951,253
Copyright © 2022 www.secdatabase.com. All Rights Reserved.Please Consider the Environment Before Printing This Document

Household Products 4,309,105 � � 4,309,105Industrial Conglomerates 6,488,659 � � 6,488,659Insurance 25,871,625 � � 25,871,625Interactive Media & Services 3,754,822 � � 3,754,822IT Services 18,370,605 � � 18,370,605Life Sciences Tools & Services 11,532,018 � � 11,532,018
BHFTII-244
Copyright © 2022 www.secdatabase.com. All Rights Reserved.Please Consider the Environment Before Printing This Document

Table of ContentsBrighthouse Funds Trust IIMFS Total Return Portfolio
Schedule of Investments as of March 31, 2022 (Unaudited)Fair Value Hierarchy��(Continued)
Description Level 1 Level 2 Level 3 TotalMachinery $10,765,848 $� $� $10,765,848Media 13,609,247 � � 13,609,247Metals & Mining � 1,425,487 � 1,425,487Multiline Retail 1,018,394 � � 1,018,394Oil, Gas & Consumable Fuels 15,304,094 � � 15,304,094Pharmaceuticals 23,753,198 4,816,849 � 28,570,047Professional Services 1,133,101 � � 1,133,101Road & Rail 9,006,641 � � 9,006,641Semiconductors & Semiconductor Equipment 19,722,186 � � 19,722,186Software 18,601,247 � � 18,601,247Specialty Retail 1,702,730 � � 1,702,730Tobacco 6,958,230 � � 6,958,230Wireless Telecommunication Services 5,226,027 � � 5,226,027
Total Common Stocks 407,342,252 10,084,530 � 417,426,782U.S. Treasury & Government Agencies
Agency Sponsored Mortgage�Backed � 72,374,601 2,746,693 75,121,294U.S. Treasury � 55,405,867 � 55,405,867
Total U.S. Treasury & Government Agencies � 127,780,468 2,746,693 130,527,161Total Corporate Bonds & Notes* � 106,101,746 � 106,101,746Total Asset-Backed Securities* � 31,351,002 � 31,351,002Total Mortgage-Backed Securities* � 15,272,385 � 15,272,385Convertible Preferred Stocks
Auto Components 1,501,170 � � 1,501,170Health Care Equipment & Supplies 3,135,323 � � 3,135,323Wireless Telecommunication Services � 1,787,345 � 1,787,345
Total Convertible Preferred Stocks 4,636,493 1,787,345 � 6,423,838Total Preferred Stocks* � 4,647,957 � 4,647,957Total Municipals* � 2,867,555 � 2,867,555Total Short-Term Investment* � 22,846,075 � 22,846,075Securities Lending Reinvestments
Certificate of Deposit � 99,983 � 99,983Commercial Paper � 1,000,399 � 1,000,399Repurchase Agreements � 31,721,257 � 31,721,257Time Deposits � 5,000,000 � 5,000,000Mutual Funds 2,000,000 � � 2,000,000
Total Securities Lending Reinvestments 2,000,000 37,821,639 � 39,821,639Total Investments $413,978,745 $360,560,702 $2,746,693 $777,286,140Collateral for Securities Loaned (Liability) $� $(39,821,179 ) $� $(39,821,179 )Futures Contracts
Futures Contracts (Unrealized Appreciation) $217,770 $� $� $217,770Futures Contracts (Unrealized Depreciation) (698,192 ) � � (698,192 )
Total Futures Contracts $(480,422 ) $� $� $(480,422 )
* See Schedule of Investments for additional detailed categorizations.
Level 3 investments at the beginning and/or end of the period in relation to net assets were not significant and accordingly, a reconciliation of Level 3assets for the period ended March 31, 2022 is not presented.
BHFTII-245
Copyright © 2022 www.secdatabase.com. All Rights Reserved.Please Consider the Environment Before Printing This Document

Table of ContentsBrighthouse Funds Trust II
MFS Value Portfolio
Schedule of Investments as of March 31, 2022 (Unaudited)Common Stocks��99.3% of Net Assets
Security Description Shares Value
Aerospace & Defense��4.2%General Dynamics Corp. 69,766 $16,826,164Lockheed Martin Corp. 34,653 15,295,834Northrop Grumman Corp. 176,490 78,929,858Raytheon Technologies Corp. 300,883 29,808,479
140,860,335
Banks��7.4%Citigroup, Inc. 767,972 41,009,705JPMorgan Chase & Co. 907,094 123,655,054PNC Financial Services Group, Inc. (The) 217,755 40,164,910Truist Financial Corp. (a) 393,931 22,335,888U.S. Bancorp (a) 352,550 18,738,032
245,903,589
Beverages��2.6%Diageo plc 997,206 50,401,974PepsiCo, Inc. 220,554 36,916,328
87,318,302
Building Products��2.9%Johnson Controls International plc 664,553 43,574,740Masco Corp. 427,471 21,801,021Trane Technologies plc 203,393 31,058,111
96,433,872
Capital Markets��7.0%BlackRock, Inc. 63,374 48,428,510Goldman Sachs Group, Inc. (The) 106,453 35,140,135KKR & Co., Inc. 320,745 18,753,960Moody�s Corp. 54,677 18,448,566Morgan Stanley 679,328 59,373,267Nasdaq, Inc. 303,548 54,092,254
234,236,692
Chemicals��4.1%DuPont de Nemours, Inc. 514,123 37,829,170International Flavors & Fragrances, Inc. 101,116 13,279,564PPG Industries, Inc. 358,205 46,949,930Sherwin-Williams Co. (The) 147,317 36,773,270
134,831,934
Consumer Finance��1.8%American Express Co. 315,206 58,943,522
Electric Utilities��5.3%American Electric Power Co., Inc. 264,497 26,388,866Duke Energy Corp. 666,202 74,388,115Southern Co. (The) 824,519 59,785,873Xcel Energy, Inc. 231,939 16,739,037
177,301,891
Electrical Equipment��1.6%Eaton Corp. plc 343,220 52,087,067
Equity Real Estate Investment Trusts��0.5%Public Storage 42,538 $16,601,731
Food Products��2.1%Archer-Daniels-Midland Co. (a) 151,944 13,714,465Nestle S.A. 419,938 54,516,693
68,231,158
Copyright © 2022 www.secdatabase.com. All Rights Reserved.Please Consider the Environment Before Printing This Document

Health Care Equipment & Supplies��4.2%Abbott Laboratories 408,938 48,401,902Boston Scientific Corp. (b) 733,373 32,481,090Medtronic plc 538,111 59,703,415
140,586,407
Health Care Providers & Services��3.5%Cigna Corp. 292,212 70,016,917McKesson Corp. (a) 147,890 45,273,566
115,290,483
Hotels, Restaurants & Leisure��1.0%Marriott International, Inc. - Class A (b) 190,652 33,507,089
Household Products��1.9%Colgate-Palmolive Co. 290,330 22,015,724Kimberly-Clark Corp. 203,638 25,080,056Reckitt Benckiser Group plc 208,937 15,970,514
63,066,294
Industrial Conglomerates��2.2%Honeywell International, Inc. 370,759 72,142,286
Insurance��10.8%Aon plc - Class A 286,058 93,149,067Chubb, Ltd. 360,978 77,213,194Marsh & McLennan Cos., Inc. 443,646 75,606,151Progressive Corp. (The) 572,904 65,305,327Travelers Cos., Inc. (The) 265,277 48,474,066
359,747,805
IT Services��3.2%Accenture plc - Class A 238,245 80,343,361Fidelity National Information Services, Inc. 257,068 25,814,769
106,158,130
Life Sciences Tools & Services��3.5%Danaher Corp. 170,569 50,033,005Thermo Fisher Scientific, Inc. 114,283 67,501,254
117,534,259
Machinery��3.1%Illinois Tool Works, Inc. 239,561 50,164,073Otis Worldwide Corp. 128,666 9,900,849PACCAR, Inc. (a) 193,241 17,018,735Stanley Black & Decker, Inc. 185,901 25,987,101
103,070,758
BHFTII-246
Copyright © 2022 www.secdatabase.com. All Rights Reserved.Please Consider the Environment Before Printing This Document

Table of ContentsBrighthouse Funds Trust IIMFS Value Portfolio
Schedule of Investments as of March 31, 2022 (Unaudited)Common Stocks��(Continued)
Security Description
Shares/PrincipalAmount* Value
Media��3.2%Charter Communications, Inc. - Class A (a)
(b) 44,693 $24,380,925Comcast Corp. - Class A 1,780,431 83,359,780
107,740,705
Multi-Utilities��1.6%Dominion Energy, Inc. 638,337 54,239,495
Oil, Gas & Consumable Fuels��3.2%ConocoPhillips 440,520 44,052,000EOG Resources, Inc. 231,356 27,584,576Pioneer Natural Resources Co. 137,400 34,354,122
105,990,698
Pharmaceuticals��7.9%Johnson & Johnson 680,935 120,682,110Merck & Co., Inc. 631,786 51,838,042Pfizer, Inc. 1,547,600 80,119,252Roche Holding AG 28,817 11,396,412
264,035,816
Professional Services��1.2%Equifax, Inc. 167,704 39,762,618
Road & Rail��2.9%Canadian National Railway Co. 164,571 22,075,554Union Pacific Corp. 271,354 74,136,626
96,212,180
Semiconductors & Semiconductor Equipment��4.9%Analog Devices, Inc. 145,639 24,056,650Intel Corp. 462,849 22,938,796NXP Semiconductors NV 165,482 30,627,409Texas Instruments, Inc. 456,599 83,776,785
161,399,640
Specialty Retail��1.5%Lowe�s Cos., Inc. 240,323 48,590,907Total Common Stocks
(Cost $2,095,838,753) 3,301,825,663
Short-Term Investment��0.6%Repurchase Agreement��0.6%Fixed Income Clearing Corp.
Repurchase Agreement dated 03/31/22at 0.000%, due on 04/01/22 with amaturity value of $21,745,854;collateralized by U.S. Treasury Note at0.125%, maturing 10/15/25, with amarket value of $22,180,858. 21,745,854 21,745,854
Total Short-Term Investments(Cost $21,745,854) 21,745,854
Securities Lending Reinvestments (c)��2.5%
Security DescriptionPrincipalAmount* Value
Certificates of Deposit��1.0%
Copyright © 2022 www.secdatabase.com. All Rights Reserved.Please Consider the Environment Before Printing This Document

Bank of Montreal0.300%, 06/02/22 7,000,000 $6,994,862
Canadian Imperial Bank of Commerce(NY)0.520%, SOFR + 0.250%, 02/03/23 (d) 2,000,000 1,997,0300.770%, SOFR + 0.500%, 03/03/23 (d) 3,000,000 3,001,906
Cooperatieve Rabobank UA0.840%, SOFR + 0.570%, 09/19/22 (d) 2,000,000 2,000,000
Natixis S.A. (New York)0.330%, 06/09/22 1,000,000 999,154
Oversea-Chinese Banking Corp., Ltd.Zero Coupon, 04/14/22 600,000 599,8980.720%, SOFR + 0.440%, 09/26/22 (d) 4,000,000 4,000,797
Royal Bank of Canada0.520%, SOFR + 0.250%, 01/11/23 (d) 2,000,000 1,995,324
Standard Chartered Bank (NY)0.460%, SOFR + 0.190%, 08/25/22 (d) 2,000,000 1,998,367
Sumitomo Mitsui Banking Corp.0.450%, SOFR + 0.180%, 08/09/22 (d) 5,000,000 4,995,115
Toronto-Dominion Bank (The)0.530%, SOFR + 0.250%, 02/09/23 (d) 1,000,000 1,000,0000.820%, FEDEFF PRV + 0.490%, 12/23/22 (d) 2,000,000 1,999,408
Westpac Banking Corp.0.500%, SOFR + 0.230%, 02/17/23 (d) 2,000,000 1,993,746
33,575,607
Commercial Paper��0.1%DNB Bank ASA
0.830%, SOFR + 0.550%, 09/07/22 (d) 3,000,000 3,001,197
Repurchase Agreements��1.3%Barclays Bank plc
Repurchase Agreement dated 03/31/22at 0.600%, due on 05/05/22 with amaturity value of $4,002,333;collateralized by various Common Stockwith an aggregate market value of$4,445,827. 4,000,000 4,000,000
BofA Securities, Inc.Repurchase Agreement dated 03/31/22at 0.270%, due on 04/01/22 with amaturity value of $1,204,378;collateralized by U.S. TreasuryObligations with rates ranging from2.000% - 5.000%, maturity datesranging from 05/15/37 - 02/15/50, andan aggregate market value of$1,228,456. 1,204,369 1,204,369
Cantor Fitzgerald & Co.Repurchase Agreement dated 03/31/22at 0.290%, due on 04/01/22 with amaturity value of $2,000,016;collateralized by U.S. Treasury and U.S.Government Agency Obligations withrates ranging from 0.125% - 8.000%,maturity dates ranging from 09/15/22 -07/20/71, and an aggregate marketvalue of $2,040,000. 2,000,000 2,000,000
BHFTII-247
Copyright © 2022 www.secdatabase.com. All Rights Reserved.Please Consider the Environment Before Printing This Document

Table of ContentsBrighthouse Funds Trust IIMFS Value Portfolio
Schedule of Investments as of March 31, 2022 (Unaudited)Securities Lending Reinvestments (c)��(Continued)
Security DescriptionPrincipalAmount* Value
Repurchase Agreements��(Continued)Citigroup Global Markets, Inc.
Repurchase Agreement dated 03/31/22 at 0.620%, due on 05/05/22 with amaturity value of $6,003,617;collateralized by U.S. TreasuryObligations with rates ranging from0.000% - 3.875%, maturity datesranging from 04/21/22 - 05/15/51, andvarious Common Stock with anaggregate market value of $6,420,365. 6,000,000 $6,000,000
Citigroup Global Markets, Ltd.Repurchase Agreement dated 03/31/22 at 0.300%, due on 04/01/22 with amaturity value of $1,400,012;collateralized by U.S. Treasury andForeign Obligations with rates rangingfrom 0.125% - 2.875%, maturity datesranging from 08/15/23 - 02/15/51, andan aggregate market value of$1,428,000. 1,400,000 1,400,000
National Bank Financial, Inc.Repurchase Agreement dated 03/31/22 at 0.320%, due on 04/01/22 with amaturity value of $2,000,018;collateralized by U.S. TreasuryObligations with rates ranging from0.125% - 3.000%, maturity datesranging from 06/30/22 - 02/15/49, andan aggregate market value of$2,041,138. 2,000,000 2,000,000
National Bank of CanadaRepurchase Agreement dated 03/31/22 at 0.450%, due on 04/07/22 with amaturity value of $13,001,138;collateralized by U.S. TreasuryObligations with rates ranging from0.500% - 3.000%, maturity datesranging from 11/30/23 - 08/15/48, andvarious Common Stock with anaggregate market value of$14,375,383. 13,000,000 13,000,000
NBC Global Finance, Ltd.Repurchase Agreement dated 03/31/22 at 0.485%, due on 04/07/22 with amaturity value of $700,066;collateralized by U.S. TreasuryObligations with rates ranging from0.125% - 4.750%, maturity datesranging from 05/15/24 - 02/15/50, andvarious Common Stock with anaggregate market value of $777,264. 700,000 700,000
Societe GeneraleRepurchase Agreement dated 03/31/22 at 0.360%, due on 04/01/22 with amaturity value of $2,000,020;collateralized by various CommonStock with an aggregate market valueof $2,222,406. 2,000,000 2,000,000
Repurchase Agreements��(Continued)
Copyright © 2022 www.secdatabase.com. All Rights Reserved.Please Consider the Environment Before Printing This Document

Societe GeneraleRepurchase Agreement dated 03/31/22 at 0.380%, due on 04/01/22 with amaturity value of $4,000,042;collateralized by various CommonStock with an aggregate market valueof $4,444,812. 4,000,000 4,000,000
TD Prime Services LLCRepurchase Agreement dated 03/31/22 at 0.400%, due on 04/01/22 with amaturity value of $6,000,066;collateralized by various CommonStock with an aggregate market valueof $6,823,039. 6,000,000 6,000,000
42,304,369
Time Deposit��0.1%National Bank of Canada
0.370%, OBFR + 0.050%, 04/07/22 (d) 3,000,000 3,000,000Total Securities Lending Reinvestments
(Cost $81,904,335) 81,881,173Total Investment�102.4%
(Cost $2,199,488,942) 3,405,452,690Other assets and liabilities (net)�(2.4)% (81,177,207 )Net Assets��100.0% $3,324,275,483
* Principal amount stated in U.S. dollars unless otherwise noted.(a) All or a portion of the security was held on loan. As of March 31, 2022, the market value of securities loaned was $79,344,421 and the collateral
received consisted of cash in the amount of $81,903,899. The cash collateral investments are disclosed in the Schedule of Investments andcategorized as Securities Lending Reinvestments.
(b) Non-income producing security.(c) Represents investment of cash collateral received from securities on loan as of March 31, 2022.(d) Variable or floating rate security. The stated rate represents the rate at March 31, 2022. Maturity date shown for callable securities reflects the
earliest possible call date. For securities based on a published reference index and spread, the index and spread are indicated in the descriptionabove. For certain variable rate securities, the coupon rate is determined by the issuer/agent based on current market conditions. For certain asset-and mortgage-backed securities, the coupon rate may fluctuate based on changes of the underlying collateral or prepayments of principal. Thesesecurities do not indicate a reference index and spread in their description above.
Glossary of Abbreviations
Index Abbreviations
(FEDEFF PRV)� Effective Federal Funds Rate(OBFR)� U.S. Overnight Bank Funding Rate(SOFR)� Secured Overnight Financing Rate
BHFTII-248
Copyright © 2022 www.secdatabase.com. All Rights Reserved.Please Consider the Environment Before Printing This Document

Table of ContentsBrighthouse Funds Trust IIMFS Value Portfolio
Schedule of Investments as of March 31, 2022 (Unaudited)
Fair Value HierarchyAccounting principles generally accepted in the United States of America (�GAAP�) define fair market value as the price that the Portfolio would receive tosell an asset or pay to transfer a liability in an orderly transaction between market participants at the measurement date. It establishes a fair valuehierarchy that prioritizes inputs to valuation methods and requires disclosure of the fair value hierarchy, separately for each major category of assets andliabilities, that segregates fair value measurements into three levels. Levels 1, 2 and 3 of the fair value hierarchy are defined as follows:
Level 1 - unadjusted quoted prices in active markets for identical investmentsLevel 2 - other significant observable inputs (including, but not limited to, quoted prices for similar assets or liabilities in markets that are either activeor inactive; inputs other than quoted prices that are observable such as interest rates, yield curves, volatilities, prepayment speeds, loss severities,credit risks, default rates, or other market corroborated inputs)Level 3 - significant unobservable inputs based on the best information available in the circumstances, to the extent observable inputs areunavailable (including the Portfolio�s own assumptions used in determining the fair value of investments and derivative financial instruments)
The inputs or methodologies used for valuing investments are not necessarily an indication of the risk associated with investing in them. Changes to theinputs or methodologies used may result in transfers between levels. A reconciliation of Level 3 securities, if any, will be disclosed following the fair valuehierarchy table. For more information about the Portfolio�s policy regarding the valuation of investments, please refer to the Notes to Schedule ofInvestments.
The following table summarizes the fair value hierarchy of the Portfolio�s investments as of March 31, 2022:
Description Level 1 Level 2 Level 3 TotalCommon Stocks
Aerospace & Defense $140,860,335 $� $ � $140,860,335Banks 245,903,589 � � 245,903,589Beverages 36,916,328 50,401,974 � 87,318,302Building Products 96,433,872 � � 96,433,872Capital Markets 234,236,692 � � 234,236,692Chemicals 134,831,934 � � 134,831,934Consumer Finance 58,943,522 � � 58,943,522Electric Utilities 177,301,891 � � 177,301,891Electrical Equipment 52,087,067 � � 52,087,067Equity Real Estate Investment Trusts 16,601,731 � � 16,601,731Food Products 13,714,465 54,516,693 � 68,231,158Health Care Equipment & Supplies 140,586,407 � � 140,586,407Health Care Providers & Services 115,290,483 � � 115,290,483Hotels, Restaurants & Leisure 33,507,089 � � 33,507,089Household Products 47,095,780 15,970,514 � 63,066,294Industrial Conglomerates 72,142,286 � � 72,142,286Insurance 359,747,805 � � 359,747,805IT Services 106,158,130 � � 106,158,130Life Sciences Tools & Services 117,534,259 � � 117,534,259Machinery 103,070,758 � � 103,070,758Media 107,740,705 � � 107,740,705Multi-Utilities 54,239,495 � � 54,239,495Oil, Gas & Consumable Fuels 105,990,698 � � 105,990,698Pharmaceuticals 252,639,404 11,396,412 � 264,035,816Professional Services 39,762,618 � � 39,762,618Road & Rail 96,212,180 � � 96,212,180Semiconductors & Semiconductor Equipment 161,399,640 � � 161,399,640Specialty Retail 48,590,907 � � 48,590,907
Total Common Stocks 3,169,540,070 132,285,593 � 3,301,825,663Total Short-Term Investment* � 21,745,854 � 21,745,854Total Securities Lending Reinvestments* � 81,881,173 � 81,881,173Total Investments $3,169,540,070 $235,912,620 $ � $3,405,452,690Collateral for Securities Loaned (Liability) $� $(81,903,899 ) $ � $(81,903,899 )
* See Schedule of Investments for additional detailed categorizations.
BHFTII-249
Copyright © 2022 www.secdatabase.com. All Rights Reserved.Please Consider the Environment Before Printing This Document

Table of ContentsBrighthouse Funds Trust II
Neuberger Berman Genesis Portfolio
Schedule of Investments as of March 31, 2022 (Unaudited)Common Stocks��98.9% of Net Assets
Security Description Shares Value
Air Freight & Logistics��0.7%Forward Air Corp. 82,664 $8,082,886
Airlines��0.6%Allegiant Travel Co. (a) 40,035 6,501,284
Auto Components��2.6%Fox Factory Holding Corp. (a) 147,131 14,411,481LCI Industries 83,365 8,654,121XPEL, Inc. (a) 91,024 4,788,773
27,854,375
Banks��10.0%Bank of Hawaii Corp. 159,909 13,419,563BOK Financial Corp. 93,833 8,815,610Columbia Banking System, Inc. 150,597 4,859,765Community Bank System, Inc. 163,473 11,467,631Cullen/Frost Bankers, Inc. 96,783 13,395,735CVB Financial Corp. 350,059 8,124,870First Financial Bankshares, Inc. 268,314 11,838,014First Hawaiian, Inc. 199,997 5,577,916Glacier Bancorp, Inc. 234,157 11,773,414Lakeland Financial Corp. 96,114 7,016,322Prosperity Bancshares, Inc. 113,572 7,879,625Stock Yards Bancorp, Inc. 41,361 2,187,997
106,356,462
Biotechnology��0.4%Abcam plc (a) 221,300 3,998,118
Building Products��2.4%AAON, Inc. 182,085 10,147,597CSW Industrials, Inc. 62,767 7,380,771Hayward Holdings, Inc. (a) 483,856 8,041,687
25,570,055
Capital Markets��2.0%Artisan Partners Asset Management, Inc. -
Class A 80,466 3,166,337Hamilton Lane, Inc. - Class A 49,746 3,844,868Houlihan Lokey, Inc. 71,463 6,274,451MarketAxess Holdings, Inc. 23,333 7,937,887
21,223,543
Chemicals��1.3%Chase Corp. 53,126 4,617,181Quaker Chemical Corp. 56,721 9,801,956
14,419,137
Commercial Services & Supplies��5.0%Driven Brands Holdings, Inc. (a) 253,574 6,663,925IAA, Inc. (a) 238,231 9,112,336MSA Safety, Inc. 92,631 12,292,133Rollins, Inc. 269,494 9,445,765Tetra Tech, Inc. 94,125 15,524,977
53,039,136
Communications Equipment��1.0%NetScout Systems, Inc. (a) 345,492 11,083,383
Construction & Engineering��1.3%Valmont Industries, Inc. 56,219 13,413,853
Copyright © 2022 www.secdatabase.com. All Rights Reserved.Please Consider the Environment Before Printing This Document

Construction Materials��1.1%Eagle Materials, Inc. 92,369 11,856,485
Containers & Packaging��0.9%AptarGroup, Inc. 81,826 9,614,555
Distributors��2.9%Pool Corp. 72,729 30,753,458
Diversified Consumer Services��0.9%Bright Horizons Family Solutions, Inc. (a) 72,234 9,584,730
Electronic Equipment, Instruments & Components��5.6%Advanced Energy Industries, Inc. 60,498 5,207,668Cognex Corp. 139,582 10,768,751Littelfuse, Inc. 56,546 14,103,138National Instruments Corp. 96,126 3,901,754Novanta, Inc. (a) 122,293 17,401,071Zebra Technologies Corp. - Class A (a) 20,805 8,607,029
59,989,411
Food & Staples Retailing��0.6%Grocery Outlet Holding Corp. (a) 188,904 6,192,273
Food Products��1.0%Lancaster Colony Corp. 51,000 7,606,650UTZ Brands, Inc. 197,276 2,915,739
10,522,389
Health Care Equipment & Supplies��3.6%Atrion Corp. 13,638 9,723,894Haemonetics Corp. (a) 196,539 12,425,196IDEXX Laboratories, Inc. (a) 16,736 9,155,596Neogen Corp. (a) 172,301 5,313,763UFP Technologies, Inc. (a) 29,802 1,971,998
38,590,447
Health Care Providers & Services��1.6%Chemed Corp. 34,390 17,420,255
Health Care Technology��1.0%Certara, Inc. (a) 85,766 1,842,254Definitive Healthcare Corp. (a) 127,140 3,134,001Simulations Plus, Inc. 106,642 5,436,609
10,412,864
Hotels, Restaurants & Leisure��0.8%Texas Roadhouse, Inc. 107,349 8,988,332
BHFTII-250
Copyright © 2022 www.secdatabase.com. All Rights Reserved.Please Consider the Environment Before Printing This Document

Table of ContentsBrighthouse Funds Trust IINeuberger Berman Genesis Portfolio
Schedule of Investments as of March 31, 2022 (Unaudited)Common Stocks��(Continued)
Security Description Shares Value
Household Products��1.8%Church & Dwight Co., Inc. 95,193 $9,460,280WD-40 Co. 50,959 9,337,218
18,797,498
Insurance��1.5%AMERISAFE, Inc. 90,729 4,506,509RLI Corp. 103,969 11,502,091
16,008,600
IT Services��1.6%Computer Services, Inc. 101,284 5,013,558Jack Henry & Associates, Inc. 60,025 11,827,926
16,841,484
Life Sciences Tools & Services��6.0%Bio-Techne Corp. 65,218 28,242,003ICON plc (a) 35,220 8,566,208West Pharmaceutical Services, Inc. 65,469 26,888,773
63,696,984
Machinery��6.7%Graco, Inc. 125,167 8,726,643Kadant, Inc. 53,840 10,455,190Lindsay Corp. 52,014 8,166,718Nordson Corp. 44,720 10,155,018Omega Flex, Inc. 29,315 3,807,139RBC Bearings, Inc. (a) 89,030 17,261,136Toro Co. (The) 145,310 12,422,552
70,994,396
Marine��0.5%Kirby Corp. (a) 73,288 5,290,661
Media��3.9%Cable One, Inc. 6,473 9,478,026Nexstar Media Group, Inc. - Class A 121,321 22,866,582TechTarget, Inc. (a) 113,041 9,187,972
41,532,580
Professional Services��3.1%Exponent, Inc. 186,705 20,173,475FTI Consulting, Inc. (a) 79,032 12,425,411
32,598,886
Real Estate Management & Development��1.3%FirstService Corp. 97,957 14,192,010
Semiconductors & Semiconductor Equipment��6.4%CMC Materials, Inc. 62,273 11,545,414FormFactor, Inc. (a) 125,641 5,280,691Lattice Semiconductor Corp. (a) 312,100 19,022,495MKS Instruments, Inc. 77,724 11,658,600
Security Description
Shares/PrincipalAmount* Value
Semiconductors & Semiconductor Equipment��(Continued)Power Integrations, Inc. 226,369 20,979,879
68,487,079
Copyright © 2022 www.secdatabase.com. All Rights Reserved.Please Consider the Environment Before Printing This Document

Software��12.3%Altair Engineering, Inc. - Class A (a) 87,003 5,602,993American Software, Inc. - Class A 195,927 4,083,119Aspen Technology, Inc. (a) 147,823 24,445,490Fair Isaac Corp. (a) 37,203 17,353,711Manhattan Associates, Inc. (a) 163,047 22,616,249Model N, Inc. (a) 211,816 5,697,850Qualys, Inc. (a) 136,901 19,496,071SPS Commerce, Inc. (a) 130,690 17,146,528Tyler Technologies, Inc. (a) 26,331 11,714,399Vertex, Inc. - Class A (a) 203,919 3,128,118
131,284,528
Specialty Retail��4.0%Asbury Automotive Group, Inc. (a) 77,438 12,405,567Floor & Decor Holdings, Inc. - Class A (a) 103,358 8,371,998Lithia Motors, Inc. 27,707 8,315,425Petco Health & Wellness Co., Inc. (a) 234,061 4,580,574Tractor Supply Co. 37,652 8,786,847
42,460,411
Trading Companies & Distributors��2.5%Richelieu Hardware, Ltd. 158,502 5,773,852SiteOne Landscape Supply, Inc. (a) 43,887 7,096,089Transcat, Inc. (a) 46,029 3,734,793Watsco, Inc. 32,538 9,912,377
26,517,111Total Common Stocks
(Cost $585,880,513) 1,054,169,659
Short-Term Investment��1.1%Repurchase Agreement��1.1%Fixed Income Clearing Corp. Repurchase
Agreement dated 03/31/22 at 0.000%,due on 04/01/22 with a maturity valueof $11,162,669; collateralized by U.S.Treasury Note at 2.500%, maturing 03/31/27, with a marketvalue of $11,385,944. 11,162,669 11,162,669
Total Short-Term Investments(Cost $11,162,669) 11,162,669
Total Investments�100.0%(Cost $597,043,182) 1,065,332,328
Other assets and liabilities (net)�0.0% 529,959Net Assets��100.0% $1,065,862,287
* Principal amount stated in U.S. dollars unless otherwise noted.(a) Non-income producing security.
BHFTII-251
Copyright © 2022 www.secdatabase.com. All Rights Reserved.Please Consider the Environment Before Printing This Document

Table of ContentsBrighthouse Funds Trust IINeuberger Berman Genesis Portfolio
Schedule of Investments as of March 31, 2022 (Unaudited)
Fair Value HierarchyAccounting principles generally accepted in the United States of America (�GAAP�) define fair market value as the price that the Portfolio would receive tosell an asset or pay to transfer a liability in an orderly transaction between market participants at the measurement date. It establishes a fair valuehierarchy that prioritizes inputs to valuation methods and requires disclosure of the fair value hierarchy, separately for each major category of assets andliabilities, that segregates fair value measurements into three levels. Levels 1, 2 and 3 of the fair value hierarchy are defined as follows:
Level 1 - unadjusted quoted prices in active markets for identical investmentsLevel 2 - other significant observable inputs (including, but not limited to, quoted prices for similar assets or liabilities in markets that are either activeor inactive; inputs other than quoted prices that are observable such as interest rates, yield curves, volatilities, prepayment speeds, loss severities,credit risks, default rates, or other market corroborated inputs)Level 3 - significant unobservable inputs based on the best information available in the circumstances, to the extent observable inputs areunavailable (including the Portfolio�s own assumptions used in determining the fair value of investments and derivative financial instruments)
The inputs or methodologies used for valuing investments are not necessarily an indication of the risk associated with investing in them. Changes to theinputs or methodologies used may result in transfers between levels. A reconciliation of Level 3 securities, if any, will be disclosed following the fair valuehierarchy table. For more information about the Portfolio�s policy regarding the valuation of investments, please refer to the Notes to Schedule ofInvestments.
The following table summarizes the fair value hierarchy of the Portfolio�s investments as of March 31, 2022:
Description Level 1 Level 2 Level 3 TotalCommon Stocks
Air Freight & Logistics $8,082,886 $� $ � $8,082,886Airlines 6,501,284 � � 6,501,284Auto Components 27,854,375 � � 27,854,375Banks 106,356,462 � � 106,356,462Biotechnology � 3,998,118 � 3,998,118Building Products 25,570,055 � � 25,570,055Capital Markets 21,223,543 � � 21,223,543Chemicals 14,419,137 � � 14,419,137Commercial Services & Supplies 53,039,136 � � 53,039,136Communications Equipment 11,083,383 � � 11,083,383Construction & Engineering 13,413,853 � � 13,413,853Construction Materials 11,856,485 � � 11,856,485Containers & Packaging 9,614,555 � � 9,614,555Distributors 30,753,458 � � 30,753,458Diversified Consumer Services 9,584,730 � � 9,584,730Electronic Equipment, Instruments & Components 59,989,411 � � 59,989,411Food & Staples Retailing 6,192,273 � � 6,192,273Food Products 10,522,389 � � 10,522,389Health Care Equipment & Supplies 38,590,447 � � 38,590,447Health Care Providers & Services 17,420,255 � � 17,420,255Health Care Technology 10,412,864 � � 10,412,864Hotels, Restaurants & Leisure 8,988,332 � � 8,988,332Household Products 18,797,498 � � 18,797,498Insurance 16,008,600 � � 16,008,600IT Services 16,841,484 � � 16,841,484Life Sciences Tools & Services 63,696,984 � � 63,696,984Machinery 70,994,396 � � 70,994,396Marine 5,290,661 � � 5,290,661Media 41,532,580 � � 41,532,580Professional Services 32,598,886 � � 32,598,886Real Estate Management & Development 14,192,010 � � 14,192,010Semiconductors & Semiconductor Equipment 68,487,079 � � 68,487,079Software 131,284,528 � � 131,284,528Specialty Retail 42,460,411 � � 42,460,411Trading Companies & Distributors 20,743,259 5,773,852 � 26,517,111
Total Common Stocks 1,044,397,689 9,771,970 � 1,054,169,659Total Short-Term Investment* � 11,162,669 � 11,162,669Total Investments $1,044,397,689 $20,934,639 $ � $1,065,332,328
Copyright © 2022 www.secdatabase.com. All Rights Reserved.Please Consider the Environment Before Printing This Document

* See Schedule of Investments for additional detailed categorizations.
BHFTII-252
Copyright © 2022 www.secdatabase.com. All Rights Reserved.Please Consider the Environment Before Printing This Document

Table of ContentsBrighthouse Funds Trust II
T. Rowe Price Large Cap Growth Portfolio
Schedule of Investments as of March 31, 2022 (Unaudited)Common Stocks��97.4% of Net Assets
Security Description Shares Value
Aerospace & Defense��0.7%Airbus SE (a) (b) 136,393 $16,486,304
Air Freight & Logistics��0.8%FedEx Corp. 79,109 18,305,032
Automobiles��6.8%Aurora Innovation, Inc. � (a) (c) 445,565 2,407,693Ferrari NV (b) 82,299 17,948,589Rivian Automotive, Inc. � (a) (c) 1,781,979 86,542,703Rivian Automotive, Inc. - Class A (a) (b) 116,350 5,845,424Tesla, Inc. (a) 48,098 51,830,405
164,574,814
Biotechnology��0.3%Argenx SE (ADR) (a) 22,627 7,134,519
Capital Markets��0.3%MarketAxess Holdings, Inc. 12,478 4,245,016Tradeweb Markets, Inc. - Class A (b) 24,027 2,111,252
6,356,268
Commercial Services & Supplies��0.2%Cintas Corp. 13,975 5,944,825
Consumer Finance��0.2%SoFi Technologies, Inc. (a) (b) 525,930 4,970,038
Electrical Equipment��0.7%Generac Holdings, Inc. (a) (b) 53,811 15,995,858
Electronic Equipment, Instruments & Components��1.1%Teledyne Technologies, Inc. (a) 55,172 26,075,942
Entertainment��3.3%Netflix, Inc. (a) 84,069 31,491,407ROBLOX Corp. - Class A (a) (b) 192,671 8,909,107Sea, Ltd. (ADR) (a) (b) 185,212 22,186,545Spotify Technology S.A. (a) 117,329 17,719,026
80,306,085
Health Care Equipment & Supplies��3.4%Align Technology, Inc. (a) 33,773 14,725,028Insulet Corp. (a) (b) 22,900 6,100,331Intuitive Surgical, Inc. (a) 120,794 36,441,134Stryker Corp. 89,737 23,991,187
81,257,680
Health Care Providers & Services��2.9%Cigna Corp. 52,366 12,547,417HCA Healthcare, Inc. 72,570 18,187,493Humana, Inc. 32,880 14,308,390UnitedHealth Group, Inc. 47,580 24,264,373
69,307,673
Hotels, Restaurants & Leisure��4.0%Airbnb, Inc. - Class A (a) 64,818 11,133,140Booking Holdings, Inc. (a) 7,613 17,878,750Chipotle Mexican Grill, Inc. (a) 16,119 25,500,742Expedia Group, Inc. (a) 85,599 16,749,156Las Vegas Sands Corp. (a) 300,983 11,699,209Wynn Resorts, Ltd. (a) (b) 170,695 13,611,219
96,572,216
Copyright © 2022 www.secdatabase.com. All Rights Reserved.Please Consider the Environment Before Printing This Document

Industrial Conglomerates��0.8%Roper Technologies, Inc. 41,634 19,660,824
Interactive Media & Services��14.3%Alphabet, Inc. - Class A (a) 43,506 121,005,413Alphabet, Inc. - Class C (a) 38,053 106,281,649Match Group, Inc. (a) (b) 158,806 17,268,564Meta Platforms, Inc. - Class A (a) 318,315 70,780,523Snap, Inc. - Class A (a) (b) 870,747 31,338,185
346,674,334
Internet & Direct Marketing Retail��11.9%Amazon.com, Inc. (a) 80,746 263,227,923Coupang, Inc. (a) (b) 395,362 6,990,000DoorDash, Inc. - Class A (a) (b) 142,317 16,678,129Maplebear, Inc. � (a) (c) (d) 17,978 1,725,888Maplebear, Inc. (Non-Voting Shares) � (a) (c)
(d) 939 90,144288,712,084
IT Services��7.3%Block, Inc. (a) 40,009 5,425,220Block, Inc. (Australian Depository Receipts)
(a) 88,527 11,677,860Fiserv, Inc. (a) (b) 232,138 23,538,793Global Payments, Inc. (b) 85,266 11,667,799MasterCard, Inc. - Class A 111,686 39,914,343MongoDB, Inc. (a) (b) 38,940 17,273,395PayPal Holdings, Inc. (a) 26,960 3,117,924Snowflake, Inc. - Class A (a) 43,451 9,955,928Stripe, Inc. - Class B � (a) (c) (d) 63,278 2,598,827Toast, Inc. - Class A (a) 11,539 250,743Twilio, Inc. - Class A (a) 32,156 5,299,630Visa, Inc. - Class A (b) 207,977 46,123,059
176,843,521
Leisure Products��0.4%Peloton Interactive, Inc. - Class A (a) (b) 342,950 9,060,739
Life Sciences Tools & Services��0.5%Avantor, Inc. (a) 342,140 11,571,175
Pharmaceuticals��1.2%AstraZeneca plc (ADR) (b) 85,303 5,659,001Eli Lilly and Co. 85,249 24,412,756
30,071,757
Professional Services��0.9%TransUnion 149,499 15,449,227
BHFTII-253
Copyright © 2022 www.secdatabase.com. All Rights Reserved.Please Consider the Environment Before Printing This Document

Table of ContentsBrighthouse Funds Trust IIT. Rowe Price Large Cap Growth Portfolio
Schedule of Investments as of March 31, 2022 (Unaudited)Common Stocks��(Continued)
Security Description Shares Value
Professional Services��(Continued)Verisk Analytics, Inc. (b) 29,800 $6,395,974
21,845,201
Semiconductors & Semiconductor Equipment��5.8%Advanced Micro Devices, Inc. (a) 268,911 29,402,729ASML Holding NV 61,180 40,863,957NVIDIA Corp. 242,737 66,233,218Taiwan Semiconductor Manufacturing
Co., Ltd. (ADR) 49,655 5,177,030141,676,934
Software��20.4%Atlassian Corp. plc - Class A (a) 60,009 17,632,445Bill.com Holdings, Inc. (a) (b) 31,249 7,086,961Black Knight, Inc. (a) 240,537 13,948,741Ceridian HCM Holding, Inc. (a) 76,754 5,246,903Datadog, Inc. - Class A (a) 82,280 12,462,952Epic Games, Inc. � (a) (c) (d) 7,860 6,772,962Hashicorp, Inc. - Class A (a) (b) 22,143 1,195,722Intuit, Inc. 107,041 51,469,594Magic Leap, Inc. - Class A � (a) (c) (d) 10,914 209,569Microsoft Corp. 882,009 271,932,195Monday.com, Ltd. (a) (b) 15,156 2,395,709Salesforce.com, Inc. (a) 153,958 32,688,363SentinelOne, Inc. - Class A (a) 293,201 11,358,607ServiceNow, Inc. (a) 67,343 37,502,643Trade Desk, Inc. (The) - Class A (a) 183,645 12,717,416UiPath, Inc. - Class A (a) (b) 179,516 3,875,750Workday, Inc. - Class A (a) 9,244 2,213,568Zoom Video Communications, Inc. -
Class A (a) 32,882 3,854,757494,564,857
Specialty Retail��1.5%Carvana Co. (a) (b) 31,357 3,740,577Ross Stores, Inc. 370,663 33,530,175
37,270,752
Technology Hardware, Storage & Peripherals��6.7%Apple, Inc. 936,115 163,455,040
Textiles, Apparel & Luxury Goods��1.0%Lululemon Athletica, Inc. (a) 63,593 23,226,071Total Common Stocks
(Cost $1,422,687,805) 2,357,920,543
Convertible Preferred Stocks��1.1%Automobiles��0.6%GM Cruise Holdings LLC - Series F � (a)
(c) (d) 196,100 5,167,235Nuro, Inc. - Series C � (a) (c) (d) 179,741 3,746,830Sila Nano, Inc. - Series F � (a) (c) (d) 52,110 1,624,269Waymo LLC - Series A-2 � (a) (c) (d) 26,511 2,431,642
12,969,976
Internet & Direct Marketing Retail��0.5%ANT International Co., Ltd. - Class C � (a)
(c) (d) 2,147,070 6,119,150
Copyright © 2022 www.secdatabase.com. All Rights Reserved.Please Consider the Environment Before Printing This Document

Maplebear, Inc. - Series A � (a) (c) (d) 2,525 242,400Maplebear, Inc. - Series G � (a) (c) (d) 36,727 3,525,792Rappi, Inc. - Series E � (a) (c) (d) 52,748 2,992,394
12,879,736Total Convertible Preferred Stocks
(Cost $23,607,524) 25,849,712
Short-Term Investment��1.2%Mutual Funds��1.2%T. Rowe Price Government Reserve Fund
(e) 29,416,821 29,416,821Total Short-Term Investments
(Cost $29,416,821) 29,416,821
Securities Lending Reinvestments (f)��9.7%Certificates of Deposit��3.9%Bank of Montreal
0.300%, 06/02/22 8,000,000 7,994,128Bank of Nova Scotia
0.400%, SOFR + 0.130%, 07/07/22 (g) 3,000,000 3,000,000Barclays Bank plc
0.180%, 04/07/22 7,000,000 6,999,741BNP Paribas S.A.
0.490%, SOFR + 0.220%, 11/17/22 (g) 4,000,000 3,994,368Canadian Imperial Bank of Commerce
(NY)0.520%, SOFR + 0.250%, 02/03/23 (g) 4,000,000 3,994,0610.770%, SOFR + 0.500%, 03/03/23 (g) 4,000,000 4,002,540
Credit Agricole S.A.0.590%, 05/24/22 2,000,000 1,999,760
Credit Industriel et CommercialZero Coupon, 04/14/22 6,000,000 5,998,980
Credit Industriel et Commercial (NY)0.480%, SOFR + 0.210%, 11/08/22 (g) 3,000,000 2,994,465
Goldman Sachs Bank USA0.470%, SOFR + 0.190%, 09/02/22 (g) 3,000,000 2,996,178
Mitsubishi UFJ Trust and Banking Corp.0.430%, SOFR + 0.160%, 07/22/22 (g) 2,000,000 1,998,718
National Westminster Bank plc0.440%, 05/11/22 3,000,000 2,999,460
Natixis S.A. (New York)0.330%, 06/09/22 2,000,000 1,998,3080.450%, SOFR + 0.180%, 06/17/22 (g) 5,000,000 4,998,717
Nordea Bank Abp.0.720%, SOFR + 0.450%, 08/30/22 (g) 2,000,000 1,999,996
Oversea-Chinese Banking Corp., Ltd.Zero Coupon, 04/14/22 2,000,000 1,999,6600.720%, SOFR + 0.440%, 09/26/22 (g) 5,000,000 5,000,997
Royal Bank of Canada0.520%, SOFR + 0.250%, 01/11/23 (g) 3,000,000 2,992,986
BHFTII-254
Copyright © 2022 www.secdatabase.com. All Rights Reserved.Please Consider the Environment Before Printing This Document

Table of ContentsBrighthouse Funds Trust IIT. Rowe Price Large Cap Growth Portfolio
Schedule of Investments as of March 31, 2022 (Unaudited)Securities Lending Reinvestments (f)��(Continued)
Security DescriptionPrincipalAmount* Value
Certificates of Deposit��(Continued)Standard Chartered Bank (NY)
0.460%, SOFR + 0.190%, 08/25/22 (g) 3,000,000 $2,997,550Sumitomo Mitsui Banking Corp.
0.200%, 04/26/22 3,000,000 2,999,3220.450%, SOFR + 0.180%, 08/09/22 (g) 5,000,000 4,995,115
Sumitomo Mitsui Trust Bank, Ltd.Zero Coupon, 04/19/22 3,000,000 2,999,250
Toronto-Dominion Bank (The)0.530%, SOFR + 0.250%, 02/09/23 (g) 4,000,000 3,999,999
Westpac Banking Corp.0.500%, SOFR + 0.230%, 02/17/23 (g) 7,000,000 6,978,111
92,932,410
Commercial Paper��0.5%Macquarie Bank Ltd.
0.510%, SOFR + 0.230%, 08/04/22 (g) 2,000,000 1,998,462Skandinaviska Enskilda Banken AB
0.200%, 04/28/22 3,000,000 2,998,860Societe Generale
0.460%, SOFR + 0.190%, 08/18/22 (g) 5,000,000 4,994,955UBS AG
0.350%, 06/08/22 3,000,000 2,995,48812,987,765
Repurchase Agreements��4.8%Barclays Bank plc
Repurchase Agreement dated 03/31/22 at0.600%, due on 05/05/22 with a maturityvalue of $5,002,917; collateralized byvarious Common Stock with an aggregatemarket value of $5,557,284. 5,000,000 5,000,000
BofA Securities, Inc.Repurchase Agreement dated 03/31/22 at0.270%, due on 04/01/22 with a maturityvalue of $15,641,883; collateralized byU.S. Treasury Obligations with ratesranging from 2.000% - 5.000%, maturitydates ranging from 05/15/37 - 02/15/50,and an aggregate market value of$15,954,604. 15,641,765 15,641,765Repurchase Agreement dated 03/31/22 at0.600%, due on 04/18/22 with a maturityvalue of $800,240; collateralized by U.S.Treasury Obligations with rates rangingfrom 0.000% - 2.250%, maturity datesranging from 07/21/22 - 08/15/49, andvarious Common Stock with an aggregatemarket value of $846,736. 800,000 800,000Repurchase Agreement dated 03/31/22 at0.600%, due on 05/05/22 with a maturityvalue of $1,200,700; collateralized by U.S.Treasury Obligations with rates rangingfrom 0.000% - 7.500%, maturity datesranging from 04/21/22 - 08/15/51, andvarious Common Stock with an aggregatemarket value of $1,262,268. 1,200,000 1,200,000
Repurchase Agreements��(Continued)
Copyright © 2022 www.secdatabase.com. All Rights Reserved.Please Consider the Environment Before Printing This Document

Cantor Fitzgerald & Co.Repurchase Agreement dated 03/31/22 at0.290%, due on 04/01/22 with a maturityvalue of $15,000,121; collateralized byU.S. Treasury and U.S. GovernmentAgency Obligations with rates rangingfrom 0.125% - 8.000%, maturity datesranging from 09/15/22 - 07/20/71, and anaggregate market value of $15,300,000. 15,000,000 15,000,000
Citigroup Global Markets, Inc.Repurchase Agreement dated 03/31/22 at0.620%, due on 05/05/22 with a maturityvalue of $5,003,014; collateralized by U.S.Treasury Obligations with rates rangingfrom 0.000% - 3.875%, maturity datesranging from 04/21/22 - 05/15/51, andvarious Common Stock with an aggregatemarket value of $5,350,305. 5,000,000 5,000,000
Citigroup Global Markets, Ltd.Repurchase Agreement dated 03/31/22 at0.300%, due on 04/01/22 with a maturityvalue of $2,700,023; collateralized by U.S.Treasury and Foreign Obligations withrates ranging from 0.125% - 2.875%,maturity dates ranging from 08/15/23 - 02/15/51, and an aggregate market value of$2,754,001. 2,700,000 2,700,000
National Bank Financial, Inc.Repurchase Agreement dated 03/31/22 at0.320%, due on 04/01/22 with a maturityvalue of $10,000,089; collateralized byU.S. Treasury Obligations with ratesranging from 0.125% - 3.000%, maturitydates ranging from 06/30/22 - 02/15/49,and an aggregate market value of$10,205,689. 10,000,000 10,000,000
National Bank of CanadaRepurchase Agreement dated 03/31/22 at0.450%, due on 04/07/22 with a maturityvalue of $24,002,100; collateralized byU.S. Treasury Obligations with ratesranging from 0.500% - 3.000%, maturitydates ranging from 11/30/23 - 08/15/48,and various Common Stock with anaggregate market value of $26,539,169. 24,000,000 24,000,000
NBC Global Finance, Ltd.Repurchase Agreement dated 03/31/22 at0.440%, due on 04/01/22 with a maturityvalue of $12,000,147; collateralized byU.S. Treasury Obligations with ratesranging from 0.125% - 4.750%, maturitydates ranging from 05/15/24 - 02/15/50,and various Common Stock with anaggregate market value of $13,324,519. 12,000,000 12,000,000Repurchase Agreement dated 03/31/22 at0.485%, due on 04/07/22 with a maturityvalue of $1,000,094; collateralized by U.S.Treasury Obligations with rates rangingfrom 0.125% - 4.750%, maturity datesranging from 05/15/24 - 02/15/50, andvarious Common Stock with an aggregatemarket value of $1,110,377. 1,000,000 1,000,000
Societe GeneraleRepurchase Agreement dated 03/31/22 at0.300%, due on 04/01/22 with a maturityvalue of $7,000,058; collateralized by U.S.Treasury Obligations with rates rangingfrom 0.125% - 3.000%, maturity datesranging from 04/30/22 - 02/15/49, and anaggregate market value of $7,140,537. 7,000,000 7,000,000
BHFTII-255
Copyright © 2022 www.secdatabase.com. All Rights Reserved.Please Consider the Environment Before Printing This Document

Table of ContentsBrighthouse Funds Trust IIT. Rowe Price Large Cap Growth Portfolio
Schedule of Investments as of March 31, 2022 (Unaudited)Securities Lending Reinvestments (f)��(Continued)
Security Description
Shares/PrincipalAmount* Value
Repurchase Agreements��(Continued)Societe Generale
Repurchase Agreement dated 03/31/22 at0.420%, due on 04/07/22 with a maturityvalue of $1,000,082; collateralized byvarious Common Stock with an aggregatemarket value of $1,111,290. 1,000,000 $1,000,000
TD Prime Services LLCRepurchase Agreement dated 03/31/22 at0.400%, due on 04/01/22 with a maturityvalue of $15,000,167; collateralized byvarious Common Stock with an aggregatemarket value of $16,899,981. 15,000,000 15,000,000
115,341,765
Time Deposits��0.3%Canadian Imperial Bank of Commerce
0.320%, 04/01/22 1,000,000 1,000,000Jyske Bank A/S
0.750%, 04/11/22 5,000,000 5,000,000Rabobank (New York)
0.310%, 04/01/22 1,000,000 1,000,000Skandi (NY)
0.300%, 04/01/22 1,000,000 1,000,0008,000,000
Mutual Funds��0.2%Goldman Sachs Financial Square
Government Fund, Institutional Shares0.250% (h) 5,000,000 5,000,000
Total Securities Lending Reinvestments(Cost $234,338,907) 234,261,940
Total Investments�109.4%(Cost $1,710,051,057) 2,647,449,016
Other assets and liabilities (net)�(9.4)% (227,405,726 )Net Assets��100.0% $2,420,043,290
* Principal amount stated in U.S. dollars unless otherwise noted.� Restricted securities are not registered under the Securities Act of 1933 and are subject to legal restrictions on resale. These securities generally
may be resold in transactions exempt from registration or to the public if the securities are subsequently registered. Disposal of these securitiesmay involve time-consuming negotiations and prompt sale at an acceptable price may be difficult. As of March 31, 2022, the market value ofrestricted securities was $126,197,498, which is 5.2% of net assets. See details shown in the Restricted Securities table that follows.
(a) Non-income producing security.(b) All or a portion of the security was held on loan. As of March 31, 2022, the market value of securities loaned was $230,747,640 and the collateral
received consisted of cash in the amount of $234,324,448 and non-cash collateral with a value of $7,678,775. The cash collateral investments aredisclosed in the Schedule of Investments and categorized as Securities Lending Reinvestments. The non-cash collateral received consists of U.S.government securities that are held in safe-keeping by the lending agent, or a third-party custodian, and cannot be sold or repledged by thePortfolio.
(c) Security was valued in good faith under procedures approved by the Board of Trustees. As of March 31, 2022, these securities represent 5.2% ofnet assets.
(d) Significant unobservable inputs were used in the valuation of this portfolio security; i.e. Level 3.(e) Affiliated Issuer.(f) Represents investment of cash collateral received from securities on loan as of March 31, 2022.(g) Variable or floating rate security. The stated rate represents the rate at March 31, 2022. Maturity date shown for callable securities reflects the
earliest possible call date. For securities based on a published reference index and spread, the index and spread are indicated in the descriptionabove. For certain variable rate securities, the coupon rate is determined by the issuer/agent based on current market conditions. For certain asset-and mortgage-backed securities, the coupon rate may fluctuate based on changes of the underlying collateral or prepayments of principal. Thesesecurities do not indicate a reference index and spread in their description above.
(h) The rate shown represents the annualized seven-day yield as of March 31, 2022.
Copyright © 2022 www.secdatabase.com. All Rights Reserved.Please Consider the Environment Before Printing This Document

Restricted SecuritiesAcquisition
Date Shares Cost ValueANT International Co., Ltd. - Class C 06/07/18 2,147,070 $8,183,290 $6,119,150Aurora Innovation, Inc. 03/01/19 445,565 1,896,572 2,407,693Epic Games, Inc. 06/18/20 7,860 4,519,500 6,772,962GM Cruise Holdings LLC - Series F 05/05/19 196,100 3,578,825 5,167,235Magic Leap, Inc. - Class A 01/20/16 10,914 5,305,346 209,569Maplebear, Inc. 08/07/20 17,978 832,991 1,725,888Maplebear, Inc. - Series A 11/18/20 2,525 154,056 242,400Maplebear, Inc. - Series G 07/02/20 36,727 1,766,271 3,525,792Maplebear, Inc. (Non-Voting Shares) 08/07/20 939 43,508 90,144Nuro, Inc. - Series C 10/30/20 179,741 2,346,447 3,746,830Rappi, Inc. - Series E 09/08/20-09/24/20 52,748 3,151,484 2,992,394Rivian Automotive, Inc. 12/23/19-01/19/21 1,781,979 28,125,286 86,542,703Sila Nano, Inc. - Series F 01/07/21 52,110 2,150,726 1,624,269Stripe, Inc. - Class B 12/17/19 63,278 992,832 2,598,827Waymo LLC - Series A-2 05/08/20 26,511 2,276,425 2,431,642
$126,197,498
BHFTII-256
Copyright © 2022 www.secdatabase.com. All Rights Reserved.Please Consider the Environment Before Printing This Document

Table of ContentsBrighthouse Funds Trust IIT. Rowe Price Large Cap Growth Portfolio
Schedule of Investments as of March 31, 2022 (Unaudited)Glossary of Abbreviations
Index Abbreviations
(SOFR)� Secured Overnight Financing Rate
Other Abbreviations
(ADR)� American Depositary Receipt
Fair Value HierarchyAccounting principles generally accepted in the United States of America (�GAAP�) define fair market value as the price that the Portfolio would receive tosell an asset or pay to transfer a liability in an orderly transaction between market participants at the measurement date. It establishes a fair valuehierarchy that prioritizes inputs to valuation methods and requires disclosure of the fair value hierarchy, separately for each major category of assets andliabilities, that segregates fair value measurements into three levels. Levels 1, 2 and 3 of the fair value hierarchy are defined as follows:
Level 1 - unadjusted quoted prices in active markets for identical investmentsLevel 2 - other significant observable inputs (including, but not limited to, quoted prices for similar assets or liabilities in markets that are either activeor inactive; inputs other than quoted prices that are observable such as interest rates, yield curves, volatilities, prepayment speeds, loss severities,credit risks, default rates, or other market corroborated inputs)Level 3 - significant unobservable inputs based on the best information available in the circumstances, to the extent observable inputs areunavailable (including the Portfolio�s own assumptions used in determining the fair value of investments and derivative financial instruments)
The inputs or methodologies used for valuing investments are not necessarily an indication of the risk associated with investing in them. Changes to theinputs or methodologies used may result in transfers between levels. A reconciliation of Level 3 securities, if any, will be disclosed following the fair valuehierarchy table. For more information about the Portfolio�s policy regarding the valuation of investments, please refer to the Notes to Schedule ofInvestments.
The following table summarizes the fair value hierarchy of the Portfolio�s investments as of March 31, 2022:
Description Level 1 Level 2 Level 3 TotalCommon Stocks
Aerospace & Defense $� $16,486,304 $� $16,486,304Air Freight & Logistics 18,305,032 � � 18,305,032Automobiles 75,624,418 88,950,396 � 164,574,814Biotechnology 7,134,519 � � 7,134,519Capital Markets 6,356,268 � � 6,356,268Commercial Services & Supplies 5,944,825 � � 5,944,825Consumer Finance 4,970,038 � � 4,970,038Electrical Equipment 15,995,858 � � 15,995,858Electronic Equipment, Instruments & Components 26,075,942 � � 26,075,942Entertainment 80,306,085 � � 80,306,085Health Care Equipment & Supplies 81,257,680 � � 81,257,680Health Care Providers & Services 69,307,673 � � 69,307,673Hotels, Restaurants & Leisure 96,572,216 � � 96,572,216Industrial Conglomerates 19,660,824 � � 19,660,824Interactive Media & Services 346,674,334 � � 346,674,334Internet & Direct Marketing Retail 286,896,052 � 1,816,032 288,712,084IT Services 162,566,834 11,677,860 2,598,827 176,843,521Leisure Products 9,060,739 � � 9,060,739Life Sciences Tools & Services 11,571,175 � � 11,571,175Pharmaceuticals 30,071,757 � � 30,071,757Professional Services 21,845,201 � � 21,845,201Semiconductors & Semiconductor Equipment 141,676,934 � � 141,676,934Software 487,582,326 � 6,982,531 494,564,857Specialty Retail 37,270,752 � � 37,270,752Technology Hardware, Storage & Peripherals 163,455,040 � � 163,455,040Textiles, Apparel & Luxury Goods 23,226,071 � � 23,226,071
Total Common Stocks 2,229,408,593 117,114,560 11,397,390 2,357,920,543Total Convertible Preferred Stocks* � � 25,849,712 25,849,712Total Short-Term Investment* 29,416,821 � � 29,416,821Securities Lending Reinvestments
Copyright © 2022 www.secdatabase.com. All Rights Reserved.Please Consider the Environment Before Printing This Document

Certificates of Deposit � 92,932,410 � 92,932,410Commercial Paper � 12,987,765 � 12,987,765Repurchase Agreements � 115,341,765 � 115,341,765
BHFTII-257
Copyright © 2022 www.secdatabase.com. All Rights Reserved.Please Consider the Environment Before Printing This Document

Table of ContentsBrighthouse Funds Trust IIT. Rowe Price Large Cap Growth Portfolio
Schedule of Investments as of March 31, 2022 (Unaudited)Fair Value Hierarchy��(Continued)
Description Level 1 Level 2 Level 3 TotalTime Deposits $� $8,000,000 $� $8,000,000Mutual Funds 5,000,000 � � 5,000,000
Total Securities Lending Reinvestments 5,000,000 229,261,940 � 234,261,940Total Investments $2,263,825,414 $346,376,500 $37,247,102 $2,647,449,016Collateral for Securities Loaned (Liability) $� $(234,324,448) $� $(234,324,448 )
* See Schedule of Investments for additional detailed categorizations.
Following is a reconciliation of Level 3 assets for which significant unobservable inputs were used to determine fair value:
Investments in Securities
Balance as ofDecember 31,
2021
Change inUnrealized
Appreciation/(Depreciation)
Balance as ofMarch 31,
2022
Change inUnrealized
Appreciation/(Depreciation)
from InvestmentsHeld at
March 31,2022
Common StocksInternet & Direct Marketing Retail $2,246,394 $ (430,362 ) $1,816,032 $ (430,362 )IT Services 4,090,923 (1,492,096 ) 2,598,827 (1,492,096 )Software 7,767,844 (785,313 ) 6,982,531 (785,313 )
Convertible Preferred StocksAutomobiles 13,496,433 (526,457 ) 12,969,976 (526,457 )Internet & Direct Marketing Retail 15,921,722 (3,041,986 ) 12,879,736 (3,041,986 )
$43,523,316 $ (6,276,214 ) $37,247,102 $ (6,276,214 )
Fair Value atMarch 31,
2022 Valuation Technique(s) Unobservable Input RangeWeightedAverage
Relationship BetweenFair Value and Input; ifinput value increases
then Fair Value:Common Stock
Internet &DirectMarketingRetail $1,816,032 (a) Market Transaction Method Precedent Transaction $118.75 $125.00 $121.88 Increase
Comparable Company Analysis Enterprise Value/EBITDA 12.7x 95.2x 43.3x IncreaseDiscount for Lack of Marketability 10.00 % 10.00 % 10.00 % Decrease
IT Services 2,598,827 Market Transaction Method Precedent Transaction $40.13 $40.13 $40.13 IncreaseComparable Company Analysis Enterprise Value/Gross Profit 25.2x 33.8x 29.5x Increase
Discount for Lack of Marketability 10.00 % 10.00 % 10.00 % DecreaseSoftware 6,772,962 Market Transaction Method Precedent Transaction $885.00 $885.00 $885.00 Increase
Comparable Company Analysis Enterprise Value/Sales 5.5x 6.6x 6.1x IncreaseDiscount for Lack of Marketability 10.00 % 10.00 % 10.00 % Decrease
209,569 Market Transaction MethodPrecedent Transaction (SplitAdj.) $19.20 $19.20 $19.20 Increase
ConvertiblePreferred Stocks
Automobiles 5,167,235 Market Transaction Method Precedent Transaction $26.35 $26.35 $26.35 Increase3,746,830 Market Transaction Method Precedent Transaction $20.85 $20.85 $20.85 Increase1,624,269 (a) Market Transaction Method Precedent Transaction $41.27 $41.27 $41.27 Increase
Comparable Company Analysis Enterprise Value/Revenue 6.2x 6.2x 6.2x IncreaseEnterprise Value/EBITDA 4.3x 4.3x 4.3x IncreaseDiscount for Lack of Marketability 10.00 % 10.00 % 10.00 % Decrease
2,431,642 Market Transaction Method Precedent Transaction $91.72 $91.72 $91.72 IncreaseInternet &
DirectMarketingRetail 6,119,150 Comparable Company Analysis Price/Earnings Multiple 8.8x 18.8x 13.8x Increase
Discount for Lack of Marketability 10.00 % 10.00 % 10.00 % Decrease
Copyright © 2022 www.secdatabase.com. All Rights Reserved.Please Consider the Environment Before Printing This Document

3,768,192 (a) Market Transaction Method Precedent Transaction $118.75 $125.00 $121.88 IncreaseComparable Company Analysis Enterprise Value/EBITDA 12.7x 95.2x 43.3x Increase
Discount for Lack of Marketability 10.00 % 10.00 % 10.00 % Decrease2,992,394 (a) Market Transaction Method Precedent Transaction $64.42 $64.42 $64.42 Increase
Comparable Company Analysis Enterprise Value/Revenue 3.3x 3.3x 3.3x IncreaseEnterprise Value/GMV 0.7x 0.7x 0.7x IncreaseDiscount for Lack of Marketability 10.00 % 10.00 % 10.00 % Decrease
(a) For the period ended March 31, 2022, the valuation technique changed to a multi-tiered approach. The investments were previously valued utilizingonly the precedent transaction price. The change was due to the consideration of the market environment and the most recent financial informationthat was available at the time the investments were valued.
BHFTII-258
Copyright © 2022 www.secdatabase.com. All Rights Reserved.Please Consider the Environment Before Printing This Document

Table of ContentsBrighthouse Funds Trust II
T. Rowe Price Small Cap Growth Portfolio
Schedule of Investments as of March 31, 2022 (Unaudited)Common Stocks��98.8% of Net Assets
Security Description Shares Value
Aerospace & Defense��1.4%Curtiss-Wright Corp. (a) 42,056 $6,315,129Hexcel Corp. (a) 82,351 4,897,414Mercury Systems, Inc. (b) 29,269 1,886,387Moog, Inc. - Class A 34,562 3,034,544Woodward, Inc. (a) 31,875 3,981,506
20,114,980
Air Freight & Logistics��0.5%GXO Logistics, Inc. (b) 99,169 7,074,716
Auto Components��0.7%Adient plc (a) (b) 71,727 2,924,310LCI Industries 21,336 2,214,890Patrick Industries, Inc. 79,303 4,781,971
9,921,171
Banks��1.2%Bancorp, Inc. (The) (a) (b) 57,328 1,624,102First Bancorp 49,677 2,075,008Metropolitan Bank Holding Corp. (b) 17,173 1,747,696Signature Bank 20,138 5,910,302Western Alliance Bancorp 66,514 5,508,690
16,865,798
Beverages��0.7%Boston Beer Co., Inc. (The) - Class A (b) 8,578 3,332,296Coca-Cola Consolidated, Inc. 11,824 5,874,754
9,207,050
Biotechnology��8.5%ACADIA Pharmaceuticals, Inc. (b) 119,864 2,903,106Agios Pharmaceuticals, Inc. (b) 61,268 1,783,511Alector, Inc. (b) 49,782 709,394Alkermes plc (b) 161,826 4,257,642Allogene Therapeutics, Inc. (a) (b) 40,292 367,060Amicus Therapeutics, Inc. (b) 167,196 1,583,346Apellis Pharmaceuticals, Inc. (b) 66,497 3,378,713Biohaven Pharmaceutical Holding Co., Ltd. (b) 61,550 7,297,984Blueprint Medicines Corp. (b) 61,444 3,925,043C4 Therapeutics, Inc. (b) 12,500 303,250CareDx, Inc. (a) (b) 55,484 2,052,353Cerevel Therapeutics Holdings, Inc. (a) (b) 36,855 1,290,294ChemoCentryx, Inc. (a) (b) 47,022 1,178,842CRISPR Therapeutics AG (a) (b) 36,982 2,321,360Denali Therapeutics, Inc. (a) (b) 88,666 2,852,385Emergent BioSolutions, Inc. (b) 29,761 1,221,987Exact Sciences Corp. (a) (b) 41,745 2,918,810Exelixis, Inc. (b) 131,740 2,986,546Fate Therapeutics, Inc. (a) (b) 63,510 2,462,283Generation Bio Co. (a) (b) 68,300 501,322Global Blood Therapeutics, Inc. (a) (b) 72,928 2,526,226Halozyme Therapeutics, Inc. (a) (b) 192,439 7,674,467Horizon Therapeutics plc (b) 73,940 7,779,227IGM Biosciences, Inc. (a) (b) 22,768 608,589Insmed, Inc. (a) (b) 174,516 4,101,126
Biotechnology��(Continued)Intellia Therapeutics, Inc. (a) (b) 61,587 4,475,527Ionis Pharmaceuticals, Inc. (a) (b) 105,487 3,907,238Iovance Biotherapeutics, Inc. (a) (b) 106,144 1,767,298Karuna Therapeutics, Inc. (a) (b) 16,294 2,065,916
Copyright © 2022 www.secdatabase.com. All Rights Reserved.Please Consider the Environment Before Printing This Document

Kymera Therapeutics, Inc. (b) 22,915 969,763Madrigal Pharmaceuticals, Inc. (a) (b) 7,627 748,361Mirati Therapeutics, Inc. (a) (b) 26,846 2,207,278Monte Rosa Therapeutics, Inc. (a) (b) 9,800 137,396Morphic Holding, Inc. (a) (b) 16,800 674,520Neurocrine Biosciences, Inc. (b) 32,046 3,004,313Nurix Therapeutics, Inc. (b) 23,600 330,636Prothena Corp. plc (a) (b) 52,814 1,931,408PTC Therapeutics, Inc. (b) 78,784 2,939,431Replimune Group, Inc. (b) 52,779 896,187Rocket Pharmaceuticals, Inc. (a) (b) 44,470 705,294Sage Therapeutics, Inc. (b) 41,892 1,386,625Sarepta Therapeutics, Inc. (b) 64,543 5,042,099Scholar Rock Holding Corp. (a) (b) 42,983 554,051Seagen, Inc. (b) 20,630 2,971,752TG Therapeutics, Inc. (a) (b) 79,381 754,913Turning Point Therapeutics, Inc. (b) 48,958 1,314,522Twist Bioscience Corp. (a) (b) 36,698 1,812,147Ultragenyx Pharmaceutical, Inc. (a) (b) 96,625 7,016,908Xencor, Inc. (b) 77,624 2,071,008Zentalis Pharmaceuticals, Inc. (a) (b) 24,973 1,152,254
119,821,711
Building Products��1.9%AAON, Inc. (a) 41,300 2,301,649Builders FirstSource, Inc. (b) 120,892 7,802,370CSW Industrials, Inc. (a) 24,390 2,868,020Gibraltar Industries, Inc. (b) 53,695 2,306,200Trex Co., Inc. (b) 72,602 4,743,089UFP Industries, Inc. 94,606 7,299,799
27,321,127
Capital Markets��1.5%Cboe Global Markets, Inc. 12,764 1,460,457FactSet Research Systems, Inc. 9,742 4,229,489LPL Financial Holdings, Inc. 51,435 9,396,146MarketAxess Holdings, Inc. 16,401 5,579,620
20,665,712
Chemicals��1.9%Balchem Corp. 25,200 3,444,840Chase Corp. (a) 26,440 2,297,901Element Solutions, Inc. 222,858 4,880,590HB Fuller Co. 46,218 3,053,623Ingevity Corp. (a) (b) 55,332 3,545,121Livent Corp. (a) (b) 141,687 3,693,780Quaker Chemical Corp. (a) 13,814 2,387,198Scotts Miracle-Gro Co. (The) (a) 24,619 3,027,152
26,330,205
BHFTII-259
Copyright © 2022 www.secdatabase.com. All Rights Reserved.Please Consider the Environment Before Printing This Document

Table of ContentsBrighthouse Funds Trust IIT. Rowe Price Small Cap Growth Portfolio
Schedule of Investments as of March 31, 2022 (Unaudited)Common Stocks��(Continued)
Security Description Shares Value
Commercial Services & Supplies��1.9%Casella Waste Systems, Inc. - Class A (b) 163,595 $14,339,102Clean Harbors, Inc. (b) 36,023 4,021,608IAA, Inc. (b) 113,789 4,352,429MSA Safety, Inc. (a) 27,381 3,633,458UniFirst Corp. 3,035 559,290
26,905,887
Communications Equipment��0.5%Lumentum Holdings, Inc. (a) (b) 51,457 5,022,203Ubiquiti, Inc. (a) 8,002 2,329,863
7,352,066
Construction & Engineering��1.0%Comfort Systems USA, Inc. 71,002 6,319,888EMCOR Group, Inc. 71,429 8,045,048
14,364,936
Construction Materials��0.4%Eagle Materials, Inc. 39,532 5,074,328
Consumer Finance��0.2%SLM Corp. (a) 180,926 3,321,801
Containers & Packaging��0.3%Berry Global Group, Inc. (b) 65,988 3,824,664Ranpak Holdings, Corp. (a) (b) 43,051 879,532
4,704,196
Distributors��0.5%Pool Corp. (a) 16,223 6,859,896
Diversified Consumer Services��0.6%Bright Horizons Family Solutions, Inc. (a) (b) 21,062 2,794,717Terminix Global Holdings, Inc. (b) 123,967 5,656,614
8,451,331
Diversified TelecommunicationServices��0.6%Cogent Communications Holdings, Inc. 60,098 3,987,502Iridium Communications, Inc. (b) 118,749 4,787,960
8,775,462
Electrical Equipment��0.5%Atkore, Inc. (b) 71,951 7,082,856
Electronic Equipment, Instruments & Components��3.0%Advanced Energy Industries, Inc. 59,876 5,154,126Cognex Corp. 63,829 4,924,407ePlus, Inc. (b) 30,434 1,706,130Fabrinet (b) 53,783 5,654,207Littelfuse, Inc. 25,477 6,354,219Novanta, Inc. (a) (b) 59,979 8,534,412Teledyne Technologies, Inc. (b) 12,810 6,054,390Zebra Technologies Corp. - Class A (b) 10,471 4,331,853
42,713,744
Energy Equipment & Services��0.7%Cactus, Inc. - Class A 101,294 5,747,422ChampionX Corp. (b) 137,936 3,376,673ProPetro Holding Corp. (b) 85,781 1,194,929
10,319,024
Copyright © 2022 www.secdatabase.com. All Rights Reserved.Please Consider the Environment Before Printing This Document

Equity Real Estate Investment Trusts��2.0%Equity LifeStyle Properties, Inc. 66,240 5,066,035First Industrial Realty Trust, Inc. 107,578 6,660,154Innovative Industrial Properties, Inc. 20,690 4,249,726Ryman Hospitality Properties, Inc. (b) 42,300 3,924,171Terreno Realty Corp. 112,770 8,350,619
28,250,705
Food & Staples Retailing��1.4%BJ�s Wholesale Club Holdings, Inc. (a) (b) 152,307 10,297,476Casey�s General Stores, Inc. 12,974 2,571,058Performance Food Group Co. (b) 121,852 6,203,485
19,072,019
Food Products��2.1%Darling Ingredients, Inc. (b) 162,552 13,065,930Hain Celestial Group, Inc. (The) (a) (b) 74,257 2,554,441J & J Snack Foods Corp. (a) 32,738 5,077,664John B Sanfilippo & Son, Inc. 29,609 2,470,575Sanderson Farms, Inc. 18,103 3,394,131Simply Good Foods Co. (The) (b) 92,600 3,514,170
30,076,911
Health Care Equipment & Supplies��4.8%AtriCure, Inc. (b) 50,432 3,311,869CONMED Corp. (a) 32,140 4,774,397Globus Medical, Inc. - Class A (b) 105,891 7,812,638Haemonetics Corp. (b) 33,247 2,101,875ICU Medical, Inc. (a) (b) 36,397 8,103,428Inari Medical, Inc. (b) 17,500 1,586,200iRhythm Technologies, Inc. (b) 3,600 566,892Lantheus Holdings, Inc. (b) 28,421 1,571,966Merit Medical Systems, Inc. (b) 106,077 7,056,242Nevro Corp. (b) 37,193 2,690,170NuVasive, Inc. (b) 8,526 483,424Penumbra, Inc. (a) (b) 18,789 4,173,601Quidel Corp. (b) 15,102 1,698,371Shockwave Medical, Inc. (b) 37,909 7,860,810STERIS plc (a) 21,684 5,242,541Tandem Diabetes Care, Inc. (b) 75,759 8,810,014
67,844,438
Health Care Providers & Services��4.3%Addus HomeCare Corp. (b) 46,958 4,380,712Amedisys, Inc. (a) (b) 42,710 7,358,506AMN Healthcare Services, Inc. (b) 99,122 10,341,398Chemed Corp. 3,784 1,916,785Corvel Corp. (b) 34,704 5,845,542Ensign Group, Inc. (The) 110,800 9,973,108Invitae Corp. (a) (b) 13,787 109,883
BHFTII-260
Copyright © 2022 www.secdatabase.com. All Rights Reserved.Please Consider the Environment Before Printing This Document

Table of ContentsBrighthouse Funds Trust IIT. Rowe Price Small Cap Growth Portfolio
Schedule of Investments as of March 31, 2022 (Unaudited)Common Stocks��(Continued)
Security Description Shares Value
Health Care Providers & Services��(Continued)ModivCare, Inc. (b) 24,757 $2,856,710Molina Healthcare, Inc. (b) 27,580 9,200,412Pennant Group Inc. (The) (b) 100,472 1,871,793Surgery Partners, Inc. (a) (b) 53,640 2,952,882U.S. Physical Therapy, Inc. (a) 42,988 4,275,157
61,082,888
Health Care Technology��1.2%Certara, Inc. (b) 63,798 1,370,381Inspire Medical Systems, Inc. (b) 27,637 7,094,142Omnicell, Inc. (a) (b) 63,290 8,195,422
16,659,945
Hotels, Restaurants & Leisure��6.4%Bloomin� Brands, Inc. (a) 139,674 3,064,448Boyd Gaming Corp. 129,105 8,492,527Choice Hotels International, Inc. 59,964 8,500,497Churchill Downs, Inc. 49,324 10,939,077Domino�s Pizza, Inc. 2,760 1,123,348Everi Holdings, Inc. (b) 131,400 2,759,400Hilton Grand Vacations, Inc. (b) 93,112 4,842,755Papa John�s International, Inc. 61,120 6,434,714Planet Fitness, Inc. - Class A (b) 96,479 8,150,546Red Rock Resorts, Inc. - Class A (a) 90,613 4,400,167SeaWorld Entertainment, Inc. (b) 70,235 5,228,293Six Flags Entertainment Corp. (b) 61,120 2,658,720Texas Roadhouse, Inc. 81,387 6,814,534Travel and Leisure Co. 92,744 5,373,587Vail Resorts, Inc. 21,583 5,617,407Wendy�s Co. (The) 278,517 6,119,018
90,519,038
Household Durables��1.9%Cavco Industries, Inc. (b) 17,654 4,251,966Helen of Troy, Ltd. (a) (b) 14,533 2,846,142LGI Homes, Inc. (a) (b) 28,512 2,785,052Skyline Champion Corp. (b) 43,724 2,399,573Tempur Sealy International, Inc. (a) 241,477 6,742,038TopBuild Corp. (a) (b) 46,225 8,384,753
27,409,524
Independent Power and Renewable Electricity Producers��0.5%Clearway Energy, Inc. - Class C 77,383 2,825,254NextEra Energy Partners L.P. 37,100 3,092,656Ormat Technologies, Inc. (a) 7,404 605,869
6,523,779
Insurance��0.9%Palomar Holdings, Inc. (b) 67,538 4,321,757Primerica, Inc. 60,028 8,213,031
12,534,788
Interactive Media & Services��0.3%Ziff Davis, Inc. (b) 38,704 3,745,773
Internet & Direct Marketing Retail ��0.0%Xometry, Inc. - Class A (a) (b) 14,967 550,037
IT Services��2.5%Broadridge Financial Solutions, Inc. 16,393 2,552,554
Copyright © 2022 www.secdatabase.com. All Rights Reserved.Please Consider the Environment Before Printing This Document

Euronet Worldwide, Inc. (b) 60,315 7,849,997EVERTEC, Inc. 51,247 2,097,540ExlService Holdings, Inc. (b) 63,191 9,053,374Gartner, Inc. (b) 11,423 3,397,886Kyndryl Holdings, Inc. (a) (b) 85,300 1,119,136Maximus, Inc. 23,200 1,738,840Perficient, Inc. (a) (b) 51,078 5,623,177Repay Holdings Corp. (a) (b) 63,364 935,886Switch, Inc. - Class A 47,256 1,456,430
35,824,820
Leisure Products��0.5%Brunswick Corp. 94,060 7,608,513
Life Sciences Tools & Services��3.4%Adaptive Biotechnologies Corp. (a) (b) 84,338 1,170,612Azenta, Inc. (a) 79,997 6,630,151Bruker Corp. 34,991 2,249,921Charles River Laboratories International, Inc.
(b) 18,535 5,263,384Maravai LifeSciences Holdings, Inc. - Class A
(b) 112,069 3,952,674Medpace Holdings, Inc. (b) 58,392 9,552,347NeoGenomics, Inc. (a) (b) 193,573 2,351,912Quanterix Corp. (b) 29,059 848,232Repligen Corp. (b) 44,197 8,313,014West Pharmaceutical Services, Inc. 17,769 7,297,906
47,630,153
Machinery��3.7%Albany International Corp. - Class A (a) 60,146 5,071,511Douglas Dynamics, Inc. 37,805 1,307,675Evoqua Water Technologies Corp. (b) 21,300 1,000,674Federal Signal Corp. 47,279 1,595,666Graco, Inc. 36,228 2,525,816John Bean Technologies Corp. 55,358 6,558,262Kadant, Inc. 30,878 5,996,199Lincoln Electric Holdings, Inc. 30,026 4,137,883RBC Bearings, Inc. (a) (b) 30,489 5,911,207SPX Corp. (b) 79,953 3,950,478Terex Corp. 67,848 2,419,460Toro Co. (The) 62,560 5,348,254Watts Water Technologies, Inc. - Class A 40,873 5,705,462
51,528,547
Media��1.4%Cable One, Inc. 3,830 5,608,039Nexstar Media Group, Inc. - Class A 42,730 8,053,750TechTarget, Inc. (b) 56,846 4,620,443Thryv Holdings, Inc. (a) (b) 58,200 1,636,584
19,918,816
BHFTII-261
Copyright © 2022 www.secdatabase.com. All Rights Reserved.Please Consider the Environment Before Printing This Document

Table of ContentsBrighthouse Funds Trust IIT. Rowe Price Small Cap Growth Portfolio
Schedule of Investments as of March 31, 2022 (Unaudited)Common Stocks��(Continued)
Security Description Shares Value
Metals & Mining��2.0%Alcoa Corp. 184,261 $16,589,018Arconic Corp. (b) 74,600 1,911,252Cleveland-Cliffs, Inc. (a) (b) 310,916 10,014,604
28,514,874
Oil, Gas & Consumable Fuels��2.6%APA Corp. 80,809 3,339,836Magnolia Oil & Gas Corp. - Class A 341,829 8,084,256Matador Resources Co. (a) 57,985 3,072,045PDC Energy, Inc. 64,359 4,677,612Range Resources Corp. (b) 52,935 1,608,165SM Energy Co. 95,651 3,725,607Targa Resources Corp. 64,254 4,849,249Texas Pacific Land Corp. (a) 4,940 6,679,424
36,036,194
Paper & Forest Products��0.4%Louisiana-Pacific Corp. 94,774 5,887,361
Personal Products��0.5%BellRing Brands, Inc. (a) (b) 107,059 2,470,922Inter Parfums, Inc. (a) 43,500 3,830,175
6,301,097
Pharmaceuticals��1.1%Arvinas, Inc. (a) (b) 39,091 2,630,824Catalent, Inc. (b) 63,149 7,003,224Pacira BioSciences, Inc. (a) (b) 41,081 3,135,302Reata Pharmaceuticals, Inc. - Class A (a) (b) 8,656 283,571Supernus Pharmaceuticals, Inc. (a) (b) 56,472 1,825,175
14,878,096
Professional Services��3.1%ASGN, Inc. (b) 78,723 9,187,761Booz Allen Hamilton Holding Corp. 62,033 5,448,979CACI International, Inc. - Class A (b) 33,129 9,980,443Exponent, Inc. 119,671 12,930,452Insperity, Inc. (a) 64,375 6,464,537
44,012,172
Road & Rail��1.4%Landstar System, Inc. 29,026 4,377,991Saia, Inc. (a) (b) 45,172 11,013,837XPO Logistics, Inc. (b) 50,556 3,680,477
19,072,305
Semiconductors & Semiconductor Equipment��5.6%Axcelis Technologies, Inc. (b) 48,404 3,655,954Cirrus Logic, Inc. (b) 41,684 3,534,386Diodes, Inc. (b) 63,886 5,557,443Entegris, Inc. 57,435 7,538,918FormFactor, Inc. (a) (b) 147,690 6,207,411Kulicke & Soffa Industries, Inc. (a) 70,554 3,952,435Lattice Semiconductor Corp. (b) 163,077 9,939,543
Semiconductors & SemiconductorEquipment��(Continued)MaxLinear, Inc. (b) 107,491 6,272,100MKS Instruments, Inc. (a) 45,425 6,813,750Monolithic Power Systems, Inc. 6,501 3,157,406Onto Innovation, Inc. (a) (b) 53,141 4,617,421
Copyright © 2022 www.secdatabase.com. All Rights Reserved.Please Consider the Environment Before Printing This Document

Power Integrations, Inc. (a) 90,757 8,411,359SiTime Corp. (b) 7,462 1,849,233Synaptics, Inc. (b) 34,223 6,827,489
78,334,848
Software��9.9%ACI Worldwide, Inc. (a) (b) 170,489 5,368,699Alarm.com Holdings, Inc. (b) 32,036 2,129,113Altair Engineering, Inc. - Class A (a) (b) 59,080 3,804,752Aspen Technology, Inc. (b) 32,978 5,453,572Bill.com Holdings, Inc. (a) (b) 10,348 2,346,823Blackbaud, Inc. (b) 33,083 1,980,679Box, Inc. - Class A (b) 178,196 5,178,376CDK Global, Inc. 102,800 5,004,304CommVault Systems, Inc. (b) 73,431 4,872,147Consensus Cloud Solutions, Inc. (a) (b) 16,070 966,289Descartes Systems Group, Inc. (The) (b) 104,510 7,656,403Digital Turbine, Inc. (b) 101,914 4,464,852DoubleVerify Holdings, Inc. (b) 41,235 1,037,885Envestnet, Inc. (b) 72,532 5,399,282Fair Isaac Corp. (b) 14,842 6,923,199Fortinet, Inc. (b) 12,799 4,373,930Manhattan Associates, Inc. (b) 77,864 10,800,515nCino, Inc. (a) (b) 13,200 540,936NCR Corp. (a) (b) 139,476 5,605,540Paylocity Holding Corp. (b) 21,950 4,516,652Pegasystems, Inc. (a) 23,820 1,921,083PTC, Inc. (b) 36,121 3,890,954Qualys, Inc. (b) 57,013 8,119,221Rapid7, Inc. (a) (b) 52,800 5,873,472Sapiens International Corp. NV (a) 137,749 3,497,447SPS Commerce, Inc. (a) (b) 65,546 8,599,635SS&C Technologies Holdings, Inc. 67,034 5,028,891Teradata Corp. (a) (b) 109,979 5,420,865Tyler Technologies, Inc. (b) 10,615 4,722,507Workiva, Inc. (a) (b) 30,014 3,541,652
139,039,675
Specialty Retail��2.7%Abercrombie & Fitch Co. - Class A (a) (b) 72,773 2,328,008Academy Sports & Outdoors, Inc. (a) 64,300 2,533,420Asbury Automotive Group, Inc. (a) (b) 39,597 6,343,439Burlington Stores, Inc. (a) (b) 17,789 3,240,622Dick�s Sporting Goods, Inc. (a) 34,622 3,462,893Floor & Decor Holdings, Inc. - Class A (b) 79,043 6,402,483Murphy USA, Inc. 22,238 4,446,711National Vision Holdings, Inc. (a) (b) 80,825 3,521,545RH (a) (b) 7,176 2,340,022Victoria�s Secret & Co. (a) (b) 71,015 3,647,330
38,266,473
BHFTII-262
Copyright © 2022 www.secdatabase.com. All Rights Reserved.Please Consider the Environment Before Printing This Document

Table of ContentsBrighthouse Funds Trust IIT. Rowe Price Small Cap Growth Portfolio
Schedule of Investments as of March 31, 2022 (Unaudited)Common Stocks��(Continued)
Security Description
Shares/PrincipalAmount* Value
Technology Hardware, Storage & Peripherals��0.1%Pure Storage, Inc. - Class A (b) 55,165 $1,947,876
Textiles, Apparel & LuxuryGoods��1.8%Capri Holdings, Ltd. (b) 145,864 7,495,951Crocs, Inc. (b) 101,387 7,745,967Deckers Outdoor Corp. (b) 34,890 9,551,835
24,793,753
Trading Companies &Distributors��1.4%Herc Holdings, Inc. 30,911 5,164,919McGrath RentCorp 18,054 1,534,229SiteOne Landscape Supply, Inc. (a) (b) 50,836 8,219,673Watsco, Inc. 15,091 4,597,322
19,516,143
Water Utilities��0.4%Middlesex Water Co. (a) 56,517 5,943,893Total Common Stocks
(Cost $1,079,648,404) 1,392,573,451
Short-Term Investment��0.9%Mutual Funds��0.9%T. Rowe Price Government Reserve Fund
(c) 12,197,347 12,197,347Total Short-Term Investments
(Cost $12,197,347) 12,197,347
Securities Lending Reinvestments (d)��11.0%Certificates of Deposit��4.0%Bank of Montreal
0.300%, 06/02/22 3,000,000 2,997,798Barclays Bank plc
0.180%, 04/07/22 5,000,000 4,999,815BNP Paribas S.A.
0.490%, SOFR + 0.220%, 11/17/22 (e) 2,000,000 1,997,184Canadian Imperial Bank of Commerce
(NY)0.520%, SOFR + 0.250%, 02/03/23 (e) 3,000,000 2,995,5460.770%, SOFR + 0.500%, 03/03/23 (e) 3,000,000 3,001,905
Cooperatieve Rabobank UA0.840%, SOFR + 0.570%, 09/19/22 (e) 1,000,000 1,000,000
Credit Agricole S.A.0.590%, 05/24/22 3,000,000 2,999,640
Credit Industriel et CommercialZero Coupon, 04/14/22 4,000,000 3,999,320
Credit Suisse Group AG0.830%, 06/03/22 5,000,000 5,000,920
Goldman Sachs Bank USA0.470%, SOFR + 0.190%, 09/02/22 (e) 2,000,000 1,997,452
Nordea Bank Abp.0.720%, SOFR + 0.450%, 08/30/22 (e) 2,000,000 1,999,996
Oversea-Chinese Banking Corp., Ltd.Zero Coupon, 04/14/22 600,000 599,8980.720%, SOFR + 0.440%, 09/26/22 (e) 3,000,000 3,000,598
Copyright © 2022 www.secdatabase.com. All Rights Reserved.Please Consider the Environment Before Printing This Document

Royal Bank of Canada0.850%, FEDEFF PRV + 0.520%, 09/21/22 (e) 3,000,000 2,999,565
Standard Chartered Bank (NY)0.460%, SOFR + 0.190%, 08/25/22 (e) 3,000,000 2,997,550
Sumitomo Mitsui Banking Corp.0.200%, 04/26/22 3,000,000 2,999,3220.450%, SOFR + 0.180%, 08/09/22 (e) 2,000,000 1,998,046
Toronto-Dominion Bank (The)0.530%, SOFR + 0.250%, 02/09/23 (e) 3,000,000 2,999,9990.820%, FEDEFF PRV + 0.490%, 12/23/22 (e) 4,000,000 3,998,816
Westpac Banking Corp.0.500%, SOFR + 0.230%, 02/17/23 (e) 2,000,000 1,993,746
56,577,116
Commercial Paper��0.4%Macquarie Bank Ltd.
0.510%, SOFR + 0.230%, 08/04/22 (e) 2,000,000 1,998,462Societe Generale
0.460%, SOFR + 0.190%, 08/18/22 (e) 3,000,000 2,996,9734,995,435
Repurchase Agreements��5.9%Barclays Bank plc
Repurchase Agreement dated 03/31/22at 0.600%, due on 05/05/22 with amaturity value of $2,001,167;collateralized by various CommonStock with an aggregate market valueof $2,222,914. 2,000,000 2,000,000
BofA Securities, Inc.Repurchase Agreement dated 03/31/22at 0.270%, due on 04/01/22 with amaturity value of $10,973,277;collateralized by U.S. TreasuryObligations with rates ranging from2.000% - 5.000%, maturity datesranging from 05/15/37 - 02/15/50, andan aggregate market value of$11,192,660. 10,973,194 10,973,194Repurchase Agreement dated 03/31/22at 0.600%, due on 04/18/22 with amaturity value of $2,000,600;collateralized by U.S. TreasuryObligations with rates ranging from0.000% - 2.250%, maturity datesranging from 07/21/22 - 08/15/49, andvarious Common Stock with anaggregate market value of $2,116,839. 2,000,000 2,000,000Repurchase Agreement dated 03/31/22at 0.600%, due on 05/05/22 with amaturity value of $3,001,750;collateralized by U.S. TreasuryObligations with rates ranging from0.000% - 7.500%, maturity datesranging from 04/21/22 - 08/15/51, andvarious Common Stock with anaggregate market value of $3,155,671. 3,000,000 3,000,000
Cantor Fitzgerald & Co.Repurchase Agreement dated 03/31/22at 0.290%, due on 04/01/22 with amaturity value of $10,000,081;collateralized by U.S. Treasury andU.S. Government Agency Obligationswith rates ranging from 0.125% -8.000%, maturity dates ranging from09/15/22 - 07/20/71, and an aggregatemarket value of $10,200,000. 10,000,000 10,000,000
BHFTII-263
Copyright © 2022 www.secdatabase.com. All Rights Reserved.Please Consider the Environment Before Printing This Document

Table of ContentsBrighthouse Funds Trust IIT. Rowe Price Small Cap Growth Portfolio
Schedule of Investments as of March 31, 2022 (Unaudited)Securities Lending Reinvestments (d)��(Continued)
Security DescriptionPrincipalAmount* Value
Repurchase Agreements��(Continued)Citigroup Global Markets, Inc.
Repurchase Agreement dated 03/31/22at 0.620%, due on 05/05/22 with amaturity value of $8,004,822;collateralized by U.S. TreasuryObligations with rates ranging from0.000% - 3.875%, maturity dates rangingfrom 04/21/22 - 05/15/51, and variousCommon Stock with an aggregate marketvalue of $8,560,487. 8,000,000 $8,000,000
Citigroup Global Markets, Ltd.Repurchase Agreement dated 03/31/22at 0.300%, due on 04/01/22 with amaturity value of $2,600,022;collateralized by U.S. Treasury andForeign Obligations with rates rangingfrom 0.125% - 2.875%, maturity datesranging from 08/15/23 - 02/15/51, and anaggregate market value of $2,652,001. 2,600,000 2,600,000
National Bank Financial, Inc.Repurchase Agreement dated 03/31/22at 0.320%, due on 04/01/22 with amaturity value of $10,000,089;collateralized by U.S. TreasuryObligations with rates ranging from0.125% - 3.000%, maturity dates rangingfrom 06/30/22 - 02/15/49, and anaggregate market value of $10,205,689. 10,000,000 10,000,000
National Bank of CanadaRepurchase Agreement dated 03/31/22at 0.320%, due on 04/07/22 with amaturity value of $2,800,174;collateralized by U.S. TreasuryObligations with rates ranging from0.000% - 4.500%, maturity dates rangingfrom 04/14/22 - 08/15/51, and anaggregate market value of $2,857,593. 2,800,000 2,800,000
NBC Global Finance, Ltd.Repurchase Agreement dated 03/31/22at 0.440%, due on 04/01/22 with amaturity value of $10,830,057;collateralized by U.S. TreasuryObligations with rates ranging from0.125% - 4.750%, maturity dates rangingfrom 05/15/24 - 02/15/50, and variousCommon Stock with an aggregate marketvalue of $12,025,294. 10,829,925 10,829,925Repurchase Agreement dated 03/31/22at 0.485%, due on 04/07/22 with amaturity value of $2,200,207;collateralized by U.S. TreasuryObligations with rates ranging from0.125% - 4.750%, maturity dates rangingfrom 05/15/24 - 02/15/50, and variousCommon Stock with an aggregate marketvalue of $2,442,828. 2,200,000 2,200,000
Societe Generale
Copyright © 2022 www.secdatabase.com. All Rights Reserved.Please Consider the Environment Before Printing This Document

Repurchase Agreement dated 03/31/22at 0.360%, due on 04/01/22 with amaturity value of $8,900,089;collateralized by various Common Stockwith an aggregate market value of$9,889,706. 8,900,000 8,900,000Repurchase Agreement dated 03/31/22at 0.380%, due on 04/01/22 with amaturity value of $800,008; collateralizedby various Common Stock with anaggregate market value of $888,962. 800,000 800,000Repurchase Agreement dated 03/31/22at 0.410%, due on 04/01/22 with amaturity value of $6,000,068;collateralized by various Common Stockwith an aggregate market value of$6,667,738. 6,000,000 6,000,000Repurchase Agreement dated 03/31/22at 0.420%, due on 04/07/22 with amaturity value of $2,800,229;collateralized by various Common Stockwith an aggregate market value of$3,111,611. 2,800,000 2,800,000
82,903,119
Time Deposits��0.7%Rabobank (New York) 0.310%, 04/01/22 5,000,000 5,000,000Skandi (NY) 0.300%, 04/01/22 5,000,000 5,000,000
10,000,000Total Securities Lending Reinvestments
(Cost $154,502,854) 154,475,670Total Investments�110.7%
(Cost $1,246,348,605) 1,559,246,468Other assets and liabilities (net)�(10.7)% (150,254,650 )Net Assets��100.0% $1,408,991,818
* Principal amount stated in U.S. dollars unless otherwise noted.(a) All or a portion of the security was held on loan. As of March 31, 2022, the market value of securities loaned was $148,232,200 and the
collateral received consisted of cash in the amount of $154,499,416 and non-cash collateral with a value of $160,879. The cash collateralinvestments are disclosed in the Schedule of Investments and categorized as Securities Lending Reinvestments. The non-cash collateralreceived consists of U.S. government securities that are held in safe-keeping by the lending agent, or a third-party custodian, and cannotbe sold or repledged by the Portfolio.
(b) Non-income producing security.(c) Affiliated Issuer.(d) Represents investment of cash collateral received from securities on loan as of March 31, 2022.(e) Variable or floating rate security. The stated rate represents the rate at March 31, 2022. Maturity date shown for callable securities reflects
the earliest possible call date. For securities based on a published reference index and spread, the index and spread are indicated in thedescription above. For certain variable rate securities, the coupon rate is determined by the issuer/agent based on current marketconditions. For certain asset- and mortgage-backed securities, the coupon rate may fluctuate based on changes of the underlyingcollateral or prepayments of principal. These securities do not indicate a reference index and spread in their description above.
Glossary of Abbreviations
Index Abbreviations
(FEDEFF PRV)� Effective Federal Funds Rate(SOFR)� Secured Overnight Financing Rate
BHFTII-264
Copyright © 2022 www.secdatabase.com. All Rights Reserved.Please Consider the Environment Before Printing This Document

Table of ContentsBrighthouse Funds Trust IIT. Rowe Price Small Cap Growth Portfolio
Schedule of Investments as of March 31, 2022 (Unaudited)Fair Value HierarchyAccounting principles generally accepted in the United States of America (�GAAP�) define fair market value as the price that the Portfolio would receive tosell an asset or pay to transfer a liability in an orderly transaction between market participants at the measurement date. It establishes a fair valuehierarchy that prioritizes inputs to valuation methods and requires disclosure of the fair value hierarchy, separately for each major category of assets andliabilities, that segregates fair value measurements into three levels. Levels 1, 2 and 3 of the fair value hierarchy are defined as follows:
Level 1 - unadjusted quoted prices in active markets for identical investmentsLevel 2 - other significant observable inputs (including, but not limited to, quoted prices for similar assets or liabilities in markets that are either activeor inactive; inputs other than quoted prices that are observable such as interest rates, yield curves, volatilities, prepayment speeds, loss severities,credit risks, default rates, or other market corroborated inputs)Level 3 - significant unobservable inputs based on the best information available in the circumstances, to the extent observable inputs areunavailable (including the Portfolio�s own assumptions used in determining the fair value of investments and derivative financial instruments)
The inputs or methodologies used for valuing investments are not necessarily an indication of the risk associated with investing in them. Changes to theinputs or methodologies used may result in transfers between levels. A reconciliation of Level 3 securities, if any, will be disclosed following the fair valuehierarchy table. For more information about the Portfolio�s policy regarding the valuation of investments, please refer to the Notes to Schedule ofInvestments.
The following table summarizes the fair value hierarchy of the Portfolio�s investments as of March 31, 2022:
Description Level 1 Level 2 Level 3 TotalTotal Common Stocks* $1,392,573,451 $� $ � $1,392,573,451Total Short-Term Investment* 12,197,347 � � 12,197,347Total Securities Lending Reinvestments* � 154,475,670 � 154,475,670Total Investments $1,404,770,798 $154,475,670 $ � $1,559,246,468Collateral for Securities Loaned (Liability) $� $(154,499,416) $ � $(154,499,416 )
* See Schedule of Investments for additional detailed categorizations.
BHFTII-265
Copyright © 2022 www.secdatabase.com. All Rights Reserved.Please Consider the Environment Before Printing This Document

Table of ContentsBrighthouse Funds Trust II
VanEck Global Natural Resources Portfolio
Schedule of Investments as of March 31, 2022 (Unaudited)Common Stocks��98.0% of Net Assets
Security Description Shares Value
Chemicals��10.7%Corteva, Inc. 438,833 $25,224,121FMC Corp. (a) 164,700 21,669,579Mosaic Co. (The) 270,500 17,988,250Nutrien, Ltd. (a) 460,823 47,920,984OCI NV (b) 170,332 5,997,047Yara International ASA 116,500 5,809,532
124,609,513
Electrical Equipment��2.5%ESS Tech, Inc. (b) 315,000 1,754,550Fluence Energy, Inc. (a) (b) 40,540 531,479FREYR Battery S.A. (a) (b) 1,002,300 12,288,198Solid Power, Inc. (b) 125,000 1,083,750Soltec Power Holdings S.A. (a) (b) 139,189 811,825Stem, Inc. (a) (b) 1,195,332 13,160,605
29,630,407
Energy Equipment & Services��5.9%Baker Hughes Co. 550,500 20,043,705ChampionX Corp. (a) (b) 387,500 9,486,000Halliburton Co. 533,700 20,211,219Liberty Oilfield Services, Inc. - Class A (a) (b) 1,314,410 19,479,556
69,220,480
Food Products��5.7%Benson Hill, Inc. (a) (b) 345,300 1,115,319Benson Hill, Inc. (b) 315,000 1,017,450Bunge, Ltd. 299,800 33,220,838Darling Ingredients, Inc. (a) (b) 136,000 10,931,680Tyson Foods, Inc. - Class A 223,100 19,996,453
66,281,740
Independent Power and Renewable ElectricityProducers��1.1%Ormat Technologies, Inc. (a) 157,900 12,920,957
Machinery��1.6%Chart Industries, Inc. (a) (b) 105,520 18,125,170
Marine��1.3%Kirby Corp. (a) (b) 217,031 15,667,468
Metals & Mining��30.6%Agnico Eagle Mines, Ltd. (U.S. Listed
Shares) (a) 322,433 19,745,797Allkem Ltd. (b) 301,947 2,526,649Anglo American plc 766,300 39,523,045Barrick Gold Corp. 870,935 21,364,035Ecograf, Ltd. (b) 1,709,849 718,891Eldorado Gold Corp. (b) 606,500 6,798,865Endeavour Mining plc (a) 397,200 9,852,555Euro Manganese, Inc. (b) 2,483,107 765,885First Quantum Minerals, Ltd. (a) 1,465,700 50,742,308Freeport-McMoRan, Inc. 896,500 44,591,910Glencore plc 3,485,100 22,648,860Kinross Gold Corp. (a) 1,979,600 11,640,048Lundin Mining Corp. (a) 1,964,100 19,905,729
Metals & Mining��(Continued)MP Materials Corp. (a) (b) 294,985 16,914,440Newmont Corp. 384,217 30,526,041Nouveau Monde Graphite, Inc. (b) 206,533 1,431,274
Copyright © 2022 www.secdatabase.com. All Rights Reserved.Please Consider the Environment Before Printing This Document

Piedmont Lithium, Inc. (a) (b) 164,608 12,014,738Sibanye Stillwater, Ltd. (ADR) (a) 1,458,700 23,674,701Talon Metals Corp. (a) (b) 1,799,500 1,223,513Vale S.A. (ADR) (a) 1,046,900 20,927,531
357,536,815
Mortgage Real Estate Investment Trusts��2.5%Hannon Armstrong Sustainable Infrastructure
Capital, Inc. (a) 614,043 29,124,060
Oil, Gas & Consumable Fuels��29.2%Chesapeake Energy Corp. (a) 140,600 12,232,200Chevron Corp. 191,400 31,165,662ConocoPhillips 352,222 35,222,200Coterra Energy, Inc. (a) 1,257,785 33,922,461Devon Energy Corp. 689,682 40,780,897Diamondback Energy, Inc. 286,906 39,329,074EQT Corp. (a) 853,900 29,382,699Equinor ASA (ADR) (a) 1,031,600 38,695,316Neste Oyj (a) 133,100 6,063,617Pioneer Natural Resources Co. 166,687 41,676,751Valero Energy Corp. 326,300 33,132,502
341,603,379
Road & Rail��0.8%TuSimple Holdings, Inc. - Class A (a) (b) 116,750 1,424,350Union Pacific Corp. (a) 28,400 7,759,164
9,183,514
Semiconductors & Semiconductor Equipment��5.4%Enphase Energy, Inc. (a) (b) 93,000 18,765,540SolarEdge Technologies, Inc. (a) (b) 138,400 44,616,008
63,381,548
Specialty Retail��0.7%EVgo, Inc. (b) 635,000 8,166,100Total Common Stocks
(Cost $687,712,736) 1,145,451,151
Warrants��0.1%Electrical Equipment��0.1%FREYR Battery S.A., Expires 09/01/27 (b) 251,000 1,059,220
Food Products��0.0%Benson Hill, Inc., Expires 12/24/25 (b) 125,625 56,531Total Warrants
(Cost $381,941) 1,115,751
BHFTII-266
Copyright © 2022 www.secdatabase.com. All Rights Reserved.Please Consider the Environment Before Printing This Document

Table of ContentsBrighthouse Funds Trust IIVanEck Global Natural Resources Portfolio
Schedule of Investments as of March 31, 2022 (Unaudited)Short-Term Investment��0.4%
Security Description
Shares/PrincipalAmount* Value
Mutual Funds��0.4%Invesco STIC Prime Portfolio 4,229,004 $4,229,004Total Short-Term Investments
(Cost $4,229,004) 4,229,004
Securities Lending Reinvestments(c)��22.5%Certificates of Deposit��8.7%Bank of Montreal
0.300%, 06/02/22 9,000,000 8,993,394Bank of Nova Scotia
0.400%, SOFR + 0.130%, 07/07/22 (d) 3,000,000 3,000,000Barclays Bank plc
0.180%, 04/07/22 9,000,000 8,999,667BNP Paribas S.A.
0.490%, SOFR + 0.220%, 11/17/22 (d) 4,000,000 3,994,368Canadian Imperial Bank of Commerce (NY)
0.770%, SOFR + 0.500%, 03/03/23 (d) 7,000,000 7,004,446Cooperatieve Rabobank UA
0.840%, SOFR + 0.570%, 09/19/22 (d) 5,000,000 5,000,000Credit Agricole S.A.
0.590%, 05/24/22 2,000,000 1,999,760Credit Industriel et Commercial
Zero Coupon, 04/14/22 6,000,000 5,998,980Credit Suisse Group AG
0.830%, 06/03/22 5,000,000 5,000,920Goldman Sachs Bank USA
0.470%, SOFR + 0.190%, 09/02/22 (d) 3,000,000 2,996,178Mitsubishi UFJ Trust and Banking Corp.
0.430%, SOFR + 0.160%, 07/22/22 (d) 2,000,000 1,998,718MUFG Bank Ltd.
0.250%, 05/04/22 5,000,000 4,998,530National Australia Bank, Ltd.
Zero Coupon, 04/25/22 2,000,000 1,999,280National Westminster Bank plc
0.440%, 05/11/22 2,000,000 1,999,640Natixis S.A. (New York)
0.330%, 06/09/22 2,000,000 1,998,308Nordea Bank Abp.
0.720%, SOFR + 0.450%, 08/30/22 (d) 2,000,000 1,999,996Oversea-Chinese Banking Corp., Ltd.
Zero Coupon, 04/14/22 1,100,000 1,099,8130.720%, SOFR + 0.440%, 09/26/22 (d) 3,000,000 3,000,598
Royal Bank of Canada0.520%, SOFR + 0.250%, 01/11/23 (d) 5,000,000 4,988,310
Standard Chartered Bank (NY)0.460%, SOFR + 0.190%, 08/25/22 (d) 5,000,000 4,995,917
Sumitomo Mitsui Banking Corp.0.450%, SOFR + 0.180%, 08/09/22 (d) 4,000,000 3,996,092
Sumitomo Mitsui Trust Bank, Ltd.Zero Coupon, 04/19/22 3,000,000 2,999,250
Toronto-Dominion Bank (The)0.530%, SOFR + 0.250%, 02/09/23 (d) 4,000,000 3,999,9990.820%, FEDEFF PRV + 0.490%, 12/23/22 (d) 5,000,000 4,998,520
Certificates of Deposit��(Continued)Westpac Banking Corp.
0.500%, SOFR + 0.230%, 02/17/23 (d) 4,000,000 3,987,492
Copyright © 2022 www.secdatabase.com. All Rights Reserved.Please Consider the Environment Before Printing This Document

102,048,176
Commercial Paper��1.4%DNB Bank ASA
0.830%, SOFR + 0.550%, 09/07/22 (d) 5,000,000 5,001,995Macquarie Bank Ltd.
0.510%, SOFR + 0.230%, 08/04/22 (d) 2,000,000 1,998,462Skandinaviska Enskilda Banken AB
0.200%, 04/28/22 6,000,000 5,997,720UBS AG
0.350%, 06/08/22 3,000,000 2,995,48815,993,665
Repurchase Agreements��9.4%Barclays Bank plc
Repurchase Agreement dated 03/31/22 at0.600%, due on 05/05/22 with a maturityvalue of $1,500,875; collateralized byvarious Common Stock with an aggregatemarket value of $1,667,185. 1,500,000 1,500,000
BofA Securities, Inc.Repurchase Agreement dated 03/31/22 at0.270%, due on 04/01/22 with a maturityvalue of $18,165,096; collateralized byU.S. Treasury Obligations with ratesranging from 2.000% - 5.000%, maturitydates ranging from 05/15/37 - 02/15/50,and an aggregate market value of$18,528,263. 18,164,960 18,164,960Repurchase Agreement dated 03/31/22 at0.600%, due on 04/18/22 with a maturityvalue of $2,000,600; collateralized by U.S.Treasury Obligations with rates rangingfrom 0.000% - 2.250%, maturity datesranging from 07/21/22 - 08/15/49, andvarious Common Stock with an aggregatemarket value of $2,116,839. 2,000,000 2,000,000Repurchase Agreement dated 03/31/22 at0.600%, due on 05/05/22 with a maturityvalue of $3,001,750; collateralized by U.S.Treasury Obligations with rates rangingfrom 0.000% - 7.500%, maturity datesranging from 04/21/22 - 08/15/51, andvarious Common Stock with an aggregatemarket value of $3,155,671. 3,000,000 3,000,000
Cantor Fitzgerald & Co.Repurchase Agreement dated 03/31/22 at0.290%, due on 04/01/22 with a maturityvalue of $10,000,081; collateralized byU.S. Treasury and U.S. GovernmentAgency Obligations with rates rangingfrom 0.125% - 8.000%, maturity datesranging from 09/15/22 - 07/20/71, and anaggregate market value of $10,200,000. 10,000,000 10,000,000
Citigroup Global Markets, Inc.Repurchase Agreement dated 03/31/22 at0.620%, due on 05/05/22 with a maturityvalue of $5,003,014; collateralized by U.S.Treasury Obligations with rates rangingfrom 1.375% - 4.375%, maturity datesranging from 02/15/39 - 05/15/47, andvarious Common Stock with an aggregatemarket value of $5,100,673. 5,000,000 5,000,000
BHFTII-267
Copyright © 2022 www.secdatabase.com. All Rights Reserved.Please Consider the Environment Before Printing This Document

Table of ContentsBrighthouse Funds Trust IIVanEck Global Natural Resources Portfolio
Schedule of Investments as of March 31, 2022 (Unaudited)Securities Lending Reinvestments (c)��(Continued)
Security DescriptionPrincipalAmount* Value
Repurchase Agreements��(Continued)Citigroup Global Markets, Inc.
Repurchase Agreement dated 03/31/22at 0.620%, due on 05/05/22 with amaturity value of $5,003,014;collateralized by U.S. TreasuryObligations with rates ranging from0.000% - 3.875%, maturity datesranging from 04/21/22 - 05/15/51, andvarious Common Stock with anaggregate market value of $5,350,305. 5,000,000 $5,000,000
Citigroup Global Markets, Ltd.Repurchase Agreement dated 03/31/22at 0.300%, due on 04/01/22 with amaturity value of $3,700,031;collateralized by U.S. Treasury andForeign Obligations with rates rangingfrom 0.125% - 2.875%, maturity datesranging from 08/15/23 - 02/15/51, andan aggregate market value of$3,774,001. 3,700,000 3,700,000
National Bank Financial, Inc.Repurchase Agreement dated 03/31/22at 0.320%, due on 04/01/22 with amaturity value of $5,000,044;collateralized by U.S. TreasuryObligations with rates ranging from0.125% - 3.000%, maturity datesranging from 06/30/22 - 02/15/49, andan aggregate market value of$5,102,844. 5,000,000 5,000,000
National Bank of CanadaRepurchase Agreement dated 03/31/22at 0.320%, due on 04/07/22 with amaturity value of $12,400,772;collateralized by U.S. TreasuryObligations with rates ranging from0.000% - 4.500%, maturity datesranging from 04/14/22 - 08/15/51, andan aggregate market value of$12,655,054. 12,400,000 12,400,000Repurchase Agreement dated 03/31/22at 0.450%, due on 04/07/22 with amaturity value of $7,700,674;collateralized by U.S. TreasuryObligations with rates ranging from0.500% - 3.000%, maturity datesranging from 11/30/23 - 08/15/48, andvarious Common Stock with anaggregate market value of $8,514,650. 7,700,000 7,700,000
NBC Global Finance, Ltd.Repurchase Agreement dated 03/31/22at 0.440%, due on 04/01/22 with amaturity value of $12,100,148;collateralized by U.S. TreasuryObligations with rates ranging from0.125% - 4.750%, maturity datesranging from 05/15/24 - 02/15/50, andvarious Common Stock with anaggregate market value of $13,435,556. 12,100,000 12,100,000
Copyright © 2022 www.secdatabase.com. All Rights Reserved.Please Consider the Environment Before Printing This Document

Societe GeneraleRepurchase Agreement dated 03/31/22at 0.410%, due on 04/01/22 with amaturity value of $8,000,091;collateralized by various Common Stockwith an aggregate market value of$8,890,318. 8,000,000 8,000,000Repurchase Agreement dated 03/31/22at 0.300%, due on 04/01/22 with amaturity value of $1,679,913;collateralized by U.S. TreasuryObligations with rates ranging from0.125% - 3.000%, maturity datesranging from 04/30/22 - 02/15/49, andan aggregate market value of$1,713,626. 1,679,899 1,679,899Repurchase Agreement dated 03/31/22at 0.360%, due on 04/01/22 with amaturity value of $3,000,030;collateralized by various Common Stockwith an aggregate market value of$3,333,609. 3,000,000 3,000,000Repurchase Agreement dated 03/31/22at 0.380%, due on 04/01/22 with amaturity value of $1,000,011;collateralized by various Common Stockwith an aggregate market value of$1,111,203. 1,000,000 1,000,000
Security Description
Shares/PrincipalAmount* Value
Repurchase Agreements��(Continued)Societe Generale
Repurchase Agreement dated 03/31/22at 0.420%, due on 04/07/22 with amaturity value of $4,500,368;collateralized by various Common Stockwith an aggregate market value of$5,000,804. 4,500,000 4,500,000
TD Prime Services LLCRepurchase Agreement dated 03/31/22at 0.400%, due on 04/01/22 with amaturity value of $6,000,067;collateralized by various Common Stockwith an aggregate market value of$6,791,515. 6,000,000 6,000,000
109,744,859
Time Deposits��2.1%Canadian Imperial Bank of Commerce
0.320%, 04/01/22 5,000,000 5,000,000Jyske Bank A/S
0.750%, 04/11/22 5,000,000 5,000,000National Bank of Canada
0.370%, OBFR + 0.050%, 04/07/22 (d) 4,500,000 4,500,000Rabobank (New York)
0.310%, 04/01/22 5,000,000 5,000,000Skandi (NY)
0.300%, 04/01/22 5,000,000 5,000,00024,500,000
Mutual Funds��0.9%BlackRock Liquidity Funds FedFund,
Institutional Shares0.230% (e) 500,000 500,000
Goldman Sachs Financial SquareGovernment Fund, Institutional Shares0.250% (e) 10,000,000 10,000,000
10,500,000Total Securities Lending Reinvestments
(Cost $262,841,018) 262,786,700Total Investments�121.0%
(Cost $955,164,699) 1,413,582,606
Copyright © 2022 www.secdatabase.com. All Rights Reserved.Please Consider the Environment Before Printing This Document

Other assets and liabilities (net)�(21.0)% (244,988,271 )Net Assets��100.0% $1,168,594,335
* Principal amount stated in U.S. dollars unless otherwise noted.(a) All or a portion of the security was held on loan. As of March 31, 2022, the market value of securities loaned was $285,806,201 and the collateral
received consisted of cash in the amount of $262,822,817 and non-cash collateral with a value of $32,041,608. The cash collateral investments aredisclosed in the Schedule of Investments and categorized as Securities Lending Reinvestments. The non-cash collateral received consists of U.S.government securities that are held in safe-keeping by the lending agent, or a third-party custodian, and cannot be sold or repledged by thePortfolio.
(b) Non-income producing security.(c) Represents investment of cash collateral received from securities on loan as of March 31, 2022.(d) Variable or floating rate security. The stated rate represents the rate at March 31, 2022. Maturity date shown for callable securities reflects the
earliest possible call date. For securities based on a published reference index and spread, the index and spread are indicated in the descriptionabove. For certain variable rate securities, the coupon rate is determined by the issuer/agent based on current market conditions. For certain asset-and mortgage-backed securities, the coupon rate may fluctuate based on changes of the underlying collateral or prepayments of principal. Thesesecurities do not indicate a reference index and spread in their description above.
(e) The rate shown represents the annualized seven-day yield as of March 31, 2022.
BHFTII-268
Copyright © 2022 www.secdatabase.com. All Rights Reserved.Please Consider the Environment Before Printing This Document

Table of ContentsBrighthouse Funds Trust IIVanEck Global Natural Resources Portfolio
Schedule of Investments as of March 31, 2022 (Unaudited)
Glossary of Abbreviations
Index Abbreviations
(FEDEFF PRV)� Effective Federal Funds Rate(OBFR)� U.S. Overnight Bank Funding Rate(SOFR)� Secured Overnight Financing Rate
Other Abbreviations
(ADR)� American Depositary Receipt
Fair Value HierarchyAccounting principles generally accepted in the United States of America (�GAAP�) define fair market value as the price that the Portfolio would receive tosell an asset or pay to transfer a liability in an orderly transaction between market participants at the measurement date. It establishes a fair valuehierarchy that prioritizes inputs to valuation methods and requires disclosure of the fair value hierarchy, separately for each major category of assets andliabilities, that segregates fair value measurements into three levels. Levels 1, 2 and 3 of the fair value hierarchy are defined as follows:
Level 1 - unadjusted quoted prices in active markets for identical investmentsLevel 2 - other significant observable inputs (including, but not limited to, quoted prices for similar assets or liabilities in markets that are either activeor inactive; inputs other than quoted prices that are observable such as interest rates, yield curves, volatilities, prepayment speeds, loss severities,credit risks, default rates, or other market corroborated inputs)Level 3 - significant unobservable inputs based on the best information available in the circumstances, to the extent observable inputs areunavailable (including the Portfolio�s own assumptions used in determining the fair value of investments and derivative financial instruments)
The inputs or methodologies used for valuing investments are not necessarily an indication of the risk associated with investing in them. Changes to theinputs or methodologies used may result in transfers between levels. A reconciliation of Level 3 securities, if any, will be disclosed following the fair valuehierarchy table. For more information about the Portfolio�s policy regarding the valuation of investments, please refer to the Notes to Schedule ofInvestments.
The following table summarizes the fair value hierarchy of the Portfolio�s investments as of March 31, 2022:
Description Level 1 Level 2 Level 3 TotalCommon Stocks
Chemicals $112,802,934 $11,806,579 $ � $124,609,513Electrical Equipment 27,064,032 2,566,375 � 29,630,407Energy Equipment & Services 69,220,480 � � 69,220,480Food Products 65,264,290 1,017,450 � 66,281,740Independent Power and Renewable Electricity Producers 12,920,957 � � 12,920,957Machinery 18,125,170 � � 18,125,170Marine 15,667,468 � � 15,667,468Metals & Mining 291,353,485 66,183,330 � 357,536,815Mortgage Real Estate Investment Trusts 29,124,060 � � 29,124,060Oil, Gas & Consumable Fuels 335,539,762 6,063,617 � 341,603,379Road & Rail 9,183,514 � � 9,183,514Semiconductors & Semiconductor Equipment 63,381,548 � � 63,381,548Specialty Retail 8,166,100 � � 8,166,100
Total Common Stocks 1,057,813,800 87,637,351 � 1,145,451,151Total Warrants* 1,115,751 � � 1,115,751Total Short-Term Investment* 4,229,004 � � 4,229,004Securities Lending Reinvestments
Certificates of Deposit � 102,048,176 � 102,048,176Commercial Paper � 15,993,665 � 15,993,665Repurchase Agreements � 109,744,859 � 109,744,859Time Deposits � 24,500,000 � 24,500,000Mutual Funds 10,500,000 � � 10,500,000
Total Securities Lending Reinvestments 10,500,000 252,286,700 � 262,786,700Total Investments $1,073,658,555 $339,924,051 $ � $1,413,582,606Collateral for Securities Loaned (Liability) $� $(262,822,817) $ � $(262,822,817 )
* See Schedule of Investments for additional detailed categorizations.
Copyright © 2022 www.secdatabase.com. All Rights Reserved.Please Consider the Environment Before Printing This Document

BHFTII-269
Copyright © 2022 www.secdatabase.com. All Rights Reserved.Please Consider the Environment Before Printing This Document

Table of ContentsBrighthouse Funds Trust II
Western Asset Management Strategic Bond Opportunities Portfolio
Schedule of Investments as of March 31, 2022 (Unaudited)Corporate Bonds & Notes��47.0% of Net Assets
Security DescriptionPrincipalAmount* Value
Advertising��0.3%Clear Channel Outdoor Holdings, Inc.
7.500%, 06/01/29 (144A) (a) 7,770,000 $7,753,333
Aerospace/Defense��0.9%Boeing Co. (The)
2.196%, 02/04/26 3,730,000 3,526,4033.250%, 02/01/35 (a) 1,740,000 1,553,6445.930%, 05/01/60 (a) 7,880,000 9,098,139
TransDigm, Inc.4.625%, 01/15/29 (a) 1,470,000 1,374,4065.500%, 11/15/27 (a) 3,480,000 3,453,9008.000%, 12/15/25 (144A) (a) 3,300,000 3,451,074
Triumph Group, Inc.7.750%, 08/15/25 3,829,000 3,857,258
26,314,824
Agriculture��0.2%Altria Group, Inc.
2.450%, 02/04/32 (a) 530,000 460,7134.800%, 02/14/29 115,000 120,5575.950%, 02/14/49 829,000 897,437
Vector Group, Ltd.10.500%, 11/01/26 (144A) 2,800,000 2,864,344
4,343,051
Airlines��1.5%Air Canada
3.875%, 08/15/26 (144A) 3,620,000 3,416,375Air Canada Pass-Through Trust
4.125%, 05/15/25 (144A) 510,217 495,550American Airlines Pass-Through Trust
4.950%, 02/15/25 2,943,938 2,822,082American Airlines, Inc.
11.750%, 07/15/25 (144A) (a) 3,440,000 4,016,166American Airlines, Inc./AAdvantage LoyaltyIP, Ltd.
5.500%, 04/20/26 (144A) (a) 3,570,000 3,596,7755.750%, 04/20/29 (144A) (a) 3,200,000 3,188,000
Delta Air Lines, Inc.7.000%, 05/01/25 (144A) 10,520,000 11,268,130
Delta Air Lines, Inc. / SkyMiles IP, Ltd.4.750%, 10/20/28 (144A) 990,000 997,580
Hawaiian Brand Intellectual Property Ltd. / HawaiianMiles Loyalty, Ltd.5.750%, 01/20/26 (144A) (a) 4,020,000 4,022,291
Spirit Loyalty Cayman, Ltd. / Spirit IPCayman, Ltd.8.000%, 09/20/25 (144A) (a) 4,655,999 4,958,639
United Airlines Pass-Through Trust4.875%, 01/15/26 648,000 639,542
United Airlines, Inc.4.625%, 04/15/29 (144A) (a) 1,260,000 1,198,197
40,619,327
Auto Manufacturers��1.1%Ford Motor Co.
3.250%, 02/12/32 (a) 4,270,000 3,813,665
Auto Manufacturers��(Continued)Ford Motor Credit Co. LLC
3.625%, 06/17/31 3,640,000 $3,287,921
Copyright © 2022 www.secdatabase.com. All Rights Reserved.Please Consider the Environment Before Printing This Document

4.000%, 11/13/30 (a) 7,300,000 6,874,4104.950%, 05/28/27 (a) 2,170,000 2,206,456
General Motors Co.6.125%, 10/01/25 970,000 1,041,3166.600%, 04/01/36 5,134,000 5,962,101
PM General Purchaser LLC9.500%, 10/01/28 (144A) (a) 7,440,000 7,310,767
30,496,636
Auto Parts & Equipment��0.2%American Axle & Manufacturing, Inc.
5.000%, 10/01/29 (a) 1,830,000 1,716,796Clarios Global L.P. / Clarios U.S. Finance
Co.8.500%, 05/15/27 (144A) 3,330,000 3,454,875
5,171,671
Banks��4.0%Banco Mercantil del Norte S.A.
6.875%, 5Y H15 + 5.035%, 07/06/22(144A) (b) 800,000 800,0007.625%, 10Y H15 + 5.353%, 01/10/28(144A) (b) 2,150,000 2,159,825
Barclays Bank plc7.625%, 11/21/22 2,817,000 2,887,346
Barclays plc2.000%, 5Y EUR Swap + 1.900%, 02/07/28 (EUR) (b) 7,010,000 7,797,4625.088%, 3M LIBOR + 3.054%, 06/20/30(a) (b) 200,000 207,4637.750%, 5Y USD Swap + 4.842%, 09/15/23 (b) 3,650,000 3,783,3538.000%, 5Y H15 + 5.672%, 06/15/24 (a)(b) 5,160,000 5,451,540
BBVA Bancomer S.A.5.125%, 5Y H15 + 2.650%, 01/18/33(144A) (b) 8,480,000 8,003,085
Citigroup, Inc.4.450%, 09/29/27 1,564,000 1,613,167
Credit Agricole S.A.7.875%, 5Y USD Swap + 4.898%, 01/23/24 (144A) (a) (b) 1,750,000 1,844,0638.125%, 5Y USD Swap + 6.185%, 12/23/25 (144A) (b) 7,050,000 7,839,036
Credit Suisse Group AG7.250%, 5Y USD + 4.332%, 09/12/25(144A) (a) (b) 650,000 657,3137.500%, 5Y USD Swap + 4.600%, 07/17/23 (144A) (a) (b) 3,390,000 3,441,697
Goldman Sachs Group, Inc. (The)6.750%, 10/01/37 2,000,000 2,520,284
HSBC Holdings plc6.000%, 5Y USD ICE Swap + 3.746%, 05/22/27 (a) (b) 390,000 396,8256.500%, 5Y USD ICE Swap + 3.606%, 03/23/28 (b) 670,000 681,725
Intesa Sanpaolo S.p.A.3.125%, 07/14/22 (144A) (a) 1,470,000 1,472,1883.375%, 01/12/23 (144A) 1,900,000 1,903,9335.710%, 01/15/26 (144A) (a) 16,030,000 16,375,413
Lloyds Banking Group plc4.582%, 12/10/25 1,011,000 1,031,8064.650%, 03/24/26 (a) 2,320,000 2,373,3944.947%, 5Y EURIBOR ICE Swap +5.290%, 06/27/25 (EUR) (b) 5,450,000 6,215,962
BHFTII-270
Copyright © 2022 www.secdatabase.com. All Rights Reserved.Please Consider the Environment Before Printing This Document

Table of ContentsBrighthouse Funds Trust IIWestern Asset Management Strategic Bond Opportunities Portfolio
Schedule of Investments as of March 31, 2022 (Unaudited)Corporate Bonds & Notes��(Continued)
Security DescriptionPrincipalAmount* Value
Banks��(Continued)Lloyds Banking Group plc
7.500%, 5Y USD Swap + 4.760%, 06/27/24 (a) (b) 3,580,000 $3,758,893
Natwest Group plc4.500%, 5Y UK Government Bond +3.992%, 03/31/28 (GBP) (b) 6,600,000 8,041,506
Santander UK Group Holdings plc7.375%, 5Y GBP Swap + 5.543%, 06/24/22 (GBP) (b) 2,620,000 3,471,877
UBS AG7.625%, 08/17/22 2,850,000 2,892,541
UBS Group AG7.000%, 5Y USD Swap + 4.344%, 01/31/24 (144A) (a) (b) 3,600,000 3,755,916
UniCredit S.p.A.5.459%, 5Y H15 + 4.750%, 06/30/35(144A) (a) (b) 4,960,000 4,739,5137.296%, 5Y USD ICE Swap + 4.914%,04/02/34 (144A) (b) 1,750,000 1,853,572
Wells Fargo & Co.5.013%, SOFR + 4.502%, 04/04/51 (a)(b) 3,360,000 3,987,549
111,958,247
Beverages��0.1%Anheuser-Busch InBev Worldwide, Inc.
5.550%, 01/23/49 (a) 1,870,000 2,280,0465.800%, 01/23/59 (a) 1,110,000 1,400,879
3,680,925
Biotechnology��0.2%Cidron Aida Finco Sarl
6.250%, 04/01/28 (144A) (GBP) 4,110,000 5,034,661
Building Materials��0.3%Builders FirstSource, Inc.
4.250%, 02/01/32 (144A) 2,644,000 2,462,225SRM Escrow Issuer LLC
6.000%, 11/01/28 (144A) (a) 5,470,000 5,394,8427,857,067
Chemicals��0.1%Minerals Technologies, Inc.
5.000%, 07/01/28 (144A) 1,690,000 1,609,725
Commercial Services��2.1%Adtalem Global Education, Inc.
5.500%, 03/01/28 (144A) (a) 4,990,000 4,827,825Allied Universal Holdco LLC / Allied
Universal Finance Corp.6.625%, 07/15/26 (144A) (a) 5,000,000 5,059,150
Carriage Services, Inc.4.250%, 05/15/29 (144A) (a) 5,320,000 4,955,154
CoreCivic, Inc.8.250%, 04/15/26 (a) 6,890,000 7,096,700
Legends Hospitality Holding Co. LLC / Legends Hospitality Co-Issuer, Inc.5.000%, 02/01/26 (144A) 6,680,000 6,412,800
Metropolitan Museum of Art (The)3.400%, 07/01/45 (a) 2,025,000 2,085,727
Copyright © 2022 www.secdatabase.com. All Rights Reserved.Please Consider the Environment Before Printing This Document

Paysafe Finance plc / Paysafe Holdings USCorp.4.000%, 06/15/29 (144A) (a) 3,300,000 2,805,099
Commercial Services��(Continued)Prime Security Services Borrower LLC /
Prime Finance, Inc.6.250%, 01/15/28 (144A) (a) 2,720,000 2,661,778
Rent-A-Center, Inc.6.375%, 02/15/29 (144A) (a) 4,165,000 3,810,975
StoneMor, Inc.8.500%, 05/15/29 (144A) (a) 7,980,000 7,900,200
United Rentals North America, Inc.4.000%, 07/15/30 (a) 1,540,000 1,472,7485.250%, 01/15/30 (a) 4,570,000 4,712,813
WW International, Inc.4.500%, 04/15/29 (144A) (a) 1,680,000 1,360,346
ZipRecruiter, Inc.5.000%, 01/15/30 (144A) (a) 1,810,000 1,767,592
56,928,907
Computers��0.2%NCR Corp.
5.125%, 04/15/29 (144A) (a) 4,000,000 3,845,360Vericast Corp.
11.000%, 09/15/26 (144A) (a) 1,800,000 1,757,25013.000%, 10/15/27 (144A) 230,000 277,150
5,879,760
Distribution/Wholesale��0.7%American News Co. LLC
8.500%, 10.000% PIK, 09/01/26 (144A)(c) 9,971,920 11,168,550
H&E Equipment Services, Inc.3.875%, 12/15/28 (144A) (a) 4,480,000 4,200,000
Ritchie Bros Holdings, Inc.4.750%, 12/15/31 (144A) (a) 3,150,000 3,071,250
18,439,800
Diversified Financial Services��2.5%Accelerate360 Holdings LLC
8.000%, 03/01/28 (144A) 10,418,100 10,860,869AerCap Ireland Capital DAC / AerCapGlobal Aviation Trust
3.300%, 01/30/32 2,410,000 2,172,5184.500%, 09/15/23 (a) 990,000 997,443
Aviation Capital Group LLC5.500%, 12/15/24 (144A) 3,560,000 3,664,109
Avolon Holdings Funding, Ltd.4.250%, 04/15/26 (144A) 2,950,000 2,909,156
B3 SA - Brasil Bolsa Balcao4.125%, 09/20/31 (144A) 7,000,000 6,305,950
Carlyle Holdings II Finance LLC5.625%, 03/30/43 (144A) 3,370,000 3,709,084
Coinbase Global, Inc.3.625%, 10/01/31 (144A) 3,720,000 3,171,300
Global Aircraft Leasing Co., Ltd.6.500%, 7.250% PIK, 09/15/24 (144A) (a)(c) 13,250,865 12,038,875
Jane Street Group / JSG Finance, Inc.4.500%, 11/15/29 (144A) 1,530,000 1,449,843
KKR Group Finance Co. II LLC5.500%, 02/01/43 (144A) 130,000 148,189
BHFTII-271
Copyright © 2022 www.secdatabase.com. All Rights Reserved.Please Consider the Environment Before Printing This Document

Table of ContentsBrighthouse Funds Trust IIWestern Asset Management Strategic Bond Opportunities Portfolio
Schedule of Investments as of March 31, 2022 (Unaudited)Corporate Bonds & Notes��(Continued)
Security DescriptionPrincipalAmount* Value
Diversified FinancialServices��(Continued)LD Holdings Group LLC
6.125%, 04/01/28 (144A) (a) 3,760,000 $3,326,773Midcap Financial Issuer Trust
5.625%, 01/15/30 (144A) (a) 2,150,000 1,899,8916.500%, 05/01/28 (144A) (a) 5,020,000 4,721,410
Navient Corp.5.625%, 08/01/33 (a) 1,680,000 1,414,560
Park Aerospace Holdings, Ltd.4.500%, 03/15/23 (144A) (a) 3,800,000 3,827,0135.250%, 08/15/22 (144A) 344,000 346,215
Rocket Mortgage LLC / Rocket MortgageCo-Issuer, Inc.4.000%, 10/15/33 (144A) (a) 3,510,000 3,074,409
StoneX Group, Inc.8.625%, 06/15/25 (144A) 1,620,000 1,686,841
VistaJet Malta Finance plc / XOManagement Holding, Inc.6.375%, 02/01/30 (144A) (a) 1,280,000 1,204,307
68,928,755
Electric��0.8%AES Corp. (The)
2.450%, 01/15/31 (a) 3,070,000 2,745,362FirstEnergy Corp.
4.400%, 07/15/27 1,640,000 1,650,4147.375%, 11/15/31 590,000 727,682
NRG Energy, Inc.3.625%, 02/15/31 (144A) (a) 400,000 351,836
NSG Holdings LLC / NSG Holdings, Inc.7.750%, 12/15/25 (144A) 1,341,561 1,368,393
Panoche Energy Center LLC6.885%, 07/31/29 (144A) 487,494 458,244
Southern California Edison Co.3.900%, 03/15/43 1,217,000 1,141,812
Talen Energy Supply LLC6.625%, 01/15/28 (144A) (a) 3,710,000 3,450,300
TransAlta Corp.6.500%, 03/15/40 9,409,000 9,691,270
21,585,313
Energy-Alternate Sources��0.2%Alta Wind Holdings LLC
7.000%, 06/30/35 (144A) 860,403 937,736Sunnova Energy Corp.
5.875%, 09/01/26 (144A) (a) 3,850,000 3,683,9884,621,724
Engineering & Construction��0.1%TopBuild Corp.
3.625%, 03/15/29 (144A) (a) 3,010,000 2,735,338
Entertainment��0.7%Allen Media LLC / Allen Media Co-Issuer,
Inc.10.500%, 02/15/28 (144A) (a) 6,590,000 6,492,995
AMC Entertainment Holdings, Inc.10.000%, 06/15/26 (144A) (a) 2,310,000 2,074,715
Entertainment��(Continued)
Copyright © 2022 www.secdatabase.com. All Rights Reserved.Please Consider the Environment Before Printing This Document

Boyne USA, Inc.4.750%, 05/15/29 (144A) (a) 4,120,000 3,955,200
Scientific Games International, Inc.8.625%, 07/01/25 (144A) (a) 1,600,000 1,682,000
Wynn Resorts Finance LLC / Wynn ResortsCapital Corp.7.750%, 04/15/25 (144A) (a) 4,268,000 4,428,733
18,633,643
Environmental Control��0.1%Madison IAQ LLC
5.875%, 06/30/29 (144A) (a) 4,590,000 4,119,525
Food��0.4%Co-operative Group Holdings, Ltd.
7.500%, 07/08/26 (GBP) (d) 2,410,000 3,355,450FAGE International S.A. / FAGE USA Dairy
Industry, Inc.5.625%, 08/15/26 (144A) 1,538,000 1,514,930
Kraft Heinz Foods Co.5.500%, 06/01/50 2,370,000 2,691,206
Simmons Foods, Inc.4.625%, 03/01/29 (144A) (a) 4,160,000 3,900,000
11,461,586
Food Service��0.1%TKC Holdings, Inc.
10.500%, 05/15/29 (144A) (a) 2,050,000 2,091,000
Forest Products & Paper��0.3%Suzano Austria GmbH
3.125%, 01/15/32 (a) 5,000,000 4,426,9005.750%, 07/14/26 4,200,000 4,504,500
8,931,400
Healthcare-Products��0.2%Mozart Debt Merger Sub, Inc.
3.875%, 04/01/29 (144A) (a) 6,510,000 6,021,750
Healthcare-Services��1.3%Akumin Escrow, Inc.
7.500%, 08/01/28 (144A) (a) 5,690,000 4,523,550Cano Health LLC
6.250%, 10/01/28 (144A) (a) 930,000 892,800CHS/Community Health Systems, Inc.
6.125%, 04/01/30 (144A) (a) 10,700,000 9,956,0296.875%, 04/15/29 (144A) (a) 3,630,000 3,566,475
Fresenius Medical Care U.S. Finance II, Inc.4.750%, 10/15/24 (144A) 700,000 722,565
HCA, Inc.5.500%, 06/15/47 (a) 360,000 406,2245.625%, 09/01/28 (a) 6,000,000 6,487,500
Radiology Partners, Inc.9.250%, 02/01/28 (144A) (a) 5,630,000 5,630,000
U.S. Renal Care, Inc.10.625%, 07/15/27 (144A) 3,931,000 3,744,277
35,929,420
BHFTII-272
Copyright © 2022 www.secdatabase.com. All Rights Reserved.Please Consider the Environment Before Printing This Document

Table of ContentsBrighthouse Funds Trust IIWestern Asset Management Strategic Bond Opportunities Portfolio
Schedule of Investments as of March 31, 2022 (Unaudited)Corporate Bonds & Notes��(Continued)
Security DescriptionPrincipalAmount* Value
Home Builders��0.1%MDC Holdings, Inc.
6.000%, 01/15/43 (a) 2,195,000 $2,253,091
Insurance��0.7%AXA S.A.
8.600%, 12/15/30 1,320,000 1,741,898Liberty Mutual Insurance Co.
7.697%, 10/15/97 � (144A) 2,600,000 3,521,020Massachusetts Mutual Life Insurance Co.
3.375%, 04/15/50 (144A) (a) 800,000 718,6404.900%, 04/01/77 (144A) 6,285,000 6,876,064
NMI Holdings, Inc.7.375%, 06/01/25 (144A) (a) 3,380,000 3,549,000
Prudential Financial, Inc.5.625%, 3M LIBOR + 3.920%, 06/15/43(a) (b) 550,000 553,4385.875%, 3M LIBOR + 4.175%, 09/15/42(b) 1,200,000 1,209,000
Teachers Insurance & Annuity Association ofAmerica
4.900%, 09/15/44 (144A) 1,771,000 1,952,1226.850%, 12/16/39 (144A) 216,000 282,702
20,403,884
Internet��0.4%Acuris Finance U.S., Inc. / Acuris Finance
Sarl5.000%, 05/01/28 (144A) 2,900,000 2,664,375
Photo Holdings Merger Sub, Inc.8.500%, 10/01/26 (144A) (a) 4,320,000 4,116,701
Tencent Holdings, Ltd.3.595%, 01/19/28 (144A) (a) 5,640,000 5,494,629
12,275,705
Investment Companies��0.2%The Vanguard Group, Inc.
3.050%, 08/28/50 7,460,000 6,408,182
Iron/Steel��0.3%Vale Overseas, Ltd.
6.250%, 08/10/26 (a) 3,990,000 4,379,8236.875%, 11/10/39 (a) 2,180,000 2,661,126
7,040,949
Leisure Time��1.7%Carnival Corp.
9.875%, 08/01/27 (144A) (a) 13,040,000 14,413,373Carnival plc
7.875%, 06/01/27 12,206,000 13,538,895NCL Corp., Ltd.
5.875%, 02/15/27 (144A) 5,450,000 5,368,2507.750%, 02/15/29 (144A) (a) 2,960,000 2,980,542
Saga plc5.500%, 07/15/26 (GBP) 5,800,000 7,162,018
VOC Escrow, Ltd.5.000%, 02/15/28 (144A) (a) 3,680,000 3,422,382
46,885,460
Lodging��0.8%Las Vegas Sands Corp.
Copyright © 2022 www.secdatabase.com. All Rights Reserved.Please Consider the Environment Before Printing This Document

2.900%, 06/25/25 50,000 46,5943.200%, 08/08/24 (a) 560,000 534,627
Melco Resorts Finance, Ltd.5.375%, 12/04/29 (144A) (a) 8,230,000 6,974,925
Sands China, Ltd.2.550%, 03/08/27 (144A) 1,440,000 1,250,6403.100%, 03/08/29 (144A) (a) 1,240,000 1,054,0003.250%, 08/08/31 (144A) (a) 470,000 383,0505.125%, 08/08/25 (a) 4,610,000 4,569,662
Wynn Macau, Ltd.5.125%, 12/15/29 (144A) (a) 5,550,000 4,703,6255.500%, 01/15/26 (144A) 990,000 900,9005.625%, 08/26/28 (144A) (a) 3,080,000 2,675,781
23,093,804
Machinery-Construction & Mining��0.2%Vertiv Group Corp.
4.125%, 11/15/28 (144A) (a) 5,780,000 5,274,915
Machinery-Diversified��0.3%Granite U.S. Holdings Corp.
11.000%, 10/01/27 (144A) (a) 7,520,000 7,933,600
Media��2.5%CCO Holdings LLC / CCO Holdings CapitalCorp.
4.500%, 05/01/32 (a) 4,940,000 4,518,6185.000%, 02/01/28 (144A) (a) 2,990,000 2,958,605
Charter Communications Operating LLC / Charter CommunicationsOperating Capital Corp.
3.500%, 03/01/42 (a) 470,000 388,5654.200%, 03/15/28 (a) 4,010,000 4,052,1425.375%, 04/01/38 1,580,000 1,622,921
CSC Holdings LLC4.500%, 11/15/31 (144A) (a) 3,800,000 3,405,8265.750%, 01/15/30 (144A) (a) 2,300,000 2,047,0006.500%, 02/01/29 (144A) (a) 11,000,000 11,087,340
Directv Financing LLC / Directv FinancingCo-Obligor, Inc.5.875%, 08/15/27 (144A) (a) 7,140,000 7,023,975
DISH DBS Corp.5.125%, 06/01/29 (a) 8,560,000 7,289,6105.750%, 12/01/28 (144A) (a) 4,330,000 4,097,2627.750%, 07/01/26 (a) 1,360,000 1,351,160
Gannett Holdings LLC6.000%, 11/01/26 (144A) (a) 4,410,000 4,266,675
iHeartCommunications, Inc.4.750%, 01/15/28 (144A) (a) 2,930,000 2,798,150
Liberty Interactive LLC8.250%, 02/01/30 1,550,000 1,415,3208.500%, 07/15/29 5,190,000 4,852,650
Time Warner Cable LLC5.875%, 11/15/40 1,942,000 2,087,086
Univision Communications, Inc.9.500%, 05/01/25 (144A) (a) 5,160,000 5,418,000
70,680,905
BHFTII-273
Copyright © 2022 www.secdatabase.com. All Rights Reserved.Please Consider the Environment Before Printing This Document

Table of ContentsBrighthouse Funds Trust IIWestern Asset Management Strategic Bond Opportunities Portfolio
Schedule of Investments as of March 31, 2022 (Unaudited)Corporate Bonds & Notes��(Continued)
Security DescriptionPrincipalAmount* Value
Metal Fabricate/Hardware��0.2%Park-Ohio Industries, Inc.
6.625%, 04/15/27 (a) 8,368,000 $7,008,200
Mining��2.3%Anglo American Capital plc
4.000%, 09/11/27 (144A) 2,740,000 2,745,343Barrick Gold Corp.
5.250%, 04/01/42 (a) 2,520,000 2,918,012Barrick North America Finance LLC
5.750%, 05/01/43 6,029,000 7,346,898First Quantum Minerals, Ltd.
6.875%, 03/01/26 (144A) (a) 5,000,000 5,139,2506.875%, 10/15/27 (144A) (a) 13,800,000 14,455,500
Freeport Minerals Corp.7.125%, 11/01/27 4,240,000 5,001,928
Freeport-McMoRan, Inc.5.450%, 03/15/43 (a) 10,000,000 11,198,400
Glencore Finance Canada, Ltd.5.550%, 10/25/42 (144A) (a) 1,000,000 1,106,167
Hudbay Minerals, Inc.4.500%, 04/01/26 (144A) (a) 2,660,000 2,584,6426.125%, 04/01/29 (144A) (a) 2,854,000 2,939,620
Midwest Vanadium Pty, Ltd.13.250%, 02/15/18 (144A) � (e) (f) (g) 931,574 0
Northwest Acquisitions ULC / DominionFinco, Inc.7.125%, 11/01/22 (144A) � (g) 8,475,000 85
Teck Resources, Ltd.5.400%, 02/01/43 4,575,000 4,935,5016.000%, 08/15/40 1,774,000 2,034,385
62,405,731
Office/Business Equipment��0.1%CDW LLC / CDW Finance Corp.
3.250%, 02/15/29 1,610,000 1,479,284
Oil & Gas��4.9%Berry Petroleum Co. LLC
7.000%, 02/15/26 (144A) (a) 13,300,000 13,133,750Colgate Energy Partners III LLC
5.875%, 07/01/29 (144A) (a) 10,880,000 11,216,736Continental Resources, Inc.
5.750%, 01/15/31 (144A) (a) 3,630,000 3,970,494Devon Energy Corp.
5.250%, 10/15/27 (a) 584,000 605,4495.600%, 07/15/41 (a) 110,000 126,9408.250%, 08/01/23 5,720,000 6,058,325
Endeavor Energy Resources L.P. / EERFinance, Inc.5.750%, 01/30/28 (144A) (a) 3,770,000 3,897,237
EQT Corp.3.125%, 05/15/26 (144A) (a) 900,000 874,1437.500%, 02/01/30 (a) 3,480,000 4,032,450
Gazprom PJSC Via Gaz Capital S.A.4.950%, 03/23/27 (144A) 7,980,000 3,271,800
KazMunayGas National Co. JSC5.375%, 04/24/30 (144A) 300,000 287,9476.375%, 10/24/48 (144A) 1,060,000 998,624
Oil & Gas��(Continued)
Copyright © 2022 www.secdatabase.com. All Rights Reserved.Please Consider the Environment Before Printing This Document

MEG Energy Corp.5.875%, 02/01/29 (144A) (a) 650,000 658,9377.125%, 02/01/27 (144A) (a) 5,290,000 5,538,630
Neptune Energy Bondco plc6.625%, 05/15/25 (144A) (a) 3,420,000 3,438,776
Northern Oil and Gas, Inc.8.125%, 03/01/28 (144A) (a) 5,580,000 5,813,356
Oasis Petroleum, Inc.6.375%, 06/01/26 (144A) 6,890,000 7,062,250
Occidental Petroleum Corp.4.500%, 07/15/44 (a) 1,765,000 1,686,696
Parsley Energy LLC / Parsley FinanceCorp.5.625%, 10/15/27 (144A) 3,920,000 4,051,321
Penn Virginia Escrow LLC9.250%, 08/15/26 (144A) 7,120,000 7,510,176
Petrobras Global Finance B.V.5.750%, 02/01/29 5,000,000 5,195,5006.850%, 06/05/15 (a) 6,170,000 5,786,473
Range Resources Corp.4.750%, 02/15/30 (144A) (a) 3,060,000 3,039,1315.875%, 07/01/22 1,665,000 1,665,0008.250%, 01/15/29 (a) 7,430,000 8,142,611
Southwestern Energy Co.4.750%, 02/01/32 (a) 3,880,000 3,875,1507.750%, 10/01/27 (a) 9,063,000 9,595,4518.375%, 09/15/28 1,670,000 1,832,825
Viper Energy Partners L.P.5.375%, 11/01/27 (144A) (a) 5,505,000 5,607,448
YPF S.A.6.950%, 07/21/27 (144A) 3,360,000 2,515,4818.500%, 07/28/25 (144A) 6,350,000 5,432,425
136,921,532
Packaging & Containers��0.5%ARD Finance S.A.
6.500%, 7.250% PIK, 06/30/27 (144A)(a) (c) 4,470,000 4,087,256
Ardagh Metal Packaging Finance U.S.A. LLC / Ardagh Metal PackagingFinance plc4.000%, 09/01/29 (144A) (a) 4,700,000 4,235,405
Cascades, Inc./Cascades USA, Inc.5.375%, 01/15/28 (144A) (a) 2,610,000 2,606,738
Pactiv LLC8.375%, 04/15/27 2,376,000 2,435,400
13,364,799
Pharmaceuticals��2.5%AbbVie, Inc.
4.050%, 11/21/39 (a) 5,080,000 5,219,2274.550%, 03/15/35 1,300,000 1,395,558
AdaptHealth LLC4.625%, 08/01/29 (144A) (a) 3,650,000 3,330,6985.125%, 03/01/30 (144A) (a) 1,840,000 1,708,900
Bausch Health Cos., Inc.6.125%, 02/01/27 (144A) (a) 2,470,000 2,485,660
BHFTII-274
Copyright © 2022 www.secdatabase.com. All Rights Reserved.Please Consider the Environment Before Printing This Document

Table of ContentsBrighthouse Funds Trust IIWestern Asset Management Strategic Bond Opportunities Portfolio
Schedule of Investments as of March 31, 2022 (Unaudited)Corporate Bonds & Notes��(Continued)
Security DescriptionPrincipalAmount* Value
Pharmaceuticals��(Continued)Bausch Health Cos., Inc.
7.000%, 01/15/28 (144A) (a) 1,070,000 $957,9509.000%, 12/15/25 (144A) (a) 770,000 797,778
Cheplapharm Arzneimittel GmbH5.500%, 01/15/28 (144A) 2,840,000 2,747,671
Cigna Corp.4.800%, 08/15/38 (a) 5,970,000 6,535,032
CVS Health Corp.4.780%, 03/25/38 (a) 7,610,000 8,316,4985.125%, 07/20/45 1,440,000 1,625,487
Endo DAC / Endo Finance LLC / EndoFinco, Inc.9.500%, 07/31/27 (144A) (a) 8,390,000 7,362,225
Endo Luxembourg Finance Co. I S.a.r.l.6.125%, 04/01/29 (144A) (a) 5,000,000 4,562,500
Option Care Health, Inc.4.375%, 10/31/29 (144A) (a) 6,360,000 5,962,500
Teva Pharmaceutical Finance Co. LLC6.150%, 02/01/36 (a) 12,835,000 12,963,350
Teva Pharmaceutical Finance NetherlandsIII B.V.4.750%, 05/09/27 (a) 4,210,000 4,041,390
70,012,424
Pipelines��3.4%Blue Racer Midstream LLC / Blue Racer
Finance Corp.7.625%, 12/15/25 (144A) (a) 5,130,000 5,363,979
DCP Midstream Operating L.P.6.750%, 09/15/37 (144A) (a) 3,480,000 4,080,300
El Paso Natural Gas Co. LLC7.500%, 11/15/26 (a) 4,250,000 4,971,0578.375%, 06/15/32 190,000 246,667
Energy Transfer L.P.5.500%, 06/01/27 1,376,000 1,478,7035.875%, 01/15/24 (a) 1,638,000 1,706,4856.250%, 3M LIBOR + 4.028%, 02/15/23(a) (b) 2,030,000 1,738,1886.250%, 04/15/49 1,090,000 1,250,7497.125%, 5Y H15 + 5.306%, 05/15/30 (b) 1,950,000 1,901,2507.600%, 02/01/24 (a) 630,000 672,240
Enterprise Products Operating LLC5.375%, 3M LIBOR + 2.570%, 02/15/78(a) (b) 13,090,000 12,162,458
EQM Midstream Partners L.P.6.000%, 07/01/25 (144A) 1,880,000 1,917,6856.500%, 07/01/27 (144A) (a) 1,660,000 1,733,936
Howard Midstream Energy Partners LLC6.750%, 01/15/27 (144A) 3,590,000 3,518,200
Kinder Morgan, Inc.4.300%, 06/01/25 (a) 740,000 760,0497.800%, 08/01/31 67,000 85,658
Northwest Pipeline LLC4.000%, 04/01/27 (a) 13,710,000 14,060,097
Plains All American Pipeline L.P.6.125%, 3M LIBOR + 4.110%, 11/15/22(a) (b) 2,148,000 1,821,504
Southern Natural Gas Co. LLC8.000%, 03/01/32 25,000 31,732
Summit Midstream Holdings LLC / Summit Midstream Finance Corp.
Copyright © 2022 www.secdatabase.com. All Rights Reserved.Please Consider the Environment Before Printing This Document

8.500%, 10/15/26 (144A) (a) 1,220,000 1,163,307
Pipelines��(Continued)Tallgrass Energy Partners L.P. / Tallgrass
Energy Finance Corp.6.000%, 12/31/30 (144A) (a) 3,230,000 3,134,230
Targa Resources Partners L.P. / Targa Resources Partners Finance Corp.4.875%, 02/01/31 5,120,000 5,171,200
Venture Global Calcasieu Pass LLC3.875%, 11/01/33 (144A) (a) 4,010,000 3,834,5624.125%, 08/15/31 (144A) (a) 3,570,000 3,502,705
Western Midstream Operating L.P.5.300%, 03/01/48 4,900,000 4,851,0005.450%, 04/01/44 (a) 11,710,000 11,871,130
93,029,071
Real Estate��0.4%Country Garden Holdings Co., Ltd.
8.000%, 01/27/24 1,110,000 950,382Five Point Operating Co. L.P. / Five PointCapital Corp.
7.875%, 11/15/25 (144A) 6,762,000 6,919,555Realogy Group LLC / Realogy Co-IssuerCorp.
5.750%, 01/15/29 (144A) (a) 3,950,000 3,722,87511,592,812
Real Estate Investment Trusts��1.1%Apollo Commercial Real Estate Finance,Inc.
4.625%, 06/15/29 (144A) 2,840,000 2,577,300Diversified Healthcare Trust
4.750%, 02/15/28 (a) 1,590,000 1,447,7589.750%, 06/15/25 3,500,000 3,683,750
GEO Group, Inc. (The)5.875%, 10/15/24 9,513,000 8,187,554
IIP Operating Partnership L.P.5.500%, 05/25/26 3,110,000 3,104,376
MPT Operating Partnership L.P. / MPTFinance Corp.
3.692%, 06/05/28 (GBP) 4,656,000 5,938,5505.500%, 12/15/27 2,035,000 1,962,7587.500%, 09/15/25 (a) 4,280,000 4,489,934
31,391,980
Retail��2.4%Bath & Body Works, Inc.
5.250%, 02/01/28 (a) 6,342,000 6,379,3546.625%, 10/01/30 (144A) (a) 1,850,000 1,942,500
Bed Bath & Beyond, Inc.5.165%, 08/01/44 (a) 9,312,000 6,611,520
Carrols Restaurant Group, Inc.5.875%, 07/01/29 (144A) (a) 2,760,000 2,249,400
Doman Building Materials Group, Ltd.5.250%, 05/15/26 (144A) (CAD) 3,680,000 2,818,542
Fertitta Entertainment LLC / Fertitta Entertainment Finance Co., Inc.4.625%, 01/15/29 (144A) (a) 1,130,000 1,070,6756.750%, 01/15/30 (144A) (a) 1,360,000 1,251,159
FirstCash, Inc.5.625%, 01/01/30 (144A) (a) 3,060,000 2,940,170
BHFTII-275
Copyright © 2022 www.secdatabase.com. All Rights Reserved.Please Consider the Environment Before Printing This Document

Table of ContentsBrighthouse Funds Trust IIWestern Asset Management Strategic Bond Opportunities Portfolio
Schedule of Investments as of March 31, 2022 (Unaudited)Corporate Bonds & Notes��(Continued)
Security DescriptionPrincipalAmount* Value
Retail��(Continued)Guitar Center, Inc.
8.500%, 01/15/26 (144A) 8,931,000 $9,112,389Macy�s Retail Holdings LLC
5.875%, 03/15/30 (144A) (a) 1,700,000 1,677,0676.125%, 03/15/32 (144A) (a) 1,450,000 1,431,875
Michaels Cos, Inc. (The)5.250%, 05/01/28 (144A) (a) 2,200,000 2,019,8207.875%, 05/01/29 (144A) (a) 5,520,000 4,726,500
Party City Holdings, Inc.8.750%, 02/15/26 (144A) (a) 3,170,000 3,022,357
PetSmart, Inc. / PetSmart Finance Corp.4.750%, 02/15/28 (144A) (a) 1,000,000 966,4057.750%, 02/15/29 (144A) (a) 1,836,000 1,895,670
Suburban Propane Partners L.P./Suburban Energy Finance Corp.5.000%, 06/01/31 (144A) (a) 2,430,000 2,278,125
Superior Plus L.P. / Superior GeneralPartner, Inc.4.500%, 03/15/29 (144A) (a) 2,320,000 2,179,942
Tendam Brands S.A.U.5.000%, 09/15/24 (144A) (EUR) 1,350,000 1,484,3545.250%, 3M EURIBOR + 5.250%, 09/15/24 (144A) (EUR) (b) 3,750,000 4,116,992
Wendy�s International LLC7.000%, 12/15/25 5,178,000 5,605,185
65,780,001
Semiconductors��0.1%Broadcom, Inc.
3.187%, 11/15/36 (144A) 135,000 117,192Uniquify, Inc.
6.000%, 06/15/24 (144A) � 1,720,000 1,725,6931,842,885
Software��1.1%Black Knight InfoServ LLC
3.625%, 09/01/28 (144A) (a) 3,680,000 3,487,536CDK Global, Inc.
5.250%, 05/15/29 (144A) 2,500,000 2,514,500Clarivate Science Holdings Corp.
4.875%, 07/01/29 (144A) (a) 2,540,000 2,389,657Minerva Merger Sub, Inc.
6.500%, 02/15/30 (144A) (a) 5,820,000 5,646,127MSCI, Inc.
3.250%, 08/15/33 (144A) (a) 1,130,000 1,015,658Open Text Holdings, Inc.
4.125%, 02/15/30 (144A) (a) 2,500,000 2,370,488Rackspace Technology Global, Inc.
3.500%, 02/15/28 (144A) (a) 4,980,000 4,455,232Rocket Software, Inc.
6.500%, 02/15/29 (144A) 3,000,000 2,722,500Ziff Davis, Inc.
4.625%, 10/15/30 (144A) 1,310,000 1,247,415ZoomInfo Technologies LLC
3.875%, 02/01/29 (144A) (a) 3,940,000 3,601,25929,450,372
Telecommunications��1.9%Altice France Holding S.A.
10.500%, 05/15/27 (144A) 5,640,000 5,902,288
Copyright © 2022 www.secdatabase.com. All Rights Reserved.Please Consider the Environment Before Printing This Document

Altice France S.A.5.125%, 07/15/29 (144A) (a) 3,300,000 2,957,6255.500%, 10/15/29 (144A) (a) 1,430,000 1,283,110
British Telecommunications plc9.625%, 12/15/30 3,875,000 5,286,908
LogMeIn, Inc.5.500%, 09/01/27 (144A) (a) 5,530,000 5,161,481
Millicom International Cellular S.A.4.500%, 04/27/31 (144A) (a) 3,930,000 3,659,9896.250%, 03/25/29 (144A) (a) 4,095,000 4,345,307
Sprint Capital Corp.8.750%, 03/15/32 3,000,000 4,041,000
Switch, Ltd.3.750%, 09/15/28 (144A) (a) 3,000,000 2,909,2354.125%, 06/15/29 (144A) (a) 2,910,000 2,862,712
T-Mobile USA, Inc.3.500%, 04/15/31 (a) 1,360,000 1,279,733
Verizon Communications, Inc.3.400%, 03/22/41 2,500,000 2,343,5423.550%, 03/22/51 (a) 1,300,000 1,221,6063.700%, 03/22/61 (a) 2,940,000 2,723,2515.250%, 03/16/37 660,000 768,887
Viavi Solutions, Inc.3.750%, 10/01/29 (144A) (a) 1,940,000 1,820,540
Vmed O2 UK Financing I plc4.750%, 07/15/31 (144A) (a) 4,620,000 4,354,350
52,921,564
Transportation��0.3%Carriage Purchaser, Inc.
7.875%, 10/15/29 (144A) 2,190,000 2,021,436XPO CNW, Inc.
6.700%, 05/01/34 (a) 7,571,000 7,746,3449,767,780
Total Corporate Bonds & Notes(Cost $1,338,850,936) 1,300,366,318
Floating Rate Loans (h)��20.1%Advertising��0.2%CMG Media Corp.
Term Loan, 3.957%, 1M LIBOR +3.500%, 12/17/26 7,270,333 7,171,013
Aerospace/Defense��0.6%Vertex Aerospace Services Corp.
1st Lien Term Loan, 4.750%, 1MLIBOR + 4.000%, 12/06/28 10,060,000 10,041,138
WP CPP Holdings LLC2nd Lien Incremental Term Loan,8.750%, 3M LIBOR + 7.750%, 04/30/26 3,300,000 3,234,000Term Loan, 4.750%, 3M LIBOR +3.750%, 04/30/25 4,951,482 4,713,811
17,988,949
BHFTII-276
Copyright © 2022 www.secdatabase.com. All Rights Reserved.Please Consider the Environment Before Printing This Document

Table of ContentsBrighthouse Funds Trust IIWestern Asset Management Strategic Bond Opportunities Portfolio
Schedule of Investments as of March 31, 2022 (Unaudited)Floating Rate Loans (h)��(Continued)
Security DescriptionPrincipalAmount* Value
Airlines��0.8%Air Canada
Term Loan B, 4.250%, 3M LIBOR +3.500%, 08/11/28 5,610,000 $5,558,107
Mileage Plus Holdings LLCTerm Loan B, 6.250%, 3M LIBOR +5.250%, 06/21/27 6,710,000 6,990,981
SkyMiles IP, Ltd.Term Loan B, 4.750%, 3M LIBOR +3.750%, 10/20/27 5,050,000 5,228,326
United Airlines, Inc.Term Loan B, 4.500%, 3M LIBOR +3.750%, 04/21/28 4,769,157 4,721,465
22,498,879
Apparel��0.2%Fanatics Commerce Intermediate Holdco
LLCTerm Loan B, 3.695%, 1M LIBOR +3.250%, 11/24/28 6,483,750 6,437,145
Auto Parts & Equipment��0.4%First Brands Group LLC
2nd Lien Term Loan, 9.500%, 3M LIBOR+ 8.500%, 03/30/28 1,950,000 1,950,000Term Loan, 6.000%, 3M LIBOR + 5.000%,03/30/27 3,207,600 3,193,968
Lakeshore Intermediate LLCTerm Loan, 4.000%, 3M LIBOR + 3.500%,09/29/28 6,044,850 5,961,733
11,105,701
Beverages��0.1%City Brewing Co. LLCTerm Loan, 4.250%, 3M LIBOR + 3.500%,04/05/28 3,601,900 3,313,748Naked Juice LLC
Delayed Draw Term Loan, 3.750%, TSFR+ 3.250%, 01/24/29 21,243 20,931Term Loan, 3.750%, TSFR + 3.250%, 01/24/29 349,523 344,389
3,679,068
Building Materials��0.4%Quikrete Holdings, Inc.
Term Loan B1, 06/11/28 (i) 3,390,000 3,334,679Solis IV B.V.
USD Term Loan B1, 4.000%, TSFR +3.500%, 02/26/29 7,630,000 7,493,293
10,827,972
Chemicals��0.3%Hexion Holdings Corp.
USD Term Loan, 5.000%, SOFR +4.500%, 03/15/29 6,170,000 6,050,456
Meridian Adhesives Group, Inc.Term Loan B, 4.750%, 3M LIBOR +4.000%, 07/24/28 2,314,200 2,291,058
8,341,514
Commercial Services��1.8%
Copyright © 2022 www.secdatabase.com. All Rights Reserved.Please Consider the Environment Before Printing This Document

Adtalem Global Education, Inc.Term Loan B, 5.250%, 1M LIBOR +4.500%, 08/12/28 3,613,906 3,606,378
Amentum Government Services HoldingsLLC
2nd Lien Term Loan, 10.000%, 3M LIBOR+ 8.750%, 01/31/28 4,140,000 4,119,300Term Loan, 4.777%, TSFR + 4.000%, 02/15/29 10,380,000 10,323,772Term Loan B, 3.957%, 1M LIBOR +3.500%, 01/29/27 4,637,474 4,604,627
Commercial Services��(Continued)Garda World Security Corp.
Term Loan B, 4.567%, SOFR + 4.250%,02/01/29 4,910,000 4,873,175
Mavis Tire Express Services Corp.Term Loan B, 4.750%, 1M LIBOR +4.000%, 05/04/28 2,342,300 2,330,589
Mister Car Wash Holdings, Inc.Term Loan B, 3.457%, 1M LIBOR +3.000%, 05/14/26 1,741,885 1,723,813
PECF USS Intermediate Holding III Corp.Term Loan B, 5.750%, 1M LIBOR +4.250%, 12/15/28 5,306,700 5,265,005
Prime Security Services Borrower LLCTerm Loan, 3.500%, 6M LIBOR + 2.750%,09/23/26 1,433,768 1,424,709
TruGreen L.P.2nd Lien Term Loan, 9.506%, 3M LIBOR+ 8.500%, 11/02/28 1,820,000 1,833,650
Verscend Holding Corp.Term Loan B, 4.457%, 1M LIBOR +4.000%, 08/27/25 1,896,268 1,893,897
VT Topco, Inc.2nd Lien Term Loan, 7.756%, 3M LIBOR+ 6.750%, 07/31/26 3,070,000 3,039,300Delayed Draw Term Loan, 3.750%, 08/01/25 (j) 237,032 235,107Incremental Term Loan, 4.500%, 1MLIBOR + 3.750%, 08/01/25 3,522,935 3,494,311
48,767,633
Computers��1.5%Magenta Buyer LLC
1st Lien Term Loan, 5.750%, 3M LIBOR +5.000%, 07/27/28 7,571,025 7,516,6042nd Lien Term Loan, 9.000%, 3M LIBOR+ 8.250%, 07/27/29 8,260,000 8,198,050
Redstone Holdco 2 L.P.2nd Lien Term Loan, 8.500%, 3M LIBOR+ 7.750%, 04/27/29 8,730,000 8,053,425Term Loan, 5.500%, 3M LIBOR + 4.750%,04/27/28 8,696,300 8,565,856
Surf Holdings LLCTerm Loan, 4.110%, 3M LIBOR + 3.500%,03/05/27 3,890,730 3,858,511
UST Holdings, LtdTerm Loan, 4.250%, 1M LIBOR + 3.750%,11/20/28 4,428,900 4,384,611
40,577,057
Construction & Engineering��0.1%Tutor Perini Corp.
Term Loan B, 5.756%, 3M LIBOR +4.750%, 08/18/27 3,733,150 3,681,819
Diversified Financial Services��1.8%AqGen Ascensus, Inc.
1st Lien Term Loan, 08/02/28 (i) 6,610,000 6,572,819Citadel Securities L.P.
Term Loan B, 2.957%, 1M LIBOR +2.500%, 02/02/28 2,976,186 2,963,698
Copyright © 2022 www.secdatabase.com. All Rights Reserved.Please Consider the Environment Before Printing This Document
CTC Holdings L.P.Term Loan B, 5.527%, TSFR + 5.000%,02/15/29 4,890,000 4,804,425
BHFTII-277
Copyright © 2022 www.secdatabase.com. All Rights Reserved.Please Consider the Environment Before Printing This Document

Table of ContentsBrighthouse Funds Trust IIWestern Asset Management Strategic Bond Opportunities Portfolio
Schedule of Investments as of March 31, 2022 (Unaudited)Floating Rate Loans (h)��(Continued)
Security DescriptionPrincipalAmount* Value
Diversified Financial Services��(Continued)Deerfield Dakota Holding LLC
2nd Lien Term Loan, 7.500%, 1M LIBOR +6.750%, 04/07/28 2,060,000 $2,065,150Term Loan B, 4.750%, 1M LIBOR +3.750%, 04/09/27 2,092,725 2,086,708
Focus Financial Partners LLCTerm Loan, 2.449%, 1M LIBOR + 2.000%,07/03/24 3,827 3,776Term Loan, 3.000%, 1M LIBOR + 2.500%,06/30/28 5,054,199 4,994,706
Greystone Select Financial LLCTerm Loan B, 5.750%, 6M LIBOR +5.000%, 06/16/28 5,461,938 5,448,284
Hudson River Trading LLCTerm Loan, 3.144%, TSFR + 3.000%, 03/20/28 10,514,511 10,373,217
Jane Street Group LLCTerm Loan, 3.207%, 1M LIBOR + 2.750%,01/26/28 6,955,328 6,880,558
VFH Parent LLCTerm Loan B, 3.500%, TSFR + 3.000%,01/13/29 2,690,000 2,668,703
48,862,044
Engineering & Construction��0.2%Brown Group Holding LLC
Term Loan B, 3.506%, 3M LIBOR +2.500%, 06/07/28 5,012,294 4,934,498
Entertainment��0.7%Allen Media LLC
Term Loan B, 6.301%, 3M LIBOR +5.500%, 02/10/27 8,830,383 8,775,193
AMC Entertainment Holdings, Inc.Term Loan B, 3.352%, 1M LIBOR +3.000%, 04/22/26 3,444,490 3,076,091
Cinemark USA, Inc.Term Loan B, 2.207%, 1M LIBOR +1.750%, 03/31/25 1,463,256 1,425,369
Scientific Games International, Inc.Term Loan B5, 3.207%, 1M LIBOR +2.750%, 08/14/24 137,306 136,027
UFC Holdings LLCTerm Loan B, 3.500%, 6M LIBOR +2.750%, 04/29/26 6,134,068 6,077,837
19,490,517
Environmental Control��0.6%Liberty Tire Recycling Holdco LLC
Term Loan, 5.506%, 3M LIBOR + 4.500%,05/05/28 7,384,293 7,255,068
LRS Holdings LLCTerm Loan B, 4.750%, 1M LIBOR +4.250%, 08/13/28 7,211,925 7,115,011
Madison IAQ LLCTerm Loan, 4.524%, 6M LIBOR + 3.250%,06/21/28 2,590,425 2,557,237
16,927,316
Food��0.6%
Copyright © 2022 www.secdatabase.com. All Rights Reserved.Please Consider the Environment Before Printing This Document

8th Avenue Food & Provisions, Inc.2nd Lien Term Loan, 8.207%, 1M LIBOR +7.750%, 10/01/26 1,452,297 1,321,590
Del Monte Foods, Inc.Term Loan, 02/15/29 (i) 7,150,000 7,062,877
Froneri International, Ltd.Term Loan, 2.375%, 6M EURIBOR +2.375%, 01/29/27 (EUR) 2,780,000 2,973,229Term Loan, 2.707%, 1M LIBOR + 2.250%,01/29/27 2,451,894 2,413,277
Sovos Brands Intermediate, Inc.Term Loan, 4.500%, 3M LIBOR + 3.750%,06/08/28 2,097,283 2,079,980
15,850,953
Food Service��0.3%TKC Holdings, Inc.
Term Loan, 6.506%, 3M LIBOR + 5.500%,05/15/28 8,513,989 8,407,564
Healthcare-Products��0.2%Knight Health Holdings LLC
Term Loan B, 12/23/28 (i) 5,775,525 5,284,606Maravai Intermediate Holdings LLC
Term Loan B, 3.500%, TSFR + 3.000%,10/19/27 1,257,116 1,253,973
6,538,579
Healthcare-Services��1.2%EyeCare Partners LLC
2nd Lien Term Loan, 7.756%, 3M LIBOR +6.750%, 11/15/29 3,930,000 3,925,087Delayed Draw Term Loan, 6.000%, 3MLIBOR + 3.750%, 11/15/28 860,000 852,116Incremental Term Loan, 4.756%, 3MLIBOR + 3.750%, 11/15/28 2,557,500 2,534,055Term Loan, 4.756%, 3M LIBOR + 3.750%,02/18/27 5,970,433 5,905,755
Global Medical Response, Inc.Term Loan B, 5.250%, 3M LIBOR +4.250%, 10/02/25 3,564,875 3,547,051
One Call Corp.Term Loan, 6.250%, 3M LIBOR + 5.500%,04/22/27 6,213,050 5,840,267
Phoenix Guarantor, Inc.Term Loan B, 3.707%, 1M LIBOR +3.250%, 03/05/26 2,598,908 2,571,526
U.S. Renal Care, Inc.Term Loan B, 5.457%, 1M LIBOR +5.000%, 06/26/26 6,384,767 5,895,534
WP CityMD Bidco LLC1st Lien Term Loan B, 3.750%, 6M LIBOR+ 3.250%, 12/22/28 3,408,674 3,393,407
34,464,798
Insurance��0.8%Acrisure LLC
Term Loan B, 3.957%, 1M LIBOR +3.500%, 02/15/27 2,930,200 2,890,642
Amerilife Holding LLCTerm Loan, 4.457%, 3M LIBOR + 4.000%,03/18/27 1,385,562 1,364,778
Asurion LLCSecond Lien Term Loan B4, 5.707%, 1MLIBOR + 5.250%, 01/20/29 8,950,000 8,771,000Term Loan B9, 3.707%, 1M LIBOR +3.250%, 07/31/27 3,253,378 3,191,701
Ryan Specialty Group LLCTerm Loan, 3.750%, 1M LIBOR + 3.000%,09/01/27 2,394,936 2,382,961
Sedgwick Claims Management Services,Inc.Term Loan B, 3.707%, 1M LIBOR +3.250%, 12/31/25 3,801,763 3,769,178
Copyright © 2022 www.secdatabase.com. All Rights Reserved.Please Consider the Environment Before Printing This Document

22,370,260
Investment Companies��0.3%Cardinal Parent, Inc.
Term Loan B, 5.250%, 3M LIBOR +4.500%, 11/12/27 5,637,060 5,631,000
Jump Financial, LLCTerm Loan B, 5.000%, 1M LIBOR +4.500%, 08/02/28 2,244,361 2,227,528
7,858,528
BHFTII-278
Copyright © 2022 www.secdatabase.com. All Rights Reserved.Please Consider the Environment Before Printing This Document

Table of ContentsBrighthouse Funds Trust IIWestern Asset Management Strategic Bond Opportunities Portfolio
Schedule of Investments as of March 31, 2022 (Unaudited)Floating Rate Loans (h)��(Continued)
Security DescriptionPrincipalAmount* Value
Leisure Time��1.3%19th Holdings Golf LLC
Term Loan B, 3.750%, TSFR + 3.250%, 02/07/29 8,100,000 $8,029,125
Carnival Corp.Incremental Term Loan B, 4.000%, 3MLIBOR + 3.250%, 10/18/28 6,892,725 6,749,129Term Loan B, 3.750%, 1M LIBOR +3.000%, 06/30/25 5,047,365 4,928,752
ClubCorp Holdings, Inc.Term Loan B, 3.756%, 3M LIBOR +2.750%, 09/18/24 8,015,090 7,633,123
Equinox Holdings, Inc.Term Loan B2, 10.006%, 3M LIBOR +9.000%, 03/08/24 2,181,150 2,213,867
Hornblower Sub LLCTerm Loan B, 5.500%, 3M LIBOR +4.500%, 04/27/25 6,750,814 6,970,215
36,524,211
Lodging��0.6%Caesars Resort Collection LLC
1st Lien Term Loan B, 3.207%, 1M LIBOR+ 2.750%, 12/23/24 6,923,136 6,897,174Term Loan B1, 3.957%, 1M LIBOR +3.500%, 07/21/25 2,840,672 2,828,835
Playa Resorts Holding B.V.Term Loan B, 3.750%, 1M LIBOR +2.750%, 04/29/24 7,716,753 7,560,010
17,286,019
Machinery-Diversified��0.3%SPX Flow, Inc.
Term Loan, 03/16/29 (i) 7,410,000 7,225,906
Media��0.1%Entercom Media Corp.
Term Loan, 2.947%, 1M LIBOR + 2.500%,11/18/24 2,486,122 2,449,348
Pharmaceuticals��0.4%Gainwell Acquisition Corp.
Term Loan B, 5.006%, 3M LIBOR +4.000%, 10/01/27 6,813,750 6,788,198
Grifols Worldwide Operations USA, Inc.Term Loan B, 2.457%, 1M LIBOR +2.000%, 11/15/27 3,187,661 3,132,983
Option Care Health, Inc.Term Loan B, 3.250%, 1M LIBOR +2.750%, 10/27/28 428,925 425,887
10,347,068
Real Estate Investment Trusts��0.3%Apollo Commercial Real Estate Finance, Inc
Incremental Term Loan B1, 4.000%, 1MLIBOR + 3.500%, 03/11/28 7,318,556 7,272,815
Retail��1.4%
Copyright © 2022 www.secdatabase.com. All Rights Reserved.Please Consider the Environment Before Printing This Document

CWGS Group LLCTerm Loan B, 3.250%, 1M LIBOR +2.500%, 06/03/28 6,543,668 6,311,368
Empire Today LLCTerm Loan B, 5.750%, 6M LIBOR +5.000%, 04/03/28 7,175,775 6,846,888
Great Outdoors Group LLCTerm Loan B1, 4.500%, 1M LIBOR +3.750%, 03/06/28 6,977,374 6,961,019
Retail��(Continued)Pacific Bells LLC
Delayed Draw Term Loan, 2.250%, 10/13/28 (j) 33,711 32,826Term Loan B, 5.000%, 1M LIBOR +4.500%, 10/13/28 3,228,198 3,143,458
Pilot Travel Centers LLCTerm Loan B, 2.457%, 1M LIBOR +2.000%, 08/04/28 4,402,887 4,348,402
Spencer Spirit IH LLCTerm Loan B, 6.209%, 1M LIBOR +6.000%, 06/19/26 5,362,003 5,358,652
Thermostat Purchaser III, Inc.Delayed Draw Term Loan, 4.500%, 08/31/28 (j) 410,604 407,524Term Loan, 5.250%, 3M LIBOR + 4.500%,08/31/28 2,343,135 2,325,561
Whatabrands LLCTerm Loan B, 3.750%, 1M LIBOR +3.250%, 08/03/28 2,284,275 2,259,719
37,995,417
Software��2.0%AppLovin Corp.
Term Loan B, 3.500%, 1M LIBOR +3.000%, 10/25/28 4,269,300 4,244,952
Athenahealth, Inc.Delayed Draw Term loan, 02/15/29 (j) 118,443 117,443Term Loan B, 4.000%, TSFR + 3.500%, 02/15/29 698,804 692,908
Castle U.S. Holding Corp.Term Loan B, 4.756%, 3M LIBOR +3.750%, 01/29/27 3,097,500 3,001,995
Cloudera, Inc.Second Lien Term Loan, 6.500%, 1MLIBOR + 6.000%, 10/08/29 3,700,000 3,653,750
DCert Buyer, Inc.2nd Lien Term Loan, 7.457%, 1M LIBOR +7.000%, 02/19/29 8,990,000 8,918,826Term Loan B, 4.457%, 1M LIBOR +4.000%, 10/16/26 8,477,000 8,430,834
Particle Investments S.a.r.l.Term Loan, 5.750%, 3M LIBOR + 5.250%,02/18/27 3,259,040 3,226,449
Planview Parent, Inc.Term Loan, 5.006%, 3M LIBOR + 4.000%,12/17/27 1,756,453 1,738,889
Rackspace Technology Global, Inc.Term Loan, 3.500%, 3M LIBOR + 2.750%,02/15/28 1,813,164 1,780,300
Seattle Spinco, Inc.Term Loan B3, 3.207%, 1M LIBOR +2.750%, 06/21/24 1,684,051 1,666,158
Symplr Software, Inc.Term Loan, 5.251%, 3M LIBOR + 4.500%,12/22/27 4,415,400 4,360,208
Virgin Pulse, Inc.2nd Lien Term Loan, 8.750%, 6M LIBOR +7.250%, 04/06/29 2,890,000 2,846,650Term Loan, 4.750%, 1M LIBOR + 4.000%,04/06/28 9,869,951 9,771,252
54,450,614
Telecommunications��0.3%
Copyright © 2022 www.secdatabase.com. All Rights Reserved.Please Consider the Environment Before Printing This Document

Global Tel*Link Corp.1st Lien Term Loan, 4.707%, 1M LIBOR +4.250%, 11/29/25 5,262,247 5,018,321
Orbcomm, Inc.Term Loan B, 5.000%, 1M LIBOR +4.250%, 09/01/28 3,103,004 3,082,316
8,100,637
BHFTII-279
Copyright © 2022 www.secdatabase.com. All Rights Reserved.Please Consider the Environment Before Printing This Document

Table of ContentsBrighthouse Funds Trust IIWestern Asset Management Strategic Bond Opportunities Portfolio
Schedule of Investments as of March 31, 2022 (Unaudited)Floating Rate Loans (h)��(Continued)
Security DescriptionPrincipalAmount* Value
Transportation��0.3%Worldwide Express Operations LLC
1st Lien Term Loan, 5.750%, 3M LIBOR+ 4.250%, 07/26/28 7,291,725 $7,227,922
Total Floating Rate Loans(Cost $557,897,677) 555,661,764
Mortgage-BackedSecurities��8.3%Collateralized MortgageObligations��4.9%Banc of America Funding Corp.
0.317%, 02/27/37 (144A) (b) 16,531,499 15,333,108Banc of America Funding Trust
0.423%, 1M LIBOR + 0.165%, 09/29/36(144A) (b) 23,121,623 22,629,0930.713%, 03/27/36 (144A) (b) 4,946,586 4,705,8498.023%, 01/27/30 (144A) (b) 20,738,875 7,269,390
Banc of America Mortgage Trust2.771%, 09/25/35 (b) 27,678 26,800
BCAP LLC Trust3.133%, 05/26/47 (144A) (b) 3,566,318 3,533,454
Bear Stearns Asset-Backed SecuritiesTrust
33.583%, -4.33x 1M LIBOR + 36.250%,07/25/36 (b) 212,855 246,957
BRAVO Residential Funding Trust3.125%, 01/29/70 (144A) (d) 5,981,137 5,655,989
Countrywide Alternative Loan Trust1.417%, 1M LIBOR + 0.960%, 07/25/35(b) 19,122 19,0945.750%, 01/25/37 1,480,772 999,3346.000%, 01/25/37 1,341,398 1,120,87615.936%, -2.2 x 1M LIBOR + 16.940%,06/25/35 (b) 859,335 820,45526.774%, -4 x 1M LIBOR + 28.600%, 07/25/36 (b) 1,577,971 1,970,05836.261%, -6 x 1M LIBOR + 39.000%, 08/25/37 (b) 696,231 1,095,271
Countrywide Alternative Loan TrustResecuritization
4.112%, 08/25/37 (b) 1,984,536 1,218,293Countrywide Home Loan ReperformingLoan REMIC Trust
5.958%, 03/25/35 (144A) � (b) (k) 2,635,137 243,628Credit Suisse Mortgage Trust
3.937%, 09/27/60 (144A) 5,360,000 5,124,27828.014%, -5.5x 1M LIBOR + 30.525%,02/25/36 (b) 558,196 643,283
CSMC Trust1.796%, 12/27/60 (144A) (b) 2,164,405 2,060,1182.000%, 10/25/60 (144A) (b) 1,292,789 1,224,228
Flagstar Mortgage Trust3.500%, 04/25/48 (144A) (b) 150,376 150,282
Freddie Mac STACR REMIC Trust2.757%, 1M LIBOR + 2.300%, 01/25/50(144A) (b) 2,210,000 2,111,2543.149%, SOFR + 3.050%, 01/25/34(144A) (b) 4,240,000 3,952,952
Copyright © 2022 www.secdatabase.com. All Rights Reserved.Please Consider the Environment Before Printing This Document

GreenPoint Mortgage Funding Trust0.897%, 1M LIBOR + 0.440%, 06/25/45(b) 630,071 599,613
GSMPS Mortgage Loan Trust0.857%, 1M LIBOR + 0.400%, 04/25/36(144A) (b) 872,518 766,634
HarborView Mortgage Loan Trust1.457%, 1M LIBOR + 1.000%, 10/25/37(b) 687,988 717,608
IndyMac INDX Mortgage Loan Trust1.177%, 1M LIBOR + 0.720%, 01/25/35(b) 538,283 466,411
JPMorgan Mortgage Trust6.500%, 01/25/36 65,666 44,107
Collateralized MortgageObligations��(Continued)Legacy Mortgage Asset Trust
3.250%, 06/25/60 (144A) (d) 2,416,821 2,395,7183.844%, 10/25/66 (144A) (d) 2,770,000 2,662,366
Lehman XS Trust0.857%, 1M LIBOR + 0.400%, 08/25/46(b) 979,922 952,366
MASTR Seasoned Securitization Trust3.465%, 10/25/32 (b) 60,209 61,944
Merrill Lynch Mortgage Investors Trust2.370%, 05/25/34 (b) 29,066 28,5642.783%, 08/25/33 (b) 208,930 200,558
Morgan Stanley Mortgage Loan Trust0.777%, 1M LIBOR + 0.320%, 01/25/35(b) 298,426 294,888
New Residential Mortgage Loan Trust3.500%, 12/25/57 (144A) (b) 2,860,000 2,776,3583.500%, 12/25/58 (144A) (b) 3,598,040 3,579,7903.750%, 11/25/58 (144A) (b) 4,462,369 4,453,7644.250%, 09/25/56 (144A) (b) 6,154,740 6,157,729
Nomura Resecuritization Trust0.707%, 1M LIBOR + 0.260%, 02/26/46(144A) (b) 1,083,313 1,089,894
NovaStar Mortgage Funding Trust0.479%, 1M LIBOR + 0.380%, 09/25/46(b) 275,193 269,363
Prime Mortgage Trust5.500%, 05/25/35 (144A) 78,430 78,184
RBSGC Mortgage Loan Trust0.907%, 1M LIBOR + 0.450%, 01/25/37(b) 386,446 141,349
Residential Accredit Loans, Inc. Trust1.332%, 11/25/37 (b) 2,096,595 1,981,997
Residential Asset Securitization Trust5.750%, 02/25/36 893,665 886,471
Seasoned Credit Risk Transfer Trust4.250%, 05/25/60 (144A) (b) 4,710,000 4,544,437
Sequoia Mortgage Trust0.904%, 6M LIBOR + 0.680%, 06/20/33(b) 48,181 47,1573.722%, 07/25/45 (144A) (b) 5,465 5,448
Structured Adjustable Rate Mortgage LoanTrust
1.731%, 1M LIBOR + 1.500%, 09/25/37(b) 2,076,397 2,032,6032.464%, 01/25/35 (b) 148,505 147,3893.010%, 09/25/35 (b) 335,708 277,274
Structured Asset Mortgage InvestmentsTrust
0.877%, 1M LIBOR + 0.420%, 05/25/46(b) 108,637 77,2911.017%, 1M LIBOR + 0.560%, 02/25/36(b) 2,250,122 2,137,977
WaMu Mortgage Pass-Through CertificatesTrust
0.997%, 1M LIBOR + 0.540%, 12/25/45(b) 195,549 196,617
Copyright © 2022 www.secdatabase.com. All Rights Reserved.Please Consider the Environment Before Printing This Document

1.417%, 1M LIBOR + 0.960%, 12/25/45(b) 5,961,890 3,876,6631.473%, COFI + 1.250%, 03/25/47 (b) 861,508 831,0072.229%, 09/25/36 (b) 290,983 268,8162.709%, 08/25/33 (b) 510,204 514,4976.223%, -1x 1M LIBOR + 6.680%, 04/25/37 (b) (k) 7,272,120 1,987,432
ZH Trust2.253%, 02/18/27 (144A) 6,900,000 6,834,340
136,538,668
Commercial Mortgage-BackedSecurities��3.4%BAMLL Re-REMIC Trust
5.831%, 08/10/45 (144A) (b) 10,513,419 4,205,368
BHFTII-280
Copyright © 2022 www.secdatabase.com. All Rights Reserved.Please Consider the Environment Before Printing This Document

Table of ContentsBrighthouse Funds Trust IIWestern Asset Management Strategic Bond Opportunities Portfolio
Schedule of Investments as of March 31, 2022 (Unaudited)Mortgage-Backed Securities��(Continued)
Security DescriptionPrincipalAmount* Value
Commercial Mortgage-BackedSecurities��(Continued)BFLD Trust
4.597%, 1M LIBOR + 4.200%, 10/15/35(144A) (b) 2,960,000 $2,882,357
BX Commercial Mortgage Trust3.549%, 03/11/44 (144A) (b) 9,066,697 8,001,753
CFK Trust3.458%, 03/15/39 (144A) (b) 4,800,000 4,325,041
Credit Suisse Commercial Mortgage Trust7.747%, 1M LIBOR + 7.350%, 07/15/32(144A) (b) 10,905,000 9,051,150
Credit Suisse Mortgage Capital Certificates3.047%, 1M LIBOR + 2.650%, 05/15/36(144A) (b) 10,620,000 10,379,682
Credit Suisse Mortgage Capital LLC4.373%, 09/15/37 (144A) 6,620,000 5,594,215
Credit Suisse Mortgage Trust3.160%, 12/15/41 (144A) 7,420,000 7,181,0038.000%, 1M LIBOR + 7.000%, 12/15/22(144A) (b) 18,450,000 17,959,130
DBUBS Mortgage Trust3.750%, 08/10/44 � (144A) 5,180,000 140,896
GMAC Commercial Mortgage Securities,Inc.
5.349%, 11/10/45 (b) 10,748 10,202GS Mortgage Securities Corp. II
2.397%, 1M LIBOR + 2.000%, 05/15/26(144A) (b) 1,540,000 1,497,7992.897%, 1M LIBOR + 2.500%, 05/15/26(144A) (b) 1,540,000 1,500,128
JPMorgan Chase Commercial MortgageSecurities Trust
4.662%, 1M LIBOR + 4.265%, 11/15/38(144A) (b) 3,760,000 3,628,3906.222%, 02/15/51 (b) 90,502 81,814
MHC Trust2.347%, 1M LIBOR + 1.950%, 05/15/23(144A) (b) 5,620,000 5,420,718
ML-CFC Commercial Mortgage Trust5.408%, 08/12/48 (b) 189,777 90,4765.408%, 08/12/48 (144A) (b) 21,714 10,3526.193%, 09/12/49 (b) 57,446 56,4416.222%, 09/12/49 (b) 79,389 77,992
Multifamily Trust14.508%, 04/25/46 (144A) (b) 3,548,157 4,008,002
SMR Mortgage Trust6.301%, 1M TSFR + 6.000%, 02/15/39(144A) (b) 2,864,834 2,819,004
Soho Trust2.697%, 08/10/38 (144A) (b) 3,330,000 2,814,701
UBS-Barclays Commercial Mortgage Trust5.000%, 05/10/63 (144A) � (b) 3,289,989 89,201
Waikiki Beach Hotel Trust2.427%, 1M LIBOR + 2.030%, 12/15/33(144A) (b) 1,860,000 1,804,129
Waterfall Commercial Mortgage Trust4.104%, 09/14/22 (144A) (b) 450,223 445,627
94,075,571
Copyright © 2022 www.secdatabase.com. All Rights Reserved.Please Consider the Environment Before Printing This Document

Total Mortgage-Backed Securities(Cost $234,483,714) 230,614,239
Asset-Backed Securities��7.8%Asset-Backed - Automobile��0.3%Avis Budget Rental Car Funding AESOPLLC
3.710%, 08/20/27 (144A) 7,750,000 7,190,163
Asset-Backed - Home Equity��0.2%Bear Stearns Asset-Backed SecuritiesTrust
1.197%, 1M LIBOR + 0.740%, 01/25/34(b) 8,770 8,306
WaMu Asset-Backed Certificates Trust0.627%, 1M LIBOR + 0.170%, 07/25/47(b) 7,377,608 5,949,617
5,957,923
Asset-Backed - ManufacturedHousing��0.1%Origen Manufactured Housing ContractTrust
1.862%, 10/15/37 (b) 492,177 461,1582.627%, 04/15/37 (b) 495,782 468,013
UCFC Manufactured Housing Contract7.095%, 04/15/29 (b) 1,621,358 1,540,766
2,469,937
Asset-Backed - Other��6.5%American Money Management Corp. CLO,Ltd.
6.051%, 3M LIBOR + 5.810%, 04/17/29(144A) (b) 6,300,000 6,054,426
Apidos CLO7.004%, 3M LIBOR + 6.750%, 04/20/31(144A) (b) 5,490,000 5,286,782
Applebee�s Funding LLC / IHOP FundingLLC
4.194%, 06/05/49 (144A) 2,970,000 2,947,395Avery Point CLO, Ltd.
3.265%, 3M LIBOR + 2.950%, 08/05/27(144A) (b) 1,540,000 1,523,408
Barings CLO, Ltd.5.934%, 3M LIBOR + 5.680%, 01/20/32(144A) (b) 5,740,000 5,508,230
Bear Stearns Asset-Backed SecuritiesTrust
6.000%, 10/25/36 1,121,369 688,001Benefit Street Partners CLO IV, Ltd.
3.854%, 3M LIBOR + 3.600%, 01/20/32(144A) (b) 3,120,000 3,119,966
Canyon Capital CLO, Ltd.6.651%, 3M LIBOR + 6.410%, 04/15/34(144A) (b) 750,000 725,075
Carlyle Global Market Strategies, CLO Ltd.1.556%, 3M LIBOR + 1.050%, 05/15/31(144A) (b) 9,007,081 8,958,244
Carlyle U.S. CLO, Ltd.3.954%, 3M LIBOR + 3.700%, 07/20/31(144A) (b) 8,500,000 8,350,731
Cathedral Lake VI, Ltd.7.468%, 3M LIBOR + 7.210%, 04/25/34(144A) (b) 2,650,000 2,527,149
Catskill Park CLO, Ltd.6.254%, 3M LIBOR + 6.000%, 04/20/29(144A) (b) 7,600,000 7,127,592
Cook Park CLO, Ltd.5.641%, 3M LIBOR + 5.400%, 04/17/30(144A) (b) 750,000 717,713
Copyright © 2022 www.secdatabase.com. All Rights Reserved.Please Consider the Environment Before Printing This Document

Countrywide Revolving Home Equity LoanResecuritization Trust0.697%, 1M LIBOR + 0.300%, 12/15/33(144A) (b) 57,241 54,985
CVP CLO, Ltd.2.904%, 3M LIBOR + 2.650%, 01/20/31(144A) (b) 4,500,000 4,249,683
Dividend Solar Loans LLC3.670%, 08/22/39 (144A) 3,766,809 3,730,364
Dryden 75 CLO, Ltd.6.841%, 3M LIBOR + 6.600%, 04/15/34(144A) (b) 7,200,000 6,990,358
Dryden Senior Loan Fund6.654%, 3M LIBOR + 6.400%, 04/20/34(144A) (b) 2,790,000 2,717,181
FNA VI LLC1.350%, 01/10/32 (144A) 1,233,885 1,177,664
Fortress Credit BSL XII, Ltd.7.266%, 3M LIBOR + 7.130%, 10/15/34(144A) � (b) 2,250,000 2,096,667
BHFTII-281
Copyright © 2022 www.secdatabase.com. All Rights Reserved.Please Consider the Environment Before Printing This Document
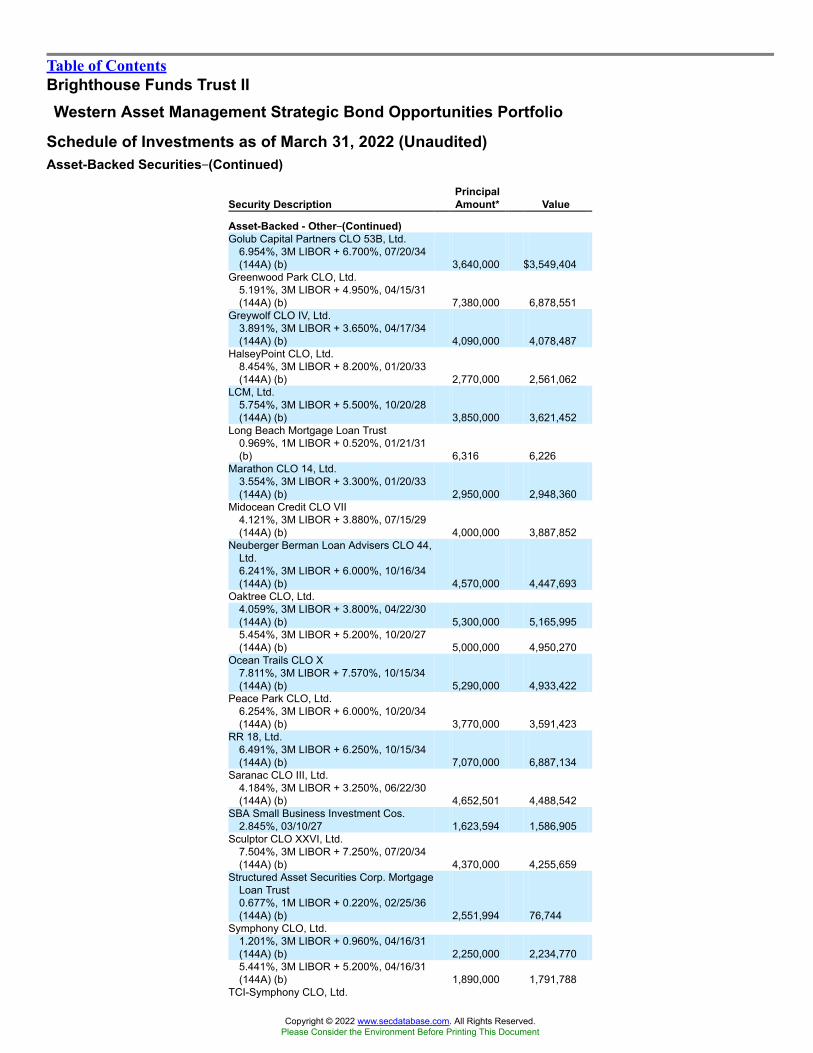
Table of ContentsBrighthouse Funds Trust IIWestern Asset Management Strategic Bond Opportunities Portfolio
Schedule of Investments as of March 31, 2022 (Unaudited)Asset-Backed Securities��(Continued)
Security DescriptionPrincipalAmount* Value
Asset-Backed - Other��(Continued)Golub Capital Partners CLO 53B, Ltd.
6.954%, 3M LIBOR + 6.700%, 07/20/34(144A) (b) 3,640,000 $3,549,404
Greenwood Park CLO, Ltd.5.191%, 3M LIBOR + 4.950%, 04/15/31(144A) (b) 7,380,000 6,878,551
Greywolf CLO IV, Ltd.3.891%, 3M LIBOR + 3.650%, 04/17/34(144A) (b) 4,090,000 4,078,487
HalseyPoint CLO, Ltd.8.454%, 3M LIBOR + 8.200%, 01/20/33(144A) (b) 2,770,000 2,561,062
LCM, Ltd.5.754%, 3M LIBOR + 5.500%, 10/20/28(144A) (b) 3,850,000 3,621,452
Long Beach Mortgage Loan Trust0.969%, 1M LIBOR + 0.520%, 01/21/31(b) 6,316 6,226
Marathon CLO 14, Ltd.3.554%, 3M LIBOR + 3.300%, 01/20/33(144A) (b) 2,950,000 2,948,360
Midocean Credit CLO VII4.121%, 3M LIBOR + 3.880%, 07/15/29(144A) (b) 4,000,000 3,887,852
Neuberger Berman Loan Advisers CLO 44,Ltd.6.241%, 3M LIBOR + 6.000%, 10/16/34(144A) (b) 4,570,000 4,447,693
Oaktree CLO, Ltd.4.059%, 3M LIBOR + 3.800%, 04/22/30(144A) (b) 5,300,000 5,165,9955.454%, 3M LIBOR + 5.200%, 10/20/27(144A) (b) 5,000,000 4,950,270
Ocean Trails CLO X7.811%, 3M LIBOR + 7.570%, 10/15/34(144A) (b) 5,290,000 4,933,422
Peace Park CLO, Ltd.6.254%, 3M LIBOR + 6.000%, 10/20/34(144A) (b) 3,770,000 3,591,423
RR 18, Ltd.6.491%, 3M LIBOR + 6.250%, 10/15/34(144A) (b) 7,070,000 6,887,134
Saranac CLO III, Ltd.4.184%, 3M LIBOR + 3.250%, 06/22/30(144A) (b) 4,652,501 4,488,542
SBA Small Business Investment Cos.2.845%, 03/10/27 1,623,594 1,586,905
Sculptor CLO XXVI, Ltd.7.504%, 3M LIBOR + 7.250%, 07/20/34(144A) (b) 4,370,000 4,255,659
Structured Asset Securities Corp. MortgageLoan Trust0.677%, 1M LIBOR + 0.220%, 02/25/36(144A) (b) 2,551,994 76,744
Symphony CLO, Ltd.1.201%, 3M LIBOR + 0.960%, 04/16/31(144A) (b) 2,250,000 2,234,7705.441%, 3M LIBOR + 5.200%, 04/16/31(144A) (b) 1,890,000 1,791,788
TCI-Symphony CLO, Ltd.
Copyright © 2022 www.secdatabase.com. All Rights Reserved.Please Consider the Environment Before Printing This Document

3.344%, 3M LIBOR + 3.100%, 10/13/32(144A) (b) 1,720,000 1,681,5416.994%, 3M LIBOR + 6.750%, 10/13/32(144A) (b) 7,640,000 7,439,656
Thrust Engine Leasing Trust4.163%, 07/15/40 (144A) 1,567,825 1,464,767
Towd Point Mortgage Trust3.414%, 06/25/57 (144A) (b) 2,900,000 2,760,985
Treman Park CLO, Ltd.2.904%, 3M LIBOR + 2.650%, 10/20/28(144A) (b) 750,000 746,446
Venture CLO, Ltd.5.981%, 3M LIBOR + 5.740%, 04/15/27(144A) (b) 4,000,000 3,543,392
Voya CLO, Ltd.6.261%, 3M LIBOR + 6.020%, 06/07/30(144A) (b) 3,100,000 2,898,1627.204%, 3M LIBOR + 6.950%, 04/20/34(144A) (b) 2,360,000 2,319,151
WhiteHorse, Ltd.3.891%, 3M LIBOR + 3.650%, 10/15/31(144A) (b) 6,180,000 5,988,642
Z Capital Credit Partners CLO, Ltd.4.441%, 3M LIBOR + 4.200%, 07/15/33(144A) (b) 4,290,000 4,188,846
179,524,941
Asset-Backed - Student Loan��0.7%Education Funding LLC
0.608%, 3M LIBOR + 0.350%, 04/25/33(144A) (b) 3,689,344 2,916,378
National Collegiate Student Loan Trust0.747%, 1M LIBOR + 0.290%, 01/25/33(b) 3,540,171 3,353,846
Navient Private Education Refi Loan Trust2.500%, 09/16/69 (144A) 4,470,000 4,195,316
SMB Private Education Loan Trust1.590%, 01/15/53 (144A) 4,550,000 4,235,8853.860%, 01/15/53 (144A) 6,240,000 5,964,347
20,665,772Total Asset-Backed Securities
(Cost $221,360,748) 215,808,736
U.S. Treasury & Government Agencies��7.6%Agency Sponsored Mortgage - Backed��6.7%Connecticut Avenue Securities Trust(CMO)
2.557%, 1M LIBOR + 2.100%, 10/25/39(144A) (b) 1,185,740 1,185,7403.199%, SOFR + 3.100%, 10/25/41(144A) (b) 6,140,000 5,649,2613.857%, 1M LIBOR + 3.400%, 10/25/39(144A) (b) 11,030,000 10,660,2254.557%, 1M LIBOR + 4.100%, 07/25/39(144A) (b) 1,960,000 1,955,0954.807%, 1M LIBOR + 4.350%, 04/25/31(144A) (b) 5,000,000 5,050,110
Fannie Mae 15 Yr. Pool2.000%, 07/01/36 4,715,723 4,585,405
Fannie Mae 20 Yr. Pool2.000%, 08/01/41 4,702,653 4,413,0842.500%, 07/01/41 2,764,421 2,672,383
Fannie Mae 30 Yr. Pool2.000%, 06/01/51 14,189,453 13,202,3632.000%, 08/01/51 2,828,042 2,634,3502.500%, 04/01/51 8,920,508 8,527,0892.500%, 09/01/51 386,163 371,5432.500%, 10/01/51 1,743,858 1,672,9663.000%, 06/01/51 17,410,850 17,082,6873.500%, 08/01/45 20,622,122 21,008,9304.500%, 04/01/48 1,429,784 1,499,2964.500%, 04/01/49 56,330 58,5174.500%, 10/01/49 31,930 33,076
Copyright © 2022 www.secdatabase.com. All Rights Reserved.Please Consider the Environment Before Printing This Document

7.000%, 05/01/26 347 3547.000%, 07/01/30 194 1977.000%, 01/01/31 104 1087.000%, 07/01/31 950 1,0017.000%, 09/01/31 950 9907.000%, 10/01/31 1,023 1,0667.000%, 11/01/31 14,177 14,8727.000%, 01/01/32 4,526 4,6187.500%, 01/01/30 231 2567.500%, 02/01/30 232 2327.500%, 06/01/30 30 317.500%, 08/01/30 59 607.500%, 09/01/30 285 3057.500%, 10/01/30 11 117.500%, 11/01/30 7,530 7,8127.500%, 02/01/31 684 687
BHFTII-282
Copyright © 2022 www.secdatabase.com. All Rights Reserved.Please Consider the Environment Before Printing This Document

Table of ContentsBrighthouse Funds Trust IIWestern Asset Management Strategic Bond Opportunities Portfolio
Schedule of Investments as of March 31, 2022 (Unaudited)U.S. Treasury & Government Agencies��(Continued)
Security DescriptionPrincipalAmount* Value
Agency Sponsored Mortgage - Backed��(Continued)Fannie Mae 30 Yr. Pool
8.000%, 08/01/27 111 $1138.000%, 07/01/30 252 2828.000%, 09/01/30 307 317
Fannie Mae Connecticut AvenueSecurities (CMO)
2.707%, 1M LIBOR + 2.250%,07/25/30 (b) 4,847,679 4,884,1894.007%, 1M LIBOR + 3.550%,07/25/30 (b) 6,050,000 5,989,4144.707%, 1M LIBOR + 4.250%,01/25/31 (b) 3,230,000 3,236,048
Fannie Mae Pool4.500%, 08/01/58 91,595 97,678
Fannie Mae REMICS (CMO)0.807%, 1M LIBOR + 0.350%,05/25/34 (b) 44,731 44,7474.500%, 06/25/29 55,668 56,749
Freddie Mac 20 Yr. Pool3.000%, 06/01/35 3,143,298 3,136,493
Freddie Mac 30 Yr. Gold Pool7.000%, 03/01/39 45,115 50,721
Freddie Mac 30 Yr. Pool4.000%, 04/01/47 7,232,274 7,459,0334.500%, 02/01/47 2,286,324 2,397,826
Freddie Mac Multifamily StructuredPass-Through Certificates1.343%, 08/25/42 (b) (k) 70,400,000 228,948
Freddie Mac Structured AgencyCredit Risk Debt Notes (CMO)
3.099%, SOFR + 3.000%, 12/25/50 (144A) (b) 8,290,000 7,750,7624.157%, 1M LIBOR + 3.700%,12/25/30 (144A) (b) 4,580,000 4,442,6724.207%, 1M LIBOR + 3.750%,08/25/50 (144A) (b) 839,862 840,8564.907%, 1M LIBOR + 4.450%,03/25/30 (b) 8,840,000 9,215,9124.957%, 1M LIBOR + 4.500%,02/25/24 (b) 1,416,229 1,445,3495.557%, 1M LIBOR + 5.100%,06/25/50 (144A) (b) 5,669,492 5,868,6895.607%, 1M LIBOR + 5.150%,10/25/29 (b) 8,310,000 8,913,710
Ginnie Mae I 30 Yr. Pool5.500%, 01/15/34 20,750 22,9505.500%, 04/15/34 5,291 5,8215.500%, 07/15/34 33,240 36,7685.500%, 10/15/34 31,923 34,4265.750%, 10/15/38 24,274 26,0966.000%, 02/15/33 706 7776.000%, 03/15/33 2,240 2,4586.000%, 06/15/33 1,587 1,7456.000%, 07/15/33 3,073 3,3306.000%, 09/15/33 1,153 1,2316.000%, 10/15/33 1,537 1,6636.500%, 03/15/29 493 5276.500%, 02/15/32 345 3776.500%, 03/15/32 351 3856.500%, 11/15/32 625 690
Copyright © 2022 www.secdatabase.com. All Rights Reserved.Please Consider the Environment Before Printing This Document

7.000%, 03/15/31 61 62Ginnie Mae II 30 Yr. Pool
2.000%, 07/20/51 2,866,119 2,737,0932.500%, 03/20/51 3,286,062 3,191,4452.500%, 05/20/51 371,158 358,8103.500%, 12/20/50 3,236,602 3,262,1674.500%, 11/20/50 1,435,957 1,493,7654.500%, 12/20/50 240,443 250,4785.500%, 03/20/34 3,315 3,6806.000%, 05/20/32 4,448 4,857
Agency Sponsored Mortgage - Backed��(Continued)Ginnie Mae II 30 Yr. Pool
6.000%, 11/20/33 5,314 5,804Government National MortgageAssociation
Zero Coupon, 04/16/52 (b) (k) 3,354,125 340.081%, 03/16/47 (b) (k) 2,854,397 5,5670.631%, 07/16/58 (b) (k) 1,767,171 62,685
Government National MortgageAssociation (CMO)3.000%, 04/20/41 63,755 64,210
Multifamily Connecticut AvenueSecurities Trust
3.707%, 1M LIBOR + 3.250%,10/15/49 (144A) (b) 2,839,450 2,686,2454.207%, 1M LIBOR + 3.750%,03/25/50 (144A) (b) 3,930,000 3,780,537
186,401,911
U.S. Treasury��0.9%U.S. Treasury Note
1.500%, 02/29/24 (a) 24,260,000 23,906,524Total U.S. Treasury & Government Agencies
(Cost $223,069,106) 210,308,435
Foreign Government��3.4%Municipal��0.1%Ciudad Autonoma De Buenos Aires
7.500%, 06/01/27 4,520,000 4,051,095
Regional Government��0.6%Provincia de Buenos Aires
3.900%, 09/01/37 (144A) (d) 27,455,990 11,696,526Provincia de Cordoba
5.000%, 06/01/27 (144A) (d) 5,515,415 3,612,65215,309,178
Sovereign��2.7%Bahamas Government International
Bond5.750%, 01/16/24 (144A) 2,570,000 2,309,171
Brazilian Government InternationalBond6.000%, 04/07/26 (a) 2,970,000 3,217,698
Bundesrepublik DeutschlandBundesanleiheZero Coupon, 08/15/26 (EUR) 3,430,000 3,746,695
Dominican Republic InternationalBonds
5.500%, 02/22/29 (144A) (a) 3,600,000 3,555,0006.000%, 02/22/33 (144A) (a) 3,800,000 3,708,838
Gabon Government InternationalBond7.000%, 11/24/31 (144A) 4,600,000 4,412,228
Indonesia Government InternationalBonds
5.125%, 01/15/45 (a) 3,000,000 3,316,8075.250%, 01/17/42 6,140,000 6,846,100
Indonesia Treasury Bonds6.500%, 02/15/31 (IDR) 9,599,000,000 656,8627.000%, 05/15/27 (IDR) 223,092,000,000 16,268,7468.375%, 09/15/26 (IDR) 66,608,000,000 5,134,741
Copyright © 2022 www.secdatabase.com. All Rights Reserved.Please Consider the Environment Before Printing This Document

Ivory Coast GovernmentInternational Bond4.875%, 01/30/32 (144A) (EUR) 1,630,000 1,585,290
Kuwait International GovernmentBond3.500%, 03/20/27 (144A) 7,230,000 7,521,369
BHFTII-283
Copyright © 2022 www.secdatabase.com. All Rights Reserved.Please Consider the Environment Before Printing This Document

Table of ContentsBrighthouse Funds Trust IIWestern Asset Management Strategic Bond Opportunities Portfolio
Schedule of Investments as of March 31, 2022 (Unaudited)Foreign Government��(Continued)
Security Description
Shares/PrincipalAmount* Value
Sovereign��(Continued)Mexico Government International Bond
4.125%, 01/21/26 (a) 4,280,000 $4,490,234Panama Government International Bond
4.500%, 04/01/56 2,700,000 2,638,791Peruvian Government International Bond
2.783%, 01/23/31 (a) 4,030,000 3,794,245Russian Federal Bond - OFZ
7.050%, 01/19/28 (RUB) (g) 1,565,280,000 577,94973,780,764
Total Foreign Government(Cost $121,430,791) 93,141,037
Convertible Preferred Stocks��1.2%Banks��0.2%Wells Fargo & Co., Series L
7.500% 4,965 6,578,625
Pipelines��1.0%MPLX L.P.
8.462% (d) (e) (f) 329,615 12,188,461Targa Resources Corp.
9.500% 14,730 15,827,80828,016,269
Total Convertible Preferred Stocks(Cost $31,777,279) 34,594,894
Convertible Bonds��0.7%Airlines��0.1%Spirit Airlines, Inc.
1.000%, 05/15/26 (a) 4,173,000 3,743,181
Entertainment��0.2%DraftKings, Inc.
Zero Coupon, 03/15/28 8,200,000 5,891,700
Leisure Time��0.0%Liberty TripAdvisor Holdings, Inc.
0.500%, 06/30/51 (144A) 740,000 606,514
Media��0.3%Dish Network Corp.
3.375%, 08/15/26 7,320,000 6,584,340Liberty Latin America, Ltd.
2.000%, 07/15/24 1,316,000 1,193,4477,777,787
Real Estate Investment Trusts��0.1%Granite Point Mortgage Trust, Inc.
5.625%, 12/01/22 (144A) 1,150,000 1,139,219Total Convertible Bonds
(Cost $20,664,726) 19,158,401Preferred Stocks��0.1%
Security Description
Shares/PrincipalAmount* Value
Capital Markets��0.1%
Copyright © 2022 www.secdatabase.com. All Rights Reserved.Please Consider the Environment Before Printing This Document

B Riley Financial, Inc.5.250%, 08/31/28 (a) 68,700 $1,647,4265.500%, 03/31/26 76,800 1,920,000
Total Preferred Stocks(Cost $3,637,500) 3,567,426
Common Stocks��0.1%Auto Components��0.0%Lear Corp. (a) 399 56,893
Chemicals��0.0%LyondellBasell Industries NV - Class A 23 2,382
Media��0.0%Cengage Learning, Inc. 10,995 189,664
Oil, Gas & Consumable Fuels��0.1%Ascent CNR Corp. - Class A 1,399,556 27,991Berry Corp. (a) 170,615 1,760,747
1,788,738Total Common Stocks
(Cost $2,222,896) 2,037,677
Municipals��0.0%Virginia Housing Development Authority
6.000%, 06/25/34(Cost $331,565) 335,115 342,100
Escrow Shares��0.0%Forest Products & Paper��0.0%Sino-Forest Corp. (e) (f) (l) 1,246,000 0Sino-Forest Corp. (e) (f) (l) 500,000 0Total Escrow Shares
(Cost $0) 0
Short-Term Investment��0.2%Repurchase Agreement��0.2%Fixed Income Clearing Corp.
Repurchase Agreement dated 03/31/22 at 0.000%, due on 04/01/22 with amaturity value of $5,076,796;collateralized by U.S. Treasury Note at2.500%, maturing 03/31/27, with amarket value of $5,178,419. 5,076,796 5,076,796
Total Short-Term Investments(Cost $5,076,796) 5,076,796
BHFTII-284
Copyright © 2022 www.secdatabase.com. All Rights Reserved.Please Consider the Environment Before Printing This Document

Table of ContentsBrighthouse Funds Trust IIWestern Asset Management Strategic Bond Opportunities Portfolio
Schedule of Investments as of March 31, 2022 (Unaudited)Securities Lending Reinvestments (m)��16.9%
Security DescriptionPrincipalAmount* Value
Certificates of Deposit��7.1%Bank of Montreal
0.300%, 06/02/22 10,000,000 $9,992,660Bank of Nova Scotia
0.320%, 06/07/22 5,000,000 4,995,9200.400%, SOFR + 0.130%, 07/07/22 (b) 3,000,000 3,000,0000.520%, SOFR + 0.250%, 02/17/23 (b) 5,000,000 4,988,887
Barclays Bank plc0.180%, 04/07/22 11,000,000 10,999,593
BNP Paribas S.A.0.490%, SOFR + 0.220%, 11/17/22 (b) 10,000,000 9,985,920
Canadian Imperial Bank of Commerce (NY)0.520%, SOFR + 0.250%, 02/03/23 (b) 10,000,000 9,985,1520.770%, SOFR + 0.500%, 03/03/23 (b) 12,000,000 12,007,622
Cooperatieve Rabobank UA0.840%, SOFR + 0.570%, 09/19/22 (b) 10,000,000 10,000,000
Credit Agricole S.A.0.590%, 05/24/22 3,000,000 2,999,640
Credit Industriel et CommercialZero Coupon, 04/14/22 10,000,000 9,998,300
Credit Industriel et Commercial (NY)0.480%, SOFR + 0.210%, 11/08/22 (b) 5,000,000 4,990,775
Credit Suisse Group AG0.830%, 06/03/22 10,000,000 10,001,840
Goldman Sachs Bank USA0.470%, SOFR + 0.190%, 09/02/22 (b) 3,000,000 2,996,178
Mitsubishi UFJ Trust and Banking Corp.0.430%, SOFR + 0.160%, 07/22/22 (b) 10,000,000 9,993,590
MUFG Bank Ltd.0.250%, 05/04/22 5,000,000 4,998,530
National Australia Bank, Ltd.Zero Coupon, 04/25/22 3,000,000 2,998,920
National Westminster Bank plc0.440%, 05/11/22 5,000,000 4,999,100
Natixis S.A. (New York)0.330%, 06/09/22 1,000,000 999,1540.450%, SOFR + 0.180%, 06/17/22 (b) 5,000,000 4,998,717
Nordea Bank Abp.0.720%, SOFR + 0.450%, 08/30/22 (b) 5,000,000 4,999,990
Oversea-Chinese Banking Corp., Ltd.Zero Coupon, 04/14/22 1,700,000 1,699,7110.720%, SOFR + 0.440%, 09/26/22 (b) 5,000,000 5,000,997
Royal Bank of Canada0.520%, SOFR + 0.250%, 01/11/23 (b) 6,000,000 5,985,972
Standard Chartered Bank (NY)0.460%, SOFR + 0.190%, 08/25/22 (b) 8,000,000 7,993,466
Sumitomo Mitsui Banking Corp.0.450%, SOFR + 0.180%, 08/09/22 (b) 5,000,000 4,995,115
Sumitomo Mitsui Trust Bank, Ltd.Zero Coupon, 04/19/22 4,000,000 3,999,0000.430%, SOFR + 0.160%, 07/22/22 (b) 6,000,000 5,994,666
Toronto-Dominion Bank (The)0.530%, SOFR + 0.250%, 02/09/23 (b) 8,000,000 7,999,9980.820%, FEDEFF PRV + 0.490%, 12/23/22 (b) 5,000,000 4,998,520
Westpac Banking Corp.0.500%, SOFR + 0.230%, 02/17/23 (b) 7,000,000 6,978,111
196,576,044
Commercial Paper��1.4%
Copyright © 2022 www.secdatabase.com. All Rights Reserved.Please Consider the Environment Before Printing This Document

Antalis S.A.0.800%, 06/01/22 5,000,000 $4,991,965
DNB Bank ASA0.830%, SOFR + 0.550%, 09/07/22 (b) 5,000,000 5,001,995
Macquarie Bank Ltd.0.510%, SOFR + 0.230%, 08/04/22 (b) 3,000,000 2,997,693
Skandinaviska Enskilda Banken AB0.200%, 04/28/22 7,000,000 6,997,340
Societe Generale0.460%, SOFR + 0.190%, 08/18/22 (b) 8,000,000 7,991,928
UBS AG0.350%, 06/08/22 10,000,000 9,984,960
37,965,881
Repurchase Agreements��6.2%Barclays Bank plc
Repurchase Agreement dated 03/31/22at 0.600%, due on 05/05/22 with amaturity value of $2,001,167;collateralized by various Common Stockwith an aggregate market value of$2,222,914. 2,000,000 2,000,000
BofA Securities, Inc.Repurchase Agreement dated 03/31/22at 0.270%, due on 04/01/22 with amaturity value of $16,054,983;collateralized by U.S. TreasuryObligations with rates ranging from2.000% - 5.000%, maturity dates rangingfrom 05/15/37 - 02/15/50, and anaggregate market value of $16,375,963. 16,054,862 16,054,862
Citigroup Global Markets, Inc.Repurchase Agreement dated 03/31/22at 0.620%, due on 05/05/22 with amaturity value of $3,001,808;collateralized by U.S. TreasuryObligations with rates ranging from1.375% - 4.375%, maturity dates rangingfrom 02/15/39 - 05/15/47, and variousCommon Stock with an aggregatemarket value of $3,060,404. 3,000,000 3,000,000Repurchase Agreement dated 03/31/22at 0.620%, due on 05/05/22 with amaturity value of $2,001,206;collateralized by U.S. TreasuryObligations with rates ranging from0.000% - 3.875%, maturity dates rangingfrom 04/21/22 - 05/15/51, and variousCommon Stock with an aggregatemarket value of $2,140,122. 2,000,000 2,000,000
Citigroup Global Markets, Ltd.Repurchase Agreement dated 03/31/22at 0.300%, due on 04/01/22 with amaturity value of $3,900,033;collateralized by U.S. Treasury andForeign Obligations with rates rangingfrom 0.125% - 2.875%, maturity datesranging from 08/15/23 - 02/15/51, and anaggregate market value of $3,978,001. 3,900,000 3,900,000
ING Financial Markets LLCRepurchase Agreement dated 03/31/22at 0.260%, due on 04/01/22 with amaturity value of $3,147,615;collateralized by U.S. GovernmentAgency Obligations with rates rangingfrom 0.350% - 6.625%, maturity datesranging from 04/05/22 - 11/15/30, and anaggregate market value of $3,210,565. 3,147,593 3,147,593
BHFTII-285
Copyright © 2022 www.secdatabase.com. All Rights Reserved.Please Consider the Environment Before Printing This Document

Table of ContentsBrighthouse Funds Trust IIWestern Asset Management Strategic Bond Opportunities Portfolio
Schedule of Investments as of March 31, 2022 (Unaudited)Securities Lending Reinvestments (m)��(Continued)
Security DescriptionPrincipalAmount* Value
Repurchase Agreements��(Continued)National Bank of Canada
Repurchase Agreement dated 03/31/22at 0.320%, due on 04/07/22 with amaturity value of $39,002,427;collateralized by U.S. TreasuryObligations with rates ranging from0.000% - 4.500%, maturity datesranging from 04/14/22 - 08/15/51, andan aggregate market value of$39,802,187. 39,000,000 $39,000,000Repurchase Agreement dated 03/31/22at 0.450%, due on 04/07/22 with amaturity value of $32,002,800;collateralized by U.S. TreasuryObligations with rates ranging from0.500% - 3.000%, maturity datesranging from 11/30/23 - 08/15/48, andvarious Common Stock with anaggregate market value of $35,385,558. 32,000,000 32,000,000
NBC Global Finance, Ltd.Repurchase Agreement dated 03/31/22at 0.440%, due on 04/01/22 with amaturity value of $10,000,122;collateralized by U.S. TreasuryObligations with rates ranging from0.125% - 4.750%, maturity datesranging from 05/15/24 - 02/15/50, andvarious Common Stock with anaggregate market value of $11,103,766. 10,000,000 10,000,000Repurchase Agreement dated 03/31/22at 0.485%, due on 04/07/22 with amaturity value of $400,038;collateralized by U.S. TreasuryObligations with rates ranging from0.125% - 4.750%, maturity datesranging from 05/15/24 - 02/15/50, andvarious Common Stock with anaggregate market value of $444,151. 400,000 400,000
Societe GeneraleRepurchase Agreement dated 03/31/22at 0.300%, due on 04/01/22 with amaturity value of $4,000,033;collateralized by U.S. TreasuryObligations with rates ranging from0.125% - 3.000%, maturity datesranging from 04/30/22 - 02/15/49, andan aggregate market value of$4,080,307. 4,000,000 4,000,000Repurchase Agreement dated 03/31/22at 0.360%, due on 04/01/22 with amaturity value of $19,800,198;collateralized by various Common Stockwith an aggregate market value of$22,001,818. 19,800,000 19,800,000
Copyright © 2022 www.secdatabase.com. All Rights Reserved.Please Consider the Environment Before Printing This Document

Repurchase Agreement dated 03/31/22at 0.380%, due on 04/01/22 with amaturity value of $6,000,063;collateralized by various Common Stockwith an aggregate market value of$6,667,218. 6,000,000 6,000,000Repurchase Agreement dated 03/31/22at 0.410%, due on 04/01/22 with amaturity value of $10,000,114;collateralized by various Common Stockwith an aggregate market value of$11,112,897. 10,000,000 10,000,000Repurchase Agreement dated 03/31/22at 0.420%, due on 04/07/22 with amaturity value of $10,600,866;collateralized by various Common Stockwith an aggregate market value of$11,779,671. 10,600,000 10,600,000
TD Prime Services LLCRepurchase Agreement dated 03/31/22at 0.400%, due on 04/01/22 with amaturity value of $10,000,111;collateralized by various Common Stockwith an aggregate market value of$11,581,883. 10,000,000 10,000,000
171,902,455
Time Deposits��1.9%Australia New Zealand Banking Group,Ltd
0.310%, 04/01/22 10,000,000 10,000,000Jyske Bank A/S
0.750%, 04/11/22 3,000,000 3,000,000National Bank of Canada
0.370%, OBFR + 0.050%, 04/07/22 (b) 20,000,000 20,000,000Rabobank (New York)
0.310%, 04/01/22 5,000,000 5,000,000Skandi (NY)
0.300%, 04/01/22 15,000,000 15,000,00053,000,000
Mutual Funds��0.3%Fidelity Government Portfolio, Institutional
Class0.160% (n) 10,000,000 10,000,000
Total Securities Lending Reinvestments(Cost $469,586,881) 469,444,380
Total Purchased Options�0.1% (o)(Cost $6,876,355) 2,870,006
Total Investments�113.5%(Cost $3,237,266,970) 3,142,992,209
Unfunded Loan Commitments�(0.1)%(Cost $(1,394,391)) (1,394,391 )
Net Investments�113.4%(Cost $3,235,872,579)) 3,141,597,818
Other assets and liabilities (net)�(13.4)% (373,323,658 )Net Assets�100.0% $2,768,274,160
* Principal and notional amounts stated in U.S. dollars unless otherwise noted.� Restricted securities are not registered under the Securities Act of 1933 and are subject to legal restrictions on resale. These
securities generally may be resold in transactions exempt from registration or to the public if the securities are subsequentlyregistered. Disposal of these securities may involve time-consuming negotiations and prompt sale at an acceptable price may bedifficult. As of March 31, 2022, the market value of restricted securities was $7,742,029, which is 0.3% of net assets. See detailsshown in the Restricted Securities table that follows.
(a) All or a portion of the security was held on loan. As of March 31, 2022, the market value of securities loaned was $497,093,541 andthe collateral received consisted of cash in the amount of $469,551,480 and non-cash collateral with a value of $53,119,730. Thecash collateral investments are disclosed in the Schedule of Investments and categorized as Securities Lending Reinvestments. Thenon-cash collateral received consists of U.S. government securities that are held in safe-keeping by the lending agent, or a third-party custodian, and cannot be sold or repledged by the Portfolio.
Copyright © 2022 www.secdatabase.com. All Rights Reserved.Please Consider the Environment Before Printing This Document

(b) Variable or floating rate security. The stated rate represents the rate at March 31, 2022. Maturity date shown for callable securitiesreflects the earliest possible call date. For securities based on a published reference index and spread, the index and spread areindicated in the description above. For certain variable rate securities, the coupon rate is determined by the issuer/agent based oncurrent market conditions. For certain asset- and mortgage-backed securities, the coupon rate may fluctuate based on changes ofthe underlying collateral or prepayments of principal. These securities do not indicate a reference index and spread in theirdescription above.
(c) Payment-in-kind security for which part of the income earned may be paid as additional principal.
BHFTII-286
Copyright © 2022 www.secdatabase.com. All Rights Reserved.Please Consider the Environment Before Printing This Document

Table of ContentsBrighthouse Funds Trust IIWestern Asset Management Strategic Bond Opportunities Portfolio
Schedule of Investments as of March 31, 2022 (Unaudited)(d) Security is a �step-up� bond where coupon increases or steps up at a predetermined date. Rate shown is current coupon rate.(e) Security was valued in good faith under procedures approved by the Board of Trustees. As of March 31, 2022, these securities
represent 0.4% of net assets.(f) Significant unobservable inputs were used in the valuation of this portfolio security; i.e. Level 3.(g) Non-income producing; security is in default and/or issuer is in bankruptcy.(h) Floating rate loans (�Senior Loans�) often require prepayments from excess cash flows or permit the borrowers to repay at their
election. The degree to which borrowers repay, whether as a contractual requirement or at their election, cannot be predicted withaccuracy. As a result, the actual remaining maturity may be substantially less than the stated maturities shown. However, SeniorLoans will generally have an expected average life of approximately two to four years. Senior Loans typically have rates ofinterest which are determined periodically by reference to a base lending rate, plus a spread. These base rates are primarily theLondon Interbank Offered Rate and secondarily, the prime rate offered by one or more major United States banks. Base lendingrates may be subject to a floor, or a minimum rate.
(i) This loan will settle after March 31, 2022, at which time the interest rate will be determined.(j) Unfunded or partially unfunded loan commitments. The Portfolio may enter into certain credit agreements for which all or a portion
may be unfunded. The Portfolio is obligated to fund these commitments at the borrower�s discretion.(k) Interest only security.(l) Non-income producing security.(m) Represents investment of cash collateral received from securities on loan as of March 31, 2022.(n) The rate shown represents the annualized seven-day yield as of March 31, 2022.(o) For a breakout of open positions, see details shown in the Purchased Options table that follows.(144A)� Securities exempt from registration under Rule 144A of the Securities Act of 1933. These securities may be resold in transactions
exempt from registration, normally to qualified institutional buyers. As of March 31, 2022, the market value of 144A securities was$1,279,698,548, which is 46.2% of net assets.
Restricted SecuritiesAcquisition
DatePrincipalAmount Cost Value
Countrywide Home Loan Reperforming Loan REMIC Trust, 5.958%, 03/25/35 01/08/15 $2,635,137 $383,742 $243,628DBUBS Mortgage Trust, 3.750%, 08/10/44 05/19/14 5,180,000 3,004,400 140,896Fortress Credit BSL XII, Ltd., 7.266%, 10/15/34 08/20/21 2,250,000 2,193,750 2,096,667Liberty Mutual Insurance Co., 7.697%, 10/15/97 06/08/11-05/30/12 2,600,000 2,522,511 3,521,020Midwest Vanadium Pty, Ltd., 13.250%, 02/15/18 05/24/11 931,574 960,686 0Northwest Acquisitions ULC / Dominion Finco, Inc., 7.125%, 11/01/22 10/06/17-11/21/19 8,475,000 8,034,929 85UBS-Barclays Commercial Mortgage Trust, 5.000%, 05/10/63 11/21/14 1,649,989 579,312 14,040Uniquify, Inc., 6.000%, 06/15/24 06/28/21 1,720,000 1,720,000 1,725,693
$7,742,029
Forward Foreign Currency Exchange Contracts
Contracts to Buy CounterpartySettlement
DateIn Exchange
for
UnrealizedAppreciation/(Depreciation)
AUD 8,700,000 BNP 04/19/22 USD 6,335,832 $ 175,494AUD 10,270,000 BNP 04/19/22 USD 7,469,533 216,825AUD 10,270,000 BNP 04/19/22 USD 7,493,724 192,635AUD 5,490,000 JPMC 04/19/22 USD 3,912,740 196,132AUD 9,150,000 JPMC 04/19/22 USD 6,508,395 339,724AUD 10,650,000 JPMC 04/19/22 USD 7,529,255 441,506AUD 10,930,000 JPMC 04/19/22 USD 7,720,296 460,025AUD 18,410,000 JPMC 04/19/22 USD 12,901,967 876,598AUD 30,555,034 JPMC 04/19/22 USD 21,907,104 961,149BRL 7,590,000 CBNA 04/19/22 USD 1,299,213 288,136BRL 4,693,206 MSCS 04/19/22 USD 807,920 173,602BRL 30,420,000 MSCS 04/19/22 USD 5,966,461 395,481CAD 8,640,055 CBNA 04/19/22 USD 6,788,120 122,563CAD 9,450,000 GSBU 04/19/22 USD 7,443,377 115,134CAD 8,660,000 MSCS 04/19/22 USD 6,798,339 128,296CAD 10,780,000 MSCS 04/19/22 USD 8,479,189 143,113CAD 12,910,000 MSCS 04/19/22 USD 10,190,020 135,946CAD 13,759,100 MSCS 04/19/22 USD 10,773,706 231,406CAD 61,461,809 MSCS 04/19/22 USD 48,294,354 865,411EUR 12,682,800 GSBU 04/05/22 USD 14,356,930 (326,205 )EUR 5,080,000 BNP 04/19/22 USD 5,750,089 (127,917 )EUR 1,316,000 CBNA 04/19/22 USD 1,505,027 (48,575 )EUR 1,697,000 CBNA 04/19/22 USD 1,943,003 (64,888 )
Copyright © 2022 www.secdatabase.com. All Rights Reserved.Please Consider the Environment Before Printing This Document

BHFTII-287
Copyright © 2022 www.secdatabase.com. All Rights Reserved.Please Consider the Environment Before Printing This Document

Table of ContentsBrighthouse Funds Trust IIWestern Asset Management Strategic Bond Opportunities Portfolio
Schedule of Investments as of March 31, 2022 (Unaudited)Forward Foreign Currency Exchange Contracts��(Continued)
Contracts to Buy CounterpartySettlement
DateIn Exchange
for
UnrealizedAppreciation/(Depreciation)
EUR 5,142,000 CBNA 04/19/22 USD 5,660,159 $ 30,630EUR 6,310,000 CBNA 04/19/22 USD 7,171,675 (188,229 )EUR 7,270,000 CBNA 04/19/22 USD 8,190,244 (144,340 )EUR 2,400,000 MSCS 04/19/22 USD 2,730,888 (74,744 )EUR 4,720,000 MSCS 04/19/22 USD 5,412,853 (189,103 )EUR 4,750,000 MSCS 04/19/22 USD 5,380,077 (123,124 )IDR 15,000,000,000 CBNA 04/19/22 USD 1,036,771 6,988JPY 1,778,460,000 BOA 04/19/22 USD 15,401,989 (789,455 )JPY 3,366,130,000 CBNA 04/19/22 USD 29,201,526 (1,544,064 )JPY 738,666,000 MSCS 04/19/22 USD 6,122,414 (53,241 )JPY 1,181,050,000 MSCS 04/19/22 USD 10,279,037 (575,060 )MXN 14,000,000 CBNA 04/19/22 USD 675,806 26,226MXN 37,209,000 CBNA 04/19/22 USD 1,824,579 41,272MXN 37,379,000 CBNA 04/19/22 USD 1,873,268 1,108MXN 71,760,000 CBNA 04/19/22 USD 3,389,576 208,840MXN 98,890,000 CBNA 04/19/22 USD 4,714,211 244,643MXN 151,720,000 CBNA 04/19/22 USD 7,252,841 355,181MXN 185,930,000 CBNA 04/19/22 USD 8,835,078 488,409MXN 215,210,000 CBNA 04/19/22 USD 10,239,902 551,836MXN 509,747,096 CBNA 04/19/22 USD 24,318,835 1,242,509MXN 54,797,136 MSCS 04/19/22 USD 2,642,010 105,801MXN 298,270,000 MSCS 04/19/22 USD 14,216,534 740,259MXN 153,535,200 JPMC 05/17/22 USD 7,280,000 380,892NOK 59,410,000 BNP 04/19/22 USD 6,796,316 (49,368 )NOK 672,182,245 BNP 04/19/22 USD 76,285,895 51,071NOK 31,365,513 GSBU 04/19/22 USD 3,587,500 (25,448 )NZD 13,348,546 GSBU 04/19/22 USD 8,950,867 298,493NZD 23,089,685 MSCS 04/19/22 USD 15,732,388 266,719RUB 613,461,382 JPMC 04/15/22 USD 7,866,907 (390,205 )RUB 300,736,586 BOA 04/19/22 USD 3,816,696 (171,558 )RUB 473,730,648 GSBU 04/19/22 USD 5,806,146 (64,199 )RUB 769,315,368 GSBU 04/19/22 USD 9,893,141 (568,499 )RUB 4,394,984,852 GSBU 04/19/22 USD 57,021,444 (3,751,147 )RUB 626,380,000 MSCS 04/19/22 USD 8,008,387 (416,222 )RUB 801,355,000 MSCS 04/19/22 USD 10,192,352 (479,368 )ZAR 198,594 CBNA 04/19/22 USD 12,557 1,008
Contracts to DeliverAUD 6,740,000 BNP 04/19/22 USD 4,948,212 (96,195 )AUD 6,730,000 BNP 04/19/22 USD 4,980,436 (56,487 )AUD 12,430,000 GSBU 04/19/22 USD 8,964,019 (338,945 )AUD 8,870,000 GSBU 04/19/22 USD 6,434,564 (203,995 )AUD 8,370,000 GSBU 04/19/22 USD 6,272,394 8,049AUD 1,390,000 GSBU 04/19/22 USD 1,022,838 (17,477 )AUD 12,770,000 JPMC 04/19/22 USD 9,355,302 (202,128 )AUD 7,260,000 JPMC 04/19/22 USD 5,318,284 (115,306 )AUD 7,120,000 JPMC 04/19/22 USD 5,126,208 (202,602 )AUD 5,710,000 JPMC 04/19/22 USD 4,137,289 (136,237 )AUD 5,610,000 JPMC 04/19/22 USD 3,996,424 (202,259 )AUD 5,610,000 JPMC 04/19/22 USD 4,002,056 (196,627 )AUD 4,200,000 JPMC 04/19/22 USD 3,044,882 (98,517 )AUD 3,910,000 JPMC 04/19/22 USD 2,845,268 (81,087 )AUD 3,690,000 JPMC 04/19/22 USD 2,693,789 (67,912 )AUD 3,690,000 JPMC 04/19/22 USD 2,696,556 (65,144 )AUD 3,580,000 JPMC 04/19/22 USD 2,558,103 (121,270 )AUD 1,790,000 JPMC 04/19/22 USD 1,279,052 (60,635 )AUD 175,001 JPMC 04/19/22 USD 126,998 (3,978 )AUD 26,829 JPMC 04/19/22 USD 19,610 (470 )BRL 28,060,000 CBNA 04/19/22 USD 5,907,368 38,989
Copyright © 2022 www.secdatabase.com. All Rights Reserved.Please Consider the Environment Before Printing This Document

BHFTII-288
Copyright © 2022 www.secdatabase.com. All Rights Reserved.Please Consider the Environment Before Printing This Document

Table of ContentsBrighthouse Funds Trust IIWestern Asset Management Strategic Bond Opportunities Portfolio
Schedule of Investments as of March 31, 2022 (Unaudited)Forward Foreign Currency Exchange Contracts��(Continued)
Contracts to Deliver CounterpartySettlement
DateIn Exchange
for
UnrealizedAppreciation/(Depreciation)
BRL 18,710,000 CBNA 04/19/22 USD 3,454,324 $ (458,626 )CAD 8,850,000 CBNA 04/19/22 USD 7,037,717 (40,888 )CAD 7,270,000 CBNA 04/19/22 USD 5,773,819 (41,036 )CAD 6,454,776 CBNA 04/19/22 USD 5,143,311 (19,493 )CAD 14,890,000 MSCS 04/19/22 USD 11,766,649 (143,005 )CAD 11,700,000 MSCS 04/19/22 USD 9,311,024 (47,133 )CAD 8,910,000 MSCS 04/19/22 USD 7,125,606 (991 )CAD 8,530,000 MSCS 04/19/22 USD 6,830,773 8,117CAD 8,500,000 MSCS 04/19/22 USD 6,812,168 13,507CAD 4,728,733 MSCS 04/19/22 USD 3,726,835 (55,406 )CAD 4,721,400 MSCS 04/19/22 USD 3,723,090 (53,286 )CAD 4,721,400 MSCS 04/19/22 USD 3,729,157 (47,219 )CNY 11,150,000 CBNA 04/19/22 USD 1,737,762 (18,695 )CNY 7,100,000 CBNA 04/19/22 USD 1,105,488 (12,972 )CNY 7,820,000 JPMC 04/19/22 USD 1,217,974 (13,909 )EUR 12,400,000 BNP 04/19/22 USD 13,728,121 4,709EUR 1,354,000 BNP 04/19/22 USD 1,487,274 (11,234 )EUR 58,904,254 CBNA 04/19/22 USD 66,665,538 1,474,623EUR 7,270,000 CBNA 04/19/22 USD 8,197,616 151,712EUR 2,290,000 CBNA 04/19/22 USD 2,536,999 2,595EUR 2,260,000 CBNA 04/19/22 USD 2,484,145 (17,058 )EUR 1,382,000 CBNA 04/19/22 USD 1,562,403 32,907EUR 7,640,000 MSCS 04/19/22 USD 8,446,627 (8,766 )EUR 7,090,000 MSCS 04/19/22 USD 7,799,337 (47,356 )GBP 17,739,189 GSBU 04/19/22 USD 24,051,733 751,181GBP 6,850,000 GSBU 04/19/22 USD 9,296,293 298,768GBP 3,830,000 MSCS 04/19/22 USD 5,261,276 230,544IDR 185,788,030,000 CBNA 04/19/22 USD 12,811,642 (116,213 )IDR 71,832,854,172 CBNA 04/19/22 USD 4,946,008 (52,402 )IDR 33,355,640,000 CBNA 04/19/22 USD 2,300,151 (20,864 )INR 2,000 CBNA 04/19/22 USD 27 �JPY 1,548,104,376 MSCS 04/19/22 USD 13,379,233 659,392JPY 1,123,590,000 MSCS 04/19/22 USD 9,786,105 554,243JPY 772,781,814 MSCS 04/19/22 USD 6,739,440 389,957JPY 760,413,992 MSCS 04/19/22 USD 6,646,855 398,992JPY 668,110,000 MSCS 04/19/22 USD 5,822,346 332,889JPY 488,389,838 MSCS 04/19/22 USD 4,229,034 216,229JPY 385,082,831 MSCS 04/19/22 USD 3,382,583 218,590JPY 294,860,000 MSCS 06/27/22 USD 2,449,003 21,324JPY 236,483,000 MSCS 09/26/22 USD 1,972,780 16,776MXN 301,600,000 CBNA 04/19/22 USD 14,603,091 (520,685 )MXN 101,820,000 CBNA 04/19/22 USD 4,963,237 (142,542 )MXN 101,700,000 CBNA 04/19/22 USD 4,884,890 (214,871 )MXN 92,154,994 CBNA 04/19/22 USD 4,436,328 (184,798 )MXN 76,340,000 CBNA 04/19/22 USD 3,697,783 (130,297 )MXN 71,020,000 CBNA 04/19/22 USD 3,426,348 (134,960 )MXN 52,423,000 CBNA 04/19/22 USD 2,481,210 (147,549 )MXN 43,663,000 CBNA 04/19/22 USD 2,182,517 (6,971 )MXN 35,754,000 CBNA 04/19/22 USD 1,717,398 (75,491 )MXN 30,800,000 CBNA 04/19/22 USD 1,489,535 (54,936 )MXN 30,100,000 CBNA 04/19/22 USD 1,429,969 (79,399 )MXN 144,730,000 GSBU 04/19/22 USD 7,079,166 (178,342 )MXN 128,790,000 GSBU 04/19/22 USD 6,370,381 (87,812 )MXN 136,650,000 MSCS 04/19/22 USD 6,660,006 (192,329 )MXN 155,610,000 CBNA 05/17/22 USD 7,377,049 (387,368 )NOK 59,380,000 BNP 04/19/22 USD 6,878,872 135,331NOK 58,900,000 BNP 04/19/22 USD 6,845,251 156,221NOK 47,350,000 BNP 04/19/22 USD 5,431,541 54,197NOK 29,330,000 BNP 04/19/22 USD 3,353,144 22,257NOK 59,607,781 MSCS 04/19/22 USD 6,830,471 61,062
Copyright © 2022 www.secdatabase.com. All Rights Reserved.Please Consider the Environment Before Printing This Document

BHFTII-289
Copyright © 2022 www.secdatabase.com. All Rights Reserved.Please Consider the Environment Before Printing This Document

Table of ContentsBrighthouse Funds Trust IIWestern Asset Management Strategic Bond Opportunities Portfolio
Schedule of Investments as of March 31, 2022 (Unaudited)Forward Foreign Currency Exchange Contracts��(Continued)
Contracts to Deliver CounterpartySettlement
DateIn Exchange
for
UnrealizedAppreciation/(Depreciation)
NOK 59,250,000 MSCS 04/19/22 USD 6,814,653 $ 85,875NOK 41,630,000 MSCS 04/19/22 USD 4,767,822 40,075NZD 12,490,000 GSBU 04/19/22 USD 8,459,352 (195,112 )NZD 9,090,000 GSBU 04/19/22 USD 6,140,677 (157,888 )NZD 9,080,000 MSCS 04/19/22 USD 6,226,792 (64,844 )NZD 8,840,000 MSCS 04/19/22 USD 6,034,360 (90,977 )RUB 132,730,000 BNP 04/19/22 USD 1,698,653 89,873RUB 13,689,435 BNP 04/19/22 USD 134,210 (31,715 )RUB 11,598,278 BNP 04/19/22 USD 134,864 (5,716 )RUB 2,244,674,642 CBNA 04/19/22 USD 29,616,052 2,409,022RUB 579,020,000 CBNA 04/19/22 USD 7,395,789 377,660RUB 264,381,000 CBNA 04/19/22 USD 3,435,550 231,066RUB 55,615,619 CBNA 04/19/22 USD 646,693 (27,407 )RUB 28,133,304 CBNA 04/19/22 USD 259,293 (81,702 )RUB 530,470,000 GSBU 04/19/22 USD 6,891,011 461,342RUB 521,986,000 GSBU 04/19/22 USD 6,831,830 504,994RUB 501,515,573 GSBU 04/19/22 USD 4,746,405 (1,332,316 )RUB 391,520,000 GSBU 04/19/22 USD 5,126,117 380,620RUB 323,010,000 GSBU 04/19/22 USD 4,203,232 288,125RUB 260,675,087 GSBU 04/19/22 USD 2,424,885 (734,680 )RUB 217,750,000 GSBU 04/19/22 USD 2,044,601 (594,682 )RUB 143,437,195 GSBU 04/19/22 USD 1,325,055 (413,504 )RUB 112,045,984 GSBU 04/19/22 USD 1,325,988 (32,088 )RUB 67,869,646 GSBU 04/19/22 USD 649,470 (173,157 )RUB 64,356,130 GSBU 04/19/22 USD 604,283 (175,759 )RUB 56,741,711 GSBU 04/19/22 USD 654,083 (33,666 )RUB 56,251,148 GSBU 04/19/22 USD 654,083 (27,720 )RUB 47,621,322 GSBU 04/19/22 USD 529,862 (47,342 )RUB 39,942,424 GSBU 04/19/22 USD 389,682 (94,448 )RUB 6,130,000 GSBU 04/19/22 USD 57,559 (16,741 )RUB 55,137,339 JPMC 04/19/22 USD 548,630 (119,673 )RUB 29,725,957 JPMC 04/19/22 USD 273,972 (86,328 )RUB 260,231,637 MSCS 04/19/22 USD 3,401,269 247,079ZAR 198,594 MSCS 04/19/22 USD 12,477 (1,088 )Net Unrealized Appreciation $ 2,134,268
Futures Contracts
Futures Contracts - LongExpiration
DateNumber ofContracts
NotionalValue
Value/Unrealized
Appreciation/(Depreciation)
90 Day Euro Dollar Futures 12/18/23 6,608 USD 1,601,944,400 $(23,566,127 )90 Day Euro Dollar Futures 12/19/22 913 USD 222,178,550 (2,791,842 )Australian 10 Year Treasury Bond Futures 06/15/22 201 AUD 25,475,349 (754,028 )U.S. Treasury Note 2 Year Futures 06/30/22 2,750 USD 582,785,159 (7,942,870 )U.S. Treasury Note Ultra 10 Year Futures 06/21/22 195 USD 26,416,406 (860,284 )U.S. Treasury Ultra Long Bond Futures 06/21/22 1,869 USD 331,046,625 (11,775,646 )
Futures Contracts - ShortEuro-Bund Futures 06/08/22 (79 ) EUR (12,534,140 ) 620,313Euro-Buxl 30 Year Bond Futures 06/08/22 (30 ) EUR (5,586,000 ) 512,906U.S. Treasury Long Bond Futures 06/21/22 (247 ) USD (37,065,438 ) 1,209,480U.S. Treasury Note 10 Year Futures 06/21/22 (1,939 ) USD (238,254,625 ) 8,004,724U.S. Treasury Note 5 Year Futures 06/30/22 (337 ) USD (38,649,688 ) (4,536 )Net Unrealized Depreciation $(37,347,910 )
BHFTII-290
Copyright © 2022 www.secdatabase.com. All Rights Reserved.Please Consider the Environment Before Printing This Document

Table of ContentsBrighthouse Funds Trust IIWestern Asset Management Strategic Bond Opportunities Portfolio
Schedule of Investments as of March 31, 2022 (Unaudited)Purchased Options
Foreign Currency OptionsStrikePrice Counterparty
ExpirationDate
Number ofContracts
NotionalAmount
PremiumsPaid
MarketValue
UnrealizedAppreciation/(Depreciation)
USD Call/EUR Put EUR 1.125 GSBU 04/01/22 70,460,000 USD 70,460,000 $572,840 $741,592 $ 168,752USD Put/JPY Call JPY 120.650 GSBU 04/05/22 16,890,000 USD 16,890,000 105,901 45,147 (60,754 )USD Put/JPY Call JPY 116.000 MSCS 06/23/22 17,006,715 USD 17,006,715 81,445 74,183 (7,262 )USD Put/JPY Call JPY 113.000 MSCS 09/21/22 17,006,715 USD 17,006,715 101,615 99,421 (2,194 )Totals $861,801 $960,343 $ 98,542
Options on Exchange-Traded Futures ContractsStrikePrice
ExpirationDate
Number ofContracts
NotionalAmount
PremiumsPaid
MarketValue
UnrealizedAppreciation/(Depreciation)
Put - S&P 500 Index E-Mini Futures USD 3,800.000 04/14/22 1,071 USD 53,550 $4,096,404 $112,455 $ (3,983,949 )Put - S&P 500 Index E-Mini Futures USD 4,000.000 04/14/22 152 USD 7,600 570,319 24,320 (545,999 )Put - S&P 500 Index E-Mini Futures USD 4,000.000 05/20/22 575 USD 28,750 553,857 725,938 172,081Put - S&P 500 Index E-Mini Futures USD 4,200.000 05/20/22 236 USD 11,800 401,696 551,650 149,954Put - S&P 500 Index E-Mini Futures USD 4,300.000 05/20/22 156 USD 7,800 392,278 495,300 103,022Totals $6,014,554 $1,909,663 $ (4,104,891 )
Written Options
Foreign Currency OptionsStrikePrice Counterparty
ExpirationDate
Number ofContracts
NotionalAmount
PremiumsReceived
MarketValue
UnrealizedAppreciation/(Depreciation)
USD Call/EUR Put EUR 1.105 GSBU 04/01/22 (70,460,000) USD (70,460,000) $(238,859 ) $(9,371 ) $ 229,488USD Call/EUR Put EUR 1.125 JPMC 04/07/22 (15,041,920) USD (15,041,920) (62,236 ) (174,426 ) (112,190 )USD Call/EUR Put EUR 1.112 GSBU 04/13/22 (26,010,000) USD (26,010,000) (115,901 ) (157,699 ) (41,798 )USD Call/EUR Put EUR 1.105 BNP 04/26/22 (26,300,000) USD (26,300,000) (127,818 ) (147,149 ) (19,331 )USD Call/JPY Put JPY 117.650 BNP 04/26/22 (35,070,000) USD (35,070,000) (151,152 ) (1,130,446) (979,294 )USD Put/CAD Call CAD 1.244 MSCS 04/20/22 (26,545,000) USD (26,545,000) (81,414 ) (141,750 ) (60,336 )USD Put/EUR Call EUR 1.168 JPMC 04/07/22 (15,041,920) USD (15,041,920) (62,236 ) (90 ) 62,146USD Put/EUR Call EUR 1.161 GSBU 04/13/22 (26,010,000) USD (26,010,000) (110,074 ) (1,769 ) 108,305USD Put/MXN Call MXN 20.415 JPMC 05/13/22 (27,300,000) USD (27,300,000) (188,643 ) (669,587 ) (480,944 )USD Put/NOK Call NOK 8.483 GSBU 04/12/22 (14,350,000) USD (14,350,000) (94,997 ) (16,000 ) 78,997USD Put/NOK Call NOK 8.540 CBNA 04/20/22 (26,545,000) USD (26,545,000) (127,151 ) (90,226 ) 36,925USD Put/RUB Call RUB 73.850 JPMC 04/14/22 (26,819,000) USD (26,819,000) (319,682 ) (344,141 ) (24,459 )Totals $(1,680,163) $(2,882,654) $ (1,202,491 )
Options on Exchange-Traded Futures ContractsStrikePrice
ExpirationDate
Number ofContracts
NotionalAmount
PremiumsReceived
MarketValue
UnrealizedAppreciation/(Depreciation)
Call - U.S. Treasury Note 10 Year Futures USD 124.000 04/22/22 (318 ) USD (318,000) $(198,200 ) $(124,219) $ 73,981Call - U.S. Treasury Note 10 Year Futures USD 122.500 04/22/22 (159 ) USD (159,000 (126,428 ) (168,938) (42,510 )Put - S&P 500 Index E-Mini Futures USD 3,900.000 05/20/22 (156 ) USD (7,800 (114,722 ) (144,300) (29,578 )Put - S&P 500 Index E-Mini Futures USD 3,800.000 05/20/22 (236 ) USD (11,800 (123,404 ) (162,250) (38,846 )Totals $(562,754 ) $(599,707) $ (36,953 )
BHFTII-291
Copyright © 2022 www.secdatabase.com. All Rights Reserved.Please Consider the Environment Before Printing This Document

Table of ContentsBrighthouse Funds Trust IIWestern Asset Management Strategic Bond Opportunities Portfolio
Schedule of Investments as of March 31, 2022 (Unaudited)Swap Agreements
Centrally Cleared Interest Rate Swaps
Pay/ReceiveFloating Rate
FloatingRate Index
PaymentFrequency
FixedRate
PaymentFrequency
MaturityDate
NotionalAmount
MarketValue
UpfrontPremiums
Paid/(Received)
UnrealizedAppreciation/(Depreciation)
Pay 28-DayTIIE
Monthly 7.440% Monthly 07/20/29
MXN 1,162,650,000 $(2,419,414) $443,245 $ (2,862,659 )
Pay 28-DayTIIE
Monthly 7.450% Monthly 07/18/29
MXN 1,118,490,000 (2,296,514) 351,840 (2,648,354 )
Pay CPURNSA Annually 3.370% Annually 11/18/26
USD 38,410,000 (1,039,670) 380,397 (1,420,067 )
Receive CPURNSA Annually 3.970% Annually 11/18/23
USD 38,410,000 1,051,600 (117,504 ) 1,169,104
Receive SOFR Annually 1.520% Annually 11/20/26
USD 43,650,000 948,937 (74,826 ) 1,023,763
Totals $(3,755,061) $983,152 $ (4,738,213 )
Centrally Cleared Credit Default Swaps on Credit Indices and Corporate Issues- Buy Protection (a)
Reference Obligation
FixedDeal
(Pay)RatePayment
FrequencyMaturity
Date
ImpliedCredit Spreadat March 31,
2022(b)Notional
Amount (c)MarketValue
UpfrontPremiums
Paid/(Received)
UnrealizedAppreciation/(Depreciation)
CDX.NA.HY.38 (5.000%) Quarterly 06/20/27
0.000 % USD 34,868,000 $(1,932,239) $(1,636,648) $ (295,591 )
General Motors Co., 4.346%,due 12/08/26
(5.000%) Quarterly 06/20/26
0.000 % USD 13,700,000 (1,861,871) (2,256,881) 395,010
Totals $(3,794,110) $(3,893,529) $ 99,419
Centrally Cleared Credit Default Swaps on Corporate Issues- Sell Protection (d)
Reference ObligationFixed Deal
Receive RatePayment
FrequencyMaturity
Date
ImpliedCredit Spreadat March 31,
2022(b)Notional
Amount (c)MarketValue
UpfrontPremiums
Paid/(Received)
UnrealizedAppreciation/(Depreciation)
Ford Motor Co., 4.346%, due12/08/26
5.000% Quarterly 06/20/26
0.000 % USD 13,700,000 $1,525,727 $1,679,158 $ (153,431 )
OTC Credit Default Swaps on Corporate Issues - Buy Protection (a)
Reference ObligationFixed Deal(Pay) Rate
PaymentFrequency
MaturityDate Counterparty
ImpliedCredit Spreadat March 31,
2022 (b)Notional
Amount (c)MarketValue
UpfrontPremium
Paid/(Received)
UnrealizedAppreciation/(Depreciation)
Daimler AG 1.400%,due 01/12/24 (1.000%) Quarterly
12/20/24 MSCS 0.000 % EUR 11,300,000 $(210,891) $(140,809 ) $ (70,082 )
OTC Credit Default Swaps on Corporate Issues - Sell Protection (d)
Reference ObligationFixed Deal
Receive RatePayment
FrequencyMaturity
Date Counterparty
ImpliedCredit Spreadat March 31,
2022 (b)Notional
Amount (c)MarketValue
UpfrontPremium
Paid/(Received)
UnrealizedAppreciation/(Depreciation)
VolkswagenInternationalFinance NV0.875%, due 01/16/23 1.000% Quarterly
12/20/24 MSCS 0.000 % EUR 11,300,000 $141,840 $ 73,805 $ 68,035
(a) If the Portfolio is a buyer of protection and a credit event occurs, as defined under the terms of that particular swap agreement, the Portfolio will either(i) receive from the seller of protection an amount equal to the notional amount of the swap and deliver the referenced obligation or underlyingsecurities comprising the referenced index or (ii) receive a net settlement amount in the form of cash or securities equal to the notional amount of theswap less the recovery value of the referenced obligation or underlying securities comprising the referenced index.
Copyright © 2022 www.secdatabase.com. All Rights Reserved.Please Consider the Environment Before Printing This Document

(b) Implied credit spreads, represented in absolute terms, utilized in determining the market value of credit default swap agreements on corporate issuesor indices as of period end serve as an indicator of the current status of the payment/performance risk and represent the likelihood or risk of default forthe credit derivative. The implied credit spread of a particular referenced entity reflects the cost of buying/selling protection and may include upfrontpayments required to be made to enter into the agreement. Wider credit spreads represent a deterioration of the referenced entity�s credit soundnessand a greater likelihood or risk of default or other credit event occurring as defined under the terms of the agreement. A credit spread identified as�Defaulted� indicates a credit event has occurred for the referenced entity or obligation.
(c) The maximum potential amount of future undiscounted payments that the Portfolio could be required to make under a credit default swap contractwould be the notional amount of the contract. These potential amounts would be partially offset by any recovery values of the referenced debtobligation or net amounts received from the settlement of purchased protection credit default swap contracts entered into by the Portfolio for the samereferenced debt obligation.
BHFTII-292
Copyright © 2022 www.secdatabase.com. All Rights Reserved.Please Consider the Environment Before Printing This Document

Table of ContentsBrighthouse Funds Trust IIWestern Asset Management Strategic Bond Opportunities Portfolio
Schedule of Investments as of March 31, 2022 (Unaudited)(d) If the Portfolio is a seller of protection and a credit event occurs, as defined under the terms of that particular swap agreement, the Portfolio will either
(i) pay to the buyer of protection an amount equal to the notional amount of the swap and take delivery of the referenced obligation or underlyingsecurities comprising the referenced index or (ii) pay a net settlement amount in the form of cash or securities equal to the notional amount of theswap less the recovery value of the referenced obligation or underlying securities comprising the referenced index.
Glossary of AbbreviationsCounterparties
(BNP)� BNP Paribas S.A.(BOA)� Bank of America N.A.(CBNA)� Citibank N.A.(GSBU)� Goldman Sachs Bank USA(JPMC)� JPMorgan Chase Bank N.A.(MSCS)� Morgan Stanley Capital Services LLC
Currencies
(AUD)� Australian Dollar(BRL)� Brazilian Real(CAD)� Canadian Dollar(CNY)� Chinese Yuan(EUR)� Euro(GBP)� British Pound(IDR)� Indonesian Rupiah(INR)� Indian Rupee(JPY)� Japanese Yen(MXN)� Mexican Peso(NOK)� Norwegian Krone(NZD)� New Zealand Dollar(RUB)� Russian Ruble(USD)� United States Dollar(ZAR)� South African Rand
Index Abbreviations
(CDX.NA.HY)� Markit North America High Yield CDS Index(COFI)� 11th District Cost of Fund Index(CPURNSA)� U.S. Consumer Price Index for All Urban Consumers Non-Seasonally Adjusted(EURIBOR)� Euro InterBank Offered Rate(FEDEFF PRV)� Effective Federal Funds Rate(H15)� U.S. Treasury Yield Curve Rate T-Note Constant Maturity Index(LIBOR)� London Interbank Offered Rate(OBFR)� U.S. Overnight Bank Funding Rate(SOFR)� Secured Overnight Financing Rate(TIIE)� Mexican Interbank Equilibrium Interest Rate(TSFR)� Term Secured Financing Rate
Other Abbreviations
(CLO)� Collateralized Loan Obligation(CMO)� Collateralized Mortgage Obligation(DAC)� Designated Activity Company(ICE)� Intercontinental Exchange, Inc.(REMIC)� Real Estate Mortgage Investment Conduit(STACR)� Structured Agency Credit Risk
BHFTII-293
Copyright © 2022 www.secdatabase.com. All Rights Reserved.Please Consider the Environment Before Printing This Document

Table of ContentsBrighthouse Funds Trust IIWestern Asset Management Strategic Bond Opportunities Portfolio
Schedule of Investments as of March 31, 2022 (Unaudited)
Fair Value HierarchyAccounting principles generally accepted in the United States of America (�GAAP�) define fair market value as the price that the Portfolio would receive tosell an asset or pay to transfer a liability in an orderly transaction between market participants at the measurement date. It establishes a fair valuehierarchy that prioritizes inputs to valuation methods and requires disclosure of the fair value hierarchy, separately for each major category of assets andliabilities, that segregates fair value measurements into three levels. Levels 1, 2 and 3 of the fair value hierarchy are defined as follows:
Level 1 - unadjusted quoted prices in active markets for identical investmentsLevel 2 - other significant observable inputs (including, but not limited to, quoted prices for similar assets or liabilities in markets that are either activeor inactive; inputs other than quoted prices that are observable such as interest rates, yield curves, volatilities, prepayment speeds, loss severities,credit risks, default rates, or other market corroborated inputs)Level 3 - significant unobservable inputs based on the best information available in the circumstances, to the extent observable inputs areunavailable (including the Portfolio�s own assumptions used in determining the fair value of investments and derivative financial instruments)
The inputs or methodologies used for valuing investments are not necessarily an indication of the risk associated with investing in them. Changes to theinputs or methodologies used may result in transfers between levels. A reconciliation of Level 3 securities, if any, will be disclosed following the fair valuehierarchy table. For more information about the Portfolio�s policy regarding the valuation of investments, please refer to the Notes to Schedule ofInvestments.
The following table summarizes the fair value hierarchy of the Portfolio�s investments as of March 31, 2022:
Description Level 1 Level 2 Level 3 TotalCorporate Bonds & Notes
Advertising $ � $7,753,333 $ � $7,753,333Aerospace/Defense � 26,314,824 � 26,314,824Agriculture � 4,343,051 � 4,343,051Airlines � 40,619,327 � 40,619,327Auto Manufacturers � 30,496,636 � 30,496,636Auto Parts & Equipment � 5,171,671 � 5,171,671Banks � 111,958,247 � 111,958,247Beverages � 3,680,925 � 3,680,925Biotechnology � 5,034,661 � 5,034,661Building Materials � 7,857,067 � 7,857,067Chemicals � 1,609,725 � 1,609,725Commercial Services � 56,928,907 � 56,928,907Computers � 5,879,760 � 5,879,760Distribution/Wholesale � 18,439,800 � 18,439,800Diversified Financial Services � 68,928,755 � 68,928,755Electric � 21,585,313 � 21,585,313Energy-Alternate Sources � 4,621,724 � 4,621,724Engineering & Construction � 2,735,338 � 2,735,338Entertainment � 18,633,643 � 18,633,643Environmental Control � 4,119,525 � 4,119,525Food � 11,461,586 � 11,461,586Food Service � 2,091,000 � 2,091,000Forest Products & Paper � 8,931,400 � 8,931,400Healthcare-Products � 6,021,750 � 6,021,750Healthcare-Services � 35,929,420 � 35,929,420Home Builders � 2,253,091 � 2,253,091Insurance � 20,403,884 � 20,403,884Internet � 12,275,705 � 12,275,705Investment Companies � 6,408,182 � 6,408,182Iron/Steel � 7,040,949 � 7,040,949Leisure Time � 46,885,460 � 46,885,460Lodging � 23,093,804 � 23,093,804Machinery-Construction & Mining � 5,274,915 � 5,274,915Machinery-Diversified � 7,933,600 � 7,933,600Media � 70,680,905 � 70,680,905Metal Fabricate/Hardware � 7,008,200 � 7,008,200Mining � 62,405,731 0 62,405,731Office/Business Equipment � 1,479,284 � 1,479,284Oil & Gas � 136,921,532 � 136,921,532Packaging & Containers � 13,364,799 � 13,364,799
Copyright © 2022 www.secdatabase.com. All Rights Reserved.Please Consider the Environment Before Printing This Document

Pharmaceuticals � 70,012,424 � 70,012,424
BHFTII-294
Copyright © 2022 www.secdatabase.com. All Rights Reserved.Please Consider the Environment Before Printing This Document

Table of ContentsBrighthouse Funds Trust IIWestern Asset Management Strategic Bond Opportunities Portfolio
Schedule of Investments as of March 31, 2022 (Unaudited)Fair Value Hierarchy ��(Continued)
Description Level 1 Level 2 Level 3 TotalPipelines $� $93,029,071 $� $93,029,071Real Estate � 11,592,812 � 11,592,812Real Estate Investment Trusts � 31,391,980 � 31,391,980Retail � 65,780,001 � 65,780,001Semiconductors � 1,842,885 � 1,842,885Software � 29,450,372 � 29,450,372Telecommunications � 52,921,564 � 52,921,564Transportation � 9,767,780 � 9,767,780
Total Corporate Bonds & Notes � 1,300,366,318 0 1,300,366,318Total Floating Rate Loans (Less Unfunded Loan Commitments of $1,394,391)* � 554,267,373 � 554,267,373Total Mortgage-Backed Securities* � 230,614,239 � 230,614,239Total Asset-Backed Securities* � 215,808,736 � 215,808,736Total U.S. Treasury & Government Agencies* � 210,308,435 � 210,308,435Total Foreign Government* � 93,141,037 � 93,141,037Convertible Preferred Stocks
Banks 6,578,625 � � 6,578,625Pipelines � 15,827,808 12,188,461 28,016,269
Total Convertible Preferred Stocks 6,578,625 15,827,808 12,188,461 34,594,894Total Convertible Bonds* � 19,158,401 � 19,158,401Total Preferred Stocks* 3,567,426 � � 3,567,426Common Stocks
Auto Components 56,893 � � 56,893Chemicals � 2,382 � 2,382Media � 189,664 � 189,664Oil, Gas & Consumable Fuels 1,760,747 27,991 � 1,788,738
Total Common Stocks 1,817,640 220,037 � 2,037,677Total Municipals* � 342,100 � 342,100Total Escrow Shares* � � 0 0Total Short-Term Investment* � 5,076,796 � 5,076,796Securities Lending Reinvestments
Certificates of Deposit � 196,576,044 � 196,576,044Commercial Paper � 37,965,881 � 37,965,881Repurchase Agreements � 171,902,455 � 171,902,455Time Deposits � 53,000,000 � 53,000,000Mutual Funds 10,000,000 � � 10,000,000
Total Securities Lending Reinvestments 10,000,000 459,444,380 � 469,444,380Purchased Options
Foreign Currency Options at Value � 960,343 � 960,343Options on Exchange-Traded Futures Contracts at Value 1,909,663 � � 1,909,663
Total Purchased Options 1,909,663 960,343 � 2,870,006Total Net Investments $23,873,354 $3,105,536,003 $12,188,461 $3,141,597,818Collateral for Securities Loaned (Liability) $� $(469,551,480 ) $� $(469,551,480 )Forward Contracts
Forward Foreign Currency Exchange Contracts (Unrealized Appreciation) $� $22,869,953 $� $22,869,953Forward Foreign Currency Exchange Contracts (Unrealized Depreciation) � (20,735,685 ) � (20,735,685 )
Total Forward Contracts $� $2,134,268 $� $2,134,268Futures Contracts
Futures Contracts (Unrealized Appreciation) $10,347,423 $� $� $10,347,423Futures Contracts (Unrealized Depreciation) (47,695,333) � � (47,695,333 )
Total Futures Contracts $(37,347,910) $� $� $(37,347,910 )Written Options
Foreign Currency Options at Value $� $(2,882,654 ) $� $(2,882,654 )
BHFTII-295
Copyright © 2022 www.secdatabase.com. All Rights Reserved.Please Consider the Environment Before Printing This Document

Table of ContentsBrighthouse Funds Trust IIWestern Asset Management Strategic Bond Opportunities Portfolio
Schedule of Investments as of March 31, 2022 (Unaudited)Fair Value Hierarchy ��(Continued)
Description Level 1 Level 2 Level 3 TotalOptions on Exchange-Traded Futures Contracts at Value $(599,707) $� $ � $(599,707 )
Total Written Options $(599,707) $(2,882,654) $ � $(3,482,361)Centrally Cleared Swap Contracts
Centrally Cleared Swap Contracts (Unrealized Appreciation) $� $2,587,877 $ � $2,587,877Centrally Cleared Swap Contracts (Unrealized Depreciation) � (7,380,102) � (7,380,102)
Total Centrally Cleared Swap Contracts $� $(4,792,225) $ � $(4,792,225)OTC Swap Contracts
OTC Swap Contracts at Value (Assets) $� $141,840 $ � $141,840OTC Swap Contracts at Value (Liabilities) � (210,891 ) � (210,891 )
Total OTC Swap Contracts $� $(69,051 ) $ � $(69,051 )
* See Schedule of Investments for additional detailed categorizations.
Level 3 investments at the beginning and/or end of the period in relation to net assets were not significant and accordingly, a reconciliation of Level 3assets for the period ended March 31, 2022 is not presented.
BHFTII-296
Copyright © 2022 www.secdatabase.com. All Rights Reserved.Please Consider the Environment Before Printing This Document

Table of ContentsBrighthouse Funds Trust II
Western Asset Management U.S. Government Portfolio
Schedule of Investments as of March 31, 2022 (Unaudited)U.S. Treasury & Government Agencies��94.2% of Net Assets
Security DescriptionPrincipalAmount* Value
Agency SponsoredMortgage��Backed��31.8%Fannie Mae 15 Yr. Pool
1.500%, 03/01/36 87,601 $83,151Fannie Mae 20 Yr. Pool
2.500%, 10/01/40 6,422,624 6,221,4902.500%, 03/01/41 541,334 528,8932.500%, 04/01/41 1,844,332 1,795,3832.500%, 05/01/41 2,026,739 1,961,7693.000%, 07/01/35 522,349 520,8113.000%, 02/01/36 817,480 815,7203.000%, 04/01/36 617,234 615,9043.000%, 07/01/36 1,280,304 1,277,0093.000%, 08/01/36 6,759,805 6,752,8763.000%, 10/01/36 2,644,504 2,645,0263.000%, 12/01/36 2,187,699 2,185,9773.000%, 12/01/37 492,678 491,6173.000%, 06/01/38 676,075 674,6623.500%, 12/01/34 153,226 155,1433.500%, 01/01/35 107,130 108,4703.500%, 02/01/37 173,460 175,6243.500%, 03/01/37 122,940 124,2783.500%, 12/01/37 186,551 191,1703.500%, 08/01/39 186,943 189,2383.500%, 02/01/40 735,043 755,9614.500%, 11/01/31 259,568 270,1234.500%, 12/01/31 331,210 344,675
Fannie Mae 30 Yr. Pool2.000%, 08/01/50 155,125 144,5332.000%, 09/01/50 79,064 73,6652.000%, 01/01/51 7,845,138 7,303,5432.000%, 02/01/51 8,036,492 7,485,6642.000%, 03/01/51 12,576,943 11,710,6022.000%, 04/01/51 8,104,193 7,543,6962.000%, 07/01/51 287,605 267,4822.000%, 08/01/51 1,058,732 984,2472.000%, 10/01/51 783,117 728,1582.000%, 11/01/51 1,184,238 1,101,5072.000%, 01/01/52 2,472,121 2,297,6802.000%, 02/01/52 3,285,871 3,057,5692.000%, 03/01/52 1,700,000 1,584,2092.500%, 09/01/50 365,716 350,5572.500%, 11/01/50 545,334 522,8082.500%, 12/01/50 173,239 165,8512.500%, 02/01/51 2,199,831 2,104,2372.500%, 03/01/51 4,432,665 4,238,4312.500%, 04/01/51 1,759,235 1,685,8532.500%, 05/01/51 637,629 609,9122.500%, 06/01/51 3,015,354 2,890,7312.500%, 07/01/51 2,106,121 2,020,5132.500%, 08/01/51 957,768 918,9522.500%, 09/01/51 4,135,025 3,967,1652.500%, 10/01/51 3,041,178 2,913,3892.500%, 11/01/51 1,487,570 1,428,9362.500%, 12/01/51 1,570,254 1,502,3252.500%, 01/01/52 6,055,965 5,806,2422.500%, 02/01/52 9,927,808 9,492,4002.500%, 03/01/52 3,294,460 3,151,366
Agency SponsoredMortgage��Backed��(Continued)
Copyright © 2022 www.secdatabase.com. All Rights Reserved.Please Consider the Environment Before Printing This Document

Fannie Mae 30 Yr. Pool2.500%, 04/01/52 400,000 382,7013.000%, 09/01/42 1,406,874 1,399,4623.000%, 08/01/46 425,329 422,1453.000%, 09/01/46 1,344,282 1,334,9063.000%, 10/01/46 614,751 610,1573.000%, 08/01/47 46,527 46,2833.000%, 11/01/48 3,619,521 3,581,4163.000%, 01/01/50 1,147,683 1,127,9563.000%, 02/01/50 13,225,688 13,126,6493.000%, 03/01/50 7,742,553 7,619,7293.000%, 08/01/50 615,977 603,9673.000%, 11/01/50 680,286 669,3843.000%, 05/01/51 563,854 553,7743.000%, 08/01/51 2,248,519 2,223,6473.000%, 09/01/51 188,784 185,4583.000%, 11/01/51 490,311 485,3063.000%, 12/01/51 787,345 778,7343.000%, 01/01/52 3,177,617 3,126,3613.000%, 02/01/52 1,096,352 1,081,5183.000%, 03/01/52 5,800,000 5,740,9733.500%, 12/01/42 184,268 187,9223.500%, 03/01/43 1,148,945 1,171,9803.500%, 08/01/44 310,080 316,2193.500%, 02/01/45 179,850 183,4373.500%, 11/01/46 506,506 512,8643.500%, 12/01/46 1,881,342 1,916,8203.500%, 03/01/47 665,087 674,4133.500%, 07/01/47 11,153,528 11,309,5313.500%, 10/01/47 58,564 59,2333.500%, 12/01/47 1,564,107 1,581,5723.500%, 02/01/48 242,881 245,7213.500%, 03/01/48 119,607 121,2063.500%, 04/01/48 164,432 165,6823.500%, 08/01/48 1,080,441 1,097,6143.500%, 11/01/48 1,303,697 1,320,2743.500%, 06/01/49 660,541 668,6493.500%, 02/01/50 640,948 646,9893.500%, 12/01/51 181,511 182,2494.000%, 02/01/40 336,549 346,9404.000%, 06/01/42 2,995,974 3,134,5784.000%, 07/01/42 849,805 883,5714.000%, 05/01/43 6,832,405 7,146,0394.000%, 10/01/43 3,304,356 3,449,9784.000%, 09/01/44 532,795 555,8014.000%, 05/01/48 4,139,970 4,269,1554.000%, 09/01/48 69,128 70,5704.000%, 07/01/50 565,831 578,3674.500%, 10/01/41 2,001,421 2,122,3454.500%, 10/01/44 650,480 690,7284.500%, 01/01/45 55,121 58,7224.500%, 05/01/46 433,424 460,7604.500%, 06/01/47 203,191 212,9244.500%, 07/01/47 808,933 847,0044.500%, 08/01/47 100,610 104,4564.500%, 06/01/48 261,741 273,881
BHFTII-297
Copyright © 2022 www.secdatabase.com. All Rights Reserved.Please Consider the Environment Before Printing This Document

Table of ContentsBrighthouse Funds Trust IIWestern Asset Management U.S. Government Portfolio
Schedule of Investments as of March 31, 2022 (Unaudited)U.S. Treasury & Government Agencies��(Continued)
Security DescriptionPrincipalAmount* Value
Agency SponsoredMortgage��Backed��(Continued)Fannie Mae 30 Yr. Pool
4.500%, 07/01/48 618,540 $649,0814.500%, 08/01/48 1,298,085 1,360,6874.500%, 11/01/48 507,201 531,6164.500%, 02/01/49 200,011 209,0334.500%, 08/01/49 208,375 217,3484.500%, 09/01/49 3,036,620 3,177,7114.500%, 11/01/49 791,818 831,2394.500%, 03/01/50 533,182 560,4304.500%, 04/01/50 156,735 162,7455.000%, 07/01/33 89,686 95,2445.000%, 09/01/33 110,281 119,1675.000%, 10/01/35 312,584 334,8725.000%, 03/01/36 477,032 515,9505.000%, 01/01/39 4,434 4,7985.000%, 12/01/39 7,249 7,8245.000%, 05/01/40 22,656 23,9115.000%, 07/01/40 13,454 14,2325.000%, 11/01/40 326,897 353,6875.000%, 01/01/41 30,338 32,2365.000%, 02/01/41 24,549 25,8465.000%, 04/01/41 30,127 32,4705.000%, 05/01/41 828,211 893,8495.000%, 06/01/41 69,732 75,4215.000%, 07/01/41 680,692 735,6255.000%, 12/01/49 629,475 663,7696.000%, 04/01/33 39,879 43,9786.000%, 02/01/34 6,461 6,9856.000%, 11/01/35 62,332 68,6616.000%, 08/01/37 144,753 159,9666.500%, 03/01/26 351 3776.500%, 04/01/29 36,485 39,1667.000%, 02/01/29 332 3337.000%, 01/01/30 1,527 1,5557.000%, 10/01/37 2,702 2,7607.000%, 11/01/37 12,813 13,3427.000%, 12/01/37 12,347 13,1397.000%, 02/01/38 2,729 2,7967.000%, 11/01/38 44,774 49,6637.000%, 02/01/39 422,053 476,4607.500%, 04/01/32 7,163 7,1878.000%, 05/01/28 1,031 1,0988.000%, 07/01/32 687 728
Fannie Mae Interest Strip (CMO)3.500%, 11/25/41 (a) 741,343 76,4214.000%, 04/25/42 (a) 1,066,890 172,2694.500%, 11/25/39 (a) 611,709 98,593
Fannie Mae Pool2.150%, 02/01/32 440,000 413,3422.930%, 06/01/30 154,711 154,9263.250%, 05/01/29 98,722 100,9993.450%, 03/01/29 96,971 100,2723.468%, 03/01/30 177,364 182,8753.500%, 08/01/42 3,432,453 3,504,4763.500%, 09/01/42 239,847 244,8943.500%, 10/01/42 1,686,146 1,721,568
Agency SponsoredMortgage��Backed��(Continued)
Copyright © 2022 www.secdatabase.com. All Rights Reserved.Please Consider the Environment Before Printing This Document
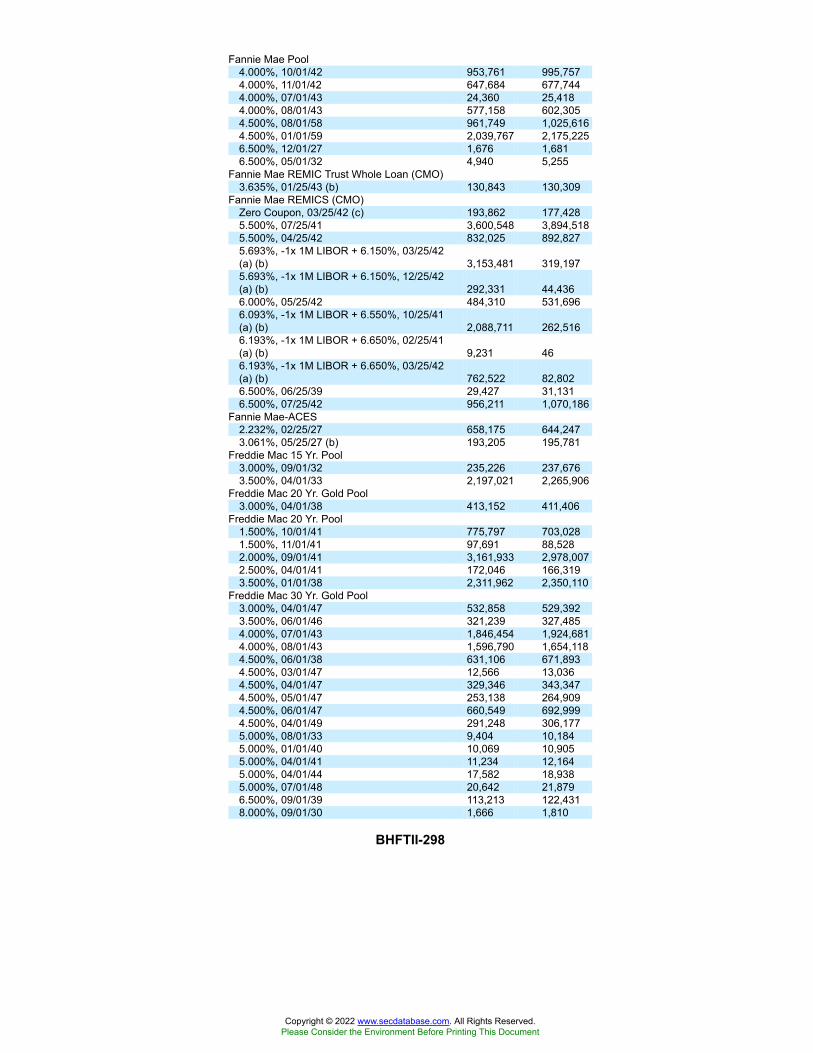
Fannie Mae Pool4.000%, 10/01/42 953,761 995,7574.000%, 11/01/42 647,684 677,7444.000%, 07/01/43 24,360 25,4184.000%, 08/01/43 577,158 602,3054.500%, 08/01/58 961,749 1,025,6164.500%, 01/01/59 2,039,767 2,175,2256.500%, 12/01/27 1,676 1,6816.500%, 05/01/32 4,940 5,255
Fannie Mae REMIC Trust Whole Loan (CMO)3.635%, 01/25/43 (b) 130,843 130,309
Fannie Mae REMICS (CMO)Zero Coupon, 03/25/42 (c) 193,862 177,4285.500%, 07/25/41 3,600,548 3,894,5185.500%, 04/25/42 832,025 892,8275.693%, -1x 1M LIBOR + 6.150%, 03/25/42(a) (b) 3,153,481 319,1975.693%, -1x 1M LIBOR + 6.150%, 12/25/42(a) (b) 292,331 44,4366.000%, 05/25/42 484,310 531,6966.093%, -1x 1M LIBOR + 6.550%, 10/25/41(a) (b) 2,088,711 262,5166.193%, -1x 1M LIBOR + 6.650%, 02/25/41(a) (b) 9,231 466.193%, -1x 1M LIBOR + 6.650%, 03/25/42(a) (b) 762,522 82,8026.500%, 06/25/39 29,427 31,1316.500%, 07/25/42 956,211 1,070,186
Fannie Mae-ACES2.232%, 02/25/27 658,175 644,2473.061%, 05/25/27 (b) 193,205 195,781
Freddie Mac 15 Yr. Pool3.000%, 09/01/32 235,226 237,6763.500%, 04/01/33 2,197,021 2,265,906
Freddie Mac 20 Yr. Gold Pool3.000%, 04/01/38 413,152 411,406
Freddie Mac 20 Yr. Pool1.500%, 10/01/41 775,797 703,0281.500%, 11/01/41 97,691 88,5282.000%, 09/01/41 3,161,933 2,978,0072.500%, 04/01/41 172,046 166,3193.500%, 01/01/38 2,311,962 2,350,110
Freddie Mac 30 Yr. Gold Pool3.000%, 04/01/47 532,858 529,3923.500%, 06/01/46 321,239 327,4854.000%, 07/01/43 1,846,454 1,924,6814.000%, 08/01/43 1,596,790 1,654,1184.500%, 06/01/38 631,106 671,8934.500%, 03/01/47 12,566 13,0364.500%, 04/01/47 329,346 343,3474.500%, 05/01/47 253,138 264,9094.500%, 06/01/47 660,549 692,9994.500%, 04/01/49 291,248 306,1775.000%, 08/01/33 9,404 10,1845.000%, 01/01/40 10,069 10,9055.000%, 04/01/41 11,234 12,1645.000%, 04/01/44 17,582 18,9385.000%, 07/01/48 20,642 21,8796.500%, 09/01/39 113,213 122,4318.000%, 09/01/30 1,666 1,810
BHFTII-298
Copyright © 2022 www.secdatabase.com. All Rights Reserved.Please Consider the Environment Before Printing This Document

Table of ContentsBrighthouse Funds Trust IIWestern Asset Management U.S. Government Portfolio
Schedule of Investments as of March 31, 2022 (Unaudited)U.S. Treasury & Government Agencies��(Continued)
Security DescriptionPrincipalAmount* Value
Agency SponsoredMortgage��Backed��(Continued)Freddie Mac 30 Yr. Pool
2.000%, 11/01/50 970,640 $903,9202.000%, 02/01/51 2,814,976 2,622,8022.000%, 03/01/51 3,876,001 3,609,3782.000%, 04/01/51 4,096,458 3,814,9112.000%, 05/01/51 6,555,917 6,110,6792.000%, 06/01/51 5,184,890 4,821,7342.000%, 11/01/51 2,465,318 2,292,3302.000%, 01/01/52 298,802 277,8022.000%, 02/01/52 1,585,640 1,473,8872.500%, 11/01/50 72,284 69,1832.500%, 12/01/50 1,377,212 1,318,5022.500%, 01/01/51 1,342,210 1,283,6852.500%, 02/01/51 435,124 415,8242.500%, 03/01/51 1,719,720 1,647,0352.500%, 05/01/51 185,934 179,3322.500%, 07/01/51 5,739,307 5,494,6052.500%, 08/01/51 3,342,321 3,207,3912.500%, 11/01/51 8,677,869 8,329,5392.500%, 01/01/52 2,570,141 2,473,9122.500%, 02/01/52 1,293,037 1,241,3792.500%, 03/01/52 700,000 669,7223.000%, 10/01/46 315,042 313,0633.000%, 09/01/48 1,306,574 1,291,3733.000%, 09/01/49 3,820,889 3,798,3223.000%, 01/01/50 166,415 163,6473.000%, 03/01/50 79,401 78,1343.000%, 10/01/51 592,765 583,6203.000%, 01/01/52 2,861,914 2,809,4653.500%, 07/01/47 4,763,525 4,816,4353.500%, 01/01/48 101,605 102,7903.500%, 03/01/48 213,079 215,5433.500%, 06/01/48 1,501,767 1,520,1414.000%, 07/01/48 356,786 365,6744.000%, 04/01/49 984,008 1,015,8034.000%, 03/01/50 34,087 34,9434.500%, 03/01/49 247,692 260,1414.500%, 07/01/49 430,022 448,5465.000%, 01/01/36 14,795 16,0125.000%, 06/01/41 1,208,225 1,290,4635.000%, 08/01/48 47,709 50,3935.000%, 10/01/48 59,635 63,1825.000%, 11/01/48 174,789 186,4036.000%, 10/01/36 342,391 378,743
Freddie Mac ARM Non-Gold Pool2.130%, 5Y H15 + 1.285%, 03/01/47 (b) 306,017 303,8492.872%, 12M LIBOR + 1.619%, 11/01/47(b) 1,275,537 1,285,0223.012%, 12M LIBOR + 1.628%, 11/01/48(b) 4,307,395 4,325,2043.089%, 12M LIBOR + 1.623%, 02/01/50(b) 2,145,275 2,156,193
Freddie Mac Gold Pool4.000%, 04/01/43 678,417 705,8784.000%, 08/01/43 342,970 359,347
Freddie Mac Multifamily Structured Pass-Through Certificates
0.363%, 12/25/28 (a) (b) 63,541,130 1,418,9810.482%, 01/25/34 (a) (b) 51,797,392 2,288,248
Copyright © 2022 www.secdatabase.com. All Rights Reserved.Please Consider the Environment Before Printing This Document

0.509%, 01/25/29 (a) (b) 85,666,075 2,705,146
Agency SponsoredMortgage��Backed��(Continued)Freddie Mac Multifamily Structured Pass-Through Certificates
0.758%, 09/25/27 (a) (b) 16,946,077 600,4740.853%, 11/25/30 (a) (b) 26,282,678 1,567,1070.882%, 11/25/30 (a) (b) 34,226,244 2,102,0423.291%, 03/25/27 4,670,000 4,726,209
Freddie Mac Pool3.500%, 10/01/42 484,543 494,7433.500%, 02/01/44 191,739 194,271
Freddie Mac REMICS (CMO)4.500%, 04/15/32 156,878 163,8456.000%, 05/15/36 223,164 244,170
Freddie Mac Structured Agency Credit RiskDebt Notes (CMO)
1.399%, SOFR + 1.300%, 02/25/42(144A) (b) 3,511,136 3,489,9581.599%, SOFR + 1.500%, 10/25/41(144A) (b) 2,270,000 2,158,7992.399%, SOFR + 2.300%, 08/25/33(144A) (b) 1,970,000 1,941,9352.499%, SOFR + 2.400%, 02/25/42(144A) (b) 3,420,000 3,327,698
Ginnie Mae I 30 Yr. Pool3.000%, 09/15/42 356,087 354,2903.000%, 10/15/42 1,940,173 1,932,4123.000%, 11/15/42 701,444 698,6373.500%, 06/15/48 2,388,321 2,458,3333.500%, 05/15/50 456,834 466,3234.000%, 03/15/50 32,828 33,9035.500%, 06/15/36 184,963 205,1846.000%, 03/15/33 431,460 474,2096.500%, 06/15/31 943 1,0076.500%, 08/15/34 100,860 107,7597.500%, 09/15/29 1,057 1,1268.500%, 06/15/25 5,608 5,876
Ginnie Mae II 30 Yr. Pool2.000%, 04/20/51 630,009 601,6503.000%, 11/20/46 204,328 203,5353.000%, 09/20/47 65,647 65,3733.000%, 11/20/47 82,992 82,6373.000%, 12/20/47 877,042 873,2473.000%, 01/20/50 685,661 677,0243.000%, 09/20/51 2,446,351 2,424,3773.000%, 01/20/52 99,658 100,8743.000%, TBA (d) 15,700,000 15,461,7233.500%, 06/20/44 801,631 823,0063.500%, 03/20/45 61,979 63,3813.500%, 01/20/46 162,964 166,7253.500%, 03/20/46 874,757 893,5483.500%, 04/20/46 457,143 465,9903.500%, 05/20/46 213,970 218,0073.500%, 06/20/46 365,248 371,8053.500%, 07/20/46 220,650 224,5563.500%, 09/20/46 20,223 20,5643.500%, 05/20/47 2,910,555 2,952,4743.500%, 02/20/49 17,562 17,8173.500%, 10/20/49 162,763 162,2263.500%, 01/20/50 1,501,394 1,511,9853.500%, 02/20/50 175,832 177,7143.500%, 07/20/50 226,415 228,1943.500%, TBA (d) 6,500,000 6,503,0474.000%, 09/20/45 344,827 353,463
BHFTII-299
Copyright © 2022 www.secdatabase.com. All Rights Reserved.Please Consider the Environment Before Printing This Document

Table of ContentsBrighthouse Funds Trust IIWestern Asset Management U.S. Government Portfolio
Schedule of Investments as of March 31, 2022 (Unaudited)U.S. Treasury & Government Agencies��(Continued)
Security DescriptionPrincipalAmount* Value
Agency SponsoredMortgage��Backed��(Continued)Ginnie Mae II 30 Yr. Pool
4.000%, 11/20/45 2,856,173 $2,946,3554.000%, 06/20/47 1,070,700 1,103,1314.000%, 07/20/47 183,954 190,5614.000%, 11/20/47 523,115 541,7084.000%, 12/20/47 199,993 207,0984.000%, 02/20/48 190,707 197,4764.000%, 03/20/48 203,244 210,4624.000%, 04/20/48 180,622 185,6524.000%, 11/20/49 104,573 105,7054.000%, 01/20/50 163,343 171,5184.000%, 02/20/50 145,991 152,7394.000%, 03/20/50 67,942 71,6234.000%, 04/20/50 612,876 640,3894.000%, TBA (d) 2,800,000 2,833,7974.500%, 01/20/40 224,771 239,3124.500%, 05/20/40 286,441 304,9724.500%, 09/20/40 6,387 6,8024.500%, 01/20/41 54,360 58,3464.500%, 07/20/41 352,478 375,2884.500%, 08/20/47 354,249 374,1374.500%, 04/20/48 552,787 578,5204.500%, 05/20/48 798,017 834,0564.500%, 06/20/48 465,989 487,0164.500%, 07/20/48 77,933 81,4514.500%, 08/20/48 2,073,022 2,151,2294.500%, 09/20/48 220,814 230,4634.500%, 10/20/48 536,078 557,8084.500%, 01/20/49 1,408,083 1,464,0674.500%, 03/20/49 387,623 403,0364.500%, 04/20/49 251,862 261,9174.500%, 02/20/50 341,106 353,0824.500%, 03/20/50 221,015 228,9134.500%, 12/20/50 338,809 352,9515.000%, 07/20/40 233,414 255,2735.000%, 11/20/48 89,167 93,6275.000%, 03/20/49 107,239 112,5505.000%, 12/20/49 166,076 174,9385.000%, 01/20/50 104,057 109,2495.000%, 04/20/50 85,923 90,7026.000%, 11/20/34 693 7696.000%, 06/20/35 1,078 1,1966.000%, 07/20/36 55,659 61,7986.000%, 09/20/36 2,604 2,8896.000%, 07/20/38 141,675 157,2936.000%, 09/20/38 348,801 384,3556.000%, 06/20/39 1,727 1,9176.000%, 05/20/40 30,203 33,5056.000%, 06/20/40 100,894 111,9836.000%, 08/20/40 52,181 57,8866.000%, 09/20/40 114,388 126,9136.000%, 10/20/40 58,995 64,9896.000%, 11/20/40 118,931 132,0176.000%, 01/20/41 62,164 67,7536.000%, 03/20/41 376,543 415,7836.000%, 07/20/41 85,500 94,910
Agency SponsoredMortgage��Backed��(Continued)
Copyright © 2022 www.secdatabase.com. All Rights Reserved.Please Consider the Environment Before Printing This Document

Ginnie Mae II 30 Yr. Pool6.000%, 12/20/41 45,522 50,5246.500%, 10/20/37 135,555 152,140
Ginnie Mae II Pool3.000%, 09/20/47 304,766 301,648
Government National Mortgage AssociationZero Coupon, 09/16/46 (a) (b) 9,448,821 940.029%, 03/16/49 (a) (b) 2,588,292 1,1630.090%, 04/16/54 (a) (b) 15,168,999 170,8200.115%, 10/16/54 (a) (b) 13,259,405 39,5610.132%, 02/16/53 (a) (b) 6,545,127 27,1470.144%, 02/16/48 (a) (b) 1,071,460 10,1480.545%, 03/16/60 (a) (b) 2,717,001 106,8490.599%, 09/16/55 (a) (b) 7,017,556 219,1600.641%, 02/16/61 (a) (b) 1,395,785 88,5630.652%, 10/16/58 (a) (b) 12,158,775 512,8390.707%, 12/16/59 (a) (b) 28,247,421 1,481,1821.041%, 02/16/46 (a) (b) 3,753,739 96,494
Government National Mortgage Association(CMO)
0.478%, 12M LIBOR + 0.250%, 10/20/68(b) 1,868,186 1,835,2590.486%, 1M LIBOR + 0.380%, 12/20/60(b) 10,318,172 10,264,7750.506%, 1M LIBOR + 0.400%, 12/20/60(b) 2,449,980 2,438,7220.536%, 1M LIBOR + 0.430%, 10/20/64(b) 3,889,519 3,871,4190.586%, 1M LIBOR + 0.480%, 03/20/61(b) 1,829,796 1,824,0470.606%, 1M LIBOR + 0.500%, 12/20/60(b) 19,708,941 19,654,0710.849%, 1M LIBOR + 0.400%, 08/20/70(b) 70,958 70,7180.899%, 1M LIBOR + 0.450%, 07/20/70(b) 5,548,176 5,519,2280.949%, 1M LIBOR + 0.500%, 07/20/70(b) 364,318 362,7011.599%, 1M LIBOR + 1.150%, 05/20/70(b) 1,305,051 1,340,6701.699%, 1M LIBOR + 1.250%, 04/20/70(b) 140,777 143,4293.000%, 07/20/49 748,779 740,3575.669%, -1x 1M LIBOR + 6.100%, 08/16/42 (a) (b) 430,716 69,0166.201%, -1x 1M LIBOR + 6.650%, 01/20/40 (a) (b) 96,077 3,482
Uniform Mortgage-Backed Securities 30 Yr.Pool2.500%, TBA (d) 32,100,000 30,613,1453.000%, TBA (d) 17,400,000 17,012,7403.500%, TBA (d) 29,800,000 29,680,1204.000%, TBA (d) 3,200,000 3,242,889
563,209,485
Federal Agencies��42.9%Fannie Mae Principal Strip
Zero Coupon, 05/15/30 30,000,000 24,179,366Federal Agricultural Mortgage Corp.
0.260%, 10/02/23 10,000,000 9,728,507Federal Farm Credit Banks Funding Corp.
0.125%, 11/23/22 10,000,000 9,923,2080.125%, 02/03/23 22,000,000 21,732,2360.160%, 02/10/23 15,000,000 14,844,3640.200%, 01/04/24 10,000,000 9,670,1370.220%, 09/08/23 20,000,000 19,444,9900.230%, 01/19/24 15,000,000 14,499,4770.375%, 01/15/25 10,000,000 9,422,0750.460%, 11/03/25 10,000,000 9,286,9660.500%, 12/01/23 30,000,000 29,169,856
BHFTII-300
Copyright © 2022 www.secdatabase.com. All Rights Reserved.Please Consider the Environment Before Printing This Document

Table of ContentsBrighthouse Funds Trust IIWestern Asset Management U.S. Government Portfolio
Schedule of Investments as of March 31, 2022 (Unaudited)U.S. Treasury & Government Agencies��(Continued)
Security DescriptionPrincipalAmount* Value
Federal Agencies��(Continued)Federal Farm Credit Banks Funding Corp.
0.680%, 12/20/23 10,000,000 $9,739,9050.780%, 06/16/25 10,000,000 9,441,8740.875%, 11/18/24 5,000,000 4,805,4861.050%, 11/17/25 10,000,000 9,483,0321.750%, 02/25/25 22,350,000 21,880,8122.600%, 04/05/27 10,000,000 10,027,2962.700%, 10/26/27 10,000,000 10,072,593
Federal Home Loan Bank0.125%, 10/21/22 5,000,000 4,965,1700.125%, 06/02/23 35,000,000 34,233,6720.125%, 08/28/23 12,000,000 11,674,7020.375%, 09/04/25 15,000,000 13,938,1650.500%, 04/14/25 14,000,000 13,197,0721.750%, 09/12/25 10,000,000 9,742,9142.125%, 06/09/23 17,700,000 17,733,2152.500%, 02/13/24 10,000,000 10,031,1272.750%, 12/13/24 10,000,000 10,075,1513.250%, 11/16/28 (e) 40,000,000 41,829,845
Federal Home Loan Mortgage Corp.Zero Coupon, 12/14/29 7,443,000 6,133,661Zero Coupon, 12/17/29 5,562,000 4,567,257Zero Coupon, 12/15/36 24,765,000 15,666,1780.125%, 10/16/23 30,000,000 29,081,1040.250%, 06/26/23 13,000,000 12,725,3840.250%, 08/24/23 20,000,000 19,490,3780.250%, 09/08/23 10,000,000 9,731,0400.250%, 11/06/23 20,000,000 19,397,0920.250%, 12/04/23 20,000,000 19,358,7070.375%, 04/20/23 6,000,000 5,913,3310.375%, 05/05/23 10,000,000 9,844,5222.750%, 06/19/23 20,000,000 20,182,631
Federal National Mortgage Association0.250%, 05/22/23 8,000,000 7,846,8170.625%, 04/22/25 5,000,000 4,721,8012.625%, 09/06/24 22,000,000 22,121,050
Freddie Mac StripsZero Coupon, 07/15/28 5,400,000 4,609,329Zero Coupon, 07/15/32 9,000,000 6,910,246
Resolution Funding Corp. Interest StripZero Coupon, 07/15/26 4,230,000 3,779,076Zero Coupon, 07/15/27 8,012,000 6,927,589Zero Coupon, 01/15/29 6,988,000 5,888,372Zero Coupon, 07/15/29 14,000,000 11,607,537Zero Coupon, 10/15/29 14,996,000 12,353,948
Resolution Funding Corp. Principal StripZero Coupon, 01/15/30 25,000,000 20,212,683Zero Coupon, 04/15/30 30,000,000 24,297,917
United States Department of Housing andUrban Development2.668%, 08/01/24 8,000,000 7,994,9112.738%, 08/01/25 6,000,000 6,003,942
United States International DevelopmentFinance Corp.1.110%, 05/15/29 14,000,000 13,160,0723.330%, 05/15/33 5,805,989 5,936,8213.540%, 06/15/30 9,706,111 9,962,294
761,198,903
U.S. Treasury��19.5%
Copyright © 2022 www.secdatabase.com. All Rights Reserved.Please Consider the Environment Before Printing This Document

U.S. Treasury Bonds1.625%, 11/15/50 23,000,000 18,847,4222.250%, 02/15/52 4,250,000 4,076,016
U.S. Treasury Notes0.125%, 01/31/23 36,000,000 35,573,9060.125%, 07/31/23 8,000,000 7,798,4380.250%, 03/15/24 15,000,000 14,409,3750.250%, 06/15/24 81,000,000 77,253,7500.375%, 01/31/26 10,000,000 9,213,6721.125%, 08/31/28 57,580,000 53,050,0731.250%, 04/30/28 3,340,000 3,111,4191.375%, 06/30/23 65,000,000 64,532,8121.500%, 03/31/23 5,000,000 4,988,2811.875%, 07/31/26 54,000,000 52,616,250
345,471,414Total U.S. Treasury & Government
Agencies(Cost $1,725,894,829) 1,669,879,802
Foreign Government��7.5%Sovereign��7.5%Abu Dhabi Government International
Bond3.125%, 09/30/49 (144A) 10,000,000 9,151,600
Colombia Government International Bond5.625%, 02/26/44 4,840,000 4,387,315
Indonesia Government InternationalBonds3.750%, 04/25/22 (144A) 410,000 410,5413.750%, 04/25/22 1,900,000 1,902,5084.750%, 02/11/29 6,280,000 6,941,273
Israel Government AID Bonds5.500%, 09/18/23 2,000,000 2,092,0705.500%, 12/04/23 33,000,000 34,692,1675.500%, 04/26/24 21,550,000 22,851,874
Mexico Government International Bond4.500%, 04/22/29 (e) 12,280,000 12,949,751
Panama Government International Bonds3.750%, 03/16/25 5,650,000 5,747,2364.500%, 05/15/47 3,200,000 3,188,9924.500%, 04/01/56 1,450,000 1,417,129
Peruvian Government International Bonds3.300%, 03/11/41 3,420,000 3,104,9503.550%, 03/10/51 1,090,000 1,015,0633.600%, 01/15/72 1,580,000 1,357,7736.550%, 03/14/37 320,000 404,243
Poland Government International Bonds3.250%, 04/06/26 5,010,000 5,102,6854.000%, 01/22/24 2,858,000 2,930,970
Qatar Government International Bond5.103%, 04/23/48 (144A) 7,300,000 8,925,622
Uruguay Government International Bond5.100%, 06/18/50 3,200,000 3,768,192
Total Foreign Government(Cost $139,274,202) 132,341,954
BHFTII-301
Copyright © 2022 www.secdatabase.com. All Rights Reserved.Please Consider the Environment Before Printing This Document

Table of ContentsBrighthouse Funds Trust IIWestern Asset Management U.S. Government Portfolio
Schedule of Investments as of March 31, 2022 (Unaudited)Corporate Bonds & Notes��3.5% of Net Assets
Security DescriptionPrincipalAmount* Value
Chemicals��0.1%Equate Petrochemical B.V.
4.250%, 11/03/26 (144A) 1,540,000 $1,559,250
Diversified Financial Services��2.5%Postal Square L.P.
6.500%, 06/15/22 488,700 492,490Private Export Funding Corp.
0.300%, 04/28/23 (144A) 25,000,000 24,509,8283.250%, 06/15/25 20,000,000 20,316,396
45,318,714
Electric��0.5%Enel Chile S.A.
4.875%, 06/12/28 4,000,000 4,143,640Perusahaan Listrik Negara PT
5.450%, 05/21/28 (144A) 4,000,000 4,290,0008,433,640
Oil & Gas��0.4%Ecopetrol S.A.
5.375%, 06/26/26 4,260,000 4,310,864Petroleos Mexicanos
6.375%, 01/23/45 3,610,000 2,887,2427,198,106
Total Corporate Bonds & Notes(Cost $64,603,701) 62,509,710
Mortgage-BackedSecurities��2.2%Collateralized Mortgage Obligations��2.2%Alternative Loan Trust
0.649%, 1M LIBOR + 0.200%, 07/20/46(b) 1,168,215 894,350
Banc of America Funding Trust0.337%, 1M LIBOR + 0.150%, 02/27/37(144A) (b) 779,114 768,202
Banc of America Mortgage Trust2.697%, 07/25/35 (b) 14,085 13,884
CIM Trust1.425%, 07/25/61 (144A) (b) 3,305,257 3,106,456
Citigroup Mortgage Loan Trust2.470%, 1Y H15 + 2.400%, 10/25/35 (b) 29,923 29,888
Countrywide Home Loan Reperforming LoanREMIC Trust0.877%, 1M LIBOR + 0.420%, 07/25/36(144A) (b) 232,097 221,259
Credit Suisse Mortgage Capital CertificatesTrust0.938%, 05/25/66 (144A) (b) 1,262,963 1,192,052
Credit Suisse Mortgage Trust0.830%, 03/25/56 (144A) (b) 802,643 771,4351.169%, 03/25/56 (144A) (b) 690,971 663,9271.991%, 1M LIBOR + 1.750%, 07/25/47(144A) (b) 1,581,877 1,553,544
CSMC Trust1.756%, 10/25/66 (144A) (b) 832,536 788,7492.000%, 10/25/60 (144A) (b) 1,030,851 976,182
Copyright © 2022 www.secdatabase.com. All Rights Reserved.Please Consider the Environment Before Printing This Document

Collateralized MortgageObligations��(Continued)Ellington Financial Mortgage Trust
3.001%, 01/25/67 (144A) (b) 950,000 876,933Freddie Mac STACR REMIC Trust
1.099%, SOFR + 1.000%, 01/25/42(144A) (b) 3,120,000 3,064,9692.199%, SOFR + 2.100%, 10/25/33(144A) (b) 980,000 957,500
GMACM Mortgage Loan Trust3.755%, 11/19/35 (b) 86,825 86,643
GS Mortgage-Backed Securities Trust3.750%, 10/25/57 (144A) 2,270,191 2,281,5714.000%, 05/25/62 (b) 884,175 881,559
JPMorgan Mortgage Trust1.921%, 06/25/34 (b) 50,836 50,0053.500%, 10/25/48 (144A) (b) 501,340 498,731
Legacy Mortgage Asset Trust2.250%, 07/25/67 (144A) (f) 909,131 865,886
MASTR Adjustable Rate Mortgages Trust1.921%, 02/25/34 (b) 105,937 98,386
MASTR Reperforming Loan Trust3.199%, 05/25/35 (144A) (b) 2,107,742 1,316,8337.000%, 08/25/34 (144A) 218,849 196,986
Morgan Stanley Mortgage Loan Trust0.597%, 1M LIBOR + 0.140%, 06/25/36(b) 432,111 110,2282.500%, 07/25/35 (b) 61,055 57,707
New Residential Mortgage Loan Trust1.156%, 11/27/56 (144A) (b) 732,894 698,8502.750%, 07/25/59 (144A) (b) 1,542,022 1,507,5873.250%, 09/25/56 (144A) (b) 1,406,133 1,394,3384.000%, 02/25/57 (144A) (b) 1,223,016 1,225,4054.000%, 05/25/57 (144A) (b) 1,864,012 1,866,6564.250%, 12/25/57 (144A) (b) 2,050,068 2,075,613
NovaStar Mortgage Funding Trust0.479%, 1M LIBOR + 0.380%, 09/25/46(b) 540,897 529,437
OBX Trust1.054%, 07/25/61 (144A) (b) 842,563 790,358
Park Capital Management Trust1.510%, 08/25/56 (144A) (b) 1,856,343 1,721,6302.071%, 11/25/56 (144A) (b) 938,028 886,072
SACO I Trust4.997%, 06/25/21 (144A) � (b) 49,037 44,470
Structured Asset Mortgage Investments IITrust0.817%, 1M LIBOR + 0.360%, 07/25/46(b) 105,789 92,764
Structured Asset Securities Corp.0.807%, 1M LIBOR + 0.350%, 04/25/35(144A) (b) 1,410,848 1,341,0923.360%, 06/25/35 (144A) (b) 73,805 68,961
Towd Point Mortgage Trust2.357%, 1M LIBOR + 1.900%, 05/25/58(144A) (b) 950,000 964,5443.000%, 04/25/60 (144A) (b) 940,000 878,290
ZH Trust2.349%, 10/17/27 (144A) 1,170,000 1,149,445
Total Mortgage-Backed Securities(Cost $41,369,549) 39,559,377
BHFTII-302
Copyright © 2022 www.secdatabase.com. All Rights Reserved.Please Consider the Environment Before Printing This Document

Table of ContentsBrighthouse Funds Trust IIWestern Asset Management U.S. Government Portfolio
Schedule of Investments as of March 31, 2022 (Unaudited)Asset-Backed Securities��0.1%
Security DescriptionPrincipalAmount* Value
Asset-Backed��Home Equity��0.0%Morgan Stanley Mortgage Loan Trust
0.637%, 1M LIBOR + 0.180%, 12/25/36 (b) 121,099 $57,2620.757%, 1M LIBOR + 0.300%, 03/25/36 (b) 67,652 66,610
123,872
Asset-Backed - Other��0.1%Securitized Asset Backed Receivables
LLC Trust1.072%, 1M LIBOR + 0.615%, 01/25/35 (b) 894,528 872,506
Structured Asset Investment Loan Trust1.657%, 1M LIBOR + 1.200%, 08/25/34 (b) 970,000 958,107
Structured Asset Securities Corp.Mortgage Loan Trust0.677%, 1M LIBOR + 0.220%, 02/25/36 (144A) (b) 4,575,989 137,610
1,968,223Total Asset-Backed Securities
(Cost $4,015,347) 2,092,095
Short-Term Investment��0.4%Repurchase Agreement��0.4%Fixed Income Clearing Corp.
Repurchase Agreement dated 03/31/22 at 0.000%, due on 04/01/22 with amaturity value of $6,795,735;collateralized by U.S. Treasury Note at2.500%, maturing 03/31/27, with amarket value of $6,931,700. 6,795,735 6,795,735
Total Short-Term Investments(Cost $6,795,735) 6,795,735
Securities LendingReinvestments(g)��0.2%Repurchase Agreements��0.1%BofA Securities, Inc.
Repurchase Agreement dated 03/31/22 at 0.270%, due on 04/01/22 with amaturity value of $265,582;collateralized by U.S. TreasuryObligations with rates ranging from2.000% - 5.000%, maturity datesranging from 05/15/37 - 02/15/50, andan aggregate market value of$270,892. 265,581 265,581
Copyright © 2022 www.secdatabase.com. All Rights Reserved.Please Consider the Environment Before Printing This Document

HSBC Securities, Inc.Repurchase Agreement dated 03/31/22 at 0.300%, due on 04/01/22 with amaturity value of $100,001;collateralized by U.S. TreasuryObligations with rates ranging from1.000% - 2.250%, maturity datesranging from 10/15/22 - 02/15/48, andan aggregate market value of$102,001. 100,000 100,000
National Bank Financial, Inc.Repurchase Agreement dated 03/31/22 at 0.320%, due on 04/01/22 with amaturity value of $100,001;collateralized by U.S. TreasuryObligations with rates ranging from0.125% - 3.000%, maturity datesranging from 06/30/22 - 02/15/49, andan aggregate market value of$102,057. 100,000 100,000
Security Description
Shares/PrincipalAmount* Value
Repurchase Agreements��(continued)National Bank of Canada
Repurchase Agreement dated 03/31/22 at 0.320%, due on 04/07/22 with amaturity value of $400,025;collateralized by U.S. TreasuryObligations with rates ranging from0.000% - 4.500%, maturity datesranging from 04/14/22 - 08/15/51, andan aggregate market value of$408,228. 400,000 $400,000
NBC Global Finance, Ltd.Repurchase Agreement dated 03/31/22 at 0.440%, due on 04/01/22 with amaturity value of $100,001;collateralized by U.S. TreasuryObligations with rates ranging from0.125% - 4.750%, maturity datesranging from 05/15/24 - 02/15/50, andvarious Common Stock with anaggregate market value of $111,038. 100,000 100,000
Societe GeneraleRepurchase Agreement dated 03/31/22 at 0.410%, due on 04/01/22 with amaturity value of $100,001;collateralized by various CommonStock with an aggregate market valueof $111,129. 100,000 100,000Repurchase Agreement dated 03/31/22 at 0.420%, due on 04/07/22 with amaturity value of $100,008;collateralized by various CommonStock with an aggregate market valueof $111,129. 100,000 100,000
1,165,581
Mutual Funds��0.1%BlackRock Liquidity Funds FedFund,
Institutional Shares0.230% (h) 400,000 400,000
Fidelity Government Portfolio,Institutional Class0.160% (h) 400,000 400,000
Goldman Sachs Financial SquareGovernment Fund, Institutional Shares0.250% (h) 400,000 400,000
Morgan Stanley Liquidity FundsGovernment Portfolio, InstitutionalShares0.230% (h) 400,000 400,000
Copyright © 2022 www.secdatabase.com. All Rights Reserved.Please Consider the Environment Before Printing This Document

STIT-Government & Agency Portfolio,Institutional Class0.250% (h) 400,000 400,000
2,000,000Total Securities Lending Reinvestments
(Cost $3,165,580) 3,165,581Total Investments�108.1%
(Cost $1,985,118,943) 1,916,344,254Other assets and liabilities (net)�(8.1)% (143,163,272 )Net Assets��100.0% $1,773,180,982
* Principal amount stated in U.S. dollars unless otherwise noted.� Restricted securities are not registered under the Securities Act of 1933 and are subject to legal restrictions on resale. These securities generally may
be resold in transactions exempt from registration or to the public if the securities are subsequently registered. Disposal of these securities mayinvolve time-consuming negotiations and prompt sale at an acceptable price may be difficult. As of March 31, 2022, the market value of restrictedsecurities was $44,470, which is 0.0% of net assets. See details shown in the Restricted Securities table that follows.
BHFTII-303
Copyright © 2022 www.secdatabase.com. All Rights Reserved.Please Consider the Environment Before Printing This Document

Table of ContentsBrighthouse Funds Trust IIWestern Asset Management U.S. Government Portfolio
Schedule of Investments as of March 31, 2022 (Unaudited)(a) Interest only security.(b) Variable or floating rate security. The stated rate represents the rate at March 31, 2022. Maturity date shown for callable securities reflects the
earliest possible call date. For securities based on a published reference index and spread, the index and spread are indicated in thedescription above. For certain variable rate securities, the coupon rate is determined by the issuer/agent based on current market conditions.For certain asset- and mortgage-backed securities, the coupon rate may fluctuate based on changes of the underlying collateral orprepayments of principal. These securities do not indicate a reference index and spread in their description above.
(c) Principal only security.(d) TBA (To Be Announced) Securities are purchased on a forward commitment basis with an approximate principal amount and no defined
maturity date. The actual principal and maturity date will be determined upon settlement date.(e) All or a portion of the security was held on loan. As of March 31, 2022, the market value of securities loaned was $6,442,650 and the collateral
received consisted of cash in the amount of $3,165,581 and non-cash collateral with a value of $3,530,894. The cash collateral investments aredisclosed in the Schedule of Investments and categorized as Securities Lending Reinvestments. The non-cash collateral received consists ofU.S. government securities that are held in safe-keeping by the lending agent, or a third-party custodian, and cannot be sold or repledged bythe Portfolio.
(f) Security is a �step-up� bond where coupon increases or steps up at a predetermined date. Rate shown is current coupon rate.(g) Represents investment of cash collateral received from securities on loan as of March 31, 2022.(h) The rate shown represents the annualized seven-day yield as of March 31, 2022.(144A)� Securities exempt from registration under Rule 144A of the Securities Act of 1933. These securities may be resold in transactions exempt from
registration, normally to qualified institutional buyers. As of March 31, 2022, the market value of 144A securities was $96,617,367, which is5.4% of net assets.
Restricted SecuritiesAcquisition
DatePrincipalAmount Cost Value
SACO I Trust, 4.997%, 06/25/21 06/03/08 $49,037 $42,693 $44,470
Futures Contracts
Futures Contracts - LongExpiration
DateNumber ofContracts Notional Value
Value/Unrealized
Appreciation/(Depreciation)
U.S. Treasury Note 10 Year Futures 06/21/22 199 USD 24,452,125 $ (761,094 )
Futures Contracts - ShortU.S. Treasury Note 5 Year Futures 06/30/22 (489 ) USD (56,082,188) 537,099U.S. Treasury Ultra Long Bond Futures 06/21/22 (20 ) USD (3,542,500 ) 590Net Unrealized Depreciation $ (223,405 )
Glossary of Abbreviations
Currencies
(USD)� United States DollarIndex Abbreviations
(H15)� U.S. Treasury Yield Curve Rate T-Note Constant Maturity Index(LIBOR)� London Interbank Offered Rate(SOFR)� Secured Overnight Financing Rate
Other Abbreviations
(ARM)� Adjustable-Rate Mortgage(ACES)� Alternative Credit Enhancement Securities(CMO)� Collateralized Mortgage Obligation(REMIC)� Real Estate Mortgage Investment Conduit(STACR)� Structured Agency Credit Risk
BHFTII-304
Copyright © 2022 www.secdatabase.com. All Rights Reserved.Please Consider the Environment Before Printing This Document

Table of ContentsBrighthouse Funds Trust IIWestern Asset Management U.S. Government Portfolio
Schedule of Investments as of March 31, 2022 (Unaudited)
Fair Value HierarchyAccounting principles generally accepted in the United States of America (�GAAP�) define fair market value as the price that the Portfolio would receive tosell an asset or pay to transfer a liability in an orderly transaction between market participants at the measurement date. It establishes a fair valuehierarchy that prioritizes inputs to valuation methods and requires disclosure of the fair value hierarchy, separately for each major category of assets andliabilities, that segregates fair value measurements into three levels. Levels 1, 2 and 3 of the fair value hierarchy are defined as follows:
Level 1 - unadjusted quoted prices in active markets for identical investmentsLevel 2 - other significant observable inputs (including, but not limited to, quoted prices for similar assets or liabilities in markets that are either activeor inactive; inputs other than quoted prices that are observable such as interest rates, yield curves, volatilities, prepayment speeds, loss severities,credit risks, default rates, or other market corroborated inputs)Level 3 - significant unobservable inputs based on the best information available in the circumstances, to the extent observable inputs areunavailable (including the Portfolio�s own assumptions used in determining the fair value of investments and derivative financial instruments)
The inputs or methodologies used for valuing investments are not necessarily an indication of the risk associated with investing in them. Changes to theinputs or methodologies used may result in transfers between levels. A reconciliation of Level 3 securities, if any, will be disclosed following the fair valuehierarchy table. For more information about the Portfolio�s policy regarding the valuation of investments, please refer to the Notes to Schedule ofInvestments.
The following table summarizes the fair value hierarchy of the Portfolio�s investments as of March 31, 2022:
Description Level 1 Level 2 Level 3 TotalTotal U.S. Treasury & Government Agencies* $� $1,669,879,802 $ � $1,669,879,802Total Foreign Government* � 132,341,954 � 132,341,954Total Corporate Bonds & Notes* � 62,509,710 � 62,509,710Total Mortgage-Backed Securities* � 39,559,377 � 39,559,377Total Asset-Backed Securities* � 2,092,095 � 2,092,095Total Short-Term Investment* � 6,795,735 � 6,795,735Securities Lending Reinvestments
Repurchase Agreements � 1,165,581 � 1,165,581Mutual Funds 2,000,000 � � 2,000,000
Total Securities Lending Reinvestments 2,000,000 1,165,581 � 3,165,581Total Investments $2,000,000 $1,914,344,254 $ � $1,916,344,254Collateral for Securities Loaned (Liability) $� $(3,165,581 ) $ � $(3,165,581 )Futures Contracts
Futures Contracts (Unrealized Appreciation) $537,689 $� $ � $537,689Futures Contracts (Unrealized Depreciation) (761,094 ) � � (761,094 )
Total Futures Contracts $(223,405 ) $� $ � $(223,405 )
* See Schedule of Investments for additional detailed categorizations.
BHFTII-305
Copyright © 2022 www.secdatabase.com. All Rights Reserved.Please Consider the Environment Before Printing This Document

Table of ContentsBrighthouse Funds Trust IINotes to the Schedule of Investments
Investment Valuation and Fair Value Measurements
Debt securities, including corporate, convertible and municipal bonds and notes; obligations of the U.S. Treasury and U.S. governmentagencies; foreign sovereign issues; and non-U.S. bonds, are generally valued based upon evaluated or composite bid quotations obtainedfrom independent pricing services and/or brokers and dealers selected by the Brighthouse Investment Advisers, LLC (the �Adviser�)(each as �pricing services�), pursuant to the authorization of and subject to general oversight by the Board of Trustees (the �Board� or�Trustees�) of the Brighthouse Funds Trust II (the �Trust�). Such pricing services may use matrix pricing, which considers observableinputs including, among other things, issuer details, maturity dates, interest rates, yield curves, rates of prepayment, credit risks/spreads,default rates, reported trades, broker dealer quotes and quoted prices for similar assets. Short-term obligations with a remaining maturityof sixty days or less may be valued at amortized cost in the absence of market quotes, so long as the amortized cost value of such short-term debt instrument is approximately the same as the fair value of the instrument as determined without the use of amortized costvaluation. Floating rate loans are generally valued based upon an evaluated or composite average of aggregate bid and ask quotationssupplied by brokers or dealers, as obtained from the pricing service. Securities that use similar valuation techniques and inputs asdescribed above are generally categorized as Level 2 within the fair value hierarchy.
Mortgage and asset-backed securities are generally valued based upon evaluated or composite bid quotations obtained from pricingservices selected by the Adviser pursuant to authorization of and subject to general oversight by the Board. These securities are usuallyissued as separate tranches, or classes, of securities within each deal. The pricing models for these securities usually consider tranchelevel attributes, current market data, estimated cash flows and market-based yield spreads for each tranche and incorporate dealcollateral performance, as available. Mortgage and asset-backed securities that use similar valuation techniques and inputs as describedabove are generally categorized as Level 2 within the fair value hierarchy.
Domestic and foreign equity securities, such as common stock, exchange-traded funds, rights, warrants, and preferred stock, that aretraded on a securities exchange on a valuation date are generally valued at their last quoted sale price or official closing price on theprimary exchange for such security, or, if no sales occurred on that day, at the last reported bid price. Equity securities traded over-the-counter (�OTC�) are generally valued at the last reported bid price. In the event of a major exchange closing during the trading day, theAdviser may use other market information obtained from quotation reporting systems, established market makers, or pricing services invaluing the securities. Valuation adjustments may be applied to certain foreign equity securities that are traded solely on foreignexchanges that close before the time as of which the Portfolio determines its net asset value (�NAV�) to account for the marketmovement between the close of the foreign exchanges and the time as of which the Portfolio determines its NAV. The Portfolio may usea systematic fair valuation model provided by a pricing service to value securities principally traded in these foreign markets to adjustfor possible market movements or other changes that may occur between the close of the foreign exchanges and the time as of which thePortfolio determines its NAV. Foreign equity securities valued using these valuation adjustments are generally categorized as Level 2within the fair value hierarchy. Equity securities that are actively traded, and have no valuation adjustments applied, are categorized asLevel 1 within the fair value hierarchy. Other equity securities traded on inactive markets, or valued in reference to similar instrumentstraded on active markets, are generally categorized as Level 2 within the fair value hierarchy.
Investments in registered open-end management investment companies are valued at reported NAV per share on the valuation date andare categorized as Level 1 within the fair value hierarchy.
Foreign currency forward contracts are valued through an independent pricing service by interpolating between forward and spotcurrency rates in the London foreign exchange markets as of a designated hour on a valuation day. These contracts are generallycategorized as Level 2 within the fair value hierarchy.
Options, whether on securities, indices, futures contracts, or otherwise, traded on exchanges are valued at the last sale price available asof the close of business on a valuation day or, if there is no such price available, at the last reported bid price. These types of options arecategorized as Level 1 within the fair value hierarchy. Futures contracts that are traded on commodity exchanges are valued at theirsettlement prices established by the exchanges on which they are traded as of the close of such exchanges and are categorized as Level 1within the fair value hierarchy.
Options, including options on swaps (�swaptions�), currencies, and futures contracts that are traded OTC are generally valued basedupon interdealer bid and ask prices or prices provided by pricing service providers who use a series of techniques, including simulationpricing models, to determine the value of the contracts. The pricing models use inputs that are observed from actively quoted marketssuch as issuer details, indices, spreads, interest rates, yield curves, credit curves, measures of volatility and exchange rates. Thesecontracts are generally categorized as Level 2 within the fair value hierarchy.
Copyright © 2022 www.secdatabase.com. All Rights Reserved.Please Consider the Environment Before Printing This Document

Swap contracts (other than centrally cleared swaps) are marked-to-market daily based on quotations and prices supplied by marketmakers, broker-dealers and other pricing services. Such quotations and prices are derived utilizing observable data, including theunderlying reference securities or indices, credit spread quotations and expected default recovery rates determined by the pricingservice. These contracts are generally categorized as Level 2 within the fair value hierarchy.
Centrally cleared swaps listed or traded on a multilateral or trade facility platform, such as a registered exchange, are valued at the dailysettlement price determined by the respective exchange or a pricing service when the exchange price is not available. For
BHFTII-306
Copyright © 2022 www.secdatabase.com. All Rights Reserved.Please Consider the Environment Before Printing This Document

Table of ContentsBrighthouse Funds Trust IINotes to the Schedule of Investments
Investment Valuation and Fair Value Measurements��(Continued)
centrally cleared credit default swaps, the clearing facility requires its members to provide actionable price levels across complete termstructures. These levels along with external third party prices are used to produce daily settlement prices. These securities arecategorized as Level 2 within the fair value hierarchy. Centrally cleared interest rate swaps are valued using a pricing model thatreferences the underlying rates, including, but not limited to, the overnight index swap rate, London Interbank Offered Rate (�LIBOR�)forward rate or other interest rates, yield curves or credit spreads produce the daily settlement price. These securities are categorized asLevel 2 within the fair value hierarchy.
If no current market quotation or other observable inputs are readily available or market value quotations are deemed to be unreliablefor an investment, the fair value of the investment will be determined in accordance with procedures approved by, and under the generalsupervision of, the Board. In such a circumstance, the Board will be assisted in its responsibility to determine the fair value of aninvestment by the Valuation Committee (�Committee�) of the Adviser. The Committee provides general pricing oversight and fair valuepricing determinations related to portfolio securities and meets on a regular basis to review reports relating to the valuation of thesecurities in each Portfolio. The Board has delegated to State Street Bank and Trust Company, the Trust�s custodian (�Custodian�), theresponsibility for calculating the NAVs of the Trust�s Portfolios. The Committee is responsible for overseeing the calculation of theNAVs of the Portfolios by the Custodian. The Committee also periodically reviews pricing services, including the pricing servicesproviding fair value pricing for the Portfolio�s foreign securities, and is responsible for overseeing the correction of pricing errors andaddressing other pricing issues that arise in the ordinary course of business, such as making real-time fair value determinations, asnecessary.
No single standard for determining the fair value of an investment can be set forth because fair value depends upon the facts andcircumstances with respect to each investment. Information relating to any relevant factors may be obtained by the Committee from anyappropriate source, including the subadviser of the Portfolio, the Custodian, a pricing service, market maker and/or broker for suchsecurity or the issuer. Appropriate methodologies for determining fair value under particular circumstances may include: matrix pricing,a discounted cash flow analysis, comparisons of securities with comparable characteristics, value based on multiples of earnings,discount from market price of similar marketable securities or a combination of these and other methods.
For information regarding a Portfolio�s other significant accounting policies, please refer to the Portfolio�s most recent Semiannual orAnnual Report.
BHFTII-307
Copyright © 2022 www.secdatabase.com. All Rights Reserved.Please Consider the Environment Before Printing This Document