
EPA Application Form
329
Authorisation Application Form * indicates required field Page 1 of 6 EPA Application Form 7.3.2 - Equivalent Level of Protection (Sewer) - Attachment Organisation Name: * Dairygold Co-Operative Society Ltd Application I.D.: * LA001622 For inspection purposes only. Consent of copyright owner required for any other use. EPA Export 07-11-2018:04:04:36
-
Upload
khangminh22 -
Category
Documents
-
view
1 -
download
0
Transcript of EPA Application Form

Authorisation Application Form
* indicates required field Page 1 of 6
EPA Application Form
7.3.2 - Equivalent Level of Protection
(Sewer) - Attachment
Organisation Name: * Dairygold Co-Operative Society Ltd
Application I.D.: * LA001622
For
insp
ectio
n pur
pose
s only
.
Conse
nt of
copy
right
owne
r req
uired
for a
ny ot
her u
se.
EPA Export 07-11-2018:04:04:36

Authorisation Application Form
* indicates required field Page 2 of 6
Amendments to this Application Form Attachment
Version
No.
Date Amendment since
previous version
Reason
V.1.0 July 2017 N/A Online application form
attachment
As above Mar 2018 Identification of required
fields
Assist consistent completion
of attachment
For
insp
ectio
n pur
pose
s only
.
Conse
nt of
copy
right
owne
r req
uired
for a
ny ot
her u
se.
EPA Export 07-11-2018:04:04:36

Authorisation Application Form
* indicates required field Page 3 of 6
7.3.1 Equivalent Level of Protection (Emissions to Sewer)
Background information
In relation to emissions to sewer, Article 15 of the Industrial Emissions Directive
(Directive 2010/75/EU) states:
With regard to indirect releases of polluting substances into water, the effect of a water
treatment plant may be taken into account when determining the emission limit values
of the installation concerned, provided that an equivalent level of protection of the
environment as a whole is guaranteed and provided this does not lead to higher levels of
pollution in the environment.
Furthermore, emission limit values (ELV’s) applied by the Agency for an installation’s
emissions to sewer must satisfy the consent conditions (ELVs and other requirements)
specified by Irish Water, as required by Section 99E of the EPA Act 1992 as amended.
(Note: To avoid unnecessary delays in the application assessment process, it is
important that the applicant licensee liaises with Irish Water (or other water services
authority responsible for the sewer network) at the earliest available opportunity, with a
view to establishing consent conditions.)
Assessment of ‘equivalent level of protection’
To comply with Article 15 above, the following must be demonstrated:
It must be demonstrated that the level of treatment of an installation’s effluent, on and
off site, is collectively equivalent to BAT and environmental quality standards will be
observed in the receiving water (i.e., ‘equivalent level of protection’).
(1) Consider the parameters relevant to the installation’s emissions to sewer (i.e.,
characteristics of discharge)
(2) Do sectoral BAT associated emission levels (BAT-AELs) exist for these
parameters? These are the relevant sectoral BAT-AELs.
(3) Do the emission limits proposed for installation comply with all the relevant
sectoral BAT-AELs? If Yes, ok; if not proceed to (4) below.
(4) If not, does the licence for the relevant Irish Water agglomeration discharge
specify limits which comply with all/the remainder of the relevant sectoral BAT-
AELs for the installation? If Yes, ok; if not proceed to (5) below.
(5) If no to (3) and (4) above, the applicant/licensee needs to otherwise determine
whether the level of treatment in the sewer network is sufficient to treat the
installation’s discharges to comply with relevant sectoral BAT-AELs.
Assessment of ‘levels of pollution in the environment’
To comply with Article 15 above, the following must be demonstrated:
In granting a licence for an installation, and in accordance with Section 83(5)(a)(iii) of
the EPA Act 1992 as amended, as well as in accordance with Articles 5 and 7 of S.I.
272 of 2009, the Agency must ensure that the quality of any relevant receiving water is
not impaired or that the relevant Environmental Quality standards are not exceeded. It
must be demonstrated whether or not, upon discharge from the Irish Water WWTP, the
For
insp
ectio
n pur
pose
s only
.
Conse
nt of
copy
right
owne
r req
uired
for a
ny ot
her u
se.
EPA Export 07-11-2018:04:04:36

Authorisation Application Form
* indicates required field Page 4 of 6
environmental quality standards1 (EQSs) for the receiving water will be breached as a
result of the installation’s discharges. (i.e. ‘does not lead to higher levels of pollution in
the environment’)
Details on level of protection provided (on and off-site)
Please provide details in the table below on the installation emissions to the sewer; the
processes which contribute to the emissions, the type of on-site treatment (if any), off-
site treatment (if any) and the proposed maximum daily flows.
Table 1: On-site treatment – abatement at installation
Emission Reference
Proposed / Existing
Process Description Abatement Proposed max. flow
(m3/day)
SE1 Proposed
Process wastewater
treatment Biological
Activated Sludge
Holding Tanking 4,000
Recycling/Divert system
Total: 4,000
Off-site treatment – Municipal Waste water treatment plant (MWWTP)
Name of sewer network/agglomeration: n/a
Normal daily flow rate in network (m3/day): n/a
Responsible authority for network/agglomeration: Irish Water
Type of treatment: n/a
Receiving water name (and waterbody type): North Channel Great Island (SW-060-0300)
No. of dilutions available in the receiving water: n/a
Waste water discharge authorisation: (Y/N) D0056-01
The maximum discharge volumes from the installation represent about 25 % of effluent discharge volumes from the Irish Water municipal wastewater treatment plant (MWWTP). The Agency’s most recent national annual report/the most recent AER indicates that this MWWTP is:
in compliance with the discharge limits for the following parameters: BOD, COD, TSS, Total N, pH
not in compliance with the discharge limits for the following parameters: Orthophosphate
1 EQSs as specified in Schedule 5 of European Communities Environmental Objectives (Surface Waters)
Regulations 2009 as amended.
For
insp
ectio
n pur
pose
s only
.
Conse
nt of
copy
right
owne
r req
uired
for a
ny ot
her u
se.
EPA Export 07-11-2018:04:04:36

Authorisation Application Form
* indicates required field Page 5 of 6
Assessment details
Please enter the required details in the assessment table below.
Edit the parameters in column 1 in accordance with the installation’s characteristics of
emissions to sewer.
Enter any limits specified by Irish Water (or other water service authority) in column 3.
In column 4 determine, if necessary for any parameter, the concentration of the
installation’s discharges after having received any treatment at the installation prior to
discharge, and after having received any treatment in the sewer network/agglomeration
prior to discharge.
Specify the relevant the BAT-AELs in Column 5.
Specify the relevant the EQSs in Column 6.
Table 2
Parameter
(sample parameters included below)
Irish Water/
WSA
After on and off site treatment
BAT-AELnote A EQSnote B EQS note C
Temperature 250C 25
0C - -
Not greater than a 1.5°C rise in ambient temperature outside the mixing zone
pH 6-9 6-9 6-9 -
mg/l mg/l mg/l
Biological Oxygen Demand
25 25 >90% removal or
20-40mg/l 25 4.0mg/l (95%ile)
Chemical Oxygen Demand
125 125 >75% removal or
125-250mg/l 125 -
Suspended Solids 35 35 50mg/l 35 Must not cause SS to increase by more than 30% above surrounding levels
Total Nitrogen 15 15 >80% removal or 5-25mg/l
15 DIN Good Status <2.6mg/l(0psu) median <0.25mg/l(34.5psu) median High Status <0.17mg/l(34.5psu) median
Total Phosphorous 2 2
>80% removal or 2-5mg/l
2
PO4
≤0.06mg/l (0-17psu) median ≤0.04mg/l (34psu) median
Oils, Fats, Grease 15 15 10-15mg/l - -
Note A: EPA BAT Guidance Note for the Dairy Processing Sector 2008
Note B: EQS for discharges from urban waste water treatment plants to sensitive areas (S.I. No.
254/2001 - Urban Waste Water Treatment Regulations, 2001, as amended).
Note C: EQS receiving waterbody (S.I. No. 272 of 2009 European Communities Environmental
Objectives (Surface Waters) Regulations 2009
For
insp
ectio
n pur
pose
s only
.
Conse
nt of
copy
right
owne
r req
uired
for a
ny ot
her u
se.
EPA Export 07-11-2018:04:04:36

Authorisation Application Form
* indicates required field Page 6 of 6
Table 3: Please include any other information you consider relevant in the (free
text) box below:
Please refer also to the following documents included in Attachment 7.3-2-1 Supporting
Documents which demonstrate that the environmental quality standards for the
receiving water will not be breached as of result of the installation’s discharges:
EIS Volume 2 Chapter 6
Wastewater Assessment for New and Existing Cheese Production Facilities at Dairygold
Mogeely, Co. Cork (Document Ref 17617_ 6007) prepared by Malachy Walsh and Partners,
2016; contained in EIS Volume 3 Appendix 6.
Assessment of Proposed Wastewater Discharges on the Receiving Waters at Rathcoursey Point (Document 17617_6011) contained in EIS Volume 3 Appendix 6.
Rathcoursey Outfall Investigation of the Impact of Treated Wastewater Discharges arising from the DairyGold Mogeely Plant to Cork Harbour, prepared by Irish Hydrodata Ltd, May 2017.
Evaluation of the Risk of Adverse Impact on Cork Harbour SPA (004030) and Great Island SAC (001058), (Document 17617_6016)prepared by Malachy Walsh and Partners, May 2017
For
insp
ectio
n pur
pose
s only
.
Conse
nt of
copy
right
owne
r req
uired
for a
ny ot
her u
se.
EPA Export 07-11-2018:04:04:36
Attachment-7-3-2-1-Supporting Documents
IEL REVIEW APPLICATION
DAIRYGOLD CO-OPERATIVE SOCIETY LIMITED
DFI Mogeely, Co. Cork
APPLICATION ID: LA001622
For
insp
ectio
n pur
pose
s only
.
Conse
nt of
copy
right
owne
r req
uired
for a
ny ot
her u
se.
EPA Export 07-11-2018:04:04:36

Industrial Emissions Application Application ID: LA001622
Attachment-7.3-2-1 Supporting Documents
The following documents are provided to demonstrate that the environmental quality
standards for the receiving water will not be breached as of result of the installation’s
discharges:
Appendix A EIS Volume 2 Chapter 6
Appendix B Wastewater Assessment for New and Existing Cheese Production Facilities at
Dairygold Mogeely, Co. Cork (Document Ref 17617_ 6007) prepared by Malachy Walsh and Partners, 2016;
Appendix C Assessment of Proposed Wastewater Discharges on the Receiving Waters at
Rathcoursey Point (Document 17617_6011)
Appendix D Rathcoursey Outfall Investigation of the Impact of Treated Wastewater Discharges
arising from the DairyGold Mogeely Plant to Cork Harbour, prepared by Irish
Hydrodata Ltd, May 2017.
Appendix E Evaluation of the Risk of Adverse Impact on Cork Harbour SPA (004030) and Great
Island SAC (001058), (Document 17617_6016)prepared by Malachy Walsh and
Partners, May 2017
For in
spec
tion p
urpo
ses o
nly.
Conse
nt of
copy
right
owne
r req
uired
for a
ny ot
her u
se.
EPA Export 07-11-2018:04:04:36

Industrial Emissions Application Application ID: LA001622
Attachment-7.3-2-1 Supporting Documents
Appendix A
EIS Volume 2 Chapter 6
For
insp
ectio
n pur
pose
s only
.
Conse
nt of
copy
right
owne
r req
uired
for a
ny ot
her u
se.
EPA Export 07-11-2018:04:04:36

Environmental Impact Statement Dairygold Mogeely - Speciality Cheese Facility Expansion
CHAPTER 6 |HYDROLOGY AND HYDROGEOLOGY
Chapter 6 MAIN EIS - VOLUME 2
Page 1 of 39
6 HYDROLOGY AND HYDROGEOLOGY
6.1 INTRODUCTION
This Chapter of the EIS details the local hydrology and hydrogeology of the application site and
surrounding area and identifies the potential for effects on surface water and groundwater
resources associated with the proposed expansion of the Dairygold Moggely Speciality Cheese
facility and related treated effluent discharge pipeline. The assessment methodology, likely
significant impacts and recommended mitigation measures are described in the following sections.
6.1.1 Scope of Assessment and Methodology
The main objectives of the study undertaken were to:
1. Establish the baseline hydrological and hydrogeological conditions relevant to development
site.
2. Identify the potential effects of the proposed development on the receiving hydrological and
hydrogeological environment.
3. Determine the significance of any identified effect.
4. Develop mitigation measures to reduce or eliminate the impacts.
5. Identify any residual impacts after mitigation measures are implemented.
The assessment methodology included desk based studies, site visits, and qualitative assessment of
the potential impacts.
The assessment had regard to the NRA Guidelines on Procedures for Assessment and Treatment of
Geology, Hydrology and Hydro-geology for National Road Schemes and EPA Guidelines – Advice
Notes on Current Practice (in the preparation of Environmental Impact Statements).
6.1.2 Sources of Information
6.1.2.1 Site Investigations
Walkover survey of the existing site and Greenfield expansion lands to identify hydrological
features on site, wet ground, drainage patterns and distribution, exposures, and drains.
Walkover survey of the entire discharge pipeline route recording all watercourse, streams
and rivers to be crossed by the proposed discharge pipeline.
Biological and physio-chemical sampling of River Kiltha.
A 48 hour Constant Discharge Pumping Test on the on-site abstraction borehole (GW1)
between 12 and 14 September, with monitoring of the abstracted groundwater quality, and
monitoring of the groundwater level recovery after completion of the 48 hour pumping
phase.
For
insp
ectio
n pur
pose
s only
.
Conse
nt of
copy
right
owne
r req
uired
for a
ny ot
her u
se.
EPA Export 07-11-2018:04:04:36

Environmental Impact Statement Dairygold Mogeely - Speciality Cheese Facility Expansion
CHAPTER 6 |HYDROLOGY AND HYDROGEOLOGY
Chapter 6 MAIN EIS - VOLUME 2
Page 2 of 39
6.1.2.2 Desk Study
A desk study of the proposed site and the surrounding area was completed in advance of
undertaking the walkover survey. The desk study involved a review of all available information,
datasets and documentation sources pertaining to the hydrology and hydrogeology of the area
surrounding the application site. Information was obtained from the following sources:
Environmental Protection Agency Database (www.epa.ie);
Geological Survey of Ireland and Teagasc Regional Scale Hydrogeological Mapping;
Geological Survey of Ireland Hydrogeology Databases (www.gsi.ie);
Geological Survey of Ireland Reports – Groundwater Body (GWB) Initial Characterisation
Reports for Middleton GWB (GSI, 2004); Dower Spring SPZ Report (Wright and Gately, 2002);
Memoir & Paper Map for the Bedrock Geology 1:100,000 scale map series, Sheet 22
(Geology of East Cork - Waterford) (Sleeman and McConnell, 1995);
Ordnance Survey of Ireland Topographic Mapping, Historical Mapping and
Orthophotography
Office of Public Works Flooding Database
National Parks & Wildlife Services Public Map Viewer (www.npws.ie); and,
Water Framework Directive “Watermaps” Map Viewer (www.wfdireland.ie);
Irish Speleological Union Caving Records for the Mogeely area;
Midleton Electoral Local Area Plan (2nd Edition January 2015);
Dairygold Mogeely Industrial Emissions Licence (P0817-01) and application documents;
Midleton Wastewater Discharge Licence (D0056-01) and application documents;
Irish Distillers Industrial Emissions Licence (P0442-02) and application documents.
Client information in respect of existing and planned future abstractions and discharges
The following existing reports relevant to the site were reviewed as part of the desk study:
DFI Mogeely IPPC License Number P0817-01, License Condition C6.14, Hydrogeological Investigation (Conroy, 2012);
DFI Mogeely IPPC License Number P0817-01, Groundwater Monitoring Well Drilling (Conroy, 2013);
DFI Mogeely IPPC License Number P0817-01, Groundwater Monitoring Report for the Environmental Protection Agency (Conroy, 2014);
DFI Mogeely IPPC License Number P0817-01, Groundwater Monitoring Report for the Environmental Protection Agency (Conroy, 2015); and,
DFI Mogeely Borehole GW1, Source Protection Zones (Conroy, 2016).
In addition the following reports prepared as part of the project design were used to inform this Chapter of the EIS:
Flood Risk Assessment (Document Ref 17617_6004) prepared by Malachy Walsh and Partners, 2016;
Wastewater Assessment for New and Existing Cheese Production Facilities at Dairygold Mogeely, Co. Cork (Document Ref 17617_ 6007) prepared by Malachy Walsh and Partners, 2016;
Water and Wastewater Design Report for Proposed Speciality Cheese Plant at Dairygold Mogeely, Co. Cork (Document Ref 17617_ 6002) prepared by Malachy Walsh and Partners, 2016;
Dairygold Food Ingredients, Mogeely Speciality Cheese Plant Expansion, Hydrogeological Impact Assessment prepared by Peter Conroy, 2016.
For
insp
ectio
n pur
pose
s only
.
Conse
nt of
copy
right
owne
r req
uired
for a
ny ot
her u
se.
EPA Export 07-11-2018:04:04:36

Environmental Impact Statement Dairygold Mogeely - Speciality Cheese Facility Expansion
CHAPTER 6 |HYDROLOGY AND HYDROGEOLOGY
Chapter 6 MAIN EIS - VOLUME 2
Page 3 of 39
6.1.3 Assessment criteria
6.1.3.1 Legislation context
The following set out the legislative context of the assessment in relation to surface and
groundwater quality.
Water Framework Directive (WFD) (2000/60/EC)
The Water Framework Directive (WFD) (2000/60/EC) establishes an integrated and coordinated
framework for the sustainable management of water. The WFD, transposed into national legislation
in 2003, aims to:
Prevent deterioration of status for surface and groundwaters and the protection,
enhancement and restoration of all water bodies;
Achieve good ecological status and good chemical status for surface waters and good
chemical and good quantitative status for groundwaters;
Progressively reduce pollution of priority substances and phase-out of priority hazardous
substances in surface waters and prevention and limitation of input of pollutants in
groundwaters;
Reverse any significant, upward trend of pollutants in groundwaters; and
Achieve standards and objectives set for protected areas in Community legislation.
The objective for each surface water and groundwater body is to prevent deterioration, maintain
high and good status waters, restore waters to at least good status where necessary, and ensure
that the requirements of associated protected areas are met.
European Communities Environmental Objectives (Surface Waters) Regulations
The European Communities Environmental Objectives (Surface waters) Regulations [S.I. No 272 of
2009], and amendment regulations 2012 [S.I. 327 of 2012], are designed to effect the requirements
of the WFD.
European Communities Environmental Objectives (Groundwater) Regulations European Communities Environmental Objectives (Groundwater) Regulations 2010 , S.I. No. 9 of 2010, and amendment regulations 2012 [S.I. 149 of 2012]
Freshwater Fish Directive & Salmonid Regulations
Bathing Water Directive
EU Shellfish Waters Directive The European Communities (Quality of Shellfish Water) Regulations 2006 (SI No 268 of 2006)
6.1.3.2 Evaluation and impact assessment categorisation
The method of impact assessment and prediction follow the EPA (2002) ‘Guidelines on the
information to be contained in Environmental Impact Statements’.
For
insp
ectio
n pur
pose
s only
.
Conse
nt of
copy
right
owne
r req
uired
for a
ny ot
her u
se.
EPA Export 07-11-2018:04:04:36

Environmental Impact Statement Dairygold Mogeely - Speciality Cheese Facility Expansion
CHAPTER 6 |HYDROLOGY AND HYDROGEOLOGY
Chapter 6 MAIN EIS - VOLUME 2
Page 4 of 39
6.2 EXISTING RECEIVING ENVIRONMENT
6.2.1 Emissions to waters from the Installation
There are currently two (2) licenced emission points to surface waters from the installation. These
are emission point SW3 which conveys combined treated process and domestic wastewater
discharges to the River Kiltha and SW4 which conveys stormwater discharges also to the River Kiltha.
It is proposed that only the existing stormwater emission point SW4 will be retained as part of the
installation redevelopment. A new discharge outfall is being proposed for process wastewater
emissions. A summary of the existing and proposed emission points to surface waters from the
installation is set out in Table 6.1 below. Further details on these emissions are provided in Sections
6.2.1.1 to 6.2.1.3.
Table 6.1 Emissions to Waters from the Installation
Type of Emission
Source Existing Scenario Future Scenario
Receiving Water
Discharge Point Proposed Receiving Water
Discharge Point
Process wastewater
Treated effluent from facility WWTP
River Kiltha Licenced Outfall SW3
North Channel Great Island
New Connection to existing Midleton Main Drainage outfall at Rathcoursey
Domestic wastewater
Canteen and sanitary facilities
River Kiltha Licenced outfall SW3
River Kiltha New Connection to public sewer network
Stormwater Site surface water run-off
River Kiltha Licenced outfall SW4
River Kiltha Exisiting Licence outfalls SW3 and SW4
6.2.1.1 Process Wastewater Emissions (Trade Effluent)
Existing Scenario
Process wastewater (Trade Effluent) is mainly generated during cleaning operations (tanks, truck and
storage tank washing, pipe line washing and sanitizing) during the manufacturing process. It
contains milk solids, detergents, sanitizers and milk wastes. All process wastewaters are directed to
the facility’s wastewater treatment plant (WWTP). The treatment process includes balancing, pH
correction, fat removal, high rate biofiltration, activated sludge, final clarification, sand filters and
sludge thickening. Full details of the waste water treatment process and effluent are provided in
Wastewater Assessment Report (Doc 17617_6007) included in Volume 3 Appendix 6.
The facility’s WWTP is regulated under the facilities IED Licence (P0817-01). This license currently
permits the facility to discharge 700m3 of treated effluent per day to the River Kiltha via the existing
licenced discharge point SW3. The discharges are sampled, monitored and analysed in accordance
with the facility IED Licence (see Schedule C2.2 Monitoring of Emissions to Water).
Proposed Scenario
It is projected that the volume of process wastewater to be generated by future site activities will be
approximately 2,700m3 per day. The Kiltha River however does not have the capacity to accept the
increased volumes of process wastewater. Therefore it is being proposed that the existing outfall
from the WWTP to the Kiltha River will be decommissioned and future discharges from the WWTP
will be into North Island Great Channel at Rathcoursey.
For
insp
ectio
n pur
pose
s only
.
Conse
nt of
copy
right
owne
r req
uired
for a
ny ot
her u
se.
EPA Export 07-11-2018:04:04:36

Environmental Impact Statement Dairygold Mogeely - Speciality Cheese Facility Expansion
CHAPTER 6 |HYDROLOGY AND HYDROGEOLOGY
Chapter 6 MAIN EIS - VOLUME 2
Page 5 of 39
6.2.1.2 Sanitary (Domestic) Waste Water Emissions
Existing Scenario
Sanitary (Domestic) wastewater is generated on site from the installations canteen, laboratory and
toilet facilities. This wastewater stream is currently collected by a series of dedicated foul water
sewer lines on-site which are directed, via a septic tank, to the on-site WWTP. The average volume
of domestic wastewater generated by the facility is 7.5m3 per day.
Proposed Scenario
It is proposed as part of the new development proposal that sanitary wastewater from the facility
will no longer be directed to the Dairygold WWTP. It is proposed that this wastewater stream will,
subject to agreement/approval from Irish Water (IW), be collected and conveyed separately from
the site to the Mogeely Village WWTP via a connection into the existing public foul sewer on the
Castlemartyr Road. It is anticipated that the volume of domestic wastewater to be generated by
future site activities will be in the order of 9.6m3 per day. Communication with Irish Water has
indicated that there is capacity in the existing public sewer network and municipal WWTP to accept
this wastewater stream.
6.2.1.3 Stormwater Emissions
Existing Scenario
Storm (or surface) water from the DFI Cheese Manfacturing facility is collected in its own separate
drainage system (separate from the site process and foul drainage systems) and discharges to an
existing licenced Storm Water Outfall (SW-4) at the South-East area of the site, into the adjacent
Kiltha River.
Prior to discharging into the river, the site storm water discharges through a monitoring chamber
with an automatic divert valve to divert all non-compliant storm water into the process sewer
system for treatment at the site wastewater treatment plant (WwTP).
The storm water passes through an oil/petrol interceptor before it discharges into the Kiltha River.
The outfall pipe has a non-return valve installed to prevent flooding of the oil/petrol interceptor in
the event of a high water level in the river.
Proposed Future Scenario
The on-site surface water drainage system will be redesigned so that the new extended facility will
have three (3) independent surface water networks/catchments within the development site. The
three distinct storm water catchments are outlined under;
Catchment 1(a) (Milk Intake/Yard Area),
Catchment 1(b) (new Tine Speciality Cheese Plant)
Catchment 2 (existing Dairygold facility),
The new storm water drainage network will discharge into the adjacent Kiltha River at two existing
outfall locations. The existing storm water catchment (Catchment 2) will continue to discharge at the
existing storm water outfall point, SW-4. The storm drainage network from the new drainage
For
insp
ectio
n pur
pose
s only
.
Conse
nt of
copy
right
owne
r req
uired
for a
ny ot
her u
se.
EPA Export 07-11-2018:04:04:36

Environmental Impact Statement Dairygold Mogeely - Speciality Cheese Facility Expansion
CHAPTER 6 |HYDROLOGY AND HYDROGEOLOGY
Chapter 6 MAIN EIS - VOLUME 2
Page 6 of 39
catchments (Catchment 1(a) & Catchment 1(b)) will have attenuation, discharge into the Kiltha River
at existing discharge point SW-3. Currently discharge point SW-3 is the outfall point from the existing
wastewater treatment plant.
Prior to discharging to the Kiltha River, the storm water networks will discharge into a storm water
monitoring/divert chamber, via full retention petrol interceptors. The storm water monitoring
chamber will analyse the storm water for pH, Conductivity and Temperature. The new
The purpose of the redesigned storm water system is such that in the event of a fire/spill on site, the
relevant affected independent storm water network will be diverted into the site process drainage
network for treatment/storage at the upgraded WwTP. Full details of the new stormwater drainage
system is set out in Document 17617_6002 included in EIS Volume 3 Appendix 6.
6.2.2 Existing site drainage of proposed Greenfield development lands
The proposed additional expansion lands are currently natural ground covered by grassland. There is
currently no surface water drainage infrastructure across the site and during a site walkover, no
artificial surface water drainage features were observed. Currently the site exhibits good natural
permeability and drainage with no evidence of ponding or significantly wet ground. The lack of
surface drainage indicates that rainwater falling within the site readily percolates into the underlying
soil/bedrock and ultimately diffuses to groundwater.
6.2.3 Groundwater Abstractions
Existing Scenario The sites process water requirement is supplied by 1 No. deep bore well (GW1). This wellfield is
situated at the northeastern edge of site close to the existing site entrance (Refer to Figure 6.1). The
current abstraction rate is approximately 525m3/day. The borehole abstracts at a rate of 60m3/day
for approximately 9 hours per day to meet the current demand.
Proposed Future Scenario
It is proposed as part of the future development the site facility process water requirement will
continue to be met by groundwater abstractions from GW1. The proposed demand for the DFI
Mogeely site following expansion of the site is 1,400m3/day.
For
insp
ectio
n pur
pose
s only
.
Conse
nt of
copy
right
owne
r req
uired
for a
ny ot
her u
se.
EPA Export 07-11-2018:04:04:36

Environmental Impact Statement Dairygold Mogeely - Speciality Cheese Facility Expansion
CHAPTER 6 |HYDROLOGY AND HYDROGEOLOGY
Chapter 6 MAIN EIS - VOLUME 2
Page 7 of 39
Figure 6.1 Location of Abstraction Well
For
insp
ectio
n pur
pose
s only
.
Conse
nt of
copy
right
owne
r req
uired
for a
ny ot
her u
se.
EPA Export 07-11-2018:04:04:36
Environmental Impact Statement Dairygold Mogeely - Speciality Cheese Facility Expansion
CHAPTER 6 |HYDROLOGY AND HYDROGEOLOGY
Chapter 6 MAIN EIS - VOLUME 2
Page 8 of 39
6.2.4 Receiving Waters
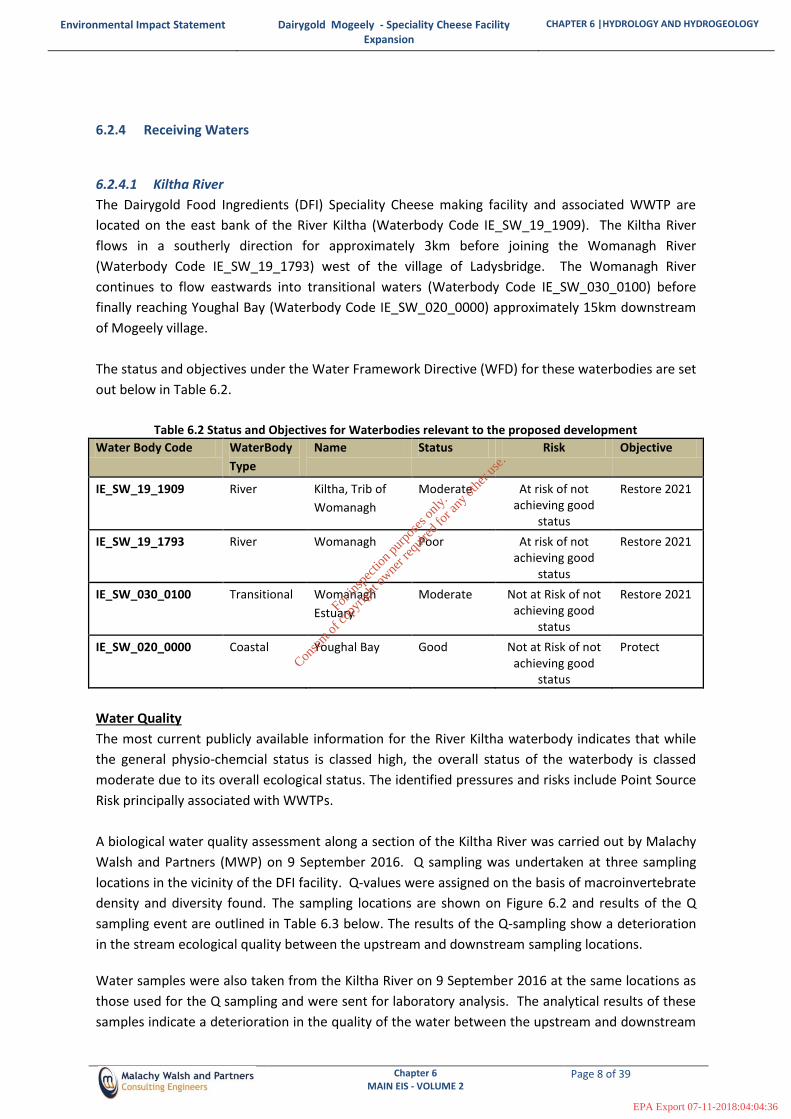
6.2.4.1 Kiltha River
The Dairygold Food Ingredients (DFI) Speciality Cheese making facility and associated WWTP are
located on the east bank of the River Kiltha (Waterbody Code IE_SW_19_1909). The Kiltha River
flows in a southerly direction for approximately 3km before joining the Womanagh River
(Waterbody Code IE_SW_19_1793) west of the village of Ladysbridge. The Womanagh River
continues to flow eastwards into transitional waters (Waterbody Code IE_SW_030_0100) before
finally reaching Youghal Bay (Waterbody Code IE_SW_020_0000) approximately 15km downstream
of Mogeely village.
The status and objectives under the Water Framework Directive (WFD) for these waterbodies are set
out below in Table 6.2.
Table 6.2 Status and Objectives for Waterbodies relevant to the proposed development
Water Body Code WaterBody
Type
Name Status Risk Objective
IE_SW_19_1909 River Kiltha, Trib of
Womanagh
Moderate At risk of not achieving good
status
Restore 2021
IE_SW_19_1793 River Womanagh Poor At risk of not achieving good
status
Restore 2021
IE_SW_030_0100 Transitional Womanagh
Estuary
Moderate Not at Risk of not achieving good
status
Restore 2021
IE_SW_020_0000 Coastal Youghal Bay Good Not at Risk of not achieving good
status
Protect
Water Quality
The most current publicly available information for the River Kiltha waterbody indicates that while
the general physio-chemcial status is classed high, the overall status of the waterbody is classed
moderate due to its overall ecological status. The identified pressures and risks include Point Source
Risk principally associated with WWTPs.
A biological water quality assessment along a section of the Kiltha River was carried out by Malachy
Walsh and Partners (MWP) on 9 September 2016. Q sampling was undertaken at three sampling
locations in the vicinity of the DFI facility. Q-values were assigned on the basis of macroinvertebrate
density and diversity found. The sampling locations are shown on Figure 6.2 and results of the Q
sampling event are outlined in Table 6.3 below. The results of the Q-sampling show a deterioration
in the stream ecological quality between the upstream and downstream sampling locations.
Water samples were also taken from the Kiltha River on 9 September 2016 at the same locations as
those used for the Q sampling and were sent for laboratory analysis. The analytical results of these
samples indicate a deterioration in the quality of the water between the upstream and downstream
For
insp
ectio
n pur
pose
s only
.
Conse
nt of
copy
right
owne
r req
uired
for a
ny ot
her u
se.
EPA Export 07-11-2018:04:04:36

Environmental Impact Statement Dairygold Mogeely - Speciality Cheese Facility Expansion
CHAPTER 6 |HYDROLOGY AND HYDROGEOLOGY
Chapter 6 MAIN EIS - VOLUME 2
Page 9 of 39
locations with higher concentrations of COD, Orthophosphate, Suspended Solids and Total
Phosphorus recorded at the downstream sampling locations. There was however no difference in
the recorded BOD concentrations at the upstream and downstream locations.
Table 6.3 Q values and Pollution Status of Kiltha River
Sampling
Station
Location Q Value Water Framework
Directive Status
1 Upstream of existing stormwater outfall (SW4) Q3-4 Moderate
2 Between existing stormwater outfall (SW4) and existing Dairygold WWTP outfall (SW3)
Q3 Poor
3 Downstream of existing Dairygold WWTP outfall (SW3)
Q3 Poor
Figure 6.2 Sampling Locations
For
insp
ectio
n pur
pose
s only
.
Conse
nt of
copy
right
owne
r req
uired
for a
ny ot
her u
se.
EPA Export 07-11-2018:04:04:36

Environmental Impact Statement Dairygold Mogeely - Speciality Cheese Facility Expansion
CHAPTER 6 |HYDROLOGY AND HYDROGEOLOGY
Chapter 6 MAIN EIS - VOLUME 2
Page 10 of 39
Special Areas of Conservation (SAC)
There are no Special Areas of Conservation designated for the Kiltha River. The lower stretches of
the Womanagh River, is a designated Special Area of Conservation from its point south of the R633
at Crompaun Bridge to where the river enters Youghal Bay. This site’s conservation value derives
largely from the presence of a number of important coastal habitats listed in Annex I of the
European Union Habitats Directive.
Special Protection Areas (SPA)
There are no Special Protection Areas designated for the Kiltha River. The lower stretches of the
Womanagh River, from its point approximately 665m north of the R633 at Crompaun Bridge to
where the river enters Youghal Bay is a Special Protection Area.
Natural Heritage Areas (NHA) There are no Natural Heritage Areas designated for the Kiltha River. The lower stretches of the
Womanagh River, is a proposed National Heritage Area from its point south of the R633 at
Crompaun Bridge to where the river enters Youghal Bay.
Surface Water Directive
Surface water is abstracted from the Rvier Kiltha upstream of Mogeely village. There are no surface
water abstractions downstream of the discharge point.
Freshwater Fish Directive & Salmonid Regulations The River Kiltha, the Womanagh River and its tributaries are not designated under these Regulations.
Bathing Water Directive There are no designated inland bathing areas in the Womanagh catchment nor are there any designated beaches on the Womanagh estuary.
EU Shellfish Waters Directive There is a Shellfish Designation in Youghal/Ballymacoda Bay where the Womanagh River discharges to the sea.
For
insp
ectio
n pur
pose
s only
.
Conse
nt of
copy
right
owne
r req
uired
for a
ny ot
her u
se.
EPA Export 07-11-2018:04:04:36

Environmental Impact Statement Dairygold Mogeely - Speciality Cheese Facility Expansion
CHAPTER 6 |HYDROLOGY AND HYDROGEOLOGY
Chapter 6 MAIN EIS - VOLUME 2
Page 11 of 39
6.2.4.2 North Channel Great Island
The North Channel Great Island (waterbody code IE_SW_060_0300) is a transitional waterbody
located approximately 10.5kilometres southwest of Mogeely village. The North Channel Great
Island waterbody covers an area of approximately 7.96km2 and is an integral part of Cork Harbour
coastal water body (IE_SW_060_0000). The main land use within the waterbody is aquaculture and
fishing.
The status and objectives under the Water Framework Directive (WFD) for the North Channel Great
Island waterbody set out below in Table 6.4.
Table 6.4 Status and Objectives for Waterbodies relevant to the proposed development
Water Body Code WaterBody
Type
Name Status Risk Objective
IE_SW_060_0300 Transitional North Channel
Great Island
Moderate At risk of not achieving good
status
Restore 2021
Special Areas of Conservation (SAC)
The North Channel Great Island is a designated Special Area of Conservation up to the point where the Ballynacorra River enters the channel between the Great Island and Rathcoursey. This site’s conservation value derives largely from the presence of a number of important habitats listed in Annex I of the European Union Habitats Directive.
Special Protection Areas (SPA)
The North Channel Great Island is a designated Special Protection Areal up to the point where the Ballynacorra River enters the channel between the Great Island and Rathcoursey. The North Channel Great Island is an integral part of Cork Harbour which is also a wetland of international importance for the birdlife it supports.
Natural Heritage Areas (NHA) The North Channel Great Island is a designated National Heritage Area Special Protection Area up to the point where the Ballynacorra River enters the channel between the Great Island and Rathcoursey. Bathing Water Directive There are no designated bathing areas within or in proximity to the North Channel Great Island.
For
insp
ectio
n pur
pose
s only
.
Conse
nt of
copy
right
owne
r req
uired
for a
ny ot
her u
se.
EPA Export 07-11-2018:04:04:37

Environmental Impact Statement Dairygold Mogeely - Speciality Cheese Facility Expansion
CHAPTER 6 |HYDROLOGY AND HYDROGEOLOGY
Chapter 6 MAIN EIS - VOLUME 2
Page 12 of 39
EU Shellfish Waters Directive Part of the North Channel Great Island has been designated as a shellfish water. Rostellan (North,
South and West) shellfish waters are also located approximately 3km from the discharge at
Rathcoursey. The European Communities (Quality of Shellfish Water) Regulations 2006 (SI No 268 of
2006) set Standard/Value for physical, chemical and microbiological requirements that designated
shellfish waters must either comply with or endeavour to improve.
Figure 6.3 Designated Shellfish Waters
Designated Shellfish Water
Nutrient Sensitive Area
The North Channel Great Island is designated a nutrient sensitive area under the UWW regulations.
Urban Waste Water is one of the principal pressures on water quality in Ireland and must be treated
prior to being released back into the environment in order to remove contaminations that could
otherwise pose a risk to the environment or public health. The Urban Waste Water Treatment
Directive requires effluent discharged from all large urban areas to comply with the following quality
standards.
Parameter limit
BOD 25 mg/l
COD 125 mg/l
Suspended Solids 35 mg/l
Total Phosphorus 2 mg/l
Total Nitrogen 15 mg/l
For
insp
ectio
n pur
pose
s only
.
Conse
nt of
copy
right
owne
r req
uired
for a
ny ot
her u
se.
EPA Export 07-11-2018:04:04:37

Environmental Impact Statement Dairygold Mogeely - Speciality Cheese Facility Expansion
CHAPTER 6 |HYDROLOGY AND HYDROGEOLOGY
Chapter 6 MAIN EIS - VOLUME 2
Page 13 of 39
Figure 6.4 Nutrient Sensitive Waters
Nutrient Sensitive Waters
6.2.5 Hydrological Environment along the proposed discharge pipeline route
The proposed discharge pipeline route will travel north from the WWTP along the eastern side of the
River Kiltha within the Dairygold premises, and will cross the Kiltha river north of the Dairygold
Cheese making facility on the south side of the L3627. (Refer to WC1 on Figure 6.5)
The proposed pipeline route crosses the Harrisgrove stream at the junction of the L3627 and the
N25 roads. (Refer to WC2 on Figure 6.5). Lough Aderry located 2 km west of Castlemartyr is the
source of the Harrisgrove Stream, which flows west-northwest towards Midleton, where it joins the
Dungourney River, which in turn joins the Owencurra River and flows into the North Channel Great
Island.
The pipeline route crosses the Dower River at two locations on the L3630 local road (Refer to WC3
and WC4 on Figure 6.5). The Dower River flows in a northeasterly direction where it combines with
the River Kiltha and in turn joins the Womanagh River west of Ladysbrigde.
The pipeline route crosses the Loughatalia Stream at the intersection of the L3629 and the R630.
(Refer to WC5 on Figure 6.5) The Loughatalia Stream appears to originate approximately 500m
south of the L3629/R630 intersection and flows north into the North Channel Great Island.
For
insp
ectio
n pur
pose
s only
.
Conse
nt of
copy
right
owne
r req
uired
for a
ny ot
her u
se.
EPA Export 07-11-2018:04:04:37

Environmental Impact Statement Dairygold Mogeely - Speciality Cheese Facility Expansion
CHAPTER 6 |HYDROLOGY AND HYDROGEOLOGY
Chapter 6 MAIN EIS - VOLUME 2
Page 14 of 39
Figure 6.5 Watercourse Crossings along Proposed Discharge Pipeline
6.2.6 Water Framework Protected Areas
The Water Framework Directive requires a register of protected areas. These are protected for their
use (such as drinking water or fisheries) or because they have important habitats and species that
directly depend on water. The register includes areas identified by the Water Framework Directive
itself or a number of other European Directives. These include:
Water bodies used for the abstraction of drinking water
Areas designated to protect economically significant aquatic species (areas protected under
Freshwater Fish Directive 78/659/EEC; Shellfish Directive 79/923/EEC)
Recreational waters (areas protected under Bathing Water Directives 76/160/EEC and
2006/7/EC)
Nutrient sensitive areas (areas protected under Nitrates Directive 91/676/EEC; Urban
Wastewater Treatment Directive 91/271/EEC)
Areas designated for the protection of habitats or species where the maintenance or
improvement of the status of water is an important factor in their protection (Natura 2000
sites under Birds Directive 79/409/EEC and Habitats Directive 92/43/EEC)
Protected Areas are to be managed to achieve the Water Framework Directive objectives and the
objectives of the existing legislation. A summary of the Water Framework Protected Areas relevant
to the proposed development are as follows:
For
insp
ectio
n pur
pose
s only
.
Conse
nt of
copy
right
owne
r req
uired
for a
ny ot
her u
se.
EPA Export 07-11-2018:04:04:37

Environmental Impact Statement Dairygold Mogeely - Speciality Cheese Facility Expansion
CHAPTER 6 |HYDROLOGY AND HYDROGEOLOGY
Chapter 6 MAIN EIS - VOLUME 2
Page 15 of 39
Waterbody Protected Areas
Kiltha River Drinking water
Womanagh Estuary SPA Habitat Conservation Objectives SAC Habitat Conservation Objectives
Youghal Bay Shellfish area SPA Habitat Conservation Objectives SAC Habitat Conservation Objectives
North Channel Great Island Nutrient Sensitive Estuary Shellfish area SPA Habitat Conservation Objectives SAC Habitat Conservation Objectives
6.2.7 Hydrogeology
6.2.7.1 Groundwater Body& Status
The study area is situated in the Middleton 1 Groundwater Body (GWB) (IE_SW_G_058) which
encompasses the limestone valley from Middleton east to the coast at Youghal Bay. The existing DFI
site and the proposed expansion area are located towards the centre of the GWB.
The proposed pipeline route runs from the DFI Mogeely Site to the south-western corner of the
GWB. The Bawnard-Rathcoursey reach of the pipeline along the L3629 road crosses into and runs
along the northern boundary of the Knockadoon_E GWB, which runs parallel and to the south of the
Midleton GWB.
These GWBs have been classified as being of Good Status for the period 2007 to 20121.
Figure 6.6 Groundwater Bodies
1 The groundwater body descriptions are available from the GSI website: www.gsi.ie and the ‘status’ is obtained from the Water Framework Directive website: www.wfdireland.ie/maps.html.
For
insp
ectio
n pur
pose
s only
.
Conse
nt of
copy
right
owne
r req
uired
for a
ny ot
her u
se.
EPA Export 07-11-2018:04:04:37

Environmental Impact Statement Dairygold Mogeely - Speciality Cheese Facility Expansion
CHAPTER 6 |HYDROLOGY AND HYDROGEOLOGY
Chapter 6 MAIN EIS - VOLUME 2
Page 16 of 39
6.2.7.2 Aquifer classification
The bedrock aquifer distribution of the study area is shown in Figure 6.7. The impure limestones, and the sandstones and mudstones of the ridges to the north and south of the Cork Syncline Valley are classified as a Locally Important Aquifer (Ll), which is moderately productive only in local zones. These Ll aquifers are outside the Midleton GWB and do not contribute groundwater flow to the GWB. The Dinantian Pure Unbedded Limestone (DPUL) bedrock underlying the Cork Syncline Valley study area is classified as a regionally important aquifer with a karstified, diffuse flow regime (RKd).
Figure 6.7 Aquifer Classification
(Source: Figure 12 Hydrogeological Impact Assessment prepared by Peter Conroy, 2016. EIS Volume 3 Appendix 6)
6.2.7.3 Vulnerability assessment
According to the GSI, groundwater vulnerability is a term used to represent the intrinsic geological
and hydrogeological characteristics that determine the ease with which groundwater may be
contaminated by human activities. The GSI uses a matrix comprising four groundwater vulnerability
categories to classify aquifer vulnerability. These categories are extreme, high, moderate and low.
The ratings are used in the GSI vulnerability Mapping Guidelines as outlined in Table 6.5.
For
insp
ectio
n pur
pose
s only
.
Conse
nt of
copy
right
owne
r req
uired
for a
ny ot
her u
se.
EPA Export 07-11-2018:04:04:37

Environmental Impact Statement Dairygold Mogeely - Speciality Cheese Facility Expansion
CHAPTER 6 |HYDROLOGY AND HYDROGEOLOGY
Chapter 6 MAIN EIS - VOLUME 2
Page 17 of 39
Table 6.5 Vulnerability Mapping Guidelines
Source: GSI Vulnerability Mapping Guidelines
The current GSI vulnerability map of the Mogeely area is shown in Figure 6.8. As part of this
assessment the map has been revised in line with the site specific data collected between 2012 and
2016. The revised groundwater vulnerability map is shown in Figure 6.9. The chief revisions involve
re-classifying areas currently mapped as low vulnerability to moderate vulnerability; and adding
areas of extreme vulnerability related to newly mapped karst features.
The available data suggest that subsoil permeability across the study area is likely to be high to
moderate. In the vicinity of Mogeely, areas with depth to bedrock (DTB) in excess of 10 m previously
mapped as Low have been reclassified as Moderate vulnerability.
The karst survey of the study area identified a large number of previously unmapped surface karst
features, an area of unmapped bedrock outcrop in Killamucky, and showed that the Killamucky
stream sinks into swallow hole KF12/02.
On the basis of the revised groundwater vulnerability map shown in Figure 6.9 the following is
determined:
The existing DFI Mogeely site and the proposed expansion site are situated over an area
classified as having moderate groundwater vulnerability. The western site boundary is mapped
as having extreme groundwater vulnerability, as it intersects the losing stream buffer zone
delineated along the Kiltha River;
The proposed pipeline is underlain by an area of moderate groundwater vulnerability for the
majority of its reach along the L3627 local road. At the Junction between the L3627 and the
N25, and in the townlands of Kilmountain and Killamucky the L3627 reach varies between high
and extreme vulnerability.
Over the remainder of the proposed pipeline route along the L3628, L3630, R629 and L3629 the
groundwater vulnerability is predominantly high, but passes through or adjacent to a number of
extremely vulnerable areas.
For
insp
ectio
n pur
pose
s only
.
Conse
nt of
copy
right
owne
r req
uired
for a
ny ot
her u
se.
EPA Export 07-11-2018:04:04:37

Environmental Impact Statement Dairygold Mogeely - Speciality Cheese Facility Expansion
CHAPTER 6 |HYDROLOGY AND HYDROGEOLOGY
Chapter 6 MAIN EIS - VOLUME 2
Page 18 of 39
Figure 6.8 Current GSI Groundwater Vulnerability Map
(Source: Figure A2.1 Hydrogeological Impact Assessment prepared by Peter Conroy, 2016. EIS Volume 3 Appendix 6)
For
insp
ectio
n pur
pose
s only
.
Conse
nt of
copy
right
owne
r req
uired
for a
ny ot
her u
se.
EPA Export 07-11-2018:04:04:37

Environmental Impact Statement Dairygold Mogeely - Speciality Cheese Facility Expansion
CHAPTER 6 |HYDROLOGY AND HYDROGEOLOGY
Chapter 6 MAIN EIS - VOLUME 2
Page 19 of 39
Figure 6.9 Revised Groundwater Vulnerability Map
(Source: Figure 11 Hydrogeological Impact Assessment prepared by Peter Conroy, 2016. EIS Volume 3 Appendix 6)
6.2.7.4 Quality of Groundwater underlying the site
Groundwater samples have been collected from the on-site borehole GW1 in February 2012; May,
August and November of 2013, February 2014 and September 2015 in line with the groundwater
monitoring regime in place under DFI IPPC license P0817-01. Two samples of untreated
groundwater were collected from GW1 on 14th and 15th September 2016 at the beginning and end of
the GW1 pumping test. The samples were analysed for physico-chemical parameters, major ions,
microbiological parameters and dissolved metals at INAB accredited laboratories. (Refer to
Hydrogeological Assessment provided in EIS Volume 3 Appendix 6 for the full suite of parameters
analysed ).
The laboratory results for the samples have been compared to the assessment criteria in SI No. 122
of 2014, i.e. the EU (Drinking Water) Regulations and the European Communities Environmental
For
insp
ectio
n pur
pose
s only
.
Conse
nt of
copy
right
owne
r req
uired
for a
ny ot
her u
se.
EPA Export 07-11-2018:04:04:37

Environmental Impact Statement Dairygold Mogeely - Speciality Cheese Facility Expansion
CHAPTER 6 |HYDROLOGY AND HYDROGEOLOGY
Chapter 6 MAIN EIS - VOLUME 2
Page 20 of 39
Objectives (Groundwater) Regulations 2010 (S.I. No. 9/2010). For the date the water quality at the
borehole GW1 is summarised as follows:
The available data indicate that the Rkd aquifer groundwater is hard (240 to 284mg/l as CaCO3) and
that the groundwater has a calcium:bicarbonate hydrochemical signature. The electrical
conductivity ranges from 512 uS/cm to 651 uS/cm while pH varies from 7.0 to 7.9.
Total and faecal coliforms were detected at GW1 on 03/02/2012 (7 and 20 cfu/100ml respectively);
however they were below the detection limit in all other samples. Ammonia was detected at
concentrations below the groundwater threshold in all samples. A sub-threshold ammonia peak
occurred in November 2013 to February 2014.
Nitrate concentration exceeded the groundwater threshold of 8.5 mg/l as N (37.5 mg/l as NO3) in
October 2005, August 2013, and September 2015. It exceed the drinking water standard of
11.3 mg/l as N (50 mg/l as NO3) in February 2014 and September 2016 (both samples). However, it
was well below the threshold in February 2012 and May 2013. Nitrate was below detection in
November 2013, which correlates with the sub-threshold peak in ammonia concentrations at that
time. Non-detectable nitrate may be due to denitrifying, anaerobic conditions that could
accompany a slug of contamination passing through the aquifer. Ammonia would also be expected
to occur under such circumstances. Orthophosphate concentrations exceeded the groundwater
threshold of 0.035 mg/l as P in February 2012 and November 2013. Maximum nitrate at Dower
spring between 2007 and 2013 was 8.9 mg/l as N, suggesting concentrations around Mogeely are
above average for the regional groundwater system.
Farmyards and/or landspreading of agricultural waste organic matter across the study area are
potential sources of intermittent microbial and chemical (ammonia, phosphate, nitrate)
contamination of the bedrock aquifer. Domestic onsite wastewater treatment systems are another
potential source. Landspreading or stockpiles of artificial fertilisers are possible sources of
phosphate, potassium and nitrate contamination. Contamination may be particularly prevalent
when weather conditions favour the entry of organic matter into karst point recharge sites (e.g.
dolines, swallow holes, etc.), poorly sited/constructed private boreholes, or potentially leaking storm
drainage from fertiliser storage yards.
Chloride concentrations exceeded the groundwater threshold of 24 mg/l in all samples, and ranged
from 39 in October 2005, to 56.1 mg/l in May 2013 and 56 mg/l in September 2016. Chloride
concentrations can be naturally high in the Middleton GWB due to chloride inputs from sea spray
(GSI, 2004). Landspreading of organic wastes can result in additional chloride inputs to
groundwater. As such the elevated chloride concentrations at GW1 may be due to a combination of
sources.
Dissolved iron and manganese concentrations at GW1 were at background concentrations in all
samples.
All other trace metals, organic compounds and physio-chemical parameters were below their
respective drinking water and groundwater thresholds at GW1.
For
insp
ectio
n pur
pose
s only
.
Conse
nt of
copy
right
owne
r req
uired
for a
ny ot
her u
se.
EPA Export 07-11-2018:04:04:37

Environmental Impact Statement Dairygold Mogeely - Speciality Cheese Facility Expansion
CHAPTER 6 |HYDROLOGY AND HYDROGEOLOGY
Chapter 6 MAIN EIS - VOLUME 2
Page 21 of 39
Overall, the water quality data suggest the groundwater at the site is subject to intermittent
contamination which is likely to derive from regional scale diffuse and point source organic matter
contamination of the bedrock aquifer, upgradient of the borehole.
6.2.8 Flood Risk
The PSFRM Guidelines document defines three flood zone types as follows:
Flood Zone A where the probability of flooding from rivers and the sea is highest (greater than 1% or 1 in 100 for river flooding or 0.5% or 1 in 200 for coastal flooding)
Flood Zone B where the probability of flooding from rivers and the sea is moderate (between 0.1% or 1 in 1000 and 1% or 1 in 100 for river flooding and between 0.1% or 1 in 1000 year and 0.5% or 1 in 200 for coastal flooding)
Flood Zone C where the probability of flooding from rivers and the sea is low (less than 0.1% or 1 in 1000 for both river and coastal flooding). Flood Zone C covers all areas of the plan which are not in zones A or B
The Midleton Electoral Area Local Area Plan 2015 (EALAP) settlement map includes an ‘Indicative
Flood Extent Map for Mogeely. The map indicates that a large portion of the existing and proposed
development site is within Flood Zone A which is defined as an area where there is a high probability
of flooding. It is however stated in the Area Plan that the flood extent map for Mogeely may be
subject to some local uncertainties.
A comprehensive site specific flood risk assessment (FRA) was therefore undertaken to determine
the actual flood risk both currently and associated with the proposed development. (Refer to See
Flood Risk Assessment Document Ref 17617_6004 provided in Volume 3 Appendix 6).
A hydraulic model was used to establish the design flood levels within the site and these were used
to produce a flood zone map for the site. The Flood Zone Map, which indicates the extent of Flood
Zones A and B, is shown on Figure 6.10 for the existing site. This map indicates the following:
The majority of the Main Site is located outside of Flood Zones A and B therefore these areas are
in Flood Zone C. These areas have a low probability of flooding.
Two small areas in the Main Site are located within Flood Zone B and therefore have a moderate
probability of flooding.
A small area towards the south of the Main Site, adjacent to the river, is within Flood Zone A and
so has the highest probability of flooding. This area of the site is currently disused and is covered
with dense vegetation.
The majority of the existing WWTP site access road is located within Flood Zone A. This is with
the exception of a small area to the north which is in flood zones B and C.
The existing WWTP is located entirely within Flood Zone A and as such it is in the highest
probability flood zone.
For
insp
ectio
n pur
pose
s only
.
Conse
nt of
copy
right
owne
r req
uired
for a
ny ot
her u
se.
EPA Export 07-11-2018:04:04:37

Environmental Impact Statement Dairygold Mogeely - Speciality Cheese Facility Expansion
CHAPTER 6 |HYDROLOGY AND HYDROGEOLOGY
Chapter 6 MAIN EIS - VOLUME 2
Page 22 of 39
Figure 6.10 Flood Risk Mapping (Existing Site)
For
insp
ectio
n pur
pose
s only
.
Conse
nt of
copy
right
owne
r req
uired
for a
ny ot
her u
se.
EPA Export 07-11-2018:04:04:37

Environmental Impact Statement Dairygold Mogeely - Speciality Cheese Facility Expansion
CHAPTER 6 |HYDROLOGY AND HYDROGEOLOGY
Chapter 6 MAIN EIS - VOLUME 2
Page 23 of 39
6.3 LIKELY SIGNIFICANT IMPACTS
This section addresses the potential impacts on the hydrological and hydrogeological environment
from activities during construction and operation of the project and makes a determination on the
likelihood of occurrence. The current proposals of all construction activities and operational
infrastructure were reviewed to identify activities likely to impact upon water bodies including
surface waters and ground waters within and remote from the site.
6.3.1 Construction Phase
The proposed development at the existing DFI Mogeely Site and the proposed greenfield expansion
area is characterised by the following works:
Construction works involving a certain amount of shallow excavation, earthworks and landscaping.
Onsite stockpiling of topsoil and subsoil excavated during the works.
Creation of temporary drainage sumps in active construction areas to allow surface runoff within the construction area to infiltrate to groundwater.
Creation of impermeable ground surfaces in areas that are currently permeable. o On the existing site the creation of a car parking area and water tanks in the south of the
site will generate at least approximately 0.35 ha of new impermeable cover. o On the proposed greenfield area the works will create at least approximately 2.5 ha of new
impermeable cover. o The alluvial subsoil zone underlying the DFI Mogeely site, Kiltha River and Kilamucky
Stream area, and which contributes groundwater to Rkd aquifer and the GW1 abstraction, has an area of 110.4 Ha. The proposed increase in hardstanding across the alluvial footprint amounts to 2.6% of the subsoil zone.
The proposed pipeline development is characterised by the following works:
Excavation of a trench 1.0m wide by 1.8m to 2.5m deep along existing public roads, installing the pipeline, backfilling of the trench with suitable fill material in line with and reinstatement of the road surface.
The pipeline route involves three surface water crossings. The crossings will be achieved by using directional drilling techniques to allow the pipeline to pass beneath the surface water course without disturbing the water course during the construction phase.
6.3.1.1 Impacts on Hydrology
6.3.1.1.1 Water Quality
Existing DFI Mogeely Site and Greenfield Area
The construction of the new development will involve activities comprising site preparation
(including stripping of topsoils, formation of the standard temporary construction site compound
and temporary storage areas for excavated spoil material); excavation of ground down to good
bearing strata for pad and raft style foundations for buildings and other site structures, excavation
for service trenches, building demolitions, importation of material for sub layers to roads, paving,
parking and building footprints and construction of the building structures. Potential sources of
water pollution from the proposed construction activities include:
For
insp
ectio
n pur
pose
s only
.
Conse
nt of
copy
right
owne
r req
uired
for a
ny ot
her u
se.
EPA Export 07-11-2018:04:04:37

Environmental Impact Statement Dairygold Mogeely - Speciality Cheese Facility Expansion
CHAPTER 6 |HYDROLOGY AND HYDROGEOLOGY
Chapter 6 MAIN EIS - VOLUME 2
Page 24 of 39
- Runoff and erosion from site surfaces, drainage channels and earth working areas: Suspended
solids can be derived from the physical disturbance of the ground during the course of
excavation, by scour as a consequence of accelerated rates of runoff, or loosened fine
particulate matter lifted from the surface of spoil heaps; from excavated surfaces or the surface
of access roads or hardstandings if not correctly compacted. Incorrect site management of
excavations could lead to loss of suspended solids to the drainage network.
Concrete (used for the construction of foundations). Concrete leachates have the potential to
affect water quality by altering pH and total suspended solids levels. The pH of concrete can be
as high as 11.0 to 12.0 units, which is highly alkaline. Concrete leachates also contain metals
and trace elements including compounds of potassium, sodium sulfate, chromium and nickel.
There is a potential risk of spillage and run off from cement trucks delivering concrete to site
during the placing of concrete and also in the washing out of trucks. The spillage of cement
material into the drainage network, unless properly controlled, could significantly impact on the
pH of the stormwater discharges from the site.
Water contamination from acidential spillages of hazardous materials Contaminants may
potentially be introduced into the drainage network, most particularly during the construction
phase, in the form of fuel oil leakage or spillage from construction equipment and vehicles;
inappropriate storage or application of lubricants; or the careless usage of construction
chemicals Incorrect management of accidental spillages on site could lead to the loss of
suspended solids to surface waters.
The Kiltha River runs along the western perimeter of the site and is thus a key sensitive receptor
which sediment, runoff or any fuel spill could eventually reach. Releasing non-attenuated
suspended solids and heavily contaminate run-off waters into the stormwater drainage network has
the potential to have a negative impact on the water quality of the Kiltha River. This would
potentially be a temporary but significant negative impact. The risk of occurrence however can be
adequately prevented by the implementation of standard best management practices and controls.
6.3.1.1.2 Changes to the Existing drainage network
The existing manufacturing site is already a sealed surface site and so existing surface water is
managed through the present surface water system. This project will see the site re-organised and
rebuilt with new buildings and yard areas. The existing surface water management system will have
to be dismantled in stages and a new system constructed to reflect the new site layout. The
sequencing of works, particularly removal of the existing network and construction of new network
will need to be carefully managed to reduce risk of contaminated run-off from the site reaching the
Kiltha River.
Currently the undeveloped site exhibits good natural permeability and drainage with no evidence of
ponding or adverse run-off patterns. The rate and volume of surface water runoff from the site will
be greater during the construction phase of the project relative to baseline conditions. This is a
function of the progressive excavation and removal of vegetation cover along the proposed
development footprint and thus removing the hydraulic absorption / buffer control from the site.
This surface water run-off will also need to be managed.
For
insp
ectio
n pur
pose
s only
.
Conse
nt of
copy
right
owne
r req
uired
for a
ny ot
her u
se.
EPA Export 07-11-2018:04:04:37

Environmental Impact Statement Dairygold Mogeely - Speciality Cheese Facility Expansion
CHAPTER 6 |HYDROLOGY AND HYDROGEOLOGY
Chapter 6 MAIN EIS - VOLUME 2
Page 25 of 39
It is proposed as part of the pre commencement activities to install a perimeter filter drain system,
with sedimentation pond, along the southern boundary with associated settlement ponds and install a
silt fence or similar along the western perimeter of the site to act as a protection measure against
run off.
The surface water run-off is therefore considered a negative impact that can be easily controlled by
appropriate interceptor drainage.
Proposed Pipeline
The construction phase works of the proposed pipeline are not expected to impact on surface
waters. Stream/river crossings will either be of directional drill (underneath) or placed in road and
bridge (above) and as such, no impact is anticipated.
6.3.1.2 Impacts on Hydrogeology
6.3.1.2.1 Physical Impacts on the Bedrock Aquifer
Existing DFI Mogeely Site and Greenfield Area
The bedrock aquifer is overlain by a thick cover of subsoil deposits in the Mogeely area. The
proposed construction involves shallow subsoil excavation only. As such, no physical impacts on the
bedrock aquifer are expected at the existing DFI Mogeely Site and adjacent Greenfield Area.
Proposed Pipeline
Where the pipeline trench crosses areas of extreme (X) groundwater vulnerability the trench may
intersect a shallow karst feature. The trench backfill may act as a pathway allowing preferential
migration of water or contaminants along the trench and into the karst feature. Alternatively it may
act as a groundwater discharge pathway in times of high or extreme groundwater levels.
Where directional drilling is used to facilitate passage of the pipeline beneath surface water courses
in areas of extreme groundwater vulnerability (i.e. DTB <3 m) the drilling activities may enhance
hydraulic connectivity between the surface water course and the bedrock aquifer, potentially
resulting in pathways between the water bodies. The crossing of the Harrisgrove Stream and the
crossing of the Womanagh River at the southern end of the L3628 road both occur in areas mapped
as Extreme (E) groundwater vulnerability. The Harrisgrove Stream may be perched above the
bedrock aquifer groundwater table such that drilled pipeline route may create a pathway for loss of
stream flow to the bedrock aquifer.
The impact of the creation of pathways along trenches intersecting the bedrock aquifer, or the
enhancement of hydraulic continuity between surface water courses and the bedrock aquifer at
directional drilling stream crossings would be considered to be negative and potentially significant
where the prevailing conditions resulted in contaminant migration between the water bodies or
excessive loss of streamflow to groundwater.
For
insp
ectio
n pur
pose
s only
.
Conse
nt of
copy
right
owne
r req
uired
for a
ny ot
her u
se.
EPA Export 07-11-2018:04:04:37

Environmental Impact Statement Dairygold Mogeely - Speciality Cheese Facility Expansion
CHAPTER 6 |HYDROLOGY AND HYDROGEOLOGY
Chapter 6 MAIN EIS - VOLUME 2
Page 26 of 39
6.3.1.2.2 Impacts on Groundwater Quality
The primary risk to groundwater quality during the works at the DFI Mogeely existing site and
proposed greenfield site, and along the proposed pipeline route, will be from hydrocarbon/chemical
spillage and/or leaching of cementitious material. These potential impacts are common to all
construction sites (such as road works and industrial sites). These potential contamination sources
will be managed carefully at the site during construction as outlined below.
There is an indirect risk from the potential transfer of existing contaminated water between water
bodies along preferential pathways created by the physical works. An accidental hydrocarbon or
chemical spillage or leak would have a direct, negative, potentially significant but reversible, impact
on groundwater water quality.
6.3.1.2.3 Impact on Groundwater Levels & Abstractions
The construction phase works at the existing DFI Mogeely site and the greenfield site are expected
to take place above the bedrock water table and are not expected to impact on groundwater levels
or abstractions.
The proposed pipeline trench may intersect areas where groundwater of subsoil or bedrock aquifer
origin may discharge into the trench. This may be most likely where the pipeline route crosses
beneath surface water courses. In the case of river crossings, the directional drilling technique can
operate in saturated conditions and no groundwater pumping is anticipated in this case. As such, no
impact on groundwater levels or abstractions is anticipated.
6.3.1.2.4 Impact on Groundwater Bodies and Groundwater Dependent Terrestrial Ecosystems
The proposed developments at the DFI Mogeely site and greenfield expansion area and the
proposed pipeline are not expected to result in any regional scale impacts that would result in a
deterioration in the status of any groundwater bodies. There are no groundwater dependent
terrestrial ecosystems delineated in the study area.
For
insp
ectio
n pur
pose
s only
.
Conse
nt of
copy
right
owne
r req
uired
for a
ny ot
her u
se.
EPA Export 07-11-2018:04:04:37

Environmental Impact Statement Dairygold Mogeely - Speciality Cheese Facility Expansion
CHAPTER 6 |HYDROLOGY AND HYDROGEOLOGY
Chapter 6 MAIN EIS - VOLUME 2
Page 27 of 39
6.3.2 Operational Phase
The operation of the cheese manufacturing facility involves point source discharges to surface
waters and groundwater abstractions. The potential sources of impact on the hydrological and
hydrogeological environments during the operational phase are discussed hereunder.
6.3.2.1 Impact on Receiving Waters
6.3.2.1.1 Trade Effluent Discharges
It is being proposed that the existing outfall from the WWTP to the Kiltha River will be decommissioned
and future discharges from the WWTP will be into North Island Great Channel at Rathcoursey. This is
considered a significant positive impact of the proposed development on the Kiltha River.
The proposed discharge point has been agreed with Irish Water and is the existing Midleton Main
Drainage Outfall at Rathcoursey. Irish Water are dictating that the proposed discharge connect to
their system downstream of their existing Tidal holding Tank at Rathcoursey. In addition, the
discharge is to take place for a three (3) hour period on each ebb tide.
The transitional and coastal waters of Cork Harbour are designated as a Protected Area which
requires special protection under EU legislation because they are nutrient sensitive and designated a
Special Protection Area, candidate Special Area of Conservation and proposed Natural Heritage Area.
According to the EPA’s most recent assessment of water quality in the Harbour it was deemed of
‘moderate’ status. The overall objective for 2021 is to restore water quality to ‘good status’. The
most critical issue in securing this objective is the delivery of the Lower Harbour Sewage Scheme
The discharge standards for the Mogeely treated wastewater have not yet been agreed with the
EPA. However it is assumed that they will be the same as the existing Midleton municipal
Wastewater Discharge Authorisation Licence (WWDA) Ref D0056-01 and the of the permitted
discharge by Irish Distillers Ltd (IDL) which also discharge to the Midleton Main Drainage outfall
under IE Licence (P0442-02)which has the following limits:
Parameter PROPOSED DISCHARGE QUALITY
Temperature 250C
pH 6.0 – 9.0
BOD 25 mg/l
COD 125 mg/l
Suspended solids 35 mg/l
Total Nitrogen 15 mg/l
Orthophosphate 2 mg/l
Fats, Oil and Grease 15 mg/l
These limits give effect to the principle of the Combined Approach as defined in the Waste Water
Discharge Authorisation Regulations, 2007 (S.I. No. 684 of 2007) whereby the emission limits for the
discharge are established on the basis of the stricter of either or both, the limits and controls
required under the Urban Waste Water Treatment Regulations (S.I. No. 254 of 2001) and the limits
For
insp
ectio
n pur
pose
s only
.
Conse
nt of
copy
right
owne
r req
uired
for a
ny ot
her u
se.
EPA Export 07-11-2018:04:04:37

Environmental Impact Statement Dairygold Mogeely - Speciality Cheese Facility Expansion
CHAPTER 6 |HYDROLOGY AND HYDROGEOLOGY
Chapter 6 MAIN EIS - VOLUME 2
Page 28 of 39
determined under statute or Directive for the purpose of achieving the environmental objectives
established for surface waters, groundwater or protected areas for the water body into which the
discharge is made.
Applying the maximum future proposed discharge volume of treated effluent at 4,000m3/day
(WWTP Design capacity) and the above proposed emission limits, calculations were undertaken to
determine the worst case initial impact of the proposed discharge from the Dairygold facility outside
the mixing zone. The calculations are provided in Document 17617_6011 Assessment of Proposed
Wastewater Discharges on the Receiving Waters at Rathcoursey Point contained in EIS Volume 3
Appendix 6.
Based on these calculations, the addition of the proposed Dairygold, Mogeely treated effluent, to
the discharge, would have a negligible impact on the quality of the receiving water body.
The average impact of the proposed maximum strength discharge from the Dairygold, Mogeely
WWTP would be to raise the background BOD, outside the mixing zone, by 0.0039 mg/l. This is the
maximum and the calculation takes no account of the very beneficial effects of tidal exchange. This
would have no discernible effect on the receiving waters. Even the overall effect of the combined
discharges from Midleton, IDL and Dairygold, Mogeely would have a negligible impact on the
receiving waters.
The average impact of the proposed maximum strength discharge from the Dairygold, Mogeely
WWTP would be to raise the background P concentration, outside the mixing zone, by 0.0003 mg/l.
This is the maximum and the calculation takes no account of the very beneficial effects of tidal
exchange. This would have no discernible effect on the receiving waters. Even the overall effect of
the combined discharges from Midleton, IDL and Dairygold, Mogeely would have a negligible impact
on the receiving waters.
The average impact of the proposed maximum strength discharge from the Dairygold, Mogeely
WWTP would be to raise the background N concentration, outside the mixing zone, by 0.0024mg/l.
This would have no discernible effect on the receiving waters. This is the maximum and the
calculation takes no account of the very beneficial effects of tidal exchange. Even the overall effect
of the combined discharges from Midleton, IDL and Dairygold, Mogeely would have a negligible
impact on the receiving waters.
The average impact of the proposed maximum strength discharge from the Dairygold, Mogeely
WWTP would be to raise background SS concentrations, outside the mixing zone, by 0.0055 mg/l.
This would have no discernible effect on the receiving waters. This is the maximum and the
calculation takes no account of the very beneficial effects of tidal exchange. Even the overall effect
of the combined discharges from Midleton, IDL and Dairygold, Mogeely would have a negligible
impact on the receiving waters.
On the basis of the above, it is considered that the discharge, either alone or in combination with
discharges from the Midleton municipal WWTP and Irish Distillers Ltd would not cause a
deterioration in the chemical status in the receiving surface water body.
For
insp
ectio
n pur
pose
s only
.
Conse
nt of
copy
right
owne
r req
uired
for a
ny ot
her u
se.
EPA Export 07-11-2018:04:04:37

Environmental Impact Statement Dairygold Mogeely - Speciality Cheese Facility Expansion
CHAPTER 6 |HYDROLOGY AND HYDROGEOLOGY
Chapter 6 MAIN EIS - VOLUME 2
Page 29 of 39
Regarding, the transitional and coastal waters of Cork Harbour, the discharge from the Mogeely
facility will not impact on the objective to restore water quality to ‘Good’ by 2021. It is recognised
that most critical issue in securing the restore objective is the delivery of the Lower Harbour Sewage
Scheme, whereby a new wastewater treatment plant located at Shanbally will negate the discharge
of untreated wastewater from Cobh, Carrigaline, Passage West/Monkstown and Ringaskiddy.
Furthermore, the upgrades to the Carrigtwohill WWTP and Midleton WWTP will reduce nutrient
inputs in the north east of the harbour which will benefit the Great Island Channel.
Table 6.6 Estimated Rise in Background Concentrations due to Wastewater Discharges on the Receiving Waters at Rathcoursey Point
Parameter Unit
Rise in concentration
due to Dairygold discharge
Rise in concentration due
to combined discharge
Rise in concentration due to combined
discharge using max IDL discharge of 5000m3
BOD mg/l 0.0039 0.0092 0.0123
P mg/l 0.0003 0.0008 0.001
N mg/l 0.0024 0.006 0.0074
SS mg/l 0.0055 0.014 0.0172
Part of the North Channel has been designated as a shellfish water. Rostellan (North, South and
West) shelfish waters are also located approximately 3km from the discharge at Rathcoursey. A key
concern in shellfish waters is the risk of bacterial contamination. A review of the Revised /Updated
Cork Great Island North Channel Pollution Reduction Programme provides that the most up to date
results of monitoring (2012) indicate that this designated shellfish water is not in compliance with
the guidevalue of 300 faecal coliforms/100ml and that the key pressure is urban wastewater systems
and on-site waste water treatment system.
The proposed treated discharges from the Dairygold facility do not pose a risk or pressure of viral or
bacterial contamination. No domestic wastewater will be discharged from the Dairygold WWTP.
As part of the proposed redevelopment it is proposed that all domestic wastewater generated on-
site will be directed to the Mogeely Municipal WWTP. Since the milk is pasteurized during the
production process there is no viral or bacterial risk from the wastewater and no need to disinfect it.
Therefore the addition of the proposed Dairygold, Mogeely treated effluent, to the existing
discharge, would not present a risk of faecal or viral contamination of the receiving water body.
The European Communities (Quality of Shellfish Water) Regulations 2006 (SI No 268 of 2006) set
Standard/Value for physical, chemical and microbiological requirements that designated shellfish
waters must either comply with or endeavour to improve. Table 6.7 considers the quality of the
discharge in relation to these Standards.
For
insp
ectio
n pur
pose
s only
.
Conse
nt of
copy
right
owne
r req
uired
for a
ny ot
her u
se.
EPA Export 07-11-2018:04:04:37

Environmental Impact Statement Dairygold Mogeely - Speciality Cheese Facility Expansion
CHAPTER 6 |HYDROLOGY AND HYDROGEOLOGY
Chapter 6 MAIN EIS - VOLUME 2
Page 30 of 39
Table 6.7 Regulatory Water Quality Standards/Value for Shellfish Waters
Shellfish Waters
Parameter Standard/Values Comment on Proposed Discharge
Mandatory Values
(Schedule 2)
pH 7-9 pH will be within this range
Coloration (After Filtration)
A discharge affecting shellfish waters must not cause the colour of the waters after filtration to deviate by more than 10 milligrams per litre from the colour of waters not so affected.
The discharge will be without colour
Suspended solids A discharge affecting shellfish waters must not cause the suspended solids content of the waters to exceed by more than 30 per cent the suspended solids content of waters not so affected.
Limit for SS of 35mg/l proposed which will not cause the SS of the water to exceed by >30%. Estimated maximumrise in background SS is
0.0055mg/l Salinity (a) less that 40 practical salinity units, and
(b) discharges affecting shellfish waters must not cause the salinity of the waters to exceed by more than 10 per cent the salinity of waters not so affected.
Discharges will not increase salinity
Dissolved oxygen (a) equal to or greater than 70 per cent (average value)
Limit of 25mg/l for BOD proposed. The discharge from the Dairygold, Mogeely WWTP would raise the background BOD, outside the mixing zone, by a maximum of 0.0039 mg/l
Petroleum hydrocarbons
Hydrocarbons must not be present in the shellfish waters in such quantities as will― (a) produce a visible film on the surface of the water or a deposit on the shellfish, or both,or (b) have harmful effects on the shellfish.
No likelihood of hydrocarbons in discharge. Trade effluent only. Surface waters on site are collected in separate drainage system which include petrol interceptors.
Polychlorinated biphenyls
0.30µg/l No likelihood of PCB in discharge. There will be no PCB substances on-site after the redevelopment
Metals (Dissolved): Arsenic Cadmium Chromium Copper Lead Mercury Nickel Silver Zinc
40.00 µg/l 5.00 µg/l 30.00 µg/l 10.00 µg/l 20.00 µg/l 0.40 µg/l 50.00 µg/l 10.00 µg/l 200.00 µg/l
Discharge unlikely to contain concentrations of heavy metals of this order.
Guide Values (Schedule 4)
Temperature A discharge affecting shellfish must not cause the temperature of the waters to exceed by more than 2 degrees Celsius the temperatures of waters not so affected.
Thermal loading of discharge unlikely to increase temp of receiving water. Wastewaters will be piped approximately 14km and will be held for periods of up to 9 hours before discharging
Salinity 12 to 38 practical salinity units. Discharges will not increase salinity
Dissolved oxygen Equal to or greater than 80 per cent (average value) Limit of 25mg/l for BOD proposed. The discharge from the Dairygold, Mogeely WWTP would raise the background BOD, outside the mixing zone, by a maximum 0.0039 mg/l
Faecal coliforms Equal to or less than 300 in the shellfish flesh and intervalvular liquid
Discharge will not contain domestic wastewater. All domestic wastewater will be directed to the Mogeely Municipal WWTP. Therefore no risk of faecal contamination
For
insp
ectio
n pur
pose
s only
.
Conse
nt of
copy
right
owne
r req
uired
for a
ny ot
her u
se.
EPA Export 07-11-2018:04:04:37

Environmental Impact Statement Dairygold Mogeely - Speciality Cheese Facility Expansion
CHAPTER 6 |HYDROLOGY AND HYDROGEOLOGY
Chapter 6 MAIN EIS - VOLUME 2
Page 31 of 39
6.3.2.1.2 Surface water Discharges
Under normal operation, stormwater emissions are not likely to significantly impact on the water
quality of the Kiltha River.
All potential risk areas on site where spills or leaks of potentially polluting materials may occur have
been identified and appropriate control and containment measures have been included in the
design. All product, chemical and fuel tanks are located within bunds. The milk intake area is
covered and the internal milk intake bays drain to the foul water system. The access road from the
entrance to the milk intake area will be protected via the revised stormwater collection system.
The system will include a full Class 1 Petrol Interceptor and a monitoring chamber with divert
system, controlled by Conductivity and pH meters. In the unlikely event of a Pollution incident the
liquids in the storm water system will be diverted to the process drains by an overflow system and
carried to the WWTP for treatment. There is adequate balancing volume available at the WWTP to
allow this.
6.3.2.2 Impact on Groundwaters
6.3.2.2.1 Groundwater abstraction
The proposed groundwater abstraction rate from borehole GW1 for the expanded plant is
1,400 m3/day, which is to be achieved by approximately continuous abstraction at a rate of
approximately 60 m3/hour. This requires an increase in abstraction from GW1 of 875 m3/day over
the current abstraction rate. The assessment of the hydrogeological environment suggests that:
The increased abstraction rate will expand the current Zone of Contribution (ZOC) to GW1. This is likely to result in an expansion of the radius of influence of the abstraction within the bedrock aquifer, and an expansion of the footprint of alluvial subsoils contributing increased recharge to the bedrock aquifer under the influence of the abstraction. The increased abstraction from GW1 would therefore have a direct, long-term, slight impact on the bedrock aquifer groundwater regime.
The increased abstraction rate will result in a small increase in drawdown of water levels in the bedrock aquifer and in the overlying alluvial subsoil deposits. This in turn will result in a small drop in the rest groundwater level in private wells in the ZOC. In BH10 the drop in the rest groundwater level after 48 hours of constant pumping from GW1 was measured at 8 cm. BH10 is the closest know private well to borehole GW1. The increased abstraction from GW1 would therefore have a direct, slight negative impact on the rest groundwater level in private wells within the ZOC of GW1.
The ZOC for Borehole GW1 sits within the greater ZOC of the Dower Spring. This means the increase in abstraction of 875 m3/day will be removed from the current discharge from the Dower Spring. This loss to the spring discharge amounts to 3% of the current annual average spring discharge of 32,880 m3/day. The estimated spring discharge is 6,200 m3/day under drought conditions. The sum of the 875 m3/day abstraction increase and the 4,500 m3/day Whitegate PWS abstraction direct from the Dower spring is 5, 375 m3/day. This is less than the estimated drought spring discharge, and is an improvement on historical precedents at Dower Spring whereby PWS abstraction would exceed the entire natural spring discharge under
For
insp
ectio
n pur
pose
s only
.
Conse
nt of
copy
right
owne
r req
uired
for a
ny ot
her u
se.
EPA Export 07-11-2018:04:04:37

Environmental Impact Statement Dairygold Mogeely - Speciality Cheese Facility Expansion
CHAPTER 6 |HYDROLOGY AND HYDROGEOLOGY
Chapter 6 MAIN EIS - VOLUME 2
Page 32 of 39
drought conditions. The increased abstraction from GW1 would therefore have a direct, long-
term, slight impact on the groundwater discharge from the Dower Spring.
Widespread groundwater flooding occurred in the Mogeely/Castlemartyr area in January 2016. The proposed increase in the GW1 abstraction rate will remove an additional 875 m3/day of groundwater from the bedrock aquifer, compared to current conditions. This additional discharge from the bedrock aquifer will help to alleviate groundwater flooding associated with the bedrock aquifer. The increased abstraction from GW1 would therefore have a direct, long-term, positive, slight to moderate impact on the groundwater flooding associated with the bedrock aquifer in the Mogeely/Castlemartyr area.
6.3.2.2.2 On site spillages and leaks
Hydrocarbons, CIP chemicals and brine are likely to be present on site during the operational phase,
which creates the potential for spillage and leakage of these substances from plant or from on-site
storage locations.
Where infiltrating recharge comes into contact with spilled or leaked substances either at the
ground surface or by way of contact with contaminated soil, subsoil or bedrock, contaminants are
likely to dissolve into the infiltrating water. The contaminated water may then proceed to migrate
down into the bedrock aquifer and subsequently migrate laterally towards other receptors such as
water supply abstractions or surface water courses.
An accidental hydrocarbon or chemical spillage, if uncontrolled, could have, depending on the scale
of the spill, a temporary to long term potentially significant negative impact on groundwater quality
in the bedrock aquifer.
6.3.2.2.3 Hardstanding Reduction in infiltration
There will be an increase in impermeable ground surface cover associated with the proposed
development at the existing DFI Mogeely site and greenfield expansion area. This will result in water
that would currently recharge the bedrock aquifer, discharging as storm runoff to the Kiltha River via
the site storm drainage system.
The proposed increase in impermeable ground cover amounts to 2.6% of the footprint of the alluvial
subsoil deposits underlying the site. The loss of recharge associated with this small area will result in
a slight decrease in groundwater flow in the bedrock aquifer, and potentially a small increase in the
ZOC for borehole GW1. The increased impermeable ground surface area would therefore have
direct long-term slight impact on the bedrock aquifer groundwater flow regime and the ZOC for
borehole GW1.
6.3.2.2.4 Impact on Groundwater Bodies and Groundwater Dependent Terrestrial Ecosystems
The proposed developments at the DFI Mogeely site and greenfield expansion area and the
proposed pipeline are not expected to result in any regional scale impacts that would result in a
deterioration in the status of any groundwater bodies. There are no groundwater dependent
terrestrial ecosystems delineated in the study area. This potential operational phase impact is
screened out at this stage and no further assessment or mitigation is required.
For
insp
ectio
n pur
pose
s only
.
Conse
nt of
copy
right
owne
r req
uired
for a
ny ot
her u
se.
EPA Export 07-11-2018:04:04:37

Environmental Impact Statement Dairygold Mogeely - Speciality Cheese Facility Expansion
CHAPTER 6 |HYDROLOGY AND HYDROGEOLOGY
Chapter 6 MAIN EIS - VOLUME 2
Page 33 of 39
6.3.2.3 Flood Risk
Almost all of the Main Site is within Flood Zone B and C and these areas are therefore appropriate
for development. The small portion of the Main Site located within Flood Zone A is currently
overgrown and disused and the area will not be affected by the proposed development. The WWTP
is within Flood Zone A.
6.3.2.3.1 Impact of Flood Risk on the Main Site
The development of the Main Site is generally located in Flood Zone C therefore the risk to
occupants would be very low.
The localised portion of the site located within Flood Zone B to the south of the proposed cheese
production facility would have a flood depth of no more than 200mm and the velocity of water
would be very low due to the overall flow regime and the separation from the main river channel.
Safe escape from this area in the event of an extreme flood would be easily achieved by travelling to
the east, west or north. The risk to occupants is therefore very low.
The majority of areas in Flood Zones A and B adjacent to the river are disused and densely
vegetated/overgrown. Some other areas are used as laydown areas. It is considered unlikely that
this area would be occupied in the event of a flood. In any case the flood extent is relatively small
and the area can be safely evacuated by travelling eastwards.
6.3.2.3.2 Impact of Flood Risk on WWTP Access Road & WWTP Site
The site of the existing WWTP, which is to house the upgraded WWTP, has been identified as being
in a flood plain by the Flood Risk Assessment carried out for this project.
The analysis carried out suggests that flood waters would rise relatively slowly while the floodplains
fill therefore users of the site are expected to have sufficient time to safely evacuate before
complete inundation occurs. It is also important to note that these areas will only be occupied
intermittently by the WWTP maintenance personnel. It is therefore unlikely that these areas would
be occupied during an extreme flood event and it is further considered that these people would be
able bodied, site inducted, made aware of the potential flood risk and be capable of quickly
evacuating the area.
In addition all individual elements of the proposed new upgraded WWTP will be constructed to
finish above the maximum 1% AEP Flood (including Climate Change) level to ensure no risk of wash-
out during an extreme flood event. The Control, MCC and Dewatering building will be raised by 1
metre above existing groundlevel to provide equal flood protection.
The flood hazard is therefore considered acceptable for the WWTP site.
For
insp
ectio
n pur
pose
s only
.
Conse
nt of
copy
right
owne
r req
uired
for a
ny ot
her u
se.
EPA Export 07-11-2018:04:04:37

Environmental Impact Statement Dairygold Mogeely - Speciality Cheese Facility Expansion
CHAPTER 6 |HYDROLOGY AND HYDROGEOLOGY
Chapter 6 MAIN EIS - VOLUME 2
Page 34 of 39
6.3.2.3.3 Impact of the Development on Flooding Elsewhere
Generally, potential impacts outside the site can occur due to increased storm water runoff rates
from roofs and paved surfaces or due to loss of water storage where part of a flood plain is filled to
accommodate development.
Once the above mitigation measures are implemented, the proposed development of the main site
will not have an adverse impact on flooding elsewhere since the existing flow paths and river
conveyance will not be changed.
Upgrading of the WWTP reduces the volume of storage available within the WWTP site. The existing
WWTP is protected from flooding to a certain level by the flood embankment to the south and west
of the site. The tanks and structures within the site are also protected from flooding, generally by
masonry barriers. The existing WWTP therefore already causes a reduction in floodplain storage.
The upgraded WWTP will occupy an additional footprint of circa 1800m2 within the floodplain.
During an extreme flood event the storage volume in this footprint would be of the order of 1100m3
for the 1% AEP event and 1300m3 for the 0.1% AEP event. The volume of the affected flood
hydrograph for the 1% and 0.1% AEP events is estimated to be circa 1.1M m3 and 1.7M m3
respectively. The reduced storage volume is negligible in the context of the flood hydrograph volume
and the overall volume of floodplain storage available adjacent to the site. The resulting impact on
flood levels downstream of the site would be immeasurably low. Upgrading of the WWTP site will,
therefore, have no impact on flooding elsewhere.
6.4 MITIGATION MEASURES
6.4.1 Mitigation of Impacts on Hydrology
6.4.2 Construction Phase
The key to avoid impacts to water during the works is down to good site management practices,
tight controls, regular inspections and ongoing vigilance with staff and employees on site. At a
minimum, the following should be undertaken:
a) Temporary Construction Compound
Drainage within the temporary site compound should be directed to an oil interceptor to
prevent pollution if any spillage occur.
Temporary toilet facilities will be connected to the public sewer network during the
construction phase. During the start up phase a self-contained port-a-loo with an integrated
waste holding tank will be used on site for toilet facilities.
A bunded containment area will be provided within the compound for the storage of fuels,
lubricants, oils etc.
The compound will be in place for the duration of the construction phase and should be
removed once commissioning is complete.
For
insp
ectio
n pur
pose
s only
.
Conse
nt of
copy
right
owne
r req
uired
for a
ny ot
her u
se.
EPA Export 07-11-2018:04:04:37

Environmental Impact Statement Dairygold Mogeely - Speciality Cheese Facility Expansion
CHAPTER 6 |HYDROLOGY AND HYDROGEOLOGY
Chapter 6 MAIN EIS - VOLUME 2
Page 35 of 39
b) Soil Stripping
The timing of the construction phase soil stripping and excavation works will take
account of predicted weather, particularly rainfall.
Soil stripping activities will be suspended during periods of prolonged rainfall events.
c) Excavation Works
Earth movement activities will be suspended during periods of prolonged rainfall events
The earthworks material will be placed and compacted in layers to prevent water ingress
and degradation of the material.
Drainage and associated pollution control measures will be implemented on site before
the main body of construction activity commences
d) Storage and Stockpiles
Temporary stockpiles of excavated earth will be constructed within the lands made
available.
Stockpiles of stripped topsoil stripped will be in locations with minimum trafficking to
prevent damage and dusting
Stockpiled sub-soils will be located at suitably sheltered areas to prevent erosion or
weathering and shall be shaped to ensure rainfall does not degrade the stored material
Where unsuitable material is encountered this will be stockpiled separately and
removed in accordance with a Site Waste Management Plan.
Stockpiles will be located away from drainage systems and Silt retaining measures (silt
fence, / silt curtain or other suitable materials) to reduce risk of silt run-off shall be
installed along the downgradient edges of stockpiled earth materials.
All excavated materials from the site or introduced materials for construction will be
either used or removed from the site.
No permanent spoil or stockpiles will be left on site, other than those materials required
for landscaping, berm construction and construction generally.
e) Drainage Controls The proposed perimeter filter drain system, with sedimentation systems, will be
installed.
The western site boundary along the Kitha River should be protected.
f) Refuelling of Construction Plant On-Site
Refuelling will be carried out using 110% capacity double bunded mobile bowsers. The
refuelling bowser will be operated by trained personnel. The bowser will have spill
containment equipment which the operators will be fully trained in using.
Plant nappies or absorbent mats to be place under refuelling point during all refuelling
to absorb drips.
Mobile bowsers, tanks and drums should be stored in secure, impermeable storage area,
away from drains and open water.
To reduce the potential for oil leaks, only vehicles and machinery will be allowed onto
the site that are mechanically sound. An up to date service record will be required from
the main contractor.
Should there be an oil leak or spill, the leak or spill will be contained immediately using
oil spill kits; the nearby dirty water drain outlet will be blocked with an oil absorbent
boom until the fuel/oil spill has been cleaned up and all oil and any contaminated
For
insp
ectio
n pur
pose
s only
.
Conse
nt of
copy
right
owne
r req
uired
for a
ny ot
her u
se.
EPA Export 07-11-2018:04:04:37

Environmental Impact Statement Dairygold Mogeely - Speciality Cheese Facility Expansion
CHAPTER 6 |HYDROLOGY AND HYDROGEOLOGY
Chapter 6 MAIN EIS - VOLUME 2
Page 36 of 39
material removed from the area. This contaminated material will be properly disposed
of in a licensed facility.
The site Environmental representative will be immediately informed of the oil leak/spill,
and will assess the cause and the management of the clean-up of the leak or spill. They
will inspect nearby drains for the presence of oil, and initiate the clean-up if necessary.
Immediate action will be facilitated by easy access to oil spill kits. An oil spill kit that
includes absorbing pads and socks will be kept at the site compound and also in site
vehicles and machinery.
Correct action in the event of a leak or spill will be facilitated by training all
vehicle/machinery operators in the use of the spill kits and the correct containment and
cleaning up of oil spills or leaks. This training will be provided by the Environmental
Manager at site induction.
In the event of a major oil spill, a company who provide a rapid response emergency
service for major fuel spills will be immediately called for assistance, their contact details
will be kept in the site office and in the spill kits kept in site vehicles and machinery.
g) Fuels and Oil Storage
Fuel containers will be stored within a secondary containment system e.g. bund for
static tanks or a drip tray for mobile stores.
Collision with oil stores will be prevented by locating oils within a steel container in a
designated area of the site compound away from vehicle movements.
Leakages of fuel/ oil from stores will be prevented by storing these materials in bunded
tanks which have a capacity of 110% of the total volume of the stored oil. Ancillary
equipment such as hoses and pipes will be contained within the bunded storage
container. Taps, nozzles or valves will be fitted with a lock system.
The volume of leakages will be prevented through monitoring oil storage tanks/drums
for leaks and signs of damage. This will be carried out daily by the Environmental
Manager.
Long term storage of waste oils will not be allowed on site. These waste oils will be
collected in leak-proof containers and removed from the site for disposal or re-cycling by
an approved service provider.
h) Construction Wheel Wash
A Construction Wheel Wash will be used to wash Truck tyres leaving the construction
site. Water residue from the wheel wash will be fed through a settlement pond,
interceptor and then discharge to the public sewer. The wheel wash area will be cleaned
regularly so as to avoid the buildup of residue.
6.4.3 Mitigation of Impacts on Hydrogeology
6.4.3.1 Mitigation of Physical Hydrogeological Impacts
In order to avoid the proposed pipeline trench behaving as a regional scale conduit for groundwater flow and/or contaminant migration, the trench backfill shall comprise plugs of impermeable clay at 250 m intervals. The plugs shall prevent flow of water along the infilled trench between the plugged sections.
Each pipeline river crossing will be designed such that the depth of the directional drilling will be sufficient to avoid any enhancement of surface water/groundwater hydraulic continuity at the crossing. The annulus of the directionally drilled hole will be backfilled with grout following installation of the pipeline to further reduce the potential for the crossing to enhance surface water/groundwater hydraulic continuity at the crossing. If the drill bore
For
insp
ectio
n pur
pose
s only
.
Conse
nt of
copy
right
owne
r req
uired
for a
ny ot
her u
se.
EPA Export 07-11-2018:04:04:37

Environmental Impact Statement Dairygold Mogeely - Speciality Cheese Facility Expansion
CHAPTER 6 |HYDROLOGY AND HYDROGEOLOGY
Chapter 6 MAIN EIS - VOLUME 2
Page 37 of 39
intersects an underground karst cavity the pipeline installed in the bore will be fitted with packers to isolate the cavity area from the rest of the bore, so that the annulus of the rest of the bore can be sealed with grout.
6.4.3.2 Mitigation of Impacts on Groundwater Quality
During the operational phase all hydrocarbon and chemical storage and use areas will be fully bunded to prevent any spillages or leaks from contaminating infiltrating recharge or from migrating down to the bedrock aquifer as free product.
Routine monitoring of groundwater quality in line with the EPA license requirements for groundwater quality monitoring at the site will provide an early warning system should there be any unforeseen, accidental contamination of the bedrock aquifer.
The construction of a new upgradient groundwater monitoring borehole in the northwest corner of the existing site is recommended to monitor shallow groundwater quality in the epikarst at the upgradient boundary.
The construction of a new downgradient groundwater monitoring borehole in the southeast corner of the greenfield expansion area is recommended to monitor groundwater quality downgradient of the greenfield expansion area.
6.4.3.3 Mitigation of Groundwater abstraction impacts
The predicted slight negative impact of the slight drawdown of groundwater levels at private wells due to the increased abstraction from GW1 can be mitigated by monitoring. Long term monitoring of groundwater levels in boreholes GW2, GW3, GW4, BH10, BH04 will allow quantification of the long term drawdown in the bedrock aquifer and overlying alluvial subsoils, should this prove to be significantly more than was observed during the 48 hour constant rate discharge test.
If any private water supply should suffer an unexpected significant water level impact following the commissioning of the development, then DFI could investigate the potential for any link between the impact and the increased DFI pumping rate at borehole GW1
The impact of the increased abstraction from GW1 on the Dower Spring is considered to be neutral and no mitigation measures are proposed.
The impact of the increased abstraction from GW1 on the groundwater flooding in the Mogeely/Castlemartyr area is considered to be positive no mitigation measures are proposed or necessary.
6.4.3.4 Mitigation of Other Impacts On Groundwater
The negative impact of the increase in impermeable ground surface cover on groundwater recharge is considered to be not significant and no mitigation is proposed or necessary.
6.4.4 Mitigation of Flood Risk Impacts
6.4.4.1 Mitigation Measures Proposed for Main Site
To ensure that there is no unacceptable flood risk, the following mitigation measures are proposed
for the Main Site:
1. The finished floor level (FFL) of all buildings should be set above the 1% AEP flood level for the
MRFS plus 500mm freeboard. On this basis, the minimum FFL for the new buildings would be as
follows;
a. Building 20 (Main cheese production facility): 17.25mOD
b. Building 21 (Milk Intake Building): 17.25mOD
c. Building 26 (Weigh Bridge Building): 18.5mOD
For
insp
ectio
n pur
pose
s only
.
Conse
nt of
copy
right
owne
r req
uired
for a
ny ot
her u
se.
EPA Export 07-11-2018:04:04:37

Environmental Impact Statement Dairygold Mogeely - Speciality Cheese Facility Expansion
CHAPTER 6 |HYDROLOGY AND HYDROGEOLOGY
Chapter 6 MAIN EIS - VOLUME 2
Page 38 of 39
d. Buildings 22, 23, 24 & 25 (other buildings immediately to the south of the existing factory):
17.25mOD
e. Buildings 17 & 28 (Water treatment building and fire water pump house, ESB
Substation/switchroom): 16.7mOD.
2. The existing ground levels in areas of the Main Site located in Flood Zones A or B should not be
increased. The only exception to this is the small area of flood zone C to the south of the new
production facility. To facilitate the construction of the new site entrance road, a small portion
of the flood zone extent has been modified. The ground level in this area will be maintained at
15.25mOD which matches the minimum existing level along the southern boundary of the main
site therefore flow paths within the floodplain will be maintained.
3. Users of the site should be made aware of the potential for flooding locally at the south and
west of the site and should be advised of the appropriate means of escape in the event of a
flood.
4. Surface water drainage from the proposed site shall be designed using a Sustainable Urban
Drainage System (SUDs).
5. Any manholes, inspection chambers, pits or the like located within Flood Zones A or B should be
sealed to prevent water ingress in the event of a flood.
6.4.4.2 Mitigation Measures Proposed for Existing WWTP Site & Access Road
The following mitigation measures are required for the WWTP site:
1. The finished floor level (FFL) of all buildings should be set above the 1% AEP flood level for the
MRFS plus 500mm freeboard. The minimum finished floor level (FFL) of the control building will
therefore be 15.3mOD. The building will be elevated above the existing ground level and as
such it will not be necessary to fill this area to achieve the required floor level.
2. It is proposed that all tanks will be constructed with an impermeable barrier (i.e. reinforced
concrete) around the perimeter. The barrier should be designed for the relevant water
pressures and shall extend at least 300mm above the 1% AEP flood level for the MRFS. Only
flood resistant components should be left unprotected. The minimum elevation at the top of all
walls will therefore be 15.1mOD.
3. The existing ground levels within the site should not be increased.
4. Users of the site should be made aware of the risk of flooding and should be advised of the
appropriate means of escape in the event of a flood. An emergency evacuation plan shall be
implemented for this site.
5. All users of the site shall have access to the control room and a platform located outside the
control room. This building will be above the design flood level with sufficient freeboard
allowance. In the event of a flood, any users would be have been trained and inducted on the
site and they will be aware of the potential for flooding to occur in the WWTP. In the unlikely
event that someone is unable to safely evacuate the site prior to the flood water rising, they will
be able to take refuge in this building until they can be safely evacuated.
6. The control room shall also have an emergency phone or intercom which will allow anyone
taking refuge there to call for help.
7. Signage will be erected at the site warning users of the potential for flooding (including the
potential for deep water). Warning signs will state “Danger: Flood Zone with deep standing
water or fast flowing water”.
8. Surface water drainage from the proposed site shall be designed using a Sustainable Urban
Drainage System (SUDs). Systems discharging effluent to the river should also be designed
taking cognisance of the potential for river flooding.
For
insp
ectio
n pur
pose
s only
.
Conse
nt of
copy
right
owne
r req
uired
for a
ny ot
her u
se.
EPA Export 07-11-2018:04:04:37

Environmental Impact Statement Dairygold Mogeely - Speciality Cheese Facility Expansion
CHAPTER 6 |HYDROLOGY AND HYDROGEOLOGY
Chapter 6 MAIN EIS - VOLUME 2
Page 39 of 39
9. Any manholes, inspection chambers, pits or the like located within Flood Zones A or B should be
sealed to prevent water ingress in the event of a flood.
6.4.4.3 Mitigation Measures for External Factors
The hydraulic model indicates that there is a potential for overtopping of the existing bridge on the
L3627 for extreme flood events, particularly if the bridge were to become blocked. If a blockage
were to occur during an extreme flood event, the water overtopping the bridge would flow along
the road to the east and west of the bridge. The backwater effects of the blockage would also cause
water to enter the Dairygold grain silo yard (located to the north of the L3627). These combined
effects would provide a potential flow path for water to enter the site. To account for this potential
residual risk the following mitigation is proposed;
1. Increase the finished ground level locally along the northern boundary of the site to 18.3mOD. Given the
road and field levels to the west of the bridge, this is the maximum conceivable level that the water could
reach;
2. Provide an alternative flow path for any water that would otherwise enter the site. This flow path will be
provided at the northwest corner of the site which will divert water from the road back into the river
downstream of the bridge.
3. The flow path level will be 17.90mOD which coincides generally with the existing levels on the road at this
location. The flow path will have a minimum width of 2m.
6.5 RESIDUAL IMPACTS
With the mitigation measures in place, residual risks are considered low.
6.6 CONCLUSION
The risk of significant impact on the water quality of the Kiltha River during the construction
phase can be adequately controlled by implementation of appropriate surface water
management controls
The risk of significant impact on the water quality of Kiltha River and the North Island Great
Channel during the operational phase can be adequately controlled through the
implementation of appropriate surface water management controls and adherence to
operating procedures in terms of accident prevention, emergency response and materials
handling under environmental and health and safety system.
The increased abstraction of the Dairygold wellfield will not prevent the GWB achieve ‘good
quantitative status’.
An increase in the abstraction rate will not put the GWBs at risk of failing to achieve ‘good
groundwater chemical status’.
There is no risk associated with the proposed development in terms of groundwater dependent
habitats.
The proposed development will not adversely affect flooding upstream or downstream of the
site.
For
insp
ectio
n pur
pose
s only
.
Conse
nt of
copy
right
owne
r req
uired
for a
ny ot
her u
se.
EPA Export 07-11-2018:04:04:37

Industrial Emissions Application Application ID: LA001622
Attachment-7.3-2-1 Supporting Documents
Appendix B Wastewater Assessment for New and Existing Cheese
Production Facilities at Dairygold Mogeely, Co. Cork (Document Ref 17617_ 6007) prepared by
Malachy Walsh and Partners, 2016;
For
insp
ectio
n pur
pose
s only
.
Conse
nt of
copy
right
owne
r req
uired
for a
ny ot
her u
se.
EPA Export 07-11-2018:04:04:37

Malachy Walsh and Partners
Consulting Engineers Cork | Tralee | Limerick | London
Wastewater Assessment for
New & Existing Cheese Production Facilities at
Dairygold
Mogeely, County Cork
for Dairygold Co-operative Society Limited
Project Document Revision Issue Prepared Checked Approved Date
17617 6007 A Information M. O’Sullivan August 2016
17617 6007 B Information M. O’Sullivan August 2016
17617 6007 C Information M. O’Sullivan October 2016
17617 6007 D Planning M. O’Sullivan D. Spillane D. Cremen October 2016
17617 6007 E Planning M. O’Sullivan D. Spillane D. Cremen November 2016
For
insp
ectio
n pur
pose
s only
.
Conse
nt of
copy
right
owne
r req
uired
for a
ny ot
her u
se.
EPA Export 07-11-2018:04:04:37

New Cheese Factory at Dairygold Mogeely Wastewater
Table of Contents
1 WASTEWATER TREATMENT PLANT ................................................................................................ 1
1.1 INTRODUCTION ....................................................................................................................... 1
1.2 WASTEWATER ......................................................................................................................... 1
1.2.1 Introduction .................................................................................................................... 1
1.2.2 Existing IED ...................................................................................................................... 1
1.2.3 Existing WWTP ................................................................................................................ 2
1.2.4 Existing WWTP Performance .......................................................................................... 3
1.2.5 Existing WWTP Condition ............................................................................................... 4
1.2.5.1 Inlet flow measurement and monitoring .................................................................... 4
1.2.5.2 Inlet Screen Chamber .................................................................................................. 5
1.2.5.3 Grit Channel ................................................................................................................ 6
1.2.5.4 DAF Tank ..................................................................................................................... 7
1.2.5.5 Balancing Tank ............................................................................................................ 8
1.2.5.6 High Rate BioTowers ................................................................................................. 10
1.2.5.7 Extended Aeration Stage .......................................................................................... 11
1.2.5.8 Secondary Clarifier .................................................................................................... 13
1.2.5.9 Tertiary upward flow sand filter ............................................................................... 14
1.2.5.10 Outfall.................................................................................................................... 14
1.2.5.11 Sludge Management system ................................................................................. 15
1.2.5.12 WWTP Controls ..................................................................................................... 15
1.2.6 Calculation of existing WWTP Treatment Efficiency ..................................................... 16
2 UPGRADE OF WWTP ..................................................................................................................... 18
2.1 FLOOD LEVELS ....................................................................................................................... 18
2.2 PROJECTED WASTEWATER VOLUMES .................................................................................. 18
2.2.1 Whey Permeate ............................................................................................................ 18
2.2.2 Design Loads ................................................................................................................. 19
2.3 DISCHARGE STANDARD ......................................................................................................... 19
2.3.1 Outfall ........................................................................................................................... 19
2.3.2 Discharge standard ....................................................................................................... 20
2.3.3 Treatment Standard ...................................................................................................... 20
2.4 RAW WASTEWATER .............................................................................................................. 21
2.5 WASTEWATER DESIGN CHARACTERISTICS ............................................................................ 22
2.5.1.1 Hydraulic design ........................................................................................................ 22
2.6 PRELIMINARY TREATMENT ................................................................................................... 23
2.6.1 Screening, Grit & Grease Removal ................................................................................ 23
2.6.2 Flow Measurement and sampling ................................................................................. 24
2.6.3 Inlet Pumping Station .................................................................................................... 24
For
insp
ectio
n pur
pose
s only
.
Conse
nt of
copy
right
owne
r req
uired
for a
ny ot
her u
se.
EPA Export 07-11-2018:04:04:37

New Cheese Factory at Dairygold Mogeely Wastewater
2.6.4 Flow balancing and pH correction ................................................................................ 25
2.7 SECONDARY TREATMENT ..................................................................................................... 26
2.7.1 High Rate Treatment Options ....................................................................................... 26
2.7.1.1 Aerobic (DAF) ............................................................................................................ 26
2.7.1.2 Anaerobic .................................................................................................................. 27
2.7.2 Nitrification/Denitrification .......................................................................................... 27
2.8 FINAL EFFLUENT BALANCING AND PUMPING ...................................................................... 28
2.9 SLUDGE MANAGEMENT ........................................................................................................ 28
2.10 ODOUR .................................................................................................................................. 29
2.11 SUMMARY OF NEW WWTP................................................................................................... 29
2.11.1 Design WWTP Performance (BOD5) .............................................................................. 30
3 CONSTRUCTION PHASING ............................................................................................................. 31
3.1 Stage 1 Works: ...................................................................................................................... 31
3.2 Stage 2 Works: ...................................................................................................................... 31
Appendix 1. IED Licence P0817-01 ............................................................................. 33
Appendix 2. Midleton WWDA (D0056-01) ................................................................. 34
Appendix 3. Layout of existing WWTP ....................................................................... 35
Appendix 4. Wastewater Treatment Plant efficiency Calculations ............................ 36
Appendix 5. Wastewater Treatment Plant Upgrade Calculations .............................. 37
Appendix 6. Wastewater Treatment Plant Upgrade Final Layout and Construction
staging ................................................................................................... 38
Appendix 7 Daily Effluent Data .................................................................................. 39
For
insp
ectio
n pur
pose
s only
.
Conse
nt of
copy
right
owne
r req
uired
for a
ny ot
her u
se.
EPA Export 07-11-2018:04:04:37

New Cheese Factory at Dairygold Mogeely Wastewater
Page 1 of 32
1 WASTEWATER TREATMENT PLANT
1.1 INTRODUCTION
This Report deals with the disposal of the Wastewaters arising from the expanded cheese making
facility at Mogeely, Co. Cork. The details of the proposed expansion are contained elsewhere in the
documentation comprising the Planning Application but it is worth repeating the elements which
directly affect the supply and disposal of water.
The present (2015) annual through-put of milk is 120,000 Tonnes producing 12,000 Tonnes of
cheese. The proposal is to increase the processing capability of the installation up to a total of
365,411 Tonnes of milk producing 37,500 Tonnes of cheese by 2025.
1.2 WASTEWATER
1.2.1 Introduction
There is an existing Process wastewater conveyance, treatment and discharge for the site. This
discharges treated effluent to the adjacent Kilta River under an Industrial Emission Discharge (IED)
Licence P0817-01 (see Appendix 1). Neither the existing Process conveyance line, the Wastewater
Treatment Plant (WWTP) nor the Kilta River have the capacity to cater for the expanded production
and all elements must be upgraded and a new discharge point is required. This discharge point has
been agreed with Irish Water and is the existing Midleton Main Drainage Outfall at Rathcoursey.
Irish Water are dictating that the proposed discharge connect to their system downstream of their
existing Tidal holding Tank at Rathcoursey. While the discharge standards for the Mogeely treated
wastewater have not yet been agreed we assume they will be the same as the existing municipal
Wastewater Discharge Authorisation (WWDA) Ref D0056-01 which has the following limits: -
pH 6.5 – 9
cBOD 25 mg/l
COD 125 mg/l
Suspended Solids 35 mg/l
Total Nitrogen 15 mg/l
Orthophosphate (as P) 2 mg/l
Clearly these are the standards that may be expected of the upgraded WWTP for Dairygold,
Mogeely.
1.2.2 Existing IED
The existing Dairygold Mogeely site operates under Industrial Emission Discharge (IED) Licence
P0817-01 which among other emissions allows the site to discharge up to a maximum of 700 m3/d of
treated effluent to the following standard: -
For
insp
ectio
n pur
pose
s only
.
Conse
nt of
copy
right
owne
r req
uired
for a
ny ot
her u
se.
EPA Export 07-11-2018:04:04:37

New Cheese Factory at Dairygold Mogeely Wastewater
Page 2 of 32
The domestic effluent from the site is discharged to a septic tank and the discharge from this septic
tank is connected to the process drain to the WWTP.
1.2.3 Existing WWTP
To achieve the above limits, Dairygold operates a Tertiary WWTP which occupies a site of
approximately 86 metres by 76 metres remote from the processing plant on the banks of the R. Kilta.
The WWTP was originally constructed in the 1970s and has had a number of upgrades in the
intervening years.
The WWTP, as it now exists, consists of the following elements: -
1. Inlet Flow Meter (Electromagnetic “Watering Can” arrangement)
a. TOC, TN & TP Monitoring by Biotector
b. Proportional sampling
2. Inlet Screening Chamber containing
a. 600 mm wide Medium Bar screen followed by
b. 900 mm wide by 2.4 m long 6 mm brushed mesh horizontal screen
c. No automatic screenings removal or washing
d. Caustic dosing at inlet end
3. Grit Chamber consisting of
a. 2 No. 300 mm wide parabolic Grit removal channels (not operated)
b. V-Notch measuring weir (drowned) with Ultrasonic level sensor and Temperature
probe (local read-out).
For
insp
ectio
n pur
pose
s only
.
Conse
nt of
copy
right
owne
r req
uired
for a
ny ot
her u
se.
EPA Export 07-11-2018:04:04:37
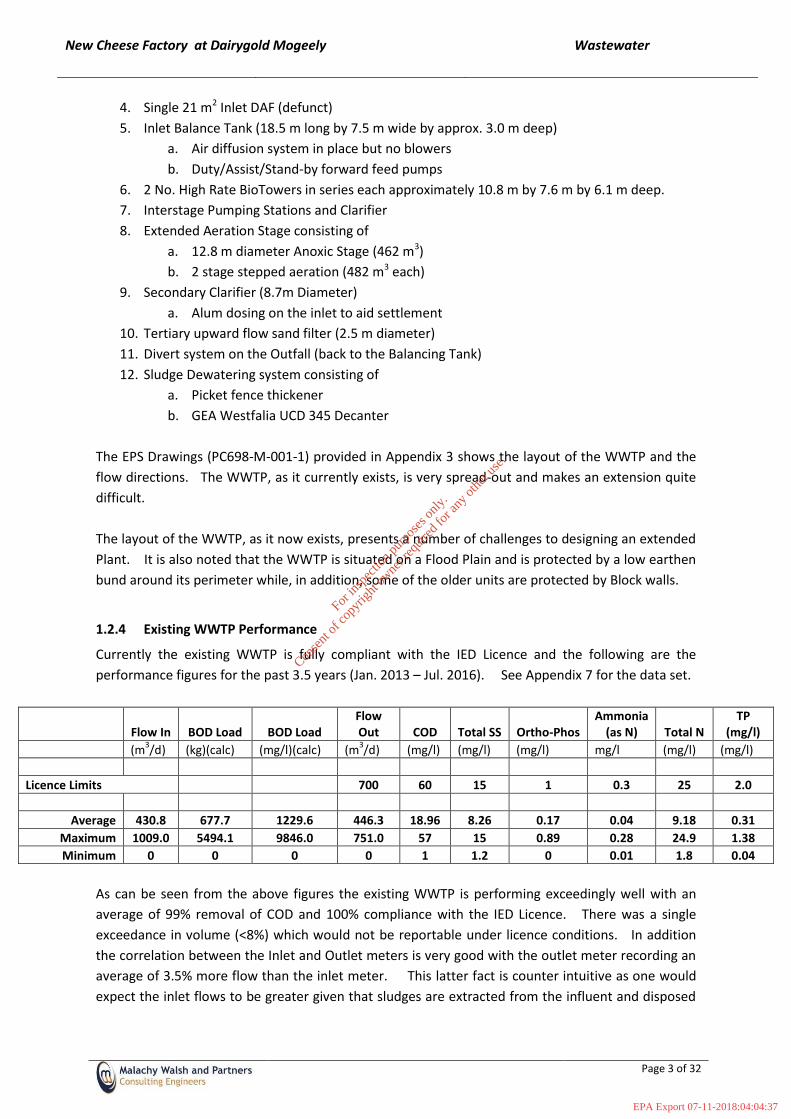
New Cheese Factory at Dairygold Mogeely Wastewater
Page 3 of 32
4. Single 21 m2 Inlet DAF (defunct)
5. Inlet Balance Tank (18.5 m long by 7.5 m wide by approx. 3.0 m deep)
a. Air diffusion system in place but no blowers
b. Duty/Assist/Stand-by forward feed pumps
6. 2 No. High Rate BioTowers in series each approximately 10.8 m by 7.6 m by 6.1 m deep.
7. Interstage Pumping Stations and Clarifier
8. Extended Aeration Stage consisting of
a. 12.8 m diameter Anoxic Stage (462 m3)
b. 2 stage stepped aeration (482 m3 each)
9. Secondary Clarifier (8.7m Diameter)
a. Alum dosing on the inlet to aid settlement
10. Tertiary upward flow sand filter (2.5 m diameter)
11. Divert system on the Outfall (back to the Balancing Tank)
12. Sludge Dewatering system consisting of
a. Picket fence thickener
b. GEA Westfalia UCD 345 Decanter
The EPS Drawings (PC698-M-001-1) provided in Appendix 3 shows the layout of the WWTP and the
flow directions. The WWTP, as it currently exists, is very spread-out and makes an extension quite
difficult.
The layout of the WWTP, as it now exists, presents a number of challenges to designing an extended
Plant. It is also noted that the WWTP is situated on a Flood Plain and is protected by a low earthen
bund around its perimeter while, in addition, some of the older units are protected by Block walls.
1.2.4 Existing WWTP Performance
Currently the existing WWTP is fully compliant with the IED Licence and the following are the
performance figures for the past 3.5 years (Jan. 2013 – Jul. 2016). See Appendix 7 for the data set.
Flow In BOD Load BOD Load
Flow Out COD Total SS Ortho-Phos
Ammonia (as N) Total N
TP (mg/l)
(m
3/d) (kg)(calc) (mg/l)(calc) (m
3/d) (mg/l) (mg/l) (mg/l) mg/l (mg/l) (mg/l)
Licence Limits
700 60 15 1 0.3 25 2.0
Average 430.8 677.7 1229.6 446.3 18.96 8.26 0.17 0.04 9.18 0.31
Maximum 1009.0 5494.1 9846.0 751.0 57 15 0.89 0.28 24.9 1.38
Minimum 0 0 0 0 1 1.2 0 0.01 1.8 0.04
As can be seen from the above figures the existing WWTP is performing exceedingly well with an
average of 99% removal of COD and 100% compliance with the IED Licence. There was a single
exceedance in volume (<8%) which would not be reportable under licence conditions. In addition
the correlation between the Inlet and Outlet meters is very good with the outlet meter recording an
average of 3.5% more flow than the inlet meter. This latter fact is counter intuitive as one would
expect the inlet flows to be greater given that sludges are extracted from the influent and disposed
For
insp
ectio
n pur
pose
s only
.
Conse
nt of
copy
right
owne
r req
uired
for a
ny ot
her u
se.
EPA Export 07-11-2018:04:04:37

New Cheese Factory at Dairygold Mogeely Wastewater
Page 4 of 32
off separately. Therefore the effluent volumes should be less than the incoming. Given the
condition of some of the concrete it is possible that infiltration accounts for the discrepancy.
While the Influent load to the WWTP averages a BOD concentration of 1,230 mg/l there are quite a
number of times when the concentrations exceeded 2,500 mg/l. The maximum BOD concentration
of 9,850 mg/l shown above is very extreme and must be the result of a spill of some kind. It is
noted that the existing WWTP is robust enough to deal with that load and that resilience needs to be
retained in the future.
It is noted that the 2nd Biotower is not being used to achieve these results which suggests that there
is some additional treatment capacity in the WWTP should that be required.
1.2.5 Existing WWTP Condition
1.2.5.1 Inlet flow measurement and monitoring
The Inlet Flow to the WWTP is measured by an Electromagnetic Flow Meter arranged in an inverted
siphon arrangement (to ensure the meter is drowned at all times). This is prefabricated in Stainless
Steel.
The unit is installed in a pit formed by standard block on flat. The walls are carried approximately
800 mm above ground level as a flood protection. This also acts as protection against falling into a
tank.
For
insp
ectio
n pur
pose
s only
.
Conse
nt of
copy
right
owne
r req
uired
for a
ny ot
her u
se.
EPA Export 07-11-2018:04:04:37

New Cheese Factory at Dairygold Mogeely Wastewater
Page 5 of 32
Influent is monitored on a continuous basis by a Biotector which measures TOC, Total Nitrogen and
Total Phosphorus. In addition there is an automatic proportional sampler installed.
1.2.5.2 Inlet Screen Chamber
From the Inlet Flow measurement chamber the liquor flows by gravity to the Inlet Screens. As has
already been mentioned parts of the existing WWTP date from the 1970s and the inlet chamber is
one of those. The concrete walls of the chamber are in poor condition with some sections, such as
pictured below, being particularly bad. A 800 mm high masonry, block on flat, wall has been
erected around the chamber as flood protection.
Also, as can be seen in the photo, a second inlet pipe has been connected into the chamber but,
while it may have been sealed outside the old wall, the one around the pipe has not been sealed. It
is not clear whether this second inlet pipe is to relieve hydraulic pressure upstream or has replaced
the original inlet pipe.
This chamber is no longer “fit for purpose” and, given the condition of the concrete, would not pass
an integrity test. The pitting of the walls encourages the growth of bacteria which will accelerate
the concrete decay. This screening chamber cannot be reused.
Caustic is dosed at the upstream end of the Screening chamber. Consideration might be given to
moving this dosing point to the outlet of the flow measurement. That would give the alkali time to
neutralise the incoming stream before it arrives into the concrete tanks. Irrespective of this, all
units likely to be affected by high or low pH must have a suitable coating (Epoxy, Polypropylene,
Stainless Steel).
For
insp
ectio
n pur
pose
s only
.
Conse
nt of
copy
right
owne
r req
uired
for a
ny ot
her u
se.
EPA Export 07-11-2018:04:04:37

New Cheese Factory at Dairygold Mogeely Wastewater
Page 6 of 32
The medium 15 mm bar screen is manually raked and may be unnecessarily fine for the duty of
protecting the downstream mesh screen. A coarser screen (to protect against large objects) is
suggested for the future.
The 6 mm brushed mesh screen appears to be functioning adequately but there is damage to the
upstream end and the brushes are missing. There is no conveyance system for the screenings
which is desirable.
1.2.5.3 Grit Channel
Following the screening chamber the influent flows by gravity through twin manually cleaned 300
mm wide parabolic grit settlement channels. These channels date from the original WWTP and
were the accepted method of grit removal of the day. These channels are not maintained and,
since the sumps are full of grit, they are not operational. As a consequence any inorganic solids
arriving at the WWTP are now entering the DAF sump and the Balancing Tank taking up treatment
capacity.
For
insp
ectio
n pur
pose
s only
.
Conse
nt of
copy
right
owne
r req
uired
for a
ny ot
her u
se.
EPA Export 07-11-2018:04:04:37

New Cheese Factory at Dairygold Mogeely Wastewater
Page 7 of 32
There is a flow measurement at the outlet end of the grit channel consisting of a V-Notch and
ultrasonic level sensor. Both these items look relatively modern but cannot be accurate as the V-
Notch is drowned due to the levels between the grit channel and DAF. Presumably this is the
reason for the new “Watering can” flow device at the inlet. The remains of a previous bubble level
measurement system which would have been linked to a Sutro Weir are still in place.
As with the Screening chamber the concrete in this channel is in poor condition and is unlikely to
pass an integrity test.
It is recommended that an upgraded combined grit and screenings removal unit be installed to
replace the two units.
1.2.5.4 DAF Tank
The original installation had a 2.8 m wide by 7.5 m long Dissolved Air Flotation (DAF) unit to remove
grease and other light solids. This was an integral part of the Influent Balancing Tank. The DAF was
decommissioned at some stage in the past and is no longer in place.
From the Grit chamber the liquor flows by gravity into the tank where the DAF was.
For
insp
ectio
n pur
pose
s only
.
Conse
nt of
copy
right
owne
r req
uired
for a
ny ot
her u
se.
EPA Export 07-11-2018:04:04:37

New Cheese Factory at Dairygold Mogeely Wastewater
Page 8 of 32
The result of this is that there is a significant built up of grease in the Balancing Tank which is difficult
to clear.
1.2.5.5 Balancing Tank
From the DAF tank the influent flows, by gravity, into the attached Balance Tank.
The Balance Tank measures some 7.5 m wide by 18.5 m long and can take a water depth of
approximately 2 m giving a balance volume of 284 m3. The tank is equipped with a side mounted air
diffusion system to keep the wastewater fresh in the tank. The pipework of this system is in place
but there are no air blowers.
For
insp
ectio
n pur
pose
s only
.
Conse
nt of
copy
right
owne
r req
uired
for a
ny ot
her u
se.
EPA Export 07-11-2018:04:04:37

New Cheese Factory at Dairygold Mogeely Wastewater
Page 9 of 32
The tank has been successfully operated to balance the Flows in and out such that there has been
only one exceedance in 3.5 years. The chart below illustrates the flattened shape of the flow out
(in red).
As mentioned earlier grease accummulation is a major problem in the Balance tank which has no
mechanism to clean it. This accummulation is visible in the photograph below.
.
In addition to the incoming process wastewater from the factory, supernatant liquor from the Sludge
Thickening and Dewatering and the Tertiary Filter discharge to the Balance Tank. Out-of Spec.
diverted flows from the outlet are also sent to this tank for recycling and further treatment.
Wastewater is pumped forward for treatment by 3 submersible pumps mounted at the eastern end
of the Balance Tank. These pumps can deliver the liquor to either the first of the High Rate
BioTowers or directly to the second stage Anoxic Tank. These pumps operate as Duty/Assist/Stand-
by.
It is noted that the fact that the incoming flows discharge to the Balance Tank by gravity means that
flows to the WWTP can be fully controlled.
For
insp
ectio
n pur
pose
s only
.
Conse
nt of
copy
right
owne
r req
uired
for a
ny ot
her u
se.
EPA Export 07-11-2018:04:04:37

New Cheese Factory at Dairygold Mogeely Wastewater
Page 10 of 32
As with the screening, grit and DAF chambers, the Balance Tank dates from the original construction
of the WWTP and a 800 mm high masonry block-on-flat wall has been constructed on it as flood
protection. As with the other tanks the concrete of this tank is in poor condition and is unlikely to
pass an integrity test.
1.2.5.6 High Rate BioTowers
The first biological treatment stage is a pair of High Rate BioTowers which operates in series with an
inter-stage clarifier between them. Each BioTower measures approximately 12.6 m (41.3 ft.) by 6.6
m (21.6 ft.) by 5.4 m (17.7 ft.) deep.
Wastewater is pumped from the Balance tank to Tower No. 1 (the eastern tower) which is filled with
a large surface area plastic media to which aerobic bacteria are attached. The liquor percolates
down through the media to the ground where it is collected and discharged, by gravity, to the 4.9 m
(16 ft.) diameter Interstage Clarifier.
From here the settled liquor discharges to the pumping station at BioTower No. 2 (western) from
where it can be pumped up to the distribution channels on Tower 2 or directly to the Anoxic Tank.
Currently the WWTP does not use Tower 2 and the flows are pumped to the anoxic tank.
Settled sludge from the Inter-stage clarifier is discharged to the Picket Fence thickener.
As can be seen, from the photograph below, the visible steelwork in BioTower No. 1 is very badly
corroded to the extent that a structural examination needs to be carried out urgently to assess
whether it is safe to continue operating this tower. In addition, there are signs of leakage through
For
insp
ectio
n pur
pose
s only
.
Conse
nt of
copy
right
owne
r req
uired
for a
ny ot
her u
se.
EPA Export 07-11-2018:04:04:37
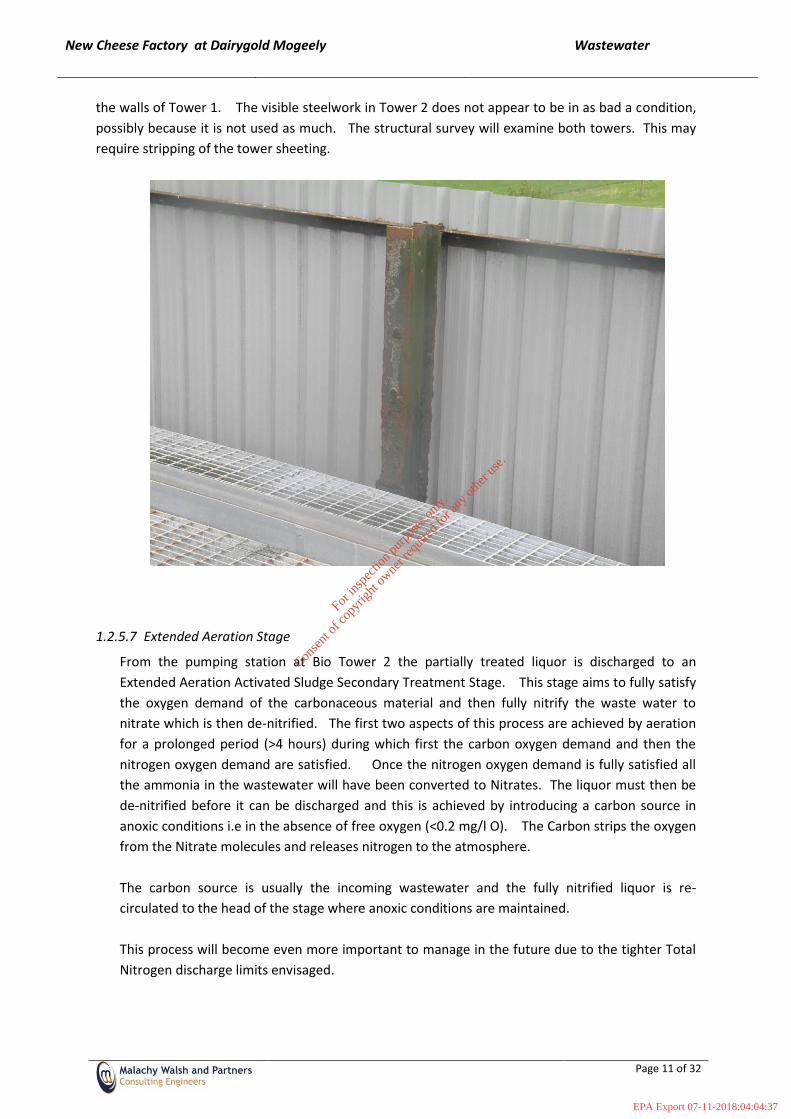
New Cheese Factory at Dairygold Mogeely Wastewater
Page 11 of 32
the walls of Tower 1. The visible steelwork in Tower 2 does not appear to be in as bad a condition,
possibly because it is not used as much. The structural survey will examine both towers. This may
require stripping of the tower sheeting.
1.2.5.7 Extended Aeration Stage
From the pumping station at Bio Tower 2 the partially treated liquor is discharged to an
Extended Aeration Activated Sludge Secondary Treatment Stage. This stage aims to fully satisfy
the oxygen demand of the carbonaceous material and then fully nitrify the waste water to
nitrate which is then de-nitrified. The first two aspects of this process are achieved by aeration
for a prolonged period (>4 hours) during which first the carbon oxygen demand and then the
nitrogen oxygen demand are satisfied. Once the nitrogen oxygen demand is fully satisfied all
the ammonia in the wastewater will have been converted to Nitrates. The liquor must then be
de-nitrified before it can be discharged and this is achieved by introducing a carbon source in
anoxic conditions i.e in the absence of free oxygen (<0.2 mg/l O). The Carbon strips the oxygen
from the Nitrate molecules and releases nitrogen to the atmosphere.
The carbon source is usually the incoming wastewater and the fully nitrified liquor is re-
circulated to the head of the stage where anoxic conditions are maintained.
This process will become even more important to manage in the future due to the tighter Total
Nitrogen discharge limits envisaged.
For
insp
ectio
n pur
pose
s only
.
Conse
nt of
copy
right
owne
r req
uired
for a
ny ot
her u
se.
EPA Export 07-11-2018:04:04:37

New Cheese Factory at Dairygold Mogeely Wastewater
Page 12 of 32
The EA stage of treatment at Mogeely consists of an above ground 12.8 m diameter circular,
fully mixed, anoxic tank (462 m3) followed by a stepped aeration (482 m3 each) stage. The total
extended aeration treatment volume provided is approximately 1,426 m3 which gives a
hydraulic retention time (HRT) of just over 48 hours for the licensed throughput of 700 m3/d.
This is a long HRT and could give rise to a filimentaeous floc which is difficult to settle.
It is noted that, at the time of the visit, aeration tank 1 was operating at a dissolved oxygen (DO)
level of 4.95 mg/l while the second tank was working at 6.37 mg/l. These are high DOs for an EA
Plant where one would expect DOs between 2.5 mg/l in the first tank and 1.2 mg/l in the second
from which the liquor is re-circulated to the anoxic tank.
The anoxic tank is a glass lined section steel tank which was installed in the last upgrade of the
WWTP in 2012. As might be expected this tank is in good condition.
The aeration tanks appear to have been added at two different times with tank 1 appearing to be
newer and the visible concrete appears to be in better condition. A metal mechanical vertical
aerator support bridge is lying on the site which suggests that this tank is quite old.
Aeration tank 2 appears to date from the original WWTP construction and the concrete support
bridge for the original mechanical aerator still in place. The visible concrete of this tank is in poor
condition.
For
insp
ectio
n pur
pose
s only
.
Conse
nt of
copy
right
owne
r req
uired
for a
ny ot
her u
se.
EPA Export 07-11-2018:04:04:37

New Cheese Factory at Dairygold Mogeely Wastewater
Page 13 of 32
Both aeration tanks will need to be emptied for a full structural and integrity test to ensure they are
capable of continuing in service.
1.2.5.8 Secondary Clarifier
From the second aeration tank the Mixed Liquor is discharged to the secondary clarifier.
Aluminium Sulphate is dosed to the MLSS as a coagulant prior to discharge to the Clarifier.
The original secondary clarifier has been replaced by a circular pre-cast concrete tank measuring
approximately 8.7m diameter (59.5m2 surface area). This tank appears to be quite new but it is not
included in the set of EPS drawings for the 2012 upgrade.
Surface loading to the secondary clarifier averages 7.22 m3/m2/day, which is a very low loading rate.
At the Licence limit of 700 m3/d that loading rate increases to 11.76 m3/m2/day which is still about
half of the expected loading rate.
The fact that alum is being dosed to the MLSS leaving the aeration tanks indicates that there is a
settlement problem with the sludge.
The use of a pre-cast concrete tank underground may present problems with EPA requirements into
the future.
For
insp
ectio
n pur
pose
s only
.
Conse
nt of
copy
right
owne
r req
uired
for a
ny ot
her u
se.
EPA Export 07-11-2018:04:04:37

New Cheese Factory at Dairygold Mogeely Wastewater
Page 14 of 32
1.2.5.9 Tertiary upward flow sand filter
The original WWTP included a rapid gravity sand filter but this has been replaced by a 2.5 m
diameter upward flow proprietary sand filter in the 2012 upgrade. Downstream of this filter is the
final effluent monitoring complete with a divert system, based on turbidity, to the Balancing Tank
should the effluent go out of spec.
1.2.5.10 Outfall
The outfall from the existing WWTP is the adjacent Kilta River. This outfall has a flap valve to
prevent backflow. The Mogeely municipal WWTP outfall is situated approximately 10 metres
downstream.
For
insp
ectio
n pur
pose
s only
.
Conse
nt of
copy
right
owne
r req
uired
for a
ny ot
her u
se.
EPA Export 07-11-2018:04:04:37

New Cheese Factory at Dairygold Mogeely Wastewater
Page 15 of 32
1.2.5.11 Sludge Management system
The sludge management system of the Mogeely WWTP consists of
a. Picket fence thickener
b. GEA Westfalia UCD 345 Decanter
The 6.4 m (21 ft) diameter by 3.66 m (12 ft.) deep Picket Fence Thickener (PFT) dates from the
original WWTP although the supernatent launder may have been replaced in recent times. The PFT
receives sludges from the Interstage Clarifier and the Secondary Clarifier.
A new Sludge Dewatering Decanter complete with associated Polyelectrolyte make-up and dosing,
thickened sludge feed pumps, sludge cake pumps and sludge skips was installed as part of the 2012
upgrade. This is a GEA UCD 345 Decanter. The system appears to be working well.
1.2.5.12 WWTP Controls
Controls for the WWTP seem to be dispersed in kiosks adjacent to the Aeration Tanks and Sludge
Dewatering Building. MCCs are located at both these locations. In addition there is a separate
kiosk for the Biotector adjacent to the Inlet flow measurement chamber.
There is a HMI in the panel at the aeration tanks but there did not appear to be any higher level
control system in place. Such a centralised control system is very desirable for a WWTP treating
such a high strength and variable wastewater as this.
For
insp
ectio
n pur
pose
s only
.
Conse
nt of
copy
right
owne
r req
uired
for a
ny ot
her u
se.
EPA Export 07-11-2018:04:04:37

New Cheese Factory at Dairygold Mogeely Wastewater
Page 16 of 32
1.2.6 Calculation of existing WWTP Treatment Efficiency
The following tables give the individual unit sizes and treatment efficiencies at the WWTP at three
(3) different loading scenarios: -
1. The existing average regime
2. The existing permitted regime (1 Bio Tower operating)
3. The existing permitted regime (both Bio Towers operating)
The detailed calculations supporting the results given below are contained in Appendix 5.
1. The existing average regime
Average Flow rate = 430 m3/d
Average BOD5 load = 680 kgs./d
Unit Dimensions Max. Loading Actual Loading BOD conc. Efficiency
Inlet Pumps 35m3/hr 35 m3/hr 1581 NA
Balance Tank 284 m3 430 m3/d
Bio-Tower 1 505 m3 5 m3/m3/d 0.91 m3/m3/d 197 87.5%
Interstage Sed
Tank
36.3 m2 NA 12.8 m3/m2/d
Bio-Tower 2 505 m3 5 m3/m3/d Off-Line Off-Line Off-Line
Anoxic Tank 462 m3 0.19 kgs/m3 0.06 kgs/m3 10 95%
Aeration Tanks 964 m3
Final Clarifier 59.5 m2 22 m3/m2/d 14.12 m3/m2/d
Tertiary Filter 4.9 m2 Not Available Not Available
Overall Efficiency 99.4%
2. The existing permitted regime (1 Bio Tower operating)
Permitted Flow rate = 700 m3/d
BOD5 load = 1,610 kgs./d
Unit Dimensions Max. Loading Actual Loading BOD conc. Efficiency
Inlet Pumps 35m3/hr 35 m3/hr 2300 NA
Balance Tank 284 m3 700 m3/d
Bio-Tower 1 505 m3 5 m3/m3/d 1.4 m3/m3/d 521 77.3%
Interstage Sed
Tank
36.3 m2 NA 12.2 m3/m2/d
Bio-Tower 2 505 m3 5 m3/m3/d Off-Line Off-Line Off-Line
Anoxic Tank 462 m3 0.19 kgs/m3 0.26 kgs/m3 52 90%
Aeration Tanks 964 m3
Final Clarifier 59.5 m2 22 m3/m2/d 14.12 m3/m2/d
Tertiary Filter 4.9 m2 Not Available Not Available
Overall Efficiency 97.7%
For
insp
ectio
n pur
pose
s only
.
Conse
nt of
copy
right
owne
r req
uired
for a
ny ot
her u
se.
EPA Export 07-11-2018:04:04:37

New Cheese Factory at Dairygold Mogeely Wastewater
Page 17 of 32
3. The existing permitted regime (both Bio Towers operating)
Permitted Flow rate = 700 m3/d
BOD5 load = 1,610 kgs./d
Unit Dimensions Max. Loading Actual Loading BOD conc. Efficiency
Inlet Pumps 35m3/hr 35 m3/hr 2300 NA
Balance Tank 284 m3 700 m3
Bio-Tower 1 505 m3 5 m3/m3/d 0.73 m3/m3/d 521 77.3%
Interstage Sed
Tank
36.3 m2 NA 12.2 m3/m2/d
Bio-Tower 2 505 m3 5 m3/m3/d 0.73 m3/m3/d 118 77.3%
Anoxic Tank 462 m3 0.19 kgs/m3 0.06 kgs/m3 6 95%
Aeration Tanks 964 m3
Final Clarifier 59.5 m2 22 m3/m2/d 14.12 m3/m2/d
Tertiary Filter 4.9 m2 Not Available Not Available
Overall Efficiency 99.7%
The above results, together with other supporting calculations in Appendix 4, show that the existing
WWTP should have adequate capacity to treat the wastewaters up to a limit of 1,050 m3/d of
wastewater from the Mogeely Cheese factory. However, it will need to be upgraded to handle the
2,700 m3/d (including 1,000 m3/d of permeate if necessary) now planned.
As pointed out earlier some units of the existing WWTP are at the end of their service life and must
be replaced anyway.
For in
spec
tion p
urpo
ses o
nly.
Conse
nt of
copy
right
owne
r req
uired
for a
ny ot
her u
se.
EPA Export 07-11-2018:04:04:37

New Cheese Factory at Dairygold Mogeely Wastewater
Page 18 of 32
2 UPGRADE OF WWTP
2.1 FLOOD LEVELS
The site of the existing WWTP, which is to house the upgraded WWTP, has been identified as being
in a flood plain by the Flood Risk Assessment carried out for this project. The entire site is already
protected by an earthen berm while the individual units, where applicable, have 900 mm high block-
on-flat masonry walls giving additional protection.
All individual elements of the proposed new upgraded WWTP will be constructed to finish above the
maximum 1% AEP Flood (including Climate Change) level to ensure no risk of wash-out during an
extreme flood event. The Control, MCC and Dewatering building will be raised by 1 metre above
existing GL to provide equal flood protection.
2.2 PROJECTED WASTEWATER VOLUMES
The Plan is to increase production to 37,500 Tonnes of cheese per annum by 2025. If the peak
effluent increased pro-rata then the effluent discharge should increase to 3,020m3/day. Efficiencies
will be introduced which will reduce this volume and Dairygold state that the process wastewater
volumes are expected to be 1,700 m3/day. Added to this would be 1,000 m3/d of permeate from an
RO process which is being introduced to reduce the volume of liquid whey to be transported for
further treatment in Mitchelstown.
We were originally instructed to design for an initial daily waste stream of 2,700m3/day with
provision to expand to 4,000m3/day at some future date. Of the 2,700m3/day we were informed
that approximately 1,000m3/day would be permeate from a Reverse Osmosis (RO) process on the
whey so that the WWTP has to cater for 1,700m3/day.
2.2.1 Whey Permeate
The whey permeate is to be discharged with the remainder of the treated effluent. This permeate is
expected to have the following characteristics
Permeate
Capacity [kg/h ] 42,231
Total Solids [%] 0.02
True Protein [%] -
NPN [%] -
Lactose [%] -
Acid (incl. in Lactose) [%] -
Ash [%] -
Fat [%] -
COD [ppm] 6
For
insp
ectio
n pur
pose
s only
.
Conse
nt of
copy
right
owne
r req
uired
for a
ny ot
her u
se.
EPA Export 07-11-2018:04:04:37

New Cheese Factory at Dairygold Mogeely Wastewater
Page 19 of 32
Based on those figures this permeate could be used to dilute the treated effluent thereby reducing
the treatment standard required. The permeate will be produced at a rate of 42.23m3/day over a
20 hour day. This would suggest 850 m3/d of permeate but provision is made for 1,000 m3/d.
However, if, for any reason, the permeate does not meet the above standard, Dairygold wishes to
make provision to pass the permeate through the secondary Treatment Plant. Since the permeate
will be balanced at the Whey RO facility there is no need to balance it in the WWTP and it will be
introduced, if necessary, into the secondary treatment process at the anoxic tanks.
2.2.2 Design Loads
Dairygold has now (06/10/2016) clarified the volumes and loads to be managed as follows: -
Wastewater (m3/d) BOD (Kgs/D) Permeate (m3/d)
Normal Peak Day Feb. – Dec.
Mon. to Fri. Inflow 1,700 3,500 1,000
Outflow 2,700
Low Peak Day Dec - Feb.
Sat. across the
season & Mon./Fri.
Inflow 450 800 224
Outflow 674
The outfall is to be designed for 4,000 m3/d.
No domestic wastewater will be discharged to this WWTP. All domestic wastewater will be directed
to the Mogeely Municipal WWTP. Since the milk is pasteurized during the production process there
is no viral or bacterial risk from the wastewater and no need to disinfect it.
2.3 DISCHARGE STANDARD
2.3.1 Outfall
This discharge point has been agreed with Irish Water and is the existing Midleton Main Drainage
Outfall at Rathcoursey
Irish Water are dictating that the proposed discharge connect to their system downstream of their
existing Tidal holding Tank at Rathcoursey. In addition, the discharge is to take place on the ebb
tide only as required by the Midleton WWDA. Each ebb tide is approximately 6hrs:15 mins. This
means that, if we take the maximum 4,000 m3/d proposed, 1,041 m3 of treated effluent storage
must be provided for the 6.25 hours between discharges (4,000 m3/d/24 *6.25 hours).
For
insp
ectio
n pur
pose
s only
.
Conse
nt of
copy
right
owne
r req
uired
for a
ny ot
her u
se.
EPA Export 07-11-2018:04:04:38

New Cheese Factory at Dairygold Mogeely Wastewater
Page 20 of 32
2.3.2 Discharge standard
While the discharge standards for the Mogeely treated wastewater have not yet been agreed with
the EPA, we must assume that they will be the same as the existing municipal Wastewater Discharge
Authorisation (WWDA) Ref D0056-01 which has the following limits: -
pH 6.5 – 9
cBOD 25 mg/l
COD 125 mg/l
Suspended Solids 35 mg/l
Total Nitrogen 15 mg/l
Orthophosphate (as P) 2 mg/l
faecal coliforms a) The geometric mean per 100ml of effluent must be ` 250fc or less.
b) 95% of all samples shall be less than 1,000fc/l00ml
Clearly these are the standards that may be expected of the upgraded WWTP for Dairygold,
Mogeely. It is noted that, since the Mogeely WWTP will only be treating process wastewater arising
from a pasteurised process, faecal coliforms are not an issue.
2.3.3 Treatment Standard
Based on the assumed discharge standard in Section 2.2.2 above the allowable mass discharge for
the 2,700m3/d will be: -
cBOD 67.5 Kgs
COD 337.5 Kgs
Suspended Solids 94.5 Kgs
Total Nitrogen 40.5 Kgs
Orthophosphate (as P) 5.4 Kgs
Based on the permeate characteristics provided by the RO provider it would appear that there will
be zero Nitrogen (True Protein = -%; NPN=-%) and only 6 mg/l COD. That suggests that this liquor
can be used to dilute the treated process wastewater. There will be 1,000 m3/d of permeate
diluting 1,700 m3/d of treated wastewater.
The Permeate will take up 6 Kgs/d of the permitted COD allowance and none for the remainder of
the parameters. Therefore the following are the treated process wastewater standards required
from the WWTP (based on 1,700 m3/d wastewater plus 1,000 m3/d permeate = 2,700 m3/d): -
pH 6.5 – 9
cBOD 39.7 mg/l
COD 195 mg/l
Suspended Solids 55.6 mg/l
Total Nitrogen 23.8 mg/l
Orthophosphate (as P) 3.2 mg/l
For
insp
ectio
n pur
pose
s only
.
Conse
nt of
copy
right
owne
r req
uired
for a
ny ot
her u
se.
EPA Export 07-11-2018:04:04:38

New Cheese Factory at Dairygold Mogeely Wastewater
Page 21 of 32
Based on the above standards secondary wastewater treatment is adequate to meet the projected
standards.
The design will be based on producing a 25:125:35:15:2 (BOD:COD:SS:N:P) mg/l standard to give
plenty of leeway.
2.4 RAW WASTEWATER
Dairygold has identified the volumes and BOD loads of the wastewater to be treated as follows: -
Wastewater (m3/d) BOD (Kgs/D) Permeate (m3/d)
Normal Peak Day Feb. – Dec.
Mon. to Fri. Inflow 1,700 3,500 1,000
Outflow 2,700
Low Peak Day Dec - Feb.
Sat. across the
season & Mon./Fri.
Inflow 450 800 224
Outflow 674
In order to design a suitable process to meet the discharge standards listed in Section 2.2.2 above
the characteristics of the wastewater, in terms of the other parameters, is required. A review of
records of the existing wastewater characteristics showed the following averages for the past 4
years: -
Parameter 2013 2014 2015 2016
Flow (m3/d) 581 524 428 465
BOD (mg/l) 1679 1537 1585 1588
TP (mg/l) 36.6 44.2 32 25.6
TN (mg/l) 94.2 110.8 102.4 87.3
NH3 (mg/l) 3.9 4.4 3.4 2.1
The above averages are quite consistent and show that the facility is becoming more water efficient.
It is considered that the relation of BOD/TP/TN can be applied to the future loads for design
purposes while keeping in mind the need to build in flexibility to allow the treatment process survive
on lower loading on occasion e.g. the winter period.
In terms of viability of a biological treatment process the need to have adequate nutrients to feed
the system is important. For an activated sludge (AS) process the minimum ratio BOD/N/P is
100/5/1. For the above 4 years the ratio has been between 100/10/3 BOD/N/P and 100/15/5
BOD/N/P. These show that there are ample nutrients available in the process wastewater to
sustain an AS process. However, the WWTP will have to remove the excess nutrients to meet the
discharge standard.
For
insp
ectio
n pur
pose
s only
.
Conse
nt of
copy
right
owne
r req
uired
for a
ny ot
her u
se.
EPA Export 07-11-2018:04:04:38

New Cheese Factory at Dairygold Mogeely Wastewater
Page 22 of 32
No information is available on the pH or FOG characteristics of the wastewater. We are informed
that the build-up of FOG in the Balance tank is cleaned once a year.
2.5 WASTEWATER DESIGN CHARACTERISTICS
The new WWTP will be designed for the following loadings: -
Parameter Normal Low
Flow (m3/d) 1,700 / 2,700 450
BOD (mg/l) 2,188 1,778
TP (mg/l) 49.7 40.4
TN (mg/l) 133.4 108.4
2.5.1.1 Hydraulic design
The incoming design hydraulic load is 2,700 m3/d of which 1,000 m3/d is permeate. The permeate
will normally be discharged directly to the Final Effluent Holding tank but provision is made to divert
it to the Activated Sludge (AS) Plant.
The normal WWTP throughput will be 1,700 m3/d. The WWTP, post Balancing tank and high-rate
treatment, will be designed to pass this flow in 20 hours (120% of average), plus permeate at a rate
of 50 m3/hr to allow room to catch up in the event of an interruption i.e.
Secondary Treatment Flow Rate = 135 m3/hr. (85 process waste + 50 permeate)
No diurnal flow (flow pattern through a typical and peak day) information is available at present. In
the absence of that information we will assume a peak flow of 6 times average flow
Preliminary Treatment Flow Rate = (1,700/24)*6 = 425 m3/hr
Pumping to outfall is to be over 6.25 hours per tide means that 25 hours of effluent (including
permeate) must be discharged in 12.5 hours. The outfall is to be designed for 4,000 m3/d (refer to
section 2.2.1) so that
Outfall pumping Rate = (4,000/24)*25= 4,167 m3 = 333.4 m3/hr
(Initial Outfall pumping Rate (2,700 m3/d in 25 hours of effluent = 225 m3/hr)
In addition to the foregoing flows, it is proposed to provide additional storage at the WWTP to cater
for Fire Water Retention in accordance with EPA Guidelines (please see the Firewater Risk
Assessment). This requires provision of an additional 1,000 m3 of storage capacity reserved
exclusively for Firewater retention. In the event of a fire at either of the Process Facilities,
production will stop and the storm water drains will be diverted to the WWTP.
For
insp
ectio
n pur
pose
s only
.
Conse
nt of
copy
right
owne
r req
uired
for a
ny ot
her u
se.
EPA Export 07-11-2018:04:04:38

New Cheese Factory at Dairygold Mogeely Wastewater
Page 23 of 32
Peak fire flow rate is 735 m3/hr. At the inlet to the Preliminary Treatment flows in excess of the
425 m3/h capacity will be diverted to a separate pump sump for lifting into the Balance/Retention
Tank.
The Fire Pump Sump will have Duty/Assist storm pumps each rated 155 m3/h.
2.6 PRELIMINARY TREATMENT
Flows to the WWTP arrive by gravity from the Cheese Production Plant. On arrival the wastewater
passes through: -
A 200 mm Φ electromagnetic flow meter, (with proportional sampling and on-line TOC
monitoring).
Coarse and Fine screening (with caustic dosing)
Grit removal (defunct)
Flow Balancing.
The former unit is too small for the proposed flows (118 l/s excluding Firewater flows) while the
latter three units have reached the end of their serviceable life and, even if they were of adequate
capacity (which they are not), will have to be replaced.
The proposed new incoming process drain will be a 400 mm Internal Φ pipe with a parallel pipe to
carry diverted fire flows in the storm system, to the Inlet pumping station. This will be a gravity
discharge as before.
Since all four elements of the Preliminary treatment works must be replaced it is proposed to
change the order of the units as follows: -
1. Fine Screens and Firewater overflow
2. Proportional sampling and TOC Monitoring
3. Grit and Grease removal
4. Flow measurement (V-Notch weir and Ultrasonic level sensor)
5. Inlet Pumping Station with overflow to Firewater Pumps
6. Above ground aerated and mixed Balancing Tank (to include a dedicated 1,000 m3 for
firewater).
7. pH Correction via static mixer on forward feed to Secondary Treatment.
All elements of the Preliminary Treatment works will have to have coatings to resist low pH.
2.6.1 Screening, Grit & Grease Removal
A 6 mm Fine Drum Screen with a vertical solids washer/conveyor, similar to the Huber Rotamat RO9,
with a capacity of 425 m3/h is required. This would be in a cast-in-situ concrete chamber and would
include a manual by-pass screen and an overflow for flows in excess of 425 m3/h i.e. fire flows.
Those flows would be diverted directly to the Inlet pumping station.
For
insp
ectio
n pur
pose
s only
.
Conse
nt of
copy
right
owne
r req
uired
for a
ny ot
her u
se.
EPA Export 07-11-2018:04:04:38

New Cheese Factory at Dairygold Mogeely Wastewater
Page 24 of 32
The Screenings removed from the flow would be deposited into a wheelie bin (or commercial sized
bin if appropriate).
Flows from the Screening chamber would pass directly into a combined aerated grit and grease
removal chamber. This chamber would have the following dimensions: -
- Length 8 m
- Breath 2 m
- Depth 1.5 m
- Air requirement 240 m3/hr.
The chamber would have a perforated baffle plate running the length of the chamber some 1 metre
from the side opposite the diffusers and a chain scraper would collect the grease to a pump chamber
at one end for pumping to a holding tank.
Grit would be removed by air-lift pumps from 4 no hoppers.
2.6.2 Flow Measurement and sampling
Inlet flow measurement would be by means of a 90ο V-Notch weir with an ultrasonic sensor reading
the head over the weir as it discharges into the inlet pumping station. NB – There must be a free fall
immediately following the V-Notch so that measuring accuracy is not compromised.
The following are the depths over the V-Notch for the relevant flows: -
- 425 m3/h (6 DWF of peak) = 118 l/s => 370 mm
- 70.83m3/h (1,700 m3/d) = 25.5 l/s => 200 mm
- 18.75 m3/h (450 m3/d) = 5.2 l/s => 106 mm
This weir will be used to set the overflow level upstream of the screen. In addition, a read-out from
this meter will be provided to a plug-in point for the proportional sampler which will be located just
before the screens.
2.6.3 Inlet Pumping Station
The Inlet Pumping Station must deal with the following flow variations: -
Fire Flow - 735 m3/h
Peak High Season Process Flow - 425 m3/h (6 DWF)
Average High Season Process Flow - 70.83 m3/h (1,700 m3/d)
Average Low Season Process flow - 18.75 m3/h (450 m3/d)
2 sets of pumps are proposed. Both sets will be Duty/Assist.
The first set will be capable of 70.83 m3/h each. The second set of pumps will be capable of 297
m3/h each. This gives a total pumping station capacity of 735 m3/h as required.
For
insp
ectio
n pur
pose
s only
.
Conse
nt of
copy
right
owne
r req
uired
for a
ny ot
her u
se.
EPA Export 07-11-2018:04:04:38

New Cheese Factory at Dairygold Mogeely Wastewater
Page 25 of 32
It is proposed that the pump sump will be a two level configuration with the smaller 70.83 m3/h
pumps (Pumps 1 & 2) in a sump which has an invert 1.5 metres below the level of the V-Notch
invert. This smaller sump will measure 2.5 m wide by 2.0 m long with an invert at 1.5 m below the
V-Notch.
The larger 297 m3/h pumps (Pumps 3 & 4) will be in a higher sump with invert starting 0.8 metres
higher than the small pumps. This sump will add a further 4 metres to the sump length giving an
overall length, at this level, of 6 metres.
The following are the proposed cut-in and cut-out levels relative to sump invert: -
Cut-in Cut-Out
Pump 1 0.55 m 0.3 m
Pump 2 0.80 m 0.3 m
Pump 3 1.14 m 0.3 m
Pump 4 1.48 m 0.3 m
A boxed spare of each pump should be held on site in case of a pump breakdown.
2.6.4 Flow balancing and pH correction
In the absence of a diurnal flow (flow pattern through a typical and peak day) it is difficult to be
precise about the volume of balancing storage required. At one extreme the peak (6 DWF) flow
rate could deliver the full daily hydraulic load (1,700 m3) to the WWTP in 4 hours while the Feed to
Full Treatment (FFT) is proposed at 85 m3/h i.e. 340 m3. That would indicate a balancing volume of
1,360 m3. That seems excessive.
The original WWTP was designed with 10 hours balancing storage and the same is proposed here i.e.
850 m3. To this storage a further 1,000 m3 is required for Firewater Retention (based on cessation
of production and continued treatment and discharge of wastewater).
1,850 m3 of Balancing Storage is proposed in an above reinforced concrete tank. This would
require a rectangular 22 m. by 16 m (internal) with a 5.25 metre water depth.
This tank will be fully mixed and aerated using a naturally aspirated venturi mixing and aeration
system to keep the balanced volume fresh thereby preventing emission of odours. This system will
use duty/stand-by recirculation pumps located outside the tank for ease of maintenance.
This tank will be constructed approximately 1 metre into the ground with Top of Structure (TOS)
being 5 metres, plus guard railings, above finished ground level.
It is proposed that following equalisation in the balancing tank pH correction would be carried out by
dosing caustic using a static mixer. This mechanism will be used to dose flocculants to the
wastewater before the Dissolved Air Flotation (DAF) Stage.
For
insp
ectio
n pur
pose
s only
.
Conse
nt of
copy
right
owne
r req
uired
for a
ny ot
her u
se.
EPA Export 07-11-2018:04:04:38

New Cheese Factory at Dairygold Mogeely Wastewater
Page 26 of 32
2.7 SECONDARY TREATMENT
As with the existing Preliminary Works the existing High Rate Biofilters have reached the end of their
serviceable life and will be demolished.
As set out in section 2.2.5 above, the new WWTP will be designed for the following loadings: -
Parameter Normal Low
Flow (m3/d) 1,700 450
BOD (mg/l) 2,188 1,778
TP (mg/l) 49.7 40.4
TN (mg/l) 133.4 108.4
The AS part of the process will be designed for the additional hydraulic load of 1,000 m3/d of
permeate
The existing WWTP consists of a single treatment stream. It is proposed that the upgraded WWTP
be designed as a parallel two (2) stream process. This will provide flexibility in treating high and low
loads of wastewater at different seasons and aid maintenance into the future.
Given the high strength of the wastewater two stages of secondary treatment are required. The
first is a high rate stage to reduce the carbonaceous fraction of the wastewater to a level where
nitrification and denitrification is possible in the second stage.
2.7.1 High Rate Treatment Options
2.7.1.1 Aerobic (DAF)
Dissolved Air Flotation (DAF), with polyelectrolyte and coagulant addition, is the most common
method of High Rate wastewater treatment currently. Without chemical addition it is used for
grease separation only.
BOD reduction rates of 40 – 50% can be achieved using a flotation plant while solids reduction of
65% - 80% and FOG reduction of 70% - 90% are achievable. The DAF has the advantage that it
doesn’t require inter-stage settling. Sludges are scraped off the top of the DAF and discharged to a
sludge holding tank.
Without using flocculation chemicals the reduction rates may only be 10%, depending on the
composition of the wastewater. This would not achieve the required COD reduction on its own.
While the DAF system has a relatively low capital cost it can have high operating costs. In addition,
if polyelectrolyte has to be used, the sludges can be difficult to handle and dispose of due to a high
grease composition.
For
insp
ectio
n pur
pose
s only
.
Conse
nt of
copy
right
owne
r req
uired
for a
ny ot
her u
se.
EPA Export 07-11-2018:04:04:38

New Cheese Factory at Dairygold Mogeely Wastewater
Page 27 of 32
It is proposed to use DAF as an initial treatment stage to both remove FOGs and solids and reduce
COD. 2 no. 11 m2 DAFs are proposed to give an overall 50% redundancy. This means that, in
normal loading, 1 DAF will be capable of handling the duty.
The machines will be located on roofs of the Anaerobic and Anoxic tanks and will be approximately
7.5 metres above finished ground level.
2.7.1.2 Anaerobic
Anaerobic treatment, particularly the upward flow sludge blanket (UASB) and attached growth
processes can be cost effective in reducing high COD loads. This process has the added advantage
of producing approximately 50% less sludge than an extended aeration AS process. An anaerobic
system for Mogeely would require 2 No. 128 m3 fixed bed reactors. The process would be
expected to give a 60% - 80% reduction in COD.
A disadvantage of the process is that it takes a long start-up time, it requires regular loading and it
may require the addition of alkalinity as it requires a high degree of alkalinity for the process. It will
require an odour treatment system but this will be a biological “shell” Filter system this same
system can also treat odours arising from the sludge storage, thickening and dewatering processes.
It is proposed to incorporate two anaerobic treatment stages in the WWTP. As with the Balance
tank, these tanks will be finished approximately 5 metres, plus guard railings, above finished ground
level. This will facilitate a gravity flow through the treatment process thereby reducing energy
costs.
This stage of the treatment process will produce 1,659 kgs of Sludge per day.
2.7.2 Nitrification/Denitrification
The existing WWTP has a Nitrification/ Denitrification process consisting of a new anoxic tank, post
the Biotowers, followed by a stepped aeration stage in the form of the original aeration basin and a
second equal tank of later vintage. These three tanks combine to give 1,426 m3 of treatment
volume. It is proposed to reuse the 12.8 m Φ Anoxic tank as a secondary clarifier for one stream of
the new process. TWL of this tank is approximately 3 metres, plus guard railings, above ground
level.
The aeration tanks will be refurbished, by lining and raising the walls by a further metre, to act as the
final balance tanks prior to discharge.
The upgraded WWTP will require a total second stage treatment volume of 3,868 m3 of treatment
capacity i.e. more than double the existing. That capacity will produce the required final effluent in
the order of 22 mg/l BOD.
As with the other process tanks these tanks will be approximately 5 metres, plus guard railings,
above finished ground level.
For
insp
ectio
n pur
pose
s only
.
Conse
nt of
copy
right
owne
r req
uired
for a
ny ot
her u
se.
EPA Export 07-11-2018:04:04:38

New Cheese Factory at Dairygold Mogeely Wastewater
Page 28 of 32
The final clarification will need to provide 258 m2 of settling tank with a recommended sidewall
depth of 3.5 m. The existing anoxic tank provides 129 m2 of this requirement so that an
additional 12.8 m Φ clarifier is required at the same level.
Phosphorus removal by means of chemical precipitation is needed to reduce the residual discharge P
concentration to 2 mg/l P as per the assumed WWDL. This stage of the treatment process will
produce 419 kgs of Sludge per day.
Tertiary treatment is no longer required.
Final effluent monitoring complete with a divert system, based on turbidity, to the Balancing Tank
will still be in place.
2.8 FINAL EFFLUENT BALANCING AND PUMPING
The Outfall Holding tank is required to store treated effluent and permeate from the RO system for a
total of 6.25 hours on each tide. Pumping to outfall is to be over 6.25 hours (the ebb) per tide
means that 25 hours of effluent (including permeate) must be discharged in 12.5 hours. The outfall
Holding Tank is sized as follows: -
(4,000/24)*6.25 = 1,085 m3
This volume will be provided by upgrading the existing Aeration basins and raising the height of the
walls by a further metre.
Prior to discharging to the outfall holding tanks, effluent will pass into an effluent monitoring
chamber complete with a divert system, based on turbidity, to the inlet Balancing Tank.
In addition to upgrading the existing Aeration Basins as final effluent balancing tanks, it is proposed
to provide an additional tank which can perform a joint role as a final effluent balancing tank or as a
silo for lime stabilised dewatered sludge over the winter period. This tank will measure 30 m long
by 11 m wide and will have vehicular (Loader) access from the surface. The tank will be 1.5 m
below ground at its deepest point and the floor will sloped at 1/10. The walls on three sides,
including the boundary will be raised to 3 metres above ground to act as a silo for lime stabilised
sludge if required.
Outfall pumping Rate = (4,000/24)*25= 4,167 m3 = 333.4 m3/hr
(Initial Outfall pumping Rate (2,700 m3/d in 25 hours of effluent = 225 m3/hr)
2.9 SLUDGE MANAGEMENT
A total of 2.1 Tonnes Dry Solids (DS) of sludge will be produced at peak load. This will be at
approximately 1% DS meaning that there will be a hydraulic load of 210 m3/d of sludge to be
handled. That will require a new 4 m deep by 7.6 m Φ Sludge Holding/Thickening tank, plus guard
railings, to be located adjacent to the relocated Sludge Dewatering Building.
For
insp
ectio
n pur
pose
s only
.
Conse
nt of
copy
right
owne
r req
uired
for a
ny ot
her u
se.
EPA Export 07-11-2018:04:04:38

New Cheese Factory at Dairygold Mogeely Wastewater
Page 29 of 32
The Sludge Dewatering building will also house the MCC room, office space and stores. The floor of
the building will be raised 1 m above existing ground level to ensure that it isn’t liable to flooding.
The building itself will be approximately 4 m. high making it 5 m above existing Ground Level.
The existing Dewatering decanter has a capacity of 18 m3/hr at 1% DS. This means that it would
require 11.5 hours operation at peak sludge production. This will be done in 2 work shifts.
Provision will be made for storing lime stabilised dewatered sludge over the winter period on site.
This will be by means of a dual purpose final balance tank with raised walls on three sides to act as a
silo for up to 900 Tonnes of stabilised sludge.
2.10 ODOUR
Odours, in a dairy WWTP, generally arise from anaerobic conditions either in the strong influent,
stagnant grease or in the sludge draw-off and treatment.
As will be seen from the foregoing paragraphs, it is proposed to replace the entire existing WWTP
with a new modern Treatment Process. As part of this new WWTP it is proposed to cover any
possible sources of odour and extract air and treat the air from these covered tanks. These sources
include the anaerobic tank, the sludge draw-offs from the settling tanks, the PFT and the dewatering
house. Air will be drawn off from these items and scrubbed in a biological “shell” type Odour filter.
There should be no issue with the other units as they are aerobic or have a water barrier.
2.11 SUMMARY OF NEW WWTP
The upgraded WWTP, as described above, will be entirely new with only three of the existing tanks
being retained and refurbished for new duties. These tanks are the existing Anoxic Tank which will
be converted to act as a final Clarifier and the existing aeration basins which will be refurbished to
act as the final effluent tidal balancing tanks.
The new WWTP will consist of the following elements: -
1. Preliminary Treatment
a. Automatic Fine Screen with Manual screen by-pass and Firewater overflow (new)
b. Proportional sampling and TOC, TN & TP Monitoring by Biotector (reuse existing
equipment)
c. Aerated Grit and Grease removal (new)
d. Flow measurement (V-Notch weir and Ultrasonic level sensor on outlet)
e. Inlet Pumping Station with overflow to Firewater Pumps (new)
f. Above ground naturally aspirated and mixed 1,850 m3 Balancing Tank using
duty/stand-by recirculation pumps (to include a dedicated 1,000 m3 for firewater)
(new)
g. pH Correction via static mixer on forward feed (duty/assist/stand-by pumps) to
Secondary Treatment (new)
h. Proportional sampling point (new)
For
insp
ectio
n pur
pose
s only
.
Conse
nt of
copy
right
owne
r req
uired
for a
ny ot
her u
se.
EPA Export 07-11-2018:04:04:38

New Cheese Factory at Dairygold Mogeely Wastewater
Page 30 of 32
2. Secondary Treatment
a. 2 no. 11 m2 Duty/Stand-by Dissolved Air Flotation (DAF) units
b. 2 No. 128 m3 fixed bed anaerobic reactors.
c. 2 No. 390 m2 by 5 m water depth Nitrification/Denitrification extended aeration
(fine bubble diffused air) Activated Sludge tanks (new)
d. 2 No. 12.8 m Φ Final Clarifiers (1 new and move the existing 2012 anoxic tank as the
second)
e. 2 No. Final Effluent Tidal Balancing Tanks (Refurbish existing aeration basins and add
a new 30 m long by 11 m wide by 1.5 m deep tank to carry out a dual role of final
effluent balancing in the summer or stabilised sludge cake storage in the winter)
3. Sludge Management
a. 7.5 m Φ Sludge Holding/Picket FenceThickening Tank (new)
b. Dewatering House (new to include MCC Room)
c. GEA Westfalia UCD 345 Decanter (Existing machine to be relocated)
4. Odour Scrubbing
a. Air extraction from Anaerobic tanks, all sludge removal areas, sludge holding tanks
and sludge dewatering room (new)
b. “shell” type Biofilter for odour scrubbing (new)
5. New Control building containing
a. Office & SCADA
b. MCC Room
c. Sludge Dewatering
2.11.1 Design WWTP Performance (BOD5)
Design Flow rate = 1,700 m3/d (+1,000 m3/d permeate in secondary stage)
BOD5 load = 3,500 kgs./d
Unit Dimensions Max. Loading Actual
Loading
BOD conc. Efficiency
Inlet Pumps 2 No. 212.5m3/hr 212.5 m3/hr 2,059 NA
Firewater Pumps 2 No. 155m3/hr 155 m3/hr NA
Balance Tank 850 m3 850 m3 NA
Firewater Storage 1,000 m3 1,000 m3 NA
Forward Feed Pumps 3 No.(D/A/S) 42.5m3/hr 42.5m3/hr NA
DAF (2 No.) 11 m2 (2 No.) 6m3/m3/d 6 m3/m3/d 1,441 30%
Anaerobic Stage 128 m2 NA 12.2 m3/m2/d 432 70%
Nit./DeNit Stage 3,868 m3 0.19kgs/m3/d 0.19kgs/m3/d
Final Clarifier (2 No.) 59.5 m2 (2 No) 12 m3/m2/d 8 m3/m2/d 22 95%
Overall Efficiency 99%
For
insp
ectio
n pur
pose
s only
.
Conse
nt of
copy
right
owne
r req
uired
for a
ny ot
her u
se.
EPA Export 07-11-2018:04:04:38

New Cheese Factory at Dairygold Mogeely Wastewater
Page 31 of 32
3 CONSTRUCTION PHASING
Construction of the new WWTP will take approximately 12 months to complete the Civil,
Mechanical, Electrical installation and commissioning. This will have to be carried out in a number
of phases over two production campaigns in order to minimise the impact of the existing cheese
factory.
Given the very restricted Site available, and the fact that production at Mogeely cannot be
interrupted, construction will be phased so that a full section of the new WWTP is commissioned
and capable of treating the full existing wastewater load to the proper standard before any of the
existing WWTP can be demolished and replaced. That treatment will have to include tertiary
treatment until such time as the new outfall is licensed, constructed and available.
The following is a summary of the proposed phasing. Sketches 17617-SK63 to 127617-SK67
included in Appendix 6 illustrate the staging of the construction and demolition of the WWTP
needed to Upgrade the WWTP while treating the process waste to the required standard.
3.1 Stage 1 Works:
The following new structures/elements will be constructed initially while the existing WWTP remains
fully operational.
These new structures include;
Inlet Screening/Grit – Grease Removal /Inlet pumping structure
New Inlet Balance Tank, Volume 1,850 m3
pH Correction facility with polyelectrolyte and ferric dosing
One treatment stream comprising DAF, Anaerobic and Extended Aeration
Demolition of the existing redundant final clarifier and construction of a new, larger final clarifier on its site.
A new pipe connection between the new treatment stream and the existing tertiary treatment and outfall.
Upon completion and commissioning this stream will take over treatment of the Mogeely process
waste discharging to the River Kilta in compliance with the existing Discharge Licence.
3.2 Stage 2 Works:
Stage 2 works comprises of two main elements;
a. The demolition of the existing WWTP (except the Aeration Basins and Tertiary treatment).
b. The construction of the remaining new structures associated with the upgrading of the
WwTP.
Stage 2 demolition works include the removal of;
Inlet screens and grit channels
Bio Towers No 1 & 2
Splitter Chambers No 1 & 2
For
insp
ectio
n pur
pose
s only
.
Conse
nt of
copy
right
owne
r req
uired
for a
ny ot
her u
se.
EPA Export 07-11-2018:04:04:38

New Cheese Factory at Dairygold Mogeely Wastewater
Page 32 of 32
Interstage Settling Tank
Balance Tank
Final Settling Tank
Activated Sludge (AS) Return Pump Chamber
Tertiary Treatment facility (once the outfall to Rathcoursey is commissioned)
The new stage 2 construction works include;
Second treatment stream comprising DAF, Anaerobic and Extended Aeration plus move and convert the existing anoxic tank to clarifier in a new location,
Sludge Tank
Activated Sludge (AS) Return Pump Chamber
Refurbish existing Aeration tanks as Final Balance tanks including final effluent pumps.
Add an additional Final Effluent Holding/Sludge Cake Storage Tank.
For
insp
ectio
n pur
pose
s only
.
Conse
nt of
copy
right
owne
r req
uired
for a
ny ot
her u
se.
EPA Export 07-11-2018:04:04:38

New Cheese Factory at Dairygold Mogeely Wastewater
Appendix 1. IED Licence P0817-01
For
insp
ectio
n pur
pose
s only
.
Conse
nt of
copy
right
owne
r req
uired
for a
ny ot
her u
se.
EPA Export 07-11-2018:04:04:38

This licence was amended on 16th December 2013 under Section S82A(11) of the Environmental Protection Agency Act 1992, as amended. The details of the Amendment must be read in conjunction with
this licence. The amendment document is entitled “IED Amendment”.
Headquarters P.O. Box 3000
Johnstown Castle Estate County Wexford
Ireland
INTEGRATED POLLUTION PREVENTION & CONTROL LICENCE
Licence Register Number: P0817-01 Licensee: Dairygold Co-Operative Society
Limited Location of Installation:
Mogeely County Cork
For
insp
ectio
n pur
pose
s only
.
Conse
nt of
copy
right
owne
r req
uired
for a
ny ot
her u
se.
EPA Export 07-11-2018:04:04:38

ENVIRONMENTAL TRQTECTION AGISXC:l ACTS, 1992 TO 2007
Decision of Agency, under Szction 83 (1) of the Environmental Protection Agency Acts, 1992 to 2007.
Refererrcc number in Register of licences: POS? 7-01
Further to notice dated 2O/I L ‘20 i 0, the Agency in exercise cf the powers conferred on it hy the Environmental Protectian Agency Acts, 1992 to 2007, for the reasons hereinafter set out, hereby grants a iicemce YO
Dairygold Cc-opcrative Socieiy Limited, Unit 5 100, Cork Airport Business Park, Kinsale Road, Cork,
I
-: the treatment and processing of milk, the quanrity of milk received being greater than 208 tnm?c:; per day (average value on a yearly basis),
at Mogeely, County Cork, sdijeect to the conditions as set out.
GIVEN under the Seal ofthe Agency this 21Sf day of April 201 1
PRESENT when the seal ofthe Agency was affixed hereto:
[ s,/ 4-a-A --______
13r Karen Creed Authorised Pcrson
[ s,/ 4-a-A --______
13r Karen Creed Authorised Pcrson
For
insp
ectio
n pur
pose
s only
.
Conse
nt of
copy
right
owne
r req
uired
for a
ny ot
her u
se.
EPA Export 07-11-2018:04:04:38

Environmental Protection Agencv Licence Rea. No. PO81 7-01
INTRODUCTION This introduction is not part of the licence and does not purport to be a legal interpretation of the licence.
This installation is located on the outskirts of Mogeely, a small village in east County Cork, 10 km east of Midleton. It produces over 7,000 tonnes annually of speciality cheeses for the niche-branded market. This production requires the treatment and processing of milk, where the quantity of milk received is greater than 200 tonnes per day (average value on a yearly basis) but less than 50 million gallons per year. As such, the installation comes under activity class 7.2.1 of New First Schedule of the EPA Act 1992 to 2007. (This installation also falls within the scope of category 6.4(c) of Annex I of Council Directive 2008/1/EC concerning integrated pollution prevention and control.) The Dairygold Mogeely installation was built in 1973. Mogeely currently employs less than 50 people and operates on a 24 hour cycle for six days a week during peak production, reducing to a five day week at other times.
Processes include pasteurisation, coagulation to produce cheese curd and whey; separation of the curd, salting and ripening of cheese. The whey is sent offsite for fkther processing. The main raw materials include milk and milk products, cultures and salt, as well as detergents and water. Process wastewaters are directed to the site’s wastewater treatment plant (WWTP), before discharging to the river Kilta. Sludge fiom the treatment plant is recovered by landspreading.
Natural gas, gas oil and electricity are used as energy inputs. There are now two boilers on site; one for hot water generation and one for steam generation. The main sources of noise are from the processing plant, water pumps and on-site traffic.
The licence sets out in detail the conditions under which Dairygold Co-operative Society Limited will operate and manage this installation.
Introduction
For
insp
ectio
n pur
pose
s only
.
Conse
nt of
copy
right
owne
r req
uired
for a
ny ot
her u
se.
EPA Export 07-11-2018:04:04:38

Environmental Protection Agenn, Licence Reg . No . PO81 7-01
Table of Contents Page No
Glossary of Terms ................................................................................................................................ 1
Decision & Reasons for the Decision ................................................................................................... 5
Part I Schedule of Activities Licensed ................................................................................................. 5
Part I1 Schedule of Activities Rehsed ................................................................................................. 5
.... Part I11 Conditions . Condition 1 . Condition 2 . Condition 3 . Condition 4 .
Condition 5 . Condition 6 . Condition 7 . Condition 8 . Condition 9 . Condition 10 . Condition 1 1 . Condition 12 .
............................................................................................................................ 6
Scope ................................................................................................................. 6
Management of the Installation ......................................................................... 6
Inii-astructure and Operation ............................................................................. 8
Interpretation ................................................................................................... 10
Control and Monitoring .................................................................................. 12
Materials Handling .......................................................................................... 15
Emissions ........................................................................................................ 11
Resource Use and Energy Efficiency .............................................................. 14
Accident Prevention and Emergency Response .............................................. 16
Closure, Restoration and Aftercare Management ........................................... 17
Notification, Records and Reports .................................................................. 18
Financial Charges and Provisions ................................................................... 20
SCHEDULE A: Limitations ................................................................................................... 21
SCHEDULE B: Emission Limits ............................................................................................ 21
SCHEDULE C: Control & Monitoring ................................................................................... 24
SCHEDULE D: Annual Environmental Report ...................................................................... 30
Contents
For
insp
ectio
n pur
pose
s only
.
Conse
nt of
copy
right
owne
r req
uired
for a
ny ot
her u
se.
EPA Export 07-11-2018:04:04:38

I
Environmental Protection Agency Licence Reg. No. PO81 7-01
Glossary of Terms
All terms in this licence should be interpreted in accordance with the definitions in the Environmental Protection Agency Acts 1992 to 2007 I Waste Management Acts 1996 to 2010, unless otherwise defined in the section.
Adequate lighting
AER
Agreement
Annually
Application
Appropriate Facility
Attachment
BAT
Biannually
Biennially
BOD
CEN
COD
Containment boom
Daily
Day
Daytime
20 lux measured at ground level.
Annual Environmental Report.
Agreement in writing.
All or part of a period of twelve consecutive months.
The application by the licensee for this licence.
A waste management facility, duly authorised under relevant law and technically suitable.
Any reference to Attachments in this licence refers to attachments submitted as part of this licence application.
Best Available Techniques.
All or part of a period of six consecutive months.
Once every two years.
5 day Biochemical Oxygen Demand (without nitrification suppression).
ComitC Europeen De Normalisation - European Committee for Standardisation.
Chemical Oxygen Demand.
A boom that can contain spillages and prevent them fkom entering drains or watercourses or fkom firther contaminating watercourses.
During all days of plant operation and, in the case of emissions, when emissions are taking place; with at least one measurement on any one day.
Any 24 hour period.
0800 hrs to 2200 hrs.
1
For
insp
ectio
n pur
pose
s only
.
Conse
nt of
copy
right
owne
r req
uired
for a
ny ot
her u
se.
EPA Export 07-11-2018:04:04:38

Environmental Protection Agency - . Licence Reg. No. PO81 7-01
Decibels (A weighted).
DO Dissolved oxygen.
Documentation Any report, record, results, data, drawing, proposal, interpretation or other document in written or electronic form which is required by this licence.
Drawing Any reference to a drawing or drawing number means a drawing or drawing number contained in the application, unless otherwise specified in this licence.
Environmental Management Programme. EMP
Emission limits Those limits, including concentration limits and deposition rates, established in Schedule B: Emission Limits, of this licence.
Environmental damage
As defined in Directive 2004/35/EC.
EPA Environmental Protection Agency.
ESB Electricity Supply Board.
European Waste Catalogue
(EWC)
A harmonised, non-exhaustive list of wastes drawn up by the European Commission and published as Commission Decision 2000/532/EC and any subsequent amendment published in the Official Journal of the European Community.
Any site or premises used for the purpose of the recovery of disposal of waste.
Facility
Fortnightly A minimum of 24 times per year, at approximately two week intervals.
Gas Oil as defiied in Council Directive 1999/32/EC and meeting the requirements of S.I. No. 119 of 2008.
Gas Oil
GC/MS Gas chromatography/mass spectroscopy.
ha Hectare.
Heavy metals This term is to be interpreted as set out in “Parameters of Water Quality, Interpretation and Standards” published by the Agency in 2001. ISBN 1-
The hours during which the installation is authorised to be operational.
84095-0 15-3.
Hours of operation
ICP Inductively coupled plasma spectroscopy.
2
For
insp
ectio
n pur
pose
s only
.
Conse
nt of
copy
right
owne
r req
uired
for a
ny ot
her u
se.
EPA Export 07-11-2018:04:04:38

I
Environmental Protection Aaenc?, Licence Rea. No. PO81 7-01
Incident
Installation
IPPC
K
kPa
Le,
Licensee
List I
List I1
Local Authority
Maintain
Mass flow limit
Mass flow threshold
Monthly
Night-time
Noise-sensitive location (NSL)
The following shall constitute as incident for the purposes of this licence: (i) an emergency;
(ii)
(iii)
(iv)
any emission which does not comply with the requirements of this licence; any trigger level specified in this licence which is attained or exceeded; and, any indication that environmental pollution has, or may have, taken place.
A stationary technical unit or plant where the activity concerned referred to in the First Schedule of EPA Acts 1992 to 2007 is or will be carried on, and shall be deemed to include any directly associated activity, which has a technical connection with the activity and is carried out on the site of the activity.
Integrated Pollution Prevention & Control.
Kelvin.
Kilopascals.
Equivalent continuous sound level.
Dairygold Co-operative Society Limited, Unit 5 100 Cork Airport Business Park, Kinsale Road, Cork.
As listed in the EC Directives 2006/11/EC and 80/68/EEC and amendments.
As listed in the EC Directives 2006/11/EC and 80/68/EEC and amendments.
Cork County Council.
Keep in a fit state, including such regular inspection, servicing, calibration and repair as may be necessary to perform its function adequately.
An emission limit value expressed as the maximum mass of a substance that can be emitted per unit time.
A mass flow rate above which a concentration limit applies.
A minimum of 12 times per year, at intervals of approximately one month.
2200 hrs to 0800 hrs.
Any dwelling house, hotel or hostel, health building, educational establishment, place of worship or entertainment, or any other installation or area of high amenity which for its proper enjoyment requires the absence of noise at nuisance levels.
3
For
insp
ectio
n pur
pose
s only
.
Conse
nt of
copy
right
owne
r req
uired
for a
ny ot
her u
se.
EPA Export 07-11-2018:04:04:38

I
Environmental Protection Aaenn, Licence Rea. No. PO81 7-01
NMP
Oil separator
PRTR
Quarterly
Sample@)
Sanitary effluent
SOP
Specified emissions
Standard method
Nutrient Management Plan.
Device installed according to the International Standard I.S. EN 858-2:2003 (Separator system for light liquids, (e.g. oil and petrol) - Part 2: Selection of normal size, installation, operation and maintenance).
Pollutant Release and Transfer Register.
All or part of a period of three consecutive months beginning on the first day of January, April, July or October.
Unless the context of this licence indicates to the contrary, the term samples shall include measurements taken by electronic instruments.
Wastewater fkom installation toilet, washroom and canteen facilities.
Standard operating procedure.
Those emissions listed in Schedule B: Emission Limits, of this licence.
A National, European or internationally recognised procedure (e.g. I.S. EN, ISO, CEN, BS or equivalent); or an in-house documented procedure based on the above references; a procedure as detailed in the current edition of “Standard Methods for the Examination of Water and Wastewater” (prepared and published jointly by A.P.H.A., A. W. W.A. & W.E.F.), American Public Health Association, 1015 Fifteenth Street, N.W., Washington DC 20005, USA; or an alternative method as may be agreed by the Agency.
Storm water
The Agency
TOC
Trade effluent
Trigger level
Water Services Authority
Weekly
WWTP
Rain water run-off fkom roof and non-process areas.
Environmental Protection Agency.
Total organic carbon.
Trade effluent has the meaning given in the Water Services Act, 2007.
A parameter value, the achievement or exceedance of which requires certain actions to be taken by the licensee.
Cork County Council Southern Division.
During all weeks of plant operation and, in the case of emissions, when emissions are taking place; with at least one measurement in any one week.
Waste water treatment plant.
4
For
insp
ectio
n pur
pose
s only
.
Conse
nt of
copy
right
owne
r req
uired
for a
ny ot
her u
se.
EPA Export 07-11-2018:04:04:38

Environmental Protection Agencv Licence Rea. No. PO81 7-01
Decision & Reasons for the Decision
The Environmental Protection Agency is satisfied, on the basis of the information available, that subject to compliance with the conditions of this licence, any emissions fiom the activity will comply with and will not contravene any of the requirements of Section 83(5) of the Environmental Protection Agency Acts 1992 to 2007.
In reaching this decision the Environmental Protection Agency has considered the application, supporting documentation and objection received fi-om the applicant, and the reports of its inspectors.
Part I Schedule of Activities Licensed
In pursuance of the powers conferred on it by the Environmental Protection Agency Acts 1992 to 2007, the Agency hereby grants this Integrated Pollution Prevention & Control licence to:
Dairygold Co-operative Society Limited, Unit 5 100, Cork Airport Business Park, Kinsale Road, Cork,
under Section 83( 1) of the said Acts to carry on the following activity:-
The treatment and processing of milk, the quantity of milk received being greater than 200 tonnes per day (average value on a yearly basis),
at Mogeely, County Cork, subject to the following twelve Conditions, with the reasons therefor and associated schedules attached thereto.
Part II Schedule of Activities Refused
None of the proposed activities as set out in the licence application have been refused.
5
For
insp
ectio
n pur
pose
s only
.
Conse
nt of
copy
right
owne
r req
uired
for a
ny ot
her u
se.
EPA Export 07-11-2018:04:04:38

Part 111 Conditions
Condition 1. Scope
1.1 IPPC activities at this installation shall be restricted to those listed and described in Part I Schedule of Activities Licensed, and shall be as set out in the licence application or as modified under Condition 1.4 of this licence and subject to the conditions of this licence.
Activities at this installation shall be limited as set out in Schedule A: Limitations, of this licence.
For the purposes of this licence, the installation authorised by this licence is the area of land outlined in red on Drawing No. 0733-D-CE-001 of the application. Any reference in this licence to “installation” shall mean the area thus outlined in red. The licensed activity shall be carried on only within the area outlined.
No alteration to, or reconstruction in respect of, the activity, or any part thereof, that would, or is likely to, result in
(i) a material change or increase in:
1.2
1.3
1.4
. .
.
the nature or quantity of any emission;
the abatemenvtreatment or recovery systems;
the range of processes to be carried out;
the fuels, raw materials, intermediates, products or wastes generated, or
(ii) any changes in: . site management, infiastructure or control with adverse environmental significance;
shall be carried out or commenced without prior notice to, and without the agreement of, the Agency.
The installation shall be controlled, operated and maintained, and emissions shall take place as set out in the licence. All programmes required to be carried out under the terms of this licence become part of this licence.
This licence is for the purpose of IPPC licensing under the EPA Acts 1992 to 2007 only and nothing in this licence shall be construed as negating the licensee’s statutory obligations or requirements under any other enactments or regulations.
1.5
1.6
Reason: To clurifi the scope of this licence.
Condition 2. Management of the Installation
2.1 Installation Management
2.1.1 The licensee shall employ a suitable qualified and experienced installation manager who shall be designated as the person in charge. The installation manager or a nominated, suitably qualified and experienced deputy shall be present on the installation at all times during its operation or as otherwise required by the Agency.
The licensee shall ensure that personnel performing specifically assigned tasks shall be qualified on the basis of appropriate education, training and experience as required and shall be aware of the requirements of this licence.
2.1.2
6
For
insp
ectio
n pur
pose
s only
.
Conse
nt of
copy
right
owne
r req
uired
for a
ny ot
her u
se.
EPA Export 07-11-2018:04:04:38

Environmental Protection Agency Licence Rea. No. PO81 7-01
2.2 Environmental Management System (EMS)
2.2.1 The licensee shall establish and maintain an Environmental Management System (EMS) within six months of the date of grant of this licence. The EMS shall be updated on an annual basis.
The EMS shall include, as a minimum, the following elements: 2.2.2
2.2.2.1
2.2.2.2
2.2.2.3
2.2.2.4
2.2.2.5
2.2.2.6
Management and Reporting Structure.
Schedule of Environmental Objectives and Targets
The licensee shall prepare and maintain a Schedule of Environmental Objectives and Targets. The schedule shall, as a minimum, provide for a review of all operations and processes, including an evaluation of practicable options, for energy and resource efficiency, the use of cleaner technology, cleaner production, the reduction of chloride emissions in SW-3 and the prevention, reduction and minimisation of waste and shall include waste reduction targets. The schedule shall include time fi-ames for the achievement of set targets and shall address a five-year period as a minimum. The schedule shall be reviewed annually and amendments thereto notified to the Agency for agreement as part of the Annual Environmental Report (AER).
Environmental Management Programme (EMP)
The licensee shall, not later than six months from the date of grant of this licence, submit to the Agency for agreement an EMP, including a time schedule, for achieving the Environmental Objectives and Targets prepared under Condition 2.2.2.2. Once agreed the EMP shall be established and maintained by the licensee. It shall include: . 9 . The EMP shall be reviewed annually and amendments thereto notified to the Agency for agreement as part of the Annual Environmental Report (AER).
A report on the programme, including the success in meeting agreed targets, shall be prepared and submitted to the Agency as part of the AER. Such reports shall be retained on-site for a period of not less than seven years and shall be available for inspection by authorised persons of the Agency.
Documentation
(i) The licensee shall establish and maintain an environmental management documentation system which shall be to the satisfaction of the Agency.
The licensee shall issue a copy of this licence to all relevant personnel whose duties relate to any condition of this licence.
designation of responsibility for targets; the means by which they may be achieved; the time within which they may be achieved.
(ii)
Corrective Action
The licensee shall establish procedures to ensure that corrective action is taken should the specified requirements of this licence not be fulfilled. The responsibility and authority for persons initiating further investigation and corrective action in the event of a reported non-conformity with this licence shall be defined.
Awareness and Training
The licensee shall establish and maintain procedures for identifying training needs, and for providing appropriate training, for all personnel whose work can have a significant effect upon the environment. Appropriate records of training shall be maintained.
For
insp
ectio
n pur
pose
s only
.
Conse
nt of
copy
right
owne
r req
uired
for a
ny ot
her u
se.
EPA Export 07-11-2018:04:04:38

Environmental Protection Agencv Licence Reg. No. PO81 7-01
2.2.2.7 Communications Programme
The licensee shall establish and maintain a Public Awareness and Communications Programme to ensure that members of the public can obtain information at the installation, at all reasonable times, concerning the environmental performance of the installation.
2.2.2.8 Maintenance Programme
The licensee shall establish and maintain a programme for maintenance of all plant and equipment based on the instructions issued by the manufacturer/supplier or installer of the equipment. Appropriate record keeping and diagnostic testing shall support this maintenance programme. The licensee shall clearly allocate responsibility for the planning, management and execution of all aspects of this programme to appropriate personnel (see Condition 2.1 above).
2.2.2.9 Efficient Process Control
The licensee shall establish and maintain a programme to ensure there is adequate control of processes under all modes of operation. The programme shall identify the key indicator parameters for process control performance, as well as identifying methods for measuring and controlling these parameters. Abnormal process operating conditions shall be documented, and analysed to identify any necessary corrective action.
Reason: To make provision for managenrent of the activity on a planned basis having regard to the desirability of ongoing assessment, recording and reporting of matters affecting the environment.
Condition 3. Infrastructure and Operation
3.1 The licensee shall establish and maintain, for each component of the installation, all infrastructure referred to in this licence. Infrastructure specified in the application that relates to the environmental performance of the installation and is not specified in the licence, shall be installed in accordance with the schedule submitted in the application.
3.2 Installation Notice Board
3.2.1 The licensee shall, within one month of the date of grant of this licence, provide an Installation Notice Board on the installation so that it is legible to persons outside the main entrance to the installation. The minimum dimensions of the board shall be 1200 mm by 750 mm. The notice board shall be maintained thereafter.
The board shall clearly show:
(i) (ii) (iii) (iv) (v) (vi)
3.2.2
the name and telephone number of the installation; the normal hours of operation; the name of the licence holder; an emergency out of hours contact telephone number; the licence reference number; and where environmental information relating to the installation can be obtained.
The licensee shall install on all emission points such sampling points or equipment, including any data-logging or other electronic communication equipment, as may be required by the Agency. All such equipment shall be consistent with the safe operation of all sampling and monitoring systems.
3.3
8
For
insp
ectio
n pur
pose
s only
.
Conse
nt of
copy
right
owne
r req
uired
for a
ny ot
her u
se.
EPA Export 07-11-2018:04:04:38

Environmental Protection Anencv Licence Rea. No. PO81 7-01
3.4 In the case of composite sampling of aqueous emissions from the operation of the installation, a separate composite sample or homogeneous sub-sample (of sufficient volume as advised) shall be refrigerated immediately after collection and retained as required for EPA use.
The licensee shall clearly label and provide safe and permanent access to all on-site sampling and monitoring points and to off-site points as required by the Agency. The requirement with regard to off-site points is subject to the prior agreement of the landowner(s) concerned.
Tank, Container and Drum Storage Areas
3.6.1
3.5
3.6
All tank, container and drum storage areas shall be rendered impervious to the materials stored therein. Bunds shall be designed having regard to Agency guidelines ‘Storage and Transfer of Materials for Scheduled Activities’ (2004).
All tank and drum storage areas shall, as a minimum, be bunded, either locally or remotely, to a volume not less than the greater of the following:
( 0 1 10% of the capacity of the largest tank or drum within the bunded area; or
(ii) 25% of the total volume of substance that could be stored within the bunded area.
All drainage from bunded areas shall be treated as hazardous waste unless it can be demonstrated to be otherwise. All drainage from bunded areas shall be diverted for collection and safe disposal.
All inlets, outlets, vent pipes, valves and gauges must be within the bunded area.
All tanks, containers and drums shall be labelled to clearly indicate their contents.
3.6.2
3.6.3
3.6.4
3.6.5
The licensee shall have in storage an adequate supply of containment booms and/or suitable absorbent material to contain and absorb any spillage at the installation. Once used, the absorbent material shall be disposed of at an appropriate facility.
Silt Traps and Oil Separators
The licensee shall, within six months of date of grant of this licence, install and maintain silt traps and oil separators at the installation:
(i) Silt traps to ensure that all storm water discharges, other than from roofs, from the installation pass through a silt trap in advance of discharge;
(ii) An oil separator on the storm water discharge from yard areas. The separator shall be a Class I full retention separator.
The silt traps and separator shall be in accordance with I.S. EN-858-2: 2003 (separator systems for light liquids
3.7
3.8
3.9 Fire-water Retention
3.9.1 The licensee shall carry out a risk assessment to determine if the activity should have a fire-water retention facility. The licensee shall submit the assessment and a report to the Agency on the findings and recommendations of the assessment within six months of the date of grant of this licence.
In the event that a significant risk exists for the release of contaminated fire-water, the licensee shall, based on the findings of the risk assessment, prepare and implement, with the agreement of the Agency, a suitable risk management programme. The risk management programme shall be fully implemented within three months of date of notification by the Agency.
The licensee shall have regard to the Environmental Protection Agency Draft Guidance Note to Industry on the Requirements for Fire-Water Retention Facilities when implementing Conditions 3.9.1,3.9.2 above.
All pumps sumps, storage tanks, lagoons or other treatment plant chambers from which spillage of environmentally significant materials might occur in such quantities as are likely to breach local or remote containment or separators, shall be fitted with high liquid level alarms (or oil detectors as appropriate) within six months from the date of grant of this licence. The provision of a catchment system to collect any leaks from flanges and valves of all over-
3.9.2
3.9.3
3.10
l k 9
For
insp
ectio
n pur
pose
s only
.
Conse
nt of
copy
right
owne
r req
uired
for a
ny ot
her u
se.
EPA Export 07-11-2018:04:04:38

Environmental Protection Aaenc?, Licence Reg. No. PO817-01
ground pipes used to transport material other than water shall be examined. This shall be incorporated into a Schedule of Environmental Objectives and Targets set out in Condition 2. of this licence for the reduction in fugitive emissions.
All wellheads, as shown on Map Drawing Number 0733-D-CE-002, Appendix 1 of the application shall be adequately protected to prevent contamination or physical damage within three months ftom the date of grant of this licence.
The licensee shall, within three months of the date of grant of this licence, install and maintain in a prominent location on the site a wind sock, or other wind direction indicator, which shall be visible from the public roadway outside the site.
Natural gas, gas oil or biodiesel meeting CEN standard EN14214 shall be used in the boilers on site. In the event of an interruption to the supply of natural gas, gas oil or biodiesel may be used.
The licensee shall, by the 30th June 201 1, provide a minimum of 16 weeks storage capacity for organic waste on-site or at an agreed storage location.
3.11
3.12
3.13
3.14
Reason: To provide for appropriate operation of the instullution to ensure protection of the environment.
Condition 4. Interpretation 4.1 Emission limit values for emissions to atmosphere in this licence shall be interpreted in the
following way:
4.1.1 Continuous Monitoring
(i)
(ii)
(iii)
No 24 hour mean value shall exceed the emission limit value.
97% of all 30 minute mean values taken continuously over an annual period shall not exceed 1.2 times the emission limit value.
No 30 minute mean value shall exceed twice the emission limit value.
4.1.2 Non-Continuous Monitoring
(i) For any parameter where, due to sampling/analytical limitations, a 30 minute sample is inappropriate, a suitable sampling period should be employed and the value obtained therein shall not exceed the emission limit value.
For flow, no hourly or daily mean value, calculated on the basis of appropriate spot readings, shall exceed the relevant limit value.
For all other parameters, no 30 minute mean value shall exceed the emission limit value.
Mass flow limits shall be calculated on the basis of the concentration, determined as an average over the specified period, multiplied by an appropriate measurement of flow. No value, so determined, shall exceed the mass flow limit value.
The concentration and volume flow limits for emissions to atmosphere specified in this licence shall be achieved without the introduction of dilution air and shall be based on gas volumes under standard conditions of:
4.2.1
(ii)
(iii)
(iv)
4.2
In the case of non-combustion gases:
Temperature 273#, Pressure 101.3 kPa (no correction for oxygen or water content).
In the case of combustion gases:
Temperature 273K, Pressure 101.3 kPa, dry gas; 3% oxygen for liquid and gas fuels.
4.2.2
10
For
insp
ectio
n pur
pose
s only
.
Conse
nt of
copy
right
owne
r req
uired
for a
ny ot
her u
se.
EPA Export 07-11-2018:04:04:38

Environmental Protection Aaenc?, Licence Rep. No. PO81 7-01
4.3 Emission limit values for emissions to waters in this licence shall be interpreted in the following way:
4.3.1 Continuous Monitoring
(i)
(ii)
(iii)
No flow value shall exceed the specific limit.
No pH value shall deviate from the specified range.
No temperature value shall exceed the limit value.
4.3.2 Composite Sampling
(i)
(ii)
No pH value shall deviate from the specified range.
For parameters other than pH and flow, eight out of ten consecutive composite results, based on flow proportional composite sampling, shall not exceed the emission limit value. No individual results similarly calculated shall exceed 1.2 times the emission limit value.
4.3.3 Discrete Sampling
For parameters other than pH and temperature, no grab sample value shall exceed 1.2 times the emission limit value.
Where the ability to measure a parameter is affected by mixing before emission, then, with agreement from the Agency, the parameter may be assessed before mixing takes place.
4.4
4.5 Noise
Noise from the installation shall not give rise to sound pressure levels (Leq, T) measured at Noise Sensitive Locations at the installation which exceed the limit value(s).
Reason: To clarijj the interpretation of limit values f i e d under the licence.
Condition 5. Emissions
5.1 No specified emission from the installation shall exceed the emission limit values set out in Schedule B: Emission Limits, of this licence. There shall be no other emissions of environmental significance.
No emissions, including odours, from the activities carried on at the site shall result in an impairment of, or an interference with amenities or the environment beyond the installation boundary or any other legitimate uses of the environment beyond the installation boundary.
No substance shall be discharged in a manner, or at a concentration, that, following initial dilution, causes tainting of fish or shellfish.
The operation of the electricity generator is limited to the period of the ESB Winter Peak Demand Reduction Scheme and is further limited to four hours per day during this period, or if outside this period, only for testing and emergency purposes, unless otherwise agreed in advance with the Agency and contingent upon compliance with Air Quality Standards Regulations 2002, SI 27 1 of 2002. The licensee shall submit, in the AER, an assessment of the emissions from the electricity generator, having regard to the Air Quality Standards Regulation 2002, SI 271 of 2002.
5.2
5.3
5.4
Reason: To provide for the protection of the environment by way of control and limitation of emissions.
11
For
insp
ectio
n pur
pose
s only
.
Conse
nt of
copy
right
owne
r req
uired
for a
ny ot
her u
se.
EPA Export 07-11-2018:04:04:38

I
Environmental Protection Agency Licence Ren. No. PO81 7-01
Condition 6. Control and Monitoring
6.1
6.2
6.3
6.4
6.5
6.6
6.7
6.8
6.9
The licensee shall carry out such sampling, analyses, measurements, examinations, maintenance and calibrations as set out below and as in accordance with Schedule C: Control & Monitoring, of this licence.
6.1.1 Analyses shall be undertaken by competent staff in accordance with documented operating procedures.
Such procedures shall be assessed for their suitability for the test matrix and performance characteristics shall be determined.
Such procedures shall be subject to a programme of Analytical Quality Control using control standards with evaluation of test responses.
Where any analysis is sub-contracted it shall be to a competent laboratory.
6.1.2
6.1.3
6.1.4
The licensee shall ensure that:
(i)
(ii) shall be carried out in accordance with CEN-standards. If CEN standards are not available, ISO, national or international standards that will ensure the provision of data of an equivalent scientific quality shall apply.
All automatic monitors and samplers shall be functioning at all times (except during maintenance and calibration) when the activity is being carried on unless alternative sampling or monitoring has been agreed in writing by the Agency for a limited period. In the event of the malfunction of any continuous monitor, the licensee shall contact the Agency as soon as practicable, and alternative sampling and monitoring facilities shall be put in place. The use of alternative equipment, other than in emergency situations, shall be as agreed by the Agency.
Monitoring and analysis equipment shall be operated and maintained as necessary so that monitoring accurately reflects the emissioddischarge (or ambient conditions where that is the monitoring objective).
The licensee shall ensure that groundwater monitoring well sampling equipment is availablehnstalled on-site and is fit for purpose at all times. The sampling equipment shall be to Agency specifications.
All treatmenuabatement and emission control equipment shall be calibrated and maintained in accordance with the instructions issued by the manufacturerhpplier or installer.
The fi-equency, methods and scope of monitoring, sampling and analyses, as set out in this licence, may be amended with the agreement of the Agency following evaluation of test results.
The licensee shall prepare a programme, to the satisfaction of the Agency, for the identification and reduction of fugitive emissions using an appropriate combination of best available techniques. This programme shall be included in the Environmental Management Programme.
The integrity and water tightness of all underground pipes, tanks, bunding structures and containers and their resistance to penetration by water or other materials carried or stored therein shall be tested and demonstrated by the licensee within twelve months of the date of grant of this licence. This testing shall be carried out by the licensee at least once every three years thereafter and reported to the Agency on each occasion. This testing shall be carried out in accordance with any guidance published by the Agency. A written record of all integrity tests and any maintenance or remedial work arising fi-om them shall be maintained by the licensee.
sampling and analysis for all parameters listed in the Schedules to this licence; and
any reference measurements for the calibration of automated measurement systems;
12
For
insp
ectio
n pur
pose
s only
.
Conse
nt of
copy
right
owne
r req
uired
for a
ny ot
her u
se.
EPA Export 07-11-2018:04:04:38

Environmental Protection Agenc?, Licence Rea. No. PO81 7-01
6.10
6.11
6.12
6.13
6.14
6.15
The drainage system (i.e., gullies, manholes, any visible drainage conduits and such other aspects as may be agreed) and bunds, silt traps and oil separators shall be inspected weekly and desludged as necessary. All sludge and drainage from these operations shall be collected for safe disposal. The drainage system, bunds, silt traps and oil interceptors shall be properly maintained at all times.
An inspection for leaks on all flanges and valves on over-ground pipes used to transport materials other than water shall be carried out weekly. A log of such inspections shall be maintained.
Process Effluent
6.12.1 The acute toxicity of the undiluted final effluent to at least four aquatic species from different trophic levels shall be determined by standardised and internationally accepted procedures and carried out by a competent laboratory. The name of the laboratory and the scope of testing to be undertaken shall be submitted, in writing, to the Agency, within three months of the date of grant of this licence. Once the testing laboratory and the scope of testing have been agreed by the Agency, the Agency shall decide when this testing is to be carried out and copies of the complete reports shall be submitted by the licensee to the Agency within six weeks of completion of the testing.
Having identified the most sensitive species outlined in Condition 6.12.1, subsequent compliance toxicity monitoring on the two most sensitive species shall be carried out by the laboratory identified in Condition 6.12.1. The Agency shall decide when this testing is to be carried out and copies of the complete reports shall be submitted by the licensee to the Agency within six weeks of completion of the testing.
A representative sample of effluent shall be screened for the presence of organic compounds. Such screening shall be repeated at intervals as requested by the Agency thereafter.
The licensee shall, within eighteen months of grant of licence, carry out a feasibility study to assess the options for the reduction of phosphorous in the final effluent. The preferred option, as well as its timeframe for implementation, shall be agreed with the Agency.
6.12.2
6.12.3
6.12.4
Storm Water
A visual examination of the storm water discharges shall be carried out daily. A log of such inspections, shall be maintained.
Ground Water
The licensee shall, subject to the results of the monitoring specified in Schedule C.6 Groundwater Monitoring, of this licence and as required by the Agency, arrange for the carrying out of a comprehensive hydrogeological investigation of the site. The scope, detail and programme, including report structure and reporting schedule, for this investigation must be agreed by the Agency prior to implementation. This investigation must have regard for the appropriate monitoring requirements for this installation; in particular, the appropriate number and location of monitoring wells, as well as the appropriate parameters and monitoring fi-equency. Furthermore, this investigation must have regard to the requirements of S.I. No.9 of 2010, and any amendments thereof, as well as any relevant guidance issued by the Agency. The implementation of any recommendations arising from a report or reports on this investigation must be agreed by the Agency. The timefi-ame for any such implementation must also be agreed with the Agency.
Noise
6.15.1 The licensee shall meet the emission limit values specified in Schedule 8.4 Noise Emissions of this licence at any noise sensitive locations.
13
For
insp
ectio
n pur
pose
s only
.
Conse
nt of
copy
right
owne
r req
uired
for a
ny ot
her u
se.
EPA Export 07-11-2018:04:04:38

I
Environmental Protection Agencv Licence Reg. No. PO81 7-01
6.16
6.17
6.15.2
6.15.3
The licensee shall carry out a comprehensive noise survey of the site operations, at four monitoring points at the site boundary (Bl, B2, B3 and B4) and at two noise sensitive locations (NSL1 and NSL2), within six months of date of grant of licence, and thereafter, annually. The survey programme shall be undertaken in accordance with the methodology specified in the ‘Environmental Noise Survey Guidance Document’ as published by the Agency.
The licensee shall, within twelve months of date of grant of licence, establish and thereafter maintain a noise reduction programme to reduce noise emissions. This shall be incorporated into the Schedule of Environmental Objectives and Targets set out in Condition 2 of this licence. The results of noise survey programme as required in Condition 6.15.2; shall be used to inform the noise reduction programme. The licensee shall submit a report on the programme as part of the AER annually.
Pollutant Release and Transfer Register (PRTR)
The licensee shall prepare and report a PRTR for the site. The substance and/or wastes to be included in the PRTR shall be as agreed by the Agency each year by reference to EC Regulations No. 166/2006 concerning the establishment of the European Pollutant Release and Transfer Register and amending Council Directives 91/689/EEC and 96/61/EC. The PRTR shall be prepared in accordance with any relevant guidelines issued by the Agency and shall be submitted electronically in specified format and as part of the AER.
The licensee shall, within six months of the date of grant of this licence, develop and establish a Data Management System for collation, archiving, assessing and graphically presenting the monitoring data generated as a result of this licence.
Reason: To provide for the protection of the environment by way of treatment and monitoring of emissions.
Condition 7. Resource Use and Energy Efficiency
7.1 The licensee shall carry out an audit of the energy efficiency of the site within one year of the date of grant of this licence. The audit shall be carried out in accordance with the guidance published by the Agency, “Guidance Note on Energy Efficiency Auditing”. The energy efficiency audit shall be repeated at intervals as required by the Agency.
The audit shall identify all practicable opportunities for energy use reduction and efficiency and the recommendations of the audit will be incorporated into the Schedule of Environmental Objectives and Targets under Condition 2 above.
The licensee shall identify opportunities for reduction in the quantity of water used on site including recycling and reuse initiatives, wherever possible. Reductions in water usage shall be incorporated into Schedule of Environmental Objectives and Targets.
The licensee shall undertake an assessment of the efficiency of use of raw materials in all processes, having particular regard to the reduction in waste generated. The assessment should take account of best international practice for this type of activity. Where improvements are identified, these shall be incorporated into the Schedule of Environmental Objectives and Targets.
7.2
7.3
7.4
Reason: To provide for the efficient use of resources and energy in all site operations. 1
14
For
insp
ectio
n pur
pose
s only
.
Conse
nt of
copy
right
owne
r req
uired
for a
ny ot
her u
se.
EPA Export 07-11-2018:04:04:38

Environmental Protection Aaencv Licence Ren. No. PO81 7-01
Condition 8. Materials Handling
8.1
8.2
8.3
8.4
8.5
8.6
8.7
8.8
8.9
8.10
Waste sent off-site for recovery or disposal shall be transported only by an authorised waste contractor or an exempted person (Waste Management (Collection Permit) Regulations, 2007- 2008). The waste shall be transported from the site of the activity to the site of recovery/disposal only in a manner which will not adversely affect the environment. Such transportation shall be in accordance with the appropriate National and European legislation and protocols.
The transport of organic waste via the public road shall be carried out in sealed containers such that no spillage can occur.
The loading and unloading of materials shall be carried out in designated areas protected against spillage and leachate run-off.
Waste shall be stored in designated areas, protected as may be appropriate against spillage and leachate run-off. The waste shall be clearly labelled and appropriately segregated.
No waste classified as green list waste in accordance with the EU Shipment of Waste Regulations (Council Regulation EEC No. 1013/2006, as may be amended) shall be consigned for recovery without the agreement of the Agency.
Waste for disposalhecovery off-site shall be analysed in accordance with Schedule C: Control & Monitoring, of this licence.
Unless approved in writing, in advance, by the Agency the licensee is prohibited fiom mixing a hazardous waste of one category with a hazardous waste of another category or with any other non-hazardous waste.
The licensee shall neither import waste into the State nor export waste out of the State except in accordance with the relevant provisions of Regulation (EC) No 1013/2006 of the European Parliament and of the Council of 14th June 2006 on shipments of waste and associated national regulations.
Organic Waste shall be considered to be a manure or fertilizer when recovered as defined in the Waste Management Acts 1996 to 2010 and as agreed by the Agency.
Organic Waste shall only be recovered by landspreading subject to the following conditions and the prior agreement of the Agency:
8.10.1 The licensee shall submit by the first of January annually and maintain on-site the following:
(i) A record of the annual production of organic waste including the nitrogen and phosphorus content of this annual production;
(ii) Summary table of customer farmers receiving organic waste. The table shall include as a minimum ‘Customer Code’ (Name to be maintained on- site), ‘Townlands’ and ‘Quantity of Organic Waste (m3)’. The table shall be updated based on a nutrient management plan, as required, to include additional lands acquired during the year;
(iii)
(iv)
Map (scale of 1:50,000) showing the location of farms where organic waste may be recovered;
Declaration by suitable qualified person that lands, for recovery of organic waste, have been inspected and are suitable for landspreading, and
15
For
insp
ectio
n pur
pose
s only
.
Conse
nt of
copy
right
owne
r req
uired
for a
ny ot
her u
se.
EPA Export 07-11-2018:04:04:38

Environmental Protection Anencv Licence Rea. No. PO81 7-01
(v) A nutrient management plan for all lands demonstrating adequate capacity for recovery of organic waste generated at the installation. Nutrient management plans shall be to the satisfaction of the Agency and shall be agreed prior to the movement of organic waste off-site. Nutrient management plans may, until 1 January 20 1 1, be based on the ‘Nitrogen and Phosphorus’ Statements issued by the Department of Agriculture, Fisheries and Food. Nutrient management plans shall be maintained on-site for inspection by authorised persons.
8.10.2 The licensee shall maintain on-site for inspection by authorised persons maps (scale 1:10,560) showing land that may be used for recovery of organic waste.
8.10.3 The licensee shall ensure, in all cases where there is a transfer of organic waste from the installation to storage provided on farms in the client list, that the recipient farmer is advised of the need to store the organic waste in a purpose-built holding structure adequate for the protection of groundwater and surface water.
Soil monitoring shall be undertaken as outlined in Schedule C.6 Ambient Monitoring, Land Used for Landspreading, of this licence and a summary report included as part of the Nutrient Management Plan.
Landspreading shall, as a minimum, be carried out in accordance with S.I. No. 101 of 2009 European Communities (Good Agricultural Practice for Protection of Waters) Regulations 2009. All landspreading activities shall be carried out in such a manner as to avoid contamination of surface waters and groundwaters, and so as to minimise odour nuisance.
Landspreading shall be undertaken only in accordance with appropriate national standards and protocols as agreed by the Agency.
Landspreading from this activity shall take place only on lands agreed in advance in writing by the Agency. Alterations to this landbank are subject to prior written agreement with the Agency.
Landspreading shall be undertaken to ensure an even spread of organic waste over land. Organic Waste shall be spread using soil injection, bandspreading or low trajectory splashplate methods. Any other method must be agreed in advance by the Agency.
8.10.4
8.10.5
8.10.6
8.10.7
8.11
Reason: To provide for the appropriate hundling of material und the protection of the environment.
Condition 9. Accident Prevention and Emergency Response
9.1 The licensee shall, within six months of date of grant of this licence, ensure that a documented Accident Prevention Procedure is in place that addresses the hazards on-site, particularly in relation to the prevention of accidents with a possible impact on the environment. This procedure shall be reviewed annually and updated as necessary.
The licensee shall, within six months of date of grant of this licence, ensure that a documented Emergency Response Procedure is in place that addresses any emergency situation which may originate on-site. This procedure shall include provision for minimising the effects of any emergency on the environment. This procedure shall be reviewed annually and updated as necessary.
9.2
9.3 Incidents
9.3.1 In the event of an incident the licensee shall immediately:
(i) carry out an investigation to identify the nature, source and cause of the incident and any emission arising therefrom;
16
For
insp
ectio
n pur
pose
s only
.
Conse
nt of
copy
right
owne
r req
uired
for a
ny ot
her u
se.
EPA Export 07-11-2018:04:04:38

Environmental Protection Agency Licence Reg. No. PO81 7-01
(ii) (iii) (iv)
(v) (vi) The licensee shall provide a proposal to the Agency for its agreement within one month of the incident occurring or as otherwise agreed by the Agency, to:
isolate the source of any such emission; evaluate the environmental pollution, if any, caused by the incident; identify and execute measures to minimise the emissions/malbnction and the effects thereof; identify the date, time and place of the incident; notify the Agency and other relevant authorities.
9.3.2
(i) identify and put in place measures to avoid recurrence of the incident; and (ii) identify and put in place any other appropriate remedial actions.
Reason: Tu provide for the protection of the environment.
Condition 10. Closure, Restoration and Aftercare Management
10.1 Following termination, or planned cessation for a period greater than six months, of use or involvement of all or part of the site in the licensed activity, the licensee shall, to the satisfaction of the Agency, decommission, render safe or remove for disposallrecovery any soil, subsoil, buildings, plant or equipment, or any waste, materials or substances or other matter contained therein or thereon, that may result in environmental pollution.
Closure, Restoration and Aftercare Management Plan (CRAMP)
10.2.1
10.2
The licensee shall prepare, to the satisfaction of the Agency, a fully detailed and costed plan for the decommissioning or closure of the site or part thereof. This plan shall be submitted to the Agency for agreement within six months of the date of grant of the licence
The plan shall be reviewed annually and proposed amendments thereto notified to the Agency for agreement as part of the AER. No amendments may be implemented without the agreement of the Agency.
The licensee shall have regard to the Environmental Protection Agency Guidance on Environmental Liability Risk Assessment, Decommissioning Management Plans and Financial Provision when implementing Condition 10.2.1 above.
10.2.2
10.2.3
10.3 The Decommissioning Management Plan shall include, as a minimum, the following:
(i) a scope statement for the plan; (ii) the criteria that define the successhl decommissioning of the activity or part
thereof, which ensures minimum impact on the environment; (iii) a programme to achieve the stated criteria; (iv) where relevant, a test programme to demonstrate the successful
implementation of the decommissioning plan; and (v) details of the costings for the plan and the financial provisions to underwrite
those costs. A final validation report to include a certificate of completion for the Decommissioning Management Plan, for all or part of the site as necessary, shall be submitted to the Agency within three months of execution of the plan. The licensee shall carry out such tests, investigations or submit certification, as requested by the Agency, to confn-m that there is no continuing risk to the environment.
10.4
Reason: To make provision for the proper closure of the activity ensuring protection of the environment.
17
For
insp
ectio
n pur
pose
s only
.
Conse
nt of
copy
right
owne
r req
uired
for a
ny ot
her u
se.
EPA Export 07-11-2018:04:04:38

Environmental Protection Aaency Licence Rea. No. PO81 7-01
Condition 11. Notification, Records and Reports
11.1
11.2
11.3
11.4
11.5
11.6
The licence shall notify the Agency by both telephone and facsimile, if available, to the Agency’s headquarters in Wexford, or to such other Agency office as may be specified by the Agency, as soon as practicable after the occurrence of any of the following:
(i) any release of environmental significance to atmosphere fi-om any potential
(ii) (iii)
emissions point including bypasses; any emission that does not comply with the requirements of this licence; any malhnction or breakdown of key control equipment or monitoring equipment set out in Schedule C: Control and Monitoring, of this licence which is likely to lead to loss of control of the abatement system; and any incident with the potential for environmental contamination of surface water or groundwater, or posing an environment threat to air or land, or requiring an emergency response by the Local Authority.
The licensee shall include as part of the notification, date and time of the incident, summary details of the occurrence, and where available, the steps taken to minimise any emissions.
In the case of any incident relating to discharges to water, the licensee shall notify the Local and Water Services Authority and Inland Fisheries Ireland as soon as practicable after such an incident.
The licensee shall make a record of any incident. This record shall include details of the nature, extent, and impact of, and circumstances giving rise to, the incident. The record shall include all corrective actions taken to manage the incident, minimise wastes generated and the effect on the environment, and avoid recurrence. The licensee shall, as soon as practicable following incident notification, submit to the Agency the incident record.
The licensee shall record all complaints of an environmental nature related to the operation of the activity. Each such record shall give details of the date and time of the complaint, the name of the complainant (if provided), and give details of the nature of the complaint. A record shall also be kept of the response made in the case of each complaint.
The licensee shall record all sampling, analyses, measurements, examinations, calibrations and maintenance carried out in accordance with the requirements of this licence and all other such monitoring which relates to the environmental performance of the installation.
The licensee shall as a minimum keep the following documents at the site:
(i) (ii) (iii) (iv)
(iv)
the licences relating to the installation; the current EMS for the installation; the previous year’s AER for the installation; records of all sampling, analyses, measurements, examinations, calibrations and maintenance carried out in accordance with the requirements of this licence and all other such monitoring which relates to the environmental performance of the installation;
(v) relevant correspondence with the Agency; (vi) up-to-date site drawings/plans showing the location of key process and
environmental infrastructure, including monitoring locations and emission points; (vii) up-to-date Standard Operational Procedures for all processes, plant and equipment
necessary to give effect to this licence or otherwise to ensure that standard operation of such processes, plant or equipment does not result in unauthorised emissions to the environment; any elements of the licence application or EIS documentation referenced in this licence.
(viii)
This documentation shall be available to the Agency for inspection at all reasonable times.
18
For
insp
ectio
n pur
pose
s only
.
Conse
nt of
copy
right
owne
r req
uired
for a
ny ot
her u
se.
EPA Export 07-11-2018:04:04:38

I
Environmental Protection Anency Licence Ren. No. PO81 7-01
11.7
11.8
11.9
11.10
11.11
The licensee shall submit to the Agency, by the 3 lSt March of each year, an AER covering the previous calendar year. This report, which shall be to the satisfaction of the Agency, shall include as a minimum the information specified in Schedule D: Annual Environmental Report, of this licence and shall be prepared in accordance with any relevant guidelines issued by the Agency.
A full record, which shall be open to inspection by authorised persons of the Agency at all times, shall be kept by the licensee on matters relating to the waste management operations and practices at this site. This record shall be maintained on a monthly basis and shall as a minimum contain details of the following:
(i) the tonnages and EWC Code for the waste materials sent off-site for disposal/recovery ;
(ii) the names of the agent and carrier of the waste, and their waste collection permit details, if required (to include issuing authority and vehicle registration number);
(iii) details of the ultimate disposal/recovery destination facility for the waste and its appropriateness to accept the consigned waste stream, to include its permit/licence details and issuing authority, if required; written conf ia t ion of the acceptance and disposalhecovery of any hazardous waste consignments sent off-site; details of all waste consigned abroad for Recovery and classified as ‘Green’ in accordance with the EU Shipment of Waste Regulations (Council Regulation EEC No. 1013/2006, as may be amended). The rationale for the classification must form part of the record; details of any rejected consignments; details of any approved waste mixing; the results of any waste analyses required under Schedule C: Control & Monitoring, of this licence; and the tonnage and EWC Code for the waste materials recovered/disposed on-site.
(iv)
(v)
(vi) (vii) (viii)
(ix) The licensee shall submit report(s) as required by the conditions of this licence to the Agency’s Headquarters in Wexford, or to such other Agency office as may be specified by the Agency.
All reports shall be certified accurate and representative by the installation manager or a nominated, suitably qualified and experienced deputy.
The licensee shall maintain an ‘Organic Waste Register’, to the satisfaction of the Agency, showing, as a minimum, details in accordance with Article 23 of S.I. No. 101 of 2009 European Communities (Good Agricultural Practice for Protection of Waters) Regulations 2009.
Reason: To provide for the collection and reporting of adequate information on the activity.
19
For
insp
ectio
n pur
pose
s only
.
Conse
nt of
copy
right
owne
r req
uired
for a
ny ot
her u
se.
EPA Export 07-11-2018:04:04:38

Environmental Protection Aaencv Licence Rea. No. PO81 7-01
Condition 12. Financial Charges and Provisions
12.1
12.2
12.3
Agency Charges
12.1.1 The licensee shall pay to the Agency an annual contribution of €14,614.72, or such sum as the Agency from time to time determines, having regard to variations in the extent of reporting, auditing, inspection, sampling and analysis or other functions carried out by the Agency, towards the cost of monitoring the activity as the Agency considers necessary for the performance of its functions under the Environmental Protection Agency Acts 1992 to 2007. The first payment shall be a pro-rata amount for the period from the date of grant of this licence to the 3 lSt day of December, and shall be paid to the Agency within one month from the date of grant of the licence. In subsequent years the licensee shall pay to the Agency such revised annual contribution as the Agency shall from time to time consider necessary to enable performance by the Agency of its relevant functions under the Environmental Protection Agency Acts 1992 to 2007, and all such payments shall be made within one month of the date upon which demanded by the Agency.
In the event that the frequency or extent of monitoring or other functions carried out by the Agency needs to be increased, the licensee shall contribute such sums as determined by the Agency to defray its costs in regard to items not covered by the said annual contribution.
Water Services Authority Charges
The licensee shall pay to the Water Services Authority such sum as may be determined from time to time, having regard to the variations in the cost of providing drainage and the variation in effluent reception and treatment costs. This payment is to be made on demand.
Environmental Liabilities
12.1.2
12.3.1
12.3.2
12.3.3
12.3.4
The licensee shall as part of the AER, provide an annual statement as to the measures taken or adopted at the site in relation to the prevention of environmental damage, and the financial provisions in place in relation to the underwriting of costs for remedial actions following anticipated events (including closure) or accidentshncidents, as may be associated with the carrying on of the activity.
The licensee shall arrange for the completion, by an independent and appropriate qualified consultant, of a comprehensive and fully costed Environmental Liabilities Risk Assessment (ELRA) to address the liabilities from past and present activities. The assessment shall include those liabilities and costs identified in Condition 10 for execution of the DMP. A report on this assessment shall be submitted to the Agency for agreement within twelve months of date of grant of this licence. The ELRA shall be reviewed as necessary to reflect any significant change on site, and in any case every three years following initial agreement. The results of the review shall be notified as part of the AER.
As part of the measures identified in Condition 12.3.1, the licensee shall, to the satisfaction of the Agency, make financial provision to cover any liabilities identified in Condition 12.3.2. The amount of indemnity held shall be reviewed and revised as necessary, but at least annually. Proof of renewal or revision of such financial indemnity shall be included in the annual ‘Statement of Measures’ report identified in Condition 12.3.1.
The licensee shall have regard to the Environmental Protection Agency Guidance on Environmental Liability Risk Assessment, Decommissioning Management Plans and Financial Provision when implementing Conditions 12.3.2 and 12.3.3 above.
Reason: To provide for adequate financing for monitoring and financial provisions for measures to protect the environment.
20
For
insp
ectio
n pur
pose
s only
.
Conse
nt of
copy
right
owne
r req
uired
for a
ny ot
her u
se.
EPA Export 07-11-2018:04:04:38

Environmental Protection Agency Licence Rea. No. PO81 7-01
SCHEDULE A: Limitations
There are no limitations on the installation specified in the Schedule
. SCHEDULE B: Emission Limits
B.1 Emissions to Air
Emission Point Reference No: Location: Volume to be emitted:
Minimum discharges height:
Al-1 Hot Water Boiler 2 Maximum in any one day: Maximum rate per hour: 33.9 m above ground
2 16,000 m3 9,000 m3
21
For
insp
ectio
n pur
pose
s only
.
Conse
nt of
copy
right
owne
r req
uired
for a
ny ot
her u
se.
EPA Export 07-11-2018:04:04:38
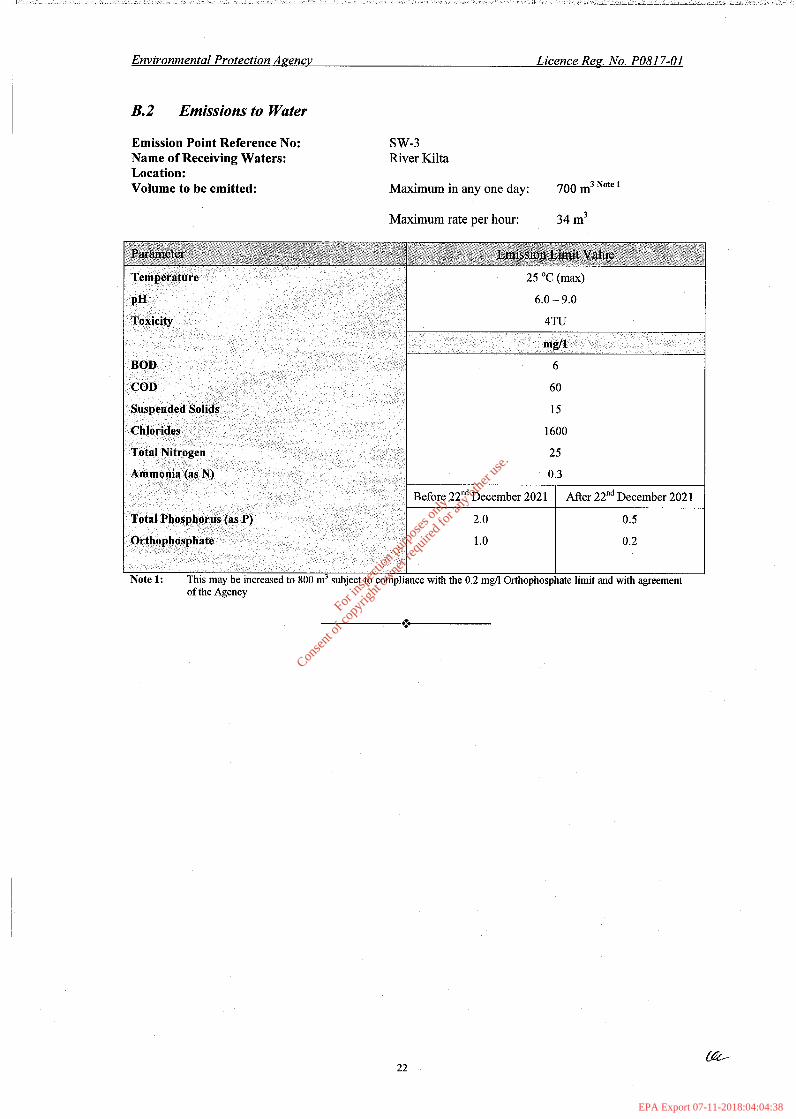
Environmental Protection AFenq Licence Reg No. PO81 7-01
B.2 Emissions to Water
Emission Point Reference No: sw-3 Name of Receiving Waters: Location: Volume to be emitted:
River Kilta
Maximum in any one day:
Maximum rate per hour:
700 m3 Note ' 34 m3
of the Agency
*::
22
For
insp
ectio
n pur
pose
s only
.
Conse
nt of
copy
right
owne
r req
uired
for a
ny ot
her u
se.
EPA Export 07-11-2018:04:04:38

Environmental Protection Agency Licence Reg. No. PO81 7-01
Daytime dB(A) (30 minutes) 55 Yote I
B.3 Emissions to Sewer
There shall be no process effluent emissions to sewer.
Night-time dB(A) (30 minutes) 55/45 Note 1,2
B.4 Noise Emissions
23
For
insp
ectio
n pur
pose
s only
.
Conse
nt of
copy
right
owne
r req
uired
for a
ny ot
her u
se.
EPA Export 07-11-2018:04:04:38

Environmental Protection Agency Licence Rea. No. PO81 7-01
SCHEDULE C: Control & Monitoring
C.1.1. Control of Emissions to Air
Apart from the process boilers there shall be no emissions to air of environmental significance.
. C.1.2. Monitoring of Emissions to Air
Emission Point Reference No: Al-1
Standard Method
Note 1: Monitoring for these parameters IS to be conducted only when marked gas oil is in use.
24
For
insp
ectio
n pur
pose
s only
.
Conse
nt of
copy
right
owne
r req
uired
for a
ny ot
her u
se.
EPA Export 07-11-2018:04:04:38
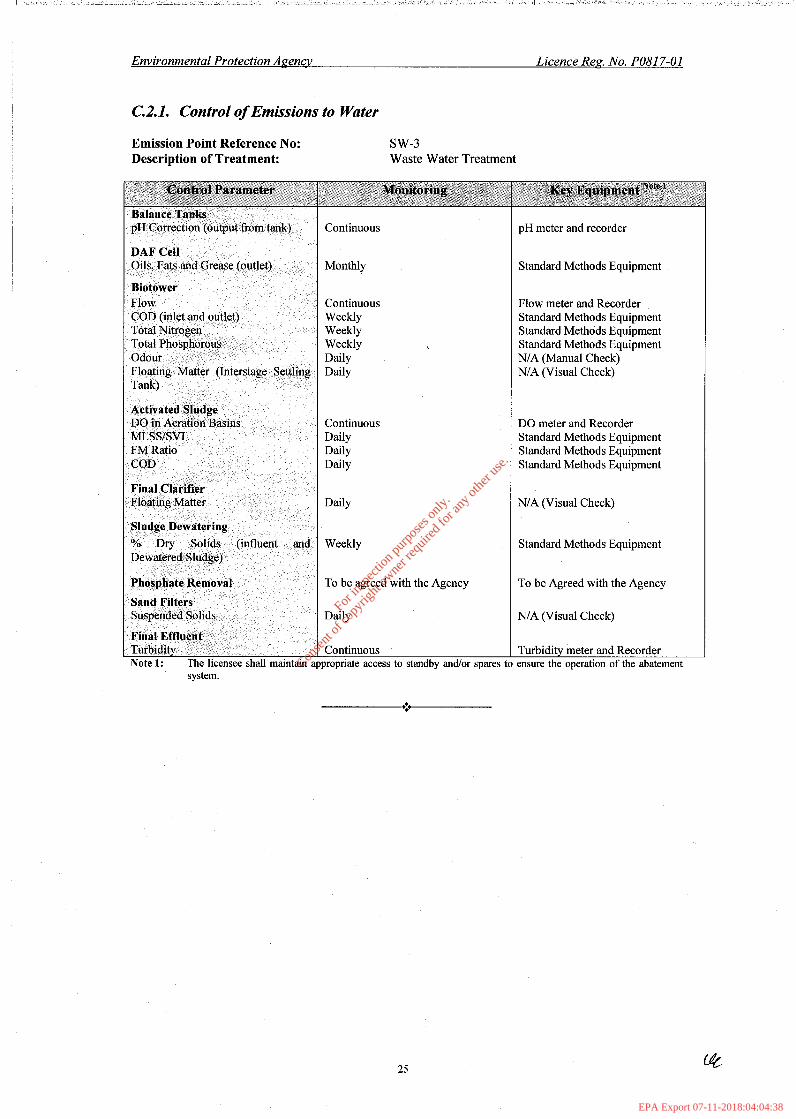
Environmental Protection Agency Licence Reg. No. PO81 7-01
C.2.1. Control of Emissions to Water
Emission Point Reference No: sw-3 Description of Treatment: Waste Water Treatment
Key Equipment Note '
pH meter and recorder
Standard Methods Equipment
Flow meter and Recorder Standard Methods Equipment Standard Methods Equipment Standard Methods Equipment NIA (Manual Check) N/A (Visual Check)
DO meter and Recorder Standard Methods Equipment Standard Methods Equipment Standard Methods Equipment
N/A (Visual Check)
Standard Methods Equipment
To be Agreed with the Agency
N/A (Visual Check)
Turbidity meter and Recorder :nsure the operation of the abatement
system.
*:e
25
For
insp
ectio
n pur
pose
s only
.
Conse
nt of
copy
right
owne
r req
uired
for a
ny ot
her u
se.
EPA Export 07-11-2018:04:04:38

C.2.2. Monitoring of Emissions to Water
Emission Point Reference No: sw-3
Control Parameter Monitoring Frequency
Flow ContinuousNo'e ' Key Equipmentmechnique
I PI
As may be required
Note 1: Note 2:
Note 3:
Total effluent discharged over the 24 hour period in which the composite sample is collected shall be recorded The licensee shall install a composite sampler within three months of date of grant of this licence All samples thereafter shall be collected on a 24 hour flow proportional composite sampling basis The number of toxic units (Tu) = 1001x hour EC/LC~O in percentage vol/vol so that higher Tu values reflect greater levels of toxicity For test regimes where species death is not easily detected, immobilisation is considered equivalent to death.
On-line flow meter with recorder
On-line temperature probe with recorder pH electrode/meter with recorder
Standard Method
Standard Method
Standard Method
Standard Method
Standard Method
Standard Method
Standard Method
Standard Method
Standard Method
Standard Method
Standard Method
To be agreed by the Agency
26
For
insp
ectio
n pur
pose
s only
.
Conse
nt of
copy
right
owne
r req
uired
for a
ny ot
her u
se.
EPA Export 07-11-2018:04:04:38

Environmental Protection Agency Licence Ren. No. PO81 7-01
C.2.3. Monitoring of Storm Water Emissions
Emission Point Reference No: sw-1
Standard method
Standard method
ple and examine for colour and
Emission Point Reference No: s w-2
I Weeklv I Standard method
Standard method
Sample and examine for colour and
C.3.1. Control of Emissions to Sewer
There shall be no process effluent emissions to sewer.
-*-
C.3.2. Monitoring of Emissions to Sewer
There shall be no process effluent emissions to Sewer.
27
For
insp
ectio
n pur
pose
s only
.
Conse
nt of
copy
right
owne
r req
uired
for a
ny ot
her u
se.
EPA Export 07-11-2018:04:04:38

Environmental Protection Ageny Licence Rep. No. PO81 7-01
C.4 Waste Monitoring
I I
C.5 Noise Monitoring
No additional noise monitoring is required in this schedule.
C. 6 Ambient Monitoring
Groundwater Monitoring
Location: GWINote 1
Annually pH electrode/meter
Annually Standard Method
Annually Standard Method
Annually Standard Method
Annually Standard Method
Annually Standard Method
Annually Standard Method
Annually Standard Method
Once-Off Standard Method
wells may change, subject to the recommendations of any hydrogeological assessment required by Condition 6.14 Parameters and monitoring frequency may change, subject to the recommendations of any hydrogeological assessment required by Condition 6.14 Screening for pollutant list substances (such as US EPA volatile and/or semi-volatile compounds).
Note 2:
Note 3:
Receiving Water Monitoring
There shall be no monitoring required for the receiving waters.
28
For
insp
ectio
n pur
pose
s only
.
Conse
nt of
copy
right
owne
r req
uired
for a
ny ot
her u
se.
EPA Export 07-11-2018:04:04:38

I
Environmental Protection Anenc?, Licence Rea. No. PO81 7-01
Land used for Landspreading
Monitoring Location: All lands included in the landbank Note
Note 1:
Note 2: Note 3: Note 4: Note 5:
Each sample should be representative of a maximum area of 4 ha except where uniform cropping and land use has been in place for the previous five years or more. In the latter situation a sample of 12 ha is acceptable. The licensee may assume ‘Index 3’ for preparation of nutrient management plans where no soil samples are available. Peach, M. and English, L. (1944) ‘Rapid micro chemical test’. Soilscience 57:167. Soil analysis shall only be conducted by Department of Agriculture, Fisheries and Food approved laboratories. The above requirements may be substituted by the requirements specified in Article 16(2) of the Nitrates Regulations, S.I. 101 of2009 until 201 1.
29
For
insp
ectio
n pur
pose
s only
.
Conse
nt of
copy
right
owne
r req
uired
for a
ny ot
her u
se.
EPA Export 07-11-2018:04:04:38

Environmental Protection Agency Licence Reg. No. PO81 7-01
SCHEDULE D: Annual Environmental Report
Annual Environmental Report Content Note ' Emissions from the installation. Waste management record. Organic Waste Register. Organic Waste Monitoring. Nutrient Management Plan. Resource consumption summary. Complaints summary. Schedule of Environmental Objectives and Targets. Environmental management programme - report for previous year. Environmental management programme - proposal for current year. Pollutant Release and Transfer Register - report for previous year. Pollutant Release and transfer Register - proposal for current year. Noise monitoring report summary. Ambient monitoring summary. Tank and pipeline testing and inspection report. Reported incidents summary. Energy efficiency audit report summary. Report on the assessment of the efficiency of use of raw materials in processes and the reduction in waste generated. Report on progress made and proposals being developed to minimise water demand and the volume of trade effluent discharges. Review of decommissioning management plan. Statement of measures in relation to prevention of environmental damage and remedial actions (Environmental Liabilities). Environmental Liabilities Risk Assessment Review (every three years or more frequently as dictated by relevant on-site change including financial provisions. Any other items specified by the Agency. ote 1: Content may be revised subject to the agreement of the Agency
Sealed by the seal of the Agency on this the 21St day of April 2011.
PRESENT when the seal of the Agency Was affixed hereto:
Dr K%-en Creed Authorised Person
.. .
30
For
insp
ectio
n pur
pose
s only
.
Conse
nt of
copy
right
owne
r req
uired
for a
ny ot
her u
se.
EPA Export 07-11-2018:04:04:38

New Cheese Factory at Dairygold Mogeely Wastewater
Appendix 2. Midleton WWDA (D0056-01)
For
insp
ectio
n pur
pose
s only
.
Conse
nt of
copy
right
owne
r req
uired
for a
ny ot
her u
se.
EPA Export 07-11-2018:04:04:38

Headquarters P.O. Box 3000
Johnstown Castle Estate C o u n t y W ex ford
Ireland
Waste Water Discharge Licence
Licence Register Number: ~. __ ~ _ _ _ _ _ .
- __
Agglomeration :
D0056-0 1 I Cork County Council Southern I D iv i si on
Mid 1 e ton
For
insp
ectio
n pur
pose
s only
.
Conse
nt of
copy
right
owne
r req
uired
for a
ny ot
her u
se.
EPA Export 07-11-2018:04:04:39

WASTE WATER DISCHARGE (ALITHORISATION) REGIJLATIONS 2007, as am ended
WASTE WATER DISCHARGE LICENCE
Decision of Agency. uiiclet- Rcgulatton 2X( I ) of the Waste Water Discharge (A ut ho ri SI t t o ti) Re ~ L I la t ions 2 00 7. as amended .
'The Agency 111 excrcisc o f the po\\'ci-s cwifki-ied on i t by the Waste \i'ater Discharge (AutIioi-i.s,~tion) Regulations 2007. ;is amended, for the i-eas(>tis lie1 einaftcr set out. hereby grants this ivaste water discharge Itcencc to Cork Count) Council Southern Division, 111
respect of the agglomeration named hlidleton, suliject to Conclitions. as set out in the s c h cd u 1 e s at t '1 ched he ret 0.
The ltcence authorises the dtschai-ge of \\ astc water from the I\ aste sen i ces the aggl o inerat I o ti d e~ci-1 hed bc I o\\ 5 ub j cc t to CO lid i t 1 otic
ater ~ ~ o r k s which
A cop>' of the Decision is rrttaclicd
GIVEN under the Seal of the Agency this 6"' day of January 201 1 .
PRESENT when the seal of the Agency
was affixed hereto: A
b&+ Da. Lynott, Di ectori thorised Person
For
insp
ectio
n pur
pose
s only
.
Conse
nt of
copy
right
owne
r req
uired
for a
ny ot
her u
se.
EPA Export 07-11-2018:04:04:39

Eiivironmentnl Protection Agcwcr - . Licerice Re2 No. DOO.56-01
INTRODUCTION This introduction is not part of the licence and does not purport to be a legal interpretation of the licence.
This licence relates to Midleton agglomeration. Waste water is collected in a partially combined drainage network. The works currently comprises of eight pumping stations.
Midleton waste water treatment plant (WWTP) provides secondary treatment by extended aeration and advanced treatment by UV disinfection of the final effluent. Nitrification and denitrification are achieved by the inclusion of an anoxic zone in the aeration plant. The plant is designed for a Population Equivalent (p.e.) of 10,000 and BOD loading of 600kgiday. The maximum hydraulic capacity of the plant is 901/s which is 3 Dry Weather Flows (3DWF). The plant is hydraulically protected by the controlled pumping capacity of the three terminal pumping stations (701/s, 13lis and 811s). The influent flow ranges from 2DWF to 3DWF even during dry periods. Treated effluent from Irish Distillers Limited bypasses the Midleton WWTP and is discharged at the primary discharge point.
The population equivalent (p.e.) is stated as 18,742. of which 2,100 p.e. is associated with Irish Distillers Limited effluent.
The primary discharge (SWOl MIDL) is to the North Channel Great Island (SW~060~0300) at Rathcoursey point via a diffuser. Four of the pumping stations have storm tanks and associated stonn water overflows which discharge to the Owenacurra estuary. Two storm water overflows do not comply with the requirements of the DoEHLG 'Procedures and Criteria in Relation to Storm Water Overflows. 1995'.
Cork County Council proposes to increase the capacity of the plant to 15.000PE by the end of201 1 and continue their infiltration remediation programme.
The licence sets out in detail the conditions under which Cork County Council, Southern Division will control and manage the waste water discharges from the agglomeration covered by this licence.
The licence requires appropriate remedial action. within specified timef'rames. to bc undcrtakcn in order to address each of the discharges within the agglomeration in particular the stomi n'ater overflows. This remedial action will ensure that appropriate protection is afforded to the receiving water environment.
The legislation governing this licence relates specitically to. and is restricted to, the regulation and control of waste water discharges from the agglomeration. Therefore any odour or noise issue that may be associated nith the waste water works including the treatment plant cannot be addressed by this licence.
For
insp
ectio
n pur
pose
s only
.
Conse
nt of
copy
right
owne
r req
uired
for a
ny ot
her u
se.
EPA Export 07-11-2018:04:04:39

Eniiroiiincntal Protection A,qencv Licericc Reg. No. DOO.56-0 I
Table of Contents
Glossary of Terms
Decision & Reasons for the Decision
Part I
Part I1 Conditions
Schedule of Discharges Licensed
Condition 1 . Scope
Condition 2. Interpretation
Condition 3. Discharges
Condition 4. Control and Monitoring
Condition 5. Programmes of Improvements
Condition 6.
Condition 7.
Notifications, Records and Reports
Financial Charges and Provisions
SCHEDULE A: Discharges
SCHEDULE B: Monitoring
SCHEDULE C: Specified Improvement Progl-ainnie
SCHEDULE D: Annual Environmental Report
Page No.
1
5
6
7
7
8
8
9
12
14
16
18
20
23
24
For
insp
ectio
n pur
pose
s only
.
Conse
nt of
copy
right
owne
r req
uired
for a
ny ot
her u
se.
EPA Export 07-11-2018:04:04:39

Em~ironrncntal P~~otectiori i/,pe~ici. Licence Re.p. No. 00056-OI
GLOSSARY OF TERMS All terriis i n this licence should be interpreted in accordance with the definitions in the Waste Waste Water Discharge (Authorisation) Regulations 2007, as amended, unless otherwise defined in this section.
AER
Agglomeration
Agreement
Annually
Application
Attachment
Biannually
Biennially
BOD
CBOD
CEN
COD
Combined approach
Daily
Day
Discharge limits
Discharge Point
DO
Annual Environmental Report.
An area where the population or economic activities or both are sufficiently concentrated for a waste water works to have been put in place.
Agreement in writing.
At least one ineasurenient in any one year
Tlie application for this licence.
Any reference to Attachments in this licence refers to attachments submitted as part of the licence application.
All or part of a period of six consecutive tiionths.
Once every two years.
5 day Biochemical Oxygen Demand (without nitrification suppression)
5 day Carbonaceous Biochemical Oxygen Demand (with nitrification suppression).
Comite Europeen De Normalisation ~ European Committee for Standardisation.
Chemical Oxygen Demand
In relation to a waste water works, means the control of discharges and emissions to waters whereby the emission limits for the discharge are established on tlie basis of the stricter of either or both, the limits and controls required under the Urban Waste Water Regulations, and tlie limits determined under statute or Directive for the purpose of achieving the environmental objectives established for surface waters, groundwater or protected areas for the water body into which the discharge is made.
During all days when discharges are taking place; with at least one measurement per day.
Any 24 hour period.
Those limits, specified for a particular parameter in Schedzile A ; Disclirrrges, of this licence.
Tlie point from which a waste water discharge occurs.
Dissolved oxygen.
P q c I
For
insp
ectio
n pur
pose
s only
.
Conse
nt of
copy
right
owne
r req
uired
for a
ny ot
her u
se.
EPA Export 07-11-2018:04:04:39

Licciicci Re,?. No. DOO.56-01
Documentation
DoEHLG
Domestic Waste Water
Drawing
EMP
Environmental damage
EPA
Fortnightly
fc
GCIMS
ICP
Incident
In d u s t r i a 1 wr a s t e water
Licensee
Licensing Regulations
Local Authority
Maintain
Monthly
Any report, record, result, data, drawing, proposal, interpretation or other document, i n written or electronic form, that is required by this licence.
Department of the Environment, Heritage and Local Government
Waste water from residential settlements and services that originates predominantly from human metabolism and from household activities.
Any reference to a drawing or drawing number means a drawing or drawing number contained in the application, unless otherwise specified in this licence.
Environmental Manageinent Programme.
As defined in Directive 2004/35/EC.
Environmental Protection Agency.
A minimum of 24 times per year, at approximately two week intervals.
Faecal coliforms.
Gas chromatography/mass spectroscopy.
Inductively coup 1 ed p 1 asma spectroscopy .
The following shall constitute an incident for the purposes of this licence:
any discharge that docs not comply with the requirements of this licence; any incident with the potential for environmental contamination of surface water or groundwater, or posing an environmental threat to land. or requiring an emergency response by the re1 evan t Water S erv i ccs Authority .
(i)
(ii)
Any waste water that is discharged l'i-om premises used for carrying 011 any trade or industry 01- other non-domestic use and excludes run-off rain water.
Cork County Council Southern Division, County Hall. Carrigrohane Koad, Cork.
Waste Water Discharge (Authorisation) Kegulations 2007, as amended.
Cork County Council.
Keep in a fit state, including such regular inspection, servicing, calibration and repair as may be necessary to perfa-in its function.
A minimum of 12 times per year, at intervals of approximately one month.
For
insp
ectio
n pur
pose
s only
.
Conse
nt of
copy
right
owne
r req
uired
for a
ny ot
her u
se.
EPA Export 07-11-2018:04:04:39

National Environmental Complaints Procedure
As established under the National Environmental Enforcement Network.
Population A measurement of organic biodegradable load and a population Equivalent equivalent of 1 (1 p.e.) means the organic biodegradable load having a
five-day biochemical oxygen demand (BODS) of 60g of oxygen per day; the load being calculated on the basis of the niaxirnum average weekly load entering the waste water works during the year, excluding unusual situations such as those due to heavy rain.
Primary Discharge water works.
The discharge with the largest volume being discharged from the waste
Protected Areas Areas designated as requiring special protection under specific Community legislation for the protection of their surface water and groundwater or for the conservation of habitats and species of European sites directly dependant on water and listed in the register established by tlie Agency in accordance with Article 8 of the Water Policy Regulations
Pollutant Release and Transfer Register. PRTR
Quarterly All or part of a period of three consecutive nionths beginning on the first day of January, April. July or October.
Sample(s) Unless the context of this licence indicates to the contrary, the term samples shall include measurements taken by electronic instruments.
Secondary Discharge
A potential. occasional or continuous discharge from the waste water works other than a primary discharge or a stonn water overflow.
SSRS Small Stream Risk Score.
Specified discharges
Those discharges listed in ScIied1rle A: Dischirrge.~, of this licence.
Standard method
A Natioiial. European or internationally recognised procedure (e.g., I.S. EN, ISO. CEN, I3S or equivalent); or an in-house documented procedure based on the above references; a procedure as detailed in the current edition of 'Standard Methods for the Examination of Water and Wastewater" (prepared and published jointly by A.P.H.A., A.W.W.A. & W.E.F.), American Public Health Association. 101 5 Fifteenth Street, N.W., Washington DC 20005, USA; or an alternative method as may be agreed by tlie Agency.
Storm water overflow
A structure or device on a sewerage system designed and constructed for the purpose of relieving tlie system of excess flows that arise as a result of rain water or melting snow in the sewcred catclunent, the excess flow being discharged to receiving waters.
The Agency Environmental Protection Agency.
For
insp
ectio
n pur
pose
s only
.
Conse
nt of
copy
right
owne
r req
uired
for a
ny ot
her u
se.
EPA Export 07-11-2018:04:04:39

E m Iii-oiimcntnl Protection A.genci8 Licciice Reg. No. 00056-0 I
Waste Water
Waste Water Works
Water Services Authority
Weekly
WSIP
WWTP
Domestic waste water or the mixture of domestic waste water with industrial waste water.
Sewers and their accessories (or any part thereof) and all associated structural devices, including waste water treatment plants, which are owned by, vested in, controlled or used by a water services authority for the collection, storage, treatment or discharge of waste water.
Cork County Council Southern Division.
During all weeks when discharges are taking place; with at least one measurement in any one week.
Water Services Investment Programme.
Waste water treatment plant.
For
insp
ectio
n pur
pose
s only
.
Conse
nt of
copy
right
owne
r req
uired
for a
ny ot
her u
se.
EPA Export 07-11-2018:04:04:39

DECISION & REASONS FOR THE DECISION The Environmental Protection Agency is satisfied, on the basis of the inforination available, that subject to compliance with the conditions of this licence, any discharges froiii the agglomeration served by the waste water works will comply with and will not contravene any of the requirements of Regulation 6 of the Waste Water Discharge (Authorisation) Regulations 2007, as amended.
Having regard to the requirement in the licence for a phased and strictly monitored programme of improvements for the waste water works servicing the Midleton agglomeration and the requirement that no deterioration in the quality of the receiving waters shall occur as a result of the discharge(s), it is considered that the licence will aim to achieve the environmental objectives including environmental quality standards established under statute and prevent and reduce environmental pollution.
In reaching this decision the Environmental Protection Agency has had regard to the requirements and objectives of Regulation 6 of the Regulations and has considered the application and supporting documentation received from the applicant, all submissions received from other parties and the report of its inspector.
For
insp
ectio
n pur
pose
s only
.
Conse
nt of
copy
right
owne
r req
uired
for a
ny ot
her u
se.
EPA Export 07-11-2018:04:04:39

PARTI SCHEDULE OF DISCHARGESLICENSED
In pursuance of the powers conferred on it by the Waste Water Discharge (Authorisation) Regulations 2007, as amended, the Environmental Protection Agency (the Agency), under Regulation 28( 1) of the said Regulations grants this Waste Water Discharge Licence to Cork County Council Southern Division, County Hall, Carrigrohane Road, Cork. The licence authorises the discharge of waste water from the waste water works servicing the Midleton agglomeration described below, subject to conditions listed in Part 11, with the reasons therefor and the associated schedules attached thereto.
Licensed Disclzarges, in accordance with the Second Schedule ofthe Waste Water Discharge (Arrtlzorisation) Regulations 200 7, as amended
Discharges fi-om aggloinerations with a population equivalent of inore than 10,000
For
insp
ectio
n pur
pose
s only
.
Conse
nt of
copy
right
owne
r req
uired
for a
ny ot
her u
se.
EPA Export 07-11-2018:04:04:39
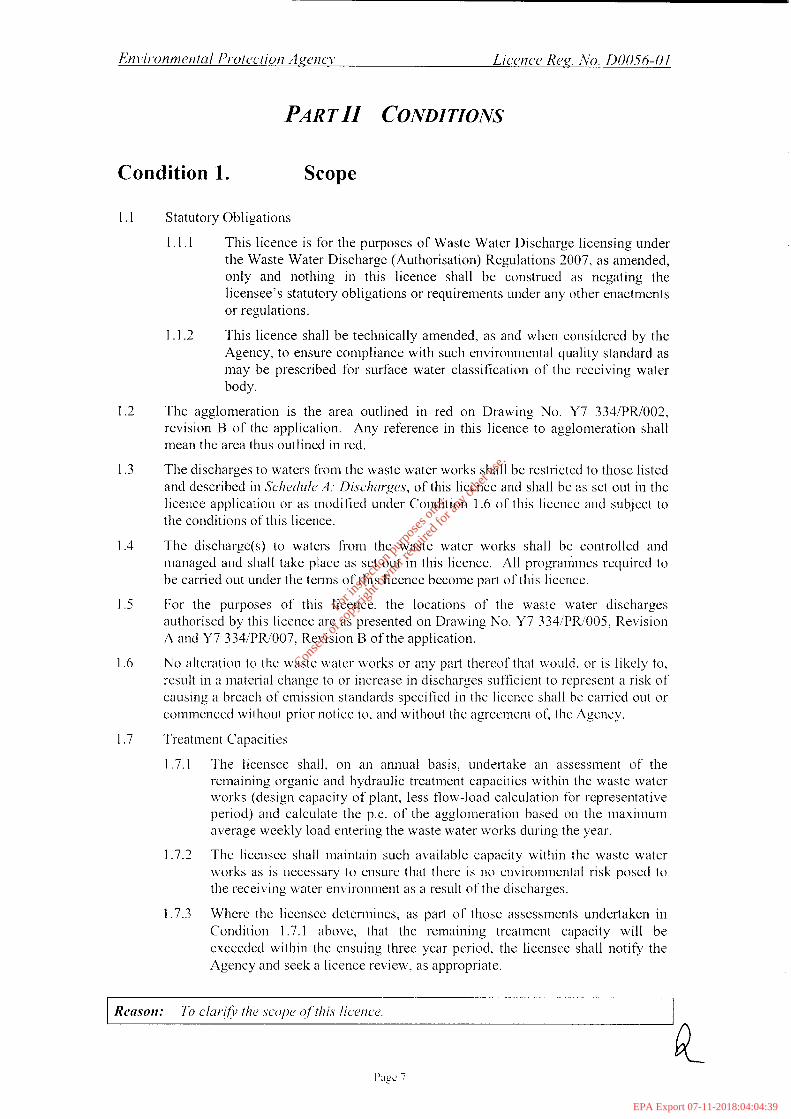
PARTII CONDITIONS
Condition 1. Scope
1 . I Statutory Obligations
1.1.1 This licence is for tlie purposes of Waste Water Discharge licensing under the Waste Water Discharge (Authorisation) Regulations 2007, as amended, only and nothing in this licence shall be construed as negating the licensee's statutory obligations or requirements under any other enactments or regulations.
This licence shall be technically amended, as and when considered by tlie Agency, to ensure compliance with such enviroimieiital quality standard as may be prescribed for surface water classification of tlie receiving water body.
The agglomeration is the area outlined in red on Drawing No. Y7 334/PR/002, revision B of the application. Any reference in this licence to agglomeration shall mean the area thus outlined in red.
Tlie discharges to waters from the waste water works shall be restricted to those listed and described in Sc/?er/rr/e A: Dischtrr-ges, of this licence and shall be as set out in the licence application or as modified under Condition 1.6 of this licence and subject to the conditions of this licence.
Tlie discharge(s) to waters from tlie waste water works shall be controlled and managed and shall take place as set out in this licence. All programmes required to be carried out under the terms of this licence become part of this licence.
1.5 For the purposes of this licence, the locations of tlie was!c water discharges authorised by this licencc arc as presented on Drawing No. Y7 334/PR/005, Revision A and Y7 334/PK/007. Revision B of the application.
N o alteration to tlie waste \3'atcr works or any pail thereof that a.ould, or is likely to, result in a material change t o or increase in discharges sufficient to represent a risk of causing a breach of emission stanclat-ds specified i n tlie licence shall be carried out or commenced without prior notice to. and without the agreement of, the Agency.
1.1.2
1.2
1.3
1.4
1.6
1.7 Tt-eatment Capacities
1 .7.1 The licensee shall, on an annual basis, undertake an assessment of tlie remaining organic atid hydraulic treatment capacities within the waste water works (design capacity of plant, less flow-load calculation for representative period) and calculate the p.e. of' the agglomeration based on tlie tiiaxinium average weekly load entering the waste water works during the year.
Tlie licensee shall maintain such available capacity within the waste water works as is necessary to ensure that there is no environnicntal risk posed to the receiving water environment as a result of the discharges.
Where the licensee determines, as part of those assessments undertaken in Condition 1.7.1 above, that the remaining treatment capacity will be exceeded within the ensuing three year period. the licensee shall notify the Agency and seek a licence review. as appropriate.
1 .7.2
1.7.3
Reason: To cl~ii-ifv the scwpe of this licence.
Page 7
For
insp
ectio
n pur
pose
s only
.
Conse
nt of
copy
right
owne
r req
uired
for a
ny ot
her u
se.
EPA Export 07-11-2018:04:04:39

Condition 2. Interpretation
2.1 Emission limit values for discharges to waters in this licence shall be interpreted in the following way:
2.1.1 Composite Sampling
(i)
(ii)
No pH value shall deviate from the specified range.
For cBOD and COD, no more than the relevant number of samples specified in Schedirle B. 3: Intcrpretution of Dischai-gc Monitoring Resiilts - Column 2, of this licence, shall exceed the concentration Emission Limit Value based on the number of samples taken as listed in Schedule B. 3: Interpretution of' Discharge Monitoi-ing Results - Column 1, of this licence. No individual result similarly calculated shall exceed the etnission limit value by more than 100%.
For Suspended Solids, no more than the relevant tiumber of samples specified in Sclietlirle B. 3: Interpvetatioii of Dischl-ge Monitoring Resiilts - Column 2, of this licence, shall exceed the concentration Emission Limit Value based on the number of samples taken as listed in Schedule B.3: Interpetution of Discharge Monitoring Results - Column 1, of this licence. No individual result similarly calculated shall exceed the emission limit value by more than 150%.
For faecal colifonns, compliance shall be measured on the basis of a fifty sample rolling programme.
For parameters other than pH, flow, cBOD, COD, Suspended Solids & faecal colifonns, eight out of ten consecutive composite results shall not exceed the emission limit value. No individual result similarly calculated shall exceed the emission limit value by more than 2004.
(iii)
(iv)
(v)
2.1.2 Discrete Sampling
For parameters other than pH, no grab sample \,slue shall exceed the emission limit value by more than 15Ooi.
Condition 3. Discharges
3.1 Where discharges fi-om the waste water works are required to comply with Emission Limit Values by a date specified in Schedcile A: Di.scliirt-ge.s, of this licence, the Water Services Authority shall, prior to this date, take such measures as are necessary to ensure that environmental pollution is not caused as a result of thc discharge.
No specified discharge from the waste water works shall exceed the limit values set out in Schediric A: L>i.scliur-gc~.s, of this licence, subject to the requirements of Condition 2 above.
The Water Services Authority shall take such measures as are necessary to ensure that no deterioration in the quality of the receiving waters shall occur as a result of the discharge.
There shall be no discharge fi-om the discharge points specified in Schedirle A.3:
3.2
3.3
3.4
Q- Dischut-ges to he Di.scoiiti/~iistl. of this licence. from the dates specified therein.
Pagc s
For
insp
ectio
n pur
pose
s only
.
Conse
nt of
copy
right
owne
r req
uired
for a
ny ot
her u
se.
EPA Export 07-11-2018:04:04:39

Emir-onmcntal Protection Agcncv Licencc Reg No. 000.56-01
3.5 Storm water overflows shall be as specified 111 Scherllrle A.4: Stornl Ililter Ow.flo\t~.~. of this licence.
The primary discharge shall not result in a temperature increase at the edge of the mixing zone of greater than 1.5"C in the receiving system. The mixing zone shall not exceed 25% of the estuarine cross sectional area at any point.
The primary discharge shall discharge to the ebb tide only.
The licensee shall ensure that all or any of the following:
3 6
3.7
3.8 . Gross solids . Litter
associated with discharges from the waste water works do not result in an inipainnent of, or an interference with, amenities or the environment.
Reason: To pl-ovide,for the protection of'thc receiving environnzent by wqy c?fcontvol and Iirnitation of discharges to the North Chunnel Great Island. To pro\~ide,for the protection of the receiving environment including designated shellfish bt,aters, by ~1u.y of control and liniitation ofdi.scharge.s to the murine eni~ironnzent.
Condition 4. Control and Monitoring
4.1 The licensee shall carry out such sampling, analyses, measurements, exaininations, maintenance and calibrations as set out below atid in accordance with Schediile B; Monitoring, of this licence.
4.1.1 Analyses shall be undertaken by competent staff in accordance with documented operating procedures.
Such procedures shall be assessed for their suitability for the test matrix and perforinatice characteristics shall be determined.
Such procedures shall be subject to a programme of' hiialytical Quality Control verified by a cotiipcteiit third party using control standards with evaluation of test responses.
4.1 .?
4.1.3
Where any analysis is sub-contracted i t shall be to a competent laboratory
The licensee shall ensure that:
(i) Sampling atid analysis for all parameters listed in the Schedules to this licence, and
(ii) Any reference measurement methods to calibrate automated measurement system
shall be carried out in accordance with CEN standards. If CEN standards are not available, ISO, national or internatioiial standards that will ensure the provision of data of an equivalent scientific quality shall apply.
The licensee shall install on all emission points such sampling points or equipment, including any data-logging or other electronic communication equipment, as may be required by the Agency. All such equipment shall be consistent with the safe operation of all sampling and monitoring system.
4.2
4.3
For
insp
ectio
n pur
pose
s only
.
Conse
nt of
copy
right
owne
r req
uired
for a
ny ot
her u
se.
EPA Export 07-11-2018:04:04:39

EH 1 i r w i i m y i ttr l Protect ion Agency Licciice Rc,e No. 00056-01
4.4
4.5
4.6
4.7
4.8
4.9
4.10
4.1 1
4.12
All automatic monitors and samplers shall be functioning at all times (except during maintenance and calibration) when tlie discharges are being made unless alternative sampling or monitoring has been agreed in writing by tlie Agency for a limited period. In the event of the malfunction of any continuous monitor, the licensee shall contact the Agency as soon as practicable and alternative saiiipliiig and monitoring facilities shall be put in place. Agreement for the use of alteiiiative equipment, other than in emergency situations, shall be obtained from the Agency.
Monitoring and analysis equipment shall be operated and maintained as necessary so that monitoring accurately reflects the discharge (or ambient conditions where that is the monitoring objective).
In the case of composite sampling of discliarge(s) from the waste water works, a separate composite sample or homogeneous sub-sample (of sufficient volume as advised by the Agency) shall be refrigerated immediately after collection and retained as required for Agency use.
The licensee shall clearly label and provide safe and pennaneiit access to all on-site sampling and monitoring points and to off-site points as required by the Agency.
The licensee shall establish and maintain corrective action procedures and shall take corrective action should the specified requirements of this licence not be fulfilled. The responsibility and authority for persons initiating further investigation and corrective action in the event of a reported non-conformity with this licence shall be defined by the licensee.
The licensee shall establish and niaintain a programme for maintenance and operation of all plant and equipment to ensure that no unauthorised waste water discharges take place. This programme shall be based on the instructions issued by the matiufacturer/supplier or installer of the equipment. Appropriate record keeping and diagnostic testing shall support this maintenance programme. The licensee shall clearly allocate responsibility for the planning management and cxecution of all aspects of this programme to appropriate personnel.
The location, frequency, methods and scope of monitoring, samplitig and analyses, as set out in this licence, may be amended with the agreement of the Agency following evaluation of test results.
A representative sample of effluent from the primary discharge point shall be screened for the presence of organic compounds and metals within twelve months of the date o f grant of this licence. The list of’ paramcters for analysis shall include, as a minimum, those organic compounds and metals identified as relcvaiit IiaL-ing regard to the European Conitnutiities Environmental Objectives (Surface Waters) Kegulatioiis 2009 (S.I. No. 272 of 2009) arid any other relevant legislation. Such screening shall be repeated at intervals as requested by the Agency thereafter.
Stonn water overflows
4.12.1 The licensee shall, within three months of the date of grant of this licence, carry out an assessment of the storm water overflows from the waste water works. The assessmetit shall either confirm the limit values specified in Scl1ediile 4 . 4 ; Storm IVLiter- Oiyfloizx, of this licence, or establish alternative spill frequency and/ or discharge volume that are in accordance with DoEHLG ’ Procetliir*cs tind Ci.itei.ilr in Relrrrion to S t o m Water- Ovei;flo~i:s‘, 1995 as a minimum. 7‘lie assessment shall have regard in particular to:
(9 (ii)
The addendum to the EIS that accompanied the licence application
Designated protected arcas and relevant legislation and programmes ,’ plans.
A
For
insp
ectio
n pur
pose
s only
.
Conse
nt of
copy
right
owne
r req
uired
for a
ny ot
her u
se.
EPA Export 07-11-2018:04:04:39

4.13
4.14
4.15
4.16
4.1 7
4.1 8
4.12.2
(iii) The outcome of consultation with the DoEFILG, the Sea Fisheries Protection Authority, the Marine Institute and Bord Iascaigh Mhara.
(iv) Provision of UV disinfection.
(v) International guidance as appropriate.
Any alternative design spill frequency and discharge volume, approved by the Agency, shall become part of this licence.
The licensee shall report annually as part of the AER the spill frequency and discharge volumes from storm water overflows. The licensee shall carry out an assessment of storm water overflows at least once every three years thereafter and report to the Agency on each occasion as part of the AER. The assessment shall include a determination of compliance the limit values specified in Schedule A.4: Stor-ni Wuter Overjlo~z:s, of this licence. The licensee shall maintain a written record of all assessments and remedial measures arising from the assessment.
The licensee shall prepare a PRTR report for the primary and secondary discharges. The substances to be included in the PRTR shall be as agreed by the Agency each year by reference to EC Regulation No. 166/2006 concerning the establishment of the European Pollutant and Transfer Register and amending Council Directives 91/689/EEC and 96/61/EC. The PRTR shall be prepared in accordance with any relevant guidelines issued by the Agency and shall be submitted electronically in specified format and as part of the AER.
The licensee shall, within six months of the date of grant of this licence, develop and establish a Data Management System for collation, archiving, assessing and graphically presenting the monitoring data generated as a result of this licence.
The licensee shall carry out monthly monitoring of the influent stream to the waste water treatment plant for cBOD, COD and Total Nitrogen i n order to measure the mass loadings and removal efficieilcies \vithin the treatment plant.
The licensee shall, subject to Condition 2, ensure that the Midleton WWTP is operated to meet the emission standards specified in the Urban Waste Water Treatment Regulations, 2001 (S.I. No. 254 of2001) in relation to BOD, SS, COD and Total Nitrogen. Monitoring frequency shall be fortnightly and samples shall be collected on a 24-hour time bascd composite basis.
The licensee shall, subject to Condition 2, ensure that the Midleton WWTP is operated to meet the following emission standards:
a ) The geometric mean of faecal coliforms per 1 OOm1 of effluent must be 250fc or less.
b) 95% of all samples shall be less than 1 ,OOOfc/lO0nil.
Monitoring frequency shall be weekly.
The licensee shall, within six months of the date of grant of this licence, install flow proportional composite sampling facilities so that sampling accurately reflects the primary discharge at a location t o be agreed by the Agency.
For
insp
ectio
n pur
pose
s only
.
Conse
nt of
copy
right
owne
r req
uired
for a
ny ot
her u
se.
EPA Export 07-11-2018:04:04:39

Environmental Protection A,gew\* Licerice R c , ~ . No. 1100.56-01
4.19 The licensee shall, within six months of the date of grant of this licence, investigate the sources of elevated levels of faecal coliforms in the primary discharge which was reported in the application (response to Regulation 18(3)(b) notice dated 15“’ September 2009). The licensee shall take such measures as are necessary to meet the emission litnit values specified in Scheddc A. I ; Pvimary Waste Water. Discharge, of this licence. A report on the investigation and measures shall be included in the AER.
4.20 Ambient Monitoring
The licensee shall report annually in the AER on the chemical and ecological status of the receiving water. The licensee shall, as a minimum, have regard to the European Communities Environmental Objectives (Surface Waters) Regulations 2009 (S.I. No. 272 of ZOOS), the Trophic Status Assessment Scheme and the Quality of Shellfish Water Regulations, 2006 (S.I. 268 of 2006) and amendment(s) in scoping the report. The licensee shall undertake such additional monitoring as is necessary to demonstrate that the discharges have not caused deterioration in the status of tlie receiving water.
Prior to submitting ambient monitoring data, the licensee must consult with the Agency with regard to the appropriate format for submittal.
4.21
Reason: To proiirle for the protection of the en\Gronment hv Mgv of contml trnd rnonitoring- of dischtrrges.
Condition 5. Programmes of Improvements
5.1 The licensee shall, as a part of the second AER (required under Condition 6.1 I ) , prepare and submit to the Agency a prograiiinie of infrastructural improvements to maximise the effectiveness and efficiency of the waste water works in order to:
a) achieve improvements in the quality of all discharges from the works;
b) meet the emission limit values spccilied i n Scliedi//c ,4: Iliscl?trrgc,.e.v, of this licence;
give effect to Regulation 2 of’ thc Waste Water Discharge (Authorisation) Regulations 2007, as amended;
d) reduce Total Phosphorus loadings in tlie discharge to the maximum practicable extent;
e) reduce Total Nitrogen loadings and priority substances in the discharge to the tiiaxiiiiuiii practicable extent;
fl cease emissions, discharges or losses of priority hazardous substances;
g) meet the obligations of Condition 1.7.
c>
5.2 ,- I he programme of infrastructural improvcnients referred to in Coiiditioti 5.1 shall include an assessment of:
a) tlie waste water treatment plant, having regard to the effectiveness of the treatment provided by reference to the following:
(1) the existing level of treatment, capacity of treatment plant and associated equipment;
For
insp
ectio
n pur
pose
s only
.
Conse
nt of
copy
right
owne
r req
uired
for a
ny ot
her u
se.
EPA Export 07-11-2018:04:04:39

Emir-onmental Pt-otectiori A,oenq, Licence Rep. No. 00056-01
(ii)
(iii)
(iv)
(v>
the integrity of the waste water works having regard to:
( 9 capacity of the waste water works;
(ii) leaks from the waste water works;
(iii) misco~inections between foul serviceskwers and surface water drainage network;
(iv) infiltration by surface water;
(v) infiltration by groundwater;
(4 such other aspects of the works as may be specified by the Agency.
all stonn water overflows associated with the waste water works to detemiine the effectiveness of their operation and in particular to identify improvements necessary to comply with the requirements of this licence.
5.3 The programme of infi-asttuctural iinprovetiients shall include a plan for implementation for each individual improvement identified. The plan for implementation shall:
a) in the case of the assessment carried out under Conditions 5.2(a) (waste water treatment plant), and 5 4 c ) (storm water overflows):
(9 clearly identify and describe tlie improveinetit and the timeframe for imple~iientation;
specify the parametric einission(s) that will be affected by the implement at ion o f t he impro\einent;
estimate the costs and sources of finding required to implement the improvement including, where appropriate, details of submissions made to the Department of- the Environment, Heritage and Idocal Government and sanctions received;
(iv) identify the anticipated improvements in the quality of the receiving waters as a result of tlie implementation of the improvement.
the emission limit values specified in Sclrc(/~//c> A: Di.schurpe.s, of this licence;
designations of the receiving water body;
water quality objective for the receiving water body;
the standards and volumetric limitations applied to any iiidustrial waste water that is licensed to discharge to tlie waste water works.
b)
c)
(ii)
(iii)
b) in tlie case of the asscssmcnt carried out under Condition 5.2(b) (waste water works):
( 0 identify. evaluate and describe the infrastructural works necessary to implement those works listed under Sche~liile C: Slwoifietl rIiil?l.oiIcriieiit P rogr.rininie. of this licence;
clearly identify and describe the improvement and the timeframe for its iniplementatioii;
estimate the costs and sources of funding required to implement the improveinent including, where appropriate, details of submissions made to the Department of the Environment, Heritage and I ,oca1 Government and sanctions received.
(ii)
(iii)
4
For
insp
ectio
n pur
pose
s only
.
Conse
nt of
copy
right
owne
r req
uired
for a
ny ot
her u
se.
EPA Export 07-11-2018:04:04:39

Emir-onmental Protection A.ccricr - . I,icencc Reg. No. DOOS6-Ol
5.4 The licensee shall complete the improvements as set out in Schediilc C: SlwcificiI Zinproiwient Progrrzrninie, of this licence, by 3 1/12/201 1 in order to ensure compliance with the emission limit values as set out in Schetlmle A: Di.schurgcs, of this licence.
The licensee shall put in place a programme of measures for the gathering, recording and retention of information in relation to the infrastructural components of the waste water works. This information shall be in the form of ' As-Constructed' drawings and electronic mapping tools, or in any other format as required by the Agency.
The licensee shall, within six months of the date of grant of this licence, submit a programme of improvement for the storm water overflows to bring them into compliance with the limit values specified in Schediile A.4: Storni Wuter Overflo~~:s, of this licence. The programme of improvement shall have regard to tlie recommendations arising from the assessment undertaken under Condition 4.12.1 in addition to the:
a) Elimination/ reduction of infiltration.
b) Provision of in-sewer flow monitoring devices.
The report on the programme of improvement shall be submitted to the Agency and the improvements shall be implemented by 31/12/2011.
5.5
5.6
Condition 6. Notifications, Records and Reports
6.1
6.2
6.3
6.4
The licensee, shall notify tlie Agency by both telephone and facsimile, to the Agency's headquarters in Wexford, or to such other Agency oftice as inay he specified by the Agency, as soon as practicable after the occurrence of any incident (as defined in this licence). The licensee shall include as pait of the notitication, date and time of the incident, summary details of the occurrence, and where available, the steps taken to minimise any discharges.
In the case of any incident relating to a discharge to water, the licensee shall notily the Ilepartment of Agriculture, Fisheries and Food and the relevant downstrcam water services authority, as soon as practicable after such an incident.
In the case of any incident relating to a discharge to a designated shellfish water, the licensee shall notify the Marine Institute (MI), Sea Fisheries Protection Authority (SFPA), Food Safety Authority (FSAI) and an Bord Iascaigh Mhara (BIM) as soon as practicable after such an incident.
The licensee shall make a record of any incident. This record shall include details of the nature, extent, and impact of, and circumstances giving rise to, the incident. The record shall include all corrective actions taken to manage the incident, to minimise the effect on the environment, and to avoid recurrence. The licensee shall, as soon as practicable following incident notiiication, submit to the Agency the incident record including clean up and rccurrence prevention measures.
For
insp
ectio
n pur
pose
s only
.
Conse
nt of
copy
right
owne
r req
uired
for a
ny ot
her u
se.
EPA Export 07-11-2018:04:04:39

Licence Re,?. No. DOO56-0 I
6.5
6.6
6.7
6.8
6.9
6.10
The licensee shall record all complaints of an environmental nature related to the discliarge(s) to waters from the waste water works in accordance with the national environmeiital complaints procedure. Each such record shall give details of the date and time of tlie complaint, the name of tlie complainant (if provided), and the nature of the complaint. A record shall also be kept oftlie response made in the case of each complaint .
The licensee shall record all sampling, analyses, measurements, examinations, calibrations aiid maintenance carried out in accordance with the requirements of this licence.
The licensee shall as a minimum keep the following documents at the headquarters of the licensee or such office as may be agreed by the Agency:
(i)
(ii)
(iii) the previous year’s AER;
(iv)
the licence application and all associated documentation;
the licence(s) relating to the discharge(s) to waters from tlie waste water works;
records of all sampling, analyses, measurements, examinations, calibrations and maintenance carried out in accordance with the requireinents of this 1 icence:
(v) relevant correspondence with the Agency;
(vi) up to date drawings/plans showing tlie location of key process aiid environnicntal infrastructure, including monitoring locations and discharge points;
(vii) up to date operational procedures for all monitoring and control equipment necessary to give effect to this licence.
This documentation shall be available to the Agency for inspection at all reasonable t i nies.
7‘he licensee shall, within six months of date of grant of this licence, ensure that a documented Emergency Response Procedure is in place, that addresses any emergency situation that may originate on-site. This procedure shall include provision for niinitnising the effects of any emergency on the environment. This procedure shall he reviewed annually and updated as necessary.
The licensee shall establish and maintain a Public Awareness aiid Communications Programme to ensure that members of the public are informed of’, and caii obtain, at all reasonable times, environmental information relating to the discharge,
Unless otherwise agreed by the Agency, all reports and notifications submitted to the Agency shall:
(i) be sent to Administration, Office of Environmental Enforcement (OEE) at the Agency’s Headquarters or to such other Agency office agreed by the Agency;
comprise one original and two copies unless additional copies are required by Agency;
be fonnatted i n accordance with any written instruction or guidance issued by the Agency;
include whatever information may be required by tlie Agency;
be identified by a unique code, indicate any modification or amendment, and be correctly dated to reflect any such modification or amendment;
(ii)
(iii)
(iv)
(v)
Paye IS
For
insp
ectio
n pur
pose
s only
.
Conse
nt of
copy
right
owne
r req
uired
for a
ny ot
her u
se.
EPA Export 07-11-2018:04:04:39
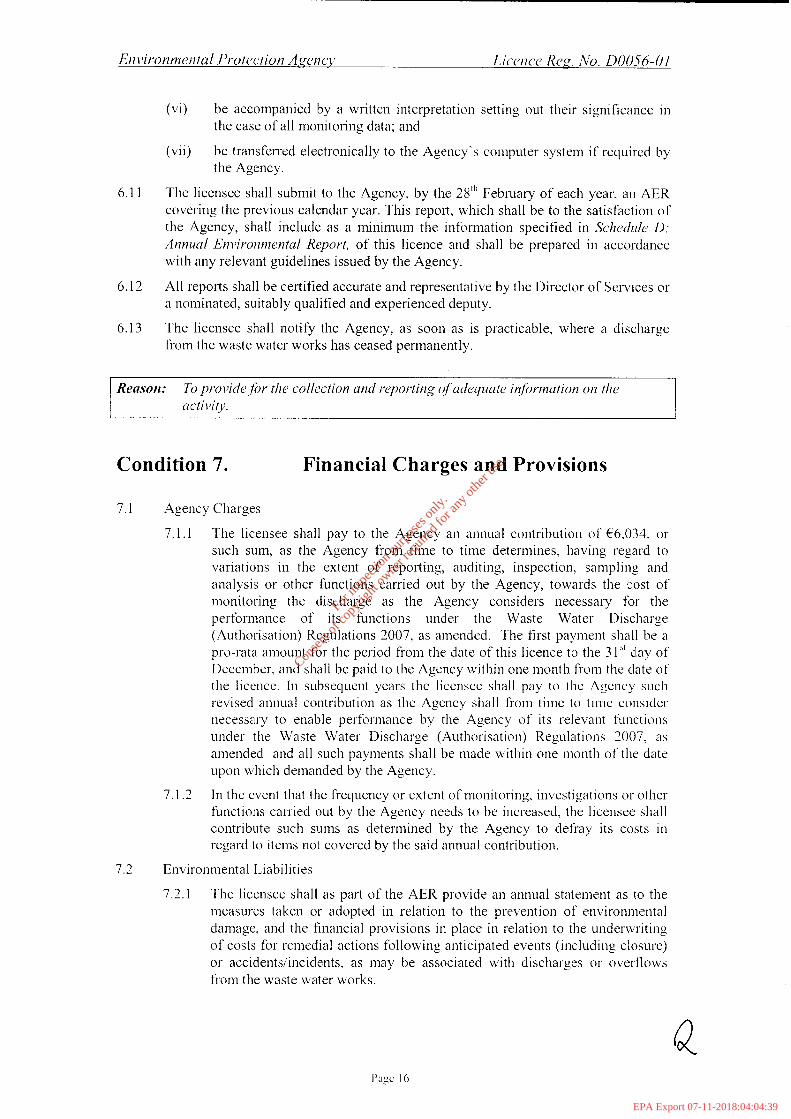
Licoicc Reg. No. 00056-01
(vi) be accompanied by a written interpretation setting out their significance i n the case of all monitoring data; and
(vii) be transferred electronically to the Agency's computer system if required by the Agency.
The licensee shall submit to the Agency, by the 28'" February of each year, an AER covering the previous calendar year. This report, which shall be to the satisfaction of the Agency, shall include as a minimum the information specified in Sc11cd11Ie D; Annuul Environmental Report, of this licence and shall be prepared in accordance with any relevant guidelines issued by the Agency.
All reports shall be certified accurate and representative by the Director of Services or a nominated, suitably qualified and experienced deputy.
The licensee shall notify the Agency, as soon as is practicable, where a discharge from the waste water works has ceased permanently.
6.1 1
6.12
6.13
Reason: To provide, ftw the collection and reputing of udequcite inforniation on the trctivit,v.
Condition 7. Financial Charges and Provisions
7.1 Agency Charges
7.1.1 The licensee shall pay to the Agency an annual contribution of f6,034, or such sum, as the Agency froin time to time determines, having regard to variations in the extent of reporting, auditing, inspection, sampling and analysis or other functions carried out by the Agency, towards the cost of monitoring the disdiarge as the Agency considers necessary for the perfonnance of its functions under the Waste Water Discharge (Authorisation) Regulations 2007, as amended. The first payment shall be a pro-rata amount for the period from the date of this licence to the 3 1 'I clay of December, and shall be paid to the Agency within one month From the date o f the licence. I n subsequent years the licensee shall pay to the Agency such revised annual contribution as the Agency shall fi-om time to time consider necessary to enable performance by the Agency of its relevant functions under the Waste Water Discharge (Authorisation) Regulations 2007, as amended and all such payments shall be made within one month of the date upon which demanded by the Agency.
7.1.2 In the event that the frequency or extent of monitoring, investigations or other functions carried out by the Agency needs to be increased, the licensee shall contribute such sums as deterniined by the Agency to defray its costs in regard to items not covered by the said annual contribution.
7.2 Environmental Liabilities
7.2.1 The licensee shall as part of the AER provide an annual statement as to the measures taken or adopted in relation to the prevention of environmental damage, and the financial provisions in place in relation to the underwriting of costs for remedial actions following anticipated events (including closure) or accidentsiiticidents, as may be associated with discharges or overflows froni the waste water works.
For
insp
ectio
n pur
pose
s only
.
Conse
nt of
copy
right
owne
r req
uired
for a
ny ot
her u
se.
EPA Export 07-11-2018:04:04:39

7.2.2 The licensee shall arrange for the completion. by an independent and appropriately qualified consultant, of a conipreliensive and fully costed Environmental Liabilities Risk Assessment ( E L M ) to address the liabilities from present or planned discharges. .4 report on this assessment shall be submitted to the Agency for agreement as part of the second AER (required under Condition 6.1 1). The E L M shall be reviewed as necessary to reflect any significant change to the volume or character of effluent discharged, and in any case every three years following initial agreement (the results of the review shall be notified as part of the AER).
7.2.3 As part of the measures identified in Condition 7.2.1 the licensee shall, to the satisfaction of the Agency, make financial provision to cover any liabilities identified in Condition 7.2.2. The amount of indemnity held shall be reviewed and revised as necessary, but at least triennially. Proof of renewal or revision of such financial indemnity shall be included in the annual 'Statement of Measures' report identified in Condition 7.2.1.
The licensee shall have regard to the Environmental Protection Agency Guidance on Environmental Liability Risk Assessment, Residuals Management Plans and Financial Provision when implementing Conditions 7.2.1, 7.2.2 and 7.2.3 above.
7.2.4
R Pagc I7
For
insp
ectio
n pur
pose
s only
.
Conse
nt of
copy
right
owne
r req
uired
for a
ny ot
her u
se.
EPA Export 07-11-2018:04:04:39

SCHEDULE A: Discharges
A. I Printaiy Waste Water Discharge
Primary Discharge Point Code:
Name of Receiving Waters:
Discharge Location
Moriitoriiig Location:
SWOI MIDL
North Channel Great Island (SWp060_0300)
186 177E. 069506N
Interim - MPOlSWOl MIDL (186603E 69729N) Filial - to be agreed by the Agency as per Condition 4.18.
Parameter
pH
Emission Limit Value
6.5 - 9
CBOD
COD
Suspended Solids
Total Nitrogen
mg/l
25
125
35
15
Orthophosphate (as P) 2
Faecal Coliforms '(ltr) ' & ' Geometric mean o f 5 750 fci 100nil.; of saiuple and 95'Kllc 5 lOOOfc lOO1iils
.:.
A.2 Secoitrlaiy Waste Water Discltarges
There shall be no Secondary Waste Water Discharges.
A.3 Discharges to be discontiticred
No discharge is I-equired to be discontinued in this schedule.
4
For
insp
ectio
n pur
pose
s only
.
Conse
nt of
copy
right
owne
r req
uired
for a
ny ot
her u
se.
EPA Export 07-11-2018:04:04:39

A. 4 Storm Water [email protected] Discharge Point Code
SW03 MIDL '
Location
187973E 073 127N Owenacurra estuary 6 spills, annum and
Name of Receiving Waters
SW04 MIDL '('Ie3
SW05 MIDL
Control Limit Value Note 1 & 2
SW07 MIDL
188045E 0725 14N
188520E 07 1783N
Owenacurra estuary discharge volume 5 1.5% of total storm water collected in the Owenacurra estuary relevant section of the waste water works '. Owenacurra estuary 188520E 07 1783N
I I I
Note I : Note 2:
Note 3 : Note 4:
Subject to Condition 4. 12 I This litnit value shall be in accordaiicc with "/'/.occ't/i/rrt.Y crnd c'ri/c,-ifr in r?/trtroi? /o Stor/?? bfirlo. ~ h c ~ ~ f ~ O I ~ : s " as a ininimum. Control limit value shall apply by the 3 1 s1 Dceeltlber 201 I Relevant section ofthe waste water works ret'ers t(1 the catcliincnt ofthe intlivitlual storlii water ovcrtlow.
For
insp
ectio
n pur
pose
s only
.
Conse
nt of
copy
right
owne
r req
uired
for a
ny ot
her u
se.
EPA Export 07-11-2018:04:04:39

EH I ii-on men ta I Pro t cct ioii A g m cl, Licciicc Kc,g. No. 000.56-01
SCHEDULE B: Monitoring
B. I Monitoring qf PrimaCV Waste Water Discharge
Primary Discharge Point Code: Monitoring Location:
SWOl MIDL Interim - MPOlSWOl MIDI. (186603E h9729N) Final ~ to be agreed by the Agency as per Condition 4.18
Parameter
Flow
Temperature
PH
- -_I__ _ _ -
Carbonaceous Biochemical Oxygen Demand
Chemical Oxygen Demand
Suspended Solids
Total Nitrogen (as N)
Total oxidised nitrogen (as
Total Ammonia (as N)
Orthophosphate (as P)
Faecal colifornis
Polychlorinated biphenyls
Dissolved metals ' Metals and Organic Compounds 'ate
Visual Inspection
Monitoring Frequency
Continuous U''tr ' Daily
Daily
Fortnightly '
Fortnightly ut'te ' Fortnightly ' Fortnightly ' Fortnightly '
Fortnightly \"" ' Fot tntghtly ""' ' Weekly
€3 t ann u a 1
R t a nnual
A b required
_ _ _ - _ Analysis MetIiodlTechnique
On-line flow meter with recorder
Temperature probe
pH electrodeimeter and recorder
Standard Method
Standard Method
Standard Method
Standard Method
Standard Method
Standard Method
Standard Method
Standard Method
Standard Method
Standard Method
Standard Method
Daily
Ilucnt \oILlIIIe clt\Llldlfed (1Lct l l lC 21-ho~lt pcllotl 111 \\lllLll tlic Lotllpcl\lte \3111p1c
Sample arid euaminc for colour. odour and petroleium hydi ocarbon film
Notc 8ote
B.2 Monitoring qf Secondary Waste Water Discharge
No monitoring of secondary waste water discliarges is recpirecl in this licence.
For
insp
ectio
n pur
pose
s only
.
Conse
nt of
copy
right
owne
r req
uired
for a
ny ot
her u
se.
EPA Export 07-11-2018:04:04:39
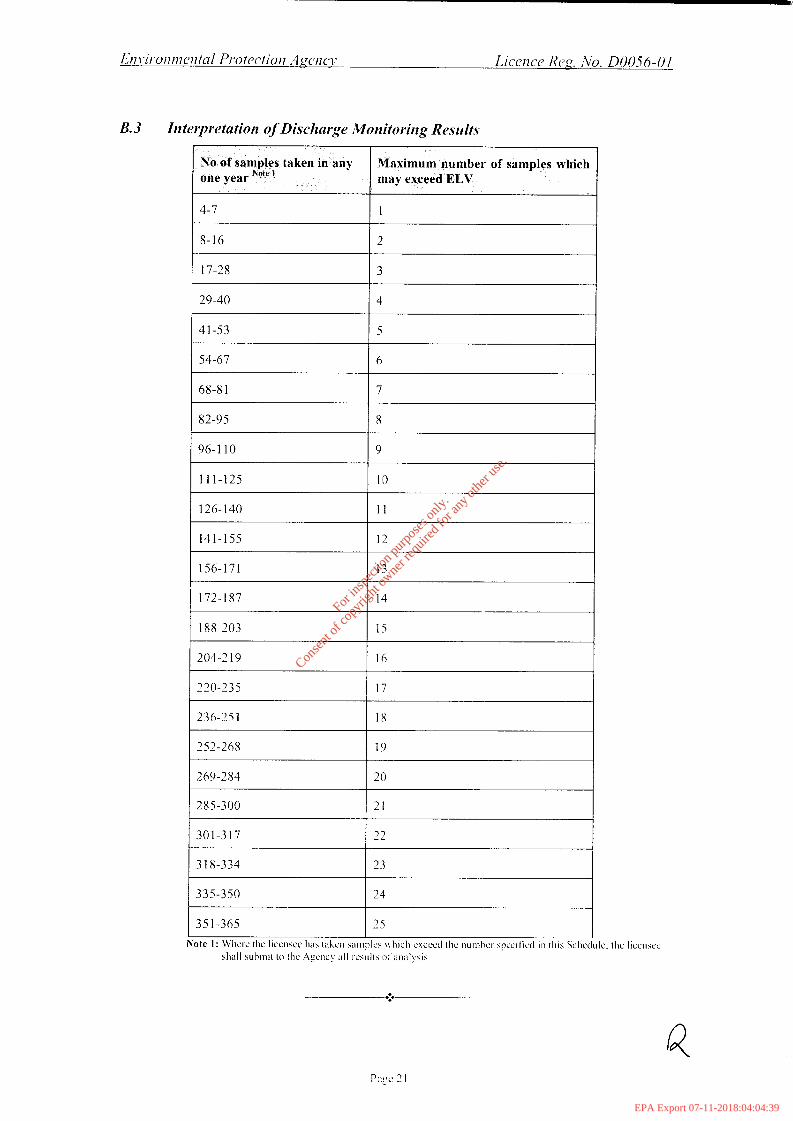
B. 3 Iiiterpretution qf Discharge Monitoring Resirlts
269-284 I 20 I
4 1-53
54-67
68-8 1
126-140
I4 1-1 55
82-95
96-1 10
11 1-125
11
12
172-187
188-203
I 156-171
14
15
I 13
2 20-2 3 5
236-251
17
18
1 204-219
301 -3 1 7
3 18-334
I 16
7 7 &..i
23
I 252-268 I I9
285-300 121
For
insp
ectio
n pur
pose
s only
.
Conse
nt of
copy
right
owne
r req
uired
for a
ny ot
her u
se.
EPA Export 07-11-2018:04:04:39

B. 4 Ambient Monitoring
Receiving Water Morritnviiig
See Condition 4.20 for requirements.
Monitoring ’ Frequency of operation Duration and volume of each spill
B.5 Monitoring of Storm Water Ovecflows
Discharge Point Code
SW03MIDL S W04MIDL S WOSMIDL SW07MIDL
For
insp
ectio
n pur
pose
s only
.
Conse
nt of
copy
right
owne
r req
uired
for a
ny ot
her u
se.
EPA Export 07-11-2018:04:04:39

SCHEDULE C: Specified Improvement Programme
C. 1 Intyrovettieizt Programme.for Primary Discharge
Specified Improvement Completion Date
Increase Midleton WWTP capacity to 15,000PE
Infiltration programme
Any other works notified in writing by the Agency
3 1 '' December 20 1 1
3 1 " December 20 1 1
As agreed I_
C. 2 Intyro vem en t Programme j h r Secoizdary Discli arge(s)
No improvements works are specified.
C.3 Itiiyrovettteizt Piqyaninie, jhr Storm Water Ove$onts
Specified Improvement
Upgrading of' Storm Water Overflows to comply with the limits outiined in S C ~ ~ L I / P 4 . 4 (Condition 5.6)
Discharge Point Code
S WO3 MI DL S W04MIDL
1 Completion Date
3 1 December 20 1 1
Infiltration programme SW03MIDL S W 04 M ID L
3 1 " December 20 1 1
As agrccd
For
insp
ectio
n pur
pose
s only
.
Conse
nt of
copy
right
owne
r req
uired
for a
ny ot
her u
se.
EPA Export 07-11-2018:04:04:39

En ivii-oiin i cw tcil Pro tectio ti A ee ti cis Licence Rea. No. 00056-01
SCHEDULE D: Annual Environmental Report
Annual Enviroriniental Report Content ' Discharges from the agglomeration. Summary report on monthly influent monitoring Data collection and reporting requirements under the Urban Waste Water Treatment Directive Coniplaints suminary Pollutant Release and Transfer Register - report for previous year. Pollutant Release and Tranqfer Register - proposal for current year. Suinmary report on ambient water quality of the North Channel Great Island Storm water overflow assessment report. Spill frequency and discharge volumes from stonn water overflows Reported incidents summary. Report on progress made and proposals being developed to meet the improveinent programme requirements "w ' Developinent/Infrastnictural works suinmary (completed in previous year or prepared for current year). Any other items specified by the Agency Note I : Note 2: Thi\ w n m , q I sh'lll plo\ldc det,Ill 011 ,111 IllC"1bU1C\ plc'pcl\ed 'lllll u~ldelt'll\en llndcl l l l i \?r'llCl set\ lLC\
Conteiir m.iy be I d subjeLl to the ,igiceiiient 01 the Agency
Ill\.e~tlllcllt Plopl'lmme 101 t i l ? ' l ~g l~~ l l l e l , i l l~~ l l . IllilLltllllg pl(lgle\\ 1epo11.. 011 Illllrl\lluL1LII'1I \ lol l , \ 'llld <I \t'llelnellt (11
io inp l i~ ince U i t l i timcti,iin
Sealed by the seal of the Agency on this the 6"' (lay of.Janoary 2011.
For
insp
ectio
n pur
pose
s only
.
Conse
nt of
copy
right
owne
r req
uired
for a
ny ot
her u
se.
EPA Export 07-11-2018:04:04:39

New Cheese Factory at Dairygold Mogeely Wastewater
Appendix 3. Layout of existing WWTP
For
insp
ectio
n pur
pose
s only
.
Conse
nt of
copy
right
owne
r req
uired
for a
ny ot
her u
se.
EPA Export 07-11-2018:04:04:39

Pumping & Treatment Systems
For
insp
ectio
n pur
pose
s only
.
Conse
nt of
copy
right
owne
r req
uired
for a
ny ot
her u
se.
EPA Export 07-11-2018:04:04:39

Pumping & Treatment Systems
For
insp
ectio
n pur
pose
s only
.
Conse
nt of
copy
right
owne
r req
uired
for a
ny ot
her u
se.
EPA Export 07-11-2018:04:04:39

Pumping & Treatment Systems
For
insp
ectio
n pur
pose
s only
.
Conse
nt of
copy
right
owne
r req
uired
for a
ny ot
her u
se.
EPA Export 07-11-2018:04:04:39

Pumping & Treatment Systems
For
insp
ectio
n pur
pose
s only
.
Conse
nt of
copy
right
owne
r req
uired
for a
ny ot
her u
se.
EPA Export 07-11-2018:04:04:39

Pumping & Treatment Systems
For
insp
ectio
n pur
pose
s only
.
Conse
nt of
copy
right
owne
r req
uired
for a
ny ot
her u
se.
EPA Export 07-11-2018:04:04:39

Pumping & Treatment Systems
For
insp
ectio
n pur
pose
s only
.
Conse
nt of
copy
right
owne
r req
uired
for a
ny ot
her u
se.
EPA Export 07-11-2018:04:04:39

Pumping & Treatment Systems
For
insp
ectio
n pur
pose
s only
.
Conse
nt of
copy
right
owne
r req
uired
for a
ny ot
her u
se.
EPA Export 07-11-2018:04:04:39

Pumping & Treatment Systems
For
insp
ectio
n pur
pose
s only
.
Conse
nt of
copy
right
owne
r req
uired
for a
ny ot
her u
se.
EPA Export 07-11-2018:04:04:39

Pumping & Treatment Systems
For
insp
ectio
n pur
pose
s only
.
Conse
nt of
copy
right
owne
r req
uired
for a
ny ot
her u
se.
EPA Export 07-11-2018:04:04:39

New Cheese Factory at Dairygold Mogeely Wastewater
Appendix 4. Wastewater Treatment Plant efficiency Calculations
For
insp
ectio
n pur
pose
s only
.
Conse
nt of
copy
right
owne
r req
uired
for a
ny ot
her u
se.
EPA Export 07-11-2018:04:04:39

WWTP Upgrade for Dairygold, Mogeely Eff. of WWTP extg. (ave)
Influent to the WWTP has the following loading: -
BOD5 Load = 680 kgs/day
Flow = 430 m3
Incoming BOD5 concentration = 1581 mgs/l
Forward Feed pump rate = 35 m3/hr
Bio-Tower 1 (10.8 m X 7.6 m X 6.1 m deep)
So 1581 mg/l Inlet So/Sf = exp (KAs*(H/Q^n))
As 100 m2/m
3Reference page 729 of Degremont
H 6.1 m
Q 5.238791 m3/d/m2
n 0.6952 coefficient
Q^n 3.162347
K Dairy 0.0108 constant
kAs*H/Qn
2.083263
exp 8.030631
Sf = 197 mg/l Outlet
87.5% BOD removal efficiency
Bio-Tower 2 (10.89 m X 7.6 m X 6.1 m deep)
So OFF-LINE mg/l Inlet
As OFF-LINE m2/m3
H OFF-LINE m
Q OFF-LINE m3/d/m2
n OFF-LINE coefficient
Q^n OFF-LINE
K Dairy OFF-LINE constant
kAs*H/QnOFF-LINE
exp OFF-LINE
Sf = OFF-LINE
Extended Aeration Stage
Volumetric loading rate for a Nitrification/Denitrification Plant is 0.19 kg BOD per m3 of reactor volume.
Treament efficiency ~ 95%
Incoming BOD Loading 84.68 Kgs
Reactor Volume required 446 m3
Existing Reactor Volume 1426 m3OK
Sf = 10 mg/l Outlet
1 of 12
For
insp
ectio
n pur
pose
s only
.
Conse
nt of
copy
right
owne
r req
uired
for a
ny ot
her u
se.
EPA Export 07-11-2018:04:04:39

WWTP Upgrade for Dairygold, Mogeely Eff. of WWTP extg. (ave)
99.4% Overall BOD removal efficiency
Design load 84.7 kg BOD
Design Flow Q 430 m3/Day
Reactor Volume 1426 m3
Design Data
BOD (@ ?? grams BOD / Hd.) Kgs./Day 84.7
TKN (@ ?? mg./l.) Kgs./Day 26
P (@ ??g./Hd./Day) Kgs./Day 10
Ta Ambient Air Temperature (Degrees C) 18
Ti Average Influent Temperature (Degrees C) 20
h Elevation (m.O.D.) (m) 20
A Surface Area of Basin(s) (m2) 418
Q Flow Rate (m3/Day) 430
f Proportionality Factor (f) 0.5
C'sw Solubility of O2 at Field Temp. 9.56
Csw Solubility of O2 at 20 Degrees C 9.17
C Minimum Disolved Oxygen in Basin(s) 0.5
B Salinity Surface Tension Factor (Beta), normally 0.9 0.9
a Oxygen Transfer Correction Factor (Alpha) for Wastewater, normally 0.8 - 0.9 0.8
T Average temperature of Wastewater in Basin, = (AfTa+Qti)/Af+Q 19.35
Fa Oxygen Solubility Correction Factor for Elevation,= (1-h,m/9450) 0.9979
Influent Concentrations
So BOD mg./l. 197
No TKN mg./l. 60
Po P mg./l. 23
MLSS mg./l. 2500
Sludge Age Days 30
Px Waste Volatile A.S. Kg./Day 119
Effluent Concentrations
S BOD mg./l. 5
N TKN mg./l. 5
P P mg./l. 1
Calculation of Air Demand for Design Load
2 of 12
For
insp
ectio
n pur
pose
s only
.
Conse
nt of
copy
right
owne
r req
uired
for a
ny ot
her u
se.
EPA Export 07-11-2018:04:04:39

WWTP Upgrade for Dairygold, Mogeely Eff. of WWTP extg. (ave)
RETENTION TIMES
Flow rates thro' the Aeration tanks, during feed, can vary from 6 DWF to 8 DWF depending on weather conditions.
At 6 DWF (7,360 cu.m./day) retention time in each cell is 1.6 hours. This reduces to 1.2 hours at 8 DWF.
Full DeNitrification should take place in about 30 mins. (depending on Temp. & MLSS).
Carbonation should also take less than an hour, so that full Carbonation should take place in Cell 1 and
Nitrification will have started. Full Nitrification will take approx. 4 hours (again depending on above parameters)
Therefore, at 6DWF flow rate, (I.e. Retention of 1.6 hours/cell) just under 50% Nitrification could take place in Cell 2.
Theoretical Oxygen Required
Kg O2/day = Q(So-S)/((BOD5/BODL)*1000) - 1.42(Px) + 4.57Q(No-N)/1000 -0.5(4.57Q(No-N)/1000)
Carbonation
Note: Degremont gives a figure of 50 - 60% of oxygen required for Nitrification is recovered during
DeNitrification. DWM Johnstone states that 62.5% of oxygen required for Nitrification can
recovered during DeNitrification. In our design 83% of Nitrogen is removed, therefore 83%
of 62.5% = 51.875% of oxygen is recovered. DWM Johnstone also states that 5% of Ammonia
is required for cell synthesis so that the factor for Nitrification should be 4.34 and not 4.57
For Carbonation -47 Kgs. O2/Day
For Nitrification 109 Kgs. O2/Day
Recovery for Denitrification 50%
Total Theoretical Oxygen Required = 7 Kgs. O2/Day
Standard Oxygen Requirement (SOR) = Theoretical requirement converted for Field Conditions
SOR = O2 / ((( C'sw*B*Fa - C)/Csw)*(1.024^(T-20))*a)
SOR = 10.2 Kgs. O2/Day
Hourly Air Requirement
Diffuser Efficiency 15%
Air Required (SOR) = 11 m3 /Hr.
Factor of Safety 150%
Blower Capacity / Hr. 16 m3 /Hr.
Nitrification DeNitrification
3 of 12
For
insp
ectio
n pur
pose
s only
.
Conse
nt of
copy
right
owne
r req
uired
for a
ny ot
her u
se.
EPA Export 07-11-2018:04:04:39

WWTP Upgrade for Dairygold, Mogeely Eff. of WWTP extg. (ave)
References: 1 - Metcalf & Eddy, Third Edition
2 - Sved Qasim, University of Texas,
3 - DWM Johnstone, AJ Rachwal, & MJ Hanbury, Thames Water @ Aqua Viro
course on "Design, Operation and uprating of Activated Sludge Processes"
4 - Degremont, Sixth Edition
4 of 12
For
insp
ectio
n pur
pose
s only
.
Conse
nt of
copy
right
owne
r req
uired
for a
ny ot
her u
se.
EPA Export 07-11-2018:04:04:39
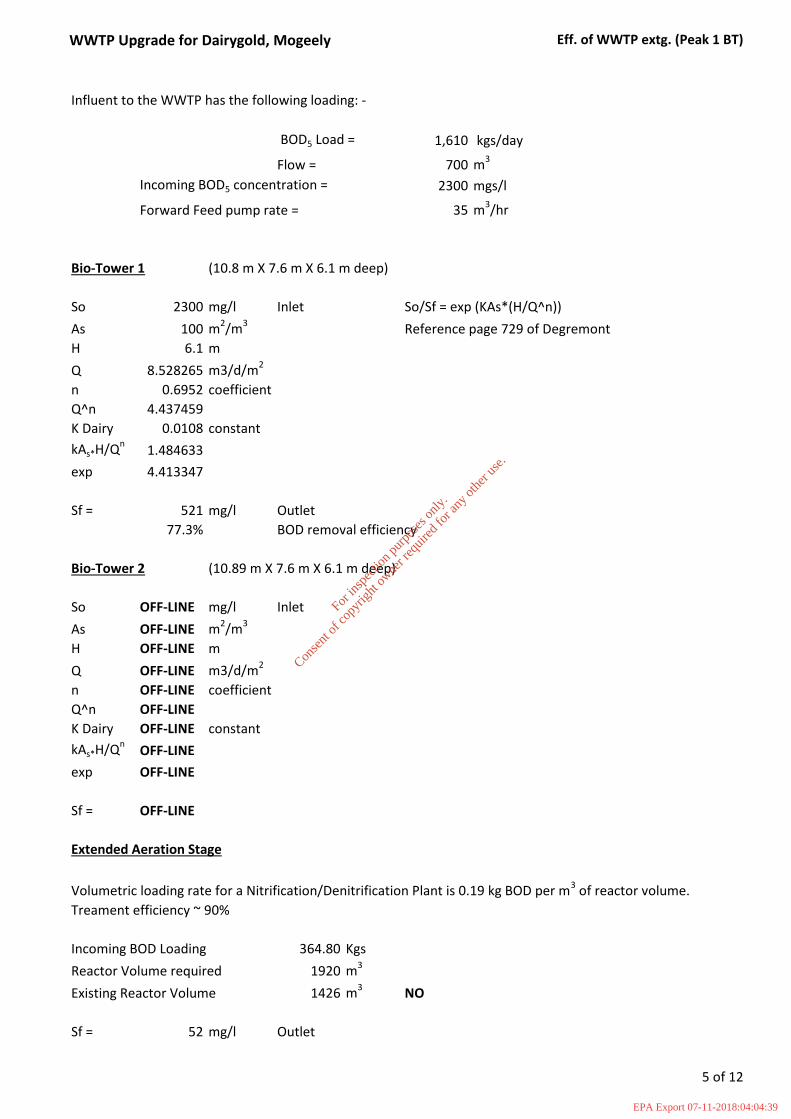
WWTP Upgrade for Dairygold, Mogeely Eff. of WWTP extg. (Peak 1 BT)
Influent to the WWTP has the following loading: -
BOD5 Load = 1,610 kgs/day
Flow = 700 m3
Incoming BOD5 concentration = 2300 mgs/l
Forward Feed pump rate = 35 m3/hr
Bio-Tower 1 (10.8 m X 7.6 m X 6.1 m deep)
So 2300 mg/l Inlet So/Sf = exp (KAs*(H/Q^n))
As 100 m2/m
3Reference page 729 of Degremont
H 6.1 m
Q 8.528265 m3/d/m2
n 0.6952 coefficient
Q^n 4.437459
K Dairy 0.0108 constant
kAs*H/Qn
1.484633
exp 4.413347
Sf = 521 mg/l Outlet
77.3% BOD removal efficiency
Bio-Tower 2 (10.89 m X 7.6 m X 6.1 m deep)
So OFF-LINE mg/l Inlet
As OFF-LINE m2/m3
H OFF-LINE m
Q OFF-LINE m3/d/m2
n OFF-LINE coefficient
Q^n OFF-LINE
K Dairy OFF-LINE constant
kAs*H/QnOFF-LINE
exp OFF-LINE
Sf = OFF-LINE
Extended Aeration Stage
Volumetric loading rate for a Nitrification/Denitrification Plant is 0.19 kg BOD per m3 of reactor volume.
Treament efficiency ~ 90%
Incoming BOD Loading 364.80 Kgs
Reactor Volume required 1920 m3
Existing Reactor Volume 1426 m3NO
Sf = 52 mg/l Outlet
5 of 12
For
insp
ectio
n pur
pose
s only
.
Conse
nt of
copy
right
owne
r req
uired
for a
ny ot
her u
se.
EPA Export 07-11-2018:04:04:39
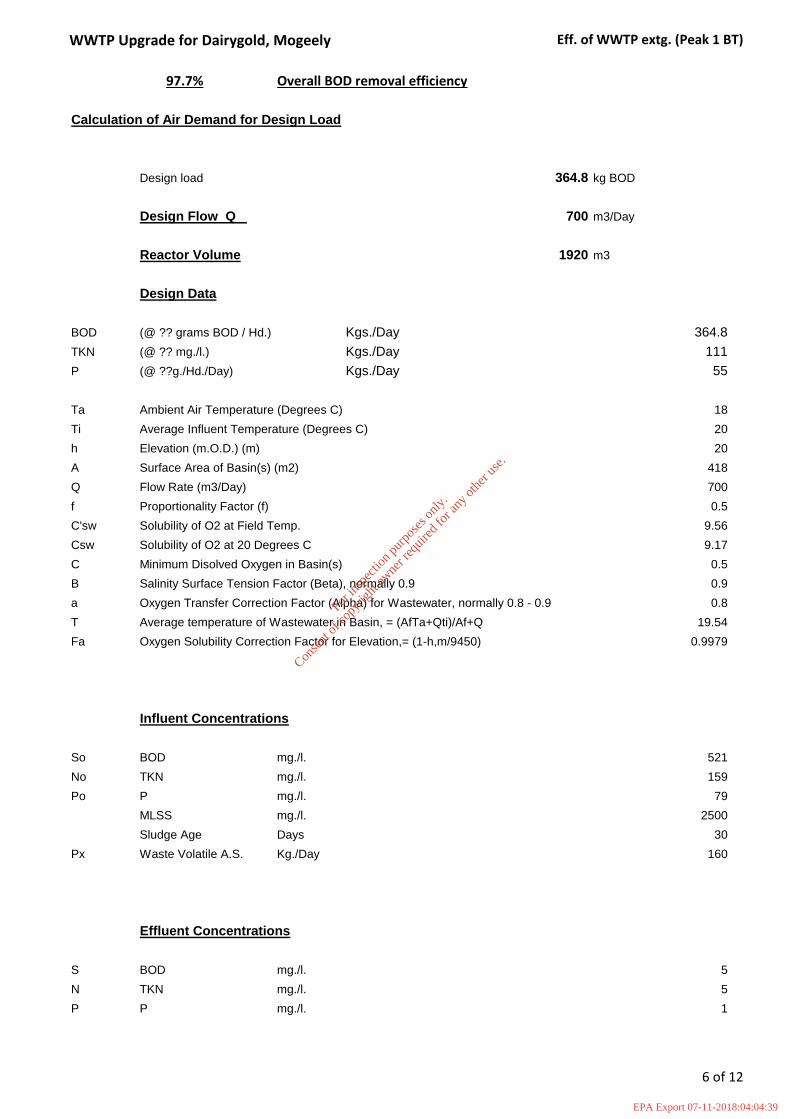
WWTP Upgrade for Dairygold, Mogeely Eff. of WWTP extg. (Peak 1 BT)
97.7% Overall BOD removal efficiency
Design load 364.8 kg BOD
Design Flow Q 700 m3/Day
Reactor Volume 1920 m3
Design Data
BOD (@ ?? grams BOD / Hd.) Kgs./Day 364.8
TKN (@ ?? mg./l.) Kgs./Day 111
P (@ ??g./Hd./Day) Kgs./Day 55
Ta Ambient Air Temperature (Degrees C) 18
Ti Average Influent Temperature (Degrees C) 20
h Elevation (m.O.D.) (m) 20
A Surface Area of Basin(s) (m2) 418
Q Flow Rate (m3/Day) 700
f Proportionality Factor (f) 0.5
C'sw Solubility of O2 at Field Temp. 9.56
Csw Solubility of O2 at 20 Degrees C 9.17
C Minimum Disolved Oxygen in Basin(s) 0.5
B Salinity Surface Tension Factor (Beta), normally 0.9 0.9
a Oxygen Transfer Correction Factor (Alpha) for Wastewater, normally 0.8 - 0.9 0.8
T Average temperature of Wastewater in Basin, = (AfTa+Qti)/Af+Q 19.54
Fa Oxygen Solubility Correction Factor for Elevation,= (1-h,m/9450) 0.9979
Influent Concentrations
So BOD mg./l. 521
No TKN mg./l. 159
Po P mg./l. 79
MLSS mg./l. 2500
Sludge Age Days 30
Px Waste Volatile A.S. Kg./Day 160
Effluent Concentrations
S BOD mg./l. 5
N TKN mg./l. 5
P P mg./l. 1
Calculation of Air Demand for Design Load
6 of 12
For
insp
ectio
n pur
pose
s only
.
Conse
nt of
copy
right
owne
r req
uired
for a
ny ot
her u
se.
EPA Export 07-11-2018:04:04:39

WWTP Upgrade for Dairygold, Mogeely Eff. of WWTP extg. (Peak 1 BT)
RETENTION TIMES
Flow rates thro' the Aeration tanks, during feed, can vary from 6 DWF to 8 DWF depending on weather conditions.
At 6 DWF (7,360 cu.m./day) retention time in each cell is 1.6 hours. This reduces to 1.2 hours at 8 DWF.
Full DeNitrification should take place in about 30 mins. (depending on Temp. & MLSS).
Carbonation should also take less than an hour, so that full Carbonation should take place in Cell 1 and
Nitrification will have started. Full Nitrification will take approx. 4 hours (again depending on above parameters)
Therefore, at 6DWF flow rate, (I.e. Retention of 1.6 hours/cell) just under 50% Nitrification could take place in Cell 2.
Theoretical Oxygen Required
Kg O2/day = Q(So-S)/((BOD5/BODL)*1000) - 1.42(Px) + 4.57Q(No-N)/1000 -0.5(4.57Q(No-N)/1000)
Carbonation
Note: Degremont gives a figure of 50 - 60% of oxygen required for Nitrification is recovered during
DeNitrification. DWM Johnstone states that 62.5% of oxygen required for Nitrification can
recovered during DeNitrification. In our design 83% of Nitrogen is removed, therefore 83%
of 62.5% = 51.875% of oxygen is recovered. DWM Johnstone also states that 5% of Ammonia
is required for cell synthesis so that the factor for Nitrification should be 4.34 and not 4.57
For Carbonation 304 Kgs. O2/Day
For Nitrification 491 Kgs. O2/Day
Recovery for Denitrification 50%
Total Theoretical Oxygen Required = 550 Kgs. O2/Day
Standard Oxygen Requirement (SOR) = Theoretical requirement converted for Field Conditions
SOR = O2 / ((( C'sw*B*Fa - C)/Csw)*(1.024^(T-20))*a)
SOR = 787.9 Kgs. O2/Day
Hourly Air Requirement
Diffuser Efficiency 15%
Air Required (SOR) = 820 m3 /Hr.
Factor of Safety 150%
Blower Capacity / Hr. 1230 m3 /Hr.
Nitrification DeNitrification
7 of 12
For
insp
ectio
n pur
pose
s only
.
Conse
nt of
copy
right
owne
r req
uired
for a
ny ot
her u
se.
EPA Export 07-11-2018:04:04:39

WWTP Upgrade for Dairygold, Mogeely Eff. of WWTP extg. (Peak 1 BT)
References: 1 - Metcalf & Eddy, Third Edition
2 - Sved Qasim, University of Texas,
3 - DWM Johnstone, AJ Rachwal, & MJ Hanbury, Thames Water @ Aqua Viro
course on "Design, Operation and uprating of Activated Sludge Processes"
4 - Degremont, Sixth Edition
8 of 12
For
insp
ectio
n pur
pose
s only
.
Conse
nt of
copy
right
owne
r req
uired
for a
ny ot
her u
se.
EPA Export 07-11-2018:04:04:39

WWTP Upgrade for Dairygold, Mogeely Eff. of WWTP extg. (Peak 2BT)
Influent to the WWTP has the following loading: -
BOD5 Load = 1,610 kgs/day
Flow = 700 m3
Incoming BOD5 concentration = 2300 mgs/l
Forward Feed pump rate = 35 m3/hr
Bio-Tower 1 (10.8 m X 7.6 m X 6.1 m deep)
So 2300 mg/l Inlet So/Sf = exp (KAs*(H/Q^n))
As 100 m2/m
3Reference page 729 of Degremont
H 6.1 m
Q 8.528265 m3/d/m2
n 0.6952 coefficient
Q^n 4.437459
K Dairy 0.0108 constant
kAs*H/Qn
1.484633
exp 4.413347
Sf = 521 mg/l Outlet
77.3% BOD removal efficiency
Bio-Tower 2 (10.89 m X 7.6 m X 6.1 m deep)
So 521 mg/l Inlet
As 100 m2/m3
H 6.1 m
Q 8.528265 m3/d/m2
n 0.6952 coefficient
Q^n 4.437459
K Dairy 0.0108 constant
kAs*H/Qn1.484633
exp 4.413347
Sf = 118 mg/l Outlet
77.3% BOD removal efficiency
Extended Aeration Stage
Volumetric loading rate for a Nitrification/Denitrification Plant is 0.19 kg BOD per m3 of reactor volume.
Treament efficiency ~ 95%
Incoming BOD Loading 82.66 Kgs
Reactor Volume required 435 m3
Existing Reactor Volume 1426 m3OK
9 of 12
For
insp
ectio
n pur
pose
s only
.
Conse
nt of
copy
right
owne
r req
uired
for a
ny ot
her u
se.
EPA Export 07-11-2018:04:04:40

WWTP Upgrade for Dairygold, Mogeely Eff. of WWTP extg. (Peak 2BT)
Sf = 6 mg/l Outlet
99.7% Overall BOD removal efficiency
Design load 82.7 kg BOD
Design Flow Q 700 m3/Day
Reactor Volume 435 m3
Design Data
BOD (@ ?? grams BOD / Hd.) Kgs./Day 82.7
TKN (@ ?? mg./l.) Kgs./Day 111
P (@ ??g./Hd./Day) Kgs./Day 55
Ta Ambient Air Temperature (Degrees C) 18
Ti Average Influent Temperature (Degrees C) 20
h Elevation (m.O.D.) (m) 20
A Surface Area of Basin(s) (m2) 418
Q Flow Rate (m3/Day) 700
f Proportionality Factor (f) 0.5
C'sw Solubility of O2 at Field Temp. 9.56
Csw Solubility of O2 at 20 Degrees C 9.17
C Minimum Disolved Oxygen in Basin(s) 0.5
B Salinity Surface Tension Factor (Beta), normally 0.9 0.9
a Oxygen Transfer Correction Factor (Alpha) for Wastewater, normally 0.8 - 0.9 0.8
T Average temperature of Wastewater in Basin, = (AfTa+Qti)/Af+Q 19.54
Fa Oxygen Solubility Correction Factor for Elevation,= (1-h,m/9450) 0.9979
Influent Concentrations
So BOD mg./l. 118
No TKN mg./l. 159
Po P mg./l. 79
MLSS mg./l. 2500
Sludge Age Days 30
Px Waste Volatile A.S. Kg./Day 36
Effluent Concentrations
S BOD mg./l. 5
N TKN mg./l. 5
P P mg./l. 1
Calculation of Air Demand for Design Load
10 of 12
For
insp
ectio
n pur
pose
s only
.
Conse
nt of
copy
right
owne
r req
uired
for a
ny ot
her u
se.
EPA Export 07-11-2018:04:04:40

WWTP Upgrade for Dairygold, Mogeely Eff. of WWTP extg. (Peak 2BT)
RETENTION TIMES
Flow rates thro' the Aeration tanks, during feed, can vary from 6 DWF to 8 DWF depending on weather conditions.
At 6 DWF (7,360 cu.m./day) retention time in each cell is 1.6 hours. This reduces to 1.2 hours at 8 DWF.
Full DeNitrification should take place in about 30 mins. (depending on Temp. & MLSS).
Carbonation should also take less than an hour, so that full Carbonation should take place in Cell 1 and
Nitrification will have started. Full Nitrification will take approx. 4 hours (again depending on above parameters)
Therefore, at 6DWF flow rate, (I.e. Retention of 1.6 hours/cell) just under 50% Nitrification could take place in Cell 2.
Theoretical Oxygen Required
Kg O2/day = Q(So-S)/((BOD5/BODL)*1000) - 1.42(Px) + 4.57Q(No-N)/1000 -0.5(4.57Q(No-N)/1000)
Carbonation
Note: Degremont gives a figure of 50 - 60% of oxygen required for Nitrification is recovered during
DeNitrification. DWM Johnstone states that 62.5% of oxygen required for Nitrification can
recovered during DeNitrification. In our design 83% of Nitrogen is removed, therefore 83%
of 62.5% = 51.875% of oxygen is recovered. DWM Johnstone also states that 5% of Ammonia
is required for cell synthesis so that the factor for Nitrification should be 4.34 and not 4.57
For Carbonation 65 Kgs. O2/Day
For Nitrification 491 Kgs. O2/Day
Recovery for Denitrification 50%
Total Theoretical Oxygen Required = 311 Kgs. O2/Day
Standard Oxygen Requirement (SOR) = Theoretical requirement converted for Field Conditions
SOR = O2 / ((( C'sw*B*Fa - C)/Csw)*(1.024^(T-20))*a)
SOR = 445.1 Kgs. O2/Day
Hourly Air Requirement
Diffuser Efficiency 15%
Air Required (SOR) = 463 m3 /Hr.
Factor of Safety 150%
Nitrification DeNitrification
11 of 12
For
insp
ectio
n pur
pose
s only
.
Conse
nt of
copy
right
owne
r req
uired
for a
ny ot
her u
se.
EPA Export 07-11-2018:04:04:40

WWTP Upgrade for Dairygold, Mogeely Eff. of WWTP extg. (Peak 2BT)
Blower Capacity / Hr. 695 m3 /Hr.
References: 1 - Metcalf & Eddy, Third Edition
2 - Sved Qasim, University of Texas,
3 - DWM Johnstone, AJ Rachwal, & MJ Hanbury, Thames Water @ Aqua Viro
course on "Design, Operation and uprating of Activated Sludge Processes"
4 - Degremont, Sixth Edition
12 of 12
For
insp
ectio
n pur
pose
s only
.
Conse
nt of
copy
right
owne
r req
uired
for a
ny ot
her u
se.
EPA Export 07-11-2018:04:04:40

New Cheese Factory at Dairygold Mogeely Wastewater
Appendix 5. Wastewater Treatment Plant Upgrade Calculations
For
insp
ectio
n pur
pose
s only
.
Conse
nt of
copy
right
owne
r req
uired
for a
ny ot
her u
se.
EPA Export 07-11-2018:04:04:40
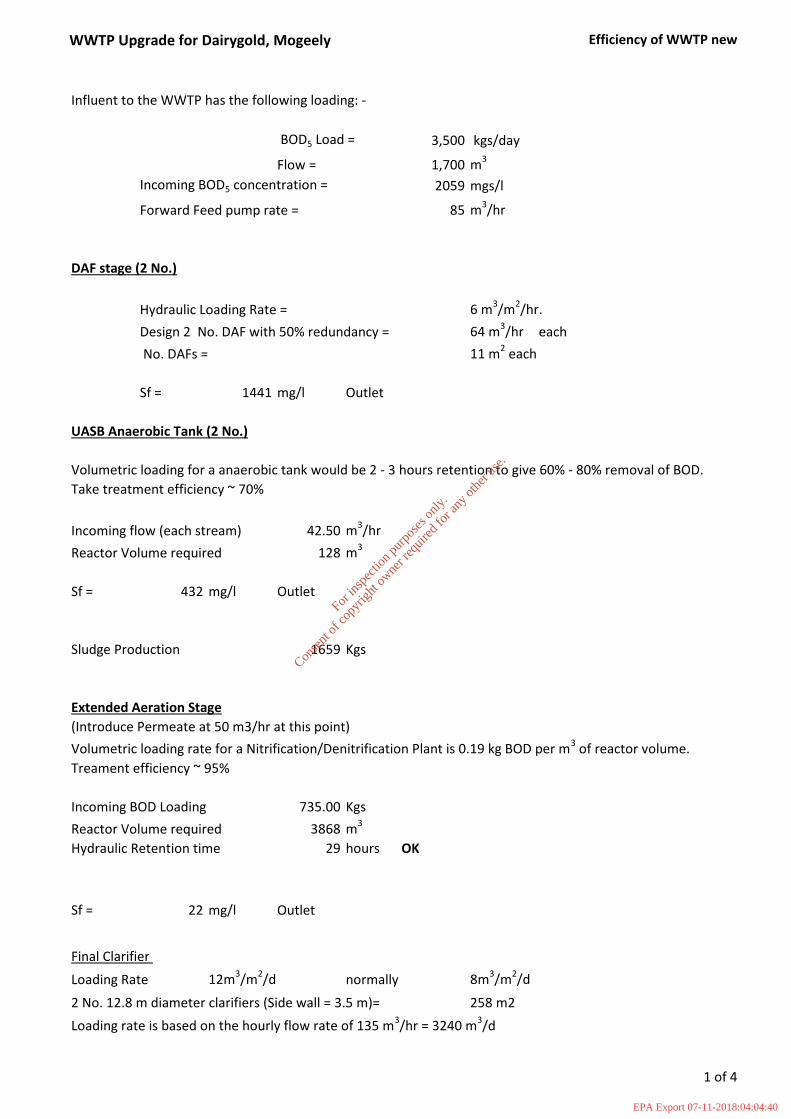
WWTP Upgrade for Dairygold, Mogeely Efficiency of WWTP new
Influent to the WWTP has the following loading: -
BOD5 Load = 3,500 kgs/day
Flow = 1,700 m3
Incoming BOD5 concentration = 2059 mgs/l
Forward Feed pump rate = 85 m3/hr
DAF stage (2 No.)
Hydraulic Loading Rate = 6 m3/m
2/hr.
Design 2 No. DAF with 50% redundancy = 64 m3/hr each
No. DAFs = 11 m2 each
Sf = 1441 mg/l Outlet
UASB Anaerobic Tank (2 No.)
Volumetric loading for a anaerobic tank would be 2 - 3 hours retention to give 60% - 80% removal of BOD.
Take treatment efficiency ~ 70%
Incoming flow (each stream) 42.50 m3/hr
Reactor Volume required 128 m3
Sf = 432 mg/l Outlet
Sludge Production 1659 Kgs
Extended Aeration Stage
(Introduce Permeate at 50 m3/hr at this point)
Volumetric loading rate for a Nitrification/Denitrification Plant is 0.19 kg BOD per m3 of reactor volume.
Treament efficiency ~ 95%
Incoming BOD Loading 735.00 Kgs
Reactor Volume required 3868 m3
Hydraulic Retention time 29 hours OK
Sf = 22 mg/l Outlet
Final Clarifier
Loading Rate 12m3/m2/d normally 8m3/m2/d
2 No. 12.8 m diameter clarifiers (Side wall = 3.5 m)= 258 m2
Loading rate is based on the hourly flow rate of 135 m3/hr = 3240 m3/d
1 of 4
For
insp
ectio
n pur
pose
s only
.
Conse
nt of
copy
right
owne
r req
uired
for a
ny ot
her u
se.
EPA Export 07-11-2018:04:04:40

WWTP Upgrade for Dairygold, Mogeely Efficiency of WWTP new
Sludge Production 418.95 Kgs
99.0% Overall BOD removal efficiency
Calculation of Air Demand for Extended Aeration
Design load 735.0 kg BOD
Design Flow Q 1700 m3/Day
Reactor Volume 3868 m3
Design Data
BOD (@ ?? grams BOD / Hd.) Kgs./Day 735.0
TKN (@ ?? mg./l.) Kgs./Day 213.44
P (@ ??g./Hd./Day) Kgs./Day 79.52
Ta Ambient Air Temperature (Degrees C) 18
Ti Average Influent Temperature (Degrees C) 20
h Elevation (m.O.D.) (m) 20
A Surface Area of Basin(s) (m2) 418
Q Flow Rate (m3/Day) 1700
f Proportionality Factor (f) 0.5
C'sw Solubility of O2 at Field Temp. 9.56
Csw Solubility of O2 at 20 Degrees C 9.17
C Minimum Disolved Oxygen in Basin(s) 0.5
B Salinity Surface Tension Factor (Beta), normally 0.9 0.9
a Oxygen Transfer Correction Factor (Alpha) for Wastewater, normally 0.8 - 0.9 0.8
T Average temperature of Wastewater in Basin, = (AfTa+Qti)/Af+Q 19.78
Fa Oxygen Solubility Correction Factor for Elevation,= (1-h,m/9450) 0.9979
Influent Concentrations
So BOD mg./l. 432
No TKN mg./l. 126
Po P mg./l. 47
MLSS mg./l. 2500
Sludge Age Days 30
Px Waste Volatile A.S. Kg./Day 322
Effluent Concentrations
2 of 4
For
insp
ectio
n pur
pose
s only
.
Conse
nt of
copy
right
owne
r req
uired
for a
ny ot
her u
se.
EPA Export 07-11-2018:04:04:40

WWTP Upgrade for Dairygold, Mogeely Efficiency of WWTP new
S BOD mg./l. 5
N TKN mg./l. 5
P P mg./l. 1
RETENTION TIMES
Flow rates thro' the Aeration tanks, during feed, can vary from 6 DWF to 8 DWF depending on weather conditions.
At 6 DWF (7,360 cu.m./day) retention time in each cell is 1.6 hours. This reduces to 1.2 hours at 8 DWF.
Full DeNitrification should take place in about 30 mins. (depending on Temp. & MLSS).
Carbonation should also take less than an hour, so that full Carbonation should take place in Cell 1 and
Nitrification will have started. Full Nitrification will take approx. 4 hours (again depending on above parameters)
Therefore, at 6DWF flow rate, (I.e. Retention of 1.6 hours/cell) just under 50% Nitrification could take place in Cell 2.
Theoretical Oxygen Required
Kg O2/day = Q(So-S)/((BOD5/BODL)*1000) - 1.42(Px) + 4.57Q(No-N)/1000 -0.5(4.57Q(No-N)/1000)
Carbonation Nitrification DeNitrification
Note: Degremont gives a figure of 50 - 60% of oxygen required for Nitrification is recovered during
DeNitrification. DWM Johnstone states that 62.5% of oxygen required for Nitrification can
recovered during DeNitrification. In our design 83% of Nitrogen is removed, therefore 83%
of 62.5% = 51.875% of oxygen is recovered. DWM Johnstone also states that 5% of Ammonia
is required for cell synthesis so that the factor for Nitrification should be 4.34 and not 4.57
For Carbonation 611 Kgs. O2/Day
For Nitrification 937 Kgs. O2/Day
Recovery for Denitrification 50%
Total Theoretical Oxygen Required = 1079 Kgs. O2/Day
Standard Oxygen Requirement (SOR) = Theoretical requirement converted for Field Conditions
SOR = O2 / ((( C'sw*B*Fa - C)/Csw)*(1.024^(T-20))*a)
SOR = 1537.4 Kgs. O2/Day
Hourly Air Requirement
Diffuser Efficiency 15%
Air Required (SOR) = 1599 m3 /Hr.
3 of 4
For
insp
ectio
n pur
pose
s only
.
Conse
nt of
copy
right
owne
r req
uired
for a
ny ot
her u
se.
EPA Export 07-11-2018:04:04:40

WWTP Upgrade for Dairygold, Mogeely Efficiency of WWTP new
Factor of Safety 150%
Blower Capacity / Hr. 2399 m3 /Hr.
References: 1 - Metcalf & Eddy, Third Edition
2 - Sved Qasim, University of Texas,
3 - DWM Johnstone, AJ Rachwal, & MJ Hanbury, Thames Water @ Aqua Viro
course on "Design, Operation and uprating of Activated Sludge Processes"
4 - Degremont, Sixth Edition
4 of 4
For
insp
ectio
n pur
pose
s only
.
Conse
nt of
copy
right
owne
r req
uired
for a
ny ot
her u
se.
EPA Export 07-11-2018:04:04:40

New Cheese Factory at Dairygold Mogeely Wastewater
Appendix 6. Wastewater Treatment Plant Upgrade Final Layout and
Construction staging
For
insp
ectio
n pur
pose
s only
.
Conse
nt of
copy
right
owne
r req
uired
for a
ny ot
her u
se.
EPA Export 07-11-2018:04:04:40

For
insp
ectio
n pur
pose
s only
.
Conse
nt of
copy
right
owne
r req
uired
for a
ny ot
her u
se.
EPA Export 07-11-2018:04:04:40

For
insp
ectio
n pur
pose
s only
.
Conse
nt of
copy
right
owne
r req
uired
for a
ny ot
her u
se.
EPA Export 07-11-2018:04:04:40

For
insp
ectio
n pur
pose
s only
.
Conse
nt of
copy
right
owne
r req
uired
for a
ny ot
her u
se.
EPA Export 07-11-2018:04:04:40

For
insp
ectio
n pur
pose
s only
.
Conse
nt of
copy
right
owne
r req
uired
for a
ny ot
her u
se.
EPA Export 07-11-2018:04:04:40

TREATMENT PLANT PLAN
Scale 1:200
SCREEN
BALANCE TANK
1,892m³
(22.8m x 15.8m x 5.25m)
TOW FGL +5.0m
DAF
SludgePFT
BALANCE TANK
1,892m³
(22.8m x 15.8m x 5.25m)
TOW FGL +5.0m
ANOXIC
(Stage 1)
AEROBIC 1
(Stage 1)
AEROBIC 2
(Stage 1)
AEROBIC 3
(Stage 1)
DAF
(ANAEROBIC
BELOW)
(Stage 1)
DAF
(ANAEROBIC
BELOW)
(Stage 2)
AEROBIC 1
(Stage 2)
AEROBIC 2
(Stage 2)
ANOXIC
(Stage 2)
AEROBIC 3
(Stage 2)
FINAL
CLARIFIER
(Stage 1)
FINAL
CLARIFIER
(Stage 2)
FINAL E
FFLUENT
TIDAL TANK 1
(540m³)
FINAL E
FFLUENT
TIDAL TANK 2
(540m³)
DEWATERIN
G
ROOM
SLU
DG
E S
KIP
SLU
DG
E S
KIP
TIDAL H
OLDING /
SLUDGE STORAGE
PIPE
14.14
TOP
O
H
W
OH
W
OH
W
O
H
W
O
H
W
OH
W
OH
W
OH
W
OH
W
O
H
W
O
H
W
O
H
W
OH
W
OH
W
OH
W
OH
W
O
H
W
O
H
W
OH
W
OH
W
O
H
W
A
A
C
C
B
B
D
D
CONTROL
ROOM
Louvered
Double D
oor
Louvered
Double Door
7170
11170
6000
6000
3660
12000
14.15
14.03
14.24
13.87
13.98
13.69
13.83
14.13
13.82
14.23
14.37
E
E
4340
7780
3210
11500
8800
8800
23400
18000
63200
3400
21380
26550
11900
11900
11800
30800
12950
14390
10670
1930
7680
18340
19370
13470
9550
12030
5200
13180
ODOUR
CONTROL
UNIT
BLOWER U
NITS
Existing F
ence reta
ined
Existing F
ence R
etained
Existing F
ence R
etained
Exis
ting F
ence
Reta
ined
(Existin
g Aeratio
n Tank
Retained and external
walls ra
ised)
(Existin
g Anoxic Tank
relocated to here and
reassigned)
(Existin
g Aeratio
n Tank
Retained and external
walls ra
ised)
PFT
CONTROL
ROOM
DEWATERING
ROOM
FFL 15.45
BALANCE TANK
Smooth
Plaster
Finish
Smooth
Plaster
Finish
Louvered
Double Door
FGL 13.82 FGL 13.83
FGL
14.19
FGL
14.20
6030
FFL 19.19Top of Tank 18.83
5000
Concrete Columns
Elevating Control and
Dewatering Rooms as per
Flood Study
Recommendations
5000
Concrete Slab
Roof Construction
Asphalt on 100mm Insulation on
150mm Concrete Slab laid to falls
Steel Platform
Louvered
Double Door
FFL 15.45
FGL 13.82
60
30
37
50
Concrete
ColumnsFree space underFree space under
100mm DIA
DOWNPIPE
Smooth
Plaster
Finish
Roof Construction
Asphalt on 100mm Insulation on
150mm Concrete Roof Slab
Elevated Building
with Void Space
Underneath to Comply
with Flood Study
FFL 15.45
FGL 13.82
60
30
BALANCE TANK
AEROBIC 3
STAGE 2
ANOXIC
STAGE 2
ANOXIC
STAGE 1
AEROBIC 3
STAGE 1 FGL 14.20
Top of Tank 19.20
50
00
FINAL CLARIFIER
STAGE 2
FINAL EFFLUENT
TIDAL TANK 2
ANOXIC
STAGE 1
AEROBIC 1
STAGE 1
FGL
13.54
FGL 13.87 FGL 14.20
Top of Tank 17.54
Top of Tank 15.87
Top of Tank 19.20
50
00
20
00
40
00
(Existing Tank Refurbished
and relocated here)
(Existing Tank Retained- Raise walls to level shown)
Smooth
Plaster
Finish
Elevated Building
with Void Space
Underneath to Comply
with Flood Study
FFL 15.45
FGL 13.82
60
30
CONTROL
ROOM
DEWATERING
ROOM
SLUDGE SKIPS
FINAL EFFLUENT
TIDAL TANK 1
FINAL EFFLUENT
TIDAL TANK 2
TIDAL HOLDING
SLUDGE STORAGE
Louvered
Double Door
Smooth
Plaster
Finish
2100
FGL 13.82
FFL 15.45
FGL 13.69
Top of Tank 16.69
Top of Tank 15.69
6030
2000
3000
Steel Access Stairs
TREATMENT PLANT PLAN
Scale 1:200
SCREEN
BALANCE TANK
1,892m³
(22.8m x 15.8m x 5.25m)
TOW FGL +5.0m
Railway Line
(Disused)
CR
S1
S2
S6
S5
S9
S10
S12
S11
S14
OHW
OHW
OHW
TP
H
M
K
R
P
O
S
T
GRATING
J1
J2
J5
TP
TP
TP
O
H
W
O
H
W
P
IP
E
24.38
PARAPET
TP
M
K
R
P
O
S
T
H
GAS
H
M
K
R
P
O
S
T
TP
GAS
AV
M
K
R
P
O
S
T
GAS
TP
BENCH
MKRPOST
24.24
PARAPET
24.97
PARAPET
21.96
PARAPET
GAS
GAS
C
o
lu
m
n
sTP
PIPE
14.14
TOP
Water Treatment Plant
Sacred Heat of JesusCatholic Church of the
UN
D
UND
OH
W
OH
W
OH
W
O
H
W
O
H
W
OH
W
O
H
W
Fence
Fallen
In Parts
1:12 F
ALL
MH
Existing Fence retained
Exis
tin
g F
en
ce
Re
tain
ed
Exis
tin
g F
en
ce
Re
tain
ed
Existing Fence Retained
GAS
MAIN PLANT CIP
PROPOSED
TREATMENT
PLANT UPGRADE
E
N
N
W
S
W
N
E
S
E
S
W
1. The external walls of all tanks are to extend up to at least 15.25mOD and shall bedesigned for external water pressures to this level. Only flood resilientcomponents are to be left unprotected from potential flooding to this level.
2. All manhole covers, inspection chamber covers and sump covers are to havewater seals.
3. All levels are in metres related ordnance datum
4. All dimensions are in millimetres
DRAWING
NUMBER:
REV:
DRAWN: CHECKED:APPROVED:
DRAWING
STATUS:
DO NOT SCALE FROM THIS DRAWING. USE FIGURED DIMENSIONS IN ALL CASES.
VERIFY DIMENSIONS ON SITE AND REPORT ANY DISCREPANCIES TO THE
DESIGNERS IMMEDIATELY.
THIS DRAWING TO BE READ IN CONJUNCTION WITH THE DESIGNERS
SPECIFICATION.
© THIS DRAWING IS COPYRIGHT AND MAY ONLY BE REPRODUCED WITH THE
DESIGNERS PERMISSION.
LEGEND:
PROJECT
NUMBER:
Park HouseMahon Technology ParkBessboro RoadBlackrockCork.I.S. EN ISO 9001
Malachy Walsh and PartnersEngineering and Environmental ConsultantsCork Tralee London
Tel : +353 (0)21 4536400fax. : +353 (0)21 4536450E-mail : [email protected]
Limerick
NOTES:
TITLE:
PROJECT:
CLIENT:
DATE: SCALE @ A1:
ARCHITECTS:
CONSULTING ENGINEERS:
The Coach House, Dundanion, Blackrock Road,Blackrock, Cork, Ireland T12 T6YCT: +353 (0)21 452 7800 F: +353 (0)21 435 9529
RKD Architects
DAIRYGOLD EXPANSION
MOGEELY, CO. CORK
DAIRYGOLD FOOD INGREDIENTS LTD.
Clonmel Road, Mitchelstown, Co. Cork
DGMY01-M17617-
17617
REV DATE DESCRIPTION BYAPP
A
50-DR-A-5101
S2
As NotedOCT 2016
NMJD DC
PROPOSED TREATMENT PLANT UPGRADE
PLAN SECTIONS AND ELEVATIONS
Section A-A
Scale: 1:200
Section B-B
Scale: 1:200
Section C-C
Scale: 1:200
Section D-D
Scale: 1:200
Control and Dewatering Room
North Elevation
Scale: 1:200
Control and Dewatering Room
West Elevation
Scale: 1:200
Section E-E
Scale: 1:200
A 25/11/16 ISSUED FOR PLANNING APPLICATION COS DC
LEGEND
New tanks and Buildings
Existing Tanks
Key Plan
For
insp
ectio
n pur
pose
s only
.
Conse
nt of
copy
right
owne
r req
uired
for a
ny ot
her u
se.
EPA Export 07-11-2018:04:04:40
AutoCAD SHX Text
Killeagh
AutoCAD SHX Text
Midleton
AutoCAD SHX Text
Station (disused)
AutoCAD SHX Text
Railway Line (disused)
AutoCAD SHX Text
TANK
AutoCAD SHX Text
Existing palisa

New Cheese Factory at Dairygold Mogeely Wastewater
Appendix 7 Daily Effluent Data
For
insp
ectio
n pur
pose
s only
.
Conse
nt of
copy
right
owne
r req
uired
for a
ny ot
her u
se.
EPA Export 07-11-2018:04:04:40

Flow In BOD Load BOD Load Flow Out COD Total SS Ortho-Phos Ammonia Total N TP (mg/l)
(m3) (kg)(calc) (mg/l)(calc) (M3) (mg/l) (mg/l) (outlet) (as N)mg/l (mg/l) (outlet)
Licience Limits 700 M³/d 60 15 1 0.3 25 2.0
Date Daily Daily Cont Daily Daily Weekly Weekly Monthly Monthly
01/01/2013 Tuesday 9 14 4.5 0.02
02/01/2013 Wednesday
03/01/2013 Thursday 20
04/01/2013 Friday 248 160 34 6 0.06
05/01/2013 Saturday 28 234 34 6 0.06
06/01/2013 Sunday 159 60.49 380 158 34 6 0.06
07/01/2013 Monday 370 240.65 650 381 17 4.2 0.04 0.02 0.19
08/01/2013 Tuesday 427 301.81 707 392 25 8.8 0.02
09/01/2013 Wednesday 343 266.3 776 420 17 4.4 0.02
10/01/2013 Thursday 411.7 400.17 972 442 14 14.4 0.05 6.6
11/01/2013 Friday 391 485.15 1241 408 10 3.2 0.03
12/01/2013 Saturday 26 10.72 412 84 10 3.2 0.03
13/01/2013 Sunday 61 25.15 412
14/01/2013 Monday 399 729.21 1828 488 13 5 0.04
15/01/2013 Tuesday 438.33 560.71 1279 470 14 4.2 0.02
16/01/2013 Wednesday 382 390.1 1021 463 16 5.6 0.06 0.02 5.2 0.17
17/01/2013 Thursday 507 459.95 907 463 13 4.4 0.03
18/01/2013 Friday 463 408.92 883 484 7 5 0.04
19/01/2013 Saturday 178 38.23 215 183 9 6.5 0.03
20/01/2013 Sunday 170 36.52 215 170 9 6.5 0.03
21/01/2013 Monday 429 532.82 1242 447 8 6.8 0.05
22/01/2013 Tuesday 398 615.62 1547 460 15 2.6 0.03 0.02 3.2 0.12
23/01/2013 Wednesday 354 704.11 1989 186 19 6.4 0.2
24/01/2013 Thursday 354 545.87 1542 184 17 1.2 0.14
25/01/2013 Friday 524 468.46 894 260 12 5 0.03
26/01/2013 Saturday 41 47.92 1169 379 11 2.2 0.1
27/01/2013 Sunday 44 51.43 1169 343 11 2.2 0.1
28/01/2013 Monday 445 480.6 1080 471 14 7 0.01
29/01/2013 Tuesday 469.81 1223.39 2604 429 24 2.2 0.02
30/01/2013 Wednesday 462 429.66 930 442 23 6 0.04
31/01/2013 Thursday 450 468.45 1041 434 16 4.2 0.02 0.02 5.4 0.14
01/02/2013 Friday 413 498.08 1206 445 10 3.8 0.03
02/02/2013 Saturday 6 3.61 602 198 15 4 0.06
03/02/2013 Sunday 54 32.47 601 81 15 4 0.06
04/02/2013 Monday 441.88 558.36 1264 402 16 8.2 0.01
05/02/2013 Tuesday 471 792.7 1683 447 16 3.8 0.02
06/02/2013 Wednesday 422 600.08 1422 462 17 3.2 0.02 0.02 5.9 0.17
07/02/2013 Thursday 360 287.71 799 433 14 6.2 0.04
08/02/2013 Friday 481 512.56 1066 518 14 3.4 0.04
09/02/2013 Saturday 53 9.79 185 17 14 3.4 0.04
10/02/2013 Sunday 98 18.11 185
11/02/2013 Monday 405 442.26 1092 456 21 3.8 0.02
12/02/2013 Tuesday 435 694.26 1596 439 18 4 0.02
13/02/2013 Wednesday 477 489.4 1026 549 15 5 0.03
14/02/2013 Thursday 439 474.12 1080 513 16 4.2 0.02 0.02 5.4 0.14
15/02/2013 Friday 386 409.01 1060 480 14 4.6 0.03
16/02/2013 Saturday 106 62.65 591 143 12 2 0.06
17/02/2013 Sunday 126 74.47 591 152 12 2 0.06
18/02/2013 Monday 540 661.61 1225 420 14 4 0.04
19/02/2013 Tuesday 570 633.38 1111 331 16 5 0.02 0.02 6 0.15
20/02/2013 Wednesday 500 537 1074 391 16 4.6 0.02
21/02/2013 Thursday 58 9.26 160 377 18 5.6 0.03
22/02/2013 Friday 52 0.44 8 93 12 5.4 0.03
23/02/2013 Saturday 124 30.8 248 151 14 6.2 0.02
24/02/2013 Sunday 123 30.55 248 149 14 6.2 0.02
25/02/2013 Monday 463 583.38 1260 397 14 5 0.02
26/02/2013 Tuesday 478 575.32 1204 513 24 6.4 0.02
27/02/2013 Wednesday 486 602.45 1240 536 22 3.6 0.04 0.02 4.6 0.12
28/02/2013 Thursday 473 610.17 1290 525 15 6.4 0.02
01/03/2013 Friday 490 455.11 929 362 20 4.8 0.02
02/03/2013 Saturday 105 4.91 47 276 23 6.2 0.03
03/03/2013 Sunday 87 4.07 47 151 23 6.2 0.03
For
insp
ectio
n pur
pose
s only
.
Conse
nt of
copy
right
owne
r req
uired
for a
ny ot
her u
se.
EPA Export 07-11-2018:04:04:40

04/03/2013 Monday 244 58.85 241 263 21 6 0.02 0.02 5 0.12
05/03/2013 Tuesday 561 543.95 970 440 20 14 0.02
06/03/2013 Wednesday 592 617.34 1043 527 20 8.2 0.02
07/03/2013 Thursday 610 608.29 997 686 22 7.8 0.04 0.02
08/03/2013 Friday 382 131.1 343 597 15 4.6 0.04
09/03/2013 Saturday 246 73.8 300 285 10 7.4 0.02
10/03/2013 Sunday 279 83.7 300 328 10 7.4 0.02
11/03/2013 Monday 729 979.78 1344 499 17 5.2 0.01
12/03/2013 Tuesday 723 963.04 1332 699 21 14 0.07
13/03/2013 Wednesday 800 1094.4 1368 686 16 8.2 0.02
14/03/2013 Thursday 685 850.77 1242 687 10 5.4 0.03
15/03/2013 Friday 523 1331.77 2546 646 26 6.5 0.02
16/03/2013 Saturday 61 7.91 130 269 23 4.3 0.02
17/03/2013 Sunday 3 0.39 130 49 23 4.3 0.03
18/03/2013 Monday 173 148.02 856 210 22 5.9 0.03
19/03/2013 Tuesday 639 1265.22 1980 631 13 8.6 0.01 0.06 0.15
20/03/2013 Wednesday 615 1110.69 1806 646 13 5.6 0.11
21/03/2013 Thursday 803 1026.23 1278 699 19 5.8 0.03
22/03/2013 Friday 433 1044.4 2412 588 17 6.8 0.04
23/03/2013 Saturday 6 4.72 787 69 8 4.8 0.08
24/03/2013 Sunday 208 163.49 786 208 8 4.8 0.08
25/03/2013 Monday 629 1015.21 1614 505 26 10.4 0.27
26/03/2013 Tuesday 645 1329.35 2061 455 26 4.8
27/03/2013 Wednesday 610 1317.6 2160 620 20 4
28/03/2013 Thursday 590 991.2 1680 686 15 10 0.07
29/03/2013 Friday 564 932.63 1654 616 17 6.8 0.04 0.04 3.8 0.16
30/03/2013 Saturday 467 437.11 936 561 22 11 0.05
31/03/2013 Sunday 155 12.37 80 275 45 13.8 0.06
01/04/2013 Monday 440 786.72 1788 455 18 7.2 0.02
02/04/2013 Tuesday 676 1117.43 1653 545 20 7.8 0.04 0.02 0.18
03/04/2013 Wednesday 652 1277.27 1959 574 26 6.8 0.01
04/04/2013 Thursday 687 1654.99 2409 574 9 5.6 0.03
05/04/2013 Friday 631 1084.69 1719 434 19 11.6 0.04
06/04/2013 Saturday 168 86.29 514 387 19 11.6 0.06
07/04/2013 Sunday 193 196.16 1016 436 33 5.6 0.06
08/04/2013 Monday 721 1232.91 1710 558 47 11.4 0.09
09/04/2013 Tuesday 652 1136.44 1743 668 38 13.4 0.07
10/04/2013 Wednesday 712 1324.32 1860 686 10 13 0.1 0.26
11/04/2013 Thursday 686 1189.52 1734 688 40 12.8 0.05 0.02
12/04/2013 Friday 422 434.24 1029 691 18 12.4 0.03
13/04/2013 Saturday 374 272.65 729 459 20 13.4 0.04
14/04/2013 Sunday 151 110.08 729 202 20 13.4 0.04
15/04/2013 Monday 720 1764.72 2451 555 9.6 6 0.03 7 0.13
16/04/2013 Tuesday 650 1262.82 1943 683 27 12 0.03
17/04/2013 Wednesday 684 1216.84 1779 693 29 8.5 0.09
18/04/2013 Thursday 599 1392.68 2325 614 21 10.8 0.04
19/04/2013 Friday 517 403.26 780 627 8 9.2 0.03 0.03
20/04/2013 Saturday 409 425.77 1041 411 34 8.8 0.03
21/04/2013 Sunday 133 138.46 1041 170 34 8.8 0.03
22/04/2013 Monday 718 1647.81 2295 553 27 11.6 0.07
23/04/2013 Tuesday 560 670.66 1198 687 16 13.6 0.09 0.03 5.6 0.36
24/04/2013 Wednesday 648 845.25 1304 659 49 13.2 0.09
25/04/2013 Thursday 672 1005.98 1497 546 10 10.6 0.08
26/04/2013 Friday 535 980.66 1833 698 24 13.2 0.08
27/04/2013 Saturday 530 362.52 684 537 30 13.4 0.08
28/04/2013 Sunday 207 141.59 684 251 30 13.4 0.08
29/04/2013 Monday 638 1575.22 2469 698 20 11.6 0.05
30/04/2013 Tuesday 785 1201.05 1530 629 26 8.8 0.06 0.02
01/05/2013 Wednesday 832 1512.58 1818 696 29 8.6 0.06 0.02
02/05/2013 Thursday 778 1577.78 2028 596 15 11.4 0.1 0.02 4.2 0.16
03/05/2013 Friday 533 881.05 1653 685 14 8.6
04/05/2013 Saturday 458 263.81 576 500 6 7.2 0.09
05/05/2013 Sunday 450 409.05 909 577 12 10.6 0.07
06/05/2013 Monday 782 1412.29 1806 699 12 10.6 0.07
07/05/2013 Tuesday 760 1320.12 1737 699 19 6.8
08/05/2013 Wednesday 856 1751.38 2046 699 36 11.6 0.34
09/05/2013 Thursday 729 1463.11 2007 699 19 7.6 0.12 0.02 2.7 0.24
10/05/2013 Friday 831 1994.4 2400 699 30 8.8 0.06
For
insp
ectio
n pur
pose
s only
.
Conse
nt of
copy
right
owne
r req
uired
for a
ny ot
her u
se.
EPA Export 07-11-2018:04:04:40
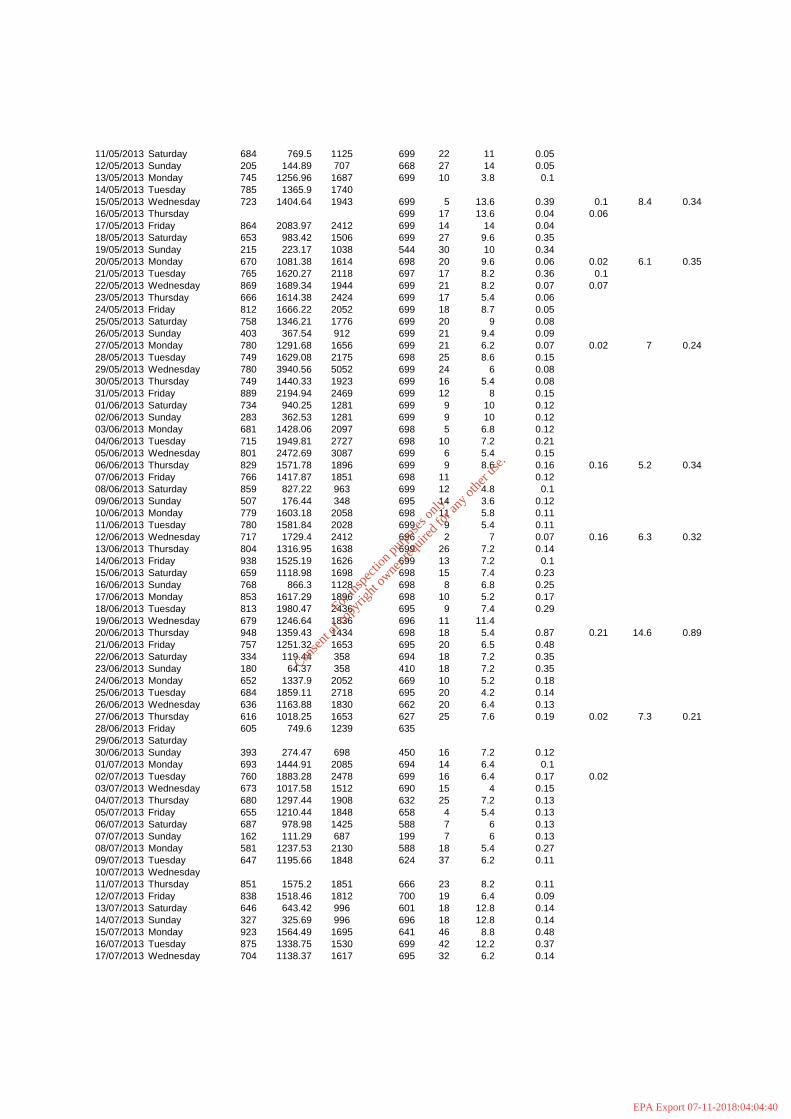
11/05/2013 Saturday 684 769.5 1125 699 22 11 0.05
12/05/2013 Sunday 205 144.89 707 668 27 14 0.05
13/05/2013 Monday 745 1256.96 1687 699 10 3.8 0.1
14/05/2013 Tuesday 785 1365.9 1740
15/05/2013 Wednesday 723 1404.64 1943 699 5 13.6 0.39 0.1 8.4 0.34
16/05/2013 Thursday 699 17 13.6 0.04 0.06
17/05/2013 Friday 864 2083.97 2412 699 14 14 0.04
18/05/2013 Saturday 653 983.42 1506 699 27 9.6 0.35
19/05/2013 Sunday 215 223.17 1038 544 30 10 0.34
20/05/2013 Monday 670 1081.38 1614 698 20 9.6 0.06 0.02 6.1 0.35
21/05/2013 Tuesday 765 1620.27 2118 697 17 8.2 0.36 0.1
22/05/2013 Wednesday 869 1689.34 1944 699 21 8.2 0.07 0.07
23/05/2013 Thursday 666 1614.38 2424 699 17 5.4 0.06
24/05/2013 Friday 812 1666.22 2052 699 18 8.7 0.05
25/05/2013 Saturday 758 1346.21 1776 699 20 9 0.08
26/05/2013 Sunday 403 367.54 912 699 21 9.4 0.09
27/05/2013 Monday 780 1291.68 1656 699 21 6.2 0.07 0.02 7 0.24
28/05/2013 Tuesday 749 1629.08 2175 698 25 8.6 0.15
29/05/2013 Wednesday 780 3940.56 5052 699 24 6 0.08
30/05/2013 Thursday 749 1440.33 1923 699 16 5.4 0.08
31/05/2013 Friday 889 2194.94 2469 699 12 8 0.15
01/06/2013 Saturday 734 940.25 1281 699 9 10 0.12
02/06/2013 Sunday 283 362.53 1281 699 9 10 0.12
03/06/2013 Monday 681 1428.06 2097 698 5 6.8 0.12
04/06/2013 Tuesday 715 1949.81 2727 698 10 7.2 0.21
05/06/2013 Wednesday 801 2472.69 3087 699 6 5.4 0.15
06/06/2013 Thursday 829 1571.78 1896 699 9 8.6 0.16 0.16 5.2 0.34
07/06/2013 Friday 766 1417.87 1851 698 11 0.12
08/06/2013 Saturday 859 827.22 963 699 12 4.8 0.1
09/06/2013 Sunday 507 176.44 348 695 14 3.6 0.12
10/06/2013 Monday 779 1603.18 2058 698 11 5.8 0.11
11/06/2013 Tuesday 780 1581.84 2028 699 9 5.4 0.11
12/06/2013 Wednesday 717 1729.4 2412 696 2 7 0.07 0.16 6.3 0.32
13/06/2013 Thursday 804 1316.95 1638 699 26 7.2 0.14
14/06/2013 Friday 938 1525.19 1626 699 13 7.2 0.1
15/06/2013 Saturday 659 1118.98 1698 698 15 7.4 0.23
16/06/2013 Sunday 768 866.3 1128 698 8 6.8 0.25
17/06/2013 Monday 853 1617.29 1896 698 10 5.2 0.17
18/06/2013 Tuesday 813 1980.47 2436 695 9 7.4 0.29
19/06/2013 Wednesday 679 1246.64 1836 696 11 11.4
20/06/2013 Thursday 948 1359.43 1434 698 18 5.4 0.87 0.21 14.6 0.89
21/06/2013 Friday 757 1251.32 1653 695 20 6.5 0.48
22/06/2013 Saturday 334 119.44 358 694 18 7.2 0.35
23/06/2013 Sunday 180 64.37 358 410 18 7.2 0.35
24/06/2013 Monday 652 1337.9 2052 669 10 5.2 0.18
25/06/2013 Tuesday 684 1859.11 2718 695 20 4.2 0.14
26/06/2013 Wednesday 636 1163.88 1830 662 20 6.4 0.13
27/06/2013 Thursday 616 1018.25 1653 627 25 7.6 0.19 0.02 7.3 0.21
28/06/2013 Friday 605 749.6 1239 635
29/06/2013 Saturday
30/06/2013 Sunday 393 274.47 698 450 16 7.2 0.12
01/07/2013 Monday 693 1444.91 2085 694 14 6.4 0.1
02/07/2013 Tuesday 760 1883.28 2478 699 16 6.4 0.17 0.02
03/07/2013 Wednesday 673 1017.58 1512 690 15 4 0.15
04/07/2013 Thursday 680 1297.44 1908 632 25 7.2 0.13
05/07/2013 Friday 655 1210.44 1848 658 4 5.4 0.13
06/07/2013 Saturday 687 978.98 1425 588 7 6 0.13
07/07/2013 Sunday 162 111.29 687 199 7 6 0.13
08/07/2013 Monday 581 1237.53 2130 588 18 5.4 0.27
09/07/2013 Tuesday 647 1195.66 1848 624 37 6.2 0.11
10/07/2013 Wednesday
11/07/2013 Thursday 851 1575.2 1851 666 23 8.2 0.11
12/07/2013 Friday 838 1518.46 1812 700 19 6.4 0.09
13/07/2013 Saturday 646 643.42 996 601 18 12.8 0.14
14/07/2013 Sunday 327 325.69 996 696 18 12.8 0.14
15/07/2013 Monday 923 1564.49 1695 641 46 8.8 0.48
16/07/2013 Tuesday 875 1338.75 1530 699 42 12.2 0.37
17/07/2013 Wednesday 704 1138.37 1617 695 32 6.2 0.14
For
insp
ectio
n pur
pose
s only
.
Conse
nt of
copy
right
owne
r req
uired
for a
ny ot
her u
se.
EPA Export 07-11-2018:04:04:40
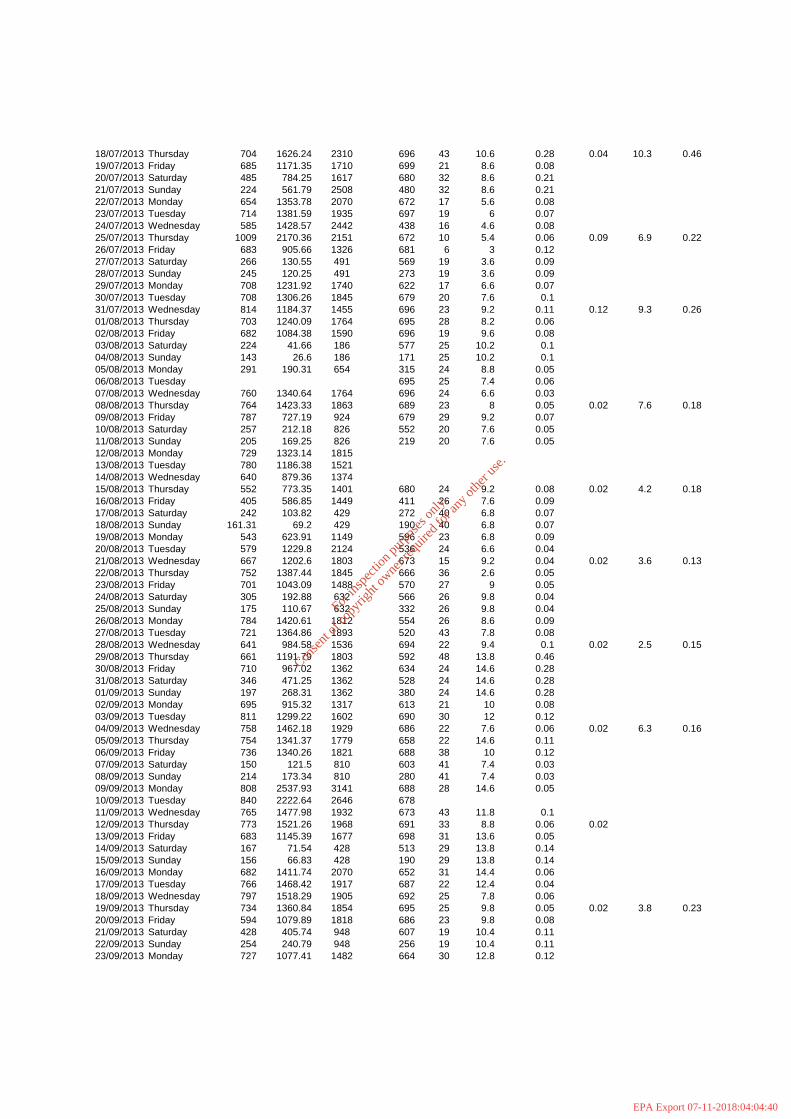
18/07/2013 Thursday 704 1626.24 2310 696 43 10.6 0.28 0.04 10.3 0.46
19/07/2013 Friday 685 1171.35 1710 699 21 8.6 0.08
20/07/2013 Saturday 485 784.25 1617 680 32 8.6 0.21
21/07/2013 Sunday 224 561.79 2508 480 32 8.6 0.21
22/07/2013 Monday 654 1353.78 2070 672 17 5.6 0.08
23/07/2013 Tuesday 714 1381.59 1935 697 19 6 0.07
24/07/2013 Wednesday 585 1428.57 2442 438 16 4.6 0.08
25/07/2013 Thursday 1009 2170.36 2151 672 10 5.4 0.06 0.09 6.9 0.22
26/07/2013 Friday 683 905.66 1326 681 6 3 0.12
27/07/2013 Saturday 266 130.55 491 569 19 3.6 0.09
28/07/2013 Sunday 245 120.25 491 273 19 3.6 0.09
29/07/2013 Monday 708 1231.92 1740 622 17 6.6 0.07
30/07/2013 Tuesday 708 1306.26 1845 679 20 7.6 0.1
31/07/2013 Wednesday 814 1184.37 1455 696 23 9.2 0.11 0.12 9.3 0.26
01/08/2013 Thursday 703 1240.09 1764 695 28 8.2 0.06
02/08/2013 Friday 682 1084.38 1590 696 19 9.6 0.08
03/08/2013 Saturday 224 41.66 186 577 25 10.2 0.1
04/08/2013 Sunday 143 26.6 186 171 25 10.2 0.1
05/08/2013 Monday 291 190.31 654 315 24 8.8 0.05
06/08/2013 Tuesday 695 25 7.4 0.06
07/08/2013 Wednesday 760 1340.64 1764 696 24 6.6 0.03
08/08/2013 Thursday 764 1423.33 1863 689 23 8 0.05 0.02 7.6 0.18
09/08/2013 Friday 787 727.19 924 679 29 9.2 0.07
10/08/2013 Saturday 257 212.18 826 552 20 7.6 0.05
11/08/2013 Sunday 205 169.25 826 219 20 7.6 0.05
12/08/2013 Monday 729 1323.14 1815
13/08/2013 Tuesday 780 1186.38 1521
14/08/2013 Wednesday 640 879.36 1374
15/08/2013 Thursday 552 773.35 1401 680 24 9.2 0.08 0.02 4.2 0.18
16/08/2013 Friday 405 586.85 1449 411 26 7.6 0.09
17/08/2013 Saturday 242 103.82 429 272 40 6.8 0.07
18/08/2013 Sunday 161.31 69.2 429 190 40 6.8 0.07
19/08/2013 Monday 543 623.91 1149 596 23 6.8 0.09
20/08/2013 Tuesday 579 1229.8 2124 536 24 6.6 0.04
21/08/2013 Wednesday 667 1202.6 1803 673 15 9.2 0.04 0.02 3.6 0.13
22/08/2013 Thursday 752 1387.44 1845 666 36 2.6 0.05
23/08/2013 Friday 701 1043.09 1488 570 27 9 0.05
24/08/2013 Saturday 305 192.88 632 566 26 9.8 0.04
25/08/2013 Sunday 175 110.67 632 332 26 9.8 0.04
26/08/2013 Monday 784 1420.61 1812 554 26 8.6 0.09
27/08/2013 Tuesday 721 1364.86 1893 520 43 7.8 0.08
28/08/2013 Wednesday 641 984.58 1536 694 22 9.4 0.1 0.02 2.5 0.15
29/08/2013 Thursday 661 1191.79 1803 592 48 13.8 0.46
30/08/2013 Friday 710 967.02 1362 634 24 14.6 0.28
31/08/2013 Saturday 346 471.25 1362 528 24 14.6 0.28
01/09/2013 Sunday 197 268.31 1362 380 24 14.6 0.28
02/09/2013 Monday 695 915.32 1317 613 21 10 0.08
03/09/2013 Tuesday 811 1299.22 1602 690 30 12 0.12
04/09/2013 Wednesday 758 1462.18 1929 686 22 7.6 0.06 0.02 6.3 0.16
05/09/2013 Thursday 754 1341.37 1779 658 22 14.6 0.11
06/09/2013 Friday 736 1340.26 1821 688 38 10 0.12
07/09/2013 Saturday 150 121.5 810 603 41 7.4 0.03
08/09/2013 Sunday 214 173.34 810 280 41 7.4 0.03
09/09/2013 Monday 808 2537.93 3141 688 28 14.6 0.05
10/09/2013 Tuesday 840 2222.64 2646 678
11/09/2013 Wednesday 765 1477.98 1932 673 43 11.8 0.1
12/09/2013 Thursday 773 1521.26 1968 691 33 8.8 0.06 0.02
13/09/2013 Friday 683 1145.39 1677 698 31 13.6 0.05
14/09/2013 Saturday 167 71.54 428 513 29 13.8 0.14
15/09/2013 Sunday 156 66.83 428 190 29 13.8 0.14
16/09/2013 Monday 682 1411.74 2070 652 31 14.4 0.06
17/09/2013 Tuesday 766 1468.42 1917 687 22 12.4 0.04
18/09/2013 Wednesday 797 1518.29 1905 692 25 7.8 0.06
19/09/2013 Thursday 734 1360.84 1854 695 25 9.8 0.05 0.02 3.8 0.23
20/09/2013 Friday 594 1079.89 1818 686 23 9.8 0.08
21/09/2013 Saturday 428 405.74 948 607 19 10.4 0.11
22/09/2013 Sunday 254 240.79 948 256 19 10.4 0.11
23/09/2013 Monday 727 1077.41 1482 664 30 12.8 0.12
For
insp
ectio
n pur
pose
s only
.
Conse
nt of
copy
right
owne
r req
uired
for a
ny ot
her u
se.
EPA Export 07-11-2018:04:04:40

24/09/2013 Tuesday 698 1547.47 2217 696 49 14.8 0.19
25/09/2013 Wednesday 735 1444.28 1965 690 45 14.2 0.18
26/09/2013 Thursday 731 1440.8 1971 680 35 14.4 0.11
27/09/2013 Friday 744 888.34 1194 674 35 14.4 0.11
28/09/2013 Saturday 319 174.94 548 476 32 11.4 0.16
29/09/2013 Sunday 219 120.1 548 314 32 11.4 0.16
30/09/2013 Monday 743 1214.81 1635 684 30 14.4 0.31
01/10/2013 Tuesday 748 1323.96 1770 692 18 10.8 0.24 0.02 3.3 0.26
02/10/2013 Wednesday 707 1287.45 1821 690 18 10.8 0.1
03/10/2013 Thursday 772 1259.9 1632 688 19 11.2 0.07
04/10/2013 Friday 664 1400.38 2109 678 12 7.4 0.08
05/10/2013 Saturday 185 32.41 175 351 14 9.2 0.06
06/10/2013 Sunday 164 28.73 175 189 14 9.2 0.06
07/10/2013 Monday 739 1376.76 1863 672 17 9 0.06
08/10/2013 Tuesday 732 1199.02 1638 687 25 13.4 0.1
09/10/2013 Wednesday 761 1385.78 1821 686 26 14.6 0.08 0.02 9.3 0.35
10/10/2013 Thursday 119 76.76 645 693 30 12.6 0.08
11/10/2013 Friday 712 724.1 1017 680 31 12.6 0.14
12/10/2013 Saturday 358 298.57 834 595 22 14.8 0.08
13/10/2013 Sunday 191 159.29 834 217 22 14.8 0.08
14/10/2013 Monday 691 974.31 1410 674 27 14 0.08
15/10/2013 Tuesday 856 1135.06 1326 684 24 7.6 0.28
16/10/2013 Wednesday 734 1019.53 1389 691 20 14 0.11 0.02 2.1 0.29
17/10/2013 Thursday 659 984.55 1494 688 14 9.4 0.13
18/10/2013 Friday 788 1099.26 1395 684 10 8.2 0.21
19/10/2013 Saturday 57 32.08 563 350 11 6.4 0.23
20/10/2013 Sunday 199 112 563 226 11 6.4 0.23
21/10/2013 Monday 693 35 5.6 0.66
22/10/2013 Tuesday 630 597.24 948 646 35 5.6 0.66
23/10/2013 Wednesday 544 1104.86 2031 579 26 6.2 0.82
24/10/2013 Thursday 706 813.31 1152 689 37 8.8 0.84
25/10/2013 Friday 501 646.29 1290 593 35 9.2 0.77
26/10/2013 Saturday 67 44.62 666 147 37 8.6 0.82
27/10/2013 Sunday 15 9.99 666 73 37 8.6 0.82
28/10/2013 Monday 264 340.56 1290 278 35 8 0.75
29/10/2013 Tuesday 806 1629.73 2022 689 26 7.4 0.61
30/10/2013 Wednesday 802 1503.75 1875 698 28 6.6 0.34
31/10/2013 Thursday 756 1299.56 1719 688 39 11.8 0.15 0.02 11.2 0.41
01/11/2013 Friday 683 663.88 972 682 48 13.4 0.06
02/11/2013 Saturday 194 153.41 791 495 31 10.2 0.16
03/11/2013 Sunday 233 184.25 791 281 31 10.2 0.16
04/11/2013 Monday 694 35 13.6 0.05
05/11/2013 Tuesday 689 1293.94 1878 689 36 6.8 0.09 0.03 4.6 0.26
06/11/2013 Wednesday 478 512.66 1073 656 24 13.4 0.09
07/11/2013 Thursday 426 453.69 1065 438 29 12.8 0.18
08/11/2013 Friday 378 395.01 1045 418 20 14.2 0.07
09/11/2013 Saturday 46 29.67 645 74 20 14.2 0.07
10/11/2013 Sunday 173 20 14.2 0.07
11/11/2013 Monday 448 414.4 925 449 21 9.4 0.05
12/11/2013 Tuesday 407 427.35 1050 456 25 14 0.13
13/11/2013 Wednesday 406 498.57 1228 433 34 9.6 0.49
14/11/2013 Thursday 371 660.38 1780 385 19 14 0.13 0.1 5.1 0.25
15/11/2013 Friday 426 501.4 1177 376 14 4.2 0.07
16/11/2013 Saturday 360 519.84 1444 340 14 4.2 0.07
17/11/2013 Sunday 84 48.47 577 252 14 4.2 0.07
18/11/2013 Monday 381 629.61 1653 429 20 5.8 0.07
19/11/2013 Tuesday 391 504.39 1290 409 10 2.6 0.05
20/11/2013 Wednesday 384 517.44 1348 406 14 5.8 0.03 0.11 3.8 0.16
21/11/2013 Thursday 411 429.5 1045 413 16 5.4 0.04
22/11/2013 Friday 408 345.78 848 403 13 4.8 0.06
23/11/2013 Saturday 61 16.78 275 155 13 6.6 0.09
24/11/2013 Sunday 114 31.35 275 131 13 6.6 0.09
25/11/2013 Monday 404 409.05 1013 432 17 5.4 0.06
26/11/2013 Tuesday 407 493.49 1213 429 16 5.8 0.07
27/11/2013 Wednesday 367 467.93 1275 421 19 11.4 0.32 0.04 3.2 0.32
28/11/2013 Thursday 406 534.91 1318 458 13 8.2 0.13
29/11/2013 Friday 355 294.65 830 360 16 9.4 0.34
30/11/2013 Saturday 37 16.65 450 111 19 10.5 0.51
For
insp
ectio
n pur
pose
s only
.
Conse
nt of
copy
right
owne
r req
uired
for a
ny ot
her u
se.
EPA Export 07-11-2018:04:04:40

01/12/2013 Sunday 85 38.25 450 116 19 10.5 0.51
02/12/2013 Monday 437 536.42 1228 451 12 11.4 0.26
03/12/2013 Tuesday 458 555.33 1213 494 16 5.6 0.23 0.02 3.7 0.42
04/12/2013 Wednesday 363 469.18 1293 421 27 7.8 0.13
05/12/2013 Thursday 397 572.48 1442 414 35 7.8 0.24
06/12/2013 Friday 298 387.4 1300 339 35 7.8 0.24
07/12/2013 Saturday 182 68.25 375 209 26 8 0.48
08/12/2013 Sunday 177 66.38 375 207 26 8 0.48
09/12/2013 Monday 481 633.72 1318 491 24 2.8 0.55
10/12/2013 Tuesday 575 587.94 1023 505 24 4.4 0.6
11/12/2013 Wednesday 463 606.53 1310 548 30 3.6 0.63 0.02 3.8 0.89
12/12/2013 Thursday 354 407.1 1150 419 17 5 0.48
13/12/2013 Friday 202 128.27 635 240 33 11.2 0.84
14/12/2013 Saturday 49 31.12 635 100 33 11.2 0.84
15/12/2013 Sunday 127 80.65 635 168 33 11.2 0.84
16/12/2013 Monday 344 389.58 1133 375 17 11.2 0.89
17/12/2013 Tuesday 375 413.44 1103 414 24 5 0.74
18/12/2013 Wednesday 372 489.18 1315 444 34 11.2 0.71 0.02 5.3 0.98
19/12/2013 Thursday 333 457.88 1375 334 26 8.6 0.71
20/12/2013 Friday 293 402.88 1375 323 14 6.4 0.24
21/12/2013 Saturday 17 73 16 6.6 0.25
22/12/2013 Sunday 66 85 16 6.6 0.25
23/12/2013 Monday 14 75 16 6.6 0.25
24/12/2013 Tuesday 7
25/12/2013 Wednesday 6
26/12/2013 Thursday 37 53 18 7.4 0.34
27/12/2013 Friday 9 18 7.4 0.34
28/12/2013 Saturday
29/12/2013 Sunday 36
30/12/2013 Monday 27
31/12/2013 Tuesday 52
01/01/2014 Wednesday 283 14 6 0.35
02/01/2014 Thursday
03/01/2014 Friday
04/01/2014 Saturday
05/01/2014 Sunday 49 13 5.6 0.36
06/01/2014 Monday 9 47 13 5.6 0.36
07/01/2014 Tuesday 60 81 13 5.6 0.36
08/01/2014 Wednesday 185 217 13 5.6 0.36
09/01/2014 Thursday 324 545.94 1685 377 13 5.6 0.36
10/01/2014 Friday 345 204.59 593 373 22 12.8 0.44
11/01/2014 Saturday 27 15.77 584 84 14 7.6 0.37
12/01/2014 Sunday 98 57.23 584 149 14 7.6 0.37
13/01/2014 Monday 304 426.36 1403 332 16 6.4 0.27
14/01/2014 Tuesday 423 581.63 1375 451 13 5.4 0.82
15/01/2014 Wednesday 389 492.09 1265 419 16 2.2 0.72 0.02 2.4 0.83
16/01/2014 Thursday 388 582.97 1503 315 13 3.8 0.65
17/01/2014 Friday 260 255.45 983 417 18 3 0.44
18/01/2014 Saturday 72 55.08 765 116 25 3.4 0.38
19/01/2014 Sunday 61 46.67 765 98 25 3.4 0.38
20/01/2014 Monday 362 691.42 1910 394 12 4.4 0.22
21/01/2014 Tuesday 391 634.4 1623 389 5 4 0.24
22/01/2014 Wednesday 328 552.68 1685 409 6 2.8 0.26 0.02 7.9 0.4
23/01/2014 Thursday 382 506.15 1325 395 9 4 0.24
24/01/2014 Friday 306 339.66 1110 412 7 4.6 0.23
25/01/2014 Saturday 48 50.59 1054 93 9 4.4 0.26
26/01/2014 Sunday 54 56.92 1054 98 9 4.4 0.26
27/01/2014 Monday 340 514.25 1513 361 9 3.6 0.24
28/01/2014 Tuesday 347 408.6 1178 395 5 4.2 0.23
29/01/2014 Wednesday 269 408.61 1519 320 7 7.6 0.27 0.02 11.1 0.38
30/01/2014 Thursday 348 575.94 1655 424 7 7.4 0.24
31/01/2014 Friday 358 438.55 1225 406 11 7.8 0.25
01/02/2014 Saturday 50 30.15 603 95 6 2.6 0.21
02/02/2014 Sunday 94 56.68 603 124 6 2.6 0.21
03/02/2014 Monday 364.67 606.27 1663 426 8 4.8 0.12
04/02/2014 Tuesday 360.31 520.65 1445 402 9 4.8 0.09
05/02/2014 Wednesday 374 609.62 1630 432 7 3.4 0.13 0.02 2.9 0.22
06/02/2014 Thursday 383 590.78 1543 429 9 3.8 0.17
For
insp
ectio
n pur
pose
s only
.
Conse
nt of
copy
right
owne
r req
uired
for a
ny ot
her u
se.
EPA Export 07-11-2018:04:04:40

07/02/2014 Friday 394 492.5 1250 436 6 3.8 0.17
08/02/2014 Saturday 97 60.14 620 183 4 2.6 0.16
09/02/2014 Sunday 36 22.32 620 79 4 2.6 0.16
10/02/2014 Monday 381 600.08 1575 391 5 4.2 0.16
11/02/2014 Tuesday 410 624.23 1523 326 7 4.2 0.23
12/02/2014 Wednesday 55 95.7 1740 109 22 7.2 0.65 0.02 4.5 0.87
13/02/2014 Thursday 269 288.1 1071 502 21 10.8 0.67
14/02/2014 Friday 137 224 1635 212 26 6.8 0.57
15/02/2014 Saturday 6 3.78 630 35 22 7.2 0.39
16/02/2014 Sunday 147 92.47 629 157 22 7.2 0.39
17/02/2014 Monday 383 574.5 1500 445 23 7.6 0.31 0.02 3.4 0.42
18/02/2014 Tuesday 376 520.76 1385 443 23 6.6 0.48
19/02/2014 Wednesday 402 598.98 1490 474 20 3.8 0.42
20/02/2014 Thursday 375 389.07 1038 406 18 5.8 0.38
21/02/2014 Friday 86 17.98 209 144 17 10.4 0.16
22/02/2014 Saturday 19 7.72 406 52 15 4 0.1
23/02/2014 Sunday 92 37.35 406 134 15 4 0.1
24/02/2014 Monday 470 17 6.4 0.06 0.02 2.8 0.19
25/02/2014 Tuesday 408 614.04 1505 470 24 4.2 0.1
26/02/2014 Wednesday 404 525.2 1300 287 8 5.4 0.05
27/02/2014 Thursday 407 510.79 1255 498 10 8.4 0.07
28/02/2014 Friday 382 668.5 1750 480 12 5 0.08
01/03/2014 Saturday 32 12.42 388 120 19 5.8 0.05
02/03/2014 Sunday 90 34.92 388 122 19 5.8 0.05
03/03/2014 Monday 409 630.89 1543 428 12 7.2 0.08
04/03/2014 Tuesday 384 672 1750 366 13 7.4 0.07
05/03/2014 Wednesday 384 671.04 1748 437 10 6 0.05
06/03/2014 Thursday 496 550.56 1110 525 20 6.4 0.15 0.02 3.4 0.36
07/03/2014 Friday 500 390 780 548 10 4.2 0.46
08/03/2014 Saturday 27 12.72 471 119 17 5.2 0.85
09/03/2014 Sunday 60 28.26 471 105 17 5.2 0.85
10/03/2014 Monday 378 633.15 1675 429 32 4.6 0.76
11/03/2014 Tuesday 444 576.09 1298 521 22 5 0.75
12/03/2014 Wednesday 451 556.99 1235 424 22 10.6 0.74 0.02 8.2 1.38
13/03/2014 Thursday 521 557.47 1070 454 18 8.4 0.88
14/03/2014 Friday 505 766.34 1518 523 15 6 0.24
15/03/2014 Saturday 144 61.92 430 312 12 6.6 0.22
16/03/2014 Sunday 26 11.18 430 60 12 6.6 0.22
17/03/2014 Monday 118 50.74 430 162 12 6.6 0.22
18/03/2014 Tuesday 455 841.75 1850 479 11 6 0.08
19/03/2014 Wednesday 476 990.08 2080 477 6 8.4 0.06 0.02 13.5 0.21
20/03/2014 Thursday 491 712.93 1452 535 13 9 0.11
21/03/2014 Friday 408 554.88 1360 485 14 6.2 0.19
22/03/2014 Saturday 97 86.91 896 124 16 5 0.09
23/03/2014 Sunday 88 78.85 896 126 16 5 0.09
24/03/2014 Monday
25/03/2014 Tuesday 578 1005.72 1740 638 10 11.2 0.16
26/03/2014 Wednesday 592 1024.16 1730 670 11 5.2 0.12
27/03/2014 Thursday 614 1281.73 2088 606 17 14.2 0.13
28/03/2014 Friday 574 987.28 1720 475 11 7.2 0.07
29/03/2014 Saturday 162 124.58 769 496 14 8.4 0.08
30/03/2014 Sunday 131 100.74 769 119 14 8.4 0.08
31/03/2014 Monday 636 1523.22 2395 558 11 7.2 0.07
01/04/2014 Tuesday 579 1384.97 2392 529 47 12.2 0.17
02/04/2014 Wednesday 586.39 1134.67 1935 578 36 13.6 0.16 0.11 15.5 0.31
03/04/2014 Thursday 568.32 1180.69 2078 573 36 14.4 0.12
04/04/2014 Friday 604 881.84 1460 571 26 13.2 0.23
05/04/2014 Saturday 224 173.38 774 501 41 12.2 0.45
06/04/2014 Sunday 159 123.07 774 189 41 11.8 0.45
07/04/2014 Monday 634 1466.13 2313 556 32 11.8 0.15
08/04/2014 Tuesday 630.3 1134.54 1800 489 29 14.6 0.18
09/04/2014 Wednesday 656 1520.28 2318 625 37 13.2 0.22
10/04/2014 Thursday 636 1160.7 1825 650 34 10.8 0.24 0.07 14 0.38
11/04/2014 Friday 623 1010.82 1623 639 39 10.4 0.29
12/04/2014 Saturday 369 435.42 1180 561 38 11.5 0.09
13/04/2014 Sunday 173 204.14 1180 285 38 11.5 0.09
14/04/2014 Monday 627 1449.94 2313 475 24 10.4 0.26
15/04/2014 Tuesday 684 1662.12 2430 594 18 9.8 0.23
For
insp
ectio
n pur
pose
s only
.
Conse
nt of
copy
right
owne
r req
uired
for a
ny ot
her u
se.
EPA Export 07-11-2018:04:04:40

16/04/2014 Wednesday 767 1624.13 2118 694 36 13 0.31
17/04/2014 Thursday 639 1234.87 1933 683 50 11.4 0.49
18/04/2014 Friday 657 1210.53 1843 633 51 10.8 0.23
19/04/2014 Saturday 570 698.25 1225 693 18 9.6 0.2
20/04/2014 Sunday 204 184.62 905 311 18 9.6 0.2
21/04/2014 Monday 765 1331.1 1740 555 23 6.2 0.16
22/04/2014 Tuesday 741 1519.05 2050 680 38 10.8 0.27
23/04/2014 Wednesday 671 2234.43 3330 688 23 6.2 0.16
24/04/2014 Thursday 744 1075.08 1445 693 36 7.2 0.32 0.08 4.6 0.39
25/04/2014 Friday 784 1289.29 1645 690 23 10.4 0.24
26/04/2014 Saturday 479 715.27 1493 685 21 10.2 0.17
27/04/2014 Sunday 385 574.9 1493 579 21 10.2 0.17
28/04/2014 Monday 661 1192.44 1804 506 18 10 0.18
29/04/2014 Tuesday 681 1301.56 1911 684 26 10.6 0.21
30/04/2014 Wednesday 670 1650.88 2464 688 35 9.2 0.22 0.02 15.3 0.33
01/05/2014 Thursday 667 1694.85 2541 637 17 10.6 0.5
02/05/2014 Friday 625 1529.69 2448 695 20 11 0.26
03/05/2014 Saturday 553 623.51 1128 672 28 11.6 0.56
04/05/2014 Sunday 412 464.53 1128 392 28 11.6 0.56
05/05/2014 Monday 743 1413.93 1903 616 15 13 0.09
06/05/2014 Tuesday 737 1860.56 2525 650 18 11 0.1 0.14 8.3 0.27
07/05/2014 Wednesday 824 2542.45 3085 689 21 7.4 0.08
08/05/2014 Thursday 724 1535.06 2120 705 27 10.6 0.1
09/05/2014 Friday 669 1350.38 2019 688 25 8 0.04
10/05/2014 Saturday 761 849.66 1117 691 24 6.2 0.08
11/05/2014 Sunday 164 183.11 1117 568 24 6.2 0.08
12/05/2014 Monday 705 1690.59 2398 695 25 9.6 0.08
13/05/2014 Tuesday 665 919.86 1383 675 28 12.4 0.15
14/05/2014 Wednesday 718 1273.55 1774 688 34 9.6 0.13
15/05/2014 Thursday 764 1600.96 2095 681 45 11.8 0.15 0.06 11.7 0.28
16/05/2014 Friday 658 1197.89 1821 689 24 10.2 0.08
17/05/2014 Saturday 487 407.13 836 639 22 11.8 0.12
18/05/2014 Sunday 193 161.35 836 294 22 11.8 0.12
19/05/2014 Monday 674 1399.39 2076 648 24 14.6 0.29
20/05/2014 Tuesday 789 1406 1782 687 24 11 0.18
21/05/2014 Wednesday 707 1215.16 1719
22/05/2014 Thursday 737 1311.31 1779 696 36 13.2 0.26 0.04 5.2 0.51
23/05/2014 Friday 728 1661.66 2283 692 18 9.6 0.21
24/05/2014 Saturday 317 270.24 852 344 22 13 0.32
25/05/2014 Sunday 349 297.52 852 574 22 13 0.32
26/05/2014 Monday 726 1457.45 2008 636 34 14.2 0.35
27/05/2014 Tuesday 394 618.68 1570 446 31 10.4 0.15
28/05/2014 Wednesday 505 915.19 1812 531 29 12.4 0.14 0.03 8 0.37
29/05/2014 Thursday 589 782.34 1328 613 51 14 0.39
30/05/2014 Friday 696 1473.78 2118 623 28 12.5 0.35
31/05/2014 Saturday 584 652.04 1117 678 23 10.3 0.27
01/06/2014 Sunday 141 226.84 1609 200 23 10.3 0.27
02/06/2014 Monday 710 1142.21 1609 609 17 10 0.37
03/06/2014 Tuesday 787 1105.93 1405 661 7 11.8 0.15
04/06/2014 Wednesday 797 1304.09 1636 693 21 11.2 0.14 0.08 7.8 0.26
05/06/2014 Thursday 727 1209.55 1664 694 24 11.1 0.25
06/06/2014 Friday 707 1261.82 1785 662 24 11.2 0.14
07/06/2014 Saturday 310 433.07 1397 632 24 11.2 0.14
08/06/2014 Sunday 92 43.26 470 245 24 11.2 0.14
09/06/2014 Monday 176 245.87 1397 177 17 8.8 0.08
10/06/2014 Tuesday 687 1350.82 1966 608 17 4.8 0.07
11/06/2014 Wednesday 803 1435.36 1787 694 27 11.2 0.16
12/06/2014 Thursday 682 1114.05 1634 692 33 12.2 0.2 0.02 7.9 0.39
13/06/2014 Friday 682 1117.8 1639 692 39 10 0.36
14/06/2014 Saturday 450 546.98 1216 570 52 11.4 0.22
15/06/2014 Sunday 163 198.13 1216 241 52 11.4 0.22
16/06/2014 Monday 666 777.22 1167 695 22 13.6 0.23
17/06/2014 Tuesday 760 959.88 1263 672 16 12.6 0.22
18/06/2014 Wednesday 683 799.11 1170 694 54 13.8 0.21 0.02 6.8 0.38
19/06/2014 Thursday 582 583.16 1002 619 34 9.5 0.43
20/06/2014 Friday 652 680.69 1044 683 22 10.5 0.22
21/06/2014 Saturday 148 85.69 579 287 25 10 0.07
22/06/2014 Sunday 118 68.32 579 104 25 10 0.07
For
insp
ectio
n pur
pose
s only
.
Conse
nt of
copy
right
owne
r req
uired
for a
ny ot
her u
se.
EPA Export 07-11-2018:04:04:40

23/06/2014 Monday 814 1196.58 1470 697 26 8 0.1
24/06/2014 Tuesday 713 1039.55 1458 687 43 11.8 0.08 0.02 4.5 0.17
25/06/2014 Wednesday 788 1115.81 1416 686 40 13 0.27
26/06/2014 Thursday 746 691 47 13.4 0.06
27/06/2014 Friday 620 692 16 9.2 0.09
28/06/2014 Saturday 131 449 16 6.6 0.05
29/06/2014 Sunday 183 191 16 6.6 0.05
30/06/2014 Monday 669 544 41 9.8 0.05
01/07/2014 Tuesday 656 698 32 13.6 0.05 0.02 3.8 0.31
02/07/2014 Wednesday 697 624 28 13.2 0.22
03/07/2014 Thursday 650 636 32 13.8 0.12
04/07/2014 Friday 570 639 23 11.4 0.15
05/07/2014 Saturday 116 139 23 11.4 0.15
06/07/2014 Sunday 164 94 23 11.4 0.15
07/07/2014 Monday 664 627 28 8.2 0.1
08/07/2014 Tuesday 622 695 33 12.2 0.06
09/07/2014 Wednesday 763 693 13 6.4 0.14
10/07/2014 Thursday 624 686 26 13.8 0.11
11/07/2014 Friday 624 686 20 13.2 0.17
12/07/2014 Saturday 300 300 20 13.2 0.17
13/07/2014 Sunday 300 300 18 8.8 0.19
14/07/2014 Monday 622 605 30 10.6 0.23
15/07/2014 Tuesday 665 690 28 13 0.29
16/07/2014 Wednesday 648 607 24 12.6 0.18
17/07/2014 Thursday 707 655 26 13 0.18 0.02 8.6 0.31
18/07/2014 Friday 825 684 33 12.8 0.31
19/07/2014 Saturday 602 690 42 12.8 0.44 0.02
20/07/2014 Sunday 485 659 39 13.4 0.23
21/07/2014 Monday 687 687 21 11.4 0.28
22/07/2014 Tuesday 764 698 21 7.2 0.17 0.02 17.8 0.21
23/07/2014 Wednesday 712 690 36 9 0.19
24/07/2014 Thursday 635 682 30 12.2 0.19
25/07/2014 Friday 580 584 25 7.2 0.17
26/07/2014 Saturday 541 623 28 9.4 0.3
27/07/2014 Sunday 148 228 28 9.4 0.3
28/07/2014 Monday 758 679 27 13.2 0.3
29/07/2014 Tuesday 813 675 12 9.8 0.28
30/07/2014 Wednesday 632 1112.2 1760 685 27 8.4 0.36 0.02 17.5 0.56
31/07/2014 Thursday 701 1051.5 1500 639 8 8.4 0.18
01/08/2014 Friday 679 1222.2 1800 695 10 8.2 0.12
02/08/2014 Saturday 232 70.43 304 534 10 8.2 0.12
03/08/2014 Sunday 294 89.26 304 283 10 8.2 0.12
04/08/2014 Monday 668 1098.19 1644 694 12 7.2 0.21
05/08/2014 Tuesday 819 1231.45 1504 659 14 5.6 0.18
06/08/2014 Wednesday 801 691 2 4.2 0.05
07/08/2014 Thursday 785 693 13 4.4 0.11 0.02 4.8
08/08/2014 Friday 731 696 15 3.4 0.11
09/08/2014 Saturday 515 645 15 3.4 0.11
10/08/2014 Sunday 185 542 33 7.6 0.14
11/08/2014 Monday 663 589 30 9.4 0.14
12/08/2014 Tuesday 658 1292.97 1965
13/08/2014 Wednesday 649 1238.29 1908 673 36 6.8 0.15
14/08/2014 Thursday 746 1329.37 1782 647 18 5.6 0.16 0.02 12.8
15/08/2014 Friday 535 818.55 1530 691 15 5 0.14
16/08/2014 Saturday 215 64.5 300 208 18 11.6 0.24
17/08/2014 Sunday 185 55.5 300 250 18 11.6 0.24
18/08/2014 Monday 615 1020.29 1659 595 20 6.6 0.13
19/08/2014 Tuesday 694 1190.9 1716 600 24 6 0.08
20/08/2014 Wednesday 714 1563.66 2190 662 16 10.6 0.14
21/08/2014 Thursday 756 1079.57 1428 689 38 13 0.24 0.02 8.4
22/08/2014 Friday 604 652.32 1080 681 47 12.8 0.21
23/08/2014 Saturday 213 46.01 216 390 33 13.4 0.21
24/08/2014 Sunday 179 38.66 216 201 33 13.4 0.21
25/08/2014 Monday 608 1185.6 1950 639 47 12 0.19
26/08/2014 Tuesday 648 973.94 1503 653 32 11.6 0.14
27/08/2014 Wednesday 673 1049.88 1560 655 28 10.6 0.31
28/08/2014 Thursday 714 1283.06 1797 651 40 14 0.21 0.02 5.6 0.38
29/08/2014 Friday 683 737.64 1080 673 36 10.2 0.21
For
insp
ectio
n pur
pose
s only
.
Conse
nt of
copy
right
owne
r req
uired
for a
ny ot
her u
se.
EPA Export 07-11-2018:04:04:40

30/08/2014 Saturday 149 43.09 289 323 38 11.6 0.26
31/08/2014 Sunday 167 48.29 289 207 38 11.6 0.26
01/09/2014 Monday 538 623 1158 559 57 12.8 0.21
02/09/2014 Tuesday 689 1417.96 2058 530 18 11.4 0.3
03/09/2014 Wednesday 680 1017.96 1497 634 11 7.2 0.14
04/09/2014 Thursday 710 826.44 1164 677 33 9.2 0.08
05/09/2014 Friday 580 680.34 1173 681 33 9.2 0.08 0.02 9.6 0.25
06/09/2014 Saturday 133 48.76 367 217 36 5.2 0.06
07/09/2014 Sunday 153 56.09 367 154 27 5.8 0.12
08/09/2014 Monday 595 929.99 1563 589 10 8.2 0.1 0.02 13.6 0.15
09/09/2014 Tuesday 633 1380.58 2181 605 32 12.6 0.15
10/09/2014 Wednesday 660 1338.48 2028 660 38 7 0.09
11/09/2014 Thursday 675 1287.9 1908 671 36 8.2 0.21
12/09/2014 Friday 649 772.96 1191 647 14 9.2 0.09
13/09/2014 Saturday 157 168.15 1071 259 14 9.2 0.09
14/09/2014 Sunday 129 83.44 647 135 21 11.6 0.12
15/09/2014 Monday 610 808.86 1326 617 48 13.6
16/09/2014 Tuesday 610 686.25 1125 623 57 13.6
17/09/2014 Wednesday 624 1418.98 2274 640 46 11.2
18/09/2014 Thursday 623 1326.99 2130 651 28 8.8 0.11 0.02 5.9 0.26
19/09/2014 Friday 630 782.46 1242 684 49 12.6 0.12
20/09/2014 Saturday 103 59.08 574 189 46 12.2 0.09
21/09/2014 Sunday 164 94.07 574 138 46 12.2 0.09
22/09/2014 Monday 617 851.46 1380 641 45 14.2 0.19
23/09/2014 Tuesday 660 809.82 1227 573 48 14.8 0.2 0.02 3.8 0.34
24/09/2014 Wednesday 657 1115.59 1698 683 48 12.8
25/09/2014 Thursday 621 1033.97 1665 659 40 12.8 0.3
26/09/2014 Friday 529 850.63 1608 552 33 14.4
27/09/2014 Saturday 244 226.92 930 244 24 10.5 0.13
28/09/2014 Sunday 224 208.32 930 255 25 11.5 0.13
29/09/2014 Monday 651 996.03 1530 649 37 12
30/09/2014 Tuesday 432 524.88 1215 486 39 13.2 0.13
01/10/2014 Wednesday 696 772.56 1110 640 52 14 0.11 0.02 11.3 0.31
02/10/2014 Thursday 640 13 15
03/10/2014 Friday 711 597.24 840 751 29 15
04/10/2014 Saturday 183 139.22 761 321 27 9
05/10/2014 Sunday 339 257.91 761 386 27 9
06/10/2014 Monday 664 1101.58 1659 678 23 10
07/10/2014 Tuesday 664 972.1 1464 682 29 8 0.13 0.02 6.5 0.25
08/10/2014 Wednesday 658 1527.08 2321 655 32 8
09/10/2014 Thursday 650 1107.6 1704 662 23 14
10/10/2014 Friday 660 708.84 1074 666 57 12
11/10/2014 Saturday 300 188.64 629 300 51 10
12/10/2014 Sunday 300 188.64 629 300 51 10
13/10/2014 Monday 668 993.98 1488 668 51 12
14/10/2014 Tuesday 563 756.67 1344 563 25 8
15/10/2014 Wednesday 699 916.39 1311 699 23 13
16/10/2014 Thursday 695 565.04 813 695 31 12 0.26 0.02 14.9 0.41
17/10/2014 Friday 697 243.39 349 697 36 8
18/10/2014 Saturday 201 107.57 535 231 29 5
19/10/2014 Sunday 190 101.69 535 190 29 5
20/10/2014 Monday 608 948.48 1560 608 6 5 0.11 0.02 9.2 0.2
21/10/2014 Tuesday 690 705.87 1023 690 16 8
22/10/2014 Wednesday 622 730.73 1175 622 17 7
23/10/2014 Thursday 457 488.62 1069 457 12 9
24/10/2014 Friday 437 64.5 148 437 15 6
25/10/2014 Saturday 152 16.87 111 152 16 5
26/10/2014 Sunday 100 11.1 111 100 16 5
27/10/2014 Monday 159 53.42 336 159 16 7
28/10/2014 Tuesday 375 360.9 962 375 21 10
29/10/2014 Wednesday 454 496.31 1093 454 17 13
30/10/2014 Thursday 509 645.92 1269 509 19 9 0.3 0.02 11.3 0.36
31/10/2014 Friday 588 589.18 1002 588
01/11/2014 Saturday 283 90.34 319 283 7 10.2 0.06
02/11/2014 Sunday 195 62.24 319 195 7 10.2 0.06
03/11/2014 Monday 568 899.71 1584 568 18 15
04/11/2014 Tuesday 450 864 1920 450 29 8.4 0.08
05/11/2014 Wednesday 446 774.97 1738 446 14 10.6
For
insp
ectio
n pur
pose
s only
.
Conse
nt of
copy
right
owne
r req
uired
for a
ny ot
her u
se.
EPA Export 07-11-2018:04:04:40

06/11/2014 Thursday 448 563.41 1258 448 19 6 0.1 0.02 20.3 0.21
07/11/2014 Friday 93 28.24 304 93 6 5.4 0.1
08/11/2014 Saturday 6 7.8 0.09
09/11/2014 Sunday 27 13.69 507 27 6 7.8 0.09
10/11/2014 Monday 434 341.38 787 434 27 7 0.21 0.02 24.3 0.31
11/11/2014 Tuesday 407 478.63 1176 407 13
12/11/2014 Wednesday 370 408.48 1104 370 18
13/11/2014 Thursday 383 422.83 1104 383 18
14/11/2014 Friday 80 29.76 372 80 7 4 0.04
15/11/2014 Saturday 55 3.96 72 55 15 5 0.11
16/11/2014 Sunday 47 3.38 72 47 15 5 0.11
17/11/2014 Monday 147 117.31 798 147 4 14.6 0.04
18/11/2014 Tuesday 330 617.76 1872 330 4 4.8 0.05 0.02 9.9 0.09
19/11/2014 Wednesday 369 1208.84 3276 369 16 7.4
20/11/2014 Thursday 305 36.6 120 305 14
21/11/2014 Friday 276 18.22 66 276 16
22/11/2014 Saturday 33 2.18 66 33 16
23/11/2014 Sunday 2 0.13 65 2 16
24/11/2014 Monday 238 127.09 534 238 11 4.4 0.08
25/11/2014 Tuesday 368 662.4 1800 368 5 3.4
26/11/2014 Wednesday 362 639 1765 362 10 14.2
27/11/2014 Thursday 319 287.1 900 319 19 9.4 0.03 0.02 11 0.32
28/11/2014 Friday 79 34.37 435 79 2 3.2
29/11/2014 Saturday 2 0.09 45 2 4 3.8
30/11/2014 Sunday 44 2.03 46 44 4 3.8
01/12/2014 Monday 34 1.96 58 34 1 5.2 0.04 0.02 2.4 0.05
02/12/2014 Tuesday 52 4.24 82 52 4 8
03/12/2014 Wednesday 182 106.36 584 182 16 3.4
04/12/2014 Thursday 319 186.43 584 319 16 4
05/12/2014 Friday 313 179.54 574 313 16 4
06/12/2014 Saturday 16 2.62 164 16 16 4
07/12/2014 Sunday 46 7.54 164 46 16 4
08/12/2014 Monday 43 6.47 150 43 18 4.2
09/12/2014 Tuesday 187 141.04 754 187 16 8.6
10/12/2014 Wednesday 320 194.88 609 320 9 6.8 0.03 0.01 11.8 0.29
11/12/2014 Thursday 340 375.36 1104 340 7 8
12/12/2014 Friday 140 8.48 61 140 2 4.8
13/12/2014 Saturday 25 2.78 111 25 4 5.4
14/12/2014 Sunday 16 1.78 111 16 4 5.4
15/12/2014 Monday 11 1.58 144 11 15 3.6 0.06
16/12/2014 Tuesday 15 2.16 144 15 15 3.6 0.06
17/12/2014 Wednesday 7 7 14 5
18/12/2014 Thursday 29 29 11 4.5
19/12/2014 Friday
20/12/2014 Saturday
21/12/2014 Sunday
22/12/2014 Monday
23/12/2014 Tuesday
24/12/2014 Wednesday
25/12/2014 Thursday
26/12/2014 Friday
27/12/2014 Saturday
28/12/2014 Sunday
29/12/2014 Monday
30/12/2014 Tuesday
31/12/2014 Wednesday
01/01/2015 Thursday
02/01/2015 Friday
03/01/2015 Saturday
04/01/2015 Sunday
05/01/2015 Monday
06/01/2015 Tuesday
07/01/2015 Wednesday
08/01/2015 Thursday
09/01/2015 Friday
10/01/2015 Saturday
11/01/2015 Sunday
12/01/2015 Monday
For
insp
ectio
n pur
pose
s only
.
Conse
nt of
copy
right
owne
r req
uired
for a
ny ot
her u
se.
EPA Export 07-11-2018:04:04:40

13/01/2015 Tuesday
14/01/2015 Wednesday
15/01/2015 Thursday 155 30 8.6
16/01/2015 Friday 234 24 8.8
17/01/2015 Saturday 88 26 7.9
18/01/2015 Sunday 106 26 7.9
19/01/2015 Monday 182 19.22 106 182 30 7.8 0.24
20/01/2015 Tuesday 254 203.6 802 254 37 12.4 0.26
21/01/2015 Wednesday 212 259.74 1225 212 30 14.4 0.2 0.02 17.8 0.35
22/01/2015 Thursday 126 109.62 870 126 22 11.4 0.19
23/01/2015 Friday 205 220.79 1077 205 44 7
24/01/2015 Saturday 99 165.73 1674 99 38 9.4
25/01/2015 Sunday 63 33.64 534 63 38 9.4
26/01/2015 Monday 206 294.17 1428 206 37 13.8 0.02 0.02 21.3 0.28
27/01/2015 Tuesday 219 294.34 1344 219 23 10.8
28/01/2015 Wednesday 232 386.98 1668 232 20 13 0.14 18.8
29/01/2015 Thursday 214 310.73 1452 438 26 12
30/01/2015 Friday 64 24.96 390 64 31 11.7
31/01/2015 Saturday 100 15.6 156 100 16 12
01/02/2015 Sunday 97 16 12
02/02/2015 Monday 356 296.9 834 356 13 8 0.05 0.02 17.8 0.24
03/02/2015 Tuesday 229 386.09 1686 251 21 11.7
04/02/2015 Wednesday 265 500.85 1890 265 30 11.8 0.08
05/02/2015 Thursday 448 456.96 1020 448 28 11
06/02/2015 Friday 432 345.77 800 432 50 9.4 0.13
07/02/2015 Saturday 53 16.15 305 53 51 5.6 0.15
08/02/2015 Sunday 101 30.79 305 101 39 5.2 0.14
09/02/2015 Monday 341 486.54 1427 341 37 8
10/02/2015 Tuesday 350 360.36 1030 350 15 7.2 0.03
11/02/2015 Wednesday 100 33 330 100 33 9.2
12/02/2015 Thursday 350 512.4 1464 350 49 10 0.03 0.02 5.6 0.11
13/02/2015 Friday 200 66 330 200 33 9.2
14/02/2015 Saturday 100 46.68 467 100 49 10
15/02/2015 Sunday 100 46.68 467 100 49 10
16/02/2015 Monday 383 498.67 1302 383 16 12.4 0.04 0.19 1.8 0.1
17/02/2015 Tuesday 360 554.04 1539 360 38 13.2
18/02/2015 Wednesday 223 405.41 1818 223 39 11
19/02/2015 Thursday 243 75.82 312 243 16 9.4
20/02/2015 Friday 4 1.25 313 4 16 9.4
21/02/2015 Saturday 39 1.97 51 39 15 10.6
22/02/2015 Sunday 93 4.69 50 93 15 10.6
23/02/2015 Monday 257 182.88 712 257 38 13.6
24/02/2015 Tuesday 226 271.2 1200 226 38 8.8 0.06 0.02 6.9 0.19
25/02/2015 Wednesday 435 836.51 1923 435 33 8.2
26/02/2015 Thursday 332 269.92 813 332 27 8.4
27/02/2015 Friday 113 22.78 202 113 23 8.4
28/02/2015 Saturday 17 3.79 223 17 19 9.6
01/03/2015 Sunday 17 3.79 223 17 19 9.6
02/03/2015 Monday 61 15.01 246 61 28 13 0.21
03/03/2015 Tuesday 158 131.77 834 158 31 13.2 0.22
04/03/2015 Wednesday 215 389.58 1812 215 25 10.2
05/03/2015 Thursday 236 257.71 1092 236 54 13.8 0.62 0.28 9.5 0.75
06/03/2015 Friday 283 110.37 390 283 20 10.2
07/03/2015 Saturday 31 9.3 300 31 23 6.2
08/03/2015 Sunday 77 23.1 300 77 23 6.2
09/03/2015 Monday 277 266.25 961 402 9 6.4 0.06 6.2 0.06
10/03/2015 Tuesday 326 489 1500 374 9 6.4
11/03/2015 Wednesday 60 15.3 255
12/03/2015 Thursday 135 34.43 255
13/03/2015 Friday 62 17.86 288
14/03/2015 Saturday 55 34.65 630 326 18 12.4
15/03/2015 Sunday 58 36.54 630 109 18 12.4
16/03/2015 Monday 355 268.38 756 209 24 9.4 0.31
17/03/2015 Tuesday 59 121.07 2052 317 24 9.4 0.31
18/03/2015 Wednesday 380 779.76 2052 326 26 8.6
19/03/2015 Thursday 472 692.42 1467 605 22 9
20/03/2015 Friday 368 342.24 930 487 34 7.4
21/03/2015 Saturday 71 70.29 990 312 28 13
For
insp
ectio
n pur
pose
s only
.
Conse
nt of
copy
right
owne
r req
uired
for a
ny ot
her u
se.
EPA Export 07-11-2018:04:04:40

22/03/2015 Sunday 70 70.29 1004 142 28 13
23/03/2015 Monday 70 69.3 990 604 27 9.2 0.21 0.17 12.4 0.34
24/03/2015 Tuesday 654 1328.27 2031 645 22 6 0.22 0.02 15.3 0.26
25/03/2015 Wednesday 593 1231.07 2076 181 17 7.8 0.05
26/03/2015 Thursday 641 1249.95 1950 694 26 8.8 0.09
27/03/2015 Friday 602 572.5 951 569 13 8.4
28/03/2015 Saturday 360 144.29 401 54 13 9.2 0.25
29/03/2015 Sunday 15 3.33 222 72 13 9.2 0.25
30/03/2015 Monday 174 36.54 210 245 18 7.8
31/03/2015 Tuesday 151 58.89 390 203 20 7.4
01/04/2015 Wednesday 611 1009.99 1653 519 6 5.2
02/04/2015 Thursday 667 1258.63 1887 693 10 5 0.06 0.02 15.9 0.21
03/04/2015 Friday 485 504.89 1041 667 17 10.8
04/04/2015 Saturday 37 24.16 653 75 9 6.4
05/04/2015 Sunday 135 88.13 653 179 9 6.4
06/04/2015 Monday 96 62.67 653 182 9 6.4
07/04/2015 Tuesday 594 1300.86 2190 528 8 4.6
08/04/2015 Wednesday 465 733.77 1578 587 5 6.4
09/04/2015 Thursday 493 718.79 1458 496 22 10.8 0.1 0.02 8.7 0.3
10/04/2015 Friday 529 689.39 1303 387 11 6.4
11/04/2015 Saturday 268 94.87 354 426 8 8.4
12/04/2015 Sunday 109 38.59 354 273 12 4.6
13/04/2015 Monday 316 364.98 1155 368 12 4.6
14/04/2015 Tuesday 561 580.64 1035 582 17 8.8
15/04/2015 Wednesday 536 824.9 1539 519 10 4 0.08 0.02 14.5 0.23
16/04/2015 Thursday 534 736.92 1380 601 10 3.4
17/04/2015 Friday 487 802.09 1647 556 7 4.2
18/04/2015 Saturday 128 62.67 490 181 7 5.2
19/04/2015 Sunday 87 7.67 88 147 7 5.2
20/04/2015 Monday 525 826.88 1575 528 10 5
21/04/2015 Tuesday 508 829.06 1632 562 3 5.8
22/04/2015 Wednesday 653 865.88 1326 584 6 4.2 0.13 0.02 13.4 0.34
23/04/2015 Thursday 659 1190.15 1806 688 10 4.2
24/04/2015 Friday 631 1154.73 1830 357 10 6
25/04/2015 Saturday 338 598.26 1770 323 12 6
26/04/2015 Sunday 158 134.62 852 612 12 6
27/04/2015 Monday 684 1142.96 1671 587 12 7.8
28/04/2015 Tuesday 825 1225.13 1485 690 9 6.2
29/04/2015 Wednesday 451 807.74 1791 684 15 6.6 0.11 0.02 10 0.27
30/04/2015 Thursday 690 1260.63 1827 673 16 10.2
01/05/2015 Friday 756 1297.3 1716 697 5 5
02/05/2015 Saturday 606 455.23 751 688 9 9.8
03/05/2015 Sunday 202 151.74 751 499 9 9.8
04/05/2015 Monday 699 1050.6 1503 596 14 9.4
05/05/2015 Tuesday 754 1655.78 2196 698 13 8.4
06/05/2015 Wednesday 697 1505.52 2160 697 13 7.8 0.34 0.02 4.8 0.6
07/05/2015 Thursday 789 1969.34 2496
08/05/2015 Friday 750 1287 1716
09/05/2015 Saturday 285 342.86 1203
10/05/2015 Sunday 110 132.33 1203
11/05/2015 Monday 660 1437.48 2178
12/05/2015 Tuesday 718 1219.16 1698
13/05/2015 Wednesday 661 1144.19 1731
14/05/2015 Thursday 747 1187.73 1590 693 6 7.2
15/05/2015 Friday 809 1868.79 2310 699 14 11.4
16/05/2015 Saturday 601 474.55 790 669 14 3.2
17/05/2015 Sunday 305 240.83 790 685 14 8.8
18/05/2015 Monday 782 1203.5 1539 698 14 8.8
19/05/2015 Tuesday 693 3 6
20/05/2015 Wednesday 644 1089.65 1692 694 16 7.2
21/05/2015 Thursday 715 1351.35 1890 687 14 13.2 0.3 0.02 16.5 0.46
22/05/2015 Friday 692 957.04 1383 682 14 5.2
23/05/2015 Saturday 191 82.74 433 631 12 9.8
24/05/2015 Sunday 207 89.67 433 363 12 9.8
25/05/2015 Monday 691 1200.27 1737 550 12 9.8
26/05/2015 Tuesday 674 1213.2 1800 688 14 4.6
27/05/2015 Wednesday 742 1104.1 1488 672 8 6.4 0.19 0.02 11.6 0.34
28/05/2015 Thursday 735 1005.48 1368 697 8 6.4
For
insp
ectio
n pur
pose
s only
.
Conse
nt of
copy
right
owne
r req
uired
for a
ny ot
her u
se.
EPA Export 07-11-2018:04:04:40

29/05/2015 Friday 661 880.45 1332 692 11 8
30/05/2015 Saturday 558 297.3 533 640 4 7
31/05/2015 Sunday 163 86.84 533 527 4 7
01/06/2015 Monday 607 997.91 1644 557 14 4
02/06/2015 Tuesday 749 1238.1 1653 682 14 4
03/06/2015 Wednesday 744 1176.26 1581 691 14 5.2
04/06/2015 Thursday 702 1480.52 2109 690 21 6 0.14 0.02 9.6 0.29
05/06/2015 Friday 699 2315.09 3312 653 19 5.6
06/06/2015 Saturday 171 100.24 586 531 26 6.8
07/06/2015 Sunday 116 68 586 238 26 6.8
08/06/2015 Monday 712 1191.89 1674 628 11 5.2
09/06/2015 Tuesday 708 1066.25 1506 685 6 4.2
10/06/2015 Wednesday 554 776.15 1401 684 7 5.4
11/06/2015 Thursday 649 1026.07 1581 681 22 4.6 0.08 0.02 12.3 0.21
12/06/2015 Friday 623 1029.82 1653 661 7 9
13/06/2015 Saturday 543 515.42 949 663 7 2.8 0.29 0.02 10.9 0.43
14/06/2015 Sunday 128 121.5 949 84 7 2.8
15/06/2015 Monday 604 1023.78 1695 690 26 4.2
16/06/2015 Tuesday 558 5494.07 9846 510 27 4.8
17/06/2015 Wednesday 552 1005.19 1821 693 23 6.8
18/06/2015 Thursday 551 652.94 1185 576 18 5.8 0.08 0.02 9.6 0.19
19/06/2015 Friday 569 1048.1 1842 657 15 4.8
20/06/2015 Saturday 377 303.11 804 365 14 3.8
21/06/2015 Sunday 226 181.7 804 320 14 3.8
22/06/2015 Monday 590 692.07 1173 694 12 3.4
23/06/2015 Tuesday 609 937.25 1539 536 4 5.8
24/06/2015 Wednesday 623 779.38 1251 688 22 6
25/06/2015 Thursday 590 798.27 1353 690 4 5 0.08 0.02 5.4 0.39
26/06/2015 Friday 519 579.2 1116 607 22 7
27/06/2015 Saturday 432 348.88 808 405 6 4.6
28/06/2015 Sunday 248 200.29 808 348 6 4.6
29/06/2015 Monday 690 935.64 1356 690 10 6.6 0.12 0.02 8.3 0.29
30/06/2015 Tuesday 664 943.41 1421 664 16 4
01/07/2015 Wednesday 710 984.06 1386 640 12 7.6
02/07/2015 Thursday 602 937.67 1558 695 20 4.4
03/07/2015 Friday 705 1354.45 1921 683 33 10.2
04/07/2015 Saturday 134 66.73 498 374 20 6.6
05/07/2015 Sunday 200 99.6 498 3 20 6.6
06/07/2015 Monday 565 630.54 1116 354 7 6.6
07/07/2015 Tuesday 544 782.05 1438 554 3 4.4
08/07/2015 Wednesday 619 1277.62 2064 600 15 7.5
09/07/2015 Thursday 627 976.24 1557 658 15 6.8
10/07/2015 Friday 600 664.2 1107 661 15 5.2
11/07/2015 Saturday 213 158.47 744 696 13 4
12/07/2015 Sunday 211 156.98 744 674 13 4
13/07/2015 Monday 570 1086.88 1907 570 13 11.6
14/07/2015 Tuesday 554 953.99 1722 602 10 4.8
15/07/2015 Wednesday 553 915.77 1656 542 11 4.4
16/07/2015 Thursday 594 1258.09 2118 697 9 3.4 0.07 0.02 6.7 0.23
17/07/2015 Friday 270 381.51 1413 388 11 4.8
18/07/2015 Saturday 133 63.52 478 173 4 2.6
19/07/2015 Sunday 227 108.41 478 218 4 2.6
20/07/2015 Monday 475 817.95 1722 641 3 3.2
21/07/2015 Tuesday 509 765.03 1503 531 12 4.6 0.08 0.02 0.19
22/07/2015 Wednesday 580 976.14 1683 562 11 3
23/07/2015 Thursday 538 1066.85 1983 621 9 3.8
24/07/2015 Friday 298 160.92 540 449 6 6.4
25/07/2015 Saturday 174 83.73 481 192 9 4.4
26/07/2015 Sunday 170 81.8 481 243 9 4.4
27/07/2015 Monday 545.21 799.82 1467 621 9 4.4
28/07/2015 Tuesday 582 843.32 1449 578 4 5.6 0.08 0.02 8.8 0.16
29/07/2015 Wednesday 710 1339.77 1887 692 10 6.6
30/07/2015 Thursday 705 1082.88 1536 660 10 3.2
31/07/2015 Friday 644 1485.71 2307 689 7 5
01/08/2015 Saturday 125 58.65 469 385 7 5
02/08/2015 Sunday 224 105.1 469 337 11 7
03/08/2015 Monday 560 893.76 1596 564 12 4.8
04/08/2015 Tuesday 600 3852 6420 585 14 3 0.12
For
insp
ectio
n pur
pose
s only
.
Conse
nt of
copy
right
owne
r req
uired
for a
ny ot
her u
se.
EPA Export 07-11-2018:04:04:40

05/08/2015 Wednesday 608 866.4 1425 688 13 6.2 3.4 0.23
06/08/2015 Thursday 568 932.09 1641 611 10 6.4
07/08/2015 Friday 558 704.75 1263 645 11 6.6
08/08/2015 Saturday 325 305.76 941 381 9 5.8
09/08/2015 Sunday 143 134.53 941 302 9 5.8
10/08/2015 Monday 675 1755.68 2601 559 1 4.6
11/08/2015 Tuesday 694 1157.59 1668 692 4.6 0.15
12/08/2015 Wednesday 794 3056.11 3849 689 5 5
13/08/2015 Thursday 752 568
14/08/2015 Friday 181 10
15/08/2015 Saturday 107 445
16/08/2015 Sunday 335 490.04 1463 580
17/08/2015 Monday 689 1508.91 2190 551 52 13.4 0.14
18/08/2015 Tuesday 628 975.91 1554 689 34 5.4
19/08/2015 Wednesday 615 1437.26 2337 698 28 4.8
20/08/2015 Thursday 601 1052.95 1752 645 27 7.6
21/08/2015 Friday 556 512.08 921 491 25 6.8
22/08/2015 Saturday 142 71.4 503 365 26 3.8
23/08/2015 Sunday 136 68.38 503 317 26 3.8
24/08/2015 Monday 555 837.5 1509 669 8 6.8 0.08 0.02 16.1
25/08/2015 Tuesday 673 705.04 1048 651 12 6
26/08/2015 Wednesday 588 1105.67 1880 691 12 15
27/08/2015 Thursday 609 893.04 1466 619 14 11
28/08/2015 Friday 428 539.28 1260 618
29/08/2015 Saturday 206 115.57 561 179 16 3.8
30/08/2015 Sunday 118 66.2 561 232 16 3.8
31/08/2015 Monday 500 586.5 1173 548 11 3.4
01/09/2015 Tuesday 353 451.13 1278 411 9 3.8
02/09/2015 Wednesday 543 878.03 1617 579 4 4 0.13 0.02 2.6 0.18
03/09/2015 Thursday 502 948.78 1890 544 5 3.4
04/09/2015 Friday 439 550.51 1254 497 2 5
05/09/2015 Saturday 211 170.91 810 286 13 5.4
06/09/2015 Sunday 148 119.88 810 180 13 5.4
07/09/2015 Monday 706 1751.59 2481 597 20 7.8
08/09/2015 Tuesday 567 923.65 1629 663 21 5.2
09/09/2015 Wednesday 538 786.02 1461 672 15 5.4 0.05 0.02 3.4 0.22
10/09/2015 Thursday 500 747 1494 120 14 14.8
11/09/2015 Friday 500 478
12/09/2015 Saturday 130 59.9 461 625 2 6.6
13/09/2015 Sunday 128 58.98 461 288 2 6.6
14/09/2015 Monday 532 616.06 1158 611 9 7.6
15/09/2015 Tuesday 543 1187.54 2187 445 10 5.4
16/09/2015 Wednesday 591 553.18 936 745 3 4
17/09/2015 Thursday 411 438.95 1068 575 12 4 0.04 0.02 9.2 0.2
18/09/2015 Friday 521 457.96 879 572 19 6
19/09/2015 Saturday 99 46.57 470 140 22 3.8
20/09/2015 Sunday 118 55.51 470 182 22 3.8
21/09/2015 Monday 475 655.5 1380 606 4 4.2
22/09/2015 Tuesday 531 989.26 1863 577 4 5.8
23/09/2015 Wednesday 514 761.75 1482 548 8 7.2 0.09 0.02 0.24
24/09/2015 Thursday 496 614.54 1239 594 19 13.2
25/09/2015 Friday 365 452.24 1239 516 8 9.6
26/09/2015 Saturday 113 44.34 392 132 13 9.6
27/09/2015 Sunday 194 76.13 392 192 13 9.6
28/09/2015 Monday 545 735.75 1350 628 15 12.8
29/09/2015 Tuesday 586 1202.47 2052 702 11 7.6
30/09/2015 Wednesday 569 902.32 1586 602 8 6
01/10/2015 Thursday 601 501.23 834 693 7 6.8 0.03 0.02 4.6 0.11
02/10/2015 Friday 548 407.71 744 588 7 7.8
03/10/2015 Saturday 64 34.18 534 185 9 4.8
04/10/2015 Sunday 102 54.47 534 110 9 4.8
05/10/2015 Monday 572 755.04 1320 649 22 5.6
06/10/2015 Tuesday 708 1142.71 1614 690 10
07/10/2015 Wednesday 576 584.06 1014 673 15 13.4
08/10/2015 Thursday 519 748.92 1443 665 7 9.8 0.07 0.02 6.1 0.4
09/10/2015 Friday 506 33.4 66 607 7 13.8
10/10/2015 Saturday 31 2.05 66 36 27 14.4
11/10/2015 Sunday 36 2.38 66 148 27 14.4
For
insp
ectio
n pur
pose
s only
.
Conse
nt of
copy
right
owne
r req
uired
for a
ny ot
her u
se.
EPA Export 07-11-2018:04:04:40

12/10/2015 Monday 221 186.97 846 281 16 12.6
13/10/2015 Tuesday 328 591.38 1803 368 16 14 0.09 0.02 22.8 0.04
14/10/2015 Wednesday 345 434.29 1259 382 19 8.4
15/10/2015 Thursday 345 248.81 721 431 16 8.8
16/10/2015 Friday 194 102.67 529 218 13.4
17/10/2015 Saturday 15 3.55 237 2
18/10/2015 Sunday 62 14.66 236 19
19/10/2015 Monday 338 365.04 1080 592
20/10/2015 Tuesday 276 336.17 1218 360 13 10.6
21/10/2015 Wednesday 210 408.24 1944 274 35 5
22/10/2015 Thursday 251 216
23/10/2015 Friday 84 257
24/10/2015 Saturday 8 12
25/10/2015 Sunday 5
26/10/2015 Monday 66 41.9 635 13 5.8
27/10/2015 Tuesday 232 41.76 180 67 5 5.4 0.04 0.02 19.4 0.09
28/10/2015 Wednesday 14 7.8
29/10/2015 Thursday
30/10/2015 Friday
31/10/2015 Saturday
01/11/2015 Sunday 50 6.96 139
02/11/2015 Monday 150 184.5 1230 150 10 4.6 0.02 0.02 24.8 0.07
03/11/2015 Tuesday 250 463.05 1852 250 12 13.6
04/11/2015 Wednesday 250 552.75 2211 250 4 12
05/11/2015 Thursday 250 206.25 825 250 10 9.8
06/11/2015 Friday 150 140.4 936 150 4 9.8
07/11/2015 Saturday 37 7.73 209 37 7 10.4
08/11/2015 Sunday 100 20.88 209 100 16 14
09/11/2015 Monday 300 360 1200 300 16 14
10/11/2015 Tuesday 300 432.9 1443 300 12 9.4 0.1 0.02 9.9 0.08
11/11/2015 Wednesday 300 402.3 1341 300 6 5.2
12/11/2015 Thursday 300 297.9 993 300 10 5.8
13/11/2015 Friday 300 241.2 804 300 6 7.6
14/11/2015 Saturday 50 14.1 282 50 4 6.8
15/11/2015 Sunday 100 28.2 282 100 4 6.8
16/11/2015 Monday 300 483.3 1611 1 8.8
17/11/2015 Tuesday 317 1328.55 4191 368 16 9.8
18/11/2015 Wednesday 384 1563.26 4071 432 14 8.8
19/11/2015 Thursday 326 1159.91 3558 387 14 8.8 0.05 0.02 11.8 0.22
20/11/2015 Friday 347 422.65 1218 362 17 8.8
21/11/2015 Saturday 44 19 7.8
22/11/2015 Sunday 76 49.16 647 91 19 7.8
23/11/2015 Monday 392 1470 3750 387 12 8.2
24/11/2015 Tuesday 322 873.26 2712 366 28 9.8
25/11/2015 Wednesday 357 1231.65 3450 434 11 8.2
26/11/2015 Thursday 283 792.12 2799 368 21 9.6 0.07 0.02 5.4 0.28
27/11/2015 Friday 300 499.5 1665 390 8 7.2
28/11/2015 Saturday 7 3.67 524 33 11 9
29/11/2015 Sunday 142 74.47 524 192 11 9
30/11/2015 Monday 347 875.06 2522 410 24 11
01/12/2015 Tuesday 370 480.63 1299 401 21 14.6
02/12/2015 Wednesday 501 769.54 1536 470
03/12/2015 Thursday 536 770.23 1437 640 10 14 0.1 0.02 7.9 0.38
04/12/2015 Friday 387 670.6 1733 513 15 6.2
05/12/2015 Saturday 35 10.67 305 92 13 6.8
06/12/2015 Sunday 24 7.31 305 41 13 6.8
07/12/2015 Monday 396 1340.06 3384 291 8 6.8
08/12/2015 Tuesday 234 185.33 792 444 6 6
09/12/2015 Wednesday 60 8.35 139 141 16 4.2
10/12/2015 Thursday 27 4.39 163 96 13 5.4 0.02 0.02 4.1 0.09
11/12/2015 Friday 83 128
12/12/2015 Saturday 11 151
13/12/2015 Sunday 13 21
14/12/2015 Monday
15/12/2015 Tuesday
16/12/2015 Wednesday
17/12/2015 Thursday
18/12/2015 Friday
For
insp
ectio
n pur
pose
s only
.
Conse
nt of
copy
right
owne
r req
uired
for a
ny ot
her u
se.
EPA Export 07-11-2018:04:04:40

19/12/2015 Saturday
20/12/2015 Sunday
21/12/2015 Monday
22/12/2015 Tuesday
23/12/2015 Wednesday
24/12/2015 Thursday
25/12/2015 Friday
26/12/2015 Saturday
27/12/2015 Sunday
28/12/2015 Monday
29/12/2015 Tuesday
30/12/2015 Wednesday
31/12/2015 Thursday
01/01/2016 Friday 279 18 11
02/01/2016 Saturday 107 22 8
03/01/2016 Sunday 41 22 8
04/01/2016 Monday 57 24 10
05/01/2016 Tuesday 24 12 10
06/01/2016 Wednesday 95 26 8 0.19 0.02 18.7 0.61
07/01/2016 Thursday 134 26 9
08/01/2016 Friday 93 28 10
09/01/2016 Saturday 138 16 7
10/01/2016 Sunday 182 16 7
11/01/2016 Monday 89 261.13 2934 131 47 14.8
12/01/2016 Tuesday 257 1030.06 4008 311 11 5
13/01/2016 Wednesday 283 534.87 1890 322 5 10.8 0.18 0.27 22.3 0.55
14/01/2016 Thursday 253 447.81 1770 294 14 11
15/01/2016 Friday 295 305.33 1035 290 5 3.8
16/01/2016 Saturday 30 5 3.8
17/01/2016 Sunday 141 145.94 1035 222 5 3.8
18/01/2016 Monday 353 20 12.4
19/01/2016 Tuesday 354 7 10.2
20/01/2016 Wednesday 394 4 5.6
21/01/2016 Thursday 386 21 5.4 0.08 0.02 24.9 0.19
22/01/2016 Friday 341 27 13
23/01/2016 Saturday 104 27 13
24/01/2016 Sunday 64 27 13
25/01/2016 Monday 345 259.79 753 409 15 12.8
26/01/2016 Tuesday 409 822.09 2010 503 1 12.2
27/01/2016 Wednesday 388 552.9 1425 457 6 6.8
28/01/2016 Thursday 722 541.5 750 580 5 9.8 0.11 0.02 21.2 0.34
29/01/2016 Friday 138 327.06 2370 395 9 13.2
30/01/2016 Saturday 15 9 13.2
31/01/2016 Sunday 43 27.09 630 76 9 13.2
01/02/2016 Monday 287 622.51 2169 338 11 14.6
02/02/2016 Tuesday 459 969.41 2112 538 8 7.2 0.08 0.02 24.8 0.3
03/02/2016 Wednesday 475 1275.38 2685 475 16 12.8
04/02/2016 Thursday 373 948.91 2544 433 5 8.8
05/02/2016 Friday 291 451.34 1551 399 2 10.6
06/02/2016 Saturday 64 82.56 1290 143 10 8
07/02/2016 Sunday 155 199.95 1290 213 10 8
08/02/2016 Monday 435 1209.74 2781 349 10 7.8
09/02/2016 Tuesday 355 773.19 2178 417 12 8.2
10/02/2016 Wednesday 419 722.78 1725 537 15 12.8
11/02/2016 Thursday 379 434.33 1146 445 15 11.2 0.14 0.02 10.9 0.46
12/02/2016 Friday 220 38.54 175 311 20 9.2
13/02/2016 Saturday 97 28.28 292 230 19 6.6
14/02/2016 Sunday 60 17.5 292 140 19 6.6
15/02/2016 Monday 325 768.3 2364 363 5 11 0.15 0.02 22.8 0.21
16/02/2016 Tuesday 487 663.29 1362 565 15 8.4
17/02/2016 Wednesday 402 148.34 369 481 13 12.2
18/02/2016 Thursday 51 4 10.8
19/02/2016 Friday 9 0.54 60 107 4 10.8
20/02/2016 Saturday 55 3.3 60 114 4 10.8
21/02/2016 Sunday
22/02/2016 Monday
23/02/2016 Tuesday 474 621.41 1311 663 12 6.8 0.02 0.02 18.4 0.62
24/02/2016 Wednesday 503 582.47 1158 561 8 8.6
For
insp
ectio
n pur
pose
s only
.
Conse
nt of
copy
right
owne
r req
uired
for a
ny ot
her u
se.
EPA Export 07-11-2018:04:04:40

25/02/2016 Thursday 579 640.96 1107 634 12 6.4
26/02/2016 Friday 834 450.36 540 686 9 8.6
27/02/2016 Saturday 44 10.4 236 440 42 6.8
28/02/2016 Sunday 96 22.69 236 152 42 6.8
29/02/2016 Monday 437 781.36 1788 435 6 6.6
01/03/2016 Tuesday 376 530.16 1410 502 9 14.2
02/03/2016 Wednesday 516 470.59 912 576 2 6.8 0.02 0.02 18.4 0.07
03/03/2016 Thursday 573 962.64 1680 617 12 6.8
04/03/2016 Friday 317 386.11 1218 379 22 8.2
05/03/2016 Saturday 5.75 1.68 292 38 18 5.8
06/03/2016 Sunday
07/03/2016 Monday 517 536.65 1038 605 8 6.8
08/03/2016 Tuesday 630 686.07 1089 702 5 6.8
09/03/2016 Wednesday 548 683.9 1248 641 8 7.6 0.07 0.02 12.2 0.12
10/03/2016 Thursday 545 645.83 1185 615 6 8.6
11/03/2016 Friday 338 134.86 399 442 6 6.8
12/03/2016 Saturday 56 25.33 452 140 8 10.8
13/03/2016 Sunday 125 56.55 452 198 8 10.8
14/03/2016 Monday 586 615.3 1050 699 12 9.6
15/03/2016 Tuesday 571 1110.02 1944 654 9 8
16/03/2016 Wednesday 374 469 21 8.8
17/03/2016 Thursday 28 6.65 238 142 21 8.8
18/03/2016 Friday 112 26.38 236 172 21 8.8
19/03/2016 Saturday 41 11.09 270 130 20 6.6
20/03/2016 Sunday 126 34.1 271 126 20 6.6
21/03/2016 Monday 452 635.96 1407 539 12 9.6
22/03/2016 Tuesday 568 986.62 1737 568 5 12.8
23/03/2016 Wednesday 531 1245.73 2346 604 19 4.8 0.08 0.02 7 0.13
24/03/2016 Thursday 438 659.63 1506 473 13 8.6
25/03/2016 Friday 582 386.92 665 667 16 9.2
26/03/2016 Saturday 139 92.41 665 231 16 9.2
27/03/2016 Sunday 36 23.93 665 65 16 9.2
28/03/2016 Monday 148 98.39 665 159 16 9.2
29/03/2016 Tuesday 574 1152.02 2007 592 10 7.8
30/03/2016 Wednesday 569 1039.57 1827 633 20 6.8
31/03/2016 Thursday 566 713.16 1260 689 20 8.4 0.09 0.02 3.5 0.19
01/04/2016 Friday 459 374.54 816 593 13 7.4
02/04/2016 Saturday 121 80.87 668 269 15 11.4
03/04/2016 Sunday 134 89.57 668 235 15 11.4
04/04/2016 Monday 507 495.85 978 559 8 8.2
05/04/2016 Tuesday 646 1180.24 1827 601 6 10
06/04/2016 Wednesday 676 760.5 1125 676 13 9.6 0.16 0.02 9.5 0.25
07/04/2016 Thursday 688 932.93 1356 688 33 10.6
08/04/2016 Friday 690 810.61 1175 690 17 5.6
09/04/2016 Saturday 301 92.11 306 301 12 8.2
10/04/2016 Sunday 448 137.09 306 448 12 8.2
11/04/2016 Monday 709 1086.9 1533 689 16 8.4
12/04/2016 Tuesday 618 1038.24 1680 558 15 4.2
13/04/2016 Wednesday 445 664.83 1494 565 15 6.6 0.09 0.02 7.5 0.22
14/04/2016 Thursday 445 675.51 1518 565 9 4.6
15/04/2016 Friday 590 577.02 978 647 15 10.2
16/04/2016 Saturday 42 30.41 724 153 18 6.4
17/04/2016 Sunday 141 102.11 724 220 18 6.4
18/04/2016 Monday 634 1340.91 2115 657 11 3.4 0.06 0.02 5.4 0.14
19/04/2016 Tuesday 578 1473.9 2550 647 17 5
20/04/2016 Wednesday 642 993.82 1548 695 9 8
21/04/2016 Thursday 657 1415.18 2154 575 14 6.2
22/04/2016 Friday 564 458.53 813 679 12 5.2
23/04/2016 Saturday 233 182.58 784 165 11 3.4
24/04/2016 Sunday 122 95.6 784 155 11 3.4
25/04/2016 Monday 713 1210.67 1698 586 5 3.6
26/04/2016 Tuesday 709 1178.36 1662 693 5 3.8
27/04/2016 Wednesday 713 1097.31 1539 683 15 2.4 0.08 0.02 11.2 0.16
28/04/2016 Thursday 705 1133.64 1608 696 16 7.8
29/04/2016 Friday 709 918.86 1296 686 13 4.8
30/04/2016 Saturday 548 813.78 1485 686 3 5.4
01/05/2016 Sunday 107 158.9 1485 583 3 5.4
02/05/2016 Monday 538 869.95 1617 620 6 6
For
insp
ectio
n pur
pose
s only
.
Conse
nt of
copy
right
owne
r req
uired
for a
ny ot
her u
se.
EPA Export 07-11-2018:04:04:40

03/05/2016 Tuesday 505 846.89 1677 645 12 13.6
04/05/2016 Wednesday 740 1409.7 1905 586 5 7.4 0.2 0.02 5.1 0.28
05/05/2016 Thursday 730 1252.68 1716 681 10 10.6
06/05/2016 Friday 709 1014.58 1431 698 16 7.2
07/05/2016 Saturday 518 514.37 993 664 17 4
08/05/2016 Sunday 500 496.5 993 558 17 4
09/05/2016 Monday 738 1306.26 1770 651 16 6.6
10/05/2016 Tuesday 811 1416.01 1746 691 10 7
11/05/2016 Wednesday 782 1241.03 1587 689 16 9.2
12/05/2016 Thursday 774 1913.33 2472 697 13 5.4 0.11 0.02 8.5 0.21
13/05/2016 Friday 688 1384.94 2013 698 9 6.4
14/05/2016 Saturday 524 1216.73 2322 638 4 5
15/05/2016 Sunday 130 301.86 2322 696 4 5
16/05/2016 Monday 628 1409.23 2244 697 8 7
17/05/2016 Tuesday 741 2892.13 3903 668 6 6
18/05/2016 Wednesday 425 824.93 1941 674 14 5.8 0.14 0.02 9.6 0.21
19/05/2016 Thursday 794 1538.77 1938 699 9 7.2
20/05/2016 Friday 708 1348.74 1905 660 4 4.2
21/05/2016 Saturday 589 618.45 1050 687 4 9.4
22/05/2016 Sunday 215 225.75 1050 310 4 9.4
23/05/2016 Monday 595 1695.75 2850 608 8 10.6
24/05/2016 Tuesday 706 2717.39 3849 682 24 14.4 0 0.02 8.9 0.67
25/05/2016 Wednesday 591 985.79 1668 688 21 8.2
26/05/2016 Thursday 591 1418.4 2400 688 12 6.4
27/05/2016 Friday 677 2274.72 3360 616 16 10.8
28/05/2016 Saturday 670 743.7 1110 698 20 6.2
29/05/2016 Sunday 153 27.73 181 342 20 6.2
30/05/2016 Monday 667 1448.72 2172 679 21 7.8
31/05/2016 Tuesday 631 1256.95 1992 699 22 10.2
01/06/2016 Wednesday 616 1410.02 2289 637 10 5.6 0.07 0.02 7.7 0.21
02/06/2016 Thursday 530 1462.8 2760 575 18 7.2
03/06/2016 Friday 694 1509.45 2175 687 12 8.2
04/06/2016 Saturday 478 648.17 1356 619 10 12.2
05/06/2016 Sunday 84 113.9 1356 126 10 12.2
06/06/2016 Monday 351 649.7 1851 434 15 8.2
07/06/2016 Tuesday 664 1346.59 2028 655 13 14
08/06/2016 Wednesday 552 678.96 1230 669 20 12.2 0.07 0.02 7.6 0.23
09/06/2016 Thursday 634 13 9.2
10/06/2016 Friday 684 13 13.2
11/06/2016 Saturday 658 7 15
12/06/2016 Sunday 161 207.69 1290 256 7 15
13/06/2016 Monday 564 798.29 1415 637 10 9.8
14/06/2016 Tuesday 676 1614.29 2388 691 14 6.8
15/06/2016 Wednesday 567 1226.42 2163 682 19 14 0.25 0.02 0.79
16/06/2016 Thursday 564 1023.66 1815 637 10 9.8
17/06/2016 Friday 684 991.12 1449 513 12 8.4
18/06/2016 Saturday 136 150.96 1110 510 14 10.8
19/06/2016 Sunday 149 165.39 1110 247 14 10.8
20/06/2016 Monday 558 959.2 1719 638 13 10.8
21/06/2016 Tuesday 595 917.49 1542 606 9 7.2
22/06/2016 Wednesday 617 1867.66 3027 557 10 10
23/06/2016 Thursday 541 1041.23 1925 668 18 11.2 0.5 0.02 0.53
24/06/2016 Friday 564 551.59 978 632 18 10.6
25/06/2016 Saturday 57 24.11 423 171 13 10.4
26/06/2016 Sunday 57 24.11 423 171 13 10.4
27/06/2016 Monday 671 740.78 1104 650 16 14.2
28/06/2016 Tuesday 618 765.7 1239
29/06/2016 Wednesday 566 925.41 1635
30/06/2016 Thursday 528 465.7 882
01/07/2016 Friday 400 412.8 1032 453 17 6.4
02/07/2016 Saturday 22 13.65 620 133 25 4.6
03/07/2016 Sunday 153 94.92 620 241 25 4.6
04/07/2016 Monday 554 809.39 1461 630 21 8.4
05/07/2016 Tuesday 564 1204.7 2136 607 15 6.8
06/07/2016 Wednesday 492 1068.62 2172 521 10 10.2
07/07/2016 Thursday 694 880.69 1269 636 10 11 0.5 0.02 9.8 0.75
08/07/2016 Friday 674 879.57 1305 695 4 6.4
09/07/2016 Saturday 121 103.09 852 553 24 13.4
For
insp
ectio
n pur
pose
s only
.
Conse
nt of
copy
right
owne
r req
uired
for a
ny ot
her u
se.
EPA Export 07-11-2018:04:04:40
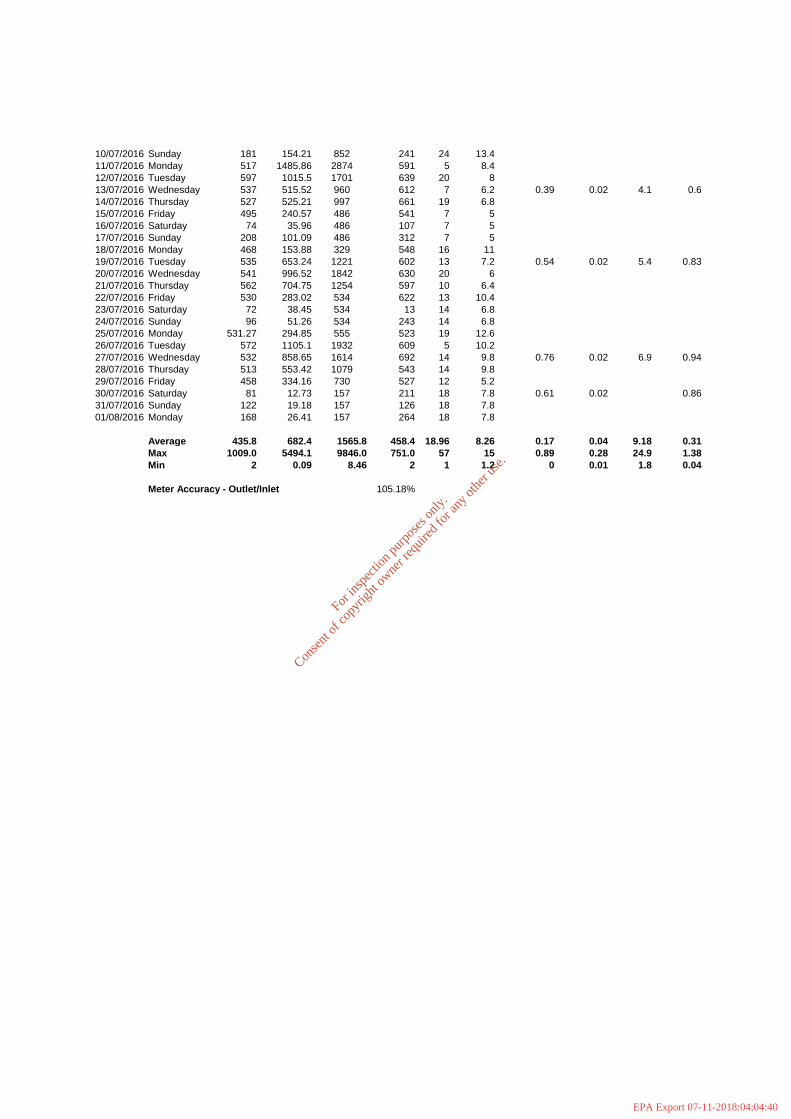
10/07/2016 Sunday 181 154.21 852 241 24 13.4
11/07/2016 Monday 517 1485.86 2874 591 5 8.4
12/07/2016 Tuesday 597 1015.5 1701 639 20 8
13/07/2016 Wednesday 537 515.52 960 612 7 6.2 0.39 0.02 4.1 0.6
14/07/2016 Thursday 527 525.21 997 661 19 6.8
15/07/2016 Friday 495 240.57 486 541 7 5
16/07/2016 Saturday 74 35.96 486 107 7 5
17/07/2016 Sunday 208 101.09 486 312 7 5
18/07/2016 Monday 468 153.88 329 548 16 11
19/07/2016 Tuesday 535 653.24 1221 602 13 7.2 0.54 0.02 5.4 0.83
20/07/2016 Wednesday 541 996.52 1842 630 20 6
21/07/2016 Thursday 562 704.75 1254 597 10 6.4
22/07/2016 Friday 530 283.02 534 622 13 10.4
23/07/2016 Saturday 72 38.45 534 13 14 6.8
24/07/2016 Sunday 96 51.26 534 243 14 6.8
25/07/2016 Monday 531.27 294.85 555 523 19 12.6
26/07/2016 Tuesday 572 1105.1 1932 609 5 10.2
27/07/2016 Wednesday 532 858.65 1614 692 14 9.8 0.76 0.02 6.9 0.94
28/07/2016 Thursday 513 553.42 1079 543 14 9.8
29/07/2016 Friday 458 334.16 730 527 12 5.2
30/07/2016 Saturday 81 12.73 157 211 18 7.8 0.61 0.02 0.86
31/07/2016 Sunday 122 19.18 157 126 18 7.8
01/08/2016 Monday 168 26.41 157 264 18 7.8
Average 435.8 682.4 1565.8 458.4 18.96 8.26 0.17 0.04 9.18 0.31
Max 1009.0 5494.1 9846.0 751.0 57 15 0.89 0.28 24.9 1.38
Min 2 0.09 8.46 2 1 1.2 0 0.01 1.8 0.04
Meter Accuracy - Outlet/Inlet 105.18%
For
insp
ectio
n pur
pose
s only
.
Conse
nt of
copy
right
owne
r req
uired
for a
ny ot
her u
se.
EPA Export 07-11-2018:04:04:40

Industrial Emissions Application Application ID: LA001622
Attachment-7.3-2-1 Supporting Documents
Appendix C
Assessment of Proposed Wastewater Discharges on
the Receiving Waters at Rathcoursey Point
(Document 17617_6011)
For
insp
ectio
n pur
pose
s only
.
Conse
nt of
copy
right
owne
r req
uired
for a
ny ot
her u
se.
EPA Export 07-11-2018:04:04:40

Malachy Walsh and Partners
Consulting Engineers Cork | Tralee | Limerick | London
Assessment of Proposed Wastewater Discharges on
the Receiving Waters at Rathcoursey Point
PROPOSED SPECIALITY CHEESE PLANT
AT
DAIRYGOLD,
MOGEELY, CO. CORK
Project Document Revision Issue Prepared Date
17617 6011 A Information M. O’Sullivan
C. FoX
October 2016
For
insp
ectio
n pur
pose
s only
.
Conse
nt of
copy
right
owne
r req
uired
for a
ny ot
her u
se.
EPA Export 07-11-2018:04:04:40

1. Background
The outfall at Rathcoursey point was constructed and commissioned in approximately 1988. At the
time it was designed to discharge comminuted raw sewage, at all stages of the tide, from the
agglomeration of Midleton and Ballinacurra and treated effluent from Irish Distillers Ltd. The
Foreshore Licence issued at the time by the Department of the Marine included a condition that
discharge be halted for 1 hour at the bottom of the tide. A Tidal tank sized for that requirement
was constructed on the foreshore some 340 metres from Rathcoursey Point.
Subsequently, a Wastewater Treatment Plant was constructed in Midleton and commissioned in
June 2000. The Foreshore Licence was varied in September 1999 to reflect this advance and the
requirement for halting the discharge at any time was removed.
In January 2011 a WWDA was issued by the EPA to Cork County Council. This Licence included a
condition that discharge be on the ebb tide only. In her recommendation to the EPA the Inspector
noted that the rise in background BOD arising from the discharge would be less than 1 mg/l as
required. In fact the effect of the discharge is so small as to be negligible.
The addition of the proposed Dairygold, Mogeely treated effluent, to the discharge, would not
change the estimation of the EPA Inspector. The following calculations demonstrate the worst case
initial impact of that discharge outside the mixing zone.
The receiving water volumes are taken from the EPA River flows report and the 1993 M. C.
O’Sullivan Preliminary Report on Midleton Sewage Treatment Plant.
For
insp
ectio
n pur
pose
s only
.
Conse
nt of
copy
right
owne
r req
uired
for a
ny ot
her u
se.
EPA Export 07-11-2018:04:04:40

100 kgsBOD/Day
Total 100
51.54639175
Cumec m3/d Cumec m3/d
Owenacurra R. 0.024 2073.6 0.079 6825.6
Dungourney R. 0.019 1641.6 0.029 2505.6
Tidal Range High Water volumeLow Water volume Tidal Prism Rise in BOD due to
discharge
metres 000m3
000m3
000m3 mg/l
1.8 18,151 9,508 8,643 0.0060
2 19,578 9,140 10,438 0.0049
2.1 21,006 9,140 11,866 0.0043
2.2 21,006 8,772 12,234 0.0042
3.5 24,847 6,647 18,200 0.0028
3.6 25,776 6,647 19,129 0.0027
3.7 26,305 6,647 19,658 0.0026
Average 0.0039
Effect of Dairygold, Mogeely design Loads on Rathcoursey discharge.
Dairygold, Mogeely = 4,000m3/d @25 mg/l =
kgs BOD/Day
Total Load per tide kgs BOD/tide
Advective Flows DWF 95%-ile
Tidal Prism at Rathcoursey Point.
For
insp
ectio
n pur
pose
s only
.
Conse
nt of
copy
right
owne
r req
uired
for a
ny ot
her u
se.
EPA Export 07-11-2018:04:04:40

86.25
125
100 kgsBOD/Day
Total 311.25
160.44
Tidal Range High Water
volume
Low Water volume Tidal Prism Rise in BOD due to
discharge
metres 000m3 000m3 000m3mg/l
1.8 18,151 9,508 8,643 0.0186
2 19,578 9,140 10,438 0.0154
2.1 21,006 9,140 11,866 0.0135
2.2 21,006 8,772 12,234 0.0131
3.5 24,847 6,647 18,200 0.0088
3.6 25,776 6,647 19,129 0.0084
3.7 26,305 6,647 19,658 0.0082
Average 0.0123
Total BOD Loads to be discharged at Rathcoursey Point
Daily design Loads
Midleton Town discharge = 15,000 @0.23 m3/head@25 mg/l = kgs BOD/Day
Irish Distillers Ltd. = 5000 m3/d @25 mg/l = kgs BOD/Day
Dairygold, Mogeely = 4,000m3/d @25 mg/l =
kgs BOD/Day
Total Load per tide kgs BOD/tide
Tidal Prism at Rathcoursey Point.
For
insp
ectio
n pur
pose
s only
.
Conse
nt of
copy
right
owne
r req
uired
for a
ny ot
her u
se.
EPA Export 07-11-2018:04:04:40

86.25
67.5
100 kgsBOD/Day
Total 253.75
130.8
Tidal Range High Water
volume
Low Water volume Tidal Prism Rise in BOD due to
discharge
metres 000m3 000m3 000m3mg/l
1.8 18,151 9,508 8,643 0.0151
2 19,578 9,140 10,438 0.0125
2.1 21,006 9,140 11,866 0.011
2.2 21,006 8,772 12,234 0.0107
3.5 24,847 6,647 18,200 0.0072
3.6 25,776 6,647 19,129 0.0068
3.7 26,305 6,647 19,658 0.0067
Average 0.0092
Total BOD Loads to be discharged at Rathcoursey Point
Daily design Loads
Midleton Town discharge = 15,000 @0.23 m3/head@25 mg/l = kgs BOD/Day
Irish Distillers Ltd. = 2,700 m3/d @25 mg/l = kgs BOD/Day
Dairygold, Mogeely = 4,000m3/d @25 mg/l =
kgs BOD/Day
Total Load per tide kgs BOD/tide
Tidal Prism at Rathcoursey Point.
For
insp
ectio
n pur
pose
s only
.
Conse
nt of
copy
right
owne
r req
uired
for a
ny ot
her u
se.
EPA Export 07-11-2018:04:04:40
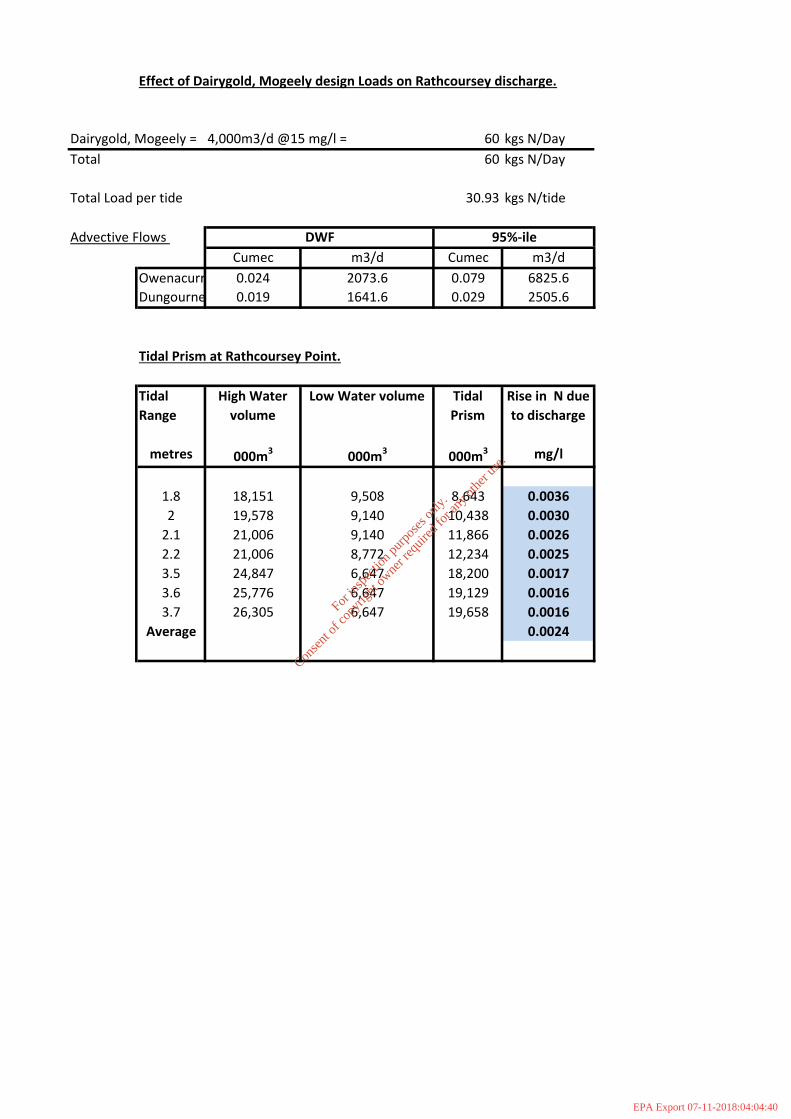
60 kgs N/Day
Total 60
30.93
Cumec m3/d Cumec m3/d
Owenacurra R. 0.024 2073.6 0.079 6825.6
Dungourney R. 0.019 1641.6 0.029 2505.6
Tidal
Range
High Water
volume
Low Water volume Tidal
Prism
Rise in N due
to discharge
metres 000m3
000m3
000m3 mg/l
1.8 18,151 9,508 8,643 0.0036
2 19,578 9,140 10,438 0.0030
2.1 21,006 9,140 11,866 0.0026
2.2 21,006 8,772 12,234 0.0025
3.5 24,847 6,647 18,200 0.0017
3.6 25,776 6,647 19,129 0.0016
3.7 26,305 6,647 19,658 0.0016
Average 0.0024
Effect of Dairygold, Mogeely design Loads on Rathcoursey discharge.
Dairygold, Mogeely = 4,000m3/d @15 mg/l =
kgs N/Day
Total Load per tide kgs N/tide
Advective Flows DWF 95%-ile
Tidal Prism at Rathcoursey Point.
For
insp
ectio
n pur
pose
s only
.
Conse
nt of
copy
right
owne
r req
uired
for a
ny ot
her u
se.
EPA Export 07-11-2018:04:04:40

51.75
75
60 kgs N/Day
Total 186.75
96.26
Tidal
Range
High Water
volume
Low Water volume Tidal
Prism
Rise in N due
to cumulative
discharge
metres 000m3
000m3
000m3
mg/l
1.8 18,151 9,508 8,643 0.0111
2 19,578 9,140 10,438 0.0092
2.1 21,006 9,140 11,866 0.0081
2.2 21,006 8,772 12,234 0.0079
3.5 24,847 6,647 18,200 0.0053
3.6 25,776 6,647 19,129 0.0050
3.7 26,305 6,647 19,658 0.0049
Average 0.0074
Total N Loads to be discharged at Rathcoursey Point
Daily design Loads
Midleton Town discharge =15,000 @0.23 m3/head@15mg/l = kgs N/Day
Irish Distillers Ltd. = 5000 m3/d @15mg/l = kgs N/Day
Dairygold, Mogeely = 4,000m3/d @15mg/l =
kgs N/Day
Total Load per tide kgs N/tide
Tidal Prism at Rathcoursey Point.
For
insp
ectio
n pur
pose
s only
.
Conse
nt of
copy
right
owne
r req
uired
for a
ny ot
her u
se.
EPA Export 07-11-2018:04:04:40

51.75
40.5
60 kgs N/Day
Total 152.25
78.48
Tidal
Range
High Water
volume
Low Water volume Tidal
Prism
Rise in N due
to cumulative
discharge
metres 000m3
000m3
000m3
mg/l
1.8 18,151 9,508 8,643 0.0091
2 19,578 9,140 10,438 0.0075
2.1 21,006 9,140 11,866 0.0066
2.2 21,006 8,772 12,234 0.0064
3.5 24,847 6,647 18,200 0.0043
3.6 25,776 6,647 19,129 0.0041
3.7 26,305 6,647 19,658 0.0040
Average 0.0060
Total N Loads to be discharged at Rathcoursey Point
Daily design Loads
Midleton Town discharge =15,000 @0.23 m3/head@15mg/l = kgs N/Day
Irish Distillers Ltd. = 2,700 m3/d @15mg/l = kgs N/Day
Dairygold, Mogeely = 4,000m3/d @15mg/l =
kgs N/Day
Total Load per tide kgs N/tide
Tidal Prism at Rathcoursey Point.
For
insp
ectio
n pur
pose
s only
.
Conse
nt of
copy
right
owne
r req
uired
for a
ny ot
her u
se.
EPA Export 07-11-2018:04:04:40

8 kgsP/Day
Total 8
4.12
Cumec m3/d Cumec m3/d
Owenacurra R. 0.024 2073.6 0.079 6825.6
Dungourney R. 0.019 1641.6 0.029 2505.6
Tidal Range High
Water
volume
Low Water
volume
Tidal
Prism
Rise in P due
to discharge
metres 000m3
000m3
000m3 mg/l
1.8 18,151 9,508 8,643 0.0005
2 19,578 9,140 10,438 0.0004
2.1 21,006 9,140 11,866 0.0003
2.2 21,006 8,772 12,234 0.0003
3.5 24,847 6,647 18,200 0.0002
3.6 25,776 6,647 19,129 0.0002
3.7 26,305 6,647 19,658 0.0002
Average 0.0003
Effect of Dairygold, Mogeely design Loads on Rathcoursey discharge.
Dairygold, Mogeely = 4,000m3/d @2 mg/l =
kgs P/Day
Total Load per tide kgs P/tide
Advective Flows DWF 95%-ile
Tidal Prism at Rathcoursey Point.
For
insp
ectio
n pur
pose
s only
.
Conse
nt of
copy
right
owne
r req
uired
for a
ny ot
her u
se.
EPA Export 07-11-2018:04:04:40

6.9
10
8 kgsP/Day
Total 24.9
12.83505
Tidal Range High
Water
volume
Low Water
volume
Tidal
Prism
Rise in P due
to cumulative
discharge
metres 000m3 000m3 000m3mg/l
1.8 18,151 9,508 8,643 0.0015
2 19,578 9,140 10,438 0.0012
2.1 21,006 9,140 11,866 0.0011
2.2 21,006 8,772 12,234 0.0010
3.5 24,847 6,647 18,200 0.0007
3.6 25,776 6,647 19,129 0.0007
3.7 26,305 6,647 19,658 0.0007
Average 0.0010
Total P Loads to be discharged at Rathcoursey Point
Daily design Loads
Midleton Town discharge = 15,000 @0.23 m3/head@2 mg/l = kgs P/Day
Irish Distillers Ltd. = 5,000 m3/d @2 mg/l = kgs P/Day
Dairygold, Mogeely = 4,000m3/d @2mg/l =
kgs P/Day
Total Load per tide kgs P/tide
Tidal Prism at Rathcoursey Point.
For
insp
ectio
n pur
pose
s only
.
Conse
nt of
copy
right
owne
r req
uired
for a
ny ot
her u
se.
EPA Export 07-11-2018:04:04:41

6.9
5.4
8 kgsP/Day
Total 20.3
10.46392
Tidal Range High
Water
volume
Low Water
volume
Tidal
Prism
Rise in P due
to cumulative
discharge
metres 000m3 000m3 000m3mg/l
1.8 18,151 9,508 8,643 0.0012
2 19,578 9,140 10,438 0.0010
2.1 21,006 9,140 11,866 0.0009
2.2 21,006 8,772 12,234 0.0009
3.5 24,847 6,647 18,200 0.0006
3.6 25,776 6,647 19,129 0.0005
3.7 26,305 6,647 19,658 0.0005
Average 0.0008
Total P Loads to be discharged at Rathcoursey Point
Daily design Loads
Midleton Town discharge = 15,000 @0.23 m3/head@2 mg/l = kgs P/Day
Irish Distillers Ltd. = 2,700 m3/d @2 mg/l = kgs P/Day
Dairygold, Mogeely = 4,000m3/d @2mg/l =
kgs P/Day
Total Load per tide kgs P/tide
Tidal Prism at Rathcoursey Point.
For
insp
ectio
n pur
pose
s only
.
Conse
nt of
copy
right
owne
r req
uired
for a
ny ot
her u
se.
EPA Export 07-11-2018:04:04:41

140 kgsSS/Day
Total 140
72.16
Cumec m3/d Cumec m3/d
Owenacurra R. 0.024 2073.6 0.079 6825.6
Dungourney R. 0.019 1641.6 0.029 2505.6
Tidal Range High Water
volume
Low Water
volume
Tidal Prism Rise in SS due to discharge
metres 000m3 000m3 000m3 mg/l
1.8 18,151 9,508 8,643 0.0083
2 19,578 9,140 10,438 0.0069
2.1 21,006 9,140 11,866 0.0061
2.2 21,006 8,772 12,234 0.0059
3.5 24,847 6,647 18,200 0.0040
3.6 25,776 6,647 19,129 0.0038
3.7 26,305 6,647 19,658 0.0037
Average 0.0055
Effect of Dairygold, Mogeely design Loads on Rathcoursey discharge.
Dairygold, Mogeely = 4,000m3/d @35 mg/l =
kgs SS/Day
Total Load per tide kgs SS/tide
Advective Flows DWF 95%-ile
Tidal Prism at Rathcoursey Point.
For
insp
ectio
n pur
pose
s only
.
Conse
nt of
copy
right
owne
r req
uired
for a
ny ot
her u
se.
EPA Export 07-11-2018:04:04:41

120.75
175
140 kgs SS/Day
Total 435.75
224.61
Tidal Range High Water
volume
Low Water
volume
Tidal Prism Rise in SS due to cumulative
discharge
metres 000m3
000m3
000m3
mg/l
1.8 18,151 9,508 8,643 0.0260
2 19,578 9,140 10,438 0.0215
2.1 21,006 9,140 11,866 0.0189
2.2 21,006 8,772 12,234 0.0184
3.5 24,847 6,647 18,200 0.0123
3.6 25,776 6,647 19,129 0.0117
3.7 26,305 6,647 19,658 0.0114
Average 0.0172
Daily design Loads
Total SS Loads to be discharged at Rathcoursey Point
Midleton Town discharge = 15,000 @0.23 m3/head@35 mg/l = kgs SS/Day
Irish Distillers Ltd. = 5000 m3/d @35 mg/l = kgs SS/Day
Dairygold, Mogeely = 4,000m3/d @35mg/l =
kgs SS/Day
Total Load per tide kgs SS/tide
Tidal Prism at Rathcoursey Point.
For
insp
ectio
n pur
pose
s only
.
Conse
nt of
copy
right
owne
r req
uired
for a
ny ot
her u
se.
EPA Export 07-11-2018:04:04:41

120.75
94.5
140 kgs SS/Day
Total 355.25
183.12
Tidal Range High Water
volume
Low Water
volume
Tidal Prism Rise in SS due to cumulative
discharge
metres 000m3
000m3
000m3
mg/l
1.8 18,151 9,508 8,643 0.0212
2 19,578 9,140 10,438 0.0175
2.1 21,006 9,140 11,866 0.0154
2.2 21,006 8,772 12,234 0.0150
3.5 24,847 6,647 18,200 0.0101
3.6 25,776 6,647 19,129 0.0096
3.7 26,305 6,647 19,658 0.0093
Average 0.0140
Daily design Loads
Total SS Loads to be discharged at Rathcoursey Point
Midleton Town discharge = 15,000 @0.23 m3/head@35 mg/l = kgs SS/Day
Irish Distillers Ltd. = 2,700 m3/d @35 mg/l = kgs SS/Day
Dairygold, Mogeely = 4,000m3/d @35mg/l =
kgs SS/Day
Total Load per tide kgs SS/tide
Tidal Prism at Rathcoursey Point.
For
insp
ectio
n pur
pose
s only
.
Conse
nt of
copy
right
owne
r req
uired
for a
ny ot
her u
se.
EPA Export 07-11-2018:04:04:41

Industrial Emissions Application Application ID: LA001622
Attachment-7.3-2-1 Supporting Documents
Appendix D
Rathcoursey Outfall Investigation of the Impact of
Treated Wastewater Discharges arising from
the DairyGold Mogeely Plant to Cork Harbour,
prepared by Irish Hydrodata Ltd, May 2017.
For
insp
ectio
n pur
pose
s only
.
Conse
nt of
copy
right
owne
r req
uired
for a
ny ot
her u
se.
EPA Export 07-11-2018:04:04:41

Document Ref. No. 1207/3/17
Rathcoursey Outfall Investigation of the Impact of
Treated Wastewater Discharges arising from the DairyGold Mogeely Plant
to Cork Harbour
Prepared for:
Irish Water
Prepared by:
Irish Hydrodata Limited
Ballygarvan Cork
Ph. 021-4311255
e-mail: [email protected]
19th May 2017
For
insp
ectio
n pur
pose
s only
.
Conse
nt of
copy
right
owne
r req
uired
for a
ny ot
her u
se.
EPA Export 07-11-2018:04:04:41

Rathcoursey Outfall Study Report
1. 1
Project Title
Project Title
Rathcoursey Outfall: Investigation of the Impact of
Treated Wastewater Discharges arising from the
DairyGold Mogeely Plant to Cork Harbour
Project No 1207/3/17
Client Irish Water
Document Final Report
Issue Date 19/May/2017
Prepared By T Bruton, J Walshe
Approved
J. F. Walshe BE,MEngSc, C.EngMIEI
For
insp
ectio
n pur
pose
s only
.
Conse
nt of
copy
right
owne
r req
uired
for a
ny ot
her u
se.
EPA Export 07-11-2018:04:04:41

Rathcoursey Outfall Study Report
1. 2
CONTENTS
1. Introduction
1.1 Background Information 1.2 Study Brief 1.3 Regulatory Framework 1.4 Summary of Study Works
2. Area Characteristics 2.1 Previous Studies at Outfall 2.2 River Inputs 2.3 Bathymetry 2.4 Tidal Levels & Volumes 2.5 Coastal Oceanography
3. Design Parameters
3.1 Midleton WWTP Discharges 3.2 Irish Distillers Discharges 3.3 Dairygold Discharges 3.4 Combined Discharges from Rathcoursey Pt 3.5 Applicable Water Quality Standards
4. Marine Outfall Simulations
4.1 Analysis Methods 4.2 Background Coastal Water Quality 4.3 Background River Water Quality 4.4 Combined Nutrient Inputs 4.5 Initial Dilutions at Outfall Diffuser Location 4.6 Water Circulation Modelling 4.7 Contaminant Dispersion Simulations 4.8 Estuary Flushing 4.9 Summary of Results
5. Conclusions
For
insp
ectio
n pur
pose
s only
.
Conse
nt of
copy
right
owne
r req
uired
for a
ny ot
her u
se.
EPA Export 07-11-2018:04:04:41

Rathcoursey Outfall Study Report
Page No: 0 2. 0
Glossary
ADF Average Daily Flow
ATT Admiralty Tide Tables
BOD Biochemical Oxygen Demand
DIN Dissolved Inorganic Nitrogen (N)
DO Dissolved Oxygen
DWF Dry Weather Flow
EC E.Coli
ELV Emission Limit Value
EPA
EQS
Environmental Protection Agency
Environmental Quality Standards
GSI Geological Survey of Ireland
HW High Water (high tide)
IHD Irish Hydrodata Ltd
LW Low Water (low tide)
MHWN Mean High Water Neap
MHWS Mean High Water Spring
MLWN Mean Low Water Neap
MLWS Mean Low Water Spring
NHA National Heritage Area
OPW Office of Public Works
PE Population Equivalent
PO4 Molybdate raective phosphorus (P)
SAC Special Area of Conservation
SS Suspended Solids
T90 Decay time
T90 E.Coli decay time
TA Total Ammonia (as N)
TON Total Oxidised Nitrogen (as N)
UWTR Urban Wastewater Treatment Regulations
WFD Water Framework Directive
WQ Water Quality
WWTP Wastewater Treatment Plant
For
insp
ectio
n pur
pose
s only
.
Conse
nt of
copy
right
owne
r req
uired
for a
ny ot
her u
se.
EPA Export 07-11-2018:04:04:41

Rathcoursey Outfall Study Report
Page No: 1 2. 1
1. Introduction 1.1 Background Information
The Rathcoursey outfall discharges treated municipal wastewaters from the town and
environs of Midleton via a tidal holding tank. It includes treated process effluent from
Irish Distillers Ltd which joins at the Ballinacurra pumping station. The discharges are
licenced by the EPA.
Dairygold Cooperative Society Limited is seeking to discharge treated process waters
from their proposed Mogeely plant to Cork Harbour via the Rathcoursey outfall. The
planning application number is PA 16/7031. The implications of this added discharge on
the harbour waters are investigated in this document.
There are three waterbodies in the locality identified under the Water Framework
Directive (WFD). These are listed in Table 1.1 and illustrated in Figure 1.2. The
Ballinacurra Estuary and the Great Island channel are designated Transitional Waters
while the lower harbour is designated as Coastal Waters.
The Great Island Channel is an SAC, an SPA and a proposed NHA (Figures 1.3 & 1.4).
There are designated shellfish waters in the Great Island Channel and in the lower
harbour off Rostellan (Figure 1.5).
1.2 Study Brief
The purpose of the study was to address queries raised in the Cork County Council further
information request in point 6 of the FI letter dated 9/2/2017.
For
insp
ectio
n pur
pose
s only
.
Conse
nt of
copy
right
owne
r req
uired
for a
ny ot
her u
se.
EPA Export 07-11-2018:04:04:41

Rathcoursey Outfall Study Report
Page No: 2 2. 2
1.3 Regulatory Framework
The main regulatory constraints that apply to the discharges are:
Urban Wastewater Treatment Regulations 2001 (SI 254/2001);
European Communities (Water Policy) Regulations (SI 722/2003);
European Communities Environmental Objectives (Surface Waters) Regs 2009 (SI 272/2009);
European Communities (Quality of Shellfish Waters) Regulations 2006 (SI 268/2006).
1.4 Summary of Study Works
The study consisted of a review of available data and previous reports relevant to the
area. Subsequently hydrodynamic & water quality models were constructed to simulate
the proposed discharges and identify the mixing zone. The analysis was undertaken by
treating the nutrients as conservative waterborne contaminants rather than using
nutrient cycling model, which would require a large number of input variables, many of
which would not be known and would be speculative.
Waterbody Risk Scores WFD Status 2010-2015
Quality 2012
UUWT Nutrient Sensitive Waters
Owenacurra Estuary - Transitional
At risk of not achieving Good
Moderate Potentially Eutrophic
Yes
North Channel Great Island - Transitional (SW_060_0300)
At risk of not achieving Good Status
Good Intermediate Yes
Cork Harbour - Coastal At risk of not achieving Good Status
Good Unpolluted No
Table 1.1 - Local WFD designated waterbodies
Figure 1.1 –Outfall diffuser location at Rathcoursey Point
For
insp
ectio
n pur
pose
s only
.
Conse
nt of
copy
right
owne
r req
uired
for a
ny ot
her u
se.
EPA Export 07-11-2018:04:04:41

Rathcoursey Outfall Study Report
Page No: 3 2. 3
Figure 1.2 - Local WFD waterbodies: Light Green = Transitional Waters Blue = Coastal Waters
Figure 1.3 - Great Island Channel SAC
Figure 1.4 - Parts of Cork Harbour SPA
Figure 1.5 - Designated shellfish beds, Great Island North Channel, Rostellan North, South & West
For
insp
ectio
n pur
pose
s only
.
Conse
nt of
copy
right
owne
r req
uired
for a
ny ot
her u
se.
EPA Export 07-11-2018:04:04:41

Rathcoursey Outfall Study Report
Page No: 4 2. 4
2. Area Characteristics
2.1 Previous Studies at the Outfall Cork Harbour and the Great Island channel area have been the subject of many
investigations over the years. Data from the various studies have been used in the
preparation of this report. These are listed in Table 2.1. While some of these documents
are relatively old the physical characteristics of the harbour have not changed and the
information they contain is still very much relevant. Information from other sources and
publications have also been employed and these are referenced when mentioned.
Report
No
Report Relevant Content
1 M.C. O Sullivan Ltd, Cork Harbour Pollution Report 1988
Contains results of extensive field studies in the harbour, includes dye and tracer release from Rathcoursey outfall location
2 Hydrographic Surveys Ltd, Midleton Outfall Dye Tracing Study 1992
Contains results of dye tracer releases from Rathcoursey outfall location
3 Irish Hydrodata Ltd, Cork Harbour Study 1991
Contains tide levels and current meter data
4 Irish Hydrodata Ltd, Midleton SS Marine Outfall Hydrographic Survey/Numerical Modelling Report 1993
Contains results of field studies at the Rathcoursey location, includes currents, tides, drogue and dye tracer releases.
5 Irish Hydrodata Ltd, Saleen Outfall Dispersion Study, 2005
Contains results of field studies for Saleen outfall
Table 2.1 - Information from various studies relevant to this report
2.2 River Inputs - Owenacurra & Dungourney Rivers
The Owenacurra and Dungourney rivers drain a combined catchment of some 165km2.
The flow characteristics are:
Owenacurra: DWF = 0.079m3/s, 95%ile = 0.100 m3/s and 50%ile = 1.36 m3/s;
Dungourney: DWF = 0.019 m3/s, 95%ile = 0.029 m3/s and 50%ile = 0.39 m3/s.
In a wider harbour context additional freshwater inputs derive primarily from the Lee,
Glashaboy, Tramore and the Owenboy rivers. The combined contributing catchment of
these sources and other smaller remnants is 1780km2.
2.3 Bathymetry
The bathymetry for the area is available from various sources in digital format. Water
depths in the immediate vicinity of the outfall are presented in Figure 2.1. These are
based on GSI multibeam data (ref:6) and single beam surveys (ref:11). A profile across
the channel is shown in Figure 2.2. The outfall pipe is constructed from a 610mm OD
steel pipe with an 18m six port diffuser array at the end.
For
insp
ectio
n pur
pose
s only
.
Conse
nt of
copy
right
owne
r req
uired
for a
ny ot
her u
se.
EPA Export 07-11-2018:04:04:41

Rathcoursey Outfall Study Report
Page No: 5 2. 5
Figure 2.1 - Water depths in the vicinity of the outfall (metres Chart Datum)
Figure 2.2 - West – East profile at outfall location (vertical exaggeration 2)
2.4 Tidal Levels & Volumes
Tidal patterns in the harbour are semi-diurnal. The Admiralty Tide Tables (ATT)
publication NP-201-16 (ref:2) provides summary tidal level information for Cobh. This
data is presented in Table 2.2. Figure 2.3 shows the tidal elevation recorded at
Ballinacurra during an earlier study. The water volumes in the Great Island (North)
channel are summarised in Table 2.3. Associated tidal and residual volumes are
presented in Table 2.4. The tidal volume represents the volume between the high and
low waters while the residual volume is the quantity of water remaining in the particular
area at low water. Figure 2.3 shows the aerial extent of residual waters at various low
waters.
Tide Tide Admiralty Tide Table Level (m CD)
(nautical convention)
MLWS Mean low water springs 0.4
MLWN Mean low water neaps 1.4
Mid Tide - 2.2
MHWN Mean high water neaps 3.2
MHWS Mean high water springs 4.1
Table 2.2 - Summary tidal statistics (Chart Datum = 0.+13m ODP)
For
insp
ectio
n pur
pose
s only
.
Conse
nt of
copy
right
owne
r req
uired
for a
ny ot
her u
se.
EPA Export 07-11-2018:04:04:41

Rathcoursey Outfall Study Report
Page No: 6 2. 6
Figure 2.3 – Measured tidal curve at Ballinacorra
Chart Datum
0.0m
MLWS
0.4m
MLWN
1.4m
MSL
2.2m
MHWN
3.2m
MHWS
4.1m
Area Upstream of Rathcoursey Outfall
Volume below
m3 4,520,442 5,435,251 8,402,718 12,068,529 18,893,173 26,564,422
Surface Area m2
2,101,260 2,462,321 3,619,123 5,611,076 7,954,645 8,731,471
Area Upstream of Marloag Point
Volume below
m3 7,564,478 8,689,851 12,215,191 16,350,409 23,770,070 31,978,693
Surface Area m2
2,619,049 2,997,510 4,197,639 6,203,501 8,551,453 9,328,760
Area inside Roches Point
Volume below
m3 191,694,000 206,089,000 247,032,000 284,798,000 337,659,000 388,540,000
Surface Area m2
34,614,000 37,327,000 44,610,000 49,764,000 55,6680,000 56,840,000
Table 2.3 - Summary volumes
Upstream of Outfall Upstream of Marloag Point Inside Roches Point
Spring Tide
Tidal Volume 21,129,171 m3 23,288,842 m3 182,451,000 m3
Residual Volume 5,435,251 m3 8,689,851 m3 206,089,000 m3
Ratio 3.9 2.7 0.89
Neap Tide
Tidal Volume 10,490,455 m3 11,554,879 m3 90,627,000 m3
Residual Volume 8,402,718 m3 12,215,191 m3 247,032,000 m3
Ratio 1.25 0.95 0.37
Table 2.4 - Summary water volumes for area upstream of the Rathcoursey outfall and Marloag Point
For
insp
ectio
n pur
pose
s only
.
Conse
nt of
copy
right
owne
r req
uired
for a
ny ot
her u
se.
EPA Export 07-11-2018:04:04:41

Rathcoursey Outfall Study Report
Page No: 7 2. 7
Lowest Astronomical Tide LAT = 0.0m CD
Mean Low Water Spring Tide MLWS = 0.4mCD
Mean Low Water Neap Tide MLWN = 1.4mCD
Figure 2.4 – Great Island (North) Channel low water (cyan) and intertidal (green) areas
2.5 Coastal Oceanography Tidal Current Data
Current profiling was conducted at Rathcoursey Point on several occasions. Peak current
speeds are summarised in Table 2.5 and shown in Figures 2.5 & 2.6. The speeds on the
flooding tide are stronger than on the ebb, with the flood lasting for about 6 hours and
the ebb for the remaining 6.42 hours. The high water slack lasts for less than 30
minutes.
Dye Release Data
Dye releases have been conducted from the outfall location on many occasions. The
most extensive were those undertaken by M C O Sullivan as part of the 1977 Cork Harbour
Pollution report (ref:17). Results from a 5 day intermittent ebb tide dye pumping test
are shown in Figures 2.7 & 2.8. Discrete dye slug tests were conducted by Hydrographic
For
insp
ectio
n pur
pose
s only
.
Conse
nt of
copy
right
owne
r req
uired
for a
ny ot
her u
se.
EPA Export 07-11-2018:04:04:41

Rathcoursey Outfall Study Report
Page No: 8 2. 8
Surveys Ltd and Irish Hydrodata Ltd. These are presented in Figures 2.9 & 2.10 and show
that rapid mixing occurs in the east passage channel. On the basis of the dye studies the
calculated exchange factor (effective amount of new water added to the tidal prism) for
the waters upstream of Rathcoursey was reported (ref:17) to be about 0.35.
Salinity
Salinity data for the outfall has been recorded during several of the studies listed in
Section 2.1. The waters are mostly well mixed with only occasional stratification during
high flows. Example profiles from the MCOS study are shown in Figures 2.11 and 2.12.
The EPA has sampled the local waters (ref:4) and salinity data from 2007 to 2013 is
plotted against the Owenacurra river discharges in Figures 2.13 & 2.14. These show that
in general the waters are well mixed with surface and seabed values in excess of 30ppt.
The combined freshwater input to the estuary upstream of Rathcoursey at the 50%ile
river flows accounts for 0.37 to 0.75% of tidal exchange volume.
Current Speeds (m/s)
Tide Flood Ebb
Spring 1.35 Surface
1.20 Bottom
1.10 Surface
1.00 Bottom
Neap 0.90 Surface
0.65 Bottom
0.85 Surface
0.70 Bottom
Table 2.5 - Summary depth averaged peak speeds at Rathcoursey
Figure 2.5 - Current meter data from previous study (ref:16)
For
insp
ectio
n pur
pose
s only
.
Conse
nt of
copy
right
owne
r req
uired
for a
ny ot
her u
se.
EPA Export 07-11-2018:04:04:41

Rathcoursey Outfall Study Report
Page No: 9 2. 9
Figure 2.6 - Current meter data from previous study (ref:17)
Figure 2.7 – 5 day pump test. High water dye distribution (ref:17)
Figure 2.8 – 5 day pump test. Low water dye distribution (ref:17)
For
insp
ectio
n pur
pose
s only
.
Conse
nt of
copy
right
owne
r req
uired
for a
ny ot
her u
se.
EPA Export 07-11-2018:04:04:41

Rathcoursey Outfall Study Report
Page No: 10 2. 10
Figure 2.9 - Ebb batch dye release (ref:9)
Figure 2.10 - Ebb batch dye release (ref:16)
Figure 2.11 – Salinity in East Passage 9/9/75 (ref:17)
Figure 2.12 – Salinity in East Passage 5/11/75 (ref:17)
Figure 2.13 – EPA water sample data vs Owenacurra discharge for location at East Ferry (1000m d/s from outfall)
Figure 2.14 – EPA water sample data vs Owenacurra discharge for location 500m upstream of outfall
For
insp
ectio
n pur
pose
s only
.
Conse
nt of
copy
right
owne
r req
uired
for a
ny ot
her u
se.
EPA Export 07-11-2018:04:04:41

Rathcoursey Outfall Study Report
Page No: 11 2. 11
3. Wastewater Parameters
3.1 Midleton WWTP Discharges
The Midleton WWTP is licenced by EPA under D0056-01. The hydraulic capacity of the
plant is 3,784,320 m3/year. Treated wastewaters are pumped to a holding tank at
Rathcoursey from where they are allowed to discharge over a 5.75 hour period on the
ebbing tide. The licensed emission limit values (ELVs) set for the Rathcoursey outfall are
listed in Table 3.1. The current discharge (2016 EPA AER) is about 2,784,950 m3/year.
Discharge Standards Emission Limit Value (ELV)
Biochemical Oxygen Demand CBOD 25mg/l
COD COD 125mg/l
Suspended Solids SS 35mg/l
Total Nitrogen (as N) TN 15mg/l
Orthophosphate (as P) OP 2mg/l
Faecal Coliforms EC <250 fc/100ml (geometric mean)
<1000 fc/100ml (95%ile)
Table 3.1 - Midleton WWTP, EPA licenced ELV’s
3.2 Irish Distillers Limited Discharges
The Irish Distillers Limited (IDL) plant discharges treated process wastewaters to the
Ballinacurra pumping station from where they are pumped to the Rathcoursey holding
tank. The IDL discharge limit is set at 5000 m3/day (SE Final) under EPA licence P0442-
01. The ELV’s outlined in Table 3.1 also apply to this discharge. The discharge has no
foul effluent component and is subjected to UV treatment (ref:10). Domestic
wastewater streams from the IDL plant connect to the Midleton town sewer on Distillery
road. The current discharge is about 1725 m3/day (2014 EPA AER).
3.3 Dairygold Discharge Characteristics
The proposed treated process water discharge from the Dairygold (DG) plant is 4000
m3/day. It is intended to meet the ELV’s outlined in Table 3.1 as a minimum. There will
be no significant bacterial content in the wastewaters as domestic wastewater will be
treated locally and discharged to the Kilta river at Mogeely. However to provide
additional assurance against any possible milk borne pathogens that survive processing a
UV disinfection system is also being provided. The treated DG process water will be
pumped to Rathcoursey from where it will discharge to the existing outfall header pipe
on the ebbing tide. It will not be routed through the existing tidal holding tank as the
tidal holding tank does not have sufficient spare capacity to cater for the the entire DG
load. DG will host their own tidal holding tank in Mogeely for this purpose.
For
insp
ectio
n pur
pose
s only
.
Conse
nt of
copy
right
owne
r req
uired
for a
ny ot
her u
se.
EPA Export 07-11-2018:04:04:41

Rathcoursey Outfall Study Report
Page No: 12 2. 12
3.4 Combined Discharges from Rathcoursey Outfall
The combined treated wastewater streams to be discharged from the Rathcoursey outfall
are listed in Table 3.2. The addition of the Dairygold wastewaters represent a
volumetric increase of 26% in current EPA licenced rates. The combined future daily
volume is 19,368 m3/day or 10,023 m3/tide. The scale of this discharge is illustrated
graphically in Figure 3.1 where it is compared with a neap tidal volume of 10,490,455 m3.
Source Current EPA Licences Proposed (Dairygold included)
Midleton WWTP 10,368 m3/day 10,368 m3/day
IDL 5,000 m3/day 5,000 m3/day
Dairygold - 4,000 m3/day
Totals 15,368 m3/s 19,368 m3/s
Volume per tide 7,953 m3 10,023 m3
Av Flow over 5.75 h 0.384 m3/s 0.484 m3/s
Table 3.2 - Proposed discharge volumes
Figure 3.1 - Outfall inputs to Great Island Channel compared to the tidal exchange volume
3.5 Applicable Water Quality Standards
The discharge from the outfall has the potential to impact on both a coastal and
transitional waterbody. The target water quality standards for the various waterbody
environments are listed in Table 3.3. Under SI 272(2009) the targets must be achieved
at the edge of the mixing zone. The method for determining the extent of mixing zone is
not defined. It is required to be restricted to the proximity of the discharge and
proportionate. A condition of the Midleton WWTP discharge licence is that it cannot
exceed more than 25% of the cross-sectional area of the estuarine channel.
There are no designated bathing waters within Cork Harbour. There are designated
shellfish waters nearby as indicated in Figure 1.4. Relevant target water quality
For
insp
ectio
n pur
pose
s only
.
Conse
nt of
copy
right
owne
r req
uired
for a
ny ot
her u
se.
EPA Export 07-11-2018:04:04:41

Rathcoursey Outfall Study Report
Page No: 13 2. 13
objectives are listed in Table 3.4. As the proposed Dairygold discharge does not contain
any faecal source material and is subject to UV disinfection bacterial contamination is
not considered here.
Parameter Transitional Waters
(Owenacurra Estuary & Great Island Channel)
Coastal Waters
(Cork Harbour)
Target Target
BOD (mg O2/l) 4.0mg/l (95%ile) Not Specified
DO (% sat)
Summer (95%ile)
80%<DO<120% (35psu)
70%<DO<130% (0psu)
Summer (95%ile)
80%<DO<120% (35psu)
SS (mg/l) Not Specified Not Specified
Total Ammonia (mg N/l) Not Specified Not Specified
PO4 (mg P/l) 0.06mg/l (0-17psu) median
0.04mg/l (34psu) median Not Specified
DIN (mg N/l) Not Specified
Good Status
<2.6mg/l(0psu) median
<0.25mg/l(34.5psu) median
High Status <0.17mg/l(34.5psu) median
Table 3.3 - Target water quality standards (EQS) for surface waters (SI 272-2009)
Parameter Target
Suspended Solids Must not cause SS to increase by more than 30% above surrounding levels
Salinity Must not cause salinity to increase by more than 10% above surrounding levels
Table 3.4 - Relevant targets for discharges to shellfish waters (SI 268-2006)
For
insp
ectio
n pur
pose
s only
.
Conse
nt of
copy
right
owne
r req
uired
for a
ny ot
her u
se.
EPA Export 07-11-2018:04:04:41

Rathcoursey Outfall Study Report
Page No: 14 2. 14
4. Marine Outfall Evaluation
4.1 Analysis Methods
The potential impacts of the proposed discharges on the marine waters were assessed
using various calculations and hydraulic modelling methods. These included:
1. Initial dilution simulations of the outfall diffuser;
2. Water circulation modelling;
3. Contaminant dispersion modelling.
A jet type model was used to simulate the effluent stream issuing from the diffuser and
to estimate the near-field dilutions at the discharge location. Water movements in the
wider area were simulated with a 2D-hydrodynamic model driven by tidal forcing. A
contaminant simulation model, driven by hydrodynamics was used to evaluate the
location-specific impacts of discharges within the mid- and far-field areas. As noted
previously the analysis treated the nutrients as conservative waterborne contaminants.
No sediment or biogenic activities were included. This linear approach allows the various
contributions to be more easily compared.
The analysis is made on the basis that the Rathcoursey outfall is just one of very many
municipal and industrial wastewater discharges to Cork Harbour. In addition the riverine
inputs of nutrients are significant and add to the overall variability. The harbour behaves
as a macro-tidal lense (ref:18) with wide dispersion and mixing. Therefore there is inter
contamination of waters masses and all sources may contribute to the water quality at
any one point. In this context background water quality data is a measure of the status
of the various harbour areas.
4.2 Background Coastal Water Quality
The background coastal water quality for the outfall area was derived from EPA
monitoring data (2007-2014). The EPA sampling locations are shown in Figure 4.1 with
summary data presented in Table 4.2.
For
insp
ectio
n pur
pose
s only
.
Conse
nt of
copy
right
owne
r req
uired
for a
ny ot
her u
se.
EPA Export 07-11-2018:04:04:41

Rathcoursey Outfall Study Report
Page No: 15 2. 15
No EPA Site Salinity BOD DO TON NH3 PO4 DIN
ppt mg/l % Sat mg/l N mg/l N mg/l P mg/l N
1 LE450 31.4 2.0 98.5 0.292 0.037 0.0099 0.365
2 LE530 28.5 2.0 107.2 0.599 0.052 0.0099 0.757
3 LE540 31.9 1.0 104.0 0.221 0.040 0.0090 0.270
4 LE550 31.8 1.0 99.4 0.202 0.040 0.0110 0.234
Average Nos 1 & 3 31.7 1.5 101.2 0.256 0.039 0.0095 0.317
Passage W LE340 30.0 1.0 95.0 0.31 0.11 0.023 0.42
Aghada LE610 33.95 1.5 100.7 0.08 0.04 0.0090 0.13
Roches Pt LE810 34.29 1.0 97.5 0.06 0.02 2
0.009 0.09
Table 4.1 - Median coastal background water quality data (no SS data available)
Cork Harbour Rathcoursey Environs
Figure 4.1 - EPA sampling stations
4.3 Background River
The background river water quality for the Owenacurra and Dungourney was obtained
from EPA (2013-2015). The river water concentrations of nutrients can vary significantly
from day to day depending on the rainfall. Averaged values for all available samples are
presented in Table 4.2. As the nutrients are relatively conservative the river contribution
to the harbour waters is effectively included in the coastal water quality data.
Salinity BOD TON NH3 PO4 DIN
Median ppt mg/l mg/l N mg/l N mg/l P mg/l N
All 1.8 1.5 4.43 0.07 0.029 4.47
Summer 2.3 1.8 3.61 0.08 0.033 3.70
Winter 1.2 1.0 4.86 0.05 0.028 4.87
Table 4.2 - River background water quality data (DIN values are calculated on individual samples)
For
insp
ectio
n pur
pose
s only
.
Conse
nt of
copy
right
owne
r req
uired
for a
ny ot
her u
se.
EPA Export 07-11-2018:04:04:41

Rathcoursey Outfall Study Report
Page No: 16 2. 16
4.4 Combined Nutrient Inputs
An estimate of the present day nutrient input to the Great Island channel area is
presented in Table 4.3. The Owenacurra and Dungourney rivers are the largest
contributors of DIN and BOD while the WWTP is the main source of PO4. The EPA
licenced inputs at the Rathcoursey outfall are listed in Table 4.4 together with the
proposed Dairygold input. The current licenced volumes combined with average river
inputs equate to a total DIN of 907 kg/day. When the proposed 60kg/day from Dairygold
is included this increases to 967 kg/day. The corresponding PO4 inputs are 35.1 kg/day
and 43.1 kg/day respectively.
Present Day Discharges
BOD
kg/day SS
kg/day DIN (N) kg/day
PO4 (P) kg/day
Freshwater m3/day
WWTP 174 244 104 13.9 6,959
IDL 43 60 26 3.5 1,725
Rivers (50%ile) 227 676 4.4 151,200
Totals 444 304 806 21.8 159,659
Table 4.3 - Estimated current average daily inputs to Great Island Channel (the WWTP licence specifies TN =15mg/l, it is assumed for simplicity of analysis that this is all DIN even though there would be other fractions present, it is also assumed that the discharges are at the stated ELV’s outlined in Table 3.1)
Licenced Discharges
BOD
kg/day SS
kg/day DIN (N) kg/day
PO4 (P) kg/day
Freshwater m3/day
WWTP 259 363 156 20.7 10,368
IDL 125 175 75 10 5,000
Rivers (50%ile) 227 676 4.4 151,200
Total 611 538 907 35.1 166,568
Proposed Dairygold 100 140 60 8 4,000
Future Total 711 678 967 43.1 170,568
Table 4.4 - Estimated future average daily inputs to Great Island Channel
4.5 Initial Dilutions at Outfall Discharge Point An effluent plume discharging from a pipe near the seabed rises to the surface at a rate
dependant on the momentum and buoyancy forces arising from temperature and salinity
differences between the effluent and ambient waters. Subsequently it goes through
various stages until spreading by advection/diffusion processes are established. In the
case of multiple plumes from a diffuser the individual plumes may interact and merge
depending on the diffuser port spacing. Analysis of this initial mixing process and
subsequent near-field dilutions were made with the IJP model (ref:6).
For
insp
ectio
n pur
pose
s only
.
Conse
nt of
copy
right
owne
r req
uired
for a
ny ot
her u
se.
EPA Export 07-11-2018:04:04:41

Rathcoursey Outfall Study Report
Page No: 17 2. 17
The speed data used in the model is based on the current meter profiles shown previously
in Figures 2.5 and 2.6. Flow and water depths are presented in Tables 4.5 and 4.6.
The predicted initial dilutions have been used to calculate the near-field concentration
of the parameters DIN, PO4, BOD and SS. Background concentrations have been taken
from the EPA data as presented in Table 4.1. The SS background has been assumed to be
1.5mg/l as there is no sample data available. The results are presented in Figures 4.2 to
4.5 with summary example results for representative neap tide ambient speeds in Table
4.7.
The outfall is located in transitional waters and so the parameter of primary concern in
terms of SI 272(2009) is the PO4 concentration which must meet the relevant EQS. On
the basis of a median background salinity of 31.7ppt (Table 4.1) and a linear
interpolation of the EQ standards in Table 3.2 the target level for PO4 at the edge of the
mixing zone is 0.042mg/l P. Similarly the target level for DIN is 0.44 mg/l N at the edge
of the mixing zone (strictly speaking this DIN target only applies to designated coastal
waters which are to the south of Marloag Point as per Figure 1.2).
Both the PO4 background levels and the specified ELV’s for the outfall are relatively low
and the calculations show that combined PO4 levels will remain below the 0.042 mg/l P
limit before the plume reaches the surface. The DIN concentrations are higher and the
predicted DIN mixing zone is indicated in Figure 4.6. It is an envelope encompassing all
the locations the surfacing plume meets the DIN EQS during the discharge period. It
extends about 70m south of the diffuser array. The predicted maximum plume width is
about 30m. At low tide (LAT) the channel here is 160m wide so that the plume occupies
(30/160)*100 = 18.75% of the available width. It thus satisfies the ‘<25% of the cross-
sectional area’ limit condition set in the licence. Figures 4.2 and 4.3 show that the PO4
concentration is below the target EQS at all times within the surfacing plume zone.
m3 /day m3 /tide m3/s averaged over 5.75hours
WWTP 10,368 5,365 0.259
IDL 5,000 2,588 0.125
Dairygold 4,000 2,070 0.100
Totals 19,368 10,023 0.484
Table 4.5 - Outfall flows from the various sources
For
insp
ectio
n pur
pose
s only
.
Conse
nt of
copy
right
owne
r req
uired
for a
ny ot
her u
se.
EPA Export 07-11-2018:04:04:41
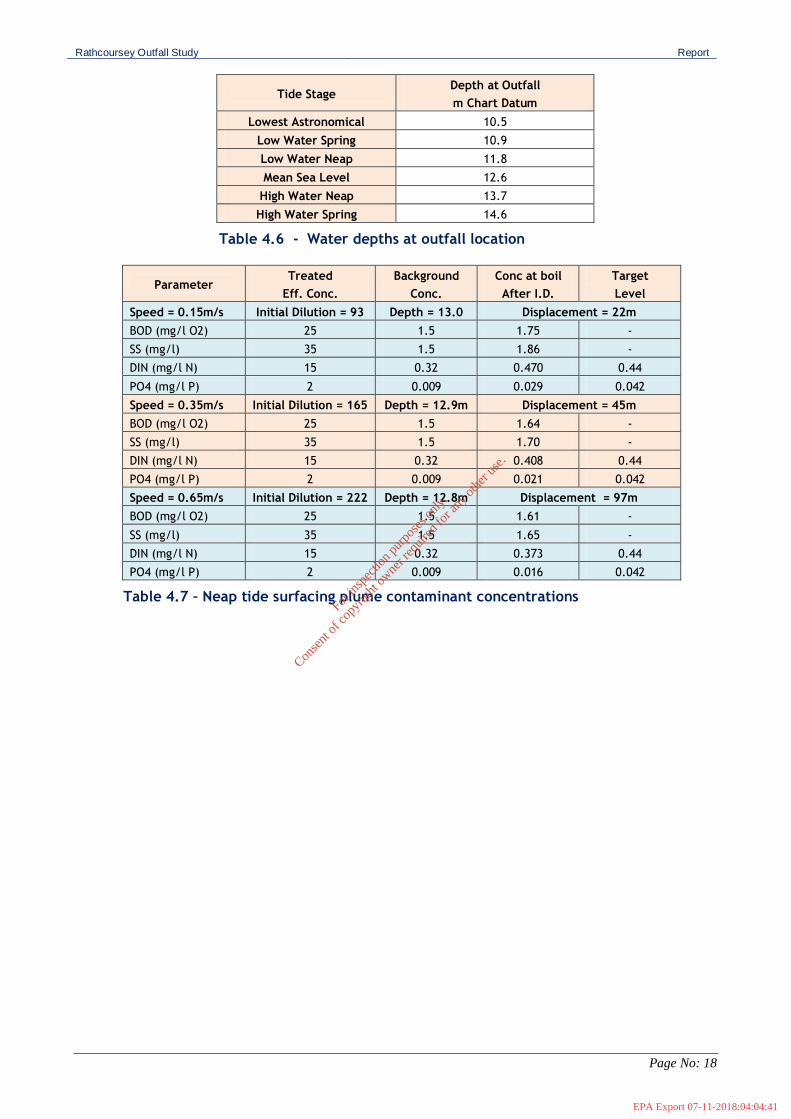
Rathcoursey Outfall Study Report
Page No: 18 2. 18
Tide Stage Depth at Outfall
m Chart Datum
Lowest Astronomical 10.5
Low Water Spring 10.9
Low Water Neap 11.8
Mean Sea Level 12.6
High Water Neap 13.7
High Water Spring 14.6
Table 4.6 - Water depths at outfall location
Parameter Treated
Eff. Conc.
Background
Conc.
Conc at boil
After I.D.
Target
Level
Speed = 0.15m/s Initial Dilution = 93 Depth = 13.0 Displacement = 22m
BOD (mg/l O2) 25 1.5 1.75 -
SS (mg/l) 35 1.5 1.86 -
DIN (mg/l N) 15 0.32 0.470 0.44
PO4 (mg/l P) 2 0.009 0.029 0.042
Speed = 0.35m/s Initial Dilution = 165 Depth = 12.9m Displacement = 45m
BOD (mg/l O2) 25 1.5 1.64 -
SS (mg/l) 35 1.5 1.70 -
DIN (mg/l N) 15 0.32 0.408 0.44
PO4 (mg/l P) 2 0.009 0.021 0.042
Speed = 0.65m/s Initial Dilution = 222 Depth = 12.8m Displacement = 97m
BOD (mg/l O2) 25 1.5 1.61 -
SS (mg/l) 35 1.5 1.65 -
DIN (mg/l N) 15 0.32 0.373 0.44
PO4 (mg/l P) 2 0.009 0.016 0.042
Table 4.7 – Neap tide surfacing plume contaminant concentrations
For
insp
ectio
n pur
pose
s only
.
Conse
nt of
copy
right
owne
r req
uired
for a
ny ot
her u
se.
EPA Export 07-11-2018:04:04:41

Rathcoursey Outfall Study Report
Page No: 19 2. 19
Figure 4.2 - Spring tide initial dilutions in vicinity of outfall
For
insp
ectio
n pur
pose
s only
.
Conse
nt of
copy
right
owne
r req
uired
for a
ny ot
her u
se.
EPA Export 07-11-2018:04:04:41

Rathcoursey Outfall Study Report
Page No: 20 2. 20
Figure 4.3 - Neap tide initial dilutions in vicinity of outfall
For
insp
ectio
n pur
pose
s only
.
Conse
nt of
copy
right
owne
r req
uired
for a
ny ot
her u
se.
EPA Export 07-11-2018:04:04:41

Rathcoursey Outfall Study Report
Page No: 21 2. 21
Figure 4.4 - Spring tide surfacing plume displacement from diffuser
Figure 4.5 - Neap tide surfacing plume displacement from diffuser
Figure 4.6 - Plot showing DIN ebb tide mixing zone envelope (concentrations within this envelope may be above the EQS depending on where the plume surfaces at the various stages of the ebb tide)
For
insp
ectio
n pur
pose
s only
.
Conse
nt of
copy
right
owne
r req
uired
for a
ny ot
her u
se.
EPA Export 07-11-2018:04:04:41

Rathcoursey Outfall Study Report
Page No: 22 2. 22
4.6 Water Circulation Modelling Tidal circulation simulated with a 2-dimensional numerical model M2D (ref:7). The
model is a general-purpose modelling package for simulating flow and transport in
surface water systems. It was used previously for the 1993 and 1997 outfall studies of
the Rathcoursey outfall location. The use of a 2-D model is justifiable on the basis that
the average freshwater inputs are low in relation to the tidal volumes and no significant
stratification is evident in EPA water sample data.
The model employed a 30m x 30m rectangular grid cover the entire harbour area (Figure
4.7) and was used to simulate water movements during a recurring average tidal range.
outlined in Table 2.2. The model was calibrated with tidal elevation, current meter and
drogue and dye track data taken from the surveys listed in Table 2.1. Model runs with
typical coefficient settings were found to reproduce the observed tidal elevations to an
acceptable level. Simulated current speeds closely resembled measured data (Figures
4.8).
Figure 4.7 - Model extents
For
insp
ectio
n pur
pose
s only
.
Conse
nt of
copy
right
owne
r req
uired
for a
ny ot
her u
se.
EPA Export 07-11-2018:04:04:41

Rathcoursey Outfall Study Report
Page No: 23 2. 23
Figure 4.8 - Comparison of modelled and measured currents (ref:16)
4.7 Contaminant Dispersion Simulations The contaminant dispersion module LAG (ref:8) was used to simulate far-field dispersion.
In this module the treated wastewater plume is simulated as a stream of particles. These
particles are advected and dispersed through the model domain. The hydrodynamic
module calculates current vectors on a 30m x 30m grid. A particle can be anywhere in
the model domain. A linear interpolation is used to calculate the appropriate advection
velocity to be applied to each particle at each time step. Diffusion is simulated by
allowing particles to further disperse using a statistical random walk method. The
particle positions are tracked as single precision variables in the fortran code. The
contaminant concentration is determined by counting the number of particles in any
spatial volume at any time. Model runs were conducted for a recurring average tide
lasting 25 days under calm conditions.
For
insp
ectio
n pur
pose
s only
.
Conse
nt of
copy
right
owne
r req
uired
for a
ny ot
her u
se.
EPA Export 07-11-2018:04:04:41

Rathcoursey Outfall Study Report
Page No: 24 2. 24
To facilitate easy comparison of results all nutrient inputs were treated as simple single
species waterborne conservative parameters. No interactions or changes in state were
permitted.
Simulation of DIN Concentrations
Model results in the form of DIN concentration contours are shown in Figures 4.9 to 4.12.
These represent DIN arising from the Great Island Channel area, other sources in the
harbour are excluded. The cases modelled are:
1. Existing inputs to the system including the Midleton WWPT, IDL and both the
Owenacurra and Dungourney rivers, total DIN = 806kg/ day;
2. Combined future outfall discharge together with inputs from the Owenacurra and
Dungourney rivers, total DIN = 976kg/ day;
3. Future outfall discharge (excluding rivers) representing the Midleton WWTP, IDL and
Dairygold, total DIN input = 291 kg/ day;
4. Future contribution from Dairygold discharge alone, DIN input = 60 kg/ day.
Figure 4.9 shows the predicted concentrations when all present day potential sources of
DIN including riverine inputs are included. Concentrations in the Great Island channel
are generally below 0.4mg/l N with higher values predicted for the Ballinacurra estuary.
The Lower Harbour area is a designated coastal waterbody and average concentrations
here are below the EQS Good Status target of 0.25mg/l N.
Figure 4.10 shows the predicted concentrations when all future potential sources of DIN
including riverine inputs are included. Concentrations in the Great Island channel are
still generally below 0.4mg/l N.
Figure 4.11 shows the predicted impact of the combined future outfall sources (WWTP,
IDL & DG) excluding rivers. The predicted impact of the Dairygold discharge alone is
shown in Figure 4.12. Its contribution to the DIN levels is small both in the Great Island
channel and the Rostellan areas.
For
insp
ectio
n pur
pose
s only
.
Conse
nt of
copy
right
owne
r req
uired
for a
ny ot
her u
se.
EPA Export 07-11-2018:04:04:41

Rathcoursey Outfall Study Report
Page No: 25 2. 25
Low Water
High Water
Figure 4.9 - Simulation of DIN concentrations arising for the present day Rathcoursey outfall (WWTP and IDL) and river inputs, DIN load = 806 kg/day
For
insp
ectio
n pur
pose
s only
.
Conse
nt of
copy
right
owne
r req
uired
for a
ny ot
her u
se.
EPA Export 07-11-2018:04:04:41

Rathcoursey Outfall Study Report
Page No: 26 2. 26
Low Water
High Water
Figure 4.10 - Simulation of DIN concentrations arising from the Rathcoursey outfall (WWTP, IDL and Dairygold) and river inputs, Future DIN load = 967 kg/day
For
insp
ectio
n pur
pose
s only
.
Conse
nt of
copy
right
owne
r req
uired
for a
ny ot
her u
se.
EPA Export 07-11-2018:04:04:41

Rathcoursey Outfall Study Report
Page No: 27 2. 27
Low Water
High Water
Figure 4.11 - Simulation of DIN concentrations arising from the Rathcoursey outfall (WWTP, IDL and Dairygold), Future DIN inputs = 291kg/day
For
insp
ectio
n pur
pose
s only
.
Conse
nt of
copy
right
owne
r req
uired
for a
ny ot
her u
se.
EPA Export 07-11-2018:04:04:41

Rathcoursey Outfall Study Report
Page No: 28 2. 28
Low Water
High Water
Figure 4.12 - Simulation of DIN concentrations arising from the Dairygold contribution, DIN input = 60kg/day
For
insp
ectio
n pur
pose
s only
.
Conse
nt of
copy
right
owne
r req
uired
for a
ny ot
her u
se.
EPA Export 07-11-2018:04:04:41

Rathcoursey Outfall Study Report
Page No: 29 2. 29
Simulation of PO4 Concentrations
Model results in the form of P04 concentration contours are shown in Figures 4.13 to
4.16. These represent PO4 arising from the Great Island Channel area, other sources in
the harbour are excluded. The cases modelled are:
1. Existing inputs to the system including the Midleton WWPT, IDL and both the
Owenacurra and Dungourney rivers, total PO4 = 21.8kg/ day;
2. Combined future outfall discharge together with river input, total PO4 = 43.1kg/ day;
3. Future outfall discharge (excluding rivers) representing the Midleton WWTP, IDL and
Dairygold, total PO4 input = 38.7 kg/ day;
4. Future contribution from Dairygold discharge, PO4 input = 8 kg/ day.
Figure 4.13 shows the predicted concentrations when all present day potential sources of
PO4 including riverine inputs are included. Concentrations in the Great Island channel
are generally below 0.01mg/l P. The Great Island channel and the Ballinacurra estuary
are designated transitional waters with EQS targets of between 0.04 and 0.06 mg/l P
depending on salinity.
Figure 4.14 shows the predicted concentrations when all future potential sources of PO4
including riverine inputs are included. Concentrations in the Great Island channel are
still generally below 0.01mg/l P. The Lower Harbour average concentrations are also
well below the EQS Good Status target of 0.04mg/l P.
Figure 4.15 shows the impact of the outfall while Figure 4.16 shows the predicted impact
of the Dairygold discharge alone. Its contribution to the PO4 levels is small both in the
Great Island channel and the Rostellan areas.
For
insp
ectio
n pur
pose
s only
.
Conse
nt of
copy
right
owne
r req
uired
for a
ny ot
her u
se.
EPA Export 07-11-2018:04:04:41

Rathcoursey Outfall Study Report
Page No: 30 2. 30
Low Water
High Water
Figure 4.13 - Simulation of PO4 concentrations arising from the Rathcoursey outfall (WWTP and IDL) and river inputs, PO4 input = 21.8kg/day
For
insp
ectio
n pur
pose
s only
.
Conse
nt of
copy
right
owne
r req
uired
for a
ny ot
her u
se.
EPA Export 07-11-2018:04:04:41

Rathcoursey Outfall Study Report
Page No: 31 2. 31
Low Water
High Water
Figure 4.14 - Simulation of PO4 concentrations arising from the Rathcoursey outfall (WWTP, IDL and Dairygold) and river inputs, Future PO4 input = 43.1kg/day
For
insp
ectio
n pur
pose
s only
.
Conse
nt of
copy
right
owne
r req
uired
for a
ny ot
her u
se.
EPA Export 07-11-2018:04:04:41
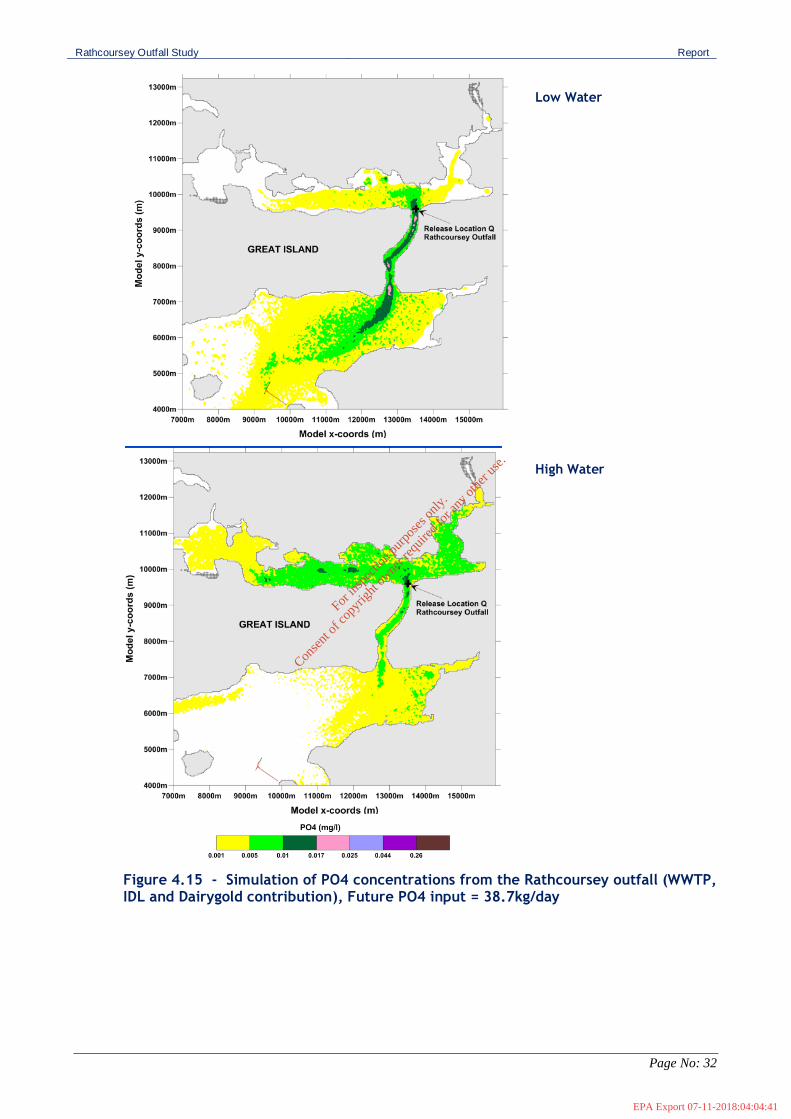
Rathcoursey Outfall Study Report
Page No: 32 2. 32
Low Water
High Water
Figure 4.15 - Simulation of PO4 concentrations from the Rathcoursey outfall (WWTP, IDL and Dairygold contribution), Future PO4 input = 38.7kg/day
For
insp
ectio
n pur
pose
s only
.
Conse
nt of
copy
right
owne
r req
uired
for a
ny ot
her u
se.
EPA Export 07-11-2018:04:04:41

Rathcoursey Outfall Study Report
Page No: 33 2. 33
Low Water
High Water
Figure 4.16 - Simulation of PO4 concentrations arising from the Dairygold discharge only, PO4 input = 8kg/day
For
insp
ectio
n pur
pose
s only
.
Conse
nt of
copy
right
owne
r req
uired
for a
ny ot
her u
se.
EPA Export 07-11-2018:04:04:41

Rathcoursey Outfall Study Report
Page No: 34 2. 34
Simulation of BOD Concentrations
Model results in the form of BOD concentration contours are shown in Figures 4.17 &
4.18. The cases modelled are:
1. Future outfall discharge representing the Midleton WWTP, IDL and Dairygold, total
BOD input = 484 kg/ day;
2. Future contribution from Dairygold discharge, BOD input = 100 kg/ day.
Figure 4.17 shows the predicted BOD concentrations arising from the Rathcoursey outfall
when all future potential sources of BOD including the WWTP, IDL and DG are included.
Concentrations in the Great Island channel are generally below 0.1mg/l with the Lower
Harbour average concentrations below 0.05mg/l.
Figure 4.18 shows the predicted impact of the Dairygold discharge alone. Its contribution
to the BOD levels is small both in the Great Island channel and the Rostellan areas. The
simulated BOD is indicative of the likely impacts on the relevant dissolved oxygen EQS
shown in Table 3.3.
For
insp
ectio
n pur
pose
s only
.
Conse
nt of
copy
right
owne
r req
uired
for a
ny ot
her u
se.
EPA Export 07-11-2018:04:04:41

Rathcoursey Outfall Study Report
Page No: 35 2. 35
Low Water
High Water
Figure 4.17 - Simulation of BOD concentrations arising from the Rathcoursey outfall (WWTP, IDL and Dairygold), Future BOD inputs = 484kg/day
For
insp
ectio
n pur
pose
s only
.
Conse
nt of
copy
right
owne
r req
uired
for a
ny ot
her u
se.
EPA Export 07-11-2018:04:04:41

Rathcoursey Outfall Study Report
Page No: 36 2. 36
Low Water
High Water
Figure 4.18 - Simulation of BOD concentrations arising from the Dairygold contribution, BOD input = 100kg/day
For
insp
ectio
n pur
pose
s only
.
Conse
nt of
copy
right
owne
r req
uired
for a
ny ot
her u
se.
EPA Export 07-11-2018:04:04:41

Rathcoursey Outfall Study Report
Page No: 37 2. 37
Simulation of SS Concentrations
Model results in the form of SS concentration contours are shown in Figures 4.19 & 4.20.
The cases modelled are:
1. Future outfall discharge representing the Midleton WWTP, IDL and Dairygold, total SS
input = 678 kg/ day;
2. Future contribution from Dairygold discharge, SS input = 140 kg/ day.
Figure 4.19 shows the predicted SS concentrations arising from the Rathcoursey outfall
when all future potential sources of SS including the WWTP, IDL and DG are included.
Concentrations in the Great Island channel are generally below 0.1mg/l with the Lower
Harbour average concentrations below 0.05mg/l.
Figure 4.20 shows the predicted impact of the Dairygold discharge alone. Its contribution
to the SS levels is small both in the Great Island channel and the Rostellan areas.
For
insp
ectio
n pur
pose
s only
.
Conse
nt of
copy
right
owne
r req
uired
for a
ny ot
her u
se.
EPA Export 07-11-2018:04:04:41
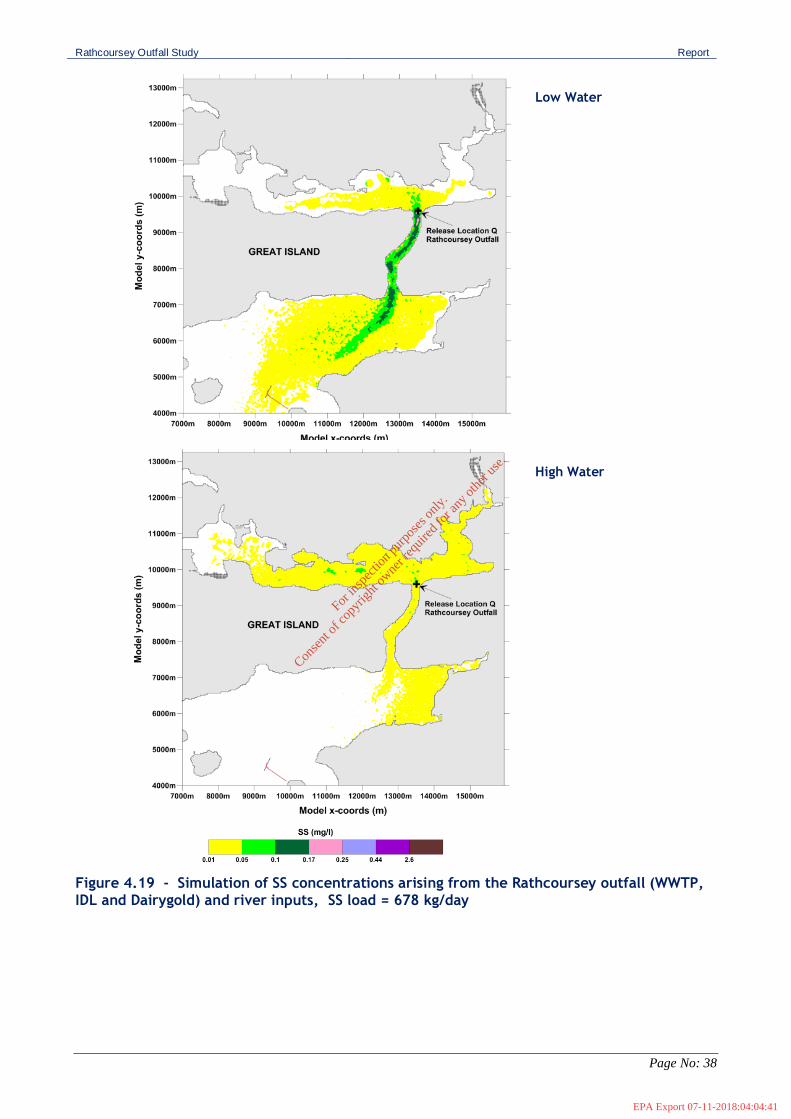
Rathcoursey Outfall Study Report
Page No: 38 2. 38
Low Water
High Water
Figure 4.19 - Simulation of SS concentrations arising from the Rathcoursey outfall (WWTP, IDL and Dairygold) and river inputs, SS load = 678 kg/day
For
insp
ectio
n pur
pose
s only
.
Conse
nt of
copy
right
owne
r req
uired
for a
ny ot
her u
se.
EPA Export 07-11-2018:04:04:41

Rathcoursey Outfall Study Report
Page No: 39 2. 39
Low Water
High Water
Figure 4.20 - Simulation of SS concentrations arising from the Dairygold contribution, SS input = 140 kg/day
For
insp
ectio
n pur
pose
s only
.
Conse
nt of
copy
right
owne
r req
uired
for a
ny ot
her u
se.
EPA Export 07-11-2018:04:04:41
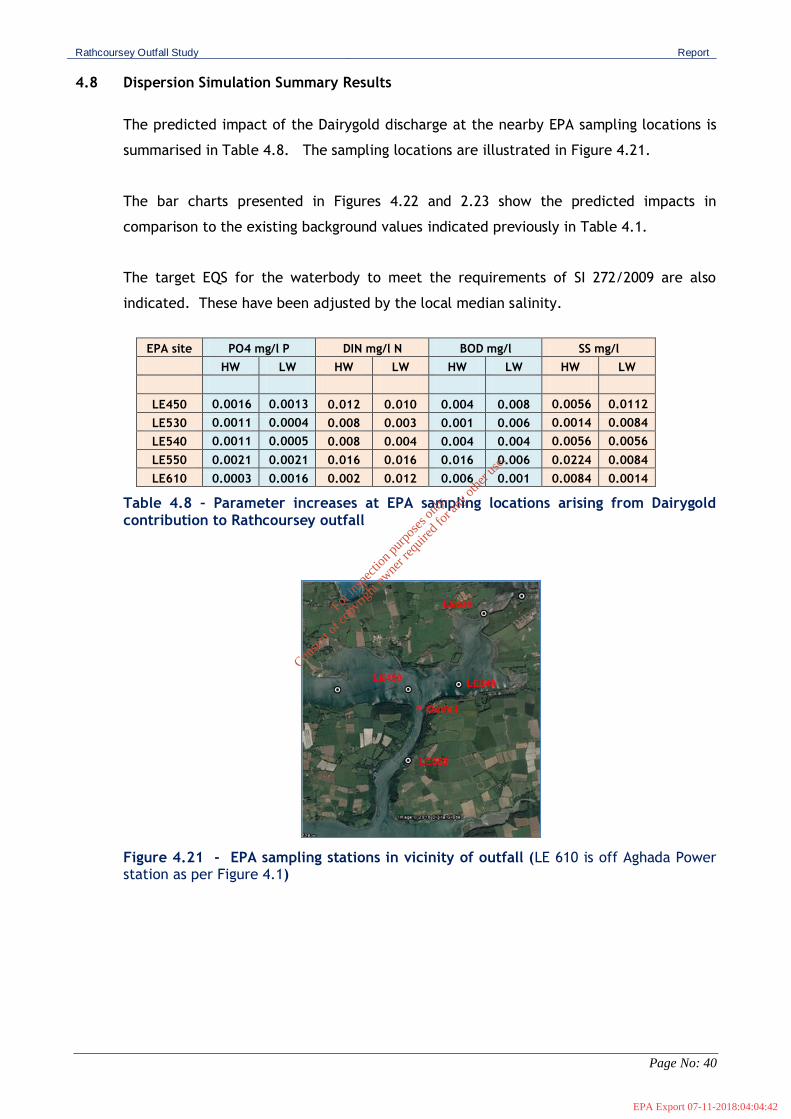
Rathcoursey Outfall Study Report
Page No: 40 2. 40
4.8 Dispersion Simulation Summary Results
The predicted impact of the Dairygold discharge at the nearby EPA sampling locations is
summarised in Table 4.8. The sampling locations are illustrated in Figure 4.21.
The bar charts presented in Figures 4.22 and 2.23 show the predicted impacts in
comparison to the existing background values indicated previously in Table 4.1.
The target EQS for the waterbody to meet the requirements of SI 272/2009 are also
indicated. These have been adjusted by the local median salinity.
EPA site PO4 mg/l P DIN mg/l N BOD mg/l SS mg/l
HW LW HW LW HW LW HW LW
LE450 0.0016 0.0013 0.012 0.010 0.004 0.008 0.0056 0.0112
LE530 0.0011 0.0004 0.008 0.003 0.001 0.006 0.0014 0.0084
LE540 0.0011 0.0005 0.008 0.004 0.004 0.004 0.0056 0.0056
LE550 0.0021 0.0021 0.016 0.016 0.016 0.006 0.0224 0.0084
LE610 0.0003 0.0016 0.002 0.012 0.006 0.001 0.0084 0.0014
Table 4.8 – Parameter increases at EPA sampling locations arising from Dairygold contribution to Rathcoursey outfall
Figure 4.21 - EPA sampling stations in vicinity of outfall (LE 610 is off Aghada Power station as per Figure 4.1)
For
insp
ectio
n pur
pose
s only
.
Conse
nt of
copy
right
owne
r req
uired
for a
ny ot
her u
se.
EPA Export 07-11-2018:04:04:42

Rathcoursey Outfall Study Report
Page No: 41 2. 41
Figure 4.22 - Average (HW+LW) PO4 and DIN increases (cyan colour) at EPA sampling stations relative to existing median background values (Table 4.1). Target EQS
values** modified by local salinity are per SI 272/2009 are also shown. **Strictly speaking the DIN target only applies to designated coastal waters which are to the south of Marloag Point and the PO4 target only applies to transitional waters which are to the north of Marloag Point.
Figure 4.23 - BOD and SS increases at EPA sampling stations relative to existing median background values (Table 4.1). No background data is available for SS, it is assumed to be 1.5mg/l for the purposes of the plot
For
insp
ectio
n pur
pose
s only
.
Conse
nt of
copy
right
owne
r req
uired
for a
ny ot
her u
se.
EPA Export 07-11-2018:04:04:42

Rathcoursey Outfall Study Report
Page No: 42 2. 42
4.9 Estuary Tidal Flushing
The tidal volume data presented in Table 2.4 show that there are large movements of
waters in and out of the Great Island channel twice a day. The spring tidal volume, at
21.1x10⁶ m3, is almost 4 times greater than the residual low tide volume of 5.4x10⁶ m3.
Comparable neap volumes are 10.5x10⁶ m3 and 8.4x10⁶ m3 with a ratio of 1.25. Figure
2.4 showed the extent of the low waters and the associated intertidal areas. When
depths are considered the majority of the channel is seen to be less than 1m deep at
spring low tide as shown in Figure 4.24. Any waters moving in and out of such an area
will be well mixed.
Figure 4.24 - MLWS intertidal area (green), low water area (cyan), 1m contour (blue)
A fundamental part of flushing calculations is establishing what portion of waters that
exit an area on the ebb tide will subsequently return on the following flood. The ebb
tide from the Great Island channel travels past Marloag Point and on to the south-west
for about 4-6 km. Mixing processes in this part of the lower harbour will determine how
much of the Great Island channel waters get replaced with ‘new’ waters. Similarly
waters in the lower Cork harbour area will in turn exit past Roches Point and a portion of
these will be replaced by ‘new’ Celtic Sea waters on the incoming tide. Part of this
mixing is due to turbulent motions of the water body but wind is also a very important
factor in the mixing process and as a consequence, in the flushing behaviour. Shallower
areas are the most responsive with enhanced mixing due to wave action and the
formation of induced circulations. The lower harbour area is geographically exposed with
mean monthly wind speeds of 10-12 knots and up 15 days with gales per year. Therefore
while short quiescent periods may occur when only tidal mixing prevails, on average
weather conditions promote increased mixing.
A simple tidal prism model when applied to the harbour as a whole gives a first estimate
of the flushing time: T= (P+V)/P where T is tidal cycles, V is the low water volume and P
is the tidal prism. Using the values presented in Table 2.4 an average flushing time for
For
insp
ectio
n pur
pose
s only
.
Conse
nt of
copy
right
owne
r req
uired
for a
ny ot
her u
se.
EPA Export 07-11-2018:04:04:42

Rathcoursey Outfall Study Report
Page No: 43 2. 43
the harbour as a whole based on neap tide volumes is T = (90.6+247)/90.6 = 3.7 tides or 2
days. The Cork Harbour Study (ref: 17) report suggested exchange factors with the open
sea waters of about 0.2 - 0.4 representing the amount of ‘new’ water that enters on the
flooding tide. Using the average exchange factor of 0.3 the flushing time would increase
to about 6 days.
The same calculation when applied to the waters upstream of Rathcoursey Point suggest
a T = (10.49 + 8.4)/8.4 = 2.2 tides = approx 1 day. Applying an exchange factor of about
0.35 (ref:17) indicates a flushing time of about 3 days during neap tides. The ‘new’
flushing waters in this case are from the lower harbour and not from the open sea as
above. However as the water sample data in Table 4.1 shows the median background
values of DIN and PO4 at the Aghada and Roches Point sampling stations are not
dissimilar.
Tides vary with the spring-neap cycle over a period of about 14 days and no two tides
have the same range. This leads to a seven day period when more water is leaving the
harbour area on the ebb than is returning on the flood. The process is reversed over the
following seven days. This tidal pumping is also an effective flushing mechanism.
The succeeding HW-LW volume differences have been calculated for 1 year of Cobh tidal
data and are presented in Figure 4.25 for the Great Island Channel. They range from
0.2x10⁶ m3 to 2x10⁶ m3 with an average of about 0.45x10⁶m3. Applying the tidal prism
method to the average mid-tide volume would indicate a flushing time of about 8 days
for the Great Island channel.
All of these prism calculations assume good mixing which is believed to be a reasonable
assumption given the tidal volumes, shallow depths and expansive areas discussed
previously.
Figure 4.25 - Succeeding HW_LW volume differences upstream of Rathcoursey Pt
For
insp
ectio
n pur
pose
s only
.
Conse
nt of
copy
right
owne
r req
uired
for a
ny ot
her u
se.
EPA Export 07-11-2018:04:04:42

Rathcoursey Outfall Study Report
Page No: 44 2. 44
5. Conclusions
The Rathcoursey outfall discharges to transitional waters which subsequently discharge to
a coastal waterbody as defined under the WFD. The target EQS as per SI 272 2009 are
MRP = 0.042mg/l P and DIN = 0.44mg/l N adjusted for local salinity. Median background
values in the vicinity of the outfall are 0.009mg/l P and 0.32 mg/l N respectively based
on EPA sampling data.
The Rathcoursey outfall is currently licenced to discharge 15,368m3 of treated waste
waters per day with the specified ELV’s set by the EPA (Table 3.1). The Dairygold
contribution will be an additional 4000m3 per day.
The extent of the mixing zone has been determined based on the combined future
discharge of 19,368 m3 and the background water quality data. This mixing zone is by
definition based on the requirement to meet the relevant EQS as specified in the SI 272
2009. The calculations have shown that the mixing zone is restricted to the vicinity of
the outfall (<70m downstream) and occupies less than 25% of the cross-sectional area of
the East Passage channel.
Nitrates from river runoff are calculated to account for about 84% of the present day
local DIN input to the Great Island channel. PO4 levels in the river waters are low and
the principal source is the Rathcoursey outfall. The calculated increases in future DIN
and PO4 loads arising from the addition of the Dairygold discharge are 60kg/day and
8kg/day respectively. Model results show that the addition of the Dairygold discharge
will increase the average background DIN by less than 0.02mg/l N and the PO4 by less
than 0.002mg/l P. These additions to the existing background levels will not cause the
EQS to be breached.
The calculated increases in future BOD and SS loads are 100kg/day and 140kg/day
respectively. Model results show that they increase the average background BOD by less
than 0.05mg/l and the SS by a similar amount. The additional increases will not
materially impact the water quality.
Discharges from the outfall are carried by the ebb tide to the south and into the lower
harbour. A high proportion returns on the subsequent flood. Based on dye tests (ref:17)
this fraction is about 65%. Estimates of flushing rates vary and are dependent on the
method used and stage of the spring neap cycle. The tidal prism volumes are large
relative to the low water volumes. Estimates range from 3-8 days for the waters
upstream of Rathcoursey Point.
For
insp
ectio
n pur
pose
s only
.
Conse
nt of
copy
right
owne
r req
uired
for a
ny ot
her u
se.
EPA Export 07-11-2018:04:04:42

Rathcoursey Outfall Study Report
Page No: 45 2. 45
References
1. Admiralty, 1977, Chart No: 1773, Upper Harbour East. 2. Admiralty, 2016, Admiralty Tide Tables. The Hydrographer of the Navy, Taunton. 3. Costello et al (2000), Measurement and Modelling of Nutrient Dynamics in Two Estuaries in Ireland, 4. Environmental Protection Agency Water Framework Directive monitoring programme for Transitional
and Coastal Waters (TraCs). 2007-2013 5. GSI Infomar bathymetric data 2016 6. Hunter 1997, User Manual for Outfall Modelling Package. Curtin University Aus. 7. Hunter 1997, User Manual for Numerical Hydrodynamic Models of Marine Systems and Associated
Plotting Package. Curtin University Aus. 8. Hunter 1997, User Manual for Two-Dimensional Lagrangian Particle Tracking Model. Curtin University
Aus. 9. Hydrographic Surveys Ltd, Midleton Outfall Dye Tracing Study 1992 10. Irish Distillers 2011, Proposed Expansion of Midleton Distillery, Environmental Impact Statement 11. Irish Hydrodata (2016), Combined bathymetric xyz dataset for Cork Harbour updated on an ongoing
basis from various sources 12. Irish Hydrodata, 2005, Saleen Outfall Dispersion Study 13. Irish Hydrodata,2006, Cobh Road Improvements Survey 14. Irish Hydrodata, 2005, Aghada Outfall Dispersion Study 2005 15. Irish Hydrodata Ltd, Cork Harbour Stuiy 1991, Survey Data 16. Irish Hydrodata Ltd, Midleton SS Marine Outfall Hydrographic Survey/Numerical Modelling Report 1993 17. M.C. O Sullivan Ltd, Cork Harbour Pollution Report 1988 18. O Kane, 2007, Modelling the Norovirus Contamination of an Oyster Farm in Cork Harbour, Cork Co Co.
For
insp
ectio
n pur
pose
s only
.
Conse
nt of
copy
right
owne
r req
uired
for a
ny ot
her u
se.
EPA Export 07-11-2018:04:04:42

Industrial Emissions Application Application ID: LA001622
Attachment-7.3-2-1 Supporting Documents
Appendix E
Evaluation of the Risk of Adverse Impact on Cork
Harbour SPA (004030) and Great Island SAC
(001058), (Document 17617_6016) prepared
by Malachy Walsh and Partners, May 2017
For in
spec
tion p
urpo
ses o
nly.
Conse
nt of
copy
right
owne
r req
uired
for a
ny ot
her u
se.
EPA Export 07-11-2018:04:04:42

Evaluation of the Risk of Adverse Impact on Cork
Harbour SPA (004030) and Great Island SAC (001058)
Planning Application Ref: P16/07031 Proposed Extension of Cheese Manufacture Facility
At Dairygold Food Ingredients Ltd, Mogeely, Co. Cork
For
insp
ectio
n pur
pose
s only
.
Conse
nt of
copy
right
owne
r req
uired
for a
ny ot
her u
se.
EPA Export 07-11-2018:04:04:42

17617-6016-A Evaluation of the Risk of Adverse Impact on
Cork Harbour SPA (004030) and Great Island SAC (001058) May 2017
ISSUE FORM
Project number 17617
Document number 6016
Document revision A (Issue Date 25May2017)
Document title Evaluation of the Risk of Adverse Impact on Cork Harbour SPA (004030) and Great Island SAC (001058)
Document status Final
Document prepared by Caitríona Fox
Monica Kane
Muiread Kelly
John Murphy
For
insp
ectio
n pur
pose
s only
.
Conse
nt of
copy
right
owne
r req
uired
for a
ny ot
her u
se.
EPA Export 07-11-2018:04:04:42

17617-6016-A Evaluation of the Risk of Adverse Impact on
Cork Harbour SPA (004030) and Great Island SAC (001058) May 2017
Contents 1 INTRODUCTION ............................................................................................................................... 1
2 LEGISLATIVE CONTEXT .................................................................................................................... 1
3 CORK HARBOUR SPA SITE CODE: 004030 ....................................................................................... 3
3.1 Conservation Objectives of the Cork Harbour SPA ................................................................. 3
3.2 Cork Harbour SPA Special Conservation Interests (SCIs) ........................................................ 4
3.3 Bird Species Distribution within Proximity to existing Outfall at Rathcoursey ....................... 4
3.4 Food Sources of Qualifying Features of the SPA ..................................................................... 8
4 GREAT ISLAND CHANNEL SAC (001058) .......................................................................................... 9
4.1 Conservation Objectives of the Great Island Channel SAC ..................................................... 9
5 Habitats / Species and their Sensitivity to Water Quality Changes .............................................. 11
5.1 Overview of Benthic Infauna Community ............................................................................. 11
5.2 Sensitivity to Increased Suspended Solids Loadings: ............................................................ 13
5.3 Sensitivity to Nutrient Inputs ................................................................................................ 13
Dissolved Inorganic Nitrogen (DIN) ............................................................................................... 13
Phosphate ..................................................................................................................................... 15
5.4 Sensitivity to Changes in oxygenation levels ........................................................................ 16
6 SUMMARY OF POTENTIAL IMPACTS IN VIEW OF CONSERVATION OBJECTIVES .......................... 20
7 CONCLUSION ................................................................................................................................. 27
APPENDIX A: Biotope / species Sensitivity Assessment
APPENDIX B: 2016/2017 Winter Bird Monitoring
For
insp
ectio
n pur
pose
s only
.
Conse
nt of
copy
right
owne
r req
uired
for a
ny ot
her u
se.
EPA Export 07-11-2018:04:04:42

17617-6016-A Evaluation of the Risk of Adverse Impact on
Cork Harbour SPA (004030) and Great Island SAC (001058) May 2017
1
1 INTRODUCTION
This report has been prepared by Malachy Walsh and Partners on behalf of Dairygold Food
Ingredient Ltd in response to a further information request by Cork County Council dated 9th
February 2017 relating to Planning Application P16/07031.
The report provides an evaluation of the risk of adverse impact on Cork Harbour SPA (004030) and
Great Island SAC (001058) in relation to proposed discharges from the Dairygold WwTP at Mogeely
to the North Channel Great Island waterbody at Rathcoursey. It identifies the bird species and
habitats for which the sites are designated. The report identifies the various overwintering bird
species that are dependent on the mudflats and sandflats of the Owenacurra Estuary and North
Channel for their dietary requirements. It then examines the sensitivity of the invertebrate fauna
supported by the mudflats and sandflats to changes in water quality using published data. It does
this in the context of the current and predicted water quality changes from the proposed Dairygold
discharges.
The evaluation is made with regard to the detailed assessment undertaken by Irish Hydrodata Ltd on
behalf of Irish Water of the proposed discharges using 2D estuarine hydraulic process modelling to
simulate of the resultant plume dispersal and pollutant exposure time.
2 LEGISLATIVE CONTEXT
Council Directive 92/43/EEC on the Conservation of Natural Habitats and of Wild Fauna and Flora,
better known as “The Habitats Directive”, provides legal protection for habitats and species of
European importance. The overall aim of the Habitats Directive is to maintain or restore the
favourable conservation status of habitats and species of community interest.
Articles 2 to 9 provide the legislative means to protect habitats and species of Community interest
through the establishment and conservation of an EU-wide network of sites known as Natura 2000.
These are Special Areas of Conservation (SACs) designated under the Habitats Directive and Special
Protection Areas (SPAs) designated under the Conservation of Wild Birds Directive (79/409/ECC) as
codified by Directive 2009/147/EC.
Articles 6(2) and 6(3) of the Habitats Directive set out the decision-making tests for plans and
projects likely to affect Natura 2000 sites.
Article 6(2) provides in full: Member States shall take appropriate steps to avoid, in the special areas of conservation, the
deterioration of natural habitats and habitats of species as well as disturbance of the species for
which the areas have been designated, in so far as such disturbance could be significant in relation
to the objectives of this Directive.
Article 6(3) establishes the requirement for Appropriate Assessment [AA] and provides that the
competent authority shall agree to a plan or project only after having ascertained that it will not
adversely affect the integrity of the site concerned.
For
insp
ectio
n pur
pose
s only
.
Conse
nt of
copy
right
owne
r req
uired
for a
ny ot
her u
se.
EPA Export 07-11-2018:04:04:42

17617-6016-A Evaluation of the Risk of Adverse Impact on
Cork Harbour SPA (004030) and Great Island SAC (001058) May 2017
2
The following is provided in the EU Commission guidance on the Assessment of plans or projects
significantly affecting Natura 2000 sites regarding Stage 2 Appropriate assessments.
“In this stage, 'the impact of the project or plan (either alone or in combination with other projects
or plans) on the integrity of the Natura 2000 site is considered with respect to the conservation
objectives of the site and to its structure and function.”
The Commission services’ guidance on Natura 2000 states that: ‘The integrity of a site involves its ecological functions. The decision as to whether it is adversely affected should focus on and be limited to the site’s conservation objectives’ (MN2000, paragraph 4.6(3)).
Therefore, in determining if an effect would compromises the integrity of a Natura 2000 site the
critical issue to ascertain is if the effect interferes with achieving the conservation objectives for the
site and the conservation status of its Special Conservation Interests (SCIs).
The favourable conservation status of a qualifying habitat or species as defined by Articles 1 (e) and
1(i) of the Habitats Directive is set out in Table 1 below.
Table 1 Favourable Conservation Status of Habitats and Species
Favourable conservation status of a qualifying habitat is achieved when: its natural range, and area it covers within that range, are stable or increasing, and the specific
structure and functions which are necessary for its long‐term maintenance exist and are likely to continue to exist for the foreseeable future, and the conservation status of its typical species is favourable.
The favourable conservation status of a qualifying species is achieved when: population dynamics data on the species concerned indicate that it is maintaining itself on a
long‐term basis as a viable component of its natural habitats, and the natural range of the species is neither being reduced nor is likely to be reduced for the
foreseeable future, and there is, and will probably continue to be, a sufficiently large habitat to maintain its populations on a
long‐term basis.
The term, ‘favourable conservation status’, refers to the biogeographic or national or European
level. The assessment of the conservation status of habitats and species is carried out by the EC
every 6 years across its territory. In its broadest sense, favourable conservation status means that
an ecological feature is being maintained in a satisfactory condition, and that this status is likely to
continue into the future.1
1 (Section 1.3 Introduction to Conservation Objectives for Cork Harbour Special Protection Area (Site Code
4030) Conservation Objectives Supporting Document (Version 1), National Parks & Wildlife Service November 2014)
For
insp
ectio
n pur
pose
s only
.
Conse
nt of
copy
right
owne
r req
uired
for a
ny ot
her u
se.
EPA Export 07-11-2018:04:04:42

17617-6016-A Evaluation of the Risk of Adverse Impact on
Cork Harbour SPA (004030) and Great Island SAC (001058) May 2017
3
3 CORK HARBOUR SPA SITE CODE: 004030
3.1 Conservation Objectives of the Cork Harbour SPA
In relation to the conservation objectives of the Cork Harbour SPA the overall aim is to maintain or
restore the favourable conservation condition of habitats and species listed as SCIs for this SPA. The
qualifying habitats and species for the Cork Harbour SPA are listed in Table 2 of Section 3.2 below.
Site-specific conservation objectives define the desired condition or range of conditions that a
habitat or species should be in, in order for these selected features within the site to be judged as
favourable.
Detailed Conservation Objectives have been published for Cork Harbour SPA in December 2014. The
Conservation Objective Report for this SPA sets out the attributes and targets for achieving
favourable conservation condition for each of the SCIs of the SPA. The attributes, measurement of
attributes and targets for SCIs of the SPA are outlined in Table 2 below.
Table 2 Detailed Conservation Objectives for Cork Harbour SPA
Special Conservation Interest
Attribute Measurement Target
Over-wintering species
Population Trend Percentage Change Long term population trend is stable or increasing
Distribution Range, timing and intensity of use of areas
No significant decrease in the range, timing or intensity of use of areas by over wintering species other than that occurring from natural patterns of variation.
Breeding species
Breeding population abundance:
Number of apparently occupied nests (AONs)
No significant decline
Productivity rate: Mean number of fledged young per breeding pair
No significant decline
Distribution: breeding colonies
Number, location, area (hectares)
No significant decline
Prey biomass available Kilogrammes No significant decline*
Barriers to connectivity Number, location, shape, area (hectares)
No significant decline
Disturbance at the breeding site
Level of impact Human activities should occur at levels that do not adversely affect the breeding common tern population
Wetlands
Habitat area Hectares The permanent area occupied by the wetland habitat should be stable and not significantly less than the area of 2,587 hectares, other than that occurring from natural patterns of variation.
*Key prey items: Small fish, crustaceans, insects and occasionally squid.
For
insp
ectio
n pur
pose
s only
.
Conse
nt of
copy
right
owne
r req
uired
for a
ny ot
her u
se.
EPA Export 07-11-2018:04:04:42

17617-6016-A Evaluation of the Risk of Adverse Impact on
Cork Harbour SPA (004030) and Great Island SAC (001058) May 2017
4
3.2 Cork Harbour SPA Special Conservation Interests (SCIs)
Cork Harbour SPA is designated for its role in supporting the following bird species which are listed
as special conservation interests for this SPA:
Table 3 Cork Harbour SPA Special Conservation Interests
Great Crested Grebe Grey Plover
Little Grebe Lapwing
Cormorant Dunlin
Grey Heron Black-tailed Godwit
Shelduck Bar-tailed Godwit
Wigeon Curlew
Teal Redshank
Pintail Black-headed Gull
Shoveler Common Gull
Red-breasted Merganser Lesser Black –backed Gull
Oystercatcher Common Tern
Golden Plover
All of the birds with the exception of the Common Tern, which breeds in the harbour over the
summer months, are non-breeding migratory species that overwinter in the harbour as
temperatures are warmer than their breeding grounds and food is readily available. Cork Harbour
SPA is also designated for supporting wetland habitats, the principal habitat of which is exposed
intertidal mudflats.
3.3 Bird Species Distribution within Proximity to existing Outfall at Rathcoursey
A review of Cork Harbour Special Protection Area (Site Code 4030) Conservation Objectives
Supporting Document VERSION 1[National Parks & Wildlife Service, November 2014] was
undertaken to identify species usage within the SPA. Table 4 below provides a summary of the
Waterbird distribution recorded during tide surveys within the Owenacurra Estuary and North
Channel.
For
insp
ectio
n pur
pose
s only
.
Conse
nt of
copy
right
owne
r req
uired
for a
ny ot
her u
se.
EPA Export 07-11-2018:04:04:42

17617-6016-A Evaluation of the Risk of Adverse Impact on
Cork Harbour SPA (004030) and Great Island SAC (001058) May 2017
5
Table 4 Waterbird distribution recorded during tide surveys (October 2010 – February 2011)
SUBSITE CODE SUBSITE NAME SPECIES OL557 Bailich Redshank, Shelduck, Teal
OL517 Loughatalia Golden Plover, Mallard, Redshank. Teal
OL568 Ballyannan pool Nothing listed
OL483 Rathcoursey Black-headed Gull, Black-tailed Godwit, Cormorant, Curlew, Greater Black-backed Gull, Greenshank, Grey Heron, Mallard, Mute Swan, Redshank, Shelduck, Teal, Wigeon
OL479 Brown Island Black-tailed Godwit, Cormorant, Curlew, Dunlin, Gadwall, Grey Plover, Mallard, Oystercatcher, Ringed Plover, Shoveler, Teal
OL552 Ballyelane to Brown Is. Cormorant, Mallard, Redshank, Shelduck
OL512 Curabally - Ballyellane Common Gull, Curlew, Mallard, Redshank, Ringed Plover, Turnstone, WIgeon
OL551 Ballydaniel Cormorant, Red-breasted Merganser
OL558 Great Island east channel
Cormorant, Mallard, Oystercatcher, Redshank, Teal
0L583 Garranekinnefeake Herring Gull, Oystercatcher
OL563 Agahda Lower Black-headed Gull, Cormorant, Common Gull, Curlew, Grey Heron, Lesser Black-backed Gull, Mediterranean Gull, Oystercatcher, Shelduck
0L564 Saleen west Black-headed Gull, Black-tailed Godwit, Common Gull, Curlew, Little Grebe, Mallard, Oystercatcher, Redshank, Turnstone
Figure 1 Subsite Locations within Cork Harbour SPA
For
insp
ectio
n pur
pose
s only
.
Conse
nt of
copy
right
owne
r req
uired
for a
ny ot
her u
se.
EPA Export 07-11-2018:04:04:42

17617-6016-A Evaluation of the Risk of Adverse Impact on
Cork Harbour SPA (004030) and Great Island SAC (001058) May 2017
6
Bird counts were also undertaken by Malachy Walsh and Partners during the 2016/2017 winter
period, within the receiving environment of the existing Midleton Main treated effluent Outfall at
Rathcoursey. The discharge point is located approximately 15m south of the Great Channel Island
SAC and approximately 15m south of the Cork Harbour SPA. Bird counts were undertaken at four
locations in the months of November 2016, January 2017 and February 2017 (Refer to Figure 2).
A summary of the species of qualifying interest recorded at the selected monitoring points are set
out in Table 5. Refer to Appendix 2 for full Bird Survey Report.
Figure 2 2016/2017 Bird Count survey Locations
For
insp
ectio
n pur
pose
s only
.
Conse
nt of
copy
right
owne
r req
uired
for a
ny ot
her u
se.
EPA Export 07-11-2018:04:04:42

17617-6016-A Evaluation of the Risk of Adverse Impact on
Cork Harbour SPA (004030) and Great Island SAC (001058) May 2017
7
Table 5 Qualifying Interest Species recorded in each location during the winter 2016/2017 survey period
Species Location 1
Upper Owenacurra
River Estuary
Location 2
Lower Owenacurra
Estuary
Location 3
North Channel
Great Island
Location 4
Saleens
Bar-tailed Godwit No No Yes No
Black-headed Gull Yes Yes Yes Yes
Black-tailed Godwit Yes Yes Yes Yes
Common Gull Yes Yes Yes Yes
Cormorant Yes Yes Yes Yes
Curlew Yes Yes Yes Yes
Dunlin Yes Yes Yes Yes
Golden Plover No No Yes No
Great Crested Grebe No Yes Yes Yes
Grey Heron Yes Yes Yes Yes
Grey Plover No Yes No No
Lapwing No Yes Yes No
Lesser Black-backed Gull
Yes Yes Yes Yes
Little Grebe No Yes Yes Yes
Oystercatcher Yes Yes Yes Yes
Pintail No No No No
Red-breasted Merganser
No Yes Yes No
Redshank Yes Yes Yes Yes
Shelduck No Yes Yes Yes
Shoveler No No No Yes
Teal Yes Yes Yes Yes
Wigeon No Yes Yes Yes
Present Not Present
For
insp
ectio
n pur
pose
s only
.
Conse
nt of
copy
right
owne
r req
uired
for a
ny ot
her u
se.
EPA Export 07-11-2018:04:04:42

17617-6016-A Evaluation of the Risk of Adverse Impact on
Cork Harbour SPA (004030) and Great Island SAC (001058) May 2017
8
3.4 Food Sources of Qualifying Features of the SPA
Table 6 below outlines the food sources for each of the qualifying SCIs of the Cork Harbour SPA.
Table 6 Food Sources of Qualifying Features of the SPA
QUALIFYING FEATURES
DIET
Great Crested Grebe Mainly fish, sometimes supplemented with aquatic invertebrates
Little Grebe A range of invertebrates (particularly insect larvae), small fish and molluscs.
Cormorant Fish
Grey Heron Fish, amphibians, small mammals, insects and reptiles.
Shelduck Chief prey source is Hydrobia ulvae, which is present in almost all estuaries, and often in large numbers. Spatial distribution is strongly influenced by the behaviour of this prey, particularly in relation to water depth. They possibly feed at night, detecting prey by tactile clues using their bills.
Wigeon Aquatic plants, grasses, roots.
Teal Small seeds predominate, but Enteromorpha sp. and molluscs are also frequently taken. Occasionally feed on chironomid larvae where available, though usually during the summer months. They feed by day where they are safe from shooting
Pintail Their diet consists largely of plant seeds and underwater plants, while insects and crustaceans are also eaten. They also feed on farmland, particularly stubble
Shoveler Feed predominantly on zooplankton which are found mostly on ephemeral wetlands, particularly turloughs and callows. They also feed on small molluscs, insects and larvae, seeds and plant material and are frequently seen dabbling around the edges of waterpools
Red-breasted Merganser
Fish comprise the major component of the diet, predominantly small cod, hake and plaice. While on freshwater during the breeding season, they feed on roach, trout, salmon, eels and pike. They have also been recorded eating crustaceans and molluscs
Oystercatcher The main food resource includes the larger invertebrates, particularly mussels and cockles that proliferate along sandy coasts. They also occasionally feed on grasslands where they prey on tipulid larvae and earthworms. They feed by both sight (for polychaete worms) and touch (bivalve mussels).
Golden Plover Feed on a variety of soil and surface-living invertebrates, principally beetles and earthworms, but also on plant material such as berries, seeds and grasses. They regularly feed in association with Lapwing & Black-headed Gulls.
Grey Plover Feeds on a wide variety of burrowing intertidal invertebrates, particularly polychaete worms, molluscs and crustaceans
Lapwing Feed on a variety of soil and surface-living invertebrates, particularly small arthropods and earthworms. Also feed at night, possibly to avoid kleptoparasitic attacks by Black-headed Gulls, but also, some of the larger earthworm species are present near the soil surface at night, and thus are more easily accessible. They use traditional feeding areas, are opportunistic, and will readily exploit temporary food sources, such as ploughed fields and on the edge of floodwaters.
Dunlin Feed predominantly on small invertebrates of estuarine mudflats, particularly polychaete worms and small gastropods. They feed in flocks, in the muddier sections of the estuaries and close to the tide edge.
Black-tailed Godwit Visual and tactile feeders - feed on a range of invertebrates, including bivalves, polychaete worms and shore crabs. Prefer to feed on muddier estuaries, but also feed in brackish pools and on nearby rough pasture. While on pasture, they feed on the larvae of crane fly (Tipulidae) and on the amphipod Corophium volutator. They have also been recorded feeding on grain in stubble fields.
Bar-tailed Godwit Feed along the tidal edge, or in shallow water (up to 15 cm depth). They usually commence feeding on an ebbing tide, and feed continuously for up to 6 hours. Polychaete worms, particularly lugworms, form a large proportion of their diet. On the muddier estuaries, where lugworms may be absent, they take ragworms and bivalves.
Curlew They feed mostly on invertebrates, particularly ragworms, crabs and molluscs. They are
For
insp
ectio
n pur
pose
s only
.
Conse
nt of
copy
right
owne
r req
uired
for a
ny ot
her u
se.
EPA Export 07-11-2018:04:04:42

17617-6016-A Evaluation of the Risk of Adverse Impact on
Cork Harbour SPA (004030) and Great Island SAC (001058) May 2017
9
QUALIFYING FEATURES
DIET
usually well dispersed across the estuary while feeding, but roost communally, usually along salt marshes and sand banks.
Redshank Detect prey visually and feed mostly during the day along the upper shore of estuaries and along muddy river channels. Feed singly or in small groups, and their prey consists mostly of Hydrobia sp., Corophium sp. and nereid worms
Greenshank Feed mostly in deep water sites, channels, brackish pools and lakes, predominantly on invertebrates, particularly shrimps, crabs and Hediste sp., and small fish. They have a variety of feeding techniques, though mostly feed by pecking at the mud, water or vegetation, and catch fish by using a dash-and-lunge technique
Black-headed Gull Opportunistic feeder. It eats insects, fish, seeds, worms, scraps, and carrion in towns, or invertebrates in ploughed fields
Lesser Black –backed Gull
Takes a wide variety of prey including fish from the sea, waste from fisheries, rubbish from landfill sites, insects in flight, young birds and food from other birds.
Common Tern Chiefly fish
Source: Birdwatch Ireland http://www.birdwatchireland.ie/IrelandsBirds
4 GREAT ISLAND CHANNEL SAC (001058)
4.1 Conservation Objectives of the Great Island Channel SAC
The site is a Special Area of Conservation (SAC) selected for the following habitats and/or species
listed on Annex I / II of the E.U. Habitats Directive
Mudflats and sandflats not covered by seawater at low tide
Atlantic salt meadows (Glauco-Puccinellietalia maritimae) Atlantic Salt Meadows
C
Site-specific conservation objectives define the desired condition or range of conditions that the
habitats should be in, in order for these selected features within the site to be judged as favourable.
Detailed Conservation Objectives have been published by the NPWS for Great Island Channel SAC in
June 2014. The Conservation Objective Report for this SAC set out the attributes and targets for
achieving favourable conservation condition for each of the qualifying interests of the SAC. The
attributes, measurement of attributes and targets for the qualifying interests of the SAC are outlined
in Table 7 below.
For
insp
ectio
n pur
pose
s only
.
Conse
nt of
copy
right
owne
r req
uired
for a
ny ot
her u
se.
EPA Export 07-11-2018:04:04:42
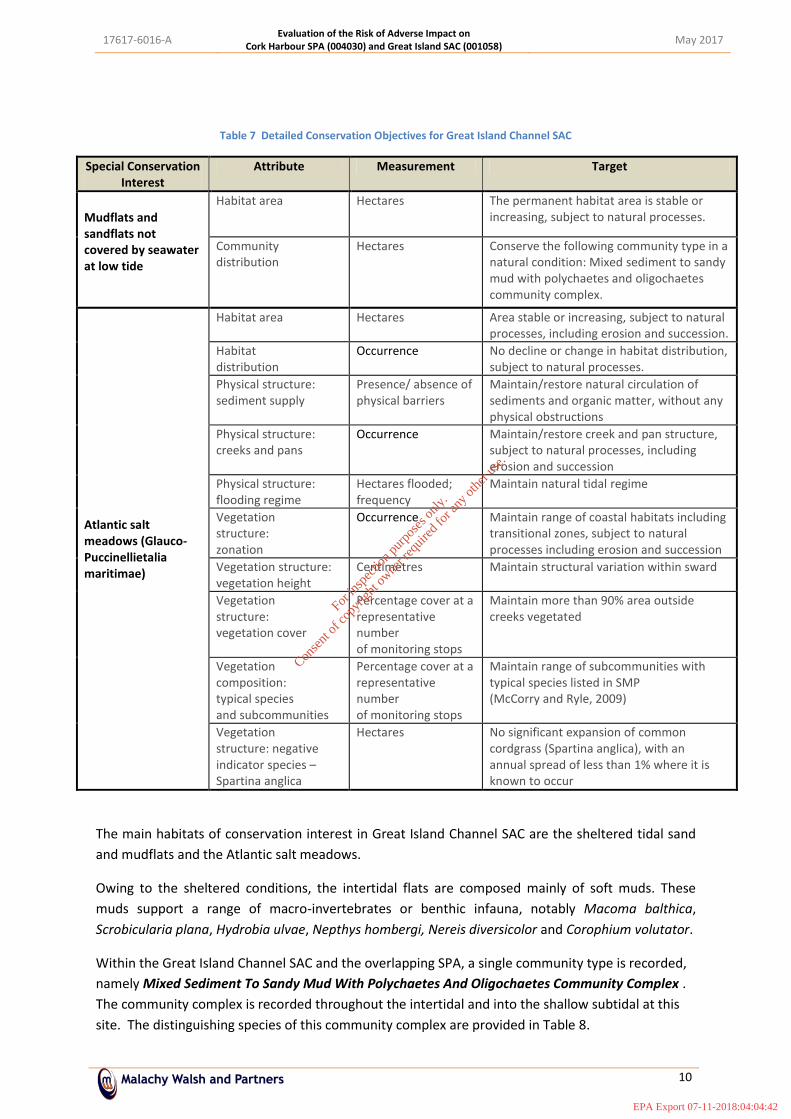
17617-6016-A Evaluation of the Risk of Adverse Impact on
Cork Harbour SPA (004030) and Great Island SAC (001058) May 2017
10
Table 7 Detailed Conservation Objectives for Great Island Channel SAC
Special Conservation Interest
Attribute Measurement Target
Mudflats and sandflats not covered by seawater at low tide
Habitat area Hectares The permanent habitat area is stable or increasing, subject to natural processes.
Community distribution
Hectares Conserve the following community type in a natural condition: Mixed sediment to sandy mud with polychaetes and oligochaetes community complex.
Atlantic salt meadows (Glauco-Puccinellietalia maritimae)
Habitat area Hectares Area stable or increasing, subject to natural processes, including erosion and succession.
Habitat distribution
Occurrence No decline or change in habitat distribution, subject to natural processes.
Physical structure: sediment supply
Presence/ absence of physical barriers
Maintain/restore natural circulation of sediments and organic matter, without any physical obstructions
Physical structure: creeks and pans
Occurrence Maintain/restore creek and pan structure, subject to natural processes, including erosion and succession
Physical structure: flooding regime
Hectares flooded; frequency
Maintain natural tidal regime
Vegetation structure: zonation
Occurrence Maintain range of coastal habitats including transitional zones, subject to natural processes including erosion and succession
Vegetation structure: vegetation height
Centimetres Maintain structural variation within sward
Vegetation structure: vegetation cover
Percentage cover at a representative number of monitoring stops
Maintain more than 90% area outside creeks vegetated
Vegetation composition: typical species and subcommunities
Percentage cover at a representative number of monitoring stops
Maintain range of subcommunities with typical species listed in SMP (McCorry and Ryle, 2009)
Vegetation structure: negative indicator species – Spartina anglica
Hectares No significant expansion of common cordgrass (Spartina anglica), with an annual spread of less than 1% where it is known to occur
The main habitats of conservation interest in Great Island Channel SAC are the sheltered tidal sand
and mudflats and the Atlantic salt meadows.
Owing to the sheltered conditions, the intertidal flats are composed mainly of soft muds. These
muds support a range of macro-invertebrates or benthic infauna, notably Macoma balthica,
Scrobicularia plana, Hydrobia ulvae, Nepthys hombergi, Nereis diversicolor and Corophium volutator.
Within the Great Island Channel SAC and the overlapping SPA, a single community type is recorded,
namely Mixed Sediment To Sandy Mud With Polychaetes And Oligochaetes Community Complex .
The community complex is recorded throughout the intertidal and into the shallow subtidal at this
site. The distinguishing species of this community complex are provided in Table 8.
For
insp
ectio
n pur
pose
s only
.
Conse
nt of
copy
right
owne
r req
uired
for a
ny ot
her u
se.
EPA Export 07-11-2018:04:04:42

17617-6016-A Evaluation of the Risk of Adverse Impact on
Cork Harbour SPA (004030) and Great Island SAC (001058) May 2017
11
Table 8 Distinguishing species of Mixed sediment to sandy mud with polychaetes and oligochaetes communities complex
Hediste diversicolor
Nephty hombergii
Peringia ulvae
Tubificoides benedii
Scrobicularia plana
The saltmarshes are scattered through the site and are all of the estuarine type on mud substrate.
Species present include Sea Purslane (Halimione portulacoides), Sea Aster (Aster tripolium), Thrift
(Armeria maritima), Common Saltmarsh-grass (Puccinellia maritima), Sea Plantain (Plantago
maritima), Greater Sea-spurrey (Spergularia media), Lax-flowered Sea-lavender (Limonium humile),
Sea Arrowgrass (Triglochin maritimum), Sea Mayweed (Matricaria maritima) and Red Fescue
(Festuca rubra).
5 Habitats / Species and their Sensitivity to Water Quality Changes
Habitats communities exhibit varying responses to changes in water chemistry and water quality.
Each species response to environmental perturbations produces measurable, and often predictable,
shifts in abundance and composition at the community level.
A desk study was undertaken of existing data on the study area relating to the benthos (community
of organisms that live in the mudflats) or the benthic infauna of Cork Harbour. Existing benthic
infauna species and habitat data was assessed against the best available information on the
sensitivity of these species and habitats and to changes in water quality.
Species data were assessed against species and habitat sensitivity data currently available through
the MarLin (Marine Life Information Network) on-line resource. MarLin has deriverd 7 different
sensitivity rating from Not Relevant/ Not Sensitive to Very High Sensitivity (www.marlin.ac.uk). The
key or distinguishing species identified below in Section 5.1 that are important for the structure and
functioning of the mudflat habitat and food source for the qualifying birds were the focus of the
evaluation.
Each of the key species was evaluated against (a) Increased Suspended Solids / Turbidity, (b)
Changes in nutrient levels, and (c) Changes in oxygenation as these were considered the key likely
sources of impact from discharges from the Dairygold Mogeely wwtp. The evaluation also looked at
sensitivities to changes in salinity and temperature.
5.1 Overview of Benthic Infauna Community
The taxa (groups of organisms that form a unit) that make up the benthic infauna in Cork harbour
typically comprise of annelids (segmented worms), crustaceans (crabs, shrimps, prawns) and
molluscs. Other less abundant taxa may include sponges and other worms. Typically abundant fauna
For
insp
ectio
n pur
pose
s only
.
Conse
nt of
copy
right
owne
r req
uired
for a
ny ot
her u
se.
EPA Export 07-11-2018:04:04:42

17617-6016-A Evaluation of the Risk of Adverse Impact on
Cork Harbour SPA (004030) and Great Island SAC (001058) May 2017
12
include oligochaetes (worms), polychaetes (marine worms) such as ragworm and gastropods (snails).
These muds support a range of macro-invertebrates, notably Macoma balthica (clam), Scrobicularia
plana (mollusc), Hydrobia ulvae (snail), Nepthys hombergi (catworm), Nereis diversicolor (worm) and
Corophium volutator (crustacean).
Cork Harbour SAC supports a mixed sediment to sandy mud with polychaetes and oligochaetes
community complex, which is recorded throughout the intertidal and into the shallow subtideal of
the site. The key or distinguishing species of this community complex are the polychaetes Hediste
diversicolor (ragworm) and Nephtys hombergii (catworm) and the oligochaetes Tubificoides benedii
(sludgeworm). Other species recorded here include the gastropod Peringia ulvae and the bivalve
Scrobicularia plana. The aim of the conservation objectives for the SAC is to maintain this mixed
sediment community complex. 2
The MarLIN sensitivity assessments for the following species and habitats are included in Appendix
A:
Macoma balthica
Peringia ulvae
Nepthys hombergi
Hediste diversicolor
Corophium volutator
Arenicola marina
Tubificoides benedii
Atlantic salt meadows
Mudflats and sandflats
2 Conservation objectives supporting document – Marine Habitats. NPWS
For
insp
ectio
n pur
pose
s only
.
Conse
nt of
copy
right
owne
r req
uired
for a
ny ot
her u
se.
EPA Export 07-11-2018:04:04:42

17617-6016-A Evaluation of the Risk of Adverse Impact on
Cork Harbour SPA (004030) and Great Island SAC (001058) May 2017
13
5.2 Sensitivity to Increased Suspended Solids Loadings:
Maximum Suspended solid (SS) concentrations in the proposed effluent discharges from the
Rathcoursey outfall are 35mg/L. The Irish Hydrodata Ltd assessment predicts that after initial
dilution Suspended solid concentrations within the receiving waterbody resulting from the Dairygold
discharges is small and would be in the order of 0.02mg/l.
The Irish Hydrodata Ltd hydraulic model assessment also shows the predicted concentrations when
all future potential sources of Suspended Solids (Middleton WWTP, IDL and Dairygold) inputs are
included. This shows concentrations in the Great Island channel are generally below 0.1mg/l.
The current background SS levels within the waterbody are conservatively estimated at 1.5mg/l. The
predicted increase in SS from the future discharges would be well below the quality target of an
increase of not greater than 30% above surrounding levels.
The key or distinguishing species identified within the mudflat and sandflat habitat are generally not
sensitive or are of low sensitivity to increased suspended solid loading and turbidity. (Refer to
Appendix A for detailed MarLIN sensitivity assessment for increase in suspended sediment and
turbidity for each of the key or distinguishing benthic infaunal species). The effects on water quality
of a change in suspended solids from the proposed Dairygold discharge are limited, and would not
have a significant effect on the key or distinguishing species identified within the mudflat and
sandflat habitat within the SAC.
5.3 Sensitivity to Nutrient Inputs
Dissolved Inorganic Nitrogen (DIN)
The lower harbour area is a designated coastal waterbody with Environmental Quality Standard
(EQS) targets for good status of between 0.25 and 2.6 DIN mg/l N depending on salinity. The Great
Island channel and the Owenacurra estuary are designated transitional waters. There is no set
legislative standard for DIN in Transitional Water. On the basis of the lower salinity levels within the
Great Island channel and the Owenacurra estuary and a linear interpolation of the EQ standards for
Coastal Waters, the target level of 0.44mg/l N for DIN would apply.
The Irish Hydrodata Ltd assessment calculated concentrations in these waters when all present day
sources of DIN including riverine inputs are included. The vast majority of the DIN input (circa 84%)
arises from the freshwater input (Refer to Table 4.3 of the Irish Hydrodata report for the existing
load). The model shows that concentrations of DIN in the Great Island channel are generally below
0.4mg/l N. Higher values (up to a maximum of 2.6mg/l) are shown to occur for the Owenacurra
estuary. The model shows that DIN concentrations gradually increase from Loughatalia to the upper
sections of the estuary at Ballynacorra.
For
insp
ectio
n pur
pose
s only
.
Conse
nt of
copy
right
owne
r req
uired
for a
ny ot
her u
se.
EPA Export 07-11-2018:04:04:42

17617-6016-A Evaluation of the Risk of Adverse Impact on
Cork Harbour SPA (004030) and Great Island SAC (001058) May 2017
14
Figure 3 General Present Day DIN concentrations within in the Owenacurra Estuary
The Irish Hydrodata Ltd model then predicted concentrations when all potential future sources
(Middleton WWTP, IDL and Dairygold) of DIN including riverine inputs are included. This shows that
DIN concentrations in the Great Island Channel are still generally below 0.4mg/l N and therefore
within the Good Status quality target. The model also shows a slight change in DIN concentrations
within the middle to lower reaches of the Owenacurra Estuary with little to no changes in the upper
reaches of the Owenacurra Estuary. The resulting DIN increases are still generally below 0.4mg/l and
therefore within the Good Status quality target.
For
insp
ectio
n pur
pose
s only
.
Conse
nt of
copy
right
owne
r req
uired
for a
ny ot
her u
se.
EPA Export 07-11-2018:04:04:42

17617-6016-A Evaluation of the Risk of Adverse Impact on
Cork Harbour SPA (004030) and Great Island SAC (001058) May 2017
15
Figure 4 General Future DIN concentrations within in the Owenacurra Estuary
The predicted impact of the Dairygold discharge contribution to the DIN levels is small and less than
0.02mg/l N both in the Great Island channel, the Owenacurra Estuary and the Rostellan areas.
Phosphate
The Great Island channel and the Owenacurra estuary are designated transitional waters with EQS
targets of between 0.04 and 0.06 mg/l P depending on salinity.
The Irish Hydrodata Ltd assessment calculated concentrations in these waters when all present day
sources of PO4 (phosphate) including riverine inputs are included. The model show shows that
concentrations of PO4 in the Great Island channel are generally below 0.01mg/l P.
The Irish Hydrodata Ltd model then predicted concentrations when all potential future sources of
PO4 (phosphate) including riverine inputs are included. This shows that PO4 concentrations in the
Great Island Channel and Owenacurra Estuary are still generally below 0.01mg/l P and therefore
within the quality target.
The predicted impact of the Dairygold discharge contribution to the PO4 levels is small and less than
0.002mg/l P both in the Great Island channel and Owenacurra Estuary and the Rostellan areas.
For
insp
ectio
n pur
pose
s only
.
Conse
nt of
copy
right
owne
r req
uired
for a
ny ot
her u
se.
EPA Export 07-11-2018:04:04:42

17617-6016-A Evaluation of the Risk of Adverse Impact on
Cork Harbour SPA (004030) and Great Island SAC (001058) May 2017
16
The key or distinguishing species identified within the mudflat and sandflat habitat are of variable
sensitivity to nutrient inputs. While some effects of nutrient enrichment may be beneficial, nutrient
enrichment can cause algal blooms and the growth of algal mats. For example, these mats physically
perturb Corophium volutator, an amphipod crustacean typical of mudflats, by preventing burrowing
and normal feeding and can reduce water and oxygen exchange resulting in localised hypoxia.
The Mudflat and sandflat benthic infaunal communities would not be affected significantly by the
increase in nutrient loadings considering the limited increase in nutrient levels and the resultant
concentration which are within EQS Good Status. Refer to Appendix A for detailed MarLIN sensitivity
assessment for changes in nutrient levels for each of the key or distinguishing benthic infaunal
species.
5.4 Sensitivity to Changes in oxygenation levels
The Great Island channel and the Owenacurra estuary are designated transitional waters with EQS
targets of between 4 mg/l for BOD and depending on salinity levels a target of >70-80% to <120-
130% saturation for dissolved oxygen (DO).
Official EPA Dissolved Oxygen (DO) saturation data (provided by Irish Hydrodata Ltd) gives average
DO saturations of 98.5% for EPA monitoring Station LE450 and 104.0% for LE540. Both stations are
within the North Channel Great Island waterbody. These are healthy DO levels within the target
environmental quality standards and show there is currently no issue for water quality with respect
to the oxygen condition.
Table 9 EXISTING DISSOVLED OXYGEN (DO) LEVEL WITHIN CORK HARBOUR
EPA Monitoring Site DO (%saturation) EQS
LE450 98.5 Lower Limit: (0 psu) 95%ile >70 saturation (35 psu) 95%ile >80% saturation Upper Limit: (0 psu) 95%ile <130 saturation
(35 psu) 95%ile <120% saturation
LE530 107.2
LE540 104.0
LE550 99.4
Passage W LE340 95.0
Aghada LE610 100.7
Roches Pt LE810 97.5
For
insp
ectio
n pur
pose
s only
.
Conse
nt of
copy
right
owne
r req
uired
for a
ny ot
her u
se.
EPA Export 07-11-2018:04:04:42

17617-6016-A Evaluation of the Risk of Adverse Impact on
Cork Harbour SPA (004030) and Great Island SAC (001058) May 2017
17
Figure 5 Location of EPA Monitoring Sites
Organic matter, measured as Biochemical Oxygen Demand (BOD) is one of the key indicators of the
oxygen content of water bodies. Most pristine rivers will have a 5-day carbonaceous BOD below
1 mg/L.
BOD concentrations in the effluent from the WwTP will be 25mg/l O2. The Irish Hydrodata Ltd
hydraulic model assessment shows the predicted concentrations when all future potential sources
of BOD (Middleton WWTP, IDL and Dairygold) inputs are included. This shows concentrations in the
Great Island channel are generally below 0.1mg/l and therefore within the quality target of 4mg/l
BOD.
The Irish Hydrodata Ltd assessment predicts that the Dairygold discharge contribution to BOD levels
within the receiving waterbody is small and would be in the order of <0.05 mg/l O2. These levels
would not significantly affect the oxygen conditions of the waterbody body.
The key or distinguishing species identified within the mudflats and sandflat habitat are of variable
sensitivity to changes in oxygen levels. Some species Nephtys hombergi, Macoma balthica and
Arenicola marina can be unaffected by short periods without oxygen, however these species have a
For
insp
ectio
n pur
pose
s only
.
Conse
nt of
copy
right
owne
r req
uired
for a
ny ot
her u
se.
EPA Export 07-11-2018:04:04:42

17617-6016-A Evaluation of the Risk of Adverse Impact on
Cork Harbour SPA (004030) and Great Island SAC (001058) May 2017
18
low intolerance if exposed to oxygen concentration as low as 2mg/l . Corophium volutator is highly
sensitive to hypoxia and suffers 50% mortality after just 4 hours in hypoxic conditions.
The effects on water quality of a change in BOD from the proposed Dairygold discharge are limited,
and would not have a significant effect on the key or distinguishing species identified within the
mudflat and sandflat habitat within the SAC
Refer to Appendix A for detailed MarLIN sensitivity assessment for changes in oxygenation for each
of the key or distinguishing benthic infaunal species.
For
insp
ectio
n pur
pose
s only
.
Conse
nt of
copy
right
owne
r req
uired
for a
ny ot
her u
se.
EPA Export 07-11-2018:04:04:42

17617-6016-A Evaluation of the Risk of Adverse Impact on
Cork Harbour SPA (004030) and Great Island SAC (001058) May 2017
19
Table 10 CURRENT AND PREDICTED CHANGES IN WATER QUALITY FROM PROPOSED DAIRYGOLD DISCHARGES
Salinity BOD mg/l DO (%saturation) PO4 mg/l P DIN mg/l N SS mg/l EQS Must not cause salinity
to increase by more than 10% above surrounding levels
4.0mg/l (95%ile)
Lower Limit: (0 psu) 95%ile >70 saturation (35 psu) 95%ile >80% saturation Upper Limit: (0 psu) 95%ile <130 saturation (35 psu) 95%ile <120% saturation
≤0.06mg/l (0-17psu) median ≤0.04mg/l (34psu) median
Good Status <2.6mg/l(0psu) median <0.25mg/l(34.5psu) median High Status <0.17mg/l(34.5psu) median
Must not cause SS to increase by more than 30% above surrounding levels
Target As above As above As above Target: 0.42mg/N Target: 0.44mg/N As above
Reference NOTE 1 NOTE 2 NOTE 2 NOTE 3 NOTE 4 NOTE 1
EPA Monitoring Site
Current Current Predicted Increase by
DG
Current Predicted Change by
DG**
Current Predicted Increase by DG
Current Predicted Increase by DG
Current* Predicted Increase by DG
HW LW HW LW HW LW HW LW
LE450 31.4 2.0 0.004 0.008 98.5 98.43 0.0099 0.0016 0.0013 0.365 0.012 0.010 1.5 0.0056 0.0112
LE530 28.5 2.0 0.001 0.006 107.2 107.16 0.0099 0.0011 0.0004 0.757 0.008 0.003 1.5 0.0014 0.0084
LE540 31.9 1.0 0.004 0.004 104.0 103.35 0.0090 0.0011 0.0005 0.270 0.008 0.004 1.5 0.0056 0.0056
LE550 31.8 1.0 0.016 0.006 99.4 99.27 0.0110 0.0021 0.0021 0.234 0.016 0.016 1.5 0.0224 0.0084
Aghada LE610 33.95 1.5 0.006 0.001 100.7 100.66 0.0090 0.0003 0.0016 0.13 0.002 0.012 1.5 0.0084 0.0014
Note 1: Targets for discharges to shellfish waters (SI 268-2006)
Note 2: Target water quality standards for Transitional Water Body (SI 272-2009)
Note 3: Target water quality standards for Transitional Water Body (SI 272-2009)
On the basis of the median background salinity and a linear interpolation of the EQ standards the target level for PO4 at the edge of the
mixing zone is 0.042mg/l P.
Note 4: Target water quality standards for Coastal Water Body (SI 272-2009).
There is no set legislative standard for DIN in Transitional Water. On the basis of the lower salinity levels within the receiving waters and a linear interpolation of the EQ standards
for Coastal Waters, the target level of 0.44mg/l N for DIN would apply.
*Assumed value as there is no sample data available
** Change in DO taking a direct relationship between the rise in BOD and 100% saturation at 8.30 mg/l DO (100% saturation for 32 mg/l salinity and 14.5οC sea temperature)
For
insp
ectio
n pur
pose
s only
.
Conse
nt of
copy
right
owne
r req
uired
for a
ny ot
her u
se.
EPA Export 07-11-2018:04:04:42

17617-6016-A Evaluation of the Risk of Adverse Impact on
Cork Harbour SPA (004030) and Great Island SAC (001058) May 2017
20
6 SUMMARY OF POTENTIAL IMPACTS IN VIEW OF CONSERVATION OBJECTIVES
Table 11 Conservation Objectives for CORK HARBOUR SPA
Special Conservation
Interest
Attribute Measurement Target Likelihood of discharges having
Significant Adverse Effect
Rationale
Over-wintering species Little Grebe, Great Crested Grebe, Cormorant, Grey Heron, Shelduck, Wigeon, Teal, Pintail, Shoveler, Red-breasted merganser, Oystercatcher, Golden plover, Grey plover, Lapwing, Dunlin, Black-tailed godwit, Bar-tailed godwit, Curlew, Redshank, Greenshank, Black-headed gull, Common gull and Lesser black-backed gull.
Population Trend
Percentage Change
Long term population trend is stable or increasing
No The latest water quality information on the North Channel Great Island waterbody from the EPA indicates that it has ‘good’ ecological status. The addition of the proposed Dairygold, Mogeely treated effluent, to the discharge, would have a negligible impact on the quality of the receiving water body. The hydrodynamic model shows that the Dairygold wwtp discharges in combination with the future Middleton and IDL discharges would not change the current “good” status classification of the waterbody under the regulations. The sensitivity assessment indicates that the habitat (biotope) would not be sensitive to the level of water quality changes and would not cause a significant change in typical species composition on which the qualifying Special Conservation Interests (SCI) feed. Therefore the Dairygold Mogeely wwtp discharges in combination with the future Middleton and IDL discharges would not significantly affect prey abundance or distribution within the receiving environment and thus would not significantly affect the long term population trend and distribution of the qualifying bird species within Cork harbour.
Distribution Range, timing and intensity of use of areas
No significant decrease in the range, timing or intensity of use of areas by over wintering species other than that occurring from natural patterns of variation.
No
Breeding species
Breeding population abundance:
Number of apparently occupied nests (AONs)
No significant decline No The latest water quality information on the North Channel Great Island waterbody from the EPA indicates that it has ‘good’ ecological status. The addition of the proposed Dairygold, Mogeely treated effluent, to the discharge, would have a negligible impact on the quality of the receiving water body. The hydrodynamic model shows that the Dairygold wwtp discharges in combination with the future Middleton and IDL discharges would not change the current
For
insp
ectio
n pur
pose
s only
.
Conse
nt of
copy
right
owne
r req
uired
for a
ny ot
her u
se.
EPA Export 07-11-2018:04:04:42

17617-6016-A Evaluation of the Risk of Adverse Impact on
Cork Harbour SPA (004030) and Great Island SAC (001058) May 2017
21
Special Conservation
Interest
Attribute Measurement Target Likelihood of discharges having
Significant Adverse Effect
Rationale
“good” status classification of the waterbody under the regulations. The sensitivity assessment indicates that the habitat (biotope) would not be sensitive to the level of water quality changes and cause a significant change in typical species composition on which the qualifying Special Conservation Interests (SCI) feed. Therefore the Dairygold Mogeely wwtp discharges in combination with the future Middleton and IDL discharges would not significantly affect prey abundance or distribution within the receiving environment and thus would not significantly affect the breeding population abundance of the qualifying bird species within Cork harbour
Productivity rate:
Mean number of fledged young per breeding pair
No significant decline No The latest water quality information on the North Channel Great Island waterbody from the EPA indicates that it has ‘good’ ecological status. The addition of the proposed Dairygold, Mogeely treated effluent, to the discharge, would have a negligible impact on the quality of the receiving water body. The hydrodynamic model shows that the Dairygold wwtp discharges in combination with the future Middleton and IDL discharges would not change the current “good” status classification of the waterbody under the regulations. The sensitivity assessment indicates that the habitat (biotope) would not be sensitive to the level of water quality changes and cause a significant change in typical species composition on which the qualifying Special Conservation Interests (SCI) feed. Therefore the Dairygold Mogeely wwtp discharges in combination with the future Middleton and IDL discharges would not significantly affect the productivity rate of the qualifying bird species within Cork harbour
Distribution: breeding colonies
Number, location, area (hectares)
No significant decline No The latest water quality information on the North Channel Great Island waterbody from the EPA indicates that it has ‘good’ ecological status. The addition of the proposed Dairygold, Mogeely treated effluent, to the discharge, would have a negligible impact on the quality of the receiving water body. The hydrodynamic model shows that the Dairygold wwtp discharges in combination with the future Middleton and IDL discharges would not change the current “good” status classification of the waterbody under the regulations.
For
insp
ectio
n pur
pose
s only
.
Conse
nt of
copy
right
owne
r req
uired
for a
ny ot
her u
se.
EPA Export 07-11-2018:04:04:42

17617-6016-A Evaluation of the Risk of Adverse Impact on
Cork Harbour SPA (004030) and Great Island SAC (001058) May 2017
22
Special Conservation
Interest
Attribute Measurement Target Likelihood of discharges having
Significant Adverse Effect
Rationale
The sensitivity assessment indicates that the habitat (biotope) would not be sensitive to the level of water quality changes and cause a significant change in typical species composition on which the qualifying Special Conservation Interests (SCI) feed. Therefore the Dairygold Mogeely wwtp discharges in combination with the future Middleton and IDL discharges would not significantly affect prey abundance or distribution within the receiving environment and thus would not significantly affect the distribution of the qualifying bird species within Cork harbour
Prey biomass available
Kilogrammes No significant decline*
No The latest water quality information on the North Channel Great Island waterbody from the EPA indicates that it has ‘good’ ecological status. The addition of the proposed Dairygold, Mogeely treated effluent, to the discharge, would have a negligible impact on the quality of the receiving water body. The hydrodynamic model shows that the Dairygold wwtp discharges in combination with the future Middleton and IDL discharges would not change the current “good” status classification of the waterbody under the regulations. The sensitivity assessment indicates that the habitat (biotope) would not be sensitive to the level of water quality changes and cause a significant change in typical species composition on which the qualifying Special Conservation Interests (SCI) feed. Therefore the Dairygold Mogeely wwtp discharges in combination with the future Middleton and IDL discharges would not significantly affect prey abundance or distribution within the receiving environment
Barriers to connectivity
Number, location, shape, area (hectares)
No significant decline No No physical barriers thus no probability of impact
Disturbance at the breeding site
Level of impact
Human activities should occur at levels that do not adversely affect the breeding common tern population
No No disturbance of habitat thus no probability of impact
For
insp
ectio
n pur
pose
s only
.
Conse
nt of
copy
right
owne
r req
uired
for a
ny ot
her u
se.
EPA Export 07-11-2018:04:04:42

17617-6016-A Evaluation of the Risk of Adverse Impact on
Cork Harbour SPA (004030) and Great Island SAC (001058) May 2017
23
Special Conservation
Interest
Attribute Measurement Target Likelihood of discharges having
Significant Adverse Effect
Rationale
Wetlands
Habitat area Hectares The permanent area occupied by the wetland habitat should be stable and not significantly less than the area of 2,587 hectares, other than that occurring from natural patterns of variation.
No No physical loss of habitat thus no probability of impact
For
insp
ectio
n pur
pose
s only
.
Conse
nt of
copy
right
owne
r req
uired
for a
ny ot
her u
se.
EPA Export 07-11-2018:04:04:42

17617-6016-A Evaluation of the Risk of Adverse Impact on
Cork Harbour SPA (004030) and Great Island SAC (001058) May 2017
24
Table 12. Conservation Objectives for Great Island Channel SAC (001058)
Special Conservation
Interest
Attribute Measurement Target Likelihood of discharges
having Significant
Adverse Effect
Rationale
Mudflats and sandflats not covered by seawater at low tide
Habitat area Hectares The permanent habitat area is stable or increasing, subject to natural processes.
No No physical loss of habitat thus no probability of impact
Community distribution
Hectares Conserve the following community type in a natural condition: Mixed sediment to sandy mud with polychaetes and oligochaetes community complex.
No The latest water quality information on the North Channel Great Island waterbody from the EPA indicates that it has ‘good’ ecological status. The addition of the proposed Dairygold, Mogeely treated effluent, to the discharge, would have a negligible impact on the quality of the receiving water body. The hydrodynamic model shows that the Dairygold wwtp discharges in combination with the future Middleton and IDL discharges would not change the current “good” status classification of the waterbody under the regulations. The sensitivity assessment indicates that the habitat (biotope) would not be sensitive to the level of water quality changes to cause a significant change in typical species composition of the habitat. Therefore the Dairygold Mogeely wwtp discharges in combination with the future Middleton and IDL discharges would not significantly compromise community distribution of the habitat
Atlantic salt meadows (Glauco-Puccinellietalia maritimae)
Habitat area Hectares Area stable or increasing, subject to natural processes, including erosion and succession.
No No physical loss of habitat thus no probability of impact
Habitat distribution
Occurrence No decline or change in habitat distribution, subject to natural processes.
No No likelihood of physical loss or change in habitat distribution thus no probability of impact
Physical structure: sediment supply
Presence/ absence of physical
Maintain/restore natural circulation of sediments and
No No presence/absence of physical barrier to affect sediment supply thus no probability of impact
For
insp
ectio
n pur
pose
s only
.
Conse
nt of
copy
right
owne
r req
uired
for a
ny ot
her u
se.
EPA Export 07-11-2018:04:04:42

17617-6016-A Evaluation of the Risk of Adverse Impact on
Cork Harbour SPA (004030) and Great Island SAC (001058) May 2017
25
Special Conservation
Interest
Attribute Measurement Target Likelihood of discharges
having Significant
Adverse Effect
Rationale
barriers organic matter, without any physical obstructions
Physical structure: creeks and pans
Occurrence Maintain/restore creek and pan structure, subject to natural processes, including erosion and succession
No No presence/absence of physical barrier to affect creeks and and pans thus no probability of impact
Physical structure: flooding regime
Hectares flooded; frequency
Maintain natural tidal regime
No No presence/absence of physical barrier to influence flooding regime thus no probability of impact
Vegetation structure: zonation
Occurrence Maintain range of coastal habitats including transitional zones, subject to natural processes including erosion and succession
No No significant affect effect on zonation. The latest water quality information on the North Channel Great Island waterbody from the EPA indicates that it has ‘good’ ecological status. The Dairygold Mogeely wwtp discharges in combination with the future Middleton and IDL discharges would not change the current “good” status classification of the waterbody under the regulations.
Vegetation structure: vegetation height
Centimetres Maintain structural variation within sward
The latest water quality information on the North Channel Great Island waterbody from the EPA indicates that it has ‘good’ ecological status. The Dairygold Mogeely wwtp discharges in combination with the future Middleton and IDL discharges would not change the current “good” status classification of the waterbody under the regulations. Therefore the Dairygold Mogeely wwtp discharges in combination with the future Middleton and IDL discharges would not have significant adverse effect on vegetation height.
Vegetation structure: vegetation cover
Percentage cover at a representative number of monitoring stops
Maintain more than 90% area outside creeks vegetated
The latest water quality information on the North Channel Great Island waterbody from the EPA indicates that it has ‘good’ ecological status. The Dairygold Mogeely wwtp discharges in combination with the future Middleton and IDL discharges would not change the current “good” status classification of the waterbody under the regulations. Therefore the Dairygold Mogeely wwtp discharges in combination with the future Middleton and IDL discharges would not significantly compromise vegetation cover.
For
insp
ectio
n pur
pose
s only
.
Conse
nt of
copy
right
owne
r req
uired
for a
ny ot
her u
se.
EPA Export 07-11-2018:04:04:42

17617-6016-A Evaluation of the Risk of Adverse Impact on
Cork Harbour SPA (004030) and Great Island SAC (001058) May 2017
26
Special Conservation
Interest
Attribute Measurement Target Likelihood of discharges
having Significant
Adverse Effect
Rationale
Vegetation composition: typical species and subcommunities
Percentage cover at a representative number of monitoring stops
Maintain range of subcommunities with typical species listed in SMP (McCorry and Ryle, 2009)
The latest water quality information on the North Channel Great Island waterbody from the EPA indicates that it has ‘good’ ecological status. The Dairygold Mogeely wwtp discharges in combination with the future Middleton and IDL discharges would not change the current “good” status classification of the waterbody under the regulations. The habitat species would not be sensitive to the level of water quality changes to have a significant change in the typical species and sub-communities.
Vegetation structure: negative indicator species – Spartina anglica
Hectares No significant expansion of common cordgrass (Spartina anglica), with an annual spread of less than 1% where it is known to occur
The latest water quality information on the North Channel Great Island waterbody from the EPA indicates that it has ‘good’ ecological status. The Dairygold Mogeely wwtp discharges in combination with the future Middleton and IDL discharges would not change the current “good” status classification of the waterbody under the regulations. The Dairygold Mogeely wwtp discharges in combination with the future Middleton and IDL discharges would therefore not lead to a significant expansion of common cordgrass.
For
insp
ectio
n pur
pose
s only
.
Conse
nt of
copy
right
owne
r req
uired
for a
ny ot
her u
se.
EPA Export 07-11-2018:04:04:42

17617-6016-A Evaluation of the Risk of Adverse Impact on
Cork Harbour SPA (004030) and Great Island SAC (001058) May 2017
27
7 CONCLUSION
The EU Water Framework Directive (2000/60/EC) provides a legislative framework to protect and
improve the quality of waters, specifically -
rivers,
lakes,
transitional (estuarine) and coastal waters
groundwaters
The Water Policy Regulations (S.I. No. 722 of 2003), Surface Waters Regulations (S.I. No. 272 of
2009) and Groundwater Regulations (S.I. No. 9 of 2010) govern the shape of the WFD characterisation,
monitoring and status assessment programmes in terms of assigning responsibilities for the monitoring
of different water categories, determining the quality elements and undertaking the characterisation
and classification assessments.
The 2009 Surface Waters Regulations institute a wide-ranging set of environmental standards for Irish
surface waters. These standards give effect to the principle of achieving the environmental objectives
established for surface waters or protected areas for the water body into which the discharge is made.
The latest water quality information on the North Channel Great Island waterbody from the EPA
indicates that it has ‘good’ ecological status. The addition of the proposed Dairygold, Mogeely treated
effluent, to the discharge, would have a negligible impact on the quality of the receiving water body. As
can be seen from the hydrodynamic model the Dairygold discharge represent a very small fraction of
the quality standard limits set for transitional water bodies and would not change the current “good”
status classification of the waterbody under the regulations.
Certain qualifying species of the Great Island Channel SAC and Cork Harbour SPA, particularly diving and
benthic-feeding bird species for which the SPA is designated may be vulnerable to changes in water
quality. It has however been shown that discharges from the project site either alone or in combination
with other existing or planned discharges from the outfall at Rathcoursey will not result in significant
effects to the water quality of Cork Harbour and subsequently would not have significant adverse affects
on the designated Great Island Channel SAC and Cork Harbour SPA sites.
For
insp
ectio
n pur
pose
s only
.
Conse
nt of
copy
right
owne
r req
uired
for a
ny ot
her u
se.
EPA Export 07-11-2018:04:04:42

17617-6016-A Evaluation of the Risk of Adverse Impact on
Cork Harbour SPA (004030) and Great Island SAC (001058) May 2017
APPENDIX A
Biotope / species Sensitivity Assessment
For
insp
ectio
n pur
pose
s only
.
Conse
nt of
copy
right
owne
r req
uired
for a
ny ot
her u
se.
EPA Export 07-11-2018:04:04:42

Macoma balthica
Physical Pressures Intolerance Recoverability Sensitivity Evidence/Confidence
Increase in suspended sediment
tolerant Not relevant Not sensitive moderate Macoma balthica is known to practice two alternative modes of feeding. It either holds its feeding organ, the siphon, at a fixed position just
above the sediment surface to filter out food particles suspended in the overlying water, or extends and moves its siphon around on the
sediment above it to vacuum up deposited food particles (Peterson & Skilleter, 1994). Facultative switching between the modes of feeding
in Macoma balthica is directly affected by food availability in the over-lying water (Lin & Hines, 1994). In turn, changes in feeding mode from suspension to deposit feeding directly affects burial depth and burrowing in the sediment is one of few defensive mechanisms
Macoma balthica has against predators. In the laboratory, Lin & Hines (1994) observed specimens of Macoma balthica kept in estuarine
water supplemented with 75 µg L-1of algae to maintain a deeper burial position whilst suspension feeding, than those without an enhanced
diet who deposit fed. Thus an increase of material in suspension will favour suspension feeding by Macoma balthica and indirectly reduce
its vulnerability to lethal and sub-lethal siphon browsing by fish and decapods. Macoma balthica is therefore assessed as 'tolerant' with the
potential for growth and reproduction to be enhanced by the increased food supply. Increase in water flow rate
intermediate high low moderate Macoma balthica thrives in low energy environments such as estuaries (Tebble, 1976) where the substratum has a high proportion of fine
sediment. Increased water flow rate will change the sediment characteristics in which the species lives, primarily by re-suspending and
preventing deposition of finer particles (Hiscock, 1983). This would result in erosion of the preferred habitat, which may cause mortality of
some portion of the population of Macoma balthica. Green (1968) recorded that towards the mouth of an estuary where sediments became
coarser and cleaner, Macoma balthica was replaced by another tellin species, Tellina tenuis. Intolerance is therefore recorded as
intermediate. Recoverability is recorded as high (see additional information below). Increase in temperature low Very high Very low moderate
The geographic range of Macoma balthica (see distribution) illustrates that the species is tolerant of a range of temperatures and probably becomes locally adapted. In Europe, the species occurs as far south as the Iberian Peninsula and hence would be expected to tolerate higher
temperatures than experienced in Britain and Ireland. Oertzen (1969) recorded that Macoma balthica could tolerate temperatures up to 49°C
before thermal numbing of gill cilia occurred presumably resulting in death. Ratcliffe et al. (1981) reported that Macoma balthica from the
Humber Estuary, UK, tolerated 6 hours of exposure to temperatures up to 37.5°C with no mortality. It seems likely therefore that the
species could adapt to a chronic change and tolerate a large acute change with no mortality. The worst case scenario following an increase
in temperature is an energetic cost associated with sub-optimal metabolic function and so intolerance is assessed as low. Metabolic activity
should rapidly return to normal when temperatures fall to original levels so recoverability is assessed as very high. Decrease in temperature tolerant Not relevant Not sensitive high
The geographical distribution of Macoma balthica suggests that it is very tolerant of low temperature. The species occurs in the Gulfs of
Finland and Bothnia where the sea freezes for several months of the year (Green, 1968). It must therefore tolerate much lower temperatures
than it experiences in Britain and Ireland. Furthermore, Macoma balthica was apparently unaffected by the severe winter of 1962/3 which
decimated populations of many other bivalve species (Crisp, 1964), and De Wilde (1975) noted that Macoma balthica kept at 0°C
maintained a high level of feeding activity. It is unlikely therefore that UK populations of Macoma balthica would be intolerant of
decreases in temperature. Increase in turbidity Low Very high Very low low
Macoma balthica does not require light and therefore is not directly affected by an increase in turbidity for the purposes of light attenuation. An increase in turbidity may affect primary production in the water column and therefore reduce the availability of phytoplankton food in
suspension and deposited at the sediment surface. However, phytoplankton will also immigrate from distant areas and so the effect may be
decreased. As the benchmark turbidity increase only persists for a year, decreased food availability would probably only affect growth and
fecundity and an intolerance of low is recorded. As soon as light levels return to normal, primary production will increase and hence
recoverability is recorded as very high. The effect of increased siltation is detailed in 'increase in suspended sediment' above. Decrease in turbidity tolerant Not relevant Not sensitive Not relevant
Macoma balthica does not require light and therefore would not be affected by a decrease in turbidity for light attenuation purposes. It is
possible that decreased turbidity would increase primary production in the water column and by micro-phyto benthos. The resultant increase in food availability may enhance growth and reproduction in Macoma balthica, but only if food was previously limiting. The effect of
decreased siltation is detailed in 'decrease in suspended sediment' above. Chemical Pressures Intolerance Recoverability Sensitivity Evidence/Confidence
Changes in nutrient levels tolerant Not relevant Not sensitive moderate It has been suggested that Macoma balthica has the potential to be used as an indicator organism of organic pollution (Pearson &
Rosenberg, 1978; Pekkarinen, 1983; Mölsa, 1986), as the species was reported to increase in abundance towards the sources of nutrient enrichment and to disappear when the organic loading became heavier (Anger, 1975 (a) & (b); Landner et al., 1977). Madsen & Jensen
(1987) reported the population of Macoma balthica to increase in abundance and biomass at two localities in the Danish Wadden Sea
experiencing nutrient enrichment caused by a waste water discharge. The increase in shell growth, productivity / biomass ratio and
improvement in 'condition' index of Macoma balthica in the organically enriched areas was presumably due to the increased food supply
(Madsen & Jensen, 1987). Owing to this evidence and that Macoma balthica is relatively tolerant to deoxygenation (an indirect effect of
nutrient enrichment) it is likely that Macoma balthica will benefit from nutrient enrichment. Increase in salinity low Very high Very low high
McLusky & Allan (1976) conducted salinity survival experiments with Macoma balthica over a period of 150 days. No deaths were reported in specimens of Macoma balthica maintained at 30.5 psu for the duration of the experiment. Macoma balthica is found in brackish
and fully saline waters (although it is more common in brackish waters) (Clay, 1967(b)) so may tolerate a state of flux. McLusky & Allan
(1976) reported that Macoma balthica failed to grow at 41 psu, but it is likely that Macoma balthica would be tolerant of increased salinity
and intolerance to a change in this factor is likely to be low. Growth should quickly return to normal when salinity returns to original levels
and so recoverability is recorded as very high. Changes in oxygenation low Very high Very low high
Macoma balthica appears to be relatively tolerant of deoxygenation. Brafield & Newell (1961) frequently observed that in conditions of
oxygen deficiency (e.g. less than 1 mg O2/l) Macoma balthica moved upwards to fully expose itself on the surface of the sand. Specimens lay on their side with the foot and siphons retracted but with valves gaping slightly allowing the mantle edge to be brought into full contact
with the more oxygenated surface water lying between sand ripples. In addition, Macoma balthica was observed under laboratory
conditions to extend its siphons upwards out of the sand in to the overlying water when water was slowly deoxygenated with a stream of
nitrogen. The lower the oxygen concentration became the further the siphons extended. This behaviour, an initial increase in activity
stimulated by oxygen deficiency, is of interest because the activity of lamellibranchs is generally inhibited by oxygen deficient conditions
(Brafield & Newell, 1961). Dries & Theede (1974) reported the following LT50 values for Macoma balthica maintained in anoxic conditions
: 50 - 70 days at 5°C, 30 days at 10°C, 25 days at 15°C and 11 days at 20°C. Theede (1984) reported that the ability of Macoma balthica to resist extreme oxygen deficiency was mainly due to cellular mechanisms. Of considerable importance are sufficient accumulations of
reserve compounds e.g. glycogen and the ability to reduce energy requirements for maintenance of life by reducing overall activity (Theede,
1984). Macoma balthica is therefore very tolerant of hypoxia, although it may react by reducing metabolic activity. Intolerance is therefore
assessed as low. Metabolic function should quickly return to normal when normoxic levels are resumed and so recoverability is recorded as
very high.
For
insp
ectio
n pur
pose
s only
.
Conse
nt of
copy
right
owne
r req
uired
for a
ny ot
her u
se.
EPA Export 07-11-2018:04:04:42

Peringia (Hydrobia) ulvae (Laver Spire Shell)
Physical Pressures Intolerance Recoverability Sensitivity Evidence/Confidence
Increase in suspended sediment Tolerant Not relevant Not sensitive low
Detritus forms one of the main food sources for this species so increased siltation may be
beneficial. As the snail lives in and on sediment, increases in sediment deposition will
probably not affect locomotion. Increase in temperature Intermediate immediate Very low
The species is quite tolerant of extremes in temperature. Can survive air temperatures below freezing.
The snails can sometimes being exposed continuously to the air for several days between spring tides.
This gives the potential for exposure to quite high air temperatures. Higher temperatures have been
implicated in the proliferation of trematode parasites which have caused mass mortalities. The breeding
season is often quite protracted. The dispersive ability of the abundant pelagic larval form is
considerable. Adults can also immigrate into the area by floating on a mucous raft.
Increase in turbidity Tolerant Not relevant Not sensitive low
This species probably has very limited facility for visual perception and as such is unlikely affected by
turbidity
Chemical Pressures Intolerance Recoverability Sensitivity Evidence/Confidence
Changes in nutrient levels low immediate Not sensitive moderate
Reported as present in polluted waters,
Increase in salinity Tolerant Not relevant Not sensitive moderate
The species is found in a wide range of salinities so changes of one or two salinity bands will be
unlikely to have any effect
Changes in oxygenation Intermediate Very high low moderate
The species can live in conditions of reduced oxygen concentration but can die if combined with
smothering or other stresses. The breeding season is often quite protracted. The dispersive ability of the
abundant pelagic larval form is considerable. Adults can also immigrate into the area by floating on a
mucous raft.
For
insp
ectio
n pur
pose
s only
.
Conse
nt of
copy
right
owne
r req
uired
for a
ny ot
her u
se.
EPA Export 07-11-2018:04:04:42

Nephtys hombergi,(Catworm)
Physical Pressures Intolerance Recoverability Sensitivity Evidence/Confidence
Increase in suspended sediment
tolerant Not relevant Not sensitive low
Nephtys hombergii lives infaunally and is a predatory species feeding on molluscs, crustaceans and other
polychaetes. Increased suspended sediment would not interfere with its feeding. An assessment of not
sensitive has been made.
Increase in temperature tolerant Not relevant Not sensitive high
By virtue of its burrowing habit and of its preference for the sublittoral and lower part of the littoral, Nephtys
hombergii seems able to withstand extremes of temperature (Clay, 1967f). The species is found to the south
of the British Isles (Mediterranean and Atlantic coasts in the southern hemisphere), so is likely to tolerate a
long-term increase of 2°C. Emery & Stevensen (1957) found that the polychaete could withstand summer
temperatures of 30-35°C so may also be able to tolerate a short-term acute increase in temperature. In
addition, the species environmental position and mobility probably protects it from the factor. Therefore, an
assessment of tolerant has been recorded
Increase in turbidity Not relevant Not relevant Not relevant Not relevant Nephtys hombergii lives infaunally between a depth of 5 and 15 cm where light is not transmitted. An
increase in turbidity is unlikely to have a detectable effect on the viability of the species and an assessment
of not relevant has been made.
Chemical Pressures Intolerance Recoverability Sensitivity Evidence/Confidence
Changes in nutrient levels low Very high Very low moderate
Nephtys hombergii is unlikely to be directly affected by nutrient enrichment as growth is not dependent on
nutrient availability. However, symptoms of eutrophication (when nutrient input may exceeds the
assimilative capacity of the environment) include hypoxia, to which Nephtys hombergii may be intolerant
over long episodes (see oxygenation below) but has been found tolerant of over short episodes. At the
benchmark level an intolerance assessment of low has been suggested as in the long term species viability
may be affected. Effects of deoxygenation are considered separately. Recoverability has been assessed to be
very high. Dittman et al. (1999) observed that Nephtys hombergii was amongst the macrofauna that
colonized experimentally disturbed tidal flats within two weeks of the disturbance that caused defaunation of
the sediment.
Increase in salinity low Very high Very low moderate
Nephtys hombergii is considered to be a brackish water species (Barnes, 1994) but where the species occurs
in open coastal locations the species would have to tolerate salinities of 25 psu and above. Within a few
months of the closure of a dam across the Krammer-Volkerak estuary in the Netherlands, Wolff (1971)
observed that species with pelagic larvae or a free-swimming phase, expanded rapidly with a concomitant
increase of salinity to 9-15 psu everywhere. Prior to the closure of the dam the estuary demonstrated
characteristics of a typical 'salt-wedge' estuary with a salinity gradient from 0.3 to 15 psu. Hence, Nephtys
hombergii is likely to survive increases in salinity within estuarine environments and intolerance has been
assessed to be low. In fully saline locations Nephtys hombergii may still be found but, may be competitively
inferior to other species of Nephtyidae (e.g. Nephtys ciliata and Nephtys hystricis) and occur in lower
densities. On return to optimal conditions recoverability is likely to be very high as recolonization via adult
migration is likely to be rapid.
Changes in oxygenation tolerant Not relevant Not sensitive high
Nephtys hombergii is a free-living, burrowing predator in marine sediments in which it has to survive
periods of severe hypoxia and sulphide exposure, while at the same time maintaining agility in order to feed
on other invertebrates. Nephtys hombergii has adapted to such conditions by utilising several strategies.
Arndt & Schiedek (1997) found Nephtys hombergii to have a remarkably high content of phosphagen
(phosphoglycocyamine), which is the primary energy source during periods of environmental stress. With
increasing hypoxia, energy is also provided via anaerobic glycolysis, with strombine as the main end-
product. Energy production via the succinate pathway becomes important only under severe hypoxia,
suggesting a biphasic response to low oxygen conditions which probably is related to the polychaete's mode
of life. The presence of sulphide resulted in a higher anaerobic energy flux and a more pronounced energy
production via glycolysis than in anoxia alone. Nevertheless, after sulphide exposure under anaerobic
conditions of <24 h, Arndt & Schiedek (1997) observed Nephtys hombergii to recover completely. Although
Nephtys hombergii appears to be well adapted to a habitat with short-term fluctuations in oxygen and
appearance of hydrogen sulphide, its high energy demand as a predator renders it likely to limit its survival
in an environment with longer lasting anoxia and concomitant sulphide exposure. For instance, Fallesen &
Jørgensen (1991) recorded Nephtys hombergii in localities in Århus Bay, Denmark, where oxygen
concentrations were permanently or regularly low, but in the late summer of 1982 a severe oxygen
deficiency killed populations of Nephtys species (Nephtys hombergii and Nephtys ciliata) in the lower part
of the bay. However, Nephtys hombergii recolonized the affected area by the end of autumn the same year.
Alheit (1978) reported a LC50 at 8°C of 23 days for Nephtys hombergii maintained under anaerobic
conditions. Such evidence suggests that Nephtys hombergii would be tolerant of short episodes of oxygen
deficiency and at the benchmark duration of one week Nephtys hombergii is unlikely to be adversely
affected by hypoxic conditions and would revive on return to oxygenated sediment. At the benchmark level
an assessment of not sensitive has been suggested.
For
insp
ectio
n pur
pose
s only
.
Conse
nt of
copy
right
owne
r req
uired
for a
ny ot
her u
se.
EPA Export 07-11-2018:04:04:42

Hediste Nereis diversicolor (Ragworm)
Physical Pressures Intolerance Recoverability Sensitivity Evidence/Confidence
Increase in suspended sediment
Tolerant Not relevant Not sensitive low
Increased siltation maybe beneficial to feeding. As a surface-deposit feeder and suspension feeder Hediste
diversicolor will be able to utilize suspended matter as a food resource. Increased deposition of silt onto the
mudflats can raise the height of the mudflats and therefore increasing the exposure time of infaunal communities
at low tide (Jones et al., 2000). At the benchmark level however, this is unlikely to have an adverse effect on
Hediste diversicolor
Increase in temperature Intermediate high low moderate
The geographic range of Hediste diversicolor (see adult distribution) suggests that it is tolerant of a range of
temperatures and a long term chronic temperature increase or decrease is unlikely to have an adverse effect on
UK populations. Hediste diversicolor can tolerate temperatures from below zero under Baltic ice to high
summer temperatures in Black Sea lagoons (Smith, 1977).
A decrease in temperature has been shown to be beneficial to Hediste diversicolor through reduction in numbers
of their predators. A severe winter in the Wadden Sea in 1995/1996 saw an increased abundance of this species
coinciding with a reduction in the numbers of Carcinus maenus and Crangon crangon (Armonies et al., 2001).
A similar increase in abundance was noted in the same area between 1978 and 1987 after a series of cold
winters: mean density increased from 24 / m² to 151 / m² respectively (Beukema, 1990).
Species dwelling in the sediments are likely to be protected from direct effects of temperature change at the
surface, for instance Hediste diversicolor burrows deeper in very cold and frosty weather (Linke, 1939). In
addition, insensitivity to temperature change is limited by the insulating properties of the mud in which it lives
(M. Kendall, pers. comm.).
Temperature change may adversely affect reproduction. Bartels-Hardege & Zeeck (1990) demonstrated that an
increase from 12°C and maintenance of water temperature at 16°C induced reproduction in specimens outside
the normal period of spawning (see reproduction), and without a drop in temperature to simulate winter
conditions the spawning period was prolonged and release of gametes was not synchronized. Poor
synchronization of spawning could result in reduced recruitment, as gametes are wasted and mature specimens
die shortly after gamete release. Therefore, an intolerance of intermediate has been recorded.
Increase in turbidity Tolerant intermediate Not sensitive low
Hediste diversicolor characteristically inhabits estuaries where turbidity is typically higher than other coastal
waters. Changes in the turbidity may influence the abundance of phytoplankton available as a food source that
may be attained through filter feeding. However, Hediste diversicolor utilizes various other feeding mechanisms
and, at the benchmark level, the likely effects of a change in turbidity are limited.
Chemical Pressures Intolerance Recoverability Sensitivity Evidence/Confidence
Changes in nutrient levels Tolerant high Not sensitive moderate
Nutrient enrichment favours the growth of opportunistic green macro-algae blooms which can cause declines in
some species and increases in others (Raffaelli, 2000). Evidence (Beukema, 1989; Reise et al., 1989; Jensen,
1992) suggested a doubling in the abundance of Hediste diversicolor in the Dutch Wadden Sea, accompanied by
a more frequent occurrence of algal blooms that were attributed to marine eutrophication. Algae may be utilized
by Hediste diversicolor in its omnivorous diet, so some effects of nutrient enrichment may be beneficial to this
species
Increase in salinity low high low low
Hediste diversicolor is an euryhaline species, able to tolerate a range of salinities from full sea water down to 5
psu or less (Barnes, 1994). Consequently a change of one category from the MNCR salinity scale (see
benchmark) for a duration of one year would not be restrictive to adults of Hediste diversicolor. Specimens
already at the extreme ends of their salinity tolerance would be more intolerant of a short term change of two
categories on the MNCR salinity scale but are sufficiently mobile to retreat to more hospitable conditions. Low
salinities (< 8 psu) can have an adverse effect on reproduction (Ozoh & Jones, 1990; Smith 1964) (see larval
sensitivity).
Changes in oxygenation intermediate high low high
The littoral muds and muddy sands which Hediste diversicolor inhabits tend to have lower oxygen levels than
other sediments. Hediste diversicolor is resistant to moderate hypoxia (Diaz & Rosenberg, 1995). The
successful survival of this species under prolonged hypoxia was confirmed by the resistance experiments of
Vismann (1990), which resulted in a mortality of only 15% during a 22 day exposure of Hediste diversicolor at
10% oxygen (ca. 2.8 mg O2 per litre). Hediste diversicolor is active at the sediment/water interface where
hydrogen sulphide concentrations increase during periods of hypoxia. Vismann (1990), also demonstrated that
the high tolerance of Hediste diversicolor to hypoxia in the presence of sulphide is enabled by elevated sulphide
oxidation activity in the blood. Hediste diversicolor may also exhibit a behavioural response to hypoxia by
leaving the sediment (Vismann, 1990) which is enhanced in the presence of sulphide. After 10 days of hypoxia
(10% oxygen saturation) with sulphide (172-187 µmM) only 35% of Hediste diversicolor had left the sediment
compared to 100% of Nereis virens. Laboratory experiments in the absence of sediments, found that Hediste
diversicolor could survive hypoxia for more than 5 days and that it had a higher tolerance to hypoxia than
Nereis virens, Nereis succinea and Nereis pelagica (Theede, 1973; Dries & Theede, 1974; Theede et al., 1973).
For
insp
ectio
n pur
pose
s only
.
Conse
nt of
copy
right
owne
r req
uired
for a
ny ot
her u
se.
EPA Export 07-11-2018:04:04:42

Corophium volutator (Mud shrimp)
Physical Pressures Intolerance Recoverability Sensitivity Evidence/Confidence
Increase in suspended sediment Intermediate high low Very low
Corophium volutator lives in areas with very high sediment loads and it might be postulated that an
increase would not affect them but the evidence for the effect of smothering (see above) suggests there
may be a reduction in number and an intolerance of intermediate has been recorded
Increase in temperature low Very high Very low low
Corophium volutator is subject to temperatures of 1°C in the winter to 17°C in the summer (Wilson &
Parker, 1996) but can tolerate much higher temperatures (Meadows & Ruagh, 1981). Therefore a long
term, chronic change of 2°C is unlikely to affect this species and tolerant has been recorded
Increase in turbidity tolerant Not relevant Not sensitive low
Corophium volutator lives in areas of extreme turbidity so it is unlikely that the increased turbidity will
have an effect and tolerant has been recorded
Chemical Pressures Intolerance Recoverability Sensitivity Evidence/Confidence
Changes in nutrient levels high Very high low high
An intolerance of high has been recorded for nutrients to account for the worst case scenario as found in
the Ythan Estuary, Scotland. Here, nutrient enrichment causes the mudflats to become covered with algal
mats consisting mainly of the gutweed Ulva intestinalis. These mats physically perturb Corophium
volutator by preventing burrowing and normal feeding. In areas where the mats did not occur, the density
of Corophium volutator was 11 times higher than under the algae. When the algae died-back in the
winter, the areas were rapidly recolonized from adjacent patches where the gutweed could not grow and
population growth was high from feeding on the rotting algae. In the spring, the gutweed returned and the
Corophium volutator are excluded once again (Raffaelli et al., 1991). The burrows of Corophium
volutator lower the depth of the redox potential discontinuity allowing oxygen to penetrate into the
sediment and can aid the recovery of organically enriched sediments (Limia & Raffaelli, 1997).
Increase in salinity tolerant none Not sensitive high
Corophium volutator is an exceptionally euryhaline species able to tolerate 2-50 psu (McLusky, 1968)
but growth is fastest at 15-20 psu (McLusky, 1967; McLusky, 1970 in Meadows & Ruagh, 1981). The
interstitial salinity is more important for Corophium volutator than that of the overlying water and there
is not ready exchange of water and solutes between the two. Sustained periods of increased salinity are
required to alter that of the interstitial water and there is a lag between salinity changes and the response
of Corophium volutator (McLusky, 1968). Salinity is thought to entrain Corophium volutator to the tides
and sudden increases in salinity delay swimming activity (Harris & Morgan, 1984a). Because of its wide
tolerance, an increase in salinity is unlikely to kill Corophium volutator but an acute change may put
their behaviour out of synchrony with the tides. Corophium volutator will also emigrate from areas of
unfavourable salinity (McLusky, 1968) and an intolerance of tolerant has been recorded.
Changes in oxygenation high Very high low high
Corophium volutator is highly sensitive to hypoxia and suffers 50% mortality after just 4 hours in
hypoxic conditions, or in 2 hours if there is rapid build-up of sulphide (Gamenick et al., 1996). These
conditions often occur in estuaries where drifting macroalgae (such as Fucus sp.) settle on the mudflats in
small patches therefore an intolerance of high has been recorded.
For
insp
ectio
n pur
pose
s only
.
Conse
nt of
copy
right
owne
r req
uired
for a
ny ot
her u
se.
EPA Export 07-11-2018:04:04:42

Arenicola marina (Lug worm) Physical Pressures Intolerance Recoverability Sensitivity Evidence/Confidence
Increase in suspended sediment
Low intermediate Not sensitive Very low
Arenicola marina is unlikely to be perturbed by increased concentrations of suspended sediment since it lives
in sediment and is probably adapted to re-suspension of sediment by wave action or during storms. Increased
siltation by fine materials, however, may modify the nature of the substratum and render it unsuitable for the
Arenicola marina. Decreases in siltation, however may result in reduced food supply for the blow lug which is
partly dependant on organic particles and detritus collected on the sediment surface for food. Therefore a rank
of low intolerance has been reported.
Increase in temperature intermediate Very high low moderate
Species dwelling in or on the surface of the sediment are likely to be affected by increased temperatures and
direct sunlight, however, deeper burrowing species like Arenicola marina are protected from direct effects.
Increased temperatures may affect infauna indirectly, by stimulating increased bacterial activity, increased
oxygen consumption and therefore depletion of oxygen from the interstitial waters resulting in reduced
oxygen levels (hypoxia) or absence of oxygen (anoxia) (see deoxygenation) in the sediment (Hayward, 1994).
Wilde & Berghuis (1979) reported 20% mortality of juveniles reared at 5 °C, negligible at 10 and 15 °C but
50% at 20 °C and 90% at 25 °C. Sommer et al. (1997) examined sub-lethal effects of temperature and
suggested a critical upper and lower temperature of 20 °C and 5 °C respectively in North Sea specimens.
Above or below these critical temperatures specimens resort to anaerobic respiration. Sommer et al. (1997)
noted that specimens could not acclimate to a 4 °C increase above the critical temperature. Therefore,
Arenicola marina is probably intolerant of a short term acute change in temperature of 5 °C although it is
unlikely to be directly affected due to its infaunal habit.
Temperature change may adversely affect reproduction. For example, spawning can be inhibited in gravid
adults maintained above 15 °C (Bentley & Pacey, 1992; Watson et al., 2000). Temperature change may affect
maturation, spawning time and synchronisation of spawning and reproduction in the long-term (Watson et al.,
2000). Therefore, temperature change may affect recruitment in the long term and an intolerance of
'intermediate' has been recorded.
Increase in turbidity Low intermediate Not sensitive Very low
Increased turbidity may reduce benthic diatom productivity and reduce this source of food for Arenicola
marina. However, Arenicola marina also feeds on meiofauna, bacteria and organic particulates in the
sediment, and is unlikely to be affected significantly
Chemical Pressures Intolerance Recoverability Sensitivity Evidence/Confidence
Changes in nutrient levels intermediate high low low
The abundance and biomass of Arenicola marina increases with increased organic content in their favoured
sediment (Longbottom, 1970; Hayward, 1994). Therefore, moderate nutrient enrichment may be beneficial.
However, increasing nutrient enrichment may result in a well studied succession from the typical sediment
community, to a community dominated by opportunist species (e.g. capitellids) with increased abundance but
reduced species richness and eventually to abiotic anoxic sediments (Pearson & Rosenberg, 1978). Indirect
effects may include algal blooms and the growth of algal mats (e.g. of Ulva sp.) on the surface of the intertidal
flats. Algal mats smother the sediment, reducing water and oxygen exchange and resulting in localised
hypoxia and anoxia when they die. Algal blooms have been implicated in mass mortalites of lugworms, e.g. in
South Wales where up to 99% mortality was reported (Holt et al. 1995; Olive & Cadman, 1990; Boalch,
1979). Feeding lug worm were present, and exploitable by bait diggers within 1 month, suggesting rapid
recovery, probably by migration from surrounding areas or juvenile nurseries. However, Cryer et al. (1987)
reported no recovery for 6 months over summer after mortalities due to bait digging
Increase in salinity low intermediate Not sensitive moderate
Once the salinity of the overlying water drops blow about 55% seawater (about 18psu) Arenicola marina stops
irrigation, and compresses itself at the bottom of its burrow. It raises its tails to the head of the burrow to 'test'
the water at intervals, about once an hour. Once normal salinities return they resume usual activity (Shumway
& Davenport, 1977; Rankin & Davenport,1981; Zebe & Schiedek, 1996). This behaviour, together with their
burrow habitat, enabled the lugworm to maintain its coelomic fluid and tissue constituents at a constant level,
whereas individuals exposed to fluctuating salinities outside their burrow did not (Shumway & Davenport,
1977). Environmental fluctuations in salinity are only likely to affect the surface of the sediment, and not
deeper organisms, since the interstital or burrow water is little affected. However, lugworms may be affected
by low salinities at low tide after heavy rains. Arenicola marina was able to osmoregulate intracellular and
extracellular volume within 72 - 114 hrs by increased urine production and increased amino acid concentration
in response to hypo-osmotic shock (low salinity) (see Zebe & Schiedek, 1996). Arenicola marina exposed to
hyper-osmotic shock (47 psu) loose weight, but are able to regulate and gain weight within 7-10 days (Zebe &
Schiedek, 1996). However, Arenicola marina is unable to tolerate salinities below 24 psu and is excluded
from areas influenced by freshwater runoff or input (e.g. the head end of estuaries) where it is replaced by
Hediste diversicolor (Hayward, 1994).
Arenicola marina in the Baltic are more tolerant of reduced salinity. For example, Barnes (1994) reports that
Arenicola marina occurs at salinities down to 18 psu in Britain, but survives as low as 8 psu in the Baltic,
whereas Shumway & Davenport (1977) reported that this species cannot survive less than 10 psu in the Baltic.
The reported salinity tolerance in the Baltic is probably a local adaptation
Changes in oxygenation low intermediate Not sensitive high
Arenicola marina is subject to reduced oxygen concentrations regularly at low tide and is capable of anaerobic
For
insp
ectio
n pur
pose
s only
.
Conse
nt of
copy
right
owne
r req
uired
for a
ny ot
her u
se.
EPA Export 07-11-2018:04:04:42

respiration. Transition from aerobic to anaerobic metabolism takes several hours and is complete within 6-8
hrs, although this is likely to be the longest period of exposure at low tide. Fully aerobic metabolism is
restored within 60 min once oxygen is returns (Zeber & Schiedek, 1996). This species was able to survive
anoxia for 90 hrs in the presence of 10 mmol/l sulphide in laboratory tests (Zeber & Schiedek, 1996).
Hydrogen sulphide (H2S) produced by chemoautotrophs within the surrounding anoxic sediment and may,
therefore, be present in Arenicola marina burrows. Although the population density of Arenicola marina
decreases with increasing H2S, Arenicola marina is able to detoxify H2S in the presence of oxygen and
maintain low internal concentration of H2S. At high concentrations of H2S in the lab (0.5, 0.76 and 1.26
mmol/l) the lugworm resorts to anaerobic metabolism (Zeber & Schiedek, 1996). At 16 °C Arenicola marina
survived 72 hrs of anoxia but only 36 hrs at 20 °C. Tolerance of anoxia was also seasonal, and in winter
anoxia tolerance was reduced at temperatures above 7 °C. Juveniles have a lower tolerance of anoxia but are
capable of anaerobic metabolism (Zebe & Schiedek, 1996). However, Arenicola marina has been found to be
unaffected by short periods of anoxia and to survive for 9 days without oxygen (Borden, 1931 and Hecht,
1932 cited in Dales, 1958; Hayward, 1994). Therefore, this species is likely to have a low intolerance if
exposed to oxygen concentration as low as 2mg/l
For
insp
ectio
n pur
pose
s only
.
Conse
nt of
copy
right
owne
r req
uired
for a
ny ot
her u
se.
EPA Export 07-11-2018:04:04:42

Atlantic salt meadows (Glauco-Puccinellietalia maritimae) Puccinellia maritime salt –marsh community
Physical Pressures Intolerance Recoverability Sensitivity Species richness Evidence/Confidence
Increase in suspended sediment
intermediate high low Minor decline moderate
Saltmarsh habitats are dependant on a balance of accretion and erosion. For example, Ranwell (1964)
reported a regular summer accretion and winter erosion pattern in the Bristol Channel, a pattern typical of
most salt marshes (Holt et al., 1995). Under suitable conditions the saltmarsh may accrete, gain in height
and increase in seaward extent (prograde) (Packham & Willis, 1997). Increased sedimentation may,
therefore, benefit pioneer or low marsh communities (e.g. Puccinellia communities) by providing additional
sediment to colonize. However, gains in the lower marsh will be compensated by loss of extent, due to
competition with more terrestrial species, in the higher marsh (e.g. Festuca rubra). Packham & Willis
(1997) reported that Puccinellia maritima could tolerate accretion rates of 5cm /year, while Gray & Scott
(1977) reported accretion rates of 10cm /yr. in the Puccinellia maritima zone. Sedimentation rates, and
hence accretion rates vary between sites e.g. 8mm /year at Scolt Head, east England and 78mm /year in the
Dovey estuary, Wales, and are determined by the hydrographic regime, and sediment supply from eroding
cliff or riverine sources. Most of the marine species associated with the biotope are probably relatively
tolerant of increased sedimentation, except Mya arenaria, which is more intolerant. Therefore, an increase
in sedimentation rate is likely to change the extent and distribution of Puccinellia maritima communities
(depending on the local hydrographic regime) and an intolerance of intermediate has been recorded. A
recoverability of high has been recorded (see additional information below).
Increase in temperature low Very high Very low Minor decline low
Increased temperatures may affect reproduction in the polychaetes Hediste diversicolor and Arenicola
marina, whereas Hydrobia ulvae can survive exposure to the air for several days. However, the marine
infauna of the lower marsh are probably at the upper limit of their range and their abundance may decrease,
or they may be lost as a result of an increase in temperature. Therefore, although the vascular plant
communities are relatively tolerant of temperature increases and temperature shock and of low intolerance,
several marine species may be lost, reducing species richness.
Increase in turbidity Not relevant Not relevant Not relevant Not relevant high
The vascular plants photosynthesise at low tide and are probably not completely covered at high tides, so
that the turbidity of the water is probably not relevant. Macroalgal mats and microphytobenthos are
probably covered by some tides, and photosynthesis reduced, but will probably compensate when exposed
to air and low tides.
Chemical Pressures Intolerance Recoverability Sensitivity Species richness Evidence/Confidence
Changes in nutrient levels
Tolerent Not relevant Not relevant No change Very low
Moderate enrichment with nutrients may be beneficial to both plant and infaunal communities. Nitrogen
was reported to be limiting in many salt marsh ecosystems and added nitrogen resulted in increased primary
production, decomposition and animal growth rates (Valiela & Teal, 1974; Long & Mason, 1983) although
Holt et al. (1995) suggested care should be taken when applying this conclusion in all salt marshes.
Increased nutrient levels has been associated with increased algal mats, which may smother some burrowing
specie, such as Mya arenaria. (Packham & Willis, 1997). Higher levels of nutrient enrichment may result in
a decrease in the oxygen levels of the sediment (see below). Plots of salt marsh treated with sewage sludge
in Massachusetts, USA, stimulated growth of Spartina alterniflora which eliminated other plants from the
area (Long & Mason 1983). However, at the benchmark level, an increase in nutrients is unlikely to have a
significant effect on communities.
Increase in salinity high moderate intermediate No change moderate
Puccinellia maritima was reported to be highly salt tolerant, communities growing at 12-30 g/l in the Exe
estuary, while Puccinellia maritima can grow at 0, 10 and 30 g/l, although it is probably exposed to much
higher salinities due to evaporation (Gray & Scott, 1977a; Rodwell, 2000). The salinity in salt pans may
vary markedly and Puccinellia maritima was found to grow around the edge of pans in the high marsh.
However, with increasing height the salinity decreases due to percolation or rainwater. Increases in salinity
are likely to favour Puccinellia maritima, by excluding its competitors (Gray & Scott, 1967, 1977b).
Increases in salinity may allow more marine species to colonize further into the marsh, for example salt
pans often have marine fauna such as Carcinus maenas and Sphaeroma sp. Terrestrial fauna may become
reduced and restricted to the high marsh, for example the aphid Macrosiphoniellia asteris selects stems of
Aster tripolium with the lowest salt content, and survived on plants grown in 0, 15 and 30% seawater but
died quickly on plants grown in 60% seawater. Overall, therefore, the relative composition of marine and
terrestrial species is likely to change but the Puccinellia maritima communities may be able to expand due
to increased salinity
Changes in oxygenation low Very high Very low Minor decline low
Oxygen levels in the soils in Puccinellia communities vary markedly with neap or spring tides (Packham &
Willis, 1997). Free sulphide was not recorded in soil occupied by Aster tripolium, Puccinellia maritima,
Spartina anglica and Suaeda maritima and growth of Puccinellia maritima was significantly inhibited by
sulphide while Salicornia europaea was not (Packham & Willis, 1997). However, the waterlogged soils of
salt marshes, favoured by Puccinellia maritima are generally anoxic. Vascular plants may not be intolerant
of deoxygenation since photosynthesis liberates oxygen, they are uncovered for the majority of the tidal
cycle, and in some species, e.g. Spartina alterniflora air spaces in the leaf sheaths aid gas transport to the
roots. Most infaunal polychaetes and oligochaetes are probably tolerant of low oxygen conditions, while
some species of oligochaete and nematode may be dependant on the locally oxygenated areas around the
For
insp
ectio
n pur
pose
s only
.
Conse
nt of
copy
right
owne
r req
uired
for a
ny ot
her u
se.
EPA Export 07-11-2018:04:04:42

roots of vascular plants. Hydrobia ulvae can tolerate emersion for several days and many insects live on
stems and leaves of vascular plants and avoid anoxic conditions, e.g. aphids. However, Cerastoderma edule
is probably intolerant to anoxic conditions and would be lost from the lower marsh. Overall, the vascular
plants are probably tolerant of anoxic soils and are exposed to the air at low tide, so that the Puccinellia
communities would probably be little affected by increases in hypoxia at the benchmark level, whereas a
few fauna may be lost. Therefore an intolerance of low has been recorded. Recovery will probably be rapid
(see additional information below).
Source: http://www.marlin.ac.uk/habitats/detail/350/puccinellia_maritima_salt-marsh_community
For
insp
ectio
n pur
pose
s only
.
Conse
nt of
copy
right
owne
r req
uired
for a
ny ot
her u
se.
EPA Export 07-11-2018:04:04:42

Mudflats and sandflats not covered by seawater at low tide
Hydrological /physical Pressures
Sensitivity assessment
Increase in suspended sediment
Changes in light penetration or attenuation associated with this pressure are not relevant to Hediste
diversicolor and Macoma balthica biotopes. As the species live in the sediment they are also likely to be
adapted to increased suspended sediment (and turbidity). However, alterations in the availability of food or the
energetic costs in obtaining food or changes in scour could either increase or decrease habitat suitability for
Hediste diversicolor, Macoma balthica as characterizing species and for other abundant species such as the
oligochaetes Tubificoides benedii and Tubificoides pseudogaster.
Hediste diversicolor characteristically inhabits estuaries where turbidity is typically higher than other coastal
waters. Changes in the turbidity may influence the abundance of phytoplankton available as a food source that
may be attained through filter feeding. Hediste diversicolor utilizes various other feeding mechanisms and, at
the benchmark level, the likely effects of a change in one rank on the WFD scale are limited.
Scrobicularia plana does not require light and therefore would not be affected by a decrease in turbidity for
light attenuation purposes. It is possible that decreased turbidity would increase primary production in the
water column and by micro-phyto benthos. The resultant increase in food availability may enhance growth and
reproduction in this species, but only if food was previously limiting.
The following sensitivity assessment relies on expert judgement, utilising evidence of species traits and
distribution and therefore confidence has been assessed as low. Resistance is ‘High’ as no significant negative
effects are identified and potential benefits from increased food resources may occur. Resilience is also ‘High’
as no recovery is required under the likely impacts. Sensitivity of the biotope is, therefore, assessed as ‘Not
Sensitive’.
Increase in temperature
Typical surface water temperatures around the UK coast vary, seasonally from 4-19°C (Huthnance, 2010). It is
likely that the important characteristic species are able to resist a long term increase in temperature of 2°C and
may resist a short term increase of 5°C. Macoma balthica may retreat north as a result of long-term warming
and climate change. However, the important characterizing species Hediste diversicolor are likely to survive a
5°C increase in temp for one month period, or 2°C for one year, although reproductive activities may be
impacted. For instance, without colder winters spawning may not be synchronised and so recruitment would be
reduced. A resistance of ‘High’, a resilience of ‘High’ (as longer lived later maturing species are present) and
a sensitivity of ‘Not sensitive’ have been assigned.
Increase in salinity
Hediste diversicolor and other characterizing species are likely to tolerate increased salinity levels above the
reduced and variable levels encountered in the biotope and variant sub-biotopes. Biotope resistance is,
therefore, assessed as ‘High’ and resilience as ‘High’ (by default) and the biotope is considered to be ‘Not
sensitive’. In locations with extremely sheltered conditions and gravelly mud is present where the biotope
LS.LMx.GvMu.HedMx.Scr characterized by Hediste diversicolor and Scrobicularia plana occurs it is possible
a transition to this variant sub-biotope will occur. However, sediment is more likely to be a stronger factor
influencing community structure.
Chemical Pressures
Sensitivity assessment
De- oxygenation Resistance to exposure to dissolved oxygen concentration of less than or equal to 2mg/l for 1 week is assessed
as ‘High’ for the characterizing species Hediste diversicolor and Macoma balthica. It is important to consider
that other species that are common or abundant in the biotope may be impacted by decreased dissolved
oxygen, such as Pygospio elegans and decreases in abundance of these species are likely. As this biotope is
found in intertidal habitats oxygen levels will be recharged during the tidal cycle lowering exposure to this
pressure for Pygospio elegans. Based on the reported tolerances for anoxia and intertidal habitat, biotope
resistance is assessed as ‘High’ resilience is assessed as ‘High’ (by default) and the biotope is considered to be
‘Not sensitive’ at the benchmark level Changes in nutrient levels
The benchmark is relatively protective and is not set at a level that would allow blooms of green algae on the
sediment, based on this consideration and based on the lack of primary producers structuring the biotope,
resistance is assessed as 'High' and resilience as 'High' (by default), so that the biotope is assessed as 'Not
sensitive'. Organic Enrichment
At the benchmark levels, a resistance of ‘High’ as the main characterizing species Hediste diversicolor is
tolerant of organic enrichment and an input at the pressure benchmark is considered unlikely to lead to gross
pollution effects . A resilience of ‘High’ is assigned (by default) and the biotope is assessed as ‘Not sensitive’.
Source: Hediste diversicolor, Macoma balthica and Scrobicularia plana in littoral sandy mud shores http://www.marlin.ac.uk/habitats/detail/331/hediste_diversicolor_macoma_balthica_and_scrobicularia_plana_in_littoral_sandy_mud_shores
For
insp
ectio
n pur
pose
s only
.
Conse
nt of
copy
right
owne
r req
uired
for a
ny ot
her u
se.
EPA Export 07-11-2018:04:04:42

For
insp
ectio
n pur
pose
s only
.
Conse
nt of
copy
right
owne
r req
uired
for a
ny ot
her u
se.
EPA Export 07-11-2018:04:04:42

17617-6016-A Evaluation of the Risk of Adverse Impact on
Cork Harbour SPA (004030) and Great Island SAC (001058) May 2017
APPENDIX B
2016/2017 Winter Bird Monitoring
For
insp
ectio
n pur
pose
s only
.
Conse
nt of
copy
right
owne
r req
uired
for a
ny ot
her u
se.
EPA Export 07-11-2018:04:04:42

2016/2017 Winter Bird Monitoring
Cork Harbour SPA (004030)
Planning Application Ref: P16/07031 Proposed Extension of Cheese Manufacture Facility
At Dairygold Food Ingredients Ltd, Mogeely, Co. Cork
For
insp
ectio
n pur
pose
s only
.
Conse
nt of
copy
right
owne
r req
uired
for a
ny ot
her u
se.
EPA Export 07-11-2018:04:04:42

17617-6017-A 2016/2017 Winter Bird Monitoring
Cork Harbour SPA (004030) May 2017
2
ISSUE FORM
Project number 17617
Document number 6017
Document revision A
Document title 2016/2017 Winter Bird Monitoring
Document status Final
Document prepared by Muiread Kelly
Monica Kane
John Murphy
For
insp
ectio
n pur
pose
s only
.
Conse
nt of
copy
right
owne
r req
uired
for a
ny ot
her u
se.
EPA Export 07-11-2018:04:04:43
17617-6017-A 2016/2017 Winter Bird Monitoring
Cork Harbour SPA (004030) May 2017
3
Contents 1 Introduction .................................................................................................................................... 4
1.1 Scope of Assessment............................................................................................................... 4
1.2 Methodology ........................................................................................................................... 4
2 Existing ENvironment ...................................................................................................................... 6
2.1 Count Location Descriptions ................................................................................................... 6
Location 1: Owenacurra River Estuary ............................................................................................ 6
Location 2 & 3: North Channel Great Island Estuary ...................................................................... 6
Location 4: Saleen Creek ................................................................................................................. 6
2.2 Designated sites ...................................................................................................................... 6
3 Results ............................................................................................................................................. 8
3.1 Location 1: Owenacurra River Estuary .................................................................................... 8
3.2 Location 2: North Channel Great Island Inner Estuary ........................................................... 9
3.3 Location 3: North Channel Great Island Outer Estuary ........................................................ 11
3.4 Location 4: Saleen Creek ....................................................................................................... 12
4 Conclusion ..................................................................................................................................... 14
For
insp
ectio
n pur
pose
s only
.
Conse
nt of
copy
right
owne
r req
uired
for a
ny ot
her u
se.
EPA Export 07-11-2018:04:04:43

17617-6017-A 2016/2017 Winter Bird Monitoring
Cork Harbour SPA (004030) May 2017
4
1 Introduction
Malachy Walsh and Partners Engineering and Environmental Consultants were commissioned by
Dairygold Co-Operative Society Ltd. to conduct bird counts within the receiving environment of a
proposed treated effluent outfall to Cork Harbour at the Midleton Main Outfall at Rathcoursey,
which is situated within the North Channel Great Island estuary. The proposed discharge point is
located approximately 15m south of the Great Channel Island SAC and approximately 15m south of
the Cork Harbour SPA as shown in Figure 1 below. Bird counts were undertaken at four locations in
this area of Cork Harbour during the months of November, January and February 2017 (Refer to
Figure 2).
Figure 1: Location of discharge outfall in relation to Natura 2000 sites.
1.1 Scope of Assessment
The aim of the bird counts was to determine the use of the receiving environment proximal to the
proposed discharge point by Annex I wintering bird species.
1.2 Methodology
Four locations within the North East Cork Harbour were chosen as count areas for the duration of
the survey period. These included Owenacurr River Estuary, The inner and outer North Channel
Great Island estuary and Saleen Creek. Each location was visited a total of three times during the
survey period. The boundaries of the count areas were predetermined prior to the survey work
commencing. Each location was surveyed between low tide and high tide. During each survey period
the following information was recorded:
Species present
Number of individuals per species
For
insp
ectio
n pur
pose
s only
.
Conse
nt of
copy
right
owne
r req
uired
for a
ny ot
her u
se.
EPA Export 07-11-2018:04:04:43

17617-6017-A 2016/2017 Winter Bird Monitoring
Cork Harbour SPA (004030) May 2017
5
Figure 2: Survey site locations (1-4)
For
insp
ectio
n pur
pose
s only
.
Conse
nt of
copy
right
owne
r req
uired
for a
ny ot
her u
se.
EPA Export 07-11-2018:04:04:43

17617-6017-A 2016/2017 Winter Bird Monitoring
Cork Harbour SPA (004030) May 2017
6
2 Existing ENvironment
2.1 Count Location Descriptions
Location 1: Owenacurra River Estuary
The Owenacurra Estuary is part of the greater Cork Harbour and is located approximately 22
kilometres east of Cork. The town of Midleton is situated at the top of the estuary. The estuary
covers an area of 1.12km². The estuary runs south for about three kilometres before flowing into the
North Channel Great Island Estuary and does not have a strong marine influence. The estuary is
relatively narrow and completely empties at low tide leaving a shallow narrow channel making it un-
navigable. The Owenacurra Estuary, owing to the sheltered conditions, has large intertidal flats with
mud being the predominant bed type. The estuary receives the water of the Owenacurra River
which drains primarily land under tillage1.
Location 2 & 3: North Channel Great Island Estuary
The North Channel Great Island Estuary is located approximately 15 kilometres east of Cork on
Ireland’s south coast and is part of greater Cork Harbour. The predominant bed type in the estuary is
mud with some areas of gravel and stones intermixed. The west side of the upper estuary contains
extensive mud flats. The estuary covers an area of 7.96km² and is strongly influenced by the marine
environment. The estuary receives the water of the Owenacurra River which runs south through the
town of Middleton and into the estuary.2 The survey area was split into two areas, inner and outer
as shown in Figure 2.
Location 4: Saleen Creek
The tidal mudflat of Saleen Creek is located at the eastern edge of Cork Harbour approximately
20km south east of Cork. This creek connects the Great Channel Island Estuary with the outer Cork
Harbour at Whitegate. Saleen Creek discharges to the southern basin of Cork Harbour at Rostellan.
2.2 Designated sites
Special Areas of Conservation (SACs)
Candidate Special Areas of Conservation are protected under the European Union (EU) ‘Habitats
Directive’ (92/43/EEC), as implemented in Ireland by the European Communities (Natural Habitats)
Regulations, 1997.
Special Protection Areas (SPAs)
Special Protection Areas were initially designated under Directive 79/409/EEC, The Directive on the
Conservation of Wild Birds (‘The Birds Directive’), and are now protected as Natura 2000 Sites under
the EU ‘Habitats Directive’.
1 http://www.wfdfish.ie/wp-content/uploads/2009/09/Owenacurra.pdf
2 http://www.wfdfish.ie/wp-content/uploads/2009/09/North-Channel-Greater-Island.pdf
For
insp
ectio
n pur
pose
s only
.
Conse
nt of
copy
right
owne
r req
uired
for a
ny ot
her u
se.
EPA Export 07-11-2018:04:04:43

17617-6017-A 2016/2017 Winter Bird Monitoring
Cork Harbour SPA (004030) May 2017
7
Sites of National Importance in the Republic of Ireland are termed, Natural Heritage Areas (NHA) and
proposed Natural Heritage Areas (pNHA). While the Wildlife (Amendment) Act 2000 has been passed
into law, pNHAs will not have legal protection until the consultative process with landowners has
been completed; this process is currently ongoing.
The four survey locations are located within two sites of international importance Cork Harbour SPA
and Great Island Channel SAC. Table 1 below presents the details of the ecological features of these
designated sites.
Table 1: Designated sites for which the survey locations are present in.
Site Name Site Code Features of Interest Survey locations within the site boundary
Cork Harbour SPA 004030
Little Grebe (Tachybaptus ruficollis) [A004] Great Crested Grebe (Podiceps cristatus) [A005] Cormorant (Phalacrocorax carbo) [A017] Grey Heron (Ardea cinerea) [A028] Shelduck (Tadorna tadorna) [A048] Wigeon (Anas penelope) [A050] Teal (Anas crecca) [A052] Pintail (Anas acuta) [A054] Shoveler (Anas clypeata) [A056] Red-breasted Merganser (Mergus serrator) [A069] Oystercatcher (Haematopus ostralegus) [A130] Golden Plover (Pluvialis apricaria) [A140] Grey Plover (Pluvialis squatarola) [A141] Lapwing (Vanellus vanellus) [A142] Dunlin (Calidris alpina) [A149] Black-tailed Godwit (Limosa limosa) [A156] Bar-tailed Godwit (Limosa lapponica) [A157] Curlew (Numenius arquata) [A160] Redshank (Tringa totanus) [A162] Black-headed Gull (Chroicocephalus ridibundus) [A179] Common Gull (Larus canus) [A182] Lesser Black-backed Gull (Larus fuscus) [A183] Common Tern (Sterna hirundo) [A193] Wetland and Waterbirds [A999]
Location 1, Location 2, Location 3, Location 4
Great Island Channel SAC 001058
Mudflats and sandflats not covered by seawater at low tide [1140] Atlantic salt meadows (Glauco-Puccinellietalia maritimae) [1330]
Location 1, Location 2, Location 3
For
insp
ectio
n pur
pose
s only
.
Conse
nt of
copy
right
owne
r req
uired
for a
ny ot
her u
se.
EPA Export 07-11-2018:04:04:43
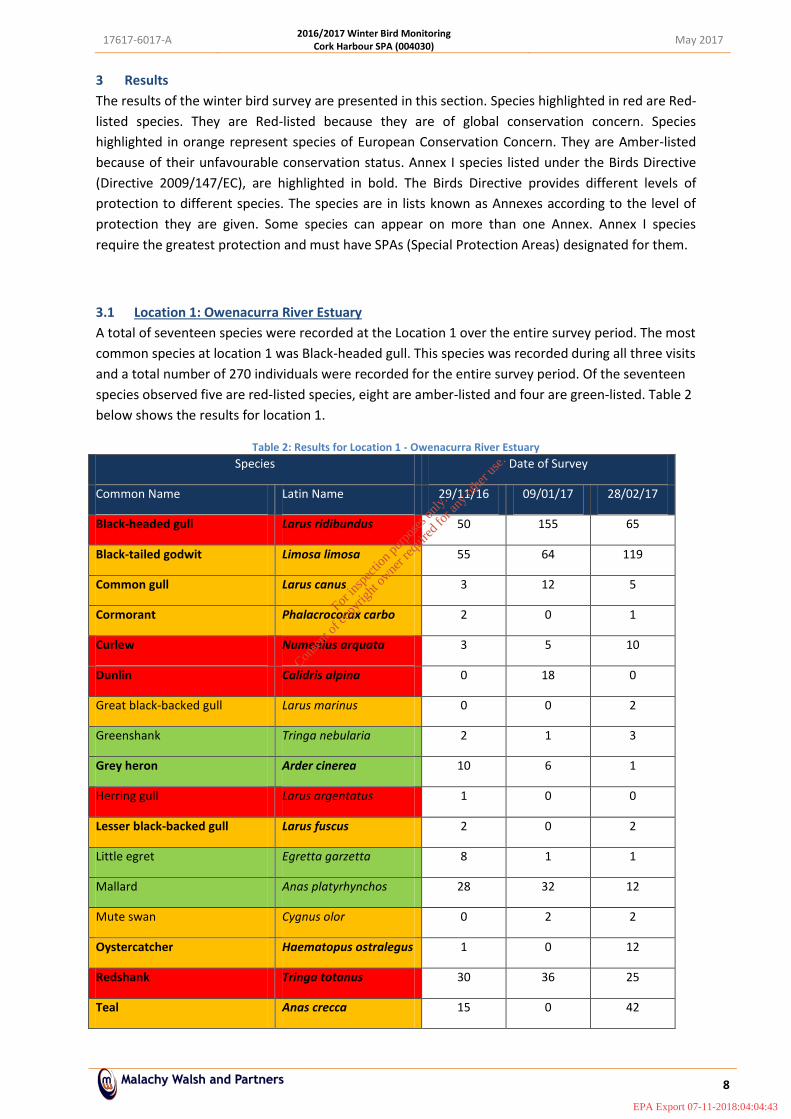
17617-6017-A 2016/2017 Winter Bird Monitoring
Cork Harbour SPA (004030) May 2017
8
3 Results
The results of the winter bird survey are presented in this section. Species highlighted in red are Red-
listed species. They are Red-listed because they are of global conservation concern. Species
highlighted in orange represent species of European Conservation Concern. They are Amber-listed
because of their unfavourable conservation status. Annex I species listed under the Birds Directive
(Directive 2009/147/EC), are highlighted in bold. The Birds Directive provides different levels of
protection to different species. The species are in lists known as Annexes according to the level of
protection they are given. Some species can appear on more than one Annex. Annex I species
require the greatest protection and must have SPAs (Special Protection Areas) designated for them.
3.1 Location 1: Owenacurra River Estuary
A total of seventeen species were recorded at the Location 1 over the entire survey period. The most
common species at location 1 was Black-headed gull. This species was recorded during all three visits
and a total number of 270 individuals were recorded for the entire survey period. Of the seventeen
species observed five are red-listed species, eight are amber-listed and four are green-listed. Table 2
below shows the results for location 1.
Table 2: Results for Location 1 - Owenacurra River Estuary
Species Date of Survey
Common Name Latin Name 29/11/16 09/01/17 28/02/17
Black-headed gull Larus ridibundus 50 155 65
Black-tailed godwit Limosa limosa 55 64 119
Common gull Larus canus 3 12 5
Cormorant Phalacrocorax carbo 2 0 1
Curlew Numenius arquata 3 5 10
Dunlin Calidris alpina 0 18 0
Great black-backed gull Larus marinus 0 0 2
Greenshank Tringa nebularia 2 1 3
Grey heron Arder cinerea 10 6 1
Herring gull Larus argentatus 1 0 0
Lesser black-backed gull Larus fuscus 2 0 2
Little egret Egretta garzetta 8 1 1
Mallard Anas platyrhynchos 28 32 12
Mute swan Cygnus olor 0 2 2
Oystercatcher Haematopus ostralegus 1 0 12
Redshank Tringa totanus 30 36 25
Teal Anas crecca 15 0 42
For
insp
ectio
n pur
pose
s only
.
Conse
nt of
copy
right
owne
r req
uired
for a
ny ot
her u
se.
EPA Export 07-11-2018:04:04:43

17617-6017-A 2016/2017 Winter Bird Monitoring
Cork Harbour SPA (004030) May 2017
9
The red listed species recorded within the Owenacurra River estuary over the winter 2017 were
Black-tailed gull (270), curlew (18), dunlin (18), herring gull (1) and redshank (91). The herring gull is
not a qualifying interest species of the Cork Harbour SPA.
The amber listed species recorded within the Owenacurra River estuary over the winter 2017 were
Black-tailed godwit (238 increasing over the survey period), common gull (20), cormorant (3), great
black-backed gull (2), lesser black-backed gull (4), mute swan (4), oystercatcher (13) and teal (57
February only). Neither mute swan nor great black backed gull are qualifying interest species of the
Cork Harbour SPA.
Of the green listed species recorded, only grey heron is a qualifying interest species of the Cork
harbour SPA.
3.2 Location 2: North Channel Great Island Inner Estuary
A total of twenty-seven species were recorded at the Location 2 over the entire survey period. The
most common species at location 2 was Wigeon. This species was recorded during all three visits and
a total number of 575 individuals were recorded for the entire survey period. Of the twenty-seven
species observed seven are red-listed species, fourteen are amber-listed and six are green-listed.
Table 3 below shows the results for location 2.
Table 3: Results for Location 2 – North Channel Great Island Estuary (Inner) Estuary
Species Date of Survey
Common Name Latin Name 29/11/16 09/01/17 28/02/17
Black-headed gull Larus ridibundus 200 77 92
Black-tailed godwit Limosa limosa 195 0 50
Common gull Larus canus 10 5 14
Cormorant Phalacrocorax carbo 64 0 15
Curlew Numenius arquata 60 10 30
Dunlin Calidris alpina 477 0 12
Great crested grebe Podiceps cristatus 2 0 2
Greater black-backed gull
Larus marinus 6 0 7
Greenshank Tringa nebularia 9 0 8
Grey heron Arder cinerea 8 0 3
Grey plover Pluvialis squatarola 12 0 0
For
insp
ectio
n pur
pose
s only
.
Conse
nt of
copy
right
owne
r req
uired
for a
ny ot
her u
se.
EPA Export 07-11-2018:04:04:43

17617-6017-A 2016/2017 Winter Bird Monitoring
Cork Harbour SPA (004030) May 2017
10
Species Date of Survey
Common Name Latin Name 29/11/16 09/01/17 28/02/17
Herring gull Larus argentatus 3 0 10
Knot Calidris canutus 0 0 16
Lapwing Vanellus vanellus 0 5 5
Lesser black-backed gull Larus fuscus 16 0 8
Little egret Egretta garzetta 7 0 3
Little grebe Tachybaptus ruficollis 1 0 2
Mallard Anas platyrhynchos 10 0 106
Mediterranean gull Larus melanocephalus 0 0 2
Mute swan Cygnus olor 5 0 0
Oystercatcher Haematopus ostralegus 30 8 16
Red-breasted merganser Mergus serrator 10 0 1
Redshank Tringa totanus 180 30 148
Shelduck Tandorna tandorna 79 2 39
Teal Anas crecca 250 85 190
Turnstone Arenaria interpres 0 0 5
Wigeon Anas penelope 300 25 250
*Buzzard Buteo buteo 1 0 0
* not a target species, incidental sighting of bird flying overhead
The red listed species recorded within the Inner North Channel Great Island estuary were Black-
headed gull (369), curlew (100), dunlin (489), herring gull (13), lapwing (10), redshank (358) and
wigeon (575). Herring gull is not a qualifying interest species of the Cork Harbour SPA.
The amber listed species recorded within the Inner North Channel Great Island estuary were Black-
tailed godwit (245), common gull (29), cormorant (79), great-crested grebe (4), great black-backed
gull (13), grey plover (12), knot (16), lesser black-backed gull (24), little grebe (3), Mediterranean gull
(2), mute swan (5), oystercatcher (54), shelduck (120) and teal (525). Great black-backed gull,
Mediterranean gull, knot and mute swan are not qualifying interest species of the Cork Harbour SPA.
The green listed species recorded within the Inner North Channel Great Island estuary were Grey
heron and red-breasted merganser.
For
insp
ectio
n pur
pose
s only
.
Conse
nt of
copy
right
owne
r req
uired
for a
ny ot
her u
se.
EPA Export 07-11-2018:04:04:43

17617-6017-A 2016/2017 Winter Bird Monitoring
Cork Harbour SPA (004030) May 2017
11
3.3 Location 3: North Channel Great Island Outer Estuary
A total of thirty species were recorded at Location 3 over the entire survey period. The most
common species at location 3 was Wigeon. This species was recorded during the all three visits and a
total number of 480 individuals were recorded for the entire survey period. Of the thirty species
observed seven are red-listed species, seventeen are amber-listed and six are green-listed. Table 4
below shows the results for location 3.
Table 4: Results for Location 3 – North Channel Great Island Estuary (Outer Estuary)
Species Date of Survey
Common Name Latin Name 29/11/16 09/01/17 28/02/17
Bar-tailed Godwit Limosa lapponica 0 30 0
Black-headed Gull Larus ridibundus 40 250 150
Black-tailed Godwit Limosa limosa 50 120 0
Common Gull Larus canus 4 58 30
Cormorant Phalacrocorax carbo 16 20 6
Curlew Numenius arquata 80 145 30
Dunlin Calidris alpina 50 0 0
Great Crested Grebe Podiceps cristatus 2 7 0
Greater Black-backed Gull
Larus marinus 3 6 7
Greenshank Tringa nebularia 5 15 5
Grey Heron Arder cinerea 6 11 2
Golden plover Pluvialis apricaria 300 - -
Herring Gull Larus argentatus 10 12 10
Lapwing Vanellus vanellus 5 0 10
Lesser Black-backed Gull
Larus fuscus 7 18 10
Little Egret Egretta garzetta 2 6 4
Little Grebe Tachybaptus ruficollis 25 13 0
Mallard Anas platyrhynchos 26 60 28
Mediterranean Gull Larus melanocephalus 0 4 0
Mute Swan Cygnus olor 3 0 0
Oystercatcher Haematopus ostralegus 50 90 0
Red-breasted Mergus serrator 12 6 0
For
insp
ectio
n pur
pose
s only
.
Conse
nt of
copy
right
owne
r req
uired
for a
ny ot
her u
se.
EPA Export 07-11-2018:04:04:43

17617-6017-A 2016/2017 Winter Bird Monitoring
Cork Harbour SPA (004030) May 2017
12
Species Date of Survey
Common Name Latin Name 29/11/16 09/01/17 28/02/17
Merganser
Redshank Tringa totanus 90 110 80
Shag Phalacrocorax aristotelis 10 5 1
Shelduck Tandorna tandorna 84 81 32
Snipe Gallinago gallinago 0 15 0
Teal Anas crecca 130 140 50
Turnstone Arenaria interpres 5 10 0
Wigeon Anas penelope 140 280 60
The red listed species recorded within the Outer North Channel Great Island estuary were Black-
headed gull (440), curlew (255), dunlin (50), golden plover (flock of 300 in Nov), herring gull (32),
lapwing (15), redshank (280) and wigeon (480). Herring gull is not a qualifying interest species of the
Cork Harbour SPA.
The amber listed species recorded within the Outer North Channel Great Island estuary were Bar-
tailed godwit (30), black-tailed godwit (170), common gull (92), cormorant (42), great-crested grebe
(9), great black-backed gull (16), lesser black-backed gull (35), little grebe (38), Mediterranean gull
(4), mute swan (3), oystercatcher (140), shag (16), shelduck (197), snipe (15) and teal (320). Great
black-backed gull, Mediterranean gull, mute swan, shag and snipe are not qualifying interest species
of the Cork Harbour SPA.
The green listed species recorded within the Inner North Channel Great Island estuary were Grey
heron and red-breasted merganser.
3.4 Location 4: Saleen Creek
A total of twenty-seven species were recorded at the Location 4 over the entire survey period. The
most common species at location 4 was Teal. This species was recorded during the all three visits
and a total number of 343 individuals were recorded for the entire survey period. Of the twenty-
seven species observed seven are red-listed species, fourteen are amber-listed and six are green-
listed. Table 5 below shows the results for location 4.
For
insp
ectio
n pur
pose
s only
.
Conse
nt of
copy
right
owne
r req
uired
for a
ny ot
her u
se.
EPA Export 07-11-2018:04:04:43

17617-6017-A 2016/2017 Winter Bird Monitoring
Cork Harbour SPA (004030) May 2017
13
Table 5: Results for Location 4 – Saleen Creek
Species Date of Survey
Common Name Latin Name 29/11/16 09/01/17 28/02/17
Black-headed gull Larus ridibundus 44 120 40
Black-tailed godwit Limosa limosa 44 40 43
Common gull Larus canus 6 16 135
Common Sandpiper Actitis hypoleucos 0 1 0
Cormorant Phalacrocorax carbo 2 4 2
Curlew Numenius arquata 43 30 25
Dunlin Calidris alpina 100 42 72
Great crested grebe Podiceps cristatus 1 0 0
Greater black-backed gull
Larus marinus 0 0 7
Greenshank Tringa nebularia 24 43 6
Grey heron Arder cinerea 4 4 3
Herring Gull Larus argentatus 0 0 10
Kingfisher Alcedo atthis 0 1 0
Lesser black-backed gull
Larus fuscus 0 0 2
Little egret Egretta garzetta 15 3 15
Little grebe Tachybaptus ruficollis 12 9 1
Mallard Anas platyrhynchos 28 48 9
Mediterranean gull Larus melanocephalus 0 21 5
Mute swan Cygnus olor 5 0 0
Oystercatcher Haematopus ostralegus 75 15 10
Redshank Tringa totanus 132 55 82
Ringed plover Charadrius hiaticula 10 0 0
Shelduck Tandorna tandorna 0 8 23
Shoveler Anas clypeata 0 3 0
Teal Anas crecca 119 102 122
Whimbrel Numenius phaeopus 0 1 0
Wigeon Anas penelope 45 80 53
For
insp
ectio
n pur
pose
s only
.
Conse
nt of
copy
right
owne
r req
uired
for a
ny ot
her u
se.
EPA Export 07-11-2018:04:04:43

17617-6017-A 2016/2017 Winter Bird Monitoring
Cork Harbour SPA (004030) May 2017
14
The red listed species recorded within Saleen creek were Black-headed gull (204), curlew (98), dunlin
(214), herring gull (10), redshank (31, 30 in Feb), shoveler (3) and wigeon (178).
The amber listed species recorded within Saleen Creek were Black-tailed godwit (127), common gull
(157), common sandpiper (1, Jan), cormorant (8), great crested grebe (1, Nov), great black-backed
gull (7), kingfisher (1, Jan), lesser black-backed gull (2, Feb), little grebe (22), Mediterranean gull (26,
all Jan), mute swan (5), oystercatcher (100), shelduck (31) and teal (343). Herring gull, Great black-
backed gull, Mediterranean gull, common sandpiper, kingfisher and mute swan are not qualifying
interest species of the Cork Harbour SPA.
Of the green listed species recorded, only grey heron is a qualifying interest species of the Cork
Harbour SPA.
4 Conclusion
The species recorded within the four locations are similar and there is a degree of overlap between
the species foraging at each location. The following table (Table 6) summarises the results of the
winter bird survey.
For in
spec
tion p
urpo
ses o
nly.
Conse
nt of
copy
right
owne
r req
uired
for a
ny ot
her u
se.
EPA Export 07-11-2018:04:04:43

17617-6017-A 2016/2017 Winter Bird Monitoring
Cork Harbour SPA (004030) May 2017
15
Table 6: Qualifying Interest Species recorded in each location during the winter 2016/2017 survey period
Species Location no.
1 Month recorded 2 Month recorded 3 Month recorded 4 Month recorded
Cormorant Yes Nov; Feb low
numbers
Yes Nov; Feb highest
numbers in Nov
Yes Nov; Jan; Feb lowest
numbers in Feb
Yes Nov; Jan; Feb low
numbers
Shelduck No - Yes Nov; Jan; Feb lowest
numbers in Jan
Yes Nov; Jan; Feb lowest
numbers in Feb
Yes Jan; Feb highest
numbers in Feb
Oystercatcher Yes Nov; Feb highest
numbers in Feb
Yes Nov; Jan; Feb highest
numbers in Nov
Yes Nov; Jan Yes Nov; Jan; Feb
highest numbers
in Nov
Golden Plover No - No - Yes Nov No -
Lapwing No - Yes Jan; Feb in low
numbers
Yes Nov; Feb No -
Dunlin Yes (Jan only) Yes Nov; Feb very high
numbers in Nov
Yes Feb Yes Nov; Jan; Feb
Black-tailed Godwit Yes Nov; Jan; Feb
highest numbers in
Feb
Yes Nov; Feb very high
numbers in Nov
Yes Nov; Jan highest
numbers in Jan
Yes Nov; Jan; Feb
Bar-tailed Godwit No - No - Yes Jan No -
Curlew Yes Nov; Jan; Feb
highest numbers in
Feb
Yes Nov; Jan; Feb Yes Nov; Jan; Feb highest
numbers in Jan
Yes Nov; Jan; Feb
For
insp
ectio
n pur
pose
s only
.
Conse
nt of
copy
right
owne
r req
uired
for a
ny ot
her u
se.
EPA Export 07-11-2018:04:04:43

17617-6017-A 2016/2017 Winter Bird Monitoring
Cork Harbour SPA (004030) May 2017
16
Species Location no.
1 Month recorded 2 Month recorded 3 Month recorded 4 Month recorded
Redshank Yes Nov; Jan; Feb Yes Nov; Jan; Feb low
numbers in Jan
Yes Nov; Jan; Feb Yes Nov; Jan; Feb
highest numbers
in Nov
Little Grebe No - Yes Nov; Feb very low
numbers
Yes Nov; Jan Yes Nov; Jan; Feb
lowest numbers
in Feb
Great Crested Grebe No - Yes Nov; Feb very low
numbers
Yes Nov ; Jan low
numbers
Yes Nov very low
numbers
Grey Heron Yes Nov; Jan; Feb
highest numbers in
Nov
Yes Nov; Feb Yes Nov; Jan; Feb Yes Nov; Jan; Feb
Wigeon No - Yes Nov; Jan; Feb lowest
numbers in Jan
Yes Nov; Jan; Feb lowest
numbers in Feb
Yes Nov; Jan; Feb
highest numbers
in Jan
Teal Yes Nov; Feb highest
numbers in Feb
Yes Nov; Jan; Feb low
numbers in Jan
Yes Nov; Jan; Feb lowest
numbers in Feb
Yes Nov; Jan; Feb
Pintail No - No - No - No -
Shoveler No - No - No - Yes Jan very low
numbers
Red-breasted Merganser
No - Yes Nov; Feb highest
numbers in Nov
Yes Nov; Jan No -
Grey Plover No - Yes Nov low numbers No - No -
For
insp
ectio
n pur
pose
s only
.
Conse
nt of
copy
right
owne
r req
uired
for a
ny ot
her u
se.
EPA Export 07-11-2018:04:04:43
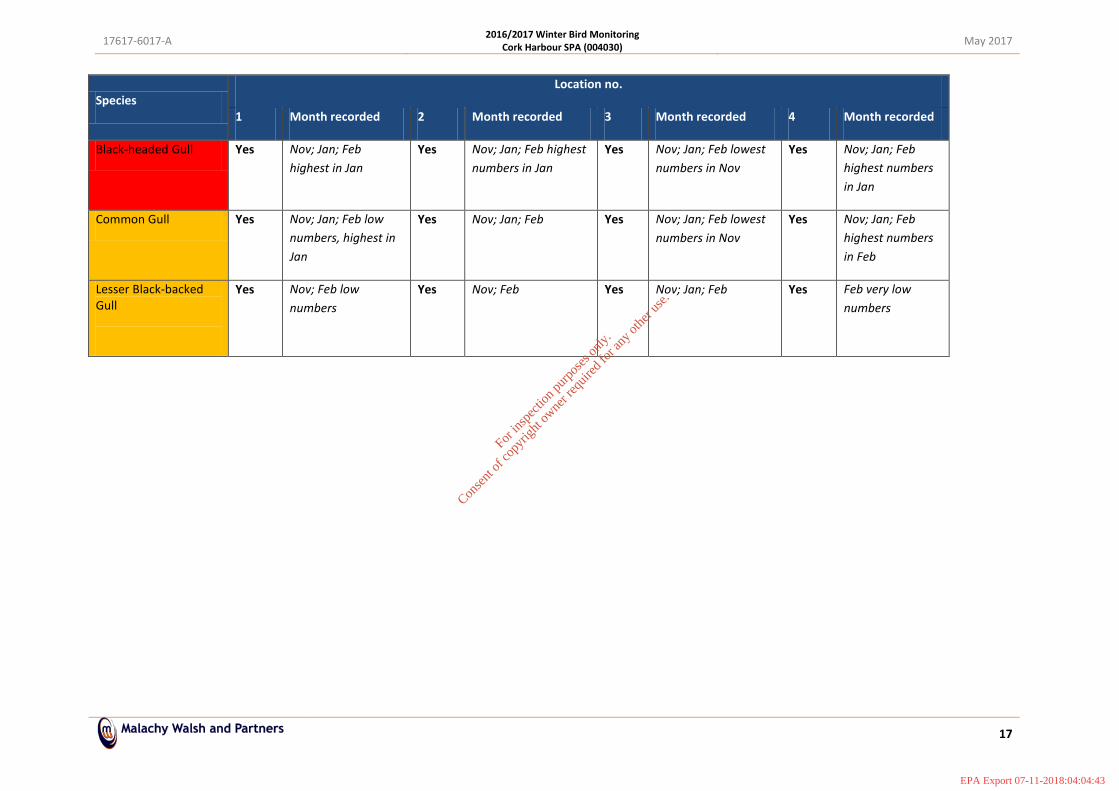
17617-6017-A 2016/2017 Winter Bird Monitoring
Cork Harbour SPA (004030) May 2017
17
Species Location no.
1 Month recorded 2 Month recorded 3 Month recorded 4 Month recorded
Black-headed Gull Yes Nov; Jan; Feb
highest in Jan
Yes Nov; Jan; Feb highest
numbers in Jan
Yes Nov; Jan; Feb lowest
numbers in Nov
Yes Nov; Jan; Feb
highest numbers
in Jan
Common Gull Yes Nov; Jan; Feb low
numbers, highest in
Jan
Yes Nov; Jan; Feb Yes Nov; Jan; Feb lowest
numbers in Nov
Yes Nov; Jan; Feb
highest numbers
in Feb
Lesser Black-backed Gull
Yes Nov; Feb low
numbers
Yes Nov; Feb Yes Nov; Jan; Feb Yes Feb very low
numbers
For
insp
ectio
n pur
pose
s only
.
Conse
nt of
copy
right
owne
r req
uired
for a
ny ot
her u
se.
EPA Export 07-11-2018:04:04:43