Financial Statements as at 31 December 2006 - Fineco
256
FinecoBank Banca Fineco S.p.A. Financial Statements as at 31 December 2006
-
Upload
khangminh22 -
Category
Documents
-
view
0 -
download
0
Transcript of Financial Statements as at 31 December 2006 - Fineco

FinecoBank Banca Fineco S.p.A.
Financial Statements as at 31 December 2006

Contents

TABLE OF CONTENTS
Management Bodies 2
Report on Operations 4
Introduction to financial highlights 5
Financial highlights 6
Key figures 7
Macro-scenario: the economy and financial markets 8
Bank performance and key initiatives for the year 11
The activity of FinecoBank S.p.A. 17 Securities brokerage 18
Online 21 Financial Advisors Network 23
Mortgages 26 Salary guaranteed loans 27
Balance sheet figures 29
Regulatory capital and prudential requirements 41
Income statement figures 42
Operating structure 52 Human resources 52
Technology infrastructure 55 Internal control system 56
Risk measurement and control 57 Organizational structure 61
Document on Security Planning 63 Communications and external relations 63
Other information on operations 65 Securitization operations 65
Dealings with the Parent Bank and other Group companies 67
Significant events occurring after year end and business outlook 72
Proposal for the approval of the financial statements and allocation of profits for the year 73
Reconciliation of income statement with reclassified income statement 74
Report of the Board of Statutory Auditors 75
Independent Auditors' Report 79
Bank financial statements 81
Balance sheet 82 Income statement 83
Statement of changes in shareholders' equity 84 Statement of cash flow 86
Notes 87
Part A - Accounting policies 89 Part B - Information on the balance sheet 107
Part C - Information on the income statement 147 Part D - Segment information 164
Part E - Information on risks and hedging policies 166 Part F - Information on shareholders' equity 243
Part G – Business combinations 247 Part H – Transactions with related parties 247
Part I - Payments based on own equity instruments 248
Appendix 249
List of financial shops as at 31 December 2006 250

- 1 -
Share capital €199,850,987.49, fully paid-up, divided into 605,609,053 shares with a face value of €0.33, 99.99% of which is held by Capitalia S.p.A. and the remaining 0.01% by minority-interest shareholders. Registered office: Piazza Durante 11, 20131 Milan, Italy
“FinecoBank Banca Fineco S.p.A.”
in abbreviated form “FinecoBank S.p.A.”, or “Banca Fineco S.p.A.” or “Fineco Banca S.p.A.” Company controlled by Capitalia S.p.A., Gruppo Bancario Capitalia, Register of Banking Groups no. 3207.8,
Member of the Interbank Fund for the Protection of Deposits, Italian Banking Association Code 03015, Tax Code and Milan Register of Companies no. 01392970404 – R.E.A. (Economic and Administrative Index) no.
1598155, VAT no. 12962340159

- 2 -
Management Bodies

- 3 -
MANAGEMENT BODIES
Board of Directors
Chairman Enrico Cotta Ramusino Deputy Chairman Stefano Landi Chief Executive Officer Alessandro Foti Directors Giuseppe Colaiacovo
Michele De Capitani Donato Fontanesi Frederik Geertman Alfredo Malguzzi Emma Marcegaglia Fulvio Montipò Luigi Terzoli
Board of Statutory Auditors
Chairman Luigi Attilio Mazzocchi Statutory Auditors Antonio Passantino
Francesco Poddighe
Alternate Auditors Umberto Bocchino Luciano Masini
Management
General Manager Franco Ravaglia Assistant General Manager Michele Casella
Independent auditors Reconta Ernst & Young S.p.A. On 12 April 2006, an ordinary meeting of the Bank's shareholders: • increased the number of members of the Board of Directors from nine to eleven; acknowledged the resignation from the Board of Directors of Messrs. Francesco Bisesti, Angelo Brizi and Michele Casella; appointed the following new members of the Board of Directors: Giuseppe Colaiacovo, Michele Ferdinando De Capitani Da
Vimercate, Donato Fontanesi, Alfredo Malguzzi, Emma Marcegaglia and Fulvio Montipò.

- 4 -
Report
on Operations

- 5 -
INTRODUCTION TO FINANCIAL HIGHLIGHTS The separate financial statements of FinecoBank Banca Fineco S.p.A. (hereinafter referred to as
“FinecoBank S.p.A.”) as at 31 December 2006 have been prepared according to the indications provided by
the Parent Bank and in compliance with the valuation criteria established by the International Financial
Reporting Standards (IFRS) and International Accounting Standards (IAS) issued by the International
Accounting Standards Board (IASB) and endorsed by the European Commission under the procedure
envisaged in article 6 of Regulation (EC) no. 1606/2002 of the European Parliament and the Council of 19
July 2002. The Community Regulation has been fully applied in Italy following Italian Legislative Decree no.
38 of 28 February 2005, which came into force on 22 March 2005.
For a significant comparison between the figures from the income statement and balance sheet for 2006,
which incorporate new indications provided by the Parent Bank, and those for 2005, the income statement
and the balance sheet as at 31 December 2005 were reclassified to account for the following: • the change in the criteria for the accounting treatment of securities lending transactions to bring them in
line with those already adopted by the other Group companies;
• the reclassification of commission income from sums recovered on credit card service by FinecoBank
S.p.A. as issuer on behalf of other Group Banks. In 2005, the aforementioned recovered sums were
recognised with other operating income; in 2006, following the indication of the Parent Bank, these sums
were recognized with commission income as at June 2006, and with other operating income from July 2006
(following the transfer of credit card contracts to the Group Banks);
• the transfer of penalties for early redemption of loans classified as Loans & Receivables and measured at
amortized cost to net interest income;
Furthermore, subsequent to the application during 2006 of the provisions of the Bank of Italy contained in
the update to circular no. 49/1989 dated 1.12.2006, the tables in the notes were reclassified to account for
the following:
• the change in the representation of repurchase agreements to distinguish between transactions involving
securities owned by the Bank from transactions involving securities received by the Bank as part of
repurchase agreements;
• the change in the representation of interest income accrued on securities owned by the Bank involved in
repurchase agreements (previously recognised with interest income on financial assets held for trading and
currently recognised with interest income on financial assets sold but not eliminated).
The section “Financial Statements” contains the Bank’s financial statements as at and for the years ended
31 December 2006 and 31 December 2005 as prepared in accordance with IAS/IFRS.
The section “Accounting Standards” sets forth the relevant international accounting standards adopted in
preparing the accounts as at 31 December 2006.
The appendix contains a table reconciling the income statement items with those of the reclassified income
statement.

- 6 -
FINANCIAL HIGHLIGHTS Reclassified income statement
31-Dec-2006 31-Dec-2005 Absolute %
Net interest income 122.228 102.140 20.088 19,7%
Profits/losses on assets/liabilitiesdesignated at fair value 4.867 3.967 900 22,7%Dividends 442 297 145 48,8%Net commissions 135.854 114.689 21.165 18,5%Other operating income/expenses 26.984 19.257 7.727 40,1%
Total revenues 290.375 240.350 50.025 20,8%
Personnel expenses (45.929) (34.988) (10.941) 31,3%Other administrative expenses (107.758) (104.918) (2.840) 2,7%Net adjustments to property, plant and equipment and intangible assets (10.649) (12.087) 1.438 -11,9%Total operating costs (164.336) (151.993) (12.343) 8,1%
Gross operating profit 126.039 88.357 37.682 42,6%
Net provisions for liabilities and contingencies (5.809) (11.467) 5.658 -49,3%Net impairment adjustments of loans (14.322) (13.112) (1.210) 9,2%Net impairment adjustments of financial asset (4.299) (3.003) (1.296) 43,2%Total provisions and adjustments (24.430) (27.582) 3.152 -11,4%
Net operating profit 101.609 60.775 40.834 67,2%Profit/loss on disposal assets and from equity investments 3.427 208 3.219 1547,6%
Profit before taxes 105.036 60.983 44.053 72,2%Income tax for the period (39.933) (7.955) (31.978) 402,0%Profit (loss) for the year 65.103 53.028 12.075 22,8%(Amounts in Euro/000)
Change
Balance sheet
31-dic-06 31-dic-05 Absolute %
Ordinary customer loans (1) 6.137.252 5.875.945 261.307 4,4%Total assets 9.094.154 7.772.137 1.322.017 17,0%Direct funding from customers (2) 5.374.564 3.808.297 1.566.267 41,1%Indirect funding (3) 8.181.028 6.932.866 1.248.162 18,0%Total customer funding 13.555.592 10.741.163 2.814.429 26,2%Shareholders’ equity 313.196 254.814 58.382 22,9%(Amounts in Euro/000)
Change
(1) Ordinary customer loans consist of all loans to ordinary customers, including securitized loans that have not been re-entered to the financial statements; (2) Direct funding from customers includes overdrawn current accounts and repurchase agreements; (3) Indirect funding consists of the Bank’s own products and third-party products placed through the sales networks of FinecoBank S.p.A. The figures are net of liquidity from discretionary accounts.

- 7 -
KEY FIGURES Operating structure
31-dic-06 31-dic-05
No. Employees 763 688No. Financial planners 1.142 1.361No. Mortgage agents 215 165No. Operating financial shops 169 195
Balance sheet highlights
Composition 31-Dec-06 31-Dec-05
Customer loans/Total assets 75.17% 83.16%Financial assets/Total assets 10.75% 7.44%Customer loans/Customer deposits 88.34% 101.98%
31-Dec-06(*) 31-Dec-05
TIER 1 7.00% 8.21%Regulatory capital / Weighted assets - Total capital ratio 9.82% 9.94%
Risk ratios 31-dic-06 31-dic-05
Net non-performing loans / Customer loans 0.36% 0.26%Net doubtful loans / Customer loans 0.89% 0.55%
Income statement highlights Profitability ratios 31-Dec-06 31-Dec-05
ROE 20.79% 20.81%ROA 0.72% 0.68%Net interest income / Total revenues 42.09% 42.50%Profit from financial operations / Total revenues 1.68% 1.65%Net commissions on services, dividendsand other net income / Total revenue 56.23% 55.85%
Operating costs / Total revenues 56.59% 63.24%Net operating costs / Total net revenues 52.20% 59.10%
Legend Number of mortgage agents: Sales network of Fineco Mutui, on which FinecoBank S.p.A. relies to place its products. Number of operating financial shops: financial shops managed by the Bank and financial shops managed by financial planners. Shareholders' equity: share capital + share price premium + reserves + profit/loss for the year. ROE: net profit / shareholders’ equity at year-end. ROA: net profit / total assets at year-end. Classified loans: bad debts and substandard loans. Net operating costs: operating costs net of recovered expenses; Total net revenues: total revenues net of any sums recovered; (*) Regulatory capital and total weighted risk assets were calculated by applying current supervisory provisions on the basis of accounting figures prepared in accordance with international accounting standards. Regulatory capital and total weighted risk assets as at 31 December 2005 were calculated by applying supervisory provisions effective at the time on the basis of accounting figures prepared in accordance with Italian Legislative Decree no. 87/92.

- 8 -
MACRO-SCENARIO: THE ECONOMY AND FINANCIAL MARKETS
The macroeconomic scenario The world economy continued to expand in 2006. The divergences in the rate of GDP growth in the major industrial
areas narrowed: growth accelerated in the Eurozone and the United Kingdom, but slowed in the United States
reflecting the pronounced weakening in the poperty, and consolidatedin Japan. Emerging economies, especially China
and India, made a substantial contribution to global development expanding by close to 10%.
The persistence of the favorable phase of the business cycle and the rising prices of row materials caused consumer
price inflation to pick up the main industrial countries. In order to prevent inflationary pressures from impacting
longer term expectations, the central banks tightened their policy stances.
In Italy, 2006 closed with the highest growth in five years, with GDP expanding by 1.9%. This growth was driven
largely by domestic demand, with strong performance of investments in the first half of the year and household
consumption in the second. Investment was boosted by the recovery in industry associated with the continuation of
the restructuring and selection of companies; while consumption was supported by weak inflation growth, the partial
recovery of purchasing power in certain segments thanks to contract renewals and the positive trend in employment.
Exports also performed well, although their contribution to growth was offset by an equivalent rise in imports, which
reflected the jump in the prices of energy products. In cyclical terms, growth was fastest in the first and second
quarters of 2006, slowing in the second half of the year. The decelaration may be attributed largely to the
strengthening of the euro and the slowing of growth in the world economy.
Last year ended on a positive note for the main stock exchange, which consolidated the record levels achieved in the
past five and a half years and maintained their robust upward trend. The European stock market achieved the most
significant gains (approximately 19.6%), whereas the U.S. S&P 500 index ended the year up by about 12.2%. After a
long period of uncertainty, Tokyo investors began to buy again with a rally in the final weeks of the year that erased
earlier losses and enabled the stock market to post a gain for the year of about 7,2%.
Chart 1: Performance of equity market
Source: Datastream

- 9 -
Bank interest rates In the United States, the Federal Reserve (Fed) raised its target for the federal funds rate by 25 basis points four
times in the first half of 2006, bringing it up to 5.25% in June. With the emergence of signs of slowing growth in the
United States economy, the Fed interrupted the series of rate hikes in the second half of the year. In the Euro Area,
the strenthening of signs of recovery and the intensification of price strains prompted, the European Central Bank to
continue the monetary tightening started in December 2005. The minimum bid rate on main refinancing operations
and that on deposits at the ECB were raised by a quarter of a percentage point no fewer than five times, bringing the
rates to 3,5% and 2,5% respectively.
During 2006, bank interest rates were gradually raised in line with the increase in official rates. In particular, in
December the average 1-year lending rate applied by banks to households and businesses was 5.92%, up from
5.26% at the end of 2005. The average deposit rate for households and businesses also rose, ending the year at
1.45% (0.95% at the end of December 2005). The short-term spread consequently widened to 4.47% in December
(compared to 4.31% at the end of 2005 (Chart 2).
Chart 2: Performance of short-term bank interest rate spreads (in percent)
Source: Bank of Italy
Credit brokerage On par with the developments in the euro zone, direct funding with banks (deposits and bonds) grew rapidly,
although less so than in 2005 (annual growth-rate of 7.8% at the end of 2006 against 8.6% in 2005). The growth in
funding was boosted by the enduring preference for liquidity, despite the rise in official rates and the interes of
investors in low-risk bonds. Funding growth was driven by the recovery in repurchase agreements, which typically
offer higher yields than current accounts, and the continued strong growth of the bond segment (annual growth of
10.4% in December 2006).
Faced with loan growth that outpaced the increase in funding, in 2006 Italian banks increased their net external
liabilities abroad

- 10 -
The recovery in economic development that took place in the first half of 2006 supported the expansion of bank
lending: in December the growth rate of loans was up 11.2% year-on-year, compared to 8.6% in December 2005.
The pick-up in bank lending was mainly tied to demand from companies, which was more than enough to offset the
slight deceleration in loans to families associated with certain securitization operations, the cooling-off of the real-
estate market, and increasing interest rates. On a geographical basis, loans to, customers in Southern Italy expanded
especially rapid, driven by business lending, which grew at a rate nearly twice that of Italy’s Centre and North. Loans
to families also increased more rapidly in the South, despite slowing down from 2005.
Credit quality showed no signs of decline in 2006, benefiting from the brisk pace of economic activity, still-moderate
interest rates, and a further reduction of mark-up.
Assets under management Investments funds posted their worst results ever in 2006. Despite the improved performance of the markets over
the second half of the year, the net change in funding over the year was extremely negative, with asset outflows of
more than €17 billion.
The weakness of the mutual fund sector was tied in part to the performance of financial markets, which in the first
half of the year penalized the bond market and then the stock market against the backdrop of uncertainty
surrounding the expected performance of inflation and the degree of tightening of monetary policy. The industry
continued to register large asset outflows even after financial markets later turned bullish.
The performance of funding had a negative impact on the performance of assets invested in mutual funds. After a
period of rapid expansion recorded from February to April, total assets invested in the mutual funds industry slowed
once more, falling to 4.2% in December 2006 from 8.7% at the end of 2005. Roundtrip funds registered a positive
performance, although less so than the previous year (10.7% in December 2006, down from 23%), while the Italian
sector contracted sharply (down 7.7%, compared to an increase of 3.3% at the end of 2005) (Chart 4).

- 11 -
BANK PERFORMANCE AND KEY INITIATIVES FOR THE YEAR
Performance of balance sheet aggregates
In the trading area, FinecoBank S.p.A. confirmed its role as the number-one Italian broker for number of executed
orders, with a market share of 7.44% (source: Assosim), up from 7.19% in 2005. Traded volumes in the securities
market underwent significant growth, supported by the development of volumes traded on behalf of Capitalia
Group companies, as well as the consolidation of trading volumes generated by newly acquired customers over the
past few years.
Total customer fundung (direct plus indirect) came to €13,556 million, showing an increase of 26.2% compared to
the same period of the previous year. Direct funding (current accounts and repurchase agreements) held by retail
customers totalled €5,271 million as at 31 December 2006, against €3,749 million as at 31 December 2005,
posting an increase of 41% and confirming a growing trend. The number of current accounts in euro increased by
5.8% over the stock existing on 31 December 2005, bringing the total number of active current accounts up to
approximately 363.000. There was a significant increase in the number of credit cards (in terms of cards issued, net of expired cards),
which rose from 857,188 as at 31 December 2005 to 1,307,501 as at 31 December 2006 (up 52.5%), due in part
to cards issued on behalf of Capitalia Group Banks, for which FinecoBank S.p.A. serves as an issuer and provider of
processing and servicing.
The process of restructuring the financial planners distribution network moved forward with the rationalization of
sales shops (128 financial shops throughout all of Italy, with an additional 41 shops managed directly by Financial
Advisors) and the revision of the organizational structure and commission system. Development of the network’s
Information Technology systems continued, involving the installation of remote connections enabling a more
nimble production process, decreased costs, and greater loyalty by financial planners. As at 31 December 2006 the
distribution network consisted of 1,142 resources. With a total of over €9,473 million under management and
administration, the assets of the financial planners network grew by 22.9% compared to 31 December 2005. Of
this total, €4,784 million consisted of assets under management (up 15.2%).
Customer loans, including securitized loans, totalled €7,204 million. Loans to retail customers came to €6,137
million (up 4.4%). During 2006, FinecoBank S.p.A. continued to enact its strategy of expansion on the residential mortgage market
through its subsidiary Fineco Mutui S.p.A., focusing on the addition of new agents, the ongoing development of
geographical coverage, the shift in the composition of the product portfolio, and the improvement of business
processes, all of which were aimed at ensuring that the products offered by the Bank on the domestic market were
increasingly distinctive and innovative.
A total of 4,464 mortgage agreements were entered into during 2006, for a total of €541 million.
FinecoBank S.p.A. leads the market in the sector of loans secured bysalry guaranteed loans, with a total of €1,504
million in loans and an increase in loans issued of 24% over 2005.

- 12 -
Performance of income statement aggregates
Total revenues were up 21% over 2005, for a total of €290 million, due to the improvement of both net interest
income, which may be attributed largely to the increase in average volumes of funding and customer loans and the
diversification of financial investments, and the commissions spread, especially in the online trading and brokerage
area.
The positive performance of revenues from typical operations, along with the reduction of operating costs, had an
impact on profit before taxes, which came to more than €105 million, posting an increase of 72.2% over the same
period of the previous year.
Net profit came to €65 million, up 22.8% from 31 December 2005.

- 13 -
Main initiatives during the year
Early redemption of the Garda securitization transaction involving salary guaranteedloans
On 20 June 2006, as per the resolution of the Board of Directors passed on 22 February 2006 and following
authorization from the Bank of Italy, the Bank bought back the portfolio of loans secured by one-fifth of
salary totalling approximately €65 million, which had been sold on 30 March 2001 to the special vehicle
purpose Garda Securitisation S.r.l.. As provided in the securitization agreements, the "optional redemption"
clause, under which the special purpose vehicle had the option of early redemption of the entirety (and not
part) of the underlying assets, in the event that the amount of principal due on the class A and class B
notes was less than €61 million, or subsequent to the date of payment, 20 September 2005 had been
activated. Although there existed no formal obligation to activate the "early redemption" clause, it was in
the interest of FinecoBank S.p.A. to close out the operation in advance since the limited amount of the
bonds in issue did not justify the costs incurred to maintain the securitization operation.
Distribution of dividends by FinecoBank S.p.A.
On 2 May 2006 dividends were paid out on 605,609,053 shares, at the amount of €0.01 per share, as per
the resolution of the Shareholders’ Meeting passed on 12 April 2006.
Equity investments
On 20 February 2006 the Board of Directors approved the sale of the total equity investment in Ktesios
S.p.A., amounting to 4.5% of the latter’s share capital, following the offer received from a leading financial
company. The sale, which allows the Bank to maintain its current commercial agreements, was closed on 13
April 2006 and generated a capital gain of €2.5 million.
On 18 January 2006 the Board of Directors approved the agreement with the insurance company Net
Insurance S.p.A. for the purchase of an equity investment amounting to 15% of the latter's share capital
for a total price of €7,500,000. The agreement aims to establish a banking and insurance hub that will best
ensure adequate development of the Bank’s operations in the salary guaranteed loans sector in a scenario
of growing competition. During 2006, a 13.04% stake was acquired in the above insurance company in two
transactions:
1. the subscription for the reserved capital stock issue for a nominal value of €0.250 million with a
disbursement of €2.5 million;
2. the purchase of an additional 500,000 shares of stock of Net Insurance S.p.A. for a total price of €5
million.
On 27 June 2006 the Board of Directors resolved to accept the proposal advanced by the Parent Bank,
which during the meeting of its Board of Directors held on 21 June 2006 had moved to transfer equity
investments of a non-strategic nature to Capitalia Merchant as part of a reorganization of the Parent Bank’s
equity investments. Under these circumstances, Capitalia offered FinecoBank S.p.A. the option of selling its
equity investment in Agenzia di Pollenzo to Capitalia Merchant for its book value. The sale was closed on 28
July 2006.
Decrease in share capital due to cancellation of own shares
On 3 August 2006, in execution of the resolution passed by the Shareholders’ Meeting held on 13 March 2006, the
period of silence required by applicable law for opposition by creditors having expired, the Bank reduced its share

- 14 -
capital by €2,442,000 from €202,292,987.49 to €199,850,987.49 by cancelling 7,400,000 own shares with a face
value of €0.33 each. On 3 August 2006 the Bank also filed a notice of change in share capital with the Milan
Register of Companies, in addition to its new updated by-laws. Consequently, effective from 3 August 2006, the
Bank’s share capital stands at €199,850,987.49, divided into 605,609,053 shares with a face value of €0.33 each.
Issue of subordinated loan
On 20 February 2006 the Board of Directors authorized the exercise of the option for early redemption of
the following lower-tier II subordinated loans:
• €51.6 million, with maturity on 30 March 2010, subscribed by Bipop-Carire, Euribor 6 months + 1%.
• €1 million, issued by Banca Manager S.p.A. (a company that was incorporated into FinecoBank S.p.A. by
merger), with maturity on 29 December 2008, subscribed by Fineco S.p.A. (now Capitalia S.p.A.), Euribor 3
months + 0.90%.
The above-mentioned loans, in addition to not meeting the requirements for full calculation for regulatory
capital purposes, since their residual maturities were less 5 years, were particularly burdensome compared
to current market conditions.
Subsequent to authorization from the Bank of Italy, the Bank issued the following tranches of a subordinated loan
for a total of €100 million, authorized by the Board of Directors on 20 February 2006:
1. a first tranche of €50 million on 7 June 2006, subscribed by Fineco Finance Ltd. (board resolution of 20
February 2006);
2. a second tranche of €20 million on 7 September 2006, subscribed by Fineco Finance Ltd. (board resolution
of 20 February 2006);
3. a final tranche of €30 million on 7 December 2006, subscribed by Fineco Finance Ltd. (board resolution of 5
October 2006).
Transfer of contractual relationships pertaining to credit cards
On 27 June 2006 the Board of Directors resolved to transfer the contractual relationships pertaining to credit cards
from FinecoBank S.p.A. to the Group Network Banks (Bipop Carire Società per Azioni, Banca di Roma, Banco di
Sicilia) effective from 1 July 2006. The transaction was undertaken free of charge, since it may be considered a
modification of the legal form of the intercompany contractual structure that does not entail substantial change to
the roles and responsibilities of the companies involved or the associated economic returns. From a management
perspective, FinecoBank S.p.A., in its capacity as agent of the Network Banks, will continue to carry out the same
servicing tasks that it currently performs in its capacity as issuer.
The Business Continuity Project and Disaster Recovery Plan
At the meeting held on 14 December 2006, the Board of Directors approved the Bank's Business Continuity Plan in
accordance with Bank of Italy regulations and guidelines set by the Parent Bank.
The Business Continuity Plan, which derives from a project started in 2005 and completed in 2006, sets forth the
operating methods adopted by the bank to ensure continuity of service to customers and the banking system in
emergency situations.
Adjustment to comply with new regulatory requirements enabled the Bank to prepare effective measures for
restoring company processes to react to events that might lead to the unavailability of one or more vital aspects of
company function (technology, logistical infrastructure, human resources). The scope of the project included
processes with a direct or indirect impact on the business that would require prompt reactivation.
The aforementioned Plan shall be updated from time to time to keep pace with the evolution of the Bank's
operations.

- 15 -
Regulatory reporting
On 31 October 2006, assimilating the resolution of the Board of Directors of Capitalia passed on 7 September 2006,
and exercising the option afforded by article 152, subsection 8, of directive 2006/48/EC of 14.6.2006 pertaining to
the access to banking activity and the exercise thereof, which established the new prudential regime for banks and
banking groups, the Bank informed the Bank of Italy of its intention to continue to implement the prudential rules
currently effective throughout 2007.
On 11 December 2006 the Bank informed the Bank of Italy of its intention to implement the “Matrix Reconciliation
of IAS/IFRS Accounts” to its supervisory reporting from 31 December 2006 forwards, thereby waiving its right to
adopt reporting rules currently effective (known as the "two-track" system).
Commercial operations and development of new services and products
FinecoBank S.p.A. has continued its work aimed at consolidating and expanding the range of services it offers. The
Bank devoted particular attention to redefining processes in end-to-end terms more in line with customer
expectations and offering greater economic efficiency.
We provide a summary of the main products and services released in 2006 below:
Enhancement of the “news” section with the News Center and Google Research (news search engine with
Google's power, speed and ease-of-use);
Enhancement of operations on equities markets, involving the possibility of trading on the Dutch, Portuguese,
English, Swiss, and Spanish stock exchanges;
Ongoing enhancement of the offer of new segments of online funds: more than 1,400 funds from 30 of the
world’s best asset management companies;
New online mortgages section: possibility for the customer to apply for a mortgage online with exclusive
conditions or request contact and consulting with an agent from Fineco Mutui S.p.A. for information about the full
range of mortgages offered and the choice of a personalized solution;
Personal loans: limit of general-purpose loan reserved for employed customers raised to €30,000;
“ExtraCash Più”: possibility for all customers who have taken out an “ExtraCash" personal loan to combine their
current loans with a second loan;
Enhancement of the “Replay” section: addition of the option of automatic balancing of the ETF portfolio through
accumulation plans;
Expanded possibilities to request current account overdraft facilities: customers may apply for the granting of an
overdraft facility on their current accounts with a pledge on Capitalia AM funds or with a power of attorney to sell
stocks or bonds;
Trading on FOREX, the global currencies exchange: FinecoBank S.p.A. was the first Italian bank to offer its
customers the possibility of trading more than 50 cross currencies directly over the internet and integrated into
one single platform;
Fineco Mobile, a lighter version of the Fineco site that may be accessed from all mobile phones or palm-top
devices. Customers may use Fineco Mobile to trade, top up their telephone credit, order electronic funds transfers,
and access all information about their accounts directly from their mobile phones;
New online services that accompany services previously provided only by call centre such as the ordering of cash
and bankers’ drafts for collection at group affiliate banks (Banca di Roma, Banco di Sicilia e Bipop-Carire);
Introduction of a roll-on plan on the U.S. market to enable the degressive reduction of fixed commissions to
$8.95;

- 16 -
Current accounts for professionals: with the enforcement of Italian Decree Law no. 233/2006 of 4 July 2006,
FinecoBank S.p.A. offers professionals the possibility of opening a current account dedicated to managing their
professional activity;
Extension to all customers of Premium services (conditional orders, alerts, intraday graphs, interactive graphs,
technical analysis sheets) without access limitations or additional costs;
Trading by call centre on 10 new markets: beginning in September FinecoBank S.p.A. will expand the number of
markets on which customers may trade through the call centre to include Austria, Denmark, Finland, Greece,
Ireland, Norway, Spain, Sweden, Switzerland, and the UK.

- 17 -
THE ACTIVITY OF FINECOBANK S.P.A.
FinecoBank S.p.A. is a bank with a nearly exclusive focus on the retail customer segment.
It is a direct bank that offers the full banking, investment and lending services of traditional banks, while
distinguishing itself from the latter by its highly innovative nature.
The Bank’s innovative nature is expressed in two areas:
• the development of innovative businesses, such as, for example, online banking and trading services, an area in
which FinecoBank S.p.A. has played a leading role in launching the market, earning itself a position of leadership
at the national and European levels in the trading sector;
• the application of innovative methods to more traditional businesses, in which FinecoBank S.p.A. has gradually
established its distribution model – consider, for example, the retail lending sector, particularly the mortgage and
“one-fifth of salary” loans segments, in which FinecoBank S.p.A. has applied its innovative character to the
distribution model, which is largely founded on the activity of product marketing networks.
The following sections contain commentary on the main balance sheet indicators and figures of the Business Areas
into which the Bank’s operations are divided.
The Bank undertakes all of its activities with the aim of earning economic returns on the “industrial” management
of the businesses themselves, minimizing the financial risk profile thereof. The financial management of
FinecoBank S.p.A. tends towards risk management aimed at protecting the industrial returns on various
businesses and not assuming risk positions on its own account.

- 18 -
SECURITIES BROKERAGE – Trading Online
FinecoBank SpA trading area currently boasts a customer base with very strong loyalty to the Bank and significant
appreciation of the services it offers. The use of the internet channel, which allows customers to undertake trading transactions on the main financial
markets directly from their personal computers, has won clear approval from investors, especially from the most
active customer segments.
The positive financial markets scenario and the steady development of DMA (direct market access) products and
services, such as trading, are the driving factors behind the Bank’s growth and gradual acquisition of greater
market share on all brokerage segments throughout 2006. The Bank’s transversal development strategy, which
involves a single platform that is segmented and focused according to various use profiles, has fully satisfied
expectations. In further detail, 2006 was a decisive year for the personalization and improvement of the three
main brokerage platforms: web-based, java-based and mobile-based, with the latter fully redesigned and further
expanded to include new functions.
New products were released and the range of existing products offered was expanded:
enhancement of the “news” section with the News Center and Google Research (news search engine with
Google's power, speed and ease-of-use);
organization of online trading courses targeted at all Fineco customers;
enhancement of operations on equities markets, involving the possibility of trading on the Dutch, Portuguese,
English, Swiss, and Spanish stock exchanges;
new spot trading in currencies on the Forex market, making FinecoBank S.p.A. the first Italian bank to offer this
service with a focus on the retail market. Foreign exchange trading, which got underway in June 2006, has already
demonstrated significant growth rates and strong cross-selling and complementarity with the range of products
offered on the platform, thereby contributing to the stabilization of business flows deriving from equities and
derivatives markets;
ongoing enhancement of the offer of new segments of funds that may be purchased online;
extension to all Fineco customers of Premium services;
trading by call centre on 10 new markets;
availability of new order services (Forex trading and electronic funds transfers) on Fineco Mobile as well;
new version of the Book, a free platform in which orders may be entered and monitored, with the possibility of
access via Fast Order.
Value of orders executed in Euro(millions of euro)
0
20.000
40.000
60.000
80.000
100.000
120.000
2000 2001 2002 2003 2004 2005 2006
Value of orders executed on U.S. market
(millions of dollars)
0
2.000
4.000
6.000
8.000
10.000
12.000
2000 2001 2002 2003 2004 2005 2006

- 19 -
Fineco orders executed broken down by market (online only)
0 2.000.000 4.000.000 6.000.000 8.000.000 10.000.000
2004
2005
2006
Other markets Italy (MTA+AH) USA France Germany
Germany 41.522 43.592 86.189
France 31.888 27.275 67.033
USA 900.190 1.036.523 1.333.894
Italy (MTA+AH) 6.242.677 7.098.486 8.880.796
Other markets 0 0 5.909
2004 2005 2006
Average amount per Borsa Italiana order (online only)(euro/000)
6,21
10,0011,88
14,21
21,04
2002 2003 2004 2005 2006
Total value of Fineco orders executed (online only)
8.6
44
.01
9
8.0
15
.35
8
7.2
16
.27
7
8.2
05
.87
6
10
.37
3.8
21
2002 2003 2004 2005 2006
- 20 -
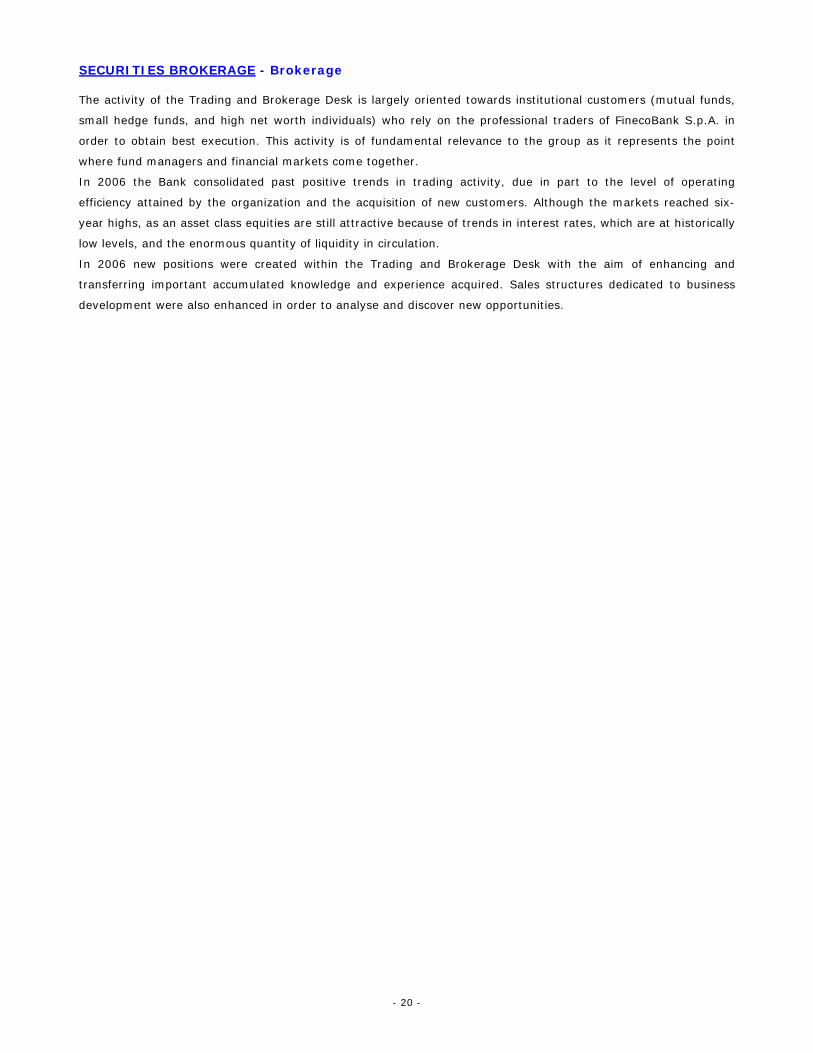
SECURITIES BROKERAGE - Brokerage The activity of the Trading and Brokerage Desk is largely oriented towards institutional customers (mutual funds,
small hedge funds, and high net worth individuals) who rely on the professional traders of FinecoBank S.p.A. in
order to obtain best execution. This activity is of fundamental relevance to the group as it represents the point
where fund managers and financial markets come together.
In 2006 the Bank consolidated past positive trends in trading activity, due in part to the level of operating
efficiency attained by the organization and the acquisition of new customers. Although the markets reached six-
year highs, as an asset class equities are still attractive because of trends in interest rates, which are at historically
low levels, and the enormous quantity of liquidity in circulation.
In 2006 new positions were created within the Trading and Brokerage Desk with the aim of enhancing and
transferring important accumulated knowledge and experience acquired. Sales structures dedicated to business
development were also enhanced in order to analyse and discover new opportunities.

- 21 -
ONLINE The Online Business Area has continued to pursue its mission of providing a wide range of banking and credit
services aimed at a target market of sophisticated customers who are open to innovation and take a critical yet
pragmatic approach to the consumption of financial services.
In 2006 the main activities in this area related to the planning and management of marketing campaigns aimed at
online target markets and word-of-mouth initiatives (“member gets member”) geared towards existing customers.
These complex initiatives are a combination of various aspects, including creativity, advertising, logistics and
monitoring.
ONLINE - Banking Deposits in the form of current accounts denominated in euro and foreign currencies totalled approximately €4,362
million as at 31 December 2006, against €3,355 million as at 31 December 2005, posting an increase of 30% and
confirming the growing trend.
The number of current accounts increased by 5.8% over the stock in existence as at 31 December 2005, bringing
the total to nearly 363 thousand active current accounts, driven by the opening of 50 thousand new current
accounts, and despite the closure of 30 thousand current accounts.
No. of current accounts and balance of direct deposits
1.7
91
.81
0
2.3
14
.91
3
2.9
52
.72
6
3.2
59
.08
7
3.7
48
.66
9
5.2
70
.62
7
32
.98
7
73
9.9
95
323.921310.211
4.792107.371
251.299
290.233
342.838
362.675
0
1.000.000
2.000.000
3.000.000
4.000.000
5.000.000
6.000.000
1999 2000 2001 2002 2003 2004 2005 2006
0
100.000
200.000
300.000
400.000
500.000
600.000
balance of direct deposits no. of current accounts
\
Direct deposits include overdrawn current accounts denominated in euro and foreign currencies and repurchase agreements with retail customers (SuperSave).
ONLINE - Credit cards During 2006, the indicators for the credit card segment posted positive results in line with the performance
recorded in 2005.
In particular, the number of holders of active credit cards with full payment of the balance at term increased by
16%, whereas the number of customers with credit cards with instalment payment plans (the revolving option)
rose by 7%.
Furthermore, the spending figure, which remains the main driver of profitability, increased by 22% over 2005, to
reach a total amount of approximately €950 million.
Spending with revolving credit cards represented 2.4% of the total.

- 22 -
Servicing activity provided on behalf of Group banks (Banca di Roma, Bipop, Banco di Sicilia) included the issue of
approximately 340 thousand new credit cards during 2006, bringing the total number of cards managed for the
Group to more than 810 thousand.
In this connection, it should also be noted that effective from 1 July, 2006 the Bank finalized the transfer of
contractual relationships en bloc in accordance with article 58 of Italian Legislative Decree no. 385/1993; the
purpose of this transfer was to transform the Network Banks from mere “placement agents” (their role until 30
June 2006) into “issuers” of payment cards under the Capitalia brand.
During 2006, FinecoBank S.p.A. accompanied its own cards, which were issued mainly on the VISA circuit, with new
credit cards, some of which relied upon the MasterCard circuit as well, while at the same time initiating the process
of gradual migration from magnetic strip to microchip technology.
No. of credit cards issued, net of expired cards
279.049 331.557 383.175495.324
812.177
335.878184.503
3.084209.988
474.013
2001 2002 2003 2004 2005 2006
Fineco cards Capitalia cards
Historical performance of total spending (cash and revolving)
92
4.3
00
70
4.4
24
61
3.9
40
47
1.5
93
34
5.5
79
14
8.7
35
23.022
8.205
2.233
11.956
14.185
16.313
0
100.000
200.000
300.000
400.000
500.000
600.000
700.000
800.000
900.000
1.000.000
2001 2002 2003 2004 2005 2006
0
5.000
10.000
15.000
20.000
25.000
cash spending revolving spending
(Amounts in Euro/000)

- 23 -
FINANCIAL PLANNERS NETWORK The purpose of the Financial Planners Network Business Area is to allow the Bank to cover a business segment that,
despite having reached a more advance stage of development, may nonetheless prove useful and synergetic to the
goal of completing the products and services offered by the Bank and the Group to which it belongs. Following the definitive transfer of the Financial Planners business division into FinecoBank S.p.A. and the thorough
process of revision of the Network’s hierarchy/organization and commissions carried out during 2005, in 2006 this
Business Area continued to make further investments aimed at fully exploiting the synergy between distribution
channels and the provision of personalized banking products and services.
The open architecture, which is based on multi-brand funds and investment certificates, was further expanded and
consolidated during 2006. This process allowed the Bank to support the growth of assets under management and
improve the quality of the customer portfolio. The advantages of the open architecture also translated into
increased satisfaction and loyalty of financial advisors.

- 24 -
Direct and indirect funding – Financial Planners Network
DIRECT FUNDINGCurrent acc. in euro, foreign currencies, and rep. 3.052.008 32,2% 2.276.417 29,5% 775.591 34,1%Total direct funding 3.052.008 32,2% 2.276.417 29,5% 775.591 34,1%
ASSETS UNDER MANAGEMENTDiscretionary accounts 324.173 3,4% 495.801 6,4% (171.628) -34,6%Mutual funds and and other Funds 3.454.962 36,5% 2.838.038 36,8% 616.924 21,7%Insurance products 821.658 8,7% 818.665 10,6% 2.994 0,4%Other assets under management 183.344 1,9% - 0,0% 183.344 -Total assets under management 4.784.138 50,5% 4.152.503 53,9% 631.634 15,2%
ASSETS UNDER ADMINISTRATIONGovernment securities, stocks and bonds 1.637.259 17,3% 1.277.595 16,6% 359.664 28,2%Total assets under administration 1.637.259 17,3% 1.277.595 16,6% 359.664 28,2%
Total direct / indirect customer funding 9.473.405 100,0% 7.706.514 100,0% 1.766.890 22,9%
% ChangeAbsolute change
% of Total31-dic-06 % of Total 31-dic-05
(Amounts in Euro/000)
The table provided above shows the stock of assets accumulated by the financial planners network as at 31
December 2006. With a total of more than €9,473 million in overall assets under management and administration
and direct deposits held with both FinecoBank S.p.A. and other Group Banks, the financial planners network
represents a significant asset. Indirect funding (FinecoBank S.p.A.)
ASSETS UNDER MANAGEMENTDiscretionary accounts 326.077 4,0% 504.299 7,3% (178.222) -35,3% of which cash 2.719 0,0% 7.470 0,1% (4.752) -63,6%Mutual funds and SICAVs 3.656.856 44,7% 3.003.737 43,3% 653.119 21,7%Insurance products 845.265 10,3% 822.667 11,9% 22.598 2,7%Other assets under management 185.429 2,3% - 0,0% 185.429 -Total assets under management 5.010.909 61,3% 4.330.703 62,6% 680.206 15,7%
ASSETS UNDER ADMINISTRATIONGovernment securities and bonds 808.198 9,9% 483.125 7,0% 325.073 67,3%Stocks 2.319.268 28,3% 2.098.970 30,3% 220.298 10,5%Other securities 42.653 0,5% 20.068 0,3% 22.585 112,5%Total assets under administration 3.170.119 38,7% 2.602.163 37,5% 567.956 21,8%
Total indirect customer funding 8.181.028 100% 6.932.866 100% 1.248.162 18,0%
% ChangeAbsolute change
% of Total31-dic-06 % of Total 31-dic-05
(Amounts in Euro/000) The table provided above sets out the figures for the stock of assets under management and administration of the
customers of FinecoBank S.p.A., whether the customers are linked to a financial advisor or are online customers.
The figures shown refer to the Bank’s own products and those of third parties placed online or through the Bank’s
sales networks.
Total indirect funding grew by more than €1,248 million over December 2005, posting a significant increase in the
area of mutual funds and foreign SICAVs (€653 million) and new structured certificates products (€185 million).
As at 31 December 2006 the distribution network consisted of 1,142 resources. A decrease of 219 resources was
recorded from the situation as at 31 December 2005.
The influx of new assets under management, net of disinvestment, came to approximately €567 million in 2006.
This influx may be broken down as follows: €503 million in funds of the Bank and third parties, €33 million in
insurance products, - €159 million in discretionary accounts, and €191 million in the new certificates.
During 2006, the range of funds offered for subscription online was significantly expanded through the placement
of the products of 11 new SICAVs (Henderson, Union, Capitalia IM, Sgam Fund and Sgam AI Equisys Fund, Merrill

- 25 -
Lynch Master Series, Mellon, Nordea, Pioneer Funds, Raiffeisen and Nomura) and one asset-management company
(Grifogest), which, along with the marketing of new segments of existing SICAVs or asset-management companies,
brought the total number of funds up to 1,700 representing 37 different brands, thereby expanding the range of
instruments available to the FinecoBank S.p.A. Network to meet the diverse needs of investors. The Bank also
began to market 14 structured investment certificates of various issuers, a real-estate fund, and open-ended
pension funds (Arca, Aletti Gestielle, Anima and Credit Agricole).
As at 31 December 2006 the distribution network was active throughout all of Italy, operating 128 financial shops
directly managed by the Bank, in addition to 41 shops managed by Financial Planners.
The rationalization of points of sale started during previous years continued throughout 2006, also in the light of
the combination of the distribution networks previously operated by the Group under the control of FinecoBank
S.p.A.
Assets under management – 2006 Performance (euro/000)
-16.
272
-19.
336
-14.
666
-7.3
19
-20.
308
-14.
653
-8.8
78
-9.0
43
-8.8
60
-17.
159
-17.
374 -5
.250
64.3
58 71.0
94
85.5
94
84.0
96
-15.
992
-10.
278
43.9
38
14.6
60
4.72
9
24.4
16
47.8
07
88.2
31
-1.6
33
2.74
1
4.43
0
4.31
4
5.46
2
4.19
7 12.1
59
-9 -18
-1.6
24
1.84
5
1.12
7
-40.000
-20.000
0
20.000
40.000
60.000
80.000
100.000Managed accounts (funds/securities) Funds Insurance Certificates
% Composition of Total Stock of Assets in Financial Planners Network as at 31 December
2006
49,5% 50,5%
1,9%
36,5%
8,7%
3,4%
Assets under administration/Current accountsManaged accounts (funds/securities)FundsInsuranceCertificates
% Composition of Total Stock of Assets in Financial Planners Network as at 31 December 2005
46,1%
36,8%
53,9%
10,6%6,4%
Assets under administration/Current accounts
Managed accounts (funds/securities)
Funds
Insurance
MORTGAGES

- 26 -
During 2006, FinecoBank S.p.A. continued to enact its strategy of expansion on the residential mortgage market
through its subsidiary Fineco Mutui S.p.A., focusing in particular on the addition of new agents, the steady
development of geographical coverage, the shift in the composition of the product portfolio and commissions, and
the improvement of business processes, all of which were aimed at ensuring that the products offered by the Bank
on the domestic market were increasingly distinctive and innovative.
As at 31 December 2006 the Bank had a multi-channel distribution structure consisting of 216 specialized agents
employed by Fineco Mutui S.p.A., 9 back-office structures, approximately 70 regional offices placed throughout all
of Italy, and more than 1,200 financial advisors a ble to indicate customers who are interested in taking out a
mortgage. FinecoBank S.p.A. further boasts a website that facilitates telephone and remote access to the Bank's
services, which include, in addition to providing information, the possibility of requesting and obtaining explanation
concerning mortgages through an exclusively online process.
It should be pointed out that among the regional offices must also be classified the new commercial shops opened
directly by agents, which are oriented towards optimizing geographical coverage under a variable cost
management model.
The Bank’s distribution system allowed it to issue approximately €541 million in mortgages and enter into 4,464
mortgage agreements during 2006.
The achievement of these results was made possible by the realization of a wide range of marketing,
communications, and organizational activities aimed at maximizing marketing and operational efficiency. In
particular, customers were provided with new products aimed at: creating a competitive advantage over other
industry players, consolidating the positions of leadership that the Bank has won for itself by expanding the range
of existing products and developing cross-selling between agents and financial planners.
Total outstanding mortgages as at 31 December 2006 came to €4,380 million, of which €2,065 million were in
portfolio, €1,952 had been sold but not eliminated from the balance sheet and the remaining €363 million had
been securitized.
As at 31 December 2006, subsequent to the redefinition of the product portfolio accomplished during the year,
FinecoBank S.p.A. Mortgages Business Area offered as many as 25 mortgage product families, with maturities
from 5 to 35 years, fixed and floating rates, with the option to switch to fixed rates, planned payments, and
flexible maturities.
During 2006, a total of €24 million in mortgages were sold at face value as part of a revolving mortgage facility. For further information on securitization operations, reference should be made to the chapter “Securitization
operations” and the Notes.

- 27 -
Performance of total stock
1.1461.694 1.863 2.065
1.264 2.3002.128 2.053 1.952
663408 388 363
1.847
693
Dec 04 Jun 05 Dec 05 Jun 06 Dec 06
Mortgages in portfolio Securitized mortgagesAssets sold but not eliminated
(Amounts in millions)
SALARY GUARANTEED LOANS Salary guaranteed loans issued in 2006 came to a total of €607 million in principal, against €490 million in 2005,
posting an increase of 23.7%.
Total outstanding salary guaranteed loans amounted to €1,504 million, of which €1,342 million were in portfolio
(of these €297 million were “delegated payment” loans), and €162 million were assets sold but not eliminated
from the balance sheet.
Number Amount issued
Salary guaranteed loans issued in 2006 34,356 606,871 Salary guaranteed loans issued in 2005 29,746 490,352
(Amounts in Euro/000)
With reference to the network of credit brokers, although the Bank has established relationships of full autonomy
with its credit brokers as required by applicable law, the development of information technology systems continued,
involving the installation of remote connections that led to a streamline production process, a reduction of internal
costs, and increased broker loyalty; 25 new connections were added in 2006, bringing the total number of
connections up to 69 at the end of 2006.
As part of the constant evolution of organizational processes and information systems, the Bank introduced
improvements that will allow it to combine ongoing technological development with the priorities and industrial
needs of this Business Area.
The Bank also completed processes aimed at improving the management of collections, with special attention on
facilitating the administration of securitization operations.
Cash held in the current accounts of the special vehicle purpose F-E Personal Loans, which came to a total of €9
million as at 31 December 2006, must also be considered as part of the category of assets sold but not eliminated
from the balance sheet.
4.109 4.230 4.305
3.804
4.380

- 28 -
During 2006, no new assignments of performing loans for securitization operations or revolving loan facilities were
undertaken. On 20 June 2006 the Bank closed the securitization operation that it had undertaken with the special vehicle
purpose Garda S.r.l. in advance of the term. For further information on securitization operations, reference should be made to the chapter “Securitization
operations” and the Notes.
(Amounts in millions)
Performance of total stock
650865
993
1.283 1.342
391
334267
214 162
107 79
209
Dec-04 Jun-05 Dec-05 Jun-06 Dec-06
Salary guaranteed loans in portfolio Assets sold but not eliminated
Salary guaranteed loans securitized
(Amounts in millions)
333410 389
468 437490
607
2000 2001 2002 2003 2004 2005 2006
Salary guaranteed loans
1.306 1.339 1.497
1.251
1.504

- 29 -
BALANCE SHEET FIGURES
ASSETS 31-Dec-2006 31-Dec-2005 Absolute %
10 Cash and cash equivalents 316 486 (170) -35,0%20 Financial assets held for trading 894.513 485.209 409.304 84,4%40 Available-for-sale financial assets 83.398 93.261 (9.863) -10,6%60 Loans to banks 1.088.915 514.161 574.754 111,8%70 Customer loans 6.835.626 6.463.671 371.955 5,8%80 Hedge derivatives 16.756 3.775 12.981 343,9%90 Adjustments to the value of financial assets
to be macro-hedged (+/-) (19.694) 3.830 (23.524) -614,2%100 Equity investments 1.118 1.118 -110 Property, plant and equipment 7.003 7.071 (68) -1,0%120 Intangible assets 32.791 34.775 (1.984) -5,7%
of which- goodwill 21.583 21.583 -
130 Tax assets 23.479 25.638 (2.159) -8,4%a) current - - - -b) prepaid 23.479 25.638 (2.159) -8,4%
140 Non-current assets and disposal groupsclassified as held for sale 145 145 -
150 Other assets 129.788 138.997 (9.209) -6,6%Total assets 9.094.154 7.772.137 1.322.017 17,0%(Amounts in Euro/000)
Change
LIABILITIES AND SHAREHOLDERS' EQUITY 31-Dec-2006 31-Dec-2005 Absolute %
10 Deposits from banks 796.985 858.059 (61.074) -7,1%20 Customer accounts 7.737.443 6.337.905 1.399.538 22,1%30 Debt securities in issue - 54.693 (54.693) -100,0%40 Financial liabilities held for trading 20.917 38.444 (17.527) -45,6%60 Hedge derivatives 4.580 15.962 (11.382) -71,3%80 Tax liabilities 8.272 6.201 2.071 33,4%
a) current 3.491 2.786 705 25,3%b) deferred 4.781 3.415 1.366 40,0%
100 Other liabilities 170.561 172.134 (1.573) -0,9%110 Employee severance payment fund 3.834 3.186 648 20,3%120 Provisions for contingencies and charges: 38.367 30.740 7.627 24,8%
b) other provisions 38.367 30.740 7.627 24,8%130 Valuation reserves 2.795 3.460 (665) -19,2%160 Reserves 45.446 (1.526) 46.972 3078,1%180 Share capital 199.851 202.293 (2.442) -1,2%190 Own shares (-) - (2.442) 2.442 -100,0%200 Net profit (loss) for the year 65.103 53.028 12.075 22,8%
Total liabilities and shareholders' equity 9.094.154 7.772.137 1.322.017 17,0%(Amounts in Euro/000)
Change
Financial assets (asset items 20 and 40) Financial assets may be broken down as follows:
Financial assets held for trading: this category includes the positive fair value measurement of derivatives
contracts held for trading, which came to €14.019 million, the positive measurement of commitments for
currencies and securities to be received and delivered, which totalled €0.354 million, in addition to stocks and
bonds classified as FVPL (fair value through profit or loss), for a total amount of €880.140 million, of which
€836.364 million pertained to bonds issued by the Parent Bank, Capitalia S.p.A.. The securities issued by the
Parent Bank are used for repurchase agreements with retail customers. The increase compared to 31 December

- 30 -
2005 may be attributed largely to the subscription of bonds denominated in euro and dollars issued by the Parent
Bank, Capitalia S.p.A. and used by FinecoBank S.p.A. in repurchase agreements;
Available-for-sale financial assets: this category consists exclusively of equity investments in companies over
which the Bank does not exercise control or a significant influence, whether directly or through its subsidiaries, and
totalled €8.262 million, in addition to senior and junior notes subscribed for as part of the Bank’s securitization
operations, for a total of €75.137 million. The junior notes subscribed for as part of the securitization operations
undertaken after 1 January 2002, which were represented in the accounts under customers loans, were eliminated
from the balance sheet.
During 2006, the junior notes issued by the special vehicle purpose Garda S.r.l. as part of the securitization of
“one-fifth of salary" loans were redeemed.
FinecoBank S.p.A. did not recognize financial assets under asset item 30, “Financial assets designated at fair
value” and item 50, “Held-to-maturity financial assets”.
31-dic-06 31-dic-05 Absolute %
Financial assets held for trading 894.513 485.209 409.304 84,4%Financial assets designated at fair value - - - -Available-for-sale financial assets 83.398 93.261 (9.863) -10,6%Held-to-maturity financial assets - - - -Total 977.911 578.470 399.441 69,1%(Amounts in Euro/000)
Change
Net loans to banks (asset item 60, liability item 10)
Type of transactions/Values 31-Dec-2006 31-Dec-2005 Absolute %
A. Loans to central banks - - - -1. Savings accounts - - - -2. Mandatory reserve - - - -3. Repurchase agreements - - - -4. Other - - - -B. Loans to banks 1.088.915 514.161 574.754 111,8%1. Current accounts and demand deposits 132.592 257.366 (124.774) -48,5%2. Savings accounts 939.526 248.165 691.361 278,6%3. Other loans: - - 3.1 Repurchase agreements 13.433 806 12.627 1566,6% 3.2 Finance leases - - - - 3.3 Other 1.800 5 1.795 35900,0%4. Debt securities - - 4.1 Structured securities 838 - 838 - 4.2 Other debt securities 726 7.819 (7.093) -90,7%5. Impaired assets - - - -6. Assets sold but not eliminated - - - -Total 1.088.915 514.161 574.754 111,8%(Amounts in Euro/000)
Change

- 31 -
Type of transactions/Values 31-Dec-2006 31-Dec-2005 Absolute %
1. Deposits from central banks - - - -2. Deposits from banks 796.984 858.059 (61.075) -7,1%2.1 Current accounts and demand deposits 171.723 221.891 (50.168) -22,6%2.2 Savings accounts 510.117 510.046 71 0,0%2.3 Loans 2.3.1 Finance leases - - - - 2.3.2 Other 113.304 126.122 (12.818) -10,2%2.4 Commitments to buy back - - own capital instruments - - - -2.5 Liabilities from assets sold but not eliminated 2.5.1 Repurchase agreements - - - - 2.5.2 Other - - - -2.6 Other payables 1.840 - 1.840 -Total 796.984 858.059 (61.075) -7,1%(Amounts in Euro/000)
Change
Loans to banks and deposits from banks in the form of current accounts and demand deposits consisted primarily
of reciprocal current accounts and lending between the Bank and Capitalia S.p.A., Bipop Carire Società per Azioni,
Banca di Roma and Banco di Sicilia.
The savings accounts recognized under assets consist of the deposit held with Capitalia for compulsory reserves,
with a book value of €83.661 million, in addition to short-term savings accounts held with Capitalia for a total of
€855.865 million.
The savings accounts recognized under liabilities consist of sums deposited by Capitalia S.p.A., with a book value
of €225.052 million, and by Banca Roma International, for a book value of €285.065 million.
The item “Other” under “Deposits from banks” consists exclusively of repurchase agreements involving securities
received as part of previous repurchase agreements.
Customer loans Customer loans, which came to a total of €6,835.626 million, may be broken down as follows:
€5,769.085 million in loans to ordinary customers; €679.504 million in repurchase agreements, of which €500.816 million with Fineco Finance Ltd.;
€154.873 million in securities lending;
€133.787 million in deposits held as collateral, initial margins, and variation margins with clearing systems in
relation to derivatives transactions;
€91.061 million in cash held in the current accounts for principal and interest of the special purpose vehicle due
to the impact of the recognition of loans sold but not eliminated from the balance sheet;
€0.910 million in relation to postal accounts;
€1.346 million in securities classified as Loans and Receivables;
€5.060 million in current accounts with institutional customers, of which €1.255 million in the current account
held with Fineco Finance Ltd.;

- 32 -
Type of transactions/Values 31-dic-06 31-dic-05 Absolute %
1. Current accounts 15.430 31.922 (16.492) -51,7%2. Repurchase agreements 834.377 828.194 6.183 0,7%3. Mortgages 2.057.282 1.681.279 376.003 22,4%4. Credit cards, personal loans and salary guaranteed loans 1.512.385 1.257.660 254.725 20,3%5. Finance leases - - - -6. Factoring - - - -7. Other transactions 144.864 141.501 3.363 2,4%8. Debt securities: 8.1 Structured 1.346 - 1.346 - 8.2 Other - - - -9. Impaired assets 58.999 34.694 24.305 70,1%10. Assets sold but not eliminated* 2.210.943 2.488.421 (277.478) -11,2%Total (book value) 6.835.626 6.463.671 371.955 5,8%(Amounts in Euro/000)
Change
* This item includes impaired assets in relation to loans sold but not eliminated from the balance sheet. Ordinary customer loans(Reclassified for management purposes) 31-dic-06 31-dic-05 Absolute %
Salary guaranteed loans and "delegated payment" loans 1.341.893 993.318 348.575 35,1%
Salary guaranteed loans and "delegated payment" loans sold but not eliminated 161.835 267.009 (105.174) -39,4%
Salary guaranteed loans and "delegated payment" loans sold - 79.168 (79.168) -100,0%Total salary guaranteed loans and "delegated payment" loans 1.503.728 1.339.495 164.233 12,3%Mortgages 2.064.503 1.693.125 371.378 21,9%Mortgages sold but not eliminated 1.952.483 2.128.937 (176.454) -8,3%Mortgages sold 362.928 408.076 (45.148) -11,1%Total mortgages 4.379.914 4.230.138 149.776 3,5%Current accounts 15.099 14.150 949 6,7%Use of credit cards 104.209 191.912 (87.703) -45,7%Personal loans and unsecured loans 93.989 78.349 15.640 20,0%Other loans 10.174 1.803 8.371 464,3%Non-performing loans 19.336 14.227 5.109 35,9%Non-performng loans sold but not eliminated 5.564 2.605 2.959 113,6%Non-performing loans sold 5.239 3.266 1.973 60,4%Total ordinary customer loans 6.137.252 5.875.945 261.307 4,4%(Amounts in Euro/000)
Change
For the purposes of evaluating the performance of ordinary customer loans from a management perspective, loans
sold but not re-entered to the balance sheet should be considered as belonging to the latter category. The total
amount of loans, which came to €6,137.252 million, posted growth of 4.4% compared to the same period of the
previous year. Total mortgage loans sold (€362.928 million), and non-performing loans sold (€5.239 million), unlike loans
recognized on the balance sheet, are entered gross of any specific and portfolio writedowns and are not recognized
at amortized cost. These loans, since they are not recognized on the balance sheet on the basis of the option
granted by IAS 39, are measured according to the criteria set forth in the section concerning securitization
operations, and the amortized cost criterion was not applied.
The item "Use of credit cards" decreased by 45.7% due to the transfer of contracts with customers holding credit
cards issued by FinecoBank S.p.A. on behalf of Bipop Carire, Banco di Sicilia, Banca di Roma and Capitalia, which
was executed on 1 July 2006.

- 33 -
Doubtful loans Doubtful loans (non-performing loans and problem loans held in portfolio and classified among loans sold but not
eliminated from the balance sheet), net of adjustments, came to a total of €61.180 million, an increase of 72.91%
over the €35.382 million recorded in December 2005; the classified loan portfolio represented 0.90% of total loans.
Net non-performing loans amounted to €24.900 million in the aggregate, up 47.92% over the €16.833 million
posted on 31 December, 2005. Of this category, 95.64% consisted of mortgage loans. Net non-performing loans
represented 0.36% of total cash loans. Net problem loans came to a total of €36.280 million; those pertaining to
mortgage loans made up €10.496 million of the total.
Net expired exposures stood at €9.327 million.
The following tables show the coverage ratios for doubtful loans, expressed as the ratio of total specific and
portfolio writedowns made (including interest on late payments deemed unrecoverable) to total gross exposures
(including written down interest on late payments).
Total doubtful loans gross of the writedown reserve
Category31-dic-06 31-dic-05 31-dic-06 31-dic-05 31-dic-06 31-dic-05 31-dic-06 31-dic-05
Non-performing loans 38.002 25.505 1.759 1.208 8.899 9.128 48.660 35.841Problem loans 12.361 13.493 25.489 6.311 1.710 738 39.560 20.542Total 50.363 38.998 27.248 7.519 10.609 9.866 88.220 56.383(Amounts in Euro/000)
Salary guaranteed loans and "delegated payment"
Mortgages Other loans Total
Total doubtful loans net of the writedown reserve
Category31-dic-06 31-dic-05 31-dic-06 31-dic-05 31-dic-06 31-dic-05 31-dic-06 31-dic-05
Non-performing loans 23.815 15.805 450 294 635 734 24.900 16.833Problem loans 10.496 11.991 25.184 6.299 600 259 36.280 18.549Total 34.311 27.796 25.634 6.593 1.235 993 61.180 35.382(Amounts in Euro/000)
Salary guaranteed loans and "delegated payment"
Mortgages Other loans Total
Coverage ratios for doubtful loans
Category31-dic-06 31-dic-05 31-dic-06 31-dic-05 31-dic-06 31-dic-05 31-dic-06 31-dic-05
Non-performing loans 37,33% 38,03% 74,40% 75,65% 92,86% 91,96% 48,83% 53,04%Problem loans 15,08% 11,13% 1,20% 0,18% 65,00% 64,92% 8,29% 9,70%Total 31,87% 28,72% 5,92% 12,31% 88,37% 89,94% 30,65% 37,25%
Salary guaranteed loans and "delegated payment"
Mortgages Other loans Total
Coverage ratios for performing and expired loans
Category31-dic-06 31-dic-05 31-dic-06 31-dic-05 31-dic-06 31-dic-05 31-dic-06 31-dic-05
Performing loans 0,19% 0,19% 0,30% 0,15% 1,05% 1,73% 0,24% 0,21%Expired loans 5,00% 0,19% 0,46% 0,11% 16,68% 5,75% 10,41% 2,53%Total 0,19% 0,19% 0,30% 0,15% 1,72% 1,85% 0,26% 0,22%
Salary guaranteed loans and "delegated payment"
Mortgages Other loans Total

- 34 -
Hedge derivatives (asset item 80 and liability item 60) and adjustment to the value of financial assets to be macro-hedged (asset item 90)
31-Dec-06 31-Dec-05 Absolute %
Hedge derivatives - assets 16,756 3,775 12,981 343.9%Hedge derivatives - liabilities (4,580) (15,962) 11,382 -71.3%Imbalance 12,176 (12,187) 24,363 -199.9%
Adjustments to the value of financial assetsto be macro-hedged (+/-) (19,694) 3,830 (23,524) -614.2%(Amounts in Euro/000)
Change
Hedge derivatives include positive and negative measurements of derivatives that the bank has entered into with
the purpose of macro-hedging against interest rate risk inherent in salary guaranteed loans and “delegated
payment” loans.
The increase in hedge derivatives, which totalled €24.363 million, and, consequently, the negative measurement
of salry guaranteed loans and “delegated payment” loans, amounting to €23.524 million, is to be attributed to the
raising of the interest rate curve, inasmuch as the relevant derivatives were IRSs involving the payment of a fixed
rate and the collection of a variable rate and fixed rate loans.
Equity investments and available-for-sale financial assets – (asset items 100 and 40) Equity investments have been classified into “Equity investments” and “Available-for-sale financial assets”.
The item “Equity investments”, with a balance of €1.118 million, includes the controlling interest in Fineco Mutui
S.p.A. and the stake held in the associated company Capitalia Investimenti Alternativi Sgr S.p.A. The item
“Available-for-sale financial assets”, totalling €8.262 million, includes the remaining equity investments in
companies over which the bank does not exercise either control or a significant influence, whether directly or
through subsidiaries.
The equity investment in Fineco Mutui S.p.A. is not consolidated in the separate financial statements of FinecoBank
S.p.A. since it is instead consolidated in the financial statements of the Parent Bank, Capitalia S.p.A..
Book value Book value
as at 31 Dec 06 % as at 31 Dec 05 %Ktesios S.p.A. - - 458 4,50%Net Insurance S.p.A. 8.189 13,04% - -Agenzia di Pollenzo S.p.A. - - 1.206 6,07%Monte Titoli S.p.A. 8 0,03% 8 0,03%Consorzio Patti Chiari 5 0,53% 5 0,53%Acroservizi S.p.A. 60 10,71% 60 10,72%Available-for-sale financial assets 8.262 1.737
Fin-Eco Investimenti Alternativi Sgr S.p.A. 258 5,00% 258 5,00%Fineco Mutui S.p.A. 860 100,00% 860 100,00%Equity investments 1.118 1.118Total 9.380 2.855(Amounts in Euro/000) Ktesios: on 13 April 2006 the Bank sold its entire equity investment in the company for a total of €3 million. The
capital gain on the sale came to a total of €2.542 million. During 2006, a total of €0.234 million in dividends were
collected, in addition to €0.203 million in earnings retained by Ktesios S.p.A..

- 35 -
Net Insurance: pursuant to the resolution passed by the Board of Directors on 21 July 2005, and on the basis of
the agreement signed with Net Insurance and shareholders on 5 August 2005, the Bank:
- subscribed to the reserved capital stock issue for a nominal value of €0.250 million and total amount of €2.5
million on 27 April 2006;
- purchased an additional 500,000 shares for a total price of €5 million on 9 May 2006.
The value of the equity investment was increased by €0.117 million for capitalizable costs directly related to the
purchase of the equity investment itself.
As at 31 December 2006 FinecoBank S.p.A. held 750,000 shares with a nominal value of €1.00 each, i.e. a percent
interest of 13.04%.
The valuation at fair value as at 31 December 2006 resulted in an increase in value of €0.572 million, which was
recognized to a specific shareholders' equity reserve.
Agenzia di Pollenzo: on 27 June 2006 the Board of Directors resolved to accept the offer advanced by Capitalia
S.p.A. to sell the full equity investment to Capitalia Merchant S.p.A.. On 28 July 2006 the Bank closed the deal,
collecting €1.206 million in payment, the equivalent of the book value of the equity investment.
Property, plant and equipment (asset item 110) Investments in electronic machines, which came to a total of €1.707 million, were primarily intended for use in
Bank branches. In particular, during 2006, a new office location was fitted out for the Business Continuity Project.
Investments in furniture, fittings and equipment were primarily intended for use in financial shops.
The book value of property, plant, and equipment includes the historical cost and the accumulated depreciation of
assets obtained under financial lease, as allowed by IAS 17.
Balance 01.01.2006
Investments in 2006
Other Changes-
Sales
Depreciation and
writedowns in 2006
Balance 31.12.2006
Buildings 3.456 - - (72) 3.384 EDP machines 1.918 1.707 (11) (1.714) 1.900 Furniture and fittings 950 689 - (611) 1.028 Plant and equipment 747 511 (1) (566) 691 TOTAL 7.071 2.907 (12) (2.963) 7.003
Balance 01.01.2005
Investments in 2005
Other Changes-
Sales
Depreciation and
writedowns in 2005
Balance 31.12.2005
Buildings 3.528 - - (72) 3.456 EDP machines 4.788 461 (41) (3.290) 1.918 Furniture and fittings 627 1.192 (324) (545) 950 Plant and equipment 1.057 1.354 (878) (786) 747 TOTAL 10.000 3.007 (1.243) (4.693) 7.071
(Amounts in Euro/000)
(Amounts in Euro/000) )

- 36 -
Intangible assets (asset item 120)
Writedowns, which totalled €7.686 million, pertained exclusively to the share of amortization applied to purchases
and the implementation of computer software programmes.
Investments concerned the implementation of information technology procedures with useful lives of several years
that are required to manage development and the constant offer of new financial products by the Bank.
Balance
01.01.2006
Investments in 2006
Other changes-
sales
Amortization and
writedowns in 2006
Balance 31.12.2006
Computer software costs 13.192 5.702 - (7.686) 11.208 Goodwill 21.583 - - - 21.583 TOTAL 34.775 5.702 - (7.686) 32.791
Balance 01.01.2005
Investments in 2005
Other changes-
sales
Amortization and
writedowns in 2005
Balance 31.12.2005
Computer software costs 13.142 8.562 (1.129) (7.383) 13.192 Goodwill 15.868 - - (11) - Other deferred charges 11 3.462 2.253 - 21.583 TOTAL 29.021 12.024 1.124 (7.394) 34.775
Tax assets and liabilities (asset item 130 and liability item 80)
The item “Tax assets”, which came to a total of €23.479 million, refers to “Prepaid tax assets”.
The item “Tax liabilities”, which amounted to €8.272 million, consists of €3.491 million in “Current tax liabilities”
and €4.781 million in “Deferred tax liabilities”.
The calculation of the aforementioned asset and liability items was affected by the impact of the adoption of
"national tax consolidation" and the application of IAS/IFRS.
For the three-year period from 2004 to 2006, FinecoBank S.p.A., in its capacity as consolidated company, was
subject to what is known as “national tax consolidation”, as established by Italian Legislative Decree no. 344 of
2003, which was carried out by the Parent Bank, Capitalia S.p.A..
Consequently, taking into account the contractual agreements entered into in this connection, the item “Taxes”
does not include charges corresponding to the IRES taxes paid by the subsidiary to the parent company, which
totalled €33.206 million.
Current tax liabilities
Current tax liabilities came to a total of €3.491 million and derive essentially from residual IRAP taxes to be paid to
the tax authorities for a total of €2.497 million.
Prepaid/deferred tax assets/liabilities
In line with applicable provisions of law and regulations:
- the valuation of prepaid taxes for IRES purposes takes into account the expected income figures for future years,
according to the provisions established by competent company bodies;
- the valuation of prepaid taxes for IRAP purposes takes place on the basis of the company’s expected income
figures for future years, and takes into account changes in the legal context;
(Amounts in Euro/000) )
(Amounts in Euro/000) )

- 37 -
- deferred taxes are recognized whenever the relevant requirements are satisfied.
The 33% IRES tax rate in effect from 1 January 2004 was taken into consideration when calculating deferred taxes.
As for IRAP, on the other hand, the applicable tax rate is 4.25%, being the base rate established by the Emilia
Romagna region, which is applied to the entire value of the Bank's production.
For more detailed information concerning “Prepaid tax assets”, reference should be made to the contents of
sections 13.1, 13.3 and 13.5 below.
For similar information concerning “Deferred tax assets”, reference should be made to the contents of sections 13.2, 13.4 and 13.6 below. Other assets (asset item 150)
31-Dec-06 31-Dec-05 Absolute %
Assets in transit 8 1 7 700.0%Outstanding and protested notes, billsand cheques pending clearance 193 136 57 41.9%Bank drafts forwarded to the teller 784 495 289 58.4%Cheques pending clearance 4,677 8,641 (3,964) -45.9%Security deposits in own name 179 118 61 51.7%Payments on account 29 - 29 -Commissions on account 331 104 227 218.3%Trade receivables 432 84 348 414.3%Advances on taxes 38,286 37,088 1,198 3.2%Tax credits fromprevious years and relative interest 4 4 - 0.0%Advances on taxes onseverance indemnities 10 7 3 42.9%Disputed items not derivingfrom banking activity 257 369 (112) -30.4%Sums to recover from third parties 197 183 14 7.7%Receivables for invoices issued 15,365 14,374 991 6.9%Sums to charge to customers 596 594 2 0.3%Placement and maintenance commissionsInsurance funds and products to be collected 12,900 11,816 1,084 9.2%Items under constructionpertaining to POS and ATM Cards 633 1,107 (474) -42.8%Sums to be settled throughthe clearing house 8,180 7,046 1,134 16.1%Sums to be settled with customers and banks 20,573 20,737 (164) -0.8%Differences (stolen cash and cheques) 51 18 33 183.3%Items pertaining to transactions in securities and cu 1,664 3,031 (1,367) -45.1%Non-classifiable accrued income 280 5,605 (5,325) -95.0%Non-classifiable prepaid expenses 21,064 24,326 (3,262) -13.4%Improvements and incremental expensesincurred on third-party assets 2,451 2,222 229 10.3%Other lesser sums 643 891 (248) -27.8%Total 129,787 138,997 (9,210) -6.6%(amounts in Euro/000)
Change

- 38 -
Customer funding and direct customer funding (liability item 20) Direct customer funding are considered to consist of funding in the form of current accounts and repurchase
agreements with retail and institutional customers, for a total amount of €5,374.564 million, which registered an
increase of 41.1% over 31 December 2005.
“Financial liabilities from assets sold but not eliminated – other” consist of the balance of the notes issued by the
special vehicle purpose after 1 January 2002, entered at amortized cost, since as required by IAS 39 the loans
securitized after that date were entered to the balance sheet as if the sale had never occurred.
Other loans include securities borrowing by the Bank, which came to a total of €155.057 million, corresponding to
an equal sum of repurchase agreements for securities lending recognized under asset item 70, "Customer loans";
repurchase agreements undertaken involving reverse repurchase agreements, for a total of €445.569 million; the
subordinated loan issued by FinecoBank S.p.A., for a total of €100.276 million, fully underwritten by FinecoFinance
Ltd.
Type of transactions/Values 31-dic-06 31-dic-05 Absolute %
1. Current accounts and demand deposits 4.361.345 3.355.145 1.006.200 30,0%2. Savings accounts 320 - 320 -3. Third-party funds under administration - - - -4. Loans 4.1 Finance leases 14 44 (30) -68,2% 4.2 Other 700.902 436.925 263.977 60,4%5. Commitments to buy back - - own capital instruments - - - -6. Liabilities from assets sold but not eliminated 6.1 Repurchase agreements 567.330 163.449 403.881 247,1% 6.2 Other 2.092.544 2.377.022 (284.478) -12,0%7. Other payables 14.988 5.320 9.668 181,7%Total 7.737.443 6.337.905 1.399.538 22,1%Total direct customer funding 5.374.564 3.808.297 1.566.267 41,1%(Amounts in Euro/000)
Change
The subordinated loan issued by FinecoBank S.p.A. was fully underwritten by Fineco Finance Ltd. in three tranches:
€50.000 million on 7 June 2006; €20.000 million on 7 September 2006; and €30.000 million on 7 December 2006. The loan is to be repaid in five equal yearly instalments, each coming to one-fifth of the amount of the loan,
payable on 7 June of each year, starting with 7 June 2013 and ending with 7 June 2017.
The loan may be redeemed in advance for the outstanding principal and on each date on which interest payments
are scheduled, starting with 7 June 2012 and ending on 7 March 2017, with an advance notice of at least 30 days,
and solely upon the borrower’s request, contingent upon the obtainment of the required authorization from the
Bank of Italy.

- 39 -
Financial liabilities held for trading (liability item 40)
Financial liabilities held for trading include the negative fair value measurement of derivatives contracts held for
trading, which came to €20.418 million, the negative measurement of commitments for currencies and securities
to be received and delivered, which totalled €0.330 million, in addition to a technical overdraft of equities classified
to the category FVPL (fair value through profit or loss), for a total sum of €0.169 million.
The negative measurement of derivatives contracts held for trading corresponded to an equal sum of positive
measurements of derivatives held for trading (€14.019 million) and securities owned by the Bank belonging to the
trading portfolio, since FinecoBank S.p.A. tends not to assume risk positions on its own account.
Other liabilities (liability item 100)
31-Dec-06 31-Dec-05 Absolute %
Liabilities in transit - 2 (2) -100.0%Sums available to customers 4,691 2,484 2,207 88.8%Incoming bank transfers pending clearance 1,394 1,094 300 27.4%Outgoing bank transfers to be settled 17,112 19,786 (2,674) -13.5%Writedowns for impairment for illiquid items in thesubject-to-collection portfolio and after collection 4,420 8,404 (3,984) -47.4%Payable to staff includingsocial security contributions 4,055 6,396 (2,341) -36.6%Social security contributions to be paid 1,245 1,306 (61) -4.7%Items pertaining to transactions in securities and c 4,287 23,196 (18,909) -81.5%Sums withheld from third partiesas withholding agent 28,849 17,372 11,477 66.1%Invoices and fees payableto suppliers and professionals 36,576 34,811 1,765 5.1%Sums to be paid to the Tax Authorityfor indirect taxes 14,926 13,584 1,342 9.9%Amounts due to shareholders for dividendsauthorized but uncollected 1 11 (10) -90.9%Sums collected on behalf of third parties 2,018 7,625 (5,607) -73.5%Sums to be settled with customers for "one-fifth of 6,778 6,330 448 7.1%Security deposits received from third parties - 6,771 (6,771) -100.0%Sums to be settled with customers and banks 9,058 10,956 (1,898) -17.3%Amounts due to Capitalia for tax consolidation 33,206 9,641 23,565 244.4%Deferred income 1,334 1,282 52 4.1%Accrued expenses 42 84 (42) -50.0%Other amounts 569 997 (428) -42.9%Total 170,561 172,132 (1,571) -0.9%(Amounts in Euro/000)
Change
Provisions for contingencies and charges (liability item 120)
The provision consisted of a total of €38.367 million and is intended to cover risks and contingencies associated
with: litigation and charges associated with the activity of financial advisors for approximately €24.075 million;
charges associated with the closure of financial outlets for €1.063 million;
further litigation and charges for lesser amounts, set aside according to the losses currently deemed probable,
for a total of €7.204 million;
personnel charges, which were not calculated in a precise manner, for a total of €6.025 million. Personnel
charges set aside within the provision for risks were recognized on the income statement under personnel
expenses.

- 40 -
31-Dec-05 006 Utilizations Effect of 2006 Net 31-Dec-06discounting provisions
Disputes and other charges pertainingto financial planners' activity 24,303 (1,102) 336 538 24,075Financial transaction closure charges 2,024 (787) - (174) 1,063Other charges and minor disputes 3,123 (1,029) 15 5,095 7,204Provisions for personnel charges 1,290 (1,057) - 5,792 6,025Total provisions for contingencies and 30,740 (3,975) 351 11,251 38,367
(Amounts in Euro/000)
Share capital and equity (liability items 130, 160, 180, 190 and 200)
As at 31 December 2006 the Bank’s share capital came to €199.851 million, and was divided into 605,609,053
shares with a nominal value of €0.33 each.
The restatement reserves incorporate changes in equity deriving from the application of international accounting
standards made to the opening balances on 1 January 2004, in addition to changes caused by the application of
IAS 32 and 39, starting on 1 January 2005.
The other reserves include the Extraordinary Reserve, which totalled €64.155 million, and was created subsequent
to the appropriation of profits earned in 2004 and 2005, and the reclassification of the Own Shares Reserve, in
addition to the IAS Profit Reserve for 2004, which amounted to €3.249 million.
On 4 November 2005 the Board of Directors resolved to request the approval of the Shareholders' Meeting for a
reduction in share capital following the cancellation of own shares.
On 13 March 2006 the Shareholders’ Meeting approved the reduction in share capital following the cancellation of
own shares; on 3 August 2006 the Bank reduced its share capital, the term of assent by silence required by
applicable law for the opposition of creditors having expired. As a consequence, the own shares reserve,
established in accordance with article 2357 ter of the Italian Civil Code by resolution of the extraordinary
Shareholders’ Meeting passed on 5 December 2002 following the merger by incorporation into FinecoBank S.p.A.
of Fineco Sim S.p.A., which held an equity investment of 2.54% in the Bank, was reclassified to the Extraordinary
Reserve and made available.
The valuation reserves include the revaluation reserve for owned real estate, net of the associated taxes, which
was established during the transition to IAS on 1 January 2004, in addition to the valuation reserve for available-
for-sale assets, which includes the positive fair value measurement of the junior Garda Mutui notes and the Net
Insurance equity investment, net of the associated taxes.
Shareholders’ equity
Items / Values 31-dic-06 31-dic-05 Absolute %
1. Share capital 199.851 202.293 (2.442) -1,2%2. Issue premiums - - - -3. Reserves - Legal reserve 3.611 960 2.651 276,1% - Reserve for merger surpluses 2.417 2.417 - 0,0% - Restatement reserves (27.985) (27.985) - 0,0% - Other 67.404 23.083 44.321 192,0%4. (Own shares) - (2.442) 2.442 -100,0%5. Valuation reserves 2.795 3.460 (665) -19,2%6. Capital instruments - - - -7. Net profit (loss) for the year 65.103 53.028 12.075 22,8%Total 313.196 254.814 58.382 22,9%(Amounts in Euro/000)
Change

- 41 -
REGULATORY CAPITAL AND PRUDENTIAL REQUIREMENTS
31-Dec-06 31-Dec-05
Core capital (tier 1) 253,386 247,734Supplementary capital (tier 2) 101,815 53,160Deductions - 860Regulatory capital 355,201 300,034
Prudential requirements 253,261 211,207Weighted risk assets 3,618,013 3,017,243
Tier 1 7.00% 8.21%Tier 2 2.82% 1.73%
Regulatory capital/weighted risk assets 9.82% 9.94%(Amounts in Euro/000)
The Bank’s regulatory capital stood at €355.201 million as at 31 December 2006, and satisfied the compulsory
prudential requirements established by applicable Bank of Italy regulations.
Regulatory capital and total weighted risk assets were calculated according to current regulatory provisions and on
the basis of accounting data that conformed to international accounting standards; core capital as at 31 December
2006 included the share of profit for the year, also calculated according to said regulatory provisions, which the
directors consider as increasing the value of reserves, amounting to €40.879 million.
Regulatory capital and total weighted risk assets as at 31 December 2005 were calculated using supervisory
provisions valid at the time, on the basis of accounting figures prepared in accordance with Italian Legislative
Decree no. 87/92.
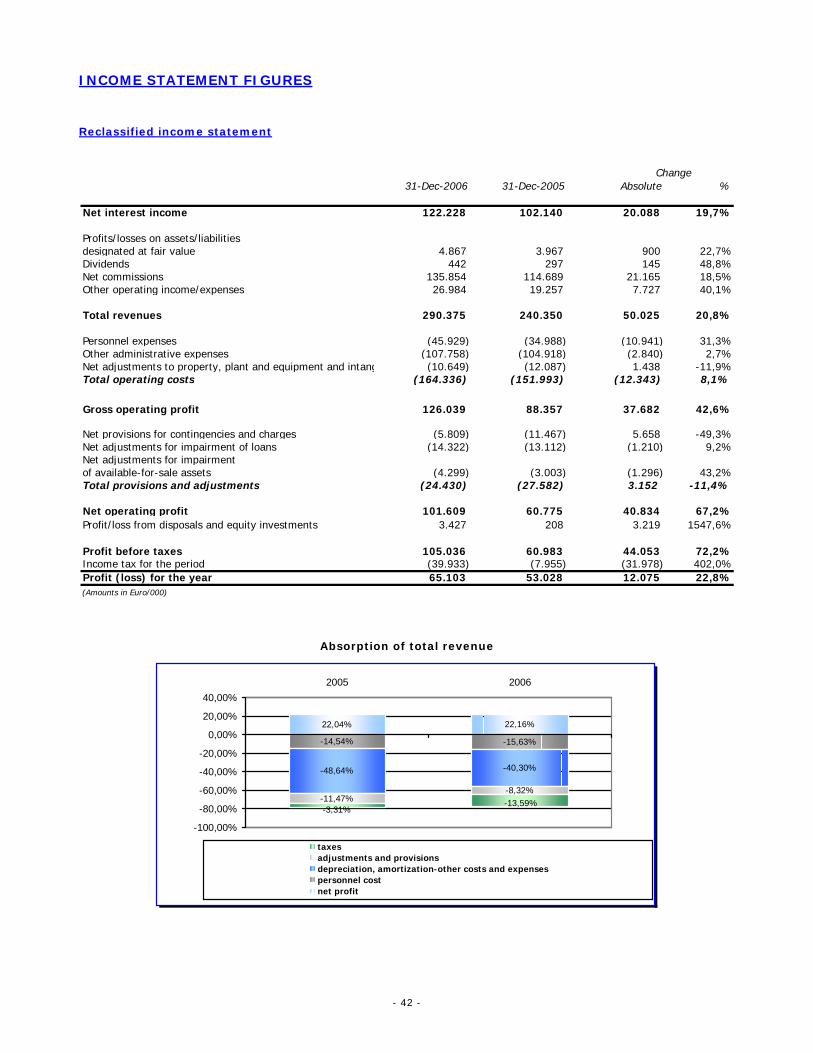
- 42 -
INCOME STATEMENT FIGURES
Reclassified income statement
31-Dec-2006 31-Dec-2005 Absolute %
Net interest income 122.228 102.140 20.088 19,7%
Profits/losses on assets/liabilitiesdesignated at fair value 4.867 3.967 900 22,7%Dividends 442 297 145 48,8%Net commissions 135.854 114.689 21.165 18,5%Other operating income/expenses 26.984 19.257 7.727 40,1%
Total revenues 290.375 240.350 50.025 20,8%
Personnel expenses (45.929) (34.988) (10.941) 31,3%Other administrative expenses (107.758) (104.918) (2.840) 2,7%Net adjustments to property, plant and equipment and intang (10.649) (12.087) 1.438 -11,9%Total operating costs (164.336) (151.993) (12.343) 8,1%
Gross operating profit 126.039 88.357 37.682 42,6%
Net provisions for contingencies and charges (5.809) (11.467) 5.658 -49,3%Net adjustments for impairment of loans (14.322) (13.112) (1.210) 9,2%Net adjustments for impairmentof available-for-sale assets (4.299) (3.003) (1.296) 43,2%Total provisions and adjustments (24.430) (27.582) 3.152 -11,4%
Net operating profit 101.609 60.775 40.834 67,2%Profit/loss from disposals and equity investments 3.427 208 3.219 1547,6%
Profit before taxes 105.036 60.983 44.053 72,2%Income tax for the period (39.933) (7.955) (31.978) 402,0%Profit (loss) for the year 65.103 53.028 12.075 22,8%(Amounts in Euro/000)
Change
Absorption of total revenue
22,04% 22,16%
-14,54%
-48,64% -40,30%
-11,47%-8,32%
-15,63%
-13,59%-3,31%
-100,00%
-80,00%
-60,00%
-40,00%
-20,00%
0,00%
20,00%
40,00%2005 2006
taxesadjustments and provisionsdepreciation, amortization-other costs and expensespersonnel costnet profit

- 43 -
The chart provided above breaks down the absorption of total revenue and gains on the sale of equity investments,
highlighting the decreased weight of administrative expenses and depreciation and amortization on total revenue
(40.30%, down from 48.64%).
The component of revenues that became net profit, despite the increased amount of revenue absorbed by taxes,
was up 22.8% over 2005, rising from €53.028 million to €65.103 million.
Net interest income
Net interest income came to a total of €122.228 million as at 31 December 2006, posting an increase of €20.088
million compared to same period of 2005.
Items/Technical forms 31-Dec-06 31-Dec-05 Absolute %
1. Financial assets held for trading 11,719 4,915 6,804 138.4%2. Available-for-sale financial assets 1,756 3,407 (1,651) -48.5%3. Held-to-maturity financial assets - - - -4. Due from banks 21,962 18,690 3,272 17.5%5. Customer loans 195,282 137,398 57,884 42.1%6. Financial assets at fair value - - - -7. Hedge derivatives - - - -8. Financial assets sold but not eliminated 116,666 95,912 20,754 21.6%9. Other assets - 490 (490) -100.0%Total interest income 347,385 260,812 86,573 33.2%(Amounts in Euro/000)
Change
Items/Technical forms 31-Dec-06 31-Dec-05 Absolute %
1. Deposits from banks (26,075) (21,434) (4,641) 21.7%2. Due to customers (102,555) (61,436) (41,119) 66.9%3. Securities in issue (803) (1,676) 873 -52.1%4. Financial liabilities held for trading (3,534) (496) (3,038) 612.5%5. Financial liabilities designated at fair value - - - -6. Financial liabilities associated with assets - - sold but not eliminated (84,665) (57,029) (27,636) 48.5%7. Other liabilities (1) (5) 4 -80.0%8. Hedge derivatives (8,395) (16,596) 8,201 -49.4%Total interest expense (226,028) (158,672) (67,356) 42.4%
Writebacks for impairment - interest 871 - 871 -
Reclassified net interest income 122,228 102,140 20,088 19.7%(Amounts in Euro/000)
Change
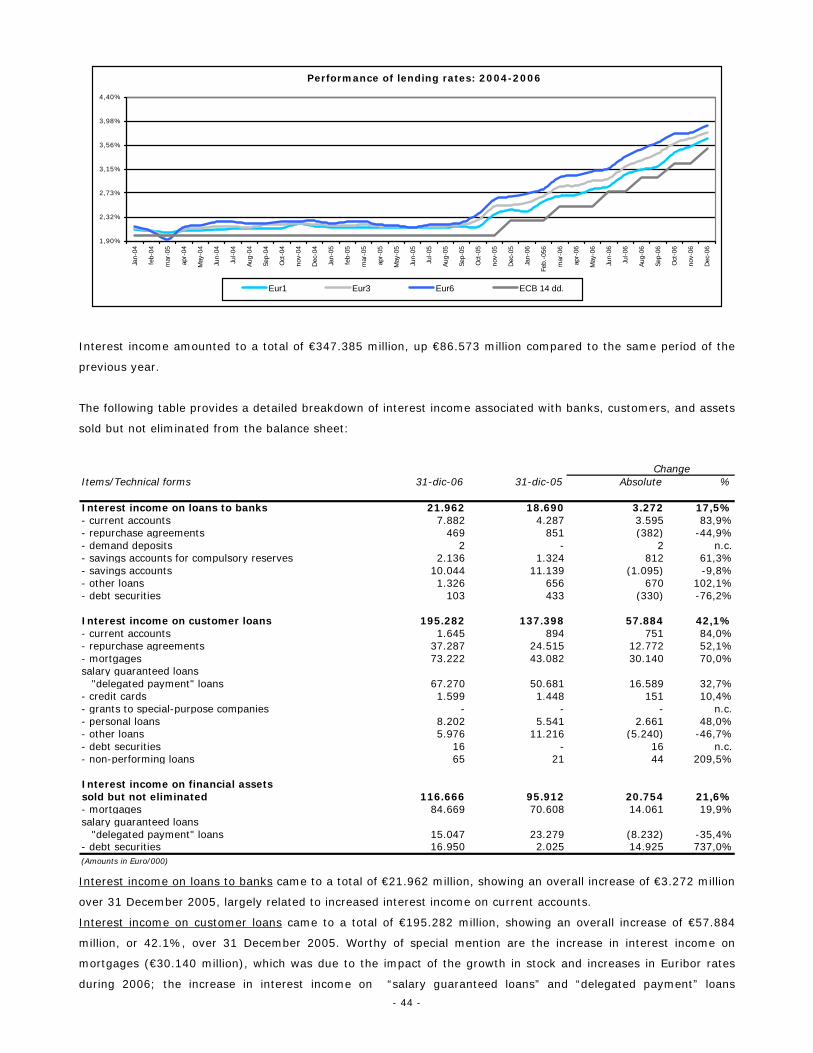
- 44 -
Performance of lending rates: 2004-2006
1,90%
2,32%
2,73%
3,15%
3,56%
3,98%
4,40%
Jan-
04
feb-
04
mar
-05
apr-
04
May
-04
Jun-
04
Jul-0
4
Aug-
04
Sep-
04
Oct
-04
nov-
04
Dec
-04
Jan-
05
feb-
05
mar
-05
apr-
05
May
-05
Jun-
05
Jul-0
5
Aug-
05
Sep-
05
Oct
-05
nov-
05
Dec
-05
Jan-
06
Feb.
-056
mar
-06
apr-
06
May
-06
Jun-
06
Jul-0
6
Aug-
06
Sep-
06
Oct
-06
nov-
06
Dec
-06
Eur1 Eur3 Eur6 ECB 14 dd.
Interest income amounted to a total of €347.385 million, up €86.573 million compared to the same period of the
previous year.
The following table provides a detailed breakdown of interest income associated with banks, customers, and assets
sold but not eliminated from the balance sheet:
Items/Technical forms 31-dic-06 31-dic-05 Absolute %
Interest income on loans to banks 21.962 18.690 3.272 17,5%- current accounts 7.882 4.287 3.595 83,9%- repurchase agreements 469 851 (382) -44,9%- demand deposits 2 - 2 n.c.- savings accounts for compulsory reserves 2.136 1.324 812 61,3%- savings accounts 10.044 11.139 (1.095) -9,8%- other loans 1.326 656 670 102,1%- debt securities 103 433 (330) -76,2%
Interest income on customer loans 195.282 137.398 57.884 42,1%- current accounts 1.645 894 751 84,0%- repurchase agreements 37.287 24.515 12.772 52,1%- mortgages 73.222 43.082 30.140 70,0%salary guaranteed loans "delegated payment" loans 67.270 50.681 16.589 32,7%- credit cards 1.599 1.448 151 10,4%- grants to special-purpose companies - - - n.c.- personal loans 8.202 5.541 2.661 48,0%- other loans 5.976 11.216 (5.240) -46,7%- debt securities 16 - 16 n.c.- non-performing loans 65 21 44 209,5%
Interest income on financial assetssold but not eliminated 116.666 95.912 20.754 21,6%- mortgages 84.669 70.608 14.061 19,9%salary guaranteed loans "delegated payment" loans 15.047 23.279 (8.232) -35,4%- debt securities 16.950 2.025 14.925 737,0%(Amounts in Euro/000)
Change
Interest income on loans to banks came to a total of €21.962 million, showing an overall increase of €3.272 million
over 31 December 2005, largely related to increased interest income on current accounts.
Interest income on customer loans came to a total of €195.282 million, showing an overall increase of €57.884
million, or 42.1%, over 31 December 2005. Worthy of special mention are the increase in interest income on
mortgages (€30.140 million), which was due to the impact of the growth in stock and increases in Euribor rates
during 2006; the increase in interest income on “salary guaranteed loans” and “delegated payment” loans

- 45 -
(€16.589 million), due to the impact of the of repurchase of the Garda securitized loans, and the growth in loans
issued recorded over the first half of 2006. During 2006, the Bank’s liquidity was primarily invested on the
interbank market, in securities, and repurchase agreements with Group companies. Also noteworthy was the
increase in interest income on personal loans and current accounts, which was fully related to the increase in the
stock of loan volumes.
Interest income on financial assets sold but not eliminated was associated with loans sold as part of securitization
operations undertaken subsequent to 1 January 2002, which according to new international accounting standards
must be re-entered to the Bank’s balance sheet. The total increase in this category of interest came to €20.754
million, of which an increase of €14.061 million was associated with the securitization of mortgage loans due to the
impact of the increase in interest rates, a decrease of €8.232 million due to the impact of the repurchase of the
aforementioned securitized Garda "one-fifth of salary" loans, and an increase in interest on debt securities involved
in repurchase agreements, for a total of €14.925 million, which may be attributed to increased volumes. It should
be noted that during 2006 no new securitization operations were undertaken.
Interest expense amounted to a total of €226.028 million, up €67.356 million over 2005.
The following table provides a detailed breakdown of interest expense associated with banks, customers, and
assets sold but not eliminated from the balance sheet:
Items/Technical forms 31-Dec-06 31-Dec-05 Absolute %
Interest expense on amounts due to banks (26,075) (21,434) (4,641) 21.7%- current accounts (2,188) (2,292) 104 -4.5%- repurchase agreements (3,827) (2,646) (1,181) 44.6%- savings accounts (17,264) (13,241) (4,023) 30.4%- other loans (2,706) (3,224) 518 -16.1%- subordinated liabilities (17) (31) 14 -45.2%- demand deposits (73) - (73) n.c.
Interest expense on amounts due to custom (102,555) (61,436) (41,119) 66.9%- current accounts and initial futures margins (85,956) (49,865) (36,091) 72.4%- repurchase agreements (9,263) (5,722) (3,541) 61.9%- securities borrowing (5,950) (5,849) (101) 1.7%- subordinated liabilities (1,386) - (1,386) n.c.
Financial liabilities associated with assetssold but not eliminated (84,665) (57,029) (27,636) 48.5%- repurchase agreements (12,650) (1,683) (10,967) 651.6%- securitization transactions (72,015) (55,346) (16,669) 30.1%(Amounts in Euro/000)
Change
Interest expense on amounts due to banks came to a total of €26.075 million, showing an overall increase of
€4.641 million over 2005, largely related to increased interest expense on repurchase agreements and savings
accounts.
Interest expense on amounts due to customers came to a total of €102.555 million, showing an overall increase of
€41.119 million over 2005, largely related to increased interest expense paid on deposits in current accounts and
repurchase agreements, due to the impact of the considerable increase in the volumes of deposits and the
increase in borrowing rates.
Financial liabilities associated with assets sold but not eliminated refer to interest expense paid on financial
liabilities issued as part of securitization operations undertaken subsequent to 1 January 2002, which were
consolidated in the Bank’s financial statements under the new international accounting standards and which

- 46 -
increased mainly as a function of rate increases, as well as to interest on repurchase agreements involving
securities owned by the Bank, the increase in which may be attributed to greater volumes.
Total revenues
31-Dec-06 31-Dec-05 Absolute %
Net interest income 122,228 102,140 20,088 19.7%
Profits/losses on assets/liabilitiesdesignated at fair value 4,867 3,967 900 22.7%Dividends 442 297 145 48.8%Net commissions 135,854 114,689 21,165 18.5%Other operating income/expenses 26,984 19,257 7,727 40.1%
Total revenues 290,375 240,350 50,025 20.8%(Amounts in Euro/000)
Change
The increase in Profits and losses on financial assets and liabilities designated at fair value may primarily be ascribed
to the gain realised on the trading of securities owned by the Bank, in addition to improved valuations of derivatives
held for trading, hedge derivatives, and the associated hedged assets, due to the impact of the increase in interest
rates.
Net commissions came to a total of €135.854 million, and were up 18.5%; the improvement is largely due to the
increase in commission income on trading and the placement of securities.
Other operating income/expenses came to a total of €26.984 million as at 31 December 2006, posting an increase
of €7.727 million, or 40.1%, compared to the same period of 2005. The overall increase may be attributed to the
greater amounts recovered on customer expenses (primarily stamp duty on current accounts and investment
dossiers) and amounts recovered from Group companies for services provided, especially for operational
management of Group credit cards.
Total revenues came to €290.375 million, and were up 20.8% compared to the same period of 2005.
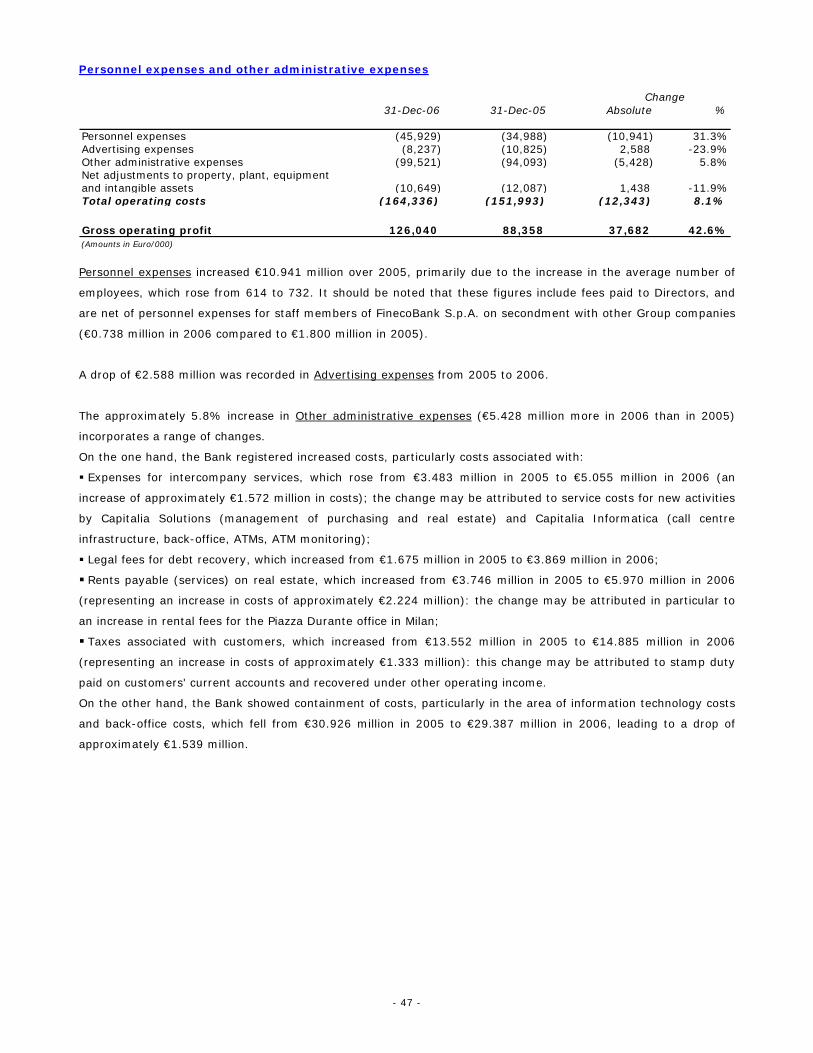
- 47 -
Personnel expenses and other administrative expenses
31-Dec-06 31-Dec-05 Absolute %
Personnel expenses (45,929) (34,988) (10,941) 31.3%Advertising expenses (8,237) (10,825) 2,588 -23.9%Other administrative expenses (99,521) (94,093) (5,428) 5.8%Net adjustments to property, plant, equipmentand intangible assets (10,649) (12,087) 1,438 -11.9%Total operating costs (164,336) (151,993) (12,343) 8.1%
Gross operating profit 126,040 88,358 37,682 42.6%(Amounts in Euro/000)
Change
Personnel expenses increased €10.941 million over 2005, primarily due to the increase in the average number of
employees, which rose from 614 to 732. It should be noted that these figures include fees paid to Directors, and
are net of personnel expenses for staff members of FinecoBank S.p.A. on secondment with other Group companies
(€0.738 million in 2006 compared to €1.800 million in 2005).
A drop of €2.588 million was recorded in Advertising expenses from 2005 to 2006.
The approximately 5.8% increase in Other administrative expenses (€5.428 million more in 2006 than in 2005)
incorporates a range of changes.
On the one hand, the Bank registered increased costs, particularly costs associated with:
Expenses for intercompany services, which rose from €3.483 million in 2005 to €5.055 million in 2006 (an
increase of approximately €1.572 million in costs); the change may be attributed to service costs for new activities
by Capitalia Solutions (management of purchasing and real estate) and Capitalia Informatica (call centre
infrastructure, back-office, ATMs, ATM monitoring);
Legal fees for debt recovery, which increased from €1.675 million in 2005 to €3.869 million in 2006;
Rents payable (services) on real estate, which increased from €3.746 million in 2005 to €5.970 million in 2006
(representing an increase in costs of approximately €2.224 million): the change may be attributed in particular to
an increase in rental fees for the Piazza Durante office in Milan;
Taxes associated with customers, which increased from €13.552 million in 2005 to €14.885 million in 2006
(representing an increase in costs of approximately €1.333 million): this change may be attributed to stamp duty
paid on customers' current accounts and recovered under other operating income.
On the other hand, the Bank showed containment of costs, particularly in the area of information technology costs
and back-office costs, which fell from €30.926 million in 2005 to €29.387 million in 2006, leading to a drop of
approximately €1.539 million.
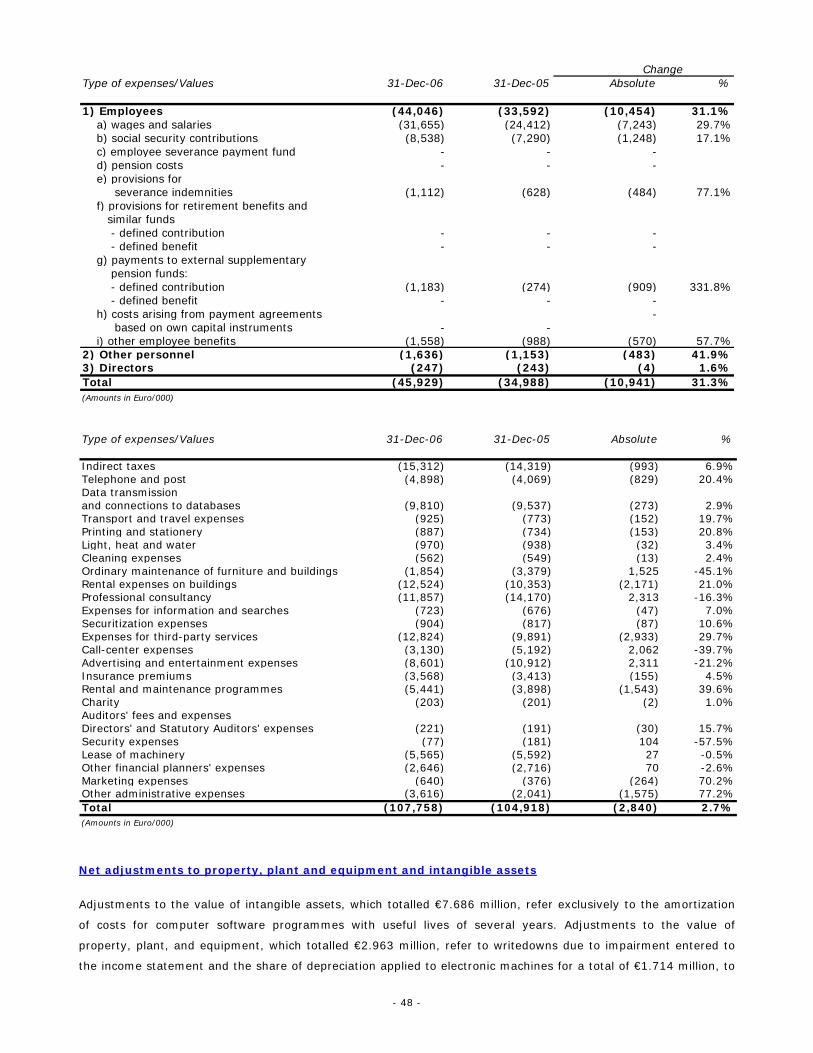
- 48 -
Type of expenses/Values 31-Dec-06 31-Dec-05 Absolute %
1) Employees (44,046) (33,592) (10,454) 31.1% a) wages and salaries (31,655) (24,412) (7,243) 29.7% b) social security contributions (8,538) (7,290) (1,248) 17.1% c) employee severance payment fund - - - d) pension costs - - - e) provisions for severance indemnities (1,112) (628) (484) 77.1% f) provisions for retirement benefits and similar funds - defined contribution - - - - defined benefit - - - g) payments to external supplementary pension funds: - defined contribution (1,183) (274) (909) 331.8% - defined benefit - - - h) costs arising from payment agreements - based on own capital instruments - - i) other employee benefits (1,558) (988) (570) 57.7%2) Other personnel (1,636) (1,153) (483) 41.9%3) Directors (247) (243) (4) 1.6%Total (45,929) (34,988) (10,941) 31.3%(Amounts in Euro/000)
Change
Type of expenses/Values 31-Dec-06 31-Dec-05 Absolute %
Indirect taxes (15,312) (14,319) (993) 6.9%Telephone and post (4,898) (4,069) (829) 20.4%Data transmissionand connections to databases (9,810) (9,537) (273) 2.9%Transport and travel expenses (925) (773) (152) 19.7%Printing and stationery (887) (734) (153) 20.8%Light, heat and water (970) (938) (32) 3.4%Cleaning expenses (562) (549) (13) 2.4%Ordinary maintenance of furniture and buildings (1,854) (3,379) 1,525 -45.1%Rental expenses on buildings (12,524) (10,353) (2,171) 21.0%Professional consultancy (11,857) (14,170) 2,313 -16.3%Expenses for information and searches (723) (676) (47) 7.0%Securitization expenses (904) (817) (87) 10.6%Expenses for third-party services (12,824) (9,891) (2,933) 29.7%Call-center expenses (3,130) (5,192) 2,062 -39.7%Advertising and entertainment expenses (8,601) (10,912) 2,311 -21.2%Insurance premiums (3,568) (3,413) (155) 4.5%Rental and maintenance programmes (5,441) (3,898) (1,543) 39.6%Charity (203) (201) (2) 1.0%Auditors' fees and expensesDirectors' and Statutory Auditors' expenses (221) (191) (30) 15.7%Security expenses (77) (181) 104 -57.5%Lease of machinery (5,565) (5,592) 27 -0.5%Other financial planners' expenses (2,646) (2,716) 70 -2.6%Marketing expenses (640) (376) (264) 70.2%Other administrative expenses (3,616) (2,041) (1,575) 77.2%Total (107,758) (104,918) (2,840) 2.7%(Amounts in Euro/000)
Net adjustments to property, plant and equipment and intangible assets
Adjustments to the value of intangible assets, which totalled €7.686 million, refer exclusively to the amortization
of costs for computer software programmes with useful lives of several years. Adjustments to the value of
property, plant, and equipment, which totalled €2.963 million, refer to writedowns due to impairment entered to
the income statement and the share of depreciation applied to electronic machines for a total of €1.714 million, to

- 49 -
plant and equipment for a total of €0.566 million, to furniture and fittings for €0.611 million, and to real estate
owned by the Bank, for €0.072 million.
Net provisions for contingencies and charges Provisions made during the year totalled €5.809 million, including €0.678 million in time value interest expense,
and were made to cover contingencies and charges associated with legal fees and new disputes with financial
advisors and customers, particularly: Litigation and contingencies associated with the activity of financial advisors for approximately €0.873 million;
Sums to be reimbursed to customers due to fraud totalling €0.550 million;
Provisions for litigation, claims, and possible legal fees to be incurred, for a total of €4.386 million.
Net adjustments for impairment of loans Net adjustments for impairment of loans, which came to a total of €14.322 million, consisted of specific
writedowns and writebacks to loans classified as doubtful (non-performing and problem loans), amounting to
€11.054 million, in addition to portfolio writedowns made to performing loans, loans expired by more than 180
days, and country risk associated with "salry guaranteed" loans, mortgage loans, personal loans, the use of
revolving credit cards, and customers' current accounts, for a total of €3.268 million. Writedowns and writebacks include measurements of loans sold but not eliminated from the balance sheet. In the reclassified income statement, writebacks due to impairment – interest, which totalled €0.871 million, were
recognized under "net interest income".
Net adjustments for impairment of financial assets
Net adjustments for impairment of available-for-sale financial assets included €3.580 million in permanent
writedowns to junior notes. Profit/loss from disposals and equity investments Profits and losses from disposals and equity investments pertain to losses on the sale of property, plant and
equipment, which came to €0.010 million, the gain realized on the sale of securities classified as Loans and
Receivables, for a total of €0.605 million, and the gain realized on debt securities and equities classified among
available-for-sale financial assets, for a total of €2.832 million.

- 50 -
Taxes
(Amounts in Euro/000)
Current income taxes were calculated according to new provisions of law introduced by Italian Legislative Decree
no. 38 of 28 January 2005, issued following the incorporation of international accounting standards (IAS/IFRS) into
the Italian legal system. Current taxes came to €40.081 million in 2006, and consisted of €33.206 million in IRES charges and €6.875
million in IRAP charges. The effects of deferred taxes were recognized for the first time in the 1999 financial statements in relation to
specific provisions issued in this area by the Bank of Italy and Consob. The new IAS provisions require that it be likely that the entity earns sufficient taxable income instead of the
reasonable certainty required by Italian accounting standards. Changes in prepaid and deferred taxes had the following effects on the income statement for 2006:
Prepaid taxes totalling approximately €0.124 million, of which approximately €5.371 million in prepaid taxes
recognized and approximately €5.495 million in taxes eliminated;
Deferred taxes totalling approximately €0.272 million, of which approximately €0.483 million in deferred taxes
recognized and approximately €0.755 million in taxes eliminated;
The tax rates used were the same as applied on the various occasions when the taxes were recognized.
31/12/2006
Type
Current IRES charges (33,206)
Current IRAP charges (6,875)
Total current taxes (40,081)
Change in prepaid taxes 124
Change in deferred taxes (272)
Total taxes (39,933)

- 51 -
Net profit
This brings us to the net profit for the year of €65.103 million, up €12.075 million compared to the same period of
2005.
This result was achieved due to the income deriving from trading and brokerage activity, the increase in volumes
of deposits and loans, cost controls, and constant striving for improvement and innovation in customer service.
60,983105,037
-7,955 -39,933
-60,000-40,000-20,000
020,00040,00060,00080,000
100,000120,000
2005 2006
Profit before taxes Income taxes
The chart provided above shows a 72% increase in profit before taxes compared to the same period of the
previous year. The impact of taxes reduced the increase in net profit, which nonetheless recorded particularly
significant growth of nearly 23%.

- 52 -
OPERATING STRUCTURE
HUMAN RESOURCES
The following tables provide information about the Bank’s workforce:
31 December 2006 31 December 2005
Number of employees 763 688 Average age (years) 34 33,7 Average length of service (years) 3,5 3,2
Classification Men Women Total
31.12.06 31.12.05 31.12.06 31.12.05 31.12.06 31.12.05 Executives 20 18 2 3 22 21 Managers (levels 1-4) 156 141 51 48 207 189 Workers 280 243 253 232 533 475 Clerks 1 3 0 0 1 3 Total 457 405 306 283 763 688
According to the new regulations established by the Bank of Italy in circular no. 262/2005, the total number of
employees includes not only employees with standard contracts, but also employees with atypical contracts, and
employees of other companies on secondment with the Bank, while excluding Bank employees on secondment
with other companies.
The following table provides a detailed breakdown of the number of employees according to the regulations
mentioned above.
Employees 31 December 2006
31 December 2005
FinecoBank employees 763 688
Employees with atypical contracts (+) 108 53
Group employees seconded to FinecoBank (+) 3 1
FinecoBank employees seconded to the Group (-) 22 6
Total 852 736
17%
20%5%
7%
39%
12%
M anagement Area "1/5 o f Salary" Area
M ortgages Area Online Area
Advisors Area Brokerage Area
0.1%
69.9%
27.1%
2.9%
Executives M anagersWorkers Clerks

- 53 -
The workforce of FinecoBank S.p.A. came to 871 employees as at 31 December 2006, an increase of 17.54% over
31 December 2005, and may be broken down as follows:
Employees 31 December 2006
31 December 2005
FinecoBank employees 763 688
Employees with atypical contracts 108 53
Total 871 741
There were three Group employees on secondment with FinecoBank S.p.A. as at 31 December 2006, compared
with only one as at 31 December 2005, whereas there were 22 FinecoBank S.p.A. employees on secondment with
the Group, up from 6 as at 31 December 2005.
There was a significant increase in the number of employees with atypical contracts (up 103.77%) due to both the
launching of initiatives promoted by the Bank over the year requiring the addition of employees with project-based
contracts as part of the Mortgages Business Unit (Proxies) and the Financial Advisors Network Business Unit (the
Sponsor Project) and the conversion of employment agency contracts into fixed-term salaried employment
contracts.
As regards the component of the workforce consisting of employees with salaried employment contracts (763),
this category registered an increase of 10.90% over the year, in line with budget projections.
A total of 139 human resources were added, of which three were due to the effects of intercompany transfers. The
Bank’s selection policy was oriented towards recruiting employees with excellent professional profiles, and
consequently the hirings were aimed at reinforcing and enhancing strategic Bank structures.
Recruitment of staff members from the external market involved, in particular, the Customer Care and Information
Technology Business Areas, in which hirings came to 69 and 20 new employees, respectively.
A total of 64 employees left the Bank, of which 9 went to Group companies, in order to allow the employees
involved to pursue their career growth goals.
Particular care was dedicated to internal mobility, which affected 8% of the Bank’s total workforce, and which took
the form of targeted reallocations of 61 employees aimed at fully exploiting their professional abilities as
individuals on a collective level while complying the Bank’s needs in terms of organization and production.
Fixed-term employment contracts made up 12.71% of the workforce (97 employees) as at 31 December 2006.
The Bank’s workforce may be broken down by classification as follows:
31/12/2006 31/12/2005 % Change Executives 22 21 +4,54
Managers 207 189 +9,52
Professional Areas 534 478 +11,71
Total 763 688 +10,90
The Bank continued to dedicate constant attention to the women in its workforce, which made up approximately
40.10% of the total, and represented 90.47% of the Bank’s 21 part-time contracts at the end of 2006 with a view
to meeting their personal and career needs.
Average length-of-service stood at 3.5 years, whereas the average age was 34, well below the sector average.
Coming to training programmes designed for the Bank’s employees, during 2006 there was particular emphasis on
issues pertaining to what is referred to as "compulsory" training (e.g., anti-money laundering, administrative
liability of banks, security measures for the protection of personal data, and the new privacy code).
The second half of the year witnessed the launch of some important training initiatives of an institutional nature
pertaining to the Business Continuity Plan, foreign languages, and Office Automation.

- 54 -
Specialized and technical training activity continued in all Business Areas in which there was need for it.
Certain organizational structures in particular are involved in ongoing training activity:
- Customer Care – updates on new products and basic training designed for incoming personnel;
- IT – technical specialization and updates.
With regard to the networks of advisors and agents, training programmes were both technical (on new products in
mortgages, insurance, finance and pensions) and behavioural (on sales and consulting techniques) in nature, as
well as addressing new tools (the Morningstar Workstations).
A total of 8,512 hours of training were provided to employees during the year and involved 792 employees,
whereas 32.261 hours of training were attended by a total of 4,414 advisors and agents.
FinecoBank S.p.A. also took a pro-active stance in its labour relations.
Among the numerous issues that were addressed with labour unions during 2006, the following are worthy of
particular notice:
- the criteria for the assignment and distribution of company bonuses for 2005, an area in which the company had
taken an active stance in the Group agreement dated 14 February 2006;
- the payment of an extraordinary bonus for the excellent results achieved by the Bank, on which, after ample
and in-depth consideration, the company has reached an arrangement with labour unions, which was included in a
specific labour union agreement;
- the organization of shifts within certain of the Bank’s Business Areas/Units according to an innovative agreement
derogating the previous provisions of the National Collective Labour Agreement;
- safeguards for workplace safety and hygienic and sanitary conditions;
- the extension of the agreement concerning the assistance fund for healthcare and insurance services;
- the presentation of the training programme for 2006;
- the presentation of targeted training programmes, which were planned as part of a company-wide training
programme presented to the Fondo For.te and the Fondo Fon.DIR, concerning which the Bank has signed specific
agreements with labour unions.

- 55 -
TECHNOLOGY INFRASTRUCTURE
The information technology systems of FinecoBank S.p.A. consist essentially of six elements: Banking activity application procedures;
the Online Trading System (dedicated applications for real-time trading of securities and financial instruments
on the Italian, French, German, Dutch, Portuguese and American markets);
the Management system for the operations room and the institution investors room, and access to the
information and order sections of a variety of Italian/foreign markets for other group companies;
the credit card management system, with the issue of cards for the VISA and MasterCard circuits;
the management system for “one-fifth of salary” loans and mortgage loans;
the management system for the advisors network, which enabled the integration of all of the products of
FinecoBank S.p.A. and other Group companies into one single portal.
During 2006, the Bank sought to develop and improve its information technology systems, with the aim of
providing constantly new and ever more versatile services with high added value for the customer, while at the
same time supporting the Bank’s internal functional areas, in order to simplify their work. The following section
contains a detailed list of the main innovations and improvements introduced over the year.
In the banking activity area, the "securities overdraft facility" (a loan against securities held in portfolio) was
released, along with the ExtraCash personal loan for amounts over €15,000, and a certain number of purely
banking services were activated, such as home delivery of banker’s drafts, the ordering of cash withdrawals over
the web, the extension of the SMS Alert service, in addition to the introduction of a series of procedural and
functional improvements to already active services.
In the online trading area, the Bank made available online spot trading (22 hours a day) in the main foreign
currencies (Forex market) and released the new Mobile website, which adapts its interface to fit the customer’s
terminal, thereby optimizing usability. The new Mobile service, the first phase of which involved releasing the
trading service, was also rounded out during the year with additional functions enabling the placement of banking
instructions (electronic funds transfers), which expanded the range of services offered to customers and increased
usability. Online trading in derivative instruments was extended to all customers, and all customers were offered
access to the site’s premium features, thereby intrinsically expanding the services offered to a vast segment of the
Bank’s customers. MIBO index options, along with a vast selection of investment certificates tradable over
FinecoBank’s organized exchange system, were also made available over the year. Finally, the Bank extended its
online trading services to five new foreign markets: Holland, Portugal, Spain, Switzerland, and Great Britain,
implementing new multicurrency accounts for the latter two. Following on the increase in the number of services
made available to customers during 2006, the Bank also introduced a series of architectural improvements with
the aim of obtaining increased stability and scalability of the entire system, and a clear improvement in the
performance of the applications that have been developed.
- 56 -
THE INTERNAL CONTROL SYSTEM
The Bank adopted an Internal Control System that is organized into four levels.
The 1st level controls are incorporated into operating procedures and are known as "line controls". These controls
are consequently included in the services and Bank segments charged with performing various work tasks by
following specifically created executive procedures. With a view to the efficient performance of these controls,
said procedures have been formally set out in internal regulations, which have been documented and published
on the Bank's intranet in order to facilitate the access of personnel to the provisions issued by the Bank.
Oversight and constant updates of processes are entrusted to "process supervisors” who are charged with
devising controls able to ensure the proper performance of daily activity by affected personnel, as well as the
observance of any delegated powers.
The formally established processes concern both structures in contact with customers and office structures.
The 2nd level controls are associated with day-to-day operations applied to quantifiable risks; they are carried out
constantly by structures separate from operating structures and are also performed on a preventative basis in
order to make full use of the possibilities offered by information technology. Controls on market, credit and
operational risk are assigned to the “Risk Management” function, which operates according to the guidelines of
the Parent Bank.
The 3rd level controls are typical of internal auditing, culminating in onsite inspections conducted with the aim of
assessing procedural flow, and incorporating paper documents drawn from databases or company reports.
Finally, Institutional Supervisory controls, including those of the Board of Statutory Auditors, must be included.
During 2006, the Bank continued to publish company processes on its intranet with the aim of constantly
completing and updating the collection of operating procedures.
During 2006, control activity, which was performed on the basis of a specific outsourcing agreement by the
Internal Audit Area of Capitalia, involved certain of the Bank’s operating areas (trading in financial instruments on
own account and on behalf of third parties, custody and administration of financial instruments, management of
the network of financial advisors, debt recovery procedures on overdrawn current accounts) and was intended to
verify the adequacy of the processes from the perspective of compliance with legal, regulatory and internal
standards both in terms of effectiveness and efficiency.

- 57 -
RISK MEASUREMENT AND CONTROL Risk control activity is based on methods of analysis that call for the concise and homogeneous representation of
the main sources of risk by quantifying the economic capital1 absorbed.
FinecoBank S.p.A. has organized its risk control structure in accordance with the instructions provided by the
Supervisory Authority and in coordination with the guidelines set by the Parent Bank, in order to afford the
Governance Body and Top Management oversight of the main risks inherent in the Bank’s activity. During 2006, the Bank continued to work towards completing the main activities required to ensuring compliance
with the provisions of the Basel II Accord concerning credit risk. These activities were aimed at the use of internal
rating models and the estimate of expected loss according to the specific characteristics of loan portfolios.
Concerning operational risks, the Bank engaged in activity aimed at attaining conformity with the minimum
requirements set out and detailed in the recent Bank of Italy regulations (March 2006) for access to the standard
approach from the beginning of 2007.
From a management perspective, the Bank continues to pursue its goal of keeping risks not typical of each
business to a minimum while carefully monitoring credit risks. Market and interest rate risks on the securities
portfolio and banking book are kept to the minimum levels compatible with the conduct of business, partly through
appropriate hedging transactions with derivative instruments. Credit risk on the banking book is constantly
controlled during both the application and performance phase with the purpose of optimizing the process of
creating value. The Bank also measures counterparty risk for its trading portfolio consisting of fixed-income
instruments and over-the-counter derivatives.
The Basel II project
Convergence towards compliance with the advanced rating models provided in the new Capital Requirements
Regulations (in short, Basel II) approved definitively by the Basel Committee in June 2004 is viewed as an
opportunity for the Bank. In particular, FinecoBank S.p.A. participates actively in the group project, with the aim of
generating all possible synergies in terms of the creation of value deriving from a prospective improvement in the
capacity to measure risks and determine optimal prices of products using risk-adjusted methods.
The Bank has also created ad hoc reporting for the Top Management and the Board of Directors of FinecoBank
S.p.A., which will allow the nature and level of the credit risks assumed by the Bank to be understood, as well as
the relationship between the latter and the adequacy of the Bank’s equity capital.
In terms of operational risks, the Accord states that banks may choose between the following approaches starting
on 1 January 2007: the basic method (15% of total income) and the standardized method (calculated using
various percentages to total income of “regulatory business lines”). Only those banks that have adopted the
standardized method will be allowed to adopt the additional approach relying on internal measurement models
(the advanced approach) starting on 1 January 2008. FinecoBank S.p.A., along with the rest of the Group, has set
itself the goal of being granted access to the standardized method, and during 2006 it initiated a self-certification
process aimed at devising adequate corporate control tools and planning an effective system for managing
operational risks.
As for corporate governance procedures for operational risks, the Bank is currently devising a policy document,
which is then to be submitted for the approval of the Boards of Directors of the Parent Bank and FinecoBank S.p.A.,
and which will indicate the roles and responsibilities assigned to company bodies and organizational structures
1 Economic capital is understood to mean total capital (equity capital) required to absorb any unexpected losses that the Bank might incur at the desired level of probability of remaining solvent. The target rating used by FinecoBank S.p.A. is a single “A” on the S&P scale, corresponding to a probability of default of 0.07%. The quantitative estimate of each individual risk is used to quantify the total risk (diversified risk) taking into account correlations existing between each source of risk.

- 58 -
involved in implementing the operational risk management process. As for the operational risk management
system, the Bank has launched a valuation process that will provide an overall estimate by relevant business lines
of the level of exposure to operational risks (cf. the consultation document published by the Bank of Italy in March
2006) by means of: a) high-level representation of the stages that make up the production cycle for products and
services distributed (process map); b) detection and analysis of weak points in processes that may generate
operational risks through the use of surveys addressed to “process owners”; c) reporting to top management and
line management.
The Basel II Committee has been established for operating management of the project's activities and schedules;
the Committee is to meet periodically to follow the state of alignment of activities with the requirements set by the
Basel II Accord.
Credit risk
Measurement and control of credit risk – defined as the likelihood that the counterparty to a contract may become
insolvent – are the responsibility of the Risk Management Department of FinecoBank S.p.A., which reports directly
to the Chief Executive Officer in accordance with the principle of strict separation of commercial duties and credit-
related responsibilities. Credit quality is monitored for each product type. The portfolio is focused on technical
forms aimed exclusively at retail customers with low risk, such as mortgages and “one-fifth of salary” loans.
Models developed by the Parent Bank have been introduced for the monitoring of the performance of mortgages
and personal loans. These models involve assigning an overall rating in the form of a probability of default (PD) to
each contract/borrower. The model is applied during the loan application process to provide a precise evaluation of
the counterparty in terms of probability of default to support the analyst’s judgement. The model incorporates
qualitative, quantitative and behavioural information.
The probability of default for the “one-fifth of salary” loan product is calculated using a simplified approach in line
with the formulation suggested by Basel II, and consists of the assignment of probability of default (PD), which
may be drawn from the outside rating, which is taken as the lower of that of the employer and the company
insuring the loan. During the first few months of 2007, the Bank, in conjunction with the competent department of
the Parent Bank, began development of an internal rating model to estimate risk parameters (PD, LGD and EAD)
pertaining to exposures deriving from “one-fifth of salary” and “delegated payment” loans.
As for technical forms consisting of personal loans to non-account holders and credit cards currently being issued,
the Bank applies a scoring system developed by a specialized outside company that draws on social and
demographical data provided by private credit bureaus. The Bank is currently in the process of implementing an ad
hoc rating model developed by the Parent Bank for current account overdraft facilities. All of the Bank’s other
exposures are assessed by applying the appropriate sector PD benchmarks (top-down or semi bottom-up methods)
and relying on outside ratings, when available.
A model has been set up to gather data on losses for internal valuation of loss given default. During 2006, the
Bank completed its data room (collection of data on losses) for mortgages transferred to non-performing loans for
which the Bank had recovered its credit. Risk on exposures deriving from the trading portfolio is calculated using the VaR credit method in the form of the
model used by the Parent Bank.

- 59 -
Market risks
Trading
Market risk is considered as the total sum of losses that may be incurred, including in the short term, on positions
in securities or derivative instruments (financial instruments) whenever changes in market conditions occur.
The Bank obtained its measurements of market risk through operational outsourcing to the Parent Bank’s systems
of calculation, which in turn measure VaR using the Montecarlo method.
During 2006, the VaR of the Bank’s held-for-trading portfolio deriving from positions in derivative instruments and
securities, calculated with a 99% confidence interval and a holding period of one day, averaged less than €1
million. The structure of limits on trading activity on the Bank’s own account was defined using VaR, exposure to
mark-to-market, and credit equivalent value measurements. The economic capital absorbed by trading activity is based on the VaR, adjusted as required to fit a one-year
holding period and the confidence interval corresponding to the target rating.
Interest rate risk (Asset/Liability Management – ALM)
Interest rate risk is the risk of potential loss deriving from significant changes in the interest rate curve over the
long term (at least one year) in the presence of gaps in the Bank’s account structure (cash inflows/outflows).
Economic capital is calculated using the parametric VaR method, which reflects the maximum potential loss that
the Bank may incur given a certain confidence interval (99.93%) and a certain holding period (one year). A
bottoms-up analysis is conducted of the Bank’s entire financial statements, including its portfolio of mortgage
loans and “one-fifth of salary” loans, both those owned by the Bank and those that have been securitized, from
which most interest rate risk originates. The estimates also consider the impact of prepayment on the “one-fifth of
salary” loan portfolio.
Interest rate risk absorbs a very small portion of economic capital due to the Bank’s application of a strict policy of
limiting non-typical risks.
The Bank also has access to VaR measurements calculated through outsourcing to the Parent Bank using a process
similar to that employed for market risk, which are used to support those calculated internally using parametric
VaR. These measurements refer to the interest rate risk on the entire banking book and enable the Bank to carry
out a static and dynamic ALM analysis using homogeneous methods at the firm-wide level.
Operational risk
Operational risk originates in the complexity and variety of the business activities undertaken. It is defined as the
risk of incurring losses deriving from the inadequacy or improper functioning of internal processes, the behaviour
of personnel (error, fraud), and the functioning of outside systems or events. It includes legal risks.
Economic capital absorbed by operational risks is calculated using a “top-down” method according to the standard
Basel II approach, which involves an estimate of capital at risk as a percentage of annual total income of individual
business lines, weighted (beta factor) differently for each of the various activity types.
In the expectation that the Parent Bank will incorporate the Basel II AMA (Advanced Measurement Approach)
Project, the Bank is already conducting systematic data collection on losses deriving from operational events. Data
are monitored for the purpose of directing appropriate action to limit risks through changes or additions to
procedures and systems.

- 60 -
Business risk
Business risk derives from losses generated by unexpected changes in profits, which are in turn caused by
unexpected changes in volumes, margins or costs. These risks are primarily strategic in nature. They are high in
business units with a high incidence of fixed costs. These risks are quantified according to a “top-down" method of the estimate of economic capital, which takes
operating costs (non-interest expenses) as the driver, weighted differently according to the various types of
business activity on the basis of which the Bank has organized its business lines. Economic capital is consequently
calculated as a percentage of the operating costs of the Bank’s business lines.

- 61 -
ORGANIZATIONAL STRUCTURE The Bank, with the aim of aligning its organizational structure with the actual dimensions perceived by its
management, including in relation to the degree of complexity of the processes, products, and services provided
by FinecoBank S.p.A., carried out a thorough review of its structure during 2006, focusing on its strengths and
proposing a functional-style model.
The matrix model previously used by FinecoBank S.p.A. was a "product matrix”. Business Unit Heads (product
managers) were hierarchically responsible for the human resources assigned to them, whereas Functional Area
Heads (project managers) oversaw and coordinated the activities performed by staff in their areas pertaining to
the projects launched in each case.
The new functional-style model was adapted to promote economies of scale and facilitate the development of skills
and vertical knowledge within each area. The new approach ensures that decision-making in FinecoBank S.p.A.
remains dynamic and continues to uphold the “horizontal connection” between the various functions,
compensating for the new functional/vertical hierarchical model. The new formulation therefore maintains the old
system for projects being defined and the release of products and services, while at the same time using the
concept of new functional specialization.
The horizontal connections mentioned above are ensured by the functioning of the four Committees (the
Management Committee, Technology Committee, Customer Committee and Credit Committee), which are already
effective, and by the establishment of the new Network Committee for issues concerning synergies between
distribution channels.
The project to transfer the matrix into a new organizational model involved the identification of three functional
lines: Physical Networks, Direct Channels, and Operational Function.
The first of the two new lines preside over the new Commercial Areas, which inherit the role of development and
distribution of products from the old model. The third line coordinates Areas charged with oversight of
organizational/operational processes, Information Technology Systems, and Logistics. The new Area heads will
continue to be functionally responsible for projects and processes, while at the same time bearing overall
hierarchical responsibility for the personnel assigned to them, thereby overcoming the problems surrounding the
conflicts inherent in the matrix model. Due to the difficulty of management and organization of the decision-
making processes of the three new lines, it was decided to delegate oversight to three newly created Assistant
General Managers.
The Assistant GM for Network Coordination is charged with operational authority to ensure the effectiveness of
interaction with the entities that at any given time constitute the Sales Network (financial advisors and financial
agents through FinecoMutui S.p.A.), and also to promote the development of new customers by out-of-branch
offering and placement of Bank products, or products of third parties who enter into specific placement
agreements with the Bank. The Assistant GM for Development, Business and Strategy is charged with the task of
overseeing the development of new products and services in the three core components of FinecoBank S.p.A.
(Trading, Investing and Banking) and the associated methods of distribution through direct distribution channels
(internet and telephone). The Assistant GM for Operations is charged with overall governance of operational
processes in order to ensure that systems are employed in the service of the business.
Lastly, due to the inherent characteristics of the “one-fifth of salary” loan business, the Bank decided to create
separate oversight under the hierarchical authority of the Deputy General Manager, to which the Credit Area,
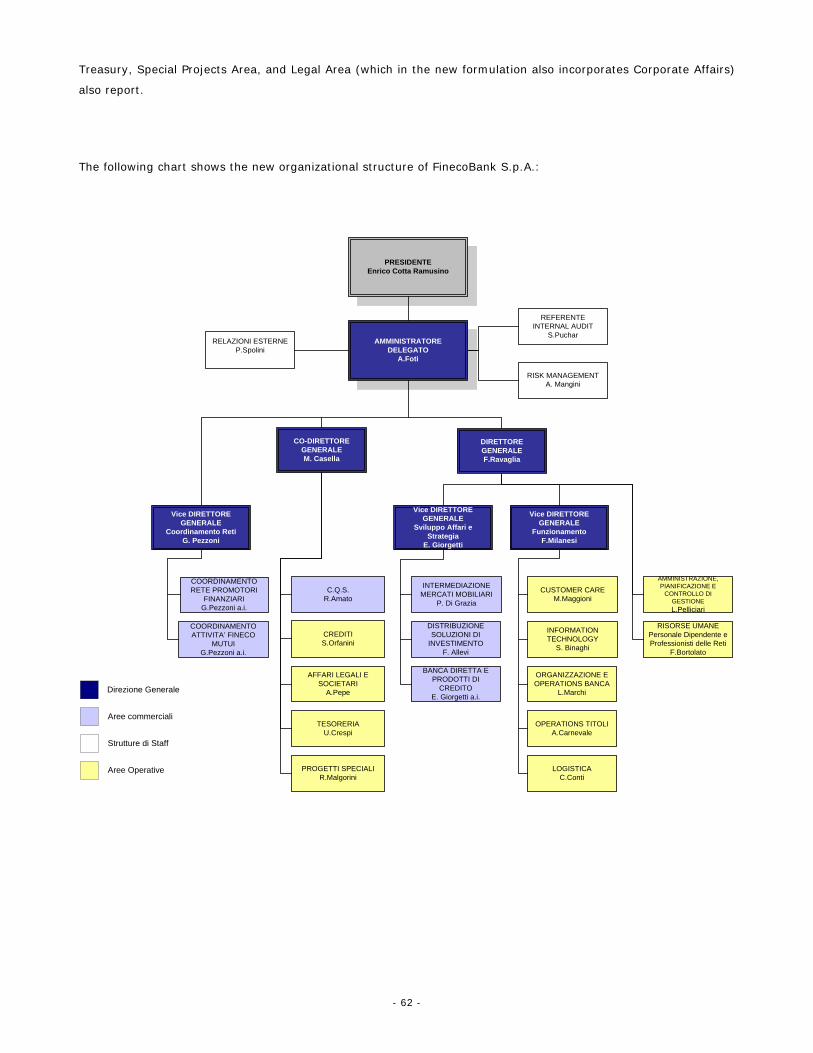
- 62 -
Treasury, Special Projects Area, and Legal Area (which in the new formulation also incorporates Corporate Affairs)
also report.
The following chart shows the new organizational structure of FinecoBank S.p.A.:
PRESIDENTEEnrico Cotta Ramusino
AMMINISTRATORE DELEGATO
A.Foti
DIRETTORE GENERALEF.Ravaglia
CO-DIRETTORE GENERALEM. Casella
C.Q.S.R.Amato
CREDITIS.Orfanini
AFFARI LEGALI E SOCIETARI
A.Pepe
Vice DIRETTORE GENERALE
Sviluppo Affari e Strategia
E. Giorgetti
Vice DIRETTORE GENERALE
FunzionamentoF.Milanesi
DISTRIBUZIONE SOLUZIONI DI
INVESTIMENTOF. Allevi
BANCA DIRETTA E PRODOTTI DI
CREDITOE. Giorgetti a.i.
INTERMEDIAZIONE MERCATI MOBILIARI
P. Di Grazia
INFORMATION TECHNOLOGY
S. Binaghi
ORGANIZZAZIONE E OPERATIONS BANCA
L.Marchi
CUSTOMER CAREM.Maggioni
OPERATIONS TITOLIA.Carnevale
LOGISTICAC.Conti
AMMINISTRAZIONE, PIANIFICAZIONE E
CONTROLLO DI GESTIONEL.Pelliciari
Vice DIRETTORE GENERALE
Coordinamento RetiG. Pezzoni
RISORSE UMANE Personale Dipendente e Professionisti delle Reti
F.Bortolato
COORDINAMENTO RETE PROMOTORI
FINANZIARIG.Pezzoni a.i.
COORDINAMENTO ATTIVITA’ FINECO
MUTUIG.Pezzoni a.i.
RELAZIONI ESTERNEP.Spolini
REFERENTE INTERNAL AUDIT
S.Puchar
TESORERIAU.Crespi
RISK MANAGEMENTA. Mangini
Direzione Generale
Aree commerciali
Strutture di Staff
Aree Operative PROGETTI SPECIALIR.Malgorini

- 63 -
DOCUMENT ON SECURITY PLANNING The “Personal Data Protection Code” (hereinafter referred to as the “Code”) described in Italian Legislative Decree
no. 196 of 30 June 2003, requires, among the various obligations for the security of data and systems, under article
34, that an updated document on security planning be drafted and kept according to the methods indicated under
rule 19 of appendix B, “Technical Regulations for Minimum Security Measures”. This rule requires the Data Processor
to draw up a document on security planning by 31 March of each year, with special attention to electronically
processed “sensitive” and legal data.
In addition, rule 26 of the Technical Regulations appended to the Code (Safeguards and Protective Measures)
includes also the obligation to indicate the drafting or updating of the document on security planning in the report
accompanying the yearly financial statements.
To this end, the Bank states that it is currently carrying out the 2007 updates to the document on security
planning prepared in accordance with article 34, paragraph 1, letter g) of Appendix B) – Technical Regulations,
rule 19 of the Code, which will be completed by the legal deadline.
COMMUNICATIONS AND EXTERNAL RELATIONS
During 2006, the Bank conducted more than 26 campaigns with four different targets, according to a system of
market segmentation appropriate for the Bank’s increasing levels of focus and specialization.
Advertising investments, which came to total of €8.237 million, were primarily on the internet, and only
secondarily in print and on satellite television.
Online advertising was used in particular to carry out “guerrilla marketing” activity and tactical communication with
the “onliners” target market, i.e. prospective customers interested in banking services, and traders, who typically
have a sophisticated approach to direct services and a natural relationship with the internet.
Print advertising supported the launch of the concept of "open multi-brand architecture" aimed at the “modern
investor” target market and in support of the financial advisors network. The campaign was then continued at the
local level.
Satellite television was used to broadcast the "operations room at home" spots, which are aimed at traders and
support brand building.
On the whole, the segmentation strategy produced satisfying results, with 50,393 new current accounts opened
and a significant increase in the average value of customers acquired (clearly the targeted messages attracted
customers truly interested in Fineco's value proposition).
Enhancement of customer care and transactional processes, which continues simultaneously with the launch of
new services and products, allowed the Bank to improve its cross-selling. On a scale of 1 to 5 (a proprietary
system to be considered merely indicative in nature), customers go from an average initial value of 2 to 4 over a
six-month period. The increasing quality is also borne out by the vigorous growth of all components of total
deposits, which were up €13.6 billion, or 26%.
There were interesting developments to the competitive scenario in 2006: traditional banks followed clearer and
more distinctive positioning strategies than in the past, including through the launch of distinctly “online” products,
such as the security keys offered by UniCredito and the ZeroTondo account offered by San Paolo. ING Direct has
focused its investments on its deposit account. Mediolanum has invested in its new positioning as a “360-degree”
bank. Intesa has replaced BancoPosta as the bank for the Italian public. Online competitors – IwBank, Directa and
Sella – have continued to pursue a highly targeted communications strategy with a considerable presence on the
internet and in specialized publications. On the whole, advertising pressure remains very strong and makes

- 64 -
“classic” campaigns with broad targets very expensive. These factors provide confirmation for the quality of
FinecoBank’s communications strategy, which focuses on specific targets.
In terms of customer satisfaction, there is an excellent level of approval and a positive perception of both the
quality and completeness of products, services and customer care. The increasing interest in word-of-mouth
(member gets member) campaigns and a reduced churn of active customers bear witness to the high level of
customer loyalty. In 2006, as part of a strict archive cleaning policy, most accounts closed were dormant accounts
opened in past years. In addition, the increase in direct deposits, which were up €5.4 billion, or 41%, confirms the
capacity to attract and provide 360-degree service to banking customers who privilege exclusive relationships with
FinecoBank S.p.A. over other banks.

- 65 -
OTHER INFORMATION ON OPERATIONS
SECURITIZATION OPERATIONS FinecoBank S.p.A. had seven active securitization operations of performing-loans as at 31 December 2006. Of
these, six consisted of residential mortgage loans, and one of personal loans deriving from “one-fifth of salary” and
“delegated payment” loans.
Securitization operations originated by FinecoBank S.p.A.
OPERATION VEHICLEYEAR OF
TRANSFERYEAR OF SECURITIZATION
OTHER ORIGINATORS
LOAN TYPECREDIT QUALITY
ASSETS FOR IAS PURPOSES
UPGRADE A (Pilot) UPGRADE 1999 1999 AKROS MORTGAGES PERFORMINGFULLY ELIMINATED
GARDA MUTUI GARDA 2001 2001 BIPOP-CARIRE MORTGAGES PERFORMINGPARTIALLY ELIMINATED
VELITES VELITES 2001 2002 NO MORTGAGES PERFORMINGFULLY ELIMINATED
HELICONUS HELICONUS 2002 2002 NO MORTGAGES PERFORMINGFULLY RECOGNIZED
F-E PERSONAL LOANS F-E PERSONAL LOANS 2003 2003 NO "ONE-FIFTH OF S PERFORMINGFULLY RECOGNIZED
F-E MORTGAGES I F-E MORTGAGES 2003 2003 NO MORTGAGES PERFORMINGFULLY RECOGNIZED
F-E MORTGAGES II F-E MORTGAGES 2005 2005 NO MORTGAGES PERFORMINGFULLY RECOGNIZED
Following the Upgrade A (“Pilot”) securitization operation, FinecoBank S.p.A. underwrote part of the senior notes
(the only sort issued by the vehicle) issued along with Bipop Carire Società per Azioni.
For the other operations it originated, FinecoBank S.p.A. underwrote the junior notes issued by the SPV as a form
of support for the transferred loans (for the Garda Mutui operation, the securities were 50% underwritten by
FinecoBank S.p.A. and 50% by the other originator, Bipop Carire Società per Azioni), except for the F-E Mortgages
II operation, in which the Bank issued the vehicle a subordinated loan.
As a further form of credit enhancement, FinecoBank S.p.A. granted the vehicles for the Heliconus, F-E Personal
Loans, and F-E Mortages I operations a line of credit that may be used in the event of a deficit of availability in the
interest account.
For all other operations, except for F-E Mortgages II, the line of credit was granted by Bipop Carire Società per
Azioni.
Securitization operations closed in advance during 2006
OPERATION VEHICLE DATE CLOSED PRICE OF REPURCHASE OF LOANS OPTION EXERCISED
GARDA CQS GARDA 6/20/2006 64,710,114.94 CLEAN UP AND CALL
During 2006, the Bank closed the Garda operation, pertaining to receivables deriving from “one-fifth of salary”
loans. The receivables were repurchased at their fair value for a price of €64.710 million. A partial redemption of
the junior notes was recorded when the operation was closed; the expected loss had been estimated in advance
and set aside in a provision during previous years.

- 66 -
Securities and subordinated loans issued in securitization operations originated by FinecoBank S.p.A.
OPERATION LOAN TYPEPAR VALUE OF NOTES
ISSUEDof which, UNDERWRITTEN
BY BANCA FINECOPAR VALUE OF NOTES TO
31.12.06
of which, UNDERWRITTEN BY BANCA FINECO TO
31.12.06
UPGRADE A (Pilot) MORTGAGES 21.448.000,00 9.362.052,00 1.961.379,75 857.122,94
GARDA MUTUI MORTGAGES 776.669.000,00 38.335.000,00 776.669.000,00 38.335.000,00
VELITES MORTGAGES 339.200.000,00 50.100.000,00 252.024.706,16 50.100.000,00
HELICONUS MORTGAGES 408.790.200,00 8.990.200,00 314.624.809,56 8.990.200,00
F-E PERSONAL LOANS "ONE-FIFTH OF S 446.610.400,00 6.810.400,00 177.600.846,95 6.810.400,00
F-E MORTGAGES I MORTGAGES 748.630.000,00 7.630.000,00 598.922.413,62 7.630.000,00
F-E MORTGAGES II MORTGAGES 1.044.130.500,00 15.430.500,00 960.875.682,12 15.430.500,00
TOTALS 3.785.478.100,00 136.658.152,00 3.082.678.838,16 128.153.222,94
Note: The value of the subordinated loan issued by FinecoBank S.p.A. to the SPV is included in the columns “PAR VALUE OF NOTES ISSUED” and “of which, UNDERWRITTEN BY BANCA FINECO” for the operation F-E Mortgages II. For further information on securitization operations, reference should be made to part E, section C of the Notes. the chapter “Securitization operations” and the Notes.

- 67 -
DEALINGS WITH THE PARENT BANK AND OTHER GROUP COMPANIES
Total dealings with companies belonging to the Capitalia S.p.A. Group 31 December 2006 Assets Item “Financial assets held for trading” 838,884 Item “Loans to banks” 1,063,599 Item “Customer loans” 502,070 Item “Other assets” 13,122 Liabilities Item “Deposits from banks” 669,131 Item "Due to customers" 159,289 Item “Financial liabilities held for trading” 12,049 Item “Hedge derivatives” 3,172 Item “Other liabilities” 45,535 Guarantees Item “Guarantees given” 28,982 Costs Item “Interest expense and similar charges” 26,359 Item “Commission expense” 12,704 Item “Administrative expenses” 11,792 Item “Net adjustments to property, plant and equipment” 23 Revenue Item “Interest income and similar revenue” 64,387 Item “Commission income” 49,480 Item “Other operating income” 10,044
(Amounts in Euro/000)
The following table shows dealings with companies belonging to the Capitalia Group as at 31 December 2006:
Company Assets Liabilities Costs RevenueCapitalia S.p.A. 1,876,468 341,269 22,495 51,909 Banca Roma S.p.A. 7,336 55,429 3,529 7,129 Fineco Mutui 838 6,160 572 1,371 Banco di Sicilia S.p.A. 1,052 36 127 2,035 Bipop Carire Società per Azioni 24,257 49,455 3,378 5,164 Fineco Finance Ltd 502,359 140,286 2,761 15,875 Banca Roma International - 285,065 9,648 - MCC S.p.A. - 220 220 - Capitalia Informatica 1 127 616 1 Fineco Leasing S.p.A. 316 4,896 236 985 Capitalia A.M. S.p.A. 4,785 281 12 38,601 Capitalia IM 105 - - 505 Capitalia Investimenti Alternativi 4 - -44 - European Trust 16 - -9 32 Communication Valley 68 36 183 - Roma Fides - 2 79 - Kyneste - 6 98 - Capitalia Solutions 43 5,908 6,977 43 Fimit 27 - - 261 Total 2,417,675 889,176 50,878 123,911
(Amounts in Euro/000)
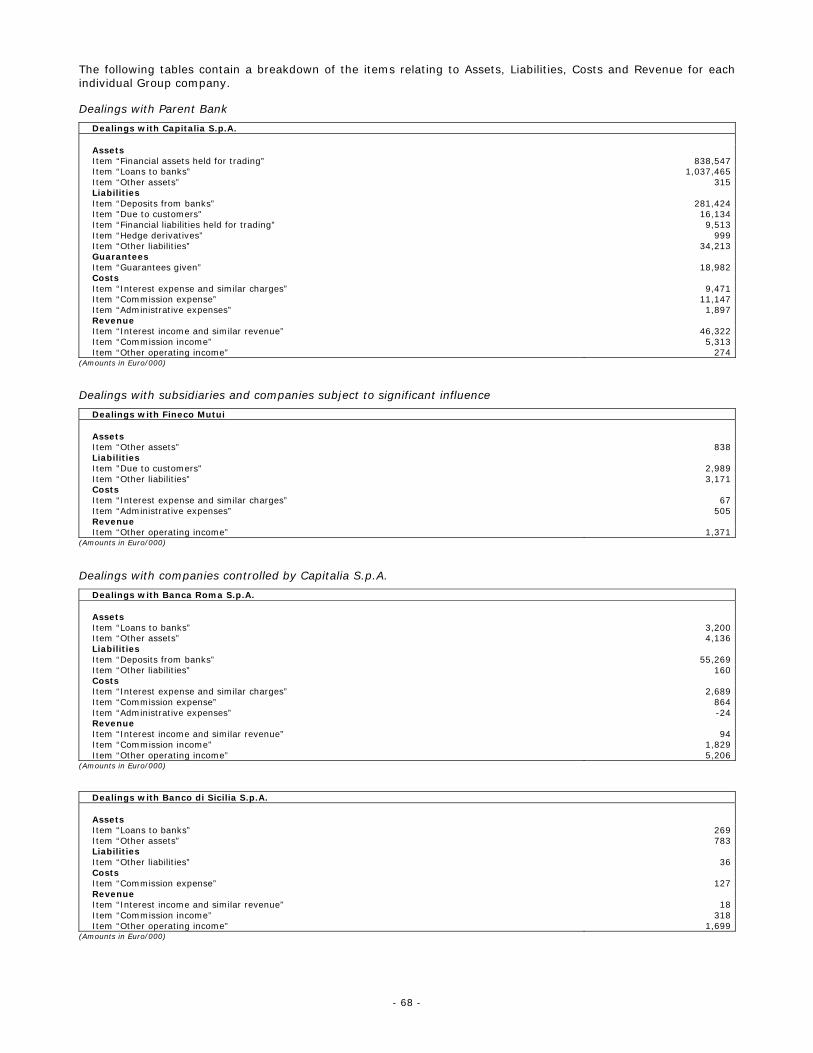
- 68 -
The following tables contain a breakdown of the items relating to Assets, Liabilities, Costs and Revenue for each individual Group company. Dealings with Parent Bank
Dealings with Capitalia S.p.A. Assets Item “Financial assets held for trading” 838,547 Item “Loans to banks” 1,037,465 Item “Other assets” 315 Liabilities Item “Deposits from banks” 281,424 Item "Due to customers" 16,134 Item “Financial liabilities held for trading” 9,513 Item “Hedge derivatives” 999 Item “Other liabilities” 34,213 Guarantees Item “Guarantees given” 18,982 Costs Item “Interest expense and similar charges” 9,471 Item “Commission expense” 11,147 Item “Administrative expenses” 1,897 Revenue Item “Interest income and similar revenue” 46,322 Item “Commission income” 5,313 Item “Other operating income” 274
(Amounts in Euro/000)
Dealings with subsidiaries and companies subject to significant influence
Dealings with Fineco Mutui Assets Item “Other assets” 838 Liabilities Item "Due to customers" 2,989 Item “Other liabilities” 3,171 Costs Item “Interest expense and similar charges” 67 Item “Administrative expenses” 505 Revenue Item “Other operating income” 1,371
(Amounts in Euro/000) Dealings with companies controlled by Capitalia S.p.A.
Dealings with Banca Roma S.p.A. Assets Item “Loans to banks” 3,200 Item “Other assets” 4,136 Liabilities Item “Deposits from banks” 55,269 Item “Other liabilities” 160 Costs Item “Interest expense and similar charges” 2,689 Item “Commission expense” 864 Item “Administrative expenses” -24 Revenue Item “Interest income and similar revenue” 94 Item “Commission income” 1,829 Item “Other operating income” 5,206
(Amounts in Euro/000)
Dealings with Banco di Sicilia S.p.A. Assets Item “Loans to banks” 269 Item “Other assets” 783 Liabilities Item “Other liabilities” 36 Costs Item “Commission expense” 127 Revenue Item “Interest income and similar revenue” 18 Item “Commission income” 318 Item “Other operating income” 1,699
(Amounts in Euro/000)

- 69 -
Dealings with Bipop Carire Società per Azioni Assets Item “Loans to banks” 22,524 Item “Other assets” 1,733 Liabilities Item “Deposits from banks” 47,373 Item “Financial liabilities held for trading” 491 Item “Other liabilities” 1,591 Guarantees Item “Guarantees given” 10,000 Costs Item “Interest expense and similar charges” 1,498 Item “Commission expense” 513 Item “Administrative expenses” 1,367 Revenue Item “Interest income and similar revenue” 2,133 Item “Commission income” 1,949 Item “Other operating income” 1,082
(Amounts in Euro/000)
Dealings with Fineco Finance Ltd Assets Item “Financial assets held for trading” 289 Item “Customer loans” 502,070 Liabilities Item "Due to customers" 136,544 Item “Financial liabilities held for trading” 1,517 Item “Hedge derivatives” 2,173 Item “Other liabilities” 52 Costs Item “Interest expense and similar charges” 2,727 Item “Commission expense” 52 Item “Administrative expenses” -18 Revenue Item “Interest income and similar revenue” 15,820 Item “Other operating income” 55
(Amounts in Euro/000)
Dealings with Banca Roma International Liabilities Item “Deposits from banks” 285,065 Costs Item “Interest expense and similar charges” 9,648
(Amounts in Euro/000)
Dealings with MCC S.p.A. Liabilities Item “Other liabilities” 1,593 Costs Item “Administrative expenses” 220
(Amounts in Euro/000)
Dealings with Capitalia Informatica Assets Item “Other assets” 1 Liabilities Item “Other liabilities” 127 Costs Item “Administrative expenses” 616 Revenue Item “Other operating income” 1
(Amounts in Euro/000)

- 70 -
Dealings with Fineco Leasing S.p.A. Assets Item “Financial assets held for trading” 48 Item “Other assets” 268 Liabilities Item "Due to customers" 4,356 Item “Financial liabilities held for trading” 527 Item “Other liabilities” 13 Costs Item “Interest expense and similar charges” 242 Item “Administrative expenses” -29 Item “Net adjustments to property, plant and equipment” 23 Revenue Item “Commission income” 735 Item “Other operating income” 250
(Amounts in Euro/000)
Dealings with Capitalia A.M. S.p.A. Assets Item “Other assets” 4,785 Liabilities Item "Due to customers" 280 Item “Other liabilities” 1 Costs Item “Interest expense and similar charges” 37 Item “Administrative expenses” -25 Revenue Item “Commission income” 38,540 Item “Other operating income” 61
(Amounts in Euro/000)
Dealings with Capitalia IM S.p.A. Assets Item “Other assets” 105 Revenue Item “Commission income” 505
(Amounts in Euro/000)
Dealings with Capitalia Investimenti Alternativi S.p.A. Assets Item “Other assets” 4 Costs Item “Administrative expenses” -44
(Amounts in Euro/000)
Dealings with European Trust Società Fiduciaria per Azioni Assets Item “Other assets” 16 Costs Item “Administrative expenses” -9 Revenue Item “Commission income” 30 Item “Other operating income” 2
(Amounts in Euro/000)
Dealings with Communication Valley Assets Item “Other assets” 68 Liabilities Item “Other liabilities” 36 Costs Item “Administrative expenses” 183
(Amounts in Euro/000)
Dealings with RomaFides Liabilities Item “Other liabilities” 2 Costs Item “Administrative expenses” 79
(Amounts in Euro/000)

- 71 -
Dealings with Kyneste Liabilities Item “Other liabilities” 6 Costs Item “Administrative expenses” 98
(Amounts in Euro/000)
Dealings with Capitalia Solutions Assets Item “Other assets” 43 Liabilities Item “Other liabilities” 5,908 Costs Item “Administrative expenses” 6,977 Revenue Item “Other operating income” 43
(Amounts in Euro/000)
Dealings with Fimit Assets Item “Other assets” 27 Revenue Item “Commission income” 261
(Amounts in Euro/000)

- 72 -
SIGNIFICANT EVENTS OCCURRING AFTER YEAR END AND BUSINESS OUTLOOK Equity investments On 16 February 2007 the Board of Directors approved the sale of the entire equity investment held in
Acroservizi to the company’s current shareholder for a total price of €60,000.00, equal to the book value as
at 31 December 2006.
On 21 February 2007 the Bank purchased a 100% interest in the special purpose vehicle Alissa Finance
S.r.l., established in accordance with Italian law no. 130/1999, for a price of €25,000.00. On the same day,
the share capital issue of €990,000.00 was subscribed for, bringing total share capital to €1,000,000.00. In
accordance with the resolution passed by the Board of Directors on 20 July 2006 and 25 January 2007, the
company was purchased as part of the project to restructure the “one-fifth of salary” loan area, with the
intention of bringing together relationships with current credit brokers transformed into agents and the
issue of loans that may be repaid through the transfer of one-fifth of salary.
2007 Budget and business outlook The company policy of FinecoBank S.p.A. in 2007 is focused on action aimed at increasing revenues and continuing
work on containing costs as part of management policies oriented towards protecting organizational balance and
risk profiles in accordance with the Parent Bank's guidelines.
The management actions that the Bank intends to undertake aim to strengthen its current business model, which
is characterized by innovation, efficiency, and long-term sustainability.

- 73 -
PROPOSAL FOR THE APPROVAL OF THE FINANCIAL STATEMENTS AND ALLOCATION OF PROFITS FOR THE YEAR Net profit for the year, after setting aside funds and income taxes, came to €65,103,367.
In accordance with article 34 of the Bank’s by-laws, the following appropriation is proposed:
5% Legal reserve
3,255,168
Extraordinary reserve
37,623,837
Dividend of €0.04 per share
24,224,362
TOTAL 65,103,367
FinecoBank S.p.A. The Chairman
Enrico Cotta Ramusino

- 74 -
RECONCILIATION OF INCOME STATEMENT WITH RECLASSIFIED INCOME STATEMENT
Layou
t acc
ord
ing
to
Cir
cula
r N
o.
26
2 o
f th
e B
an
k o
f It
aly
of
22
Dece
mb
er
20
05
10;
20;
130 a
,b,c
,d (
share
due t
o w
rite
back
s fo
r im
pairm
ent
- in
tere
st);
80;
90;
100 b
(sh
are
due t
o sa
les
of lis
ted c
om
panie
s);
100 d
; 110
70
40;
50
190
150 a
150 b
170,
180
160
130 a
,d (
net
of sh
are
due t
o w
rite
back
s fo
r im
pairm
ent
- in
tere
st)
130 b
,c (
net
of s
hare
due t
o w
rite
back
s fo
r im
pairm
ent
- in
tere
st)
230
100 a
,b (
net
of sa
les
of lis
ted c
om
panie
s),c
; 210;
240
220
260
280
290
Recl
assi
fied
in
com
e s
tate
men
t
Net
inte
rest
in
com
e
Pro
fits
/loss
es o
n a
sset
s/lia
bili
ties
des
ignate
d a
t fa
ir v
alu
e
Div
idends
Net
com
mis
sions
Oth
er
opera
ting inco
me/e
xpense
s
Tota
l re
ven
ues
Pers
onnel expense
s
Oth
er
adm
inis
trative e
xpense
s
Net
adju
stm
ents
to p
ropert
y,
pla
nt
and e
quip
ment
and inta
ngib
le a
ssets
To
tal o
pera
tin
g c
osts
Gro
ss
op
era
tin
g p
rofi
t
Net
pro
vis
ions
for
contingenci
es
and c
harg
es
Net
adju
stm
ents
for
impairm
ent
of lo
ans
and o
ther
finan
cial tr
ansa
ctio
ns
Net
adju
stm
ents
for
impairm
ent
of financi
al ass
ets
Net
adju
stm
ents
to g
oodw
ill
Tota
l p
rovis
ion
s an
d a
dju
stm
en
ts
Net
op
era
tin
g p
rofi
t
Pro
fit/
loss
fro
m d
isposa
ls a
nd e
quity invest
men
ts
Net
inco
me fro
m t
he fair v
alu
e m
easu
rem
ent
of pro
pert
y, p
lant
and e
quip
ment
and inta
Pro
fit
befo
re t
axes
Inco
me t
axes
on c
ontinuin
g o
pera
tions
Pro
fit/
loss
fro
m d
isposa
l gro
ups
class
ifie
d a
s held
for
sale
aft
er
tax
Net
pro
fit
(Loss
) fo
r th
e y
ear
Layo
ut
acc
ord
ing
to
Cir
cula
r N
o.
26
2 o
f th
e B
an
k o
f It
aly
of
22
Dece
mb
er
20
0
ass
et ite
m 7
0
asse
t item
s 20;
30;
40;
50
Repurc
hase
agre
em
ents
and c
urr
ent
acc
ounts
ente
red t
o lia
bili
ty ite
m 2
0
ass
et
item
60 -
lia
bili
ty ite
m 1
0
liabili
ty ite
ms
130;
150;
160;
170;
180;
200
Main
bala
nce
sh
eet
ag
gre
gate
s
Loans
to c
ust
om
ers
Finan
cial as
sets
Direct
cust
om
er
deposi
ts
Net
inte
rban
k b
ala
nce
Share
hold
ers
’ equity

- 75 -
Report of the
Board of Statutory Auditors

- 76 -
Shareholders,
the draft financial statements as at 31 December 2006, prepared by your Board of Directors, and delivered to
us before the term set forth by article 2429 of the Italian Civil Code, show a net profit of €65,103,367.
In accordance with the Parent Bank’s provisions, as required by Italian Legislative Decree no. 38/2005, the
financial statements were prepared in accordance with International Financial Reporting Standards (IFRS) and
International Accounting Standards (IAS) issued by the International Accounting Standards Board (IASB) and
the relative interpretations of the International Financial Reporting Interpretations Committee (IFRIC),
approved by the European Commission according to the established procedure.
Compared with the figures from the previous year, which were also prepared in accordance with international
accounting standards (IAS), the financial statements are organized according to the accounting schedules
specified by the Bank of Italy in Circular no. 262 of 22 December 2005, and include the Balance Sheet, Income
Statement, Statement of Changes in Shareholders’ Equity, Cash Flow Statement, Notes, and the Report on
Operations.
We verified compliance with provisions of law applicable to banks and financial institutions concerning the
preparation of the financial statements and the report on operations through direct controls and specific
information provided by the Independent Auditors.
Judgments pertaining to the content of the financial statements and associated documents are by virtue of
article 156 of Italian Legislative Decree no. 58 of 24 January 1998 reserved to the Independent Auditors, who
under their engagement for the three-year period 2005/2007 were responsible for verifying proper keeping of
accounting records, proper recognition of management events, the agreement of accounting records with
financial statement figures, and compliance with international accounting standards (IFRS and IAS) and recent
instructions of the Supervisory Authority concerning financial statements.
The Board of Statutory Auditors, as required by article 150 of Italian Legislative Decree no. 58/98, maintained
contacts and exchanged information with representatives of the Independent Auditors, and accordingly refers
the reader to the Report drafted by Reconta Ernst & Young S.p.A. for judgments pertaining to the financial
statements, in accordance with article 156 and article 165 of Italian Legislative Decree no. 58 of 24 February
1998, from which no significant events or situations emerge.
Said report, dated 28 March 2007, contains no observations.
Insofar as falls to our competence, we acknowledge that:
the valuation principles and international accounting standards (IFRS and IAS) adopted and used to
quantify the items of the balance sheet and income statement meet with our approval and are exhaustively
listed in the Notes;
the Board of Directors, in the Report on Operations, has thoroughly illustrated the events and
circumstances that characterized the Bank’s activity during the year ended as at 31 December 2006 and
over the first few months of this year;
the financial statement documents make clear reference to the dealings with the Parent Bank, other Group
Companies, and related parties, as defined by Consob;
the recognition of intangible fixed assets in the financial statements met with our approval, as provided by
item 5 of article 2426 of the Italian Civil Code, with an explicit request for the observance of the
restrictions set forth therein.
In accordance with article 153, paragraph 2, of Italian Legislative Decree no. 58 of 24 February 1998 and
article 249, paragraph 2, of the Italian Civil Code, the Board of Statutory Auditors has no observations to make
concerning the financial statements and reports on the oversight activity required by the law that it conducted

- 77 -
during the year ended as at 31 December 2006 in accordance with the code of conduct recommended by the
Italian Accounting Profession, and also considering the instructions of the Supervisory Body and the
recommendations provided by Consob in its communications, and in particular in communication no. 1025564
of 6 April 2001 and subsequent updates.
We may therefore state that we have:
participated in the Shareholders’ Meetings and the meetings of the Board of Directors and obtained from
the Directors information on the activity conducted and operations of greatest significance to the Bank’s
income statement, cash flow, and balance sheet figures; the Bank, in pursuing its project of rationalizing
and restructuring its activities in conformity with the Group Business Plan, has confirmed the positive
indications of the recent past, and we may therefore assure you with reasonable certainty that the actions
planned and undertaken were compliant with the law and the Bank's by-laws, were not imprudent in
nature, did not comprise the integrity of the Bank's capital, and were not in potential conflict of interest or
at odds with resolutions passed with the Shareholders’ Meeting or the Board of Directors;
supervised, insofar as fell to our competence, the operations of the internal control system, which was
outsourced to the Internal Audit Department of Capitalia S.p.A., monitoring of which was performed in
compliance with the standards indicated in the Group Governance Implementation Regulations, and of
which this Board expresses a positive opinion;
maintained systematic relations with both the staff member of the Parent Bank charged with the Internal
Audit of FinecoBank S.p.A. and the Internal Audit Contact for the purpose of assessing the internal control
system's adequacy for company needs;
supervised the adequacy and reliability of the administration and accounting system in relation to the need
to represent management events properly by means of the examination of company documents, the
gathering of information from the heads of certain departments, and the analysis of the work performed by
the Independent Auditors;
performed controls of the Bank’s activity considered appropriate over the year;
supervised the observance of the law and the Bank’s by-laws and the compliance with standards of proper
administration;
verified and supervised the Bank’s conduct in dealing with complaints, and the manner in which units
providing control and containment of risks intervened in any critical situations, whether by taking
disciplinary action or by acting to remove the cause of said critical situations.
We further report that:
the Bank took steps to deal with anomalies detected during the year and critical issues carried over from
previous years;
as for the “financial advisors” area, in observing the constant overall improvement of said area, which was
the result of the difficult work undertaken over the past few years to rationalize the structure and increase
its efficiency and cost-effectiveness, we acknowledge that said area, although it continues to post an
overall loss, seems on track to reach the break-even point; continuing action must be taken with the aim
of containing costs and gradually refining processes in the areas of operations, organization, control and
risk management pertaining to said area;
the Bank, according to the resolutions passed by the Board of Directors, did not undertake any
transactions with related parties deemed atypical and/or unusual or capable of having a significant impact
on its income statement, balance sheet, and cash flow situation; transactions undertaken with Group
Companies, insofar as fall to this Board's competence, were part of the Bank's normal operations and were
approved through the established procedures;

- 78 -
we acknowledged the actions taken by the Bank in order to incorporate duly the indications provided by
the Parent Bank, insofar as we were able to evaluate said aspect in relation to the Bank’s organizational
structure and operational processes;
on 12 April 2006 the ordinary Shareholders’ Meeting increased the number of members of the Board of
Directors from nine to eleven;
during 2006 12 meetings of the Board of Directors were held, the Board of Statutory Auditors meet 14
times and attended all of the Shareholders’ Meetings and meetings of the Board of Directors;
supervisory activity was performed by the Board of Statutory Auditors both individually and collectively.
In conclusion, we would like to inform you that we were able to observe that the Management Body is
conducting its activity in compliance with the Parent Bank’s guidelines, and, as demonstrated by the results
achieved, of which this Board wishes to express its sincerest appreciation, said Body continues to act with the
aim of constant improvement.
The profit earned and figures disclosed under individual account items provide a measure of the Bank’s
commitment to increasing its profitability.
Having certified that no circumstances deemed irregular or worthy of mention to the Shareholders emerged
from our supervisory activity, and having informed you that we have not detected any irregularities in
accordance with article 149, paragraph 3, of Italian Legislative Decree no. 58 of 24 February 1998, we hereby
judge the financial statements to provide complete and clear disclosure in the light of the requirements of the
law and the accounting standards adopted.
The Board of Statutory Auditors, in reference to the foregoing, and inasmuch falls to its competence,
consequently expresses its favourable opinion as to the approval of the financial statements as at 31 December
2006 and agrees with the proposal of the directors concerning the appropriation of profit for the year.
Reggio Emilia, 28 March 2007
The Board of Statutory Auditors
Luigi Attilio Mazzocchi - Chairman
Francesco Poddighe – Regular Auditor
Antonio Passantino – Regular Auditor

- 79 -
Independent
Auditors' Report

- 80 -
ERNST & YOUNG Reconta Ernst & Young S.p.A. Tel. (+39) 02 722121 Via della Chiusa 2
20123 Milan, Italy Fax (+39) 02 72212037 www.ey.com
INDEPENDENT AUDITORS’ REPORT
pursuant to articles 156 and 165 of Italian Legislative Decree no. 58 of 24 February 1998
To the shareholders of FinecoBank Banca Fineco S.p.A. We have audited the financial statements of FinecoBank Banca Fineco S.p.A. (hereinafter referred to as "FinecoBank S.p.A.") as at 31 December 2006, which comprise the Balance Sheet, the Income Statement, the Statement of Changes in Shareholders’ Equity, the Cash Flow Statement, and the Notes. The Board of Directors of FinecoBank S.p.A. is responsible for the preparation of the financial statements. We are responsible for issuing a professional opinion of the financial statements on the basis of our audit thereof. Our examination was conducted in accordance with the auditing principles and criteria recommended by Consob. In compliance with said principles and criteria, we planned and executed our audit with the aim of acquiring all information required to determine whether the financial statements contained significant errors and whether they may be considered generally reliable. Our auditing procedure calls for the use of spot checks to examine probative elements that support the balances and information disclosed in the financial statements, as well as an evaluation of the adequacy and accuracy of the accounting standards employed and the reasonable nature of the estimates made by the directors. It is our opinion that our work provides a reasonable basis on which to express a professional judgment. In terms of the evaluation of the financial statements for the previous year, whose figures are included for comparative purposes, reference should be made to the report we issued on 28 March 2006. In our opinion, the financial statements of FinecoBank S.p.A. as at 31 December 2006 comply with the International Financial Reporting Standards adopted by the European Union, as well as the provisions issued in implementation of article 9 of Italian Legislative Decree no. 38/2005. As a consequence, said financial statements have been prepared in a clear manner and present a truthful and accurate representation of the balance sheet, financial position, income figures, changes in shareholders' equity, and cash flow of FinecoBank S.p.A. for the year ended on said date. Milan, 28 March 2007
Reconta Ernst & Young S.p.A. [signed]
Massimiliano Bonfiglio
Reconta Ernst & Young S.p.A.
Registered Office: 00196, Rome, Italy – Via G.D. Romagnosi 18/A Share capital: €1,259,500.00, fully paid up
Registered in the Register of Companies maintained by the Chamber of Commerce, Industry, Agriculture and Handicraft of Rome
Tax code and registration number: 00434000584 VAT no.: 00891231003
(Former Companies Register no. 6697/89, Economic and Administrative Index no. 250904)

Bank Financial Statements

- 82 -
BALANCE SHEET
ASSETS 31-Dec-2006 31-Dec-2005 Absolute %
10 Cash and cash equivalents 316.337 485.508 (169.171) -34,8%20 Financial assets held for trading 894.513.071 485.209.173 409.303.898 84,4%40 Available-for-sale financial assets 83.398.429 93.260.605 (9.862.176) -10,6%60 Loans to banks 1.088.915.319 514.161.345 574.753.974 111,8%70 Customer loans 6.835.626.228 6.463.670.693 371.955.535 5,8%80 Hedge derivatives 16.755.757 3.775.071 12.980.686 343,9%90 Adjustments to the value of financial assets
to be macro-hedged (+/-) (19.694.000) 3.830.000 (23.524.000) -614,2%100 Equity investments 1.118.228 1.118.228 -110 Property, plant and equipment 7.002.531 7.071.435 (68.904) -1,0%120 Intangible assets 32.790.767 34.775.122 (1.984.355) -5,7%
of which- goodwill 21.583.442 21.583.442 -
130 Tax assets 23.479.322 25.637.826 (2.158.504) -8,4%a) current - - - -b) prepaid 23.479.322 25.637.826 (2.158.504) -8,4%
140 Non-current assets and disposal groupsclassified as held for sale 144.608 144.608 -
150 Other assets 129.787.250 138.996.897 (9.209.647) -6,6%Total assets 9.094.153.847 7.772.136.511 1.322.017.336 17,0%
Change
LIABILITIES AND SHAREHOLDERS' EQUITY 31-Dec-2006 31-Dec-2005 Absolute %
10 Deposits from banks 796.984.660 858.058.698 (61.074.038) -7,1%20 Customer accounts 7.737.443.047 6.337.905.345 1.399.537.702 22,1%30 Debt securities in issue - 54.693.270 (54.693.270) -100,0%40 Financial liabilities held for trading 20.916.800 38.444.117 (17.527.317) -45,6%60 Hedge derivatives 4.579.503 15.961.759 (11.382.256) -71,3%80 Tax liabilities 8.272.443 6.201.403 2.071.040 33,4%
a) current 3.491.237 2.786.392 704.845 25,3%b) deferred 4.781.206 3.415.011 1.366.195 40,0%
100 Other liabilities 170.561.253 172.132.030 (1.570.777) -0,9%110 Employee severance payment fund 3.833.654 3.185.642 648.012 20,3%120 Provisions for contingencies and charges: 38.366.931 30.740.300 7.626.631 24,8%
b) other provisions 38.366.931 30.740.300 7.626.631 24,8%130 Valuation reserves 2.794.788 3.460.455 (665.667) -19,2%160 Reserves 45.446.414 (1.525.584) 46.971.998 3079,0%180 Share capital 199.850.987 202.292.987 (2.442.000) -1,2%190 Own shares (-) - (2.442.000) 2.442.000 -100,0%200 Net profit (loss) for the year 65.103.367 53.028.089 12.075.278 22,8%
Total liabilities and shareholders' equity 9.094.153.847 7.772.136.511 1.322.017.336 17,0%
Change

- 83 -
INCOME STATEMENT
INCOME STATEMENT 31-Dec-06 31-Dec-05 Absolute %
10 Interest income and similar revenue 347,384,788 260,811,720 86,573,068 33.2%20 Interest expense and similar charges (226,027,928) (158,671,413) (67,356,515) 42.5%30 Net interest income 121,356,860 102,140,307 19,216,553 18.8%40 Commission income 234,900,106 222,775,357 12,124,749 5.4%50 Commission expense (99,045,905) (108,086,146) 9,040,241 -8.4%60 Net commissions 135,854,201 114,689,211 21,164,990 18.5%70 Dividends and similar income 442,298 296,604 145,694 49.1%80 Net income from trading activities 3,757,454 3,579,908 177,546 5.0%90 Net income from hedging activities 1,110,294 386,689 723,605 187.1%
100 Profit/loss from the sale of: 3,437,738 (207,899) 3,645,637 1753.6%a) loans 605,299 42,707 562,592 1317.3%b) available-for-sale financial assets 2,832,439 (250,606) 3,083,045 1230.2%
120 Total income 265,958,845 220,884,820 45,074,025 20.4%130 Net adjustments for impairment of: (17,749,908) (16,115,295) (1,634,613) 10.1%
a) loans (13,450,532) (13,112,336) (338,196) 2.6%b) available-for-sale financial assets (3,580,392) (2,523,767) (1,056,625) 41.9%d) other financial transactions (718,984) (479,192) (239,792) 50.0%
140 Net income from financial operations 248,208,937 204,769,525 43,439,412 21.2%150 Administrative expenses (153,687,192) (139,906,228) (13,780,964) 9.9%
a) personnel expenses (45,929,162) (34,988,508) (10,940,654) 31.3%b) other administrative expenses (107,758,030) (104,917,720) (2,840,310) 2.7%
160 Net provisions for contingencies and charges (5,809,225) (11,466,672) 5,657,447 -49.3%170 Net adjustments to property, plant and equipment (2,962,984) (4,693,007) 1,730,023 -36.9%180 Net adjustments to intangible assets (7,686,355) (7,393,703) (292,652) 4.0%190 Other operating income/expenses 26,984,157 19,256,860 7,727,297 40.1%200 Operating costs (143,161,599) (144,202,750) 1,041,151 -0.7%240 Profit (Loss) from sale of investments (10,621) 416,099 (426,720) -102.6%250 Profit (Loss) from continuing operations
before taxes 105,036,717 60,982,874 44,053,843 72.2%260 Income taxes on continuing operations (39,933,350) (7,954,785) (31,978,565) 402.0%270 Profit (Loss) from continuing operations
after taxes 65,103,367 53,028,089 12,075,278 22.8%290 Net profit (Loss) for the year 65,103,367 53,028,089 12,075,278 22.8%
Change

- 84 -
STATEMENT OF CHANGES IN SHAREHOLDERS' EQUITY
-
199.8
50.9
87
43.0
29.6
91
2.4
16.7
23
1.6
53.4
26
1.1
41.3
62 -
65.1
03.3
67
313.1
95.5
56
65.1
03.3
67
65.1
03.3
67
Sto
ck
options -
Der
ivat
iv
es o
n
ow
n
shar
es
-
Chan
ge
in
capital
inst
rum
ents
-
Ext
raord
inar
y
div
iden
d
dis
trib
ution -
Purc
has
e of
ow
n s
hare
s
(2.4
42.0
00)
2.4
42.0
00
(2.4
42.0
00)
2.4
42.0
00 -
Issu
e of
new
shar
es
-
(665.6
67)
(665.6
67)
(6.0
56.0
91)
(6.0
56.0
91)
46.9
71.9
98
(46.9
71.9
98) -
6
Allo
cation o
f in
com
e fr
om
pre
vious
year
Equity
tran
sact
ions
Chan
ges
ove
r th
e ye
ar
Res
erve
s
Div
iden
ds
and o
ther
dis
trib
utions
Chan
ges
in
rese
rves
Profit
(Loss
)
to 3
1.1
2.0
6
Shar
ehold
ers'
equity
-
31.1
2.0
6

- 85 -
-
25.2
59.8
99
(25.2
59.8
99) -
202.2
92.9
87
(31.3
16.7
13)
4.8
58.7
23
813.8
69
(2.4
42.0
00)
25.2
59.8
99
199.4
66.7
65
(30.1
86.4
69)
(2.4
42.0
00) -
(32.6
28.4
69)
202.2
92.9
87
(1.1
30.2
44)
4.8
58.7
23
813.8
69
25.2
59.8
99
232.0
95.2
34
Shar
e ca
pital
:
a) o
rdin
ary
shar
es
b)
oth
er s
har
es
Issu
e pre
miu
ms
Res
erve
s:
a) o
f pro
fits
b)
oth
er
Val
uat
ion r
eser
ves:
a) a
vaila
ble
for
sale
b)
cash
flo
w h
edge
c) o
ther
Cap
ital
inst
rum
ents
Ow
n s
har
es
Profit
(Loss
) fo
r th
e ye
ar
Shar
ehold
ers’
equity
Sta
tem
en
t o
f ch
an
ges
in s
hare
hold
ers
' eq
uit
y a
s at
31
.12
.05
Allo
cation o
f in
com
e fr
om
pre
vious
year
Bal
ance
s -
31.1
2.0
4
Chan
ge
in
open
ing
bal
ance
Bal
ance
s -
1.1
.05
Res
erve
s
Div
iden
ds
and o
ther
dis
trib
utions

- 86 -
STATEMENT OF CASH FLOW Indirect method A. OPERATING ACTIVITIES 31-Dec-2006 31-Dec-2005
1. Operations 141.500.381 103.021.308- net profit 65.103.367 53.028.089- capital gains/losses on financial assets held for trading and on assets/liabilities designated at fair value (695.010) (3.579.908)- capital gains/losses on hedging activities (1.110.294) (386.689)- net adjustments for impairment 19.073.234 16.527.437- net adjustments to property, plant and equipment and intangible fixed assets 10.649.339 12.086.710- net provisions for contingencies and charges and other costs/revenue 12.713.949 12.094.810- unpaid taxes 36.468.067 13.458.364- net adjustments to non-current assets and discontinued operations, net of the tax effect -- other adjustments (702.271) (207.505)
2. Cash flows from/used in financial assets (1.363.851.650) (1.084.847.417)- financial assets held for trading (415.312.674) (237.178.968)- financial assets designated at fair value -- available-for-sale financial assets 6.281.784 70.106.197- loans to banks: on demand 122.979.148 68.283.530- loans to banks: other loans (697.310.851) 109.434.338- customer loans (383.723.978) (1.102.205.440)- other assets 3.234.921 6.712.926
3. Cash flows from/used in financial liabilities 1.236.391.970 992.610.142- deposits from banks: on demand (48.327.326) 34.938.030- deposits from banks: other deposits (12.817.527) (30.513.852)- customer accounts 1.394.642.172 1.096.056.168- securities in issue (54.270.923) 2.625.233- financial liabilities held for trading 169.195 (40.208.981)- financial liabilities designated at fair value - -- other liabilities (43.003.621) (70.286.456)
Net cash from/used in operating activities 14.040.701 10.784.033
B. INVESTING ACTIVITIES
1. Cash flows from:- sales of equity investments - -- net dividends collected on equity investments 442.298 296.604- sales/redemptions of held-to-maturity financial assets - -- sales of property, plant and equipment 12.120 356.472- sales of intangible assets - 251.727- sales of business divisions - 1.367.568
2. Cash flows used in:- purchases of equity investments - -- purchases of held-to-maturity financial assets - -- purchases of property, plant and equipment (2.906.199) (2.120.622)- purchases of intangible assets (5.702.000) (11.147.006)- purchases of business divisions -
Net cash from/used in investing activities (8.153.781) (10.995.257)
C. FINANCING ACTIVITIES
- issue/purchases of own shares - -- issue/purchase of capital instruments - -- dividends and other distributions (6.056.091) -
Net cash from/used in financing activities (6.056.091) -

- 87 -
Notes

Notes
- 88 -
Part A - Accounting policies Part B - Information on the balance sheet Part C - Information on the income statement Part D - Segment reporting Part E - Information on risks and hedging policies Part F - Information on shareholders' equity Part G - Combination transactions involving businesses or business divisions Part H - Related party transactions Part I - Payment agreements based on own capital instruments

Notes
-89-
PART A - ACCOUNTING POLICIES A.1 GENERAL PART Section 1 - Statement of conformity with international accounting standards The Bank’s financial statements as at 31 December 2006 were prepared, as required by Italian Legislative Decree
no. 38/2005, in accordance with International Financial Reporting Standards and International Accounting
Standards (hereinafter referred to as “IFRS”, “IAS”, or international accounting standards) issued by the
International Accounting Standards Board (IASB) and the relative interpretations of the International Financial
Reporting Interpretations Committee (IFRIC), approved by the European Commission according to the procedure
set forth under article 6 of Community Regulation (EC) no. 1606/2002 of 19 July 2002.
The financial statements as at 31 December 2006 were compared with the figures through 31 December 2005.
Both sets of figures were prepared in accordance with international accounting standards (IAS) and on the basis of
Circular no. 262 of 22 December 2005, Bank Financial Statements: Format and Standards for Preparation, issued
by the Bank of Italy by provision of its General Director.
The financial statements were prepared using the euro as the accounting currency. The Balance Sheet, Income
Statement, Statement of Changes in Shareholders’ Equity and the Cash Flow Statement were all prepared in euro.
Amounts referred to in these notes are expressed in thousands of euro.
Section 2 - General principles of preparation The financial statements are governed by the general principles set forth in the Framework for preparation and
presentation. As a consequence, the financial statements were prepared according to the accrual basis accounting
standards and on a going concern basis assuming business continuity. The general principles of the relevance and
significance of information and the prevalence of substance over form were observed during preparation. Each
material class of similar items is presented separately. Items of a dissimilar nature or function are presented
separately unless they are immaterial. Offsetting of assets with liabilities or income with expenses is prohibited
unless it is explicitly endorsed or required by a standard or by an interpretation. The financial statements comprise the Balance Sheet, Income Statement, Statement of Changes in Shareholders’
Equity, Cash Flow Statement, and the Notes, in addition to the Directors’ Report on Operations. The format of the
balance sheet and the income statement consists of items, sub-items and further information (the "of which"
under items and sub-items). Items with null values for this year and the previous year are not presented. On the
Income Statement, revenues are shown without a sign, while costs are indicated in parentheses.
Tables in the notes with null values for this year and the previous year were not included.

Notes
-90-
Section 3 - Events after the end of the half-yearly reporting period On 16 February 2007 the Board of Directors approved the sale of the entire equity investment held in
Acroservizi to the company’s current shareholder for a total price of €60,000.00, equal to the book value as
at 31 December 2006.
On 21 February 2007 the Bank purchased a 100% interest in the special purpose vehicle Alissa Finance
S.r.l., established in accordance with Italian Law no. 130/1999, for a price of €25,000.00. On the same day,
the share capital issue of €990,000.00 was subscribed for, bringing total share capital to €1,000,000.00. In
accordance with the resolution passed by the Board of Directors on 20 July 2006 and 25 January 2007, the
company was purchased with the intention of bringing together relationships with current credit brokers
transformed into agents and the issue of loans that may be repaid through the transfer of one-fifth of
salary.
Section 4 - Other aspects The financial statements were audited by the firm Reconta Ernst & Young.

Notes
-91-
A.2 PART RELATING TO THE MAIN FINANCIAL STATEMENT ITEMS This chapter sets out the accounting standards used to prepare the financial statements as at 31 December 2006.
The presentation of accounting standards is divided into the stages of recognition, classification, measurement,
and derecognition of the various asset and liability items. A description of the related economic effects is included
for each of the above stages, when relevant.
1 - Financial assets held for trading
Recognition
Financial assets held for trading are initially recognized on the settlement date for debt and equity securities, and
on the subscription date for derivative contracts.
Financial assets held for trading are initially recognized at fair value, which is typically equal to the amount paid or
collected. In the event that said amount differs from the fair value, the financial asset is recognized at its fair value,
and the difference between said amount and the fair value is recorded in the income statement.
Derivative contracts embedded in financial instruments or in other contractual forms with economic characteristics
and risks that are not related to those of host instrument, or with characteristics qualifying them for consideration
as derivative contracts, are recognized separately under financial assets held for trading, except when the complex
host instrument is measured at fair value with effects on the income statement. When an embedded derivative is
separated from its host instrument, the primary contract follows the accounting standards for the relative category
of classification.
Classification
This category includes financial assets, regardless of their technical form, that are held for trading over the short
term. It includes derivatives with positive values, even if originating from the separation of embedded derivatives,
provided they are not part of effective hedges.
Measurement
Subsequent to initial recognition, financial assets held for trading are measured at their fair value. The calculation
of the fair value of financial assets or liabilities is based on the official prices recorded on the reporting date if the
financial instruments are listed on active markets. The fair value of financial instruments, including equities, that
are not listed on active markets is calculated by making use of valuation techniques and data available on the
market, such as the trading price of similar instruments on an active market, discounted cash flow calculations,
option price calculation models, and values recorded in recent comparable transactions.
For equities and the associated derivatives, if the fair value may not be reliably calculated using valuation
techniques, the financial instruments are measured at cost and adjusted to account for impairment losses.
Derecognition
Financial assets held for trading are derecognized from the balance sheet when the contractual rights related to
the cash flows have expired, or when a sale transaction has occurred transferring all the risks and benefits
pertaining to the ownership of the transferred asset to third parties. However, if the majority of risks and rewards
relating to the transferred financial assets are retained, these will continue to be recognized on the balance sheet,
even though in legal terms the ownership of said assets has been effectively transferred.

Notes
-92-
If it is not possible to ascertain that the risks and rewards have been substantially transferred, the financial assets
are derecognized from the balance sheet if no type of control over these is retained. However, if control is retained,
even partly, this means that the assets are carried in the balance sheet to the extent of the remaining involvement,
as measured by the exposure to changes in the value of the transferred assets and changes in the related cash
flows.
Recognition of income
The results of the measurement of financial assets held for trading are entered to the income statement.
2 - Available-for-sale financial assets
Recognition
Available-for-sale financial assets are initially recognized on the settlement date for debt securities and equities,
and the issue date for loans. Available-for-sale financial assets are initially recognized at their fair value, which is
typically equal to the amount paid or collected. In the event that said amount differs from the fair value, the
financial asset is recognized at its fair value, and the difference between said amount and the fair value is recorded
in the income statement. The initial recognition value includes incidental expense and income associated with the
transaction.
Classification
This category includes financial assets other than derivatives that are not classified as "Financial assets held for
trading", "Financial assets designated at fair value", "Held-to-maturity financial assets", "Loans to banks", and
"Customer loans".
In further detail, the item includes the following: equity investments in companies other than subsidiaries, joint
ventures and associates that are not held for trading; unlisted mutual fund shares, or mutual fund shares with low
liquidities; and specific bonds identified on a case-by-case basis in relation to the purpose for which they are
purchased or held.
Measurement
Subsequent to initial recognition, available-for-sale financial assets are measured at their fair value.
The criteria set forth in the paragraph concerning financial assets held for trading are also used to calculate the fair
value of available-for-sale financial assets. For equities, if the fair value may not be reliably calculated using
valuation techniques, the financial instruments are measured at cost and adjusted to account for impairment
losses.
Derecognition
Available-for sale financial assets are derecognized from the balance sheet when the contractual rights associated
with the cash flows have expired, or when a sale transaction has been undertaken thereby transferring all the risks
and rewards deriving from the ownership of the transferred asset to third parties. However, if the majority of the
risks and rewards relating to the transferred financial assets are retained, these will continue to be recognized on
the balance sheet, even though ownership of said assets has been legally transferred.
If it is not possible to ascertain that the risks and rewards have been substantially transferred, the financial assets
are derecognized from the balance sheet if no type of control over these has been retained. However, if control is
retained, even partly, this means that the assets are carried on the balance sheet to the extent of the remaining

Notes
-93-
involvement, as measured by the exposure to changes in the value of the transferred assets and to changes in the
related cash flows.
Lastly, the transferred financial assets are derecognized from the balance sheet if the contractual rights to receive
the respective cash flows are retained with the concurrent assumption of an obligation to pay these flows, and only
these, to other third parties.
Recognition of income
Profits and losses on the change in fair value are entered to a specific shareholders' equity reserve until the assets
are derecognized, while an amount equal to the amortized cost of the available-for-sale assets is entered to the
income statement.
Available-for-sale financial assets are tested in order to determine whether there is objective evidence of
impairment. If such evidence is found to exist, the amount of the loss recorded in the income statement is
measured as being the difference between the carrying amount of the asset and the current value of estimated
future cash flows, discounted at the original effective interest rate, or by using specific valuation methods for
equities.
If the reasons for the impairment loss are removed as a result of an event occurring after recognition of
impairment, write-backs are applied and recorded in the income statement in the case of loans or debt securities,
and under shareholders' equity in the case of equities. The total amount written back cannot in any event exceed
the amortized cost which would have applied to the instrument in the absence of previous write-downs.
In addition to the recognition of impairment loss, accumulated profits or losses in the shareholders' equity reserve
are transferred to the income statement when the asset is disposed of as indicated above.
Dividends paid on an instrument representing capital available for sale are entered to the income statement when
the right to receive the payment thereof arises.
3 - Held-to-maturity financial assets
Recognition
Held-to-maturity financial assets are initially recognized on the settlement date. Held-to-maturity financial assets
are initially recognized at their fair value, which is typically equal to the amount paid or collected. In the event that
said amount differs from the fair value, the financial asset is recognized at its fair value, and the difference
between said amount and the fair value is recorded in the income statement. The initial recognition value includes
incidental expenses and income pertaining to the transaction.
Financial assets recorded in this category subsequent to the reclassification of available-for-sale financial assets
are recognized at their amortized cost, which is initially assumed to be equal to their fair value on the date they
are reclassified.
Classification
The item “Held-to-maturity financial assets” includes financial assets other than derivative instruments with fixed
or determinable contractual payments, which the entity has the intention and capacity to hold until maturity. If,
due to a change in the entity’s intent or ability, it is no longer appropriate to carry an investment as held-to-
maturity, this is reclassified amongst available-for-sale financial assets.
Measurement
Subsequent to initial recognition, held-to- maturity financial assets are measured at amortized cost and
Notes
-94-
subject to testing for impairment loss.
The amortized cost of a given financial asset equals its value at initial recognition, net of payments against
principal, increased or decreased by total amortization, which is calculated according to the effective interest rate
method on any differences between the initial value and the value at maturity, deducting any writedowns (applied
directly or through the use of a provision) subsequent to impairment or irrecoverability.
Derecognition
Financial assets classified to this category are derecognized when the contractual rights to the cash flows from the
assets expire or when the financial assets are transferred and all the risks and rewards related thereto are
substantially transferred. However, if the majority of risks and rewards relating to the transferred financial assets
are maintained, these will continue to be recognized in the balance sheet, even though ownership of said assets
has been legally transferred.
If it is not possible to ascertain that the risks and rewards have been substantially transferred, the financial assets
are derecognized from the balance sheet if no type of control over these is retained. However, if control is retained,
even partly, this means that the assets are carried in the balance sheet to the extent equal of the remaining
involvement, as measured by the exposure to changes in value of the transferred assets and changes in their cash
flows.
Finally, the transferred financial assets are derecognized from the balance sheet if the contractual rights to receive
the respective cash flows are preserved with the concurrent assumption of an obligation to pay these flows, and
only these, to other third parties.
Recognition of income
Profits and losses are entered to the income statement when the assets are derecognized. Interest is recorded
according to the amortized cost method, which involves the application of the effective interest rate. In the event
that amortized cost is not applied, interest is entered to the income statement according to the straight-line
method.
If objective evidence of impairment loss exists at the reporting date, the amount of impairment entered to the
income statement is measured as being the difference between the carrying amount of the asset and the current
value of estimated future cash flows, discounted at the original effective interest rate.
If the reasons for the impairment are no longer valid as a result of an event occurring after the recognition of the
impairment loss, the resulting writebacks are recognized in the income statement. Any writebacks made may not
result in a carrying amount exceeding the value of the amortized cost that the financial asset would have had if the
impairment loss had never been recognized.
Writebacks corresponding to interest accrued during the year on the basis of the original effective interest rate
previously used to calculate impairment losses are entered as writebacks under the specific item “net adjustments
for impairment”.
4 - Loans
Recognition
Loans are recognized on the balance sheet when they are issued, or on the settlement date in the case of debt
securities. The initial recognition value is equal to the amount issued or the subscription price including the
marginal costs and income directly related to the transaction and quantifiable on the date of recognition, even if
settled at a later date. The initial recognition value does not include costs that are to be recouped from the

Notes
-95-
borrower, nor shares of internal costs of an administrative nature.
The initial recognition value of loans issued under conditions differing from those offered on the market is equal to
the fair value of such loans calculated by using valuation techniques; the difference between the fair value and the
amount issued or subscription price is entered to the income statement.
Swaps and repurchase agreements with a repurchase or resale obligation at the term of the agreement are
recognized on the balance sheet as deposits or loan transactions; repurchase agreements are recognized on the
balance sheet as payables for the amount received spot, whereas reverse repurchase agreements are recognized
as loans for the amount paid spot.
Classification
The items “Loans to banks” and “Customer loans” include loans, whether issued directly by the Bank or acquired
from third parties, that are not listed on active markets, with fixed and determinable payments, other than loans
classified under the items: “Financial assets held for trading”, “Financial assets designated at fair value”, and
“Available-for-sale financial assets”. The categories also include any securities with characteristics similar to those
of loans.
These also include working capital loans, repurchase agreements and loans originating from finance lease
transactions.
Measurement
After initial recognition, loans are measured at amortized cost according to the methods set forth in the previous
paragraph concerning the measurement of held-to-maturity financial assets. The amortized cost method is not applied to loans with maturities of less than short term, technical forms without
fixed maturities, and revocable lines of credit, for which the effect of the application of said method is not deemed
significant. The above categories are measured at cost.
The loan portfolio is assessed at the end of each reporting period in order to determine whether there is evidence
of impairment loss. Impaired loans include non-performing loans, problem loans, restructured exposures, and
expired exposures.
Impairment loss is recognized only in the event that, subsequent to the initial recognition of the loan, there is
objective evidence that events have occurred leading to a reduction in the value of the loan such as to entail a
change in the related cash flows according to a reliable estimate.
Loans that show impairment through objective evidence of loss are subject to analytical valuation. The amount of
the loss is measured as the difference between the carrying value of the asset and the current value of estimated
future cash flows, discounted at the original effective interest rate for the financial asset. The following are
considered in measuring loans:
the “maximum recoverable amount” corresponding to the best estimate arising from the expected cash flows
from the loan and the related interest; when collection is considered probable, interest on late payment and the
realizable value of any guarantees are also considered, net of any expenses to be incurred for recovery;
recovery times, estimated according to contractual maturities, when present, or on the basis of reasonable
estimates in the absence of contractual agreements;
the discounting rate, which may be identified as the original effective interest rate; for impaired loans
outstanding on the date of transition, for which obtaining data was overly burdensome, reasonable estimates were
adopted, such as the average rate of transfer to non-performing loans or the restructuring rate for the year.
In the analytic valuation procedure, cash flows expected to be recovered in the near term are not discounted. The

Notes
-96-
original effective rate of each loan remains unchanged over time even in the event of a restructuring of the loan
that involves a change in the contractual rate and even if the loan, in practice, no longer bears any contractual
interest.
Loans for which there is no objective evidence of impairment loss are subject to collective valuation through the
creation of groups of positions with a similar risk profile. The amount of the writedown is calculated on the basis of
the historical performance of losses related to each group. For the purpose of determining historical series,
positions subject to analytic valuation are eliminated from the population. Writedowns determined collectively are
charged to the income statement.
Endorsement credits are also tested for impairment using criteria similar to those established for loans subject to
collective valuation.
Derecognition
Transferred loans are derecognized from the balance sheet only if the transfer involved the substantial transfer of
all the risks and rewards connected to the loans. However, if the majority of the risks and rewards relating to the
transferred loans are retained, these will continue to be recognized in the balance sheet, even though the
ownership of the loan has been legally transferred.
If it is not possible to ascertain that the risks and rewards have been substantially transferred, the loans are
derecognized from the balance sheet if no type of control over these has been retained. Otherwise, the retention,
even in part, of said control leads to carrying the loans in the balance sheet to the extent of the residual
involvement, as measured by the exposure to changes in value of transferred loans and to changes in their cash
flows.
Finally, the transferred loans are derecognized from the balance sheet if the contractual rights to receive the
respective cash flows are retained with the concurrent assumption of an obligation to pay these flows, and only
these, to other third parties.
IFRS 1 allows for a specific exception to the application of derecognition rules for transfers of financial assets,
including securitization transactions, if undertaken prior to 1 January 2004. By virtue of this exception, the
reporting entity may decide to continue to adopt previous accounting standards or to adopt the provisions of IAS
39 retroactively from a date chosen by said entity to the accounting treatment of securitization transactions
undertaken prior to said date, provided that the information required for the application of the above IAS standard
to the assets previously derecognized from the balance sheet was available when said transactions were initially
recognized. In this connection, the Capitalia Group has decided to adopt previous accounting standards to the
treatment of securitization transactions undertaken up to financial year 2001.
Recognition of income
Subsequent to initial recognition, loans are measured at their amortized cost, which is equal to the initial
recognition value decreased/increased by the principal repayments, writedowns/writebacks and amortization - the
latter being calculated according to the effective interest rate method – of the difference between the total amount
issued and the amount repayable at maturity, which is typically due to the costs/income pertaining directly to each
individual loan. The effective interest rate is determined by calculating the rate equal to the current value of future
cash flows on the loan, for principal and interest, to the amount issued, inclusive of loan-related costs/income. This
accounting method, which uses a financial logic, allows for the distribution of the economic effect of costs/income
over the expected residual life of the loan.
The amortized cost method is not used for short-term loans for which the effect of application of the discounting
logic is considered negligible. These loans are instead measured at historical cost. A similar valuation principle

Notes
-97-
is adopted for loans without a definite maturity or revocable loans.
Impairment loss, as defined above in the paragraph concerning the measurement of loans, is entered to the
income statement.
If the reasons for the loss are no longer valid as a result of an event occurring after the recognition of the
impairment loss to the asset, the resulting writebacks are recognized in the income statement. Any writebacks
made may not result in a carrying amount exceeding the value of the amortized cost that the loan would have had
if the impairment loss had never been recognized. Writebacks corresponding to interest accrued during the year on the basis of the original effective interest rate
previously used to calculate impairment losses are entered as writebacks under the specific item “net adjustments
for impairment”.
5 - Financial assets designated at fair value
Recognition
Financial assets designated at fair value are initially recognized on the settlement date for debt or equity securities.
Financial assets designated at fair value are initially recognized at fair value, which is typically equal to the amount
paid. In the event that said amount differs from the fair value, the financial asset is recognized at its fair value,
and the difference between said amount and the fair value is recorded in the income statement.
Classification
The item “Financial assets designated at fair value” also includes financial assets that, regardless of their technical
form, have been designated at fair value since initial recognition.
Measurement
Subsequent to initial recognition, financial assets classified to this category are measured at fair value. Reference
should be made to the paragraph concerning the measurement of financial assets held for trading for information
about the criteria used to determine fair value. For equities and the associated derivatives, if the fair value may
not be reliably calculated using valuation techniques, the financial instruments are measured at cost and adjusted
in the presence of impairment losses.
Derecognition
Financial assets designated at fair value are derecognized from the balance sheet when the contractual rights
related to the cash flows have expired, or when a sale transaction has been undertaken thereby transferring all the
risks and rewards pertaining to the ownership of the transferred asset to third parties.
Recognition of income
The result of the measurement is entered to the income statement.
6 - Hedging transactions
Recognition
Hedging derivatives and financial assets and liabilities covered by effective hedges are recognized on the balance
sheet according to the criteria for the accounting treatment of hedges.
Transactions designated as hedges, accompanied by formal documentation of the relationship

Notes
-98-
between the hedged instrument and the hedging instrument, are considered to be effective if the changes in the
fair value or the cash flows of the hedged instrument are almost entirely offset by the changes in the fair value or
the cash flows of the hedging instrument at the outset and for the full duration of the hedge. At the end of each
reporting period the hedging relationship is subject to prospective and retrospective testing and is considered to be
effective if the relationship between the changes in value does not exceed the established limit of the range of 80-
125%.
Classification
Derivative contracts for hedging purposes are used to protect the holder against one or more types of risk (interest
rate risk, exchange rate risk, price risk, credit risk). In particular, fair value hedges are undertaken with the aim of
hedging the exposure to the changes in fair value; cash flow hedges are undertaken with the aim of hedging the
exposure to changes in cash flows.
The items “Hedge derivatives” in the assets and liabilities section of the balance sheet include the positive and
negative values of derivatives that are part of effective hedges.
Recognition of income
Derivatives classified under the items "Hedge derivatives" in the assets and liabilities sections of the balance sheet
are measured at fair value. Changes in the fair value of derivatives hedging against changes in fair value are
entered to the income statement; changes in the fair value of derivatives hedging against changes in cash flows
are entered to shareholders’ equity for the effective share of the hedge, and are only entered to the income
statement when there is a change in cash flows to be offset for the hedged item.
Changes in the fair value of fair value hedges due to the risk hedged by the hedged asset or the liability are
entered to the income statement. For micro-hedges, the hedged asset or liability, recognized on the balance sheet
under the relevant category, is written down or written back for the amount of the change in the fair value related
to the hedged risk.
Derecognition
If the tests performed do not confirm the effectiveness of the hedge, the accounting treatment of the hedging
transaction according to the criteria set forth in this paragraph ceases, the accounting treatment provided for the
relevant category is used, and the derivative is reclassified to instruments held for trading; subsequent changes in
fair value are entered to the income statement. For cash flow hedges, if it is decided that the hedged transaction is
no longer to be undertaken, the accumulated value of profits and losses entered to the shareholders’ equity
reserve is transferred to the income statement.
7 – Equity investments
Recognition
Equity investments are initially recognized at their cost on the settlement date, including any costs or income
directly related to the transaction, when present.
Classification
The item “Equity investments” includes investments in subsidiaries, joint ventures, and associates.
Investments in associates and joint ventures, and other investments held for the purposes of investment in risk
capital (“venture capital”) are treated according to IAS 39.

Notes
-99-
Subsidiaries are defined as companies in which the reporting entity directly or indirectly holds more than half of
voting rights, unless it may be demonstrated that holding said rights does not represent control; control is also
considered to exist when an entity wields the power to determine financial and management policies.
Joint ventures are defined as companies for which control is shared with other parties according to contractual
agreement.
Associates are defined as companies in which the reporting entity directly or indirectly holds a minimum of 20
percent of voting rights, or in which the reporting entity, despite holding a lesser percentage of voting rights,
wields significant influence, which in turn is defined as the power to participate in determining financial and
management policies, without however exercising control or joint control.
The bond between the reporting entity and a subsidiary, joint venture, or associate is considered severed in the
event that the definition of the investee company’s financial and management policies is removed from governance
bodies and attributed to a government body, the court, or in other similar situations. In such circumstances, the
equity investment is treated according to IAS 39 in the same manner as financial instruments.
In evaluating the nature of the equity investment, only elements that exist at the level of the separate financial
statements (percent stake, effective and potential voting rights, circumstances of de facto significant influence) are
considered.
Equity investments in subsidiaries, joint ventures, and associates classified as available for sale are recognized
separately on the balance sheet as discontinued operations and measured at the lesser of the book value and the
fair value, net of disposal costs.
Measurement
Equity investments in subsidiaries, joint ventures, and associates are measured at cost in the separate financial
statements. If there is evidence that the value of an equity investment may have become impaired, the
recoverable value of the investment is estimated, taking into account the market value or the current value of
future cash flows. If the recoverable value is less than the carrying amount, the difference is recognized in the
income statement as an impairment loss.
Derecognition
Equity investments are derecognized when the contractual rights to the cash flows from the investments
themselves expire or when the investments are transferred and all the risks and rewards related thereto are
substantially transferred.
Measurement of income
Dividends received on equity investments measured at cost are entered to the income statement when the right to
receive the payment thereof arises.
Impairment loss on equity investments in subsidiaries, associates and joint ventures is measured at cost and
entered to the income statement. If the reasons for the impairment are no longer valid as a result of an event
occurring after the recognition of the impairment loss, the loss is written back and recognized on the income
statement.
8 - Property, plant and equipment
Recognition
Property, plant and equipment are initially recognized at cost, which also includes any incidental expenses

Notes
-100-
directly related to the purchase and to the operation of the asset. Extraordinary maintenance costs that involve an
increase in the future economic benefits are recognized as increasing the value of the assets, while other ordinary
maintenance costs are recognized on the income statement.
Assets used under finance lease agreements in which the reporting entity is the lessee are also recognized under
"Property, plant and equipment" if said entity has assumed substantially all risks and rewards of ownership. These
assets are initially recognized at a value equal to the lesser of the fair value and the current value of the minimum
lease payments. This value is then depreciated over time.
Classification
The category “Property, plant and equipment” includes land, instrumental buildings, real estate investments,
technical installations, furniture, furnishings and equipment. The item includes assets held for use in the
production or provision of goods and services, to be leased to third parties, or for administrative purposes, and
which are expected to be used for more than one reporting period.
Measurement
Property, plant and equipment, including real estate investments, are measured at cost, less depreciation and
impairment losses. On the date of transition to IFRS, 1 January 2004, buildings were measured at fair value, and
their fair value was booked instead of cost.
Depreciation is calculated systematically on the basis of the residual useful lives of the assets. The depreciation
rates used for the main categories of property, plant and equipment are as follows: furnishings (12 percent),
ordinary office machines (12 percent), miscellaneous machines, devices and equipment (15 percent), alarm
systems and camera and television circuits (30 percent), electronic machines (20 percent), hoisting systems and
equipment (7.5 percent). The base value to be depreciated is the cost of the assets since the residual value at the
end of the depreciation process is considered insignificant. Buildings are depreciated at the rate of 2 percent per
year, which is considered adequate to represent the depreciation of such assets due to their use over time, taking
into account extraordinary maintenance expenses, which are carried to increase the value of the relative assets.
Land is not subject to depreciation, regardless of whether it is purchased separately or incorporated in the value of
a detached building.
Derecognition
An item of property, plant and equipment is derecognized from the balance sheet on disposal or when the asset is
permanently withdrawn from use and no future economic benefits are expected from its disposal.
Measurement of income
Depreciation is entered to the income statement. If there are indications to the effect that there is a potential
impairment loss on an item of property, plant and equipment, the book value and the recoverable value of the
asset are compared, with the recoverable value being equal to the greater of the value in use, defined as the
current value of future cash flows deriving from the asset, and the asset’s fair value, net of disposal costs. Any
negative difference between the book value and recoverable value of the asset is then entered to the income
statement. If the reasons that determined the writedown of an item of property, plant and equipment are removed,
a writeback is entered to the income statement. Writebacks may not result in a book value that exceeds the value
that the asset would have had net of depreciation calculated in the absence of previous impairment losses.

Notes
-101-
9 - Intangible assets
Recognition
Intangible assets are recognized at cost, adjusted for any incidental expenses only if it is likely that the future
economic benefits of the assets will be realized and if the cost of the asset can be reliably measured. If the
opposite is the case, the cost of the intangible asset is charged to the income statement in the year in which it was
incurred.
Goodwill generated by business combination transactions (for example, transactions to acquire company divisions)
may be recognized under intangible assets. Goodwill generated by business combination transactions undertaken
subsequent to 1 January 2004, is recognized at a value equal to the positive difference between the fair value of
the assets and liabilities acquired and the purchase cost of the business combination, including incidental expenses,
if said positive difference represents future earnings capacity. The difference between the cost of the business
combination and the fair value of the assets and liabilities acquired is entered to the income statement, regardless
of whether said difference is negative or positive, if it does not represent future earnings capacity. Goodwill
generated by business combination transactions undertaken prior to the date of transition to IFRS is measured
according to historical cost and represents the same value as recognized under Italian accounting standards.
Classification
Intangible assets are recognized as such if they are identifiable and arise from legal or contractual rights. This
category includes computer software. Expenses incurred to renovate properties owned by third parties that are not
independently functional and usable are by convention classified under other assets, as provided in Bank of Italy
Circular no. 262; depreciation of such properties, which may be applied for a period no longer than the duration of
the lease agreement, is reported under other operating expenses.
Measurement
Intangible assets recognized at cost are subject to amortization on a straight-line basis according to the estimated
residual useful life of the asset, which in the case of computer software may not exceed five years.
Goodwill is subjected to impairment testing from time to time.
Derecognition
Intangible assets are eliminated from the balance sheet when they have been disposed of and when no further
future economic benefits are expected from the use or disposal thereof.
Measurement of income
Amortization is entered to the income statement. If there are indications to the effect that the value of an item of
intangible assets has been impaired, a test is conducted to verify impairment losses, and any negative difference
between the book value and the recoverable value of the assets is entered to the income statement. If the reasons
that had determined the writedown of an item of intangible assets other than goodwill are removed, a writeback is
entered to the income statement. Writebacks may not result in a book value that exceeds the value that the asset
would have had net of amortization calculated in the absence of previous impairment losses.

Notes
-102-
10 - Non-current assets and discontinued operations
Recognition and classification
This item includes non-current assets available for sale and assets and liabilities pertaining to disposal groups, the
sale of which is scheduled for within 12 months from the date of classification, such as equity investments in
subsidiaries, associates and joint ventures, property, plant and equipment, intangible assets, and assets and
liabilities pertaining to company divisions available for sale.
Measurement and recognition of income
The assets and liabilities classified to this item are measured at the lesser of book value and fair value, net of the
sales costs. The respective income and expenses (net of the tax effect) are disclosed separately in the income
statement.
11 - Current and deferred taxation
Recognition
Income taxes are recognized on the income statement except for those relating to items charged or credited
directly to shareholders’ equity. Deferred tax assets are recognized when it is considered likely that they will be
recovered. Deferred taxes are recognized whenever it is likely that the associated charge will arise.
Classification
Prepaid and deferred taxes are entered in the balance sheet with open balances and without offsetting, with the
former entered under the item "Tax assets" and the latter under the item "Tax liabilities".
Measurement
When the results of transactions are entered directly to shareholders’ equity, current taxes, prepaid tax assets,
and deferred tax liabilities are also entered to shareholders' equity.
Deferred and prepaid tax assets and liabilities are then measured from time to time to take into account any
legislative changes or modifications in tax rates.
Recognition of income
Income taxes are recognized on the income statement, except for those relating to items charged or credited
directly to shareholders’ equity. Current taxes are calculated on the basis of the tax results for the period. Tax
charges and credits for current taxes are recognized at the value that is expected to be paid/recovered to/from the
tax authorities by applying current tax rates and legislation. Prepaid and deferred income taxes are calculated on
the temporary differences between the value of assets and liabilities stated on the balance sheet and the
corresponding values for tax purposes.
12 - Provisions for contingencies and charges
Pension funds and similar provisions
Recognition and classification
Defined-contribution plans are plans that provide benefits for employees subsequent to the termination of

Notes
-103-
employment, that involve the payment of fixed contributions to a fund, and for which there is no obligation to pay
additional contributions if the fund does not have adequate assets to pay out the benefits to employees. The
internal pension funds are set up in accordance with company agreements and come under the definition of
defined-benefit plans.
Measurement and recognition of income
The liability relating to these internal (defined-benefit) pension funds and the respective current service cost are
determined on the basis of actuarial assumptions by applying the projected unit credit method. The book value of
the obligation on the reporting date is also adjusted by the fair value of the plan’s assets (if any). Actuarial gains
and losses are entered to the income statement on the basis of the corridor method, limited to the part of actuarial
gains and losses that had not been recognized at the end of the previous year that exceeds the greater of 10
percent of the current value of the benefits generated by the plan and 10 percent of the fair value of the plan’s
assets (if any). This surplus is recognized on the basis of the average expected working life of the plan’s
participants.
For defined-contribution funds (external funds), the contributions payable by the company are charged to the
income statement and determined according to the service plan. The obligation is calculated each year according
to the contributions due during said year.
Other provisions for contingencies and charges
Recognition and classification
Provisions for contingencies and charges are recognized on the income statement and entered to the liabilities
section of the balance sheet when there is a current obligation, whether legal or implicit, deriving from a past
event, in relation to which it is considered probable that the fulfilment of the obligation is compulsory, provided
that the loss associated with the liability may be reliably estimated.
Provisions are entered at a value representing the best estimate of the amount required to discharge the obligation,
or to transfer it to third parties by the end of the accounting period.
When the financial effect of the year is significant and the dates of payment of obligations have been reliably
estimated, the provision is discounted at current market rates on the reporting date.
Measurement and recognition of income
The amounts recognized as provisions are re-examined on each reporting date and are adjusted to reflect the best
estimate of the expenditure required to fulfil the obligations existing at the end of the accounting period.
The effect of the year and the effect of changes in interest rates are entered to the income statement under net
provisions for the period.
Derecognition
Provisions are only used for the charges for which they were originally recognized. When it is no longer considered
likely that the fulfilment of the obligation will require the use of resources, the provision is released and reallocated
to the income statement.

Notes
-104-
13 - Payables and debt securities in issue
Recognition
Payables and debt securities in issue are initially recognized according to the fair value of the liability, which is
normally equal to the amount collected or the issue price, increased or decreased by any marginal costs or income
directly related to the transaction that have not been not repaid by the borrower. Internal administrative costs are
not included. Any financial liabilities issued at conditions other than common market conditions are recognized at
fair value according to an estimate, and the difference between the fair value and the issue price or value is
entered to the income statement.
Classification
The category “Payables and debt securities in issue” includes financial liabilities not held for trading in the near
term, such as various technical forms of funding on the interbank market and with customers and funding
collected through certificates of deposit and the issue of other debt securities, net of any amounts that have been
bought back.
This category also includes payables recognized by the lessee under finance lease transactions.
Measurement and recognition of income
Subsequent to initial recognition, these items are measured at amortized cost according to the effective interest
rate method, except for short-term liabilities, which are entered at the amount collected, provided that they meet
the requirements of the general principle of significance and relevance. Reference should be made to the previous
paragraph on held-to-maturity financial assets for the methods according to which amortized cost is calculated.
Derecognition
The financial liabilities reported under these items are derecognized from the balance sheet when they are
redeemed or reach maturity, or also when previously issued securities are bought back. In the latter case, the
difference between the carrying amount of the liability and the amount paid to purchase it is charged to the
income statement.
The replacement of own shares on the market subsequent to their repurchase is considered a new issue and
consequently entails recognition of the new placement price with no effect on the income statement.
14 - Financial liabilities held for trading
Recognition
Financial liabilities held for trading are initially recognized on the settlement date for debt securities and equities,
and the date of subscription for derivative contracts. Financial liabilities held for trading are initially recognized at
their fair value, which is typically equal to the amount collected.
In the event that said amount differs from the fair value, the financial liability is recognized at its fair value, and
the difference between said amount and the fair value is recorded in the income statement.
Derivative contracts embedded in financial instruments or in other contractual forms with economic characteristics
and risks that are not correlated with the host instrument or with characteristics qualifying them for consideration
as derivative contracts are recognized separately, if negative, under financial liabilities held for trading, except
when the combined host instrument is measured at fair value with effects on the income statement.

Notes
-105-
Classification
This item includes the negative value of derivative contracts that are not part of hedges and the negative value of
derivatives embedded in the combined contracts. The item “Financial liabilities held for trading” also includes
liabilities that derive from technical account overdrafts produced by securities trading activity.
Measurement
Subsequent to initial recognition, financial liabilities held for trading are measured at their fair value. Reference
should be made to the above paragraph concerning the measurement of financial assets held for trading for
information about the criteria for determining fair value.
Derecognition
Financial liabilities held for trading are derecognized when they are redeemed or reach maturity.
Recognition of income
The results of the measurement of financial liabilities held for trading are entered to the income statement.
15 - Financial liabilities designated at fair value
This item was not included in the financial statements since the Capitalia Group did not exercise the fair value
option for liability items.
16 - Foreign currency transactions
Recognition
Transactions in foreign currency are recorded, at the time of their initial recognition, in the accounting currency,
using the foreign currency exchange rate valid on the transaction date.
Recognition of income
On the reporting date, foreign currency items are recorded as follows:
monetary items are converted at the exchange rate valid on the reporting date;
non-monetary items measured at historical cost are converted at the exchange rate valid on the transaction
date;
non-monetary items carried at fair value are converted by using the exchange rates valid on the reporting date;
Exchange differences arising on the settlement of monetary items or the translation of monetary items at rates
different from those at which they were translated when initially recognized or in previous financial statements are
recognized as income in the period in which they arise.
When profit or loss relating to a non-monetary element is recorded under shareholders' equity, any exchange
difference relating to that element is also recorded under shareholders' equity. Otherwise, when profit or loss is
recorded in the income statement, any related exchange difference is also recorded in the income statement.
17 - Other information
Employee severance payment fund

Notes
-106-
Employee severance benefits are recognized on the basis of their value, which is calculated according to the
actuarial criteria set forth by IAS 19 for defined-benefit employee plans.
The value of the liability reported on the financial statements is therefore subject to actuarial assessments that
take into account the future changes in employment, among the other variables.
Future cash flows associated with employee severance benefits are discounted on the reporting date on the basis
of the projected unit credit method. Actuarial gains and losses are recognized on the basis of the corridor method,
limited to the part of actuarial gains and losses that had not been recognized at the end of the previous year
exceeding the greater of 10 percent of the current value of the benefits generated by the plan. This surplus is
recognized on the basis of the average expected working life of the plan’s participants.
The liability recognized on the balance sheet represents the current value of the obligation, increased by any
unreported actuarial gains, and decreased by any unreported actuarial losses.
Revenue recognition
Revenue is recognized when it is realized, or, in the event of the sale of assets or products, when it is likely that
future benefits will be received and such benefits may be reliably estimated, or, in the event of the provision of
services, when said services are provided. In particular:
interest is recognized on a pro-rata temporis basis according to the contractual interest rate and the effective
interest rate in the event of application of the amortized cost method;
dividends are recognized on the income statement at the time that their distribution is decided;
commissions for service revenue are recognized on the basis of the existence of contractual agreements during
the period when said services were provided;
the revenues arising from the sale of financial instruments, calculated as the difference between the transaction
price and the fair value of the instrument, are recognized on the income statement when the transaction is
recorded if the fair value can be determined with reference to recent parameters or transactions on the same
market in which the instrument is traded. If the above values are not readily available or if they are characterized
by reduced liquidity, the financial instrument is recognized at an amount equal to the transaction price, decreased
by the commercial margin; the difference between this price and the fair value of the instrument is entered to the
income statement over the duration of the transaction by means of a gradual reduction of the corrective factor
applied in the valuation model associated with the reduced liquidity of the instrument;
revenue arising from the sale of non-financial assets is recognized when the sale is closed, unless the Bank has
retained the majority of the risks and rewards relating to said asset.

Notes
-107-
PART B - INFORMATION ON THE BALANCE SHEET ASSETS Section 1 - Cash on hand and deposits with central banks - Item 10 1.1 Cash on hand and deposits with central banks: breakdown
31-Dec-06 31-Dec-05 Absolute %
(a) Cash 316 486 (170) -35.0%(b) Demand deposits with central banks - - - -Total 316 486 (170) -35.0%(amounts in Euro/000)
Change
Section 2 - Financial assets held for trading - Item 20 2.1 Financial assets held for trading: breakdown by category
Items/ValuesListed Unlisted Listed Unlisted
A. Cash assets1. Debt securities 1.1 Structured securities 18,703 2,353 12,249 2,948 1.2 Other debt securities 22,782 259,865 33,831 251,2752. Equities 1 22 11 83. Units in OICR - - - -4. Loans 4.1 Repurchase agreements - - - - 4.2 Other - - - -5. Impaired assets - 1 - -6. Assets sold but not eliminated - 576,413 - 163,227Total A 41,486 838,654 46,091 417,458B. Derivative instruments1. Financial derivatives 1.1 used for trading activities 35 14,153 - 21,395 1.2 associated with the fair value option - - - - 1.3 other - 185 - 2652. Credit derivatives - - - - 2.1 used for trading activities - - - - 2.2 associated with the fair value option - - - - 2.3 other - - - -Total B 35 14,338 - 21,660
Total (A+B) 41,521 852,992 46,091 439,118(Amounts in Euro/000)
31-Dec-06 31-Dec-05
The book value of owned securities involved in repurchase agreements was entered under item A.6.
The assets underlying the derivative contracts incorporated in the structure of the Bank’s structured debt security
issues consist largely of market variables such as market indices.

Notes
-108-
2.2 Financial assets held for trading: breakdown by debtors/issuers
Items/Values31-Dec-06 31-Dec-05 Absolute %
A. CASH ASSETS1. Debt securities a) Governments and central banks 17,006 12,642 4,364 34.5% b) Other public entities 803 1,128 (325) -28.8% c) Banks 263,156 272,608 (9,452) -3.5% d) Other issuers 22,738 13,925 8,813 63.3%2. Equities a) Banks - - - - b) Other issuers: - - - insurance companies - - - - - financial companies - - - - - non-financial companies 23 19 4 21.1% - other - - - -3. Units in OICR - - - -4. Loans - - a) Governments and central banks - - - - b) Other public entities - - - - c) Banks - - - - d) Other entities - - - -5. Impaired assets - - a) Governments and central banks - - - - b) Other public entities - - - - c) Banks - - - - d) Other entities 1 - 1 -6. Assets sold but not eliminated - - a) Governments and central banks - - - - b) Other public entities - - - - c) Banks 576,413 163,227 413,186 253.1% d) Other issuers - - - -Total A 880,140 463,549 416,591 89.9%B. DERIVATIVE INSTRUMENTS a) Banks 11,045 7,453 3,592 48.2% b) Customers 3,328 14,207 (10,879) -76.6%Total B 14,373 21,660 (7,287) -33.6%
Total (A+B) 894,513 485,209 409,304 84.4%(Amounts in Euro/000)
Change

Notes
-109-
2.3 Financial assets held for trading: derivative instruments
As at 31 December 2006
Types of derivatives/underlying assets Interest rates Currencies and gold
Equities Loans Other Total
A) Listed derivatives 1. Financial derivatives: With exchange of capital - - - - - - - Options purchased - - - - - - - Other derivatives - - 35 - - 35 Without exchange of capital - - - - - - - Options purchased - - - - - - - Other derivatives - - - - - - 2. Credit derivatives: With exchange of capital - - - - - - Without exchange of capital - - - - - -Total A - - 35 - - 35B) Unlisted derivatives 1. Financial derivatives: With exchange of capital - - - - - - - Options purchased 185 3 - - 188 - Other derivatives - 319 - - - 319 Without exchange of capital - - - - - - - Options purchased 72 7,475 - - 7,547 - Other derivatives 6,284 - - - 6,284 2. Credit derivatives: With exchange of capital - - - - - - Without exchange of capital - - - - - -Total B 6,541 319 7,478 - - 14,338
Total (A+B) 6,541 319 7,513 - - 14,373(Amounts in Euro/000)
As at 31 December 2005
Types of derivatives/underlying assets Interest rates Currencies and gold
Equities Loans Other Total
A) Listed derivatives 1. Financial derivatives: With exchange of capital - - - - - - - Options purchased - - - - - - - Other derivatives - - - - - - Without exchange of capital - - - - - - - Options purchased - - - - - - - Other derivatives - - - - - - 2. Credit derivatives: With exchange of capital - - - - - - Without exchange of capital - - - - - -Total A - - - - - -B) Unlisted derivatives 1. Financial derivatives: With exchange of capital - - - - - - - Options purchased - 1 264 - - 265 - Other derivatives - - - - - - Without exchange of capital - - - - - - - Options purchased 208 20 7,922 - - 8,150 - Other derivatives 13,189 56 - - - 13,245 2. Credit derivatives: With exchange of capital - - - - - - Without exchange of capital - - - - - -Total B 13,397 77 8,186 - - 21,660
Total (A+B) 13,397 77 8,186 - - 21,660(Amounts in Euro/000)

Notes
-110-
2.4 Cash financial assets held for trading other than those sold but not eliminated and impaired assets: changes over the year As at 31 December 2006
Debt securities Equities Units in OICR Loans TotalA. Opening balance 300,303 19 - - 300,322B. Increases 1,663,014 188,160 - - 1,851,174B1. Purchases 1,654,453 187,737 - - 1,842,190B2. Increases in fair value 233 1 - - 234B3. Other changes 8,328 422 - - 8,750C. Decreases (1,659,614) (188,156) - - (1,847,770)C1. Sales (1,653,008) (187,913) - - (1,840,921)C2. Redemptions - - - - -C3. Decreases in fair value (460) (1) - - (461)C4. Other changes (6,146) (242) - - (6,388)D. Closing balance 303,703 23 - - 303,726(Amounts in Euro/000) The transitional measures issued by the Bank of Italy by provision of its General Director dated 22 December 2005,
allowed banks that had exercised the option of adopting the new financial statement format beginning with the
year ended as at 31 December 2005, the possibility of not providing the information required under this paragraph.
Section 3 - Financial assets designated at fair value - Item 30 FinecoBank S.p.A. did not book any financial assets classified to the category "Fair value through profit and loss"
to the item "Financial assets designated at fair value".
Section 4 - Available-for-sale financial assets - Item 40 4.1 Available-for-sale financial assets: breakdown by category
Items/ValuesListed Unlisted Listed Unlisted
1. Debt securities 1.1 Structured securities - 1.2 Other debt securities - 75,137 - 91,5242. Equities 2.1 Measured at fair value - 8,189 - - 2.2 Measured at cost - 73 - 1,7373. Units in OICR - - - -4. Loans - - - -5. Impaired assets - -6. Assets sold but not eliminated - - -Total - 83,399 - 93,261(Amounts in Euro/000)
31-Dec-06 31-Dec-05

Notes
-111-
4.2 Available-for-sale financial assets: breakdown by debtors/issuers
Items/Values Change
31-Dec-06 31-Dec-05 Absolute %
1. Debt securities a) Governments and central banks - - - - b) Other public entities - - - - c) Banks - - - - d) Other issuers 75,137 91,524 (16,387) -17.9%2. Equities - - a) Banks - - - - b) Other issuers: - - - - - insurance companies 8,189 - 8,189 - - financial companies 13 466 (453) -97.2% - non-financial companies 60 1,271 (1,211) -95.3% - other - - - -3. Units in OICR - - - -4. Loans - - a) Governments and central banks - - - - b) Other public entities - - - - c) Banks - - - - d) Other entities - - - -5. Impaired assets - - a) Governments and central banks - - - - b) Other public entities - - - - c) Banks - - - - d) Other entities - - - -6. Assets sold but not eliminated - - a) Governments and central banks - - - - b) Other public entities - - - - c) Banks - - - - d) Other entities - - - -Total 83,399 93,261 (9,862) -10.6%(Amounts in Euro/000)
4.3 Available-for-sale financial assets: hedged assets
This table was not included since the Bank had no hedged available-for-sale financial assets.
4.4 Available-for-sale financial assets: assets under micro-hedge
This table was not included since the Bank had no micro-hedged available-for-sale financial assets.

Notes
-112-
4.5 Available-for-sale financial assets other than those sold but not eliminated and impaired assets: changes over the year
As at 31 December 2006
Debt securities Equities Units in OICR Loans TotalA. Opening balance 91,523 1,737 - - 93,260B. Increases 291 10,731 - - 11,022B1. Purchases - 7,500 - - 7,500B2. Increases in FV 572 - - 572B3. Writebacks - - - - - - to income statement - - - - - - to shareholders' equity - - - - -B4. Transfers to other portfolios - - - -B5. Other changes 291 2,659 - - 2,950C. Decreases (16,677) (4,206) - - (20,883)C1. Sales - (4,206) - - (4,206)C2. Redemptions (11,294) - - - (11,294)C3. Decreases in FV (1,803) - - - (1,803)C4. Writedowns for impairment - - - - - - to income statement (3,580) - - (3,580) - to shareholders' equity - - - - -C5. Transfers to other portfolios - - - - -C6. Other changes - - - -D. Closing balance 75,137 8,262 - - 83,399(Amounts in Euro/000)
Other increases include gains realized on the disposal of available-for-sale financial assets.
As at 31 December 2005
Debt securities Equities Units in OICR Loans TotalA. Opening balance 187,496 1,631 - - 189,127B. Increases 3,461 369 - - 3,830B1. Purchases - 97 - - 97B2. Increases in FV 3,461 - - - 3,461B3. Writebacks - - - - - - to income statement - - - - - - to shareholders' equity - - - - -B4. Transfers to other portfolios - 195 - - 195B5. Other changes - 77 - - 77C. Decreases (99,433) (263) - - (99,696)C1. Sales - (98) - - (98)C2. Redemptions (56,483) - - - (56,483)C3. Decreases in FV - - - - -C4. Writedowns for impairment - - - - - - to income statement (2,359) (165) - - (2,524) - to shareholders' equity - - - - -C5. Transfers to other portfolios - - - - -C6. Other changes (40,591) - - - (40,591)D. Closing balance 91,524 1,737 - - 93,261(Amounts in Euro/000)
Other increases and decreases include gains and losses realized on the disposal of available-for-sale financial
assets, in addition to the book value of the junior notes, which came to a total of €23,431 thousand. The junior
notes were eliminated from the balance sheet on 1 January 2005 subsequent to recognition of loans sold but not
eliminated under the option granted by International Accounting Standards (IAS 39).

Notes
-113-
In compliance with the general principle of the prevalence of economic substance over legal form, the mere
transfer of ownership is not adequate to allow a financial asset to be derecognized from the balance sheet. Instead,
it must be verified that the risks and rewards deriving from the transferred asset have been effectively transferred
to the purchaser.
FinecoBank S.p.A. has applied the provisions of IAS 39 to its disposal transactions, and, consequently, to its
securitization of loans, from 1 January 2002 forward, in addition to the “Garda Mutui” revolving loan securitization,
from 1 January 2002 forward.
Section 5 – Financial assets held to maturity – Item 50 FinecoBank S.p.A. did not book any financial assets under the item “Financial assets held to maturity”.
Section 6 - Due from banks - Item 60 6.1 Due from banks: breakdown by category
Type of transactions/Values 31-Dec-2006 31-Dec-2005 Absolute %
A. Loans to central banks - - - -1. Savings accounts - - - -2. Mandatory reserve - - - -3. Repurchase agreements - - - -4. Other - - - -B. Loans to banks 1.088.915 514.161 574.754 111,8%1. Current accounts and demand deposits 132.592 257.366 (124.774) -48,5%2. Savings accounts 939.526 248.165 691.361 278,6%3. Other loans: - - 3.1 Repurchase agreements 13.433 806 12.627 1566,6% 3.2 Finance leases - - - - 3.3 Other 1.800 5 1.795 35900,0%4. Debt securities - - 4.1 Structured securities 838 - 838 - 4.2 Other debt securities 726 7.819 (7.093) -90,7%5. Impaired assets - - - -6. Assets sold but not eliminated - - - -Total (book value) 1.088.915 514.161 574.754 111,8%Total (fair value) 1.088.915 514.161 574.754 111,8%(Amounts in Euro/000)
Change
6.2 Due from banks: assets under micro-hedge This table was not included since the Bank had no micro-hedges on sums due from banks.
6.3 Finance leases FinecoBank S.p.A. is the lessee in its finance lease transactions. Section 7 - Customer loans - Item 70

Notes
-114-
7.1 Customer loans: breakdown by category
Type of transactions/Values 31-Dec-06 31-Dec-05 Absolute %
1. Current accounts 15,430 31,922 (16,492) -51.7%2. Repurchase agreements 834,377 680,972 153,405 22.5%3. Mortgages 2,057,282 1,681,279 376,003 22.4%4. Credit cards, personal loans and "one-fifth of salary" loans 1,512,385 1,257,660 254,725 20.3%5. Finance leases - - - -6. Factoring - - - -7. Other transactions 144,864 288,723 (143,859) -49.8%8. Debt securities: 8.1 Structured 1,346 - 1,346 - 8.2 Other - - - -9. Impaired assets 58,999 34,694 24,305 70.1%10. Assets sold but not eliminated 2,210,943 2,488,421 (277,478) -11.2%Total (book value) 6,835,626 6,463,671 371,955 5.8%Total (fair value) 7,156,336 6,834,270 322,066 4.7%(Amounts in Euro/000)
Change
7.2 Customer loans: breakdown by debtors/issuers
Type of transactions/Values 31-Dec-06 31-Dec-05 Absolute %
1. Debt securities a) Governments and central banks - - - - b) Other public entities 3 - 3 - c) Other issuers - - - - - non-financial companies 950 - 950 - - financial companies 393 - 393 - - insurance companies - - - - - other - - - -2. Loans to: a) Governments and central banks - - - - b) Other public entities 20 - 20 - c) Other issuers: - - - - - non-financial companies 5,909 673 5,236 778.0% - financial companies 655,915 817,353 (161,438) -19.8% - insurance companies 3 7 (4) -57.1% - other 3,902,491 3,122,523 779,968 25.0%3. Impaired assets a) Governments and central banks - - - - b) Other public entities - - - - c) Other issuers: - - - - - non-financial companies 221 33 188 569.7% - financial companies 3,826 65 3,761 5786.2% - insurance companies - - - - - other 54,952 34,596 20,356 58.8%4. Assets sold but not eliminated a) Governments and central banks - - - - b) Other public entities - - - - c) Other issuers: - - - - - non-financial companies 371 - 371 - - financial companies 91,178 89,869 1,309 1.5% - insurance companies - - - - - other 2,119,394 2,398,552 (279,158) -11.6%Total 6,835,626 6,463,671 371,955 5.8%(Amounts in Euro/000)
Change

Notes
-115-
7.3 Customer loans: assets under micro-hedge This table was not included since the Bank had no micro-hedges on customer loans.
7.4 Finance leases FinecoBank S.p.A. is the lessee in its finance lease transactions. Section 8 - Hedge derivatives - Item 80 8.1 Hedge derivatives: breakdown by type of contracts and underlying assets As at 31 December 2006 Types of derivatives/underlying assets Interest rates Currencies
and goldEquities Loans Other Total
A) Listed derivatives 1. Financial derivatives: With exchange of capital - - - - - - - Options purchased - - - - - - - Other derivatives - - - - - - Without exchange of capital - - - - - - - Options purchased - - - - - - - Other derivatives - - - - - - 2. Credit derivatives: With exchange of capital - - - - - - Without exchange of capital - - - - - -Total A - - - - - -B) Unlisted derivatives 1. Financial derivatives: With exchange of capital - - - - - - - Options purchased - - - - - - - Other derivatives - - - - - - Without exchange of capital - - - - - - - Options purchased - - - - - - - Other derivatives 16,756 - - - - 16,756 2. Credit derivatives: With exchange of capital - - - - - - Without exchange of capital - - - - - -Total B 16,756 - - - - 16,756
Total (A+B) 16,756 - - - - 16,756(Amounts in Euro/000)

Notes
-116-
As at 31 December 2005 Types of derivatives/underlying assets Interest rates Currencies
and goldEquities Loans Other Total
A) Listed derivatives 1. Financial derivatives: With exchange of capital - - - - - - - Options purchased - - - - - - - Other derivatives - - - - - - Without exchange of capital - - - - - - - Options purchased - - - - - - - Other derivatives - - - - - - 2. Credit derivatives: With exchange of capital - - - - - - Without exchange of capital - - - - - -Total A - - - - - -B) Unlisted derivatives 1. Financial derivatives: With exchange of capital - - - - - - - Options purchased - - - - - - - Other derivatives - - - - - - Without exchange of capital - - - - - - - Options purchased 311 - - - - 311 - Other derivatives 3,464 - - - - 3,464 2. Credit derivatives: With exchange of capital - - - - - - Without exchange of capital - - - - - -Total B 3,775 - - - - 3,775
Total (A+B) 3,775 - - - - 3,775(Amounts in Euro/000)
8.2 Hedge derivatives: breakdown by portfolios hedged and by type of hedge As at 31 December 2006
Transactions/Type of hedgeInterest rate
riskExchange rate risk
Credit risk Price risk Several risks
1. Available-for-sale financial assets - - - - - -2. Loans - - - - -3. Financial assets held to maturity - - - -4. Portfolio 16,756 -Total assets - - - - - 16,756 - -1. Financial liabilities - - - - -2. Portfolio - -Total liabilities - - - - - - - -(Amounts in Euro/000)
MacroMicro
Macro
Fair value Cash flow
Micro

Notes
-117-
As at 31 December 2005
Transactions/Type of hedgeInterest rate
riskExchange rate risk
Credit risk Price risk Several risks
1. Available-for-sale financial assets - - - - - -2. Loans - - - - -3. Financial assets held to maturity - - - -4. Portfolio 3,775 -Total assets - - - - - 3,775 - -1. Financial liabilities - - - - -2. Portfolio - -Total liabilities - - - - - - - -(Amounts in Euro/000)
MacroMicro
Macro
Fair value Cash flow
Micro
Section 9 - Adjustments to the value of financial assets under macro-hedge - Item 90 9.1 Adjustments to the value of hedged financial assets: breakdown of hedged portfolios
31-Dec-06 31-Dec-05 Absolute %
1. Increase1.1 of specific portfolios a) loans - 3,830 (3,830) -100.0% b) available-for-sale financial assets - - - -1.2 total - - - -2. Decrease2.1 of specific portfolios a) loans (19,694) - (19,694) 100.0% b) available-for-sale financial assets - - - -2.2 total - - - -Total (19,694) 3,830 (23,524) -614.2%(Amounts in Euro/000)
ChangeAdjustments to the value of hedged financial assets/Values
9.2 Assets macro-hedged against interest rate risk: breakdown
31-Dec-06 31-Dec-05 Absolute %
1. Loans 1,342,212 1,260,325 81,887 6.5%2. Available-for-sale assets - - - -3. Portfolio - - - -Total 1,342,212 1,260,325 81,887 6.5%(amounts in Euro/000)
ChangeHedged assets
Section 10 – Equity investments - Item 100 10.1 Equity investments in subsidiaries, jointly owned companies and companies subject to significant influence: information on investment relationships

Notes
-118-
Company name Head office Percent Percent ofstake votes held
A. Wholly owned companies 1. Fineco Mutui S.p.A. Piazza Durante 11, Milan, Italy 100% 100%B. Jointly owned companies
C. Companies subject to significant influence 1. Capitalia Investimenti Alternativi S.g.r. Piazza Durante 11, Milan, Italy 5% 5%(amounts in Euro/000)
The equity investment in the company Capitalia Investimenti Alternativi S.g.r. was classified to the category of
“Companies subject to significant influence” out of the consideration that FinecoBank S.p.A., despite only holding a
share of less than 20% of capital and voting rights in the Shareholders' Meeting, has representatives on the
company's Board of Directors.
10.2 Equity investments in subsidiaries, jointly owned companies and companies subject to significant influence: accounting data Company name Total assets Total revenue Profit (Loss) Shareholders' Book value Fair value
equityA. Wholly owned companies 1. Fineco Mutui S.p.A. 7,220 15,476 1,641 1,164 860B. Jointly owned companies
C. Companies subject to significant influence 1. Capitalia Investimenti Alternativi S.g.r. 7,796 4,302 148 6,051 258 n.a.(amounts in Euro/000)
10.3 Equity investments: changes over the year
31-Dec-2006 31-Dec-2005 Absolute %
A. Opening balance 1.118 1.312 (194) -14,8%B. Increases - - - -B.1. Purchases - - - -B.2. Writebacks - - - -B.3. Revaluations - - - -B.4. Other changes - - - -C. Decreases - (194) 194 -100,0%C.1. Sales - - - -C.2. Writedowns - - - -C.3. Other changes - (194) 194 -100,0%D. Closing balance 1.118 1.118 -E. Total revaluations - - - -F. Total adjustments - - - -(Amounts in Euro/000)
Change
10.4 Commitments relating to equity investments in subsidiaries The Bank had no commitments relating to equity investments in subsidiaries. 10.5 Commitments relating to equity investments in jointly owned companies The Bank had no commitments relating to equity investments in jointly owned companies.

Notes
-119-
10.6 Commitments relating to equity investments in companies subject to significant influence The Bank had no commitments relating to equity investments in companies subject to significant influence. Section 11 - Property, plant and equipment - Item 110 11.1 Property, plant and equipment: breakdown of assets valued at cost
Assets/Values 31-Dec-2006 31-Dec-2005 Absolute %
A. Functional assets 1.1 owned a) land - - - - b) buildings 3.384 3.456 (72) -2,1% c) furniture 1.028 950 78 8,2% d) electronic equipment 1.899 1.918 (19) -1,0% e) other 683 716 (33) -4,6% 1.2 acquired under finance leases a) land - - - - b) buildings - - - - c) furniture - - - - d) electronic equipment - - - - e) other 8 31 (23) -74,2%Total A 7.002 7.071 (69) -1,0%B. Assets held for investment purposes 2.1 owned a) land - - - - b) buildings - - - - 2.2 acquired under finance leases a) land - - - - b) buildings - - - -Total B - - - -Total (A+B) 7.002 7.071 (69) -1,0%(Amounts in Euro/000)
Change
Reference should be made to section 11 of the income statement for a description of the methods used to calculate depreciation. 11.2 Property, plant and equipment: breakdown of assets measured at fair value or revalued amounts This table was not included since FinecoBank S.p.A. did not own any items of property, plant and equipment
measured at fair value or revalued.

Notes
-120-
11.3 Functional items of property, plant and equipment: changes over the year As at 31 December 2006
Land Buildings Furniture Electronic equipment
Other Total
A. Gross opening balance - 3,600 3,412 25,769 5,151 37,932A.1 Total reductions in value, net - (144) (2,462) (23,851) (4,404) (30,861)A.2 Net opening balance - 3,456 950 1,918 747 7,071B. Increases:B.1 Purchases - - 689 1,706 511 2,906B.2 Capitalised improvement costs - - - - - -B.3 Writebacks - - - - - -B.4 Increases in fair value charged to - - - - - - a) shareholders' equity - - - - - - b) income statement - - - - - -B.5 Exchange gains - - - - - -B.6 Transfers from buildings held for investment purposes - - - - - -B.7 Other increases - - - - - -C. DecreasesC.1 Sales - - - (11) (1) (12)C.2 Depreciation - (72) (418) (1,642) (546) (2,678)C.3 Writedowns for impairment charged to a) shareholders' equity - - - - - - b) income statement - - (193) (72) (20) (285)C.4 Decreases in fair value charged to a) shareholders' equity - - - - - - b) income statement - - - - - -C.5 Exchange losses - - - - - -C.6 Transfers to: a) PPE held for investment purposes - - - - - - b) discontinued operations - - - - - -C.7 Other decreases - - - - - -D. Net closing balance - 3,384 1,028 1,899 691 7,002D.1 Total reductions in value, net - (216) (2,491) (13,901) (4,951) (21,559)D.2 Gross closing balance - 3,600 3,519 15,800 5,642 28,561E. Measurement at cost - 3,384 1,028 1,899 691 7,002(Amounts in Euro/000)

Notes
-121-
As at 31 December 2005
Land Buildings Furniture Electronic equipment
Other Total
A. Gross opening balance - 3,600 2,367 26,782 4,198 36,947A.1 Total reductions in value, net - (72) (1,740) (21,994) (3,141) (26,947)A.2 Net opening balance - 3,528 627 4,788 1,057 10,000B. Increases:B.1 Purchases - - 1,192 461 1,354 3,007B.2 Capitalised improvement costs - - - - - -B.3 Writebacks - - - - - -B.4 Increases in fair value charged to - - - - - - a) shareholders' equity - - - - - - b) income statement - - - - - -B.5 Exchange gains - - - - - -B.6 Transfers from buildings held for investment purposes - - - - - -B.7 Other increases - - - - - -C. DecreasesC.1 Sales - - (88) (34) (234) (356)C.2 Depreciation - (72) (529) (3,290) (750) (4,641)C.3 Writedowns for impairment charged to a) shareholders' equity - - - - - - b) income statement - - (16) - (36) (52)C.4 Decreases in fair value charged to a) shareholders' equity - - - - - - b) income statement - - - - - -C.5 Exchange losses - - - - - -C.6 Transfers to: a) PPE held for investment purposes - - - - - - b) discontinued operations - - - - - -C.7 Other decreases - - (236) (7) (644) (887)D. Net closing balance - 3,456 950 1,918 747 7,071D.1 Total reductions in value, net - (144) (2,462) (23,851) (4,404) (30,861)D.2 Gross closing balance - 3,600 3,412 25,769 5,151 37,932E. Measurement at cost - 3,456 950 1,918 747 7,071(Amounts in Euro/000) 11.4 Property, plant and equipment held for investment purposes: changes over the year This table was not included since FinecoBank S.p.A. did not own any items of property, plant and equipment held for investment purposes. 11.5 Commitments to purchase property, plant and equipment The Bank had no commitments to purchase property, plant and equipment as at 31 December 2006.

Notes
-122-
Section 12 – Intangible assets - Item 120 12.1 Intangible assets: breakdown by type of asset Assets/Values
Limited duration Unlimited duration
Limited duration Unlimited duration
A.1 Goodwill - 21,583 - 21,583A.2 Other intangible assets 11,207 - 13,192 -A.2.1 Assets measured at cost: 11,207 - 13,192 - a) Intangible assets generated internally - - - - b) Other assets 11,207 - 13,192 -A.2.2 Assets measured at fair value: - - - - a) Intangible assets generated internally - - - - b) Other assets - - - -Total 11,207 21,583 13,192 21,583(Amounts in Euro/000)
31-Dec-06 31-Dec-05
Reference should be made to section 12 of the income statement for a description of the methods used to
calculate amortization.
The impairment testing conducted on goodwill supports the value reported in the financial statements.

Notes
-123-
12.2 Intangible assets: changes over the year
As at 31 December 2006
Limited duration
Unlimited duration
Limited duration
Unlimited duration
A. Gross opening balance 27,738 - - 59,374 - 87,112A.1 Total reductions in value, net (6,155) - - (46,182) - (52,337)A.2 Net opening balance 21,583 - - 13,192 - 34,775B. IncreasesB.1 Purchases - - - 5,702 - 5,702B.2 Increases in internal intangible assets - - - - -B.3 Writebacks - - - - -B.4 Increases in fair value charged to a) shareholders' equity - - - - - b) income statement - - - - -B.5 Exchange gains - - - - - -B.6 Other increases - - - - - -C. DecreasesC.1 Sales - - - - - -C.2 Writedowns - Amortisation - - (7,687) - (7,687) - Writedowns + shareholders' equity - - - - - + income statement - - - - - -C.3 Decreases in fair value - - - - - - + shareholders' equity - - - - - + income statement - - - - -C.4 Transfers to non-current assets classified as held for sale - - - - - -C.5 Exchange losses - - - - - -C.6 Other decreases - - - - - -D. Net closing balance 21,583 - - 11,207 - 32,790D.1 Total net writedowns (6,155) - - (53,868) - (60,023)D.2 Gross closing balance 27,738 - - 65,075 - 92,813E. Measurement at cost 21,583 - - 11,207 - 32,790(amounts in Euro/000)
Other intangible assets: generated internally
Other intangible assets: other
Goodwill Total

Notes
-124-
As at 31 December 2005
Limited duration
Unlimited duration
Limited duration
Unlimited duration
A. Gross opening balance 22,023 - - 51,071 - 73,094A.1 Total reductions in value, net (6,155) - - (37,918) - (44,073)A.2 Net opening balance 15,868 - - 13,153 - 29,021B. IncreasesB.1 Purchases 3,462 - - 8,562 - 12,024B.2 Increases in internal intangible assets - - - - -B.3 Writebacks - - - - -B.4 Increases in fair value charged to a) shareholders' equity - - - - - b) income statement - - - - -B.5 Exchange gains - - - - - -B.6 Other increases 2,253 - - - - 2,253C. DecreasesC.1 Sales - - - (9) - (9)C.2 Writedowns - Amortisation - - (7,394) - (7,394) - Writedowns + shareholders' equity - - - - - + income statement - - - - - -C.3 Decreases in fair value - - - - - - + shareholders' equity - - - - - + income statement - - - - -C.4 Transfers to non-current assets classified as held for sale - - - - - -C.5 Exchange losses - - - - - -C.6 Other decreases - - - (1,120) - (1,120)D. Net closing balance 21,583 - - 13,192 - 34,775D.1 Total net writedowns (6,155) - - (46,182) - (52,337)D.2 Gross closing balance 27,738 - - 59,374 - 87,112E. Measurement at cost 21,583 - - 13,192 - 34,775(amounts in Euro/000)
Other intangible assets: generated internally
Other intangible assets: other
Goodwill Total
12.3 Other information There were no circumstances preventing the distribution of capital gains on revalued intangible assets to the
Bank’s shareholders. The Bank did not acquire any intangible assets through government concession. No intangible
assets were established to guarantee the Bank's own debts. There were no commitments to purchase intangible
assets. Lastly, there were no intangible assets on lease.
Section 13 – Tax Assets and Tax Liabilities – Asset item 130 and liability item 80
General aspects
The item “Tax assets”, which came to a total of €23,479 thousand, refers to “Prepaid tax assets”.
The item “Tax liabilities”, which amounted to €8,272 thousand, consists of €3,491 thousand in “Current tax
liabilities” and €4,781 thousand in “Deferred tax liabilities”.
The calculation of the aforementioned asset and liability items was affected by the impact of the adoption of
"national tax consolidation" and the application of IAS/IFRS.

Notes
-125-
National tax consolidation
For the three-year period from 2004 to 2006, FinecoBank S.p.A., in its capacity as consolidated company, was
subject to what is known as “national tax consolidation”, as established by Italian Legislative Decree no. 344 of
2003, which was carried out by the Parent Bank, Capitalia S.p.A..
Consequently, taking into account the contractual agreements entered into in this connection, the item “Taxes”
does not include charges corresponding to the IRES taxes paid by the subsidiary to the parent company, which
totalled €33,206 thousand.
Current tax liabilities
Current tax liabilities came to a total of €3,491 thousand and derive essentially from residual IRAP taxes to be paid
to the tax authorities for a total of €2,497 thousand.
Prepaid/deferred tax assets/liabilities
In line with applicable provisions of law and regulations:
- the valuation of prepaid taxes for IRES purposes takes into account the expected income figures for future years,
according to the provisions established by competent company bodies;
- the valuation of prepaid taxes for IRAP purposes takes place on the basis of the company’s expected income
figures for future years, and takes into account changes in the legal context;
- deferred taxes are recognized whenever the relevant requirements are satisfied.
The 33 percent IRES tax rate in effect from 1 January 2004 was taken into consideration when calculating deferred
taxes.
As for IRAP, on the other hand, the relevant tax rate is 4.25%, being the base rate established by the Emilia
Romagna region, which is applied to the entire value of the Bank's production.
For more detailed information concerning “Prepaid tax assets”, reference should be made to the contents of
sections 13.1, 13.3 and 13.5 below.
For similar information concerning “Deferred tax assets”, reference should be made to the contents of sections
13.2, 13.4 and 13.6 below.
13.1 Prepaid tax assets: breakdown
Assets/Values 31-Dec-06 31-Dec-05 Absolute %
Writedowns of junior notes held for sale 5,590 4,408 1,182 26.8%Provisions for contingencies and charges 9,413 8,457 956 11.3%Amortised cost of loansissued prior to 1 January 2005 741 10,511 (9,770) -93.0%Writedown of loans 4,537 - 4,537 -Future personnel charges 2,178 - 2,178 -Other 1,020 2,262 (1,242) -54.9%Total 23,479 25,638 (2,159) -8.4%(Amounts in Euro/000)
Change

Notes
-126-
13.2 Deferred tax liabilities: breakdown
Assets/Values 31-Dec-06 31-Dec-05 Absolute %
Goodwill 2,405 1,937 468 24.2%Deferred charges 777 777 - 0.0%Reserve for loan losses 674 674 - 0.0%Valuation of junior notes 547Other 378 27 351 1300.0%Total 4,781 3,415 1,366 40.0%(Amounts in Euro/000)
Change
13.3 Changes in prepaid taxes (balancing entry in income statement)
Change31-Dec-06 31-Dec-05 Absolute %
1. Opening balance 25,638 584 25,054 4290.1%2. Increases2.1 Prepaid taxes recorded during the year 5,371 41,070 (35,699) -86.9% a) relating to previous years - - - - b) due to the change in accounting policies - 25,588 (25,588) -100.0% c) writebacks - - - - d) other 5,371 15,482 (10,111) -65.3%2.2 New taxes or increases in tax rates - - - -2.3 Other increases - - - -3. Decreases3.1 Prepaid taxes paid during the year (7,530) (16,016) 8,486 -53.0% a) reversals (7,530) (16,016) 8,486 -53.0% b) writedowns for irrecoverability - - - - c) change in accounting policies - - - -3.2 Reduction in tax rates - - - -3.3 Other decreases - - - -4. Final amount 23,479 25,638 (2,159) -8.4%(Amounts in Euro/000)
The main changes in prepaid taxes recorded during the year with a balancing entry in the income statement refer
primarily to:
- the increase resulting from the writedown of the AFS junior notes, allocations to the provision for risks and
contingencies, the reclassification of the amortized cost of loans issued prior to 1 January 2005 with a writedown
of the loans, and provisions for staff expenses.
- the decrease resulting from the reclassification of the amortized cost of the loans issued prior to 1 January 2005,
the use of the provision for risks and contingencies, and payments made to staff.

Notes
-127-
13.4 Changes in deferred taxes (balancing entry in income statement)
Change
31-Dec-06 31-Dec-05 Absolute %
1. Opening balance 3,415 1,962 1,453 74.1%2. Increases2.1 Deferred taxes recorded during the year 2,062 9,443 (7,381) -78.2% a) relating to previous years - - - - b) due to the change in accounting policies - 7,491 (7,491) -100.0% c) other 2,062 1,952 110 5.6%2.2 New taxes or increases in tax rates - - - -2.3 Other increases 624 - 624 -3. Decreases3.1 Deferred taxes paid during the year (755) (7,990) 7,235 -90.6% a) reversals (755) (7,990) 7,235 -90.6% b) due to the change in accounting policies - - - - c) other - - - -3.2 Reduction in tax rates - - - -3.3 Other decreases (1,142) - (1,142) -4. Final amount 4,204 3,415 789 23.1%(Amounts in Euro/000)
The main changes in deferred taxes recorded during the year in a balancing entry in the income statement refer
primarily to:
- the increase resulting from the effect of the new tax treatment of goodwill and the valuation of the junior notes;
- the decrease resulting primarily from the valuation of the loans hedged by derivatives recorded upon FTA and the
reclassification of the valuation of the Garda junior notes to shareholders’ equity.
13.5 Changes in prepaid taxes (balancing entry in shareholders' equity)
This table was not included since the Bank did not book any prepaid taxes in a balancing entry in shareholders’
equity.
13.6 Changes in deferred taxes (balancing entry in shareholders' equity)
Change31-Dec-06 31-Dec-05 Absolute %
1. Opening balance - - - -2. Increases2.1 Deferred taxes recorded during the year 30 155 (125) -80.6% a) relating to previous years - - - - b) due to the change in accounting policies - 155 (155) -100.0% c) other 30 - 30 -2.2 New taxes or increases in tax rates - - - -2.3 Other increases 1,142 - 1,142 -3. Decreases3.1 Deferred taxes paid during the year (595) (155) (440) 283.9% a) reversals (595) (155) (440) 283.9% b) due to the change in accounting policies - - - - c) other - - - -3.2 Reduction in tax rates - - - -3.3 Other decreases - - - -4. Final amount 577 - 577 -(Amounts in Euro/000)

Notes
-128-
The deferred taxes recorded during the year in a balancing entry in shareholders’ equity refer to:
- the reclassification of the valuation of the Garda junior notes to shareholders' equity;
- the revaluation of the equity investment in Net Insurance and the Garda junior notes.
Section 14 - Non-current assets and discontinued operations and associated liabilities - Assets item
140 and liabilities item 90
14.1 Non-current assets and discontinued operations: breakdown by type of asset
31-Dec-06 31-Dec-05 Absolute %
A. Individual assetsA.1 Equity investments - - - -A.2 Property, plant and equipment 145 145 - 0.0%A.3 Intangible assets - - - -A.4 Other non-current assets - - - -Total A 145 145 - 0.0%B. Groups of assets (operating units sold)B.1 Financial assets held for trading - - - -B.2 Financial assets designated at fair value - - - -B.3 Available-for-sale financial assets - - - -B.4 Held-to-maturity financial assets - - - -B.5 Loans to banks - - - -B.6 Customer loans - - - -B.7 Equity investments - - - -B.8 Property, plant and equipment - - - -B.9 Intangible assets - - - -B.10 Other assets - - - -Total B - - - -C. Liabilities associated with non-current assets for disposalC.1 Payables - - - -C.2 Securities - - - -C.3 Other liabilities - - - -Total C - - - -D. Liabilities associated with discontinued operationsD.1 Deposits from banks - - - -D.2 Customer accounts - - - -D.3 Debt securities in issue - - - -D.4 Financial liabilities held for trading - - - -D.5 Financial liabilities designated at fair value - - - -D.6 Provisions - - - -D.7 Other liabilities - - - -Total D - - - -(amounts in Euro/000)
Change
14.3 Information on equity investments in companies subject to significant influence not valued according to the
equity method
Reference should be made to the information presented in table 10.2 concerning the equity investment in Capitalia
Investimenti S.g.r..

Notes
-129-
Section 15 - Other assets - Item 150
15.1 Other assets: breakdown
31-Dec-06 31-Dec-05 Absolute %
Assets in transit 8 1 7 700.0%Outstanding and protested notes, billsand cheques being processed 193 136 57 41.9%Bank drafts payable by the teller 784 495 289 58.4%Cheques being processed 4,677 8,641 (3,964) -45.9%Security deposits in own name 179 118 61 51.7%Payments on account 29 - 29 -Commissions on account 331 104 227 218.3%Trade receivables 432 84 348 414.3%Advances on taxes 38,286 37,088 1,198 3.2%Tax credits fromprevious years and relative interest 4 4 - 0.0%Advances on taxes onseverance indemnities 10 7 3 42.9%Disputed items not derivingfrom lending 257 369 (112) -30.4%Sums to recover from third parties 197 183 14 7.7%Receivables for invoices issued 15,365 14,374 991 6.9%Sums to charge to customers 596 594 2 0.3%Placement and maintenance commissionsInsurance funds and products to collect 12,900 11,816 1,084 9.2%Items under constructionpertaining to POS and ATM Cards 633 1,107 (474) -42.8%Sums to be settled throughthe clearing house 8,180 7,046 1,134 16.1%Sums to be settled with customers and banks 20,573 20,737 (164) -0.8%Differences (stolen cash and cheques) 51 18 33 183.3%Items pertaining to transactions in securities and cu 1,664 3,031 (1,367) -45.1%Non-classifiable accrued income 280 5,605 (5,325) -95.0%Non-classifiable prepaid expenses 21,064 24,326 (3,262) -13.4%Improvements and incremental expensesincurred on third-party assets 2,451 2,222 229 10.3%Other lesser sums 643 891 (248) -27.8%Total 129,787 138,997 (9,210) -6.6%(amounts in Euro/000)
Change

Notes
-130-
LIABILITIES Section 1 – Deposits from banks - Item 10 1.1 Deposits from banks: breakdown by category
Type of transactions/Values 31-Dec-06 31-Dec-05 Absolute %
1. Deposits from Central Banks - - - -2. Deposits from banks 796,984 858,059 (61,075) -7.1%2.1 Current accounts and demand deposits 171,723 221,891 (50,168) -22.6%2.2 Savings accounts 510,117 510,046 71 0.0%2.3 Loans 2.3.1 Finance leases - - - - 2.3.2 Other 113,304 126,122 (12,818) -10.2%2.4 Commitments to buy back - - own capital instruments - - - -2.5 Liabilities from assets sold but not eliminated 2.5.1 Repurchase agreements - - - - 2.5.2 Other - - - -2.6 Other payables 1,840 - 1,840 -Total 796,984 858,059 (61,075) -7.1%Fair value 796,984 858,059 (61,075) -7.1%(Amounts in Euro/000)
Change
1.2 Breakdown of item 10 "Deposits from banks”: subordinated debts
Type of transactions/Values 31-Dec-06 31-Dec-05 Absolute %
1. Deposits from Central Banks - - - -2. Deposits from banks - 1,000 (1,000) -100.0%2.1 Current accounts and demand deposits - - - -2.2 Savings accounts - - - -2.3 Loans 2.3.1 Finance leases - - - - 2.3.2 Other - 1,000 (1,000) -100.0%2.4 Commitments to buy back - - own capital instruments - - - -2.5 Liabilities from assets sold but not eliminated 2.5.1 Repurchase agreements - - - - 2.5.2 Other - - - -2.6 Other payables - - - -Total - 1,000 (1,000) -100.0%Fair value - 1,000 (1,000) -100.0%(Amounts in Euro/000)
Change
1.3 Breakdown of item 10 "Deposits from banks": structured debts FinecoBank S.p.A. has no structured debts to banks to report. 1.4 Deposits from banks: liabilities under micro-hedge
This table was not included since FinecoBank S.p.A. had no micro-hedges on sums due to banks to report.

Notes
-131-
1.5 Finance lease debts FinecoBank S.p.A. has no finance lease debts to banks to report. Section 2 – Customer accounts- Item 20 2.1 Customer accounts: breakdown by category
Type of transactions/Values 31-Dec-06 31-Dec-05 Absolute %
1. Current accounts and demand deposits 4,361,345 3,355,145 1,006,200 30.0%2. Savings accounts 320 - 320 -3. Third-party funds under administration - - - -4. Loans 4.1 Finance leases 14 44 (30) -68.2% 4.2 Other 700,902 436,925 263,977 60.4%5. Commitments to buy back - - own capital instruments - - - -6. Liabilities from assets sold but not eliminated 6.1 Repurchase agreements 567,330 163,449 403,881 247.1% 6.2 Other 2,092,544 2,377,022 (284,478) -12.0%7. Other payables 14,988 5,320 9,668 181.7%Total 7,737,443 6,337,905 1,399,538 22.1%Fair value 7,752,839 6,355,083 1,397,756 22.0%(Amounts in Euro/000)
Change
2.2 Breakdown of item 20 "Customer accounts": subordinated debts
Type of transactions/Values 31-Dec-06 31-Dec-05 Absolute %
1. Current accounts and demand deposits - - - -2. Savings accounts - - - -3. Third-party funds under administration - - - -4. Loans 4.1 Finance leases - - - - 4.2 Other 100,276 - 100,276 -5. Commitments to buy back - - own capital instruments - - - -6. Liabilities from assets sold but not eliminated 6.1 Repurchase agreements - - - - 6.2 Other - - - -7. Other payables - - - -Total 100,276 - 100,276 -Fair value 100,276 - 100,276 -(Amounts in Euro/000)
Change
The subordinated loan issued by FinecoBank S.p.A. was fully underwritten by Fineco Finance Ltd. in three tranches:
€50,000 thousand on 7 June 2006; €20,000 thousand on 7 September 2006; and €30,000 thousand on 7
December 2006. The loan is to be repaid in five equal yearly instalments, each coming to one-fifth of the amount of the loan,
payable on 7 June of each year, starting with 7 June 2013 and ending with 7 June 2017.

Notes
-132-
The loan may be redeemed in advance for the outstanding principal and on each date on which interest payments
are scheduled, starting with 7 June 2012 and ending on 7 March 2017, with an advance notice of at least 30 days,
and solely upon the borrower’s request, contingent upon the attainment of the required authorization from the
Bank of Italy.
Interest accruing on the loan is payable on a quarterly basis and is calculated on the basis of the three-month
Euribor plus a spread of 0.50% multiplied by the number of effective days in the reference period and divided by
360. During the last five years, if the borrower does not exercise the prepayment option, the quarterly interest
shall be calculated on the basis of the three-month Euribor rate plus a spread of 1.10%.
2.3 Breakdown of item 20 "Customer accounts": structured debts FinecoBank S.p.A. has no structured debts to customers to report.
2.4 Customer accounts: liabilities under micro-hedge This table was not included since FinecoBank S.p.A. had no micro-hedges on sums due to customers to report. 2.4 Finance lease debts FinecoBank S.p.A. has entered into finance lease agreements for insignificant amounts for the use of electronic
machines and motor vehicles.
The following table presents the information required by paragraphs 31 and 65 of IAS 17.
31-Dec-2006 31-Dec-2005 Absolute %
Minimum future payments due within 1 year 12 33 (21) -63,6%CV Minimum future payments due within 1 year 11 32 (21) -65,6%Minimum future payments due within 1-5 years 1 11 (10) -90,9%CV Minimum future payments due within 1-5 years 1 11 (10) -90,9%Effective financial charges 2 5 (3) -60,0%Historical cost 1.080 1.170 (90) -7,7%Accumulated amortisation (1.072) (1.139) 67 -5,9%Net book value 8 31 (23) -74,2%Amortisation, writedowns and writebacks (23) (42) 19 -45,2%(Amounts in Euro/000)
Change
Minimum future payments: outstanding lease payments. CV of minimum future payments: current value of outstanding lease payments. Effective financial charges: effective financial charges accrued during the year and charged to the income statement. Historical cost: the historical cost of the leased assets entered to the assets section of the balance sheet. Accumulated depreciation: accumulated depreciation for the leased assets entered to the assets section of the balance sheet. Depreciation, writedowns and writebacks: depreciation, writedowns and writebacks recorded in the income statement.

Notes
-133-
Section 3 - Securities in issue - Item 30
3.1 Securities in issue: breakdown by category
Type of securities / Values Book value Fair value Book value Fair value
A. Listed securities 1. bonds 1.1 structured - - - - 1.2 other - - - - 2. other securities 2.1 structured - - - - 2.2 other - - - -B. Unlisted securities 1. bonds 1.1 structured - - - - 1.2 other - - 52.068 52.068 2. other securities 2.1 structured - - - - 2.2 other - - 2.625 2.625Total - - 54.693 54.693(Amounts in Euro/000)
31-Dec-2006 31-Dec-2005
3.2 Breakdown of item 30 "Securities in issue": subordinated notes
Type of securities / Values Book value Fair value Book value Fair value
A. Listed securities 1. bonds 1.1 structured - - - - 1.2 other - - - - 2. other securities 2.1 structured - - - - 2.2 other - - - -B. Unlisted securities 1. bonds 1.1 structured - - - - 1.2 other - - 52.068 52.068 2. other securities 2.1 structured - - - - 2.2 other - - - -Total - - 52.068 52.068(Amounts in Euro/000)
31-Dec-2006 31-Dec-2005
3.3 Securities in issue: securities under micro-hedge
This table was not included since FinecoBank S.p.A. had no micro-hedges on securities in issue to report.

Notes
-134-
Section 4 - Financial liabilities held for trading - Item 40
4.1 Financial liabilities held for trading: breakdown by category
Type of transactions/ValuesL UL L UL
A. Cash liabilities1. Deposits from banks - - - - - - - -2. Due to customers 990 169 - 169 - - - -3. Debt securities 3.1 Bonds 3.1.1 Structured - - - - - - 3.1.2 Other bonds - - - - - - 3.2 Other securities 3.2.1 Structured - - - - - - 3.2.2 Other - - - - - -Total A 990 169 - 169 - - - -B. Derivative instruments1. Financial derivatives 1.1 Used for trading activities 29 20,719 - 38,444 1.2 Associated with the fair value option - - - - 1.3 Other - - - -2. Credit derivatives 2.1 Used for trading activities - - - - 2.2 Associated with the fair value option - - - - 2.3 Other - - - -Total B 29 20,719 - 38,444Total (A+B) 990 198 20,719 169 - - 38,444 -(Amounts in Euro/000)
FV*
31-Dec-06 31-Dec-05FV FV
NV FV* NV
FV = fair value FV* = Fair value calculated by excluding the changes in value due to the change in the issuer's credit rating since the issue date NV = nominal or notional value L = listed UL = unlisted 4.2 Item 40 "Financial liabilities held for trading": subordinated liabilities FinecoBank S.p.A. has not issued any subordinated financial liabilities held for trading. 4.3 Item 40 "Financial liabilities held for trading": structured debts FinecoBank S.p.A. has not issued any structured financial liabilities held for trading.

Notes
-135-
4.4 Financial liabilities held for trading: derivative instruments As at 31 December 2006 Types of derivatives/underlying assets Interest rates Currencies
and goldEquities Loans Other Total
A) Listed derivatives 1. Financial derivatives: With exchange of capital - - - - - - - Options issued - - - - - - - Other derivatives - - 29 - - 29 Without exchange of capital - - - - - - - Options issued - - - - - - - Other derivatives - - - - - - 2. Credit derivatives: With exchange of capital - - - - - - Without exchange of capital - - - - - -Total A - - 29 - - 29B) Unlisted derivatives 1. Financial derivatives: With exchange of capital - - - - - - - Options issued - - - - - - - Other derivatives - 301 - - - 301 Without exchange of capital - - - - - - - Options issued 55 - 7,468 - - 7,523 - Other derivatives 12,895 - - - - 12,895 2. Credit derivatives: With exchange of capital - - - - - - Without exchange of capital - - - - - -Total B 12,950 301 7,468 - - 20,719
Total (A+B) 12,950 301 7,497 - - 20,748(Amounts in Euro/000)
As at 31 December 2005 Types of derivatives/underlying assets Interest rates Currencies
and goldEquities Loans Other Total
A) Listed derivatives 1. Financial derivatives: With exchange of capital - - - - - - - Options issued - - - - - - - Other derivatives - - - - - - Without exchange of capital - - - - - - - Options issued - - - - - - - Other derivatives - - - - - - 2. Credit derivatives: With exchange of capital - - - - - - Without exchange of capital - - - - - -Total A - - - - - -B) Unlisted derivatives 1. Financial derivatives: With exchange of capital - - - - - - - Options issued - - - - - - - Other derivatives - - - - - - Without exchange of capital - - - - - - - Options issued 200 20 7,982 - - 8,202 - Other derivatives 30,195 47 - - - 30,242 2. Credit derivatives: With exchange of capital - - - - - - Without exchange of capital - - - - - -Total B 30,395 67 7,982 - - 38,444
Total (A+B) 30,395 67 7,982 - - 38,444(Amounts in Euro/000)

Notes
-136-
4.5 Financial cash liabilities (excluding "technical overdrafts") held for trading: changes This table was not included since FinecoBank S.p.A. had not classified any sums due to banks, due to customers,
or securities in issue among financial liabilities held for trading.
Section 5 - Financial liabilities designated at fair value - Item 50 FinecoBank S.p.A. has not booked any financial liabilities under the item “Financial liabilities designated at fair
value”.
Section 6 - Hedge derivatives - Item 60 6.1 Hedge derivatives: breakdown by type of contracts and underlying assets As at 31 December 2006 Types of derivatives/underlying assets Interest rates Currencies
and goldEquities Loans Other Total
A) Listed derivatives 1. Financial derivatives: With exchange of capital - - - - - - - Options issued - - - - - - - Other derivatives - - - - - - Without exchange of capital - - - - - - - Options issued - - - - - - - Other derivatives - - - - - - 2. Credit derivatives: With exchange of capital - - - - - - Without exchange of capital - - - - - -Total A - - - - - -B) Unlisted derivatives 1. Financial derivatives: With exchange of capital - - - - - - - Options issued - - - - - - - Other derivatives - - - - - - Without exchange of capital - - - - - - - Options issued - - - - - - - Other derivatives 4,580 - - - - 4,580 2. Credit derivatives: With exchange of capital - - - - - - Without exchange of capital - - - - - -Total B 4,580 - - - - 4,580
Total (A+B) 4,580 - - - - 4,580(Amounts in Euro/000)
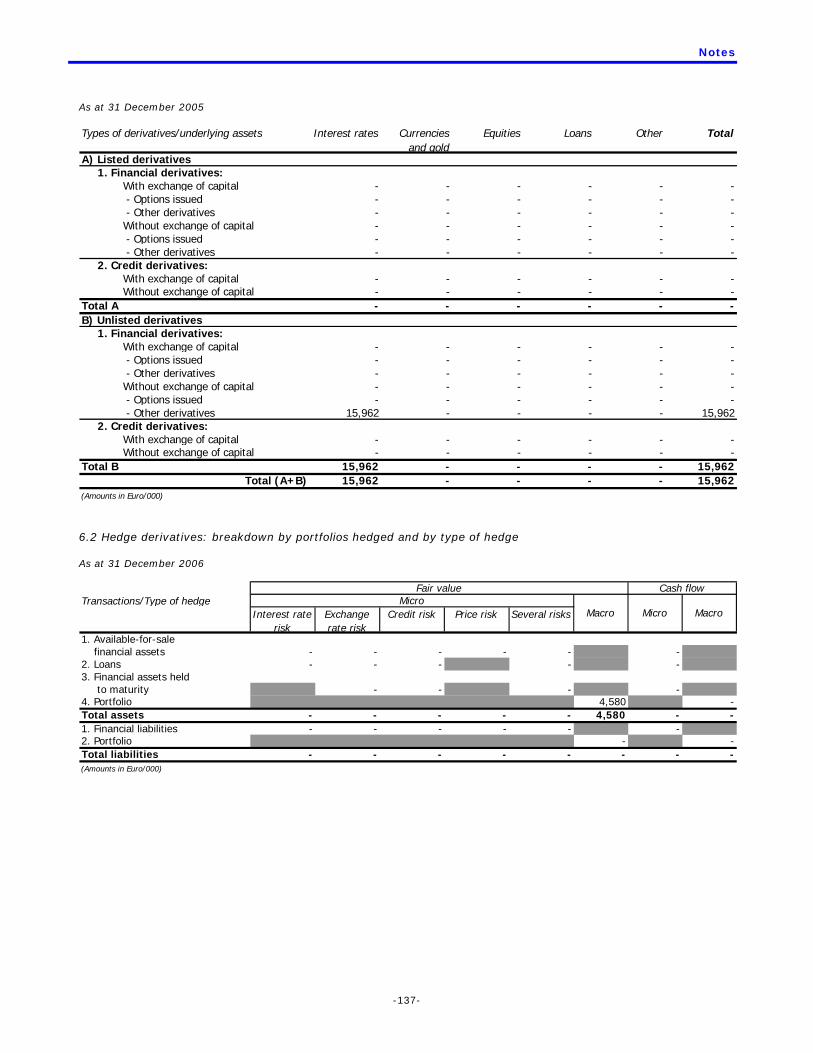
Notes
-137-
As at 31 December 2005 Types of derivatives/underlying assets Interest rates Currencies
and goldEquities Loans Other Total
A) Listed derivatives 1. Financial derivatives: With exchange of capital - - - - - - - Options issued - - - - - - - Other derivatives - - - - - - Without exchange of capital - - - - - - - Options issued - - - - - - - Other derivatives - - - - - - 2. Credit derivatives: With exchange of capital - - - - - - Without exchange of capital - - - - - -Total A - - - - - -B) Unlisted derivatives 1. Financial derivatives: With exchange of capital - - - - - - - Options issued - - - - - - - Other derivatives - - - - - - Without exchange of capital - - - - - - - Options issued - - - - - - - Other derivatives 15,962 - - - - 15,962 2. Credit derivatives: With exchange of capital - - - - - - Without exchange of capital - - - - - -Total B 15,962 - - - - 15,962
Total (A+B) 15,962 - - - - 15,962(Amounts in Euro/000)
6.2 Hedge derivatives: breakdown by portfolios hedged and by type of hedge As at 31 December 2006
Transactions/Type of hedgeInterest rate
riskExchange rate risk
Credit risk Price risk Several risks
1. Available-for-sale financial assets - - - - - -2. Loans - - - - -3. Financial assets held to maturity - - - -4. Portfolio 4,580 -Total assets - - - - - 4,580 - -1. Financial liabilities - - - - - -2. Portfolio - -Total liabilities - - - - - - - -(Amounts in Euro/000)
MacroMicro
Macro
Fair value Cash flow
Micro

Notes
-138-
As at 31 December 2005 Transactions/Type of hedge
Interest rate risk
Exchange rate risk
Credit risk Price risk Several risks
1. Available-for-sale financial assets - - - - - -2. Loans - - - - -3. Financial assets held to maturity - - - -4. Portfolio 15,962 -Total assets - - - - - 15,962 - -1. Financial liabilities - - - - - -2. Portfolio - -Total liabilities - - - - - - - -(Amounts in Euro/000)
MacroMicro
Macro Micro
Section 7 - Adjustment to the value of financial liabilities under macro-hedge - Item 70 FinecoBank S.p.A. had no financial liabilities under macro hedging. Section 8 - Tax liabilities - Item 80 See section 13 of the balance sheet – assets. Section 9 - Liabilities associated with discontinued operations - Item 90 See section 14 of the balance sheet – assets.

Notes
-139-
Section 10 - Other liabilities - Item 100 10.1 Other liabilities: breakdown
31-Dec-06 31-Dec-05 Absolute %
Liabilities in transit - 2 (2) -100.0%Sums available to customers 4,691 2,484 2,207 88.8%Incoming bank transfers pending clearance 1,394 1,094 300 27.4%Outgoing bank transfer to be settled 17,112 19,786 (2,674) -13.5%Writedowns for impairment for illiquid items in thesubject-to-collection portfolio and after collection 4,420 8,404 (3,984) -47.4%Payable to staffincluding social security contributions 4,055 6,396 (2,341) -36.6%Social security contributions to be paid 1,245 1,306 (61) -4.7%Items pertaining to transactions in securities and cu 4,287 23,196 (18,909) -81.5%Sums withheld from third partiesas withholding agent 28,849 17,372 11,477 66.1%Invoices and fees payableto suppliers and professionals 36,576 34,811 1,765 5.1%Sums to be paid to the Tax Authorityfor indirect taxes 14,926 13,584 1,342 9.9%Amounts due to shareholders for dividendsauthorized and uncollected 1 11 (10) -90.9%Sums collected on behalf of third parties 2,018 7,625 (5,607) -73.5%Sums to be settled with customers for "one-fifth of s 6,778 6,330 448 7.1%Security deposits received from third parties - 6,771 (6,771) -100.0%Sums to be settled with customers and banks 9,058 10,956 (1,898) -17.3%Amounts due to Capitalia for tax consolidation 33,206 9,641 23,565 244.4%Deferred income 1,334 1,282 52 4.1%Accrued expenses 42 84 (42) -50.0%Other amounts 569 997 (428) -42.9%Total 170,561 172,132 (1,571) -0.9%(Amounts in Euro/000)
Change
Section 11 - Employee severance payment fund - Item 110 11.1 Employee severance payment fund: changes over the year
31-Dec-06 31-Dec-05 Absolute %
A. Opening balance 3,186 3,290 (104) -3.2%B. Increases B.2 Amounts set aside in the year 1,112 628 484 77.1% B.3 Other increases 27 475 (448) -94.3%C. Decreases C.2 Payments made (441) (461) 20 -4.3% 0.3 Other decreases (50) (746) 696 -93.3%D. Closing balance 3,834 3,186 648 20.3%(Amounts in Euro/000)
Change
Provisions for the year and other decreases for the year ended on 31 December 2005 included the share of the
employee severance payment fund to be paid into external supplementary pension funds.

Notes
-140-
Section 12 - Provisions for contingencies and charges - Item 120
12.1 Provisions for contingencies and charges: breakdown
31-Dec-06 31-Dec-05 Absolute %
1. Company pension funds - - - -2. Other provisions for contingencies and charges 2.1 legal disputes 23,741 24,180 (439) -1.8% 2.2 personnel charges 6,025 1,290 4,735 367.1% 2.3 other 8,601 5,270 3,331 63.2%Total 38,367 30,740 7,627 24.8%(Amounts in Euro/000)
Change
12.2 Provisions for contingencies and charges – “Pension funds”: changes over the year FinecoBank S.p.A. did not make any allocations to the “Company pension funds” item of provisions for contingencies and charges. 12.2 Provisions for contingencies and charges: changes over the year
Pension funds
This table was not included since FinecoBank S.p.A. did not make any allocations to “Company pension funds” and
provisions for contingencies and charges.
Other provisions
31-Dec-06 31-Dec-05 Absolute %
A. Opening balance 30,740 29,055 1,685 5.8%B.Increases - - - - B.1 Amounts set aside in the year 11,130 12,272 (1,142) -9.3% B.2 Changes over time 678 515 163 31.7% B.3 Changes due to changes in the discount rate - - - - B.4 Other increases - - - -C. Decreases - - - - C.1 Amounts used in the year (3,975) (11,072) 7,097 -64.1% C.2 Changes due to changes in the discount rate (206) (30) (176) 586.7% C.3 Other decreases - - - -D. Closing balance 38,367 30,740 7,627 24.8%(Amounts in Euro/000)
Change
Net allocations for the year also include the share relating to the provision for staff expenses charged to the
income statement under item 150 a) Personnel expenses, which came to a total of €5,793 thousand.
12.3 Defined-benefit company pension funds FinecoBank S.p.A. did not make any allocations to the “Company pension funds” item of provisions for contingencies and charges.

Notes
-141-
12.4 Provisions for contingencies and charges - other provisions
31-Dec-2005 2006 Util- Effect of 2006 Net 31-Dec-2006izations discounting provisions
Disputes and other charges pertainingto financial planners' activity 24.303 (1.102) 442 432 24.075Financial transaction closure charges 2.024 (787) - (174) 1.063Other charges and minor disputes 3.123 (1.029) 30 5.080 7.204Provision for personnel charges 1.290 (1.057) - 5.792 6.025Total provisions for contingencies and 30.740 (3.975) 472 11.130 38.367
(Amounts in Euro/000)
Section 13 - Redeemable shares - Item 140 13.1 Redeemable shares: breakdown FinecoBank S.p.A. had no redeemable shares. Section 14 - Bank's shareholders' equity - Items 130, 150, 160, 170, 180, 190 and 200 14.1 Bank's shareholders' equity: breakdown
Items/Values 31-Dec-06 31-Dec-05 Absolute %
1. Share capital 199,851 202,293 (2,442) -1.2%2. Issue premiums - - - -3. Reserves - Legal reserve 3,611 960 2,651 276.1% - Reserve for merger surpluses 2,417 2,417 - 0.0% - Restatement reserves (27,985) (27,985) - 0.0% - Other 67,404 23,083 44,321 192.0%4. (Own shares) - (2,442) 2,442 -100.0%5. Valuation reserves 2,795 3,460 (665) -19.2%6. Capital instruments - - - -7. Net profit (Loss) for the year 65,103 53,028 12,075 22.8%Total 313,196 254,814 58,382 22.9%(Amounts in Euro/000)
Change
As at 31 December 2006 the Bank’s share capital came to €199,851 thousand, and was divided into 605,609,053
shares with a nominal value of €0.33 each.
The restatement reserves incorporate changes in equity deriving from the application of international accounting
standards made to the opening balances on 1 January 2004, in addition to changes due to the application of IAS
32 and 39, starting on 1 January 2005.
The other reserves include the Extraordinary Reserve, which totalled €64,155 thousand, and was created
subsequent to the appropriation of profits earned in 2004 and 2005, and the reclassification of the Own Shares
Reserve, in addition to the IAS Profit Reserve for 2004, which amounted to €3,249 thousand.
On 4 November 2005 the Board of Directors resolved to request the approval of the Shareholders' Meeting for a
reduction in share capital following the cancellation of own shares.
On 13 March 2006, the Shareholders' Meeting approved the reduction in share capital following the cancellation of
own shares; on 3 August 2006 the Bank reduced its share capital, the term of assent by silence required by
applicable law for the opposition of creditors having expired. As a consequence, the own shares reserve,

Notes
-142-
established in accordance with article 2357 ter of the Italian Civil Code by resolution of the extraordinary
Shareholders’ Meeting passed on 5 December 2002 following the merger by incorporation into FinecoBank S.p.A.
of Fineco Sim S.p.A., which held an equity investment of 2.54% in the Bank, was reclassified to the Extraordinary
Reserve and made available.
The valuation reserves include the revaluation reserve for owned real estate, net of the associated taxes, which
was established during the transition to IASs on 1 January 2004, in addition to the valuation reserve for available-
for-sale assets, which includes the positive fair value measurement of the Garda Mutui junior notes and the Net
Insurance equity investment, net of the associated taxes.
Information on the availability and distributability of shareholders’ equity Following the modification of article 2427 of the Italian Civil Code, due to the effect of the new provisions of
Legislative Decree no. 6 of 17 January 2003, and in accordance with document no. 1 issued on 25 October 2004
by the Italian Accounting Board, the following table provides an analytical description of the individual items of
shareholders’ equity, including their availability, distributability, and any utilization during the past three years.
Type/description AmountPossibility of
utilisationAvailable for distribution
to cover lossesfor other reasons
Share capital 199,851 - - - -Capital reserves:Issue premiums - A, B, C -(1) - -Own shares reserve - - - - -Reserve for merger surpluses 2,417 A, B, C - - -Reserves of profits: -Legal reserve 3,611 B - - -Extraordinary reserves 64,155 A, B, C -(2) - 328Other reserves 3,249 A, B, C - - -Restatement reserves (27,985) - - - -Valuation reserves 2,795 - - - -Retained earnings (Losses) - A, B, C -(2) - -Net profit 65,103 A, B, C -(2)
- -
Summary of amounts used in the last three years
Legend: A: for capital increase. B: to cover losses. C: for distribution to shareholders. Notes: (1) Pursuant to article 2431 of the Italian Civil Code, the sum total of said reserve may only be distributed on the condition that the legal reserve has reached the limit set out under article 2430 of the Italian Civil Code. (2) Undistributable up to coverage of the book value of intangible assets (article 2426 of the Italian Civil Code).
14.2 "Share capital" and "Own shares": breakdown The share capital is made up of 605,609,053 ordinary shares with a face value of €0.33 each.
As at 31 December 2006 FinecoBank S.p.A. held no own shares in portfolio.

Notes
-143-
14.3 Share capital - Number of shares: changes over the year Items/Types
Ordinary Other Ordinary OtherA. Shares existing at the start of the year - fully paid-up 613,009,053 - 613,009,053 - - not fully paid-up - - - -A. Own shares (-) (7,400,000) - (7,400,000) -A.2 Shares in issue: opening balance 605,609,053 - 605,609,053 -B. IncreasesB.1 New issues - for cash: - business combination transactions - - - - - conversion of bonds - - - - - exercise of warrants - - - - - other - - - - - free - for employees - - - - - for directors - - - - - other - - - -B.2 Sale of own shares - - - -B.3 Other increases - - - -C. DecreasesC.1 Cancellation 7,400,000 - - -C.2 Purchase of own shares - - - -C.3 Business transfer transactions - - - -C.4 Other decreases - - - -D. Shares in issue: closing balance 605,609,053 - 605,609,053 -D.1 Own shares (+) - (7,400,000) -D.2 Shares existing at the end of the year - - - - - fully paid-up 605,609,053 - 613,009,053 - - not fully paid-up - - - -
31-Dec-06 31-Dec-05
14.7 Valuation reserves: breakdown
31-Dec-06 31-Dec-05 Absolute %
1. Available-for-sale financial assets 1,654 2,319 (665) -28.7%2. Property, plant and equipment - - - -3. Intangible assets - -4. Foreign investment hedge - - - -5. Cash flow hedge - - - -6. Exchange differences - - - -7. Non-current assets and discontinued operations - - - -8. Special revaluation laws 1,141 1,141 - 0.0%Total 2,795 3,460 (665) -19.2%(Amounts in Euro/000)
Change
The valuation reserve, which totalled €2,795 thousand, consisted of:
- the revaluation of the building net of the substitute tax governed by Law 266/2005 (€1,141 thousand), which
must be considered to be governed by the regulations set forth under Section II of Title I of Law no. 342/2000, as
the latter is cited by Law no. 266/2005;
- the revaluation of the AFS junior notes (€1,112 thousand), net of the relative tax effect;
- the revaluation of the equity investment in Net Insurance S.p.A. (€542 thousand), net of the relative tax effect.

Notes
-144-
14.8 Valuation reserves: changes over the year
Available-for-sale financial assets
Property, plant and equipmen
t
Intangible assets
Foreign investment
hedge
Cash flow hedge
Exchange difference
s
Non-current assets and
discontinued operations
Special revaluation
laws
A. Opening balance 2,319 - - - - - - 1,141B. Increases 542 - - - - - - -B.1 Increases in fair value 542 - - - - -B.2 Other increases - - - - - -C. Decreases (1,207) - - - - - - -C.1 Decreases in fair value (1,207) - - - - -C.2 Other decreases - - - - - -D. Closing balance 1,654 - - - - - - 1,141(Amounts in Euro/000) 14.9 Valuation reserves for available-for-sale financial assets: breakdown Assets/Values
Positive reserveNegative reserve
Positive reserveNegative reserve
1. Debt securities 1,112 - 2,319 -2. Equities 542 - - -3. Units in OICR - - - -4. Loans - - - -Total 1,654 - 2,319 -(Amounts in Euro/000)
31-Dec-06 31-Dec-05
14.10 Valuation reserves for available-for-sale financial assets: changes over the year As at 31 December 2006
Debt securities Equities Units in OICR Loans1. Opening balance 2,319 - - -2. Increases - 542 - -2.1 Increases in fair value - 542 - -2.2 Transfer of negative reserves to income statement - - - by impairment - by realisation2.3 Other increases - -3. Decreases (1,207) - - -3.1 Decreases in fair value (1,207) - -3.2 Transfer of positive reserves to income statement - - - by realisation - -3.3 Other decreases - -4. Closing balance 1,112 542 - -(Amounts in Euro/000)

Notes
-145-
As at 31 December 2005
Debt securities Equities Units in OICR Loans1. Opening balance - - - -2. Increases 2,319 - - -2.1 Increases in fair value 2,319 - - -2.2 Transfer of negative reserves to income statement - by impairment - - - - - by realisation - - - -2.3 Other increases - - - -3. Decreases - - - -3.1 Decreases in fair value - - - -3.2 Transfer of positive reserves to income statement - by realisation - - - -3.3 Other decreases - - - -4. Closing balance 2,319 - - -(Amounts in Euro/000)
Section 15 - Other information 1 Guarantees given and commitments
Transactions 31-dic-06 31-dic-05 Absolute %
1) Financial guarantees given a) Banks 28.983 31.192 (2.209) -7,1% b) Customers - -2) Commercial guarantees given a) Banks - 42 (42) -100,0% b) Customers 3.308 3.599 (291) -8,1%3) Irrevocable commitments to lend funds a) Banks i) certain to be called on 347 619 (272) -43,9% ii) not certain to be called on 9.744 9.744 - 0,0% b) Customers i) certain to be called on 1.647 2.799 (1.152) -41,2% ii) not certain to be called on - - - -4) Commitments underlying credit derivatives: sales of protection - - - -5) Assets given as collateral for third-party obligations - - - -6) Other commitments 32 32 - 0,0%Total 44.061 48.027 (3.966) -8,3%(amounts in Euro/000)
Change
2. Assets given as collateral for own liabilities and commitments
Portfolios 31-Dec-06 31-Dec-05 Absolute %
1. Financial assets held for trading 576,413 163,727 412,686 252.1%2. Financial assets designated at fair value - - - -3. Available-for-sale financial assets - - - -4. Held-to-maturity financial assets - - - -5. Due from banks - - - -6. Customer loans - - - -7. Property, plant and equipment - - - -Total 576,413 163,727 412,686 252.1%(Amounts in Euro/000)
Change

Notes
-146-
3. Information on operational lease FinecoBank S.p.A. has entered into various operational lease agreements for insignificant amounts, with the
exception of two agreements with leading IT companies, with lease payments for electronic machines.
On the basis of the lease agreements in existence as at 31 December 2006, FinecoBank S.p.A. must make
minimum payments of €4,510 thousand by 31 December 2007 and €5,257 thousand over the next four years.
The Bank did not undertake any subleasing transactions.
4. Administration and brokerage for third parties
Type of services 31-Dec-06 31-Dec-05 Absolute %
1. Trading of financial instruments on behalf of third parties Securities a) Purchases 1. Settled 109,554,582 104,190,604 5,363,978 5.1% 2. Unsettled 1,269,396 742,822 526,574 70.9% b) Sales 1. Settled 109,671,347 103,619,193 6,052,154 5.8% 2. Unsettled 1,318,937 764,437 554,500 72.5% Derivative contracts a) Purchases 1. Settled 182,581,957 155,705,611 26,876,346 17.3% 2. Unsettled 19,315 12,961 6,354 49.0% b) Sales 1. Settled 183,066,604 158,159,053 24,907,551 15.7% 2. Unsettled 24,598 11,096 13,502 121.7%2. Discretionary accounts a) individual - - - - b) collective - - - -3. Custody and administration of securities a) third-party securities deposited: associated with the provision of custodian banking (excluding discretionary accounts) 1. securities issued by the Bank - - - - 2. other securities - - - - b) third-party securities deposited (excluding discretionary accoun 3,049,477 1,794,863 1,254,614 69.9% 1. securities issued by the Bank 1 2 (1) -50.0% 2. other securities 3,049,476 1,794,861 1,254,615 69.9% c) third-party securities deposited with third parties 3,049,477 1,794,863 1,254,614 69.9% d) own securities deposited with third parties 987,039 604,728 382,311 63.2%4. Other transactions - - - -(Amounts in Euro/000)
Change

Notes
-147-
PART C - INFORMATION ON THE INCOME STATEMENT
SECTION 1 – INTEREST - Items 10 and 20
1.1 Interest income and similar revenue: breakdown
As at 31 December 2006
Items/Technical forms Debt securities Loans
1. Financial assets held for trading 11,719 - - - 11,7192. Available-for-sale financial assets 1,756 - - - 1,7563. Held-to-maturity financial assets - - - - -4. Due from banks 103 21,859 - - 21,9625. Customer loans 16 192,728 2,538 - 195,2826. Financial assets at fair value - - - - -7. Hedge derivatives: - - - - -8. Financial assets sold but not eliminated 16,950 99,433 283 - 116,6669. Other assets - - - - -Total 30,544 314,020 2,821 - 347,385(Amounts in Euro/000)
Performing financial assets Impaired financial assets
Other assets Total
As at 31 December 2005
Items/Technical forms Debt securities Loans
1. Financial assets held for trading 4,915 - - - 4,9152. Available-for-sale financial assets 3,407 - - - 3,4073. Held-to-maturity financial assets - - - - -4. Due from banks 433 18,257 - - 18,6905. Customer loans - 137,377 21 - 137,3986. Financial assets at fair value - - - - -7. Hedge derivatives - - - - -8. Financial assets sold but not eliminated 2,025 93,887 - - 95,9129. Other assets - - - 490 490Total 10,780 249,521 21 490 260,812(Amounts in Euro/000)
Performing financial assets Impaired financial assets
Other assets Total
As at 31 December 2005, interest income on impaired assets consisted solely of interest on non-performing
positions.
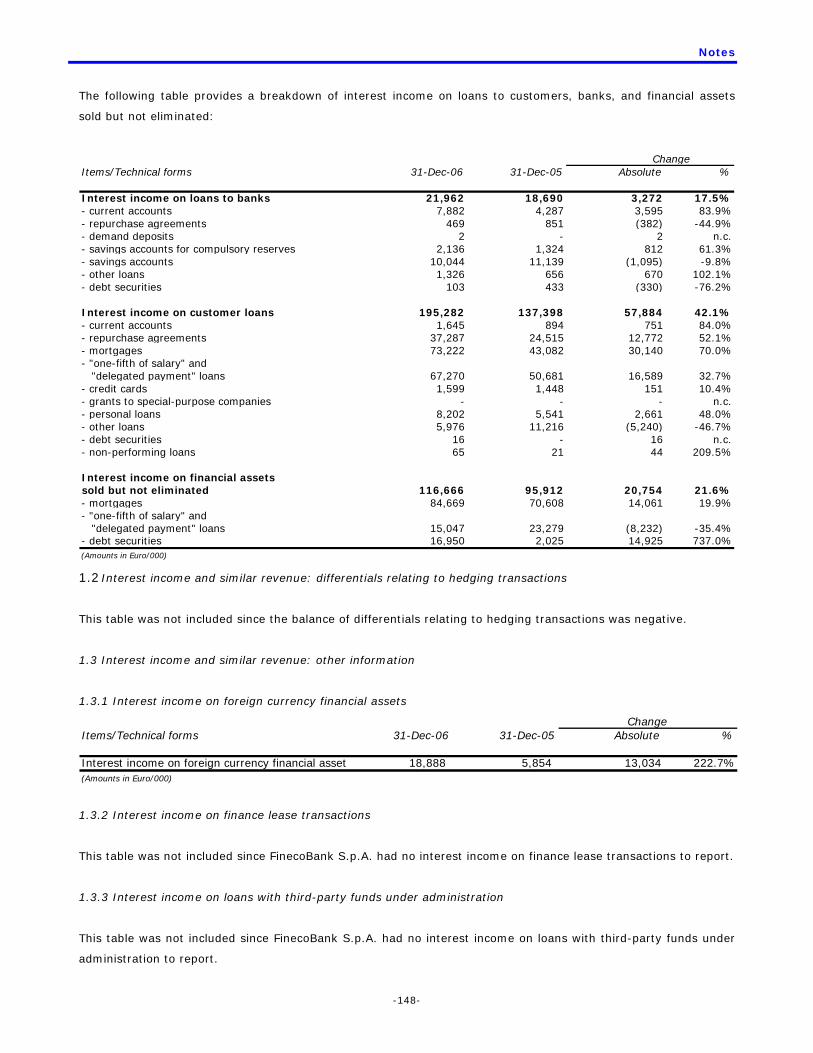
Notes
-148-
The following table provides a breakdown of interest income on loans to customers, banks, and financial assets
sold but not eliminated:
Items/Technical forms 31-Dec-06 31-Dec-05 Absolute %
Interest income on loans to banks 21,962 18,690 3,272 17.5%- current accounts 7,882 4,287 3,595 83.9%- repurchase agreements 469 851 (382) -44.9%- demand deposits 2 - 2 n.c.- savings accounts for compulsory reserves 2,136 1,324 812 61.3%- savings accounts 10,044 11,139 (1,095) -9.8%- other loans 1,326 656 670 102.1%- debt securities 103 433 (330) -76.2%
Interest income on customer loans 195,282 137,398 57,884 42.1%- current accounts 1,645 894 751 84.0%- repurchase agreements 37,287 24,515 12,772 52.1%- mortgages 73,222 43,082 30,140 70.0%- "one-fifth of salary" and "delegated payment" loans 67,270 50,681 16,589 32.7%- credit cards 1,599 1,448 151 10.4%- grants to special-purpose companies - - - n.c.- personal loans 8,202 5,541 2,661 48.0%- other loans 5,976 11,216 (5,240) -46.7%- debt securities 16 - 16 n.c.- non-performing loans 65 21 44 209.5%
Interest income on financial assetssold but not eliminated 116,666 95,912 20,754 21.6%- mortgages 84,669 70,608 14,061 19.9%- "one-fifth of salary" and "delegated payment" loans 15,047 23,279 (8,232) -35.4%- debt securities 16,950 2,025 14,925 737.0%(Amounts in Euro/000)
Change
1.2 Interest income and similar revenue: differentials relating to hedging transactions
This table was not included since the balance of differentials relating to hedging transactions was negative.
1.3 Interest income and similar revenue: other information
1.3.1 Interest income on foreign currency financial assets
Items/Technical forms 31-Dec-06 31-Dec-05 Absolute %
Interest income on foreign currency financial asset 18,888 5,854 13,034 222.7%(Amounts in Euro/000)
Change
1.3.2 Interest income on finance lease transactions
This table was not included since FinecoBank S.p.A. had no interest income on finance lease transactions to report.
1.3.3 Interest income on loans with third-party funds under administration
This table was not included since FinecoBank S.p.A. had no interest income on loans with third-party funds under
administration to report.
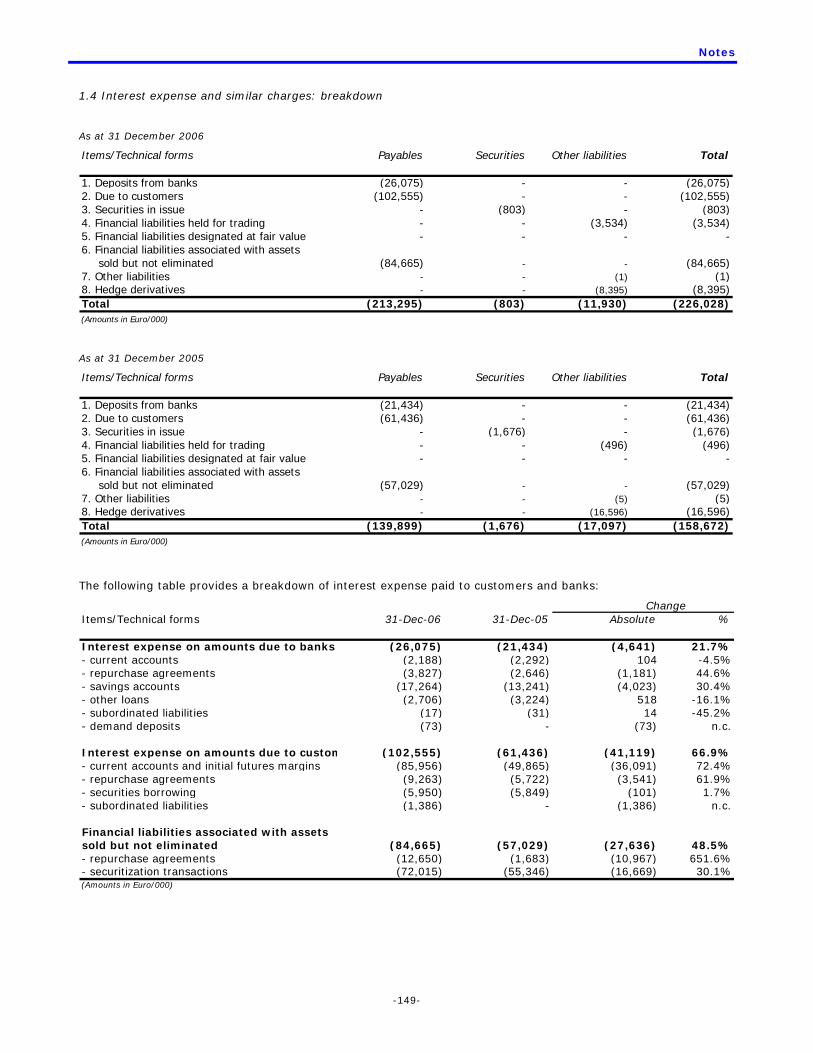
Notes
-149-
1.4 Interest expense and similar charges: breakdown
As at 31 December 2006
Items/Technical forms Payables Securities Other liabilities Total
1. Deposits from banks (26,075) - - (26,075)2. Due to customers (102,555) - - (102,555)3. Securities in issue - (803) - (803)4. Financial liabilities held for trading - - (3,534) (3,534)5. Financial liabilities designated at fair value - - - -6. Financial liabilities associated with assets sold but not eliminated (84,665) - - (84,665)7. Other liabilities - - (1) (1)8. Hedge derivatives - - (8,395) (8,395)Total (213,295) (803) (11,930) (226,028)(Amounts in Euro/000)
As at 31 December 2005
Items/Technical forms Payables Securities Other liabilities Total
1. Deposits from banks (21,434) - - (21,434)2. Due to customers (61,436) - - (61,436)3. Securities in issue - (1,676) - (1,676)4. Financial liabilities held for trading - - (496) (496)5. Financial liabilities designated at fair value - - - -6. Financial liabilities associated with assets sold but not eliminated (57,029) - - (57,029)7. Other liabilities - - (5) (5)8. Hedge derivatives - - (16,596) (16,596)Total (139,899) (1,676) (17,097) (158,672)(Amounts in Euro/000)
The following table provides a breakdown of interest expense paid to customers and banks:
Items/Technical forms 31-Dec-06 31-Dec-05 Absolute %
Interest expense on amounts due to banks (26,075) (21,434) (4,641) 21.7%- current accounts (2,188) (2,292) 104 -4.5%- repurchase agreements (3,827) (2,646) (1,181) 44.6%- savings accounts (17,264) (13,241) (4,023) 30.4%- other loans (2,706) (3,224) 518 -16.1%- subordinated liabilities (17) (31) 14 -45.2%- demand deposits (73) - (73) n.c.
Interest expense on amounts due to custom (102,555) (61,436) (41,119) 66.9%- current accounts and initial futures margins (85,956) (49,865) (36,091) 72.4%- repurchase agreements (9,263) (5,722) (3,541) 61.9%- securities borrowing (5,950) (5,849) (101) 1.7%- subordinated liabilities (1,386) - (1,386) n.c.
Financial liabilities associated with assetssold but not eliminated (84,665) (57,029) (27,636) 48.5%- repurchase agreements (12,650) (1,683) (10,967) 651.6%- securitization transactions (72,015) (55,346) (16,669) 30.1%(Amounts in Euro/000)
Change

Notes
-150-
1.5 Interest expense and similar charges: differentials relating to hedging transactions
Items/Values 31-Dec-06 31-Dec-05 Absolute %
A. Positive differentials relative to transactions for:A.1 Micro-hedges of fair value of assets - - - -A.2 Micro-hedges of fair value of liabilities - - - -A.3 Macro-hedges of interest rate risk 1,336 88 1,248 1418.2%A.4 Micro-hedges of cash flows of assets - - - -A.5 Micro-hedges of cash flows of liabilities - - - -A.6 Cash flow macro-hedges - - - -Total positive differentials (A) 1,336 88 1,248 14B. Negative differentials relative to transactions for:B.1 Micro-hedges of fair value of assets - - - -B.2 Micro-hedges of fair value of liabilities - - - -B.3 Macro-hedges of interest rate risk (9,731) (16,684) 6,953 -41.7%B.4 Micro-hedges of cash flows of assets - - - -B.5 Micro-hedges of cash flows of liabilities - - - -B.6 Cash flow macro-hedges - - - -Total negative differentials (B) (9,731) (16,684) 6,953 -41.7%C. Balance (A-B) (8,395) (16,596) 8,201 -49.4%(Amounts in Euro/000)
Change
1.6 Interest expense and similar charges: other information
1.6.1 Interest expense on foreign currency liabilities
Items/Technical Forms 31-Dec-06 31-Dec-05 Absolute %
Interest expense on foreign currency liabilities (13,757) (5,964) (7,793) 130.7%(Amounts in Euro/000)
Change
1.6.2 Interest expense on finance lease liabilities
Items/Technical Forms 31-Dec-06 31-Dec-05 Absolute %
Interest expense on financelease liabilities (1) (5) 4 -80.0%(Amounts in Euro/000)
Change
1.6.3 Interest expense on third party funds under administration
This table was not included since FinecoBank S.p.A. had no interest expense on third-party funds under
administration to report.

Notes
-151-
SECTION 2 - COMMISSIONS - Items 40 and 50
2.1 Commission income: breakdown
Type of services/Values 31-Dec-06 31-Dec-05 Absolute %
(a) guarantees given - - -(b) credit derivatives - - -(c) management, brokerage, and consulting services: 1. trading of financial instruments 96,546 85,225 11,321 13.3% 2. foreign currency trading 1,250 - 1,250 3. discretionary accounts - - - 3.1. individual - - - 3.2. collective - - - 4. custody and administration of securities 911 651 260 39.9% 5. custodian bank - - - 6. securities placement 55,810 50,645 5,165 10.2% 7. acceptance of instructions - - - 8. consulting activities - - - 9. distribution of third-party services 9.1. discretionary accounts: 8,465 13,282 (4,817) -36.3% 9.1.1 individual 8,465 13,282 (4,817) -36.3% 9.1.2 collective - - - 9.2. insurance products 10,801 10,592 209 2.0% 9.3. other products 191 314 (123) -39.2%(d) collection and payment services 3,073 2,480 593 23.9%(e) servicing for securitisation transactions 52 120 (68) -56.7%(f) services for factoring transactions - - -(g) tax collection services - - - (h) other services 57,801 59,466 (1,665) -2.8%Total 234,900 222,775 12,125 5.4%(Amounts in Euro/000)
Change
2.2 Commission income: distribution channels for products and services
Channels/Values 31-Dec-06 31-Dec-05 Absolute %
(a) at own branches: 1. discretionary accounts - - - 2. securities placement - - - 3. third-party products and services - - - (b) cold calling: 1. discretionary accounts 8,465 13,282 (4,817) -36.3% 2. securities placement 38,325 45,642 (7,317) -16.0% 3. third-party products and services 10,992 10,906 86 0.8%(c) other distribution channels: 1. discretionary accounts - - - 2. securities placement 17,485 5,003 12,482 249.5% 3. third-party products and services - - -Total 75,267 74,833 434 0.6%(Amounts in Euro/000)
Change
Securities placement commissions through "other distribution channels" refer to commissions collected on the
placement of shares with advance subscription and online funds, which are transactions undertaken directly by
customers over the internet channel.

Notes
-152-
2.3 Commission expense: breakdown
31-Dec-06 31-Dec-05 Absolute %
(a) guarantees received (19) (505) 486 -96.2%(b) credit derivatives - - - (c) management and brokerage services: 1. trading of financial instruments (12,331) (14,557) 2,226 -15.3% 2. foreign currency trading - - - 3. discretionary accounts 3.1. own portfolio - - - 3.2. third-party portfolio - - - 4. custody and administration of securities (20) (48) 28 -58.3% 5. placing of financial instruments - - - 6. cold calling to offer securities, products and services (63,776) (65,192) 1,416 -2.2%(d) collection and payment services (2,509) (2,132) (377) 17.7%(e) other services (20,391) (25,652) 5,261 -20.5%Total (99,046) (108,086) 9,040 -8.4%(Amounts in Euro/000)
Change
SECTION 3 - DIVIDENDS AND SIMILAR INCOME - Item 70
3.1 Dividends and similar income: breakdown
Items/Income 31-Dec-06 31-Dec-05 Absolute %
A. Financial assets held for trading Dividends 1 - 1 n.c. Income from units in OICR - - - B. Available-for-sale financial assets Dividends 441 297 144 48.5% Income from units in OICR - - - C. Financial assets designated at fair value Dividends - - - Income from units in OICR - - - D. Shareholdings Dividends - - - Income from units in OICRTotal 442 297 145 48.8%(Amounts in Euro/000)
Change

Notes
-153-
SECTION 4 - Net income from trading activities - Item 80
4.1 Net income from trading activities: breakdown
As at 31 December 2006
Operations/Income components Capital gains Profits from Capital losses Losses from Net profit(A) trading (B) (C) trading (D)
1. Financial assets held for trading 1.1 Debt securities 614 2,174 (17,413) (150) (14,775) 1.2 Equities - 346 (3) (107) 236 1.3 Units in OICR - - - - - 1.4 Loans - - - - - 1.5 Other - 359 - - 3592. Financial liabilities held for trading 2.1 Debt securities - - - - - 2.2 Other 12 - - - 123. Other financial assets and liabilities: exchange differences 16,5144. Derivative instruments 4.1 Financial derivatives: - Debt securities and interest rates 29,083 69,846 (11,619) (86,229) 1,081 - Equities and equity indices - 514 - (202) 312 - Currencies and gold 18 - Other - - - - - 4.2 Credit derivatives - - - - -Total 29,709 73,239 (29,035) (86,688) 3,757(Amounts in Euro/000)
As at 31 December 2005
Operations/Income components Capital gains Profits from Capital losses Losses from Net profit(A) trading (B) (C) trading (D)
1. Financial assets held for trading 1.1 Debt securities 1,711 2,129 (2,792) (301) 747 1.2 Equities 1 423 (16) (186) 222 1.3 Units in OICR - - - - - 1.4 Loans - - - - - 1.5 Other - - - - -2. Financial liabilities held for trading 2.1 Debt securities - - - - - 2.2 Other - - - - -3. Other financial assets and liabilities: exchange differences 7784. Derivative instruments 4.1 Financial derivatives: - Debt securities and interest rates 7,555 47,976 (5,447) (47,519) 2,565 - Equities and equity indices - - - (741) (741) - Currencies and gold 9 - Other - - - - - 4.2 Credit derivatives - - - - -Total 9,267 50,528 (8,255) (48,747) 3,580(Amounts in Euro/000)

Notes
-154-
SECTION 5 - Net income from hedging activities - Item 90
5.1 Net income from hedging activities: breakdown
Income components/values 31-Dec-06 31-Dec-05 Absolute %
A. Income relating to:A.1 Fair value hedge derivatives 25,052 13,269 11,783 88.8%A.2 Financial assets hedged (fair value) - - - A.3 Financial liabilities hedged (fair value) - - - A.4 Cash flow hedge financial derivatives - - - A.5 Foreign currency assets and liabilities - - - Total income from hedging activities (A) 25,052 13,269 11,783 88.8%B. Expenses relating to:B.1 Fair value hedge derivatives (418) - (418) A.2 Financial assets hedged (fair value) (23,524) (12,882) (10,642) 82.6%A.3 Financial liabilities hedged (fair value) - - - B.4 Cash flow hedge financial derivatives - - - B.5 Foreign currency assets and liabilities - - - Total expenses from hedging activities (B) (23,942) (12,882) (11,060) 85.9%C. Net income from hedging activities (A-B) 1,110 387 723 186.8%(Amounts in Euro/000)
Change
SECTION 6 - Profit (Loss) from sale/repurchase - Item 100
6.1 Profit (Loss) from sale/repurchase: breakdown
Items/Income components
Profit Loss Net profit Profit Loss Net profitFinancial assets1. Due from banks 603 - 603 43 - 432. Customer loans 2 - 2 - - -3. Available-for-sale financial assets 3.1 Debt securities 291 - 291 - (328) (328) 3.2 Equities 2,542 - 2,542 77 - 77 3.3 Units in OICR - - - - - - 3.4 Loans - - - - - -4. Held-to-maturity financial assets - - - - - -Total assets 3,438 - 3,438 120 (328) (208)Financial liabilities1. Deposits from banks - - - - - -2. Due to customers - - - - - -3. Securities in issue - - - - - -Total liabilities - - - - - -(Amounts in Euro/000)
31-Dec-06 31-Dec-05

Notes
-155-
SECTION 7 - Net income from financial assets and liabilities at fair value - Item 110
7.1 Net change in the value of financial assets/liabilities at fair value breakdown
This table was not included since FinecoBank S.p.A. did not have any financial assets or liabilities at fair value to
report.
SECTION 8 - Net adjustments for impairment - Item 130
8.1 Net adjustments for impairment of loans: breakdown
As at 31 December 2006
Operations/Income componentsWrite-Offs Other A B A B
A. Loans to banks - - - - - - - -B. Customer loans (542) (12,594) (4,495) 871 2,082 - 1,227 (13,451)C. Total (542) (12,594) (4,495) 871 2,082 - 1,227 (13,451)(Amounts in Euro/000)
TotalWritedowns (1)
Specific PortfolioPortfolio
SpecificWritebacks (2)
As at 31 December 2005
Operations/Income componentsWrite-Offs Other A B A B
A. Loans to banks - - - - - - - -B. Customer loans (1,479) (12,869) (2,825) - 559 - 3,502 (13,112)C. Total (1,479) (12,869) (2,825) - 559 - 3,502 (13,112)(Amounts in Euro/000)
TotalWritedowns (1)
Specific PortfolioPortfolio
SpecificWritebacks (2)
Legend
A = From interest B = Other writebacks
8.2 Net adjustments for impairment of available-for-sale financial assets: breakdown
As at 31 December 2006
Operations/Income componentsWrite-offs Other A B
A. Debt securities - (3,580) - - (3,580)B. Equities - - -C. Units in OICR - - - -D. Loans to banks - - - - -E. Customer loans - - - - -F. Total - (3,580) - - (3,580)(Amounts in Euro/000)
TotalWritedowns (1)
SpecificWritebacks (2)
Specific

Notes
-156-
As at 31 December 2005
Operations/Income componentsWrite-offs Other A B
A. Debt securities - (2,360) - - (2,360)B. Equities - (164) (164)C. Units in OICR - - - -D. Loans to banks - - - - -E. Customer loans - - - - -F. Total - (2,524) - - (2,524)(Amounts in Euro/000)
TotalWritedowns (1)
SpecificWritebacks (2)
Specific
Legend
A = From interest
B = Other writebacks
8.3 Net adjustments for impairment of held-to-maturity financial assets: breakdown
This table was not included since FinecoBank S.p.A. did not have any held-to-maturity financial assets or liabilities
to report.
8.4 Net adjustments for impairment of other financial transactions: breakdown
As at 31 December 2006
Operations/Income componentsWrite-offs Other A B A B
A. Guarantees given - - - - - - - -B. Credit derivatives - - - - - - - -C. Commitments to lend funds - - - - - - - -D. Other transactions - (719) - - - - - (719)E. Total - (719) - - - - - (719)(Amounts in Euro/000)
TotalWritedowns (1)
SpecificWritebacks (2)
PortfolioPortfolio
Specific
As at 31 December 2005
Operations/Income componentsWrite-offs Other A B A B
A. Guarantees given - - (479) - - - - (479)B. Credit derivatives - - - - - - - -C. Commitments to lend funds - - - - - - - -D. Other transactions - - - - - - - -E. Total - - (479) - - - - (479)(Amounts in Euro/000)
TotalWritedowns (1)
SpecificWritebacks (2)
PortfolioPortfolio
Specific
Legend
A = From interest
B = Other writebacks

Notes
-157-
SECTION 9 - Administrative expenses - Item 150
9.1 Personnel expenses: breakdown
Type of expenses/Values 31-Dec-06 31-Dec-05 Absolute %
1) Employees (44,046) (33,592) (10,454) 31.1% a) wages and salaries (31,655) (24,412) (7,243) 29.7% b) social security contributions (8,538) (7,290) (1,248) 17.1% c) employee severance payment fund - - - d) pension costs - - - e) provisions for severance indemnities (1,112) (628) (484) 77.1% f) provisions for retirement benefits and similar funds: - defined contribution - - - - defined benefit - - - g) payments to external supplementary pension funds: - defined contribution (1,183) (274) (909) 331.8% - defined benefit - - - h) costs arising from payment agreements - based on own capital instruments - - i) other employee benefits (1,558) (988) (570) 57.7%2) Other personnel (1,636) (1,153) (483) 41.9%3) Directors (247) (243) (4) 1.6%Total (45,929) (34,988) (10,941) 31.3%(Amounts in Euro/000)
Change
9.2 Average number of employees by category
31-Dec-06 31-Dec-05 Absolute %
Employees 711 605 106 17.5%(a) executives 21 21 - 0.0%(b) Total managers 194 159 35 22.0% - of which: 3rd and 4th level 64 53 11 20.8%(c) other employees 496 425 71 16.7%Other personnel 83 37 46 124.3%
Change
9.3 Defined-benefit company pension funds: total costs
There were no defined-benefit company pension funds.

Notes
-158-
9.5 Other administrative expenses: breakdown
Type of expenses/Values 31-Dec-06 31-Dec-05 Absolute %
Indirect taxes (15,312) (14,319) (993) 6.9%Telephone and post (4,898) (4,069) (829) 20.4%Data transmissionand connections to databases (9,810) (9,537) (273) 2.9%Transport and travel expenses (925) (773) (152) 19.7%Printing and stationery (887) (734) (153) 20.8%Light, heat and water (970) (938) (32) 3.4%Cleaning expenses (562) (549) (13) 2.4%Ordinary maintenance of furniture and buildings (1,854) (3,379) 1,525 -45.1%Rental expenses on buildings (12,524) (10,353) (2,171) 21.0%Professional consultancy (11,857) (14,170) 2,313 -16.3%Expenses for information and searches (723) (676) (47) 7.0%Securitization expenses (904) (817) (87) 10.6%Expenses for third-party services (12,824) (9,891) (2,933) 29.7%Call-center expenses (3,130) (5,192) 2,062 -39.7%Advertising and entertainment expenses (8,601) (10,912) 2,311 -21.2%Insurance premiums (3,568) (3,413) (155) 4.5%Rental and maintenance programmes (5,441) (3,898) (1,543) 39.6%Charity (203) (201) (2) 1.0%Auditors' fees and expensesDirectors' and Statutory Auditors' expenses (221) (191) (30) 15.7%Security expenses (77) (181) 104 -57.5%Lease of machinery (5,565) (5,592) 27 -0.5%Other financial planners' expenses (2,646) (2,716) 70 -2.6%Marketing expenses (640) (376) (264) 70.2%Other administrative expenses (3,616) (2,041) (1,575) 77.2%Total (107,758) (104,918) (2,840) 2.7%(Amounts in Euro/000)
SECTION 10 - Net provisions for contingencies and charges - Item 160
10.1 Net provisions for contingencies and charges: breakdown
Type of expenses/Values 31-Dec-06 31-Dec-05 Absolute %
Litigation and charges associated with theactivity of financial advisors (873) (8,318) 7,445 -89.5%Financial transaction closure charges 174 (147) 321 n.c.Capitalized charges for rented financial outlet - (1,850) 1,850 -100.0%Other charges and minor disputes (5,110) (1,152) (3,958) 343.6%Total (5,809) (11,467) 5,658 -49.3%(Amounts in Euro/000)
Change

Notes
-159-
SECTION 11 - Net adjustments to property, plant and equipment - Item 170
11.1 Net adjustments to property, plant and equipment: breakdown
As at 31 December 2006
Assets/Income components Depreciation Writedowns Writebacks Net profit(a) for impairment (b) (c)
A. Property, plant and equipment A.1 owned - functional use (2.655) (285) - (2.940) - for investment - - - - A.2 Acquired under finance leases - functional use (23) - - (23) - for investment - - - -Total (2.678) (285) - (2.963)(Amounts in Euro/000) As at 31 December 2005
Assets/Income components Depreciation Writedowns Writebacks Net profit(a) for impairment (b) (c)
A. Property, plant and equipment A.1 owned - functional use (4.599) (52) - (4.651) - for investment - - - - A.2 Acquired under finance leases - functional use (42) - - (42) - for investment - - - -Total (4.641) (52) - (4.693)(Amounts in Euro/000)
Ordinary percent depreciation rates applied during the reporting period:
• instrumental properties: 2%
• furnishings: 15%
• miscellaneous plant and equipment: 15%; plant and equipment acquired through the merger with Fineco Sim
S.p.A.: 20%
• furniture and ordinary machines: 12%
• EDP machines: 20%
• mobile phones and television camera systems: 20%
• alarm and security systems: 30%
• hoisting equipment systems: 7.5%
• motor vehicles: 25%; motor vehicles acquired through the merger with Fineco Sim S.p.A.

Notes
-160-
SECTION 12 - Net adjustments to intangible assets - Item 180
12.1 Net adjustments to intangible assets: breakdown
As at 31 December 2006
Assets/Income components Amortization Writedowns Writebacks Net profit(a) for impairment (b) (c)
A. Intangible assets A.1 owned - Generated internally by the company - - - - - Other (7,686) - - (7,686) A.2 Acquired under finance leasesTotal (7,686) - - (7,686)(Amounts in Euro/000)
As at 31 December 2005
Assets/Income components Amortization Writedowns Writebacks Net profit(a) for impairment (b) (c)
A. Intangible assets A.1 owned - Generated internally by the company - - - - - Other (7,394) - - (7,394) A.2 Acquired under finance leasesTotal (7,394) - - (7,394)(Amounts in Euro/000)
Amortization of intangible assets is calculated pro-rata temporis.
Percent amortization rates applied during the reporting period:
• software acquired directly by FinecoBank S.p.A. since 1 January 2001: 33.33%
• pre-2002 software acquired through the merger with Fineco Sim S.p.A. and software acquired through the
merger with Banca Manager S.p.A.: 20%
SECTION 13 - Other operating income and expenses - Item 190
13.1 Other operating expenses: breakdown
Types/Values 31-Dec-06 31-Dec-05 Absolute %
Charges for repurchase of securitized loans (68) (26) (42) 161.5%Improvements and incremental expensesincurred on third-party assets (1,104) (1,858) 754 -40.6%Credit card fraud (4,306) (3,310) (996) 30.1%Other overhead costs (2,943) (2,040) (903) 44.3%Total (8,421) (7,234) (1,187) 16.4%(Amounts in Euro/000)
Change
Other operating expenses relating to costs incurred for credit card fraud were partly recovered (€1,620 thousand
in 2006 and €888 thousand in 2005) by the Parent Bank for credit cards issued for Group banks and recorded in
other operating income and commission income.

Notes
-161-
13.2 Other operating income: breakdown
Types/Values 31-Dec-06 31-Dec-05 Absolute %
Recovery of expenses on "one-fifth of salary" loa 66 40 26 65.0%Recovery of expenses on mortgages 4,772 5,304 (532) -10.0%Recovery of stamp duty 14,424 13,093 1,331 11,762Rents receivable 181 34 147 432.4%Other 15,962 8,020 7,942 99.0%Total 35,405 26,491 8,914 33.6%(Amounts in Euro/000)
Change
SECTION 14 - Gains (losses) from investments - Item 210
14.1 Gains (losses) from investments: breakdown
This table was not included since the Bank did not realize any gains (losses) on equity investments.
SECTION 15 - Net income from the fair value measurement of property, plant and equipment
and intangible assets - Item 220
15.1 Net income from the fair value measurement of the revalued value of property, plant and equipment and
intangible assets: breakdown
This table was not included since FinecoBank S.p.A. did not make any fair value measurements of any items of
property, plant and equipment or intangible assets.
SECTION 16 - Net adjustments to goodwill - Item 230
16.1 Net adjustments to goodwill: breakdown
This table was not included since goodwill, which was tested for impairment, did not give any signs of having
decreased in value.
SECTION 17 - Profit (Loss) from sale of investments - Item 240
17.1 Profit (loss) from sale of investments: breakdown
Income components/Values 31-Dec-06 31-Dec-05 Absolute %
A. Buildings - Profits from sale - - - - - Losses from sale - - - -B. Other assets - Profits from sale 1 673 (672) -99.9% - Losses from sale (12) (257) 245 -95.3%Net profit (11) 416 (427) -102.6%(Amounts in Euro/000)
Change

Notes
-162-
SECTION 18 - Income taxes on continuing operations - Item 260
18.1 Income taxes on continuing operations: breakdown
Component/Values 31-Dec-06 31-Dec-05 Absolute %
1. Current taxes (40,705) (13,459) (27,246) 202.4%2. Changes in current taxes from previous years 4,237 - 4,237 -3. Decrease in current taxes for the year - - - -4. Change in prepaid taxes (2,158) (534) (1,624) 304.1%5. Change in deferred taxes (1,307) 6,038 (7,345) -121.6%6. Income taxes for the year (39,933) (7,955) (31,978) 402.0%(Amounts in Euro/000)
Change
18.2 Reconciliation between theoretical taxes and actual taxes
Statutory profit before taxes 105,036
IRES IRAP TotalAmount corresponding to theoretical tax rate 34,662 4,464 39,126+ Tax effects of charges not relevant to the determination of the taxable base 1,017 2,957 3,974- Tax effects of income not relevant to the determination of the taxable base (2,473) (545) (3,018)- Tax effects deriving from the use of tax losses from previous years - -- Tax effects deriving from the application of substitute taxes - - -Amount corresponding to the actual tax rate 33,206 6,876 40,082(Amounts in Euro/000)
SECTION 19 - Profit (Loss) from discontinued operations after tax - Item 280
19.1 Profit (Loss) from discontinued operations after tax: breakdown
This table was not included since the Bank did not realize any profits (losses) on discontinued operations.
19.2 Breakdown of income taxes on discontinued operations (assets/liabilities):
This table was not included since the Bank did not realize any profits (losses) on discontinued operations.
SECTION 20 - Other information
1.1 Designation of Parent Bank
CAPITALIA S.p.A.
Rome Register of Companies no. 28540
Register of Banking Groups no. 3207.8
1.2 Registered Office of Parent Bank
Via M. Minghett i , 17 – 00187 Rome, Italy

Notes
-163-
1.3 Key figures for the Parent Bank (income statement, balance sheet, structure)
Figures for 2005
Customer loans 3,507
Financial assets 15,396
Direct customer deposits 26,382
Net interbank balance 6,517
Shareholders’ equity 7,917
Net interest income (317)
Total revenues 954
Gross operating profit (loss) 600
Provisions and adjustments (186)
Profits/losses from disposals 7
Result before taxes 421
Profit for the year 596
Employees 1,112
Branches operating in Italy and abroad 1
(amounts in millions)
SECTION 21 - Earnings per share
21.1 Average number of diluted ordinary shares and share capital
21.2 Other information

Notes
-164-
PART D - SEGMENT REPORTING
A. PRIMARY STATEMENT
Organization of Business Units
The Capitalia Group, in keeping with the management structure and organization set forth in the 2005-2007
Business Plan, is divided into five Business Units for segment reporting purposes:
the Retail Business Unit, which includes the activities of the Commercial Banks involving Private Customers and
Small Business Customers;
the Corporate Business Unit, which includes the Mid-Corporate Customers of Commercial Banks and the
customer operations of the Foreign Branches;
the Wholesale & Investment Banking Business Unit, which represents the results of Large Corporate and
Institutional Customers, Investment Banking activities, and finance operations undertaken by the Parent Bank and
its individual subsidiaries;
the Financial Services Business Unit, which includes product companies operating in the Wealth Management
sector, the “new” MCC, Fineco Leasing, and Capitalia Leasing & Factoring;
the Corporate Center Business Unit, which is responsible for treasury activity.
Due to its type of business, FinecoBank S.p.A. falls under the Financial Services Business Unit, which includes the
following specific activities:
Mortgages;
"One-fifth of salary" loans;
Online (Credit cards, Banking, Trading);
Financial Advisors;
Brokerage.
The Corporate Center Business Unit includes the economic results from margins generated on lending and
borrowing to and from banks and institutional customers.
The Wholesale & Investment Banking Business Unit includes net interest income relating to securities owned by
the Bank.
Criteria governing the preparation of the income statement by business unit The net profit for each business unit was formed according to the following principles:
Net interest income was calculated by contribution according to the internal transfer rates differentiated for each
product. Interest income earned on capital shields, which represent the profitability of absorbed capital otherwise
concentrated in the Treasury (the Corporate Center Business Unit), is attributed to individual Business Units;
Non-interest income was calculated by direct allocation of real commission components to the Business Units;
Operating expenses were distributed using a full-costing model that allocates all operating expenses to the
Business Units;
Adjustments and profits/losses on the disposal of investments were allocated to the Business Units that
generated them;
Taxes were calculated on the basis of a standard IRES and IRAP tax rate, and the difference between the latter
and the effective tax charges was allocated to the Corporate Center Business Unit.
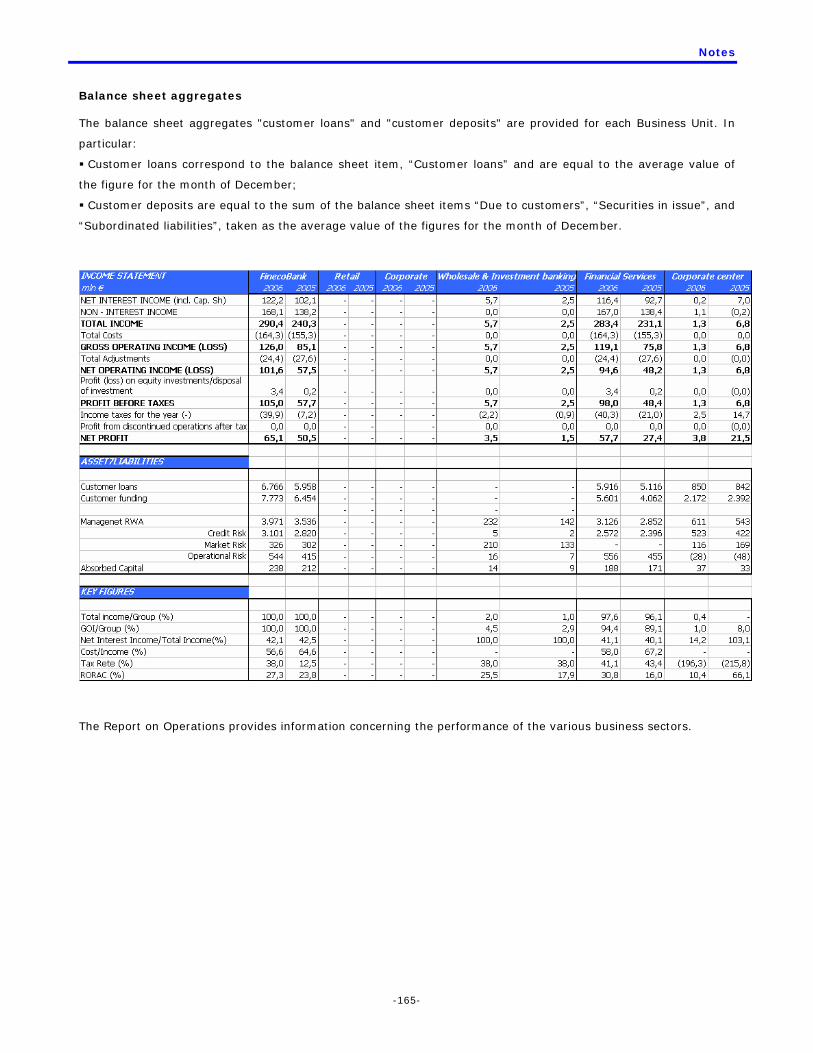
Notes
-165-
Balance sheet aggregates The balance sheet aggregates "customer loans" and "customer deposits" are provided for each Business Unit. In
particular:
Customer loans correspond to the balance sheet item, “Customer loans” and are equal to the average value of
the figure for the month of December;
Customer deposits are equal to the sum of the balance sheet items “Due to customers”, “Securities in issue”, and
“Subordinated liabilities”, taken as the average value of the figures for the month of December.
The Report on Operations provides information concerning the performance of the various business sectors.

Notes
-166-
PART E – INFORMATION ON RISKS AND HEDGING POLICIES
The responsibility for the development and definition of the methods used to measure risks, the activity of
controlling risks at the firm-wide level, and the strategic management of these risks is centralized with the Parent
Bank. Group companies retain the responsibility for first-level monitoring, especially for verifying that the risk level
of individual companies is compatible with the guidelines set by the Parent Bank, individual companies’ equity, and
prudential supervisory rules.
In order to ensure efficient management of risks, the risk management process is structured in accordance with
the organizational choices made for the Group and the provisions of the Supervisory Instructions for Banks
pertaining to the internal control system.
This process calls for the risks of the holding company and its subsidiaries to be monitored and measured by
Capitalia S.p.A., which verifies that the assigned limits have been observed and provides analyses to both
individual subsidiaries and the Parent Bank’s ALM and Risk Committees in relation to strategic decisions concerning
the setting of the desired profiles for the various risks.
The Parent Bank draws on the analyses and indications provided by the ALM and Risk Committees in taking action
required to bring the risk profiles of Group companies back into balance, optimize the Group’s overall risk/return
profile, and increase the efficiency in the use of the Group’s economic capital.
Group companies consequently refer to the Parent Bank in order to undertake the hedging transactions required to
bring their risk profiles into line with the target, taking into account their equity and individual supervisory rules. The definition of the methods used to measure and control risks is centralized with the Parent Bank; the risks of
Group companies are measured by using these same methods and the same technology system.
SECTION 1 - CREDIT RISK
QUALITATIVE INFORMATION
1. General issues
FinecoBank’s goal is to develop its loans in the retail segment by seizing the opportunities offered by the market
and exploiting the efficiency of its distribution model. This development must be balanced against the maintenance
of the quality of the loan portfolio and adequate coverage of risks that allows for the monitoring of profitability.
The Bank attempts to expand its lending both through the development of new products or the modification of
existing products and protecting the market share it has won.
The quality of the loan portfolio, which is constantly monitored and supported by risk mitigation instruments, is
protected by rating and scoring tools that contribute to evaluation during the approval process, ensuring that it is
consistent and controlled. This monitoring enables the Bank to make changes to the rules that govern the loan
evaluation process by modifying automatic systems and policies, and especially by taking preventative action to
limit and identify credit risk.
The Bank seeks to increase its profitability by developing new products and by protecting its existing portfolio
against changes in the competitive scenario.
In particular, in 2006 the Bank developed products with automatic creditworthiness evaluation systems that
facilitated the marketing of products over the internet channel. The Bank also established adequate oversight of
the portfolio of mortgage loans in order to limit the commercial aggressiveness of its competitors.

Notes
-167-
As part of its trading activity, the Treasury assumes minimal positions in terms of the specific risk associated with
operations in bonds and derivatives. Choices concerning the investment of the Bank's liquidity are governed by a
prudential approach aimed at containing credit risk and mainly involve the use of Parent Bank issues. OTC
exchange rate derivatives were traded with international bank counterparties with high credit standing as part of
the coverage of loans.
2. Risk management policies
2.1 Organizational aspects
The factors that generate credit risk in the retail banking business spring from acceptance and creditworthiness
assessment policies, which must always be sufficiently correlated with the ratio of risk to return and, consequently,
product yield.
In particular, policies aimed at simplifying the evaluation process and reducing the time required to issue loans
may have an influence on the risk level.
Risk factors are managed through the use of scoring/rating tools that analyse the social and demographic profiles
of customers by conducting a statistical assessment of individual counterparties and incorporating this assessment
into the support provided by credit bureaus.
FinecoBank’s Credit Division is charged with the management and monitoring of risks related to the activity of
issuing credit and is divided into two main areas of activity: the Bank’s Credit Policies Division supervises Bank
functions in their integration of the guidelines issued by the Parent Bank’s Credit Policies Division, which conducts
ongoing evaluation of the relevant economic scenarios and proposes adequate policy rules for individual products.
The Credit Policies Division is also responsible for credit monitoring activity, i.e. supervising the loan portfolio and
proposing changes to scoring systems and policies on the basis of the results of its analyses.
The Credit Division oversees the issuing of credit, which is carried out at the level of individual functional units
within the various business units, while individual credit functional units are charged with managing the granting of
credit to customers in accordance with established procedures and evaluating customers’ current and potential risk
profiles while respecting strategic guidelines.
2.2 Management, measurement and control system
The measurement of credit risk during the issue process is supported by credit scoring or rating systems for all
products. Only the loans secured by transfer of one-fifth of salary product is not restricted by the use of automatic
credit risk prediction systems in relation to insurance coverage for cases of default.
The rating systems that have been used for the entire home mortgage portfolio since 2005 were provided by the
Parent Bank and satisfy the requirements of the Basel II Accord.
For personal loans to account holders, an internal rating system is used along with a synthetic indicator derived
from credit bureaus. For non-account holders, on the other hand, a scoring system developed by an outside
supplier on the basis of a benchmark development sample is used during the loan evaluation process.
The issue of credit cards and opening of current accounts are also subject to credit scoring integrated with data
provided by credit bureaus.
During the loan application process, attention is always focussed on the possibility of best using all information
concerning customers that has been provided by the Bank, the Group and the System.
Collective writedowns of the portfolio of performing loans are calculated by combining internal and external rating
models, when applicable, with empirical evidence available within the Bank (default rates and recovery rates). The

Notes
-168-
Group’s internal model is used for home mortgage portfolio, as opposed to the “one-fifth of salary” loan portfolio, for
which an approach based on external ratings of borrowers and insurance companies is utilized. The rating models
generally provide the parameters, probability of default, loss given default, and exposure at default which are
required to calculate the expected loss or the amount to be written down.
The monitoring of credit risk as part of the management of the trading book is conducted through the calculation
of indicators of exposure and expected and unexpected loss (Credit VaR), on the basis of which the composition of
the trading book is then analysed by rating class and sector of issue and the risk implicit in contracts deriving from
unexpected changes in the creditworthiness of said contracts.
Indicators of exposure and expected loss are calculated on a monthly basis.
In its trading in over-the-counter derivatives in particular, the Treasury deals exclusively with bank counterparties
and on specific lines of credit set by the Division in coordination with the Credit Policies Division of the Parent Bank.
2.3 Techniques for mitigating credit risk
In order to mitigate risk in the various forms in which credit is granted, several different types of collateral and/or
personal securities are acquired. Pledges on shares or investment funds are used to secure credit lines on current
accounts, while the registration of a first-priority lien is always required for the issue of a home mortgage loan.
Further support is provided to reduce credit risk on mortgage lending by requesting a personal security from a
family member of the borrower.
Insurance products are also used to cover the risk of decease and risk of default for loans secured by transfer of
one-fifth of salary and for the share exceeding 80% of the ratio between the value of the asset and the amount of
the loan (loan-to-value) for home mortgages.
2.4 Impaired financial assets
Loans are classified as problem loans or non-performing loans in accordance with the criteria set forth by the Bank
of Italy, with methods differing according to product type. The criterion according to which risk levels are
structured is generally highly objective for mortgage loans and loans secured by the transfer of one-fifth of salary,
although these criteria may sometimes be replaced by analytical assessment and mitigated or accelerated for
reasons of opportunity, repayment plans, or agreements with customers.
Loans classified as expired or past due by more than 180 days are limited in amount because they may largely be
considered problem loans. As concerns loans secured by the transfer of one-fifth of salary issued to the
government/public sector in particular, the category of past due by 180 days is of little analytic value as to the
creditworthiness of the counterparty, considering the average delays in payment of administrations.
The classification criterion used for overdrawn accounts is related to the performance of debt recovery activity or
the forced sale of securities to cover debts.
The restructuring of loans is only authorized if the amount past due has been paid in full in observance of the
original payment schedule, or if considerable payments have been made leading the Bank to believe the debt
exposure is highly likely to be repaid.
The procedure for the management of irregularly performing loans involves actions that may be taken to recover
debts by ranking them by seniority of expiration.

Notes
-169-
QUANTITATIVE INFORMATION
A. CREDIT QUALITY
A.1 IMPAIRED AND PERFORMING EXPOSURES: VALUES, ADJUSTMENTS, TREND, ECONOMIC
AND GEOGRAPHICAL DISTRIBUTION
A.1.1 Breakdown of financial assets according to portfolios and credit quality (book values)
As at 31 December 2006
Portfolios/quality Non-performing Problem Restructured Expired Country risk Other assets Totalloans loans exposures exposures
1. Financial assets held for trading - 1 - - 427 894,085 894,5132. Available-for-sale financial assets - - - - - 83,398 83,3983. Held-to-maturity financial assets - - - - - - -4. Due from banks - - - - - 1,088,915 1,088,9155. Customer loans 24,900 36,279 - 9,327 4 6,765,116 6,835,6266. Financial assets at fair value: - - - - - - -7. Discontinued operations - - - - - - -8. Hedge derivatives - - - - - 16,756 16,756Total 24,900 36,280 - 9,327 431 8,848,270 8,919,208
(Amounts in Euro/000)
As at 31 December 2005
Portfolios/quality Non-performing Problem Restructured Expired Country risk Other assets Totalloans loans exposures exposures
1. Financial assets held for trading - - - - - 485,209 485,2092. Available-for-sale financial assets - - - - - 93,261 93,2613. Held-to-maturity financial assets - - - - - - -4. Due from banks - - - - - 514,161 514,1615. Customer loans 16,833 18,549 - 7,312 26 6,420,951 6,463,6716. Financial assets at fair value: - - - - - - -7. Discontinued operations - - - - - - -8. Hedge derivatives - - - - - 3,775 3,775Total 16,833 18,549 - 7,312 26 7,517,357 7,560,077
(Amounts in Euro/000)
A.1.2 Breakdown of financial assets according to portfolios and credit quality (gross and net values)
As at 31 December 2006
Portfolios/quality Gross Specific Portfolio Net Gross Portfolio Net exposure adjustments adjustments exposure exposure adjustments exposure
1. Financial assets held for trading 1 - - 1 894,512 894,5132. Available-for-sale financial assets - - - - 83,398 - 83,398 83,3983. Held-to-maturity financial assets - - - - - - - -4. Due from banks - - - - 1,088,915 - 1,088,915 1,088,9155. Customer loans 98,630 (27,040) (1,084) 70,506 6,777,969 (12,849) 6,765,120 6,835,6266. Financial assets at fair value: - - - - - -7. Discontinued operations - - - - - - - -8. Hedge derivatives - - - - 16,756 16,756Total 98,631 (27,040) (1,084) 70,507 7,950,282 (12,849) 8,848,701 8,919,208
(Amounts in Euro/000)
Impaired assets Other assets Total (net exposure)

Notes
-170-
As at 31 December 2005
Impaired assets Other assetsTotal (net exposure)
Portfolios/quality Gross Specific Portfolio Net Gross Portfolio Net exposure adjustments adjustments exposure exposure adjustments exposure
1. Financial assets held for trading - - - - 485,209 485,2092. Available-for-sale financial assets - - - - 93,261 - 93,261 93,2613. Held-to-maturity financial assets - - - - - - - -4. Due from banks - - - - 514,161 - 514,161 514,1615. Customer loans 63,885 (21,191) - 42,694 6,431,403 (10,426) 6,420,977 6,463,6716. Financial assets at fair value: - - - - - - - -7. Discontinued operations - - - - - - - -8. Hedge derivatives - - - - 3,775 - 3,775 3,775Total 63,885 (21,191) - 42,694 7,042,600 (10,426) 7,517,383 7,560,077
(Amounts in Euro/000)
A.1.3 Cash and off-balance-sheet exposures to banks: gross and net values
As at 31 December 2006
Types of exposures/Values Gross Specific Portfolio Netexposures adjustments adjustments exposures
A. Cash exposures - - - - a) Non-performing loans - - - - b) Problem loans - - - - c) Restructured exposures - - - - d) Expired exposures - - - - e) Country risk - - - f) Other assets 1,928,514 - 1,928,514 Total 1,928,514 - - 1,928,514
B. Off-balance-sheet exposuresa) Impaired - - - - b) Other 61,809 - 61,809 Total 61,809 - - 61,809
(Amounts in Euro/000)
As at 31 December 2005
Types of exposures/Values Gross Specific Portfolio Netexposures adjustments adjustments exposures
A. Cash exposures - - - - a) Non-performing loans - - - - b) Problem loans - - - - c) Restructured exposures - - - - d) Expired exposures - - - - e) Country risk - - - f) Other assets 960,965 - 959,621 Total 960,965 - - 959,621
B. Off-balance-sheet exposuresa) Impaired - - - - b) Other 31,853 - 31,853 Total 31,853 - - 31,853
(Amounts in Euro/000)

Notes
-171-
A.1.4 Cash exposures to banks: trend of impaired and "country risk" exposures
This table was not included since FinecoBank S.p.A. did not have any impaired (non-performing, problem, expired,
or restructured) exposures or "country risk" exposures to report.
A.1.5 Cash exposures to banks: trend in gross adjustments
This table was not included since FinecoBank S.p.A. did not have any impaired (non-performing, problem, expired,
or restructured) exposures or "country risk" exposures to report.
A.1.6 Cash and off-balance-sheet exposures to customers: gross and net values
As at 31 December 2006
Types of exposures/Values Gross Specific Portfolio Netexposures adjustments adjustments exposures
A. Cash exposuresa) Non-performing loans 48,660 (23,760) - 24,900b) Problem loans 39,560 (3,280) - 36,280c) Restructured exposures - - - -d) Expired exposures 10,411 - (1,084) 9,327e) Country risk 433 (2) 431f) Other assets 6,901,476 (12,847) 6,888,629Total 7,000,540 (27,040) (13,933) 6,959,567
B. Off-balance-sheet exposuresa) Impaired - - - -b) Other 21,820 - 21,820Total 21,820 - - 21,820
(Amounts in Euro/000)
As at 31 December 2005
Types of exposures/Values Gross Specific Portfolio Netexposures adjustments adjustments exposures
A. Cash exposuresa) Non-performing loans 35,841 (19,008) - 16,833b) Problem loans 20,542 (1,993) - 18,549c) Restructured exposures - - - -d) Expired exposures 7,502 (190) - 7,312e) Country risk 39 (13) 26f) Other assets 6,578,267 (10,413) 6,557,736Total 6,642,191 (21,191) (10,426) 6,600,456
B. Off-balance-sheet exposuresa) Impaired - - - -b) Other 25,214 - 25,214Total 25,214 - - 25,214
(Amounts in Euro/000)
A.1.7 Cash exposures to customers: trend of impaired and "country risk" exposures, gross

Notes
-172-
As at 31 December 2006
Description/Categories on-performing loan Problem loans Restructured Expired Countryexposures exposures Risk
A. Opening gross exposure 35,841 20,542 - 7,502 39 of which: exposures transferred but not elimin 4,258 5,874 - - -B. Increases 21,843 62,342 - 17,227 433 B.1. inflows from performing loans 3,955 53,110 - 16,690 433 B.2. transfers from other categories of impaired exposures 17,255 7,032 - - - B.3 other increases 633 2,200 - 537 -C. Decreases (9,024) (43,324) - (14,318) (39) C.1. outflows to performing loans - (18,184) - (4,051) - C.2 write-offs (4,229) - - - - C.3 collections (4,120) (7,682) - (3,227) (39) C.4 disposals - - - - - C.5. transfers to other categories of impaired exposures - (17,255) - (7,032) - C.6 other decreases (675) (203) (8)D. Closing gross exposure 48,660 39,560 - 10,411 433 of which: exposures transferred but not elimin 8,894 5,898 - 784 -(Amounts in Euro/000)
As at 31 December 2005
Description/Categories on-performing loan Problem loans Restructured Expired Countryexposures exposures Risk
A. Opening gross exposure 13,725 8,855 - - - of which: exposures transferred but not elimin - - - - -B. Increases 27,675 48,465 - 18,334 39 B.1. inflows from performing loans 8,669 35,276 - 5,437 39 B.2. transfers from other categories of impaired exposures 18,944 7,561 - 5,508 - B.3 other increases 62 5,628 - 7,389 -C. Decreases (5,559) (36,778) - (10,832) - C.1. outflows to performing loans - (7,854) - (3,212) - C.2 write-offs (3,439) - - - - C.3 collections (1,915) (4,290) - (43) - C.4 disposals - - - - - C.5. transfers to other categories of impaired exposures - (24,452) - (7,561) - C.6 other decreases (205) (182) (16)D. Closing gross exposure 35,841 20,542 - 7,502 39 of which: exposures transferred but not elimin 4,258 5,874 - - -(Amounts in Euro/000)
A.1.8 Cash exposures to customers: trend in gross adjustments
As at 31 December 2006

Notes
-173-
Description/Categories on-performing loan Problem loans Restructured Expired Countryexposures exposures Risk
A. Gross opening adjustments 19,008 1,993 - 190 13 of which: exposures transferred but not elimin 1,653 480 - - -B. Increases 11,345 3,067 - 903 2 B.1 writedowns 10,154 3,067 - 903 2 B.2. transfers from other categories of impaired exposures 1,169 - - - - B.3 other increases 22 - - - -C. Decreases (6,593) (1,780) - (9) (13) C.1 writebacks from valuation (1,229) (414) - (9) - C.2 writebacks from collection (1,135) (197) - - (13) C.3 write-offs (4,229) - - - - C.4. transfers to other categories of impaired exposures - (1,169) - - - C.5 other decreases -D. Total closing adjustments 23,760 3,280 - 1,084 2 of which: exposures transferred but not elimin 3,330 722 - 18 -(Amounts in Euro/000)
As at 31 December 2005
Description/Categories on-performing loan Problem loans Restructured Expired Countryexposures exposures Risk
A. Gross opening adjustments 5,154 1,797 - - - of which: exposures transferred but not elimin - - - - -B. Increases 17,701 2,456 - 190 13 B.1 writedowns 13,019 1,600 - 190 13 B.2. transfers from other categories of impaired exposures 2,110 - - - - B.3 other increases 2,572 856 - - -C. Decreases (3,847) (2,260) - - - C.1 writebacks from valuation (90) (57) - - - C.2 writebacks from collection (318) (93) - - - C.3 write-offs (3,439) - - - - C.4. transfers to other categories of impaired exposures - (2,110) - - - C.5 other decreases -D. Total closing adjustments 19,008 1,993 - 190 13 of which: exposures transferred but not elimin 1,653 480 - - -(Amounts in Euro/000)
A.2 CLASSIFICATION OF EXPOSURES BASED ON EXTERNAL AND INTERNAL RATINGS
During 2006, work continued towards the implementation of Basel II regulations at the Group level.
The rating models used for corporate exposures and the models used for retail exposures may be broken down
into macro classes. The credit exposures of FinecoBank S.p.A. are almost entirely limited to the retail segment.
The ratings models generally rely on a modular approach with the aim of integrating financial information,
performance information, and qualitative evaluations of the counterparty into each model. The performance
component is especially relevant for the retail portfolios in particular.
In terms of the lending process, the stages of the process of loan issue, monitoring and management of
irregularities were revised and innovated with the purpose of improving their function under logic that complies
with Basel II principles.

Notes
-174-
Process innovations reached an advance stage of implementation involving the use of internal ratings models and
information technology tools in support of lending decisions.
Work on the estimate of the LGD parameter continued, involving the use of specific data rooms and the collection
of data useful in reconstructing, when possible, the historical series concerning the positions redeemed over the
past seven years.
At the same time, activity also moved forward in the area of the software engineering of the estimate of LGD and
EAD for each position that exceeds the regulatory default threshold.
From an organizational and technical point of view, the project is divided into the database structure, data input
procedures, quality controls, and the creation of estimate calculation engines.
Historical series of past-due exposures required for the IRB approach were reconstructed for the EAD parameter.
The overall internal rating system must be officially submitted for the approval of the Supervisory Authorities in
order to be used to calculate regulatory capital requirements under the Internal Rating Based approach.
In this regard, the pre-validation activities launched by the Bank of Italy in 2005 are currently underway.
As part of its provision of strategic, management, and technical and operational guidance, the Parent Bank sets
the principles and guidelines for loan issue and management systems.
The rules for the treatment of customers granted credit by several Group banks are also set at the Group level,
both in terms of the issue and rating assignment stage and the credit management stage, with the aim of
optimizing the oversight of these customers and the use of common information technology assets.
Ratings and expected loss are the benchmarks referred to in the evaluation of requests for credit, the
differentiation of decision-making authority, pricing, management activity and lending policies.
In this regard, decision-making powers concerning lending have been differentiated both in terms of the nominal
risk taken, as well as in terms of expected loss. The latter is calculated according to rating parameters (EAD and
LGD).
Additional activities related to the larger Basel II project concern information technology issues pertaining to the
implementation of management tools for the entire lending process.
Computer procedures supporting the issue of loans also call for the evaluation of guarantors and securities given
for loans.
The evaluation of securities as a source of auxiliary repayment in the event of default by the customer in particular
involves a preliminary assessment procedure that considers the correspondence of the guarantor’s assets with the
personal security that has been provided, the relationship between the borrower and guarantor, the guarantor's
profile and rating, when available, and the description of and evaluation of the assets backed by collateral security.
Exposures to non-retail entities derive from trading in derivative products to cover banking-book interest rate
positions and, to a residual extent, over-the-counter brokerage activity. These contracts were entered into with the
Parent Bank and leading bank counterparties with high credit standing.

Notes
-175-
AAA/AA- A+/A- BBB+/BBB- BB+/BB- B+/B- Below B-A. Cash exposures 87.554 2.510.247 1.648 549 257 6.287.825 8.888.080B. Derivatives B.1 Financial derivatives 14.396 16.192 - - - - 541 31.129 B.2 Credit derivatives - - - - - - - -C. Guarantees given - 28.983 - - - - 3.308 32.291D. Commitments to lend funds - - - - - - 20.210 20.210Total 101.950 2.555.422 1.648 549 257 - 6.311.884 8.971.710(Amounts in Euro/000)
ExposuresExternal rating class
No rating Total
Low risk Medium-to-low riskMedium-to-high
riskHigh risk
A. Cash exposures 3.320.561 351.884 259.645 152.211 4.803.779 8.888.080B. Derivatives B.1 Financial derivatives - - - - 31.129 31.129 B.2 Credit derivatives - - - - - -C. Guarantees given - - - - 32.291 32.291D. Commitments to lend funds - - - - 20.210 20.210Total 3.320.561 351.884 259.645 152.211 4.887.409 8.971.710(Amounts in Euro/000)
ExposuresInternal rating class
No rating Total

Notes
-176-
A.3 BREAKDOWN OF SECURED LOANS BY TYPE OF SECURITY
A.3.1 Secured cash exposures to banks and customers
- -
4,0
37,2
92
591
Other entities
460
39
Banks
Other public institutions
Governments
Other entities
Banks
Other public institutions
Governments
Other assets
238
21
Securities 2,2
65
Buildings
4,0
34,3
29
531
4,0
43,0
34
674
1.
Secu
red e
xposu
res
to b
anks
:
1.1
fully
secu
red
1.2
part
ially
secu
red
2.
Secu
red e
xposu
res
to c
ust
om
ers
:
2.1
fully
secu
red
2.2
part
ially
secu
red
(Am
ounts
in E
uro
/000)
To 3
1 D
ece
mber,
2006
Endors
em
ent
credits
Total
Value of exposure
Cre
dit d
erivatives
Colla
tera
l se
curities
Pers
onal se
curities

Notes
-177-
A.3.2 Secured “off-balance-sheet” exposures to banks and customers
This table was not included since FinecoBank S.p.A. did not have any secured “off-balance-sheet” exposures to
banks and customers to report.
A.3.3 Secured impaired cash exposures to banks and customers
51,5
91
222
235
34,5
74
139
221
Other entities
Non-financial companies
Insurance companies
Financial companies
Banks
Other public institutions
Governments and central banks
Other entities
Non-financial companies
Insurance companies
Financial companies
Banks
Other public institutions
Governments and central banks
Other assets
Securities
1
Buildings
34,5
73
139
221
34,8
05
139
221
34,8
05
139
221
1.
Secu
red e
xposu
res
to b
anks
:
1.1
more
than
150%
1.2
betw
een 1
00%
and 1
50%
1.3
betw
een 5
0%
and 1
00%
1.4
more
than
50%
2.
Secu
red e
xposu
res
to c
ust
omers
:
2.1
more
than
150%
2.2
betw
een 1
00%
and 1
50%
2.3
betw
een 5
0%
and 1
00%
2.4
more
than
50%
(Am
ounts
in E
uro
/000)
To 3
1 D
ece
mber,
2006
Endors
em
ent
credits
Total
Fair value excess, security
Amount secured
Value of exposure
Cre
dit d
erivatives
Colla
tera
l se
curities
Pers
onal se
curities
Secu
rities
(fair v
alu
e)

Notes
-178-
A.3.4 Secured impaired “off-balance-sheet” exposures to banks and customers
This table was not included since FinecoBank S.p.A. did not have any secured impaired “off-balance-sheet”
exposures to banks and customers to report.
B. CREDIT DISTRIBUTION AND CONCENTRATION
B.1 Breakdown of cash exposures and off-balance-sheet exposures to customers by sector
Net exposure 24,6
45
36,2
74
5,5
40
6,0
10,3
79
6,0
76,8
38
11,0
61
11,0
61
Portfolio adjustments (966)
(12,8
13)
(13,7
79) -
Specific adjustments
(23,0
99)
(3,2
72)
(26,3
71) -
Gross exposure 47,7
44
39,5
46
6,5
06
6,0
23,1
92
6,1
16,9
88
11,0
61
11,0
61
Net exposure 216 3 2
7,8
80
8,1
01
1,6
47
1,6
47
Portfolio adjustments (2)
(9)
(11) -
Specific adjustments
(208)
(4)
(212) -
Gross exposure 424 7 4
7,8
89
8,3
24
1,6
47
1,6
47
Net exposure
8,2
03
8,2
03
4,4
83
4,4
83
Portfolio adjustments - -
Specific adjustments - -
Gross exposure
8,2
03
8,2
03
4,4
83
4,4
83
Net exposure
39 2
3,7
85
844,7
95
848,6
21
4,1
96
4,1
96
Portfolio adjustments
(115)
(27)
(142) -
Specific adjustments
(453)
(5)
(458) -
Gross exposure
492 7
3,9
00
844,8
22
849,2
21
4,1
96
4,1
96
Net exposure 826
826
207
207
Portfolio adjustments - -
Specific adjustments - -
Gross exposure 826
826
207
207
Net exposure
16,9
77
16,9
77
226
226
Portfolio adjustments - -
Specific adjustments - -
Gross exposure
16,9
77
16,9
77
226
226
To 3
1 D
ecem
ber
, 2006
A.
Cash
exp
osu
res
A.1
Non
-per
form
ing loan
s
A.2
Pro
ble
m loa
ns
A.3
Res
truct
ure
d e
xpos
ure
s
A.4
Exp
ired e
xposu
res
A.5
Oth
er e
xpos
ure
s
TO
TAL
B.
Off
-bala
nce
-sh
eet
exp
osu
res
B.1
Non
-per
form
ing loan
s
B.2
Pro
ble
m loa
ns
B.3
Oth
er im
pair
ed a
sset
s
B.4
Oth
er e
xpos
ure
s
TO
TAL
(Am
ounts
in E
uro
/000)
Insu
rance
co
mpan
ies
Non-f
inanci
al c
ompanie
sO
ther
entities
Exp
osu
res
/ Cou
nte
rpar
ties
Gov
ern
ment
and
centr
al b
anks
Oth
er p
ublic
in
Finan
cial co
mpan
ies

Notes
-179-
Net exposure 16,7
35
18,5
49
7,3
12
5,6
02,9
75
5,6
45,5
71
22,4
15
22,4
15
Portfolio adjustments
(10,3
29)
(10,3
29) -
Specific adjustments
(18,5
07)
(1,9
93)
(190)
(20,6
90) -
Gross exposure 35,2
42
20,5
42
7,5
02
5,6
13,2
97
5,6
76,5
83
22,4
15
22,4
15
Net exposure
33
2,6
14
2,6
47
365
365
Portfolio adjustments (1)
(1) -
Specific adjustments
(82)
(82) -
Gross exposure 115
2,7
80
2,8
95
365
365
Net exposure 39
39
17
17
Portfolio adjustments - -
Specific adjustments - -
Gross exposure 39
39
17
17
Net exposure
65
938,3
65
938,4
30
741
741
Portfolio adjustments
(96)
(96) -
Specific adjustments
(419)
(419) -
Gross exposure
484
948,3
34
948,8
18
741
741
Net exposure
1,1
27
1,1
27
671
671
Portfolio adjustments - -
Specific adjustments - -
Gross exposure
1,1
29
1,1
29
671
671
Net exposure
12,6
42
12,6
42
1,0
05
1,0
05
Portfolio adjustments - -Specific adjustments - -
Gross exposure
12,7
27
12,7
27
1,0
05
1,0
05
To
31 D
ece
mber
, 2005
A.
Cash
exp
osu
res
A.1
Non-p
erfo
rmin
g loa
ns
A.2
Pro
ble
m loa
ns
A.3
Res
truct
ure
d e
xposu
res
A.4
Exp
ired
exp
osu
res
A.5
Oth
er e
xposu
res
TO
TAL
B.
Off
-bala
nce
-sh
eet
exp
osu
res
B.1
Non-p
erfo
rmin
g loa
ns
B.2
Pro
ble
m loa
ns
B.3
Oth
er im
pai
red a
sset
s
B.4
Oth
er e
xposu
res
TO
TAL
(Am
ounts
in E
uro
/000)
Insu
rance
co
mpan
ies
Non
-fin
anci
al c
ompan
ieO
ther
entities
Exp
osure
s /
Cou
nte
rpar
ties
Gov
ernm
ent
and
centr
al b
anks
Oth
er p
ublic
inst
itu
Financi
al co
mpan
ies

Notes
-180-
B.2 Breakdown of loans to non-financial resident companies
31-Dec-06 31-Dec-05 Absolute %
(a) Other market services 4,958 1,820 3,138 172.4%(b) Trade services, recoveries and reparations 281 468 (187) -40.0%(c) Construction and public works 166 156(d) Hotels, bars and restaurants 104 4(e) Agriculture products 17 7(f) Other branches 40 739 (699) -94.6%Total 5,566 3,194 2,252 70.5%(Amounts in Euro/000)
Change
B.3 Breakdown of cash and off-balance-sheet exposures to customers by geographical area
As at 31 December 2006
Gro
ss e
xposu
re
Net
exp
osure
Gro
ss e
xposu
re
Net
exp
osure
Gro
ss e
xposu
re
Net
exp
osure
Gro
ss e
xposu
re
Net
exp
osure
Gro
ss e
xposu
re
Net
exp
osure
A. Cash exposuresA.1 Non-performing loans 48,554 24,840 106 60 - - - - - -A.2 Problem loans 39,560 36,279 - - 1 1 - - - -A.3 Restructured exposures - - - - - - - - -A.4 Expired exposures 10,411 9,327 - - - - - - - -A.5 Other exposures 6,280,118 6,267,276 554,724 554,718 67,048 67,048 7 7 11 11TOTAL 6,378,643 6,337,722 554,830 554,778 67,049 67,049 7 7 11 11B. Off-balance-sheet exposuresB.1 Non-performing loansB.2 Problem loansB.3 Other impaired assetsB.4 Other exposures 12,202 12,202 8,940 8,940 672 672 6 6TOTAL 12,202 12,202 8,940 8,940 672 672 - - 6 6
TOTAL 6,390,845 6,349,924 563,770 563,718 67,721 67,721 7 7 17 17(Amounts in Euro/000)
ASIA REST OF THE WORLD
Exposures / Geographical areas
ITALYOTHER EUROPEAN
COUNTRIESAMERICA

Notes
-181-
B.4 Breakdown of cash and off-balance-sheet exposures to banks by geographical area
As at 31 December 2006
Gro
ss e
xposu
re
Net
exp
osure
Gro
ss e
xposu
re
Net
exp
osure
Gro
ss e
xposu
re
Net
exp
osure
Gro
ss e
xposu
re
Net
exp
osure
Gro
ss e
xposu
re
Net
exp
osure
A. Cash exposuresA.1 Non-performing loansA.2 Problem loansA.3 Restructured exposuresA.4 Expired exposuresA.5 Other exposures 1,921,507 1,921,507 4,661 4,661 2,257 2,257 89 89TOTAL 1,921,507 1,921,507 4,661 4,661 2,257 2,257 - - 89 89B. Off-balance-sheet exposuresB.1 Non-performing loansB.2 Problem loansB.3 Other impaired assetsB.4 Other exposures 49,655 49,655 11,843 11,843 261 261 50 50TOTAL 49,655 49,655 11,843 11,843 261 261 - - 50 50
TOTAL 1,971,162 1,971,162 16,504 16,504 2,518 2,518 - - 139 139(Amounts in Euro/000)
ASIA REST OF THE WORLD
Exposures / Geographical areas
ITALYOTHER EUROPEAN
COUNTRIESAMERICA
As at 31 December 2005
Gro
ss e
xpos
ure
Net
exp
osu
re
Gro
ss e
xpos
ure
Net
exp
osu
re
Gro
ss e
xpos
ure
Net
exp
osu
re
Gro
ss e
xpos
ure
Net
exp
osu
re
Gro
ss e
xpos
ure
Net
exp
osu
re
A. Cash exposuresA.1 Non-performing loansA.2 Problem loansA.3 Restructured exposuresA.4 Expired exposuresA.5 Other exposures 952,799 951,263 1,562 1,562 4,397 4,589 34 34TOTAL 952,799 951,263 1,562 1,562 4,397 4,589 - - 34 34B. Off-balance-sheet exposuresB.1 Non-performing loansB.2 Problem loansB.3 Other impaired assetsB.4 Other exposures 31,628 31,628 225 225TOTAL 31,628 31,628 225 225 - - - - - -
TOTAL 984,427 982,891 1,787 1,787 4,397 4,589 - - 34 34(Amounts in Euro/000)
ASIA REST OF THE WORLD
Exposures / Geographical areas
ITALYOTHER EUROPEAN
COUNTRIESAMERICA
B.5 Significant exposures
The Bank did not have any positions that were considered “significant exposures” according to current supervisory
regulations as at 31 December 2006.

Notes
-182-
C. SECURITIZATION AND ASSET TRANSFER TRANSACTIONS
C.1 SECURITIZATION TRANSACTIONS
QUANTITATIVE INFORMATION
During 2006, FinecoBank S.p.A. did not undertake any new loan transfer transactions, instead focusing on
completing previous revolving securitization transactions.
Furthermore, during the first half of the year the Bank concluded in advance a securitization transaction it had
undertaken with the Garda vehicle involving fifth of salary personal loans.
In compliance with the general principle of the prevalence of economic substance over legal form, the mere
transfer of ownership is not sufficient to allow a financial asset to be derecognized from the balance sheet. Instead,
both the conditions surrounding the transfer of the rights to the cash flows and the effective transfer of the risks
and rewards related to the transferred asset to the purchaser must be verified.
FinecoBank S.p.A. has applied the provisions of IAS 39 to its transfer transactions, and, consequently, to its
securitization of loans, from 1 January 2002 forward, in addition to the “Garda Mutui” revolving loan securitization,
from 1 January 2002 forward.
Firstly, although FinecoBank S.p.A. did not transfer the unexpired rights to receive the cash flows from the assets,
it has entered into a servicing agreement and thereby assumed an obligation that meets the conditions to be
considered a “pass-through” agreement, i.e. to transfer the cash flows to the transferee without delay and not to
reinvest them for its own benefit. The Bank is compensated for its servicing activity at market conditions.
Furthermore, the securitization transactions undertaken by FinecoBank S.p.A. allow the latter to retain
substantially all the risks and rewards deriving from the ownership of the financial assets and the exposure to
changes in future cash flows.
The relevant transactions involve entering into a swap contract that calls for the issuer to pay the counterparty to
the swap all the cash flows generated by the portfolio as interest and receive on each note coupon payment date
precisely the amount required to service its debt and other periodic expenses of an administrative nature.

Notes
-183-
The following table summarizes the securitization transactions originated by FinecoBank S.p.A. that were
underway as at 31 December 2006.
TRANSACTIONDATE OF
TRANSFERLOAN TYPE
TYPE OF NOTES
DATE OF ISSUE FACE VALUE OF NOTESORIGINAL RATING
CURRENT RATING
S&P MOODY'S FITCH S&P MOODY'S FITCH
UPGRADE A (Pilot 11/22/1999 MORTGAGES 12/31/1999 10,724,000.00 N.R. N.R. N.R. N.R. N.R. N.R.12/31/1999 10,724,000.00 N.R. N.R. N.R. N.R. N.R. N.R.
21,448,000.00
GARDA MUTUI 3/31/2001 MORTGAGES Class A 7/18/2001 670,000,000.00 AAA Aaa N.R. AAA Aaa N.R.Class B 7/18/2001 30,000,000.00 A A2 N.R. A A2 N.R.Class C 7/18/2001 76,669,000.00 N.R. N.R. N.R. N.R. N.R. N.R.
776,669,000.00
VELITES 9/30/2001 MORTGAGES Class A 3/27/2002 269,800,000.00 AAA Aaa N.R. AAA Aaa N.R.Class B 3/27/2002 19,300,000.00 A A2 N.R. A+ A2 N.R.Class C 3/27/2002 50,100,000.00 N.R. N.R. N.R. N.R. N.R. N.R.
339,200,000.00
HELICONUS 8/5/2002 MORTGAGES Class A 11/8/2002 369,000,000.00 AAA Aaa AAA AAA Aaa AAAClass B 11/8/2002 30,800,000.00 N.R. A2 A N.R. A2 AClass C 11/8/2002 8,990,200.00 N.R. N.R. N.R. N.R. N.R. N.R.
408,790,200.00
F-E PERSONAL LO 4/23/2003 "ONE-FIFTH OFClass A 6/16/2003 413,000,000.00 AAA Aaa N.R. AAA Aaa N.R.Class B 6/16/2003 26,800,000.00 AA Aa2 N.R. AA Aa2 N.R.Class C 6/16/2003 6,810,400.00 N.R. N.R. N.R. N.R. N.R. N.R.
446,610,400.00
F-E MORTGAGES 9/30/2003 MORTGAGES Class A 11/28/2003 682,000,000.00 AAA Aaa AAA AAA Aaa AAAClass B 11/28/2003 48,000,000.00 A A1 A A A1 AClass C 11/28/2003 11,000,000.00 BBB Baa2 BBB BBB Baa2 BBBClass D 11/28/2003 7,630,000.00 N.R. N.R. N.R. N.R. N.R. N.R.
748,630,000.00
F-E MORTGAGES 2/28/2005 MORTGAGES Class A 4/8/2005 951,600,000.00 AAA Aaa AAA AAA Aaa AAAClass B 4/8/2005 41,100,000.00 AA+ A1 A AA+ A1 AClass C 4/8/2005 36,000,000.00 BBB Baa2 BBB BBB Baa2 BBBSub. loan 4/8/2005 15,430,500.00 N.R. N.R. N.R. N.R. N.R. N.R.
1,044,130,500.00
TOTAL 3,785,478,100.00
Notes: for the transaction F-E MORTGAGES II, the column “Face Value of Notes” contains the amount of the subordinated loan
issued by FinecoBank S.p.A. to the vehicle.
In relation to the Velites Mutui transaction, an historical increase in the rating of the Class B notes was recorded,
confirming the excellent performance of the transaction.
In the other cases, the ratings assigned when the transactions were closed were always confirmed at annual
surveillance and have never been downgraded.
Strategies
The situation of 2006, which is an extension of the trend in previous years, is that of continuing growth of
customer loans. In the Bank’s future business plans, great importance is attached to the lending sector, especially
for the purchase of real estate and durable consumer goods, resulting in important funding and organizational
choices. Due to this growth, it is likely that it may become necessary in the future, as in previous years, to have
recourse to a sector of the capital markets that is currently significant, namely the ABS ("Asset-Backed Securities")
sector.
These operations are mainly aimed at rationalizing the Bank’s assets and funding the expansion of its lending
activity through the use of innovative instruments, such as the securitization of loans.

Notes
-184-
Operations
The securitized loans are loans originated by FinecoBank S.p.A. as part of its normal business and are all classified
as performing. The portfolio of transferred loans consists of mortgage loans, fifth of salary loans, and delegated
payment loans issued to customers residing in Italy.
The loans were transferred to the special purpose vehicle without recourse.
The special purpose vehicle, which was established in accordance with Law 130/99, funded the purchase of the
loan portfolios by issuing several classes of notes with various levels of priority of the payment of principal and
interest. The classes of notes to which the highest ratings were assigned were underwritten directly by the
arrangers of each of the securitization transactions and placed on the international capital market, while the class
of notes or subordinated loans with the highest level of subordination (junior notes or subordinated loans) was
purchased by the originators (Bipop Carire Società per Azioni and FinecoBank S.p.A.).
Solely in the case of the Pilot Upgrade transaction, in which only senior notes were issued, did the originators
underwrite all tranches of notes.
During the revolving period, when applicable, the issuer has the right of applying sums received as partial or full
repayment of principal by borrowers to the purchase of new loans originated by the sellers. At the end of this
period, and for the rest of the duration of the transaction, the principal collected on the loans is used to repay the
principal on the notes that have been issued.
In the Garda and Velites securitization transactions, the issuer has the right of repaying the notes in full through
optional redemption (a call option). Unless they are repaid, the interest rate on the notes is to increase by 1.00%
(the "step-up spread"), to be applied over the rest of the duration of the transaction.
It should be pointed out that in the Heliconus, F-E Personal Loans, F-E Mortgages and F-E Mortgages II
securitization transactions, the notes have an original maturity equal to that of the securitized loans, which were
fully backed when issued. As a consequence, there is no “step-up call option” even in the event of optional
redemption.
Risks
The risk for the originators inherent in the securitization transaction may generally be defined as the risk that the
vehicle company might not be able to make full payment of all of the interest that accrues from time to time on
the junior notes that have been purchased and make payment of the principal of the notes at maturity.
It should be noted that the repayment of the junior notes that have been purchased is contingent upon the
repayment of all other types of notes issued by the special purpose vehicle as part of the securitization transaction.
This situation is a direct consequence of the risk to which the vehicle is exposed, namely that the securitized
assets may not be able to generate sufficient cash flows over time to ensure the regular repayment of the interest
accrued on the notes and the repayment of the principal at maturity, or that the portfolio of transferred loans may
show non-performance sufficient to lead to losses due to uncollectibility greater than those provided for in the
definition of the transfer price of the loans.
The valuation of this risk is represented in the valuation of the junior notes in portfolio as at 31 December 2006
(for securitization transactions undertaken prior to 1 January 2002) and in the valuation of the loans (for
securitization transactions undertaken subsequent to 1 January 2002), which are presented under customer loans,
as required by IAS 39.
The underwritten junior and senior notes have been recognized as available-for-sale securities within the Bank’s
proprietary portfolio. These notes were initially recognized at purchase cost, decreased by any losses considered
permanent, when applicable. The losses in value were calculated considering the degree of collectibility of the

Notes
-185-
issuer (the special purpose vehicle), which is closely tied to the predisposition of the transferred loans (home
mortgage loans and fifth of salary loans) to show losses due to the insolvency of the borrowers. It was therefore
deemed appropriate to calculate impairment loss by applying the EL percentage recorded on the category of loans
consisting of home mortgage loans and fifth of salary loans.
Loans transferred subsequent to 1 January 2002 as part of the Heliconus, F-E Personal, F-E Mortgages and F-E
Mortgages II transactions were recognized on the balance sheet of FinecoBank S.p.A. at their amortized cost and
subject to impairment loss. It must further be noted that the return on the portfolios of securitized loans is greater
than the overall costs incurred by the vehicles (this difference being known as the “excess spread”) and the
transactions were undertaken without realizing a gain on the sale of the loans. Consequently, the junior notes
underwritten by the Bank were fully backed when they were issued, and the repayment of the notes is facilitated
by the existence of the above excess spread.
In particular, adequate “asset backing” for the notes issued is maintained using the “principal deficiency ledger”
mechanism (consisting of virtual ledgers for each class of notes in which a periodic record is kept of the difference
between the total sum of the notes to be repaid and the value of the principal of the performing loans), whereby
the excess spread available to the vehicle is used to replace loans classified as defaulted and re-establish the full
backing of all the notes to be repaid (and thereby bringing the balance of the various principal deficiency ledgers
back to zero).
The risk level of the portfolios of securitized loans is measured on a monthly basis, as for the rest of the Bank’s
proprietary portfolio, by assigning a probability of default and loss given default value to each contract. This
method allows the Bank to prepare an estimate of the expected loss for the entire portfolio with a time span of one
year.
Servicing of the loans and auxiliary roles
The originator, FinecoBank S.p.A., has also been appointed the servicer for its portfolio of transferred loans. This
task entails the performance of various duties, including:
• the management of collection and payment for the transferred loans;
• ordinary administration of the portfolio;
• monitoring of management activity in terms of the compliance of the procedures followed with the law and the
contracts governing the transaction;
• periodic reporting to the Risk Center, anti-money laundering controls, and compliance with privacy laws;
• control and authorization of out-of-court and legal procedures required to recover debt on loans classified as
non-performing.
Lastly, the special purpose vehicles Upgrade S.r.l., Garda S.r.l. and Velites S.r.l. have engaged the company
Zenith Service S.r.l. to take the role of special servicer and calculation agent for their securitization transactions.
Under this engagement, Zenith Service S.r.l. is responsible for providing a series of administrative services and
serving as the calculation agent. The originator monitors and retains the responsibility for the debt-recovery
activity undertaken by Zenith Service S.r.l..
In the Heliconus, F-E Personal Loans, F-E Mortgages and F-E Mortgages II securitization transactions, FinecoBank
S.p.A. also took on the role of special servicer, which had previously been assigned to the company Zenith Service
S.r.l., and was responsible for the management of non-performing loans and the filing of reports required by
supervisory regulations on behalf of the vehicle.

Notes
-186-
In these latter securitization transactions, FinecoBank S.p.A. has also taken on the role of account bank and makes
the majority of the payments to the special purpose vehicle’s creditors.
Organizational structure
The organizational structure of the Bank that oversees the process described above is divided into three general
stages.
1. Start-up
After an analysis has been conducted of the assets required, the effect of a possible securitization transaction on
the income statement is assessed and certain of the Bank’s organizational structures are engaged to prepare a
detailed report concerning the impact on the Bank’s accounting and tax situation, legal issues, capital
requirements and risk measurement system, and internal control system. This report also contains the methods of
selection of the specialized outside company (known as the arranger) that will be responsible for organizing the
securitization transaction.
The preliminary proposal is thus supplemented and forwarded to the Parent Bank for the required corporate
governance approval.
The preliminary opinion issued by the Parent Bank allows the Bank to start its own internal authorization procedure
by submitting the securitization transaction to the Board of Directors.
The Board of Directors, in addition to deciding whether to undertake the securitization transaction, establishes the
relative guidelines, appoints a Project Manager, issues a formal power of attorney for the Legal Representative
who is to sign the documents pertaining to the transaction, and sets the arranger's restrictions and area of
competence, as well as those of the company that is to place the notes issued through the securitization
transaction on the market (known as the “bookrunner”) and outside legal consultants.
After the Board of Directors has reached a decision, activities relating to the identification of the portfolio of
transferable loans, the preparation and approval of the contracts, and the transfer of the loans are completed.
2. Ordinary management
The organizational structures involved in the securitization process perform a series of activities on behalf of the
special purpose vehicle. These activities are governed as appropriate by a specific servicing agreement.
These structures, in addition to managing the collection and the accounting treatment of the payments on
securitized loans as they fall due, also manage a series of supplementary services of an accounting or
administrative nature, such as, for example: the preparation of periodic reports, the preparation of data to be used
in drafting the special purpose vehicle’s financial statements, the generation of periodic report flows for the
Supervisory Bodies (the Bank of Italy and the Italian Exchange Office). These structures also recover debts on
behalf of the special purpose vehicle.
3. Extraordinary management
These structures also supervise any extraordinary events such as the buying-back or renegotiation of loans by the
Bank or the advance conclusion of securitization transactions following the exercise of buy-back options on the
portfolio of transferred loans by FinecoBank S.p.A..

Notes
-187-
Effects on the income statement from 1 January 2006 to 31 December 2006
In order to assess the effect that the securitization transactions had on the income statement during 2006, it is
essential that transactions that were fully or partially derecognized from the financial statements be considered
separately from transactions involving loans that have been sold but not eliminated.
Transactions that have been fully eliminated from the balance sheet
Special-purpose vehicle Item 40 Item 50 Item 80 Item 100 Item 190 TotalCommission Commission Net profit on Profit/loss on Other charges /
income expense trading activity ale of AFS asset other income1 Upgrade S.r.l. 1.1 Pilot mortgage transaction Sale - - - - - - Buy-back - - - - - - Renegotiation - - - - - - Revolving - - - - - - Cash flow swap - - 58 - - 58 Valuation swap - - - - - - Junior notes - - - - - - Servicing 1 - - - - 1Total 1 - 58 - - 59(Amounts in Euro/000)
Special-purpose vehicle Item 40 Item 50 Item 80 Item 100 Item 190 TotalCommission Commission Net profit on Profit/loss on Other charges /
income expense trading activity ale of AFS asset other income3 Velites S.r.l. 3.1 Mortgage loans Sale - - - - - - Buy-back - - - - - - Renegotiation - - - - (37) (37) Revolving - - - - - - Cash flow swap - - 255 - - 255 Valuation swap - - (1,320) - - (1,320) Junior notes - - - (3,580) - (3,580) Servicing 24 - - - - 24Total 24 - (1,065) (3,580) (37) (4,658)(Amounts in Euro/000)

Notes
-188-
Transactions that have been partially eliminated from the balance sheet
It should be noted that the revolving securitization transactions undertaken by the special purpose vehicle Garda
S.r.l. subsequent to 1 January 2002 are only presented on the balance sheet of FinecoBank S.p.A..
Special-purpose vehicle Item 10 Item 40 Item 50 Item 80 Item 100 Item 130 Item 190 TotalInterest Commission Commission Net profit Profit/loss Net adjustmentOther expenses/income income expense on trading on the sale to the value other income
activity of AFS assets of loans2 Garda Securitisation S.r.l. 2.1 Mortgage loans Sale - - - - - - - - Buy-back - - - - - - - - Renegotiation - - - - - - (31) (31) Revolving - - (201) - - - - (201) Cash flow swap - - - 40 - - - 40 Valuation swap - - - (1,052) - - - (1,052) Junior notes - - - - - - - - Servicing - 23 - - - - - 23 Amortized cost of loans (57) - - - - - - (57) Writedown of loans - - - - - (64) - (64) 2.2 "Fifth of salary" loans - Sale - - - - - - - - Buy-back - - - - - - - - Renegotiation - - - - - - - - Revolving - - - - - - - - Cash flow swap - - - 173 - - - 173 Valuation swap - - - (275) - - - (275) Junior notes - - - - 291 - - 291 Servicing - 4 - - - - - 4Total (57) 27 (201) (1,114) 291 (64) (31) (1,149)(Amounts in Euro/000)
Transactions involving loans sold but not eliminated from the balance sheet
Special-purpose vehicle Item 10 Item 20 Item 50 Item 130 Item 150 TotalInterest Interest Commission Net adjustments Administrativeincome expense expense to loans expenses
4 Heliconus S.r.l. 4.1 Mortgage loans Transferred loans 16,014 - - - - 16,014 Amortized cost of transferred loans (1,946) - - - - (1,946) Financial liabilities - (10,854) - - - (10,854) Amortized cost of financial liabilities - (190) - - - (190) Commission swap - - (152) - - (152) Ongoing expenses - - - - (304) (304) Writedown of loans - - - (174) - (174)Total 14,068 (11,044) (152) (174) (304) 2,394(amounts in Euro/000)
Special-purpose vehicle Item 10 Item 20 Item 50 Item 130 Item 150 TotalInterest Interest Commission Net adjustments Administrativeincome expense expense to loans expenses
5 F-E Personal Loans S.r.l. 5.1 "Fifth of salary" and "delegated payment" loans Transferred loans 12,270 - - - - 12,270 Amortized cost of transferred loans 2,777 - - - - 2,777 Financial liabilities - (7,887) - - - (7,887) Amortized cost of financial liabilities - (228) - - - (228) Commission swap - - (42) - - (42) Ongoing expenses - - - - (197) (197) Writedown of loans - - - 116 - 116Total 15,047 (8,115) (42) 116 (197) 6,809(amounts in Euro/000)

Notes
-189-
Special-purpose vehicle Item 10 Item 20 Item 50 Item 130 Item 150 TotalInterest Interest Commission Net adjustments Administrativeincome expense expense to loans expenses
6 F-E Mortgages S.r.l. 6.1 Mortgage loans Transferred loans 30,028 - - - - 30,028 Amortized cost of transferred loans (3,329) - - - - (3,329) Financial liabilities - (21,154) - - - (21,154) Amortized cost of financial liabilities - (331) - - - (331) Commission swap - - (129) - - (129) Ongoing expenses - - - - (219) (219) Writedown of loans - - - (578) - (578)Total 26,699 (21,485) (129) (578) (219) 4,288(amounts in Euro/000)
Special-purpose vehicle Item 10 Item 20 Item 50 Item 130 Item 150 TotalInterest Interest Commission Net adjustments Administrativeincome expense expense to loans expenses
7 F-E Mortgages S.r.l. II 7.1 Mortgage loans Transferred loans 47,886 - - - - 47,886 Amortized cost of transferred loans (3,984) - - - - (3,984) Financial liabilities - (31,201) - - - (31,201) Amortized cost of financial liabilities - (169) - - - (169) Commission swap - - (54) - - (54) Ongoing expenses - - - - (184) (184) Writedown of loans - - - (744) - (744)Total 43,902 (31,370) (54) (744) (184) 11,550(amounts in Euro/000)

Notes
-190-
Transferee companies (special purpose vehicles)
Upgrade S.r.l.
Upgrade S.r.l., a loan securitization vehicle established in 1999 under Italian Law 130/99, having its registered
office in Brescia, Italy, and quota capital of €100,000.00, its company object being to undertake several loan
securitization transactions in Italy (a “multi-purpose” vehicle).
The company was established under the form of an Italian-law joint-stock company (S.p.A.) with share capital of
€100,000.00 and was subsequently transformed into a limited-liability company (S.r.l.).
The company’s quota capital may be broken down as follows:
Bipop Carire Società per Azioni 10%
Zenith Holding S.r.l. 45%
Law 130 Securitisation Limited 45%
Total 100%
Garda Securitisation S.r.l.
Garda Securitisation S.r.l., a loan securitization vehicle established in 2000 under Italian Law 130/99, having its
registered office in Brescia, Italy, and quota capital of €12,000.00, its company object being to undertake several
loan securitization transactions in Italy (a “multi-purpose” vehicle).
The company’s quota capital may be broken down as follows:
Zenith Holding S.r.l. 31%
Net Insurance S.p.A. 9%
Zenith Service S.p.A. 60%
Total 100%
Velites S.r.l.
Velites S.r.l., a loan securitization vehicle established in 2001 under Italian Law 130/99, having its registered office
in Brescia, Italy, and quota capital of €12,000.00, its company object being to undertake several loan
securitization transactions in Italy (a “multi-purpose” vehicle).
The company’s quota capital may be broken down as follows:
Zenith Holding S.r.l. 90%
Zenith Service S.p.A. 10%
Total 100%
Zenith Italia and FinecoBank S.p.A. have entered into a Quotaholders’ Agreement under which FinecoBank S.p.A.
has the option of purchasing the entire equity investment quotas in the vehicle 100% owned by Zenith Italia (i.e.,
a call option) within six months after the securitization has been settled. Under the same agreement, Zenith Italia
has the option of selling its quota to FinecoBank S.p.A. within six months after the securitization has been settled
(i.e., a put option).

Notes
-191-
Heliconus S.r.l.
Heliconus S.r.l., a loan securitization vehicle established in 2002 under Italian Law 130/99, having its registered
office in Milan, Italy, and quota capital of €10,000.00, its company object being to undertake several loan
securitization transactions in Italy (a “multi-purpose” vehicle).
The company’s quota capital may be broken down as follows:
Stichting Mathema I 50%
Stichting Mathema II 50%
Total 100%
Stichting Mathema I, Stichting Mathema II, and FinecoBank S.p.A. have entered into a Quotaholders’ Agreement
under which FinecoBank S.p.A. has the option of purchasing the entire equity investment quotas in the vehicle,
which are 50% owned by each of the above entities (i.e., a call option) within six months after the securitization
has been settled. Under the same agreement, the two entities have the option of selling their quotas to
FinecoBank S.p.A. within six months after the securitization has been settled (i.e., a put option).
F-E Personal Loans S.r.l.
F-E Personal Loans S.r.l., a loan securitization vehicle established in 2003 under Italian Law 130/99, having its
registered office in Rome, Italy, and quota capital of €10,000.00, its company object being to undertake several
loan securitization transactions in Italy (a “multi-purpose” vehicle).
The company’s quota capital may be broken down as follows:
Stichting Symonds 50%
Stichting Williamson 50%
Total 100%
Stichting Symonds, Stichting Williamson, and FinecoBank S.p.A. have entered into a Quotaholders’ Agreement
under which FinecoBank S.p.A. has the option of purchasing the entire equity investment quotas in the vehicle,
which are 50% owned by each of the above entities (i.e., a call option) within six months after the securitization
has been settled. Under the same agreement, the two entities have the option of selling their quotas to
FinecoBank S.p.A. within six months after the securitization has been settled (i.e., a put option).
F-E Mortgages S.r.l.
F-E Mortgages S.r.l., a loan securitization vehicle established in 2003 under Italian Law 130/99, having its
registered office in Milan, Italy, and quota capital of €10,000.00, its company object being to undertake several
loan securitization transactions in Italy (a “multi-purpose” vehicle).
The company’s quota capital may be broken down as follows:
Stichting Nadi 50%
Stichting Taveuni 50%
Total 100%

Notes
-192-
Stichting Nadi, Stichting Taveuni and FinecoBank S.p.A. have entered into a Quotaholders’ Agreement under which
FinecoBank S.p.A. has the option to purchase the entire equity investment quotas in the vehicle, which is 50%
owned by each of the above entities (i.e., a call option). This option right may be exercised initially on a quota
equal to 51% of the company’s quota capital, provided that subsequent to the date of first issue the nominal value
of the loans classified as non-performing is greater than or equal to 10% of the nominal value of the loans (and
only for as long as this condition continues to hold true). The option may be exercised at a second stage
exclusively during the six months subsequent to the date on which the notes have been fully redeemed and
derecognized, or on 31 December 2006, whichever of the two comes first, and allows the acquisition of 100% of
the company’s quota capital, in the event that the first option described above has not been exercised, or 49% of
the company’s quota capital, in the event that the first option has been exercised.
Main features of the securitization transactions undertaken
1. Upgrade S.r.l.
a. Introduction
The Bank undertook two loan securitization transactions with the special purpose vehicle Upgrade S.r.l. on 31
January 2001 and 11 April 2001 (the relative loans having been transferred during the year ended 31 December
2000). The former consisted of a portfolio of performing mortgage loans and the latter of performing fifth of salary
loans. Both of these transactions were concluded during 2005 in advance of term.
As at 31 December 2006, the only securitization transaction still underway with the Upgrade vehicle was that
referred to as the “pilot”, the relative loans having been transferred to the special purpose vehicle on 22 November
1999.
The loans held by said vehicle were not re-entered to the balance sheet since the Bank exercised the option
afforded by IFRS 1 and IAS 39 to recognize only loans transferred subsequent to 1 January 2002. The senior notes
underwritten by FinecoBank S.p.A. were classified to the category “Available-for-sale financial assets” and entered
to the balance sheet under line 40 of assets, “Available-for-sale financial assets”.
Bipop-Carire granted a liquidity line of €3,098,741.39 for this transaction.

Notes
-193-
b. General information
Pilot securitization of mortgage loans (figures as at 31 December 2006)
Special-purpose vehicle Upgrade S.r.l.Loan transfer date 22.11.1999Type of loans transferred Mortgage loansQuality of loans transferred PerformingGeographical area of loans transferred ItalyEconomic activity of transferred borrowers Private entitiesLoans transferred by FinecoBank S.p.A.gross of value adjustments 9,361Loans transferred by FinecoBank S.p.A.net of value adjustments 9,361Price of loans transferred by FinecoBank S.p.A. 9,361Profit on FinecoBank S.p.A. securitization -Loans transferred by AkrosCasagross of value adjustments 12,088Loans transferred by AkrosCasanet of value adjustments 12,088Price of loans transferred by AkrosCasa 12,088Profit on AkrosCasa securitization -Assets originated by FinecoBank againsttotal securitized assets 43.64%Revolving securitization of 22.12.00 2,278Principal collected by FinecoBank S.p.A. -10,793 of which, collected in 2006 -999Interest collected by FinecoBank S.p.A. -2,777 of which, collected in 2006 -63Total receivable by FinecoBank S.p.A. to 31.12.2006 846 of which, total impaired loans 71Total receivable by AkrosCasato 31.12.2006 903 of which, total impaired loans 172Date of issue of 99/07 senior notes 12/31/1999Date of maturity of 99/07 senior notes 12/31/2007Face value of 99/07 senior notesunderwritten by FinecoBank S.p.A. 857Book value of 99/07 senior notesunderwritten by FinecoBank S.p.A. 857Face value of 99/07 senior notesunderwritten by Bipop Carire Società per Azioni 1,104Book value of 99/07 senior notesunderwritten by Bipop Carire Società per Azioni 1,127Interest rate of underwritten 99/07 senior notes 6-month Eur. + 0.70% - Tax max. 5%Date of issue of 99/09 senior notes 12/31/1999Date of maturity of 99/09 senior notes 12/31/2009Face value of 99/09 senior notesunderwritten by FinecoBank S.p.A. -Book value of 99/09 senior notesunderwritten by FinecoBank S.p.A. -Face value of 99/09 senior notesunderwritten by Bipop Carire Società per Azioni -Book value of 99/09 senior notesunderwritten by Bipop Carire Società per Azioni -Interest rate of underwritten 99/09 senior notes 6-month Eur. + 0.90% - Tax max. 5.50%Date of IRS swap contract 12/31/1999Face value of IRS 6,540(Amounts in Euro/000)
The 99/09 senior notes had been fully redeemed on 31 December 2006.
c. The IRS contract
The portfolio of securitized loans consists of fixed and floating-rate loans, some of which were linked to parameters
other than the Euribor.
In order to mitigate the risk related to the special purpose vehicle’s exposure to unfavourable changes in lending
interest rates on loans and borrowing interest rates on notes, the issuer entered into an IRS contract with
FinecoBank S.p.A. to hedge the risk on the mortgage loan portfolio.

Notes
-194-
Under the above derivative contract, the issuer must pay the counterparty to the swap all the cash flows
generated by the portfolio as interest and, on each note coupon payment date, receive precisely the amount
required to service its debt and other periodic expenses of an administrative nature.
2. Garda Securitisation S.r.l.
a. Introduction
The Bank undertook one loan securitization transaction with the special purpose vehicle Garda Securitisation S.r.l.
on 18 July 2001 (the relative loans having been transferred during the year ended 31 December 2001). The
portfolio consists of performing mortgage loans.
The securitized loans were originated by FinecoBank S.p.A. and Bipop Carire Società per Azioni during normal
business operations.
The loans held by said vehicle were partially re-entered to the Bank’s balance sheet since the Bank exercised the
option afforded by IFRS 1 and IAS 39 to recognize only revolving loan securitizations undertaken subsequent to 1
January 2002, which were booked to the balance sheet at their amortized cost under line 70 of assets, “Customer
loans”. The junior notes underwritten by FinecoBank S.p.A. were reclassified to the category "Available-for-sale
financial assets" and entered to the balance sheet under line 40 of assets, “Available-for-sale financial assets”.
As a form of credit enhancement, Bipop-Carire granted a liquidity line of €15,000,000.00.
During the first half of 2006, the loan securitization transaction undertaken on 31 October 2001 (the relative loans
having been transferred during the year ended 31 December 2001) was concluded in advance of term. The
portfolio consisted of performing fifth of salary loans.
The loans securitized in this transaction had been originated exclusively by FinecoBank S.p.A. during its normal
business operations.
b. Buy-back of securitized loans
On 20 June 2006 the Bank exercised its clean-up and call option, which afforded the seller (FinecoBank S.p.A.) the
possibility of buying back the portfolio of securitized loans on any date of payment subsequent to that falling on 20
September 2005. Concurrently with the buying back of the loans, measured at fair value, for a total of €64,710
thousand, the special purpose vehicle proceeded with early full redemption of all class A and class B notes (rated),
and partial redemption of the class C notes (unrated and underwritten entirely by the seller). In its capacity as
originator, FinecoBank S.p.A. expressly surrendered the sums owed to it by the special purpose vehicle in relation
to the principal of the class C notes, which came to a nominal total of €2,483 thousand, due to the failure to
recoup the initial capital gain on sale (which had been €8,736 thousand), only partially recovered on a quarterly
basis through the additional redemption amount mechanism (equal to the excess spread, i.e. the difference
between the return on the portfolio of securitized loans and the overall cost incurred by the vehicle). The expected
loss on the class C Notes had been estimated in advance and set aside in a provision on the income statement of
FinecoBank S.p.A. during previous years.
The conclusion of the operation had been authorized in advance by the Bank of Italy on the seller’s request and
was justified by the financial expedience of exercising the call option.
The average price paid to buy back the portfolio was 101.28%. The fair value was calculated at the level of each
individual loan by classifying loans according to performance category (i.e., performing and non-performing loans).
The interest rate spread was calculated by taking into consideration general costs, funding costs, expected loss,
the interest rate arising from the volatility of early redemptions, and the Bank’s expected consideration.

Notes
-195-
The loans that were bought back were measured as follows:
• Fair value of performing loans
Loans with a number of past due loan payments less than or equal to 8 were classified as performing.
The fair value of performing loans was calculated by discounting the expected cash flows from individual loans.
In the event of past due loan payments, the fair value was calculated as the sum of past due payments and the
current value of expected future cash flows.
A constant early redemption rate, which was calculated as the average value of early redemption rates recorded
on the portfolio on a historical basis, was factored in to the calculation of expected future cash flows.
Discounting was conducted by using the zero curve from 31 May 2006 increased by an interestrate spread of
1.10%.
The interest rate spread was calculated by using a bottoms-up approach, considering that the loans that had been
issued by FinecoBank S.p.A. to date were not fully comparable with those being bought back in terms of their
maturities.
• Fair value of non-performing loans
Loans with a number of past due loan payments greater than or equal to 8 were classified as non-performing.
Fair value was calculated as equal to the nominal value of the debt claimed from the borrower (the sum of past
due instalments and outstanding principal payments).
In the event of non-performing loans for which legal action was underway, an analytical valuation was made in line
with the procedure that the Bank follows for similar loans.

Notes
-196-
b. General information
Securitization of mortgage loans and fifth of salary loans (figures as at 31 December 2006)
Special-purpose vehicle Garda Securitisation S.r.l. Loan transfer date 31.03.2001 and 31.05.2001Type of loans transferred Mortgage loansQuality of loans transferred PerformingGeographical area of loans transferred ItalyEconomic activity of transferred borrowers Private entitiesLoans transferred by FinecoBank S.p.A.gross of value adjustments 225,686Loans transferred by FinecoBank S.p.A.net of value adjustments 225,686Price of loans transferred by FinecoBank S.p.A. 261,648Profit on FinecoBank S.p.A. securitization 35,962Loans transferred by Bipop Carire Società per Azionigross of value adjustments 488,078Loans transferred by Bipop Carire Società per Azioninet of value adjustments 488,078Price of loans transferred by Bipop Carire Società per Azioni 511,940Profit on Bipop Carire Società per Azioni securitization 23,862Assets originated by FinecoBank againsttotal securitized assets 33.82%2001 FinecoBank S.p.A. revolving securitization 4,2862002 FinecoBank S.p.A. revolving securitization 14,0792003 FinecoBank S.p.A. revolving securitization 13,3812004 FinecoBank S.p.A. revolving securitization 18,0292005 FinecoBank S.p.A. revolving securitization 19,9772006 FinecoBank S.p.A. revolving securitization 23,798Buy-back of FinecoBank S.p.A. mortgage loans -280Charges on the buy-back of FinecoBank S.p.A. mortgage loans -20Charges on the renegotiation of FinecoBank S.p.A. mortgage loans -38Principal collected by FinecoBank S.p.A. -91,615 of which, collected in 2006 -25,344Interest collected by FinecoBank S.p.A. -65,682 of which, collected in 2006 -11,342Interest due but not collected 589Total receivable by FinecoBank S.p.A. to 31.12.06 227,930 of which, total impaired loans 5,222Total receivable by Bipop Carire Società per Azioni to 31.12.06 487,821 of which, total impaired loans -Date of issue of junior notes 7/18/2001Date of maturity of junior notes 11/5/2032Face value of junior notes underwrittenby FinecoBank S.p.A. 38,335Book value of junior notes underwrittenby FinecoBank S.p.A. 39,246Face value of junior notes underwrittenby Bipop Carire Società per Azioni 38,334Book value of junior notes underwrittenby Bipop Carire Società per Azioni 39,163Interest rate on underwritten notes 3-month EURIBOR + a spread of 0.2% + 1.0%Date of Basis Swap - IRS contract 7/18/2001Face value of FinecoBank S.p.A. Basis Swap - IRS contract 711,750(Amounts in Euro/000)
c. The basis swap contract
The portfolio of securitized loans consists of floating-rate loans, some of which were linked to parameters other
than the Euribor.
In order to mitigate the risk related to the special purpose vehicle’s exposure to unfavourable changes in lending
interest rates on loans and borrowing interest rates on notes, the issuer entered into a basis swap contract with an
intermediary with a high credit rating (Dresdner Bank) to hedge the risk on the mortgage loan portfolio.
Under the above swap contract, the issuer must pay the counterparty to the swap all the cash flows generated by
the portfolio as interest and, on each note coupon payment date, receive precisely the amount required to service
its debt and other periodic expenses of an administrative nature.
The swap's effects on the counterparty’s income statement were reflected in a derivative contract that the
counterparty entered into with FinecoBank S.p.A. (a back-to-back swap), by virtue of which the counterparty to

Notes
-197-
the swap must pay FinecoBank S.p.A. the sums obtained by the special purpose vehicle and collect from
FinecoBank S.p.A. the sums owed to the special purpose vehicle.
3. Velites S.r.l.
a. Introduction
The Bank undertook one loan securitization transaction with the special purpose vehicle Velites S.r.l. on 27 March
2002 (the relative loans having been transferred during the year ended 31 December 2001). The portfolio consists
of performing mortgage loans.
The loans securitized in this transaction had been originated exclusively by FinecoBank S.p.A. during its normal
business operations.
The special purpose vehicle for the securitization, Velites S.r.l., was established in accordance with Italian Law
130/99. The loans were sold to the special purpose vehicle without recourse.
The loans held by said vehicle were not re-entered to the balance sheet since the Bank exercised the option
afforded by IFRS 1 and IAS 39 to recognize only loans transferred subsequent to 1 January 2002. The junior notes
underwritten by FinecoBank S.p.A. were classified to the category “Available-for-sale financial assets” and entered
to the balance sheet under line 40 of assets, “Available-for-sale financial assets”.
Bipop-Carire granted a liquidity line of €5,000,000.00 for this transaction as a form of credit enhancement.
b. General information
Securitization of mortgage loans (figures as at 31 December 2006)
Special-purpose vehicle Velites S.r.l.Loan transfer date 30.06.2001 and 30.09.2001Type of loans transferred Mortgage loansQuality of loans transferred PerformingGeographical area of loans transferred ItalyEconomic activity of transferred borrowers Private entitiesLoans transferred gross of value adjustments 296,385Loans transferred net of value adjustments 296,385Price of loans transferred 338,883Profit on securitization transaction 42,498Assets originated by FinecoBank againsttotal securitized assets 100.00%2002 revolving securitization 13,1742003 revolving securitization 15,854Buy-back of mortgage loans -1,211Charges to buy-back mortgage loans -214Charges to re-negotiate mortgage loans -37Principal collected -110,466 of which, collected in 2006 -26,660Interest collected -73,411 of which, collected in 2006 -11,331Interest due but not collected 523Total receivable as at 31.12.06 214,259 of which, total impaired loans 5,418Date of issue of junior notes 3/27/2002Date of maturity of junior notes 8/5/2032Face value of junior notes underwritten 50,100Book value of junior notes underwritten 35,033Interest rate on underwritten notes 3-month EURIBOR + a spread of 0.2% + 1.0%Date of basis swap contract 3/27/2002Nominal value of basis swap 211,270(Amounts in Euro/000)

Notes
-198-
c. The basis swap contract
The portfolio of securitized loans consists of floating-rate loans, some of which were linked to benchmarks other
than the Euribor.
In order to mitigate the risk related to the special purpose vehicle’s exposure to unfavourable changes in lending
interest rates on loans and borrowing interest rates on notes, the issuer entered into a basis swap contract with an
intermediary with a high credit rating (Dresdner Bank).
Under the above derivative contract, the issuer must pay the counterparty to the swap all the cash flows
generated by the portfolio as interest and, on each note coupon payment date, receive precisely the amount
required to service its debt and other periodic expenses of an administrative nature.
The swap's effects on the counterparty’s income statement were reflected in a derivative contract that the
counterparty entered into with FinecoBank S.p.A. (a back-to-back swap), by virtue of which the counterparty to
the swap must pay FinecoBank S.p.A. the sums obtained by the special purpose vehicle and collect from
FinecoBank S.p.A. the sums owed to the special purpose vehicle.
4. Heliconus S.r.l.
a. Introduction
The Bank undertook one loan securitization transaction with the special purpose vehicle Heliconus S.r.l. on 8
November 2002 (the relative loans having been transferred during the year ended 31 December 2002). The
portfolio consists of performing mortgage loans.
The loans securitized in this transaction had been originated exclusively by FinecoBank S.p.A. during its normal
business operations and, unlike the previous transactions, were sold at par value.
The special purpose vehicle for the securitization, Heliconus S.r.l., was established in accordance with Italian Law
130/99. The loans were sold to the special purpose vehicle without recourse.
The loans held by said vehicle were partially re-entered to the Bank’s balance sheet since the Bank exercised the
option afforded by IFRS 1 and IAS 39 to recognize only loans transferred subsequent to 1 January 2002. The
junior notes underwritten by FinecoBank S.p.A. were eliminated, while the re-entered loans were recognized on
the balance sheet at their amortized cost under line 70 of assets, “Customer loans”.
FinecoBank S.p.A. granted the vehicle a liquidity line of €8,500,000.00, with the option of extending it to
€10,220,000.00 if the quality of the portfolio of securitized loans deteriorated.
In the second half of 2006, the liquidity facility was increased to €10,220,000.00, since the ratio of the value of
principal of loans with at least seven past-due payments and the value of the principal of the entire portfolio
exceeded the threshold of 1%.

Notes
-199-
b. General information
Securitization of mortgage loans (figures as at 31 December 2006)
Special-purpose vehicle Heliconus S.r.l.Loan transfer date 05.08.2002Type of loans transferred Mortgage loansQuality of loans transferred PerformingGeographical area of loans transferred ItalyEconomic activity of transferred borrowers Private entitiesLoans transferred gross of value adjustments 408,790Loans transferred net of value adjustments 408,790Price of loans transferred 408,790Profit on securitization transaction -Assets originated by FinecoBank againsttotal securitized assets 100.00%2003 revolving securitization 20,6162004 revolving securitization 6,567Charges on the renegotiation of mortgage loans -27Principal collected -128,661 of which, collected in 2006 -40,373Interest collected -75,086 of which, collected in 2006 -15,896Interest due but not collected 349Total receivable through 31.12.06 307,661 of which, total impaired loans 3,982Date of issue of junior notes 11/8/2002Date of maturity of junior notes 2/10/2036Face value of junior notes underwritten 8,990Book value of junior notes underwritten 8,990Interest rate on underwritten notes 3-month EURIBOR + a spread of -1.00% + AdditionalDate of basis swap contract 11/8/2002Nominal value of basis swap 304,618(Amounts in Euro/000)
c. The basis swap contract
The portfolio of securitized loans consists of floating-rate loans, some of which were linked to benchmarks other
than the Euribor.
In order to mitigate the risk related to the special purpose vehicle’s exposure to unfavourable changes in lending
interest rates on loans and borrowing interest rates on notes, the issuer entered into a swap contract with an
intermediary with a high credit rating (CDC IXIS Capital Markets, hereinafter referred to as the “counterparty to
the swap”). Under the above derivative contract, the issuer is required to pay the counterparty to the swap all the
expected cash flows from the portfolio as interest, net of the issuer’s senior expenses and a spread calculated on
the current residual debt on the portfolio, and, on each note coupon payment date, receive precisely the amount
required to service its debt and cover other periodic expenses of an administrative nature. The counterparty to the
swap in its turn entered into a corresponding derivative contract directly with FinecoBank S.p.A. (a back-to-back
swap), by virtue of which the counterparty to the swap is required to pay FinecoBank S.p.A. the sums obtained by
the special purpose vehicle and collect from FinecoBank S.p.A. the sums owed to the special purpose vehicle.
It should be pointed out that the transaction does not contain a step-up call option clause (i.e. an increase in the
spread on the notes and a consequent call option on the residual portfolio for the Bank), with the consequence that
the vehicle, which purchased the transferred loans, secured its funding by issuing long-term bonds.
The originator is, however, granted a buy-back option (known as a clean-up call option) on the entire portfolio, but
only on the condition that this portfolio comes to less than or equal to 10% of the initial portfolio over the duration
of the transaction.

Notes
-200-
Due to having entered into the swap contract, FinecoBank S.p.A. retains substantially all the risks and rewards
deriving from the ownership of the financial assets and the exposure to changes in future cash flows.
Under IAS 39, Heliconus is classified among transactions not eliminated from the balance sheet, and, consequently,
swap flows are entered to the balance sheet of FinecoBank S.p.A. by separating out the individual income
components: interest income on loans, interest expense on financial liabilities, commission expense, and
administrative expenses.
5. F-E Personal Loans S.r.l.
a. Introduction
During the first half of 2003, a further loan securitization transaction was undertaken on 16 June 2003 (the
relative loans having been transferred on 23 April 2003 at par). The portfolio consisted of performing fifth of salary
and delegated payment loans.
The loans securitized in this transaction had been originated exclusively by FinecoBank S.p.A. during its normal
business operations and, as in the case of the previous Heliconus S.r.l. transaction, were sold at par value.
The special purpose vehicle for the securitization, F-E Personal Loans S.r.l., was established in accordance with
Italian Law 130/99. The loans were sold to the special purpose vehicle without recourse.
The loans held by said vehicle were partially re-entered to the Bank’s balance sheet since the Bank exercised the
option afforded by IFRS 1 and IAS 39 to recognize only loans transferred subsequent to 1 January 2002. The
junior notes underwritten by FinecoBank S.p.A. were eliminated, while the re-entered loans were recognized on
the balance sheet at their amortized cost under line 70 of assets, “Customer loans”.
In the event of a shortfall in cash on hand in the interest account, the vehicle may draw on the liquidity line
granted by FinecoBank S.p.A., up to a maximum value of €15,000,000.00.

Notes
-201-
b. General information
Securitization of fifth of salary loans (figures as at 31 December 2006)
Special-purpose vehicle F-E Personal Loans S.r.l.Loan transfer date 23.04.2003Type of loans transferred One-fifth of salary loansQuality of loans transferred PerformingGeographical area of loans transferred ItalyEconomic activity of transferred borrowers Private entitiesLoans transferred gross of value adjustments 446,610Loans transferred net of value adjustments 446,610Price of loans transferred 446,610Profit on securitization transaction -Assets originated by FinecoBank againsttotal securitized assets 100.00%2003 revolving securitization 47,6312004 revolving securitization 80,611Principal collected -410,307 of which, collected in 2006 -107,850Interest collected -74,570 of which, collected in 2006 -12,430Interest due but not collected 557Total receivable through 31.12.06 165,102 of which, total impaired loans 1,624Date of issue of junior notes 6/16/2003Date of maturity of junior notes 12/20/2015Face value of junior notes underwritten 6,810Book value of junior notes underwritten 6,810Interest rate on underwritten notes 3-month EURIBOR + Additional PremiumDate of basis swap contract 6/16/2003Nominal value of basis swap 162,586(Amounts in Euro/000)
With regard to the figures for the transfer of fifth of salary and delegated payment loans, the payments to the
special purpose vehicle do not account for delays in the processing of collection. Consequently, "theoretical"
residual debt totalled €162,692 thousand as at 31 December 2006.
c. The interest rate swap contract
The portfolio of securitized loans consists of fixed-rate loans.
In order to mitigate the risk related to the special purpose vehicle’s exposure to unfavourable changes in lending
interest rates on loans and borrowing interest rates on notes, the issuer entered into a swap contract with an
intermediary with a high credit rating (Dresdner Kleinwort Wasserstein). Under the above derivative contract, the
issuer must pay the counterparty to the swap all the expected cash flows from the portfolio as interest, net of the
issuer’s senior expenses and a spread calculated on the current residual debt on the portfolio, and, on each note
coupon payment date, receive precisely the amount required to service its debt and cover other periodic expenses
of an administrative nature.
The swap's effects on the counterparty’s income statement were reflected in a derivative contract that the
counterparty entered into with FinecoBank S.p.A. (a back-to-back swap), by virtue of which the counterparty to
the swap must pay FinecoBank S.p.A. the sums obtained by the special purpose vehicle and collect from
FinecoBank S.p.A. the sums owed to the special purpose vehicle.
It should be pointed out that the transaction does not contain a step-up call option clause (i.e. an increase in the
spread on the notes and a consequent call option on the residual portfolio for the Bank), with the consequence that
the vehicle, which purchased the transferred loans, funded itself by issuing long-term bonds.

Notes
-202-
This transaction differs from the other transactions originated by FinecoBank S.p.A. in that it incorporates an
additional form of security for the noteholders, provided by the adjustment reserve mechanism.
This form of credit enhancement calls for the special purpose vehicle to set aside a share of the sums collected
during each quarter on each date of payment, drawing on the funds available in the interest account, thereby
depriving FinecoBank S.p.A. of part of the additional premium on the Class C notes.
On the basis of this mechanism, the unavailable reserve created in the special purpose vehicle, which is set aside
in a specific account, is to be returned to FinecoBank S.p.A. nine months after the loan has been collected, or in
the form of unprocessed sums collected for past due payments or in the form of a deferred additional premium on
the Class C notes.
It should also be noted that the originator is, however, granted a buy-back option (known as a clean-up call option)
on the entire portfolio, but only on the condition that this portfolio comes to less than or equal to 10% of the initial
portfolio over the duration of the transaction.
Due to having entered into the swap contract, FinecoBank S.p.A. retains substantially all the risks and rewards
deriving from the ownership of the financial assets and the exposure to changes in future cash flows.
Under IAS 39, F-E Personal is classified among transactions not eliminated from the balance sheet, and,
consequently, swap flows are entered to the balance sheet of FinecoBank S.p.A. by separating out the individual
income components: interest income on loans, interest expense on financial liabilities, commission expense, and
administrative expenses.
6. F-E Mortgages S.r.l.
a. Introduction
During 2003, a further securitization transaction was undertaken involving the sale at par value of a portfolio of
performing mortgage loans (transferred at par value on 30 June 2003 and 30 September 2003).
The loans securitized in this transaction had been originated exclusively by FinecoBank S.p.A. during its normal
business operations and, as in the case of the previous Heliconus S.r.l. and F-E Personal Loans S.r.l. transactions,
were sold at par value.
The special purpose vehicle for the securitization, F-E Mortgages S.r.l., was established in accordance with Italian
Law 130/99. The loans were sold to the special purpose vehicle without recourse.
On 28 November 2003 the Bank undertook the first transaction in a series of securitizations of home mortgage
loans classified as performing and originated by FinecoBank S.p.A. with its own customers. The securitization of
the various portfolios, which will all flow into a single separate asset pool, may be undertaken over a period of
approximately four years, and is to be funded from time to time through the concurrent issue of notes with a value
equal to the residual debt outstanding on the date of valuation of the acquired mortgage loans. The overall
maximum limit that the programme may not exceed at any time is €3 billion.
The master trust structure of the transaction is also characterized by the absence of a revolving period: during the
first 18 months after each series of notes has been issued (the lock-up period), cash that accumulates with the
special purpose vehicle from time to time is to be employed in cash management techniques to increase the
transaction’s performance. During the amortising period of the notes portfolio, the cash management techniques will be limited to the excess
of the security on cash flows, which is set at €15 million for the transaction.
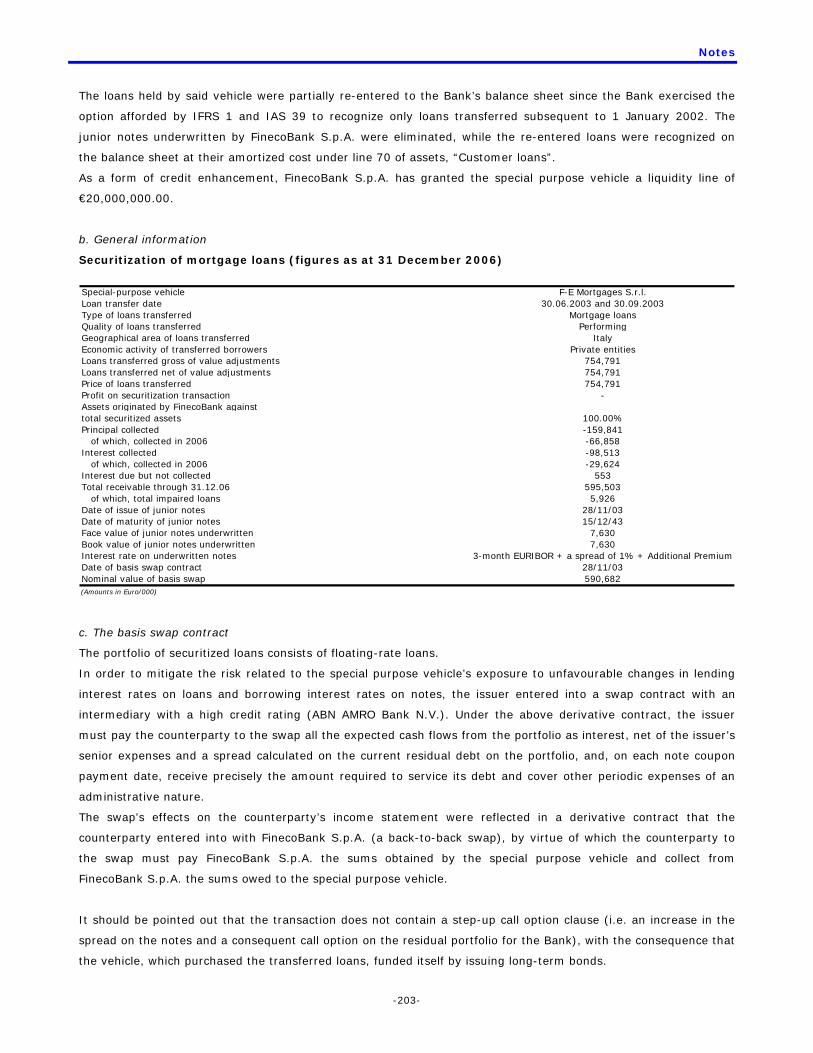
Notes
-203-
The loans held by said vehicle were partially re-entered to the Bank’s balance sheet since the Bank exercised the
option afforded by IFRS 1 and IAS 39 to recognize only loans transferred subsequent to 1 January 2002. The
junior notes underwritten by FinecoBank S.p.A. were eliminated, while the re-entered loans were recognized on
the balance sheet at their amortized cost under line 70 of assets, “Customer loans”.
As a form of credit enhancement, FinecoBank S.p.A. has granted the special purpose vehicle a liquidity line of
€20,000,000.00.
b. General information
Securitization of mortgage loans (figures as at 31 December 2006)
Special-purpose vehicle F-E Mortgages S.r.l.Loan transfer date 30.06.2003 and 30.09.2003Type of loans transferred Mortgage loansQuality of loans transferred PerformingGeographical area of loans transferred ItalyEconomic activity of transferred borrowers Private entitiesLoans transferred gross of value adjustments 754,791Loans transferred net of value adjustments 754,791Price of loans transferred 754,791Profit on securitization transaction -Assets originated by FinecoBank againsttotal securitized assets 100.00%Principal collected -159,841 of which, collected in 2006 -66,858Interest collected -98,513 of which, collected in 2006 -29,624Interest due but not collected 553Total receivable through 31.12.06 595,503 of which, total impaired loans 5,926Date of issue of junior notes 28/11/03Date of maturity of junior notes 15/12/43Face value of junior notes underwritten 7,630Book value of junior notes underwritten 7,630Interest rate on underwritten notes 3-month EURIBOR + a spread of 1% + Additional PremiumDate of basis swap contract 28/11/03Nominal value of basis swap 590,682(Amounts in Euro/000)
c. The basis swap contract
The portfolio of securitized loans consists of floating-rate loans.
In order to mitigate the risk related to the special purpose vehicle’s exposure to unfavourable changes in lending
interest rates on loans and borrowing interest rates on notes, the issuer entered into a swap contract with an
intermediary with a high credit rating (ABN AMRO Bank N.V.). Under the above derivative contract, the issuer
must pay the counterparty to the swap all the expected cash flows from the portfolio as interest, net of the issuer’s
senior expenses and a spread calculated on the current residual debt on the portfolio, and, on each note coupon
payment date, receive precisely the amount required to service its debt and cover other periodic expenses of an
administrative nature.
The swap's effects on the counterparty’s income statement were reflected in a derivative contract that the
counterparty entered into with FinecoBank S.p.A. (a back-to-back swap), by virtue of which the counterparty to
the swap must pay FinecoBank S.p.A. the sums obtained by the special purpose vehicle and collect from
FinecoBank S.p.A. the sums owed to the special purpose vehicle.
It should be pointed out that the transaction does not contain a step-up call option clause (i.e. an increase in the
spread on the notes and a consequent call option on the residual portfolio for the Bank), with the consequence that
the vehicle, which purchased the transferred loans, funded itself by issuing long-term bonds.
Notes
-204-
Due to having entered into the swap contract, FinecoBank S.p.A. retains substantially all the risks and rewards
deriving from the ownership of the financial assets and the exposure to changes in future cash flows.
Under IAS 39, F-E Mortgages is classified among transactions not eliminated from the balance sheet, and,
consequently, swap flows are entered to the balance sheet of FinecoBank S.p.A. by separating out the individual
income components: interest income on loans, interest expense on financial liabilities, commission expense, and
administrative expenses.
6. F-E Mortgages S.r.l. II
a. Introduction
During 2005, a further securitization transaction was undertaken on 28 February 2005 involving the sale at par
value of a portfolio of performing mortgage loans.
The loans securitized in this transaction had been originated exclusively by FinecoBank S.p.A. during its normal
business operations and, as in the case of the previous Heliconus S.r.l., F-E Personal Loans S.r.l., and (the first of
the) F-E Mortgages transactions, were sold at par value.
The special purpose vehicle for the securitization, F-E Mortgages S.r.l., was established in accordance with Italian
Law 130/99. The loans were sold to the special purpose vehicle without recourse.
On 8 April 2005 the Bank securitized home mortgage loans classified as performing and originated by FinecoBank
S.p.A. with its own customers.
This transaction represents the second issue of notes by the company F-E Mortgages as part of securitization
transactions in accordance with Italian Law 130.
This transaction is not to be considered as the second tranche of the programme described above, but rather an
independent transaction.
The transaction is characterized by the absence of a revolving period: during the first 18 months after each series
of notes has been issued (the lock-up period), the cash that accumulates with the special purpose vehicle from
time to time is to be employed in cash management techniques to increase the transaction’s performance.
During the amortising period of the notes portfolio, the cash management techniques will be limited to the excess
of the security on cash flows, which is set at €5 million for the transaction.
As a form of credit enhancement, FinecoBank S.p.A. has issued the special purpose vehicle a subordinated loan for
€15,430,500.00, which was deposited to a current account taken out for this purpose by the SPV with the English
Account Bank.
The loans held by said vehicle were partially re-entered to the Bank’s balance sheet since the Bank exercised the
option afforded by IFRS 1 and IAS 39 to recognize only loans transferred subsequent to 1 January 2002. The
subordinated loan underwritten by FinecoBank S.p.A. was eliminated, while the re-entered loans were recognized
on the balance sheet at their amortized cost under line 70 of assets, “Customer loans”.

Notes
-205-
b. General information
Securitization of mortgage loans (figures as at 31 December 2006)
Special-purpose vehicle F-E Mortgages S.r.l.Loan transfer date 28.02.05Type of loans transferred Mortgage loansQuality of loans transferred PerformingGeographical area of loans transferred ItalyEconomic activity of transferred borrowers Private entitiesLoans transferred gross of value adjustments 1.028.684Loans transferred net of value adjustments 1.028.684Price of loans transferred 1.028.684Profit on securitization transaction -Assets originated by FinecoBank againsttotal securitized assets 100,00%Principal collected -107.174 of which, collected in 2006 -73.444Interest collected -78.349 of which, collected in 2006 -45.456Interest due but not collected 480Total receivable through 31.12.06 921.990 of which, total impaired loans 3.739Date of issue of subordinated loan 08/04/05Date of maturity of subordinated loan 30/10/43Face value of subordinated loan issue 15.430Book value of subordinated loan issue 15.430Interest rate on loan issue 3-month EURIBOR + a spread of 0.50% + Additional PremiumDate of basis swap contract 08/04/05Nominal value of basis swap 919.600(Amounts in Euro/000)
c. The basis swap contract
The portfolio of securitized loans consists of floating-rate loans.
In order to mitigate the risk related to the special purpose vehicle’s exposure to unfavourable changes in lending
interest rates on loans and borrowing interest rates on notes, the issuer entered into a swap contract with an
intermediary with a high credit rating (UBS Limited). Under the above derivative contract, the issuer must pay the
counterparty to the swap all the expected cash flows generated by the portfolio as interest and, on each note
coupon payment date, receive precisely the amount equal to the base interest on the notes.
The swap's effects on the counterparty’s income statement were reflected in a derivative contract that the
counterparty entered into with FinecoBank S.p.A. (a back-to-back swap), by virtue of which the counterparty to
the swap must pay FinecoBank S.p.A. the sums obtained by the special purpose vehicle and collect from
FinecoBank S.p.A. the sums owed to the special purpose vehicle.
It should be pointed out that the transaction does not contain a step-up call option clause (i.e. an increase in the
spread on the notes and a consequent call option on the residual portfolio for the Bank), with the consequence that
the vehicle, which purchased the transferred loans, funded itself by issuing long-term bonds.
Due to having entered into the swap contract, FinecoBank S.p.A. retains substantially all the risks and rewards
deriving from the ownership of the financial assets and the exposure to changes in future cash flows.
Under IAS 39, F-E Mortgages II is classified among transactions not eliminated from the balance sheet, and,
consequently, swap flows are entered to the balance sheet of FinecoBank S.p.A. by separating out the individual
income components: interest income on loans, interest expense on financial liabilities, commission expense, and
administrative expenses.
Valuations and allocations to provisions related to the swap contract and the junior notes pertaining to
securitization transactions undertaken prior to 1 January 2002

Notes
-206-
The method used to valuate the junior notes, considering that the transaction will be concluded in advance of term
(there is a high probability that the call option will be exercised), takes into account the failure to recoup the gain
realized by the originator on the sale of the loans, thereby leading to a potential loss on the notes with the highest
levels of subordination.
It is assumed that the originator will acquire the loans at their market value. This market value was calculated by
considering the characteristics of the portfolio (performing and non-performing loans), the expected cash flows
from the portfolio, and the commercial spread applied to loans with similar characteristics. The market price of
non-performing loans was calculated on the basis of analytical and lump-sum valuations applied to the portfolio.
The back-to-back swap was measured until the call date by discounting the cash flows that originate from both
legs of the swap on the zero-coupon curve. The cash flows were adjusted, when necessary, by considering both
expected defaults and early redemptions of the loan portfolio.

Notes
-207-
Quantitative information
C.1.1 Exposures from securitization transactions broken down by underlying asset quality
Net exposure
45,2
20
Gross exposure 4
5,2
20
Net exposure
Gross exposure
Net exposure
Gross exposure
Net exposure
Gross exposure
Net exposure
Gross exposure
Net exposure
Gross exposure
Net exposure
102,4
71
25,9
72
Gross exposure
101,9
27
25,3
69
Net exposure
Gross exposure
Net exposure 374
483
Gross exposure
374
483
A.
Ow
n u
nd
erl
yin
g a
sse
ts:
a)
Impai
red
b)
Oth
er
B.
Th
ird
-part
y u
nd
erl
yin
g a
sse
ts:
a)
Impai
red
b)
Oth
er
(Am
ounts
in E
uro
/000)
Qual
ity
of u
nderlyi
ng a
ssets
/
Exp
osu
res
Guar
ante
es p
rovi
ded
Junio
rM
ezz
anin
eSenio
rSen
ior
Mezz
anin
eJu
nio
r
Cas
h e
xposu
res
Cre
dit faci
litie
s
Junio
rM
ezza
nin
eSenio
r

Notes
-208-
C.1.2 Exposures from the main Bank securitization transactions broken down by type of securitized assets and
type of exposure
Adjustments
Book value
10,2
20
15,0
00
20,0
00
Adjustments
Book value
Adjustments
Book value
Adjustments
Book value
Adjustments
Book value
Adjustments
Book value
Adjustments
(3,5
80)
(610)
Book value
35,0
33
13,2
74
12,3
34
8,9
29
14,2
98
18,6
03
Adjustments
Book value
Adjustments
Book value 374
A.
Fu
lly e
lim
inate
d f
rom
th
e b
ala
nce
sh
eet
A.1
Upgra
de M
ortg
ages
(pilo
t)
-
Perf
orm
ing m
ortg
age
loan
s
A.4
Velit
es
Mor
tgag
es
-
Perf
orm
ing m
ortg
age
loan
s
B.
Part
ially e
lim
inate
d f
rom
th
e
bala
nce
sh
eet
A.3
Gar
da
mor
tgages
-
Perf
orm
ing m
ortg
age
loan
sC
. N
ot
elim
inate
d f
rom
th
e b
ala
nce
sh
eet
C.1
Helic
onus
mort
gages
-
Perf
orm
ing m
ortg
age
loan
s
C.2
F-E
Pers
onal F
ifth o
f Sal
ary
Loan
s
-
Perf
orm
ing fift
h o
f sa
lary
loan
s
C.3
F-E
Mort
gag
es
mor
tgag
es
-
Perf
orm
ing m
ortg
age
loan
s
C.3
F-E
Mort
gag
es
II m
ortg
ages
-
Perf
orm
ing m
ortg
age
loan
s
(Am
ounts
in E
uro
/000)
Cre
dit fac
ilities
Junio
rM
ezz
anin
eSen
ior
Type
of underlyin
g a
sset
s /
Exp
osu
res
Guar
ante
es p
rovi
ded
Junio
rM
ezza
nin
eSenio
rSenio
rM
ezz
anin
eJu
nio
r
Cas
h e
xpos
ure
s

Notes
-209-
C.1.3 Exposures from the main third-party securitization transactions broken down by type of securitized assets
and type of exposure
Adjustments
Book value
Adjustments
Book value
Adjustments
Book value
Adjustments
Book value
Adjustments
Book value
Adjustments
Book value
Adjustments
(1,1
93)
Book value
25,9
72
Adjustments
Book value
Adjustments
Book value 483
A.1
Upgra
de
Mort
gages
(pilo
t)
-
Perf
orm
ing m
ortg
age
loans
A.3
Gard
a m
ort
gag
es
-
Perf
orm
ing m
ortg
age
loans
(Am
ounts
in E
uro
/000)
Type o
f underlyin
g a
ssets
/ E
xpos
ure
s
Guar
ante
es
pro
vided
Junio
rM
ezza
nin
eSen
ior
Senio
rM
ezz
anin
eJu
nio
r
Cash
exp
osu
res
Cre
dit fac
ilities
Junio
rM
ezza
nin
eSenio
r

Notes
-210-
C.1.4 Exposures to securitizations broken down by portfolio and type
As at 31 December 2006
Exposure / portfolioFinancial
assets held for trading
Financial assets
designated at fair value
Financial assets
available for sale
Financial assets held to
maturityLoans Total
1. Cash exposures- Senior - - 857 - - 857- Mezzanine - - - - - -- Junior - - 74,280 - - 74,2802. Off-balance-sheet exposures- Senior - - - - - -- Mezzanine - - - - - -- Junior - - - - - -(Amounts in Euro/000)
As at 31 December 2005
Exposure / portfolioFinancial
assets held for trading
Financial assets
designated at fair value
Financial assets
available for sale
Financial assets held to
maturityLoans Total
1. Cash exposures- Senior - - 1,409 - - 1,409- Mezzanine - - - - - -- Junior - - 90,115 - - 90,1152. Off-balance-sheet exposures- Senior - - - - - -- Mezzanine - - - - - -- Junior - - - - - -(Amounts in Euro/000)
The assets transferred in the Garda mortgage securitization transaction were partially eliminated from the balance
sheet considering that the revolving loan securitizations undertaken subsequent to 1 January 2002 were re-
entered. The junior notes from the Garda transaction are, however, represented on the balance sheet under line
40, “Available-for-sale financial assets”.

Notes
-211-
C.1.5 Total amount of securitized assets underlying the junior notes and other forms of credit enhancement
Assets / values Traditional securitization Synthetic securitization
A. Own underlying assets:A.1 Fully eliminated 1. Non-performing loans 2,534 2. Problem loans 2,774 3. Restructured exposures - 4. Expired exposures 110 5. Other assets 208,842A.2 Partially eliminated 1. Non-performing loans 1,432 2. Problem loans 1,140 3. Restructured exposures - 4. Expired exposures 40 5. Other assets 111,356A.3 Not eliminated 1. Non-performing loans 8,737 - 2. Problem loans 5,750 - 3. Restructured exposures - - 4. Expired exposures 784 - 5. Other assets 1,974,986 -B. Third-party underlying assets:B.1 Non-performing loans - -B.2 Problem loans - -B.3 Restructured exposures - -B.4 Expired exposures - -B.5 Other assets 244,073 -(Amounts in Euro/000)
The loans shown above are presented at cost, i.e. gross of any loan writedown reserves and not adjusted for the
effect of amortized cost.
C.1.6 Equity interests in special purpose vehicles
FinecoBank S.p.A. does not hold any equity interests in special purpose vehicles.

Notes
-212-
C.1.7 Servicing: collection of securitized loans and payment of notes issued by the special purpose vehicle
Perf
orm
ing
ass
ets
0.0
0%
0.0
0%
100.0
0%
0.0
0%
0.0
0%
0.0
0%
0.0
0%
0.0
0%
Impaired
as
sets
0.0
0%
0.0
0%
0.0
0%
0.0
0%
0.0
0%
0.0
0%
0.0
0%
0.0
0%
Perf
orm
ing
ass
ets
0.0
0%
0.0
0%
100.0
0%
0.0
0%
0.0
0%
0.0
0%
0.0
0%
0.0
0%
Impaired
asse
ts
0.0
0%
0.0
0%
0.0
0%
0.0
0%
0.0
0%
0.0
0%
0.0
0%
0.0
0%
Perf
orm
ing
ass
ets
90.8
6%
0.0
0%
100.0
0%
25.7
0%
23.0
4%
60.2
3%
20.0
0%
7.9
7%
Impaired
ass
ets
0.0
0%
0.0
0%
0.0
0%
0.0
0%
0.0
0%
0.0
0%
0.0
0%
0.0
0%
999
25,3
44
16,3
46
26,6
60
40,3
73
107,8
50
66,8
58
73,4
44
- - - - - - - -
775
222,7
08 -
208,8
42
303,6
79
163,4
78
589,5
77
918,2
51
71
5,2
22 -
5,4
18
3,9
82
1,6
24
5,9
26
3,7
39
Upgra
de S
.r.l.
(pilo
t)
Gard
a S
.r.l.
mor
tgages
Gard
a S
.r.l.
fift
h o
f sa
lary
loa
ns
Velit
es
S.r
.l.
mor
tgages
Helic
onus
S.r
.l.
mort
gages
F-E P
ers
onal S
.r.l.
fift
h o
f sa
lary
loa
ns
F-E M
ortg
ages
S.r
.l.
mort
gages
F-E M
ortg
ages
S.r
.l.
II m
ortg
ages
(Am
ounts
in E
uro
/000)
Junio
r
Perc
ent
quot
a o
f not
es
redeem
ed (
end-o
f-period
fig
ure
)
Per
form
ing
Impaired
Sen
ior
Mezz
anin
e
The
loan
s sh
ow
n a
bove
are
pre
sente
d a
t co
st,
i.e.
gro
ss o
f an
y lo
an w
rite
dow
n r
eser
ves
and n
ot
adju
sted
for
the
effe
ct o
f am
ort
ized c
ost
.
Sum
s co
llect
ed o
n loan
s ove
r th
e ye
ar w
ere
sub-d
ivid
ed a
ccord
ing t
o t
he
stat
us
of
the
loan
at
the
tim
e of
the
tran
sfer
.
Perf
orm
ing
Impaired
Speci
al-
purp
ose
vehic
le
Loans
colle
cted
during
the y
ear
Secu
ritize
d a
sset
s (e
nd-
of-p
eriod
fig
ure
)

Notes
-213-
C.2 TRANSFER TRANSACTIONS
C.2.1 Financial assets sold but not eliminated
C
- - -
223,1
76
5,1
58
22
8,3
34
B
- - -
74,3
48
94
74
,44
2
A
576,4
13 - -
2,1
25,0
89
11,4
13
2,7
12
,91
5
C
223,1
76
5,1
58
22
8,3
34
B
74,3
48
94
74
,44
2
A
2,1
25,0
89
11,4
13
2,1
36
,50
2
C
-
B
-
A
-
C
-
B
-
A
-
C
-
B
-
A
-
C
-
B
-
A
-
C
-
B
-
A
576,4
13
57
6,4
13
A.
Cash
ass
ets
1.
Deb
t se
curities
2.
Equitie
s
3.
Units
in O
ICR
4.
Loan
s
5.
Impai
red a
sset
s
B.
Deri
vati
ve i
nst
rum
en
ts
Tota
l 3
1/
12
/0
6
(Am
ounts
in E
uro
/000)
Financi
al
ass
ets
availa
ble
for
sa
leTec
hnic
al f
orm
s /
Port
folio
Financi
al
ass
ets
desi
gnate
d a
t fa
ir v
alue
Financi
al a
sset
s hel
d
for
trad
ing
Finan
cial a
sset
s hel
d t
o m
atu
rity
Loans
to b
anks
Loan
s to
cust
om
ers
Tot
al
C
- - -
227,0
45
2,3
91
22
9,4
36
B
- - -
57,4
91 -
57
,49
1
A
163,2
27 - -
2,4
22,9
30
8,0
00
2,5
94
,15
7
C
227,0
45
2,3
91
22
9,4
36
B
57,4
91
57
,49
1
A
2,4
22,9
30
8,0
00
2,4
30
,93
0
C
-
B
-
A
-
C
-
B
-
A
-
C
-
B
-
A
-
C
-
B
-
A
-
C
-
B
-
A
163,2
27
16
3,2
27
A. C
ash
ass
ets
1. D
ebt
secu
rities
2. Equitie
s
3. U
nits
in O
ICR
4. Lo
ans
5. Im
pai
red a
sset
s
B. D
eri
vati
ve in
stru
men
ts
Tota
l 3
1/1
2/0
5
Finan
cial
as
sets
av
aila
ble
for
sa
leTe
chnic
al for
ms
/ Po
rtfo
lio
Finan
cial
as
sets
des
ignat
ed a
t fa
ir v
alue
Finan
cial
ass
ets
hel
d
for
trad
ing
Finan
cial
ass
ets
hel
d t
o m
aturity
Loan
s to
ban
ksLo
ans
to c
ust
omer
sTo
tal
Legend: A = transferred financial assets, fully recognized (book value) B = transferred financial assets, partially recognized (book value) C = transferred financial assets, partially recognized (entire value)

Notes
-214-
C.2.2. Financial liabilities from assets sold but not eliminated
Tota
l
-
2,5
85,8
37
74,0
37 - - -
2,6
59
,87
4
Loan
s to
cu
stom
ers
2,0
18,5
07
74,0
37
2,0
92
,54
4
Loan
s to
banks
-
Finan
cial a
ssets
hel
d t
o m
atu
rity -
Finan
cial
ass
ets
ava
ilable
for
sa
le
-
Finan
cial
ass
ets
des
ignate
d a
t fa
ir v
alue
-
Finan
cial
ass
ets
hel
d for
trad
ing
567,3
30
56
7,3
30
Liab
ilities
/ A
sset
por
tfol
io
1.
Du
e t
o c
ust
om
ers
a
) fr
om
fully
reco
gniz
ed a
sset
s
b
) fr
om
par
tial
ly r
eco
gniz
ed a
sset
s
2.
Dep
osit
s fr
om
ban
ks
a
) fr
om
fully
reco
gniz
ed a
sset
s
b
) fr
om
par
tial
ly r
eco
gniz
ed a
sset
s
Tota
l 3
1/1
2/0
6
(Am
ounts
in E
uro
/000)
Tota
l
-
2,4
82,4
75
57,4
91 - - -
2,5
39
,96
6
Loan
s to
cu
stom
ers
2,3
19,5
31
57,4
91
2,3
77
,02
2
Loan
s to
banks
-
Finan
cial a
ssets
hel
d t
o m
atu
rity -
Finan
cial
ass
ets
ava
ilable
for
sa
le
-
Finan
cial
ass
ets
des
ignate
d a
t fa
ir v
alue
-
Finan
cial
ass
ets
hel
d for
trad
ing
162,9
44
16
2,9
44
Liab
ilities
/ A
sset
por
tfol
io
1.
Du
e t
o c
ust
om
ers
a
) fr
om
fully
reco
gniz
ed a
sset
s
b
) fr
om
par
tial
ly r
eco
gniz
ed a
sset
s
2.
Dep
osit
s fr
om
ban
ks
a
) fr
om
fully
reco
gniz
ed a
sset
s
b
) fr
om
par
tial
ly r
eco
gniz
ed a
sset
s
Tota
l 3
1/1
2/0
5
(Am
ounts
in E
uro
/000)

Notes
-215-
D – CREDIT RISK MEASUREMENT MODELS
D.1 Measurement of Credit Risk – Trading Book
Capitalia Holding employs the portfolio model to its measurement of credit risk from the trading book.
The monitoring of credit risk taken as part of the management of the trading book is conducted through the
calculation of indicators of exposure and expected and unexpected loss (Credit VaR), on the basis of which the
composition of the trading book is then analysed by rating class and sector and the implicit risk deriving from
unexpected changes in creditworthiness. These indicators are calculated on a periodic basis and made available to
the heads of the affected business units through a specific reporting process.
For the purposes of the measurement and monitoring of credit risk taken as part of the activity of managing the
trading book, Capitalia Holding has developed a portfolio model (known as the Portfolio Credit Risk Engine) that
allows it to measure the economic capital absorbed (credit VaR) by the risk factors. During 2006, the following changes were made to the portfolio model for the measurement of credit risk: - the definition of default was modified (to include past-due exposures);
- the percent coverage of probability of default of internal Group ratings was extended.
The following indicators of exposure and loss are calculated by the model:
the current value, equal to the value of the contract calculated at the time of measurement. This is a marked-to-
model value. For derivatives, the indicator may take on positive and/or negative values on the basis of the levels
of the market variables of which the indicator is a function. For debt securities, a positive value is obtained when
there is a long position, and a negative value is obtained when there is a short position;
the actual exposure, which is equal to the greater of the current value of the position, and zero. For derivatives
contracts in particular, it represents the replacement cost of the contract, or the cost that the bank must incur in
the event that the counterparty becomes insolvent and must turn to the market to acquire an equivalent position.
In the event that netting agreements (ISDA Master Agreement) are in place with the counterparty, the overall
exposure to said counterparty is instead calculated as the algebraic sum of the individual positions;
the total exposure, i.e. the maximum value at the time of measurement that the exposure to the counterparty
might reach during the period under consideration. The exposure depends on the values assumed by the market
variables, which are simulated on the basis of a set of scenarios (the Montecarlo Multistep method) for each time
step in the simulation. The calculation of the exposure consequently determines the maximum value (known as the
peak exposure);
the mean loss, i.e. the value of expected loss, calculated as the average of the vector containing the expected
losses on all scenarios, obtained as the sum of the default values for each time step, weighted for the relative
marginal probabilities of default;
the annual credit VaR, i.e. the maximum potential loss calculated on the book, with a holding period of one year,
and a specific confidence level (99%). The possibility of recording a loss on the book in excess of expectations is
related to unexpected changes in the market value of credit positions, caused by an unexpected change in the
creditworthiness of a counterparty to which there is an exposure;
the marginal VaR, i.e. the contribution of each individual counterparty to the credit VaR of the entire book;

Notes
-216-
the % marginal VaR, i.e. the contribution of each individual counterparty to the credit VaR of the entire book,
expressed as a percentage of the exposure in the book and relative to the same counterparty.
The credit VaR on FinecoBank’s trading book came to approximately €120 thousand per year as at 31 December
2006.
D.2 Measurement of Credit Risk – Banking Book The second stage of the project involving the use of a portfolio method for the measurement of credit risk on the
banking book has been completed. During this stage, a database was created that allows for broad coverage of the
bank’s loan portfolio (all ordinary performing customers, excluding only intercompany exposures).
Measurements of the economic capital absorbed (credit CaR, component credit CaR) are produced on a monthly
basis by using a variety of risk drivers, such as exposure at the moment of default (EaD), loss given default (LGD),
asset-return correlation, and the probability of default (PD), drawing on PD figures derived from the application of
external benchmarks, where PD estimates with internal models are not available.
The model estimates the distribution of losses on the book according to the Montecarlo method and the importance
sampling technique over a time span of one year and with a level of probability of 99.93%. The latter is a single-
factor version of a Merton-type default/non-default model with stochastic LGD.
The model also allows the book’s risk capital to be allocated between the various sub-books obtained by grouping
together counterparties by: rating class, institution, macro-region, region, branch of activity, sector of activity,
economic group (for clients included in the top 200 groups by exposure), and business unit. Sub-books may also
be constructed by combining the exposures classified under two or three of the previous categories in a cross
pattern. This enables the creation of a "management dashboard" for the monitoring of the risk level and the
concentration of the various sub-books. On the basis of the results provided by the model, the first management
applications were launched in terms of monitoring the concentration profile of the loan book, thereby providing
support to the process of setting credit policy guidelines.
The model’s database allows for broad coverage of the bank’s loan book (all ordinary performing customers,
including exposures for amounts less than €35 thousand, exposures to book counterparties; only intercompany
exposures are excluded).
During 2006, the following changes were made to the portfolio model for the measurement of credit risk:
- exposures to bank counterparties were introduced to the perimeter of sub-threshold exposures (i.e., below €35
thousand);
- a report was produced by business unit;
- the definition of default was modified (to include past-due exposures);
- the percent coverage of probability of default of internal Group ratings was extended (to approximately 75% of
the Group’s total exposure);
- LGD was introduced to the Group’s internal rating models in replacement of the previous assumption of LGD
equal to 35% for home mortgage loans and 45% for the remaining exposures.

Notes
-217-
The portfolio model developed by the holding company and adopted by FinecoBank S.p.A. calculates the
distribution of portfolio losses according to a Montecarlo method (which generates 75,000 scenarios) and the
importance sampling technique to reduce the variance in the estimate, with a holding period of one year. The
latter is a single-factor version of a Merton-type model. Only the insolvency of counterparties is considered as a
loss event (the binomial model), without considering the possibility of creditworthiness migration (the multinomial
model). In a given scenario, the loss for each counterparty is equal to the product of the individual EaD and LGD, if
the counterparty is insolvent in said scenario; otherwise, it is equal to zero. The portfolio loss is obtained by adding
up all of the losses for all of the counterparties under the scenario. The LGD value for each counterparty is
stochastic, not deterministic. A beta distribution of LGD is assumed with an average equal to the average LGD for
the counterparty and a volatility of 20%. In order to simulate whether a counterparty is insolvent or not, a random
variable is considered that represents the value of its assets. If in a given scenario the value of said variable falls
below a certain threshold that represents the value of the counterparty's debt, then the counterparty is insolvent;
otherwise, the counterparty is not considered insolvent.
The distribution of portfolio losses is obtained by generating 75,000 portfolio loss scenarios according to the
aforementioned method. From the distribution of losses, the expected and unexpected loss values (credit CaR) are
obtained with a level of probability of 99.93%. While expected loss only takes into account the individual
characteristics of each counterparty (PD, LGD, EaD), unexpected loss also contemplates the portfolio’s
diversification characteristics (correlations between insolvencies and the concentration of individual exposures).
Credit CaR is the value of the loss that will not be exceeded with a 99.93% level of probability and a holding period
of one year, less the expected loss.
The Credit CaR of FinecoBank S.p.A. came to €49,303 thousand as at 31 December 2006, up slightly from 31
December 2005 (€8,829 thousand), mainly subsequent to the changes made to the portfolio model (in particular,
the extension of the model's exposure perimeter and the increased use of PD figures provided by internal rating
systems).
The following is a list of estimated risk measurements at the level of geographic regions in thousands of euro:
• Exposure: equal to total cash and endorsement credits, including overdrafts within the above perimeter. The
value of commercial endorsement credits is weighted at 50%, while financial endorsement credits are weighted at
100%;
• Credit CaR (CaR): i.e., the 99.93 percentile of the distribution of losses by individual sub-book (a non-
additive measure). This is a stand-alone measure, in that it does not take into consideration the benefits of
diversification with the rest of the portfolio;
• Component Credit CaR (C-CaR): i.e., the absorption of total credit CaR, namely the economic capital that
may be attributed to the sub-book under consideration (an additive measure). C-Car is constructed taking into
consideration the benefits of diversification with the rest of the portfolio;
• Concentration index: an indicator of the percent increase in the book’s credit CaR due to the concentration
or the increased risk level of the nth sub-book, which is constructed starting with the distance between component
credit CaR and the corresponding credit CaR assuming infinite granularity, i.e. without any concentration.
Regions Exposure CaR Component
CaR Component
CaR % Concentration
Index ABRUZZO 56,798 1,248 1,098 2.23% 0.00%
BASILICATA 21,361 591 511 1.04% 0.00%

Notes
-218-
CALABRIA 104,544 3,111 2,981 6.05% 0.00%
CAMPANIA 545,709 8,796 8,571 17.38% 0.00%
EMILIA ROMAGNA 205,806 1,981 1,859 3.77% 0.03%
FRIULI VENEZIA GIULIA 61,247 803 676 1.37% 0.00%
LAZIO 418,388 7,731 7,527 15.27% 0.02%
LIGURIA 135,655 808 628 1.27% 0.00%
LOMBARDY 789,238 6,621 5,494 11.14% 0.36%
MARCHE 38,337 286 166 0.34% 0.01%
MOLISE 21,197 559 419 0.85% 0.00%
PIEDMONT 297,271 2,886 2,675 5.43% 0.00%
PUGLIA 159,314 3,677 3,547 7.19% 0.00%
UNDEFINED REGION 12,412 1,896 244 0.49% 0.05%
SARDINIA 51,253 946 923 1.87% 0.05%
SICILY 259,096 8,040 8,094 16.42% 0.27%
TUSCANY 93,636 2,027 1,903 3.86% 0.00%
TRENTINO ALTO ADIGE 9,513 388 279 0.57% 0.00%
UMBRIA 29,939 631 507 1.03% 0.00%
VALLE D' AOSTA 3,747 185 47 0.09% 0.00%
VENETO 233,521 1,291 1,155 2.34% 0.06%
TOTAL 3,547,983 49,303 100.00% 0.84%
The book showed a negligible level of concentration (0.84%). The main regions that contribute to the risk level of
portfolio are the following:
- Campania: it contributes 17.38% to the risk level;
- Sicily: its weight on the book CaR is 16.42%, despite its percent exposure contribution of only 7.30%.
Sicily's risk level is mainly due to its level of PD, which is above the book average;
- Lazio: it contributes 15.27% of the portfolio’s risk level;
- Lombardy: this is the region with the highest exposure (22.24% in percent terms). Its contribution to risk,
however, is 11.14%, due to its PD level, which is below the book average.
2. MARKET RISKS
Finance activity is aimed at ensuring efficient management of cash on hand and the owned securities portfolio
consists mainly of variable-rate bonds issued by the Parent Bank and junior tranches (with floating rates) of notes
issued in securitizations of which FinecoBank S.p.A. was the originator. The portfolio also contains, to a residual
extent, stock deriving from brokerage activity with retail and institutional customers and concerning various types
of plain-vanilla and structured listed and unlisted bond issues. Listed derivative instruments are used to cover
interest rate and equity risk inherent in positions.
The Bank measures and monitors market risks with reference to the entire trading book, which includes both
positions that the Bank has assumed as part of its management of its owned asset portfolio and the positions it
has assumed as part of its brokerage activity.
Market risks are measured on a monthly basis by using VaR (Value at Risk) type methods. The method of
calculation that the Bank has adopted is a Montecarlo simulation, which is used to determine the maximum
Notes
-219-
potential loss (VaR) both for each individual risk factor and on the aggregate level, with a holding period of one
day and a confidence interval of 99%. In order to assess the impact of extreme events, VaR was combined with an
additional risk measurement, the expected shortfall, which is suitable to assess losses in the event of
circumstances the probability of occurrence of which is below 1%.
The net VaR on FinecoBank’s trading book as at 31 December 2006 came to a total of €1.14 million, up from 31
December 2005 (€0.3 million) due to the impact of the increased exposure of Capitalia securities denominated in
U.S. dollars. During the first half of 2006, average VaR held constantly below €1 million.
The risk component that made the largest contribution to the format of the net VaR for the year is related to the
volatility of the EUR/USD exchange rate. The trading book contains exposures in USD generated by the trend in
the creation/redemption of repurchase agreements in USD (liability item) by customers on Capitalia securities held
in portfolio (asset item). Nonetheless, the exchange rate risk position on the held-for-trading book is neutralized at
the overall level when the sum total of asset and liability items in foreign currencies in the banking book is
considered.
In order to assess the impact of extreme changes in risk factors, the trading book is remeasured on a daily basis
by using both historical scenarios and sensitivity scenarios, while continuing to consider the specific characteristics
of the exposures in the book, which in substance bears a modest level of exchange rate risk.
As for the more negative historical scenarios, it should be observed that with regard to 31 December 2006, an
event equivalent to the 1987 U.S. stock market crisis would lead to losses in value to the book of €12 million.
As for the sensitivity scenarios, the most significant scenarios are associated with variations in the EUR/USD
exchange rate. A downwards shift in the EUR/USD exchange rate of 10% to which the book is exposed would
entail a loss of approximately €12 million. With regard to sensitivity scenarios on interest rate risk factors, a
parallel shift of 100 basis points of the short-term nodes of the euro curve would generate a loss of approximately
€4 million.
The following table contains a summary of the figures calculated during 2006 for FinecoBank’s trading book:
Key figures
Holding period of one day, confidence interval of 99% (figures in thousands of euro).
Min. VaR Av. VaR Max. VaR
HFT Book 439 931 1,533
2.1 INTEREST RATE RISK - TRADING BOOK
QUALITATIVE INFORMATION
A. General aspects
The Bank aims at protecting itself against the interest rate risk potentially arising from the trading book.

Notes
-220-
B. Processes for managing and methods for measuring interest rate risk
Market risks are measured and monitored within the context of the Bank’s management of its trading book
through the use of the results of the VaR model developed by the Parent Bank.
In terms of the component associated with the interest rate risk factors in particular, an interest rate VaR indicator
is calculated on a monthly basis and measures the maximum potential loss that may be attributed to adverse
changes in the structure of interest rates and the relative volatilities.
In order to calculate this indicator, the rate curves on which the book’s exposure is concentrated were determined.
The volatility and correlation for each risk factor are then estimated by drawing on the market trading prices of the
nodes of the curves thus created. Scenarios are then created in agreement with the chosen model (for example,
the shape of the distribution of risk factors). The particular hypothesis assumed is that the various risk factors are
distributed in a Gaussian normal distribution. On the basis of this hypothesis, a number of new values is generated
for each risk factor equal to the number of scenarios that are to be generated.
The financial instruments in the book are then revalued to correspond to each scenario that has been generated by
using specific pricing formulae.
This results in the calculation of the yield frequency distribution. By ranking the values obtained through the above
process, from worst to best, and cutting the distribution at the desired percentile, the value for the risk indicator is
obtained.
In order to assess the impact of extreme changes in risk factors, the trading book is revalued by applying
sensitivity scenarios that estimate the impact of sudden and significant changes in the interest rate risk factors
monitored by the risk management system developed by the Bank.
QUANTITATIVE INFORMATION
1. Regulatory trading book: distribution by residual maturity (repricing date) of cash financial assets and liabilities and financial derivatives
This table has not been prepared since an analysis of the sensitivity to interest rate risk on the basis of internal
models is provided under point 2.
2. Trading book: internal models and other methods for the sensitivity analysis
The interest rate VaR for the trading book came to approximately €214 thousand per day as at 31 December 2006.
The following table contains a summary of the figures calculated during 2006 for the component of interest rate
VaR absorbed by FinecoBank’s trading book:
Key figures
Holding period of one day, confidence interval of 99% (figures in millions of euro).
Min IR VaR Av. IR VaR Max. IR VaR
Held-for-trading portfolio 74 151 214

Notes
-221-
2.2 INTEREST RATE RISK – BANKING BOOK
QUALITATIVE INFORMATION
A. General aspects, management processes and measurement methods for interest rate risk
In order to measure and monitor the interest rate risk profile at the individual and consolidated level, Capitalia has
worked with the main Group companies on the development of an ALM system that enables the calculation on a
monthly basis of the impacts generated by changes in the structure of interest-rates on the entirety of the annual
financial statements, expressed in terms of the change in the economic value of shareholders’ equity and net
interest income.
In terms of net interest income, the model allows an estimate of the value assuming deterministic or stochastic
variations in the interest rate curve (earnings at risk). In terms of variations in the economic value of capital, an
estimate is made of the impact of parallel shocks to the interest rate curve on the value of shareholders’ equity
items; this analysis is integrated with the measurement of the interest rate VaR indicator obtained through the use
of the Montecarlo method with a holding period of one month.
In line with the strategic risk management process established by the Parent Bank’s Board of Directors, the
interest rate risk profile is managed at the consolidated level in order to exploit the natural diversification existing
between the deposit and loan positions of the various subsidiary banks.
The interest rate risk management process calls in particular for FinecoBank S.p.A. to send the Parent Bank the
information flows required to prepare risk indicators on a monthly basis.
The indicators produced, and any changes aimed at rebalancing the Group’s consolidated risk profile, are
submitted for the prior approval of the holding company’s Risks and ALM Committee.
B. Fair value hedging activities
Interest rate risk positions are subject to macro hedging in accordance with the IAS rules governing fair-value
hedges. As at 31 December 2006 in particular, the Bank had positions in interest rate derivatives (interest rate swaps)
hedging the fixed-rate loan portfolio (fifth-of-salary and delegated-payment loans). The risk components covered by the hedges in place are therefore associated with the change in fair value arising
from the fluctuation of the interest rate structure on the value of the loan portfolio (fifth-of-salary and delegated-
payment).
C. Cash flow hedging activity
There are currently no cash flow hedges generated by Group business operations.
QUANTITATIVE INFORMATION
1. Banking book: Distribution by residual maturity (repricing date) of financial assets and liabilities

Notes
-222-
This table has not been prepared since an analysis of the sensitivity to interest rate risk on the basis of internal
models is provided under point 2.
2. Banking book: Internal models and other methods of sensitivity analysis
FinecoBank S.p.A. maintained a moderate interest rate risk profile throughout 2006. The following table provides
key figures for the results of the analyses that were conducted.
Holding period of one month, confidence interval of 99% (figures in millions of euro).
Value analysis (shift + 100 bp) Net interest analysis (shift + 100 bp) IR VaR EaR
- 23 -2 6.5 1
Interest rate risk indicators
The sensitivity analysis on net-interest income, which was conducted assuming a shift of +100 basis points on the
euro interest rate curve, highlighted an impact of -€2 million as at 31 December 2006, or approximately 0.6% of
FinecoBank’s individual shareholders’ equity.
Assuming stochastic variations in the interest rate curve, EaR (earnings at risk) totalled €1 million, or
approximately 0.8% of FinecoBank’s net interest income.
The sensitivity analysis on the value of shareholders’ equity, which was conducted assuming a shift of +100 basis
points on the euro interest rate curve, showed an impact of -€23 million as at 31 December 2006, or
approximately 7% of FinecoBank’s individual shareholders’ equity.
The interest rate VaR figure for FinecoBank S.p.A. came to approximately €6.5 million, the equivalent of
approximately 2% of FinecoBank’s individual shareholders’ equity.
2.3 PRICE RISK - TRADING BOOK
QUALITATIVE INFORMATION
A. General aspects
The equity component of the trading book is negligible and generates a daily VaR of less than €0.02 million.
B. Management processes and measurement methods for price risk
As mentioned in the introduction, market risks assumed as part of the management of the Bank’s trading book are
measured and monitored through the use of the results of the VaR model developed by the Parent Bank.

Notes
-223-
QUANTITATIVE INFORMATION
1. Regulatory trading book: cash exposures to equities and units in O.I.C.R.
Types of exposures/ValuesListed Unlisted
A. EquitiesA.1 Stock 1 22A.2 Innovative capital instruments - -A.3 Other equities - -B. Units in OICRB.1 Italian-law - harmonized open funds - - - unharmonized open funds - - - closed funds - - - reserved funds - - - speculative funds - -B.2 Of other EU countries - harmonized funds - - - unharmonized funds - - - unharmonized closed funds - -B.2 Of other non-EU countries - open funds - - - closed funds - -Total 1 22(Amounts in Euro/000)
Book value
2. Regulatory trading book: breakdown of exposures in equities and equity indices by main country of listing
Type of transactions/Listing indexItaly United StatesUnited Kingdom Portugal
A. Equities - long positions 1 22 - short positions 169 -B. Unsettled transactions in equities - long positions 91 44 44 2 5 - short positions 91 43 43 2 5C. Other equity derivatives - long positions 70 - short positionsD. Equity index derivatives - long positions 53,030 - short positions 3,470 53,030(Amounts in Euro/000)
Listed Unlisted
3. Regulatory trading book: internal models and other methods of sensitivity analysis
The positions comprising the trading book of FinecoBank S.p.A. are characterized by a modest level of exposure to
price risk. As at 31 December 2006, equity VaR came to approximately €13 thousand per day.

Notes
-224-
2.4 PRICE RISK - BANKING BOOK
QUALITATIVE INFORMATION
A. General aspects, management processes and measurement methods for price risk
Price risk affecting FinecoBank’s banking book is mainly concentrated within the available-for-sale portfolio.
The risk absorbed by this portfolio is measured and monitored through the use of the same instruments developed
for the trading book.
B. Price risk hedging activities
Considering the small amount of the exposure, no price risk hedging activities are provided.
QUANTITATIVE INFORMATION
1. Banking book: cash exposures to equities and units in O.I.C.R.
Types of exposures/Values
Listed UnlistedA. EquitiesA.1 Stock - 9,380A.2 Innovative capital instruments - -A.3 Other equities - -B. Units in OICRB.1 Italian-law - harmonized open funds - - - unharmonized open funds - - - closed funds - - - reserved funds - - - speculative funds - -B.2 Of other EU countries - harmonized funds - - - unharmonized funds - - - unharmonized closed funds - -B.2 Of other non-EU countries - open funds - - - closed funds - -Total - 9,380(Amounts in Euro/000)
Book value
2. Banking book: internal models and other methods of sensitivity analysis
Considering the small amount of the exposure, no internal models or other methods have been provided for
sensitivity analysis.

Notes
-225-
2.5 EXCHANGE RATE RISK
QUALITATIVE INFORMATION
A. General aspects, management processes and measurement methods for exchange rate risk
As part of its treasury activities, FinecoBank S.p.A. collects funding in foreign currencies, mainly in U.S. dollars,
through customer current accounts. It then uses this funding in short-term monetary instruments denominated in
the same currency.
In order to measure and monitor the exchange rate risk profile at the individual and consolidated level, Capitalia
Holding has developed an internal measurement model that enables the calculation on a monthly basis of the
impacts generated by changes in the structure of exchange rates on the entirety of the annual financial statements,
expressed in terms of the change in the economic value of assets.
An estimate of the impact on the value of balance sheet items is prepared by using an FX VaR indicator obtained
through the Montecarlo method with a holding period of one month.
B. Exchange rate risk hedging activities
Exchange rate risk is hedged through the matching of assets and liabilities in foreign currencies or through spot
transactions in foreign currencies.
The component of exchange rate risk that contributes to the preparation of the trading book’s overall VaR is tied to
the temporal mismatch between lending in securities denominated in USD and the undertaking of repurchase
agreements with customers involving the same securities. Nonetheless, the Bank’s exposure to EUR/USD
exchange rate risk is on the whole covered.
QUANTITATIVE INFORMATION
1. Breakdown of assets, liabilities and derivatives by currency of denomination
US dollarsPounds sterling
Yen Swiss FrancsCanadian
dollarOther
currenciesA. Financial assets 419,846 7,385 728 49,346 13 3,272A.1 Debt securities 271,941 7 - - - -A.2 Equities 1 - - - - -A.3 Loans to banks 87,749 6,583 658 938 - 3,264A.4 Loans to customers 60,155 795 70 48,408 13 8A.5 Other financial assets - - - - - -B. Other assets 18 - - - - -C. Financial liabilities 415,124 4,354 17 49,442 92 484C.1 Due to banks - - - 47,373 38 328C.2 Due to customers 415,124 4,354 17 2,069 54 156C.3 Debt securities - - - - - -D. Other liabilities 4 311 - - - -E. Financial derivatives 512,944 55,624 129,377 29,003 3,160 50,272 - Options + Long positions - - - - - - + Short positions - - - - - - - Other + Long positions 256,139 27,824 64,684 14,427 1,543 25,143 + Short positions 256,805 27,800 64,693 14,576 1,617 25,129Total assets 676,003 35,209 65,412 63,773 1,556 28,415Total liabilities 671,933 32,465 64,710 64,018 1,709 25,613Imbalance 4,070 2,744 702 (245) (153) 2,802(Amounts in Euro/000)
CurrenciesExposure / portfolio

Notes
-226-
2. Internal models and other methods of sensitivity analysis
As at 31 December 2006, the forex VaR of FinecoBank S.p.A. came to €0.3 million per month.
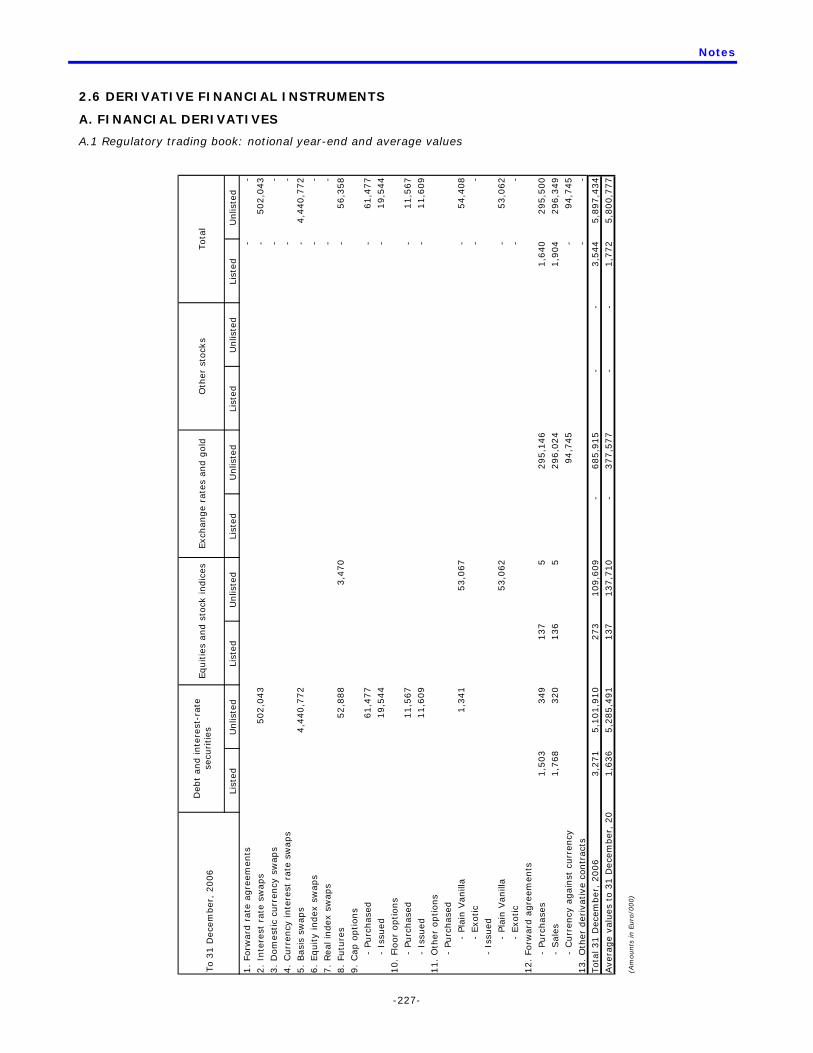
Notes
-227-
2.6 DERIVATIVE FINANCIAL INSTRUMENTS
A. FINANCIAL DERIVATIVES
A.1 Regulatory trading book: notional year-end and average values
Unlis
ted
-502,0
43 - -
4,4
40,7
72 - -
56,3
58
61,4
77
19,5
44
11,5
67
11,6
09
54,4
08 -
53,0
62 -
295,5
00
296,3
49
94,7
45 -
5,8
97,4
34
5,8
00,7
77
List
ed
- - - - - - - - - - - - - - - -
1,6
40
1,9
04 - -
3,5
44
1,7
72
Unlis
ted
- -
List
ed
- -
Unlis
ted
295,1
46
296,0
24
94,7
45
685,9
15
377,5
77
List
ed
- -
Unlis
ted
3,4
70
53,0
67
53,0
62 5 5
109,6
09
137,7
10
List
ed
137
136
273
137
Unlis
ted
502,0
43
4,4
40,7
72
52,8
88
61,4
77
19,5
44
11,5
67
11,6
09
1,3
41
349
320
5,1
01,9
10
5,2
85,4
91
List
ed 1,5
03
1,7
68
3,2
71
1,6
36
1.
Forw
ard
rate
agre
emen
ts2.
Inte
rest
rate
sw
aps
3. D
om
est
ic c
urr
ency
sw
aps
4.
Curr
ency
inte
rest
rate
sw
aps
5.
Basi
s sw
aps
6.
Equity
index
sw
aps
7.
Real
index
swap
s8.
Futu
res
9.
Cap o
ption
s -
Purc
hase
d -
Issu
ed
10.
Floor
option
s -
Purc
hase
d -
Issu
ed
11.
Oth
er
option
s -
Purc
hase
d
-
Pla
in V
anill
a -
Exo
tic
-
Issu
ed
-
Pla
in V
anill
a -
Exo
tic
12.
Forw
ard
agre
emen
ts
-
Purc
hase
s -
Sal
es -
Curr
ency
again
st c
urr
ency
13.
Oth
er
deriva
tive
contr
acts
Tot
al 3
1 D
ecem
ber,
2006
Ave
rage
val
ues
to 3
1 D
ece
mber
, 20
(Am
ounts
in E
uro
/000)
To
31 D
ece
mber,
2006
Tota
lO
ther
sto
cks
Deb
t an
d inte
rest
-rat
e
secu
rities
Equitie
s and s
tock
indic
esExch
ange r
ates
and g
old

Notes
-228-
Unlis
ted
-
1,1
02,4
13 - -
4,2
68,1
18 - -
22,7
49
25,2
64
25,2
59
14,7
68
14,7
59
104,5
16 -
108,5
35 -
8,1
67
9,5
71 - -
5,7
04,1
19
n.d
.
List
ed
- - - - - - - - - - - - - - - - - - - - - -
Unlis
ted
- -
List
ed
- -
Unlis
ted
25,0
00
26,5
00
8,1
67
9,5
71
69,2
38
n.d
.
List
ed
- -
Unlis
ted
4,2
59
79,5
16
82,0
35
165,8
10
n.d
.
List
ed
- -
Unlis
ted
1,1
02,4
13
4,2
68,1
18
18,4
90
25,2
64
25,2
59
14,7
68
14,7
59
5,4
69,0
71
n.d
.
List
ed
- -
1.
Forw
ard
rate
agre
emen
ts2.
Inte
rest
rate
sw
aps
3.
Dom
estic
curr
ency
sw
aps
4.
Curr
ency
inte
rest
rate
sw
aps
5.
Basi
s sw
aps
6.
Equity index s
waps
7.
Real in
dex
sw
aps
8.
Futu
res
9.
Cap o
ption
s
-
Purc
hase
d
-
Issu
ed
10.
Floor
options
-
Purc
hase
d
-
Issu
ed
11.
Oth
er
options
-
Purc
hase
d
-
Pla
in V
anill
a
-
Exot
ic -
Issu
ed
-
Pla
in V
anill
a
-
Exot
ic12.
Forw
ard
agre
emen
ts
-
Purc
hase
s
-
Sale
s
-
Curr
ency
again
st c
urr
ency
13.
Oth
er
derivative c
ontr
act
sTota
l 31 D
ece
mber,
2005
Ave
rage v
alu
es
to 3
1 D
ece
mber,
20
(Am
ounts
in E
uro
/000)
To 3
1 D
ece
mber,
2005
Tota
lO
ther
stock
sD
ebt
and inte
rest
-rate
se
curities
Equitie
s and s
tock
indic
esExch
ange
rate
s and g
old

Notes
-229-
A.2 Banking book: notional year-end and average values
A.2.1 Hedges
Unlis
ted
-
1,8
66,5
56 - - - - - -
37,4
86 - - - - - - - - - - -
1,9
04,0
42
1,6
94,7
74
List
ed
- - - - - - - - - - - - - - - - - - - - - -
Unlis
ted
- -
List
ed
- -
Unlis
ted
- -
List
ed
- -
Unlis
ted
- -
List
ed
- -
Unlis
ted
1,8
66,5
56
37,4
86
1,9
04,0
42
1,6
94,7
74
List
ed
- -
1.
Forw
ard
rate
agre
emen
ts
2.
Inte
rest
rate
sw
aps
3. D
om
est
ic c
urr
ency
sw
aps
4.
Curr
ency
inte
rest
rate
sw
aps
5.
Basi
s sw
aps
6.
Equity
index
sw
aps
7.
Real
index
swap
s
8.
Futu
res
9.
Cap o
ption
s
-
Purc
hase
d
-
Issu
ed
10.
Floor
option
s
-
Purc
hase
d
-
Issu
ed
11.
Oth
er
option
s
-
Purc
hase
d
-
Pla
in v
anill
a
-
Exo
tic
-
Issu
ed
-
Pla
in v
anill
a
-
Exo
tic
12.
Forw
ard
agre
emen
ts
-
Purc
hase
s
-
Sal
es
-
Curr
ency
again
st c
urr
ency
13.
Oth
er
deriva
tive
contr
acts
Tot
al 3
1 D
ecem
ber,
2006
Ave
rage
val
ues
to 3
1 D
ece
mber
, 20
(Am
ounts
in E
uro
/000)
To
31 D
ece
mber,
2006
Tota
lO
ther
sto
cks
Deb
t se
curities
and
inte
rest
rate
sEquitie
s and s
tock
indic
esExch
ange r
ates
and g
old

Notes
-230-
Unlis
ted
-
1,3
75,5
04 - - - - - -
110,0
01 - - - - - - - - - - -
1,4
85,5
05
n.d
.
List
ed
- - - - - - - - - - - - - - - - - - - - - -
Unlis
ted
- -
List
ed
- -
Unlis
ted
- -
List
ed
- -
Unlis
ted
- -
List
ed
- -
Unlis
ted
1,3
75,5
04
110,0
01
1,4
85,5
05
n.d
.
List
ed
- -
1.
Forw
ard
rate
agre
em
ents
2.
Inte
rest
rate
sw
aps
3.
Dom
est
ic c
urr
ency
sw
aps
4.
Curr
ency
inte
rest
rate
sw
aps
5.
Basi
s sw
aps
6.
Equity in
dex
swaps
7.
Real i
ndex
sw
aps
8.
Futu
res
9.
Cap o
ption
s
-
Purc
hase
d
-
Issu
ed
10.
Floo
r op
tions
-
Purc
hase
d
-
Issu
ed
11.
Oth
er
option
s
-
Purc
hase
d
-
Pla
in v
anill
a
-
Exo
tic
-
Issu
ed
-
Pla
in v
anill
a
-
Exo
tic
12.
Forw
ard
agre
emen
ts
-
Purc
hase
s
-
Sale
s
-
Curr
ency
again
st c
urr
ency
13.
Oth
er
deriva
tive c
ontr
act
sTo
tal 3
1 D
ece
mber,
2005
Avera
ge v
alu
es
to 3
1 D
ece
mber,
20
(Am
ounts
in E
uro
/000)
To 3
1 D
ece
mber,
2005
Tota
lO
ther
stock
sD
ebt
secu
rities
and
inte
rest
rate
sEquitie
s and s
tock
indic
es
Exc
hange r
ate
s and g
old

Notes
-231-
A.2.2 Other derivatives
This table was not included since FinecoBank S.p.A. did not have any “other derivatives” to report.
A.3 Derivatives: purchase and sale of underlying securities
Unlis
ted
296,9
10
299,8
12
94,7
45
156,0
89
609,1
06 - - - -
162,5
86
1,7
41,4
55 - - - - - - -
List
ed 1,6
40
1,9
04 - - - - - - - - - - - - - - - -
Unlis
ted
List
edU
nlis
ted
295,1
46
296,0
24
94,7
45
List
edU
nlis
ted
74
3,4
68
53,0
30
53,0
37
List
ed
137
136
Unlis
ted
1,6
90
320
103,0
59
556,0
69
162,5
86
1,7
41,4
55
List
ed 1,5
03
1,7
68
To
31 D
ece
mber
, 2006
A.
Reg
ula
tory
tra
din
g b
oo
k:
1.
Tra
nsa
ctio
ns
with e
xchange o
f ca
pital
- Purc
has
es
- Sal
es
- C
urr
ency
agai
nst
curr
ency
2.
Tra
nsa
ctio
ns
without
exch
ange
of ca
pital
- Purc
has
es
- Sal
es
- C
urr
ency
agai
nst
curr
ency
B.
Ban
kin
g b
oo
k:
B.1
Hed
gin
g
1.
Tra
nsa
ctio
ns
with e
xchange o
f ca
pital
- Purc
has
es
- Sal
es
- C
urr
ency
agai
nst
curr
ency
2.
Tra
nsa
ctio
ns
without
exch
ange
of ca
pital
- Purc
has
es
- Sal
es
- C
urr
ency
agai
nst
curr
ency
B.2
. O
ther
deri
vati
ves
1.
Tra
nsa
ctio
ns
with e
xchange o
f ca
pital
- Purc
has
es
- Sal
es
- C
urr
ency
agai
nst
curr
ency
2.
Tra
nsa
ctio
ns
without
exch
ange
of ca
pital
- Purc
has
es
- Sal
es
- C
urr
ency
agai
nst
curr
ency
(Am
ounts
in E
uro
/000)
Transa
ctio
n/U
nder
lyin
g c
ateg
ory
Tot
alO
ther
stock
sD
ebt
secu
rities
and
inte
rest
rate
sEquitie
s and s
tock
indic
esExch
ange
rate
s and g
old

Notes
-232-
Unlis
ted
34,8
41
38,7
12 -
642,9
00
719,5
49 - - - - -
1,4
85,5
05 - - - - - - -
List
ed
- - - - - - - - - - - - - - - - - -
Unlis
ted
List
ed
Unlis
ted
34,6
67
34,5
71
List
ed
Unlis
ted 1
74
4,1
41
79,4
78
82,0
17
List
ed
Unlis
ted
563,4
22
637,5
32
1,4
85,5
05
List
ed
To 3
1 D
ece
mber,
2005
A.
Reg
ula
tory
tra
din
g b
ook:
1.
Tra
nsa
ctio
ns
with e
xchange o
f ca
pital
- Pu
rchas
es
- Sal
es
- C
urr
ency
again
st c
urr
ency
2.
Tra
nsa
ctio
ns
without
exch
ange o
f ca
pital
- Pu
rchas
es
- Sal
es
- C
urr
ency
again
st c
urr
ency
B.
Ban
kin
g b
ook
:
B.1
Hed
gin
g
1.
Tra
nsa
ctio
ns
with e
xchange o
f ca
pital
- Pu
rchas
es
- Sal
es
- C
urr
ency
again
st c
urr
ency
2.
Tra
nsa
ctio
ns
without
exch
ange o
f ca
pital
- Pu
rchas
es
- Sal
es
- C
urr
ency
again
st c
urr
ency
B.2
. O
ther
deri
vati
ves
1.
Tra
nsa
ctio
ns
with e
xchange o
f ca
pital
- Pu
rchas
es
- Sal
es
- C
urr
ency
again
st c
urr
ency
2.
Tra
nsa
ctio
ns
without
exch
ange o
f ca
pital
- Pu
rchas
es
- Sal
es
- C
urr
ency
again
st c
urr
ency
(Am
ounts
in E
uro
/000)
Tra
nsa
ctio
n/U
nderlyin
g c
ategory
Tota
lO
ther
stock
sD
ebt
secu
rities
and
inte
rest
rate
sEquitie
s and s
tock
indic
es
Exc
hange r
ate
s and g
old

Notes
-233-
A.4 Over-the-counter derivatives: positive fair value – counterparty risk
- -
- -
- -
- -
- -
- - -
- -
160
159
31
9 -
2,1
60
1,0
28
3,1
88 -
- -
5,1
48
2,3
30
7,4
78 -
567
95 8 4
67
4
1,6
15 -
694
2,3
09
- -
5,7
37
469
150
185
6,5
41
11,6
12
853
4,2
91
16
,75
6
A.
Reg
ula
tory
tra
din
g b
ook
A.1
Govern
ments
and c
entr
al banks
A.2
Public
entities
A.3
Ban
ks
A.4
Fin
anci
al co
mpanie
s
A.5
Insu
rance
com
pan
ies
A.6
Non-f
inanci
al co
mpanie
s
A.7
Oth
er
entities
To
tal
31
Dece
mb
er,
20
06
B.
Ban
kin
g b
oo
k
B.1
Govern
ments
and c
entr
al banks
B.2
Public
entities
B.3
Banks
B.4
Fin
anci
al co
mpanie
s
B.5
Insu
rance
com
panie
s
B.6
Non-f
inanci
al co
mpanie
s
B.7
Oth
er
entities
To
tal
31
Dece
mb
er,
20
06
(Am
ounts
in E
uro
/000)
Gross value prior to netting
Gross value after netting
Counte
rpart
ies/
Under
lyin
g s
ecurities
Diffe
rent
underlyin
g
secu
rities
Oth
er
stock
sD
ebt
secu
rities
and
inte
rest
rate
sEquitie
s and s
tock
in
dic
es
Exch
ange
rate
s and
gold
Future exposure
Gross value prior to netting
Future exposure
Gross value after netting
Gross value after netting
Future exposure
After netting
Future exposure
Gross value prior to netting
Future exposure
Gross value prior to netting
Gross value after netting

Notes
-234-
- -
- -
- -
- -
- -
1,2
50
1,2
50 -
- -
17
17 -
6,3
58
85
6,4
43 -
- -
7,9
25 5
7,9
30 -
700
701
53 7
1,4
61
2,9
36
409
917
4,2
62
- -
12,6
45
4,3
01
2,1
82 1
19
,12
9
3,2
75
319
1,2
15
4,8
09
A.
Reg
ula
tory
tra
din
g b
ook
A.1
Govern
men
ts a
nd c
entr
al banks
A.2
Public
entities
A.3
Ban
ks
A.4
Fin
anci
al co
mpanie
s
A.5
Insu
rance
com
pan
ies
A.6
Non-f
inanci
al co
mpanie
s
A.7
Oth
er
entities
To
tal
31
Dece
mb
er,
20
05
B.
Ban
kin
g b
oo
k
B.1
Govern
men
ts a
nd c
entr
al banks
B.2
Public
entities
B.3
Banks
B.4
Fin
anci
al co
mpanie
s
B.5
Insu
rance
com
panie
s
B.6
Non-f
inanci
al co
mpanie
s
B.7
Oth
er
entities
To
tal
31
Dece
mb
er,
20
05
(Am
ounts
in E
uro
/000)
Future exposure
Gross value after netting
Gross value after netting
Future exposure
After netting
Future exposure
Gross value prior to netting
Future exposure
Gross value prior to netting
Gross value after netting
Gross value prior to netting
Gross value after nettingC
ounte
rpart
ies/
Under
lyin
g s
ecurities
Diffe
rent
underlyin
g
secu
rities
Oth
er
stock
sD
ebt
secu
rities
and
inte
rest
rate
sEquitie
s and s
tock
in
dic
es
Exch
ange r
ate
s and
gold
Future exposure
Gross value prior to netting

Notes
-235-
A.5 Over-the-counter derivatives: negative fair value – financial risk
- -
- -
- -
- -
- -
- - -
- -
134
167
30
1 -
-
4,2
42
4,2
42 -
- -
-
7,4
68
7,4
68 -
150
98 - 4
25
2
498
161 -
65
9
- -
10,8
66
2,0
83 - 1
12
,95
0
2,2
21
2,3
59 -
4,5
80
A.
Reg
ula
tory
tra
din
g b
ook
A.1
Govern
ments
and c
entr
al banks
A.2
Public
entities
A.3
Ban
ks
A.4
Fin
anci
al co
mpanie
s
A.5
Insu
rance
com
panie
s
A.6
Non-f
inanci
al co
mpanie
s
A.7
Oth
er
entities
To
tal
31
Dece
mb
er,
20
06
B.
Ban
kin
g b
oo
k
B.1
Govern
ments
and c
entr
al banks
B.2
Public
entities
B.3
Banks
B.4
Fin
anci
al co
mpanie
s
B.5
Insu
rance
com
panie
s
B.6
Non-f
inanci
al co
mpanie
s
B.7
Oth
er
entities
To
tal
31
Dece
mb
er,
20
06
(Am
ounts
in E
uro
/000)
Gross value prior to netting
Gross value after netting
Counte
rpart
ies/
Under
lyin
g s
ecurities
Diffe
rent
underlyin
g
secu
rities
Oth
er
stock
sD
ebt
secu
rities
and
inte
rest
rate
sEquitie
s and s
tock
in
dic
es
Exch
ange
rate
s and
gold
Future exposure
Gross value prior to netting
Future exposure
Gross value after netting
Gross value after netting
Future exposure
After netting
Future exposure
Gross value prior to netting
Future exposure
Gross value prior to netting
Gross value after netting

Notes
-236-
- -
- -
- -
- -
- -
1,3
25
1,3
25 -
- -
17
17 -
2,3
18
4,4
20
6,7
38 -
- -
736
7,2
51
7,9
87 -
1,2
21
1,1
12 - 7
2,3
40
1,4
67
522
115
2,1
04
- -
39,8
44
9,2
32 4
28
49
,10
8
4,8
68
2,4
42
187
7,4
97
A.
Reg
ula
tory
tra
din
g b
ook
A.1
Govern
ments
and c
entr
al banks
A.2
Public
entities
A.3
Ban
ks
A.4
Fin
anci
al co
mpanie
s
A.5
Insu
rance
com
panie
s
A.6
Non-f
inanci
al co
mpanie
s
A.7
Oth
er
entities
To
tal 3
1 D
ece
mb
er,
20
05
B.
Ban
kin
g b
oo
k
B.1
Govern
ments
and c
entr
al banks
B.2
Public
entities
B.3
Banks
B.4
Fin
anci
al co
mpanie
s
B.5
Insu
rance
com
panie
s
B.6
Non-f
inanci
al co
mpanie
s
B.7
Oth
er
entities
To
tal 3
1 D
ece
mb
er,
20
05
(Am
ounts
in E
uro
/000)
Gross value prior to netting
Gross value after nettingC
ounte
rpart
ies/
Under
lyin
g s
ecurities
Diffe
rent
underlyin
g
secu
rities
Oth
er
stock
sD
ebt
secu
rities
and
inte
rest
rate
sEquitie
s and s
tock
in
dic
es
Exch
ange
rate
s and
gold
Future exposure
Gross value prior to netting
Future exposure
Gross value after netting
Gross value after netting
Future exposure
After netting
Future exposure
Gross value prior to netting
Future exposure
Gross value prior to netting
Gross value after netting

Notes
-237-
A.6 Residual maturities of over-the-counter derivatives: notional values
As at 31 December 2006
Underlying securities / Residual maturities Less than 1 yearBetween 1 and 5
yearsMore than 5
yearsTotal
A. Regulatory trading bookA.1 Financial derivatives on debt securities and interest rates 693,622 2,010,335 2,401,223 5,105,180A.2 Financial derivatives on equities and equity indices 109,813 - 69 109,882A.3 Financial derivatives on exchange rates and gold 685,915 - - 685,915A.4 Financial derivatives on other instruments - - - -
-B. Banking bookB.1 Financial derivatives on debt securities and interest rates 550,948 1,218,713 134,381 1,904,042B.2 Financial derivatives on equities and equity indices - - - -B.3 Financial derivatives on exchange rates and gold - - - -B.4 Financial derivatives on other instruments - - - -Total 2,040,298 3,229,048 2,535,673 7,805,019(Amounts in Euro/000)
As at 31 December 2005
Underlying securities / Residual maturities Less than 1 yearBetween 1 and 5
yearsMore than 5
yearsTotal
A. Regulatory trading bookA.1 Financial derivatives on debt securities and interest rates 687,359 2,078,131 2,703,582 5,469,072A.2 Financial derivatives on equities and equity indices 51,934 113,807 69 165,810A.3 Financial derivatives on exchange rates and gold 51,500 - - 51,500A.4 Financial derivatives on other instruments - - - -
-B. Banking bookB.1 Financial derivatives on debt securities and interest rates 463,064 923,829 98,612 1,485,505B.2 Financial derivatives on equities and equity indices - - - -B.3 Financial derivatives on exchange rates and gold - - - -B.4 Financial derivatives on other instruments - - - -Total 1,253,857 3,115,767 2,802,263 7,171,887(Amounts in Euro/000)
B. CREDIT DERIVATIVES
These tables were not included since FinecoBank S.p.A. did not have any outstanding credit derivatives to report.
3. LIQUIDITY RISKS
QUALITATIVE INFORMATION
A. General aspects, management processes and measurement methods for liquidity risk
As part of its normal business operations, FinecoBank S.p.A. undertakes short-term funding operations (customer
current accounts) and long-term lending operations (mortgages and fifth-of-salary loans), resulting in structural
liquidity gaps. The Bank consequently resorts to planned securitization transactions in order to rebalance its
treasury position and reduce substantially the maturities of its long-term assets.
The Bank’s Treasury coordinates the management of liquidity risk with the Parent Bank. Treasury policies are
aimed at maintaining the balance between the maturities of lending and funding. Transactions with the Parent
Bank and the subsidiaries allow the Bank to handle any liquidity shortfalls/surpluses.

Notes
-238-
QUANTITATIVE INFORMATION
1. Distribution of financial assets and liabilities by residual contractual maturity Denominated in euro
Cash assetsA.1 Government securities 1 - - - 3 - 11,679 5,197 81 A.2 Listed debt securities 17 - - 55 143 155 21,133 2,202 513 A.3 Other debt securities 929 5 41 4 150 86 209,671 359,634 74,514 A.4 Units in OICR - - - - - - - - - A.5 Loans - Banks 974,308 1,800 - - - 11,100 951 - - - Customers 119,515 82,618 592,935 10,100 177,157 87,512 155,595 1,038,946 2,065,128 Cash liabilitiesB.1 Deposits - Banks 68,716 - - - - - - 513,553 51,833 - Customers 4,102,305 - - - - - - - 320 B.2 Debt securities - - - - - - - - - B.3 Other liabilities 6,721 107,701 151,565 218,196 349,579 49,122 90,734 - 100,276 Off-balance-sheet transactionsC.1 Derivatives with exchange of capital - Long positions 367 2,073 - - 3,473 - 80 706 594 - Short positions 318 1,849 - - - - 66 997 603 C.2 Deposits and loans to be collected - Long positions - - - - - - - - - - Short positions - - - - - - - - - C.3 Irrevocable commitments to lend funds - Long positions - - - - - - - - - - Short positions 8,402 - - - - - - - -
(Amounts in Euro/000)
Items / Time bracketsMore than 5
years
Between 6 months and
1 yearOn demand
Between 1 and 7 days
Between 7 and 15 days
Between 15 days and 1
month
Between 1 and 3
months
Between 3 and 6
months
Between 1 and 5 years
Denominated in dollars
Cash assetsA.1 Government securities - - - - - - - 4 5 A.2 Listed debt securities - - - - - 42 14 172 61 A.3 Other debt securities - - - - - - 53,475 218,166 2 A.4 Units in OICR - - - - - - - - - A.5 Loans - Banks 86,367 - - - - 1,046 336 - - - Customers 4,244 43,197 73 558 8,349 1,861 1,873 - - Cash liabilitiesB.1 Deposits - Banks - - - - - - - - - - Customers 252,411 - - - - - - - - B.2 Debt securities - - - - - - - - - B.3 Other liabilities 3,407 24,692 20,589 48,417 65,608 - - - - Off-balance-sheet transactionsC.1 Derivatives with exchange of capital - Long positions - 472,076 - - - - 14 62 2 - Short positions - 472,014 - - - - - 63 29 C.2 Deposits and loans to be collected - Long positions - - - - - - - - - - Short positions - - - - - - - - - C.3 Irrevocable commitments to lend funds - Long positions - - - - - - - - - - Short positions - - - - - - - - -
(Amounts in Euro/000)
Items / Time bracketsMore than 5
years
Between 6 months and
1 yearOn demand
Between 1 and 7 days
Between 7 and 15 days
Between 15 days and 1
month
Between 1 and 3
months
Between 3 and 6
months
Between 1 and 5 years

Notes
-239-
Denominated in Swiss francs
Cash assetsA.1 Government securities - - - - - - - - - A.2 Listed debt securities - - - - - - - - - A.3 Other debt securities - - - - - - - - - A.4 Units in OICR - - - - - - - - - A.5 Loans - Banks 937 - - - - - - - - - Customers 73 36 62 151 521 779 1,585 13,258 30,616 Cash liabilitiesB.1 Deposits - Banks 47,373 - - - - - - - - - Customers 2,069 - - - - - - - - B.2 Debt securities - - - - - - - - - B.3 Other liabilities - - - - - - - - - Off-balance-sheet transactionsC.1 Derivatives with exchange of capital - Long positions - 24,510 - - - - - - - - Short positions - 24,517 - - - - - - - C.2 Deposits and loans to be collected - Long positions - - - - - - - - - - Short positions - - - - - - - - - C.3 Irrevocable commitments to lend funds - Long positions - - - - - - - - - - Short positions - - - - - - - - -
(Amounts in Euro/000)
Items / Time bracketsMore than 5
years
Between 6 months and
1 yearOn demand
Between 1 and 7 days
Between 7 and 15 days
Between 15 days and 1
month
Between 1 and 3
months
Between 3 and 6
months
Between 1 and 5 years
Denominated in pounds sterling
Cash assetsA.1 Government securities - - - - 1 - - 7 - A.2 Listed debt securities - - - - - - - - - A.3 Other debt securities - - - - - - - - - A.4 Units in OICR - - - - - - - - - A.5 Loans - Banks 6,583 - - - - - - - - - Customers 34 761 - - - - - - - Cash liabilitiesB.1 Deposits - Banks - - - - - - - - - - Customers 4,333 - - - - - - - - B.2 Debt securities - - - - - - - - - B.3 Other liabilities 21 - - - - - - - - Off-balance-sheet transactionsC.1 Derivatives with exchange of capital - Long positions - 32,719 - - 5 - - - - - Short positions - 32,748 - - 2 - - - - C.2 Deposits and loans to be collected - Long positions - - - - - - - - - - Short positions - - - - - - - - - C.3 Irrevocable commitments to lend funds - Long positions - - - - - - - - - - Short positions - - - - - - - - -
(Amounts in Euro/000)
Items / Time bracketsMore than 5
years
Between 6 months and
1 yearOn demand
Between 1 and 7 days
Between 7 and 15 days
Between 15 days and 1
month
Between 1 and 3
months
Between 3 and 6
months
Between 1 and 5 years

Notes
-240-
Denominated in Japanese yen
Cash assetsA.1 Government securities - - - - - - - - - A.2 Listed debt securities - - - - - - - - - A.3 Other debt securities - - - - - - - - - A.4 Units in OICR - - - - - - - - - A.5 Loans - Banks 658 - - - - - - - - - Customers 46 24 - - - - - - - Cash liabilitiesB.1 Deposits - Banks - - - - - - - - - - Customers 17 - - - - - - - - B.2 Debt securities - - - - - - - - - B.3 Other liabilities - - - - - - - - - Off-balance-sheet transactionsC.1 Derivatives with exchange of capital - Long positions - 114,991 - - - - - - - - Short positions - 114,989 - - - - - - - C.2 Deposits and loans to be collected - Long positions - - - - - - - - - - Short positions - - - - - - - - - C.3 Irrevocable commitments to lend funds - Long positions - - - - - - - - - - Short positions - - - - - - - - -
(Amounts in Euro/000)
Items / Time bracketsMore than 5
years
Between 6 months and
1 yearOn demand
Between 1 and 7 days
Between 7 and 15 days
Between 15 days and 1
month
Between 1 and 3
months
Between 3 and 6
months
Between 1 and 5 years
Denominated in other currencies
Cash assetsA.1 Government securities - - - - - - - - - A.2 Listed debt securities - - - - - - - - - A.3 Other debt securities - - - - - - - - - A.4 Units in OICR - - - - - - - - - A.5 Loans - Banks 3,265 - - - - - - - - - Customers 12 10 - - - - - - - Cash liabilitiesB.1 Deposits - Banks 366 - - - - - - - - - Customers 209 - - - - - - - - B.2 Debt securities - - - - - - - - - B.3 Other liabilities - - - - - - - - - Off-balance-sheet transactionsC.1 Derivatives with exchange of capital - Long positions - 41,643 - - - - 8 6 - - Short positions - 41,644 - - - - 8 6 - C.2 Deposits and loans to be collected - Long positions - - - - - - - - - - Short positions - - - - - - - - - C.3 Irrevocable commitments to lend funds - Long positions - - - - - - - - - - Short positions - - - - - - - - -
(Amounts in Euro/000)
Items / Time bracketsMore than 5
years
Between 6 months and
1 yearOn demand
Between 1 and 7 days
Between 7 and 15 days
Between 15 days and 1
month
Between 1 and 3
months
Between 3 and 6
months
Between 1 and 5 years

Notes
-241-
2. Distribution of financial liabilities by segment
As at 31 December 2006
1. Due to customers - 1 252,483 28,945 38,679 5,324,792 2. Securities in issue - - - - - - 3. Financial liabilities held for trading - - 9,580 - 170 167 4. Financial liabilities designated at fair value - - - - - - Total - 1 262,063 28,945 38,849 5,324,959
(Amounts in Euro/000)
Insurance companies
Non-financial companies
Other entitiesExposures / CounterpartiesGovernment and central
banks
Other public institutions
Financial companies
As at 31 December 2005
1. Due to customers - 1 167,046 24,157 18,789 6,127,912 2. Securities in issue - - 52,068 - - 2,625 3. Financial liabilities held for trading - - 38,444 - - - 4. Financial liabilities designated at fair value - - - - - - Total - 1 257,558 24,157 18,789 6,130,537
(Amounts in Euro/000)
Insurance companies
Non-financial companies
Other entitiesExposures / CounterpartiesGovernment and central
banks
Other public institutions
Financial companies
3. Geographical distribution of financial liabilities
As at 31 December 2006
1. Due to customers 5,503,998 128,977 11,282 130 513 2. Deposits from banks 506,720 290,265 - - - 3. Securities in issue - - - - - 4. Financial liabilities held for trading 10,935 7,553 2,429 - - 5. Financial liabilities designated at fair value - - - - - Total 6,021,653 426,795 13,711 130 513
(amounts in Euro/000)
ASIAREST OF THE
WORLDExposures / Counterparties ITALY
OTHER EUROPEAN COUNTRIES
AMERICA
As at 31 December 2005
1. Due to customers 6,261,369 54,442 22,039 - 55 2. Deposits from banks 572,966 285,093 - - - 3. Securities in issue 54,693 - - - - 4. Financial liabilities held for trading 28,653 9,791 - - - 5. Financial liabilities designated at fair value - - - - - Total 6,917,681 349,326 22,039 - 55
(amounts in Euro/000)
ASIAREST OF THE
WORLDExposures / Counterparties ITALY
OTHER EUROPEAN COUNTRIES
AMERICA

Notes
-242-
4. OPERATIONAL RISKS
QUALITATIVE INFORMATION
A. General aspects, management processes and measurement methods for operational risk
During 2006, the Measurement and Control Division of the Parent Bank moved forward with its activity in the area
of the adoption of a standardized method for the calculation of the regulatory capital requirement set by Basel II.
The criteria governing the classification of assets into regulatory business lines were established, and work was
begun on the collection of significant data on losses involving the definition of an internal process for systematic
monitoring and reporting (internal rules). Under this system, the assessment of the exposure to operational risks
is founded on the mapping of risks inherent in business processes, the assignment of the level of “danger”
perceived by the management/expert personnel, and the definition of action priorities for risk mitigation. A
systematic reporting model on the quantitative and qualitative aspects is currently being prepared.
QUANTITATIVE INFORMATION
The regulatory capital requirement of FinecoBank S.p.A. in relation to operational risks, as calculated using the
Standardized Approach, came to €35,384 thousand as at 31 December 2006:
Business line Capital requirementCorporate Finance -Trading & Sales 10,254Retail banking 14,647Commercial Banking 256Payment & settlementAgency services -Asset management Retail brokerage 10,227Total 35,384(Amounts in Euro/000)
Operational risk

Notes
-243-
PART F – INFORMATION ON SHAREHOLDERS’ EQUITY
SECTION 1 - Bank's shareholders' equity
A. Qualitative information
Shareholders’ equity is the Bank’s first line of defence against risks associated with banking activity.
Equity is calculated on a quarterly basis in accordance with supervisory regulations by the Financial Statement
Administration and Supervisory Body Reporting Division. The results are reported to the Parent Bank’s Board of
Directors.
B. Quantitative information
Bank solvency ratio
31-Dec-06 31-Dec-05
Regulatory capital 355,201 300,034Total credit activities 2,383,427 2,012,617Bank solvency ratio 14.90% 14.91%(Amounts in Euro/000)
Bank asset absorption ratio
31-Dec-06 31-Dec-05
Absorption of credit risk 166,840 140,883Absorption of market risk 17,736 8,914Absorption of other requirements 68,685 61,410
Total asset absorption 253,261 211,207
Total assets (credit, market, and other requirements) 3,618,013 3,017,243
Bank asset absorption ratio 9.82% 9.94%(Amounts in Euro/000)
SECTION 2 - Regulatory capital and capital-adequacy ratios
2.1 Regulatory capital
The Bank’s regulatory capital stood at €355,201 thousand as at 31 December 2006, and satisfied the compulsory
prudential requirements established by current Bank of Italy regulations.
Regulatory capital and total weighted risk assets were calculated by applying current regulatory provisions and on
the basis of accounting data that conformed to international accounting standards; core capital as at 31 December
2006 included the share of profit for the year, also calculated according to said regulatory provisions, which the
directors consider as increasing the value of reserves, amounting to €40,879 thousand.

Notes
-244-
Regulatory capital and total weighted risk assets as at 31 December 2005 were calculated by applying supervisory
provisions effective at the time, on the basis of accounting figures prepared in accordance with Italian Legislative
Decree no. 87/92.
A. Qualitative information
31-Dec-06 31-Dec-05
Core capital (tier 1) 253,386 247,734Supplementary capital (tier 2) 101,815 53,160Items to be deducted - 860Regulatory capital 355,201 300,034(Amounts in Euro/000)
1. Core capital
The positive components of core capital consist of share capital, which included 605,609,053 ordinary shares, the
reserves, and the share of profit or loss for 2006 that the directors intend to designate for shareholders’ equity.
The negative components of core capital consist of the book value of goodwill and intangible assets.
2. Supplementary capital
The admitted positive value of supplementary capital consists of calculable subordinated liabilities, 50% of the
positive reserves on available-for-sale securities, and the reserve for special revaluation laws, net of non-existent
assets that have not yet been charged to the income statement, and lump-sum writedowns on unsecured
exposures to entities residing in Zone B countries. The latter are subtracted from supplementary capital to the
extent not charged to the income statement.
The subordinated loan issued by FinecoBank S.p.A. was fully underwritten by Fineco Finance Ltd. in three tranches:
€50,000 thousand on 7 June 2006; €20,000 thousand on 7 September 2006; and €30,000 thousand on 7
December 2006. The loan is to be repaid in five equal yearly instalments, each coming to one-fifth of the amount of the loan,
payable on 7 June of each year, starting with 7 June 2013 and ending with 7 June 2017.
The loan may be redeemed in advance for the outstanding principal and on each date on which interest payments
are scheduled, starting with 7 June 2012 and ending on 7 March 2017, with an advance notice of at least 30 days,
and solely upon the borrower’s request, contingent upon the obtainment of the required authorization from the
Bank of Italy.
Interest accruing on the loan is payable on a quarterly basis and is calculated on the basis of the three-month
Euribor increased by a spread of 0.50% multiplied by the number of effective days in the reference period and
divided by 360. During the last five years, if the borrower does not exercise the prepayment option, the quarterly
interest shall be calculated on the basis of the three-month Euribor rate increased by a spread of 1.10%.
During the first quarter of 2006, FinecoBank S.p.A. exercised early redemption of the subordinated loans for
€1,000 thousand and €51,646 thousand, which had been underwritten by Capitalia S.p.A. and Bipop Carire Società
per Azioni, respectively.
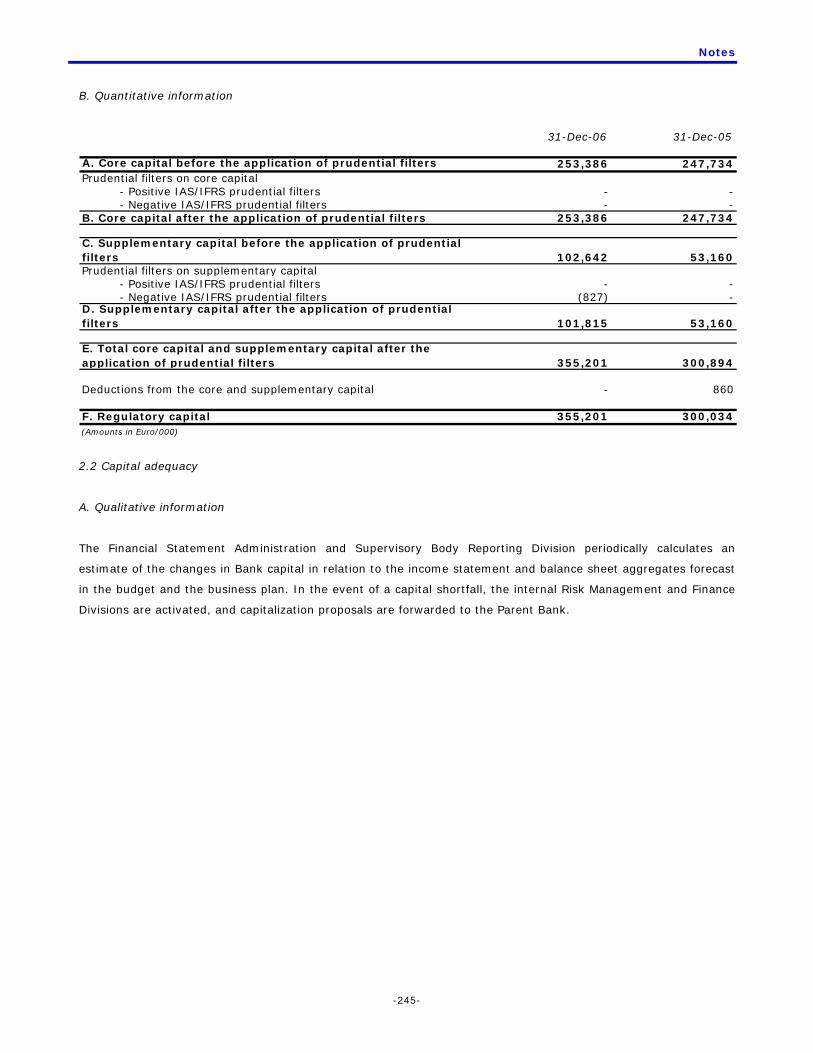
Notes
-245-
B. Quantitative information
31-Dec-06 31-Dec-05
A. Core capital before the application of prudential filters 253,386 247,734Prudential filters on core capital - Positive IAS/IFRS prudential filters - - - Negative IAS/IFRS prudential filters - -B. Core capital after the application of prudential filters 253,386 247,734
C. Supplementary capital before the application of prudential filters 102,642 53,160Prudential filters on supplementary capital - Positive IAS/IFRS prudential filters - - - Negative IAS/IFRS prudential filters (827) -D. Supplementary capital after the application of prudential filters 101,815 53,160
E. Total core capital and supplementary capital after the application of prudential filters 355,201 300,894
Deductions from the core and supplementary capital - 860
F. Regulatory capital 355,201 300,034(Amounts in Euro/000)
2.2 Capital adequacy
A. Qualitative information
The Financial Statement Administration and Supervisory Body Reporting Division periodically calculates an
estimate of the changes in Bank capital in relation to the income statement and balance sheet aggregates forecast
in the budget and the business plan. In the event of a capital shortfall, the internal Risk Management and Finance
Divisions are activated, and capitalization proposals are forwarded to the Parent Bank.

Notes
-246-
B. Quantitative information
31-dec-2006 31-dec-2005 31- dec-2006 31-dec-2005A. RISK ASSETSA.1 CREDIT RISKSTANDARD APPROACHCASH ASSETS 4.995.018 3.789.546 2.354.466 1.987.2381. Exposures (other than equities and other subordinated assets) to (or secured by): 3.092.602 2.255.968 1.368.991 1.192.8271.1 Governments and central banks 637.290 413.050 - -1.2 Public bodies 270.115 204.193 54.023 40.8391.3 Banks 1.016.240 561.755 203.248 112.3511.4 Other entities (other than mortgage loans on residential and non-residential properties) 1.168.957 1.076.970 1.111.720 1.039.6372. Mortgage loans on residential properties 1.832.987 1.457.822 916.494 728.9113. Mortgage loans on non-residential properties 52.230 48.279 52.230 48.279
4. Stock, equity investments, and subordinated assets 9.147 1.996 9.147 2.0565. Other cash assets 8.052 25.481 7.604 15.165OFF-BALANCE-SHEET ASSETS 70.619 57.842 28.962 25.3791. Securities and commitments to (or secured by): 44.592 47.277 21.406 22.2631.1 Governments and central banks1.2 Public bodies1.3 Banks 28.983 31.267 5.797 6.2531.4 Other subjects 15.609 16.010 15.609 16.0102. Derivative contracts with (or secured by): 26.027 10.565 7.556 3.1162.1 Governments and central banks2.2 Public bodies2.3 Banks 18.192 7.222 3.638 1.4442.4 Other subjects 7.835 3.343 3.918 1.672B. REGULATORY CAPITAL REQUIREMENTSB.1 CREDIT RISK 166.840 140.883B.2 MARKET RISKS 17.736 8.9141. STANDARD APPROACH 17.736 8.914of which:+ position risk on debt securities 15.716 6.322+ position risk on equities 583 651+ exchange rate risk 867 894+ other risks 570 1.0472. INTERNAL MODELS - -of which:+ position risk on debt securities - -+ position risk on equities - -+ exchange rate risk - -B.3 OTHER MINIMUM REQUIREMENTS 68.685 61.410B.4 TOTAL MINIMUM REQUIREMENTS 253.261 211.207C. RISK ASSETS AND CAPITAL RATIOSC.1 Weighted risk assets 3.618.013 3.017.243
C.2 Core capital/weighted risk assets (Tier I capital ratio) 7,00% 8,21%C.3 Regulatory capital/Weighted risk assets (Total capital ratio) 9,82% 9,94%(Amounts in Euro/000)
Weighted valuesCategories/Values Unweighted values

Notes
-247-
PART G - COMBINATION TRANSACTIONS INVOLVING BUSINESSES OR BUSINESS
DIVISIONS
SECTION 1 – Transactions undertaken during the year
No business combination transactions were undertaken during 2006.
SECTION 2 – Transactions undertaken after year-end
No business combination transactions were undertaken after year-end.
PART H – RELATED PARTY TRANSACTIONS
1 Information on fees for directors and managers
31-dic-06 31-dic-05 Absolute %
Directors’ fees 247 243 4 1,6%
of which, fees for directors from Group companies, reimbursed by the company of origin 14 27 (13) -48,1%
Fees paid to "Strategic Managers" 2.025 1.536 489 31,8%of which, short-term benefits 1.928 1.451 477 32,8%of which, post-termination benefits 97 85 12 14,5%
Number of "strategic managers" 3 2 1 50,0%(Amounts in Euro/000)
Change
2. Information on related party transactions
In relation to Consob communications no. 97001574 of 20 February 1997, no. 98015375 of 27 February 1998, and
no. 2064231 of 30 September 2002, it should be noted that dealings with companies belonging to the Capitalia
banking group and dealings with subsidiaries are part of the normal business operations of a group structured
according to a polyfunctional model, and consist of reciprocal deals for services rendered, deposits, funding (for
banking companies), distribution of products and/or financial services, consulting, and, more generally, the
provision of services complementary to banking activity.
It should be clarified that the term "related parties" is meant to include parties identified by article 2359 of the
Italian Civil Code, International Accounting Standard no. 24 issued by the International Accounting Standards
Committee, and the aforementioned Consob communication no. 2064231 of 30 September 2002.
In order to ensure compliance with applicable external regulations, and to incorporate the governance guidelines
set by the Parent Bank, Capitalia S.p.A., FinecoBank S.p.A. has issued a system of internal operating rules for its
own structures that regulate the information flows required enabling "critical" transactions (i.e. atypical and/or
unusual and with ordinary related parties) to be recognized in summary form and properly represented to the
shareholders of the Parent Bank, Capitalia S.p.A., when accounting information is provided.
In further detail, internal regulations explicitly establish the criteria of substantial and procedural propriety, while
ensuring the required operating flexibility, providing for different treatment of activities linked to transactions
between related parties classified as “between ordinary related parties” and those classified as “atypical and/or

Notes
-248-
unusual”, that is to say all transactions that due to their significance/relevance, the nature of the counterparties,
the object of the transaction, the transfer price calculation method and timeframe may give rise to doubts as to
the propriety/completeness of information in the financial statements, conflicts of interest, the protection of the
Bank’s equity, and the safeguarding of minority shareholders.
In particular, the operating procedure issued internally by the Bank is divided into five different stages:
Preparation and constant updating of the list of entities that may be qualified as “Related Parties” by FinecoBank
S.p.A. in coordination with Capitalia S.p.A.;
Detection, investigation and preliminary valuation of the critical transaction (whether atypical and/or unusual or
ordinary) by FinecoBank S.p.A. with the aim of classifying it before it is concluded;
Reporting of the transaction by FinecoBank S.p.A. to Capitalia S.p.A., which records said transaction, if
necessary, in a specific ledger containing all critical transactions undertaken within the Bank;
Depending on how the transaction was classified, formalization may be preceded by authorization from the
competent bodies (whether within the Bank or the Group). “Atypical and/or unusual” transactions are always
subject to the evaluation and approval of the Boards of Directors of the Bank and the Parent Bank, while
transactions with “related parties” are only subject to such approval in certain circumstances;
At the conclusion of the transaction, the Parent Bank makes the disclosures required by the applicable
regulations under the circumstance specified in the Issuer Regulations.
In terms of transactions with related parties, no atypical and/or unusual transactions were undertaken during the
year, nor were any outstanding at year-end; atypical and/or unusual transactions are considered transactions not
part of the ordinary business operations of the Bank, or such as to have a significant impact on its income
statement, balance sheet, or cash flow situation.
FinecoBank S.p.A. is subject to the management and control activity of Capitalia S.p.A..
The details of dealings with companies belonging to the Capitalia S.p.A. group, the Parent Bank, subsidiaries, and
companies subject to significant influence are provided in the section of the Report on Operations.
PART I – PAYMENT AGREEMENTS BASED ON OWN EQUITY INSTRUMENTS
FinecoBank S.p.A. did not have any payment agreements based on own equity instruments to report.

-249-
Appendix
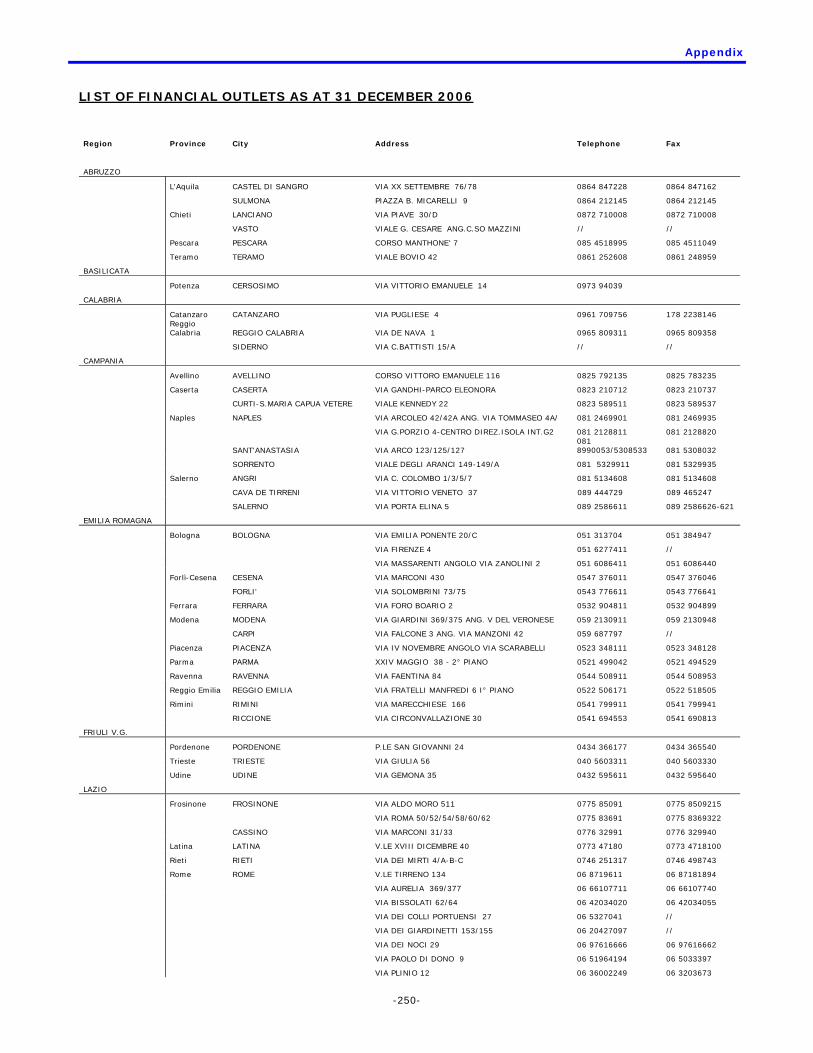
Appendix
-250-
LIST OF FINANCIAL OUTLETS AS AT 31 DECEMBER 2006
Region Province City Address Telephone Fax
ABRUZZO L'Aquila CASTEL DI SANGRO VIA XX SETTEMBRE 76/78 0864 847228 0864 847162
SULMONA PIAZZA B. MICARELLI 9 0864 212145 0864 212145
Chieti LANCIANO VIA PIAVE 30/D 0872 710008 0872 710008
VASTO VIALE G. CESARE ANG.C.SO MAZZINI // //
Pescara PESCARA CORSO MANTHONE' 7 085 4518995 085 4511049
Teramo TERAMO VIALE BOVIO 42 0861 252608 0861 248959
BASILICATA
Potenza CERSOSIMO VIA VITTORIO EMANUELE 14 0973 94039
CALABRIA
Catanzaro CATANZARO VIA PUGLIESE 4 0961 709756 178 2238146
Reggio Calabria REGGIO CALABRIA VIA DE NAVA 1 0965 809311 0965 809358
SIDERNO VIA C.BATTISTI 15/A // //
CAMPANIA
Avellino AVELLINO CORSO VITTORO EMANUELE 116 0825 792135 0825 783235
Caserta CASERTA VIA GANDHI-PARCO ELEONORA 0823 210712 0823 210737
CURTI-S.MARIA CAPUA VETERE VIALE KENNEDY 22 0823 589511 0823 589537
Naples NAPLES VIA ARCOLEO 42/42A ANG. VIA TOMMASEO 4A/ 081 2469901 081 2469935
VIA G.PORZIO 4-CENTRO DIREZ.ISOLA INT.G2 081 2128811 081 2128820
SANT'ANASTASIA VIA ARCO 123/125/127 081 8990053/5308533 081 5308032
SORRENTO VIALE DEGLI ARANCI 149-149/A 081 5329911 081 5329935
Salerno ANGRI VIA C. COLOMBO 1/3/5/7 081 5134608 081 5134608
CAVA DE TIRRENI VIA VITTORIO VENETO 37 089 444729 089 465247
SALERNO VIA PORTA ELINA 5 089 2586611 089 2586626-621
EMILIA ROMAGNA
Bologna BOLOGNA VIA EMILIA PONENTE 20/C 051 313704 051 384947
VIA FIRENZE 4 051 6277411 //
VIA MASSARENTI ANGOLO VIA ZANOLINI 2 051 6086411 051 6086440
Forlì-Cesena CESENA VIA MARCONI 430 0547 376011 0547 376046
FORLI' VIA SOLOMBRINI 73/75 0543 776611 0543 776641
Ferrara FERRARA VIA FORO BOARIO 2 0532 904811 0532 904899
Modena MODENA VIA GIARDINI 369/375 ANG. V DEL VERONESE 059 2130911 059 2130948
CARPI VIA FALCONE 3 ANG. VIA MANZONI 42 059 687797 //
Piacenza PIACENZA VIA IV NOVEMBRE ANGOLO VIA SCARABELLI 0523 348111 0523 348128
Parma PARMA XXIV MAGGIO 38 - 2° PIANO 0521 499042 0521 494529
Ravenna RAVENNA VIA FAENTINA 84 0544 508911 0544 508953
Reggio Emilia REGGIO EMILIA VIA FRATELLI MANFREDI 6 I° PIANO 0522 506171 0522 518505
Rimini RIMINI VIA MARECCHIESE 166 0541 799911 0541 799941
RICCIONE VIA CIRCONVALLAZIONE 30 0541 694553 0541 690813
FRIULI V.G.
Pordenone PORDENONE P.LE SAN GIOVANNI 24 0434 366177 0434 365540
Trieste TRIESTE VIA GIULIA 56 040 5603311 040 5603330
Udine UDINE VIA GEMONA 35 0432 595611 0432 595640
LAZIO
Frosinone FROSINONE VIA ALDO MORO 511 0775 85091 0775 8509215
VIA ROMA 50/52/54/58/60/62 0775 83691 0775 8369322
CASSINO VIA MARCONI 31/33 0776 32991 0776 329940
Latina LATINA V.LE XVIII DICEMBRE 40 0773 47180 0773 4718100
Rieti RIETI VIA DEI MIRTI 4/A-B-C 0746 251317 0746 498743
Rome ROME V.LE TIRRENO 134 06 8719611 06 87181894
VIA AURELIA 369/377 06 66107711 06 66107740
VIA BISSOLATI 62/64 06 42034020 06 42034055
VIA DEI COLLI PORTUENSI 27 06 5327041 //
VIA DEI GIARDINETTI 153/155 06 20427097 //
VIA DEI NOCI 29 06 97616666 06 97616662
VIA PAOLO DI DONO 9 06 51964194 06 5033397
VIA PLINIO 12 06 36002249 06 3203673
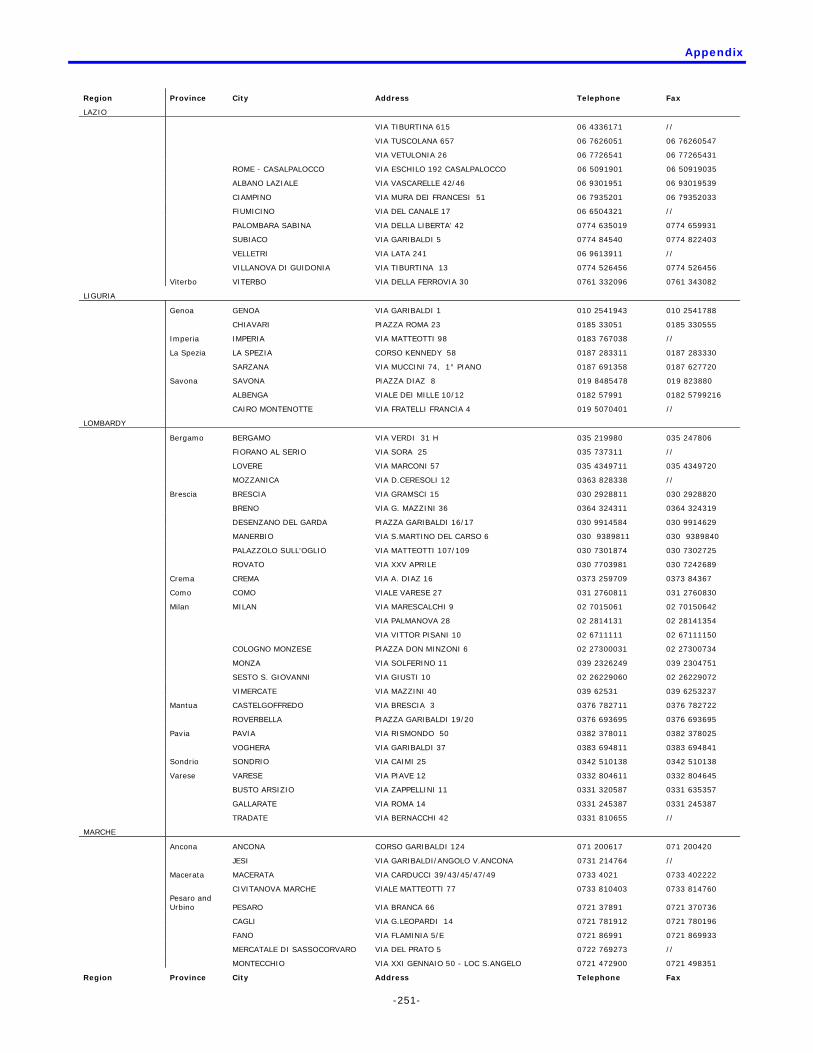
Appendix
-251-
Region Province City Address Telephone Fax LAZIO
VIA TIBURTINA 615 06 4336171 //
VIA TUSCOLANA 657 06 7626051 06 76260547
VIA VETULONIA 26 06 7726541 06 77265431
ROME - CASALPALOCCO VIA ESCHILO 192 CASALPALOCCO 06 5091901 06 50919035
ALBANO LAZIALE VIA VASCARELLE 42/46 06 9301951 06 93019539
CIAMPINO VIA MURA DEI FRANCESI 51 06 7935201 06 79352033
FIUMICINO VIA DEL CANALE 17 06 6504321 //
PALOMBARA SABINA VIA DELLA LIBERTA' 42 0774 635019 0774 659931
SUBIACO VIA GARIBALDI 5 0774 84540 0774 822403
VELLETRI VIA LATA 241 06 9613911 //
VILLANOVA DI GUIDONIA VIA TIBURTINA 13 0774 526456 0774 526456
Viterbo VITERBO VIA DELLA FERROVIA 30 0761 332096 0761 343082
LIGURIA
Genoa GENOA VIA GARIBALDI 1 010 2541943 010 2541788
CHIAVARI PIAZZA ROMA 23 0185 33051 0185 330555
Imperia IMPERIA VIA MATTEOTTI 98 0183 767038 //
La Spezia LA SPEZIA CORSO KENNEDY 58 0187 283311 0187 283330
SARZANA VIA MUCCINI 74, 1° PIANO 0187 691358 0187 627720
Savona SAVONA PIAZZA DIAZ 8 019 8485478 019 823880
ALBENGA VIALE DEI MILLE 10/12 0182 57991 0182 5799216
CAIRO MONTENOTTE VIA FRATELLI FRANCIA 4 019 5070401 //
LOMBARDY
Bergamo BERGAMO VIA VERDI 31 H 035 219980 035 247806
FIORANO AL SERIO VIA SORA 25 035 737311 //
LOVERE VIA MARCONI 57 035 4349711 035 4349720
MOZZANICA VIA D.CERESOLI 12 0363 828338 //
Brescia BRESCIA VIA GRAMSCI 15 030 2928811 030 2928820
BRENO VIA G. MAZZINI 36 0364 324311 0364 324319
DESENZANO DEL GARDA PIAZZA GARIBALDI 16/17 030 9914584 030 9914629
MANERBIO VIA S.MARTINO DEL CARSO 6 030 9389811 030 9389840
PALAZZOLO SULL'OGLIO VIA MATTEOTTI 107/109 030 7301874 030 7302725
ROVATO VIA XXV APRILE 030 7703981 030 7242689
Crema CREMA VIA A. DIAZ 16 0373 259709 0373 84367
Como COMO VIALE VARESE 27 031 2760811 031 2760830
Milan MILAN VIA MARESCALCHI 9 02 7015061 02 70150642
VIA PALMANOVA 28 02 2814131 02 28141354
VIA VITTOR PISANI 10 02 6711111 02 67111150
COLOGNO MONZESE PIAZZA DON MINZONI 6 02 27300031 02 27300734
MONZA VIA SOLFERINO 11 039 2326249 039 2304751
SESTO S. GIOVANNI VIA GIUSTI 10 02 26229060 02 26229072
VIMERCATE VIA MAZZINI 40 039 62531 039 6253237
Mantua CASTELGOFFREDO VIA BRESCIA 3 0376 782711 0376 782722
ROVERBELLA PIAZZA GARIBALDI 19/20 0376 693695 0376 693695
Pavia PAVIA VIA RISMONDO 50 0382 378011 0382 378025
VOGHERA VIA GARIBALDI 37 0383 694811 0383 694841
Sondrio SONDRIO VIA CAIMI 25 0342 510138 0342 510138
Varese VARESE VIA PIAVE 12 0332 804611 0332 804645
BUSTO ARSIZIO VIA ZAPPELLINI 11 0331 320587 0331 635357
GALLARATE VIA ROMA 14 0331 245387 0331 245387
TRADATE VIA BERNACCHI 42 0331 810655 //
MARCHE
Ancona ANCONA CORSO GARIBALDI 124 071 200617 071 200420
JESI VIA GARIBALDI/ANGOLO V.ANCONA 0731 214764 //
Macerata MACERATA VIA CARDUCCI 39/43/45/47/49 0733 4021 0733 402222
CIVITANOVA MARCHE VIALE MATTEOTTI 77 0733 810403 0733 814760
Pesaro and Urbino PESARO VIA BRANCA 66 0721 37891 0721 370736
CAGLI VIA G.LEOPARDI 14 0721 781912 0721 780196
FANO VIA FLAMINIA 5/E 0721 86991 0721 869933
MERCATALE DI SASSOCORVARO VIA DEL PRATO 5 0722 769273 //
MONTECCHIO VIA XXI GENNAIO 50 - LOC S.ANGELO 0721 472900 0721 498351
Region Province City Address Telephone Fax

Appendix
-252-
MOLISE
Campobasso CAMPOBASSO VIA XXIV MAGGIO 207 A/B/C/D 0874 49781 0874 497835
PIEDMONT
Alessandria ALESSANDRIA VIA TROTTI 25 0131 261320 0131 236264
Asti ASTI C.SO DANTE 5 0141 437464 //
Biella BIELLA VIA DEI SEMINARI 9/B 015 2520838 //
Cuneo CUNEO C.SO G. FERRARIS 6 0171 690468 //
ALBA C.SO PIAVE, 4 - TERZO PIANO // //
Novara NOVARA ROTONDA MASSIMO D'AZEGLIO 13 0321 617311 0321 397432
BORGOMANERO VIA F.PIANA 7 0322 835773 0322 869901
Turin TURIN CORSO FRANCIA 177 011 7741786 011 7575094
VIA ALFIERI 11 BIS 011 5619481/5619967 011 5618446
VIA C.MASSAIA 48 011 2166514 011 259801
VIA SUSA 19 // 011 19703636
CIRIE' VIA TORINO 62 011 9225211 011 9225241
NICHELINO VIA TORINO 66 011 6816111 //
PUGLIA
Bari BARI VIA DE VITO FRANCESCO 61/63 080 5471411 080 5471441
BARLETTA VIA G. DE NITTIS 6 (1° PIANO) 0883 349810 0883 532449
Lecce LECCE V.LE DEGLI STUDENTI 1/G 0832 277411 0832 277415
Taranto TARANTO V.LE VIRGILIO 105 / V.LE LUCANIA 099 7327511 099 7327526
GROTTAGLIE VIA DIAZ 84 099 5623878 099 5623878
SARDINIA
Cagliari CAGLIARI PIAZZA JENNE 5 I°PIANO 070 652567 070 666266
Sassari SASSARI VIALE ITALIA 48 079 2119106 //
SICILY
Agrigento AGRIGENTO VIA LUNGA 1 TRAVERSA VIA EMPEDOCLE 0922 402509 0922 460526
Caltanissetta GELA VIA VOLTA 24 0933 922570 //
Catania CATANIA VIA ARTALE ALAGONA 27/31 095 7320911 095 7320942
ADRANO VIA ROMA 40 095 7602740 095 7690489
GIARRE VIA GALLIPOLI 70/74 095 7820811 095 7820822
PATERNO' VIA CIRCONVALLAZIONE 440 095 7973411 095 7973412
VIZZINI PIAZZA MARCONI 4 0933 965935 0933 965935
Messina MESSINA VIA E. L. PELLEGRINO29 ANG. VIALE SAN MARTINO 090 2286111 090 2286137
CAPO D'ORLANDO VIA LIBERTA' 73 0941 918213 0941 918213
Palermo PALERMO VIALE LAZIO 64/A 091 6951211 091 6951237
Ragusa RAGUSA VIA ING.MIGLIORISI 42 ANG.VIA E.ORLANDO 0932 658311 0932 658335
VITTORIA VIA XX SETTEMBRE 105/107 0932 864646 933 864646
Syracuse SYRACUSE VIALE TICA 0931 400611 0931 400635
AVOLA VIA ROMA 37 ANG. VIA MAZZINI 0931 815213 0931 815215
LENTINI VIA GARIBALDI 137 095 7851011 095 7851021
NOTO VIA C. CONFALONIERI 16 0931 839999 //
Trapani MAZARA DEL VALLO PIAZZA MOKARTA 13 - 1° PIANO 0923 941639 0923 909661
TUSCANY
Arezzo AREZZO VIA CALAMANDREI 62 0575 353697 0575 250338
Florence FLORENCE VIA CAVOUR 91 055 4635411 055 4635461
Grosseto GROSSETO VIA ALFIERI 1/A-B 0564 427906 0564 410960
Livorno LIVORNO VIA INDIPENDENZA 30/32 0586 884387 0586 885882
Lucca LUCCA VIA A. CATALANI 27 0583 589121 0583 316783
ALTOPASCIO P.ZZA TRIPOLI 14 0583 216650 //
Massa-Carrara MASSA VIALE DELLA STAZIONE 12/A 0585 488036 0585 499199
Pisa PISA VIA ITALO BARGAGNA 82 050 970040 //
Prato PRATO VIA BOLOGNA 84/86 0574 47121 0574 471246
Pistoia MONTECATINI TERME VIA PROVINCIALE LUCCHESE 47 0572 92771 0572 927745 TRENTINO ALTO ADIGE
Trento TRENTO VIA GUARDINI 9/B 0461 434800 0461 434845
UMBRIA
Perugia PERUGIA VIA R. D'ANDROTTO 87/89/91 075 50149 075 5014945
CITTA' DI CASTELLO VIA C.LIVIERO 2/7 - TERZO PIANO 075 8520218 075 8557561
FOLIGNO VIA A. DA S.GALLO 17/U // //
Region Province City Address Telephone Fax

Appendix
-253-
UMBRIA
Terni TERNI VIA G.LEOPARDI 14/18 V. PASCARELLA 13 0744 492211 0744 492249
VENETO
Belluno CESIOMAGGIORE- LOC BUSCHE VIA NAZIONALE 34 0439 392038 0439 392039
Padua PADUA VIA TOMMASEO 69 - 1° PIANO SC. D 049 8283311 049 8283390
PADUA VIA TOMMASEO 76/E - PT 049 8765080 049 8762217
Rovigo ROVIGO VIA OROBONI 43/G 0425 200511 //
Treviso TREVISO STRADA COMUNALE DELLE CORTI 59 0422 305772 0422 421972
CASTELFRANCO VENETO VIA BORGO TREVISO 124 0423 734611 //
Venice SPINEA VIA GIOBERTI 2 041 5089511 //
Vicenza VICENZA VIALE VERONA 49 - 1° PIANO 0444 288450 0444 291732
Verona VERONA VIA STANGA 15 045 8904404 045 8900308