Consolidated Financial Statements as of December 31, 2020
65
AgroGeneration Group - Consolidated Financial Statements as of and for the year ended December 31, 2020 Page 1 Consolidated Financial Statements as of December 31, 2020
-
Upload
khangminh22 -
Category
Documents
-
view
0 -
download
0
Transcript of Consolidated Financial Statements as of December 31, 2020
AgroGeneration Group - Consolidated Financial Statements as of and for the year ended December 31, 2020 Page 1
Consolidated Financial Statements
as of December 31, 2020
AgroGeneration Group - Consolidated Financial Statements as of and for the year ended December 31, 2020 Page 2
TABLE OF CONTENTS
CONSOLIDATED STATEMENT OF FINANCIAL POSITION 4
CONSOLIDATED INCOME STATEMENT 5
CONSOLIDATED STATEMENT OF COMPREHENSIVE INCOME 6
CONSOLIDATED STATEMENT OF CHANGES IN EQUITY 7
CONSOLIDATED CASH FLOW STATEMENT 9
NOTES TO THE CONSOLIDATED FINANCIAL STATEMENTS 11
1. SCOPE OF CONSOLIDATION 11
General information and background 11
2. MAJOR EVENTS OF THE PERIOD 12
2.1. Optimization of Cypriot legal structure 12
2.2. Litigation with EHGO/ORNANE 12
3. FINANCIAL RISK MANAGEMENT 12
3.1. Geopolitical risks in Ukraine 12
3.2. Risks related to changes in the legal and fiscal environment 15
3.3. Risks related to changes in exchange rates 15
3.4. Risks related to commodities price changes 16
3.5. Liquidity risks on crop financing 17
3.6. Counterparty risks 17
3.7. Capital repatriation risks 17
4. CRITICAL ACCOUNTING JUDGMENTS AND ESTIMATES 17
4.1. Impairment test on intangible assets 18
4.2. Fair value of biological assets and net realisable value of agricultural produce 18
4.3. Equity-settled share-based transactions 18
4.4. Fair value of fixed assets 18
5. RESTATEMENT OF EXPENSE CLASSIFICATION 19
6. EVENTS AFTER THE BALANCE SHEET DATE 21
6.1. Impact of COVID-19 on the Group’s operations 21
7. SUMMARY OF SIGNIFICANT ACCOUNTING POLICIES 22
7.1. Basis of preparation and changes in accounting policies 22
7.2. Consolidation 23
7.3. Foreign currency translation 24
7.4. Intangible assets 25
7.5. Property, plant and equipment 26
7.6. Impairment of non-financial assets 27
7.7. Agriculture 27
7.8. Leases, Right-of-use assets and lease liabilities 29
7.9. Government grants 30
7.10. Inventories 30
7.11. Share capital 30
7.12. Current and deferred income tax 31
7.13. Employees benefits 32
7.14. Provisions 32
7.15. Revenue 33
7.16. Share-based payment 33
8. SEGMENT REPORTING 33
AgroGeneration Group - Consolidated Financial Statements as of and for the year ended December 31, 2020 Page 3
9. INTANGIBLE ASSETS AND LAND LEASES 34
10. RIGHT OF USE ASSETS (LAND) 35
11. PROPERTY, PLANT AND EQUIPMENT 36
12. FINANCIAL ASSETS 38
13. CORPORATE INCOME TAX 39
13.1. Analysis of Income tax expense – Tax proof 39
14. INVENTORIES 40
15. BIOLOGICAL ASSETS 41
16. TRADE AND OTHER RECEIVABLES 43
17. CASH AND CASH EQUIVALENTS 44
18. BORROWINGS AND LEASE LIABILITIES FOR RIGHT-OF-USE ASSETS 45
19. SHARE CAPITAL 48
20. PROVISIONS 49
21. TRADE AND OTHER PAYABLES 50
22. FINANCIAL ASSETS AND LIABILITIES 51
23. REVENUES FROM OPERATING ACTIVITIES 53
24. FUNCTIONAL COSTS / COSTS BY NATURE 54
25. OTHER INCOME AND EXPENSE 54
26. NET FINANCIAL INCOME / (EXPENSES) 55
27. EARNINGS PER SHARE 56
28. SHARE-BASED COMPENSATION 57
28.1. Allocation of BSPCE warrants 57
28.2. Allocation of stock-options 58
28.3. ORNANE stock warrants (BSA) 60
29. RELATED PARTIES 62
29.1. Ownership and governance 62
29.2. Transactions with related parties 63
30. FEES PAID TO AUDITORS 64
31. LIST OF CONSOLIDATED COMPANIES 65
AgroGeneration Group - Consolidated Financial Statements as of and for the year ended December 31, 2020 Page 4
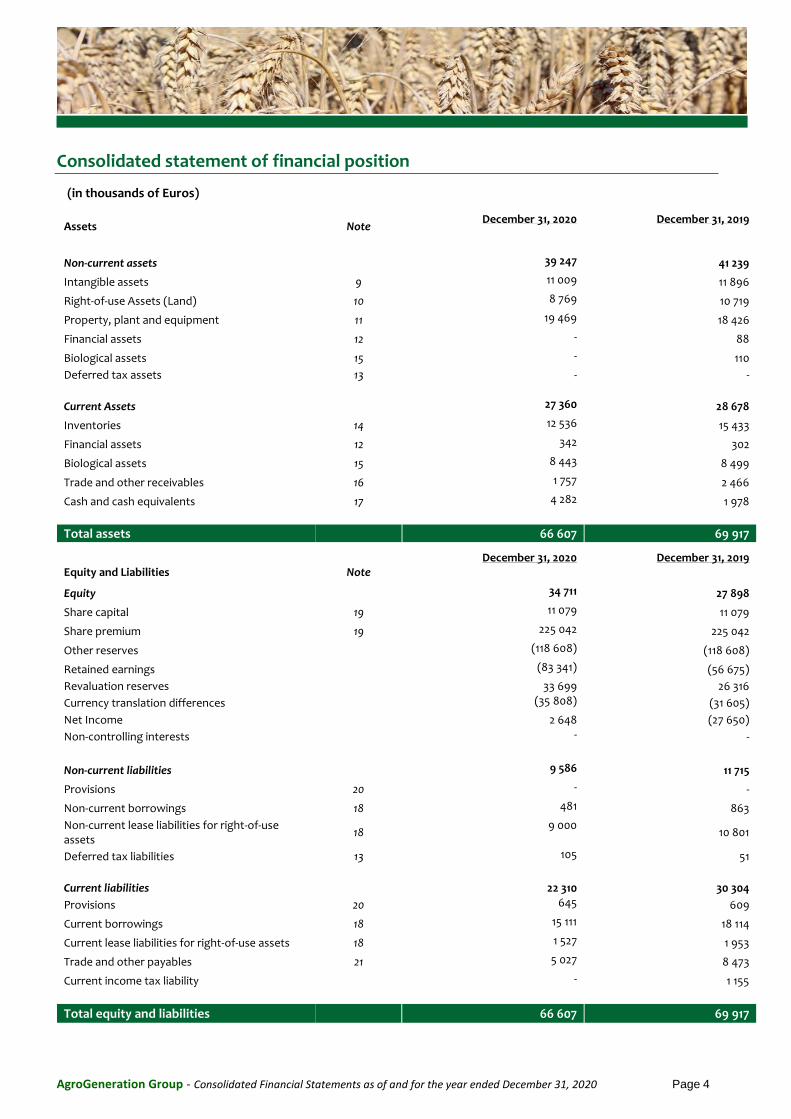
Consolidated statement of financial position
(in thousands of Euros)
Assets Note December 31, 2020
December 31, 2019
Non-current assets
39 247 41 239
Intangible assets 9 11 009 11 896
Right-of-use Assets (Land) 10 8 769 10 719
Property, plant and equipment 11 19 469 18 426
Financial assets 12 - 88
Biological assets 15 - 110
Deferred tax assets 13 - -
Current Assets
27 360 28 678
Inventories 14 12 536 15 433
Financial assets 12 342 302
Biological assets 15 8 443 8 499
Trade and other receivables 16 1 757 2 466
Cash and cash equivalents 17 4 282 1 978
Total assets 66 607 69 917
Equity and Liabilities Note December 31, 2020
December 31, 2019
Equity
34 711 27 898
Share capital 19 11 079 11 079
Share premium 19 225 042 225 042
Other reserves
(118 608) (118 608)
Retained earnings
(83 341) (56 675)
Revaluation reserves
33 699 26 316
Currency translation differences (35 808) (31 605)
Net Income
2 648 (27 650)
Non-controlling interests
- -
Non-current liabilities
9 586 11 715
Provisions 20 - -
Non-current borrowings 18 481 863
Non-current lease liabilities for right-of-use assets
18 9 000
10 801
Deferred tax liabilities 13 105 51
Current liabilities
22 310 30 304
Provisions 20 645 609
Current borrowings 18 15 111 18 114
Current lease liabilities for right-of-use assets 18 1 527 1 953
Trade and other payables 21 5 027 8 473
Current income tax liability
- 1 155
Total equity and liabilities 66 607 69 917
AgroGeneration Group - Consolidated Financial Statements as of and for the year ended December 31, 2020 Page 5
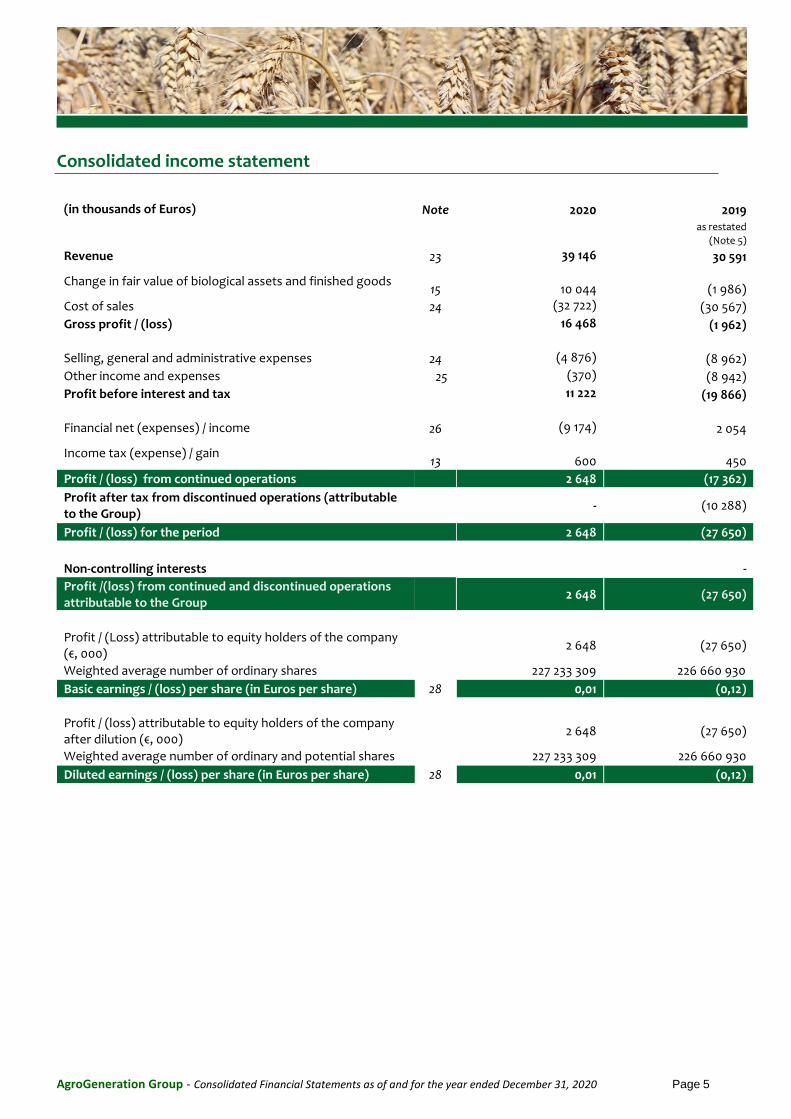
Consolidated income statement
(in thousands of Euros) Note 2020 2019
as restated
(Note 5) Revenue 23 39 146 30 591
Change in fair value of biological assets and finished goods 15
10 044 (1 986)
Cost of sales 24 (32 722) (30 567)
Gross profit / (loss) 16 468 (1 962)
Selling, general and administrative expenses 24 (4 876) (8 962)
Other income and expenses 25 (370) (8 942)
Profit before interest and tax 11 222 (19 866)
Financial net (expenses) / income 26 (9 174) 2 054
Income tax (expense) / gain 13
600 450
Profit / (loss) from continued operations 2 648 (17 362)
Profit after tax from discontinued operations (attributable to the Group)
- (10 288)
Profit / (loss) for the period 2 648 (27 650)
Non-controlling interests -
Profit /(loss) from continued and discontinued operations attributable to the Group
2 648 (27 650)
Profit / (Loss) attributable to equity holders of the company (€, 000)
2 648 (27 650)
Weighted average number of ordinary shares 227 233 309 226 660 930
Basic earnings / (loss) per share (in Euros per share) 28 0,01 (0,12)
Profit / (loss) attributable to equity holders of the company after dilution (€, 000)
2 648 (27 650)
Weighted average number of ordinary and potential shares 227 233 309 226 660 930
Diluted earnings / (loss) per share (in Euros per share) 28 0,01 (0,12)
AgroGeneration Group - Consolidated Financial Statements as of and for the year ended December 31, 2020 Page 6
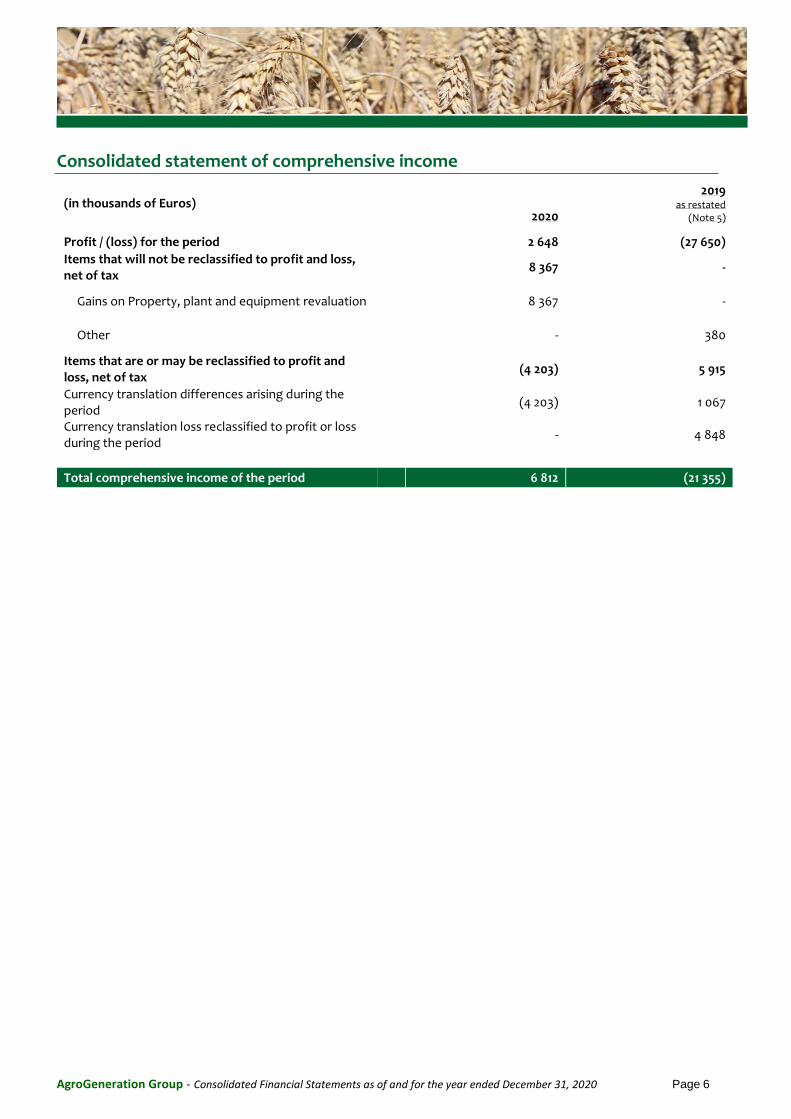
Consolidated statement of comprehensive income
(in thousands of Euros)
2020
2019 as restated
(Note 5)
Profit / (loss) for the period
2 648 (27 650)
Items that will not be reclassified to profit and loss, net of tax
8 367 -
Gains on Property, plant and equipment revaluation
8 367 -
Other
- 380
Items that are or may be reclassified to profit and loss, net of tax
(4 203) 5 915
Currency translation differences arising during the period
(4 203) 1 067
Currency translation loss reclassified to profit or loss during the period
- 4 848
Total comprehensive income of the period 6 812 (21 355)
AgroGeneration Group - Consolidated Financial Statements as of and for the year ended December 31, 2020 Page 7
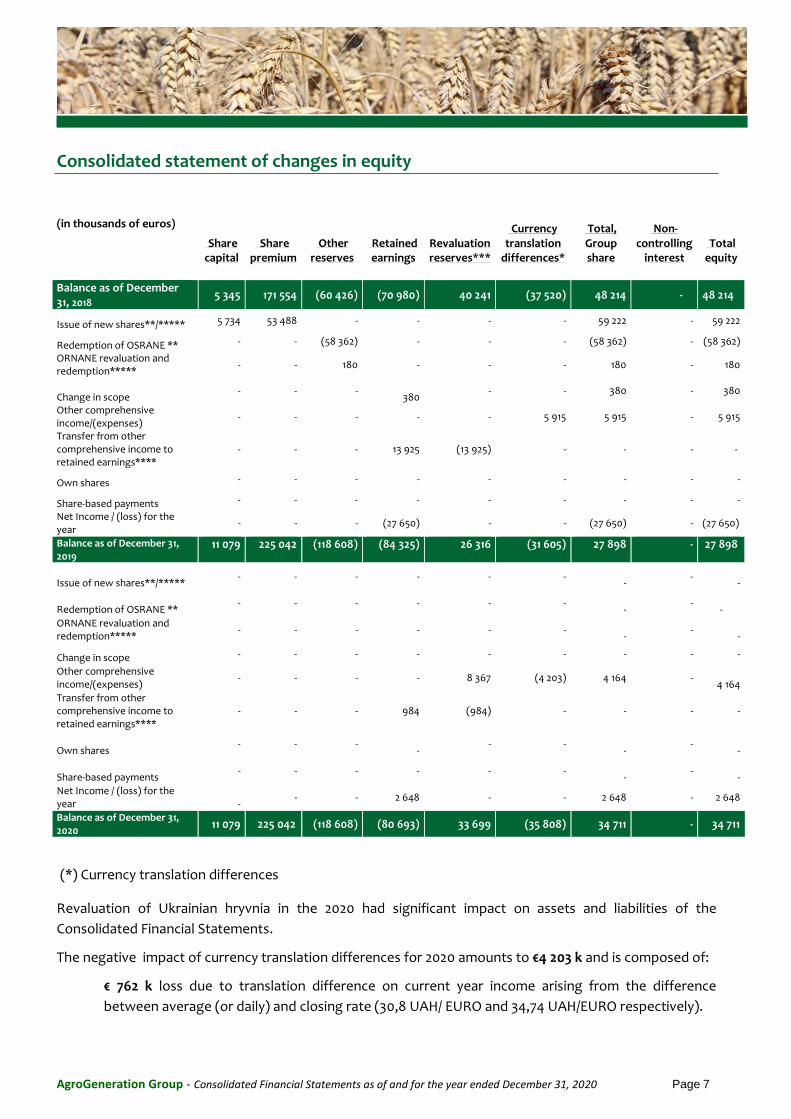
Consolidated statement of changes in equity
(in thousands of euros)
Share capital
Share premium
Other reserves
Retained earnings
Revaluation reserves***
Currency translation
differences*
Total, Group share
Non-controlling
interest Total equity
Balance as of December 31, 2018
5 345 171 554 (60 426) (70 980) 40 241 (37 520) 48 214 - 48 214
Issue of new shares**/***** 5 734 53 488 - - - - 59 222 - 59 222
Redemption of OSRANE ** - - (58 362) - - - (58 362) - (58 362)
ORNANE revaluation and redemption*****
- - 180 - - - 180 - 180
Change in scope - - -
380
- - 380 - 380
Other comprehensive income/(expenses)
- - - - - 5 915 5 915 - 5 915
Transfer from other comprehensive income to retained earnings****
- - - 13 925 (13 925) - - - -
Own shares - - - - - - - - -
Share-based payments - - - - - - - - -
Net Income / (loss) for the year
- - - (27 650) - - (27 650) - (27 650)
Balance as of December 31, 2019
11 079 225 042 (118 608) (84 325) 26 316 (31 605) 27 898 - 27 898
Issue of new shares**/***** - - - - - -
-
-
-
Redemption of OSRANE ** - - - - - -
-
- -
ORNANE revaluation and redemption*****
- - - - - -
- -
-
Change in scope - - - - - - - - -
Other comprehensive income/(expenses)
- - - - 8 367 (4 203) 4 164 -
4 164
Transfer from other comprehensive income to retained earnings****
- - - 984 (984) - - - -
Own shares - - -
-
- -
- -
-
Share-based payments - - - - - -
-
-
-
Net Income / (loss) for the year
-
- - 2 648 - - 2 648 - 2 648
Balance as of December 31, 2020
11 079 225 042 (118 608) (80 693) 33 699 (35 808) 34 711 - 34 711
(*) Currency translation differences
Revaluation of Ukrainian hryvnia in the 2020 had significant impact on assets and liabilities of the
Consolidated Financial Statements.
The negative impact of currency translation differences for 2020 amounts to €4 203 k and is composed of:
€ 762 k loss due to translation difference on current year income arising from the difference
between average (or daily) and closing rate (30,8 UAH/ EURO and 34,74 UAH/EURO respectively).
AgroGeneration Group - Consolidated Financial Statements as of and for the year ended December 31, 2020 Page 8
€ 3 441 k loss due to translating the opening net assets at a closing rate (34,74 UAH/EURO) that
differs from the previous closing rate (26,42 UAH/EURO): the loss is due to the fact that retained
earnings of Ukrainian entities are positive.
(**) OSRANE early redemption
Relates to the early redemption of OSRANE and related issue of new shares. For more details on issue of
OSRANE refer to the Note 2.2 of Consolidated financial statements as of December 31, 2015. In first quarter,
2019 OSRANE has been fully redeemed.
(***) Revaluation reserves
Relates to the revaluation of the fixed assets, this revaluation recognised in other comprehensive income
in 2020 amounts to €8,4 m (cf. Note 11 as of December 31, 2020)
(****) Revaluation surplus on fixed assets disposed in 2020.
(*****) ORNANE revaluation and redemption
For more details on the ORNANE and related issue of new shares refer to the Note 2.1 Consolidated
financial statements as of December 31, 2018 and Note 2.3 and 19.
AgroGeneration Group - Consolidated Financial Statements as of and for the year ended December 31, 2020 Page 9
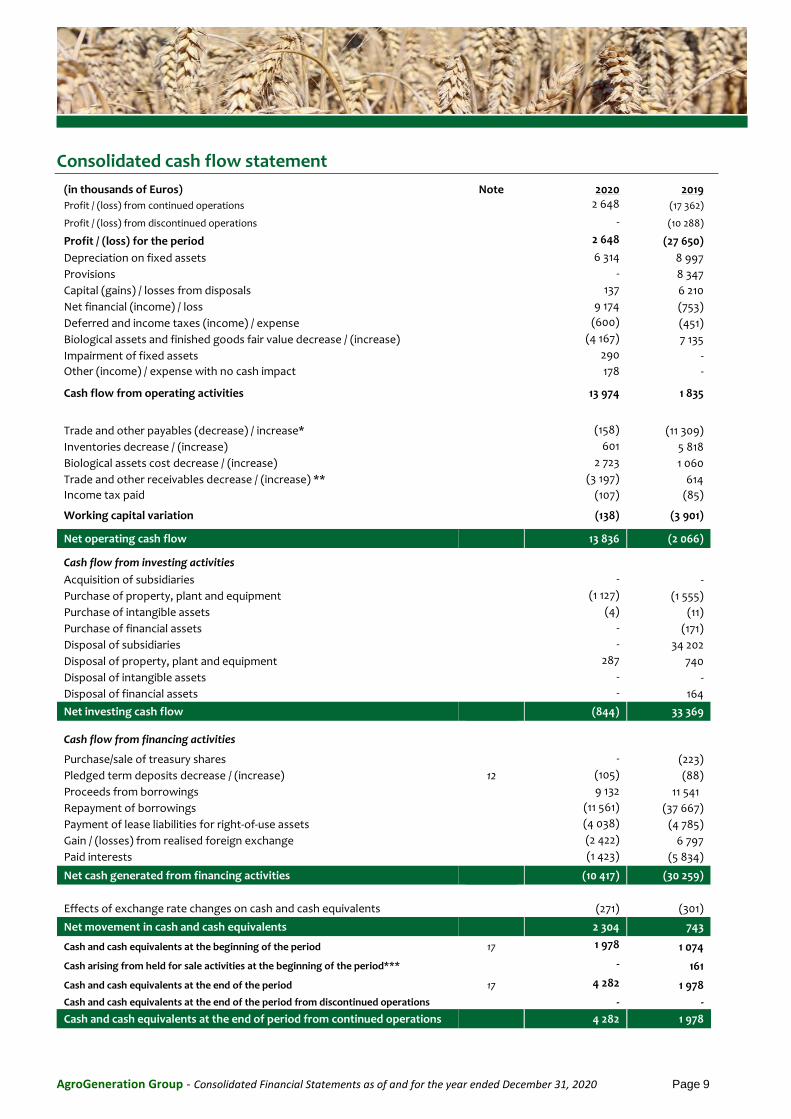
Consolidated cash flow statement
(in thousands of Euros) Note 2020 2019
Profit / (loss) from continued operations 2 648 (17 362)
Profit / (loss) from discontinued operations - (10 288)
Profit / (loss) for the period
2 648 (27 650)
Depreciation on fixed assets
6 314 8 997
Provisions
- 8 347
Capital (gains) / losses from disposals
137 6 210
Net financial (income) / loss
9 174 (753)
Deferred and income taxes (income) / expense
(600) (451)
Biological assets and finished goods fair value decrease / (increase) (4 167) 7 135
Impairment of fixed assets 290 -
Other (income) / expense with no cash impact
178 -
Cash flow from operating activities
13 974 1 835
Trade and other payables (decrease) / increase*
(158) (11 309)
Inventories decrease / (increase)
601 5 818
Biological assets cost decrease / (increase)
2 723 1 060
Trade and other receivables decrease / (increase) **
(3 197) 614
Income tax paid
(107) (85)
Working capital variation
(138) (3 901)
Net operating cash flow
13 836 (2 066)
Cash flow from investing activities
Acquisition of subsidiaries
- -
Purchase of property, plant and equipment
(1 127) (1 555)
Purchase of intangible assets
(4) (11)
Purchase of financial assets
- (171)
Disposal of subsidiaries
- 34 202
Disposal of property, plant and equipment
287 740
Disposal of intangible assets
- -
Disposal of financial assets
- 164
Net investing cash flow
(844) 33 369
Cash flow from financing activities
Purchase/sale of treasury shares
- (223)
Pledged term deposits decrease / (increase) 12 (105) (88)
Proceeds from borrowings
9 132 11 541
Repayment of borrowings
(11 561) (37 667)
Payment of lease liabilities for right-of-use assets (4 038) (4 785)
Gain / (losses) from realised foreign exchange
(2 422) 6 797
Paid interests
(1 423) (5 834)
Net cash generated from financing activities
(10 417) (30 259)
Effects of exchange rate changes on cash and cash equivalents
(271) (301)
Net movement in cash and cash equivalents
2 304 743
Cash and cash equivalents at the beginning of the period 17 1 978 1 074
Cash arising from held for sale activities at the beginning of the period*** - 161
Cash and cash equivalents at the end of the period 17 4 282 1 978
Cash and cash equivalents at the end of the period from discontinued operations - -
Cash and cash equivalents at the end of period from continued operations 4 282 1 978
AgroGeneration Group - Consolidated Financial Statements as of and for the year ended December 31, 2020 Page 10
* In the consolidated balance sheet, the accounts receivable as of December, 31 2020 include prepayments made to suppliers of the
Group in connection with inputs for the 2020 harvest. In the consolidated cash flow statement, the variation in prepayments to
suppliers (positive cash flow / decrease in receivable), which stands at € 200k, not inclusive of exchange rate effects, is presented as a
change in accounts payable.
** In the consolidated balance sheet, the accounts payable as of December, 31 2020 include prepayments received from Group
customers in respect of upcoming deliveries in the end of financial year 2020. In the consolidated cash flow statement, the change in
customer prepayments (negative cash flow / decrease in debt), which amounts to € 20k, not inclusive of exchange rate effects, is
presented as a change in accounts receivable.
AgroGeneration Group - Consolidated Financial Statements as of and for the year ended December 31, 2020 Page 11
Notes to the Consolidated Financial Statements
The Consolidated Financial Statements of the AgroGeneration Group (“AgroGeneration”, “the Group” or
“the Company”) for the year ended December 31, 2020 were authorized for issue by the Board of Directors
on April 27, 2021. These Financial Statements are presented in thousands of euro for all financial years,
except for the per-share information.
1. Scope of consolidation
The Group’s Consolidated Financial Statements for the year ended December 31, 2020 include the accounts
of AgroGeneration SA and of all companies controlled by the Group, as well as companies over which the
Group exercises significant influence. Please refer to the Note 31 for the List of consolidated companies.
General information and background
AgroGeneration was created in March 2007. The parent company is a Joint Stock Company
(AgroGeneration SA) recorded on the Paris Trade and Companies Register with number 494 765 951,
whose shares have been listed on the Alternext market of NYSE-Euronext Paris since March 1, 2010.
The registered office address is 19 boulevard Malesherbes, 75008 Paris with effect from October 1, 2020.
The information on ownership and governance is presented in the Note 29.1.
AgroGeneration Group - Consolidated Financial Statements as of and for the year ended December 31, 2020 Page 12
2. Major events of the period
2.1. Optimization of Cypriot legal structure
AgroGeneration continued optimization of the Group’s legal structure through 2020. Number of Cypriot
legal entities has been reduced from 5 to 2 by the 2020 year-end. Holding of the Ukrainian legal entities has
been concentrated on Harmelia Investments Limited, AgroGeneration SA and Marrimore Holdings Ltd by
June 30, 2020. In the second half 2020 AgroGeneration transferred the Group’s control over some service
operating companies, namely 3 Cypriot companies : Azent Limited Company, Wellaxo Investments Limited,
Zeanovi Limited and 1 Ukrainian service operating company Agro Dom Plus to the third party buyer. This
reorganization resulted in the restructuring of the Group’ tax liabilities. The income tax and related
payables by the 3 disposed Cypriot companies has been effectively replaced by the Group payable to the
third party buyer and Agro Dom Plus as a third party.
2.2. Litigation with EHGO/ORNANE
During the first-half year 2019 EHGO requested before the Paris Commercial Court termination of the
ORNANE agreement and early repayment of the ORNANE bonds, for a total amount of €1.9 million in cash.
AgroGeneration is contesting the EHGO request and considers that it was acting within its rights. The
related cases have been remanded to the courts several times in 2020 and are still pending. No judgment
was pronounced as of the date of disclosure of these financial statements.
The related risks are covered by a provision booked in the Group accounts as of December 31, 2020 (see
Note 20) based on weighted risk scenario.
For more details on the ORNANE refer to the Note 2.1 Consolidated financial statements as of December 31,
2018.
3. Financial risk management
3.1. Geopolitical risks in Ukraine
The Group conducts most of its operations in Ukraine. The Ukrainian economy while deemed to be of
market status continues to display certain characteristics consistent with that of an economy in transition.
These characteristics include, but are not limited to, low levels of liquidity in the capital markets, relatively
high level of inflation, and some imbalances in the public finance and international trade. Although
Ukraine’s economy demonstrated positive recovery trend in recent years, it has been growing well below
potential and should have grown faster given the depth of its previous fall. Ukrainian government
continues to pursue a comprehensive structural reform agenda aiming at the removal of the existing
imbalances in the economy, public finance and governance, fighting corruption, reforming judiciary
system, etc. with the ultimate goal to ensure sustainable economic growth in the country. Until February
2020, the Ukrainian economy was in a robust macroeconomic state thanks to the successful
implementation of a reform program, with declining public debt, falling inflation and positive growth
AgroGeneration Group - Consolidated Financial Statements as of and for the year ended December 31, 2020 Page 13
forecasts. But the Covid-19 outbreak and associated lockdown measures resulted in a sharp economic
downturn.
Declining nominal GDP and Covid-19-related fiscal stimulus widened the fiscal deficit, reaching -5.6% GDP in
2020 (from -1.8% in 2019) and projected to amount -3.8% GDP in 2021 and -3% GDP in 2022 (according to IMF).
Public debt increased significantly, from 50.1% GDP in 2019 to 65.7% GDP in 2020, and is expected to stay
high in 2021 (64.3% GDP) and 2022 (61.8% GDP) (IMF). During 2020, the hryvnya lost -16% vs the USD with
UAH/USD rate rising from 23.7 as of the end of 2019 to 28.3 as of the end of 2020, but inflation declined to
3.2% in 2020 (from 7.9% in 2019) due to the easing of energy and food prices. Inflation is expected to
increase again to 6% in 2021 and 5.7% in 2022. As a result, after contracting by 4.6% in 2020, the Ukrainian
economy is expected to return to GDP growth of about 4% in the medium term according to NBU’s
forecasts.
Ukraine's unemployment rate was falling until 2019, but due to the negative economic impact of the
COVID-19 pandemic, it has increased to 10.1% in Q4 2020 and is forecasted to stay high in 2021 (9.2%) and
2022 (8.5%) according to the Ministry of Finance of Ukraine. The economy is expected to return to growth
in 2021 as activity recovers, with fiscal and monetary stimulus providing further support. Among the
reasons are the high demand in the world for the products of domestic agro-industrial complex, a much
more stable banking system compared to previous crisis episodes, lower prices for imported energy
products, continued structural reforms in cooperation with international partners. Still, possible
prolongation of the health crisis, loss of reform momentum and weaknesses in the banking system could
deteriorate the outlook.
The conflict in eastern Ukraine and more generally strained relations with Russia continue to hurt the
economy, which remains fragile and dependent on international financial assistance. In June 2020, the IMF
Board of Directors has approved an 18-month Stand-By Arrangement (SBA) for Ukraine with the total
access of US$ 5 billion for a period of 5 years (new agreement came in place of $3.9 billion stand-by
financing program approved in late 2018, of which $1.4 billion tranche was obtained by Ukraine in late
December 2018). The first tranche of the new IMF loan of US$2.1 billion was received in June 2020. The
funds are to be directed for providing social protection of the population, including measures to prevent
the spread of acute respiratory disease COVID-19 caused by the coronavirus SARS-CoV-2 in Ukraine, as well
as to ensure timely debt servicing. No further disbursements were made by IMF yet due to lack of reform
progress in Ukraine. In late December 2020, IMF started the review procedure with the Ukrainian
authorities to asses the progress in implementing the policies and reforms supported by the current Stand-
By Arrangement.
The IMF program opened up opportunities for financial support from a number of international partners, in
particular: from the World Bank and the European Union. In June 2020, Ukraine has received from the
European Commission the second tranche under the fourth EU macro-financial assistance (MFA) program
with a nominal amount of EUR 500 million. The money disbursed is a loan at 0.125% per annum with the
loan repayment date being 10 June, 2035. The resource will be used to finance state budget expenditures
and help reduce external financial pressure on Ukraine as well as improve the balance of payments. The
first tranche under the 4th EU macro-financial assistance program Ukraine received In December 2018 with
a nominal amount of EUR 500 million. The total amount of preferential EU credit assistance received by
AgroGeneration Group - Consolidated Financial Statements as of and for the year ended December 31, 2020 Page 14
Ukraine in the framework of the implementation of four EU MFA programs during 2014-2020 reached EUR
3.81 billion.
In December 2020, EU disburses €600 million in macro-financial assistance to Ukraine under the new
“exclusive” EU macro-financial assistance program to Ukraine to support efforts to address the spread of
acute respiratory disease COVID-19 caused by the coronavirus SARS-CoV-2. Under the total EUR 1.2 billion
program, which is intended for 12 months and involves payment of two tranches, the first tranche is
unconditional. The disbursement of the second tranche will be conditional on fulfilling the eight specific
measures laid down at the Memorandum of Understanding (MoU). These include measures in the areas of
public finance management, the fight against corruption, improving the business environment and the
governance of state-owned enterprises.
In December 2020, The World Bank approved a loan to Ukraine in the amount of $300 million for the
Second Additional Financing for COVID-19 Response under the Social Safety Nets Modernization Project.
This additional financing is aimed to help strengthen Ukraine’s Guaranteed Minimum Income Program
(GMI) to prevent around 1 million Ukrainians from falling into poverty due to the COVID-19 pandemic. It is
the second Additional Financing under this Project, after $150 million approved on April 2020. Earlier, in
April 2020, the World Bank also approved financing program of $135 million for the Serving People,
Improving Health Project.
Also in June 2020, the World Bank approved a $350 million First Economic Recovery Development Policy
Loan (DPL) for Ukraine in support of reforms that are critical to economic recovery and to help mitigate
the impact of the COVID-19 pandemic. This DPL is the first of two planned loans (with total amount of $700
million), with the second DPL expected to support the additional important land reform legislation and
further strengthen pension benefits for the elderly population. The development policy loan is a part of the
World Bank’s stepped-up support to Ukraine to address the impacts of COVID-19.
In 2020, Ukraine started to adopt new land market reform. At the end of March 2020, the Verkhovna Rada
approved the new law regarding the sale of agricultural land and opening of the land market. The reform
envisages that the moratorium for land sale will be removed starting from the second half of 2021 (a
moratorium on farmland sales in Ukraine has been in place since 2001 and affected close to 70% of the
territory and 16% of the Ukraine’s population, which could not freely dispose of their farmland plots). The
opening of the land market is scheduled for July 1st, 2021. Under the new law the sale of land in one hand in
the first two years after the start of the land reform is limited to 100 hectares, and only individuals who are
Ukrainian citizens will be eligible to buy land until January 1st, 2024. Only after January 1st, 2024 Ukrainian
legal entities will be allowed to buy land at a concentration of no more than 10,000 ha. The ban on sale of
state and municipal agricultural land remains in force. Admission of foreigners to the purchase of land on
the territory of Ukraine will be possible only after the relevant decision is taken through a national
referendum. It is expected that the new land market reform will boost economic growth by as much as 3%
p.a. and substantially increase the value of the economy.
The known and estimable effects of the above events on the financial position and performance of the
Group in the reporting period have been taken into account in preparing these consolidated financial
statements. All farming subsidiaries of the Group are located in the Kharkiv oblast of Ukraine, where there
is a limited risk in the escalation of protests and possible military conflicts as the situation has stabilized
significantly in 2016 already. As of December 31, 2020, the carrying value of the Group’s assets located in
AgroGeneration Group - Consolidated Financial Statements as of and for the year ended December 31, 2020 Page 15
the Kharkiv oblast is €49.3 m. Sowings of the Group in 2020 in Kharkiv oblast represented around 56,000
ha. Management is monitoring the developments in the current environment and taking actions, where
appropriate, to minimize any negative effects to the extent possible. Further adverse developments in the
political, macroeconomic and/or international trade conditions may further adversely affect the Group’s
financial position and performance in a manner not currently determinable.
3.2. Risks related to changes in the legal and fiscal environment
Ukraine currently lacks a comprehensive legal system allowing it to foster and consolidate a stable market
economy. Its fundamental laws are relatively recent, little tested, subject to change and often
characterised by ambiguity and inconsistency. While the pace of change of Ukraine’s legislative framework
is fast, several fundamental laws are still in the process of discussion or adoption by the Ukrainian
parliament.
Uncertainties also arise due to the fact that different regulatory authorities can choose to reinterpret an
applicable law, particularly in the field of taxation, possibly with retroactive effect. Also, the corpus of law
relies on implementing decrees which have often not yet been promulgated, creating legal loopholes or
else that have been promulgated with substantial differences in relation to the rules and conditions
established by the corresponding law, which generates a lack of clarity and many conflicts between
companies and the authorities.
No assurance can be given that the legal and fiscal environment in which the Company operates will
become more stable in the near future. Insofar as Ukraine is continuing to develop its corpus of law, some
existing laws might change and have a negative impact on the Company.
3.3. Risks related to changes in exchange rates
Incomes and expenses of the Group are partly exposed to changes in exchange rates, particularly the euro,
the USD and the hryvnia.
Ukraine operations
Starting July 9, 2012 the National Bank of Ukraine (NBU) fixed the exchange rate for USD / hryvnia at the
rate of 7,993 hryvnia per 1 USD. On February 6, 2014 this measure was released and NBU stopped
supporting the exchange rate of hryvnia. This measure together with the economic situation resulted in a
sharp decline of hryvnia foreign exchange rate which reached 15,77 UAH/USD as of the end of 2014. During
2015 –2020 hryvnia continued its decline till 26,96 UAH/USD
The devaluation of hryvnia against the euro was in line with EURO/USD exchange rate.
Ukrainian legislation concerning the hryvnia prohibits the use of most of the exchange rate hedging
instruments that are available in other countries. Options, futures, forwards, and swaps are not available in
hryvnia. Therefore, AgroGeneration does not actively cover its exposure to fluctuations in the hryvnia on
financial markets.
AgroGeneration Group - Consolidated Financial Statements as of and for the year ended December 31, 2020 Page 16
The Group is partially naturally hedged against a risk of change in exchange rate of the hryvnia against the
USD. Indeed, in the scope of its operations in Ukraine, crop revenues and some of the Group’s costs
(seeds, chemicals, pesticides, etc.) are influenced by worldwide commodity market in USD even if
denominated in UAH. In case the local price is not automatically adjusted to the international market, the
Group has sufficient storage capacity to postpone its sales.
At last, the currency risk in relation to USD denominated liabilities for crop financing is partially mitigated
by the existence of USD export sales.
Financial debt
Interest rate risk sensitivity analysis
At December 31, 2020, if interest rates (for both variable-rate and fixed-rate borrowings) at that date had
been 10 basis points higher/lower with all other variables held constant, interest expense for the year
would have been € 245k higher/lower (December 31, 2019– €317k)).
Foreign currency exchange rate sensitivity analysis
The Group's foreign currency denominated monetary assets and liabilities as of December 31, 2020 consist
of US dollar denominated loans and other debts. Other monetary assets and liabilities are not significant.
At December 31, 2020, if the USD had weakened/increased versus EUR by 10 per cent with all other
variables held constant, pre-tax profit for the year would have been € 459k higher/ lower.
3.4. Risks related to commodities price changes
Due to the size of its grain production, the Group is exposed to fluctuations of crop prices.
For a few years now, agricultural markets have been characterized by high volatility of prices, which
depend on world prices which are mainly formed on the stock exchanges of agricultural products. The
main factors affecting prices are the climatic factors, the level of energy and inputs prices, and the
seasonality of demand.
The market for agricultural commodities in Ukraine is subject to fluctuations in agricultural commodity
prices on international markets. It is also subject to conditions of Ukraine’s local demand and export
capacity, especially when export quota policies are set up, as was the case in 2010. Since Ukraine is a
member of the WTO, these quotas are intended to be exceptional and of limited duration, justified only by
a significant reduction in production on a country-wide scale. To limit this risk, the Group has developed its
own storage capacity enabling it to better manage the pace of commercialization of its production.
The Group hedges against the pricing risk, making forward sales in Ukraine (sales at a fixed price with
forward delivery, denominated in U.S. dollars) in the months prior to the harvest, so as to lock in its margin.
The Group’s goal is to be hedged at the rate of around 30% to 40% of its production prior to the harvest.
AgroGeneration Group - Consolidated Financial Statements as of and for the year ended December 31, 2020 Page 17
3.5. Liquidity risks on crop financing
The main liquidity risk arises from the seasonality of agricultural production. Costs and required working
capital reach their peak in spring ahead of the harvest. The cash inflows are concentrated in the second
half of the year after harvest. The Group remedies this seasonality by expanding its own storage capacity
which allows it to sell its production throughout the year. In addition, the management team controls the
liquidity risk by monitoring key performance indicators, including those regarding cash flow.
Companies face significant liquidity problems due to poor sources of foreign investment and low lending
capacity by the domestic banking system.
The Group continues collaboration with Ukrainian private bank, Alfa-Bank Ukraine, which agreed a crop
financing “revolver” credit line at the prior year level.
In addition to the above elements, the Group is putting in place alternative sources of financing, such as
prepayments of forward contracts and the use of guaranteed promissory notes and extended credit terms
provided by some of the input suppliers. These additional sources of financing give additional comfort to
continue normal operations through the harvest season.
3.6. Counterparty risks
The Group is exposed to credit risks through its cash and cash equivalents, which are kept in current
accounts and with financial institutions (local banks), its supplier credit and customer credit, which includes
commitments towards third parties. Credit risks are not concentrated in a particular counterparty.
Although the company receives lines of credit from many input suppliers during the season, there is no line
of credit secured in advance by the company because the Group manages its positions on a case by case
basis. The Group tends to work with banks and financial institutions owned by leading international
groups.
3.7. Capital repatriation risks
Risks related to repatriation of capital come from the investments in its Ukrainian subsidiaries. To date,
foreign groups are able to repatriate their capital through dividend payments or the repayment of
shareholder loans without tax implications. AgroGeneration finances most of its investments in Ukraine via
shareholder loans, normally through its Cypriot entities. The capital repatriation risks are linked to these
investments. Possible changes in the political environment in Ukraine or in Cyprus could lead to restrictions
on repatriation of capital invested in this country.
4. Critical accounting judgments and estimates
The preparation of Consolidated Financial Statements requires the use of certain critical accounting
estimates. It also requires management to exercise its judgment in the process of applying the Group’s
accounting policies. The areas involving a higher degree of judgment or complexity, or areas where
assumptions and estimates are significant to the Consolidated Financial Statements are the following.
AgroGeneration Group - Consolidated Financial Statements as of and for the year ended December 31, 2020 Page 18
Estimates and judgments are continually evaluated on the basis of historical experience and other factors,
including expectations of future events that are believed to be reasonable under the circumstances.
4.1. Impairment test on intangible assets
Intangible assets are tested for impairment at each balance sheet date and whenever there are indications
of impairment. The outcome of this exercise is highly sensitive to certain assumptions (weighted average
cost of capital, fluctuation of the commodities price, yields).
4.2. Fair value of biological assets and net realisable value of agricultural produce
The Group’s biological assets are measured at fair value less costs to sell at each balance sheet date. The
fair value of biological assets varies according to climatic conditions during growth and harvest, yield
potential and price development. A change in any of these estimates could lead to a material change in the
income statement. If the management team’s assumptions as of December 31, 2020, would have been by
10% better/lower, then the fair value of the biological assets and gross margin would increase/decrease by
around € 1 277 k.
The agricultural produce harvested by the Group is first fair valued at the harvest date when accounted for
in inventory in the “Agricultural produce”. They are later revalued at the lower of that fair value and the
net realizable value at the balance sheet date. The value used for agricultural produce in the assessment of
fair value at harvest time and subsequently for the net realizable value at the balance sheet date is
determined based on the actual prices less costs to sell at the point of harvest and contract prices on the
presold crops.
4.3. Equity-settled share-based transactions
The Group measures the cost of equity-settled transactions with employees by reference to the fair value
of the equity instruments at the date at which they are granted. Estimating fair value requires determining
the most appropriate valuation model for a grant of equity instruments, which is dependent on the terms
and conditions of the grant. This also requires determining the most appropriate inputs to the valuation
model including the expected life of the option, volatility and dividend yield and making assumptions about
them.
4.4. Fair value of fixed assets
Starting from January 1, 2015 the Group applies revaluation model to its tangible assets situated in Ukraine,
such as buildings, constructions, machinery and equipment and other assets.
Under this model, property is carried at fair value less any subsequent accumulated depreciation and
impairment losses. An impairment loss is recognized in the income statement, unless the relevant asset is
carried at a revalued amount, in which case the impairment loss is treated as a revaluation decrease.
Estimating the fair value of property requires the exercise of judgment and the use of assumptions. At
each reporting date, the Group carries out a review of the macroeconomic factors such as, inflation rate in
AgroGeneration Group - Consolidated Financial Statements as of and for the year ended December 31, 2020 Page 19
Ukraine and depreciation of UAH, to determine whether the carrying amount of tangible assets differs
materially from fair value.
Based on the results of the review, the Group concluded that the carrying amount of building,
constructions, machinery and equipment and other assets does not materially differ from the fair value as
of December 31, 2020.
5. Restatement of expense classification
The Group decided to amend its Group accounting policy as from the 2020 in relation to certain expenses.
The expenses which are incurred by agricultural producers are integral to supporting the production
agricultural activities of such an enterprise, and relate exclusively to agricultural production, are classified
as cost of production overheads.
Some of the expenses have been classified within the Group’ Administrative expenses in 2019, including :
- salaries of employees employed at farms (directors, accountants, car drivers),
- cars fuel and maintenance,
- farms premises costs (rental of premises, premises supplies).
Such expenses are classified as production overheads according to the Group accounting policy since 2020
ahead.
The 2019 Consolidated income statement 2019 is restated accordingly.
There is no impact on the balance sheet for the year ended December 31, 2019.
There is no impact on the total operating, investing and financing cash flow for the year ended December
31, 2019.
The tables below summarize the total impact on the Group’s consolidated financial statements as
December 31, 2019.
AgroGeneration Group - Consolidated Financial Statements as of and for the year ended December 31, 2020 Page 20
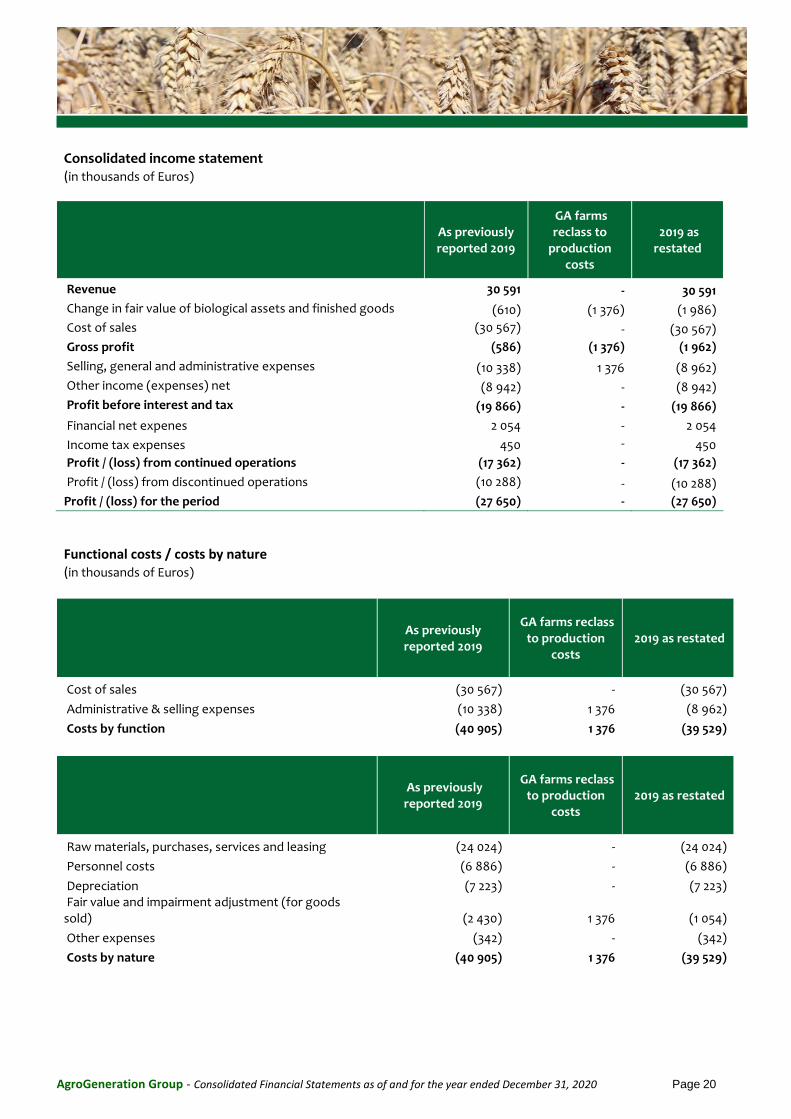
Consolidated income statement (in thousands of Euros)
As previously reported 2019
GA farms reclass to
production costs
2019 as restated
Revenue 30 591 - 30 591
Change in fair value of biological assets and finished goods (610) (1 376) (1 986)
Cost of sales (30 567) - (30 567)
Gross profit (586) (1 376) (1 962)
Selling, general and administrative expenses (10 338) 1 376 (8 962)
Other income (expenses) net (8 942) - (8 942)
Profit before interest and tax (19 866) - (19 866)
Financial net expenes 2 054 - 2 054
Income tax expenses 450 - 450
Profit / (loss) from continued operations (17 362) - (17 362)
Profit / (loss) from discontinued operations (10 288) - (10 288)
Profit / (loss) for the period (27 650) - (27 650)
Functional costs / costs by nature (in thousands of Euros)
As previously reported 2019
GA farms reclass to production
costs 2019 as restated
Cost of sales (30 567) - (30 567)
Administrative & selling expenses (10 338) 1 376 (8 962)
Costs by function (40 905) 1 376 (39 529)
As previously reported 2019
GA farms reclass to production
costs 2019 as restated
Raw materials, purchases, services and leasing (24 024) - (24 024)
Personnel costs (6 886) - (6 886)
Depreciation (7 223) - (7 223) Fair value and impairment adjustment (for goods sold) (2 430) 1 376 (1 054)
Other expenses (342) - (342)
Costs by nature (40 905) 1 376 (39 529)
AgroGeneration Group - Consolidated Financial Statements as of and for the year ended December 31, 2020 Page 21
6. Events after the balance sheet date
6.1. Impact of COVID-19 on the Group’s operations
In December 2019, an outbreak of a new strain of coronavirus (COVID-19) originated in Wuhan, China and
has since spread worldwide. On March 11, 2020, the World Health Organization declared COVID-19 as a
pandemic. Ukraine declared a state of emergency on March 25, 2020. Currently Ukraine is under
an adaptive quarantine until June 30, 2021 which means that most of the restrictions have been lifted, but
in the areas with high infection rate all quarantine restrictions are to be maintained. Decisions on easing of
or return to confinement measures in cities or regions are to be taken by local and regional authorities. In
response to increases in COVID-19 cases, local authorities introduce quarantine measures for specified time
periods including limitations to public transportation and indoor public places (cinemas and other cultural
establishments, shopping malls, restaurants, cafes and other). Wearing masks is mandatory in all public
places and individuals and establishments can be fined for not complying.
Ukraine remains among the countries in Europe most severely affected by the COVID-19 pandemic in health
terms. By the end of 2020, Ukraine had adopted a National COVID-19 Vaccination Roadmap, and a
vaccination campaign started in February 2021. The Ukrainian government has approved the use of
AstraZeneca/Covishield, Sinovac Biotech, and Pfizer vaccines in Ukraine. Vaccinations are currently ongoing
and Ukraine makes efforts to secure sufficient vaccine supplies to cover the country’s needs.
Due to the COVID-19 pandemic, Ukrainian economic sectors have been hit hard in 2020, and a slow
recovery is expected in 2021, subject to global post-pandemic recovery. Agriculture is expected to be
among the least affected by quarantine restrictions, while service, trade and transport have been the most
affected. The direct impact of the pandemic on the economy has been channelled through stopped
domestic economic activity in sectors affected by the shutdown, as well as lower demand for Ukrainian
exports and lower remittances from abroad. Second-round effects stem from reduced household income,
redirection of government spending and disruption of investment plans of companies, resulting in lower
demand for a wide range of goods and service.
In accordance with the national regulations and the best practices recommendations, AgroGeneration has
put in place sanitary measures in its operations to ensure employees safety, including observing social
distancing, providing proper sanitizing, etc. Administrative employees are working from home as much as
possible. Travel has been virtually eliminated so that employees may observe stay-in-place orders and
quarantines, with those in field operations observing all sanitary norms during the crisis. Since the start of
the outbreak, there has been no notable negative impact to AgroGeneration’s operations, no change nor
impact on the company’s profitability position, and management does not see any material change to the
company’s business operations.
Should the situation worsen, the Covid-19 pandemic may have potential impacts on the financial
statements: the company could potentially see an impact on future revenues, costs of inputs, timing of
inputs supplies (and thus a change in yields), lower world crop prices, and increase storage costs. These
and other factors could influence the cash flow of the company and the balance sheet. A prolonged
outbreak could strain the financing to the company that is currently in place. Still, for now, despite the
pandemic, the company continues to meet all its obligations. Management will continue to closely monitor
the situation and assess the need for any future additional measures as the situation develops.
AgroGeneration Group - Consolidated Financial Statements as of and for the year ended December 31, 2020 Page 22
7. Summary of significant accounting policies
The principal accounting policies applied are summarized below.
7.1. Basis of preparation and changes in accounting policies
AgroGeneration’s Consolidated Financial Statements are prepared in accordance with International
Financial Reporting Standards (IFRS), issued by the International Accounting Standards Board (IASB) and
as endorsed by the European Union (EU) as of December 31, 2020. They comprise (i) the IFRS, (ii) the
International Accounting Standards (IAS) and (iii) the interpretations provided by the International
Financial Reporting Interpretations Committee (IFRIC) or the former Standing Interpretations Committee
(SIC).
The Group’s Consolidated Financial Statements include the Financial Statements of AgroGeneration and
those of all its subsidiaries as of December 31, 2020. The Financial Statements of the subsidiaries are
prepared for the same accounting period as those of the parent company and are based on the same
accounting policies.
The IFRS accounting policies used by AgroGeneration in the preparation of these Consolidated Financial
Statements as of December 31, 2020 are the same as for 2019 ones presented, except for those pertaining
to the effect of the new or amended standards or interpretations detailed below.
(a) Standards and amendments for mandatory application in the European Union for financial period ended
December 31, 2020
IFRS 17 – Insurance Contracts (effective for annual reporting periods beginning on or after 1
January 2023).
Amendments to IAS 1 – Classification of Liabilities as Current or Non-current (applied for annual
periods beginning on or after 1 January 2023).
Amendments to IFRS 3 – Reference to the Conceptual Framework (applied for annual periods
beginning on or after 1 January 2022).
Amendments to IAS 16 – Property, Plant and Equipment: Proceeds before Intended Use (applied
for annual periods beginning on or after 1 January 2022).
Amendments to IAS 37 – Onerous Contracts – Costs of Fulfilling a Contract (applied for annual
periods beginning on or after 1 January 2022).
Amendments to IFRS 1 First-time Adoption of International Financial Reporting Standards –
Subsidiary as a first-time adopter (applied for annual periods beginning on or after 1 January 2022).
Amendments to IFRS 9 Financial Instruments – Fees in the ’10 per cent’ test for derecognition of
financial liabilities (applied for annual periods beginning on or after 1 January 2022).
Amendments to IAS 41 Agriculture – Taxation in fair value measurements (applied for annual
periods beginning on or after 1 January 2022).
Amendment to IFRS 16 Leases COVID-19-Related Rent Concessions (the amendment is effective 1
June 2020 but, to ensure the relief is available when needed most, lessees can apply the
amendment immediately in any financial statements—interim or annual—not yet authorised for
issue).
AgroGeneration Group - Consolidated Financial Statements as of and for the year ended December 31, 2020 Page 23
Amendments to IFRS 9, IAS 39, IFRS 7, IFRS 4 and IFRS 16 – Interest Rate Benchmark Reform –
Phase 2 (applied for annual periods beginning on or after 1 January 2021).
Amendment to IFRS 16 Leases Covid 19-Related Rent Concessions (issued on 28 May 2020).
Amendments to IFRS 3 Business Combinations (issued on 22 October 2018.
Amendments to IFRS 9, IAS 39 and IFRS 7: Interest Rate Benchmark Reform (issued on
26 September 2019).
Amendments to IAS 1 and IAS 8: Definition of Material (issued on 31 October 2018).
Amendments to References to the Conceptual Framework in IFRS Standards (issued on 29 March
2018).
These standards did not have material effect on the Group’s financial statements.
(b) Standards and Interpretations published by the IASB but not yet endorsed by the EU and not applied by
AgroGeneration
Amendments to IFRS 17: insurance contracts
Amendments to IAS 1: Classification of Liabilities as Current or Non-Current
Amendments to IFRS 3: Reference to the Conceptual Framework
Amendments to IAS 16: Property, Plant and Equipment — Proceeds before Intended Use
Amendments to IAS 37: Onerous Contracts — Cost of Fulfilling a Contract
Amendments to IFRS 4: Extension of the Temporary Exemption from Applying IFRS 9
7.2. Consolidation
(a) Subsidiaries
All the subsidiaries in which the Group exercises control are fully consolidated. Control exists
when all the following conditions are met:
power over the subsidiary;
exposure, or rights, to variable returns from its involvement with the subsidiary;
the ability to use its power to affect its returns.
The Group reassesses whether or not it controls an investee if facts and circumstances indicate that
there are changes to one or more of the three elements of control listed above. Consolidation of a
subsidiary begins when the Group obtains control over the subsidiary and ceases when the Group loses
control of the subsidiary. The Group does not exert joint control over any of the entities within its scope of
consolidation as at December 31, 2020.
All intercompany balances and transactions as well as income, expenses and unrealised gain/losses, which
are included in the net book value of assets, which derive from intercompany transactions, are fully
eliminated.
(b) Accounting for business combinations
AgroGeneration Group - Consolidated Financial Statements as of and for the year ended December 31, 2020 Page 24
The acquisitions of subsidiaries from third parties (which constitute Business Combination under IFRS)
are accounted for using the acquisition method. On acquisition, the assets, liabilities and contingent
liabilities of a subsidiary are measured at fair values.
Goodwill is measured as the excess of the sum of the consideration transferred, the amount of any non-
controlling interests in the acquired subsidiary, and the fair value of the Group’s previously held equity
interest in the acquired subsidiary (if any) over the net of the acquisition-date amounts of the
identifiable assets acquired and the liabilities and contingent liabilities assumed.
In case identifiable net assets attributable to the Group, after reassessment, exceed the cost of
acquisition, the difference is recognized in the Consolidated Income Statement as a bargain purchase
gain.
7.3. Foreign currency translation
(a) Functional and presentation currency
Items included in the Financial Statements of each Group entity are measured using the currency of
primary economic environment in which the entity operates (“the functional currency”).
The functional currency of the parent and Cypriote subsidiaries is the euro (EUR) and the functional
currency of Ukrainian subsidiaries is the hryvnia (UAH).
The presentation currency of the Consolidated Financial Statements is the euro (EUR).
(b) Foreign transactions
Foreign currency transactions are translated into the respective functional currencies using the exchange
rates prevailing at the dates of the transactions. Foreign exchange gains and losses resulting from the
settlement of such transactions and from the translation at year-end exchange rates of monetary assets
and liabilities denominated in foreign currencies are recognised as financial income and expense in the
income statement, except when deferred in other comprehensive income as qualifying cash flow hedges
and qualifying net investment hedges.
Long-term intercompany loans to a foreign operation for which settlement is neither planned nor likely to
occur in the foreseeable future are classified as net investments in the foreign operation.
Where a subsidiary that is a foreign operation repays a net investment loan but there is no change in the
parent’s proportionate percentage shareholding, cumulative translation adjustment is not reclassified from
other comprehensive income to the income statement.
(c) Translation of Financial Statements expressed in foreign currencies
The income statements and statements of financial position of all Group entities that have a functional
currency different from the presentation currency (none having a currency of a hyperinflationary economy
as of December 31, 2020) are translated into the presentation currency as follows:
AgroGeneration Group - Consolidated Financial Statements as of and for the year ended December 31, 2020 Page 25
Assets and liabilities of the statement of financial position are translated at the exchange rate of
closing date,
Revenues and charges in the income statement are translated at exchange rates at the dates of
the transactions (for practical reasons, the Group translates items of income and expenses for
each period presented in the financial statements using the average exchange rates for such an
accounting period, if such translations reasonably approximate the results translated at
exchange rates prevailing on the dates of the transactions),
Residual foreign exchange differences are recognized in a separate component of equity.
The exchange rates used for translating Financial Statements of subsidiaries in Ukraine are the following:
December 31, 2020 December 31, 2019
Monetary unit per € 1 Average Closing Average Closing
Ukrainian Hryvnia (UAH) 30,8013 34,7396 28,6641 26,4220
American Dollar (USD) 1,1423 1,2287 1,1178 1,1155
The rates used for the hryvnia and the U.S. dollar are those of the National Bank of Ukraine (“NBU”) in
force.
Exchange rate differences on a monetary item forming part of the net investment of the entity presenting
the Financial Statements in a foreign operation are recognised in other comprehensive income and
reclassified from equity to Income Statement upon partial or total disposal of this net investment.
Goodwill and fair value adjustments recognised in the acquisition of a foreign entity are recognised as
assets and liabilities of the foreign entity and translated at closing exchange rate.
7.4. Intangible assets
The main intangible assets recognised are goodwill and leasehold rights. These have been recognised as
part of the business combination process.
Subsequent to initial recognition goodwill is recognized at initial cost less accumulated impairment losses,
if any.
Cash-generating unit (CGU) for the goodwill impairment test was determined to be equal to the operating
segment "Ukraine".
Where goodwill forms part of a CGU and part of the operation within that unit is disposed of, the goodwill
associated with the operation disposed of is included in the carrying amount of the operation when
determining the gain or loss on disposal of the operation. Goodwill disposed of in this circumstance is
measured based on the relative values of the operation disposed of and the portion of the CGU retained.
AgroGeneration Group - Consolidated Financial Statements as of and for the year ended December 31, 2020 Page 26
7.5. Property, plant and equipment
Starting from January 1, 2015 the Group applies revaluation model for fixed assets situated in Ukraine.
Under this model, fixed assets are carried at fair value less any subsequent accumulated depreciation and
impairment losses.
Revaluation is made with sufficient regularity to ensure that the carrying amount does not differ materially
from that which would be determined using fair value at the date of reporting period.
The acquisition cost of the tangible fixed assets includes all the expenses directly attributable to the
acquisition of the fixed assets. Subsequently capitalized costs include major expenditures for
improvements and replacements that extend the useful lives of the assets or increase their revenue
generating capacity. All other repairs and maintenance costs are charged to the income statement during
the financial period in which they are incurred. The carrying amount of the replaced limited-life component
is derecognised.
Fixed assets are depreciated over their estimated useful lives:
Buildings 10 – 55 years
Machinery and equipment 5 – 30 years
Other tangible assets 3 - 30 years
Production facilities represent immobile agricultural production equipment, mainly dryers and cleaners.
Machinery and vehicles include other mobile agricultural equipment (tractors, combines, harvesters, seed
planters, trucks etc.).
The assets’ useful lives are reviewed, and adjusted if appropriate, at each financial year-end. The effect of
any changes from previous estimates is accounted for prospectively as a change in an accounting
estimate.
The gain or loss arising on a sale or disposal of an item of property, plant and equipment is determined
as the difference between the sales proceeds and the carrying amount of the asset and is recognized in
the income statement.
Construction in progress comprises costs directly related to the construction of property, plant and
equipment including an appropriate allocation of directly attributable variable overheads that are
incurred in construction. Construction in progress is not depreciated. Depreciation of construction in
progress commences when the assets are available for use, i.e. when they are in the location and
condition necessary for them to be capable of operating in the manner intended by the management.
On the subsequent sale or retirement of revalued assets, the revaluation surplus remaining in the
revaluation reserve is transferred directly to retained earnings. No transfer is made from the revaluation
reserve to retained earnings except when an asset is derecognized.
AgroGeneration Group - Consolidated Financial Statements as of and for the year ended December 31, 2020 Page 27
7.6. Impairment of non-financial assets
Non-financial assets other than goodwill are reviewed for possible impairment at each reporting date and
whenever events or changes in circumstances indicate that the carrying amount may not be recoverable.
An impairment loss is recognised for the amount by which the asset’s carrying amount exceeds its
recoverable amount. The recoverable amount is the higher of an asset’s fair value less costs to sell and
value in use. For the purposes of assessing impairment, assets are grouped at the lowest levels for which
there are separately identifiable cash flows (cash-generating units).
An impairment loss is recognized immediately in the Consolidated Income Statement unless the relevant
asset is carried at revalued amount, in which case the impairment loss is treated as a revaluation decrease.
7.7. Agriculture
(a) Definitions
The Group accounting policies for agricultural activities are based on IAS 41 "Agriculture".
Agricultural activity is defined as a biological transformation of biological assets into agricultural products
or into other biological assets.
Group classifies following biological assets: crops in field and livestock.
Agricultural produce are the products of the harvest of biological assets of the Group and produce
received from cattle breeding, i.e. harvested grain that is stored, milk, meat and other livestock produce.
The Group recognizes a biological asset or an agricultural produce when the Group controls the asset as
a result of past events, and it is probable that future economic benefits associated with the asset will
flow to the Group, and the fair value or cost of the asset can be measured reliably.
(b) Biological assets
Biological assets are measured at initial recognition and at each balance sheet date at their fair value less
costs to sell, with any resulting gain or loss recognized in the income statement. Costs to sell include all
costs that would be necessary to sell the assets, including costs necessary to get the assets to market.
Biological assets are measured using the present value of expected net cash flows from the sale of an
asset discounted at a current market determined rate. The objective of a calculation of the present value
of expected net cash flows is to determine the fair value of a biological asset. The difference between fair
value less costs to sell and total production costs is allocated to biological assets held in stock as of each
reporting date as a fair value adjustment.
Based on the above policy, the principal groups of biological assets are stated as follows:
(i) Crops in fields
The fair value of crops in fields is determined by reference to the discounted cash flows that will be
obtained from sales of harvested crops, with an allowance for costs to be incurred and risks to be faced
during the remaining transformation process.
AgroGeneration Group - Consolidated Financial Statements as of and for the year ended December 31, 2020 Page 28
The fair value of plant-growing Biological assets is determined based on, among other estimates, weather
conditions, quality of soils, growth potential, yields, harvest conditions and price development.
As of December 31, 2020, the Group had identified for each type of plant growing biological asset their
respective principle market, and measures their fair value based on the following:
in determining prices
Management assessment of future prices at the date of harvest reconciled to the Ukrainian FOB prices or Western markets offset prices on the balance sheet date. These prices have been reduced by fobbing and transport costs.
in determining yields
Management assessment of future yields for crop based on the most relevant recent data from the crop surveys carried out in the fields.
Given the nature of these input parameters, the fair value of the biological assets is categorised as Level 3
as defined by IFRS 13. Change in any estimates could lead to recognition of significant fair values changes in
income statement.
(ii) Livestock
The fair value of livestock is determined based on market prices of livestock of similar age, breed and
genetic merit. Cattle, for which market-determined prices or values are not available and for which
alternative estimates of fair value are determined to be clearly unreliable, are measured using the
present value of expected net cash flows from the asset discounted at a current market-determined pre-
tax rate.
Biological assets are recorded as current or non-current assets based on the operational cycle of the
Group’s biological assets.
(c) Agricultural produce
Agricultural produce harvested by the Group is initially measured at the time of harvest at its fair value less
cost to sell at the point of harvest. It is subsequently recorded as inventory in “Agricultural produce” and
stated at the lower of fair value at the time of harvest and net realizable value. This valuation at net
realizable value is presented in the form of inventory depreciation. ("Change in fair value of finished
goods", cf. Note 15).
The value of agricultural produce used for the assessment of fair value at the time of harvest and
subsequent net realizable value is determined based on the actual prices less costs to sell at the point of
harvest and contract prices on the presold crops.
AgroGeneration Group - Consolidated Financial Statements as of and for the year ended December 31, 2020 Page 29
(d) Work in progress (inventory of work in progress)
Work in progress is represented by the costs of preparing the land which has not been sown at balance
sheet date (case of spring plants in Ukraine – corn, soybean, sunflower, etc. – when valued as of December
31). The soil preparation costs are measured on the basis of the historical costs incurred by the Group.
7.8. Leases, Right-of-use assets and lease liabilities
Leases are recognized, measured and presented in line with IFRS 16 Leases. The Group recognizes a right-
of-use assets and a lease liability at the commencement date of the contract for all leases conveying the
right to control the use of an identified assets for a period of time.
The right-of-use asset is depreciated using the straight-line method from the commencement date to the
earlier of the end of the useful life of the right-of-use asset or the end of the lease term. In addition, the
right-of-use assets is periodically reduced by impairment losses, if any, and adjusted for certain
remeasurements of the lease liability.
The lease liability if initially measured at the present value of the lease payments that are not paid at the
commencement date, discounted using the Group’s incremental borrowing rate.
Lease payments included in the measurement of the lease liability comprise the following:
- fixed payments,
- variable lease payments that depend on an index or rate, initially measured using the index or
rate at the commencement date;
- amounts expected to be payable under a residual value guarantee; and
- the exercise price under the purchase option that the Group is reasonably certain to exercise,
lease payment in an optional renewal period if the Group is reasonable certain to exercise an
extension option, and penalties for early termination of a lease unless the Group is reasonably
certain not to terminate early.
The Group has elected not to recognize right-of-use assets and lease liabilities for short-term leases (leases
with lease term of 12 months or less, without any purchase option). The Group recognizes the lease
payments associated with these leases as an expense on a straight-line basis over the lease term.
Amounts recognized in profit or loss
(in thousands of Euros)
2020
Interest on lease liabilities 2 611
Additional lease payments not contractual and not included in the measurement of lease liabilities* 1 671
Income from sub-leasing right-of-use assets 72
Expenses relating to short-term leases 129
*Estimation of Lease liabilities for right-of-use assets is based on contractual terms. However, majority of land lease
agreements were concluded away back that caused a lag between contractual terms and current market conditions.
Actual payments to landholders are higher than those stipulated in the contracts and reflect additional component not
contractual within the meaning of IFRS 16. That additional component is attributable to market growing tendency.
AgroGeneration Group - Consolidated Financial Statements as of and for the year ended December 31, 2020 Page 30
Additional portion of not contractual land lease expenses would have an effect of €3 558k on lease debt for
continued operations as at December 31, 2020.
Amounts recognized in the statement of cash flows
(in thousands of Euros)
2020
Total cash outflow for leases 4 038
7.9. Government grants
An unconditional government grant is recognised as income when the government grant becomes
receivable.
If a government grant is conditional, the Group recognises the government grant as income when the
conditions attaching to the government grant are met (area-aid environmental subsidies) and until then aid
received is recognised as a liability.
7.10. Inventories
(a) Raw material and other supplies
Inventories are stated at the lower of cost and net realizable value. Costs comprise raw materials and, where applicable, direct labour costs and those overheads that have been incurred in bringing the inventories to their present locations and condition.
Cost is calculated using the weighted average cost method. Net realizable value is determined as the estimated selling price less all estimated costs of completion and costs to be incurred in marketing, selling and distribution.
(b) Finished goods (agricultural produce)
Cf. note 7.7 (c) – Agriculture.
(c) Work in progress
Cf. note 7.7 (d) – Agriculture.
7.11. Share capital
Ordinary shares are classified as equity. Incremental costs directly attributable to the issue of new shares
or to the exercise of new options are recorded directly in equity as a deduction from the issue premium,
net of tax effects.
AgroGeneration Group - Consolidated Financial Statements as of and for the year ended December 31, 2020 Page 31
7.12. Current and deferred income tax
(a) General tax treatment
The current income tax charge is calculated on the basis of the tax laws enacted or substantively enacted
at the balance sheet date in the countries where the Group’s subsidiaries operate and generate taxable
income.
The tax rates applicable on December 31, 2020 are 31% in France, 18% in Ukraine (see (b) Agricultural tax
schemes for agricultural concerns in Ukraine) and 12,5% in Cyprus.
Tax reform measures in France (2016) already provided for a progressive reduction of the ordinary
corporate tax rate from 33,33% to 28%. The Finance Law for 2018 provides for a further progressive
reduction of the corporate income tax rate to 25%, fully applicable for financial years opened in 2022. The
schedule for phased-in application of the progressive reduction will be as follows:
For financial years opened as from 1 January 2019, the standard rate of corporate income tax is reduced to 31%, with the first €500,000 of profit being still subject to the 28% rate.
For financial years opened as from 1 January 2020, the 28% rate of corporate income tax will become the new “ordinary rate” (for all profits).
For financial years opened as from 1 January 2021, the ordinary rate of corporate income tax will be reduced to 26.5%.
For financial years opened as from 1 January 2022, the ordinary rate of corporate income tax will be reduced to 25%.
The deferred tax is determined using the tax rate and the tax regulations in effect or in effect in essence at
the balance sheet date and which are likely to be applied when the deferred tax assets will be used or
when the deferred tax liability will be paid.
Deferred tax is accounted for using the balance sheet liability method in respect of temporary
differences arising from differences between the carrying amount of assets and liabilities in the
consolidated financial statements and the corresponding tax basis used in the computation of taxable
profit. Deferred tax liabilities are generally recognized for all taxable temporary differences and deferred
tax assets are recognized to the extent that it is probable that taxable profits will be available against
which deductible temporary differences can be utilized.
However, the deferred tax is not accounted for if at initial recognition of an asset or a liability at the time
of a transaction other than a business combination the transaction has no implications for the
accounting income or the taxable income.
Deferred tax is charged or credited to the income statement, except when it relates to items credited or
charged directly to equity, in which case the deferred tax is also dealt with in equity.
The carrying amount of deferred tax assets is reviewed at the end of each reporting period and reduced
to the extent that it is no longer probable that sufficient taxable profits will be available to allow all or
part of the asset to be recovered.
Deferred tax assets and liabilities are offset when:
The Group has a legally enforceable right to set off the recognized amounts of current tax
AgroGeneration Group - Consolidated Financial Statements as of and for the year ended December 31, 2020 Page 32
assets and current tax liabilities;
The Group has an intention to settle on a net basis, or to realize the asset and settle the liability
simultaneously;
The deferred tax assets and the deferred tax liabilities relate to income taxes levied by the same
taxation authority in each future period in which significant amounts of deferred tax liabilities and
assets are expected to be settled or recovered.
(b) Agricultural tax scheme for agricultural companies in Ukraine
In Ukraine, a company is considered to be a farming company if at least 75% of its revenues from the
previous fiscal year arise from the sale of agricultural products. In this case, a farming company enjoys
special regime on corporate income tax.
Starting from January 1, 2017, the privileged VAT regime for agricultural companies has been cancelled. For
more detailed refer to the Consolidated Financial Statements as of December 31, 2016.
Corporate income tax: agricultural companies are not subject to corporate income tax but to the tax on
land which is calculated on the basis of a percentage of the value of the land used for agricultural
production. The related corresponding costs are classified in “Cost of sales”.
Among the 9 legal entities that the Group controls in Ukraine as of December 31, 2020, 6 are involved in
agricultural production and are eligible for the special tax regime for agricultural companies in Ukraine in
2020.
7.13. Employees benefits
(a) Pension obligations
The Group does not operate any significant pension schemes. The contributions to the local pension funds
are treated as defined contribution benefits.
(b) Termination benefits
Termination benefits are payable when employment is terminated by the Group before the normal
retirement date, or whenever an employee accepts voluntary redundancy in exchange for these benefits.
The Group recognises termination benefits when it is demonstrably committed to either terminate the
employment of current employees according to a detailed formal plan without possibility of withdrawal or
to provide termination benefits as a result of an offer made to encourage voluntary redundancy. Benefits
falling due more than 12 months after the balance sheet date are discounted to present value.
7.14. Provisions
Provisions must be recognized when the Company has a present obligation (legal or constructive) as a
result of a past event, and it is probable that an outflow of resources embodying economic benefits will be
required to settle the obligation, and a reliable estimate can be made of the amount of the obligation.
Provisions are not recognised for future operating losses.
AgroGeneration Group - Consolidated Financial Statements as of and for the year ended December 31, 2020 Page 33
7.15. Revenue
Revenue represents the proceeds from ordinary business activities. These proceeds are measured at fair
value of the counterparty received or to be received for the sale of goods or services in the scope of the
Group’s typical operations.
The proceeds from typical operations presented for the Group's Ukrainian activities exclude the VAT
collection on sales.
These same proceeds from agricultural operations are presented net of discounts and rebates, and after
elimination of intra-Group sales.
Revenue is recognized to the extent that it is probable that the economic benefits will flow to the Group
and the revenue can be reliably measured.
The following specific recognition criteria must also be met before revenue is recognized:
Sale of Goods and Finished Products – Revenue is recognized when the significant risks and
rewards of ownership of goods for resale and finished products have passed to the buyer, the
amount of revenue can be measured reliably and the Group retains neither continuing
managerial involvement to the degree usually associated with ownership nor effective control
over the goods sold. The point of transfer of risk, which may occur at delivery or shipment, varies
for contracts with different types of customers.
Rendering of Services – Revenue is recognized in the accounting period in which services are
rendered.
The Group’s main revenue arises from the sales of agricultural produce.
7.16. Share-based payment
The fair value of services assumed to have been received in exchange for the equity instruments (warrants)
issued is recognised as an expense in the income statement and in other reserves in equity during the
vesting period (from the grant date of warrants until the vesting date). The fair value of the services
received is determined by reference to the fair value (market value) of equity instruments granted at the
grant date.
8. Segment reporting
The Group has one operating segment in Ukraine, which is composed of 9 legal entities operating around
57 000 hectares of farmland.
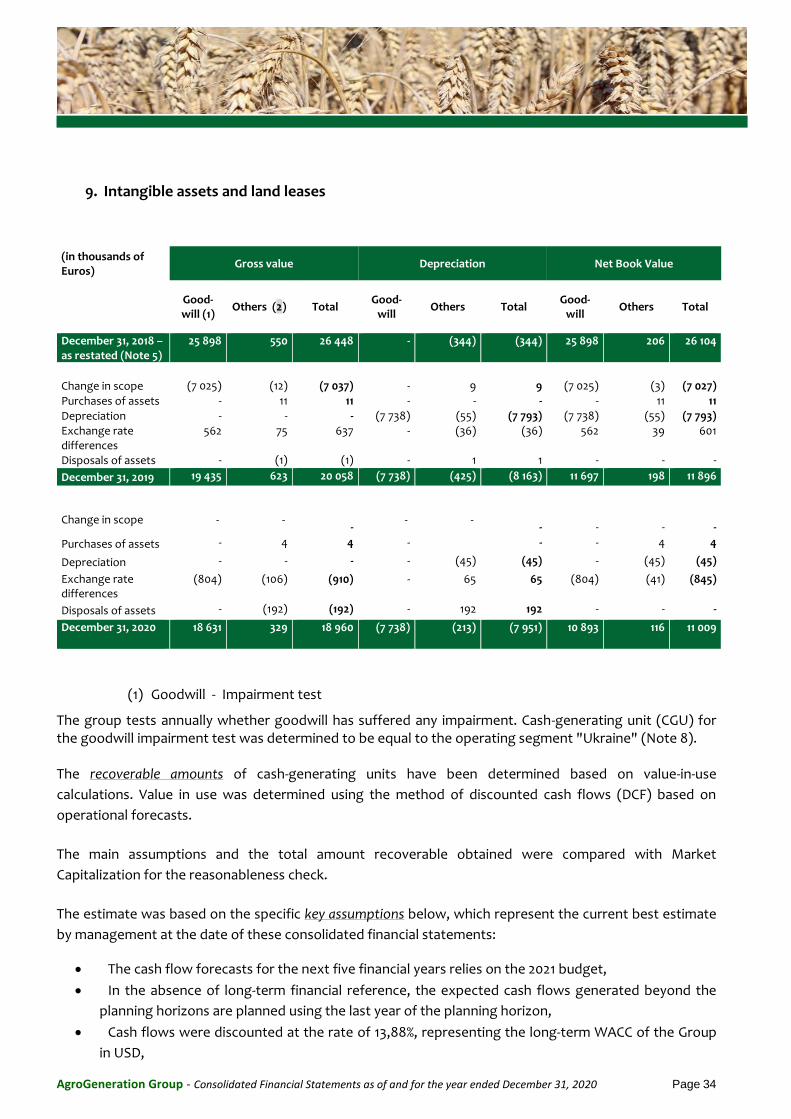
AgroGeneration Group - Consolidated Financial Statements as of and for the year ended December 31, 2020 Page 34
9. Intangible assets and land leases
(in thousands of Euros)
Gross value Depreciation Net Book Value
Good-will (1)
Others (2) Total Good-
will Others Total
Good-will
Others Total
December 31, 2018 – as restated (Note 5)
25 898 550 26 448 - (344) (344) 25 898 206 26 104
Change in scope (7 025) (12) (7 037) - 9 9 (7 025) (3) (7 027)
Purchases of assets - 11 11 - - - - 11 11
Depreciation - - - (7 738) (55) (7 793) (7 738) (55) (7 793)
Exchange rate differences
562 75 637 - (36) (36) 562 39 601
Disposals of assets - (1) (1) - 1 1 - - -
December 31, 2019 19 435 623 20 058 (7 738) (425) (8 163) 11 697 198 11 896
Change in scope - -
- - -
-
-
-
-
Purchases of assets - 4 4 - - - 4 4
Depreciation - - - - (45) (45) - (45) (45)
Exchange rate differences
(804) (106) (910) - 65 65 (804) (41) (845)
Disposals of assets - (192) (192) - 192 192 - - -
December 31, 2020
18 631 329 18 960 (7 738) (213) (7 951) 10 893 116 11 009
(1) Goodwill - Impairment test
The group tests annually whether goodwill has suffered any impairment. Cash-generating unit (CGU) for the goodwill impairment test was determined to be equal to the operating segment "Ukraine" (Note 8). The recoverable amounts of cash-generating units have been determined based on value-in-use
calculations. Value in use was determined using the method of discounted cash flows (DCF) based on
operational forecasts.
The main assumptions and the total amount recoverable obtained were compared with Market
Capitalization for the reasonableness check.
The estimate was based on the specific key assumptions below, which represent the current best estimate
by management at the date of these consolidated financial statements:
The cash flow forecasts for the next five financial years relies on the 2021 budget,
In the absence of long-term financial reference, the expected cash flows generated beyond the
planning horizons are planned using the last year of the planning horizon,
Cash flows were discounted at the rate of 13,88%, representing the long-term WACC of the Group
in USD,
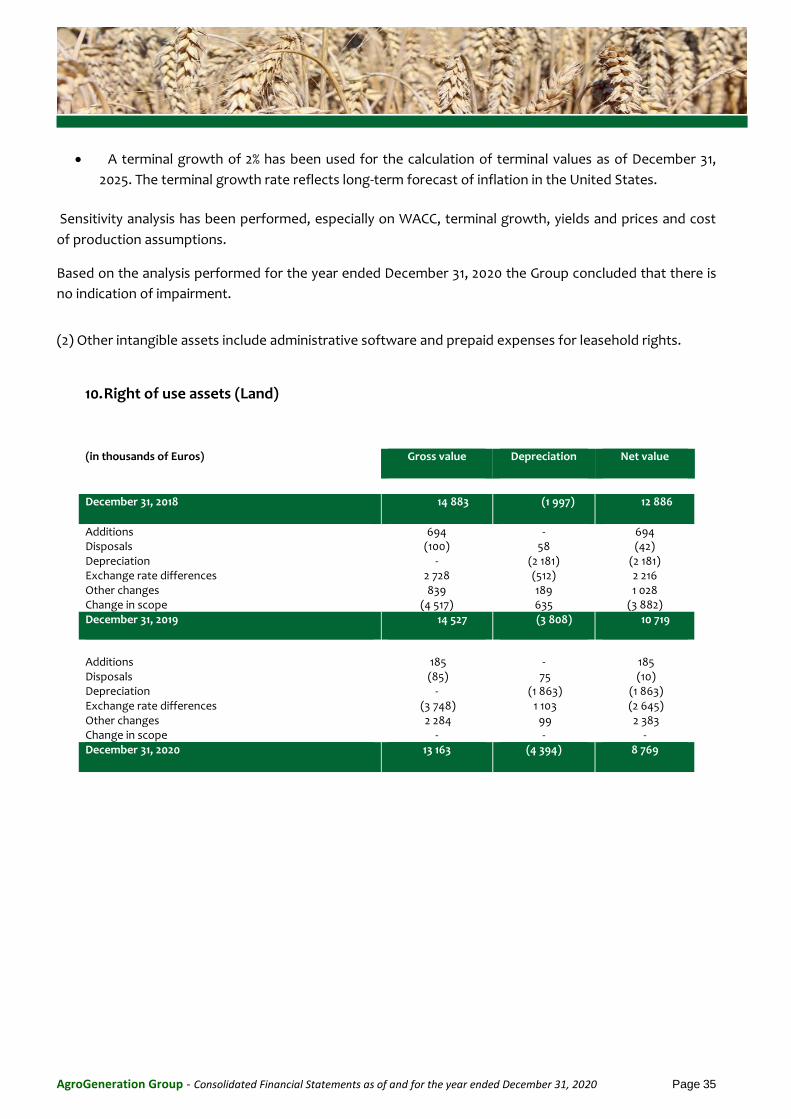
AgroGeneration Group - Consolidated Financial Statements as of and for the year ended December 31, 2020 Page 35
A terminal growth of 2% has been used for the calculation of terminal values as of December 31,
2025. The terminal growth rate reflects long-term forecast of inflation in the United States.
Sensitivity analysis has been performed, especially on WACC, terminal growth, yields and prices and cost
of production assumptions.
Based on the analysis performed for the year ended December 31, 2020 the Group concluded that there is
no indication of impairment.
(2) Other intangible assets include administrative software and prepaid expenses for leasehold rights.
10. Right of use assets (Land)
(in thousands of Euros) Gross value Depreciation Net value
December 31, 2018 14 883 (1 997) 12 886
Additions 694 - 694 Disposals (100) 58 (42) Depreciation - (2 181) (2 181) Exchange rate differences 2 728 (512) 2 216 Other changes 839 189 1 028 Change in scope (4 517) 635 (3 882) December 31, 2019 14 527 (3 808) 10 719
Additions 185 - 185 Disposals (85) 75 (10) Depreciation - (1 863) (1 863) Exchange rate differences (3 748) 1 103 (2 645) Other changes 2 284 99 2 383 Change in scope - - - December 31, 2020 13 163 (4 394) 8 769
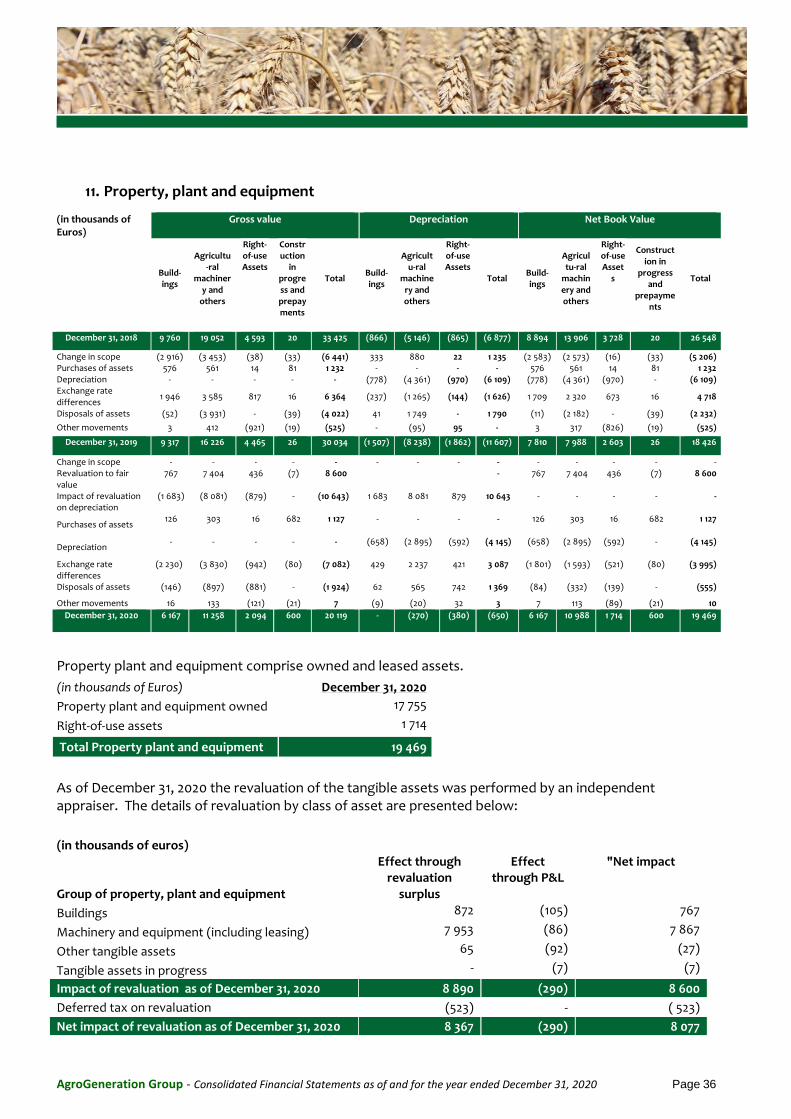
AgroGeneration Group - Consolidated Financial Statements as of and for the year ended December 31, 2020 Page 36
11. Property, plant and equipment
(in thousands of Euros)
Gross value Depreciation Net Book Value
Build-ings
Agricultu-ral
machinery and
others
Right-of-use Assets
Construction
in progress and prepayments
Total Build-ings
Agricultu-ral
machinery and others
Right-of-use Assets
Total Build-ings
Agricultu-ral
machinery and others
Right-of-use Asset
s
Construction in
progress and
prepayments
Total
December 31, 2018 9 760 19 052 4 593 20 33 425 (866) (5 146) (865) (6 877) 8 894 13 906 3 728 20 26 548
Change in scope (2 916) (3 453) (38) (33) (6 441) 333 880 22 1 235 (2 583) (2 573) (16) (33) (5 206) Purchases of assets 576 561 14 81 1 232 - - - - 576 561 14 81 1 232 Depreciation - - - - - (778) (4 361) (970) (6 109) (778) (4 361) (970) - (6 109) Exchange rate differences
1 946 3 585 817 16 6 364 (237) (1 265) (144) (1 626) 1 709 2 320 673 16 4 718
Disposals of assets (52) (3 931) - (39) (4 022) 41 1 749 - 1 790 (11) (2 182) - (39) (2 232)
Other movements 3 412 (921) (19) (525) - (95) 95 - 3 317 (826) (19) (525)
December 31, 2019 9 317 16 226 4 465 26 30 034 (1 507) (8 238) (1 862) (11 607) 7 810 7 988 2 603 26 18 426
Change in scope - - - - - - - - - - - - - - Revaluation to fair value
767 7 404 436 (7) 8 600 - 767 7 404 436 (7) 8 600
Impact of revaluation on depreciation
(1 683) (8 081) (879) - (10 643) 1 683 8 081 879 10 643 - - - - -
Purchases of assets 126 303 16 682 1 127 - - - - 126 303 16 682 1 127
Depreciation - - - - - (658) (2 895) (592) (4 145) (658) (2 895) (592) - (4 145)
Exchange rate differences
(2 230) (3 830) (942) (80) (7 082) 429 2 237 421 3 087 (1 801) (1 593) (521) (80) (3 995)
Disposals of assets
(146) (897) (881) - (1 924) 62 565 742 1 369 (84) (332) (139) - (555)
Other movements 16 133 (121) (21) 7 (9) (20) 32 3 7 113 (89) (21) 10
December 31, 2020
6 167 11 258 2 094 600 20 119 - (270) (380) (650) 6 167 10 988 1 714 600 19 469
Property plant and equipment comprise owned and leased assets.
(in thousands of Euros) December 31, 2020
Property plant and equipment owned 17 755
Right-of-use assets 1 714
Total Property plant and equipment 19 469
As of December 31, 2020 the revaluation of the tangible assets was performed by an independent appraiser. The details of revaluation by class of asset are presented below:
(in thousands of euros)
Group of property, plant and equipment
Effect through revaluation
surplus
Effect through P&L
"Net impact
Buildings 872 (105) 767
Machinery and equipment (including leasing) 7 953 (86) 7 867
Other tangible assets 65 (92) (27)
Tangible assets in progress - (7) (7)
Impact of revaluation as of December 31, 2020 8 890 (290) 8 600
Deferred tax on revaluation (523) - ( 523)
Net impact of revaluation as of December 31, 2020 8 367 (290) 8 077
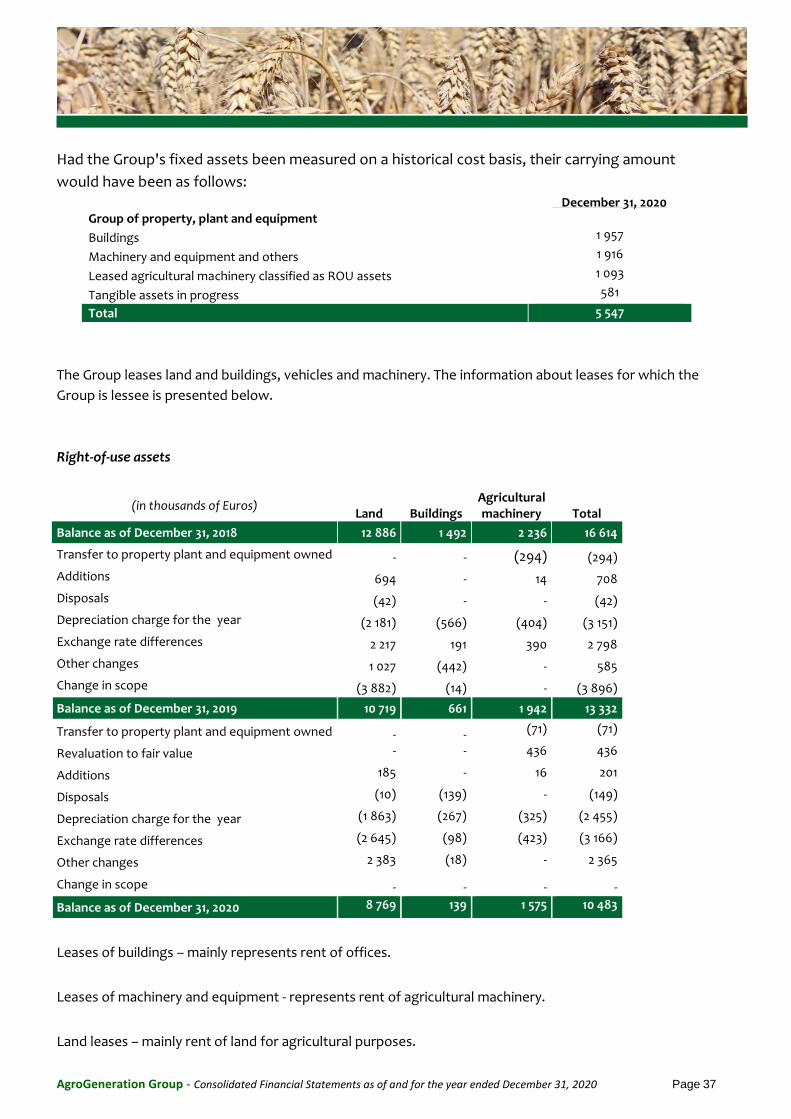
AgroGeneration Group - Consolidated Financial Statements as of and for the year ended December 31, 2020 Page 37
Had the Group's fixed assets been measured on a historical cost basis, their carrying amount
would have been as follows:
Group of property, plant and equipment December 31, 2020
Buildings 1 957
Machinery and equipment and others 1 916
Leased agricultural machinery classified as ROU assets 1 093
Tangible assets in progress 581
Total 5 547
The Group leases land and buildings, vehicles and machinery. The information about leases for which the
Group is lessee is presented below.
Right-of-use assets
(in thousands of Euros) Land Buildings
Agricultural machinery Total
Balance as of December 31, 2018 12 886 1 492 2 236 16 614
Transfer to property plant and equipment owned - - (294) (294)
Additions 694 - 14 708
Disposals (42) - - (42)
Depreciation charge for the year (2 181) (566) (404) (3 151)
Exchange rate differences 2 217 191 390 2 798
Other changes 1 027 (442) - 585
Change in scope (3 882) (14) - (3 896)
Balance as of December 31, 2019 10 719 661 1 942 13 332
Transfer to property plant and equipment owned - - (71) (71)
Revaluation to fair value - - 436 436
Additions 185 - 16 201
Disposals (10) (139) - (149)
Depreciation charge for the year (1 863) (267) (325) (2 455)
Exchange rate differences (2 645) (98) (423) (3 166)
Other changes 2 383 (18) - 2 365
Change in scope - - - -
Balance as of December 31, 2020 8 769 139 1 575 10 483
Leases of buildings – mainly represents rent of offices.
Leases of machinery and equipment - represents rent of agricultural machinery.
Land leases – mainly rent of land for agricultural purposes.
AgroGeneration Group - Consolidated Financial Statements as of and for the year ended December 31, 2020 Page 38
The total net carrying amount of tangible assets pledged as of December 31, 2020 amounts to €8 087k
(€ 1 682k pledge on buildings, and € 6 405k pledge on agricultural machinery and other tangible fixed
assets).
12. Financial assets
Non-current
Total
(in thousands of Euros) Non-consolidated
subsidiaries (1)
Other financial assets (2)
Term deposit (3)
December 31, 2018 56 55 906 1 017
Change in scope - - (799) (799)
Acquisition of subsidiaries - - - -
Purchases of financial assets - 173 1 416 1 589
Disposals of financial assets (2) (165) (1 313) (1 480)
Other transactions - (43) (4) (47)
Exchange rate difference 12 2 97 111
December 31, 2019 66 22 303 391
Change in scope - (10) - (10)
Acquisition of subsidiaries - - - -
Purchases of financial assets - 1 551 552
Disposals of financial assets - (7) (440) (447)
Other transactions (57) (2) - (59)
Exchange rate difference (9) (4) (72) (85)
December 31, 2020 - - 342 342
(1) Non-consolidated subsidiaries included 8,96% shares of Agro-Farm, acquired in March 2013. It was
disposed due to disposal of Agro Dom Plus in 2020.
(2) The “Other financial assets” were mainly represented by a deposit made with a specialized financial
intermediary in the scope of liquidity contract concerning transactions on the AgroGeneration share on the
NYSE Euronext Alternext market. This contract has been in place since March 1, 2010, the date that the
AgroGeneration security was admitted to Alternext.
The Group terminated this contract in December 2019.
(3) As of December 31, 2020 the Group had some short-term deposits.
AgroGeneration Group - Consolidated Financial Statements as of and for the year ended December 31, 2020 Page 39
Reconciliation of movements of financial assets to cash flows arising from financing activities:
(in thousands of Euros) Financial assets
Non-current financial
assets Current financial
assets Total
Balance as of December 31, 2019 88 302 391
Purchase of financial assets 1 551 552
Disposal of financial assets (7) (440) (447)
Change in scope (10) - (10)
Other transactions (59) - (59)
Foreign exchange adjustments (13) (72) (85)
Balance as of December 31, 2020 - 342 342
13. Corporate income tax
13.1. Analysis of Income tax expense – Tax proof
Breakdown of income tax expense is presented below:
(in thousands of euros) December 31, 2020 December 31, 2019
Current taxes 85 448
Deferred taxes 515 3
Total income taxes from continued operations - (expense)/gain 600 451
The analysis of the income tax expense reveals the following factors:
(in thousands of euros) December
31, 2020 December 31,
2019
Accounting profit before tax 2 048 (28 801)
Accounting profit before tax 2 048 (28 801)
French corporate tax rate 25,00% 25,00%*
Theoretical income tax (expense) / gain (512) 7 025
Impact from:
profit/(losses) of agricultural producers exempt from taxation in Ukraine (cf. Note 7.12) 1 635 (3 334)
unrecognised deferred tax assets and unused tax losses (666) (3 540)
permanent differences between accounting profit and taxable profit (1 930) (2 587)
used tax losses 1 783 1
difference between French and foreign tax rates 290 2 886
Gain / (loss) out of effective taxation 600 451
Income tax (expense) / gain reported in the consolidated income statement 600 451
For more details refer to note 7.12.
AgroGeneration Group - Consolidated Financial Statements as of and for the year ended December 31, 2020 Page 40
14. Inventories
December 31, 2020
December 31, 2019
(in thousands of Euros) Gross Value
Depreciation Net value
Gross Value Depreciation Net value
Raw materials and other supplies
1 607
(122) 1 485
1 055 (12) 1 043
Works in progress 3 693 - 3 693 5 244 - 5 244
Agricultural produce 7 359
(1) 7 358
9 257
(111) 9 146
Total 12 659 (123) 12 536 15 556 (123) 15 433
Raw materials and other supplies are inputs to be used in the agricultural campaign 2019/2020, including
purchased seeds, fertilizers, fuel, spare parts and other suppliers. Work in progress includes costs
accumulated before crop sowing.
As of December 31, 2020, agricultural produce representing €7 358 k, is substantially made up of 29 612 tons
of crops mainly from the 2020 harvest (45 382 tons as of December 31, 2019) (cf. Note 15 Biological assets).
Depreciation represents write-down provisions of inventory to the net realizable value at the reporting
date.
As of December 31, 2020, €4 328k (16 800 tons) of finished goods has been pledged for the trade financing
credit facility ((€7 477k (35 039 tons) of finished goods has been pledged as of December 31, 2019).
AgroGeneration Group - Consolidated Financial Statements as of and for the year ended December 31, 2020 Page 41
15. Biological assets
December 31, 2020
December 31, 2019
(in thousands of Euros)
Biological assets at cost
Adjustment to
fair value
Fair value
Biological assets at cost
Adjustment to
fair value
Fair value
Non-current
Crops in fields
- - -
- - - Livestock
- - -
168 (58) 110
Total non-current biological assets
168 (58) 110
Current
Crops in fields
3 342 5 085 8 427
4 805 3 633 8 438
Livestock
16 - 16
251 (189) 62
Total current biological assets
3 358 5 085 8 443
5 056 3 444 8 500
TOTAL BIOLOGICAL ASSETS
3 358 5 085 8 443
5 224 3 386 8 610
The Group’s biological assets are cereals that are planted as of December 31, 2020 for harvest in the second half of 2021 in Ukraine. It also included livestock as of December 31, 2019, consisting mainly of meat cows and other cattle. The meat cows and other cattle have been disposed in 2020.
The biological assets of the Group are measured at fair value less estimated costs to sell and are within level 3 of the fair value hierarchy (for more details refer to Note 7.7). At the balance sheet date, the fair value of the current crops in fields is determined on the basis of the planted area and the following significant unobservable inputs as of December 31, 2020:
Crops price
Crops yields (tonnes per hectare)
Expected production costs
December 31, 2020 December 31, 2019
Cultivated area (in
hectares)
Average yields
(ton / ha)
Average price
(EURO/ton)
Fair value (in kEURO)
Cultivated area (in hectares)
Average yields (ton / ha)
Average price (EURO/ton)
Fair value (in kEURO)
Winter Wheat
27 918 4,1 122 8 427
26 080 4,2 146 8 381
TOTAL 27 918 8 427 26 080
8 381
If the management team’s assumptions as of December 31, 2020, would have been different by 10%
better/lower, then the fair value of the biological assets and gross margin would increase/decrease by
around € 1 277 k.
The significant unobservable inputs used in the fair value measurement of the livestock are as follows:
Average number of heads and its weight
Expected future inflows from livestock
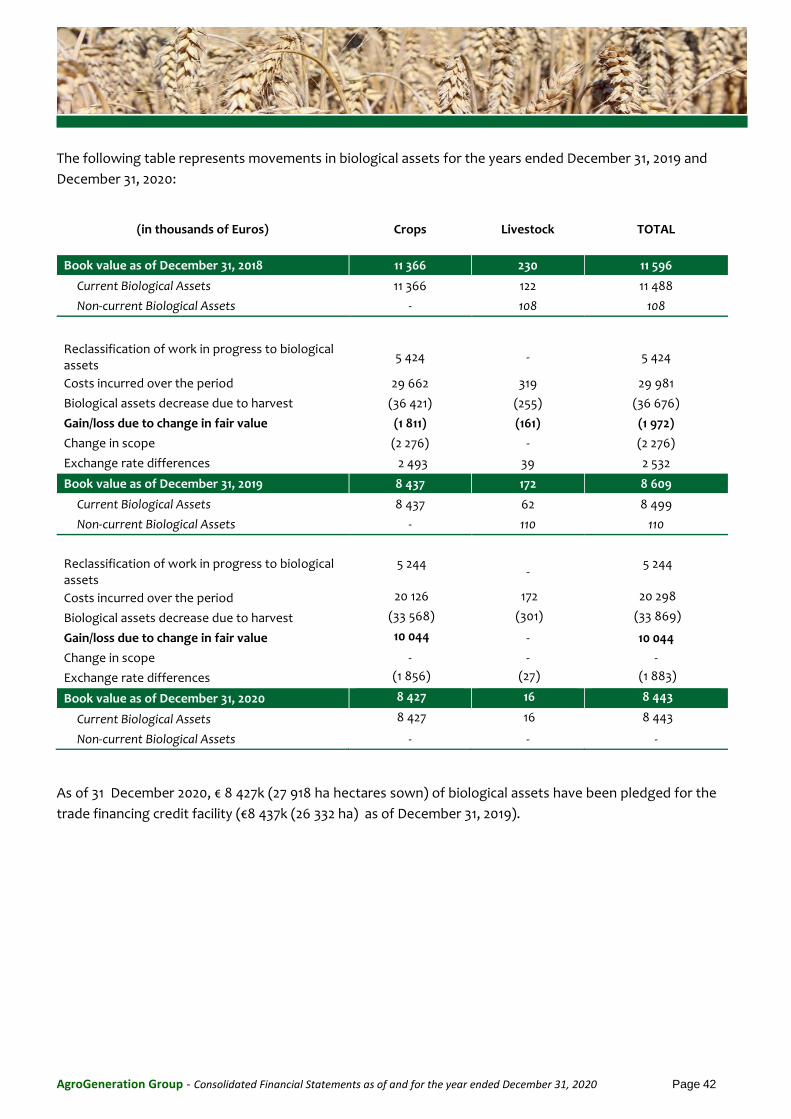
AgroGeneration Group - Consolidated Financial Statements as of and for the year ended December 31, 2020 Page 42
The following table represents movements in biological assets for the years ended December 31, 2019 and
December 31, 2020:
(in thousands of Euros) Crops Livestock TOTAL
Book value as of December 31, 2018 11 366 230 11 596
Current Biological Assets 11 366 122 11 488
Non-current Biological Assets - 108 108
Reclassification of work in progress to biological assets
5 424 - 5 424
Costs incurred over the period 29 662 319 29 981
Biological assets decrease due to harvest (36 421) (255) (36 676)
Gain/loss due to change in fair value (1 811) (161) (1 972)
Change in scope (2 276) - (2 276)
Exchange rate differences 2 493 39 2 532
Book value as of December 31, 2019 8 437 172 8 609
Current Biological Assets 8 437 62 8 499
Non-current Biological Assets - 110 110
Reclassification of work in progress to biological assets
5 244 -
5 244
Costs incurred over the period 20 126 172 20 298
Biological assets decrease due to harvest (33 568) (301) (33 869)
Gain/loss due to change in fair value 10 044 - 10 044
Change in scope - - -
Exchange rate differences (1 856) (27) (1 883)
Book value as of December 31, 2020 8 427 16 8 443
Current Biological Assets 8 427 16 8 443
Non-current Biological Assets - - -
As of 31 December 2020, € 8 427k (27 918 ha hectares sown) of biological assets have been pledged for the
trade financing credit facility (€8 437k (26 332 ha) as of December 31, 2019).
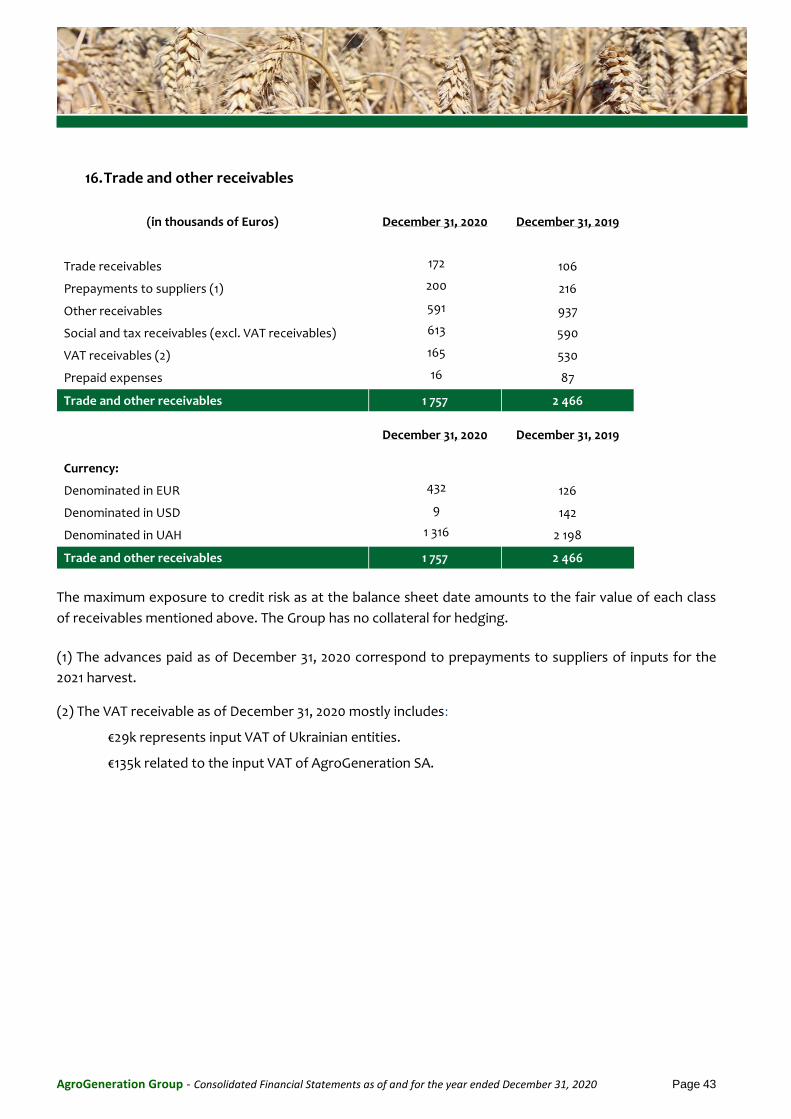
AgroGeneration Group - Consolidated Financial Statements as of and for the year ended December 31, 2020 Page 43
16. Trade and other receivables
(in thousands of Euros) December 31, 2020 December 31, 2019
Trade receivables 172 106
Prepayments to suppliers (1) 200 216
Other receivables 591 937
Social and tax receivables (excl. VAT receivables) 613 590
VAT receivables (2) 165 530
Prepaid expenses 16 87
Trade and other receivables 1 757 2 466
December 31, 2020 December 31, 2019
Currency:
Denominated in EUR 432 126
Denominated in USD 9 142
Denominated in UAH 1 316 2 198
Trade and other receivables 1 757 2 466
The maximum exposure to credit risk as at the balance sheet date amounts to the fair value of each class
of receivables mentioned above. The Group has no collateral for hedging.
(1) The advances paid as of December 31, 2020 correspond to prepayments to suppliers of inputs for the
2021 harvest.
(2) The VAT receivable as of December 31, 2020 mostly includes:
€29k represents input VAT of Ukrainian entities.
€135k related to the input VAT of AgroGeneration SA.
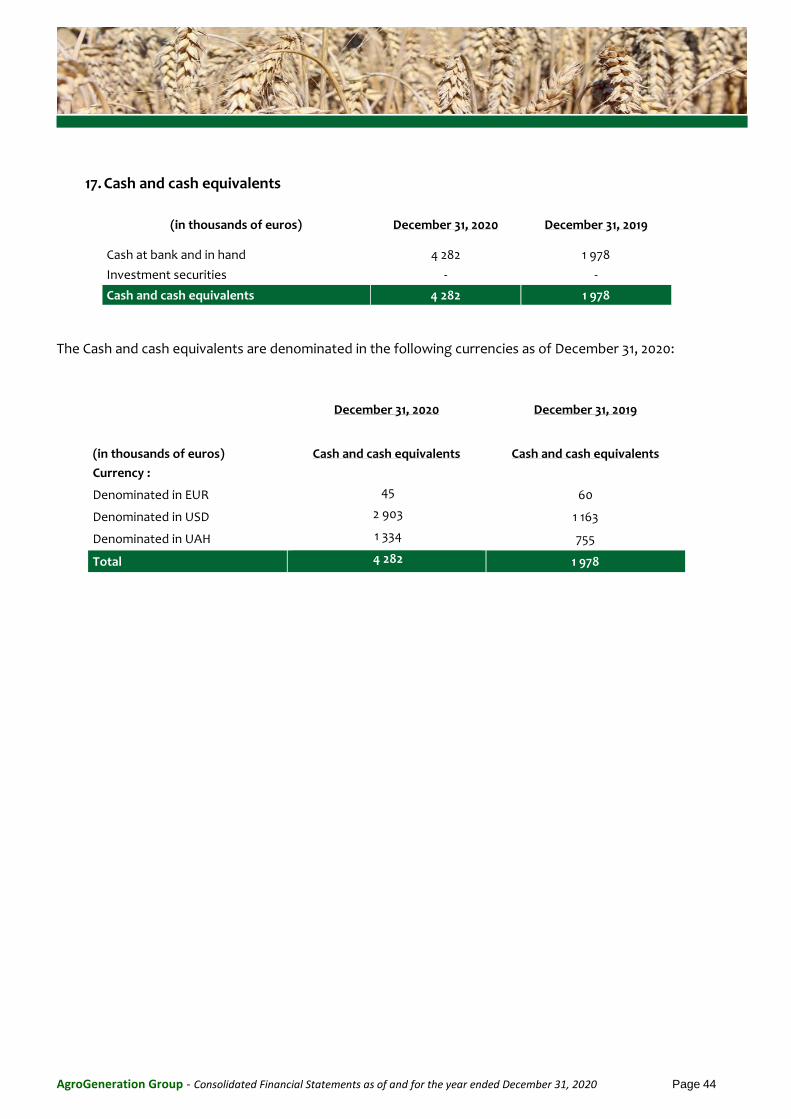
AgroGeneration Group - Consolidated Financial Statements as of and for the year ended December 31, 2020 Page 44
17. Cash and cash equivalents
(in thousands of euros) December 31, 2020 December 31, 2019
Cash at bank and in hand 4 282 1 978
Investment securities - -
Cash and cash equivalents 4 282 1 978
The Cash and cash equivalents are denominated in the following currencies as of December 31, 2020:
December 31, 2020 December 31, 2019
(in thousands of euros) Cash and cash equivalents Cash and cash equivalents
Currency :
Denominated in EUR 45 60
Denominated in USD 2 903 1 163
Denominated in UAH 1 334 755
Total 4 282 1 978
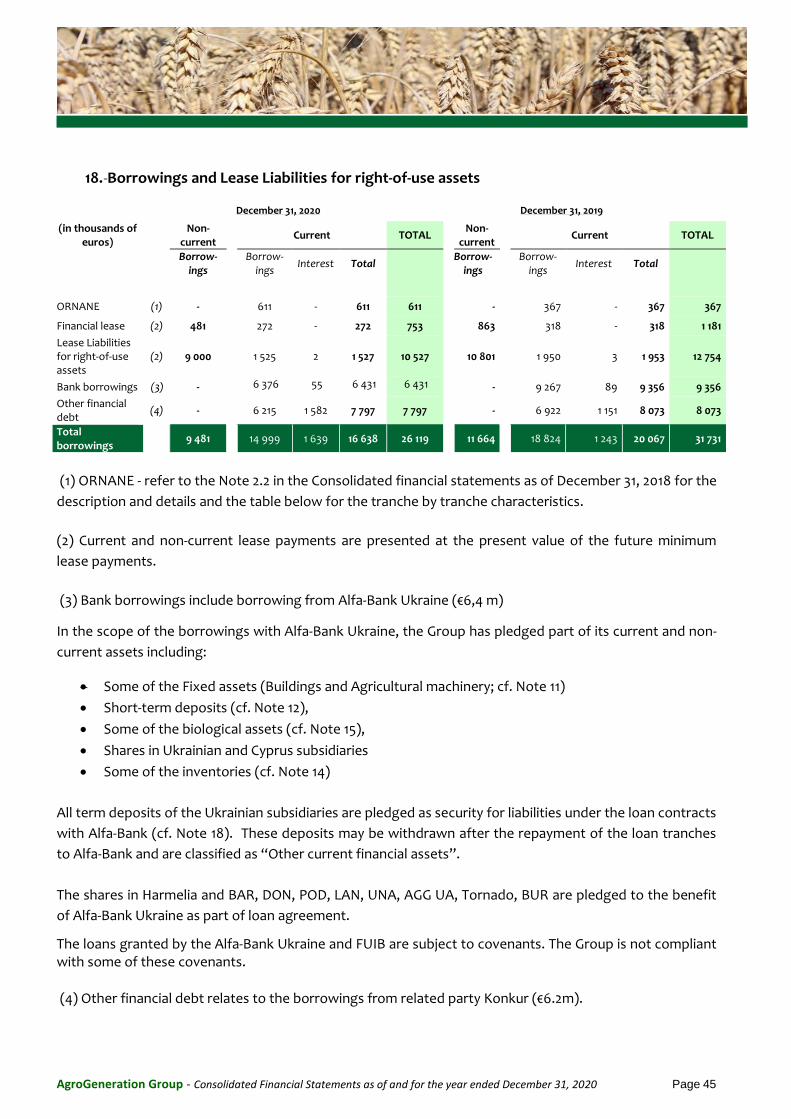
AgroGeneration Group - Consolidated Financial Statements as of and for the year ended December 31, 2020 Page 45
18. Borrowings and Lease Liabilities for right-of-use assets
December 31, 2020
December 31, 2019
(in thousands of
euros) Non-
current Current TOTAL
Non-
current Current TOTAL
Borrow-
ings Borrow-
ings Interest Total
Borrow-
ings Borrow-
ings Interest Total
ORNANE (1) - 611 - 611 611 - 367 - 367 367
Financial lease (2) 481 272 - 272 753
863
318 - 318 1 181
Lease Liabilities for right-of-use assets
(2) 9 000 1 525 2 1 527 10 527 10 801 1 950 3 1 953 12 754
Bank borrowings (3) - 6 376 55 6 431 6 431
-
9 267 89 9 356 9 356
Other financial debt
(4) - 6 215 1 582 7 797 7 797
-
6 922 1 151 8 073 8 073
Total borrowings
9 481 14 999 1 639 16 638 26 119
11 664
18 824 1 243 20 067 31 731
(1) ORNANE - refer to the Note 2.2 in the Consolidated financial statements as of December 31, 2018 for the
description and details and the table below for the tranche by tranche characteristics.
(2) Current and non-current lease payments are presented at the present value of the future minimum
lease payments.
(3) Bank borrowings include borrowing from Alfa-Bank Ukraine (€6,4 m)
In the scope of the borrowings with Alfa-Bank Ukraine, the Group has pledged part of its current and non-
current assets including:
Some of the Fixed assets (Buildings and Agricultural machinery; cf. Note 11)
Short-term deposits (cf. Note 12),
Some of the biological assets (cf. Note 15),
Shares in Ukrainian and Cyprus subsidiaries
Some of the inventories (cf. Note 14)
All term deposits of the Ukrainian subsidiaries are pledged as security for liabilities under the loan contracts
with Alfa-Bank (cf. Note 18). These deposits may be withdrawn after the repayment of the loan tranches
to Alfa-Bank and are classified as “Other current financial assets”.
The shares in Harmelia and BAR, DON, POD, LAN, UNA, AGG UA, Tornado, BUR are pledged to the benefit
of Alfa-Bank Ukraine as part of loan agreement.
The loans granted by the Alfa-Bank Ukraine and FUIB are subject to covenants. The Group is not compliant with some of these covenants.
(4) Other financial debt relates to the borrowings from related party Konkur (€6.2m).
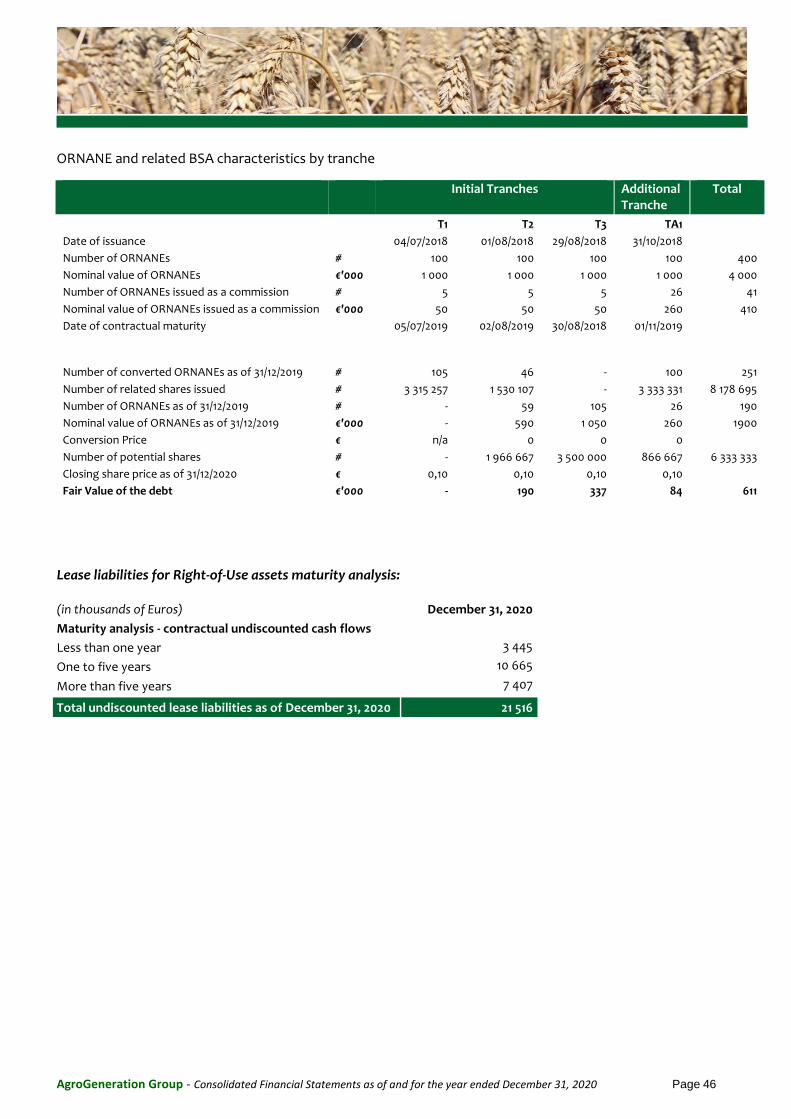
AgroGeneration Group - Consolidated Financial Statements as of and for the year ended December 31, 2020 Page 46
ORNANE and related BSA characteristics by tranche
Initial Tranches Additional Tranche
Total
T1 T2 T3 TA1
Date of issuance
04/07/2018 01/08/2018 29/08/2018 31/10/2018 Number of ORNANEs # 100 100 100 100 400
Nominal value of ORNANEs €'000 1 000 1 000 1 000 1 000 4 000
Number of ORNANEs issued as a commission # 5 5 5 26 41
Nominal value of ORNANEs issued as a commission €'000 50 50 50 260 410
Date of contractual maturity
05/07/2019 02/08/2019 30/08/2018 01/11/2019
Number of converted ORNANEs as of 31/12/2019 # 105 46 -
100 251
Number of related shares issued # 3 315 257 1 530 107 - 3 333 331 8 178 695
Number of ORNANEs as of 31/12/2019 # - 59 105 26 190
Nominal value of ORNANEs as of 31/12/2019 €'000 - 590 1 050 260 1900
Conversion Price € n/a 0 0 0 Number of potential shares # - 1 966 667 3 500 000 866 667 6 333 333
Closing share price as of 31/12/2020 € 0,10 0,10 0,10 0,10 Fair Value of the debt €'000 - 190 337 84 611
Lease liabilities for Right-of-Use assets maturity analysis:
(in thousands of Euros) December 31, 2020
Maturity analysis - contractual undiscounted cash flows
Less than one year 3 445
One to five years 10 665
More than five years 7 407
Total undiscounted lease liabilities as of December 31, 2020 21 516
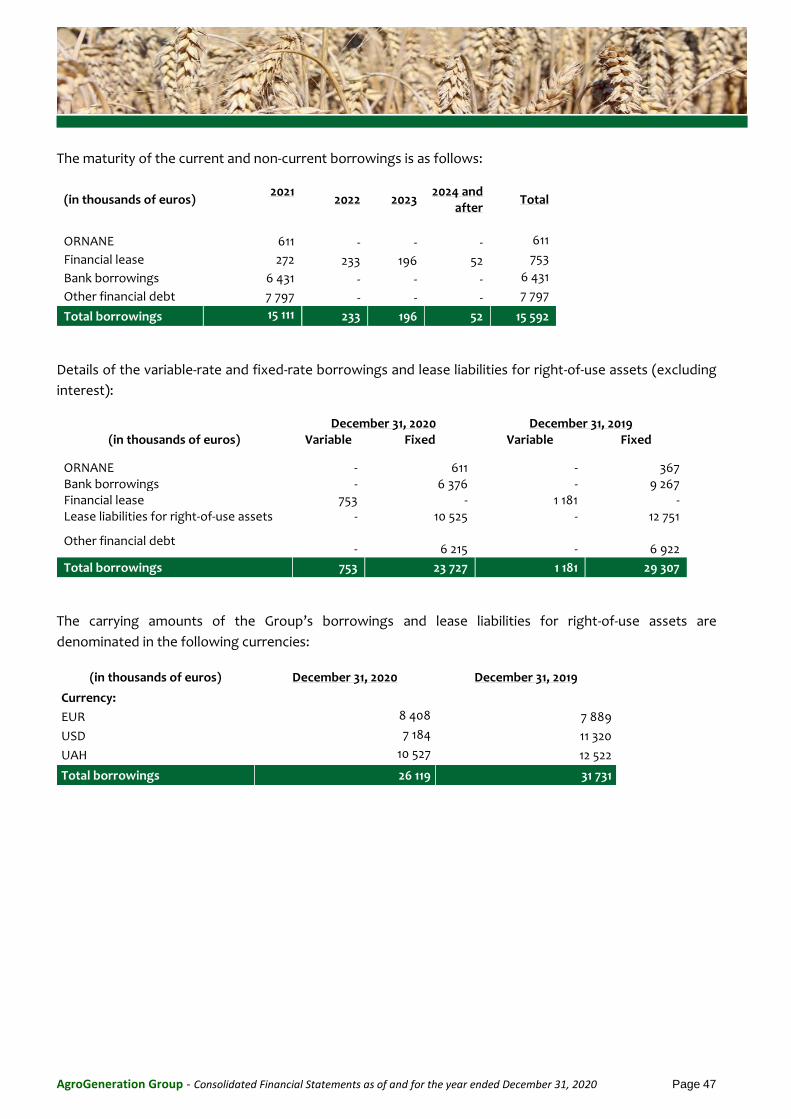
AgroGeneration Group - Consolidated Financial Statements as of and for the year ended December 31, 2020 Page 47
The maturity of the current and non-current borrowings is as follows:
(in thousands of euros) 2021
2022 2023 2024 and
after Total
ORNANE 611 - - - 611
Financial lease 272 233 196 52 753
Bank borrowings 6 431 - - - 6 431
Other financial debt 7 797 - - - 7 797
Total borrowings 15 111 233 196 52 15 592
Details of the variable-rate and fixed-rate borrowings and lease liabilities for right-of-use assets (excluding
interest):
December 31, 2020 December 31, 2019
(in thousands of euros) Variable Fixed Variable Fixed
ORNANE - 611 - 367 Bank borrowings - 6 376 - 9 267 Financial lease 753 - 1 181 - Lease liabilities for right-of-use assets - 10 525 - 12 751
Other financial debt
- 6 215 - 6 922
Total borrowings 753 23 727 1 181 29 307
The carrying amounts of the Group’s borrowings and lease liabilities for right-of-use assets are
denominated in the following currencies:
(in thousands of euros) December 31, 2020 December 31, 2019
Currency:
EUR 8 408 7 889
USD 7 184 11 320
UAH 10 527 12 522
Total borrowings 26 119 31 731
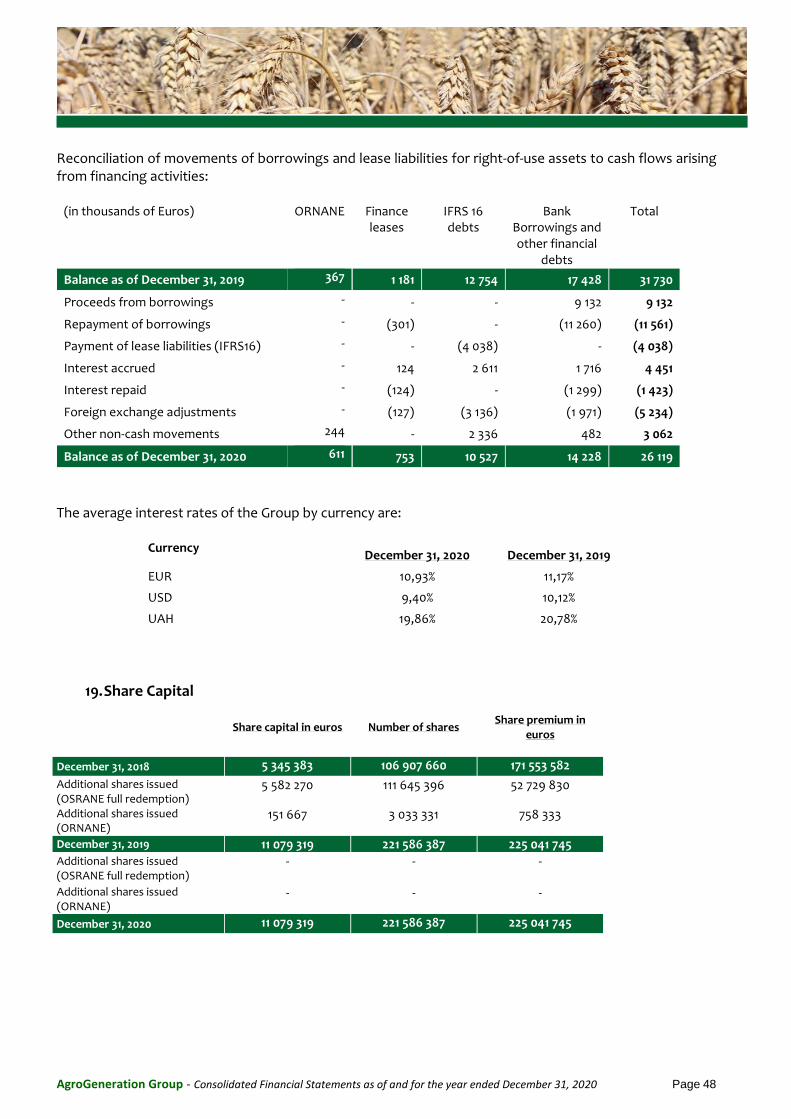
AgroGeneration Group - Consolidated Financial Statements as of and for the year ended December 31, 2020 Page 48
Reconciliation of movements of borrowings and lease liabilities for right-of-use assets to cash flows arising from financing activities:
(in thousands of Euros) ORNANE Finance leases
IFRS 16 debts
Bank Borrowings and other financial
debts
Total
Balance as of December 31, 2019 367 1 181 12 754 17 428 31 730
Proceeds from borrowings - - - 9 132 9 132
Repayment of borrowings - (301) - (11 260) (11 561)
Payment of lease liabilities (IFRS16) - - (4 038) - (4 038)
Interest accrued - 124 2 611 1 716 4 451
Interest repaid - (124) - (1 299) (1 423)
Foreign exchange adjustments - (127) (3 136) (1 971) (5 234)
Other non-cash movements 244 - 2 336 482 3 062
Balance as of December 31, 2020 611 753 10 527 14 228 26 119
The average interest rates of the Group by currency are:
Currency December 31, 2020 December 31, 2019
EUR 10,93% 11,17%
USD 9,40% 10,12%
UAH 19,86% 20,78%
19. Share Capital
Share capital in euros Number of shares
Share premium in euros
December 31, 2018 5 345 383 106 907 660 171 553 582
Additional shares issued (OSRANE full redemption)
5 582 270 111 645 396 52 729 830
Additional shares issued (ORNANE)
151 667 3 033 331 758 333
December 31, 2019 11 079 319 221 586 387 225 041 745
Additional shares issued (OSRANE full redemption)
-
- -
Additional shares issued (ORNANE)
- - -
December 31, 2020 11 079 319 221 586 387 225 041 745
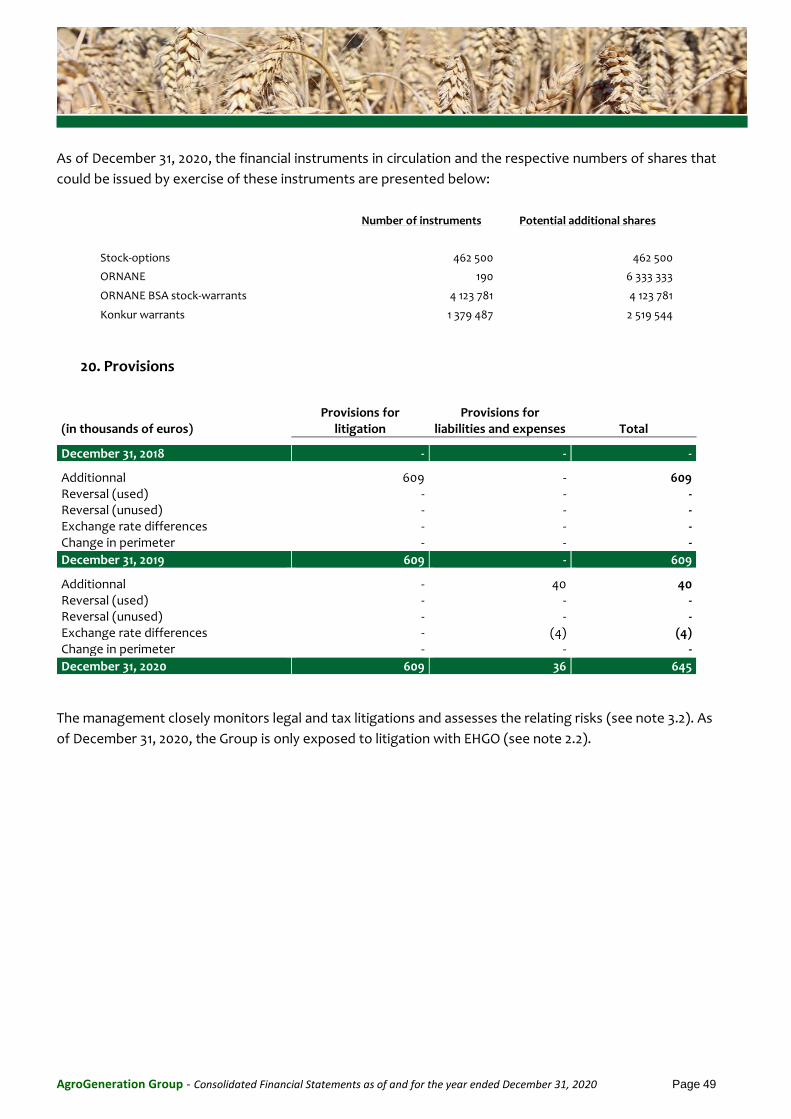
AgroGeneration Group - Consolidated Financial Statements as of and for the year ended December 31, 2020 Page 49
As of December 31, 2020, the financial instruments in circulation and the respective numbers of shares that
could be issued by exercise of these instruments are presented below:
Number of instruments Potential additional shares
Stock-options 462 500 462 500
ORNANE 190 6 333 333
ORNANE BSA stock-warrants 4 123 781 4 123 781
Konkur warrants 1 379 487 2 519 544
20. Provisions
(in thousands of euros) Provisions for
litigation Provisions for
liabilities and expenses Total
December 31, 2018 - - -
Additionnal 609 - 609 Reversal (used) - - - Reversal (unused) - - - Exchange rate differences - - - Change in perimeter - - -
December 31, 2019 609 - 609
Additionnal - 40 40 Reversal (used) - - - Reversal (unused) - - - Exchange rate differences - (4) (4) Change in perimeter - - -
December 31, 2020 609 36 645
The management closely monitors legal and tax litigations and assesses the relating risks (see note 3.2). As
of December 31, 2020, the Group is only exposed to litigation with EHGO (see note 2.2).
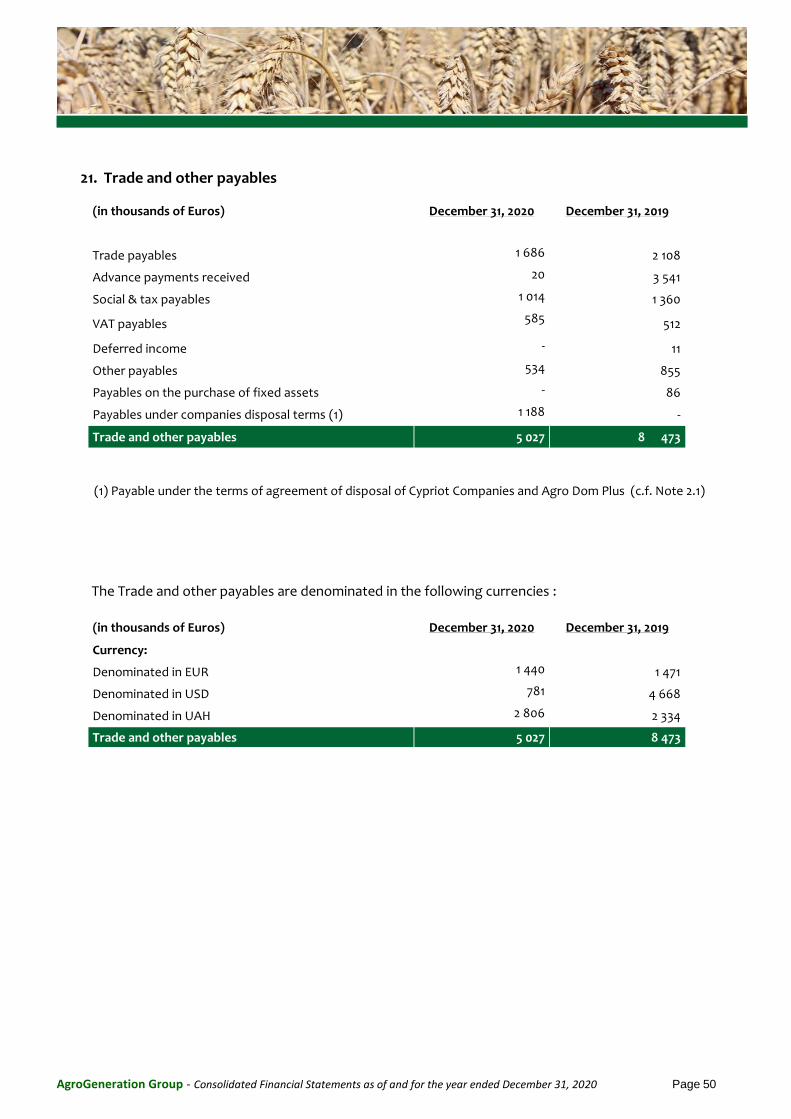
AgroGeneration Group - Consolidated Financial Statements as of and for the year ended December 31, 2020 Page 50
21. Trade and other payables
(in thousands of Euros) December 31, 2020 December 31, 2019
Trade payables 1 686 2 108
Advance payments received 20 3 541
Social & tax payables 1 014 1 360
VAT payables 585 512
Deferred income - 11
Other payables 534 855
Payables on the purchase of fixed assets - 86
Payables under companies disposal terms (1) 1 188 -
Trade and other payables 5 027 8 473
(1) Payable under the terms of agreement of disposal of Cypriot Companies and Agro Dom Plus (c.f. Note 2.1)
The Trade and other payables are denominated in the following currencies :
(in thousands of Euros) December 31, 2020 December 31, 2019
Currency:
Denominated in EUR 1 440 1 471
Denominated in USD 781 4 668
Denominated in UAH 2 806 2 334
Trade and other payables 5 027 8 473
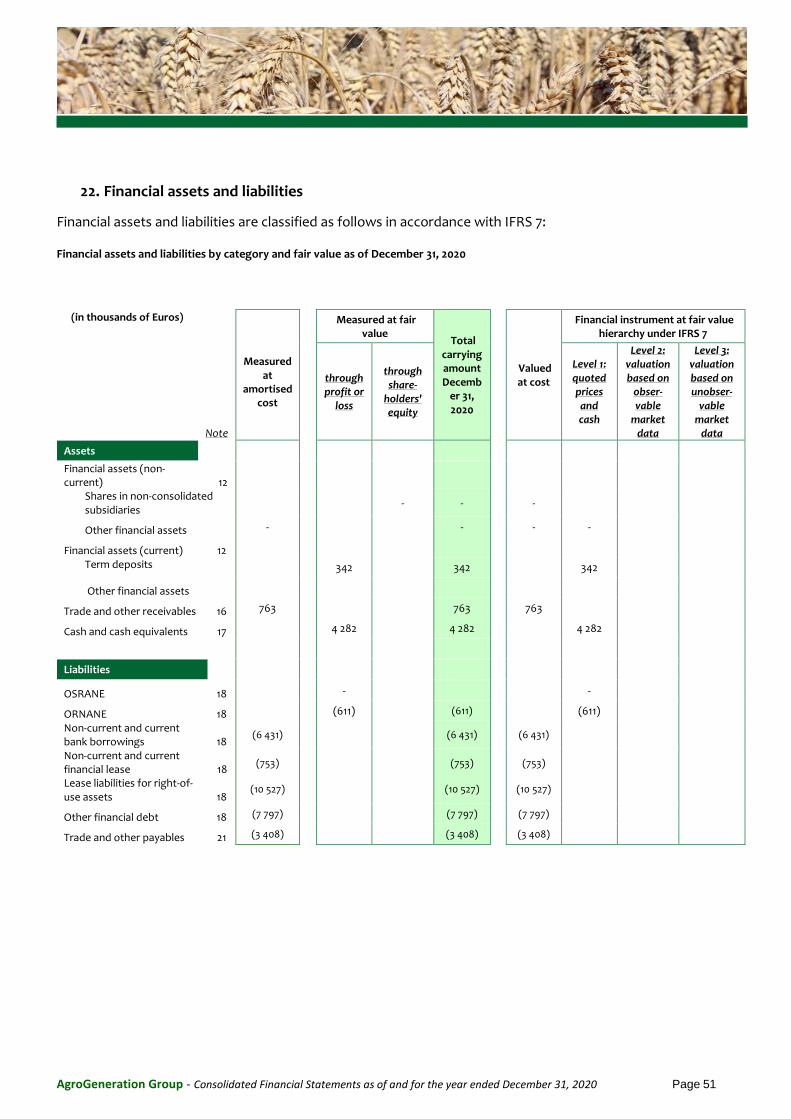
AgroGeneration Group - Consolidated Financial Statements as of and for the year ended December 31, 2020 Page 51
22. Financial assets and liabilities
Financial assets and liabilities are classified as follows in accordance with IFRS 7:
Financial assets and liabilities by category and fair value as of December 31, 2020
(in thousands of Euros)
Measured
at amortised
cost
Measured at fair value
Total carrying amount Decemb
er 31, 2020
Valued at cost
Financial instrument at fair value hierarchy under IFRS 7
Note
through profit or
loss
through share-
holders' equity
Level 1: quoted prices
and cash
Level 2: valuation based on
obser-vable
market data
Level 3: valuation based on unobser-
vable market
data
Assets
Financial assets (non-current) 12
Shares in non-consolidated subsidiaries
- - -
Other financial assets
- - - -
Financial assets (current) 12
Term deposits
342 342 342
Other financial assets
Trade and other receivables 16 763 763 763
Cash and cash equivalents 17 4 282 4 282 4 282
Liabilities
OSRANE 18 - -
ORNANE 18 (611) (611) (611)
Non-current and current bank borrowings 18
(6 431) (6 431) (6 431)
Non-current and current financial lease Lease liabilities for right-of-use assets
18 18
(753)
(10 527)
(753)
(10 527)
(753)
(10 527)
Other financial debt 18 (7 797) (7 797) (7 797)
Trade and other payables 21 (3 408) (3 408) (3 408)
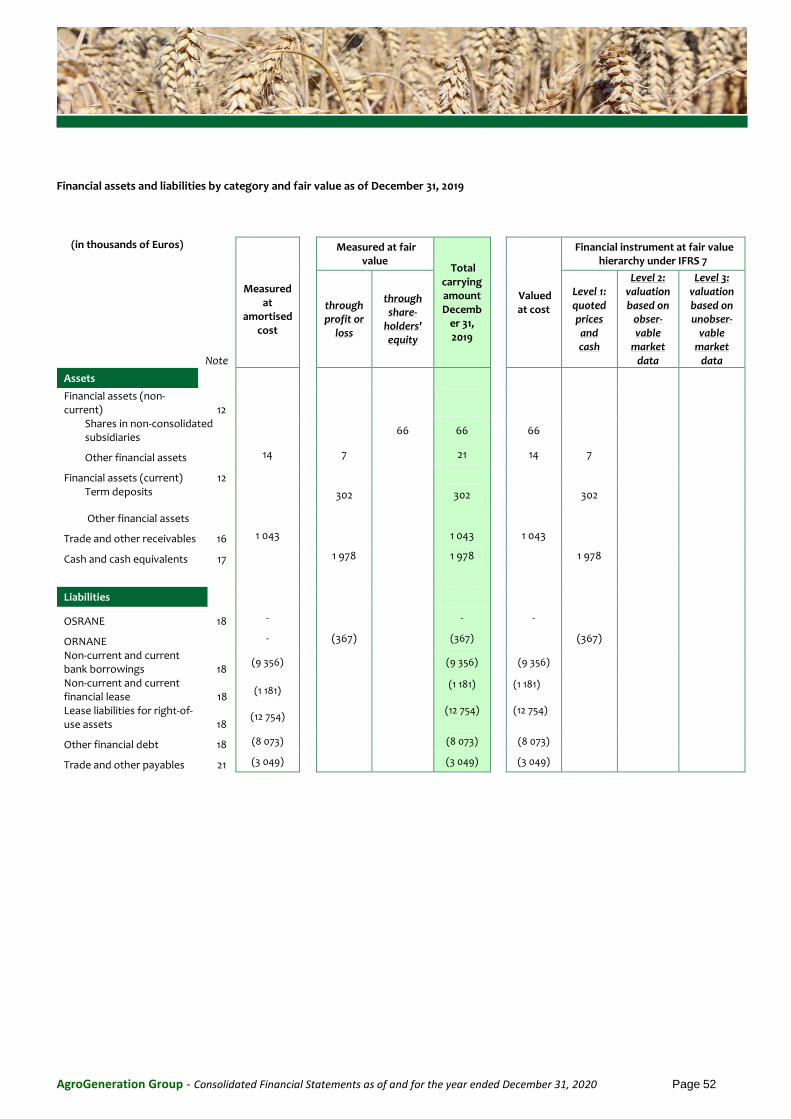
AgroGeneration Group - Consolidated Financial Statements as of and for the year ended December 31, 2020 Page 52
Financial assets and liabilities by category and fair value as of December 31, 2019
(in thousands of Euros)
Measured
at amortised
cost
Measured at fair value
Total carrying amount Decemb
er 31, 2019
Valued at cost
Financial instrument at fair value hierarchy under IFRS 7
Note
through profit or
loss
through share-
holders' equity
Level 1: quoted prices
and cash
Level 2: valuation based on
obser-vable
market data
Level 3: valuation based on unobser-
vable market
data
Assets
Financial assets (non-current) 12
Shares in non-consolidated subsidiaries
66 66
66
Other financial assets
14
7
21
14 7
Financial assets (current) 12 Term deposits
302
302
302
Other financial assets
Trade and other receivables 16 1 043
1 043
1 043
Cash and cash equivalents 17 1 978
1 978
1 978
Liabilities
OSRANE 18 -
-
-
ORNANE - (367) (367) (367)
Non-current and current bank borrowings 18
(9 356)
(9 356)
(9 356)
Non-current and current financial lease Lease liabilities for right-of-use assets
18 18
(1 181)
(12 754)
(1 181)
(12 754)
(1 181) (12 754)
Other financial debt 18 (8 073)
(8 073)
(8 073)
Trade and other payables 21 (3 049)
(3 049)
(3 049)
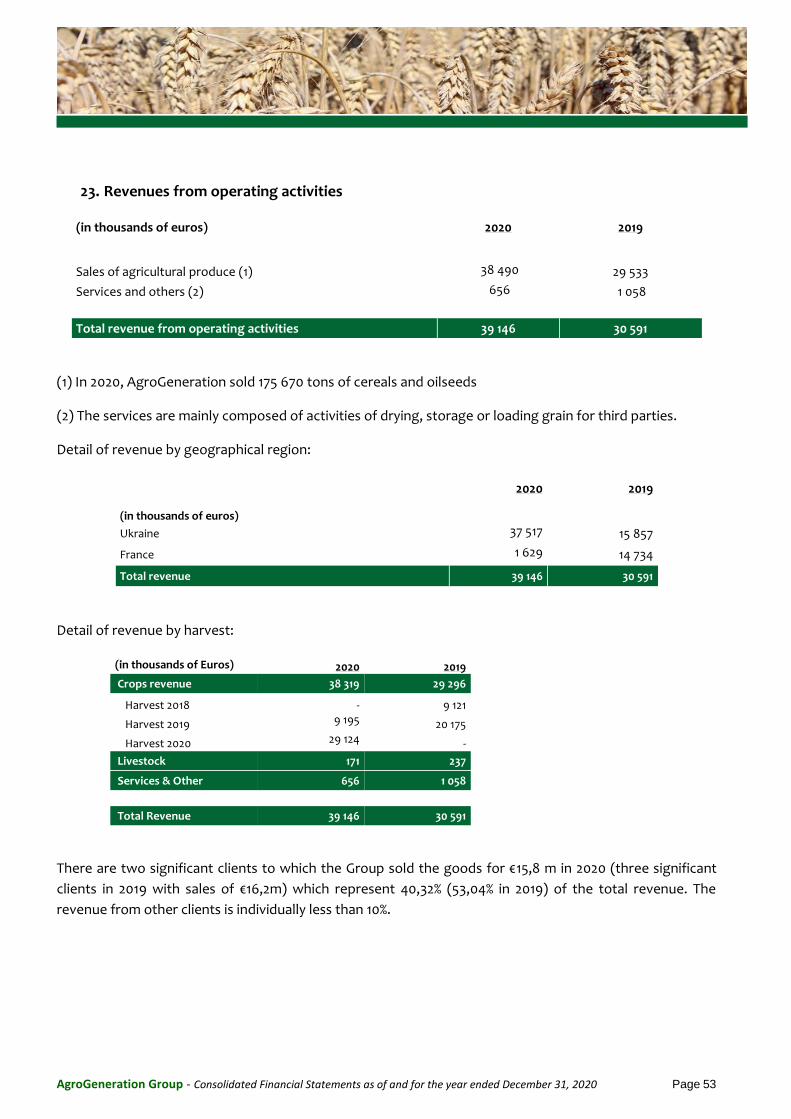
AgroGeneration Group - Consolidated Financial Statements as of and for the year ended December 31, 2020 Page 53
23. Revenues from operating activities
(in thousands of euros) 2020 2019
Sales of agricultural produce (1) 38 490 29 533
Services and others (2) 656 1 058
Total revenue from operating activities 39 146 30 591
(1) In 2020, AgroGeneration sold 175 670 tons of cereals and oilseeds
(2) The services are mainly composed of activities of drying, storage or loading grain for third parties.
Detail of revenue by geographical region:
2020 2019
(in thousands of euros)
Ukraine 37 517 15 857
France 1 629 14 734
Total revenue 39 146 30 591
Detail of revenue by harvest:
(in thousands of Euros) 2020 2019
Crops revenue 38 319 29 296
Harvest 2018 - 9 121
Harvest 2019 9 195 20 175
Harvest 2020 29 124 -
Livestock 171 237
Services & Other 656 1 058
Total Revenue 39 146 30 591
There are two significant clients to which the Group sold the goods for €15,8 m in 2020 (three significant
clients in 2019 with sales of €16,2m) which represent 40,32% (53,04% in 2019) of the total revenue. The
revenue from other clients is individually less than 10%.
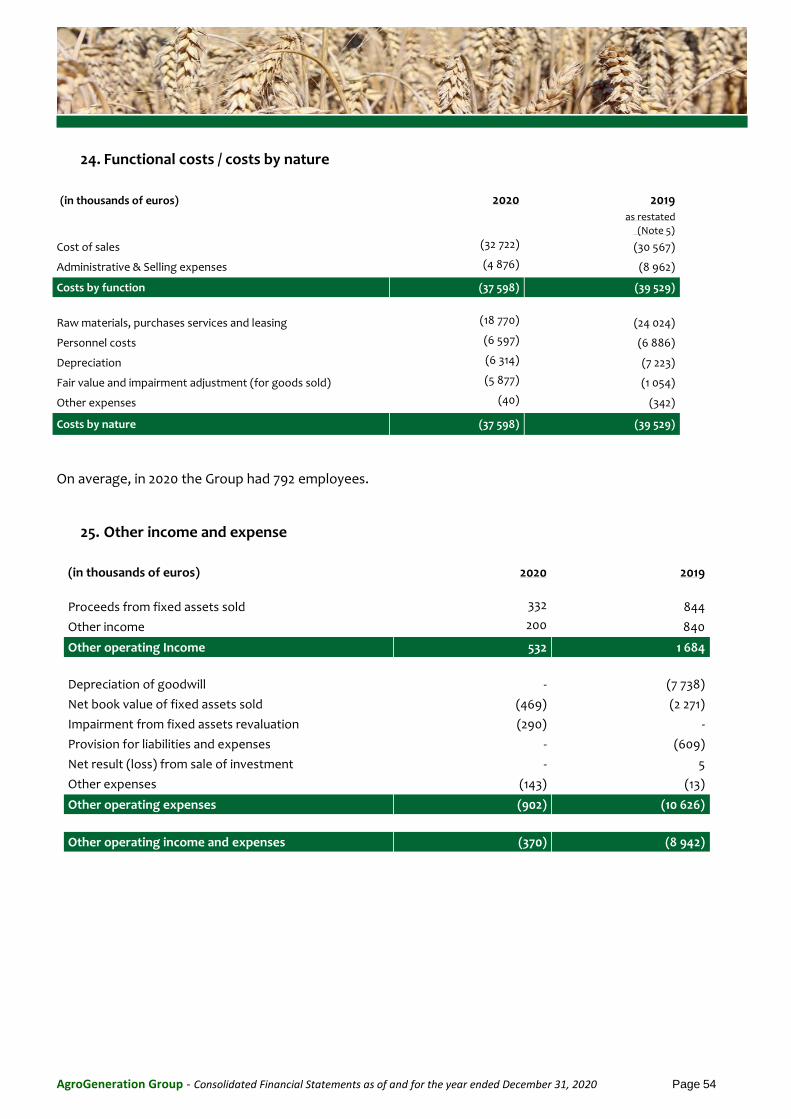
AgroGeneration Group - Consolidated Financial Statements as of and for the year ended December 31, 2020 Page 54
24. Functional costs / costs by nature
(in thousands of euros) 2020 2019
as restated
(Note 5)
Cost of sales (32 722) (30 567)
Administrative & Selling expenses (4 876) (8 962)
Costs by function (37 598) (39 529)
Raw materials, purchases services and leasing (18 770) (24 024)
Personnel costs (6 597) (6 886)
Depreciation (6 314) (7 223)
Fair value and impairment adjustment (for goods sold) (5 877) (1 054)
Other expenses (40) (342)
Costs by nature (37 598) (39 529)
On average, in 2020 the Group had 792 employees.
25. Other income and expense
(in thousands of euros) 2020 2019
Proceeds from fixed assets sold 332 844
Other income 200 840
Other operating Income 532 1 684
Depreciation of goodwill - (7 738)
Net book value of fixed assets sold (469) (2 271)
Impairment from fixed assets revaluation (290) -
Provision for liabilities and expenses - (609)
Net result (loss) from sale of investment - 5
Other expenses (143) (13)
Other operating expenses (902) (10 626)
Other operating income and expenses (370) (8 942)
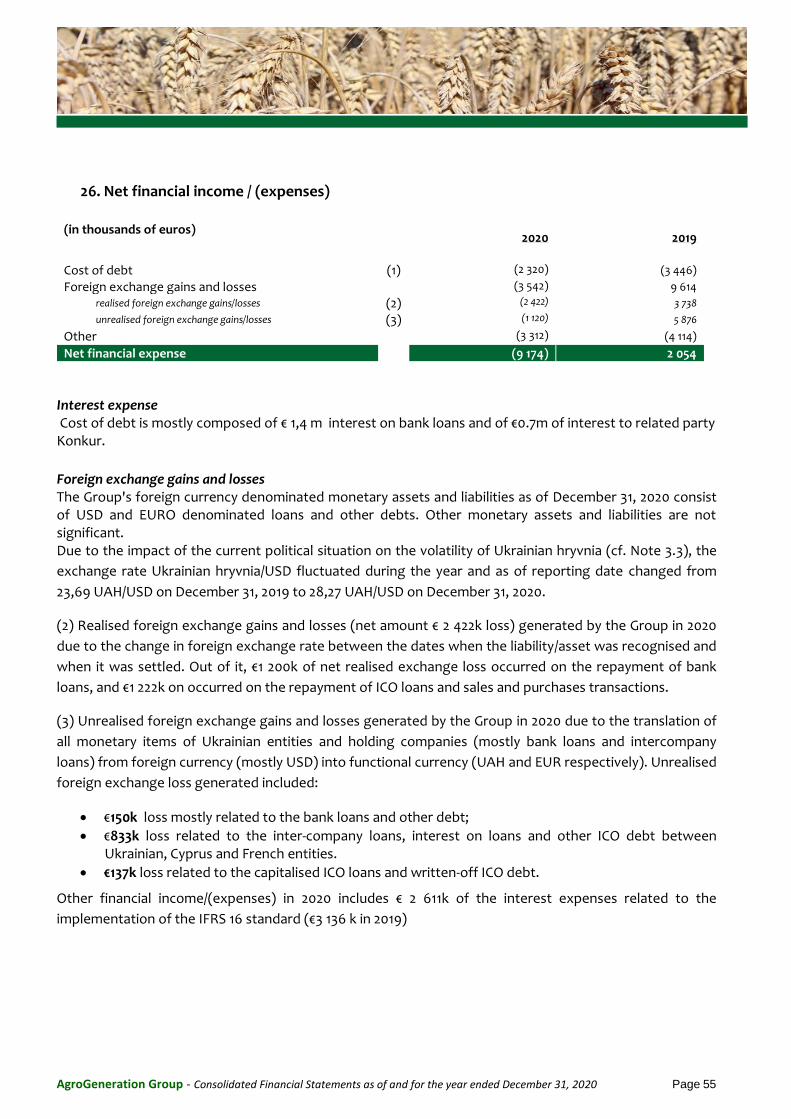
AgroGeneration Group - Consolidated Financial Statements as of and for the year ended December 31, 2020 Page 55
26. Net financial income / (expenses)
(in thousands of euros) 2020 2019
Cost of debt (1) (2 320) (3 446)
Foreign exchange gains and losses
(3 542) 9 614
realised foreign exchange gains/losses (2) (2 422) 3 738
unrealised foreign exchange gains/losses (3) (1 120) 5 876
Other
(3 312) (4 114)
Net financial expense
(9 174) 2 054
Interest expense Cost of debt is mostly composed of € 1,4 m interest on bank loans and of €0.7m of interest to related party Konkur.
Foreign exchange gains and losses The Group's foreign currency denominated monetary assets and liabilities as of December 31, 2020 consist of USD and EURO denominated loans and other debts. Other monetary assets and liabilities are not significant. Due to the impact of the current political situation on the volatility of Ukrainian hryvnia (cf. Note 3.3), the
exchange rate Ukrainian hryvnia/USD fluctuated during the year and as of reporting date changed from
23,69 UAH/USD on December 31, 2019 to 28,27 UAH/USD on December 31, 2020.
(2) Realised foreign exchange gains and losses (net amount € 2 422k loss) generated by the Group in 2020
due to the change in foreign exchange rate between the dates when the liability/asset was recognised and
when it was settled. Out of it, €1 200k of net realised exchange loss occurred on the repayment of bank
loans, and €1 222k on occurred on the repayment of ICO loans and sales and purchases transactions.
(3) Unrealised foreign exchange gains and losses generated by the Group in 2020 due to the translation of
all monetary items of Ukrainian entities and holding companies (mostly bank loans and intercompany
loans) from foreign currency (mostly USD) into functional currency (UAH and EUR respectively). Unrealised
foreign exchange loss generated included:
€150k loss mostly related to the bank loans and other debt;
€833k loss related to the inter-company loans, interest on loans and other ICO debt between Ukrainian, Cyprus and French entities.
€137k loss related to the capitalised ICO loans and written-off ICO debt.
Other financial income/(expenses) in 2020 includes € 2 611k of the interest expenses related to the
implementation of the IFRS 16 standard (€3 136 k in 2019)
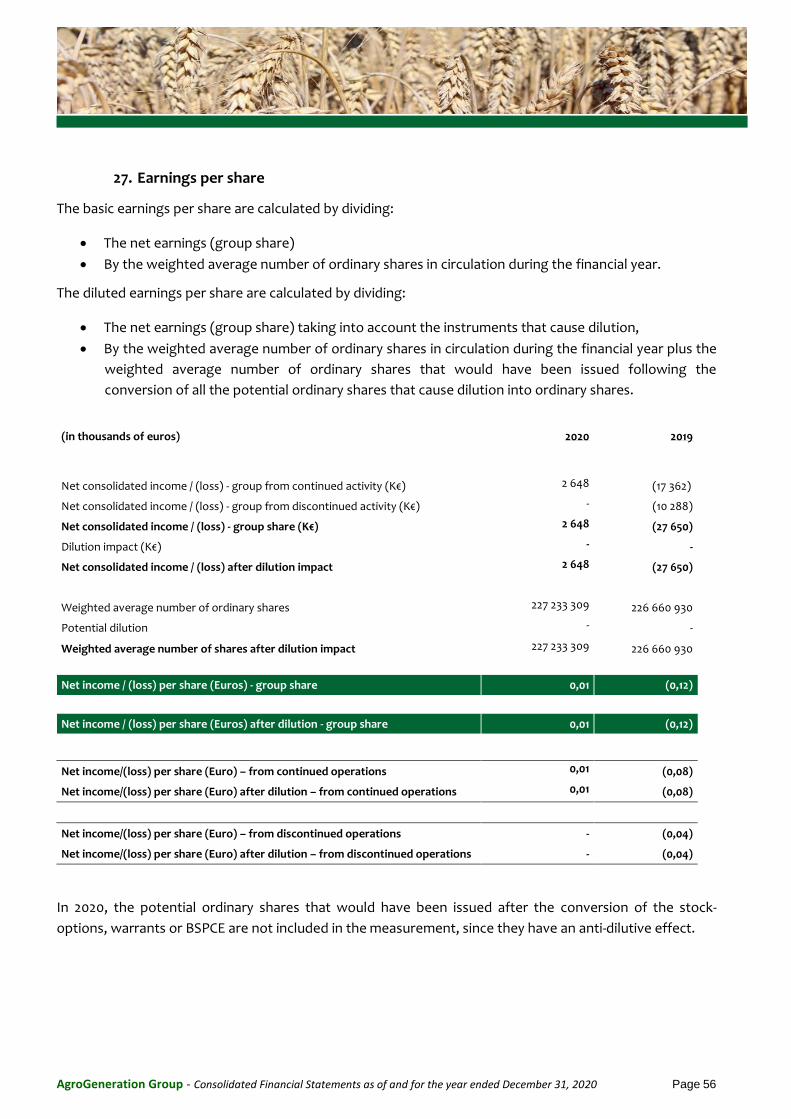
AgroGeneration Group - Consolidated Financial Statements as of and for the year ended December 31, 2020 Page 56
27. Earnings per share
The basic earnings per share are calculated by dividing:
The net earnings (group share)
By the weighted average number of ordinary shares in circulation during the financial year.
The diluted earnings per share are calculated by dividing:
The net earnings (group share) taking into account the instruments that cause dilution,
By the weighted average number of ordinary shares in circulation during the financial year plus the
weighted average number of ordinary shares that would have been issued following the
conversion of all the potential ordinary shares that cause dilution into ordinary shares.
(in thousands of euros) 2020 2019
Net consolidated income / (loss) - group from continued activity (K€) 2 648 (17 362)
Net consolidated income / (loss) - group from discontinued activity (K€) - (10 288)
Net consolidated income / (loss) - group share (K€) 2 648 (27 650)
Dilution impact (K€) - -
Net consolidated income / (loss) after dilution impact 2 648 (27 650)
Weighted average number of ordinary shares 227 233 309 226 660 930
Potential dilution - -
Weighted average number of shares after dilution impact 227 233 309 226 660 930
Net income / (loss) per share (Euros) - group share 0,01 (0,12)
Net income / (loss) per share (Euros) after dilution - group share 0,01 (0,12)
Net income/(loss) per share (Euro) – from continued operations 0,01 (0,08)
Net income/(loss) per share (Euro) after dilution – from continued operations 0,01 (0,08)
Net income/(loss) per share (Euro) – from discontinued operations - (0,04)
Net income/(loss) per share (Euro) after dilution – from discontinued operations - (0,04)
In 2020, the potential ordinary shares that would have been issued after the conversion of the stock-
options, warrants or BSPCE are not included in the measurement, since they have an anti-dilutive effect.
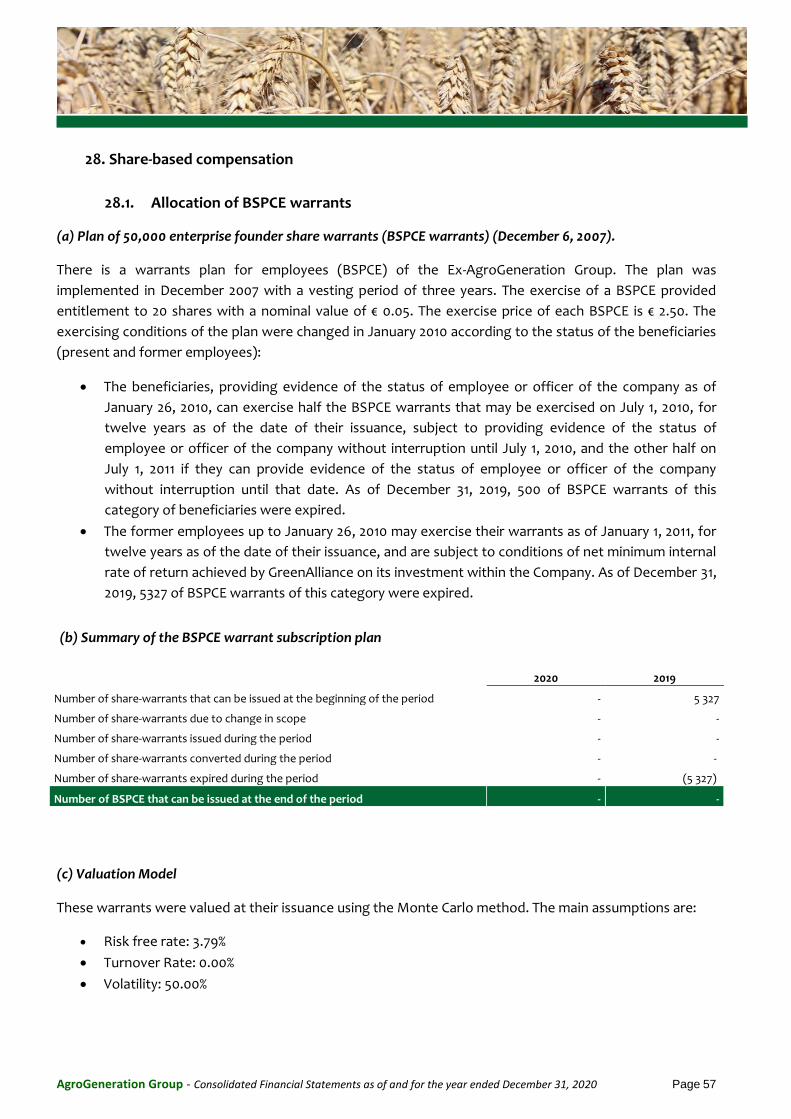
AgroGeneration Group - Consolidated Financial Statements as of and for the year ended December 31, 2020 Page 57
28. Share-based compensation
28.1. Allocation of BSPCE warrants
(a) Plan of 50,000 enterprise founder share warrants (BSPCE warrants) (December 6, 2007).
There is a warrants plan for employees (BSPCE) of the Ex-AgroGeneration Group. The plan was
implemented in December 2007 with a vesting period of three years. The exercise of a BSPCE provided
entitlement to 20 shares with a nominal value of € 0.05. The exercise price of each BSPCE is € 2.50. The
exercising conditions of the plan were changed in January 2010 according to the status of the beneficiaries
(present and former employees):
The beneficiaries, providing evidence of the status of employee or officer of the company as of
January 26, 2010, can exercise half the BSPCE warrants that may be exercised on July 1, 2010, for
twelve years as of the date of their issuance, subject to providing evidence of the status of
employee or officer of the company without interruption until July 1, 2010, and the other half on
July 1, 2011 if they can provide evidence of the status of employee or officer of the company
without interruption until that date. As of December 31, 2019, 500 of BSPCE warrants of this
category of beneficiaries were expired.
The former employees up to January 26, 2010 may exercise their warrants as of January 1, 2011, for
twelve years as of the date of their issuance, and are subject to conditions of net minimum internal
rate of return achieved by GreenAlliance on its investment within the Company. As of December 31,
2019, 5327 of BSPCE warrants of this category were expired.
(b) Summary of the BSPCE warrant subscription plan
2020 2019
Number of share-warrants that can be issued at the beginning of the period - 5 327
Number of share-warrants due to change in scope - -
Number of share-warrants issued during the period - -
Number of share-warrants converted during the period - -
Number of share-warrants expired during the period - (5 327)
Number of BSPCE that can be issued at the end of the period - -
(c) Valuation Model
These warrants were valued at their issuance using the Monte Carlo method. The main assumptions are:
Risk free rate: 3.79%
Turnover Rate: 0.00%
Volatility: 50.00%
AgroGeneration Group - Consolidated Financial Statements as of and for the year ended December 31, 2020 Page 58
28.2. Allocation of stock-options
(a) Plan to issue 533 000 options (January 26, 2009)
On January 26, 2009, pursuant to the delegation given by the Special General Meeting held on June 26,
2008, after the consent of the Supervisory Board given on January 30, 2009, the Executive Board of Ex-
AgroGeneration Group distributed 533 000 stock options. Each stock option provides entitlement to a
share at the strike price of € 2,02. These stock options are approved in thirds over three years and can be
exercised after the fourth year (on January 26, 2013) in blocks of 25% minimum until 2019.
This plan was replaced subsequently, for all the options but 50 000, by the plan dated January 26, 2010.
As of December 31, 2019, 50 000 of stock-options issued under this plan has been expired.
(b) Plan to issue 483 000 options (January 26, 2010)
On January 26, 2010, pursuant to the delegation given by the Special General Meeting held on
December 7, 2009, after the consent of the Supervisory Board given on January 14, 2010, the Executive
Board of Ex-AgroGeneration Group issued 483 000 stock options, each one providing entitlement to one
share at the strike price of € 1,79. The beneficiary must provide evidence of his status as an employee or
officer of the Group as of January 1, 2013, and if he / she separates from the company prior to that date, he
/ she will lose, unless authorized otherwise by the Executive Board:
- 1/6 of his / her options if he / she separates from the company after July 1, 2012 and before January 1, 2013, - 2/6 of his / her options if he / she separates from the company after January 1, 2012 and before July 1, 2012, - 3/6 of his / her options if he / she separates from the company after July 1, 2011 and before January 1, 2012, - 4/6 of his / her options if he / she separates from the company after January 1, 2011 and before July 1, 2011, - 5/6 of his / her options if he / she separates from the company after July 1, 2010 and before January 1, 2011, - all of his / her options if he / she separates from the company after January 1, 2010 and before July 1, 2010.
The options can be exercised for ten years with a latency period of 4 years from the date of grant
(January 26, 2014).
As of December 31, 2020, 405 333 options issued under this plan has been expired .
(c) Plan to issue 400,000 options (February 24, 2010)
On February 24, 2010, pursuant to the delegation given by the Special General Meeting held on
December 7, 2009, and after the consent of the Supervisory Board given on February 23, 2010, the
Executive Board of Ex-AgroGeneration Group decided to issue 400,000 stock options, the strike
procedures of which are identical to the Plan to issue 483 000 options on January 26, 2010 (strike price of
€ 1,79, condition of presence, strike period of ten years including a four-year latency period).
As of December 31, 2020, 400 000 options issued under this plan has been expired .
(d) Plan to issue 850,000 options (December 9, 2011)
On December 9, 2011, pursuant to the delegation given by the Special General Meeting held on June 7, 2011,
and after the consent of the Supervisory Board given on July 12, 2011, the Executive Board of Ex-
AgroGeneration Group - Consolidated Financial Statements as of and for the year ended December 31, 2020 Page 59
AgroGeneration Group decided to issue 850 000 stock options, each one providing entitlement to one
share pursuant to the following strike procedures:
Strike price of € 1,95,
Conditions of presence:
If the beneficiary has more than three years of seniority as of December 9, 2011, he / she must
provide evidence of his / her status as an employee or officer of the Group as of July 1, 2014, and if
he / she separates from the company prior to that date, he / she will lose, unless authorized
otherwise by the Executive Board:
- 1/6 of his / her options if he / she separates from the company after January 1, 2014 and before July 1, 2014, - 2/6 of his / her options if he / she separates from the company after July 1, 2013 and before January 1, 2014, - 3/6 of his / her options if he / she separates from the company after January 1, 2013 and before July 1, 2013, - 4/6 of his / her options if he / she separates from the company after July 1, 2012 and before January 1, 2013, - 5/6 of his / her options if he / she separates from the company after January 1, 2012 and before July 1, 2012, - all of his / her options if he / she separates from the company before January 1, 2012.
If the beneficiary has between one and three years of seniority as of December 9, 2011, he / she
must provide evidence of his / her status as an employee or officer of the Group as of July 1, 2015,
and if he / she separates from the company prior to that date, he / she will lose, unless authorized
otherwise by the Executive Board:
- 1/8 of his / her options if he / she separates from the company after January 1, 2015 and before July 1, 2015, - 2/8 of his / her options if he / she separates from the company after July 1, 2014 and before January 1, 2015, - 3/8 of his / her options if he / she separates from the company after January 1, 2014 and before July 1, 2014, - 4/8 of his / her options if he / she separates from the company after July 1, 2013 and before January 1, 2014, - 5/8 of his / her options if he / she separates from the company after January 1, 2013 and before July 1, 2013, - 6/8 of his / her options if he / she separates from the company after July 1, 2012 and before January 1, 2013, - 7/8 of his / her options if he / she separates from the company after January 1, 2012 and before July 1, 2012, - all of his / her options if he / she separates from the company before January 1, 2012.
If the beneficiary has less than one year of seniority on December 9, 2011, he / she must provide
evidence of his / her status as an employee or officer of the Group as of July 1, 2015, and if he / she
separates from the company prior to that date, he / she will lose, unless authorized otherwise by
the Executive Board:
- Half of his / her options if he / she separates from the company after July 1, 2013 and before July 1, 2015, - All of his / her options if he / she separates from the company before July 1, 2013. - Strike period of ten years including a 4-year latency period.
The number of remaining options as of December 31, 2020 is 462 500.
AgroGeneration Group - Consolidated Financial Statements as of and for the year ended December 31, 2020 Page 60
(e) Summary of the stock-options subscription plan
2020 2019
Number of stock options at the beginning of the period 1 267 833 1 317 833
Number of stock options due to change in scope - -
Number of stock options attributed during the period - -
Number of stock options replaced during the period - -
Number of stock options expired during the period (805 333) (50 000)
Number of stock options converted during the period - -
Number of stock options at the end of the period 462 500 1 267 833
(f) Valuation model
The major computation assumptions used in the issuance of each stock option plan are as follows:
Plans Risk-free rate Turnover Volatility Valuation model
2009 and 2010 2.80% 0% 50% Binomiale
December 9, 2011 2.85% 7.50% 31% Black & Scholes
Expected volatility for the 2009 and 2010 plans was determined from the historical volatility of a group of
comparable companies over a period comparable to the period of vesting.
The expected volatility of the 2011 plan was estimated on the basis of the historical volatility of
AgroGeneration.
28.3. ORNANE stock warrants (BSA)
(a) BSA warrants
The BSA which are attached to each ORNANE and issued upon exercise of the Issuance Warrants, have the
following characteristics:
o each BSA grants its holder the right, during the exercise period to subscribe to one new AgroGeneration’s share
o the BSA’s exercise price shell be equal to 130% of the lowest daily volume-weighted average price for the AgroGeneration share over the 10 trading days immediately preceding the tranche issuance date.
o they may be exercised for a period of 3 years as from their issuance; o the global nominal amount of BSA is capped at 50% of the nominal amount of related tranche of ORNANE for
the first three tranches, and 25% of the nominal value of ORNANE for all subsequent tranches.
AgroGeneration Group - Consolidated Financial Statements as of and for the year ended December 31, 2020 Page 61
Initial Tranches Additional Tranche
Total
T1 T2 T3 TA1
Number of BSA # 1 063 829 1 063 829 1 162 790 833 333 4 123 781
Fair value of BSAs at the issuance date €'000 82 71 68 46 267
Maturity date
03/07/2021
31/07/2021
28/08/2021
30/10/2021
Exercise price € 0,47 0,47 0,43 0,30 Volatility % 40,3% 39,4% 37,0% 38,1%
The ORNANE BSAs were evaluated using Black & Scholes valuation model with the following assumptions:
- Dividend yield = 0%, - Risk-free rate =0% - Volatility - has been determined based on historical volatility of AgroGeneration over the period of 3 years.
According to IFRS 9 and IAS 32, the BSA meet the definition of stand-alone derivatives on own shares
settled by the settled by the delivery of a number of shares for cash on the basis of an exercise price. At
issuance, the fair value of BSA is recognized in other comprehensive income (OCI) and in the profit and loss
account of the corresponding period. Being an equity instrument, BSAs are not re-valued at subsequent
period end closings.
As of December 31, 2020 the maximum number of BSA able to be exercised is 4 123 781.
(b) Summary of the BSA subscription plan
2020 2019
Number of stock options at the beginning of the period 4 123 781 4 123 781
Number of stock options due to change in scope - -
Number of stock options attributed during the period - -
Number of stock options replaced during the period - -
Number of stock options expired during the period - -
Number of stock options converted during the period - -
Number of stock options at the end of the period 4 123 781 4 123 781
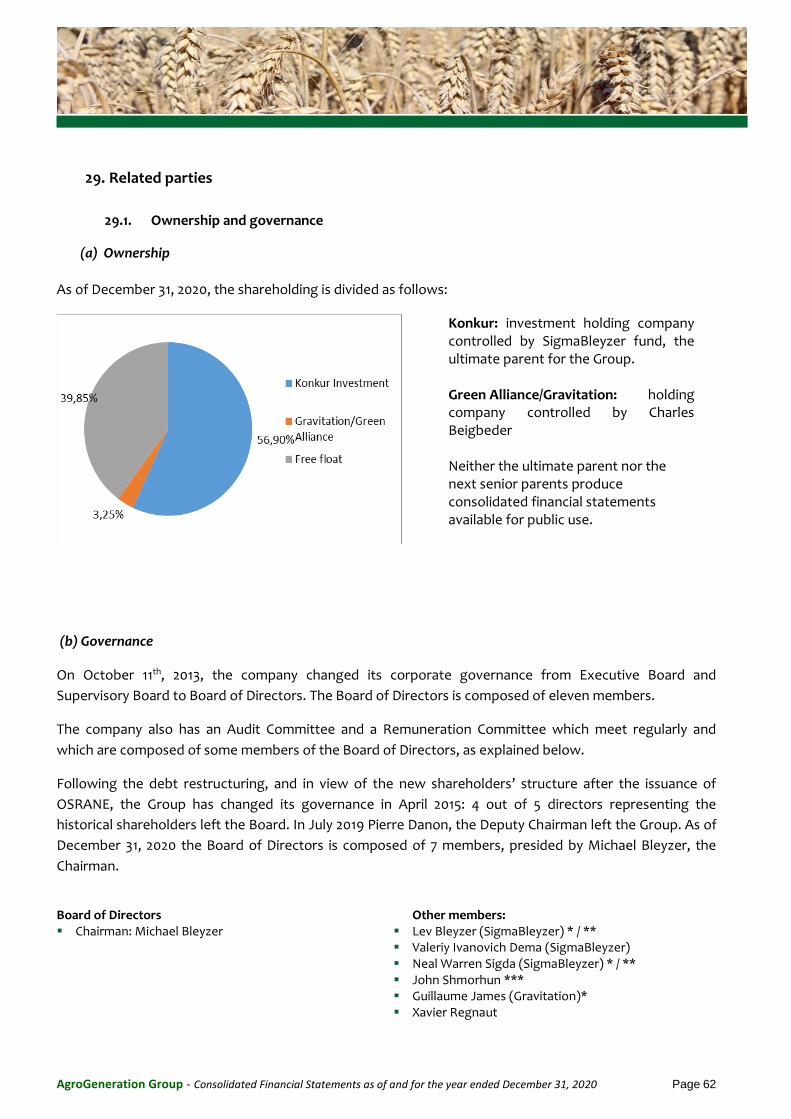
AgroGeneration Group - Consolidated Financial Statements as of and for the year ended December 31, 2020 Page 62
29. Related parties
29.1. Ownership and governance
(a) Ownership
As of December 31, 2020, the shareholding is divided as follows:
Konkur: investment holding company controlled by SigmaBleyzer fund, the ultimate parent for the Group. Green Alliance/Gravitation: holding company controlled by Charles Beigbeder Neither the ultimate parent nor the next senior parents produce consolidated financial statements available for public use.
(b) Governance
On October 11th, 2013, the company changed its corporate governance from Executive Board and
Supervisory Board to Board of Directors. The Board of Directors is composed of eleven members.
The company also has an Audit Committee and a Remuneration Committee which meet regularly and
which are composed of some members of the Board of Directors, as explained below.
Following the debt restructuring, and in view of the new shareholders’ structure after the issuance of
OSRANE, the Group has changed its governance in April 2015: 4 out of 5 directors representing the
historical shareholders left the Board. In July 2019 Pierre Danon, the Deputy Chairman left the Group. As of
December 31, 2020 the Board of Directors is composed of 7 members, presided by Michael Bleyzer, the
Chairman.
Board of Directors Chairman: Michael Bleyzer
Other members: Lev Bleyzer (SigmaBleyzer) * / ** Valeriy Ivanovich Dema (SigmaBleyzer) Neal Warren Sigda (SigmaBleyzer) * / ** John Shmorhun *** Guillaume James (Gravitation)* Xavier Regnaut
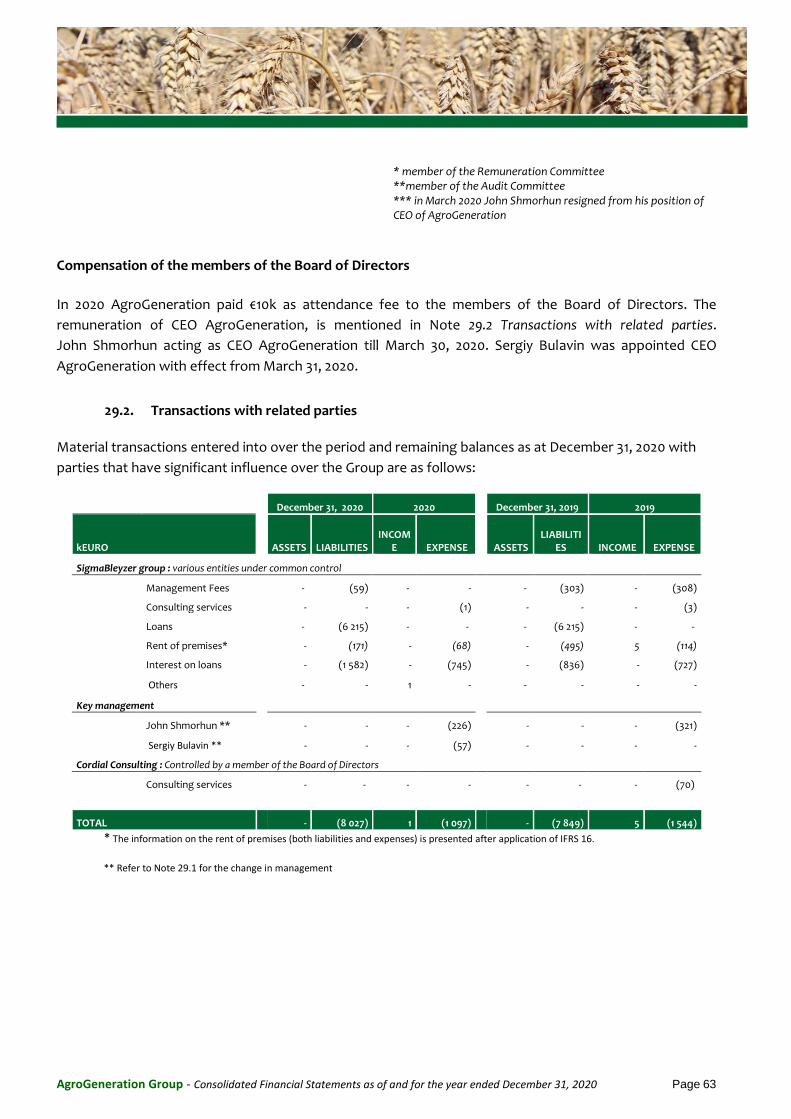
AgroGeneration Group - Consolidated Financial Statements as of and for the year ended December 31, 2020 Page 63
* member of the Remuneration Committee **member of the Audit Committee *** in March 2020 John Shmorhun resigned from his position of CEO of AgroGeneration
Compensation of the members of the Board of Directors
In 2020 AgroGeneration paid €10k as attendance fee to the members of the Board of Directors. The
remuneration of CEO AgroGeneration, is mentioned in Note 29.2 Transactions with related parties.
John Shmorhun acting as CEO AgroGeneration till March 30, 2020. Sergiy Bulavin was appointed CEO
AgroGeneration with effect from March 31, 2020.
29.2. Transactions with related parties
Material transactions entered into over the period and remaining balances as at December 31, 2020 with
parties that have significant influence over the Group are as follows:
December 31, 2020 2020 December 31, 2019 2019
kEURO
ASSETS
LIABILITIES
INCOM
E EXPENSE ASSETS
LIABILITI
ES INCOME EXPENSE
SigmaBleyzer group : various entities under common control
Management Fees - (59) - - - (303) - (308)
Consulting services - - - (1) - - - (3)
Loans - (6 215) - - - (6 215) - -
Rent of premises* - (171) - (68) - (495) 5 (114)
Interest on loans - (1 582) - (745) - (836) - (727)
Others - - 1 - - - - -
Key management
John Shmorhun ** - - - (226) - - - (321)
Sergiy Bulavin ** - - - (57) - - - -
Cordial Consulting : Controlled by a member of the Board of Directors
Consulting services - - - - - - - (70)
TOTAL - (8 027) 1 (1 097) - (7 849) 5 (1 544)
* The information on the rent of premises (both liabilities and expenses) is presented after application of IFRS 16.
** Refer to Note 29.1 for the change in management
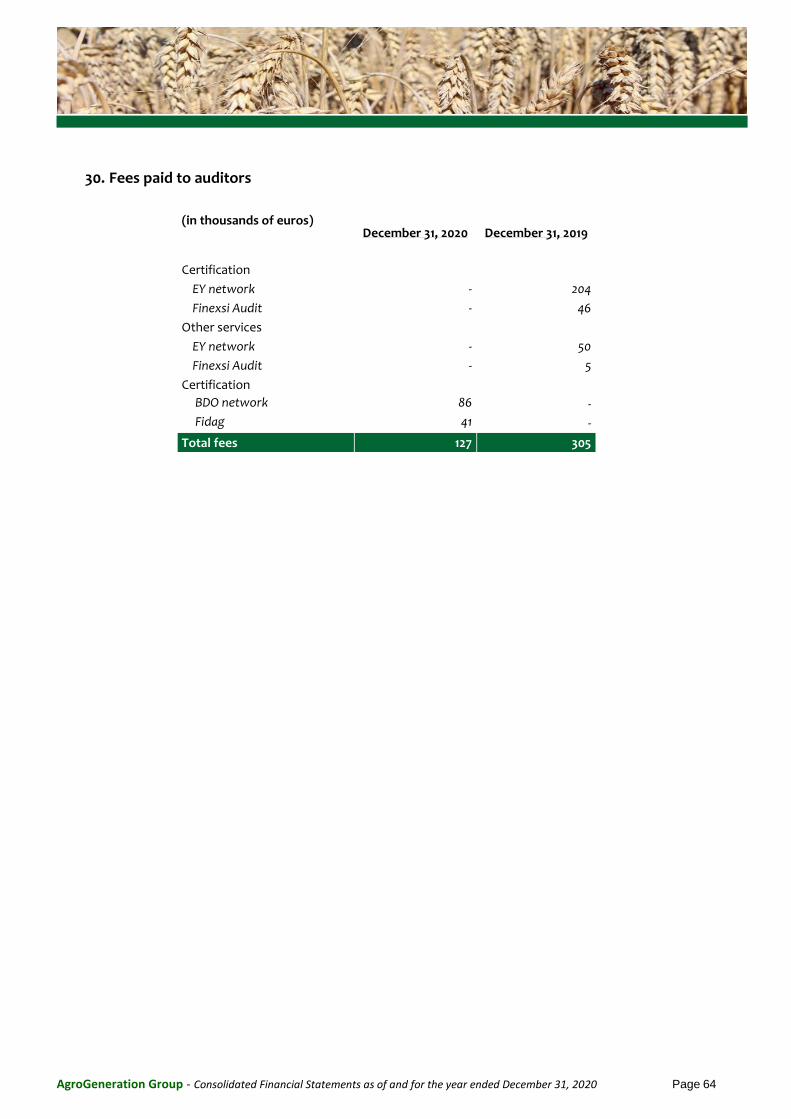
AgroGeneration Group - Consolidated Financial Statements as of and for the year ended December 31, 2020 Page 64
30. Fees paid to auditors
(in thousands of euros) December 31, 2020 December 31, 2019
Certification
EY network - 204
Finexsi Audit - 46
Other services
EY network - 50
Finexsi Audit - 5
Certification
BDO network 86 -
Fidag 41 -
Total fees 127 305
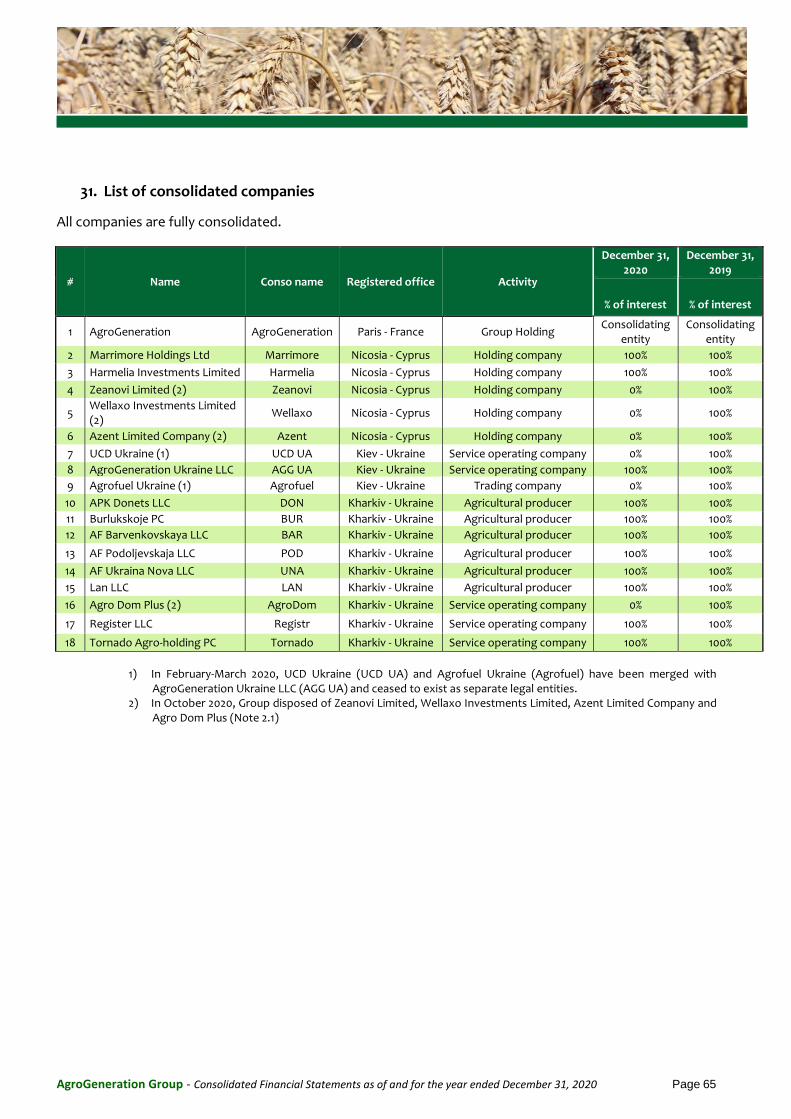
AgroGeneration Group - Consolidated Financial Statements as of and for the year ended December 31, 2020 Page 65
31. List of consolidated companies
All companies are fully consolidated.
# Name Conso name Registered office Activity
December 31, 2020
December 31, 2019
% of interest
% of interest
1 AgroGeneration AgroGeneration Paris - France Group Holding Consolidating
entity Consolidating
entity
2 Marrimore Holdings Ltd Marrimore Nicosia - Cyprus Holding company 100% 100%
3 Harmelia Investments Limited Harmelia Nicosia - Cyprus Holding company 100% 100%
4 Zeanovi Limited (2) Zeanovi Nicosia - Cyprus Holding company 0% 100%
5 Wellaxo Investments Limited (2)
Wellaxo Nicosia - Cyprus Holding company 0% 100%
6 Azent Limited Company (2) Azent Nicosia - Cyprus Holding company 0% 100%
7 UCD Ukraine (1) UCD UA Kiev - Ukraine Service operating company 0% 100%
8 AgroGeneration Ukraine LLC AGG UA Kiev - Ukraine Service operating company 100% 100%
9 Agrofuel Ukraine (1) Agrofuel Kiev - Ukraine Trading company 0% 100%
10 APK Donets LLC DON Kharkiv - Ukraine Agricultural producer 100% 100%
11 Burlukskoje PC BUR Kharkiv - Ukraine Agricultural producer 100% 100%
12 AF Barvenkovskaya LLC BAR Kharkiv - Ukraine Agricultural producer 100% 100%
13 AF Podoljevskaja LLC POD Kharkiv - Ukraine Agricultural producer 100% 100%
14 AF Ukraina Nova LLC UNA Kharkiv - Ukraine Agricultural producer 100% 100%
15 Lan LLC LAN Kharkiv - Ukraine Agricultural producer 100% 100%
16 Agro Dom Plus (2) AgroDom Kharkiv - Ukraine Service operating company 0% 100%
17 Register LLC Registr Kharkiv - Ukraine Service operating company 100% 100%
18 Tornado Agro-holding PC Tornado Kharkiv - Ukraine Service operating company 100% 100%
1) In February-March 2020, UCD Ukraine (UCD UA) and Agrofuel Ukraine (Agrofuel) have been merged with
AgroGeneration Ukraine LLC (AGG UA) and ceased to exist as separate legal entities. 2) In October 2020, Group disposed of Zeanovi Limited, Wellaxo Investments Limited, Azent Limited Company and
Agro Dom Plus (Note 2.1)