6 consolidated financial statements - Crédit Agricole
143
292 CRÉDIT AGRICOLE S.A. 2014 REGISTRATION DOCUMENT 6 CONSOLIDATED FINANCIAL STATEMENTS General framework The consolidated financial statements consist of the general framework, the consolidated financial statements and the notes to the consolidated financial statements. GENERAL FRAMEWORK LEGAL PRESENTATION OF THE ENTITY Since the Extraordinary General Meeting of Shareholders of 29 November 2001, the Company’s name has been: Crédit Agricole S.A. Since 1 July 2012, the address of the Company’s registered office has been: 12, place des États-Unis, 92127 Montrouge Cedex, France. Registration number: 784 608 416, Nanterre Trade and Companies Register NAF code: 6419Z Crédit Agricole S.A. is a French Public Limited Company (Société Anonyme) with a Board of Directors governed by ordinary company law and more specifically by Book II of the French Commercial Code. Crédit Agricole S.A. is also subject to the provisions of the French Monetary and Financial Code and more specifically Articles L. 512-47 et seq. thereof. Crédit Agricole S.A. was licensed as an authorised lending institution in the mutual and co-operative banks category on 17 November 1984. As such, it is subject to oversight by the banking supervisory authorities, and more particularly by the French Regulatory and Resolution Supervisory Authority. Crédit Agricole S.A. shares are admitted for trading on Euronext Paris. Crédit Agricole S.A. is subject to the prevailing stock market regulations particularly with respect to public disclosure obligations.
-
Upload
khangminh22 -
Category
Documents
-
view
4 -
download
0
Transcript of 6 consolidated financial statements - Crédit Agricole

292 CRÉDIT AGRICOLE S.A. 2014 REGISTRATION DOCUMENT
6 CONSOLIDATED FINANCIAL STATEMENTSGeneral framework
The consolidated financial statements consist of the general framework, the consolidated financial statements and the notes to the consolidated financial statements.
GENERAL FRAMEWORK
LE GAL PRESENTATION OF THE ENTITY
Since the Extraordinary General Meeting of Shareholders of 29 November 2001, the Company’s name has been: Crédit Agricole S.A.
Since 1 July 2012, the address of the Company’s registered office has been: 12, place des États-Unis, 92127 Montrouge Cedex, France.
Registration number: 784 608 416, Nanterre Trade and Companies Register
NAF code: 6419Z
Crédit Agricole S.A. is a French Public Limited Company (Société Anonyme) with a Board of Directors governed by ordinary company law and more specifically by Book II of the French Commercial Code.
Crédit Agricole S.A. is also subject to the provisions of the French Monetary and Financial Code and more specifically Articles L. 512-47 et seq. thereof.
Crédit Agricole S.A. was licensed as an authorised lending institution in the mutual and co-operative banks category on 17 November 1984. As such, it is subject to oversight by the banking supervisory authorities, and more particularly by the French Regulatory and Resolution Supervisory Authority.
Crédit Agricole S.A. shares are admitted for trading on Euronext Paris. Crédit Agricole S.A. is subject to the prevailing stock market regulations particularly with respect to public disclosure obligations.
CRÉDIT AGRICOLE S.A. 2014 REGISTRATION DOCUMENT 293
6
CONSOLIDATED FINANCIAL STATEMENTSGeneral framework
A bank with mutual roots
SAS Rue La Boétie, which is wholly owned by the Regional Banks, holds the majority of Crédit Agricole S.A.’s share capital. Shares in SAS Rue La Boétie may not be transferred outside the Regional Banks’ network. Furthermore, any trading in these shares between Regional Banks is governed by a liquidity agreement that in particular sets out the procedures for determining the transaction price. This encompasses both disposals of shares between the Regional Banks and capital increases at SAS Rue La Boétie.
The Fédération Nationale du Crédit Agricole (FNCA) acts as a consultative and representative body, and as a communication forum for the Regional Banks.
In accordance with the provisions of the French Monetary and Financial Code (Articles L. 511-31 and L. 511-32), as the central body of the Crédit Agricole network, Crédit Agricole S.A. is responsible for exercising administrative, technical and financial control over the institutions affiliated to it in order to maintain a cohesive network (as defined in Article R. 512-18 of the French Monetary and Financial Code) and to ensure their proper functioning and compliance with all regulations and legislation governing them. In that regard, Crédit Agricole S.A. may take all necessary measures notably to ensure the liquidity and solvency of the network as a whole and of each of its affiliated institutions.
294 CRÉDIT AGRICOLE S.A. 2014 REGISTRATION DOCUMENT
6 CONSOLIDATED FINANCIAL STATEMENTSGeneral framework
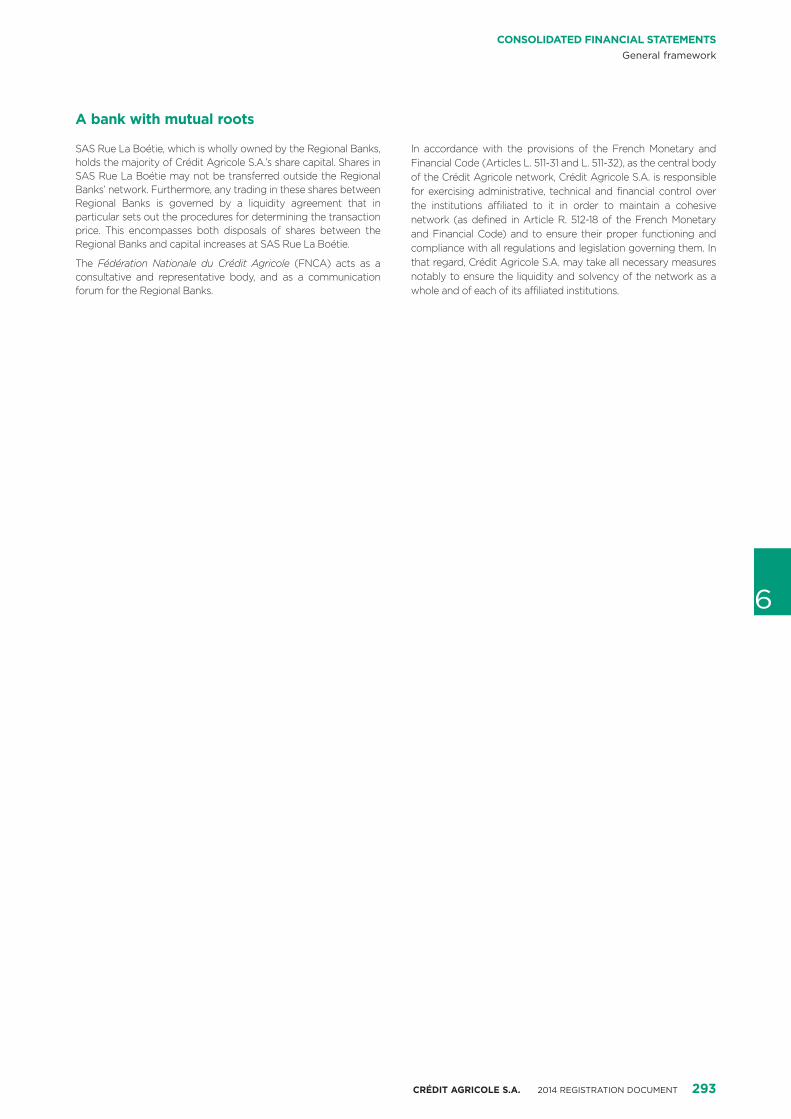
Crédit Agricole S.A.
RETAIL BANKING
IN FRANCE
SPECIALISED FINANCIALSERVICES
INTERNATIONAL RETAIL BANKING
38 REGIONALBANKS
SCCV
76.5%
CARIPARMA
SPA Italy
95.1%
4.9%SACAMDEVELOPPEMENT
LCLLE CRÉDIT LYONNAIS
SAFRIULADRIASPA Italy
10%
77.8%
22.2%
CRÉDITAGRICOLE
BANK
CRÉDIT DU
MAROC
PJSC Ukraine
SA Morocco
CRÉDITAGRICOLEPOLSKA
SA Poland
80.2%
80%
47.4%CRÉDIT
AGRICOLEEGYPT
CRÉDIT AGRICOLE
BANKA SRBIJA AD NOVI SAD
SA Serbia
13.1% EgyptSAE
100%
CRÉDIT AGRICOLELEASING
& FACTORINGSA
100%EFL
SA Poland
100%
CACONSUMER FINANCESA
25%
100%
CARISPEZIASPA Italy
13.5%
SACAMINTERNATIONAL
EFL
CRÉDIT AGRICOLE CIB
100%
78.7%
FONDATION CARIPARMA
(1) Direct % interest held by Crédit Agricole S.A. and its subsidiaries.
(2) % interest of 14.7% excluding treasury shares.
CRÉDIT AGRICOLE S.A. 2014 REGISTRATION DOCUMENT 295
6
CONSOLIDATED FINANCIAL STATEMENTSGeneral framework
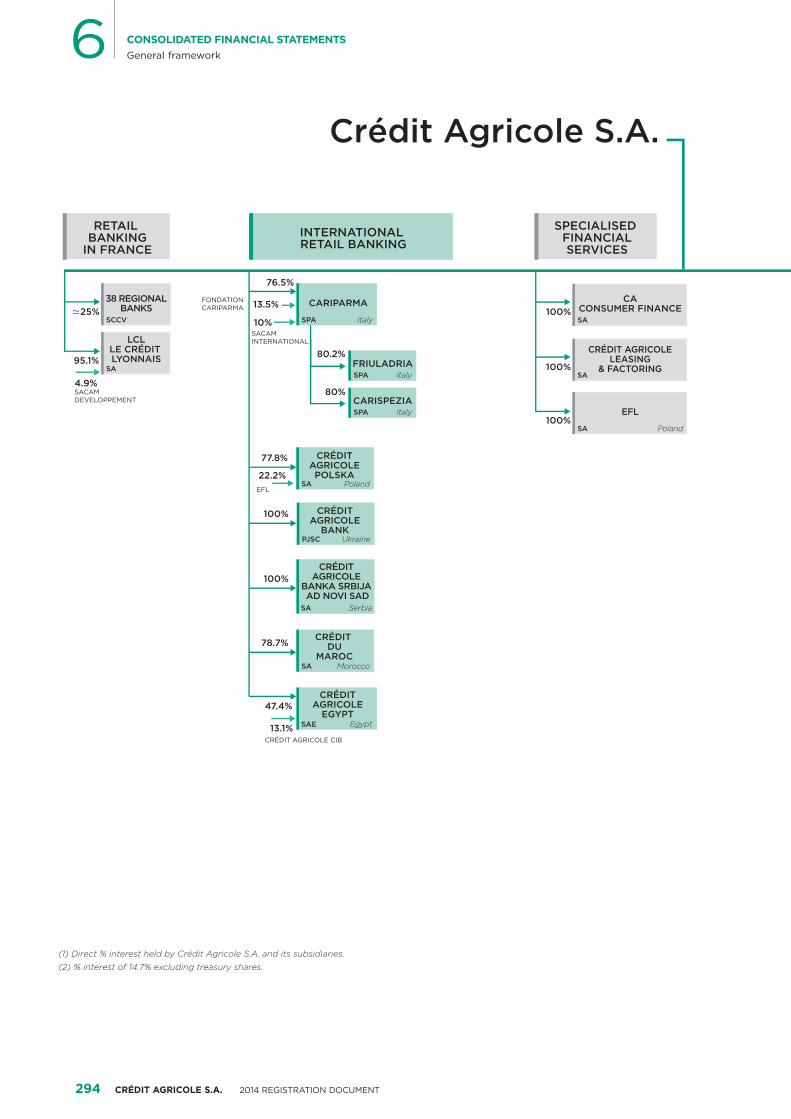
at 31/12/2014 (% interest)(1)
SAVINGS MANAGEMENTAND INSURANCE
100%
CA PRIVATEBANKING
SA
CRÉDITAGRICOLE
LUXEMBOURGSA Luxembourg
SwitzerlandSA
CRÉDITAGRICOLE
(SWITZERLAND)
CRÉDITFONCIER
DE MONACOSA Monaco
97.8%CRÉDIT
AGRICOLECIB
SA
100%CACIF
SA
49.6%
50.4%
SILCA
CAISSE REGIONALE DE CORSE
SCCV99.9%
DELFINANCES100%
100%UNI-ÉDITIONS
SAS
50%
50% SA
SAS
OTHER GROUPCOMPANIES
Private banking
SNC
50%
CRÉDITAGRICOLE
IMMOBILIERSA
31.1%
BANK SAUDIFRANSI
100%PREDICA
SA
100%PACIFICA
SA
100%
CRÉDITAGRICOLECREDITOR INSURANCE
SAS
100%
CA VITA
ItalySPA
100%
FONCARIS
Luxembourg
SA
CRÉDIT AGRICOLE ASSURANCES
SA
Insurance
100%
50%REGIONALBANKS
2.2%SACAM DEVELOPPEMENT
50%SACAM
IMMOBILIER
78.6% AMUNDI GROUP
SA
AMUNDISA
S2GSA
ÉTOILEGESTION
SA
CPR AMSA
Asset management
85% 15%CACEIS
NATIXIS
Securities and financial services
100%
100%
100%
100%
SA
20%SOCIÉTÉ GÉNÉRALE
1.4%SACAMDEVELOPPEMENT
50%SACAM FIA-NET EUROPE
100%
68.9%
100% CA INDOSUEZ
PRIVATE BANKING
SA
BFT GestionSA100%
CORPORATE CENTRECORPORATE
AND INVESTMENT BANKING
CACARDS &
PAYMENTSSNC
50%
GNB SEGUROS(Ex. BES SEGUROS)
SA Portugal
100% 100%
CACEIS BANK FRANCESA
CACEIS FUNDADMINISTRATIONSA
100%
CACEIS BANKLUXEMBOURG
SA Luxembourg 100%
CACEIS SWITZERLAND
SA Switzerland
100%
CACEIS BANKDEUTSCHLANDGmbH Germany
100%
CACEIS CORPORATE
TRUSTSA
100%
SA Saudi Arabia
FIA-NETEUROPE
14.1%
EURAZEO (2)
SA

296 CRÉDIT AGRICOLE S.A. 2014 REGISTRATION DOCUMENT
6 CONSOLIDATED FINANCIAL STATEMENTSGeneral framework
CRÉDIT AGRICOLE INTERNAL RELATIONS
Internal financing mechanismsCrédit Agricole has instituted a number of internal financing mechanisms specific to the Group.
Regional Banks’ current accountsEach Regional Bank holds a current account with Crédit Agricole S.A., which records the financial movements resulting from internal financial transactions within the Group. This account, which may be in credit or debit, is presented in the balance sheet under “Crédit Agricole internal transactions – Current Accounts” and integrated on a specific line item, either “Loans and receivables due from credit institutions” or “Due to credit institutions”.
Special savings accountsFunds held in special savings accounts (popular savings plans and accounts, sustainable development passbook accounts (Livret de développement durable), home purchase savings plans and accounts, youth passbook accounts and Livret A passbook savings accounts) are collected by the Regional Banks on behalf of Crédit Agricole S.A. These funds are required to be transferred to the latter. Crédit Agricole S.A. recognises them on its balance sheet as “Due to customers”.
Term deposits and advancesThe Regional Banks also collect savings funds (passbook accounts, bonds, certain term accounts and related accounts, etc.) on behalf of Crédit Agricole S.A. These funds are transferred to Crédit Agricole S.A. and are recognised as such on its balance sheet.
Special savings accounts and time deposits and advances are used by Crédit Agricole S.A. to make “advances” (loans) to the Regional Banks, with a view to funding their medium and long-term loans.
A series of four internal financial reforms has been implemented. These reforms have permitted the transfer back to the Regional Banks, in the form of “advances” (loans) of a specific percentage of the funds collected by them (first 15%, 25%, then 33% and, since 31 December 2001, 50%), via “mirror advances” with maturities and interest rates precisely matching those of the savings funds received, and which they are free to use at their discretion.
Since 1 January 2004, the financial margins generated by the centralised management of funds collected (and not transferred back via mirror advances) are shared by the Regional Banks and Crédit Agricole S.A. and are determined by using replacement models and applying market rates.
Furthermore, 50% of new loans written since 1 January 2004 and falling within the field of application of financial relations between Crédit Agricole S.A. and the Regional Banks may be refinanced in the form of advances negotiated at market rates with Crédit Agricole S.A.
Hence, there are currently two types of advances: advances governed by financial rules from before 1 January 2004 and those governed by the new rules.
Crédit Agricole S.A. may also make additional financing available to the Regional Banks at market rates.
Transfer of Regional Banks’ liquidity surplusesThe Regional Banks may use their monetary deposits (demand deposits, non-centralised term deposits and negotiable certificates of deposit) to finance lending to their customers. Surpluses must
be transferred to Crédit Agricole S.A. where they are booked as current or term accounts, under “Crédit Agricole internal transactions”.
Investment of Regional Banks’ surplus capital with Crédit Agricole S.A.Regional Banks’ available surplus capital may be invested with Crédit Agricole S.A. in the form of three- to ten-year instruments, with the same characteristics of interbank money market transactions in all respects.
Foreign currency transactionsCrédit Agricole S.A. represents the Regional Banks with respect to the Bank of France and centralises their foreign currency transactions.
Medium and long-term notes issued by Crédit Agricole S.A.These are placed mainly on the market or by the Regional Banks with their customers. They are booked by Crédit Agricole S.A. under liabilities either as Debt securities or as Subordinated debt, depending on the type of security issued.
Coverage of liquidity and solvency risksDuring the IPO of Crédit Agricole S.A. in 2001, CNCA (now Crédit Agricole S.A.) signed an agreement with the Regional Banks to govern internal relations within the Crédit Agricole Group. The agreement notably provided for the creation of a Fund for Bank Liquidity and Solvency Risks (FRBLS) designed to enable Crédit Agricole S.A. to fulfil its role as central body by providing assistance to any member of the Crédit Agricole network as defined by the French Monetary and Financial Code experiencing difficulties. The main provisions of this agreement are set out in Chapter 3 of the registration document filed by Crédit Agricole S.A. with the Commission des Opérations de Bourse on 22 October 2001 under number R. 01-453. The fund was originally allocated €610 million in assets. It stood at €1,005 million at 31 December 2014, having been increased by €34 million over the year.
European legislation relating to the resolution of banking crises adopted in 2014 (the BRRD directive and the regulation on the Single Resolution Mechanism) introduced a number of significant changes in the regulations applicable to credit institutions.
The new system, which includes measures to prevent and to resolve banking crises, is intended to preserve financial stability, to ensure the continuity of activities, services and operations of institutions whose failure could significantly impact the economy, to protect depositors and to avoid or limit the use of public financial support. The system provides European resolution authorities, including the Single Resolution Board, with extensive powers to take all necessary measures in connection with the resolution of all or part of a credit institution or the group to which it belongs.
The European resolution system, the principal provisions of which were partially adopted in advance by the French law on the Separation and Regulation of Banking Activities of 26 July 2013, does not affect the legal internal financial solidarity mechanism provided by Article L. 511-31 of the French Monetary and Financial Code, which applies to the Crédit Agricole network, as defined in Article R. 512-18 of the same Code. Crédit Agricole S.A. believes that, from a practical perspective, this mechanism should be implemented prior to any resolution procedure, given that, as

CRÉDIT AGRICOLE S.A. 2014 REGISTRATION DOCUMENT 297
6
CONSOLIDATED FINANCIAL STATEMENTSGeneral framework
central body and a member of the network, Crédit Agricole must take all measures necessary to ensure the liquidity and solvency of each network member, as well as the network as a whole. As a result, each member of the Network (including Crédit Agricole S.A.), benefits from this internal financial solidarity mechanism.
Accordingly, if a resolution procedure were to be instituted in respect of the Crédit Agricole Group, this would mean that the application of the legal internal financial solidarity mechanism would not have remedied the financial difficulty of one or more affiliated entities of the Group, and thus of the network as a whole. The resolution mechanism would also effectively limit the likelihood of the occurrence of the conditions necessary for the application of the guarantee of the obligations of Crédit Agricole S.A. to third party creditors, granted in 1988 by the Regional Banks on a joint and several basis to the extent of their total equity capital. It is recalled that this guarantee may be called upon if the assets of Crédit Agricole S.A. in a liquidation or dissolution procedure are insufficient.
In connection with the institution of a resolution procedure, the Autorité de contrôle prudentiel et de résolution should respect the fundamental principle that no creditor should suffer losses in connection with a resolution procedure that are greater than those it would suffer if the entity had been liquidated in a normal insolvency procedure (the “No Creditor Worse Off than on Liquidation” – NCWOL – principle, set forth in Article L. 613-31-16 II of the French Monetary and Financial Code, and Article 73 of the BRRD directive). Because of this principle, Crédit Agricole S.A. believes that the existence of the guarantee granted in 1988 by the Regional Banks in favor of the creditors of Crédit Agricole S.A. should be taken into account by the Autorité de contrôle prudentiel et de résolution, although it is not possible to determine how this will be done.
Specific guarantees provided by the Regional Banks to Crédit Agricole S.A. (Switch)The “Switch” guarantee mechanism established on 23 December 2011 and supplemented by an addendum signed on 19 December 2013 forms part of the financial arrangements between Crédit Agricole S.A., as central body, and the mutual network of Crédit Agricole Regional Banks. The new guarantees took effect on 2 January 2014, replacing the previous guarantees, and expire on 1 March 2027, subject to early termination or extension in accordance with the terms of the contract.
With this mechanism, and subject to the upper limit specified in the agreement, the Regional Banks assume, on behalf of Crédit Agricole S.A., prudential requirements relating to the equity method of accounting for certain equity investments held by Crédit Agricole S.A. They also assume the associated economic risks in the form of compensation, where applicable.
The guarantees allow the transfer of prudential requirements both in relation to Crédit Agricole S.A.’s equity investments in the Regional Banks (CCI/CCA), and in Crédit Agricole Assurances (CAA), the latter being equity-accounted for prudential reasons. They are subject to fixed remuneration covering the present value of the risk and the cost of capital of the Regional Banks.
The effectiveness of the mechanism is secured by cash deposits paid by the Regional Banks to Crédit Agricole S.A. The security deposits are calibrated to show the capital savings generated by Crédit Agricole S.A., and are remunerated at a fixed rate based on conditions prevailing for long-term liquidity.
The mechanism therefore protects Crédit Agricole S.A. from a decline in the overall equity-accounted value of these equity
investments, subject to payment by the Regional Banks of compensation from the security deposit. Likewise, if the overall equity-accounted value later recovers, Crédit Agricole S.A. returns previously paid compensation in accordance with a clawback provision.
In prudential terms:
� Crédit Agricole S.A. reduces its capital requirements in proportion to the amount of the guarantees provided by the Regional Banks;
� the Regional Banks symmetrically record capital requirements matching those offloaded by Crédit Agricole S.A.
This mechanism, which is neutral at Crédit Agricole Group level, enables the rebalancing of capital allocation between Crédit Agricole S.A. and the Regional Banks.
In accounting terms, the guarantees are essentially insurance contracts, due to the existence of a global insurance risk as defined by IFRS 4. For the insured, they are treated as a first demand guarantee received and their remuneration is recognised in stages as a deduction from the interest margin under Revenues. In the event of a call on guarantees, or following an improvement in fortunes, where applicable, the compensation payment or redemption proceeds would be recognised under Cost of risk.
Capital ties between Crédit Agricole S.A. and the Regional BanksThe capital ties between Crédit Agricole S.A. and the Regional Banks are governed by an agreement entered into by the parties prior to Crédit Agricole S.A.’s initial public offering.
Under the terms of this agreement, the Regional Banks exercise their control over Crédit Agricole S.A. through SAS Rue La Boétie, a holding company wholly-owned by them. The purpose of SAS Rue La Boétie is to hold enough shares to ensure that it always owns at least 50% of the share capital and voting rights of Crédit Agricole S.A.
In addition, under the agreement, Crédit Agricole S.A. directly owns approximately 25% of the share capital of each Regional Bank (except for the Caisse Régionale de la Corse which is owned at 100%).
Its holding is in the form of Certificats coopératifs d’associés and Certificats coopératifs d’investissement, both types of non-voting shares which are issued for a term equal to the Company’s lifetime and which give the holders a right in the Company’s net assets in proportion to the amount of share capital they represent.
Crédit Agricole S.A., the central body of the Crédit Agricole network, also holds one mutual share in each Regional Bank, which gives it the status of member.
These arrangements enable Crédit Agricole S.A., as the central body of the Crédit Agricole network, to account for the Regional Banks using the equity method.
Given the Group’s equity structure and the resulting break in the chain of control, the Regional Banks’ interests in SAS Rue La Boétie are recovered in the consolidated financial statements of Crédit Agricole S.A. at its share in the Regional Banks.
However, dividends from SAS Rue La Boétie received by the Regional Banks are eliminated from income with a corresponding entry in reserves within each Regional Bank’s contribution, given that these dividends represent a portion of the income already recognised in the consolidated financial statements of Crédit Agricole S.A.
298 CRÉDIT AGRICOLE S.A. 2014 REGISTRATION DOCUMENT
6 CONSOLIDATED FINANCIAL STATEMENTSGeneral framework
In the consolidated financial statements of the Regional Banks, and consequently in their equity-accounted value in the consolidated financial statements of Crédit Agricole S.A., shares in SAS Rue La Boétie must be measured at fair value. These shares are not quoted in an active market and establishing a valuation that takes account of all the rights and obligations associated with owning shares in SAS Rue La Boétie is complicated by the difficulty to appraise the valuation of intangible and non-marketable items such as:
� the Group’s stable capital structure, which gives the Regional Banks permanent collective control over Crédit Agricole S.A.;
� the coverage of the liquidity and solvency risks of the Regional Banks;
� Crédit Agricole Group’s internal economic and financial relations;
� the pooling of resources; and
� the promotion, development and use of the Crédit Agricole brand.
As a result, and pursuant to IAS 39, where valuation models do not enable a reliable valuation, shares in SAS Rue La Boétie are valued at cost. Where there are objective indications of impairment, the shares are impaired when the share’s carrying amount exceeds a reference value determined using a multi-criteria approach, which is designed to value the expected future cash flows discounted at a rate that would be applied in the market for a similar asset in accordance with paragraph 66 of IAS 39. This approach combines a valuation of the future expected cash flows from the various Group businesses discounted at a market rate, a valuation of the Group’s net asset value, a valuation of the Group’s businesses by reference to recently observed transaction prices for similar businesses, a valuation based on the Crédit Agricole S.A. stock price plus a control premium and, where necessary, a valuation by reference to internal transactions.
RELATED PARTIES
The related parties of Crédit Agricole S.A. Group are the consolidated companies, including companies accounted for using the equity method, and Senior Executives of the Group.
In accordance with the internal financial mechanisms at Crédit Agricole, transactions between Crédit Agricole S.A. and the Regional Banks(1) are presented as Crédit Agricole internal transactions in the balance sheet and income statement (Note 4.1 “Interest income and expenses”, Note 4.2 “Net fees and commissions” and Note 6.5 “Loans and receivables due from credit institutions and due from customers”).
Other shareholders’ agreementsShareholder agreements signed during the year are detailed in Note 2 “Major transactions and material events during the period”.
Relationships between controlled companies affecting the consolidated balance sheetA list of Crédit Agricole S.A. Group companies can be found in Note 12 “Scope of consolidation at 31 December 2014”. Since the transactions and outstandings at year-end between the Group’s fully consolidated companies are eliminated on consolidation, only transactions with companies consolidated by the equity method affect the Group’s consolidated financial statements.
The main corresponding outstandings in the consolidated balance sheet at 31 December 2014 relate to the groups UBAF, Menafinance, FGA Capital, Forso and Elipso Finance SRL, for the following amounts:
� loans and receivables due from credit institutions: €1,568 million;
� loans and receivables due from customers: €3,481 million;
� due to credit institutions: €204 million;
� due to customers: €11 million.
The transactions entered into with these groups did not have a material effect on the income statement for the period.
Management of retirement, early retirement and end-of-career allowance commitments: Internal hedging contracts within the GroupAs presented in Note 1.3 “Accounting policies and principles”, employees are provided with various types of post-employment benefits. These include:
� end-of-career allowances;
� retirement plans, which may be either “defined-contribution” or “defined-benefit” plans.
The liability in this respect is partially funded by collective insurance contracts taken out with Predica, Crédit Agricole Group’s life insurance company.
These contracts govern:
� the setting up by the insurance company of mutual funds for investing contributions made by the employer to build up sufficient funds to cover end-of-career allowances or retirement benefits;
� the management of the funds by the insurance company;
� the payment to the beneficiaries of the allowances and of the benefits due under the various plans.
Information on post-employment benefits is provided in Note 7 “Employee benefits and other compensation” in paragraphs 7.3 and 7.4.
Relations with senior managementDetailed information on senior management compensation is provided in Note 7 “Employee benefits and other compensation” in paragraph 7.7, as well as in the part on “Compensation policy” in chapter 3 “Corporate governance” of the registration document.
There exist no material transactions between Crédit Agricole S.A. and its senior management, their families or the companies they control and which are not included in the Group’s scope of consolidation.
(1) Except for the Caisse Régionale de la Corse, fully consolidated
CRÉDIT AGRICOLE S.A. 2014 REGISTRATION DOCUMENT 299
6
CONSOLIDATED FINANCIAL STATEMENTSConsolidated financial statements
CONSOLIDATED FINANCIAL STATEMENTS
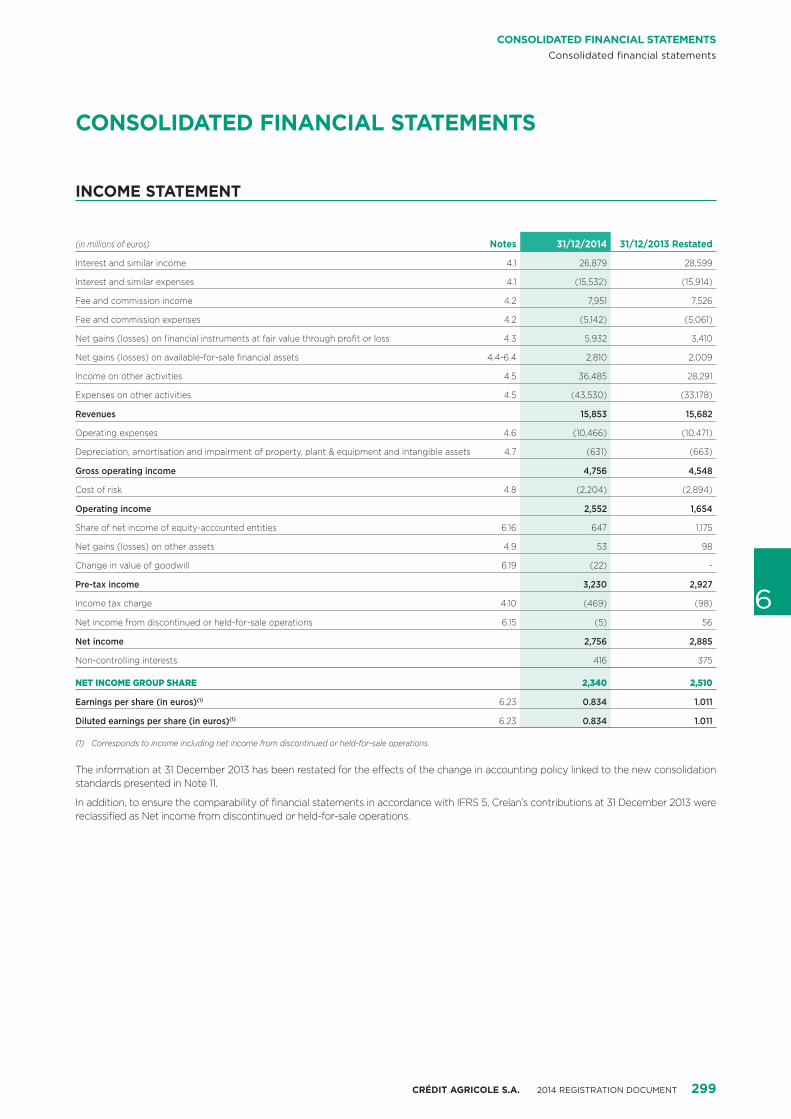
INCOME STATEMENT
(in millions of euros) Notes 31/12/2014 31/12/2013 Restated
Interest and similar income 4.1 26,879 28,599
Interest and similar expenses 4.1 (15,532) (15,914)
Fee and commission income 4.2 7,951 7,526
Fee and commission expenses 4.2 (5,142) (5,061)
Net gains (losses) on financial instruments at fair value through profit or loss 4.3 5,932 3,410
Net gains (losses) on available-for-sale financial assets 4.4-6.4 2,810 2,009
Income on other activities 4.5 36,485 28,291
Expenses on other activities 4.5 (43,530) (33,178)
Revenues 15,853 15,682
Operating expenses 4.6 (10,466) (10,471)
Depreciation, amortisation and impairment of property, plant & equipment and intangible assets 4.7 (631) (663)
Gross operating income 4,756 4,548
Cost of risk 4.8 (2,204) (2,894)
Operating income 2,552 1,654
Share of net income of equity-accounted entities 6.16 647 1,175
Net gains (losses) on other assets 4.9 53 98
Change in value of goodwill 6.19 (22) -
Pre-tax income 3,230 2,927
Income tax charge 4.10 (469) (98)
Net income from discontinued or held-for-sale operations 6.15 (5) 56
Net income 2,756 2,885
Non-controlling interests 416 375
NET INCOME GROUP SHARE 2,340 2,510
Earnings per share (in euros)(1) 6.23 0.834 1.011
Diluted earnings per share (in euros)(1) 6.23 0.834 1.011
(1) Corresponds to income including net income from discontinued or held-for-sale operations.
The information at 31 December 2013 has been restated for the effects of the change in accounting policy linked to the new consolidation standards presented in Note 11.
In addition, to ensure the comparability of financial statements in accordance with IFRS 5, Crelan’s contributions at 31 December 2013 were reclassified as Net income from discontinued or held-for-sale operations.

300 CRÉDIT AGRICOLE S.A. 2014 REGISTRATION DOCUMENT
6 CONSOLIDATED FINANCIAL STATEMENTSConsolidated financial statements
NET INCOME AND OTHER COMPREHENSIVE INCOME
(in millions of euros) Notes 31/12/2014 31/12/2013 Restated
Net income 2,756 2,885
Actuarial gains and losses on post-employment benefits 4.11 (300) 41
Gains and losses on non-current assets held for sale 4.11 - -
Pre-tax other comprehensive income on items that will not be reclassified to profit and loss excluding equity-accounted entities (300) 41
Pre-tax other comprehensive income on items that will not be reclassified to profit and loss on equity-accounted entities 4.11 135 (39)
Income tax related to items that will not be reclassified to profit and loss excluding equity-accounted entities 4.11 97 (15)
Income tax related to items that will not be reclassified to profit and loss on equity-accounted entities 4.11 12 -
Other comprehensive income on items that will not be reclassified subsequently to profit and loss net of income tax (56) (13)
Gains and losses on translation adjustements 4.11 442 (286)
Gains and losses on available-for-sale financial assets 4.11 1,905 (70)
Gains and losses on hedging derivative instruments 4.11 699 (406)
Gains and losses on non-current assets held for sale 4.11 41 15
Pre-tax other comprehensive income on items that may be reclassified to profit and loss excluding equity-accounted entities 3,087 (747)
Pre-tax other comprehensive income on items that may be reclassified to profit and loss on equity-accounted entities, Group Share 4.11 266 (130)
Income tax related to items that may be reclassified to profit and loss excluding equity-accounted entities 4.11 (856) 227
Income tax related to items that may be reclassified to profit and loss on equity-accounted entities 4.11 - (3)
Other comprehensive income on items that may be reclassified subsequently to profit and loss net of income tax 2,497 (653)
OTHER COMPREHENSIVE INCOME NET OF INCOME TAX 2,441 (666)
NET INCOME AND OTHER COMPREHENSIVE INCOME 5,197 2,219
of which Group share 4,517 1,927
of which non-controlling interests 680 292
The information at 31 December 2013 has been restated for the effects of the change in accounting policy linked to the new consolidation standards presented in Note 11.
Reclassification of discontinued or held-for-sale operations had no material impact on the presentation of other comprehensive income at 31 December 2013 and at 31 December 2014.
CRÉDIT AGRICOLE S.A. 2014 REGISTRATION DOCUMENT 301
6
CONSOLIDATED FINANCIAL STATEMENTSConsolidated financial statements
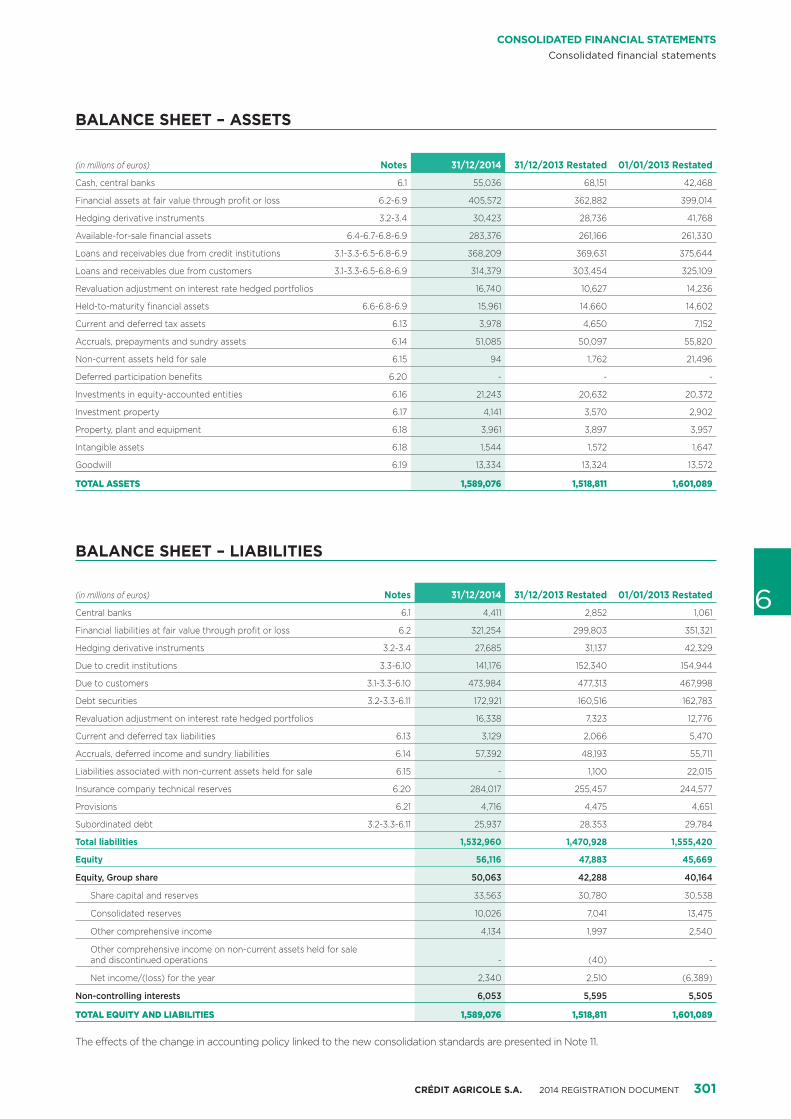
BALANCE SHEET – ASSETS
(in millions of euros) Notes 31/12/2014 31/12/2013 Restated 01/01/2013 Restated
Cash, central banks 6.1 55,036 68,151 42,468
Financial assets at fair value through profit or loss 6.2-6.9 405,572 362,882 399,014
Hedging derivative instruments 3.2-3.4 30,423 28,736 41,768
Available-for-sale financial assets 6.4-6.7-6.8-6.9 283,376 261,166 261,330
Loans and receivables due from credit institutions 3.1-3.3-6.5-6.8-6.9 368,209 369,631 375,644
Loans and receivables due from customers 3.1-3.3-6.5-6.8-6.9 314,379 303,454 325,109
Revaluation adjustment on interest rate hedged portfolios 16,740 10,627 14,236
Held-to-maturity financial assets 6.6-6.8-6.9 15,961 14,660 14,602
Current and deferred tax assets 6.13 3,978 4,650 7,152
Accruals, prepayments and sundry assets 6.14 51,085 50,097 55,820
Non-current assets held for sale 6.15 94 1,762 21,496
Deferred participation benefits 6.20 - - -
Investments in equity-accounted entities 6.16 21,243 20,632 20,372
Investment property 6.17 4,141 3,570 2,902
Property, plant and equipment 6.18 3,961 3,897 3,957
Intangible assets 6.18 1,544 1,572 1,647
Goodwill 6.19 13,334 13,324 13,572
TOTAL ASSETS 1,589,076 1,518,811 1,601,089
BALANCE SHEET – LIABILITIES
(in millions of euros) Notes 31/12/2014 31/12/2013 Restated 01/01/2013 Restated
Central banks 6.1 4,411 2,852 1,061
Financial liabilities at fair value through profit or loss 6.2 321,254 299,803 351,321
Hedging derivative instruments 3.2-3.4 27,685 31,137 42,329
Due to credit institutions 3.3-6.10 141,176 152,340 154,944
Due to customers 3.1-3.3-6.10 473,984 477,313 467,998
Debt securities 3.2-3.3-6.11 172,921 160,516 162,783
Revaluation adjustment on interest rate hedged portfolios 16,338 7,323 12,776
Current and deferred tax liabilities 6.13 3,129 2,066 5,470
Accruals, deferred income and sundry liabilities 6.14 57,392 48,193 55,711
Liabilities associated with non-current assets held for sale 6.15 - 1,100 22,015
Insurance company technical reserves 6.20 284,017 255,457 244,577
Provisions 6.21 4,716 4,475 4,651
Subordinated debt 3.2-3.3-6.11 25,937 28,353 29,784
Total liabilities 1,532,960 1,470,928 1,555,420
Equity 56,116 47,883 45,669
Equity, Group share 50,063 42,288 40,164
Share capital and reserves 33,563 30,780 30,538
Consolidated reserves 10,026 7,041 13,475
Other comprehensive income 4,134 1,997 2,540
Other comprehensive income on non-current assets held for sale and discontinued operations - (40) -
Net income/(loss) for the year 2,340 2,510 (6,389)
Non-controlling interests 6,053 5,595 5,505
TOTAL EQUITY AND LIABILITIES 1,589,076 1,518,811 1,601,089
The effects of the change in accounting policy linked to the new consolidation standards are presented in Note 11.

302 CRÉDIT AGRICOLE S.A. 2014 REGISTRATION DOCUMENT
6 CONSOLIDATED FINANCIAL STATEMENTSConsolidated financial statements
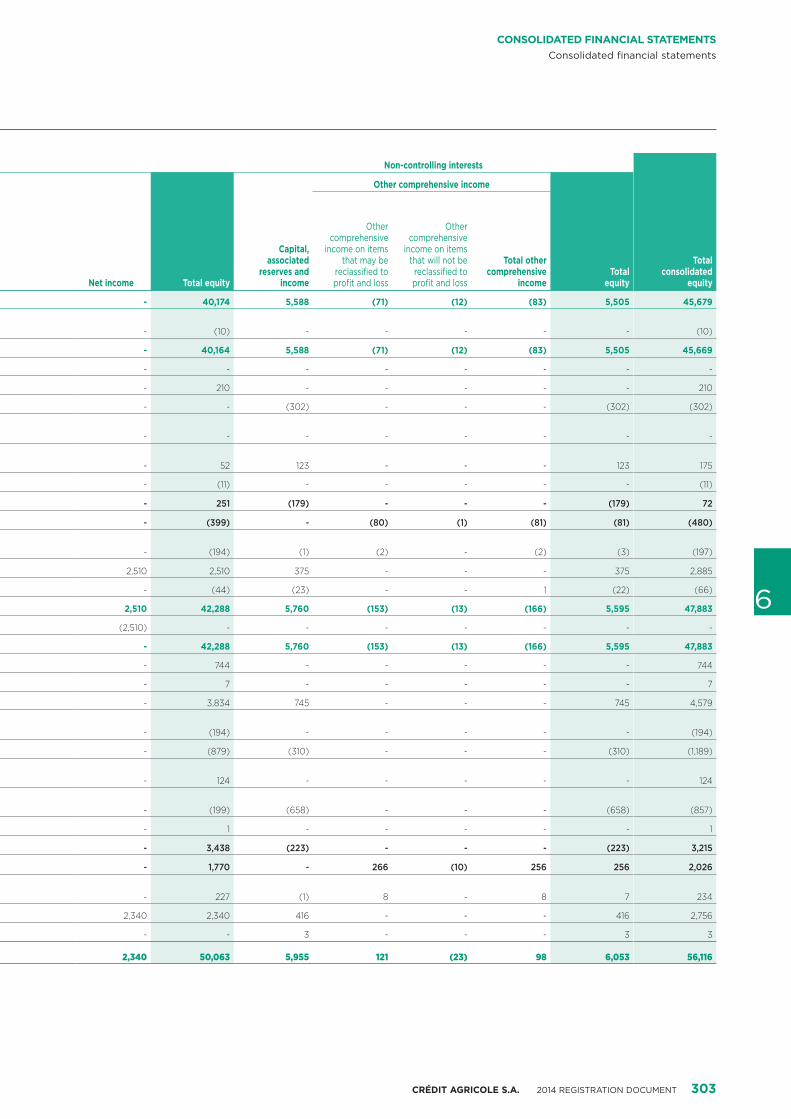
STATEMENT OF CHANGES IN EQUITY
(in millions of euros)
Group share
Share capital and reserves Other comprehensive income
Share capital
Share premium and consolidated
reserves
Elimination of treasury
sharesOther equity instruments
Total capital and
consolidated reserves
Other comprehensive
income on items that
may be reclassified
to profit and loss
Other comprehensive
income on items that will not be
reclassified to profit and loss
Total other comprehensive
income
Equity at 1 January 2013 stated 7,494 30,511 (370) - 37,635 2,921 (382) 2,539
Impacts on the new consolidation standards (IFRS 10) - (10) - - (10) - - -
Equity at 1 January 2013 restated 7,494 30,501 (370) - 37,625 2,921 (382) 2,539
Capital increase 11 (11) - - - - - -
Changes in treasury shares held - - 210 - 210 - - -
Dividends paid in 2013 - - - - - - - -
Dividends received from Regional Banks and subsidiaries - - - - - - - -
Impact of acquisitions/disposals on non-controlling interests - 52 - - 52 - - -
Changes due to share-based payments - (11) - - (11) - - -
Changes due to transactions with shareholders 11 30 210 - 251 - - -
Changes in other comprehensive income - - - - - (423) 24 (399)
Share of changes in equity of equity-accounted entities - (10) - - (10) (144) (40) (184)
Net income at 31 December 2013 - - - - - - - -
Other changes - (45) - - (45) 1 - 1
Equity at 31 December 2013 restated 7,505 30,476 (160) - 37,821 2,355 (398) 1,957
Appropriation of 2013 net income - 2,510 - - 2,510 - - -
Equity at 1 January 2014 7,505 32,986 (160) - 40,331 2,355 (398) 1,957
Capital increase 224 520 - - 744 - - -
Changes in treasury shares held - - 7 - 7 - - -
Issuance of equity instruments(1) - (27) - 3,861 3,834 - - -
2014 remuneration of undated deeply subordinated notes(1) - (194) - - (194) - - -
Dividends paid in 2014 - (879) - - (879) - - -
Dividends received from Regional Banks and subsidiaries - 124 - - 124 - - -
Impact of acquisitions/disposals on non-controlling interests(2) - (199) - - (199) - - -
Changes due to share-based payments - 1 - - 1 - - -
Change due to transactions with shareholders 224 (654) 7 3,861 3,438 - - -
Changes in other comprehensive income - - - - - 1,963 (193) 1,770
Share of changes in equity of equity-accounted entities - (180) - - (180) 260 147 407
Net income at 31 December 2014 - - - - - - - -
Other changes - - - - - - - -
EQUITY AT 31 DECEMBER 2014 7,729 32,152 (153) 3,861 43,589 4,578 (444) 4,134
(1) As part of efforts to increase the Group’s regulatory capital, on 23 January, 8 April and 18 September 2014, Crédit Agricole S.A. issued Additional Tier 1 deeply subordinated perpetual bonds (in USD, GBP and euros) for €3,640 million, net of issuance costs and accrued interest.
On 14 October 2014, Crédit Agricole Assurances issued in euros Additional Tier 1 subordinated perpetual bonds for €745 million, net of issuance costs and accrued interest. This issue was subscribed by non-Group entities and is recognised in equity – Non-controlling interests.
(2) The impact of acquisitions and disposals on non-controlling interests mainly corresponds to the liquidation of CA Preferred Funding Trust2 for -€404 million, the acquisition of 5% of Amundi Group by Crédit Agricole S.A. for -€155 million, and the acquisition of 1.5% of Cariparma for -€72 million.
CRÉDIT AGRICOLE S.A. 2014 REGISTRATION DOCUMENT 303
6
CONSOLIDATED FINANCIAL STATEMENTSConsolidated financial statements
Non-controlling interests
Total consolidated
equityNet income Total equity
Capital, associated
reserves and income
Other comprehensive income
Total equity
Other comprehensive
income on items that may be
reclassified to profit and loss
Other comprehensive
income on items that will not be
reclassified to profit and loss
Total other comprehensive
income
- 40,174 5,588 (71) (12) (83) 5,505 45,679
- (10) - - - - - (10)
- 40,164 5,588 (71) (12) (83) 5,505 45,669
- - - - - - - -
- 210 - - - - - 210
- - (302) - - - (302) (302)
- - - - - - - -
- 52 123 - - - 123 175
- (11) - - - - - (11)
- 251 (179) - - - (179) 72
- (399) - (80) (1) (81) (81) (480)
- (194) (1) (2) - (2) (3) (197)
2,510 2,510 375 - - - 375 2,885
- (44) (23) - - 1 (22) (66)
2,510 42,288 5,760 (153) (13) (166) 5,595 47,883
(2,510) - - - - - - -
- 42,288 5,760 (153) (13) (166) 5,595 47,883
- 744 - - - - - 744
- 7 - - - - - 7
- 3,834 745 - - - 745 4,579
- (194) - - - - - (194)
- (879) (310) - - - (310) (1,189)
- 124 - - - - - 124
- (199) (658) - - - (658) (857)
- 1 - - - - - 1
- 3,438 (223) - - - (223) 3,215
- 1,770 - 266 (10) 256 256 2,026
- 227 (1) 8 - 8 7 234
2,340 2,340 416 - - - 416 2,756
- - 3 - - - 3 3
2,340 50,063 5,955 121 (23) 98 6,053 56,116

304 CRÉDIT AGRICOLE S.A. 2014 REGISTRATION DOCUMENT
6 CONSOLIDATED FINANCIAL STATEMENTSConsolidated financial statements
CASH FLOW STATEMENT
The cash flow statement is presented using the indirect method.
Operating activities show the impact of cash inflows and outflows arising from Crédit Agricole S.A. Group’s income-generating activities, including those associated with assets classified as held-to-maturity financial assets.
Tax inflows and outflows are included in full within operating activities.
Investment activities show the impact of cash inflows and outflows associated with purchases and sales of investments in consolidated and non-consolidated companies, property, plant and equipment and intangible assets. This section includes
strategic equity investments classified as available-for-sale financial assets.
Financing activities show the impact of cash inflows and outflows associated with equity and long-term borrowing.
The net cash flows attributable to the operating, investment and financing activities of discontinued operations are presented on separate lines in the cash flow statement.
Net cash and cash equivalents include cash, debit and credit balances with central banks and debit and credit demand balances with credit institutions.

CRÉDIT AGRICOLE S.A. 2014 REGISTRATION DOCUMENT 305
6
CONSOLIDATED FINANCIAL STATEMENTSConsolidated financial statements
(in millions of euros) Notes 31/12/2014 31/12/2013 Restated
Pre-tax income 3,230 2,927
Net depreciation and impairment of property, plant & equipment and intangible assets 646 679
Impairment of goodwill and other fixed assets 6.19 22 -
Net depreciation charges to provisions 17,950 14,169
Share of net income (loss) of equity-accounted entities (647) (1,175)
Net income (loss) from investment activities 149 (173)
Net income (loss) from financing activities 3,835 3,987
Other movements (1,346) (3,990)
Total non-cash and other adjustment items included in pre-tax income 20,609 13,497
Change in interbank items (10,082) (15,817)
Change in customer items (16,573) 38,092
Change in financial assets and liabilities (24,151) (24,246)
Change in non-financial assets and liabilities 9,069 (2,794)
Dividends received from equity-accounted entities(1) 364 311
Tax paid 521 (659)
Net change in assets and liabilities used in operating activities (40,852) (5,113)
Cash provided (used) by discontinued operations 6.15 6 (181)
Total net cash flows from (used by) operating activities (A) (17,007) 11,130
Change in equity investments(2) (992) (15)
Change in property, plant & equipment and intangible assets (742) (636)
Cash provided (used) by discontinued operations 6.15 (113) (55)
Total net cash flows from (used by) investment activities (B) (1,847) (706)
Cash received from (paid to) shareholders(3) 3,546 36
Other cash provided (used) by financing activities (4) (2,114) (3,045)
Cash provided (used) by discontinued operations 6.15 (8) (25)
Total net cash flows from (used by) financing activities (C) 1,424 (3,034)
Impact of exchange rate changes on cash and cash equivalent (D) 2,765 (2,979)
NET INCREASE/(DECREASE) IN CASH & CASH EQUIVALENT (A + B + C + D) (14,665) 4,411
Cash and cash equivalents at beginning of period 55,964 51,553
Net cash accounts and accounts with central banks* 65,385 41,813
Net demand loans and deposits with credit institutions** (9,421) 9,740
Cash and cash equivalents at end of period 41,299 55,964
Net cash accounts and accounts with central banks* 50,619 65,385
Net demand loans and deposits with credit institutions** (9,320) (9,421)
NET CHANGE IN CASH AND CASH EQUIVALENTS (14,665) 4,411
* Consisting of the net balance of the Cash and central banks item, excluding accrued interest and including cash of entities reclassified as held-for-sale operations.
** Consisting of the balance of Performing current accounts in debit and Performing overnight accounts and advances as detailed in Note 6.5 and Current accounts in credit and overnight accounts and advances as detailed in Note 6.10 (excluding accrued interest).
(1) Dividends received from equity-accounted entities:At 31 December 2014, this amount mainly includes the payment of dividends from the Regional Banks for €269 million.
(2) Change in equity investments:This line shows the net effects on cash of acquisitions and disposals of equity investments. These external operations are described in Note 2.The net impact on Group cash of acquisitions and disposals of consolidated equity investments (subsidiaries and equity-accounted entities) at 31 December 2014 is €259 million. The main transactions relate in particular to the acquisition of Amundi shares for €353 million and of Cariparma shares for €80 million, less the disposal of Nordic entities of CA Consumer Finance for €149 million, of Semeru Asia Equity High Yield Fund for €35 million and of BNI Madagascar and CA Bulgarie for €21 million.Furthermore, the main disposals of equity-accounted companies are Newedge (€273 million) and Banco Espiríto Santo (€106 million). Lastly, the subscription to the capital increase of Banco Espiríto Santo had an impact of -€33 million on cash.In the same period, the net impact on Group cash of acquisitions and disposals of non-consolidated equity investments came to -€1,251 million, primarily related to the acquisitions and disposals carried out as part of the programme of insurance company investments for -€1,269 million, less the disposal of ESAF securities for €30 million, Immobiliara Colonial for €64 million and exit from the scope of consolidation of the IFUK securities for €40 million. Finally, Crédit Agricole S.A. Group subscribed to capital increase of the Caisse de Refinancement de l’Habitat (CRH) for -€95 million.
(3) Cash received from (paid to) shareholders:This line includes -€4,567 million in issue of capital instruments and the liquidation of a sub-fund of CA Preferred LLC for -€415 million. In addition, -€616 million in dividends, excluding dividends paid in shares, were paid by the subsidiaries of Crédit Agricole S.A. to their minority shareholders.
(4) Other net cash flows from financing activities:At 31 December 2014, bond issues totalled €22,743 million and redemptions -€18,023 million. Subordinated debt issues totalled €696 million and redemptions -€3,770 million.This line also includes cash flows from interest payments on subordinated debt and bonds.
Impacts of the change of method related to the new consolidation standards are shown in Note 11.
306 CRÉDIT AGRICOLE S.A. 2014 REGISTRATION DOCUMENT
6 CONSOLIDATED FINANCIAL STATEMENTSNotes to the financial statements
NOTES TO THE FINANCIAL STATEMENTS
NOTE 1 Group accounting policies and principles, assessments and estimates 3071.1 Applicable standards and comparability 307
1.2 Presentation of financial statements 308
1.3 Accounting policies and principles 308
1.4 Consolidation principles and methods (IFRS 10, IFRS 11 and IAS 28) 319
NOTE 2 Major structural transactions and material events during the period 3222.1 Comprehensive Assessment: asset quality
review and stress tests of European banks by the European Central Bank 322
2.2 Structural transactions over the period 322
2.3 Operations of Crédit Agricole S.A. Group in Portugal 324
2.4 Analysis of the impacts of the application of IFRS 10 and IFRS 11 324
2.5 Interest in the share capital of Bank of Italy 324
2.6 Specific guarantees provided by the Regional Banks to Crédit Agricole S.A. (Switch) 324
2.7 Issue of undated deeply subordinated bonds by Crédit Agricole S.A. 325
NOTE 3 Financial management, risk exposure and hedging policy 3253.1 Credit risk 325
3.2 Market risk 331
3.3 Liquidity and financing risk 334
3.4 Cash flow and fair value interest rate and foreign exchange hedging 337
3.5 Operational risks 337
3.6 Capital management and regulatory ratios 338
NOTE 4 Notes to the income statement and other comprehensive income 3394.1 Interest income and expenses 339
4.2 Net fees and commissions 339
4.3 Net gains (losses) on financial instruments at fair value through profit or loss 340
4.4 Net gains (losses) on available-for-sale financial assets 341
4.5 Net income (expenses) on other activities 341
4.6 Operating expenses 342
4.7 Depreciation, amortisation and impairment of property, plant & equipment and intangible assets 342
4.8 Cost of risk 343
4.9 Net gains (losses) on other assets 343
4.10 Income tax charge 344
4.11 Changes in other comprehensive income 345
NOTE 5 Segment reporting 3475.1 Operating segment information 348
5.2 Segment information: geographical analysis 349
5.3 Insurance specificities 350
5.4 French retail banking – Regional Banks 351
NOTE 6 Notes to the balance sheet 3526.1 Cash, central banks 352
6.2 Financial assets and liabilities at fair value through profit or loss 352
6.3 Hedging derivative instruments 353
6.4 Available-for-sale financial assets 354
6.5 Loans and receivables due from credit institutions and due from customers 354
6.6 Held-to-maturity financial assets 3556.7 Transferred assets not derecognised
or derecognised with continuing involvement 3566.8 Impairment deducted from financial assets 3586.9 Exposure to sovereign risk 3606.10 Due to credit institutions and to customers 3646.11 Debt securities and subordinated debt 3656.12 Information on the offsetting of financial assets
and financial liabilities 3666.13 Current and deferred tax assets and liabilities 3686.14 Accrued income and expenses and other assets
and liabilities 3696.15 Assets, liabilities and income from discontinued
or held-for-sale operations 3706.16 Joint ventures and associates 3726.17 Investment properties 3766.18 Property, plant & equipment and intangible
assets (excluding goodwill) 3776.19 Goodwill 3786.20 Insurance company technical reserves 3806.21 Provisions 3816.22 Equity – Preferred shares 3836.23 Equity Group share 3836.24 Non-controlling interests 3856.25 Breakdown of financial assets and liabilities
by contractual maturity 387
NOTE 7 Employee benefits and other compensation 3887.1 Analysis of employee expenses 3887.2 Headcount at year-end 3887.3 Post-employment benefits, defined-contribution
plans 3887.4 Post-employment obligations, defined-benefit plans 3897.5 Other employee benefits 3917.6 Share-based payments 3917.7 Executive compensation 393
NOTE 8 Financing and guarantee commitments and other guarantees 394
NOTE 9 Reclassification of financial instruments 395
NOTE 10 Fair value of financial instruments 39710.1 Fair value of financial assets and liabilities
measured at cost 39710.2 Information about financial instruments
measured at fair value 40110.3 Estimated impact of inclusion of the margin
at inception 411
NOTE 11 Impacts of accounting changes (new consolidation standards) and other events 412
NOTE 12 Scope of consolidation at 31 December 2014 41812.1 Information on subsidiaries 41812.2 Scope of consolidation 419
NOTE 13 Investments in non-consolidated companies and structured entities 43213.1 Investments in non-consolidated companies 43213.2 Non-consolidated structured entities 43213.3 Risks related to interests in non-consolidated
structured entities 433
NOTE 14 Events after the reporting period 43414.1 Acquisition of BAWAG P.S.K. Invest by Amundi 434
Detailed summary of the notes

CRÉDIT AGRICOLE S.A. 2014 REGISTRATION DOCUMENT 307
6
CONSOLIDATED FINANCIAL STATEMENTSNotes to the financial statements / Note 1
NOTE 1 Group accounting policies and principles, assessments and estimates
1.1 Applicable standards and comparability
Pursuant to EC Regulation no. 1606/2002, the consolidated financial statements have been prepared in accordance with IAS/IFRS and IFRIC applicable at 31 December 2014 and as adopted by the European Union (carve-out version), thus using certain exceptions in the application of IAS 39 on macro-hedge accounting.
These standards and interpretations are available on the European Commission website at: http://ec.europa.eu/internal_market/accounting/ias/index_fr.htm
The standards and interpretations are the same as those applied and described in the Group’s financial statements for the year ended 31 December 2013.
They have been supplemented by the IFRS as adopted by the European Union at 31 December 2014 and that must be applied for the first time in the 2014 financial year. These cover the following:
Standards, amendments or interpretations
Date published by the European Union
Date of first-time application: financial years from
Applicable in the Group
IFRS 10 on consolidated financial statements 11 December 2012 (EU no. 1254/2012)
1 January 2014 Yes
IFRS 11 on joint arrangements 11 December 2012 (EU no. 1254/2012)
1 January 2014 Yes
IFRS 12 on disclosure of interests in other entities 11 December 2012 (EU no. 1254/2012)
1 January 2014 Yes
Amended IAS 27 on parent company’s financial statements 11 December 2012 (EU no. 1254/2012)
1 January 2014 No
Amended IAS 28 on investments in associates and joint ventures 11 December 2012 (EU no. 1254/2012)
1 January 2014 Yes
Amendment to IAS 32 on presentation of financial assets and financial liabilities offsetting effects
13 December 2012(EU no. 1256/2012)
1 January 2014 Yes
Amendments related to IFRS 10 transitional provisions: Consolidated financial statements, IFRS 11: Joint arrangements and IFRS 12: Disclosures of interests in other entities
4 April 2013(EU no. 313/2013)
1 January 2014 Yes
Amendments to IFRS 10 and 12 relating to investment entities 20 November 2013(EU no. 1174/2013)
1 January 2014 No
Amendment to IAS 36 on recoverable amount disclosures for non financial assets 19 December 2013(EU no. 1374/2013)
1 January 2014 Yes
Amendments to IAS 39 on financial instruments: recognition and measurement relating to the novation of derivatives and continuation of hedge accounting
19 December 2013(EU no. 1375/2013)
1 January 2014 Yes
The consolidation standards IFRS 10, 11 and 12 and IAS 28 amended came into effect on 1 January 2014, and apply retrospectively. They require the nature of equity interests to be reviewed in light of the new control model, changes in the consolidation method in the event of joint control, and disclosures in the notes.
IFRS 10 supersedes IAS 27 and SIC 12 and introduces a common framework for analysing control based on three cumulative criteria:
� power held over the relevant activities of the investee;
� exposure or rights to variable returns; and
� the ability to use the power over the investee to affect its returns.
The main impact of the first-time application of IFRS 10 was the inclusion of the following entities within the scope of consolidation:
� two multi-seller ABCP conduits (LMA and Atlantic) and 16 “fonds communs de titrisation” (FCT – Securitisation Funds) designed to refinance on the market securitisation transactions on behalf of customers, in Europe and in the United States. Indeed, the conduit sponsor and liquidity provider roles played by Crédit Agricole S.A. Group give it power directly connected with the variability of returns from the business. The liquidity facilities protect investors from credit risk and guarantee the liquidity of the conduits.
The inclusion of these entities into the scope of consolidation increased the balance sheet at 1 January 2013 by €8,128 million. The impact on the income statement was deemed immaterial.
� 172 funds backing unit-linked insurance contracts.
Although the investment is done on behalf of the policyholders, Crédit Agricole S.A. Group nevertheless remains directly exposed to the variability of returns from the funds. Control is deemed when the percentage control is considered significant using the relative approach.
The inclusion of these funds into the scope of consolidation increased the balance sheet at 1 January 2013 by €2,190 million with no impact on the income statement.
For the asset management business, all managed funds were reviewed in light of the new decision-making criteria introduced by IFRS 10. Thus, when Crédit Agricole S.A. Group acts as fund manager, it may have decision-making powers that, combined with a certain level of exposure to the variability of returns, indicates that it is acting as principal and that it has control. Otherwise, Crédit Agricole S.A. Group acts as agent. This analysis did not result in a material change in the scope of consolidation of this business.
308 CRÉDIT AGRICOLE S.A. 2014 REGISTRATION DOCUMENT
6 CONSOLIDATED FINANCIAL STATEMENTSNotes to the financial statements / Note 1
IFRS 11 supersedes IAS 31 and SIC 13. It outlines how joint control is exercised through two forms of arrangements: joint operation and joint venture.
In joint operations, the parties have rights to the entity’s assets, obligations in respect of its liabilities, and must recognise the assets, liabilities, income and expenses relating to their interest in the joint operation. Conversely, joint ventures in which the parties share the rights to the net assets are no longer proportionally consolidated, but are accounted for under the equity method in accordance with IAS 28 amended.
At 31 December 2014, Crédit Agricole S.A. Group was a joint venturer in 50 entities.
The change in consolidation method associated with the first-time application of IFRS 11 and IAS 28 amended, means that the share of interests in such entities is now presented on a single line in the balance sheet, income statement and other comprehensive income.
The effect was to reduce the size of the balance sheet at 1 January 2013 by €26,647 million with no change in net financial position.
The main impacts of the new consolidation standards can be found in Note 11 “Impact of accounting changes (new consolidation standards) and other events”. Changes to the scope of consolidation are explained in Note 12 Scope of consolidation at 31 December 2014.
The new disclosures required by IFRS 12 are given in the following notes:
� Note 6.16 “Joint ventures and associates”;
� Note 6.24 “Non-controlling interests”;
� Note 12.1.1 “Restrictions on entities under Group control”;
� Note 12.1.2 “Support for structured entities(1) under Group control”;
� Note 13.2 “Non-consolidated structured entities”.
The entry into force of the other texts applicable from 1 January 2014 had no significant impact on the Group’s financial statements.
(1) A structured entity is one that has been designed so that voting or other similar rights are not the determining factor in deciding control of the entity, such as when any voting rights relate to administrative tasks only and the relevant activities are directed by means of contractual arrangements.
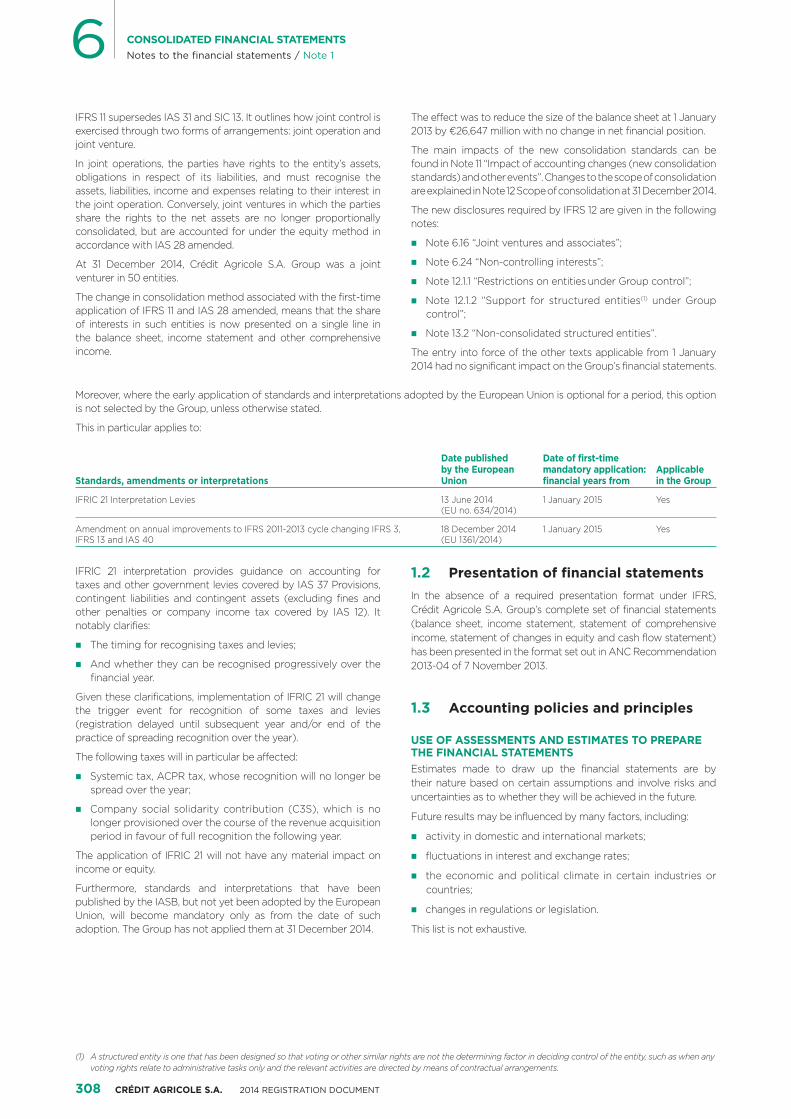
Moreover, where the early application of standards and interpretations adopted by the European Union is optional for a period, this option is not selected by the Group, unless otherwise stated.
This in particular applies to:
Standards, amendments or interpretations
Date published by the European Union
Date of first-time mandatory application: financial years from
Applicable in the Group
IFRIC 21 Interpretation Levies 13 June 2014(EU no. 634/2014)
1 January 2015 Yes
Amendment on annual improvements to IFRS 2011-2013 cycle changing IFRS 3, IFRS 13 and IAS 40
18 December 2014(EU 1361/2014)
1 January 2015 Yes
IFRIC 21 interpretation provides guidance on accounting for taxes and other government levies covered by IAS 37 Provisions, contingent liabilities and contingent assets (excluding fines and other penalties or company income tax covered by IAS 12). It notably clarifies:
� The timing for recognising taxes and levies;
� And whether they can be recognised progressively over the financial year.
Given these clarifications, implementation of IFRIC 21 will change the trigger event for recognition of some taxes and levies (registration delayed until subsequent year and/or end of the practice of spreading recognition over the year).
The following taxes will in particular be affected:
� Systemic tax, ACPR tax, whose recognition will no longer be spread over the year;
� Company social solidarity contribution (C3S), which is no longer provisioned over the course of the revenue acquisition period in favour of full recognition the following year.
The application of IFRIC 21 will not have any material impact on income or equity.
Furthermore, standards and interpretations that have been published by the IASB, but not yet been adopted by the European Union, will become mandatory only as from the date of such adoption. The Group has not applied them at 31 December 2014.
1.2 Presentation of financial statementsIn the absence of a required presentation format under IFRS, Crédit Agricole S.A. Group’s complete set of financial statements (balance sheet, income statement, statement of comprehensive income, statement of changes in equity and cash flow statement) has been presented in the format set out in ANC Recommendation 2013-04 of 7 November 2013.
1.3 Accounting policies and principles
USE OF ASSESSMENTS AND ESTIMATES TO PREPARE THE FINANCIAL STATEMENTSEstimates made to draw up the financial statements are by their nature based on certain assumptions and involve risks and uncertainties as to whether they will be achieved in the future.
Future results may be influenced by many factors, including:
� activity in domestic and international markets;
� fluctuations in interest and exchange rates;
� the economic and political climate in certain industries or countries;
� changes in regulations or legislation.
This list is not exhaustive.
CRÉDIT AGRICOLE S.A. 2014 REGISTRATION DOCUMENT 309
6
CONSOLIDATED FINANCIAL STATEMENTSNotes to the financial statements / Note 1
Accounting estimates based on assumptions are principally used in the following assessments:
� financial instruments measured at fair value;
� investments in non-consolidated companies;
� retirement plans and other post-employment benefits;
� stock option plans;
� long-term depreciation of available-for-sale financial assets and held-to-maturity investments;
� impairment of loans;
� provisions;
� impairment of goodwill;
� deferred tax assets;
� valuation of equity-accounted entities;
� deferred participation benefits.
The procedures for the use of assessments or estimates are described in the relevant sections below.
FINANCIAL INSTRUMENTS (IAS 32 AND 39)Financial assets and liabilities are treated in the financial statements in accordance with IAS 39 as endorsed by the European Commission.
At the time of initial recognition, financial assets and financial liabilities are measured at fair value including trading costs (with the exception of financial instruments recognised at fair value through profit or loss). Subsequently, financial assets and financial liabilities are measured according to their classification, either at fair value or at amortised cost based on the effective interest rate method.
IFRS 13 defines fair value as the price that would be received to sell an asset or paid to transfer a liability in an ordinary transaction between market participants, on the principal or the most advantageous market, at the measurement date.
The effective interest rate is the rate that exactly discounts estimated future cash payments or receipts through the expected life of the financial instrument or, when appropriate, a shorter period, to obtain the net carrying amount of the financial asset or financial liability.
Securities
Classification of financial assetsUnder IAS 39, securities are divided into four categories:
� Financial assets held for trading or financial assets designated at fair value through profit or loss;
� held-to-maturity financial assets;
� loans and receivables;
� available-for-sale financial assets.
Financial assets held for trading or financial assets designated at fair value through profit or lossAccording to IAS 39, this portfolio comprises securities that are classified under financial assets at fair value through profit or loss either as a result of a genuine intention to trade them (financial assets held for trading) or of being designated at fair value by Crédit Agricole S.A. Group.
Financial assets at fair value through profit or loss are assets acquired or generated by the enterprise primarily with the aim of disposal in the short term or which are included in a portfolio of financial instruments managed as a unit and with the purpose of making a profit from short term price fluctuations or an arbitrage margin.
Financial assets, provided they meet the conditions specified in the standard, can be designated as at fair value through profit or loss in the following three cases: for hybrid instruments comprising one or more embedded derivatives, where the fair value option would reduce an accounting mismatch or for a group of financial assets under management whose performance is measured at fair value. This method is generally used so that derivatives embedded in hybrid instruments do not have to be recognised and measured separately.
To this end, Crédit Agricole S.A. Group has designated the following assets at fair value through profit or loss:
� assets backing unit-linked contracts;
� private equity business portfolio.
Securities that are classified under financial assets at fair value through profit or loss are recognised at fair value at inception, excluding transaction costs attributable directly to their acquisition (which are taken directly to profit or loss) and including accrued interest.
They are subsequently carried at fair value and changes in fair value are taken to profit or loss.
No impairment losses are booked for this category of securities.
Outstanding syndication securities held for sale are recognised as financial assets at fair value through profit or loss and are marked to market.
Held-to-maturity financial assetsThe category Held-to-maturity financial assets (applicable to securities with fixed maturities) includes securities with fixed or determinable payments that Crédit Agricole S.A. Group has the intention and ability to hold until maturity other than:
� securities that are initially designated as financial assets at fair value through profit or loss at the time of initial recognition by Crédit Agricole S.A. Group;
� securities that fall into the “Loans and receivables” category. Hence, debt securities that are not traded in an active market cannot be included in the “Held-to-maturity financial assets” category.
Classification as held-to-maturity means that the entity must abide by the prohibition on the sale of securities prior to maturity, except where allowed under IAS 39.
Hedging of interest rate risk for this category of securities is not allowed for hedge accounting under IAS 39.
Held-to-maturity financial assets are initially recognised at acquisition cost, including transaction costs that are directly attributable to the acquisition and including accrued interest.
They are subsequently measured at amortised cost with amortisation of any premium or discount and transaction costs using the effective interest method.
Impairment rules for this financial asset category are disclosed in the section on “Impairment of securities” for securities measured at amortised cost.
Loans and receivablesLoans and receivables comprise unlisted financial assets that generate fixed or determinable payments.
Securities of the Loans and receivables portfolio are initially recognised at acquisition cost, including transaction costs that are directly attributable to the acquisition and including accrued interest.
They are subsequently measured at amortised cost with amortisation of any premium or discount and transaction costs using the corrected effective interest method.

310 CRÉDIT AGRICOLE S.A. 2014 REGISTRATION DOCUMENT
6 CONSOLIDATED FINANCIAL STATEMENTSNotes to the financial statements / Note 1
Impairment rules for this financial asset category are disclosed in the section on “Impairment of securities” for securities measured at amortised cost.
Available-for-sale financial assetsIAS 39 defines available-for-sale financial assets as assets that are other designated as available-for-sale or as the default category.
Available-for-sale financial assets are initially recognised at fair value, including transaction costs that are directly attributable to the acquisition and including accrued interest.
Available-for-sale financial assets are later measured at fair value and subsequent changes in fair value are recorded in other comprehensive income.
If the securities are sold, these changes are transferred to the income statement.
Amortisation of any premiums or discounts and transaction costs on fixed-income securities is recognised in the income statement using the effective interest rate method.
Impairment rules for this financial asset category are disclosed in the section on “Impairment of securities”.
Impairment of securitiesImpairment shall be booked when there is objective evidence of impairment as a result of one or more events that occurred after the initial recognition of the securities, other than assets measured as at fair value through profit or loss.
Objective evidence of loss corresponds to a prolonged or significant decline in the value of the security for equity securities or the appearance of significant deterioration in credit risk evidenced by a risk of non-recovery for debt securities.
For equity securities, Crédit Agricole S.A. Group uses quantitative criteria as indicators of potential impairment. These quantitative criteria are mainly based on a loss of 30% or more of the value of the equity instrument over a period of six consecutive months. Crédit Agricole S.A. Group may also take account of other factors such as financial difficulties of the issuer, or short term prospects, etc.
Notwithstanding the above-mentioned criteria, Crédit Agricole S.A. Group recognises an impairment loss when there is a decline in the value of the equity instrument higher than 50% or prolonged over three years.
For debt securities, impairment criteria are the same as for loans and receivables.
Such impairment is only recognised when it translates into a probable loss of all or part of the amount invested:
� for securities measured at amortised cost through the use of an impairment account, the amount of the loss is recognised in the income statement, and may be reversed in case of subsequent improvements;
� for available-for-sale securities, the amount of the aggregate loss is transferred from other comprehensive income to the income statement; in the event of subsequent recovery in the price of the securities, the loss previously transferred to the income statement may be reversed when justified by circumstances for debt instruments.
Recognition date of securitiesCrédit Agricole S.A. records on the settlement date securities classified in the following two categories: Held-to-maturity financial assets and Loans and receivables. Other securities, regardless of type or classification, are recognised on the trading date.
Reclassification of financial assetsIAS 39 allows “available-for-sale financial assets” to be reclassified as “held-to-maturity financial assets” where there is a change in management intention and if the criteria for reclassification as held-to-maturity are respected.
In accordance with the amendment to IAS 39 as published and adopted by the European Union in October 2008, the following reclassifications are also allowed:
� from the financial assets held-for-trading and available-for-sale financial assets categories to the Loans and receivables category, if the entity now has the intention and ability to hold the financial asset for the foreseeable future or until maturity and if the classification criteria for this category are met upon the transfer date (in particular, financial asset not quoted in an active market);
� in rare documented circumstances, from financial assets held-for-trading to available-for-sale financial assets or held-to-maturity financial assets if the eligibility criteria are met upon the transfer date for each category.
The fair value on the date of reclassification becomes the new cost or amortised cost, as applicable, of the reclassified financial asset.
Information on reclassifications made by Crédit Agricole S.A. Group under the terms of the amendment to IAS 39 is provided in Note 9 “Reclassification of financial instruments”.
Temporary investments in/disposals of securitiesWithin the meaning of IAS 39, temporary sales of securities (securities lending/borrowing, repurchase agreements) do not fulfil the derecognition conditions of IAS 39 and are regarded as collateralised financing.
Securities lent or sold under repurchase agreements remain on the balance sheet. If applicable, the amounts received, representing the liability to the transferee, are recognised on the liability side of balance sheet by the transferer.
Items borrowed or bought under repurchase agreements are not recognised on the balance sheet of the transferee. A receivable is recognised for the amount paid. If the security is subsequently resold, however, the transferee records a liability equivalent to the fair value of fulfilling their obligation to return the security received under the agreement.
Revenue and expenses relating to such transactions are posted to profit and loss on a prorata temporis basis, except in the case of assets and liabilities recognised at fair value through profit or loss.
Lending operationsLoans are principally allocated to the Loans and receivables category. In accordance with IAS 39, they are initially valued at fair value and subsequently valued at amortised cost using the effective interest rate method. The effective interest rate is the rate that exactly discounts estimated future cash payments to the original net loan amount. This rate includes the discounts and any transaction income or transaction costs that are an integral part of the effective interest rate.
Syndication loans held for trading are classified as financial assets held for trading and are marked to market.
Subordinated loans and repurchase agreements (represented by certificates or securities) are included under the various categories of loans and receivables according to counterparty type.
Income calculated based on the effective interest rate is recognised in the balance sheet under accrued interests in the income statement.

CRÉDIT AGRICOLE S.A. 2014 REGISTRATION DOCUMENT 311
6
CONSOLIDATED FINANCIAL STATEMENTSNotes to the financial statements / Note 1
Advances made by Crédit Agricole S.A. to the Regional Banks do not represent a direct risk for Crédit Agricole S.A. with respect to the corresponding customer loans made by the Regional Banks. They do, however, represent a potential indirect risk with respect to the financial strength of the Regional Banks. Crédit Agricole S.A. has not made any provisions for such advances to the Regional Banks.
Impairment of loansIn accordance with IAS 39, loans classified under Loans and receivables are impaired whenever there is objective indication of impairment as a result of one or more loss events occurring after the initial recognition of these loans, such as:
� borrower in serious financial difficulties;
� a breach of contract such as a default on the payment of interest or principal;
� the granting by the lender to the borrower, for economic or legal reasons connected with the borrower’s financial difficulties, of a facility that the lender would not have envisaged under other circumstances (loan restructuring);
� increasing probability of bankruptcy or other financial restructuring of the borrower.
Impairment may be individual or collective, or in the form of discounts on loans that have been restructured due to customer default.
Impairment charges and reversals of impairment losses for non-recovery risk are recognised in cost of risk and any increase in the carrying amount of the loan arising from the accretion of the impairment or amortisation of the restructured loan discount is recognised in interest margin.
Impairment losses are discounted and estimated on the basis of several factors, notably business- or sector-related. It is possible that future assessments of the credit risk may differ significantly from current estimates, which may lead to an increase or decrease in the amount of the impairment.
Probable losses in respect of off-balance sheet commitments are covered by provisions recognised as liabilities.
Loans individually assessed for impairmentEach loan is first individually assessed for known risk of loss. Projected losses are thus measured by means of individual impairment losses for all types of loans, including guaranteed, where there is objective indication of impairment. The amount of impairment losses is the difference between the carrying amount of loans (amortised cost) and the sum of estimated future flows, discounted at the original effective interest rate.
Possible losses in respect of portfolios of small loans with similar characteristics may be estimated on a statistical basis rather than individually assessed.
Loans collectively assessed for impairmentStatistical and historical customer default experience shows that there is an identified risk of partial uncollectibility of loans not individually impaired. To cover these risks, which cannot by nature be allocated to individual loans, Crédit Agricole S.A. Group takes various collective impairment charges, calculated using models developed on the basis of these statistical data, by way of deduction from asset values. These are determined for each homogenous class of loans displaying similar credit risk characteristics.
� Calculation of impairment losses using Basel models:
Under Basel regulations, each Crédit Agricole S.A. Group’s entity calculates the amount of losses anticipated within one year, using statistical tools and databases, based on a variety of observation criteria that meet the definition of a “loss event” within the meaning of IAS 39.
The amount of impairment is based on the probability of default in each rating class assigned to borrowers, and also on management’s experienced judgement.
The amount of this impairment is obtained by applying to the amount of anticipated losses calculated using the Basel models a maturity correction factor designed to take account of the need to record impairment charges for the anticipated losses up to maturity.
� Other loans collectively assessed for impairment:
Crédit Agricole S.A. Group also sets aside collective impairment charges to cover customer risks that are not allocated to individual loans, such as sector or country impairment losses. These provisions are intended to cover estimated risks based on a sector or geographical analysis for which there is statistical or historical risk of partial non-recovery.
Loan restructuringLoans restructured due to financial difficulties are loans for which the entity changed the initial financial terms (interest rate, term) for economic or legal reasons connected with the borrower’s financial difficulties, in a manner that would not have been considered under other circumstances. They therefore consist of loans that are classified as in default and, since 1 January 2014, performing loans at the date they are restructured.
This excludes loans renegotiated for commercial reasons, with a view to developing or preserving a commercial relationship, and not due to the counterparty’s financial difficulties.
The reduction of future flows granted to a counterparty, which may notably stem from these flows being postponed as part of the restructuring, results in the recognition of a discount. It represents future loss of cash flow discounted at the original effective interest rate.
It is equal to the difference between:
� the carrying amount of the loan;
� and the sum of theoretical future cash flows from the restructured loan, discounted at the original effective interest rate (defined at the date of the financing commitment).
The loss recognised when a loan is restructured is recorded under cost of risk. Its amortisation then affects the interest margin.
Restructured loans are monitored based on ratings in accordance with Basel rules and are impaired on the basis of the estimated credit risk. They are individually impaired within 30 days of a missed payment.
Restructured loans remain in this category for two years (three years if they were in default when restructured).
Watch list loansWatch list loans consist of loans for which payment arrears have been recorded but for which no individual impairment has been set aside.
312 CRÉDIT AGRICOLE S.A. 2014 REGISTRATION DOCUMENT
6 CONSOLIDATED FINANCIAL STATEMENTSNotes to the financial statements / Note 1
Subsidised loans (IAS 20)Under French Government measures to support the agricultural and rural sector and to help home buyers, certain Crédit Agricole S.A. Group entities grant subsidised loans at rates fixed by the Government. Consequently, the Government pays these entities the difference between the subsidised lending rate and a predetermined benchmark rate. Accordingly, no discounts are recognised against subsidised loans.
The subsidy system is periodically reviewed by the Government.
In accordance with IAS 20, subsidies received from the Government are recorded under Interest and similar income and spread over the life of the corresponding loans.
Financial liabilitiesIAS 39 as endorsed by the European Union recognises three categories of financial liabilities:
� financial liabilities at fair value through profit or loss. Fair value changes on this portfolio are recognised in profit or loss at accounting end-periods;
� financial liabilities designated at fair value through profit or loss. Financial liabilities that meet the conditions specified in the standard can be designated as at fair value through profit or loss in the following three cases: for hybrid instruments comprising one or more embedded derivatives, where the fair value option would reduce an accounting mismatch or for a group of financial liabilities under management whose performance is measured at fair value. This method is generally used so that derivatives embedded in hybrid instruments do not have to be recognised and measured separately;
� Other financial liabilities: this includes all types of other financial liabilities. These liabilities are initially measured at fair value (including transaction income and costs) and subsequently at amortised cost using the effective interest method.
The valuation of issues recorded at fair value includes the change in own credit risk of the Group.
Securities classified as financial liabilities or equity
Distinction between liabilities and equitySecurities are classed as debt instruments or equity instruments based on the economic substance of the contractual terms.
A debt instrument is a contractual obligation to:
� deliver cash or another financial asset or
� exchange instruments under potentially unfavourable conditions.
An equity instrument is a contract that offers a discretionary return, represents a residual interest in a company’s net assets after deducting liabilities and is not qualified as a debt instrument.
Treasury shares buy-backTreasury shares (or equivalent derivative instruments, such as stock options) bought back by Crédit Agricole S.A. Group, including shares held to cover stock option plans, do not meet the definition of a financial asset and are deducted from equity. They do not generate any impact on the income statement.
DepositsAll deposits are recorded under the category “Due to customers” in spite of the characteristics of the collection system within Crédit Agricole Group, with deposits originating from the Regional Banks centralised at Crédit Agricole S.A. For the Group, the ultimate counterparty for these deposits is the end customer.
The deposits are initially measured at fair value and subsequently at amortised cost.
Regulated savings products are by nature deemed to be at market rates.
Provisions are taken where necessary against home purchase savings plans and accounts as set out in Note 6.21 “Provisions”.
Derivative instrumentsDerivative instruments are financial assets or liabilities and are recognised on the balance sheet at fair value at inception of the transaction. At the end of each reporting period, derivatives are measured at fair value, whether they are held for trading purposes or used for hedging.
Any change in the value of derivatives on the balance sheet is recorded in the income statement (except in the special case of a cash flow hedging relationship).
Hedge accountingFair value hedges are intended to provide protection from exposure to a change in the fair value of an asset or of a liability that has been recognised, or of a firm commitment that has not been recognised.
Cash flow hedges are intended to provide protection from a change in future cash flows from financial instruments associated with a recognised asset or liability (for example, with all or part of future interest payments on a floating-rate debt) or a projected transaction that is considered to be highly probable.
Hedges of net investments in a foreign operation are intended to provide protection from the risk of an adverse movement in fair value arising from the foreign exchange risks associated with a foreign investment in a currency other than the euro.
Hedges must meet the following criteria in order to be eligible for hedge accounting:
� the hedging instrument and the instrument hedged must be eligible;
� there must be formal documentation from inception, primarily including the individual identification and characteristics of the hedged item, the hedging instrument, the nature of the hedging relationship and the nature of the hedged risk;
� the effectiveness of the hedge must be demonstrated, at inception and retrospectively, by testing at each reporting date.
For interest rate hedges for a portfolio of financial assets or financial liabilities, Crédit Agricole S.A. Group documents the hedging relationship for fair value hedges in accordance with the carve-out version of IAS 39 as endorsed by the European Union.
The Group also documents these hedging relationships based on its gross position in derivative instruments and hedged items.
The effectiveness of the hedging relationships is measured by maturity schedules.
CRÉDIT AGRICOLE S.A. 2014 REGISTRATION DOCUMENT 313
6
CONSOLIDATED FINANCIAL STATEMENTSNotes to the financial statements / Note 1
The change in value of the derivative is recorded in the financial statements as follows:
� fair value hedges: the change in value of the derivative is recognised in the income statement symmetrically with the change in value of the hedged item in the amount of the hedged risk. Only the net amount of any ineffective portion of the hedge is recognised in the income statement;
� cash flow hedges: the change in value of the derivative is recognised in the balance sheet through a specific account in other comprehensive income for the efficient portion and any inefficient portion of the hedge is recognised in the income statement. Any profits or losses on the derivative accrued through other comprehensive income are then reclassified in the income statement when the hedged cash flows occur;
� hedge of a net investment in a foreign operation: the change in value of the derivative is recognised in the balance sheet in the translation adjustment equity account and any ineffective portion of the hedge is recognised in the income statement.
Where the conditions for benefiting from hedge accounting are no longer met, the following accounting treatment must be applied prospectively:
� fair value hedges: only the hedging instrument continues to be revalued through profit or loss. The hedged item is wholly accounted for according to its classification. For available-for-sale securities, changes in fair value subsequent to the ending of the hedging relationship are recorded in other comprehensive income. For hedged items valued at amortised cost, which were interest rate hedged, the revaluation adjustment is amortised over the remaining life of those hedged items.
� cash flow hedges: the hedging instrument is valued at fair value through profit or loss. The amounts accumulated in other comprehensive income under the effective portion of the hedging remain in other comprehensive income until the hedged element affects profit or loss. For interest rate hedged instruments, profit or loss is affected according to the payment of interest. The revaluation adjustment is therefore amortised over the remaining life of those hedged items.
� hedges of net investments in a foreign operation: the amounts accumulated in other comprehensive income under the effective portion of the hedging remain in other comprehensive income while the net investment is held. The income is recorded once the net investment in a foreign operation exits the scope of consolidation.
Embedded derivativesAn embedded derivative is a component of a hybrid contract that meets the definition of a derivative product. Embedded derivatives must be accounted for separately from the host contract if the following three conditions are met:
� the hybrid contract is not measured at fair value through profit or loss;
� the embedded component taken separately from the host contract has the characteristics of a derivative;
� the characteristics of the derivative are not closely related to those of the host contract.
Determination of the fair value of financial instrumentsWhen determining the fair value of financial instruments observable inputs must be prioritised. It is presented using the hierarchy defined in IFRS 13.
IFRS 13 defines fair value as the price that would be received to sell an asset or paid to transfer a liability in an ordinary transaction between market participants, on the principal or the most advantageous market, at the measurement date.
Fair value applies individually to each financial asset or financial liability. A portfolio exemption may be used where the management and risk monitoring strategy so allow and are appropriately documented. Thus, certain fair value parameters are calculated on a net basis when a group of financial assets and financial liabilities is managed on the basis of its net exposure to market or credit risks. This is notably true of the CVA/DVA calculation.
The Group considers that the best evidence of fair value is reference to quoted prices published in an active market.
When such quoted prices are not available, fair value is established by using valuation techniques based on observable data or unobservable inputs.
Fair value of structured issuesIn accordance with IFRS 13, the Group values its structured issues, recognised at fair value, by taking as a reference the issuer spread that specialist participants agree to receive to acquire new Group issues.
Counterparty risk on derivative instrumentsCrédit Agricole S.A. Group incorporates into fair value the assessment of counterparty risk for derivative assets (Credit Valuation Adjustment or CVA) and, using a symmetrical treatment, the non-performance risk for derivative liabilities (Debt Valuation Adjustment or DVA or own credit risk).
The CVA makes it possible to determine the expected losses due to the counterparty from the perspective of Crédit Agricole Group, and DVA, the expected losses due to Crédit Agricole Group from the perspective of the counterparty.
The CVA/DVA is calculated on the basis of an estimate of expected losses based on the probability of default and loss given default. The methodology used maximises the use of observable market inputs. It is primarily based on market data such as registered and listed CDS (or Single Name CDS) or index CDS in the absence of registered CDS on the counterparty. In certain circumstances, historical default data can be used.
Fair value hierarchyThe standard classifies fair value into three levels based on the observability of inputs used in valuation techniques.
Level 1: fair value corresponding to quoted prices (unadjusted) in active marketsLevel 1 is composed of financial instruments that are directly quoted in active markets for identical assets and liabilities that the entity can access at the measurement date. These are stocks and bonds quoted in active markets (such as the Paris Stock Exchange, the London Stock Exchange or the New York Stock Exchange, etc.) and also fund securities quoted in an active market and derivatives traded on an organised market, in particular futures.
A market is regarded as being active if quoted prices are readily and regularly available from an exchange, broker, dealer, pricing service or regulatory agency, and those prices represent actual and regularly occurring market transactions on an arm’s length basis.
For financial assets and liabilities with offsetting market risks, Crédit Agricole S.A. Group uses mid-prices as a basis for establishing fair values for the offsetting risk positions. The Group applies the current bid price to asset held or liability to be issued (open long position) and the current asking price to asset to be acquired or liability held (open short position).

314 CRÉDIT AGRICOLE S.A. 2014 REGISTRATION DOCUMENT
6 CONSOLIDATED FINANCIAL STATEMENTSNotes to the financial statements / Note 1
Level 2: fair value measured using directly or indirectly observable inputs other than those in Level 1The inputs used are observable either directly (i.e. prices) or indirectly (derived from prices) and generally consist of: data from outside the company, which are publicly available or accessible and based on a market consensus.
Level 2 is composed of:
� stocks and bonds quoted in an inactive market or non quoted in an active market but for which fair value is established using a valuation methodology usually used by market participants (such as discounted cash flow techniques or the Black & Scholes model) and based on observable market data;
� instruments that are traded over the counter, the fair value of which is measured with models using observable market data, i.e. derived from various and independent available external sources which can be obtained on a regular basis. For example, the fair value of interest rate swaps is generally derived from the yield curves of market interest rates as observed at the reporting date.
When the models are consistent notably with standard models based on observable market data (such as interest rate yield curves or implied volatility surfaces), the day one gain or loss resulting from the initial fair value measurement of the related instruments is recognised in profit or loss at inception.
Level 3: fair value that is measured using significant unobservable inputsFor some complex instruments that are not traded in an active market, fair value measurement is based on valuation techniques using assumptions i.e. that cannot be observed on the market for an identical instrument. These instruments are disclosed within Level 3.
This mainly concerns complex interest rate instruments, equity derivatives, structured credit instruments which fair value measurement includes for instance correlation or volatility inputs that are not directly benchmarkable.
Since the transaction price is deemed to reflect the fair value at initial recognition, any day one gain or loss recognition is deferred.
The day one gain or loss relating to these structured financial instruments is generally recognised through profit or loss over the period during which inputs are deemed unobservable. When market data become “observable”, the remaining margin to be deferred is immediately recognised in profit or loss.
Valuation methodologies and models used for financial instruments that are disclosed within Levels 2 and 3 incorporate all factors that market participants would consider in setting a price. They shall be beforehand validated by an independent control. Fair value measurement notably includes both liquidity risk and counterparty risk.
Absence of accepted valuation method to determine equity instruments’ fair valueIn accordance with IAS 39 principles, if there is no satisfactory method or if the estimates obtained using the various methods differ excessively, the security is valued at cost and stays recorded under available-for-sale financial Assets because its fair value cannot be reliably measured. In this case, the Group does not report a fair value, in accordance with the applicable recommendations of IFRS 7. These primarily include equity investments in companies that are not quoted in an active market and whose fair value is difficult to measure reliably.
Net gains (losses) on financial instruments
Net gains (losses) on financial instruments at fair value through profit or lossFor financial instruments designated at fair value through profit or loss and financial assets and liabilities held-for-trading, this heading mainly includes the following income statement items:
� dividends and other revenues from equities and other variable-income securities which are classified under financial assets at fair value through profit or loss;
� changes in fair value of financial assets or liabilities at fair value through profit or loss;
� gains and losses on disposal of financial assets at fair value through profit or loss;
� changes in fair value and gains and losses on disposal or termination of derivative instruments not included in a fair value hedging relationship or cash flow hedge.
This heading also includes the inefficient portion of hedges.
Net gains (losses) on available-for-sale financial assetsFor available-for-sale financial assets, this heading mainly includes the following income statement items:
� dividends and other revenues from equities and other variable-income securities which are classified as available-for-sale financial assets;
� gains and losses on disposal of fixed-income and variable-income securities which are classified as available-for-sale financial assets;
� losses in value of variable-income securities;
� net income on disposal or termination of instruments used for fair value hedges of available-for-sale financial assets when the hedged item is sold;
� gains and losses on disposal or termination of loans and receivables and held-to-maturity securities in those cases provided for by IAS 39.
Offsetting of financial assets and financial liabilitiesIn accordance with IAS 32, Crédit Agricole S.A. Group nets a financial asset and a financial liability and reports the net amount when, and only when, it has a legally enforceable right to offset the amounts reported and intends either to settle on a net basis, or to realise the asset and settle the liability simultaneously.
The derivative instruments and the repurchase agreements handled with clearing houses that meet the two criteria required by IAS 32 have been offset on the balance sheet.
The effect of this offsetting is presented in the table in Note 6.12 on the amendment to IFRS 7 on disclosures regarding the offsetting of financial assets and financial liabilities.
Financial guarantees givenA financial guarantee contract is a contract that calls for specific payments to be made by the issuer to reimburse the holder for a loss incurred due to a specified debtor’s failure to make a payment when due under the initial or amended terms of a debt instrument.
Financial guarantee contracts are recognised at fair value initially then subsequently at the higher of:
� the amount calculated in accordance with IAS 37 “Provisions, Contingent Liabilities and Contingent Assets”; or
CRÉDIT AGRICOLE S.A. 2014 REGISTRATION DOCUMENT 315
6
CONSOLIDATED FINANCIAL STATEMENTSNotes to the financial statements / Note 1
� the amount initially recognised, less any depreciation recognised in accordance with IAS 18 “Income on ordinary activities”.
Financing commitments that are not designated as fair value through profit or loss or not treated as derivative instruments within the meaning of IAS 39 are not recognised on the balance sheet. They are, however, covered by provisions in accordance with IAS 37.
Derecognition of financial instrumentsA financial asset (or group of financial assets) is fully or partially derecognised if:
� the contractual rights to the cash flows from the financial asset expire,
� or are transferred or are deemed to have expired or been transferred because they belong de facto to one or more beneficiaries; and substantially all the risks and rewards of ownership in the financial asset are transferred.
In this case, any rights or obligations created or retained at the time of transfer are recognised separately as assets and liabilities.
If the contractual rights to the cash flows are transferred but some of the risks and rewards of ownership as well as control are retained, the financial assets continue to be recognised to the extent of the Group’s continuing involvement in the asset.
A financial liability is derecognised in full or in part:
� when it is extinguished, or
� when quantitative and qualitative analyses suggest it has undergone a substantial change following restructuring.
PROVISIONS (IAS 37 AND 19)Crédit Agricole S.A. Group has identified all obligations (legal or constructive) resulting from a past event for which it is probable that an outflow of resources will be required to settle the obligation, and for which the due date or amount of the settlement is uncertain but can be reliably estimated. These estimates are discounted where applicable whenever there is a material impact.
For obligations other than those related to credit risk, Crédit Agricole S.A. Group has set aside general provisions to cover:
� operational risks;
� employee benefits;
� financing commitment execution risks;
� claims and liability guarantees;
� tax risks;
� risks in connection with home purchase savings plans.
The latter provision is designed to cover the Group’s obligations in the event of unfavourable movements in home purchase savings schemes. These obligations are: i) to pay a fixed rate of interest on the savings contract from inception for an undefined period of time; and ii) to grant a loan to home purchase savings plan savers at a rate fixed at inception of the contract. The provision is calculated for each generation of a home purchase savings plan and for all home purchase savings accounts, with no netting of obligations between generations.
The amount of these obligations is calculated taking account notably of:
� saver behaviour models, based on assumptions regarding customer behaviour drawn from historical experience, which may not necessarily reflect actual trends in future behaviour;
� an estimate of the amount and term of the loans that will be granted in the future, based on historical experience over an extended period of time;
� the yield curve for market rates and reasonably foreseeable trends.
Certain estimates may be made to determine the amount of the following provisions:
� the reserve for operational risks, which although subject to examination for identified risks, requires Management to make assessments with regard to incident frequency and the potential financial impact;
� the reserve for legal risks, which is based on Management’s best estimate in light of the information in its possession at the end of the reporting period.
Detailed information is provided in Note 6.21 Provisions.
EMPLOYEE BENEFITS (IAS 19)In accordance with IAS 19, employee benefits are recorded in four categories:
� short-term employee benefits, including salaries, social security contributions, annual leave, profit-sharing and incentive plans and premiums, are defined as those which are expected to be settled within twelve months of the period in which the related services have been rendered;
� long-term employee benefits (long-service awards, variable compensation and compensation payable 12 months or more after the end of the period);
� termination benefits;
� post-employment benefits fall into two categories: defined-benefit plans and defined contribution plans.
Long-term employee benefitsLong-term employee benefits are employee benefits other than post-employment benefits or termination benefits but not fully due to employees within twelve months after the end of the period in which the related services have been rendered.
These include, in particular, bonuses and other deferred compensation payable twelve or more months after the end of the period in which they were earned, but which are not share-based.
The measurement method is similar to the one used by the Group for post-employment benefits with defined-benefit plans.
Post-employment benefits
Defined-benefit plansAt each reporting date, Crédit Agricole S.A. Group sets aside reserves to cover its liabilities for retirement and similar benefits and all other employee benefits falling in the category of defined-benefit plans.
In keeping with IAS 19, these commitments are stated based on a set of actuarial, financial and demographic assumptions, and in accordance with the projected Unit Credit Method. Under this method, for each year of service, a charge is booked in an amount corresponding to the employee’s vested benefits for the period. The charge is calculated based on the discounted future benefit.
Liabilities for retirement and other employee benefits are based on assumptions made by Management with respect to the discount rate, staff turnover rate and probable increases in salary and social security costs. If the actual figures differ from the assumptions made, the retirement liability may increase or decrease in future
316 CRÉDIT AGRICOLE S.A. 2014 REGISTRATION DOCUMENT
6 CONSOLIDATED FINANCIAL STATEMENTSNotes to the financial statements / Note 1
years (see Note 7.4 Post-employment benefits, defined-benefit plans).
Discount rates are determined based on the average term of the commitment, that is, the arithmetical average of the terms calculated between the valuation date and the payment date weighted by employee turnover assumptions.
The anticipated return on plan assets is also estimated by Management. Returns are estimated on the basis of expected returns on fixed income securities, and notably bonds.
The expected return on plan assets is determined using discount rates applied to measure the defined benefit obligation.
In accordance with IAS 19 revised, all actuarial gains or losses are recognised in other comprehensive income.
The amount of the provision is equal to:
� the present value of the obligation to provide the defined-benefits at the end of the reporting period, calculated in accordance with the actuarial method recommended by IAS 19;
� if necessary, reduced by the fair value of the assets allocated to covering these commitments. These may be represented by an eligible insurance policy. In the event that 100% of the obligation is covered by a policy that meets exactly the expense amount payable over the period for all or part of a defined-benefit plan, the fair value of the policy is deemed to be the value of the corresponding obligation, i.e. the amount of the corresponding actuarial liability.
For such obligations that are not covered, a provision for retirement benefits is recognised under Provisions on the liabilities side of the balance sheet. This provision is equal to Crédit Agricole S.A. Group’s liabilities towards employees in service at year-end, governed by the Crédit Agricole Group collective agreement that came into effect on 1 January 2005.
A provision to cover the cost of early retirement commitments is also listed under Provisions. This provision covers the additional discounted cost of the various early retirement agreements signed by Crédit Agricole Group entities under which employees of eligible age may take early retirement.
Lastly, certain Group companies are liable to pay supplementary retirement benefits. A provision is calculated on the basis of the Company’s actuarial liability for these benefits. These provisions are also shown on the liabilities side of the balance sheet under Provisions.
Defined contribution plansEmployers contribute to a variety of compulsory pension schemes. Plan assets are managed by independent organisations and the contributing companies have no legal or implied obligation to pay additional contributions if the funds do not have sufficient assets to cover all benefits corresponding to services rendered by employees during the year and during prior years. Consequently, Crédit Agricole S.A. Group has no liabilities in this respect other than their on-going contributions.
SHARE-BASED PAYMENTS (IFRS 2)IFRS 2 on Share-based payment requires valuation of share-based payment transactions in the Company’s income statement and balance sheet. This standard applies to transactions with employees and more specifically to:
� share-based payment transactions settled in equity instruments;
� share-based payment transactions settled in cash.
Share-based payment plans initiated by Crédit Agricole S.A. Group that are eligible for IFRS 2, are mainly transactions settled in equity instruments (stock options, free share allocation plans, variable compensation settled in cash indexed or in shares, etc.).
Options granted are measured at their fair value on the date of grant primarily using the Black & Scholes model. These options are recognised as a charge under Employee expenses, with a corresponding adjustment to equity, spread over the vesting period (four years for existing plans).
Employee share issues offered to employees as part of the Employee Saving Plan are also subject to the IFRS 2 standard. Shares may be offered to employees with a discount of no more than 20%. These plans have no vesting period but the shares are subject to a lock-up period of five years. The benefit granted to employees is measured as the difference between the fair value per share acquired taking account of the lock-up period and the purchase price paid by the employee on the issue date multiplied by the number of shares issued.
A more detailed description of the method, existing plans and valuation methods is provided in Note 7.6 “Share-based payment”.
The cost of stock options settled in Crédit Agricole S.A. equity instruments and the cost of share subscriptions are now recognised in the financial statements of the entities that employ the plan beneficiaries. The impact is recorded under Employee expenses, with a corresponding increase in consolidated reserves (Group share).
CURRENT AND DEFERRED TAXESIn accordance with IAS 12, the income tax charge includes all income taxes, whether current or deferred.
IAS 12 defines current tax liability as “the amount of income tax payable (recoverable) in respect of the taxable profit (tax loss) for a reporting period”. Taxable income is the profit (or loss) for a given accounting period measured in accordance with the rules determined by the taxation authorities.
The applicable rates and rules used to measure the current tax liability are those in effect in each country where the Group’s companies are established.
The current tax liability relates to any income due or that will become due, for which payment is not subordinated to the completion of future transactions, even if payment is spread over several years.
The current tax liability must be recognised as a liability until it is paid. If the amount that has already been paid for the current year and previous years exceeds the amount due for these years, the surplus must be recognised under assets.
Moreover, certain transactions carried out by the entity may have tax consequences that are not taken into account in measuring the current tax liability. IAS 12 defines a difference between the carrying amount of an asset or liability and its tax basis as a temporary difference.
CRÉDIT AGRICOLE S.A. 2014 REGISTRATION DOCUMENT 317
6
CONSOLIDATED FINANCIAL STATEMENTSNotes to the financial statements / Note 1
This standard requires that deferred taxes be recognised in the following cases:
� a deferred tax liability should be recognised for any taxable temporary differences between the carrying amount of an asset or liability on the balance sheet and its tax base, unless the deferred tax liability arises from:
� initial recognition of goodwill,
� the initial recognition of an asset or a liability in a transaction that is not a business combination and that does not affect either the accounting or the taxable profit (taxable loss) at the transaction date;
� a deferred tax asset should be recognised for any deductible temporary differences between the carrying amount of an asset or liability on the balance sheet and its tax base, insofar as it is deemed probable that a future taxable profit will be available against which such deductible temporary differences can be allocated;
� a deferred tax asset should also be recognised for carrying forward unused tax losses and tax credits insofar as it is probable that a future taxable profit will be available against which the unused tax losses and tax credits can be allocated.
The tax rates applicable in each country are used.
Deferred taxes are not discounted.
Taxable unrealised gains on securities do not generate any taxable temporary differences between the carrying amount of the asset and the tax base. As a result, deferred tax is not recognised on these gains. When the relevant securities are classified as available-for-sale securities, unrealised gains and losses are recognised directly through other comprehensive income. The tax charge or saving effectively borne by the entity arising from these unrealised gains or losses is reclassified as a deduction from these gains.
In France, all but 12% of long-term capital gains on the sale of equity investments, as defined by the General Tax Code, are exempt from tax as from the tax year commencing on 1 January 2007; the 12% of long term capital gains are taxed at the normally applicable rate. Accordingly, unrealised gains recognised at the end of the year generate a temporary difference requiring the recognition of deferred tax on this share.
Current and deferred tax is recognised in net income for the year, unless the tax arises from:
� either a transaction or event that is recognised directly through other comprehensive income, during the same year or during another year, in which case it is directly debited or credited to other comprehensive income; or
� a business combination.
Deferred tax assets and liabilities are offset against each other if, and only if:
� the entity has a legally enforceable right to offset current tax assets against current tax liabilities; and
� the deferred tax assets and liabilities apply to income taxes assessed by the same tax authority:
� either for the same taxable entity, or
� for different taxable entities that intend either to settle current tax assets and liabilities on a net basis, or to settle their tax assets and liabilities at the same time during each
future financial year in which it is expected that substantial deferred tax assets or liabilities will be paid or recovered.
When tax credits on income from securities portfolios and amounts receivable are effectively used to pay income tax due for the year, they are recognised under the same heading as the income with which they are associated. The corresponding tax charge continues to be recognised under the Income tax charge heading in the income statement.
However, given that the legislative intent when introducing the tax credit for competitiveness and employment (Crédit d’Impôt pour la Compétitivité et l’Emploi – CICE) was to reduce employee expenses, Crédit Agricole S.A. Group chose to recognise the CICE (Article 244 quater C of the French General Tax Code – CGI) as a reduction in employee expenses.
TREATMENT OF FIXED ASSETS (IAS 16, 36, 38 AND 40)Crédit Agricole S.A. Group applies component accounting for all of its property, plant and equipment. In accordance with the provisions of IAS 16, the depreciable amount takes account of the potential residual value of property, plant and equipment.
Land is measured at cost less any impairment losses.
Property used in operations, investment property and equipment are measured at cost less accumulated depreciation and impairment losses since the time they were placed in service.
Purchased software is measured at purchase price less accumulated depreciation and impairment losses since acquisition.
Proprietary software is measured at cost less accumulated depreciation and impairment losses since completion.
Apart from software, intangible assets are mainly assets acquired during a business combination resulting from contract law (e.g. distribution agreement).
Fixed assets are depreciated over their estimated useful lives.
The following components and depreciation periods have been adopted by Crédit Agricole S.A. Group following the application of the measures on component accounting for property, plant and equipment. These depreciation periods are adjusted according to the type of asset and its location:
ComponentDepreciation
period
Land Not depreciable
Structural works 30 to 80 years
Non-structural works 8 to 40 years
Plant and equipment 5 to 25 years
Fixtures and fittings 5 to 15 years
Computer equipment 4 to 7 years
Special equipment 4 to 5 years
Exceptional depreciation charges corresponding to tax-related depreciation and not to any real impairment in the value of the asset are eliminated in the consolidated financial statements.
Based on available information, Crédit Agricole S.A. Group has concluded that impairment testing would not lead to any change in the existing amount of its fixed assets at the end of the reporting period.
318 CRÉDIT AGRICOLE S.A. 2014 REGISTRATION DOCUMENT
6 CONSOLIDATED FINANCIAL STATEMENTSNotes to the financial statements / Note 1
FOREIGN CURRENCY TRANSACTIONS (IAS 21)In accordance with IAS 21, a distinction is made between monetary and non-monetary items.
On the reporting date, foreign-currency denominated monetary assets and liabilities are translated into Crédit Agricole S.A. Group’s functional currency on the closing date. The resulting translation adjustments are recorded in the income statement. There are two exceptions to this rule:
� for available-for-sale financial assets, only the translation adjustments calculated on amortised cost is taken to the income statement; the balance is recorded in equity;
� translation adjustments on elements designated as cash flow hedges or forming part of a net investment in a foreign entity are recognised in other comprehensive income.
Non-monetary items are treated differently depending on the type of items:
� items at historical cost are measured at the exchange rate on the transaction date;
� items at fair value are measured at the exchange rate at the end of the reporting period.
Translation adjustments on non-monetary items are recognised:
� in the income statement if the gain or loss on the non-monetary item is recorded in the income statement;
� in other comprehensive income if the gain or loss on the non-monetary item is recorded in other comprehensive income.
FEES AND COMMISSIONS (IAS 18)Fee and commission income and expenses are recognised in income based on the nature of services with which they are associated:
� fees and commissions that are an integral part of the effective yield on a financial instrument are recognised as an adjustment to the yield on the instrument and included in its effective interest rate;
� when the result from a transaction involving the rendering of services can be estimated reliably, revenue associated with the transaction is recognised in Fees and commissions by reference to the stage of completion of the transaction at the end of the reporting period:
� fees and commissions paid or received in consideration for non-recurring services are fully recognised in the income statement.
Fees and commissions payable or receivable that are contingent upon meeting a performance target are recognised only if all the following conditions are met:
− the amount of fees and commissions can be reliably estimated,
− it is probable that the future economic benefits from the services rendered will flow to the Company,
− the stage of completion of the service can be reliably estimated, and the costs incurred for the service and the costs to complete it can be reliably estimated,
� fees and commissions in consideration for on-going services, such as fees and commissions on payment instruments, are recognised in the income statement and spread over the duration of the service rendered.
INSURANCE BUSINESSES (IFRS 4)Liabilities remain partially valued under French GAAP, as permitted by IAS and IFRS regulations, pending further amendments to the existing standards. Financial assets held by Crédit Agricole S.A. Group’s insurance companies have been reclassified into the financial assets categories set out in IAS 39.
Contracts containing discretionary participation features are collectively classified as a liability under insurance company’s technical reserves. They are recognised in the same way as insurance contracts. Premiums on these contracts are recognised as income and the increase in obligations to policyholders is recognised as an expense.
Life insurance technical reserves are conservatively estimated based on the technical rates defined in the contracts. Liabilities associated with contracts with or without discretionary participation features or guaranteed elements, are measured based on the fair value of the underlying assets or its equivalent at the end of the reporting period and are recorded under financial liabilities.
The financial margin on these policies is taken to profit or loss, after reversing out the technical items (premiums, benefits, etc.), according to deposit accounting principles.
Property and casualty insurance policy liabilities are estimated at the end of the reporting period, without applying any discount. Claims management costs associated with technical reserves are charged to a provision in the financial statements at the reporting date.
For non-life insurance contracts, acquisition costs are recognised as and when the premium is earned. For life insurance contracts, directly identifiable acquisition costs are deferred over the profit generation period.
Total expenses related to the insurance business are presented in Note 4.5 Net income (expenses) on other activities.
As permitted by the extension of local GAAP specified by IFRS 4 and CRC Regulation 2000-05 pertaining to consolidated financial statements for insurance companies, “shadow accounting” is used to account for insurance liabilities for contracts with discretionary participation features. Under this practice, positive or negative valuation differences in the corresponding financial assets that will potentially revert to policyholders are recognised in a “Deferred profit sharing” account.
The deferred profit sharing is recognised on the liabilities side of the balance sheet under insurance company’s technical reserves or on the asset side with an offsetting entry in the income statement or in the valuation reserve, in the same way as unrealised gains and losses on the underlying assets.
The deferred profit sharing is determined in two stages:
� by allocating unrealised gains and losses on the assets to insurance contracts with participation features on the basis of a three-year historic average;
� then by applying to the remeasurements of insurance contracts with participation features a historical distribution key observed over the past three years for redeemable securities and a 100% key for the other financial assets.
To determine whether the deferred profit-sharing asset is recoverable, tests are carried out to determine whether any unrealised losses can be applied to future surpluses before testing for liability shortfall in accordance with the CNC recommendation of 19 December 2008.
CRÉDIT AGRICOLE S.A. 2014 REGISTRATION DOCUMENT 319
6
CONSOLIDATED FINANCIAL STATEMENTSNotes to the financial statements / Note 1
These tests are based:
� first, on liquidity analyses of the Company, which show the enterprise’s capacity to access funding sources to meet its obligations and its ability to hold assets with unrealised losses even if new production declines. The tests were performed with and without new production;
� second, on a comparison between the average value of future services measured by the internal model replicating the Company’s management decisions and the value of the assets representing the obligations at fair value. This shows the enterprise’s ability to meet its obligations.
Lastly, sensitivity tests on the ability to activate the deferred profit sharing are also carried out:
� in the event of a uniform 15% increase in redemptions applied to redemption rates drawn from scenarios similar to those used by the French Prudential and Resolution Supervisory Authority;
� in the event of an additional 10% decline in the equity markets.
In accordance with IFRS 4, at each reporting date, the Group also ascertains that insurance liabilities (net of deferred acquisition costs and associated intangible assets) are adequate to meet estimated future cash flows.
The liability adequacy test used to verify this must meet the following minimum requirements, as defined in paragraph 16 of the standard:
� it must consider current estimates of all future contractual cash flows, including associated management costs, fees and commissions as well as options and guarantees implicit in these contracts;
� if the test shows that the liability is inadequate, it is wholly recognised in profit or loss.
LEASES (IAS 17)As required by IAS 17, leases are analysed in accordance with their substance and financial reality. They are classified as operating leases or finance leases.
Finance lease transactions are treated as an acquisition of a fixed asset by the lessee financed by a loan from the lessor.
In the lessor’s financial statements, analysis of the economic substance of the transactions results in the following:
� recognition of a financial receivable from the customer, which is amortised by the lease payments received;
� lease payments are broken down into interest and principal, known as financial amortisation;
� recognition of a net lease reserve. This is equal to the difference between:
� the net lease receivable: amount owed by the lessee, comprising outstanding finance lease receivable and accrued interest at the reporting date;
� the net carrying amount of the leased fixed assets;
� the provision for deferred taxes.
In the lessee’s financial statements, finance leases are restated such that they are recognised in the same way as if the asset had been purchased on credit, by recognising a financial liability, recording the purchased asset under assets and depreciating the asset.
In the income statement, the theoretical depreciation charge (the charge that would have been recognised if the asset had been
purchased) and the finance expenses (incurred in connection with the financing) are recorded in the place of the lease payments.
For operating leases, the lessee recognises payments as expenses and the lessor records the corresponding income under rents, and the leased assets on its balance sheet.
NON-CURRENT ASSETS HELD FOR SALE AND DISCONTINUED OPERATIONS (IFRS 5)A non-current asset (or a disposal group) is classified as held-for-sale if its carrying amount will be recovered principally through a sale transaction rather than through continuing use.
For this to be the case, the asset (or disposal group) must be available for immediate sale in its present condition and its sale must be highly probable.
The relevant assets and liabilities are shown separately on the balance sheet under Non-current assets held-for-sale and Liabilities associated with non-current assets held-for-sale.
A non-current asset (or disposal group) classified as held-for-sale is measured at the lower of its carrying amount and fair value less costs of sale. A charge for impairment of unrealised gains is recognised in the income statement. Unrealised gains are no longer amortised when they are reclassified.
If the fair value of a disposal group less selling costs is under its carrying amount after impairment of non-current assets, the difference is allocated to other disposal group assets including the financial assets and is recognised under net income of held-for-sale operations.
A discontinued operation is a component that the Group has either disposed of, or is classified as held-for-sale, according to the following situations:
� it represents a separate major business line or geographical area of operations;
� it is part of a single coordinated plan to dispose of a separate major business line or geographical area of operations; or
� is a subsidiary acquired exclusively with a view to resale.
The following are disclosed on a separate line of the income statement:
� the profit or loss from discontinued operations until the date of disposal, net of tax;
� the gain or loss recognised on the disposal or on measurement to fair value less costs of sale of the assets and liabilities constituting the discontinued operations, net of tax.
1.4 Consolidation principles and methods (IFRS 10, IFRS 11 and IAS 28)
SCOPE OF CONSOLIDATIONThe consolidated financial statements include the financial statements of Crédit Agricole S.A. and those of all companies over which, in compliance with IFRS 10, IFRS 11 and IAS 28, Crédit Agricole S.A. exercises control, joint control or significant influence.
Definitions of controlIn compliance with international standards, all entities under control, under joint control or under significant influence are consolidated, provided that they are not covered by the exclusions below.
320 CRÉDIT AGRICOLE S.A. 2014 REGISTRATION DOCUMENT
6 CONSOLIDATED FINANCIAL STATEMENTSNotes to the financial statements / Note 1
Exclusive control over an entity is deemed to exist if Crédit Agricole S.A. is exposed to or entitled to receive variable returns as a result of its involvement with the entity and if the power it holds over this entity allows it to influence these returns. Power in this context means substantive (voting or contractual) rights. Rights are considered substantive if the holder of the rights can in practice exercise them when decisions about the company’s relevant activities are made.
Crédit Agricole S.A. is deemed to control a subsidiary through voting rights when its rights give it the practical ability to direct the subsidiary’s relevant activities. Crédit Agricole S.A. is generally considered to control a subsidiary when it holds more than half the existing or potential voting rights in an entity, whether directly or indirectly through subsidiaries, except when it can be clearly demonstrated that such ownership does not give it the power to direct its relevant activities. Control is also deemed to exist where Crédit Agricole S.A. holds half or less than half of the voting rights, including potential rights, in an entity but is able in practice to direct its relevant activities at its sole discretion, notably because of the existence of contractual arrangements, the size of its stake in the voting rights compared to those of other investors, or other reasons.
Control of a structured entity is not assessed on the basis of voting rights as these have no effect on the entity’s returns. When assessing control, consideration is given not only to contractual arrangements in force but also to whether Crédit Agricole S.A. was involved in creating the entity and what decisions it made at the time, what agreements were made at its inception and what risks are borne by Crédit Agricole S.A., any rights under agreements that give the investor the power to direct relevant activities in specific circumstances only and any other facts or circumstances that indicate the investor can direct the entity’s relevant activities. Where there is a management agreement, the extent of decision-making powers granted to the delegated manager and the remuneration accorded by such contractual agreements are examined to establish whether the manager is in practice acting as an agent (with delegated powers) or as a principal (on their own account).
Furthermore, when decisions on the entity’s relevant activities are taken, the indicators used to assess whether an entity is acting as agent or principal are as follows: the extent of the decision-making powers compared to the powers over the entity delegated to the manager, the remuneration provided for under the contractual agreements, any substantive rights that may affect the decision-making capacity of other parties involved in the entity and the exposure to variable returns of other interests in the entity.
Joint control is deemed to exist when there is a contractual division of control over an economic activity. Decisions affecting the entity’s relevant activities require unanimous agreement of the joint controllers.
In traditional entities, significant influence is defined as the power to influence but not control a company’s financial and operational policies. Crédit Agricole S.A. is presumed to have significant influence if it owns 20% or more of the voting rights in an entity, whether directly or indirectly through subsidiaries.
Exclusions from the scope of consolidationIn accordance with IAS 28 §18, minority interests held by venture capital entities are excluded from the scope of consolidation insofar as they are classified under financial assets at fair value through profit or loss (including financial assets held for trading and financial assets designated at fair value through profit or loss).
CONSOLIDATION METHODSThe methods of consolidation are respectively defined by IFRS 10 and IAS 28 revised. They depend on the type of control exercised by Crédit Agricole S.A. over the entities that can be consolidated, regardless of activity or whether or not they have legal entity status:
� full consolidation, for controlled entities, including entities with different financial statement structures, even if their business is not an extension of that of Crédit Agricole S.A.;
� the equity method, for the entities over which Crédit Agricole S.A. exercises significant influence or joint control.
Full consolidation consists in substituting for the value of the shares each of the assets and liabilities carried by each subsidiary. The equity and income attributable to non-controlling interests is presented separately in the consolidated balance sheet and income statement.
Non-controlling interests are as defined by IFRS 10 and incorporate instruments representing present ownership interests and that give right to a proportional share of the net assets in the event of liquidation and the other equity instruments issued by the subsidiary and not held by the Group.
The equity method consists in substituting for the value of shares the Group’s proportional share of the equity and income of the companies concerned.
The change in the carrying amount of these shares includes changes in goodwill.
In the event of incremental share purchases or partial disposals with continued joint control or significant influence, Crédit Agricole S.A. Group recognises:
� in the case of an increase in the percentage of interest, additional goodwill,
� in the case of a reduction in the percentage of interest, a gain or loss on disposal/dilution in profit or loss.
RESTATEMENTS AND ELIMINATIONSWhere necessary, financial statements are restated to harmonise the valuation methods applied by consolidated companies.
The impact of Group internal transactions on the consolidated balance sheet and income statement is eliminated for fully consolidated entities.
Capital gains or losses arising from intra-Group asset transfers are eliminated; any potential lasting impairment measured at the time of disposal in an internal transaction is recognised.
TRANSLATION OF FOREIGN SUBSIDIARIES’ FINANCIAL STATEMENTS (IAS 21)Financial statements of subsidiaries denominated in foreign currencies are translated into euros in two stages:
� if applicable, the local currency in which the financial statements are prepared is translated into the functional currency (currency of the main business environment of the entity). The translation is made as if the information had been recognised initially in the functional currency (same translation principles as for foreign currency transactions);
� the functional currency is translated into euros, the currency in which the Group’s consolidated financial statements are presented. Assets and liabilities are translated at the closing rate. Income and expenses included in the income statement

CRÉDIT AGRICOLE S.A. 2014 REGISTRATION DOCUMENT 321
6
CONSOLIDATED FINANCIAL STATEMENTSNotes to the financial statements / Note 1
are translated at the average exchange rate for the period. Translation adjustments for assets, liabilities and income statement items are recorded under a specific item in equity. These translation differences are recognised as income during the total or partial transfer of the entity. In the event of the sale of a subsidiary (exclusive control), the reclassification of equity as income takes place only in the event of a loss of control.
BUSINESS COMBINATIONS - GOODWILLBusiness combinations are accounted for using the acquisition method in accordance with IFRS 3, except for business combinations under common control (in particular mergers of Regional Banks), which are excluded from the field of application of IFRS 3. Pursuant to IAS 8, these transactions are entered at carrying amount using the pooling of interests method, with reference to US standard ASU805-50 which seems to comply with the IFRS general principles.
On the date of acquisition, the identifiable assets, liabilities and contingent liabilities of the acquired entity which satisfy the conditions for recognition set out in IFRS 3 are recognised at their fair value.
Notably, restructuring liabilities are only recognised as a liability of the acquired entity if, at the date of acquisition, the acquiree is under an obligation to complete the restructuring.
Price adjustment clauses are recognised at fair value even if their application is not probable. Subsequent changes in the fair value of clauses if they are financial liabilities are recognised in the income statement. Only price adjustment clauses relating to transactions where control was obtained at the latest by 31 December 2009 may still be recorded against goodwill, because these transactions were accounted for under IFRS 3 pre revision (2004).
The non-controlling interests that are shares of current interests giving rights to a share of the net assets in the event of liquidation may be measured, at acquirer’s choice, in two ways:
� at fair value on the date of acquisition;
� the share of the identifiable assets and liabilities of the acquired company revalued at fair value.
The option may be exercised at each acquisition.
The balance of interests not allowing control (equity instruments issued by the subsidiary and not held by the Group) should be recognised for its fair value on the date of acquisition.
The initial assessment of assets, liabilities and contingent liabilities may be revised within a maximum period of twelve months after the date of acquisition.
Some transactions relating to the acquired entity are recognised separately from the business combination. This applies primarily to:
� transactions that end an existing relationship between the acquired company and the acquiring company;
� transactions that compensate employees or shareholders of the acquired company for future services;
� transactions whose aim is to have the acquired company or its former shareholders repay expenses borne by the acquirer.
These separate transactions are generally recognised in the income statement at the acquisition date.
The transferred consideration at the time of a business combination (the acquisition cost) is measured as the total of fair values transferred by the acquirer, on the date of acquisition in exchange for control of the acquired entity (for example: cash, equity instruments, etc.).
The costs directly attributable to the business combination shall be recognised as expenses, separately from the business combination. If the transaction has very strong possibilities of occurring, they are recognised under the heading Net gains (losses) on other assets, otherwise they are recognised under the heading General operating expenses.
The difference between the cost of acquisition and non-controlling interests and the net balance on the date of acquisition of acquired identifiable assets and liabilities taken over, valued at their fair value is recognised, when it is positive, in the assets side of the consolidated balance sheet, under the heading Goodwill when the acquired entity is fully consolidated and in the heading Investments in equity-accounted entities when the acquired company is consolidated using the equity method of accounting. Any negative change in value of goodwill is recognised immediately through profit or loss.
Goodwill is carried in the balance sheet at its initial amount in the currency of the acquired entity and translated at the closing rate at the end of the reporting period.
When control is taken by stages, the interest held before taking control is revalued at fair value through profit or loss at the date of acquisition and the goodwill is calculated once, using the fair value at the date of acquisition of acquired assets and liabilities taken over.
Goodwill is tested for impairment whenever there is objective evidence of a loss of value and at least once a year.
The choices and assumptions used in assessing the holdings that do not allow control at the date of acquisition may influence the amount of initial goodwill and any impairment resulting from a loss of value.
For the purpose of impairment testing, goodwill is allocated to the Group Cash Generating Units (CGUs) that are expected to benefit from the business combination. The CGUs have been defined within the Group’s business lines as the smallest identifiable group of assets and liabilities functioning in a single business model. Impairment testing consists of comparing the carrying amount of each CGU, including any goodwill allocated to it, with its recoverable amount.
The recoverable amount of the CGU is defined as the higher of market value and value in use. The value in use is the present value of the future cash flows of the CGU, as set out in medium term business plans prepared by the Group for management purposes.
When the recoverable amount is lower than the carrying amount, a corresponding impairment loss is recognised for the goodwill allocated to the CGU. This impairment is irreversible.
In the case of an increase in the percentage of interest of the Group in an entity that is already exclusively controlled, the difference between the acquisition cost and the share of net assets acquired is recognised under the item Consolidated reserves, Group share; in the event that the Group’s percentage of ownership interest in an entity that remains under its exclusive control declines, the difference between the selling price and the carrying amount of the share of net assets sold is also recognised directly under Consolidated reserves, Group share. The expenses arising from these transactions are recognised in equity.
The accounting treatment of sale options granted to minority shareholders is as follows:
� when a sale option is granted to the minority shareholders of a fully consolidated subsidiary, a liability is recognised in the balance sheet; on initial recognition, the liability is measured at the estimated present value of the exercise price of the options granted. Against this liability, the share of net assets
322 CRÉDIT AGRICOLE S.A. 2014 REGISTRATION DOCUMENT
6 CONSOLIDATED FINANCIAL STATEMENTSNotes to the financial statements / Note 2
belonging to the minority shareholders concerned is reduced to zero and the remainder is deducted from equity;
� subsequent changes in the estimated value of the exercise price will affect the amount of the liability, offset by an equity adjustment. Symmetrically, subsequent changes in the share of net assets due to minority shareholders are cancelled, offset in equity.
When there is a loss of control, the proceeds from the disposal are calculated on the entirety of the entity sold and any investment
share kept is recognised in the balance sheet at its fair value on the date control was lost.
In all the notes below, prior year data in tables have been restated following the entry into force of the new consolidation standards applied in 2014.
The impact of the change in accounting methods required by the new standards is explained in Note 11 Impact of accounting changes (new consolidation standards) and other events.
NOTE 2 Major structural transactions and material events during the period
The scope of consolidation and changes to it at 31 December 2014 are shown in detail at the end of the notes in Note 12 “Scope of consolidation”.
2.1 Comprehensive Assessment: asset quality review and stress tests of European banks by the European Central Bank
As part of the implementation of the European Single Supervisory Mechanism (SSM), Crédit Agricole Group was involved in the asset quality review exercises (AQR) and forward-looking stress tests of the 130 largest European banks. These exercises, carried out by the European Central Bank (ECB), were based on the financial statements at 31 December 2013.
The ECB’s conclusions were published on 26 October 2014. The assessment was performed under the current EU Capital Requirements Regulation and Directive (CRR/CRD 4). It was aimed at strengthening banks’ balance sheets, enhancing transparency and building confidence. The review provided the ECB with substantial information on the banks that fall under its direct supervision and furthers its efforts to create a level playing field for supervision.
The results of the stress tests and asset quality review are available on the websites of the ACPR (https://acpr.banque-france.fr/international/les-grands-enjeux/stress-tests.html) and ECB (http://www.ecb.europa.eu/ssm/assessment/html/index.en.html).
For Crédit Agricole Group, the asset quality review covered all significant portfolios both in France and abroad, and confirmed the robustness of its financial structure. The stress tests found that Crédit Agricole Group is able to absorb severe stress without additional capital requirements; the capital surplus compared with the threshold defined by the ECB puts it in the top tier of eurozone banks.
The asset quality review performed by the ECB was basically a regulatory exercise. However, the Group has taken the appropriate decisions with regard to the potential impact on the financial statements, in accordance with current accounting standards. The impacts are not material in terms of amount and presentation of Crédit Agricole S.A.’s consolidated financial statements.
2.2 Structural transactions over the period
DISPOSAL OF NEWEDGEOn 7 May 2014, Crédit Agricole S.A. announced the finalisation of the transactions envisaged in the agreement signed on 20 December 2013 by Crédit Agricole CIB and Société Générale for the disposal by Crédit Agricole CIB of its 50% stake in Newedge Group, their brokerage joint venture.
In view of the steps taken and the negotiations held, Newedge had been re-classified in accordance with IFRS 5 and IAS 31 since 30 September 2013.
In the financial statements at 31 December 2013, the contribution of Newedge to the dedicated accounts of the balance sheet and income statement, based on the percentage holding of the Crédit Agricole S.A. Group in Newedge, or 48.9%, was as follows:
� Non-current assets held for sale stood at €24,438 million and Liabilities associated with non-current assets held for sale stood at €24,189 million in the stated financial statements at 31 December 2013;
� Net income from discontinued or held-for-sale operations, at -€162 million, mainly corresponded to the difference between the fair value of Newedge assets held by Crédit Agricole CIB and the carrying amount of those assets.
In the restated financial statements at 31 December 2013, in accordance with IFRS 11, the equity investment in Newedge is no longer consolidated under the proportionate method but equity-accounted under the relevant balance sheet and income statement items for discontinued operations. Given this change in consolidation method, Newedge’s contribution to Non-current assets held for sale amounted to €249 million, a reduction of €24,189 million compared with the stated financial statements at 31 December 2013.
The completion of the disposal had a negligible impact on Crédit Agricole CIB’s contribution to Crédit Agricole S.A.’s accounts
ACQUISITION OF AN ADDITIONAL 5% STAKE IN AMUNDIOn 7 May 2014, Crédit Agricole S.A. announced the completion of transactions envisaged in the agreement signed on 20 December 2013 by Crédit Agricole CIB and Société Générale, whereby Crédit Agricole S.A. would acquire a 5% stake from Société Générale in Amundi, their asset management joint venture.
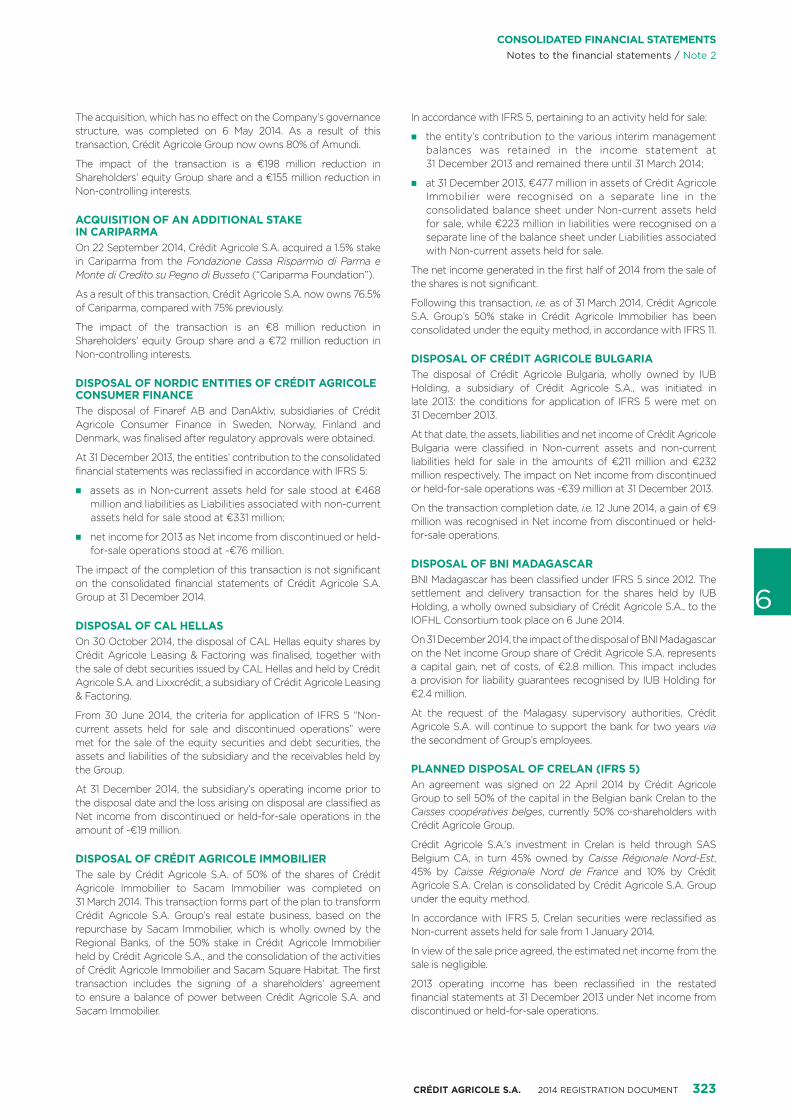
CRÉDIT AGRICOLE S.A. 2014 REGISTRATION DOCUMENT 323
6
CONSOLIDATED FINANCIAL STATEMENTSNotes to the financial statements / Note 2
The acquisition, which has no effect on the Company’s governance structure, was completed on 6 May 2014. As a result of this transaction, Crédit Agricole Group now owns 80% of Amundi.
The impact of the transaction is a €198 million reduction in Shareholders’ equity Group share and a €155 million reduction in Non-controlling interests.
ACQUISITION OF AN ADDITIONAL STAKE IN CARIPARMAOn 22 September 2014, Crédit Agricole S.A. acquired a 1.5% stake in Cariparma from the Fondazione Cassa Risparmio di Parma e Monte di Credito su Pegno di Busseto (“Cariparma Foundation”).
As a result of this transaction, Crédit Agricole S.A. now owns 76.5% of Cariparma, compared with 75% previously.
The impact of the transaction is an €8 million reduction in Shareholders’ equity Group share and a €72 million reduction in Non-controlling interests.
DISPOSAL OF NORDIC ENTITIES OF CRÉDIT AGRICOLE CONSUMER FINANCEThe disposal of Finaref AB and DanAktiv, subsidiaries of Crédit Agricole Consumer Finance in Sweden, Norway, Finland and Denmark, was finalised after regulatory approvals were obtained.
At 31 December 2013, the entities’ contribution to the consolidated financial statements was reclassified in accordance with IFRS 5:
� assets as in Non-current assets held for sale stood at €468 million and liabilities as Liabilities associated with non-current assets held for sale stood at €331 million;
� net income for 2013 as Net income from discontinued or held-for-sale operations stood at -€76 million.
The impact of the completion of this transaction is not significant on the consolidated financial statements of Crédit Agricole S.A. Group at 31 December 2014.
DISPOSAL OF CAL HELLASOn 30 October 2014, the disposal of CAL Hellas equity shares by Crédit Agricole Leasing & Factoring was finalised, together with the sale of debt securities issued by CAL Hellas and held by Crédit Agricole S.A. and Lixxcrédit, a subsidiary of Crédit Agricole Leasing & Factoring.
From 30 June 2014, the criteria for application of IFRS 5 “Non-current assets held for sale and discontinued operations” were met for the sale of the equity securities and debt securities, the assets and liabilities of the subsidiary and the receivables held by the Group.
At 31 December 2014, the subsidiary’s operating income prior to the disposal date and the loss arising on disposal are classified as Net income from discontinued or held-for-sale operations in the amount of -€19 million.
DISPOSAL OF CRÉDIT AGRICOLE IMMOBILIERThe sale by Crédit Agricole S.A. of 50% of the shares of Crédit Agricole Immobilier to Sacam Immobilier was completed on 31 March 2014. This transaction forms part of the plan to transform Crédit Agricole S.A. Group’s real estate business, based on the repurchase by Sacam Immobilier, which is wholly owned by the Regional Banks, of the 50% stake in Crédit Agricole Immobilier held by Crédit Agricole S.A., and the consolidation of the activities of Crédit Agricole Immobilier and Sacam Square Habitat. The first transaction includes the signing of a shareholders’ agreement to ensure a balance of power between Crédit Agricole S.A. and Sacam Immobilier.
In accordance with IFRS 5, pertaining to an activity held for sale:
� the entity’s contribution to the various interim management balances was retained in the income statement at 31 December 2013 and remained there until 31 March 2014;
� at 31 December 2013, €477 million in assets of Crédit Agricole Immobilier were recognised on a separate line in the consolidated balance sheet under Non-current assets held for sale, while €223 million in liabilities were recognised on a separate line of the balance sheet under Liabilities associated with Non-current assets held for sale.
The net income generated in the first half of 2014 from the sale of the shares is not significant.
Following this transaction, i.e. as of 31 March 2014, Crédit Agricole S.A. Group’s 50% stake in Crédit Agricole Immobilier has been consolidated under the equity method, in accordance with IFRS 11.
DISPOSAL OF CRÉDIT AGRICOLE BULGARIAThe disposal of Crédit Agricole Bulgaria, wholly owned by IUB Holding, a subsidiary of Crédit Agricole S.A., was initiated in late 2013: the conditions for application of IFRS 5 were met on 31 December 2013.
At that date, the assets, liabilities and net income of Crédit Agricole Bulgaria were classified in Non-current assets and non-current liabilities held for sale in the amounts of €211 million and €232 million respectively. The impact on Net income from discontinued or held-for-sale operations was -€39 million at 31 December 2013.
On the transaction completion date, i.e. 12 June 2014, a gain of €9 million was recognised in Net income from discontinued or held-for-sale operations.
DISPOSAL OF BNI MADAGASCARBNI Madagascar has been classified under IFRS 5 since 2012. The settlement and delivery transaction for the shares held by IUB Holding, a wholly owned subsidiary of Crédit Agricole S.A., to the IOFHL Consortium took place on 6 June 2014.
On 31 December 2014, the impact of the disposal of BNI Madagascar on the Net income Group share of Crédit Agricole S.A. represents a capital gain, net of costs, of €2.8 million. This impact includes a provision for liability guarantees recognised by IUB Holding for €2.4 million.
At the request of the Malagasy supervisory authorities, Crédit Agricole S.A. will continue to support the bank for two years via the secondment of Group’s employees.
PLANNED DISPOSAL OF CRELAN (IFRS 5)An agreement was signed on 22 April 2014 by Crédit Agricole Group to sell 50% of the capital in the Belgian bank Crelan to the Caisses coopératives belges, currently 50% co-shareholders with Crédit Agricole Group.
Crédit Agricole S.A.’s investment in Crelan is held through SAS Belgium CA, in turn 45% owned by Caisse Régionale Nord-Est, 45% by Caisse Régionale Nord de France and 10% by Crédit Agricole S.A. Crelan is consolidated by Crédit Agricole S.A. Group under the equity method.
In accordance with IFRS 5, Crelan securities were reclassified as Non-current assets held for sale from 1 January 2014.
In view of the sale price agreed, the estimated net income from the sale is negligible.
2013 operating income has been reclassified in the restated financial statements at 31 December 2013 under Net income from discontinued or held-for-sale operations.
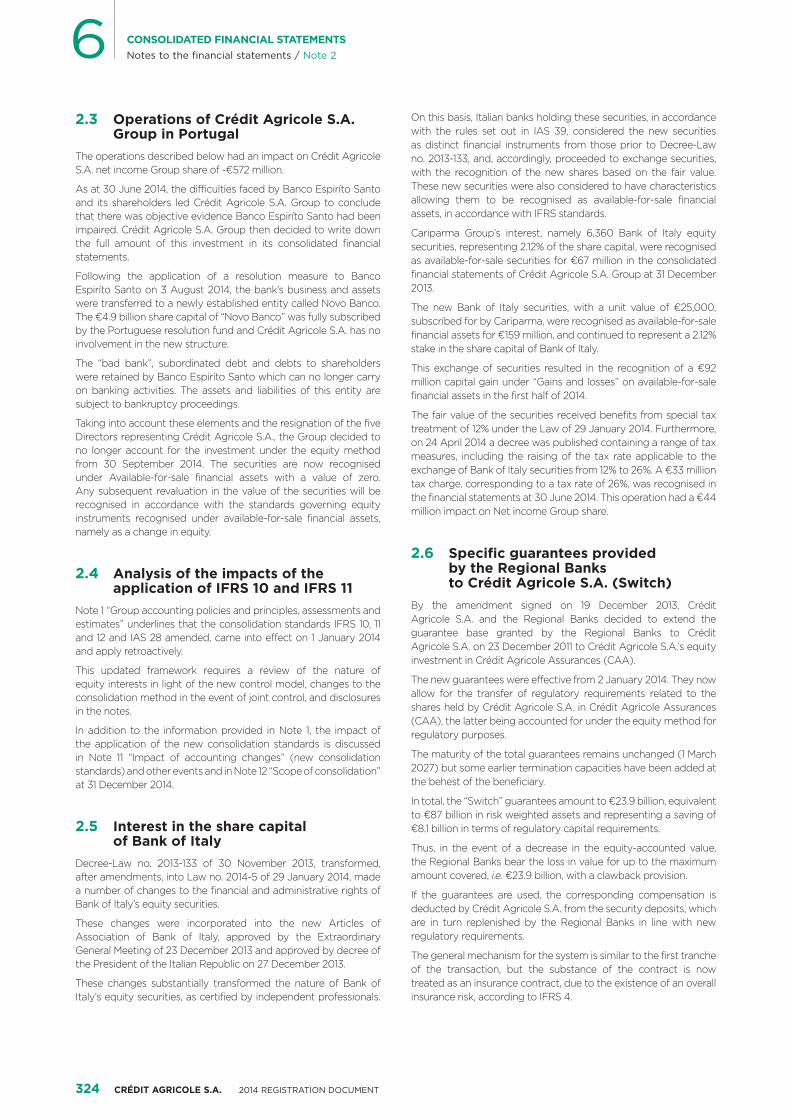
324 CRÉDIT AGRICOLE S.A. 2014 REGISTRATION DOCUMENT
6 CONSOLIDATED FINANCIAL STATEMENTSNotes to the financial statements / Note 2
2.3 Operations of Crédit Agricole S.A. Group in Portugal
The operations described below had an impact on Crédit Agricole S.A. net income Group share of -€572 million.
As at 30 June 2014, the difficulties faced by Banco Espiríto Santo and its shareholders led Crédit Agricole S.A. Group to conclude that there was objective evidence Banco Espiríto Santo had been impaired. Crédit Agricole S.A. Group then decided to write down the full amount of this investment in its consolidated financial statements.
Following the application of a resolution measure to Banco Espiríto Santo on 3 August 2014, the bank’s business and assets were transferred to a newly established entity called Novo Banco. The €4.9 billion share capital of “Novo Banco” was fully subscribed by the Portuguese resolution fund and Crédit Agricole S.A. has no involvement in the new structure.
The “bad bank”, subordinated debt and debts to shareholders were retained by Banco Espiríto Santo which can no longer carry on banking activities. The assets and liabilities of this entity are subject to bankruptcy proceedings.
Taking into account these elements and the resignation of the five Directors representing Crédit Agricole S.A., the Group decided to no longer account for the investment under the equity method from 30 September 2014. The securities are now recognised under Available-for-sale financial assets with a value of zero. Any subsequent revaluation in the value of the securities will be recognised in accordance with the standards governing equity instruments recognised under available-for-sale financial assets, namely as a change in equity.
2.4 Analysis of the impacts of the application of IFRS 10 and IFRS 11
Note 1 “Group accounting policies and principles, assessments and estimates” underlines that the consolidation standards IFRS 10, 11 and 12 and IAS 28 amended, came into effect on 1 January 2014 and apply retroactively.
This updated framework requires a review of the nature of equity interests in light of the new control model, changes to the consolidation method in the event of joint control, and disclosures in the notes.
In addition to the information provided in Note 1, the impact of the application of the new consolidation standards is discussed in Note 11 “Impact of accounting changes” (new consolidation standards) and other events and in Note 12 “Scope of consolidation” at 31 December 2014.
2.5 Interest in the share capital of Bank of Italy
Decree-Law no. 2013-133 of 30 November 2013, transformed, after amendments, into Law no. 2014-5 of 29 January 2014, made a number of changes to the financial and administrative rights of Bank of Italy’s equity securities.
These changes were incorporated into the new Articles of Association of Bank of Italy, approved by the Extraordinary General Meeting of 23 December 2013 and approved by decree of the President of the Italian Republic on 27 December 2013.
These changes substantially transformed the nature of Bank of Italy’s equity securities, as certified by independent professionals.
On this basis, Italian banks holding these securities, in accordance with the rules set out in IAS 39, considered the new securities as distinct financial instruments from those prior to Decree-Law no. 2013-133, and, accordingly, proceeded to exchange securities, with the recognition of the new shares based on the fair value. These new securities were also considered to have characteristics allowing them to be recognised as available-for-sale financial assets, in accordance with IFRS standards.
Cariparma Group’s interest, namely 6,360 Bank of Italy equity securities, representing 2.12% of the share capital, were recognised as available-for-sale securities for €67 million in the consolidated financial statements of Crédit Agricole S.A. Group at 31 December 2013.
The new Bank of Italy securities, with a unit value of €25,000, subscribed for by Cariparma, were recognised as available-for-sale financial assets for €159 million, and continued to represent a 2.12% stake in the share capital of Bank of Italy.
This exchange of securities resulted in the recognition of a €92 million capital gain under “Gains and losses” on available-for-sale financial assets in the first half of 2014.
The fair value of the securities received benefits from special tax treatment of 12% under the Law of 29 January 2014. Furthermore, on 24 April 2014 a decree was published containing a range of tax measures, including the raising of the tax rate applicable to the exchange of Bank of Italy securities from 12% to 26%. A €33 million tax charge, corresponding to a tax rate of 26%, was recognised in the financial statements at 30 June 2014. This operation had a €44 million impact on Net income Group share.
2.6 Specific guarantees provided by the Regional Banks to Crédit Agricole S.A. (Switch)
By the amendment signed on 19 December 2013, Crédit Agricole S.A. and the Regional Banks decided to extend the guarantee base granted by the Regional Banks to Crédit Agricole S.A. on 23 December 2011 to Crédit Agricole S.A.’s equity investment in Crédit Agricole Assurances (CAA).
The new guarantees were effective from 2 January 2014. They now allow for the transfer of regulatory requirements related to the shares held by Crédit Agricole S.A. in Crédit Agricole Assurances (CAA), the latter being accounted for under the equity method for regulatory purposes.
The maturity of the total guarantees remains unchanged (1 March 2027) but some earlier termination capacities have been added at the behest of the beneficiary.
In total, the “Switch” guarantees amount to €23.9 billion, equivalent to €87 billion in risk weighted assets and representing a saving of €8.1 billion in terms of regulatory capital requirements.
Thus, in the event of a decrease in the equity-accounted value, the Regional Banks bear the loss in value for up to the maximum amount covered, i.e. €23.9 billion, with a clawback provision.
If the guarantees are used, the corresponding compensation is deducted by Crédit Agricole S.A. from the security deposits, which are in turn replenished by the Regional Banks in line with new regulatory requirements.
The general mechanism for the system is similar to the first tranche of the transaction, but the substance of the contract is now treated as an insurance contract, due to the existence of an overall insurance risk, according to IFRS 4.
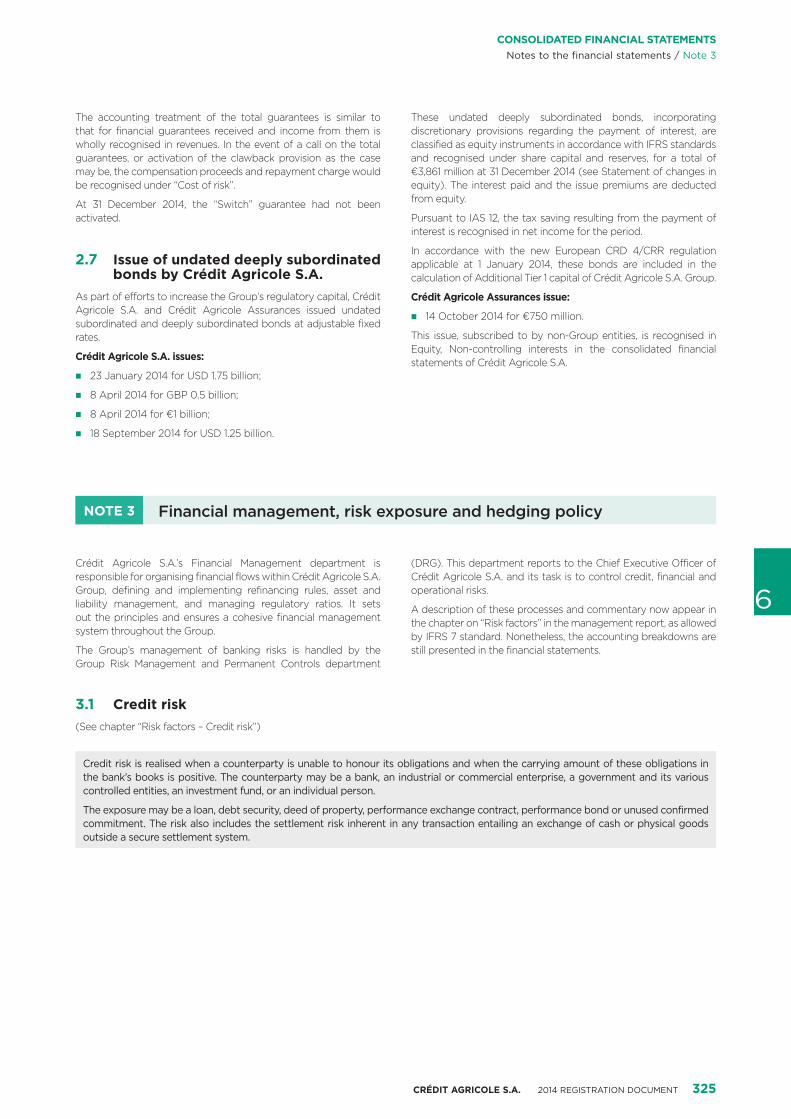
CRÉDIT AGRICOLE S.A. 2014 REGISTRATION DOCUMENT 325
6
CONSOLIDATED FINANCIAL STATEMENTSNotes to the financial statements / Note 3
The accounting treatment of the total guarantees is similar to that for financial guarantees received and income from them is wholly recognised in revenues. In the event of a call on the total guarantees, or activation of the clawback provision as the case may be, the compensation proceeds and repayment charge would be recognised under “Cost of risk”.
At 31 December 2014, the “Switch” guarantee had not been activated.
2.7 Issue of undated deeply subordinated bonds by Crédit Agricole S.A.
As part of efforts to increase the Group’s regulatory capital, Crédit Agricole S.A. and Crédit Agricole Assurances issued undated subordinated and deeply subordinated bonds at adjustable fixed rates.
Crédit Agricole S.A. issues:
� 23 January 2014 for USD 1.75 billion;
� 8 April 2014 for GBP 0.5 billion;
� 8 April 2014 for €1 billion;
� 18 September 2014 for USD 1.25 billion.
These undated deeply subordinated bonds, incorporating discretionary provisions regarding the payment of interest, are classified as equity instruments in accordance with IFRS standards and recognised under share capital and reserves, for a total of €3,861 million at 31 December 2014 (see Statement of changes in equity). The interest paid and the issue premiums are deducted from equity.
Pursuant to IAS 12, the tax saving resulting from the payment of interest is recognised in net income for the period.
In accordance with the new European CRD 4/CRR regulation applicable at 1 January 2014, these bonds are included in the calculation of Additional Tier 1 capital of Crédit Agricole S.A. Group.
Crédit Agricole Assurances issue:
� 14 October 2014 for €750 million.
This issue, subscribed to by non-Group entities, is recognised in Equity, Non-controlling interests in the consolidated financial statements of Crédit Agricole S.A.
NOTE 3 Financial management, risk exposure and hedging policy
Crédit Agricole S.A.’s Financial Management department is responsible for organising financial flows within Crédit Agricole S.A. Group, defining and implementing refinancing rules, asset and liability management, and managing regulatory ratios. It sets out the principles and ensures a cohesive financial management system throughout the Group.
The Group’s management of banking risks is handled by the Group Risk Management and Permanent Controls department
(DRG). This department reports to the Chief Executive Officer of Crédit Agricole S.A. and its task is to control credit, financial and operational risks.
A description of these processes and commentary now appear in the chapter on “Risk factors” in the management report, as allowed by IFRS 7 standard. Nonetheless, the accounting breakdowns are still presented in the financial statements.
3.1 Credit risk(See chapter “Risk factors – Credit risk”)
Credit risk is realised when a counterparty is unable to honour its obligations and when the carrying amount of these obligations in the bank’s books is positive. The counterparty may be a bank, an industrial or commercial enterprise, a government and its various controlled entities, an investment fund, or an individual person.
The exposure may be a loan, debt security, deed of property, performance exchange contract, performance bond or unused confirmed commitment. The risk also includes the settlement risk inherent in any transaction entailing an exchange of cash or physical goods outside a secure settlement system.
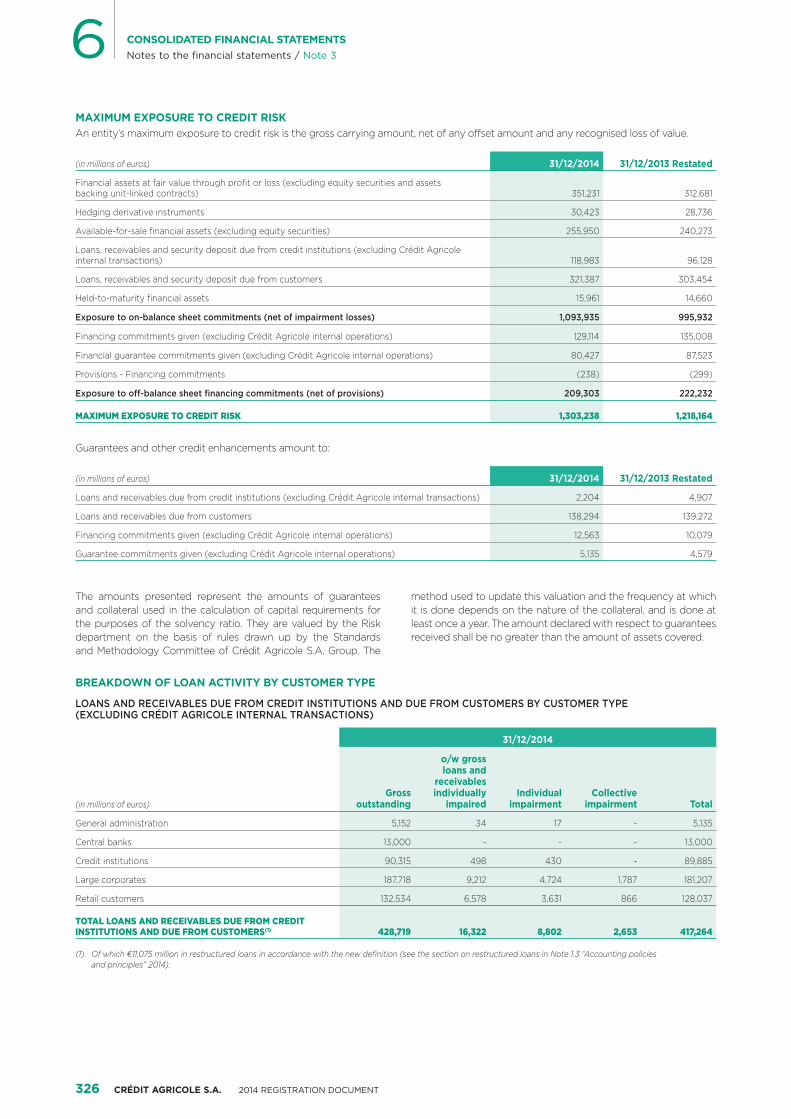
326 CRÉDIT AGRICOLE S.A. 2014 REGISTRATION DOCUMENT
6 CONSOLIDATED FINANCIAL STATEMENTSNotes to the financial statements / Note 3
MAXIMUM EXPOSURE TO CREDIT RISKAn entity’s maximum exposure to credit risk is the gross carrying amount, net of any offset amount and any recognised loss of value.
(in millions of euros) 31/12/2014 31/12/2013 Restated
Financial assets at fair value through profit or loss (excluding equity securities and assets backing unit-linked contracts) 351,231 312,681
Hedging derivative instruments 30,423 28,736
Available-for-sale financial assets (excluding equity securities) 255,950 240,273
Loans, receivables and security deposit due from credit institutions (excluding Crédit Agricole internal transactions) 118,983 96,128
Loans, receivables and security deposit due from customers 321,387 303,454
Held-to-maturity financial assets 15,961 14,660
Exposure to on-balance sheet commitments (net of impairment losses) 1,093,935 995,932
Financing commitments given (excluding Crédit Agricole internal operations) 129,114 135,008
Financial guarantee commitments given (excluding Crédit Agricole internal operations) 80,427 87,523
Provisions - Financing commitments (238) (299)
Exposure to off-balance sheet financing commitments (net of provisions) 209,303 222,232
MAXIMUM EXPOSURE TO CREDIT RISK 1,303,238 1,218,164
Guarantees and other credit enhancements amount to:
(in millions of euros) 31/12/2014 31/12/2013 Restated
Loans and receivables due from credit institutions (excluding Crédit Agricole internal transactions) 2,204 4,907
Loans and receivables due from customers 138,294 139,272
Financing commitments given (excluding Crédit Agricole internal operations) 12,563 10,079
Guarantee commitments given (excluding Crédit Agricole internal operations) 5,135 4,579
The amounts presented represent the amounts of guarantees and collateral used in the calculation of capital requirements for the purposes of the solvency ratio. They are valued by the Risk department on the basis of rules drawn up by the Standards and Methodology Committee of Crédit Agricole S.A. Group. The
method used to update this valuation and the frequency at which it is done depends on the nature of the collateral, and is done at least once a year. The amount declared with respect to guarantees received shall be no greater than the amount of assets covered.
BREAKDOWN OF LOAN ACTIVITY BY CUSTOMER TYPE
LOANS AND RECEIVABLES DUE FROM CREDIT INSTITUTIONS AND DUE FROM CUSTOMERS BY CUSTOMER TYPE (EXCLUDING CRÉDIT AGRICOLE INTERNAL TRANSACTIONS)
(in millions of euros)
31/12/2014
Gross outstanding
o/w gross loans and
receivables individually
impairedIndividual
impairmentCollective
impairment Total
General administration 5,152 34 17 - 5,135
Central banks 13,000 - - - 13,000
Credit institutions 90,315 498 430 - 89,885
Large corporates 187,718 9,212 4,724 1,787 181,207
Retail customers 132,534 6,578 3,631 866 128,037
TOTAL LOANS AND RECEIVABLES DUE FROM CREDIT INSTITUTIONS AND DUE FROM CUSTOMERS(1) 428,719 16,322 8,802 2,653 417,264
(1) Of which €11,075 million in restructured loans in accordance with the new definition (see the section on restructured loans in Note 1.3 “Accounting policies and principles” 2014).

CRÉDIT AGRICOLE S.A. 2014 REGISTRATION DOCUMENT 327
6
CONSOLIDATED FINANCIAL STATEMENTSNotes to the financial statements / Note 3
(in millions of euros)
31/12/2013 Restated
Gross outstanding
o/w gross loans and
receivables individually
impairedIndividual
impairmentCollective
impairment Total
General administration(2) 32,618 3,071 1,427 321 30,870
Central banks 13,489 - - - 13,489
Credit institutions 83,046 650 407 - 82,639
Large corporates 140,389 5,330 2,815 1,468 136,106
Retail customers 141,691 7,673 4,362 851 136,478
TOTAL LOANS AND RECEIVABLES DUE FROM CREDIT INSTITUTIONS AND DUE FROM CUSTOMERS(1) 411,233 16,724 9,011 2,640 399,582
(1) Restructured performing loans amounted to €2,480 million at 31 December 2013 restated (see section on restructured loans in Note 1.3 “Accounting policies and principles 2013”).
(2) This line includes the amounts presented on the “Institutions other than credit institutions” and “Central governments” lines in the Notes published at 31 December 2013.
COMMITMENTS GIVEN TO CUSTOMERS BY CUSTOMER TYPE
(in millions of euros) 31/12/2014 31/12/2013 Restated
Financing commitments given to customers
General administration(1) 1,050 21,046
Large corporates 96,267 75,842
Retail customers 18,535 20,809
TOTAL LOAN COMMITMENTS 115,852 117,697
Guarantee commitments given to customers
General administration(1) 573 12,181
Large corporates 70,153 35,874
Retail customers 1,257 29,990
TOTAL GUARANTEE COMMITMENTS 71,983 78,045
(1) This line includes the amounts presented on the “Institutions other than credit institutions” and “Central governments” lines in the Notes published at 31 December 2013.
DUE TO CUSTOMERS BY CUSTOMER TYPE
(in millions of euros) 31/12/2014 31/12/2013 Restated
General administration(1) 7,699 50,325
Large corporates 150,516 117,410
Retail customers 315,769 309,578
TOTAL AMOUNT DUE TO CUSTOMERS 473,984 477,313
(1) This line includes the amounts presented on the “Institutions other than credit institutions” and “Central governments” lines in the Notes published at 31 December 2013.
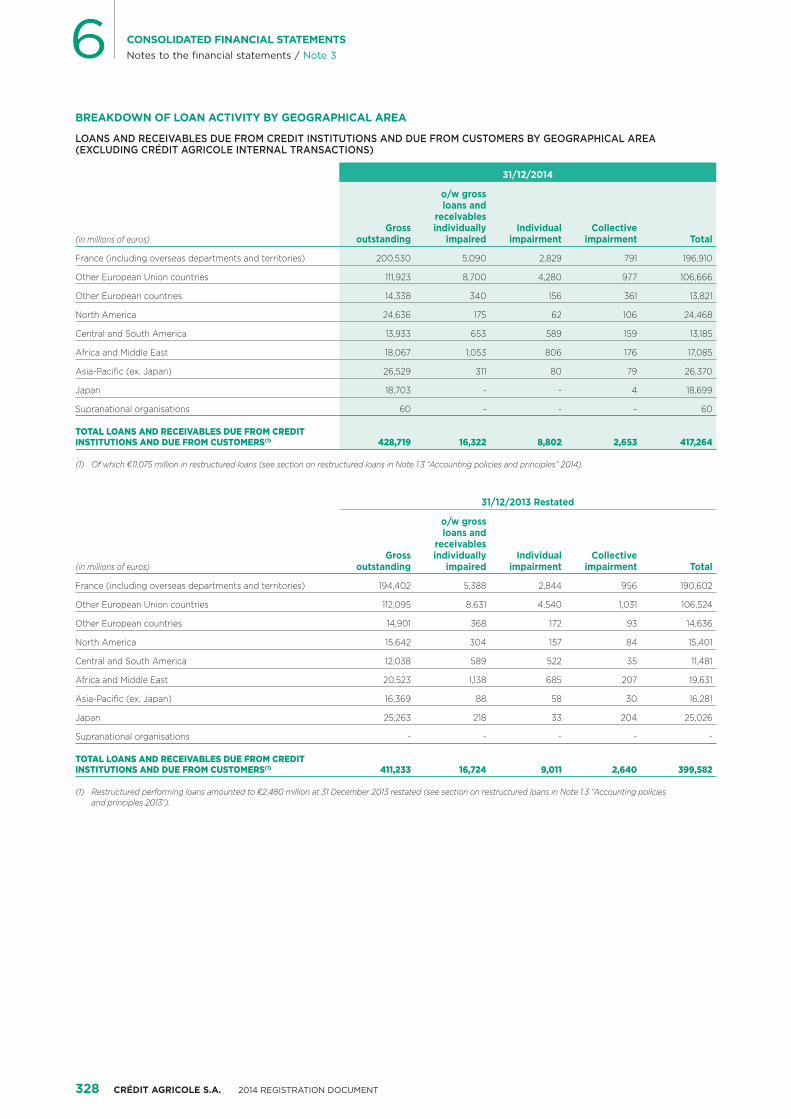
328 CRÉDIT AGRICOLE S.A. 2014 REGISTRATION DOCUMENT
6 CONSOLIDATED FINANCIAL STATEMENTSNotes to the financial statements / Note 3
BREAKDOWN OF LOAN ACTIVITY BY GEOGRAPHICAL AREA
LOANS AND RECEIVABLES DUE FROM CREDIT INSTITUTIONS AND DUE FROM CUSTOMERS BY GEOGRAPHICAL AREA (EXCLUDING CRÉDIT AGRICOLE INTERNAL TRANSACTIONS)
(in millions of euros)
31/12/2014
Gross outstanding
o/w gross loans and
receivables individually
impairedIndividual
impairmentCollective
impairment Total
France (including overseas departments and territories) 200,530 5,090 2,829 791 196,910
Other European Union countries 111,923 8,700 4,280 977 106,666
Other European countries 14,338 340 156 361 13,821
North America 24,636 175 62 106 24,468
Central and South America 13,933 653 589 159 13,185
Africa and Middle East 18,067 1,053 806 176 17,085
Asia-Pacific (ex. Japan) 26,529 311 80 79 26,370
Japan 18,703 - - 4 18,699
Supranational organisations 60 - - - 60
TOTAL LOANS AND RECEIVABLES DUE FROM CREDIT INSTITUTIONS AND DUE FROM CUSTOMERS(1) 428,719 16,322 8,802 2,653 417,264
(1) Of which €11,075 million in restructured loans (see section on restructured loans in Note 1.3 “Accounting policies and principles” 2014).
(in millions of euros)
31/12/2013 Restated
Gross outstanding
o/w gross loans and
receivables individually
impairedIndividual
impairmentCollective
impairment Total
France (including overseas departments and territories) 194,402 5,388 2,844 956 190,602
Other European Union countries 112,095 8,631 4,540 1,031 106,524
Other European countries 14,901 368 172 93 14,636
North America 15,642 304 157 84 15,401
Central and South America 12,038 589 522 35 11,481
Africa and Middle East 20,523 1,138 685 207 19,631
Asia-Pacific (ex. Japan) 16,369 88 58 30 16,281
Japan 25,263 218 33 204 25,026
Supranational organisations - - - - -
TOTAL LOANS AND RECEIVABLES DUE FROM CREDIT INSTITUTIONS AND DUE FROM CUSTOMERS(1) 411,233 16,724 9,011 2,640 399,582
(1) Restructured performing loans amounted to €2,480 million at 31 December 2013 restated (see section on restructured loans in Note 1.3 “Accounting policies and principles 2013”).

CRÉDIT AGRICOLE S.A. 2014 REGISTRATION DOCUMENT 329
6
CONSOLIDATED FINANCIAL STATEMENTSNotes to the financial statements / Note 3
COMMITMENTS GIVEN TO CUSTOMERS: GEOGRAPHICAL ANALYSIS
(in millions of euros) 31/12/2014 31/12/2013 Restated
Financing commitments given to customers
France (including overseas departments and territories) 45,428 47,822
Other European Union countries 29,204 34,266
Other European countries 4,139 4,502
North America 22,775 18,462
Central and South America 5,655 3,634
Africa and Middle East 2,066 2,033
Asia-Pacific (ex. Japan) 5,547 6,342
Japan 1,038 636
TOTAL LOAN COMMITMENTS 115,852 117,697
Guarantee commitments given to customers
France (including overseas departments and territories) 45,549 47,652
Other European Union countries 11,595 11,930
Other European countries 3,022 2,045
North America 4,873 9,452
Central and South America 741 637
Africa and Middle East 1,719 1,394
Asia-Pacific (ex. Japan) 2,925 3,726
Japan 1,559 1,209
TOTAL GUARANTEE COMMITMENTS 71,983 78,045
DUE TO CUSTOMERS: GEOGRAPHICAL ANALYSIS
(in millions of euros) 31/12/2014 31/12/2013 Restated
France (including overseas departments and territories) 342,315 338,950
Other European Union countries 74,622 74,925
Other European countries 10,881 10,647
North America 12,985 20,549
Central and South America 4,753 4,427
Africa and Middle East 16,129 15,982
Asia-Pacific (ex. Japan) 6,139 6,585
Japan 4,846 5,248
Supranational organisations 1,314 -
TOTAL AMOUNT DUE TO CUSTOMERS 473,984 477,313
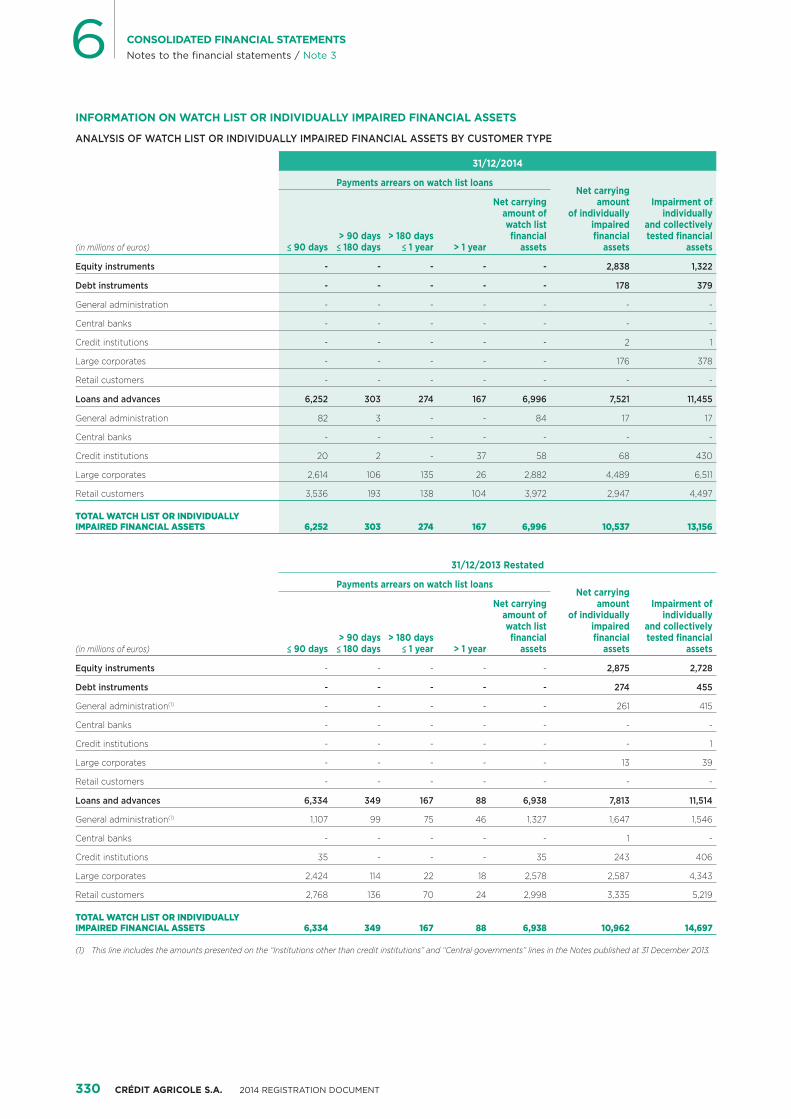
330 CRÉDIT AGRICOLE S.A. 2014 REGISTRATION DOCUMENT
6 CONSOLIDATED FINANCIAL STATEMENTSNotes to the financial statements / Note 3
INFORMATION ON WATCH LIST OR INDIVIDUALLY IMPAIRED FINANCIAL ASSETS
ANALYSIS OF WATCH LIST OR INDIVIDUALLY IMPAIRED FINANCIAL ASSETS BY CUSTOMER TYPE
(in millions of euros)
31/12/2014
Payments arrears on watch list loansNet carrying
amount of individually
impaired financial
assets
Impairment of individually
and collectively tested financial
assets≤ 90 days> 90 days ≤ 180 days
> 180 days ≤ 1 year > 1 year
Net carrying amount of watch list financial
assets
Equity instruments - - - - - 2,838 1,322
Debt instruments - - - - - 178 379
General administration - - - - - - -
Central banks - - - - - - -
Credit institutions - - - - - 2 1
Large corporates - - - - - 176 378
Retail customers - - - - - - -
Loans and advances 6,252 303 274 167 6,996 7,521 11,455
General administration 82 3 - - 84 17 17
Central banks - - - - - - -
Credit institutions 20 2 - 37 58 68 430
Large corporates 2,614 106 135 26 2,882 4,489 6,511
Retail customers 3,536 193 138 104 3,972 2,947 4,497
TOTAL WATCH LIST OR INDIVIDUALLY IMPAIRED FINANCIAL ASSETS 6,252 303 274 167 6,996 10,537 13,156
(in millions of euros)
31/12/2013 Restated
Payments arrears on watch list loansNet carrying
amount of individually
impaired financial
assets
Impairment of individually
and collectively tested financial
assets≤ 90 days> 90 days ≤ 180 days
> 180 days ≤ 1 year > 1 year
Net carrying amount of watch list financial
assets
Equity instruments - - - - - 2,875 2,728
Debt instruments - - - - - 274 455
General administration(1) - - - - - 261 415
Central banks - - - - - - -
Credit institutions - - - - - - 1
Large corporates - - - - - 13 39
Retail customers - - - - - - -
Loans and advances 6,334 349 167 88 6,938 7,813 11,514
General administration(1) 1,107 99 75 46 1,327 1,647 1,546
Central banks - - - - - 1 -
Credit institutions 35 - - - 35 243 406
Large corporates 2,424 114 22 18 2,578 2,587 4,343
Retail customers 2,768 136 70 24 2,998 3,335 5,219
TOTAL WATCH LIST OR INDIVIDUALLY IMPAIRED FINANCIAL ASSETS 6,334 349 167 88 6,938 10,962 14,697
(1) This line includes the amounts presented on the “Institutions other than credit institutions” and “Central governments” lines in the Notes published at 31 December 2013.
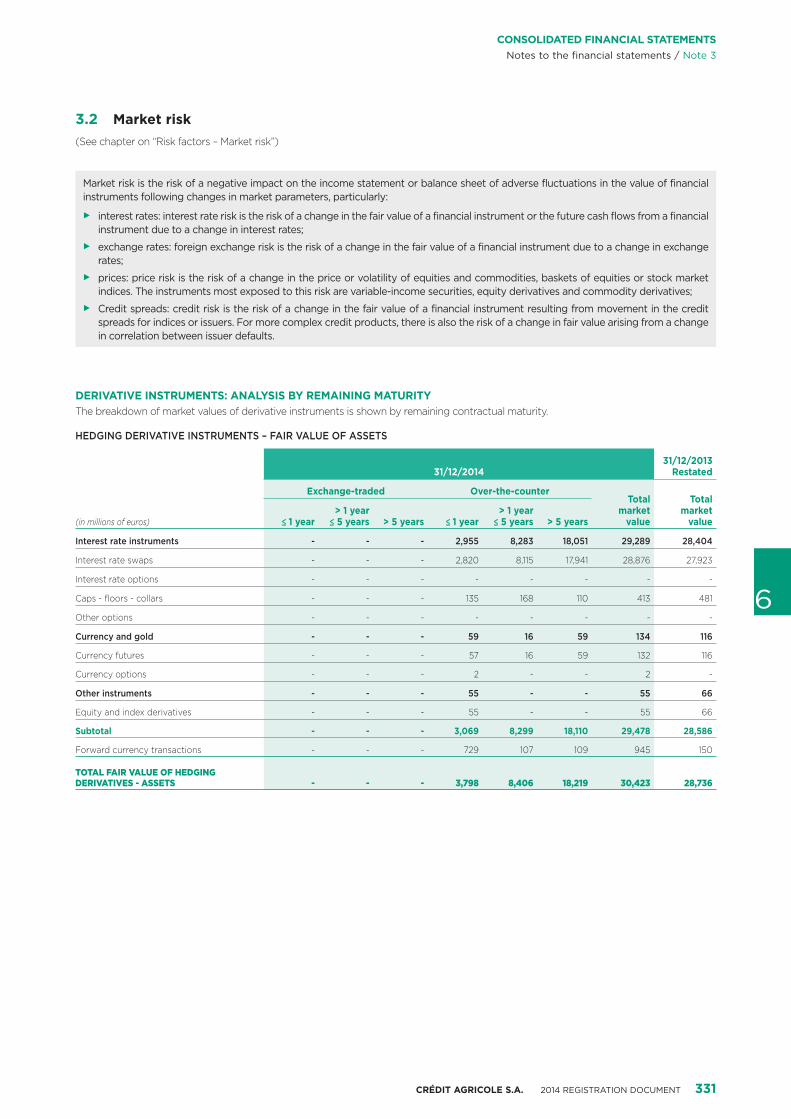
CRÉDIT AGRICOLE S.A. 2014 REGISTRATION DOCUMENT 331
6
CONSOLIDATED FINANCIAL STATEMENTSNotes to the financial statements / Note 3
3.2 Market risk(See chapter on “Risk factors – Market risk”)
Market risk is the risk of a negative impact on the income statement or balance sheet of adverse fluctuations in the value of financial instruments following changes in market parameters, particularly:
3 interest rates: interest rate risk is the risk of a change in the fair value of a financial instrument or the future cash flows from a financial instrument due to a change in interest rates;
3 exchange rates: foreign exchange risk is the risk of a change in the fair value of a financial instrument due to a change in exchange rates;
3 prices: price risk is the risk of a change in the price or volatility of equities and commodities, baskets of equities or stock market indices. The instruments most exposed to this risk are variable-income securities, equity derivatives and commodity derivatives;
3 Credit spreads: credit risk is the risk of a change in the fair value of a financial instrument resulting from movement in the credit spreads for indices or issuers. For more complex credit products, there is also the risk of a change in fair value arising from a change in correlation between issuer defaults.
DERIVATIVE INSTRUMENTS: ANALYSIS BY REMAINING MATURITYThe breakdown of market values of derivative instruments is shown by remaining contractual maturity.
HEDGING DERIVATIVE INSTRUMENTS – FAIR VALUE OF ASSETS
(in millions of euros)
31/12/201431/12/2013
Restated
Exchange-traded Over-the-counterTotal
market value
Total market
value≤ 1 year> 1 year
≤ 5 years > 5 years ≤ 1 year> 1 year
≤ 5 years > 5 years
Interest rate instruments - - - 2,955 8,283 18,051 29,289 28,404
Interest rate swaps - - - 2,820 8,115 17,941 28,876 27,923
Interest rate options - - - - - - - -
Caps - floors - collars - - - 135 168 110 413 481
Other options - - - - - - - -
Currency and gold - - - 59 16 59 134 116
Currency futures - - - 57 16 59 132 116
Currency options - - - 2 - - 2 -
Other instruments - - - 55 - - 55 66
Equity and index derivatives - - - 55 - - 55 66
Subtotal - - - 3,069 8,299 18,110 29,478 28,586
Forward currency transactions - - - 729 107 109 945 150
TOTAL FAIR VALUE OF HEDGING DERIVATIVES - ASSETS - - - 3,798 8,406 18,219 30,423 28,736

332 CRÉDIT AGRICOLE S.A. 2014 REGISTRATION DOCUMENT
6 CONSOLIDATED FINANCIAL STATEMENTSNotes to the financial statements / Note 3
HEDGING DERIVATIVE INSTRUMENTS – FAIR VALUE OF LIABILITIES
(in millions of euros)
31/12/201431/12/2013
Restated
Exchange-traded Over-the-counterTotal
market value
Total market
value≤ 1 year> 1 year
≤ 5 years > 5 years ≤ 1 year> 1 year
≤ 5 years > 5 years
Interest rate instruments - - - 4,282 8,725 14,426 27,433 30,802
Interest rate swaps - - - 4,033 8,724 14,311 27,068 30,387
Interest rate options - - - - - - - -
Caps - floors - collars - - - 248 - 114 362 410
Other options - - - 1 1 1 3 5
Currency and gold - - - 56 42 5 103 160
Currency futures - - - 54 42 5 101 160
Currency options - - - 2 - - 2 -
Other instruments - - - 6 - - 6 8
Equity and index derivatives - - - 6 - - 6 8
Subtotal - - - 4,344 8,767 14,431 27,542 30,970
Forward currency transactions - - - 135 5 3 143 167
TOTAL FAIR VALUE OF HEDGING DERIVATIVES - LIABILITIES - - - 4,479 8,772 14,434 27,685 31,137
DERIVATIVE INSTRUMENTS HELD FOR TRADING – FAIR VALUE OF ASSETS
(in millions of euros)
31/12/201431/12/2013
Restated
Exchange-traded Over-the-counterTotal
market value
Total market
value≤ 1 year> 1 year
≤ 5 years > 5 years ≤ 1 year> 1 year
≤ 5 years > 5 years
Interest rate instruments 7 311 1,174 12,337 36,455 92,904 143,188 119,162
Futures 7 304 1,174 - - - 1,485 1
FRAs - - - 463 105 - 568 387
Interest rate swaps - - - 10,931 27,898 57,532 96,361 81,944
Interest rate options - - - 181 2,986 31,472 34,639 25,305
Caps - floors - collars - - - 762 5,466 3,900 10,128 11,404
Other options - 7 - - - - 7 121
Currency and gold - - - 6,507 3,606 2,946 13,059 9,176
Currency futures - - - 4,461 1,445 1,189 7,095 4,351
Currency options - - - 2,046 2,161 1,757 5,964 4,825
Other instruments 63 153 9 2,603 7,004 488 10,320 12,787
Equity and index derivatives 63 153 9 1,748 4,157 352 6,482 7,052
Precious metal derivatives - - - 2 1 - 3 13
Commodities derivatives - - - - - - - -
Credit derivatives - - - 853 2,841 135 3,829 5,722
Other - - - - 5 1 6 -
Subtotal 70 464 1,183 21,447 47,065 96,338 166,567 141,125
Forward currency transactions - - - 12,299 3,357 217 15,873 9,219
TOTAL FAIR VALUE OF TRANSACTION DERIVATIVES - ASSETS 70 464 1,183 33,746 50,422 96,555 182,440 150,344

CRÉDIT AGRICOLE S.A. 2014 REGISTRATION DOCUMENT 333
6
CONSOLIDATED FINANCIAL STATEMENTSNotes to the financial statements / Note 3
DERIVATIVE INSTRUMENTS HELD FOR TRADING – FAIR VALUE OF LIABILITIES
(in millions of euros)
31/12/201431/12/2013
Restated
Exchange-traded Over-the-counterTotal
market value
Total market
value≤ 1 year> 1 year
≤ 5 years > 5 years ≤ 1 year> 1 year
≤ 5 years > 5 years
Interest rate instruments 64 285 798 13,008 34,972 95,662 144,789 117,693
Futures 64 285 798 - - - 1,147 -
FRAs - - - 440 103 - 543 380
Interest rate swaps - - - 11,749 24,987 58,205 94,941 76,318
Interest rate options - - - 345 3,587 32,511 36,443 27,134
Caps - floors - collars - - - 470 6,276 4,881 11,627 13,757
Other options - - - 4 19 65 88 104
Currency and gold 9 - - 4,486 3,596 2,641 10,732 8,948
Currency futures - - - 2,924 1,310 1,203 5,437 3,652
Currency options 9 - - 1,562 2,286 1,438 5,295 5,296
Other instruments 44 124 6 4,164 6,060 469 10,867 13,126
Equity and index derivatives 44 124 6 2,941 3,013 364 6,492 6,802
Precious metal derivatives - - - 1 - - 1 14
Commodities derivatives - - - - - - - -
Credit derivatives - - - 1,202 3,038 89 4,329 6,291
Other - - - 20 9 16 45 19
Subtotal 117 409 804 21,658 44,628 98,772 166,388 139,767
Forward currency transactions - - - 13,006 1,264 204 14,474 9,491
TOTAL FAIR VALUE OF TRANSACTION DERIVATIVES - LIABILITIES 117 409 804 34,664 45,892 98,976 180,862 149,258
DERIVATIVE INSTRUMENTS: TOTAL COMMITMENTS
(in millions of euros)
31/12/2014 31/12/2013 Restated
Total notional amount outstanding
Total notional amount outstanding
Interest rate instruments 11,323,287 12,404,129
Futures 7,164,071 1,951,696
FRAs 70,976 96,953
Interest rate swaps 2,039,270 8,065,598
Interest rate options 1,155,609 1,304,230
Caps - floors - collars 847,300 985,523
Other options 46,061 129
Currency and gold 3,172,143 2,444,153
Currency futures 2,609,087 1,971,497
Currency options 563,056 472,656
Other instruments 445,083 756,371
Equity and index derivatives 63,305 75,309
Precious metal derivatives 222 594
Commodities derivatives 1 -
Credit derivatives 381,454 680,465
Other 101 3
Subtotal 14,940,513 15,604,653
Forward currency transactions 360,294 254,789
TOTAL NOTIONAL AMOUNT 15,300,807 15,859,442

334 CRÉDIT AGRICOLE S.A. 2014 REGISTRATION DOCUMENT
6 CONSOLIDATED FINANCIAL STATEMENTSNotes to the financial statements / Note 3
FOREIGN EXCHANGE RISK
ANALYSIS OF THE CONSOLIDATED BALANCE SHEET BY CURRENCY
(in millions of euros)
31/12/2014 31/12/2013 Restated
Assets Liabilities Assets Liabilities
EUR 1,257,253 1,280,703 1,193,174 1,199,577
Other European Union currencies 31,411 33,316 34,916 41,454
USD 218,654 212,395 209,516 213,358
JPY 36,826 28,786 30,457 24,790
Other currencies 44,932 33,876 50,748 39,632
TOTAL 1,589,076 1,589,076 1,518,811 1,518,811
BREAKDOWN OF BONDS AND SUBORDINATED DEBT BY CURRENCY
(in millions of euros)
31/12/2014 31/12/2013 Restated
Bonds
Dated subordinated
debt
Undated subordinated
debt Bonds
Dated subordinated
debt
Undated subordinated
debt
EUR 66,205 15,633 4,349 64,990 16,096 5,806
Other European Union currencies 492 1,067 1,082 1,253 978 1,010
USD 8,320 1,197 1,990 6,903 1,138 2,730
JPY 3,694 - - 1,735 - -
Other currencies 2,228 146 204 1,701 143 190
TOTAL 80,939 18,043 7,625 76,582 18,355 9,736
3.3 Liquidity and financing risk(See chapter on “Risk factors – Asset/Liability Management”)
Liquidity and financing risk is the risk of loss if the Company is unable to meet its financial commitments in timely fashion or to renew its borrowings at reasonable prices when they reach maturity.
These commitments include obligations to depositors and suppliers, as well as commitments in respect of loans and investments.
LOANS AND RECEIVABLES DUE FROM CREDIT INSTITUTIONS AND DUE FROM CUSTOMERS BY RESIDUAL MATURITY
(in millions of euros)
31/12/2014
≤ 3 months> 3 months up
to ≤ 1 year> 1 year up
to ≤ 5 years > 5 years Indefinite Total
Loans and receivables due from credit institutions (including Crédit Agricole internal transactions) 99,842 79,632 126,394 62,178 593 368,639
Loans and receivables due from customers (o/w finance leases) 75,975 40,425 109,481 94,232 5,291 325,404
Total 175,817 120,057 235,875 156,410 5,884 694,043
Impairment (11,455)
TOTAL LOANS AND RECEIVABLES DUE FROM CREDIT INSTITUTIONS AND FROM CUSTOMERS 682,588

CRÉDIT AGRICOLE S.A. 2014 REGISTRATION DOCUMENT 335
6
CONSOLIDATED FINANCIAL STATEMENTSNotes to the financial statements / Note 3
(in millions of euros)
31/12/2013 Restated
≤ 3 months> 3 months up
to ≤ 1 year> 1 year up
to ≤ 5 years > 5 years Indefinite Total
Loans and receivables due from credit institutions (including Crédit Agricole internal transactions) 112,621 77,275 116,660 62,162 1,320 370,038
Loans and receivables due from customers (o/w finance leases) 77,046 32,959 108,305 91,969 4,417 314,696
Total 189,667 110,234 224,965 154,131 5,737 684,734
Impairment (11,649)
TOTAL LOANS AND RECEIVABLES DUE FROM CREDIT INSTITUTIONS AND FROM CUSTOMERS 673,085
DUE TO CREDIT INSTITUTIONS AND TO CUSTOMERS BY RESIDUAL MATURITY
(in millions of euros)
31/12/2014
≤ 3 months> 3 months up
to ≤ 1 year> 1 year up
to ≤ 5 years > 5 years Indefinite Total
Due to credit institutions (including Crédit Agricole internal transactions) 77,641 10,274 29,464 22,536 1,261 141,176
Due to customers 398,575 32,619 35,037 6,354 1,399 473,984
TOTAL AMOUNT DUE TO CREDIT INSTITUTIONS AND TO CUSTOMERS 476,216 42,893 64,501 28,890 2,660 615,160
(in millions of euros)
31/12/2013 Restated
≤ 3 months> 3 months up
to ≤ 1 year> 1 year up to
≤ 5 years > 5 years Indefinite Total
Due to credit institutions (including Crédit Agricole internal transactions) 82,522 14,430 34,411 20,251 726 152,340
Due to customers 401,796 34,437 29,871 7,470 3,739 477,313
TOTAL AMOUNT DUE TO CREDIT INSTITUTIONS AND TO CUSTOMERS 484,318 48,867 64,282 27,721 4,465 629,653
DEBT SECURITIES AND SUBORDINATED DEBT
(in millions of euros)
31/12/2014
≤ 3 months> 3 months up
to ≤ 1 year> 1 year up
to ≤ 5 years > 5 years Indefinite Total
Debt securities
Interest bearing notes 79 102 9 - - 190
Money-market instruments - 2,420 7,310 9,005 - 18,735
Negotiable debt instrument 30,467 26,115 12,282 167 - 69,031
Bonds 6,173 10,930 39,756 24,080 - 80,939
Other debt securities 928 1,867 1,082 149 - 4,026
TOTAL DEBT SECURITIES 37,647 41,434 60,439 33,401 - 172,921
Subordinated debt
Dated subordinated debt 319 128 9,028 8,568 - 18,043
Undated subordinated debt 147 9 27 - 7,442 7,625
Mutual security deposits - - - - 148 148
Participating securities and loans - - - 1 120 121
TOTAL SUBORDINATED DEBT 466 137 9,055 8,569 7,710 25,937

336 CRÉDIT AGRICOLE S.A. 2014 REGISTRATION DOCUMENT
6 CONSOLIDATED FINANCIAL STATEMENTSNotes to the financial statements / Note 3
(in millions of euros)
31/12/2013 Restated
≤ 3 months> 3 months up
to ≤ 1 year> 1 year up
to ≤ 5 years > 5 years Indefinite Total
Debt securities
Interest bearing notes 112 67 - - - 179
Money-market instruments - 2,544 7,704 10,129 - 20,377
Negotiable debt instruments 33,938 15,056 10,769 255 - 60,018
Bonds 7,661 7,610 40,880 20,431 - 76,582
Other debt securities 1,445 1,408 423 84 - 3,360
TOTAL DEBT SECURITIES 43,156 26,685 59,776 30,899 - 160,516
Subordinated debt
Dated subordinated debt 585 539 5,045 12,186 - 18,355
Undated subordinated debt 3 117 - 1,210 8,406 9,736
Mutual security deposits - - - - 141 141
Participating securities and loans - - - 1 120 121
TOTAL SUBORDINATED DEBT 588 656 5,045 13,397 8,667 28,353
FINANCIAL GUARANTEES AT RISK GIVEN BY EXPECTED MATURITYThe amounts presented correspond to the expected amount of the call of financial guarantees at risk, i.e. guarantees that have been impaired or are on a watch-list.
(in millions of euros)
31/12/2014
≤ 3 months> 3 months to ≤ 1 year
> 1 year to ≤ 5 years > 5 years Indefinite Total
Financial guarantees given 165 58 - - - 223
(in millions of euros)
31/12/2013 Restated
≤ 3 months> 3 months to ≤ 1 year
> 1 year to ≤ 5 years > 5 years Indefinite Total
Financial guarantees given 201 340 - - - 541
The remaining contractual maturities of derivative instruments are shown in Note 3.2 “Market Risk”.
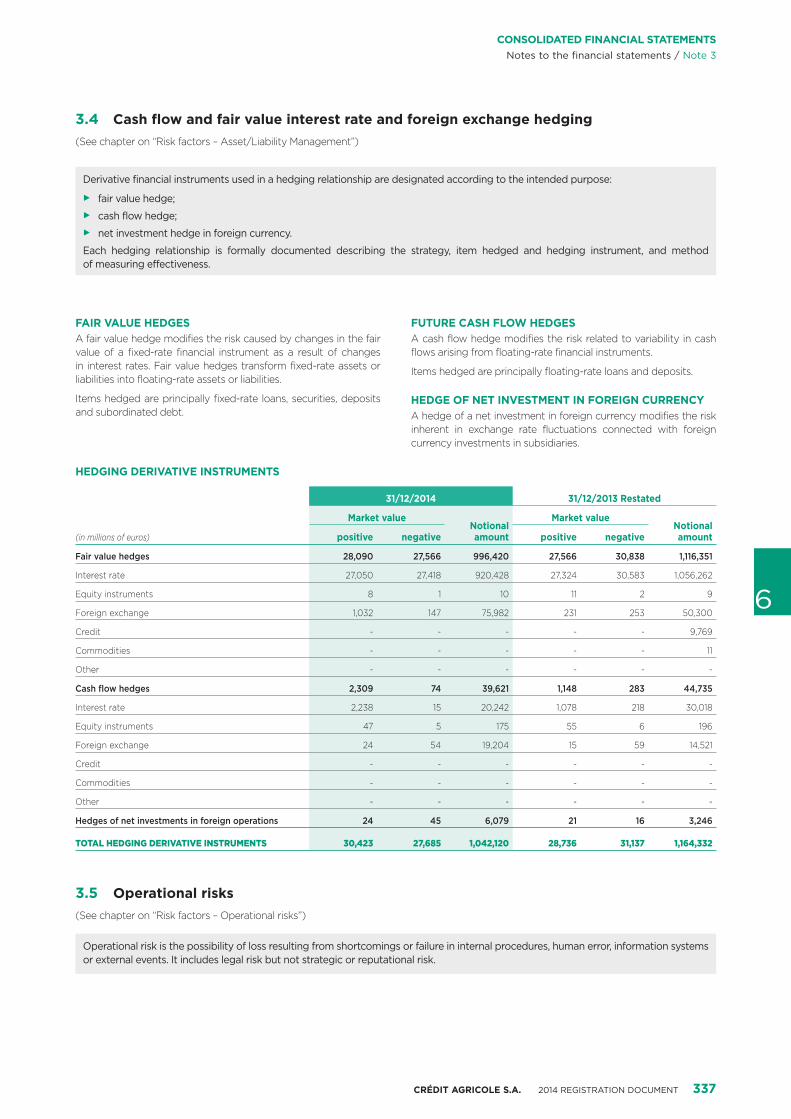
CRÉDIT AGRICOLE S.A. 2014 REGISTRATION DOCUMENT 337
6
CONSOLIDATED FINANCIAL STATEMENTSNotes to the financial statements / Note 3
3.4 Cash flow and fair value interest rate and foreign exchange hedging(See chapter on “Risk factors – Asset/Liability Management”)
Derivative financial instruments used in a hedging relationship are designated according to the intended purpose:
3 fair value hedge;
3 cash flow hedge;
3 net investment hedge in foreign currency.
Each hedging relationship is formally documented describing the strategy, item hedged and hedging instrument, and method of measuring effectiveness.
FAIR VALUE HEDGESA fair value hedge modifies the risk caused by changes in the fair value of a fixed-rate financial instrument as a result of changes in interest rates. Fair value hedges transform fixed-rate assets or liabilities into floating-rate assets or liabilities.
Items hedged are principally fixed-rate loans, securities, deposits and subordinated debt.
FUTURE CASH FLOW HEDGESA cash flow hedge modifies the risk related to variability in cash flows arising from floating-rate financial instruments.
Items hedged are principally floating-rate loans and deposits.
HEDGE OF NET INVESTMENT IN FOREIGN CURRENCYA hedge of a net investment in foreign currency modifies the risk inherent in exchange rate fluctuations connected with foreign currency investments in subsidiaries.
HEDGING DERIVATIVE INSTRUMENTS
(in millions of euros)
31/12/2014 31/12/2013 Restated
Market valueNotional amount
Market valueNotional amountpositive negative positive negative
Fair value hedges 28,090 27,566 996,420 27,566 30,838 1,116,351
Interest rate 27,050 27,418 920,428 27,324 30,583 1,056,262
Equity instruments 8 1 10 11 2 9
Foreign exchange 1,032 147 75,982 231 253 50,300
Credit - - - - - 9,769
Commodities - - - - - 11
Other - - - - - -
Cash flow hedges 2,309 74 39,621 1,148 283 44,735
Interest rate 2,238 15 20,242 1,078 218 30,018
Equity instruments 47 5 175 55 6 196
Foreign exchange 24 54 19,204 15 59 14,521
Credit - - - - - -
Commodities - - - - - -
Other - - - - - -
Hedges of net investments in foreign operations 24 45 6,079 21 16 3,246
TOTAL HEDGING DERIVATIVE INSTRUMENTS 30,423 27,685 1,042,120 28,736 31,137 1,164,332
3.5 Operational risks(See chapter on “Risk factors – Operational risks”)
Operational risk is the possibility of loss resulting from shortcomings or failure in internal procedures, human error, information systems or external events. It includes legal risk but not strategic or reputational risk.
338 CRÉDIT AGRICOLE S.A. 2014 REGISTRATION DOCUMENT
6 CONSOLIDATED FINANCIAL STATEMENTSNotes to the financial statements / Note 3
3.6 Capital management and regulatory ratios
The amendment to IAS 1 adopted by the European Union on 11 January 2006 requires disclosure of information on the entity’s capital and management of its capital. The purpose of the amendment is to disclose to users information on the entity’s objectives, policies and processes for managing capital. It requires disclosure of qualitative and quantitative information in the notes to the financial statements, namely summary quantitative data about what the entity manages as capital, a description of any externally imposed requirements on the entity’s capital (such as regulatory requirements), indication as to whether the entity has complied with regulatory requirements, and, if it has not complied, the consequences of such non-compliance.
In accordance with regulatory regulations applicable to banks, which transpose into French law the European directives on “the capital adequacy of investment firms and credit institutions” and “financial conglomerates”, Crédit Agricole S.A. Group must comply with the solvency ratio, with liquidity ratios and with rules on the division of risks and balance sheet management.
Crédit Agricole S.A. Group manages its capital so as to comply with regulatory capital requirements within the meaning of European Directive 2013/36 and Regulation 575/2013 since 1 January 2014 and as required by the competent authorities, the European Central Bank and the French Regulatory and Resolution Supervisory Authority (ACPR) in order to cover risk weighted assets for credit risk, operational risk and market risk.
The regulatory framework was strengthened by the Basel 3 reform, which notably involves raising the quality and level of required regulatory capital, better assessing risks, building in capital buffers and additional requirements in terms of liquidity and leverage. Certain provisions are being phased in up to 31 December 2017, just like the capital buffer requirement.
However, the regulator maintained the capital requirements relating to floors (the Basel 3 requirement cannot be less than 80% of the Basel 1 requirement). The floor was eliminated, however, disclosures on Basel 1 requirements remain mandatory and will continue up until the end of the transitional period.
Regulatory capital breaks down into three categories:
� Common Equity Tier 1 (CET1), determined on the basis of the Group’s equity and excluding in particular certain equity instruments that are classified as Additional Tier 1 (AT1) and intangible assets;
� Tier 1 which is comprised of Common Equity Tier 1 and Additional Tier 1 capital;
� total capital, consisting of Tier 1 and Tier 2 capital comprising subordinated instruments with a minimum maturity of five years from the issue date.
Tier 1 and Tier 2 equity instruments must satisfy more demanding criteria before being recognised under Basel 3. If these instruments are not eligible under Basel 3, they can benefit from grandfathering rules for a period of ten years to end-2021 so as to progressively eliminate them from capital.
Deductions for equity investments in other credit institutions reduce the total of this capital and are respectively allocated, depending on the type of instrument, to the amount of CET1, Tier 1 (AT1) and Tier 2. They also apply to holdings in the insurance sector when the institution is exempt from the “Financial Conglomerate directive”, otherwise the equity-accounted values of the insurance company securities held by the Group are risk-weighted.
In 2014, as in 2013 and in accordance with current regulations, Crédit Agricole S.A. Group complied with regulatory requirements.
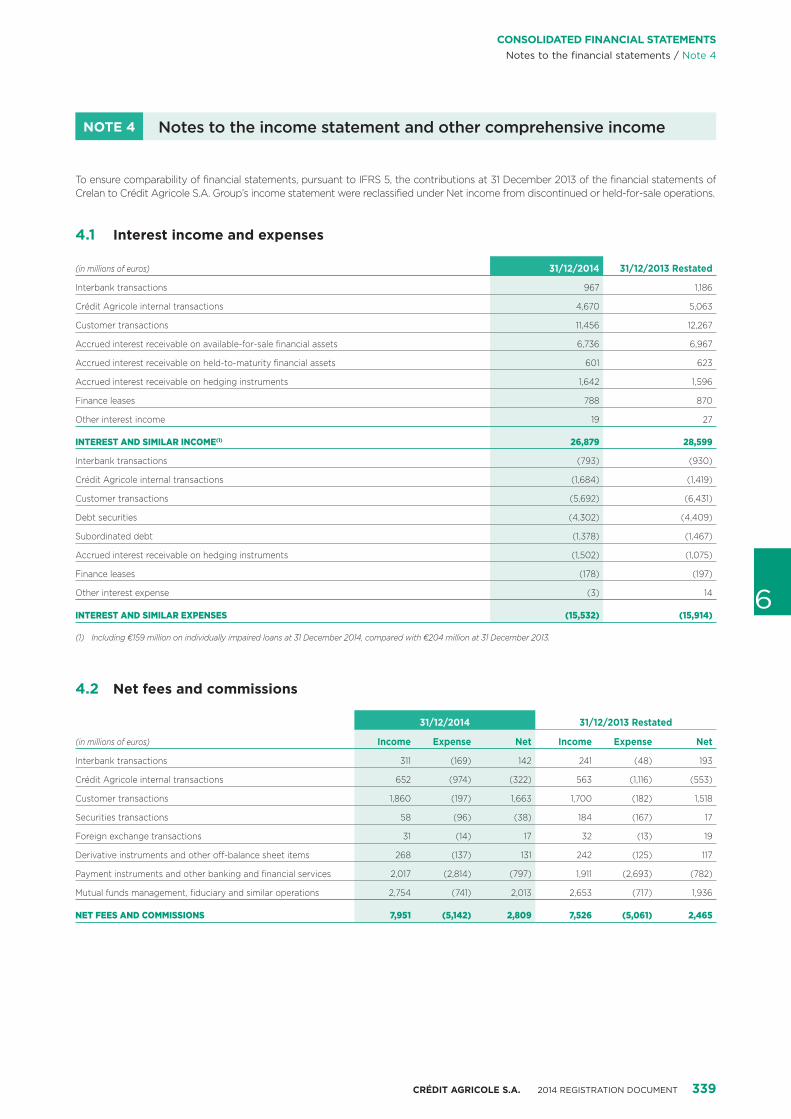
CRÉDIT AGRICOLE S.A. 2014 REGISTRATION DOCUMENT 339
6
CONSOLIDATED FINANCIAL STATEMENTSNotes to the financial statements / Note 4
NOTE 4 Notes to the income statement and other comprehensive income
To ensure comparability of financial statements, pursuant to IFRS 5, the contributions at 31 December 2013 of the financial statements of Crelan to Crédit Agricole S.A. Group’s income statement were reclassified under Net income from discontinued or held-for-sale operations.
4.1 Interest income and expenses
(in millions of euros) 31/12/2014 31/12/2013 Restated
Interbank transactions 967 1,186
Crédit Agricole internal transactions 4,670 5,063
Customer transactions 11,456 12,267
Accrued interest receivable on available-for-sale financial assets 6,736 6,967
Accrued interest receivable on held-to-maturity financial assets 601 623
Accrued interest receivable on hedging instruments 1,642 1,596
Finance leases 788 870
Other interest income 19 27
INTEREST AND SIMILAR INCOME(1) 26,879 28,599
Interbank transactions (793) (930)
Crédit Agricole internal transactions (1,684) (1,419)
Customer transactions (5,692) (6,431)
Debt securities (4,302) (4,409)
Subordinated debt (1,378) (1,467)
Accrued interest receivable on hedging instruments (1,502) (1,075)
Finance leases (178) (197)
Other interest expense (3) 14
INTEREST AND SIMILAR EXPENSES (15,532) (15,914)
(1) Including €159 million on individually impaired loans at 31 December 2014, compared with €204 million at 31 December 2013.
4.2 Net fees and commissions
(in millions of euros)
31/12/2014 31/12/2013 Restated
Income Expense Net Income Expense Net
Interbank transactions 311 (169) 142 241 (48) 193
Crédit Agricole internal transactions 652 (974) (322) 563 (1,116) (553)
Customer transactions 1,860 (197) 1,663 1,700 (182) 1,518
Securities transactions 58 (96) (38) 184 (167) 17
Foreign exchange transactions 31 (14) 17 32 (13) 19
Derivative instruments and other off-balance sheet items 268 (137) 131 242 (125) 117
Payment instruments and other banking and financial services 2,017 (2,814) (797) 1,911 (2,693) (782)
Mutual funds management, fiduciary and similar operations 2,754 (741) 2,013 2,653 (717) 1,936
NET FEES AND COMMISSIONS 7,951 (5,142) 2,809 7,526 (5,061) 2,465
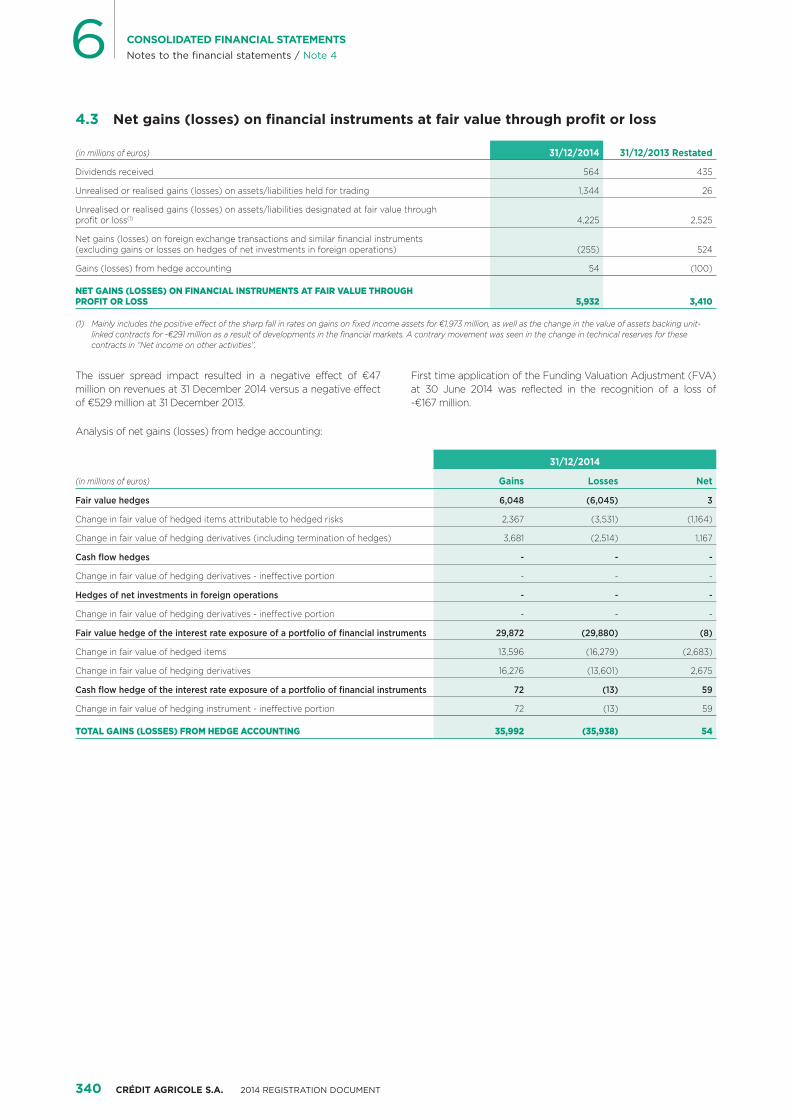
340 CRÉDIT AGRICOLE S.A. 2014 REGISTRATION DOCUMENT
6 CONSOLIDATED FINANCIAL STATEMENTSNotes to the financial statements / Note 4
4.3 Net gains (losses) on financial instruments at fair value through profit or loss
(in millions of euros) 31/12/2014 31/12/2013 Restated
Dividends received 564 435
Unrealised or realised gains (losses) on assets/liabilities held for trading 1,344 26
Unrealised or realised gains (losses) on assets/liabilities designated at fair value through profit or loss(1) 4,225 2,525
Net gains (losses) on foreign exchange transactions and similar financial instruments (excluding gains or losses on hedges of net investments in foreign operations) (255) 524
Gains (losses) from hedge accounting 54 (100)
NET GAINS (LOSSES) ON FINANCIAL INSTRUMENTS AT FAIR VALUE THROUGH PROFIT OR LOSS 5,932 3,410
(1) Mainly includes the positive effect of the sharp fall in rates on gains on fixed income assets for €1,973 million, as well as the change in the value of assets backing unit-linked contracts for -€291 million as a result of developments in the financial markets. A contrary movement was seen in the change in technical reserves for these contracts in “Net income on other activities”.
Analysis of net gains (losses) from hedge accounting:
(in millions of euros)
31/12/2014
Gains Losses Net
Fair value hedges 6,048 (6,045) 3
Change in fair value of hedged items attributable to hedged risks 2,367 (3,531) (1,164)
Change in fair value of hedging derivatives (including termination of hedges) 3,681 (2,514) 1,167
Cash flow hedges - - -
Change in fair value of hedging derivatives - ineffective portion - - -
Hedges of net investments in foreign operations - - -
Change in fair value of hedging derivatives - ineffective portion - - -
Fair value hedge of the interest rate exposure of a portfolio of financial instruments 29,872 (29,880) (8)
Change in fair value of hedged items 13,596 (16,279) (2,683)
Change in fair value of hedging derivatives 16,276 (13,601) 2,675
Cash flow hedge of the interest rate exposure of a portfolio of financial instruments 72 (13) 59
Change in fair value of hedging instrument - ineffective portion 72 (13) 59
TOTAL GAINS (LOSSES) FROM HEDGE ACCOUNTING 35,992 (35,938) 54
The issuer spread impact resulted in a negative effect of €47 million on revenues at 31 December 2014 versus a negative effect of €529 million at 31 December 2013.
First time application of the Funding Valuation Adjustment (FVA) at 30 June 2014 was reflected in the recognition of a loss of -€167 million.
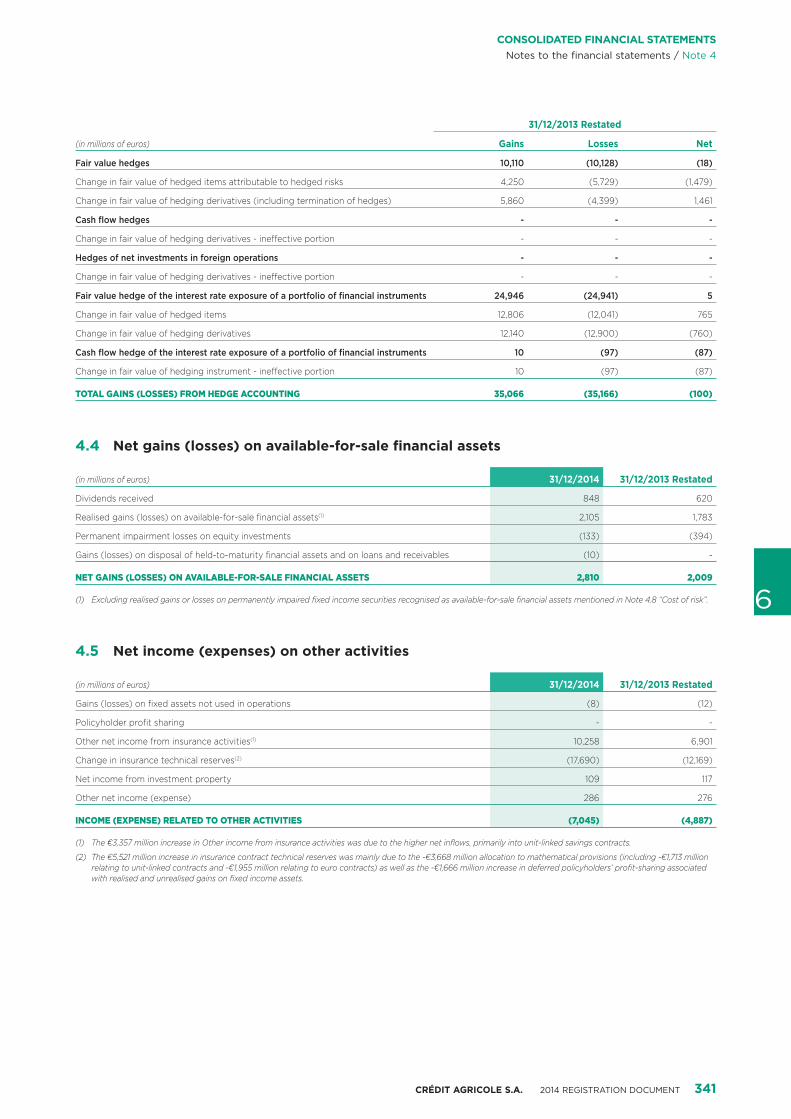
CRÉDIT AGRICOLE S.A. 2014 REGISTRATION DOCUMENT 341
6
CONSOLIDATED FINANCIAL STATEMENTSNotes to the financial statements / Note 4
(in millions of euros)
31/12/2013 Restated
Gains Losses Net
Fair value hedges 10,110 (10,128) (18)
Change in fair value of hedged items attributable to hedged risks 4,250 (5,729) (1,479)
Change in fair value of hedging derivatives (including termination of hedges) 5,860 (4,399) 1,461
Cash flow hedges - - -
Change in fair value of hedging derivatives - ineffective portion - - -
Hedges of net investments in foreign operations - - -
Change in fair value of hedging derivatives - ineffective portion - - -
Fair value hedge of the interest rate exposure of a portfolio of financial instruments 24,946 (24,941) 5
Change in fair value of hedged items 12,806 (12,041) 765
Change in fair value of hedging derivatives 12,140 (12,900) (760)
Cash flow hedge of the interest rate exposure of a portfolio of financial instruments 10 (97) (87)
Change in fair value of hedging instrument - ineffective portion 10 (97) (87)
TOTAL GAINS (LOSSES) FROM HEDGE ACCOUNTING 35,066 (35,166) (100)
4.4 Net gains (losses) on available-for-sale financial assets
(in millions of euros) 31/12/2014 31/12/2013 Restated
Dividends received 848 620
Realised gains (losses) on available-for-sale financial assets(1) 2,105 1,783
Permanent impairment losses on equity investments (133) (394)
Gains (losses) on disposal of held-to-maturity financial assets and on loans and receivables (10) -
NET GAINS (LOSSES) ON AVAILABLE-FOR-SALE FINANCIAL ASSETS 2,810 2,009
(1) Excluding realised gains or losses on permanently impaired fixed income securities recognised as available-for-sale financial assets mentioned in Note 4.8 “Cost of risk”.
4.5 Net income (expenses) on other activities
(in millions of euros) 31/12/2014 31/12/2013 Restated
Gains (losses) on fixed assets not used in operations (8) (12)
Policyholder profit sharing - -
Other net income from insurance activities(1) 10,258 6,901
Change in insurance technical reserves(2) (17,690) (12,169)
Net income from investment property 109 117
Other net income (expense) 286 276
INCOME (EXPENSE) RELATED TO OTHER ACTIVITIES (7,045) (4,887)
(1) The €3,357 million increase in Other income from insurance activities was due to the higher net inflows, primarily into unit-linked savings contracts.
(2) The €5,521 million increase in insurance contract technical reserves was mainly due to the -€3,668 million allocation to mathematical provisions (including -€1,713 million relating to unit-linked contracts and -€1,955 million relating to euro contracts) as well as the -€1,666 million increase in deferred policyholders’ profit-sharing associated with realised and unrealised gains on fixed income assets.
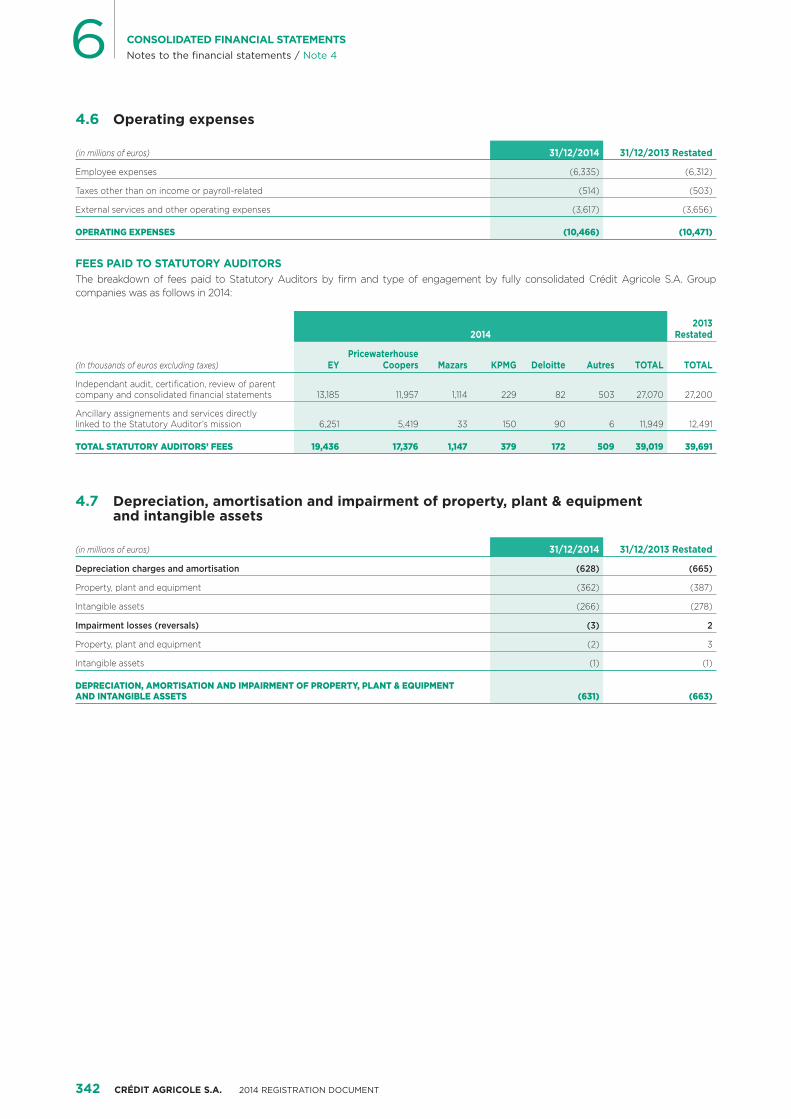
342 CRÉDIT AGRICOLE S.A. 2014 REGISTRATION DOCUMENT
6 CONSOLIDATED FINANCIAL STATEMENTSNotes to the financial statements / Note 4
4.6 Operating expenses
(in millions of euros) 31/12/2014 31/12/2013 Restated
Employee expenses (6,335) (6,312)
Taxes other than on income or payroll-related (514) (503)
External services and other operating expenses (3,617) (3,656)
OPERATING EXPENSES (10,466) (10,471)
FEES PAID TO STATUTORY AUDITORSThe breakdown of fees paid to Statutory Auditors by firm and type of engagement by fully consolidated Crédit Agricole S.A. Group companies was as follows in 2014:
(In thousands of euros excluding taxes)
20142013
Restated
EYPricewaterhouse
Coopers Mazars KPMG Deloitte Autres TOTAL TOTAL
Independant audit, certification, review of parent company and consolidated financial statements 13,185 11,957 1,114 229 82 503 27,070 27,200
Ancillary assignements and services directly linked to the Statutory Auditor’s mission 6,251 5,419 33 150 90 6 11,949 12,491
TOTAL STATUTORY AUDITORS’ FEES 19,436 17,376 1,147 379 172 509 39,019 39,691
4.7 Depreciation, amortisation and impairment of property, plant & equipment and intangible assets
(in millions of euros) 31/12/2014 31/12/2013 Restated
Depreciation charges and amortisation (628) (665)
Property, plant and equipment (362) (387)
Intangible assets (266) (278)
Impairment losses (reversals) (3) 2
Property, plant and equipment (2) 3
Intangible assets (1) (1)
DEPRECIATION, AMORTISATION AND IMPAIRMENT OF PROPERTY, PLANT & EQUIPMENT AND INTANGIBLE ASSETS (631) (663)
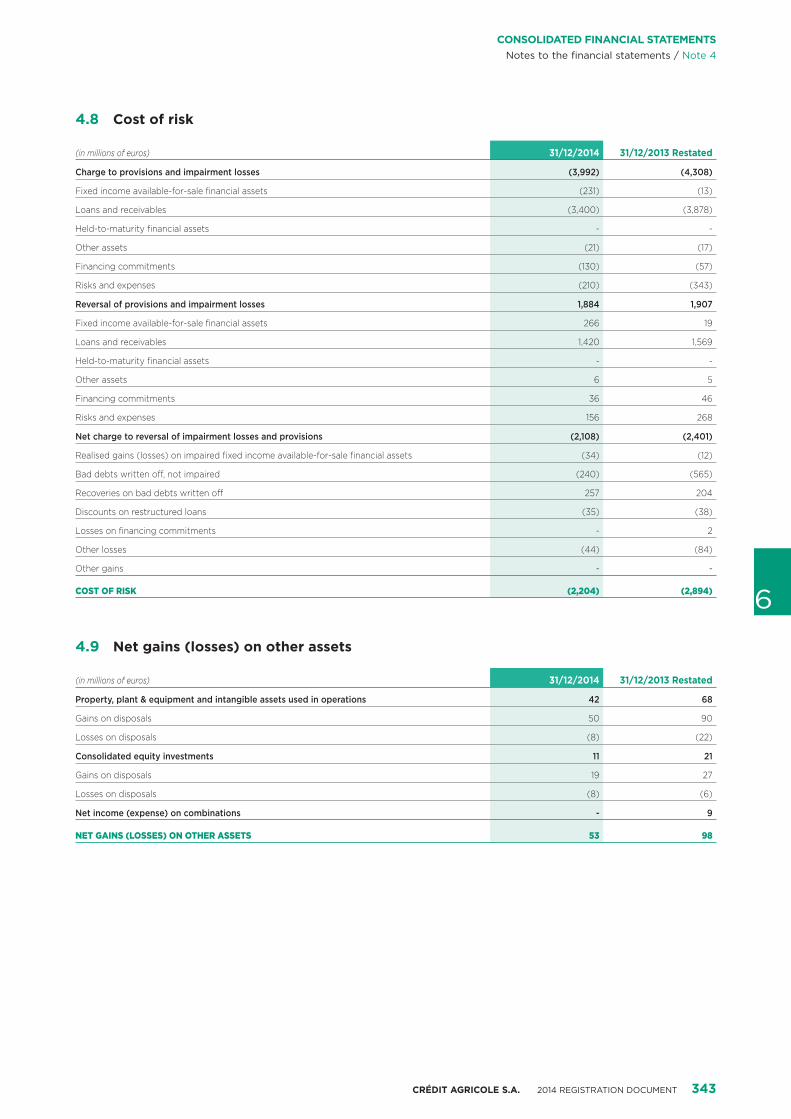
CRÉDIT AGRICOLE S.A. 2014 REGISTRATION DOCUMENT 343
6
CONSOLIDATED FINANCIAL STATEMENTSNotes to the financial statements / Note 4
4.8 Cost of risk
(in millions of euros) 31/12/2014 31/12/2013 Restated
Charge to provisions and impairment losses (3,992) (4,308)
Fixed income available-for-sale financial assets (231) (13)
Loans and receivables (3,400) (3,878)
Held-to-maturity financial assets - -
Other assets (21) (17)
Financing commitments (130) (57)
Risks and expenses (210) (343)
Reversal of provisions and impairment losses 1,884 1,907
Fixed income available-for-sale financial assets 266 19
Loans and receivables 1,420 1,569
Held-to-maturity financial assets - -
Other assets 6 5
Financing commitments 36 46
Risks and expenses 156 268
Net charge to reversal of impairment losses and provisions (2,108) (2,401)
Realised gains (losses) on impaired fixed income available-for-sale financial assets (34) (12)
Bad debts written off, not impaired (240) (565)
Recoveries on bad debts written off 257 204
Discounts on restructured loans (35) (38)
Losses on financing commitments - 2
Other losses (44) (84)
Other gains - -
COST OF RISK (2,204) (2,894)
4.9 Net gains (losses) on other assets
(in millions of euros) 31/12/2014 31/12/2013 Restated
Property, plant & equipment and intangible assets used in operations 42 68
Gains on disposals 50 90
Losses on disposals (8) (22)
Consolidated equity investments 11 21
Gains on disposals 19 27
Losses on disposals (8) (6)
Net income (expense) on combinations - 9
NET GAINS (LOSSES) ON OTHER ASSETS 53 98

344 CRÉDIT AGRICOLE S.A. 2014 REGISTRATION DOCUMENT
6 CONSOLIDATED FINANCIAL STATEMENTSNotes to the financial statements / Note 4
4.10 Income tax charge
INCOME TAX CHARGE
(in millions of euros) 31/12/2014 31/12/2013 Restated
Current tax charge 133 635
Deferred tax charge (602) (733)
TAX CHARGE FOR THE PERIOD (469) (98)
RECONCILIATION OF THEORETICAL TAX RATE AND EFFECTIVE TAX RATE
AT 31 DECEMBER 2014
(in millions of euros) Base Tax rate Tax
Pre-tax income, goodwill impairment, discontinued operations and share of net income of equity-accounted entities 2,604 38.02% (990)
Impact of permanent differences (3.69%) 96
Impact of different tax rates on foreign subsidiaries (6.84%) 178
Impact of losses for the year, utilisation of tax loss carryforwards and temporary differences 1.69% (44)
Impact of reduced tax rate (8.53%) 222
Impact of other items (2.65%) 69
EFFECTIVE TAX RATE AND TAX CHARGE 18.01% (469)
The theoretical tax rate is the tax rate applicable under ordinary law (including the additional social contribution and the exceptional contribution to corporate income tax) to taxable profits in France for the year ended 31 December 2014.
AT 31 DECEMBER 2013
(in millions of euros) Base Tax rate Tax
Pre-tax income, goodwill impairment, discontinued operations and share of net income of equity-accounted entities 1,752 38.00% (666)
Impact of permanent differences 10.90% (191)
Impact of different tax rates on foreign subsidiaries (7.19%) 126
Impact of losses for the year, utilisation of tax loss carryforwards and temporary differences (2.00%) 35
Impact of reduced tax rate (18.66%) 327
Impact of other items (15.47%) 271
EFFECTIVE TAX RATE AND TAX CHARGE 5.58% (98)
The theoretical tax rate is the tax rate applicable under ordinary law (including the additional social contribution and the exceptional contribution to corporate income tax) to taxable profits in France for the year ended 31 December 2013.
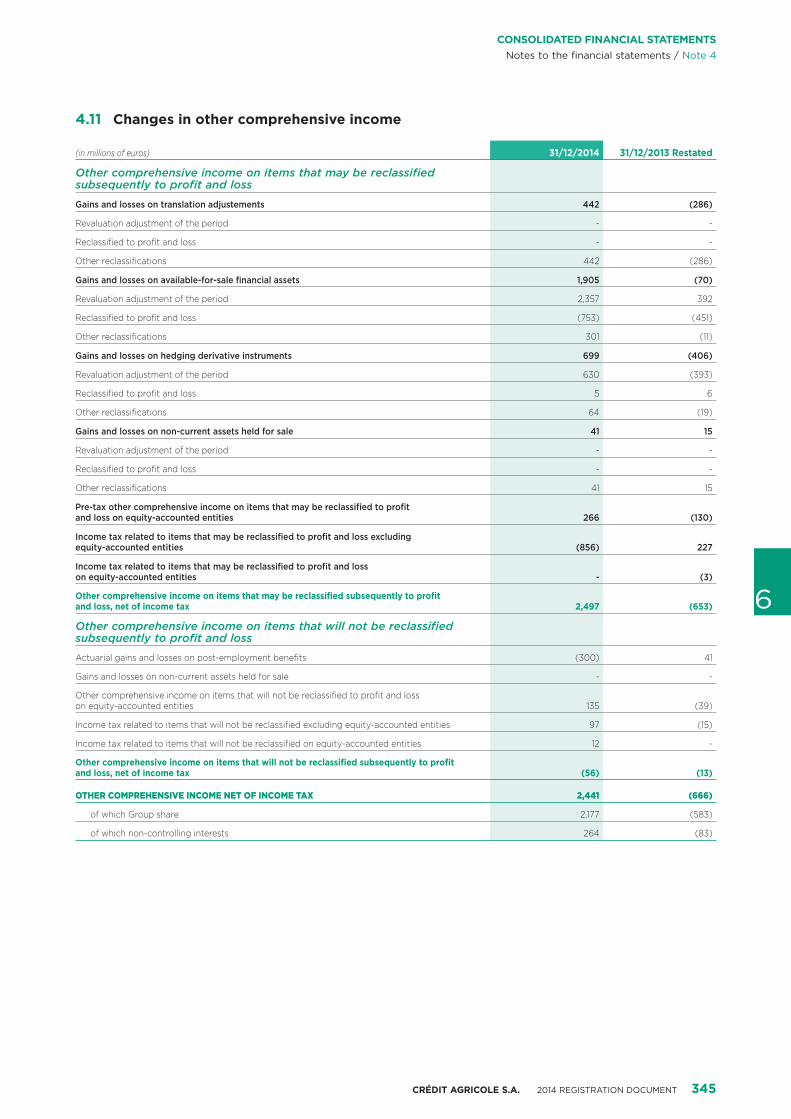
CRÉDIT AGRICOLE S.A. 2014 REGISTRATION DOCUMENT 345
6
CONSOLIDATED FINANCIAL STATEMENTSNotes to the financial statements / Note 4
4.11 Changes in other comprehensive income
(in millions of euros) 31/12/2014 31/12/2013 Restated
Other comprehensive income on items that may be reclassified subsequently to profit and loss
Gains and losses on translation adjustements 442 (286)
Revaluation adjustment of the period - -
Reclassified to profit and loss - -
Other reclassifications 442 (286)
Gains and losses on available-for-sale financial assets 1,905 (70)
Revaluation adjustment of the period 2,357 392
Reclassified to profit and loss (753) (451)
Other reclassifications 301 (11)
Gains and losses on hedging derivative instruments 699 (406)
Revaluation adjustment of the period 630 (393)
Reclassified to profit and loss 5 6
Other reclassifications 64 (19)
Gains and losses on non-current assets held for sale 41 15
Revaluation adjustment of the period - -
Reclassified to profit and loss - -
Other reclassifications 41 15
Pre-tax other comprehensive income on items that may be reclassified to profit and loss on equity-accounted entities 266 (130)
Income tax related to items that may be reclassified to profit and loss excluding equity-accounted entities (856) 227
Income tax related to items that may be reclassified to profit and loss on equity-accounted entities - (3)
Other comprehensive income on items that may be reclassified subsequently to profit and loss, net of income tax 2,497 (653)
Other comprehensive income on items that will not be reclassified subsequently to profit and loss
Actuarial gains and losses on post-employment benefits (300) 41
Gains and losses on non-current assets held for sale - -
Other comprehensive income on items that will not be reclassified to profit and loss on equity-accounted entities 135 (39)
Income tax related to items that will not be reclassified excluding equity-accounted entities 97 (15)
Income tax related to items that will not be reclassified on equity-accounted entities 12 -
Other comprehensive income on items that will not be reclassified subsequently to profit and loss, net of income tax (56) (13)
OTHER COMPREHENSIVE INCOME NET OF INCOME TAX 2,441 (666)
of which Group share 2,177 (583)
of which non-controlling interests 264 (83)

346 CRÉDIT AGRICOLE S.A. 2014 REGISTRATION DOCUMENT
6 CONSOLIDATED FINANCIAL STATEMENTSNotes to the financial statements / Note 4
BREAKDOWN OF TAX IMPACTS RELATED TO OTHER COMPREHENSIVE INCOME
(in millions of euros)
31/12/2013 Restated Changes 31/12/2014
Gross
Income tax
charges
Net of income
tax
Net of income tax o/w
Group Share Gross
Income tax
charges
Net of income
tax
Net of income tax o/w
Group Share Gross
Income tax
charges
Net of income
tax
Net of income tax o/w
Group Share
Other comprehensive income on items that may be reclassified subsequently to profit and loss
Gains and losses on translation adjustements (469) - (469) (289) 442 - 442 224 (27) - (27) (65)
Gains and losses on available-for-sale financial assets 2,966 (723) 2,243 2,220 1,905 (632) 1,273 1,238 4,871 (1,355) 3,516 3,458
Gains and losses on hedging derivative instruments 550 (183) 367 360 699 (226) 473 463 1,249 (409) 840 823
Gains and losses on non-current assets held for sale (41) (2) (43) (39) 41 2 43 39 - - - -
Other comprehensive income on items that may be reclassified to profit and loss excluding equity-accounted entities 3,006 (908) 2,098 2,252 3,087 (856) 2,231 1,964 6,093 (1,764) 4,329 4,216
Other comprehensive income on items that may be reclassified to profit and loss on equity-accounted entities 160 (59) 101 102 266 - 266 260 426 (59) 367 362
Other comprehensive income on items that may be reclassified subsequently to profit and loss 3,166 (967) 2,199 2,354 3,353 (856) 2,497 2,224 6,519 (1,823) 4,696 4,578
Other comprehensive income on items that will not be reclassified subsequently to profit and loss
Actuarial gains and losses on post-employment benefits (290) 86 (204) (192) (300) 97 (203) (194) (590) 183 (407) (386)
Gains and losses on non-current assets held for sale - - - - - - - - - - - -
Other comprehensive income on items that will not be reclassified to profit and loss excluding equity-accounted entities (290) 86 (204) (192) (300) 97 (203) (194) (590) 183 (407) (386)
Other comprehensive income on items that will not be reclassified to profit and loss on equity-accounted entities (215) 10 (205) (205) 135 12 147 147 (80) 22 (58) (58)
Other comprehensive income on items that will not be reclassified to profit and loss (505) 96 (409) (397) (165) 109 (56) (47) (670) 205 (465) (444)
OTHER COMPREHENSIVE INCOME 2,661 (871) 1,790 1,957 3,188 (747) 2,441 2,177 5,849 (1,618) 4,231 4,134

CRÉDIT AGRICOLE S.A. 2014 REGISTRATION DOCUMENT 347
6
CONSOLIDATED FINANCIAL STATEMENTSNotes to the financial statements / Note 5
NOTE 5 Segment reporting
DEFINITION OF OPERATING SEGMENTSAccording to IFRS 8, information disclosed is based on the internal reporting that is used by the Executive Committee to manage Crédit Agricole S.A., to assess performance, and to make decisions about resources to be allocated to the identified operating segments.
Operating segments according to the internal reporting consist of the business lines of the Group.
Crédit Agricole S.A.s activities are organised into seven operating segments:
� Six business lines:
� French retail banking – Regional Banks,
� French retail banking – LCL,
� International retail banking,
� Savings management and Insurance,
� Specialised financial services,
� Corporate and investment banking;
� as well as the “Corporate centre”.
PRESENTATION OF BUSINESS LINES
1. French retail banking – Regional BanksThis business line comprises the Regional Banks and their subsidiaries.
The Regional Banks provide banking services for individual customers, farmers, small businesses, corporates and local authorities, with a very strong local presence.
Crédit Agricole Regional Banks provide a full range of banking and financial products and services: savings products (money market, bonds, securities); life insurance investment products; lending (namely home and consumer finance, loans to corporates, small businesses and farmers); payment instruments; personal services; banking-related services; and wealth management. The Regional Banks also distribute a very large range of property & casualty and death & disability insurance products.
2. French retail banking – LCLFrench retail banking network with a strong presence in urban areas. It is organised into four business lines: retail banking for individual customers, retail banking for small businesses, private banking and corporate banking.
LCL offers a full range of banking products and services, together with asset management, insurance and wealth management products.
3. International retail bankingThis business line encompasses foreign subsidiaries and investments - that are mainly involved in retail banking.
These subsidiaries and investments are mostly in Europe: Cariparma, FriulAdria and Carispezia in Italy, Crédit Agricole Polska in Poland, Banco Espiríto Santo in Portugal (deconsolidated on 30 September 2014), Bankoa in Spain, PJSC Crédit Agricole Bank in Ukraine, Crédit Agricole Banka Srbija A.D. Novi Sad in Serbia, Crédit Agricole Romania, Crédit Agricole Bank Albania S.A., as well as Crelan S.A. in Belgium classified under Net income from discontinued or held-for-sale operations, in accordance with IFRS 5.
There are fewer subsidiaries in the Middle East and Africa, with Crédit du Maroc and Crédit Agricole Egypt.
The foreign subsidiaries in consumer finance, lease finance and factoring (subsidiaries of CA Consumer Finance, of Crédit Agricole Leasing & Factoring and EFL in Poland, etc.) are however not included in this division but are reported in the “Specialised financial services” segment.
4. Savings management and InsuranceThis business line encompasses:
� the asset management activities of the Amundi group, offering savings solutions for individuals and investment solutions for institutions;
� asset servicing for institutions: CACEIS Bank for custody and CACEIS Fund Administration for fund administration;
� life-insurance and personal insurance, conducted by Predica and Médicale de France and CA Vita in Italy;
� property & casualty insurance, conducted by Pacifica and GNB Seguros in Portugal;
� creditor insurance activities, conducted by Crédit Agricole Creditor Insurance;
� As well as private banking activities conducted mainly by CA Indosuez Private Banking and by Crédit Agricole CIB subsidiaries (Crédit Agricole Suisse, Crédit Agricole Luxembourg, Crédit Foncier de Monaco, etc.).
5. Specialised financial servicesSpecialised financial services comprises the Group subsidiaries that provide financial products and services to individual customers, small businesses, corporates and local authorities in France and abroad. These include:
� consumer finance companies around Crédit Agricole Consumer Finance in France and through its subsidiaries or partnerships outside France (Agos S.p.A., Forso, Credit-Plus, Ribank, Credibom, Interbank Group and FGA Capital S.p.A.);
� specialised financial services for companies such as factoring and lease finance (Crédit Agricole Leasing & Factoring Group, EFL).
6. Corporate and investment bankingCorporate and investment banking breaks down into three major businesses, most of which are carried out by Crédit Agricole CIB:
� financing activities comprise traditional commercial banking in France and abroad and structured finance: project financing, aeronautical financing, shipping finance, acquisition finance, real estate financing, and international trade;
� capital markets and investment banking activities bring together capital market activities (treasury, foreign exchange, interest rate derivatives, debt markets), and investment banking activities (merger and acquisitions consulting and primary equity);
� since the new organisation of Crédit Agricole CIB was established in the third quarter of 2012, following the adjustment plan, businesses in run-off now include the correlation business, the CDO, CLO and ABS portfolios, equity derivatives excluding corporates and convertibles, exotic rate derivatives, and the impaired portfolios with residential underlyings.

348 CRÉDIT AGRICOLE S.A. 2014 REGISTRATION DOCUMENT
6 CONSOLIDATED FINANCIAL STATEMENTSNotes to the financial statements / Note 5
7. Corporate centreThis segment mainly encompasses Crédit Agricole S.A.’s central body function, asset and liability management and management of debt connected with acquisitions of subsidiaries or equity investments.
It also includes the results of the private equity business and results of various other Crédit Agricole S.A. Group companies (Uni-Éditions, Foncaris, etc.).
This segment also includes the income from management companies, real-estate companies holding properties used in operations by several business lines and by activities undergoing reorganisation.
Lastly, it also incorporates the net impact of tax consolidation for Crédit Agricole S.A. as well as the revaluation of structured debt issued by Crédit Agricole CIB.
5.1 Operating segment informationTransactions between operating segments are effected at arm’s length.
Segment assets are calculated on the basis of accounting items comprising the balance sheet for each operating segment.
(in millions of euros)
31/12/2014
French retail bankingInternational
retail banking
Savings management
and Insurance
Specialised financial services
Corporate and investment
bankingCorporate
centre(1) TotalRegional
Banks LCL
Revenues 3,677 2,646 5,113 2,639 3,816 (2,038) 15,853
Operating expenses (2,532) (1,469) (2,565) (1,350) (2,295) (886) (11,097)
Gross operating income 1,145 1,177 2,548 1,289 1,521 (2,924) 4,756
Cost of risk (183) (749) (63) (1,044) (252) 87 (2,204)
Operating income 962 428 2,485 245 1,269 (2,837) 2,552
Share of net income of equity-accounted entities 1,026 - (717) 17 136 161 24 647
Net gains (losses) on other assets (1) (2) 50 - 4 2 53
Change in value of goodwill - - (22) - - - (22)
Pre-tax income 1,026 961 (291) 2,530 381 1,434 (2,811) 3,230
Income tax charge (347) (140) (834) (37) (384) 1,273 (469)
Net gains (losses) on discontinued or held-for-sale operations - 14 - (22) 3 - (5)
Net income 1,026 614 (417) 1,696 322 1,053 (1,538) 2,756
Non-controlling interests 30 83 146 43 23 91 416
Net income Group share 1,026 584 (500) 1,550 279 1,030 (1,629) 2,340
Segment assets
of which investments in equity-accounted entities 16,791 - 121 104 1,669 1,956 602 21,243
of which goodwill - 5,263 2,018 4,555 1,022 476 - 13,334
TOTAL ASSETS(1) 10,285 131,420 62,815 443,144 81,159 755,079 105,174 1,589,076
(1) The Crédit Agricole CIB issuer spread is classified under the Corporate centre for -€47 million in Revenues, +€16 million in Income tax charge, -€31 million in Net income including -€1 million in Non-controlling interests.
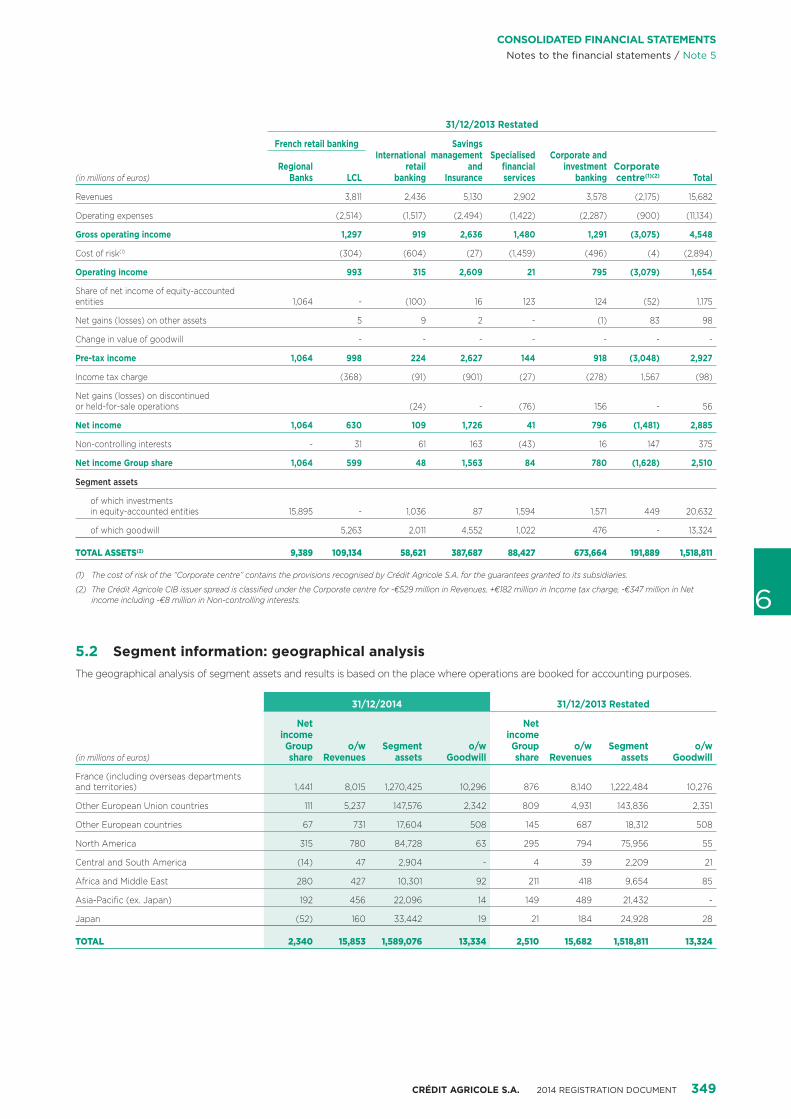
CRÉDIT AGRICOLE S.A. 2014 REGISTRATION DOCUMENT 349
6
CONSOLIDATED FINANCIAL STATEMENTSNotes to the financial statements / Note 5
(in millions of euros)
31/12/2013 Restated
French retail bankingInternational
retail banking
Savings management
and Insurance
Specialised financial services
Corporate and investment
bankingCorporate centre(1)(2) Total
Regional Banks LCL
Revenues 3,811 2,436 5,130 2,902 3,578 (2,175) 15,682
Operating expenses (2,514) (1,517) (2,494) (1,422) (2,287) (900) (11,134)
Gross operating income 1,297 919 2,636 1,480 1,291 (3,075) 4,548
Cost of risk(1) (304) (604) (27) (1,459) (496) (4) (2,894)
Operating income 993 315 2,609 21 795 (3,079) 1,654
Share of net income of equity-accounted entities 1,064 - (100) 16 123 124 (52) 1,175
Net gains (losses) on other assets 5 9 2 - (1) 83 98
Change in value of goodwill - - - - - - -
Pre-tax income 1,064 998 224 2,627 144 918 (3,048) 2,927
Income tax charge (368) (91) (901) (27) (278) 1,567 (98)
Net gains (losses) on discontinued or held-for-sale operations (24) - (76) 156 - 56
Net income 1,064 630 109 1,726 41 796 (1,481) 2,885
Non-controlling interests - 31 61 163 (43) 16 147 375
Net income Group share 1,064 599 48 1,563 84 780 (1,628) 2,510
Segment assets
of which investments in equity-accounted entities 15,895 - 1,036 87 1,594 1,571 449 20,632
of which goodwill 5,263 2,011 4,552 1,022 476 - 13,324
TOTAL ASSETS(2) 9,389 109,134 58,621 387,687 88,427 673,664 191,889 1,518,811
(1) The cost of risk of the “Corporate centre” contains the provisions recognised by Crédit Agricole S.A. for the guarantees granted to its subsidiaries.
(2) The Crédit Agricole CIB issuer spread is classified under the Corporate centre for -€529 million in Revenues, +€182 million in Income tax charge, -€347 million in Net income including -€8 million in Non-controlling interests.
5.2 Segment information: geographical analysisThe geographical analysis of segment assets and results is based on the place where operations are booked for accounting purposes.
(in millions of euros)
31/12/2014 31/12/2013 Restated
Net income Group share
o/w Revenues
Segment assets
o/w Goodwill
Net income Group share
o/w Revenues
Segment assets
o/w Goodwill
France (including overseas departments and territories) 1,441 8,015 1,270,425 10,296 876 8,140 1,222,484 10,276
Other European Union countries 111 5,237 147,576 2,342 809 4,931 143,836 2,351
Other European countries 67 731 17,604 508 145 687 18,312 508
North America 315 780 84,728 63 295 794 75,956 55
Central and South America (14) 47 2,904 - 4 39 2,209 21
Africa and Middle East 280 427 10,301 92 211 418 9,654 85
Asia-Pacific (ex. Japan) 192 456 22,096 14 149 489 21,432 -
Japan (52) 160 33,442 19 21 184 24,928 28
TOTAL 2,340 15,853 1,589,076 13,334 2,510 15,682 1,518,811 13,324
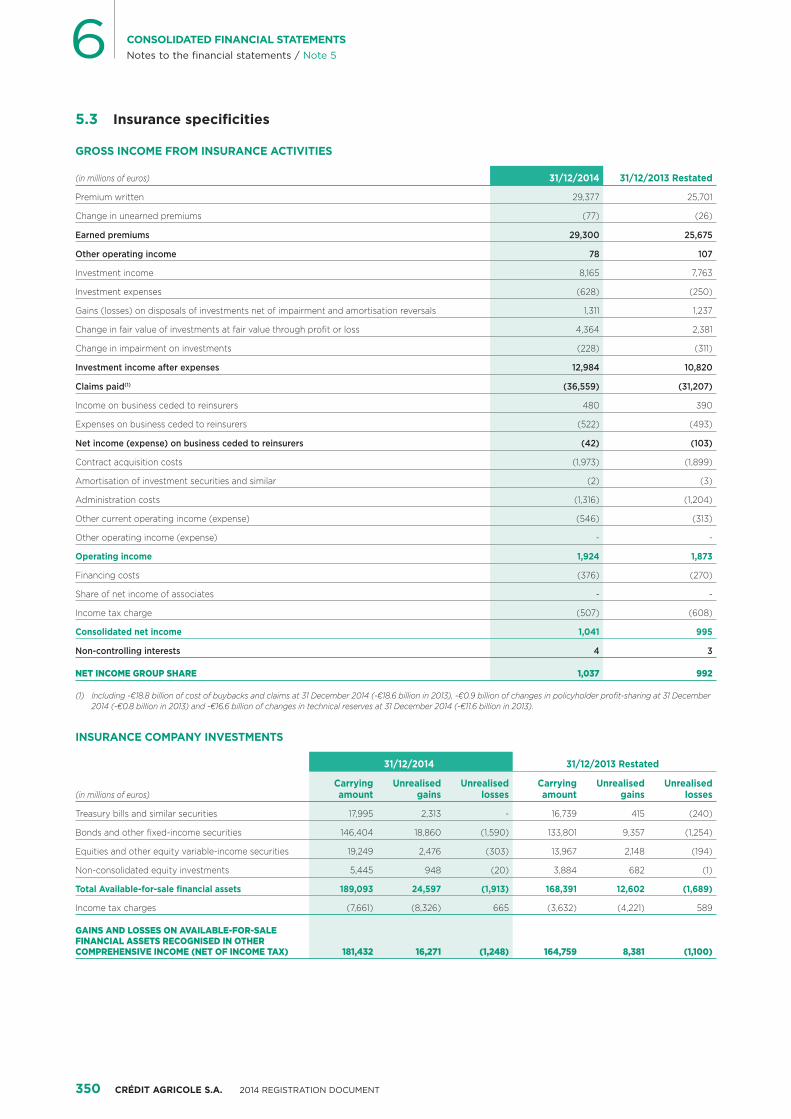
350 CRÉDIT AGRICOLE S.A. 2014 REGISTRATION DOCUMENT
6 CONSOLIDATED FINANCIAL STATEMENTSNotes to the financial statements / Note 5
5.3 Insurance specificities
GROSS INCOME FROM INSURANCE ACTIVITIES
(in millions of euros) 31/12/2014 31/12/2013 Restated
Premium written 29,377 25,701
Change in unearned premiums (77) (26)
Earned premiums 29,300 25,675
Other operating income 78 107
Investment income 8,165 7,763
Investment expenses (628) (250)
Gains (losses) on disposals of investments net of impairment and amortisation reversals 1,311 1,237
Change in fair value of investments at fair value through profit or loss 4,364 2,381
Change in impairment on investments (228) (311)
Investment income after expenses 12,984 10,820
Claims paid(1) (36,559) (31,207)
Income on business ceded to reinsurers 480 390
Expenses on business ceded to reinsurers (522) (493)
Net income (expense) on business ceded to reinsurers (42) (103)
Contract acquisition costs (1,973) (1,899)
Amortisation of investment securities and similar (2) (3)
Administration costs (1,316) (1,204)
Other current operating income (expense) (546) (313)
Other operating income (expense) - -
Operating income 1,924 1,873
Financing costs (376) (270)
Share of net income of associates - -
Income tax charge (507) (608)
Consolidated net income 1,041 995
Non-controlling interests 4 3
NET INCOME GROUP SHARE 1,037 992
(1) Including -€18.8 billion of cost of buybacks and claims at 31 December 2014 (-€18.6 billion in 2013), -€0.9 billion of changes in policyholder profit-sharing at 31 December 2014 (-€0.8 billion in 2013) and -€16.6 billion of changes in technical reserves at 31 December 2014 (-€11.6 billion in 2013).
INSURANCE COMPANY INVESTMENTS
(in millions of euros)
31/12/2014 31/12/2013 Restated
Carrying amount
Unrealised gains
Unrealised losses
Carrying amount
Unrealised gains
Unrealised losses
Treasury bills and similar securities 17,995 2,313 - 16,739 415 (240)
Bonds and other fixed-income securities 146,404 18,860 (1,590) 133,801 9,357 (1,254)
Equities and other equity variable-income securities 19,249 2,476 (303) 13,967 2,148 (194)
Non-consolidated equity investments 5,445 948 (20) 3,884 682 (1)
Total Available-for-sale financial assets 189,093 24,597 (1,913) 168,391 12,602 (1,689)
Income tax charges (7,661) (8,326) 665 (3,632) (4,221) 589
GAINS AND LOSSES ON AVAILABLE-FOR-SALE FINANCIAL ASSETS RECOGNISED IN OTHER COMPREHENSIVE INCOME (NET OF INCOME TAX) 181,432 16,271 (1,248) 164,759 8,381 (1,100)

CRÉDIT AGRICOLE S.A. 2014 REGISTRATION DOCUMENT 351
6
CONSOLIDATED FINANCIAL STATEMENTSNotes to the financial statements / Note 5
(in millions of euros)
31/12/2014 31/12/2013 Restated
Carrying amount Fair value Carrying amount Fair value
Bonds and other fixed-income securities 3,039 3,977 3,171 3,655
Treasury bills and similar securities 11,105 13,380 11,169 12,590
Impairment - - - -
Total Held-to-maturity financial assets 14,144 17,357 14,340 16,245
Loans and receivables 5,355 5,343 5,547 5,484
Investment property 4,084 6,158 3,493 5,527
(in millions of euros)
31/12/2014 31/12/2013 Restated
Carrying amount Carrying amount
Financial assets at fair value through profit or loss classified as held-for-trading or designated at fair value through profit or loss 86,057 69,878
Assets backing unit-linked contracts 36,592 34,619
Securities bought under repurchase agreements - -
Treasury bills and similar securities 13,971 5,941
Bonds and other fixed-income securities 20,913 19,777
Equities and other equity variable-income securities 12,874 8,466
Derivative instruments 1,707 1,075
(in millions of euros)
31/12/2014 31/12/2013 Restated
Carrying amount Carrying amount
TOTAL INSURANCE COMPANY INVESTMENTS 298,734 261,649
5.4 French retail banking – Regional Banks
OPERATIONS AND CONTRIBUTION OF THE REGIONAL BANKS AND THEIR SUBSIDIARIES
(in millions of euros) 31/12/2014 31/12/2013 Restated
Revenues 13,550 14,172
Operating expenses (7,620) (7,658)
Gross operating income 5,930 6,514
Cost of risk (704) (1,005)
Operating income 5,226 5,509
Other income (2) 5
Income tax charge (1,899) (2,032)
Adjusted aggregate net income of Regional Banks 3,325 3,482
Adjusted aggregate net income of Regional Banks’ subsidiaries 95 46
Net aggregate income (100%) 3,420 3,528
Net aggregate income contributed before restatements (~25%) 878 906
Increase in share of Regional Banks’ net income(1) 160 152
Income from dilution/accretion on charges in share capital (12) 5
Other consolidation restatements and eliminations - 1
SHARE OF NET INCOME OF EQUITY-ACCOUNTED ENTITIES 1,026 1,064
(1) Difference between dividends actually paid by the Regional Banks to Crédit Agricole S.A. and dividends calculated on the basis of Crédit Agricole S.A.’s percentage ownership of the Regional Banks.

352 CRÉDIT AGRICOLE S.A. 2014 REGISTRATION DOCUMENT
6 CONSOLIDATED FINANCIAL STATEMENTSNotes to the financial statements / Note 6
NOTE 6 Notes to the balance sheet
6.1 Cash, central banks
(in millions of euros)
31/12/2014 31/12/2013 Restated
Assets Liabilities Assets Liabilities
Cash 1,390 1,387
Central banks 53,646 4,411 66,764 2,852
CARRYING AMOUNT 55,036 4,411 68,151 2,852
6.2 Financial assets and liabilities at fair value through profit or loss
STRUCTURED ISSUES OF CRÉDIT AGRICOLE CIBIn accordance with IFRS 13, the Group values its structured issues, recognised at fair value, by taking as a reference the issuer spread that specialist participants agree to receive to acquire new Group issues.
The change in issuer spread on structured issues issued by Crédit Agricole CIB, and valued on the basis of the last end-of-period share issue table, generated:
� at 31 December 2014: an expense of -€47 million in Revenues and a loss of -€31 million in Net income;
� at 31 December 2013: an expense of -€529 million in Revenues and a loss of -€347 million in Net income.
FINANCIAL ASSETS AT FAIR VALUE THROUGH PROFIT OR LOSS
(in millions of euros) 31/12/2014 31/12/2013 Restated
Financial assets held for trading 316,050 281,371
Financial assets designated at fair value through profit or loss 89,522 81,511
CARRYING AMOUNT 405,572 362,882
Of which lent securities 225 1
HELD-FOR-TRADING FINANCIAL ASSETS
(in millions of euros) 31/12/2014 31/12/2013 Restated
Equity instruments 5,167 3,351
Equities and other variable-income securities 5,167 3,351
Debt securities 43,488 42,162
Treasury bills and similar securities 35,126 35,360
Bonds and other fixed-income securities 8,362 6,802
Loans and advances 84,955 85,514
Loans and receivables due from customers 261 358
Securities bought under repurchase agreements 84,694 85,156
Pledged securities - -
Derivative instruments 182,440 150,344
CARRYING AMOUNT 316,050 281,371
Securities acquired under repurchase agreements include those that the entity is authorised to use as collateral.

CRÉDIT AGRICOLE S.A. 2014 REGISTRATION DOCUMENT 353
6
CONSOLIDATED FINANCIAL STATEMENTSNotes to the financial statements / Note 6
FINANCIAL LIABILITIES AT FAIR VALUE THROUGH PROFIT OR LOSS
(in millions of euros) 31/12/2014 31/12/2013 Restated
Financial liabilities held for trading 290,180 266,512
Financial liabilities designated at fair value through profit or loss 31,074 33,291
CARRYING AMOUNT 321,254 299,803
HELD-FOR-TRADING FINANCIAL LIABILITIES
(in millions of euros) 31/12/2014 31/12/2013 Restated
Securities sold short 34,876 30,246
Securities sold under repurchase agreements 74,442 87,007
Debt securities - -
Derivative instruments 180,862 149,259
CARRYING AMOUNT 290,180 266,512
FINANCIAL ASSETS DESIGNATED AT FAIR VALUE THROUGH PROFIT OR LOSS
(in millions of euros) 31/12/2014 31/12/2013 Restated
Equity instruments 13,918 12,520
Equities and other variable-income securities 13,918 12,520
Debt securities 73,792 67,698
Assets backing unit-linked contracts 36,592 34,619
Treasury bills and similar securities 13,971 5,941
Bonds and other fixed-income securities 23,229 27,138
Loans and advances 1,812 1,293
Loans and receivables due from customers 1,613 1,087
Loans and receivables due from credit institutions 199 206
Securities bought under repurchase agreements - -
Pledged securities - -
CARRYING AMOUNT 89,522 81,511
FINANCIAL LIABILITIES DESIGNATED AT FAIR VALUE THROUGH PROFIT OR LOSS
(in millions of euros)
31/12/2014 31/12/2013 Restated
Fair value on the balance
sheet
Difference between carrying
amount and due on maturity
Fair value on the balance
sheet
Difference between carrying
amount and due on maturity
Deposits and subordinated liabilities 3,814 - - -
Other deposits 3,814 - - -
Subordinated liabilities - - - -
Debt securities 27,260 (419) 33,291 (452)
Other financial liabilities - - - -
TOTAL 31,074 (419) 33,291 (452)
6.3 Hedging derivative instrumentsDetailed information is provided in Note 3.4 on cash flow and fair value hedges, and more particularly with respect to interest rates and foreign exchange rates.
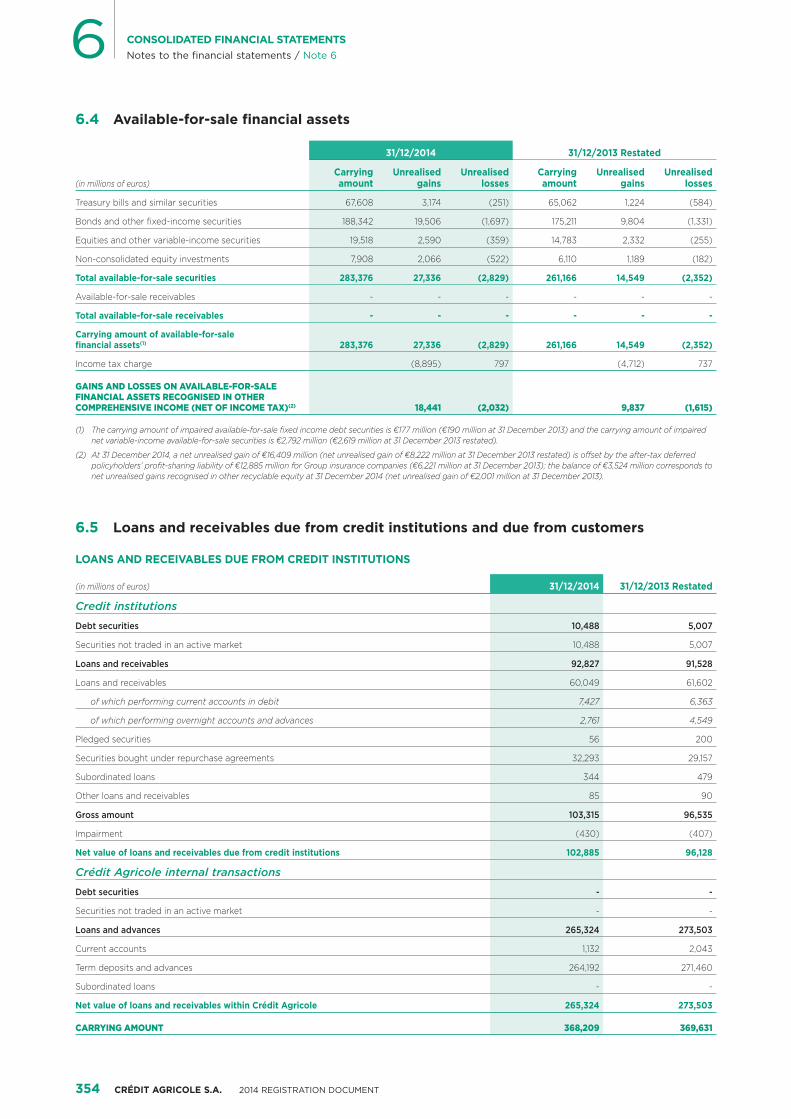
354 CRÉDIT AGRICOLE S.A. 2014 REGISTRATION DOCUMENT
6 CONSOLIDATED FINANCIAL STATEMENTSNotes to the financial statements / Note 6
6.4 Available-for-sale financial assets
(in millions of euros)
31/12/2014 31/12/2013 Restated
Carrying amount
Unrealised gains
Unrealised losses
Carrying amount
Unrealised gains
Unrealised losses
Treasury bills and similar securities 67,608 3,174 (251) 65,062 1,224 (584)
Bonds and other fixed-income securities 188,342 19,506 (1,697) 175,211 9,804 (1,331)
Equities and other variable-income securities 19,518 2,590 (359) 14,783 2,332 (255)
Non-consolidated equity investments 7,908 2,066 (522) 6,110 1,189 (182)
Total available-for-sale securities 283,376 27,336 (2,829) 261,166 14,549 (2,352)
Available-for-sale receivables - - - - - -
Total available-for-sale receivables - - - - - -
Carrying amount of available-for-sale financial assets(1) 283,376 27,336 (2,829) 261,166 14,549 (2,352)
Income tax charge (8,895) 797 (4,712) 737
GAINS AND LOSSES ON AVAILABLE-FOR-SALE FINANCIAL ASSETS RECOGNISED IN OTHER COMPREHENSIVE INCOME (NET OF INCOME TAX)(2) 18,441 (2,032) 9,837 (1,615)
(1) The carrying amount of impaired available-for-sale fixed income debt securities is €177 million (€190 million at 31 December 2013) and the carrying amount of impaired net variable-income available-for-sale securities is €2,792 million (€2,619 million at 31 December 2013 restated).
(2) At 31 December 2014, a net unrealised gain of €16,409 million (net unrealised gain of €8,222 million at 31 December 2013 restated) is offset by the after-tax deferred policyholders’ profit-sharing liability of €12,885 million for Group insurance companies (€6,221 million at 31 December 2013); the balance of €3,524 million corresponds to net unrealised gains recognised in other recyclable equity at 31 December 2014 (net unrealised gain of €2,001 million at 31 December 2013).
6.5 Loans and receivables due from credit institutions and due from customers
LOANS AND RECEIVABLES DUE FROM CREDIT INSTITUTIONS
(in millions of euros) 31/12/2014 31/12/2013 Restated
Credit institutions
Debt securities 10,488 5,007
Securities not traded in an active market 10,488 5,007
Loans and receivables 92,827 91,528
Loans and receivables 60,049 61,602
of which performing current accounts in debit 7,427 6,363
of which performing overnight accounts and advances 2,761 4,549
Pledged securities 56 200
Securities bought under repurchase agreements 32,293 29,157
Subordinated loans 344 479
Other loans and receivables 85 90
Gross amount 103,315 96,535
Impairment (430) (407)
Net value of loans and receivables due from credit institutions 102,885 96,128
Crédit Agricole internal transactions
Debt securities - -
Securities not traded in an active market - -
Loans and advances 265,324 273,503
Current accounts 1,132 2,043
Term deposits and advances 264,192 271,460
Subordinated loans - -
Net value of loans and receivables within Crédit Agricole 265,324 273,503
CARRYING AMOUNT 368,209 369,631

CRÉDIT AGRICOLE S.A. 2014 REGISTRATION DOCUMENT 355
6
CONSOLIDATED FINANCIAL STATEMENTSNotes to the financial statements / Note 6
LOANS AND RECEIVABLES DUE FROM CUSTOMERS
(in millions of euros) 31/12/2014 31/12/2013 Restated
Loans and receivables due from customers
Debt securities 11,811 10,742
Securities not traded in an active market 11,811 10,742
Loans and receivables 299,358 288,601
Trade receivables 21,114 14,639
Other customer loans 261,064 256,267
Securities bought under repurchase agreements 2,392 2,066
Subordinated loans 128 139
Insurance receivables 711 487
Reinsurance receivables 302 277
Advances in associates current accounts 137 126
Current accounts in debit 13,510 14,600
Gross amount 311,169 299,343
Impairment (10,735) (10,661)
Net value of loans and receivables due from customers 300,434 288,682
Finance Leases
Property leasing 6,237 7,183
Equipment leases, operating leases and similar transaction 7,998 8,170
Gross amount 14,235 15,353
Impairment (290) (581)
Net carrying amount of lease financing operations 13,945 14,772
CARRYING AMOUNT 314,379 303,454
6.6 Held-to-maturity financial assets
(in millions of euros) 31/12/2014 31/12/2013 Restated
Treasury bills and similar securities 12,922 11,489
Bonds and other fixed-income securities 3,039 3,171
Total 15,961 14,660
Impairment - -
CARRYING AMOUNT 15,961 14,660
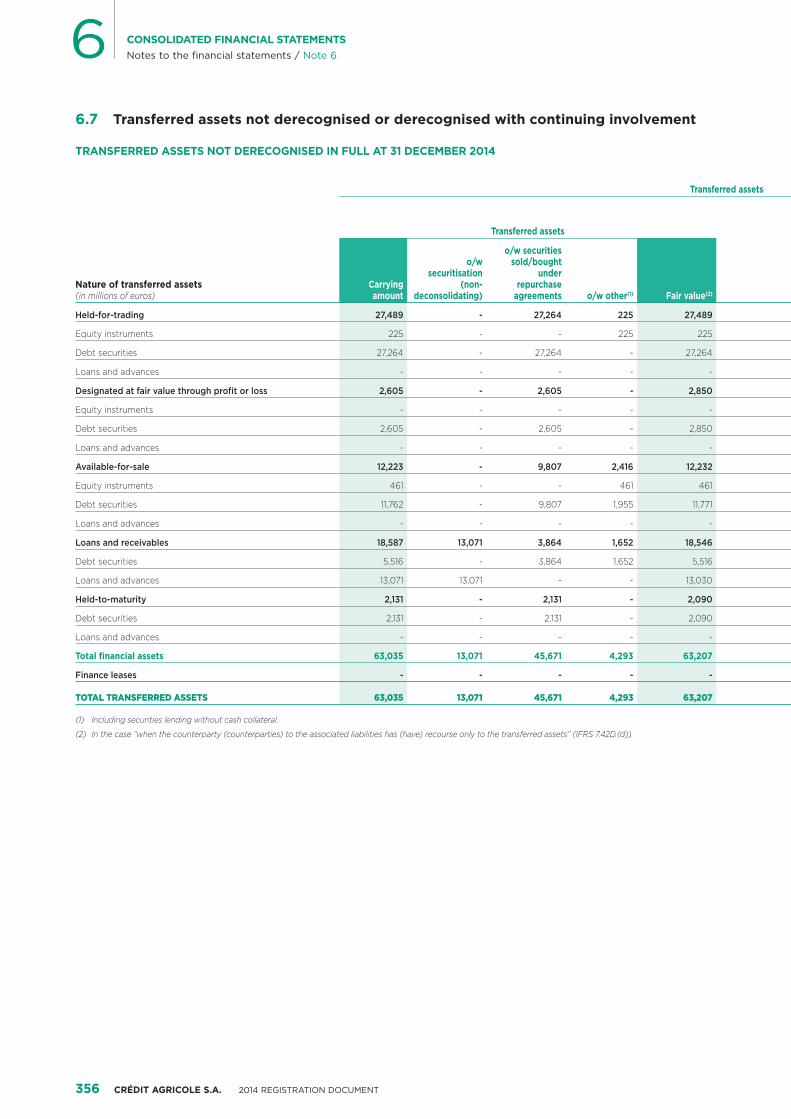
356 CRÉDIT AGRICOLE S.A. 2014 REGISTRATION DOCUMENT
6 CONSOLIDATED FINANCIAL STATEMENTSNotes to the financial statements / Note 6
6.7 Transferred assets not derecognised or derecognised with continuing involvement
TRANSFERRED ASSETS NOT DERECOGNISED IN FULL AT 31 DECEMBER 2014
Nature of transferred assets(in millions of euros)
Transferred assets
Transferred assets
Carrying amount
o/w securitisation
(non-deconsolidating)
o/w securities sold/bought
under repurchase
agreements o/w other(1) Fair value(2)
Held-for-trading 27,489 - 27,264 225 27,489
Equity instruments 225 - - 225 225
Debt securities 27,264 - 27,264 - 27,264
Loans and advances - - - - -
Designated at fair value through profit or loss 2,605 - 2,605 - 2,850
Equity instruments - - - - -
Debt securities 2,605 - 2,605 - 2,850
Loans and advances - - - - -
Available-for-sale 12,223 - 9,807 2,416 12,232
Equity instruments 461 - - 461 461
Debt securities 11,762 - 9,807 1,955 11,771
Loans and advances - - - - -
Loans and receivables 18,587 13,071 3,864 1,652 18,546
Debt securities 5,516 - 3,864 1,652 5,516
Loans and advances 13,071 13,071 - - 13,030
Held-to-maturity 2,131 - 2,131 - 2,090
Debt securities 2,131 - 2,131 - 2,090
Loans and advances - - - - -
Total financial assets 63,035 13,071 45,671 4,293 63,207
Finance leases - - - - -
TOTAL TRANSFERRED ASSETS 63,035 13,071 45,671 4,293 63,207
(1) Including securities lending without cash collateral.
(2) In the case “when the counterparty (counterparties) to the associated liabilities has (have) recourse only to the transferred assets” (IFRS 7.42D.(d)).

CRÉDIT AGRICOLE S.A. 2014 REGISTRATION DOCUMENT 357
6
CONSOLIDATED FINANCIAL STATEMENTSNotes to the financial statements / Note 6
but still fully recognisedTransferred assets recognised to the extent
of the entity’s continuing involvement
Associated liabilities
Assets and associated
liabilities
Initial total carrying
amount of assets prior
to transfer
Carrying amount of assets still
recognised (continuing
involvement)
Carrying amount of associated
liabilitiesCarrying amount
o/w securitisation
(non-deconsolidating)
o/w securities sold/bought
under repurchase
agreements o/w other(1) Fair value(2)Net
fair value
26,322 - 26,097 225 26,322 1,167 - - -
225 - - 225 225 - - - -
26,097 - 26,097 - 26,097 1,167 - - -
- - - - - - - - -
2,605 - 2,605 - 2,605 245 - - -
- - - - - - - - -
2,605 - 2,605 - 2,605 245 - - -
- - - - - - - - -
9,894 - 9,807 87 9,894 2,338 - - -
87 - - 87 87 374 - - -
9,807 - 9,807 - 9,807 1,964 - - -
- - - - - - - - -
12,765 8,957 3,808 - 13,730 4,816 - - -
3,808 - 3,808 - 3,808 1,708 - - -
8,957 8,957 - - 9,922 3,108 - - -
2,132 - 2,132 - 2,132 (42) - - -
2,132 - 2,132 - 2,132 (42) - - -
- - - - - - - - -
53,718 8,957 44,449 312 54,683 8,524 - - -
- - - - - - - - -
53,718 8,957 44,449 312 54,683 8,524 - - -

358 CRÉDIT AGRICOLE S.A. 2014 REGISTRATION DOCUMENT
6 CONSOLIDATED FINANCIAL STATEMENTSNotes to the financial statements / Note 6
TRANSFERRED ASSETS NOT DERECOGNISED IN FULL AT 31 DECEMBER 2013
Nature of transferred assets(in millions of euros)
Transferred assets,
Transferred assets
Carrying amount
o/w securitisation
(non-deconsolidating)
o/w securities sold/bought
under repurchase
agreements o/w other(1) Fair value(2)
Held-for-trading 25,902 - 25,902 - 25,902
Equity instruments - - - - -
Debt securities 25,902 - 25,902 - 25,902
Loans and advances - - - - -
Designated at fair value through profit or loss 472 - 472 - 457
Equity instruments - - - - -
Debt securities 472 - 472 - 457
Loans and advances - - - - -
Available-for-sale 13,649 - 11,676 1,974 13,574
Equity instruments 383 - - 383 383
Debt securities 13,266 - 11,676 1,591 13,191
Loans and advances - - - - -
Loans and receivables 16,899 14,359 2,404 136 16,899
Debt securities 2,540 - 2,404 136 2,540
Loans and advances 14,359 14,359 - - 14,359
Held-to-maturity 1,915 - 1,915 - 1,869
Debt securities 1,915 - 1,915 - 1,869
Loans and advances - - - - -
Total financial assets 58,837 14,359 42,369 2,110 58,701
Finance leases - - - - -
TOTAL TRANSFERRED ASSETS 58,837 14,359 42,369 2,110 58,701
(1) Including securities lending without cash collateral.
(2) In the case “when the counterparty (counterparties) to the associated liabilities has (have) recourse only to the transferred assets” (IFRS 7.42D.(d)).
6.8 Impairment deducted from financial assets
(in millions of euros)31/12/2013
RestatedChanges in scope Depreciation
Reversals and
utilisationsTranslation adjustment
Transfers in non-current assets held
for saleOther
movements 31/12/2014
Loans and receivables due from credit institutions 407 - 11 (27) 39 - - 430
Loans and receivables due from customers 10,661 (1) 3,497 (3,626) 202 - 2 10,735
of which collective impairment 2,640 - 311 (363) 100 (1) (34) 2,653
Finance leases 581 - 143 (365) - (151) 82 290
Held-to-maturity securities - - - - - - - -
Available-for-sale financial assets 1,885 (13) 366 (680) 15 - - 1,573
Other financial assets 119 - 28 (42) 4 - - 109
TOTAL IMPAIRMENT OF FINANCIAL ASSETS 13,653 (14) 4,045 (4,740) 260 (151) 84 13,137
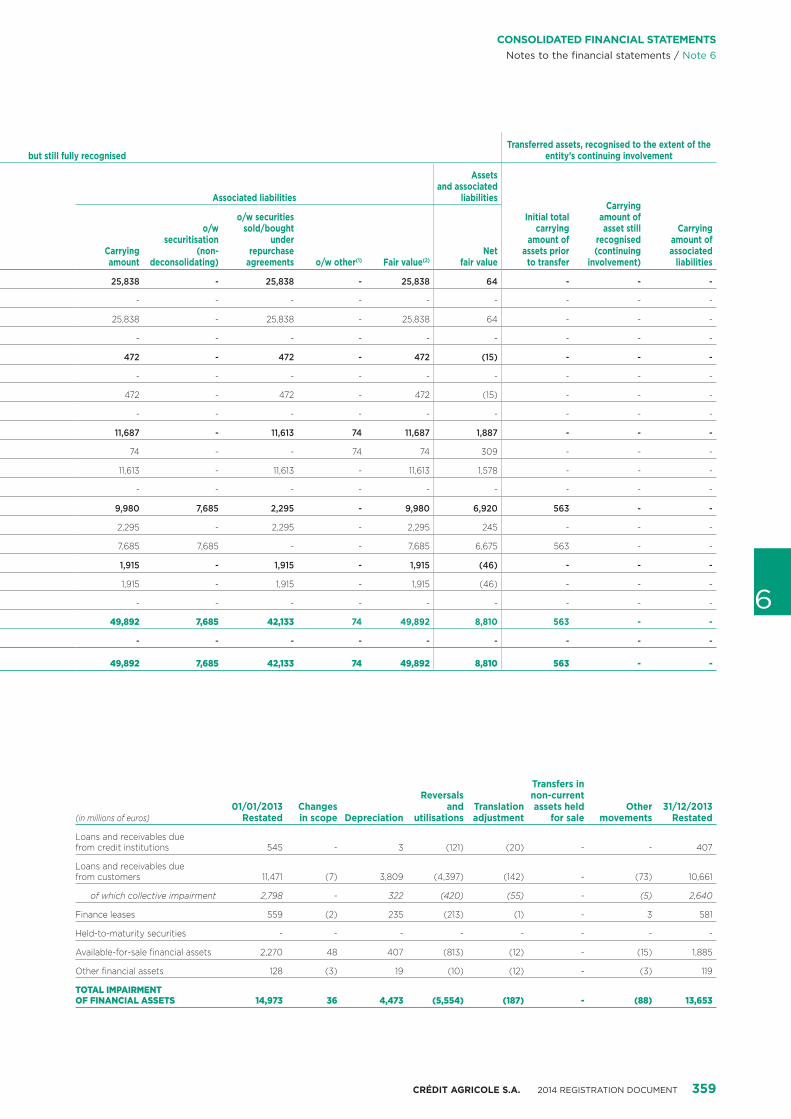
CRÉDIT AGRICOLE S.A. 2014 REGISTRATION DOCUMENT 359
6
CONSOLIDATED FINANCIAL STATEMENTSNotes to the financial statements / Note 6
but still fully recognisedTransferred assets, recognised to the extent of the
entity’s continuing involvement
Associated liabilities
Assets and associated
liabilities
Initial total carrying
amount of assets prior
to transfer
Carrying amount of asset still
recognised (continuing
involvement)
Carrying amount of associated
liabilitiesCarrying amount
o/w securitisation
(non-deconsolidating)
o/w securities sold/bought
under repurchase
agreements o/w other(1) Fair value(2)Net
fair value
25,838 - 25,838 - 25,838 64 - - -
- - - - - - - - -
25,838 - 25,838 - 25,838 64 - - -
- - - - - - - - -
472 - 472 - 472 (15) - - -
- - - - - - - - -
472 - 472 - 472 (15) - - -
- - - - - - - - -
11,687 - 11,613 74 11,687 1,887 - - -
74 - - 74 74 309 - - -
11,613 - 11,613 - 11,613 1,578 - - -
- - - - - - - - -
9,980 7,685 2,295 - 9,980 6,920 563 - -
2,295 - 2,295 - 2,295 245 - - -
7,685 7,685 - - 7,685 6,675 563 - -
1,915 - 1,915 - 1,915 (46) - - -
1,915 - 1,915 - 1,915 (46) - - -
- - - - - - - - -
49,892 7,685 42,133 74 49,892 8,810 563 - -
- - - - - - - - -
49,892 7,685 42,133 74 49,892 8,810 563 - -
(in millions of euros)01/01/2013
RestatedChanges in scope Depreciation
Reversals and
utilisationsTranslation adjustment
Transfers in non-current assets held
for saleOther
movements31/12/2013
Restated
Loans and receivables due from credit institutions 545 - 3 (121) (20) - - 407
Loans and receivables due from customers 11,471 (7) 3,809 (4,397) (142) - (73) 10,661
of which collective impairment 2,798 - 322 (420) (55) - (5) 2,640
Finance leases 559 (2) 235 (213) (1) - 3 581
Held-to-maturity securities - - - - - - - -
Available-for-sale financial assets 2,270 48 407 (813) (12) - (15) 1,885
Other financial assets 128 (3) 19 (10) (12) - (3) 119
TOTAL IMPAIRMENT OF FINANCIAL ASSETS 14,973 36 4,473 (5,554) (187) - (88) 13,653
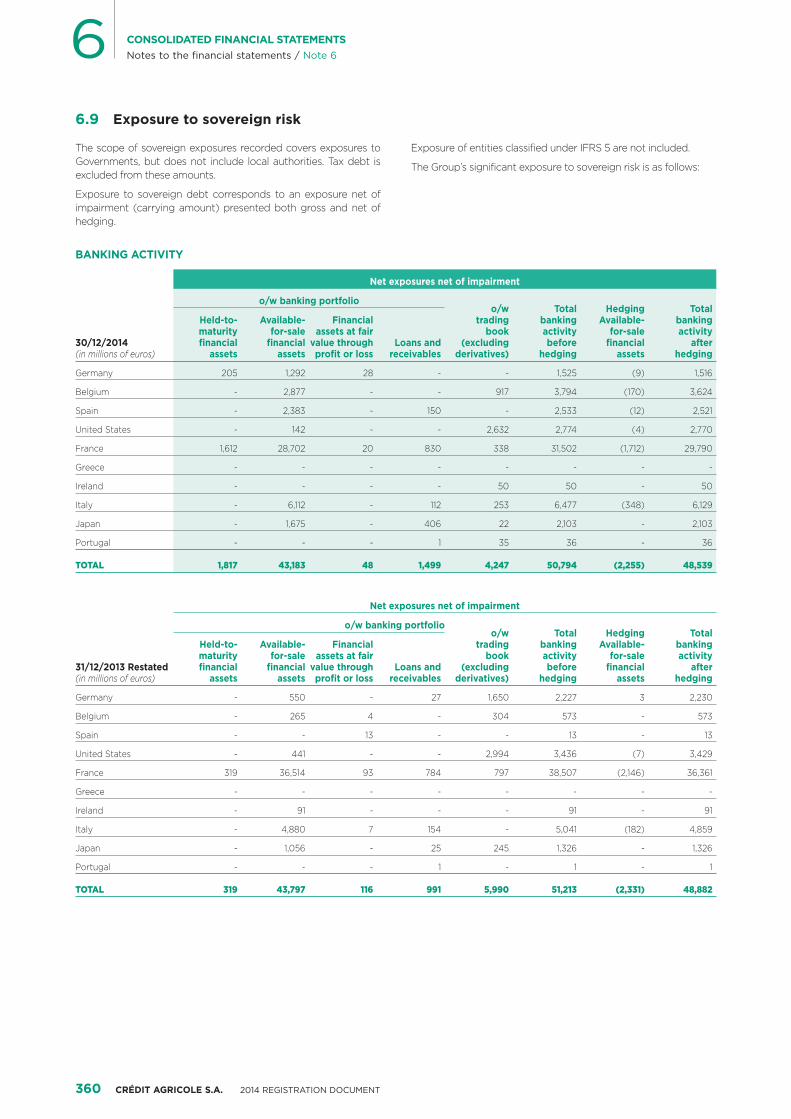
360 CRÉDIT AGRICOLE S.A. 2014 REGISTRATION DOCUMENT
6 CONSOLIDATED FINANCIAL STATEMENTSNotes to the financial statements / Note 6
6.9 Exposure to sovereign risk
The scope of sovereign exposures recorded covers exposures to Governments, but does not include local authorities. Tax debt is excluded from these amounts.
Exposure to sovereign debt corresponds to an exposure net of impairment (carrying amount) presented both gross and net of hedging.
Exposure of entities classified under IFRS 5 are not included.
The Group’s significant exposure to sovereign risk is as follows:
BANKING ACTIVITY
30/12/2014 (in millions of euros)
Net exposures net of impairment
o/w banking portfolioo/w
trading book
(excluding derivatives)
Total banking activity before
hedging
Hedging Available-
for-sale financial
assets
Total banking activity
after hedging
Held-to-maturity financial
assets
Available-for-sale
financial assets
Financial assets at fair
value through profit or loss
Loans and receivables
Germany 205 1,292 28 - - 1,525 (9) 1,516
Belgium - 2,877 - - 917 3,794 (170) 3,624
Spain - 2,383 - 150 - 2,533 (12) 2,521
United States - 142 - - 2,632 2,774 (4) 2,770
France 1,612 28,702 20 830 338 31,502 (1,712) 29,790
Greece - - - - - - - -
Ireland - - - - 50 50 - 50
Italy - 6,112 - 112 253 6,477 (348) 6,129
Japan - 1,675 - 406 22 2,103 - 2,103
Portugal - - - 1 35 36 - 36
TOTAL 1,817 43,183 48 1,499 4,247 50,794 (2,255) 48,539
31/12/2013 Restated (in millions of euros)
Net exposures net of impairment
o/w banking portfolioo/w
trading book
(excluding derivatives)
Total banking activity before
hedging
Hedging Available-
for-sale financial
assets
Total banking activity
after hedging
Held-to-maturity financial
assets
Available-for-sale
financial assets
Financial assets at fair
value through profit or loss
Loans and receivables
Germany - 550 - 27 1,650 2,227 3 2,230
Belgium - 265 4 - 304 573 - 573
Spain - - 13 - - 13 - 13
United States - 441 - - 2,994 3,436 (7) 3,429
France 319 36,514 93 784 797 38,507 (2,146) 36,361
Greece - - - - - - - -
Ireland - 91 - - - 91 - 91
Italy - 4,880 7 154 - 5,041 (182) 4,859
Japan - 1,056 - 25 245 1,326 - 1,326
Portugal - - - 1 - 1 - 1
TOTAL 319 43,797 116 991 5,990 51,213 (2,331) 48,882
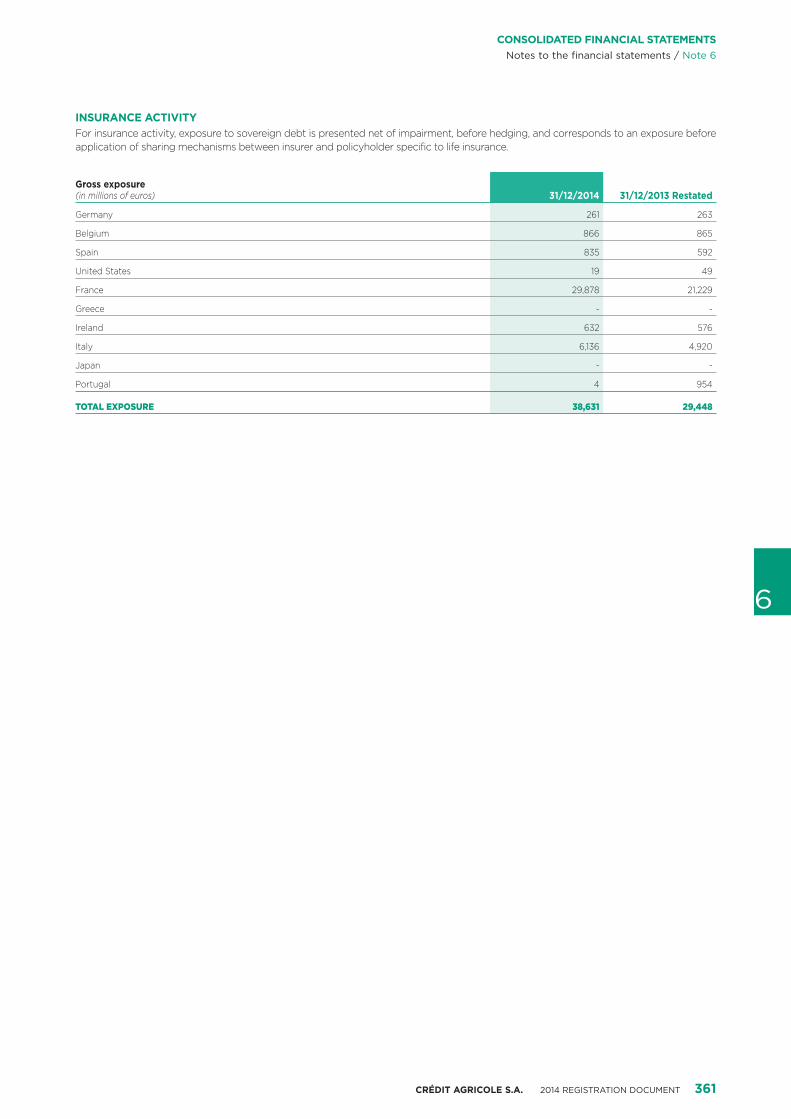
CRÉDIT AGRICOLE S.A. 2014 REGISTRATION DOCUMENT 361
6
CONSOLIDATED FINANCIAL STATEMENTSNotes to the financial statements / Note 6
INSURANCE ACTIVITYFor insurance activity, exposure to sovereign debt is presented net of impairment, before hedging, and corresponds to an exposure before application of sharing mechanisms between insurer and policyholder specific to life insurance.
Gross exposure(in millions of euros) 31/12/2014 31/12/2013 Restated
Germany 261 263
Belgium 866 865
Spain 835 592
United States 19 49
France 29,878 21,229
Greece - -
Ireland 632 576
Italy 6,136 4,920
Japan - -
Portugal 4 954
TOTAL EXPOSURE 38,631 29,448
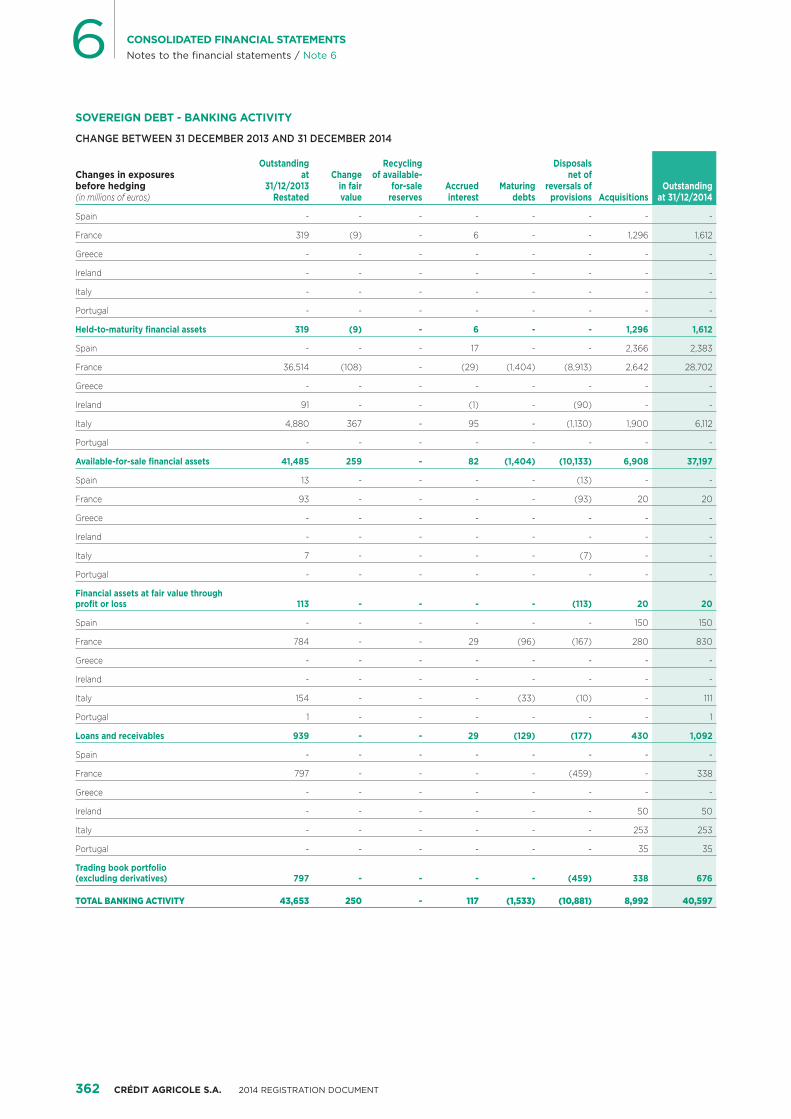
362 CRÉDIT AGRICOLE S.A. 2014 REGISTRATION DOCUMENT
6 CONSOLIDATED FINANCIAL STATEMENTSNotes to the financial statements / Note 6
SOVEREIGN DEBT - BANKING ACTIVITY
CHANGE BETWEEN 31 DECEMBER 2013 AND 31 DECEMBER 2014
Changes in exposures before hedging(in millions of euros)
Outstanding at
31/12/2013 Restated
Change in fair value
Recycling of available-
for-sale reserves
Accrued interest
Maturing debts
Disposals net of
reversals of provisions Acquisitions
Outstanding at 31/12/2014
Spain - - - - - - - -
France 319 (9) - 6 - - 1,296 1,612
Greece - - - - - - - -
Ireland - - - - - - - -
Italy - - - - - - - -
Portugal - - - - - - - -
Held-to-maturity financial assets 319 (9) - 6 - - 1,296 1,612
Spain - - - 17 - - 2,366 2,383
France 36,514 (108) - (29) (1,404) (8,913) 2,642 28,702
Greece - - - - - - - -
Ireland 91 - - (1) - (90) - -
Italy 4,880 367 - 95 - (1,130) 1,900 6,112
Portugal - - - - - - - -
Available-for-sale financial assets 41,485 259 - 82 (1,404) (10,133) 6,908 37,197
Spain 13 - - - - (13) - -
France 93 - - - - (93) 20 20
Greece - - - - - - - -
Ireland - - - - - - - -
Italy 7 - - - - (7) - -
Portugal - - - - - - - -
Financial assets at fair value through profit or loss 113 - - - - (113) 20 20
Spain - - - - - - 150 150
France 784 - - 29 (96) (167) 280 830
Greece - - - - - - - -
Ireland - - - - - - - -
Italy 154 - - - (33) (10) - 111
Portugal 1 - - - - - - 1
Loans and receivables 939 - - 29 (129) (177) 430 1,092
Spain - - - - - - - -
France 797 - - - - (459) - 338
Greece - - - - - - - -
Ireland - - - - - - 50 50
Italy - - - - - - 253 253
Portugal - - - - - - 35 35
Trading book portfolio (excluding derivatives) 797 - - - - (459) 338 676
TOTAL BANKING ACTIVITY 43,653 250 - 117 (1,533) (10,881) 8,992 40,597
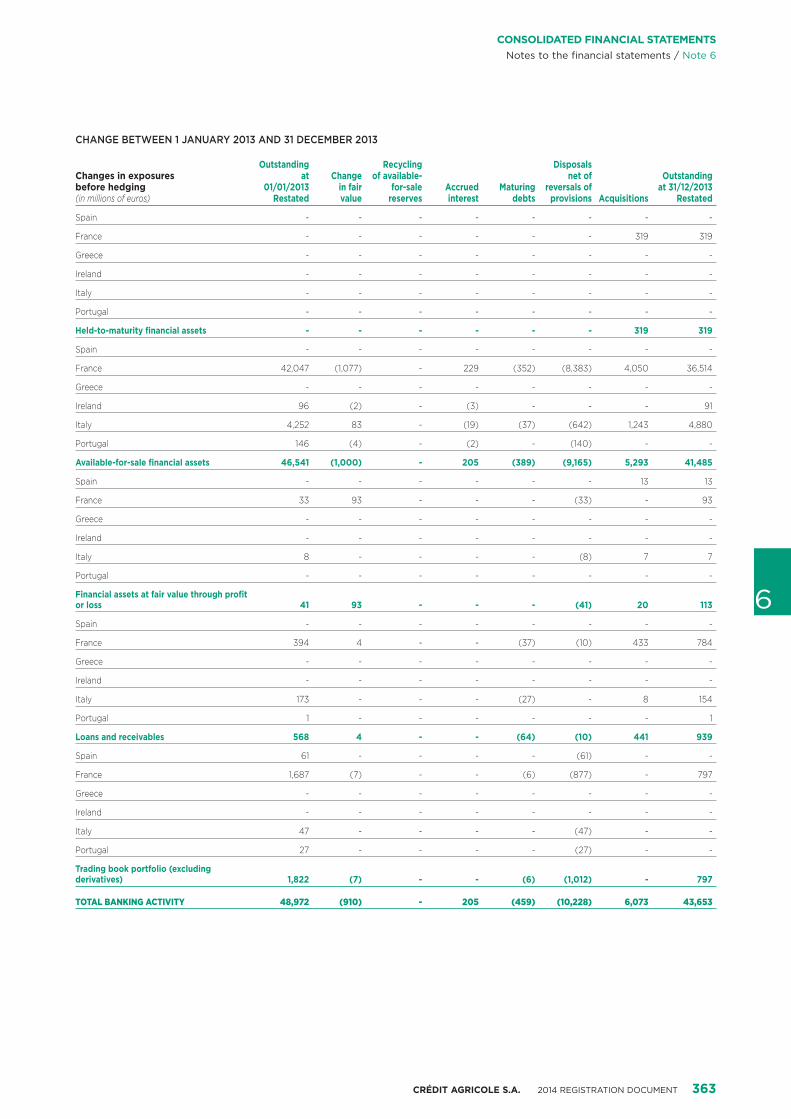
CRÉDIT AGRICOLE S.A. 2014 REGISTRATION DOCUMENT 363
6
CONSOLIDATED FINANCIAL STATEMENTSNotes to the financial statements / Note 6
CHANGE BETWEEN 1 JANUARY 2013 AND 31 DECEMBER 2013
Changes in exposures before hedging(in millions of euros)
Outstanding at
01/01/2013 Restated
Change in fair value
Recycling of available-
for-sale reserves
Accrued interest
Maturing debts
Disposals net of
reversals of provisions Acquisitions
Outstanding at 31/12/2013
Restated
Spain - - - - - - - -
France - - - - - - 319 319
Greece - - - - - - - -
Ireland - - - - - - - -
Italy - - - - - - - -
Portugal - - - - - - - -
Held-to-maturity financial assets - - - - - - 319 319
Spain - - - - - - - -
France 42,047 (1,077) - 229 (352) (8,383) 4,050 36,514
Greece - - - - - - - -
Ireland 96 (2) - (3) - - - 91
Italy 4,252 83 - (19) (37) (642) 1,243 4,880
Portugal 146 (4) - (2) - (140) - -
Available-for-sale financial assets 46,541 (1,000) - 205 (389) (9,165) 5,293 41,485
Spain - - - - - - 13 13
France 33 93 - - - (33) - 93
Greece - - - - - - - -
Ireland - - - - - - - -
Italy 8 - - - - (8) 7 7
Portugal - - - - - - - -
Financial assets at fair value through profit or loss 41 93 - - - (41) 20 113
Spain - - - - - - - -
France 394 4 - - (37) (10) 433 784
Greece - - - - - - - -
Ireland - - - - - - - -
Italy 173 - - - (27) - 8 154
Portugal 1 - - - - - - 1
Loans and receivables 568 4 - - (64) (10) 441 939
Spain 61 - - - - (61) - -
France 1,687 (7) - - (6) (877) - 797
Greece - - - - - - - -
Ireland - - - - - - - -
Italy 47 - - - - (47) - -
Portugal 27 - - - - (27) - -
Trading book portfolio (excluding derivatives) 1,822 (7) - - (6) (1,012) - 797
TOTAL BANKING ACTIVITY 48,972 (910) - 205 (459) (10,228) 6,073 43,653
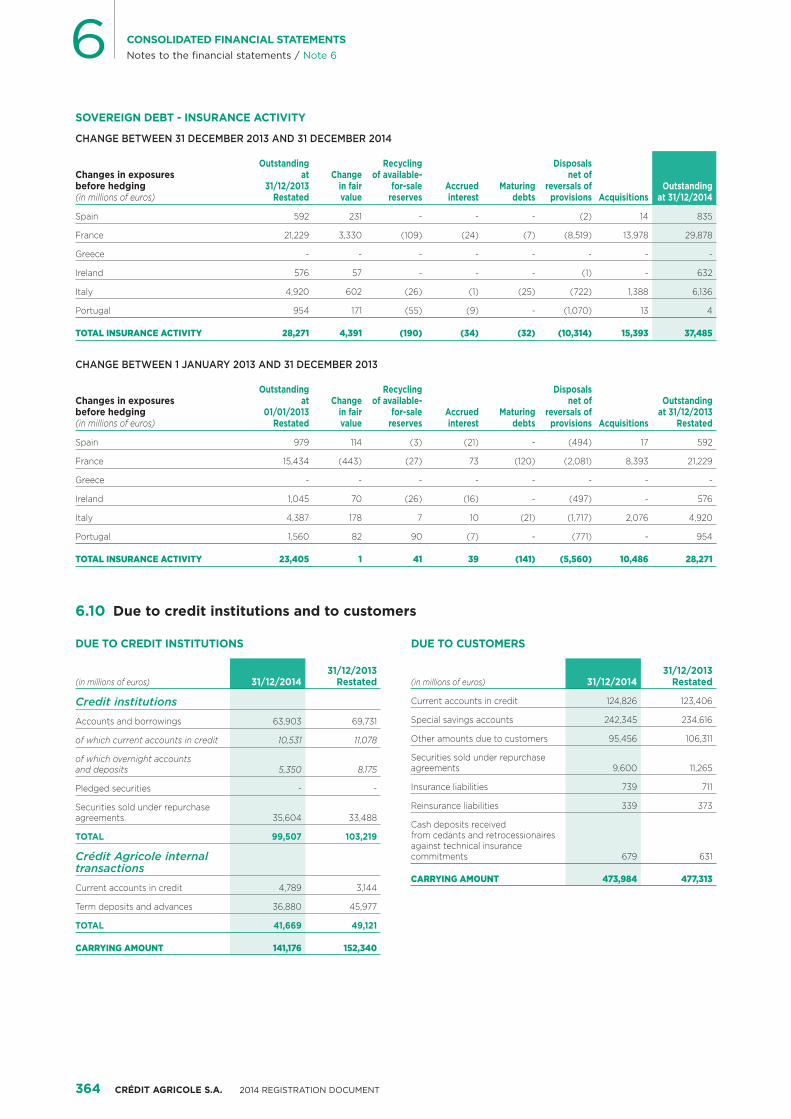
364 CRÉDIT AGRICOLE S.A. 2014 REGISTRATION DOCUMENT
6 CONSOLIDATED FINANCIAL STATEMENTSNotes to the financial statements / Note 6
SOVEREIGN DEBT - INSURANCE ACTIVITY
CHANGE BETWEEN 31 DECEMBER 2013 AND 31 DECEMBER 2014
Changes in exposures before hedging(in millions of euros)
Outstanding at
31/12/2013 Restated
Change in fair value
Recycling of available-
for-sale reserves
Accrued interest
Maturing debts
Disposals net of
reversals of provisions Acquisitions
Outstanding at 31/12/2014
Spain 592 231 - - - (2) 14 835
France 21,229 3,330 (109) (24) (7) (8,519) 13,978 29,878
Greece - - - - - - - -
Ireland 576 57 - - - (1) - 632
Italy 4,920 602 (26) (1) (25) (722) 1,388 6,136
Portugal 954 171 (55) (9) - (1,070) 13 4
TOTAL INSURANCE ACTIVITY 28,271 4,391 (190) (34) (32) (10,314) 15,393 37,485
CHANGE BETWEEN 1 JANUARY 2013 AND 31 DECEMBER 2013
Changes in exposures before hedging(in millions of euros)
Outstanding at
01/01/2013 Restated
Change in fair value
Recycling of available-
for-sale reserves
Accrued interest
Maturing debts
Disposals net of
reversals of provisions Acquisitions
Outstanding at 31/12/2013
Restated
Spain 979 114 (3) (21) - (494) 17 592
France 15,434 (443) (27) 73 (120) (2,081) 8,393 21,229
Greece - - - - - - - -
Ireland 1,045 70 (26) (16) - (497) - 576
Italy 4,387 178 7 10 (21) (1,717) 2,076 4,920
Portugal 1,560 82 90 (7) - (771) - 954
TOTAL INSURANCE ACTIVITY 23,405 1 41 39 (141) (5,560) 10,486 28,271
6.10 Due to credit institutions and to customers
DUE TO CREDIT INSTITUTIONS
(in millions of euros) 31/12/201431/12/2013
Restated
Credit institutions
Accounts and borrowings 63,903 69,731
of which current accounts in credit 10,531 11,078
of which overnight accounts and deposits 5,350 8,175
Pledged securities - -
Securities sold under repurchase agreements 35,604 33,488
TOTAL 99,507 103,219
Crédit Agricole internal transactions
Current accounts in credit 4,789 3,144
Term deposits and advances 36,880 45,977
TOTAL 41,669 49,121
CARRYING AMOUNT 141,176 152,340
DUE TO CUSTOMERS
(in millions of euros) 31/12/201431/12/2013
Restated
Current accounts in credit 124,826 123,406
Special savings accounts 242,345 234,616
Other amounts due to customers 95,456 106,311
Securities sold under repurchase agreements 9,600 11,265
Insurance liabilities 739 711
Reinsurance liabilities 339 373
Cash deposits received from cedants and retrocessionaires against technical insurance commitments 679 631
CARRYING AMOUNT 473,984 477,313
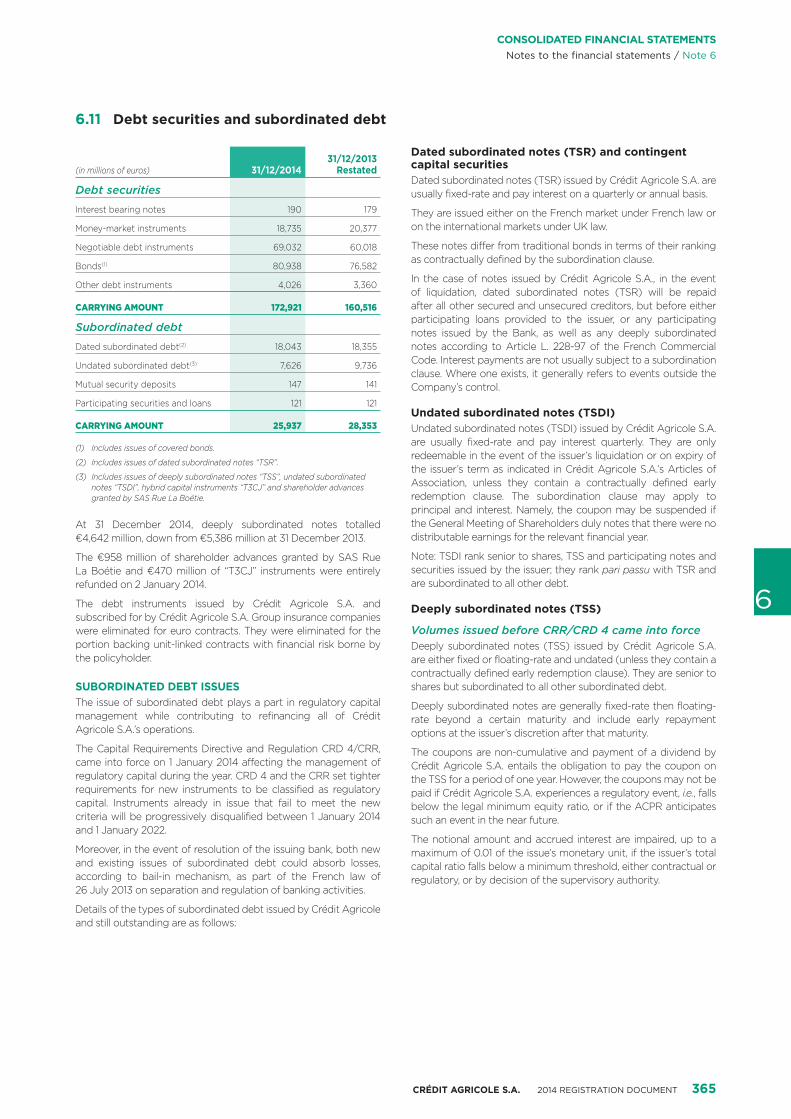
CRÉDIT AGRICOLE S.A. 2014 REGISTRATION DOCUMENT 365
6
CONSOLIDATED FINANCIAL STATEMENTSNotes to the financial statements / Note 6
6.11 Debt securities and subordinated debt
(in millions of euros) 31/12/201431/12/2013
Restated
Debt securities
Interest bearing notes 190 179
Money-market instruments 18,735 20,377
Negotiable debt instruments 69,032 60,018
Bonds(1) 80,938 76,582
Other debt instruments 4,026 3,360
CARRYING AMOUNT 172,921 160,516
Subordinated debt
Dated subordinated debt(2) 18,043 18,355
Undated subordinated debt(3) 7,626 9,736
Mutual security deposits 147 141
Participating securities and loans 121 121
CARRYING AMOUNT 25,937 28,353
(1) Includes issues of covered bonds.
(2) Includes issues of dated subordinated notes “TSR”.
(3) Includes issues of deeply subordinated notes “TSS”, undated subordinated notes “TSDI”, hybrid capital instruments “T3CJ” and shareholder advances granted by SAS Rue La Boétie.
At 31 December 2014, deeply subordinated notes totalled €4,642 million, down from €5,386 million at 31 December 2013.
The €958 million of shareholder advances granted by SAS Rue La Boétie and €470 million of “T3CJ” instruments were entirely refunded on 2 January 2014.
The debt instruments issued by Crédit Agricole S.A. and subscribed for by Crédit Agricole S.A. Group insurance companies were eliminated for euro contracts. They were eliminated for the portion backing unit-linked contracts with financial risk borne by the policyholder.
SUBORDINATED DEBT ISSUESThe issue of subordinated debt plays a part in regulatory capital management while contributing to refinancing all of Crédit Agricole S.A.’s operations.
The Capital Requirements Directive and Regulation CRD 4/CRR, came into force on 1 January 2014 affecting the management of regulatory capital during the year. CRD 4 and the CRR set tighter requirements for new instruments to be classified as regulatory capital. Instruments already in issue that fail to meet the new criteria will be progressively disqualified between 1 January 2014 and 1 January 2022.
Moreover, in the event of resolution of the issuing bank, both new and existing issues of subordinated debt could absorb losses, according to bail-in mechanism, as part of the French law of 26 July 2013 on separation and regulation of banking activities.
Details of the types of subordinated debt issued by Crédit Agricole and still outstanding are as follows:
Dated subordinated notes (TSR) and contingent capital securitiesDated subordinated notes (TSR) issued by Crédit Agricole S.A. are usually fixed-rate and pay interest on a quarterly or annual basis.
They are issued either on the French market under French law or on the international markets under UK law.
These notes differ from traditional bonds in terms of their ranking as contractually defined by the subordination clause.
In the case of notes issued by Crédit Agricole S.A., in the event of liquidation, dated subordinated notes (TSR) will be repaid after all other secured and unsecured creditors, but before either participating loans provided to the issuer, or any participating notes issued by the Bank, as well as any deeply subordinated notes according to Article L. 228-97 of the French Commercial Code. Interest payments are not usually subject to a subordination clause. Where one exists, it generally refers to events outside the Company’s control.
Undated subordinated notes (TSDI)Undated subordinated notes (TSDI) issued by Crédit Agricole S.A. are usually fixed-rate and pay interest quarterly. They are only redeemable in the event of the issuer’s liquidation or on expiry of the issuer’s term as indicated in Crédit Agricole S.A.’s Articles of Association, unless they contain a contractually defined early redemption clause. The subordination clause may apply to principal and interest. Namely, the coupon may be suspended if the General Meeting of Shareholders duly notes that there were no distributable earnings for the relevant financial year.
Note: TSDI rank senior to shares, TSS and participating notes and securities issued by the issuer; they rank pari passu with TSR and are subordinated to all other debt.
Deeply subordinated notes (TSS)
Volumes issued before CRR/CRD 4 came into forceDeeply subordinated notes (TSS) issued by Crédit Agricole S.A. are either fixed or floating-rate and undated (unless they contain a contractually defined early redemption clause). They are senior to shares but subordinated to all other subordinated debt.
Deeply subordinated notes are generally fixed-rate then floating-rate beyond a certain maturity and include early repayment options at the issuer’s discretion after that maturity.
The coupons are non-cumulative and payment of a dividend by Crédit Agricole S.A. entails the obligation to pay the coupon on the TSS for a period of one year. However, the coupons may not be paid if Crédit Agricole S.A. experiences a regulatory event, i.e., falls below the legal minimum equity ratio, or if the ACPR anticipates such an event in the near future.
The notional amount and accrued interest are impaired, up to a maximum of 0.01 of the issue’s monetary unit, if the issuer’s total capital ratio falls below a minimum threshold, either contractual or regulatory, or by decision of the supervisory authority.

366 CRÉDIT AGRICOLE S.A. 2014 REGISTRATION DOCUMENT
6 CONSOLIDATED FINANCIAL STATEMENTSNotes to the financial statements / Note 6
Issue of Additional Tier 1 (AT1) securitiesIn 2014, Crédit Agricole S.A. issued Additional Tier 1 subordinated bonds qualifying for the new CRD 4 rules on coupon payment and bail-in.
The Additional Tier 1 (AT1) bonds issued by Crédit Agricole S.A. are either fixed and/or floating-rate and undated (unless they contain a contractually defined early redemption clause). They are senior to shares but subordinated to all other subordinated debt and pari passu with TSS.
AT1 bonds are generally fixed-rate but resettable beyond a certain maturity and include early repayment options at the issuer’s discretion after that maturity.
They include a clause allowing partial temporary impairment of the securities if Crédit Agricole Group’s phased-in Common Equity Tier 1 capital ratio should fall below a 7% or if Crédit Agricole S.A.’s phased-in Common Equity Tier 1 capital should fall below 5.125%. They may be impaired up to a maximum of 0.01 of the issue’s monetary unit.
Coupons are optional at the discretion of the regulator and issuer and subject to regulatory limits if distributable amounts are insufficient or the Group or Crédit Agricole S.A. fails to meet regulatory requirements for total capital (including capital buffers).
Additional Tier 1 issuances realised in 2014 are shown in Note 2 “Major structural transactions and material events during the period”.
Early redemption at the issuer’s discretionDated subordinated notes (TSR), undated subordinated notes (TSDI) and deeply subordinated notes (TSS) may be early redeemed, through buy-back transactions, either on the market through public takeover bids or exchange offers or over-the-counter, subject to prior approval by the regulatory authority and at the issuer’s initiative, in accordance with the contractual clauses applicable to each issue.
Furthermore, after securing approval from the regulatory authority, Crédit Agricole S.A. is entitled to redeem the subordinated notes prior to their maturity, by the exercise of an early redemption clause at the issuer’s hand (call option) under the conditions and at the times defined by the contractual terms of the issue, in the event that the issuance agreement for the securities contains such a clause.
Early payabilityExisting debt instruments may become due and payable immediately under certain circumstances, for example upon non-payment of principal and interest, after a predetermined grace period has elapsed, following which they become due and payable, the insolvency of Crédit Agricole S.A. as issuer and in the case of breach by Crédit Agricole S.A. of its other contractual obligations. TSS contain no early repayment clauses, except in the event of the liquidation of Crédit Agricole S.A.
Hybrid capital instrumentsCrédit Agricole S.A. exercised its early redemption option on the €470 million of its hybrid capital instruments still in issue (titres de créances complexes de capital jumelés T3CJ) on 2 January 2014.
COVERED BOND-TYPE ISSUESIn order to increase the amount of medium and long term financing, the Group issues covered bonds through two subsidiaries:
� Crédit Agricole Home Loan SFH, whose initial issue was launched in January 2009. The total amount outstanding, in euro equivalent, was €21.1 billion at 31 December 2014;
� Crédit Agricole Public Sector SCF, whose initial issue was launched in October 2012. The total amount issued and outstanding was €2 billion at 31 December 2014.
6.12 Information on the offsetting of financial assets and financial liabilities
OFFSETTING – FINANCIAL ASSETS
Type of financial instrument(in millions of euros)
31/12/2014
Offsetting effects on financial assets covered by master netting agreements and similar agreements
Gross amounts of recognised
financial assets before
offsetting
Gross amounts of recognised
financial liabilities set off
in the financial statements(4)
Net amounts of
financial assets reported in the financial
statements
Other amounts that can be offset under given conditions
Net amount after all offsetting
effects
Gross amounts of
financial liabilities covered
by master netting
agreements
Amounts of other financial
instruments received as
collateral, including
security deposits
Derivatives(1) 328,850 143,069 185,780 158,194 11,975 15,612
Reverse repurchase agreements(2) 106,081 18,728 87,353 66,648 13,441 7,264
Securities lent(3) 3,026 - 3,026 - 465 2,561
Other financial instruments - - - - - -
TOTAL FINANCIAL ASSETS SUBJECTS TO OFFSETTING 437,957 161,797 276,159 224,842 25,881 25,437
(1) The amount of derivatives subject to offsetting represents 87.28% of the derivatives on the asset side of the balance sheet at the end of the reporting period.
(2) The amount of reverse repurchase agreements subject to offsetting represents 73.14% of the reverse repurchase agreements on the asset side of the balance sheet at the end of the reporting period.
(3) The amount of securities lent subject to offsetting represents 74.60% of the securities lent on the asset side of the balance sheet at the end of the reporting period.
(4) Including margin calls.

CRÉDIT AGRICOLE S.A. 2014 REGISTRATION DOCUMENT 367
6
CONSOLIDATED FINANCIAL STATEMENTSNotes to the financial statements / Note 6
Type of financial instrument(in millions of euros)
31/12/2013 Restated
Offsetting effects on financial assets covered by master netting agreement and similar agreements
Gross amounts of recognised
financial assets before offsetting
Gross amounts of recognised
financial liabilities set off
in the financial statements(4)
Net amounts of
financial assets reported in
the financial statements
Other amounts that can be offset under given conditions
Net amount after all offsetting
effects
Gross amounts of
financial liabilities covered
by master netting
agreement
Amounts of other financial
instruments received as
collateral, including
security deposits
Derivatives(1) 330,438 158,731 171,707 156,067 5,408 10,232
Reverse repurchase agreements(2) 53,101 - 53,101 43,156 1,332 8,613
Securities lent(3) 3,878 - 3,878 - 383 3,495
Other financial instruments - - - - - -
TOTAL FINANCIAL ASSETS SUBJECT TO OFFSETTING 387,417 158,731 228,686 199,223 7,123 22,340
(1) The amount of derivatives subject to offsetting represents 95.89% of the derivatives on the asset side of the balance sheet at the end of the reporting period.
(2) The amount of reverse repurchase agreements subject to offsetting represents 45.55% of the reverse repurchase agreements on the asset side of the balance sheet at the end of the reporting period.
(3) The amount of securities lent subject to offsetting represents 63.45% of the securities lent on the asset side of the balance sheet at the end of the reporting period.
(4) Including margin calls.
OFFSETTING – FINANCIAL LIABILITIES
Type of financial instrument (in millions of euros)
31/12/2014
Offsetting effects on financial liabilities covered by master netting agreements and similar agreements
Gross amounts of recognised
financial liabilities
before offsetting
Gross amounts of recognised
financial assets set off in
the financial statements(3)
Net amounts of
financial liabilities
reported in the financial
statements
Other amounts that can be offset under given conditions
Net amount after all offsetting
effects
Gross amounts of
financial assets covered by
master netting agreement
Amounts of other financial
instruments given as guarantee,
including security deposits
Derivatives(1) 331,598 143,070 188,528 158,194 17,003 13,331
Repurchase agreements(2) 104,153 18,728 85,426 66,648 10,555 8,223
Securities borrowed - - - - - -
Other financial instruments - - - - - -
TOTAL FINANCIAL LIABILITIES SUBJECT TO OFFSETTING 435,751 161,798 273,954 224,842 27,558 21,554
(1) The amount of derivatives subject to offsetting represents 90.40% of the derivatives on the liability side of the balance sheet at the end of the reporting period.
(2) The amount of repurchase agreements subject to offsetting represents 71.40% of the repurchase agreements on the liability side of the balance sheet at the end of the reporting period.
(3) Including margin calls.
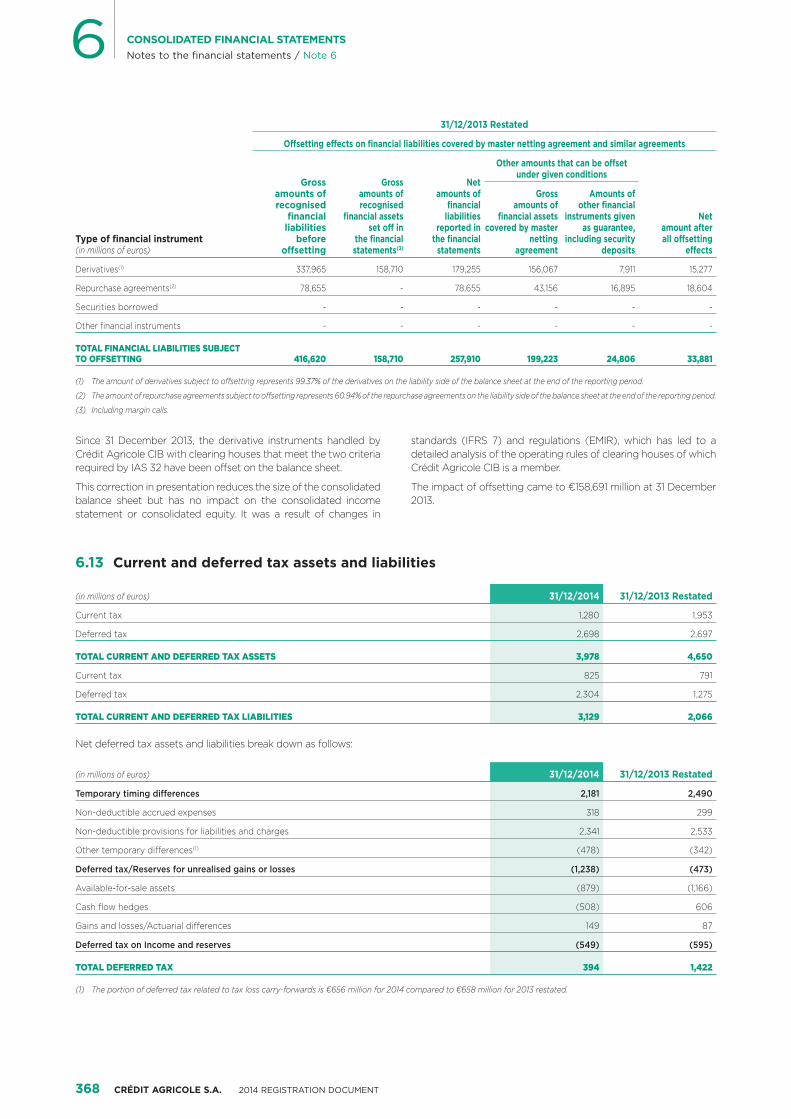
368 CRÉDIT AGRICOLE S.A. 2014 REGISTRATION DOCUMENT
6 CONSOLIDATED FINANCIAL STATEMENTSNotes to the financial statements / Note 6
Type of financial instrument(in millions of euros)
31/12/2013 Restated
Offsetting effects on financial liabilities covered by master netting agreement and similar agreements
Gross amounts of recognised
financial liabilities
before offsetting
Gross amounts of recognised
financial assets set off in
the financial statements(3)
Net amounts of
financial liabilities
reported in the financial
statements
Other amounts that can be offset under given conditions
Net amount after all offsetting
effects
Gross amounts of
financial assets covered by master
netting agreement
Amounts of other financial
instruments given as guarantee,
including security deposits
Derivatives(1) 337,965 158,710 179,255 156,067 7,911 15,277
Repurchase agreements(2) 78,655 - 78,655 43,156 16,895 18,604
Securities borrowed - - - - - -
Other financial instruments - - - - - -
TOTAL FINANCIAL LIABILITIES SUBJECT TO OFFSETTING 416,620 158,710 257,910 199,223 24,806 33,881
(1) The amount of derivatives subject to offsetting represents 99.37% of the derivatives on the liability side of the balance sheet at the end of the reporting period.
(2) The amount of repurchase agreements subject to offsetting represents 60.94% of the repurchase agreements on the liability side of the balance sheet at the end of the reporting period.
(3) Including margin calls.
Since 31 December 2013, the derivative instruments handled by Crédit Agricole CIB with clearing houses that meet the two criteria required by IAS 32 have been offset on the balance sheet.
This correction in presentation reduces the size of the consolidated balance sheet but has no impact on the consolidated income statement or consolidated equity. It was a result of changes in
standards (IFRS 7) and regulations (EMIR), which has led to a detailed analysis of the operating rules of clearing houses of which Crédit Agricole CIB is a member.
The impact of offsetting came to €158,691 million at 31 December 2013.
6.13 Current and deferred tax assets and liabilities
(in millions of euros) 31/12/2014 31/12/2013 Restated
Current tax 1,280 1,953
Deferred tax 2,698 2,697
TOTAL CURRENT AND DEFERRED TAX ASSETS 3,978 4,650
Current tax 825 791
Deferred tax 2,304 1,275
TOTAL CURRENT AND DEFERRED TAX LIABILITIES 3,129 2,066
Net deferred tax assets and liabilities break down as follows:
(in millions of euros) 31/12/2014 31/12/2013 Restated
Temporary timing differences 2,181 2,490
Non-deductible accrued expenses 318 299
Non-deductible provisions for liabilities and charges 2,341 2,533
Other temporary differences(1) (478) (342)
Deferred tax/Reserves for unrealised gains or losses (1,238) (473)
Available-for-sale assets (879) (1,166)
Cash flow hedges (508) 606
Gains and losses/Actuarial differences 149 87
Deferred tax on Income and reserves (549) (595)
TOTAL DEFERRED TAX 394 1,422
(1) The portion of deferred tax related to tax loss carry-forwards is €656 million for 2014 compared to €658 million for 2013 restated.
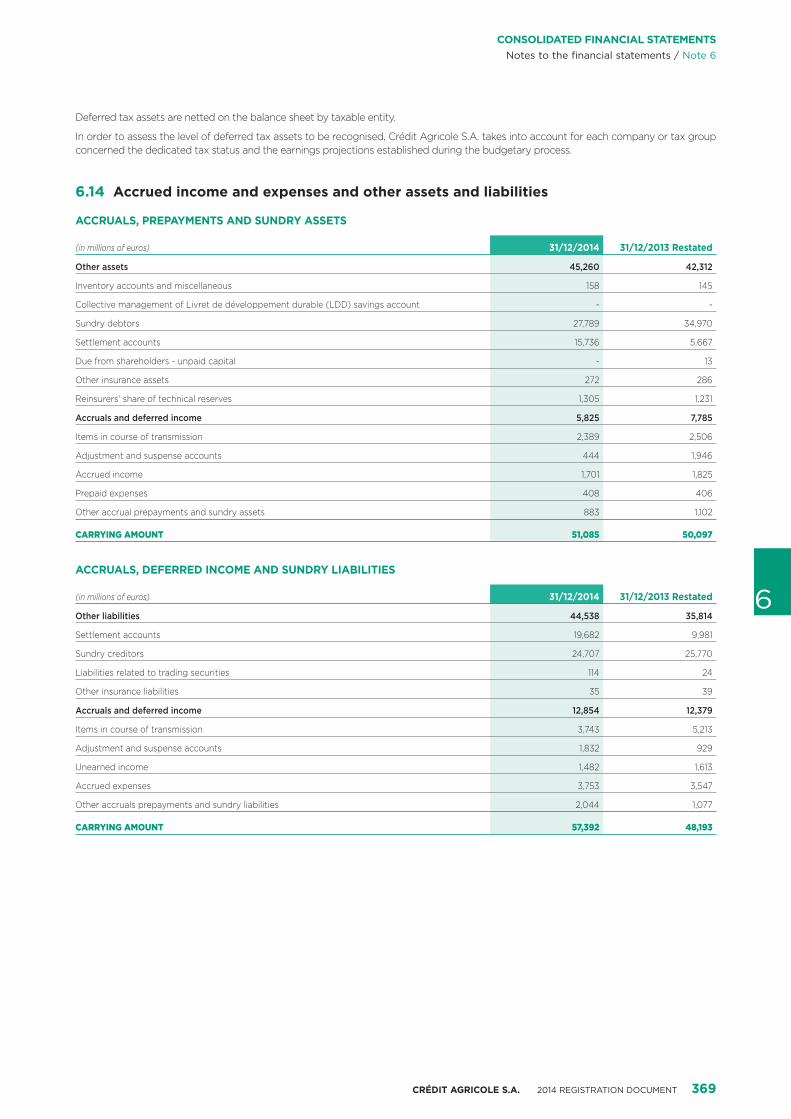
CRÉDIT AGRICOLE S.A. 2014 REGISTRATION DOCUMENT 369
6
CONSOLIDATED FINANCIAL STATEMENTSNotes to the financial statements / Note 6
Deferred tax assets are netted on the balance sheet by taxable entity.
In order to assess the level of deferred tax assets to be recognised, Crédit Agricole S.A. takes into account for each company or tax group concerned the dedicated tax status and the earnings projections established during the budgetary process.
6.14 Accrued income and expenses and other assets and liabilities
ACCRUALS, PREPAYMENTS AND SUNDRY ASSETS
(in millions of euros) 31/12/2014 31/12/2013 Restated
Other assets 45,260 42,312
Inventory accounts and miscellaneous 158 145
Collective management of Livret de développement durable (LDD) savings account - -
Sundry debtors 27,789 34,970
Settlement accounts 15,736 5,667
Due from shareholders - unpaid capital - 13
Other insurance assets 272 286
Reinsurers’ share of technical reserves 1,305 1,231
Accruals and deferred income 5,825 7,785
Items in course of transmission 2,389 2,506
Adjustment and suspense accounts 444 1,946
Accrued income 1,701 1,825
Prepaid expenses 408 406
Other accrual prepayments and sundry assets 883 1,102
CARRYING AMOUNT 51,085 50,097
ACCRUALS, DEFERRED INCOME AND SUNDRY LIABILITIES
(in millions of euros) 31/12/2014 31/12/2013 Restated
Other liabilities 44,538 35,814
Settlement accounts 19,682 9,981
Sundry creditors 24,707 25,770
Liabilities related to trading securities 114 24
Other insurance liabilities 35 39
Accruals and deferred income 12,854 12,379
Items in course of transmission 3,743 5,213
Adjustment and suspense accounts 1,832 929
Unearned income 1,482 1,613
Accrued expenses 3,753 3,547
Other accruals prepayments and sundry liabilities 2,044 1,077
CARRYING AMOUNT 57,392 48,193
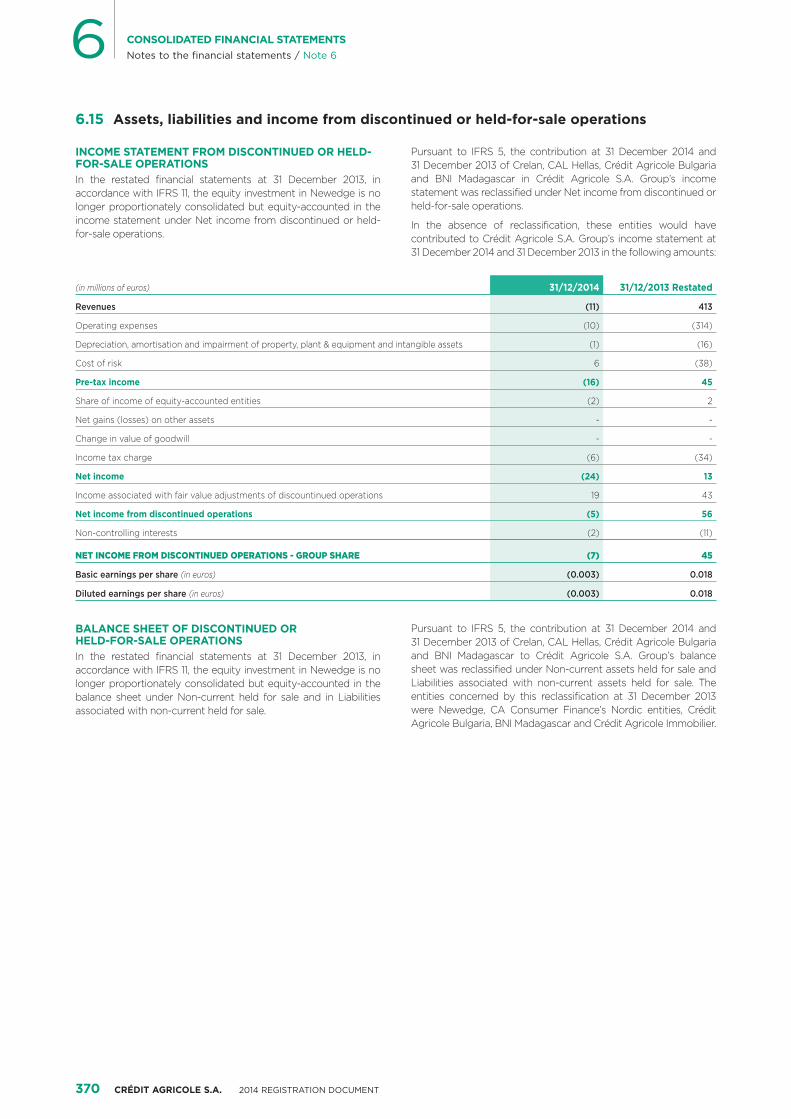
370 CRÉDIT AGRICOLE S.A. 2014 REGISTRATION DOCUMENT
6 CONSOLIDATED FINANCIAL STATEMENTSNotes to the financial statements / Note 6
6.15 Assets, liabilities and income from discontinued or held-for-sale operations
INCOME STATEMENT FROM DISCONTINUED OR HELD-FOR-SALE OPERATIONSIn the restated financial statements at 31 December 2013, in accordance with IFRS 11, the equity investment in Newedge is no longer proportionately consolidated but equity-accounted in the income statement under Net income from discontinued or held-for-sale operations.
Pursuant to IFRS 5, the contribution at 31 December 2014 and 31 December 2013 of Crelan, CAL Hellas, Crédit Agricole Bulgaria and BNI Madagascar in Crédit Agricole S.A. Group’s income statement was reclassified under Net income from discontinued or held-for-sale operations.
In the absence of reclassification, these entities would have contributed to Crédit Agricole S.A. Group’s income statement at 31 December 2014 and 31 December 2013 in the following amounts:
(in millions of euros) 31/12/2014 31/12/2013 Restated
Revenues (11) 413
Operating expenses (10) (314)
Depreciation, amortisation and impairment of property, plant & equipment and intangible assets (1) (16)
Cost of risk 6 (38)
Pre-tax income (16) 45
Share of income of equity-accounted entities (2) 2
Net gains (losses) on other assets - -
Change in value of goodwill - -
Income tax charge (6) (34)
Net income (24) 13
Income associated with fair value adjustments of discountinued operations 19 43
Net income from discontinued operations (5) 56
Non-controlling interests (2) (11)
NET INCOME FROM DISCONTINUED OPERATIONS - GROUP SHARE (7) 45
Basic earnings per share (in euros) (0.003) 0.018
Diluted earnings per share (in euros) (0.003) 0.018
BALANCE SHEET OF DISCONTINUED OR HELD-FOR-SALE OPERATIONSIn the restated financial statements at 31 December 2013, in accordance with IFRS 11, the equity investment in Newedge is no longer proportionately consolidated but equity-accounted in the balance sheet under Non-current held for sale and in Liabilities associated with non-current held for sale.
Pursuant to IFRS 5, the contribution at 31 December 2014 and 31 December 2013 of Crelan, CAL Hellas, Crédit Agricole Bulgaria and BNI Madagascar to Crédit Agricole S.A. Group’s balance sheet was reclassified under Non-current assets held for sale and Liabilities associated with non-current assets held for sale. The entities concerned by this reclassification at 31 December 2013 were Newedge, CA Consumer Finance’s Nordic entities, Crédit Agricole Bulgaria, BNI Madagascar and Crédit Agricole Immobilier.
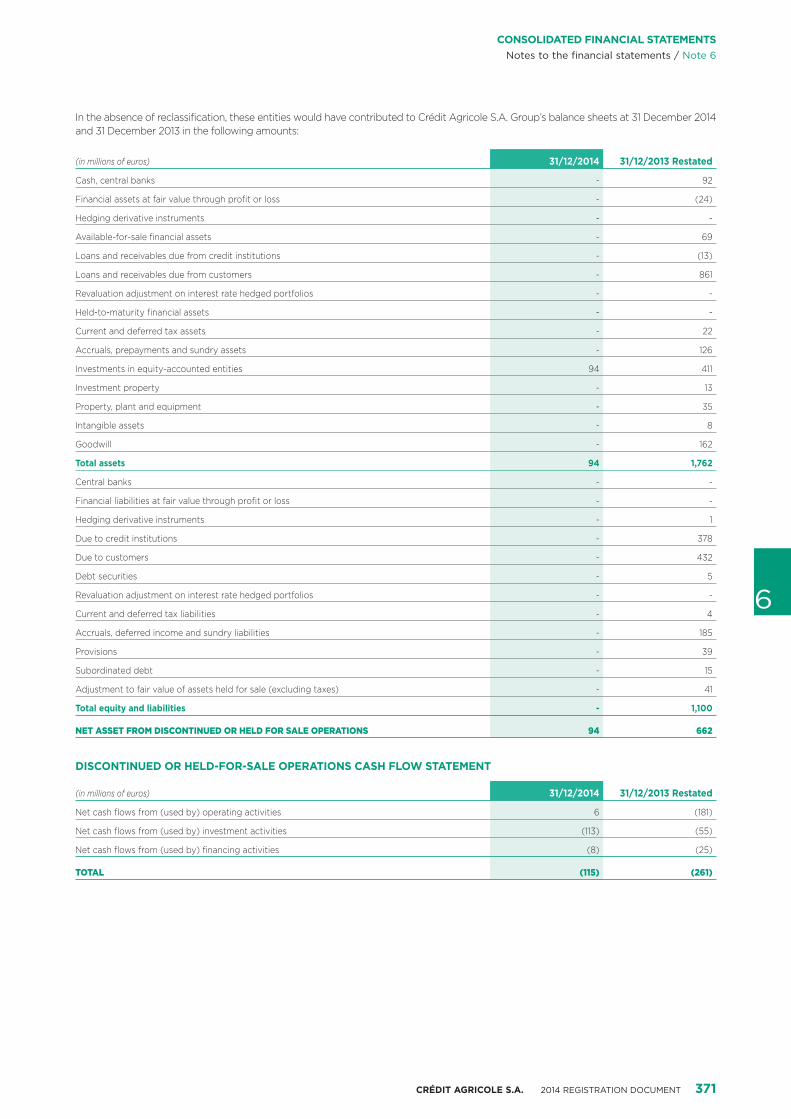
CRÉDIT AGRICOLE S.A. 2014 REGISTRATION DOCUMENT 371
6
CONSOLIDATED FINANCIAL STATEMENTSNotes to the financial statements / Note 6
In the absence of reclassification, these entities would have contributed to Crédit Agricole S.A. Group’s balance sheets at 31 December 2014 and 31 December 2013 in the following amounts:
(in millions of euros) 31/12/2014 31/12/2013 Restated
Cash, central banks - 92
Financial assets at fair value through profit or loss - (24)
Hedging derivative instruments - -
Available-for-sale financial assets - 69
Loans and receivables due from credit institutions - (13)
Loans and receivables due from customers - 861
Revaluation adjustment on interest rate hedged portfolios - -
Held-to-maturity financial assets - -
Current and deferred tax assets - 22
Accruals, prepayments and sundry assets - 126
Investments in equity-accounted entities 94 411
Investment property - 13
Property, plant and equipment - 35
Intangible assets - 8
Goodwill - 162
Total assets 94 1,762
Central banks - -
Financial liabilities at fair value through profit or loss - -
Hedging derivative instruments - 1
Due to credit institutions - 378
Due to customers - 432
Debt securities - 5
Revaluation adjustment on interest rate hedged portfolios - -
Current and deferred tax liabilities - 4
Accruals, deferred income and sundry liabilities - 185
Provisions - 39
Subordinated debt - 15
Adjustment to fair value of assets held for sale (excluding taxes) - 41
Total equity and liabilities - 1,100
NET ASSET FROM DISCONTINUED OR HELD FOR SALE OPERATIONS 94 662
DISCONTINUED OR HELD-FOR-SALE OPERATIONS CASH FLOW STATEMENT
(in millions of euros) 31/12/2014 31/12/2013 Restated
Net cash flows from (used by) operating activities 6 (181)
Net cash flows from (used by) investment activities (113) (55)
Net cash flows from (used by) financing activities (8) (25)
TOTAL (115) (261)

372 CRÉDIT AGRICOLE S.A. 2014 REGISTRATION DOCUMENT
6 CONSOLIDATED FINANCIAL STATEMENTSNotes to the financial statements / Note 6
6.16 Joint ventures and associates
The market value shown below is the quoted price of the shares on the market at 31 December. This value may not be representative of the selling value since the value in use of equity-accounted entities may be different from the equity-accounted value determined pursuant to IAS 28. Investments in equity-accounted entities were subject to impairment tests using the same methodology as for goodwill, i.e., by using expected future cash flow estimates of the companies in question and by using the valuation parameters described in Note 6.19 “Goodwill”.
Crédit Agricole S.A. Group is subject to the following restrictions:
Regulatory constraintsThe subsidiaries of Crédit Agricole S.A. Group are subject to prudential regulation and regulatory capital requirements in their host countries. The minimum equity capital (solvency ratio), leverage ratio and liquidity ratio requirements limit the capacity of these entities to pay dividends or to transfer assets to Crédit Agricole S.A. Group.
Legal constraintsThe subsidiaries of Crédit Agricole S.A. Group are subject to legal provisions concerning the distribution of capital and distributable earnings. These requirements limit the ability of the subsidiaries
to distribute dividends. In the majority of cases, these are less restrictive than the regulatory limitations mentioned above.
Other constraintsA subsidiary of Crédit Agricole CIB, Banque Saudi Fransi, is required to obtain prior approval for the payment of dividends from their prudential authorities (namely the Saudi Monetary Authority).
6.16.1 JOINT VENTURES
INFORMATION ON THE FGA CAPITAL JOINT VENTUREFGA Capital is a joint venture created with Fiat Chrysler Automobiles Group. In July 2013, Crédit Agricole S.A. with Crédit Agricole Consumer Finance on the one hand and Fiat Group Automobiles (FGA) on the other signed an agreement to extend their joint venture – FGA Capital (FGAC) – equally owned by shareholders, until 31 December 2021. Active in 16 European countries, the company manages all financing operations for car dealers and private customers for the following brands: Fiat, Lancia, Alfa Romeo, Maserati, Chrysler, Jeep, Fiat Professional, Abarth in Europe as well as Jaguar Land Rover in continental Europe. It is thus strategic for the development of the car finance partnership business of the Group. In January 2015, FGA Capital adopted the status of bank and changed its name to FCA Bank.
(in millions of euros)
31/12/2014
Equity-accounted value
Share of market value
Dividends paid to Group’s entities
Share of net income
FGA Capital S.p.A. 1,288 - (41) 105
Others 405 - (10) (17)
NET CARRYING AMOUNT OF INVESTMENTS IN EQUITY-ACCOUNTED ENTITIES 1,693 88
(in millions of euros)
31/12/2013
Equity-accounted value
Share of market value
Dividends paid to Group’s entities
Share of net income
FGA Capital S.p.A. 1,216 - (15) 87
Others 320 - (12) 14
NET CARRYING AMOUNT OF INVESTMENTS IN EQUITY-ACCOUNTED ENTITIES 1,536 101
The amounts below correspond to the most recent financial statements prepared under IFRS published by the joint venture after restatement for consistency and before elimination of results of non-reciprocal intra-Group transactions.
(in millions of euros)
31/12/2014
Profit & Loss
Revenues
Gross operating
income Cost of risk
Income tax charge
/income Net income
Other comprehensive
income
Net income & Other
comprehensive income
FGA Capital S.p.A. 599 374 (74) (87) 214 (8) 206

CRÉDIT AGRICOLE S.A. 2014 REGISTRATION DOCUMENT 373
6
CONSOLIDATED FINANCIAL STATEMENTSNotes to the financial statements / Note 6
(in millions of euros)
31/12/2013
Profit & Loss
Revenues
Gross operating
income Cost of risk
Income tax charge
/income Net income
Other comprehensive
income
Net income & Other
comprehensive income
FGA Capital S.p.A. 587 356 (99) (79) 178 3 181
(in millions of euros)
31/12/2014
Assets Liabilities
Total assets
o/w financial assets at fair value
through P&L
o/w available-
for-sale financial
assets
o/w loans and
receivables
o/w cash and cash
equivalentsTotal
liabilities
o/w financial
liabilities at fair value
through P&L
o/w due to credit
institutions/customers
o/w debt instruments
Total equity
FGA Capital S.p.A. 16,921 14 10 14,740 - 14,947 17 6,880 7,098 1,973
(in millions of euros)
31/12/2013
Assets Liabilities
Total assets
o/w financial assets at fair value
through P&L
o/w available-
for-sale financial
assets
o/w loans and
receivables
o/w cash and cash
equivalentsTotal
liabilities
o/w financial
liabilities at fair value
through P&L
o/w due to credit
institutions/customers
o/w debt instruments
Total equity
FGA Capital S.p.A. 16,567 37 10 14,645 - 14,737 39 7,486 6,367 1,830
The reconciliation between equity of the joint ventures and the carrying amount of the investment in Crédit Agricole S.A. Group’s consolidated financial statements is as follows:
(in millions of euros)
31/12/2014
Share of shareholders’
equity(1)Consolidation
adjustments GoodwillEquity-
accounted value
FGA Capital S.p.A. 895 - 393 1,288
Others 498 (141) 48 405
TOTAL 1,393 (141) 441 1,693
(1) Equity, Group share in the financial statements of the joint venture when the joint venture is a sub-group.
(in millions of euros)
31/12/2013
Share of shareholders’
equity(1)Consolidation
adjustments GoodwillEquity-
accounted value
FGA Capital S.p.A. 823 - 393 1,216
Others 291 10 18 320
TOTAL 1,114 10 411 1,536
(1) Equity, Group share in the financial statements of the joint venture when the joint venture is a sub-group.
FINANCIAL INFORMATION ON NON-MATERIAL JOINT VENTURES
Joint ventures (in millions of euros) 31/12/2014 31/12/2013
Aggregate carrying amount of interests held 17 42
Share of net profit (loss) from ongoing operations (18) 18
Share of post-tax net profit (loss) from discontinued or held-for-sale operations - -
Share of other comprehensive income 3 (4)
Share of net income and other comprehensive income (15) 14
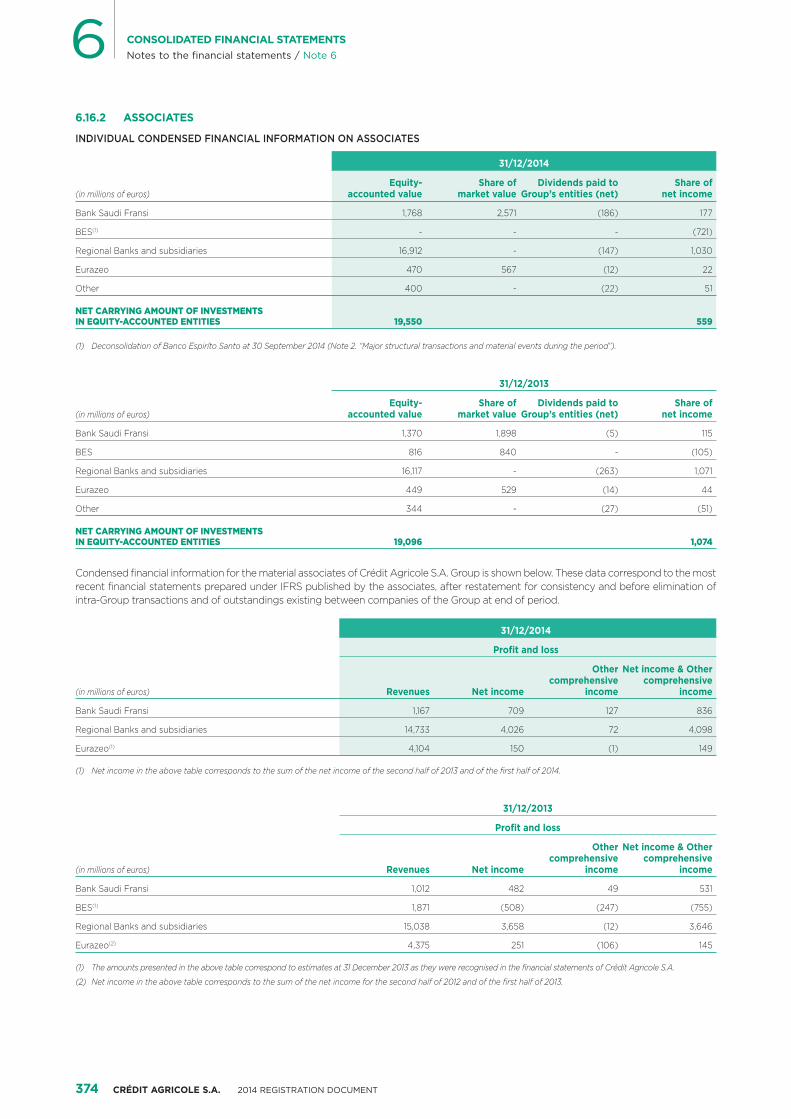
374 CRÉDIT AGRICOLE S.A. 2014 REGISTRATION DOCUMENT
6 CONSOLIDATED FINANCIAL STATEMENTSNotes to the financial statements / Note 6
6.16.2 ASSOCIATES
INDIVIDUAL CONDENSED FINANCIAL INFORMATION ON ASSOCIATES
(in millions of euros)
31/12/2014
Equity-accounted value
Share of market value
Dividends paid to Group’s entities (net)
Share of net income
Bank Saudi Fransi 1,768 2,571 (186) 177
BES(1) - - - (721)
Regional Banks and subsidiaries 16,912 - (147) 1,030
Eurazeo 470 567 (12) 22
Other 400 - (22) 51
NET CARRYING AMOUNT OF INVESTMENTS IN EQUITY-ACCOUNTED ENTITIES 19,550 559
(1) Deconsolidation of Banco Espiríto Santo at 30 September 2014 (Note 2. “Major structural transactions and material events during the period”).
(in millions of euros)
31/12/2013
Equity-accounted value
Share of market value
Dividends paid to Group’s entities (net)
Share of net income
Bank Saudi Fransi 1,370 1,898 (5) 115
BES 816 840 - (105)
Regional Banks and subsidiaries 16,117 - (263) 1,071
Eurazeo 449 529 (14) 44
Other 344 - (27) (51)
NET CARRYING AMOUNT OF INVESTMENTS IN EQUITY-ACCOUNTED ENTITIES 19,096 1,074
Condensed financial information for the material associates of Crédit Agricole S.A. Group is shown below. These data correspond to the most recent financial statements prepared under IFRS published by the associates, after restatement for consistency and before elimination of intra-Group transactions and of outstandings existing between companies of the Group at end of period.
(in millions of euros)
31/12/2014
Profit and loss
Revenues Net income
Other comprehensive
income
Net income & Other comprehensive
income
Bank Saudi Fransi 1,167 709 127 836
Regional Banks and subsidiaries 14,733 4,026 72 4,098
Eurazeo(1) 4,104 150 (1) 149
(1) Net income in the above table corresponds to the sum of the net income of the second half of 2013 and of the first half of 2014.
(in millions of euros)
31/12/2013
Profit and loss
Revenues Net income
Other comprehensive
income
Net income & Other comprehensive
income
Bank Saudi Fransi 1,012 482 49 531
BES(1) 1,871 (508) (247) (755)
Regional Banks and subsidiaries 15,038 3,658 (12) 3,646
Eurazeo(2) 4,375 251 (106) 145
(1) The amounts presented in the above table correspond to estimates at 31 December 2013 as they were recognised in the financial statements of Crédit Agricole S.A.
(2) Net income in the above table corresponds to the sum of the net income for the second half of 2012 and of the first half of 2013.
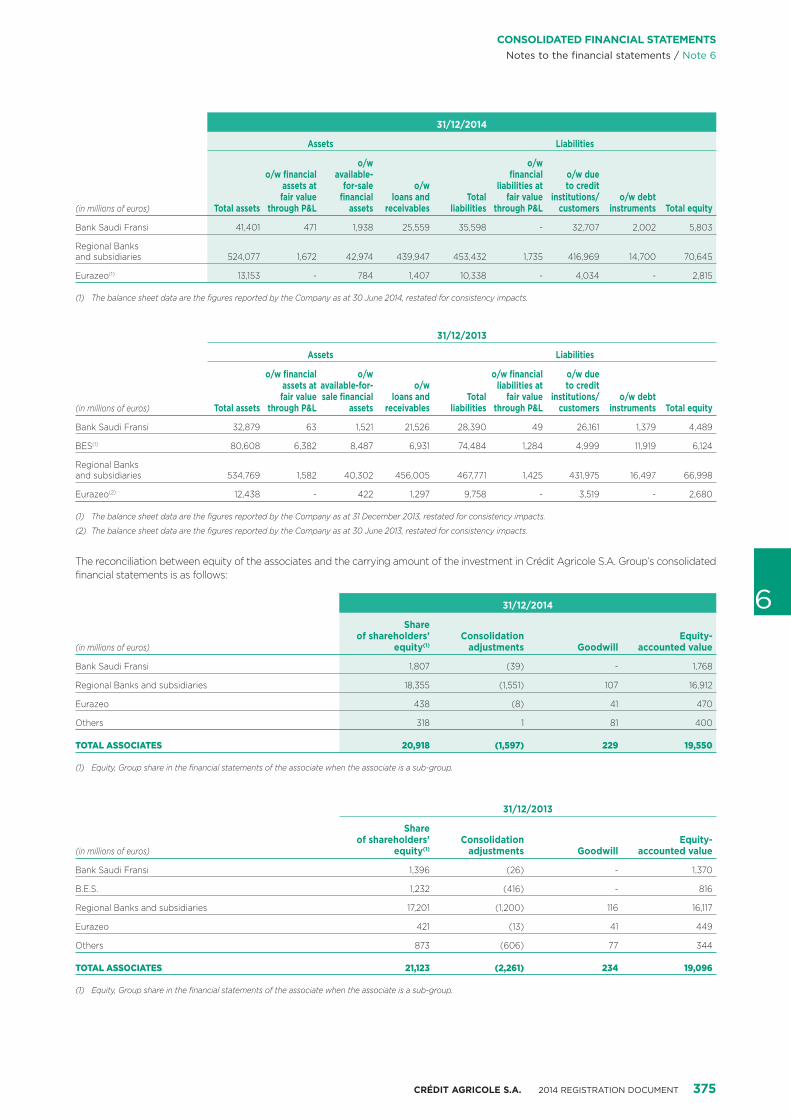
CRÉDIT AGRICOLE S.A. 2014 REGISTRATION DOCUMENT 375
6
CONSOLIDATED FINANCIAL STATEMENTSNotes to the financial statements / Note 6
(in millions of euros)
31/12/2014
Assets Liabilities
Total assets
o/w financial assets at fair value
through P&L
o/w available-
for-sale financial
assets
o/w loans and
receivablesTotal
liabilities
o/w financial
liabilities at fair value
through P&L
o/w due to credit
institutions/customers
o/w debt instruments Total equity
Bank Saudi Fransi 41,401 471 1,938 25,559 35,598 - 32,707 2,002 5,803
Regional Banks and subsidiaries 524,077 1,672 42,974 439,947 453,432 1,735 416,969 14,700 70,645
Eurazeo(1) 13,153 - 784 1,407 10,338 - 4,034 - 2,815
(1) The balance sheet data are the figures reported by the Company as at 30 June 2014, restated for consistency impacts.
(in millions of euros)
31/12/2013
Assets Liabilities
Total assets
o/w financial assets at fair value
through P&L
o/w available-for-sale financial
assets
o/w loans and
receivablesTotal
liabilities
o/w financial liabilities at
fair value through P&L
o/w due to credit
institutions/customers
o/w debt instruments Total equity
Bank Saudi Fransi 32,879 63 1,521 21,526 28,390 49 26,161 1,379 4,489
BES(1) 80,608 6,382 8,487 6,931 74,484 1,284 4,999 11,919 6,124
Regional Banks and subsidiaries 534,769 1,582 40,302 456,005 467,771 1,425 431,975 16,497 66,998
Eurazeo(2) 12,438 - 422 1,297 9,758 - 3,519 - 2,680
(1) The balance sheet data are the figures reported by the Company as at 31 December 2013, restated for consistency impacts.
(2) The balance sheet data are the figures reported by the Company as at 30 June 2013, restated for consistency impacts.
The reconciliation between equity of the associates and the carrying amount of the investment in Crédit Agricole S.A. Group’s consolidated financial statements is as follows:
(in millions of euros)
31/12/2014
Share of shareholders’
equity(1)Consolidation
adjustments GoodwillEquity-
accounted value
Bank Saudi Fransi 1,807 (39) - 1,768
Regional Banks and subsidiaries 18,355 (1,551) 107 16,912
Eurazeo 438 (8) 41 470
Others 318 1 81 400
TOTAL ASSOCIATES 20,918 (1,597) 229 19,550
(1) Equity, Group share in the financial statements of the associate when the associate is a sub-group.
(in millions of euros)
31/12/2013
Share of shareholders’
equity(1)Consolidation
adjustments GoodwillEquity-
accounted value
Bank Saudi Fransi 1,396 (26) - 1,370
B.E.S. 1,232 (416) - 816
Regional Banks and subsidiaries 17,201 (1,200) 116 16,117
Eurazeo 421 (13) 41 449
Others 873 (606) 77 344
TOTAL ASSOCIATES 21,123 (2,261) 234 19,096
(1) Equity, Group share in the financial statements of the associate when the associate is a sub-group.
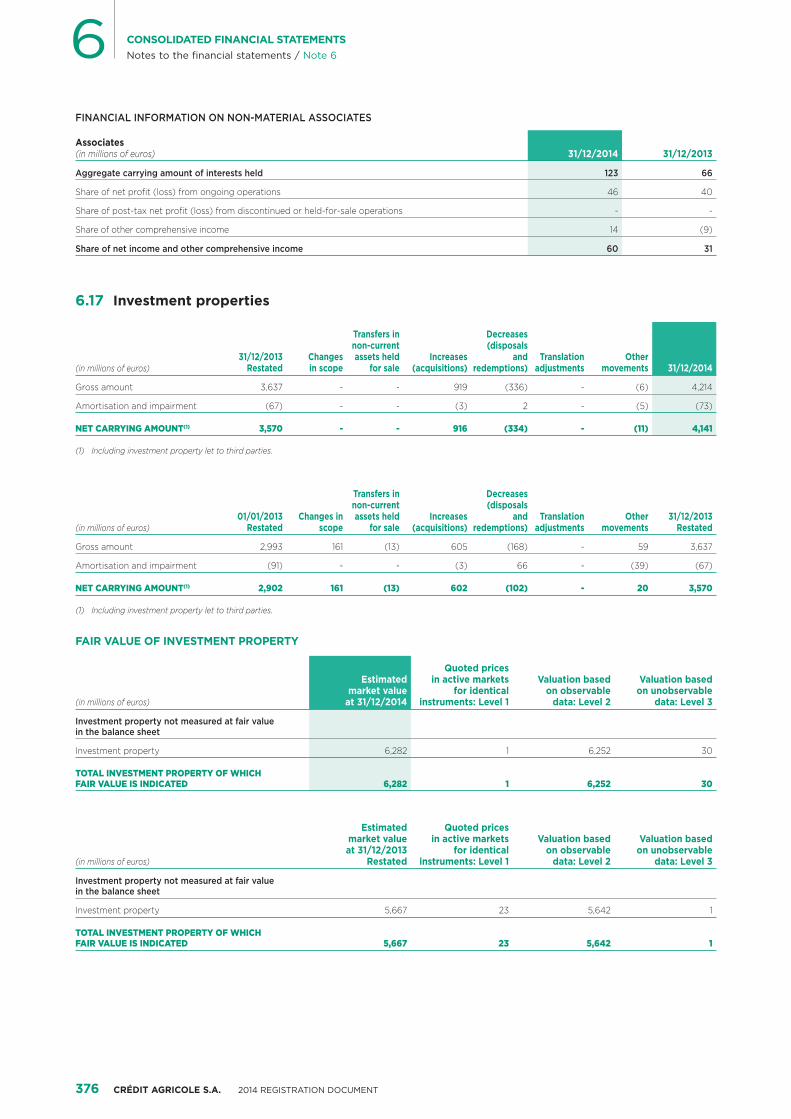
376 CRÉDIT AGRICOLE S.A. 2014 REGISTRATION DOCUMENT
6 CONSOLIDATED FINANCIAL STATEMENTSNotes to the financial statements / Note 6
FINANCIAL INFORMATION ON NON-MATERIAL ASSOCIATES
Associates (in millions of euros) 31/12/2014 31/12/2013
Aggregate carrying amount of interests held 123 66
Share of net profit (loss) from ongoing operations 46 40
Share of post-tax net profit (loss) from discontinued or held-for-sale operations - -
Share of other comprehensive income 14 (9)
Share of net income and other comprehensive income 60 31
6.17 Investment properties
(in millions of euros)31/12/2013
RestatedChanges in scope
Transfers in non-current assets held
for saleIncreases
(acquisitions)
Decreases (disposals
and redemptions)
Translation adjustments
Other movements 31/12/2014
Gross amount 3,637 - - 919 (336) - (6) 4,214
Amortisation and impairment (67) - - (3) 2 - (5) (73)
NET CARRYING AMOUNT(1) 3,570 - - 916 (334) - (11) 4,141
(1) Including investment property let to third parties.
(in millions of euros)01/01/2013
RestatedChanges in
scope
Transfers in non-current assets held
for saleIncreases
(acquisitions)
Decreases (disposals
and redemptions)
Translation adjustments
Other movements
31/12/2013 Restated
Gross amount 2,993 161 (13) 605 (168) - 59 3,637
Amortisation and impairment (91) - - (3) 66 - (39) (67)
NET CARRYING AMOUNT(1) 2,902 161 (13) 602 (102) - 20 3,570
(1) Including investment property let to third parties.
FAIR VALUE OF INVESTMENT PROPERTY
(in millions of euros)
Estimated market value
at 31/12/2014
Quoted prices in active markets
for identical instruments: Level 1
Valuation based on observable
data: Level 2
Valuation based on unobservable
data: Level 3
Investment property not measured at fair value in the balance sheet
Investment property 6,282 1 6,252 30
TOTAL INVESTMENT PROPERTY OF WHICH FAIR VALUE IS INDICATED 6,282 1 6,252 30
(in millions of euros)
Estimated market value at 31/12/2013
Restated
Quoted prices in active markets
for identical instruments: Level 1
Valuation based on observable
data: Level 2
Valuation based on unobservable
data: Level 3
Investment property not measured at fair value in the balance sheet
Investment property 5,667 23 5,642 1
TOTAL INVESTMENT PROPERTY OF WHICH FAIR VALUE IS INDICATED 5,667 23 5,642 1

CRÉDIT AGRICOLE S.A. 2014 REGISTRATION DOCUMENT 377
6
CONSOLIDATED FINANCIAL STATEMENTSNotes to the financial statements / Note 6
6.18 Property, plant & equipment and intangible assets (excluding goodwill)
(in millions of euros)31/12/2013
RestatedChanges in scope
Transfers in non-current assets held
for sale
Increases (acquisitions,
business combinations)
Decreases (disposals
and redemptions)
Translation adjustments
Other movements 31/12/2014
Property, plant & equipment used in operations
Gross amount 7,536 - - 486 (361) 14 171 7,846
Depreciation and impairment(1) (3,639) - - (376) 239 (16) (93) (3,885)
CARRYING AMOUNT 3,897 - - 110 (122) (2) 78 3,961
Intangible assets
Gross amount 4,620 - - 343 (53) 8 (2) 4,916
Amortisation and impairment (3,048) - - (306) 33 (8) (43) (3,372)
CARRYING AMOUNT 1,572 - - 37 (20) - (45) 1,544
(1) Including depreciation on fixed assets let to third parties.
(in millions of euros)01/01/2013
RestatedChanges in scope
Transfers in non-current assets held
for sale
Increases (acquisitions,
business combinations)
Decreases (disposals
and redemptions)
Translation adjustments
Other movements
31/12/2013 Restated
Property, plant & equipment used in operations
Gross amount 7,552 39 - 413 (603) (45) 180 7,536
Depreciation and impairment(1) (3,595) 1 - (404) 438 28 (107) (3,639)
CARRYING AMOUNT 3,957 40 - 9 (165) (17) 73 3,897
Intangible assets
Gross amount 4,441 (4) - 418 (201) (10) (24) 4,620
Amortisation and impairment (2,794) 4 - (327) 117 9 (57) (3,048)
CARRYING AMOUNT 1,647 - - 91 (84) (1) (81) 1,572
(1) Including depreciation on fixed assets let to third parties.

378 CRÉDIT AGRICOLE S.A. 2014 REGISTRATION DOCUMENT
6 CONSOLIDATED FINANCIAL STATEMENTSNotes to the financial statements / Note 6
6.19 Goodwill
(in millions of euros)
31.12.2013 Restated
GROSS
31.12.2013 Restated
NETIncreases
(Acquisitions)Decreases
(Divestments)
Impairment losses
during the period
Translation adjustments
Other movements
31.12.2014 GROSS
31.12.2014 NET
French retail banking 5,263 5,263 - - - - - 5,263 5,263
o/w LCL Group 5,263 5,263 - - - - - 5,263 5,263
International retail banking 3,425 2,011 - - - 7 - 3,391 2,018
o/w Italy 2,872 1,660 - - - - - 2,872 1,660
o/w Poland 265 265 - - - - - 265 265
o/w Ukraine 115 - - - - - - 68 -
o/w other countries 173 86 - - - 7 - 186 93
Savings management and Insurance 4,552 4,552 13 - (22) 14 (2) 4,579 4,555
o/w asset management 2,049 2,049 13 - - 13 (2) 2,073 2,073
o/w investor services 655 655 - - - - - 655 655
o/w insurance 1,214 1,214 - - - - - 1,214 1,214
o/w international private banking 634 634 - - (22) 1 - 637 613
Specialised financial services 2,735 1,022 - - - - - 2,735 1,022
o/w Consumer finance 1,714 953 - - - - - 1,714 953
o/w Consumer finance - Agos 569 - - - - - - 569 -
o/w Consumer finance - Car partnerships - - - - - - - - -
o/w Factoring 452 69 - - - - - 452 69
Corporate and investment banking 1,701 476 - - - - - 1,701 476
Corporate centre - - - - - - - - -
TOTAL 17,676 13,324 13 - (22) 21 (2) 17,669 13,334
Group Share 17,251 13,075 10 - (22) 14 14 17,250 13,091
Non-controlling interests 425 249 3 - - 7 (16) 419 243
Pursuant to IFRS 11, goodwill acquired on the Specialised financial services – Consumer credit Car finance partnerships - CGU was reclassified under equity-accounted value for a gross amount of €411 million.
DETERMINING THE VALUE IN USE OF THE CGUs Goodwill was subject to impairment tests based on the assessment of the value in use of the cash generating units (CGU) to which it is associated. The determination of value in use was calculated by discounting the CGU’s estimated future cash flows calculated from the Medium Term Plans developed for Group management purposes.
The following assumptions were made:
� The forecasts in the business line plans were prepared on the basis of the economic scenario of Crédit Agricole S.A. at end-September 2014, which assumed that long-term interest
rates would remain very low while nevertheless normalising towards the end of the period.
The main assumptions relating to the economic environment are as follows:
� A gradual improvement in the outlook for the Eurozone, marked by a fragile recovery, due to uncertainties surrounding public finances, in France in particular, and the rise in geopolitical risk in Central Europe;
� A return to normal in the US where confidence seems to have returned. Unemployment should continue to fall while growth strengthens,
� Limited visibility for emerging countries, with contrasting fortunes: growth under pressure in China, a fragile recovery in India, growth permanently below par in Brazil and an economic slowdown in Russia compounded by the geopolitical crisis.

CRÉDIT AGRICOLE S.A. 2014 REGISTRATION DOCUMENT 379
6
CONSOLIDATED FINANCIAL STATEMENTSNotes to the financial statements / Note 6
� Perpetual growth rates, discount rate and capital allocated rate: rates by CGU are as shown in the table below:
In 2014Perpetual
growth ratesDiscount
rateCapital
allocated
French retail banking 2.0% 8.30% 8.0%
International retail banking 2.0% to 5.0% 10.0% to 16.9% 8.0% to 9.0%
Specialised financial services 2.0% 8.3% to 8.7% 8.0%
Savings management and Insurance 2.0% 8.3% to 9.2% 8.0% to 9.0%80% of solvency
margin
Corporate and investment banking 2.0% 10.0% 8.0%
SENSITIVITY OF CGUs VALUATION TO THE MAIN VALUATION PARAMETERS
Sensitivity to capital allocated
Sensitivity to discount rates
Sensitivity to cost of risk in the final year
+100bp -50bp +50bp -10bp +10bp
French retail banking (4.2%) 7.0% (6.0%) 6.6% (6.6%)
International retail banking (4.4%) 5.7% (5.1%) 3.3% (3.3%)
Specialised financial services (8.4%) 8.6% (7.4%) 6.5% (6.5%)
Savings management and Insurance (5.9%) 7.2% (6.2%) n.m. n.m.
Corporate and investment banking (10.5%) 6.8% (6.0%) 8.7% (8.7%)
Sensitivity tests were conducted on goodwill Group share with changes in the main valuation parameters applied equally for all CGUs.
� With regard to financial parameters, these showed that:
� a variation of +50 basis points in the discount rates would lead to an impairment charge of about €170 million:
− €50 million on the French retail banking CGU,
− €120 million on the Asset servicing CGU,
� a variation of +100 basis points in the level of equity allocated to the banking CGUs would lead to an impairment charge of about €90 million on the Asset servicing CGU,
� a variation of -50 basis points in the perpetual growth rates would lead to an impairment charge of about €80 million on the Asset servicing CGU;
� With regard to operational parameters, these showed that:
� a variation of +100 basis points in the cost/income ratio during the final year of financial projections would lead to an impairment charge of about €60 million on the Asset servicing CGU,
� a variation of +10 basis points in the cost of risk during the final year of financial projections would lead to an impairment charge of about €100 million on the French retail banking CGU.
None of these scenarios would lead to impairment charges on the other CGUs.
Equity allocated to the various business lines corresponds, at 31 December 2014, to 80% of the solvency margin for insurance activities, 8% of risk weighted assets for banking activities with an allocation rate of 9% for the Italian banking business and 9% of risk weighted assets for asset management compared to 8% at 31 December 2013 for these two business lines.
The persistent downward trend in long-term interest rates, particularly in France, was factored in when calculating the
discount rate. The effect is to reduce the rates applied to French subsidiaries by around 90 basis points compared to end-2013, consistent with the change in rate assumptions used to calculate budgets and three-year projections.
The discount rate applied to the corporate and investment banking business was revised down to reflect the changing risk profile of this business.
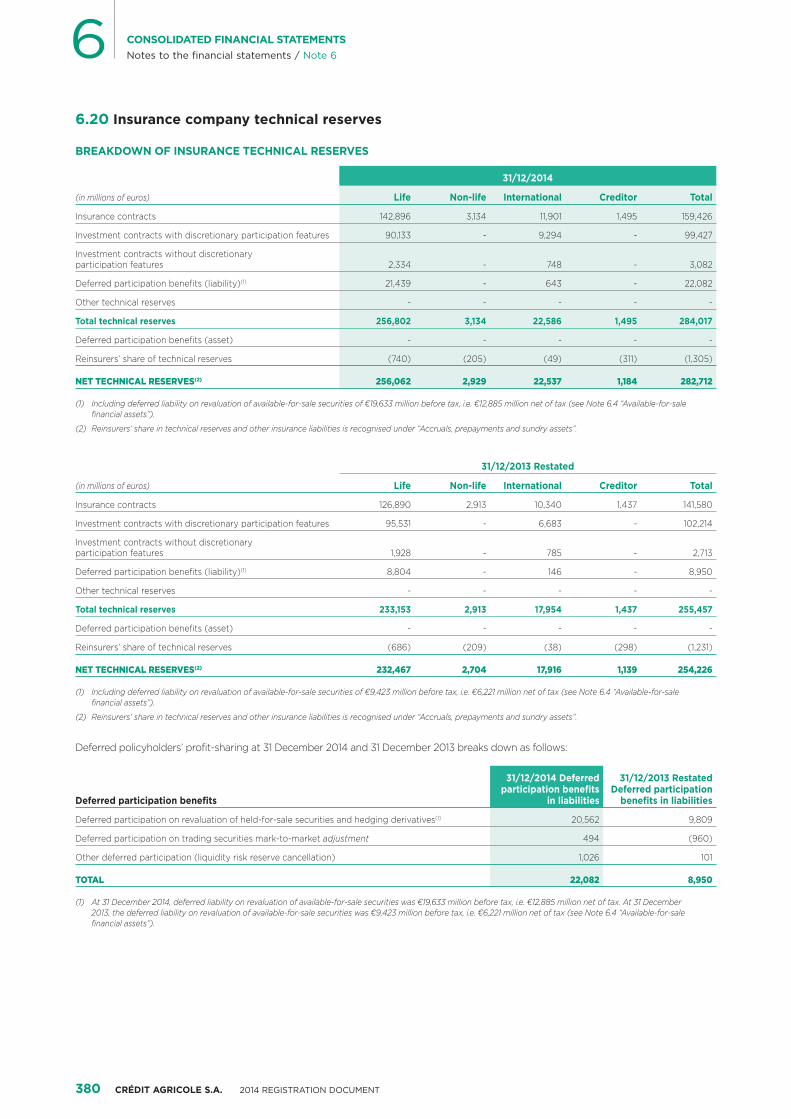
380 CRÉDIT AGRICOLE S.A. 2014 REGISTRATION DOCUMENT
6 CONSOLIDATED FINANCIAL STATEMENTSNotes to the financial statements / Note 6
6.20 Insurance company technical reserves
BREAKDOWN OF INSURANCE TECHNICAL RESERVES
(in millions of euros)
31/12/2014
Life Non-life International Creditor Total
Insurance contracts 142,896 3,134 11,901 1,495 159,426
Investment contracts with discretionary participation features 90,133 - 9,294 - 99,427
Investment contracts without discretionary participation features 2,334 - 748 - 3,082
Deferred participation benefits (liability)(1) 21,439 - 643 - 22,082
Other technical reserves - - - - -
Total technical reserves 256,802 3,134 22,586 1,495 284,017
Deferred participation benefits (asset) - - - - -
Reinsurers’ share of technical reserves (740) (205) (49) (311) (1,305)
NET TECHNICAL RESERVES(2) 256,062 2,929 22,537 1,184 282,712
(1) Including deferred liability on revaluation of available-for-sale securities of €19,633 million before tax, i.e. €12,885 million net of tax (see Note 6.4 “Available-for-sale financial assets”).
(2) Reinsurers’ share in technical reserves and other insurance liabilities is recognised under “Accruals, prepayments and sundry assets”.
(in millions of euros)
31/12/2013 Restated
Life Non-life International Creditor Total
Insurance contracts 126,890 2,913 10,340 1,437 141,580
Investment contracts with discretionary participation features 95,531 - 6,683 - 102,214
Investment contracts without discretionary participation features 1,928 - 785 - 2,713
Deferred participation benefits (liability)(1) 8,804 - 146 - 8,950
Other technical reserves - - - - -
Total technical reserves 233,153 2,913 17,954 1,437 255,457
Deferred participation benefits (asset) - - - - -
Reinsurers’ share of technical reserves (686) (209) (38) (298) (1,231)
NET TECHNICAL RESERVES(2) 232,467 2,704 17,916 1,139 254,226
(1) Including deferred liability on revaluation of available-for-sale securities of €9,423 million before tax, i.e. €6,221 million net of tax (see Note 6.4 “Available-for-sale financial assets”).
(2) Reinsurers’ share in technical reserves and other insurance liabilities is recognised under “Accruals, prepayments and sundry assets”.
Deferred policyholders’ profit-sharing at 31 December 2014 and 31 December 2013 breaks down as follows:
Deferred participation benefits
31/12/2014 Deferred participation benefits
in liabilities
31/12/2013 Restated Deferred participation
benefits in liabilities
Deferred participation on revaluation of held-for-sale securities and hedging derivatives(1) 20,562 9,809
Deferred participation on trading securities mark-to-market adjustment 494 (960)
Other deferred participation (liquidity risk reserve cancellation) 1,026 101
TOTAL 22,082 8,950
(1) At 31 December 2014, deferred liability on revaluation of available-for-sale securities was €19,633 million before tax, i.e. €12,885 million net of tax. At 31 December 2013, the deferred liability on revaluation of available-for-sale securities was €9,423 million before tax, i.e. €6,221 million net of tax (see Note 6.4 “Available-for-sale financial assets”).
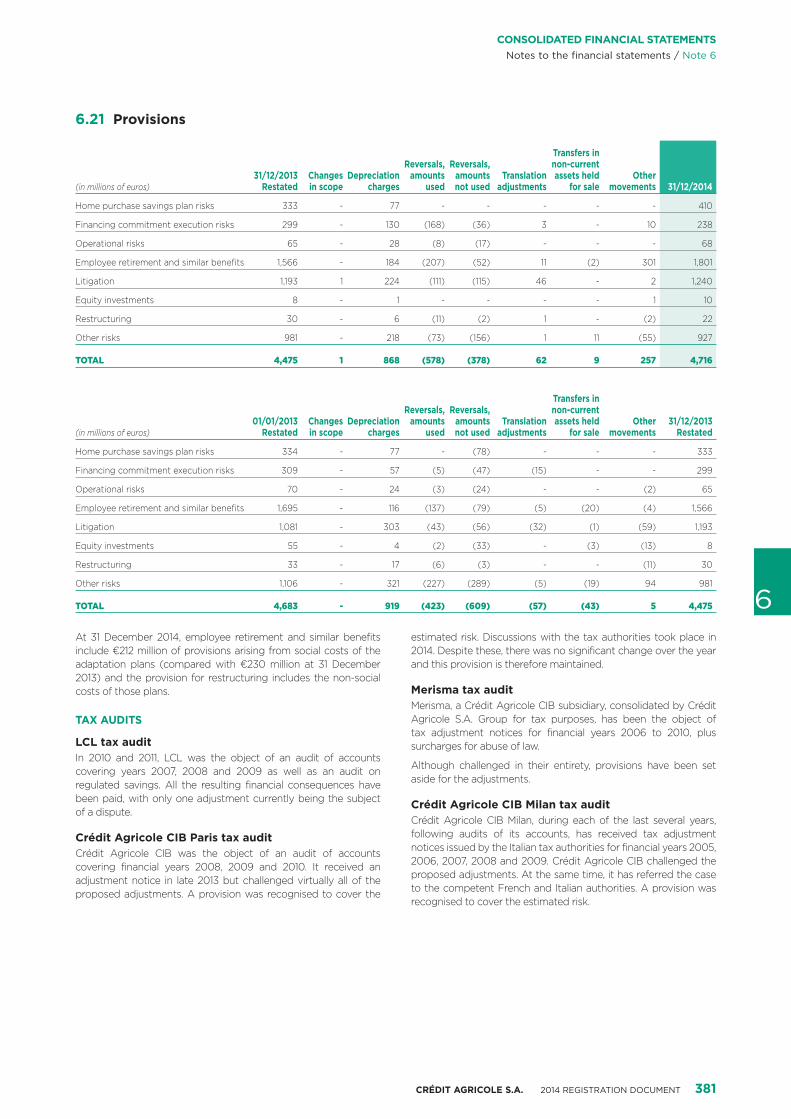
CRÉDIT AGRICOLE S.A. 2014 REGISTRATION DOCUMENT 381
6
CONSOLIDATED FINANCIAL STATEMENTSNotes to the financial statements / Note 6
6.21 Provisions
(in millions of euros)31/12/2013
RestatedChanges in scope
Depreciation charges
Reversals, amounts
used
Reversals, amounts not used
Translation adjustments
Transfers in non-current assets held
for saleOther
movements 31/12/2014
Home purchase savings plan risks 333 - 77 - - - - - 410
Financing commitment execution risks 299 - 130 (168) (36) 3 - 10 238
Operational risks 65 - 28 (8) (17) - - - 68
Employee retirement and similar benefits 1,566 - 184 (207) (52) 11 (2) 301 1,801
Litigation 1,193 1 224 (111) (115) 46 - 2 1,240
Equity investments 8 - 1 - - - - 1 10
Restructuring 30 - 6 (11) (2) 1 - (2) 22
Other risks 981 - 218 (73) (156) 1 11 (55) 927
TOTAL 4,475 1 868 (578) (378) 62 9 257 4,716
(in millions of euros)01/01/2013
RestatedChanges in scope
Depreciation charges
Reversals, amounts
used
Reversals, amounts not used
Translation adjustments
Transfers in non-current assets held
for saleOther
movements31/12/2013
Restated
Home purchase savings plan risks 334 - 77 - (78) - - - 333
Financing commitment execution risks 309 - 57 (5) (47) (15) - - 299
Operational risks 70 - 24 (3) (24) - - (2) 65
Employee retirement and similar benefits 1,695 - 116 (137) (79) (5) (20) (4) 1,566
Litigation 1,081 - 303 (43) (56) (32) (1) (59) 1,193
Equity investments 55 - 4 (2) (33) - (3) (13) 8
Restructuring 33 - 17 (6) (3) - - (11) 30
Other risks 1,106 - 321 (227) (289) (5) (19) 94 981
TOTAL 4,683 - 919 (423) (609) (57) (43) 5 4,475
At 31 December 2014, employee retirement and similar benefits include €212 million of provisions arising from social costs of the adaptation plans (compared with €230 million at 31 December 2013) and the provision for restructuring includes the non-social costs of those plans.
TAX AUDITS
LCL tax auditIn 2010 and 2011, LCL was the object of an audit of accounts covering years 2007, 2008 and 2009 as well as an audit on regulated savings. All the resulting financial consequences have been paid, with only one adjustment currently being the subject of a dispute.
Crédit Agricole CIB Paris tax auditCrédit Agricole CIB was the object of an audit of accounts covering financial years 2008, 2009 and 2010. It received an adjustment notice in late 2013 but challenged virtually all of the proposed adjustments. A provision was recognised to cover the
estimated risk. Discussions with the tax authorities took place in 2014. Despite these, there was no significant change over the year and this provision is therefore maintained.
Merisma tax auditMerisma, a Crédit Agricole CIB subsidiary, consolidated by Crédit Agricole S.A. Group for tax purposes, has been the object of tax adjustment notices for financial years 2006 to 2010, plus surcharges for abuse of law.
Although challenged in their entirety, provisions have been set aside for the adjustments.
Crédit Agricole CIB Milan tax auditCrédit Agricole CIB Milan, during each of the last several years, following audits of its accounts, has received tax adjustment notices issued by the Italian tax authorities for financial years 2005, 2006, 2007, 2008 and 2009. Crédit Agricole CIB challenged the proposed adjustments. At the same time, it has referred the case to the competent French and Italian authorities. A provision was recognised to cover the estimated risk.
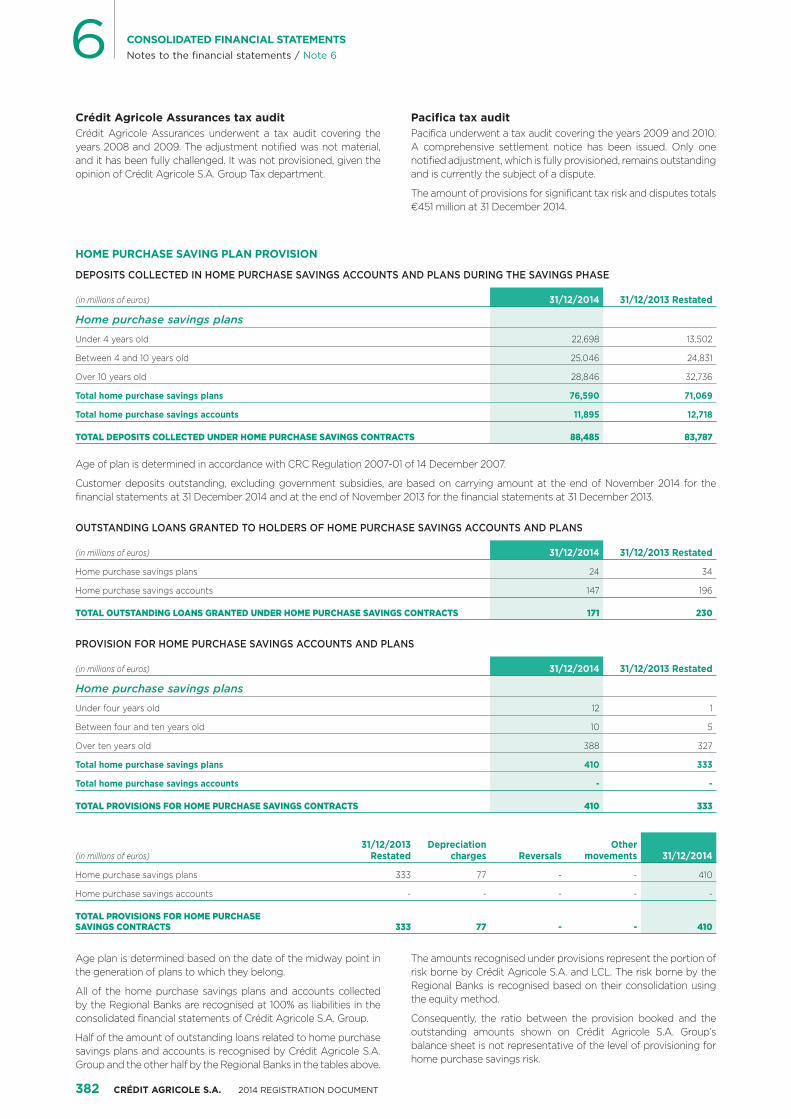
382 CRÉDIT AGRICOLE S.A. 2014 REGISTRATION DOCUMENT
6 CONSOLIDATED FINANCIAL STATEMENTSNotes to the financial statements / Note 6
Crédit Agricole Assurances tax auditCrédit Agricole Assurances underwent a tax audit covering the years 2008 and 2009. The adjustment notified was not material, and it has been fully challenged. It was not provisioned, given the opinion of Crédit Agricole S.A. Group Tax department.
Pacifica tax auditPacifica underwent a tax audit covering the years 2009 and 2010. A comprehensive settlement notice has been issued. Only one notified adjustment, which is fully provisioned, remains outstanding and is currently the subject of a dispute.
The amount of provisions for significant tax risk and disputes totals €451 million at 31 December 2014.
HOME PURCHASE SAVING PLAN PROVISION
DEPOSITS COLLECTED IN HOME PURCHASE SAVINGS ACCOUNTS AND PLANS DURING THE SAVINGS PHASE
(in millions of euros) 31/12/2014 31/12/2013 Restated
Home purchase savings plans
Under 4 years old 22,698 13,502
Between 4 and 10 years old 25,046 24,831
Over 10 years old 28,846 32,736
Total home purchase savings plans 76,590 71,069
Total home purchase savings accounts 11,895 12,718
TOTAL DEPOSITS COLLECTED UNDER HOME PURCHASE SAVINGS CONTRACTS 88,485 83,787
Age of plan is determined in accordance with CRC Regulation 2007-01 of 14 December 2007.
Customer deposits outstanding, excluding government subsidies, are based on carrying amount at the end of November 2014 for the financial statements at 31 December 2014 and at the end of November 2013 for the financial statements at 31 December 2013.
OUTSTANDING LOANS GRANTED TO HOLDERS OF HOME PURCHASE SAVINGS ACCOUNTS AND PLANS
(in millions of euros) 31/12/2014 31/12/2013 Restated
Home purchase savings plans 24 34
Home purchase savings accounts 147 196
TOTAL OUTSTANDING LOANS GRANTED UNDER HOME PURCHASE SAVINGS CONTRACTS 171 230
PROVISION FOR HOME PURCHASE SAVINGS ACCOUNTS AND PLANS
(in millions of euros) 31/12/2014 31/12/2013 Restated
Home purchase savings plans
Under four years old 12 1
Between four and ten years old 10 5
Over ten years old 388 327
Total home purchase savings plans 410 333
Total home purchase savings accounts - -
TOTAL PROVISIONS FOR HOME PURCHASE SAVINGS CONTRACTS 410 333
(in millions of euros)31/12/2013
RestatedDepreciation
charges ReversalsOther
movements 31/12/2014
Home purchase savings plans 333 77 - - 410
Home purchase savings accounts - - - - -
TOTAL PROVISIONS FOR HOME PURCHASE SAVINGS CONTRACTS 333 77 - - 410
Age plan is determined based on the date of the midway point in the generation of plans to which they belong.
All of the home purchase savings plans and accounts collected by the Regional Banks are recognised at 100% as liabilities in the consolidated financial statements of Crédit Agricole S.A. Group.
Half of the amount of outstanding loans related to home purchase savings plans and accounts is recognised by Crédit Agricole S.A. Group and the other half by the Regional Banks in the tables above.
The amounts recognised under provisions represent the portion of risk borne by Crédit Agricole S.A. and LCL. The risk borne by the Regional Banks is recognised based on their consolidation using the equity method.
Consequently, the ratio between the provision booked and the outstanding amounts shown on Crédit Agricole S.A. Group’s balance sheet is not representative of the level of provisioning for home purchase savings risk.

CRÉDIT AGRICOLE S.A. 2014 REGISTRATION DOCUMENT 383
6
CONSOLIDATED FINANCIAL STATEMENTSNotes to the financial statements / Note 6
6.22 Equity – Preferred shares
Issuer Issue dateIssue amount
(in millions of dollars)Issue amount
(in millions of euros)31/12/2014
(in millions of euros)31/12/2013 Restated
(in millions of euros)
CA Preferred Funding LLC January 2003 1,500 - 1,235 1,088
CA Preferred Funding LLC July 2003 550 - - 399
CA Preferred Funding LLC December 2003 - 550 550 550
TOTAL 2,050 550 1,785 2,037
6.23 Equity Group share
OWNERSHIP STRUCTURE AT 31 DECEMBER 2014At 31 December 2014, to the knowledge of Crédit Agricole S.A., the distribution of capital and voting rights is as follows:
ShareholdersNumber of shares
at 31/12/2014% of
the share capital% of
voting rights
S.A.S. Rue La Boétie 1,454,590,012 56.46% 56.57%
Treasury shares 4,855,393 0.19% -
Employees (ESOP) 104,035,134 4.04% 4.05%
Public 1,012,885,235 39.31% 39.38%
Institutional investors 761,401,441 29.55% 29.60%
Individual shareholders 251,483,794 9.76% 9.78%
TOTAL 2,576,365,774 100.00% 100.00%
SAS Rue La Boétie is wholly owned by the Regional Banks. Given the Group’s equity structure and the resulting break in the chain of control, the Regional Banks’ interests in SAS Rue La Boétie are recognised in the consolidated financial statements of Crédit Agricole S.A. at its share in the Regional Banks.
The treasury shares are held as part of Crédit Agricole S.A.’s share buyback programme designed to cover stock options and as part of a share liquidity agreement.
Concerning Crédit Agricole S.A. stock, a liquidity agreement was signed on 25 October 2006 with Crédit Agricole Cheuvreux S.A., acquired by Kepler, renamed Kepler Cheuvreux (see Note 2.1 “Major transactions and material events occurring in 2013”). This
agreement is automatically renewed every year. So that the operator can conduct the operations stipulated in the agreement with complete independence the agreement has been allocated an amount of €50 million.
The par value of the shares is 3 euros. All the shares are fully paid up.
To the Company’s knowledge, no other shareholder owns 5% or more of the share capital or voting rights, either directly or indirectly or with others.
On 31 December 2014, Crédit Agricole S.A.’s share capital amounted to €7,729,097,322 shares divided into 2,576,365,774 ordinary shares each with a par value of 3 euros.
UNDATED DEEPLY SUBORDINATED NOTES The main issues of undated deeply subordinated notes qualifying as equity are as follows:
Issue date Currency
Amount in currency at 31 December 2013
(in million of units)
Partial repurchases and redemptions(in million of units)
Amount in currency at 31 December 2014
(in million of units)
Amount in euros at inception rate (in million of euros)
Interests paid at 31 December 2014
(in million of euros)
23/01/2014 USD - - 1,750 1,283 (97)
08/04/2014 GBP - - 500 607 (34)
08/04/2014 EUR - - 1,000 1,000 (46)
18/09/2014 USD - - 1,250 971 (20)
Movements in undated deeply subordinated notes were as follows:
(in million of euros) 31/12/2014
Interests paid accounted as dividend (197)
Changes in nominal amounts in 2014 3,861
Income tax savings related to interest to be paid to security holders recognised in OCI(1) 74
Issuance costs (net of tax) (24)
Others -
(1) Tax recognised in Net income.
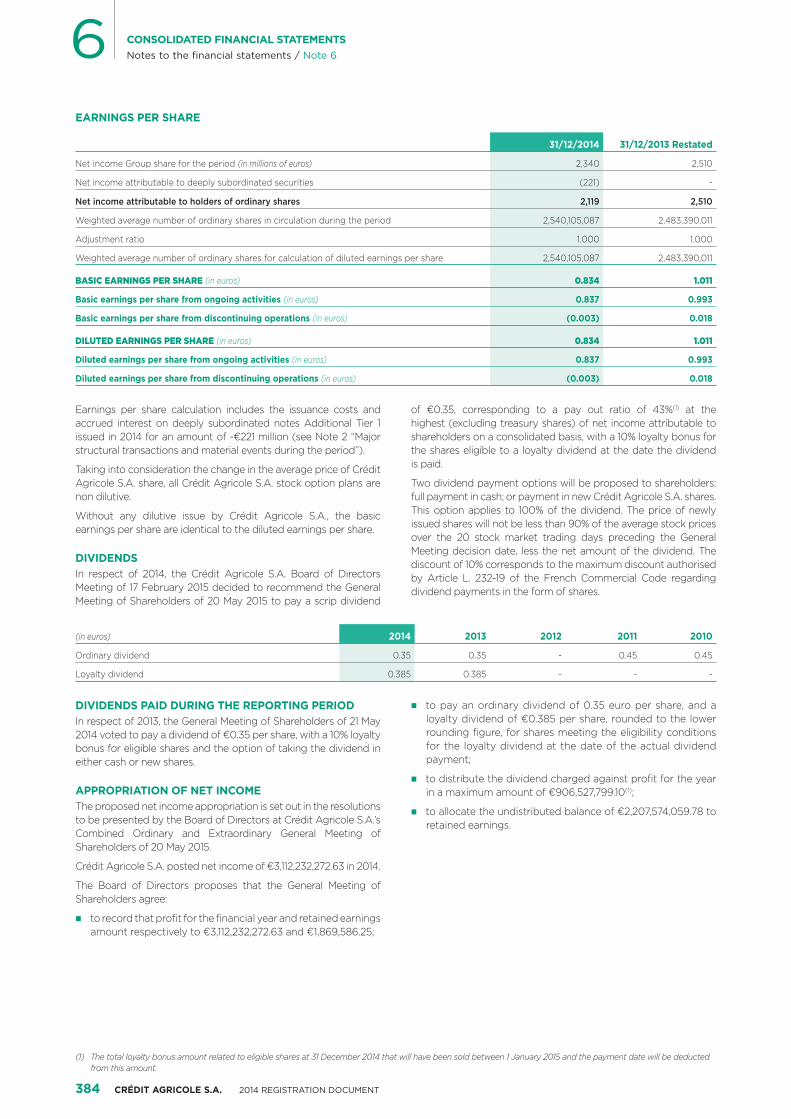
384 CRÉDIT AGRICOLE S.A. 2014 REGISTRATION DOCUMENT
6 CONSOLIDATED FINANCIAL STATEMENTSNotes to the financial statements / Note 6
EARNINGS PER SHARE
31/12/2014 31/12/2013 Restated
Net income Group share for the period (in millions of euros) 2,340 2,510
Net income attributable to deeply subordinated securities (221) -
Net income attributable to holders of ordinary shares 2,119 2,510
Weighted average number of ordinary shares in circulation during the period 2,540,105,087 2,483,390,011
Adjustment ratio 1.000 1.000
Weighted average number of ordinary shares for calculation of diluted earnings per share 2,540,105,087 2,483,390,011
BASIC EARNINGS PER SHARE (in euros) 0.834 1.011
Basic earnings per share from ongoing activities (in euros) 0.837 0.993
Basic earnings per share from discontinuing operations (in euros) (0.003) 0.018
DILUTED EARNINGS PER SHARE (in euros) 0.834 1.011
Diluted earnings per share from ongoing activities (in euros) 0.837 0.993
Diluted earnings per share from discontinuing operations (in euros) (0.003) 0.018
Earnings per share calculation includes the issuance costs and accrued interest on deeply subordinated notes Additional Tier 1 issued in 2014 for an amount of -€221 million (see Note 2 “Major structural transactions and material events during the period”).
Taking into consideration the change in the average price of Crédit Agricole S.A. share, all Crédit Agricole S.A. stock option plans are non dilutive.
Without any dilutive issue by Crédit Agricole S.A., the basic earnings per share are identical to the diluted earnings per share.
DIVIDENDSIn respect of 2014, the Crédit Agricole S.A. Board of Directors Meeting of 17 February 2015 decided to recommend the General Meeting of Shareholders of 20 May 2015 to pay a scrip dividend
of €0.35, corresponding to a pay out ratio of 43%(1) at the highest (excluding treasury shares) of net income attributable to shareholders on a consolidated basis, with a 10% loyalty bonus for the shares eligible to a loyalty dividend at the date the dividend is paid.
Two dividend payment options will be proposed to shareholders: full payment in cash; or payment in new Crédit Agricole S.A. shares. This option applies to 100% of the dividend. The price of newly issued shares will not be less than 90% of the average stock prices over the 20 stock market trading days preceding the General Meeting decision date, less the net amount of the dividend. The discount of 10% corresponds to the maximum discount authorised by Article L. 232-19 of the French Commercial Code regarding dividend payments in the form of shares.
(1) The total loyalty bonus amount related to eligible shares at 31 December 2014 that will have been sold between 1 January 2015 and the payment date will be deducted from this amount.
(in euros) 2014 2013 2012 2011 2010
Ordinary dividend 0.35 0.35 - 0.45 0.45
Loyalty dividend 0.385 0.385 - - -
DIVIDENDS PAID DURING THE REPORTING PERIODIn respect of 2013, the General Meeting of Shareholders of 21 May 2014 voted to pay a dividend of €0.35 per share, with a 10% loyalty bonus for eligible shares and the option of taking the dividend in either cash or new shares.
APPROPRIATION OF NET INCOMEThe proposed net income appropriation is set out in the resolutions to be presented by the Board of Directors at Crédit Agricole S.A.’s Combined Ordinary and Extraordinary General Meeting of Shareholders of 20 May 2015.
Crédit Agricole S.A. posted net income of €3,112,232,272.63 in 2014.
The Board of Directors proposes that the General Meeting of Shareholders agree:
� to record that profit for the financial year and retained earnings amount respectively to €3,112,232,272.63 and €1,869,586.25;
� to pay an ordinary dividend of 0.35 euro per share, and a loyalty dividend of €0.385 per share, rounded to the lower rounding figure, for shares meeting the eligibility conditions for the loyalty dividend at the date of the actual dividend payment;
� to distribute the dividend charged against profit for the year in a maximum amount of €906,527,799.10(1);
� to allocate the undistributed balance of €2,207,574,059.78 to retained earnings.
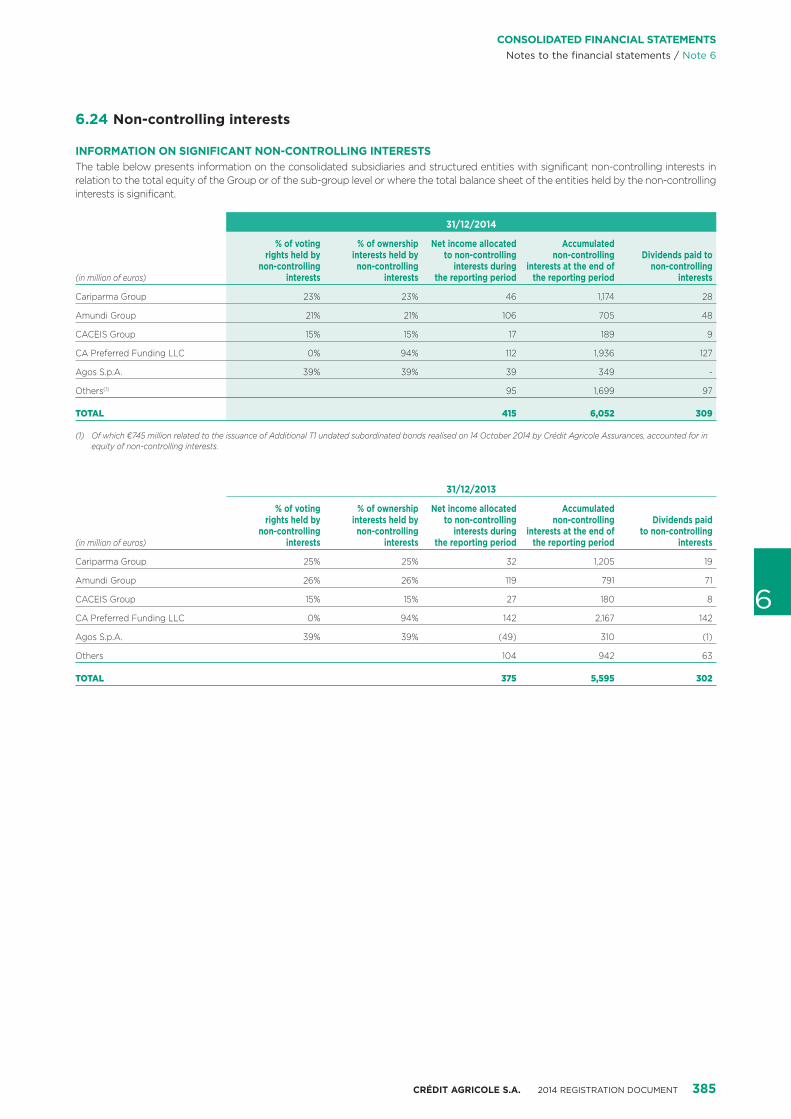
CRÉDIT AGRICOLE S.A. 2014 REGISTRATION DOCUMENT 385
6
CONSOLIDATED FINANCIAL STATEMENTSNotes to the financial statements / Note 6
6.24 Non-controlling interests
INFORMATION ON SIGNIFICANT NON-CONTROLLING INTERESTSThe table below presents information on the consolidated subsidiaries and structured entities with significant non-controlling interests in relation to the total equity of the Group or of the sub-group level or where the total balance sheet of the entities held by the non-controlling interests is significant.
(in million of euros)
31/12/2014
% of voting rights held by
non-controlling interests
% of ownership interests held by non-controlling
interests
Net income allocated to non-controlling
interests during the reporting period
Accumulated non-controlling
interests at the end of the reporting period
Dividends paid to non-controlling
interests
Cariparma Group 23% 23% 46 1,174 28
Amundi Group 21% 21% 106 705 48
CACEIS Group 15% 15% 17 189 9
CA Preferred Funding LLC 0% 94% 112 1,936 127
Agos S.p.A. 39% 39% 39 349 -
Others(1) 95 1,699 97
TOTAL 415 6,052 309
(1) Of which €745 million related to the issuance of Additional T1 undated subordinated bonds realised on 14 October 2014 by Crédit Agricole Assurances, accounted for in equity of non-controlling interests.
(in million of euros)
31/12/2013
% of voting rights held by
non-controlling interests
% of ownership interests held by non-controlling
interests
Net income allocated to non-controlling
interests during the reporting period
Accumulated non-controlling
interests at the end of the reporting period
Dividends paid to non-controlling
interests
Cariparma Group 25% 25% 32 1,205 19
Amundi Group 26% 26% 119 791 71
CACEIS Group 15% 15% 27 180 8
CA Preferred Funding LLC 0% 94% 142 2,167 142
Agos S.p.A. 39% 39% (49) 310 (1)
Others 104 942 63
TOTAL 375 5,595 302
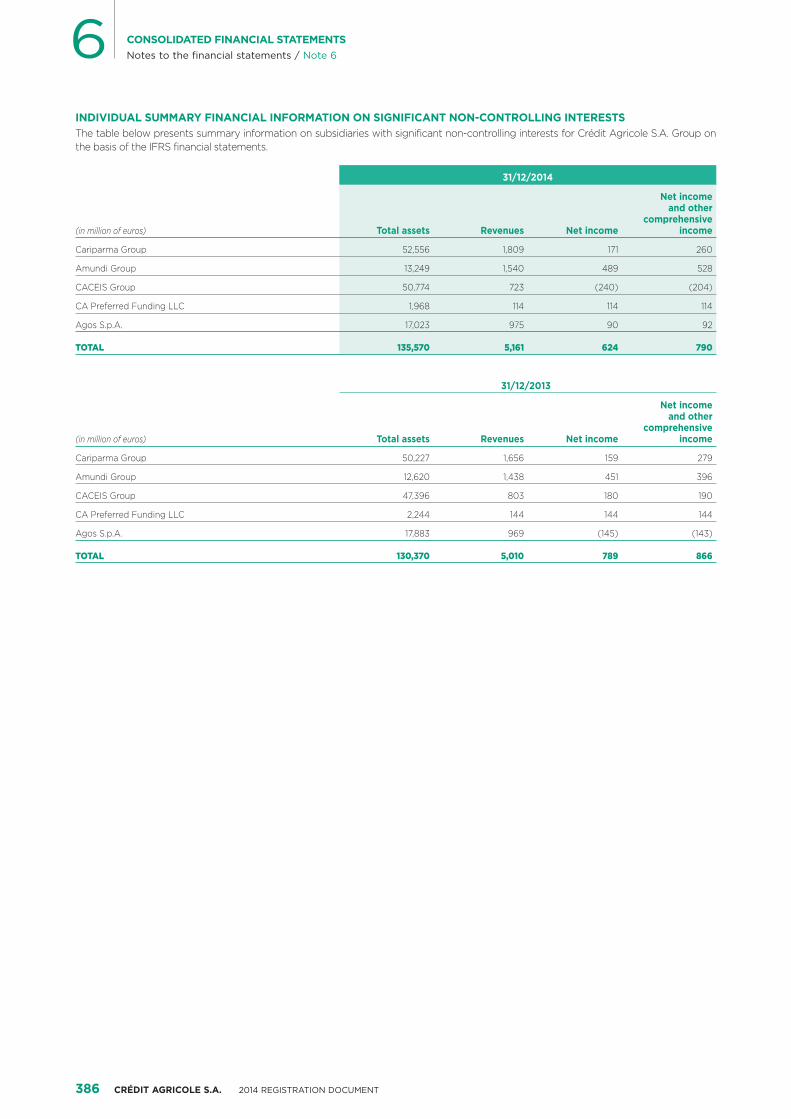
386 CRÉDIT AGRICOLE S.A. 2014 REGISTRATION DOCUMENT
6 CONSOLIDATED FINANCIAL STATEMENTSNotes to the financial statements / Note 6
INDIVIDUAL SUMMARY FINANCIAL INFORMATION ON SIGNIFICANT NON-CONTROLLING INTERESTSThe table below presents summary information on subsidiaries with significant non-controlling interests for Crédit Agricole S.A. Group on the basis of the IFRS financial statements.
(in million of euros)
31/12/2014
Total assets Revenues Net income
Net income and other
comprehensive income
Cariparma Group 52,556 1,809 171 260
Amundi Group 13,249 1,540 489 528
CACEIS Group 50,774 723 (240) (204)
CA Preferred Funding LLC 1,968 114 114 114
Agos S.p.A. 17,023 975 90 92
TOTAL 135,570 5,161 624 790
(in million of euros)
31/12/2013
Total assets Revenues Net income
Net income and other
comprehensive income
Cariparma Group 50,227 1,656 159 279
Amundi Group 12,620 1,438 451 396
CACEIS Group 47,396 803 180 190
CA Preferred Funding LLC 2,244 144 144 144
Agos S.p.A. 17,883 969 (145) (143)
TOTAL 130,370 5,010 789 866

CRÉDIT AGRICOLE S.A. 2014 REGISTRATION DOCUMENT 387
6
CONSOLIDATED FINANCIAL STATEMENTSNotes to the financial statements / Note 6
6.25 Breakdown of financial assets and liabilities by contractual maturity
The breakdown of balance sheet financial assets and liabilities is made according to contractual maturity date.
The maturities of derivative instruments held for trading and for hedging correspond to their date of contractual maturity.
Equities and other variable-income securities are by nature without maturity; they are classified “Indefinite”.
Value adjustments on interest rate risk hedged portfolios are considered to have an indefinite maturity given the absence of a defined maturity.
(in millions of euros)
31/12/2014
≤ 3 months> 3 months up
to ≤ 1 year> 1 year up
to ≤ 5 years > 5 years Indefinite Total
Cash, central banks 55,036 - - - - 55,036
Financial assets at fair value through profit or loss 103,785 27,562 74,807 135,160 64,258 405,572
Hedging derivative instruments 2,609 1,190 8,405 18,219 - 30,423
Available-for-sale financial assets 14,890 19,930 89,081 129,736 29,739 283,376
Loans and receivables due from credit institutions 99,448 79,597 126,393 62,178 593 368,209
Loans and receivables due from customers 69,461 39,645 108,387 93,654 3,232 314,379
Value adjustment on interest rate risk hedged portfolios 16,740 - - - - 16,740
Held-to-maturity financial assets - 598 4,429 10,934 - 15,961
TOTAL FINANCIAL ASSETS BY MATURITY 361,969 168,522 411,502 449,881 97,822 1,489,696
Central banks 3,011 - 1,400 - - 4,411
Financial liabilities at fair value through profit or loss 105,802 17,320 68,427 129,704 1 321,254
Hedging derivative instruments 3,546 934 8,772 14,433 - 27,685
Due to credit institutions 77,641 10,274 29,464 22,536 1,261 141,176
Due to customers 398,575 32,619 35,037 6,354 1,399 473,984
Debt securities 37,647 41,434 60,439 33,401 - 172,921
Subordinated debt 466 137 9,055 8,569 7,710 25,937
Value adjustment on interest rate risk hedged portfolios 16,338 - - - - 16,338
TOTAL FINANCIAL LIABILITIES BY MATURITY 643,026 102,718 212,594 214,997 10,371 1,183,706
(in millions of euros)
31/12/2013
≤ 3 months> 3 months up
to ≤ 1 year> 1 year up
to ≤ 5 years > 5 years Indefinite Total
Cash, central banks 68,151 - - - - 68,151
Financial assets at fair value through profit or loss 114,189 23,803 73,782 91,275 59,833 362,882
Hedging derivative instruments 2,119 1,356 10,421 14,840 - 28,736
Available-for-sale financial assets 18,545 18,628 76,822 123,872 23,299 261,166
Loans and receivables due from credit institutions 111,787 76,908 116,658 62,044 2,234 369,631
Loans and receivables due from customers 71,808 32,768 106,068 90,624 2,186 303,454
Value adjustment on interest rate risk hedged portfolios 10,627 - - - - 10,627
Held-to-maturity financial assets 141 69 4,631 9,819 - 14,660
TOTAL FINANCIAL ASSETS BY MATURITY 397,367 153,532 388,382 392,474 87,552 1,419,307
Central banks 2,852 - - - - 2,852
Financial liabilities at fair value through profit or loss 114,741 17,558 76,598 88,044 2,862 299,803
Hedging derivative instruments 1,766 1,063 10,697 17,611 - 31,137
Due to credit institutions 82,524 14,431 34,412 20,252 721 152,340
Due to customers 401,795 34,437 29,872 7,470 3,739 477,313
Debt securities 43,156 26,685 59,776 30,899 - 160,516
Subordinated debt 588 656 5,045 13,397 8,667 28,353
Value adjustment on interest rate risk hedged portfolios 7,323 - - - - 7,323
TOTAL FINANCIAL LIABILITIES BY MATURITY 654,745 94,830 216,400 177,673 15,989 1,159,637

388 CRÉDIT AGRICOLE S.A. 2014 REGISTRATION DOCUMENT
6 CONSOLIDATED FINANCIAL STATEMENTSNotes to the financial statements / Note 7
NOTE 7 Employee benefits and other compensation
7.1 Analysis of employee expenses
(in millions of euros) 31/12/2014 31/12/2013 Restated
Salaries(1) (4,261) (4,213)
Contributions to defined-contribution plans (361) (367)
Contributions to defined-benefit plans (79) (25)
Other social security expenses (1,047) (1,084)
Profit-sharing and incentive plans (229) (231)
Payroll-related tax (358) (392)
TOTAL EMPLOYEE EXPENSES (6,335) (6,312)
(1) Regarding deferred variable compensation paid to market professionals, the Crédit Agricole S.A. Group booked a charge for share-based payments of €53 million at 31 December 2014, compared to €57 million at 31 December 2013.
7.2 Headcount at year-end
Number of employees 31/12/2014 31/12/2013
France 38,053 39,276
International 34,514 36,253
TOTAL 72,567 75,529
7.3 Post-employment benefits, defined-contribution plans
Employers contribute to a variety of compulsory pension schemes. Plan assets are managed by independent organisations and the contributing companies have no legal or implied obligation to pay additional contributions if the funds do not have sufficient assets to cover all benefits corresponding to services rendered by employees during the year and during prior years. Consequently,
Crédit Agricole S.A. Group companies have no liability in this respect other than the contributions payable.
Within the Group, there are several compulsory defined-contribution plans, the main ones being Agirc/Arrco, which are French supplementary retirement plans, and some supplementary plans in place notably within UES Crédit Agricole S.A.
ANALYSIS OF SUPPLEMENTARY PENSION PLANS IN FRANCE
Business Line EntityCompulsory supplementary pension plans
Number of employees
covered. Estimate at 31/12/2014
Number of employees
covered. Estimate at 31/12/2013
Central Support Functions UES Crédit Agricole S.A. Agriculture industry plan 1.24% 2,887 3,063
Central Support Functions UES Crédit Agricole S.A. “Article 83” Group Executive managers plan 216 213
French retail banking LCL “Article 83” Group Executive managers plan 312 310
Corporate and investment banking CACIB “Article 83” type plan 4,836 4,928
Corporate and investment banking IPB/IG/CAPB(1) “Article 83” type plan 527 433
Insurance Predica/CAA/Caagis/Pacifica/Sirca Agriculture industry plan 1.24% 3,149 3,004
Insurance Predica/CAA/Caagis/Pacifica/CACI “Article 83” Group Executive managers plan 73 76
Insurance CACI “Article 83” type plan 190 212
(1) Indosuez Private Banking/Indosuez Gestion/CA Private Banking.
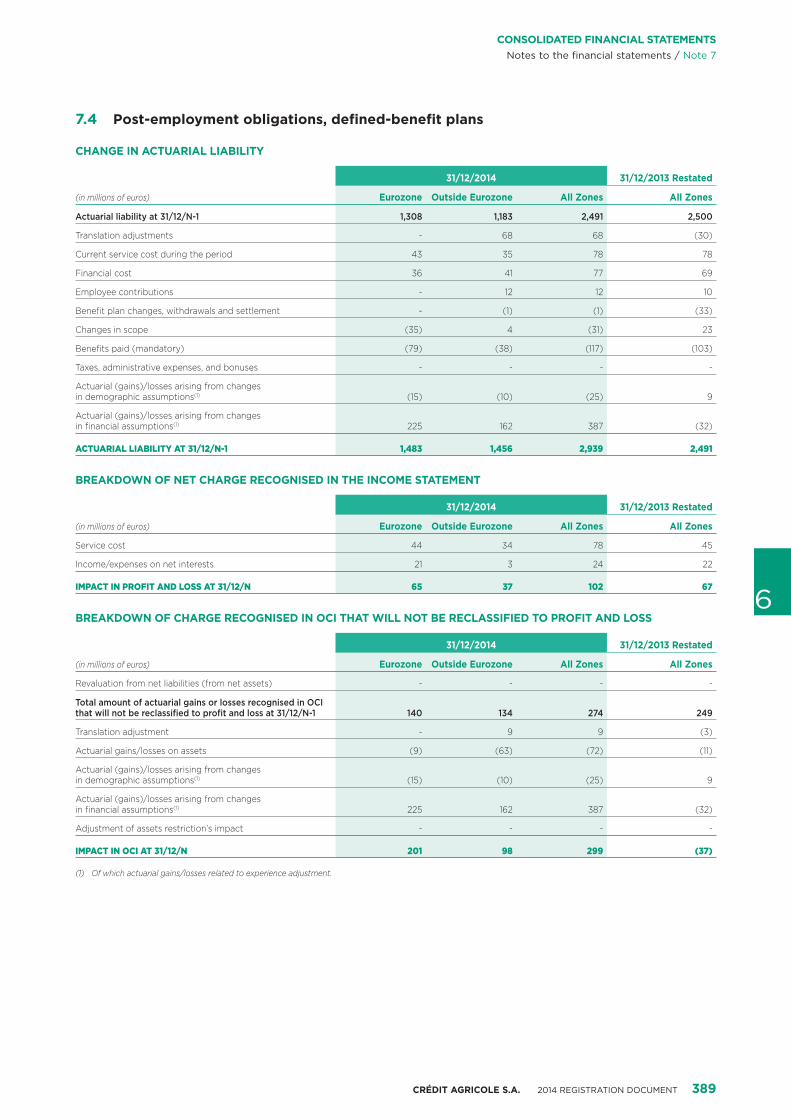
CRÉDIT AGRICOLE S.A. 2014 REGISTRATION DOCUMENT 389
6
CONSOLIDATED FINANCIAL STATEMENTSNotes to the financial statements / Note 7
7.4 Post-employment obligations, defined-benefit plans
CHANGE IN ACTUARIAL LIABILITY
(in millions of euros)
31/12/2014 31/12/2013 Restated
Eurozone Outside Eurozone All Zones All Zones
Actuarial liability at 31/12/N-1 1,308 1,183 2,491 2,500
Translation adjustments - 68 68 (30)
Current service cost during the period 43 35 78 78
Financial cost 36 41 77 69
Employee contributions - 12 12 10
Benefit plan changes, withdrawals and settlement - (1) (1) (33)
Changes in scope (35) 4 (31) 23
Benefits paid (mandatory) (79) (38) (117) (103)
Taxes, administrative expenses, and bonuses - - - -
Actuarial (gains)/losses arising from changes in demographic assumptions(1) (15) (10) (25) 9
Actuarial (gains)/losses arising from changes in financial assumptions(1) 225 162 387 (32)
ACTUARIAL LIABILITY AT 31/12/N-1 1,483 1,456 2,939 2,491
BREAKDOWN OF NET CHARGE RECOGNISED IN THE INCOME STATEMENT
(in millions of euros)
31/12/2014 31/12/2013 Restated
Eurozone Outside Eurozone All Zones All Zones
Service cost 44 34 78 45
Income/expenses on net interests 21 3 24 22
IMPACT IN PROFIT AND LOSS AT 31/12/N 65 37 102 67
BREAKDOWN OF CHARGE RECOGNISED IN OCI THAT WILL NOT BE RECLASSIFIED TO PROFIT AND LOSS
(in millions of euros)
31/12/2014 31/12/2013 Restated
Eurozone Outside Eurozone All Zones All Zones
Revaluation from net liabilities (from net assets) - - - -
Total amount of actuarial gains or losses recognised in OCI that will not be reclassified to profit and loss at 31/12/N-1 140 134 274 249
Translation adjustment - 9 9 (3)
Actuarial gains/losses on assets (9) (63) (72) (11)
Actuarial (gains)/losses arising from changes in demographic assumptions(1) (15) (10) (25) 9
Actuarial (gains)/losses arising from changes in financial assumptions(1) 225 162 387 (32)
Adjustment of assets restriction’s impact - - - -
IMPACT IN OCI AT 31/12/N 201 98 299 (37)
(1) Of which actuarial gains/losses related to experience adjustment.
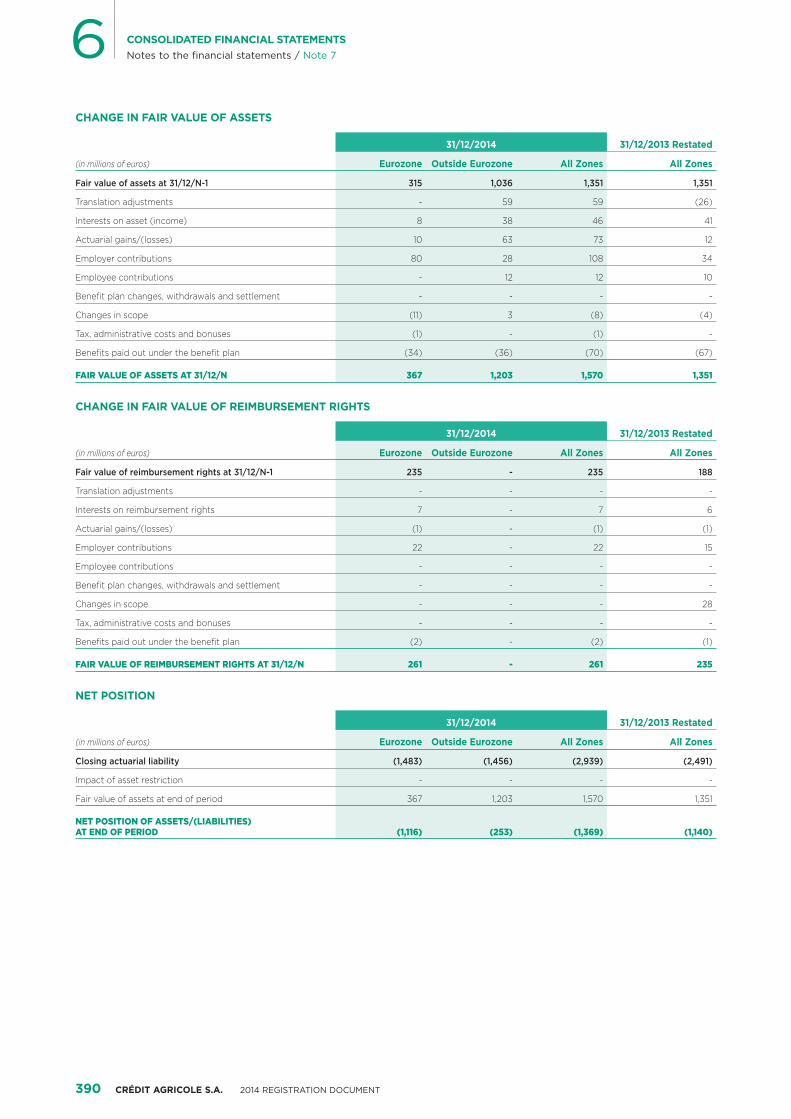
390 CRÉDIT AGRICOLE S.A. 2014 REGISTRATION DOCUMENT
6 CONSOLIDATED FINANCIAL STATEMENTSNotes to the financial statements / Note 7
CHANGE IN FAIR VALUE OF ASSETS
(in millions of euros)
31/12/2014 31/12/2013 Restated
Eurozone Outside Eurozone All Zones All Zones
Fair value of assets at 31/12/N-1 315 1,036 1,351 1,351
Translation adjustments - 59 59 (26)
Interests on asset (income) 8 38 46 41
Actuarial gains/(losses) 10 63 73 12
Employer contributions 80 28 108 34
Employee contributions - 12 12 10
Benefit plan changes, withdrawals and settlement - - - -
Changes in scope (11) 3 (8) (4)
Tax, administrative costs and bonuses (1) - (1) -
Benefits paid out under the benefit plan (34) (36) (70) (67)
FAIR VALUE OF ASSETS AT 31/12/N 367 1,203 1,570 1,351
CHANGE IN FAIR VALUE OF REIMBURSEMENT RIGHTS
(in millions of euros)
31/12/2014 31/12/2013 Restated
Eurozone Outside Eurozone All Zones All Zones
Fair value of reimbursement rights at 31/12/N-1 235 - 235 188
Translation adjustments - - - -
Interests on reimbursement rights 7 - 7 6
Actuarial gains/(losses) (1) - (1) (1)
Employer contributions 22 - 22 15
Employee contributions - - - -
Benefit plan changes, withdrawals and settlement - - - -
Changes in scope - - - 28
Tax, administrative costs and bonuses - - - -
Benefits paid out under the benefit plan (2) - (2) (1)
FAIR VALUE OF REIMBURSEMENT RIGHTS AT 31/12/N 261 - 261 235
NET POSITION
(in millions of euros)
31/12/2014 31/12/2013 Restated
Eurozone Outside Eurozone All Zones All Zones
Closing actuarial liability (1,483) (1,456) (2,939) (2,491)
Impact of asset restriction - - - -
Fair value of assets at end of period 367 1,203 1,570 1,351
NET POSITION OF ASSETS/(LIABILITIES) AT END OF PERIOD (1,116) (253) (1,369) (1,140)
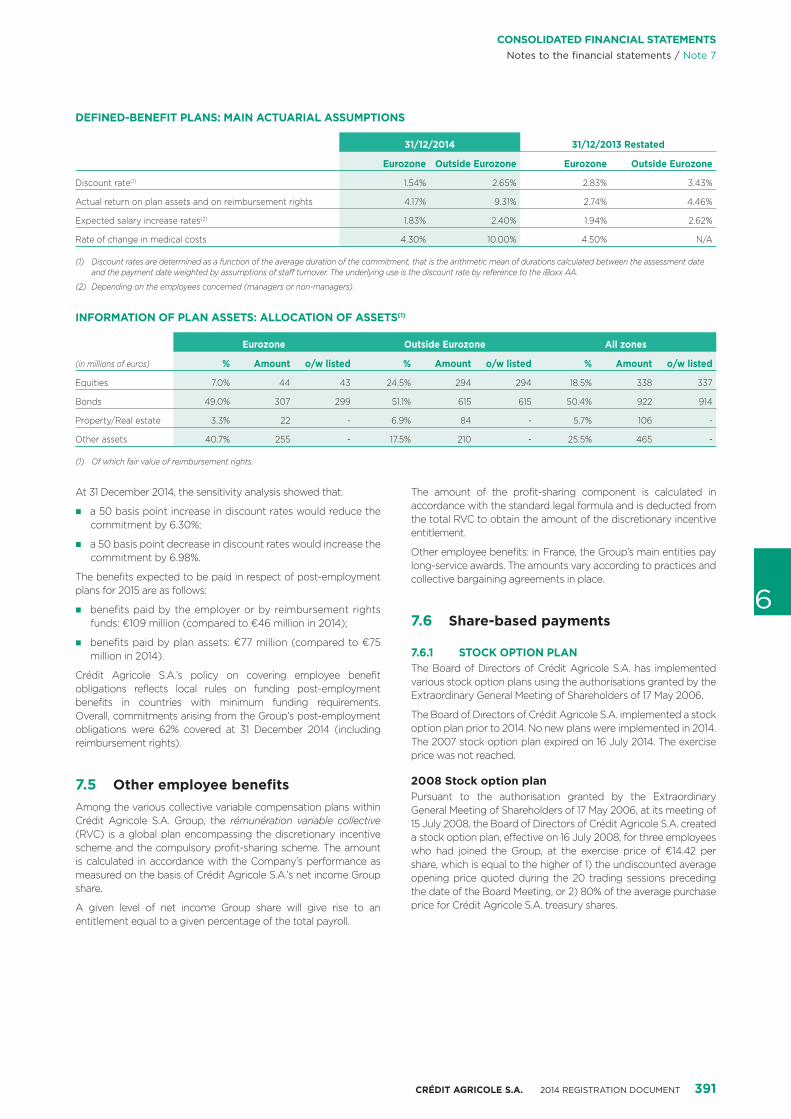
CRÉDIT AGRICOLE S.A. 2014 REGISTRATION DOCUMENT 391
6
CONSOLIDATED FINANCIAL STATEMENTSNotes to the financial statements / Note 7
DEFINED-BENEFIT PLANS: MAIN ACTUARIAL ASSUMPTIONS
31/12/2014 31/12/2013 Restated
Eurozone Outside Eurozone Eurozone Outside Eurozone
Discount rate(1) 1.54% 2.65% 2.83% 3.43%
Actual return on plan assets and on reimbursement rights 4.17% 9.31% 2.74% 4.46%
Expected salary increase rates(2) 1.83% 2.40% 1.94% 2.62%
Rate of change in medical costs 4.30% 10.00% 4.50% N/A
(1) Discount rates are determined as a function of the average duration of the commitment, that is the arithmetic mean of durations calculated between the assessment date and the payment date weighted by assumptions of staff turnover. The underlying use is the discount rate by reference to the iBoxx AA.
(2) Depending on the employees concerned (managers or non-managers).
INFORMATION OF PLAN ASSETS: ALLOCATION OF ASSETS(1)
(in millions of euros)
Eurozone Outside Eurozone All zones
% Amount o/w listed % Amount o/w listed % Amount o/w listed
Equities 7.0% 44 43 24.5% 294 294 18.5% 338 337
Bonds 49.0% 307 299 51.1% 615 615 50.4% 922 914
Property/Real estate 3.3% 22 - 6.9% 84 - 5.7% 106 -
Other assets 40.7% 255 - 17.5% 210 - 25.5% 465 -
(1) Of which fair value of reimbursement rights.
At 31 December 2014, the sensitivity analysis showed that:
� a 50 basis point increase in discount rates would reduce the commitment by 6.30%;
� a 50 basis point decrease in discount rates would increase the commitment by 6.98%.
The benefits expected to be paid in respect of post-employment plans for 2015 are as follows:
� benefits paid by the employer or by reimbursement rights funds: €109 million (compared to €46 million in 2014);
� benefits paid by plan assets: €77 million (compared to €75 million in 2014).
Crédit Agricole S.A.’s policy on covering employee benefit obligations reflects local rules on funding post-employment benefits in countries with minimum funding requirements. Overall, commitments arising from the Group’s post-employment obligations were 62% covered at 31 December 2014 (including reimbursement rights).
7.5 Other employee benefitsAmong the various collective variable compensation plans within Crédit Agricole S.A. Group, the rémunération variable collective (RVC) is a global plan encompassing the discretionary incentive scheme and the compulsory profit-sharing scheme. The amount is calculated in accordance with the Company’s performance as measured on the basis of Crédit Agricole S.A.’s net income Group share.
A given level of net income Group share will give rise to an entitlement equal to a given percentage of the total payroll.
The amount of the profit-sharing component is calculated in accordance with the standard legal formula and is deducted from the total RVC to obtain the amount of the discretionary incentive entitlement.
Other employee benefits: in France, the Group’s main entities pay long-service awards. The amounts vary according to practices and collective bargaining agreements in place.
7.6 Share-based payments
7.6.1 STOCK OPTION PLANThe Board of Directors of Crédit Agricole S.A. has implemented various stock option plans using the authorisations granted by the Extraordinary General Meeting of Shareholders of 17 May 2006.
The Board of Directors of Crédit Agricole S.A. implemented a stock option plan prior to 2014. No new plans were implemented in 2014. The 2007 stock option plan expired on 16 July 2014. The exercise price was not reached.
2008 Stock option planPursuant to the authorisation granted by the Extraordinary General Meeting of Shareholders of 17 May 2006, at its meeting of 15 July 2008, the Board of Directors of Crédit Agricole S.A. created a stock option plan, effective on 16 July 2008, for three employees who had joined the Group, at the exercise price of €14.42 per share, which is equal to the higher of 1) the undiscounted average opening price quoted during the 20 trading sessions preceding the date of the Board Meeting, or 2) 80% of the average purchase price for Crédit Agricole S.A. treasury shares.
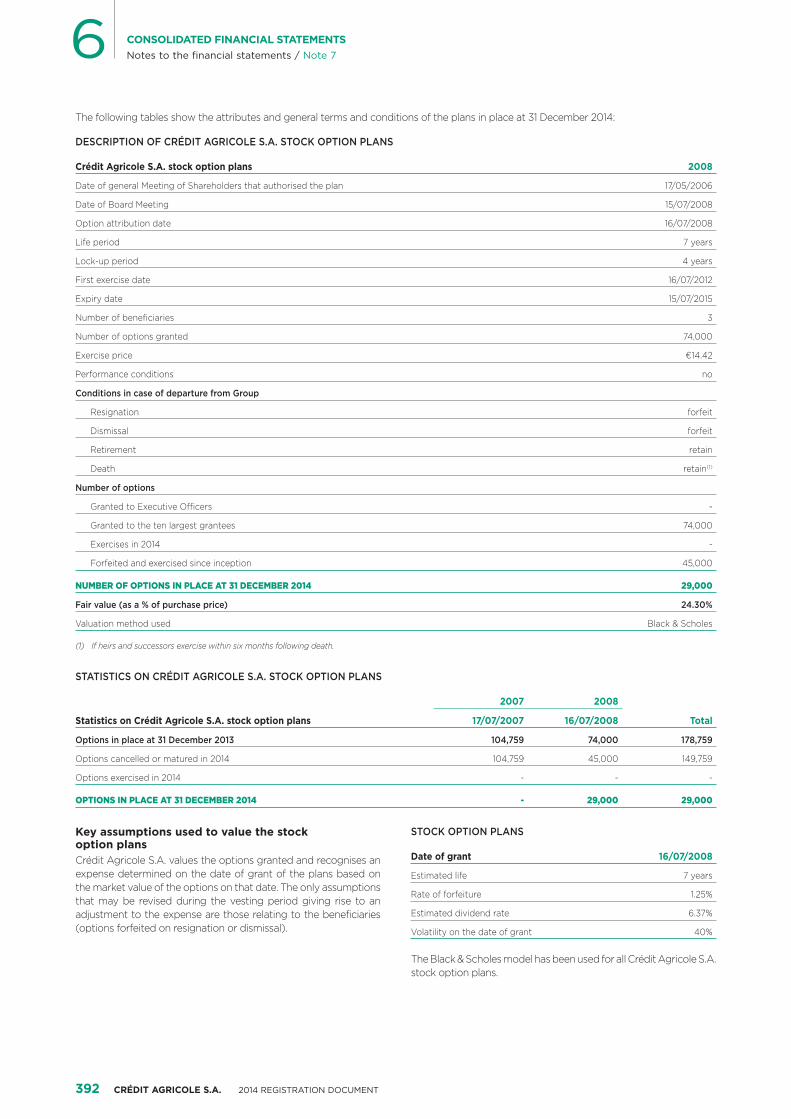
392 CRÉDIT AGRICOLE S.A. 2014 REGISTRATION DOCUMENT
6 CONSOLIDATED FINANCIAL STATEMENTSNotes to the financial statements / Note 7
The following tables show the attributes and general terms and conditions of the plans in place at 31 December 2014:
DESCRIPTION OF CRÉDIT AGRICOLE S.A. STOCK OPTION PLANS
Crédit Agricole S.A. stock option plans 2008
Date of general Meeting of Shareholders that authorised the plan 17/05/2006
Date of Board Meeting 15/07/2008
Option attribution date 16/07/2008
Life period 7 years
Lock-up period 4 years
First exercise date 16/07/2012
Expiry date 15/07/2015
Number of beneficiaries 3
Number of options granted 74,000
Exercise price €14.42
Performance conditions no
Conditions in case of departure from Group
Resignation forfeit
Dismissal forfeit
Retirement retain
Death retain(1)
Number of options
Granted to Executive Officers -
Granted to the ten largest grantees 74,000
Exercises in 2014 -
Forfeited and exercised since inception 45,000
NUMBER OF OPTIONS IN PLACE AT 31 DECEMBER 2014 29,000
Fair value (as a % of purchase price) 24.30%
Valuation method used Black & Scholes
(1) If heirs and successors exercise within six months following death.
STATISTICS ON CRÉDIT AGRICOLE S.A. STOCK OPTION PLANS
Statistics on Crédit Agricole S.A. stock option plans
2007 2008
Total17/07/2007 16/07/2008
Options in place at 31 December 2013 104,759 74,000 178,759
Options cancelled or matured in 2014 104,759 45,000 149,759
Options exercised in 2014 - - -
OPTIONS IN PLACE AT 31 DECEMBER 2014 - 29,000 29,000
Key assumptions used to value the stock option plansCrédit Agricole S.A. values the options granted and recognises an expense determined on the date of grant of the plans based on the market value of the options on that date. The only assumptions that may be revised during the vesting period giving rise to an adjustment to the expense are those relating to the beneficiaries (options forfeited on resignation or dismissal).
STOCK OPTION PLANS
Date of grant 16/07/2008
Estimated life 7 years
Rate of forfeiture 1.25%
Estimated dividend rate 6.37%
Volatility on the date of grant 40%
The Black & Scholes model has been used for all Crédit Agricole S.A. stock option plans.
CRÉDIT AGRICOLE S.A. 2014 REGISTRATION DOCUMENT 393
6
CONSOLIDATED FINANCIAL STATEMENTSNotes to the financial statements / Note 7
7.6.2. EMPLOYEE BONUS SHARE PLANPursuant to the authorisations granted by the Extraordinary General Meeting of Shareholders of 18 May 2011, at its meeting of 9 November 2011, the Board of Directors decided to implement a bonus share plan to allow all employees of Crédit Agricole S.A. Group to participate in the Company’s capital and success.
This plan provides for individual grants of 60 shares each to more than 82,000 Crédit Agricole S.A. employees in 58 countries. No condition of performance is required. The plan includes, however, two-restrictions: attendance during the vesting period and the prohibition to transfer or sell the shares during the lock-up period.
In France, the shares were delivered at the end of 2013 and are subject to a two-year lock-in period. In the rest of the world, the delivery calendar was adapted to local circumstances, including local tax rules. In countries where shares were not delivered in 2013 they will be delivered at the end of 2015. There will be no lock-in period on these shares.
No new plans were implemented in 2014.
7.6.3 DEFERRED VARIABLE COMPENSATION SETTLED EITHER IN SHARES OR IN CASH INDEXED TO THE SHARE PRICE
The deferred variable compensation plans implemented by the Group in respect of services rendered in 2013 comprise:
� equity-settled plans;
� cash-settled plans indexed on the Crédit Agricole S.A. share price.
In both cases, variable compensation is subject to conditions of attendance and performance and deferred by thirds to March 2015, March 2016 and March 2017.
The expense related to these plans is recognised in compensation expenses on a straight-line basis over the vesting period to reflect the condition of attendance, along with an entry to:
� equity, in the case of equity-settled plans, with the expense being revalued solely on the basis of the estimated number of
shares to be paid (in relation to the conditions of attendance and performance);
� liabilities to employees, in the case of cash-settled plans, with periodical revaluation of the liability through profit or loss until the settlement date, depending on the evolution of the share price of Crédit Agricole S.A. and on vesting conditions (conditions of attendance and performance).
7.7 Executive compensationTop Executives include all members of the Executive Committee, namely the Chief Executive Officer and Deputy Chief Executive Officers of Crédit Agricole S.A., the Chief Executive Officers of the main subsidiaries and the heads of the Group’s core business activities.
Compensation and benefits paid to the members of the Executive Committee in 2014 were as follows:
� short term benefits: €34.1 million for fixed and variable compensation (of which €4.1 million paid in shares), including social security expenses and benefits in kind;
� post-employment benefits: €3,3 million for end-of-career benefits and for the supplementary pension plan for Group Senior Executive Officers;
� other long-term benefits: the amount of long-service awards granted was not material;
� employment contract termination indemnities: not material;
� other share based payment: not applicable.
Total Directors’ fees paid to members of Crédit Agricole S.A. Board of Directors in 2014 in consideration for serving as Directors of Crédit Agricole S.A. amounted to €515,586.
These amounts included the compensation and benefits paid to the Chief Executive Officer and Deputy Chief Executive Officers of Crédit Agricole S.A. set out in the “Governance and internal control” section of the registration document.

394 CRÉDIT AGRICOLE S.A. 2014 REGISTRATION DOCUMENT
6 CONSOLIDATED FINANCIAL STATEMENTSNotes to the financial statements / Note 8
NOTE 8 Financing and guarantee commitments and other guarantees
Financing and guarantee commitments and other guarantees include discontinued or held-for-sale operations.
COMMITMENTS GIVEN AND RECEIVED
(in millions of euros) 31/12/2014 31/12/2013 Restated
Commitments given
Financing commitments 140,928 163,717
Commitments given to credit institutions 25,076 46,020
Commitments given to customers 115,852 117,697
� Confirmed credit lines 98,622 94,795
Documentary credits 5,276 6,721
Other confirmed credit lines 93,346 88,074
� Other commitments given to customers 17,230 22,902
Guarantee commitments 80,627 90,392
Credit institutions 8,644 12,347
� Confirmed documentary credit lines 2,137 1,917
� Other 6,507 10,430
Customers 71,983 78,045
� Property guarantees 2,447 2,526
� Other customer guarantees 69,536 75,519
Commitments received
Financing commitments 71,882 107,205
Commitments received from credit institutions 65,048 93,470
Commitments received from customers 6,834 13,735
Guarantee commitments 249,226 201,494
Commitments received from credit institutions(1) 77,561 66,994
Commitments received from customers 171,665 134,500
� Guarantees received from government bodies or similar institutions 18,840 16,868
� Other guarantees received 152,825 117,632
(1) Of which €23.9 billion for total “Switch” guarantees, constituted on 2 January 2014, amending the previous guarantees granted on 23 December 2011 in the amount of €14.7 billion.
FINANCIAL INSTRUMENTS GIVEN AND RECEIVED AS COLLATERAL
(in millions of euros) 31/12/2014 31/12/2013 Restated
Carrying amount of financial assets provided as collateral (including transferred assets)
Securities and receivables provided as collateral for the refinancing structures (SFEF, Banque de France, CRH, etc.) 148,645 182,179
Securities lent 5,056 6,113
Security deposits on market transactions 20,547 19,591
Other deposits
Securities sold under repurchase agreements 119,646 129,064
TOTAL CARRYING AMOUNT OF FINANCIAL ASSETS PROVIDED AS COLLATERAL 293,894 336,947
Fair value of instruments received as reusable and reused collateral
Securities borrowed 2 2
Securities bought under repurchase agreements 275,227 270,453
Securities sold short 34,875 30,244
TOTAL FAIR VALUE OF INSTRUMENTS RECEIVED AS REUSABLE AND REUSED COLLATERAL 310,104 300,699
CRÉDIT AGRICOLE S.A. 2014 REGISTRATION DOCUMENT 395
6
CONSOLIDATED FINANCIAL STATEMENTSNotes to the financial statements / Note 9
GUARANTEES HELDGuarantees held and assets received as collateral by Crédit Agricole S.A. Group which it is allowed to sell or to use as collateral are mostly within Crédit Agricole S.A. for €101.9 billion. The majority of these are receivables pledged as collateral by the Regional Banks to Crédit Agricole S.A., as it acts as the centralising body with regard to the external refinancing organisations. Crédit Agricole CIB also has €145.7 billion in assets received as collateral.
The majority of these guarantees consist of mortgage liens, collateral or guarantees received, regardless of the quality of the assets guaranteed. They are mainly related to repurchase agreements and securities pledged to guarantee brokerage transactions.
Crédit Agricole S.A. Group policy is to sell seized collateral as soon as possible. Crédit Agricole CIB and Crédit Agricole S.A. had no such assets at 31 December 2014.
RECEIVABLES RECEIVED AND PLEDGED AS COLLATERALAt 31 December 2014, Crédit Agricole S.A. deposited €74.8 billion of receivables (mainly on behalf of the Regional Banks) for refinancing transactions to the Banque de France, compared to
€88.8 billion at 31 December 2013, and €14.5 billion of receivables were deposited directly by subsidiaries.
At 31 December 2014, Crédit Agricole S.A. deposited €19.7 billion of receivables for refinancing transactions to the Caisse de Refinancement de l’Habitat on behalf of the Regional Banks, down from €21.7 billion at 31 December 2013, and €6.9 billion of receivables were deposited directly by LCL.
At 31 December 2014, due to all of its refinancing transactions to SFEF from 2009 reaching maturity, no receivables were pledged as collateral by Crédit Agricole S.A. Group (compared with €10.8 billion at 31 December 2013).
At 31 December 2014, €35.6 billion of Regional Banks and LCL receivables had been pledged as collateral for the covered bond issues of Crédit Agricole Home Loan SFH, a financial company wholly owned by Crédit Agricole S.A.
These processes, for which there is no transfer of contractual cash flows, do not form part of the asset transfers mentioned in Note 6.6 “Transferred assets not derecognised or derecognised with on-going involvement”.
NOTE 9 Reclassification of financial instruments
PRINCIPLES APPLIED BY CRÉDIT AGRICOLE S.A. GROUPReclassifications outside the categories “Financial assets held-for-trading” and “Available-for-sale financial assets” were decided and performed in accordance with IAS 39 amended, adopted by the European Union on 15 October 2008. They were entered in the new accounting category at fair value on the reclassification date.
RECLASSIFICATIONS PERFORMED BY CRÉDIT AGRICOLE S.A. GROUPPursuant to the amendment to IAS 39 as published and adopted by the European Union on 15 October 2008, reclassifications were carried out as authorised by this amendment. Information on these and previous reclassifications is shown below.
NATURE, JUSTIFICATION AND AMOUNT OF RECLASSIFICATIONSIn 2014, the Group implemented reclassifications from “Available-for-sale financial assets” to “Loans and receivables”. Reclassification between these two categories is provided for by IAS 39. The reclassification concerns units in the fonds communs de titrisation (FCT - Securitisation Fund) subscribed to secure financing and meeting the definition of “Loans and receivables”.
These reclassifications were made on 30 June 2014 for the available-for-sale financial assets and on 16 December 2014 for the financial assets at fair value through profit or loss.
Reclassifications in prior years concern reclassifications from “Financial assets at fair value through profit or loss” to “Loans and receivables” and are related to syndication transactions or securitisation assets.
For assets reclassified during 2014, the table below shows their value on the reclassification date, as well as the value, at 31 December 2014, of assets reclassified before this date and still included in the Group’s assets at that date:
(in millions of euros)
Total reclassified assets Assets reclassified in 2014 Assets reclassified before
Carrying amount
31/12/2014
Estimated market
value at 31/12/2014
Reclassification value
Carrying amount
31/12/2014
Estimated market
value 31/12/2014
Carrying amount
31/12/2014
Estimated market
value 31/12/2014
Carrying amount
31/12/2013 Restated
Estimated market
value 31/12/2013
Restated
Financial assets at fair value through profit or loss reclassified as loans and receivables 1,572 1,533 24 24 22 1,548 1,511 2,786 2,755
Available-for-sale financial assets reclassified as loans and receivables 396 396 398 396 396 - - - -
TOTAL RECLASSIFIED ASSETS 1,968 1,929 422 420 418 1,548 1,511 2,786 2,755

396 CRÉDIT AGRICOLE S.A. 2014 REGISTRATION DOCUMENT
6 CONSOLIDATED FINANCIAL STATEMENTSNotes to the financial statements / Note 9
CHANGE IN FAIR VALUE OF RECLASSIFIED ASSETS RECOGNISED IN PROFIT OR LOSSThe table below gives the change in fair value of assets recognised in profit or loss reclassified in 2014
(in millions of euros)
In 2014, as of reclassification
date In 2013
Financial assets at fair value through profit or loss reclassified as loans and receivables - -
Available-for-sale financial assets reclassified as loans and receivables 2 -
TOTAL RECLASSIFIED ASSETS 2 -
CONTRIBUTION OF RECLASSIFIED ASSETS TO NET INCOME SINCE THE RECLASSIFICATION DATEThe contribution of the reclassified assets since the date of reclassification to net income for the year includes all gains, losses, income and expenses recognised in profit or loss or in other comprehensive income.
Analysis of the impact of the transferred assets:
IMPACT ON PRE-TAX INCOME SINCE RECLASSIFICATION DATE
(in millions of euros)
Reclassified assets in 2014 Assets reclassified before
Impact in 2014Cumulative impact
at 31/12/2013 Restated Impact in 2014Cumulative impact
at 31/12/2014
Actual income and
expenses recognised
If asset had been retained
in its former category (change
in fair value)
Actual income and
expenses recognised
If asset had been retained
in its former category (change
in fair value)
Actual income and
expenses recognised
If asset had been retained
in its former category (change
in fair value)
Actual income and
expenses recognised
If asset had been retained
in its former category (change
in fair value)
Financial assets at fair value through profit or loss reclassified as loans and receivables 2 - (104) (174) 56 47 (46) (127)
Available-for-sale financial assets reclassified as loans and receivables 10 10 - - - - 10 10
TOTAL RECLASSIFIED ASSETS 12 10 (104) (174) 56 47 ( 36) (117)
ADDITIONAL INFORMATIONThe information given below relates solely to the assets reclassified in 2014:
EXPECTED VALUE AT RECLASSIFICATION DATE
(in millions of euros) Future Cash FlowEIR (Effective
Interest Rate) (in %)
Financial assets at fair value through profit or loss reclassified as loans and receivables 24 1.80%
Available-for-sale financial assets transferred as loans and receivables 428 2.23%
TOTAL RECLASSIFIED ASSETS 452
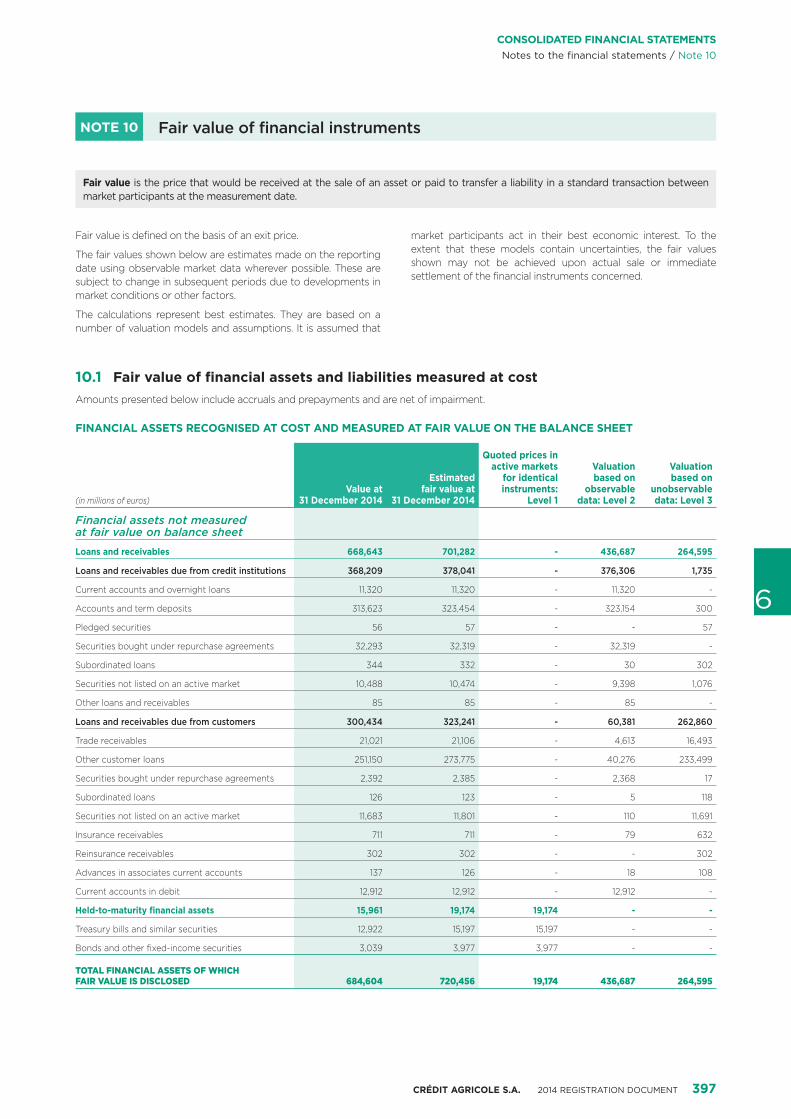
CRÉDIT AGRICOLE S.A. 2014 REGISTRATION DOCUMENT 397
6
CONSOLIDATED FINANCIAL STATEMENTSNotes to the financial statements / Note 10
NOTE 10 Fair value of financial instruments
Fair value is defined on the basis of an exit price.
The fair values shown below are estimates made on the reporting date using observable market data wherever possible. These are subject to change in subsequent periods due to developments in market conditions or other factors.
The calculations represent best estimates. They are based on a number of valuation models and assumptions. It is assumed that
market participants act in their best economic interest. To the extent that these models contain uncertainties, the fair values shown may not be achieved upon actual sale or immediate settlement of the financial instruments concerned.
10.1 Fair value of financial assets and liabilities measured at costAmounts presented below include accruals and prepayments and are net of impairment.
FINANCIAL ASSETS RECOGNISED AT COST AND MEASURED AT FAIR VALUE ON THE BALANCE SHEET
(in millions of euros)Value at
31 December 2014
Estimated fair value at
31 December 2014
Quoted prices in active markets
for identical instruments:
Level 1
Valuation based on
observable data: Level 2
Valuation based on
unobservable data: Level 3
Financial assets not measured at fair value on balance sheet
Loans and receivables 668,643 701,282 - 436,687 264,595
Loans and receivables due from credit institutions 368,209 378,041 - 376,306 1,735
Current accounts and overnight loans 11,320 11,320 - 11,320 -
Accounts and term deposits 313,623 323,454 - 323,154 300
Pledged securities 56 57 - - 57
Securities bought under repurchase agreements 32,293 32,319 - 32,319 -
Subordinated loans 344 332 - 30 302
Securities not listed on an active market 10,488 10,474 - 9,398 1,076
Other loans and receivables 85 85 - 85 -
Loans and receivables due from customers 300,434 323,241 - 60,381 262,860
Trade receivables 21,021 21,106 - 4,613 16,493
Other customer loans 251,150 273,775 - 40,276 233,499
Securities bought under repurchase agreements 2,392 2,385 - 2,368 17
Subordinated loans 126 123 - 5 118
Securities not listed on an active market 11,683 11,801 - 110 11,691
Insurance receivables 711 711 - 79 632
Reinsurance receivables 302 302 - - 302
Advances in associates current accounts 137 126 - 18 108
Current accounts in debit 12,912 12,912 - 12,912 -
Held-to-maturity financial assets 15,961 19,174 19,174 - -
Treasury bills and similar securities 12,922 15,197 15,197 - -
Bonds and other fixed-income securities 3,039 3,977 3,977 - -
TOTAL FINANCIAL ASSETS OF WHICH FAIR VALUE IS DISCLOSED 684,604 720,456 19,174 436,687 264,595
Fair value is the price that would be received at the sale of an asset or paid to transfer a liability in a standard transaction between market participants at the measurement date.
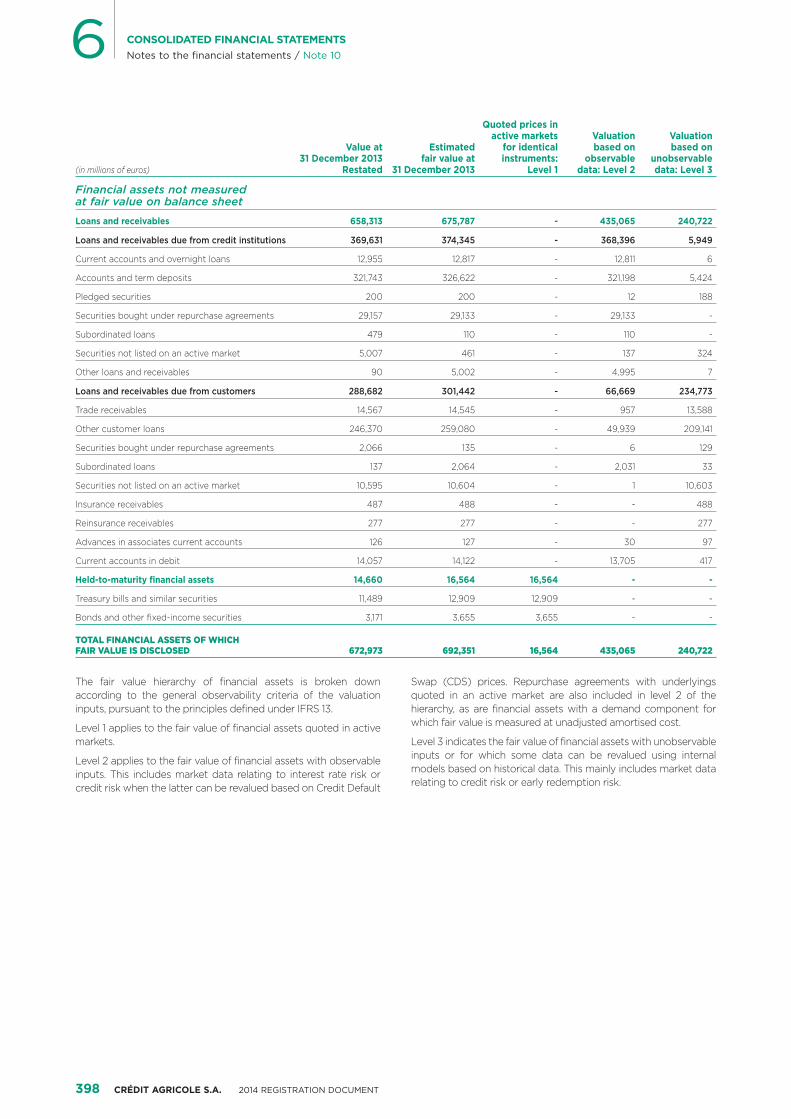
398 CRÉDIT AGRICOLE S.A. 2014 REGISTRATION DOCUMENT
6 CONSOLIDATED FINANCIAL STATEMENTSNotes to the financial statements / Note 10
(in millions of euros)
Value at 31 December 2013
Restated
Estimated fair value at
31 December 2013
Quoted prices in active markets
for identical instruments:
Level 1
Valuation based on
observable data: Level 2
Valuation based on
unobservable data: Level 3
Financial assets not measured at fair value on balance sheet
Loans and receivables 658,313 675,787 - 435,065 240,722
Loans and receivables due from credit institutions 369,631 374,345 - 368,396 5,949
Current accounts and overnight loans 12,955 12,817 - 12,811 6
Accounts and term deposits 321,743 326,622 - 321,198 5,424
Pledged securities 200 200 - 12 188
Securities bought under repurchase agreements 29,157 29,133 - 29,133 -
Subordinated loans 479 110 - 110 -
Securities not listed on an active market 5,007 461 - 137 324
Other loans and receivables 90 5,002 - 4,995 7
Loans and receivables due from customers 288,682 301,442 - 66,669 234,773
Trade receivables 14,567 14,545 - 957 13,588
Other customer loans 246,370 259,080 - 49,939 209,141
Securities bought under repurchase agreements 2,066 135 - 6 129
Subordinated loans 137 2,064 - 2,031 33
Securities not listed on an active market 10,595 10,604 - 1 10,603
Insurance receivables 487 488 - - 488
Reinsurance receivables 277 277 - - 277
Advances in associates current accounts 126 127 - 30 97
Current accounts in debit 14,057 14,122 - 13,705 417
Held-to-maturity financial assets 14,660 16,564 16,564 - -
Treasury bills and similar securities 11,489 12,909 12,909 - -
Bonds and other fixed-income securities 3,171 3,655 3,655 - -
TOTAL FINANCIAL ASSETS OF WHICH FAIR VALUE IS DISCLOSED 672,973 692,351 16,564 435,065 240,722
The fair value hierarchy of financial assets is broken down according to the general observability criteria of the valuation inputs, pursuant to the principles defined under IFRS 13.
Level 1 applies to the fair value of financial assets quoted in active markets.
Level 2 applies to the fair value of financial assets with observable inputs. This includes market data relating to interest rate risk or credit risk when the latter can be revalued based on Credit Default
Swap (CDS) prices. Repurchase agreements with underlyings quoted in an active market are also included in level 2 of the hierarchy, as are financial assets with a demand component for which fair value is measured at unadjusted amortised cost.
Level 3 indicates the fair value of financial assets with unobservable inputs or for which some data can be revalued using internal models based on historical data. This mainly includes market data relating to credit risk or early redemption risk.
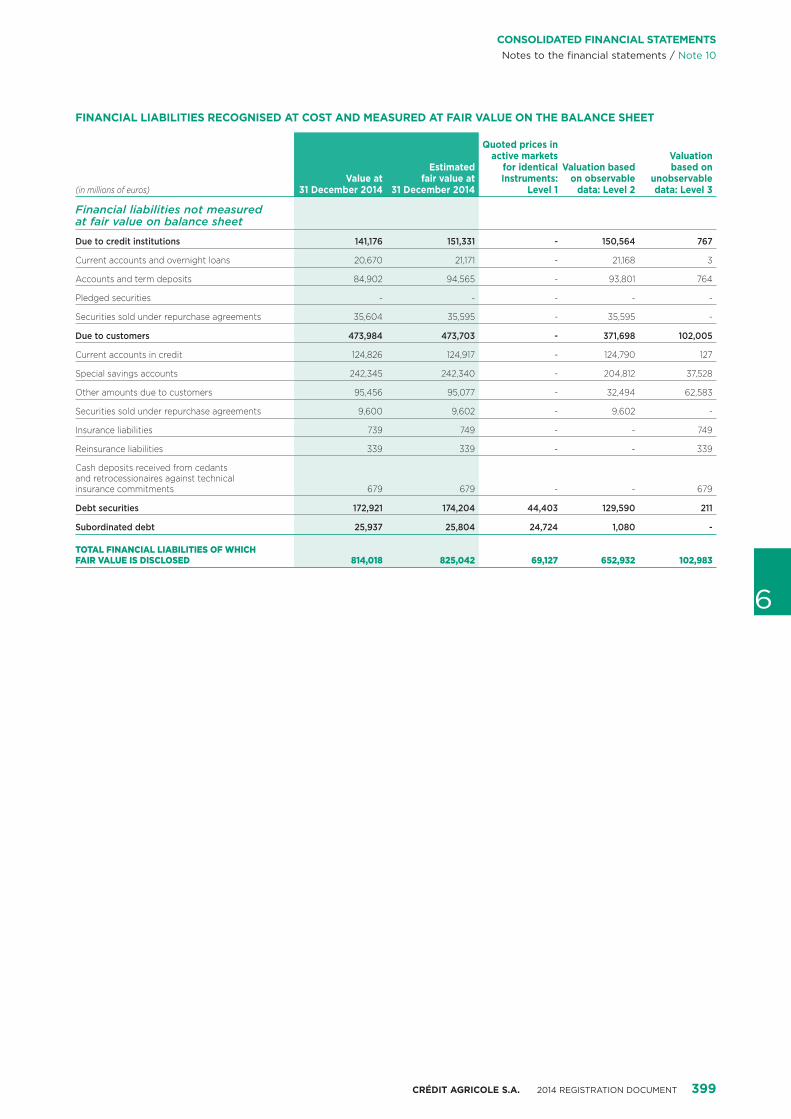
CRÉDIT AGRICOLE S.A. 2014 REGISTRATION DOCUMENT 399
6
CONSOLIDATED FINANCIAL STATEMENTSNotes to the financial statements / Note 10
FINANCIAL LIABILITIES RECOGNISED AT COST AND MEASURED AT FAIR VALUE ON THE BALANCE SHEET
(in millions of euros)Value at
31 December 2014
Estimated fair value at
31 December 2014
Quoted prices in active markets
for identical Instruments:
Level 1
Valuation based on observable
data: Level 2
Valuation based on
unobservable data: Level 3
Financial liabilities not measured at fair value on balance sheet
Due to credit institutions 141,176 151,331 - 150,564 767
Current accounts and overnight loans 20,670 21,171 - 21,168 3
Accounts and term deposits 84,902 94,565 - 93,801 764
Pledged securities - - - - -
Securities sold under repurchase agreements 35,604 35,595 - 35,595 -
Due to customers 473,984 473,703 - 371,698 102,005
Current accounts in credit 124,826 124,917 - 124,790 127
Special savings accounts 242,345 242,340 - 204,812 37,528
Other amounts due to customers 95,456 95,077 - 32,494 62,583
Securities sold under repurchase agreements 9,600 9,602 - 9,602 -
Insurance liabilities 739 749 - - 749
Reinsurance liabilities 339 339 - - 339
Cash deposits received from cedants and retrocessionaires against technical insurance commitments 679 679 - - 679
Debt securities 172,921 174,204 44,403 129,590 211
Subordinated debt 25,937 25,804 24,724 1,080 -
TOTAL FINANCIAL LIABILITIES OF WHICH FAIR VALUE IS DISCLOSED 814,018 825,042 69,127 652,932 102,983
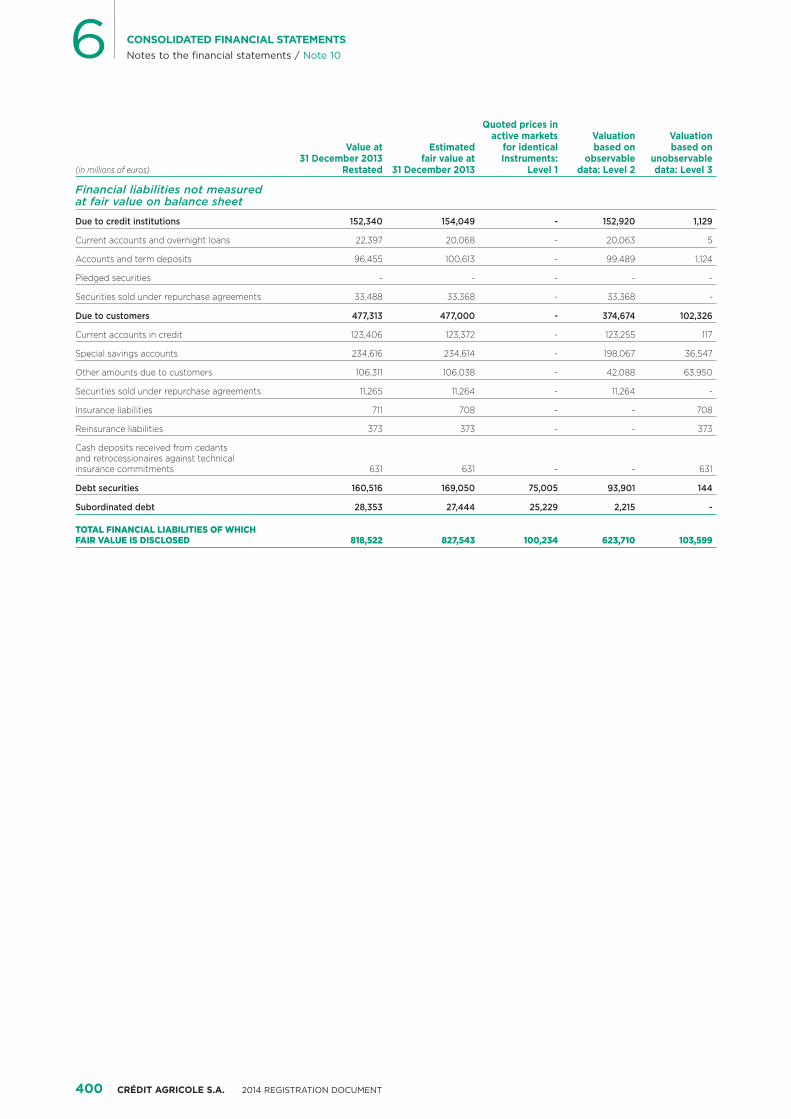
400 CRÉDIT AGRICOLE S.A. 2014 REGISTRATION DOCUMENT
6 CONSOLIDATED FINANCIAL STATEMENTSNotes to the financial statements / Note 10
(in millions of euros)
Value at 31 December 2013
Restated
Estimated fair value at
31 December 2013
Quoted prices in active markets
for identical Instruments:
Level 1
Valuation based on
observable data: Level 2
Valuation based on
unobservable data: Level 3
Financial liabilities not measured at fair value on balance sheet
Due to credit institutions 152,340 154,049 - 152,920 1,129
Current accounts and overnight loans 22,397 20,068 - 20,063 5
Accounts and term deposits 96,455 100,613 - 99,489 1,124
Pledged securities - - - - -
Securities sold under repurchase agreements 33,488 33,368 - 33,368 -
Due to customers 477,313 477,000 - 374,674 102,326
Current accounts in credit 123,406 123,372 - 123,255 117
Special savings accounts 234,616 234,614 - 198,067 36,547
Other amounts due to customers 106,311 106,038 - 42,088 63,950
Securities sold under repurchase agreements 11,265 11,264 - 11,264 -
Insurance liabilities 711 708 - - 708
Reinsurance liabilities 373 373 - - 373
Cash deposits received from cedants and retrocessionaires against technical insurance commitments 631 631 - - 631
Debt securities 160,516 169,050 75,005 93,901 144
Subordinated debt 28,353 27,444 25,229 2,215 -
TOTAL FINANCIAL LIABILITIES OF WHICH FAIR VALUE IS DISCLOSED 818,522 827,543 100,234 623,710 103,599
CRÉDIT AGRICOLE S.A. 2014 REGISTRATION DOCUMENT 401
6
CONSOLIDATED FINANCIAL STATEMENTSNotes to the financial statements / Note 10
The fair value hierarchy of financial liabilities is broken down according to the general observability criteria of the valuation inputs, pursuant to the principles defined under IFRS 13.
Level 1 applies to the fair value of financial liabilities quoted in active markets.
Level 2 applies to the fair value of financial liabilities with relevant observable inputs. This includes market data relating to interest rate risk or credit risk when the latter can be revalued based on Credit Default Swap (CDS) prices. Repurchase agreements with underlyings quoted in an active market are also included in level 2 of the hierarchy, as are financial liabilities with a demand component for which fair value is measured at unadjusted amortised cost.
Level 3 indicates the fair value of financial liabilities with unobservable inputs or for which some data can be revalued using internal models based on historical data. This mainly includes market data relating to credit risk or early redemption risk.
In some cases, market values are close to carrying amounts. This applies primarily to:
� assets or liabilities at variable rates for which interest rate changes do not have a significant influence on the fair value, since the rates on these instruments frequently adjust themselves to the market rates;
� short-term assets or liabilities where the redemption value is considered to be close to the market value;
� regulated instruments (e.g. regulated savings accounts) where prices are fixed by the government;
� demand assets or liabilities;
� transactions for which there are no reliable observable data.
10.2 Information about financial instruments measured at fair value
VALUATION METHODSFinancial instruments are valued by management information systems and checked by a team that reports to the Risk Management department and is independent from the market operators.
Valuations are based on the following:
� prices or inputs obtained from independent sources and/or validated by the Market Risk department using a series of available sources such as pricing service vendors, market consensus data and brokers;
� models validated by the Market Risk department’s quantitative teams.
The valuation produced for each instrument is a mid-market valuation, which does not take account of the direction of the trade, the bank’s aggregate exposure, market liquidity or counterparty
quality. Adjustments are then made to the market valuations to incorporate those factors, as well as the potential uncertainties inherent in the models or inputs used.
The main types of valuation adjustments are the following:
Mark-to-market adjustments: these adjustments correct any potential variance between the mid-market valuation of an instrument obtained using internal valuation models and the associated inputs and the valuation obtained from external sources or market consensus data. These adjustments can be positive or negative.
Bid/ask reserves: these adjustments incorporate the bid/ask spread for a given instrument in order to reflect the price at which the position could be reversed. These adjustments are always negative.
Uncertainty reserves: these adjustments constitute a risk premium taken into account by potential acquirers. These adjustments are always negative:
� input uncertainty reserves seek to incorporate any uncertainty that might exist as regards one or more of the inputs used;
� model uncertainty reserves seek to incorporate any uncertainty that might exist due to the choice of model used.
Furthermore, Crédit Agricole S.A. makes a Credit Valuation Adjustment (CVA) to its derivative assets to reflect counterparty risk and a Debit Valuation Adjustment or own credit risk (DVA) to its derivative liabilities to reflect the risk of non-execution.
The CVA factors in the credit risk are associated with the counterparty (risk of non-payment of sums due in the event of default). It is calculated on an aggregate basis by counterparty according to the future exposure profile of the transactions after deducting any collateral. This adjustment is always negative and is deducted from the fair value of the financial assets.
The Debt Value Adjustment (DVA) factors in the risk are carried by our counterparties. It is calculated on an aggregate basis by counterparty according to the future exposure profile of the transactions. This adjustment is always positive and is deducted from the fair value of the financial liabilities.
The CVA/DVA is calculated on the basis of an estimate of expected losses based on the probability of default and loss given default. The methodology used maximises the use of observable market inputs. It is based first and foremost on market inputs such as quoted CDSs, or CDS proxys, when they are considered to be sufficiently liquid. In certain circumstances, historical default data may also be used.
Funding Valuation Adjustment (FVA)The value of non-collateralised derivative instruments incorporates a FVA related to the financing of these instruments.
Its first time application at 30 June 2014 was reflected in the recognition of a loss of €167 million.
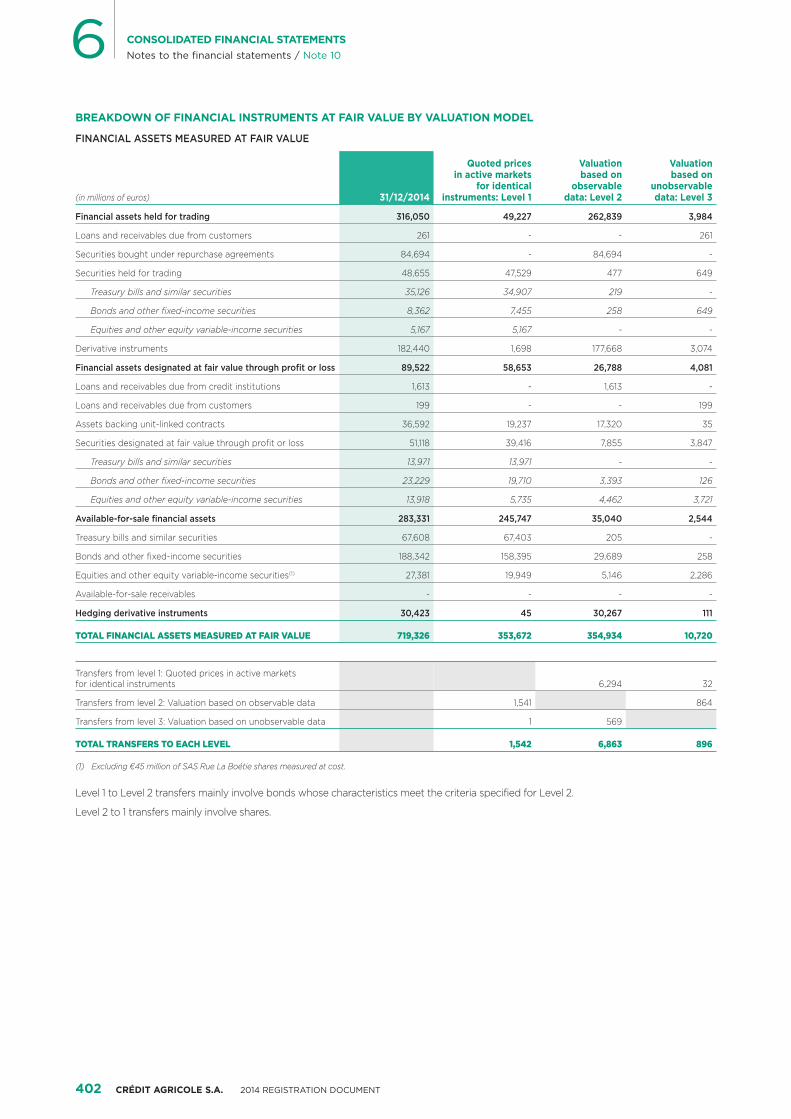
402 CRÉDIT AGRICOLE S.A. 2014 REGISTRATION DOCUMENT
6 CONSOLIDATED FINANCIAL STATEMENTSNotes to the financial statements / Note 10
BREAKDOWN OF FINANCIAL INSTRUMENTS AT FAIR VALUE BY VALUATION MODEL
FINANCIAL ASSETS MEASURED AT FAIR VALUE
(in millions of euros) 31/12/2014
Quoted prices in active markets
for identical instruments: Level 1
Valuation based on
observable data: Level 2
Valuation based on
unobservable data: Level 3
Financial assets held for trading 316,050 49,227 262,839 3,984
Loans and receivables due from customers 261 - - 261
Securities bought under repurchase agreements 84,694 - 84,694 -
Securities held for trading 48,655 47,529 477 649
Treasury bills and similar securities 35,126 34,907 219 -
Bonds and other fixed-income securities 8,362 7,455 258 649
Equities and other equity variable-income securities 5,167 5,167 - -
Derivative instruments 182,440 1,698 177,668 3,074
Financial assets designated at fair value through profit or loss 89,522 58,653 26,788 4,081
Loans and receivables due from credit institutions 1,613 - 1,613 -
Loans and receivables due from customers 199 - - 199
Assets backing unit-linked contracts 36,592 19,237 17,320 35
Securities designated at fair value through profit or loss 51,118 39,416 7,855 3,847
Treasury bills and similar securities 13,971 13,971 - -
Bonds and other fixed-income securities 23,229 19,710 3,393 126
Equities and other equity variable-income securities 13,918 5,735 4,462 3,721
Available-for-sale financial assets 283,331 245,747 35,040 2,544
Treasury bills and similar securities 67,608 67,403 205 -
Bonds and other fixed-income securities 188,342 158,395 29,689 258
Equities and other equity variable-income securities(1) 27,381 19,949 5,146 2,286
Available-for-sale receivables - - - -
Hedging derivative instruments 30,423 45 30,267 111
TOTAL FINANCIAL ASSETS MEASURED AT FAIR VALUE 719,326 353,672 354,934 10,720
Transfers from level 1: Quoted prices in active markets for identical instruments 6,294 32
Transfers from level 2: Valuation based on observable data 1,541 864
Transfers from level 3: Valuation based on unobservable data 1 569
TOTAL TRANSFERS TO EACH LEVEL 1,542 6,863 896
(1) Excluding €45 million of SAS Rue La Boétie shares measured at cost.
Level 1 to Level 2 transfers mainly involve bonds whose characteristics meet the criteria specified for Level 2.
Level 2 to 1 transfers mainly involve shares.
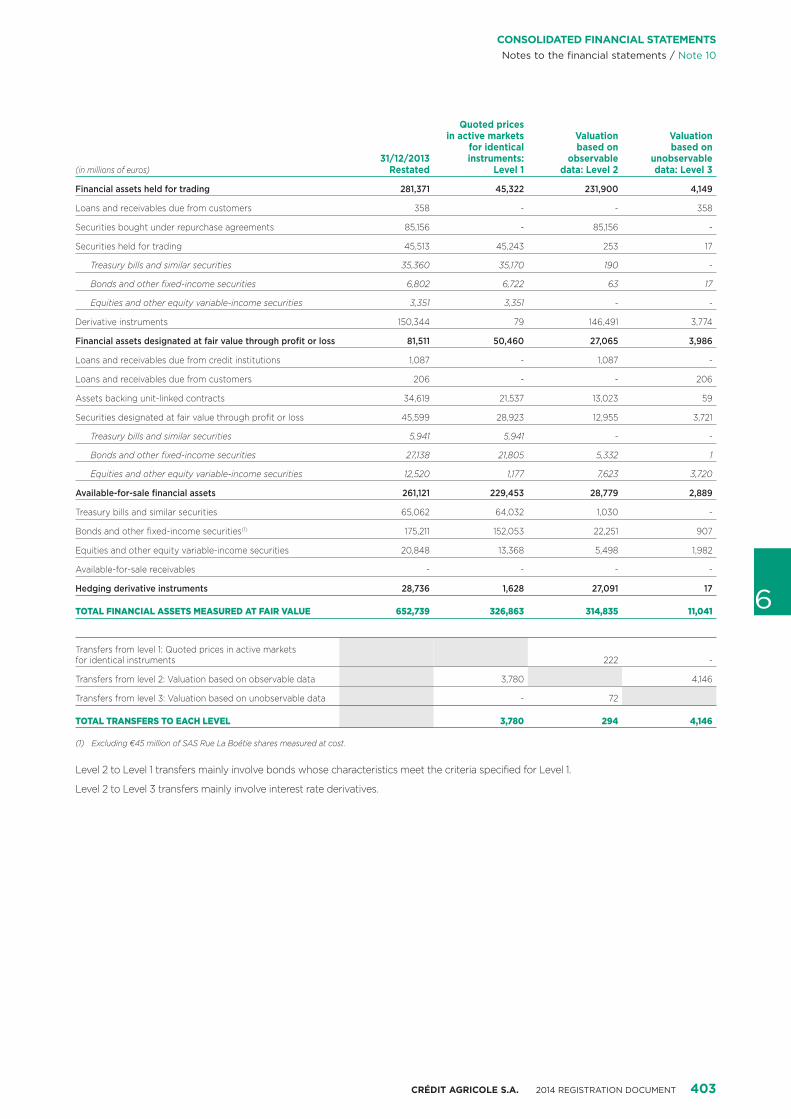
CRÉDIT AGRICOLE S.A. 2014 REGISTRATION DOCUMENT 403
6
CONSOLIDATED FINANCIAL STATEMENTSNotes to the financial statements / Note 10
(in millions of euros)31/12/2013
Restated
Quoted prices in active markets
for identical instruments:
Level 1
Valuation based on
observable data: Level 2
Valuation based on
unobservable data: Level 3
Financial assets held for trading 281,371 45,322 231,900 4,149
Loans and receivables due from customers 358 - - 358
Securities bought under repurchase agreements 85,156 - 85,156 -
Securities held for trading 45,513 45,243 253 17
Treasury bills and similar securities 35,360 35,170 190 -
Bonds and other fixed-income securities 6,802 6,722 63 17
Equities and other equity variable-income securities 3,351 3,351 - -
Derivative instruments 150,344 79 146,491 3,774
Financial assets designated at fair value through profit or loss 81,511 50,460 27,065 3,986
Loans and receivables due from credit institutions 1,087 - 1,087 -
Loans and receivables due from customers 206 - - 206
Assets backing unit-linked contracts 34,619 21,537 13,023 59
Securities designated at fair value through profit or loss 45,599 28,923 12,955 3,721
Treasury bills and similar securities 5,941 5,941 - -
Bonds and other fixed-income securities 27,138 21,805 5,332 1
Equities and other equity variable-income securities 12,520 1,177 7,623 3,720
Available-for-sale financial assets 261,121 229,453 28,779 2,889
Treasury bills and similar securities 65,062 64,032 1,030 -
Bonds and other fixed-income securities(1) 175,211 152,053 22,251 907
Equities and other equity variable-income securities 20,848 13,368 5,498 1,982
Available-for-sale receivables - - - -
Hedging derivative instruments 28,736 1,628 27,091 17
TOTAL FINANCIAL ASSETS MEASURED AT FAIR VALUE 652,739 326,863 314,835 11,041
Transfers from level 1: Quoted prices in active markets for identical instruments 222 -
Transfers from level 2: Valuation based on observable data 3,780 4,146
Transfers from level 3: Valuation based on unobservable data - 72
TOTAL TRANSFERS TO EACH LEVEL 3,780 294 4,146
(1) Excluding €45 million of SAS Rue La Boétie shares measured at cost.
Level 2 to Level 1 transfers mainly involve bonds whose characteristics meet the criteria specified for Level 1.
Level 2 to Level 3 transfers mainly involve interest rate derivatives.
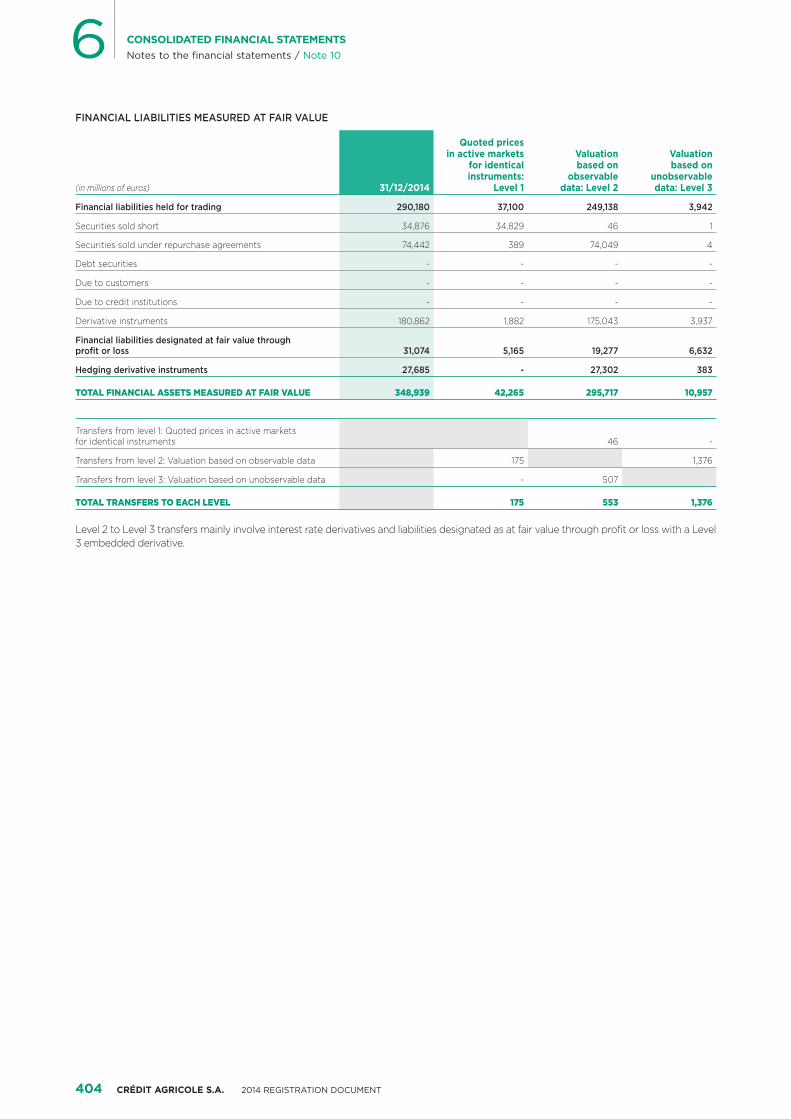
404 CRÉDIT AGRICOLE S.A. 2014 REGISTRATION DOCUMENT
6 CONSOLIDATED FINANCIAL STATEMENTSNotes to the financial statements / Note 10
FINANCIAL LIABILITIES MEASURED AT FAIR VALUE
(in millions of euros) 31/12/2014
Quoted prices in active markets
for identical instruments:
Level 1
Valuation based on
observable data: Level 2
Valuation based on
unobservable data: Level 3
Financial liabilities held for trading 290,180 37,100 249,138 3,942
Securities sold short 34,876 34,829 46 1
Securities sold under repurchase agreements 74,442 389 74,049 4
Debt securities - - - -
Due to customers - - - -
Due to credit institutions - - - -
Derivative instruments 180,862 1,882 175,043 3,937
Financial liabilities designated at fair value through profit or loss 31,074 5,165 19,277 6,632
Hedging derivative instruments 27,685 - 27,302 383
TOTAL FINANCIAL ASSETS MEASURED AT FAIR VALUE 348,939 42,265 295,717 10,957
Transfers from level 1: Quoted prices in active markets for identical instruments 46 -
Transfers from level 2: Valuation based on observable data 175 1,376
Transfers from level 3: Valuation based on unobservable data - 507
TOTAL TRANSFERS TO EACH LEVEL 175 553 1,376
Level 2 to Level 3 transfers mainly involve interest rate derivatives and liabilities designated as at fair value through profit or loss with a Level 3 embedded derivative.
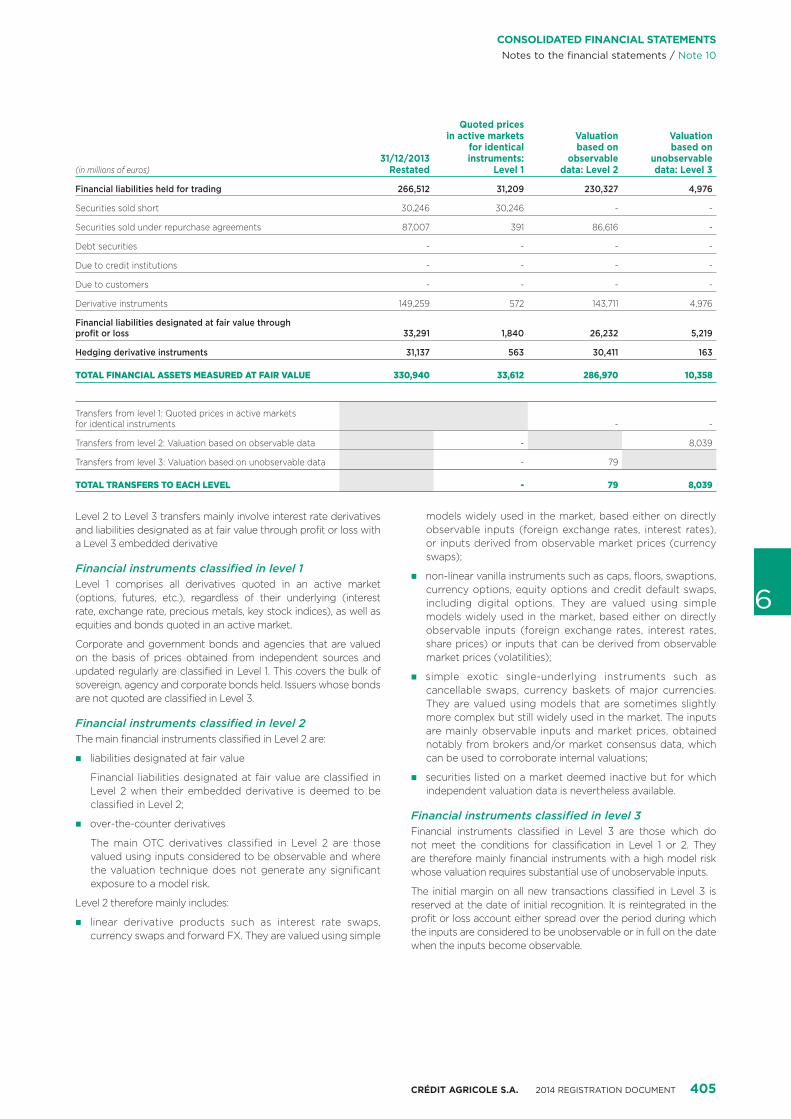
CRÉDIT AGRICOLE S.A. 2014 REGISTRATION DOCUMENT 405
6
CONSOLIDATED FINANCIAL STATEMENTSNotes to the financial statements / Note 10
Level 2 to Level 3 transfers mainly involve interest rate derivatives and liabilities designated as at fair value through profit or loss with a Level 3 embedded derivative
Financial instruments classified in level 1Level 1 comprises all derivatives quoted in an active market (options, futures, etc.), regardless of their underlying (interest rate, exchange rate, precious metals, key stock indices), as well as equities and bonds quoted in an active market.
Corporate and government bonds and agencies that are valued on the basis of prices obtained from independent sources and updated regularly are classified in Level 1. This covers the bulk of sovereign, agency and corporate bonds held. Issuers whose bonds are not quoted are classified in Level 3.
Financial instruments classified in level 2The main financial instruments classified in Level 2 are:
� liabilities designated at fair value
Financial liabilities designated at fair value are classified in Level 2 when their embedded derivative is deemed to be classified in Level 2;
� over-the-counter derivatives
The main OTC derivatives classified in Level 2 are those valued using inputs considered to be observable and where the valuation technique does not generate any significant exposure to a model risk.
Level 2 therefore mainly includes:
� linear derivative products such as interest rate swaps, currency swaps and forward FX. They are valued using simple
models widely used in the market, based either on directly observable inputs (foreign exchange rates, interest rates), or inputs derived from observable market prices (currency swaps);
� non-linear vanilla instruments such as caps, floors, swaptions, currency options, equity options and credit default swaps, including digital options. They are valued using simple models widely used in the market, based either on directly observable inputs (foreign exchange rates, interest rates, share prices) or inputs that can be derived from observable market prices (volatilities);
� simple exotic single-underlying instruments such as cancellable swaps, currency baskets of major currencies. They are valued using models that are sometimes slightly more complex but still widely used in the market. The inputs are mainly observable inputs and market prices, obtained notably from brokers and/or market consensus data, which can be used to corroborate internal valuations;
� securities listed on a market deemed inactive but for which independent valuation data is nevertheless available.
Financial instruments classified in level 3Financial instruments classified in Level 3 are those which do not meet the conditions for classification in Level 1 or 2. They are therefore mainly financial instruments with a high model risk whose valuation requires substantial use of unobservable inputs.
The initial margin on all new transactions classified in Level 3 is reserved at the date of initial recognition. It is reintegrated in the profit or loss account either spread over the period during which the inputs are considered to be unobservable or in full on the date when the inputs become observable.
(in millions of euros)31/12/2013
Restated
Quoted prices in active markets
for identical instruments:
Level 1
Valuation based on
observable data: Level 2
Valuation based on
unobservable data: Level 3
Financial liabilities held for trading 266,512 31,209 230,327 4,976
Securities sold short 30,246 30,246 - -
Securities sold under repurchase agreements 87,007 391 86,616 -
Debt securities - - - -
Due to credit institutions - - - -
Due to customers - - - -
Derivative instruments 149,259 572 143,711 4,976
Financial liabilities designated at fair value through profit or loss 33,291 1,840 26,232 5,219
Hedging derivative instruments 31,137 563 30,411 163
TOTAL FINANCIAL ASSETS MEASURED AT FAIR VALUE 330,940 33,612 286,970 10,358
Transfers from level 1: Quoted prices in active markets for identical instruments - -
Transfers from level 2: Valuation based on observable data - 8,039
Transfers from level 3: Valuation based on unobservable data - 79
TOTAL TRANSFERS TO EACH LEVEL - 79 8,039
406 CRÉDIT AGRICOLE S.A. 2014 REGISTRATION DOCUMENT
6 CONSOLIDATED FINANCIAL STATEMENTSNotes to the financial statements / Note 10
Level 3 therefore mainly comprises:
� securities
Level 3 securities mainly include:
� unlisted shares or bonds for which no independent valuation is available,
� ABSs and CLOs for which there are indicative independent quotes but these are not necessarily executable,
� ABSs, CLOs and super senior and mezzanine CDO tranches where it cannot be demonstrated that the market is active.
� liabilities designated at fair value
Financial liabilities designated at fair value are classified in Level 3 when their embedded derivative is deemed to be classified in Level 3;
� over-the-counter derivatives
Products that are not observable due to the underlying: some products, which are mostly classified in Level 2, may be considered to fall within Level 3 due to their underlying currency or maturity. An observability table defines the maximum maturity considered to be observable for each instrument/currency pair. Observability is a function of the input’s liquidity and the availability of observable sources enabling its valuation.
Level 3 mainly comprises:
� interest rate exposures or very long-dated currency swaps;
� equity exposures, mainly through products traded on shallow option markets or indexed to volatility and long-dated forward or futures contracts;
� exposures to non-linear long-dated products (interest rate, currency or shares) on key currencies/indices. It also includes vanilla options and simple exotic derivatives such as cancellable swaps;
� non-linear exposures to emerging market currencies.
Complex derivatives: complex derivatives are classified in Level 3 as their valuation requires the use of unobservable inputs. The main exposures involved are:
� products whose underlying is the difference between two interest rates, such as options, binary options or exotic products. These products are based on a correlation between the two rates, which is considered to be unobservable due to reduced liquidity. The valuation of these exposures is nonetheless adjusted at the month-end on the basis of correlation levels derived from market consensus data;
� products whose underlying is the forward volatility of an index (Euribor, CMS spread). These products are deemed
unobservable as there is significant model risk and their thin liquidity prevents regular accurate estimates of inputs;
� securitisation swaps generating an exposure to the prepayment rate. The prepayment rate is determined on the basis of historical data on similar portfolios. The assumptions and inputs used are checked regularly on the basis of actual prepayments;
� hybrid long-term interest rate/FX products, such as Power Reverse Dual Currency notes, which mainly involve the USD/JPY currency pair or products whose underlying is a basket of currencies. The correlation parameters between interest rates and currencies as well as between the two interest rates are determined using an internal methodology based on historical data. Results are cross-checked against market consensus data to ensure that the overall method is coherent;
� multiple-underlying products generating an exposure to correlations, regardless of the underlyings concerned (interest rates, equities, credit, FX, inflation). This category includes cross-asset products such as dual range, emerging market currency baskets and Credit Default Baskets. Correlations are determined conservatively as a function of the bank’s aggregate exposure, based on historical data. If the diversity of correlations is high, exposures to each one remain measured;
� Equity correlation and hybrid equity products, whose pay-off depends on the relative performance of shares or indices in a basket (a basket which may sometimes include not just equities but other instruments such as indices or commodities). Measurements of these products are sensitive to the correlation between the basket components and may be classed as level 3 depending on their maturity, hybrid nature and the composition of the underlying basket.
� Interest rate derivatives whose coupon is indexed to forward volatility (Vol bonds);
� CDOs based on corporate credit baskets. The valuation model for these products uses both observable inputs (CDS prices) and unobservable inputs (default correlations). For the least liquid Senior tranches, Crédit Agricole CIB has introduced valuation inputs that are tailored to its assessment of the intrinsic risk of its exposures. Market risk of the CDO derivatives book was sold to a fund managed by Blue Mountain Capital in 2012.
� Market risk on complex equity derivative portfolios was transferred to an external counterparty on 31 December 2013.

CRÉDIT AGRICOLE S.A. 2014 REGISTRATION DOCUMENT 407
6
CONSOLIDATED FINANCIAL STATEMENTSNotes to the financial statements / Note 10
For most of these products, the table below shows the valuation techniques and the main unobservable inputs with their value interval. This analysis has been carried out on CIB’s derivative instruments.
AT 31 DECEMBER 2014
Instrument classes
Carrying amount (€m) Main product
types comprising Level 3
Valuation technique used
Main unobservable inputs
Unobservable data intervalAssets Liabilities
Interest rate derivatives
2,428 3,631 Long-dated cancellable products (cancellable swaps, cancellable zero coupon swaps)
Interest rate options valuation model
Forward volatility -
Options on interest rate differentials
CMS correlations 0%/100%
Securitisation swaps Prepayment modelling and discounted future cash flows
Prepayment rate 0%/50%
Long-dated hybrid interest rate/exchange rate products (PRDC)
Interest rate/FX hybrid product valuation model
Interest rate/interest rate correlation
50%/80%
Interest rate/FX correlation -50%/50%
Multiple-underlying products (dual range, etc.)
Valuation models for instruments with multiple underlyings
Fx/equity correlation -50%/75%
FX/FX correlation -20%/50%
Interest rate/equity correlation
-25%/75%
Interest rate/interest rate correlation
-10%/100%
Interest rate/FX correlation -75%/75%
Credit derivatives 502 539 CDOs indexed to corporate credit baskets
Correlation projection techniques and expected cash flow modelling
Default correlations 50%/90%
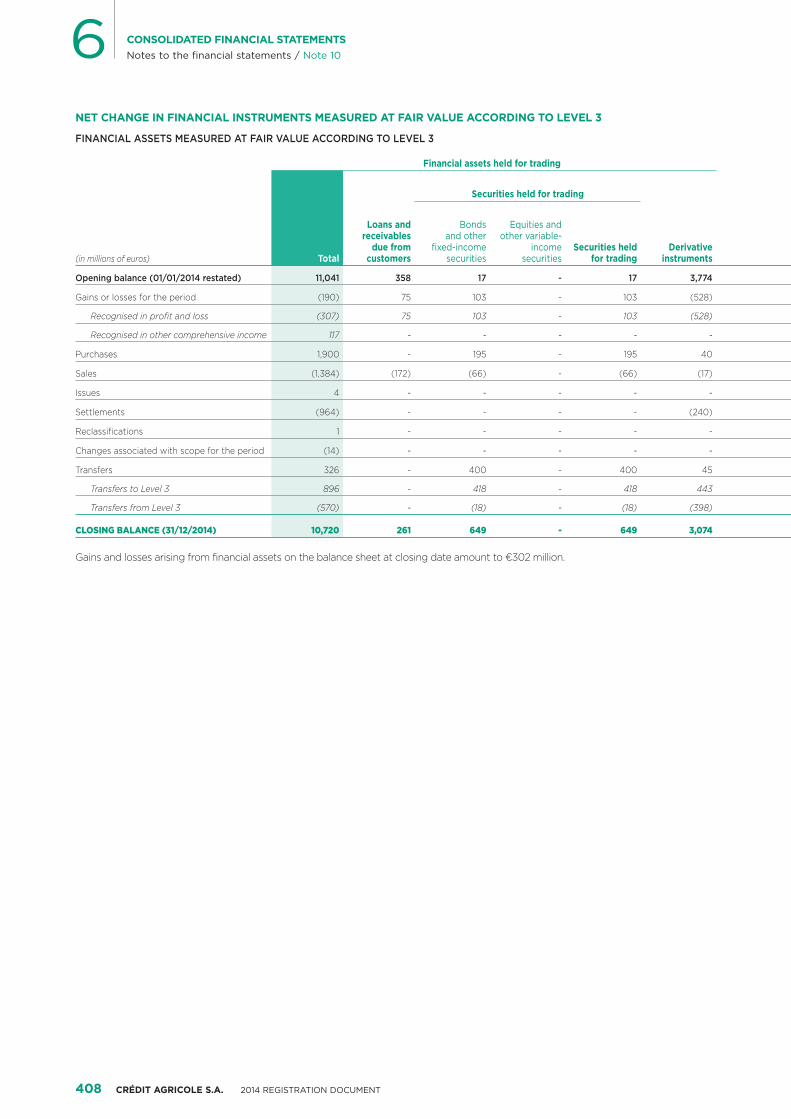
408 CRÉDIT AGRICOLE S.A. 2014 REGISTRATION DOCUMENT
6 CONSOLIDATED FINANCIAL STATEMENTSNotes to the financial statements / Note 10
NET CHANGE IN FINANCIAL INSTRUMENTS MEASURED AT FAIR VALUE ACCORDING TO LEVEL 3
FINANCIAL ASSETS MEASURED AT FAIR VALUE ACCORDING TO LEVEL 3
(in millions of euros)
Financial assets held for trading
Total
Loans and receivables
due from customers
Securities held for trading
Derivative instruments
Bonds and other
fixed-income securities
Equities and other variable-
income securities
Securities held for trading
Opening balance (01/01/2014 restated) 11,041 358 17 - 17 3,774
Gains or losses for the period (190) 75 103 - 103 (528)
Recognised in profit and loss (307) 75 103 - 103 (528)
Recognised in other comprehensive income 117 - - - - -
Purchases 1,900 - 195 - 195 40
Sales (1,384 ) (172) (66) - (66) (17)
Issues 4 - - - - -
Settlements (964) - - - - (240)
Reclassifications 1 - - - - -
Changes associated with scope for the period (14) - - - - -
Transfers 326 - 400 - 400 45
Transfers to Level 3 896 - 418 - 418 443
Transfers from Level 3 (570) - (18) - (18) (398)
CLOSING BALANCE (31/12/2014) 10,720 261 649 - 649 3,074
Gains and losses arising from financial assets on the balance sheet at closing date amount to €302 million.
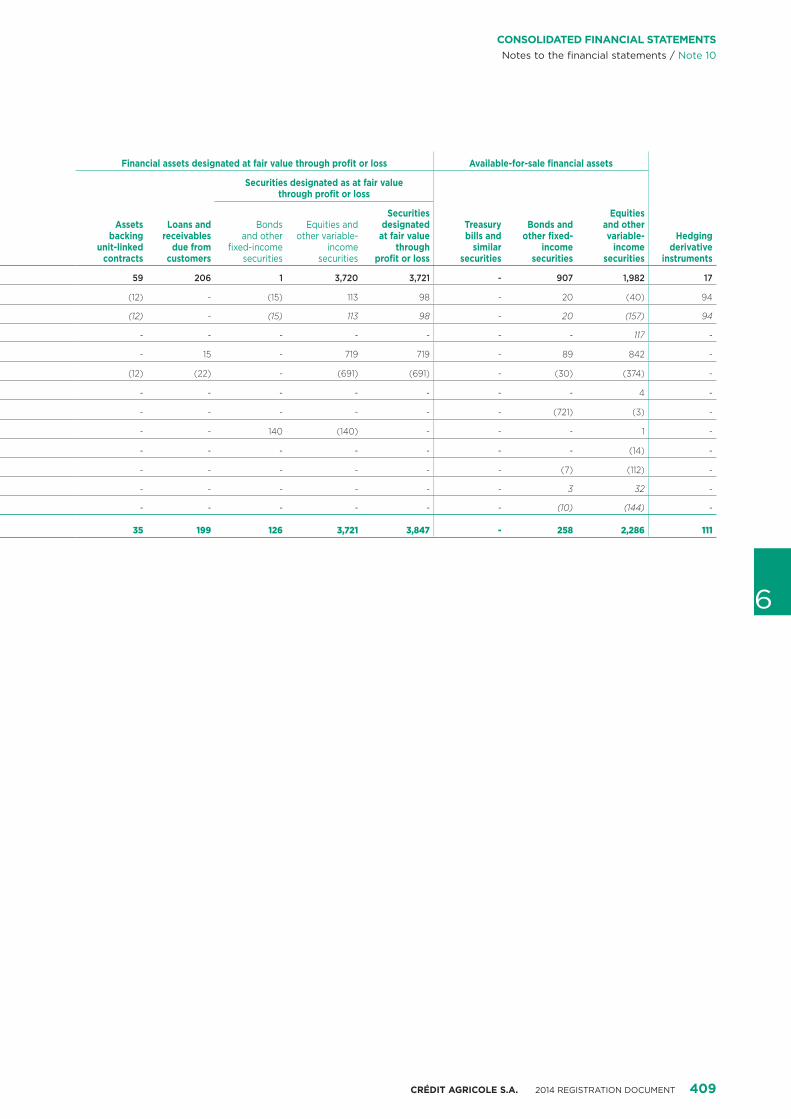
CRÉDIT AGRICOLE S.A. 2014 REGISTRATION DOCUMENT 409
6
CONSOLIDATED FINANCIAL STATEMENTSNotes to the financial statements / Note 10
Financial assets designated at fair value through profit or loss Available-for-sale financial assets
Hedging derivative
instruments
Assets backing
unit-linked contracts
Loans and receivables
due from customers
Securities designated as at fair value through profit or loss
Treasury bills and
similar securities
Bonds and other fixed-
income securities
Equities and other variable-
income securities
Bonds and other
fixed-income securities
Equities and other variable-
income securities
Securities designated
at fair value through
profit or loss
59 206 1 3,720 3,721 - 907 1,982 17
(12) - (15) 113 98 - 20 (40) 94
(12) - (15) 113 98 - 20 (157) 94
- - - - - - - 117 -
- 15 - 719 719 - 89 842 -
(12) (22) - (691) (691) - (30) (374) -
- - - - - - - 4 -
- - - - - - (721) (3) -
- - 140 (140) - - - 1 -
- - - - - - - (14) -
- - - - - - (7) (112) -
- - - - - - 3 32 -
- - - - - - (10) (144) -
35 199 126 3,721 3,847 - 258 2,286 111
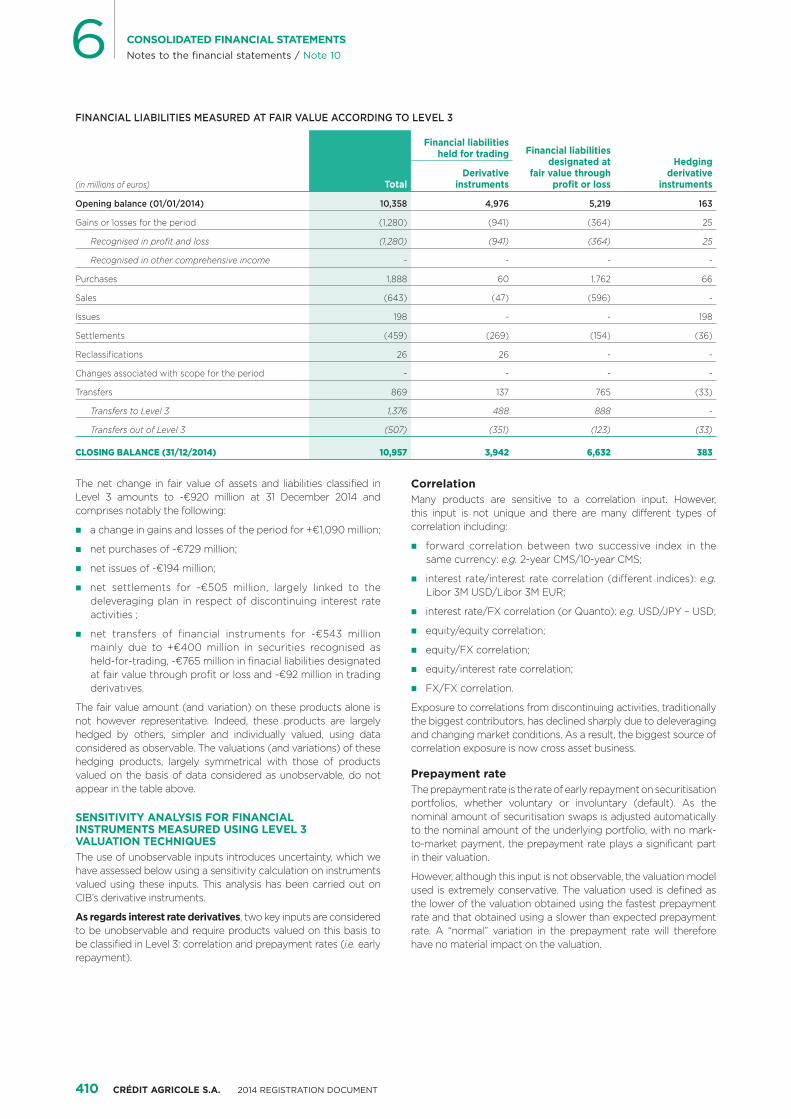
410 CRÉDIT AGRICOLE S.A. 2014 REGISTRATION DOCUMENT
6 CONSOLIDATED FINANCIAL STATEMENTSNotes to the financial statements / Note 10
FINANCIAL LIABILITIES MEASURED AT FAIR VALUE ACCORDING TO LEVEL 3
(in millions of euros) Total
Financial liabilities held for trading Financial liabilities
designated at fair value through
profit or loss
Hedging derivative
instrumentsDerivative
instruments
Opening balance (01/01/2014) 10,358 4,976 5,219 163
Gains or losses for the period (1,280) (941) (364) 25
Recognised in profit and loss (1,280) (941) (364) 25
Recognised in other comprehensive income - - - -
Purchases 1,888 60 1,762 66
Sales (643) (47) (596) -
Issues 198 - - 198
Settlements (459) (269) (154) (36)
Reclassifications 26 26 - -
Changes associated with scope for the period - - - -
Transfers 869 137 765 (33)
Transfers to Level 3 1,376 488 888 -
Transfers out of Level 3 (507) (351) (123) (33)
CLOSING BALANCE (31/12/2014) 10,957 3,942 6,632 383
The net change in fair value of assets and liabilities classified in Level 3 amounts to -€920 million at 31 December 2014 and comprises notably the following:
� a change in gains and losses of the period for +€1,090 million;
� net purchases of -€729 million;
� net issues of -€194 million;
� net settlements for -€505 million, largely linked to the deleveraging plan in respect of discontinuing interest rate activities ;
� net transfers of financial instruments for -€543 million mainly due to +€400 million in securities recognised as held-for-trading, -€765 million in finacial liabilities designated at fair value through profit or loss and -€92 million in trading derivatives.
The fair value amount (and variation) on these products alone is not however representative. Indeed, these products are largely hedged by others, simpler and individually valued, using data considered as observable. The valuations (and variations) of these hedging products, largely symmetrical with those of products valued on the basis of data considered as unobservable, do not appear in the table above.
SENSITIVITY ANALYSIS FOR FINANCIAL INSTRUMENTS MEASURED USING LEVEL 3 VALUATION TECHNIQUESThe use of unobservable inputs introduces uncertainty, which we have assessed below using a sensitivity calculation on instruments valued using these inputs. This analysis has been carried out on CIB’s derivative instruments.
As regards interest rate derivatives, two key inputs are considered to be unobservable and require products valued on this basis to be classified in Level 3: correlation and prepayment rates (i.e. early repayment).
CorrelationMany products are sensitive to a correlation input. However, this input is not unique and there are many different types of correlation including:
� forward correlation between two successive index in the same currency: e.g. 2-year CMS/10-year CMS;
� interest rate/interest rate correlation (different indices): e.g. Libor 3M USD/Libor 3M EUR;
� interest rate/FX correlation (or Quanto): e.g. USD/JPY – USD;
� equity/equity correlation;
� equity/FX correlation;
� equity/interest rate correlation;
� FX/FX correlation.
Exposure to correlations from discontinuing activities, traditionally the biggest contributors, has declined sharply due to deleveraging and changing market conditions. As a result, the biggest source of correlation exposure is now cross asset business.
Prepayment rateThe prepayment rate is the rate of early repayment on securitisation portfolios, whether voluntary or involuntary (default). As the nominal amount of securitisation swaps is adjusted automatically to the nominal amount of the underlying portfolio, with no mark-to-market payment, the prepayment rate plays a significant part in their valuation.
However, although this input is not observable, the valuation model used is extremely conservative. The valuation used is defined as the lower of the valuation obtained using the fastest prepayment rate and that obtained using a slower than expected prepayment rate. A “normal” variation in the prepayment rate will therefore have no material impact on the valuation.
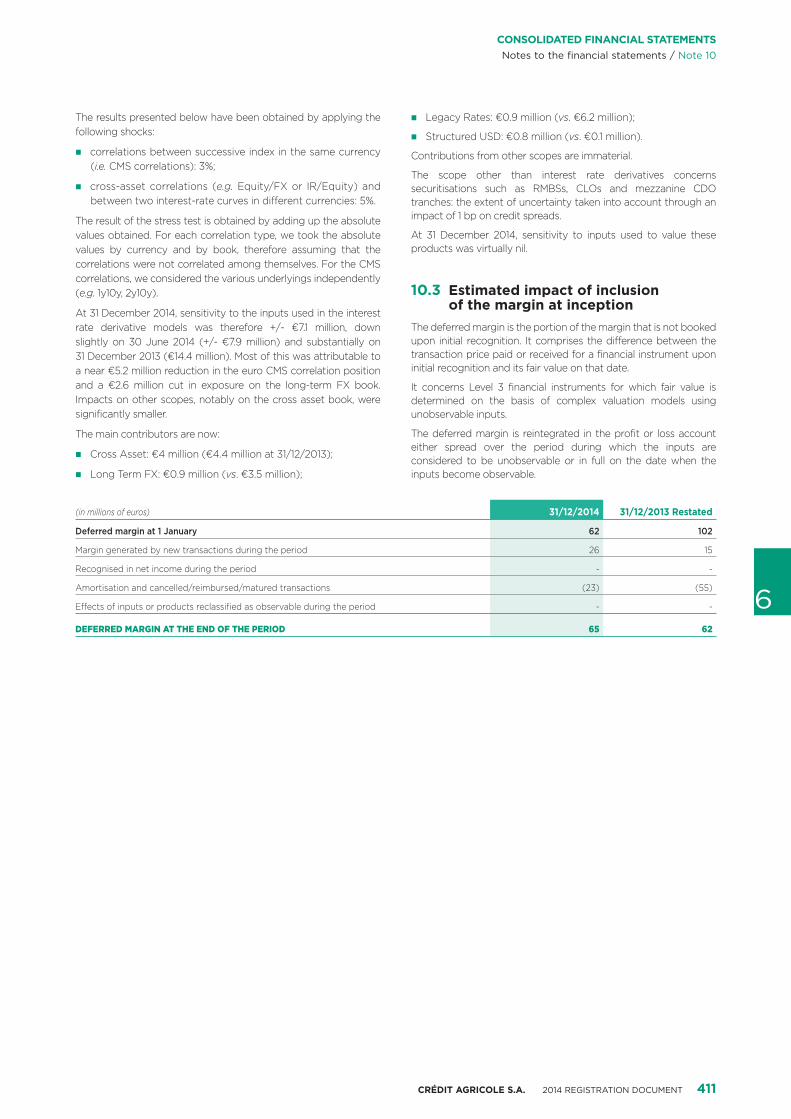
CRÉDIT AGRICOLE S.A. 2014 REGISTRATION DOCUMENT 411
6
CONSOLIDATED FINANCIAL STATEMENTSNotes to the financial statements / Note 10
The results presented below have been obtained by applying the following shocks:
� correlations between successive index in the same currency (i.e. CMS correlations): 3%;
� cross-asset correlations (e.g. Equity/FX or IR/Equity) and between two interest-rate curves in different currencies: 5%.
The result of the stress test is obtained by adding up the absolute values obtained. For each correlation type, we took the absolute values by currency and by book, therefore assuming that the correlations were not correlated among themselves. For the CMS correlations, we considered the various underlyings independently (e.g. 1y10y, 2y10y).
At 31 December 2014, sensitivity to the inputs used in the interest rate derivative models was therefore +/- €7.1 million, down slightly on 30 June 2014 (+/- €7.9 million) and substantially on 31 December 2013 (€14.4 million). Most of this was attributable to a near €5.2 million reduction in the euro CMS correlation position and a €2.6 million cut in exposure on the long-term FX book. Impacts on other scopes, notably on the cross asset book, were significantly smaller.
The main contributors are now:
� Cross Asset: €4 million (€4.4 million at 31/12/2013);
� Long Term FX: €0.9 million (vs. €3.5 million);
� Legacy Rates: €0.9 million (vs. €6.2 million);
� Structured USD: €0.8 million (vs. €0.1 million).
Contributions from other scopes are immaterial.
The scope other than interest rate derivatives concerns securitisations such as RMBSs, CLOs and mezzanine CDO tranches: the extent of uncertainty taken into account through an impact of 1 bp on credit spreads.
At 31 December 2014, sensitivity to inputs used to value these products was virtually nil.
10.3 Estimated impact of inclusion of the margin at inception
The deferred margin is the portion of the margin that is not booked upon initial recognition. It comprises the difference between the transaction price paid or received for a financial instrument upon initial recognition and its fair value on that date.
It concerns Level 3 financial instruments for which fair value is determined on the basis of complex valuation models using unobservable inputs.
The deferred margin is reintegrated in the profit or loss account either spread over the period during which the inputs are considered to be unobservable or in full on the date when the inputs become observable.
(in millions of euros) 31/12/2014 31/12/2013 Restated
Deferred margin at 1 January 62 102
Margin generated by new transactions during the period 26 15
Recognised in net income during the period - -
Amortisation and cancelled/reimbursed/matured transactions (23) (55)
Effects of inputs or products reclassified as observable during the period - -
DEFERRED MARGIN AT THE END OF THE PERIOD 65 62
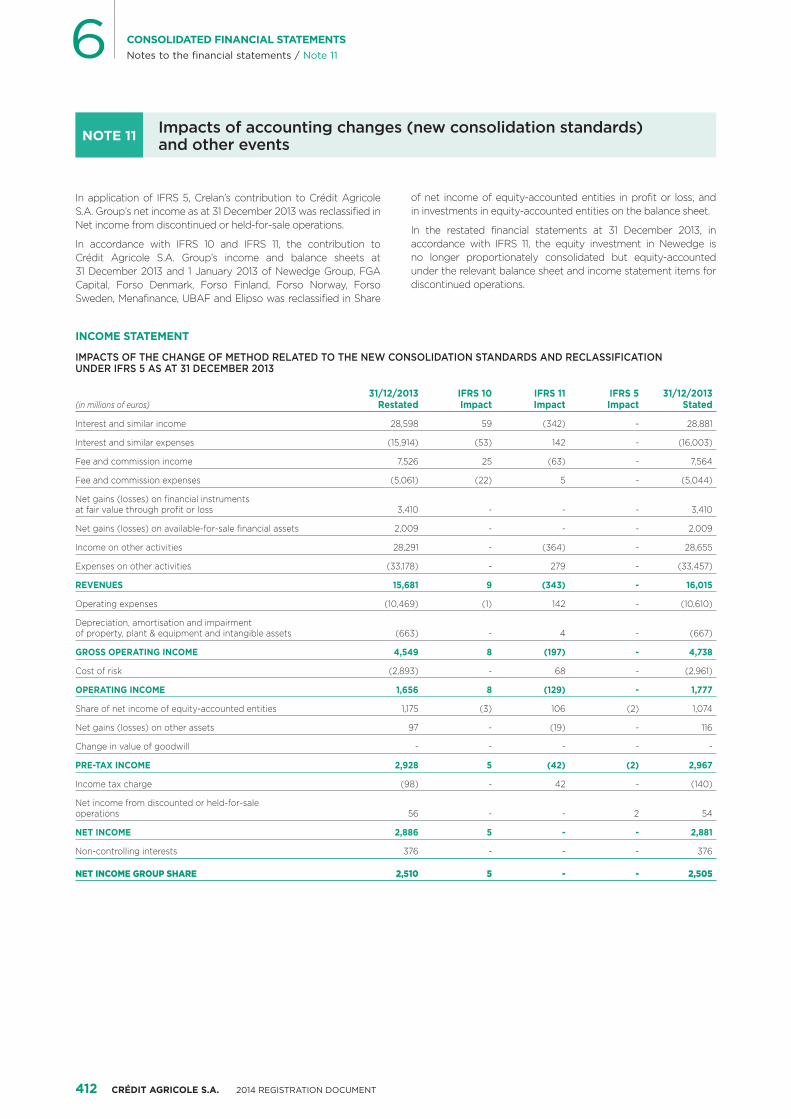
412 CRÉDIT AGRICOLE S.A. 2014 REGISTRATION DOCUMENT
6 CONSOLIDATED FINANCIAL STATEMENTSNotes to the financial statements / Note 11
NOTE 11 Impacts of accounting changes (new consolidation standards) and other events
In application of IFRS 5, Crelan’s contribution to Crédit Agricole S.A. Group’s net income as at 31 December 2013 was reclassified in Net income from discontinued or held-for-sale operations.
In accordance with IFRS 10 and IFRS 11, the contribution to Crédit Agricole S.A. Group’s income and balance sheets at 31 December 2013 and 1 January 2013 of Newedge Group, FGA Capital, Forso Denmark, Forso Finland, Forso Norway, Forso Sweden, Menafinance, UBAF and Elipso was reclassified in Share
of net income of equity-accounted entities in profit or loss, and in investments in equity-accounted entities on the balance sheet.
In the restated financial statements at 31 December 2013, in accordance with IFRS 11, the equity investment in Newedge is no longer proportionately consolidated but equity-accounted under the relevant balance sheet and income statement items for discontinued operations.
INCOME STATEMENT
IMPACTS OF THE CHANGE OF METHOD RELATED TO THE NEW CONSOLIDATION STANDARDS AND RECLASSIFICATION UNDER IFRS 5 AS AT 31 DECEMBER 2013
(in millions of euros)31/12/2013
RestatedIFRS 10 Impact
IFRS 11 Impact
IFRS 5 Impact
31/12/2013 Stated
Interest and similar income 28,598 59 (342) - 28,881
Interest and similar expenses (15,914) (53) 142 - (16,003)
Fee and commission income 7,526 25 (63) - 7,564
Fee and commission expenses (5,061) (22) 5 - (5,044)
Net gains (losses) on financial instruments at fair value through profit or loss 3,410 - - - 3,410
Net gains (losses) on available-for-sale financial assets 2,009 - - - 2,009
Income on other activities 28,291 - (364) - 28,655
Expenses on other activities (33,178) - 279 - (33,457)
REVENUES 15,681 9 (343) - 16,015
Operating expenses (10,469) (1) 142 - (10,610)
Depreciation, amortisation and impairment of property, plant & equipment and intangible assets (663) - 4 - (667)
GROSS OPERATING INCOME 4,549 8 (197) - 4,738
Cost of risk (2,893) - 68 - (2,961)
OPERATING INCOME 1,656 8 (129) - 1,777
Share of net income of equity-accounted entities 1,175 (3) 106 (2) 1,074
Net gains (losses) on other assets 97 - (19) - 116
Change in value of goodwill - - - - -
PRE-TAX INCOME 2,928 5 (42) (2) 2,967
Income tax charge (98) - 42 - (140)
Net income from discounted or held-for-sale operations 56 - - 2 54
NET INCOME 2,886 5 - - 2,881
Non-controlling interests 376 - - - 376
NET INCOME GROUP SHARE 2,510 5 - - 2,505
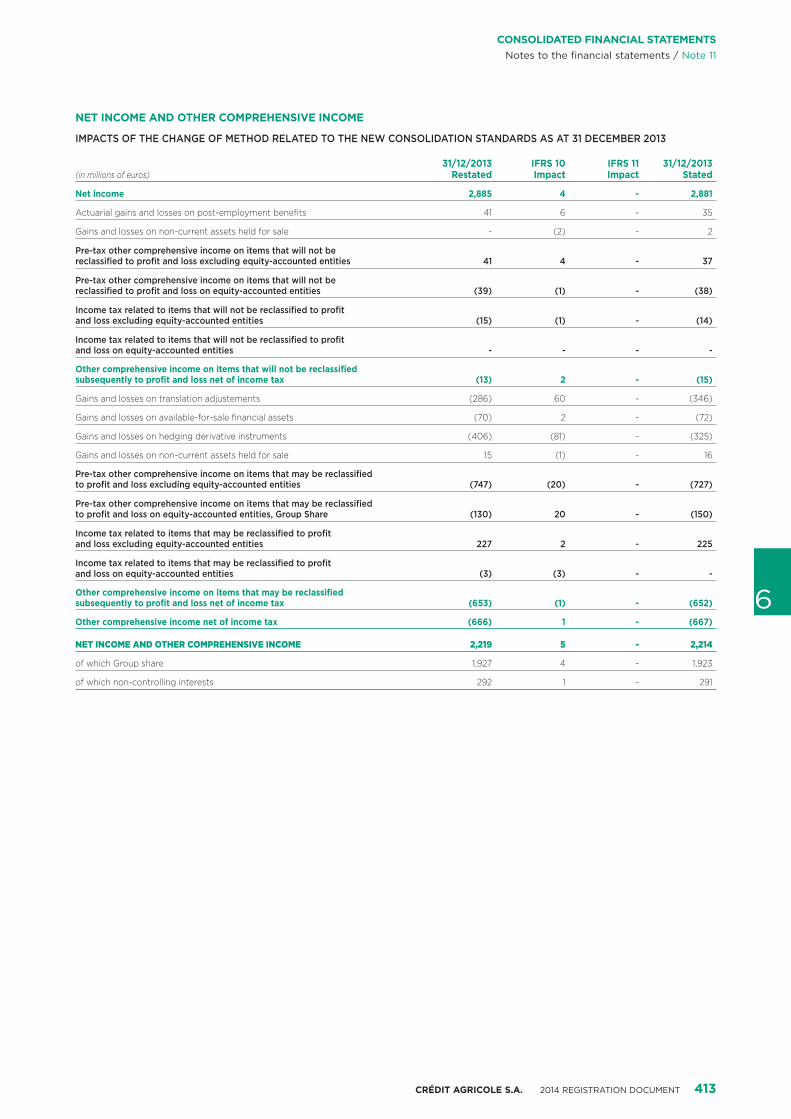
CRÉDIT AGRICOLE S.A. 2014 REGISTRATION DOCUMENT 413
6
CONSOLIDATED FINANCIAL STATEMENTSNotes to the financial statements / Note 11
NET INCOME AND OTHER COMPREHENSIVE INCOME
IMPACTS OF THE CHANGE OF METHOD RELATED TO THE NEW CONSOLIDATION STANDARDS AS AT 31 DECEMBER 2013
(in millions of euros)31/12/2013
RestatedIFRS 10 Impact
IFRS 11 Impact
31/12/2013 Stated
Net income 2,885 4 - 2,881
Actuarial gains and losses on post-employment benefits 41 6 - 35
Gains and losses on non-current assets held for sale - (2) - 2
Pre-tax other comprehensive income on items that will not be reclassified to profit and loss excluding equity-accounted entities 41 4 - 37
Pre-tax other comprehensive income on items that will not be reclassified to profit and loss on equity-accounted entities (39) (1) - (38)
Income tax related to items that will not be reclassified to profit and loss excluding equity-accounted entities (15) (1) - (14)
Income tax related to items that will not be reclassified to profit and loss on equity-accounted entities - - - -
Other comprehensive income on items that will not be reclassified subsequently to profit and loss net of income tax (13) 2 - (15)
Gains and losses on translation adjustements (286) 60 - (346)
Gains and losses on available-for-sale financial assets (70) 2 - (72)
Gains and losses on hedging derivative instruments (406) (81) - (325)
Gains and losses on non-current assets held for sale 15 (1) - 16
Pre-tax other comprehensive income on items that may be reclassified to profit and loss excluding equity-accounted entities (747) (20) - (727)
Pre-tax other comprehensive income on items that may be reclassified to profit and loss on equity-accounted entities, Group Share (130) 20 - (150)
Income tax related to items that may be reclassified to profit and loss excluding equity-accounted entities 227 2 - 225
Income tax related to items that may be reclassified to profit and loss on equity-accounted entities (3) (3) - -
Other comprehensive income on items that may be reclassified subsequently to profit and loss net of income tax (653) (1) - (652)
Other comprehensive income net of income tax (666) 1 - (667)
NET INCOME AND OTHER COMPREHENSIVE INCOME 2,219 5 - 2,214
of which Group share 1,927 4 - 1,923
of which non-controlling interests 292 1 - 291
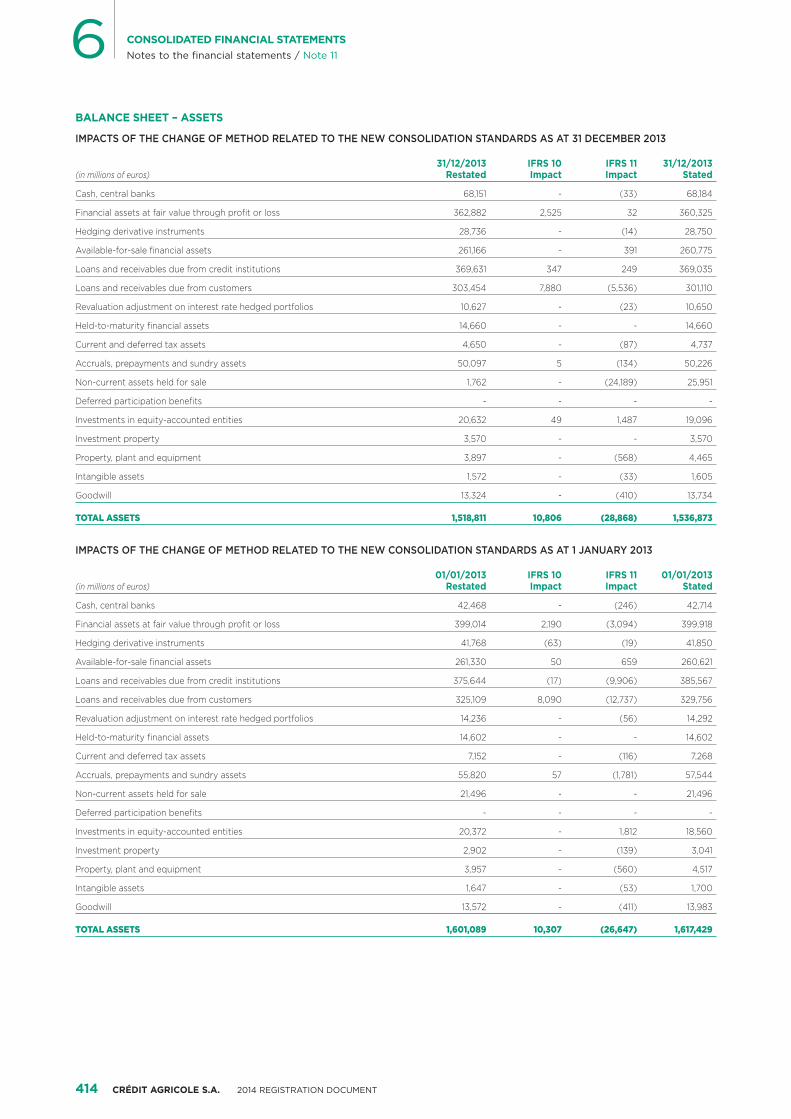
414 CRÉDIT AGRICOLE S.A. 2014 REGISTRATION DOCUMENT
6 CONSOLIDATED FINANCIAL STATEMENTSNotes to the financial statements / Note 11
BALANCE SHEET – ASSETS
IMPACTS OF THE CHANGE OF METHOD RELATED TO THE NEW CONSOLIDATION STANDARDS AS AT 31 DECEMBER 2013
(in millions of euros)31/12/2013
RestatedIFRS 10 Impact
IFRS 11 Impact
31/12/2013 Stated
Cash, central banks 68,151 - (33) 68,184
Financial assets at fair value through profit or loss 362,882 2,525 32 360,325
Hedging derivative instruments 28,736 - (14) 28,750
Available-for-sale financial assets 261,166 - 391 260,775
Loans and receivables due from credit institutions 369,631 347 249 369,035
Loans and receivables due from customers 303,454 7,880 (5,536) 301,110
Revaluation adjustment on interest rate hedged portfolios 10,627 - (23) 10,650
Held-to-maturity financial assets 14,660 - - 14,660
Current and deferred tax assets 4,650 - (87) 4,737
Accruals, prepayments and sundry assets 50,097 5 (134) 50,226
Non-current assets held for sale 1,762 - (24,189) 25,951
Deferred participation benefits - - - -
Investments in equity-accounted entities 20,632 49 1,487 19,096
Investment property 3,570 - - 3,570
Property, plant and equipment 3,897 - (568) 4,465
Intangible assets 1,572 - (33) 1,605
Goodwill 13,324 - (410) 13,734
TOTAL ASSETS 1,518,811 10,806 (28,868) 1,536,873
IMPACTS OF THE CHANGE OF METHOD RELATED TO THE NEW CONSOLIDATION STANDARDS AS AT 1 JANUARY 2013
(in millions of euros)01/01/2013
RestatedIFRS 10 Impact
IFRS 11 Impact
01/01/2013 Stated
Cash, central banks 42,468 - (246) 42,714
Financial assets at fair value through profit or loss 399,014 2,190 (3,094) 399,918
Hedging derivative instruments 41,768 (63) (19) 41,850
Available-for-sale financial assets 261,330 50 659 260,621
Loans and receivables due from credit institutions 375,644 (17) (9,906) 385,567
Loans and receivables due from customers 325,109 8,090 (12,737) 329,756
Revaluation adjustment on interest rate hedged portfolios 14,236 - (56) 14,292
Held-to-maturity financial assets 14,602 - - 14,602
Current and deferred tax assets 7,152 - (116) 7,268
Accruals, prepayments and sundry assets 55,820 57 (1,781) 57,544
Non-current assets held for sale 21,496 - - 21,496
Deferred participation benefits - - - -
Investments in equity-accounted entities 20,372 - 1,812 18,560
Investment property 2,902 - (139) 3,041
Property, plant and equipment 3,957 - (560) 4,517
Intangible assets 1,647 - (53) 1,700
Goodwill 13,572 - (411) 13,983
TOTAL ASSETS 1,601,089 10,307 (26,647) 1,617,429
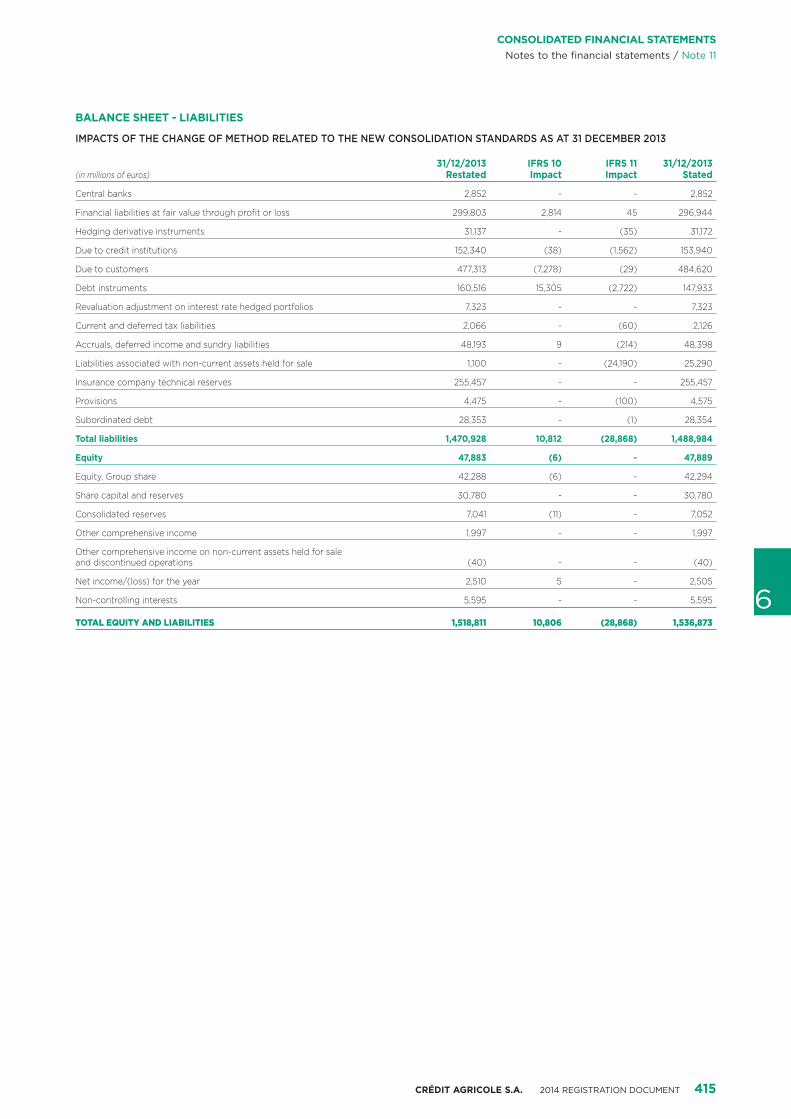
CRÉDIT AGRICOLE S.A. 2014 REGISTRATION DOCUMENT 415
6
CONSOLIDATED FINANCIAL STATEMENTSNotes to the financial statements / Note 11
BALANCE SHEET - LIABILITIES
IMPACTS OF THE CHANGE OF METHOD RELATED TO THE NEW CONSOLIDATION STANDARDS AS AT 31 DECEMBER 2013
(in millions of euros)31/12/2013
RestatedIFRS 10 Impact
IFRS 11 Impact
31/12/2013 Stated
Central banks 2,852 - - 2,852
Financial liabilities at fair value through profit or loss 299,803 2,814 45 296,944
Hedging derivative instruments 31,137 - (35) 31,172
Due to credit institutions 152,340 (38) (1,562) 153,940
Due to customers 477,313 (7,278) (29) 484,620
Debt instruments 160,516 15,305 (2,722) 147,933
Revaluation adjustment on interest rate hedged portfolios 7,323 - - 7,323
Current and deferred tax liabilities 2,066 - (60) 2,126
Accruals, deferred income and sundry liabilities 48,193 9 (214) 48,398
Liabilities associated with non-current assets held for sale 1,100 - (24,190) 25,290
Insurance company technical reserves 255,457 - - 255,457
Provisions 4,475 - (100) 4,575
Subordinated debt 28,353 - (1) 28,354
Total liabilities 1,470,928 10,812 (28,868) 1,488,984
Equity 47,883 (6) - 47,889
Equity, Group share 42,288 (6) - 42,294
Share capital and reserves 30,780 - - 30,780
Consolidated reserves 7,041 (11) - 7,052
Other comprehensive income 1,997 - - 1,997
Other comprehensive income on non-current assets held for sale and discontinued operations (40) - - (40)
Net income/(loss) for the year 2,510 5 - 2,505
Non-controlling interests 5,595 - - 5,595
TOTAL EQUITY AND LIABILITIES 1,518,811 10,806 (28,868) 1,536,873
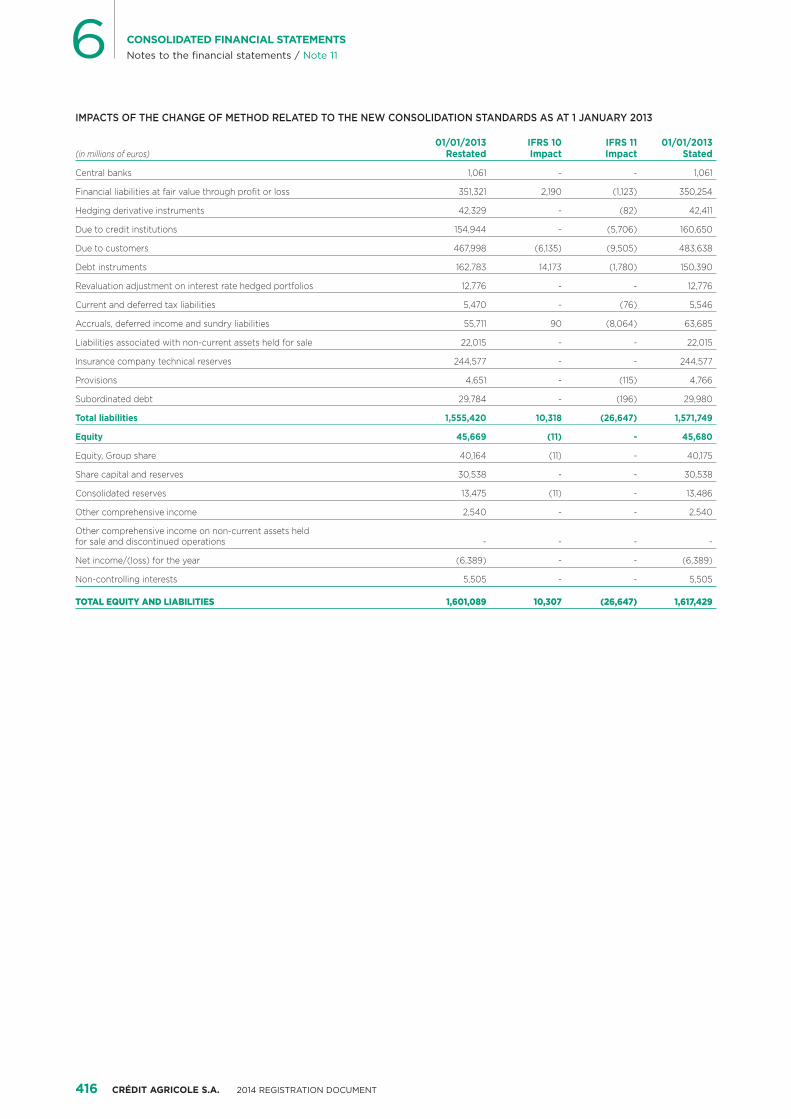
416 CRÉDIT AGRICOLE S.A. 2014 REGISTRATION DOCUMENT
6 CONSOLIDATED FINANCIAL STATEMENTSNotes to the financial statements / Note 11
IMPACTS OF THE CHANGE OF METHOD RELATED TO THE NEW CONSOLIDATION STANDARDS AS AT 1 JANUARY 2013
(in millions of euros)01/01/2013
RestatedIFRS 10 Impact
IFRS 11 Impact
01/01/2013 Stated
Central banks 1,061 - - 1,061
Financial liabilities at fair value through profit or loss 351,321 2,190 (1,123) 350,254
Hedging derivative instruments 42,329 - (82) 42,411
Due to credit institutions 154,944 - (5,706) 160,650
Due to customers 467,998 (6,135) (9,505) 483,638
Debt instruments 162,783 14,173 (1,780) 150,390
Revaluation adjustment on interest rate hedged portfolios 12,776 - - 12,776
Current and deferred tax liabilities 5,470 - (76) 5,546
Accruals, deferred income and sundry liabilities 55,711 90 (8,064) 63,685
Liabilities associated with non-current assets held for sale 22,015 - - 22,015
Insurance company technical reserves 244,577 - - 244,577
Provisions 4,651 - (115) 4,766
Subordinated debt 29,784 - (196) 29,980
Total liabilities 1,555,420 10,318 (26,647) 1,571,749
Equity 45,669 (11) - 45,680
Equity, Group share 40,164 (11) - 40,175
Share capital and reserves 30,538 - - 30,538
Consolidated reserves 13,475 (11) - 13,486
Other comprehensive income 2,540 - - 2,540
Other comprehensive income on non-current assets held for sale and discontinued operations - - - -
Net income/(loss) for the year (6,389) - - (6,389)
Non-controlling interests 5,505 - - 5,505
TOTAL EQUITY AND LIABILITIES 1,601,089 10,307 (26,647) 1,617,429
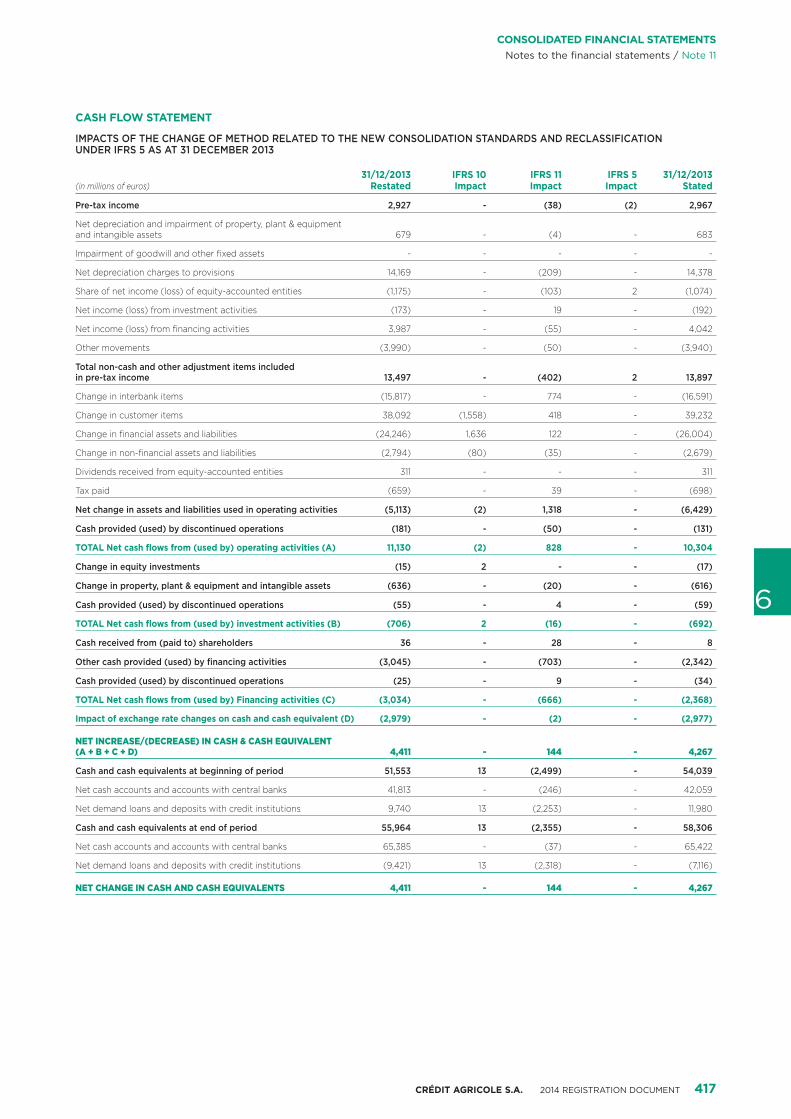
CRÉDIT AGRICOLE S.A. 2014 REGISTRATION DOCUMENT 417
6
CONSOLIDATED FINANCIAL STATEMENTSNotes to the financial statements / Note 11
CASH FLOW STATEMENT
IMPACTS OF THE CHANGE OF METHOD RELATED TO THE NEW CONSOLIDATION STANDARDS AND RECLASSIFICATION UNDER IFRS 5 AS AT 31 DECEMBER 2013
(in millions of euros)31/12/2013
RestatedIFRS 10 Impact
IFRS 11 Impact
IFRS 5 Impact
31/12/2013 Stated
Pre-tax income 2,927 - (38) (2) 2,967
Net depreciation and impairment of property, plant & equipment and intangible assets 679 - (4) - 683
Impairment of goodwill and other fixed assets - - - - -
Net depreciation charges to provisions 14,169 - (209) - 14,378
Share of net income (loss) of equity-accounted entities (1,175) - (103) 2 (1,074)
Net income (loss) from investment activities (173) - 19 - (192)
Net income (loss) from financing activities 3,987 - (55) - 4,042
Other movements (3,990) - (50) - (3,940)
Total non-cash and other adjustment items included in pre-tax income 13,497 - (402) 2 13,897
Change in interbank items (15,817) - 774 - (16,591)
Change in customer items 38,092 (1,558) 418 - 39,232
Change in financial assets and liabilities (24,246) 1,636 122 - (26,004)
Change in non-financial assets and liabilities (2,794) (80) (35) - (2,679)
Dividends received from equity-accounted entities 311 - - - 311
Tax paid (659) - 39 - (698)
Net change in assets and liabilities used in operating activities (5,113) (2) 1,318 - (6,429)
Cash provided (used) by discontinued operations (181) - (50) - (131)
TOTAL Net cash flows from (used by) operating activities (A) 11,130 (2) 828 - 10,304
Change in equity investments (15) 2 - - (17)
Change in property, plant & equipment and intangible assets (636) - (20) - (616)
Cash provided (used) by discontinued operations (55) - 4 - (59)
TOTAL Net cash flows from (used by) investment activities (B) (706) 2 (16) - (692)
Cash received from (paid to) shareholders 36 - 28 - 8
Other cash provided (used) by financing activities (3,045) - (703) - (2,342)
Cash provided (used) by discontinued operations (25) - 9 - (34)
TOTAL Net cash flows from (used by) Financing activities (C) (3,034) - (666) - (2,368)
Impact of exchange rate changes on cash and cash equivalent (D) (2,979) - (2) - (2,977)
NET INCREASE/(DECREASE) IN CASH & CASH EQUIVALENT (A + B + C + D) 4,411 - 144 - 4,267
Cash and cash equivalents at beginning of period 51,553 13 (2,499) - 54,039
Net cash accounts and accounts with central banks 41,813 - (246) - 42,059
Net demand loans and deposits with credit institutions 9,740 13 (2,253) - 11,980
Cash and cash equivalents at end of period 55,964 13 (2,355) - 58,306
Net cash accounts and accounts with central banks 65,385 - (37) - 65,422
Net demand loans and deposits with credit institutions (9,421) 13 (2,318) - (7,116)
NET CHANGE IN CASH AND CASH EQUIVALENTS 4,411 - 144 - 4,267
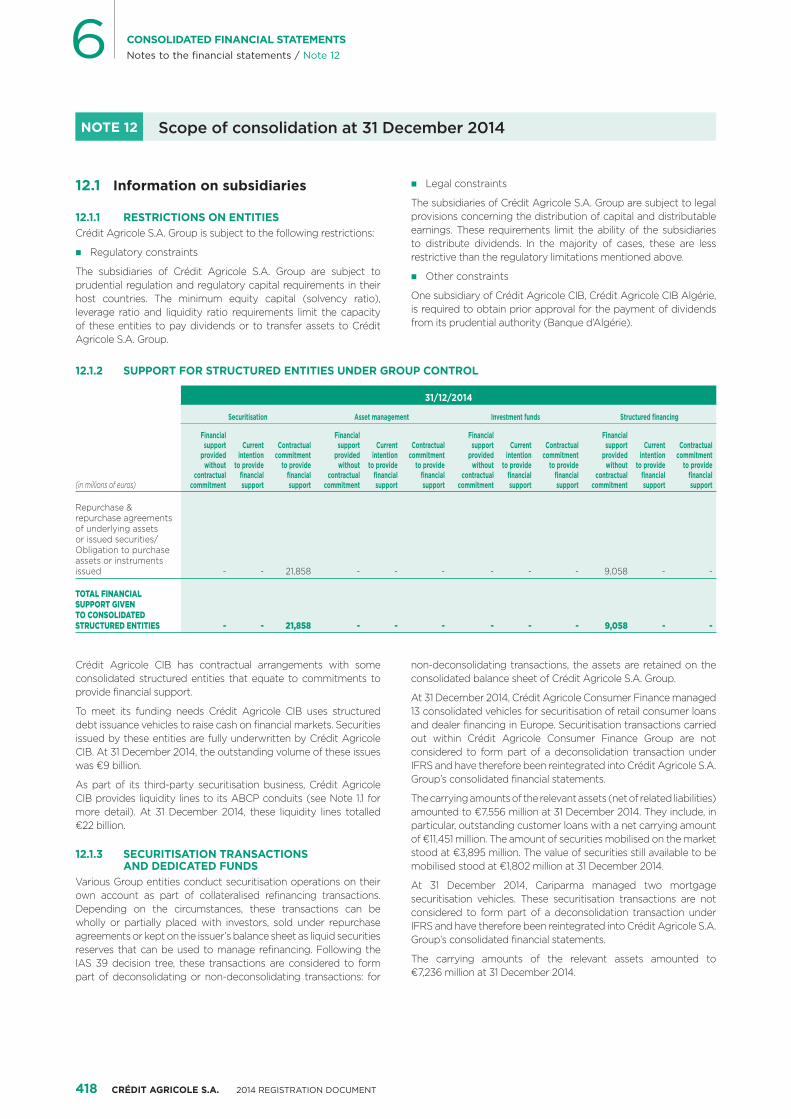
418 CRÉDIT AGRICOLE S.A. 2014 REGISTRATION DOCUMENT
6 CONSOLIDATED FINANCIAL STATEMENTSNotes to the financial statements / Note 12
NOTE 12 Scope of consolidation at 31 December 2014
12.1 Information on subsidiaries
12.1.1 RESTRICTIONS ON ENTITIESCrédit Agricole S.A. Group is subject to the following restrictions:
� Regulatory constraints
The subsidiaries of Crédit Agricole S.A. Group are subject to prudential regulation and regulatory capital requirements in their host countries. The minimum equity capital (solvency ratio), leverage ratio and liquidity ratio requirements limit the capacity of these entities to pay dividends or to transfer assets to Crédit Agricole S.A. Group.
� Legal constraints
The subsidiaries of Crédit Agricole S.A. Group are subject to legal provisions concerning the distribution of capital and distributable earnings. These requirements limit the ability of the subsidiaries to distribute dividends. In the majority of cases, these are less restrictive than the regulatory limitations mentioned above.
� Other constraints
One subsidiary of Crédit Agricole CIB, Crédit Agricole CIB Algérie, is required to obtain prior approval for the payment of dividends from its prudential authority (Banque d’Algérie).
12.1.2 SUPPORT FOR STRUCTURED ENTITIES UNDER GROUP CONTROL
(in millions of euros)
31/12/2014
Securitisation Asset management Investment funds Structured financing
Financial support
provided without
contractual commitment
Current intention
to provide financial support
Contractual commitment
to provide financial support
Financial support
provided without
contractual commitment
Current intention
to provide financial support
Contractual commitment
to provide financial support
Financial support
provided without
contractual commitment
Current intention
to provide financial support
Contractual commitment
to provide financial support
Financial support
provided without
contractual commitment
Current intention
to provide financial support
Contractual commitment
to provide financial support
Repurchase & repurchase agreements of underlying assets or issued securities/Obligation to purchase assets or instruments issued - - 21,858 - - - - - - 9,058 - -
TOTAL FINANCIAL SUPPORT GIVEN TO CONSOLIDATED STRUCTURED ENTITIES - - 21,858 - - - - - - 9,058 - -
Crédit Agricole CIB has contractual arrangements with some consolidated structured entities that equate to commitments to provide financial support.
To meet its funding needs Crédit Agricole CIB uses structured debt issuance vehicles to raise cash on financial markets. Securities issued by these entities are fully underwritten by Crédit Agricole CIB. At 31 December 2014, the outstanding volume of these issues was €9 billion.
As part of its third-party securitisation business, Crédit Agricole CIB provides liquidity lines to its ABCP conduits (see Note 1.1 for more detail). At 31 December 2014, these liquidity lines totalled €22 billion.
12.1.3 SECURITISATION TRANSACTIONS AND DEDICATED FUNDS
Various Group entities conduct securitisation operations on their own account as part of collateralised refinancing transactions. Depending on the circumstances, these transactions can be wholly or partially placed with investors, sold under repurchase agreements or kept on the issuer’s balance sheet as liquid securities reserves that can be used to manage refinancing. Following the IAS 39 decision tree, these transactions are considered to form part of deconsolidating or non-deconsolidating transactions: for
non-deconsolidating transactions, the assets are retained on the consolidated balance sheet of Crédit Agricole S.A. Group.
At 31 December 2014, Crédit Agricole Consumer Finance managed 13 consolidated vehicles for securitisation of retail consumer loans and dealer financing in Europe. Securitisation transactions carried out within Crédit Agricole Consumer Finance Group are not considered to form part of a deconsolidation transaction under IFRS and have therefore been reintegrated into Crédit Agricole S.A. Group’s consolidated financial statements.
The carrying amounts of the relevant assets (net of related liabilities) amounted to €7,556 million at 31 December 2014. They include, in particular, outstanding customer loans with a net carrying amount of €11,451 million. The amount of securities mobilised on the market stood at €3,895 million. The value of securities still available to be mobilised stood at €1,802 million at 31 December 2014.
At 31 December 2014, Cariparma managed two mortgage securitisation vehicles. These securitisation transactions are not considered to form part of a deconsolidation transaction under IFRS and have therefore been reintegrated into Crédit Agricole S.A. Group’s consolidated financial statements.
The carrying amounts of the relevant assets amounted to €7,236 million at 31 December 2014.
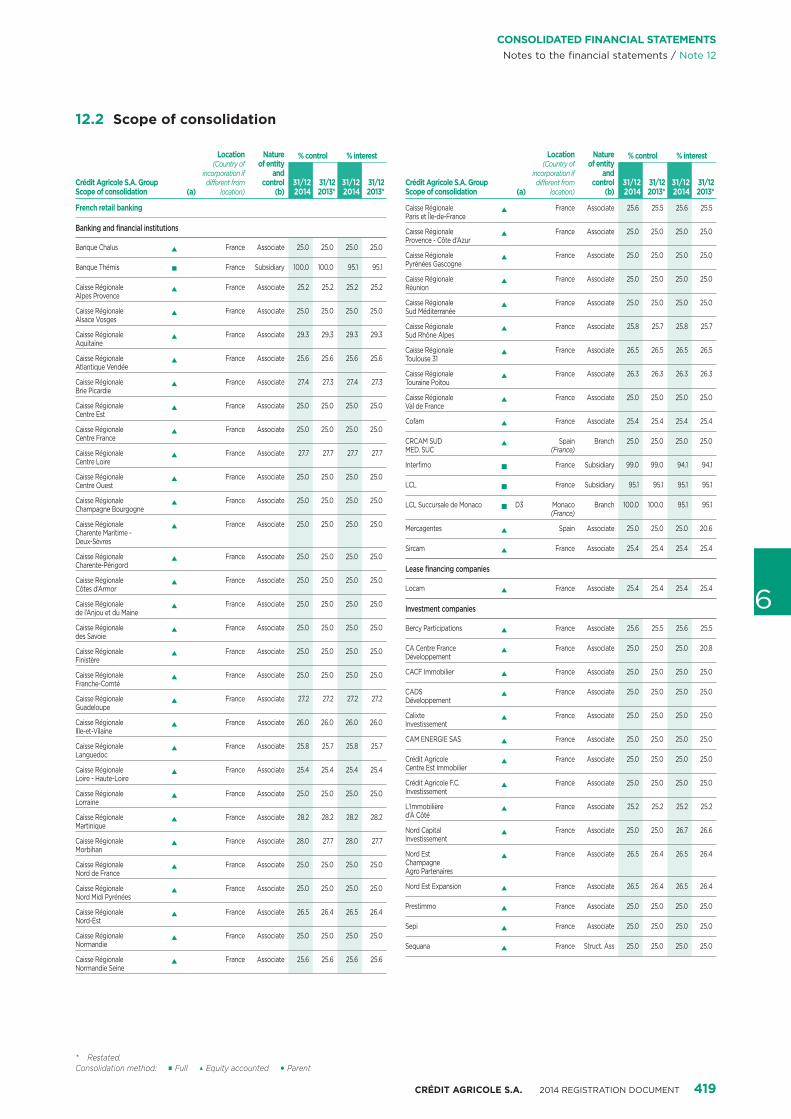
CRÉDIT AGRICOLE S.A. 2014 REGISTRATION DOCUMENT 419
6
CONSOLIDATED FINANCIAL STATEMENTSNotes to the financial statements / Note 12
12.2 Scope of consolidation
Crédit Agricole S.A. Group Scope of consolidation (a)
Location(Country of
incorporation if different from
location)
Nature of entity
and control
(b)
% control % interest
31/122014
31/122013*
31/122014
31/122013*
French retail banking
Banking and financial institutions
Banque Chalusi
France Associate 25.0 25.0 25.0 25.0
Banque Thémisp
France Subsidiary 100.0 100.0 95.1 95.1
Caisse Régionale Alpes Provence
iFrance Associate 25.2 25.2 25.2 25.2
Caisse Régionale Alsace Vosges
iFrance Associate 25.0 25.0 25.0 25.0
Caisse Régionale Aquitaine
iFrance Associate 29.3 29.3 29.3 29.3
Caisse Régionale Atlantique Vendée
iFrance Associate 25.6 25.6 25.6 25.6
Caisse Régionale Brie Picardie
iFrance Associate 27.4 27.3 27.4 27.3
Caisse Régionale Centre Est
iFrance Associate 25.0 25.0 25.0 25.0
Caisse Régionale Centre France
iFrance Associate 25.0 25.0 25.0 25.0
Caisse Régionale Centre Loire
iFrance Associate 27.7 27.7 27.7 27.7
Caisse Régionale Centre Ouest
iFrance Associate 25.0 25.0 25.0 25.0
Caisse Régionale Champagne Bourgogne
iFrance Associate 25.0 25.0 25.0 25.0
Caisse Régionale Charente Maritime - Deux-Sèvres
iFrance Associate 25.0 25.0 25.0 25.0
Caisse Régionale Charente-Périgord
iFrance Associate 25.0 25.0 25.0 25.0
Caisse Régionale Côtes d’Armor
iFrance Associate 25.0 25.0 25.0 25.0
Caisse Régionale de l’Anjou et du Maine
iFrance Associate 25.0 25.0 25.0 25.0
Caisse Régionale des Savoie
iFrance Associate 25.0 25.0 25.0 25.0
Caisse Régionale Finistère
iFrance Associate 25.0 25.0 25.0 25.0
Caisse Régionale Franche-Comté
iFrance Associate 25.0 25.0 25.0 25.0
Caisse Régionale Guadeloupe
iFrance Associate 27.2 27.2 27.2 27.2
Caisse Régionale Ille-et-Vilaine
iFrance Associate 26.0 26.0 26.0 26.0
Caisse Régionale Languedoc
iFrance Associate 25.8 25.7 25.8 25.7
Caisse Régionale Loire - Haute-Loire
iFrance Associate 25.4 25.4 25.4 25.4
Caisse Régionale Lorraine
iFrance Associate 25.0 25.0 25.0 25.0
Caisse Régionale Martinique
iFrance Associate 28.2 28.2 28.2 28.2
Caisse Régionale Morbihan
iFrance Associate 28.0 27.7 28.0 27.7
Caisse Régionale Nord de France
iFrance Associate 25.0 25.0 25.0 25.0
Caisse Régionale Nord Midi Pyrénées
iFrance Associate 25.0 25.0 25.0 25.0
Caisse Régionale Nord-Est
iFrance Associate 26.5 26.4 26.5 26.4
Caisse Régionale Normandie
iFrance Associate 25.0 25.0 25.0 25.0
Caisse Régionale Normandie Seine
iFrance Associate 25.6 25.6 25.6 25.6
Crédit Agricole S.A. Group Scope of consolidation (a)
Location(Country of
incorporation if different from
location)
Nature of entity
and control
(b)
% control % interest
31/122014
31/122013*
31/122014
31/122013*
Caisse Régionale Paris et Île-de-France
iFrance Associate 25.6 25.5 25.6 25.5
Caisse Régionale Provence - Côte d’Azur
iFrance Associate 25.0 25.0 25.0 25.0
Caisse Régionale Pyrénées Gascogne
iFrance Associate 25.0 25.0 25.0 25.0
Caisse Régionale Réunion
iFrance Associate 25.0 25.0 25.0 25.0
Caisse Régionale Sud Méditerranée
iFrance Associate 25.0 25.0 25.0 25.0
Caisse Régionale Sud Rhône Alpes
iFrance Associate 25.8 25.7 25.8 25.7
Caisse Régionale Toulouse 31
iFrance Associate 26.5 26.5 26.5 26.5
Caisse Régionale Touraine Poitou
iFrance Associate 26.3 26.3 26.3 26.3
Caisse Régionale Val de France
iFrance Associate 25.0 25.0 25.0 25.0
Cofami
France Associate 25.4 25.4 25.4 25.4
CRCAM SUD MED. SUC
iSpain
(France)Branch 25.0 25.0 25.0 25.0
Interfimop
France Subsidiary 99.0 99.0 94.1 94.1
LCLp
France Subsidiary 95.1 95.1 95.1 95.1
LCL Succursale de Monacop
D3 Monaco(France)
Branch 100.0 100.0 95.1 95.1
Mercagentesi
Spain Associate 25.0 25.0 25.0 20.6
Sircami
France Associate 25.4 25.4 25.4 25.4
Lease financing companies
Locami
France Associate 25.4 25.4 25.4 25.4
Investment companies
Bercy Participationsi
France Associate 25.6 25.5 25.6 25.5
CA Centre France Développement
iFrance Associate 25.0 25.0 25.0 20.8
CACF Immobilieri
France Associate 25.0 25.0 25.0 25.0
CADS Développement
iFrance Associate 25.0 25.0 25.0 25.0
Calixte Investissement
iFrance Associate 25.0 25.0 25.0 25.0
CAM ENERGIE SASi
France Associate 25.0 25.0 25.0 25.0
Crédit Agricole Centre Est Immobilier
iFrance Associate 25.0 25.0 25.0 25.0
Crédit Agricole F.C. Investissement
iFrance Associate 25.0 25.0 25.0 25.0
L’Immobilière d’À Côté
iFrance Associate 25.2 25.2 25.2 25.2
Nord Capital Investissement
iFrance Associate 25.0 25.0 26.7 26.6
Nord Est Champagne Agro Partenaires
iFrance Associate 26.5 26.4 26.5 26.4
Nord Est Expansioni
France Associate 26.5 26.4 26.5 26.4
Prestimmoi
France Associate 25.0 25.0 25.0 25.0
Sepii
France Associate 25.0 25.0 25.0 25.0
Sequanai
France Struct. Ass 25.0 25.0 25.0 25.0
Consolidation method: p Full i Equity accounted 1 Parent * Restated.
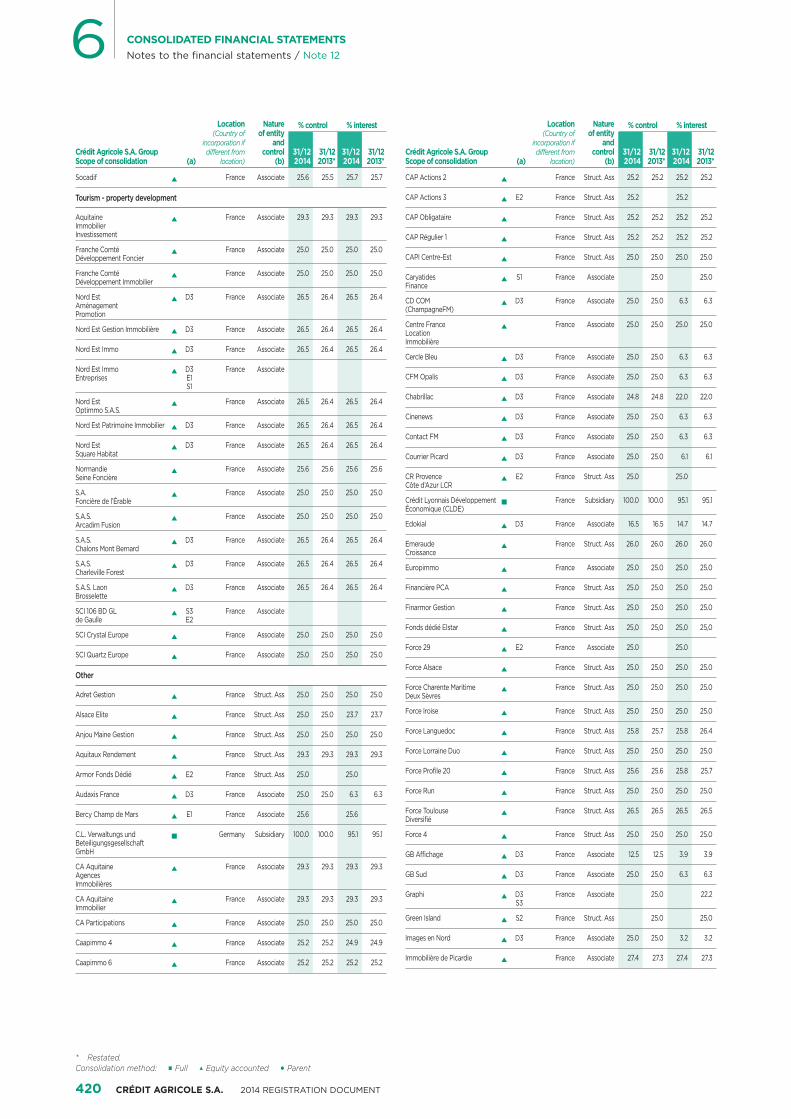
420 CRÉDIT AGRICOLE S.A. 2014 REGISTRATION DOCUMENT
6 CONSOLIDATED FINANCIAL STATEMENTSNotes to the financial statements / Note 12
Crédit Agricole S.A. Group Scope of consolidation (a)
Location(Country of
incorporation if different from
location)
Nature of entity
and control
(b)
% control % interest
31/122014
31/122013*
31/122014
31/122013*
Socadifi
France Associate 25.6 25.5 25.7 25.7
Tourism - property development
Aquitaine Immobilier Investissement
iFrance Associate 29.3 29.3 29.3 29.3
Franche Comté Développement Foncier
iFrance Associate 25.0 25.0 25.0 25.0
Franche Comté Développement Immobilier
iFrance Associate 25.0 25.0 25.0 25.0
Nord Est Aménagement Promotion
iD3 France Associate 26.5 26.4 26.5 26.4
Nord Est Gestion Immobilièrei
D3 France Associate 26.5 26.4 26.5 26.4
Nord Est Immoi
D3 France Associate 26.5 26.4 26.5 26.4
Nord Est Immo Entreprises
iD3E1S1
France Associate
Nord Est Optimmo S.A.S.
iFrance Associate 26.5 26.4 26.5 26.4
Nord Est Patrimoine Immobilieri
D3 France Associate 26.5 26.4 26.5 26.4
Nord Est Square Habitat
iD3 France Associate 26.5 26.4 26.5 26.4
Normandie Seine Foncière
iFrance Associate 25.6 25.6 25.6 25.6
S.A. Foncière de l’Érable
iFrance Associate 25.0 25.0 25.0 25.0
S.A.S. Arcadim Fusion
iFrance Associate 25.0 25.0 25.0 25.0
S.A.S. Chalons Mont Bernard
iD3 France Associate 26.5 26.4 26.5 26.4
S.A.S. Charleville Forest
iD3 France Associate 26.5 26.4 26.5 26.4
S.A.S. Laon Brosselette
iD3 France Associate 26.5 26.4 26.5 26.4
SCI 106 BD GL de Gaulle
iS3E2
France Associate
SCI Crystal Europei
France Associate 25.0 25.0 25.0 25.0
SCI Quartz Europei
France Associate 25.0 25.0 25.0 25.0
Other
Adret Gestioni
France Struct. Ass 25.0 25.0 25.0 25.0
Alsace Elitei
France Struct. Ass 25.0 25.0 23.7 23.7
Anjou Maine Gestioni
France Struct. Ass 25.0 25.0 25.0 25.0
Aquitaux Rendementi
France Struct. Ass 29.3 29.3 29.3 29.3
Armor Fonds Dédiéi
E2 France Struct. Ass 25.0 25.0
Audaxis Francei
D3 France Associate 25.0 25.0 6.3 6.3
Bercy Champ de Marsi
E1 France Associate 25.6 25.6
C.L. Verwaltungs und Beteiligungsgesellschaft GmbH
pGermany Subsidiary 100.0 100.0 95.1 95.1
CA Aquitaine Agences Immobilières
iFrance Associate 29.3 29.3 29.3 29.3
CA Aquitaine Immobilier
iFrance Associate 29.3 29.3 29.3 29.3
CA Participationsi
France Associate 25.0 25.0 25.0 25.0
Caapimmo 4i
France Associate 25.2 25.2 24.9 24.9
Caapimmo 6i
France Associate 25.2 25.2 25.2 25.2
Crédit Agricole S.A. Group Scope of consolidation (a)
Location(Country of
incorporation if different from
location)
Nature of entity
and control
(b)
% control % interest
31/122014
31/122013*
31/122014
31/122013*
CAP Actions 2i
France Struct. Ass 25.2 25.2 25.2 25.2
CAP Actions 3i
E2 France Struct. Ass 25.2 25.2
CAP Obligatairei
France Struct. Ass 25.2 25.2 25.2 25.2
CAP Régulier 1i
France Struct. Ass 25.2 25.2 25.2 25.2
CAPI Centre-Esti
France Struct. Ass 25.0 25.0 25.0 25.0
Caryatides Finance
iS1 France Associate 25.0 25.0
CD COM (ChampagneFM)
iD3 France Associate 25.0 25.0 6.3 6.3
Centre France Location Immobilière
iFrance Associate 25.0 25.0 25.0 25.0
Cercle Bleui
D3 France Associate 25.0 25.0 6.3 6.3
CFM Opalisi
D3 France Associate 25.0 25.0 6.3 6.3
Chabrillaci
D3 France Associate 24.8 24.8 22.0 22.0
Cinenewsi
D3 France Associate 25.0 25.0 6.3 6.3
Contact FMi
D3 France Associate 25.0 25.0 6.3 6.3
Courrier Picardi
D3 France Associate 25.0 25.0 6.1 6.1
CR Provence Côte d’Azur LCR
iE2 France Struct. Ass 25.0 25.0
Crédit Lyonnais Développement Économique (CLDE)
pFrance Subsidiary 100.0 100.0 95.1 95.1
Edokiali
D3 France Associate 16.5 16.5 14.7 14.7
Emeraude Croissance
iFrance Struct. Ass 26.0 26.0 26.0 26.0
Europimmoi
France Associate 25.0 25.0 25.0 25.0
Financière PCAi
France Struct. Ass 25.0 25.0 25.0 25.0
Finarmor Gestioni
France Struct. Ass 25.0 25.0 25.0 25.0
Fonds dédié Elstari
France Struct. Ass 25,0 25,0 25,0 25,0
Force 29i
E2 France Associate 25.0 25.0
Force Alsacei
France Struct. Ass 25.0 25.0 25.0 25.0
Force Charente Maritime Deux Sèvres
iFrance Struct. Ass 25.0 25.0 25.0 25.0
Force Iroisei
France Struct. Ass 25.0 25.0 25.0 25.0
Force Languedoci
France Struct. Ass 25.8 25.7 25.8 26.4
Force Lorraine Duoi
France Struct. Ass 25.0 25.0 25.0 25.0
Force Profile 20i
France Struct. Ass 25.6 25.6 25.8 25.7
Force Runi
France Struct. Ass 25.0 25.0 25.0 25.0
Force Toulouse Diversifié
iFrance Struct. Ass 26.5 26.5 26.5 26.5
Force 4i
France Struct. Ass 25.0 25.0 25.0 25.0
GB Affichagei
D3 France Associate 12.5 12.5 3.9 3.9
GB Sudi
D3 France Associate 25.0 25.0 6.3 6.3
Graphii
D3S3
France Associate 25.0 22.2
Green Islandi
S2 France Struct. Ass 25.0 25.0
Images en Nordi
D3 France Associate 25.0 25.0 3.2 3.2
Immobilière de Picardiei
France Associate 27.4 27.3 27.4 27.3
Consolidation method: p Full i Equity accounted 1 Parent * Restated.
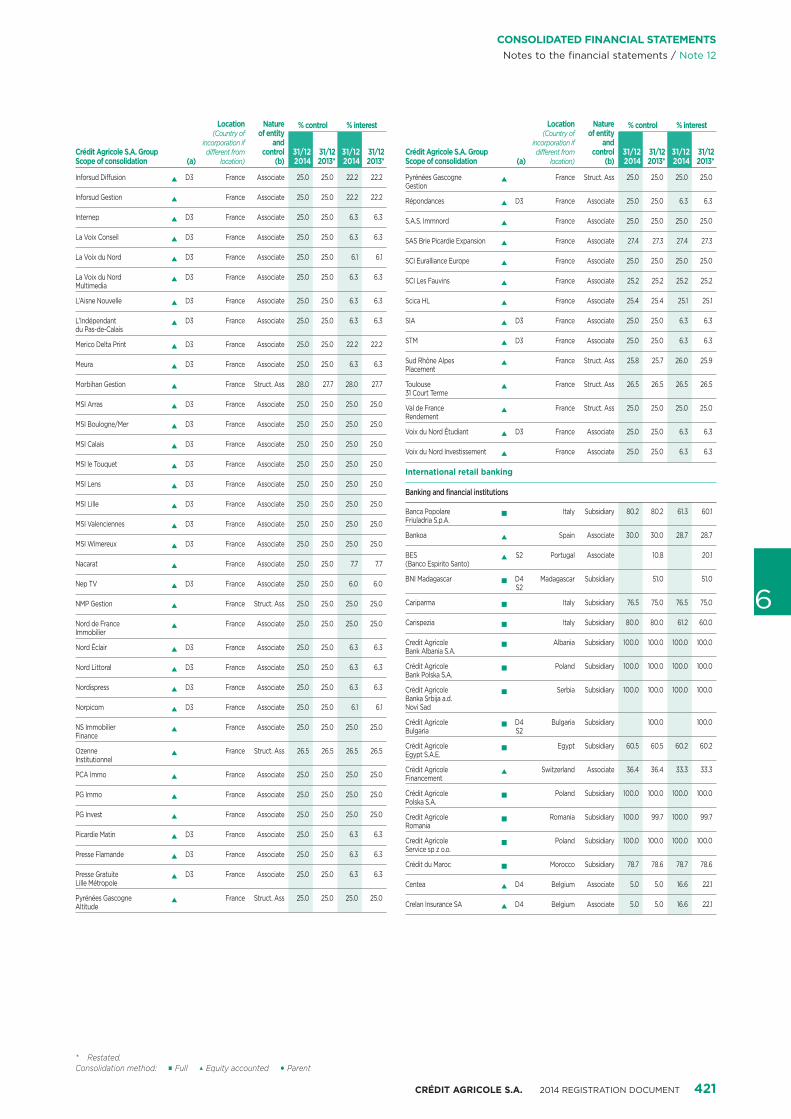
CRÉDIT AGRICOLE S.A. 2014 REGISTRATION DOCUMENT 421
6
CONSOLIDATED FINANCIAL STATEMENTSNotes to the financial statements / Note 12
Crédit Agricole S.A. Group Scope of consolidation (a)
Location(Country of
incorporation if different from
location)
Nature of entity
and control
(b)
% control % interest
31/122014
31/122013*
31/122014
31/122013*
Inforsud Diffusioni
D3 France Associate 25.0 25.0 22.2 22.2
Inforsud Gestioni
France Associate 25.0 25.0 22.2 22.2
Internepi
D3 France Associate 25.0 25.0 6.3 6.3
La Voix Conseili
D3 France Associate 25.0 25.0 6.3 6.3
La Voix du Nordi
D3 France Associate 25.0 25.0 6.1 6.1
La Voix du Nord Multimedia
iD3 France Associate 25.0 25.0 6.3 6.3
L’Aisne Nouvellei
D3 France Associate 25.0 25.0 6.3 6.3
L’Indépendant du Pas-de-Calais
iD3 France Associate 25.0 25.0 6.3 6.3
Merico Delta Printi
D3 France Associate 25.0 25.0 22.2 22.2
Meurai
D3 France Associate 25.0 25.0 6.3 6.3
Morbihan Gestioni
France Struct. Ass 28.0 27.7 28.0 27.7
MSI Arrasi
D3 France Associate 25.0 25.0 25.0 25.0
MSI Boulogne/Meri
D3 France Associate 25.0 25.0 25.0 25.0
MSI Calaisi
D3 France Associate 25.0 25.0 25.0 25.0
MSI le Touqueti
D3 France Associate 25.0 25.0 25.0 25.0
MSI Lensi
D3 France Associate 25.0 25.0 25.0 25.0
MSI Lillei
D3 France Associate 25.0 25.0 25.0 25.0
MSI Valenciennesi
D3 France Associate 25.0 25.0 25.0 25.0
MSI Wimereuxi
D3 France Associate 25.0 25.0 25.0 25.0
Nacarati
France Associate 25.0 25.0 7.7 7.7
Nep TVi
D3 France Associate 25.0 25.0 6.0 6.0
NMP Gestioni
France Struct. Ass 25.0 25.0 25.0 25.0
Nord de France Immobilier
iFrance Associate 25.0 25.0 25.0 25.0
Nord Éclairi
D3 France Associate 25.0 25.0 6.3 6.3
Nord Littorali
D3 France Associate 25.0 25.0 6.3 6.3
Nordispressi
D3 France Associate 25.0 25.0 6.3 6.3
Norpicomi
D3 France Associate 25.0 25.0 6.1 6.1
NS Immobilier Finance
iFrance Associate 25.0 25.0 25.0 25.0
Ozenne Institutionnel
iFrance Struct. Ass 26.5 26.5 26.5 26.5
PCA Immoi
France Associate 25.0 25.0 25.0 25.0
PG Immoi
France Associate 25.0 25.0 25.0 25.0
PG Investi
France Associate 25.0 25.0 25.0 25.0
Picardie Matini
D3 France Associate 25.0 25.0 6.3 6.3
Presse Flamandei
D3 France Associate 25.0 25.0 6.3 6.3
Presse Gratuite Lille Métropole
iD3 France Associate 25.0 25.0 6.3 6.3
Pyrénées Gascogne Altitude
iFrance Struct. Ass 25.0 25.0 25.0 25.0
Crédit Agricole S.A. Group Scope of consolidation (a)
Location(Country of
incorporation if different from
location)
Nature of entity
and control
(b)
% control % interest
31/122014
31/122013*
31/122014
31/122013*
Pyrénées Gascogne Gestion
iFrance Struct. Ass 25.0 25.0 25.0 25.0
Répondancesi
D3 France Associate 25.0 25.0 6.3 6.3
S.A.S. Immnordi
France Associate 25.0 25.0 25.0 25.0
SAS Brie Picardie Expansioni
France Associate 27.4 27.3 27.4 27.3
SCI Euralliance Europei
France Associate 25.0 25.0 25.0 25.0
SCI Les Fauvinsi
France Associate 25.2 25.2 25.2 25.2
Scica HLi
France Associate 25.4 25.4 25.1 25.1
SIAi
D3 France Associate 25.0 25.0 6.3 6.3
STMi
D3 France Associate 25.0 25.0 6.3 6.3
Sud Rhône Alpes Placement
iFrance Struct. Ass 25.8 25.7 26.0 25.9
Toulouse 31 Court Terme
iFrance Struct. Ass 26.5 26.5 26.5 26.5
Val de France Rendement
iFrance Struct. Ass 25.0 25.0 25.0 25.0
Voix du Nord Étudianti
D3 France Associate 25.0 25.0 6.3 6.3
Voix du Nord Investissementi
France Associate 25.0 25.0 6.3 6.3
International retail banking
Banking and financial institutions
Banca Popolare Friuladria S.p.A.
pItaly Subsidiary 80.2 80.2 61.3 60.1
Bankoai
Spain Associate 30.0 30.0 28.7 28.7
BES (Banco Espirito Santo)
iS2 Portugal Associate 10.8 20.1
BNI Madagascarp
D4S2
Madagascar Subsidiary 51.0 51.0
Cariparmap
Italy Subsidiary 76.5 75.0 76.5 75.0
Carispeziap
Italy Subsidiary 80.0 80.0 61.2 60.0
Credit Agricole Bank Albania S.A.
pAlbania Subsidiary 100.0 100.0 100.0 100.0
Crédit Agricole Bank Polska S.A.
pPoland Subsidiary 100.0 100.0 100.0 100.0
Crédit Agricole Banka Srbija a.d. Novi Sad
pSerbia Subsidiary 100.0 100.0 100.0 100.0
Crédit Agricole Bulgaria
pD4S2
Bulgaria Subsidiary 100.0 100.0
Crédit Agricole Egypt S.A.E.
pEgypt Subsidiary 60.5 60.5 60.2 60.2
Crédit Agricole Financement
iSwitzerland Associate 36.4 36.4 33.3 33.3
Crédit Agricole Polska S.A.
pPoland Subsidiary 100.0 100.0 100.0 100.0
Credit Agricole Romania
pRomania Subsidiary 100.0 99.7 100.0 99.7
Credit Agricole Service sp z o.o.
pPoland Subsidiary 100.0 100.0 100.0 100.0
Crédit du Marocp
Morocco Subsidiary 78.7 78.6 78.7 78.6
Centeai
D4 Belgium Associate 5.0 5.0 16.6 22.1
Crelan Insurance SAi
D4 Belgium Associate 5.0 5.0 16.6 22.1
Consolidation method: p Full i Equity accounted 1 Parent * Restated.
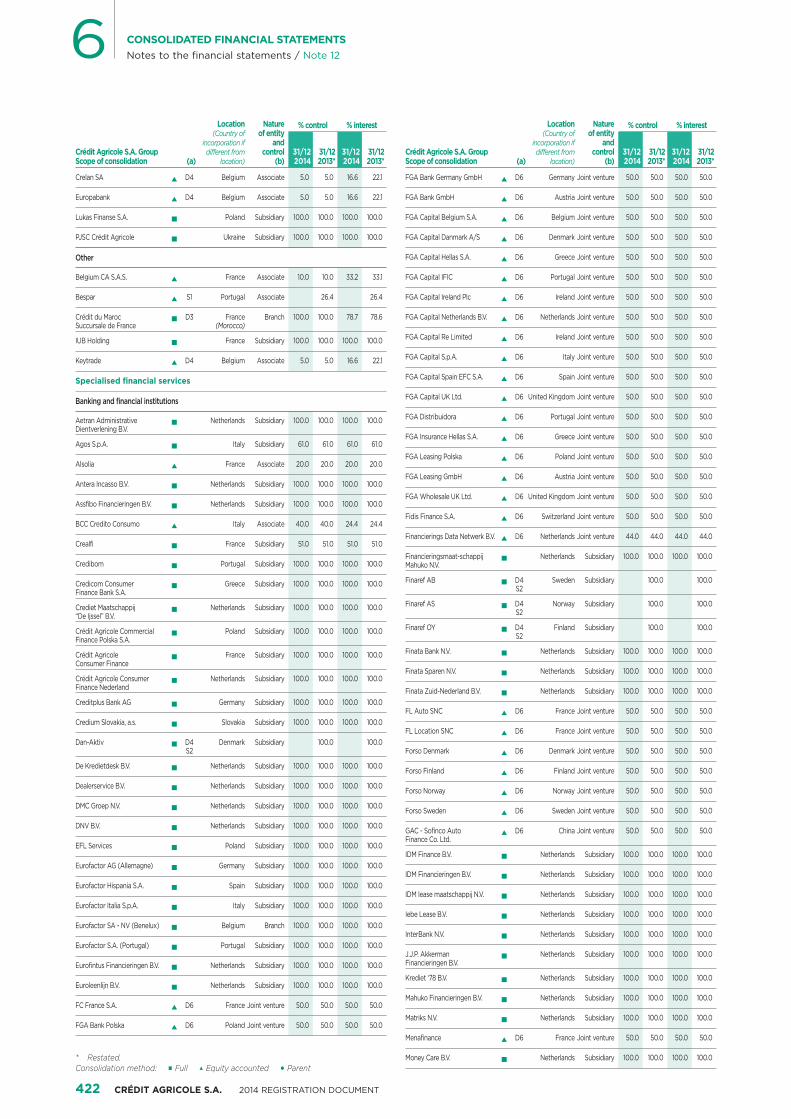
422 CRÉDIT AGRICOLE S.A. 2014 REGISTRATION DOCUMENT
6 CONSOLIDATED FINANCIAL STATEMENTSNotes to the financial statements / Note 12
Crédit Agricole S.A. Group Scope of consolidation (a)
Location(Country of
incorporation if different from
location)
Nature of entity
and control
(b)
% control % interest
31/122014
31/122013*
31/122014
31/122013*
Crelan SAi
D4 Belgium Associate 5.0 5.0 16.6 22.1
Europabanki
D4 Belgium Associate 5.0 5.0 16.6 22.1
Lukas Finanse S.A.p
Poland Subsidiary 100.0 100.0 100.0 100.0
PJSC Crédit Agricolep
Ukraine Subsidiary 100.0 100.0 100.0 100.0
Other
Belgium CA S.A.S.i
France Associate 10.0 10.0 33.2 33.1
Bespari
S1 Portugal Associate 26.4 26.4
Crédit du Maroc Succursale de France
pD3 France
(Morocco)Branch 100.0 100.0 78.7 78.6
IUB Holdingp
France Subsidiary 100.0 100.0 100.0 100.0
Keytradei
D4 Belgium Associate 5.0 5.0 16.6 22.1
Specialised financial services
Banking and financial institutions
Aetran Administrative Dientverlening B.V.
pNetherlands Subsidiary 100.0 100.0 100.0 100.0
Agos S.p.A.p
Italy Subsidiary 61.0 61.0 61.0 61.0
Alsoliai
France Associate 20.0 20.0 20.0 20.0
Antera Incasso B.V.p
Netherlands Subsidiary 100.0 100.0 100.0 100.0
Assfibo Financieringen B.V.p
Netherlands Subsidiary 100.0 100.0 100.0 100.0
BCC Credito Consumoi
Italy Associate 40.0 40.0 24.4 24.4
Crealfip
France Subsidiary 51.0 51.0 51.0 51.0
Credibomp
Portugal Subsidiary 100.0 100.0 100.0 100.0
Credicom Consumer Finance Bank S.A.
pGreece Subsidiary 100.0 100.0 100.0 100.0
Crediet Maatschappij “De Ijssel” B.V.
pNetherlands Subsidiary 100.0 100.0 100.0 100.0
Crédit Agricole Commercial Finance Polska S.A.
pPoland Subsidiary 100.0 100.0 100.0 100.0
Crédit Agricole Consumer Finance
pFrance Subsidiary 100.0 100.0 100.0 100.0
Crédit Agricole Consumer Finance Nederland
pNetherlands Subsidiary 100.0 100.0 100.0 100.0
Creditplus Bank AGp
Germany Subsidiary 100.0 100.0 100.0 100.0
Credium Slovakia, a.s.p
Slovakia Subsidiary 100.0 100.0 100.0 100.0
Dan-Aktivp
D4S2
Denmark Subsidiary 100.0 100.0
De Kredietdesk B.V.p
Netherlands Subsidiary 100.0 100.0 100.0 100.0
Dealerservice B.V.p
Netherlands Subsidiary 100.0 100.0 100.0 100.0
DMC Groep N.V.p
Netherlands Subsidiary 100.0 100.0 100.0 100.0
DNV B.V.p
Netherlands Subsidiary 100.0 100.0 100.0 100.0
EFL Servicesp
Poland Subsidiary 100.0 100.0 100.0 100.0
Eurofactor AG (Allemagne)p
Germany Subsidiary 100.0 100.0 100.0 100.0
Eurofactor Hispania S.A.p
Spain Subsidiary 100.0 100.0 100.0 100.0
Eurofactor Italia S.p.A.p
Italy Subsidiary 100.0 100.0 100.0 100.0
Eurofactor SA - NV (Benelux)p
Belgium Branch 100.0 100.0 100.0 100.0
Eurofactor S.A. (Portugal)p
Portugal Subsidiary 100.0 100.0 100.0 100.0
Eurofintus Financieringen B.V.p
Netherlands Subsidiary 100.0 100.0 100.0 100.0
Euroleenlijn B.V.p
Netherlands Subsidiary 100.0 100.0 100.0 100.0
FC France S.A.i
D6 France Joint venture 50.0 50.0 50.0 50.0
FGA Bank Polskai
D6 Poland Joint venture 50.0 50.0 50.0 50.0
Crédit Agricole S.A. Group Scope of consolidation (a)
Location(Country of
incorporation if different from
location)
Nature of entity
and control
(b)
% control % interest
31/122014
31/122013*
31/122014
31/122013*
FGA Bank Germany GmbHi
D6 Germany Joint venture 50.0 50.0 50.0 50.0
FGA Bank GmbHi
D6 Austria Joint venture 50.0 50.0 50.0 50.0
FGA Capital Belgium S.A.i
D6 Belgium Joint venture 50.0 50.0 50.0 50.0
FGA Capital Danmark A/Si
D6 Denmark Joint venture 50.0 50.0 50.0 50.0
FGA Capital Hellas S.A.i
D6 Greece Joint venture 50.0 50.0 50.0 50.0
FGA Capital IFICi
D6 Portugal Joint venture 50.0 50.0 50.0 50.0
FGA Capital Ireland Plci
D6 Ireland Joint venture 50.0 50.0 50.0 50.0
FGA Capital Netherlands B.V.i
D6 Netherlands Joint venture 50.0 50.0 50.0 50.0
FGA Capital Re Limitedi
D6 Ireland Joint venture 50.0 50.0 50.0 50.0
FGA Capital S.p.A.i
D6 Italy Joint venture 50.0 50.0 50.0 50.0
FGA Capital Spain EFC S.A.i
D6 Spain Joint venture 50.0 50.0 50.0 50.0
FGA Capital UK Ltd.i
D6 United Kingdom Joint venture 50.0 50.0 50.0 50.0
FGA Distribuidorai
D6 Portugal Joint venture 50.0 50.0 50.0 50.0
FGA Insurance Hellas S.A.i
D6 Greece Joint venture 50.0 50.0 50.0 50.0
FGA Leasing Polskai
D6 Poland Joint venture 50.0 50.0 50.0 50.0
FGA Leasing GmbHi
D6 Austria Joint venture 50.0 50.0 50.0 50.0
FGA Wholesale UK Ltd.i
D6 United Kingdom Joint venture 50.0 50.0 50.0 50.0
Fidis Finance S.A.i
D6 Switzerland Joint venture 50.0 50.0 50.0 50.0
Financierings Data Netwerk B.V.i
D6 Netherlands Joint venture 44.0 44.0 44.0 44.0
Financieringsmaat-schappij Mahuko N.V.
pNetherlands Subsidiary 100.0 100.0 100.0 100.0
Finaref ABp
D4S2
Sweden Subsidiary 100.0 100.0
Finaref ASp
D4S2
Norway Subsidiary 100.0 100.0
Finaref OYp
D4S2
Finland Subsidiary 100.0 100.0
Finata Bank N.V.p
Netherlands Subsidiary 100.0 100.0 100.0 100.0
Finata Sparen N.V.p
Netherlands Subsidiary 100.0 100.0 100.0 100.0
Finata Zuid-Nederland B.V.p
Netherlands Subsidiary 100.0 100.0 100.0 100.0
FL Auto SNCi
D6 France Joint venture 50.0 50.0 50.0 50.0
FL Location SNCi
D6 France Joint venture 50.0 50.0 50.0 50.0
Forso Denmarki
D6 Denmark Joint venture 50.0 50.0 50.0 50.0
Forso Finlandi
D6 Finland Joint venture 50.0 50.0 50.0 50.0
Forso Norwayi
D6 Norway Joint venture 50.0 50.0 50.0 50.0
Forso Swedeni
D6 Sweden Joint venture 50.0 50.0 50.0 50.0
GAC - Sofinco Auto Finance Co. Ltd.
iD6 China Joint venture 50.0 50.0 50.0 50.0
IDM Finance B.V.p
Netherlands Subsidiary 100.0 100.0 100.0 100.0
IDM Financieringen B.V.p
Netherlands Subsidiary 100.0 100.0 100.0 100.0
IDM lease maatschappij N.V.p
Netherlands Subsidiary 100.0 100.0 100.0 100.0
Iebe Lease B.V.p
Netherlands Subsidiary 100.0 100.0 100.0 100.0
InterBank N.V.p
Netherlands Subsidiary 100.0 100.0 100.0 100.0
J.J.P. Akkerman Financieringen B.V.
pNetherlands Subsidiary 100.0 100.0 100.0 100.0
Krediet ‘78 B.V.p
Netherlands Subsidiary 100.0 100.0 100.0 100.0
Mahuko Financieringen B.V.p
Netherlands Subsidiary 100.0 100.0 100.0 100.0
Matriks N.V.p
Netherlands Subsidiary 100.0 100.0 100.0 100.0
Menafinancei
D6 France Joint venture 50.0 50.0 50.0 50.0
Money Care B.V.p
Netherlands Subsidiary 100.0 100.0 100.0 100.0Consolidation method: p Full i Equity accounted 1 Parent * Restated.
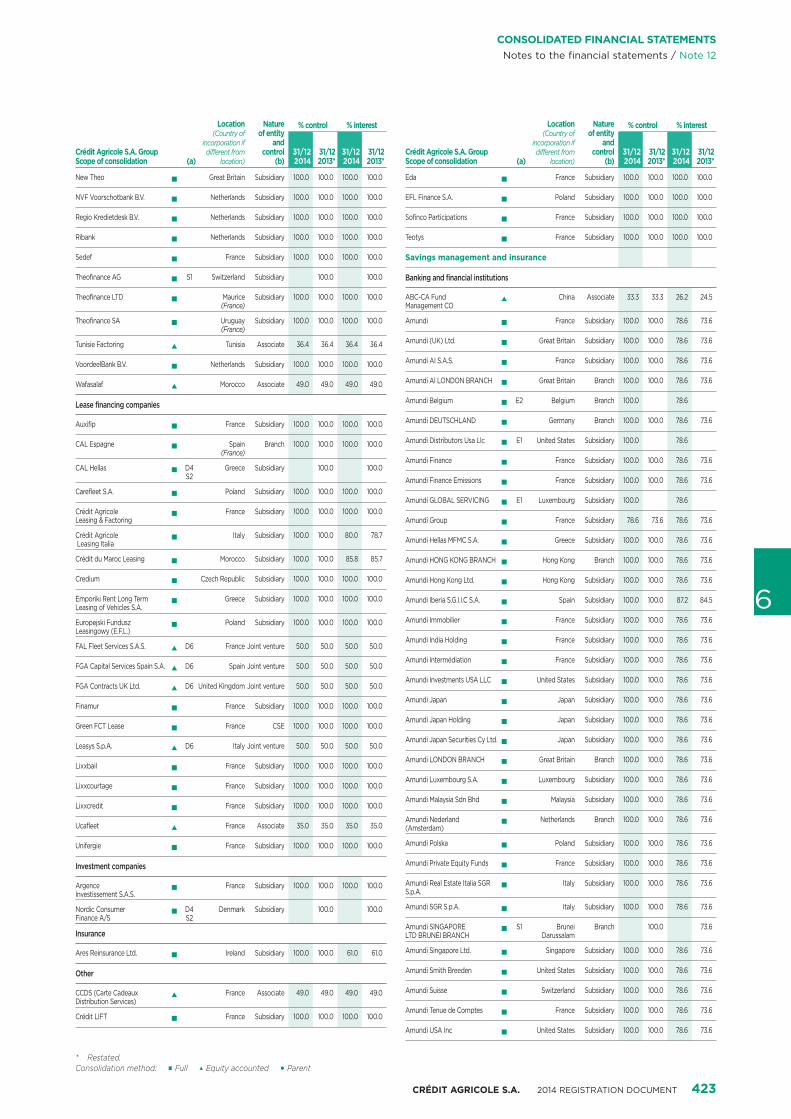
CRÉDIT AGRICOLE S.A. 2014 REGISTRATION DOCUMENT 423
6
CONSOLIDATED FINANCIAL STATEMENTSNotes to the financial statements / Note 12
Crédit Agricole S.A. Group Scope of consolidation (a)
Location(Country of
incorporation if different from
location)
Nature of entity
and control
(b)
% control % interest
31/122014
31/122013*
31/122014
31/122013*
New Theop
Great Britain Subsidiary 100.0 100.0 100.0 100.0
NVF Voorschotbank B.V.p
Netherlands Subsidiary 100.0 100.0 100.0 100.0
Regio Kredietdesk B.V.p
Netherlands Subsidiary 100.0 100.0 100.0 100.0
Ribankp
Netherlands Subsidiary 100.0 100.0 100.0 100.0
Sedefp
France Subsidiary 100.0 100.0 100.0 100.0
Theofinance AGp
S1 Switzerland Subsidiary 100.0 100.0
Theofinance LTDp
Maurice(France)
Subsidiary 100.0 100.0 100.0 100.0
Theofinance SAp
Uruguay(France)
Subsidiary 100.0 100.0 100.0 100.0
Tunisie Factoringi
Tunisia Associate 36.4 36.4 36.4 36.4
VoordeelBank B.V.p
Netherlands Subsidiary 100.0 100.0 100.0 100.0
Wafasalafi
Morocco Associate 49.0 49.0 49.0 49.0
Lease financing companies
Auxifipp
France Subsidiary 100.0 100.0 100.0 100.0
CAL Espagnep
Spain(France)
Branch 100.0 100.0 100.0 100.0
CAL Hellasp
D4S2
Greece Subsidiary 100.0 100.0
Carefleet S.A.p
Poland Subsidiary 100.0 100.0 100.0 100.0
Crédit Agricole Leasing & Factoring
pFrance Subsidiary 100.0 100.0 100.0 100.0
Crédit Agricole Leasing Italia
pItaly Subsidiary 100.0 100.0 80.0 78.7
Crédit du Maroc Leasingp
Morocco Subsidiary 100.0 100.0 85.8 85.7
Crediump
Czech Republic Subsidiary 100.0 100.0 100.0 100.0
Emporiki Rent Long Term Leasing of Vehicles S.A.
pGreece Subsidiary 100.0 100.0 100.0 100.0
Europejski Fundusz Leasingowy (E.F.L.)
pPoland Subsidiary 100.0 100.0 100.0 100.0
FAL Fleet Services S.A.S.i
D6 France Joint venture 50.0 50.0 50.0 50.0
FGA Capital Services Spain S.A.i
D6 Spain Joint venture 50.0 50.0 50.0 50.0
FGA Contracts UK Ltd.i
D6 United Kingdom Joint venture 50.0 50.0 50.0 50.0
Finamurp
France Subsidiary 100.0 100.0 100.0 100.0
Green FCT Leasep
France CSE 100.0 100.0 100.0 100.0
Leasys S.p.A.i
D6 Italy Joint venture 50.0 50.0 50.0 50.0
Lixxbailp
France Subsidiary 100.0 100.0 100.0 100.0
Lixxcourtagep
France Subsidiary 100.0 100.0 100.0 100.0
Lixxcreditp
France Subsidiary 100.0 100.0 100.0 100.0
Ucafleeti
France Associate 35.0 35.0 35.0 35.0
Unifergiep
France Subsidiary 100.0 100.0 100.0 100.0
Investment companies
Argence Investissement S.A.S.
pFrance Subsidiary 100.0 100.0 100.0 100.0
Nordic Consumer Finance A/S
pD4S2
Denmark Subsidiary 100.0 100.0
Insurance
Ares Reinsurance Ltd.p
Ireland Subsidiary 100.0 100.0 61.0 61.0
Other
CCDS (Carte Cadeaux Distribution Services)
iFrance Associate 49.0 49.0 49.0 49.0
Crédit LIFTp
France Subsidiary 100.0 100.0 100.0 100.0
Crédit Agricole S.A. Group Scope of consolidation (a)
Location(Country of
incorporation if different from
location)
Nature of entity
and control
(b)
% control % interest
31/122014
31/122013*
31/122014
31/122013*
Edap
France Subsidiary 100.0 100.0 100.0 100.0
EFL Finance S.A.p
Poland Subsidiary 100.0 100.0 100.0 100.0
Sofinco Participationsp
France Subsidiary 100.0 100.0 100.0 100.0
Teotysp
France Subsidiary 100.0 100.0 100.0 100.0
Savings management and insurance
Banking and financial institutions
ABC-CA Fund Management CO
iChina Associate 33.3 33.3 26.2 24.5
Amundip
France Subsidiary 100.0 100.0 78.6 73.6
Amundi (UK) Ltd.p
Great Britain Subsidiary 100.0 100.0 78.6 73.6
Amundi AI S.A.S.p
France Subsidiary 100.0 100.0 78.6 73.6
Amundi Al LONDON BRANCHp
Great Britain Branch 100.0 100.0 78.6 73.6
Amundi Belgiump
E2 Belgium Branch 100.0 78.6
Amundi DEUTSCHLANDp
Germany Branch 100.0 100.0 78.6 73.6
Amundi Distributors Usa Llcp
E1 United States Subsidiary 100.0 78.6
Amundi Financep
France Subsidiary 100.0 100.0 78.6 73.6
Amundi Finance Emissionsp
France Subsidiary 100.0 100.0 78.6 73.6
Amundi GLOBAL SERVICINGp
E1 Luxembourg Subsidiary 100.0 78.6
Amundi Groupp
France Subsidiary 78.6 73.6 78.6 73.6
Amundi Hellas MFMC S.A.p
Greece Subsidiary 100.0 100.0 78.6 73.6
Amundi HONG KONG BRANCHp
Hong Kong Branch 100.0 100.0 78.6 73.6
Amundi Hong Kong Ltd.p
Hong Kong Subsidiary 100.0 100.0 78.6 73.6
Amundi Iberia S.G.I.I.C S.A.p
Spain Subsidiary 100.0 100.0 87.2 84.5
Amundi Immobilierp
France Subsidiary 100.0 100.0 78.6 73.6
Amundi India Holdingp
France Subsidiary 100.0 100.0 78.6 73.6
Amundi Intermédiationp
France Subsidiary 100.0 100.0 78.6 73.6
Amundi Investments USA LLCp
United States Subsidiary 100.0 100.0 78.6 73.6
Amundi Japanp
Japan Subsidiary 100.0 100.0 78.6 73.6
Amundi Japan Holdingp
Japan Subsidiary 100.0 100.0 78.6 73.6
Amundi Japan Securities Cy Ltd.p
Japan Subsidiary 100.0 100.0 78.6 73.6
Amundi LONDON BRANCHp
Great Britain Branch 100.0 100.0 78.6 73.6
Amundi Luxembourg S.A.p
Luxembourg Subsidiary 100.0 100.0 78.6 73.6
Amundi Malaysia Sdn Bhdp
Malaysia Subsidiary 100.0 100.0 78.6 73.6
Amundi Nederland (Amsterdam)
pNetherlands Branch 100.0 100.0 78.6 73.6
Amundi Polskap
Poland Subsidiary 100.0 100.0 78.6 73.6
Amundi Private Equity Fundsp
France Subsidiary 100.0 100.0 78.6 73.6
Amundi Real Estate Italia SGR S.p.A.
pItaly Subsidiary 100.0 100.0 78.6 73.6
Amundi SGR S.p.A.p
Italy Subsidiary 100.0 100.0 78.6 73.6
Amundi SINGAPORE LTD BRUNEI BRANCH
pS1 Brunei
DarussalamBranch 100.0 73.6
Amundi Singapore Ltd.p
Singapore Subsidiary 100.0 100.0 78.6 73.6
Amundi Smith Breedenp
United States Subsidiary 100.0 100.0 78.6 73.6
Amundi Suissep
Switzerland Subsidiary 100.0 100.0 78.6 73.6
Amundi Tenue de Comptesp
France Subsidiary 100.0 100.0 78.6 73.6
Amundi USA Incp
United States Subsidiary 100.0 100.0 78.6 73.6
Consolidation method: p Full i Equity accounted 1 Parent * Restated.

424 CRÉDIT AGRICOLE S.A. 2014 REGISTRATION DOCUMENT
6 CONSOLIDATED FINANCIAL STATEMENTSNotes to the financial statements / Note 12
Crédit Agricole S.A. Group Scope of consolidation (a)
Location(Country of
incorporation if different from
location)
Nature of entity
and control
(b)
% control % interest
31/122014
31/122013*
31/122014
31/122013*
Amundi Venturesp
E1 France Subsidiary 100.0 78.6
BFT Gestionp
France Subsidiary 100.0 100.0 78.6 73.6
CA Brasil DTVMp
Brazil Subsidiary 100.0 100.0 97.8 97.8
CA Indosuez Gestionp
France Subsidiary 100.0 100.0 97.8 97.8
CA Indosuez Private Bankingp
France Subsidiary 100.0 100.0 97.8 97.8
CACEIS (Canada) Ltd.p
Canada Subsidiary 100.0 100.0 85.0 85.0
CACEIS (USA) Inc.p
United States Subsidiary 100.0 100.0 85.0 85.0
CACEIS Bank Deutschland GmbH
pGermany Subsidiary 100.0 100.0 85.0 85.0
CACEIS BANK Francep
France Subsidiary 100.0 100.0 85.0 85.0
CACEIS Bank Luxembourgp
Luxembourg Subsidiary 100.0 100.0 85.0 85.0
CACEIS Bank Luxembourg (Amsterdam)
pNetherlands Branch 100.0 100.0 85.0 85.0
CACEIS Bank Luxembourg (Brussels)
pBelgium Branch 100.0 100.0 85.0 85.0
CACEIS Bank Luxembourg (Dublin)
pIreland Branch 100.0 100.0 85.0 85.0
CACEIS Bank Luxembourg (Milan)
pItaly Branch 100.0 100.0 85.0 85.0
CACEIS Belgiump
Belgium Subsidiary 100.0 100.0 85.0 85.0
CACEIS Corporate Trustp
France Subsidiary 100.0 100.0 85.0 85.0
CACEIS Fund Administrationp
France Subsidiary 100.0 100.0 85.0 85.0
CACEIS Ireland Limitedp
Ireland Subsidiary 100.0 100.0 85.0 85.0
CACEIS Switzerland S.A.p
Switzerland Subsidiary 100.0 100.0 85.0 85.0
Clam Philadelphiap
France Subsidiary 100.0 100.0 78.6 73.6
CPR AMp
France Subsidiary 100.0 100.0 78.6 73.6
Crédit Agricole Luxembourgp
Luxembourg Subsidiary 100.0 100.0 97.8 97.8
Crédit Agricole Luxembourg (Belgique)
pBelgium
(Luxembourg)Branch 100.0 100.0 97.8 97.8
Crédit Agricole Luxembourg (Espagne)
pSpain
(Luxembourg)Branch 100.0 100.0 97.8 97.8
Crédit Agricole Suissep
Switzerland Subsidiary 100.0 100.0 97.8 97.8
Crédit Agricole Suisse (Bahamas) Ltd.
pBahamas Subsidiary 100.0 100.0 97.8 97.8
Crédit Agricole Suisse (Hong Kong)
pHong Kong
(Switzerland)Branch 100.0 100.0 97.8 97.8
Crédit Agricole Suisse (Singapour)
pSingapore
(Switzerland)Branch 100.0 100.0 97.8 97.8
Crédit Foncier de Monacop
Monaco Subsidiary 70.1 70.1 67.4 67.4
Etoile Gestionp
France Subsidiary 100.0 100.0 78.6 73.6
Finanziaria Indosuez International Ltd.
pSwitzerland Subsidiary 100.0 100.0 97.8 97.8
Fund Channeli
Luxembourg Associate 50.0 50.0 39.3 36.8
IKS KBp
Czech Republic Subsidiary 100.0 100.0 78.6 73.6
Investor Service House S.A.p
Luxembourg Subsidiary 100.0 100.0 85.0 85.0
LCL Emissionsp
E1 France Subsidiary 100.0 78.6
NH-CA Asset Management Ltd.
iSouth Korea Associate 40.0 40.0 31.4 29.4
Partinvest S.A.p
Luxembourg Subsidiary 100.0 100.0 85.0 85.0
Société Générale Gestion (S2G)
pFrance Subsidiary 100.0 100.0 78.6 73.6
State Bank of India Fund Management
iIndia Associate 37.0 37.0 29.1 27.2
Wafa Gestioni
Morocco Associate 34.0 34.0 26.7 25.0
Crédit Agricole S.A. Group Scope of consolidation (a)
Location(Country of
incorporation if different from
location)
Nature of entity
and control
(b)
% control % interest
31/122014
31/122013*
31/122014
31/122013*
Investment companies
CACEIS S.A. France Subsidiary 85.0 85.0 85.0 85.0
Insurance
Assurances Mutuelles Fédéralesp
France Subsidiary 100.0 100.0 100.0 100.0
CA Assicurazionip
Italy Subsidiary 100.0 100.0 100.0 100.0
CACI DANNIp
Italy(Ireland)
Branch 100.0 100.0 100.0 100.0
CACI LIFE LIMITEDp
Ireland Subsidiary 100.0 100.0 100.0 100.0
CACI NON LIFE LIMITEDp
Ireland Subsidiary 100.0 100.0 100.0 100.0
CACI NON VIEp
France(Ireland)
Branch 100.0 100.0 100.0 100.0
CACI Reinsurance Ltd.p
Ireland Subsidiary 100.0 100.0 100.0 100.0
CACI VIEp
France(Ireland)
Branch 100.0 100.0 100.0 100.0
CACI VITAp
Italy(Ireland)
Branch 100.0 100.0 100.0 100.0
CALI Europe Succursale Francep
France Branch 100.0 100.0 99.9 99.9
CALI Europe Succursale Pologne
pPoland
(Luxembourg)Branch 100.0 100.0 99.9 99.9
Crédit Agricole Assurances (CAA)
pFrance Subsidiary 100.0 100.0 100.0 100.0
Crédit Agricole Creditor Insurance (CACI)
pFrance Subsidiary 100.0 100.0 100.0 100.0
Crédit Agricole Lifep
Greece Subsidiary 100.0 100.0 100.0 100.0
Crédit Agricole Life Insurance Company Japan Ltd.
pJapan Subsidiary 100.0 100.0 100.0 100.0
Crédit Agricole Life Insurance Europe
pLuxembourg Subsidiary 100.0 100.0 99.9 99.9
Crédit Agricole Reinsurance S.A.
pLuxembourg Subsidiary 100.0 100.0 100.0 100.0
Crédit Agricole Vita S.p.A.p
Italy Subsidiary 100.0 100.0 100.0 100.0
Dolcea Viep
S4 France Subsidiary 100.0 100.0
Finaref Assurancesp
France Subsidiary 100.0 100.0 100.0 100.0
Finaref Risques Diversp
France Subsidiary 100.0 100.0 100.0 100.0
Finaref Viep
France Subsidiary 100.0 100.0 100.0 100.0
GNB Seguros (formerly BES Seguros)
pPortugal Subsidiary 50.0 50.0 50.0 55.0
Médicale de Francep
France Subsidiary 100.0 99.8 100.0 99.8
Pacificap
France Subsidiary 100.0 100.0 100.0 100.0
Predicap
France Subsidiary 100.0 100.0 100.0 100.0
Predica - Prévoyance Dialogue du Crédit Agricole
pSpain Branch 100.0 100.0 100.0 100.0
Space Holding (Ireland) Ltd
pIreland Subsidiary 100.0 100.0 100.0 100.0
Space Luxp
Luxembourg Subsidiary 100.0 100.0 100.0 100.0
Spiricap
France Subsidiary 100.0 100.0 100.0 100.0
UCITS
Acaciap
D3 France CSE 100.0 100.0 78.6 73.6
Acajoup
D3 France CSE 100.0 100.0 78.6 73.6
Amundi Absolute Credit
pD5 France CSE 29.8 29.8 23.5 23.5
Amundi Corporate 3 Anni
pItaly CSE 100.0 89.0 100.0 89.0
Amundi Funds Equity Global Minimum Variance
pD5 Luxembourg CSE 23.0 23.0 18.1 18.1
Amundi GRD 22 FCPp
France CSE 100.0 99.0 100.0 99.0
Consolidation method: p Full i Equity accounted 1 Parent * Restated.
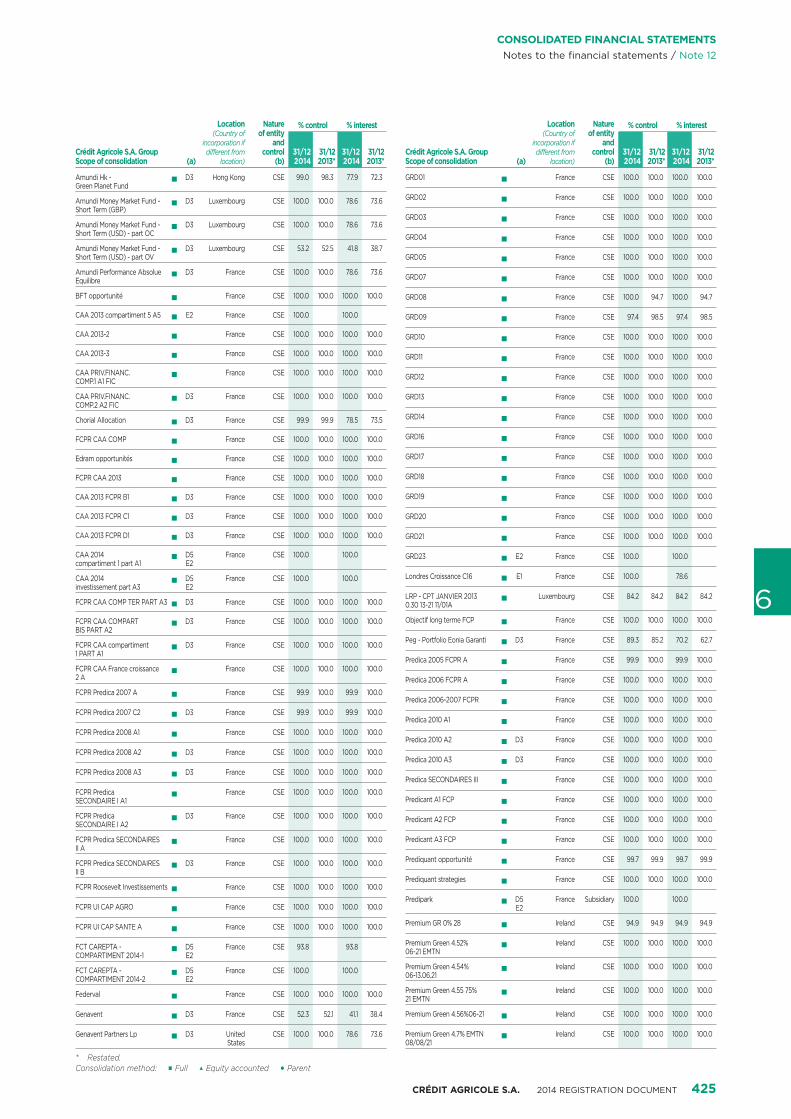
CRÉDIT AGRICOLE S.A. 2014 REGISTRATION DOCUMENT 425
6
CONSOLIDATED FINANCIAL STATEMENTSNotes to the financial statements / Note 12
Crédit Agricole S.A. Group Scope of consolidation (a)
Location(Country of
incorporation if different from
location)
Nature of entity
and control
(b)
% control % interest
31/122014
31/122013*
31/122014
31/122013*
Amundi Hk - Green Planet Fund
pD3 Hong Kong CSE 99.0 98.3 77.9 72.3
Amundi Money Market Fund - Short Term (GBP)
pD3 Luxembourg CSE 100.0 100.0 78.6 73.6
Amundi Money Market Fund - Short Term (USD) - part OC
pD3 Luxembourg CSE 100.0 100.0 78.6 73.6
Amundi Money Market Fund - Short Term (USD) - part OV
pD3 Luxembourg CSE 53.2 52.5 41.8 38.7
Amundi Performance Absolue Equilibre
pD3 France CSE 100.0 100.0 78.6 73.6
BFT opportunitép
France CSE 100.0 100.0 100.0 100.0
CAA 2013 compartiment 5 A5p
E2 France CSE 100.0 100.0
CAA 2013-2p
France CSE 100.0 100.0 100.0 100.0
CAA 2013-3p
France CSE 100.0 100.0 100.0 100.0
CAA PRIV.FINANC.COMP.1 A1 FIC
pFrance CSE 100.0 100.0 100.0 100.0
CAA PRIV.FINANC.COMP.2 A2 FIC
pD3 France CSE 100.0 100.0 100.0 100.0
Chorial Allocationp
D3 France CSE 99.9 99.9 78.5 73.5
FCPR CAA COMPp
France CSE 100.0 100.0 100.0 100.0
Edram opportunitésp
France CSE 100.0 100.0 100.0 100.0
FCPR CAA 2013p
France CSE 100.0 100.0 100.0 100.0
CAA 2013 FCPR B1p
D3 France CSE 100.0 100.0 100.0 100.0
CAA 2013 FCPR C1p
D3 France CSE 100.0 100.0 100.0 100.0
CAA 2013 FCPR D1p
D3 France CSE 100.0 100.0 100.0 100.0
CAA 2014 compartiment 1 part A1
pD5E2
France CSE 100.0 100.0
CAA 2014 investissement part A3
pD5E2
France CSE 100.0 100.0
FCPR CAA COMP TER PART A3p
D3 France CSE 100.0 100.0 100.0 100.0
FCPR CAA COMPART BIS PART A2
pD3 France CSE 100.0 100.0 100.0 100.0
FCPR CAA compartiment 1 PART A1
pD3 France CSE 100.0 100.0 100.0 100.0
FCPR CAA France croissance 2 A
pFrance CSE 100.0 100.0 100.0 100.0
FCPR Predica 2007 Ap
France CSE 99.9 100.0 99.9 100.0
FCPR Predica 2007 C2p
D3 France CSE 99.9 100.0 99.9 100.0
FCPR Predica 2008 A1p
France CSE 100.0 100.0 100.0 100.0
FCPR Predica 2008 A2p
D3 France CSE 100.0 100.0 100.0 100.0
FCPR Predica 2008 A3p
D3 France CSE 100.0 100.0 100.0 100.0
FCPR Predica SECONDAIRE I A1
pFrance CSE 100.0 100.0 100.0 100.0
FCPR Predica SECONDAIRE I A2
pD3 France CSE 100.0 100.0 100.0 100.0
FCPR Predica SECONDAIRES II A
pFrance CSE 100.0 100.0 100.0 100.0
FCPR Predica SECONDAIRES II B
pD3 France CSE 100.0 100.0 100.0 100.0
FCPR Roosevelt Investissementsp
France CSE 100.0 100.0 100.0 100.0
FCPR UI CAP AGROp
France CSE 100.0 100.0 100.0 100.0
FCPR UI CAP SANTE Ap
France CSE 100.0 100.0 100.0 100.0
FCT CAREPTA - COMPARTIMENT 2014-1
pD5E2
France CSE 93.8 93.8
FCT CAREPTA - COMPARTIMENT 2014-2
pD5E2
France CSE 100.0 100.0
Federvalp
France CSE 100.0 100.0 100.0 100.0
Genaventp
D3 France CSE 52.3 52.1 41.1 38.4
Genavent Partners Lpp
D3 United States
CSE 100.0 100.0 78.6 73.6
Crédit Agricole S.A. Group Scope of consolidation (a)
Location(Country of
incorporation if different from
location)
Nature of entity
and control
(b)
% control % interest
31/122014
31/122013*
31/122014
31/122013*
GRD01p
France CSE 100.0 100.0 100.0 100.0
GRD02p
France CSE 100.0 100.0 100.0 100.0
GRD03p
France CSE 100.0 100.0 100.0 100.0
GRD04p
France CSE 100.0 100.0 100.0 100.0
GRD05p
France CSE 100.0 100.0 100.0 100.0
GRD07p
France CSE 100.0 100.0 100.0 100.0
GRD08p
France CSE 100.0 94.7 100.0 94.7
GRD09p
France CSE 97.4 98.5 97.4 98.5
GRD10p
France CSE 100.0 100.0 100.0 100.0
GRD11p
France CSE 100.0 100.0 100.0 100.0
GRD12p
France CSE 100.0 100.0 100.0 100.0
GRD13p
France CSE 100.0 100.0 100.0 100.0
GRD14p
France CSE 100.0 100.0 100.0 100.0
GRD16p
France CSE 100.0 100.0 100.0 100.0
GRD17p
France CSE 100.0 100.0 100.0 100.0
GRD18p
France CSE 100.0 100.0 100.0 100.0
GRD19p
France CSE 100.0 100.0 100.0 100.0
GRD20p
France CSE 100.0 100.0 100.0 100.0
GRD21p
France CSE 100.0 100.0 100.0 100.0
GRD23p
E2 France CSE 100.0 100.0
Londres Croissance C16p
E1 France CSE 100.0 78.6
LRP - CPT JANVIER 2013 0.30 13-21 11/01A
pLuxembourg CSE 84.2 84.2 84.2 84.2
Objectif long terme FCPp
France CSE 100.0 100.0 100.0 100.0
Peg - Portfolio Eonia Garantip
D3 France CSE 89.3 85.2 70.2 62.7
Predica 2005 FCPR Ap
France CSE 99.9 100.0 99.9 100.0
Predica 2006 FCPR Ap
France CSE 100.0 100.0 100.0 100.0
Predica 2006-2007 FCPRp
France CSE 100.0 100.0 100.0 100.0
Predica 2010 A1p
France CSE 100.0 100.0 100.0 100.0
Predica 2010 A2p
D3 France CSE 100.0 100.0 100.0 100.0
Predica 2010 A3p
D3 France CSE 100.0 100.0 100.0 100.0
Predica SECONDAIRES IIIp
France CSE 100.0 100.0 100.0 100.0
Predicant A1 FCPp
France CSE 100.0 100.0 100.0 100.0
Predicant A2 FCPp
France CSE 100.0 100.0 100.0 100.0
Predicant A3 FCPp
France CSE 100.0 100.0 100.0 100.0
Prediquant opportunitép
France CSE 99.7 99.9 99.7 99.9
Prediquant strategiesp
France CSE 100.0 100.0 100.0 100.0
Prediparkp
D5E2
France Subsidiary 100.0 100.0
Premium GR 0% 28p
Ireland CSE 94.9 94.9 94.9 94.9
Premium Green 4.52%06-21 EMTN
pIreland CSE 100.0 100.0 100.0 100.0
Premium Green 4.54%06-13.06.21
pIreland CSE 100.0 100.0 100.0 100.0
Premium Green 4.55 75%21 EMTN
pIreland CSE 100.0 100.0 100.0 100.0
Premium Green 4.56%06-21p
Ireland CSE 100.0 100.0 100.0 100.0
Premium Green 4.7% EMTN 08/08/21
pIreland CSE 100.0 100.0 100.0 100.0
Consolidation method: p Full i Equity accounted 1 Parent * Restated.
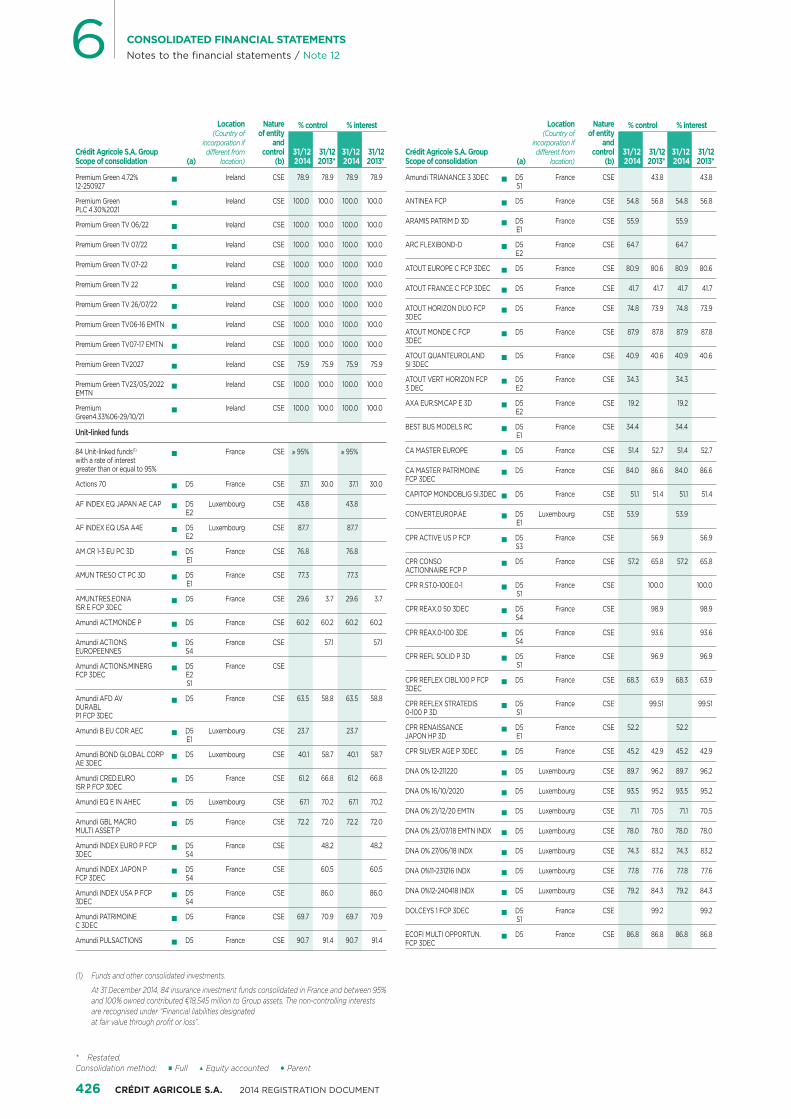
426 CRÉDIT AGRICOLE S.A. 2014 REGISTRATION DOCUMENT
6 CONSOLIDATED FINANCIAL STATEMENTSNotes to the financial statements / Note 12
Crédit Agricole S.A. Group Scope of consolidation (a)
Location(Country of
incorporation if different from
location)
Nature of entity
and control
(b)
% control % interest
31/122014
31/122013*
31/122014
31/122013*
Premium Green 4.72%12-250927
pIreland CSE 78.9 78.9 78.9 78.9
Premium Green PLC 4.30%2021
pIreland CSE 100.0 100.0 100.0 100.0
Premium Green TV 06/22p
Ireland CSE 100.0 100.0 100.0 100.0
Premium Green TV 07/22p
Ireland CSE 100.0 100.0 100.0 100.0
Premium Green TV 07-22p
Ireland CSE 100.0 100.0 100.0 100.0
Premium Green TV 22p
Ireland CSE 100.0 100.0 100.0 100.0
Premium Green TV 26/07/22p
Ireland CSE 100.0 100.0 100.0 100.0
Premium Green TV06-16 EMTNp
Ireland CSE 100.0 100.0 100.0 100.0
Premium Green TV07-17 EMTNp
Ireland CSE 100.0 100.0 100.0 100.0
Premium Green TV2027p
Ireland CSE 75.9 75.9 75.9 75.9
Premium Green TV23/05/2022 EMTN
pIreland CSE 100.0 100.0 100.0 100.0
Premium Green4.33%06-29/10/21
pIreland CSE 100.0 100.0 100.0 100.0
Unit-linked funds
84 Unit-linked funds(1) with a rate of interest greater than or equal to 95%
pFrance CSE ≥ 95% ≥ 95%
Actions 70p
D5 France CSE 37.1 30.0 37.1 30.0
AF INDEX EQ JAPAN AE CAPp
D5E2
Luxembourg CSE 43.8 43.8
AF INDEX EQ USA A4Ep
D5E2
Luxembourg CSE 87.7 87.7
AM CR 1-3 EU PC 3Dp
D5E1
France CSE 76.8 76.8
AMUN TRESO CT PC 3Dp
D5E1
France CSE 77.3 77.3
AMUN.TRES.EONIA ISR E FCP 3DEC
pD5 France CSE 29.6 3.7 29.6 3.7
Amundi ACT.MONDE Pp
D5 France CSE 60.2 60.2 60.2 60.2
Amundi ACTIONS EUROPEENNES
pD5S4
France CSE 57.1 57.1
Amundi ACTIONS.MINERG FCP 3DEC
pD5E2S1
France CSE
Amundi AFD AV DURABL P1 FCP 3DEC
pD5 France CSE 63.5 58.8 63.5 58.8
Amundi B EU COR AECp
D5E1
Luxembourg CSE 23.7 23.7
Amundi BOND GLOBAL CORP AE 3DEC
pD5 Luxembourg CSE 40.1 58.7 40.1 58.7
Amundi CRED.EURO ISR P FCP 3DEC
pD5 France CSE 61.2 66.8 61.2 66.8
Amundi EQ E IN AHECp
D5 Luxembourg CSE 67.1 70.2 67.1 70.2
Amundi GBL MACRO MULTI ASSET P
pD5 France CSE 72.2 72.0 72.2 72.0
Amundi INDEX EURO P FCP 3DEC
pD5S4
France CSE 48.2 48.2
Amundi INDEX JAPON P FCP 3DEC
pD5S4
France CSE 60.5 60.5
Amundi INDEX USA P FCP 3DEC
pD5S4
France CSE 86.0 86.0
Amundi PATRIMOINE C 3DEC
pD5 France CSE 69.7 70.9 69.7 70.9
Amundi PULSACTIONSp
D5 France CSE 90.7 91.4 90.7 91.4
(1) Funds and other consolidated investments.
At 31 December 2014, 84 insurance investment funds consolidated in France and between 95% and 100% owned contributed €18,545 million to Group assets. The non-controlling interests are recognised under “Financial liabilities designated at fair value through profit or loss”.
Crédit Agricole S.A. Group Scope of consolidation (a)
Location(Country of
incorporation if different from
location)
Nature of entity
and control
(b)
% control % interest
31/122014
31/122013*
31/122014
31/122013*
Amundi TRIANANCE 3 3DECp
D5S1
France CSE 43.8 43.8
ANTINEA FCPp
D5 France CSE 54.8 56.8 54.8 56.8
ARAMIS PATRIM D 3Dp
D5E1
France CSE 55.9 55.9
ARC FLEXIBOND-Dp
D5E2
France CSE 64.7 64.7
ATOUT EUROPE C FCP 3DECp
D5 France CSE 80.9 80.6 80.9 80.6
ATOUT FRANCE C FCP 3DECp
D5 France CSE 41.7 41.7 41.7 41.7
ATOUT HORIZON DUO FCP 3DEC
pD5 France CSE 74.8 73.9 74.8 73.9
ATOUT MONDE C FCP 3DEC
pD5 France CSE 87.9 87.8 87.9 87.8
ATOUT QUANTEUROLAND SI 3DEC
pD5 France CSE 40.9 40.6 40.9 40.6
ATOUT VERT HORIZON FCP 3 DEC
pD5E2
France CSE 34.3 34.3
AXA EUR.SM.CAP E 3Dp
D5E2
France CSE 19.2 19.2
BEST BUS MODELS RCp
D5E1
France CSE 34.4 34.4
CA MASTER EUROPEp
D5 France CSE 51.4 52.7 51.4 52.7
CA MASTER PATRIMOINE FCP 3DEC
pD5 France CSE 84.0 86.6 84.0 86.6
CAPITOP MONDOBLIG SI.3DECp
D5 France CSE 51.1 51.4 51.1 51.4
CONVERT.EUROP.AEp
D5E1
Luxembourg CSE 53.9 53.9
CPR ACTIVE US P FCPp
D5S3
France CSE 56.9 56.9
CPR CONSO ACTIONNAIRE FCP P
pD5 France CSE 57.2 65.8 57.2 65.8
CPR R.ST.0-100E.0-1p
D5S1
France CSE 100.0 100.0
CPR REAX.0 50 3DECp
D5S4
France CSE 98.9 98.9
CPR REAX.0-100 3DEp
D5S4
France CSE 93.6 93.6
CPR REFL SOLID P 3Dp
D5S1
France CSE 96.9 96.9
CPR REFLEX CIBL.100 P FCP 3DEC
pD5 France CSE 68.3 63.9 68.3 63.9
CPR REFLEX STRATEDIS 0-100 P 3D
pD5S1
France CSE 99.51 99.51
CPR RENAISSANCE JAPON HP 3D
pD5E1
France CSE 52.2 52.2
CPR SILVER AGE P 3DECp
D5 France CSE 45.2 42.9 45.2 42.9
DNA 0% 12-211220p
D5 Luxembourg CSE 89.7 96.2 89.7 96.2
DNA 0% 16/10/2020p
D5 Luxembourg CSE 93.5 95.2 93.5 95.2
DNA 0% 21/12/20 EMTNp
D5 Luxembourg CSE 71.1 70.5 71.1 70.5
DNA 0% 23/07/18 EMTN INDXp
D5 Luxembourg CSE 78.0 78.0 78.0 78.0
DNA 0% 27/06/18 INDXp
D5 Luxembourg CSE 74.3 83.2 74.3 83.2
DNA 0%11-231216 INDXp
D5 Luxembourg CSE 77.8 77.6 77.8 77.6
DNA 0%12-240418 INDXp
D5 Luxembourg CSE 79.2 84.3 79.2 84.3
DOLCEYS 1 FCP 3DECp
D5S1
France CSE 99.2 99.2
ECOFI MULTI OPPORTUN.FCP 3DEC
pD5 France CSE 86.8 86.8 86.8 86.8
Consolidation method: p Full i Equity accounted 1 Parent * Restated.
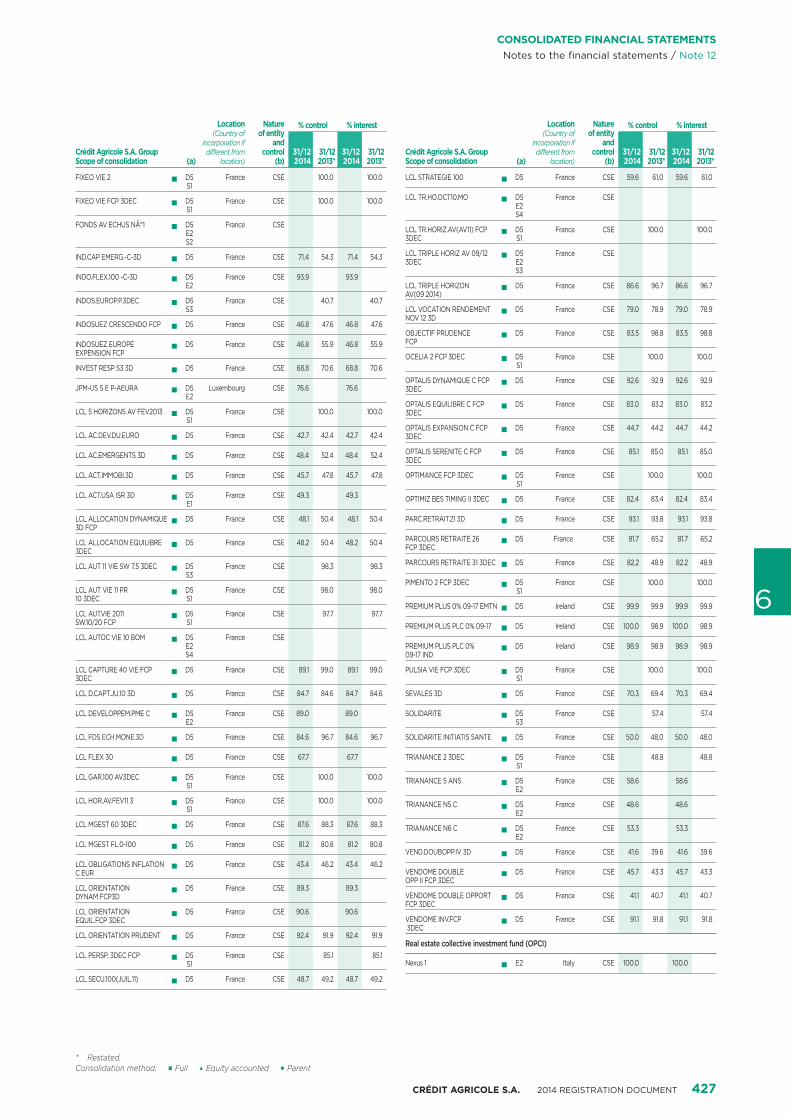
CRÉDIT AGRICOLE S.A. 2014 REGISTRATION DOCUMENT 427
6
CONSOLIDATED FINANCIAL STATEMENTSNotes to the financial statements / Note 12
Crédit Agricole S.A. Group Scope of consolidation (a)
Location(Country of
incorporation if different from
location)
Nature of entity
and control
(b)
% control % interest
31/122014
31/122013*
31/122014
31/122013*
FIXEO VIE 2p
D5S1
France CSE 100.0 100.0
FIXEO VIE FCP 3DECp
D5S1
France CSE 100.0 100.0
FONDS AV ECHUS N°1p
D5E2S2
France CSE
IND.CAP EMERG.-C-3Dp
D5 France CSE 71.4 54.3 71.4 54.3
INDO.FLEX.100 -C-3Dp
D5E2
France CSE 93.9 93.9
INDOS.EUROP.P.3DECp
D5S3
France CSE 40.7 40.7
INDOSUEZ CRESCENDO FCPp
D5 France CSE 46.8 47.6 46.8 47.6
INDOSUEZ EUROPE EXPENSION FCP
pD5 France CSE 46.8 55.9 46.8 55.9
INVEST RESP S3 3Dp
D5 France CSE 68.8 70.6 68.8 70.6
JPM-US S E P-AEURAp
D5E2
Luxembourg CSE 76.6 76.6
LCL 5 HORIZONS AV FEV2013p
D5S1
France CSE 100.0 100.0
LCL AC.DEV.DU.EUROp
D5 France CSE 42.7 42.4 42.7 42.4
LCL AC.EMERGENTS 3Dp
D5 France CSE 48.4 52.4 48.4 52.4
LCL ACT.IMMOBI.3Dp
D5 France CSE 45.7 47.8 45.7 47.8
LCL ACT.USA ISR 3Dp
D5E1
France CSE 49.3 49.3
LCL ALLOCATION DYNAMIQUE 3D FCP
pD5 France CSE 48.1 50.4 48.1 50.4
LCL ALLOCATION EQUILIBRE 3DEC
pD5 France CSE 48.2 50.4 48.2 50.4
LCL AUT 11 VIE SW 7.5 3DECp
D5S3
France CSE 98.3 98.3
LCL AUT VIE 11 PR 10 3DEC
pD5S1
France CSE 98.0 98.0
LCL AUT.VIE 2011 SW.10/20 FCP
pD5S1
France CSE 97.7 97.7
LCL AUTOC VIE 10 BOMp
D5E2S4
France CSE
LCL CAPTURE 40 VIE FCP 3DEC
pD5 France CSE 89.1 99.0 89.1 99.0
LCL D.CAPT.JU.10 3Dp
D5 France CSE 84.7 84.6 84.7 84.6
LCL DEVELOPPEM.PME Cp
D5E2
France CSE 89.0 89.0
LCL FDS ECH.MONE.3Dp
D5 France CSE 84.6 96.7 84.6 96.7
LCL FLEX 30p
D5 France CSE 67.7 67.7
LCL GAR.100 AV3DECp
D5S1
France CSE 100.0 100.0
LCL HOR.AV.FEV11 3p
D5S1
France CSE 100.0 100.0
LCL MGEST 60 3DECp
D5 France CSE 87.6 88.3 87.6 88.3
LCL MGEST FL.0-100p
D5 France CSE 81.2 80.8 81.2 80.8
LCL OBLIGATIONS INFLATION C EUR
pD5 France CSE 43.4 46.2 43.4 46.2
LCL ORIENTATION DYNAM FCP3D
pD5 France CSE 89.3 89.3
LCL ORIENTATION EQUIL.FCP 3DEC
pD5 France CSE 90.6 90.6
LCL ORIENTATION PRUDENTp
D5 France CSE 92.4 91.9 92.4 91.9
LCL PERSP. 3DEC FCPp
D5S1
France CSE 85.1 85.1
LCL SECU.100(JUIL.11)p
D5 France CSE 48.7 49.2 48.7 49.2
Crédit Agricole S.A. Group Scope of consolidation (a)
Location(Country of
incorporation if different from
location)
Nature of entity
and control
(b)
% control % interest
31/122014
31/122013*
31/122014
31/122013*
LCL STRATEGIE 100p
D5 France CSE 59.6 61.0 59.6 61.0
LCL TR.HO.OCT10.MOp
D5E2S4
France CSE
LCL TR.HORIZ.AV(AV11) FCP 3DEC
pD5S1
France CSE 100.0 100.0
LCL TRIPLE HORIZ AV 09/12 3DEC
pD5E2S3
France CSE
LCL TRIPLE HORIZON AV(09 2014)
pD5 France CSE 86.6 96.7 86.6 96.7
LCL VOCATION RENDEMENT NOV 12 3D
pD5 France CSE 79.0 78.9 79.0 78.9
OBJECTIF PRUDENCE FCP
pD5 France CSE 83.5 98.8 83.5 98.8
OCELIA 2 FCP 3DECp
D5S1
France CSE 100.0 100.0
OPTALIS DYNAMIQUE C FCP 3DEC
pD5 France CSE 92.6 92.9 92.6 92.9
OPTALIS EQUILIBRE C FCP 3DEC
pD5 France CSE 83.0 83.2 83.0 83.2
OPTALIS EXPANSION C FCP 3DEC
pD5 France CSE 44.7 44.2 44.7 44.2
OPTALIS SERENITE C FCP 3DEC
pD5 France CSE 85.1 85.0 85.1 85.0
OPTIMANCE FCP 3DECp
D5S1
France CSE 100.0 100.0
OPTIMIZ BES TIMING II 3DECp
D5 France CSE 82.4 83.4 82.4 83.4
PARC.RETRAIT.21 3Dp
D5 France CSE 93.1 93.8 93.1 93.8
PARCOURS RETRAITE 26 FCP 3DEC
pD5 France CSE 81.7 65.2 81.7 65.2
PARCOURS RETRAITE 31 3DECp
D5 France CSE 82.2 48.9 82.2 48.9
PIMENTO 2 FCP 3DECp
D5S1
France CSE 100.0 100.0
PREMIUM PLUS 0% 09-17 EMTNp
D5 Ireland CSE 99.9 99.9 99.9 99.9
PREMIUM PLUS PLC 0% 09-17p
D5 Ireland CSE 100.0 98.9 100.0 98.9
PREMIUM PLUS PLC 0% 09-17 IND
pD5 Ireland CSE 98.9 98.9 98.9 98.9
PULSIA VIE FCP 3DECp
D5S1
France CSE 100.0 100.0
SEVALES 3Dp
D5 France CSE 70.3 69.4 70.3 69.4
SOLIDARITEp
D5S3
France CSE 57.4 57.4
SOLIDARITE INITIATIS SANTEp
D5 France CSE 50.0 48.0 50.0 48.0
TRIANANCE 2 3DECp
D5S1
France CSE 48.8 48.8
TRIANANCE 5 ANSp
D5E2
France CSE 58.6 58.6
TRIANANCE N5 Cp
D5E2
France CSE 48.6 48.6
TRIANANCE N6 Cp
D5E2
France CSE 53.3 53.3
VEND.DOUBOPP.IV 3Dp
D5 France CSE 41.6 39.6 41.6 39.6
VENDOME DOUBLE OPP II FCP 3DEC
pD5 France CSE 45.7 43.3 45.7 43.3
VENDOME DOUBLE OPPORT FCP 3DEC
pD5 France CSE 41.1 40.7 41.1 40.7
VENDOME INV.FCP 3DEC
pD5 France CSE 91.1 91.8 91.1 91.8
Real estate collective investment fund (OPCI)
Nexus 1p
E2 Italy CSE 100.0 100.0
Consolidation method: p Full i Equity accounted 1 Parent * Restated.

428 CRÉDIT AGRICOLE S.A. 2014 REGISTRATION DOCUMENT
6 CONSOLIDATED FINANCIAL STATEMENTSNotes to the financial statements / Note 12
Crédit Agricole S.A. Group Scope of consolidation (a)
Location(Country of
incorporation if different from
location)
Nature of entity
and control
(b)
% control % interest
31/122014
31/122013*
31/122014
31/122013*
OPCI Camp Investp
France CSE 68.8 69.0 68.8 69.0
OPCI Immanensp
D3 France CSE 100.0 100.0 78.6 73.6
OPCI Immo Emissionsp
D3 France CSE 100.0 100.0 78.6 73.6
OPCI Iris Invest 2010p
France CSE 80.1 80.0 80.1 80.0
OPCI KARTp
D5E2
France CSE 100.0 100.0
OPCI Messidorp
France CSE 93.6 94.0 93.6 94.0
OPCIMMO LCL SPPICAV 5DECp
D5 France CSE 95.0 92.3 95.0 92.3
OPCIMMO PREM SPPICAV 5DECp
D5 France CSE 96.6 89.1 96.6 89.1
Predica OPCI Bureaup
France CSE 100.0 100.0 100.0 100.0
Predica OPCI Commercesp
France CSE 100.0 100.0 100.0 100.0
Predica OPCI Habitationp
France CSE 100.0 100.0 100.0 100.0
Non-trading real estate investment company (SCI)
SCI Bmedic habitationp
France Subsidiary 100.0 100.0 100.0 100.0
SCI Vicq d’Azir Vellefauxp
D5 France Subsidiary 100.0 100.0 100.0 100.0
SCI Campus Medicis St Denisp
E1 France Subsidiary 70.0 70.0
SCI Campus Rimbaud St Denisp
E1 France Subsidiary 70.0 70.0
SCI FEDERALE PEREIRE VICTOIRE
pFrance Subsidiary 99.0 99.0 99.0 99.0
SCI FEDERALE VILLIERSp
France Subsidiary 100.0 100.0 100.0 100.0
SCI FEDERCOMp
France Subsidiary 100.0 100.0 100.0 100.0
SCI FEDERLOGp
France Subsidiary 99.9 99.9 99.9 99.9
SCI FEDERLONDRESp
France Subsidiary 100.0 100.0 100.0 100.0
SCI FEDERPIERREp
France Subsidiary 100.0 100.0 100.0 100.0
SCI GRENIER VELLEFp
France Subsidiary 100.0 100.0 100.0 100.0
SCI IMEFA 001p
France Subsidiary 100.0 100.0 100.0 100.0
SCI IMEFA 004p
France Subsidiary 100.0 100.0 100.0 100.0
SCI IMEFA 005p
France Subsidiary 100.0 100.0 100.0 100.0
SCI IMEFA 006p
France Subsidiary 100.0 100.0 100.0 100.0
SCI IMEFA 008p
E1 France Subsidiary 100.0 100.0
SCI IMEFA 011p
France Subsidiary 100.0 100.0 100.0 100.0
SCI IMEFA 013p
France Subsidiary 100.0 100.0 100.0 100.0
SCI IMEFA 016p
E1 France Subsidiary 100.0 100.0
SCI IMEFA 017p
France Subsidiary 100.0 100.0 100.0 100.0
SCI IMEFA 018p
France Subsidiary 100.0 100.0 100.0 100.0
SCI IMEFA 020p
France Subsidiary 100.0 100.0 100.0 100.0
SCI IMEFA 022p
E1 France Subsidiary 100.0 100.0
SCI IMEFA 025p
E1 France Subsidiary 100.0 100.0
SCI IMEFA 032p
France Subsidiary 100.0 100.0 100.0 100.0
SCI IMEFA 033p
France Subsidiary 100.0 100.0 100.0 100.0
SCI IMEFA 034p
France Subsidiary 100.0 100.0 100.0 100.0
SCI IMEFA 035p
France Subsidiary 100.0 100.0 100.0 100.0
SCI IMEFA 036p
France Subsidiary 100.0 100.0 100.0 100.0
SCI IMEFA 037p
France Subsidiary 100.0 100.0 100.0 100.0
SCI IMEFA 038p
France Subsidiary 100.0 100.0 100.0 100.0
SCI IMEFA 039p
France Subsidiary 100.0 100.0 100.0 100.0
SCI IMEFA 042p
France Subsidiary 100.0 100.0 100.0 100.0
Crédit Agricole S.A. Group Scope of consolidation (a)
Location(Country of
incorporation if different from
location)
Nature of entity
and control
(b)
% control % interest
31/122014
31/122013*
31/122014
31/122013*
SCI IMEFA 043p
France Subsidiary 100.0 100.0 100.0 100.0
SCI IMEFA 044p
France Subsidiary 100.0 100.0 100.0 100.0
SCI IMEFA 047p
France Subsidiary 100.0 100.0 100.0 100.0
SCI IMEFA 048p
France Subsidiary 100.0 100.0 100.0 100.0
SCI IMEFA 051p
France Subsidiary 100.0 100.0 100.0 100.0
SCI IMEFA 052p
France Subsidiary 100.0 100.0 100.0 100.0
SCI IMEFA 054p
France Subsidiary 100.0 100.0 100.0 100.0
SCI IMEFA 057p
France Subsidiary 100.0 100.0 100.0 100.0
SCI IMEFA 058p
France Subsidiary 100.0 100.0 100.0 100.0
SCI IMEFA 060p
France Subsidiary 100.0 100.0 100.0 100.0
SCI IMEFA 061p
France Subsidiary 100.0 100.0 100.0 100.0
SCI IMEFA 062p
France Subsidiary 100.0 100.0 100.0 100.0
SCI IMEFA 063p
France Subsidiary 100.0 100.0 100.0 100.0
SCI IMEFA 064p
France Subsidiary 100.0 100.0 100.0 100.0
SCI IMEFA 067p
France Subsidiary 100.0 100.0 100.0 100.0
SCI IMEFA 068p
France Subsidiary 100.0 100.0 100.0 100.0
SCI IMEFA 069p
France Subsidiary 100.0 100.0 100.0 100.0
SCI IMEFA 072p
France Subsidiary 100.0 100.0 100.0 100.0
SCI IMEFA 073p
France Subsidiary 100.0 100.0 100.0 100.0
SCI IMEFA 074p
France Subsidiary 100.0 100.0 100.0 100.0
SCI IMEFA 076p
France Subsidiary 100.0 100.0 100.0 100.0
SCI IMEFA 077p
France Subsidiary 100.0 100.0 100.0 100.0
SCI IMEFA 078p
France Subsidiary 100.0 100.0 100.0 100.0
SCI IMEFA 079p
France Subsidiary 100.0 100.0 100.0 100.0
SCI IMEFA 080p
France Subsidiary 100.0 100.0 100.0 100.0
SCI IMEFA 082p
France Subsidiary 100.0 100.0 100.0 100.0
SCI IMEFA 083p
E1 France Subsidiary 100.0 100.0
SCI IMEFA 084p
France Subsidiary 100.0 100.0 100.0 100.0
SCI IMEFA 085p
France Subsidiary 100.0 100.0 100.0 100.0
SCI IMEFA 089p
France Subsidiary 100.0 100.0 100.0 100.0
SCI IMEFA 091p
France Subsidiary 100.0 100.0 100.0 100.0
SCI IMEFA 092p
France Subsidiary 100.0 100.0 100.0 100.0
SCI IMEFA 094p
E1S4
France Subsidiary
SCI IMEFA 096p
France Subsidiary 100.0 100.0 100.0 100.0
SCI IMEFA 100p
France Subsidiary 100.0 100.0 100.0 100.0
SCI IMEFA 101p
France Subsidiary 100.0 100.0 100.0 100.0
SCI IMEFA 102p
France Subsidiary 100.0 100.0 100.0 100.0
SCI IMEFA 103p
France Subsidiary 100.0 100.0 100.0 100.0
SCI IMEFA 104p
France Subsidiary 100.0 100.0 100.0 100.0
SCI IMEFA 105p
France Subsidiary 100.0 100.0 100.0 100.0
SCI IMEFA 107p
France Subsidiary 100.0 100.0 100.0 100.0
SCI IMEFA 108p
France Subsidiary 100.0 100.0 100.0 100.0
SCI IMEFA 109p
France Subsidiary 100.0 100.0 100.0 100.0
SCI IMEFA 110p
France Subsidiary 100.0 100.0 100.0 100.0
SCI IMEFA 112p
France Subsidiary 100.0 100.0 100.0 100.0
SCI IMEFA 113p
France Subsidiary 100.0 100.0 100.0 100.0
SCI IMEFA 115p
France Subsidiary 100.0 100.0 100.0 100.0
SCI IMEFA 116p
France Subsidiary 100.0 100.0 100.0 100.0Consolidation method: p Full i Equity accounted 1 Parent * Restated.
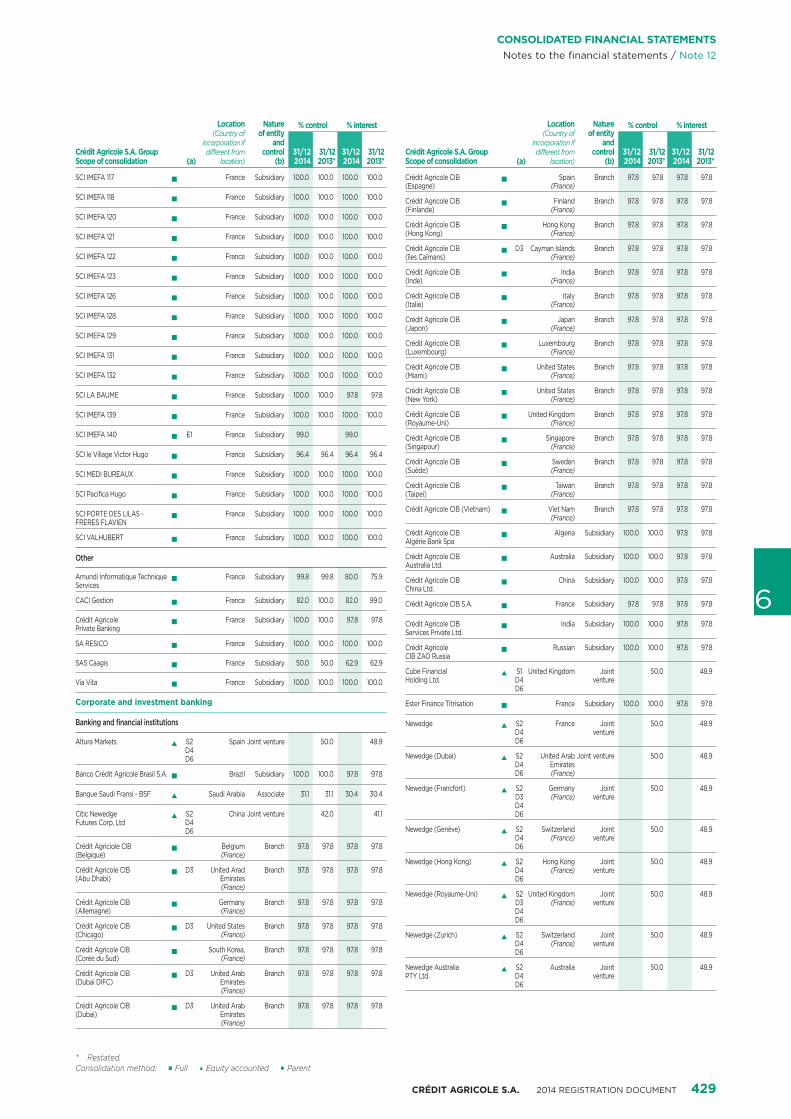
CRÉDIT AGRICOLE S.A. 2014 REGISTRATION DOCUMENT 429
6
CONSOLIDATED FINANCIAL STATEMENTSNotes to the financial statements / Note 12
Crédit Agricole S.A. Group Scope of consolidation (a)
Location(Country of
incorporation if different from
location)
Nature of entity
and control
(b)
% control % interest
31/122014
31/122013*
31/122014
31/122013*
SCI IMEFA 117p
France Subsidiary 100.0 100.0 100.0 100.0
SCI IMEFA 118p
France Subsidiary 100.0 100.0 100.0 100.0
SCI IMEFA 120p
France Subsidiary 100.0 100.0 100.0 100.0
SCI IMEFA 121p
France Subsidiary 100.0 100.0 100.0 100.0
SCI IMEFA 122p
France Subsidiary 100.0 100.0 100.0 100.0
SCI IMEFA 123p
France Subsidiary 100.0 100.0 100.0 100.0
SCI IMEFA 126p
France Subsidiary 100.0 100.0 100.0 100.0
SCI IMEFA 128p
France Subsidiary 100.0 100.0 100.0 100.0
SCI IMEFA 129p
France Subsidiary 100.0 100.0 100.0 100.0
SCI IMEFA 131p
France Subsidiary 100.0 100.0 100.0 100.0
SCI IMEFA 132p
France Subsidiary 100.0 100.0 100.0 100.0
SCI LA BAUMEp
France Subsidiary 100.0 100.0 97.8 97.8
SCI IMEFA 139p
France Subsidiary 100.0 100.0 100.0 100.0
SCI IMEFA 140p
E1 France Subsidiary 99.0 99.0
SCI le Village Victor Hugop
France Subsidiary 96.4 96.4 96.4 96.4
SCI MEDI BUREAUXp
France Subsidiary 100.0 100.0 100.0 100.0
SCI Pacifica Hugop
France Subsidiary 100.0 100.0 100.0 100.0
SCI PORTE DES LILAS - FRERES FLAVIEN
pFrance Subsidiary 100.0 100.0 100.0 100.0
SCI VALHUBERTp
France Subsidiary 100.0 100.0 100.0 100.0
Other
Amundi Informatique Technique Services
pFrance Subsidiary 99.8 99.8 80.0 75.9
CACI Gestionp
France Subsidiary 82.0 100.0 82.0 99.0
Crédit Agricole Private Banking
pFrance Subsidiary 100.0 100.0 97.8 97.8
SA RESICOp
France Subsidiary 100.0 100.0 100.0 100.0
SAS Caagisp
France Subsidiary 50.0 50.0 62.9 62.9
Via Vitap
France Subsidiary 100.0 100.0 100.0 100.0
Corporate and investment banking
Banking and financial institutions
Altura Marketsi
S2D4D6
Spain Joint venture 50.0 48.9
Banco Crédit Agricole Brasil S.A.p
Brazil Subsidiary 100.0 100.0 97.8 97.8
Banque Saudi Fransi - BSFi
Saudi Arabia Associate 31.1 31.1 30.4 30.4
Citic Newedge Futures Corp, Ltd
iS2D4D6
China Joint venture 42.0 41.1
Crédit Agriciole CIB (Belgique)
pBelgium (France)
Branch 97.8 97.8 97.8 97.8
Crédit Agricole CIB (Abu Dhabi)
pD3 United Arad
Emirates (France)
Branch 97.8 97.8 97.8 97.8
Crédit Agricole CIB (Allemagne)
pGermany (France)
Branch 97.8 97.8 97.8 97.8
Crédit Agricole CIB (Chicago)
pD3 United States
(France)Branch 97.8 97.8 97.8 97.8
Crédit Agricole CIB (Corée du Sud)
pSouth Korea,
(France)Branch 97.8 97.8 97.8 97.8
Crédit Agricole CIB (Dubai DIFC)
pD3 United Arab
Emirates(France)
Branch 97.8 97.8 97.8 97.8
Crédit Agricole CIB (Dubai)
pD3 United Arab
Emirates(France)
Branch 97.8 97.8 97.8 97.8
Crédit Agricole S.A. Group Scope of consolidation (a)
Location(Country of
incorporation if different from
location)
Nature of entity
and control
(b)
% control % interest
31/122014
31/122013*
31/122014
31/122013*
Crédit Agricole CIB (Espagne)
pSpain
(France)Branch 97.8 97.8 97.8 97.8
Crédit Agricole CIB (Finlande)
pFinland
(France)Branch 97.8 97.8 97.8 97.8
Crédit Agricole CIB (Hong Kong)
pHong Kong
(France)Branch 97.8 97.8 97.8 97.8
Crédit Agricole CIB (îles Caïmans)
pD3 Cayman Islands
(France)Branch 97.8 97.8 97.8 97.8
Crédit Agricole CIB (Inde)
pIndia
(France)Branch 97.8 97.8 97.8 97.8
Crédit Agricole CIB (Italie)
pItaly
(France)Branch 97.8 97.8 97.8 97.8
Crédit Agricole CIB (Japon)
pJapan
(France)Branch 97.8 97.8 97.8 97.8
Crédit Agricole CIB (Luxembourg)
pLuxembourg
(France)Branch 97.8 97.8 97.8 97.8
Crédit Agricole CIB (Miami)
pUnited States
(France)Branch 97.8 97.8 97.8 97.8
Crédit Agricole CIB (New York)
pUnited States
(France)Branch 97.8 97.8 97.8 97.8
Crédit Agricole CIB (Royaume-Uni)
pUnited Kingdom
(France)Branch 97.8 97.8 97.8 97.8
Crédit Agricole CIB (Singapour)
pSingapore
(France)Branch 97.8 97.8 97.8 97.8
Crédit Agricole CIB (Suède)
pSweden (France)
Branch 97.8 97.8 97.8 97.8
Crédit Agricole CIB (Taipei)
pTaiwan
(France)Branch 97.8 97.8 97.8 97.8
Crédit Agricole CIB (Vietnam)p
Viet Nam(France)
Branch 97.8 97.8 97.8 97.8
Crédit Agricole CIB Algérie Bank Spa
pAlgeria Subsidiary 100.0 100.0 97.8 97.8
Crédit Agricole CIB Australia Ltd.
pAustralia Subsidiary 100.0 100.0 97.8 97.8
Crédit Agricole CIB China Ltd.
pChina Subsidiary 100.0 100.0 97.8 97.8
Crédit Agricole CIB S.A.p
France Subsidiary 97.8 97.8 97.8 97.8
Crédit Agricole CIB Services Private Ltd.
pIndia Subsidiary 100.0 100.0 97.8 97.8
Crédit Agricole CIB ZAO Russia
pRussian Subsidiary 100.0 100.0 97.8 97.8
Cube Financial Holding Ltd.
iS1D4D6
United Kingdom Joint venture
50.0 48.9
Ester Finance Titrisationp
France Subsidiary 100.0 100.0 97.8 97.8
Newedgei
S2D4D6
France Joint venture
50.0 48.9
Newedge (Dubai)i
S2D4D6
United Arab Emirates (France)
Joint venture 50.0 48.9
Newedge (Francfort)i
S2D3D4D6
Germany (France)
Joint venture
50.0 48.9
Newedge (Genève)i
S2D4D6
Switzerland (France)
Joint venture
50.0 48.9
Newedge (Hong Kong)i
S2D4D6
Hong Kong (France)
Joint venture
50.0 48.9
Newedge (Royaume-Uni)i
S2D3D4D6
United Kingdom (France)
Joint venture
50.0 48.9
Newedge (Zurich)i
S2D4D6
Switzerland (France)
Joint venture
50.0 48.9
Newedge Australia PTY Ltd.
iS2D4D6
Australia Joint venture
50.0 48.9
Consolidation method: p Full i Equity accounted 1 Parent * Restated.

430 CRÉDIT AGRICOLE S.A. 2014 REGISTRATION DOCUMENT
6 CONSOLIDATED FINANCIAL STATEMENTSNotes to the financial statements / Note 12
Crédit Agricole S.A. Group Scope of consolidation (a)
Location(Country of
incorporation if different from
location)
Nature of entity
and control
(b)
% control % interest
31/122014
31/122013*
31/122014
31/122013*
Newedge Broker Hong-Kong Ltd.
iS2D4D6
Hong Kong Joint venture
50.0 48.9
Newedge Broker India PTE Ltd.i
S2D4D6
India Joint venture
50.0 48.9
Newedge Canada Inc.i
S2D4D6
Canada Joint venture
50.0 48.9
Newedge Facilities Management Inc.
iS2D4D6
United States Joint venture
50.0 48.9
Newedge Financial Hong-Kong Ltd.
iS2D4D6
Hong Kong Joint venture
50.0 48.9
Newedge Financial Singapore Pte Ltd.
iS2D4D6
Singapore Joint venture
50.0 48.9
Newedge Japan Inc.i
S2D4D6
Japan Joint venture
50.0 48.9
Newedge Representações Ltda.i
S2D4D6
Brazil Joint venture
50.0 48.9
Newedge UK Financial Ltd.
iS2D4D6
United Kingdom Joint venture
50.0 48.9
Newedge USA LLCi
S2D4D6
United States Joint venture
50.0 48.9
UBAFi
D6 France Joint venture
47.0 47.0 46.0 46.0
UBAF (Corée du Sud)i
D6 South Korea (France)
Joint venture
47.0 47.0 46.0 46.0
UBAF (Japon)i
D6 Japan (France)
Joint venture
47.0 47.0 46.0 46.0
UBAF (Singapour)i
D6 Singapore (France)
Joint venture
47.0 47.0 46.0 46.0
Brokers
Crédit Agricole Securities (USA) Inc.
pUnited States Subsidiary 100.0 100.0 97.8 97.8
Investment companies
Compagnie Française de l’Asie (CFA)
pFrance Subsidiary 100.0 100.0 97.8 97.8
Crédit Agricole CIB Air Finance S.A.
pFrance Subsidiary 100.0 100.0 97.8 97.8
Crédit Agricole CIB Holdings Ltd.
pUnited Kingdom Subsidiary 100.0 100.0 97.8 97.8
Crédit Agricole Global Partners Inc.
pUnited States Subsidiary 100.0 100.0 97.8 97.8
Crédit Agricole North America Inc.
pS1 United States Subsidiary 100.0 97.8
Crédit Agricole Securities Asia BV
pNetherlands Subsidiary 100.0 100.0 97.8 97.8
Crédit Agricole Securities Asia BV (Tokyo)
pJapan
(Netherlands)Branch 100.0 100.0 97.8 97.8
Crédit Agricole Securities Taiwan
pTaiwan Subsidiary 100.0 100.0 97.8 97.8
Doumer Finance S.A.S. France Subsidiary 100.0 100.0 97.8 97.8
Fininvestp
France Subsidiary 98.3 98.3 96.1 96.1
Fletirecp
France Subsidiary 100.0 100.0 97.8 97.8
I.P.F.O.p
France Subsidiary 100.0 100.0 97.8 97.8
Indosuez CM II Inc.p
United States Subsidiary 100.0 100.0 97.8 97.8
L.F. Investment Inc.p
United States Subsidiary 100.0 100.0 97.8 97.8
L.F. Investment L.P.p
United States Subsidiary 100.0 100.0 97.8 97.8
Insurance
Crédit Agricole S.A. Group Scope of consolidation (a)
Location(Country of
incorporation if different from
location)
Nature of entity
and control
(b)
% control % interest
31/122014
31/122013*
31/122014
31/122013*
CAIRS Assurance S.A.p
France Subsidiary 100.0 100.0 97.8 97.8
Other
Acieralliage EURO FCCp
D5 France CSE 100.0 100.0
Acieralliage USD FCCp
D5 United States CSE 100.0 100.0
Armo-Investp
France Subsidiary 100.0 100.0 97.3 97.3
Atlantic Asset Securitization LLC
pD5 United States CSE 100.0 100.0
Benelpartp
Belgium Subsidiary 99.0 99.0 96.3 96.3
CAL Conseilp
Luxembourg Subsidiary 100.0 100.0 97.8 97.8
Calciphosp
France Subsidiary 100.0 100.0 97.3 97.3
Calixis Financep
France CSE 100.0 100.0 97.8 97.8
Calliope SRLp
Italy CSE 100.0 100.0 97.8 97.8
Calyce P.L.C.p
United Kingdom CSE 100.0 100.0 97.8 97.8
Clifapp
France Subsidiary 100.0 100.0 97.8 97.8
CLSA Financial Products Ltd
pBermuda CSE 100.0 100.0 97.8 97.8
Crédit Agricole America Services Inc.
pUnited States Subsidiary 100.0 100.0 97.8 97.8
Crédit Agricole Asia Shipfinance Ltd.
pHong Kong Subsidiary 100.0 100.0 97.8 97.8
Crédit Agricole CIB Finance (Guernsey) Ltd.
pGuernesey CSE 99.9 99.9 97.7 97.7
Crédit Agricole CIB Financial Prod. (Guernsey) Ltd.
pGuernesey CSE 99.9 99.9 97.7 97.7
Crédit Agricole CIB Financial Solutions
pFrance CSE 99.6 99.7 97.4 97.5
Crédit Agricole CIB Global Banking
pFrance Subsidiary 100.0 100.0 97.8 97.8
Crédit Agricole Leasing (USA) Corp.
pUnited States Subsidiary 100.0 100.0 97.8 97.8
Crédit Agricole Private Banking Management Company
pE2 Luxembourg Subsidiary 100.0 97.8
DGAD International SARLp
Luxembourg Subsidiary 100.0 100.0 97.8 97.8
Elipso Finance S.r.li
D5 Italy Joint venture
50.0 50.0 48.9 48.9
ESNI (compartiment Cédit Agricole CIB)
pE2 France CSE 100.0 97.8
Eucalyptus FCTp
D5 France CSE 100.0 100.0
FCT Cablage FCTp
D5 France CSE 100.0 100.0
FIC-FIDCp
D3 Brazil CSE 100.0 100.0 97.8 97.8
Financière des Scarabéesp
Belgium Subsidiary 100.0 100.0 97.6 97.6
Héphaïstos EUR FCCp
D5 France CSE 100.0 100.0
Héphaïstos GBP FCTp
D5 France CSE 100.0 100.0
Héphaïstos Multidevises FCTp
D5 France CSE 100.0 100.0
Héphaïstos USD FCTp
D5 France CSE 100.0 100.0
Himalia P.L.C.p
United Kingdom CSE 100.0 100.0 97.8 97.8
Immobilière Sirius S.A.p
Luxembourg Subsidiary 100.0 100.0 97.8 97.8
Indosuez Holding SCA IIp
Luxembourg CSE 100.0 100.0 97.8 97.8
Indosuez Management Luxembourg II
pLuxembourg CSE 100.0 100.0 97.8 97.8
Island Refinancing SRLp
Italy CSE 100.0 100.0 97.8 97.8
Lafinap
Belgium Subsidiary 100.0 100.0 96.6 96.6
LMA SAp
D5 France CSE 100.0 100.0
Consolidation method: p Full i Equity accounted 1 Parent * Restated.
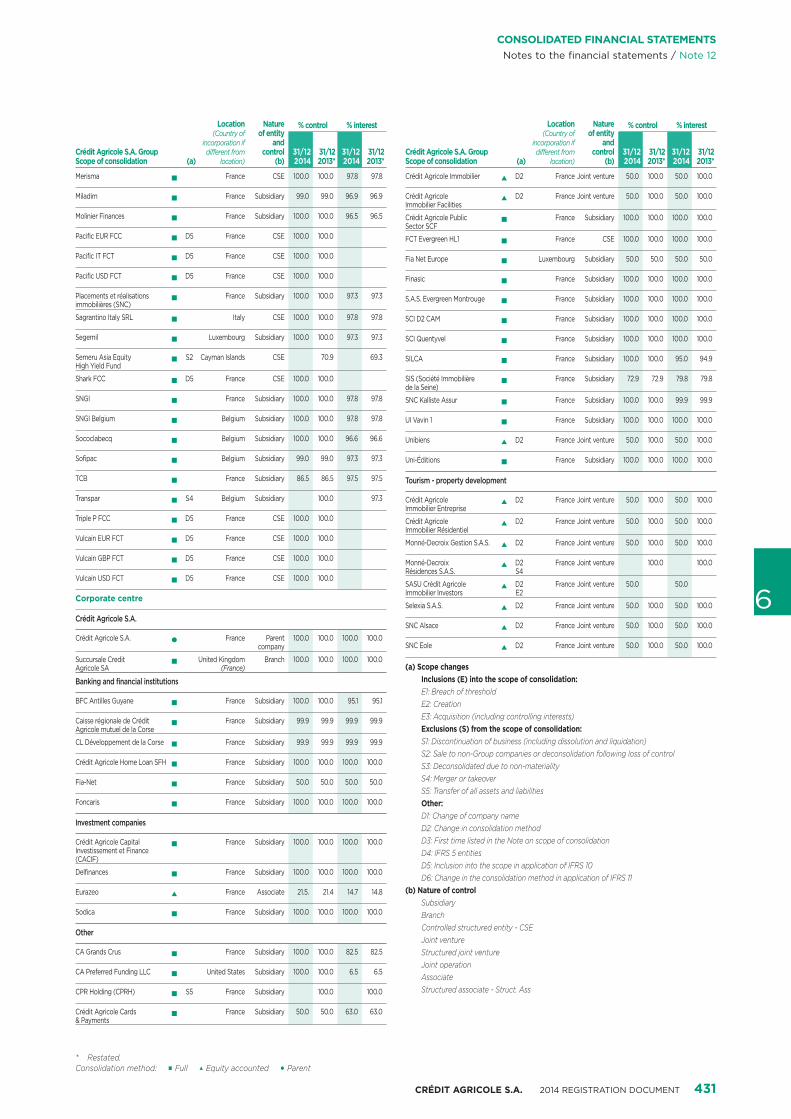
CRÉDIT AGRICOLE S.A. 2014 REGISTRATION DOCUMENT 431
6
CONSOLIDATED FINANCIAL STATEMENTSNotes to the financial statements / Note 12
Crédit Agricole S.A. Group Scope of consolidation (a)
Location(Country of
incorporation if different from
location)
Nature of entity
and control
(b)
% control % interest
31/122014
31/122013*
31/122014
31/122013*
Merismap
France CSE 100.0 100.0 97.8 97.8
Miladimp
France Subsidiary 99.0 99.0 96.9 96.9
Molinier Financesp
France Subsidiary 100.0 100.0 96.5 96.5
Pacific EUR FCCp
D5 France CSE 100.0 100.0
Pacific IT FCTp
D5 France CSE 100.0 100.0
Pacific USD FCTp
D5 France CSE 100.0 100.0
Placements et réalisations immobilières (SNC)
pFrance Subsidiary 100.0 100.0 97.3 97.3
Sagrantino Italy SRLp
Italy CSE 100.0 100.0 97.8 97.8
Segemilp
Luxembourg Subsidiary 100.0 100.0 97.3 97.3
Semeru Asia Equity High Yield Fund
pS2 Cayman Islands CSE 70.9 69.3
Shark FCCp
D5 France CSE 100.0 100.0
SNGIp
France Subsidiary 100.0 100.0 97.8 97.8
SNGI Belgiump
Belgium Subsidiary 100.0 100.0 97.8 97.8
Sococlabecqp
Belgium Subsidiary 100.0 100.0 96.6 96.6
Sofipacp
Belgium Subsidiary 99.0 99.0 97.3 97.3
TCBp
France Subsidiary 86.5 86.5 97.5 97.5
Transparp
S4 Belgium Subsidiary 100.0 97.3
Triple P FCCp
D5 France CSE 100.0 100.0
Vulcain EUR FCTp
D5 France CSE 100.0 100.0
Vulcain GBP FCTp
D5 France CSE 100.0 100.0
Vulcain USD FCTp
D5 France CSE 100.0 100.0
Corporate centre
Crédit Agricole S.A.
Crédit Agricole S.A.1
France Parent company
100.0 100.0 100.0 100.0
Succursale Credit Agricole SA
pUnited Kingdom
(France)Branch 100.0 100.0 100.0 100.0
Banking and financial institutions
BFC Antilles Guyanep
France Subsidiary 100.0 100.0 95.1 95.1
Caisse régionale de Crédit Agricole mutuel de la Corse
pFrance Subsidiary 99.9 99.9 99.9 99.9
CL Développement de la Corsep
France Subsidiary 99.9 99.9 99.9 99.9
Crédit Agricole Home Loan SFHp
France Subsidiary 100.0 100.0 100.0 100.0
Fia-Netp
France Subsidiary 50.0 50.0 50.0 50.0
Foncarisp
France Subsidiary 100.0 100.0 100.0 100.0
Investment companies
Crédit Agricole Capital Investissement et Finance (CACIF)
pFrance Subsidiary 100.0 100.0 100.0 100.0
Delfinancesp
France Subsidiary 100.0 100.0 100.0 100.0
Eurazeoi
France Associate 21.5. 21.4 14.7 14.8
Sodicap
France Subsidiary 100.0 100.0 100.0 100.0
Other
CA Grands Crusp
France Subsidiary 100.0 100.0 82.5 82.5
CA Preferred Funding LLCp
United States Subsidiary 100.0 100.0 6.5 6.5
CPR Holding (CPRH)p
S5 France Subsidiary 100.0 100.0
Crédit Agricole Cards & Payments
pFrance Subsidiary 50.0 50.0 63.0 63.0
Crédit Agricole S.A. Group Scope of consolidation (a)
Location(Country of
incorporation if different from
location)
Nature of entity
and control
(b)
% control % interest
31/122014
31/122013*
31/122014
31/122013*
Crédit Agricole Immobilieri
D2 France Joint venture 50.0 100.0 50.0 100.0
Crédit Agricole Immobilier Facilities
iD2 France Joint venture 50.0 100.0 50.0 100.0
Crédit Agricole Public Sector SCF
pFrance Subsidiary 100.0 100.0 100.0 100.0
FCT Evergreen HL1p
France CSE 100.0 100.0 100.0 100.0
Fia Net Europep
Luxembourg Subsidiary 50.0 50.0 50.0 50.0
Finasicp
France Subsidiary 100.0 100.0 100.0 100.0
S.A.S. Evergreen Montrougep
France Subsidiary 100.0 100.0 100.0 100.0
SCI D2 CAMp
France Subsidiary 100.0 100.0 100.0 100.0
SCI Quentyvelp
France Subsidiary 100.0 100.0 100.0 100.0
SILCAp
France Subsidiary 100.0 100.0 95.0 94.9
SIS (Société Immobilière de la Seine)
pFrance Subsidiary 72.9 72.9 79.8 79.8
SNC Kalliste Assurp
France Subsidiary 100.0 100.0 99.9 99.9
UI Vavin 1p
France Subsidiary 100.0 100.0 100.0 100.0
Unibiensi
D2 France Joint venture 50.0 100.0 50.0 100.0
Uni-Éditionsp
France Subsidiary 100.0 100.0 100.0 100.0
Tourism - property development
Crédit Agricole Immobilier Entreprise
iD2 France Joint venture 50.0 100.0 50.0 100.0
Crédit Agricole Immobilier Résidentiel
iD2 France Joint venture 50.0 100.0 50.0 100.0
Monné-Decroix Gestion S.A.S.i
D2 France Joint venture 50.0 100.0 50.0 100.0
Monné-Decroix Résidences S.A.S.
iD2S4
France Joint venture 100.0 100.0
SASU Crédit Agricole Immobilier Investors
iD2E2
France Joint venture 50.0 50.0
Selexia S.A.S.i
D2 France Joint venture 50.0 100.0 50.0 100.0
SNC Alsacei
D2 France Joint venture 50.0 100.0 50.0 100.0
SNC Eolei
D2 France Joint venture 50.0 100.0 50.0 100.0
(a) Scope changesInclusions (E) into the scope of consolidation:E1: Breach of thresholdE2: CreationE3: Acquisition (including controlling interests)Exclusions (S) from the scope of consolidation:S1: Discontinuation of business (including dissolution and liquidation)S2: Sale to non-Group companies or deconsolidation following loss of controlS3: Deconsolidated due to non-materialityS4: Merger or takeoverS5: Transfer of all assets and liabilitiesOther:D1: Change of company nameD2: Change in consolidation methodD3: First time listed in the Note on scope of consolidationD4: IFRS 5 entitiesD5: Inclusion into the scope in application of IFRS 10D6: Change in the consolidation method in application of IFRS 11
(b) Nature of controlSubsidiaryBranchControlled structured entity - CSEJoint ventureStructured joint ventureJoint operationAssociate Structured associate - Struct. Ass
Consolidation method: p Full i Equity accounted 1 Parent * Restated.
432 CRÉDIT AGRICOLE S.A. 2014 REGISTRATION DOCUMENT
6 CONSOLIDATED FINANCIAL STATEMENTSNotes to the financial statements / Note 13
13.1 Investments in non-consolidated companies
This line item amounts to €7,908 million at 31 December 2014, compared with €6,135 million at 31 December 2013. At 31 December 2014, the main investments in non-consolidated companies where percentage of control is greater than 20% and which have significant value on the balance sheet are Korian, Crédit Logement (shares A and B) and Altarea. The Group’s investment in these companies amounts to €668 million, €507 million and €445 million, respectively.
These shares represent 24% of Korian’s share capital, 33% of Crédit Logement’s and 27% of Altarea’s, but do not confer any significant influence on these entities, which are jointly held by various French banks and companies.
13.2 Non-consolidated structured entities
INFORMATION ON THE NATURE AND EXTENT OF INTERESTS HELDAt 31 December 2014, Crédit Agricole S.A. and its subsidiaries had interests in certain non-consolidated structured entities, the main characteristics of which are presented below on the basis of their type of activity:
SecuritisationCrédit Agricole S.A. Group, mainly through its subsidiaries in the Corporate and investment banking business line, is tasked with structuring securitisation vehicles through the purchase of trade or financial receivables. The vehicles fund such purchases by issuing multiple tranches of debt and equity investments, with repayment being linked to the performance of the assets in such vehicles. It invests in and provides liquidity facilities to the securitisation vehicles it has sponsored on behalf of customers.
Asset managementCrédit Agricole S.A. Group, through its subsidiaries in the Savings management and Insurance business line, structures and manages entities on behalf of customers wishing to invest in specific assets in order to obtain the best possible return having regard to the chosen level of risk. Crédit Agricole S.A. Group entities may thus either be required to hold interests in such entities in order to ensure a successful launch or to guarantee the performance of such structures.
Investment fundsEntities in the Savings management and Insurance business line of Crédit Agricole S.A. Group invest in companies established in response to requests from investors in connection a) with treasury management and b) with the investment of insurance premiums received from insurance company customers pursuant to the regulatory provisions set out in the French Insurance Code. Insurance company investments are meant to cover commitments to policyholders over the life of insurance policies. Their value and returns are correlated to these commitments.
Structured financeLastly, Crédit Agricole S.A. Group, via its subsidiaries in the Corporate and investment banking business line, is involved in special purpose asset acquisition entities. These entities may take the form of asset financing companies or lease financing companies. In structured entities, the financing is secured by the asset. The Group’s involvement is often limited to the financing or to financing commitments.
SPONSORED ENTITIESCrédit Agricole S.A. Group sponsors structured entities in the following instances:
� Crédit Agricole S.A. Group is involved in establishing the entity and that involvement, which is remunerated, is deemed essential for ensuring the proper completion of transactions;
� Structuring takes place at the request of Crédit Agricole S.A. Group and it is the main user thereof;
� Crédit Agricole S.A. Group transfers its own assets to the structured entity;
� Crédit Agricole S.A. Group is the manager;
� The name of a subsidiary or of the parent company of Crédit Agricole S.A. Group is linked to the name of structured entity or to the financial instruments issued by it.
Crédit Agricole S.A. Group has sponsored non-consolidated structured entities in which it held no interest at 31 December 2014.
Gross income, mainly consisting of fee and commission income in the securitisation and asset management business lines, from sponsored entities in which Crédit Agricole S.A. Group did not hold an interest at the reporting date amounted to €2,004 million at 31 December 2014.
NOTE 13 Investments in non-consolidated companies and structured entities

CRÉDIT AGRICOLE S.A. 2014 REGISTRATION DOCUMENT 433
6
CONSOLIDATED FINANCIAL STATEMENTSNotes to the financial statements / Note 13
MAXIMUM EXPOSURE TO LOSS RISKThe maximum exposure to loss risk on financial instruments corresponds to the value recognised on the balance sheet, with the exception of option sale derivatives and credit default swaps for which the exposure corresponds to assets for the notional amount and to liabilities for the notional amount less the mark-
to-market. The maximum exposure to loss risk on commitments given corresponds to the notional amount and the provision for commitments given in the amount recognised on the balance sheet.
INFORMATION ON THE RISKS RELATED TO INTERESTS
Financial support for structured entities
In 2014, Crédit Agricole S.A. provided no financial support for non-consolidated structured entities.At 31 December 2014, Crédit Agricole S.A. had no intention to provide financial support for non-consolidated structured entity.
RISKS RELATED TO INTERESTS IN NON-CONSOLIDATED STRUCTURED ENTITIES
(in millions of euros)
31/12/2014
Securitisation Asset management Investment funds(1) Structured finance(1)
Carrying Amount
Maximum loss
Carrying Amount
Maximum loss
Carrying Amount
Maximum loss
Carrying Amount
Maximum loss
Maximum exposure
to loss risk
Maximum exposure
to loss risk
Maximum exposure
to loss risk
Maximum exposure
to loss risk
Financial assets held for trading 1,216 1,270 535 535 118 118 1,320 1,320
Financial assets designated at fair value through profit or loss - - 382 382 - - 15,578 15,578
Available-for-sale financial assets 262 257 1,303 1,303 73 73 5,202 5,199
Loans and receivables 11,082 11,082 - - 3,422 3,422 553 553
Held-to-maturity financial assets - - - - - - - -
Total assets related to non-consolidated structured entities 12,560 12,609 2,219 2,219 3,613 3,613 22,653 22,650
Equity instruments - - -
Financial liabilities held for trading 984 20 1,741 - 7 7 796 -
Financial liabilities designated at fair value through profit or loss - - - -
Debt 3,196 - 781 1,600
Total liabilities related to non-consolidated structured entities 4,180 20 1,741 - 788 7 2,396 -
Commitments given
Financing commitments 13,116 - 531 69
Guarantee commitments 24 22,761 240 -
Others - - - 199
Provisions – Financing commitments - (6) - -
Total off-balance sheet commitments net of provisions related to non-consolidated structured entities 13,140 22,754 771 268
TOTAL BALANCE SHEET OF NON-CONSOLIDATED STRUCTURED ENTITIES(2) 15,072 98,497 4,369 184,742
(1) Non-sponsored structured entities generate no specific risk related to the nature of the entity. Information concerning these exposures is set out in Note 3.1 “Exposure to credit risk” and Note 3.2 “Market risk”. These are investment funds in which the Group is not a manager, and structured financing entities in which the Group has only granted a loan.
(2) The share of total assets of non-consolidated structured entities held by both Asset management and Investment fund entities amounted to €22,501 million.
434 CRÉDIT AGRICOLE S.A. 2014 REGISTRATION DOCUMENT
6 CONSOLIDATED FINANCIAL STATEMENTSNotes to the financial statements / Note 14
NOTE 14 Events after the reporting period
14.1 Acquisition of BAWAG P.S.K. Invest by Amundi
On 23 October 2014, BAWAG P.S.K. and Amundi announced the finalisation of a long-term asset management partnership. Under this agreement, Amundi bought out BAWAG P.S.K. Invest, the asset management subsidiary of the Austrian bank. The two parties also signed a distribution contract. This transaction, approved by the respective boards of directors of BAWAG P.S.K. and Amundi in 2014, was finalised on 9 February 2015.
A wholly-owned subsidiary of BAWAG P.S.K., at 30 June 2014, BAWAG P.S.K. Invest had €4.6 billion in assets under management via 78 funds aimed at individual and institutional investors who are clients of the bank. On the one hand, Amundi will continue to develop BAWAG P.S.K. Invest’s business in Austria on the basis of the existing franchise. On the other, BAWAG P.S.K. will distribute Amundi’s products throughout Austria via its physical networks (500 branches country-wide) and via its digital channels.