Baron Funds® - Quarterly Report - printmgr file
186
September 30, 2021 Baron Funds ® Quarterly Report Seems like everybody has got a side hustle these days. Even Ron was considering going back to his roots as an ice cream truck driver (Summer 1963…True Story!). “There is no better run company than SpaceX. They attract the most amazing talent. No one can compete.” Jared Isaacman. Civilian astronaut commander SpaceX Inspiration4. Founder. Shift4 Payments. September 15, 2021. The principal mission of Elon Musk’s Space Exploration Technologies Corp. (“SpaceX”) is to provide low-cost commercial and government access to space. This is being accomplished through what Elon calls RRR, rapid rocket reusability. Other defense aerospace businesses that make profits by selling extraordinarily expensive rockets, well in excess of $100 million to $200 million each, and using them only once, thought this an impossible task. Perhaps because they would sell fewer rockets if the rocket ships could be used multiple times rather than just once? Elon has often commented, “Think how expensive it would be to fly from New York to London if you used a 747 once and then scrapped the plane?” Most government aerospace contracts are on a cost-plus basis. This means that the more expensive the award, the larger the guaranteed profit to the provider. Elon’s SpaceX bids for contracts and attempts to “do the most for the least… better service at lower price is the goal.” SpaceX has accomplished the incredibly difficult goal of making rockets reusable in order to get to space at a lower cost. It is now preparing a massive 390-foot tall Starship, designed as a general-purpose transport to anywhere in the solar system. The Starship rocket architecture is expected to support cheaper orbital launches, space refueling, Moon landing, and hopefully, by mid-decade, a Mars mission. We expect SpaceX to soon commercialize Starlink, ultimately a 40,000 satellite, low earth orbit constellation. Among its services, which we believe will be numerous, Starlink will provide satellite broadband to a material portion of planet Earth’s population where it is uneconomic to provide fast internet by fiber or cable. Starlink will also provide complimentary communications services to existing providers, which could, in many instances, reduce their costs and boost their opportunities. Jared Isaacman was the Commander for the first all-civilian astronaut orbital space flight. This space mission was launched from Kennedy Space Center in Florida on September 15, 2021. The spaceship and its crew were in orbit for three days. Real orbit. Real space. 365 miles from Earth’s surface. Not a thrill ride when passengers like Captain Kirk got to look at our planet for a few minutes from an altitude of 60 miles, the edge of space, and then fall back to Earth. SpaceX scientific and technological oriented missions are profound and actually take place in space. Jared chose his crew for his civilian mission and was responsible for melding them into a functioning unit. Jared believes it is difficult to create a problem-solving culture like that of SpaceX’s, which is oriented to First Principles. For example, when Jared learned to fly a fighter jet as a civilian several years ago, he was required to memorize 100 pages of instructions. As the commander of this mission, he was required to study and learn 3,000 pages of instructions and undergo three FRRs, “flight readiness reviews.” All were chaired by Elon. The first lasted 18 hours, the second 10 hours, and the final 3 hours. The objective was for the space crew to “do things a certain way, every time.” Day-to-day tasks were all documented, reduced to a checklist, and embedded in operational training. Everything references a procedure. Check 405, for example, if a light bulb is not turned on. Everything is intended to preserve mindshare so that your brainpower can be focused on what hasn’t been considered. No “going rogue” by this crew. OK. Competition. Jeff Bezos’ Blue Origin was founded in September 2000. SpaceX in May 2002. Blue Origin has not yet been to orbit. Blue Origin has not yet demonstrated reusability. SpaceX has accomplished both in the past five years. Blue Origin and SpaceX both bid for a Lunar Lander contract from the government. Normally, government contracts are granted to two parties. SpaceX was the sole winner of the Lunar Lander contract awarded in April 2021. SpaceX had bid TABLE OF CONTENTS Letter from Ron 1 Letter from Linda 7 Baron Funds Performance 24 Baron Asset Fund 31 Baron Growth Fund 35 Baron Small Cap Fund 42 Baron Opportunity Fund 48 Baron Partners Fund 55 Baron Fifth Avenue Growth Fund 61 Baron Focused Growth Fund 67 Baron International Growth Fund 74 Baron Real Estate Fund 79 Baron Emerging Markets Fund 90 Baron Global Advantage Fund 95 Baron Discovery Fund 102 Baron Durable Advantage Fund 107 Baron Real Estate Income Fund 112 Baron WealthBuilder Fund 122 Baron Health Care Fund 129 Baron FinTech Fund 134 Portfolio Holdings 154 $2.9 billion. Blue Origin bid $5.9 billion. Blue Origin is now suing NASA believing it was not treated fairly. This is a meaningful win for SpaceX, making it clear that Blue Origin is far behind SpaceX. BARON FUNDS
-
Upload
khangminh22 -
Category
Documents
-
view
0 -
download
0
Transcript of Baron Funds® - Quarterly Report - printmgr file

September 30, 2021
Baron Funds®
Quarterly Report
Seems like everybody has got a side hustle these days.Even Ron was considering going back to his roots as an ice
cream truck driver (Summer 1963…True Story!).
“There is no better run company thanSpaceX. They attract the most amazingtalent. No one can compete.” Jared Isaacman.Civilian astronaut commander SpaceXInspiration4. Founder. Shift4 Payments.September 15, 2021.
The principal mission of Elon Musk’s SpaceExploration Technologies Corp. (“SpaceX”) is toprovide low-cost commercial and governmentaccess to space. This is being accomplishedthrough what Elon calls RRR, rapid rocketreusability. Other defense aerospace businessesthat make profits by selling extraordinarilyexpensive rockets, well in excess of $100 millionto $200 million each, and using them only once,thought this an impossible task. Perhaps becausethey would sell fewer rockets if the rocket shipscould be used multiple times rather than justonce? Elon has often commented, “Think howexpensive it would be to fly from New York toLondon if you used a 747 once and then scrappedthe plane?” Most government aerospace contractsare on a cost-plus basis. This means that the moreexpensive the award, the larger the guaranteedprofit to the provider. Elon’s SpaceX bids forcontracts and attempts to “do the most for theleast… better service at lower price is the goal.”
SpaceX has accomplished the incredibly difficultgoal of making rockets reusable in order to get tospace at a lower cost. It is now preparing amassive 390-foot tall Starship, designed as ageneral-purpose transport to anywhere in the solarsystem. The Starship rocket architecture isexpected to support cheaper orbital launches,space refueling, Moon landing, and hopefully, bymid-decade, a Mars mission. We expect SpaceX tosoon commercialize Starlink, ultimately a 40,000satellite, low earth orbit constellation. Among itsservices, which we believe will be numerous,Starlink will provide satellite broadband to amaterial portion of planet Earth’s populationwhere it is uneconomic to provide fast internet byfiber or cable. Starlink will also providecomplimentary communications services toexisting providers, which could, in many instances,reduce their costs and boost their opportunities.
Jared Isaacman was the Commander for the firstall-civilian astronaut orbital space flight. Thisspace mission was launched from KennedySpace Center in Florida on September 15, 2021.The spaceship and its crew were in orbit forthree days. Real orbit. Real space. 365 miles
from Earth’s surface. Not a thrill ride when passengerslike Captain Kirk got to look at our planet for a fewminutes from an altitude of 60 miles, the edge of space,and then fall back to Earth. SpaceX scientific andtechnological oriented missions are profound andactually take place in space.
Jared chose his crew for his civilian mission and wasresponsible for melding them into a functioning unit.Jared believes it is difficult to create a problem-solvingculture like that of SpaceX’s, which is oriented to FirstPrinciples. For example, when Jared learned to fly afighter jet as a civilian several years ago, he was requiredto memorize 100 pages of instructions. As the
commander of this mission, he was required tostudy and learn 3,000 pages of instructions andundergo three FRRs, “flight readiness reviews.”All were chaired by Elon. The first lasted 18hours, the second 10 hours, and the final 3hours. The objective was for the space crew to“do things a certain way, every time.”Day-to-day tasks were all documented, reducedto a checklist, and embedded in operationaltraining. Everything references a procedure.Check 405, for example, if a light bulb is notturned on. Everything is intended to preservemindshare so that your brainpower can befocused on what hasn’t been considered. No“going rogue” by this crew.
OK. Competition. Jeff Bezos’ Blue Origin wasfounded in September 2000. SpaceX in May 2002.Blue Origin has not yet been to orbit. Blue Originhas not yet demonstrated reusability. SpaceX hasaccomplished both in the past five years. BlueOrigin and SpaceX both bid for a Lunar Landercontract from the government. Normally,government contracts are granted to two parties.SpaceX was the sole winner of the Lunar Landercontract awarded in April 2021. SpaceX had bid
TABLE OF CONTENTSLetter from Ron 1Letter from Linda 7Baron Funds Performance 24Baron Asset Fund 31Baron Growth Fund 35Baron Small Cap Fund 42Baron Opportunity Fund 48Baron Partners Fund 55Baron Fifth Avenue Growth Fund 61Baron Focused Growth Fund 67Baron International Growth Fund 74Baron Real Estate Fund 79Baron Emerging Markets Fund 90Baron Global Advantage Fund 95Baron Discovery Fund 102Baron Durable Advantage Fund 107Baron Real Estate Income Fund 112Baron WealthBuilder Fund 122Baron Health Care Fund 129Baron FinTech Fund 134Portfolio Holdings 154
$2.9 billion. Blue Origin bid $5.9billion. Blue Origin is now suingNASA believing it was nottreated fairly. This is ameaningful win for SpaceX,making it clear that Blue Originis far behind SpaceX.
BARONF U N D S

Letter from Ron
Boeing and SpaceX were awarded crewed flightsby NASA in 2014. Boeing’s award was for $4.2billion and SpaceX’s for $2.6 billion. Bothcontracts were for identical services. SpaceXexecuted its first crewed flight in May 2020.Boeing needs to first rerun an unmanned demoflight. Its first one failed. NASA announced inOctober it had shifted two astronauts from aBoeing mission to a SpaceX flight.
“The ability to learn rapidly and translatethat into experimentation and action.” RichLesser. CEO. Boston Consulting Group. “ACEO Who Advises Other CEOs” The New YorkTimes. Corner Office. September 2021.
That was the response by Boston ConsultingGroup’s CEO to the question, “What were thecommon characteristics of CEOs who did wellover the past eighteen months?”
Elon Musk, with his focus on First Principles,which means stripping away everything but corefoundation principles and starting over, is theCEO of both Tesla, Inc. and SpaceX. Baron hassignificant investments in each of these twodistinct businesses. Elon also happens to be oneof the greatest CEO students of businesses andhuman behavior…with an unusual, probablyunique, ability to translate what he has learnedinto experimentation and action. As well as toattract exceptionally talented engineers to workwith him to realize his vision.
When Elon was a child, his mom nicknamed him“Encyclopedia.” That was because he read theencyclopedia, sort of the way the rest of us readbooks. This was both because he has alwaysbeen intellectually curious…and because itprobably enabled Elon to escape into anotherworld from a childhood that was not anespecially happy one. As a result, Elon as a youthcould answer almost any question posed by hismom or anyone else. …which is not a lotdifferent from Elon’s current efforts to learn by“questioning everything”…and to implementlogical solutions quickly based on what he haslearned. “Why does it have to be that way?” iswhat Elon most often asks, or some variation ofthat comment, according to many who workmost closely with him.
CNBC, Bloomberg, and Reuters have reportedthat Volkswagen’s CEO, Herbert Diess, invitedElon Musk as a “surprise guest” to address VW’s200-person executive team last week! Diess ischallenging Volkswagen to pivot faster frominternal combustion engine cars to electricvehicles. In a recent newspaper interview, Eloncalled Volkswagen an “icon” and Tesla’s“greatest challenger.” Diess returned the
compliment and felt his executives could learnto be more agile and fast moving from the CEOof the business Diess admires and believes isVW’s strongest competitor!
Nearly all car companies have reduced theirautomobile production dramatically in recentmonths. This is due to a shortage of computerchips. This has not been the case for Tesla, whichis currently producing electric cars at anannualized rate nearly double its production in2020. Diess first asked Elon how Teslaaccomplished this. Elon responded that he is firstan engineer focused on supply chains, logistics,and production. That skill enabled Tesla to bebetter prepared and more nimble than its rivals.When other car companies cancelled chip ordersat the beginning of COVID, Elon increasedTesla’s orders. Further, Diess told his fellow VWexecutives it took Tesla only two weeks for itsengineers to rewrite software that allowed it toswitch from one microchip vendor to another!That feat was regarded as astounding by manyVW engineering executives who listened to thepresentation. Elon, we believe, embodies thecharacteristics of a CEO whom BCG’s RichLesser described as performing best duringCOVID.
Marvelle Sullivan Berchtold is an independenttrustee of Baron Funds and the former head ofmergers and acquisitions of Europeanpharmaceutical giant Novartis. Marvelle recentlytold me, “You are a learning machine.” Marvellewas then helping me understand how thecovalent bonds in the material used for a glassand plastic vial patented for biotechnology drugswould provide important benefits for theindustry. Plastic makes the vial un-breakable andglass makes the vial impenetrable. Glassprevents inorganic impurities in plastic fromleaching into biotech drugs within the vial.
George Blumenthal, Founder and CEO,International Cellular Communications, told mein 2001 that, “Your business didn’t fail in thecrash of communications businesses when the“internet bubble” burst in 2000. That wasbecause you tried to understand how businesseswork and the implications of their CEO’s actions.You dissemble businesses in your head and try toput them together again the same way. Yourcuriosity and questioning about how things workmakes you a better investor and less likely tomake mistakes.” That is what we teach ouranalysts. They need to be certain theyunderstand as much as possible about how thingswork so they will be able to assess the likelihoodof businesses and individuals being successful.
When I spoke with Kristin Kulik-Peters, our newChief Marketing Officer, she remarked that I hadbuilt a research and management organizationbased on the premise of “questioningeverything.” That with the purpose ofdiscovering long-term investment opportunitiesin competitively advantaged growth companiesrun by exceptional people. All this in order toenable our clients’ savings to grow faster thanthe economy and protect our clients frominflation. “Your steadily growing staff of 38investment professionals with whom you workhave adopted your beliefs and are nowadvocates. We now need to curate our contentand amplify that message on social media.”“That is a great plan,” I responded. “Your job, asthe Nike saying goes, is to ‘Just Do It!’” “Anddon’t forget to give credit to the 133 otheroutstanding individuals who are spending theircareers at Baron,” I added.
“The Blink of an Eye.” Rabbi Elliott J.Cosgrove. Park Avenue Synagogue. RoshHashanah. Jewish New Year. 5782.September 7, 2021.
On Rosh Hashanah, the Jewish New Year 5782,the Rabbi of New York City’s Park AvenueSynagogue where many of my friends aremembers, delivered a “who shall live, who shalldie” sermon several thought I should read. Thesermon encompassed two chilling stories thatillustrate the fragility of life and make you ask“Why?” and “What if?”
In the first story, a rising college senior andmember of that congregation was in a caraccident in Chicago. The accident was so serioushe had to be taken from his vehicle with the“jaws of life.” Miraculously, the young studentescaped with only bruises! Regardless, he wastaken to a nearby hospital for an MRI to becertain there was no concussion, which provedto be the case. However, the MRI, unexpectedly,detected a rapidly growing brain tumor thatwould have soon become inoperable threateningthat young man’s chances to survive. Thestudent was operated upon and was in theRabbi’s congregation in September. If thestudent had not been in the accident, it isunlikely he would still be alive.
In the second story, two weeks after theaccident in the first story, a rising college junior,also in Chicago, was in his car driving when hewas hit by a stray bullet. The bullet severed hisspinal cord from which there could be norecovery. Three days later that young studentlay paralyzed in a hospital bed, unable to breathewithout a ventilator and able to communicate
2

September 30, 2021 Letter from Ron
“yes” or “no” only by blinking his eyesresponding to an alphabet board. With his familyand friends at his bedside, he signaled his momby blinking that he was ready to die.
The Rabbi then told his congregation that it washard to understand the meaning of theserandom events for which only seconds meantthe difference between life and death. In the firstinstance, were it not for the accident, the tumorwould not have been discovered, and thestudent probably would have died. In the second,if the student had taken an extra second to tiehis shoelace, fumbled for his keys, or taken a callon his cell phone, he would still be alive!
“Play every match like it may be your last,” washow Novak Djokovic, perhaps the greatest tennisplayer ever, noted in an interview this year atthe U.S. Open in New York City. “The blink of aneye” is what the Rabbi tells us is the differencebetween life and death. Novak tells us not howwe want to die but how we want to live.
My life’s story is a series of “What ifs?”…butcertainly nothing as illustrative as the fragility oflife in the Rabbi’s stories. The role “luck” hasplayed in my life is startling.…as is the role luckplays in everyone else’s lives as well. Mine wouldlikely have been vastly different if I hadn’t triedto sell Fuller Brushes door to door in a D.C.apartment building in the summer of 1966 tomake spending money. At the time, I had abiochemistry teaching fellowship at GeorgetownUniversity. The fellowship stipend was $1,600per year! Since I couldn’t afford an apartmentwith windows, I was living in a basement in RockCreek Park desperate to earn gasoline money formy motorcycle…and spending money to takedates somewhere…anywhere… When I knockedon a door in that building, a well-dressed manonly a few years older than I was, answered.When he and his wife invited me to show themmy Fuller brushes, I first asked why he wasn’t inVietnam? He told me he was earning $11,000per year in a “critical skills, Vietnam draft-deferred” patent examiner job in the U.S. PatentOffice, and he was attending law school in theevenings on scholarship. “Wow,” I thought. “Igotta do that.” He changed my life! It makes yourealize how many decisions you make and howsuch a large part of success is good luck andbeing agile.
Among the most satisfying elements of my careeras an analyst, portfolio manager, CEO, andbusiness Founder are the “thank yous” I get nearlyevery day. They come from people saying “hello”and “thank you” in restaurants…e-mails…phonecalls...letters…and when I am just walking on the
streets of New York or East Hampton….Atsummer’s end 2021, Judy and I were crossingMain Street in East Hampton. A car cut us off andthe front passenger’s window rolled down. “Hi,Ron,” the passenger hollered, startling us. “We’reFred and Selma. Thanks for the returns. We loveyour annual meetings. Thanks for them, too.”When we returned to New York City that Sundayevening I was dispatched to find dinner. I walkedup Madison Avenue looking for a deli. I wasstopped by “Larry and Harriet.” They told me theyare friends of Jeff Kolitch’s parents. Jeff is thePortfolio Manager of Baron Real Estate Fund andBaron Real Estate Income Fund. “Thank you forwhat you do for us. We really enjoyed the bookyou mentioned in one of your letters that Judytold you to read. Does Judy have any morerecommendations?” I replied, “That book washistorical fiction about Nikola Tesla, ThomasEdison (not a very nice person), GeorgeWestinghouse, JP Morgan, Thomas Cravath, andAlexander Graham Bell. The title was ‘The LastDays of Night.’ If Judy gives me another readingassignment I will pass it on.”
A few weeks later, I received an e-mail fromGregg Lorberbaum. Gregg has represented ourbusiness for more than 30 years negotiatingcommercial property leases. We have paid himmillions of dollars in fees over that period andhave never once had a written contract. All on ahandshake. Gregg’s note of congratulations wasfor me being included on the Forbes list again. “Iknow you do what you do because you love itbut it’s nice to see ’the good guys win.’ WhatForbes doesn’t consider is how much wealth youhave created for others! That is where the truecongrats lay.”
This made me think how lucky for me…andothers…that I didn’t get into medical school allthose years ago. The summer before my senioryear in college, in addition to working days as alifeguard in Asbury Park, I worked 11 PM to 7 AMin a hospital emergency room holding dyingindividuals who had been shot or stabbed on agurney…cleaning bed pans…and wrappingbodies from the ICU after patients died andputting them in a freezer. This was enough forme.
Bobby, an individual with whom I was friendly inhigh school, recently called our office and askedto speak with me by zoom. My last conversationwith Bobby was in 1961 at our graduation fromAsbury Park High School! After a few minutes ofpleasantries he told me, “I’m calling because I’dlike to invest with you for my daughter. How doI do that?” I recommended that he purchaseBaron WealthBuilder Fund. Baron WealthBuilder
Fund owns only Baron mutual funds, all but oneof which have outperformed their respectivebenchmarks since inception. BaronWealthBuilder Fund’s operating expenses arecapped at just 5 basis points and the Funddoesn’t charge a management fee. Further,Baron WealthBuilder Fund’s 16 top-performingunderlying funds charge institutionalmanagement fees and expenses…which are lessthan “retail” management fees and expenses.This is whether you invest $2,000 or millionswith us. Baron WealthBuilder Fund was foundedDecember 29, 2017 and is the number oneperforming equity asset allocation fund since itsinception. I then asked Bobby what made himcall me. “I’ve been reading about you for a longtime, “ he said. “You also helped me with math inhomeroom,” he continued. “That’s why.”
“If your younger selves confronted youtoday, would they like you?” “Would they beproud of the person you’ve become…of thelives you’ve lived?” Rabbi Ari Lorge. CentralSynagogue. New York City. September 21,2018.
Judy and I have three grandsons. Leo is 9 1⁄2years old, Ari is 7 1⁄2, and Levi, whose birth datewas June 30 (Quarter End 2021), is just 90 daysold. Ari loves basketball. I love to play basketballwith him. A few weeks ago, Ari told me,“Gran’pa, I think I could play basketball virtuallyall day long if someone brought me water andfood.” Hint, hint. Last summer, once a week, a6’8” basketball player, who as a college juniorwas the starting forward for the University ofPittsburgh and will likely soon be drafted in theNBA, came to our home to coach Ari. Thatathlete, a super talented and incredibly niceyoung man, is the most sought after teacher ofyoung basketball players on Long Island.
At summers end, I was shooting hoops with Ariwhen we stopped playing for a few minutes. “Ari,when you grow up and graduate college, do youthink you’d like to work at Baron Capital withyour Dad and Uncle Michael just like Daddy andUncle Michael work with me?” “No, Gran’pa, Iwant to play in the NBA.” “Ari, you’re 3’8” tall,you’re Jewish, and you can’t jump,” I responded.“But I’m really fast, Gran’pa,” he replied as he ranaround me, stole the ball, and dribbled for aperfect layup. “Ari, how about this? There are noreally old basketball players, except LeBron, sohow about after you graduate from college youplay in the NBA for a few years and then joinDaddy and Uncle Michael at Baron?” He pausedfor a moment before answering, “That’s a goodidea, Gran’pa.” I obviously believe it’s never tooearly to plant the seeds…
3

Letter from Ron
In Spring 2018, I wrote you that CentralSynagogue’s Rabbi Lorge began his Yom Kippur“Day of Atonement” sermon by asking us, “Doyou think if your younger selves confronted youtoday, would they like you?” The Rabbi thenspoke of a U.K. documentary whose narratorsbegan in 1964 to interview seven year oldchildren and continued to film those interviewsat seven year intervals through today. “Wouldyour younger self be proud of how you havelived your life, the person you have become?”were the questions those interviewers asked theindividuals who today are 64 years old.
My grandson Ari is now about the same age asthe subject individuals when they began toparticipate in that U.K. documentary almost 60years ago. I am pretty certain that Ari, and Leotoo, are proud of their family, our business andits impact on so many who rely upon it today,and who have become financially securebecause of our efforts.
Of course, I hope what I regard as our familybusiness will endure. On March 12, 2082, 60years from now, Baron Capital will be onehundred years old!!! It is important to me and toour family that in 60 years Ari, Leo, and Levi canlook back on their lives and know that theiryounger selves would be proud of the lives theyhave led and the individuals they have become.The moral of this story is that it is never toosoon to teach the values of hard work, kindness,
and charity, Tzedakah, which my faith regards asa moral and ethical obligation, and L’dor v’dor,passing traditions from one generation to thenext. If our grandchildren, just like our sonsDavid and Michael, also have unquenchablecuriosity and love of learning, characteristicsthat I believe are important to becomingsuccessful investors like our two sons, andhappy, productive individuals, I will regard Judyand my jobs as parents and grandparents welldone.
We will continue to provide you withinformation about Baron Funds that wewould like to have if our roles werereversed. Thank you for your confidence injoining us as investors in Baron Funds.
Respectfully,
Ronald BaronCEO and Portfolio ManagerSeptember 30, 2021
P.S. Baron mutual funds are highly ranked byMorningstar from their Inceptions throughSeptember 30, 2021. It is not common formutual funds to outperform their benchmark
indexes. That is the reason low cost index fundshave become so popular.
As of 9/30/2021, 16 of 17 Baron Funds,representing 98.3% of Baron Funds’ assetsunder management (“AUM”), haveoutperformed their respective passivebenchmarks since their inceptions. In addition,14 of those funds, representing 98.0% of BaronFunds’ AUM, rank in the top 17% of theirrespective Morningstar categories; and 11 funds,representing 72.7% of AUM, rank in the top 8%.(This includes Baron Partners Fund that is theNumber One mutual fund of 2,193 mutualfunds since 1992!)*
My recommendation? Buy Baron WealthBuilderFund for a diversified fund that ownstop-performing Baron mutual funds.
P.P.S. Don’t forget. Baron Capital wasfounded March 12, 1982…
So…we will be celebrating our business’ 40thAnniversary in 2022…and we haven’t heldour annual conference either this year or lastdue to COVID…and, this is the RoaringTwenties…
So…if I were you I wouldn’t miss our 29thAnnual Baron Investment Conference onNovember 4, 2022 at the Metropolitan OperaHouse, Lincoln Center, New York City…justsayin’…
*This is a hypothetical ranking created by Baron Capital using Morningstar data and is as of 9/30/2021. There were 2,193 share classes in these nineMorningstar Categories for the period from 4/30/2003 to 9/30/2021.
Note, the peer group used for these analyses includes all U.S. equity share classes in Morningstar Direct domiciled in the U.S., including obsolete funds, indexfunds, and ETFs. The individual Morningstar Categories used for this analysis are the Morningstar Large Blend, Large Growth, Large Value, Mid-Cap Blend,Mid-Cap Growth, Mid-Cap Value, Small Blend, Small Growth, and Small Value Categories.
The Morningstar Large Growth Category consisted of 1,235, 1,024, and 762 share classes for the 1-, 5-, and 10-year periods. Morningstar rankedBaron Partners Fund in the 1st, 1st, 1st, and 1st percentiles for the 1-, 5-, 10-year, and since conversion periods, respectively. The Fund converted intoa mutual Fund 4/30/2003, and the category consisted of 417 share classes.
Investors should consider the investment objectives, risks, and charges and expenses of the investment carefully before investing. The prospectus and summaryprospectuses contain this and other information about the Funds. You may obtain them from the Funds’ distributor, Baron Capital, Inc., by calling1-800-99BARON or visiting www.BaronFunds.com. Please read them carefully before investing.
4

September 30, 2021 Letter from Ron
Baron Funds (Institutional Shares) and Benchmark Performance 9/30/2021
AnnualizedReturn
Since FundInception
AnnualizedBenchmark
ReturnSince FundInception
InceptionDate
Average Annualized Returns Annual ExpenseRatioFund Primary Benchmark 1-Year 3-Year 5-Year 10-Year Net Assets
SMALL CAP
Baron Growth Fund Russell 2000 Growth Index 14.25% 8.89% 12/31/1994 36.55% 19.75% 21.16% 17.64% 1.04%(3) $9.20 billion
Baron Small Cap Fund Russell 2000 Growth Index 11.58% 7.32% 9/30/1997 30.11% 17.86% 20.29% 17.15% 1.05%(3) $5.32 billion
Baron Discovery Fund† Russell 2000 Growth Index 20.03% 11.97% 9/30/2013 35.93% 20.48% 25.55% N/A 1.08%(3) $2.03 billion
SMALL/MID CAP
Baron Focused Growth Fund(1) Russell 2500 Growth Index 14.54% 9.33% 5/31/1996 42.30% 40.46% 32.52% 21.40% 1.07%(4) $745.08 million
MID CAP
Baron Asset Fund Russell Midcap Growth Index 12.46% 11.08%(2) 6/12/1987 25.29% 18.72% 20.45% 18.00% 1.05%(3) $6.17 billion
LARGE CAP
Baron Fifth Avenue GrowthFund Russell 1000 Growth Index 11.98% 12.31% 4/30/2004 19.44% 22.93% 24.52% 20.65% 0.78%/0.75%(3)(6) $837.21 million
Baron Durable Advantage Fund S&P 500 Index 18.23% 15.66% 12/29/2017 28.07% 20.31% N/A N/A 2.40%/0.70%(3)(7) $41.16 million
ALL CAP
Baron Partners Fund(1) Russell Midcap Growth Index 16.45% 10.90% 1/31/1992 57.43% 49.25% 38.93% 27.63% 1.30%(4)(5) $7.15 billion
Baron Opportunity Fund† Russell 3000 Growth Index 10.77% 6.96% 2/29/2000 33.91% 34.26% 32.95% 21.52% 1.08%(3) $1.61 billion
INTERNATIONAL
Baron Emerging Markets Fund MSCI EM Index 6.41% 3.25% 12/31/2010 17.95% 12.17% 9.61% 8.90% 1.09%(4) $9.52 billion
Baron Global Advantage Fund† MSCI ACWI Index 19.81% 10.67% 4/30/2012 22.56% 32.66% 29.58% N/A 0.92%/0.90%(4)(8) $2.77 billion
Baron International GrowthFund MSCI ACWI ex USA Index 12.75% 8.07% 12/31/2008 30.30% 16.32% 14.55% 12.13% 1.01%/0.95%(4)(9) $743.70 million
SECTOR
Baron Real Estate Fund MSCI USA IMI Extended RealEstate Index 16.88% 12.72% 12/31/2009 33.50% 25.89% 19.56% 19.05% 1.08%(4) $1.82 billion
Baron Real Estate Income Fund MSCI US REIT Index 15.29% 7.37% 12/29/2017 31.24% 19.37% N/A N/A 3.45%/0.80%(4)(10) $85.20 million
Baron Health Care Fund Russell 3000 Health CareIndex 25.35% 16.62% 4/30/2018 32.78% 23.11% N/A N/A 1.45%/0.85%(4)(11) $211.61 million
Baron FinTech Fund S&P 500 Index 37.32% 19.83% 12/31/2019 34.52% N/A N/A N/A 2.43%/0.95%(12) $77.04 million
EQUITY ALLOCATION
Baron WealthBuilder Fund S&P 500 Index 24.71% 15.66% 12/29/2017 35.42% 26.94% N/A N/A 1.22%/1.11%(4)(13) $481.86 million
(1) Reflects the actual fees and expenses that were charged when the Funds were partnerships. The predecessor partnerships charged a 20% performance fee (Baron PartnersFund) or a 15% performance fee (Baron Focused Growth Fund) after reaching a certain performance benchmark. If the annual returns for the Funds did not reflect theperformance fee for the years the predecessor partnerships charged a performance fee, returns would be higher. The Funds’ shareholders are not charged a performance fee.
(2) For the period June 30, 1987 to September 30, 2021.(3) As of 9/30/2020.(4) As of 12/31/2020.(5) Comprised of operating expenses of 1.05% and interest expenses of 0.25%.(6) Annual expense ratio was 0.78%, but the net annual expense ratio was 0.75% (net of Adviser’s fee waivers).(7) Annual expense ratio was 2.40%, but the net annual expense ratio was 0.70% (net of Adviser’s fee waivers).(8) Annual expense ratio was 0.92%, but the net annual expense ratio was 0.90% (net of Adviser’s fee waivers).(9) Annual expense ratio was 1.01%, but the net annual expense ratio was 0.95% (net of Adviser’s fee waivers).(10) Annual expense ratio was 3.45%, but the net annual expense ratio was 0.80% (net of Adviser’s fee waivers).(11) Annual expense ratio was 1.45%, but the net annual expense ratio was 0.85% (net of Adviser’s fee waivers).(12) Annual expense ratio was 2.43%, but the net annual expense ratio was 0.95% (net of Adviser’s fee waivers).(13) Annual expense ratio was 1.22%, but the net annual expense ratio was 1.11% (includes acquired fund fees and expenses, net of the Adviser’s fee waivers).† The Fund’s historical performance was impacted by gains from IPOs. There is no guarantee that these results can be repeated or that the Fund’s level of participation in
IPOs will be the same in the future.
The performance data quoted represents past performance. Past performance is no guarantee of future results. The investment return and principal value of aninvestment will fluctuate; an investor’s shares, when redeemed, may be worth more or less than their original cost. The Adviser reimburses certain Baron Fundexpenses pursuant to a contract expiring on August 29, 2032, unless renewed for another 11-year term and the Fund’s transfer agency expenses may bereduced by expense offsets from an unaffiliated transfer agent, without which performance would have been lower. Current performance may be lower orhigher than the performance data quoted. For performance information current to the most recent month end, visit www.BaronFunds.com or call1-800-99BARON.
5

Letter from Ron
Performance for the Institutional Shares prior to 5/29/2009 is based on the performance of the Retail Shares, which have a distribution fee. The InstitutionalShares do not have a distribution fee. If the annual returns for the Institutional Shares prior to 5/29/2009 did not reflect this fee, the returns would be higher.
Asset Fund’s 3Q 2021, Discovery Fund’s YTD, 1-, 3- and 5-year, Fifth Avenue Growth Fund’s 3Q 2021, FinTech Fund’s 3Q 2021, Global AdvantageFund’s YTD, 3- and 5-year, Opportunity Fund’s 3Q 2021, 3-, 5- and 10-year, and Small Cap Fund’s 3Q 2021 historical performance were impacted by gainsfrom IPOs and there is no guarantee that these results can be repeated or that the Funds’ level of participation in IPOs will be the same in the future.
Risks: All investments are subject to risk and may lose value.
Portfolio holdings as a percentage of net assets as of September 30, 2021 for securities mentioned are as follows: Tesla, Inc. – Baron Opportunity Fund (3.3%),Baron Partners Fund (40.5%*), Baron Focused Growth Fund (33.4%); Space Exploration Technologies Corp. – Baron Asset Fund (0.7%), Baron OpportunityFund (0.8%), Baron Partners Fund (4.2%*), Baron Fifth Avenue Growth Fund (0.2%), Baron Focused Growth Fund (3.6%), Baron Global Advantage Fund(0.4%).* % of Long Positions.
Portfolio holdings are subject to change. Current and future portfolio holdings are subject to risk.
Ranking information provided is calculated for the Retail Share Class and is as of 9/30/2021. The number of share classes in each category may vary dependingon the date that Baron downloaded information from Morningstar Direct. Morningstar calculates its category average performance and rankings using itsFractional Weighting methodology. Morningstar rankings are based on total returns and do not include sales charges. Total returns account formanagement, administrative, and 12b-1 fees and other costs automatically deducted from fund assets. The Morningstar Large Growth Categoryconsisted of 1,235, 1,024, and 762 share classes for the 1-, 5-, and 10-year periods. Morningstar ranked Baron Opportunity Fund in the 9th, 3rd, 7th, and 4th
percentiles for the 1-, 5-, 10-year, and since inception periods, respectively. The Fund launched 2/29/2000, and the category consisted of 265 share classes.Morningstar ranked Baron Partners Fund in the 1st, 1st, 1st, and 1st percentiles for the 1-, 5-, 10-year, and since conversion periods, respectively. The Fundconverted into a mutual Fund 4/30/2003, and the category consisted of 417 share classes. The Morningstar Mid-Cap Growth Category consisted of 584,495, and 386 share classes for the 1-, 5-, and 10-year periods. Morningstar ranked Baron Asset Fund in the 85th, 30th, 26th and 17th percentiles for the 1-, 5-,10-year, and since inception periods, respectively. The Fund launched 6/12/1987, and the category consisted of 19 share classes. Morningstar ranked BaronGrowth Fund in the 27th, 26th, 34th, and 8th percentiles for the 1-, 5-, 10-year, and since inception periods, respectively. The Fund launched 12/31/1994, and thecategory consisted of 54 share classes. Morningstar ranked Baron Focused Growth Fund in the 13th, 2nd, 2nd, and 4th percentiles for the 1-, 5-, 10-year, and sinceconversion periods, respectively. The Fund converted into a mutual Fund 6/30/2008, and the category consisted of 316 share classes. The Morningstar SmallGrowth Category consisted of 611, 506, and 381 share classes for the 1-, 5-, and 10-year time periods. Morningstar ranked Baron Small Cap Fund in the 86th,35th, 43rd, and 14th percentiles for the 1-, 5-, 10-year, and since inception periods, respectively. The Fund launched 9/30/1997, and the category consisted of91 share classes. Morningstar ranked Baron Discovery Fund in the 63rd, 7th, and 2nd percentiles for the 1-, 5-year, and since inception periods, respectively. TheFund launched 9/30/2013, and the category consisted of 430 share classes. The Morningstar Real Estate Category consisted of 246, 199, and 147 shareclasses for the 1-, 5-, and 10-year time periods. Morningstar ranked Baron Real Estate Fund in the 51st, 1st, 1st, and 1st percentiles for the 1-, 5-, 10-year, andsince inception periods, respectively. The Fund launched 12/31/2009, and the category consisted of 128 share classes. Morningstar ranked Baron Real EstateIncome Fund in the 74th and 3rd percentiles for the 1-year and since inception periods, respectively. The Fund launched 12/29/2017, and the category consistedof 221 share classes. The Morningstar Foreign Large Growth Category consisted of 439, 322, 221, and 197 share classes for the 1-, 5-, 10-year, and sinceinception (12/31/2008) periods. Morningstar ranked Baron International Growth Fund in the 4th, 17th, 20th, and 12th percentiles, respectively. The MorningstarDiversified Emerging Markets Category consisted of 784, 598, 317, and 279 share classes for the 1-, 5-, 10-year, and since inception (12/31/2010) periods.Morningstar ranked Baron Emerging Markets Fund in the 64th, 37th, 12th, and 4th percentiles, respectively. The Morningstar World Large-Stock GrowthCategory consisted of 352, 263, and 167 share classes for the 1-, 5-year, and since inception (4/30/2012) periods. Morningstar ranked Baron Global AdvantageFund in the 74th, 2nd, and 2nd percentiles, respectively. The Morningstar Health Category consisted of 167 and 138 share classes for the 1-year and sinceinception (4/30/2018) periods. Morningstar ranked Baron Health Care Fund in the 8th and 5th percentiles, respectively. The Morningstar Allocation—85%+Equity Category consisted of 166 and 153 share classes for the 1-year and since inception (12/29/2017) periods. Morningstar ranked Baron WealthBuilderFund in the 10th and 2nd percentiles, respectively.
© 2021 Morningstar. All Rights Reserved. The Morningstar information contained herein: (1) is proprietary to Morningstar and/or its content providers; (2) maynot be copied or distributed; and (3) is not warranted to be accurate, complete or timely. Neither Morningstar nor its content providers are responsible for anydamages or losses arising from any use of this information. Past performance is no guarantee of future results.
The discussions of the companies herein are not intended as advice to any person regarding the advisability of investing in any particular security. The viewsexpressed in this report reflect those of the respective portfolio managers only through the end of the period stated in this report. The portfolio manager’sviews are not intended as recommendations or investment advice to any person reading this report and are subject to change at any time based on marketand other conditions and Baron has no obligation to update them.
Diversification cannot guarantee a profit or protect against loss.
BAMCO, Inc. is an investment adviser registered with the U.S. Securities and Exchange Commission (SEC). Baron Capital, Inc. is a limited purpose broker/dealerregistered with the SEC and member of the Financial Industry Regulatory Authority, Inc. (FINRA).
6

September 30, 2021 Letter from Linda
LINDA MARTINSON
CHAIRMAN, PRESIDENT AND COO
Every day for the past 18 months has been overly charged with uncertainty.The social and economic aftermath of the pandemic has been extraordinary,but the response and adaptability demonstrated by people and businessesaround the world have been remarkable. The pandemic is not yet in therear-view mirror, and we continue to face major challenges, including healthcare overloads, disruptions for employers and employees, and widespreadsupply chain issues. Nonetheless, we have become better at coping with thevolatility and changes caused by COVID. No one knows what lies ahead, yetthe efforts and recovery progress we see every day – in meetings andconversations with the companies we invest in and through generaleconomic and business data – makes us feel optimistic about the future.
We recognize that many things are different after such massive globalshock, and we anticipate some changes may be lasting. Yet, our main long-term investment premise remains unchanged – we expect, with noguarantees, that economies around the world will continue to grow at asolid pace over the coming decades, and equity markets will continue topresent attractive investment opportunities. The latest data from theInternational Monetary Fund supports our premise. As shown in the chartsbelow, developed and developing economies are expected to grow at amoderate to strong pace, and emerging economies are expected to increasetheir share of global GDP over the next five years, continuing the trend ofthe past 30 years.
World GDP Is Expected to Grow at A Solid Pace…Expected GDP Growth
Developed ex. U.S.
Emerging
World
U.S.
2%
3%
4%
5%
6%
7%
8%
2022 2023 2024 2025 2026
…Driven By Developing EconomiesShare of World GDP
United States
Developed Countries
ex. USA
China
India
Emerging Countriesex. China and India
Frontier/StandaloneRest of World
0%
10%
20%
30%
40%
50%
60%
70%
80%
90%
100%
0%
10%
20%
30%
40%
50%
60%
70%
80%
90%
100%
1980
1982
1984
1986
1988
1990
1992
1994
1996
1998
2000
2002
2004
2006
2008
2010
2012
2014
2016
2018
2020
E20
22E
2024
E20
26E
Sources: GDP data from the International Monetary Fund, World Economic OutlookDatabase, April 2021. Country classifications from MSCI.
For over a decade, Baron has applied our long-term investment approach tonon-U.S. equities. Until recently, we had three mutual funds dedicated tonon-U.S./global equity investing. In July, we launched our fourth product,Baron New Asia Fund, a diversified portfolio which invests primarily incompanies with significant growth potential in Asia.
Our commitment to our non-U.S. products is driven by our strong belief thatthere are attractive investments outside the U.S. While many U.S. companiesare operating in non-U.S. markets, we believe that U.S. equities are not fullycapturing the dynamics and secular growth trends in other economies.
Investors tend to fall prey to home bias, a tendency to overinvest in theirhome country equities, which may result in missing out on the bestinvestment opportunities across the world. U.S. investors are not anexception. According to research by J.P. Morgan, the average U.S. investorhas about 78% of his or her equity allocation invested in U.S. stocks. At thesame time, U.S. stocks represent less than half of the total value of all globalpublic equities, and the U.S. represents less than 25% of global GDP, asshown on the next page.
7

Letter from Linda
U.S. Equity Investors Have a Home Bias
U.S. Investors
Average Equity Allocationby Geography
Global Equity Market
Market Cap Distribution
as of 9/30/2021
World GDP Estimates
GDP Percent Share
U.S. Equities
78%
Non-U.S.
Equities22%
U.S. Equities
43%Non-U.S. Equities
57%
$118 Tn
U.S.24.2%
Other Countries
75.8%
Sources: U.S. investors average equity allocation data from J.P. Morgan (published 9/30/2021); market capitalization data from FactSet as of 9/30/2021;
2021 GDP estimates data from the International Monetary Fund, World Economic Outlook Database, April 2021.
In the past, higher transaction costs and inaccessibility made non-U.S.equity investing difficult and inefficient. Nowadays, these hurdles have beenminimized, and investors have plenty of options to gain direct exposure tonon-U.S. markets.
One of the key advantages of investing globally is diversification. Companiesin different countries are positively or negatively affected by local changesand trends, independently of other developments around the world.
When stock prices are declining in the U.S., non-U.S. equities may move in adifferent direction or by a different magnitude, serving as potential offsetagainst the impact of the U.S. market.
Diversification helps investors mitigate the volatility of the returns of theirportfolios. Lower levels of correlations across markets provide a goodindicator of diversification opportunities. The chart below shows thecorrelation of returns of U.S. and non-U.S. equities over the past three, five,and 10 years. According to the data, the correlation between U.S. andemerging markets equities has been about 0.70 – 0.75, indicating amoderate tendency of the two to move similarly, which can providediversification benefits. The correlation with developed equity markets hasbeen slightly larger but still suggests diversification potential*.
Non-U.S. Equities Have Historically Offered DiversificationHistorical 3-, 5-, and 10-Year Correlations of U.S. Equities vs. Non-U.S. Equitiesas of 9/30/2021
0.97
0.82
0.74
0.97
0.81
0.70
0.96
0.81
0.69
0.50
0.75
1.00
World Equities
Non-U.S.Developed
EquityMarkets
Non-U.S.Emerging
EquityMarkets
3-Year
5-Year
10-Year
Sources: FactSet, Baron Capital.
World Equities are represented by the MSCI ACWI Index, Non-U.S. Developed Equity Markets are represented by the MSCI EAFE Index; Non-U.S. Emerging Equity Markets arerepresented by the MSCI Emerging Markets Index.
Note: A correlation of zero implies no relationship, while correlations close to 1 or -1 imply a strong positive or negative relationship, respectively. Correlations between 0.50 and0.70 are generally considered moderate. Correlation does not imply there is a causal relationship.
* Please note that diversification cannot guarantee a profit or protect against loss.
8

September 30, 2021 Letter from Linda
Historically, the relationship between the performance of U.S. and non-U.S.equities has moved in cycles. As shown on the charts below, periods ofbetter performance of U.S. stocks have been followed by periods of betterperformance of non-U.S. stocks. Over the past 10 years, the S&P 500 Indexhas outperformed both developed and emerging market equities. Althoughthis period of outperformance is longer than typical, it is not unprecedented(e.g., emerging markets outperformed U.S. stocks for about a decade, from2001 to 2012), and we believe that this cyclical pattern will remain.
The Performance of U.S. and Non-U.S. Equities Has BeenCyclical
Rolling 3-Year Differences in Annualized Returns
S&P 500 Index vs. (Developed MSCI EAFE Index)
-40%
-30%
-20%
-10%
0%
10%
20%
30%
Dec
-72
Dec
-74
Dec
-76
Dec
-78
Dec
-80
Dec
-82
Dec
-84
Dec
-86
Dec
-88
Dec
-90
Dec
-92
Dec
-94
Dec
-96
Dec
-98
Dec
-00
Dec
-02
Dec
-04
Dec
-06
Dec
-08
Dec
-10
Dec
-12
Dec
-14
Dec
-16
Dec
-18
Dec
-20
S&P 500 Index Outperformed
MSCI EAFE Index Outperformed
S&P 500 Index vs. (Emerging MSCI EM Index)
-40%
-30%
-20%
-10%
0%
10%
20%
30%
40%
50%
Dec
-72
Dec
-74
Dec
-76
Dec
-78
Dec
-80
Dec
-82
Dec
-84
Dec
-86
Dec
-88
Dec
-90
Dec
-92
Dec
-94
Dec
-96
Dec
-98
Dec
-00
Dec
-02
Dec
-04
Dec
-06
Dec
-08
Dec
-10
Dec
-12
Dec
-14
Dec
-16
Dec
-18
Dec
-20
S&P 500 Index Outperformed
MSCI EM Index Outperformed
Sources: FactSet, Baron Capital.
The performance data quoted represents past performance. Past performance is noguarantee of future results. The index performance is not fund performance; onecannot invest directly into an index.
We cannot predict if or when the outperformance cycle may reverse. Itcould take a week, a year, or longer until it changes. As we have discussedmany times in the past, we believe market timing is not a good and durableinvestment strategy. We do believe, however, that having a balancedinvestment in global equities allows investors to capture opportunities asthey arise.
One reason to think the relative performance cycle may turn sooner thanlater is current relative valuations. As the charts below show, both developedand emerging market equities are valued significantly below U.S. equities. Itis hard to imagine that these discounts could become larger before somereversion to the historical average occurs.
Non-U.S. Equity Valuations Are Attractive
Forward P/E Ratio of Developed Foreign Equities
as Percent of U.S. Equities
76%
Historical Average
90%
40%
50%
60%
70%
80%
90%
100%
110%
Sep-
01
Sep-
02
Sep-
03
Sep-
04
Sep-
05
Sep-
06
Sep-
07
Sep-
08
Sep-
09
Sep-
10
Sep-
11
Sep-
12
Sep-
13
Sep-
14
Sep-
15
Sep-
16
Sep-
17
Sep-
18
Sep-
19
Sep-
20
Sep-
21
Forward P/E Ratio of Emerging Foreign Equities
as Percent of U.S. Equities
63%
Historical Average
74%
40%
50%
60%
70%
80%
90%
100%
110%
Sep-
01
Sep-
02
Sep-
03
Sep-
04
Sep-
05
Sep-
06
Sep-
07
Sep-
08
Sep-
09
Sep-
10
Sep-
11
Sep-
12
Sep-
13
Sep-
14
Sep-
15
Sep-
16
Sep-
17
Sep-
18
Sep-
19
Sep-
20
Sep-
21
Sources: FactSet, Baron Capital.
Note: Forward P/E Ratio is the next 12-month price-to-earnings ratio, based onFactSet estimates.
U.S. Equities are represented by the S&P 500 Index; Developed Foreign Equities arerepresented by the MSCI EAFE Index; Emerging Foreign Equities are represented by theMSCI EM Index.
9

Letter from Linda
The lasting underperformance of non-U.S. developed and emerging marketequity indexes does not mean that there haven’t been lucrativeopportunities in those markets. The performance of the popular indexes is amarket-cap weighted average outcome and does not provide informationabout the dispersion of the returns of the underlying index constituents.
The chart below illustrates the range of returns, or dispersion, of the stocksin the U.S. and non-U.S. equity markets over the past 10 years, as well asthe average stock returns in those markets. For example, in the U.S., thestock(s) that ranked in the 10th percentile by performance returned around
35% annualized, while the stock(s) that ranked in the 90th percentile lostaround 40% of their value on an annualized basis. (Our analysis is based onthe 10th and 90th percentiles to mitigate the effects of outliers.) Theaverage stock return in the U.S. was approximately 5.8% per year. Similarly,in China, stock performance ranged between 47% and -31%, with anaverage of 5.3% per year. This information suggests at least two things:(i) judging by the average returns, both the U.S. and China were good placesto invest, and (ii) the performance of the companies in both countries variedsignificantly.
Stocks In Different Markets Have Generated Attractive Spreads of ReturnsDispersion of Returns by Markets9/30/2011 – 9/30/2021, annualized
90th percentile
10th percentile
average
-60%
-45%
-30%
-15%
0%
15%
30%
U.S. E
quities
Emer
ging
Mar
kets
Develo
ped e
x. U.S.
United K
ingd
om
Fran
ce
Germ
any
Israe
l
Japan
Nether
lands
Spain
Switz
erlan
dKore
a
China
India
Brazil
Russia
60%
45%
Source: FactSet, Baron Capital.
U.S. Equities are represented by the Russell 3000 Index; Emerging Markets – by the MSCI EM Index; Developed ex. U.S. – by the MSCI EAFE Index; individual countries arerepresented by the stocks in the MSCI ACWI ex USA Index classified in the respective country. Dispersion is measured as the difference between the returns at the 10th and 90th
percentiles. The performance data quoted represents past performance. Past performance is no guarantee of future results. The index performance is not fund performance; onecannot invest directly into an index.
The average returns of U.S. and Chinese stocks were moderately good butcertainly not great. Since both markets experienced large dispersion, a skilledactive manager who is picking specific stocks could have producedsignificantly better results.
This conclusion is supported by an additional analysis, which also shows thatnot only were there great stocks in non-U.S. markets over the past decade,but also that there were plenty of them. According to the data shown
below, around 30% of the companies in the MSCI EAFE Index (developedmarkets equities) and the MSCI EM Index (emerging markets equities)outperformed the U.S. stock market in a typical calendar year. This result isdespite the lasting poor relative performance of both indexes versus U.S.equities. This result has been consistent in the first nine months of 2021 – asubstantial number of non-U.S. stocks have delivered higher returns than theS&P 500 Index despite the underperformance of both the MSCI EAFE Indexand the MSCI EM Index.
There are Always Good Opportunities in Non-U.S. Equity Markets
Index Returns and Outperformance Rates of Non-U.S. Stocks by Calendar Year*YTD 9/30/21 CY 2020 CY 2019 CY 2018 CY 2017 CY 2016 CY 2015 CY 2014 CY 2013 CY 2012 CY 2011
S&P 500 Index – Return 15.92% 18.40% 31.49% –4.38% 21.83% 11.96% 1.38% 13.69% 32.39% 16.00% 2.11%MSCI EAFE Index –Return 8.35% 7.82% 22.01% –13.79% 25.03% 1.00% –0.81% –4.90% 22.78% 17.32% –12.14%MSCI EM Index – Return –1.25% 18.31% 18.42% –14.58% 37.28% 11.19% –14.92% –2.19% –2.60% 18.22% –18.42%
% of Stocks in MSCIEAFE IndexOutperforming the S&P500 Index
32% 31% 32% 30% 57% 29% 51% 21% 35% 52% 25%
% of Stocks in MSCI EMIndex Outperforming theS&P 500 Index
30% 37% 28% 35% 55% 38% 23% 32% 11% 56% 19%
Source: FactSet, Baron Capital.
* Except for YTD 9/30/21, which is the period from 12/31/20 to 9/30/21. The performance data quoted represents past performance, including dividends. Past performance is noguarantee of future results. The index performance is not fund performance; one cannot invest directly into an index.
10

September 30, 2021 Letter from Linda
Performing the same analysis over rolling three-year periods shows similar results: typically, 20%-30% of non-U.S. stocks outperformed the S&P 500 Index.
Index Returns and Outperformance Rates of Non-U.S. Stocks by Rolling Three-Year PeriodsFor the 3 Years Ended:
9/30/21 12/31/20 12/31/19 12/31/18 12/31/17 12/31/16 12/31/15 12/31/14 12/31/13
S&P 500 Index – Return 56.07% 48.85% 53.17% 30.42% 38.29% 29.05% 52.59% 74.60% 56.82%
MSCI EAFE Index – Return 24.66% 13.41% 31.52% 8.87% 25.26% –4.73% 15.81% 36.98% 26.55%
MSCI EM Index – Return 28.03% 19.69% 38.89% 30.40% 29.87% –7.47% –18.94% 12.63% –6.07%
% of Stocks in MSCI EAFE IndexOutperforming the S&P 500 Index
12% 20% 27% 29% 42% 22% 27% 24% 24%
% of Stocks in MSCI EM IndexOutperforming the S&P 500 Index
20% 19% 26% 41% 30% 16% 9% 18% 11%
Source: FactSet, Baron Capital. The performance data quoted represents past performance, including dividends.Past performance is no guarantee of future results. The index performance is not fund performance; one cannot invest directly into an index.
There are two significant takeaways from the above data:
(i) Non-U.S. developed and emerging markets equities havecontinuously offered attractive investment opportunities; and
(ii) The MSCI EAFE Index and the MSCI EM Index haveunderperformed the S&P 500 Index most of the time over thepast decade, which indicates their construction has not enabledthem to capture the attractive investment opportunities in anoptimal way.
While the popular non-U.S. equity indexes can serve as a rough proxy forthe potential benefits of non-U.S. investing, in our view indexes have manydesign flaws to serve as models for actual investments.
One of the biggest drawbacks of such indexes is overdiversification due tothe inclusion of many stocks. As of 9/30/2021, the MSCI EAFE Index had845 constituents, and the MSCI EM Index had 1,418 constituents. After ahundred or so investments, the marginal diversification benefits of eachadditional holding become close to zero and turn mostly into redundancies.
In addition, many popular indexes are constructed to give more weight tostocks that have done best in the past, rather than the ones with higherfuture growth opportunities. This exposes investors in passive products thattrack these indexes to unmanaged momentum risk, among other risks.
Furthermore, indexes cannot account for a variety of risks and developmentsthat are important but hard to quantify or evaluate. These include politicalrisks, corruption, structural reforms, secular growth trends, demographicchanges, and many more. The nature and variety of these risks makes beingflexible and forward looking an essential prerequisite, particularly wheninvesting in less efficient markets.
In our view, skilled active non-U.S. equity managers can build and manage well-balanced portfolios without the deficiencies of an index and, as a result,potentially deliver significantly better returns. The scorecard below shows thatactive non-U.S. equity managers tend to outperform their Morningstar categorybenchmark a significant percentage of the time, delivering strong excess returns,particularly over longer investment periods. Their outperformance rates tend tobe stronger than those of active U.S. equity managers. The results from our high-level analysis include all active managers, good and bad.
A Significant Portion of Active Non-U.S. Equity Managers Have OutperformedHistorical Track Record of Active Managers in Select Equity Categoriesas of 9/30/2021
ForeignLarge Blend
ForeignLarge Growth
ForeignLarge Value
DiversifiedEmerging Markets
WorldStock*
AllForeign Funds
AllU.S. Funds**
Based on 1-YrExcess Returns
% Active Funds Outperforming 58% 77% 36% 60% 52% 59% 52%
Average Excess Return – All Active Funds 0.58% 3.60% –2.17% 3.06% 0.32% 1.98% 1.01%
Average Excess Return – Outperforming Funds 4.38% 6.01% 6.40% 8.34% 6.50% 7.18% 7.32%
Based on 3-YrExcess Returns
% Active Funds Outperforming 48% 63% 79% 62% 45% 58% 35%
Average Excess Return – All Active Funds –0.11% 1.46% 1.30% 2.43% –0.10% 1.22% –0.81%
Average Excess Return – Outperforming Funds 2.26% 3.59% 1.92% 4.96% 3.74% 3.86% 3.51%
Based on 5-YrExcess Returns
% Active Funds Outperforming 44% 68% 55% 44% 44% 51% 37%
Average Excess Return – All Active Funds –0.45% 1.25% 0.21% 0.38% –0.33% 0.37% –0.72%
Average Excess Return – Outperforming Funds 1.32% 2.64% 1.21% 2.89% 2.67% 2.61% 2.57%
Based on 10-YrExcess Returns
% Active Funds Outperforming 77% 76% 87% 57% 49% 68% 26%
Average Excess Return – All Active Funds 0.83% 1.35% 1.21% 0.68% –0.17% 0.82% –1.10%
Average Excess Return – Outperforming Funds 1.32% 1.98% 1.51% 1.95% 1.75% 1.88% 1.37%
Source: Morningstar Direct, Baron Capital. Note: The calculations are based on excess returns of each fund’s oldest share class vs. the category benchmark of the Morningstarcategory in which the fund was classified as of 9/30/2021. * Includes all funds classified in the following categories: US Fund World Large-Stock Blend, US Fund World Large-StockGrowth, US Fund World Large-Stock Value, US Fund World Small/Mid Stock. ** Includes all U.S. equity funds classified in Morningstar’s nine traditional style boxes. Theperformance data quoted represents past performance. Past performance is no guarantee of future results.
11

Letter from Linda
In our view, the meaningful outperformance rates and excess returns of active non-U.S. equity managers make a strong case for active over passive investing.Yet, flows in passive products continue to prevail, with those investors getting rewarded with only average market returns and missing a significantopportunity to outperform by a large margin.
Baron’s Approach to Non-U.S. Equity Investing
For over a decade, non-U.S. equity markets have been a significant source for investment ideas at Baron. Just as in the U.S., we are focused on innovation,durable, long-term growth opportunities, competitive advantages, and strong management teams. Currently, we have six investment professionals dedicatedto non-U.S. equity research, and many of our other research team members often contribute their industry expertise and global perspectives.
As of September 30, 2021, Baron Capital had over $14 billion invested in non-U.S. equities across all portfolios we manage. This represented approximately26% of our assets under management. Most of these assets were invested in our Global, International, and Emerging Markets Strategies.
Baron Has Significant Investments in Non-U.S. EquitiesBaron Capital – Breakdown of Total Assets Under Management,
as of 9/30/2021
U.S. Equities72.9%
Foreign -Emerging Markets18.5%
Foreign -Developed
Markets
Other 1.2%
7.2%
Total AssetsUnder
Management$54.6 Bn
Source: Morningstar Direct, Baron Capital.
Our top 10 largest mutual fund investments in non-U.S. equities had a combined value of $2.8 billion as of 9/30/2021. As shown in the table below, Baron’scost for these investments was $1.6 billion, and over time they have generated $1.4 billion in realized and unrealized gains for our shareholders. For moreinformation about these companies, please see the appendix to this letter for business descriptions and our investment premises.
Baron’s Top Non-U.S. Holdings Have Generated Significant ReturnsBaron Funds – Top 10 Largest Non-U.S. Positions (Currently Held)
as of 9/30/2021
Security Cumulative Excess Return vs.
Security Name
AggregateBaron Funds
Cost($ millions)
AggregateBaron Funds
Gains($ millions)
AggregateBaron FundsInvestment
Value($ millions)
AggregateBaron Funds
% of NetAssets
# ofYearsHeld
SecurityCumulativeTotal Return
Russell 3000Growth Index
MSCI ACWIex USA Index
MSCI EMIndex
Bajaj Finance Ltd $ 191 $ 162 $ 367.5 0.76% 2.9 229.0% 128.1% 188.8% 186.8%
Taiwan Semiconductor Manufacturing Company Ltd. $ 182 $ 226 $ 345.7 0.72% 8.3 669.0% 364.4% 597.2% 604.4%
Endava plc $ 77 $ 230 $ 299.0 0.62% 3.2 439.1% 351.5% 413.6% 414.3%
Alibaba Group Holding Ltd $ 269 $ 46 $ 281.8 0.58% 7.0 57.7% –157.1% 10.8% 14.6%
Tencent Holdings Ltd. $ 181 $ 111 $ 280.5 0.58% 7.4 356.1% 116.5% 308.8% 307.3%
Samsung Electronics Co., Ltd. $ 166 $ 134 $ 272.4 0.56% 7.9 169.3% –89.6% 114.9% 118.0%
Adyen N.V. $ 84 $ 172 $ 255.4 0.53% 3.3 422.5% 332.8% 398.1% 401.4%
Wix.com Ltd. $ 128 $ 247 $ 240.5 0.50% 4.8 351.0% 183.9% 290.8% 283.3%
Reliance Industries Ltd. $ 147 $ 83 $ 236.8 0.49% 2.6 78.9% –7.3% 47.3% 50.8%
Spotify Technology S.A. $ 217 –$ 5 $ 215.0 0.44% 1.7 46.0% –3.1% 25.9% 25.4%
Total: $1,642 $ 1,407 $2,795 5.8%
Source: FactSet, Baron Capital.
The performance data quoted represents past performance. Past performance is no guarantee of future results. Portfolio holdings are subject to change. Current and futureportfolio holdings are subject to risk.
These 10 stocks are not only our largest non-U.S. investments; some of them are also among our longest-held investments. All 10 stocks have delivered significantabsolute returns over time, and all 10 have outperformed the MSCI EM Index and MSCI ACWI ex USA Index. Furthermore, despite the decade-long outperformanceof U.S. equities, six of these investments have significantly outperformed the Russell 3000 Index, and another two performed almost as well as the index.
12

September 30, 2021 Letter from Linda
Currently, Baron has four mutual funds dedicated to non-U.S./global equity investing:
- Baron Global Advantage Fund, which invests in growth companies around the world; and- Baron International Growth Fund, which invests mainly in non-U.S. growth companies in developed countries; and- Baron Emerging Markets Fund, which invests mainly in emerging market growth companies; and- Baron New Asia Fund, which invests primarily in growth companies located in Asia.
Like every Baron product, all four Funds invest with a long-term view, and their primary objective is to generate excess returns driven by positive stockselection. However, each Fund’s strategy for achieving this objective is different. The chart on the left below shows each Fund’s equity investments by country.There are distinct differences among the Funds and versus a popular global equity index. The chart on the right shows the end market exposures of theportfolio companies, as it reflects the geographic source of their revenues.
The Baron Non-U.S./Global Equity Funds Are Distinctly DifferentBaron International Funds – Weights by Region/Country
as of 9/30/2021
61.1%58.6%
19.3%
67.7%
5.8% 6.5%
29.4%
10.4%
11.6%
32.6%
8.5%
6.7%3.4%8.4%
29.4%
48.9%
5.8% 9.8%
31.7% 34.4%
3.7%
0%
10%
20%
30%
40%
50%
60%
70%
80%
90%
100%
China
India
Baron Global Advantage Fund
Baron International Growth Fund
Baron Emerging Markets F
und
Baron New Asia Fund
MSCI ACWI IMI In
dex
Other Emerging
Other Developed
USA
Source: FactSet, Baron Capital.
Calculations exclude cash held in the portfolios. Revenue Exposure is estimated usingFactSet’s geographical revenue data as of 9/30/2021.
Baron International Funds – Revenue Exposure by Region/Country,
as of 9/30/2021
22.4%
9.3% 5.1% 5.2%
27.4%
27.9%
31.4%
8.5% 10.7%
34.2%
20.1%
23.4%
32.1%20.4%
20.4%3.6%4.5%
6.7%
7.5%
3.8%26.0% 31.4%
47.6%56.2%
14.2%
0%
10%
20%
30%
40%
50%
60%
70%
80%
90%
100%
Baron Global Advantage Fund
Baron International Growth Fund
Baron Emerging Markets F
und
Baron New Asia Fund
MSCI ACWI IMI In
dex
Baron Global Advantage Fund has been managed by Alex Umansky since its inception in April 2012. Typically, the Fund has around 45 – 55 investments, farfewer than its primary benchmark, the MSCI ACWI Index (~3,000 holdings). As of 9/30/2021, its top 10 holdings represented over 36% of the portfolio,reflecting the high conviction of the manager. Yet, the Fund is well diversified across market capitalization, industries, geographies, and end markets. The chartsbelow show the Fund’s absolute and relative exposures by sector and geography.
Alex focuses on businesses that are driving or benefitting from disruptive change. To find such companies, Alex looks for the agents and/or beneficiaries ofdisruptive change in areas such as digitization, big data, cloud computing, machine learning, and autonomous driving.
He finds platform companies to be particularly well positioned to potentially benefit from disruptive change, as they can capitalize on scalable network effectsand large and diverse global addressable markets. Alex focuses on platform businesses with meaningful barriers to entry that have the ability to create aneco-system around their businesses that incentivizes partners to co-create value, benefit from network effects, which increases moats over time, and earn highmarginal profits (as the platform increases in value). In addition to the above criteria, Alex favors companies that have secular organic growth, strong free cashflows, higher/rising returns on invested capital, and low capital intensity. Our latest Baron Investor piece on Baron Global Advantage Fund, available on ourwebsite1, offers greater detail about the Fund and how Alex finds investment ideas.
1 https://www.baronfunds.com/investment-insights
13

Letter from Linda
Baron Global Advantage Fund is Differentfrom its BenchmarkBaron Global Advantage Fund vs. MSCI ACWI Indexas of 9/30/2021
SectorPortfolio Weight
Overweight/Underweight
16.4%%8.83Information Technology%9.7%6.91Health Care
%2.5%5.41Communication Services%6.4%0.71Consumer Discretionary
%2.1-%4.1Real Estate%6.2---Utilities
%5.3---Energy%0.4-%7.0Materials
Consumer Staples -- -6.8%%2.8-%5.1Industrials
%2.01-%1.4Financials
CountriesPortfolio Weight
Overweight/Underweight
%8.4%0.5Israel%0.4%3.5Netherlands
%5.3%6.3Argentina%4.2%3.5Canada
%9.1%3.3India%7.1%7.5China%6.1%6.1Uruguay%3.1%5.1Indonesia%2.1%7.1Brazil%9.0%4.06United States%6.0%7.0Poland
%1.0%4.0Mexico%1.0-%6.3KingdomUnited%9.0-%7.0Korea
Other Emerging -- -3.9%Other Developed -- -20.5%
Sources: FactSet, Baron Capital, MSCI.
Baron International Growth Fund has been managed by Michael Kasssince its inception in December 2008. The Fund usually invests in fewer than100 companies, far below the number of constituents in its primarybenchmark, the MSCI ACWI ex USA Index (~2,300 holdings). As of9/30/2021, its top 10 holdings represented over 20% of the portfolio.Michael takes significant active positions across individual companies,industries, and markets, which makes Baron International Growth Fundnotably different from its benchmark. The charts below show the Fund’sabsolute and relative exposures by sector and geography.
Michael has been combining investment themes and fundamental bottom-upstock picking to manage Baron International Growth Fund. Themes may bedriven by developments such as regulatory, political, or technologicalchanges; vertical integration in an industry; or changes in the financial oreconomic environment. They may be industry-specific (e.g., industrialautomation & robotics), country- and regional-specific (e.g., capital marketand credit expansion), or global in scope (e.g., intellectual capital,best-in-class). In international markets, we emphasize entrepreneurialmanagement, founders with significant ownership stakes, leaders withstrategic vision and financial sophistication, and management that thinks andacts like an “owner.” Our latest Baron Investor piece on Baron InternationalGrowth Fund, available on our website1, offers greater detail about the Fundand describes how Michael combines secular growth themes and bottom-upinvesting to find attractive investments outside the U.S.
Baron International Growth Fund is Differentfrom its BenchmarkBaron International Growth Fund vs. MSCI ACWI ex USA Indexas of 9/30/2021
SectorPortfolio Weight
Overweight/Underweight
%3.4%6.01Communication Services
%1.2%6.11CareHealth
%9.1%1.51Information Technology
%8.0%8.8Materials
%4.0-%8.11Industrials
%2.1EstateReal -1.4%
%9.2Energy -2.0%
Consumer Discretionary 10.3% -2.4%
--Utilities -3.0%
%5.41Financials -4.8%
Consumer Staples 2.8% -5.7%
CountriesPortfolio Weight
Overweight/Underweight
%4.8%5.71KingdomUnited
%9.3%5.7India
%7.2%9.3Russia
%3.2%7.2Israel
%3.2%3.2StatesUnited
%1.2%2.5Netherlands
%6.1%0.3Brazil
%6.1%1.3Spain
%6.0%8.0Poland
%2.0%6.0Norway
%30.0-%5.0Mexico
%2.0-%1.2Sweden
%4.0-%7.6France
%5.0-%0.1Italy
%6.0-%0.1Denmark
%0.1-%8.0KongHong
%3.1-%8.8China
%6.1-%4.4Switzerland
%8.1-%0.4Germany
%6.2-%1.1Korea
Other Developed -- -2.8%
%7.3-%7.0Australia
%1.5-%0.2Canada
%2.6-%2.9Japan
Other Emerging -- -8.9%
Sources: FactSet, Baron Capital, MSCI.
Baron Emerging Markets Fund has also been managed by Michael Kass sinceits inception in December 2010. The Fund usually invests in fewer than 100companies, significantly below the number of constituents in its primarybenchmark, the MSCI EM Index (~1,400 holdings). As of 9/30/2021, its top 10holdings represented over 25% of the portfolio. Michael takes significant activepositions across individual companies, industries, and markets, which makesBaron Emerging Markets Fund notably different from its benchmark. The chartsbelow show the Fund’s absolute and relative exposures by sector and geography.
Similar to Baron International Growth Fund, Michael has been combininginvestment themes and fundamental bottom-up stock picking to manage BaronEmerging Markets Fund. He looks for global economic, financial, and politicaldevelopments that will drive inflection points or trends. According to Michael,trends yield long-term value creation around which he constructs investablethemes. Some examples of current themes include: digitization, where the
1 https://www.baronfunds.com/investment-insights
14

September 30, 2021 Letter from Linda
primary beneficiaries include e-commerce platforms, data center operators, andmobile gaming & advertising companies; and India financialization, where theprimary beneficiaries include asset/mutual fund managers, wealth managers,and life insurers. In addition, Michael emphasizes entrepreneurial management,capital efficiency, and shareholder-friendly governance. Our latest Baron Investorpiece on Baron Emerging Markets Fund, available on our website1, offers greaterdetail about the Fund and describes how Michael finds attractive investmentopportunities in the complex world of emerging markets.
Baron Emerging Markets Fund is Differentfrom its BenchmarkBaron Emerging Markets Fund vs. MSCI EM Indexas of 9/30/2021
SectorPortfolio Weight
Overweight/Underweight
%5.5%4.01Industrials
%8.3%8.8Health Care
%3.0-%8.1Real Estate
Consumer Staples 5.3% -0.7%
%8.0-%0.5Energy
%3.1-%4.7Materials
%3.1-%1.81Financials
Consumer Discretionary 12.5% -2.2%
%3.2---Utilities
Communication Services 6.4% -3.9%
Information Technology 15.4% -5.5%
CountriesPortfolio Weight
Overweight/Underweight
%6.41%8.62India
%9.3%8.7Russia
%2.2%2.2Hong Kong
%7.1%2.6Brazil
%7.1%7.1United Kingdom
%1.1%1.1Japan
%0.1%2.1Hungary
%6.0%2.1Philippines
%4.0%4.0Norway
%4.0%4.0United States
%2.0%4.0Peru
%2.0%9.0Poland
%10.0%9.1Mexico
United Arab Emirates 0.3% -0.5%
%1.5-%9.82China
%5.7-%1.5Korea
%1.01-%6.4Taiwan
Other Emerging -- -13.6%
Sources: FactSet, Baron Capital, MSCI.
Baron New Asia Fund was launched in July this year and is managed byMichael Kass and Anuj Aggarwal. The Fund is expected to invest in fewerthan 100 companies, and its benchmark is the MSCI Asia ex Japan Index,which contains around 1,200 stocks. As of 9/30/2021, the top 10 holdings inthe Fund represented nearly 23% of the portfolio. Like all Baron portfolios,Baron New Asia Fund is expected to be significantly different from itsbenchmark. The charts below show the Fund’s absolute and relativeexposures by sector and geography as of the end of the third quarter.
The Fund focuses on higher growth, strategic, and forward-lookinginvestment opportunities consistent with Asia’s pivot in economicdevelopment. Michael and Anuj emphasize future leaders – companies theybelieve will be future winners that are small today but could become muchlarger in the future. Baron New Asia Fund is intended to be largely aconcentrated play on “best of quality growth” in India and China. Inaddition, there are also companies in the ASEAN markets, Taiwan, and Japanthat are exciting “New Asia” growth opportunities or that are helping Chinadevelop its value-added industries.
Baron New Asia Fund is Different from its BenchmarkBaron New Asia Fund vs. MSCI AC Asia ex Japan Index
as of 9/30/2021
SectorPortfolio Weight
Overweight/Underweight
%2.4%3.9Health Care
%6.2%6.8Industrials
%0.1%0.6Consumer Staples
%0.1%4.6Materials
%2.0-%8.2Energy
%2.1-%6.2Real Estate
Communication Services 8.2% -2.0%
%6.2---Utilities
Consumer Discretionary 12.4% -3.4%
%6.8-%3.01Financials
Information Technology 13.8% -10.0%
CountriesPortfolio Weight
Overweight/Underweight
%5.52%3.93India
%1.4%1.4Japan
%3.1%3.1United States
%3.0-%6.1Indonesia
Other Developed -- -2.5%
Other Emerging -- -4.1%
%9.5-%2.1Hong Kong
%3.11-%7.72China
%8.21-%6.1Korea
%2.31-%6.3Taiwan
Sources: FactSet, Baron Capital, MSCI.
1 https://www.baronfunds.com/investment-insights
15

Letter from Linda
Track Record of the Non-U.S. Baron Funds
The three seasoned Baron Funds presented above have deliveredoutstanding absolute and relative results since their inceptions and overshorter periods. The table below shows that as of 9/30/2021 all three Fundsgenerated significant positive absolute performance over various standardperiods, and all have outperformed their benchmarks over the past 3-, 5-,10-years, and since inception. In addition, the data shows that the excessreturns have been largely a result of superior stock selection.
The Baron Funds Have Delivered Outstanding ResultsDue to Stock SelectionAnnualized Returnsas of 9/30/2021
BaronInternationalGrowth Fund
BaronEmerging
Markets Fund
Baron GlobalAdvantage
Fund
1-YearMonthlyRollingExcessReturns
Funds
% of TimeOutperformance 82% 69% 81%
AverageExcess Return 4.90% 3.31% 12.41%
CategoryAverage
% of TimeOutperformance 77% 41% 78%
AverageExcess Return 2.16% –0.54% 2.94%
3-YearMonthlyRollingExcessReturns
Funds
% of TimeOutperformance 100% 74% 95%
Average ExcessReturn 3.74% 2.80% 10.03%
CategoryAverage
% of TimeOutperformance 94% 28% 94%
Average ExcessReturn 1.98% –0.58% 2.41%
5-YearMonthlyRollingExcessReturns
Funds
% of TimeOutperformance 100% 84% 100%
Average ExcessReturn 3.68% 2.36% 9.77%
CategoryAverage
% of TimeOutperformance 100% 20% 100%
Average ExcessReturn 1.76% –0.67% 2.26%
As fundamental stock pickers, we expect to add value over the long term,primarily through stock selection. The charts below show that stockselection has been a consistent driver of the excess return for each of thethree Funds discussed above. The first chart, for example, shows that on athree-year rolling basis Baron Global Advantage Fund has generated positivestock specific effect 100% of the time since the Fund’s inception. As aresult, the Fund has outperformed its benchmark 95% of the time. Commonmarket factors, such as style, industry, and country biases, have also beenadding significantly to excess returns over the past few years.
The Baron Non-U.S. Funds Have Consistently GeneratedPositive Stock Selection
Baron Global Advantage FundRolling Cumulative Three-Year Excess Return, Stock-Specific, andFactor Effectsas of 9/30/2021
-20%
0%
20%
40%
60%
80%
100%
120%
-20%
0%
20%
40%
60%
80%
100%
120%
Jun-
15Se
p-15
Dec
-15
Mar
-16
Jun-
16Se
p-16
Dec
-16
Mar
-17
Jun-
17Se
p-17
Dec
-17
Mar
-18
Jun-
18Se
p-18
Dec
-18
Mar
-19
Jun-
19Se
p-19
Dec
-19
Mar
-20
Jun-
20Se
p-20
Dec
-20
Mar
-21
Jun-
21Se
p-21
Excess Return From Stock Specific Effect
Excess Return From Factors
Total Excess Return
Source: MSCI, Baron Capital.
Note: Excess return was attributed using MSCI Barra’s GEMLT multi-factor modelmodel.
The performance data quoted represents past performance. Past performance is noguarantee of future results. The investment return and principal value of an investmentwill fluctuate; an investor’s shares, when redeemed, may be worth more or less thantheir original cost. The Adviser reimburses certain Baron Fund expenses pursuant to acontract expiring on August 29, 2032, unless renewed for another 11-year term andthe Fund’s transfer agency expenses may be reduced by expense offsets from anunaffiliated transfer agent, without which performance would have been lower.Current performance may be lower or higher than the performance data quoted. Forperformance information current to the most recent month end, visitwww.BaronFunds.com or call 1-800-99BARON.
Source: MSCI, Baron Capital.
Fund inception dates: Baron International Growth Fund – 12/31/2008; Baron Emerging Markets Fund – 12/31/2010; and Baron Global Advantage Fund – 4/30/2012. Fund returnsand excess returns vs. primary benchmark are based on each Fund’s Institutional Share class performance. Primary benchmarks: Baron International Growth Fund’s primarybenchmark is the MSCI AC World ex USA Index; Baron Emerging Markets Fund’s primary is the MSCI EM Index and Baron Global Advantage Fund’s primary is the MSCI All CountryWorld Index. Annual expense ratios for Inst. shares as of 12/31/2020: Baron International Growth Fund, 1.01%, but the net annual expense ratio was 0.95% (net of the Adviser’sfee waivers), Baron Emerging Markets Fund, 1.09%, Baron Global Advantage Fund, 1.00%, but the net annual expense ratio was 0.90% (net of the Adviser’s fee waivers).
The calculations above are transaction-based and are produced from the underlying security-level data. Excess Return from Stock Specific Effect is not available since inception forBaron Emerging Markets Fund and Baron International Growth Fund due to FactSet reporting limitations when using MSCI Barra factor models for periods longer than 10 years.
Stock specific effects are the result of the Funds’ factor-based performance attributions versus their respective benchmarks. Factor-based performance attribution is the processof attributing excess performance to different factors or groups of factors using a multi-factor model (in this case the MSCI Barra GEMLT model). It allows for the assessment ofsources of returns based on several return components, including style return, country return, currency return, industry return, world return, and stock specific returns. Theproportion of excess return that is not attributed to these components or common factors (countries, industries, currencies, world, and styles) is attributed to company-specificsources or events. In this letter, this is referred to as “Excess Return From Stock Specific Effect”.
16

September 30, 2021 Letter from Linda
Baron International Growth Fund, which has always outperformed itsbenchmark on a 3-year rolling basis since inception, has also generatedconsistently strong stock specific effect – 100% of the time.
Baron International Growth FundRolling Cumulative Three-Year Excess Return, Stock-Specific,and Factor Effectsas of 9/30/2021
-10%
-5%
0%
5%
10%
15%
20%
25%
30%
35%
40%
-10%
-5%
0%
5%
10%
15%
20%
25%
30%
35%
40%
Dec
-11
Jun-
12D
ec-1
2Ju
n-13
Dec
-13
Jun-
14D
ec-1
4Ju
n-15
Dec
-15
Jun-
16D
ec-1
6Ju
n-17
Dec
-17
Jun-
18D
ec-1
8Ju
n-19
Dec
-19
Jun-
20D
ec-2
0Ju
n-21
Excess Return From Stock Specific Effect
Excess Return From Factors
Total Excess Return
Source: MSCI, Baron Capital.Note: Excess return was attributed using MSCI Barra’s GEMLT multi-factor modelmodel. The performance data quoted represents past performance. Past performanceis no guarantee of future results. Current performance may be lower or higher than theperformance data quoted.
Similarly, Baron Emerging Markets Fund delivered positive stock specificeffect 97% of the time over 3-year rolling periods since the inception of theFund. This outcome has helped significantly for the Fund’s 74%outperformance rate.
Baron Emerging Markets FundRolling Cumulative Three-Year Excess Return, Stock-Specific,and Factor Effectsas of 9/30/2021
-20%
-10%
0%
10%
20%
30%
40%
50%
-20%
-10%
0%
10%
20%
30%
40%
50%
Dec
-13
Mar
-14
Jun-
14Se
p-14
Dec
-14
Mar
-15
Jun-
15Se
p-15
Dec
-15
Mar
-16
Jun-
16Se
p-16
Dec
-16
Mar
-17
Jun-
17Se
p-17
Dec
-17
Mar
-18
Jun-
18Se
p-18
Dec
-18
Mar
-19
Jun-
19Se
p-19
Dec
-19
Mar
-20
Jun-
20Se
p-20
Dec
-20
Mar
-21
Jun-
21Se
p-21
Excess Return From Stock Specific Effect
Excess Return From Factors
Total Excess Return
Source: MSCI, Baron Capital.Note: Excess return was attributed using MSCI Barra’s GEMLT multi-factor modelmodel. The performance data quoted represents past performance. Past performanceis no guarantee of future results. Current performance may be lower or higher than theperformance data quoted.
The strong relative results of the three Baron Funds have been highly persistentover time, particularly over the medium and long terms. In addition, their highbatting averages and average excess returns have been better than the respectiveMorningstar category averages for each Fund, as shown in the table below.
The Baron Non-U.S. Funds Have Performed Better ThanPeer Group AverageHistorical Track Record and Batting Averagesas of 9/30/2021
Baron GlobalAdvantage
Fund
BaronInternationalGrowth Fund
BaronEmerging
Markets Fund
1-YearMonthlyRollingExcessReturns
Funds
% of TimeOutperformance 81% 82% 69%
Average ExcessReturn 12.41% 4.90% 3.31%
CategoryAverage
% of TimeOutperformance 78% 77% 41%
AverageExcess Return 2.94% 2.16% –0.54%
3-YearMonthlyRollingExcessReturns
Funds
% of TimeOutperformance 95% 100% 74%
AverageExcess Return 10.03% 3.74% 2.80%
CategoryAverage
% of TimeOutperformance 94% 94% 28%
AverageExcess Return 2.41% 1.98% –0.58%
5-YearMonthlyRollingExcessReturns
Funds
% of TimeOutperformance 100% 100% 84%
AverageExcess Return 9.77% 3.68% 2.36%
CategoryAverage
% of TimeOutperformance 100% 100% 20%
AverageExcess Return 2.26% 1.76% –0.67%
Source: Morningstar Direct.
The % of time outperformance rates for each Fund and the corresponding categoryaverage are calculated since each Fund’s inception date until 9/30/2021. BaronInternational Growth Fund’s Morningstar category is US Fund Foreign Large Growth;Baron Emerging Markets Fund’s Morningstar category is US Fund Diversified EmergingMkts; and Baron Global Advantage Fund Morningstar Category is US Fund World Large-Stock Growth. Fund returns and excess returns vs. primary benchmark are based on eachFund’s Institutional Share class performance. Past performance is no guarantee of futureresults. Current performance may be lower or higher than the performance data quoted.
The charts on the next page show that over the past 10 years1 the Fundsranked in the top quartile of excess returns and risk-adjusted performanceand achieved an attractive upside/downside capture balance. A separateanalysis we performed with Morningstar data as of 9/30/2021 showed thatBaron Emerging Markets Fund and Baron International Growth Fund’s10-year performance, rolling quarterly, has ranked in the top quartile 100%of the time. Since Baron Global Advantage Fund does not have a 10-yeartrack record, we performed the same analysis on a five-year basis. The Fundranked in the top quartile 100% of the time.
1 The analysis for Baron Global Advantage Fund was performed since its inception, as it does not have a 10-year track record.
17

Letter from Linda
The Baron Non-U.S. Funds Have Delivered Outstanding Results Versus Peers
Baron Global Advantage FundPerformance-Based Statistics Since Inception, as of 9/30/2021
ExcessReturn(ann.)
SharpeRatio(ann.)
InformationRatio(ann.)
Alpha(ann.)
StandardDeviation
(ann.)Upside
CaptureDownsideCapture
TrackingError
Worst
Best Best
Worst Worst
Best Best
Worst
Higher
Lower
Higher
Lower
Higher
Lower
Higher
Bottom Quartile 3rd Quartile 2nd Quartile Top Quartile
Higher
Lower
Baron Global Advantage Fund MSCI ACWI Index Morningstar US Fund World Large-Stock Growth Average
-4.0%
-2.0%
0.0%
2.0%
4.0%
6.0%
8.0%
10.0%
0.40
0.50
0.60
0.70
0.80
0.90
1.00
1.10
-0.60
-0.40
-0.20
0.00
0.20
0.40
0.60
0.80
1.00
-4.0%
-2.0%
0.0%
2.0%
4.0%
6.0%
8.0%
10.0%
0.80
0.85
0.90
0.95
1.00
1.05
1.10
1.15
1.20
12.0%
13.0%
14.0%
15.0%
16.0%
17.0%
18.0%
19.0%
20.0%
80.0%
90.0%
100.0%
110.0%
120.0%
130.0%
80.0%
90.0%
100.0%
110.0%
120.0%
0.0%
2.0%
4.0%
6.0%
8.0%
10.0%
12.0%
Beta
Lower
Source: Morningstar Direct.
Baron International Growth Fund10-Year Performance-Based Statistics, as of 9/30/2021
Excess Return(ann.)
SharpeRatio(ann.)
InformationRatio(ann.)
Alpha(ann.)
StandardDeviation
(ann.)Upside
CaptureDownsideCapture
Tracking Error
Worst
Best Best
Worst Worst
Best Best
Worst
Higher
Lower Lower
Higher
Lower
Higher
Lower
Higher Higher
Lower
Baron International Growth Fund MSCI ACWI ex USA Index Morningstar US Fund Foreign Large Growth Average
Bottom Quartile 3rd Quartile 2nd Quartile Top Quartile
0.0%
1.0%
2.0%
3.0%
4.0%
5.0%
6.0%
7.0%
0.40
0.50
0.60
0.70
0.80
0.90
1.00
0.000.100.200.300.400.500.600.700.800.901.001.10
0.0%
1.0%
2.0%
3.0%
4.0%
5.0%
6.0%
7.0%
0.75
0.80
0.85
0.90
0.95
1.00
1.05
12.0%
12.5%
13.0%
13.5%
14.0%
14.5%
15.0%
15.5%
16.0%
85.0%
90.0%
95.0%
100.0%
105.0%
110.0%
65.0%
70.0%
75.0%
80.0%
85.0%
90.0%
95.0%
100.0%
3.0%
4.0%
5.0%
6.0%
7.0%
8.0%
Beta
Source: Morningstar Direct.
Baron Emerging Markets Fund10-Year Performance-Based Statistics, as of 9/30/2021
Excess Return(ann.)
SharpeRatio(ann.)
InformationRatio(ann.)
Alpha(ann.)
StandardDeviation
(ann.)Upside
CaptureDownsideCapture
Tracking Error
Worst
Best Best
Worst Worst
Best Best
Worst
Higher
Lower Lower
Higher
Lower
Higher
Lower
Higher Higher
Lower
Baron Emerging Markets Fund MSCI Emerging Markets Index Morningstar US Fund Diversified Emerging Mkts Average
-3.0%
-2.0%
-1.0%
0.0%
1.0%
2.0%
3.0%
4.0%
0.00
0.10
0.20
0.30
0.40
0.50
0.60
-0.50-0.40-0.30-0.20-0.100.000.100.200.300.400.500.60
-2.0%
-1.0%
0.0%
1.0%
2.0%
3.0%
4.0%
5.0%
0.70
0.75
0.80
0.85
0.90
0.95
1.00
1.05
1.10
14.0%
15.0%
16.0%
17.0%
18.0%
19.0%
20.0%
75.0%
80.0%
85.0%
90.0%
95.0%
100.0%
105.0%
110.0%
65.0%
75.0%
85.0%
95.0%
105.0%
115.0%
2.0%
3.0%
4.0%
5.0%
6.0%
7.0%
8.0%
9.0%
10.0%
Bottom Quartile 3rd Quartile 2nd Quartile Top Quartile
Beta
Source: Morningstar Direct.
The performance data quoted represents past performance. Past performance is no guarantee of future results. Current performance may be lower or higher than the performancedata quoted.
18

September 30, 2021 Letter from Linda
Our long-term track record investing globally shows that significant valuecan be added for investors with predominantly U.S. equity exposure. In ourview, investors are selling themselves short when they invest in passiveproducts, particularly in non-U.S. equities. In today’s uncertain times,balancing risks and opportunities is especially important. Active managershave the capability and flexibility to make decisions about country andregion exposures, industry concentration, and specific stocks. At Baron, webelieve that such decisions can result in above-average long-term returns forour shareholders. We are optimistic about global growth, and we remaincommitted to finding the best opportunities around the world by applyingour time-tested approach and expertise.
Sincerely,
Linda S. MartinsonChairman, President, and COOSeptember 30, 2021
Investors should consider the investment objectives, risks, and charges and expenses of the investment carefully before investing. The prospectus and summaryprospectuses contain this and other information about the Funds. You may obtain them from the Funds’ distributor, Baron Capital, Inc., by calling1-800-99BARON or visiting www.BaronFunds.com. Please read them carefully before investing.
Baron International Growth Fund: Performance for the Institutional Shares prior to 5/29/2009 is based on the performance of the Retail Shares, which havea distribution fee. The Institutional Shares do not have a distribution fee. If the annual returns for the Institutional Shares prior to 5/29/2009 did not reflect thisfee, the returns would be higher.
The Baron Global Advantage Fund’s YTD, 3- and 5-year historical performance was impacted by gains from IPOs and there is no guarantee that these resultscan be repeated or that the Fund’s level of participation in IPOs will be the same in the future.
Risks: Growth stocks can react differently to issuer, political, market and economic developments than the market as a whole. Non-U.S. investments mayinvolve additional risks to those inherent in U.S. investments, including exchange-rate fluctuations, political or economic instability, the imposition of exchangecontrols, expropriation, limited disclosure and illiquid markets. In addition, investments in developing countries may have increased risks due to a greaterpossibility of settlement delays; currency and capital controls; interest rate sensitivity; corruption and crime; exchange rate volatility; and inflation or deflation.Securities of small and medium-sized companies may be thinly traded and more difficult to sell. Baron New Asia: Government actions, bureaucratic obstaclesand inconsistent economic reform within the Indian government have had a significant effect on the Indian economy and could adversely affect marketconditions, economic growth and the profitability of private enterprises in India.
The discussion of market trends is not intended as advice to any person regarding the advisability of investing in any particular security. The views expressed inthis document reflect those of the respective writer. Some of our comments are based on management expectations and are considered “forward-lookingstatements.” Actual future results, however, may prove to be different from our expectations. Our views are a reflection of our best judgment at the time andare subject to change at any time based on market and other conditions and Baron has no obligation to update them.
Portfolio holdings as a percentage of net assets as of September 30, 2021 for securities mentioned are as follows: Bajaj Finance Ltd. – Baron InternationalGrowth Fund (1.9%), Baron Emerging Markets Fund (3.1%), Baron Global Advantage Fund (2.0%), Baron New Asia Fund (3.2%); Taiwan SemiconductorManufacturing Company Ltd. – Baron Emerging Markets Fund (3.6%), Baron New Asia Fund (2.1%); Endava plc – Baron Small Cap Fund (1.9%), BaronOpportunity Fund (1.7%), Baron International Growth Fund (1.8%), Baron Global Advantage Fund (3.6%), Baron Discovery Fund (2.7%), Baron FinTech Fund(4.2%); Alibaba Group Holding Ltd. – Baron Opportunity Fund (0.3%), Baron International Growth Fund (1.0%), Baron Emerging Markets Fund (2.4%), BaronGlobal Advantage Fund (1.4%), Baron New Asia Fund (1.2%); Tencent Holdings Ltd. – Baron International Growth Fund (1.2%), Baron Emerging Markets Fund(3.0%), Baron New Asia Fund (1.6%); Samsung Electronics Co. Ltd. – Baron Emerging Markets Fund (2.9%); Adyen N.V. – Baron Opportunity Fund (0.5%),Baron Partners Fund (2.1%*), Baron Fifth Avenue Growth Fund (2.1%), Baron Focused Growth Fund (2.2%), Baron Global Advantage Fund (1.6%), BaronFinTech Fund (3.1%); Wix.com Ltd. – Baron Asset Fund (1.6%), Baron Small Cap Fund (1.1%), Baron Opportunity Fund (0.8%), Baron Fifth Avenue GrowthFund (1.7%), Baron International Growth Fund (0.7%), Baron Global Advantage Fund (1.9%), Baron FinTech Fund (3.1%); Reliance Industries Ltd. – BaronInternational Growth Fund (1.1%), Baron Emerging Markets Fund (2.5%), Baron New Asia Fund (2.8%); Spotify Technology S.A. – Baron Partners Fund(2.3%*), Baron Focused Growth Fund (3.9%), Baron International Growth Fund (0.6%).
* % of Long Positions.Portfolio holdings are subject to change. Current and future portfolio holdings are subject to risk.
19
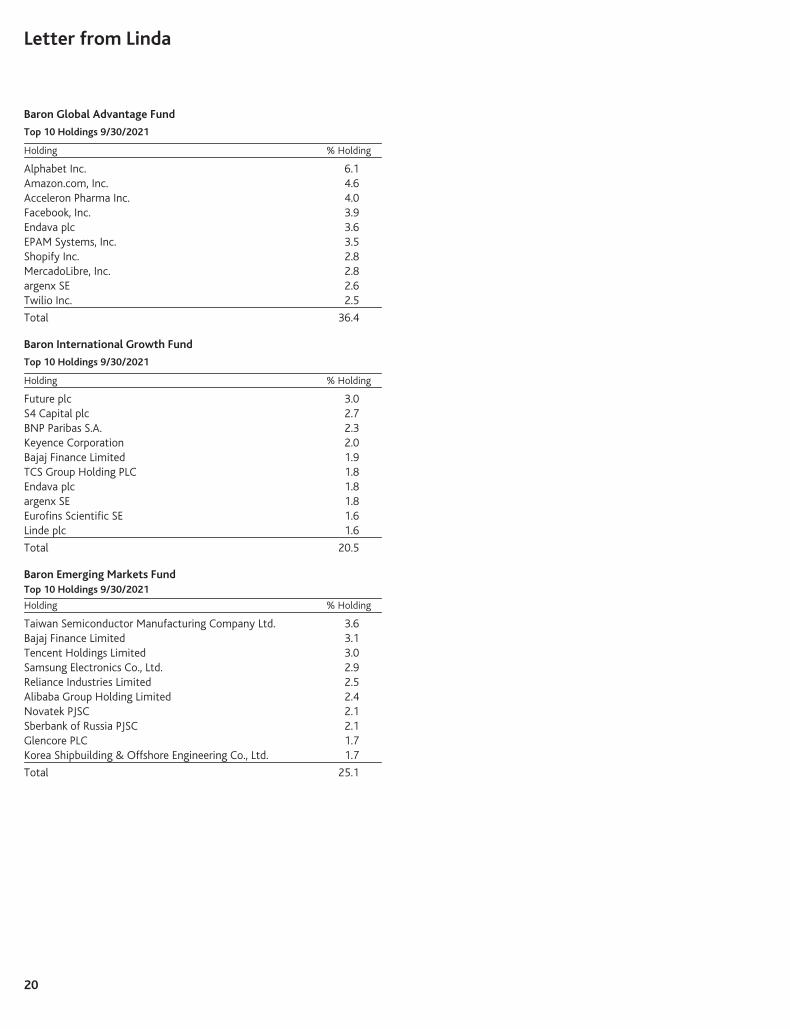
Letter from Linda
Baron Global Advantage Fund
Top 10 Holdings 9/30/2021
Holding % Holding
Alphabet Inc. 6.1Amazon.com, Inc. 4.6Acceleron Pharma Inc. 4.0Facebook, Inc. 3.9Endava plc 3.6EPAM Systems, Inc. 3.5Shopify Inc. 2.8MercadoLibre, Inc. 2.8argenx SE 2.6Twilio Inc. 2.5
Total 36.4
Baron International Growth Fund
Top 10 Holdings 9/30/2021
Holding % Holding
Future plc 3.0S4 Capital plc 2.7BNP Paribas S.A. 2.3Keyence Corporation 2.0Bajaj Finance Limited 1.9TCS Group Holding PLC 1.8Endava plc 1.8argenx SE 1.8Eurofins Scientific SE 1.6Linde plc 1.6
Total 20.5
Baron Emerging Markets FundTop 10 Holdings 9/30/2021
Holding % Holding
Taiwan Semiconductor Manufacturing Company Ltd. 3.6Bajaj Finance Limited 3.1Tencent Holdings Limited 3.0Samsung Electronics Co., Ltd. 2.9Reliance Industries Limited 2.5Alibaba Group Holding Limited 2.4Novatek PJSC 2.1Sberbank of Russia PJSC 2.1Glencore PLC 1.7Korea Shipbuilding & Offshore Engineering Co., Ltd. 1.7
Total 25.1
20
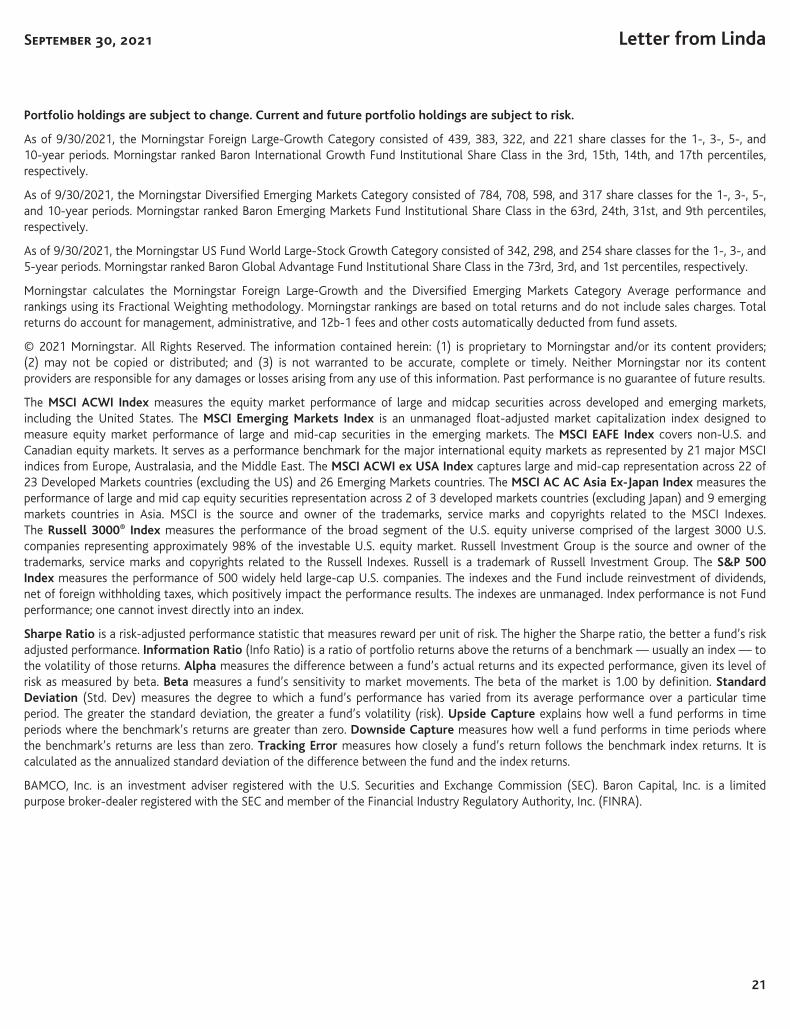
September 30, 2021 Letter from Linda
Portfolio holdings are subject to change. Current and future portfolio holdings are subject to risk.
As of 9/30/2021, the Morningstar Foreign Large-Growth Category consisted of 439, 383, 322, and 221 share classes for the 1-, 3-, 5-, and10-year periods. Morningstar ranked Baron International Growth Fund Institutional Share Class in the 3rd, 15th, 14th, and 17th percentiles,respectively.
As of 9/30/2021, the Morningstar Diversified Emerging Markets Category consisted of 784, 708, 598, and 317 share classes for the 1-, 3-, 5-,and 10-year periods. Morningstar ranked Baron Emerging Markets Fund Institutional Share Class in the 63rd, 24th, 31st, and 9th percentiles,respectively.
As of 9/30/2021, the Morningstar US Fund World Large-Stock Growth Category consisted of 342, 298, and 254 share classes for the 1-, 3-, and5-year periods. Morningstar ranked Baron Global Advantage Fund Institutional Share Class in the 73rd, 3rd, and 1st percentiles, respectively.
Morningstar calculates the Morningstar Foreign Large-Growth and the Diversified Emerging Markets Category Average performance andrankings using its Fractional Weighting methodology. Morningstar rankings are based on total returns and do not include sales charges. Totalreturns do account for management, administrative, and 12b-1 fees and other costs automatically deducted from fund assets.
© 2021 Morningstar. All Rights Reserved. The information contained herein: (1) is proprietary to Morningstar and/or its content providers;(2) may not be copied or distributed; and (3) is not warranted to be accurate, complete or timely. Neither Morningstar nor its contentproviders are responsible for any damages or losses arising from any use of this information. Past performance is no guarantee of future results.
The MSCI ACWI Index measures the equity market performance of large and midcap securities across developed and emerging markets,including the United States. The MSCI Emerging Markets Index is an unmanaged float-adjusted market capitalization index designed tomeasure equity market performance of large and mid-cap securities in the emerging markets. The MSCI EAFE Index covers non-U.S. andCanadian equity markets. It serves as a performance benchmark for the major international equity markets as represented by 21 major MSCIindices from Europe, Australasia, and the Middle East. The MSCI ACWI ex USA Index captures large and mid-cap representation across 22 of23 Developed Markets countries (excluding the US) and 26 Emerging Markets countries. The MSCI AC AC Asia Ex-Japan Index measures theperformance of large and mid cap equity securities representation across 2 of 3 developed markets countries (excluding Japan) and 9 emergingmarkets countries in Asia. MSCI is the source and owner of the trademarks, service marks and copyrights related to the MSCI Indexes.The Russell 3000® Index measures the performance of the broad segment of the U.S. equity universe comprised of the largest 3000 U.S.companies representing approximately 98% of the investable U.S. equity market. Russell Investment Group is the source and owner of thetrademarks, service marks and copyrights related to the Russell Indexes. Russell is a trademark of Russell Investment Group. The S&P 500Index measures the performance of 500 widely held large-cap U.S. companies. The indexes and the Fund include reinvestment of dividends,net of foreign withholding taxes, which positively impact the performance results. The indexes are unmanaged. Index performance is not Fundperformance; one cannot invest directly into an index.
Sharpe Ratio is a risk-adjusted performance statistic that measures reward per unit of risk. The higher the Sharpe ratio, the better a fund’s riskadjusted performance. Information Ratio (Info Ratio) is a ratio of portfolio returns above the returns of a benchmark — usually an index — tothe volatility of those returns. Alpha measures the difference between a fund’s actual returns and its expected performance, given its level ofrisk as measured by beta. Beta measures a fund’s sensitivity to market movements. The beta of the market is 1.00 by definition. StandardDeviation (Std. Dev) measures the degree to which a fund’s performance has varied from its average performance over a particular timeperiod. The greater the standard deviation, the greater a fund’s volatility (risk). Upside Capture explains how well a fund performs in timeperiods where the benchmark’s returns are greater than zero. Downside Capture measures how well a fund performs in time periods wherethe benchmark’s returns are less than zero. Tracking Error measures how closely a fund’s return follows the benchmark index returns. It iscalculated as the annualized standard deviation of the difference between the fund and the index returns.
BAMCO, Inc. is an investment adviser registered with the U.S. Securities and Exchange Commission (SEC). Baron Capital, Inc. is a limitedpurpose broker-dealer registered with the SEC and member of the Financial Industry Regulatory Authority, Inc. (FINRA).
21

Letter from Linda
Appendix 1 – Non U.S. Baron Funds Top Holdings & Investment Premisesas of 9/30/2021
Company
MarketCapitalization
(billions) Company Description Baron’s Investment Premise CountryGICS
Sub-Industry
Bajaj Finance Limited $ 62.35 Bajaj Finance Limited (BAF.IN) is a leadingnon-banking financial corporation (NBFC) inIndia. It offers various financial products andservices including housing loans, consumerdurables financing, small- and medium-sizedenterprise credit, and rural loans.
We think Bajaj is well positioned to benefitfrom growing demand for consumer financialservices in India. The company’s data analyticsplatform is a key competitive advantage,which enables it to earn high risk adjustedreturns (ROEs can sustain 20% to 22%, in ourview). The company is quickly becomingIndia’s largest FinTech player by creating anecosystem of apps offering insurance,brokerages, and wealth management, amongmany other new products and services. Weexpect Bajaj to grow earnings by roughly 30%over the next five years.
India ConsumerFinance
Taiwan SemiconductorManufacturingCompany Ltd.
$579.03 Taiwan Semiconductor ManufacturingCompany Ltd. (TSMC) is the world’s largestindependent semiconductor foundry,manufacturing chips on behalf of othercompanies.
Taiwan Semiconductor remains the dominantforce in leading edge semiconductor foundrymanufacturing, as it benefits from economiesof scale and a superior cost structure. Itssuccessful track record of deploying newtechnology faster than its competition enablesit to maintain its market share and pricingpower. We believe Taiwan Semiconductor’sinvestments in advanced nodes (5, <3nanometers) will solidify its superior marketpositioning and profitability over itscompetition in the long run.
Taiwan Semiconductors
Endava plc $ 7.57 Endava plc (DAVA) provides outsourcedsoftware development for business customers.
Endava benefits from growing demand for ITservices and digital transformation frombusinesses worldwide. The company’scompetitive differentiation comes from itsability to hire and retain highly skilled,low-cost software engineers, primarily inEastern Europe. Endava’s strong technicalcapabilities and differentiated labor poolenable the company to work on higher-valueclient projects with better pricing power thanpeers. We believe Endava will continue gainingshare in a large, growing market by adding newclients and increasing wallet share withexisting clients.
UnitedKingdom
IT Consulting &Other Services
Alibaba Group HoldingLimited
$402.43 Alibaba Group Holding Limited (BABA) is thelargest e-commerce company in the world.Alibaba owns and operates the two largestonline shopping platforms in China, Taobaoand Tmall, as well as a 33% stake in AntFinancial, which is the country’s dominantpayments platform.
With over 779 million active buyers and over10 million merchants, we believe Alibaba ispoised to benefit disproportionately from theincreased penetration of internet, mobile, ande-commerce in China. It enjoys more than70% market share of all e-commercetransactions in China, and we expect it tocontinue growing revenue at a rate of morethan 20% for years to come. We also seesignificant positive optionality in Alibaba’scloud computing, data management, andelectronic payment platforms.
China Internet &DirectMarketingRetail
22

September 30, 2021 Letter from Linda
Company
MarketCapitalization
(billions) Company Description Baron’s Investment Premise CountryGICS
Sub-Industry
Tencent HoldingsLimited
$573.57 Tencent Holdings Limited (700 HK) is aleading internet service company and the topgame developer in China. Its primaryplatforms include QQ for instant messaging,WeChat for mobile messaging, and Qzonefor social networking.
We are bullish on Tencent’s ability to growEPS at +DD% rates in the long term. Tencentbenefits from virtuous network effects, andwe think it has a long runway to monetize itslarge user base by pushing value-addedservices and advertising through itsplatforms. We believe online advertising willcontinue to drive growth as managementfocuses on capturing a greater share of Chinaad spend, with increasing contribution fromthe gaming and fintech segments.
China InteractiveMedia &Services
Samsung ElectronicsCo., Ltd.
$372.61 Samsung Electronics Co., Ltd. (005930 KS)is a Korean technology conglomerate knownfor its leadership in consumer electronics andsemiconductor manufacturing.
Samsung is the bellwether for globaltechnology innovation and continues todeliver robust earnings across memory, logic,display, smartphones, and home appliances.We are confident that Samsung’s technologyleadership will be sustainable for decades tocome, given its strong track record for R&Dand the ability to meet the ever-changingglobal consumer demand.
Korea TechnologyHardware,Storage &Perispherals
Adyen N.V. $ 85.39 Adyen N.V. (ADYEN.NA) providestechnology solutions that enable merchantsto accept electronic payments.
As a payment processor mostly for onlinemerchants, Adyen benefits from the rapidgrowth of e-commerce. The company has along runway for growth given its small share ofa large and rapidly growing global market.Adyen is gaining share due to its globalpresence, advanced technology platform, andability to achieve higher authorization rates formerchants. We believe margins shouldcontinue expanding due to operating leverage.
Netherlands DataProcessing &OutsourcedServices
Wix.com Ltd. $ 11.05 Wix.com Ltd. (WIX) provides software tohelp micro-businesses build and maintainwebsites and operate their businesses. Wixhas over 200 million registered users andover 5.5 million premium users.
Wix is a leading do-it-yourself website-design software, targeting a large market, asmost businesses use professional websitedevelopment services. We think Wix hasstrong competitive advantages, driven byproduct innovation, data-driven distribution,and its leading brand. Wix’s technologicaledge, supported by over 1,500 R&Dpersonnel, results in fast iteration withfirst-to-market features and verticalofferings. Wix’s recently introduceddo-it-for-me solutions open a large new TAMfor it to address.
Israel InternetServices &Infrastructure
Reliance IndustriesLimited
$222.33 Reliance Industries Limited (RIL IN) isIndia’s leading conglomerate, with businessinterests that include oil refining,petrochemicals, media, telecommunications,and retail.
We believe Reliance is well-positioned toleverage its telecommunications network totransform into a digital services company,offering products such as video streaming,broadband, and e-commerce services. Thecompany is also laying the groundwork tocreate an online marketplace that willconnect over 12 million mom & pop retailersto over 400 million mobile and internetsubscribers. We believe earnings will sustainhigh double-digit growth over the next threeto five years.
India Oil & Gas,Refining &Marketing
Spotify TechnologyS.A.
$ 42.99 Spotify Technology S.A. (SPOT) is theleading music streaming service globally,with approximately 40% market share.
With over 155 million paying subscribers,Spotify has created a two-sided marketplacewhere creators can monetize their work andconsumers can stream music. Longer term,we expect the company to grow to over250 million subscribers and improve marginsthrough negotiations with music labels andartists.
Sweden CommunicationServices
23

Baron Funds PerformanceBaron Asset Fund
Comparison of the change in value of $10,000 investment in Baron Asset Fund (Institutional Shares)†
in relation to the Russell Midcap Growth Index and the S&P 500 Index
$0
$100,000
$200,000
$600,000
$500,000
$300,000
$400,000
$560,576
$365,199
$303,354
Baron Asset Fund1,4
S&P 500 Index1
Russell Midcap Growth Index1
6/12/87 9/2112/88 12/91 12/94 12/97 12/00 12/03 12/06 12/09 12/12 12/15 12/18
Baron Asset Fund’s annualized returns as of September 30, 2021: 3-month, (0.14)%; 1-year, 25.29%; 3-year, 18.72%; 5-year, 20.45%; 10-year, 18.00%; and Since Inception, 12.46%.
Baron Growth FundComparison of the change in value of $10,000 investment in Baron Growth Fund (Institutional Shares)†
in relation to the Russell 2000 Growth Index and the S&P 500 Index
$200,000
$0
$50,000
$400,000
$300,000
$350,000
$250,000
$150,000
$100,000
Baron Growth Fund2,4
S&P 500 Index2
Russell 2000 Growth Index2
12/31/94 9/21
$352,787
$156,240
$97,662
12/00 12/03 12/06 12/09 12/12 12/15 12/1812/97
Baron Growth Fund’s annualized returns as of September 30, 2021: 3-month, 3.63%; 1-year, 36.55%; 3-year, 19.75%; 5-year, 21.16%; 10-year, 17.64%; and Since Inception, 14.25%.
Baron Small Cap FundComparison of the change in value of $10,000 investment in Baron Small Cap Fund (Institutional Shares)†
in relation to the Russell 2000 Growth Index and the S&P 500 Index
$0
$20,000
$140,000
$120,000
$100,000
$80,000
$60,000
$40,000
$138,678
$71,243
$54,445
Baron Small Cap Fund3,4
S&P 500 Index3
Russell 2000 Growth Index3
9/30/97 9/2112/0112/98 12/04 12/10 12/13 12/1612/07 12/19
Baron Small Cap Fund’s annualized returns as of September 30, 2021: 3-month, 1.32%; 1-year, 30.11%; 3-year, 17.86%; 5-year, 20.29%; 10-year, 17.15%; and Since Inception, 11.58%.
1 The Russell Midcap® Growth Index measures the performance of medium-sized U.S. companies that are classified as growth and the S&P 500 Index of 500 widely held large cap U.S. companies. Theindexes and Baron Asset Fund are with dividends, which positively impact the performance results. The indexes are unmanaged. The Fund’s 3-month historical performance was impacted by gains fromIPOs, and there is no guarantee that these results can be repeated or that the Fund’s level of participation in IPOs will be the same in the future.
2 The Russell 2000® Growth Index measures the performance of small-sized U.S. companies that are classified as growth and the S&P 500 Index of 500 widely held large cap U.S. companies. Theindexes and Baron Growth Fund are with dividends, which positively impact the performance results. The indexes are unmanaged.
3 The Russell 2000® Growth Index measures the performance of small-sized U.S. companies that are classified as growth and the S&P 500 Index of 500 widely held large cap U.S. companies. Theindexes and Baron Small Cap Fund are with dividends, which positively impact the performance results. The indexes are unmanaged. The Fund’s 3-month historical performance was impacted bygains from IPOs, and there is no guarantee that these results can be repeated or that the Fund’s level of participation in IPOs will be the same in the future.
4 Past performance is not predictive of future performance. The performance data does not reflect the deduction of taxes that a shareholder would pay on Fund distributions or redemptions of Fund shares.† Performance for the Institutional Shares prior to May 29, 2009 is based on the performance of the Retail Shares, which have a distribution fee. The Institutional Shares do not have a distribution
fee. If the annual returns for the Institutional Shares prior to May 29, 2009 did not reflect this fee, the returns would be higher.
24

Baron Funds Performance
Baron Opportunity FundComparison of the change in value of $10,000 investment in Baron Opportunity Fund (Institutional Shares)†
in relation to the Russell 3000 Growth Index and the S&P 500 Index
Baron Opportunity Fund1,4
S&P 500 Index1
Russell 3000 Growth Index1
$20,000
$40,000
$60,000
$47,756$42,690
$90,953
2/29/00$0
$100,000
$80,000
9/2112/2012/0512/02 12/08 12/11 12/14 12/17
Baron Opportunity Fund’s annualized returns as of September 30, 2021: 3-month, (2.03)%; 1-year, 33.91%; 3-year, 34.26%; 5-year, 32.95%; 10-year, 21.52%; and Since Inception, 10.77%.
Baron Partners FundComparison of the change in value of $10,000 investment in Baron Partners Fund (Institutional Shares)†
in relation to the Russell Midcap Growth Index and the S&P 500 Index
$200,000
$0
$1,000,000
$800,000
$600,000
$400,000
$917,438
$215,260$191,097
Baron Partners Fund2,4,5
S&P 500 Index2
Russell Midcap Growth Index2
1/31/92 9/2112/1812/1512/94 12/97 12/00 12/03 12/06 12/09 12/12
Baron Partners Fund’s annualized returns as of September 30, 2021: 3-month, 5.52%; 1-year, 57.43%; 3-year, 49.25%; 5-year, 38.93%; 10-year, 27.63%; and Since Inception, 16.45%.
Baron Fifth Avenue Growth FundComparison of the change in value of $10,000 investment in Baron Fifth Avenue Growth Fund (Institutional Shares)†
in relation to the Russell 1000 Growth Index and the S&P 500 Index
Baron Fifth Avenue Growth Fund3,4
S&P 500 Index3
Russell 1000 Growth Index3
$10,000
$20,000
$30,000
$80,000
$70,000
$60,000
$50,000
$40,000
$75,528
$55,369
$71,715
4/30/04 9/21$0
12/2012/1812/14 12/1612/04 12/06 12/08 12/10 12/12
Baron Fifth Avenue Growth Fund’s annualized returns as of September 30, 2021: 3-month, (1.42)%; 1-year, 19.44%; 3-year, 22.93%; 5-year, 24.52%; 10-year, 20.65%; and Since Inception, 11.98%.
1 The Russell 3000® Growth Index measures the performance of those companies classified as growth among the largest 3,000 U.S. companies and the S&P 500 Index of 500 widely held large capU.S. companies. The indexes and Baron Opportunity Fund are with dividends, which positively impact the performance results. The indexes are unmanaged. The Fund’s 3-month, 3-, 5-, and10-year historical performance was impacted by gains from IPOs and there is no guarantee that these results can be repeated or that the Fund’s level of participation in IPOs will be the same inthe future.
2 The Russell Midcap® Growth Index measures the performance of medium-sized U.S. companies that are classified as growth and the S&P 500 Index of 500 widely held large cap U.S. companies.The indexes and Baron Partners Fund are with dividends, which positively impact the performance results. The indexes are unmanaged.
3 The Russell 1000® Growth Index measures the performance of large-sized U.S. companies that are classified as growth and the S&P 500 Index of 500 widely held large cap U.S. companies. The indexes andBaron Fifth Avenue Growth Fund are with dividends, which positively impact the performance results. The indexes are unmanaged. The Fund’s 3-month historical performance was impacted by gains from IPOs,and there is no guarantee that these results can be repeated or that the Fund’s level of participation in IPOs will be the same in the future.
4 Past performance is not predictive of future performance. The performance data does not reflect the deduction of taxes that a shareholder would pay on Fund distributions or redemption of Fund shares.5 Reflects the actual fees and expenses that were charged when the Fund was a partnership. The predecessor partnership charged a 20% performance fee after reaching a certain performance
benchmark. If the annual returns for the Fund did not reflect the performance fees for the years the predecessor partnership charged a performance fee, returns would be higher. The Fund’sshareholders will not be charged a performance fee. The predecessor partnership’s performance is only for periods before the Fund’s registration statement was effective, which was April 30, 2003.During those periods, the predecessor partnership was not registered under the Investment Company Act of 1940 and was not subject to its requirements or the requirements of the InternalRevenue Code relating to registered investment companies, which, if it were, might have adversely affected its performance.
† Performance for the Institutional Shares prior to May 29, 2009 is based on the performance of the Retail Shares, which have a distribution fee. The Institutional Shares do not have a distributionfee. If the annual returns for the Institutional Shares prior to May 29, 2009 did not reflect this fee, the returns would be higher.
25

Baron Funds Performance
Baron Focused Growth FundComparison of the change in value of $10,000 investment in Baron Focused Growth Fund (Institutional Shares)†
in relation to the Russell 2500 Growth Index and the S&P 500 Index
$50,000
$350,000
$300,000
$250,000
$150,000
$200,000
$100,000
$0
Baron Focused Growth Fund1,4,5
S&P 500 Index1
Russell 2500 Growth Index1
$311,485
$95,917$103,544
5/31/96 9/2112/97 12/15 12/1812/00 12/03 12/06 12/09 12/12
Baron Focused Growth Fund’s annualized returns as of September 30, 2021: 3-month, 4.86%; 1-year, 42.30%; 3-year, 40.46%; 5-year, 32.52%; 10-year, 21.40%; andSince Inception, 14.54%.
Baron International Growth FundComparison of the change in value of $10,000 investment in Baron International Growth Fund (Institutional Shares)†
in relation to the MSCI ACWI ex USA Index and the MSCI ACWI ex USA IMI Growth Index
$15,000
$5,000
$20,000
$10,000
$50,000
$45,000
$40,000
$30,000
$35,000$33,151
$26,911
$46,182
$0
$25,000
2,5Baron International Growth Fund
MSCI ACWI ex USA Index2
2MSCI ACWI ex USA IMI Growth Index
12/31/08 12/1212/10 12/14 12/16 12/2012/18 9/21
Baron International Growth Fund’s annualized returns as of September 30, 2021: 3-month, (1.03)%; 1-year, 30.30%; 3-year, 16.32%; 5-year, 14.55%; 10-year, 12.13%; andSince Inception, 12.75%.
Baron Real Estate FundComparison of the change in value of $10,000 investment in Baron Real Estate Fund (Institutional Shares)
in relation to the MSCI USA IMI Extended Real Estate Index and MSCI US REIT Index
$0
$10,000
$70,000
$60,000
$50,000
$20,000
$62,489
$40,823
$30,475
Baron Real Estate Fund3,5
MSCI USA IMI Extended Real Estate Index3
MSCI US REIT Index3
$30,000
$40,000
12/31/09 9/2112/13 12/15 12/17 12/1912/11
Baron Real Estate Fund’s annualized returns as of September 30, 2021: 3-month, (1.66)%; 1-year, 33.50%; 3-year, 25.89%; 5-year, 19.56%; 10-year, 19.05%; andSince Inception, 16.88%.
1 The Russell 2500™ Growth Index measures the performance of small- to medium-sized U.S. companies that are classified as growth and the S&P 500 Index of 500 widely held large-cap U.S.companies. The indexes and Baron Focused Growth Fund are with dividends, which positively impact the performance results. The indexes are unmanaged.
2 The MSCI ACWI ex USA Index Net USD is a free float-adjusted market capitalization weighted index that is designed to measure the equity market performance of large- and mid-cap securitiesacross developed and emerging markets, excluding the United States. The MSCI ACWI ex USA IMI Growth Index Net USD is a free float-adjusted market capitalization weighted index that isdesigned to measure the performance of large-, mid-, and small-cap growth securities across developed and emerging markets, excluding the United States. MSCI is the source and owner of thetrademarks, service marks and copyrights related to the MSCI Indexes. The indexes and Baron International Growth Fund include reinvestment of dividends, net of foreign withholding taxes, whichpositively impact the performance results. The indexes are unmanaged.
3 The MSCI USA IMI Extended Real Estate Index is a custom index calculated by MSCI for, and as requested by, BAMCO, Inc. The index includes real estate and real estate-related GICS classificationsecurities. MSCI makes no express or implied warranties or representations and shall have no liability whatsoever with respect to any MSCI data contained herein. The MSCI data may not befurther redistributed or used as a basis for other indexes or any securities or financial products. This report is not approved, reviewed or produced by MSCI. The MSCI US REIT Index is a free float-adjusted market capitalization index that measures the performance of all equity REITs in the US equity market, except for specialty equity REITs that do not generate a majority of their revenueand income from real estate rental and leasing operations. MSCI is the source and owner of the trademarks, service marks and copyrights related to the MSCI Indexes. The indexes and Baron RealEstate Fund are with dividends, which positively impact performance results. The indexes are unmanaged.
4 Reflects the actual fees and expenses that were charged when the Fund was a partnership. The predecessor partnership charged a 15% performance fee through 2003 after reaching a certainperformance benchmark. If the annual returns for the Fund did not reflect the performance fees for the years the predecessor partnership charged a performance fee, the returns would be higher.The Fund’s shareholders will not be charged a performance fee. The predecessor partnership’s performance is only for the periods before the Fund’s registration statement was effective, which wasJune 30, 2008. During those periods, the predecessor partnership was not registered under the Investment Company Act of 1940 and was not subject to its requirements or the requirements ofthe Internal Revenue Code relating to registered investment companies, which, if it were, might have adversely affected its performance.
5 Past performance is not predictive of future performance. The performance data does not reflect the deduction of taxes that a shareholder would pay on Fund distributions or redemption of Fund shares.† Performance for the Institutional Shares prior to May 29, 2009 is based on the performance of the Retail Shares, which have a distribution fee. The Institutional Shares do not have a distribution
fee. If the annual returns for the Institutional Shares prior to May 29, 2009 did not reflect this fee, the returns would be higher.
26

Baron Funds Performance
Baron Emerging Markets FundComparison of the change in value of $10,000 investment in Baron Emerging Markets Fund (Institutional Shares)
in relation to the MSCI EM Index and the MSCI EM IMI Growth Index
$0
$5,000
$10,000
$15,000
$25,000
$20,000
$14,104
$16,716
$19,494
Baron Emerging Markets Fund1,3
1MSCI EM Index
MSCI EM IMI Growth Index1
12/31/10 12/16 12/20 9/2112/18 12/1912/1712/1412/11 12/1312/12 12/15
Baron Emerging Markets Fund’s annualized returns as of September 30, 2021: 3-month, (6.47)%; 1-year, 17.95%; 3-year, 12.17%; 5-year, 9.61%; 10-year, 8.90%; andSince Inception, 6.41%.
Baron Global Advantage FundComparison of the change in value of $10,000 investment in Baron Global Advantage Fund (Institutional Shares)
in relation to the MSCI ACWI Index and the MSCI ACWI Growth Index
$20,000
$0
$60,000
$50,000
$40,000
$30,000
Baron Global Advantage Fund2,3
MSCI ACWI Index2
MSCI ACWI Growth Index2
$25,978
$54,845
$32,689
$10,000
4/30/12 12/20 9/2112/1812/1312/12 12/14 12/16 12/17 12/1912/15
Baron Global Advantage Fund’s annualized returns as of September 30, 2021: 3-month, (4.91)%; 1-year, 22.56%; 3-year, 32.66%; 5-year, 29.58%; and Since Inception, 19.81%.
1 The MSCI EM (Emerging Markets) Index and the MSCI EM (Emerging Markets) IMI Growth Index are free float-adjusted market capitalization weighted indexes. The MSCI EM (Emerging Markets)Index Net USD and the MSCI EM (Emerging Markets) IMI Growth Index Net USD are designed to measure the equity market performance of large-, mid-, and small-cap securities in the emergingmarkets. The MSCI EM (Emerging Markets) IMI Growth Index Net USD screens for growth-style securities. MSCI is the source and owner of the trademarks, service marks and copyrights related tothe MSCI Indexes. The indexes and Baron Emerging Markets Fund include reinvestment of dividends, net of withholding taxes, which positively impact the performance results. The indexes areunmanaged.
2 The MSCI ACWI Index and the MSCI ACWI Growth Index are free float-adjusted market capitalization weighted indexes. The MSCI ACWI Index Net USD and the MSCI ACWI Growth Index NetUSD are designed to measure the equity market performance of large- and mid-cap securities across developed and emerging markets, including the United States. The MSCI ACWI Growth IndexNet USD screens for growth-style securities. MSCI is the source and owner of the trademarks, service marks and copyrights related to the MSCI Indexes. The indexes and Baron Global AdvantageFund include reinvestment of dividends, net of foreign withholding taxes, which positively impact the performance results. The indexes are unmanaged. The Fund’s 3- and 5-year historicalperformance was impacted by gains from IPOs and there is no guarantee that these results can be repeated or that the Fund’s level of participation in IPOs will be the same in the future.
3 Past performance is not predictive of future performance. The performance data does not reflect the deduction of taxes that a shareholder would pay on Fund distributions or redemption of Fund shares.
27
Baron Funds Performance
Baron Discovery Fund
Comparison of the change in value of $10,000 investment in Baron Discovery Fund (Institutional Shares)in relation to the Russell 2000 Growth Index and the S&P 500 Index
$0
$50,000
$43,097
$29,981
$24,713
$40,000
$30,000
9/30/13 12/20 9/21
Baron Discovery Fund1,4
S&P 500 Index1
Russell 2000 Growth Index1
12/1412/13 12/15 12/16 12/1812/17
$10,000
$20,000
12/19
Baron Discovery Fund’s annualized returns as of September 30, 2021: 3-month, (5.02)%; 1-year, 35.93%; 3-year, 20.48%; 5-year, 25.55%; and Since Inception, 20.03%.
Baron Durable Advantage Fund
Comparison of the change in value of $10,000 investment in Baron Durable Advantage Fund (Institutional Shares)in relation to the S&P 500 Index
$0
$10,000
$5,000
$20,000$18,737$17,255
$15,000
12/29/17 9/216/2112/206/206/18 12/18 6/19
Baron Durable Advantage Fund2,4
S&P 500 Index2
12/19
Baron Durable Advantage Fund’s annualized returns as of September 30, 2021: 3-month, 2.12%; 1-year, 28.07%; 3-year, 20.31%; and Since Inception, 18.23%.
Baron Real Estate Income Fund
Comparison of the change in value of $10,000 investment in Baron Real Estate Income Fund (Institutional Shares)in relation to the MSCI US REIT Index
$0
$5,000
$20,000
$13,057
$17,051
$15,000
12/29/17 9/216/2112/206/206/18
$10,000
6/1912/18
Baron Real Estate Income Fund3,4
MSCI US REIT Index3
12/19
Baron Real Estate Income Fund’s annualized returns as of September 30, 2021: 3-month, (1.61)%; 1-year, 31.24%; 3-year, 19.37%; and Since Inception, 15.29%.
1 The Russell 2000® Growth Index measures the performance of small-sized U.S. companies that are classified as growth and the S&P 500 Index of 500 widely held large cap U.S. companies. Theindexes and Baron Discovery Fund are with dividends, which positively impact the performance results. The indexes are unmanaged. The Fund’s 1-, 3-, and 5-year historical performance wasimpacted by gains from IPOs and there is no guarantee that these results can be repeated or that the Fund’s level of participation in IPOs will be the same in the future.
2 The S&P 500 Index measures the performance of 500 widely held large cap U.S. companies. The index and Baron Durable Advantage Fund are with dividends, which positively impact theperformance results. The index is unmanaged.
3 The MSCI US REIT Index is a free float-adjusted market capitalization index that measures the performance of all equity REITs in the US equity market, except for specialty equity REITs that donot generate a majority of their revenue and income from real estate rental and leasing operations. MSCI is the source and owner of the trademarks, service marks and copyrights related to theMSCI Indexes. The index and Baron Real Estate Income Fund include reinvestment of interest, capital gains and dividends, which positively impact the performance results. The index performanceis not Fund performance; one cannot invest directly into an index. The index is unmanaged.
4 Past performance is not predictive of future performance. The performance data does not reflect the deduction of taxes that a shareholder would pay on Fund distributions or redemption of Fundshares.
28

Baron Funds Performance
Baron WealthBuilder Fund
Comparison of the change in value of $10,000 investment in Baron WealthBuilder Fund (Institutional Shares)in relation to the S&P 500 Index and the MSCI ACWI Index
$0
$5,000
$25,000
$17,255
$14,814
$22,891
$20,000
Baron WealthBuilder Fund
S&P 500 Index1
MSCI ACWI Index1
$10,000
$15,000
12/29/17 9/216/2112/206/18 12/18 6/19
1,3
12/19 6/20
Baron WealthBuilder Fund’s annualized returns as of September 30, 2021: 3-month, 0.56%; 1-year, 35.42%; 3-year, 26.94%; and Since Inception, 24.71%.
Baron Health Care Fund
Comparison of the change in value of $10,000 investment in Baron Health Care Fund (Institutional Shares)in relation to the Russell 3000 Health Care Index and the S&P 500 Index
$0
$5,000
$25,000
$20,000$21,643
$17,321$16,908
Baron Health Care Fund
Russell 3000 Health Care Index 2
S&P 500 Index2
$10,000
$15,000
4/30/18 9/216/2112/20
2,3
6/18 6/1912/18 12/19 6/20
Baron Health Care Fund’s annualized returns as of September 30, 2021: 3-month, 1.18%; 1-year, 32.78%; 3-year 23.11%; and Since Inception, 25.35%.
1 The S&P 500 Index measures the performance of 500 widely held large cap U.S. companies. The MSCI ACWI Index is an unmanaged, free float-adjusted marketcapitalization weighted index reflected in US dollars that measures the equity market performance of large- and mid-cap securities across developed and emergingmarkets, including the United States. MSCI is the source and owner of the trademarks, service marks and copyrights related to the MSCI Indexes. The indexes and BaronWealthBuilder Fund are with dividends, which positively impact the performance results. The MSCI ACWI Index is net of foreign withholding taxes. The indexes areunmanaged.
2 The Russell 3000® Health Care Index is a free float-adjusted market capitalization index that measures the performance of all equity in the US equity market. The S&P500 Index measures the performance of 500 widely held large-cap U.S. companies. The indexes and Baron Health Care Fund are with dividends, which positively impactthe performance results. The indexes are unmanaged.
3 Past performance is not predictive of future performance. The performance data does not reflect the deduction of taxes that a shareholder would pay on Funddistributions or redemption of Fund shares.
29

Baron Funds Performance
Baron FinTech Fund
Comparison of the change in value of $10,000 investment in Baron FinTech Fund (Institutional Shares)in relation to the S&P 500 Index and the FactSet Global FinTech Index
$0
$5,000
$10,000
$20,000
$15,000
$17,420
$14,057$13,725
Baron FinTech Fund1,2
12/31/19 3/20 9/213/2112/209/206/20 6/21
S&P 500 Index1
FactSet Global FinTech Index1
Baron FinTech Fund’s returns as of September 30, 2021: 3-month, 2.65%; 1-year, 34.52%; and Since Inception, 37.32%.
1 The S&P 500 Index measures the performance of 500 widely held large-cap U.S. companies. The FactSet Global Fintech Index is an unmanaged and equal-weighted indexthat measures the equity market performance of companies engaged in Financial Technologies, primarily in the areas of software and consulting, data and analytics,digital payment processing, money transfer, and payment transaction-related hardware, across 30 developed and emerging markets. The indexes and Baron FinTech Fundare with dividends, which positively impact the performance results. The indexes are unmanaged. The Fund’s 3-month historical performance was impacted by gains fromIPOs, and there is no guarantee that these results can be repeated or that the Fund’s level of participation in IPOs will be the same in the future.
2 Past performance is not predictive of future performance. The performance data does not reflect the deduction of taxes that a shareholder would pay on Funddistributions or redemption of Fund shares.
Russell Investment Group is the source and owner of the trademarks, service marks and copyrights related to the Russell Indexes. Russell is a trademark of RussellInvestment Group.
3-month returns for all funds are not annualized.
Investors should consider the investment objectives, risks, and charges and expenses of the investment carefully before investing. The prospectus and summaryprospectuses contain this and other information about the Funds. You may obtain them from the Funds’ distributor, Baron Capital, Inc., by calling 1-800-99BARON or visiting www.BaronFunds.com. Please read them carefully before investing.
The performance data quoted represents past performance. Past performance is no guarantee of future results. The investment return and principal value of aninvestment will fluctuate; an investor’s shares, when redeemed, may be worth more or less than their original cost. The Adviser reimburses certain Fundexpenses pursuant to a contract expiring on August 29, 2032, unless renewed for another 11-year term, and the Fund’s transfer agency expenses may bereduced by expense offsets from an unaffiliated transfer agent, without which performance would have been lower. Current performance may be lower orhigher than the performance data quoted. For performance information current to the most recent month end, visit www.BaronFunds.com or call 1-800-99BARON
Risks: The Funds invest primarily in equity securities, which are subject to price fluctuations in the stock market. Non-U.S. investments may involve additional risks to thoseinherent in U.S. investments, including exchange-rate fluctuations, political or economic instability, the imposition of exchange controls, expropriation, limited disclosure andilliquid markets. This may result in greater share price volatility. Investments in developing countries may have increased risks due to a greater possibility of: settlement delays;currency and capital controls; interest rate sensitivity; corruption and crime; exchange rate volatility; and inflation or deflation. Investments in health care companies aresubject to a number of risks, including the adverse impact of legislative actions and government regulations. Securities issued by small and medium sized companies may bethinly traded and may be more difficult to sell during market downturns. Companies propelled by innovation, including technology advances and new business models, maypresent the risk of rapid change and product obsolescence, and their success may be difficult to predict for the long term. In addition to general market conditions, the valueof the real estate and real estate related investments will be affected by the strength of the real estate markets as well as by interest rate fluctuations, credit risk,environmental issues and economic conditions. Even though the Funds are diversified, they may establish significant positions where the Adviser has the greatest conviction.This could increase volatility of the Funds’ returns.
The index performance is not Fund performance; one cannot invest directly into an index.
BAMCO, Inc. is an investment adviser registered with the U.S. Securities and Exchange Commission (SEC). Baron Capital, Inc. is a limited purpose broker-dealer registered withthe SEC and member of the Financial Industry Regulatory Authority, Inc. (FINRA).
30

September 30, 2021 Baron Asset Fund
ANDREW PECK Retail Shares: BARAXInstitutional Shares: BARIX
PORTFOLIO MANAGER R6 Shares: BARUX
DEAR BARON ASSET FUND SHAREHOLDER:
PERFORMANCE
The recent run in U.S. equities paused during the quarter. June and July sawmarket strength driven by favorable corporate earnings, robustmacroeconomic data, and the FDA’s full approval of Pfizer’s COVID-19vaccine. However, these gains reversed late in the quarter, as investorsappeared to be focused on potential risks associated with tapering by theFederal Reserve, the impact of higher interest rates on equity earningsmultiples, spiking energy prices, and political dysfunction.
Within the mid-cap universe, the Financials, Real Estate, Health Care,Information Technology (“IT”), and Energy sectors eked out gains, whileCommunication Services declined the most. In addition, growth stockscontinued to reverse some of their recent underperformance versus valuestocks, particularly in the larger-cap segments.
Against this backdrop, Baron Asset Fund (the “Fund”) declined 0.14%(Institutional Shares), while the Russell Midcap Growth Index (the “Index”)declined 0.76%, and the S&P 500 Index gained 0.58%. The Fund’soutperformance versus the Index was mainly due to differences in sector/sub-industry weights.
Table I.PerformanceAnnualized for periods ended September 30, 2021
BaronAssetFundRetail
Shares1,2
BaronAssetFund
InstitutionalShares1,2,3
RussellMidcapGrowthIndex1
S&P500
Index1
Three Months5 (0.20)% (0.14)% (0.76)% 0.58%Nine Months5 8.54% 8.75% 9.60% 15.92%One Year 24.97% 25.29% 30.45% 30.00%Three Years 18.41% 18.72% 19.14% 15.99%Five Years 20.13% 20.45% 19.27% 16.90%Ten Years 17.69% 18.00% 17.54% 16.63%Fifteen Years 11.41% 11.66% 11.98% 10.37%Since Inception
(June 12, 1987) 12.35% 12.46% 11.08%4 10.46%
Outperformance of investments in Communication Services and Industrials,higher exposure to the better performing Health Care sector, and lack ofexposure to the lagging Consumer Staples sector added the most value.Favorable stock selection in Communication Services came from ZoomInfoTechnologies Inc., a leading go-to-market intelligence platform for sales andmarketing teams. We believe that the company’s recent acquisition of Chorus.ai,a conversation intelligence business, dramatically increased the data visibilityand benefits that ZoomInfo can offer its clients. In addition, its organic revenuesreaccelerated for a fifth consecutive quarter and management significantlyraised its earnings guidance. Within Industrials, data and analytics vendor VeriskAnalytics, Inc. added the most value after reporting solid quarterly earningswith notable strength in its Insurance segment and ongoing improvement in itsEnergy segment. Real estate information and marketing services companyCoStar Group, Inc. also performed well after investors cheered the company’sdecision to enter the residential real estate market.
Performance listed in the above table is net of annual operating expenses. Annual expense ratio for the Retail Shares and Institutional Shares as ofSeptember 30, 2020 was 1.31% and 1.05%, respectively. The performance data quoted represents past performance. Past performance is no guarantee offuture results. The investment return and principal value of an investment will fluctuate; an investor’s shares, when redeemed, may be worth more or less thantheir original cost. The Fund’s transfer agency expenses may be reduced by expense offsets from an unaffiliated transfer agent, without which performancewould have been lower. Current performance may be lower or higher than the performance data quoted. For performance information current to the mostrecent month end, visit www.BaronFunds.com or call 1-800-99BARON.
The Fund’s 3Q 2021 historical performance was impacted by gains from IPOs and there is no guarantee that these results can be repeated or that the Fund’s level ofparticipation in IPOs will be the same in the future.
1 The Russell Midcap® Growth Index measures the performance of medium-sized U.S. companies that are classified as growth and the S&P 500 Index of 500 widely heldlarge cap U.S. companies. Russell Investment Group is the source and owner of the trademarks, service marks and copyrights related to the Russell Indexes. Russell is atrademark of Russell Investment Group. The indexes and the Fund include reinvestment of dividends, net of withholding taxes, which positively impact the performanceresults. The indexes are unmanaged. Index performance is not Fund performance; one cannot invest directly into an index.
2 The performance data in the table does not reflect the deduction of taxes that a shareholder would pay on Fund distributions or redemption of Fundshares.
3 Performance for the Institutional Shares prior to May 29, 2009 is based on the performance of the Retail Shares, which have a distribution fee. TheInstitutional Shares do not have a distribution fee. If the annual returns for the Institutional Shares prior to May 29, 2009 did not reflect this fee, thereturns would be higher.
4 For the period June 30, 1987 to September 30, 2021.5 Not annualized.
BARONF U N D S
31

Baron Asset Fund
Underperformance of investments in IT, Consumer Discretionary, andFinancials detracted the most from relative results. Wix.com Ltd. providessoftware that helps microbusinesses build and maintain their websites. Itsstock was the largest detractor from performance after the company’squarterly results showed a modest year-over-year slowdown in newcustomer additions, driven primarily by the waning of pandemic-driventrends. Chinese data center operator GDS Holdings Limited declinedalongside other Chinese technology-related companies in response totightening regulations and unknown future government actions againstbusinesses that may not be perceived as aligned with the government’sgoals. We sold GDS during the quarter to reallocate capital to higherconviction ideas. Weakness in Consumer Discretionary was largely due toshare price declines in online personal styling service Stitch Fix, Inc. andluxury fashion e-commerce marketplace Farfetch Limited. Stitch Fix’sshares fell in the aftermath of poorly communicated changes to its stylistemployment program, while Farfetch’s stock was pressured by concernsabout increased regulations on luxury spending in China. Adverse stockselection in Financials, linked to the underperformance of electronic tradingplatform MarketAxess Holdings Inc., was somewhat offset by the Fund’shigher exposure to this top performing sector.
The Fund also benefited from tailwinds from style biases, particularlyunderexposure to the poor performing residual volatility and beta factors.
Table II.Top contributors to performance for the quarter ended September 30, 2021
YearAcquired
PercentImpact
Gartner, Inc. 2007 1.39%West Pharmaceutical Services, Inc. 2014 0.45Ceridian HCM Holding Inc. 2018 0.41Verisk Analytics, Inc. 2009 0.38FactSet Research Systems, Inc. 2006 0.34
Shares of Gartner, Inc., a provider of syndicated research, consultingservices, and industry conferences, contributed to performance after thecompany reported financial results that exceeded Street estimates. Revenuegrowth in Gartner’s research business, its largest segment, reaccelerated todouble-digit levels after being depressed by pandemic-driven headwinds.Research growth was led by the company’s GBS segment, which benefitedfrom its multi-year investment cycle. We expect ongoing revenue growthand renewed focus on cost control to drive margin expansion and enhancedfree cash flow generation. In addition, Gartner’s balance sheet is in excellentshape, allowing the company to aggressively repurchase its shares and tomake accretive bolt-on acquisitions.
West Pharmaceutical Services, Inc. manufactures components andsystems for the packaging and delivery of injectable drugs. Its shares roseafter the company reported financial results that exceeded Streetexpectations in both its base business, as well as sales of its products relatedto COVID-19 vaccines. Based on these strong results, management raised itsearnings guidance for the full year. We continue to believe West has a longrunway for growth and margin expansion driven by a shift in its businesstoward high-value packaging components.
Shares of payroll software provider Ceridian HCM Holding Inc. contributedto performance. Growth of Ceridian’s flagship Dayforce platformreaccelerated toward 30%, helped by continued market share gains, successin serving larger enterprises, and the ongoing employment recovery in thecompany’s installed customer base. We are particularly excited by growingcustomer adoption of the company’s Wallet suite. We believe this has thepotential to revolutionize payroll software by enabling all employees beingpaid through Dayforce to request and receive their wages as they areearned, rather than on the typical two-week payment cycle.
Shares of Verisk Analytics, Inc., a leading data and analytics vendor,contributed to performance. The company reported solid second quarterearnings with notable strength in its core Insurance segment and ongoingimprovement in its Energy segment. While the Financial Services segmentremained weak, this remains a small part of its overall business, and thecompany will start to overcome the contract transition headwinds for thissegment after this quarter. We remain positive about the company’scompetitive positioning, long-term growth, margin expansion, and prospectsfor capital deployment.
Shares of FactSet Research Systems, Inc., a leading provider of investmentmanagement tools, contributed to performance. FactSet reported strongearnings and provided encouraging forward guidance. The company’svarious investments in technology and content made during the past fewyears started to be reflected in an accelerated growth rate. We remainoptimistic about our investment because of the company’s large addressablemarket, consistent execution on both new product development andfinancial results, and robust free cash flow generation.
Table III.Top detractors from performance for the quarter ended September 30, 2021
YearAcquired
PercentImpact
Wix.com Ltd. 2018 –0.71%Zillow Group, Inc. 2015 –0.66RingCentral, Inc. 2019 –0.35Stitch Fix, Inc. 2020 –0.33GDS Holdings Limited 2020 –0.24
Wix.com Ltd. is the leading provider of software that helps microbusinessesbuild and maintain their websites. Its shares declined after the companyreported quarterly results that showed some slowdown in new customeradditions. This was primarily the result of difficult comparisons to priorperiods, when some demand for new corporate websites was pulled forwardby behavioral changes caused by the pandemic. We retain conviction inWix’s large, long-term market opportunity to enable small businesses totransition online in a post-pandemic world, and we believe that thecompany’s slowdown in growth was a result of broad market factors thatimpacted many other businesses.
Zillow Group, Inc. operates leading U.S. real estate sites, a mortgageorigination marketplace, and a home-buying business. Shares were downbecause of concerns related to rising interest rates and the potential impactthis could have on the housing market. Our research has indicated that thehousing market remains robust, despite modestly higher rates, which remainlow by historic standards. Even if housing demand were to soften, we believeZillow’s core offering could become more valuable, as it delivers high-qualitybuyer and seller leads to real estate agents. Longer term, we believe Zillowhas an ample runway for growth given its well-regarded management team,compelling product offerings, and its large addressable market.
32

September 30, 2021 Baron Asset Fund
RingCentral, Inc. provides a cloud-based unified communications systemthat replaces businesses’ legacy on-premises phone systems. Despitereporting results that showed accelerating revenue growth and increasedearnings guidance, the company’s shares lagged during the quarter. Webelieve this was attributable to investor concerns about a possiblecontraction in its total addressable market and increased competition fromMicrosoft and Zoom. We believe that RingCentral’s addressable market islarge enough to support multiple long-term winners and that the companycan continue to rapidly innovate its platform, while sustaining pricing levelsand winning significant market share.
Stitch Fix, Inc. is an online apparel retailer that uses recommendationengines and data science to make personalized clothing recommendations.Its shares fell after the company reduced the number of personal stylists itemployed. Stylists were abruptly notified that they had to choose between afull-time work schedule or a severance package. Despite the optics of theannouncement, we retain conviction in Stitch Fix’s transition from abusiness model heavily reliant on personal stylists to one that utilizes adata-driven approach and proprietary algorithms.
GDS Holdings Limited is a leading data center operator focused on Tier 1Chinese cities. Its shares fell in concert with a widespread sell-off in Chinesetechnology-related companies. This occurred in response to tighteningregulations against businesses that may not be perceived as aligned with theChinese government’s goals. Given the uncertainty about futuregovernmental actions, we exited our position.
Portfolio Structure
At September 30, 2021, Baron Asset Fund had 65 positions. The Fund’s 10largest holdings represented 40.3% of assets, and the 20 largest represented61.8% of assets. The Fund’s largest weighting was in the IT sector at 30.8%of assets. This sector includes software companies, IT consulting firms,internet services companies, and data processing firms. The Fund had 26.5%of its assets in the Health Care sector, which includes investments in lifesciences companies, and health care equipment, supplies, and technologycompanies. The Fund had 14.2% of its assets in the Industrials sector, whichincludes investments in research and consulting companies, industrialconglomerates, and machinery companies. The Fund also had significantweightings in Financials at 10.4% of assets and Consumer Discretionary at6.7% of assets.
Table IV.Top 10 holdings as of September 30, 2021
YearAcquired
MarketCap
WhenAcquired(billions)
QuarterEnd
MarketCap
(billions)
QuarterEnd
InvestmentValue
(millions)
Percentof NetAssets
Gartner, Inc. 2007 $2.9 $25.4 $455.0 7.4%IDEXX Laboratories, Inc. 2006 2.5 52.9 418.9 6.8Mettler-Toledo
International, Inc. 2008 2.4 31.8 267.4 4.3Vail Resorts, Inc. 1997 0.2 13.5 201.6 3.3ANSYS, Inc. 2009 2.3 29.7 194.7 3.2Bio-Techne Corporation 2015 4.0 19.0 193.8 3.1Verisk Analytics, Inc. 2009 4.9 32.3 192.5 3.1West Pharmaceutical
Services, Inc. 2014 2.9 31.4 188.7 3.1CoStar Group, Inc. 2016 5.0 34.0 185.5 3.0Ceridian HCM Holding Inc. 2018 4.3 16.9 184.3 3.0
Recent Activity
Table V.Top net purchases for the quarter ended September 30, 2021
Quarter EndMarket Cap
(billions)
AmountPurchased(millions)
HubSpot, Inc. $31.8 $20.2Clearwater Analytics Holdings, Inc. 5.9 13.2Warby Parker Inc. 5.9 2.7Stitch Fix, Inc. 4.3 1.4
HubSpot, Inc. is a cloud-based software provider whose initial MarketingHub software helped establish the Inbound Marketing space. The productwas initially focused on helping small and medium businesses (those with20 to 200 employees) determine how to get customers to discover theirproducts and services online with targeted content. The company built uponits success in this market to expand into adjacent spaces with its Sales andService Hubs, and it has also begun selling its products to larger customers.
The company’s software products have been built largely organically. Webelieve this has helped make the user experience easy, sped productinnovation and new releases, and driven quick expansion into adjacent areas.In addition, HubSpot has a large ecosystem of integrations with third-partydata sources, which makes it easy for customers to enrich their overall salesand marketing data sets.
The company’s key performance indicators (“KPIs”) include its net dollarexpansion rate, net new customer additions, and revenue growth. During thepast year, these KPIs have been growing faster than their recent trendline.We believe that the pandemic has increased the need for businesses to havea digital front end to attract, service, and sell to customers, resulting in themarket increasingly “coming to them.” In addition, HubSpot’s enhancedproduct portfolio is resonating with larger-sized customers, as the companylaunched Enterprise versions of their Marketing and Sales Hubs.
During the past five years, growth has been tied largely to user growth.However, with the company’s continued success selling to larger customers,we believe that average subscription revenue per customer, a key measureof pricing, can soon become a more meaningful driver of revenue growthover time. In addition, the introduction of the “freemium” offering, whichwas launched about a year ago, has lowered the barrier for new customeradoption. This, in turn, is helping drive faster growth in the pool ofcustomers that can be converted to paid users. HubSpot also recentlyannounced a payments solution to make it easier for its customers to sellseamlessly online. As a result of these factors, we believe HubSpot can growits revenues at a 30%-plus rate for several years, eventually achieving 25%to 30% free cash flow margins.
33

Baron Asset Fund
Table VI.Top net sales for the quarter ended September 30, 2021
AmountSold
(millions)
GDS Holdings Limited $38.1IDEXX Laboratories, Inc. 23.8Illumina, Inc. 14.0Teleflex Incorporated 10.8The Trade Desk 7.9
As discussed, we sold our position in GDS Holdings Limited because ofuncertainty over future policies of the Chinese government toward privatelyowned businesses. We reduced our stake in successful long-term holdingIDEXX Laboratories, Inc. to raise capital to allocate elsewhere in the Fund.We reduced our stake in Illumina, Inc., the leader in DNA sequencingtechnology, given uncertainty about the outcome of its proposed acquisitionof GRAIL, a cancer screening company, which is being challenged bygovernmental antitrust regulators. We reduced our stake in TeleflexIncorporated, a medical device manufacturer, over competitive concernssurrounding one of its product lines. We reduced our stake in The TradeDesk, an advertising technology company, given its elevated near-termvaluation.
Outlook
We remain a long-term investor in businesses that we believe will benefitfrom long-lived secular growth drivers, with sustainable competitiveadvantages, led by best-in-class management. We invest in stocks that webelieve, based on our deep fundamental research, will double in value over afive-year period, and all new and existing holdings must meet that objective.
We believe that we have created value for our investors throughout theFund’s long history by understanding and analyzing businesses better thanmany others. We do not believe that we have greater insight than mostothers about macroeconomic, political, or public health issues, and we donot make investment decisions premised on those issues. Consistent withthis approach, we do not have strong views about the near-term level ofinflation or interest rates, perhaps the two issues that have been having thegreatest recent impact on the stock market. Similarly, we do not have a Firmview about whether growth or value stocks are likely to lead the market inthe near term, but we remain convinced that attractive growth stocks arethe best place to be invested for the long term.
We continue to follow our investment methodology, while working hard toidentify beneficiaries of accelerating advances in technology and consumerpreferences, many of which appear to have been permanently impacted bythe pandemic. We believe that this approach will generate strongperformance for our portfolio, regardless of the economic or political climate.
Sincerely,
Andrew PeckPortfolio ManagerSeptember 30, 2021
Investors should consider the investment objectives, risks, and charges and expenses of the investment carefully before investing. The prospectusand summary prospectus contain this and other information about the Funds. You may obtain them from its distributor, Baron Capital, Inc., bycalling 1-800-99BARON or visiting www.BaronFunds.com. Please read them carefully before investing.
Risks: The Adviser believes that there is more potential for capital appreciation in mid-sized companies, but there also may be more risk.Specific risks associated with investing in mid-sized companies include that the securities may be thinly traded and they may be more difficultto sell during market downturns. Even though the Fund is diversified, it may establish significant positions where the Adviser has the greatestconviction. This could increase volatility of the Fund’s returns. The Fund may not achieve its objectives. Portfolio holdings are subject tochange. Current and future portfolio holdings are subject to risk.
The discussions of the companies herein are not intended as advice to any person regarding the advisability of investing in any particularsecurity. The views expressed in this report reflect those of the respective portfolio managers only through the end of the period stated in thisreport. The portfolio manager’s views are not intended as recommendations or investment advice to any person reading this report and aresubject to change at any time based on market and other conditions and Baron has no obligation to update them.
This report does not constitute an offer to sell or a solicitation of any offer to buy securities of Baron Asset Fund by anyone in any jurisdictionwhere it would be unlawful under the laws of that jurisdiction to make such offer or solicitation.
The portfolio manager defines “Best-in-class” as well-managed, competitively advantaged, faster growing companies with higher margins andreturns on invested capital and lower leverage that are leaders in their respective markets. Note that this statement represents the manager’sopinion and is not based on a third-party ranking.
Beta measures a fund’s sensitivity to market movements. The beta of the market is 1.00 by definition.
BAMCO, Inc. is an investment adviser registered with the U.S. Securities and Exchange Commission (SEC). Baron Capital, Inc. is a limitedpurpose broker-dealer registered with the SEC and member of the Financial Industry Regulatory Authority, Inc. (FINRA).
34

September 30, 2021 Baron Growth Fund
NEAL ROSENBERG RONALD BARON Retail Shares: BGRFXCO-PORTFOLIO CEO AND LEAD Institutional Shares: BGRIXMANAGER PORTFOLIO MANAGER R6 Shares: BGRUX
Dear Baron Growth Fund Shareholder:
Performance
Baron Growth Fund (the “Fund”) gained 3.63% (Institutional Shares) duringthe quarter ended September 30, 2021. This exceeded the Fund’s primarybenchmark, the Russell 2000 Growth Index (the “Benchmark”), whichdeclined 5.65%. The S&P 500 Index, which measures the performance ofpublicly traded large-cap U.S. companies, gained 0.58%. We are pleased bythe Fund’s absolute and relative performance this quarter and on ayear-to-date basis and that outperformance was driven by favorable stockselection.
We have always focused on investing in businesses that boast sustainablecompetitive advantages and are run by exceptional management teams whoperpetually reinvest back into their businesses to grow and expand barriersto entry. Barriers to entry help insulate businesses from competitors andenable many to consistently raise prices. We also primarily invest inbusinesses that have high incremental margins on each additional productsold. To achieve this, such companies tend to sell products or services thatuse digital inputs, are asset light, employ high levels of automation, andhave almost no exposure to commodity prices. We believe such companiesbenefit from a favorable spread between pricing power and cost increases,and this positions them to prosper in inflationary environments.
Table I.PerformanceAnnualized for periods ended September 30, 2021
BaronGrowth
FundRetail
Shares1,2
BaronGrowth
FundInstitutional
Shares1,2,3
Russell2000
GrowthIndex1
S&P500
Index1
Three Months4 3.56% 3.63% (5.65)% 0.58%Nine Months4 12.54% 12.76% 2.82% 15.92%One Year 36.19% 36.55% 33.27% 30.00%Three Years 19.45% 19.75% 11.70% 15.99%Five Years 20.85% 21.16% 15.34% 16.90%Ten Years 17.33% 17.64% 15.74% 16.63%Since Inception
(December 31,1994) 14.11% 14.25% 8.89% 10.82%
Small-capitalization growth stocks, as represented by the Russell 2000Growth Index, declined approximately 5.7% in the quarter, while larger-capitalization stocks, as represented by the S&P 500 Index, finished broadlyunchanged. Both indexes declined in September, and respectively sit 12.5%and 5% below highs realized during the year. We attribute the late-quarterdeclines to investors’ struggle to recalibrate expectations for variousmacroeconomic or geopolitical risks. This quarter, investors sought toextract a signal from the cacophony of noise that included surging energyprices, rising supply chain pressures, fluctuating assessments of the impactof COVID on the global economy, and mixed messaging from a chorus ofFederal Reserve bankers. Add in concerns about potential contagion fromChina’s Evergrande and the seemingly never-ending saga in Washington andit is easy to understand why markets were volatile. This list is neithercomprehensive nor unusually long this quarter, but instead represents theperpetual miasma that investors must attempt to penetrate if they trademarkets.
Performance listed in the above table is net of annual operating expenses. Annual expense ratio for the Retail shares and Institutional shares as of September 30,2020 was 1.30% and 1.04%, respectively. The performance data quoted represents past performance. Past performance is no guarantee of future results. Theinvestment return and principal value of an investment will fluctuate; an investor’s shares, when redeemed, may be worth more or less than their original cost.The Fund’s transfer agency expenses may be reduced by expense offsets from an unaffiliated transfer agent, without which performance would have beenlower. Current performance may be lower or higher than the performance data quoted. For performance information current to the most recent month end,visit www.BaronFunds.com or call 1-800-99BARON.1 The Russell 2000® Growth Index measures the performance of small-sized U.S. companies that are classified as growth and the S&P 500 Index of 500 widely held large
cap U.S. companies. Russell Investment Group is the source and owner of the trademarks, service marks and copyrights related to the Russell Indexes. Russell is a trademarkof Russell Investment Group. The indexes and the Fund include reinvestment of dividends, net of withholding taxes, which positively impact the performance results. Theindexes are unmanaged. Index performance is not Fund performance; one cannot invest directly into an index.
2 The performance data in the table does not reflect the deduction of taxes that a shareholder would pay on Fund distributions or redemption of Fundshares.
3 Performance for the Institutional Shares prior to May 29, 2009 is based on the performance of the Retail Shares, which have a distribution fee. TheInstitutional Shares do not have a distribution fee. If the annual returns for the Institutional Shares prior to May 29, 2009 did not reflect this fee, thereturns would be higher.
4 Not annualized.
BARONF U N D S
35

Baron Growth Fund
We believe that attempts to predict what is unpredictable and invest basedon those variables are unlikely to be successful, since such events are oftencontradictory, almost always transitory, and may already be reflected inequity prices. Instead, we focus on identifying and researching well-managed unique businesses with significant barriers to entry and compellinggrowth prospects, investing in them at attractive prices, and holding themfor the long term. However, we do believe that inflation is a persistent andenduring feature of everyday life, regardless how it is quantified bymacroeconomic metrics such as CPI or PPI or characterized by centralbankers.
We have always focused on investing in businesses that boast sustainablecompetitive advantages, run by management teams that are perpetuallyinvesting in their businesses. Constant investment helps expand addressablemarkets and raises barriers to entry, which helps shield these businessesfrom competitors and provides pricing power. On the cost side, we haveprimarily invested in companies that incur high fixed costs to build theircore asset and have high incremental margins on each additional productsold. To achieve this, such companies tend to sell products or services thatuse digital inputs, are asset light, employ high levels of automation, andhave almost no exposure to commodity prices.
For example, index provider MSCI, Inc. and analytics and marketplacevendor CoStar Group, Inc. have incurred significant fixed costs to constructthe proprietary data and methodologies on which their products are built.Once their core assets have been created, the companies can develop andsell new products that leverage this data without adding significantadditional cost. Customer contracts and growing barriers to entry enablethem to raise prices at a rate that exceeds their cost of growth, helping todrive earnings and cash flow higher. Software vendors like ANSYS, Inc. andGuidewire Software, Inc. use purely digital raw materials to build theirproducts. These digital building blocks generally benefit from deflationthanks to declining hardware costs. While this is partially offset by wageinflation paid to software developers, the aggregate growth in their costbase remains slower than the price increases they pass through. Finally,companies such as Mettler-Toledo International, Inc., Bright HorizonsFamily Solutions, Inc., and IDEXX Laboratories, Inc. offer such compellingproducts and services, and are so effective at constantly improving theirmanufacturing processes and driving operational efficiencies that they passalong price increases that comfortably exceed the growth in their costs,creating an incremental tailwind to profit growth.
Table II groups our portfolio based on our assessment of the attributes thatbest characterize each investment. While this does not perfectly correlate tothe Global Industry Classification Standard, the industry standardnomenclature, we believe it provides added transparency into our thoughtprocess.
Table II.Total returns by category for the three months ended September 30, 2021
% of NetAssets
(as of 9/30/2021)
TotalReturn
(%)
Contributionto Return
(%)
Financials 32.5 7.20 2.29
FactSet Research Systems, Inc. 5.1 17.89 0.77
MSCI, Inc. 11.0 14.31 1.45
Houlihan Lokey, Inc. 0.5 13.14 0.05
Moelis & Company 0.4 9.77 0.04
Cohen & Steers, Inc. 1.7 2.57 0.04
The Carlyle Group Inc. 1.0 2.26 0.02
Morningstar, Inc. 2.8 0.87 0.02
Primerica, Inc. 2.7 0.63 0.00
Essent Group Ltd. 0.2 –1.71 –0.00
Kinsale Capital Group, Inc. 1.8 –1.80 –0.02
Arch Capital Group Ltd. 3.8 –1.95 –0.06
SS&C TechnologiesHoldings, Inc. 1.5 –3.46 –0.03
Core Growth 29.0 6.20 1.86
Gartner, Inc. 5.2 25.47 1.07
West PharmaceuticalServices, Inc. 2.4 18.28 0.39
Dechra Pharmaceuticals PLC 0.4 8.10 0.04
Bio-Techne Corporation 4.5 7.70 0.34
Littelfuse, Inc. 0.2 7.46 0.01
CoStar Group, Inc. 5.0 3.91 0.20
Trex Company, Inc. 2.1 –0.29 0.00
Mettler-ToledoInternational, Inc. 1.3 –0.58 0.00
IDEXX Laboratories, Inc. 4.8 –1.51 –0.01
Marel hf. 0.3 –1.64 –0.00
Bright Horizons FamilySolutions, Inc. 2.0 –5.24 –0.11
Neogen Corp. 0.5 –5.67 –0.03
BrightView Holdings, Inc. 0.2 –8.44 –0.02
Krispy Kreme, Inc. 0.1 –18.16 –0.02
Real/Irreplaceable Assets 25.6 2.90 0.59
Manchester United plc 0.6 28.02 0.14
Red Rock Resorts, Inc. 0.9 20.52 0.15
Choice Hotels International, Inc. 4.1 6.50 0.23
Alexandria Real EstateEquities, Inc. 1.6 5.64 0.10
Vail Resorts, Inc. 7.3 5.54 0.31
Boyd Gaming Corporation 0.3 2.88 0.01
Gaming and LeisureProperties, Inc. 2.7 1.31 0.04
American Assets Trust, Inc. 0.1 1.10 0.00
Marriott VacationsWorldwide Corp. 2.1 –0.88 –0.04
OneSpa World Holdings Limited 0.0 –3.23 –0.00
Douglas Emmett, Inc. 1.3 –5.17 –0.07
Penn National Gaming, Inc. 4.6 –5.27 –0.28
36

September 30, 2021 Baron Growth Fund
Table II. (continued)Total returns by category for the three months ended September 30, 2021
% of NetAssets
(as of 9/30/2021)
TotalReturn
(%)
Contributionto Return
(%)
Russell 2000 Growth Index –5.65
Disruptive Growth 12.8 –6.18 –0.83
Farmers Business Network, Inc. 0.3 29.76 0.05
SmartRent, Inc. 0.1 16.66 0.01
Wix.com Ltd. – 5.85 0.01
Guidewire Software, Inc. 1.3 5.46 0.07
Northvolt AB 0.2 0.92 0.00
Altair Engineering Inc. 0.5 –0.04 0.00
Iridium Communications Inc. 3.4 –0.36 –0.01
ANSYS, Inc. 4.3 –1.90 –0.05
Pegasystems, Inc. 1.4 –8.66 –0.13
Adaptive BiotechnologiesCorporation 0.1 –16.34 –0.03
Velo3D, Inc. 0.3 –17.04 –0.06
ACV Auctions Inc. – –23.73 –0.03
Schrodinger, Inc. 0.5 –27.69 –0.21
Denali Therapeutics Inc. 0.3 –35.62 –0.21
Desktop Metal, Inc. – –38.43 –0.04
Zymergen Inc. 0.1 –67.63 –0.21
Cash 0.1 – –0.02
Fees – -0.28 –0.28
Total 100.0 3.61* 3.61*
Sources: FactSet PA, BAMCO, and Russell, Inc.* Represents the blended return of all share classes of the Fund.
As demonstrated above, our investments in Financials, Core Growth, andReal/Irreplaceable Assets are in roughly equal balance, representingbetween 25% and 33% of the net assets individually and approximately87% of the Fund’s net assets in aggregate. The remaining 13% of net assetsis invested in businesses that we consider to be Disruptive Growthbusinesses, which we believe offer greater growth potential, albeit withmodestly more risk relative to other investments. We believe this balanceappropriately reflects our goal to generate superior returns over time withless risk than our benchmark.
Last quarter, we highlighted the compelling secular drivers that we believeunderpin our investments in select Financials stocks. This quarter weelaborate on our investments in Core Growth businesses, which spansectors including Health Care, Industrials, and Information Technology.These businesses all target large addressable markets, are benefiting fromfavorable secular trends, have high barriers to entry, create recurring revenuestreams, are highly profitable, and generate robust free cash flow. All havedemonstrated the ability to generate consistent, compounded revenue andearnings growth over time. On average, this group has generated 10%annual revenue growth and 19% annual EPS growth over the past three
years, which includes the adverse impact of COVID. We believe that all cansustain or accelerate their revenue earnings growth rates beyond our five-year investment horizon.
We view our investment in Gartner, Inc. as representative of the CoreGrowth cohort. Gartner is the world’s leading provider of syndicatedresearch serving end users in technology, HR, finance, sales, marketing, andlegal departments. We estimate that Gartner’s addressable market exceeds$100 billon of annual recurring revenue, which is at least 25 times largerthan its current research business. This provides ample runway for sustainedmid-teens recurring revenue growth. Gartner has created large and growingbarriers to entry through its brand, its intellectual property, and its uniquepositioning at the intersection of buyers, sellers, and customers. Thecompany enjoys dramatic scale advantages in the number of analysts,number of quota-carrying salespeople, and gross margin dollars, all of whichhelp to extend barriers to entry. Gartner’s products deliver meaningful ROIsto customers by offering on-demand access to proprietary expertise for alow annual subscription. This helps its products become deeply embedded incustomer workflows, facilitating annual price increases of 3% to 6% anddollar retention rates that exceed 100%. Gartner sells its research on asubscription basis with annual contract terms and upfront cash payments,creating strong revenue visibility and a working capital tailwind. As notedpreviously, this business model carries high incremental gross margins dueto the low marginal cost of goods sold, and an ongoing mix shift towards itsResearch segment. While this is obscured by aggressive sales headcountadditions, persistent productivity increases should drive EBITDA marginexpansion over time. Finally, Gartner is extremely cash generative, whichmanagement has deployed to make growth-enhancing acquisitions and toaggressively repurchase stock.
We have owned Gartner since 2007, when the company generated$1.0 billion in revenue and $1.15 free cash flow per share. In 2021, Gartnerwill generate $4.6 billion of revenue and around $11.50 of free cash flow pershare. This represents an 11% CAGR in revenue and an 18% CAGR in FCF/share over the past 14 years. We expect to see a similar growth trajectorygoing forward, with similarly positive stock performance.
This quarter, we funded previous private placement commitments inVelo3D, Inc. and SmartRent, Inc., which completed their de-SPACprocesses during the quarter. We also participated in the IPO of KrispyKreme, Inc., which came public in July, and made a modest follow-oninvestment in privately held Farmers Business Network, Inc. Please see thesection titled “Recent Purchases” for more information on some of theseinvestments.
We exited modest positions in ACV Auctions Inc., Zymergen Inc. commonstock, and Desktop Metal, Inc. during the quarter. We think that these salesexemplify the merits of maintaining small initial position sizes. We wereinitially excited by the long-term opportunities represented by thesebusinesses. Our ongoing and iterative due diligence efforts, coupled withadverse changes in these companies’ end markets, raised issues regardingtheir ability to generate the financial results expected. We sold these smallpositions to reallocate that capital to investments that we believe offermore attractive risk-adjusted returns.
37

Baron Growth Fund
Table III.Performance Based Characteristics as of September 30, 2021
Millennium Internet Bubbleto Financial Panic
12/31/1999 to 12/31/2008Financial Panic to Present12/31/2008 to 9/30/2021
Millennium Internet Bubbleto Present
12/31/1999 to 9/30/2021Inception
12/31/1994 to 9/30/2021
Alpha (%) 5.05 4.35 5.88 7.40Beta 0.58 0.80 0.69 0.71
Table IV.PerformanceMillennium Internet Bubble to COVID-19 Pandemic. The Impact of Not Losing Money.
Millennium InternetBubble to Financial Panic
12/31/1999 to 12/31/2008Financial Panic to Present12/31/2008 to 9/30/2021
Millennium Internet Bubbleto Present
12/31/1999 to 9/30/2021Inception
12/31/1994 to 9/30/2021
Value$10,000 Annualized
Value$10,000 Annualized
Value$10,000 Annualized
Value$10,000 Annualized
Baron Growth Fund (Institutional Shares) $12,448 2.46% $76,613 17.32% $95,372 10.93% $352,787 14.25%Russell 2000 Growth Index $ 6,476 –4.71% $63,225 15.56% $40,942 6.70% $ 97,662 8.89%S&P 500 Index $ 7,188 –3.60% $61,906 15.37% $44,498 7.10% $156,240 10.82%
Index performance is not Fund performance; one cannot invest directly intoan index.
The Fund has meaningfully outperformed its Benchmark over the long term.This is principally the result of not losing money during the nine years endedDecember 2008, when most others did…as well as outstanding performanceof our growth stock investments. Fund performance has compounded at14.25% annually since its inception on December 31, 1994, which exceedsthat of the Benchmark by 5.36% annually. While the Fund did not makemuch money from December 31, 1999 through December 31, 2008, aperiod which includes the highs of the Internet Bubble and the lows of theFinancial Panic, it did generate a positive annualized return of 2.46%.Conversely, a hypothetical investment in a fund designed to track the Fund’sBenchmark would have declined in value by 4.71% on an annualized basisover the same time, while a hypothetical investment in a fund designed totrack the large-cap S&P 500 Index would have declined 3.60% annualized.(Please see Table IV – Millennium Internet Bubble to Financial Panic). Fromthe Financial Panic to the present, the Fund generated an annualized returnof 17.32%, which exceeded that of its Benchmark by 1.76% annually. Thisrepresents robust absolute and relative returns across a variety of marketenvironments, driven primarily by favorable stock selection.
We believe that the power of compounding is better demonstrated byviewing these returns in dollar terms. A hypothetical investment of $10,000in the Fund at its inception on December 31, 1994 would be worth$352,787 at September 30, 2021. This is approximately 3.6 times greaterthan the $97,662 the same hypothetical investment made in a funddesigned to track the Benchmark would be worth. Hypothetically, ourreturns were achieved with approximately 30% less volatility than theBenchmark, as represented by its beta. (Please see Tables III and IV.) We arepleased that our long-term investments in what we believe arecompetitively advantaged growth companies with exceptional managementteams have generated attractive returns in good markets and have helped toprotect capital during more challenging ones.
Table V.Top contributors to performance for the quarter ended September 30, 2021
YearAcquired
MarketCap
WhenAcquired(billions)
QuarterEnd
MarketCap
(billions)Total
ReturnPercentImpact
MSCI, Inc. 2007 $1.8 $50.2 14.31% 1.45%Gartner, Inc. 2007 2.3 25.4 25.47 1.07FactSet Research
Systems, Inc. 2006 2.5 14.9 17.89 0.77West Pharmaceutical
Services, Inc. 2013 2.3 31.4 18.28 0.39Bio-Techne Corporation 2009 2.1 19.0 7.70 0.34
MSCI, Inc., a leading provider of investment decision support tools,contributed to performance. The company reported strong second quarterearnings results and management continued to express optimism regardingthe economic and market backdrop moving forward. MSCI also enhanced itsprivate markets capabilities with the acquisition of Real Capital Analytics.We retain long-term conviction as the company owns strong, “all weather”franchises and remains positioned to benefit from numerous seculartailwinds in the investment community.
Gartner, Inc., a provider of syndicated research, contributed to performanceafter reporting financial results that exceeded Street estimates. Growth inthe company’s research business has reaccelerated to double-digit levels.Research growth is led by the company’s GBS segment, which is benefitingfrom a multi-year investment cycle. We expect improved revenue growthand focus on cost control to drive margin expansion and enhanced cashgeneration. The company’s balance sheet is in excellent shape and cansupport aggressive share repurchases and bolt-on acquisitions.
FactSet Research Systems, Inc., a leading provider of investmentmanagement tools, contributed to performance. FactSet reported strongearnings and provided encouraging guidance as technology and contentinvestments the company has been making over the past few years startedto pay off with stronger growth. We retain conviction in FactSet due to thelarge addressable market, consistent execution on both new productdevelopment and financial results, and robust free cash flow generation.
38

September 30, 2021 Baron Growth Fund
Table VI.Top detractors from performance for the quarter ended September 30, 2021
YearAcquired
MarketCap
WhenAcquired(billions)
Quarter EndMarket Cap
(billions)Total
ReturnPercentImpact
Penn National Gaming,Inc. 2008 $2.5 $11.4 –5.27% –0.28%
Schrodinger, Inc. 2020 1.7 3.9 –27.69 –0.21Denali Therapeutics Inc. 2017 1.6 6.1 –35.62 –0.21Zymergen Inc. 2021 3.8 1.3 –67.63 –0.21Pegasystems, Inc. 2010 1.2 10.4 –8.66 –0.13
Shares of regional casino company Penn National Gaming, Inc. declinedas investors fretted about lower market share in online sports betting, andmore aggressive marketing spend from competitors in their facility-basedbusinesses. We believe Penn’s recently announced acquisition of ScoreMedia and Gaming, combined with its Barstool acquisition last year,should help drive customers to its betting App, enhancing its market share.Penn has a strong balance sheet with earnings growth accelerating overtime.
Schrodinger, Inc. is a hybrid biotechnology and technology company thatuses molecular dynamics and free energy perturbations to model drug/target interactions for both third parties and its own internal efforts. Sharesfell following second quarter financial results in which the company did notraise guidance and noted that revenue was weighted toward the fourthquarter. As we focus on company fundamentals and not these types ofshort-term issues, we remain shareholders.
Denali Therapeutics Inc. is a biotechnology company developing drugs totreat neurological disorders. Shares fell after an interim update reportingmixed results from its Phase 1/2 study of a program in treating Huntersyndrome. We remain optimistic that Denali will be successful with its suiteof approaches targeting the brain.
RECENT PURCHASES
This quarter we initiated a position in additive manufacturing vendorVelo3D, Inc. Velo produces a full-stack hardware and software solutionbased on proprietary powder bed fusion additive manufacturing technology.Its technology enables support-free production of highly complex, mission-critical metal parts.
Additive manufacturing has always promised cost-efficient design freedom,inventory reduction, part consolidation, and less waste compared totraditional manufacturing methods. Adoption has been gated by the needthat parts be specifically “designed for additive” and frequently requiredsupport structures to prevent warpage, significantly reducing the purportedbenefits. Velo’s unique technology eliminates the need for these supportstructures, enabling customers to unlock the true value proposition ofadditive manufacturing by avoiding inefficient redesign and wastefuladditional processing steps associated with supports. Velo’s products givecustomers in space, aviation, defense, energy and industrial markets thefreedom to design and produce metal parts with complex internal featuresand geometries that had previously been considered impossible to producewith additive manufacturing. Customers such as SpaceX, Honeywell, andLam Research all use Velo’s technology today, and many plan to expand thetechnology to additional applications.
We believe Velo is uniquely positioned to create a new market for additivemanufacturing that legacy systems could not support. The high-value metalparts market today is approximately $100 billion, with additivemanufacturing only holding a 2% share. We expect the market to grow tobe $180 billion by 2030, of which $20 billion will be exclusively served bysupport-free printing capabilities. We expect Velo to accelerate productdevelopment, sales, and marketing efforts to enhance its technologyleadership and penetrate additional use cases, customers, and geographies.Velo will also release its larger and faster SapphireXC printer in late 2021,which already has a strong bookings and pre-order backlog to support near-term growth targets. Customers have the option to purchase the hardwareoutright or to subscribe to a hardware-as-a-service model, which providesVelo with a recurring revenue stream based on its existing footprint. Finally,we believe that CEO and founder Benny Buller has built an exceptionalmanagement team.
We also participated in the IPO of Krispy Kreme, Inc., one of the mostbeloved and well-known sweet treat brands in the world. Krispy Kremeoperates in the large, stable, and steadily growing $650 billion globalindulgence market. Indulgence foods have proven to be recession resilient,and data indicates that nearly 97% of consumers enjoy indulgences at leastoccasionally. We believe that Krispy Kreme’s iconic, globally recognizedbrand with rich history positions it well to meet this growing consumerdemand.
The company operates an omni-channel model, selling doughnuts across itsiconic Hot Light Theater Shops, Fresh Shops (smaller shops and kiosks), andDelivered Fresh Daily (“DFD”), where Krispy Kreme branded doughnutcabinets are placed within high traffic grocery and convenience locations. Toreach consumers, they operate a Hub & Spoke model, with Hot LightTheater Shops and Doughnut Factories (hubs) providing fresh doughnuts toFresh Shops and DFD doors (spokes). Going forward, we expect the companyto grow both “Hubs” and “Spokes” to further expand its reach and ensureproducts are available wherever consumers choose to shop.
New management has expanded the company’s reach by launchingadditional products and through strategic acquisitions. Krispy Kremelaunched its Branded Sweet Treats line in 2020. Products include ninedifferent packaged, shelf-stable offerings, including a variety of DoughnutBites and Mini Crullers that are available at a range of grocery, massmerchandise, and convenience retailers. The company also has a 74.7%interest in Insomnia Cookies, a fast-growing, digital first cookie concept thatcan deliver warm treats locally within 30 minutes, or next-day to more than95% of addresses in the U.S.
We see Krispy Kreme as fitting squarely within the Core Growth categoryhighlighted above. We believe that growth from the core doughnut business,combined with Branded Sweet Treats and Insomnia cookies will enable thecompany to grow revenue in the high single to low double-digit range overthe long term. Additional efficiencies from scaling the hub-and-spoke modelin the U.S. and leverage on recent investments in Branded Sweet Treatsshould lead to low to mid double-digit EBITDA growth. Finally, we expectearnings to grow even faster than EBITDA as the company generates cashflow and pays down debt.
39

Baron Growth Fund
Finally, we acquired shares of SmartRent, Inc., a leader in technology forresidential rentals. SmartRent provides a suite of renter products includingkeyless entry, self-guided tours, smart parking, video intercom, packagedelivery, community wifi, leak detection, and temperature controlmanagement. SmartRent’s products enhance the convenience andexperience for renters, while enabling property managers to increase rentsby $25 to $100 per month and reduce leasing costs. SmartRent has anopen-source, hardware agnostic platform allowing for ease of integrationwith existing hardware and property management software combined witha large and growing installer network that creates a strong moat in theretrofit market.
The company has already deployed 200,000 units to over 450,000 totalusers and has experienced zero churn to date. Through strategic partnershipswith 15 of the top 20 institutional apartment owners, the company has apipeline of 600,000 committed units to deploy, which represents a subset ofthe 3.5 million unit opportunity within its existing customer base.SmartRent charges a low recurring base monthly fee of $8/month toapartment owners. We estimate that cross-selling current products tocurrent customers could yield a $2 billion recurring revenue stream, withadditional growth generated from new customer acquisitions and newproduct launches. In addition, we believe there is upside potential longerterm through emerging initiatives that could open several exciting adjacentgrowth verticals such as international and student/senior housing. Lastly,with approximately $500 million of cash, we expect M&A opportunities tolayer on additional services to augment growth both to the product offeringas well as monthly pricing.
PORTFOLIO STRUCTURE AND INVESTMENT STRATEGY
We seek to invest in businesses with attractive fundamental characteristicsunderpinned by sustainable competitive advantages. We search forbusinesses that serve large addressable markets benefiting from favorablesecular tailwinds. We favor business models that have high levels ofrecurring revenue, generate attractive incremental margins, are cashgenerative, and are not dependent on third-party financing. We exclusivelyinvest with management teams that we consider exceptional and areinvesting in their businesses to generate long-term profitable growth.
We hold investments for the long term. As of September 30, 2021, theweighted average holding period of the portfolio was 13.7 years. This isdramatically longer than most other small-cap growth funds, which,according to Morningstar, turn over about 82% of their portfolios annually.The portfolio’s 10 largest positions have a weighted average holding periodof 16.5 years, ranging from a 12.7 year investment in Bio-TechneCorporation and ANSYS, Inc., to a 24.9 year investment in Choice HotelsInternational, Inc. Twenty-one investments, representing 74.5% of theportfolio’s net assets, have been held for more than 10 years. Thirteeninvestments, representing 19.4% of the portfolio’s net assets, have beenheld between 5 and 10 years. A further 17 investments, representing 6.0%of the portfolio’s net assets, have been owned for less than 5 years.
We believe that Table VII and Table VIII demonstrate the merits of our long-term holding philosophy, as our longest tenured investments have continuedto generate robust absolute and relative returns.
Table VII.Top performing stocks owned more than five years
Year ofFirst Purchase
CumulativeTotal Return
Since First Dateof Purchase
IDEXX Laboratories, Inc. 2005 4,221.0%Choice Hotels International, Inc. 1996 2,545.1MSCI, Inc. 2007 2,536.5CoStar Group, Inc. 2004 2,049.4Vail Resorts, Inc. 1996 1,935.3Mettler-Toledo International, Inc. 2008 1,809.3
The cohort of investments that we have held for more than five yearsearned an annualized rate of return of 20.4% based on weighted averageassets since we first purchased them, which exceeded the performance ofthe Fund’s Benchmark by 9.0% per year annualized. Seven of theseinvestments have achieved annualized returns that exceeded the Benchmarkby more than 10% per year, including four that have achieved annualizedreturns that exceeded the Benchmark by more than 15% per year and twothat have exceeded the benchmark by more than 20% annually. The subsetof this cohort that we have held for more than 10 years has compounded ata similar 19.8% and exceeded the benchmark by 8.9% annualized.
Table VIII.Top performing stocks owned less than five years
Year ofFirst Purchase
CumulativeTotal Return
Since First Dateof Purchase
Kinsale Capital Group, Inc. 2016 506.8%Schrodinger, Inc. 2018 415.5Altair Engineering Inc. 2017 276.5
The cohort of investments that we have held for less than five years hasreturned 35.6% annually based on weighted average assets since our initialpurchase and exceeded the Benchmark by 19.7% annualized. Nine of theseinvestments have achieved annualized returns that exceeded the Benchmarkby more than 10% per year, including five that have achieved annualizedreturns that exceeded the Benchmark by more than 20% per year.
40

September 30, 2021 Baron Growth Fund
Portfolio Holdings
As of September 30, 2021, Baron Growth Fund had 51 investments. The top10 holdings represented 55.9% of the Fund’s net assets. All were small-capbusinesses at the time of purchase and have become top 10 positionsmostly through stock appreciation. Our holdings in these stocks haveincreased by an average of 19.0 times since our initial investment and haveexceeded the Benchmark by an average of 8.2% annually. We believe all ourpositions offer significant further appreciation potential individually, andthat the Fund’s diversification offers potentially better-than-market returnswith less risk than the market as measured by beta. Note that diversificationcannot guarantee a profit or protect against loss.
We only purchase small-cap companies. Since we hold investments for thelong term, we have a significant percentage of assets invested in securitiesthat have appreciated beyond their market capitalizations at the time ofpurchase. Baron Growth Fund’s median market cap is $6.7 billion and itsweighted average market cap is $20.7 billion. This compares toMorningstar’s U.S. market cap breakpoints for small- and mid-cap funds of$7.0 billion and $37.5 billion, respectively, as of September 30, 2021. BaronGrowth Fund’s top 10 holdings represent 55.9% of the Fund’s assets undermanagement. These investments have increased in value significantly sincewe purchased their shares. They have also significantly outperformed theirBenchmark principally because their businesses have grown faster thancompanies in their Benchmark index…. which we expect to continue.
Table IX.Top 10 holdings as of September 30, 2021
YearAcquired
MarketCap
WhenAcquired(billions)
QuarterEnd
MarketCap
(billions)
QuarterEnd
InvestmentValue
(millions)
Percentof NetAssets
MSCI, Inc. 2007 $1.8 $50.2 $1,009.8 11.0%Vail Resorts, Inc. 1997 0.2 13.5 668.1 7.3Gartner, Inc. 2007 2.3 25.4 478.6 5.2FactSet Research
Systems, Inc. 2006 2.5 14.9 473.7 5.1CoStar Group, Inc. 2004 0.7 34.0 463.9 5.0IDEXX Laboratories, Inc. 2005 1.9 52.9 441.5 4.8Penn National Gaming,
Inc. 2008 2.5 11.4 424.6 4.6Bio-Techne Corporation 2009 2.1 19.0 409.5 4.5ANSYS, Inc. 2009 2.3 29.7 391.5 4.3Choice Hotels
International, Inc. 1996 0.4 7.0 379.1 4.1
Thank you for joining us as fellow shareholders in Baron Growth Fund. Weare appreciative of the confidence you have shown in us, and we willcontinue to work hard to justify that confidence.
Respectfully,
Ronald BaronCEO and Lead Portfolio ManagerSeptember 30, 2021
Neal RosenbergCo-Portfolio Manager
Investors should consider the investment objectives, risks, and charges and expenses of the investment carefully before investing. The prospectusand summary prospectus contain this and other information about the Funds. You may obtain them from its distributor, Baron Capital, Inc., bycalling 1-800-99BARON or visiting www.BaronFunds.com. Please read them carefully before investing.
Risks: The Adviser believes that there is more potential for capital appreciation in smaller companies, but there also may be more risk. Specificrisks associated with investing in smaller companies include that the securities may be thinly traded, and they may be more difficult to sellduring market downturns. The Fund may not achieve its objectives. Portfolio holdings are subject to change. Current and future portfolioholdings are subject to risk.
The discussions of the companies herein are not intended as advice to any person regarding the advisability of investing in any particularsecurity. The views expressed in this report reflect those of the respective portfolio managers only through the end of the period stated in thisreport. The portfolio manager’s views are not intended as recommendations or investment advice to any person reading this report and aresubject to change at any time based on market and other conditions and Baron has no obligation to update them.
This report does not constitute an offer to sell or a solicitation of any offer to buy securities of Baron Growth Fund by anyone in anyjurisdiction where it would be unlawful under the laws of that jurisdiction to make such offer or solicitation.
Alpha: measures the difference between a fund’s actual returns and its expected performance, given its level of risk as measured by beta.
Beta: measures a fund’s sensitivity to market movements. The beta of the market (Russell 2000 Growth Index) is 1.00 by definition.
BAMCO, Inc. is an investment adviser registered with the U.S. Securities and Exchange Commission (SEC). Baron Capital, Inc. is a limitedpurpose broker-dealer registered with the SEC and member of the Financial Industry Regulatory Authority, Inc. (FINRA).
41

Baron Small Cap Fund
CLIFF GREENBERG Retail Shares: BSCFXInstitutional Shares: BSFIX
PORTFOLIO MANAGER R6 Shares: BSCUX
Dear Baron Small Cap Fund Shareholder:
Performance
Baron Small Cap Fund (the “Fund”) gained 1.32% (Institutional Shares) inthe third quarter of 2021. For the first nine months of the year, the Fund isup 10.65%. The Fund soundly beat the performance of the Russell 2000Growth Index (the “Index”) in the quarter, which was down 5.65%, and forthe year, with the Index up just 2.82%. The S&P 500 was up 0.58% for thequarter and is up 15.92% for the year, as large-cap stocks have outpacedsmall caps this year.
The Fund has outperformed the Index for most time periods. Over the life ofthe Fund, we have compounded at over 400 basis points more than theIndex…11.58% versus 7.32%, which means that if you invested in the Fundsince inception, it’s now worth 2.5 times more than if you had invested in afund designed to track the Index.
Table I.PerformanceAnnualized for periods ended September 30, 2021
BaronSmall Cap
FundRetail
Shares1,2
BaronSmall Cap
FundInstitutional
Shares1,2,3
Russell2000
GrowthIndex1
S&P500
Index1
Three Months4 1.24 % 1.32 % (5.65)% 0.58%Nine Months4 10.43% 10.65% 2.82% 15.92%One Year 29.77% 30.11% 33.27% 30.00%Three Years 17.55% 17.86% 11.70% 15.99%Five Years 19.98% 20.29% 15.34% 16.90%Ten Years 16.85% 17.15% 15.74% 16.63%Fifteen Years 11.46% 11.70% 10.59% 10.37%Since Inception
(September 30, 1997) 11.43% 11.58% 7.32% 8.53%
The market was flat to down in the quarter. As opposed to the past fewquarters, when the economy was accelerating rapidly and earnings weresurging (from depressed levels caused by COVID), headwinds arose in thisperiod. The Delta variant surged in much of the country, slowing the
reopening of the economy and impeding growth. Ever-increasing supplychain issues saddled companies with higher costs and troubles deliveringgoods and services. Labor shortages and wage increases also pressured day-to-day operations and profit margins. And interest rates trended higherbecause of increased inflation, the Federal Reserve’s signaling of a lessaccommodating monetary policy, and the possibility of higher Federaldeficits that would be brought on by anticipated increases in governmentspending. With all these issues in play, the market has remained resilient.
The concerns listed above notwithstanding, we still expect economic growthto be strong this year and into next year, as COVID cases and concernswane and normalcy returns. We think that corporations (at least the ones inwhich we invest) will be able to deal with the near-term cost pressures andthat profits will revert to strong uptrends. We do believe that inflation willstay elevated and that interest rates will trend higher.
Performance listed in the above table is net of annual operating expenses. Annual expense ratio for the Retail Shares and Institutional Shares as ofSeptember 30, 2020 was 1.31% and 1.05%, respectively. The performance data quoted represents past performance. Past performance is no guarantee offuture results. The investment return and principal value of an investment will fluctuate; an investor’s shares, when redeemed, may be worth more or less thantheir original cost. The Fund’s transfer agency expenses may be reduced by expense offsets from an unaffiliated transfer agent, without which performancewould have been lower. Current performance may be lower or higher than the performance data quoted. For performance information current to the mostrecent month end, visit www.BaronFunds.com or call 1-800-99BARON.
The Fund’s 3Q 2021 historical performance was impacted by gains from IPOs and there is no guarantee that these results can be repeated or that the Fund’s level ofparticipation in IPOs will be the same in the future.
1 The Russell 2000® Growth Index measures the performance of small-sized U.S. companies that are classified as growth and the S&P 500 Index of 500 widelyheld large cap U.S. companies. Russell Investment Group is the source and owner of the trademarks, service marks and copyrights related to the Russell Indexes.Russell is a trademark of Russell Investment Group. The indexes and the Fund include reinvestment of dividends, net of withholding taxes, which positively impactthe performance results. The indexes are unmanaged. Index performance is not Fund performance; one cannot invest directly into an index.
2 The performance data in the table does not reflect the deduction of taxes that a shareholder would pay on Fund distributions or redemption of Fundshares.
3 Performance for the Institutional Shares prior to May 29, 2009 is based on the performance of the Retail Shares, which have a distribution fee. TheInstitutional Shares do not have a distribution fee. If the annual returns for the Institutional Shares prior to May 29, 2009 did not reflect this fee, thereturns would be higher.
4 Not annualized.BARONF U N D S
42

September 30, 2021 Baron Small Cap Fund
Large-cap stocks did better than smaller caps this quarter, which is often thecase in uncertain environments. The seesaw between growth and valuestocks was less pronounced, as both had had their day in the sun over thelast few quarters and were more in equilibrium. The Fund benefited in thequarter from its higher weighting of larger market cap stocks than the Index.
The Fund primarily outperformed because of stock selection. Our Fund’sperformance most often is driven by fundamentals, not so much the macrofactors or market trends that so many focus on. We materiallyoutperformed in three of the four sectors in which we primarily invest. OurInformation Technology (“IT”) stocks performed well. Gartner, Inc., ourlargest position, posted another quarter of strong results and its stockcontinued to climb. Same with payments company Nuvei TechnologiesCorp. Digital enablers Grid Dynamics Holdings Inc. and Endava plc alsoshowed accelerating growth and benefited from multiple expansion. OurHealth Care holdings rose nicely in the quarter, in contrast to those in theIndex, which were down double digits. Our best performers were ICON Plcand DexCom, Inc., two long-term holdings with strong outlooks, andmedical products companies Inspire Medical Systems, Inc. and Silk RoadMedical, Inc. Our Consumer Discretionary holdings did much better thanthose in the Index as well. Our best performers were flooring retailerFloor & Decor Holdings, Inc. and locals casino operator Red Rock Resorts,Inc. New additions European Wax Center, Inc. and Dutch Bros Inc. alsoperformed well. Our Industrials holdings were a drag on performance thisquarter. Defense contractors Mercury Systems, Inc. and Kratos Defense &Security Solutions, Inc. both declined on weak earnings and an uncertainfunding environment. Shares of Clarivate Plc and Hydrofarm HoldingsGroup, Inc. were down as well, as their near-term earnings prospectsbecame a bit cloudy.
Table II.Top contributors to performance for the quarter ended September 30, 2021
PercentImpact
Gartner, Inc. 1.09%ICON Plc 0.76Grid Dynamics Holdings Inc. 0.61Nuvei Technologies Corp. 0.45ASGN Incorporated 0.45
Shares of Gartner, Inc., the provider of syndicated research to businessleaders with insights on technology and managerial issues, continued toclimb this quarter after reporting outstanding results. Growth in thecompany’s research business reaccelerated to double digits, doubling thepace of growth in the prior quarter. Forward-looking metrics were excellent,led by contract value growth of 18% in the GBS division, which bodes wellfor strong future growth. Margin flow through was very strong as was freecash flow conversion. After significantly raising guidance last quarter, thecompany did so again this quarter, with free cash flow now projected to be33% more than prior expectations. The company aggressively repurchasedstock, like it did in the old days, which highlights its strong balance sheetand confidence in the future. Though the stock has almost doubled this year,we believe FCF per share will compound at 20% plus for years to come(from about $12 per share in 2022 to $20 per share in 2025) and the stockhas considerable upside from here.
ICON Plc is the second largest Contract Research Organization and providesoutsourced drug development services to pharmaceutical and biotechnology
companies. During the quarter, ICON completed its acquisition of PRAHealth Sciences, Inc. (another long-time holding of the Fund), and the stockrose as investors warmed to the merger. Initial concerns about potentialdisruption to the business waned as ICON detailed positive customerreception and shared strong new customer wins. We are very excited aboutthe combined company, which brings together two fine, high-performing,well-run organizations with complementary skill sets. We believe that thedebt taken on to finance the deal is appropriate and will be paid downquickly with cash flow. The combination of solid organic growth, marginexpansion through capturing large synergies, and reduced interest payments,should drive strong earnings growth and garner a premium valuation.
Grid Dynamics Holdings Inc., which provides digital transformationservices to large businesses, reported a great second quarter that handilybeat estimates. Revenues grew 72% organically versus last year and 18%versus the prior quarter. EBITDA margins expanded significantly to reach thecompany’s 20% long-term target much faster than expected. The demandenvironment remains robust, and Grid is doubling its headcount of highlyskilled, yet relatively low-cost employees, primarily in Eastern Europe, toserve the needs of its clientele. Grid has done a terrific job in expanding itsclient base from primarily retail to technology and other industries. Webelieve the growth prospects for Grid are terrific, and now the marketappreciates that as well. We did trim our position somewhat in the quarter,as the stock ran up a lot.
Nuvei Technologies Corp., the fintech payments processor focused on e-commerce and partnering in high-growth verticals like gaming, retail, anddigital services, reported a strong quarter with revenues and volumes up68%. Growth was broad based across verticals and geographies.Management is targeting sustained organic growth of over 30%. Nuvei’sstrong momentum validates its differentiation and the value proposition ofoffering a full stack payments platform. The company closed an acquisitionand announced another, adding additional capabilities to its offering. Thestock has advanced on recognition of its competitive advantages and stronggrowth outlook, and it now trades in line with other high-growth paymentscompanies.
Shares of ASGN Incorporated, a leading provider of skilled workers to the ITand digital/creative industries for staffing and consulting work, rose as thecompany reported strong results for the quarter. Revenues grew 17% andearnings gained 24%, driven by a healthy rebound in the depressed staffingbusiness and a robust 62% organic growth rate in its burgeoning consultingsegment. Guidance is for continued strong growth, which we think shouldgreatly surpass industry rates. ASGN closed on the sale of its Oxford divisionin the third quarter, a strategic decision we like very much, as it will focusthe company on higher-growth end-markets and services. After the sale, thecompany is well capitalized, and management is indicating that it willpursue acquisitions in its consulting and government services segments. Wethink they have been masterful acquirors in the past. ASGN stock isappreciating not just on the back of strong results but is being re-rated. Thecompany is no longer a cyclical, low-multiple business, but now a strongsecular grower, with market-leading capabilities and relationships, servinggreat end-markets.
Other holdings that rose over 20% in the quarter but contributed less to theFund’s performance were DexCom, Inc., BRP Group, Inc., Red Rock Resorts,Inc., Inspire Medical Systems, Inc., and new issues European Wax Center,Inc., Dutch Bros Inc., and Clearwater Analytics Holdings, Inc.
43

Baron Small Cap Fund
Table III.Top detractors from performance for the quarter ended September 30, 2021
PercentImpact
Wix.com Ltd. –0.51%Clarivate Plc –0.41Mercury Systems, Inc. –0.40Installed Building Products, Inc. –0.39Americold Realty Trust –0.39
Wix.com Ltd. is the leading provider of software that helps microbusinessesbuild and maintain their websites. Shares declined this quarter after thecompany reported a slowdown in new customer additions versus last yearwhen demand for their services surged because of COVID. Guidance wasreduced, as management has less visibility about the growth rate of the “topof the funnel.” The other important metrics, such as conversion rates,retention rates, and attachment of new services, are all running at recordrates, so not an issue. We have taken a more conservative approach toestimating future profitability and valuation, but still see good upside in theshares, so we are hanging in.
Clarivate Plc is an information services company that maintains leading/comprehensive IP and scientific databases and sells data, tools, and servicesto health care and other industries. The company reported a deceleration insubscription growth and slower-than-expected organic growth in the secondquarter. Management, who we greatly admire for how they have assembledand run this leading company and one before, has laid out aggressive growthtargets, which investors are now concerned about even though thoseprojections were reiterated. Also, the company received a second requestfrom the Federal Trade Commission related to a large acquisition, which hasdelayed approval. This is causing near-term dilution, as the funds to closethe transaction have already been raised. We retain our conviction that thecompany can achieve its growth objectives and would expect the multipleto recover as they prove so.
Mercury Systems, Inc., a provider of defense electronics solutions, fell afterthe company reduced full-year guidance due to delays on some largeprograms and explained that the issues will continue for the remainder ofthis calendar year. On the positive side, management unveiled importantcost savings initiatives and forecasted a strong rebound in growth in theupcoming year. We believe the company should be able to revert to historicgrowth rates of high single-digit organic growth and higher profit growth,and continue to do accretive and strategic acquisitions, which has been theircalling card. But the stock is in the doghouse until that is reestablished and,realizing that we reduced our position in the quarter.
Installed Building Products, Inc. is the largest installer of insulation andcomplementary building products to the residential housing market. Thestock declined because of mixed business trends, and because interest ratesticked up, which is considered bad for housing stocks. Margins are underpressure as the company is suffering from supply chain issues…primarilygetting the products they install in a timely fashion. On the other hand,revenue growth reaccelerated as the company gained market share.Management is positive about the pricing environment and believe they willbe able to pass on higher insulation costs. They have been focused onretaining their labor force for years, which is now reaping benefits and is amajor competitive advantage. And we expect acceleration in acquisitions, asthe pipeline is stocked. These purchases are highly accretive and are a corecompetency of management. We think there is lots to like, and the stock ischeap.
Americold Realty Trust is one of the largest global owner/operators of coldstorage warehouses. The stock fell as the company reported weak results forthe third quarter in a row. The primary issue is that food producers are notable to produce enough to service customer demand and maintain inventorylevels. It’s disappointing that this dynamic is now projected to persist,causing management to reduce guidance and lose face with investors. Wethink the long-term story and investment thesis remains intact, so aresticking with our position. The stock trades at a big discount to its privateasset value.
Other holdings that fell over 20% in the quarter were Kratos Defense &Security Solutions, Inc., UTZ Brands, Inc., Ollie’s Bargain OutletHoldings, Inc., Hydrofarm Holdings Group, Inc., SOC Telemed, Inc.,Shoals Technologies Group, Inc., and Figs Inc.
PORTFOLIO STRUCTURE & RECENT ACTIVITY
As of September 30, 2021, the Fund had $5.3 billion under management.The top 10 holdings made up 30.8% of the Fund’s net assets. We held 76stocks.
Table IV.Top 10 holdings as of September 30, 2021
YearAcquired
Quarter EndInvestment
Value(millions)
Percentof NetAssets
Gartner, Inc. 2007 $288.7 5.4%ICON Plc 2013 196.5 3.7ASGN Incorporated 2012 175.4 3.3Installed Building Products, Inc. 2017 160.7 3.0SiteOne Landscape Supply, Inc. 2016 159.6 3.0Floor & Decor Holdings, Inc. 2017 151.0 2.8Vertiv Holdings, LLC 2020 150.6 2.8Guidewire Software, Inc. 2012 145.6 2.7DexCom, Inc. 2012 109.4 2.1SBA Communications Corp. 2004 105.8 2.0
The sectors of greatest concentration are Information Technology (28.7% ofnet assets), Industrials (23.7%), Consumer Discretionary (16.7%), andHealth Care (15.6%). Compared to the Russell 2000 Growth Index, we areoverweight in Industrials, IT, and Consumer Discretionary, and meaningfullyunderweight in Health Care. These weightings come from our bottom-upstock picking and do not reflect a view on which sector is next to performthe best–we do not have such a view. This last quarter, the majority of ournew purchases, either new stocks or additions to existing positions weremostly in the Consumer Discretionary and Industrials space. They were one-off opportunities that we uncovered, not a thematic move to increase theFund’s weighting in those sectors. Similarly, we sold or trimmed some of ourHealth Care and IT holdings, which were also isolated decisions not drivenby a view on sector concentration.
Our holdings across sectors have common characteristics. We favorinvesting in companies that are well established, leaders in their niches,special, and differentiated; and have considerable barriers to entry,significant opportunities to grow, and superb management teams. We doour own due diligence to uncover such businesses and have great experienceand, in my humble opinion, expertise in doing so. We hope to buy into ourcompanies when they are small-ish (the market cap of our investmentsgoing in is $1.6 billion on average) and be long-term investors in the
44
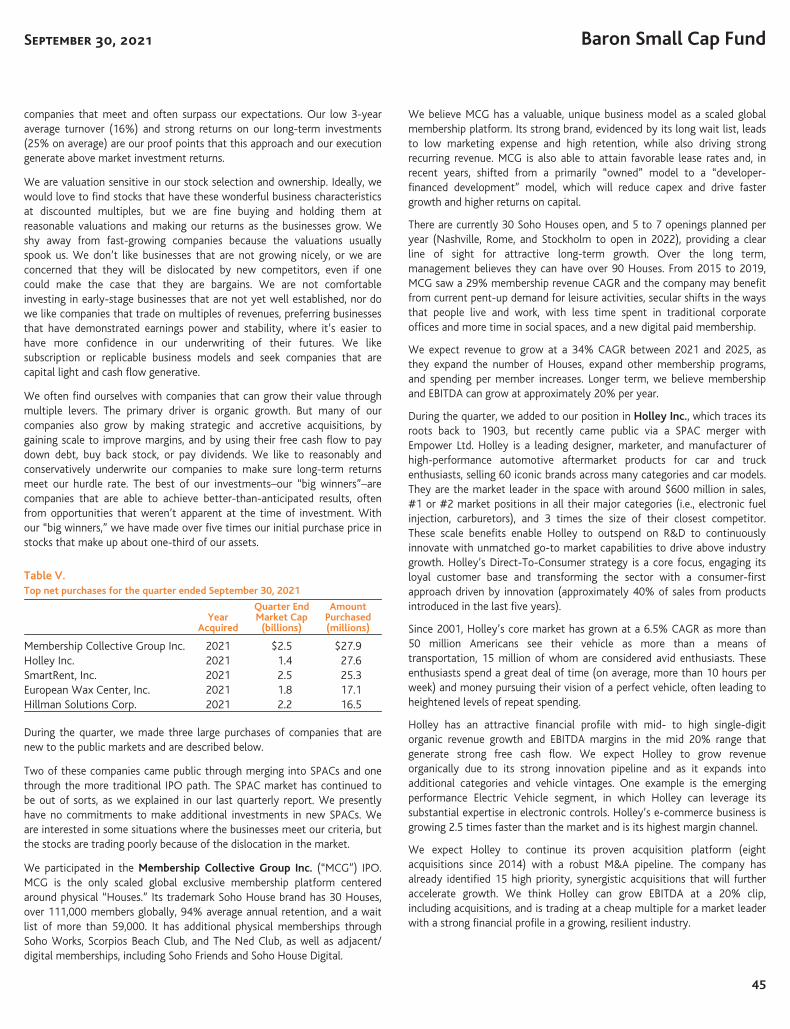
September 30, 2021 Baron Small Cap Fund
companies that meet and often surpass our expectations. Our low 3-yearaverage turnover (16%) and strong returns on our long-term investments(25% on average) are our proof points that this approach and our executiongenerate above market investment returns.
We are valuation sensitive in our stock selection and ownership. Ideally, wewould love to find stocks that have these wonderful business characteristicsat discounted multiples, but we are fine buying and holding them atreasonable valuations and making our returns as the businesses grow. Weshy away from fast-growing companies because the valuations usuallyspook us. We don’t like businesses that are not growing nicely, or we areconcerned that they will be dislocated by new competitors, even if onecould make the case that they are bargains. We are not comfortableinvesting in early-stage businesses that are not yet well established, nor dowe like companies that trade on multiples of revenues, preferring businessesthat have demonstrated earnings power and stability, where it’s easier tohave more confidence in our underwriting of their futures. We likesubscription or replicable business models and seek companies that arecapital light and cash flow generative.
We often find ourselves with companies that can grow their value throughmultiple levers. The primary driver is organic growth. But many of ourcompanies also grow by making strategic and accretive acquisitions, bygaining scale to improve margins, and by using their free cash flow to paydown debt, buy back stock, or pay dividends. We like to reasonably andconservatively underwrite our companies to make sure long-term returnsmeet our hurdle rate. The best of our investments–our “big winners”–arecompanies that are able to achieve better-than-anticipated results, oftenfrom opportunities that weren’t apparent at the time of investment. Withour “big winners,” we have made over five times our initial purchase price instocks that make up about one-third of our assets.
Table V.Top net purchases for the quarter ended September 30, 2021
YearAcquired
Quarter EndMarket Cap
(billions)
AmountPurchased(millions)
Membership Collective Group Inc. 2021 $2.5 $27.9Holley Inc. 2021 1.4 27.6SmartRent, Inc. 2021 2.5 25.3European Wax Center, Inc. 2021 1.8 17.1Hillman Solutions Corp. 2021 2.2 16.5
During the quarter, we made three large purchases of companies that arenew to the public markets and are described below.
Two of these companies came public through merging into SPACs and onethrough the more traditional IPO path. The SPAC market has continued tobe out of sorts, as we explained in our last quarterly report. We presentlyhave no commitments to make additional investments in new SPACs. Weare interested in some situations where the businesses meet our criteria, butthe stocks are trading poorly because of the dislocation in the market.
We participated in the Membership Collective Group Inc. (“MCG”) IPO.MCG is the only scaled global exclusive membership platform centeredaround physical “Houses.” Its trademark Soho House brand has 30 Houses,over 111,000 members globally, 94% average annual retention, and a waitlist of more than 59,000. It has additional physical memberships throughSoho Works, Scorpios Beach Club, and The Ned Club, as well as adjacent/digital memberships, including Soho Friends and Soho House Digital.
We believe MCG has a valuable, unique business model as a scaled globalmembership platform. Its strong brand, evidenced by its long wait list, leadsto low marketing expense and high retention, while also driving strongrecurring revenue. MCG is also able to attain favorable lease rates and, inrecent years, shifted from a primarily “owned” model to a “developer-financed development” model, which will reduce capex and drive fastergrowth and higher returns on capital.
There are currently 30 Soho Houses open, and 5 to 7 openings planned peryear (Nashville, Rome, and Stockholm to open in 2022), providing a clearline of sight for attractive long-term growth. Over the long term,management believes they can have over 90 Houses. From 2015 to 2019,MCG saw a 29% membership revenue CAGR and the company may benefitfrom current pent-up demand for leisure activities, secular shifts in the waysthat people live and work, with less time spent in traditional corporateoffices and more time in social spaces, and a new digital paid membership.
We expect revenue to grow at a 34% CAGR between 2021 and 2025, asthey expand the number of Houses, expand other membership programs,and spending per member increases. Longer term, we believe membershipand EBITDA can grow at approximately 20% per year.
During the quarter, we added to our position in Holley Inc., which traces itsroots back to 1903, but recently came public via a SPAC merger withEmpower Ltd. Holley is a leading designer, marketer, and manufacturer ofhigh-performance automotive aftermarket products for car and truckenthusiasts, selling 60 iconic brands across many categories and car models.They are the market leader in the space with around $600 million in sales,#1 or #2 market positions in all their major categories (i.e., electronic fuelinjection, carburetors), and 3 times the size of their closest competitor.These scale benefits enable Holley to outspend on R&D to continuouslyinnovate with unmatched go-to market capabilities to drive above industrygrowth. Holley’s Direct-To-Consumer strategy is a core focus, engaging itsloyal customer base and transforming the sector with a consumer-firstapproach driven by innovation (approximately 40% of sales from productsintroduced in the last five years).
Since 2001, Holley’s core market has grown at a 6.5% CAGR as more than50 million Americans see their vehicle as more than a means oftransportation, 15 million of whom are considered avid enthusiasts. Theseenthusiasts spend a great deal of time (on average, more than 10 hours perweek) and money pursuing their vision of a perfect vehicle, often leading toheightened levels of repeat spending.
Holley has an attractive financial profile with mid- to high single-digitorganic revenue growth and EBITDA margins in the mid 20% range thatgenerate strong free cash flow. We expect Holley to grow revenueorganically due to its strong innovation pipeline and as it expands intoadditional categories and vehicle vintages. One example is the emergingperformance Electric Vehicle segment, in which Holley can leverage itssubstantial expertise in electronic controls. Holley’s e-commerce business isgrowing 2.5 times faster than the market and is its highest margin channel.
We expect Holley to continue its proven acquisition platform (eightacquisitions since 2014) with a robust M&A pipeline. The company hasalready identified 15 high priority, synergistic acquisitions that will furtheraccelerate growth. We think Holley can grow EBITDA at a 20% clip,including acquisitions, and is trading at a cheap multiple for a market leaderwith a strong financial profile in a growing, resilient industry.
45

Baron Small Cap Fund
We acquired shares of SmartRent, Inc. during the quarter. SmartRent hasemerged as the category-leading enterprise grade software companyproviding a fully integrated solution to the real estate industry. The coreproduct is built around smart access or keyless entry (products enableresident access, self-guided tours, smart parking, video intercom, packagedelivery) as well as community Wi-Fi, leak detection, and temperaturecontrol management that lower costs, mitigate risks, and increase rents formulti-family property owners. In exchange, SmartRent charges a lowrecurring monthly fee to apartment owners and continuously improves itssoftware application. No enterprise-level solution existed prior toSmartRent, and their digital amenities are elevating the rental resident andlandlord experience.
CEO/Founder Lucas Haldeman, previously the CTO of Colony StarwoodHomes, understands firsthand the acute pain points of institutionalresidential landlords and the value proposition underpinning SmartRent’soffering. SmartRent has 211,000 units deployed with over 450,000 totalusers, never having a customer churn and strategic partnerships with 15 ofthe top 20 institutional apartment owners. Not only has SmartRent servedmore units than all competitors combined, the company has 606,000 unitscommitted (just a fraction of the 28 million multi-family U.S. units) and a$2 billion revenue opportunity just with property owners who are alreadyexisting customers. SmartRent has an open-source, hardware-agnosticplatform allowing for ease of integration, with existing hardware andproperty management software, and a large, growing installer network,which creates a strong moat in the retrofit market. The company’s softwarecomponent provides a multi-year, high-margin, recurring revenue streamdeserving of a high multiple. With approximately $500 million of cash, weexpect M&A opportunities to layer on additional services to augmentgrowth. We believe there is a path to create over $200 million of run-raterecurring cash flow (negligible today) over the near term given the in-placecustomer commitments and future sales wins plus longer-term upsidepotential through emerging initiatives that could open several excitingadjacent growth verticals (for example, international and student/seniorhousing).
Table VI.Top net sales for the quarter ended September 30, 2021
YearAcquired
Market CapWhen
Acquired(billions)
Quarter EndMarket Cap or
Market CapWhen Sold(billions)
AmountSold
(millions)
Array Technologies, Inc. 2020 $4.6 $ 1.6 $23.7Vertiv Holdings, LLC 2020 1.1 8.5 20.7Certara, Inc. 2020 5.8 4.0 19.1The Trade Desk 2017 1.7 33.7 17.3Mercury Systems, Inc. 2016 0.8 2.7 15.1
Our largest sales during the quarter had us exiting positions all together aswell as reducing the position sizes of some of our larger positions whosevaluations we felt were extended.
We sold out entirely of Array Technologies, Inc. after losing confidence inthe durability of its business. We sold our small positions in Certara, Inc.and Olink Holding AB to redeploy the capital to other higher convictionnames.
We trimmed our positions in Vertiv Holdings, LLC, The Trade Desk, andGartner, Inc. into strength to somewhat reduce position sizing. We soldsome Mercury Systems, Inc. and Americold Realty Trust because of near-term concerns, as mentioned earlier.
OUTLOOK
The economic and investment environment is murkier than in the recentpast. During the last few quarters, the debate was over how fast we wouldgrow and concerns about valuation levels and trading excesses. Now, thereis more to consider. Supply chain troubles are wreaking havoc withbusinesses, resulting in higher costs and execution challenges. And theproblems now feel like they will not settle out so soon. The labor market isdislocated, and many service and industrial businesses can’t find workersand have to pay higher wages to keep employees. This too feels like acondition that will last a while. These factors are resulting in slower overallgrowth than previously expected and will likely cause profit shortfalls versusprior estimates. The market shrugged this off last quarter as a temporarycondition, but we are not sure that it will continue to do so.
Inflation is pervasive and persistent, and a real issue. The CPI has acceleratedto over 5% in the latest reading and oil is at a seven-year high. It is harder toaccept that inflation is “transitory” as the Fed has stated. Interest rates areinching higher. The Fed is talking about “tapering” its asset purchases. TheU.S. government remains dysfunctional and on the verge of passingspending programs that would add greatly to the existing large deficit andextra stimulus to an already hot economy. It seems reasonable to expecthigher interest rates.
Against this, consumer demand is super strong. Consumer balance sheets areflush. There seems to be little consumer pushback on the higher costs of goodsand services. And discussions with our portfolio companies lead us to believethat they have the pricing power to pass through higher operating costs.
It’s a lot to consider. Our take is that even when the macroeconomic picturegets confusing, the most important thing for us to focus on with respect tothe returns of the Fund is the actual performance of the businesses in whichwe invest. We own terrific companies that are doing well, and that weexpect to continue to do well. They are innovators, disruptors, and leaders.None of the macro factors we discuss in this letter should obscure the factthat we are in an era of great opportunity, and we believe our companieswill continue to thrive and grow their value.
Thanks to David Goldsmith, who is doing a bang up job as AssistantPortfolio Manager. And a shout out to the terrific research team at Baron fortheir invaluable contributions to helping the Fund and all the funds at Baron.And thanks to my fellow shareholders for your confidence in us.
Cliff GreenbergPortfolio ManagerSeptember 30, 2021
46

September 30, 2021 Baron Small Cap Fund
Investors should consider the investment objectives, risks, and charges and expenses of the investment carefully before investing. The prospectusand summary prospectus contain this and other information about the Funds. You may obtain them from its distributor, Baron Capital, Inc., bycalling 1-800-99BARON or visiting www.BaronFunds.com. Please read them carefully before investing.
Risks: The Adviser believes that there is more potential for capital appreciation in smaller companies, but there also may be more risk. Specificrisks associated with investing in smaller companies include that the securities may be thinly traded and they may be more difficult to sellduring market downturns. The Fund may not achieve its objectives. Portfolio holdings are subject to change. Current and future portfolioholdings are subject to risk.
The discussions of the companies herein are not intended as advice to any person regarding the advisability of investing in any particularsecurity. The views expressed in this report reflect those of the respective portfolio manager only through the end of the period stated in thisreport. The portfolio manager’s views are not intended as recommendations or investment advice to any person reading this report and aresubject to change at any time based on market and other conditions and Baron has no obligation to update them.
This report does not constitute an offer to sell or a solicitation of any offer to buy securities of Baron Small Cap Fund by anyone in anyjurisdiction where it would be unlawful under the laws of that jurisdiction to make such offer or solicitation.
BAMCO, Inc. is an investment adviser registered with the U.S. Securities and Exchange Commission (SEC). Baron Capital, Inc. is a limitedpurpose broker-dealer registered with the SEC and member of the Financial Industry Regulatory Authority, Inc. (FINRA).
47

Baron Opportunity Fund
MICHAEL A. LIPPERT Retail Shares: BIOPXInstitutional Shares: BIOIX
PORTFOLIO MANAGER R6 Shares: BIOUX
Dear Baron Opportunity Fund Shareholder:
Performance
Baron Opportunity Fund (the “Fund”) had an up-and-down quarter, withboth the market and Fund trading off in September, finishing the perioddown 2.03% (Institutional Shares). For the period, the Fund trailed theRussell 3000 Growth Index, which rose 0.69%, and the S&P 500 Index,which increased 0.58%. The Fund has performed well to start the fourthquarter, and as of this writing (October 15), the Fund is up 14.08% year-to-date, a solid follow through on top of 2020’s nearly 90% return. Butlong-term returns are what really matter, and as shown in the chart below,the Fund continues to outperform its benchmarks across all annual trailingperiods.
Table I.PerformanceAnnualized for periods ended September 30, 2021
BaronOpportunity
FundRetail
Shares1,2
BaronOpportunity
FundInstitutional
Shares1,2,3
Russell3000
GrowthIndex1
S&P500
Index1
Three Months4 (2.09)% (2.03)% 0.69% 0.58%Nine Months4 8.64% 8.86% 13.49% 15.92%One Year 33.58% 33.91% 27.57% 30.00%Three Years 33.88% 34.26% 21.27% 15.99%Five Years 32.60% 32.95% 22.30% 16.90%Ten Years 21.19% 21.52% 19.40% 16.63%Fifteen Years 15.54% 15.79% 13.13% 10.37%Since Inception
(February 29, 2000) 10.60% 10.77% 6.96% 7.51%
Review & Outlook
From the perspective of stock prices – not fundamentals for the themes,trends, industry verticals, and companies in which we invest – the Fund andmarket had an up-and-down quarter. The market sold off in September, withU.S. equities struggling to preserve third-quarter gains as investorenthusiasm over strong corporate earnings, robust macroeconomic data,and the FDA’s full approval of Pfizer’s COVID-19 vaccine, among otherpositives, temporarily lost momentum to risk-off fears triggered by loomingFed tapering, higher interest rates, debt-ceiling politics, persistent supplychain disruptions, as well as President Xi’s regulatory crackdown and“Common Prosperity” agenda and Evergrande’s liquidity crisis.
Performance listed in the above table is net of annual operating expenses. Annual expense ratio for the Retail Shares and Institutional Shares as of September 30, 2020was 1.34% and 1.08%, respectively. The performance data quoted represents past performance. Past performance is no guarantee of future results. The investment returnand principal value of an investment will fluctuate; an investor’s shares, when redeemed, may be worth more or less than their original The Adviser reimburses certain BaronFund expenses pursuant to a contract expiring on August 29, 2032, unless renewed for another 11-year term and the Fund’s transfer agency expenses may be reduced byexpense offsets from an unaffiliated transfer agent, without which performance would have been lower. Current performance may be lower or higher than the performancedata quoted. For performance information current to the most recent month-end, visit www.BaronFunds.com or call 1-800-99BARON.
The Fund’s 3Q21, 3-, 5- and 10-year historical performance was impacted by gains from IPOs and there is no guarantee that these results can be repeated or that the Fund’slevel of participation in IPOs will be the same in the future.
1 The Russell 3000® Index measures the performance of the broad segment of the U.S. equity universe comprised of the largest 3000 U.S. companies representingapproximately 98% of the investable U.S. equity market. The Russell 3000® Growth Index measures the performance of those companies classified as growth among thelargest 3,000 U.S. companies and the S&P 500 Index of 500 widely held large cap U.S. companies. Russell Investment Group is the source and owner of the trademarks,service marks and copyrights related to the Russell Indexes. Russell is a trademark of Russell Investment Group. The indexes and the Fund include reinvestment of dividends,net of withholding taxes, which positively impact the performance results. The indexes are unmanaged. Index performance is not Fund performance; one cannot investdirectly into an index.
2 The performance data in the table does not reflect the deduction of taxes that a shareholder would pay on Fund distributions or redemption of Fundshares.
3 Performance for the Institutional Shares prior to May 29, 2009 is based on the performance of the Retail Shares, which have a distribution fee. TheInstitutional Shares do not have a distribution fee. If the annual returns for the Institutional Shares prior to May 29, 2009 did not reflect this fee, thereturns would be higher.
4 Not annualized.
BARONF U N D S
48

September 30, 2021 Baron Opportunity Fund
Aside from the partial impact of interest rates on valuation multiples –which we have addressed in recent letters, including our March 31, 2021quarterly1 – essentially none of the above issues have any influence over ourlong-term investing approach or the multi-year returns of our investments.Indeed, as mentioned above, the market and Fund have performed well tostart October. But while that is nice to write, it is just more short-termnoise. What matters – and what we doggedly focus our attention, research,analysis, and portfolio management on – is identifying the powerful anddurable secular growth trends that will drive economic growth regardless ofpolitics, short-term economic cycles, or stock market gyrations, and theindividual companies that are leading or capitalizing on those trends. It isthe bedrock of our long-term performance.
As I emphasize in all my investor communications, we believe secular trends,durability of growth, and free cash flow (“FCF”) generation at scale are thekey factors in long-term growth investing and ultimately stock returns. Asan investment drives down the long-term return highway, the ability of thebusiness to grow faster-for-longer is the engine that propels it steadily andrelentlessly forward. Faster-for-longer is a mantra for the Fund’s researchteam. As I look back over my 20-year career at Baron Capital, I cannot thinkof a great growth investment that didn’t surprise the market with itsdurability of growth. Compounding is the long-term investor’s reliablepartner.
Faster-for-longer is a hallmark of all great growth stocks. It is what we lookfor in almost all our investments. But how does a management team andcompany achieve that? In our experience, it is through relentless disruptiveinnovation, trial and error, iterative improvement, knocking down walls. It isexpanding and then capturing a meaningful share of a company’s totaladdressable market, or TAM, by becoming a multi-product or servicebusiness with the right product-market fit – with the ambitious goal ofbeing recognized as a platform company. Within our research team, wecolloquially refer to such TAM expansion as open-ended growth, second orthird acts, or multiple TAMs. In our first quarter letter, we gave the exampleof ServiceNow, Inc., where the compounding effects of seven years ofstrong revenue growth (and FCF generation) drove the company’s 30%-plusannualized return over the period studied, despite eight valuation multipledeclines averaging over 30%. ServiceNow started off as an InformationTechnology (“IT”) service management cloud-software vendor, but over theyears it became a workflow digital automation platform with new servicesincluding IT operations and asset management, customer servicemanagement, HR service delivery, field service management, financial closeautomation, and the ability for companies to automate custom workflowsusing the company’s App Engine Studio. ServiceNow’s management teambelieves these additional acts and multiple TAMs will enable it to achieve$10 billion of subscription revenue faster than any other software company.
Think about other great growth companies that are now household names –Google, Amazon, and Apple. Each grew faster for longer because of second,third or more acts; each achieved better-than-expected open-ended growthbecause they developed multiple TAMs; and each created enormousshareholder value. Google started out as just a search engine, a massiveTAM in and of itself, before becoming a digital media company with
YouTube, a business and consumer software provider with Gmail andChrome, an ad-tech platform with DoubleClick, and an IT platform withGoogle Cloud, not to mention Waymo autonomous driving or Waze andGoogle Maps or many other services. Amazon launched its business as anonline book seller, before expanding category-by-category to become ane-commerce platform that sells pretty much everything. It also disruptedlegacy logistics by building the rails that can deliver products to your doorthe day after you order them if not the same day, and it pioneered thecurrent generation of cloud computing with Amazon Web Services, not tomention Amazon Prime, Amazon Video and Music, Whole Foods, Twitch,digital advertising, etc. Lastly, Apple, which spent years innovating in thecomputer space to capture a few percentage points of share from theMicrosoft Windows operating system ecosystem, before forever changingthe world – and driving unprecedented growth and shareholder returns –with iPods, iPhones, iPads, the AppStore, AirPods, iTunes, etc., effectivelyushering in the age of digital mobility.
The Fund continues to own ServiceNow, Google (now a subsidiary ofAlphabet Inc.), and Amazon.com, Inc. Here are a few other faster-for-longer, second or third act, or multiple TAM examples from across ourportfolio:
• Tesla, Inc. – CEO Elon Musk co-founded Tesla with the auspicious goalof addressing and disrupting the entire automobile market, in whichabout 100 million new cars are sold each year, to bring sustainable andsafer automotive transportation to the entire world, with a full line ofvehicles of various styles and price points and innovations likeAutopilot autonomous driving. Tesla has had more “acts” and TAMexpanders over the last decade than most companies have over theirlifetimes. Tesla first hit the market with the Roadster, an ultra-high-endsports car. It further attacked the high end of the auto market with theModel S sedan and the Model X SUV. But Tesla vastly expanded itsTAM, and forever disrupted the automotive mass market, with itsModel 3 and Model Y vehicles. Model 3 is now the best-selling car of itsclass globally, with Model Y set to surpass it next year. Future vehiclesaimed at addressing nearly the entire 100 million new passenger carmarket include the Cybertruck and a $25,000 model. Tesla is now wellpositioned to achieve CEO Elon Musk’s public goal of selling 20 millioncars by growing vehicles delivered at a 50% annual rate. Moreover,Tesla has multiple acts or new TAMs that have yet to hit their stridewith Autopilot, for Tesla vehicles and third-party cars; solar and batterystorage; ride share; humanoid robots; and more.
• Ceridian HCM Holding Inc. – Ceridian, a payroll and human capitalmanagement software company, hit the market with a focus on payrollautomation. Over the years, it innovated and expanded its Dayforcesoftware platform to become a full-service human capital management(“HCM”) vendor, with modules including human resources, workforcemanagement, talent management, benefits and more. As discussedmore fully below, Ceridian recently launched the Dayforce Wallet,which addresses a pain point for many workers, who live paycheck topaycheck, by enabling them to have same-day access to the wagesthey earn. Wallet significantly expands Ceridian’s TAM with the
1 “In our internal valuation and price target work, we don’t shift our targets around based on applying prevailing multiples – which often overshoot or undershoot intrinsicvalue. Instead, we calculate and establish ranges of long-term average or median multiples for sets of comparable companies (reflecting sectors and peer groups), based onand adjusted for our projections of revenue growth rates, profit margins and cash generation at scale, competitive intensity and risks, and other fundamental factors. Weestablish (and monitor) short- and long-term price targets for our holdings and prospects, utilizing our own internal projections of revenues, earnings, and free cash flow,and what we believe is the appropriate multiple (or tight ranges of multiples) for each company based on the factors cited above.”
49

Baron Opportunity Fund
potential to double the per-employee-per-month revenues it earnsfrom some of its customers. We believe Ceridian’s Dayforce recurringrevenue can compound at a 30% rate.
• PayPal Holdings, Inc. – PayPal first caught consumers’ attention as apeer-to-peer digital payment application, particularly as a convenientand trustworthy way for eBay buyers to pay eBay sellers in the earlydays of online shopping. Over the years it expanded to become a near-ubiquitous online retail payments platform, while also offering othershopping tools and digital services, such as digital wallet, bill pay, BuyNow-Pay Later, crypto-currency, in-store retail, and more. According toPayPal’s CEO, these new acts enabled the company to increase theTAM it “play[s] in” by “over six times in the last three years.” PayPalhas 403 million active accounts today and is on its way towards its750 million target by 2025 and 1 billion longer term, for a total TAMsized at over $1 trillion.
• HubSpot, Inc. – HubSpot started out focused on inbound marketing,providing cloud software that helps businesses attract customers bycreating valuable content and experiences tailored to them when usersvisit a company’s website or App. Over the years, HubSpot expandedto become a full platform for sales, marketing, and service for the morethan 3 million small and mid-market businesses (with 200 to 2,000employees) globally. More recently, HubSpot launched a customer dataplatform, which integrates and analyzes a company’s customer datafrom every source, and payments to help customers close the loop onbusiness-to-business (“B2B”) buying, which has been a notable laggardin digital payments. We estimate that over 50% of the $1 trillion ofthe B2B payments market is still paper based today. These second andthird acts have propelled HubSpot to accelerated growth this year(over 40% from 31% in 2020), and we believe should enable thecompany to grow at a 30%-plus rate for years to come.
• CrowdStrike, Inc. – CrowdStrike disrupted the cybersecurity marketwith a cloud-native endpoint protection solution, replacing the legacyanti-virus tools used to protect computers, smartphones, and the like.Today, CrowdStrike offers over 20 different modules – collecting dataonce and analyzing it in different ways – to protect enterpriseendpoints and cloud workloads from many different types of cyberthreats, and providing threat intelligence, cyber analytics, vulnerabilitymanagement, and automated and people-based remediation services.CrowdStrike has a highly efficient go-to-market motion because itssingle, integrated, cloud-native platform enables existing and newcustomers to start free in-App trials at the click of a button to try outCrowdStrike’s offerings for themselves. We believe these new TAMshave enabled CrowdStrike to expand its addressable market over fivetimes from its initial offering and should yield over 30% growth for thenext several years.
• Stitch Fix, Inc., an online apparel retailer, has been transitioning from asubscription-style service (a Fix, with a box of personalized outfitsdelivered to your door) to an open online shopping experience whereconsumers can browse an AI-driven personalized “virtual closet.” StichFix’s goal is to offer a much wider swath of customers a personalized
digital store by leveraging its data-driven approach and proprietaryalgorithms. With this new offering, branded Freestyle, Stitch Fix will bebreaking out a blockbuster new second act and expanding its TAMfrom the niche fashion subscription market to the $400 billion U.S.apparel market.
Below is a partial list of the secular megatrends we focus on. These themeswill be the key drivers of revenue, earnings, and cash flow growth – andstock performance – for the companies in which we are invested:
• Cloud computing• Software-as-a-service (“SaaS”)• Artificial Intelligence (“AI”) and big data• Mobile• Digital communications• Digital media/entertainment• Targeted, people-based digital advertising• e-commerce• Genomics• Genetic medicine• Minimally invasive surgical procedures• Cybersecurity• Electric-drive vehicles/autonomous driving• Electronic payments
By investing in businesses capitalizing on these potent trends, we have beenable to build portfolios that have revenue growth rates that are multiples ofthe general economy, as reflected in broad market indexes. Below wecompare the revenue growth rates of our Fund and three indexes for thetrailing four quarters for which we have reliable data (please note that thedata below for the most recent periods, particularly the broad marketindexes, are skewed by reopening trends, not sustainable underlying growth):
Comparison of Revenue Growth (based on quarter-end holdings)
ActualQ2 2021
ActualQ1 2021
ActualQ4 2020
ActualQ3 2020
Baron Opportunity Fund 38.2% 38.5% 30.6% 24.0%
S&P 500 Index 25.5% 12.7% 2.8% –1.1%
Russell 3000 Index 27.7% 12.5% 2.5% –1.6%
Russell 3000 Growth Index 34.2% 16.8% 8.9% 4.0%
Sources: BAMCO and FactSet.
Table II.Top contributors to performance for the quarter ended September 30, 2021
PercentImpact
Acceleron Pharma Inc. 0.73%Gartner, Inc. 0.49ZoomInfo Technologies Inc. 0.44Atlassian Corporation Plc 0.40Microsoft Corporation 0.39
50

September 30, 2021 Baron Opportunity Fund
Acceleron Pharma Inc. is a biotechnology company with the rare profile ofhaving two blockbuster assets in the pipeline: cardiovascular drugsotatercept and anemia drug luspatercept. Shares increased during thequarter on news that Acceleron was the target of a potential acquisition byMerck. On September 30, Merck entered into an agreement to acquireAcceleron for $180 per share in cash. (Josh Riegelhaupt)
Shares of Gartner, Inc., a provider of syndicated research, contributed toperformance after reporting financial results that exceeded Street estimates,with revenue beating by $50 million and operating cash flow by $80 million.Growth in the company’s research business has reaccelerated to double-digit levels. Research growth is led by the company’s Global Business Salessegment, which delivered 18% contract value growth and is benefiting froma multi-year investment cycle. We expect improved revenue growth andfocus on cost control to drive margin expansion and enhanced cashgeneration. The company’s balance sheet is in excellent shape and cansupport aggressive share repurchases and bolt-on acquisitions. (NealRosenberg)
ZoomInfo Technologies Inc. contributed to performance following a well-received acquisition and a positive earnings report. Quarterly revenues weremeaningfully above Street expectations, with sales up 57% versus the Streetexpecting a 47% increase, as was forward-looking guidance. Its recentacquisition of Chorus.ai, a conversation intelligence business, dramaticallyincreased the data visibility and benefits that ZoomInfo can offer its clients.We continue to believe that ZoomInfo will become a much larger companyover time as it grows into its $70 billion TAM. ZoomInfo is founder led and arare 40/40 business, with both revenue growth and free cash flow marginsabove 40%. (Ashim Mehra)
Atlassian Corporation Plc provides development and collaborationsoftware tools to help software developers, IT professionals, and businessusers such as project managers. Shares performed well after reporting astrong quarter underpinned by an acceleration in subscription growth ofmore than 50% year-over-year and increased guidance calling for low- tomid-40% growth in fiscal year 2022, up from prior projections of the mid-30% level. We continue to believe Atlassian is one of the best long-term-positioned companies in software, with a founder-led management teamand a top-quality business model delivering high growth and healthy freecash flow. (Brian Neigut)
Shares of Microsoft Corporation, a cloud-software leader and provider ofsoftware productivity tools and infrastructure, rose during the quarterfollowing a strong earnings report highlighting solid demand for its broadproduct stack and continued momentum migrating its business to the cloud.Microsoft’s results continued to be strong across the board, with totalrevenue beating Street estimates by 4.5%, an acceleration in CommercialCloud revenue to 31% constant-currency growth, a four-point improvementin Commercial Cloud gross margins (to 70% from 66%), and GAAP earningsup 42%. We believe the company is positioned to deliver 13% to 15%organic growth over the next three years, underpinned by TAM expansionacross its disruptive cloud product portfolio, as more companies look totransform and digitize their businesses, as well as strong operating leverageas its cloud products gain scale. (Brian Neigut)
Table III.Top detractors from performance for the quarter ended September 30, 2021
PercentImpact
Stitch Fix, Inc. –0.66%RingCentral, Inc. –0.62Pinterest, Inc. –0.60Arrowhead Pharmaceuticals, Inc. –0.59Alibaba Group Holding Limited –0.50
Stitch Fix, Inc., an online apparel retailer, detracted due, in large part, to thecompany’s poorly communicated changes to its stylist employmentprogram. Mostly part-time workers who help clients select outfits, stylistswere abruptly notified that they had to choose between a full-time workschedule or a severance package. Despite the optics of the announcement,we retain conviction in Stitch Fix’s expansion from a business model heavilyreliant on personal stylists to an online retailer with multiple offerings,including its newly launched direct buy service (branded “Freestyle”), thatdelivers personalization through a data-driven, algorithmic, and digitalapproach. Stich Fix’s fiscal fourth quarter results significantly beat Streetprojections, with sales up 29% and operating cash flow more than triplingStreet estimates. Still, Stich Fix’s management team gave what we believe isconservative guidance for fiscal year 2022, as it invests in and ramps up itsFreestyle offering. (Ashim Mehra)
Despite an acceleration in revenue and increased guidance, shares ofRingCentral, Inc., a leading cloud unified communications (phone, video,messaging) provider, lagged during the quarter on investor fears aroundcontraction of its TAM and increasing competition from Microsoft andZoom Video. On the earnings front, RingCentral’s subscription revenuegrowth accelerated to 37% (from 34%) and it had a record number of$1 million-plus total contract value wins, including one deal over$10 million, and it guided for revenue to continue to grow over 30% thisyear. Regarding competition, we have long believed the cloudcommunications market is big enough to support multiple long-termwinners – at 300 million to 400 million seats and single-digit penetrationtoday – and that RingCentral can continue to innovate at a fast rate andleverage its partners’ installed base of over 200 million legacy phone seats,winning healthy enough share to support 30%-plus top-line growth for thenext several years. (Brian Neigut)
Visual search, discovery, and inspiration platform Pinterest, Inc. detractedfrom performance after the company provided disappointing monthly activeuser engagement metrics despite a strong quarter financially (revenuegrowth of 125% and almost 30% operating cash flow margins). As theeconomy reopened and COVID-19-related restrictions were lifted, userengagement for web users (who tend to be less engaged and generate lessrevenue) declined. At the same time, the company pivoted to a new video-based engagement model, called Idea Pins. The transition to Idea Pins (notyet monetized) may cannibalize some monetized engagement in the nearterm, thus penalizing short-term revenues, but we remain encouraged bythe long runway for growth as Pinterest improves its platform and expandsinternationally. (Ashim Mehra)
51

Baron Opportunity Fund
Arrowhead Pharmaceuticals, Inc., a biotechnology company developingRNAi (i=interference) drugs, and a top performer last quarter, lagged thisperiod. Shares dropped after a July announcement that the company waspausing its early-stage clinical trial for a treatment for cystic fibrosis. A fewweeks after the July announcement, the company presented positive datafor a treatment targeting a protein in kidney cancer. We retain conviction inArrowhead and the long-term prospects of RNAi as a drug category. (JoshRiegelhaupt)
Alibaba Group Holding Limited is the largest retailer and e-commercecompany in China. Alibaba operates shopping platforms Taobao and T-Malland owns 33% of Ant Group, which operates Alipay, China’s largest third-party online payment provider. Shares of Alibaba were down givencrackdowns by Chinese regulators on various aspects of digital technologyand consumer data, as President Xi and the Chinese Communist Party seekto seize greater control of social discourse and consumer data and curbmonopolistic behavior. We decreased our Alibaba weighting in light of thisuncertainty. Despite the uncertain environment, we do retain convictionthat Alibaba will benefit from rapid growth in cloud services, logistics, anddigital retail. (Ashim Mehra)
Portfolio Structure
The Fund invests in secular growth and innovative businesses across allmarket capitalizations, with the bulk of the portfolio landing in the large-capzone. The Fund is categorized as US Large Growth by Morningstar. As of theend of the first quarter, the largest market cap holding in the Fund was $2.1trillion and the smallest was $435 million. The median market cap of theFund was $21.1 billion.
The Fund had $1.6 billion of assets under management. The Fund hadinvestments in 72 securities. The Fund’s top 10 positions accounted for39.0% of net assets.
Fund inflows, which accelerated during 2020, continued to be positive year-to-date.
Table IV.Top 10 holdings as of September 30, 2021
Quarter EndMarket Cap
(billions)
Quarter EndInvestment
Value(millions)
Percentof NetAssets
Microsoft Corporation $2,118.6 $139.2 8.6%Alphabet Inc. 1,779.8 105.4 6.5Amazon.com, Inc. 1,663.7 79.7 4.9Tesla, Inc. 776.9 52.7 3.3ZoomInfo Technologies Inc. 25.2 47.6 3.0Acceleron Pharma Inc. 10.5 45.7 2.8Ceridian HCM Holding Inc. 16.9 43.1 2.7NVIDIA Corporation 517.9 42.8 2.6Gartner, Inc. 25.4 40.0 2.5argenx SE 15.5 34.3 2.1
Recent Activity
Table V.Top net purchases for the quarter ended September 30, 2021
Quarter EndMarket Cap
(billions)
AmountPurchased(millions)
Natera, Inc. $10.5 $16.1Nerdy Inc. 1.7 15.5Markforged Holding Corporation 1.2 7.7Toast, Inc. 25.1 7.4Ceridian HCM Holding Inc. 16.9 5.4
We initiated a position in Natera, Inc., a diagnostics company with a cell-free DNA platform that detects tiny amounts of DNA in a blood sample.Natera first applied its technology platform to women’s health, where thecompany markets a blood test that can detect fetal DNA in the blood ofpregnant women, enabling early detection of chromosomal abnormalitieswith a non-invasive test. Through the strength of its technology platform,clinical data, and customer service, Natera has established a marketleadership position in non-invasive prenatal testing. Natera is seeingtailwinds in its women’s health business from recently expanded insurancecoverage for average risk pregnancies. Natera is now applying its technologyplatform to other markets, including the oncology market and the organtransplant market. In the oncology market, Natera offers a personalizedblood-based DNA test called Signatera, which detects and quantifies howmuch residual cancer DNA remains in the body after surgery. Signaterahelps physicians determine whether chemotherapy is necessary after surgeryand monitor for cancer recurrence before the cancer is detectable withstandard imaging. We think Signatera will change the standard of care and isin the early innings of adoption in a market we estimate at over $15 billion.We think Natera has a long runway for growth with expanding margins andprofitability.
Nerdy Inc. operates Varsity Tutors, a leading platform for delivering liveonline learning. Varsity Tutors has helped over 500,000 students with anaverage 4.9/5.0 rating (according to its site). Upon signing in, students cantake evaluation quizzes so they can be better matched to a personallytailored curriculum that addresses their specific learning needs. Nerdy alsoprovides industry-leading instructors flexible scheduling, so that they maytutor after work hours. This unlocks a highly skilled workforce ofprofessionals, professors, and educators. As a marketplace that operatesvirtual classes, Nerdy can match the best instructor for a specific student,regardless of where in the U.S. each is located. The offering includes K-12courses, college, professional, GMAT, SAT, and other prep. Nerdy isexperiencing strong growth and momentum in its core one-on-one classoffering, small group classes, and professional certificates. We believe Nerdy
52

September 30, 2021 Baron Opportunity Fund
will continue to innovate and accelerate the launch of new products thatwill drive incremental growth by reaching new audiences and going deeperwith existing learners. For example, Nerdy recently launched an after-schoolclub subscription program. It also launched star courses, where celebritieslike Bill Nye can host an open session that attracts new users to the site.This has been a powerful customer acquisition tool. Further, Nerdy shouldbenefit from the recently passed American Rescue Plan, which is set toprovide $24 billion to schools to address COVID learning loss. Nerdy hasalready launched “Varsity Tutors for Schools” which allows stateeducational agencies and school districts to deliver online tutoring at scale.We believe that Nerdy has a long runway for growth given the vastopportunity ahead.
During the quarter, we participated in the SPAC offering of MarkforgedHolding Corporation, an innovative 3D printing or additive manufacturingcompany. The stock traded down materially after the SPAC deal closed andwe ultimately decided to sell some of our Markforged shares to harvest ashort-term tax loss and provide capital for an investment in another 3Dprinting company.
Toast, Inc. is a cloud-based end-to-end technology platform purpose-builtfor the restaurant industry. Its platform provides a comprehensive suite ofcloud software products and financial technology solutions to its customersto connect front-of-house with back-of-house operations across allcustomer channels. Toast’s core module is its point-of-sale softwaresolution and requires all customers to use Toast as their payment processor.Customers then have the option to bundle or add-on additional modulesacross operations, digital ordering and delivery, marketing and loyalty, teammanagement, and back office. Toast today powers 48,000 restaurants withinthe 860,000 U.S. restaurant industry, largely focusing on small- andmedium-sized (“SMB”) restaurant customers (generally fewer than 10locations but up to 50), with some larger enterprise customers as well. Toastis the clear market leader in SMB restaurant technology with the bestproduct offering and only full, end-to-end platform. We believe that asrestaurants continue to invest in technology at an accelerated paceemerging from COVID, Toast will be a big beneficiary given its leadingmarket position and best-in-class product. At less than 6% penetration ofU.S. restaurants and 3% penetration of its $15 billion recurring-revenueTAM, Toast has a long runway for growth by signing on additional locationsto the platform and increasing the attach rate of its value-add modules.Only 54% of customers today use 4 or more of Toast’s 10-plus modules,each of which provide significant value to the customer and would driveToast’s recurring revenue stream higher.
We added meaningfully to our existing investment in Ceridian HCMHolding Inc., which we have owned since its 2018 IPO. We believe thatCOVID has reshaped the traditional compact between employers andemployees. Employers are rushing to recruit and retain employees byoffering improved work-life balance, including remote or hybrid positions,and enhancements to training, benefits, and pay cycles. We think this isdriving an increase in demand for Ceridian’s innovative Dayforce payroll andHCM platform, which allows employers to deliver this innovation andflexibility at scale with a consumer-grade user experience. We also believethat the COVID-induced employment headwinds of 2020 have now turnedto tailwinds, helping to generate incremental recurring revenue growth forCeridian.
We are also more optimistic regarding the opportunity for Dayforce Wallet.Dayforce Wallet allows employees to request and be paid their earnedwages at any point during a pay cycle, rather than having to wait for thetraditional two week pay period. Ceridian is uniquely able to provide thisservice due to the native integration of its pay and time modules, whichenables the continuous calculation of wages and lets Ceridian generatelegally compliant payrolls on demand. Ceridian’s innovative approach topricing has made Wallet free to employees and employers and letscompanies maintain their traditional two-week funding cycle. Instead,Ceridian gets paid via interchange fees every time a Wallet customer usesher Wallet debit card for a transaction. We think Ceridian has a long runwayfor additional innovation in Wallet, including a wide array of financialproducts and employment passporting.
We think that Dayforce recurring revenue can compound at a 30% rate foryears. We think that Wallet can effectively double Ceridian’s currentrevenue per employee, helping to drive growth that is additive to this target.Most excitingly, since Ceridian will be paid via interchange fees, revenue willeffectively be 100% margin, so each incremental revenue dollar convertsalmost completely into a dollar of free cash flow.
Table VI.Top net sales for the quarter ended September 30, 2021
Quarter EndMarket Cap or
Market CapWhen Sold(billions)
AmountSold
(millions)
Farfetch Limited $ 14.3 $11.7Alibaba Group Holding Limited 402.4 10.7Tripadvisor, Inc. 4.7 8.8RingCentral, Inc. 19.9 8.3Pinterest, Inc. 32.8 7.8
We sold our shares of Farfetch Limited to harvest a short-term tax loss.Farfetch’s large opportunity in China and its partnership with Alibaba isunfortunately clouded by many of the issues discussed in the Alibabadiscussion above.
We reduced our position in Alibaba Group Holding Limited as discussedabove.
On our investments in Tripadvisor, Inc., RingCentral, Inc., and Pinterest,Inc., we identified issues relating to our long-term theses in each companyand focused our research on these topics. Given these issues and becausewe continued to have a solid flow of new ideas, we reduced each of thesestocks to what we considered to be more appropriate position sizes.
• We decreased our weighting in Tripadvisor as we analyzed newdevelopments in and changes to its Trip Plus subscription offering. Ourresearch is ongoing, but our work so far has led us to remain convincedof Tripadvisor’s long-term opportunity with Trip Plus, which we believeis an important second act and TAM expander for the company.Tripadvisor has massive reach and brand equity with 460 millionunique visitors to its sites. However, the company has historicallyunder-monetized that traffic, with most of its revenue coming fromhotel advertising, not directly from its end users. The Trip Plus
53

Baron Opportunity Fund
subscription addresses this opportunity and is a differentiated newavenue for growth. For $99 per year, subscribers get perks like upgradesand discounts on Tripadvisor bookings. Management is passing on itscommission from hotel bookings as savings to the end-consumer. Webelieve this is a compelling value proposition, which should drivecustomer loyalty and unlock a significant new revenue driver for thecompany.
• We decided to sell some shares of RingCentral that we bought earlierthis year to harvest a short-term tax loss, as well as to partially fundother software investments, including Ceridian discussed above. We aredigging into the developments in the competitive environment tosupport our long-term investment thesis in the company. As discussedabove, we continue to have a meaningful investment in RingCentraland remain positive on its longer-term growth opportunity.
• Considering the issues discussed above, we decided to decrease ourweighting in Pinterest and to carefully monitor the developments ofuser engagement and the Idea Pins rollout.
To conclude, I remain confident in and committed to the strategy of theFund: durable growth based on powerful, long-term, innovation-drivensecular growth trends. As we approach the “new normal” after the COVIDcrisis, we continue to believe that non-cyclical, sustainable, and resilientgrowth should be part of investors’ portfolios.
Sincerely,
Michael A. LippertPortfolio ManagerSeptember 30, 2021
Investors should consider the investment objectives, risks, and charges and expenses of the investment carefully before investing. The prospectusand summary prospectus contain this and other information about the Funds. You may obtain them from its distributor, Baron Capital, Inc., bycalling 1-800-99BARON or visiting www.BaronFunds.com. Please read them carefully before investing.
Risks: The Adviser believes that there is more potential for capital appreciation in securities of high growth businesses benefiting frominnovation through development of pioneering, transformative or technologically advanced products or services, but there also is more risk.Companies propelled by innovation, including technological advances and new business models, may present the risk of rapid change andproduct obsolescence and their successes may be difficult to predict for the long term. Securities issued by small and medium sized companiesmay be thinly traded and may be more difficult to sell during market downturns. Even though the Fund is diversified, it may establishsignificant positions where the Adviser has the greatest conviction. This could increase volatility of the Fund’s returns. The Fund may notachieve its objectives. Portfolio holdings are subject to change. Current and future portfolio holdings are subject to risk.
The discussions of the companies herein are not intended as advice to any person regarding the advisability of investing in any particularsecurity. The views expressed in this report reflect those of the respective portfolio managers only through the end of the period stated in thisreport. The portfolio manager’s views are not intended as recommendations or investment advice to any person reading this report and aresubject to change at any time based on market and other conditions and Baron has no obligation to update them.
This report does not constitute an offer to sell or a solicitation of any offer to buy securities of Baron Opportunity Fund by anyone in anyjurisdiction where it would be unlawful under the laws of that jurisdiction to make such offer or solicitation.
BAMCO, Inc. is an investment adviser registered with the U.S. Securities and Exchange Commission (SEC). Baron Capital, Inc. is a limitedpurpose broker-dealer registered with the SEC and member of the Financial Industry Regulatory Authority, Inc. (FINRA).
54

September 30, 2021 Baron Partners Fund
MICHAEL BARON RON BARON Retail Shares: BPTRXCO-PORTFOLIO CEO AND LEAD Institutional Shares: BPTIXMANAGER PORTFOLIO MANAGER R6 Shares: BPTUX
Dear Baron Partners Fund Shareholder:
Performance
Baron Partners Fund (the “Fund”) increased 5.52% (Institutional Shares) in the thirdquarter of 2021. This result nicely outpaced that of its primary benchmark, theRussell Midcap Growth Index (the “Index”), which declined 0.76%. The S&P 500Index rose 0.58% while the Morningstar Large Growth Category (the “Peer Group”)Average declined 0.07%. The Fund was the second-best performing fund in theperiod according to Morningstar. There were 1,280 funds in the category.
The Fund’s year-to-date returns now marginally exceed its Index but stilltrail the S&P 500 Index. The Fund has gained 10.19%, while its benchmarkIndex and S&P 500 Index have risen 9.60% and 15.92%, respectively.
Table I.PerformanceAnnualized for periods ended September 30, 2021
BaronPartners
FundRetail
Shares1,2,3
BaronPartners
FundInstitutionalShares1,2,3,4
RussellMidcapGrowthIndex2
S&P500
Index2
Three Months5 5.45% 5.52% (0.76)% 0.58%Nine Months5 9.98% 10.19% 9.60% 15.92%One Year 57.03% 57.43% 30.45% 30.00%Three Years 48.86% 49.25% 19.14% 15.99%Five Years 38.56% 38.93% 19.27% 16.90%Ten Years 27.29% 27.63% 17.54% 16.63%Fifteen Years 16.68% 16.94% 11.98% 10.37%Since Conversion
(April 30, 2003) 19.05% 19.26% 13.18% 10.97%Since Inception
(January 31, 1992) 16.33% 16.45% 10.90% 10.46%
The Fund’s long-term absolute and relative performance have been exceptional.As demonstrated in Table I, the Fund has meaningfully exceeded its Index overthe 1-, 3-, 5-, and 10- year periods. Additionally, for over 18 years since BaronPartners Fund converted into a mutual fund, it has an annualized return of19.26%. Since its conversion, it was ranked number one among all U.S. equityfunds (2,193 share classes) through September 30, 2021.*
Performance listed in the above table is net of annual operating expenses. Annual expense ratio for the Retail Shares as of December 31, 2020 was 1.56% (comprised ofoperating expenses of 1.31% and interest expense of 0.25%) and Institutional Shares was 1.30% (comprised of operating expenses of 1.05% and interest expense of0.25%). The performance data quoted represents past performance. Past performance is no guarantee of future results. The investment return and principal value of aninvestment will fluctuate; an investor’s shares, when redeemed, may be worth more or less than their original cost. The Adviser reimburses certain Baron Fund expensespursuant to a contract expiring on August 29, 2032, unless renewed for another 11-year term and the Fund’s transfer agency expenses may be reduced by expenseoffsets from an unaffiliated transfer agent, without which performance would have been lower. Current performance may be lower or higher than the performance dataquoted. For performance information current to the most recent month end, visit www.BaronFunds.com or call 1-800-99BARON.1 Reflects the actual fees and expenses that were charged when the Fund was a partnership. The predecessor partnership charged a 20% performance fee after reaching a
certain performance benchmark. If the annual returns for the Fund did not reflect the performance fees the returns would be higher. The Fund’s shareholders will not becharged a performance fee. The predecessor partnership’s performance is only for periods before the Fund’s registration statement was effective, which was April 30, 2003.During those periods, the predecessor partnership was not registered under the Investment Company Act of 1940 and was not subject to its requirements or therequirements of the Internal Revenue Code relating to registered investment companies, which, if it were, might have adversely affected its performance.
2 The Russell Midcap® Growth Index measures the performance of medium-sized U.S. companies that are classified as growth and the S&P 500 Index of 500 widely heldlarge cap U.S. companies. Russell Investment Group is the source and owner of the trademarks, service marks and copyrights related to the Russell Indexes. Russell is atrademark of Russell Investment Group. The indexes and the Fund include reinvestment of dividends, net of withholding taxes, which positively impact the performanceresults. The indexes are unmanaged. Index performance is not Fund performance; one cannot invest directly into an index.
3 The performance data in the table does not reflect the deduction of taxes that a shareholder would pay on Fund distributions or redemption of Fund shares.4 Performance for the Institutional Shares prior to May 29, 2009 is based on the performance of the Retail Shares, which have a distribution fee. The Institutional Shares do
not have a distribution fee. If the annual returns for the Institutional Shares prior to May 29, 2009 did not reflect this fee, the returns would be higher.5 Not annualized.
* This is a hypothetical ranking created by Baron Capital using Morningstar data and is as of 9/30/2021. Note, the peer group used for this analysis includes all U.S.equity share classes in Morningstar Direct domiciled in the U.S., including obsolete funds, index funds, and ETFs. The individual Morningstar Categories used for thisanalysis are the Morningstar Large Blend, Large Growth, Large Value, Mid-Cap Blend, Mid-Cap Growth, Mid-Cap Value, Small Blend, Small Growth, and Small ValueCategories. There were 2,193 share classes in these nine Morningstar Categories for the period from 4/30/2003 to 9/30/2021.
The Morningstar Large Growth Category consisted of 1,280, 1,235, 1,024, and 762 share classes for the quarter-to-date, 1-, 5-, and 10-year periods.Morningstar ranked Baron Partners Fund in the 1st, 1st, 1st, 1st, and 1st percentiles for the quarter-to-date, 1-, 5-, 10-year, and since conversionperiods, respectively. The Fund converted into a mutual Fund on 4/30/2003, and the category consisted of 417 share classes. On an absolute basis,Morningstar ranked Baron Partners Fund Institutional Share Class as the 3rd, 2nd, 1st, 1st, and 1st best performing share class in its Category, for thequarter-to-date, 1-, 3-, 5-, and 10-year periods, respectively.
Morningstar calculates the Morningstar Large Growth Category average performance and rankings using its Fractional Weightingmethodology. Morningstar rankings are based on total returns and do not include sales charges. Total returns do account formanagement, administrative, and 12b-1 fees and other costs automatically deducted from fund assets.© 2021 Morningstar. All Rights Reserved. The Morningstar information contained herein: (1) is proprietary to Morningstar and/or its contentproviders; (2) may not be copied or distributed; and (3) is not warranted to be accurate, complete, or timely. Neither Morningstar nor its contentproviders are responsible for any damages or losses arising from any use of this information. Past performance is no guarantee of future results.
BARONF U N D S
55

Baron Partners Fund
The market has been volatile. Investors still grapple with the lingeringeconomic implications of the COVID-19 pandemic. Concerns about supplychain disruptions, labor shortages, and wage rates have impacted manystock prices. Increased scrutiny by the Chinese government, companydefault risks, and rising interest rates have also given investors pause. In thisenvironment, companies that have demonstrated an ability to execute ontheir business plans have been rewarded. However, investors have alsoshifted to a more defensive stance favoring cyclical businesses rather thanthe fast-growing companies that we generally favor and that are perceivedto be in the crosshairs of these issues. We believe this is a good environmentfor our active investment approach.
Although Baron Partners Fund is a non-diversified portfolio, it is diversifiedby business type. In our quarterly analysis, we segment the Fund’s portfoliointo four business categories (Disruptive Growth, Financials, Real/Irreplaceable Assets, and Core Growth) and attempt to explain how eachhas performed in the current setting.
Disruptive Growth companies made the largest contribution, but also hadthe greatest dispersion of results. Three holdings gained more than 10% inthe quarter, while four positions declined more than 10%. Companies thatdemonstrated business advancements appreciated, while those that facedexternal pressures declined. The largest contributors to performance in thisgroup were Tesla, Inc., Space Exploration Technologies Corp. (“SpaceX”),and Moderna, Inc. These companies showed meaningful improvements inkey metrics. Despite global supply chain disruptions, Tesla delivered 241,000units in the period, a 73% increase over last year. And this growth is beforenew facilities open in Berlin and Texas and capacity upgrades areimplemented in China and California. Consolidation of chemistry materialsshould enable battery production to outpace vehicle growth. This higherproduction should lead to the energy storage business becoming moreimpactful for the company over the coming years and provide even moreupside for current shareholders. SpaceX reached orbital velocity with civilianpassengers on its Inspiration4 mission. Its altitude of 585 km surpassed theHubble Space Telescope and International Space Station. Its three-dayjourney significantly outpaced those of “comparable” companies like BlueOrigin and Virgin Galactic, which only reached a suborbital distance ofapproximately 100 km for mere seconds. While that SpaceX launch inspiredmany and raised significant funds for St. Jude’s Hospital, SpaceX’s othercommercial aspects also advanced. Its new Starlink satellites havesatellite-to-satellite communication capabilities (rather thansatellite-to-ground station communication capabilities). This link is faster,more secure, and provides greater coverage than previous versions. Finally,we believe Moderna (and BioNTech SE) vaccines are gaining increasedacceptance. We believe the use cases for mRNA biotechnology will expandin the coming years.
However, some Disruptive Growth businesses, like Zillow Group, Inc.,RingCentral, Inc., and Zymergen Inc., declined in value. We retain confidence
in Zillow and RingCentral. Both companies continue to grow despite perceivedcompetition and macro headwinds. Fundamentals of Zillow remain strongdespite residential real estate concerns. The company has obtained limitedmarket share for real estate transactions despite a superior experience. Webelieve it is positioned to grow. Its Premier Agent offering grew 82%; itsHomes revenue grew 71%; and, its Mortgage business grew 68%. We believethese high growth rates can be sustained as they continually take marketshare and expand their offerings. RingCentral’s annualized recurring revenuegrowth is at its highest rate in more than five years. Its partnerships, whichprovide access to approximately half of eligible customers, should assistcontinued customer penetration. The company is also an attractive target forlarger technology companies that desire RingCentral’s geographic reach andcarrier relationships. However, we exited the position in Zymergen after welost confidence in its ability to launch key products.
Financials and Real/Irreplaceable Assets companies had more uniformity intheir results. Inflation and interest rate outlooks provided a positivemacroeconomic environment for these segments. Financial technologybusinesses FactSet Research Systems, Inc. and MSCI, Inc. made the largestcontributions among the Fund’s Financials holdings. These companies havewell received new products along with a favorable sector backdrop. Newproducts have been successfully sold to a well-established and loyal client base.FactSet has reaccelerated growth without sacrificing margins. They haveimproved their deep sector data and moved infrastructure to the cloud. Theircustomer base has grown as a result. MSCI’s asset-based products hadappreciation and inflows. Additionally, it is replicating its public marketinformation success within the private markets. This expansion should enableyears of future growth. The soccer franchise Manchester United plc (which wecategorize as an “Irreplaceable Asset”) appreciated because of the reopening ofits stadium and the signing of incredibly talented Cristiano Ronaldo.Generational fans are eager to watch (in-person) and support the club.
Core Growth businesses were hurt by the rotation into more value andcyclical businesses. Despite the rotation, this business category stilloutperformed the broader Index. Gartner, Inc. and Adyen N.V. werestandouts, while GDS Holdings Limited and Activision Blizzard, Inc. werepressured by political activities. Gartner has accelerated growth, improvedmargins, and repurchased shares. Adyen improved growth in all regions. Itsnewer North American business expanded 80%. It also received a federalbanking license. This license will make Adyen less reliant on third-partyproviders and improve its service. It will now be able to settle transactionsdirectly, which will lower operational costs. But not all Core Growthbusinesses fared as well. GDS and Activision both faced regulatory concernsin China and investors shifted to more stable businesses. While we do notattempt to predict the Chinese government’s future regulatory changes,GDS is already experiencing a high level of government oversight. ItsChinese data center services are essential for the country’s growingeconomy. Increased government oversight in the segment should help theGDS offering standout among its peers.
56

September 30, 2021 Baron Partners Fund
Table II.Total returns by category for the three months ended September 30, 2021
% ofNet Assets
(as of9/30/2021)
TotalReturn
(%)
Contributionto Return
(%)
Disruptive Growth 61.3 6.43 3.75
Moderna, Inc. 0.2 60.81 0.13
BioNTech SE 0.2 19.50 0.07
Tesla, Inc. 45.3 14.09 5.70
Guidewire Software, Inc. 1.5 5.46 0.09
Space Exploration TechnologiesCorp. 4.7 4.24 0.19
Northvolt AB 0.1 1.61 0.00
Iridium Communications Inc. 0.9 –0.35 0.01
Airbnb, Inc. – –6.88 –0.00
Shopify Inc. 1.3 –7.20 –0.09
Archer Aviation Inc. 0.1 –9.26 –0.01
Spotify Technology S.A. 2.5 –18.16 –0.26
RingCentral, Inc. 1.1 –25.17 –0.35
Zillow Group, Inc. 3.4 –27.71 –1.37
Zymergen Inc. – –79.35 –0.35
Financials 13.9 5.57 0.77
FactSet Research Systems, Inc. 3.9 17.89 0.61
MSCI, Inc. 1.3 14.31 0.18
Brookfield Asset ManagementReinsurance Partners Ltd. 0.1 7.30 –0.01
Brookfield Asset Management Inc. 0.7 5.20 0.05
Cohen & Steers, Inc. 0.4 2.58 0.01
The Charles Schwab Corp. 4.0 0.28 –0.02
Arch Capital Group Ltd. 3.5 –1.95 –0.06
Real/Irreplaceable Assets 13.3 4.85 0.58
Manchester United plc 1.3 28.29 0.32
Red Rock Resorts, Inc. 0.5 20.57 0.09
Vail Resorts, Inc. 4.7 5.54 0.21
Gaming and Leisure Properties, Inc. 1.2 1.31 0.02
Hyatt Hotels Corp. 3.6 –0.50 –0.02
Marriott Vacations WorldwideCorp. 1.5 –0.88 –0.03
Douglas Emmett, Inc. 0.5 –5.17 –0.03
% ofNet Assets
(as of9/30/2021)
TotalReturn
(%)
Contributionto Return
(%)
Core Growth 23.4 2.30 0.75
Gartner, Inc. 3.0 25.47 0.65
Adyen N.V. 2.3 13.99 0.36
CoStar Group, Inc. 8.9 3.91 0.38
Warby Parker Inc. 0.1 –0.90 –0.00
IDEXX Laboratories, Inc. 7.0 –1.53 –0.01
Applovin Corporation 0.1 –3.72 –0.00
HEICO Corporation 0.4 –5.06 –0.03
Krispy Kreme, Inc. 0.4 –18.06 –0.07
Activision Blizzard, Inc. 0.9 –18.90 –0.22
GDS Holdings Limited 0.3 –28.54 –0.31
Russell Midcap Growth Index –0.76
Cash –11.9 0.28 –0.03
Fees – –0.31 –0.33
Total 100.0 5.49* 5.49*
Sources: FactSet PA, BAMCO, and Russell, Inc.* Represents the blended return of all share classes of the Fund.
Table III.Top contributors to performance for the quarter ended September 30, 2021
YearAcquired
MarketCap
WhenAcquired(billions)
QuarterEnd
MarketCap
(billions)Total
ReturnPercentImpact
Tesla, Inc. 2014 $22.0 $776.9 14.09% 5.70%Gartner, Inc. 2013 5.7 25.4 25.47 0.65FactSet Research
Systems, Inc. 2007 2.7 14.9 17.89 0.61CoStar Group,
Inc. 2005 0.7 34.0 3.91 0.38Adyen N.V. 2020 27.3 85.4 13.99 0.36
Tesla, Inc. designs, manufactures, and sells fully electric vehicles, solarproducts, energy storage solutions, and battery cells. The stock contributedas Tesla continued to present strong deliveries growth and a meaningfulimprovement in profitability despite a complex supply-chain environment.Demand remains robust, new localized manufacturing capacity is expectedto support more efficient growth, and the autonomous program isaccelerating. We expect Tesla’s growing vehicle offering, battery technology,and energy businesses to drive meaningful growth opportunities.
57

Baron Partners Fund
Shares of Gartner, Inc., a provider of syndicated research, contributed toperformance after reporting financial results that exceeded Street estimates.Growth in the company’s research business has reaccelerated to double-digit levels. Research growth is led by the company’s GBS segment, which isbenefiting from a multi-year investment cycle. We expect improved revenuegrowth and focus on cost control to drive margin expansion and enhancedcash generation. The company’s balance sheet is in excellent shape and cansupport aggressive share repurchases and bolt-on acquisitions.
Shares of FactSet Research Systems, Inc., a leading provider of investmentmanagement tools, contributed to performance. FactSet reported strongearnings and provided encouraging guidance as technology and contentinvestments the company has been making over the past few years startedto pay off with stronger growth. We retain conviction in FactSet due to thelarge addressable market, consistent execution on both new productdevelopment and financial results, and robust free cash flow generation.
Shares of CoStar Group, Inc., a real estate information and marketingservices company, contributed to performance this quarter. The companyhas moved to enter the residential real estate market, which meaningfullyexpands its total addressable market and should amplify growth as CoStarlaunches new technological innovations. While this move requiresmeaningful investments in the short term, we expect it to ultimately yieldhigh returns that will boost CoStar’s revenue growth rate and margin profileover time.
Adyen N.V. provides technology that enables merchants to acceptelectronic payments. The stock increased after the company reported strongresults for the first half of the year, with 46% revenue growth and 65%EBITDA growth. Processed volume growth rose to 67% due to resiliente-commerce demand, easier comparisons, and the onboarding of eBay.Margins also expanded despite rapid hiring and significant growthinvestments.
Table IV.Top detractors from performance for the quarter ended September 30, 2021
YearAcquired
MarketCap
WhenAcquired(billions)
QuarterEnd
MarketCap orMarket
CapWhenSold
(billions)Total
ReturnPercentImpact
Zillow Group, Inc. 2015 $ 1.5 $22.4 –27.71% –1.37%RingCentral, Inc. 2021 23.5 19.9 –25.17 –0.35Zymergen Inc. 2021 3.8 0.8 –79.35 –0.35GDS Holdings
Limited 2019 7.0 10.6 –28.54 –0.31Spotify
TechnologyS.A. 2020 22.6 43.0 –18.16 –0.26
Zillow Group, Inc. operates leading U.S. real estate sites, a mortgagemarketplace, and a home-buying business. Shares were down due toconcerns around rising interest rates and the potential knock-on effects tothe housing market. Our channel checks have indicated that the housingmarket remains robust. Even if demand were to soften, Zillow’s offeringcould become even more valuable as it delivers high-quality buyer and sellerleads. Longer term, we believe Zillow has an ample runway for growth givenits strong management team and large customer base.
Despite an acceleration in revenue and increased guidance, shares ofRingCentral, Inc., a leading Unified Communications as a Service provider,lagged during the quarter on investor fears around contraction in its totaladdressable market and increasing competition from Microsoft and Zoom.We believe the market is big enough to support multiple long-term winnersand that RingCentral can continue to innovate at a fast rate with itsplatform, sustaining pricing and winning strong share.
Zymergen Inc. is a company dedicated to biofacturing, or harnessingbacteria to manufacture materials. Zymergen was a detractor following anunexpected update announcing both a major delay in the launch of leadproduct Hyaline and the removal of CEO Josh Hoffman, who was replacedby company chairman and former Illumina CEO Jay Flatley. We exited ourposition given material impacts to the business.
GDS Holdings Limited is a leading Chinese data center operator within Tier1 cities. Shares fell in concert with a general sell-off in Chinese technology-related companies in response to tightening regulations and unknown futuregovernment actions against businesses that may not be perceived as alignedwith the government’s goals. We retain conviction in GDS given durablesecular tailwinds in cloud adoption (early innings in China), increasedvisibility of growth, ample capital, and its status as a provider of choice toChina’s leading technology companies.
Spotify Technology S.A. is a leading digital music service available in 178international markets, offering on-demand audio streaming through paidpremium subscriptions as well as a free ad-supported model. Shares weredown as engagement declined while economies reopened and pandemicrestrictions were lifted. We continue to view Spotify as a long-term winnerin music streaming with potential to go from 158 million paying subscriberstoday to over 250 million in four years, driven by its scalable core musicproduct as well as its growing library of spoken word content.
Investment Strategy and Portfolio Structure
Baron Partners Fund seeks to invest in businesses that we believe coulddouble in value within five or six years. The Fund invests for the long term ina focused portfolio of appropriately capitalized, well-managed growthbusinesses at attractive prices across market capitalizations. We attempt tocreate a portfolio of approximately 30 securities diversified by GICS sectors,but with the top 10 positions representing a significant portion of net assets.These businesses are identified by our analysts and portfolio managers usingour proprietary research. We think these well-managed businesses havesustainable competitive advantages and strong, long-term growthopportunities. We use modest leverage to enhance returns, which increasesits volatility.
As of September 30, 2021, Baron Partners Fund held 36 investments. Themedian market capitalization of these growth companies was $15.9 billion.The top 10 positions represented 88.8% of net assets. Leverage was 11.9%.
Portfolio leverage has increased slightly but is still significantly belowhistorical levels. We have traditionally managed the portfolio with 20% to30% leverage (the average leverage over the prior five years was 21.3%). Atthe start of 2020, leverage was 27.0%. However, due to a combination of arapidly rising market, higher market volatility, and increased concentrationin our top holdings, we managed risk by reducing the amount of leverageused. Quarterly leverage bottomed at 3.3% at the end of March 2021.Market volatility enabled us to make a few new investments in companieswe have long followed at what we believe are attractive prices. Therefore,leverage has slowly risen, but is still meaningfully below historical levels.
58

September 30, 2021 Baron Partners Fund
While we expect legacy positions to be the main contributors ofperformance in the near term, we expect these new investments to becontributors in the future.
The long-term absolute and relative performance of the Fund has been verygood. The Fund has returned 16.45% annualized since inception as a privatepartnership on January 31, 1992, beating its benchmark Index by 5.55% peryear. The Fund’s performance has also exceeded its Index over the prior 1-,3-, 5-, 10-, 15-, and 20-year periods. In addition to viewing the Fund’sreturns over various trailing periods, we believe it is helpful to understandhow the Fund has performed over an economic cycle. (Please see Table V.)
The Fund has appreciated considerably in good times…
The Fund performed very well during the current economic expansion thatfollowed the Financial Panic. For nearly 13 years, there has been sizablegrowth in the economy and stock market appreciation. While the markethad strong returns, the Fund’s returns were significantly better. BaronPartners Fund’s annualized return during this period was 24.34%. Had youhypothetically invested $10,000 in the Fund on January 31, 2008, it wouldhave been worth $160,864 on September 30, 2021. Had you only tried tomimic the Index’s returns by investing in a Fund designed to track the Index,that $10,000 hypothetical investment would be worth $82,301.
The Fund has retained value in difficult times…
We believe it is equally important to examine the Fund’s performanceduring more challenging economic times. The nine-year period from theInternet Bubble collapse through the Financial Panic (12/31/1999–12/31/2008) saw lower returns for the Fund. It had annualized returns of1.54%. However, the Index declined substantially. $10,000 hypotheticallyinvested in the Fund at the start of this period would have been worth$11,479 after those nine years. A $10,000 hypothetical investment in fundsdesigned to track the Index would be worth only $6,488. The Fund preserved(and slightly grew) capital during this difficult economic time because itsinvestments in high-quality growth businesses were able to weather theenvironment and enhance their competitive positioning.
The strong relative returns during difficult times are what we believe setsthe Fund apart and makes its returns over an entire cycle exceptional. A$10,000 hypothetical investment at the start of the cycle on December 31,1999 would have been worth $184,651 on September 30, 2021. That same$10,000 hypothetical investment would be worth 71% less had it beeninvested in a fund designed to track the Russell Midcap Growth Index. Thatinvestment would be worth only $53,394.
During periods of strong economic expansion, investors often disregardmore challenging periods. Losing capital during those periods, we believe,makes it nearly impossible to have exceptionally strong returns over thelong term. Baron Partners Fund has shown a prior ability to modestly growcapital during those tough times. We believe the high-quality growthportfolio should be able to perform well again in future difficult economicstretches, although there is no guarantee that will be the case.
Table V.PerformanceMillennium to COVID-19 Pandemic. The Impact of Not Losing Money.
Millennium Internet Bubbleto Financial Panic
12/31/1999 to 12/31/2008
Financial Panic toPresent
12/31/2008 to 9/30/2021
Millennium Internet Bubbleto Present
12/31/1999 to 9/30/2021
Inception1/31/1992 to
9/30/2021
Value$10,000 Annualized
Value$10,000 Annualized
Value$10,000 Annualized
Value$10,000 Annualized
Baron Partners Fund (Institutional Shares) $11,479 1.54% $160,864 24.34% $184,651 14.35% $917,438 16.45%Russell Midcap Growth Index $ 6,488 (4.69)% $ 82,301 17.98% $ 53,394 8.01% $215,260 10.90%S&P 500 Index $ 7,188 (3.60)% $ 61,906 15.37% $ 44,498 7.10% $191,097 10.46%
The indexes are unmanaged. Index performance is not Fund performance; one cannot invest directly into an index.
59

Baron Partners Fund
Portfolio Holdings
Table VI.Top 10 holdings as of September 30, 2021
YearAcquired
MarketCap
WhenAcquired(billions)
QuarterEnd
MarketCap
(billions)
QuarterEnd
InvestmentValue
(millions)
Percentof Total
Investments
Tesla, Inc. 2014 $22.0 $776.9 $3,237.6 40.5%CoStar Group, Inc. 2005 0.7 34.0 632.5 7.9IDEXX
Laboratories, Inc. 2013 4.7 52.9 497.5 6.2Space Exploration
TechnologiesCorp. 2017 – – 334.5 4.2
Vail Resorts, Inc. 2008 1.6 13.5 334.1 4.2The Charles
Schwab Corp. 1992 1.0 137.5 284.1 3.5FactSet Research
Systems, Inc. 2007 2.7 14.9 276.3 3.5Hyatt Hotels Corp. 2009 4.2 8.5 254.4 3.2Arch Capital Group
Ltd. 2002 0.6 15.1 250.1 3.1Zillow Group, Inc. 2015 1.5 22.4 243.6 3.0
Thank you for joining us as fellow shareholders in Baron Partners Fund. Wecontinue to work hard to justify your confidence and trust in ourstewardship of your hard-earned savings. We remain committed toproviding you with the information we would like to have if our roles werereversed. We hope this letter enables you to make an informed decisionabout whether this Fund remains an appropriate investment.
Respectfully,
Ronald BaronCEO and Lead Portfolio ManagerSeptember 30, 2021
Michael BaronCo-Portfolio Manager
Investors should consider the investment objectives, risks, and charges and expenses of the investment carefully before investing. The prospectusand summary prospectus contain this and other information about the Funds. You may obtain them from its distributor, Baron Capital, Inc., bycalling 1-800-99BARON or visiting www.BaronFunds.com. Please read them carefully before investing.
Risks: The Fund is non-diversified which means, in addition to increased volatility of the Fund’s returns, it will likely have a greater percentageof its assets in a single issuer or a small number of issuers, including in a particular industry than a diversified fund. Single issuer risk is thepossibility that factors specific to an issuer to which the Fund is exposed will affect the market prices of the issuer’s securities and therefore thenet asset value of the Fund. As of the date of the latest prospectus supplement, about 40% of the Fund’s assets are invested in Tesla stock.Therefore, the Fund is exposed to the risk that were Tesla stock to lose significant value, which could happen rapidly, the Fund’s performancewould be adversely affected. Specific risks associated with leverage include increased volatility of the Fund’s returns and exposure of the Fundto greater risk of loss in any given period. The Fund may not achieve its objectives. Portfolio holdings are subject to change. Current and futureportfolio holdings are subject to risk.
The discussions of the companies herein are not intended as advice to any person regarding the advisability of investing in any particularsecurity. The views expressed in this report reflect those of the respective portfolio managers only through the end of the period stated in thisreport. The portfolio manager’s views are not intended as recommendations or investment advice to any person reading this report and aresubject to change at any time based on market and other conditions and Baron has no obligation to update them.
This report does not constitute an offer to sell or a solicitation of any offer to buy securities of Baron Partners Fund by anyone in anyjurisdiction where it would be unlawful under the laws of that jurisdiction to make such offer or solicitation.
BAMCO, Inc. is an investment adviser registered with the U.S. Securities and Exchange Commission (SEC). Baron Capital, Inc. is a limitedpurpose broker-dealer registered with the SEC and member of the Financial Industry Regulatory Authority, Inc. (FINRA).
60

September 30, 2021 Baron Fifth Avenue Growth Fund
ALEX UMANSKY Retail Shares: BFTHXInstitutional Shares: BFTIX
PORTFOLIO MANAGER R6 Shares: BFTUX
DEAR BARON FIFTH AVENUE GROWTH FUND SHAREHOLDER:
PERFORMANCE
Baron Fifth Avenue Growth Fund (the “Fund”) declined 1.4% (InstitutionalShares) during the third quarter, which compared to a gain of 1.2% for theRussell 1000 Growth Index (“R1KG”) and a gain of 0.6% for the S&P 500Index (“SPX”), the Fund’s benchmarks. Year-to-date, the Fund is up 10.4%,which trails the returns of 14.3% and 15.9% for its two benchmarks,respectively.
Table I.PerformanceAnnualized for periods ended September 30, 2021
Baron FifthAvenueGrowth
FundRetail
Shares1,2
Baron FifthAvenueGrowth
FundInstitutional
Shares1,2,3
Russell1000
GrowthIndex1
S&P500
Index1
Three Months4 (1.48)% (1.42)% 1.16% 0.58%Nine Months4 10.22% 10.44% 14.30% 15.92%One Year 19.13% 19.44% 27.32% 30.00%Three Years 22.62% 22.93% 22.00% 15.99%Five Years 24.20% 24.52% 22.84% 16.90%Ten Years 20.34% 20.65% 19.68% 16.63%Fifteen Years 12.29% 12.52% 13.33% 10.37%Since Inception
(April 30, 2004) 11.78% 11.98% 12.31% 10.33%
This was not a good quarter for us. We were down a bit, and ourbenchmarks were up a bit. While the investing environment had shifted backto a headwind again, relative to the kinds of companies that we tend tofavor, it was our stock selection that was the culprit.
From an attribution perspective, the Fund’s underperformance was drivenentirely by poor stock selection, which detracted from performanceeverywhere except for Communication Services and Real Estate. On theother hand, overweights in Health Care and Information Technology (“IT”)and underweights in Industrials and Consumer Discretionary added value.
Looking under the hood within IT, a portion of our underperformance wasdriven by being overweight the worst performing sub-industries such asinternet services & infrastructure and data processing & outsourced services,which were down 24.8% and 5.8%, respectively, in the R1KG. Our stockselection was also disappointing in IT, with Wix, Twilio, and RingCentralaccounting for most of the weakness in the sector. Within Health Care, ourlife sciences tools & services holdings (10X Genomics and Illumina) wereresponsible for all of our performance shortfall in the sector due to aresurgence of the COVID Delta variant, which slowed down lab activity,negatively impacting those businesses in the near term. Offsetting some ofthose headwinds was favorable stock selection in Communication Services,namely driven by our ZoomInfo and Alphabet positions, along with anunderweight in Industrials, which together added 86bps to our relativeresults.
Performance listed in the table above is net of annual operating expenses. Annual expense ratio for the Retail and Institutional Shares as of September 30, 2020was 1.05% and 0.78%, but the net annual expense ratio was 1.00% and 0.75% (net of the Adviser’s fee waivers, restated to reflect current fee waivers). Theperformance data quoted represents past performance. Past performance is no guarantee of future results. The investment return and principal value of aninvestment will fluctuate; an investor’s shares, when redeemed, may be worth more or less than their original cost. The Adviser reimburses certain Baron Fundexpenses pursuant to a contract expiring on August 29, 2032, unless renewed for another 11-year term and the Fund’s transfer agency expenses may be reducedby expense offsets from an unaffiliated transfer agent, without which performance would have been lower. Current performance may be lower or higher than theperformance data quoted. For performance information current to the most recent month end, visit www.BaronFunds.com or call 1-800-99BARON.
The Fund’s 3Q 2021 historical performance was impacted by gains from IPOs and there is no guarantee that these results can be repeated or that the Fund’s level ofparticipation in IPOs will be the same in the future.
1 The Russell 1000® Growth Index measures the performance of large-sized U.S. companies that are classified as growth and the S&P 500 Index of 500 widely held large cap U.S.companies. Russell Investment Group is the source and owner of the trademarks, service marks and copyrights related to the Russell Indexes. Russell is a trademark of RussellInvestment Group. The indexes and the Fund include reinvestment of dividends, net of withholding taxes, which positively impact the performance results. The indexes areunmanaged. Index performance is not Fund performance; one cannot invest directly into an index.
2 The performance data in the table does not reflect the deduction of taxes that a shareholder would pay on Fund distributions or redemption of Fundshares.
3 Performance for the Institutional Shares prior to May 29, 2009 is based on the performance of the Retail Shares, which have a distribution fee. TheInstitutional Shares do not have a distribution fee. If the annual returns for the Institutional Shares prior to May 29, 2009 did not reflect this fee, thereturns would be higher.
4 Not annualized.
BARONF U N D S
61

Baron Fifth Avenue Growth Fund
On an absolute performance basis, we had a few more detractors thancontributors with 9 double-digit gainers against 10 double-digit decliners.Acceleron, ServiceNow, Alphabet, EPAM, Dynatrace, Datadog, Snowflake,ZoomInfo, and Intuitive Surgical contributed over 25bps each to absolutereturns. Wix, Twilio, RingCentral, 10X Genomics, Alibaba, Zoom Video,Illumina, Amazon, and PayPal detracted over 25bps each. All in all, therewas just a bit more bad than good, which is how we ended up down 1.4% forthe quarter.
Two of the most important questions we must answer prior to making aninvestment are “What is the source of the company’s competitiveadvantage?” followed by “Why is it sustainable?” Similarly, more and moreoften we find our investors posing the same two questions to us. Theimportance of having an edge in our business is fairly obvious. If we expectto generate excess risk-adjusted returns over a benchmark and do it over thelong term, there must be something unique and differentiated andrepeatable about the way we do it. There must be some sort of an edge,otherwise, the expectation for excess returns would be entirely irrational.
We can think of five sources of competitive advantage in the business ofinvesting: informational, analytical, behavioral, time arbitrage, andstructural. An informational edge is typically referred to or interpreted ashaving access to information that other market participants do not have. Ananalytical edge is the ability to analyze the same information everyone has,only in a differentiated way – build better models, conduct better duediligence, and perform more rigorous valuation work. A behavioral edge isharder to explain, and even harder to execute, but to us, it means creatingan environment most conducive to better decision-making, whileovercoming behavioral biases. A time arbitrage edge refers to a long-termownership mindset and longer-term thinking, while a structural edge can beseen in the strength of the manager’s platform, as well as the mandate’sflexibility and the size of the opportunity set.
The informational edge has largely been arbitraged away over time. Sincethe introduction of fair disclosure regulations and the widespread adoptionof mobile internet, all interested parties can access all legally availableinformation at the same time. Still, there is an advantage in knowing whatquestions to ask, what information to consider and to ignore, and how toproperly weigh it. We think we may have a slight edge in that. Similarly, theanalytical edge is becoming increasingly more difficult to harvest. While wehire the very best people we can, so does the competition. This is the mostcompetitive arena in the world! The stock market is a complex adaptivesystem that is constantly learning and becoming smarter from the collectiveinputs. If we have an analytical edge, it is once again likely to be slight. Timearbitrage, behavioral, and structural are where we believe we really setourselves apart.
“Buy, sell, repeat! No room for ‘hold’ in whipsawing markets”1 urged theheadline of a 2020 Reuters article. In years past, information was delayed,and trading was costly. Investors would typically call their investmentadvisor if they were concerned about the market and wanted to sell a stock,and the advisor would at least get an opportunity to explain what is goingon, and a shot at advocating patience. Now trading is free (not onlycommission-wise, but bid-ask spread-wise as well) and Schwab’s robo-adviser is not going to “talk” anyone out of taking action. At the same time,you have high-frequency and algorithmic trading vacuuming up every ounceof inefficiency that is being created by Robinhood’s daily “warriors.” Even
before ML and AI, computers and algorithms could recognize patterns muchfaster than human beings. In the short term, human logic and intuition can’tpossibly compete with the speed or size of capital being deployed by thealgos. But computers do not know how to assess a business’ uniqueness andcompetitive advantage. They do not know how to value culture or priceingenuity. We do. These factors may not impact the day-to-day price of astock, but they will determine whether a company will likely be a successfulinvestment. While most market participants are focused on trying to figureout whether consensus expectations are too high or too low for the nextquarter or two, we are focused on answering entirely different questions –How big can the business be at maturity? How sustainable are itscompetitive advantages? How critical are the problems they solve forcustomers, and could they solve more problems over time? How much valuedoes every dollar that is reinvested back into the business generate? Ismanagement building the right culture? The average holding period for aU.S. stock in 2020 was 5.5 months. The Fund’s turnover in 2020 was 10.7%,which translates to a holding period of 9.3 years! Our long-term ownershipmindset and longer-term thinking is a significant edge in our view.
Over many years, we have developed an investment process focused onminimizing behavioral biases. Confirmation bias is when investors start with aview and then go look for data that fits and confirms that view rather thanvice-versa. Recency bias is assigning more weight in decision making to themost recent news and events. Groupthink is often a dangerous pitfall whenthere is a breakdown in diversity. We work to minimize those biases bypracticing probabilistic thinking – making investment decisions against arange of possible outcomes and their respective probabilities andconsequences. Seeking disconfirming evidence and differing points of vieware core to our research approach and due diligence process. For instance,rather than interview the partners and customers of our companies, we focusmuch of our due diligence on the partners and customers of theircompetitors. Requiring conviction in the duration of growth enables us toassign a more appropriate weight to recent developments and assess themagainst our long-term thesis. It also helps us to be patient if the stock pricegoes against us. Most of these investment blind spots, once identified andinternalized, are no longer blind spots. But we take it a step further. Wedeliberately focus on creating an environment that is most conducive togood, balanced decision-making with an emphasis on separating ouremotions from facts to enable objective investment decision making. We buyonly when we gain conviction in the duration of growth, with a presence of amargin of safety relative to our estimate of intrinsic value. We sell when ouroriginal thesis is no longer valid, when we judge the shares to be meaningfullyovervalued, or if we believe we have made a mistake. This all seems simpleenough, but it takes years of practice and is by no means easy. Knowledgealone is not enough. It takes time and perseverance to learn how to translateknowledge into behavior. We believe our behavioral edge is quite meaningful.
Finally, Baron Capital’s platform as well as the Fund’s ability to invest in thebest ideas anywhere in the world give us a meaningful structural advantage.Over its nearly 40-year history, the Firm has built a culture, anorganizational structure, and a reputation as a high-quality, long-terminvestor. We are solely focused on investing in unique, competitivelyadvantaged, growing businesses for the long term. The incentives for ALL ofour investment professionals are driven by success in long-term investmentoutcomes. The vertical structure of our research team enables us toaccumulate deep industry expertise, better identify disruptive change
1 https://www.reuters.com/article/us-health-coronavirus-short-termism-anal/buy-sell-repeat-no-room-for-hold-in-whipsawing-markets-idUSKBN24Z0XZ
62

September 30, 2021 Baron Fifth Avenue Growth Fund
dynamics, and build pattern recognition over time. Our collaborative culturepromotes diversity of opinions and enables us to make better decisions,while continuously learning from one another.
When we add it all up, we think there is reason to continue to be optimisticabout what lies ahead.
Table II.Top contributors to performance for the quarter ended September 30, 2021
Quarter EndMarket Cap
(billions)PercentImpact
Acceleron Pharma Inc. $ 10.5 0.55%ServiceNow, Inc. 123.3 0.49Alphabet Inc. 1,779.8 0.46EPAM Systems, Inc. 32.3 0.42Dynatrace Holdings LLC 20.2 0.35
Acceleron Pharma Inc. is a biotechnology company with the rare profile ofhaving two blockbuster assets in the pipeline: cardiovascular drugsotatercept and anemia drug luspatercept. Sotatercept helps cure pulmonaryarterial hypertension (“PAH”). PAH is caused by the progressive structuralremodeling of the pulmonary arteries, which eventually results in heartfailure and death. Acceleron’s drug sotatercept acts by rebalancing signaling,thereby reversing the vascular remodeling seen in PAH. This would be thefirst PAH drug with the potential to reverse the disease. Shares increased37.1% during the quarter on news that Acceleron was the target of apotential acquisition by Merck, which was announced in late September.
ServiceNow, Inc. offers cloud-based solutions focused on improvingworkflow efficiency through automation and digitalization. ServiceNow’sstock appreciated 13.2% during the quarter due to an upbeat analyst dayand a strong quarterly report that described improving growth andprofitability trends, supported by market demand, ServiceNow’s leadershippositioning, and the expanding capabilities of its flexible platform. After2020’s complex spending environment, which was characterized by longersales cycles, we expect the accelerated demand from digital transformationinitiatives at enterprise customers in 2021 to continue into 2022.
Alphabet Inc. is the parent company of Google, the world’s largest search andonline advertising company. Shares of Alphabet were up 8.0% in the quarterdriven by further acceleration in ad spending (with total revenues up 62%year-over-year, and a 2-year CAGR of 26%), strong cloud revenue growth (up54% in the second quarter year-over-year), and continued cost controls(operating margins reached 31%). We remain excited about Alphabet’s meritsas it continues to benefit from growth in mobile and online video advertising,which accrues to its core assets of search, YouTube, and the Google adnetwork. We are further encouraged by Alphabet’s investments in AI,autonomous driving (Waymo), and life sciences (Verily, Calico).
EPAM Systems, Inc. provides outsourced software development services tobusiness customers. Shares continued their upward trend and gained 11.6%during the quarter driven by strong financial results (revenues up 39% year-over-year) that exceeded Street expectations. EPAM operates at theforefront of digitization by helping customers optimize ways to interact withtheir clients, enabling them to become more engaging, responsive, andefficient. Following last year’s COVID-driven slowdown, investments indigital transformation have risen in priority, and EPAM has seen a strongrecovery in demand and revenue growth. We remain excited about EPAM’slong runway for growth underpinned by the need for digital transformations
and the company’s strong execution in addressing this growing demand.Despite years of strong double-digit growth, it still accounts for less than 3%of the $150 billion annual spending on digital engineering services.
Dynatrace Holdings LLC is a software company offering a full-stacksolution that consists of application performance monitoring, infrastructure,and log management. Dynatrace shares appreciated 21.5% during thequarter as the company reported strong results, underpinned by robustcustomer demand as a result of accelerating digital transformation trends.With its new, function-rich platform, and continued investments in salesand marketing, Dynatrace is experiencing record competitive win rates. Wehave high conviction in Dynatrace’s long growth duration driven by thesecular tailwinds of cloud computing, increasingly complex technologystacks (multi-cloud hybrid environments), and a growing demand forapplication monitoring.
Table III.Top detractors from performance for the quarter ended September 30, 2021
Quarter EndMarket Cap or
Market CapWhen Sold(billions)
PercentImpact
Wix.com Ltd. $ 11.1 –0.73%Twilio Inc. 56.5 –0.67RingCentral, Inc. 19.9 –0.6610X Genomics, Inc. 16.1 –0.51Alibaba Group Holding Limited 519.9 –0.38
Wix.com Ltd. is the leading provider of cloud software that helps micro-businesses build and maintain their websites as well as operate theirbusinesses. Shares of Wix declined 32.5% during the third quarter due to aslowdown in new customer additions as a result of abating positive COVIDtrends, which drove a pull-forward in demand and a material rerating of thestock during the early stages of the pandemic. We continue believing inWix’s long-term opportunity as it helps small businesses digitize, which hasbecome crucial, especially in a post-COVID world. Over time, Wix wouldalso benefit from continued innovation on its platform, expanding the set ofsolutions it offers small business owners.
Shares of Twilio Inc., the leading Communications Platform-as-a-Serviceprovider, corrected 19.1% during the third quarter despite reporting over50% year-over-year organic revenue growth in its second quarter results.This decline was driven by investor concerns around a potential slowdownfrom the accelerated growth trends seen during the last 18 months as wellas gross margin pressure, which was slightly below consensus. The marginpressure resulted from higher messaging volumes and strong internationalgrowth, where margins are lower due to higher connection fees. Wecontinue to believe that the accelerating pace of digitization will enableTwilio to grow at high rates for many years and that margins will improveover time as its product portfolio scales.
Despite an acceleration in revenue and higher guidance, shares ofRingCentral, Inc., a leading Unified Communications-as-a-Service provider,lagged during the quarter. RingCentral’s stock declined 25.1% on investorfears around the company’s ability to maintain business growth trendsrealized over the last 18 months and increasing competition from Microsoftand Zoom. We believe the market is large enough to support multiple long-term winners and that RingCentral can continue innovating at a fast rate,sustaining pricing, and winning market share, which will support acceleratedgrowth rates for years to come.
63

Baron Fifth Avenue Growth Fund
10X Genomics, Inc. sells products that combine hardware, software, andchemistry to provide life sciences researchers with single-cell, spatial, and insitu (targeted gene expression maps on specific tissue sections) views ofbiological systems. Shares corrected 25.7% in the quarter after rising 38.3%in the first half as high-valuation, high-growth companies in tools/diagnostics came under pressure following renewed uncertainty around theimpact of the Delta variant on lab activity. We view 10X Genomics as aleader in cutting-edge life sciences research and maintain long-termconviction.
Alibaba Group Holding Limited is the largest retailer and e-commercecompany in China. Alibaba operates shopping platforms Taobao and Tmalland owns 33% of Ant Group, which operates Alipay, China’s largest third-party online payment provider. Shares of Alibaba were down 14.5% for theperiod held, driven by the continued crackdown of Chinese regulators onlarge technology platforms. We decided to sell our position due to thewidening range of possible outcomes on the regulatory front and theincreased risk in the business.
PORTFOLIO STRUCTURE
The Fund’s portfolio is constructed on a bottom-up basis with the quality ofideas and conviction level determining the size of each investment. Sectorweights tend to be an outcome of the portfolio construction process and arenot meant to indicate a positive or a negative “view.” As of September 30,2021, our top 10 positions represented 45.8% of the Fund and the top 20were 73.1%. IT, Health Care, Communication Services, ConsumerDiscretionary, and Financials made up 96.4% of net assets. The remaining3.6% was made up of Equinix, a REIT classified in Real Estate; GM Cruiseand SpaceX, our two private investments classified in Industrials; and cash.
Table IV.Top 10 holdings as of September 30, 2021
Quarter EndMarket Cap
(billions)
Quarter EndInvestment
Value(millions)
Percent ofNet Assets
Amazon.com, Inc. $1,663.7 $63.3 7.6%Alphabet Inc. 1,779.8 58.1 6.9ServiceNow, Inc. 123.3 39.9 4.8Facebook, Inc. 956.9 39.5 4.7EPAM Systems, Inc. 32.3 36.3 4.3Adobe Inc. 273.9 31.5 3.8Intuitive Surgical, Inc. 118.2 31.2 3.7Veeva Systems Inc. 44.2 28.9 3.5ASML Holding N.V. 309.2 27.5 3.3Mastercard Incorporated 343.1 27.0 3.2
RECENT ACTIVITY
During the quarter, we initiated two new investments – the Southeast Asiane-commerce leader, Sea, and a leading cloud-based platform for therestaurant industry, Toast. We also added to eight existing holdings as wecontinued putting the Fund’s inflows to work.
Table V.Top net purchases for the quarter ended September 30, 2021
Quarter EndMarket Cap
(billions)
AmountPurchased(millions)
Sea Limited $176.0 $8.1Shopify Inc. 169.2 6.4NVIDIA Corporation 517.9 6.0Square, Inc. 110.3 5.7Toast, Inc. 25.1 4.0
Our largest purchase in the quarter was our new position in Sea Limited.Sea is a pan-Southeast Asian technology conglomerate with a #1 regionalposition in e-commerce (under the Shopee brand), a highly profitable globaldigital gaming business (led by the hit game Free Fire), and a nascent, fast-growing regional digital financial services business. Sea started a decade agoas a regional distributor of digital mobile games, found immense successwith its proprietary Free Fire game (which has become one of the largestmobile gaming properties in the world in recent years), and has since beeninvesting the cash generated from that segment into its fintech ande-commerce segments, the latter of which became the largest platform inSoutheast Asia in 2020 and expanded into Latin America last year. We viewe-commerce and digital financial services as particularly large opportunitiesacross Southeast Asia, owing to the region’s low e-commerce penetration(less than 10% region-wide, less than 5% in some countries like Vietnamand the Philippines) and large un/under-banked populations. We areimpressed by Sea’s execution, particularly its ability to hyper-localize itsoffering for seven ASEAN countries in both e-commerce and gaming and itsability to leverage technology to overcome barriers to historicale-commerce adoption, particularly logistics. These have powered itsemergence as the largest e-commerce platform across the region despitehaving started much later than its incumbent competitors. We expect thatlead to continue to expand. Although global digital gaming has historicallybeen a cyclical, hit-driven business, we like that Sea is aggressivelyreinvesting its gaming cash flows into these larger, longer durationopportunities, and expect the gaming segment to become an ever-decreasing fraction of total value over the next half decade whilee-commerce and fintech become multiple times larger.
We also initiated a new position in Toast, Inc., a cloud-based end-to-endrestaurant technology platform. Toast’s platform provides a comprehensivesuite of cloud software products and financial technology solutions, enablingcustomers to manage their restaurants more efficiently. Toast’s solutionsinclude a point-of-sale module (which is integrated with paymentprocessing) along with solutions for operations, digital ordering and delivery,marketing and loyalty, team management, and back office. Toast is the clearmarket leader in the SMB restaurant segment, benefiting from highcustomer satisfaction rates, which drive strong inbound and referralbusiness. Toast differentiates itself from competitors with its hyper-local,feet-on-the-street go-to-market strategy, getting to know the restaurants ineach local market and upselling customers over time. Over two-thirds of itsemployees are from the restaurant industry, so the company trulyunderstands the pain points customers face and is driving innovationaccordingly. We believe that as restaurants continue to undergo digitaltransformation at an accelerated pace, Toast will be a big beneficiary givenits leading market position and best-in-class product. At only 5.6%penetration of U.S. restaurants (Toast powers 48,000 restaurants out of the860,000 restaurants in the U.S.) and 3% penetration of its $15 billionrecurring revenue addressable market, Toast has a long runway for growth
64

September 30, 2021 Baron Fifth Avenue Growth Fund
underpinned by adding more customers and expanding existing customerrelationships. Over time, we also believe that Toast has the potential topenetrate the Enterprise portion of the restaurant industry (customers withover 50 locations) as well as international markets (22 million totallocations) and further expand its addressable market.
In a continuation of our decisions in the second quarter, we added to severalhigher-conviction, newer positions in the Fund including the leadingcommerce software platform, Shopify Inc., the artificial intelligence leader,NVIDIA Corporation, and the fintech leader, Square, Inc. All threepositions exited the quarter at a 3.0% weight, just below our top 10 positionsizing.
Table VI.Top net sales for the quarter ended September 30, 2021
Quarter EndMarket Cap or
Market CapWhen Sold(billions)
AmountSold
(millions)
Alibaba Group Holding Limited $519.9 $20.3BridgeBio Pharma, Inc. 7.3 7.6ASML Holding N.V. 309.2 1.8Illumina, Inc. 63.5 1.7Splunk, Inc. 23.4 1.7
We trimmed three positions: ASML Holding N.V., Illumina, Inc., andSplunk, Inc.; and exited three others: Alibaba Group Holding Limited,BridgeBio Pharma, Inc., and Airbnb. While China has historically been afertile ground for the types of companies we find attractive (big ideas,beneficiaries of disruptive change, platform businesses), the regulatorydevelopments over the last 12 months have made investing in Chinaincreasingly challenging. As a result, we sold our position in Alibaba. We alsosold our smaller holdings in BridgeBio and Airbnb (a stub position that wecould not graduate into a core position due to valuation). Proceeds werereallocated to companies in which we saw more positively skewed risk/reward profiles.
At the end of the quarter, the Fund had 39 investments. This numberincludes three private holdings (Rivian, GM Cruise, and SpaceX), whichtogether represent less than 1.0% of the Fund’s net assets.
OUTLOOK
The October release of the inflation numbers for September showed thatCPI remained solidly above 5% (5.4% actually) and that the economycontinues to improve with unemployment dipping below 5% again, raising/confirming expectations for the beginning of Fed tapering, and driving areversal in the 10-year U.S. Treasury bond yield, which after hitting a low of1.2% in July, is now hovering around 1.6%. Higher interest rates ostensibly
present a headwind to growth stocks for the reasons that we explained inprior letters. However, for now the market appears to be interpreting themdifferently. Quarter-to-date through October 21, the R1KG is actually up6.4%, and the Fund is up 7.4%. David Schneider, our Head Trader andinflation afficionado, explained it this way: “You don’t get it. Taperingsooner and raising rates earlier and perhaps more aggressively, means theFed is more likely to get ahead of it and nip inflation in the bud, which willflatten the longer part of the yield curve, which is obviously bullish for high-growth stocks.” So, wait… higher interest rates are good for growthequities? David is definitely right. I do not get it.
In any case, the market will do what it will do. We think rotations, pullbacks,and corrections are generally necessary and healthy, and they often createattractive opportunities for long-term investors like ourselves. With 10-yearU.S. Treasury bonds yielding below 2% and inflation running around 5% (orhigher), real interest rates continue to be well below 0%, which is a greatbackdrop for businesses that are able to reinvest excess cash flow at highrates of a return. In other words, the types of businesses that we tend tofavor. We continue to focus on the quality of our decisions, and on takingwhat we believe are high percentage shots.
Every day we live and invest in an uncertain world. Well-known conditionsand widely anticipated events, such as Federal Reserve rate changes (up anddown), ongoing trade disputes, government shutdowns, and theunpredictable behavior of important politicians the world over, are shruggedoff by the financial markets one day and seem to drive them up or down thenext. We often find it difficult to know why market participants do whatthey do over the short term. The constant challenges we face are real andserious, with clearly uncertain outcomes. History would suggest that mostwill prove passing or manageable. The business of capital allocation (orinvesting) is the business of taking risk, managing the uncertainty, andtaking advantage of the long-term opportunities that those risks anduncertainties create. We are confident that our process is the right one, andwe believe that it will enable us to make good investment decisions overtime.
We are optimistic about the long-term prospects of the companies in whichwe are invested and continue to search for new ideas and investmentopportunities while remaining patient and investing only when we believethe target companies are trading significantly below their intrinsic values.
Sincerely,
Alex UmanskyPortfolio ManagerSeptember 30, 2021
65

Baron Fifth Avenue Growth Fund
Investors should consider the investment objectives, risks, and charges and expenses of the investment carefully before investing. The prospectusand summary prospectus contain this and other information about the Funds. You may obtain them from its distributor, Baron Capital, Inc., bycalling 1-800-99BARON or visiting www.BaronFunds.com. Please read them carefully before investing.
Risks: The Fund invests primarily in large cap equity securities which are subject to price fluctuations in the stock market. The Fund may not achieve itsobjectives. Portfolio holdings are subject to change. Current and future portfolio holdings are subject to risk. There is no guarantee that these objectives will bemet.
The discussions of the companies herein are not intended as advice to any person regarding the advisability of investing in any particular security. The viewsexpressed in this report reflect those of the respective portfolio managers only through the end of the period stated in this report. The portfolio manager’sviews are not intended as recommendations or investment advice to any person reading this report and are subject to change at any time based on marketand other conditions and Baron has no obligation to update them.
This report does not constitute an offer to sell or a solicitation of any offer to buy securities of Baron Fifth Avenue Growth Fund by anyone in any jurisdictionwhere it would be unlawful under the laws of that jurisdiction to make such offer or solicitation.
BAMCO, Inc. is an investment adviser registered with the U.S. Securities and Exchange Commission (SEC). Baron Capital, Inc. is a limited purpose broker-dealerregistered with the SEC and member of the Financial Industry Regulatory Authority, Inc. (FINRA).
66

September 30, 2021 Baron Focused Growth Fund
DAVID BARON RONALD BARON Retail Shares: BFGFXCO-PORTFOLIO CEO AND LEAD Institutional Shares: BFGIXMANAGER PORTFOLIO MANAGER R6 Shares: BFGUX
DEAR BARON FOCUSED GROWTH FUND SHAREHOLDER:
PERFORMANCE
Baron Focused Growth Fund (the “Fund”) increased 4.86% (Institutional Shares)in the third quarter, making it the second-best performing fund in the categoryaccording to Morningstar. The Russell 2500 Growth Index (the “Index”), thebenchmark against which we compare the performance of the Fund, declined3.53%, and the S&P 500 Index increased by 0.58% over the same period. TheS&P 500 Index measures the performance of large-cap companies. The Fund hasoutperformed its benchmarks for the 1-, 3-, 5-, and 10-year periods. Since itsinception on May 31, 1996, the Fund has increased 14.54% annualized. Thiscompares favorably to the Index, which has increased 9.33%, and the S&P 500Index, which has increased 9.67%. Among U.S. equity funds, the Fund is ranked82nd out of 3,474 share classes, which places it in the top 3% since itsconversion from a partnership in 2008.*
Table I.PerformanceAnnualized for periods ended September 30, 2021
BaronFocusedGrowth
FundRetail
Shares1,2,3
BaronFocusedGrowth
FundInstitutionalShares1,2,3,4
Russell2500
GrowthIndex2
S&P500
Index2
Three Months5 4.78% 4.86% (3.53)% 0.58%Nine Months5 7.29% 7.52% 4.84% 15.92%One Year 41.88% 42.30% 31.98% 30.00%Three Years 40.11% 40.46% 16.01% 15.99%Five Years 32.19% 32.52% 18.21% 16.90%Ten Years 21.10% 21.40% 17.20% 16.63%Fifteen Years 14.75% 14.98% 11.87% 10.37%Since Inception
(May 31, 1996) 14.40% 14.54% 9.33% 9.67%
Third quarter performance for the Fund was led by companies that began toexperience accelerating revenue growth generated by recent investments.These include Tesla, Inc., BioNTech SE, Manchester United plc, andFactSet Research Systems, Inc.
Performance listed in the above table is net of annual operating expenses. Annual expense ratio for the Retail Shares and Institutional Shares as of December 31, 2020was 1.35% and 1.07%, respectively. The performance data quoted represents past performance. Past performance is no guarantee of future results. The investmentreturn and principal value of an investment will fluctuate; an investor’s shares, when redeemed, may be worth more or less than their original cost. The Adviserreimburses certain Baron Fund expenses pursuant to a contract expiring on August 29, 2032, unless renewed for another 11-year term and the Fund’s transfer agencyexpenses may be reduced by expense offsets from an unaffiliated transfer agent, without which performance would have been lower. Current performance may be loweror higher than the performance data quoted. For performance information current to the most recent month end, visit www.BaronFunds.com or call 1-800-99BARON.1 Reflects the actual fees and expenses that were charged when the Fund was a partnership. The predecessor partnership charged a 15% performance fee through 2003 after reaching a
certain performance benchmark. If the annual returns for the Fund did not reflect the performance fees for the years the predecessor partnership charged a performance fee, thereturns would be higher. The Fund’s shareholders will not be charged a performance fee. The performance is only for the periods before the Fund’s registration statement waseffective, which was June 30, 2008. During those periods, the predecessor partnership was not registered under the Investment Company Act of 1940 and was not subject to itsrequirements or the requirements of the Internal Revenue Code relating to registered investment companies, which, if it were, might have adversely affected its performance.
2 The Russell 2500™ Growth Index measures are classified as growth and the S&P 500 Index of 500 widely the performance of small to medium-sized U.S. companies thatheld large cap U.S. companies. Russell Investment Group is the source and owner of the trademarks, service marks and copyrights related to the Russell Indexes. Russell is atrademark of Russell Investment Group. The indexes and the Fund include reinvestment of dividends, net of withholding taxes, which positively impact the performanceresults. The indexes are unmanaged. Index performance is not Fund performance; one cannot invest directly into an index.
3 The performance data does not reflect the deduction of taxes that a shareholder would pay on Fund distributions or redemption of Fund shares.4 Performance for the Institutional Shares prior to May 29, 2009 is based on the performance of the Retail Shares, which have a distribution fee. The Institutional Shares do
not have a distribution fee. If the annual returns for the Institutional Shares prior to May 29, 2009 did not reflect this fee, the returns would be higher.5 Not annualized.* This is a hypothetical ranking created by Baron Capital using Morningstar data and is as of 9/30/2021. Note, the peer group used for this analysis includes all U.S.
equity share classes in Morningstar Direct domiciled in the U.S., including obsolete funds, index funds, and ETFs. The individual Morningstar Categories used for thisanalysis are the Morningstar Large Blend, Large Growth, Large Value, Mid-Cap Blend, Mid-Cap Growth, Mid-Cap Value, Small Blend, Small Growth, and Small ValueCategories. There were 3,474 share classes in these nine Morningstar Categories for the period from 6/30/2008 to 9/30/2021.The Morningstar Mid-Cap Growth Category consisted of 613, 584, 495, and 386 share classes for the quarter-to-date, 1-, 5-, and 10-year periods.Morningstar ranked Baron Focused Growth Fund in the 1st, 13th, 2nd, 2nd, and 4th percentiles for the quarter-to-date, 1-, 5-, 10-year, and since conversion
periods, respectively. The Fund converted into a mutual Fund on 6/30/2008, and the category consisted of 316 share classes. On anabsolute basis, Morningstar ranked Baron Focused Growth Fund Institutional Share Class as the 2nd, 39th, 3rd, 7th, and 5th best performingshare class in its Category, for the quarter-to-date, 1-, 3-, 5-, and 10-year periods, respectively.Morningstar calculates the Morningstar Mid-Cap Growth Category average performance and rankings using its Fractional Weightingmethodology. Morningstar rankings are based on total returns and do not include sales charges. Total returns do account formanagement, administrative, and 12b-1 fees and other costs automatically deducted from fund assets.© 2021 Morningstar. All Rights Reserved. The information contained herein: (1) is proprietary to Morningstar and/or its content providers; (2) may not becopied or distributed; and (3) is not warranted to be accurate, complete or timely. Neither Morningstar nor its content providers are responsible for anydamages or losses arising from any use of this information. Past performance is no guarantee of future results.
BARONF U N D S
67
Baron Focused Growth Fund
Tesla increased 14.1% in the quarter as deliveries and productionaccelerated sharply. This was despite supply chain issues as the companybenefited from having its own cell manufacturing facility and has become amore vertically integrated business. Tesla’s share price increase boosted theFund’s performance by 425 basis points in the quarter. Tesla is the Fund’slargest holding and at quarter end represented approximately a third of netassets. We believe Tesla sales could increase substantially when additionalproduction capacity is opened in Berlin, Germany in October 2021 andAustin, Texas in early 2022. Demand for Tesla cars remains extremelystrong.
BioNTech increased 18.8% in the quarter and helped performance by 181basis points due to continued success of its mRNA COVID vaccine. TheFDA’s recent approval of its COVID boosters in adults aged 12 and older willalso help. We continue to believe BioNTech has a strong program inengineered cell therapies. The company has the potential to disrupt thebiopharmaceutical space with a large pipeline of new opportunities fromoncology to influenza and other infectious and rare diseases.
Manchester United increased 28.2% in the quarter and helped performance by65 basis points. We attribute this to Manchester United’s successful recruitingof Cristiano Ronaldo to its team under a two-year contract. Fan engagementhas increased as has interest in additional sponsorship and merchandise sales.This benefit combined with the reopening of its Old Trafford stadium athigher ticket prices should result in additional EBITDA in the coming years.With the stadium back to full capacity and Cristiano on the roster, we believethe company’s position as a unique media brand with over 1.1 billion fans iseven stronger and that its broad global appeal should compound value.
FactSet increased 17.9% in the quarter and helped performance by 65 basispoints. The company experienced an acceleration in revenue growth due tothe introduction of new tools, which the company has begun to sell to bothnew and existing clients.. This has led to increased pricing power and newuse cases. We expect further revenue and earnings growth as well asimproved cash flow, which the company can use for additional acquisitionsand share repurchases. We retain conviction in FactSet due to its largeaddressable market, consistent execution on both new product developmentand financial results, and robust free cash flow generation.
The strong performance from our investments in companies where growthaccelerated was slightly offset by modest declines in growth companiesseemingly negatively impacted by the reopening of the economy aspandemic restrictions were lifted. Also negatively impacting our portfoliowas uncertainty in China with the potential for increased governmentscrutiny and further regulations and supply chain concerns leading toworries about higher input and transportation costs. Spotify TechnologyS.A., GDS Holdings Limited, and Figs Inc. were among those companies.
Spotify declined by 18.6% in the quarter as engagement modestly declinedwhile economies reopened and pandemic restrictions were lifted. Spotifyhurt performance in the period by 66 basis points. We continue to viewSpotify as a long-term beneficiary in music streaming and podcasts. Webelieve it has potential to increase subscribers by 50% over the next threeyears, driven by its scalable core music product as well as its growing libraryof spoken-word content.
GDS, a Chinese data center company, declined 28.6% in the quarter andhurt performance by 62 basis points. This was due to concerns aboutpossible increased government regulation from China. Regardless, we believeGDS’s interests are aligned with the government, and GDS should help growthe Chinese economy through the digitization of many companies. We thinkthe company has a strong competitive advantage given its vast land bankand the scarcity of land. Further, approvals required to develop new centersare usually difficult to obtain. GDS is generating strong returns on its newcenters. Since we believe China is in the early innings of cloud adoption, thecompany should experience significant demand growth for many years.
Figs is a leading direct-to-consumer brand specializing in uniforms, apparel,and accessories for health care professionals. Its stock price declined 25.9%in the quarter and penalized the Fund’s performance by 62 basis points. Figs’share price weakness was due to slowing growth in the second half of thisyear due to supply chain issues. That has resulted in increasedtransportation costs as well as higher input costs. However, we believe theseissues to be transitory and should not impact long-term growth prospectsthat we believe remain attractive. Figs has a large addressable market andstrong, unaided brand awareness and should grow its margins and cash flowas it scales. Co-CEOs own over 18% of Figs stock.
In terms of our categories of investments, performance was led by ourDisruptive Growth investments, rapid, early-stage growth businesses thatare disruptive to their industries. These stocks increased 6.9% in the quarterand represent more than half of the Fund. The strength was led by ourinvestments in BioNTech and Tesla, offset somewhat by declines in Spotifyand Figs, as mentioned above.
Our Real/Irreplaceable Assets, which are those companies with assets thatgenerally have strong pricing power and are hedges against inflation,increased 3.9% in the quarter and represent a quarter of the Fund. Thisincrease was led by our investment in Manchester United as noted above, aswell as Red Rock Resorts, Inc., which together comprised 4.6% of the Fundat quarter end.
Red Rock, a Las Vegas locals casino company, increased 20.6% in thequarter and contributed 31 basis points to the Fund’s performance. RedRock’s earnings growth across its properties accelerated. The companyachieved EBITDA significantly above pre-COVID-19 levels. The Las Vegaslocals market is benefiting from a new higher-income customer base, whichis staying longer and spending more. The closure of some non-gamingamenities, a reduction in the work force, and more targeted marketing hasalso helped increase margins and cash flow. This, combined with theexpected sale of the Palms, which should close by the end of the year, willhelp improve the company’s balance sheet and increase its cash flow.
The Fund’s Core Growth investments, which are those companies thatcontinue to grow revenue and earnings steadily while returning excess cashflow to investors through dividends and share repurchases, increased 3.3%in the quarter. Those investments represent 18.0% of the Fund. This increasewas led by our investment in FactSet, which represented 4.0% of the Fundat quarter end, offset slightly by declines in GDS, which represented 1.5% ofthe Fund at quarter end as noted above.
68

September 30, 2021 Baron Focused Growth Fund
Table II.Total returns by category for the quarter ended September 30, 2021
% ofNet Assets
(as of 9/30/2021)
TotalReturn
(%)
Contributionto Return
(%)
Disruptive Growth 53.5 6.91 3.64
BioNTech SE 2.5 18.75 1.81
Tesla, Inc. 33.4 14.09 4.25
SmartRent, Inc. 1.8 8.33 0.13
Space ExplorationTechnologies Corp. 3.6 4.24 0.14
Guidewire Software, Inc. 2.9 2.31 0.02
Iridium Communications Inc. 2.1 –0.35 0.03
Spotify Technology S.A. 3.9 –18.63 –0.66
Figs Inc. 1.5 –25.87 –0.62
Schrodinger, Inc. 0.6 –27.63 –0.37
Stitch Fix, Inc. 0.5 –35.49 –0.53
Denali Therapeutics Inc. 0.7 –35.54 –0.57
Real/Irreplaceable Assets 25.0 3.94 0.90
Manchester United plc 2.9 28.20 0.65
Red Rock Resorts, Inc. 1.7 20.60 0.31
Choice Hotels International,Inc. 2.6 6.50 0.15
Vail Resorts, Inc. 6.0 5.54 0.25
Hyatt Hotels Corp. 4.7 –0.32 0.01
American Homes 4 Rent 1.2 –1.64 –0.00
Penn National Gaming, Inc. 5.5 –5.27 –0.34
Americold Realty Trust 0.4 –22.68 –0.13
Core Growth 18.0 3.29 0.67
FactSet Research Systems,Inc. 4.0 17.89 0.65
Adyen N.V. 2.2 13.99 0.36
CoStar Group, Inc. 7.2 3.91 0.32
Arch Capital Group Ltd. 3.1 –1.95 –0.05
GDS Holdings Limited 1.5 –28.56 –0.62
Russell 2500 Growth Index –3.53
Cash 3.5 –0.60 –0.03
Fees – –0.29 –0.30
Total 100.0 4.84* 4.84*
Sources: FactSet PA, BAMCO, and Russell, Inc.
* Represents the blended return of all share classes of the Fund.
Table III.PerformancePeriods Baron Focused Growth Fund underperformed
InternetBubble
Baron Growth StocksUnderperform
2014-2016
Annualized Returns
10/8/1998 to3/9/2000
12/31/2013 to12/31/2016
Baron Focused Growth Fund(Institutional Shares) 41.77% 0.45%
Russell 2500 Growth Index 126.53% 5.45%S&P 500 Index 32.29% 8.87%
The indexes are unmanaged. Index performance is not Fund performance; one cannotinvest directly into an index.
From 2014 through 2016, the Fund invested in several companies whosestocks underperformed when they were investing in their businesses. CoStarGroup, Inc. and Tesla, Inc. were among those businesses. Their stocksoutperformed in 2019 and 2020 as those investments began to generatestrong returns. These companies continue to invest in themselves, althoughnow that they are financially stronger, they are better able to finance theseinvestments while continuing to grow their core businesses.
We believe the Fund’s underperformance from 2014 through 2016 isanalogous to instances when, after brief periods of underperformance, theFund subsequently outperformed for an extended period. For example, in the18-month period from October 1998 through March 2000, at the height ofthe Internet Bubble, the Fund, which owned no internet stocks, increased41.77% annualized while the Index increased 126.53% annualized. This wasimmediately prior to the Internet Bubble bursting and the Index fallingmaterially over the next eight years. The Fund increased in value during thatsame period. (Please see Tables III and IV.)
Analogous to the Fund’s relatively strong performance in the post-InternetBubble period, we expect the Fund to perform well over the next severalyears. This is despite our expectation that there will be periods when valuestocks outperform the growth stocks in which we have invested. We cancertainly give no assurance this will be the case. Currently, we believe someof our growth companies are trading as if they were value stocks, despitehaving strong liquidity and balance sheets. They are already recoveringquickly as vaccines are administered to combat the virus, and we see furtherupside still to come.
Since its inception on May 31, 1996, through September 30, 2021, theFund’s 14.54% annualized performance has exceeded that of its Index by521 basis points per year. This means that a hypothetical $10,000investment in Baron Focused Growth Fund over 25 years ago wouldnow be worth approximately $311,500! If an investor had insteadhypothetically invested $10,000 in a fund designed to track the Index,it would be worth approximately $95,900. (Please see Tables I and IV.)
The Fund’s beta has averaged 0.82 since inception. This means the Fund hasbeen 82% as volatile as the Index. As a result of the Fund’s strong absoluteand relative returns and lower risk, the Fund has achieved 7.03% annualalpha, a measure of risk-adjusted performance since inception.
69

Baron Focused Growth Fund
Table IV.PerformanceMillennium to COVID-19 Pandemic. The Impact of Not Losing Money.
Millennium InternetBubble
to Financial Panic12/31/1999 to 12/31/2008
Financial Panic toPresent
12/31/2008 to 9/30/2021
Millennium Internet Bubbleto Present
12/31/1999 to 9/30/2021Inception
5/31/1996 to 9/30/2021
Value$10,000 Annualized
Value$10,000 Annualized
Value$10,000 Annualized
Value$10,000 Annualized
Baron Focused Growth Fund (InstitutionalShares) $12,732 2.72% $101,386 19.92% $129,084 12.48% $311,485 14.54%
Russell 2500 Growth Index $ 6,931 –3.99% $ 77,408 17.41% $ 53,651 8.03% $ 95,917 9.33%S&P 500 Index $ 7,188 –3.60% $ 61,906 15.37% $ 44,498 7.10% $103,544 9.67%
The indexes are unmanaged. Index performance is not Fund performance; one cannot invest directly into an index.
We did not make much money from December 31, 1999, throughDecember 31, 2008 (amid the highs of the Internet Bubble and the lows ofthe Financial Crisis). But…we did make something…which gave investors amuch better outcome than if they had hypothetically invested in a passiveindex fund mirroring either the Index or the S&P 500 Index. Both indexeslost a material amount of money during that period. (Please see Table IV.)
Due to the power of compounding and of not losing money from theMillennium Internet Bubble to the Financial Panic period and outperformingthe market during upswings from the Financial Panic to Present, $10,000hypothetically invested in Baron Focused Growth Fund at the Fund’sinception on May 31, 1996 was worth $311,485 on September 30, 2021.That is more than three times the value of a hypothetical investment of thesame amount in funds designed to track the S&P 500 and Russell 2500Growth Indexes. (Please see Table IV.)
Table V.Top contributors to performance for the quarter ended September 30, 2021
YearAcquired
MarketCap
WhenAcquired(billions)
QuarterEnd
MarketCap
(billions)Total
ReturnPercentImpact
Tesla, Inc. 2014 $31.2 $776.9 14.09% 4.25%BioNTech SE 2020 24.1 66.2 18.75 1.81Manchester United plc 2012 2.3 3.2 28.20 0.65FactSet Research
Systems, Inc. 2008 2.5 14.9 17.89 0.65Adyen N.V. 2020 29.1 85.4 13.99 0.36
Tesla, Inc. designs, manufactures, and sells fully electric vehicles, solarproducts, energy storage solutions, and battery cells. The stock contributedas Tesla continued to present strong deliveries growth and a meaningfulimprovement in profitability despite a complex supply-chain environment.Demand remains robust, new localized manufacturing capacity is expectedto support more efficient growth, and the autonomous program isaccelerating. We expect Tesla’s growing vehicle offering, battery technology,and energy businesses to drive meaningful growth opportunities.
BioNTech SE is a leader in the emerging field of mRNA drugs, withadditional programs in engineered cell therapies, antibodies, andimmunomodulators. Shares performed well for the quarter. The COVID-19vaccine rollout continues with the addition of a booster shot, and we believethe pandemic has been a strong proof point of the speed and efficacy of themRNA platform. Beyond vaccines, we think BioNTech has potential todisrupt the biopharmaceutical space with a pipeline spanning oncology,infectious diseases, and rare diseases.
Manchester United plc is the best known team in the English PremierLeague and generates revenue from broadcasting, sponsorship, and licensing.Shares increased as the iconic Old Trafford Stadium re-opened to fans. Theclub also announced the signing of Cristiano Ronaldo, one of the greatestplayers in the world. With the stadium back to full capacity and Cristiano onthe roster, we view the company as a unique media brand with over1.1 billion fans and broad global appeal that should compound value.
Shares of FactSet Research Systems, Inc., a leading provider of investmentmanagement tools, contributed to performance. FactSet reported strongearnings and provided encouraging guidance as technology and contentinvestments the company has been making over the past few years startedto pay off with stronger growth. We retain conviction in FactSet due to thelarge addressable market, consistent execution on both new productdevelopment and financial results, and robust free cash flow generation.
Adyen N.V. provides technology that enables merchants to acceptelectronic payments. The stock increased after the company reported strongresults for the first half of the year, with 46% revenue growth and 65%EBITDA growth. Processed volume growth rose to 67% due to resiliente-commerce demand, easier comparisons, and the onboarding of eBay.Margins also expanded despite rapid hiring and significant growthinvestments.
70

September 30, 2021 Baron Focused Growth Fund
Table VI.Top detractors from performance for the quarter ended September 30, 2021
YearAcquired
MarketCap
WhenAcquired(billions)
QuarterEnd
MarketCap
(billions)Total
ReturnPercentImpact
Spotify Technology S.A. 2020 $45.4 $43.0 –18.63% –0.66%GDS Holdings Limited 2020 9.3 10.6 –28.56 –0.62Figs Inc. 2021 4.8 6.1 –25.87 –0.62Denali Therapeutics Inc. 2020 8.4 6.1 –35.54 –0.57Stitch Fix, Inc. 2021 10.0 4.3 –35.49 –0.53
Spotify Technology S.A. is a leading digital music service available in 178international markets, offering on-demand audio streaming through paidpremium subscriptions as well as a free ad-supported model. Shares weredown as engagement declined while economies re-opened and pandemicrestrictions were lifted. We continue to view Spotify as a long-term winnerin music streaming with potential to go from 158 million paying subscriberstoday to over 250 million in four years, driven by its scalable core musicproduct as well as its growing library of spoken-word content.
GDS Holdings Limited is a leading Chinese data center operator within Tier1 cities. Shares fell in concert with a general sell-off in Chinese technology-related companies in response to tightening regulations and unknown futuregovernment actions against businesses that may not be perceived as alignedwith the government’s goals. We retain conviction in GDS given durablesecular tailwinds in cloud adoption (early innings in China), increasedvisibility of growth, ample capital, and its status as a provider of choice toChina’s leading technology companies.
Figs Inc. is the leading direct-to-consumer brand specializing in uniforms,apparel, and accessories for health care professionals. The share price fellduring the quarter on likely profit taking following a positive reaction to itsMay IPO. Despite the near-term weakness, we remain bullish on Figs’ long-term opportunity to disrupt the medical apparel market both domesticallyand overseas. We like the company’s financial operating model and see apath to $1 billion in revenue at attractive EBITDA margins.
Denali Therapeutics Inc. is a biotechnology company developing drugs totreat neurological disorders. Shares fell after an interim update reportingmixed results from its Phase 1/2 study of a program in treating Huntersyndrome. We remain convicted in Denali for its suite of approaches towardtargeting the brain.
Stitch Fix, Inc., an online apparel retailer, detracted due to the company’spoorly communicated changes to its stylist employment program. Mostlypart-time workers who help clients style outfits, stylists were abruptlynotified that they must choose between a full-time work schedule or aseverance package. Despite the optics of the announcement, we retainconviction in Stitch Fix’s expansion from a business model that is heavilyreliant on personal stylists to an online retailer that creates personalizationwith a data-driven approach and proprietary algorithms.
INVESTMENT STRATEGY & PORTFOLIO STRUCTURE
Despite current market volatility and investor angst, we have continued tomanage the Fund the same way we have historically–looking for companieswith large addressable market opportunities that have the potential todisrupt industries and take market share given strong competitiveadvantages inherent in their businesses.
In the third quarter, we initiated a small position in SmartRent, Inc., acategory-leading software company providing a fully integrated solution tothe real estate industry. The core product is built around smart access orkeyless entry as well as community Wi-Fi, leak detection, and temperaturecontrol management. The product offering leads to lower costs, which savecustomers on utilities, leasing costs, risk mitigation, and leads to increasedrents for multi-family property owners. In exchange, SmartRent charges alow recurring base monthly fee to apartment owners and continuouslyimproves its software application. SmartRent has over 200,000 unitsdeployed today with over 450,000 total users, experienced zero churn todate and developed strategic partnerships with 15 of the top 20 institutionalapartment owners. In addition, the company has a pipeline of 600,000committed units and a 3.5 million unit opportunity within its existingcustomer base.
We also added to our positions in Spotify Technology S.A. and GuidewireSoftware, Inc. Both companies have large addressable markets with strongbrands that should allow them to take significant market share over time.We believe they are both appropriately financed and should generatesignificant cash to continue investing in their businesses for further growth.
While we have made other modest changes on the margin, the Fund’sstrategy remains the same. We continue to invest for the long term in afocused portfolio of what we believe are appropriately capitalized,competitively advantaged, well-managed, small- and mid-cap growthbusinesses at attractive prices. We attempt to create a portfolio of between20 and 25 securities diversified by GICS sectors that will be approximately80% as volatile (as measured by beta) as the market. Since inception, theFund has generated approximately 97% of the upside when the market risesbut just 78% of the downside when the market declines. Businesses in whichthe Fund invests are identified by our analysts and portfolio managers usingour proprietary research and time-tested investment approach.
As of September 30, 2021, we held 24 investments. The Fund’s averageportfolio turnover for the past three years was 12%. This means the Fundhas an average holding period for its investments of approximately 8.3years. This contrasts sharply with the average mid-cap growth mutual fund,which typically turns over its portfolio every 15 months. From a qualitystandpoint, the Fund’s investments have stronger sales and EPS growth thanthe holdings in the Index, higher EBITDA and operating margins, strongerreturns on invested capital, and more robust balance sheets. We believethese metrics are important to limit risk in this focused portfolio.
While focused, the Fund is diversified by sector. The Fund’s weightings aresignificantly different than those of the Index. For example, the Fund isheavily weighted in Consumer Discretionary businesses with 54.5% of itsnet assets in this sector versus 15.4% for the Index. While the Fund hashistorically not invested in pharmaceuticals and biotechnology, it has addedtwo biotechnology investments over the past year and now has 3.2% of netassets in two stocks, Denali Therapeutics Inc. and BioNTech SE. Whilethere is somewhat greater risk investing in these companies, we think thesmall positions do not significantly alter the portfolio’s risk profile and giveus upside potential should either of these companies discover newmedicines and procedures. The Fund is further diversified by investments inbusinesses at different stages of growth and development as discussedabove and shown below.
71

Baron Focused Growth Fund
Table VII.Disruptive Growth Companies as of September 30, 2021
Percentof NetAssets
YearAcquired
CumulativeReturnSinceInitial
Purchase
Tesla, Inc. 33.4% 2014 1,448.42%Spotify Technology S.A. 3.9 2020 –5.83Space Exploration Technologies Corp. 3.6 2017 200.22Guidewire Software, Inc. 2.9 2013 157.18BioNTech SE 2.5 2020 172.83Iridium Communications Inc. 2.1 2019 47.32SmartRent, Inc. 1.8 2021 5.43Figs Inc. 1.5 2021 23.72Denali Therapeutics Inc. 0.7 2020 –27.87Schrodinger, Inc. 0.6 2020 3.78Stitch Fix, Inc. 0.5 2021 –58.19
Disruptive Growth firms accounted for 53.5% of the Fund’s net assets. Oncurrent metrics, these businesses may appear expensive; however, we thinkthey will continue to grow significantly and, if we are correct, they have thepotential to generate exceptional returns over time. Examples of thesecompanies include electric vehicle leader Tesla, Inc., commercial satellitecompany Iridium Communications Inc., and systems software provider tothe insurance industry Guidewire Software, Inc. All of these companieshave large addressable markets relative to the current size of thosecompetitively advantaged businesses.
Table VIII.Investments with Real/Irreplaceable Assets as of September 30, 2021
Percentof NetAssets
YearAcquired
CumulativeReturnSinceInitial
Purchase
Vail Resorts, Inc. 6.0% 2013 522.03%Penn National Gaming, Inc. 5.5 2019 245.21Hyatt Hotels Corp. 4.7 2009 181.04Manchester United plc 2.9 2012 49.99Choice Hotels International, Inc. 2.6 2010 517.91Red Rock Resorts, Inc. 1.7 2017 143.28American Homes 4 Rent 1.2 2018 88.13Americold Realty Trust 0.4 2020 –12.10
Companies that own what we believe are Real/Irreplaceable Assetsrepresented 25.0% of net assets. Vail Resorts, Inc., owner of the premier skiresort portfolio in the world, upscale lodging brand Hyatt Hotels Corp., andstoried English Premier League sports franchise Manchester United plc areexamples of companies we believe possess meaningful brand equity andbarriers to entry that equate to pricing power over time. Penn NationalGaming, Inc.’s state-granted licenses for its regional casinos provideimportant protection from competitors. Online sports betting and i-casinogaming offer large opportunities for future growth for the company.
Table IX.Core Growth Investments: Growth, Dividends, and Share Repurchases as of
September 30, 2021
Percentof NetAssets
YearAcquired
CumulativeReturnSinceInitial
Purchase
CoStar Group, Inc. 7.2% 2014 302.15%FactSet Research Systems, Inc. 4.0 2008 792.53Arch Capital Group Ltd. 3.1 2003 948.58Adyen N.V. 2.2 2020 191.31GDS Holdings Limited 1.5 2020 –7.92
Core Growth investments, steady growers that continually return excessfree cash flow to shareholders, represented 18.0% of net assets. Examples ofthese companies include CoStar Group, Inc. and FactSet ResearchSystems, Inc. CoStar continues to add new services both in the commercialand residential areas of real estate that has grown its addressable marketand added new services for its clients further improving retention and cashflow.
As one of the leading financial intelligence systems for the assetmanagement industry, FactSet continues to grow into new areas via fixedincome, risk management, and, most recently, private equity. This shouldenable the company to grow while generating a steady stream of recurringcash flow that it uses for acquisitions, dividends, and buybacks.
Portfolio Holdings
For the quarter ended September 30, 2021, the Fund’s top 10 holdingsrepresented 74.3% of net assets. A number of these investments have beensuccessful and were purchased when they were much smaller businesses.We believe they continue to offer significant further appreciation potential,although we cannot guarantee that will be the case.
The top five positions in the portfolio, Tesla, Inc., CoStar Group, Inc., VailResorts, Inc., Penn National Gaming, Inc., and Hyatt Hotels Corp. allhave, in our view, significant competitive advantages due to irreplaceableassets, strong brand awareness, technologically superior know-how, orexclusive data that is integral to their operations. We think these businessescannot be easily duplicated, which enhances their potential for superiorearnings growth and returns over time.
72

September 30, 2021 Baron Focused Growth Fund
Table X.Top 10 holdings as of September 30, 2021
YearAcquired
MarketCap
WhenAcquired(billions)
QuarterEnd
MarketCap
(billions)
QuarterEnd
InvestmentValue
(millions)
Percentof NetAssets
Tesla, Inc. 2014 $31.2 $776.9 $248.9 33.4%CoStar Group, Inc. 2014 6.2 34.0 53.4 7.2Vail Resorts, Inc. 2013 2.3 13.5 44.8 6.0Penn National
Gaming, Inc. 2019 2.5 11.4 41.1 5.5Hyatt Hotels Corp. 2009 4.2 8.5 34.7 4.7FactSet Research
Systems, Inc. 2008 2.5 14.9 29.6 4.0Spotify Technology
S.A. 2020 45.4 43.0 29.4 3.9Space Exploration
TechnologiesCorp. 2017 – – 26.6 3.6
Arch Capital GroupLtd. 2003 0.9 15.1 22.9 3.1
GuidewireSoftware, Inc. 2013 2.7 9.9 21.6 2.9
Thank you for investing in Baron Focused Growth Fund. We continue towork hard to justify your confidence and trust in our stewardship of yourfamily’s hard-earned savings. We also continue to try to provide you withinformation we would like to have if our roles were reversed. This is so youcan make an informed judgment about whether Baron Focused GrowthFund remains an appropriate investment for your family.
Respectfully,
Ronald BaronCEO and Lead Portfolio ManagerSeptember 30, 2021
David BaronCo-Portfolio Manager
Investors should consider the investment objectives, risks, and charges and expenses of the investment carefully before investing. The prospectusand summary prospectus contain this and other information about the Funds. You may obtain them from its distributor, Baron Capital, Inc., bycalling 1-800-99BARON or visiting www.BaronFunds.com. Please read them carefully before investing.
Risks: The Fund is non-diversified which means, in addition to increased volatility of the Fund’s returns, it will likely have a greater percentage of its assets in asingle issuer or a small number of issuers, including in a particular industry than a diversified fund. Single issuer risk is the possibility that factors specific to anissuer to which the Fund is exposed will affect the market prices of the issuer’s securities and therefore the net asset value of the Fund. As of the date of thelatest prospectus supplement, about 40% of the Fund’s assets are invested in Tesla stock. Therefore, the Fund is exposed to the risk that were Tesla stock tolose significant value, which could happen rapidly, the Fund’s performance would be adversely affected. Specific risks associated with investing in small andmedium-sized companies include that the securities may be thinly traded and more difficult to sell during market downturns. Portfolio holdings are subject tochange. Current and future holdings are subject to risk.
The discussions of the companies herein are not intended as advice to any person regarding the advisability of investing in any particular security. The viewsexpressed in this report reflect those of the respective portfolio managers only through the end of the period stated in this report. The portfolio manager’sviews are not intended as recommendations or investment advice to any person reading this report and are subject to change at any time based on marketand other conditions and Baron has no obligation to update them.
This report does not constitute an offer to sell or a solicitation of any offer to buy securities of Baron Focused Growth Fund by anyone in any jurisdictionwhere it would be unlawful under the laws of that jurisdiction to make such offer or solicitation.
Beta: measures a fund’s sensitivity to market movements. The beta of the market (Russell 2500 Growth Index) is 1.00 by definition.
Alpha: measures the difference between a fund’s actual returns and its expected performance, given its level of risk as measured by beta.
Upside Capture explains how well a fund performs in time periods where the benchmark’s returns are greater than zero.
Downside Capture measures how well a fund performs in time periods where the benchmark’s returns are less than zero.
BAMCO, Inc. is an investment adviser registered with the U.S. Securities and Exchange Commission (SEC). Baron Capital, Inc. is a limited purpose broker-dealerregistered with the SEC and member of the Financial Industry Regulatory Authority, Inc. (FINRA).
73

Baron International Growth Fund
MICHAEL KASS Retail Shares: BIGFXInstitutional Shares: BINIX
PORTFOLIO MANAGER R6 Shares: BIGUX
DEAR BARON INTERNATIONAL GROWTH FUND SHAREHOLDER:
PERFORMANCE
Baron International Growth Fund (the “Fund”) retreated 1.03% (InstitutionalShares) during the third quarter of 2021, while its principal benchmarkindex, the MSCI ACWI ex USA Index, declined 2.99%. The MSCI ACWI exUSA IMI Growth Index retreated 3.06% for the quarter. The Fundcomfortably outperformed its principal benchmark index, as well as theall-cap growth proxy, and stands well ahead of both benchmarks for theyear-to-date period. It was a difficult quarter for international equities, andparticularly emerging market (“EM”) equities, both of which meaningfullytrailed U.S. equities, as defined by the S&P 500 Index. The quarter featured areturn to inflation and central bank tightening concerns in general, whileCOVID-related disruptions and supply constraints continued. On thepositive side, Delta-variant infections and hospitalizations appeared to peakin several jurisdictions, though in the short term, we suspect this may beadding fuel to the fire of supply/demand imbalances. The focal point forglobal investors during the quarter was a series of adverse regulatorymeasures and an escalation of stress in the property sector in China, whichtriggered a major correction in Chinese equities as well as weakness in manyrelated markets and sectors. We believe the correction in China is welladvanced, with such equities poised to outperform when policymakers beginto relent on aggressive tightening measures. We address these subjects ingreater detail in the Outlook section of this letter. We reaffirm the viewfrom our previous letter that a mid-cycle global economic slowdown is likelyunderway and is necessary to address supply/demand imbalances, thoughU.S. and developed country equities are earlier in the process of discountinga coincident pause in earnings momentum. We would welcome a cooling ofgrowth, inflation, and earnings expectations, which we believe would allowtime for supply shortages to normalize and accommodate a prolongedphase of global expansion. Such a scenario would likely favor internationaland EM equity performance over a multi-year term. We are confident thatwe have invested in many well-positioned and well-managed companies ona bottom-up basis that are poised to benefit from long-term and attractiveinvestment themes.
Table I.PerformanceAnnualized for periods ended September 30, 2021
BaronInternational
GrowthFundRetail
Shares1,2
BaronInternational
GrowthFund
InstitutionalShares1,2,3
MSCIACWI ex
USAIndex1
MSCIACWI exUSA IMIGrowthIndex1
Three Months4 (1.07)% (1.03)% (2.99)% (3.06)%Nine Months4 9.73% 9.90% 5.90% 3.75%One Year 30.02% 30.30% 23.92% 18.51%Three Years 16.04% 16.32% 8.03% 12.07%Five Years 14.27% 14.55% 8.94% 11.31%Ten Years 11.85% 12.13% 7.48% 9.45%Since Inception
(December 31, 2008) 12.47% 12.75% 8.07% 9.86%
Performance listed in the above table is net of annual operating expenses. Annual expense ratio for the Retail Shares and Institutional Shares as of December 31,2020 was 1.28% and 1.01%, but the net annual expense ratio was 1.20% and 0.95% (net of the Adviser’s fee waivers), respectively. The performance dataquoted represents past performance. Past performance is no guarantee of future results. The investment return and principal value of an investment willfluctuate; an investor’s shares, when redeemed, may be worth more or less than their original cost. The Adviser reimburses certain Baron Fund expensespursuant to a contract expiring on August 29, 2032, unless renewed for another 11-year term and the Fund’s transfer agency expenses may be reduced byexpense offsets from an unaffiliated transfer agent, without which performance would have been lower. Current performance may be lower or higher than theperformance data quoted. For performance information current to the most recent month end, visit www.BaronFunds.com or call 1-800-99BARON.1 The MSCI ACWI ex USA indexes cited are unmanaged, free float-adjusted market capitalization weighted indexes. The MSCI ACWI ex USA Index Net USD measures the
equity market performance of large- and mid-cap securities across developed and emerging markets, excluding the United States. The MSCI ACWI ex USA IMI GrowthIndex Net USD measures the equity market performance of large-, mid- and small-cap growth securities across developed and emerging markets, excluding the UnitedStates. MSCI is the source and owner of the trademarks, service marks and copyrights related to the MSCI Indexes. The indexes and the Fund include reinvestment ofdividends, net of foreign withholding taxes, which positively impact the performance results. Index performance is not Fund performance; one cannotinvest directly into an index.
2 The performance data does not reflect the deduction of taxes that a shareholder would pay on Fund distributions or redemption of Fund shares.3 Performance for the Institutional Shares prior to 5/29/2009 is based on the performance of the Retail Shares, which have a distribution fee. The
Institutional Shares do not have a distribution fee. If the annual returns for the Institutional Shares prior to 5/29/2009 did not reflect this fee, the returnswould be higher.
4 Not annualized.
BARONF U N D S
74

September 30, 2021 Baron International Growth Fund
For the third quarter of 2021, we outperformed our primary benchmark, theMSCI ACWI ex USA Index, as well as the all-cap international growth proxy.Within the international markets landscape, third quarter trends weremarked with increased volatility, primarily driven by China’s growingregulatory scrutiny over its technology, education, health care, and propertysectors. Solvency concerns relating to China Evergrande Group, a largeChinese conglomerate and property developer, also weighed on markets.China’s energy supply shortages and COVID-related supply chain disruptionsalso contributed to increased uncertainty. We are pleased with our recentperformance, which reflects the active risk management element of ourprocess. From a sector perspective, strong stock selection inCommunications Services, driven by our digitization-related investments (S4Capital plc, Future plc, and Vivendi SA) powered a solid majority ofrelative outperformance. The Real Estate sector, led by our long-heldinvestment in Godrej Properties Limited, India’s leading residential realestate developer, also contributed meaningfully. Finally, Indian non-bankfinancial company Bajaj Finance Limited was mostly responsible forfavorable stock selection in the Financials sector. Offsetting a portion of theabove was adverse stock selection effect in the Information Technologysector, most notably driven by a decline in Wix.com Ltd. resulting from aslowdown in new customer additions as COVID-19 tailwinds abated, andStoneCo Ltd. after the company disclosed unexpected asset-quality issuesin its credit business, which triggered loss provisions and a temporary halt innew loans.
From a country perspective, positive allocation effect together with strongstock selection in the U.K. and India, led by the above-mentionedinvestments, contributed the most to relative performance during thequarter. Our overweight exposure, along with weak stock selection effect, inBrazil was the largest detractor from relative performance during the period.Adverse stock selection in China, Israel, Sweden, Germany, and Korea alsonegatively impacted relative results.
Table II.Top contributors to performance for the quarter ended September 30, 2021
PercentImpact
S4 Capital plc 0.67%Godrej Properties Limited 0.44Bajaj Finance Limited 0.41Future plc 0.41Endava plc 0.31
S4 Capital plc is a global marketing services business founded by Sir MartinSorrell, the founder and former CEO of WPP, the largest ad agency in theworld. S4 encompasses creative production firm MediaMonks and data-driven media consultancy MightyHive. Shares of S4 were up on recoveringglobal ad spend, continued M&A, and increasing investor awareness. Webelieve S4 has meaningful potential over the long term to grow revenue atnorth of 25% annually at high-teens EBITDA margins, benefiting from digitaltransformation across industries and geographies.
Godrej Properties Limited is a leading residential real estate developer inIndia. Shares rose on market share gains and improving earnings visibility asthe worst of COVID-19 in India appears to be over. The real estate sector isalso entering an upcycle which should further support long-term growthprospects. We retain conviction due to Godrej’s strong brand positioning,best-in-class management team, and solid execution track record. In ourview, Godrej will continue to gain market share and sustain pre-sales growthof 20% or more over the next three to five years.
Bajaj Finance Limited is a leading, data-driven, non-bank financial companyin India. Share gains were driven by improving earnings visibility and growthprospects as the worst of COVID-19 in India appeared to be over. We retainconviction. The company is well positioned to benefit from growing demandfor consumer financial services such as personal and credit card loans,mortgages, and other related products. It benefits from a best-in-classmanagement team, robust long-term growth outlook, and conservative riskmanagement frameworks.
Future plc is a special-interest publisher of digital content, magazines, andevents with a brand portfolio including TechRadar, PC Gamer, and Gizmodo.Shares of Future were up on tailwinds to e-commerce in Future’s largestcategories – tech, gaming, music, sports, home, and lifestyle – as well ascontinued strength in the broader advertising environment. We believeFuture can continue to grow both organically and through M&A, withpotential to compete meaningfully in the $150 billion global B2B marketwith lead generation and business intelligence offerings.
Endava plc provides outsourced software development for businesscustomers. Shares increased on quarterly results and guidance that exceededStreet expectations. Following a brief slowdown in the early months of thepandemic, business has fully rebounded and accelerated as clients recognizethe need for greater investment in digital transformation. Managementexpects organic revenue growth to exceed 20%, with upside from accretiveacquisitions. We believe Endava will continue gaining share in a large globalmarket for IT services.
Table III.Top detractors from performance for the quarter ended September 30, 2021
PercentImpact
Zai Lab Limited –0.59%Alibaba Group Holding Limited –0.45Korea Shipbuilding & Offshore Engineering Co., Ltd. –0.43Wix.com Ltd. –0.35StoneCo Ltd. –0.30
Zai Lab Limited is a leading biotechnology company helping to modernizethe Chinese health care industry. Zai Lab’s initial focus centered aroundin-licensing western medicines for commercialization in China; this hasexpanded into internal pipeline efforts. Shares fell alongside the broaderChinese equity markets given concerns around regulations the governmenthas enacted in education, technology, and real estate. While we are payingattention to these developments, so far, we think innovative and research-driven health care companies will not be subject to any draconian rulings.
Alibaba Group Holding Limited is the largest retailer and e-commercecompany in China. Alibaba operates shopping platforms Taobao and Tmalland owns 33% of Ant Group, which operates Alipay, China’s largest third-party online payment provider. Shares of Alibaba were down givenanticipated regulatory tightening in China that may impact the company’sgrowth and profit potential. Despite the regulatory uncertainty, we retainconviction that Alibaba will benefit from growth in cloud services, logistics,and retail.
75
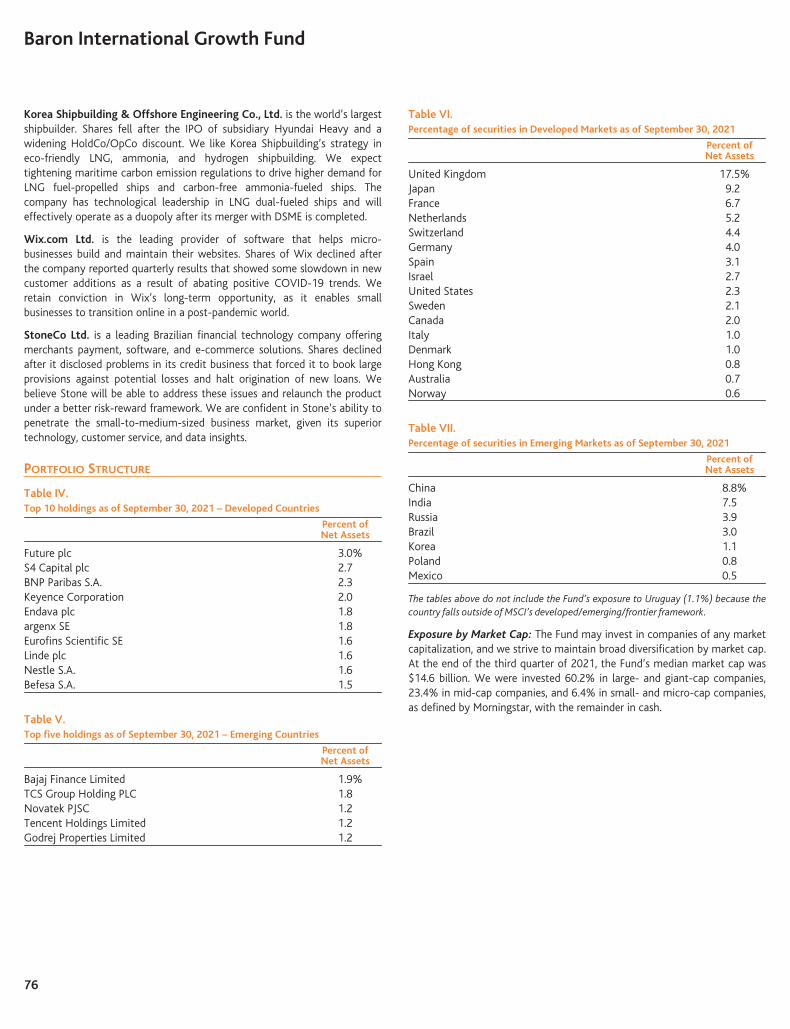
Baron International Growth Fund
Korea Shipbuilding & Offshore Engineering Co., Ltd. is the world’s largestshipbuilder. Shares fell after the IPO of subsidiary Hyundai Heavy and awidening HoldCo/OpCo discount. We like Korea Shipbuilding’s strategy ineco-friendly LNG, ammonia, and hydrogen shipbuilding. We expecttightening maritime carbon emission regulations to drive higher demand forLNG fuel-propelled ships and carbon-free ammonia-fueled ships. Thecompany has technological leadership in LNG dual-fueled ships and willeffectively operate as a duopoly after its merger with DSME is completed.
Wix.com Ltd. is the leading provider of software that helps micro-businesses build and maintain their websites. Shares of Wix declined afterthe company reported quarterly results that showed some slowdown in newcustomer additions as a result of abating positive COVID-19 trends. Weretain conviction in Wix’s long-term opportunity, as it enables smallbusinesses to transition online in a post-pandemic world.
StoneCo Ltd. is a leading Brazilian financial technology company offeringmerchants payment, software, and e-commerce solutions. Shares declinedafter it disclosed problems in its credit business that forced it to book largeprovisions against potential losses and halt origination of new loans. Webelieve Stone will be able to address these issues and relaunch the productunder a better risk-reward framework. We are confident in Stone’s ability topenetrate the small-to-medium-sized business market, given its superiortechnology, customer service, and data insights.
PORTFOLIO STRUCTURE
Table IV.Top 10 holdings as of September 30, 2021 – Developed Countries
Percent ofNet Assets
Future plc 3.0%S4 Capital plc 2.7BNP Paribas S.A. 2.3Keyence Corporation 2.0Endava plc 1.8argenx SE 1.8Eurofins Scientific SE 1.6Linde plc 1.6Nestle S.A. 1.6Befesa S.A. 1.5
Table V.Top five holdings as of September 30, 2021 – Emerging Countries
Percent ofNet Assets
Bajaj Finance Limited 1.9%TCS Group Holding PLC 1.8Novatek PJSC 1.2Tencent Holdings Limited 1.2Godrej Properties Limited 1.2
Table VI.Percentage of securities in Developed Markets as of September 30, 2021
Percent ofNet Assets
United Kingdom 17.5%Japan 9.2France 6.7Netherlands 5.2Switzerland 4.4Germany 4.0Spain 3.1Israel 2.7United States 2.3Sweden 2.1Canada 2.0Italy 1.0Denmark 1.0Hong Kong 0.8Australia 0.7Norway 0.6
Table VII.Percentage of securities in Emerging Markets as of September 30, 2021
Percent ofNet Assets
China 8.8%India 7.5Russia 3.9Brazil 3.0Korea 1.1Poland 0.8Mexico 0.5
The tables above do not include the Fund’s exposure to Uruguay (1.1%) because thecountry falls outside of MSCI’s developed/emerging/frontier framework.
Exposure by Market Cap: The Fund may invest in companies of any marketcapitalization, and we strive to maintain broad diversification by market cap.At the end of the third quarter of 2021, the Fund’s median market cap was$14.6 billion. We were invested 60.2% in large- and giant-cap companies,23.4% in mid-cap companies, and 6.4% in small- and micro-cap companies,as defined by Morningstar, with the remainder in cash.
76

September 30, 2021 Baron International Growth Fund
RECENT ACTIVITY
During the third quarter of 2021, we added a few new investments whilealso increasing position sizes in several existing holdings. We initiated aposition in Stevanato Group S.p.A, a 70-year old company and leadingprovider of drug containment products, such as vials and syringes, amongother products and services. The company serves many of the world’slargest pharmaceutical and biotechnology companies. Its products areincluded in the regulatory filings for the drugs they contain, which results inhigh switching costs and provides recurring revenue for the life of thedrug. We believe Stevanato has a stable growth business that should benefitfrom product mix shifts toward higher-value, higher-priced, higher-marginproducts such as EZ Fill (ready-to-fill products provided to customers afterthey have been washed, sterilized, and depryogenated), Alba (a material thatreduces silicon oil particle leaks and delamination), and Nexa (a materialthat provides high mechanical resistance). In our view, the business cangrow sales at high single-digit rates to low double-digit rates with EBITDAmargins expanding to the high 20% range over time.
We were also active in adding to our China value-added theme, mostnotably via a new investment in Zhejiang Hangzhou Dingli Machinery Co.,Ltd. Dingli is China’s largest manufacturer of Aerial Work Platforms(“AWPs”) with a roughly 40% market share. An AWP is a mechanical deviceused to provide temporary flexible access in construction and maintenanceand is designed to be operated by a single person. The AWP market issignificantly underpenetrated market in China, and, in our view, there is along-term structural growth opportunity for rising AWP adoption in thecountry. This is due to increased affordability of AWP rentals as comparedto rising labor costs and a growing priority for corporates to focus on workersafety and productivity. China’s AWP fleet expanded at a 40% compoundrate over the past five years, resulting in greater than 50% AWP equipmentsales volume. Dingli is the first mover and largest player in the industry withpremium quality products and is the only Chinese manufacturer tosuccessfully compete with foreign brands abroad.
During the quarter, we participated in the IPO of Mister Spex SE, afounder-led, German eyewear retailer. The company was founded in 2007 asan online-only seller of sunglasses and has pivoted in recent years toopening physical stores (42 today) in order to shift its mix towardprescription eyewear. European prescription eyewear is a large addressablemarket (€6 billion in Germany, €23 billion in targeted western Europeancountries) with high gross margins (70% to 90%) served by a fragmentedbase of independent opticians and chains with low online presence/capability. These characteristics in other retail categories have historicallytranslated into substantial opportunities for a disruptive, digital-firstchallenger. Mister Spex is such a challenger, and we expect the company togrow revenue at over 20% per annum at attractive returns on investedcapital for several years. Plans to rapidly roll out stores to 250 over the next5 years will drive profitability through its mix shift to more prescriptioneyewear sales, which carry higher ASPs and margins, and a gradual increasein own-brand penetration. In our view, Mister Spex’s 2% market share inGermany can quintuple in the long run, and early indications regarding itsexpansion into Austria, Switzerland, and Nordic countries are encouraging.
We also added to several existing positions, notably Keyence Corporation,Nestle S.A., eDreams ODIGEO SA, Alibaba Group Holding Limited,Midea Group Co., Ltd., InPost S.A., SMS Co., Ltd., and TeamViewer AG.Based on our goal to increase portfolio concentration and/or due to shiftingfundamentals or valuations reaching levels inconsistent with our view of
fundamentals, we exited positions in FANUC Corp., Detsky Mir PJSC,Tower Semiconductor Ltd., Itau Unibanco Holding SA, Winning HealthTechnology Group Co., Ltd., Sony Corporation, NEXON Co., Ltd., GDSHoldings Limited, Kotak Mahindra Bank Ltd., Network InternationalHoldings Ltd., and Hemnet Group AB.
OUTLOOK
Something happened on the way to the mid-cycle slowdown. As weremarked in our previous letter, “In recent months, bond yields and inflationfever indeed peaked, as an ongoing slowdown in Chinese credit growth, thespread of the Delta variant of COVID-19, and rising conviction that the Fedwould not fall too far behind the curve, coalesced to cool both globalgrowth expectations and spiraling commodity prices… (T)hese conditionsresulted in growth stocks, particularly in the U.S., outperforming during therecent quarter.” While the second quarter was characterized by cooling ofinflation fever, as we progressed through the third, the peaking of Delta-variant infections coincident with increasing supply bottlenecks in variousforms – labor, commodities, materials, oil, natural gas, inventories, andtransportation and logistics capacity – remained a challenge and sparked areturn to concerns over inflation, rising interest rates, and more aggressivecentral bank tightening. This round of supply-related concerns has emergedcoincident with an apparent economic slowdown, and since we believe itwill be difficult and will take some time for central bankers to address theseissues, we suspect the correction in global equities that began in earlySeptember may have more room to run, particularly among thetop-performing equities in the year-to-date period. We believe costpressures may lead to margin compression for many companies at a time ofslowing revenue growth; a tough combination given existing elevatedearnings expectations and valuations. We believe some time to allowimbalances to correct would be healthy, and we remain optimistic that amulti-year period of global economic expansion, and a flow of capital fromfixed income to equity assets, which favors international and EM markets,remains likely.
From our international perch, the seminal event during the quarter was themanifestation and aggressive discounting of the regulatory and credittightening China started late in 2020. While the financial media offers noshortage of skeptics on the subject, we believe the policy measures China isundertaking make sense in the context of the stated goal of enhancing thesocial, political, economic, and financial stability of the country. Thesemeasures have been in development for some time and theirimplementation was delayed by the COVID crisis last year. Given next year’sParty Congress, during which President Xi will strive to achieve the rare thirdterm, we believe we are witnessing the peak in tightening as the Party willwant to facilitate economic momentum in advance of the Party Congress.While many biased commentators suggest that “China has becomeun-investible,” we strongly disagree. Policy makers are merely shining a lighton the divide in China that we have been discussing for some time. Webelieve recent events illuminate the importance of active stock selection inChina and enhance the case for investing in the value-added, intellectualcapital-based companies that further China’s goal of becoming self-sufficient in strategic sectors such as semiconductors, software, artificialintelligence, electronic vehicles and autonomous driving, biotechnology andinnovative health care products and services, and automation and robotics.Then there are the companies that have come under regulatory pressuregiven their potential long-term threat to China’s social, political, andfinancial stability due to the high cost of education/tutoring, the high cost
77

Baron International Growth Fund
of housing, excessive leverage or speculation, or perceived monopoly-likemarket concentration and/or ownership and leverage of strategic data. Webelieve that China’s regulatory and credit tightening was intentional and iswell advanced. The panic selling during the third quarter, particularly byinternational and U.S. investors, represents the capitulation phase, at leaston a relative basis. We believe China has the capacity to arrest contagionand spark a targeted economic recovery. China views episodes such asEvergrande’s likely restructuring as necessary to guard against moral hazardand reinforce the deleveraging message that is a consistent objective of Xi’sstability strategy. While the correction in China may not be over, we areconfident we are in the late innings and believe a legitimate policy easingsignal would trigger a strong recovery and outperformance phase forChinese equities.
Looking forward, we remain optimistic regarding our portfolio ofinvestments and, notwithstanding the dominance of U.S. equities in recentyears, we caution investors not to overlook the attractiveness of theinternational asset class, particularly at current valuations. We think that theglobal economy, corporate earnings, and asset prices are influenced by thetwo major axes of macroeconomic activity and liquidity – China, whichtends to correlate more closely to international economies and equities, and
the U.S., which tends to be more insular. As we mention above, China’sregulatory and credit tightening cycle is nearing its trough, while the U.S.appears to be passing through a near-term peak, with a phase of moderatinggrowth or tightening increasingly inevitable. While we suspect that thecurrent correction may have to run a bit further to correct imbalances, weare increasingly confident that international and EM equities are poised for aperiod of mean-reverting outperformance.
Thank you for investing in the Baron International Growth Fund.
Sincerely,
Michael KassPortfolio ManagerSeptember 30, 2021
Investors should consider the investment objectives, risks, and charges and expenses of the investment carefully before investing. The prospectusand summary prospectus contain this and other information about the Funds. You may obtain them from its distributor, Baron Capital, Inc., bycalling 1-800-99BARON or visiting www.BaronFunds.com. Please read them carefully before investing.
Risks: Non-U.S. investments may involve additional risks to those inherent in U.S. investments, including exchange-rate fluctuations, politicalor economic instability, the imposition of exchange controls, expropriation, limited disclosure and illiquid markets. This may result in greatershare price volatility. Securities of small and medium-sized companies may be thinly traded and more difficult to sell. Even though the Fund isdiversified, it may establish significant positions where the Adviser has the greatest conviction. This could increase volatility of the Fund’sreturns. Portfolio holdings are subject to change. Current and future portfolio holdings are subject to risk.
The discussions of the companies herein are not intended as advice to any person regarding the advisability of investing in any particularsecurity. The views expressed in this report reflect those of the respective portfolio manager only through the end of the period stated in thisreport. The portfolio manager’s views are not intended as recommendations or investment advice to any person reading this report and aresubject to change at any time based on market and other conditions and Baron has no obligation to update them.
This report does not constitute an offer to sell or a solicitation of any offer to buy securities of Baron International Growth Fund by anyone inany jurisdiction where it would be unlawful under the laws of that jurisdiction to make such offer or solicitation.
BAMCO, Inc. is an investment adviser registered with the U.S. Securities and Exchange Commission (SEC). Baron Capital, Inc. is a limitedpurpose broker-dealer registered with the SEC and member of the Financial Industry Regulatory Authority, Inc. (FINRA).
78

September 30, 2021 Baron Real Estate Fund
JEFFREY KOLITCH Retail Shares: BREFXInstitutional Shares: BREIX
PORTFOLIO MANAGER R6 Shares: BREUX
Dear Baron Real Estate Fund Shareholder:
In the most recent three-month period ended September 30, 2021, the BaronReal Estate Fund (the “Fund”) declined a modest 1.66% (Institutional Shares),marginally underperforming its primary benchmark index, the MSCI USA IMIExtended Real Estate Index (the “MSCI Real Estate Index”), and the MSCI USREIT Index (the “REIT Index”), which increased 0.10% and 0.75%, respectively.
For the first nine months of 2021, the Fund increased 14.31%.
We are pleased to report that as of September 30, 2021, the Fund had a5-star Overall Morningstar Rating™ again and has remained in the top 1%of all real estate funds for its 10-year, 5-year, and 3-year performance.
For our more detailed thoughts on the Fund’s recent performance, pleaserefer to our “A Review of Recent Activity and Performance” section later inthis letter.
We will address the following topics in this letter:
Š A review of recent activity and performanceŠ Investing prospects for real estate (preview: we remain bullish)Š Our investment themes and portfolio constructionŠ Interest rates and inflation and their impact on real estateŠ Concluding thoughts
As of 9/30/2021, the Morningstar Ratings™ were based on 231, 199, 147, and 231 share classes for the 3-year, 5-year, 10-year, and Overallperiods, respectively. The Baron Real Estate Fund received 5, 5, 5, and 5 stars, respectively. The Morningstar Ratings are for the Institutional ShareClass only; other classes may have different performance characteristics. The Morningstar Ratings are based on the Morningstar Risk-AdjustedReturn measures.
As of 9/30/2021, the Morningstar Real Estate Category consisted of 246, 231, 199, and 147 share classes for the 1-, 3-, 5-, and 10-year periods.Morningstar ranked Baron Real Estate Fund Institutional Share Class in the 48th, 1st, 1st, and 1st percentiles, respectively.
Morningstar calculates the Morningstar Real Estate Category Average performance and rankings using its Fractional Weighting methodology.Morningstar rankings are based on total returns and do not include sales charges. Total returns do account for management, administrative, and12b-1 fees and other costs automatically deducted from fund assets.
The Morningstar Rating™ for funds, or “star rating”, is calculated for managed products (including mutual funds, variable annuity and variable life subaccounts, exchange-traded funds, closed-end funds, and separate accounts) with at least a three-year history. Exchange-traded funds and open-ended mutual funds are considered a singlepopulation for comparative purposes. It is calculated based on a Morningstar Risk-Adjusted Return measure that accounts for variation in a managed product’s monthly excessperformance, placing more emphasis on downward variations and rewarding consistent performance. The Morningstar Rating does not include any adjustment for sales loads.The top 10% of products in each product category receive 5 stars, the next 22.5% receive 4 stars, the next 35% receive 3 stars, the next 22.5% receive 2 stars, and the bottom10% receive 1 star. The Overall Morningstar Rating for a managed product is derived from a weighted average of the performance figures associated with its three-, five-, and10-year (if applicable) Morningstar Rating metrics. The weights are: 100% three-year rating for 36-59 months of total returns, 60% five-year rating/40% three-year rating for60-119 months of total returns, and 50% 10-year rating/30% five-year rating/20% three-year rating for 120 or more months of total returns. While the10-year overall star rating formula seems to give the most weight to the 10- year period, the most recent three-year period actually has the greatestimpact because it is included in all three rating periods.
© 2021 Morningstar. All Rights Reserved. The information contained herein: (1) is proprietary to Morningstar and/or its content providers; (2) may not becopied or distributed; and (3) is not warranted to be accurate, complete or timely. Neither Morningstar nor its content providers are responsible for anydamages or losses arising from any use of this information. Past performance is no guarantee of future results.
BARONF U N D S
79

Baron Real Estate Fund
Table I.PerformanceAnnualized for periods ended September 30, 2021
BaronReal Estate
FundRetail
Shares1,2
BaronReal Estate
FundInstitutional
Shares1,2
MSCIUSA IMI
ExtendedReal Estate
Index1
MSCI USREIT
Index1
Three Months3 (1.73)% (1.66)% 0.10% 0.75%Nine Months3 14.10% 14.31% 20.16% 22.15%One Year 33.15% 33.50% 32.60% 35.77%Three Years 25.57% 25.89% 12.89% 8.82%Five Years 19.25% 19.56% 11.48% 5.55%Ten Years 18.75% 19.05% 14.51% 9.88%Since Inception
(December 31, 2009)(Annualized) 16.58% 16.88% 12.72% 9.95%
Since Inception(December 31, 2009)(Cumulative)3 506.61% 524.89% 308.23% 204.75%
A REVIEW OF RECENT ACTIVITY AND PERFORMANCE
Recent Activity
Like our portfolio management playbook employed in 2020, we maintainedour unusually elevated active approach to managing the Fund in the firstnine months of 2021 due to the acceleration and emergence of headwindsand tailwinds in certain segments of real estate, the unprecedentedeconomic and social lockdown and reopening, and the resulting stockmarket volatility.
Table II.Top net purchases for the quarter ended September 30, 2021
Quarter EndMarket Cap
(billions)
AmountPurchased(millions)
Caesars Entertainment Corporation $24.0 $36.8MGM Resorts International 20.8 36.7Hyatt Hotels Corp. 8.5 27.8Hillman Solutions Corp. 2.2 26.4Lennar Corporation 28.4 25.9
In the most recent quarter, we acquired shares or made additionalpurchases in:
Š Caesars Entertainment Corporation: Caesars is the largest and mostdiversified casino gaming and entertainment company in the U.S. Thecompany manages 47 casino properties across 13 states and5 countries and has a #1 or #2 market share position in most markets.Brands include Caesars, Harrah’s, Planet Hollywood, Paris Las Vegas,and Nobu Hotel, among others. Led by highly regarded CEO Tom Reeg,we believe Caesar’s has several opportunities to continue to drivestrong cash flow growth and create value through operationalimprovements, sports betting market share growth, real estate assetsales, debt reduction, and ongoing investments in customerengagement, its hotel room products, and digital technology.
Š MGM Resorts International: MGM Resorts is a global casino andentertainment company operating 19 properties throughout the LasVegas Strip, Macau, and the broader U.S. Approximately 80% of thecompany’s cash flow is generated in the U.S. We believe thecompany is well positioned to benefit from an ongoing recovery inLas Vegas. The company’s BetMGM iGaming business is the clearleader in the U.S. with a 30% market share, and its combined sportsbetting and iGaming business is the #2 ranked business by marketshare in the U.S. Following several prudent strategic and financialsteps, MGM Resorts will soon have more than $10 billion of cash thatit can deploy for additional growth opportunities, share repurchases,dividends, debt reduction, and other opportunities to createshareholder value.
Š Hyatt Hotels Corp.: Following its recent announcement to acquireApple Leisure Group, a highly desirable independent resortmanagement company with 102 resorts in 10 countries, we re-acquired shares in Hyatt, a leading hotel company. We believe thisacquisition will accelerate Hyatt’s industry-leading growth by adding aportfolio of resort brands with a large pipeline. Hyatt’s managementhas also announced its intention to accelerate its transformation togreater fee-based earnings and create additional liquidity by seeking tosell $2 billion of owned hotels in the next three years. We believe thecombination of industry-leading growth, hotel asset sales at attractivevaluations, and the company’s ongoing transformation to more of anasset-light business will result in an improvement in Hyatt’s valuationand strong shareholder returns.
Performance listed in the above table is net of annual operating expenses. Annual expense ratio for the Retail Shares and Institutional Shares as of December 31,2020 was 1.34% and 1.08%, respectively. The performance data quoted represents past performance. Past performance is no guarantee of future results. Theinvestment return and principal value of an investment will fluctuate; an investor’s shares, when redeemed, may be worth more or less than their original cost.The Adviser reimburses certain Baron Fund expenses pursuant to a contract expiring on August 29, 2032, unless renewed for another 11-year term and theFund’s transfer agency expenses may be reduced by expense offsets from an unaffiliated transfer agent, without which performance would have been lower.Current performance may be lower or higher than the performance data quoted. For performance information current to the most recent month end, visitwww.BaronFunds.com or call 1-800-99BARON.1 The MSCI USA IMI Extended Real Estate Index is a custom index calculated by MSCI for, and as requested by, BAMCO, Inc. The index includes real estate and real estate-
related GICS classification securities. MSCI makes no express or implied warranties or representations and shall have no liability whatsoever with respect to any MSCI datacontained herein. The MSCI data may not be further redistributed or used as a basis for other indexes or any securities or financial products. This report is not approved,reviewed or produced by MSCI. The MSCI US REIT Index is a free float-adjusted market capitalization index that measures the performance of all equity REITs in the USequity market, except for specialty equity REITs that do not generate a majority of their revenue and income from real estate rental and leasing operations. MSCI is thesource and owner of the trademarks, service marks and copyrights related to the MSCI Indexes. The indexes and the Fund include reinvestment of interest, capital gains anddividends, which positively impact the performance results. The indexes are unmanaged. Index performance is not Fund performance; one cannot invest directly into anindex.
2 The performance data in the table does not reflect the deduction of taxes that a shareholder would pay on Fund distributions or redemption of Fund shares.3 Not annualized.
80
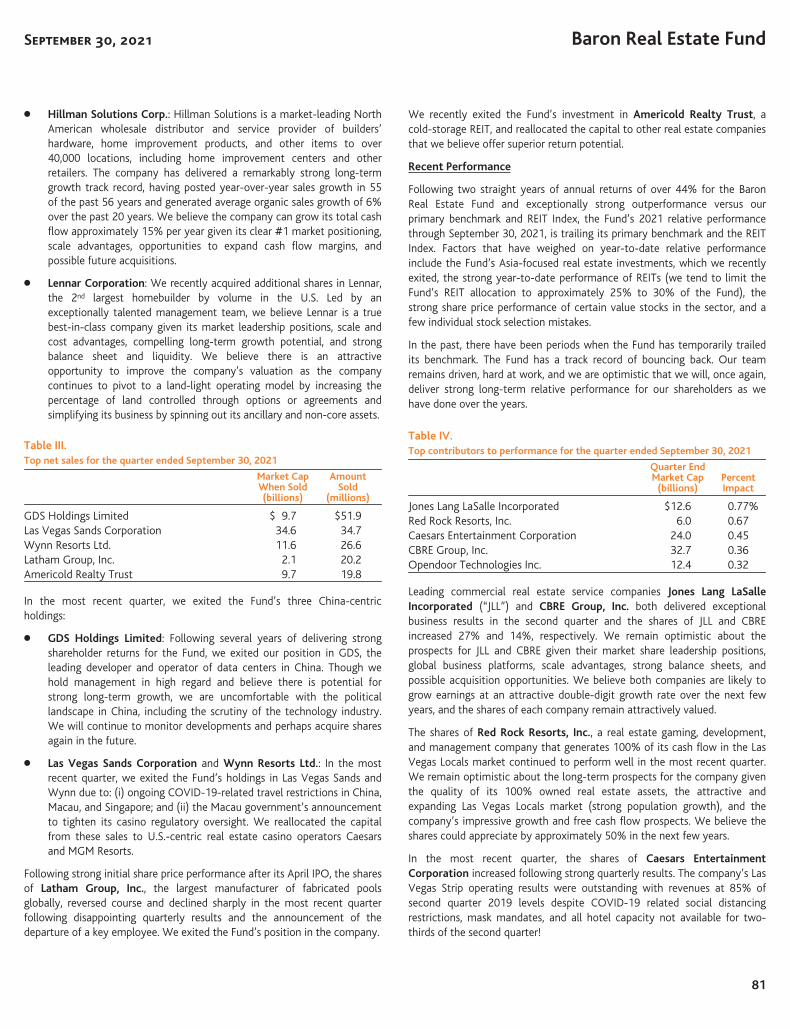
September 30, 2021 Baron Real Estate Fund
Š Hillman Solutions Corp.: Hillman Solutions is a market-leading NorthAmerican wholesale distributor and service provider of builders’hardware, home improvement products, and other items to over40,000 locations, including home improvement centers and otherretailers. The company has delivered a remarkably strong long-termgrowth track record, having posted year-over-year sales growth in 55of the past 56 years and generated average organic sales growth of 6%over the past 20 years. We believe the company can grow its total cashflow approximately 15% per year given its clear #1 market positioning,scale advantages, opportunities to expand cash flow margins, andpossible future acquisitions.
Š Lennar Corporation: We recently acquired additional shares in Lennar,the 2nd largest homebuilder by volume in the U.S. Led by anexceptionally talented management team, we believe Lennar is a truebest-in-class company given its market leadership positions, scale andcost advantages, compelling long-term growth potential, and strongbalance sheet and liquidity. We believe there is an attractiveopportunity to improve the company’s valuation as the companycontinues to pivot to a land-light operating model by increasing thepercentage of land controlled through options or agreements andsimplifying its business by spinning out its ancillary and non-core assets.
Table III.Top net sales for the quarter ended September 30, 2021
Market CapWhen Sold(billions)
AmountSold
(millions)
GDS Holdings Limited $ 9.7 $51.9Las Vegas Sands Corporation 34.6 34.7Wynn Resorts Ltd. 11.6 26.6Latham Group, Inc. 2.1 20.2Americold Realty Trust 9.7 19.8
In the most recent quarter, we exited the Fund’s three China-centricholdings:
Š GDS Holdings Limited: Following several years of delivering strongshareholder returns for the Fund, we exited our position in GDS, theleading developer and operator of data centers in China. Though wehold management in high regard and believe there is potential forstrong long-term growth, we are uncomfortable with the politicallandscape in China, including the scrutiny of the technology industry.We will continue to monitor developments and perhaps acquire sharesagain in the future.
Š Las Vegas Sands Corporation and Wynn Resorts Ltd.: In the mostrecent quarter, we exited the Fund’s holdings in Las Vegas Sands andWynn due to: (i) ongoing COVID-19-related travel restrictions in China,Macau, and Singapore; and (ii) the Macau government’s announcementto tighten its casino regulatory oversight. We reallocated the capitalfrom these sales to U.S.-centric real estate casino operators Caesarsand MGM Resorts.
Following strong initial share price performance after its April IPO, the sharesof Latham Group, Inc., the largest manufacturer of fabricated poolsglobally, reversed course and declined sharply in the most recent quarterfollowing disappointing quarterly results and the announcement of thedeparture of a key employee. We exited the Fund’s position in the company.
We recently exited the Fund’s investment in Americold Realty Trust, acold-storage REIT, and reallocated the capital to other real estate companiesthat we believe offer superior return potential.
Recent Performance
Following two straight years of annual returns of over 44% for the BaronReal Estate Fund and exceptionally strong outperformance versus ourprimary benchmark and REIT Index, the Fund’s 2021 relative performancethrough September 30, 2021, is trailing its primary benchmark and the REITIndex. Factors that have weighed on year-to-date relative performanceinclude the Fund’s Asia-focused real estate investments, which we recentlyexited, the strong year-to-date performance of REITs (we tend to limit theFund’s REIT allocation to approximately 25% to 30% of the Fund), thestrong share price performance of certain value stocks in the sector, and afew individual stock selection mistakes.
In the past, there have been periods when the Fund has temporarily trailedits benchmark. The Fund has a track record of bouncing back. Our teamremains driven, hard at work, and we are optimistic that we will, once again,deliver strong long-term relative performance for our shareholders as wehave done over the years.
Table IV.Top contributors to performance for the quarter ended September 30, 2021
Quarter EndMarket Cap
(billions)PercentImpact
Jones Lang LaSalle Incorporated $12.6 0.77%Red Rock Resorts, Inc. 6.0 0.67Caesars Entertainment Corporation 24.0 0.45CBRE Group, Inc. 32.7 0.36Opendoor Technologies Inc. 12.4 0.32
Leading commercial real estate service companies Jones Lang LaSalleIncorporated (“JLL”) and CBRE Group, Inc. both delivered exceptionalbusiness results in the second quarter and the shares of JLL and CBREincreased 27% and 14%, respectively. We remain optimistic about theprospects for JLL and CBRE given their market share leadership positions,global business platforms, scale advantages, strong balance sheets, andpossible acquisition opportunities. We believe both companies are likely togrow earnings at an attractive double-digit growth rate over the next fewyears, and the shares of each company remain attractively valued.
The shares of Red Rock Resorts, Inc., a real estate gaming, development,and management company that generates 100% of its cash flow in the LasVegas Locals market continued to perform well in the most recent quarter.We remain optimistic about the long-term prospects for the company giventhe quality of its 100% owned real estate assets, the attractive andexpanding Las Vegas Locals market (strong population growth), and thecompany’s impressive growth and free cash flow prospects. We believe theshares could appreciate by approximately 50% in the next few years.
In the most recent quarter, the shares of Caesars EntertainmentCorporation increased following strong quarterly results. The company’s LasVegas Strip operating results were outstanding with revenues at 85% ofsecond quarter 2019 levels despite COVID-19 related social distancingrestrictions, mask mandates, and all hotel capacity not available for two-thirds of the second quarter!
81

Baron Real Estate Fund
Table V.Top detractors from performance for the quarter ended September 30, 2021
Quarter EndMarket Cap or
Market CapWhen Sold(billions)
PercentImpact
Latham Group, Inc. $ 2.2 –0.81%Zillow Group, Inc. 22.4 –0.75GDS Holdings Limited 9.2 –0.68Hippo Holdings Inc. 2.5 –0.45Las Vegas Sands Corporation 33.3 –0.35
As mentioned above, the shares of Latham Group, Inc., the largestmanufacturer of fabricated pools globally, declined sharply for the periodheld following disappointing quarterly results and the announcement of thedeparture of a key employee. We exited the Fund’s position in thecompany.
In 2020, the shares of Zillow Group, Inc., a technology-centric housing-related company, increased sharply, up 184%. We trimmed the Fund’sposition earlier in 2021, yet the shares have continued to decline and aredown approximately 32% year-to-date. We believe concerns that homesales volume and prices may decline due to home affordability andmortgage rate fears and concerns about increased competition in thecompany’s i-buying business have weighed on the shares. At its currentprice, we believe Zillow’s shares are attractively valued and remainoptimistic about the long-term prospects for the company.
Despite strong quarterly operating results, the shares of GDS HoldingsLimited, the leading developer and operator of data centers in China,declined sharply for the period held due to concerns about China’sregulatory backdrop and uncertainty around the ultimate impact on thecountry’s leading technology companies, many of whom are key customersof GDS. We exited the Fund’s position in the company.
Hippo Holdings Inc. is an innovative homeowners’ insurance business thatleverages technology to underwrite policies and improve the customerexperience in an industry dominated by less innovative incumbents.Although we remain optimistic about the company’s long-term prospects,we exited the Fund’s position in the company and reallocated the capital toother companies that we believe offer superior shareholder returnprospects.
INVESTING PROSPECTS FOR REAL ESTATE
We continue to believe the near-term and long-term prospects forpublic real estate remain attractive.
Near-Term Case for Real Estate
1. Demand continues to outstrip supply
A generally favorable relationship between demand and supply bodeswell for real estate.
Regarding the demand outlook, commercial occupancy and rents andresidential home sales and homes for rent are, in most cases, improvingagainst a backdrop of modest inventory levels.
Regarding the supply outlook, we are not witnessing warning signs ofexcess inventory and sharp increases in new construction.
Commercial real estate construction activity and inventory levels remainmodest due, in part, to elevated construction costs and labor shortages.
In the single-family for-sale home segment, inventory levels remaindepressed relative to historical standards and demographics.
2. Business conditions are improving for most of our real estatecompanies – both residential and commercial real estate – and theoutlook does not portend a recession
The performance of several real estate companies lagged in 2020largely due to the Coronavirus headwind that led to a sharp slowdownin business activity for hotels, real estate casinos, urban apartment andoffice landlords, malls and shopping centers, and other real estatecategories. The inability for people to assemble disproportionatelyweighed on a large segment of real estate.
Last year’s real estate headwinds have begun to recede, and we expectthis trend to continue in the months ahead. We anticipate thatportions of real estate will continue to be key beneficiaries of aneconomic reopening.
In September, we were extremely busy attending several real estateconferences and meetings and furthering our research. Bottom linetakeaway: Broadly encouraging updates and outlooks for most realestate categories and companies.
3. Balance sheets are strong
Although credit access is available at historically low financing rates,most public real estate companies are maintaining strong and liquidbalance sheets and are not utilizing excessive use of debt relative tocompany-generated cash flow.
4. The real estate cycle has reset, and we believe the multi-yearoutlook is attractive
Most real estate cycles tend to last five to seven years (like aneconomic cycle).
We believe much of real estate is in the relatively early stages of amulti-year recovery, fueled by improving prospects for demand,subdued construction inventory levels, strong and liquid balance sheets,and well-functioning credit markets with historically low interest rates.
5. Substantial private capital is still in pursuit of real estateownership supported by widely available debt capital at lowinterest rates
We continue to believe that real estate merger and acquisition activitywill remain strong.
We estimate that approximately $344 billion of capital has been raisedby private equity sources to invest in real estate, which equates toapproximately $1.1 trillion of total real estate purchasing capacity,assuming typical 70% financing!
We anticipate that large amounts of capital from private equityinvestors such as Blackstone and Brookfield Asset Management,sovereign wealth funds, endowments, pension funds, and others willcontinue to step in and capitalize on the opportunity to buy qualitypublic real estate given the compelling arbitrage opportunity in thepublic real estate market relative to the private market. This embeddedput scenario should limit the downside for valuations and stock prices.
82

September 30, 2021 Baron Real Estate Fund
6. We continue to identify real estate companies that remain on saleand are attractively valued
We took advantage of the major buying opportunities created in 2020following the swift and intense stock market correction.
For some of the Fund’s holdings, stock prices have recovered, andprospective shareholder returns are likely to come from earnings orcash flow growth rather than an improvement in a company’svaluation (i.e., multiple expansion or cap rate compression).
However, we continue to identify real estate companies that offerprospects for both valuation multiple expansion (or cap ratecompression) and earnings or cash flow growth. We prioritize realestate companies that have this two-pronged return potential becausethey have the potential to generate outsized returns.
Long-Term Case for Real Estate
We believe the long-term case for public real estate is compelling.
1. Solid historical long-term returns with ongoing potential
For the 25-year period ended September 30, 2021, U.S. equity REITshave delivered the best cumulative return relative to the S&P 500 Index,fixed income alternatives, international equities, and commodities.
Since inception on December, 31 2009 through September, 30 2021,the Baron Real Estate Fund, which owns REITs and non-REIT real estatecompanies, has delivered a cumulative return of 524.89%, faroutdistancing the 204.75% return of the REIT Index.
We remain optimistic about the potential for real estate to continue togenerate solid long-term absolute and relative performance.
2. Diversification and low correlation to equities and bonds
According to FactSet, over the last 25 years (through 9/30/2021), REITshave provided diversification benefits due to their modest correlationversus stocks (0.59 versus S&P 500 Index) and low correlation versusbonds (0.20 versus Bloomberg Barclays U.S. Aggregate Index).
3. Inflation protection
Historically, certain real estate has had the ability to raise prices toprovide inflation protection. Please see the section titled “Interest ratesand inflation and their impact on real estate” later in this letter for ourmore complete thoughts on this topic.
OUR INVESTMENT THEMES AND PORTFOLIO CONSTRUCTION
Investment Themes
In the second half of 2020, we structured the Fund to take advantage ofthree compelling investing themes and have maintained these themes in thefirst nine months of 2021. They are:
Š COVID-19 recovery beneficiariesŠ Opportunities in residential real estateŠ The intersection of technology and real estate
1. COVID-19 recovery beneficiaries
This investment theme encompasses what we call the epicenter realestate companies of the 2020 pandemic.
Last year, certain REITs and other real estate-related businesses thatrely on the assembly of people were severely impacted byCOVID-19 as they were forced to shut down all or a large part ofoperations almost without exception. The share prices of many ofthese companies declined last year and most remain below peakprices.
With the recent peak in COVID-19 and Delta variant cases, increase invaccinations and booster shots, and new anti-viral medications, weanticipate a further release of pent-up consumer and commercialdemand and a rebound in cash flows for several of the hardest hitsegments of real estate – particularly the travel-related segments – asmore people are inoculated with COVID-19 vaccines and economicactivity resumes.
Examples of the Fund’s COVID-19 recovery beneficiaries include:
Real estate casino and gaming companiesRed Rock Resorts, Inc., Boyd Gaming Corporation, CaesarsEntertainment Corporation, MGM Resorts International, and PennNational Gaming, Inc.
Vacation timeshare companiesMarriott Vacations Worldwide Corp., Travel + Leisure Co., andHilton Grand Vacations Inc.
Amusement park operatorsSix Flags Entertainment Corporation
Commercial real estate services companiesCBRE Group, Inc. and Jones Lang LaSalle Incorporated
Real estate operating companiesBrookfield Asset Management Inc.
Land development companiesThe Howard Hughes Corporation
Certain REITs (office, apartment, mall, shopping center, hotel, healthcare, and gaming REITs)Douglas Emmett, Inc., Simon Property Group, Inc., Vornado RealtyTrust, American Assets Trust, Inc., Equity Residential, MGMGrowth Properties LLC, and Gaming and Leisure Properties, Inc.
On September 30, 2021, COVID-19 recovery beneficiary companiesrepresented 50.8% of the Fund’s net assets.
Table VI.COVID-19 Recovery Beneficiaries as of September 30, 2021
Percent ofNet Assets
Casinos & Gaming Operators 13.6%Certain REITs 11.2Hotels, Timeshare Operators, and Other Leisure Companies 9.6Commercial Real Estate Services Companies 6.8Real Estate Operating Companies 3.9Amusement Park Companies 2.0Land Development Companies 2.0OTAs 1.7
Total 50.8%
83

Baron Real Estate Fund
2. Opportunities in residential real estate
Despite some near-term headwinds such as material and laborbottlenecks and the recent uptick in mortgage rates, we remainbullish on the multi-year prospects for U.S. residential real estate.
Areas of investment focus include:
HomebuildersLennar Corporation, D.R. Horton, Inc., and Toll Brothers, Inc.
Single-family rental REITsInvitation Homes, Inc.
Manufactured housing REITsEquity Lifestyle Properties, Inc.
Residential building products/services companiesLowe’s Companies, Inc., Home Depot, Inc., Installed BuildingProducts, Inc., and Hillman Solutions Corp.
Apartment REITsEquity Residential
Technology-centric residential-related real estate companiesSmartRent, Inc., Zillow Group, Inc., and Opendoor Technologies Inc.
The key component of our optimism is that there has been a structuralunderinvestment in the construction of residential real estate that webelieve is likely to reverse in the years ahead.
Today, the U.S. is building the same number of homes annually as it didin 1959 – approximately 1.4 million homes, which also equals the60-year average. This annual construction figure is shockingly lowwhen one considers that the U.S. population is more than 150 millionpeople larger than it was in 1959 – 330 million people today versus178 million people in 1959!
Ever since the housing crisis from 2007 to 2010, housing supply hasnot kept pace with housing demand, household formation, andpopulation growth leading to a structural shortage of housing.According to the U.S. Census, 12.3 million American households wereformed from January 2012 to June 2021, but just 7 million new single-family homes were built during that time. The result? The U.S. is shortmore than 5 million homes.
Housing-related demand prospects are also encouraging especiallyfrom the approximately 73 million millennials – ages 25 to 40 – manyof whom are now looking to buy or rent a home. Millennials are thelargest generation in the workforce – many have jobs, their wages areincreasing, and their multi-year delay of household formation isreversing. There are signs that millennials are debunking the view thatthe “American Dream” to own or rent a home is over.
The large imbalance between pent-up housing demand and lowconstruction levels bodes well for new single-family homepurchases, so long as mortgage rates do not spike to levels thatwould deter would-be homebuyers. It also bodes well for home andapartment rentals.
Other cyclical and secular tailwinds that should aid the U.S. housingmarket in the years ahead include:
Cyclical tailwinds
In addition to cyclically depressed levels of construction activity andpent-up demand, low inventory levels, low mortgage rates, higherconsumer savings, meaningful stimulus checks, and a rebound in joband economic growth should continue to benefit the U.S. housingmarket. The current situation is nothing like what occurred during theglobal Financial Crisis when our country’s inventory of homes wassignificantly oversupplied relative to demand.
Secular tailwinds
COVID-19 has also given rise to secular tailwinds that may aid the U.S.housing market for several years:
Suburban may become the new urban: More U.S. families have beenmoving out of urban areas to suburban towns. We expect demand forsingle-family homes – to purchase or rent – to remain strong.
Work from home or anywhere: Should work-from-home arrangementsbecome more permanent, people will have more flexibility to relocateaway from urban centers. This should lead to an increase in new homesales and demand for single-family rentals.
More time at home may lead to more investment in the home:Homeowners are likely to spend more time at home than ever beforeas more employees work from home. This trend should contribute tohomeowners spending more on home repair and remodeling activity(home office, outdoor decks and living spaces, pools, kitchens, andrefreshing paint jobs). The Fund currently has investments in severalcompanies that should benefit from this trend including Home Depot,Inc., Lowe’s Companies, Inc., Fortune Brands Home & Security,Inc., Installed Building Products, Inc., SiteOne Landscape Supply,Inc., Pool Corporation, Trex Company, Inc., and The AZEKCompany Inc.
We are mindful of, and will continue to monitor, the potential risks tothe Fund’s investments in residential real estate-related companies. Forexample, a sharp increase in mortgage rates coupled with double-digithome price growth would make homes less affordable.
Regarding home price affordability, despite strong recent home priceappreciation, we believe affordability remains attractive in part due toincreases in household income and historically low mortgage rates. Wewill elaborate on this topic in our next shareholder letter.
We would also note that many builders are currently holding back thesales of homes so that they can better match the home sales pricewith the cost to build a home (lumber, labor, etc.) and generate anattractive profitability margin. The implication is that the recentslowdown in new home sales is partly technical (supply-induced, notdue to a lack of demand), and, if so, any home sale slowdown may notpersist.
Should headwinds begin to surface for the housing market, we wouldexpect any correction in the share prices of residential real estate-related companies to be relatively shallow given the powerful cyclicaland secular housing-related tailwinds.
The Fund’s ability to invest in non-REIT residential-related real estatecompanies such as homebuilders, land developers, building products/services companies, and home centers is one of the importantdifferentiators that affords the Fund the ability to distinguish itselfversus REIT funds.
84

September 30, 2021 Baron Real Estate Fund
As of September 30, 2021, residential-related real estate companiesrepresented 22.6% of the Fund’s net assets.
Table VII.Residential-related Real Estate Companies as of September 30, 2021
Percent ofNet Assets
Building Products/Services 9.4%Homebuilders 4.9Home Centers 4.2REITs
Single-Family Rental 2.5Manufactured Housing 1.6
Total1 22.6%
1 Total would be 28.3% if included residential-related technology companiesZillow Group, Inc., Opendoor Technologies Inc., and SmartRent, Inc.
3. The intersection of technology and real estate
The impact of technology on real estate is undeniable. The growth incloud computing, the internet, mobile data and cellphones, andwireless infrastructure are powerful secular drivers that should continueunabated for years and are impacting real estate, along with manyother industries.
If anything, the pandemic has accelerated these secular trends as morepeople conduct business, leisure, residential, and commercial activitiesonline.
Further, the digitization of real estate is an emerging investment themeand new area of prioritization for our real estate team. The real estateindustry has avoided decades of technology innovation while manyother industries have evolved rapidly. We are seeing evidence that realestate companies are increasingly adopting technology as a source ofcompetitive differentiation and evolution across property sectors. Thecollision of real estate and technology has led to a new sub-industrywithin real estate: real estate technology, also referred to as proptech.Proptech is the usage of technology and software to assist in realestate needs. We have identified several real estate companies that arewell positioned to capitalize on this burgeoning secular growth trendincluding SmartRent, Inc., Zillow Group, Inc., OpendoorTechnologies Inc., and CoStar Group, Inc.
Real estate-related companies that embrace and adopt the latesttechnological advances and innovations remain an important focus for us.Key beneficiaries of the technology revolution include data centercompanies, wireless tower companies, industrial REITs, and real estate dataanalytics companies, among others.
On September 30, 2021, technology-related real estate companiesrepresented 21.4% of the Fund’s net assets.
Table VIII.Technology-related Real Estate Companies as of September 30, 2021
Percent ofNet Assets
Real Estate Data Analytics Companies 6.1%Residential-Related Technology Companies 2.0Wireless Tower Operators 1.9Data Centers 0.8REITs
Wireless Tower REITs 3.9Data Center REITs 3.1Industrial REITs 3.0Data-Related REITs 0.6
Total 21.4%
Portfolio Construction
In addition to prioritizing the three investment themes cited above, we havecontinued to implement a barbell approach to the Fund’s portfolioconstruction that includes a mix between best-in-class real estate growthcompanies and real estate value opportunities.
We believe our current barbell approach is prudent because COVID-19 andthe Delta variant have led to a wide disparity in share price performance andvaluation for many real estate companies.
We have maintained our investments in competitively advantaged best-in-class real estate companies with long runways for growth. Examples include:
Š Alexandria Real Estate Equities, Inc., American Tower Corp., CBREGroup, Inc., CoStar Group, Inc., Equinix, Inc., Lowe’s Companies,Inc., Prologis, Inc., and Zillow Group, Inc.
The Fund’s long-term investment philosophy remains the prioritization ofbest-in-class real estate growth companies.
We have continued to acquire and maintain shares in several real estatecompanies that are attractively valued and are “on sale.” Examples include:
Š Brookfield Asset Management Inc., Douglas Emmett, Inc., JonesLang LaSalle Incorporated, MGM Resorts International, SimonProperty Group, Inc., Vornado Realty Trust, and The HowardHughes Corporation.
85

Baron Real Estate Fund
We currently have investments in REITs, plus eight additional real estate-related categories (not including Unclassified securities). Our percentageallocations to these categories vary, and they are based on our research andassessment of opportunities in each category (See Table IX. below).
Table IX.Fund investments in real estate-related categories as of September 30, 2021
Percentof NetAssets
REITs 25.9%Real Estate Service Companies 16.6Casinos & Gaming Operators 13.6Building Products/Services 12.6Hotels & Leisure 11.6Homebuilders & Land Developers 7.8Real Estate Operating Companies 3.9Unclassified 2.0Tower Operators 1.9Data Centers1 0.8
Cash and Cash Equivalents 3.3
Total 100.0%
1 Total would be 3.9% if data center REITs Equinix, Inc. and CoreSite RealtyCorporation were included.
INTEREST RATES AND INFLATION AND THEIR IMPACT ON REAL ESTATE
We are mindful that interest rates and inflation are a current, top-of-mind topic.
It appears that the consensus expectation is that interest rates are likely torise, and elevated inflation may persist.
Should this occur, real estate can perform well in a rising interest rateand inflationary environment.
The Performance of Baron Real Estate Fund In Rising Interest RateEnvironments
Since the launch of the Fund at the end of 2009, there have been six periodswhen the U.S. 10-year Treasury yield increased by at least 80 basis points.During these rising interest rate periods, the Baron Real Estate Fund:
Š Generated positive absolute performance in five of the six periods. Theonly period the Fund did not generate a positive return was a13-month period when it declined 1.82%.
Š Outperformed the REIT Index 100% of the time (in six out of six periods).
The following table summarizes the Fund’s performance during the periodswhen interest rates have increased at least 80 basis points.
Table X.Performance of Baron Real Estate Fund When Interest Rates Have Risen
Date
Increase in10-YearTreasury
Yield
Change inIncrease in
10-YearTreasury
Yield (bps)
Baron RealEstate FundPerformance
MSCI USREIT Index
Performance
MSCI USAIMI
ExtendedReal Estate
Performance
10/8/2010 to2/10/2011 2.38% to 3.72% + 134 bps 16.61% 9.04% 13.85%
7/24/2012 to1/1/2014 1.39% to 3.04% + 165 bps 60.33% 3.47% 32.83%
1/30/2015 to6/10/2015 1.64% to 2.48% + 84 bps 3.76% -10.62% -1.36%
7/8/2016 to3/13/2017 1.36% to 2.63% + 127 bps 5.92% -8.43% 1.42%
9/7/2017 to10/5/2018 2.06% to 3.23% + 117 bps -1.82% -1.97% 4.56%
3/9/2020 to3/31/2021 0.50% to 1.74% + 124 bps 83.59% 12.00% 35.18%
Source: BAMCO and FactSet.
The Performance Of Baron Real Estate Fund In Rising InflationaryEnvironments
Since the launch of the Fund at the end of 2009, there have been six periodswhen the one-year inflation increased at least 100 basis points. In aggregate,the Fund and real estate more generally have proven to be respectableinflation hedges.
During these inflationary periods, the Baron Real Estate Fund:
Š Generated positive absolute performance in five of the six periods. Theonly period the Fund did not generate a positive return was a10-month period beginning on November 30, 2010, when it declined7.51%.
Š Outperformed the REIT Index in four of six periods with an averageoutperformance of 537 basis points.
Š Outperformed the MSCI Real Estate Index in four of six periods with anaverage outperformance of 253 basis points.
86

September 30, 2021 Baron Real Estate Fund
The following table summarizes the Fund’s performance during the periods when the one-year inflation increased at least 100 basis points.
Table XI.Performance of Baron Real Estate Fund When Inflation Has Risen
Cumulative Total Returns Excess Returns vs.:
Date
PeriodLength
(months)
1-YrInflationChange
BaronReal Estate
Fund(Institutional
Shares)
MSCI USAIMI
ExtendedReal Estate
IndexMSCI US
REIT Index
MSCI USAIMI
ExtendedReal Estate
IndexMSCI US
REIT Index
11/30/2010 to 9/30/2011 10 2.73% –7.51% –9.00% –2.28% 1.49% –5.23%
10/31/2013 to 5/31/2014 7 1.29% 13.29% 8.50% 9.78% 4.79% 3.51%
1/31/2015 to 2/28/2017 25 2.98% 0.31% 14.47% 5.06% –14.16% –4.75%
6/30/2017 to 7/31/2018 13 1.23% 8.39% 8.95% 2.90% –0.56% 5.49%
2/28/2019 to 1/31/2020 11 1.00% 23.56% 15.55% 11.86% 8.01% 11.70%
5/31/2020 to 9/30/2021 16 5.15% 63.03% 47.42% 41.51% 15.61% 21.52%
Sources: Morningstar Direct, FactSet, Board of Governors of the Federal Reserve System (US) via the Federal Reserve Bank of St. Louis, U.S. Bureau of Labor Statistics.
Case Study: “Taper Tantrum” of 2013 and 2014 – Perception VersusReality
Currently, there appears to be daily media reports about the upcomingwithdrawal of one of the tools utilized by the Federal Reserve to hold downinterest rates–the implementation of tapering of quantitative easing or theend of bond purchases.
Perception
In 2013, then Fed Chairman Ben Bernanke alluded to tapering and someonecoined the phrase “taper tantrum” and fueled the belief that tapering leadsto a sharp drop in stock and bond prices. Consequently, it appears that manybelieve that today’s Federal Reserve must avoid a repeat of the “mistakes”of the 2013 “taper tantrum.”
Reality
The reaction to the 2013 taper talk and 2014 tapering was benign.
In both 2013 and 2014, stocks performed well, the Baron Real Estate Fundperformed well, and much of real estate performed well.
Š 2013 Taper Talk
May 2013: Fed Chairman Ben Bernanke alluded to tapering, the marketpulled back approximately 5% over the course of a month, andsomeone coined the phrase “taper tantrum.”
July–December 2013: The S&P 500 Index increased approximately 16%in six months.
Full-Year 2013:
– 10-Year U.S. Treasury yield increased by 138 basis pointsfrom a low of 1.66% (May 2) to 3.04% (Dec. 31)
– S&P 500 Index increased 32.4%– Baron Real Estate Fund increased 27.5% (vs. primary
benchmark +17.4% and REIT Index up 1.3%)– Several homebuilding stocks generated double-digit returns
(e.g., Toll Brothers, Inc. and D.R. Horton, Inc.)
• 2013–2014 Tapering
December 18, 2013: The Fed announces the beginning of tapering andthen steadily reduces monthly bond purchases throughout 2014(ending them entirely in October 2014).
Full-Year 2014:
– 10-Year U.S. Treasury yield declined from 3.04% on12/31/13 to 2.17% on 12/31/14 (decline of 87 basis points)
– S&P 500 Index increased 13.7%– Baron Real Estate Fund increased 16.9% (vs. primary
benchmark +18.0% and REIT Index up 28.8%)– Some homebuilding stocks increased by double-digits (e.g.,
D.R. Horton, Inc. +13.3%, Lennar Corporation +11.4%)
Key Takeaways
In 2013 and 2014, the expectation and perception that tapering would leadto a sharp correction in the stock market and real estate was misplaced. Infact, the opposite happened.
Fast forward to 2021. Regarding the upcoming end to quantitative easing,will the past be prologue? Maybe or maybe not. In our opinion, no oneknows. Due to this uncertainty, we have not made rash, knee-jerkadjustments to the Fund’s real estate investments. We will, of course,continue to monitor macroeconomic and company-specific developmentsand make considered adjustments if warranted.
Real Estate As an Inflation Hedge
Historically, certain real estate businesses have had the ability to raise pricesto provide inflation protection:
Inflation-linked property value and pricing power: Higher prices for labor,land, and materials may constrain new real estate construction (increase incosts are currently outstripping the increase in rents which leads to lowerdevelopment returns) thereby supporting the ability for current landlords insupply-constrained markets to increase occupancies and pass along higheroperating costs by raising rents (i.e., pricing power).
87

Baron Real Estate Fund
Short-lease duration: Real estate segments with short-lease terms couldraise rents relatively quickly to offset inflation. Examples include hotels(1 day), self-storage real estate (30 days), apartments (1 year), single-familyrental homes (1 year), and senior housing facilities (1 year).
Annual rent escalators: Certain real estate leases have contractual annualrent escalators, in some cases tied to an inflation index (i.e., consumer priceindex or CPI).
Playbook For Rising Rate or Inflationary Environment
If it became clear that interest rates and inflation would continue to rise andremain elevated, we could implement elements of our well-tested playbook.
They include the following:
Š Carefully monitor our exposure to certain REITs and other dividendyielding securities. Higher bond yields can decrease the attractivenessof dividend-oriented stocks such as REITs. Further, REITs are moresusceptible to higher borrowing costs than many other companiesbecause REITs must pay out at least 90% of their taxable income individends and therefore are more reliant on access to the debt markets.
Š Focus on short-lease duration real estate and minimize exposure tolong-lease duration real estate. Real estate companies such as hotels,self-storage, apartments, single-family home rentals, senior housingoperators and other types of real estate companies can re-price moreoften to take advantage of interest rate fluctuations. They are likely togrow faster as the economy improves and can better offset increases ininterest rates than REITs that focus on office buildings, shoppingcenters, and malls, which may be saddled with 5- to 10-year leases.
Š Emphasize real estate companies that will benefit disproportionatelyfrom an improvement in the economy, such as housing-relatedsecurities, hotels, and gaming to the extent there is a real estatecomponent.
Š Own real estate companies with a strong pipeline of futuredevelopment projects.
Š Invest in companies with strong balance sheets that can weather a risein interest rates.
CONCLUDING THOUGHTS
We are mindful of concerns about the outlook for the markets. Some of theconcerns include:
Š Elevated inflation–in part due to supply chain bottlenecksŠ Continued uncertainty regarding the Fed’s future action on tapering its
bond purchases and raising interest ratesŠ Negative real yieldsŠ Uncertainty regarding China’s regulatory environment, slowing
economy, and the possible spillover effectsŠ Never-ending gridlock and worsening partisan politics in the U.S.Š Rising energy pricesŠ Geopolitical and humanitarian crisesŠ Elevated valuations for certain segments of the stock market
While we recognize that in the months ahead there may be choppy periodsin the market, we remain directionally positive about the prospects for realestate and the Fund.
Have We Missed the Recovery In Real Estate?
Our answer: No
Š We believe we are in the early innings of a new real estate cycle.Š Real estate demand should continue to improve if the headwinds from
COVID-19 and the Delta variant continue to subside.Š Slower supply growth should support occupancy, rent growth, home
sales and prices.Š Interest rates–though they may rise a bit–appear likely to remain low
relative to history given tremendous central bank support, ongoingglobal economic challenges, and the strong desire for yield and relativeappeal of U.S. Treasuries.
Š Valuations remain attractive for several real estate companies.Š Certain types of real estate may deliver strong relative returns in an
inflationary environment.
We Remain Optimistic About the Prospects for Baron Real EstateFund.
Š We believe the benefits of our broader approach and flexibility willbecome even more apparent in the years ahead in part due to the newand evolving real estate landscape.
Š We continue to believe the Fund comprises quality companies. Thebusinesses that we continue to own are well managed, have market-leading positions, possess quality balance sheets, own well-located realestate, and grow cash flow at faster rates than most of their peers.
Š We believe the Fund is structured to capitalize on compellinginvestment themes.
Š A portion of the Fund’s real estate companies, such as certain REITs,real estate service companies, homebuilders, casinos & gamingcompanies, and other commercial and residential-related real estatecompanies, remain on sale at appealing prices.
Table XIII.Top 10 holdings as of September 30, 2021
Quarter EndMarket Cap
(billions)
Quarter EndInvestment
Value(millions)
Percent ofNet Assets
Red Rock Resorts, Inc. $ 6.0 $73.3 4.0%Brookfield Asset Management Inc. 83.8 71.0 3.9Jones Lang LaSalle Incorporated 12.6 69.6 3.8Lowe’s Companies, Inc. 140.5 55.7 3.1CBRE Group, Inc. 32.7 54.8 3.0Marriott Vacations Worldwide Corp. 6.7 54.8 3.0Boyd Gaming Corporation 7.1 53.6 2.9American Tower Corp. 120.8 52.8 2.9Simon Property Group, Inc. 42.7 46.3 2.5Invitation Homes, Inc. 22.8 45.6 2.5
88

September 30, 2021 Baron Real Estate Fund
Thank you for your past and continuing support.
Of course, I proudly continue as a major shareholder of the Baron RealEstate Fund, alongside you.
Sincerely,
Jeffrey KolitchPortfolio ManagerSeptember 30, 2021
Investors should consider the investment objectives, risks, and charges and expenses of the investment carefully before investing. The prospectus and summaryprospectus contain this and other information about the Funds. You may obtain them from its distributor, Baron Capital, Inc., by calling 1-800-99BARON orvisiting www.BaronFunds.com. Please read them carefully before investing.
Risks: In addition to general market conditions, the value of the Fund will be affected by the strength of the real estate markets. Factors that could affect the value of theFund’s holdings include the following: overbuilding and increased competition; increases in property taxes and operating expenses; declines in the value of real estate; lack ofavailability of equity and debt financing to refinance maturing debt; vacancies due to economic conditions and tenant bankruptcies; losses due to costs resulting fromenvironmental contamination and its related cleanup; changes in interest rates; changes in zoning laws, casualty or condemnation losses; variations in rental income; changesin neighborhood values; and functional obsolescence and appeal of properties to tenants. The Fund may not achieve its objectives. Portfolio holdings are subject to change.Current and future portfolio holdings are subject to risk.
The portfolio manager defines “Best-in-class” as well-managed, competitively advantaged, faster growing companies with higher margins and returns on invested capital andlower leverage that are leaders in their respective markets. Note that this statement represents the manager’s opinion and is not based on a third-party ranking.
Discussions of the companies herein are not intended as advice to any person regarding the advisability of investing in any particular security. The views expressed in thisreport reflect those of the respective portfolio managers only through the end of the period stated in this report. The portfolio manager’s views are not intended asrecommendations or investment advice to any person reading this report and are subject to change at any time based on market and other conditions and Baron has noobligation to update them.
This report does not constitute an offer to sell or a solicitation of any offer to buy securities of Baron Real Estate Fund by anyone in any jurisdiction where it would beunlawful under the laws of that jurisdiction to make such an offer or solicitation.
BAMCO, Inc. is an investment adviser registered with the U.S. Securities and Exchange Commission (SEC). Baron Capital, Inc. is a limited purpose broker-dealer registered withthe SEC and member of the Financial Industry Regulatory Authority, Inc. (FINRA).
89

Baron Emerging Markets Fund
MICHAEL KASS Retail Shares: BEXFXInstitutional Shares: BEXIX
PORTFOLIO MANAGER R6 Shares: BEXUX
Dear Baron Emerging Markets Fund Shareholder:
Performance
Baron Emerging Markets Fund (the “Fund”) retreated 6.47% (Institutional Shares)during the third quarter of 2021, while its principal benchmark index, the MSCI EMIndex, declined 8.09%. The MSCI EM IMI Growth Index declined 9.97% for thequarter. The Fund comfortably outperformed its principal benchmark index, aswell as the all-cap growth proxy, during a difficult quarter for emerging market(“EM”) equities. The EM asset class meaningfully trailed U.S. and global indexes ina period marked by regulatory and policy tightening in China and a return toinflation and central bank tightening concerns in general. COVID-relateddisruptions and supply constraints continued during the quarter, but on thepositive side, Delta-variant infections and hospitalizations appeared to peak inseveral jurisdictions, though in the short term, we suspect this may be adding fuelto the fire of supply/demand imbalances. The focal point for global investorsduring the quarter was a series of adverse regulatory measures and an escalationof stress in the property sector in China, which triggered a major correction inChinese equities as well as related weakness in many EM markets. We believe thecorrection in China is likely well advanced, with such equities poised tooutperform when policymakers begin to relent on aggressive tightening measures.We address these subjects in more detail in the Outlook section of this letter. Wereaffirm the view from our previous letter that a mid-cycle global economicslowdown is likely underway and is necessary to address supply/demandimbalances, though U.S. and developed equities are earlier in the process ofdiscounting a coincident pause in earnings momentum. We would welcome acooling of growth, inflation, and earnings expectations, which we believe wouldallow time for supply shortages to normalize and accommodate a prolongedphase of global expansion. Such a scenario would likely favor EM and internationalequity performance over a multi-year term. We are confident that we haveinvested in many well-positioned and well-managed companies on a bottom-upbasis that are poised to benefit from long-term and attractive investment themes.
Table I.PerformanceAnnualized for periods ended September 30, 2021
BaronEmergingMarkets
FundRetail
Shares1,2
BaronEmergingMarkets
FundInstitutional
Shares1,2MSCI EM
Index1
MSCIEM IMIGrowthIndex1
Three Months3 (6.50)% (6.47)% (8.09)% (9.97)%Nine Months3 (2.21)% (2.10)% (1.25)% (4.08)%One Year 17.70% 17.95% 18.20% 12.40%Three Years 11.89% 12.17% 8.58% 12.46%Five Years 9.34% 9.61% 9.23% 11.14%Ten Years 8.64% 8.90% 6.09% 8.08%Since Inception
(December 31, 2010) 6.14% 6.41% 3.25% 4.90%
For the third quarter of 2021, we outperformed our primary benchmark, theMSCI EM Index, while also comfortably outperforming the all-cap EM growthproxy. Within the EM landscape, third quarter trends were marked withincreased volatility, primarily driven by China’s growing regulatory scrutinyover its technology, education, health care, and property sectors. Solvencyconcerns relating to China Evergrande Group, a large Chinese conglomerateand property developer, also weighed on markets. China’s energy supplyshortages and COVID-related supply chain disruptions also contributed toincreased uncertainty. We are pleased with our recent performance, whichreflects the active risk management element of our process. During thequarter, our large overweight positioning in India together with good stockselection across various themes powered the vast majority of relativeoutperformance. As expressed in the second quarter letter, the worst ofCOVID-related disruptions in India are likely behind us, which together withthe fruits of many ongoing economic reforms, should continue to supportstructurally higher relative earnings growth and solid equity performanceover the long run. In addition, our underweight positioning in China andKorea, and our overweight in Russia, contributed notably to relativeperformance during the quarter. Offsetting a portion of the above was ouroverweight positioning and poor stock selection effect in Brazil. Ourunderweight sizing in Taiwan together with adverse stock selection, and ourlack of exposure to Saudi Arabia also detracted from relative performance.
Performance listed in the above table is net of annual operating expenses. Annual expense ratio for the Retail Shares and Institutional Shares as of December 31, 2020 was1.35% and 1.09%, respectively. The performance data quoted represents past performance. Past performance is no guarantee of future results. The investment return andprincipal value of an investment will fluctuate; an investor’s shares, when redeemed, may be worth more or less than their original cost. The Adviser reimburses certainBaron Fund expenses pursuant to a contract expiring on August 29, 2032, unless renewed for another 11-year term and the Fund’s transfer agency expenses may bereduced by expense offsets from an unaffiliated transfer agent, without which performance would have been lower. Current performance may be lower or higher than theperformance data quoted. For performance information current to the most recent month end, visit www.BaronFunds.com or call 1-800-99BARON.
1 The MSCI EM (Emerging Markets) Index Net USD is designed to measure equity market performance of large and mid-cap securities across 27 EmergingMarkets countries. The MSCI EM (Emerging Markets) IMI Growth Index Net USD is a free float-adjusted market capitalization index designed tomeasure equity market performance of large, mid and small-cap securities exhibiting overall growth characteristics across 27 Emerging Markets countries.MSCI is the source and owner of the trademarks, service marks and copyrights related to the MSCI Indexes. The indexes and the Fund include reinvestmentof dividends, net of foreign withholding taxes, which positively impact the performance results. The indexes are unmanaged. Index performance is not Fundperformance; one cannot invest directly into an index.
2 The performance data does not reflect the deduction of taxes that a shareholder would pay on Fund distributions or redemption of Fund shares.3 Not annualized.
BARONF U N D S
90

September 30, 2021 Baron Emerging Markets Fund
From a sector or theme perspective, solid stock selection in the ConsumerDiscretionary sector (Titan Company Limited, Jubilant FoodWorksLimited, and Think & Learn Private Limited) and Financials, led by our Indiawealth management/consumer finance investments (Bajaj Finance Limitedand SBI Life Insurance Company Limited) and fintech theme (Sberbank ofRussia PJSC) contributed the most to relative performance. In addition,favorable stock selection in the Communication Services sector (Bharti AirtelLimited and Tata Communications Limited) and Real Estate (GodrejProperties Limited) also bolstered relative results. Partially offsetting theabove was weak stock selection effect in the Information Technology sector,primarily attributable to some of our China value-added/SaaS softwareinvestments (Kingsoft Corporation Ltd. and Will Semiconductor Co., Ltd.),and select investments in our fintech (StoneCo Ltd.) and digitization (GDSHoldings Limited) themes. Adverse stock selection in the Health Care sector(Zai Lab Limited, Notre Dame Intermedica Participacoes S.A., andShenzhen Mindray Bio-Medical Electronics Co., Ltd.) also detracted fromrelative performance.
Table II.Top contributors to performance for the quarter ended September 30, 2021
PercentImpact
Bajaj Finance Limited 0.66%Godrej Properties Limited 0.40Reliance Industries Limited 0.39Novatek PJSC 0.37Hyundai Heavy Industries Co., Ltd. 0.29
Bajaj Finance Limited is a leading, data-driven, non-bank financial companyin India. Share gains were driven by improving earnings visibility and growthprospects as the worst of COVID-19 in India appeared to be over. We retainconviction. The company is well positioned to benefit from growing demandfor consumer financial services such as personal and credit card loans,mortgages, and other related products. It benefits from a best-in-classmanagement team, robust long-term growth outlook, and conservative riskmanagement frameworks.
Godrej Properties Limited is a leading residential real estate developer inIndia. Shares rose on market share gains and improving earnings visibility asthe worst of COVID-19 in India appears to be over. The real estate sector isalso entering an upcycle which should further support long-term growthprospects. We retain conviction due to Godrej’s strong brand positioning,best-in-class management team, and solid execution track record. In ourview, Godrej will continue to gain market share and sustain pre-sales growthof 20% or more over the next three to five years.
Reliance Industries Limited is India’s leading conglomerate, with businessinterests that include oil refining, petrochemicals, retail, andtelecommunications. Shares increased on recently announced governmentrelief measures to support the telecommunications industry and improvingearnings visibility as the worst of COVID-19 in India appears to be over.Reliance is fast transforming into a digital services company, leveraging itstelco network to offer digital and e-commerce services. We believe earningswill sustain high double-digit growth over the next three to five years.
Novatek PJSC is one of the largest and lowest-cost liquified natural gas(“LNG”) producers in the world. A sharp rise in natural gas prices in Chinaand Europe drove up the share price. We are bullish on the long-termgrowth outlook for natural gas as a substitute for coal, diesel, and othermore environmentally unfriendly carbon fuel sources. We expect demand tobenefit from progressive environmental policies in China, India, and many
other emerging markets. Novatek has a deep pipeline of LNG exportprojects, which should allow LNG sales to triple by 2030.
Hyundai Heavy Industries Co., Ltd. is the world’s largest shipbuilder andglobal leader in LNG-powered ships and other high-end vessels. Sharesincreased after a successful IPO. We think Hyundai Heavy will be the leadingbeneficiary of the decarbonization of shipping. The company hastechnological leadership in eco-friendly LNG-powered, as well as ammonia-,methanol-, and hydrogen-powered, ships. We expect tighteninginternational maritime carbon emission regulations to drive higher demandfor LNG fuel-propelled ships and carbon-free ammonia-fueled ships.
Table III.Top detractors from performance for the quarter ended September 30, 2021
PercentImpact
Alibaba Group Holding Limited –1.31%Zai Lab Limited –0.79Tencent Holdings Limited –0.77Korea Shipbuilding & Offshore Engineering Co., Ltd. –0.63StoneCo Ltd. –0.58
Alibaba Group Holding Limited is the largest retailer and e-commercecompany in China. Alibaba operates shopping platforms Taobao and Tmalland owns 33% of Ant Group, which operates Alipay, China’s largest third-party online payment provider. Shares of Alibaba were down givenanticipated regulatory tightening in China that may impact the company’sgrowth and profit potential. Despite the regulatory uncertainty, we retainconviction that Alibaba will benefit from growth in cloud services, logistics,and retail.
Zai Lab Limited is a leading biotechnology company helping to modernizethe Chinese health care industry. Zai Lab’s initial focus centered aroundin-licensing western medicines for commercialization in China; this hasexpanded into internal pipeline efforts. Shares fell alongside the broaderChinese equity markets given concerns around regulations the governmenthas enacted in education, technology, and real estate. While we are payingattention to these developments, so far, we think innovative and researchdriven health care companies will not be subject to any draconian rulings.
Tencent Holdings Limited operates the leading social network andmessaging platforms (QQ, WeChat), the largest online entertainment andmedia business, and the largest online gaming business in China. Shares ofTencent were down given anticipated regulatory tightening in China thatmay impact the company’s growth and profit potential. Despite the near-term regulatory uncertainty, we retain conviction that Tencent can sustaindurable growth given its track record of execution, scale, and unique anddiversified online assets.
Korea Shipbuilding & Offshore Engineering Co., Ltd. is the world’s largestshipbuilder. Shares fell after the IPO of subsidiary Hyundai Heavy and awidening HoldCo/OpCo discount. We like Korea Shipbuilding’s strategy ineco-friendly LNG, ammonia, and hydrogen shipbuilding. We expecttightening maritime carbon emission regulations to drive higher demand forLNG fuel-propelled ships and carbon-free ammonia-fueled ships. Thecompany has technological leadership in LNG dual-fueled ships and willeffectively operate as a duopoly after its merger with DSME is completed.
91

Baron Emerging Markets Fund
StoneCo Ltd. is a leading Brazilian financial technology company offeringmerchants payment, software, and e-commerce solutions. Shares declinedafter it disclosed problems in its credit business that forced it to book largeprovisions against potential losses and halt origination of new loans. Webelieve Stone will be able to address these issues and relaunch the productunder a better risk-reward framework. We are confident in Stone’s ability topenetrate the small-to-medium-sized business market, given its superiortechnology, customer service, and data insights.
Portfolio Structure
Table IV.Top 10 holdings as of September 30, 2021
Percent ofNet Assets
Taiwan Semiconductor Manufacturing Company Ltd. 3.6%Bajaj Finance Limited 3.1Tencent Holdings Limited 3.0Samsung Electronics Co., Ltd. 2.9Reliance Industries Limited 2.5Alibaba Group Holding Limited 2.4Novatek PJSC 2.1Sberbank of Russia PJSC 2.1Glencore PLC 1.7Korea Shipbuilding & Offshore Engineering Co., Ltd. 1.7
Exposure By Country
Table V.Percentage of securities by country as of September 30, 2021
Percent ofNet Assets
China 28.9%India 26.8Russia 7.8Brazil 6.2Korea 5.1Taiwan 4.6Hong Kong 2.2Mexico 1.9United Kingdom 1.7Hungary 1.2Philippines 1.2Japan 1.1Poland 0.9Norway 0.4United States 0.4Peru 0.4United Arab Emirates 0.3
Exposure by Market Cap: The Fund may invest in companies of any marketcapitalization, and we have generally been broadly diversified across large-,mid-, and small-cap companies, as we believe developing world companiesof all sizes can exhibit attractive growth potential. At the end of the thirdquarter of 2021, the Fund’s median market cap was $14.3 billion, and wewere invested 45.0% in giant-cap companies, 35.9% in large-cap companies,8.9% in mid-cap companies, and 1.3% in small- and micro-cap companiesas defined by Morningstar, with the remainder in cash.
Recent Activity
During the third quarter of 2021, we initiated new ideas to our existingthemes while also increasing exposure to a few positions established in priorquarters. We added to our China value-added theme during the quarter,most notably by initiating positions in Zhejiang Hangzhou DingliMachinery Co., Ltd., WuXi Biologics Cayman Inc., and NARI TechnologyCo. Ltd. Dingli is China’s largest manufacturer of Aerial Work Platforms(“AWPs”) with a roughly 40% market share. An AWP is a mechanical deviceused to provide temporary flexible access in construction and maintenanceand is designed to be operated by a single person. The AWP market issignificantly underpenetrated in China, and, in our view, there is a long-termstructural growth opportunity for rising AWP adoption in the country. This isdue to increased affordability of AWP rentals as compared to rising laborcosts and a growing priority for corporates to focus on worker safety andproductivity. China’s AWP fleet expanded at a 40% compound rate over thepast five years, resulting in greater than 50% AWP equipment sales volume.Dingli is the first mover and largest player in the industry with premiumquality products and is the only Chinese manufacturer to successfullycompete with foreign brands abroad.
WuXi is China’s largest outsourced manufacturer of biologics drugdevelopment with over 75% market share. The company is a key beneficiaryof China’s booming biotechnology industry as local biotechnology/pharmaceutical players are increasingly outsourcing development andmanufacturing to trusted partners such as WuXi. The company has four keyinnovative technical platforms: 1) WuXiBody Bispecific platform; 2) WuXia(cell line development); 3) WuXiUP (continuous perfusion cell culture); and4) WuXi Bio ADC. These platforms enable WuXi to provide a superior serviceoffering to clients and maintain market leadership and high growth over thenext several years. We expect the company to deliver over 40% EBITDAgrowth per annum over the next three to five years.
NARI is a leading player in China’s power grid automation industry. Thecompany has about a 40% market share in automation equipment andcommunication technology solutions for the grid. In our view, NARI shouldbe a key beneficiary from the upgrade of China’s power grid infrastructureto accommodate more renewable energy to meet the country’s carbonneutrality pledge by 2060. The rapid growth in renewable energy requiresinvestments in more flexible, reliable grid systems to enable the handling ofgreater daily variations in electricity supply. The Chinese government alsoplans to shift investments from conventional electrical hardware to smartgrid, software, and automation equipment that directly benefits NARI givenits technological edge from over two decades of R&D spending. We expectthe company to deliver 20% compound earnings growth over the next fiveyears while maintaining at least a 15% return on equity.
As part of our sustainability theme, we recently participated in the IPO ofHyundai Heavy Industries Co., Ltd., which is the main subsidiary of anexisting portfolio holding, Korea Shipbuilding & Offshore Engineering Co.,Ltd. Hyundai Heavy is the world’s largest shipbuilder based on orderbooksize, and it is the global leader in high-end vessels including LNG poweredships. In our view, the company is well positioned to become a keybeneficiary of “decarbonization of shipping.” Hyundai Heavy has technologyleadership and a dominant market position in eco-friendly LNG dual fueledships as well as first mover advantage in next generation ammonia,methanol, and hydrogen shipbuilding. We expect tightening internationalmaritime carbon emission regulations to drive much higher demand forLNG-propelled ships and carbon free ammonia-fueled ships. Hyundai Heavyowns the largest ship engine maker in the world and its vertically integratedbusiness model differentiates it from peers.
92

September 30, 2021 Baron Emerging Markets Fund
We added to several of our existing positions during the quarter, mostnotably Taiwan Semiconductor Manufacturing Company Ltd., BhartiAirtel Limited, Alibaba Group Holding Limited, Bajaj Finance Limited,China Conch Venture Holdings Ltd., and Midea Group Co., Ltd.
During the quarter, we also exited a few positions due to concerns regardingfundamental developments or valuation, or due to our endeavor to increaseconcentration where we have the highest conviction in quality and returnpotential. Stocks sold during the period include Itau Unibanco Holding SA,Ping An Insurance (Group) Company of China, Ltd., Lufax Holding Ltd.,and PagSeguro Digital Ltd.
Outlook
Something happened on the way to the mid-cycle slowdown. As weremarked in our previous letter, “In recent months, bond yields and inflationfever indeed peaked, as an ongoing slowdown in Chinese credit growth, thespread of the Delta variant of COVID-19, and rising conviction that the Fedwould not fall too far behind the curve, coalesced to cool both globalgrowth expectations and spiraling commodity prices… (T)hese conditionsresulted in growth stocks, particularly in the U.S., outperforming during therecent quarter.” While the second quarter was characterized by cooling ofinflation fever, as we progressed through the third, the peaking of Delta-variant infections coincident with increasing supply bottlenecks in variousforms–labor, commodities, materials, oil, natural gas, inventories, andtransportation and logistics capacity–remained a challenge and sparked areturn to concerns over inflation and more aggressive central banktightening. This round of supply-related concerns has emerged coincidentwith an apparent economic slowdown, and since we believe it will bedifficult and will take some time for central bankers to address these issues,we suspect the correction in global equities that began in early Septembermay have some room to run, particularly among the top-performingequities in the year-to-date period. We believe cost pressures may lead tomargin compression for many companies at a time of slowing revenuegrowth; a tough combination given existing elevated earnings expectationsand valuations. We believe a period of moderating growth, which will allowimbalances to correct, would be healthy, and we remain optimistic that amulti-year period of global economic expansion and a flow of capital fromfixed income to equity assets, which favors EM and international markets,remains likely.
From our EM/international perch, the seminal event during the quarter wasthe manifestation and aggressive discounting of the regulatory and credittightening China started late in 2020. While the financial media offers noshortage of skeptics on the subject, we believe the policy measures China isundertaking make sense in the context of its stated goal of enhancing thesocial, political, economic, and financial stability of the country. Thesemeasures have been in development for some time and theirimplementation was delayed by the COVID crisis last year. Given next year’sParty Congress, during which President Xi will strive to achieve the rare thirdterm, we believe we are witnessing the peak in tightening as the Party willwant to facilitate economic momentum in advance of the Party Congress.While many biased commentators suggest that “China has becomeun-investible,” we strongly disagree. Policy makers are merely shining a lighton the divide in China that we have been discussing for some time. Webelieve recent events illuminate the importance of active stock selection inChina, and enhance the case for investing in the value-added, intellectualcapital-based companies that further China’s goal of becoming self-sufficient in strategic sectors such as semiconductors, software, artificialintelligence, electronic vehicles and autonomous driving, biotechnology andinnovative health care products and services, and automation and robotics.Then there are the companies that have come under regulatory pressuregiven their potential long-term threat to China’s social, political, andfinancial stability due to the high cost of education/tutoring, the high costof housing, excessive leverage or speculation, or perceived monopoly-likemarket concentration and/or ownership and leverage of strategic data. Webelieve that China’s regulatory and credit tightening was intentional and iswell advanced. The panic selling during the third quarter, particularly byinternational and U.S. investors, represents the capitulation phase, at leaston a relative basis. We believe China has the capacity to arrest contagionand spark a targeted economic recovery. China views episodes such asEvergrande’s likely restructuring as necessary to guard against moral hazardand reinforce the deleveraging message that is a consistent objective of Xi’sstability strategy. While the correction in China may not be over, we areconfident we are in its late innings and believe a legitimate policy easingsignal would trigger a strong recovery and outperformance phase for Chinaequities. We believe a moderation of tightening will spark a significant rallyeven in the industries that have come under direct regulatory scrutinybecause we believe China’s final requirements will not impact thefundamentals of these businesses as much as currently feared. At currentlevels many of these stocks are trading well below their intrinsic valuesunder even more draconian assumptions.
While events in China captivated investor attention throughout the thirdquarter, we would be remiss not to mention the strength of Indian equities,many of which broke out to significant new highs based improvingCOVID-19 trends and strong fundamentals. Better fundamentals largelyreflect the positive reform backdrop engineered by the Modi administrationin recent years. We have often reported on these reforms and the manybottom-up beneficiaries in which we have invested, and we credit ouroutperformance in the recent quarter largely to such holdings.
93

Baron Emerging Markets Fund
Looking forward, we remain optimistic regarding our portfolio ofinvestments and, though year-to-date performance of EM equities is poorrelative to U.S. equity performance, we caution investors not to overlook theattractiveness of this asset class, particularly at current valuations. Ratherthan conclude that “China has become un-investible,” we suggest that theglobal economy, corporate earnings, and asset prices are influenced by thetwo major axes of macroeconomic activity and liquidity–China and the U.S.As we mention above, China’s regulatory and credit tightening cycle isnearing its trough, and, in our view, this campaign can be considered asuccess based on the stress already apparent in economic activity and assetprices. The stability and discipline message has been delivered. On the otherhand, the U.S. appears to be passing through a near-term peak, with a phaseof moderation in growth and/or financial tightening increasingly inevitable.While we suspect that the current global correction may have to run a bit
further to address imbalances, we are increasingly confident that EM andinternational equities are poised for a period of mean-revertingoutperformance.
Thank you for investing in the Baron Emerging Markets Fund.
Sincerely,
Michael KassPortfolio ManagerSeptember 30, 2021
Investors should consider the investment objectives, risks, and charges and expenses of the investment carefully before investing. The prospectusand summary prospectus contain this and other information about the Funds. You may obtain them from its distributor, Baron Capital, Inc., bycalling 1-800-99BARON or visiting www.BaronFunds.com. Please read them carefully before investing.
Risks: In addition to the general stock market risk that securities may fluctuate in value, investments in developing countries may haveincreased risks due to a greater possibility of: settlement delays; currency and capital controls; interest rate sensitivity; corruption and crime;exchange rate volatility; and inflation or deflation. The Fund invests in companies of all sizes, including small and medium sized companieswhose securities may be thinly traded and more difficult to sell during market downturns. The Fund may not achieve its objectives. Portfolioholdings are subject to change. Current and future portfolio holdings are subject to risk.
The discussions of the companies herein are not intended as advice to any person regarding the advisability of investing in any particularsecurity. The views expressed in this report reflect those of the respective portfolio manager only through the end of the period stated in thisreport. The portfolio manager’s views are not intended as recommendations or investment advice to any person reading this report and aresubject to change at any time based on market and other conditions and Baron has no obligation to update them.
This report does not constitute an offer to sell or a solicitation of any offer to buy securities of Baron Emerging Markets Fund by anyone in anyjurisdiction where it would be unlawful under the laws of that jurisdiction to make such offer or solicitation.
BAMCO, Inc. is an investment adviser registered with the U.S. Securities and Exchange Commission (SEC). Baron Capital, Inc. is a limitedpurpose broker-dealer registered with the SEC and member of the Financial Industry Regulatory Authority, Inc. (FINRA).
94

September 30, 2021 Baron Global Advantage Fund
ALEX UMANSKY Retail Shares: BGAFXInstitutional Shares: BGAIX
PORTFOLIO MANAGER R6 Shares: BGLUX
Dear Baron Global Advantage Fund Shareholder:
Performances
Baron Global Advantage Fund (the “Fund”) declined 4.9% (InstitutionalShares) during the third quarter as compared to the declines of 1.1% and0.7% for the MSCI ACWI Index and the MSCI ACWI Growth Index,respectively, the Fund’s benchmarks, essentially giving up last quarter’soutperformance. Year-to-date, the Fund is up 4.5%, trailing the benchmarkreturns of 11.1% and 9.5%, respectively.
Table I.Performance†
Annualized for periods ended September 30, 2021
BaronGlobal
AdvantageFundRetail
Shares1,2
BaronGlobal
AdvantageFund
InstitutionalShares1,2
MSCIACWIIndex1
MSCIACWI
GrowthIndex1
Three Months3 (4.95)% (4.91)% (1.05)% (0.72)%Nine Months3 4.29% 4.46% 11.12% 9.49%One Year 22.27% 22.56% 27.44% 23.83%Three Years 32.34% 32.66% 12.58% 18.33%Five Years 29.29% 29.58% 13.20% 17.76%Since Inception
(April 30, 2012) 19.55% 19.81% 10.67% 13.40%
This was a challenging quarter for us. The investing environment shiftedback to a headwind again, relative to the kinds of companies that we tend tofavor, and we had an unusually high number of blowups.
After nearly a year and a half of rising stock prices as markets reboundedfrom the depths of the pandemic on March 23, 2020, there was a correctionduring the month of September with the MSCI ACWI Index declining 4.1%(the Fund was down 6.0% during the month). This was partially driven by areversal in interest rates, with 10-year U.S. Treasury yields hitting a low of1.2% in July, then started climbing back up, and are now hovering around1.6%. We think corrections are both inevitable and healthy and are par forthe course. To put it in perspective, the MSCI ACWI Index is still up a hefty89.5% on a cumulative basis since March 23, 2020. The Fund is up 123.3%over the same period of time.
From an attribution perspective, most of the Fund’s underperformance wasdue to stock selection, which was responsible for 3.3% of our 3.9% shortfallrelative to the MSCI ACWI Index. Continuing the negative trend from thesecond quarter, Consumer Discretionary and Health Care were once againtwo of our weakest sectors, detracting 4.2% combined, from relativereturns. On the other hand, strong stock selection in InformationTechnology (“IT”), Communication Services, and Real Estate, as well as anoverweight in IT helped mitigate the overall results.
When analyzed through the sub-industry lens, our allocation effect wasresponsible for 4.4% of underperformance, while stock selection actuallycontributed 0.9% (most of that thanks to our education services names thatwere down less than the benchmark at 20.9% despite the remarkableblowup of TAL Education).
Performance listed in the table above is net of annual operating expenses. Annual expense ratio for the Retail Shares and Institutional Shares as of December 31,2020 was 1.17% and 0.92%, respectively, but the net annual expense ratio is 1.15% and 0.90% (net of the Adviser’s fee waivers), respectively. The performancedata quoted represents past performance. Past performance is no guarantee of future results. The investment return and principal value of an investment willfluctuate; an investor’s shares, when redeemed, may be worth more or less than their original cost. The Adviser reimburses certain Baron Fund expenses pursuantto a contract expiring on August 29, 2032, unless renewed for another 11-year term and the Fund’s transfer agency expenses may be reduced by expense offsetsfrom an unaffiliated transfer agent, without which performance would have been lower. Current performance may be lower or higher than the performance dataquoted. For performance information current to the most recent month end, visit www.BaronFunds.com or call 1-800-99BARON.† The Fund’s YTD, 3-, and 5-year historical performance was impacted by gains from IPOs and there is no guarantee that these results can be repeated or
that the Fund’s level of participation in IPOs will be the same.1 The MSCI ACWI indexes cited are unmanaged, free float-adjusted market capitalization weighted indexes reflected in US dollars. The MSCI ACWI
Growth Index Net USD measures the equity market performance of large- and mid-cap growth securities across developed and emerging markets. TheMSCI ACWI Index Net USD measures the equity market performance of large- and mid-cap securities across developed and emerging markets. MSCI isthe source and owner of the trademarks, service marks and copyrights related to the MSCI Indexes. The indexes and the Baron Global Advantage Fundinclude reinvestment of dividends, net of foreign withholding taxes, which positively impact the performance results. The indexes are unmanaged. Indexperformance is not Fund performance; one cannot invest directly into an index.
2 The performance data in the table does not reflect the deduction of taxes that a shareholder would pay on Fund distributions or redemption of Fund shares.3 Not annualized.
BARONF U N D S
95

Baron Global Advantage Fund
From a geographical perspective, most of our shortfall in the third quarterwas due to our investments in emerging markets, which were responsible for2.7% of the shortfall. Within emerging markets, China continues to be ourworst performing country. In the third quarter, it was responsible for 2.5% ofour underperformance (and for 5.0%, year-to-date). We have significantlyreduced the position sizes of our Chinese investments as a result of thewidening range of outcomes under the current regulatory regime in thecountry. Our holdings in Brazil also detracted from our relative results withBrazilian stocks declining 20.2% in the third quarter (the worst performingcountry in the MSCI ACWI Index) driven by growing inflation concerns andrising interest rates, which increased from 2.75% to 6.25% over the last sixmonths.
At the company-specific level, we had an unusually wide dispersion ofreturns in the quarter with 21 double-digit gainers, against 24 double-digitdecliners. We have suffered permanent losses of capital in TAL Educationand Zymergen, thankfully, two of our smaller-sized investments, and whatwe hope were temporary setbacks with half a dozen other holdings. Sharesof TAL Education declined over 80% for the period held, after the Chinesegovernment published its updated policy (“Double Reduction”) and decreedthat the entire after-school tutoring industry had to convert to non-profitstatus. Though the regulatory decree was rumored to be in the works, wefailed to assign a material enough probability to this worst possibleoutcome. Managing the position size down over the last year helpedmitigate some of the damage. Zymergen, a synthetic biology company thatuses bacteria to manufacture materials, announced a significant delay in itsproduct commercialization efforts and saw its shares drop 68%. More onboth disappointments later in the letter.
According to Morningstar, as of September 30, 2021, Baron GlobalAdvantage Fund ranked in the top 73% for its 1-year return, the top 3% forits 3-year return, and the top 1% for its 5-year return. The Fund is alsoranked in the top 1% since its inception on 4/30/2012. The Fund hasreceived a 5-star Morningstar Rating™ for its 3-year, 5-year, and Overall
risk-adjusted performance. Since its inception, Baron Global Advantage Fundhas returned 448.5% (Institutional Shares), cumulatively, compared to159.8% for the MSCI ACWI Index, and 226.9% for the MSCI ACWI GrowthIndex. Over that same period of time, the Fund has outperformed theMorningstar World Large-Stock Growth Category average, by 233.2%,cumulatively. On an annualized since inception basis, the Fund generatedexcess returns of 9.1% and 6.4% over its benchmarks, the MSCI ACWI Indexand the MSCI ACWI Growth Index, respectively. On an annualized sinceinception basis, the Fund generated excess returns of 6.8% over its peergroup average.*
Two of the most important questions we must answer prior to making aninvestment are “What is the source of the company’s competitiveadvantage?” followed by “Why is it sustainable?” Similarly, more and moreoften we find our investors posing the same two questions to us. Theimportance of having an edge in our business is fairly obvious. If we expectto generate excess risk-adjusted returns over a benchmark and do it over thelong term, there must be something unique and differentiated andrepeatable about the way we do it. There must be some sort of an edge,otherwise, the expectation for excess returns would be entirely irrational.
We can think of five sources of competitive advantage in the business ofinvesting: informational, analytical, behavioral, time arbitrage, andstructural. An informational edge is typically referred to or interpreted ashaving access to information that other market participants do not have. Ananalytical edge is the ability to analyze the same information everyone has,only in a differentiated way – build better models, conduct better duediligence, and perform more rigorous valuation work. A behavioral edge isharder to explain, and even harder to execute, but to us, it means creatingan environment most conducive to better decision-making, whileovercoming behavioral biases. A time arbitrage edge refers to a long-termownership mindset and longer-term thinking, while a structural edge can beseen in the strength of the manager’s platform, as well as the mandate’sflexibility and the size of the opportunity set.
As of 9/30/2021, the Morningstar Ratings™ were based on 298, 254, and 298 share classes for the 3-year, 5-year and Overall periods,respectively. The Morningstar Ratings™ are for the Institutional share class only; other classes may have different performance characteristics.The Morningstar Ratings are based on the Morningstar Risk-Adjusted Return measures.As of 9/30/2021, the Morningstar World Large-Stock Growth Category consisted of 342, 298, 254, and 167 share classes for the 1-, 3-, 5-yearand since inception (4/30/2012) periods. Morningstar ranked Baron Global Advantage Fund in the 73rd, 3rd, 1st, and 1st percentiles,respectively.
* As of 9/30/2021, the annualized returns of the Morningstar World Large Stock Category average were 24.85%, 17.56%, 17.05%, and 12.97%for the 1-, 3-, 5-year, and since inception (4/30/2012) periods, respectively.Morningstar calculates the Morningstar World Large-Stock Growth Category average performance and rankings using its Fractional Weightingmethodology. Morningstar rankings are based on total returns and do not include sales charges. Total returns do account for management,administrative, and 12b-1 fees and other costs automatically deducted from fund assets.The Morningstar Rating™ for funds, or “star rating”, is calculated for managed products (including mutual funds, variable annuity and variable life subaccounts, exchange-traded funds, closed-end funds, and separate accounts) with at least a three-year history. Exchange-traded funds and open-ended mutual funds are considered a singlepopulation for comparative purposes. It is calculated based on a Morningstar Risk-Adjusted Return measure that accounts for variation in a managed product’s monthlyexcess performance, placing more emphasis on downward variations and rewarding consistent performance. The Morningstar Rating does not include any adjustment forsales loads. The top 10% of products in each product category receive 5 stars, the next 22.5% receive 4 stars, the next 35% receive 3 stars, the next 22.5% receive 2 stars,and the bottom 10% receive 1 star. The Overall Morningstar Rating for a managed product is derived from a weighted average of the performance figures associated withits three-, five-, and 10-year (if applicable) Morningstar Rating metrics. The weights are: 100% three-year rating for 36-59 months of total returns, 60% five-year rating/40% three-year rating for 60-119 months of total returns, and 50% 10-year rating/30% five-year rating/20% three-year rating for 120 or more months of total returns.While the 10-year overall star rating formula seems to give the most weight to the 10- year period, the most recent three-year period actually has the greatest impactbecause it is included in all three rating periods.
© 2021 Morningstar. All Rights Reserved. The information contained herein: (1) is proprietary to Morningstar and/or its content providers; (2) may not be copied ordistributed; and (3) is not warranted to be accurate, complete or timely. Neither Morningstar nor its content providers are responsible for any damages or losses arisingfrom any use of this information. Past performance is no guarantee of future results.
96
September 30, 2021 Baron Global Advantage Fund
The informational edge has largely been arbitraged away over time. Sincethe introduction of fair disclosure regulations and the widespread adoptionof mobile internet, all interested parties can access all legally availableinformation at the same time. Still, there is an advantage in knowing whatquestions to ask, what information to consider and to ignore, and how toproperly weigh it. We think we may have a slight edge in that. Similarly, theanalytical edge is becoming increasingly more difficult to harvest. While wehire the very best people we can, so does the competition. This is the mostcompetitive arena in the world! The stock market is a complex adaptivesystem that is constantly learning and becoming smarter from the collectiveinputs. If we have an analytical edge, it is once again likely to be slight. Timearbitrage, behavioral, and structural are where we believe we really setourselves apart.
“Buy, sell, repeat! No room for ‘hold’ in whipsawing markets”1 urged theheadline of a 2020 Reuters article. In years past, information was delayed,and trading was costly. Investors would typically call their investmentadvisor if they were concerned about the market and wanted to sell a stock,and the advisor would at least get an opportunity to explain what is goingon, and a shot at advocating patience. Now trading is free (not onlycommission-wise but bid-ask spread-wise as well) and Schwab’s robo-adviser is not going to “talk” anyone out of taking action. At the same time,you have high-frequency and algorithmic trading vacuuming up every ounceof inefficiency that is being created by Robinhood’s daily “warriors.” Evenbefore ML and AI, computers and algorithms could recognize patterns muchfaster than human beings. In the short term, human logic and intuition can’tpossibly compete with the speed or size of capital being deployed by thealgos. But computers do not know how to assess a business’ uniqueness andcompetitive advantage. They do not know how to value culture or priceingenuity. We do. These factors may not impact the day-to-day price of astock, but they will determine whether a company will likely be a successfulinvestment. While most market participants are focused on trying to figureout whether consensus expectations are too high or too low for the nextquarter or two, we are focused on answering entirely different questions –How big can the business be at maturity? How sustainable are itscompetitive advantages? How critical are the problems they solve forcustomers, and could they solve more problems over time? How much valuedoes every dollar that is reinvested back into the business generate? Ismanagement building the right culture? The average holding period for aU.S. stock in 2020 was 5.5 months. The Fund’s turnover in 2020 was 8.8%,which translates to a holding period of 11.4 years! Our long-term ownershipmindset and longer-term thinking is a significant edge in our view.
Over many years, we have developed an investment process focused onminimizing behavioral biases. Confirmation bias is when investors start witha view and then go look for data that fits and confirms that view rather thanvice-versa. Recency bias is assigning more weight in decision making to themost recent news and events. Groupthink is often a dangerous pitfall whenthere is a breakdown in diversity. We work to minimize those biases bypracticing probabilistic thinking – making investment decisions against arange of possible outcomes and their respective probabilities andconsequences. Seeking disconfirming evidence and differing points of vieware core to our research approach and due diligence process. For instance, in
addition to interviewing partners and customers of our companies, we focusmuch of our due diligence on the partners and customers of theircompetitors. Requiring conviction in the duration of growth enables us toassign a more appropriate weight to recent developments and assess themagainst our long-term thesis. It also helps us to be patient if the stock pricegoes against us. Most of these investment blind spots, once identified andinternalized, are no longer blind spots. But we take it a step further. Wedeliberately focus on creating an environment that is most conducive togood, balanced decision making with an emphasis on separating ouremotions from facts to enable objective investment decision making. Webuy only when we gain conviction in the duration of growth, with apresence of a margin of safety relative to our estimate of intrinsic value. Wesell when our original thesis is no longer valid, when we judge the shares tobe meaningfully overvalued, or if we believe we have made a mistake. Thisall seems simple enough, but it takes years of practice and is by no meanseasy. Knowledge alone is not enough. It takes time and perseverance tolearn how to translate knowledge into behavior. We believe our behavioraledge is quite meaningful.
Finally, Baron Capital’s platform as well as the Fund’s ability to invest in thebest ideas anywhere in the world give us a meaningful structural advantage.The Fund’s mandate was designed to provide maximum flexibility and tocreate the broadest opportunity set for growth equity investing. Over itsnearly 40-year history, the Firm has built a culture, an organizationalstructure, and a reputation as a high-quality, long-term investor. We are solelyfocused on investing in unique, competitively advantaged, growing businessesfor the long term. The incentives for ALL of our investment professionals aredriven by success in long-term investment outcomes. The vertical structure ofour research team enables us to accumulate deep industry expertise, betteridentify disruptive change dynamics, and build pattern recognition over time.Our collaborative culture promotes diversity of opinions and enables us tomake better decisions, while continuously learning from one another.
When we add it all up, we think there is reason to continue to be optimisticabout what lies ahead.
Table II.Top contributors to performance for the quarter ended September 30, 2021
Quarter EndMarket Cap
(billions)PercentImpact
Acceleron Pharma Inc. $10.5 0.98%Nuvei Technologies Corp. 17.8 0.67Endava plc 7.6 0.60Bajaj Finance Limited 62.4 0.40Bill.com Holdings, Inc. 26.6 0.39
Acceleron Pharma Inc. is a biotechnology company with the rare profile ofhaving two blockbuster assets in the pipeline: cardiovascular drugsotatercept and anemia drug luspatercept. Sotatercept helps cure pulmonaryarterial hypertension (“PAH”). PAH is caused by the progressive structuralremodeling of the pulmonary arteries, which eventually results in heartfailure and death. Acceleron’s drug sotatercept acts by rebalancing signaling,thereby reversing the vascular remodeling seen in PAH. This would be thefirst PAH drug with the potential to reverse the disease. Shares increased37.1% during the quarter on news that Acceleron was the target of apotential acquisition by Merck, which was announced in late September.
1 https://www.reuters.com/article/us-health-coronavirus-short-termism-anal/buy-sell-repeat-no-room-for-hold-in-whipsawing-markets-idUSKBN24Z0XZ
97

Baron Global Advantage Fund
Nuvei Technologies Corp. is a Canadian-based payment processor thatserves online merchants around the world. The stock increased 40.0% in thethird quarter after the company reported strong results with 68% pro formarevenue growth, a continued acceleration from prior trends. Managementalso raised its medium-term growth outlook, which now calls for over 30%annual growth in payment volumes and revenues with expanding margins.We continue to own the stock due to Nuvei’s numerous growthopportunities and strong execution.
Endava plc provides outsourced software development services to businesscustomers. The company operates at the forefront of the digital revolutionby helping clients find new ways to interact with their customers, enablingthem to become more engaging, responsive, and efficient. Endava’s stockwas up 19.8% during the third quarter after reporting strong results withaccelerating revenue growth to over 48% year-on-year, while guiding forcontinued strong growth into the next fiscal year. As companies continue todigitally transform to avoid being disrupted (especially in a post-COVIDworld), they turn to companies like Endava for help. We believe that thisdynamic will be a tailwind to Endava’s market share in the large global ITservices market for years to come.
Bajaj Finance Limited is a leading, data-driven, non-bank financial companyin India. Shares of Bajaj were up 27.0% during the quarter driven byimproving earnings visibility and growth prospects as we believe the worstof COVID in India is likely behind us. Over the long term, we believe thatBajaj is well positioned to benefit from the growing demand for consumerfinancial services such as mortgages, personal and credit card loans, vehiclefinancing, and other related financial products. At the same time, Bajaj israpidly transforming into one of India’s largest fintech players by leveragingits proprietary technology platform to create a “supermarket of financialproducts,” opening an opportunity for it to become a true financial platform.
Bill.com Holdings, Inc., a leading provider of cloud-based software thatsimplifies, digitizes, and automates complex back office financial operations,contributed to performance with shares up 45.7%. The company reportedstrong earnings results with revenues up 86% year-over-year (and 61%organically), closed its acquisition of Divvy, and provided fiscal year 2022guidance well above investor expectations. We retain conviction as webelieve the digitization of B2B payments is a powerful secular trend with along runway for continued growth and Bill.com is well positioned to be awinner in the small- to medium-sized business market.
Table III.Top detractors from performance for the quarter ended September 30, 2021
Quarter EndMarket Cap
(billions)PercentImpact
Alibaba Group Holding Limited $402.4 –0.94%Wix.com Ltd. 11.1 –0.84Zymergen Inc. 1.3 –0.83Zai Lab Limited 10.1 –0.82Fiverr International Ltd. 6.7 –0.67
Alibaba Group Holding Limited is the largest retailer and e-commercecompany in China. Alibaba operates shopping platforms Taobao and Tmalland owns 33% of Ant Group, which operates Alipay, China’s largest third-party online payment provider. Shares of Alibaba were down 35.4% duringthe third quarter, driven by the continued crackdown of Chinese regulatorson large technology platforms. We believe that true earnings are masked bya host of earlier stage (and rapidly growing) businesses such as Ali cloud(Alibaba’s “AWS”), logistics, and New Retail. While the stock is alsoinexpensive, we decided to trim our position due to a widening range ofpossible outcomes on the regulatory front.
Wix.com Ltd. is the leading provider of software that helps micro-businesses build and maintain their websites as well as operate theirbusinesses. Shares of Wix declined 32.4% during the third quarter due to aslowdown in new customer additions as a result of abating positive COVIDtrends, which drove a pull-forward in demand and a material rerating of thestock during the early stages of the pandemic. We remain believers in Wix’slong-term opportunity as it helps small businesses digitize, which hasbecome crucial, especially in a post-COVID world. Over time, Wix is alsodeepening its platform, expanding the set of solutions it offers to helpbusiness owners run their businesses better.
Zymergen Inc. is a company dedicated to biofacturing, or harnessingbacteria to manufacture materials. Zymergen was a detractor, with its stockdeclining 67.6% during the quarter, following an unexpected updateannouncing both a major delay in the launch of its lead product, Hyaline,and the removal of CEO, Josh Hoffman, who was replaced by companychairman and former Illumina CEO Jay Flatley. We significantly reduced ourposition given the material impact these events may have on the business.
Zai Lab Limited is a leading biotechnology company helping to modernizethe Chinese health care industry. Zai Lab’s initial focus centered aroundin-licensing western medicines for commercialization in China, which theyhave expanded over time into internal pipeline efforts. Shares fell 40.9%alongside the broader Chinese equity markets given concerns aroundregulations the government has enacted in education, technology, and realestate. While we continue watching these developments closely and havereduced our position to account for the wider range of possible outcomes,we think that it is unlikely that health care will face draconian rulings sinceZai Lab provides access to medications that would not otherwise beavailable in China.
Shares of Fiverr International Ltd., a two-sided online marketplace forfreelance services, detracted from performance after declining 24.7% duringthe third quarter. The company reported earnings that missed analystforecasts and reduced guidance after experiencing hyper-seasonality asmany parts of the world lifted COVID-19 restrictions, driving anormalization from the accelerated COVID trends. We believe underlyingbusiness fundamentals remain strong (revenues were up 60% year-over-year and guidance calls for around 50% growth for the full calendar year).We retain conviction since Fiverr remains early in its growth curve withfreelance work being a secularly growing part of the global economy (with amulti-billion dollar total addressable market) as Millennials and Gen-Zersbecome a larger part of the working population and as organizations realizethey can benefit from reducing inefficiencies associated with searching for,contracting, and collaborating with freelance employees. Finally, we believethat the company’s early-mover and scale advantages and well-knownbrand lead to a virtuous cycle that reinforces its competitive moat.
Portfolio Structure
The portfolio is constructed on a bottom-up basis with the quality of ideasand conviction level having the most significant roles in determining the sizeof each individual investment. Sector and country weights are an outcomeof the stock selection process and are not meant to indicate a positive or anegative “view.”
As of September 30, 2021, the top 10 positions represented 36.4% of theFund, and the top 20 represented 58.2%. Our investments in the IT, HealthCare, Consumer Discretionary, Communication Services, and Financialssectors, as classified by GICS, represented 94.0% of the Fund’s net assets. Ourinvestments in non-U.S. companies represented 38.4% of net assets and ourinvestments in emerging markets and unclassified countries totaled 19.2%.
98

September 30, 2021 Baron Global Advantage Fund
As explained in the prior letter, we are in the process of reducing the numberof holdings in the Fund towards our preferred range of 40 to 50. We endedthis quarter with 63 investments, though the top 50 holdings accounted forjust over 94% of net assets.
Table IV.Top 10 holdings as of September 30, 2021
Quarter EndMarket Cap
(billions)
Quarter EndInvestment
Value(millions)
Percentof NetAssets
Alphabet Inc. $1,779.8 $167.8 6.1%Amazon.com, Inc. 1,663.7 126.2 4.6Acceleron Pharma Inc. 10.5 110.1 4.0Facebook, Inc. 956.9 109.1 3.9Endava plc 7.6 98.7 3.6EPAM Systems, Inc. 32.3 97.8 3.5Shopify Inc. 169.2 78.6 2.8MercadoLibre, Inc. 83.5 77.3 2.8argenx SE 15.5 72.1 2.6Twilio Inc. 56.5 68.0 2.5
Exposure By Country
Table V.Percentage of securities by country as of September 30, 2021
Percentof NetAssets
United States 60.4%China 5.7Canada 5.3Netherlands 5.3Israel 5.0Argentina 3.6United Kingdom 3.6India 3.3Brazil 1.7Uruguay 1.6Indonesia 1.5Poland 0.7Korea 0.7Mexico 0.4
Recent Activity
During the third quarter, we initiated three new investments: a leadingdiagnostics company, Natera, the leading gaming and artificial intelligencecompany, NVIDIA, and the leading Indian online food delivery company,Zomato. We also added to 11 existing holdings, continuing to scale up ourinvestments in the leading Southeast Asian gaming and e-commercecompany, Sea, as well as in the leading Canadian e-commerce platform,Shopify. We exited five positions and trimmed four of our holdings,
including the Chinese names – TAL Education, Alibaba, GDS, and Zai Labdue to a widening range of outcomes on the regulatory front, whichprompted an increase in our required margin of safety. On the private side,we continue to hold six private investments that together represent 3.6% ofthe Fund’s net assets: Farmers Business Network, Rivian, Resident Home,SpaceX, GM Cruise, and Think & Learn. Note that as we are writing thisletter, Rivian is in the process of going public and we expect it to beremoved from this list in the next reporting period.
Table VI.Top net purchases for the quarter ended September 30, 2021
Quarter EndMarket Cap
(billions)
AmountPurchased(millions)
Natera, Inc. $ 10.5 $40.5Sea Limited 176.0 31.4Shopify Inc. 169.2 20.4NVIDIA Corporation 517.9 19.9MaxCyte, Inc. 1.2 12.8
During the third quarter, we initiated a position in Natera, Inc., adiagnostics company with a cell-free DNA platform that enables it to detecttiny amounts of DNA in a blood sample. Natera first applied its technologyplatform to women’s health, where the company markets a blood test thatcan detect fetal DNA in the blood of pregnant women, enabling earlydetection of chromosomal abnormalities with a non-invasive test. Throughthe strength of its technology platform, clinical data, and customer service,Natera has established a market leadership position in non-invasive prenataltesting. Natera is seeing tailwinds in its women’s health business fromrecently expanded insurance coverage for average risk pregnancies. Natera isnow applying its technology platform to other markets, including theoncology market and the organ transplant market. In the oncology market,Natera offers a personalized blood-based DNA test called Signatera, whichdetects and quantifies how much residual cancer DNA remains in the bodyafter surgery. Signatera helps physicians determine whether chemotherapyis necessary after surgery and monitor for cancer recurrence before thecancer is detectable with standard imaging. We think Signatera will changethe standard of cancer care and is in the early innings of adoption in amarket we estimate at over $15 billion. We think Natera has a long runwayfor growth with expanding margins and profitability.
We also initiated a new position in NVIDIA Corporation, a leading fablesssemiconductor company. Jensen Huang founded the company in 1993 tofocus on computer graphics. Over the years, NVIDIA has become the leaderin gaming cards for PCs, and over the last decade it has become one of thekey enablers of AI. NVIDIA’s cards are at the heart of several large seculartrends, including AI, autonomous driving, gaming, and robotics. The maininnovation responsible for NVIDIA’s success was the realization that itsgraphic cards’ parallel processing capabilities (which is core to gamingcomputations – parallel rendering), is also the main computation requiredfor AI workloads (matrix multiplication), while the existing CPU architectureis at its core a sequential calculation machine. With that realization, NVIDIA
99

Baron Global Advantage Fund
has invested in an integrated hardware and software stack to make itsgaming architecture relevant for these new use cases. Today, it is poweringmost of AI training and inference across hyperscalers and enterprises. It hasover 75% gaming market share (desktops and notebooks), it is one of a fewkey players in the autonomous driving space, and it is expanding intorobotics, AI at the edge, health care industrial AI, and more. With demandfor computing power doubling every one to two years, and Moore’s Lawslowing down, there is more need for computing power than ever. At thesame time, the “near free” supply growth that was possible thanks toMoore’s Law has slowed dramatically. NVIDIA’s accelerated architecture,with parallel computing at scale, meets that need and creates a long runwayfor NVIDIA to disrupt computing.
We also continued scaling up our positions in the two e-commerce leaders –Shopify Inc. and Sea Limited. Sea is a Singapore-based, pan-SoutheastAsian technology conglomerate with a #1 regional position in e-commerce(under the Shopee brand), a highly profitable global digital gaming business(led by the hit game Free Fire), and a nascent, fast-growing regional digitalfinancial services business. Sea started a decade ago as a regional distributorof digital mobile games, found immense success with its proprietary FreeFire game, which has become one of the largest mobile gaming properties inthe world in recent years, and has since been investing the cash generatedfrom that segment into its fintech and e-commerce segments, the latter ofwhich became the largest platform in Southeast Asia in 2020 and expandedinto Latin America last year. We view e-commerce and digital financialservices as particularly large opportunities across Southeast Asia, owing tothe region’s low e-commerce penetration (less than 10% region-wide, lessthan 5% in some countries like Vietnam and the Philippines) and large un/under-banked populations. We are impressed by Sea’s execution, particularlyits ability to hyper-localize its offering for seven ASEAN countries in bothe-commerce and gaming and its ability to leverage technology to overcomebarriers to historical e-commerce adoption, particularly logistics. These havepowered its emergence as the largest e-commerce platform across theregion despite having started much later than its incumbent competitors.We expect that lead to continue growing. Although global digital gaminghas historically been a cyclical, hit-driven business, we like that Sea isaggressively reinvesting its gaming cash flows into these larger, longerduration opportunities, and expect the gaming segment to become an ever-decreasing fraction of total value over the next half decade whilee-commerce and fintech become multiple times larger.
We also added to our small position in MaxCyte, Inc., which is a lifesciences tools company that recently completed an IPO on the NASDAQ.MaxCyte offers an electroporation platform for transfecting cells, which isthe process of adding DNA or RNA into cells and is used in cell and genetherapy. The technology utilizes an electrical pulse to create a temporarypore in the cell membrane through which DNA can then enter the cell tointroduce a novel function. MaxCyte’s platform enables a high-throughputtransfection process with premium transfection efficiencies and cell viability,and it is used across both research and clinical settings. We are particularlyinterested in the clinical side, where MaxCyte has built up a pipeline of 75programs in which its platform is used for cell therapy manufacturing. Withits current program pipeline, MaxCyte already has over $950 million inpotential milestones, as well as potential downstream sales-based paymentsif any of these programs are successfully commercialized. Longer term, weview MaxCyte as a compelling picks and shovels platform that would benefitfrom the long duration of growth in cell and gene therapy.
Table VII.Top net sales for the quarter ended September 30, 2021
Quarter EndMarket Cap or
Market CapWhen Sold(billions)
AmountSold
(millions)
Alibaba Group Holding Limited $402.4 $46.3Arco Platform Limited 1.2 16.4Monday.com Ltd. 17.2 13.1GDS Holdings Limited 10.6 11.2Zai Lab Limited 10.1 6.8
During the quarter, we significantly reduced the size of our investments inChinese companies – selling out of one of our most successful long-termholdings, TAL Education, as well as reducing our positions in Alibaba GroupHolding Limited, GDS Holdings Limited, and Zai Lab Limited. As a result,we ended the quarter with our lowest exposure to China and Hong Kong inthe history of the Fund at 5.7%. Note that while we do not make portfolioconstruction decisions top-down, the continued regulatory clampdown inChina significantly increased the risk (which we define as the probability ofpermanent loss of capital), requiring us to demand a higher margin of safetyfor all investments domiciled there. We continue to monitor the situation inChina closely and expect to take further action once we gain more clarity.
We have also sold our positions in Arco Platform Limited, a Brazilian K-12edtech platform, and Monday.com Ltd., the Israeli work managementsoftware business, reallocating to higher conviction ideas.
Outlook
Well… a majority of the talking heads appear to continue to be preoccupiedwith inflation. The October release of the inflation numbers for Septembershowed that CPI remained solidly above 5% (5.4% actually) and that theeconomy continues to improve with unemployment dipping below 5%again, raising/confirming expectations for the beginning of Fed tapering, anddriving a reversal in the 10-year U.S. Treasury yield, which after hitting a lowof 1.2% in July is now hovering around 1.6%. Higher interest ratesostensibly present a headwind to growth stocks for the reasons that weexplained in prior letters. However, for now the market appears to be doingthe opposite. Quarter-to-date through October 21, the MSCI ACWI Index isup 4.7%, and the Fund is up 7.9% (erasing all of the September shortfall).David Schneider, our Head Trader and inflation afficionado, explained it thisway: “You don’t get it. Tapering sooner and raising rates earlier and perhapsmore aggressively means the Fed is more likely to get ahead of it and nipinflation in the bud, which will flatten the longer part of the yield curve,which is obviously bullish for high-growth stocks.” So, wait… higher interestrates are good for growth equities? David is definitely right. I do not get it.
In any case, the market will do what it will do. We think rotations, pullbacks,and corrections are generally necessary and healthy, and they often createattractive opportunities for long-term investors like ourselves. With 10-yearU.S. Treasury bonds yielding below 2% and inflation running around 5% (orhigher), real interest rates continue to be well below 0%, which is a greatbackdrop for businesses that are able to reinvest excess cash flow at highrates of a return. In other words, the types of businesses that we tend tofavor. We continue to focus on the quality of our decisions, and on takingwhat we believe are high percentage shots.
100

September 30, 2021 Baron Global Advantage Fund
Every day we live and invest in an uncertain world. Well-known conditionsand widely anticipated events, such as Federal Reserve rate changes (up anddown), ongoing trade disputes, government shutdowns, and theunpredictable behavior of important politicians the world over, are shruggedoff by the financial markets one day and seem to drive them up or down thenext. We often find it difficult to know why market participants do whatthey do over the short term. The constant challenges we face are real andserious, with clearly uncertain outcomes. History would suggest that mostwill prove passing or manageable. The business of capital allocation (orinvesting) is the business of taking risk, managing the uncertainty, andtaking advantage of the long-term opportunities that those risks anduncertainties create. We are confident that our process is the right one, andwe believe that it will enable us to make good investment decisions overtime.
Sincerely,
Alex UmanskyPortfolio ManagerSeptember 30, 2021
Investors should consider the investment objectives, risks, and charges and expenses of the investment carefully before investing. The prospectusand summary prospectus contain this and other information about the Funds. You may obtain them from its distributor, Baron Capital, Inc., bycalling 1-800-99BARON or visiting www.BaronFunds.com. Please read them carefully before investing.
Risks: Growth stocks can react differently to issuer, political, market and economic developments than the market as a whole. Non-U.S.investments may involve additional risks to those inherent in U.S. investments, including exchange-rate fluctuations, political or economicinstability, the imposition of exchange controls, expropriation, limited disclosure and illiquid markets, resulting in greater share price volatility.Securities of small and medium-sized companies may be thinly traded and more difficult to sell. The Fund may not achieve its objectives.Portfolio holdings are subject to change. Current and future portfolio holdings are subject to risk.
The discussions of the companies herein are not intended as advice to any person regarding the advisability of investing in any particularsecurity. The views expressed in this report reflect those of the respective portfolio managers only through the end of the period stated in thisreport. The portfolio manager’s views are not intended as recommendations or investment advice to any person reading this report and aresubject to change at any time based on market and other conditions and Baron has no obligation to update them.
This report does not constitute an offer to sell or a solicitation of any offer to buy securities of Baron Global Advantage Fund by anyone in anyjurisdiction where it would be unlawful under the laws of that jurisdiction to make such offer or solicitation.
BAMCO, Inc. is an investment adviser registered with the U.S. Securities and Exchange Commission (SEC). Baron Capital, Inc. is a limitedpurpose broker-dealer registered with the SEC and member of the Financial Industry Regulatory Authority, Inc. (FINRA).
101

Baron Discovery Fund
RANDY GWIRTZMAN AND LAIRD BIEGER Retail Shares: BDFFXInstitutional Shares: BDFIX
PORTFOLIO MANAGERS R6 Shares: BDFUX
Dear Baron Discovery Fund Shareholder:
Performance
During the third quarter, Baron Discovery Fund (the “Fund”) was down5.02% (Institutional Shares) which was 0.63% better than the Russell 2000Growth Index (the “Benchmark”). Market conditions deteriorated in thethird quarter as the Delta variant of COVID spread across the globe creatingpressures on both the demand and supply of goods and services. Thissetback in the expected COVID recovery timeline dragged stocks lower,ceding some of the gains the Fund experienced earlier in the year. Year-to-date, we remained pleased with the Fund’s performance, up 8.28% and5.46% better than the Benchmark. While the Delta variant has certainlybeen a “speed bump” in the pace of the economic recovery, it is our beliefthat the U.S. economy is back on track and the economic impact of Delta ismostly in the rearview mirror.
Table I.Performance†
Annualized for periods ended September 30, 2021
BaronDiscovery
FundRetail
Shares1,2
BaronDiscovery
FundInstitutional
Shares1,2
Russell2000
GrowthIndex1
S&P 500Index1
Three Months3 (5.06)% (5.02)% (5.65)% 0.58%Nine Months3 8.08% 8.28% 2.82% 15.92%One Year 35.61% 35.93% 33.27% 30.00%Three Years 20.16% 20.48% 11.70% 15.99%Five Years 25.23% 25.55% 15.34% 16.90%Since Inception(September 30, 2013)
(Annualized) 19.74% 20.03% 11.97% 14.71%Since Inception(September 30, 2013)
(Cumulative)3 322.47% 330.97% 147.13% 199.81%
Across almost every sector in which we invest, conversations with ourmanagement teams combined with incoming economic data lead us toconclude that economic fundamentals continue to improve (especially as itpertains to demand). As a result, we expect strong revenue growth rates forour portfolio companies over the near to medium term. Offsetting a portionof this strong revenue growth, however, is our more muted outlook onexpenses. We are seeing inflationary pressures in everything fromcommodities (agricultural and metals), energy (oil and natural gas), andlabor (and labor availability), to logistics (the cost to ship a container fromChina to the U.S. hit a record high during the quarter). The net result ofthese crosscurrents is that we still expect profit growth for our companies toshow solid year-over-year growth in 2022 but not to the same extent as onemight expect given the strong demand trends and revenue growth we areforecasting.
Performance listed in the above table is net of annual operating expenses. Annual expense ratio for the Retail Shares and Institutional Shares as of September 30, 2020 was 1.35%and 1.08%, respectively. The performance data quoted represents past performance. Past performance is no guarantee of future results. The investment return and principal valueof an investment will fluctuate; an investor’s shares, when redeemed, may be worth more or less than their original cost. The Adviser reimburses certain Baron Fund expensespursuant to a contract expiring on August 29, 2032, unless renewed for another 11-year term and the Fund’s transfer agency expenses may be reduced by expense offsets from anunaffiliated transfer agent, without which performance would have been lower. Current performance may be lower or higher than the performance data quoted. For performanceinformation current to the most recent month end, visit www.BaronFunds.com or call 1-800-99BARON.
† The Fund’s YTD, 1-, 3-, and 5-year historical performance was impacted by gains from IPOs and there is no guarantee that these results can be repeated or that the Fund’slevel of participation in IPOs will be the same.
1 The Russell 2000® Growth Index measures the performance of small-sized U.S. companies that are classified as growth and the S&P 500 Index of 500 widely held large
cap U.S. companies. Russell Investment Group is the source and owner of the trademarks, service marks and copyrights related to the Russell Indexes.Russell is a trademark of Russell Investment Group. The indexes and the Fund include reinvestment of dividends, net of withholding taxes, whichpositively impact the performance results. The indexes are unmanaged. Index performance is not Fund performance; one cannot invest directly into anindex.
2 The performance data in the table does not reflect the deduction of taxes that a shareholder would pay on Fund distributions or redemption of Fundshares.
3 Not annualized.
BARONF U N D S
102

September 30, 2021 Baron Discovery Fund
Table II.Top contributors to performance for the quarter ended September 30, 2021
PercentImpact
The Beauty Health Company 1.00%S4 Capital plc 0.51Endava plc 0.48Indie Semiconductor, Inc. 0.37Future plc 0.32
The Beauty Health Company is an innovative skin care and aestheticscompany providing consumers the benefits of a professional medicaltreatment with the experience of a consumer brand. Shares outperformed inthe third quarter following better-than-expected earnings results and theannouncement of two new retail partnerships with Nordstrom and Ulta,where the company expects to sell an aesthetics device that customers canuse in their home. We continue to be attracted to the company’s asset-light, recurring revenue business model and see the company doubling itsrevenues organically over the next few years. We also believe that BeautyHealth will boost shareholder value over time through accretive acquisitions.
S4 Capital plc is a global marketing services business founded by Sir MartinSorrell, the founder and former CEO of WPP, the largest ad agency in theworld. S4 encompasses creative production firm MediaMonks and data-driven media consultancy MightyHive. Shares of S4 were up during thequarter on recovering global ad spending, continued M&A, and increasinginvestor awareness. We believe S4 has a highly attractive growth algorithmof annual revenue growth greater than 25% and high-teens EBITDA margins.We also think that S4 is, and will continue to be, a prime beneficiary ofdigital transformation across industries and geographies.
Endava plc provides outsourced software development for businesscustomers. As has been the case in recent quarters, shares outperformedafter the company reported better-than-expected quarterly results andannual guidance. Following a brief slowdown in the early months of thepandemic, business has fully rebounded and accelerated as clients recognizethe need for greater investment in digital transformation. Managementexpects organic revenue growth to exceed 20% with upside from accretiveacquisitions. We continue to own the stock because we believe Endava willcontinue gaining share in the large global market for IT services.
Indie Semiconductor, Inc. is a fabless designer, developer, and marketer ofautomotive semiconductors for automated driver assistance systems, userexperience, and electrification applications. Indie leverages its cross-domainsemiconductor expertise in analog, processing and power chips to integratemultiple chips and capabilities into a single package and offer its customerslower cost products in a smaller form-factor. Indie has strong market sharein applications such as Apple CarPlay and ultrasonic parking assist withmultiple contracts ramping in the coming quarters in applications such asadvanced lighting controls, telematics, and electrification. The stock rose onincreasing investor recognition of the longer-term opportunity for thecompany, especially in light of the current automotive semiconductorsupply shortage. Semiconductor content in cars is expected to growsubstantially over the coming decade as automated safety features andelectrification penetrate an increasing percentage of vehicles.
Future plc is a special-interest publisher of digital content, magazines, andevents with a brand portfolio including TechRadar, PC Gamer, and Gizmodo.Shares of Future were up during the quarter as a result of e-commercetailwinds in the company’s largest categories–tech, gaming, music, sports,home, and lifestyle–as well as continued strength in the broader advertisingenvironment. We believe the company can continue to grow bothorganically and through M&A for many years into the future (pun intended).
Table III.Top detractors from performance for the quarter ended September 30, 2021
PercentImpact
Mercury Systems, Inc. –0.72%CareDx, Inc. –0.63Inogen, Inc. –0.63Zymergen Inc. –0.55Eargo, Inc. –0.54
Mercury Systems, Inc., a provider of defense electronics solutions, was adetractor from performance in the quarter. In early August, the companyannounced earnings that beat consensus but took down full-year 2021guidance due to some program delays on ship-based radar, fighter jetelectronics, missile defense systems, and foreign military sales. Managementindicated that it expected some carryover into fiscal 2022 but with a strongrebound in the back half of 2022 into 2023. Given strong bi-partisan supportfor a military budget proposal, and the positioning of Mercury to counterthe most important threats from Russia and China, we believe that Mercurywill see organic reacceleration in mid-2022 and 2023. In addition, thecompany has been setting up its infrastructure for an even greateracquisition cadence. All in, we believe that the company can grow for manyyears at a mid-teens rate. At current share prices, we believe that Mercuryoffers significant upside potential.
CareDx, Inc. provides transplant testing and ancillary services. The companyreported strong second quarter earnings (it beat and raised full-yearguidance), driven by its kidney and heart transplant tests. It also is movingforward with studies on more transplant tests (liver, stem cell/bone marrowtransplant, cell transplant, and lung). We believe the weak share priceperformance was related to noise surrounding a competitor’s hearttransplant test study that purported to be more accurate than CareDx’stest. While the headline number looks better for the competitor, it isimportant to note that CareDx’s Heart Care combination test, whichincludes both donor-derived DNA and gene expression testing, iscomparable to the competitor’s accuracy. Also, while the full publication hasnot yet been released, it appears that the competitor’s testing results arefrom retrospective (looking back) as opposed to prospective (blind andforward looking) patient results. So, this may not be a fully “apples-to-apples” comparison. The same competitor has previously had similar testdata and a competitive product launch in kidney (by far the largest revenueproducer for CareDx) but has still failed to garner meaningful share. CareDxhas proven itself to be a terrific long-term partner to its customers,providing not only tests, but services to transplant centers and their patientswhich creates brand stickiness, and therefore competitive advantage beyondpure testing. We are not concerned by the short-term dip in the share priceas CareDx still has significant market opportunity in kidney, heart, and all ofits pipeline products.
103

Baron Discovery Fund
Inogen, Inc. makes portable oxygen concentrators (“POCs”) for patientswith lung issues. Shares were down in the quarter despite the companyhandily beating June 2021 consensus numbers (driven by both sales andrentals of POCs) because Inogen took down full-year 2021 estimates as acomponent supply shortage (chips) is preventing the company from meetingstrong demand. We believe this situation is much like the one in theautomobile industry and that it will be resolved over the next few quartersas chip supply increases. In the meantime, management is procuringalternative supplies even at much higher prices, which it can pass on via lowsingle-digit price increases (as the chips are a very small part of the overallcost of goods sold). Given that we are in the early stages of the transition ofthe oxygen treatment industry from tanks to POC’s (perhaps only 25%converted at this point) shares now trade for a bargain price, in our view.
While rare, we do occasionally experience some drama with ourinvestments. In the quarter, we had two negative bluebird events. Thepercentage price drop of each stock was significant, but combined theydetracted only about 1% from relative results due to our risk managementdiscipline of keeping our position sizes in our earlier stage and smallermarket capitalization companies small. Zymergen Inc. is a synthetic biologycompany that has an integrated infrastructure for producing novel chemicalcompounds from microbes. The company’s lead compound is Hyaline, anelectronic screen protection film, and other compounds in the pipelineinclude insect repellants and agricultural products. Shares underperformedfor the quarter after the company issued a negative update that delayed itsproduct delivery timelines and revenue projections, revised downward itsestimates for the addressable market opportunity and market growth rate,and announced the CEO was stepping down. We exited our investmentbecause we believe this update has impaired our thesis on the commercialviability of Zymergen’s platform and management’s ability to identify andexecute on commercial opportunities. Eargo, Inc. offers a hearing aid that isvirtually invisible, affordable, and delivered through a telecare-based,direct-to-consumer model. Shares underperformed for the quarter after thecompany disclosed it was undergoing a claims audit by an insurancecompany which then turned into an investigation by the Department ofJustice as the claims related to government insurance plans. While we haveseen many situations involving insurance audits with our companies, wehave never seen something that has escalated so quickly with theDepartment of Justice. We sold our investment as the claims being auditedrepresented a significant amount of the company’s growth, and theinvestigation adds too much uncertainty to the story.
Portfolio Structure
Table IV.Top 10 holdings as of September 30, 2021
YearAcquired
Quarter EndInvestment
Value(millions)
Percent ofNet Assets
Endava plc 2018 $54.3 2.7%The Beauty Health Company 2021 51.9 2.6Future plc 2019 47.2 2.3Mercury Systems, Inc. 2015 45.4 2.2S4 Capital plc 2019 44.1 2.2Progyny, Inc. 2019 42.5 2.1Floor & Decor Holdings, Inc. 2019 42.3 2.1Axonics, Inc. 2020 41.5 2.0Kinsale Capital Group, Inc. 2016 40.4 2.0Advanced Energy Industries, Inc. 2019 40.4 2.0
Our top 10 holdings represented 22.2% of the Fund’s net assets at the endof the third quarter. This is essentially unchanged from the second quarterlevel of 22.3%. We remain comfortable with this concentration. As we havementioned in prior quarterly letters, our top 10 concentration is not adeliberate strategy on our part, but rather the natural result of the additionof new investments across the portfolio, and our judgment about theposition sizes of each of these top holdings based on risk and valuation.
Recent Activity
Table V.Top net purchases for the quarter ended September 30, 2021
YearAcquired
Quarter EndMarket Cap
(billions)
AmountPurchased(millions)
Couchbase, Inc. 2021 $1.3 $29.2SmartRent, Inc. 2021 2.5 27.0Membership Collective Group Inc. 2021 2.5 20.8ForgeRock, Inc. 2021 3.2 17.5Qualys, Inc. 2013 4.3 16.2
Couchbase, Inc., a new position in the Fund after a successful IPO, providesa modern database that collects and stores data and powers enterpriseapplications, for which there is no tolerance for disruption, inaccuracy, ordowntime. The Couchbase database is based on a platform called NoSQL,which means that rather than having a pre-determined rigid structure tostore data (like legacy relational database software), it stores data indocuments, making it easy to have a flexible set of items that can move intoand out of each record. Its solution is fast as it utilizes caching, or retrievalfrom memory, versus hard drives; scales to large numbers of records, whichis expensive for old-style relational databases and not even possible withsome of the other NoSQL solutions; and works in all settings (on-premise, inthe cloud, or in mixed hybrid environments). Couchbase is addressing a largetotal market of $62 billion, which is slowly migrating to the cloud and usingless rigid database structures. We believe Couchbase can win its fair share ofthese workloads over time given its unified platform, ability to scale runanywhere, and its familiar query language that makes it easier for developersto quickly create solutions. The company’s growth rate is currently beingimpacted by COVID (about 15% of Couchbase’s customers are in the traveland hospitality industries), but we believe a return to normal pre-COVIDspending levels later this year and into early 2022 should help to accelerategrowth. Longer term, we believe that management will improve its go-to-market efficiency, which will further accelerate growth. Given that revenuesare only about $150 million now, it has a huge opportunity in this$62 billion marketplace, and we expect that Couchbase will be a profitableinvestment for many years to come.
We acquired shares of SmartRent, Inc. during the quarter. SmartRent hasemerged as a category-leading enterprise grade software company providinga fully integrated solution to the real estate industry. The core product isbuilt around smart access or keyless entry. Products enable resident access,self-guided tours, smart parking, video intercom, package delivery as well ascommunity Wi-Fi, leak detection, and temperature control managementthat will lower cost, mitigate risk, and increase rents for multi-familyproperty owners. Cost savings range from 20% to 30% on utilities and 20%to 50% on leasing costs. In exchange, SmartRent charges a low recurringbase monthly fee per apartment. No enterprise-level solution existed priorto SmartRent and its digital amenities are elevating the resident andlandlord experience.
104

September 30, 2021 Baron Discovery Fund
SmartRent has over 200,000 units deployed today with over 450,000 totalusers. The company has experienced zero churn and importantly hasdeveloped strategic partnerships with 15 of the top 20 institutionalapartment owners. In addition, the company has a pipeline of 600,000committed units and a 3.5 million unit opportunity within its existingcustomer base, which could yield a $2 billion recurring revenue stream overtime just with property owners who are already existing customers. Webelieve there is a path to achieve $450 million of software revenue from$25 million today yielding roughly $200 million of run-rate recurring cashflow (versus negligible cash flow today) over the near term given thein-place customer commitments and future sales wins, which could lead tothe stock price doubling. In addition, we believe there is upside potentiallonger term through emerging initiatives that could open up several excitingadjacent growth verticals (e.g., international, student and senior housing).Lastly, with approximately $500 million of cash, we expect M&Aopportunities to layer on additional services to augment growth both to theproduct offering as well as from increased monthly pricing.
During the quarter, we purchased Membership Collective Group Inc.(“MCG”), a global membership platform centered around club houses inmetropolitan areas. Its trademark Soho House brand has 30 Houses withmore than 111,000 members globally, 94% average annual retention, and await list of over 59,000 people. In addition to the core Soho House brand,the company has additional membership brands including Soho Works,Scorpios Beach Club, The Ned Club as well as adjacent/digital memberships,including Soho Friends and Soho House Digital. We believe MCG has avaluable, unique business model as a scaled global membership platform. Itsstrong brand, evidenced by its long wait list, leads to very low marketingexpenses and high retention, while also driving strong recurringrevenue. There are currently 30 Soho Houses open, and 5 to 7 new openingsare planned per year, providing a clear line of sight for attractive long-termgrowth. Over the long term, management believes they can have close to100 houses globally.
We believe MCG’s growth pipeline, recurring revenue potential, operatingleverage, and de-leveraging should drive solid financial growth in the mediumterm. We expect revenue to grow at a 34% CAGR between 2021 and 2025as it expands the number of houses, expands other membership programs,and spending per member increases. We also expect EBITDA margins tobenefit from the ramp up in new houses (the company targets House-LevelContribution Margins of 20% to 30% by year five) as well as from improvingoperations of existing houses and leveraging corporate expense. Thecombination of strong top-line revenue, expanding EBITDA margins, and thepotential for investors to better understand the recurring revenue businessmodel should result in significant shareholder value over time.
During the quarter, we invested in ForgeRock, Inc., which provides anidentity software platform that enterprises use to authenticate theircustomers, employees, and devices. Its products, which include singlesign-on, multi-factor authentication, and identity governance, are used bymore than 1,300 companies to secure over 3 billion identities globally.ForgeRock is a technology leader in the external customer identity accessmanagement (“CIAM”) use case. The CIAM industry is growing faster thanthe more mature workforce identity management market as companiesinvest more in digital transformation initiatives and focus on improving userexperience and security during the sign-up and log-in process. With a rise incybersecurity threats, companies are increasingly turning to modern,flexible, prebuilt software platforms like ForgeRock to replace homegrowntools and legacy on-premise vendors. We think ForgeRock is well positionedbenefit from these secular trends due to its scalable architecture, its abilityto operate in complex IT environments, and its AI-powered identitygovernance tools. We also see an opportunity for ForgeRock to improve itsunit economics as it converts existing customers to its SaaS product, whichgenerates a meaningful uplift in average revenue per managed identity andhas a shorter sales cycle.
We added to our position in Qualys, Inc., a provider of cybersecuritysoftware that protects endpoints by ensuring that all devices on a networkare mapped out (asset view and inventory), that software configurations areup to date on those devices (vulnerability management (“VM”)) and thatthe settings on the devices are in compliance with corporate policies (policycompliance (“PC”)). The company generates significant free cash flow fromits legacy VM and PC products, and it has been working on new productsthat extend its knowledge of the information within its customers’networks. These products fit into the endpoint detection and response(“EDR”) category and can be very powerful tools, as they use artificialintelligence to detect improper network intrusions and then automatedefensive responses to them. From our due diligence, we believe that theQualys EDR system is starting to gain traction at its enterprise customers,which would help to re-accelerate the company’s top-line growth from thelow teens percentage growth, back to the high teens or even over 20%growth. Our purchases were made at what we believe were favorablevaluations. We also believe that Qualys would be an interesting takeovertarget for another cybersecurity company given its high margins, significantfree cash flow, premium market positioning, and fully cloud-deliveredservice, which would make integration into another company fairlyseamless.
Table VI.Top net sales for the quarter ended September 30, 2021
YearAcquired
MarketCap
WhenAcquired(billions)
Quarter EndMarket Cap or
Market CapWhen Sold(billions)
AmountSold
(millions)
Raven Industries Inc. 2018 $1.3 $2.1 $25.9Red Rock Resorts, Inc. 2020 3.0 6.0 12.1The Beauty Health
Company 2021 0.7 3.5 11.2Ollie’s Bargain Outlet
Holdings, Inc. 2019 3.5 4.2 10.0American Assets
Trust, Inc. 2020 1.6 2.3 9.2
105

Baron Discovery Fund
During the quarter, Raven Industries Inc. agreed to be acquired by CNHIndustrial at a 49% premium to the stock’s price the day before theannouncement. Raven, a leader in precision and autonomous agriculturetechnology, will, in our opinion, significantly improve CNH’s ability toinnovate and compete in its markets. We thank the management team forcreating significant shareholder value during our ownership. Raven is thesecond company in the Fund’s portfolio to agree to be acquired in 2021 (theother was Medallia, Inc.) As we have written in the past, we never invest in abusiness with the primary investment thesis being that we believe thecompany is likely to be acquired. That said, we believe that our early stage,fast growing businesses tend to make great bolt-on acquisitions for larger-cap companies in need of additional growth, as was the case with Raven.
We trimmed our positions in Red Rock Resorts, Inc. and The BeautyHealth Company after meaningful increases in their respective stock pricesin an effort to manage their position sizes. We sold our position in Ollie’sBargain Outlet Holdings, Inc. after that company experienced operatingchallenges. We exited our investment in American Assets Trust, Inc. whenthe stock reached our price target.
Outlook
As we look to the end of 2021 and into 2022, we continue to believe ourportfolio companies are well positioned to benefit from the economicresurgence that we expect to come post-COVID. We have a large pipeline ofinnovative emerging growth companies that are trading at attractivevaluations.
Thank you for your interest and support!
Randy Gwirtzman & Laird BiegerPortfolio ManagersSeptember 30, 2021
Investors should consider the investment objectives, risks, and charges and expenses of the investment carefully before investing. The prospectusand summary prospectus contain this and other information about the Funds. You may obtain them from its distributor, Baron Capital, Inc., bycalling 1-800-99BARON or visiting www.BaronFunds.com. Please read them carefully before investing.
Risks: The Adviser believes that there is more potential for capital appreciation in smaller companies, but there also may be more risk. Specificrisks associated with investing in smaller companies include that the securities may be thinly traded and they may be more difficult to sellduring market downturns. The Fund may not achieve its objectives. Portfolio holdings are subject to change. Current and future portfolioholdings are subject to risk.
The discussions of the companies herein are not intended as advice to any person regarding the advisability of investing in any particularsecurity. The views expressed in this report reflect those of the respective portfolio manager only through the end of the period stated in thisreport. The portfolio managers’ views are not intended as recommendations or investment advice to any person reading this report and aresubject to change at any time based on market and other conditions and Baron has no obligation to update them.
This report does not constitute an offer to sell or a solicitation of any offer to buy securities of Baron Discovery Fund by anyone in anyjurisdiction where it would be unlawful under the laws of that jurisdiction to make such offer or solicitation.
BAMCO, Inc. is an investment adviser registered with the U.S. Securities and Exchange Commission (SEC). Baron Capital, Inc. is a limitedpurpose broker-dealer registered with the SEC and member of the Financial Industry Regulatory Authority, Inc. (FINRA).
106

September 30, 2021 Baron Durable Advantage Fund
ALEX UMANSKY Retail Shares: BDAFXInstitutional Shares: BDAIX
PORTFOLIO MANAGER R6 Shares: BDAUX
Dear Baron Durable Advantage Fund Shareholder:
Performance
Baron Durable Advantage Fund (the “Fund”) gained 2.1% (InstitutionalShares) during the third quarter, outperforming the 0.6% gain for the S&P500 Index (“SPX”), the Fund’s benchmark. For the year-to-date period, theFund outperformed its benchmark by 3.1%.
Table I.PerformanceAnnualized for periods ended September 30, 2021
BaronDurable
AdvantageFundRetail
Shares1,2
BaronDurable
AdvantageFund
InstitutionalShares1,2
S&P500
Index1
Three Months3 2.03% 2.12% 0.58%Nine Months3 18.74% 19.00% 15.92%One Year 27.77% 28.07% 30.00%Three Years 20.04% 20.31% 15.99%Since Inception
(December 29, 2017) 17.96% 18.23% 15.66%
This was a nice, quiet, relatively uneventful quarter for the Fund. Thebroader market was flattish, and we were marginally better. On the year, themarket is continuing to grind higher, now up 15.9%, and we are managingnot only to keep up, but to keep adding value, now up 19.0% year-to-date.
From an attribution perspective, stock selection was responsible for thelarger part of the Fund’s outperformance relative to the SPX. Our best sectorby a wide margin was Health Care with 106bps of outperformance, followedby Industrials and Communication Services, which contributed 39bps and23bps to our relative results, respectively. Looking under the hood withinHealth Care, our outperformance was driven entirely by stock selectionwhich contributed 109bps to relative outperformance. Our core holdingsDanaher and Thermo Fisher Scientific, as well as a newcomer StevanatoGroup accounted for most of the strength in the sector. Stock selection inFinancials, Information Technology (“IT”), and Consumer Discretionarydetracted from relative returns.
Examining the broader portfolio, roughly half of our investments were upduring the quarter and half of them were down. But we had seven double-digit gainers against three double-digit decliners and that as much asanything accounted for our ability to outperform over the last three months.Danaher, Alphabet, Monolithic Power Systems, MSCI, Thermo FisherScientific, Stevanato Group, Intuit, Microsoft, and Costco eachcontributed 25bps or more to absolute returns, while Fair Isaac was ouronly 25bp detractor.
Two of the most important questions we must answer prior to making aninvestment are “What is the source of the company’s competitiveadvantage?” followed by “Why is it sustainable?” Similarly, more and moreoften we find our investors posing the same two questions to us. Theimportance of having an edge in our business is fairly obvious. If we expectto generate excess risk-adjusted returns over a benchmark and do it over thelong term, there must be something unique and differentiated andrepeatable about the way we do it. There must be some sort of an edgeotherwise, the expectation for excess returns would be entirely irrational.
Performance listed in the table above is net of annual operating expenses. Annual expense ratio for the Retail and Institutional Shares as of September 30, 2020 was 2.80% and2.40%, respectively, but the net annual expense ratio was 0.95% and 0.70% (net of the Adviser’s fee waivers), respectively. The performance data quoted represents pastperformance. Past performance is no guarantee of future results. The investment return and principal value of an investment will fluctuate; an investor’s shares, when redeemed,may be worth more or less than their original cost. The Adviser reimburses certain Baron Fund expenses pursuant to a contract expiring on August 29, 2032, unless renewed foranother 11-year term and the Fund’s transfer agency expenses may be reduced by expense offsets from an unaffiliated transfer agent, without which performance would have beenlower. Current performance may be lower or higher than the performance data quoted. For performance information current to the most recent month end, visitwww.BaronFunds.com or call 1-800-99BARON.
1 The S&P 500 Index measures the performance of 500 widely held large cap U.S. companies. The index and the Fund are with dividends, which positivelyimpact the performance results. The index and the Fund include reinvestment of dividends, net of withholding taxes, which positively impact theperformance results. The index is unmanaged. Index performance is not Fund performance; one cannot invest directly into an index.
2 The performance data in the table does not reflect the deduction of taxes that a shareholder would pay on Fund distributions or redemption of Fundshares.
3 Not annualized.
BARONF U N D S
107

Baron Durable Advantage Fund
We can think of five sources of competitive advantage in the business ofinvesting: informational, analytical, behavioral, time arbitrage, andstructural. An informational edge is typically referred to or interpreted ashaving access to information that other market participants do not have. Ananalytical edge is the ability to analyze the same information everyone has,only in a differentiated way – build better models, conduct better duediligence, and perform more rigorous valuation work. A behavioral edge isharder to explain, and even harder to execute, but to us, it means creatingan environment most conducive to better decision-making, whileovercoming behavioral biases. A time arbitrage edge refers to long-termownership mindset and longer-term thinking, while a structural edge can beseen in the strength of the manager’s platform, as well as the mandate’sflexibility and the size of the opportunity set.
The informational edge has largely been arbitraged away over time. Sincethe introduction of fair disclosure regulations and the widespread adoptionof mobile internet all interested parties can access all legally availableinformation at the same time. Still, there is an advantage in knowing whatquestions to ask, what information to consider and to ignore, and how toproperly weigh it. We think we may have a slight edge in that. Similarly, theanalytical edge is becoming increasingly more difficult to harvest. While wehire the very best people we can, so does the competition. This is the mostcompetitive arena in the world! The stock market is a complex adaptivesystem that is constantly learning and becoming smarter from the collectiveinputs. If we have an analytical edge, it is once again, likely to be slight. Timearbitrage, behavioral, and structural edges are where we believe we really setourselves apart.
“Buy, sell, repeat! No room for ‘hold’ in whipsawing markets”1 urged theheadline of a 2020 Reuters article. In years past, information was delayed,and trading was costly. Investors would typically call their investmentadvisor if they were concerned about the market and wanted to sell a stock,and the advisor would at least get an opportunity to explain what is goingon, and a shot at advocating patience. Now trading is free (not onlycommission-wise but bid-ask spread-wise as well) and Schwab’s robo-adviser is not going to “talk” anyone out of taking action. At the same time,you have high-frequency and algorithmic trading vacuuming up every ounceof inefficiency that is being created by Robinhood’s daily “warriors.” Evenbefore ML and AI, computers and algorithms could recognize patterns muchfaster than human beings. In the short term, human logic and intuition can’tpossibly compete with the speed or size of capital being deployed by thealgos. But computers do not know how to assess a business’ uniqueness andcompetitive advantage. They do not know how to value culture or priceingenuity. We do. These factors may not impact the day-to-day price of astock, but they will determine whether a company will likely be a successfulinvestment. While most market participants are focused on trying to figureout whether consensus expectations are too high or too low for the nextquarter or two, we are focused on answering entirely different questions–How big can the business be at maturity? How sustainable are itscompetitive advantages? How critical are the problems they solve forcustomers, and could they solve more problems over time? How much valuedoes every dollar that is reinvested back into the business generate? Ismanagement building the right culture? The average holding period for aU.S. stock in 2020 was 5.5 months. The Fund’s turnover in 2020 was 14.4%,which translates to a holding period of almost 7 years! Our long-termownership mindset and longer-term thinking is a significant edge in ourview.
Over many years, we have developed an investment process focused onminimizing behavioral biases. Confirmation bias is when investors start witha view and then go look for data that fits and confirms that view rather thanvice-versa. Recency bias is assigning more weight in decision-making to themost recent news and events. Groupthink is often a dangerous pitfall whenthere is a breakdown in diversity. We work to minimize those biases bypracticing probabilistic thinking – making investment decisions against arange of possible outcomes and their respective probabilities andconsequences. Seeking disconfirming evidence and differing points of vieware core to our research approach and due diligence process. For instance,rather than simply interviewing partners and customers of our companies,we focus much of our due diligence on partners and customers of theircompetitors. Requiring conviction in the duration of growth enables us toassign a more appropriate weight to recent developments and assess themagainst our long-term thesis. It also helps us to be patient if the stock pricegoes against us. Most of these investment blind spots, once identified andinternalized, are no longer blind spots. But we take it a step further. Wedeliberately focus on creating an environment that is most conducive togood, balanced decision-making with an emphasis on separating ouremotions from facts to enable objective investment decision-making. Webuy only when we gain conviction in the duration of growth, with apresence of a margin of safety relative to our estimate of intrinsic value. Wesell when our original thesis is no longer valid, when we judge the shares tobe meaningfully overvalued, or if we believe we have made a mistake. Thisall seems simple enough, but it takes years of practice and is by no meanseasy. Knowledge alone is not enough. It takes time and perseverance tolearn how to translate knowledge into behavior. We believe our behavioraledge is quite meaningful.
Finally, Baron Capital’s platform gives us a meaningful structural advantage.Over its nearly 40-year history, the Firm has built a culture, anorganizational structure, and a reputation as a high-quality, long-terminvestor. We are solely focused on investing in unique, competitivelyadvantaged businesses for the long term. The incentives for ALL of ourinvestment professionals are driven by success in long-term investmentoutcomes. The vertical structure of our research team enables us toaccumulate deep industry expertise, better identify disruptive changedynamics, and build pattern recognition over time. Our collaborative culturepromotes diversity of opinions and enables us to make better decisions,while continuously learning from one another.
When we add it all up, we think there is reason to continue to be optimisticabout what lies ahead.
Table II.Top contributors to performance for the quarter ended September 30, 2021
Quarter EndMarket Cap
(billions)PercentImpact
Danaher Corporation $ 217.3 0.58%Alphabet Inc. 1,779.8 0.52Monolithic Power Systems, Inc. 22.3 0.49MSCI, Inc. 50.2 0.40Thermo Fisher Scientific Inc. 224.8 0.35
1 https://www.reuters.com/article/us-health-coronavirus-short-termism-anal/buy-sell-repeat-no-room-for-hold-in-whipsawing-markets-idUSKBN24Z0XZ
108

September 30, 2021 Baron Durable Advantage Fund
Danaher Corporation is a leading manufacturer in the life sciences,diagnostics, and environmental markets. Shares increased 13.6% on strongquarterly financial results and an analyst day at which the companyprovided a long-term financial outlook consisting of mid-single-digit corerevenue growth, 50bps to 75bps of annual operating margin expansion, anddouble-digit earnings per share growth. We continue to hold the stock sincewe view Danaher as a stable growth business with a top-class managementteam that is focused on continued operational improvement and believethey could generate above-average earnings growth for years to come.
Alphabet Inc. is the parent company of Google, the world’s largest searchand online advertising company. Shares of Alphabet were up 6.5% in thequarter driven by further acceleration in ad spending, strong cloud revenuegrowth, and continued cost controls (operating margins reached 31%). Weremain excited about Alphabet’s merits as it continues to benefit fromgrowth in mobile and online video advertising, which accrues to its coreassets of search, YouTube, and the Google ad network. We are furtherencouraged by Alphabet’s investments in AI, autonomous driving (Waymo),and life sciences (Verily, Calico).
Monolithic Power Systems, Inc. is a fabless high-performance analogpower semiconductor company. Reports of another beat and raise quarterdue to continued market share gains and broad-based demand strengthacross end markets, led to positive momentum in the shares, which were up29.8%. Monolithic remains in the relative early stages of a multi-yeargrowth inflection driven by share and content gains from design wins withnew customers in new applications. As it has just a small share of each of itsdiversified markets and is moving into more content-rich applications, webelieve the company has a long runway for continued industryoutperformance.
Shares of MSCI, Inc., a leading provider of investment decision support tools,contributed to performance after rising 14.4% during the quarter. Thecompany reported strong second quarter earnings results and managementcontinued to express optimism regarding the economic and marketbackdrop moving forward. MSCI also enhanced its private marketscapabilities with the acquisition of Real Capital Analytics. We retain long-term conviction in MSCI as the company owns strong, “all-weather”franchises and remains well positioned to benefit from a number ofprominent tailwinds in the investment industry such as the continuingdevelopment of emerging markets, passive investing, and the adoption ofESG.
Thermo Fisher Scientific Inc. sells analytical instruments, laboratoryequipment, software, services, consumables, and reagents for life sciencesresearch, manufacturing, analysis, discovery, and diagnostics. Shares gained13.4% on encouraging long-term financial goals provided at the company’sinvestor day. Management is targeting 7% to 9% core organic revenuegrowth and mid-teens earnings per share and free cash flow growth through2025. We continue to believe Thermo Fisher is well positioned for the longterm as it benefits from secular tailwinds in life sciences (aging populationswith chronic conditions, rising standards of living in emerging markets, andscientific advances) without the risk inherent in drug development.
Table III.Top detractors from performance for the quarter ended September 30, 2021
Quarter EndMarket Cap or
Market CapWhen Sold(billions)
PercentImpact
Fair Isaac Corporation $ 11.3 –0.25%Mastercard Incorporated 343.1 –0.23Constellation Brands, Inc. 40.5 –0.23Visa, Inc. 489.4 –0.19Fidelity National Information Services, Inc. 76.2 –0.18
Shares of Fair Isaac Corporation, a data and analytics company focused onpredicting consumer behavior, declined 20.9% during the quarter. Fair Isaacreported solid earnings, but the stock pulled back following some pressreports about one client abandoning the company’s FICO Score.Management has been clear that they do not see any systemic issues andpricing power in FICO Score remains. While we somewhat reduced ourposition to account for the wider range of possible outcomes, we believethat in the more likely scenarios, Fair Isaac will be a steady earningscompounder, benefiting from continued optimization of pricing in its Scoresegment, and from the transition of its software business to the cloud.
Mastercard Incorporated is a leading global payment network. Thecompany reported good quarterly financial results that exceededexpectations with improving volume trends. However, sharesunderperformed and were down 4.6% due to concerns that COVID-19variants could delay the recovery in high-margin cross-border travel.Additionally, some investors are worried about competitive threats frombuy-now-pay-later services, emerging closed-loop networks, open bankingplatforms, and regional payment networks. We believe these fears areoverblown and that Mastercard’s dominant competitive position and growthopportunities remain intact.
Constellation Brands, Inc. is a leading producer and marketer of importedbeer and premium wine and spirits. Shares declined 9.6% during the quarterdue to rising costs, slower growth in beer volume, and supply chainchallenges. While the company is not immune to cost pressures, we believeit is better positioned than peers to manage these headwinds. Longer term,we see sustained high single-digits beer revenue growth supported bycontinued brand momentum, distribution expansion, innovation, andfavorable demographics.
Visa, Inc. is a leading global payment network. The company reported goodquarterly financial results that exceeded expectations with improvingvolume trends. However, shares underperformed and were down 4.6% dueto concerns that COVID-19 variants could delay the recovery in high-margincross-border travel. Additionally, some investors are worried aboutcompetitive threats from buy-now-pay-later services, emerging closed-loopnetworks, open banking platforms, and regional payment networks. Webelieve these fears are overblown and that Visa’s dominant competitiveposition and growth opportunities remain intact.
Fidelity National Information Services, Inc. provides software to financialinstitutions and enables merchants to accept electronic payments. Thecompany reported solid quarterly financial results that exceeded expectationsand raised annual guidance for revenue and earnings. However, the stockunderperformed and was down 13.5% due to concerns that FidelityNational’s “legacy” technology is losing market share to newer competitorswith more “modern” technology. We decided to sell our position as we sawmore favorable risk/reward profiles in other opportunities.
109

Baron Durable Advantage Fund
Portfolio Structure
The Fund’s portfolio is constructed on a bottom-up basis with the quality ofideas and conviction level (rather than benchmark weights) determining thesize of each individual investment. Sector weights tend to be an outcome ofthe portfolio construction process and are not meant to indicate a positiveor a negative “view.”
As of September 30, 2021, our top 10 positions represented 48.2% of theFund, the top 20 were 76.7%, and we exited the quarter with 34investments. IT, our largest sector, represented 36.0% of the Fund. HealthCare, Financials and Communication Services were 20.0%, 16.0%, and12.6%, respectively (48.6% together), while Industrials, Consumer Staples,and Real Estate, represented another 12.4% of the Fund. Cash and ourEcolab investment, which is classified under Materials, were the remaining3.0%.
Table IV.Top 10 holdings as of September 30, 2021
Quarter EndMarket Cap
(billions)
Quarter EndInvestment
Value(millions)
Percent ofNet Assets
Microsoft Corporation $2,118.6 $3.7 8.9%Alphabet Inc. 1,779.8 3.1 7.4Facebook, Inc. 956.9 2.1 5.1Danaher Corporation 217.3 1.8 4.3UnitedHealth Group
Incorporated 368.4 1.7 4.2Adobe Inc. 273.9 1.7 4.1Visa, Inc. 489.4 1.7 4.0IHS Markit Ltd. 46.5 1.4 3.5Mastercard Incorporated 343.1 1.4 3.4Accenture plc 203.2 1.4 3.3
Recent Activity
During the third quarter, we initiated one new investment, buying a mediumsized position in Stevanato Group, a leading provider of drug containmentproducts. We also took advantage of flows into the Fund, adding to 29existing holdings. Finally, we trimmed Fair Isaac and sold out of threeothers–Fidelity National, Charter Communications, and Alibaba.
Table V.Top net purchases for the quarter ended September 30, 2021
Quarter EndMarket Cap
(billions)
AmountPurchased(millions)
Microsoft Corporation $2,118.6 $1.4UnitedHealth Group Incorporated 368.4 1.0IHS Markit Ltd. 46.5 0.7BlackRock Inc. 128.5 0.7Alphabet Inc. 1,779.8 0.6
During the quarter, we initiated a new position in Stevanato Group, acompany based in Italy with a 70-year history. Stevanato is a leadingprovider of drug containment products, such as vials and syringes, amongother products and services. The company serves many of the world’slargest pharmaceutical and biotechnology companies. The company’sproducts are included in regulatory filings for the drugs they contain, whichresults in high switching costs and provides recurring revenue for the life of
the drug. We believe Stevanato has a stable growth business that shouldbenefit from product mix shifts towards higher-value, higher-priced, higher-margin products such as EZ Fill (ready-to-fill products provided tocustomers after they have been washed, sterilized, and depryogenated), Alba(a material that reduces silicon oil particle leaks and delamination), andNexa (a material that provides high mechanical resistance). We think thebusiness can grow sales by high single-digit rates to low double-digit rateswith EBITDA margins expanding to the high 20% range over time.
We also utilized our inflows, continuing to add to some of our highestconviction holdings such as Microsoft Corporation and Alphabet Inc. Webelieve that both companies will benefit from accelerated digitizationtrends, while their competitive moats continue to widen over time.
Table VI.Top net sales for the quarter ended September 30, 2021
Quarter EndMarket Cap or
Market CapWhen Sold(billions)
AmountSold
(millions)
Fidelity National Information Services, Inc. $ 76.2 $0.5Charter Communications, Inc. 165.3 0.4Alibaba Group Holding Limited 519.9 0.3Fair Isaac Corporation 11.3 0.1
As mentioned above, we trimmed our Fair Isaac Corporation position andsold out of our Fidelity National Information Services, Inc. position as aresult of a widening range of outcomes and since we saw a more favorablerisk-reward profile elsewhere (such as in Microsoft, UnitedHealth Group, andAlphabet).
We also sold our Charter Communications, Inc. position, which we haveowned since April 2018. Our original thesis has been rooted in three primarytenets:
• While consensus was worried about the decline in TV, we thought itwould have little impact on cash flows as broadband had nearly 100%margins and was growing.
• Broadband growth was underpinned by the accelerating adoption ofvideo streaming.
• Charter had a near-monopoly positioning in broadband thanks to itslimited geographical overlap with fiber.
Our thesis has played out over the last three years with the growth inbroadband penetration supporting continued expansion in free-cash-floweven as TV declined. Today, we believe that the consensus is now morealigned with our view. At the same time, competition has begun to intensifyand the runway for growth in broadband has been reduced. As a result, wehave decided to exit our position.
We also realized that we made a mistake buying Alibaba Group HoldingLimited last quarter. While the stock remains undervalued, the recentregulatory developments have made investing in China increasinglychallenging. This is mostly due to a widening range of possible outcomesand an increase in the risk profile. As a result, we decided to cut our lossesand exit our position.
110

September 30, 2021 Baron Durable Advantage Fund
Outlook
The October release of the inflation numbers for September showed thatCPI remains above 5% (5.4% actually), and as the economy continues toimprove with unemployment now again below 5%, the expectations for thebeginning of Fed tapering have risen. This drove a reversal in the U.S.10-year Treasury yield – which after hitting a low of 1.2% in July is nowhovering around 1.6%.
While higher interest rates tend to be a net negative for equities all elsebeing equal, barring a significant move higher in rates, other variables tendto come into play. The market is a complex, multi-variable adaptive systemthat is receiving many different inputs every day. Looking at the market’sbehavior during the previous tapering cycle in 2013 to 2014, while therewas a short-term sell-off (stocks sold off 5%) following Bernanke’s May2013 congressional appearance in which he disclosed that the Fed wasconsidering tapering, the S&P 500 Index was up 16% in the following sixmonths and continued rising while the Fed tapered throughout 2014.
While we have neither the expertise to judge, nor a view on whether therecent inflationary burst is transitory, we believe that the types ofbusinesses we hold in the Fund will perform just fine under either scenario. Ifinflation persists, the inherent pricing power of our holdings will help themoffset rising costs. Our holdings are not highly levered and have stablegrowth profiles, so we also think higher interest rates should be less of aheadwind for them.
In any case, the market will do what it will do. We think rotations, pullbacks,and corrections are generally necessary and healthy, and they often createattractive opportunities for long-term investors like ourselves. With U.S.10-year Treasuries yielding below 2% and inflation running around 5% (orhigher), real interest rates continue to be well below 0%, which is a greatbackdrop for businesses that are able to reinvest excess cash flow at highrates of a return. In other words, the types of businesses that we tend tofavor. We continue to focus on the quality of our decisions, and on takingwhat we believe are high percentage shots.
Every day, we live and invest in an uncertain world. Well-known conditionsand widely anticipated events, such as Federal Reserve rate changes,ongoing trade disputes, government shutdowns, and the unpredictablebehavior of important politicians the world over, are shrugged off by thefinancial markets one day and seem to drive them up or down the next. Weoften find it difficult to know why market participants do what they do overthe short term. The constant challenges we face are real and serious, withclearly uncertain outcomes. History would suggest that most will provepassing or manageable. The business of capital allocation (or investing) isthe business of taking risk, managing the uncertainty, and taking advantageof the long-term opportunities that those risks and uncertainties create. Weare confident that our process is the right one, and we believe that it willenable us to make good investment decisions over time.
Our goal is to invest in large-cap companies with, in our view, strong anddurable competitive advantages, proven track records of successful capitalallocation, high returns on invested capital, and high free cash flowgeneration, a significant portion of which is regularly returned back toshareholders in the form of dividends or share repurchases. It is our beliefthat investing in great businesses at attractive valuations will enable us toearn excess risk-adjusted returns for our shareholders over the long term.We are optimistic about the prospects of the companies in which we areinvested and continue to search for new ideas and investment opportunities.
Sincerely,
Alex UmanskyPortfolio ManagerSeptember 30, 2021
Investors should consider the investment objectives, risks, and charges and expenses of the investment carefully before investing. The prospectusand summary prospectus contain this and other information about the Funds. You may obtain them from its distributor, Baron Capital, Inc., bycalling 1-800-99BARON or visiting www.BaronFunds.com. Please read them carefully before investing.
Risks: The Fund invests primarily in large cap equity securities which are subject to price fluctuations in the stock market. The Fund may notachieve its objectives. Portfolio holdings are subject to change. Current and future portfolio holdings are subject to risk.
The discussions of the companies herein are not intended as advice to any person regarding the advisability of investing in any particularsecurity. The views expressed in this report reflect those of the respective portfolio managers only through the end of the period stated in thisreport. The portfolio manager’s views are not intended as recommendations or investment advice to any person reading this report and aresubject to change at any time based on market and other conditions and Baron has no obligation to update them.
This report does not constitute an offer to sell or a solicitation of any offer to buy securities of Baron Fifth Avenue Growth Fund by anyone inany jurisdiction where it would be unlawful under the laws of that jurisdiction to make such offer or solicitation.
BAMCO, Inc. is an investment adviser registered with the U.S. Securities and Exchange Commission (SEC). Baron Capital, Inc. is a limitedpurpose broker-dealer registered with the SEC and member of the Financial Industry Regulatory Authority, Inc. (FINRA).
111

Baron Real Estate Income Fund
JEFFREY KOLITCH Retail Shares: BRIFXInstitutional Shares: BRIIX
PORTFOLIO MANAGER R6 Shares: BRIUX
Dear Baron Real Estate Income Fund Shareholder:
In the most recent three-month period ended September 30, 2021, theBaron Real Estate Income Fund (the “Fund”) declined a modest 1.61%(Institutional Shares), underperforming its primary benchmark index, theMSCI US REIT Index (the “REIT Index”), which increased 0.75%.
For the first nine months of 2021, the Fund increased 14.76%.
We are pleased to report that as of September 30, 2021, the Fund retainedits 5-Star Overall Morningstar Rating™ and has remained in the top 3% ofall real estate funds for its 3-year performance.
For our more detailed thoughts on the Fund’s recent performance, pleaserefer to our “A Review of Recent Activity and Performance” section later inthis letter.
We will address the following topics in this letter:
• A review of recent activity and performance• A REIT market update (preview: strong start to 2021, and we remain
bullish)• Key takeaways from recent REIT meetings and conferences• Our investment themes and portfolio construction• Interest rates and inflation and their impact on real estate• Concluding thoughts
As of 9/30/2021, the Morningstar Ratings™ were based on 231 share classes for the 3-year and Overall periods. The Baron Real Estate Income Fundreceived 5 Stars for both periods. The Morningstar Ratings are for the Institutional Share Class only; other classes may have different performancecharacteristics. The Morningstar Ratings are based on the Morningstar Risk-Adjusted Return measures.
As of 9/30/2021, the Morningstar Real Estate Category consisted of 246 and 231 share classes for the 1- and 3-year periods. Morningstar rankedBaron Real Estate Income Fund in the 69th and 3rd percentiles for the 1- and 3-year periods, respectively.
Morningstar calculates the Morningstar Real Estate Category Average performance and rankings using its Fractional Weighting methodology.Morningstar rankings are based on total returns and do not include sales charges. Total returns do account for management, administrative, and12b-1 fees and other costs automatically deducted from fund assets.
The Morningstar Rating™ for funds, or “star rating”, is calculated for managed products (including mutual funds, variable annuity and variable lifesubaccounts, exchange-traded funds, closed-end funds, and separate accounts) with at least a three-year history. Exchange-traded funds and open-endedmutual funds are considered a single population for comparative purposes. It is calculated based on a Morningstar Risk-Adjusted Return measure that accountsfor variation in a managed product’s monthly excess performance, placing more emphasis on downward variations and rewarding consistent performance. TheMorningstar Rating does not include any adjustment for sales loads. The top 10% of products in each product category receive 5 stars, the next 22.5% receive4 stars, the next 35% receive 3 stars, the next 22.5% receive 2 stars, and the bottom 10% receive 1 star. The Overall Morningstar Rating for a managedproduct is derived from a weighted average of the performance figures associated with its three-, five-, and 10-year (if applicable) Morningstar Rating metrics.The weights are: 100% three-year rating for 36-59 months of total returns, 60% five-year rating/40% three-year rating for 60-119 months oftotal returns, and 50% 10-year rating/30% five-year rating/20% three-year rating for 120 or more months of total returns. While the10-year overall star rating formula seems to give the most weight to the 10- year period, the most recent three-year period actually has thegreatest impact because it is included in all three rating periods.
© 2021 Morningstar. All Rights Reserved. The information contained herein: (1) is proprietary to Morningstar and/or its content providers; (2) may not becopied or distributed; and (3) is not warranted to be accurate, complete or timely. Neither Morningstar nor its content providers are responsible for anydamages or losses arising from any use of this information. Past performance is no guarantee of future results.
BARONF U N D S
112

September 30, 2021 Baron Real Estate Income Fund
Baron Real Estate Income Fund Performance
Table I.PerformanceFor periods ended September 30, 2021
BaronReal
EstateIncome
FundRetail
Shares1,2
BaronReal
EstateIncome
FundInstitutional
Shares1,2
MSCIUS REITIndex1
Three Months3 (1.68)% (1.61)% 0.75%Nine Months3 14.48% 14.76% 22.15%One Year 30.80% 31.24% 35.77%Three Years 19.15% 19.37% 8.82%Since Inception (December 29, 2017) 15.07% 15.29% 7.37%Since Inception (December 29, 2017)
(Cumulative) 69.27% 70.51% 30.57%
Recent Activity
A REVIEW OF RECENT ACTIVITY AND PERFORMANCE
Recent Activity
Like our portfolio management playbook employed in 2020, we maintainedour unusually elevated active approach to managing the Fund in the firstnine months of 2021 due to the acceleration and emergence of headwindsand tailwinds in certain segments of real estate, the unprecedentedeconomic and social lockdown and reopening, and the resulting stockmarket volatility.
Table II.Top net purchases for the quarter ended September 30, 2021
Quarter EndMarket Cap
(billions)
AmountPurchased(millions)
AvalonBay Communities, Inc. $30.9 $4.4Equity Residential 30.3 3.3Ventas, Inc. 21.7 3.0Camden Property Trust 14.8 1.7Travel + Leisure Co. 4.7 1.6
In the most recent quarter, we acquired shares or made additional purchasesin three apartment REITs. We remain optimistic about the prospects formany apartment REITS and other residential-related real estate companies
and have categorized residential-related real estate as one of our keyinvestment themes. Please see our “Investment Themes and PortfolioConstruction” section later in this letter for our more detailed thoughts onthe case for residential-related real estate.
The three apartment REITs we purchased or added to in the most recentquarter are:
• AvalonBay Communities, Inc.: AvalonBay is a REIT that owns a$38 billion portfolio of high-quality apartments. The company primarilyoperates in the West and East Coasts (Los Angeles, Boston, SuburbanVirginia, San Jose, Oakland, Northern New Jersey, New York, Seattle, SanFrancisco) and is an active and talented developer. The companymaintains an excellent and liquid balance sheet that provides the companywith a competitive advantage relative to many private developers.
• Equity Residential: Equity Residential is the largest U.S. apartment REITwith a portfolio valued at $45 billion. The company primarily focuses onmajor markets such as Los Angeles, Seattle, San Francisco, Boston, andNew York, but has begun to also prioritize Sun Belt markets and otherregions like Denver. Like AvalonBay, Equity Residential maintains a strongbalance sheet and liquidity position. We recently spent time withmanagement and are encouraged about the company’s prospects forgrowth in the year ahead.
• Camden Property Trust: Unlike AvalonBay and Equity Residential,Camden, an apartment REIT that owns a $18 billion portfolio, prioritizesthe Sun Belt markets (Houston, Atlanta, Phoenix, Dallas, Orlando,Charlotte, Raleigh-Durham). Like most of its apartment REIT peers,Camden maintains an excellent balance sheet, and we expect thecontinuation of strong operating fundamentals.
We recently acquired shares in Ventas, Inc., a health care REIT that owns a$30 billion portfolio of senior housing, medical office, hospitals, and lifescience properties. The company’s scale allows it to swiftly act on largeinvestment opportunities. We believe the company’s senior housingportfolio, which represents approximately 45% of assets, should deliverimproved operating results as the headwinds from COVID-19 and the Deltavariant subside. We also believe the shares remain attractively valued andoffer prospects for strong total shareholder returns.
In September, we attended an investor day with the management team ofTravel + Leisure Co., a leading timeshare and hospitality company. We areencouraged by management’s four-year growth plan which includesexpectations to grow earnings at a compound annual growth rate of 17% to22% annually. Management also expects to generate approximately$3 billion of cumulative cash flow in the next four years which may be usedfor dividends, share repurchases, strategic mergers and acquisitions, and
Performance listed in the above table is net of annual operating expenses. Annual expense ratio for the Retail Shares and Institutional Shares as of December 31,2020 was 4.40% and 3.45%, respectively, but the net annual expense ratio was 1.05% and 0.80% (net of the Adviser’s fee waivers), respectively. Theperformance data quoted represents past performance. Past performance is no guarantee of future results. The investment return and principal value of aninvestment will fluctuate; an investor’s shares, when redeemed, may be worth more or less than their original cost The Adviser reimburses certain Baron Fundexpenses pursuant to a contract expiring on August 29, 2032, unless renewed for another 11-year term and the Fund’s transfer agency expenses may be reducedby expense offsets from an unaffiliated transfer agent, without which performance would have been lower. Current performance may be lower or higher than theperformance data quoted. For performance information current to the most recent month end, visit www.BaronFunds.com or call 1-800-99BARON.1 The MSCI US REIT Index is a free float-adjusted market capitalization index that measures the performance of all equity REITs in the US equity market, except for specialty
equity REITs that do not generate a majority of their revenue and income from real estate rental and leasing operations. MSCI is the source and owner of the trademarks,service marks and copyrights related to the MSCI Indexes. The index and the Fund include reinvestment of interest, capital gains and dividends, which positively impact theperformance results. The index is unmanaged. Index performance is not Fund performance; one cannot invest directly into an index.
2 The performance data in the table does not reflect the deduction of taxes that a shareholder would pay on Fund distributions or redemption of Fund shares.3 Not annualized.
113

Baron Real Estate Income Fund
reinvesting in the business. We recently acquired additional shares that webelieve are attractively valued and offer compelling prospects for strongshareholder returns in the next few years.
Table III.Top net sales for the quarter ended September 30, 2021
Quarter EndMarket Cap or
Market CapWhen Sold(billions)
AmountSold
(millions)
GDS Holdings Limited $12.1 $1.6Vornado Realty Trust 8.0 1.2Americold Realty Trust 8.1 1.1CoreSite Realty Corporation 7.0 0.9Las Vegas Sands Corporation 34.6 0.9
In the most recent quarter, we exited the Fund’s China-centric holdingsincluding:
• GDS Holdings Limited: Following several years of delivering strongshareholder returns for the Fund, we exited our position in GDS, theleading developer and operator of data centers in China. Though we holdmanagement in high regard and believe there is potential for strong long-term growth, we are uncomfortable with the political landscape in China,including the scrutiny of the technology industry. We will continue tomonitor developments and perhaps acquire shares again in the future.
• Las Vegas Sands Corporation: In the most recent quarter, we exited theFund’s holdings in Las Vegas Sands (and Wynn Resorts Ltd.) due to:(i) ongoing COVID-19-related travel restrictions in China, Macau, andSingapore; and (ii) the Macau government’s decision to tighten its casinoregulatory oversight.
In the third quarter, we reduced the Fund’s investment in Vornado RealtyTrust, a REIT that owns a high-quality portfolio of office and street retailassets concentrated in New York City, and redeployed the capital to otherREIT investment opportunities. As economic activity improves andemployees return to work, we expect leasing and occupancy trends toimprove. At its recent price of $43, we believe the shares are attractivelyvalued at an approximate 40% discount to our estimate of net asset value.The stock’s current dividend yield is approximately 5%.
Following several quarters of disappointing quarterly results, we exited theFund’s investment in Americold Realty Trust, a cold-storage REIT, andreallocated the capital to other REITs that we believe offer superior long-term return potential.
We recently trimmed the Fund’s position in CoreSite Realty Corporation.CoreSite is a REIT that operates a high-quality real estate portfolio of 25well-located real estate data centers in 8 markets in the U.S. We believe thecompany is poised for a positive inflection in cash flow growth in the nextfew years. In our opinion, the company is attractively valued relative to itspublic data center peers and recent private market transactions.
Recent Performance
Following two straight years of strong annual returns for the Baron RealEstate Income Fund (22.30% in 2020 and 36.54% in 2019) andexceptionally strong relative outperformance versus the REIT Index, the
Fund’s 2021 relative performance through September 30, 2021 is trailingthat of the REIT Index. Factors that have weighed on year-to-date relativeperformance include the Fund’s Asia-focused real estate investments, whichwe recently exited, the strong year-to-date performance of certain valueREITs (e.g., shopping centers and retail malls), and a few individual stockselection mistakes.
In the past, there have been periods when the Fund has temporarily trailedits benchmark. The Fund has a track record of bouncing back. Our teamremains driven, hard at work, and we are optimistic that we will, once again,deliver strong long-term relative performance for our shareholders as wehave done over the years.
Table IV.Top contributors to performance for the quarter ended September 30, 2021
Quarter EndMarket Cap
(billions)PercentImpact
Red Rock Resorts, Inc. $ 6.0 0.51%MGM Growth Properties LLC 10.3 0.21Invitation Homes, Inc. 22.8 0.19Prologis, Inc. 92.8 0.19Sun Communities, Inc. 21.5 0.19
The shares of Red Rock Resorts, Inc., a real estate gaming, developmentand management company that generates 100% of its cash flow in the LasVegas Locals market, continued to perform well in the most recent quarter.We remain optimistic about the long-term prospects for the company giventhe quality of its 100% owned real estate assets, the attractive andexpanding Las Vegas Locals market (strong population growth), and thecompany’s impressive growth and free cash flow prospects. We believe theshares could appreciate by approximately 50% in the next few years.
In the most recent quarter, MGM Growth Properties LLC, a gaming REIT,announced that it would be acquired by VICI Properties, another gamingREIT, in a $17 billion strategic acquisition. The combined company willbecome America’s largest owner of experiential real estate and will improveMGM’s diversification, scale, and cost of capital.
The shares of Invitation Homes, Inc. continued to perform well in the mostrecent quarter following strong business results. Invitation Homes is thelargest single-family home leasing company in the U.S. with approximately80,000 homes concentrated in California, Florida, Georgia, Arizona, Seattle,and the Carolinas. Its primary business strategy focuses on acquiring,renovating, leasing, and operating single-family homes as rentals. We arebullish about the long-term prospects for the company given multiplegrowth opportunities which include: i) significant pent-up demand from themillennial generation to rent single-family homes versus a backdrop ofconstrained inventory (which we expect will lead to rental and occupancygrowth); ii) acquisitions of homes in high-growth geographic markets; andiii) the expansion of ancillary home services for residents (e.g., enhancedsmart home, pest control, landscape, and pet services).
Following strong quarterly results, the shares of Prologis, Inc. continued toincrease this quarter. Prologis is a REIT that owns a $40 billion globalindustrial portfolio. The company continues to benefit from robust demandfor its warehouse facilities driven by the growth of e-commerce and theneed for infill real estate locations to service “last mile” delivery.
114

September 30, 2021 Baron Real Estate Income Fund
Table V.Top detractors from performance for the quarter ended September 30, 2021
Quarter EndMarket Cap or
Market CapWhen Sold(billions)
PercentImpact
DigitalBridge Group, Inc. $ 3.0 –0.61%GDS Holdings Limited 12.1 –0.37Vornado Realty Trust 8.0 –0.26Ventas, Inc. 21.7 –0.24Americold Realty Trust 8.1 –0.22
Following exceptionally strong performance in the first six months of 2021when its stock price appreciated 64%, the shares of DigitalBridge Group,Inc., a digital infrastructure REIT that invests in data centers, macro-celltowers, fiber networks, small-cell networks and other data infrastructure-related categories, declined in the most recent quarter. We recently metwith CEO Marc Ganzi, who we hold in high regard, and remain optimisticabout the company’s long-term growth prospects and share priceappreciation potential.
Despite strong quarterly operating results, the shares of GDS HoldingsLimited, the leading developer and operator of data centers in China,declined sharply for the period held due to concerns about China’sregulatory backdrop and uncertainty around the ultimate impact on theleading technology companies many of whom are key customers of GDS.We exited the Fund’s position in the company.
The shares of Vornado Realty Trust, a REIT that owns a high-qualityportfolio of office and street retail assets concentrated in New York City,declined in the most recent quarter likely due in part to the Delta variantand concerns that it will delay a return to the office for several companies.As economic activity improves and employees return to work, we expectleasing and occupancy trends to improve. At its recent price of $43, webelieve the shares are attractively valued at an approximate 40% discountto our estimate of net asset value. The stock’s current dividend yield isapproximately 5%.
The shares of Ventas, Inc., a health care REIT that owns a $30 billionportfolio of senior housing, medical office, hospitals, and life scienceproperties, declined modestly after we acquired shares in mid-July. Weremain optimistic about the prospects for the company. Ventas’ scale allowsit to swiftly act on large investment opportunities. We believe thecompany’s senior housing portfolio which represents approximately 45% ofassets should deliver improved operating results as the headwinds fromCOVID-19 and the Delta variant subside. We also believe the shares remainattractively valued and offer prospects for strong total shareholder returns.
A REIT MARKET UPDATE
At the end of 2020, we stated that we believed REITs would perform well in2021. In the first nine months of 2021, the REIT Index increased 22.15%,outperforming the S&P 500 Index, which gained 15.92%.
Why REITs Performed Well YTD
1. Much of real estate lagged in 2020, in part because the businessmodels of several segments of real estate – apartments, office, retailmalls, shopping centers, hotels – are based on people assembling. Thesebusinesses have been in the bullseye of the pandemic recession. Thisheadwind has begun to reverse. 2020: S&P 500 Index +18%, NASDAQ
Composite Index +45%, Global Equities +16%, and REIT Index declined9% with many REITs down 20% to 40%!
2. Several segments of public real estate have been attractivelyvalued relative to equity, bond, and private real estate alternatives.
3. Real estate is at the doorstep or the very early stages of a newcycle. We believe the ingredients are in place for real estate to performwell and real estate cycles tend to last five to seven years.
4. REITs and real estate generally should be one of the primebeneficiaries of an improvement in economic conditions if, in fact,a large percentage of the population becomes vaccinated.
5. Certain REITs offer inflation protection characteristics. For ourmore complete thoughts on this topic please see the “Interest Ratesand Inflation and Their Impact on Real Estate” section later in thisletter.
We Think REITs Can Continue to Perform Well
1. We are still in the relatively early days of the real estate recovery.
2. Business fundamentals have stabilized, and, in many cases, havebegun to rebound.
3. REIT growth prospects are encouraging.
Growth fueled by broadly improving demand and constrained supplyand growth through acquisitions, development, and redevelopmentshould, in many cases, accelerate cash flow growth.
4. Balance sheets are strong.
Although credit access is available at historically low financing rates,most REITs are maintaining strong and liquid balance sheets and arenot using debt excessively relative to company-generated cash flow.
5. Many REITs remain on sale in the public markets.
We see a shift from multiple expansion or cap rate compression toearnings growth as the key driver of REIT returns going forward.However, the valuations of several REITs remain discounted and offerprospects for cap rate compression and growth.
6. Certain REITs offer inflation-protection characteristics.
Should inflation continue to rear its head, some REITs serve as a hedgeand provide inflation-protection characteristics such as annual rentescalators, short-lease durations, and pricing power within supply-constrained markets.
And so, we remain bullish.
KEY TAKEAWAYS FROM RECENT REIT MEETINGS AND CONFERENCES
We have remained busy participating in REIT management meetings (mostlythrough Zoom!) and conducting our ongoing research. September was anotably active month for real estate conferences and meetings. We areencouraged by what we have learned.
Business prospects continue to improve for several REIT categories thatlagged in 2020 largely due to the Coronavirus headwind that led to a sharpslowdown in business activity – examples include hotels, apartments, officelandlords, malls and shopping centers, health care, and gaming REITs.
Other REITs less impacted by COVID-19 are benefiting from tailwinds thatshould lead to ongoing strength in business fundamentals – industrial
115

Baron Real Estate Income Fund
warehouse REITs, data center and wireless tower REITs, manufacturedhousing REITs, single-family home rental REITs, and life sciences real estateREITs.
Our summary observations for various REIT categories are as follows:
Apartment REITs
Occupancy and rents are improving and public valuations, in somecases, remain at discounts to recent private market transactions.Management teams expect strong growth in 2022.
Office REITs
Return to work plans have been delayed by the Delta variant, but thecontinued reopening of cities is leading to an uptick in leasingvolumes. We believe most office REITs are currently valued atsignificant discounts to replacement cost.
Industrial Warehouse REITs
Very strong business fundamentals fueled by growth in online sales asbusinesses and consumers relentlessly seek faster delivery bodes wellfor the continuation of excellent tenant demand for industrialwarehouse REITs.
Retail REITs
Tenant demand is improving. Foot traffic, retail sales, and tenanthealth have rebounded. We believe the growth prospects for thelargest mall REIT, Simon Property Group, Inc., remain compelling.
Self-Storage REITs
Demand for self-storage real estate remains strong driven by thestrength of the housing market and increasing mobility (pandemic-induced relocations and hybrid work). Elevated construction costs areconstraining new construction.
Health Care REITs
Senior housing occupancy has bottomed, construction activity ismodest, thereby setting the stage for more favorable cash flowprospects.
Hotel REITs
Leisure travel is accelerating, business travel is re-emerging (albeitslowly), and hotel REITs are currently valued at steep discounts toreplacement cost.
Gaming REITs
Casino gaming business is strong in Las Vegas and most regionalmarkets. We believe gaming REITs are attractively valued relative toprivate market transactions. M&A activity has picked up.
Data Center REITs
Secular demand trends of cloud adoption and IT outsourcing remainintact. The price paid by Blackstone for its recent $10 billion acquisitionof data center REIT, QTS Realty Trust Inc., implies that some datacenter REITs are attractively valued and could be take-out candidates.
Wireless Tower REITs
The long-term growth prospects for tower REITs remain encouraginggiven strong secular growth expectations for mobile data usage, 5Gtechnology, and “connected homes and cars,” which will requireincreased wireless bandwidth and increased spending by the mobilecarriers.
Single-Family Rental REITs
Limited inventory combined with a strong desire by households torent homes in suburbs rather than rent apartments in cities orpurchase homes is leading to robust rent growth for single-familyrental REITs.
Life Science REITs
An increase in funding for health care drug development is contributingto demand for life science buildings that continues to exceed supply,resulting in strong business fundamentals in key geographic markets.
Manufactured Housing REITs
Demand for affordable housing remains strong against a backdrop oflimited supply.
Health Care REITs
Improved performance in the hard-hit senior housing sector, althoughslowed recently by the Delta variant. Medical office buildings continueto perform well.
Cold Storage REITs: Supply chain challenges and labor cost inflation areweighing on growth and margins, with issues expected to persistthrough at least mid-2022.
Student Housing REITs
Showing signs of improvement.
OUR INVESTMENT THEMES AND PORTFOLIO CONSTRUCTION
Investment Themes
We are currently prioritizing three investment themes:
• COVID-19 recovery beneficiaries• Residential-related real estate• Intersection of technology and real estate
1. COVID-19 recovery beneficiaries
This investment theme encompasses what we call the “epicenter”REITs and non-REIT real estate companies of the 2020 pandemic.
Last year, certain REITs and other real estate-related businesses thatrely on people assembling were severely impacted by COVID-19 asthey were forced to shut down all or a large part of operations almostwithout exception. The share prices of many of these companiesdeclined last year and remain well below peak prices.
There is a broad swath of COVID-19 recovery beneficiaries includinghotel, office, apartment, gaming, mall, and health care REITS as well ascasinos & gaming operators and real estate operating companies.
116

September 30, 2021 Baron Real Estate Income Fund
Most of the real estate businesses that we are prioritizing arecyclically depressed, but not secularly challenged. Consequently, weexpect the cash flows of many of these real estate businesses torebound significantly as more people become inoculated withCOVID-19 vaccines and normalized social and economic activityresumes.
Despite a recent rebound in the share prices of many of theCOVID-19 recovery beneficiaries, we believe several companiesremain discounted to their two- to three-year prospective values.Examples include:
Hotel REITs
Host Hotels & Resorts, Inc., Park Hotels & Resorts Inc., andPebblebrook Hotel Trust
Office REITs
Douglas Emmett, Inc., Vornado Realty Trust, JBG SMITHProperties, and Paramount Group, Inc.
Apartment REITs
Equity Residential, AvalonBay Communities, Inc., and CamdenProperty Trust
Gaming REITs
Gaming and Leisure Properties, Inc.
Mall REITs
Simon Property Group, Inc.
Health Care REITs
Ventas, Inc.
Timeshare & Gaming Companies
Red Rock Resorts, Inc., Penn National Gaming, Inc., and Travel +Leisure Co.
Real Estate Services Companies
Kennedy-Wilson Holdings, Inc.
On September 30, 2021, COVID-19 recovery beneficiary companiesrepresented 35.9% of the Fund’s net assets.
Table VI.COVID-19 recovery beneficiaries as of September 30, 2021
Percent ofNet Assets
Hotel REITs 9.6%Office REITs 8.9Timeshare & Gaming Companies 8.1Health Care REITs 4.0Mall REITs 3.8Commercial Real Estate Services Companies 1.5
Total 35.9%
2. Residential-related real estate
We believe the case for residential real estate is compelling.
The key component underpinning our favorable view is due to astructural underinvestment in the construction of residential realestate. Today, the U.S. is building the same number of homes annuallyas it did in 1959 – approximately 1.4 million homes, which also equalsthe 60-year average. This annual construction figure is shockingly lowwhen one considers that the U.S. population is more than 150 millionpeople larger than it was in 1959 – 330 million people today versus178 million people in 1959! Recently, the Census Bureau released astudy that the U.S. constructed only 7 million homes over the last 10years while 12 million households were created – leading to a supplyshortage of 5 million homes solely in this time.
Demand prospects are also encouraging especially from theapproximately 73 million millennials – ages 25 to 40 – many of whomare now looking to buy or rent a home. The large imbalance betweenpent-up housing demand and low construction levels bodes well formulti-family apartment rentals, single-family home rentals, andmanufactured homes, as well as new single-family home purchases (aslong as mortgage rates and home prices do not spike to levels thatwould deter homebuyers).
• Robust demand
We believe that current demand drivers remain supportive forapartments, single-family rental homes, and manufacturedhomes.
Apartment REITs
Demand for coastal apartments has snapped back faster thananyone could have anticipated with current market rents at orabove pre-COVID levels and landlord rental concessions virtuallynon-existent today. Near-term demand is being supported by:
– Residents who temporarily left, returning to cities oncethey could enjoy their entertainment and social aspects;
– Roommates taking the opportunity to decouple with adesire for more space given work-from-home flexibility;
– Bargain hunters taking advantage of vacant inventoryand landlord concessions during COVID to trade up ormove to neighborhoods that were unaffordable before;and,
– Demand from two classes of graduates (2020 and2021) hitting the market simultaneously with officesbeginning to reopen in the fall.
All these trends rapidly are leading to limited inventoryavailability and significant pricing power for landlords. Note thatthe majority of the urban apartment demand is driven by tenantswho are in their early thirties or younger.
Single-Family Rental REITs
Demand for suburban life or “the American Dream” also continuesunbated. The primary renter of a single-family home is 39 yearsold, has two kids, a pet and is seeking good schools with an easycommute. While some families may have “pulled forward” theirdecision to move during the pandemic, we expect the multi-yeardemand drivers to endure. Recently signed new leases approached20% year-over-year growth with high single-digit growth on
117

Baron Real Estate Income Fund
renewals and nearly full occupancy. There remain 73 millionmillennials who represent future demand for single-family rentalhomes. Key drivers of demand include a “rentership” cultureamong millennials while prioritizing experiences over possessions,limited supply of entry level housing, high student debt burdens/limited savings for a down payment and the increasinginstitutionalization of the asset class with professionally managedhomes.
Manufactured Housing REITs
In the aftermath of the economic impact from COVID-19, weexpect demand for affordable housing to continue to benefitmanufactured housing REITs.
• No affordability concerns
Affordability remains a key topic of conversation given thehistorically high absolute rental growth we are witnessing in thereported results of both single-family and multi-family landlords.While rents have increased, the monthly income to rent ratiosremain at or even above historical levels (approximately 5 times).Wage growth has remained strong and many of our companiestarget an affluent demographic that has saved a significantamount of money over the last 12 to 18 months. In other words,the tenant credit quality has improved despite the unprecedentrent growth, which should give landlords the ability to increaserents further, once again, on renewals.
• Strong absolute and relative growth
The growth outlook for residential real estate is one of thestrongest across most categories of REITs given: i) strongimbedded mark-to-market rents; ii) cycling leases that weresigned with heavy concessions during pandemic lows; and iii)burning off bad debt expense. These factors, combined withstrong continued demand, should lead to outsized overall growthrelative to REITs overall. Recently, Mark Parrell, CEO of EquityResidential, stated: “2022 is going to be a year of acceleration forus, we think. And we believe the company is going to post thebest numbers in its history in terms of same-store revenuegrowth.”
• Short-lease duration real estate
We have often discussed short-lease duration real estate as agood inflation hedge with the ability to reset rents every year–webelieve apartment, single-family home rental, and manufacturedhousing landlords will continue to enjoy pricing power that couldnot only lead to strong top-line growth but margin expansion aswell.
• Attractive values
Despite strong stock performance in 2021 to date, we believe,based on transactions we have observed, that residential realestate REITs still offer compelling value relative to their imbeddedgrowth and private market values. We believe if some of theseassets traded in the private market today, they could fetchpremiums of 30% or more.
On September 30, 2021, residential-related real estaterepresented 26.7% of the Fund’s net assets.
Table VII.Residential-related real estate as of September 30, 2021
Percent ofNet Assets
Multi-Family Apartment REITs 12.2%Single-Family Rental REITs 9.0Manufactured Housing REITs 5.5
Total 26.7%
3. Intersection of technology and real estate
Several technology-related REITs performed well in 2020. We noted inour 2020 fourth quarter letter that valuations were generally lesscompelling than one year ago and the performance of the stocks mayunderperform in the near term relative to laggard REIT categories thatshould benefit if economic growth accelerates in 2021. This hasoccurred in the first nine months of 2021. Now, as then, we are bullishon the long-term prospects for several real estate technologycompanies.
The impact of technology on real estate is undeniable. The growth incloud computing, the internet, mobile data and cellphones, andwireless infrastructure are powerful secular drivers that should continueunabated for years and are impacting real estate, along with manyother industries.
If anything, the pandemic has accelerated these secular trends as morepeople conduct business, leisure, residential, and commercial activitiesonline.
Real estate-related companies that embrace and adopt the latesttechnological advances and innovations remain an important focus forus. Key beneficiaries of the technology revolution include data centerREITs, wireless tower REITs, and industrial REITs, among others.
Wireless Tower REITs
Our tower REITs (American Tower Corp., SBA CommunicationsCorp., and Crown Castle International Corp.) are, in our view,positioned to grow for several years as the demand for dataintensive devices accelerates, and new wireless technologiescontinue to emerge and improve.
New technological innovations and greater data demand require agreater number of antennae rental space that will continue tobenefit tower companies. Like data centers, we expect wirelesstowers to continue to benefit from increased home-basedconsumer and commercial activity (e.g., online shopping, videostreaming, and working from home).
Data Center REITs
Our data center REITs (Equinix, Inc. and CoreSite RealtyCorporation) are benefiting from the meteoric growth in theoutsourcing of information technology, increased cloudcomputing adoption, and the growth in U.S. mobile data andinternet traffic.
The rapid transition to a world of computer screen meetings andconferencing should also benefit data centers due to the need tostore a greater library of data to conduct and support these virtualonline meetings.
118

September 30, 2021 Baron Real Estate Income Fund
Industrial REITs
We expect business conditions for the Fund’s industrial REITholdings (Prologis, Inc., Rexford Industrial Realty, Inc., andDuke Realty Corporation) to remain strong for several years.
Each of these companies is expected to continue to benefit fromrobust warehouse demand and increased rents. This is due, in part,to broader e-commerce needs resulting from the acceleratedgrowth of online sales as businesses and consumers relentlesslyseek faster delivery.
On September 30, 2021, REITs and non-REIT technology-relatedreal estate companies that we expect to directly benefit fromlong-term technology growth represented 23.3% of the Fund’snet assets.
Table VIII.Intersection of technology and real estate as of September 30, 2021
Percent ofNet Assets
Wireless Tower REITs 7.5%Industrial REITs 7.3Data Center REITs1 6.9Residential-Related Technology Companies 1.6
Total 23.3%
1 - Data Center REITs include infrastructure-related REIT DigitalBridge Group, Inc.
Baron Real Estate Income Fund currently has investments in several REITcategories and non-REIT real estate companies. Our percentage allocationsto these categories are based on our research and assessment ofopportunities in each category on a bottom-up basis (see Table IX below).
Table IX.Fund investments in REIT categories as of September 30, 2021
Percent ofNet Assets
Non-REIT Real Estate Companies 14.8%Multi-Family REITs 12.2Hotel REITs 9.6Single-Family Rental REITs 9.0Wireless Tower REITs 7.5Industrial REITs 7.3Office REITs 6.3Manufactured Housing REITs 5.5Data Center REITs 4.7Other REITs 4.7Triple Net REITs 4.5Health Care REITs 4.0Mall REITs 3.9Self-Storage REITs 3.3
Cash and Cash Equivalents 2.7
Total 100.0%
INTEREST RATES AND INFLATION AND THEIR IMPACT ON REALESTATE
We are mindful that interest rates and inflation are a current, top-of-mindtopic.
It appears that the consensus expectation is that interest rates are likely torise, and elevated inflation may persist.
Should this occur, we believe the Fund, REITs and real estate-relatedcompanies can perform well in a rising interest rate and inflationaryenvironment.
Real Estate In a Rising Interest Rate Environment
We believe there is a perception, for some, that REITs and real estate-relatedcompanies may perform poorly should interest rates rise.
We acknowledge that a sharp and rapid rise in interest rates would increasefinancing costs and may negatively impact the relative appeal of somedividend yielding securities such as REITs, yet we believe a sharp andrapid rise in interest rates could also unsettle the broader equity market. Anincrease in interest rates that reflects an improvement in the economy,however, often leads to an improvement in real estate businessfundamentals–occupancy gains, rent increases, and cash flow growth.
We believe the Fund and many REITs can perform well in a rising rateenvironment if real estate business fundamentals are improving, and boththe rate of change in interest rates does not create sticker shock and theultimate level of interest rates does not become a headwind to operatingperformance.
Recent case study – March 9, 2020 to October 8, 2021
Since bottoming at 0.54% on March 9, 2020, the 10-yearTreasury yield has increased 107 basis points to 1.61% as ofOctober 8, 2021. During this period of rising interest rates, theBaron Real Estate Income Fund increased 56.3% on a cumulativebasis, which compares favorably to the REIT Index whichincreased 27.9%.
A review of additional time periods (such as the Fed interest rate hikecycle that began in 2004) also supports the notion that REITs canperform well in a rising interest rate environment.
Real Estate As an Inflation Hedge
Historically, certain real estate businesses have had the ability to raise pricesto provide inflation protection:
• Inflation-linked property value and pricing power
Higher prices for labor, land, and materials may constrain new realestate construction (increase in costs are currently outstripping theincrease in rents which leads to lower development returns) therebysupporting the ability for current landlords in supply-constrainedmarkets to increase occupancies and pass along higher operating costsby raising rents (i.e., pricing power).
• Short-lease duration
Real estate segments with short-lease terms could raise rents relativelyquickly to offset inflation. Examples include: hotels (1 day); self-storagereal estate (30 days); apartments (1 year); single-family rental homes(1 year); and senior housing facilities (1 year).
• Annual rent escalators
Certain real estate leases have contractual annual rent escalators, insome cases tied to an inflation index (i.e., consumer price index).
119

Baron Real Estate Income Fund
Playbook For Rising Rate or Inflationary Environment
If it became clear that interest rates and inflation would continue to rise andremain elevated, we could implement elements of our well-tested playbook.They include the following:
• Focus on short-lease duration real estate and minimize exposure to long-lease duration real estate. REITs and real estate-related companies such ashotels, self-storage, apartments, single-family home rentals, seniorhousing operators, and other types of real estate companies can re-pricemore often to take advantage of interest rate fluctuations. They are likelyto grow faster as the economy improves and can better offset increases ininterest rates than REITs that focus on office buildings, shopping centers,and malls, which may be saddled with 5- to 10-year leases.
• Emphasize REITs and real estate-related companies that will benefitdisproportionately from an improvement in the economy, such asresidential-related REITs hotels, and gaming to the extent there is a realestate component.
• Own real estate companies with a strong pipeline of futuredevelopment projects.
• Invest in companies with strong balance sheets that can weather a risein interest rates.
• Carefully monitor our REIT versus non-REIT exposure. Some REITs maybe more susceptible to higher borrowing costs than other non-REIT realestate companies because REITs must pay out at least 90% of theirtaxable income in dividends and therefore are more reliant on access tothe debt markets.
Concluding Thoughts
We are mindful of concerns about the outlook for the markets. Some of theconcerns include:
• Elevated inflation – in part due to supply chain bottlenecks• Continued uncertainty regarding the Fed’s future action on tapering its
bond purchases and raising interest rates• Negative real yields• Uncertainty regarding China’s regulatory environment, slowing
economy, and the possible spillover effects• Never-ending gridlock and worsening partisan politics in the U.S.• Rising energy prices• Geopolitical and humanitarian crises• Elevated valuations for certain segments of the stock market
While we recognize that in the months ahead there may be choppy periodsin the market, we remain directionally positive about the prospects for realestate and the Fund.
Following generally strong performance of the stock market, real estate, andthe Fund, we have recently been asked the following question:
Have We Missed the Recovery In Real Estate?
Our answer: No
• We believe we are in the early innings of a new real estate cycle.• Real estate demand should continue to improve if the headwinds from
COVID-19 and the Delta variant continue to subside.
• Slower supply growth should support occupancy, rent growth, andcash flow growth.
• Interest rates – though they may rise a bit – appear likely to remainlow relative to history given tremendous central bank support,ongoing global economic challenges, and the strong desire for yieldand relative appeal of U.S. Treasuries.
• Valuations remain attractive for several REITs and real estate-relatedcompanies.
• Certain types of REITs and real estate-related companies may deliverstrong relative returns in an inflationary environment.
We Remain Optimistic About the Prospects for Baron Real EstateIncome Fund.
• The Fund is composed of quality companies.
We have meticulously assembled a portfolio of REITs and non-REITreal estate companies that we believe should provide strong risk-adjusted returns.
The businesses that we own are well managed, have market-leadingpositions, possess quality balance sheets, own well-located realestate, and grow cash flow at faster rates than most of their peers.
The businesses that we tend to emphasize also have uniquecompetitive advantages, deliver compelling acquisition anddevelopment returns, and operate relatively capital efficient businessmodels.
• We believe the Fund is structured to capitalize on compellinginvestment themes.
• Valuations for several REITs and non-REIT real estate segmentsremain compelling.
The valuations for a portion of the Fund’s real estate companiesremain “on sale” at appealing prices.
• Classic REIT attributes such as yield will remain in demand.
We expect investors to continue to search for yield in a low interestrate environment, and this should aid REITs and other dividend-yielding real estate companies.
Table X.Top 10 holdings as of September 30, 2021
Quarter EndMarket Cap
(billions)
Quarter EndInvestment
Value(millions)
Percentof NetAssets
Invitation Homes, Inc. $ 22.8 $4.9 5.7%Equity Residential 30.3 4.4 5.2American Tower Corp. 120.8 4.4 5.2AvalonBay Communities, Inc. 30.9 4.3 5.1Simon Property Group, Inc. 42.7 3.3 3.9Travel + Leisure Co. 4.7 3.1 3.6Brookfield Infrastructure Partners
L.P. 23.4 3.1 3.6Prologis, Inc. 92.8 3.0 3.6Public Storage Incorporated 52.1 2.8 3.3Ventas, Inc. 21.7 2.8 3.2
120

September 30, 2021 Baron Real Estate Income Fund
Thank you for your past and continuing support.
Of course, I proudly continue as a major shareholder of the Baron RealEstate Income Fund, alongside you.
Sincerely,
Jeffrey KolitchPortfolio ManagerSeptember 30, 2021
Investors should consider the investment objectives, risks, and charges and expenses of the investment carefully before investing. The prospectusand summary prospectus contain this and other information about the Funds. You may obtain them from its distributor, Baron Capital, Inc., bycalling 1-800-99BARON or visiting www.BaronFunds.com. Please read them carefully before investing.
Risks: In addition to general market conditions, the value of the Fund will be affected by the strength of the real estate markets as well as byinterest rate fluctuations, credit risk, environmental issues and economic conditions. The Fund invests in companies of all sizes, including smalland medium sized companies whose securities may be thinly traded and more difficult to sell during market downturns. Prices of equitysecurities may decline significantly over short or extended period. Debt or fixed income securities such as those held by the Fund, are alsosubject to derivatives risk, liquidity risk, and income risk. As interest rates rise, bond prices fall. The Fund may not achieve its objectives.Portfolio holdings are subject to change. Current and future portfolio holdings are subject to risk.
Discussions of the companies herein are not intended as advice to any person regarding the advisability of investing in any particular security.The views expressed in this report reflect those of the respective portfolio managers only through the end of the period stated in this report.The portfolio manager’s views are not intended as recommendations or investment advice to any person reading this report and are subject tochange at any time based on market and other conditions and Baron has no obligation to update them.
This report does not constitute an offer to sell or a solicitation of any offer to buy securities of Baron Real Estate Income Fund by anyone inany jurisdiction where it would be unlawful under the laws of that jurisdiction to make such an offer or solicitation.
BAMCO, Inc. is an investment adviser registered with the U.S. Securities and Exchange Commission (SEC). Baron Capital, Inc. is a limitedpurpose broker-dealer registered with the SEC and member of the Financial Industry Regulatory Authority, Inc. (FINRA).
121

Baron WealthBuilder Fund
MICHAEL BARON RONALD BARON Retail Shares: BWBFXCO PORTFOLIO CEO AND PORTFOLIO Institutional Shares: BWBIXMANAGER MANAGER TA Shares: BWBTX
Dear Baron WealthBuilder Fund Shareholder:
Performance
Baron WealthBuilder Fund (the “Fund”) increased 0.56% (InstitutionalShares) in the third quarter. This result was similar to that of the S&P 500Index (the “Index”), which rose 0.58%. However, the Fund’s performanceexceeded that of the MSCI ACWI Index, a measure of global returns, andthat of the Morningstar Allocation–85%+ Equity Category (the “PeerGroup”) average. They both declined 1.05%.
The Fund’s trailing 12-month absolute and relative performance has beenstrong. Over that period, the Fund advanced 35.42%. This result comparesfavorably to that of its benchmarks and Peer Group average. The Index andMSCI ACWI Index gained 30.00% and 27.44%, respectively, over the prioryear. The Peer Group also rose 30.00% over this period.
Table I.Performance – Baron WealthBuilder FundAnnualized for periods ended September 30, 2021
RetailShares1,2
InstitutionalShares1,2
TAShares1,2
S&P500
Index1
MSCIACWIIndex1
Three Months3 0.51% 0.56% 0.56% 0.58% (1.05)%Nine Months3 9.81% 10.00% 10.00% 15.92% 11.12%One Year 35.06% 35.42% 35.34% 30.00% 27.44%Three Years 26.64% 26.94% 26.90% 15.99% 12.58%Since Inception
(December 29, 2017) 24.44% 24.71% 24.71% 15.66% 11.05%
Since its inception, Baron WealthBuilder Fund has an annualized return of24.71%. The Fund ranks as the #1 fund in the Peer Group since its inception.
As of 9/30/2021, the Morningstar Allocation–85%+ Equity Category consisted of 166, 154, and 153 share classes for the 1-year, 3-year, and sinceinception (12/29/2017) periods. Morningstar ranked Baron WealthBuilder Fund Institutional Share Class in the 8th, 1st, and 1st percentiles,respectively. On an absolute basis, Morningstar ranked Baron WealthBuilder Fund Institutional Share Class as the 11th, 3rd, and 1st best performingshare class in its category for the 1-year, 3-year, and since inception (12/29/2017) periods, respectively. As of 9/30/2021, the annualized returns of theMorningstar Allocation–85%+ Equity Category Average were 30.00%, 11.68%, and 10.14% for the 1-year, 3-year, and since inception (12/29/2017) periods,respectively.
Morningstar calculates the Morningstar Allocation–85%+ Equity Category Average performance and rankings using its Fractional Weightingmethodology. Morningstar rankings are based on total returns and do not include sales charges. Total returns account for management,administrative, and 12b-1 fees and other costs automatically deducted from fund assets.
© 2021 Morningstar. All Rights Reserved. The Morningstar information contained herein: (1) is proprietary to Morningstar and/or its content providers; (2) maynot be copied or distributed; and (3) is not warranted to be accurate, complete or timely. Neither Morningstar nor its content providers are responsible for anydamages or losses arising from any use of this information. Past performance is no guarantee of future results.
Performance listed in the above table is net of annual operating expenses. Annual expense ratio for the Retail Shares, Institutional Shares, and TA Shares as ofDecember 31, 2020 was 1.47%, 1.22%, and 1.22%, respectively, but the net annual expense ratio was 1.36%, 1.11%, and 1.11% (includes acquired fund fees of1.06%, net of the Adviser’s fee waivers), respectively. The performance data quoted represents past performance. Past performance is no guarantee of future results. Theinvestment return and principal value of an investment will fluctuate; an investor’s shares, when redeemed, may be worth more or less than their original cost. BAMCO,Inc. (‘BAMCO” or the “Adviser”) has agreed that, pursuant to a contract expiring on August 29, 2032, unless renewed for another 11-year term, it will reimburse certainexpenses of the Fund, limiting net annual operating expenses (portfolio transaction costs, interest, dividend, acquired fund fees and expenses and extraordinary expensesare not subject to the operating expense limitation) to 0.30% of average daily nest assets of Retail Shares, 0.05% of average daily net assets of Institutional Shares and0.05% of average daily net assets of TA Shares, without which performance would have been lower. Current performance may be lower or higher than the performancedata quoted. For performance information current to the most recent month end, visit www.BaronFunds.com or call 1-800-99BARON.1 The S&P 500 Index measures the performance of 500 widely held large cap U.S. companies. The MSCI ACWI Index is an unmanaged, free float-
adjusted market capitalization weighted index reflected in US dollars that measures the equity market performance of large- and mid-cap securitiesacross developed and emerging markets. MSCI is the source and owner of the trademarks, service marks and copyrights related to the MSCI Indexes. Theindexes and the Fund include reinvestment of dividends, net of withholding taxes, which positively impact the performance results. The indexes areunmanaged. Index performance is not Fund performance; one cannot invest directly into an index.
2 The performance data in the table does not reflect the deduction of taxes that a shareholder would pay on Fund distributions or redemption of Fund shares.3 Not annualized.
BARONF U N D S
122

September 30, 2021 Baron WealthBuilder Fund
While the Fund and the Index ended the quarter nearly where they started,markets were not placid. Gains in July and August were followed by declinesin September. Investors still grapple with the lingering economicimplications of the COVID-19 pandemic. Recent concerns about supplychain disruptions, labor shortages, and wage rates have impacted manystock prices. Increased corporate scrutiny by the Chinese government,company default risks, and interest rate moves have also given investorspause. In this environment, companies that have demonstrated an ability toexecute on their business plans have been rewarded. However, investorshave also shifted to a more defensive stance and punished the value ofcompanies that are perceived to be in the crosshairs of these issues. Webelieve this is a good environment for Baron Funds’ active investmentapproach.
Baron WealthBuilder Fund holds 16 investments in different Baron Funds.Eleven of those funds, representing 75.4% of the portfolio at the end of thequarter, outperformed their respective benchmarks in the quarter.
However, as investors became cautious, most of those growth indexestrailed the broader market. Only three underlying funds’ benchmarks,corresponding with 13.5% of the portfolio at the end of the quarter,exceeded the return of the S&P 500 Index in the quarter. We are satisfiedwith our underlying funds’ relative performance in this period. We do notexpect these growth-oriented benchmarks to trail the Index over the longterm.
Diversified portfolios of high-quality, consistently growing companies wereamong some of the top performers in the quarter. This group includes BaronGrowth, Baron Small Cap, and Baron Durable Advantage Funds. Companieswith reliable growth are heavily favored in these portfolios. Gartner, Inc., forexample, is the leading provider of syndicated technology research. Webelieve its addressable market is 25 times larger than represented by itscurrent revenues. Its products are deeply integrated in clients’ workflows,and Gartner continuously improves its offering. It has consistently increasedsubscription prices with little client attrition. This revenue growth has high-incremental gross margins.
Inflation and interest rate outlooks particularly benefited the Fund’sfinancial and real estate-related holdings. Financial exchanges & databusinesses, including FactSet Research Systems, Inc. and MSCI, Inc hadsome of the largest contributions. These companies have well-received newproducts along with a favorable sector backdrop. New services have beensuccessfully sold to a well-established and loyal client base. FactSet hasreaccelerated growth without sacrificing margins. It has improved its deepsector data and moved infrastructure to the cloud. Its customer base hasgrown as a result. MSCI’s asset-based products had appreciation and inflows.Additionally, it is replicating its public market information success within theprivate markets. This expansion should enable years of future growth. RedRock Resorts, Inc., a provider of entertainment, gaming, and lodging for thelocal Las Vegas community, also benefited. Population and wage growth intheir communities provide the company with a favorable backdrop. Itsbest-in-class and well-maintained locals-oriented properties, along withvaluable real estate ownership should lead to high-incremental cash flow asrevenue rebounds.
Higher-growth portfolios had the greatest dispersion of results. Someconcentrated and sector-focused high-growth underlying funds were large
contributors to performance. This includes Baron Partners, Baron FocusedGrowth, Baron Health Care, and Baron FinTech Funds. High-growthcompanies in these funds demonstrated business advancements andappreciated considerably. Disruptive companies like Tesla Inc., NuveiTechnologies Corp., and Acceleron Pharma Inc., had meaningfulimprovements in key metrics. Despite global supply chain interruptions,Tesla delivered 241,000 cars in the period, a 73% increase over last year.And this growth came before new facilities open in Berlin, Germany andAustin, Texas, and capacity upgrades are implemented in China andCalifornia. Consolidation of chemistry materials should enable batteryproduction to outpace vehicle growth. This higher production should lead tothe energy storage business becoming more impactful for the company overthe coming years and provide even more upside for current shareholders.Payment processor Nuvei serves online merchants. It has made keyacquisitions in fast-growing markets and expanded payment methods. Itsvolume and take-rate both exceeded estimates while all regions hadaccelerating growth. Acceleron continues to advance its two major drugs.One drug launch has had improved acceptance, and we believe can reach amulti-billion dollar market. Another product reported positive data from itsdrug trials and could achieve even greater revenue. This drug developmentpipeline attracted the attention of major pharmaceutical companies.Acceleron was acquired at the end of the quarter.
However, several diversified high-growth underlying funds had exposure tocompanies that faced external pressures. Investor rotation to more stablebusinesses caused these stocks to decline. These portfolios include BaronDiscovery, Baron Fifth Avenue Growth, and Baron Opportunity Funds. Theyhold businesses like RingCentral, Inc. and Wix.com Ltd. Both companiescontinue to grow despite perceived competition and tough comparisons toresults achieved during the pandemic. RingCentral’s annualized recurringrevenue growth is at its highest rate in more than five years. Its partnerships,which provide access to approximately half of eligible customers, shouldassist continued customer penetration. The company is also an attractivetarget for larger technology companies that desire RingCentral’s geographicreach and carrier relationships. Wix had a slowdown in new customeradditions, the result of a pull forward of customers during the height of thepandemic. However, other metrics remain compelling. Churn should remainnegative as customer upgrades more than offset canceled subscriptions.
Baron WealthBuilder Fund also has broader geographic exposure than theIndex. While the Index’s holdings are only in domestic businesses, the Fundcontains non-U.S. investments held predominantly in Baron EmergingMarkets, Baron International Growth, and Baron Global Advantage Funds.We believe this variety should provide steadier long-term returns for theFund. However, those foreign businesses largely detracted from performancein the current period. Inflation, central bank tightening, and supply chaindisruptions impacted many of these jurisdictions. Additionally, increasedregulatory oversight and company default risk affected investments inChina. Zai Lab Limited, a Chinese biotechnology company, and AlibabaGroup Holding Limited, the e-commerce giant, both declined on thesefears. We believe both will be able to navigate the regulatory landscape andcontribute to China’s rapid growth in these segments.
We encourage you to read the various quarterly letters found in this reportfor a deeper understanding of the funds that make up Baron WealthBuilderFund.
123

Baron WealthBuilder Fund
Table II.Baron Funds PerformanceAs of September 30, 2021
Institutional Share Class Data
% of NetAssetsof Fund
Third Quarterof 2021*
Annualized12/29/17 to
9/30/21 Primary BenchmarkThird Quarter
of 2021*
Annualized12/29/17 to
9/30/21
29.7% Small Cap
4.3% Baron Discovery Fund (5.02)% 24.82% Russell 2000 Growth Index (5.65)% 13.60%
13.2% Baron Growth Fund 3.63% 21.12%
12.2% Baron Small Cap Fund 1.32% 19.49%
4.1% Small/Mid Cap
4.1% Baron Focused Growth Fund 4.86% 36.91% Russell 2500 Growth Index (3.53)% 17.10%
12.9% Mid Cap
12.9% Baron Asset Fund (0.14)% 20.35% Russell Midcap Growth Index (0.76)% 18.96%
7.9% Large Cap
6.1% Baron Fifth Avenue Growth Fund (1.42)% 24.39% Russell 1000 Growth Index 1.16% 22.28%
1.8% Baron Durable Advantage Fund 2.12% 17.32%† S&P 500 Index 0.58% 15.39%†
21.5% All Cap
6.0% Baron Opportunity Fund (2.03)% 35.67% Russell 3000 Growth Index 0.69% 21.67%
15.5% Baron Partners Fund 5.52% 43.97% Russell Midcap Growth Index (0.76)% 18.96%
12.6% International
3.8% Baron Emerging Markets Fund (6.47)% 5.58% MSCI EM Index (8.09)% 4.56%
6.4% Baron Global Advantage Fund (4.91)% 28.00%† MSCI ACWI Index (1.05)% 10.26%†
2.4% Baron International Growth Fund (1.03)% 12.04% MSCI ACWI ex USA Index (2.99)% 5.49%
11.3% Specialty
4.7% Baron Real Estate Fund (1.66)% 17.95%MSCI USA IMI Extended Real Estate
Index 0.10% 10.53%
1.4% Baron Real Estate Income Fund (1.61)% 2.68%*† MSCI US REIT Index 0.75% 6.10%*†
2.8% Baron Health Care Fund 1.18% 26.87%† Russell 3000 Health Care Index 0.17% 14.56%†
2.4% Baron FinTech Fund 2.65% 41.10%† S&P 500 Index 0.58% 28.21%†
The performance data quoted represents past performance. Past performance is no guarantee of future results. The indexes are unmanaged. The indexperformance is not Fund performance; one cannot invest directly into an index.
* Not annualized.† Performance is calculated from the time the Fund was added to Baron WealthBuilder Fund: Baron Durable Advantage Fund – 3/13/2018; Baron Global Advantage Fund –
1/9/2018; Baron Health Care Fund – 10/18/2018; Baron FinTech Fund – 2/27/2020 and Baron Real Estate Income Fund–5/17/2021. An investor cannot invest directly in anindex.
124

September 30, 2021 Baron WealthBuilder Fund
FUND OF FUNDS STRUCTURE AND INVESTMENT STRATEGY
Table III.3-Year Performance and Performance Based Characteristics as of
September 30, 2021
BaronWealthBuilder
FundS&P 500
Index
MorningstarAllocation
85%+Equity
Category
Annualized Returns (%) 26.94 15.99 11.68Alpha (%) – Annualized 7.14 0.00 -3.86Beta 1.21 1.00 0.97Sharpe Ratio 1.05 0.79 0.53Standard Deviation (%) –
Annualized 24.47 18.81 18.53Upside Capture (%) 124.38 100.00 86.62Downside Capture (%) 95.87 100.00 99.53
Source: FactSet SPAR. The performance data quoted represents past performance.Past performance is no guarantee of future results. The indexes are unmanaged. Theindex performance is not Fund performance; one cannot invest directly into an index.
Except for Standard Deviation and Sharpe Ratio, the performance based characteristicsabove were calculated relative to the S&P 500 Index.
Combining our various Baron Funds into a single portfolio has producedcategory leading returns and performance characteristics that we believe arestellar. Compared to the Index, the Fund’s three-year alpha is 7.14%, yet itsbeta is only 1.21. Its Sharpe ratio, a measure of return per level of risk, is1.05 compared to the that of the Index at 0.79. And we believe its upsidecapture of 124.38% is even more impressive when viewed alongside itsdownside capture of only 95.87%.
Baron WealthBuilder Fund closely mimics the way we would incrementallyinvest across our various funds and strategies. The Fund allows investors todiversify across Baron Funds, gain exposure to various market caps, sectors,and geographies in a single product and benefit from our rebalancing in atax efficient manner. The portfolio managers of each underlying fund abideby the same core investment process and philosophy, focused on proprietaryresearch to discover competitively advantaged businesses with immenseopportunities. These businesses are led by executives who we think aresmart and honorable.
Baron Funds has had broad historical success. Our investment approach andprocess have yielded outstanding results since the Firm’s founding in 1982.As of 9/30/2021, 16 of 17 Baron Funds, representing 98.3% of Baron Funds’assets under management (“AUM”), have outperformed their respectivepassive benchmarks since their inceptions. In addition, 14 of those funds,representing 98.0% of Baron Funds’ AUM, rank in the top 17% of theirrespective Morningstar categories; and 11 funds, representing 72.7% ofAUM, rank in the top 8%.
This strong relative performance has continued. Since their inclusion inBaron WealthBuilder Fund, all but one underlying Baron mutual fund haveexceeded their respective benchmark indexes. And that only outlier, BaronReal Estate Income Fund, was only added to the Fund in the second quarterof 2021 because of investment opportunities in the segment. We havealways strived to provide top performance in various asset categories. BaronWealthBuilder Fund allows individuals to gain access to a variety of thesestrategies in a single fund. We are pleased with the composition and results.
The makeup of the underlying investments is very different from the Fund’skey indexes. Therefore, the Fund has a high active share when measuredagainst its benchmarks. We feel the diversity in regions and sectors shouldmitigate risk while providing strong absolute returns. While holding nearlythe same number of securities as its primary benchmark (504 in theunderlying funds vs. 502 in the Index), the similarities end there. Theholdings in the underlying funds have a lower dividend yield on average(0.4% vs. 1.4% for the Index), with companies electing to reinvest earningsback in their businesses for growth. And the approach is working; theprojected earnings per share growth rate over the next three to five years is27.2% for the Fund’s underlying holdings vs. 16.1% for the Index (or morethan 1,100 basis points higher). We think that many of our investmentscould exceed external projections. Many of these businesses have depressedmargins as they sacrifice current profitability for more sustainable andhigher long-term growth. We believe higher and prolonged growth shouldreward long-term investors.
The Fund also favors higher-growth sectors and companies with uniqueattributes and competitive advantages. Information Technology, ConsumerDiscretionary, and Health Care are the top three sectors by weight in theFund. These sectors also possess some of the highest growth rates in theeconomy. The portfolio is also distinct in its industry weightings. The Indexhas a higher share of companies in industries that we believe have lowergrowth prospects and fewer defensible advantages. The Index has a greaterweight in technology hardware storage and peripherals, semiconductors andsemiconductor equipment, and banks. The Fund favors higher-growth andcompetitively advantaged industries like (electronic and autonomous)automobiles, IT services, and professional services. We believe companies inthese industries have greater growth potential and advantages that can bemaintained over the long term.
Finally, the Fund has exposure to non-U.S. companies while the Index’sconstituents are solely domestic. We believe geographic diversity providesbenefits, such as lower volatility over time. The Fund is also differentiatedfrom the global coverage of the MSCI ACWI Index. The U.S. is 59.5% of theMSCI ACWI Index compared to 84.7% for the Fund. The non-U.S. exposurefor the MSCI ACWI Index is heavily skewed towards slower growthdeveloped countries, whereas the Fund seeks faster growth in emergingeconomies. Of WealthBuilder Fund’s non-U.S. exposure, 37.1% was inemerging countries. These countries represented 30.0% of the MSCI ACWIIndex’s non-U.S. investments. The MSCI ACWI Index had larger exposure tolower growth economies like Japan and France. Of its non-U.S. investments,Japan and France represented 15.3% and 7.1%, respectively, of the MSCIACWI Index while they represented only 1.7% and 1.1% for the Fund,respectively.
We believe the portfolio allocation of the underlying Baron Funds, theirexposure to various industries, and their geographic diversification shouldcontinue to produce good returns over the long term.
125

Baron WealthBuilder Fund
Table IV.Sector exposures as of September 30, 2021
Percentof NetAssets
S&P500 Index
MSCIACWI Index
Information Technology 24.1% 27.6% 22.3%Consumer Discretionary 22.1 12.4 12.4Health Care 16.1 13.3 11.7Financials 11.1 11.4 14.4Industrials 10.8 8.0 9.7Communication Services 7.8 11.3 9.3Real Estate 5.6 2.6 2.6Materials 1.1 2.5 4.7Consumer Staples 0.7 5.8 6.8Energy 0.3 2.7 3.5Unclassified 0.2 – –Utilities – 2.5 2.6
Table V.Country exposures as of September 30, 2021
Percentof NetAssets
S&P500 Index
MSCIACWI Index
United States 84.7% 100.0% 59.5%United Kingdom 2.5 – 3.7China 1.9 – 4.1Netherlands 1.7 – 1.2Canada 1.5 – 2.9India 1.4 – 1.5Israel 1.0 – 0.2Sweden 0.7 – 0.9Ireland 0.6 – 0.2Argentina 0.5 – 0.1Other 3.4 – 25.8
Table VI.Fund of fund holdings as of September 30, 2021
Percentof NetAssets
Baron Partners Fund 15.5%Baron Growth Fund 13.2Baron Asset Fund 12.9Baron Small Cap Fund 12.2Baron Global Advantage Fund 6.4Baron Fifth Avenue Growth Fund 6.1Baron Opportunity Fund 6.0Baron Real Estate Fund 4.7Baron Discovery Fund 4.3Baron Focused Growth Fund 4.1Baron Emerging Markets Fund 3.8Baron Health Care Fund 2.8Baron International Growth Fund 2.4Baron FinTech Fund 2.4Baron Durable Advantage Fund 1.8Baron Real Estate Income Fund 1.4
Thank you for joining us as fellow shareholders in Baron WealthBuilder Fund.We continue to work hard to justify your confidence and trust in ourstewardship of your hard-earned savings. We remain dedicated to providingyou the information we would like to have if our roles were reversed. Wehope this letter enables you to make an informed decision about whetherthis Fund remains an appropriate investment.
Respectfully,
Ronald Baron Michael BaronCEO and Portfolio Manager Assistant Portfolio ManagerSeptember 30, 2021
Investors should consider the investment objectives, risks, and charges and expenses of the investment carefully before investing. The prospectus and summaryprospectus contain this and other information about the Funds. You may obtain them from its distributor, Baron Capital, Inc., by calling 1-800-99BARON orvisiting www.BaronFunds.com. Please read them carefully before investing.
Risks: The Fund is a diversified fund because it invests, at any given time, in the securities of a select number of Baron mutual funds (the “Underlying Funds”), representingspecific investment strategies. The Fund can invest in funds holding U.S. and international stocks; small-cap, small to mid-cap, large-cap, all-cap stocks; and specialty stocks.Each of the Underlying Funds has its own investment risks, and those risks can affect the value of the Fund’s investments and therefore the value of the Fund’s shares. To theextent that the Fund invests more of its assets in one Underlying Fund than in another, it will have greater exposure to the risks of that Underlying Fund. For furtherinformation regarding the investment risks of the Underlying Funds, please refer to the Underlying Funds’ prospectus.
Active Share: a term used to describe the share of a portfolio’s holdings that differ from that portfolio’s benchmark index. It is calculated by comparing the weight of eachholding in the Fund to that holding’s weight in the benchmark. Positions with either a positive or negative weighting versus the benchmark have Active Share. An Active Shareof 100% implies zero overlap with the benchmark. Active Share was introduced in 2006 in a study by Yale academics, M. Cremers and A. Petajisto, as a measure of activeportfolio management. Alpha measures the difference between a fund’s actual returns and its expected performance, given its level of risk as measured by beta. Betameasures a fund’s sensitivity to market movements. The beta of the market is 1.00 by definition. EPS Growth Rate (3-5-year forecast) indicates the long term forecasted EPSgrowth of the companies in the portfolio, calculated using the weighted average of the available 3-to-5 year forecasted growth rates for each of the stocks in the portfolioprovided by FactSet Estimates. The EPS Growth rate does not forecast the Fund’s performance. Price/Earnings Ratio (trailing 12-months): is a valuation ratio of a company’scurrent share price compared to its actual earnings per share over the last twelve months. If a company’s actual EPS is negative, it is excluded from the portfolio levelcalculation. Sharpe Ratio is a risk-adjusted performance statistic that measures reward per unit of risk. The higher the Sharpe ratio, the better a fund’s risk adjustedperformance. Upside Capture explains how well a fund performs in time periods where the benchmark’s returns are greater than zero. Downside Capture measures how wella fund performs in time periods where the benchmark’s returns are less than zero. Standard Deviation (Std. Dev) measures the degree to which a fund’s performance hasvaried from its average performance over a particular time period. The greater the standard deviation, the greater a fund’s volatility (risk).
126

September 30, 2021 Baron WealthBuilder Fund
The discussions of the companies herein are not intended as advice to any person regarding the advisability of investing in any particular security. The views expressed in thisreport reflect those of the respective portfolio managers only through the end of the period stated in this report. The portfolio manager’s views are not intended asrecommendations or investment advice to any person reading this report and are subject to change at any time based on market and other conditions and Baron has noobligation to update them. This report does not constitute an offer to sell or a solicitation of any offer to buy securities of Baron WealthBuilder Fund by anyone in anyjurisdiction where it would be unlawful under the laws of that jurisdiction to make such offer or solicitation.
Ranking information provided is calculated for the Retail Share Class and is as of 9/30/2021. The number of share classes in each category may vary depending on the datethat Baron downloaded information from Morningstar Direct. Morningstar calculates its category average performance and rankings using its Fractional Weightingmethodology. Morningstar rankings are based on total returns and do not include sales charges. Total returns account for management, administrative, and 12b-1fees and other costs automatically deducted from fund assets. The Morningstar Large Growth Category consisted of 1,235, 1,024, and 762 share classes for the 1-, 5-,and 10-year periods. Morningstar ranked Baron Opportunity Fund in the 9th, 3rd, 7th, and 4th percentiles for the 1-, 5-, 10-year, and since inception periods, respectively. TheFund launched 2/29/2000, and the category consisted of 265 share classes. Morningstar ranked Baron Partners Fund in the 1st, 1st, 1st, and 1st percentiles for the 1-, 5-,10-year, and since conversion periods, respectively. The Fund converted into a mutual Fund 4/30/2003, and the category consisted of 417 share classes. The MorningstarMid-Cap Growth Category consisted of 584, 495, and 386 share classes for the 1-, 5-, and 10-year periods. Morningstar ranked Baron Asset Fund in the 85th, 30th, 26th and17th percentiles for the 1-, 5-, 10-year, and since inception periods, respectively. The Fund launched 6/12/1987, and the category consisted of 19 share classes. Morningstarranked Baron Growth Fund in the 27th, 26th, 34th, and 8th percentiles for the 1-, 5-, 10-year, and since inception periods, respectively. The Fund launched 12/31/1994, andthe category consisted of 54 share classes. Morningstar ranked Baron Focused Growth Fund in the 13th, 2nd, 2nd, and 4th percentiles for the 1-, 5-, 10-year, and sinceconversion periods, respectively. The Fund converted into a mutual Fund 6/30/2008, and the category consisted of 316 share classes. The Morningstar Small GrowthCategory consisted of 611, 506, and 381 share classes for the 1-, 5-, and 10-year time periods. Morningstar ranked Baron Small Cap Fund in the 86th, 35th, 43rd, and 14thpercentiles for the 1-, 5-, 10-year, and since inception periods, respectively. The Fund launched 9/30/1997, and the category consisted of 91 share classes. Morningstar rankedBaron Discovery Fund in the 63rd, 7th, and 2nd percentiles for the 1-, 5-year, and since inception periods, respectively. The Fund launched 9/30/2013, and the categoryconsisted of 430 share classes. The Morningstar Real Estate Category consisted of 246, 199, and 147 share classes for the 1-, 5-, and 10-year time periods. Morningstarranked Baron Real Estate Fund in the 51st, 1st, 1st, and 1st percentiles for the 1-, 5-, 10-year, and since inception periods, respectively. The Fund launched 12/31/2009, and thecategory consisted of 128 share classes. Morningstar ranked Baron Real Estate Income Fund in the 74th and 3rd percentiles for the 1-year and since inception periods,respectively. The Fund launched 12/29/2017, and the category consisted of 221 share classes. The Morningstar Foreign Large Growth Category consisted of 439, 322, 221,and 197 share classes for the 1-, 5-, 10-year, and since inception (12/31/2008) periods. Morningstar ranked Baron International Growth Fund in the 4th, 17th, 20th, and 12thpercentiles, respectively. The Morningstar Diversified Emerging Markets Category consisted of 784, 598, 317, and 279 share classes for the 1-, 5-, 10-year, and sinceinception (12/31/2010) periods. Morningstar ranked Baron Emerging Markets Fund in the 64th, 37th, 12th, and 4th percentiles, respectively. The Morningstar World Large-Stock Growth Category consisted of 352, 263, and 167 share classes for the 1-, 5-year, and since inception (4/30/2012) periods. Morningstar ranked Baron Global AdvantageFund in the 74th, 2nd, and 2nd percentiles, respectively. The Morningstar Health Category consisted of 167 and 138 share classes for the 1-year and since inception(4/30/2018) periods. Morningstar ranked Baron Health Care Fund in the 8th and 5th percentiles, respectively. The Morningstar Allocation—85%+ Equity Category consistedof 166 and 153 share classes for the 1-year and since inception (12/29/2017) periods. Morningstar ranked Baron WealthBuilder Fund in the 10th and 2nd percentiles,respectively.
© 2021 Morningstar. All Rights Reserved. The Morningstar information contained herein: (1) is proprietary to Morningstar and/or its content providers; (2) may not be copiedor distributed; and (3) is not warranted to be accurate, complete or timely. Neither Morningstar nor its content providers are responsible for any damages or losses arisingfrom any use of this information. Past performance is no guarantee of future results.
Risk: All investments are subject to risk and may lose value. Index performance is not fund performance; one cannot invest directly into an index.
BAMCO, Inc. is an investment adviser registered with the U.S. Securities and Exchange Commission (SEC). Baron Capital, Inc. is a limited purpose broker-dealer registered withthe SEC and member of the Financial Industry Regulatory Authority, Inc. (FINRA).
127

Baron WealthBuilder Fund
Baron Funds (Institutional Shares) and Benchmark Performance 9/30/2021
Fund Primary Benchmark
AnnualizedReturn Since
Fund Inception
AnnualizedBenchmark
Return SinceFund Inception
InceptionDate
Average Annualized Returns AnnualExpense Ratio Net Assets1-Year 3-Year 5-Year 10-Year
SMALL CAP
Baron Growth Fund Russell 2000 Growth Index 14.25% 8.89% 12/31/1994 36.55% 19.75% 21.16% 17.64% 1.04%(3) $9.20 billion
Baron Small Cap Fund Russell 2000 Growth Index 11.58% 7.32% 9/30/1997 30.11% 17.86% 20.29% 17.15% 1.05%(3) $5.32 billion
Baron Discovery Fund† Russell 2000 Growth Index 20.03% 11.97% 9/30/2013 35.93% 20.48% 25.55% N/A 1.08%(3) $2.03 billion
SMALL/MID CAP
Baron Focused GrowthFund(1) Russell 2500 Growth Index 14.54% 9.33% 5/31/1996 42.30% 40.46% 32.52% 21.40% 1.07%(4) $745.08 million
MID CAP
Baron Asset Fund Russell Midcap GrowthIndex 12.46% 11.08%(2) 6/12/1987 25.29% 18.72% 20.45% 18.00% 1.05%(3) $6.17 billion
LARGE CAP
Baron Fifth Avenue GrowthFund Russell 1000 Growth Index 11.98% 12.31% 4/30/2004 19.44% 22.93% 24.52% 20.65% 0.78%/0.75%(3)(6) $837.21 million
Baron Durable AdvantageFund S&P 500 Index 18.23% 15.66% 12/29/2017 28.07% 20.31% N/A N/A 2.40%/0.70%(3)(7) $41.16 million
ALL CAP
Baron Partners Fund(1) Russell Midcap GrowthIndex 16.45% 10.90% 1/31/1992 57.43% 49.25% 38.93% 27.63% 1.30%(4)(5) $7.15 billion
Baron Opportunity Fund† Russell 3000 Growth Index 10.77% 6.96% 2/29/2000 33.91% 34.26% 32.95% 21.52% 1.08%(3) $1.61 billion
INTERNATIONAL
Baron Emerging MarketsFund MSCI EM Index 6.41% 3.25% 12/31/2010 17.95% 12.17% 9.61% 8.90% 1.09%(4) $9.52 billion
Baron Global AdvantageFund† MSCI ACWI Index 19.81% 10.67% 4/30/2012 22.56% 32.66% 29.58% N/A 0.92%/0.90%(4)(8) $2.77 billion
Baron International GrowthFund MSCI ACWI ex USA Index 12.75% 8.07% 12/31/2008 30.30% 16.32% 14.55% 12.13% 1.01%/0.95%(4)(9) $743.70 million
SECTOR
Baron Real Estate Fund† MSCI USA IMI ExtendedReal Estate Index 16.88% 12.72% 12/31/2009 33.50% 25.89% 19.56% 19.05% 1.08%(4) $1.82 billion
Baron Real Estate IncomeFund MSCI US REIT Index 15.29% 7.37% 12/29/2017 31.24% 19.37% N/A N/A 3.45%/0.80%(4)(10) $85.20 million
Baron Health Care Fund Russell 3000 Health CareIndex 25.35% 16.62% 4/30/2018 32.78% 23.11% N/A N/A 1.45%/0.85%(4)(11) $211.61 million
Baron FinTech Fund S&P 500 Index 37.32% 19.83% 12/31/2019 34.52% N/A N/A N/A 2.43%/0.95%(12) $77.04 million
EQUITY ALLOCATION
Baron WealthBuilder Fund S&P 500 Index 24.71% 15.66% 12/29/2017 35.42% 26.94% N/A N/A 1.22%/1.11%(4)(13) $481.86 million
(1) Reflects the actual fees and expenses that were charged when the Funds were partnerships. The predecessor partnerships charged a 20% performance fee (Baron PartnersFund) or a 15% performance fee (Baron Focused Growth Fund) after reaching a certain performance benchmark. If the annual returns for the Funds did not reflect theperformance fee for the years the predecessor partnerships charged a performance fee, returns would be higher. The Funds’ shareholders are not charged a performance fee.
(2) For the period June 30, 1987 to September 30, 2021.(3) As of 9/30/2020.(4) As of 12/31/2020.(5) Comprised of operating expenses of 1.05% and interest expenses of 0.25%.(6) Annual expense ratio was 0.78%, but the net annual expense ratio was 0.75% (net of Adviser’s fee waivers).(7) Annual expense ratio was 2.40%, but the net annual expense ratio was 0.70% (net of Adviser’s fee waivers).(8) Annual expense ratio was 0.92%, but the net annual expense ratio was 0.90% (net of Adviser’s fee waivers).(9) Annual expense ratio was 1.01%, but the net annual expense ratio was 0.95% (net of Adviser’s fee waivers).(10) Annual expense ratio was 3.45%, but the net annual expense ratio was 0.80% (net of Adviser’s fee waivers).(11) Annual expense ratio was 1.45%, but the net annual expense ratio was 0.85% (net of Adviser’s fee waivers).(12) Annual expense ratio was 2.43%, but the net annual expense ratio was 0.95% (net of Adviser’s fee waivers).(13) Annual expense ratio was 1.22%, but the net annual expense ratio was 1.11% (includes acquired fund fees and expenses, net of the Adviser’s fee waivers).† The Fund’s historical performance was impacted by gains from IPOs. There is no guarantee that these results can be repeated or that the Fund’s level of participation in
IPOs will be the same in the future.* Not annualized.
128

September 30, 2021 Baron Health Care Fund
NEAL KAUFMAN Retail Shares: BHCFXInstitutional Shares: BHCHX
PORTFOLIO MANAGER R6 Shares: BHCUX
DEAR BARON HEALTH CARE FUND SHAREHOLDER:
PERFORMANCE
In the quarter ended September 30, 2021, Baron Health Care Fund (the“Fund”) advanced 1.18% (Institutional Shares), compared with the 0.17%gain for the Russell 3000 Health Care Index (the “Benchmark”) and the0.58% gain for the S&P 500 Index. Year-to-date, the Fund increased 13.40%compared with the 10.66% increase for the Benchmark and the 15.92% gainfor the S&P 500 Index. Since inception (April 30, 2018), the Fund increased25.35% on an annualized basis compared with the 16.62% gain for theBenchmark and the 17.44% gain for the S&P 500 Index.
Table I.PerformanceFor periods ended September 30, 2021
BaronHealth Care
FundRetail
Shares1,2
BaronHealth Care
FundInstitutional
Shares1,2
Russell3000
Health CareIndex1
S&P 500Index1
Three Months3 1.09% 1.18% 0.17% 0.58%Nine Months3 13.17% 13.40% 10.66% 15.92%One Year 32.42% 32.78% 21.81% 30.00%Three Years 22.78% 23.11% 12.91% 15.99%Since Inception
(April 30, 2018) 25.03% 25.35% 16.62% 17.44%
In the third quarter, the Fund outperformed the Benchmark by 101 basispoints due to stock selection and, to a lesser extent, differences insub-industry exposures.
Investments in life sciences tools & services, pharmaceuticals, andspecialized REITs and minimal exposure to lagging health care servicesstocks added the most value. Within life sciences tools & services,meaningfully higher exposure to this strong performing sub-industry andoutperformance of contract clinical research services provider ICON Plcbolstered relative results. ICON was the top contributor after the companydelivered a top-line beat and management raised 2021 guidance toincorporate the contribution of the recently acquired PRA Health Sciences,Inc. Strength in the sub-industry also came from integrated drugcontainment and delivery solutions provider Stevanato Group S.p.A and
life sciences tools developer Bio-Techne Corporation. Stevanato’s shares,which were initially down following the company’s mid-July IPO,subsequently rallied after attracting attention from investors who believedthe business was trading at a discount. Bio-Techne’s stock rose in responseto strong quarterly financial results and an upbeat investor day. Strength inpharmaceuticals was driven by veterinary pharmaceutical specialist DechraPharmaceuticals PLC, whose financial results came in ahead of Streetexpectations due to market share gains, healthy companion animal trends,successful product launches/acquisitions, and ongoing geographicexpansion. The Fund’s unique exposure to the specialized REITs sub-industrythrough its investment in Alexandria Real Estate Equities, Inc. addedvalue. Shares of life science office REIT Alexandria were up after reportingstrong quarterly results. Management also provided a bright outlook for theremainder of the year as fundamentals remain excellent across thecompany’s real estate footprint.
Performance listed in the above table is net of annual operating expenses. Annual expense ratio for the Retail Shares and Institutional Shares as of December 31,2020 was 1.73% and 1.45%, respectively, but the net annual expense ratio was 1.10% and 0.85% (net of the Adviser’s fee waivers), respectively. Theperformance data quoted represents past performance. Past performance is no guarantee of future results. The investment return and principal value of aninvestment will fluctuate; an investor’s shares, when redeemed, may be worth more or less than their original cost. The Adviser reimburses certain Baron Fundexpenses pursuant to a contract expiring on August 29, 2032, unless renewed for another 11-year term and the Fund’s transfer agency expenses may bereduced by expense offsets from an unaffiliated transfer agent, without which performance would have been lower. Current performance may be lower orhigher than the performance data quoted. For performance information current to the most recent month end, visit www.BaronFunds.com or call1-800-99BARON.1 The Russell 3000® Health Care Index is an unmanaged index representative of companies involved in medical services or health care in the Russell
3000 Index, which is comprised of the 3,000 largest U.S. companies as determined by total market capitalization. The S&P 500 Index measures theperformance of 500 widely held large cap U.S. companies. Russell Investment Group is the source and owner of the trademarks, service marks andcopyrights related to the Russell Indexes. Russell is a trademark of Russell Investment Group. The indexes and the Fund include reinvestment ofdividends, net of withholding taxes, which positively impact the performance results. The indexes are unmanaged. Index performance is not Fundperformance; one cannot invest directly into an index.
2 The performance data in the table does not reflect the deduction of taxes that a shareholder would pay on Fund distributions or redemptions of Fundshares.
3 Not annualized.BARONF U N D S
129

Baron Health Care Fund
Underperformance of investments in commodity chemicals and managedhealth care and lower exposure to strong performing health care equipmentstocks weighed the most on relative results. Weakness in commoditychemicals came from Zymergen Inc., a company dedicated to fermentingbacteria to make materials. The company’s shares fell sharply aftermanagement withdrew previous financial targets due to the delayedcommercial launch of the company’s lead product, Hyaline. We exited theposition given material impacts to the business. The Fund’s managed healthcare holdings underperformed after falling 7.9% as a group, with HumanaInc. and HealthEquity, Inc. driving the decline. Humana’s shares were hurtby limited near-term earnings visibility and uncertainty about MedicareAdvantage rate cuts. HealthEquity’s stock was under pressure before beingsold due to lower interest rates and ongoing headwinds to the commuterbenefits business as many employees continue to work from home.
Our strategy is to identify competitively advantaged growth companies thatwe can own for years. Similar to other Baron Funds, we remain focused onfinding businesses that we believe have open-ended secular growthopportunities, durable competitive advantages, and strong managementteams. We conduct independent research and take a long-term perspective.We are particularly focused on businesses that solve problems in healthcare, whether by reducing costs, enhancing efficiency, and/or improvingpatient outcomes.
We continue to think the Health Care sector will offer attractive investmentopportunities over the next decade and beyond. Health Care is one of thelargest and most complex sectors in the U.S. economy, accounting forapproximately 18% of GDP and encompassing a diverse array ofsub-industries. Health Care is also a dynamic industry undergoing changesdriven by legislation, regulation, and advances in science and technology.We think navigating these changes requires investment experience andsector expertise, which makes the Health Care sector particularly well suitedfor active management.
Table II.Top contributors to performance for the quarter ended September 30, 2021
PercentImpact
ICON Plc 1.27%Acceleron Pharma Inc. 1.10Moderna, Inc. 0.91BioNTech SE 0.46Stevanato Group S.p.A 0.44
ICON Plc is the second largest global Contract Research Organization(“CRO”) after its July merger with PRA Health Sciences. Shares of ICON,which provides outsourced drug development services to pharmaceuticaland biotechnology companies, rose as investors warmed to the merger andinitial concerns regarding potential disruptions receded. We remaininvestors. The merger brings together complementary strengths of two well-managed CROs, customer reception has been positive, and cost and salessynergies appear achievable.
Acceleron Pharma Inc. is a biotechnology company with the rare profile ofhaving two blockbuster assets in the pipeline: cardiovascular drugsotatercept and anemia drug luspatercept. Shares increased on news thatAcceleron was the target of a potential acquisition by Merck. We think ofAcceleron as a first class company and continue to be shareholders.
Moderna, Inc. is a leader in the emerging field of mRNA-based vaccines andtherapeutics. Shares performed well for the quarter. Moderna has been oneof the most successful companies in the race to develop and provide aCOVID-19 vaccine and is focusing on introducing a COVID-19 boostercombined with the flu shot. With the COVID-19 vaccine success under itsbelt, we think Moderna has potential to disrupt the entire biopharmaceuticalindustry, from infectious disease vaccines to oncology and rare diseasetreatment.
BioNTech SE is a leader in the emerging field of mRNA drugs, withadditional programs in engineered cell therapies, antibodies, andimmunomodulators. Shares performed well for the quarter. The COVID-19vaccine rollout continues with the addition of a booster shot, and we believethe pandemic has been a strong proof point of the speed and efficacy of themRNA platform. Beyond vaccines, we think BioNTech has potential todisrupt the biopharmaceutical space with a pipeline spanning oncology,infectious diseases, and rare diseases.
Stevanato Group S.p.A is a leading global provider of drug containment,drug delivery, and diagnostic solutions to the pharmaceutical,biotechnology, and life sciences industries. After initially falling in its firstfew post-IPO trading sessions, the stock rose as investors quickly came torealize the company is a high-quality business with a steady growth outlookthat was trading at a discount. We think the business can grow by highsingle-digits to low double-digits on the top-line with EBITDA marginexpansion to the high 20% range over time.
Table III.Top detractors from performance for the quarter ended September 30, 2021
PercentImpact
Zai Lab Limited –0.70%Zymergen Inc. –0.66Eargo, Inc. –0.55Arrowhead Pharmaceuticals, Inc. –0.47Denali Therapeutics Inc. –0.45
Zai Lab Limited is a leading biotechnology company helping to modernizethe Chinese health care industry. Zai’s initial focus centered aroundin-licensing western medicines for commercialization in China; this hasexpanded into internal pipeline efforts. Shares fell alongside the broaderChinese equity markets given concerns around regulations the governmenthas enacted in education, technology, and real estate. While we are payingattention to these developments, so far, we think health care will not besubject to any draconian rulings.
Zymergen Inc. is a company dedicated to biofacturing, or harnessingbacteria to manufacture materials. Zymergen was a detractor following anunexpected update announcing both a major delay in the launch of leadproduct Hyaline and the removal of CEO Josh Hoffman, who was replacedby company chairman and former Illumina CEO Jay Flatley. We exited ourposition given material impacts to the business.
Eargo, Inc. offers a hearing aid that is virtually invisible, affordable, anddelivered through a telecare-based direct-to-consumer model. Shares fellsharply for the period held after the company disclosed it was undergoing aclaims audit by an insurance company that then escalated into aninvestigation by the Department of Justice. We exited our position becausewe believe this development fundamentally changed our investment thesis.
130

September 30, 2021 Baron Health Care Fund
Arrowhead Pharmaceuticals, Inc. is a biotechnology company developingRNAi (i=interference) drugs. Shares dropped after a July announcement thatthe company was pausing its early stage clinical trial for a treatment forcystic fibrosis. A few weeks after the July announcement, the companypresented positive data for a treatment targeting a protein in kidney cancer.We retain conviction in Arrowhead and the long-term prospects of RNAi asa drug category.
Denali Therapeutics Inc. is a biotechnology company developing drugs totreat neurological disorders. Shares fell after an interim update reportingmixed results from its Phase 1/2 study of a program in treating Huntersyndrome. We remain convicted in Denali for its suite of approaches towardtargeting the brain.
PORTFOLIO STRUCTURE
We build the portfolio from the bottom up, one stock at a time, using theBaron investment approach. We do not try to mimic an index, and weexpect the Fund to look very different from its Benchmark. We loosely groupthe portfolio into three categories of stocks: earnings compounders, high-growth companies, and biotechnology companies. We define earningscompounders as companies that we believe can compound earnings atdouble-digit rates over the long term. We define high-growth businesses asthose that may not be profitable today, that we expect can generatemid-teens or better revenue growth, and that we believe can be highlyprofitable in the future. We expect the portfolio to have a mix of earningscompounders, high-growth, and biotechnology companies. We typically aimto have roughly 50% of the portfolio in earnings compounders with thebalance divided between biotechnology and high-growth companies but ourallocations among these three categories can change depending upon ourview of the opportunity set and the market environment.
As of September 30, 2021, the Fund’s active share was 74.1%. The Fundmay invest in stocks of any market capitalization and may hold bothdomestic and international stocks. As of September 30, 2021, the Fund held51 positions. This compares with 638 positions in its Benchmark.International stocks represented 20.7% of the Fund’s net assets. The Fund’s10 largest holdings represented 41.1% of net assets. Compared with itsBenchmark, the Fund was overweight life sciences tools & services andhealth care technology, and underweight pharmaceuticals, health careequipment, and health care services, among other sub-industries. Themarket cap range of investments in the Fund was $257 million to$368 billion, with a weighted average market cap of $64.6 billion. Thiscompared with the Benchmark’s weighted average market cap of$143.8 billion.
We continue to invest in many of the themes we have written about in priorquarterly letters, such as genomics/proteomics, genetic medicine,technology-enabled drug development/discovery, minimally invasivesurgery, diabetes management, “picks and shovels” life sciences toolsproviders, and animal health, among others. During the quarter, we added toGoodRx Holdings, Inc. and Figs Inc., both of which have strongdirect-to-consumer health care brands.
To be clear, this list is not exhaustive: we own stocks in the portfolio that donot fit neatly into these themes and there are other themes not mentionedhere that are in the portfolio. We evaluate each stock on its own merits.
Table IV.Top 10 holdings as of September 30, 2021
YearAcquired
MarketCap
WhenAcquired(billions)
QuarterEnd
MarketCap
(billions)
QuarterEnd
InvestmentValue
(millions)
Percentof NetAssets
Natera, Inc. 2021 $ 10.2 $ 10.5 $12.8 6.0%ICON Plc 2018 8.0 20.9 11.6 5.5UnitedHealth Group
Incorporated 2018 227.4 368.4 11.4 5.4Acceleron Pharma Inc. 2018 1.6 10.5 9.3 4.4Thermo Fisher Scientific
Inc. 2019 117.6 224.8 9.2 4.3Bio-Techne Corporation 2018 5.7 19.0 9.0 4.2argenx SE 2018 2.8 15.5 7.4 3.5Dechra Pharmaceuticals
PLC 2018 3.9 7.1 5.6 2.7Eli Lilly and Company 2021 187.4 221.0 5.4 2.6Zoetis Inc. 2019 55.9 92.0 5.2 2.5
Table V.Fund investments in GICS sub-industries as of September 30, 2021
Percent ofNet Assets
Life Sciences Tools & Services 29.2%Health Care Equipment 17.7Biotechnology 17.2Pharmaceuticals 7.7Managed Health Care 6.9Health Care Technology 5.1Health Care Supplies 3.7Specialized REITs 1.7
Cash and Cash Equivalents 10.8
Total 100.0%
Recent Activity
Table VI.Top net purchases for the quarter ended September 30, 2021
Quarter EndMarket Cap
(billions)
AmountPurchased(millions)
Natera, Inc. $ 10.5 $13.2GoodRx Holdings, Inc. 16.2 5.2Mirati Therapeutics, Inc. 9.1 4.0Stevanato Group S.p.A 7.5 3.1Thermo Fisher Scientific Inc. 224.8 2.7
During the third quarter, we established seven new positions and exitedseven positions. Below we discuss some of our top net purchases and sales.
131

Baron Health Care Fund
We initiated a position in Natera, Inc., a diagnostics company with a cell-free DNA platform that enables it to detect tiny amounts of DNA in a bloodsample. Natera first applied its technology platform to women’s health,where the company markets a blood test that can detect fetal DNA in theblood of pregnant women, enabling early detection of chromosomalabnormalities with a non-invasive test. Through the strength of itstechnology platform, clinical data, and customer service, Natera hasestablished itself as a market leader in non-invasive prenatal testing. Naterais seeing tailwinds in its women’s health business from recently expandedinsurance coverage for average risk pregnancies. Natera is now applying itstechnology platform to other markets, including the oncology market andthe organ transplant market. In the oncology market, Natera offers apersonalized blood-based DNA test called Signatera, which detects andquantifies how much residual cancer DNA remains in the body after surgery.Signatera helps physicians determine whether chemotherapy is necessaryafter surgery and monitor for cancer recurrence before the cancer isdetectable with standard imaging. We think Signatera will change thestandard of care and is in the early innings of adoption in a market weestimate to be over $15 billion. We think Natera has a long runway forgrowth with expanding margins and profitability.
We initiated a position in GoodRx Holdings, Inc., a leading consumer-focused digital health care platform. The company’s core offering is a freeApp that provides consumers with access to discounts on prescriptionmedications. This increases medication adherence since GoodRx’sdiscounted prices enable consumers to afford to fill their prescriptions,resulting in better health care outcomes and lower costs to the health caresystem. GoodRx generates revenue each time the consumer uses theGoodRx discount card for a new or refilled prescription. As GoodRx attractsmore consumers to its platform, the company increases its scale, whichenables it to negotiate lower prices, which attracts moreconsumers. GoodRx has a growing subscription business where consumerspay monthly subscription fees to access even lower drug prices. Thesubscription business increases GoodRx’s revenue visibility and customerlifetime value. GoodRx has a strong brand with exceptionally high NetPromoter Scores among consumers and health care providers. With20 million monthly visitors, GoodRx has a valuable platform that it ismonetizing by adding new products and services. Recent examples includeits telehealth offering, pharmaceutical manufacturer solutions business, andproprietary health care content, which should help solidify GoodRx’spositioning as the go-to health care platform for consumers. GoodRx isprofitable and growing rapidly with strong margins and cash flows.
We initiated a position in Mirati Therapeutics, Inc., a clinical-stagebiotechnology company developing novel therapeutics targeting the geneticand immunologic drivers of cancer. The company’s lead drug, known asAdagrasib, targets a protein called KRAS that is a central node in drivingtumor growth. We think Adagrasib has a best-in-class profile in a multi-billion-dollar drug category. Currently, Amgen has a competing drug on themarket, but clinical data on Adagrasib presented at the recent EuropeanSociety of Medical Oncology meeting gives us confidence that Mirati’s drughas better attributes including residence time on target, efficacy responserates, longer duration of treatment, combinability opportunities, and bloodbrain barrier penetration.
We initiated a position Stevanato Group S.p.A, a company based in Italywith a 70-year history. Stevanato is a leading provider of drug containerproducts, such as vials and syringes, among other products and services. Thecompany serves many of the world’s largest pharmaceutical andbiotechnology companies. The company’s products are included as part ofthe regulatory filings for the drugs they contain, which results in highswitching costs and provides recurring revenue for the life of the drug. Webelieve Stevanato has a stable growth business that should benefit fromproduct mix shifts towards higher-value, higher-priced, higher-marginproducts such as EZ Fill (ready-to-fill products provided to customers afterthey have been washed, sterilized, and depryogenated), Alba (a material thatreduces silicon oil particle leaks and delamination), and Nexa, a materialthat provides high mechanical resistance. We think the business can grow byhigh single-digit to low double-digit rates on the top line with EBITDAmargin expanding to the high 20% range over time.
We added to our position in Thermo Fisher Scientific Inc., a leadingprovider of life sciences tools & services. Thermo Fisher is a well-managedbusiness with secular tailwinds in attractive life sciences end markets. At thecompany’s annual investor day, management provided long-term financialtargets consisting of 7% to 9% core organic revenue growth and mid-teensannual earnings and free cash flow growth. We continue to like ThermoFisher as a long-term earnings compounder.
Table VII.Top net sales for the quarter ended September 30, 2021
AmountSold
(millions)
Humana Inc. $2.6Moderna, Inc. 2.1Teleflex Incorporated 1.8HealthEquity, Inc. 1.8Cigna Corporation 1.6
We reduced our position in Humana Inc. due to the lack of near-termearnings visibility and potential for Medicare Advantage rate cuts. Wetrimmed our position in Moderna, Inc. due to valuation. We reduced ourposition in Teleflex Incorporated due to the proposed reduction inMedicare payments for UroLift procedures in physicians’ offices, whichwould result in a headwind to growth. We exited our positions inHealthEquity, Inc. and Cigna Corporation due to concerns about businessheadwinds.
132

September 30, 2021 Baron Health Care Fund
Outlook
Stock market volatility has increased due to macroeconomic factors: oilprices, supply chain issues, inflation, interest rates, the COVID-19 pandemic,and the debt ceiling. Although we take these issues into consideration, wedo not invest by trying to predict the outcome or direction ofmacroeconomic events. We have been holding more cash in the Fund thanusual due to stretched valuations, but recent volatility is presenting us withopportunities to deploy cash into some great businesses.
As it relates more specifically to health care, politicians continue to discusspotential health care policy changes, including a proposal for Medicare tonegotiate drug prices with biopharmaceutical companies. If enacted, thisproposal could negatively impact biopharmaceutical R&D spending. Wethink moderates will prevail and this proposal will not go through, but weare closely monitoring the situation. Despite this uncertainty, we continueto believe now is an exciting time to be a long-term investor in Health Carebecause of major advances in science, medicine, and technology.
As always, I would like to thank my colleague Josh Riegelhaupt, AssistantPortfolio Manager of Baron Health Care Fund, for his invaluablecontributions to the Fund.
Thank you for investing in Baron Health Care Fund. I remain an investor inthe Fund, alongside you.
Sincerely,
Neal KaufmanPortfolio ManagerSeptember 30, 2021
Investors should consider the investment objectives, risks, and charges and expenses of the investment carefully before investing. The prospectusand summary prospectus contains this and other information about the Funds. You may obtain them from its distributor, Baron Capital, Inc., bycalling 1-800-99BARON or visiting www.BaronFunds.com. Please read them carefully before investing.
Risks: In addition to general market conditions, the value of the Fund will be affected by investments in health care companies which aresubject to a number of risks, including the adverse impact of legislative actions and government regulations. The Fund is non-diversified, whichmeans it may have a greater percentage of its assets in a single issuer than a diversified fund. The Fund invests in small and medium sizedcompanies whose securities may be thinly traded and more difficult to sell during market downturns. Portfolio holdings are subject to change.Current and future portfolio holdings are subject to risk.
The discussions of the companies herein are not intended as advice to any person regarding the advisability of investing in any particularsecurity. The views expressed in this report reflect those of the respective portfolio manager only through the end of the period stated in thisreport. The portfolio manager’s views are not intended as recommendations or investment advice to any person reading this report and aresubject to change at any time based on market and other conditions and Baron has no obligation to update them.
This report does not constitute an offer to sell or a solicitation of any offer to buy securities of Baron Health Care Fund by anyone in anyjurisdiction where it would be unlawful under the laws of that jurisdiction to make such offer or solicitation.
BAMCO, Inc. is an investment adviser registered with the U.S. Securities and Exchange Commission (SEC). Baron Capital, Inc. is a limitedpurpose broker-dealer registered with the SEC and member of the Financial Industry Regulatory Authority, Inc. (FINRA).
133

Baron FinTech Fund
JOSH SALTMAN Retail Shares: BFINXInstitutional Shares: BFIIX
PORTFOLIO MANAGER R6 Shares: BFIUX
Dear Baron FinTech Fund Shareholder:
Performance
In the quarter ended September 30, 2021, Baron FinTech Fund (the “Fund”)rose 2.65% (Institutional Shares) compared with a 0.58% gain for the S&P500 Index (the “Benchmark”) and a 3.72% decline for the FactSet GlobalFinTech Index. Year-to-date, the Fund has risen 18.34% compared with a15.92% gain for the Benchmark and a 4.30% gain for the FactSet GlobalFinTech Index. Since inception (December 31, 2019), the Fund has risen37.32% on an annualized basis compared with a 19.83% gain for theBenchmark and a 21.48% gain for the FactSet Global FinTech Index.
Table I.Performance†
For period ended September 30, 2021
BaronFinTech
FundRetail
Shares1,2
BaronFinTech
FundInstitutional
Shares1,2
S&P500
Index1
FactSetGlobal
FinTechIndex1
Three Months3 2.66% 2.65% 0.58% (3.72)%Nine Months3 18.18% 18.34% 15.92% 4.30%One Year 34.26% 34.52% 30.00% 26.56%Since Inception
(December 31, 2019) 37.05% 37.32% 19.83% 21.48%
U.S. equity indexes rose modestly in the third quarter as initial investorenthusiasm about strong corporate earnings, robust macroeconomic data,and the FDA’s full approval of Pfizer’s COVID-19 vaccine was offset late inthe quarter by risk-off sentiment related to higher inflation, looming Fedtapering, debt ceiling drama, and persistent supply chain disruptions.Emerging market equities trailed their developed market peers, with China’songoing regulatory crackdown and Evergrande’s liquidity crisis accountingfor most of the weakness. Financials led the way during the quarter withbanks benefiting from rising Treasury yields. Growth stocks outperformedvalue stocks, particularly for large caps. Smaller-cap stocks underperformedtheir large-cap counterparts after performing well earlier this year.
During the quarter, the Fund outperformed the Benchmark by 2.07% due tostock selection and, to a lesser extent, differences in sector weights. Four ofthe Fund’s seven investment themes outperformed the Benchmark in theperiod: Digital IT Services, E-commerce, Enterprise Software, and Tech-Enabled Financials.
Favorable stock selection in Information Technology (“IT”) and Industrialswas responsible for the outperformance in the quarter. Strength in IT waslargely due to sharp gains from payment processor Nuvei TechnologiesCorp. and money transfer company Wise Plc. Nuvei was the topcontributor after reporting strong revenue growth during the quarter andraising long-term growth and margin targets. Wise went public via a directlisting in mid-July, and its shares subsequently rose due to strong investor
Performance listed in the above table is net of annual operating expenses. Annual expense ratio for the Retail Shares and Institutional Shares as of December 31,2020 was 3.09% and 2.43%, respectively, but the net annual estimated expense ratio was 1.20% and 0.95% (net of the Adviser’s fee waivers), respectively.The performance data quoted represents past performance. Past performance is no guarantee of future results. The investment return and principal value of aninvestment will fluctuate; an investor’s shares, when redeemed, may be worth more or less than their original cost. The Adviser reimburses certain Baron Fundexpenses pursuant to a contract expiring on August 29, 2032, unless renewed for another 11-year term and the Fund’s transfer agency expenses may bereduced by expense offsets from an unaffiliated transfer agent, without which performance would have been lower. Current performance may be lower orhigher than the performance data quoted. For performance information current to the most recent month end, visit www.BaronFunds.com orcall 1-800-99BARON.† The Fund’s Q3 2021 and YTD historical performance was impacted by gains from IPOs and there is no guarantee that these results can be repeated or that the Fund’s level
of participation in IPOs will be the same.1 The S&P 500 Index measures the performance of 500 widely held large cap U.S. companies. The FactSet Global FinTech Index™ is an unmanaged and
equal-weighted index that measures the equity market performance of companies engaged in Financial Technologies, primarily in the areas of softwareand consulting, data, and analytics, digital payment processing, money transfer, and payment transactional-related hardware across 30 developed andemerging markets. The indexes and the Fund include reinvestment of dividends, net of withholding taxes, which positively impact the performanceresults. The indexes are unmanaged. Index performance is not Fund performance; one cannot invest directly into an index.
2 The performance data in the table does not reflect the deduction of taxes that a shareholder would pay on Fund distributions or redemptions of Fundshares.
3 Not annualized.
BARONF U N D S
134

September 30, 2021 Baron FinTech Fund
interest and a low supply of shares floated. Digital IT services businessesEndava plc, Grid Dynamics Holdings Inc., and EPAM Systems, Inc. alsoperformed well after delivering strong earnings growth as business clientscontinue to invest in technology and digital transformation. The Fund’sIndustrials holdings outperformed after appreciating 4.5% as a group, withdata and analytics vendor Verisk Analytics, Inc. leading the way. Veriskreported solid quarterly earnings with strength in its Insurance segment andongoing improvement in its Energy segment.
Underperformance of our investments in Communication Services andFinancials detracted the most from relative results. Weakness inCommunication Services again came from Zillow Group, Inc., whichoperates real estate websites, a mortgage marketplace, and a home-buyingbusiness. Zillow was the third largest detractor due to concerns aboutnegative impacts on the housing market from higher interest rates as well asexecution risks in the company’s home-buying business. Adverse stockselection in Financials, owing largely to share price declines for Braziliandigital bank Banco Inter S.A. and online personal finance company SoFiTechnologies, Inc., was partly offset by the Fund’s high exposure to thistop-performing sector. Banco Inter’s shares fell after the company reportedhigher loan delinquencies and rising customer acquisition costs. Despitereporting solid quarterly results, SoFi’s stock pulled back after managementfailed to raise guidance.
Table II.Top contributors to performance for the quarter ended September 30, 2021
PercentImpact
Nuvei Technologies Corp. 0.97%Endava plc 0.83Grid Dynamics Holdings Inc. 0.65Bill.com Holdings, Inc. 0.50Wise Plc 0.50
Nuvei Technologies Corp. is a Canadian-based payment processor thatserves online merchants around the world. Shares increased after thecompany reported strong quarterly results with 68% pro forma revenuegrowth, a meaningful acceleration from the prior quarter. Managementraised its medium-term growth targets, which now call for over 30% annualgrowth in payment volumes and revenues with expanding margins. Wecontinue to own the stock due to Nuvei’s numerous growth opportunitiesand strong execution.
Endava plc provides outsourced software development for businesscustomers. Shares increased on quarterly results and guidance that exceededStreet expectations. Following a brief slowdown in the early months of thepandemic, business has fully rebounded and accelerated as clients recognizethe need for greater investment in digital transformation. Managementexpects organic revenue growth to exceed 20%, with upside from accretiveacquisitions. We believe Endava will continue gaining share in a large globalmarket for IT services.
Grid Dynamics Holdings Inc. provides outsourced software developmentto business customers. Shares increased after the company reported strongquarterly results with 72% organic revenue growth and raised annualguidance. Grid is benefiting from robust demand as clients across industriesinvest in digital transformation. The company issued new shares in late June,which temporarily depressed the share price but provided dry powder forM&A. We continue to own the stock because we believe the company hasunique capabilities and a long runway for growth.
Bill.com Holdings, Inc., a leading provider of cloud-based software thatsimplifies, digitizes, and automates back office financial operations,contributed to performance. The company reported strong quarterly results,closed its acquisition of Divvy, and provided fiscal year 2022 guidance thatwas well above investor expectations. We retain conviction as we believethe digitization of B2B payments is a powerful secular trend with a longrunway for continued growth, and Bill.com is positioned to be a winner inthe small-to-medium-sized business market.
Wise Plc provides international money transfers for individuals andbusinesses. Wise completed its IPO in July, and its shares subsequently rosedue to strong investor interest and a low supply of shares floated. Webelieve Wise’s proprietary infrastructure, which bypasses traditionalcorrespondent banks, provides a structural cost advantage that should leadto continued market share gains and attractive margins over time.
Table III.Top detractors from performance for the quarter ended September 30, 2021
PercentImpact
Fair Isaac Corporation –0.51%PayPal Holdings, Inc. –0.40Zillow Group, Inc. –0.36Fidelity National Information Services, Inc. –0.34Banco Inter S.A. –0.31
Shares of Fair Isaac Corporation, a data and analytics company focused onpredicting consumer behavior, detracted from performance. Fair Isaacreported solid earnings, but the stock pulled back following some pressreports about a client abandoning the company’s FICO Score. Managementbelieves this was a one-off customer loss, which happened over a year agowith no per.ceptible impact on revenue. We believe Fair Isaac will be asteady earnings grower, which should drive solid returns for the stock over amulti-year period.
PayPal Holdings, Inc. enables digital payments for consumers and merchantsworldwide. Shares fell on quarterly financial results and guidance that werebelow investor expectations due to a faster roll-off of eBay business, whichshould only be a temporary headwind. PayPal also announced the acquisitionof Paidy, the leading buy-now-pay-later provider in Japan, which expandsPayPal’s addressable market into a fast-growing category. We remaininvestors because we believe PayPal is a prime beneficiary of the seculargrowth of e-commerce and digital financial services.
Zillow Group, Inc. operates leading U.S. real estate sites, a mortgagemarketplace, and a home-buying business. Shares were down due toconcerns around rising interest rates and the potential knock-on effects tothe housing market. Our channel checks have indicated that the housingmarket remains robust. Even if demand were to soften, Zillow’s offeringcould become even more valuable as it delivers high-quality buyer and sellerleads. Longer term, we believe Zillow has an ample runway for growth givenits strong management team and large customer base.
Fidelity National Information Services, Inc. provides software to financialinstitutions and enables merchants to accept electronic payments. Thecompany reported solid quarterly financial results that exceededexpectations and raised annual guidance for revenue and earnings. However,the stock fell due to concerns that Fidelity National’s legacy technology islosing market share to newer competitors with more modern technology.We believe these concerns are overblown and that Fidelity National remainswell positioned to grow revenues organically at a high single-digit rate andearnings at a double-digit rate over time.
135

Baron FinTech Fund
Banco Inter S.A. is a Brazilian digital bank that provides checking accounts,loans, credit and debit cards, e-commerce, investments, and insuranceproducts to over 14 million users through its mobile App. Shares declinedduring the quarter after the company posted higher loan delinquencies andrising customer acquisition costs. We view these trends as in line with thecompany’s strategy and growth ambitions and regard Banco Inter as one ofBrazil’s preeminent digital banks disrupting the financial services industry.
Portfolio Structure
The Fund seeks to invest in competitively advantaged, growing fintechcompanies that we can own for years. We conduct independent,fundamental research and take a long-term perspective. The Fund invests incompanies across all market capitalizations and geographies. The quality ofthe ideas and level of conviction determine the position size of eachinvestment. We do not try to mimic an index, and we expect the Fund willlook very different from the Benchmark.
As of September 30, 2021, the Fund held 53 positions. International stocksrepresented 26.5% of the Fund’s net assets. The Fund’s 10 largest holdingsrepresented 35.6% of net assets, and the 20 largest holdings represented63.0% of net assets. The market capitalization range of the investments in theFund was $1.4 billion to $489.4 billion with a median of $18.3 billion and anasset-weighted average of $88.5 billion. The Fund’s active share was 94.6%.
We segment the Fund’s holdings into seven investment themes. Somecompanies have characteristics that span more than one theme, but we classifyeach company by a single theme that we believe is most representative.
1. Payments: The world is migrating to electronic payments, but $18trillion of consumer payments each year are still made with cash orcheck. Visa, Inc. and Mastercard Incorporated operate the leadingglobal networks that facilitate electronic payments for consumers,merchants, and banks. We own several companies that facilitateelectronic payments, including Square, Inc., Marqeta, Inc., GlobalPayments Inc., and Bill.com Holdings, Inc.
2. E-commerce: We have several investments that benefit from thesecular growth of e-commerce. Online sales are growing much fasterthan in-store sales, but e-commerce penetration is still low at onlyaround 15% of total U.S. retail sales. As payment processors for mostlyonline merchants, PayPal Holdings, Inc., Adyen N.V., NuveiTechnologies Corp., and DLocal Limited benefit from the rapidgrowth of e-commerce around the world. MercadoLibre, Inc. operatesa leading online marketplace and payment service in Latin America,while Shopify Inc. provides software and services that make it easierfor merchants to sell online.
3. Enterprise Software: We have several investments in softwarecompanies that help businesses manage their financial processes andoperations. Fidelity National Information Services, Inc., Jack Henry &Associates, Inc., and nCino Inc. provide software that enables banks tomanage account and transaction data. Intuit Inc. provides accountingand payroll solutions for small businesses as well as tax preparationsoftware for consumers and tax professionals. Guidewire Software, Inc.and Duck Creek Technologies, Inc. are leading providers of coresystems software for the global insurance industry.
4. Information Services: Financial institutions increasingly rely oninformation and insights to improve loan pricing, insuranceunderwriting, marketing efficiency, and investment returns. We haveseveral investments in companies that provide critical data to helpfinancial institutions improve performance and fulfill regulatoryrequirements. Rating agencies S&P Global Inc. and Moody’sCorporation provide credit ratings that are deeply embedded into thefinancial ecosystem. TransUnion provides the data and Fair IsaacCorporation provides the rating methodology used by lenders forconsumer credit decisions. The insurance industry relies on VeriskAnalytics, Inc. for underwriting data, and the real estate industry relieson CoStar Group, Inc. and Zillow Group, Inc. for property data.
5. Digital IT Services: Many banks, insurers, and other businesses havedecades-old technology that is difficult to maintain. Disruption fromnew tech-enabled entrants is forcing incumbents to either upgradetheir legacy systems or risk losing customers. EPAM Systems, Inc.,Endava plc, Accenture plc, and Grid Dynamics Holdings Inc. provideconsulting and outsourced software development for businesscustomers to help them modernize their systems and navigate complexdigital transformations.
6. Capital Markets: Investing decisions and trade execution increasinglyrely on digital solutions to improve performance and reduce costs.MarketAxess Holdings Inc. and Tradeweb Markets Inc. operate theleading electronic trading platforms for fixed income markets andbenefit from the secular shift from voice-based trading to electronictrading. CME Group, Inc. is the world’s largest and most diversifiedderivatives marketplace whose electronic exchanges are used bytraders around the world to manage risk.
7. Tech-Enabled Financials: Forward thinking financial institutions areusing technology in particularly innovative ways to better serve theircustomers and operate more efficiently. BlackRock Inc. usestechnology to evaluate risk for institutional investors and managetrillions of dollars’ worth of ETF assets at very low cost. KinsaleCapital Group, Inc. is an insurance company that uses proprietarytechnology to enable faster underwriting and create meaningful costadvantages over the competition. Wise Plc provides internationalmoney transfers that are cheaper, faster, and more convenient thanbank transfers. TCS Group Holding PLC and SoFi Technologies, Inc.offer banking and brokerage services through mobile Apps and aregaining market share from traditional banks.
As of September 30, 2021, Information Services represented 20.7% of netassets, E-commerce represented 19.9%, Payments represented 16.5%,Enterprise Software represented 14.6%, Digital IT Services represented11.3%, Tech-Enabled Financials represented 10.7%, and Capital Marketsrepresented 4.5%, with the remainder in cash.
136
September 30, 2021 Baron FinTech Fund
Table IV.Top 10 holdings as of September 30, 2021
YearAcquired
MarketCap
WhenAcquired(billions)
QuarterEnd
MarketCap
(billions)
QuarterEnd
InvestmentValue
(millions)
Percentof NetAssets
Endava plc 2020 $ 2.6 $ 7.6 $3.3 4.2%Intuit Inc. 2020 69.3 147.3 3.0 3.9PayPal Holdings, Inc. 2020 130.0 305.8 2.9 3.7Square, Inc. 2020 73.9 110.3 2.8 3.6Visa, Inc. 2020 411.0 489.4 2.8 3.6S&P Global Inc. 2020 67.9 102.4 2.8 3.6EPAM Systems, Inc. 2020 11.9 32.3 2.6 3.3Shopify Inc. 2020 118.7 169.2 2.5 3.3Mastercard Incorporated 2020 306.1 343.1 2.5 3.2MSCI, Inc. 2020 22.5 50.2 2.5 3.2
Table V.Fund investments in GICS sub-industries as of September 30, 2021
Percent ofNet Assets
Data Processing & Outsourced Services 33.9%Application Software 15.6Financial Exchanges & Data 11.9IT Consulting & Other Services 11.3Research & Consulting Services 7.5Internet Services & Infrastructure 3.3Internet & Direct Marketing Retail 3.0Diversified Banks 2.8Asset Management & Custody Banks 2.8Interactive Media & Services 2.0Investment Banking & Brokerage 1.6Consumer Finance 1.0Insurance Brokers 0.8Property & Casualty Insurance 0.7
Cash and Cash Equivalents 1.8
Total 100.0%
Recent Activity
During the quarter, the Fund initiated four new positions and exited twopositions. Below we discuss some of our top net purchases and sales.
Table VI.Top net purchases for the quarter ended September 30, 2021
Quarter EndMarket Cap
(billions)
AmountPurchased(millions)
Wise Plc $ 14.6 $1.7nCino Inc. 6.8 1.1Shopify Inc. 169.2 1.0Square, Inc. 110.3 0.7Ceridian HCM Holding Inc. 16.9 0.7
We participated in the IPO of U.K.-based Wise Plc, an international moneytransfer service that is disrupting traditional banks. Formerly known asTransferWise, Wise was founded 10 years by CEO Kristo Käärmann andChairman Taavet Hinrikus to reduce the time and expense of moving money
across borders. Banks control two-thirds of the $25 trillion global cross-border payments market and rely on legacy infrastructure and a complexweb of intermediaries, resulting in high fees, opaque pricing, and slowdelivery times. Wise bypasses the traditional correspondent banking networkby using direct connections with local payment systems, partnerships with85 financial institutions, and in-country group accounts to net two-waycurrency flows. This proprietary infrastructure eliminates intermediary costsand improves delivery times, creating a unique cost advantage over peers.Wise passes on the benefits of lower unit costs to its 6 million customers inthe form of lower fees, which are up to eight times cheaper than banks.
The combination of low costs, low prices, and a better customer experiencehas led to increasing market share and solid profitability. Over the last twoyears, Wise has achieved 35% customer growth, 42% volume growth, and54% revenue growth on an annualized basis. Unlike many consumer-facingtechnology companies, Wise spends relatively little on marketing (only 5%of revenue) thanks to its high net promoter score of 76 with 67% of newcustomers coming from referrals. Low customer acquisition costs and adigital-only service with no need for physical branches resulted in an EBITDAmargin over 25% and a cash conversion rate above 95% last year. With onlya 2.5% share of consumer money transfers and less than a 1% share ofsmall business money transfers, Wise has a long runway for growth, in ouropinion. We expect Wise to achieve management’s medium-term targets ofover 20% revenue growth and over 20% EBITDA margins.
We participated in the IPO of Clearwater Analytics Holdings, Inc., amodern investment accounting platform that is disrupting decades-oldlegacy systems. Every day, Clearwater’s platform aggregates andstandardizes data on over $5.6 trillion of invested assets for over 1,000clients to provide them with a comprehensive view of their investmentportfolios. Asset managers, insurance companies, and large corporationsrequire timely and accurate information about their investment portfolios tomake decisions, manage risk, measure performance, comply withregulations, and communicate with stakeholders. These businesses havehistorically used multiple systems that require large teams of people tomanually review and enter data, correct errors, and build custom reports.Clearwater enables its clients to replace these legacy systems with cloud-based software that helps them reduce cost, errors, and risk, and save time.The company enjoys economies of scale related to its single source ofinvestment data where securities are only processed once and are accessedby all customers. Clearwater has achieved high levels of client satisfactionwith a 98% retention rate and a strong net promoter score. The company isgaining market share with an 80% win rate for new clients.
With less than a 3% share of a $10 billion addressable market, we believeClearwater is well positioned to achieve consistent mid-20s organic revenuegrowth through a combination of growth from existing clients, winning newclients in core end markets, international expansion, and deeper penetrationinto new client types. The company has a highly recurring revenue modeland attractive margins that should expand meaningfully over time. Webelieve that Clearwater will be a steady earnings grower, which should drivesolid returns for the stock over a multi-year period.
We also participated in the IPO of Toast, Inc., a provider of technology andpayment services for the restaurant industry. The company’s core offering isa point-of-sale hardware and software solution with integrated paymentprocessing. Customers can add other features across operations includingdigital ordering and delivery, marketing and loyalty, team management, andback office. Toast powers 48,000 restaurant locations across 29,000customers, most of which are small operators with under 10 locations. Toast
137

Baron FinTech Fund
is the clear leader in the technology market for small restaurants with thebest product offering and the only end-to-end platform. Customers love theproduct and recommend it to their friends in the industry, driving stronginbound and referral business. Toast differentiates itself from thecompetition through its large field-based sales team that is deeplyembedded in local communities, helping retain and upsell existingcustomers and onboard new customers.
We believe that as restaurants invest more in technology, Toast will be aprime beneficiary given its leading market position and best-in-classproduct. With an under 6% share of the 860,000 restaurant locations in theU.S. and a 3% share of a $15 billion addressable market, we believe Toasthas a long runway for growth by adding customer locations and cross-sellingadditional products. Only 54% of Toast locations use four or more ofToast’s 10-plus products, each of which provide significant customer valueand are additive to revenue. Toast stays close to its customers andcontinues to add innovative new features. Over time, we expect Toast willmigrate up-market to increasingly serve the enterprise segment of therestaurant industry (customers with over 50 locations) and will enter newcountries (22 million locations outside the U.S.), further expanding theaddressable market and growth opportunity.
We added to existing positions in nCino Inc., Shopify Inc., Square, Inc., andCeridian HCM Holding Inc. We also added a new position, Riskified Ltd.
Table VII.Top net sales for the quarter ended September 30, 2021
AmountSold
(millions)
Alibaba Group Holding Limited $0.6London Stock Exchange Group PLC 0.3
We sold our position in Alibaba Group Holding Limited due to unfavorableregulatory developments. We had invested in Alibaba due its dominante-commerce marketplace and its 33% ownership of Ant Financial, theleading fintech platform in China. While Alibaba remains China’s leadingonline shopping destination, we believe that its moat is narrowing due tonewer competitors and increasing government intervention. Mandatedchanges to Ant Financial’s business model have likely impaired its earningsgrowth and market value. We also sold our small position in London StockExchange Group PLC due to slow progress on its integration of Refinitivand, on reassessment, our more negative opinion of the value of thisacquisition.
Outlook
As we approach the end of the year, we are monitoring numerouscrosscurrents that could impact near-term share prices. The potential forpersistently high inflation, Fed tapering, rising interest rates, and capitalgains tax changes could lead to further market volatility. A rising rateenvironment could cause a rotation back into banks and other cyclicals andaway from fintech and growth stocks. Questions remain about the financialimpacts of COVID variants, waning stimulus impacts, and a pull-forward ofdemand for some businesses due to COVID.
Nevertheless, we remain optimistic about the long-term prospects for ourfintech investments. The Fund is diversified across companies, themes, and
geographies. The Fund is also balanced between lower-risk, steady growerswith modest valuation multiples and higher-risk, fast growers with highervaluation multiples. The common element across all of our holdings remainsour objective to invest in competitively advantaged growth companies thatcan double in value within five years. These companies benefit from avariety of durable themes that should persist regardless of themacroeconomic environment.
A key industry trend we observe is the convergence of software andfinancial services. Business software providers are increasingly integratingpayment processing and other financial services with their core softwareplatforms to increase customer engagement and monetization. Thesecompanies will often land new customers with business managementsoftware, embed payments to help customers get paid, and then usecustomer information to offer them loans. By monitoring transactionactivity in real time, these software providers gain unique insights abouttheir customers’ creditworthiness, enabling them to make better lendingdecisions. The combination of software with financial services is a powerfulbusiness model that creates value for both companies and their customers.The software companies benefit from additional revenue through efficientcross-selling and higher customer retention rates from offering a broadersuite of services. Customers also benefit from the simplicity and potentiallylower costs from bundling services with a single provider. The Fund ownsseveral companies that follow this playbook, including Square, Intuit,Shopify, and Toast. We expect more software companies to become fintechcompanies over time by embedding payments and financial services intotheir product offerings.
We also see an ongoing trend of industry consolidation. The third quarterwas the best ever for fintech M&A with $154 billion of announced volumeacross 381 transactions, according to FT Partners. Several companies in theFund announced sizable acquisitions during the quarter, including Square’s$29 billion acquisition of Afterpay, TransUnion’s $3.1 billion acquisition ofNeustar, PayPal’s $2.7 billion acquisition of Paidy, Moody’s $2.0 billionacquisition of RMS, Visa’s $960 million acquisition of Currencycloud, MSCI’s$950 million acquisition of Real Capital Analytics, Bill.com’s $625 millionacquisition of Invoice2Go, and Global Payments’ $500 million acquisition ofMineralTree. While every deal entails potential integration and valuationrisks, fintech consolidation can create meaningful shareholder value througheconomies of scale and scope as acquirers leverage their vast distributionnetworks to increase their targets’ sales. We expect additional consolidationwith our portfolio companies either acquiring or being acquired.
Thank you for investing in Baron FinTech Fund. We are working hard toidentify good investment ideas that we expect will generate attractivereturns over the long term.
Sincerely,
Josh SaltmanPortfolio ManagerSeptember 30, 2021
138

September 30, 2021 Baron FinTech Fund
Investors should consider the investment objectives, risks, and charges and expenses of the investment carefully before investing. The prospectusand summary prospectus contains this and other information about the Funds. You may obtain them from its distributor, Baron Capital, Inc., bycalling 1-800-99BARON or visiting www.BaronFunds.com. Please read them carefully before investing.
Risks: In addition to general market conditions, the value of the Fund will be affected by investments in fin tech companies which are subjectto a number of risks, including the adverse impact of legislative actions and government regulations. The Fund is non-diversified, which meansit may have a greater percentage of its assets in a single issuer than a diversified fund. The Fund invests in small and medium sized companieswhose securities may be thinly traded and more difficult to sell during market downturns. Portfolio holdings are subject to change. Current andfuture portfolio holdings are subject to risk.
The discussions of the companies herein are not intended as advice to any person regarding the advisability of investing in any particularsecurity. The views expressed in this report reflect those of the respective portfolio manager only through the end of the period stated in thisreport. The portfolio manager’s views are not intended as recommendations or investment advice to any person reading this report and aresubject to change at any time based on market and other conditions and Baron has no obligation to update them.
This report does not constitute an offer to sell or a solicitation of any offer to buy securities of Baron FinTech Fund by anyone in anyjurisdiction where it would be unlawful under the laws of that jurisdiction to make such offer or solicitation.
BAMCO, Inc. is an investment adviser registered with the U.S. Securities and Exchange Commission (SEC). Baron Capital, Inc. is a limitedpurpose broker-dealer registered with the SEC and member of the Financial Industry Regulatory Authority, Inc. (FINRA).
139

Baron Funds
Portfolio Market Capitalization (Unaudited)
Baron Asset Fund
Baron Asset Fund invests in mid-sized growth companies with market capitalizations above $2.5 billion or the smallest market cap stock in the Russell MidcapGrowth Index at reconstitution, whichever is larger, and below the largest market cap stock in the Russell Midcap Growth Index at reconstitution.
Company
EquityMarket Cap(in millions)
% ofNet
Assets
The Charles Schwab Corp. . . . . . . . . . . . . . . . . . . . $137,522 2.2%Fidelity National Information Services, Inc. . . . . . . 75,161 1.2Equinix, Inc. . . . . . . . . . . . . . . . . . . . . . . . . . . . . . . . 70,914 1.0Illumina, Inc. . . . . . . . . . . . . . . . . . . . . . . . . . . . . . . 63,478 1.4IDEXX Laboratories, Inc. . . . . . . . . . . . . . . . . . . . . . 52,909 6.8DexCom, Inc. . . . . . . . . . . . . . . . . . . . . . . . . . . . . . . 52,908 1.5MSCI, Inc. . . . . . . . . . . . . . . . . . . . . . . . . . . . . . . . . 50,153 0.3Roper Technologies Inc. . . . . . . . . . . . . . . . . . . . . . 47,033 1.9T. Rowe Price Group, Inc. . . . . . . . . . . . . . . . . . . . . 44,639 0.8Veeva Systems Inc. . . . . . . . . . . . . . . . . . . . . . . . . . 44,210 2.1Amphenol Corporation . . . . . . . . . . . . . . . . . . . . . . 43,805 1.1SBA Communications Corp. . . . . . . . . . . . . . . . . . . 36,215 1.9First Republic Bank . . . . . . . . . . . . . . . . . . . . . . . . . 34,537 0.7CoStar Group, Inc. . . . . . . . . . . . . . . . . . . . . . . . . . . 33,990 3.0The Trade Desk . . . . . . . . . . . . . . . . . . . . . . . . . . . . 33,651 0.8Pinterest, Inc. . . . . . . . . . . . . . . . . . . . . . . . . . . . . . 32,844 0.4CBRE Group, Inc. . . . . . . . . . . . . . . . . . . . . . . . . . . . 32,687 0.9Verisk Analytics, Inc. . . . . . . . . . . . . . . . . . . . . . . . . 32,314 3.1EPAM Systems, Inc. . . . . . . . . . . . . . . . . . . . . . . . . . 32,307 1.2Mettler-Toledo International, Inc. . . . . . . . . . . . . . 31,840 4.3HubSpot, Inc. . . . . . . . . . . . . . . . . . . . . . . . . . . . . . 31,780 0.7West Pharmaceutical Services, Inc. . . . . . . . . . . . . 31,407 3.1Liberty Broadband Corporation . . . . . . . . . . . . . . . 31,284 0.9Willis Towers Watson Public Limited Company . . 29,997 0.6ANSYS, Inc. . . . . . . . . . . . . . . . . . . . . . . . . . . . . . . . 29,705 3.2Alexandria Real Estate Equities, Inc. . . . . . . . . . . . . 29,112 0.6Gartner, Inc. . . . . . . . . . . . . . . . . . . . . . . . . . . . . . . 25,419 7.4ZoomInfo Technologies Inc. . . . . . . . . . . . . . . . . . . 25,194 1.7CDW Corporation . . . . . . . . . . . . . . . . . . . . . . . . . . 25,027 1.2Verisign, Inc. . . . . . . . . . . . . . . . . . . . . . . . . . . . . . . 22,935 2.0Zillow Group, Inc. . . . . . . . . . . . . . . . . . . . . . . . . . . 22,377 1.8TransUnion . . . . . . . . . . . . . . . . . . . . . . . . . . . . . . . 21,507 2.7The Cooper Companies, Inc. . . . . . . . . . . . . . . . . . . 20,378 1.4
Company
EquityMarket Cap(in millions)
% ofNet
Assets
RingCentral, Inc. . . . . . . . . . . . . . . . . . . . . . . . . . . . $19,903 1.0%Bio-Techne Corporation . . . . . . . . . . . . . . . . . . . . . 19,014 3.1Tradeweb Markets Inc. . . . . . . . . . . . . . . . . . . . . . . 18,804 0.4SS&C Technologies Holdings, Inc. . . . . . . . . . . . . . 17,715 0.9Teleflex Incorporated . . . . . . . . . . . . . . . . . . . . . . . 17,623 1.0Rollins, Inc. . . . . . . . . . . . . . . . . . . . . . . . . . . . . . . . 17,385 0.9Ceridian HCM Holding Inc. . . . . . . . . . . . . . . . . . . . 16,877 3.010X Genomics, Inc. . . . . . . . . . . . . . . . . . . . . . . . . . 16,143 0.2MarketAxess Holdings Inc. . . . . . . . . . . . . . . . . . . . 15,986 1.8IDEX Corporation . . . . . . . . . . . . . . . . . . . . . . . . . . 15,728 1.1argenx SE . . . . . . . . . . . . . . . . . . . . . . . . . . . . . . . . 15,535 0.2Arch Capital Group Ltd. . . . . . . . . . . . . . . . . . . . . . 15,121 1.4Avalara, Inc. . . . . . . . . . . . . . . . . . . . . . . . . . . . . . . . 15,086 1.1FactSet Research Systems, Inc. . . . . . . . . . . . . . . . . 14,915 2.4Clarivate Plc . . . . . . . . . . . . . . . . . . . . . . . . . . . . . . 14,015 0.8Vail Resorts, Inc. . . . . . . . . . . . . . . . . . . . . . . . . . . . 13,493 3.3Farfetch Limited . . . . . . . . . . . . . . . . . . . . . . . . . . . 13,297 0.6Guardant Health, Inc. . . . . . . . . . . . . . . . . . . . . . . . 12,663 0.7Fair Isaac Corporation . . . . . . . . . . . . . . . . . . . . . . . 11,296 0.8Wix.com Ltd. . . . . . . . . . . . . . . . . . . . . . . . . . . . . . . 11,054 1.6Acceleron Pharma Inc. . . . . . . . . . . . . . . . . . . . . . . 10,481 0.4Guidewire Software, Inc. . . . . . . . . . . . . . . . . . . . . . 9,875 2.7Hyatt Hotels Corp. . . . . . . . . . . . . . . . . . . . . . . . . . 8,474 0.7Bright Horizons Family Solutions, Inc. . . . . . . . . . . 8,443 0.3Aspen Technology, Inc. . . . . . . . . . . . . . . . . . . . . . . 8,237 0.8Choice Hotels International, Inc. . . . . . . . . . . . . . . 7,030 1.1Clearwater Analytics Holdings, Inc. . . . . . . . . . . . . 5,928 0.3Warby Parker Inc. . . . . . . . . . . . . . . . . . . . . . . . . . . 5,915 0.0Diversey Holdings, Ltd. . . . . . . . . . . . . . . . . . . . . . . 4,832 0.5Tripadvisor, Inc. . . . . . . . . . . . . . . . . . . . . . . . . . . . . 4,651 0.8Stitch Fix, Inc. . . . . . . . . . . . . . . . . . . . . . . . . . . . . . 4,344 0.7
98.5%
140

Baron Funds
Baron Growth Fund
Baron Growth Fund invests in small-sized growth companies with market capitalizations up to the largest market cap stock in the Russell 2000 Growth Indexat reconstitution, or companies with market capitalizations up to $2.5 billion, whichever is larger.
Company
EquityMarket Cap(in millions)
% ofNet
Assets
IDEXX Laboratories, Inc. . . . . . . . . . . . . . . . . . . . . . $52,909 4.8%MSCI, Inc. . . . . . . . . . . . . . . . . . . . . . . . . . . . . . . . . 50,153 11.0CoStar Group, Inc. . . . . . . . . . . . . . . . . . . . . . . . . . . 33,990 5.0Mettler-Toledo International, Inc. . . . . . . . . . . . . . 31,840 1.3West Pharmaceutical Services, Inc. . . . . . . . . . . . . 31,407 2.4ANSYS, Inc. . . . . . . . . . . . . . . . . . . . . . . . . . . . . . . . 29,705 4.3Alexandria Real Estate Equities, Inc. . . . . . . . . . . . . 29,112 1.6Gartner, Inc. . . . . . . . . . . . . . . . . . . . . . . . . . . . . . . 25,419 5.2Bio-Techne Corporation . . . . . . . . . . . . . . . . . . . . . 19,014 4.5SS&C Technologies Holdings, Inc. . . . . . . . . . . . . . 17,715 1.5The Carlyle Group Inc. . . . . . . . . . . . . . . . . . . . . . . 16,759 1.0Arch Capital Group Ltd. . . . . . . . . . . . . . . . . . . . . . 15,121 3.8FactSet Research Systems, Inc. . . . . . . . . . . . . . . . . 14,915 5.1Vail Resorts, Inc. . . . . . . . . . . . . . . . . . . . . . . . . . . . 13,493 7.3Trex Company, Inc. . . . . . . . . . . . . . . . . . . . . . . . . . 11,757 2.1Penn National Gaming, Inc. . . . . . . . . . . . . . . . . . . 11,361 4.6Morningstar, Inc. . . . . . . . . . . . . . . . . . . . . . . . . . . . 11,156 2.8Gaming and Leisure Properties, Inc. . . . . . . . . . . . . 10,853 2.7Pegasystems, Inc. . . . . . . . . . . . . . . . . . . . . . . . . . . 10,353 1.4Guidewire Software, Inc. . . . . . . . . . . . . . . . . . . . . . 9,875 1.3Bright Horizons Family Solutions, Inc. . . . . . . . . . . 8,443 2.0Boyd Gaming Corporation . . . . . . . . . . . . . . . . . . . 7,099 0.3Dechra Pharmaceuticals PLC . . . . . . . . . . . . . . . . . 7,077 0.4Choice Hotels International, Inc. . . . . . . . . . . . . . . 7,030 4.1Littelfuse, Inc. . . . . . . . . . . . . . . . . . . . . . . . . . . . . . 6,727 0.2
Company
EquityMarket Cap(in millions)
% ofNet
Assets
Marriott Vacations Worldwide Corp. . . . . . . . . . . . $6,719 2.1%Houlihan Lokey, Inc. . . . . . . . . . . . . . . . . . . . . . . . . 6,293 0.5Denali Therapeutics Inc. . . . . . . . . . . . . . . . . . . . . . 6,137 0.3Primerica, Inc. . . . . . . . . . . . . . . . . . . . . . . . . . . . . . 6,064 2.7Red Rock Resorts, Inc. . . . . . . . . . . . . . . . . . . . . . . . 5,960 0.9Douglas Emmett, Inc. . . . . . . . . . . . . . . . . . . . . . . . 5,547 1.3Marel hf. . . . . . . . . . . . . . . . . . . . . . . . . . . . . . . . . . 5,269 0.3Iridium Communications Inc. . . . . . . . . . . . . . . . . . 5,258 3.4Altair Engineering Inc. . . . . . . . . . . . . . . . . . . . . . . . 5,223 0.5Essent Group Ltd. . . . . . . . . . . . . . . . . . . . . . . . . . . 4,924 0.2Adaptive Biotechnologies Corporation . . . . . . . . . 4,785 0.1Neogen Corp. . . . . . . . . . . . . . . . . . . . . . . . . . . . . . 4,668 0.5Moelis & Company . . . . . . . . . . . . . . . . . . . . . . . . . 4,577 0.4Cohen & Steers, Inc. . . . . . . . . . . . . . . . . . . . . . . . . 4,042 1.7Schrodinger, Inc. . . . . . . . . . . . . . . . . . . . . . . . . . . . 3,868 0.5Kinsale Capital Group, Inc. . . . . . . . . . . . . . . . . . . . 3,688 1.8Manchester United plc . . . . . . . . . . . . . . . . . . . . . . 3,157 0.6SmartRent, Inc. . . . . . . . . . . . . . . . . . . . . . . . . . . . . 2,522 0.1Krispy Kreme, Inc. . . . . . . . . . . . . . . . . . . . . . . . . . . 2,340 0.1American Assets Trust, Inc. . . . . . . . . . . . . . . . . . . . 2,263 0.1Velo3d Inc . . . . . . . . . . . . . . . . . . . . . . . . . . . . . . . . 1,772 0.3BrightView Holdings, Inc. . . . . . . . . . . . . . . . . . . . . 1,553 0.2Zymergen Inc. . . . . . . . . . . . . . . . . . . . . . . . . . . . . . 1,348 0.1OneSpa World Holdings Limited . . . . . . . . . . . . . . 902 0.0
99.4%
141

Baron Funds
Baron Small Cap Fund
Baron Small Cap Fund invests 80% of its net assets in small-sized growth companies with market capitalizations up to the largest market cap stock in theRussell 2000 Growth Index at reconstitution, or companies with market capitalizations up to $2.5 billion, whichever is larger.
Company
EquityMarket Cap(in millions)
% ofNet
Assets
IDEXX Laboratories, Inc. . . . . . . . . . . . . . . . . . . . . . $52,909 1.1%DexCom, Inc. . . . . . . . . . . . . . . . . . . . . . . . . . . . . . . 52,908 2.1SBA Communications Corp. . . . . . . . . . . . . . . . . . . 36,215 2.0TransDigm Group, Inc. . . . . . . . . . . . . . . . . . . . . . . 34,422 1.5The Trade Desk . . . . . . . . . . . . . . . . . . . . . . . . . . . . 33,651 1.3Waste Connections, Inc. . . . . . . . . . . . . . . . . . . . . . 32,807 1.2Mettler-Toledo International, Inc. . . . . . . . . . . . . . 31,840 1.0Liberty Broadband Corporation . . . . . . . . . . . . . . . 31,284 1.1Gartner, Inc. . . . . . . . . . . . . . . . . . . . . . . . . . . . . . . 25,419 5.4ICON Plc . . . . . . . . . . . . . . . . . . . . . . . . . . . . . . . . . 20,854 3.7DraftKings, Inc. . . . . . . . . . . . . . . . . . . . . . . . . . . . . 19,527 0.8Nuvei Technologies Corp. . . . . . . . . . . . . . . . . . . . . 17,817 1.6Ceridian HCM Holding Inc. . . . . . . . . . . . . . . . . . . . 16,877 1.8Liberty SiriusXM Group . . . . . . . . . . . . . . . . . . . . . . 15,926 0.6Cognex Corporation . . . . . . . . . . . . . . . . . . . . . . . . 14,176 1.8Clarivate Plc . . . . . . . . . . . . . . . . . . . . . . . . . . . . . . 14,015 1.6Floor & Decor Holdings, Inc. . . . . . . . . . . . . . . . . . . 12,712 2.8Guardant Health, Inc. . . . . . . . . . . . . . . . . . . . . . . . 12,663 0.6Liberty Media Corporation - Liberty Formula
One . . . . . . . . . . . . . . . . . . . . . . . . . . . . . . . . . . . 11,783 1.2Trex Company, Inc. . . . . . . . . . . . . . . . . . . . . . . . . . 11,757 1.4Penn National Gaming, Inc. . . . . . . . . . . . . . . . . . . 11,361 1.4Wix.com Ltd. . . . . . . . . . . . . . . . . . . . . . . . . . . . . . . 11,054 1.1Guidewire Software, Inc. . . . . . . . . . . . . . . . . . . . . . 9,875 2.7SiteOne Landscape Supply, Inc. . . . . . . . . . . . . . . . 8,886 3.0Vertiv Holdings, LLC . . . . . . . . . . . . . . . . . . . . . . . . 8,492 2.8Bright Horizons Family Solutions, Inc. . . . . . . . . . . 8,443 1.6Berry Global Group, Inc. . . . . . . . . . . . . . . . . . . . . . 8,237 0.9Aspen Technology, Inc. . . . . . . . . . . . . . . . . . . . . . . 8,237 1.8WEX Inc. . . . . . . . . . . . . . . . . . . . . . . . . . . . . . . . . . 7,891 1.1Americold Realty Trust . . . . . . . . . . . . . . . . . . . . . . 7,584 1.4Endava plc . . . . . . . . . . . . . . . . . . . . . . . . . . . . . . . . 7,570 1.9Dutch Bros Inc. . . . . . . . . . . . . . . . . . . . . . . . . . . . . 7,307 0.3Dechra Pharmaceuticals PLC . . . . . . . . . . . . . . . . . 7,077 1.2Planet Fitness, Inc. . . . . . . . . . . . . . . . . . . . . . . . . . 6,802 1.2Shift4 Payments, Inc. . . . . . . . . . . . . . . . . . . . . . . . 6,426 0.6Inspire Medical Systems, Inc. . . . . . . . . . . . . . . . . . 6,351 1.4Houlihan Lokey, Inc. . . . . . . . . . . . . . . . . . . . . . . . . 6,293 1.1RBC Bearings Incorporated . . . . . . . . . . . . . . . . . . . 6,126 0.9
Company
EquityMarket Cap(in millions)
% ofNet
Assets
Figs Inc. . . . . . . . . . . . . . . . . . . . . . . . . . . . . . . . . . . $6,069 0.4%ASGN Incorporated . . . . . . . . . . . . . . . . . . . . . . . . 5,985 3.3Red Rock Resorts, Inc. . . . . . . . . . . . . . . . . . . . . . . . 5,960 1.9Clearwater Analytics Holdings, Inc. . . . . . . . . . . . . 5,928 0.2The AZEK Company Inc. . . . . . . . . . . . . . . . . . . . . . 5,656 0.8HealthEquity, Inc. . . . . . . . . . . . . . . . . . . . . . . . . . . 5,408 1.0Altair Engineering Inc. . . . . . . . . . . . . . . . . . . . . . . . 5,223 1.0Driven Brands Holdings Inc. . . . . . . . . . . . . . . . . . . 4,835 1.0Shoals Technologies Group, Inc. . . . . . . . . . . . . . . . 4,645 0.6Jamf Holding Corp. . . . . . . . . . . . . . . . . . . . . . . . . . 4,571 0.5Madison Square Garden Sports Corp. . . . . . . . . . . 4,485 0.8John Bean Technologies Corporation . . . . . . . . . . . 4,465 1.3Avient Corporation . . . . . . . . . . . . . . . . . . . . . . . . . 4,232 1.6Ollie’s Bargain Outlet Holdings, Inc. . . . . . . . . . . . 3,923 0.6Kinsale Capital Group, Inc. . . . . . . . . . . . . . . . . . . . 3,688 1.4BRP Group, Inc. . . . . . . . . . . . . . . . . . . . . . . . . . . . . 3,606 1.9E2open Inc. . . . . . . . . . . . . . . . . . . . . . . . . . . . . . . . 3,379 1.5Installed Building Products, Inc. . . . . . . . . . . . . . . . 3,183 3.0CryoPort, Inc. . . . . . . . . . . . . . . . . . . . . . . . . . . . . . 3,061 0.4Axonics, Inc. . . . . . . . . . . . . . . . . . . . . . . . . . . . . . . 3,003 1.2First Advantage Corporation . . . . . . . . . . . . . . . . . 2,912 0.6Kratos Defense & Security Solutions, Inc. . . . . . . . 2,766 1.0Mercury Systems, Inc. . . . . . . . . . . . . . . . . . . . . . . . 2,699 0.9Membership Collective Group Inc. . . . . . . . . . . . . . 2,538 0.5SmartRent, Inc. . . . . . . . . . . . . . . . . . . . . . . . . . . . . 2,522 0.9Madison Square Garden Entertainment Corp. . . . . 2,468 0.3The Cheesecake Factory, Inc. . . . . . . . . . . . . . . . . . 2,452 1.0UTZ Brands, Inc. . . . . . . . . . . . . . . . . . . . . . . . . . . . 2,345 1.0Hillman Solutions Corp. . . . . . . . . . . . . . . . . . . . . . 2,238 0.7Repay Holdings Corporation . . . . . . . . . . . . . . . . . 2,086 1.5Silk Road Medical, Inc. . . . . . . . . . . . . . . . . . . . . . . 1,909 1.0Grid Dynamics Holdings Inc . . . . . . . . . . . . . . . . . . 1,815 1.2European Wax Center, Inc. . . . . . . . . . . . . . . . . . . . 1,785 0.5Janus International Group, Inc. . . . . . . . . . . . . . . . . 1,694 0.7Hydrofarm Holdings Group, Inc. . . . . . . . . . . . . . . 1,663 0.4Holley Inc. . . . . . . . . . . . . . . . . . . . . . . . . . . . . . . . . 1,409 1.0Paya Holdings Inc. . . . . . . . . . . . . . . . . . . . . . . . . . 1,385 0.7MaxCyte, Inc. . . . . . . . . . . . . . . . . . . . . . . . . . . . . . 1,223 0.6
99.9%
142

Baron Funds
Baron Opportunity Fund
Baron Opportunity Fund invests in high growth businesses of any market capitalization selected for their capital appreciation potential.
Company
EquityMarket Cap(in millions)
% ofNet
Assets
Microsoft Corporation . . . . . . . . . . . . . . . . . . . . . . $2,118,598 8.6%Alphabet Inc. . . . . . . . . . . . . . . . . . . . . . . . . . . . . . . 1,779,767 6.5Amazon.com, Inc. . . . . . . . . . . . . . . . . . . . . . . . . . . 1,663,677 4.9Tesla, Inc. . . . . . . . . . . . . . . . . . . . . . . . . . . . . . . . . 776,851 3.3NVIDIA Corporation . . . . . . . . . . . . . . . . . . . . . . . . 517,900 2.6Visa, Inc. . . . . . . . . . . . . . . . . . . . . . . . . . . . . . . . . . 489,388 2.1Alibaba Group Holding Limited . . . . . . . . . . . . . . . 402,426 0.3Mastercard Incorporated . . . . . . . . . . . . . . . . . . . . 343,082 1.6PayPal Holdings, Inc. . . . . . . . . . . . . . . . . . . . . . . . . 305,755 1.9Adobe Inc. . . . . . . . . . . . . . . . . . . . . . . . . . . . . . . . . 273,928 1.2Netflix, Inc. . . . . . . . . . . . . . . . . . . . . . . . . . . . . . . . 270,134 0.9ServiceNow, Inc. . . . . . . . . . . . . . . . . . . . . . . . . . . . 123,272 1.5Intuitive Surgical, Inc. . . . . . . . . . . . . . . . . . . . . . . . 118,203 1.1Snap Inc. . . . . . . . . . . . . . . . . . . . . . . . . . . . . . . . . . 116,796 2.0Square, Inc. . . . . . . . . . . . . . . . . . . . . . . . . . . . . . . . 110,254 0.8Atlassian Corporation Plc . . . . . . . . . . . . . . . . . . . . 98,606 1.2Snowflake Inc. . . . . . . . . . . . . . . . . . . . . . . . . . . . . . 91,001 0.6Adyen N.V. . . . . . . . . . . . . . . . . . . . . . . . . . . . . . . . 85,394 0.5MercadoLibre, Inc. . . . . . . . . . . . . . . . . . . . . . . . . . . 83,486 0.9Equinix, Inc. . . . . . . . . . . . . . . . . . . . . . . . . . . . . . . . 70,914 0.7Edwards Lifesciences Corp. . . . . . . . . . . . . . . . . . . . 70,567 0.9Illumina, Inc. . . . . . . . . . . . . . . . . . . . . . . . . . . . . . . 63,478 0.6Workday, Inc. . . . . . . . . . . . . . . . . . . . . . . . . . . . . . 61,973 1.4CrowdStrike, Inc. . . . . . . . . . . . . . . . . . . . . . . . . . . . 56,085 0.9Electronic Arts Inc. . . . . . . . . . . . . . . . . . . . . . . . . . 40,482 1.0CoStar Group, Inc. . . . . . . . . . . . . . . . . . . . . . . . . . . 33,990 1.7The Trade Desk . . . . . . . . . . . . . . . . . . . . . . . . . . . . 33,651 0.5Pinterest, Inc. . . . . . . . . . . . . . . . . . . . . . . . . . . . . . 32,844 1.0HubSpot, Inc. . . . . . . . . . . . . . . . . . . . . . . . . . . . . . 31,780 1.0Gartner, Inc. . . . . . . . . . . . . . . . . . . . . . . . . . . . . . . 25,419 2.5ZoomInfo Technologies Inc. . . . . . . . . . . . . . . . . . . 25,194 3.0Toast, Inc. . . . . . . . . . . . . . . . . . . . . . . . . . . . . . . . . 25,105 0.6Zillow Group, Inc. . . . . . . . . . . . . . . . . . . . . . . . . . . 22,377 1.1RingCentral, Inc. . . . . . . . . . . . . . . . . . . . . . . . . . . . 19,903 1.5Take-Two Interactive Software, Inc. . . . . . . . . . . . . 17,952 0.5
Company
EquityMarket Cap(in millions)
% ofNet
Assets
Ceridian HCM Holding Inc. . . . . . . . . . . . . . . . . . . . $16,877 2.7%10X Genomics, Inc. . . . . . . . . . . . . . . . . . . . . . . . . . 16,143 0.5MarketAxess Holdings Inc. . . . . . . . . . . . . . . . . . . . 15,986 0.4argenx SE . . . . . . . . . . . . . . . . . . . . . . . . . . . . . . . . 15,535 2.1Avalara, Inc. . . . . . . . . . . . . . . . . . . . . . . . . . . . . . . . 15,086 0.8Endeavor Group Holdings, Inc. . . . . . . . . . . . . . . . . 12,886 1.2Guardant Health, Inc. . . . . . . . . . . . . . . . . . . . . . . . 12,663 0.8SoFi Technologies, Inc. . . . . . . . . . . . . . . . . . . . . . . 12,620 1.0Opendoor Technologies Inc. . . . . . . . . . . . . . . . . . . 12,413 1.4Wix.com Ltd. . . . . . . . . . . . . . . . . . . . . . . . . . . . . . . 11,054 0.8GDS Holdings Limited . . . . . . . . . . . . . . . . . . . . . . 10,580 0.8Acceleron Pharma Inc. . . . . . . . . . . . . . . . . . . . . . . 10,481 2.8Natera, Inc. . . . . . . . . . . . . . . . . . . . . . . . . . . . . . . . 10,451 1.0Guidewire Software, Inc. . . . . . . . . . . . . . . . . . . . . . 9,875 1.7Endava plc . . . . . . . . . . . . . . . . . . . . . . . . . . . . . . . . 7,570 1.7ShockWave Medical, Inc. . . . . . . . . . . . . . . . . . . . . 7,237 1.7Arrowhead Pharmaceuticals, Inc. . . . . . . . . . . . . . . 6,509 1.9Figs Inc. . . . . . . . . . . . . . . . . . . . . . . . . . . . . . . . . . . 6,069 0.4Clearwater Analytics Holdings, Inc. . . . . . . . . . . . . 5,928 0.1Tripadvisor, Inc. . . . . . . . . . . . . . . . . . . . . . . . . . . . . 4,651 1.5Stitch Fix, Inc. . . . . . . . . . . . . . . . . . . . . . . . . . . . . . 4,344 1.3Schrodinger, Inc. . . . . . . . . . . . . . . . . . . . . . . . . . . . 3,868 0.4CareDx, Inc. . . . . . . . . . . . . . . . . . . . . . . . . . . . . . . . 3,335 0.9Kratos Defense & Security Solutions, Inc. . . . . . . . 2,766 0.9Butterfly Network, Inc. . . . . . . . . . . . . . . . . . . . . . . 2,025 0.3Taboola.com Ltd. . . . . . . . . . . . . . . . . . . . . . . . . . . 1,787 0.0Velo3d Inc . . . . . . . . . . . . . . . . . . . . . . . . . . . . . . . . 1,772 0.2Nerdy Inc. . . . . . . . . . . . . . . . . . . . . . . . . . . . . . . . . 1,668 0.8PAR Technology Corporation . . . . . . . . . . . . . . . . . 1,653 1.3Indie Semiconductor, Inc. . . . . . . . . . . . . . . . . . . . . 1,601 1.3similarweb Ltd. . . . . . . . . . . . . . . . . . . . . . . . . . . . . 1,557 0.4Markforged Holding Corporation . . . . . . . . . . . . . . 1,215 0.3Khosla Ventures Acquisition Co. II . . . . . . . . . . . . . 435 0.1
94.9%
143

Baron Funds
Baron Partners Fund
Baron Partners Fund is a non-diversified fund that invests primarily in U.S. companies of any size with significant growth potential.
Company
EquityMarket Cap(in millions)
% ofTotal
Investments
Tesla, Inc. . . . . . . . . . . . . . . . . . . . . . . . . . . . . $776,851 40.5%Shopify Inc. . . . . . . . . . . . . . . . . . . . . . . . . . . 169,247 1.1Moderna, Inc. . . . . . . . . . . . . . . . . . . . . . . . . . 155,347 0.2The Charles Schwab Corp. . . . . . . . . . . . . . . . 137,522 3.5Adyen N.V. . . . . . . . . . . . . . . . . . . . . . . . . . . . 85,394 2.1Brookfield Asset Management Inc. . . . . . . . . 83,785 0.7BioNTech SE . . . . . . . . . . . . . . . . . . . . . . . . . 66,205 0.2Activision Blizzard, Inc. . . . . . . . . . . . . . . . . . 60,187 0.8IDEXX Laboratories, Inc. . . . . . . . . . . . . . . . . 52,909 6.2MSCI, Inc. . . . . . . . . . . . . . . . . . . . . . . . . . . . . 50,153 1.1Spotify Technology S.A. . . . . . . . . . . . . . . . . . 42,994 2.3CoStar Group, Inc. . . . . . . . . . . . . . . . . . . . . . 33,990 7.9Applovin Corporation . . . . . . . . . . . . . . . . . . 26,947 0.1Gartner, Inc. . . . . . . . . . . . . . . . . . . . . . . . . . . 25,419 2.7Zillow Group, Inc. . . . . . . . . . . . . . . . . . . . . . . 22,377 3.0RingCentral, Inc. . . . . . . . . . . . . . . . . . . . . . . . 19,903 0.9HEICO Corporation . . . . . . . . . . . . . . . . . . . . 16,762 0.4Arch Capital Group Ltd. . . . . . . . . . . . . . . . . . 15,121 3.1
Company
EquityMarket Cap(in millions)
% ofTotal
Investments
FactSet Research Systems, Inc. . . . . . . . . . . . $14,915 3.5%Vail Resorts, Inc. . . . . . . . . . . . . . . . . . . . . . . . 13,493 4.2Gaming and Leisure Properties, Inc. . . . . . . . 10,853 1.1GDS Holdings Limited . . . . . . . . . . . . . . . . . . 10,580 0.3Guidewire Software, Inc. . . . . . . . . . . . . . . . . 9,875 1.4Hyatt Hotels Corp. . . . . . . . . . . . . . . . . . . . . 8,474 3.2Marriott Vacations Worldwide Corp. . . . . . . 6,719 1.4Red Rock Resorts, Inc. . . . . . . . . . . . . . . . . . . 5,960 0.4Warby Parker Inc. . . . . . . . . . . . . . . . . . . . . . 5,915 0.1Douglas Emmett, Inc. . . . . . . . . . . . . . . . . . . 5,547 0.4Iridium Communications Inc. . . . . . . . . . . . . 5,258 0.8Cohen & Steers, Inc. . . . . . . . . . . . . . . . . . . . 4,042 0.4Manchester United plc . . . . . . . . . . . . . . . . . 3,157 1.2Krispy Kreme, Inc. . . . . . . . . . . . . . . . . . . . . . 2,340 0.3Archer Aviation Inc. . . . . . . . . . . . . . . . . . . . . 2,137 0.1Brookfield Asset Management Reinsurance
Partners Ltd. . . . . . . . . . . . . . . . . . . . . . . . . 604 0.1
95.7%
Baron Fifth Avenue Growth Fund
Baron Fifth Avenue Growth Fund invests in large-sized growth companies with market capitalizations no smaller than the top 85th percentile by total marketcapitalization of the Russell 1000 Growth Index at June 30, or companies with market capitalizations above $10 billion, whichever is smaller.
Company
EquityMarket Cap(in millions)
% ofNet
Assets
Alphabet Inc. . . . . . . . . . . . . . . . . . . . . . . . . . . . . . . $1,779,767 6.9%Amazon.com, Inc. . . . . . . . . . . . . . . . . . . . . . . . . . . 1,663,677 7.6Facebook, Inc. . . . . . . . . . . . . . . . . . . . . . . . . . . . . . 956,891 4.7NVIDIA Corporation . . . . . . . . . . . . . . . . . . . . . . . . 517,900 3.0Visa, Inc. . . . . . . . . . . . . . . . . . . . . . . . . . . . . . . . . . 489,388 2.7Mastercard Incorporated . . . . . . . . . . . . . . . . . . . . 343,082 3.2ASML Holding N.V. . . . . . . . . . . . . . . . . . . . . . . . . . 309,245 3.3PayPal Holdings, Inc. . . . . . . . . . . . . . . . . . . . . . . . . 305,755 2.7Adobe Inc. . . . . . . . . . . . . . . . . . . . . . . . . . . . . . . . . 273,928 3.8Sea Limited . . . . . . . . . . . . . . . . . . . . . . . . . . . . . . . 175,988 1.0Shopify Inc. . . . . . . . . . . . . . . . . . . . . . . . . . . . . . . . 169,247 3.0ServiceNow, Inc. . . . . . . . . . . . . . . . . . . . . . . . . . . . 123,272 4.8Intuitive Surgical, Inc. . . . . . . . . . . . . . . . . . . . . . . . 118,203 3.7Square, Inc. . . . . . . . . . . . . . . . . . . . . . . . . . . . . . . . 110,254 3.0S&P Global Inc. . . . . . . . . . . . . . . . . . . . . . . . . . . . . 102,399 2.3Snowflake Inc. . . . . . . . . . . . . . . . . . . . . . . . . . . . . . 91,001 1.8Adyen N.V. . . . . . . . . . . . . . . . . . . . . . . . . . . . . . . . 85,394 2.1MercadoLibre, Inc. . . . . . . . . . . . . . . . . . . . . . . . . . . 83,486 2.4Zoom Video Communications, Inc. . . . . . . . . . . . . 77,699 0.9
Company
EquityMarket Cap(in millions)
% ofNet
Assets
Equinix, Inc. . . . . . . . . . . . . . . . . . . . . . . . . . . . . . . . $70,914 2.0%Illumina, Inc. . . . . . . . . . . . . . . . . . . . . . . . . . . . . . . 63,478 2.4Twilio Inc. . . . . . . . . . . . . . . . . . . . . . . . . . . . . . . . . 56,520 3.1CrowdStrike, Inc. . . . . . . . . . . . . . . . . . . . . . . . . . . . 56,085 2.7Veeva Systems Inc. . . . . . . . . . . . . . . . . . . . . . . . . . 44,210 3.5Datadog, Inc. . . . . . . . . . . . . . . . . . . . . . . . . . . . . . . 43,821 1.4EPAM Systems, Inc. . . . . . . . . . . . . . . . . . . . . . . . . . 32,307 4.3UiPath, Inc. . . . . . . . . . . . . . . . . . . . . . . . . . . . . . . . 27,017 0.2ZoomInfo Technologies Inc. . . . . . . . . . . . . . . . . . . 25,194 2.2Toast, Inc. . . . . . . . . . . . . . . . . . . . . . . . . . . . . . . . . 25,105 0.6Splunk, Inc. . . . . . . . . . . . . . . . . . . . . . . . . . . . . . . . 23,377 1.3Dynatrace Holdings LLC . . . . . . . . . . . . . . . . . . . . . 20,176 2.2RingCentral, Inc. . . . . . . . . . . . . . . . . . . . . . . . . . . . 19,903 2.210X Genomics, Inc. . . . . . . . . . . . . . . . . . . . . . . . . . 16,143 1.6argenx SE . . . . . . . . . . . . . . . . . . . . . . . . . . . . . . . . 15,535 1.5Wix.com Ltd. . . . . . . . . . . . . . . . . . . . . . . . . . . . . . . 11,054 1.7Acceleron Pharma Inc. . . . . . . . . . . . . . . . . . . . . . . 10,481 2.3
98.1%
144

Baron Funds
Baron Focused Growth Fund
Baron Focused Growth Fund is a non-diversified fund that invests in small and mid-sized growth companies with market capitalizations up to the largestmarket cap stock in the Russell Midcap Growth Index at reconstitution.
Company
EquityMarket Cap(in millions)
% ofNet
Assets
Tesla, Inc. . . . . . . . . . . . . . . . . . . . . . . . . . . . . . . . . $776,851 33.4%Adyen N.V. . . . . . . . . . . . . . . . . . . . . . . . . . . . . . . . 85,394 2.2BioNTech SE . . . . . . . . . . . . . . . . . . . . . . . . . . . . . . 66,205 2.5Spotify Technology S.A. . . . . . . . . . . . . . . . . . . . . . 42,994 3.9CoStar Group, Inc. . . . . . . . . . . . . . . . . . . . . . . . . . . 33,990 7.2Arch Capital Group Ltd. . . . . . . . . . . . . . . . . . . . . . 15,121 3.1FactSet Research Systems, Inc. . . . . . . . . . . . . . . . . 14,915 4.0Vail Resorts, Inc. . . . . . . . . . . . . . . . . . . . . . . . . . . . 13,493 6.0American Homes 4 Rent . . . . . . . . . . . . . . . . . . . . 12,307 1.2Penn National Gaming, Inc. . . . . . . . . . . . . . . . . . . 11,361 5.5GDS Holdings Limited . . . . . . . . . . . . . . . . . . . . . . 10,580 1.5Guidewire Software, Inc. . . . . . . . . . . . . . . . . . . . . . 9,875 2.9
Company
EquityMarket Cap(in millions)
% ofNet
Assets
Hyatt Hotels Corp. . . . . . . . . . . . . . . . . . . . . . . . . . $8,474 4.7%Americold Realty Trust . . . . . . . . . . . . . . . . . . . . . . 7,584 0.4Choice Hotels International, Inc. . . . . . . . . . . . . . . 7,030 2.6Denali Therapeutics Inc. . . . . . . . . . . . . . . . . . . . . . 6,137 0.7Figs Inc. . . . . . . . . . . . . . . . . . . . . . . . . . . . . . . . . . . 6,069 1.5Red Rock Resorts, Inc. . . . . . . . . . . . . . . . . . . . . . . . 5,960 1.7Iridium Communications Inc. . . . . . . . . . . . . . . . . . 5,258 2.1Stitch Fix, Inc. . . . . . . . . . . . . . . . . . . . . . . . . . . . . . 4,344 0.5Schrodinger, Inc. . . . . . . . . . . . . . . . . . . . . . . . . . . . 3,868 0.6Manchester United plc . . . . . . . . . . . . . . . . . . . . . . 3,157 2.9SmartRent, Inc. . . . . . . . . . . . . . . . . . . . . . . . . . . . . 2,522 1.8
92.9%
145

Baron Funds
Baron International Growth Fund
Baron International Growth Fund is a diversified fund that invests in non-U.S companies with significant growth potential. Investments may be made across allmarket capitalizations. The Fund invests principally in companies of developed countries and may invest up to 35% in companies of developing countries.
Company
EquityMarket Cap(in millions)
% ofNet
Assets
Tencent Holdings Limited . . . . . . . . . . . . . . . . . . . . $573,568 1.2%Alibaba Group Holding Limited . . . . . . . . . . . . . . . 402,426 1.0LVMH Moet Hennessy Louis Vuitton SE . . . . . . . . 362,564 0.8Nestle S.A. . . . . . . . . . . . . . . . . . . . . . . . . . . . . . . . . 340,416 1.6Reliance Industries Limited . . . . . . . . . . . . . . . . . . . 222,327 1.1AstraZeneca PLC . . . . . . . . . . . . . . . . . . . . . . . . . . . 186,081 1.2Linde plc . . . . . . . . . . . . . . . . . . . . . . . . . . . . . . . . . 151,228 1.6Keyence Corporation . . . . . . . . . . . . . . . . . . . . . . . 145,735 2.0HDFC Bank Limited . . . . . . . . . . . . . . . . . . . . . . . . . 118,985 0.4Industria de Diseno Textil, S.A. . . . . . . . . . . . . . . . . 114,876 1.1Recruit Holdings Co., Ltd. . . . . . . . . . . . . . . . . . . . . 105,922 1.5Sberbank of Russia PJSC . . . . . . . . . . . . . . . . . . . . . 101,567 0.8BNP Paribas S.A. . . . . . . . . . . . . . . . . . . . . . . . . . . . 80,261 2.3Novatek PJSC . . . . . . . . . . . . . . . . . . . . . . . . . . . . . 80,189 1.2China Tourism Group Duty Free
Corporation Limited . . . . . . . . . . . . . . . . . . . . . . 78,557 0.4Midea Group Co., Ltd. . . . . . . . . . . . . . . . . . . . . . . . 75,192 0.7Shenzhen Mindray Bio-Medical
Electronics Co., Ltd. . . . . . . . . . . . . . . . . . . . . . . 72,507 0.5Tokyo Electron Limited . . . . . . . . . . . . . . . . . . . . . . 69,550 1.0Housing Development Finance
Corporation Limited . . . . . . . . . . . . . . . . . . . . . . 67,073 0.6Glencore PLC . . . . . . . . . . . . . . . . . . . . . . . . . . . . . 62,954 0.8Bajaj Finance Limited . . . . . . . . . . . . . . . . . . . . . . . 62,351 1.9Compagnie Financiere Richemont SA . . . . . . . . . . 60,023 0.8Pernod Ricard SA . . . . . . . . . . . . . . . . . . . . . . . . . . 57,848 1.3Takeda Pharmaceutical Company Limited . . . . . . . 52,076 1.3Universal Music Group N.V. . . . . . . . . . . . . . . . . . . 48,550 0.8Agilent Technologies, Inc. . . . . . . . . . . . . . . . . . . . . 47,688 1.1Lloyds Banking Group plc . . . . . . . . . . . . . . . . . . . . 44,549 1.5Spotify Technology S.A. . . . . . . . . . . . . . . . . . . . . . 42,994 0.6Cellnex Telecom, S.A. . . . . . . . . . . . . . . . . . . . . . . . 41,942 0.9Experian plc . . . . . . . . . . . . . . . . . . . . . . . . . . . . . . . 38,657 0.9Telefonaktiebolaget LM Ericsson . . . . . . . . . . . . . . 37,388 0.7Techtronic Industries Co. Ltd. . . . . . . . . . . . . . . . . . 36,540 0.8Koninklijke DSM N.V. . . . . . . . . . . . . . . . . . . . . . . . 34,976 1.2Constellation Software, Inc. . . . . . . . . . . . . . . . . . . 34,717 1.3Will Semiconductor Co., Ltd. . . . . . . . . . . . . . . . . . 32,609 0.5Grupo Mexico, S.A.B. de C.V. . . . . . . . . . . . . . . . . . 31,074 0.5Genmab A/S . . . . . . . . . . . . . . . . . . . . . . . . . . . . . . 28,704 1.0Credit Suisse Group AG . . . . . . . . . . . . . . . . . . . . . 26,435 1.1Eurofins Scientific SE . . . . . . . . . . . . . . . . . . . . . . . 24,626 1.6Epiroc AB . . . . . . . . . . . . . . . . . . . . . . . . . . . . . . . . . 24,068 0.8XP Inc. . . . . . . . . . . . . . . . . . . . . . . . . . . . . . . . . . . . 22,457 0.6Galaxy Entertainment Group Limited . . . . . . . . . . 22,364 0.4Symrise AG . . . . . . . . . . . . . . . . . . . . . . . . . . . . . . . 18,384 1.1TCS Group Holding PLC . . . . . . . . . . . . . . . . . . . . . 18,296 1.8Advantest Corporation . . . . . . . . . . . . . . . . . . . . . . 18,236 0.8DLocal Limited . . . . . . . . . . . . . . . . . . . . . . . . . . . . 15,982 1.1argenx SE . . . . . . . . . . . . . . . . . . . . . . . . . . . . . . . . 15,535 1.8Arch Capital Group Ltd. . . . . . . . . . . . . . . . . . . . . . 15,121 1.1Wise Plc . . . . . . . . . . . . . . . . . . . . . . . . . . . . . . . . . 14,567 0.3
Company
EquityMarket Cap(in millions)
% ofNet
Assets
Monday.com Ltd. . . . . . . . . . . . . . . . . . . . . . . . . . . $14,394 0.6%Vivendi SA . . . . . . . . . . . . . . . . . . . . . . . . . . . . . . . . 14,002 0.7Suzano S.A. . . . . . . . . . . . . . . . . . . . . . . . . . . . . . . . 13,628 0.7Kingdee International Software Group Co. Ltd. . . . 11,616 0.5MonotaRO Co., Ltd. . . . . . . . . . . . . . . . . . . . . . . . . 11,175 0.5Wix.com Ltd. . . . . . . . . . . . . . . . . . . . . . . . . . . . . . . 11,054 0.7StoneCo Ltd. . . . . . . . . . . . . . . . . . . . . . . . . . . . . . . 10,766 0.4Zai Lab Limited . . . . . . . . . . . . . . . . . . . . . . . . . . . . 10,055 0.8CAE Inc. . . . . . . . . . . . . . . . . . . . . . . . . . . . . . . . . . . 9,464 0.7Godrej Properties Limited . . . . . . . . . . . . . . . . . . . . 8,658 1.2China Conch Venture Holdings Ltd. . . . . . . . . . . . . 8,460 0.7Notre Dame Intermedica Participacoes S.A. . . . . . 8,429 0.5InPost S.A. . . . . . . . . . . . . . . . . . . . . . . . . . . . . . . . . 8,276 0.8B&M European Value Retail S.A. . . . . . . . . . . . . . . 7,968 1.0Endava plc . . . . . . . . . . . . . . . . . . . . . . . . . . . . . . . . 7,570 1.8Stevanato Group S.p.A . . . . . . . . . . . . . . . . . . . . . . 7,488 1.0Dechra Pharmaceuticals PLC . . . . . . . . . . . . . . . . . 7,077 0.9Hua Hong Semiconductor Limited . . . . . . . . . . . . . 6,749 0.4Square Enix Holdings Co., Ltd. . . . . . . . . . . . . . . . . 6,529 0.3S4 Capital plc . . . . . . . . . . . . . . . . . . . . . . . . . . . . . 6,297 2.7Clariant AG . . . . . . . . . . . . . . . . . . . . . . . . . . . . . . . 6,278 0.9Han’s Laser Technology Industry
Group Co., Ltd . . . . . . . . . . . . . . . . . . . . . . . . . . . 6,247 0.4Future plc . . . . . . . . . . . . . . . . . . . . . . . . . . . . . . . . 5,997 3.0Korea Shipbuilding & Offshore
Engineering Co., Ltd. . . . . . . . . . . . . . . . . . . . . . . 5,954 1.1TeamViewer AG . . . . . . . . . . . . . . . . . . . . . . . . . . . 5,890 0.9Kingsoft Corporation Ltd. . . . . . . . . . . . . . . . . . . . . 5,475 0.6Zhejiang Hangzhou Dingli Machinery Co., Ltd. . . . 5,297 0.8Max Financial Services Limited . . . . . . . . . . . . . . . . 4,716 1.0NEXTDC Limited . . . . . . . . . . . . . . . . . . . . . . . . . . . 3,926 0.7Nippon Life India Asset Management Limited . . . . 3,555 0.5SMS Co., Ltd. . . . . . . . . . . . . . . . . . . . . . . . . . . . . . . 3,202 1.2Befesa S.A. . . . . . . . . . . . . . . . . . . . . . . . . . . . . . . . . 3,053 1.5Watches of Switzerland Group Limited . . . . . . . . . 3,052 1.0Afya Limited . . . . . . . . . . . . . . . . . . . . . . . . . . . . . . 1,850 0.5J D Wetherspoon plc . . . . . . . . . . . . . . . . . . . . . . . . 1,809 0.7Taboola.com Ltd. . . . . . . . . . . . . . . . . . . . . . . . . . . 1,787 0.5similarweb Ltd. . . . . . . . . . . . . . . . . . . . . . . . . . . . . 1,557 0.5Golar LNG Ltd. . . . . . . . . . . . . . . . . . . . . . . . . . . . . 1,426 0.6Arco Platform Limited . . . . . . . . . . . . . . . . . . . . . . 1,250 0.4JM Financial Limited . . . . . . . . . . . . . . . . . . . . . . . . 1,189 0.4AMG Advanced Metallurgical Group N.V. . . . . . . . 1,054 1.4eDreams ODIGEO SA . . . . . . . . . . . . . . . . . . . . . . . 1,039 1.0Edelweiss Financial Services Limited . . . . . . . . . . . 999 0.4Mister Spex SE . . . . . . . . . . . . . . . . . . . . . . . . . . . . 794 0.6Okamoto Industries, Inc. . . . . . . . . . . . . . . . . . . . . 704 0.5ION Acquisition Corp. 3 Ltd. . . . . . . . . . . . . . . . . . 316 0.2ION Acquisition Corp 2 Ltd. . . . . . . . . . . . . . . . . . . 313 0.2WANdisco plc . . . . . . . . . . . . . . . . . . . . . . . . . . . . . 245 0.2
90.0%
146

Baron Funds
Baron Real Estate Fund
Baron Real Estate Fund is a diversified fund that invests 80% of its net assets in equity securities of U.S. and non-U.S. real estate and real estate-relatedcompanies of any size. The Fund’s investment in non-U.S. companies will not exceed 25%.
Company
EquityMarket Cap(in millions)
% ofNet
Assets
Home Depot, Inc. . . . . . . . . . . . . . . . . . . . . . . . . . . $346,432 1.1%Lowe’s Companies, Inc. . . . . . . . . . . . . . . . . . . . . . . 140,467 3.1American Tower Corp. . . . . . . . . . . . . . . . . . . . . . . 120,799 2.9Prologis, Inc. . . . . . . . . . . . . . . . . . . . . . . . . . . . . . . 92,786 1.9Brookfield Asset Management Inc. . . . . . . . . . . . . . 83,785 3.9Equinix, Inc. . . . . . . . . . . . . . . . . . . . . . . . . . . . . . . . 70,914 2.0Simon Property Group, Inc. . . . . . . . . . . . . . . . . . . 42,711 2.5Cellnex Telecom, S.A. . . . . . . . . . . . . . . . . . . . . . . . 41,942 1.9SBA Communications Corp. . . . . . . . . . . . . . . . . . . 36,215 1.0CoStar Group, Inc. . . . . . . . . . . . . . . . . . . . . . . . . . . 33,990 2.4CBRE Group, Inc. . . . . . . . . . . . . . . . . . . . . . . . . . . . 32,687 3.0Equity Residential . . . . . . . . . . . . . . . . . . . . . . . . . . 30,301 1.2D.R. Horton, Inc. . . . . . . . . . . . . . . . . . . . . . . . . . . . 30,078 1.5Alexandria Real Estate Equities, Inc. . . . . . . . . . . . . 29,112 1.4Lennar Corporation . . . . . . . . . . . . . . . . . . . . . . . . . 28,386 2.3Caesars Entertainment Corporation . . . . . . . . . . . . 23,964 2.5Invitation Homes, Inc. . . . . . . . . . . . . . . . . . . . . . . 22,791 2.5Vulcan Materials Company . . . . . . . . . . . . . . . . . . 22,444 2.1Zillow Group, Inc. . . . . . . . . . . . . . . . . . . . . . . . . . . 22,377 2.1MGM Resorts International . . . . . . . . . . . . . . . . . . 20,793 2.2Pool Corporation . . . . . . . . . . . . . . . . . . . . . . . . . . . 17,420 0.4Equity Lifestyle Properties, Inc. . . . . . . . . . . . . . . . . 14,352 1.6Jones Lang LaSalle Incorporated . . . . . . . . . . . . . . . 12,579 3.8Opendoor Technologies Inc. . . . . . . . . . . . . . . . . . . 12,413 1.5Fortune Brands Home & Security, Inc. . . . . . . . . . . 12,329 1.2Trex Company, Inc. . . . . . . . . . . . . . . . . . . . . . . . . . 11,757 0.2Penn National Gaming, Inc. . . . . . . . . . . . . . . . . . . 11,361 1.9Gaming and Leisure Properties, Inc. . . . . . . . . . . . . 10,853 1.0MGM Growth Properties LLC . . . . . . . . . . . . . . . . . 10,265 1.3SiteOne Landscape Supply, Inc. . . . . . . . . . . . . . . . 8,886 1.1
Company
EquityMarket Cap(in millions)
% ofNet
Assets
Rexford Industrial Realty, Inc. . . . . . . . . . . . . . . . . . $8,559 1.1%Hyatt Hotels Corp. . . . . . . . . . . . . . . . . . . . . . . . . . 8,474 1.6Vornado Realty Trust . . . . . . . . . . . . . . . . . . . . . . . 8,048 1.3Boyd Gaming Corporation . . . . . . . . . . . . . . . . . . . 7,099 2.9CoreSite Realty Corporation . . . . . . . . . . . . . . . . . . 6,976 1.1Toll Brothers, Inc. . . . . . . . . . . . . . . . . . . . . . . . . . . 6,730 1.1Marriott Vacations Worldwide Corp. . . . . . . . . . . . 6,719 3.0Red Rock Resorts, Inc. . . . . . . . . . . . . . . . . . . . . . . . 5,960 4.0Hilton Grand Vacations Inc. . . . . . . . . . . . . . . . . . . 5,720 2.4The AZEK Company Inc. . . . . . . . . . . . . . . . . . . . . . 5,656 1.2Douglas Emmett, Inc. . . . . . . . . . . . . . . . . . . . . . . . 5,547 1.4The Howard Hughes Corporation . . . . . . . . . . . . . 4,841 2.0Travel + Leisure Co. . . . . . . . . . . . . . . . . . . . . . . . . 4,706 2.4Tripadvisor, Inc. . . . . . . . . . . . . . . . . . . . . . . . . . . . . 4,651 1.7NEXTDC Limited . . . . . . . . . . . . . . . . . . . . . . . . . . . 3,926 0.8JBG SMITH Properties . . . . . . . . . . . . . . . . . . . . . . . 3,907 0.6Six Flags Entertainment Corporation . . . . . . . . . . . 3,650 2.0Installed Building Products, Inc. . . . . . . . . . . . . . . . 3,183 1.0DigitalBridge Group, Inc. . . . . . . . . . . . . . . . . . . . . . 2,973 0.6Membership Collective Group Inc. . . . . . . . . . . . . . 2,538 0.2SmartRent, Inc. . . . . . . . . . . . . . . . . . . . . . . . . . . . . 2,522 2.0American Assets Trust, Inc. . . . . . . . . . . . . . . . . . . . 2,263 0.5Hillman Solutions Corp. . . . . . . . . . . . . . . . . . . . . . 2,238 1.4Janus International Group, Inc. . . . . . . . . . . . . . . . . 1,694 0.8Go Acquisition Corp. . . . . . . . . . . . . . . . . . . . . . . . . 705 0.4RXR Acquisition Corp. . . . . . . . . . . . . . . . . . . . . . . . 425 0.7Tishman Speyer Innovation Corp. II . . . . . . . . . . . . 368 0.3Fifth Wall Acquisition Corp. III . . . . . . . . . . . . . . . . 347 0.7
96.7%
147

Baron Funds
Baron Emerging Markets Fund
Baron Emerging Markets Fund is a diversified fund that invests 80% of its net assets in non-U.S. companies of all sizes domiciled, headquartered or whoseprimary business activities or principal trading markets are in developing countries. The Fund may invest up to 20% in companies in developed marketcountries and in Frontier Countries.
Company
EquityMarket Cap(in millions)
% ofNet
Assets
Taiwan Semiconductor ManufacturingCompany Ltd. . . . . . . . . . . . . . . . . . . . . . . . . . . . $579,025 3.6%
Tencent Holdings Limited . . . . . . . . . . . . . . . . . . . . 573,568 3.0Alibaba Group Holding Limited . . . . . . . . . . . . . . . 402,426 2.4Samsung Electronics Co., Ltd. . . . . . . . . . . . . . . . . . 372,607 2.9Reliance Industries Limited . . . . . . . . . . . . . . . . . . . 222,327 2.5Meituan Inc. . . . . . . . . . . . . . . . . . . . . . . . . . . . . . . 194,252 0.4Keyence Corporation . . . . . . . . . . . . . . . . . . . . . . . 145,735 1.1HDFC Bank Limited . . . . . . . . . . . . . . . . . . . . . . . . . 118,985 0.9Sberbank of Russia PJSC . . . . . . . . . . . . . . . . . . . . . 101,567 2.1Hindustan Unilever Limited . . . . . . . . . . . . . . . . . . 85,523 0.8Novatek PJSC . . . . . . . . . . . . . . . . . . . . . . . . . . . . . 80,189 2.1China Tourism Group Duty Free
Corporation Limited . . . . . . . . . . . . . . . . . . . . . . 78,557 0.9Midea Group Co., Ltd. . . . . . . . . . . . . . . . . . . . . . . . 75,192 1.3Shenzhen Mindray Bio-Medical
Electronics Co., Ltd. . . . . . . . . . . . . . . . . . . . . . . 72,507 0.9WuXi Biologics Cayman Inc. . . . . . . . . . . . . . . . . . . 68,901 0.5Housing Development Finance
Corporation Limited . . . . . . . . . . . . . . . . . . . . . . 67,073 1.4Glencore PLC . . . . . . . . . . . . . . . . . . . . . . . . . . . . . 62,954 1.7Bajaj Finance Limited . . . . . . . . . . . . . . . . . . . . . . . 62,351 3.1Wal-Mart de Mexico, S.A.B. de C.V. . . . . . . . . . . . . 59,326 1.2Kotak Mahindra Bank Ltd. . . . . . . . . . . . . . . . . . . . 53,578 0.2Bharti Airtel Limited . . . . . . . . . . . . . . . . . . . . . . . . 50,927 1.4S. F. Holding Co., Ltd. . . . . . . . . . . . . . . . . . . . . . . . 46,078 0.4Asian Paints Limited . . . . . . . . . . . . . . . . . . . . . . . . 41,929 1.0Techtronic Industries Co. Ltd. . . . . . . . . . . . . . . . . . 36,540 1.5Budweiser Brewing Company APAC Limited . . . . . 33,582 0.7Will Semiconductor Co., Ltd. . . . . . . . . . . . . . . . . . 32,609 0.8Shenzhou International Group Holdings Ltd. . . . . . 32,016 1.1Grupo Mexico, S.A.B. de C.V. . . . . . . . . . . . . . . . . . 31,074 0.7NARI Technology Co. Ltd. . . . . . . . . . . . . . . . . . . . . 30,818 0.3Yandex N.V. . . . . . . . . . . . . . . . . . . . . . . . . . . . . . . 28,480 0.8Titan Company Limited . . . . . . . . . . . . . . . . . . . . . 25,857 1.0China Mengniu Dairy Co. Ltd. . . . . . . . . . . . . . . . . . 25,441 1.3Yum China Holdings Inc. . . . . . . . . . . . . . . . . . . . . 24,903 1.0Delta Electronics, Inc. . . . . . . . . . . . . . . . . . . . . . . . 23,495 0.9Hangzhou Tigermed Consulting Co., Ltd. . . . . . . . . 22,790 1.1XP Inc. . . . . . . . . . . . . . . . . . . . . . . . . . . . . . . . . . . . 22,457 0.9PJSC Polyus . . . . . . . . . . . . . . . . . . . . . . . . . . . . . . . 22,370 0.5Galaxy Entertainment Group Limited . . . . . . . . . . 22,364 0.7Yunnan Baiyao Group Co., Ltd. . . . . . . . . . . . . . . . . 19,357 0.8China Molybdenum Co., Ltd. . . . . . . . . . . . . . . . . . 18,955 0.7TCS Group Holding PLC . . . . . . . . . . . . . . . . . . . . . 18,296 0.9Beijing Oriental Yuhong Waterproof
Technology Co., Ltd. . . . . . . . . . . . . . . . . . . . . . . 17,308 1.0Divi’s Laboratories Ltd. . . . . . . . . . . . . . . . . . . . . . . 17,162 1.2OTP Bank Plc. . . . . . . . . . . . . . . . . . . . . . . . . . . . . . 16,425 1.2SBI Life Insurance Company Limited . . . . . . . . . . . 16,373 1.0Sino Biopharmaceutical Ltd. . . . . . . . . . . . . . . . . . . 15,642 0.3Kanzhun Limited . . . . . . . . . . . . . . . . . . . . . . . . . . . 14,719 0.0Zomato Limited . . . . . . . . . . . . . . . . . . . . . . . . . . . 14,437 0.1
Company
EquityMarket Cap(in millions)
% ofNet
Assets
Godrej Consumer Products Limited . . . . . . . . . . . . $14,187 0.3%Suzano S.A. . . . . . . . . . . . . . . . . . . . . . . . . . . . . . . . 13,628 1.2Glodon Company Limited . . . . . . . . . . . . . . . . . . . 12,243 0.4Kingdee International Software Group Co. Ltd. . . . 11,616 0.9Dr. Reddy’s Laboratories Ltd. . . . . . . . . . . . . . . . . . 10,938 0.9StoneCo Ltd. . . . . . . . . . . . . . . . . . . . . . . . . . . . . . . 10,766 0.7GDS Holdings Limited . . . . . . . . . . . . . . . . . . . . . . 10,580 0.7Credicorp Ltd. . . . . . . . . . . . . . . . . . . . . . . . . . . . . . 10,471 0.4Ozon Holdings PLC . . . . . . . . . . . . . . . . . . . . . . . . . 10,288 0.7Tata Consumer Products Limited . . . . . . . . . . . . . . 10,095 1.0Zai Lab Limited . . . . . . . . . . . . . . . . . . . . . . . . . . . . 10,055 1.1ICICI Lombard General Insurance
Company Limited . . . . . . . . . . . . . . . . . . . . . . . . 9,736 0.7Ayala Land, Inc. . . . . . . . . . . . . . . . . . . . . . . . . . . . . 9,662 0.6BDO Unibank, Inc. . . . . . . . . . . . . . . . . . . . . . . . . . 9,508 0.6Godrej Properties Limited . . . . . . . . . . . . . . . . . . . . 8,658 1.1Hyundai Heavy Industries Co., Ltd. . . . . . . . . . . . . 8,472 0.6China Conch Venture Holdings Ltd. . . . . . . . . . . . . 8,460 1.6Notre Dame Intermedica Participacoes S.A. . . . . . 8,429 0.9InPost S.A. . . . . . . . . . . . . . . . . . . . . . . . . . . . . . . . . 8,276 1.0Muthoot Finance Ltd. . . . . . . . . . . . . . . . . . . . . . . . 7,839 0.9Fix Price Group Ltd. . . . . . . . . . . . . . . . . . . . . . . . . . 7,637 0.7Localiza Rent a Car S.A. . . . . . . . . . . . . . . . . . . . . . 7,586 0.8Banco Inter S.A. . . . . . . . . . . . . . . . . . . . . . . . . . . . . 7,323 0.3Jubilant FoodWorks Limited . . . . . . . . . . . . . . . . . . 7,184 0.8Hua Hong Semiconductor Limited . . . . . . . . . . . . . 6,749 0.7Han’s Laser Technology Industry Group Co., Ltd . . 6,247 0.9Korea Shipbuilding & Offshore
Engineering Co., Ltd. . . . . . . . . . . . . . . . . . . . . . . 5,954 1.7Kingsoft Corporation Ltd. . . . . . . . . . . . . . . . . . . . . 5,475 0.9Tata Communications Limited . . . . . . . . . . . . . . . . 5,344 1.2Zhejiang Hangzhou Dingli Machinery Co., Ltd. . . . 5,297 1.3Americanas S.A. . . . . . . . . . . . . . . . . . . . . . . . . . . . 5,127 0.3Winning Health Technology Group Co., Ltd. . . . . . 4,817 0.5Max Financial Services Limited . . . . . . . . . . . . . . . . 4,716 1.6Aarti Industries Ltd . . . . . . . . . . . . . . . . . . . . . . . . . 4,541 0.6Venustech Group Inc. . . . . . . . . . . . . . . . . . . . . . . . 3,989 0.6Nippon Life India Asset Management Limited . . . . 3,555 0.9Network International Holdings Ltd. . . . . . . . . . . . 2,747 0.3ACM Research, Inc. . . . . . . . . . . . . . . . . . . . . . . . . . 2,140 0.4Afya Limited . . . . . . . . . . . . . . . . . . . . . . . . . . . . . . 1,850 0.4Shanghai Henlius Biotech, Inc. . . . . . . . . . . . . . . . . 1,714 0.1Lojas Americanas S.A. . . . . . . . . . . . . . . . . . . . . . . . 1,619 0.2New Frontier Health Corporation . . . . . . . . . . . . . 1,481 0.3Golar LNG Ltd. . . . . . . . . . . . . . . . . . . . . . . . . . . . . 1,426 0.4JM Financial Limited . . . . . . . . . . . . . . . . . . . . . . . . 1,189 0.6Aeris Industria Comercio Equipamentos
Geracao Energia SA . . . . . . . . . . . . . . . . . . . . . . 1,124 0.4Edelweiss Financial Services Limited . . . . . . . . . . . 999 0.4Hemisphere Properties India Limited . . . . . . . . . . . 547 0.1DD3 Acquisition Corp. II . . . . . . . . . . . . . . . . . . . . . 131 0.0
90.0%
148

Baron Funds
Baron Global Advantage Fund
Baron Global Advantage Fund is a diversified fund that invests primarily in established and emerging markets companies located throughout the world withcapitalization within the range of companies included in the MSCI ACWI Index.
Company
EquityMarket Cap(in millions)
% ofNet
Assets
Alphabet Inc. . . . . . . . . . . . . . . . . . . . . . . . . . . . . . . $1,779,767 6.1%Amazon.com, Inc. . . . . . . . . . . . . . . . . . . . . . . . . . . 1,663,677 4.6Facebook, Inc. . . . . . . . . . . . . . . . . . . . . . . . . . . . . . 956,891 3.9NVIDIA Corporation . . . . . . . . . . . . . . . . . . . . . . . . 517,900 0.7Alibaba Group Holding Limited . . . . . . . . . . . . . . . 402,426 1.4ASML Holding N.V. . . . . . . . . . . . . . . . . . . . . . . . . . 309,245 1.0Meituan Inc. . . . . . . . . . . . . . . . . . . . . . . . . . . . . . . 194,252 1.6Sea Limited . . . . . . . . . . . . . . . . . . . . . . . . . . . . . . . 175,988 1.5Shopify Inc. . . . . . . . . . . . . . . . . . . . . . . . . . . . . . . . 169,247 2.8Pinduoduo Inc. . . . . . . . . . . . . . . . . . . . . . . . . . . . . 113,636 0.6Snowflake Inc. . . . . . . . . . . . . . . . . . . . . . . . . . . . . . 91,001 1.8Adyen N.V. . . . . . . . . . . . . . . . . . . . . . . . . . . . . . . . 85,394 1.6MercadoLibre, Inc. . . . . . . . . . . . . . . . . . . . . . . . . . . 83,486 2.8Illumina, Inc. . . . . . . . . . . . . . . . . . . . . . . . . . . . . . . 63,478 2.0Bajaj Finance Limited . . . . . . . . . . . . . . . . . . . . . . . 62,351 2.0Twilio Inc. . . . . . . . . . . . . . . . . . . . . . . . . . . . . . . . . 56,520 2.5CrowdStrike, Inc. . . . . . . . . . . . . . . . . . . . . . . . . . . . 56,085 2.4Coupang, LLC . . . . . . . . . . . . . . . . . . . . . . . . . . . . . 48,336 0.7Veeva Systems Inc. . . . . . . . . . . . . . . . . . . . . . . . . . 44,210 2.0Datadog, Inc. . . . . . . . . . . . . . . . . . . . . . . . . . . . . . . 43,821 1.1Okta, Inc. . . . . . . . . . . . . . . . . . . . . . . . . . . . . . . . . . 36,825 0.7Zscaler, Inc. . . . . . . . . . . . . . . . . . . . . . . . . . . . . . . . 36,379 1.2Cloudflare, Inc. . . . . . . . . . . . . . . . . . . . . . . . . . . . . 35,195 1.5EPAM Systems, Inc. . . . . . . . . . . . . . . . . . . . . . . . . . 32,307 3.5Bill.com Holdings, Inc. . . . . . . . . . . . . . . . . . . . . . . . 26,582 1.3ZoomInfo Technologies Inc. . . . . . . . . . . . . . . . . . . 25,194 2.2Dynatrace Holdings LLC . . . . . . . . . . . . . . . . . . . . . 20,176 2.4RingCentral, Inc. . . . . . . . . . . . . . . . . . . . . . . . . . . . 19,903 2.0Nuvei Technologies Corp. . . . . . . . . . . . . . . . . . . . . 17,817 2.5
Company
EquityMarket Cap(in millions)
% ofNet
Assets
10X Genomics, Inc. . . . . . . . . . . . . . . . . . . . . . . . . . $16,143 1.6%DLocal Limited . . . . . . . . . . . . . . . . . . . . . . . . . . . . 15,982 1.6argenx SE . . . . . . . . . . . . . . . . . . . . . . . . . . . . . . . . 15,535 2.6Zomato Limited . . . . . . . . . . . . . . . . . . . . . . . . . . . 14,437 0.1Guardant Health, Inc. . . . . . . . . . . . . . . . . . . . . . . . 12,663 1.5SoFi Technologies, Inc. . . . . . . . . . . . . . . . . . . . . . . 12,620 2.1Opendoor Technologies Inc. . . . . . . . . . . . . . . . . . . 12,413 1.4Globant, S.A. . . . . . . . . . . . . . . . . . . . . . . . . . . . . . . 11,665 0.9Wix.com Ltd. . . . . . . . . . . . . . . . . . . . . . . . . . . . . . . 11,054 1.9StoneCo Ltd. . . . . . . . . . . . . . . . . . . . . . . . . . . . . . . 10,766 0.7GDS Holdings Limited . . . . . . . . . . . . . . . . . . . . . . 10,580 1.0Acceleron Pharma Inc. . . . . . . . . . . . . . . . . . . . . . . 10,481 4.0Natera, Inc. . . . . . . . . . . . . . . . . . . . . . . . . . . . . . . . 10,451 1.5Zai Lab Limited . . . . . . . . . . . . . . . . . . . . . . . . . . . . 10,055 1.2InPost S.A. . . . . . . . . . . . . . . . . . . . . . . . . . . . . . . . . 8,276 0.7Endava plc . . . . . . . . . . . . . . . . . . . . . . . . . . . . . . . . 7,570 3.6BridgeBio Pharma, Inc. . . . . . . . . . . . . . . . . . . . . . . 7,020 0.8nCino Inc. . . . . . . . . . . . . . . . . . . . . . . . . . . . . . . . . 6,833 0.0Fiverr International Ltd. . . . . . . . . . . . . . . . . . . . . . 6,676 2.2Arrowhead Pharmaceuticals, Inc. . . . . . . . . . . . . . . 6,509 0.9Schrodinger, Inc. . . . . . . . . . . . . . . . . . . . . . . . . . . . 3,868 0.8Afya Limited . . . . . . . . . . . . . . . . . . . . . . . . . . . . . . 1,850 1.0Taboola.com Ltd. . . . . . . . . . . . . . . . . . . . . . . . . . . 1,787 0.8Zymergen Inc. . . . . . . . . . . . . . . . . . . . . . . . . . . . . . 1,348 0.0MaxCyte, Inc. . . . . . . . . . . . . . . . . . . . . . . . . . . . . . 1,223 0.8ION Acquisition Corp 2 Ltd. . . . . . . . . . . . . . . . . . . 313 0.2Sarissa Capital Acquisition Corp. . . . . . . . . . . . . . . 247 0.5DD3 Acquisition Corp. II . . . . . . . . . . . . . . . . . . . . . 131 0.4
95.2%
149

Baron Funds
Baron Discovery Fund
Baron Discovery Fund invests in small-sized growth companies with market capitalizations up to the largest market cap stock in the Russell 2000 Growth Indexat reconstitution, or companies with market capitalizations up to $2.5 billion, whichever is larger.
Company
EquityMarket Cap(in millions)
% ofNet
Assets
Dynatrace Holdings LLC . . . . . . . . . . . . . . . . . . . . . $20,176 1.2%Floor & Decor Holdings, Inc. . . . . . . . . . . . . . . . . . . 12,712 2.1Liberty Media Corporation - Liberty Formula
One . . . . . . . . . . . . . . . . . . . . . . . . . . . . . . . . . . . 11,783 0.4Trex Company, Inc. . . . . . . . . . . . . . . . . . . . . . . . . . 11,757 1.1Penn National Gaming, Inc. . . . . . . . . . . . . . . . . . . 11,361 0.5Biohaven Pharmaceutical Holding Company
Ltd. . . . . . . . . . . . . . . . . . . . . . . . . . . . . . . . . . . . 9,085 0.7SiteOne Landscape Supply, Inc. . . . . . . . . . . . . . . . 8,886 1.7Rexford Industrial Realty, Inc. . . . . . . . . . . . . . . . . . 8,559 1.2Brooks Automation, Inc. . . . . . . . . . . . . . . . . . . . . . 7,604 0.6Americold Realty Trust . . . . . . . . . . . . . . . . . . . . . . 7,584 1.0Endava plc . . . . . . . . . . . . . . . . . . . . . . . . . . . . . . . . 7,570 2.7Kornit Digital Ltd. . . . . . . . . . . . . . . . . . . . . . . . . . . 6,698 1.8Varonis Systems, Inc. . . . . . . . . . . . . . . . . . . . . . . . 6,506 1.9Definitive Healthcare Corp. . . . . . . . . . . . . . . . . . . 6,454 0.9Shift4 Payments, Inc. . . . . . . . . . . . . . . . . . . . . . . . 6,426 0.8Inspire Medical Systems, Inc. . . . . . . . . . . . . . . . . . 6,351 0.6S4 Capital plc . . . . . . . . . . . . . . . . . . . . . . . . . . . . . 6,297 2.2Allegro MicroSystems, Inc. . . . . . . . . . . . . . . . . . . . 6,061 1.1Future plc . . . . . . . . . . . . . . . . . . . . . . . . . . . . . . . . 5,997 2.3Red Rock Resorts, Inc. . . . . . . . . . . . . . . . . . . . . . . . 5,960 1.8Clearwater Analytics Holdings, Inc. . . . . . . . . . . . . 5,928 0.8Everbridge, Inc. . . . . . . . . . . . . . . . . . . . . . . . . . . . . 5,798 1.5Petco Health and Wellness Company, Inc. . . . . . . 5,576 1.3Novanta Inc. . . . . . . . . . . . . . . . . . . . . . . . . . . . . . . 5,483 0.1DoubleVerify, Inc. . . . . . . . . . . . . . . . . . . . . . . . . . . 5,392 1.0Progyny, Inc. . . . . . . . . . . . . . . . . . . . . . . . . . . . . . . 5,006 2.1Wingstop Inc. . . . . . . . . . . . . . . . . . . . . . . . . . . . . . 4,876 0.1Tripadvisor, Inc. . . . . . . . . . . . . . . . . . . . . . . . . . . . . 4,651 1.0Qualys, Inc. . . . . . . . . . . . . . . . . . . . . . . . . . . . . . . . 4,334 1.2Inari Medical, Inc. . . . . . . . . . . . . . . . . . . . . . . . . . . 4,049 0.5SailPoint Technologies Holdings, Inc. . . . . . . . . . . . 3,985 1.7JBG SMITH Properties . . . . . . . . . . . . . . . . . . . . . . . 3,907 1.5Recursion Pharmaceuticals, Inc. . . . . . . . . . . . . . . . 3,877 0.7Kinsale Capital Group, Inc. . . . . . . . . . . . . . . . . . . . 3,688 2.0Fevertree Drinks plc . . . . . . . . . . . . . . . . . . . . . . . . 3,657 1.3BRP Group, Inc. . . . . . . . . . . . . . . . . . . . . . . . . . . . . 3,606 1.2The Beauty Health Company . . . . . . . . . . . . . . . . . 3,465 2.6Advanced Energy Industries, Inc. . . . . . . . . . . . . . . 3,367 2.0CareDx, Inc. . . . . . . . . . . . . . . . . . . . . . . . . . . . . . . . 3,335 1.7Veracyte, Inc. . . . . . . . . . . . . . . . . . . . . . . . . . . . . . 3,291 2.0
Company
EquityMarket Cap(in millions)
% ofNet
Assets
ForgeRock, Inc. . . . . . . . . . . . . . . . . . . . . . . . . . . . . $3,155 1.1%Olink Holding AB . . . . . . . . . . . . . . . . . . . . . . . . . . 3,068 0.2CryoPort, Inc. . . . . . . . . . . . . . . . . . . . . . . . . . . . . . 3,061 0.7Axonics, Inc. . . . . . . . . . . . . . . . . . . . . . . . . . . . . . . 3,003 2.0Nova Ltd. . . . . . . . . . . . . . . . . . . . . . . . . . . . . . . . . 2,901 1.3Accolade, Inc. . . . . . . . . . . . . . . . . . . . . . . . . . . . . . 2,786 0.7ACV Auctions Inc. . . . . . . . . . . . . . . . . . . . . . . . . . . 2,773 0.9Kratos Defense & Security Solutions, Inc. . . . . . . . 2,766 1.2Mercury Systems, Inc. . . . . . . . . . . . . . . . . . . . . . . . 2,699 2.2Helios Technologies, Inc. . . . . . . . . . . . . . . . . . . . . 2,660 0.8Membership Collective Group Inc. . . . . . . . . . . . . . 2,538 0.9SmartRent, Inc. . . . . . . . . . . . . . . . . . . . . . . . . . . . . 2,522 1.6The Cheesecake Factory, Inc. . . . . . . . . . . . . . . . . . 2,452 1.0UTZ Brands, Inc. . . . . . . . . . . . . . . . . . . . . . . . . . . . 2,345 0.6MYT Netherlands Parent B.V. . . . . . . . . . . . . . . . . . 2,324 0.5Alkami Technology Inc. . . . . . . . . . . . . . . . . . . . . . 2,152 1.2Seer, Inc. . . . . . . . . . . . . . . . . . . . . . . . . . . . . . . . . . 2,122 0.1Ping Identity Corporation . . . . . . . . . . . . . . . . . . . . 2,018 1.5ESCO Technologies, Inc. . . . . . . . . . . . . . . . . . . . . . 2,007 0.3Revance Therapeutics, Inc. . . . . . . . . . . . . . . . . . . . 2,001 1.8Silk Road Medical, Inc. . . . . . . . . . . . . . . . . . . . . . . 1,909 1.7Melco International Development Limited . . . . . . 1,784 0.2Velo3d Inc . . . . . . . . . . . . . . . . . . . . . . . . . . . . . . . . 1,772 0.7Montrose Environmental Group, Inc. . . . . . . . . . . . 1,772 1.8Hydrofarm Holdings Group, Inc. . . . . . . . . . . . . . . 1,663 0.9PAR Technology Corporation . . . . . . . . . . . . . . . . . 1,653 1.7Indie Semiconductor, Inc. . . . . . . . . . . . . . . . . . . . . 1,601 1.8Couchbase, Inc. . . . . . . . . . . . . . . . . . . . . . . . . . . . . 1,348 1.5TPI Composites, Inc. . . . . . . . . . . . . . . . . . . . . . . . . 1,257 0.9Markforged Holding Corporation . . . . . . . . . . . . . . 1,215 0.5ViewRay Incorporated . . . . . . . . . . . . . . . . . . . . . . 1,185 1.4Ichor Holdings, Ltd. . . . . . . . . . . . . . . . . . . . . . . . . . 1,165 1.2Cerus Corporation . . . . . . . . . . . . . . . . . . . . . . . . . . 1,045 0.8Inogen, Inc. . . . . . . . . . . . . . . . . . . . . . . . . . . . . . . . 974 1.4Viant Technology Inc. . . . . . . . . . . . . . . . . . . . . . . . 736 0.3AxoGen, Inc. . . . . . . . . . . . . . . . . . . . . . . . . . . . . . . 654 0.4Live Oak Acquisition Corp. II . . . . . . . . . . . . . . . . . 512 0.5Khosla Ventures Acquisition Co. II . . . . . . . . . . . . . 435 0.6Sientra, Inc. . . . . . . . . . . . . . . . . . . . . . . . . . . . . . . . 332 0.7Acutus Medical, Inc. . . . . . . . . . . . . . . . . . . . . . . . . 306 0.5Laird Superfood, Inc. . . . . . . . . . . . . . . . . . . . . . . . . 172 0.1
93.1%
150

Baron Funds
Baron Durable Advantage Fund
Baron Durable Advantage Fund invests primarily in large-sized companies with market capitalizations no smaller than the top 90th percentile by marketcapitalization of the S&P 500 Index at June 30, or companies with market capitalizations above $10 billion, whichever is smaller.
Company
EquityMarket Cap(in millions)
% ofNet
Assets
Microsoft Corporation . . . . . . . . . . . . . . . . . . . . . . $2,118,598 8.9%Alphabet Inc. . . . . . . . . . . . . . . . . . . . . . . . . . . . . . . 1,779,767 7.4Facebook, Inc. . . . . . . . . . . . . . . . . . . . . . . . . . . . . . 956,891 5.1Visa, Inc. . . . . . . . . . . . . . . . . . . . . . . . . . . . . . . . . . 489,388 4.0UnitedHealth Group Incorporated . . . . . . . . . . . . . 368,436 4.2Mastercard Incorporated . . . . . . . . . . . . . . . . . . . . 343,082 3.4Adobe Inc. . . . . . . . . . . . . . . . . . . . . . . . . . . . . . . . . 273,928 4.1Thermo Fisher Scientific Inc. . . . . . . . . . . . . . . . . . 224,772 3.2Danaher Corporation . . . . . . . . . . . . . . . . . . . . . . . 217,340 4.3Accenture plc . . . . . . . . . . . . . . . . . . . . . . . . . . . . . 203,180 3.3Costco Wholesale Corporation . . . . . . . . . . . . . . . 198,534 2.3Texas Instruments Incorporated . . . . . . . . . . . . . . . 177,450 2.5Intuit Inc. . . . . . . . . . . . . . . . . . . . . . . . . . . . . . . . . . 147,336 3.3BlackRock Inc. . . . . . . . . . . . . . . . . . . . . . . . . . . . . . 128,451 3.3The Estee Lauder Companies Inc. . . . . . . . . . . . . . . 108,321 1.1S&P Global Inc. . . . . . . . . . . . . . . . . . . . . . . . . . . . . 102,399 2.0Equinix, Inc. . . . . . . . . . . . . . . . . . . . . . . . . . . . . . . . 70,914 0.7CME Group, Inc. . . . . . . . . . . . . . . . . . . . . . . . . . . . 69,450 2.4
Company
EquityMarket Cap(in millions)
% ofNet
Assets
Moody’s Corporation . . . . . . . . . . . . . . . . . . . . . . . $66,122 3.1%Ecolab Inc. . . . . . . . . . . . . . . . . . . . . . . . . . . . . . . . . 59,684 0.7MSCI, Inc. . . . . . . . . . . . . . . . . . . . . . . . . . . . . . . . . 50,153 3.1Agilent Technologies, Inc. . . . . . . . . . . . . . . . . . . . . 47,688 2.5IHS Markit Ltd. . . . . . . . . . . . . . . . . . . . . . . . . . . . . 46,513 3.5Iqvia Holdings Inc. . . . . . . . . . . . . . . . . . . . . . . . . . 45,899 2.8TE Connectivity Ltd. . . . . . . . . . . . . . . . . . . . . . . . . 45,008 2.0Constellation Brands, Inc. . . . . . . . . . . . . . . . . . . . . 40,505 2.0Mettler-Toledo International, Inc. . . . . . . . . . . . . . 31,840 1.5Alexandria Real Estate Equities, Inc. . . . . . . . . . . . . 29,112 0.8Monolithic Power Systems, Inc. . . . . . . . . . . . . . . . 22,257 2.3SS&C Technologies Holdings, Inc. . . . . . . . . . . . . . 17,715 1.5HEICO Corporation . . . . . . . . . . . . . . . . . . . . . . . . . 16,762 2.0Arch Capital Group Ltd. . . . . . . . . . . . . . . . . . . . . . 15,121 2.1Fair Isaac Corporation . . . . . . . . . . . . . . . . . . . . . . . 11,296 0.7Stevanato Group S.p.A . . . . . . . . . . . . . . . . . . . . . . 7,488 1.6
97.7%
Baron Real Estate Income Fund
Baron Real Estate Income Fund is a non-diversified fund that under normal circumstances, invests at least 80% of its net assets in real estate income-producing securities and other real estate securities of any market capitalization, including common stocks and equity securities, debt and preferred securities,non-U.S. real estate income-producing securities, and any other real estate-related yield securities.
Company
EquityMarket Cap(in millions)
% ofNet
Assets
American Tower Corp. . . . . . . . . . . . . . . . . . . . . . . $120,799 5.2%Prologis, Inc. . . . . . . . . . . . . . . . . . . . . . . . . . . . . . . 92,786 3.6Crown Castle International Corp. . . . . . . . . . . . . . . 74,908 1.6Equinix, Inc. . . . . . . . . . . . . . . . . . . . . . . . . . . . . . . . 70,914 2.6Public Storage Incorporated . . . . . . . . . . . . . . . . . . 52,060 3.3Simon Property Group, Inc. . . . . . . . . . . . . . . . . . . 42,711 3.9SBA Communications Corp. . . . . . . . . . . . . . . . . . . 36,215 0.8Welltower Inc. . . . . . . . . . . . . . . . . . . . . . . . . . . . . . 34,819 0.7AvalonBay Communities, Inc. . . . . . . . . . . . . . . . . . 30,945 5.1Equity Residential . . . . . . . . . . . . . . . . . . . . . . . . . . 30,301 5.2Alexandria Real Estate Equities, Inc. . . . . . . . . . . . . 29,112 1.8Brookfield Infrastructure Partners L.P. . . . . . . . . . . 23,419 3.6Invitation Homes, Inc. . . . . . . . . . . . . . . . . . . . . . . 22,791 5.7Ventas, Inc. . . . . . . . . . . . . . . . . . . . . . . . . . . . . . . . 21,724 3.2Sun Communities, Inc. . . . . . . . . . . . . . . . . . . . . . . 21,454 2.7Duke Realty Corporation . . . . . . . . . . . . . . . . . . . . 18,111 1.1VICI Properties Inc. . . . . . . . . . . . . . . . . . . . . . . . . . 17,868 1.0Camden Property Trust . . . . . . . . . . . . . . . . . . . . . 14,832 2.0Equity Lifestyle Properties, Inc. . . . . . . . . . . . . . . . . 14,352 2.7American Homes 4 Rent . . . . . . . . . . . . . . . . . . . . 12,307 3.2
Company
EquityMarket Cap(in millions)
% ofNet
Assets
Host Hotels & Resorts, Inc. . . . . . . . . . . . . . . . . . . $11,659 3.2%Penn National Gaming, Inc. . . . . . . . . . . . . . . . . . . 11,361 1.5Gaming and Leisure Properties, Inc. . . . . . . . . . . . . 10,853 1.8MGM Growth Properties LLC . . . . . . . . . . . . . . . . . 10,265 1.7Rexford Industrial Realty, Inc. . . . . . . . . . . . . . . . . . 8,559 2.6Vornado Realty Trust . . . . . . . . . . . . . . . . . . . . . . . 8,048 1.4CoreSite Realty Corporation . . . . . . . . . . . . . . . . . . 6,976 2.2Red Rock Resorts, Inc. . . . . . . . . . . . . . . . . . . . . . . . 5,960 3.0Douglas Emmett, Inc. . . . . . . . . . . . . . . . . . . . . . . . 5,547 1.5Travel + Leisure Co. . . . . . . . . . . . . . . . . . . . . . . . . 4,706 3.6Park Hotels & Resorts Inc. . . . . . . . . . . . . . . . . . . . 4,527 3.2JBG SMITH Properties . . . . . . . . . . . . . . . . . . . . . . . 3,907 1.4DigitalBridge Group, Inc. . . . . . . . . . . . . . . . . . . . . . 2,973 2.1Kennedy-Wilson Holdings, Inc. . . . . . . . . . . . . . . . . 2,945 1.5Pebblebrook Hotel Trust . . . . . . . . . . . . . . . . . . . . . 2,944 3.2SmartRent, Inc. . . . . . . . . . . . . . . . . . . . . . . . . . . . . 2,522 1.6American Assets Trust, Inc. . . . . . . . . . . . . . . . . . . . 2,263 0.8Paramount Group, Inc. . . . . . . . . . . . . . . . . . . . . . . 1,969 2.0
97.3%
151

Baron Funds
Baron Health Care Fund
Baron Health Care Fund is a non-diversified fund that under normal circumstances, invests at least 80% of its net assets in equity securities in the form of commonstock of companies engaged in the research, development, production, sale, delivery or distribution of products and services related to the health care industry.
Company
EquityMarket Cap(in millions)
% ofNet
Assets
UnitedHealth Group Incorporated . . . . . . . . . . . . . $368,436 5.4%Thermo Fisher Scientific Inc. . . . . . . . . . . . . . . . . . 224,772 4.3Eli Lilly and Company . . . . . . . . . . . . . . . . . . . . . . . 221,018 2.6Abbott Laboratories . . . . . . . . . . . . . . . . . . . . . . . . 209,423 1.8Moderna, Inc. . . . . . . . . . . . . . . . . . . . . . . . . . . . . . 155,347 0.9Intuitive Surgical, Inc. . . . . . . . . . . . . . . . . . . . . . . . 118,203 1.6Zoetis Inc. . . . . . . . . . . . . . . . . . . . . . . . . . . . . . . . . 92,012 2.5Edwards Lifesciences Corp. . . . . . . . . . . . . . . . . . . . 70,567 2.4BioNTech SE . . . . . . . . . . . . . . . . . . . . . . . . . . . . . . 66,205 0.8Illumina, Inc. . . . . . . . . . . . . . . . . . . . . . . . . . . . . . . 63,478 0.5IDEXX Laboratories, Inc. . . . . . . . . . . . . . . . . . . . . . 52,909 1.1DexCom, Inc. . . . . . . . . . . . . . . . . . . . . . . . . . . . . . . 52,908 1.1Humana Inc. . . . . . . . . . . . . . . . . . . . . . . . . . . . . . . 50,008 1.5Veeva Systems Inc. . . . . . . . . . . . . . . . . . . . . . . . . . 44,210 0.6Mettler-Toledo International, Inc. . . . . . . . . . . . . . 31,840 2.0West Pharmaceutical Services, Inc. . . . . . . . . . . . . 31,407 1.5Alexandria Real Estate Equities, Inc. . . . . . . . . . . . . 29,112 1.7Genmab A/S . . . . . . . . . . . . . . . . . . . . . . . . . . . . . . 28,704 1.9ICON Plc . . . . . . . . . . . . . . . . . . . . . . . . . . . . . . . . . 20,854 5.5Insulet Corp. . . . . . . . . . . . . . . . . . . . . . . . . . . . . . . 19,576 1.8Bio-Techne Corporation . . . . . . . . . . . . . . . . . . . . . 19,014 4.2Teleflex Incorporated . . . . . . . . . . . . . . . . . . . . . . . 17,623 0.8GoodRx Holdings, Inc. . . . . . . . . . . . . . . . . . . . . . . 16,229 2.310X Genomics, Inc. . . . . . . . . . . . . . . . . . . . . . . . . . 16,143 0.6argenx SE . . . . . . . . . . . . . . . . . . . . . . . . . . . . . . . . 15,535 3.5Guardant Health, Inc. . . . . . . . . . . . . . . . . . . . . . . . 12,663 1.6
Company
EquityMarket Cap(in millions)
% ofNet
Assets
Acceleron Pharma Inc. . . . . . . . . . . . . . . . . . . . . . . $10,481 4.4%Natera, Inc. . . . . . . . . . . . . . . . . . . . . . . . . . . . . . . . 10,451 6.0Zai Lab Limited . . . . . . . . . . . . . . . . . . . . . . . . . . . . 10,055 1.0Mirati Therapeutics, Inc. . . . . . . . . . . . . . . . . . . . . . 9,133 1.9Stevanato Group S.p.A . . . . . . . . . . . . . . . . . . . . . . 7,488 1.9ShockWave Medical, Inc. . . . . . . . . . . . . . . . . . . . . 7,237 1.2Dechra Pharmaceuticals PLC . . . . . . . . . . . . . . . . . 7,077 2.7Arrowhead Pharmaceuticals, Inc. . . . . . . . . . . . . . . 6,509 1.2Definitive Healthcare Corp. . . . . . . . . . . . . . . . . . . 6,454 0.9Inspire Medical Systems, Inc. . . . . . . . . . . . . . . . . . 6,351 1.3Denali Therapeutics Inc. . . . . . . . . . . . . . . . . . . . . . 6,137 0.7Figs Inc. . . . . . . . . . . . . . . . . . . . . . . . . . . . . . . . . . . 6,069 1.1Beam Therapeutics Inc. . . . . . . . . . . . . . . . . . . . . . . 5,773 0.4Twist Bioscience Corporation . . . . . . . . . . . . . . . . . 5,273 0.4Certara, Inc. . . . . . . . . . . . . . . . . . . . . . . . . . . . . . . . 5,209 0.6Inari Medical, Inc. . . . . . . . . . . . . . . . . . . . . . . . . . . 4,049 1.4Recursion Pharmaceuticals, Inc. . . . . . . . . . . . . . . . 3,877 0.2Schrodinger, Inc. . . . . . . . . . . . . . . . . . . . . . . . . . . . 3,868 0.9Olink Holding AB . . . . . . . . . . . . . . . . . . . . . . . . . . 3,068 0.8CryoPort, Inc. . . . . . . . . . . . . . . . . . . . . . . . . . . . . . 3,061 0.7Butterfly Network, Inc. . . . . . . . . . . . . . . . . . . . . . . 2,025 0.1Silk Road Medical, Inc. . . . . . . . . . . . . . . . . . . . . . . 1,909 0.6Establishment Labs Holdings Inc. . . . . . . . . . . . . . . 1,699 1.2MaxCyte, Inc. . . . . . . . . . . . . . . . . . . . . . . . . . . . . . 1,223 1.5Opsens Inc. . . . . . . . . . . . . . . . . . . . . . . . . . . . . . . . 257 1.6
89.2%
152

Baron Funds
Baron FinTech Fund
Baron FinTech Fund is a non-diversified fund that, under normal circumstances, invests at least 80% of its net assets in securities of companies that develop,use, or rely on innovative technologies or services, in a significant way, for banking, lending, capital markets, financial data analytics, insurance, payments, assetmanagement, or wealth management. The Fund may purchase securities of companies of any market capitalization and may invest in foreign stocks, includingemerging market securities.
Company
EquityMarket Cap(in millions)
% ofNet
Assets
Visa, Inc. . . . . . . . . . . . . . . . . . . . . . . . . . . . . . . . . . $489,388 3.6%Mastercard Incorporated . . . . . . . . . . . . . . . . . . . . 343,082 3.2PayPal Holdings, Inc. . . . . . . . . . . . . . . . . . . . . . . . . 305,755 3.7Accenture plc . . . . . . . . . . . . . . . . . . . . . . . . . . . . . 203,180 2.5Shopify Inc. . . . . . . . . . . . . . . . . . . . . . . . . . . . . . . . 169,247 3.3Intuit Inc. . . . . . . . . . . . . . . . . . . . . . . . . . . . . . . . . . 147,336 3.9BlackRock Inc. . . . . . . . . . . . . . . . . . . . . . . . . . . . . . 128,451 2.8Square, Inc. . . . . . . . . . . . . . . . . . . . . . . . . . . . . . . . 110,254 3.6S&P Global Inc. . . . . . . . . . . . . . . . . . . . . . . . . . . . . 102,399 3.6Adyen N.V. . . . . . . . . . . . . . . . . . . . . . . . . . . . . . . . 85,394 3.1MercadoLibre, Inc. . . . . . . . . . . . . . . . . . . . . . . . . . . 83,486 3.1Fidelity National Information Services, Inc. . . . . . . 75,161 2.1CME Group, Inc. . . . . . . . . . . . . . . . . . . . . . . . . . . . 69,450 0.5Moody’s Corporation . . . . . . . . . . . . . . . . . . . . . . . 66,122 2.3MSCI, Inc. . . . . . . . . . . . . . . . . . . . . . . . . . . . . . . . . 50,153 3.2IHS Markit Ltd. . . . . . . . . . . . . . . . . . . . . . . . . . . . . 46,513 2.4Global Payments Inc. . . . . . . . . . . . . . . . . . . . . . . . 46,289 0.9CoStar Group, Inc. . . . . . . . . . . . . . . . . . . . . . . . . . . 33,990 1.6Verisk Analytics, Inc. . . . . . . . . . . . . . . . . . . . . . . . . 32,314 1.0EPAM Systems, Inc. . . . . . . . . . . . . . . . . . . . . . . . . . 32,307 3.3Bill.com Holdings, Inc. . . . . . . . . . . . . . . . . . . . . . . . 26,582 1.5ZoomInfo Technologies Inc. . . . . . . . . . . . . . . . . . . 25,194 1.1Toast, Inc. . . . . . . . . . . . . . . . . . . . . . . . . . . . . . . . . 25,105 0.6Zillow Group, Inc. . . . . . . . . . . . . . . . . . . . . . . . . . . 22,377 0.9TransUnion . . . . . . . . . . . . . . . . . . . . . . . . . . . . . . . 21,507 2.5Tradeweb Markets Inc. . . . . . . . . . . . . . . . . . . . . . . 18,804 1.4TCS Group Holding PLC . . . . . . . . . . . . . . . . . . . . . 18,296 2.4
Company
EquityMarket Cap(in millions)
% ofNet
Assets
Nuvei Technologies Corp. . . . . . . . . . . . . . . . . . . . . $17,817 3.2%Ceridian HCM Holding Inc. . . . . . . . . . . . . . . . . . . . 16,877 1.5MarketAxess Holdings Inc. . . . . . . . . . . . . . . . . . . . 15,986 1.0DLocal Limited . . . . . . . . . . . . . . . . . . . . . . . . . . . . 15,982 2.7Wise Plc . . . . . . . . . . . . . . . . . . . . . . . . . . . . . . . . . 14,567 2.7SoFi Technologies, Inc. . . . . . . . . . . . . . . . . . . . . . . 12,620 1.0Jack Henry & Associates, Inc. . . . . . . . . . . . . . . . . . 12,143 0.7Marqeta, Inc. . . . . . . . . . . . . . . . . . . . . . . . . . . . . . . 11,932 0.8Fair Isaac Corporation . . . . . . . . . . . . . . . . . . . . . . . 11,296 2.1Guidewire Software, Inc. . . . . . . . . . . . . . . . . . . . . . 9,875 2.0Endava plc . . . . . . . . . . . . . . . . . . . . . . . . . . . . . . . . 7,570 4.2Banco Inter S.A. . . . . . . . . . . . . . . . . . . . . . . . . . . . . 7,323 0.4nCino Inc. . . . . . . . . . . . . . . . . . . . . . . . . . . . . . . . . 6,833 1.4Shift4 Payments, Inc. . . . . . . . . . . . . . . . . . . . . . . . 6,426 0.7Houlihan Lokey, Inc. . . . . . . . . . . . . . . . . . . . . . . . . 6,293 1.6Clearwater Analytics Holdings, Inc. . . . . . . . . . . . . 5,928 1.0Duck Creek Technologies, Inc. . . . . . . . . . . . . . . . . 5,827 1.1Kinsale Capital Group, Inc. . . . . . . . . . . . . . . . . . . . 3,688 0.7Riskified Ltd. . . . . . . . . . . . . . . . . . . . . . . . . . . . . . . 3,655 0.8BRP Group, Inc. . . . . . . . . . . . . . . . . . . . . . . . . . . . . 3,606 0.8Paymentus Holdings, Inc. . . . . . . . . . . . . . . . . . . . . 2,892 0.6Network International Holdings Ltd. . . . . . . . . . . . 2,747 0.7Alkami Technology Inc. . . . . . . . . . . . . . . . . . . . . . 2,152 0.3Repay Holdings Corporation . . . . . . . . . . . . . . . . . 2,086 0.5Grid Dynamics Holdings Inc . . . . . . . . . . . . . . . . . . 1,815 1.2Paya Holdings Inc. . . . . . . . . . . . . . . . . . . . . . . . . . 1,385 0.4
98.2%
153

Baron Funds
Baron Asset Fund — PORTFOLIO HOLDINGS
September 30, 2021
Shares Cost Value
Common Stocks (98.54%)
Communication Services (5.64%)
Cable & Satellite (0.93%)330,000 Liberty Broadband
Corporation, Cl C1 $ 23,532,283 $ 56,991,000
Interactive Media &Services (4.71%)
450,000 Pinterest, Inc., Cl A1 17,342,210 22,927,5001,378,144 Tripadvisor, Inc.1 48,150,707 46,650,1741,287,965 Zillow Group, Inc., Cl C1 44,039,787 113,521,2351,755,709 ZoomInfo Technologies Inc., Cl A1 44,675,583 107,431,834
154,208,287 290,530,743
Total Communication Services 177,740,570 347,521,743
Consumer Discretionary (6.71%)
Education Services (0.34%)150,000 Bright Horizons Family
Solutions, Inc.1 16,921,054 20,913,000
Hotels, Resorts & CruiseLines (1.80%)
546,442 Choice Hotels International, Inc. 5,198,084 69,053,876543,233 Hyatt Hotels Corp., Cl A1 16,817,762 41,883,264
22,015,846 110,937,140
Internet & Direct MarketingRetail (1.30%)
1,000,000 Farfetch Limited, Cl A1,2 28,985,121 37,480,0001,075,000 Stitch Fix, Inc., Cl A1 63,486,884 42,946,250
92,472,005 80,426,250
Leisure Facilities (3.27%)603,538 Vail Resorts, Inc.1,5 11,683,688 201,611,869
Total Consumer Discretionary 143,092,593 413,888,259
Financials (10.40%)
Asset Management & CustodyBanks (0.76%)
237,514 T. Rowe Price Group, Inc. 5,729,987 46,719,004
Financial Exchanges &Data (4.85%)
370,725 FactSet Research Systems, Inc. 19,898,420 146,354,816257,267 MarketAxess Holdings, Inc. 31,487,484 108,229,654
30,000 MSCI, Inc. 7,783,774 18,250,200326,189 Tradeweb Markets, Inc., Cl A 11,978,713 26,349,547
71,148,391 299,184,217
Insurance Brokers (0.60%)158,421 Willis Towers Watson plc2 19,439,430 36,826,546
Investment Banking &Brokerage (2.16%)
1,825,936 The Charles Schwab Corp. 1,609,715 133,001,178
Property & CasualtyInsurance (1.36%)
2,203,444 Arch Capital Group Ltd.1,2 7,933,936 84,127,492
Regional Banks (0.67%)216,421 First Republic Bank 5,518,736 41,743,282
Total Financials 111,380,195 641,601,719
Health Care (26.46%)
Biotechnology (0.62%)136,925 Acceleron Pharma, Inc.1 13,026,017 23,564,793
48,366 argenx SE, ADR1,2 15,852,353 14,606,532
28,878,370 38,171,325
Shares Cost Value
Common Stocks (continued)
Health Care (continued)
Health Care Equipment (9.31%)173,000 DexCom, Inc.1 $ 55,276,880 $ 94,606,780673,630 IDEXX Laboratories, Inc.1 12,186,829 418,930,497161,644 Teleflex, Inc. 29,645,959 60,867,048
97,109,668 574,404,325
Health Care Supplies (4.55%)215,418 The Cooper Companies, Inc. 36,713,299 89,034,414
50,000 Warby Parker, Inc., Cl A1 2,704,500 2,652,500444,404 West Pharmaceutical Services, Inc. 19,259,047 188,667,274
58,676,846 280,354,188
Health Care Technolgy (2.15%)459,386 Veeva Systems, Inc., Cl A1 27,115,596 132,381,264
Life Sciences Tools &Services (9.83%)
100,682 10X Genomics, Inc., Cl A1 3,926,598 14,657,285399,986 Bio-Techne Corporation 39,595,546 193,821,216336,000 Guardant Health, Inc.1,4 29,804,184 42,003,360217,552 Illumina, Inc.1 9,280,300 88,241,267194,117 Mettler-Toledo International, Inc.1 11,674,111 267,368,991
94,280,739 606,092,119
Total Health Care 306,061,219 1,631,403,221
Industrials (13.58%)
Environmental & FacilitiesServices (0.94%)
1,643,418 Rollins, Inc. 24,597,482 58,061,958
IndustrialConglomerates (1.90%)
262,192 Roper Technologies, Inc. 27,877,853 116,971,717
Industrial Machinery (1.14%)340,760 IDEX Corporation 24,525,881 70,520,282
Research & ConsultingServices (9.60%)
2,230,474 Clarivate Plc1,2 35,903,681 48,847,3802,154,930 CoStar Group, Inc.1 42,162,593 185,453,2761,468,500 TransUnion 79,691,638 164,927,235
961,206 Verisk Analytics, Inc. 23,863,743 192,500,726
181,621,655 591,728,617
Total Industrials 258,622,871 837,282,574
Information Technology (30.81%)
Application Software (15.20%)571,856 ANSYS, Inc.1 20,310,482 194,688,375395,300 Aspen Technology, Inc.1 40,628,908 48,542,840390,000 Avalara, Inc.1 55,839,446 68,160,300
1,636,093 Ceridian HCM Holding, Inc.1 64,026,866 184,256,794609,340 Clearwater Analytics
Holdings, Inc., Cl A1 13,205,253 15,605,197125,000 Fair Isaac Corp.1 51,657,237 49,741,250
1,421,809 Guidewire Software, Inc.1 77,473,157 169,010,43663,861 HubSpot, Inc.1 38,242,458 43,175,784
290,000 RingCentral, Inc., Cl A1 65,867,482 63,075,000771,076 SS&C Technologies Holdings, Inc. 20,933,204 53,512,674669,000 The Trade Desk, Inc., Cl A1 13,112,791 47,030,700
461,297,284 936,799,350
Data Processing & OutsourcedServices (1.21%)
614,217 Fidelity National InformationServices, Inc. 35,255,588 74,737,925
154

Baron Funds
Baron Asset Fund — PORTFOLIO HOLDINGS (Continued)
September 30, 2021
Shares Cost Value
Common Stocks (continued)
Information Technology (continued)
Electronic Components (1.07%)900,000 Amphenol Corp., Cl A $ 42,881,684 $ 65,907,000
Internet Services &Infrastructure (3.56%)
592,103 Verisign, Inc.1 27,318,889 121,387,036500,000 Wix.com Ltd.1,2 46,031,911 97,985,000
73,350,800 219,372,036
IT Consulting & OtherServices (8.60%)
132,000 EPAM Systems, Inc.1 75,568,309 75,303,3601,497,323 Gartner, Inc.1 32,461,274 455,006,513
108,029,583 530,309,873
TechnologyDistributors (1.17%)
397,363 CDW Corp. 26,228,965 72,328,013
Total Information Technology 747,043,904 1,899,454,197
Materials (0.48%)
Specialty Chemicals (0.48%)1,853,529 Diversey Holdings Ltd.1,2 27,802,935 29,730,605
Real Estate (4.46%)
Real Estate Services (0.86%)542,323 CBRE Group, Inc., Cl A1 6,067,334 52,800,567
Specialized REITs (3.60%)205,000 Alexandria Real Estate
Equities, Inc.4 30,958,643 39,169,35080,416 Equinix, Inc. 5,298,108 63,539,094
360,856 SBA Communications Corp. 9,303,270 119,288,168
45,560,021 221,996,612
Total Real Estate 51,627,355 274,797,179
TOTAL COMMON STOCKS 1,823,371,642 6,075,679,497
Private Preferred Stocks (0.65%)
Industrials (0.65%)
Aerospace & Defense (0.65%)96,298 Space Exploration
Technologies Corp., Cl N1,3,4 26,000,460 39,979,078
Principal Amount Cost Value
Short Term Investments (0.91%)
$56,289,320 Repurchase Agreement withFixed Income Clearing Corp.,dated 9/30/2021, 0.00% due10/1/2021; Proceeds atmaturity - $56,289,320; (Fullycollateralized by $56,471,000U.S. Treasury Note, 1.625%due 5/15/2031 Marketvalue - $57,415,125) $ 56,289,320 $ 56,289,320
TOTAL INVESTMENTS (100.10%) $1,905,661,422 6,171,947,895
LIABILITIES LESS CASH AND OTHERASSETS (-0.10%)6 (6,276,686)
NET ASSETS $6,165,671,209
RETAIL SHARES (Equivalent to $120.59 per sharebased on 23,812,800 shares outstanding) $2,871,697,681
INSTITUTIONAL SHARES (Equivalent to $126.47 per sharebased on 24,576,421 shares outstanding) $3,108,205,976
R6 SHARES (Equivalent to $126.45 per sharebased on 1,469,128 shares outstanding) $ 185,767,552
% Represents percentage of net assets.1 Non-income producing securities.2 Foreign corporation.3 At September 30, 2021, the market value of restricted and fair valued securities
amounted to $39,979,078 or 0.65% of net assets. This security is not deemedliquid.
4 The Adviser has reclassified/classified certain securities in or out of thissub-industry. Such reclassifications/classifications are not supported by S&P orMSCI (unaudited).
5 All or a portion of these securities are segregated for an unfunded commitment.Total value of securities segregated is $15,032,250.
6 Includes net unrealized depreciation of $346,731 on an unfunded commitmentwith a special purpose acquisition company to purchase a when-issued privateinvestment in a public entity.
ADR American Depositary Receipt.
155

Baron Funds
Baron Growth Fund — PORTFOLIO HOLDINGS
September 30, 2021
Shares Cost Value
Common Stocks (99.39%)
Communication Services (4.05%)
Alternative Carriers (3.42%)7,900,000 Iridium Communications, Inc.1,4 $ 48,702,979 $ 314,815,000
Movies & Entertainment (0.63%)3,000,000 Manchester United plc, Cl A2 40,663,063 58,110,000
Total Communication Services 89,366,042 372,925,000
Consumer Discretionary (21.47%)
Casinos & Gaming (5.86%)440,000 Boyd Gaming Corporation 1 11,056,072 27,834,400
5,860,000 Penn National Gaming, Inc.1 76,269,257 424,615,6001,695,000 Red Rock Resorts, Inc., Cl A1 31,464,689 86,817,900
118,790,018 539,267,900
Education Services (1.98%)1,310,000 Bright Horizons Family
Solutions, Inc.1 41,415,154 182,640,200
Hotels, Resorts & CruiseLines (6.27%)
3,000,000 Choice Hotels International, Inc.4 72,782,127 379,110,0001,255,000 Marriott Vacations
Worldwide Corp. 67,098,661 197,449,150
139,880,788 576,559,150
Leisure Facilities (7.26%)2,000,000 Vail Resorts, Inc.1,6 56,102,209 668,100,000
Restaurants (0.10%)665,166 Krispy Kreme, Inc.1 11,123,467 9,312,324
Total Consumer Discretionary 367,311,636 1,975,879,574
Financials (30.96%)
Asset Management & CustodyBanks (2.72%)
1,925,000 The Carlyle Group, Inc. 39,343,287 91,014,0001,900,000 Cohen & Steers, Inc. 41,176,154 159,163,000
80,519,441 250,177,000
Financial Exchanges & Data (18.88%)1,200,000 FactSet Research Systems, Inc. 59,954,575 473,736,000
980,000 Morningstar, Inc. 20,062,517 253,849,4001,660,000 MSCI, Inc. 31,110,586 1,009,844,400
111,127,678 1,737,429,800
Investment Banking &Brokerage (0.84%)
450,000 Houlihan Lokey, Inc. 19,625,873 41,445,000575,000 Moelis & Co., Cl A 10,512,876 35,575,250
30,138,749 77,020,250
Life & Health Insurance (2.71%)1,625,000 Primerica, Inc. 34,117,583 249,648,750
Property & CasualtyInsurance (5.56%)
9,165,000 Arch Capital Group Ltd.1,2 28,618,247 349,919,7001,000,000 Kinsale Capital Group, Inc. 35,007,763 161,700,000
63,626,010 511,619,700
Thrifts & Mortgage Finance (0.25%)520,000 Essent Group Ltd.2 14,300,210 22,885,200
Total Financials 333,829,671 2,848,780,700
Shares Cost Value
Common Stocks (continued)
Health Care (14.88%)
Biotechnology (0.33%)600,000 Denali Therapeutics, Inc.1 $ 11,149,573 $ 30,270,000
Health Care Equipment (4.80%)710,000 IDEXX Laboratories, Inc.1 10,098,555 441,549,000
Health Care Supplies (2.96%)1,147,434 Neogen Corp.1 13,141,411 49,833,059
525,000 West Pharmaceutical Services, Inc. 17,892,374 222,883,500
31,033,785 272,716,559
Health CareTechnology (0.54%)
900,000 Schrödinger, Inc.1 12,855,679 49,212,000
Life Sciences Tools &Services (5.83%)
300,000 Adaptive BiotechnologiesCorporation1 8,492,535 10,197,000
845,000 Bio-Techne Corporation 44,647,907 409,461,65085,000 Mettler-Toledo International, Inc.1 3,889,531 117,075,600
57,029,973 536,734,250
Pharmaceuticals (0.42%)598,076 Dechra Pharmaceuticals PLC
(United Kingdom)2 18,422,044 39,083,614
Total Health Care 140,589,609 1,369,565,423
Industrials (7.90%)
Building Products (2.05%)1,850,000 Trex Company, Inc.1 16,703,505 188,570,500
Environmental & FacilitiesServices (0.20%)
1,220,102 BrightView Holdings, Inc.1 15,117,285 18,008,706
Industrial Machinery (0.61%)4,275,000 Marel hf (Netherlands)2 18,281,671 29,216,4803,303,044 Velo3D, Inc.1,3,5 33,030,440 27,018,900
51,312,111 56,235,380
Research & ConsultingServices (5.04%)
5,390,000 CoStar Group, Inc.1 22,535,814 463,863,400
Total Industrials 105,668,715 726,677,986
Information Technology (14.50%)
Application Software (9.12%)725,000 Altair Engineering, Inc., Cl A1 11,330,019 49,981,500
1,150,000 ANSYS, Inc.1 26,542,827 391,517,5001,025,000 Guidewire Software, Inc.1 31,789,104 121,841,7501,000,000 Pegasystems, Inc. 13,997,009 127,100,000
740,741 SmartRent, Inc.1 7,407,410 9,644,4482,000,000 SS&C Technologies Holdings, Inc. 15,291,856 138,800,000
106,358,225 838,885,198
Electronic Components (0.18%)60,000 Littelfuse, Inc. 6,452,400 16,396,200
IT Consulting & OtherServices (5.20%)
1,575,000 Gartner, Inc.1 22,061,706 478,611,000
Total Information Technology 134,872,331 1,333,892,398
156

Baron Funds
Baron Growth Fund — PORTFOLIO HOLDINGS (Continued)
September 30, 2021
Shares Cost Value
Common Stocks (continued)
Real Estate (5.63%)
Diversified REITs (0.08%)200,000 American Assets Trust, Inc. $ 3,437,272 $ 7,484,000
Office REITs (1.27%)3,700,000 Douglas Emmett, Inc. 39,249,426 116,957,000
Specialized REITs (4.28%)750,000 Alexandria Real Estate
Equities, Inc.5 26,054,962 143,302,5005,400,000 Gaming and Leisure
Properties, Inc. 114,745,147 250,128,000
140,800,109 393,430,500
Total Real Estate 183,486,807 517,871,500
TOTAL COMMON STOCKS 1,355,124,811 9,145,592,581
Private Convertible Preferred Stocks (0.50%)
Industrials (0.18%)
Electrical Components &Equipment (0.18%)
59,407,006 Northvolt AB, Series E(Sweden)2,3,5 9,374,988 16,346,194
Materials (0.32%)
Commodity Chemicals (0.05%)418,777 Zymergen, Inc., Series D1,3 9,350,000 4,979,259
Fertilizers & AgriculturalChemicals (0.27%)
80,440 Farmers Business Network, Inc.,Series G1,3,5 5,000,000 4,782,962
341,838 Farmers Business Network, Inc.,Series F1,3,5 11,300,002 20,059,054
16,300,002 24,842,016
Total Materials 25,650,002 29,821,275
TOTAL PRIVATE CONVERTIBLEPREFERRED STOCKS 35,024,990 46,167,469
Warrants (0.00%)
Consumer Discretionary (0.00%)
Hotels, Resorts & CruiseLines (0.00%)
96,515 OneSpaWorld Holdings Ltd.Warrants, Exp 3/19/20241,2,5 0 289,545
Principal Amount Cost Value
Short Term Investments (0.10%)
$8,848,377 Repurchase Agreement with FixedIncome Clearing Corp., dated9/30/2021, 0.00% due10/1/2021; Proceeds atmaturity - $8,848,377; (Fullycollateralized by $9,072,200U.S. Treasury Note, 1.25%due 9/30/2028 Marketvalue - $9,025,424) $ 8,848,377 $ 8,848,377
TOTAL INVESTMENTS (99.99%) $1,398,998,178 9,200,897,972
CASH AND OTHER ASSETS LESSLIABILITIES (0.01%)7 1,073,452
NET ASSETS $9,201,971,424
RETAIL SHARES (Equivalent to $117.64 per sharebased on 25,852,465 shares outstanding) $3,041,361,238
INSTITUTIONAL SHARES (Equivalent to $122.73 per sharebased on 48,355,821 shares outstanding) $5,934,832,087
R6 SHARES (Equivalent to $122.75 per sharebased on 1,839,378 shares outstanding) $ 225,778,099
% Represents percentage of net assets.1 Non-income producing securities.2 Foreign corporation.3 At September 30, 2021, the market value of restricted and fair valued securities
amounted to $73,186,369 or 0.80% of net assets. These securities are notdeemed liquid.
4 An “Affiliated” investment may include any company in which the Fund owns5% or more of its outstanding shares.
5 The Adviser has reclassified/classified certain securities in or out of thissub-industry. Such reclassifications/classifications are not supported by S&P orMSCI (unaudited).
6 All or a portion of these securities are segregated for an unfunded commitment.Total value of securities segregated is $26,389,950.
7 Includes net unrealized depreciation of $746,100 on unfunded commitmentswith special purpose acquisition companies to purchase when-issued privateinvestments in a public entities.
157

Baron Funds
Baron Small Cap Fund — PORTFOLIO HOLDINGS
September 30, 2021
Shares Cost Value
Common Stocks (99.93%)
Communication Services (3.96%)
Cable & Satellite (1.66%)80,000 Liberty Broadband
Corporation, Cl A1 $ 319,985 $ 13,468,000260,000 Liberty Broadband
Corporation, Cl C1 1,017,091 44,902,000625,000 Liberty Media Corp.-Liberty
SiriusXM, Cl C1 1,322,731 29,668,750
2,659,807 88,038,750
Movies & Entertainment (2.30%)1,250,000 Liberty Media Corporation-Liberty
Formula One, Cl C1 22,521,105 64,262,500225,000 Madison Square Garden
Entertainment Corp.1 3,552,159 16,350,750225,000 Madison Square Garden
Sports Corp.1 8,416,556 41,838,750
34,489,820 122,452,000
Total Communication Services 37,149,627 210,490,750
Consumer Discretionary (16.73%)
Auto Parts & Equipment (0.96%)4,250,000 Holley, Inc.1 42,725,069 50,745,000
Casinos & Gaming (4.16%)925,000 DraftKings, Inc., Cl A1 11,844,047 44,548,000
1,025,000 Penn National Gaming, Inc.1 18,170,393 74,271,5002,000,000 Red Rock Resorts, Inc., Cl A1 43,795,020 102,440,000
73,809,460 221,259,500
Education Services (1.64%)625,000 Bright Horizons Family
Solutions, Inc.1 19,174,147 87,137,500
General MerchandiseStores (0.62%)
550,000 Ollie’s Bargain OutletHoldings, Inc.1 32,232,509 33,154,000
Home Improvement Retail (2.84%)1,250,000 Floor & Decor Holdings, Inc., Cl A1 44,151,665 150,987,500
Homebuilding (3.02%)1,500,000 Installed Building Products, Inc.4 83,052,523 160,725,000
Hotels, Resorts & Cruise Lines (0.47%)2,000,000 Membership Collective
Group, Inc., Cl A1 27,900,478 24,880,000
Leisure Facilities (1.18%)800,000 Planet Fitness, Inc., Cl A1 28,416,505 62,840,000
Restaurants (1.31%)1,100,000 The Cheesecake Factory, Inc.1 26,921,175 51,700,000
418,182 Dutch Bros, Inc., Cl A1 9,618,186 18,115,644
36,539,361 69,815,644
Specialized ConsumerServices (0.53%)
1,000,000 European Wax Center, Inc., Cl A1 17,067,333 28,010,000
Total Consumer Discretionary 405,069,050 889,554,144
Consumer Staples (0.97%)
Packaged Foods & Meats (0.97%)3,000,000 UTZ Brands, Inc. 49,020,000 51,390,000
Shares Cost Value
Common Stocks (continued)
Financials (4.41%)
Insurance Brokers (1.88%)3,000,000 BRP Group, Inc., Cl A1 $ 48,364,954 $ 99,870,000
Investment Banking &Brokerage (1.08%)
625,000 Houlihan Lokey, Inc. 28,909,333 57,562,500
Property & CasualtyInsurance (1.45%)
475,000 Kinsale Capital Group, Inc. 67,820,848 76,807,500
Total Financials 145,095,135 234,240,000
Health Care (15.62%)
Health Care Equipment (7.21%)1,000,000 Axonics, Inc.1 35,459,918 65,090,000
300,000 CryoPort, Inc.1 13,683,573 19,953,000200,000 DexCom, Inc.1 2,652,860 109,372,000
95,000 IDEXX Laboratories, Inc.1 1,314,205 59,080,500320,000 Inspire Medical Systems, Inc.1,5 16,558,159 74,521,600
1,000,000 Silk Road Medical, Inc.1,5 38,972,604 55,030,000
108,641,319 383,047,100
Health Care Supplies (0.35%)500,000 Figs, Inc., Cl A1 12,760,012 18,570,000
Life Sciences Tools &Services (5.86%)
250,000 Guardant Health, Inc.1,5 4,953,266 31,252,500750,000 ICON plc1,2 49,241,341 196,515,000
2,652,592 MaxCyte, Inc. (United Kingdom)1,5 31,357,616 32,353,98037,500 Mettler-Toledo International, Inc.1 1,817,455 51,651,000
87,369,678 311,772,480
Managed Health Care (0.97%)800,000 HealthEquity, Inc.1 13,208,487 51,808,000
Pharmaceuticals (1.23%)1,000,000 Dechra Pharmaceuticals PLC
(United Kingdom)2 28,027,985 65,348,909
Total Health Care 250,007,481 830,546,489
Industrials (23.71%)
Aerospace & Defense (3.35%)2,350,000 Kratos Defense & Security
Solutions, Inc.1 35,335,984 52,428,5001,000,000 Mercury Systems, Inc.1 25,872,953 47,420,000
125,000 TransDigm Group, Inc.1 0 78,071,250
61,208,937 177,919,750
Building Products (2.83%)3,000,000 Janus International
Group, Inc., Cl A1 30,000,000 36,720,0001,090,609 The AZEK Co., Inc.1 25,084,007 39,839,947
725,000 Trex Company, Inc.1 27,101,408 73,899,250
82,185,415 150,459,197
Diversified SupportServices (1.00%)
1,850,000 Driven Brands Holdings, Inc.1 45,803,401 53,446,500
Electrical Components &Equipment (3.46%)
1,200,000 Shoals TechnologiesGroup, Inc., Cl A1 32,825,720 33,456,000
6,250,000 Vertiv Holdings Co. 61,620,882 150,562,500
94,446,602 184,018,500
158

Baron Funds
Baron Small Cap Fund — PORTFOLIO HOLDINGS (Continued)
September 30, 2021
Shares Cost Value
Common Stocks (continued)
Industrials (continued)
Environmental & FacilitiesServices (1.18%)
500,000 Waste Connections, Inc.2 $ 21,833,333 $ 62,965,000
Human Resource & EmploymentServices (3.93%)
1,550,000 ASGN, Inc.1 34,021,695 175,367,0001,750,000 First Advantage Corp.1 26,390,061 33,337,500
60,411,756 208,704,500
Industrial Machinery (2.22%)500,000 John Bean Technologies Corp. 42,775,112 70,275,000225,000 RBC Bearings, Incorporated1 24,593,639 47,745,000
67,368,751 118,020,000
Research & Consulting Services (1.65%)4,000,000 Clarivate Plc1,2 44,078,833 87,600,000
Trading Companies &Distributors (4.09%)
3,250,000 Hillman Solutions Corp.1,5 37,752,933 38,772,500500,000 Hydrofarm Holdings Group, Inc.1,5 23,336,421 18,925,000800,000 SiteOne Landscape Supply, Inc.1 19,405,950 159,576,000
80,495,304 217,273,500
Total Industrials 557,832,332 1,260,406,947
Information Technology (28.69%)
Application Software (11.16%)750,000 Altair Engineering, Inc., Cl A1 11,935,619 51,705,000800,000 Aspen Technology, Inc.1 29,983,938 98,240,000850,000 Ceridian HCM Holding, Inc.1 23,711,721 95,727,000500,000 Clearwater Analytics
Holdings, Inc., Cl A1 10,820,073 12,805,0005,000,000 E2open Parent Holdings, Inc.1 50,859,472 56,500,0001,886,792 E2open Parent Holdings, Inc., Cl A1,3 19,999,995 20,547,1651,225,000 Guidewire Software, Inc.1 31,269,358 145,615,7503,500,000 SmartRent, Inc. (formerly, Fifth
Wall Acquisition Corp. I)1,5 38,625,571 45,570,000950,000 The Trade Desk, Inc., Cl A1 3,372,500 66,785,000
220,578,247 593,494,915
Data Processing & OutsourcedServices (5.53%)
750,000 Nuvei Corp., (Canada), 144A1,2 20,780,312 86,640,0003,500,000 Paya Holdings, Inc., Cl A1 36,561,336 38,045,0003,500,000 Repay Holdings Corporation1 30,228,850 80,605,001
405,170 Shift4 Payments, Inc., Cl A1 9,677,975 31,408,778325,000 WEX, Inc.1 13,547,002 57,245,500
110,795,475 293,944,279
Electronic Equipment & Instruments (1.81%)1,200,000 Cognex Corp. 9,420,069 96,264,000
Internet Services & Infrastructure (1.11%)300,000 Wix.com Ltd.1,2 15,501,799 58,791,000
IT Consulting & Other Services (8.58%)750,000 Endava plc, ADR1,2 23,557,249 101,887,500950,000 Gartner, Inc.1 14,034,173 288,686,000
2,250,000 Grid Dynamics Holdings, Inc.1 22,274,704 65,745,000
59,866,126 456,318,500
Systems Software (0.50%)682,429 Jamf Holding Corp.1,5 19,287,457 26,287,165
Total Information Technology 435,449,173 1,525,099,859
Shares Cost Value
Common Stocks (continued)
Materials (2.49%)
Metal & GlassContainers (0.91%)
800,000 Berry Global Group, Inc.1 $ 12,652,147 $ 48,704,000
Specialty Chemicals (1.58%)1,809,631 Avient Corp. 57,788,524 83,876,396
Total Materials 70,440,671 132,580,396
Real Estate (3.35%)
Specialized REITs (3.35%)2,500,000 Americold Realty Trust5 51,727,682 72,625,000
320,000 SBA Communications Corp. 1,289,008 105,782,400
Total Real Estate 53,016,690 178,407,400
TOTAL COMMON STOCKS 2,003,080,159 5,312,715,985
Principal Amount
Short Term Investments (0.06%)
$2,983,303 Repurchase Agreement with FixedIncome Clearing Corp., dated9/30/2021, 0.00% due10/1/2021; Proceeds atmaturity - $2,983,303; (Fullycollateralized by $2,904,600U.S. Treasury Bond, 2.25% due5/15/2041 Marketvalue - $3,043,023) 2,983,303 2,983,303
TOTAL INVESTMENTS (99.99%) $2,006,063,462 5,315,699,288
CASH AND OTHER ASSETS LESSLIABILITIES (0.01%) 757,259
NET ASSETS $5,316,456,547
RETAIL SHARES (Equivalent to $40.67 per sharebased on 44,983,254 shares outstanding) $1,829,446,479
INSTITUTIONAL SHARES (Equivalent to $43.12 per sharebased on 74,547,365 shares outstanding) $3,214,212,037
R6 SHARES (Equivalent to $43.10 per sharebased on 6,329,204 shares outstanding) $ 272,798,031
% Represents percentage of net assets.1 Non-income producing securities.2 Foreign corporation.3 At September 30, 2021, the market value of restricted and fair valued
securities amounted to $20,547,165 or 0.39% of net assets. This security isnot deemed liquid.
4 An “Affiliated” investment may include any company in which the Fund owns5% or more of its outstanding shares.
5 The Adviser has reclassified/classified certain securities in or out of thissub-industry. Such reclassifications/classifications are not supported by S&Por MSCI (unaudited).
ADR American Depositary Receipt.144A Security is exempt from registration pursuant to Rule 144A under the
Securities Act of 1933. This security may be resold in transactions that areexempt from registration, normally to qualified institutional buyers. AtSeptember 30, 2021, the market value of Rule 144A securities amounted to$86,640,000 or 1.63% of net assets.
159

Baron Funds
Baron Opportunity Fund — PORTFOLIO HOLDINGS
September 30, 2021
Shares Cost Value
Common Stocks (95.00%)
Communication Services (18.54%)
Interactive HomeEntertainment (1.45%)
114,000 Electronic Arts, Inc. $ 13,119,491 $ 16,216,50047,500 Take-Two Interactive Software, Inc.1 5,288,028 7,318,325
18,407,519 23,534,825
Interactive Media &Services (15.01%)
39,550 Alphabet, Inc., Cl C1,5 53,222,693 105,413,011321,000 Pinterest, Inc., Cl A1 8,876,431 16,354,950428,000 Snap, Inc., Cl A1 6,424,269 31,616,360699,406 Tripadvisor, Inc.1 23,476,136 23,674,893199,303 Zillow Group, Inc., Cl C1 12,604,492 17,566,566778,369 ZoomInfo Technologies Inc., Cl A1 25,572,629 47,628,399
130,176,650 242,254,179
Movies & Entertainment (2.08%)650,000 Endeavor Group
Holdings, Inc., Cl A1 15,600,000 18,635,50024,425 Netflix, Inc.1 3,966,732 14,907,555
19,566,732 33,543,055
Total Communication Services 168,150,901 299,332,059
Consumer Discretionary (11.57%)
AutomobileManufacturers (3.26%)
67,900 Tesla, Inc.1 2,677,714 52,655,092
Education Services (0.84%)1,350,000 Nerdy, Inc.1,4 15,485,331 13,486,500
Internet & Direct MarketingRetail (7.47%)
35,000 Alibaba Group HoldingLimited, ADR1,2 2,433,089 5,181,750
24,275 Amazon.com, Inc.1 29,742,115 79,744,3468,529 MercadoLibre, Inc.1 4,838,488 14,323,603
533,000 Stitch Fix, Inc., Cl A1 28,973,389 21,293,350
65,987,081 120,543,049
Total Consumer Discretionary 84,150,126 186,684,641
Financials (1.33%)
Consumer Finance (0.97%)990,099 SoFi Technologies, Inc.1 9,900,990 15,722,772
Financial Exchanges &Data (0.36%)
13,600 MarketAxess Holdings, Inc. 2,665,441 5,721,384
Total Financials 12,566,431 21,444,156
Health Care (15.39%)
Biotechnology (7.82%)265,779 Acceleron Pharma, Inc.1 22,137,670 45,740,566113,639 argenx SE, ADR1,2 13,172,425 34,318,978487,600 Arrowhead Pharmaceuticals, Inc.1 22,064,385 30,440,868141,086 Natera, Inc.1,4 16,131,117 15,722,624
73,505,597 126,223,036
Health Care Equipment (4.04%)525,000 Butterfly Network, Inc.1 5,250,000 5,481,000131,100 Edwards Lifesciences Corp.1 7,561,453 14,841,831
17,235 Intuitive Surgical, Inc.1 7,296,036 17,134,175134,500 Shockwave Medical, Inc.1 6,674,952 27,690,860
26,782,441 65,147,866
Shares Cost Value
Common Stocks (continued)
Health Care (continued)
Health Care Supplies (0.38%)165,779 Figs, Inc., Cl A1 $ 5,156,730 $ 6,157,032
Health Care Technology (0.39%)116,374 Schrödinger, Inc.1 2,485,556 6,363,330
Life Sciences Tools &Services (2.76%)
50,419 10X Genomics, Inc., Cl A1 3,006,785 7,339,998235,096 CareDx, Inc.1,4 7,719,306 14,898,034
98,637 Guardant Health, Inc.1,4 10,366,504 12,330,61124,415 Illumina, Inc.1 3,703,768 9,902,968
24,796,363 44,471,611
Total Health Care 132,726,687 248,362,875
Industrials (3.18%)
Aerospace & Defense (0.94%)682,969 Kratos Defense & Security
Solutions, Inc.1 11,162,207 15,237,038
Industrial Machinery (0.56%)836,708 Markforged Holding Corp.1 7,237,382 5,488,805425,000 Velo3D, Inc.1,4 4,238,907 3,557,250
11,476,289 9,046,055
Research & ConsultingServices (1.68%)
315,330 CoStar Group, Inc.1 12,772,623 27,137,300
Total Industrials 35,411,119 51,420,393
Information Technology (42.78%)
Application Software (14.14%)34,900 Adobe, Inc.1 8,174,023 20,092,62849,000 Atlassian Corp. PLC, Cl A1,2 11,935,490 19,179,58075,000 Avalara, Inc.1 10,855,775 13,107,750
383,070 Ceridian HCM Holding, Inc.1 28,971,891 43,141,34469,346 Clearwater Analytics
Holdings, Inc., Cl A1 1,248,228 1,775,951232,100 Guidewire Software, Inc.1 11,878,404 27,589,727
25,000 HubSpot, Inc.1 13,504,652 16,902,250108,100 RingCentral, Inc., Cl A1 20,153,567 23,511,750
39,500 ServiceNow, Inc.1,4 9,588,431 24,579,665333,283 SimilarWeb Ltd.1,2 7,167,469 6,975,613116,910 The Trade Desk, Inc., Cl A1 278,394 8,218,773
92,900 Workday, Inc., Cl A1 22,587,105 23,214,781
146,343,429 228,289,812
Data Processing & OutsourcedServices (7.37%)
3,000 Adyen N.V., (Netherlands), 144A1,2 2,422,754 8,386,08572,300 MasterCard Incorporated, Cl A 16,486,273 25,137,264
115,200 PayPal Holdings, Inc.1 16,572,834 29,976,19254,500 Square, Inc., Cl A1 10,459,131 13,071,280
184,054 Toast, Inc., Cl A1 7,362,160 9,193,497149,300 Visa, Inc., Cl A 25,109,011 33,256,575
78,412,163 119,020,893
Electronic Equipment &Instruments (1.32%)
345,133 PAR Technology Corp.1 14,931,208 21,229,131
Internet Services &Infrastructure (1.59%)
220,677 GDS Holdings Limited, ADR1,2 11,246,223 12,492,52567,043 Wix.com Ltd.1,2 3,803,923 13,138,417
15,050,146 25,630,942
160

Baron Funds
Baron Opportunity Fund — PORTFOLIO HOLDINGS (Continued)
September 30, 2021
Shares Cost Value
Common Stocks (continued)
Information Technology (continued)
IT Consulting & OtherServices (4.18%)
202,368 Endava plc, ADR1,2 $ 6,819,469 $ 27,491,693131,587 Gartner, Inc.1 6,742,678 39,986,657
13,562,147 67,478,350
Semiconductors (4.00%)1,770,000 indie Semiconductor, Inc., Cl A1 17,169,776 21,788,700
206,400 NVIDIA Corp. 18,021,140 42,757,824
35,190,916 64,546,524
Systems Software (10.18%)61,723 Crowdstrike Holdings, Inc., Cl A1 3,067,061 15,170,279
493,900 Microsoft Corporation 78,400,719 139,240,28832,508 Snowflake, Inc., Cl A1,4 3,900,960 9,831,394
85,368,740 164,241,961
Total Information Technology 388,858,749 690,437,613
Real Estate (2.06%)
Real Estate Services (1.36%)1,073,230 Opendoor Technologies, Inc.1 10,732,300 22,033,412
Specialized REITs (0.70%)14,225 Equinix, Inc. 2,122,124 11,239,599
Total Real Estate 12,854,424 33,273,011
Special Purpose Acquisition Company (0.15%)231,800 Khosla Ventures
Acquisition Co. II, Cl A1 2,455,228 2,359,724
TOTAL COMMON STOCKS 837,173,665 1,533,314,472
Private Common Stocks (0.30%)
Industrials (0.30%)9,099 Space Exploration
Technologies Corp., Cl A1,3,4 3,821,489 3,777,5412,806 Space Exploration
Technologies Corp., Cl C1,3,4 1,178,492 1,164,939
TOTAL PRIVATE COMMON STOCKS 4,999,981 4,942,480
Private Convertible Preferred Stocks (2.15%)
Consumer Discretionary (1.35%)
AutomobileManufacturers (1.35%)
484,183 Rivian Automotive, Inc., Series E1,3,4 7,499,995 17,425,746122,117 Rivian Automotive, Inc., Series F1,3,4 4,500,011 4,440,174
Total Consumer Discretionary 12,000,006 21,865,920
Materials (0.80%)
Fertilizers & AgriculturalChemicals (0.80%)
219,321 Farmers Business Network, Inc.,Series F1,3,4 7,250,007 12,869,756
TOTAL PRIVATE CONVERTIBLEPREFERRED STOCKS 19,250,013 34,735,676
Shares Cost Value
Private Preferred Stocks (0.88%)
Industrials (0.88%)
Aerospace & Defense (0.48%)18,519 Space Exploration
Technologies Corp., Cl N1,3,4 $ 5,000,130 $ 7,688,348
Trucking (0.40%)266,956 GM Cruise Holdings, Cl G1,3,4 7,034,290 6,479,022
TOTAL PRIVATE PREFERRED STOCKS 12,034,420 14,167,370
Warrants (0.01%)
Communication Services (0.01%)
Interactive Media & Services (0.01%)106,682 Taboola.com Ltd., 6/29/20261,2 192,759 197,362
Principal Amount
Short Term Investments (1.86%)
$29,940,909 Repurchase Agreement with FixedIncome Clearing Corp., dated9/30/2021, 0.00% due10/1/2021; Proceeds atmaturity - $29,940,909; (Fullycollateralized by $14,645,800U.S. Treasury Note, 1.25% due9/30/2028 Market value -$14,570,286 and $17,082,500U.S. Treasury Note, 0.625% due5/15/2030 Marketvalue - $15,969,468) 29,940,909 29,940,909
TOTAL INVESTMENTS (100.20%) $ 903,591,747 1,617,298,269
LIABILITIES LESS CASH AND OTHER ASSETS (-0.20%)6 (3,262,186)
NET ASSETS $1,614,036,083
RETAIL SHARES (Equivalent to $43.49 per sharebased on 19,922,040 shares outstanding) $ 866,473,654
INSTITUTIONAL SHARES (Equivalent to $45.85 per sharebased on 15,516,269 shares outstanding) $ 711,422,767
R6 SHARES (Equivalent to $45.90 per sharebased on 787,311 shares outstanding) $ 36,139,662
% Represents percentage of net assets.1 Non-income producing securities.2 Foreign corporation.3 At September 30, 2021, the market value of restricted and fair valued
securities amounted to $53,845,526 or 3.34% of net assets. These securitiesare not deemed liquid.
4 The Adviser has reclassified/classified certain securities in or out of thissub-industry. Such reclassifications/classifications are not supported by S&Por MSCI (unaudited).
5 All or a portion of these securities are segregated for unfunded commitments.Total value of securities segregated is $13,326,550.
6 Includes net unrealized depreciation of $299,342 on unfunded commitmentswith special purpose acquisition companies to purchase when-issued privateinvestments in public entities.
ADR American Depositary Receipt.144A Security is exempt from registration pursuant to Rule 144A under the
Securities Act of 1933. This security may be resold in transactions that areexempt from registration, normally to qualified institutional buyers. AtSeptember 30, 2021, the market value of Rule 144A securities amounted to$8,386,085 or 0.52% of net assets.
161

Baron Funds
Baron Partners Fund — PORTFOLIO HOLDINGS
September 30, 2021 (Unaudited)
Shares Cost Value
Common Stocks (107.10%)
Communication Services (9.03%)
Alternative Carriers (0.86%)1,550,000 Iridium Communications, Inc.1 $ 36,086,794 $ 61,767,500
Interactive HomeEntertainment (0.87%)
800,000 Activision Blizzard, Inc. 46,968,391 61,912,000
Interactive Media &Services (3.41%)
2,750,000 Zillow Group, Inc., Cl A1 107,616,333 243,595,000
Movies & Entertainment (3.89%)5,000,000 Manchester United plc, Cl A2 86,728,246 96,850,000
804,497 Spotify Technology SA1,2 183,803,091 181,285,354
270,531,337 278,135,354
Total Communication Services 461,202,855 645,409,854
Consumer Discretionary (55.93%)
Automobile Manufacturers (45.31%)4,175,000 Tesla, Inc.1,5 188,464,376 3,237,629,000
Casinos & Gaming (0.50%)700,000 Red Rock Resorts, Inc., Cl A1 18,183,732 35,854,000
Hotels, Resorts & CruiseLines (5.10%)
3,300,000 Hyatt Hotels Corp., Cl A1 113,614,807 254,430,000700,000 Marriott Vacations
Worldwide Corp. 81,762,309 110,131,000
195,377,116 364,561,000
Leisure Facilities (4.67%)1,000,000 Vail Resorts, Inc.1,6 48,702,009 334,050,000
Restaurants (0.35%)1,794,179 Krispy Kreme, Inc.1 30,083,729 25,118,506
Total Consumer Discretionary 480,810,962 3,997,212,506
Financials (13.93%)
Asset Management & CustodyBanks (1.15%)
1,000,000 Brookfield AssetManagement, Inc., Cl A2 35,923,845 53,510,000
343,079 Cohen & Steers, Inc. 24,604,255 28,739,728
60,528,100 82,249,728
Financial Exchanges & Data (5.14%)700,000 FactSet Research Systems, Inc. 46,576,636 276,346,000150,000 MSCI, Inc. 37,181,742 91,251,000
83,758,378 367,597,000
Investment Banking &Brokerage (3.98%)
3,900,000 The Charles Schwab Corp. 86,233,677 284,076,000
Property & CasualtyInsurance (3.50%)
6,550,000 Arch Capital Group Ltd.1,2 30,153,581 250,079,000
Reinsurance (0.16%)200,000 Brookfield Asset Management
Reinsurance Partners Ltd., Cl A2 11,967,341 11,112,000
Total Financials 272,641,077 995,113,728
Shares Cost Value
Common Stocks (continued)
Health Care (7.53%)
Biotechnology (0.42%)48,003 BioNTech SE, ADR1,2 $ 10,344,715 $ 13,104,33944,000 Moderna, Inc.1 7,630,038 16,933,840
17,974,753 30,038,179
Health Care Equipment (6.96%)800,000 IDEXX Laboratories, Inc.1 35,048,047 497,520,000
Health Care Supplies (0.15%)200,000 Warby Parker, Inc., Cl A1 10,701,350 10,610,000
Total Health Care 63,724,150 538,168,179
Industrials (9.40%)
Aerospace & Defense (0.55%)500,000 Archer Aviation, Inc., Cl A
(formerly, Atlas CrestInvestment Corp. units)1,4 4,720,280 4,440,000
500,000 Archer Aviation, Inc., Cl A1,3,4 5,000,000 4,270,000125,625 HEICO Corp. 9,632,520 16,566,169116,875 HEICO Corp., Cl A 7,586,429 13,841,506
26,939,229 39,117,675
Research & ConsultingServices (8.85%)
7,350,000 CoStar Group, Inc.1 98,974,400 632,541,000
Total Industrials 125,913,629 671,658,675
Information Technology (9.62%)
Application Software (2.73%)124,287 AppLovin Corp., Cl A1 9,942,960 8,994,650925,000 Guidewire Software, Inc.1 74,997,711 109,954,750350,000 RingCentral, Inc., Cl A1 91,698,861 76,125,000
176,639,532 195,074,400
Data Processing & OutsourcedServices (2.32%)
59,246 Adyen N.V., 144A (Netherlands)1,2 53,544,382 165,614,001
Internet Services &Infrastructure (1.60%)
400,000 GDS Holdings Limited, ADR1,2 22,241,873 22,644,00067,500 Shopify, Inc., Cl A1,2 48,766,450 91,515,150
71,008,323 114,159,150
IT Consulting & OtherServices (2.97%)
700,000 Gartner, Inc.1 83,980,674 212,716,000
Total Information Technology 385,172,911 687,563,551
Real Estate (1.66%)
Office REITs (0.48%)1,085,000 Douglas Emmett, Inc. 29,974,652 34,296,850
Specialized REITs (1.18%)1,819,296 Gaming and Leisure
Properties, Inc.1 57,585,382 84,269,790
Total Real Estate 87,560,034 118,566,640
TOTAL COMMON STOCKS 1,877,025,618 7,653,693,133
162

Baron Funds
Baron Partners Fund — PORTFOLIO HOLDINGS (Continued)
September 30, 2021 (Unaudited)
Shares Cost Value
Private Common Stocks (1.46%)
Industrials (1.46%)
Aerospace & Defense (1.46%)221,631 Space Exploration
Technologies Corp., Cl A1,3,4 $ 29,920,185 $ 92,012,32630,221 Space Exploration
Technologies Corp., Cl C1,3,4 4,079,835 12,546,550
TOTAL PRIVATE COMMON STOCKS 34,000,020 104,558,876
Private Convertible Preferred Stocks (0.11%)
Industrials (0.11%)
Electrical Components &Equipment (0.11%)
21,213,656 Northvolt AB, Series E2(Sweden)1,2,3,4 7,843,621 7,423,740
Private Preferred Stocks (3.22%)
Industrials (3.22%)
Aerospace & Defense (3.22%)311,111 Space Exploration
Technologies Corp., Cl H1,3,4 41,999,985 129,160,843131,657 Space Exploration
Technologies Corp., Cl I1,3,4 22,250,032 54,658,720111,111 Space Exploration
Technologies Corp., Cl N1,3,4 29,999,970 46,128,843
TOTAL PRIVATE PREFERRED STOCKS 94,249,987 229,948,406
Warrants (0.00%)
Industrials (0.00%)
Aerospace & Defense (0.00%)166,666 Archer Aviation, Inc., Cl A
Exp 9/16/20261,4 279,719 264,999
Principal Amount Cost Value
Short Term Investments (0.00%)
$111,303 Repurchase Agreement with FixedIncome Clearing Corp., dated9/30/2021, 0.00% due10/1/2021; Proceeds atmaturity - $111,303; (Fullycollateralized by $111,700U.S. Treasury Note, 1.625%due 5/15/2031 Marketvalue - $113,567) $ 111,303 $ 111,303
TOTAL INVESTMENTS (111.89%) $2,013,510,268 7,996,000,457
LIABILITIES LESS CASH AND OTHER ASSETS(-11.89%)7 (849,853,374)
NET ASSETS $7,146,147,083
RETAIL SHARES (Equivalent to $172.52 per sharebased on 18,871,715 shares outstanding) $3,255,739,659
INSTITUTIONAL SHARES (Equivalent to $178.23 per sharebased on 18,896,310 shares outstanding) $3,367,796,531
R6 Shares (Equivalent to $178.21 per sharebased on 2,932,491 shares outstanding) $ 522,610,893
% Represents percentage of net assets.1 Non-income producing securities.2 Foreign corporation.3 At September 30, 2021, the market value of restricted and fair valued
securities amounted to $346,201,022 or 4.84% of net assets. These securitiesare not deemed liquid.
4 The Adviser has reclassified/classified certain securities in or out of thissub-industry. Such reclassifications/classifications are not supported by S&Por MSCI (unaudited).
5 Investors in the Fund may view Tesla, Inc.’s financial statements on theEDGAR website of the U.S. Securities and Exchange Commission by going tohttps://www.sec.gov/cgi-bin/browse-edgar?CIK=1318605&owner=exclude.Please note that the Fund is not responsible for Tesla’s financial statementsand can provide no assurances as to their accuracy or completeness.
6 All or a portion of these securities are segregated for an unfundedcommitment. Total Value of securities segregated is $22,047,300.
7 Includes unrealized depreciation of $1,512,600 on an unfunded commitmentwith a special purpose acquisition company to purchase a when-issuedprivate investment in a public entity.
ADR American Depositary Receipt.144A Security is exempt from registration pursuant to Rule 144A under the
Securities Act of 1933. This security may be resold in transactions that areexempt from registration, normally to qualified institutional buyers. AtSeptember 30, 2021, the market value of Rule 144A securities amounted to$165,614,001 or 2.32% of net assets.
163
Baron Funds
Baron Fifth Avenue Growth Fund — PORTFOLIO HOLDINGS
September 30, 2021
Shares Cost Value
Common Stocks (98.09%)
Communication Services (14.83%)
Interactive Home Entertainment (0.97%)25,415 Sea Ltd., ADR1,2 $ 8,094,524 $ 8,100,523
Interactive Media & Services (13.86%)11,490 Alphabet, Inc., Cl A1 17,696,238 30,718,74510,283 Alphabet, Inc., Cl C1 4,420,382 27,407,383
116,389 Facebook, Inc., Cl A1 16,229,480 39,501,262301,416 ZoomInfo Technologies Inc., Cl A1 9,285,584 18,443,645
47,631,684 116,071,035
Total Communication Services 55,726,208 124,171,558
Consumer Discretionary (9.99%)
Internet & Direct Marketing Retail (9.99%)19,267 Amazon.com, Inc.1 8,804,069 63,292,86612,138 MercadoLibre, Inc.1 7,661,536 20,384,557
Total Consumer Discretionary 16,465,605 83,677,423
Financials (2.30%)
Financial Exchanges & Data (2.30%)45,219 S&P Global, Inc. 10,911,824 19,213,101
Health Care (15.02%)
Biotechnology (3.86%)112,455 Acceleron Pharma, Inc.1 11,815,692 19,353,505
42,879 argenx SE, ADR1,2 12,945,859 12,949,458
24,761,551 32,302,963
Health Care Equipment (3.72%)31,366 Intuitive Surgical, Inc.1 13,622,943 31,182,509
Health Care Technology (3.46%)100,453 Veeva Systems, Inc., Cl A1 7,493,348 28,947,541
Life Sciences Tools & Services (3.98%)90,959 10X Genomics, Inc., Cl A1 9,317,474 13,241,81149,489 Illumina, Inc.1 7,204,506 20,073,234
16,521,980 33,315,045
Total Health Care 62,399,822 125,748,058
Information Technology (53.92%)
Application Software (12.96%)54,742 Adobe, Inc.1 27,393,137 31,516,06484,251 RingCentral, Inc., Cl A1 18,380,517 18,324,59364,177 ServiceNow, Inc.1,3 26,333,590 39,935,42278,303 Splunk, Inc.1 9,872,185 11,331,22728,394 Zoom Video Communications, Inc., Cl A1 10,484,592 7,425,031
92,464,021 108,532,337
Data Processing & OutsourcedServices (14.24%)
6,218 Adyen N.V., 144A (Netherlands)1,2 4,711,862 17,381,55977,774 MasterCard Incorporated, Cl A 7,508,689 27,040,46486,502 PayPal Holdings, Inc.1 18,667,515 22,508,685
103,821 Square, Inc., Cl A1 23,693,250 24,900,42998,916 Toast, Inc., Cl A1 3,956,640 4,940,854
100,918 Visa, Inc., Cl A 6,191,852 22,479,485
64,729,808 119,251,476
Shares Cost Value
Common Stocks (continued)
Information Technology (continued)
Internet Services &Infrastructure (4.69%)
18,649 Shopify, Inc., Cl A1,2 $ 23,830,050 $ 25,283,94171,087 Wix.com Ltd.1,2 10,110,189 13,930,919
33,940,239 39,214,860
IT Consulting & Other Services (4.33%)63,602 EPAM Systems, Inc.1 9,148,341 36,283,669
Semiconductor Equipment (3.28%)36,842 ASML Holding N.V.2 3,568,785 27,451,343
Semiconductors (2.98%)120,401 NVIDIA Corp. 18,553,380 24,942,271
Systems Software (11.44%)93,792 Crowdstrike Holdings, Inc., Cl A1 5,972,732 23,052,19883,835 Datadog, Inc., Cl A1,3 2,263,545 11,850,077
256,769 Dynatrace, Inc.1,3 11,122,881 18,222,89649,773 Snowflake, Inc., Cl A1,3 6,209,275 15,052,84881,789 Twilio, Inc., Cl A1,3 11,034,337 26,094,78128,607 UiPath, Inc., Cl A1 1,601,992 1,505,014
38,204,762 95,777,814
Total Information Technology 260,609,336 451,453,770
Real Estate (2.03%)
Specialized REITs (2.03%)21,508 Equinix, Inc. 4,587,574 16,994,116
TOTAL COMMON STOCKS 410,700,369 821,258,026
Private Common Stocks (0.18%)
Industrials (0.18%)2,730 Space Exploration
Technologies Corp., Cl A1,3,4 1,146,573 1,133,387841 Space Exploration
Technologies Corp., Cl C1,3,4 353,211 349,149
TOTAL PRIVATE COMMON STOCKS 1,499,784 1,482,536
Private Convertible Preferred Stocks (0.35%)
Consumer Discretionary (0.35%)
Automobile Manufacturers (0.35%)81,411 Rivian Automotive, Inc., Series F1,3,4 2,999,995 2,960,104
Private Preferred Stocks (0.39%)
Industrials (0.39%)
Trucking (0.39%)133,288 GM Cruise Holdings, Cl G1,3,4 3,512,139 3,234,900
164
Baron Funds
Baron Fifth Avenue Growth Fund — PORTFOLIO HOLDINGS (Continued)
September 30, 2021
Principal Amount Cost Value
Short Term Investments (1.00%)
$8,370,965 Repurchase Agreement with FixedIncome Clearing Corp., dated9/30/2021, 0.00% due 10/1/2021;Proceeds at maturity - $8,370,965;(Fully collateralized by $9,133,500U.S. Treasury Note, 0.625%due 5/15/2030 Marketvalue - $8,538,395) $ 8,370,965 $ 8,370,965
TOTAL INVESTMENTS (100.01%) $427,083,252 837,306,531
LIABILITIES LESS CASH ANDOTHER ASSETS (-0.01%) (96,211)
NET ASSETS $837,210,320
RETAIL SHARES (Equivalent to $55.33 per sharebased on 3,395,464 shares outstanding) $187,861,080
INSTITUTIONAL SHARES (Equivalent to $56.82 per sharebased on 10,732,044 shares outstanding) $609,786,466
R6 SHARES (Equivalent to $56.84 per sharebased on 696,059 shares outstanding) $ 39,562,774
% Represents percentage of net assets.1 Non-income producing securities.2 Foreign corporation.3 The Adviser has reclassified/classified certain securities in or out of this
sub-industry. Such reclassifications/classifications are not supported by S&Por MSCI (unaudited).
4 At September 30, 2021, the market value of restricted and fair valuedsecurities amounted to $7,677,540 or 0.92% of net assets. These securitiesare not deemed liquid.
ADR American Depositary Receipt.144A Security is exempt from registration pursuant to Rule 144A under the
Securities Act of 1933. This security may be resold in transactions that areexempt from registration, normally to qualified institutional buyers. AtSeptember 30, 2021, the market value of Rule 144A securities amounted to$17,381,559 or 2.08% of net assets.
165

Baron Funds
Baron Focused Growth Fund — PORTFOLIO HOLDINGS
September 30, 2021 (Unaudited)
Shares Cost Value
Common Stocks (92.89%)
Communication Services (8.98%)
Alternative Carriers (2.15%)401,472 Iridium Communications, Inc.1 $ 2,949,375 $ 15,998,659
Movies & Entertainment (6.83%)1,110,794 Manchester United plc, Cl A2 18,923,566 21,516,080
130,503 Spotify Technology SA1,2 30,610,744 29,407,546
49,534,310 50,923,626
Total Communication Services 52,483,685 66,922,285
Consumer Discretionary (54.48%)
Automobile Manufacturers (33.41%)321,000 Tesla, Inc.1,5 13,812,210 248,929,080
Casinos & Gaming (7.24%)567,501 Penn National Gaming, Inc.1 10,857,402 41,121,122250,000 Red Rock Resorts, Inc., Cl A1 3,110,299 12,805,000
13,967,701 53,926,122
Hotels, Resorts & CruiseLines (7.28%)
155,000 Choice Hotels International, Inc. 5,375,923 19,587,350450,000 Hyatt Hotels Corp., Cl A1 20,174,187 34,695,000
25,550,110 54,282,350
Internet & Direct MarketingRetail (0.54%)
100,000 Stitch Fix, Inc., Cl A1 4,135,377 3,995,000
Leisure Facilities (6.01%)134,000 Vail Resorts, Inc.1,6 8,130,896 44,762,700
Total Consumer Discretionary 65,596,294 405,895,252
Financials (7.05%)
Financial Exchanges & Data (3.97%)75,000 FactSet Research Systems, Inc. 5,828,282 29,608,500
Property & CasualtyInsurance (3.08%)
600,000 Arch Capital Group Ltd.1,2 12,581,802 22,908,000
Total Financials 18,410,084 52,516,500
Health Care (5.21%)
Biotechnology (3.17%)68,004 BioNTech SE, ADR1,2 6,537,442 18,564,412
100,000 Denali Therapeutics, Inc.1 6,604,891 5,045,000
13,142,333 23,609,412
Health Care Supplies (1.45%)292,000 Figs, Inc., Cl A1 8,977,596 10,844,880
Health Care Technology (0.59%)80,000 Schrödinger, Inc.1 5,390,750 4,374,400
Total Health Care 27,510,679 38,828,692
Shares Cost Value
Common Stocks (continued)
Industrials (7.16%)
Research & ConsultingServices (7.16%)
620,000 CoStar Group, Inc.1 $ 11,035,717 $ 53,357,200
Information Technology (8.41%)
Application Software (4.69%)181,870 Guidewire Software, Inc.1 14,920,144 21,618,887
1,025,673 SmartRent, Inc.1,4 12,606,005 13,354,262
27,526,149 34,973,149
Data Processing & OutsourcedServices (2.20%)
5,854 Adyen N.V. (Netherlands), 144A1,2 5,352,874 16,364,048
Internet Services &Infrastructure (1.52%)
200,000 GDS Holdings Limited, ADR1,2 12,006,019 11,322,000
Total Information Technology 44,885,042 62,659,197
Real Estate (1.60%)
Residential REITs (1.15%)225,000 American Homes 4 Rent, Cl A 4,700,804 8,577,000
Specialized REITs (0.45%)115,000 Americold Realty Trust4 3,907,872 3,340,750
Total Real Estate 8,608,676 11,917,750
TOTAL COMMON STOCKS 228,530,177 692,096,876
Private Common Stocks (1.32%)
Industrials (1.32%)
Aerospace & Defense (1.32%)20,859 Space Exploration
Technologies Corp., Cl A1,3,4 2,815,965 8,659,8222,844 Space Exploration
Technologies Corp., Cl C1,3,4 383,940 1,180,715
TOTAL PRIVATE COMMON STOCKS 3,199,905 9,840,537
Private Preferred Stocks (2.25%)
Industrials (2.25%)
Aerospace & Defense (2.25%)29,630 Space Exploration
Technologies Corp., Cl H1,3,4 4,000,050 12,301,1911,479 Space Exploration
Technologies Corp., Cl I1,3,4 249,951 614,0229,259 Space Exploration
Technologies Corp., Cl N1,3,4 2,499,930 3,843,966
TOTAL PRIVATE PREFERRED STOCKS 6,749,931 16,759,179
166

Baron Funds
Baron Focused Growth Fund — PORTFOLIO HOLDINGS (Continued)
September 30, 2021 (Unaudited)
Principal Amount Cost Value
Short Term Investments (4.46%)
$33,223,286 Repurchase Agreement with FixedIncome Clearing Corp., dated9/30/2021, 0.00% due 10/1/2021;-Proceeds at maturity -$33,223,286; (Fully collateralizedby $36,249,700 U.S. TreasuryNote, 0.625% due 5/15/2030Market value - $33,887,805) $ 33,223,286 $ 33,223,286
TOTAL INVESTMENTS (100.92%) $271,703,299 751,919,878
LIABILITIES LESS CASH ANDOTHER ASSETS (-0.92%)7 (6,839,860)
NET ASSETS $745,080,018
RETAIL SHARES (Equivalent to $45.12 per sharebased on 4,039,811 shares outstanding) $182,276,329
INSTITUTIONAL SHARES (Equivalent to $46.51 per sharebased on 5,847,158 shares outstanding) $271,944,206
R6 SHARES (Equivalent to $46.54 per sharebased on 6,249,988 shares outstanding) $290,859,483
% Represents percentage of net assets.1 Non-income producing securities.2 Foreign corporation.3 At September 30, 2021, the market value of restricted and fair valued
securities amounted to $26,599,716 or 3.57% of net assets. These securitiesare not deemed liquid.
4 The Adviser has reclassified/classified certain securities in or out of thissub-industry. Such reclassifications/classifications are not supported by S&Por MSCI (unaudited).
5 Investors in the Fund may view Tesla, Inc.’s financial statements on theEDGAR website of the U.S. Securities and Exchange Commission by going tohttps://www.sec.gov/cgi-bin/browse-edgar?CIK=1318605&owner=exclude.Please note that the Fund is not responsible for Tesla’s financial statementsand can provide no assurances as to their accuracy or completeness.
6 All or a portion of these securities are segregated for an unfundedcommitment. Total Value of securities segregated is $11,023,650.
7 Includes unrealized appreciation of $6,800 on an unfunded commitment witha special purpose acquisition company to purchase a when-issued privateinvestment in a public entity.
ADR American Depositary Receipt.144A Security is exempt from registration pursuant to Rule 144A under the
Securities Act of 1933. This security may be resold in transactions that areexempt from registration, normally to qualified institutional buyers. AtSeptember 30, 2021, the market value of Rule 144A securities amounted to$16,364,048 or 2.20% of net assets.
167

Baron Funds
Baron International Growth Fund — PORTFOLIO HOLDINGS
September 30, 2021 (Unaudited)
Shares Cost Value
Common Stocks (89.92%)
Australia (0.74%)644,822 NEXTDC Limited1 $ 3,195,310 $ 5,492,876
Brazil (2.97%)203,670 Afya Ltd., Cl A1 4,052,790 4,020,446120,934 Arco Platform Limited, Cl A1 3,928,368 2,624,268246,403 Notre Dame Intermedica
Participacoes S.A. 2,746,302 3,375,86776,005 StoneCo Ltd., Cl A1 4,870,467 2,638,893
528,790 Suzano SA1 4,885,496 5,293,969102,142 XP, Inc., Cl A1 3,611,052 4,103,044
Total Brazil 24,094,475 22,056,487
Canada (1.94%)168,186 CAE, Inc.1 2,082,977 5,024,600
5,753 Constellation Software, Inc. 1,761,296 9,424,909
Total Canada 3,844,273 14,449,509
China (8.81%)50,315 Alibaba Group Holding Limited, ADR1,2 8,240,935 7,449,136
1,114,021 China Conch Venture Holdings Ltd. 4,856,793 5,172,81768,159 China Tourism Group Duty Free
Corporation Ltd., Cl A 775,657 2,730,764546,989 Galaxy Entertainment Group Ltd.1 4,087,389 2,806,618576,835 Han’s Laser Technology Industry
Group Co., Ltd., Cl A 3,513,167 3,353,563602,284 Hua Hong Semiconductor
Limited, 144A1 1,421,927 3,089,2121,197,374 Kingdee International Software
Group Co. Ltd.1 747,698 3,986,8451,080,701 Kingsoft Corp. Ltd. 4,431,102 4,302,681
467,930 Midea Group Co., Ltd., Cl A 4,082,222 5,031,48257,639 Shenzhen Mindray Bio-Medical
Electronics Co. Ltd., Cl A 1,625,815 3,440,657152,024 Tencent Holdings Limited 7,651,900 9,075,638
92,454 Will Semiconductor Co. Ltd.Shanghai, Cl A 3,269,815 3,450,765
55,833 Zai Lab Limited, ADR1 1,174,286 5,884,240528,597 Zhejiang Dingli Machinery Co. Ltd., Cl A 5,308,155 5,769,045
Total China 51,186,861 65,543,463
Denmark (1.02%)173,153 Genmab A/S, ADR1 7,034,037 7,566,786
France (6.73%)271,533 BNP Paribas S.A. 11,591,321 17,372,862
91,320 Eurofins Scientific SE 2,327,909 11,724,7128,810 LVMH Moët Hennessy Louis Vuitton SE 2,734,359 6,310,283
42,741 Pernod Ricard SA 8,264,435 9,422,811413,564 Vivendi SA 8,356,499 5,206,747
Total France 33,274,523 50,037,415
Germany (4.01%)146,490 Befesa SA, 144A 7,071,613 11,141,112187,853 Mister Spex SE1 5,572,574 4,223,606
60,194 Symrise AG 5,218,374 7,889,690224,171 TeamViewer AG, 144A1 7,841,632 6,558,250
Total Germany 25,704,193 29,812,658
Hong Kong (0.83%)311,500 Techtronic Industries Co. Ltd. 2,131,519 6,155,721
Shares Cost Value
Common Stocks (continued)
India (7.52%)140,002 Bajaj Finance Limited $ 7,057,303 $ 14,405,976
2,573,163 Edelweiss Financial Services Ltd. 2,162,198 2,717,518279,909 Godrej Properties Ltd.1 3,762,871 8,677,362149,203 HDFC Bank Ltd. 2,221,756 3,189,699125,802 Housing Development
Finance Corp., Ltd. 3,530,942 4,649,3752,171,478 JM Financial Limited 2,615,303 2,694,592
548,081 Max Financial Services Limited1 3,895,199 7,469,317681,376 Nippon Life India Asset
Management Ltd., 144A 2,395,677 3,881,338233,839 Reliance Industries Limited 5,093,394 7,914,231
12,984 Reliance Industries Limited PP 115,279 325,459
Total India 32,849,922 55,924,867
Israel (2.65%)128,423 ION Acquisition Corp. 2 Limited1 1,284,230 1,286,799150,000 ION Acquisition Corp. 3 Limited, Cl A1 1,500,000 1,465,500
12,905 monday.com Ltd.1 2,054,845 4,209,611184,257 SimilarWeb Ltd.1 3,971,201 3,856,499404,478 Taboola.com Ltd.1 3,980,972 3,421,884
28,060 Wix.com Ltd.1 3,231,212 5,498,918
Total Israel 16,022,460 19,739,211
Italy (1.02%)300,823 Stevanato Group SpA1 6,317,283 7,613,830
Japan (9.16%)65,316 Advantest Corporation 3,434,849 5,820,27725,557 Keyence Corporation 9,924,917 15,254,232
162,100 MonotaRO Co, Ltd. 878,167 3,632,683104,365 Okamoto Industries, Inc. 4,791,855 3,845,886177,000 Recruit Holdings Co, Ltd. 4,885,462 10,819,270252,800 SMS Co. Ltd. 7,080,427 9,209,328
44,600 Square Enix Holdings Co, Ltd. 1,419,557 2,383,681302,300 Takeda Pharmaceutical
Company Limited 11,976,315 9,970,69116,302 Tokyo Electron Limited 3,928,027 7,201,873
Total Japan 48,319,576 68,137,921
Korea, Republic of (1.12%)97,697 Korea Shipbuilding & Offshore
Engineering Co. Ltd.1 9,407,011 8,302,640
Mexico (0.53%)997,779 Grupo México S.A.B. de C.V., Series B 2,683,414 3,967,624
Netherlands (5.19%)330,618 AMG Advanced Metallurgical Group NV 10,410,255 10,701,757
43,181 argenx SE, ADR1 1,904,769 13,040,66245,192 Koninklijke DSM NV 6,603,481 9,037,310
218,710 Universal Music Group NV1 6,474,769 5,856,017
Total Netherlands 25,393,274 38,635,746
Norway (0.59%)336,246 Golar LNG Ltd.1 3,536,415 4,361,111
Poland (0.83%)372,672 InPost SA1 7,285,004 6,183,904
168

Baron Funds
Baron International Growth Fund — PORTFOLIO HOLDINGS (Continued)
September 30, 2021 (Unaudited)
Shares Cost Value
Common Stocks (continued)
Russia (3.86%)33,408 Novatek PJSC, GDR $ 4,889,899 $ 8,823,053
1,100 Novatek PJSC, GDR (United Kingdom) 153,019 288,007333,867 Sberbank of Russia PJSC, ADR 3,957,007 6,224,464145,799 TCS Group Holding PLC, GDR 3,689,935 13,384,348
Total Russia 12,689,860 28,719,872
Spain (3.07%)111,195 Cellnex Telecom S.A., 144A 6,227,391 6,865,185863,830 eDreams ODIGEO SA1 6,843,147 7,554,661227,691 Industria de Diseno Textil, S.A. 7,335,086 8,378,059
Total Spain 20,405,624 22,797,905
Sweden (2.12%)281,414 Epiroc AB, Cl A 4,208,821 5,850,469
19,316 Spotify Technology SA1 2,790,396 4,352,667494,828 Telefonaktiebolaget LM Ericsson, ADR 4,503,458 5,542,074
Total Sweden 11,502,675 15,745,210
Switzerland (4.34%)376,689 Clariant AG 7,747,136 7,070,562
54,075 Compagnie Financiere Richemont SA 6,377,909 5,606,608814,116 Credit Suisse Group AG 8,487,488 8,040,423
96,080 Nestle S.A. 10,783,686 11,576,681
Total Switzerland 33,396,219 32,294,274
United Kingdom (17.48%)144,508 AstraZeneca PLC, ADR 5,429,097 8,679,151920,893 B&M European Value Retail S.A. 4,218,892 7,305,822
98,806 Dechra Pharmaceuticals PLC 3,329,156 6,456,86497,910 Endava plc, ADR1 2,300,130 13,301,074
168,355 Experian plc 3,854,297 7,052,412442,543 Future PLC 7,584,254 22,002,825
1,247,484 Glencore PLC 5,118,529 5,868,295351,668 J D Wetherspoon PLC1 4,122,663 4,942,125
39,713 Linde Public Limited Company 7,560,276 11,678,73817,759,343 Lloyds Banking Group 6,847,487 11,053,783
1,738,981 S4 Capital PLC1 5,047,766 19,799,223435,206 WANdisco plc1 3,773,599 1,794,374604,286 Watches of Switzerland
Group PLC, 144A1 5,361,340 7,702,475160,000 Wise PLC, CI A1 1,875,107 2,343,398
Total United Kingdom 66,422,593 129,980,559
United States (2.25%)54,278 Agilent Technologies, Inc. 2,697,622 8,550,413
215,344 Arch Capital Group Ltd.1 4,878,484 8,221,834
Total United States 7,576,106 16,772,247
Uruguay (1.14%)155,214 Dlocal Ltd., Cl A1 3,259,494 8,468,476
TOTAL COMMON STOCKS 457,532,121 668,760,312
Warrants (0.02%)
Israel (0.02%)56,745 Taboola.com Ltd., Exp 6/29/20261 104,540 104,978
Principal Amount Cost Value
Convertible Bonds (0.06%)
Switzerland (0.06%)$ 350,000 Credit Suisse Group
Guernsey VII Ltd., 144A, 3.00%due 11/12/2021 $ 385,399 $ 404,663
TOTAL CONVERTIBLE BONDS 385,399 404,663
Short Term Investments (10.66%)
79,313,588 Repurchase Agreement with FixedIncome Clearing Corp., dated9/30/2021, 0.00% due 10/1/2021;Proceeds at maturity -$79,313,588; (Fully collateralizedby $81,319,200 U.S. TreasuryNote, 1.25% due 9/30/2028Market value - $80,899,918) 79,313,588 79,313,588
TOTAL INVESTMENTS (100.66%) $537,335,648 748,583,541
LIABILITIES LESS CASH ANDOTHER ASSETS (-0.66%)3 (4,878,912)
NET ASSETS $743,704,629
RETAIL SHARES (Equivalent to $35.05 per sharebased on 2,768,142 shares outstanding) $ 97,013,169
INSTITUTIONAL SHARES (Equivalent to $35.70 per sharebased on 13,682,555 shares outstanding) $488,504,764
R6 SHARES (Equivalent to $35.68 per sharebased on 4,432,940 shares outstanding) $158,186,696
% Represents percentage of net assets.1 Non-income producing securities.2 All or a portion of these securities are segregated for an unfunded
commitment. Total value of securities segregated is $5,625,900.3 Includes unrealized depreciation of $317,900 on an unfunded commitment
with a special purpose acquisition company to purchase a when-issuedprivate investment in a public entity.
ADR American Depositary Receipt.GDR Global Depositary Receipt.144A Security is exempt from registration pursuant to Rule 144A under the
Securities Act of 1933. This security may be resold in transactions that areexempt from registration, normally to qualified institutional buyers. AtSeptember 30, 2021, the market value of Rule 144A securities amounted to$39,642,235 or 5.33% of net assets.
Summary of Investments by Sectoras of September 30, 2021
Percentage ofNet Assets
Information Technology 15.1%Financials 14.5%Industrials 11.8%Health Care 11.6%Communication Services 10.6%Consumer Discretionary 10.3%Materials 8.8%Energy 2.9%Consumer Staples 2.8%Real Estate 1.2%Special Purpose Acquisition Company 0.4%Cash and Cash Equivalents* 10.0%
100.0%
* Includes short term investments.
169

Baron Funds
Baron Real Estate Fund — PORTFOLIO HOLDINGS
September 30, 2021 (Unaudited)
Shares Cost Value
Common Stocks (96.71%)
Communication Services (5.76%)
Integrated TelecommunicationServices (1.95%)
574,496 Cellnex Telecom S.A., 144A (Spain)2 $ 31,932,710 $ 35,469,412
Interactive Media & Services (3.81%)889,704 Tripadvisor, Inc.1 31,645,156 30,116,480444,610 Zillow Group, Inc., Cl C1 39,588,460 39,187,926
71,233,616 69,304,406
Total Communication Services 103,166,326 104,773,818
Consumer Discretionary (35.62%)
Casinos & Gaming (13.57%)846,800 Boyd Gaming Corporation1 21,937,698 53,568,568402,851 Caesars Entertainment, Inc.1 36,794,821 45,232,110945,000 MGM Resorts International 36,638,059 40,776,750470,260 Penn National Gaming, Inc.1 17,337,393 34,075,039
1,430,417 Red Rock Resorts, Inc., Cl A1 16,953,492 73,265,959
129,661,463 246,918,426
Distributors (0.44%)18,600 Pool Corp. 3,697,960 8,080,026
Home Improvement Retail (4.15%)60,050 The Home Depot, Inc. 12,361,386 19,712,013
274,750 Lowe’s Companies, Inc. 41,151,066 55,735,785
53,512,452 75,447,798
Homebuilding (5.87%)321,647 D.R. Horton, Inc. 24,685,281 27,008,699164,373 Installed Building Products, Inc. 8,986,233 17,612,567456,400 Lennar Corp., Cl A 38,521,258 42,755,552353,350 Toll Brothers, Inc. 16,377,665 19,536,721
88,570,437 106,913,539
Hotels, Resorts & CruiseLines (9.59%)
912,373 Hilton Grand Vacations, Inc.1 26,639,550 43,401,584373,000 Hyatt Hotels Corp., Cl A1 27,788,500 28,758,300348,336 Marriott Vacations Worldwide Corp. 40,789,598 54,803,703371,988 Membership Collective
Group, Inc., Cl A1 3,708,649 4,627,531786,397 Travel + Leisure Co. 47,899,918 42,882,228
146,826,215 174,473,346
Leisure Facilities (2.00%)857,474 Six Flags Entertainment Corp.1 25,332,053 36,442,645
Total Consumer Discretionary 447,600,580 648,275,780
Financials (3.90%)
Asset Management & CustodyBanks (3.90%)
1,326,557 Brookfield AssetManagement, Inc., Cl A2 44,802,634 70,984,065
Industrials (8.26%)
Building Products (3.42%)238,100 Fortune Brands Home &
Security, Inc. 18,272,578 21,290,9021,255,038 Janus International
Group, Inc., Cl A1 13,522,237 15,361,665592,601 The AZEK Co., Inc.1 23,056,966 21,647,715
38,800 Trex Co., Inc.1 1,148,735 3,954,884
56,000,516 62,255,166
Shares Cost Value
Common Stocks (continued)
Industrials (continued)
Research & ConsultingServices (2.36%)
498,500 CoStar Group, Inc.1 $ 31,561,213 $ 42,900,910
Trading Companies &Distributors (2.48%)
2,088,826 Hillman Solutions Corp.1,3 26,404,367 24,919,694101,977 SiteOne Landscape Supply, Inc.1 12,172,226 20,341,352
38,576,593 45,261,046
Total Industrials 126,138,322 150,417,122
Information Technology (2.81%)
Application Software (2.03%)2,835,301 SmartRent, Inc. (formerly, Fifth Wall
Acquisition Corp. I)1,3 28,607,896 36,915,619
Internet Services & Infrastructure (0.78%)1,660,900 NEXTDC Limited (Australia)1,2 8,234,614 14,148,274
Total Information Technology 36,842,510 51,063,893
Materials (2.11%)
Construction Materials (2.11%)227,250 Vulcan Materials Co. 34,393,246 38,441,610
Real Estate (36.24%)
Diversified Real EstateActivities (1.69%)
145,072 CoreSite Realty Corp. 19,764,609 20,098,2751,753,470 DigitalBridge Group, Inc.1 8,909,133 10,573,424
28,673,742 30,671,699
Diversified REITs (0.51%)247,600 American Assets Trust, Inc. 6,992,634 9,265,192
Industrial REITs (2.98%)274,000 Prologis, Inc. 19,543,707 34,367,820350,759 Rexford Industrial Realty, Inc. 14,778,586 19,905,573
34,322,293 54,273,393
Office REITs (3.29%)805,150 Douglas Emmett, Inc. 21,358,964 25,450,791376,674 JBG SMITH Properties 11,985,410 11,153,317555,850 Vornado Realty Trust 22,252,651 23,351,259
55,597,025 59,955,367
Real Estate Development (1.98%)409,850 The Howard Hughes Corp.1 34,946,328 35,988,928
Real Estate Services (8.37%)562,950 CBRE Group, Inc., Cl A1 30,253,913 54,808,812280,500 Jones Lang LaSalle, Inc.1 40,866,875 69,589,245
1,361,520 Opendoor Technologies, Inc.1 17,901,928 27,952,006
89,022,716 152,350,063
Residential REITs (5.30%)365,750 Equity LifeStyle Properties, Inc. 21,021,028 28,565,075276,500 Equity Residential 18,294,699 22,374,380
1,189,400 Invitation Homes, Inc. 37,097,488 45,589,702
76,413,215 96,529,157
Retail REITs (2.55%)356,350 Simon Property Group, Inc. 34,875,928 46,314,809
170

Baron Funds
Baron Real Estate Fund — PORTFOLIO HOLDINGS (Continued)
September 30, 2021 (Unaudited)
Shares Cost Value
Common Stocks (continued)
Real Estate (continued)
Specialized REITs (9.57%)132,200 Alexandria Real Estate
Equities, Inc.3 $ 12,755,479 $ 25,259,454198,800 American Tower Corp. 34,705,694 52,763,508
45,790 Equinix, Inc. 10,745,056 36,180,053385,348 Gaming and Leisure
Properties, Inc. 11,501,945 17,849,319606,600 MGM Growth
Properties LLC, Cl A 15,234,030 23,232,78056,850 SBA Communications Corp. 14,225,433 18,792,905
99,167,637 174,078,019
Total Real Estate 460,011,518 659,426,627
Special Purpose Acquisition Company (2.01%)1,250,000 Fifth Wall Acquisition
Corp. III, Cl A1,2 12,500,000 12,275,000700,000 GO Acquisition Corp., Cl A1 7,026,345 6,867,000
1,290,554 RXR Acquisition Corp.1 12,905,540 12,711,957475,000 Tishman Speyer
Innovation Corp. II1 4,750,000 4,750,000
Total Special Purpose Acquisition Company 37,181,885 36,603,957
TOTAL COMMON STOCKS 1,290,137,021 1,759,986,872
Principal Amount
Short Term Investments (2.84%)
$51,707,268 Repurchase Agreement withFixed Income Clearing Corp.,dated 9/30/2021, 0.00% due10/1/2021; Proceeds atmaturity - $51,707,268; (Fullycollateralized by $37,534,300U.S. Treasury Note, 0.625%due 5/15/2030 Market value -$35,088,706) and $17,362,500U.S. Treasury Note, 1.625%due 5/15/2031 Marketvalue - $17,652,779) 51,707,268 51,707,268
TOTAL INVESTMENTS (99.55%) $1,341,844,289 1,811,694,140
CASH AND OTHER ASSETSLESS LIABILITIES (0.45%) 8,108,901
NET ASSETS $1,819,803,041
RETAIL SHARES (Equivalent to $39.18 per sharebased on 11,898,184 shares outstanding) $ 466,228,961
INSTITUTIONAL SHARES (Equivalent to $40.18 per sharebased on 32,964,371 shares outstanding) $1,324,613,140
R6 SHARES (Equivalent to $40.18 per sharebased on 720,743 shares outstanding) $ 28,960,940
% Represents percentage of net assets.1 Non-income producing securities.2 Foreign corporation.3 The Adviser has reclassified/classified certain securities in or out of this
sub-industry. Such reclassifications/classifications are not supported by S&Por MSCI (unaudited).
144A Security is exempt from registration pursuant to Rule 144A under theSecurities Act of 1933. This security may be resold in transactions that areexempt from registration, normally to qualified institutional buyers. AtSeptember 30, 2021, the market value of Rule 144A securities amounted to$35,469,412 or 1.95% of net assets.
171

Baron Funds
Baron Emerging Markets Fund — PORTFOLIO HOLDINGS
September 30, 2021 (Unaudited)
Shares Cost Value
Common Stocks (89.94%)
Brazil (6.16%)22,898,612 Aeris Indústria E Comércio De
Equipamentos Para Geracão DeEnergia SA1 $ 26,317,435 $ 33,596,825
2,171,314 Afya Ltd., Cl A1 54,656,362 42,861,7384,818,819 Americanas SA1 65,534,773 27,360,3972,816,930 Banco Inter SA Units 36,063,057 24,130,7057,869,931 Localiza Rent a Car SA 61,340,600 78,717,374
25,539,650 Lojas Americanas SA 46,072,324 22,604,9886,567,481 Notre Dame Intermedica
Participacoes S.A. 79,711,240 89,978,3791,993,993 StoneCo Ltd., Cl A1 88,519,845 69,231,437
11,128,197 Suzano SA1 109,514,941 111,409,6872,161,691 XP, Inc., Cl A1 79,250,310 86,835,127
Total Brazil 646,980,887 586,726,657
China (28.92%)1,563,003 Alibaba Group Holding
Limited, ADR1,3 188,181,568 231,402,59414,289,146 Beijing Oriental Yuhong Waterproof
Technology Co. Ltd., Cl A 77,051,379 97,446,85533,479,242 China Conch Venture Holdings Ltd. 135,760,165 155,456,66219,666,732 China Mengniu Dairy Co. Ltd. 60,391,504 126,650,46749,812,811 China Molybdenum Co. Ltd., Cl A 38,180,021 46,057,13431,459,436 China Molybdenum Co. Ltd., Cl H 17,051,290 19,422,272
2,044,642 China Tourism Group Duty FreeCorporation Ltd., Cl A 28,224,347 81,917,804
12,204,115 Galaxy Entertainment Group Ltd.1 93,013,287 62,619,692780,966 GDS Holdings Limited, ADR1 31,316,264 44,210,485
3,301,052 GDS Holdings Limited, Cl A(Hong Kong)1 31,554,875 23,406,777
3,447,459 Glodon Co. Ltd., Cl A 15,634,661 35,564,15214,845,197 Han’s Laser Technology Industry
Group Co., Ltd., Cl A 86,483,200 86,305,9763,798,397 Hangzhou Tigermed
Consulting Co. Ltd., Cl A 58,064,684 102,153,40413,664,795 Hua Hong Semiconductor
Limited, 144A1 38,285,683 70,088,95352,376 Kanzhun Ltd., ADR1 1,006,712 1,885,012
24,887,166 Kingdee International SoftwareGroup Co. Ltd.1 18,051,118 82,865,738
22,245,494 Kingsoft Corp. Ltd. 93,779,183 88,567,7481,102,500 Meituan Inc., Cl B, 144A1 10,293,814 35,193,367
11,084,433 Midea Group Co., Ltd., Cl A 89,669,199 119,186,8964,891,575 NARI Technology Co. Ltd., Cl A 23,110,069 27,016,2712,330,550 New Frontier Health Corp.1 24,085,361 26,172,0773,378,407 SF Holding Co. Ltd., Cl A 24,010,221 34,065,7144,264,361 Shanghai Henlius
Biotech, Inc., Cl H, 144A1 26,314,653 13,448,2681,504,412 Shenzhen Mindray Bio-Medical
Electronics Co. Ltd., Cl A5 52,408,778 89,803,1754,978,486 Shenzhou International
Group Holdings Ltd. 39,257,816 105,660,70235,244,047 Sino Biopharmaceutical Ltd. 15,053,976 29,243,579
4,545,782 Tencent Holdings Limited 160,668,482 271,377,352249,894 Tencent Holdings Limited, ADR 12,993,700 14,936,164
12,953,319 Venustech Group, Inc., Cl A 65,921,862 55,272,3692,074,035 Will Semiconductor Co. Ltd.
Shanghai, Cl A5 78,721,550 77,411,55221,444,083 Winning Health Technology
Group Co. Ltd., Cl A 58,670,454 48,025,7962,711,532 Wuxi Biologics Cayman, Inc., 144A1 43,328,112 43,981,8301,077,182 Yum China Holdings, Inc. 61,381,659 62,595,046
635,734 Yum China Holdings, Inc.(Hong Kong) 35,739,128 37,456,874
Shares Cost Value
Common Stocks (continued)
China (continued)5,260,134 Yunnan Baiyao Group Co. Ltd., Cl A $ 79,128,363 $ 79,459,398
993,065 Zai Lab Limited, ADR1 19,849,696 104,659,12011,125,371 Zhejiang Dingli
Machinery Co. Ltd., Cl A 111,367,924 121,420,985
Total China 2,044,004,758 2,752,408,260
Hong Kong (2.19%)25,246,909 Budweiser Brewing Co.
APAC Ltd., 144A 80,514,268 64,128,1547,275,950 Techtronic Industries Co. Ltd. 45,049,018 143,784,012
Total Hong Kong 125,563,286 207,912,166
Hungary (1.24%)2,023,540 OTP Bank Nyrt1 88,990,588 118,403,534
India (25.63%)4,835,562 AARTI Industries Ltd. 56,940,848 60,417,7872,253,531 Asian Paints Ltd. 62,543,549 98,233,3252,896,250 Bajaj Finance Limited 149,754,670 298,019,362
14,543,855 Bharti Airtel Ltd.1 112,115,202 134,443,7391,838,456 Divi’s Laboratories Ltd. 30,792,500 118,700,4251,001,081 Dr. Reddy’s Laboratories Ltd. 44,574,751 65,671,033
336,374 Dr. Reddy’s Laboratories Ltd., ADR 14,850,315 21,911,40238,114,302 Edelweiss Financial Services Ltd. 54,158,461 40,252,525
1,953,533 Godrej Consumer Products Ltd.1 28,554,148 27,021,8583,338,620 Godrej Properties Ltd.1 66,529,375 103,499,4074,024,157 HDFC Bank Ltd. 62,439,269 86,029,4334,240,903 Hemisphere Properties
India Limited1 15,438,180 8,045,5772,056,116 Hindustan Unilever Ltd. 60,369,513 74,764,8653,519,234 Housing Development
Finance Corp., Ltd. 100,099,343 130,063,4293,286,547 ICICI Lombard General
Insurance Co. Ltd., 144A 61,094,779 70,194,51345,890,161 JM Financial Limited 66,442,836 56,945,216
1,339,991 Jubilant FoodWorks Ltd. 57,450,938 72,762,424693,928 Kotak Mahindra Bank Ltd. 7,702,569 18,675,289
11,097,250 Max Financial Services Ltd.1 104,796,528 151,234,7144,180,817 Muthoot Finance Ltd. 67,755,447 81,334,995
14,233,443 Nippon Life India AssetManagement Ltd., 144A 55,423,489 81,078,295
6,759,514 Reliance Industries Limited 143,392,564 228,774,294408,995 Reliance Industries Limited PP 4,039,531 10,251,946
5,976,623 SBI Life Insurance CompanyLimited, 144A 67,324,176 97,778,965
5,857,135 Tata Communications Ltd. 54,225,820 109,860,2428,357,390 Tata Consumer Products Ltd. 39,186,196 91,334,2603,182,940 Titan Co. Ltd. 55,452,114 92,378,3935,151,879 Zomato Ltd.1 5,352,656 9,480,943
Total India 1,648,799,767 2,439,158,656
Japan (1.06%)168,962 Keyence Corporation 70,194,720 100,848,518
Korea, Republic of (5.14%)610,995 Hyundai Heavy Industries Co. Ltd.1 32,017,205 59,602,975
1,853,108 Korea Shipbuilding & OffshoreEngineering Co. Ltd.1 193,138,310 157,483,741
4,393,434 Samsung Electronics Co., Ltd. 163,226,779 272,369,188
Total Korea, Republic of 388,382,294 489,455,904
Mexico (1.92%)26,518 DD3 Acquisition Corp. II
Private Units1,2 265,181 260,67216,944,343 Grupo México S.A.B. de C.V.,
Series B 45,019,539 67,378,42134,058,996 Wal-Mart de Mexico, S.A.B de C.V. 91,573,446 115,419,265
Total Mexico 136,858,166 183,058,358
172

Baron Funds
Baron Emerging Markets Fund — PORTFOLIO HOLDINGS (Continued)
September 30, 2021 (Unaudited)
Shares Cost Value
Common Stocks (continued)
Norway (0.41%)3,023,619 Golar LNG Ltd.1 $ 29,727,098 $ 39,216,338
Peru (0.39%)332,331 Credicorp, Ltd. 42,173,345 36,868,801
Philippines (1.22%)83,692,765 Ayala Land, Inc. 62,168,929 54,963,88228,413,276 BDO Unibank, Inc. 61,167,819 61,539,197
Total Philippines 123,336,748 116,503,079
Poland (0.96%)5,490,994 InPost SA1 113,982,156 91,114,391
Russia (7.79%)2,410,411 Fix Price Group Ltd., GDR 21,010,993 21,657,5434,746,202 Fix Price Group Ltd., GDR, 144A 46,272,864 42,644,625
718,157 Novatek PJSC, GDR 112,552,181 189,665,26442,392 Novatek PJSC, GDR
(United Kingdom ) 8,119,531 11,099,2761,324,685 Ozon Holdings PLC, ADR1 59,646,733 66,830,358
156,141 Polyus PJSC 30,711,176 25,598,528226,702 Polyus PJSC, GDR
(United Kingdom ) 22,485,319 18,630,1839,976,057 Sberbank of Russia PJSC, ADR 118,054,279 185,989,047
695,221 Sberbank of Russia PJSC, ADR(United Kingdom ) 11,088,032 13,035,394
691,796 TCS Group Holding PLC, GDR 41,273,832 63,506,873272,121 TCS Group Holding PLC, GDR
(United Kingdom ) 19,861,516 24,744,365984,233 Yandex N.V., Cl A1 29,496,843 78,433,528
Total Russia 520,573,299 741,834,984
Taiwan (4.57%)9,928,879 Delta Electronics, Inc. 40,036,761 88,964,4123,095,662 Taiwan Semiconductor
Manufacturing Co., Ltd., ADR 153,713,586 345,630,663
Total Taiwan 193,750,347 434,595,075
United Arab Emirates (0.28%)5,374,684 Network International
Holdings plc, 144A1 32,309,083 26,309,642
United Kingdom (1.67%)33,807,056 Glencore PLC 116,991,762 159,031,913
United States (0.39%)340,822 ACM Research, Inc., Cl A1 30,680,219 37,490,420
TOTAL COMMON STOCKS 6,353,298,523 8,560,936,696
Private Common Stocks (0.51%)
India (0.51%)27,027 Pine Labs PTE. Ltd., Series 11,2 10,077,362 12,279,988
6,833 Pine Labs PTE. Ltd., Series A1,2 2,547,771 3,104,6427,600 Pine Labs PTE. Ltd., Series B1,2 2,833,757 3,453,1366,174 Pine Labs PTE. Ltd., Series B21,2 2,302,055 2,805,2199,573 Pine Labs PTE. Ltd., Series C1,2 3,569,416 4,349,5881,932 Pine Labs PTE. Ltd., Series C11,2 720,371 877,8232,459 Pine Labs PTE. Ltd., Series D1,2 916,870 1,117,271
45,680 Pine Labs PTE. Ltd., Series J1,2 17,032,398 20,755,165
TOTAL PRIVATE COMMON STOCKS 40,000,000 48,742,832
Shares Cost Value
Rights (0.02%)
India (0.02%)1,038,846 Bharti Airtel Ltd., Exp
10/21/20211,2 $ 0 $ 2,139,762
Private Convertible Preferred Stocks (0.60%)
India (0.60%)15,334 Think & Learn Private
Limited, Series F1,2 49,776,072 57,277,836
Principal Amount
Short Term Investments (10.09%)
$960,135,493 Repurchase Agreement withFixed Income Clearing Corp.,dated 9/30/2021, 0.00% due10/1/2021; Proceeds atmaturity - $960,135,493;(Fully collateralized by$984,413,900 U.S. TreasuryNote, 1.25% due 9/30/2028Market value - $979,338,262) 960,135,493 960,135,493
TOTAL INVESTMENTS (101.16%) $7,403,210,088 9,629,232,619
LIABILITIES LESS CASH ANDOTHER ASSETS (-1.16%)4 (110,427,466)
NET ASSETS $9,518,805,153
RETAIL SHARES (Equivalent to $18.55 per sharebased on 25,607,227 shares outstanding) $ 474,938,308
INSTITUTIONAL SHARES (Equivalent to $18.66 per sharebased on 483,861,827 shares outstanding) $9,030,770,581
R6 SHARES (Equivalent to $18.67 per sharebased on 701,290 shares outstanding) $ 13,096,264
% Represents percentage of net assets.1 Non-income producing securities.2 At September 30, 2021, the market value of restricted and fair valued
securities amounted to $108,421,102 or 1.14% of net assets. These securitiesare not deemed liquid.
3 All or a portion of these securities are segregated for an unfundedcommitment. Total Value of securities segregated is $20,134,800.
4 Includes unrealized appreciation of $1,816,595 on an unfunded commitmentwith a special purpose acquisition company to purchase a when-issuedprivate investment in a public entity.
ADR American Depositary Receipt.GDR Global Depositary Receipt.144A Security is exempt from registration pursuant to Rule 144A under the
Securities Act of 1933. This security may be resold in transactions that areexempt from registration, normally to qualified institutional buyers. AtSeptember 30, 2021, the market value of Rule 144A securities amounted to$544,846,612 or 5.72% of net assets.
173
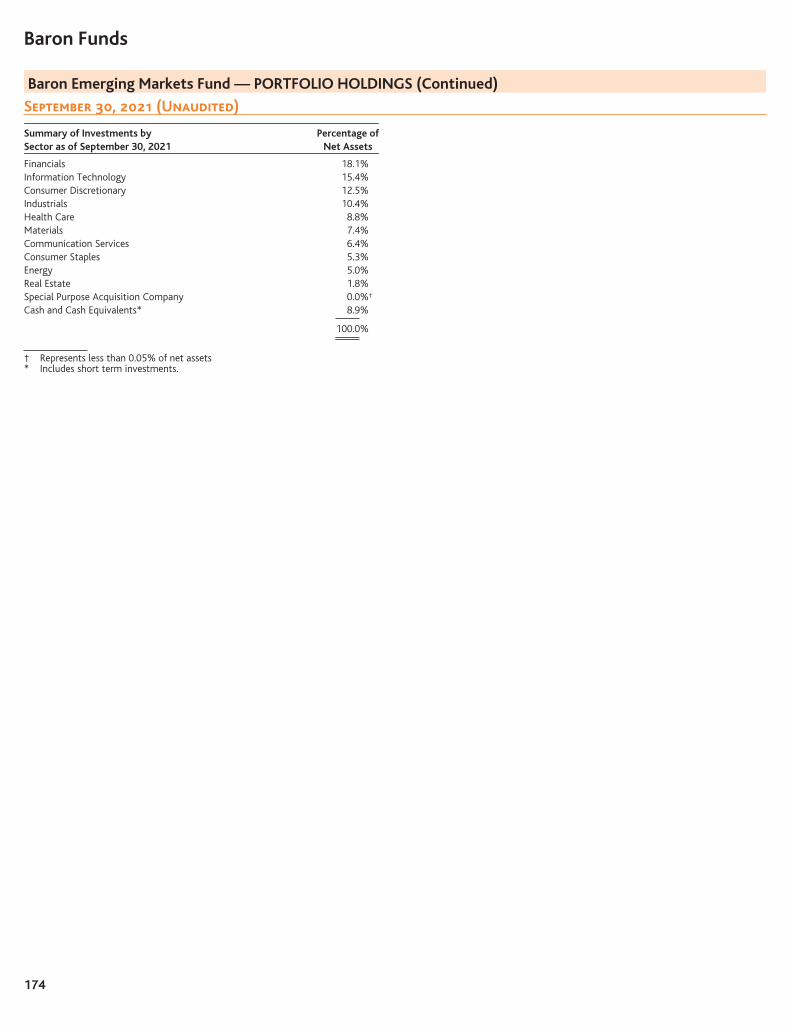
Baron Funds
Baron Emerging Markets Fund — PORTFOLIO HOLDINGS (Continued)
September 30, 2021 (Unaudited)
Summary of Investments bySector as of September 30, 2021
Percentage ofNet Assets
Financials 18.1%Information Technology 15.4%Consumer Discretionary 12.5%Industrials 10.4%Health Care 8.8%Materials 7.4%Communication Services 6.4%Consumer Staples 5.3%Energy 5.0%Real Estate 1.8%Special Purpose Acquisition Company 0.0%†
Cash and Cash Equivalents* 8.9%
100.0%
† Represents less than 0.05% of net assets* Includes short term investments.
174

Baron Funds
Baron Global Advantage Fund — PORTFOLIO HOLDINGS
September 30, 2021 (Unaudited)
Shares Cost Value
Common Stocks (95.09%)
Argentina (3.64%)83,710 Globant S.A.1 $ 7,081,799 $ 23,523,34746,026 MercadoLibre, Inc.1 31,748,310 77,296,064
Total Argentina 38,830,109 100,819,411
Brazil (1.71%)1,350,809 Afya Ltd., Cl A1 30,749,275 26,664,970
596,088 StoneCo Ltd., Cl A1 20,823,871 20,696,175
Total Brazil 51,573,146 47,361,145
Canada (5.29%)587,696 Nuvei Corp., 144A1 21,077,497 67,890,642
58,005 Shopify, Inc., Cl A1 54,284,292 78,642,019
Total Canada 75,361,789 146,532,661
China (5.73%)254,532 Alibaba Group Holding
Limited, ADR1,4 46,962,619 37,683,463480,782 GDS Holdings Limited, ADR1 29,079,191 27,217,069
1,381,225 Meituan Inc., Cl B, 144A1 26,631,860 44,090,665189,309 Pinduoduo, Inc., ADR1 9,401,278 17,164,647309,512 Zai Lab Limited, ADR1 19,624,672 32,619,470
Total China 131,699,620 158,775,314
India (2.10%)534,508 Bajaj Finance Limited 33,760,009 54,999,994
1,699,815 Zomato Ltd.1 1,734,839 3,128,150
Total India 35,494,848 58,128,144
Indonesia (1.53%)133,151 Sea Ltd., ADR1 38,749,923 42,439,218
Israel (4.96%)326,882 Fiverr International Ltd.1 7,503,852 59,714,804551,889 ION Acquisition Corp. 2 Limited1 5,518,890 5,529,928
2,470,231 Taboola.com Ltd.1 24,285,210 20,898,154261,265 Wix.com Ltd.1 48,470,851 51,200,102
Total Israel 85,778,803 137,342,988
Korea, Republic of (0.66%)654,000 Coupang, Inc., Cl A1 22,890,000 18,213,900
Mexico (0.35%)996,069 DD3 Acquisition Corp. II1,2,3 9,115,057 9,552,302
8,652 DD3 Acquisition Corp. IIPrivate Units1,2,3 86,516 85,049
Total Mexico 9,201,573 9,637,351
Netherlands (5.27%)16,186 Adyen N.V., 144A1 16,437,273 45,245,725
238,698 argenx SE, ADR1 45,917,552 72,086,79638,227 ASML Holding N.V. 8,394,703 28,557,793
Total Netherlands 70,749,528 145,890,314
Poland (0.69%)1,157,114 InPost SA1 22,975,374 19,200,483
United Kingdom (3.57%)726,800 Endava plc, ADR1 31,977,783 98,735,780
Shares Cost Value
Common Stocks (continued)
United States (58.00%)296,371 10X Genomics, Inc., Cl A1 $ 26,654,003 $ 43,145,690639,858 Acceleron Pharma, Inc.1 53,505,388 110,119,562
62,964 Alphabet, Inc., Cl C1 98,418,779 167,818,57938,418 Amazon.com, Inc.1 91,152,664 126,204,667
402,314 Arrowhead Pharmaceuticals, Inc.1 27,471,371 25,116,463137,887 Bill.Com Holdings, Inc.1 5,238,091 36,808,934461,820 BridgeBio Pharma, Inc.1 28,867,909 21,645,503371,841 Cloudflare, Inc., Cl A1 9,123,087 41,887,889270,282 Crowdstrike Holdings, Inc., Cl A1 29,414,048 66,429,910214,501 Datadog, Inc., Cl A1 10,250,761 30,319,716933,945 Dynatrace, Inc.1 33,781,139 66,282,077171,386 EPAM Systems, Inc.1 40,897,771 97,772,285321,312 Facebook, Inc., Cl A1 70,543,702 109,050,080327,879 Guardant Health, Inc.1 25,308,759 40,988,154138,687 Illumina, Inc.1 44,958,886 56,252,834923,813 MaxCyte, Inc.1 (United Kingdom ) 10,715,379 11,265,728984,081 MaxCyte, Inc.1 12,793,053 12,015,629365,159 Natera, Inc.1 40,513,111 40,693,319
8,586 nCino, Inc.1 266,166 609,86499,715 NVIDIA Corp. 19,890,028 20,656,95985,082 Okta, Inc.1 13,384,601 20,193,362
1,953,501 Opendoor Technologies, Inc.1 19,535,010 40,105,375258,892 RingCentral, Inc., Cl A1 70,464,733 56,309,010
1,493,774 Sarissa Capital Acquisition Corp.1,3 14,937,740 15,012,429422,406 Schrödinger, Inc.1 15,544,854 23,097,160166,087 Snowflake, Inc., Cl A1 21,425,516 50,229,691
3,743,491 SoFi Technologies, Inc.1 37,434,910 59,446,637213,201 Twilio, Inc., Cl A1 40,536,986 68,021,779189,872 Veeva Systems, Inc., Cl A1 34,015,516 54,715,414
1,000,838 ZoomInfo Technologies Inc., Cl A1 32,829,689 61,241,277123,983 Zscaler, Inc.1 8,588,945 32,510,822
Total United States 988,462,595 1,605,966,798
Uruguay (1.59%)807,566 Dlocal Ltd., Cl A1 17,803,247 44,060,801
TOTAL COMMON STOCKS 1,621,548,338 2,633,104,308
Private Common Stocks (0.36%)
United States (0.36%)18,197 Space Exploration
Technologies Corp., Cl A1,2 7,642,558 7,554,6675,613 Space Exploration
Technologies Corp., Cl C1,2 2,357,404 2,330,293
TOTAL PRIVATE COMMON STOCKS 9,999,962 9,884,960
Private Convertible Preferred Stocks (2.92%)
India (1.24%)9,201 Think & Learn Private
Limited, Series F1,2 29,867,591 34,368,943
United States (1.68%)219,321 Farmers Business
Network, Inc., Series F1,2 7,250,006 12,869,75680,440 Farmers Business
Network, Inc., Series G1,2 5,000,000 4,782,96269,926 Resident Home, Inc., Series B11,2 4,999,968 3,705,379
484,183 Rivian Automotive, Inc., Series E1,2 7,499,995 17,425,746176,391 Rivian Automotive, Inc., Series F1,2 6,500,008 6,413,577100,775 Zymergen, Inc., Series D1,2 2,249,993 1,198,215
Total United States 33,499,970 46,395,635
TOTAL PRIVATE CONVERTIBLEPREFERRED STOCKS 63,367,561 80,764,578
175
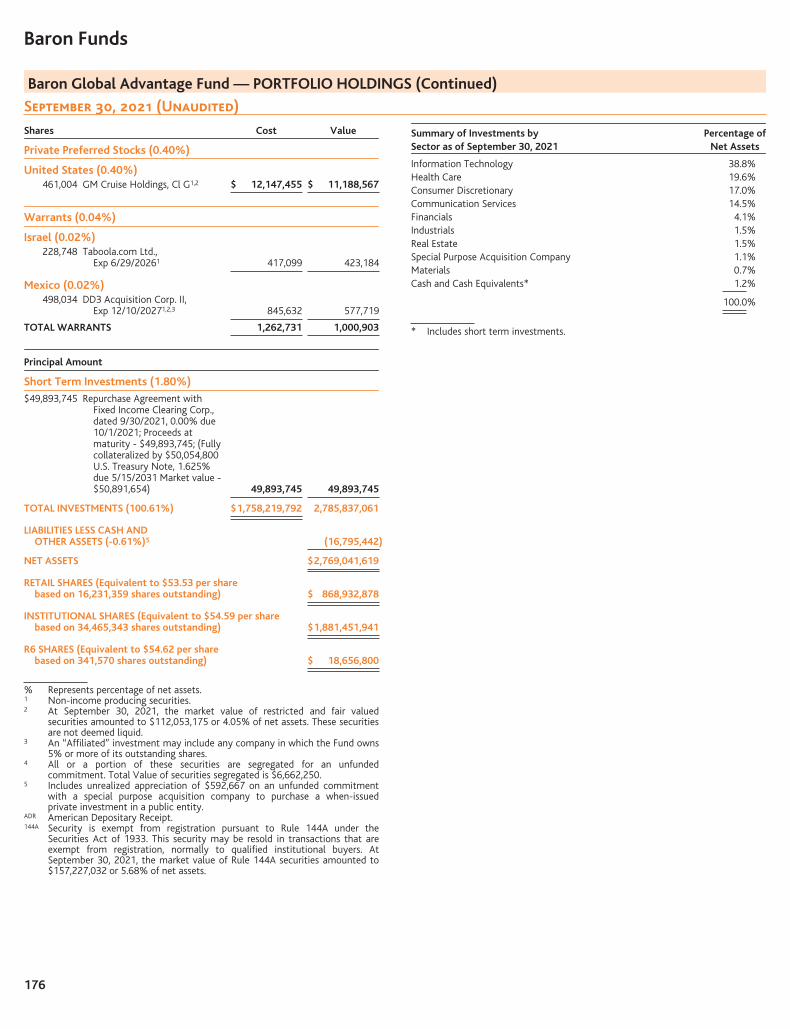
Baron Funds
Baron Global Advantage Fund — PORTFOLIO HOLDINGS (Continued)
September 30, 2021 (Unaudited)
Shares Cost Value
Private Preferred Stocks (0.40%)
United States (0.40%)461,004 GM Cruise Holdings, Cl G1,2 $ 12,147,455 $ 11,188,567
Warrants (0.04%)
Israel (0.02%)228,748 Taboola.com Ltd.,
Exp 6/29/20261 417,099 423,184
Mexico (0.02%)498,034 DD3 Acquisition Corp. II,
Exp 12/10/20271,2,3 845,632 577,719
TOTAL WARRANTS 1,262,731 1,000,903
Principal Amount
Short Term Investments (1.80%)
$49,893,745 Repurchase Agreement withFixed Income Clearing Corp.,dated 9/30/2021, 0.00% due10/1/2021; Proceeds atmaturity - $49,893,745; (Fullycollateralized by $50,054,800U.S. Treasury Note, 1.625%due 5/15/2031 Market value -$50,891,654) 49,893,745 49,893,745
TOTAL INVESTMENTS (100.61%) $1,758,219,792 2,785,837,061
LIABILITIES LESS CASH ANDOTHER ASSETS (-0.61%)5 (16,795,442)
NET ASSETS $2,769,041,619
RETAIL SHARES (Equivalent to $53.53 per sharebased on 16,231,359 shares outstanding) $ 868,932,878
INSTITUTIONAL SHARES (Equivalent to $54.59 per sharebased on 34,465,343 shares outstanding) $1,881,451,941
R6 SHARES (Equivalent to $54.62 per sharebased on 341,570 shares outstanding) $ 18,656,800
% Represents percentage of net assets.1 Non-income producing securities.2 At September 30, 2021, the market value of restricted and fair valued
securities amounted to $112,053,175 or 4.05% of net assets. These securitiesare not deemed liquid.
3 An “Affiliated” investment may include any company in which the Fund owns5% or more of its outstanding shares.
4 All or a portion of these securities are segregated for an unfundedcommitment. Total Value of securities segregated is $6,662,250.
5 Includes unrealized appreciation of $592,667 on an unfunded commitmentwith a special purpose acquisition company to purchase a when-issuedprivate investment in a public entity.
ADR American Depositary Receipt.144A Security is exempt from registration pursuant to Rule 144A under the
Securities Act of 1933. This security may be resold in transactions that areexempt from registration, normally to qualified institutional buyers. AtSeptember 30, 2021, the market value of Rule 144A securities amounted to$157,227,032 or 5.68% of net assets.
Summary of Investments bySector as of September 30, 2021
Percentage ofNet Assets
Information Technology 38.8%Health Care 19.6%Consumer Discretionary 17.0%Communication Services 14.5%Financials 4.1%Industrials 1.5%Real Estate 1.5%Special Purpose Acquisition Company 1.1%Materials 0.7%Cash and Cash Equivalents* 1.2%
100.0%
* Includes short term investments.
176

Baron Funds
Baron Discovery Fund — PORTFOLIO HOLDINGS
September 30, 2021
Shares Cost Value
Common Stocks (93.12%)
Communication Services (5.93%)
Advertising (2.17%)3,875,000 S4 Capital PLC (United Kingdom)1,2 $ 12,841,181 $ 44,118,935
Interactive Media &Services (1.00%)
600,000 Tripadvisor, Inc.1 20,442,129 20,310,000
Movies & Entertainment (0.43%)185,000 Liberty Media Corporation-Liberty
Formula One, Cl A1 5,634,811 8,704,250
Publishing (2.33%)950,000 Future PLC (United Kingdom)2 18,404,637 47,233,114
Total Communication Services 57,322,758 120,366,299
Consumer Discretionary (8.34%)
Casinos & Gaming (2.46%)2,673,000 Melco International
Development Ltd. (Hong Kong)1,2 5,107,059 3,148,780150,371 Penn National Gaming, Inc.1 2,663,946 10,895,883700,000 Red Rock Resorts, Inc., Cl A1 17,350,047 35,854,000
25,121,052 49,898,663
Home Improvement Retail (2.08%)350,000 Floor & Decor Holdings, Inc., Cl A1 11,227,099 42,276,500
Hotels, Resorts & Cruise Lines (0.92%)1,500,000 Membership Collective Group, Inc. 1 20,762,901 18,660,000
Internet & Direct MarketingRetail (0.47%)
350,000 MYT NetherlandsParent BV, ADR1,2,4 9,100,000 9,415,000
Restaurants (1.06%)425,000 The Cheesecake Factory, Inc.1 14,758,560 19,975,000
9,266 Wingstop, Inc. 766,969 1,518,975
15,525,529 21,493,975
Specialty Stores (1.35%)1,300,000 Petco Health & Wellness Co., Inc.1 27,164,882 27,430,000
Total Consumer Discretionary 108,901,463 169,174,138
Consumer Staples (4.64%)
Packaged Foods & Meats (0.73%)100,000 Laird Superfood, Inc.1 2,547,796 1,908,000750,000 UTZ Brands, Inc. 12,255,000 12,847,500
14,802,796 14,755,500
Personal Products (2.56%)2,000,000 The Beauty Health Co.1 21,322,653 51,940,000
Soft Drinks (1.35%)875,000 Fevertree Drinks PLC
(United Kingdom)2 26,629,565 27,458,332
Total Consumer Staples 62,755,014 94,153,832
Financials (3.22%)
Insurance Brokers (1.23%)750,007 BRP Group, Inc., Cl A1 15,155,098 24,967,733
Property & CasualtyInsurance (1.99%)
250,000 Kinsale Capital Group, Inc. 20,250,978 40,425,000
Total Financials 35,406,076 65,392,733
Shares Cost Value
Common Stocks (continued)
Health Care (21.60%)
Biotechnology (1.43%)106,000 Biohaven Pharmaceutical
Holding Co. Ltd.1,2 $ 4,582,203 $ 14,724,460620,143 Recursion Pharmaceuticals, Inc., Cl A1 12,216,506 14,269,490
16,798,709 28,993,950
Health Care Equipment (9.32%)1,135,000 Acutus Medical, Inc.1 21,335,786 10,033,400
580,084 AxoGen, Inc.1 9,919,925 9,165,327637,982 Axonics, Inc.1 28,878,670 41,526,249202,500 CryoPort, Inc.1 5,127,704 13,468,275114,823 Inari Medical, Inc.1 4,216,755 9,312,145682,985 Inogen, Inc.1 31,469,030 29,429,824
50,000 Inspire Medical Systems, Inc.1,4 2,923,748 11,644,000640,208 Silk Road Medical, Inc.1,4 27,145,351 35,230,646
4,060,000 ViewRay, Inc.1 20,943,586 29,272,600
151,960,555 189,082,466
Health Care Services (0.67%)323,963 Accolade, Inc.1 9,020,518 13,661,520
Health Care Supplies (1.46%)2,629,967 Cerus Corp.1 14,027,651 16,016,4992,365,363 Sientra, Inc.1 17,781,625 13,553,530
31,809,276 29,570,029
Health Care Technology (0.88%)418,543 Definitive Healthcare Corp.1 11,300,661 17,926,197
Life Sciences Tools &Services (3.98%)
547,558 CareDx, Inc.1,4 13,105,658 34,698,751150,000 Olink Holding AB, ADR1,2 5,649,156 3,637,500
68,980 Seer, Inc.1 1,310,620 2,381,879861,926 Veracyte, Inc.1,4 25,343,693 40,036,463
45,409,127 80,754,593
Managed Health Care (2.09%)758,279 Progyny, Inc.1 19,842,501 42,463,624
Pharmaceuticals (1.77%)1,291,732 Revance Therapeutics, Inc.1 28,479,368 35,987,653
Total Health Care 314,620,715 438,440,032
Industrials (14.96%)
Aerospace & Defense (3.45%)1,102,370 Kratos Defense & Security
Solutions, Inc.1 19,500,520 24,593,875957,680 Mercury Systems, Inc.1 52,325,093 45,413,185
71,825,613 70,007,060
Building Products (1.11%)220,000 Trex Company, Inc.1 7,416,878 22,424,600
Diversified SupportServices (0.88%)
1,000,000 ACV Auctions, Inc., Cl A1 28,687,917 17,890,000
Environmental & FacilitiesServices (1.82%)
599,642 Montrose EnvironmentalGroup, Inc.1 10,554,326 37,021,897
Heavy ElectricalEquipment (0.88%)
528,900 TPI Composites, Inc.1 10,257,577 17,850,375
177

Baron Funds
Baron Discovery Fund — PORTFOLIO HOLDINGS (Continued)
September 30, 2021
Shares Cost Value
Common Stocks (continued)
Industrials (continued)Industrial Machinery (4.17%)
86,600 ESCO Technologies, Inc. $ 4,658,023 $ 6,668,200200,000 Helios Technologies, Inc. 7,717,454 16,422,000253,105 Kornit Digital Ltd.1,2 8,856,307 36,634,418
1,705,185 Markforged Holding Corp.1 14,565,524 11,186,0131,040,000 Velo3D, Inc. (formerly, Jaws Spitfire
Acquisition Corp.)1,4 10,641,845 8,704,800618,272 Velo3D, Inc1,3,4 6,182,720 5,057,465
52,621,873 84,672,896
Trading Companies &Distributors (2.65%)
500,000 Hydrofarm Holdings Group, Inc.1,4 25,269,555 18,925,000175,000 SiteOne Landscape Supply, Inc.1,5 9,431,317 34,907,250
34,700,872 53,832,250
Total Industrials 216,065,056 303,699,078
Information Technology (29.68%)Application Software (6.41%)
1,000,000 Alkami Technology, Inc.1 30,552,625 24,680,000625,663 Clearwater Analytics
Holdings, Inc., Cl A1 14,626,090 16,023,230600,000 DoubleVerify Holdings, Inc.1 18,527,343 20,496,000200,000 Everbridge, Inc.1 22,401,606 30,208,000
2,500,000 SmartRent, Inc. (formerly, Fifth WallAcquisition Corp. I)1,4 31,046,952 32,550,000
500,000 Viant Technology, Inc., Cl A1 13,515,462 6,110,000
130,670,078 130,067,230
Data Processing & OutsourcedServices (0.76%)
200,000 Shift4 Payments, Inc., Cl A1 7,218,579 15,504,000
Electronic Equipment &Instruments (3.81%)
460,321 Advanced Energy Industries, Inc. 34,345,774 40,393,16810,431 Novanta, Inc.1,2 272,590 1,611,589
575,000 PAR Technology Corp.1 21,254,484 35,368,250
55,872,848 77,373,007
IT Consulting & OtherServices (2.68%)
400,000 Endava plc, ADR1,2 10,717,821 54,340,000
SemiconductorEquipment (3.05%)
115,000 Brooks Automation, Inc. 12,170,966 11,770,250585,800 Ichor Holdings Ltd.1,2 16,144,595 24,070,522255,000 Nova Ltd., (formerly, Nova
Measuring Instruments Ltd.)1,2 8,116,967 26,083,950
36,432,528 61,924,722
Semiconductors (2.91%)725,000 Allegro MicroSystems, Inc.1 10,150,000 23,171,000
2,910,000 indie Semiconductor, Inc., Cl A1 27,712,225 35,822,100
37,862,225 58,993,100
Systems Software (10.06%)997,500 Couchbase, Inc.1,4 29,191,929 31,032,225333,775 Dynatrace, Inc.1,4 6,243,606 23,688,012578,460 ForgeRock, Inc., Cl A1,4 17,534,310 22,519,448
1,234,531 Ping Identity Holding Corp.1 25,203,528 30,332,426215,000 Qualys, Inc.1 18,211,240 23,927,350815,000 Sailpoint Technologies
Holdings, Inc.1 42,481,737 34,947,200621,000 Varonis Systems, Inc.1 19,427,813 37,787,850
158,294,163 204,234,511
Total Information Technology 437,068,242 602,436,570
Shares Cost Value
Common Stocks (continued)
Real Estate (3.65%)
Industrial REITs (1.19%)425,000 Rexford Industrial Realty, Inc. $ 17,240,450 $ 24,118,750
Office REITs (1.46%)1,000,000 JBG SMITH Properties 33,666,311 29,610,000
Specialized REITs (1.00%)700,000 Americold Realty Trust4 19,240,492 20,335,000
Total Real Estate 70,147,253 74,063,750
Special Purpose Acquisition Company (1.10%)1,200,000 Khosla Ventures
Acquisition Co. II, Cl A1 12,706,516 12,216,0001,000,000 Live Oak Acquisition
Corp. II, Cl A1 9,986,703 9,980,000
Total Special Purpose Acquisition Company 22,693,219 22,196,000
TOTAL COMMON STOCKS 1,324,979,796 1,889,922,432
Principal Amount
Short Term Investments (6.68%)
$135,649,363 Repurchase Agreement withFixed Income Clearing Corp.,dated 9/30/2021, 0.00% due10/1/2021; Proceeds atmaturity - $135,649,363;(Fully collateralized by$139,079,500 U.S. TreasuryNote, 1.25% due 9/30/2028Market value - $138,362,406) 135,649,363 135,649,363
TOTAL INVESTMENTS (99.80%) $1,460,629,159 2,025,571,795
CASH AND OTHER ASSETSLESS LIABILITIES (0.20%)6 4,027,589
NET ASSETS $2,029,599,384
RETAIL SHARES (Equivalent to $36.93 per sharebased on 7,319,989 shares outstanding) $ 270,330,428
INSTITUTIONAL SHARES (Equivalent to $37.68 per sharebased on 45,684,460 shares outstanding) $1,721,197,181
R6 SHARES (Equivalent to $37.68 per sharebased on 1,010,404 shares outstanding) $ 38,071,775
% Represents percentage of net assets.1 Non-income producing securities.2 Foreign corporation.3 At September 30, 2021, the market value of restricted and fair valued
securities amounted to $5,057,465 or 0.25% of net assets. This security is notdeemed liquid.
4 The Adviser has reclassified/classified certain securities in or out of thissub-industry. Such reclassifications/classifications are not supported by S&Por MSCI (unaudited).
5 All or a portion of these securities are segregated for an unfundedcommitment. Total value of securities segregated is $7,579,860.
6 Includes unrealized depreciation of $170,095 on an unfunded commitmentwith a special purpose acquisition company to purchase a when-issuedprivate investment in a public entity.
ADR American Depositary Receipt.
178

Baron Funds
Baron Durable Advantage Fund — PORTFOLIO HOLDINGS
September 30, 2021
Shares Cost Value
Common Stocks (97.70%)
Communication Services (12.58%)
Interactive Media & Services (12.58%)172 Alphabet, Inc., Cl A1 $ 488,101 $ 459,845975 Alphabet, Inc., Cl C1 1,659,810 2,598,677
6,248 Facebook, Inc., Cl A1 1,667,340 2,120,509
Total Communication Services 3,815,251 5,179,031
Consumer Staples (5.41%)
Distillers & Vintners (1.97%)3,835 Constellation Brands, Inc., Cl A 811,065 807,996
Hypermarkets & Super Centers (2.29%)2,099 Costco Wholesale Corp. 740,504 943,186
Personal Products (1.15%)1,582 The Estée Lauder Companies, Inc., Cl A 394,728 474,489
Total Consumer Staples 1,946,297 2,225,671
Financials (16.03%)
Asset Management & CustodyBanks (3.35%)
1,644 BlackRock, Inc. 1,256,580 1,378,757
Financial Exchanges & Data (10.61%)5,074 CME Group, Inc. 958,043 981,2103,568 Moody’s Corp. 881,776 1,267,0322,100 MSCI, Inc. 884,036 1,277,5141,977 S&P Global, Inc. 462,402 840,008
3,186,257 4,365,764
Property & Casualty Insurance (2.07%)22,364 Arch Capital Group Ltd.1,2 850,759 853,858
Total Financials 5,293,596 6,598,379
Health Care (19.95%)
Health Care Equipment (4.31%)5,823 Danaher Corp. 1,151,417 1,772,754
Life Sciences Tools & Services (11.48%)6,441 Agilent Technologies, Inc. 881,659 1,014,6514,774 Iqvia Holdings, Inc.1 882,665 1,143,564
442 Mettler-Toledo International, Inc.1 472,779 608,79325,382 Stevanato Group SpA1,2 533,022 642,419
2,301 Thermo Fisher Scientific, Inc. 926,009 1,314,630
3,696,134 4,724,057
Managed Health Care (4.16%)4,383 UnitedHealth Group, Incorporated 1,543,857 1,712,613
Total Health Care 6,391,408 8,209,424
Industrials (5.52%)
Aerospace & Defense (2.04%)7,092 HEICO Corp., Cl A 784,515 839,906
Research & Consulting Services (3.48%)12,275 IHS Markit Ltd.2 1,116,317 1,431,510
Total Industrials 1,900,832 2,271,416
Information Technology (36.03%)
Application Software (9.61%)2,925 Adobe, Inc.1 1,278,820 1,683,981
763 Fair Isaac Corp.1 312,482 303,6202,488 Intuit, Inc. 1,108,372 1,342,3018,987 SS&C Technologies Holdings, Inc. 562,339 623,698
3,262,013 3,953,600
Shares Cost Value
Common Stocks (continued)
Information Technology (continued)Data Processing & Outsourced
Services (7.37%)3,978 MasterCard Incorporated, Cl A $ 1,238,614 $ 1,383,0717,419 Visa, Inc., Cl A 1,639,604 1,652,582
2,878,218 3,035,653
Electronic ManufacturingServices (1.98%)
5,942 TE Connectivity Ltd.2 743,041 815,361
IT Consulting & Other Services (3.35%)4,315 Accenture plc, Cl A2 1,064,673 1,380,455
Semiconductors (4.81%)1,969 Monolithic Power Systems, Inc. 750,581 954,3355,330 Texas Instruments, Inc. 896,539 1,024,479
1,647,120 1,978,814
Systems Software (8.91%)13,007 Microsoft Corporation 2,918,283 3,666,934
Total Information Technology 12,513,348 14,830,817
Materials (0.70%)Specialty Chemicals (0.70%)
1,388 Ecolab, Inc. 285,843 289,565
Real Estate (1.48%)Specialized REITs (1.48%)
1,697 Alexandria Real Estate Equities, Inc.3 261,495 324,246359 Equinix, Inc. 178,765 283,656
Total Real Estate 440,260 607,902
TOTAL COMMON STOCKS 32,586,835 40,212,205
Principal Amount
Short Term Investments (8.23%)$3,386,820 Repurchase Agreement with Fixed
Income Clearing Corp., dated9/30/2021, 0.00% due 10/1/2021;Proceeds at maturity - $3,386,820;(Fully collateralized by $3,472,500 U.S.Treasury Note, 1.25% due 9/30/2028Market value - $3,454,596) 3,386,820 3,386,820
TOTAL INVESTMENTS (105.93%) $35,973,655 43,599,025
LIABILITIES LESS CASH ANDOTHER ASSETS (-5.93%) (2,441,111)
NET ASSETS $41,157,914
RETAIL SHARES (Equivalent to $18.47 per sharebased on 527,742 shares outstanding) $ 9,746,212
INSTITUTIONAL SHARES (Equivalent to $18.63 per sharebased on 1,456,740 shares outstanding) $27,135,571
R6 SHARES (Equivalent to $18.63 per sharebased on 229,572 shares outstanding) $ 4,276,131
% Represents percentage of net assets.1 Non-income producing securities.2 Foreign corporation.3 The Adviser has reclassified/classified certain securities in or out of this
sub-industry. Such reclassifications/classifications are not supported by S&P orMSCI (unaudited).
179

Baron Funds
Baron Real Estate Income Fund — PORTFOLIO HOLDINGS
September 30, 2021 (Unaudited)
Shares Cost Value
Common Stocks (97.29%)
Consumer Discretionary (8.11%)
Casinos & Gaming (4.51%)17,438 Penn National Gaming, Inc.1 $ 1,094,603 $ 1,263,55750,382 Red Rock Resorts, Inc., Cl A1 1,098,359 2,580,566
2,192,962 3,844,123
Hotels, Resorts & Cruise Lines (3.60%)56,237 Travel + Leisure Co. 3,115,532 3,066,604
Total Consumer Discretionary 5,308,494 6,910,727
Information Technology (1.62%)
Application Software (1.62%)105,966 SmartRent, Inc. (formerly, Fifth Wall
Acquisition Corp. I)1,3 1,109,649 1,379,678
Real Estate (83.98%)
Diversified REITs (2.90%)17,990 American Assets Trust, Inc. 482,787 673,186
297,975 DigitalBridge Group, Inc.1 1,599,402 1,796,789
2,082,189 2,469,975
Health Care REITs (0.75%)7,711 Welltower, Inc. 527,507 635,387
Hotel & Resort REITs (11.29%)166,985 Host Hotels & Resorts, Inc.1 2,753,070 2,726,865
38,507 MGM Growth Properties LLC, Cl A 1,219,457 1,474,818142,195 Park Hotels & Resorts, Inc.1 2,848,903 2,721,612120,345 Pebblebrook Hotel Trust 2,471,153 2,696,932
9,292,583 9,620,227
Industrial REITs (7.30%)20,187 Duke Realty Corp. 813,565 966,35224,180 Prologis, Inc. 2,426,972 3,032,89739,083 Rexford Industrial Realty, Inc. 2,020,133 2,217,960
5,260,670 6,217,209
Office REITs (6.28%)39,495 Douglas Emmett, Inc. 1,173,203 1,248,43740,334 JBG SMITH Properties 1,269,213 1,194,290
192,356 Paramount Group, Inc. 1,812,725 1,729,28028,013 Vornado Realty Trust 1,129,134 1,176,826
5,384,275 5,348,833
Real Estate OperatingCompanies (1.52%)
62,034 Kennedy-Wilson Holdings, Inc. 1,132,454 1,297,751
Residential REITs (26.66%)72,135 American Homes 4 Rent, Cl A 2,495,168 2,749,78619,590 AvalonBay Communities, Inc. 4,413,940 4,341,92811,265 Camden Property Trust 1,666,446 1,661,25029,835 Equity LifeStyle Properties, Inc. 1,981,318 2,330,11354,697 Equity Residential 4,148,640 4,426,081
127,687 Invitation Homes, Inc. 4,364,230 4,894,24312,515 Sun Communities, Inc. 1,948,057 2,316,526
21,017,799 22,719,927
Retail REITs (3.85%)25,230 Simon Property Group, Inc. 2,749,542 3,279,143
Shares Cost Value
Common Stocks (continued)
Real Estate (continued)
Specialized REITs (23.43%)8,169 Alexandria Real Estate Equities, Inc.3 $ 1,370,344 $ 1,560,851
16,532 American Tower Corp. 4,005,830 4,387,75813,343 CoreSite Realty Corp. 1,640,268 1,848,539
7,685 Crown Castle International Corp. 1,202,790 1,331,9642,773 Equinix, Inc. 1,829,361 2,191,031
32,800 Gaming and Leisure Properties, Inc. 1,405,561 1,519,2969,507 Public Storage 2,557,782 2,824,5302,142 SBA Communications Corp. 592,644 708,081
49,812 Ventas, Inc. 2,966,458 2,750,12129,540 VICI Properties, Inc. 879,931 839,231
18,450,969 19,961,402
Total Real Estate 65,897,988 71,549,854
Utilities (3.58%)
Multi-Utilities (3.58%)54,437 Brookfield Infrastructure Partners L.P.2 2,803,543 3,054,460
TOTAL COMMON STOCKS 75,119,674 82,894,719
Principal Amount
Short Term Investments (2.08%)
$1,770,151 Repurchase Agreement with FixedIncome Clearing Corp., dated9/30/2021, 0.00% due 10/1/2021;Proceeds at maturity - $1,770,151;(Fully collateralized by $1,815,000 U.S.Treasury Note, 1.25% due 9/30/2028Market value - $1,805,642) 1,770,151 1,770,151
TOTAL INVESTMENTS (99.37%) $76,889,825 84,664,870
CASH AND OTHER ASSETSLESS LIABILITIES (0.63%) 538,062
NET ASSETS $85,202,932
RETAIL SHARES (Equivalent to $15.99 per sharebased on 886,070 shares outstanding) $14,165,562
INSTITUTIONAL SHARES (Equivalent to $16.11 per sharebased on 4,365,511 shares outstanding) $70,314,278
R6 SHARES (Equivalent to $16.09 per sharebased on 44,931 shares outstanding) $ 723,092
% Represents percentage of net assets.1 Non-income producing securities.2 Foreign corporation.3 The Adviser has reclassified/classified certain securities in or out of this
sub-industry. Such reclassifications/classifications are not supported by S&P orMSCI (unaudited).
180

Baron Funds
Baron WealthBuilder Fund — PORTFOLIO HOLDINGS
September 30, 2021 (Unaudited)
Shares Cost Value
Affiliated Mutual Funds (100.02%)
Small Cap Funds (29.64%)547,302 Baron Discovery Fund - Institutional Shares $ 15,968,578 $ 20,616,881518,049 Baron Growth Fund - Institutional Shares 49,953,216 63,580,158
1,359,515 Baron Small Cap Fund - Institutional Shares 48,923,459 58,622,304
Total Small Cap Funds 114,845,253 142,819,343
Small to Mid Cap Funds (4.15%)429,876 Baron Focused Growth Fund - Institutional Shares 12,280,426 19,993,517
Mid Cap Funds (12.94%)492,972 Baron Asset Fund - Institutional Shares 49,075,487 62,346,210
Large Cap Funds (7.88%)457,319 Baron Durable Advantage Fund - Institutional Shares 6,706,113 8,524,434517,909 Baron Fifth Avenue Growth Fund - Institutional Shares 22,060,268 29,427,613
Total Large Cap Funds 28,766,381 37,952,047
All Cap Funds (21.54%)631,833 Baron Opportunity Fund - Institutional Shares 19,629,179 28,969,552419,726 Baron Partners Fund - Institutional Shares 37,381,855 74,803,551
Total All Cap Funds 57,011,034 103,773,103
International Funds (12.61%)989,880 Baron Emerging Markets Fund - Institutional Shares 16,494,830 18,471,163563,737 Baron Global Advantage Fund - Institutional Shares 23,745,933 30,774,395323,331 Baron International Growth Fund - Institutional Shares 9,220,121 11,542,933
Total International Funds 49,460,884 60,788,491
Sector Funds (11.26%)656,381 Baron FinTech Fund - Institutional Shares 9,093,402 11,434,164626,686 Baron Health Care Fund - Institutional Shares 11,040,805 13,367,209561,407 Baron Real Estate Fund - Institutional Shares 18,694,633 22,557,350428,752 Baron Real Estate Income Fund - Institutional Shares 6,921,708 6,907,190
Total Sector Funds 45,750,548 54,265,913
TOTAL AFFILIATED INVESTMENTS (100.02%) $357,190,013 481,938,624
LIABILITIES LESS CASH AND OTHER ASSETS (-0.02%) (83,499)
NET ASSETS $481,855,125
RETAIL SHARES (Equivalent to $21.49 per share based on 4,292,988 shares outstanding) $ 92,253,050
TA SHARES (Equivalent to $21.67 per share based on 1,949,599 shares outstanding) $ 42,245,275
INSTITUTIONAL SHARES (Equivalent to $21.67 per share based on 16,026,704 shares outstanding) $347,356,800
% Represents percentage of net assets.
181

Baron Funds
Baron Health Care Fund — PORTFOLIO HOLDINGS
September 30, 2021 (Unaudited)
Shares Cost Value
Common Stocks (89.21%)
Health Care (87.47%)
Biotechnology (17.24%)54,025 Acceleron Pharma, Inc.1 $ 5,943,074 $ 9,297,70224,378 argenx SE, ADR1,2 6,391,949 7,362,15642,253 Arrowhead Pharmaceuticals, Inc.1 2,456,933 2,637,85510,317 Beam Therapeutics, Inc.1 978,234 897,682
6,375 BioNTech SE, ADR1,2 590,930 1,740,31129,200 Denali Therapeutics, Inc.1 2,105,148 1,473,14089,914 Genmab A/S, ADR1,2 3,494,697 3,929,24222,500 Mirati Therapeutics, Inc.1 3,971,510 3,980,475
5,132 Moderna, Inc.1 596,374 1,975,10217,237 Recursion Pharmaceuticals, Inc., Cl A1 310,266 396,623
7,400 Twist Bioscience Corp.1 836,794 791,57819,036 Zai Lab Limited, ADR1,2 2,065,700 2,006,204
29,741,609 36,488,070
Health Care Equipment (17.70%)32,262 Abbott Laboratories 3,254,581 3,811,11022,500 Butterfly Network, Inc.1 225,000 234,90022,191 CryoPort, Inc.1 764,574 1,475,923
4,147 DexCom, Inc.1 1,251,833 2,267,82845,351 Edwards Lifesciences Corp.1 3,711,720 5,134,187
3,895 IDEXX Laboratories, Inc.1 1,598,485 2,422,30137,028 Inari Medical, Inc.1 2,960,237 3,002,97112,035 Inspire Medical Systems, Inc.1,3 1,768,419 2,802,71113,715 Insulet Corp.1 3,215,393 3,898,214
3,411 Intuitive Surgical, Inc.1 2,293,360 3,391,0461,387,480 Opsens, Inc. (Canada)1,2 2,019,084 3,319,173
12,500 Shockwave Medical, Inc.1 918,119 2,573,50024,662 Silk Road Medical, Inc.1,3 1,118,684 1,357,150
4,673 Teleflex, Inc. 1,907,399 1,759,618
27,006,888 37,450,632
Health Care Supplies (3.75%)36,152 Establishment Labs Holdings, Inc.1,2 2,778,312 2,587,76061,000 Figs, Inc., Cl A1 2,318,554 2,265,540
7,234 West Pharmaceutical Services, Inc. 2,030,553 3,071,123
7,127,419 7,924,423
Health Care Technology (5.09%)36,738 Certara, Inc.1 1,231,022 1,216,02841,839 Definitive Healthcare Corp.1 1,129,653 1,791,964
116,500 GoodRx Holdings, Inc., Cl A1 5,162,999 4,778,83033,319 Schrödinger, Inc.1 1,662,800 1,821,883
4,060 Veeva Systems, Inc., Cl A1 945,478 1,169,970
10,131,952 10,778,675
Life Sciences Tools & Services (29.15%)8,740 10X Genomics, Inc., Cl A1 983,351 1,272,369
18,530 Bio-Techne Corporation 6,818,543 8,979,08227,754 Guardant Health, Inc.1,3 3,198,527 3,469,52844,223 ICON plc1,2 8,719,668 11,587,310
2,837 Illumina, Inc.1 848,377 1,150,71655,418 MaxCyte, Inc.1,3 720,434 676,654
211,654 MaxCyte, Inc. (United Kingdom)1,2,3 2,331,633 2,581,0813,110 Mettler-Toledo International, Inc.1 3,304,433 4,283,590
114,662 Natera, Inc.1,3 13,233,647 12,777,93369,822 Olink Holding AB, ADR1,2 1,914,953 1,693,183
158,795 Stevanato Group SpA1,2 3,147,337 4,019,10116,099 Thermo Fisher Scientific, Inc. 7,648,637 9,197,842
52,869,540 61,688,389
Shares Cost Value
Common Stocks (continued)
Health Care (continued)
Managed Health Care (6.87%)8,050 Humana, Inc. $ 3,458,804 $ 3,132,658
29,172 UnitedHealth Group, Incorporated 9,914,765 11,398,667
13,373,569 14,531,325Pharmaceuticals (7.67%)
85,722 Dechra Pharmaceuticals PLC(United Kingdom)1,2 4,324,463 5,601,839
23,392 Eli Lilly & Co. 5,319,597 5,404,72226,928 Zoetis, Inc. 4,444,775 5,227,802
14,088,835 16,234,363
Total Health Care 154,339,812 185,095,877
Real Estate (1.74%)
Specialized REITs (1.74%)19,329 Alexandria Real Estate Equities, Inc.3 3,282,347 3,693,192
TOTAL COMMON STOCKS 157,622,159 188,789,069
Principal Amount
Short Term Investments (11.02%)
$23,315,431 Repurchase Agreement with FixedIncome Clearing Corp., dated9/30/2021, 0.00% due 10/1/2021;Proceeds at maturity -$23,315,431; (Fully collateralizedby $23,905,000 U.S. TreasuryNote, 1.25% due 9/30/2028Market value - $23,781,746) 23,315,431 23,315,431
TOTAL INVESTMENTS (100.23%) $180,937,590 212,104,500
LIABILITIES LESS CASH ANDOTHER ASSETS (-0.23%) (495,298)
NET ASSETS $211,609,202
RETAIL SHARES (Equivalent to $21.14 per sharebased on 2,886,690 shares outstanding) $ 61,022,862
INSTITUTIONAL SHARES (Equivalent to $21.32 per sharebased on 6,764,160 shares outstanding) $144,243,547
R6 SHARES (Equivalent to $21.32 per sharebased on 297,547 shares outstanding) $ 6,342,793
% Represents percentage of net assets.1 Non-income producing securities.2 Foreign corporation.3 The Adviser has reclassified/classified certain securities in or out of this
sub-industry. Such reclassifications/classifications are not supported by S&Por MSCI (unaudited).
ADR American Depositary Receipt.
182

Baron Funds
Baron FinTech Fund — PORTFOLIO HOLDINGS
September 30, 2021 (Unaudited)
Shares Cost Value
Common Stocks (98.25%)
Communication Services (1.97%)
Interactive Media & Services (1.97%)7,500 Zillow Group, Inc., Cl C1 $ 956,220 $ 661,050
14,000 ZoomInfo Technologies Inc., Cl A1 648,237 856,660
Total Communication Services 1,604,457 1,517,710
Consumer Discretionary (3.05%)
Internet & Direct Marketing Retail (3.05%)1,400 MercadoLibre, Inc.1 2,106,421 2,351,160
Financials (21.66%)
Asset Management & CustodyBanks (2.78%)
2,550 BlackRock, Inc. 2,076,327 2,138,583
Consumer Finance (1.02%)49,505 SoFi Technologies, Inc.1 495,050 786,139
Diversified Banks (2.78%)33,000 Banco Inter SA Units (Brazil)1,2 434,315 282,68820,400 TCS Group Holding PLC, GDR2 1,479,790 1,861,951
1,914,105 2,144,639
Financial Exchanges & Data (11.97%)2,000 CME Group, Inc. 395,044 386,7601,800 MarketAxess Holdings, Inc. 835,096 757,2425,000 Moody’s Corp. 1,474,386 1,775,5504,050 MSCI, Inc. 1,662,856 2,463,7776,500 S&P Global, Inc. 2,270,536 2,761,785
13,300 Tradeweb Markets, Inc., Cl A 1,035,751 1,074,374
7,673,669 9,219,488
Insurance Brokers (0.82%)19,000 BRP Group, Inc., Cl A1 555,770 632,510
Investment Banking & Brokerage (1.60%)13,400 Houlihan Lokey, Inc. 916,275 1,234,140
Property & Casualty Insurance (0.69%)3,300 Kinsale Capital Group, Inc. 478,155 533,610
Total Financials 14,109,351 16,689,109
Industrials (7.54%)
Research & Consulting Services (7.54%)14,300 CoStar Group, Inc.1 1,179,197 1,230,65816,000 IHS Markit Ltd.2 1,483,248 1,865,92017,000 TransUnion 1,661,228 1,909,270
4,000 Verisk Analytics, Inc. 718,838 801,080
Total Industrials 5,042,511 5,806,928
Shares Cost Value
Common Stocks (continued)
Information Technology (64.03%)
Application Software (15.58%)10,000 Alkami Technology, Inc.1 $ 277,152 $ 246,800
4,300 Bill.Com Holdings, Inc.1 472,774 1,147,88510,000 Ceridian HCM Holding, Inc.1 1,050,750 1,126,20030,000 Clearwater Analytics Holdings, Inc., Cl A1 721,847 768,30020,000 Duck Creek Technologies, Inc.1 844,851 884,800
4,000 Fair Isaac Corp. 1 1,798,974 1,591,72013,000 Guidewire Software, Inc.1 1,521,665 1,545,310
5,500 Intuit, Inc. 1,883,887 2,967,30515,300 nCino, Inc.1 1,086,068 1,086,75928,000 Riskified Ltd.1,2 689,977 638,680
10,347,945 12,003,759Data Processing & Outsourced
Services (33.89%)860 Adyen N.V., 144A (Netherlands)1,2 1,353,721 2,404,011
38,000 Dlocal Ltd., Cl A1,2 906,023 2,073,28013,500 Fidelity National Information Services, Inc. 1,911,549 1,642,680
4,400 Global Payments, Inc. 856,855 693,3523,500 Jack Henry & Associates, Inc. 568,980 574,210
27,000 Marqeta, Inc.1 720,973 597,2407,100 MasterCard Incorporated, Cl A 2,403,497 2,468,528
115,000 Network International Holdings plc, 144A(United Kingdom)1,2 583,480 562,937
21,300 Nuvei Corp. (Canada)1,2 937,262 2,460,57625,000 Paya Holdings, Inc., Cl A1 281,291 271,75020,000 Paymentus Holdings, Inc., Cl A1 451,901 492,80011,000 PayPal Holdings, Inc.1 2,214,406 2,862,31017,000 Repay Holdings Corporation1 320,579 391,510
7,000 Shift4 Payments, Inc., Cl A1 345,977 542,64011,700 Square, Inc., Cl A1 2,408,516 2,806,128
9,000 Toast, Inc., Cl A1 362,871 449,55012,400 Visa, Inc., Cl A 2,620,809 2,762,100
140,000 Wise PLC (United Kingdom)1,2 1,700,864 2,050,474
20,949,554 26,106,076
Internet Services &Infrastructure (3.29%)
1,870 Shopify, Inc., Cl A1,2 2,375,633 2,535,309
IT Consulting & Other Services (11.27%)6,000 Accenture plc, Cl A2 1,563,869 1,919,520
24,000 Endava plc, ADR1,2 1,503,332 3,260,4004,500 EPAM Systems, Inc.1 1,317,148 2,567,160
32,000 Grid Dynamics Holdings, Inc.1 391,672 935,040
4,776,021 8,682,120
Total Information Technology 38,449,153 49,327,264
TOTAL COMMON STOCKS 61,311,893 75,692,171
183
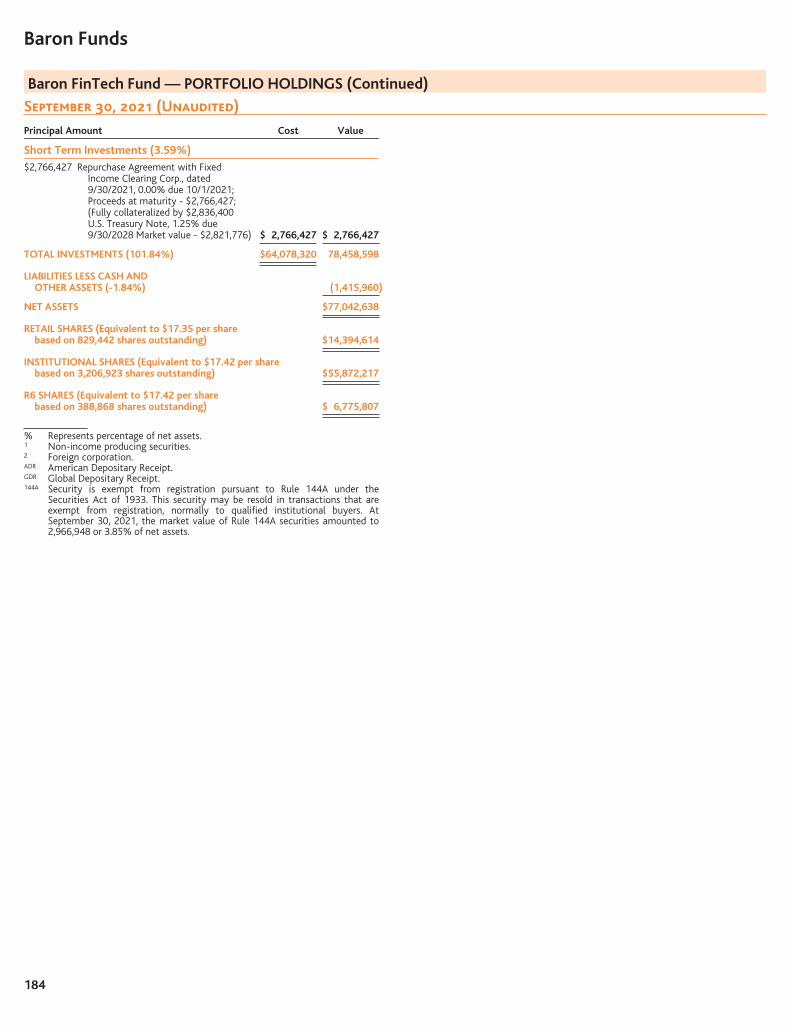
Baron Funds
Baron FinTech Fund — PORTFOLIO HOLDINGS (Continued)
September 30, 2021 (Unaudited)
Principal Amount Cost Value
Short Term Investments (3.59%)
$2,766,427 Repurchase Agreement with FixedIncome Clearing Corp., dated9/30/2021, 0.00% due 10/1/2021;Proceeds at maturity - $2,766,427;(Fully collateralized by $2,836,400U.S. Treasury Note, 1.25% due9/30/2028 Market value - $2,821,776) $ 2,766,427 $ 2,766,427
TOTAL INVESTMENTS (101.84%) $64,078,320 78,458,598
LIABILITIES LESS CASH ANDOTHER ASSETS (-1.84%) (1,415,960)
NET ASSETS $77,042,638
RETAIL SHARES (Equivalent to $17.35 per sharebased on 829,442 shares outstanding) $14,394,614
INSTITUTIONAL SHARES (Equivalent to $17.42 per sharebased on 3,206,923 shares outstanding) $55,872,217
R6 SHARES (Equivalent to $17.42 per sharebased on 388,868 shares outstanding) $ 6,775,807
% Represents percentage of net assets.1 Non-income producing securities.2 Foreign corporation.ADR American Depositary Receipt.GDR Global Depositary Receipt.144A Security is exempt from registration pursuant to Rule 144A under the
Securities Act of 1933. This security may be resold in transactions that areexempt from registration, normally to qualified institutional buyers. AtSeptember 30, 2021, the market value of Rule 144A securities amounted to2,966,948 or 3.85% of net assets.
184

Go Paperless !It’s fast, simple and a smart way to help the environment.
Enjoy the speed and convenience of receiving Fund documents electronically.For more information and to enroll today go to www.baronfunds.com/edelivery
B A R O NF U N D S
767 Fifth Avenue, 49th Fl.New York, NY 10153
1.800.99.BARON212-583-2000
www.BaronFunds.com

BARON
FUNDS
Sept
embe
r30
Qua
rter
ly09
3021