printmgr file - RiverSource
44
AB Variable Products Series Fund, Inc. AB Balanced Wealth Strategy Portfolio Portfolio of Investments March 31, 2021 (unaudited) Company Shares U.S. $ Value COMMON STOCKS – 40.6% Information Technology – 8.9% Communications Equipment – 0.0% Telefonaktiebolaget LM Ericsson - Class B 1,571 $ 20,824 Electronic Equipment, Instruments & Components – 0.4% Arrow Electronics, Inc. (a) 829 91,870 CDW Corp./DE 4,758 788,638 880,508 IT Services – 1.8% Accenture PLC - Class A 151 41,714 Atos SE (a) 347 27,054 Automatic Data Processing, Inc. 3,612 680,754 EPAM Systems, Inc. (a) 236 93,619 Genpact Ltd. 17,469 748,022 Mastercard, Inc. - Class A 204 72,634 PayPal Holdings, Inc. (a) 2,990 726,092 Shopify, Inc. - Class A (a) 49 54,097 Visa, Inc. - Class A (b) 9,385 1,987,086 4,431,072 Semiconductors & Semiconductor Equipment – 1.9% Advanced Micro Devices, Inc. (a) 284 22,294 Applied Materials, Inc. 1,055 140,948 ASML Holding NV 139 85,286 Lam Research Corp. 32 19,048 NVIDIA Corp. 1,479 789,682 NXP Semiconductors NV 4,366 879,050 QUALCOMM, Inc. 8,269 1,096,387 STMicroelectronics NV 1,641 62,695 Teradyne, Inc. 194 23,606 Texas Instruments, Inc. 5,755 1,087,637 Xilinx, Inc. 4,083 505,884 4,712,517 Software – 3.2% Adobe, Inc. (a) 1,281 608,949 Autodesk, Inc. (a) 22 6,097 Cadence Design Systems, Inc. (a) 675 92,468 Citrix Systems, Inc. 4,648 652,393 Constellation Software, Inc./Canada 28 39,103 Crowdstrike Holdings, Inc. - Class A (a) (b) 88 16,061 Dropbox, Inc. - Class A (a) 1,871 49,881 Fair Isaac Corp. (a) 67 32,565 Intuit, Inc. 42 16,089 Microsoft Corp. 21,413 5,048,543 Oracle Corp. 13,063 916,631 ServiceNow, Inc. (a) 188 94,021 Trade Desk, Inc. (The) - Class A (a) 13 8,472 Trend Micro, Inc./Japan 800 40,158 WiseTech Global Ltd. 151 3,360 Xero Ltd. (a) 281 27,197 7,651,988 1
-
Upload
khangminh22 -
Category
Documents
-
view
1 -
download
0
Transcript of printmgr file - RiverSource

AB Variable Products Series Fund, Inc.
AB Balanced Wealth Strategy Portfolio
Portfolio of Investments
March 31, 2021 (unaudited)
Company Shares U.S. $ Value
COMMON STOCKS – 40.6%
Information Technology – 8.9%
Communications Equipment – 0.0%
Telefonaktiebolaget LM Ericsson - Class B 1,571 $ 20,824
Electronic Equipment, Instruments & Components – 0.4%
Arrow Electronics, Inc.(a) 829 91,870
CDW Corp./DE 4,758 788,638
880,508
IT Services – 1.8%
Accenture PLC - Class A 151 41,714
Atos SE(a) 347 27,054
Automatic Data Processing, Inc. 3,612 680,754
EPAM Systems, Inc.(a) 236 93,619
Genpact Ltd. 17,469 748,022
Mastercard, Inc. - Class A 204 72,634
PayPal Holdings, Inc.(a) 2,990 726,092
Shopify, Inc. - Class A(a) 49 54,097
Visa, Inc. - Class A(b) 9,385 1,987,086
4,431,072
Semiconductors & Semiconductor Equipment – 1.9%
Advanced Micro Devices, Inc.(a) 284 22,294
Applied Materials, Inc. 1,055 140,948
ASML Holding NV 139 85,286
Lam Research Corp. 32 19,048
NVIDIA Corp. 1,479 789,682
NXP Semiconductors NV 4,366 879,050
QUALCOMM, Inc. 8,269 1,096,387
STMicroelectronics NV 1,641 62,695
Teradyne, Inc. 194 23,606
Texas Instruments, Inc. 5,755 1,087,637
Xilinx, Inc. 4,083 505,884
4,712,517
Software – 3.2%
Adobe, Inc.(a) 1,281 608,949
Autodesk, Inc.(a) 22 6,097
Cadence Design Systems, Inc.(a) 675 92,468
Citrix Systems, Inc. 4,648 652,393
Constellation Software, Inc./Canada 28 39,103
Crowdstrike Holdings, Inc. - Class A(a) (b) 88 16,061
Dropbox, Inc. - Class A(a) 1,871 49,881
Fair Isaac Corp.(a) 67 32,565
Intuit, Inc. 42 16,089
Microsoft Corp. 21,413 5,048,543
Oracle Corp. 13,063 916,631
ServiceNow, Inc.(a) 188 94,021
Trade Desk, Inc. (The) - Class A(a) 13 8,472
Trend Micro, Inc./Japan 800 40,158
WiseTech Global Ltd. 151 3,360
Xero Ltd.(a) 281 27,197
7,651,988
1

Company Shares U.S. $ Value
Technology Hardware, Storage & Peripherals – 1.6%
Apple, Inc. 25,451 $ 3,108,840
Topicus.com, Inc.(a) 52 3,415
Western Digital Corp. 10,352 690,996
3,803,251
21,500,160
Consumer Discretionary – 4.7%
Auto Components – 0.4%
Aisin Seiki Co., Ltd. 2,800 106,641
Faurecia SE(a) 22 1,171
Lear Corp. 83 15,044
Magna International, Inc. (Canada) - Class A 530 46,678
Magna International, Inc. (United States) - Class A 9,840 866,314
1,035,848
Automobiles – 0.3%
Ford Motor Co.(a) 915 11,209
General Motors Co.(a) 908 52,174
Stellantis NV 1,320 23,343
Stellantis NV(b) 26,715 475,260
Tesla, Inc.(a) 81 54,102
616,088
Distributors – 0.2%
LKQ Corp.(a) 12,697 537,464
Diversified Consumer Services – 0.1%
Chegg, Inc.(a) 3,412 292,272
Hotels, Restaurants & Leisure – 0.1%
Aristocrat Leisure Ltd. 1,313 34,447
Chipotle Mexican Grill, Inc. - Class A(a) 61 86,670
Domino’s Pizza, Inc.(b) 20 7,356
La Francaise des Jeux SAEM(c) 411 18,677
McDonald’s Corp. 32 7,172
154,322
Household Durables – 0.0%
Electrolux AB - Class B 1,974 54,879
Whirlpool Corp. 47 10,357
65,236
Internet & Direct Marketing Retail – 1.2%
Amazon.com, Inc.(a) 890 2,753,731
eBay, Inc. 265 16,229
HelloFresh SE(a) 1,103 82,182
Zalando SE(a) (c) 562 55,069
2,907,211
2

Company Shares U.S. $ Value
Multiline Retail – 0.0%
Dollar General Corp. 83 $ 16,818
Next PLC(a) 608 65,896
82,714
Specialty Retail – 1.6%
AutoZone, Inc.(a) 780 1,095,354
Home Depot, Inc. (The) 6,197 1,891,634
Lowe’s Cos., Inc. 22 4,184
TJX Cos., Inc. (The) 13,534 895,274
3,886,446
Textiles, Apparel & Luxury Goods – 0.8%
Deckers Outdoor Corp.(a) 2,007 663,153
LVMH Moet Hennessy Louis Vuitton SE 61 40,745
NIKE, Inc. - Class B 8,722 1,159,066
Pandora A/S(a) 616 65,881
1,928,845
11,506,446
Health Care – 4.4%
Biotechnology – 0.5%
AbbVie, Inc. 828 89,606
Amgen, Inc. 100 24,881
Regeneron Pharmaceuticals, Inc.(a) 850 402,169
Vertex Pharmaceuticals, Inc.(a) 3,561 765,223
1,281,879
Health Care Equipment & Supplies – 1.2%
Align Technology, Inc.(a) 67 36,283
Edwards Lifesciences Corp.(a) 8,529 713,366
Medtronic PLC 12,576 1,485,603
ResMed, Inc. 109 21,148
Zimmer Biomet Holdings, Inc. 3,518 563,161
2,819,561
Health Care Providers & Services – 1.4%
AmerisourceBergen Corp. - Class A 681 80,406
Anthem, Inc. 2,611 937,218
McKesson Corp. 376 73,335
Molina Healthcare, Inc.(a) 280 65,453
UnitedHealth Group, Inc. 5,758 2,142,379
3,298,791
Health Care Technology – 0.0%
Cerner Corp. 1,009 72,527
Veeva Systems, Inc. - Class A(a) 107 27,953
100,480
Life Sciences Tools & Services – 0.1%
Bio-Rad Laboratories, Inc. - Class A(a) 124 70,825
Lonza Group AG 17 9,508
Mettler-Toledo International, Inc.(a) 66 76,276
Sartorius Stedim Biotech 119 48,974
Waters Corp.(a) 91 25,859
231,442
3

Company Shares U.S. $ Value
Pharmaceuticals – 1.2%
Eli Lilly & Co. 539 $ 100,696
Johnson & Johnson 3,331 547,450
Merck & Co., Inc. 641 49,415
Novo Nordisk A/S - Class B 688 46,360
Roche Holding AG 173 56,042
Roche Holding AG (Sponsored ADR) 28,580 1,159,205
Takeda Pharmaceutical Co., Ltd. 1,900 69,259
Zoetis, Inc. 5,149 810,864
2,839,291
10,571,444
Real Estate – 4.3%
Diversified Real Estate Activities – 0.3%
Mitsubishi Estate Co., Ltd. 3,800 66,544
Mitsui Fudosan Co., Ltd. 9,700 221,116
New World Development Co., Ltd. 18,000 93,504
Sumitomo Realty & Development Co., Ltd. 1,300 46,051
Sun Hung Kai Properties Ltd. 11,000 166,560
UOL Group Ltd. 7,700 45,282
639,057
Diversified REITs – 0.3%
Alexander & Baldwin, Inc. 3,260 54,735
Armada Hoffler Properties, Inc. 3,732 46,799
Broadstone Net Lease, Inc. 1,660 30,378
Cofinimmo SA 270 39,310
Daiwa House REIT Investment Corp. 14 37,619
Essential Properties Realty Trust, Inc. 4,184 95,521
Fibra Uno Administracion SA de CV 13,590 15,911
Hulic Reit, Inc. 42 65,882
ICADE 570 41,640
Land Securities Group PLC 6,570 62,472
Merlin Properties Socimi SA 7,690 78,721
Nomura Real Estate Master Fund, Inc. 30 45,168
Stockland 40,300 135,284
749,440
Equity Real Estate Investment Trusts (REITs) – 1.2%
American Campus Communities, Inc. 13,008 561,555
American Tower Corp. 1,958 468,080
Mid-America Apartment Communities, Inc. 5,801 837,432
Orix JREIT, Inc. 16 27,867
Prologis, Inc. 8,952 948,912
Scentre Group 2,055 4,425
VICI Properties, Inc.(b) 2,049 57,864
2,906,135
Health Care REITs – 0.3%
Assura PLC 10,859 10,792
Medical Properties Trust, Inc. 6,640 141,299
Omega Healthcare Investors, Inc. 3,357 122,967
Physicians Realty Trust 5,803 102,539
Welltower, Inc. 3,120 223,485
601,082
4

Company Shares U.S. $ Value
Hotel & Resort REITs – 0.1%
Apple Hospitality REIT, Inc. 3,240 $ 47,207
Japan Hotel REIT Investment Corp. 35 19,786
Park Hotels & Resorts, Inc.(a) 4,100 88,478
RLJ Lodging Trust 5,596 86,626
242,097
Industrial REITs – 0.3%
Americold Realty Trust 3,497 134,530
Ascendas Real Estate Investment Trust 18,800 42,706
Dream Industrial Real Estate Investment Trust 4,045 43,196
GLP J-Reit 38 62,442
Industrial & Infrastructure Fund Investment Corp. 30 51,518
Mitsui Fudosan Logistics Park, Inc. 9 44,508
Plymouth Industrial REIT, Inc. 1,112 18,737
Rexford Industrial Realty, Inc. 1,851 93,290
Segro PLC 10,786 139,389
STAG Industrial, Inc. 2,779 93,402
723,718
Office REITs – 0.3%
Alexandria Real Estate Equities, Inc. 1,137 186,809
Allied Properties Real Estate Investment Trust 1,685 54,491
alstria office REIT-AG 2,390 38,625
Boston Properties, Inc. 1,045 105,817
Cousins Properties, Inc. 2,842 100,465
Covivio 380 32,501
Daiwa Office Investment Corp. 9 63,427
Japan Prime Realty Investment Corp. 17 63,560
Japan Real Estate Investment Corp. 7 41,366
Kilroy Realty Corp. 1,339 87,878
Nippon Building Fund, Inc. 6 35,357
True North Commercial Real Estate Investment Trust 3,060 16,728
827,024
Real Estate Development – 0.1%
CIFI Holdings Group Co., Ltd. 38,000 36,976
CK Asset Holdings Ltd. 8,000 48,701
Instone Real Estate Group AG(a) (c) 2,115 58,162
143,839
Real Estate Management & Development – 0.0%
CBRE Group, Inc. - Class A(a) 205 16,218
FirstService Corp. 90 13,359
29,577
Real Estate Operating Companies – 0.3%
ADLER Group SA(a) (c) 2,920 79,968
Aroundtown SA 10,290 73,284
CA Immobilien Anlagen AG 1,378 58,353
CTP BV(a) (c) 2,463 43,614
Deutsche Wohnen SE 4,080 190,326
5

Company Shares U.S. $ Value
Fastighets AB Balder - Class B(a) 1,780 $ 88,124
Grainger PLC 13,860 50,968
Kojamo Oyj 2,070 40,551
LEG Immobilien SE 770 101,283
Shurgard Self Storage SA 560 25,513
Swire Properties Ltd. 16,000 49,664
Wharf Real Estate Investment Co., Ltd. 6,000 33,740
835,388
Residential REITs – 0.4%
American Homes 4 Rent - Class A 4,013 133,794
Bluerock Residential Growth REIT, Inc. 1,800 18,198
Daiwa Securities Living Investments Corp. 45 44,195
Equity Residential 310 22,205
Essex Property Trust, Inc. 622 169,085
Independence Realty Trust, Inc. 6,097 92,675
Invitation Homes, Inc. 3,580 114,524
Killam Apartment Real Estate Investment Trust 6,151 90,598
Minto Apartment Real Estate Investment Trust(c) 2,790 48,198
Sun Communities, Inc. 1,168 175,247
UDR, Inc. 2,850 125,001
1,033,720
Retail REITs – 0.4%
AEON REIT Investment Corp. 25 33,723
Brixmor Property Group, Inc. 5,974 120,854
CapitaLand Integrated Commercial Trust 42,580 68,899
Eurocommercial Properties NV(a) 3,100 68,238
Kenedix Retail REIT Corp. 8 19,456
Link REIT 12,768 116,492
Mercialys SA 3,050 33,583
NETSTREIT Corp. 1,664 30,767
Simon Property Group, Inc. 1,959 222,875
SITE Centers Corp. 7,465 101,225
Vicinity Centres 75,236 95,110
911,222
Specialized REITs – 0.3%
CubeSmart 3,086 116,743
Digital Realty Trust, Inc. 1,860 261,963
EPR Properties 1,080 50,317
MGM Growth Properties LLC - Class A 2,660 86,769
National Storage Affiliates Trust 3,172 126,658
Safestore Holdings PLC 4,540 49,789
692,239
10,334,538
Communication Services – 4.1%
Diversified Telecommunication Services – 0.6%
Comcast Corp. - Class A 26,300 1,423,093
Telenor ASA 1,727 30,426
1,453,519
Entertainment – 0.5%
Electronic Arts, Inc. 7,513 1,017,035
Netflix, Inc.(a) 240 125,198
Nintendo Co., Ltd. 100 56,364
1,198,597
6

Company Shares U.S. $ Value
Interactive Media & Services – 2.6%
Alphabet, Inc. - Class A(a) 79 $ 162,939
Alphabet, Inc. - Class C(a) 1,861 3,849,721
Facebook, Inc. - Class A(a) 8,169 2,406,015
6,418,675
Wireless Telecommunication Services – 0.4%
Softbank Corp. 2,200 28,621
T-Mobile US, Inc.(a) 7,022 879,786
908,407
9,979,198
Financials – 3.9%
Banks – 2.0%
Bank of America Corp. 42,232 1,633,956
BNP Paribas SA(a) 993 60,503
Citigroup, Inc. 12,645 919,924
Fifth Third Bancorp 1,724 64,564
JPMorgan Chase & Co. 853 129,852
Mebuki Financial Group, Inc. 21,000 49,552
PNC Financial Services Group, Inc. (The) 3,618 634,633
Signature Bank/New York NY 197 44,542
Societe Generale SA(a) 2,160 56,473
SVB Financial Group(a) 218 107,618
Wells Fargo & Co. 30,202 1,179,992
4,881,609
Capital Markets – 1.2%
Ameriprise Financial, Inc. 30 6,973
CME Group, Inc. - Class A 3,377 689,685
Goldman Sachs Group, Inc. (The) 4,466 1,460,382
LPL Financial Holdings, Inc. 3,118 443,255
Moody’s Corp. 180 53,750
Nomura Holdings, Inc. 7,200 38,149
Raymond James Financial, Inc. 857 105,034
S&P Global, Inc. 109 38,463
2,835,691
Consumer Finance – 0.0%
Ally Financial, Inc. 811 36,665
Diversified Financial Services – 0.1%
Kinnevik AB - Class B(a) 1,722 83,692
M&G PLC 24,177 69,090
152,782
Insurance – 0.6%
AIA Group Ltd. 400 4,895
Athene Holding Ltd. - Class A(a) 581 29,282
Aviva PLC 2,165 12,203
CNP Assurances(a) 4,892 92,786
iA Financial Corp., Inc. 1,539 83,679
7

Company Shares U.S. $ Value
Manulife Financial Corp. 1,020 $ 21,939
MetLife, Inc. 1,474 89,605
Progressive Corp. (The) 5,973 571,079
Prudential Financial, Inc. 1,079 98,297
Reinsurance Group of America, Inc. - Class A 4,505 567,855
Sun Life Financial, Inc. 473 23,904
1,595,524
9,502,271
Industrials – 3.7%
Aerospace & Defense – 0.3%
L3Harris Technologies, Inc. 4,186 848,418
Air Freight & Logistics – 0.1%
Kuehne & Nagel International AG 243 69,407
United Parcel Service, Inc. - Class B 475 80,745
150,152
Airlines – 0.2%
Southwest Airlines Co.(a) 9,920 605,715
Building Products – 0.1%
Carrier Global Corp. 1,332 56,237
Cie de Saint-Gobain(a) 710 41,927
Masco Corp. 826 49,477
Otis Worldwide Corp. 665 45,519
Xinyi Glass Holdings Ltd. 6,000 19,711
212,871
Commercial Services & Supplies – 0.0%
Cintas Corp. 13 4,437
Copart, Inc.(a) 173 18,790
23,227
Construction & Engineering – 0.4%
AECOM(a) 12,811 821,313
Shimizu Corp. 6,700 54,251
875,564
Electrical Equipment – 0.7%
Acuity Brands, Inc. 667 110,055
Eaton Corp. PLC 6,819 942,932
Prysmian SpA 1,379 44,776
Regal Beloit Corp. 2,518 359,268
Rockwell Automation, Inc. 133 35,304
Siemens Gamesa Renewable Energy SA 955 37,039
Vestas Wind Systems A/S 367 75,707
1,605,081
Industrial Conglomerates – 0.2%
Honeywell International, Inc. 1,898 411,999
Machinery – 0.2%
Deere & Co. 203 75,950
Mitsubishi Heavy Industries Ltd. 200 6,228
Snap-on, Inc. 466 107,525
Techtronic Industries Co., Ltd. 5,500 94,291
Volvo AB - Class B(a) 3,563 90,233
374,227
8

Company Shares U.S. $ Value
Marine – 0.0%
Nippon Yusen KK 2,500 $ 85,501
Professional Services – 0.5%
Booz Allen Hamilton Holding Corp. 4,699 378,410
Randstad NV 363 25,481
Robert Half International, Inc. 9,190 717,463
1,121,354
Road & Rail – 0.7%
CSX Corp. 11,443 1,103,334
Knight-Swift Transportation Holdings, Inc. 15,085 725,438
1,828,772
Trading Companies & Distributors – 0.3%
United Rentals, Inc.(a) 2,302 758,071
WW Grainger, Inc. 6 2,406
760,477
8,903,358
Energy – 2.2%
Energy Equipment & Services – 0.0%
Baker Hughes Co. - Class A 533 11,518
Oil, Gas & Consumable Fuels – 2.2%
Aker BP ASA 7,048 199,933
BP PLC 121,953 495,367
Canadian Natural Resources Ltd. 671 20,744
Cheniere Energy, Inc.(a) 558 40,182
Chevron Corp. 12,427 1,302,225
ENEOS Holdings, Inc. 26,300 119,320
EOG Resources, Inc. 11,859 860,134
Exxon Mobil Corp. 4,136 230,913
Galp Energia SGPS SA 2,905 33,675
LUKOIL PJSC (Sponsored ADR) 1,350 109,067
Neste Oyj 78 4,142
Parkland Corp./Canada 484 14,543
PetroChina Co., Ltd. - Class H 548,000 198,683
Petroleo Brasileiro SA (Preference Shares) 39,600 169,554
Pioneer Natural Resources Co. 161 25,570
Repsol SA 21,147 262,475
Royal Dutch Shell PLC - Class A 1,579 30,694
Royal Dutch Shell PLC - Class B 51,379 945,756
TOTAL SE 7,749 361,256
Woodside Petroleum Ltd. 314 5,739
5,429,972
5,441,490
Materials – 1.7%
Chemicals – 0.6%
CF Industries Holdings, Inc. 1,585 71,927
Clariant AG 579 11,682
Covestro AG(c) 1,080 72,663
9

Company Shares U.S. $ Value
Daicel Corp. 2,600 $ 20,033
Evonik Industries AG 2,148 76,007
FMC Corp. 37 4,093
Kuraray Co., Ltd. 7,200 82,362
LANXESS AG 507 37,419
LyondellBasell Industries NV - Class A 6,134 638,243
Mitsubishi Chemical Holdings Corp. 3,600 27,038
Mitsui Chemicals, Inc. 1,300 41,142
Orbia Advance Corp. SAB de CV 30,101 80,262
RPM International, Inc. 180 16,533
Sika AG 156 44,609
Umicore SA 725 38,464
Yara International ASA 1,550 80,747
1,343,224
Construction Materials – 0.1%
Breedon Group PLC(a) 28,900 37,212
Buzzi Unicem SpA 1,660 43,118
Fletcher Building Ltd. 10,890 53,957
Grupo Cementos de Chihuahua SAB de CV 3,320 22,911
157,198
Containers & Packaging – 0.0%
Sealed Air Corp. 1,017 46,599
Smurfit Kappa Group PLC 602 28,246
74,845
Metals & Mining – 1.0%
Agnico Eagle Mines Ltd. 3,981 230,142
Alcoa Corp.(a) 3,460 112,415
Anglo American PLC 5,035 197,210
AngloGold Ashanti Ltd. 5,909 128,621
APERAM SA 2,580 115,993
ArcelorMittal SA(a) 5,343 153,779
BHP Group Ltd. 756 26,225
Boliden AB 2,635 97,767
First Quantum Minerals Ltd. 4,901 93,403
Fortescue Metals Group Ltd. 429 6,538
Glencore PLC(a) 90,653 355,941
Industrias Penoles SAB de CV(a) 1,909 24,637
Lundin Mining Corp. 5,655 58,183
MMC Norilsk Nickel PJSC (ADR) 2,130 66,648
Northern Star Resources Ltd. 3,550 25,715
Orocobre Ltd.(a) 5,420 19,705
OZ Minerals Ltd. 2,685 46,833
Polyus PJSC (GDR)(c) 730 67,509
Regis Resources Ltd. 12,150 26,885
Rio Tinto PLC 4,060 309,730
St. Barbara Ltd. 23,750 35,596
Steel Dynamics, Inc. 125 6,345
Vale SA (Sponsored ADR) - Class B 13,656 237,341
Yamana Gold, Inc. 4,751 20,642
2,463,803
Paper & Forest Products – 0.0%
Suzano SA(a) 9,200 112,045
4,151,115
10
Company Shares U.S. $ Value
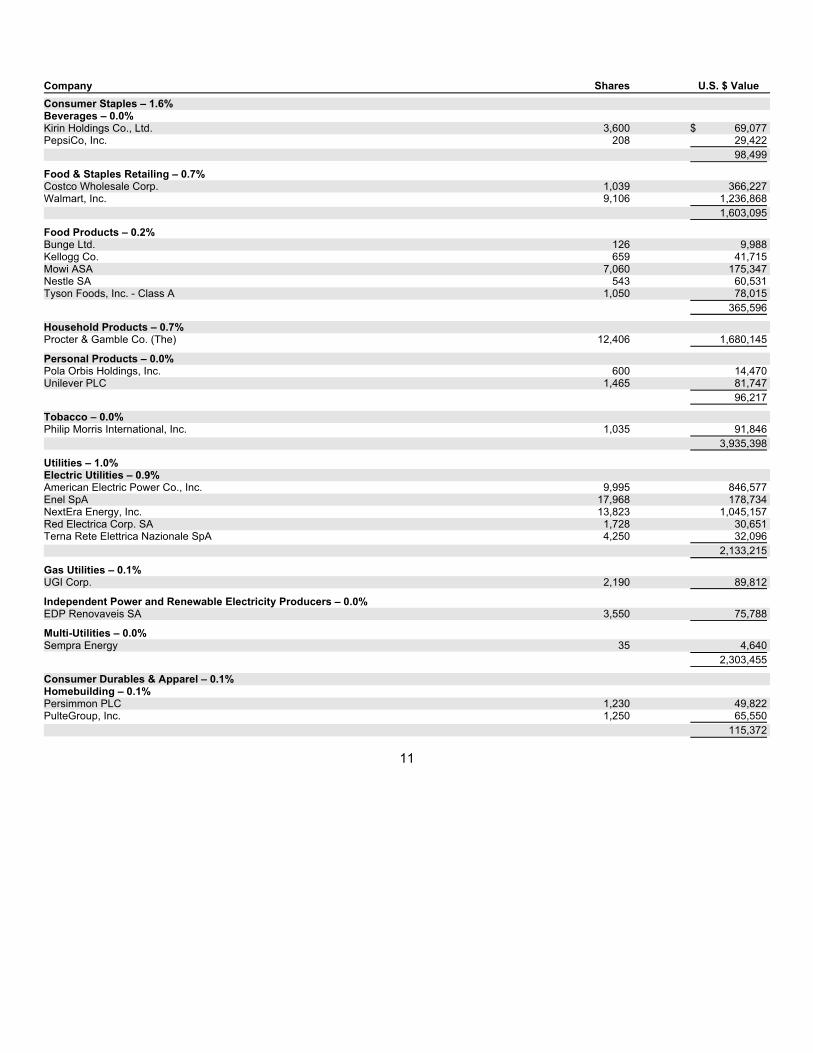
Consumer Staples – 1.6%
Beverages – 0.0%
Kirin Holdings Co., Ltd. 3,600 $ 69,077
PepsiCo, Inc. 208 29,422
98,499
Food & Staples Retailing – 0.7%
Costco Wholesale Corp. 1,039 366,227
Walmart, Inc. 9,106 1,236,868
1,603,095
Food Products – 0.2%
Bunge Ltd. 126 9,988
Kellogg Co. 659 41,715
Mowi ASA 7,060 175,347
Nestle SA 543 60,531
Tyson Foods, Inc. - Class A 1,050 78,015
365,596
Household Products – 0.7%
Procter & Gamble Co. (The) 12,406 1,680,145
Personal Products – 0.0%
Pola Orbis Holdings, Inc. 600 14,470
Unilever PLC 1,465 81,747
96,217
Tobacco – 0.0%
Philip Morris International, Inc. 1,035 91,846
3,935,398
Utilities – 1.0%
Electric Utilities – 0.9%
American Electric Power Co., Inc. 9,995 846,577
Enel SpA 17,968 178,734
NextEra Energy, Inc. 13,823 1,045,157
Red Electrica Corp. SA 1,728 30,651
Terna Rete Elettrica Nazionale SpA 4,250 32,096
2,133,215
Gas Utilities – 0.1%
UGI Corp. 2,190 89,812
Independent Power and Renewable Electricity Producers – 0.0%
EDP Renovaveis SA 3,550 75,788
Multi-Utilities – 0.0%
Sempra Energy 35 4,640
2,303,455
Consumer Durables & Apparel – 0.1%
Homebuilding – 0.1%
Persimmon PLC 1,230 49,822
PulteGroup, Inc. 1,250 65,550
115,372
11

Company Shares U.S. $ Value
Transportation – 0.0%
Highways & Railtracks – 0.0%
Transurban Group 6,998 $ 71,143
Consumer Services – 0.0%
Hotels, Resorts & Cruise Lines – 0.0%
Hilton Grand Vacations, Inc.(a) 1,250 46,862
Leisure Facilities – 0.0%
Planet Fitness, Inc.(a) 285 22,031
68,893
Telecommunication Services – 0.0%
Integrated Telecommunication Services – 0.0%
Infrastrutture Wireless Italiane SpA(c) 4,130 45,997
Software & Services – 0.0%
Internet Services & Infrastructure – 0.0%
GDS Holdings Ltd. (ADR)(a) 350 28,381
Total Common Stocks
(cost $64,831,897) 98,458,659
INVESTMENT COMPANIES – 26.2%
Funds and Investment Trusts – 26.2%(d) (e)
AB Discovery Growth Fund, Inc. - Class Z 200,740 3,123,509
AB Trust – AB Discovery Value Fund - Class Z 127,151 3,105,038
Bernstein Fund, Inc. - International Small Cap Portfolio - Class Z 646,091 8,237,654
Bernstein Fund, Inc. - International Strategic Equities Portfolio - Class Z 3,185,999 42,246,348
Bernstein Fund, Inc. - Small Cap Core Portfolio - Class Z 208,853 3,111,909
Sanford C. Bernstein Fund, Inc. - Emerging Markets Portfolio - Class Z 112,995 3,857,647
Total Investment Companies
(cost $58,881,950) 63,682,105
Principal
Amount
(000)
GOVERNMENTS - TREASURIES – 13.0%
Australia – 1.6%
Australia Government Bond
Series 144
3.75%, 04/21/2037(c) AUD 620 562,035
Series 145
2.75%, 06/21/2035(c) 802 651,496
Series 150
3.00%, 03/21/2047(c) 920 738,554
Series 160
1.00%, 12/21/2030(c) 320 226,564
Series 161
0.25%, 11/21/2025(c) 1,770 1,318,819
Series 164
0.50%, 09/21/2026(c) 475 353,235
3,850,703
12

Principal
Amount
(000) U.S. $ Value
Austria – 0.3%
Republic of Austria Government Bond
0.75%, 02/20/2028(c) EUR 510 $ 644,984
Belgium – 0.1%
Kingdom of Belgium Government Bond
Series 76
1.90%, 06/22/2038(c) 180 263,712
Canada – 0.1%
Canadian Government Bond
0.25%, 03/01/2026 CAD 425 325,969
China – 0.8%
China Government Bond
Series INBK
3.27%, 11/19/2030 CNY 5,690 872,155
3.39%, 03/16/2050 7,870 1,118,183
1,990,338
Colombia – 0.1%
Colombian TES
Series B
5.75%, 11/03/2027 COP 1,050,100 278,798
Finland – 0.1%
Finland Government Bond
0.50%, 09/15/2028(c) EUR 115 143,429
France – 0.2%
French Republic Government Bond OAT
0.50%, 06/25/2044(c) 337 387,217
Germany – 0.7%
Bundesrepublik Deutschland Bundesanleihe
0.10%, 08/15/2030-08/15/2050(c) 929 1,068,026
Series 2007
4.25%, 07/04/2039(c) 120 250,523
Series 3
4.75%, 07/04/2034(c) 250 487,538
1,806,087
Italy – 1.3%
Italy Buoni Poliennali Del Tesoro
0.95%, 09/15/2027(c) 1,610 1,973,255
1.50%, 04/30/2045(c) 670 788,537
1.80%, 03/01/2041(c) 270 339,984
3,101,776
13

Principal
Amount
(000) U.S. $ Value
Japan – 3.2%
Japan Government Five Year Bond
Series 137
0.10%, 09/20/2023 JPY 86,750 $ 788,025
Japan Government Ten Year Bond
Series 358
0.10%, 03/20/2030 205,850 1,865,952
Series 359
0.10%, 06/20/2030 277,550 2,514,105
Series 360
0.10%, 09/20/2030 26,850 242,873
Japan Government Twenty Year Bond
Series 169
0.30%, 06/20/2039 31,650 278,709
Series 171
0.30%, 12/20/2039 44,850 393,833
Japan Government Thirty Year Bond
Series 62
0.50%, 03/20/2049 63,600 553,678
Series 65
0.40%, 12/20/2049 62,950 530,122
Series 68
0.60%, 09/20/2050 69,900 620,145
7,787,442
Malaysia – 0.1%
Malaysia Government Bond
Series 0310
4.498%, 04/15/2030 MYR 1,088 283,605
Mexico – 0.1%
Mexican Bonos
Series M
7.75%, 05/29/2031 MXN 3,135 163,445
Spain – 0.3%
Spain Government Bond
1.20%, 10/31/2040(c) EUR 455 555,194
4.20%, 01/31/2037(c) 114 203,141
758,335
United Kingdom – 0.7%
United Kingdom Gilt
0.625%, 10/22/2050(c) GBP 157 176,208
1.25%, 10/22/2041(c) 215 290,243
1.75%, 09/07/2037(c) 821 1,213,616
1,680,067
United States – 3.3%
U.S. Treasury Bonds
1.125%, 05/15/2040-08/15/2040 U.S.$ 2,880 2,337,178
1.875%, 02/15/2051 690 609,895
4.50%, 08/15/2039 455 614,463
4.625%, 02/15/2040 100 137,516
U.S. Treasury Notes
0.25%, 05/31/2025 1,435 1,407,197
1.625%, 10/31/2026 1,345 1,383,038
14

Principal
Amount
(000) U.S. $ Value
2.125%, 05/31/2026 U.S.$ 1,390 $ 1,469,925
7,959,212
Total Governments - Treasuries
(cost $32,562,884) 31,425,119
CORPORATES - INVESTMENT GRADE – 7.9%
Industrial – 3.7%
Basic – 0.4%
Alpek SAB de CV
3.25%, 02/25/2031(c) 200 197,050
AngloGold Ashanti Holdings PLC
3.75%, 10/01/2030 201 201,440
Inversiones CMPC SA
3.85%, 01/13/2030(c) 200 212,312
SABIC Capital II BV
4.00%, 10/10/2023(c) 335 360,439
Suzano Austria GmbH
3.75%, 01/15/2031 32 33,037
1,004,278
Capital Goods – 0.0%
Westinghouse Air Brake Technologies Corp.
3.20%, 06/15/2025 10 10,615
4.40%, 03/15/2024 67 72,859
83,474
Communications - Media – 0.4%
Charter Communications Operating LLC/Charter Communications Operating Capital
4.80%, 03/01/2050 17 18,303
5.125%, 07/01/2049 84 94,826
5.375%, 05/01/2047 35 40,613
Fox Corp.
4.709%, 01/25/2029 215 247,835
Prosus NV
3.68%, 01/21/2030(c) 220 227,425
ViacomCBS, Inc.
3.70%, 06/01/2028 23 24,922
Weibo Corp.
3.375%, 07/08/2030 200 197,852
851,776
Communications - Telecommunications – 0.3%
AT&T, Inc.
3.50%, 09/15/2053(c) 200 184,954
Series B
2.875%, 03/02/2025(f) EUR 100 117,136
British Telecommunications PLC
9.625%, 12/15/2030 U.S.$ 145 224,169
Sprint Spectrum Co. LLC/Sprint Spectrum Co. II LLC/Sprint Spectrum Co. III LLC
4.738%, 03/20/2025(c) 200 215,154
741,413
15

Principal
Amount
(000) U.S. $ Value
Consumer Cyclical - Automotive – 0.3%
Harley-Davidson Financial Services, Inc.
0.90%, 11/19/2024(c) EUR 200 $ 238,494
3.35%, 06/08/2025(c) U.S.$ 30 31,490
Lear Corp.
3.80%, 09/15/2027 127 138,481
Nissan Motor Co., Ltd.
4.345%, 09/17/2027(c) 200 217,874
Volkswagen Bank GmbH
1.25%, 06/10/2024(c) EUR 100 121,560
Volkswagen Leasing GmbH
2.625%, 01/15/2024(c) 73 91,636
839,535
Consumer Cyclical - Other – 0.1%
Las Vegas Sands Corp.
3.50%, 08/18/2026 U.S.$ 89 92,845
3.90%, 08/08/2029 91 93,495
186,340
Consumer Cyclical - Retailers – 0.0%
Ross Stores, Inc.
4.70%, 04/15/2027 24 27,381
Consumer Non-Cyclical – 0.4%
Altria Group, Inc.
3.125%, 06/15/2031 EUR 270 364,934
Anheuser-Busch InBev Worldwide, Inc.
5.55%, 01/23/2049 U.S.$ 145 186,994
BAT Capital Corp.
4.906%, 04/02/2030 55 62,741
BAT Netherlands Finance BV
3.125%, 04/07/2028(c) EUR 100 133,724
CVS Health Corp.
5.05%, 03/25/2048 U.S.$ 125 153,441
DH Europe Finance II SARL
0.45%, 03/18/2028 EUR 143 168,565
1,070,399
Energy – 0.9%
Boardwalk Pipelines LP
4.80%, 05/03/2029 U.S.$ 125 138,477
BP Capital Markets PLC
1.573%, 02/16/2027(c) EUR 175 221,556
3.25%, 03/22/2026(c) (f) 135 169,799
Cenovus Energy, Inc.
5.375%, 07/15/2025 U.S.$ 32 36,010
Enbridge Energy Partners LP
7.375%, 10/15/2045 87 124,627
Energy Transfer Operating LP
5.50%, 06/01/2027 100 115,353
6.25%, 04/15/2049 175 206,412
16

Principal
Amount
(000) U.S. $ Value
Eni SpA
Series NC5.
2.625%, 10/13/2025(c) (f) EUR 129 $ 158,229
Husky Energy, Inc.
4.40%, 04/15/2029 U.S.$ 182 194,451
ONEOK, Inc.
4.55%, 07/15/2028 104 115,018
6.35%, 01/15/2031 130 163,101
Plains All American Pipeline LP/PAA Finance Corp.
3.55%, 12/15/2029 16 15,998
3.80%, 09/15/2030 42 42,786
4.50%, 12/15/2026 29 31,839
Saudi Arabian Oil Co.
2.875%, 04/16/2024(c) 200 210,004
TOTAL SE
2.625%, 02/26/2025(c) (f) EUR 100 123,827
Valero Energy Corp.
6.625%, 06/15/2037 U.S.$ 32 41,587
2,109,074
Other Industrial – 0.1%
Alfa SAB de CV
5.25%, 03/25/2024(c) 200 218,000
Services – 0.1%
Alibaba Group Holding Ltd.
2.125%, 02/09/2031 204 194,089
Booking Holdings, Inc.
0.50%, 03/08/2028 EUR 100 118,036
Expedia Group, Inc.
6.25%, 05/01/2025(c) U.S.$ 3 3,469
315,594
Technology – 0.4%
Baidu, Inc.
3.075%, 04/07/2025 205 215,482
Broadcom, Inc.
4.11%, 09/15/2028 149 162,686
5.00%, 04/15/2030 35 39,890
Fidelity National Information Services, Inc.
1.00%, 12/03/2028 EUR 165 198,977
Fiserv, Inc.
1.125%, 07/01/2027 200 245,247
Oracle Corp.
3.95%, 03/25/2051 U.S.$ 140 144,544
1,006,826
Transportation - Airlines – 0.1%
Delta Air Lines, Inc.
7.00%, 05/01/2025(c) 99 113,992
Transportation - Services – 0.2%
ENA Master Trust
4.00%, 05/19/2048(c) 200 201,750
17

Principal
Amount
(000) U.S. $ Value
Heathrow Funding Ltd.
6.75%, 12/03/2026(c) GBP 135 $ 234,476
436,226
9,004,308
Financial Institutions – 3.7%
Banking – 2.5%
American Express Co.
Series B
3.622% (LIBOR 3 Month + 3.43%), 05/15/2021(f) (g) U.S.$ 8 8,001
Series C
3.469% (LIBOR 3 Month + 3.29%), 06/15/2021(f) (g) 17 16,899
Australia & New Zealand Banking Group Ltd.
4.40%, 05/19/2026(c) 215 240,852
Bank of America Corp.
1.776%, 05/04/2027(c) EUR 248 313,037
BNP Paribas SA
2.219%, 06/09/2026(c) U.S.$ 200 205,050
BPCE SA
4.625%, 07/11/2024(c) 200 220,930
CaixaBank SA
0.375%, 11/18/2026(c) EUR 200 234,371
Capital One Financial Corp.
Series E
3.991% (LIBOR 3 Month + 3.80%), 06/01/2021(f) (g) U.S.$ 44 43,980
Citigroup, Inc.
1.50%, 07/24/2026(c) EUR 155 191,628
5.95%, 01/30/2023(f) U.S.$ 90 94,455
Series Q
4.289% (LIBOR 3 Month + 4.10%), 05/15/2021(f) (g) 82 81,888
Cooperatieve Rabobank UA
3.25%, 12/29/2026(c) (f) EUR 200 239,852
Credit Suisse Group AG
4.194%, 04/01/2031(c) U.S.$ 250 271,885
Danske Bank A/S
3.244%, 12/20/2025(c) 350 372,589
5.375%, 01/12/2024(c) 200 222,998
DNB Bank ASA
6.50%, 03/26/2022(c) (f) 210 218,045
Fifth Third Bancorp
Series L
4.50%, 09/30/2025(f) 41 43,642
Goldman Sachs Group, Inc. (The)
1.25%, 05/01/2025(c) EUR 190 230,614
HSBC Holdings PLC
6.375%, 03/30/2025(f) U.S.$ 200 220,630
18

Principal
Amount
(000) U.S. $ Value
ING Groep NV
2.727%, 04/01/2032 U.S.$ 240 $ 239,779
3.00%, 02/18/2026(c) GBP 100 148,765
6.50%, 04/16/2025(f) U.S.$ 232 255,576
JPMorgan Chase & Co.
1.09%, 03/11/2027(c) EUR 170 207,894
Series I
3.682% (LIBOR 3 Month + 3.47%), 04/30/2021(f) (g) U.S.$ 34 33,888
Series V
3.558% (LIBOR 3 Month + 3.32%), 07/01/2021 (f) (g) 17 16,867
Series Z
4.005% (LIBOR 3 Month + 3.80%), 05/01/2021(f) (g) 31 31,019
Morgan Stanley
Series G
1.375%, 10/27/2026 EUR 100 124,506
Series H
3.851% (LIBOR 3 Month + 3.61%), 07/15/2021(f) (g) U.S.$ 9 8,992
Series J
4.051% (LIBOR 3 Month + 3.81%), 04/15/2021(f) (g) 128 128,043
Natwest Group PLC
Series U
2.573% (LIBOR 3 Month + 2.32%), 09/30/2027(f) (g) 200 197,886
PNC Financial Services Group, Inc. (The)
Series O
6.75%, 08/01/2021(f) 17 17,260
Societe Generale SA
4.25%, 04/14/2025(c) 205 221,347
Standard Chartered PLC
1.722% (LIBOR 3 Month + 1.51%), 01/30/2027(c) (f) (g) 200 187,570
Truist Financial Corp.
Series Q
5.10%, 03/01/2030(f) 75 81,789
UBS Group AG
7.125%, 08/10/2021(c) (f) 230 234,338
UniCredit SpA
2.569%, 09/22/2026(c) 350 351,666
US Bancorp
Series I
3.727% (LIBOR 3 Month + 3.49%), 04/15/2021(f) (g) 53 52,934
Wells Fargo & Co.
1.375%, 10/26/2026(c) EUR 110 136,392
6,147,857
19

Principal
Amount
(000) U.S. $ Value
Brokerage – 0.1%
Charles Schwab Corp. (The)
Series I
4.00%, 06/01/2026(f) U.S.$ 201 $ 204,122
Finance – 0.4%
Air Lease Corp.
2.875%, 01/15/2026 67 69,344
3.625%, 04/01/2027 14 14,786
3.875%, 07/03/2023 6 6,380
4.25%, 02/01/2024 21 22,777
Aircastle Ltd.
2.85%, 01/26/2028(c) 79 75,353
4.25%, 06/15/2026 3 3,159
4.40%, 09/25/2023 67 71,426
5.25%, 08/11/2025(c) 72 78,446
Aviation Capital Group LLC
1.95%, 01/30/2026(c) 13 12,667
2.875%, 01/20/2022(c) 11 11,157
3.50%, 11/01/2027(c) 18 18,507
3.875%, 05/01/2023(c) 44 45,963
4.125%, 08/01/2025(c) 2 2,130
4.375%, 01/30/2024(c) 13 13,826
4.875%, 10/01/2025(c) 23 25,104
5.50%, 12/15/2024(c) 47 52,682
GE Capital European Funding Unlimited Co.
4.625%, 02/22/2027 EUR 100 146,414
GE Capital Funding LLC
4.40%, 05/15/2030(c) U.S.$ 200 226,760
Synchrony Financial
3.95%, 12/01/2027 25 26,941
4.50%, 07/23/2025 51 56,489
980,311
Insurance – 0.4%
Alleghany Corp.
3.625%, 05/15/2030 109 117,530
ASR Nederland NV
3.375%, 05/02/2049(c) EUR 100 130,924
Centene Corp.
4.25%, 12/15/2027 U.S.$ 28 29,431
4.625%, 12/15/2029 37 40,056
CNP Assurances
4.50%, 06/10/2047(c) EUR 200 281,636
Credit Agricole Assurances SA
4.25%, 01/13/2025(c) (f) 200 261,315
Voya Financial, Inc.
5.65%, 05/15/2053 U.S.$ 153 163,381
1,024,273
20

Principal
Amount
(000) U.S. $ Value
REITS – 0.3%
CyrusOne LP/CyrusOne Finance Corp.
1.45%, 01/22/2027 EUR 100 $ 118,152
Digital Euro Finco LLC
2.50%, 01/16/2026(c) EUR 220 283,930
Host Hotels & Resorts LP
Series D
3.75%, 10/15/2023 U.S.$ 10 10,553
WPC Eurobond BV
2.125%, 04/15/2027 EUR 148 187,829
600,464
8,957,027
Utility – 0.5%
Electric – 0.5%
Abu Dhabi National Energy Co. PJSC
4.375%, 04/23/2025(c) U.S.$ 250 278,281
E.ON International Finance BV
1.25%, 10/19/2027(c) EUR 54 67,419
EDP Finance BV
0.375%, 09/16/2026(c) 170 201,091
Enel Finance International NV
2.65%, 09/10/2024(c) U.S.$ 308 324,158
Iberdrola International BV
Series NC6
1.45%, 11/09/2026(c) (f) EUR 100 117,917
Naturgy Finance BV
4.125%, 11/18/2022(c) (f) 100 123,445
SSE PLC
1.375%, 09/04/2027(c) 160 200,718
1,313,029
Total Corporates - Investment Grade
(cost $18,520,788) 19,274,364
CORPORATES - NON-INVESTMENT GRADE – 2.4%
Industrial – 2.0%
Basic – 0.3%
Axalta Coating Systems LLC
3.375%, 02/15/2029(c) U.S.$ 150 146,265
INEOS Quattro Finance 2 PLC
2.50%, 01/15/2026(c) EUR 100 117,311
Ingevity Corp.
3.875%, 11/01/2028(c) U.S.$ 88 85,355
Solvay SA
2.50%, 12/02/2025(f) EUR 100 120,049
SPCM SA
4.875%, 09/15/2025(c) U.S.$ 200 205,582
WEPA Hygieneprodukte GmbH
2.875%, 12/15/2027(c) EUR 120 140,724
815,286
21

Principal
Amount
(000) U.S. $ Value
Capital Goods – 0.3%
Ardagh Metal Packaging Finance USA LLC/Ardagh Metal Packaging Finance PLC
2.00%, 09/01/2028(c) EUR 135 $ 158,354
Rolls-Royce PLC
0.875%, 05/09/2024(c) 160 180,791
TransDigm, Inc.
6.25%, 03/15/2026(c) U.S.$ 110 116,614
Vertical Midco GmbH
4.375%, 07/15/2027(c) EUR 140 172,607
628,366
Communications - Media – 0.1%
Cable One, Inc.
4.00%, 11/15/2030(c) U.S.$ 53 52,409
CSC Holdings LLC
6.75%, 11/15/2021 45 46,294
Netflix, Inc.
3.625%, 05/15/2027 EUR 147 197,383
296,086
Communications - Telecommunications – 0.2%
Lumen Technologies, Inc.
4.50%, 01/15/2029(c) U.S.$ 103 100,505
T-Mobile USA, Inc.
2.625%, 04/15/2026 73 74,023
2.875%, 02/15/2031 48 46,400
3.375%, 04/15/2029 78 78,919
Telecom Italia SpA/Milano
1.625%, 01/18/2029(c) EUR 140 160,615
Telefonica Europe BV
3.75%, 03/15/2022(c) (f) 100 120,624
581,086
Consumer Cyclical - Automotive – 0.2%
Allison Transmission, Inc.
3.75%, 01/30/2031(c) U.S.$ 105 101,960
Clarios Global LP/Clarios US Finance Co.
4.375%, 05/15/2026(c) EUR 120 145,730
Ford Motor Co.
8.50%, 04/21/2023 U.S.$ 108 120,423
Tenneco, Inc.
5.00%, 07/15/2024(c) EUR 100 120,202
488,315
Consumer Cyclical - Entertainment – 0.1%
Carnival PLC
1.00%, 10/28/2029 200 180,438
Consumer Cyclical - Restaurants – 0.1%
1011778 BC ULC/New Red Finance, Inc.
3.50%, 02/15/2029(c) U.S.$ 116 112,810
22

Principal
Amount
(000) U.S. $ Value
Consumer Cyclical - Retailers – 0.1%
Dufry One BV
2.50%, 10/15/2024(c) EUR 105 $ 121,149
Levi Strauss & Co.
3.50%, 03/01/2031(c) U.S.$ 55 53,104
174,253
Consumer Non-Cyclical – 0.4%
Albertsons Cos., Inc./Safeway, Inc./New Albertsons LP/Albertsons LLC
3.50%, 02/15/2023(c) 61 62,411
Avantor Funding, Inc.
2.625%, 11/01/2025(c) EUR 102 122,471
Cheplapharm Arzneimittel GmbH
3.50%, 02/11/2027(c) 120 142,569
Grifols SA
1.625%, 02/15/2025(c) 200 235,077
IQVIA, Inc.
1.75%, 03/15/2026(c) 170 199,831
Newell Brands, Inc.
4.70%, 04/01/2026 U.S.$ 81 89,333
4.875%, 06/01/2025 20 22,079
Tenet Healthcare Corp.
4.625%, 07/15/2024 102 104,119
977,890
Other Industrial – 0.1%
H&E Equipment Services, Inc.
3.875%, 12/15/2028(c) 118 114,630
Rexel SA
2.125%, 06/15/2025(c) EUR 120 141,826
256,456
Technology – 0.0%
Dell International LLC/EMC Corp.
7.125%, 06/15/2024(c) U.S.$ 14 14,409
Transportation - Services – 0.1%
Chicago Parking Meters LLC
4.93%, 12/30/2025(h) 200 216,171
4,741,566
Financial Institutions – 0.4%
Banking – 0.2%
Banco Santander SA
6.75%, 04/25/2022(c) (f) EUR 200 247,147
Credit Suisse Group AG
7.50%, 12/11/2023(c) (f) U.S.$ 200 216,610
Discover Financial Services
Series D
6.125%, 06/23/2025(f) 117 129,809
593,566
23

Principal
Amount
(000) U.S. $ Value
Finance – 0.2%
Lincoln Financing SARL
3.625%, 04/01/2024(c) EUR 120 $ 142,175
Navient Corp.
6.625%, 07/26/2021 U.S.$ 170 173,220
SLM Corp.
4.20%, 10/29/2025 96 100,780
416,175
REITS – 0.0%
MGM Growth Properties Operating Partnership LP/MGP Finance Co-Issuer, Inc.
4.625%, 06/15/2025(c) 58 61,123
1,070,864
Total Corporates - Non-Investment Grade
(cost $5,692,849) 5,812,430
QUASI-SOVEREIGNS – 1.7%
Quasi-Sovereign Bonds – 1.7%
China – 1.3%
China Development Bank
Series 1805
4.88%, 02/09/2028 CNY 14,390 2,363,619
Series 1910
3.65%, 05/21/2029 2,040 311,277
Series 2004
3.43%, 01/14/2027 1,780 270,106
Series 2009
3.39%, 07/10/2027 1,140 172,500
3,117,502
Indonesia – 0.2%
Indonesia Asahan Aluminium Persero PT
4.75%, 05/15/2025(c) U.S.$ 200 217,340
Perusahaan Perseroan Persero PT Perusahaan Listrik Negara
3.375%, 02/05/2030(c) 210 211,116
428,456
Mexico – 0.1%
Comision Federal de Electricidad
3.348%, 02/09/2031(c) 200 191,937
Petroleos Mexicanos
5.95%, 01/28/2031 39 37,245
7.69%, 01/23/2050 120 110,880
340,062
United Arab Emirates – 0.1%
DP World Crescent Ltd.
3.875%, 07/18/2029(c) 200 209,500
Total Quasi-Sovereigns
(cost $3,906,312) 4,095,520
24

Principal
Amount
(000) U.S. $ Value
COLLATERALIZED MORTGAGE OBLIGATIONS – 1.5%
Risk Share Floating Rate – 1.0%
Bellemeade Re Ltd.
Series 2019-1A, Class M1B
1.859% (LIBOR 1 Month + 1.75%), 03/25/2029(c) (g) U.S.$ 220 $ 217,673
Series 2019-2A, Class M2
3.209% (LIBOR 1 Month + 3.10%), 04/25/2029(c) (g) 150 151,048
Connecticut Avenue Securities Trust
Series 2019-R02, Class 1M2
2.409% (LIBOR 1 Month + 2.30%), 08/25/2031(c) (g) 45 45,319
Series 2019-R03, Class 1M2
2.259% (LIBOR 1 Month + 2.15%), 09/25/2031(c) (g) 31 31,326
Series 2019-R04, Class 2M2
2.209% (LIBOR 1 Month + 2.10%), 06/25/2039(c) (g) 54 53,833
Series 2019-R05, Class 1M2
2.109% (LIBOR 1 Month + 2.00%), 07/25/2039(c) (g) 32 32,078
Series 2019-R06, Class 2M2
2.209% (LIBOR 1 Month + 2.10%), 09/25/2039(c) (g) 66 66,297
Series 2019-R07, Class 1M2
2.209% (LIBOR 1 Month + 2.10%), 10/25/2039(c) (g) 44 43,905
Eagle RE Ltd.
Series 2018-1, Class M1
1.809% (LIBOR 1 Month + 1.70%), 11/25/2028(c) (g) 56 56,041
Federal Home Loan Mortgage Corp. Structured Agency Credit Risk Debt Notes
Series 2014-DN3, Class M3
4.109% (LIBOR 1 Month + 4.00%), 08/25/2024(g) 113 114,981
Series 2014-HQ3, Class M3
4.859% (LIBOR 1 Month + 4.75%), 10/25/2024(g) 47 47,306
Series 2019-DNA3, Class M2
2.159% (LIBOR 1 Month + 2.05%), 07/25/2049(c) (g) 20 20,404
Series 2019-HQA1, Class M2
2.459% (LIBOR 1 Month + 2.35%), 02/25/2049(c) (g) 46 45,686
Federal National Mortgage Association Connecticut Avenue Securities
Series 2015-C01, Class 1M2
4.409% (LIBOR 1 Month + 4.30%), 02/25/2025(g) 45 45,206
Series 2015-C02, Class 1M2
4.109% (LIBOR 1 Month + 4.00%), 05/25/2025(g) 63 63,723
25

Principal
Amount
(000) U.S. $ Value
Series 2015-C02, Class 2M2
4.109% (LIBOR 1 Month + 4.00%), 05/25/2025(g) U.S.$ 29 $ 29,617
Series 2015-C03, Class 1M2
5.109% (LIBOR 1 Month + 5.00%), 07/25/2025(g) 30 31,005
Series 2015-C03, Class 2M2
5.109% (LIBOR 1 Month + 5.00%), 07/25/2025(g) 45 45,231
Series 2015-C04, Class 1M2
5.809% (LIBOR 1 Month + 5.70%), 04/25/2028(g) 34 35,958
Series 2015-C04, Class 2M2
5.659% (LIBOR 1 Month + 5.55%), 04/25/2028(g) 120 126,073
Series 2016-C01, Class 1M2
6.859% (LIBOR 1 Month + 6.75%), 08/25/2028(g) 40 42,102
Series 2016-C02, Class 1M2
6.109% (LIBOR 1 Month + 6.00%), 09/25/2028(g) 74 77,844
Series 2016-C06, Class 1M2
4.359% (LIBOR 1 Month + 4.25%), 04/25/2029(g) 87 91,002
Series 2017-C01, Class 1M2
3.659% (LIBOR 1 Month + 3.55%), 07/25/2029(g) 58 59,683
Series 2017-C02, Class 2M2
3.759% (LIBOR 1 Month + 3.65%), 09/25/2029(g) 123 126,789
Series 2017-C05, Class 1M2
2.309% (LIBOR 1 Month + 2.20%), 01/25/2030(g) 108 109,367
JPMorgan Madison Avenue Securities Trust
Series 2014-CH1, Class M2
4.359% (LIBOR 1 Month + 4.25%), 11/25/2024(g) (i) 13 13,085
PMT Credit Risk Transfer Trust
Series 2019-1R, Class A
2.127% (LIBOR 1 Month + 2.00%), 03/27/2024(c) (g) 71 66,998
Radnor Re Ltd.
Series 2019-1, Class M1B
2.059% (LIBOR 1 Month + 1.95%), 02/25/2029(c) (g) 140 140,856
STACR Trust
Series 2018-DNA3, Class M2
2.209% (LIBOR 1 Month + 2.10%), 09/25/2048(c) (g) 174 173,348
Triangle Re Ltd.
Series 2021-1, Class M1B
3.107% (LIBOR 1 Month + 3.00%), 08/25/2033(c) (g) 149 149,356
26
Principal
Amount
(000) U.S. $ Value
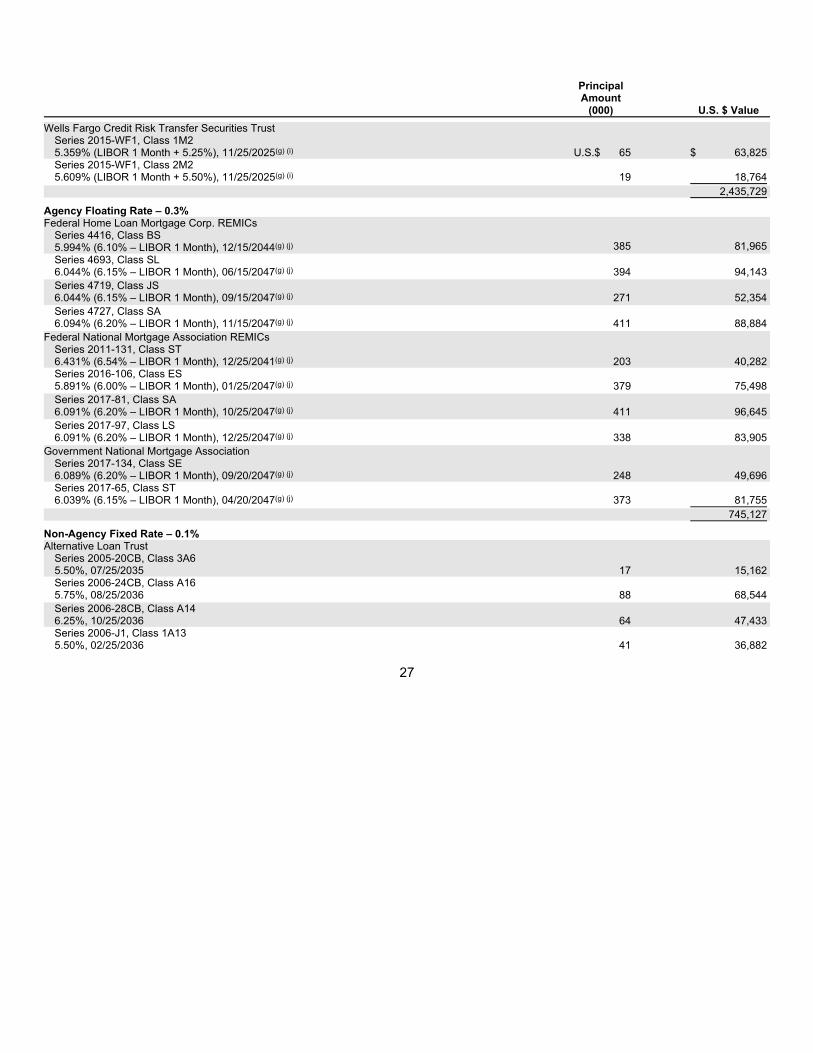
Wells Fargo Credit Risk Transfer Securities Trust
Series 2015-WF1, Class 1M2
5.359% (LIBOR 1 Month + 5.25%), 11/25/2025(g) (i) U.S.$ 65 $ 63,825
Series 2015-WF1, Class 2M2
5.609% (LIBOR 1 Month + 5.50%), 11/25/2025(g) (i) 19 18,764
2,435,729
Agency Floating Rate – 0.3%
Federal Home Loan Mortgage Corp. REMICs
Series 4416, Class BS
5.994% (6.10% – LIBOR 1 Month), 12/15/2044(g) (j) 385 81,965
Series 4693, Class SL
6.044% (6.15% – LIBOR 1 Month), 06/15/2047(g) (j) 394 94,143
Series 4719, Class JS
6.044% (6.15% – LIBOR 1 Month), 09/15/2047(g) (j) 271 52,354
Series 4727, Class SA
6.094% (6.20% – LIBOR 1 Month), 11/15/2047(g) (j) 411 88,884
Federal National Mortgage Association REMICs
Series 2011-131, Class ST
6.431% (6.54% – LIBOR 1 Month), 12/25/2041(g) (j) 203 40,282
Series 2016-106, Class ES
5.891% (6.00% – LIBOR 1 Month), 01/25/2047(g) (j) 379 75,498
Series 2017-81, Class SA
6.091% (6.20% – LIBOR 1 Month), 10/25/2047(g) (j) 411 96,645
Series 2017-97, Class LS
6.091% (6.20% – LIBOR 1 Month), 12/25/2047(g) (j) 338 83,905
Government National Mortgage Association
Series 2017-134, Class SE
6.089% (6.20% – LIBOR 1 Month), 09/20/2047(g) (j) 248 49,696
Series 2017-65, Class ST
6.039% (6.15% – LIBOR 1 Month), 04/20/2047(g) (j) 373 81,755
745,127
Non-Agency Fixed Rate – 0.1%
Alternative Loan Trust
Series 2005-20CB, Class 3A6
5.50%, 07/25/2035 17 15,162
Series 2006-24CB, Class A16
5.75%, 08/25/2036 88 68,544
Series 2006-28CB, Class A14
6.25%, 10/25/2036 64 47,433
Series 2006-J1, Class 1A13
5.50%, 02/25/2036 41 36,882
27

Principal
Amount
(000) U.S. $ Value
Chase Mortgage Finance Trust
Series 2007-S5, Class 1A17
6.00%, 07/25/2037 U.S.$ 29 $ 20,463
Countrywide Home Loan Mortgage Pass-Through Trust
Series 2006-10, Class 1A8
6.00%, 05/25/2036 40 28,406
Series 2006-13, Class 1A19
6.25%, 09/25/2036 21 13,923
First Horizon Alternative Mortgage Securities Trust
Series 2006-FA3, Class A9
6.00%, 07/25/2036 78 53,580
284,393
Non-Agency Floating Rate – 0.1%
Deutsche Alt-A Securities Mortgage Loan Trust
Series 2006-AR4, Class A2
0.489% (LIBOR 1 Month + 0.38%), 12/25/2036(g) 205 101,748
HomeBanc Mortgage Trust
Series 2005-1, Class A1
0.609% (LIBOR 1 Month + 0.50%), 03/25/2035(g) 49 44,886
146,634
Total Collateralized Mortgage Obligations
(cost $3,606,169) 3,611,883
MORTGAGE PASS-THROUGHS – 1.3%
Agency Fixed Rate 30-Year – 1.3%
Federal Home Loan Mortgage Corp.
Series 2019
3.50%, 09/01/2049-10/01/2049 486 521,216
Series 2020
2.50%, 07/01/2050 134 138,269
Federal Home Loan Mortgage Corp. Gold
Series 2019
4.50%, 02/01/2049 159 175,863
Federal National Mortgage Association
Series 2012
3.50%, 11/01/2042 278 301,388
Series 2013
3.50%, 04/01/2043 182 196,962
Series 2018
3.50%, 02/01/2048 143 151,626
4.50%, 09/01/2048 336 370,923
Series 2019
3.50%, 11/01/2049 154 164,703
Series 2020
2.50%, 07/01/2050 758 786,986
Uniform Mortgage-Backed Security
Series 2021
2.50%, 04/01/2051, TBA 400 410,156
Total Mortgage Pass-Throughs
(cost $3,178,228) 3,218,092
28

Principal
Amount
(000) U.S. $ Value
INFLATION-LINKED SECURITIES – 1.3%
France – 0.7%
French Republic Government Bond OAT
Series OATE
0.10%, 03/01/2026(c) EUR 1,237 $ 1,591,252
Germany – 0.6%
Deutsche Bundesrepublik Inflation Linked Bond
0.10%, 04/15/2026(c) 1,229 1,590,693
Total Inflation-Linked Securities
(cost $3,239,276) 3,181,945
COMMERCIAL MORTGAGE-BACKED SECURITIES – 0.8%
Non-Agency Floating Rate CMBS – 0.6%
Ashford Hospitality Trust
Series 2018-KEYS, Class A
1.106% (LIBOR 1 Month + 1.00%), 06/15/2035(c) (g) U.S.$ 200 199,815
BAMLL Commercial Mortgage Securities Trust
Series 2017-SCH, Class AF
1.106% (LIBOR 1 Month + 1.00%), 11/15/2033(c) (g) 375 366,062
BHMS
Series 2018-ATLS, Class A
1.356% (LIBOR 1 Month + 1.25%), 07/15/2035(c) (g) 158 157,948
BX Trust
Series 2018-EXCL, Class A
1.194% (LIBOR 1 Month + 1.09%), 09/15/2037(c) (g) 163 158,439
DBWF Mortgage Trust
Series 2018-GLKS, Class A
1.14% (LIBOR 1 Month + 1.03%), 12/19/2030(c) (g) 166 165,520
Invitation Homes Trust
Series 2018-SFR4, Class A
1.208% (LIBOR 1 Month + 1.10%), 01/17/2038(c) (g) 210 211,038
Morgan Stanley Capital I Trust
Series 2015-XLF2, Class SNMA
2.056% (LIBOR 1 Month + 1.95%), 11/15/2026(g) (i) 90 76,402
Starwood Retail Property Trust
Series 2014-STAR, Class A
1.576% (LIBOR 1 Month + 1.47%), 11/15/2027(c) (g) 176 129,167
1,464,391
29

Principal
Amount
(000) U.S. $ Value
Non-Agency Fixed Rate CMBS – 0.2%
GS Mortgage Securities Trust
Series 2013-G1, Class A2
3.557%, 04/10/2031(c) U.S.$ 276 $ 267,741
JPMorgan Chase Commercial Mortgage Securities Trust
Series 2012-C6, Class E
5.142%, 05/15/2045(c) 119 76,927
LSTAR Commercial Mortgage Trust
Series 2016-4, Class A2
2.579%, 03/10/2049(c) 141 143,305
Wells Fargo Commercial Mortgage Trust
Series 2015-SG1, Class C
4.463%, 09/15/2048 102 96,301
584,274
Total Commercial Mortgage-Backed Securities
(cost $2,173,156) 2,048,665
EMERGING MARKETS - CORPORATE BONDS – 0.5%
Industrial – 0.5%
Basic – 0.0%
Volcan Cia Minera SAA
4.375%, 02/11/2026(c) 24 24,480
24,480
Capital Goods – 0.2%
Cemex SAB de CV
3.875%, 07/11/2031(c) 200 195,300
Embraer Netherlands Finance BV
6.95%, 01/17/2028(c) 200 219,060
414,360
Communications - Media – 0.1%
Globo Comunicacao e Participacoes SA
4.875%, 01/22/2030(c) 200 201,313
Consumer Non-Cyclical – 0.1%
BRF GmbH
4.35%, 09/29/2026(c) 200 204,563
Energy – 0.0%
Leviathan Bond Ltd.
6.125%, 06/30/2025(c) 46 50,149
Transportation - Services – 0.1%
Rumo Luxembourg SARL
5.875%, 01/18/2025(c) 200 210,000
1,104,865
Utility – 0.0%
Electric – 0.0%
Terraform Global Operating LLC
6.125%, 03/01/2026(i) 14 14,350
Total Emerging Markets - Corporate Bonds
(cost $1,116,159) 1,119,215
30

Principal
Amount
(000) U.S. $ Value
EMERGING MARKETS - SOVEREIGNS – 0.4%
Bahrain – 0.1%
Bahrain Government International Bond
5.25%, 01/25/2033(b) (c) U.S.$ 200 $ 190,000
Egypt – 0.1%
Egypt Government International Bond
5.875%, 02/16/2031(b) (c) 200 187,000
Ivory Coast – 0.0%
Ivory Coast Government International Bond
5.875%, 10/17/2031(c) EUR 100 123,793
Oman – 0.1%
Oman Government International Bond
4.875%, 02/01/2025(c) U.S.$ 200 208,437
South Africa – 0.1%
Republic of South Africa Government International Bond
4.30%, 10/12/2028 230 226,622
Total Emerging Markets - Sovereigns
(cost $901,595) 935,852
COLLATERALIZED LOAN OBLIGATIONS – 0.4%
CLO - Floating Rate – 0.4%
ICG US CLO Ltd.
Series 2015-1A, Class A1R
1.363% (LIBOR 3 Month + 1.14%), 10/19/2028(c) (g) 293 293,036
Octagon Loan Funding Ltd.
Series 2014-1A, Class ARR
1.369% (LIBOR 3 Month + 1.18%), 11/18/2031(c) (g) 320 320,042
TIAA CLO IV Ltd.
Series 2018-1A, Class A1A
1.454% (LIBOR 3 Month + 1.23%), 01/20/2032(c) (g) 250 250,009
Total Collateralized Loan Obligations
(cost $863,020) 863,087
LOCAL GOVERNMENTS - PROVINCIAL BONDS – 0.3%
Canada – 0.3%
Province of Ontario Canada 235 197,683
Province of Quebec Canada 465 395,703
Total Local Governments - Provincial Bonds
(cost $608,654) 593,386
31

Principal
Amount
(000) U.S. $ Value
COVERED BONDS – 0.2%
Turkiye Vakiflar Bankasi TAO
2.375%, 05/04/2021(c) EUR 140 $ 163,521
UBS AG/London
4.00%, 04/08/2022(c) 158 193,690
1.375%, 04/16/2021(c) 140 164,265
Total Covered Bonds
(cost $501,708) 521,476
GOVERNMENTS - SOVEREIGN BONDS – 0.2%
Chile – 0.1%
Chile Government International Bond
1.625%, 01/30/2025 125 155,658
Mexico – 0.1%
Mexico Government International Bond
4.75%, 04/27/2032 U.S.$ 280 310,362
Total Governments - Sovereign Bonds
(cost $457,940) 466,020
GOVERNMENTS - SOVEREIGN AGENCIES – 0.1%
Canada – 0.1%
Canada Housing Trust No. 1
1.80%, 12/15/2024(c) CAD 200 164,288
1.95%, 12/15/2025(c) 195 160,557
Total Governments - Sovereign Agencies
(cost $325,044) 324,845
ASSET-BACKED SECURITIES – 0.0%
Autos - Fixed Rate – 0.0%
Flagship Credit Auto Trust
Series 2016-4, Class D
3.89%, 11/15/2022(c)
(cost $97,505) U.S.$ 98 98,670
Total Investments Before Security Lending Collateral for Securities Loaned – 98.8%
(cost $201,465,134) 239,731,333
Shares
INVESTMENTS OF CASH COLLATERAL FOR SECURITIES LOANED – 0.3%
Investment Companies – 0.3%
AB Fixed Income Shares, Inc. - Government Money Market Portfolio -
Class AB, 0.01%(d) (e) (k)
(cost $678,440) 678,440 678,440
Total Investments – 99.1%
(cost $202,143,574)(l) 240,409,773
Other assets less liabilities – 0.9% 2,291,328
Net Assets – 100.0% $ 242,701,101
32

FUTURES
Description
Number
of
Contracts
Expiration
Month
Current
Notional
Value and
Unrealized
Appreciation/
(Depreciation)
Purchased Contracts
Euro-Bund Futures 3 June 2021 $ 602,580 $ 630
Euro-Schatz Futures 4 June 2021 525,839 42
U.S. T-Note 5 Yr (CBT) Futures 20 June 2021 2,467,969 (20,095)
Sold Contracts
10 Yr Canadian Bond Futures 9 June 2021 993,817 4,649
Euro-BOBL Futures 5 June 2021 792,042 (463)
U.S. 10 Yr Ultra Futures 21 June 2021 3,017,438 57,824
$ 42,587
FORWARD CURRENCY EXCHANGE CONTRACTS
Counterparty
Contracts to
Deliver
(000)
In Exchange
For
(000)
Settlement
Date
Unrealized
Appreciation/
(Depreciation)
Barclays Bank PLC BRL 4,023 USD 706 04/05/2021 $ (8,611)
Barclays Bank PLC USD 739 BRL 4,023 04/05/2021 (24,647)
Barclays Bank PLC AUD 5,213 USD 3,976 06/04/2021 15,346
BNP Paribas SA GBP 2,906 USD 3,960 04/09/2021 (46,710)
BNP Paribas SA SEK 3,404 USD 413 04/15/2021 23,500
BNP Paribas SA MXN 8,046 USD 383 04/16/2021 (9,755)
BNP Paribas SA CAD 4,523 USD 3,564 04/22/2021 (35,657)
Citibank, NA BRL 3,792 USD 679 04/05/2021 5,496
Citibank, NA USD 666 BRL 3,792 04/05/2021 8,117
Citibank, NA ZAR 5,954 USD 403 04/08/2021 (765)
Citibank, NA INR 60,116 USD 812 04/15/2021 (7,899)
Citibank, NA USD 826 KRW 911,835 04/22/2021 (17,345)
Citibank, NA COP 1,424,088 USD 403 05/20/2021 14,576
Citibank, NA JPY 1,001,224 USD 9,448 05/20/2021 401,305
Citibank, NA USD 394 COP 1,462,013 05/20/2021 4,693
Deutsche Bank AG USD 812 INR 60,412 04/15/2021 11,395
Deutsche Bank AG COP 1,187,174 USD 332 05/20/2021 7,958
Deutsche Bank AG USD 92 PEN 340 05/20/2021 (1,236)
Goldman Sachs Bank USA USD 1,372 CAD 1,725 04/22/2021 931
Goldman Sachs Bank USA USD 801 RUB 59,814 05/25/2021 (14,879)
HSBC Bank USA USD 831 IDR 11,643,006 04/15/2021 (33,238)
JPMorgan Chase Bank, NA ZAR 6,005 USD 395 04/08/2021 (12,142)
JPMorgan Chase Bank, NA USD 1,009 GBP 742 04/09/2021 13,302
JPMorgan Chase Bank, NA IDR 11,481,616 USD 808 04/15/2021 20,731
JPMorgan Chase Bank, NA USD 511 CAD 637 04/22/2021 (3,439)
JPMorgan Chase Bank, NA PLN 1,546 USD 395 06/24/2021 3,898
Morgan Stanley Capital Services, Inc. USD 1,032 GBP 755 04/09/2021 9,096
Morgan Stanley Capital Services, Inc. CNY 23,177 USD 3,567 04/22/2021 40,049
Morgan Stanley Capital Services, Inc. JPY 87,279 USD 803 05/20/2021 14,631
33
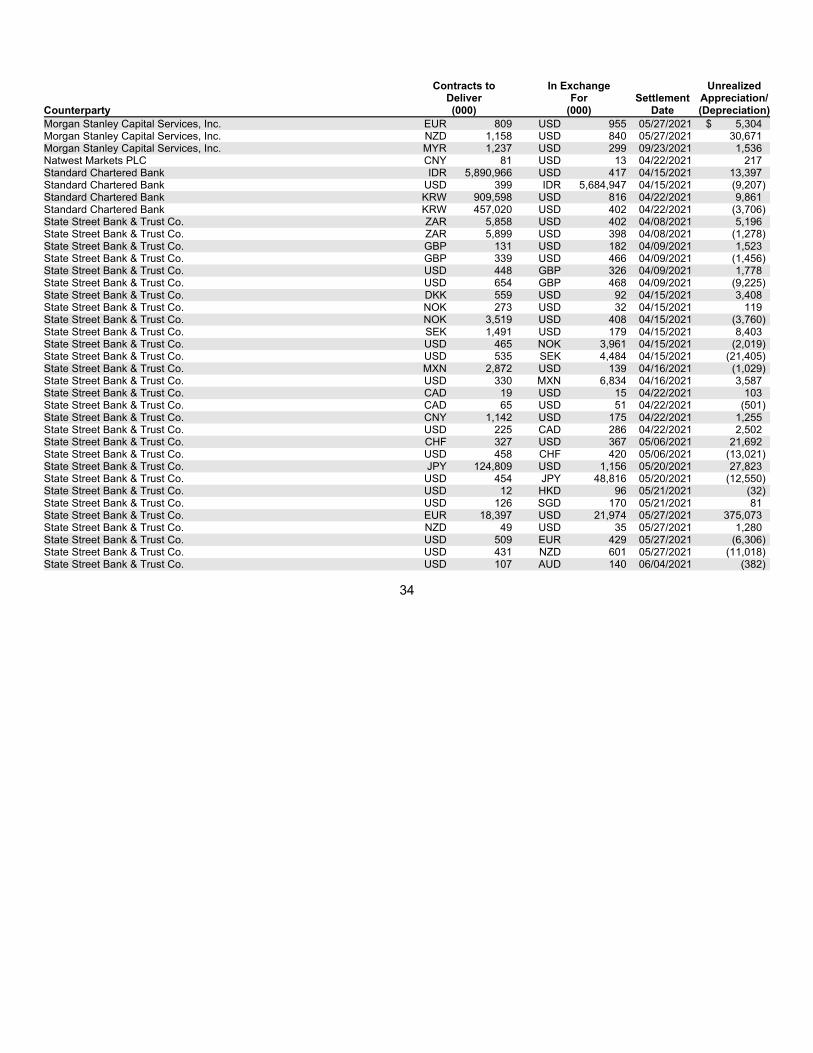
Counterparty
Contracts to
Deliver
(000)
In Exchange
For
(000)
Settlement
Date
Unrealized
Appreciation/
(Depreciation)
Morgan Stanley Capital Services, Inc. EUR 809 USD 955 05/27/2021 $ 5,304
Morgan Stanley Capital Services, Inc. NZD 1,158 USD 840 05/27/2021 30,671
Morgan Stanley Capital Services, Inc. MYR 1,237 USD 299 09/23/2021 1,536
Natwest Markets PLC CNY 81 USD 13 04/22/2021 217
Standard Chartered Bank IDR 5,890,966 USD 417 04/15/2021 13,397
Standard Chartered Bank USD 399 IDR 5,684,947 04/15/2021 (9,207)
Standard Chartered Bank KRW 909,598 USD 816 04/22/2021 9,861
Standard Chartered Bank KRW 457,020 USD 402 04/22/2021 (3,706)
State Street Bank & Trust Co. ZAR 5,858 USD 402 04/08/2021 5,196
State Street Bank & Trust Co. ZAR 5,899 USD 398 04/08/2021 (1,278)
State Street Bank & Trust Co. GBP 131 USD 182 04/09/2021 1,523
State Street Bank & Trust Co. GBP 339 USD 466 04/09/2021 (1,456)
State Street Bank & Trust Co. USD 448 GBP 326 04/09/2021 1,778
State Street Bank & Trust Co. USD 654 GBP 468 04/09/2021 (9,225)
State Street Bank & Trust Co. DKK 559 USD 92 04/15/2021 3,408
State Street Bank & Trust Co. NOK 273 USD 32 04/15/2021 119
State Street Bank & Trust Co. NOK 3,519 USD 408 04/15/2021 (3,760)
State Street Bank & Trust Co. SEK 1,491 USD 179 04/15/2021 8,403
State Street Bank & Trust Co. USD 465 NOK 3,961 04/15/2021 (2,019)
State Street Bank & Trust Co. USD 535 SEK 4,484 04/15/2021 (21,405)
State Street Bank & Trust Co. MXN 2,872 USD 139 04/16/2021 (1,029)
State Street Bank & Trust Co. USD 330 MXN 6,834 04/16/2021 3,587
State Street Bank & Trust Co. CAD 19 USD 15 04/22/2021 103
State Street Bank & Trust Co. CAD 65 USD 51 04/22/2021 (501)
State Street Bank & Trust Co. CNY 1,142 USD 175 04/22/2021 1,255
State Street Bank & Trust Co. USD 225 CAD 286 04/22/2021 2,502
State Street Bank & Trust Co. CHF 327 USD 367 05/06/2021 21,692
State Street Bank & Trust Co. USD 458 CHF 420 05/06/2021 (13,021)
State Street Bank & Trust Co. JPY 124,809 USD 1,156 05/20/2021 27,823
State Street Bank & Trust Co. USD 454 JPY 48,816 05/20/2021 (12,550)
State Street Bank & Trust Co. USD 12 HKD 96 05/21/2021 (32)
State Street Bank & Trust Co. USD 126 SGD 170 05/21/2021 81
State Street Bank & Trust Co. EUR 18,397 USD 21,974 05/27/2021 375,073
State Street Bank & Trust Co. NZD 49 USD 35 05/27/2021 1,280
State Street Bank & Trust Co. USD 509 EUR 429 05/27/2021 (6,306)
State Street Bank & Trust Co. USD 431 NZD 601 05/27/2021 (11,018)
State Street Bank & Trust Co. USD 107 AUD 140 06/04/2021 (382)
34

Counterparty
Contracts to
Deliver
(000)
In Exchange
For
(000)
Settlement
Date
Unrealized
Appreciation/
(Depreciation)
State Street Bank & Trust Co. PLN 1,603 USD 408 06/24/2021 $ 2,136
UBS AG USD 785 ZAR 11,897 04/08/2021 20,949
UBS AG USD 2,007 JPY 212,359 05/20/2021 (88,090)
$ 731,610
CENTRALLY CLEARED INTEREST RATE SWAPS
Rate Type
Notional
Amount
(000)
Termination
Date
Payments
made
by the
Fund
Payments
received
by the
Fund
Payment
Frequency
Paid/
Received
Market
Value
Upfront
Premiums
Paid
(Received)
Unrealized
Appreciation/
(Depreciation)
BRL 4,032 01/02/2023 1 Day CDI 4.910% Maturity $ (12,784) $ — $ (12,784)
BRL 2,815 01/02/2023 1 Day CDI 4.590% Maturity (8,139) — (8,139)
BRL 2,815 01/02/2023 4.590% 1 Day CDI Maturity 8,139 7,560 579
BRL 2,040 01/02/2023 1 Day CDI 4.915% Maturity (6,515) — (6,515)
CAD 3,780 05/22/2024
3 Month
CDOR 1.980%
Semi-Annual/
Semi-Annual 109,501 1 109,500
EUR 540 09/30/2050 0.122%
6 Month
EURIBOR
Annual/
Semi-Annual 65,329 — 65,329
EUR 540 09/30/2050
6 Month
EURIBOR (0.017)%
Semi-Annual/
Annual (90,681) — (90,681)
EUR 550 11/10/2050 0.022%
6 Month
EURIBOR
Annual/
Semi-Annual 85,021 6,542 78,479
EUR 550 11/10/2050
6 Month
EURIBOR (0.043)%
Semi-Annual/
Annual (96,371) — (96,371)
$ 53,500 $ 14,103 $ 39,397
35

CREDIT DEFAULT SWAPS
Swap Counterparty &
Referenced Obligation
Fixed
Rate
(Pay)
Receive
Payment
Frequency
Implied
Credit
Spread at
March 31,
2021
Notional
Amount
(000)
Market
Value
Upfront
Premiums
Paid
(Received)
Unrealized
Appreciation/
(Depreciation)
Sale Contracts
Deutsche Bank AG
CDX-CMBX.NA.BBB- Series 6, 05/11/2063* 3.00% Monthly 12.50% USD 8 $ (2,155) $ (910) $ (1,245)
CDX-CMBX.NA.BBB- Series 6, 05/11/2063* 3.00 Monthly 12.50 USD 9 (2,424) (501) (1,923)
CDX-CMBX.NA.BBB- Series 6, 05/11/2063* 3.00 Monthly 12.50 USD 52 (14,009) (5,771) (8,238)
CDX-CMBX.NA.BBB- Series 6, 05/11/2063* 3.00 Monthly 12.50% USD 53 (14,278) (5,885) (8,393)
Goldman Sachs International
CDX-CMBX.NA.BBB- Series 6, 05/11/2063* 3.00 Monthly 12.50 USD 4 (1,078) (348) (730)
CDX-CMBX.NA.BBB- Series 6, 05/11/2063* 3.00 Monthly 12.50 USD 8 (2,155) (767) (1,388)
CDX-CMBX.NA.BBB- Series 6, 05/11/2063* 3.00 Monthly 12.50 USD 8 (2,155) (709) (1,446)
CDX-CMBX.NA.BBB- Series 6, 05/11/2063* 3.00 Monthly 12.50 USD 58 (15,620) (9,202) (6,418)
CDX-CMBX.NA.BBB- Series 6, 05/11/2063* 3.00 Monthly 12.50 USD 53 (14,278) (5,481) (8,797)
CDX-CMBX.NA.BBB- Series 6, 05/11/2063* 3.00 Monthly 12.50 USD 82 (22,084) (13,197) (8,887)
CDX-CMBX.NA.BBB- Series 6, 05/11/2063* 3.00 Monthly 12.50 USD 75 (20,199) (11,191) (9,008)
CDX-CMBX.NA.BBB- Series 6, 05/11/2063* 3.00 Monthly 12.50 USD 78 (21,013) (10,304) (10,709)
$ (131,448) $ (64,266) $ (67,182)
* Termination date
INFLATION (CPI) SWAPS
Rate Type
Swap Counterparty
Notional
Amount
(000)
Termination
Date
Payments
made
by the
Fund
Payments
received
by the
Fund
Payment
Frequency
Paid/
Received
Market
Value
Upfront
Premiums
Paid
(Received)
Unrealized
Appreciation/
(Depreciation)
Bank of America, NA USD 10,000 07/11/2024 2.416% CPI# Maturity $ (80,092) $ — $ (80,092)
# Variable interest rate based on the rate of inflation as determined by the Consumer Price Index (CPI).
(a) Non-income producing security.
(b) Represents entire or partial securities out on loan.
(c) Security is exempt from registration under Rule 144A of the Securities Act of 1933. These securities are considered restricted, but liquid and may be
resold in transactions exempt from registration, normally to qualified institutional buyers. At March 31, 2021, the aggregate market value of these
securities amounted to $39,213,764 or 16.2% of net assets.
(d) Affiliated investments.
36

(e) To obtain a copy of the fund’s shareholder report, please go to the Securities and Exchange Commission’s website at www.sec.gov, or call AB at
(800) 227-4618.
(f) Securities are perpetual and, thus, do not have a predetermined maturity date. The date shown, if applicable, reflects the next call date.
(g) Floating Rate Security. Stated interest/floor/ceiling rate was in effect at March 31, 2021.
(h) Fair valued by the Adviser.
(i) Security is exempt from registration under Rule 144A of the Securities Act of 1933. These securities, which represent 0.09% of net assets as of
March 31, 2021, are considered illiquid and restricted. Additional information regarding such securities follows:
144A/Restricted & Illiquid
Securities
Acquisition
Date Cost
Market
Value
Percentage
of
Net Assets
JPMorgan Madison Avenue Securities Trust
Series 2014-CH1, Class M2
4.359%, 11/25/2024 11/06/2015 $13,214 $13,085 0.01%
Morgan Stanley Capital I Trust
Series 2015-XLF2, Class SNMA
2.056%, 11/15/2026 11/16/2015 89,658 76,402 0.03%
Terraform Global Operating LLC
6.125%, 03/01/2026 02/08/2018 14,000 14,350 0.01%
Wells Fargo Credit Risk Transfer Securities Trust
Series 2015-WF1, Class 1M2
5.359%, 11/25/2025 09/28/2015 65,181 63,825 0.03%
Wells Fargo Credit Risk Transfer Securities Trust
Series 2015-WF1, Class 2M2
5.609%, 11/25/2025 09/28/2015 18,898 18,764 0.01%
(j) Inverse interest only security.
(k) The rate shown represents the 7-day yield as of period end.
(l) As of March 31, 2021, the cost basis of investment securities owned was substantially identical for both book and tax purposes. Gross unrealized
appreciation of investments was $43,290,508 and gross unrealized depreciation of investments was $(4,357,989), resulting in net unrealized
appreciation of $38,932,519.
Currency Abbreviation:
AUD – Australian Dollar
BRL – Brazilian Real
CAD – Canadian Dollar
CHF – Swiss Franc
CNY – Chinese Yuan Renminbi
COP – Colombian Peso
DKK – Danish Krone
EUR – Euro
GBP – Great British Pound
HKD – Hong Kong Dollar
IDR – Indonesian Rupiah
INR – Indian Rupee
JPY – Japanese Yen
KRW – South Korean Won
MXN – Mexican Peso
MYR – Malaysian Ringgit
NOK – Norwegian Krone
NZD – New Zealand Dollar
PEN – Peruvian Sol
PLN – Polish Zloty
RUB – Russian Ruble
SEK – Swedish Krona
SGD – Singapore Dollar
USD – United States Dollar
ZAR – South African Rand
37

Glossary:
ADR – American Depositary Receipt
BOBL – Bundesobligationen
CBT – Chicago Board of Trade
CDI – Brazil CETIP Interbank Deposit Rate
CDOR – Canadian Dealer Offered Rate
CDX-CMBX.NA – North American Commercial Mortgage-Backed Index
CLO – Collateralized Loan Obligations
CMBS – Commercial Mortgage-Backed Securities
CPI – Consumer Price Index
EURIBOR – Euro Interbank Offered Rate
GDR – Global Depositary Receipt
LIBOR – London Interbank Offered Rate
OAT – Obligations Assimilables du Trésor
PJSC – Public Joint Stock Company
REIT – Real Estate Investment Trust
REMICs – Real Estate Mortgage Investment Conduits
TBA – To Be Announced
38
AB Variable Products Series Fund, Inc.
AB Balanced Wealth Strategy Portfolio
March 31, 2021 (unaudited)
In accordance with U.S. GAAP regarding fair value measurements, fair value is defined as the price that the Portfolio would
receive to sell an asset or pay to transfer a liability in an orderly transaction between market participants at the
measurement date. U.S. GAAP establishes a framework for measuring fair value, and a three-level hierarchy for fair value
measurements based upon the transparency of inputs to the valuation of an asset or liability (including those valued based
on their market values). Inputs may be observable or unobservable and refer broadly to the assumptions that market
participants would use in pricing the asset or liability. Observable inputs reflect the assumptions market participants would
use in pricing the asset or liability based on market data obtained from sources independent of the Portfolio. Unobservable
inputs reflect the Portfolio’s own assumptions about the assumptions that market participants would use in pricing the asset
or liability based on the best information available in the circumstances. Each investment is assigned a level based upon
the observability of the inputs which are significant to the overall valuation. The three-tier hierarchy of inputs is summarized
below.
• Level 1 - quoted prices in active markets for identical investments
• Level 2 - other significant observable inputs (including quoted prices for similar investments, interest rates,
prepayment speeds, credit risk, etc.)
• Level 3 - significant unobservable inputs (including the Portfolio’s own assumptions in determining the fair value
of investments)
The fair value of debt instruments, such as bonds, and over-the-counter derivatives is generally based on market price
quotations, recently executed market transactions (where observable) or industry recognized modeling techniques and are
generally classified as Level 2. Pricing vendor inputs to Level 2 valuations may include quoted prices for similar
investments in active markets, interest rate curves, coupon rates, currency rates, yield curves, option adjusted spreads,
default rates, credit spreads and other unique security features in order to estimate the relevant cash flows which is then
discounted to calculate fair values. If these inputs are unobservable and significant to the fair value, these investments will
be classified as Level 3. In addition, non-agency rated investments are classified as Level 3.
Other fixed income investments, including non-U.S. government and corporate debt, are generally valued using quoted
market prices, if available, which are typically impacted by current interest rates, maturity dates and any perceived credit
risk of the issuer. Additionally, in the absence of quoted market prices, these inputs are used by pricing vendors to derive a
valuation based upon industry or proprietary models which incorporate issuer specific data with relevant yield/spread
comparisons with more widely quoted bonds with similar key characteristics. Those investments for which there are
observable inputs are classified as Level 2. Where the inputs are not observable, the investments are classified as Level 3.
Where readily available market prices or relevant bid prices are not available for certain equity investments, such
investments may be valued based on similar publicly traded investments, movements in relevant indices since last
available prices or based upon underlying company fundamentals and comparable company data (such as multiples to
earnings or other multiples to equity). Where an investment is valued using an observable input, by pricing vendors, such
as another publicly traded security, the investment will be classified as Level 2. If management determines that an
adjustment is appropriate based on restrictions on resale, illiquidity or uncertainty, and such adjustment is a significant
component of the valuation, the investment will be classified as Level 3. An investment will also be classified as Level 3
where management uses company fundamentals and other significant inputs to determine the valuation.
39

Valuations of mortgage-backed or other asset backed securities, by pricing vendors, are based on both proprietary and
industry recognized models and discounted cash flow techniques. Significant inputs to the valuation of these instruments
are value of the collateral, the rates and timing of delinquencies, the rates and timing of prepayments, and default and loss
expectations, which are driven in part by housing prices for residential mortgages. Significant inputs are determined based
on relative value analyses, which incorporate comparisons to instruments with similar collateral and risk profiles, including
relevant indices. Mortgage and asset backed securities for which management has collected current observable data
through pricing services are generally categorized within Level 2. Those investments for which current observable data has
not been provided are classified as Level 3.
The following table summarizes the valuation of the Portfolio’s investments by the above fair value hierarchy levels as of
March 31, 2021:
Investments in Securities: Level 1 Level 2 Level 3 Total
Assets:
Common Stocks:
Information Technology $ 21,233,586 $ 266,574 $ — $ 21,500,160
Consumer Discretionary 10,980,858 525,588 — 11,506,446
Health Care 10,341,301 230,143 — 10,571,444
Real Estate 7,179,482 3,155,056 — 10,334,538
Communication Services 9,863,787 115,411 — 9,979,198
Financials 9,034,928 467,343 — 9,502,271
Industrials 8,258,806 644,552 — 8,903,358
Energy 2,784,450 2,657,040 — 5,441,490
Materials 1,947,090 2,204,025 — 4,151,115
Consumer Staples 3,534,226 401,172 — 3,935,398
Utilities 1,986,186 317,269 — 2,303,455
Consumer Durables & Apparel 65,550 49,822 — 115,372
Transportation — 71,143 — 71,143
Consumer Services 68,893 — — 68,893
Telecommunication Services — 45,997 45,997
Software & Services 28,381 — — 28,381
Investment Companies 63,682,105 — — 63,682,105
Governments - Treasuries — 31,425,119 — 31,425,119
Corporates - Investment Grade — 19,274,364 — 19,274,364
Corporates - Non-Investment Grade — 5,812,430 — 5,812,430
Quasi-Sovereigns — 4,095,520 — 4,095,520
Collateralized Mortgage Obligations — 3,611,883 — 3,611,883
Mortgage Pass-Throughs — 3,218,092 — 3,218,092
Inflation-Linked Securities — 3,181,945 — 3,181,945
Commercial Mortgage-Backed Securities — 2,048,665 — 2,048,665
Emerging Markets - Corporate Bonds — 1,119,215 — 1,119,215
Emerging Markets - Sovereigns — 935,852 — 935,852
Collateralized Loan Obligations — 863,087 — 863,087
Local Governments - Provincial Bonds — 593,386 — 593,386
Covered Bonds — 521,476 — 521,476
Governments - Sovereign Bonds — 466,020 — 466,020
40

Investments in Securities: Level 1 Level 2 Level 3 Total
Governments - Sovereign Agencies — 324,845 — 324,845
Asset-Backed Securities — 98,670 — 98,670
Investments of Cash Collateral for Securities Loaned in Affiliated Money Market
Fund 678,440 — — 678,440
Total Investments in Securities 151,668,069 88,741,704 — 240,409,773
Other Financial Instruments(a):
Assets:
Futures 63,145 — — 63,145
Forward Currency Exchange Contracts — 1,132,918 — 1,132,918
Centrally Cleared Interest Rate Swaps — 267,990 — 267,990
Liabilities:
Futures (20,558) — — (20,558)
Forward Currency Exchange Contracts — (401,308) — (401,308)
Centrally Cleared Interest Rate Swaps — (214,490) — (214,490)
Credit Default Swaps — (131,448) — (131,448)
Inflation (CPI) Swaps — (80,092) — (80,092)
Total $ 151,710,656 $ 89,315,274 $ — $ 241,025,930
(a) Other financial instruments are derivative instruments, such as futures, forwards and swaps, which are valued at the unrealized appreciation/
(depreciation) on the instrument. Other financial instruments may also include swaps with upfront premiums, options written and swaptions written
which are valued at market value.
A summary of the Portfolio’s transactions in AB mutual funds for the three months ended March 31, 2021 is as follows:
Distributions
Fund
Market
Value
12/31/2020
(000)
Purchases
at Cost
(000)
Sales
Proceeds
(000)
Realized
Gain
(Loss)
(000)
Change
in
Unrealized
Appr./
(Depr.)
(000)
Market
Value
03/31/2021
(000)
Dividend
Income
(000)
Realized
Gains
(000)
AB Discovery Growth Fund, Inc. $ 3,073 $ 0 $ 0 $ 0 $ 51 $ 3,124 $ 0 $ 0
AB Discovery Value Fund, Inc. 3,151 0 701 0 655 3,105 0 0
Bernstein Fund, Inc. International Small Cap
Portfolio 8,410 0 697 0 525 8,238 0 0
Bernstein Fund, Inc. - International
Strategic Equities Portfolio 42,917 0 2,350 0 1,679 42,246 0 0
Bernstein Fund, Inc. - Small Cap
Core Portfolio 3,105 0 408 0 415 3,112 0 0
Government Money Market Portfolio 1,673 13,723 15,396 0 0 0 0** 0
Government Money Market Portfolio* 0 1,929 1,251 0 0 678 0** 0
Sanford C Bernstein Fund,
Inc. – Emerging Markets Portfolio 3,965 0 297 0 190 3,858 0 0
Total $ 66,294 $ 15,652 $ 21,100 $ 0 $ 3,515 $ 64,361 $ 0 $ 0
* Investments of cash collateral for securities lending transactions.
** Amount less than $500.
41

This Page Intentionally Left Blank

This Page Intentionally Left Blank

1QT8000_03_L01_(03/21)