printmgr file - ETNet
565
Stock Code: 1691 Joint Sponsors Joint Global Coordinators, Joint Bookrunners and Joint Lead Managers GLOBAL OFFERING (Incorporated in the Cayman Islands with limited liability) JS 環球生活有限公司 JS GLOBAL LIFESTYLE COMPANY LIMITED
-
Upload
khangminh22 -
Category
Documents
-
view
0 -
download
0
Transcript of printmgr file - ETNet

JS 環球生活有限公司
JS GLO
BAL LIFESTYLE C
OM
PAN
Y LIMITED
Stock Code: 1691
Joint Sponsors
Joint Global Coordinators, Joint Bookrunners and Joint Lead Managers
GLOBALOFFERING
(Incorporated in the Cayman Islands with limited liability)
JS 環球生活有限公司JS GLOBAL LIFESTYLE COMPANY LIMITED
C
M
Y
CM
MY
CY
CMY
K
Golf_PPTUS Cover_24_R1_Eng_OP.pdf 1 19/10/2019 下午3:17
IMPORTANT
If you are in any doubt about any of the contents of this prospectus, you should seek independent professional advice.
JS Global Lifestyle Company LimitedJS
(Incorporated in the Cayman Islands with limited liability)
GLOBAL OFFERINGTotal Number of Offer Shares under the Global Offering : 499,830,000 Shares (subject to the Over-allotment
Option)Number of Hong Kong Offer Shares : 49,983,000 Shares (subject to adjustment)
Number of International Offer Shares : 449,847,000 Shares (subject to the Over-allotmentOption and adjustment)
Offer Price : HK$5.55 to HK$7.25 per Offer Share, plus brokerage of1%, SFC transaction levy of 0.0027% and StockExchange trading fee of 0.005% (payable in full onapplication in Hong Kong dollars and subject to refund)
Nominal value : US$0.00001 per ShareStock code : 1691
Joint Sponsors
Joint Global Coordinators, Joint Bookrunners and Joint Lead Managers
Joint Bookrunners and Joint Lead Managers
Hong Kong Exchanges and Clearing Limited, The Stock Exchange of Hong Kong Limited and Hong Kong Securities Clearing Company Limited takeno responsibility for the contents of this prospectus, make no representation as to its accuracy or completeness and expressly disclaim any liability whatsoeverfor any loss howsoever arising from or in reliance upon the whole or any part of the contents of this prospectus. A copy of this prospectus, having attachedthereto the documents specified in “Documents Delivered to the Registrar of Companies” in Appendix V to this prospectus, has been registered by theRegistrar of Companies in Hong Kong as required by section 342C of the Companies (Winding Up and Miscellaneous Provisions) Ordinance (Cap. 32).Neither the Securities and Futures Commission of Hong Kong nor the Registrar of Companies in Hong Kong takes any responsibility for the contents of thisprospectus or any other documents referred to above.
The Offer Price is expected to be determined by agreement between the Joint Global Coordinators, on behalf of the Underwriters, and our Company onor around October 25, 2019 or such later time as may be agreed between the parties, but in any event, no later than October 28, 2019. If, for any reason, theJoint Global Coordinators, on behalf of the Underwriters, and our Company are unable to reach an agreement on the Offer Price by October 28, 2019, theGlobal Offering will not proceed and will lapse immediately. The Offer Price will be not more than HK$7.25 per Offer Share and is expected to be not lessthan HK$5.55 per Offer Share, unless otherwise announced. Investors applying for the Hong Kong Offer Shares must pay, on application, the maximum offerprice of HK$7.25 for each Offer Share together with brokerage of 1% per Offer Share, SFC transaction levy of 0.0027% and Stock Exchange trading fee of0.005% subject to refund if the Offer Price is lower than HK$7.25. The Joint Global Coordinators, on behalf of the Underwriters, may, with the consent of ourCompany, reduce the number of Offer Shares being offered under the Global Offering and/or the indicative Offer Price range below that stated in thisprospectus at any time prior to the morning of the last day for lodging applications under the Hong Kong Public Offering. In such a case, notices of suchreduction will be published on the websites of the Stock Exchange at www.hkexnews.hk and the Company at www.jsgloballife.com as soon as practicablebut in any event not later than the morning of the last day for lodging applications under the Hong Kong Public Offering. See “Structure of the GlobalOffering” and “How to Apply for the Hong Kong Offer Shares.”
Prior to making an investment decision, prospective investors should carefully consider all of the information set out in this prospectus, in particular,the risk factors set out in “Risk Factors.”
Pursuant to the termination provisions contained in the Hong Kong Underwriting Agreement in respect of the Offer Shares, the Joint GlobalCoordinators, on behalf of the Hong Kong Underwriters, have the right in certain circumstances, in their absolute discretion, to terminate the obligations of theHong Kong Underwriters pursuant to the Hong Kong Underwriting Agreement at any time prior to 8:00 a.m. on the Listing Date. Further details of the termsof the termination provisions are set out in “Underwriting—Underwriting Arrangements and Expenses—Hong Kong Public Offering—Hong KongUnderwriting Agreement—Grounds for Termination.” It is important that you refer to that section for further details.
The Offer Shares have not been and will not be registered under the U.S. Securities Act or any state securities law in the United States and may not be offered,sold, pledged or transferred within the United States or to, or for the account or benefit of US persons (as defined in Regulation S) except in transactions exempt from,or not subject to, the registration requirements of the U.S. Securities Act. The Offer Shares are being offered and sold (i) solely to QIBs as defined in Rule 144Apursuant to an exemption from registration under the U.S. Securities Act and (ii) outside the United States in offshore transactions in accordance with Regulation S.
October 22, 2019
EXPECTED TIMETABLE(1)
If there is any change in the following expected timetable, our Company will issue anannouncement to be published on the website of the Hong Kong Stock Exchange atwww.hkexnews.hk and the website of our Company at www.jsgloballife.com.
Public Offer commences and WHITE and YELLOWApplication Forms available from . . . . . . . . . . . . . . . . . . . . . 9:00 a.m. on Tuesday, October 22, 2019
Latest time for completing electronic applications under HKeIPO White Form service through one of the below ways(2):
(1) the IPO App, which can be downloaded by searching“IPO App” in App Store or Google Play ordownloaded at www.hkeipo.hk/IPOApp orwww.tricorglobal.com/IPOApp
(2) the designated website www.hkeipo.hk . . . . . . . . . . . . . 11:30 a.m. on Friday, October 25, 2019Application lists open(3) . . . . . . . . . . . . . . . . . . . . . . . . . . . . . . . . 11:45 a.m. on Friday, October 25, 2019Latest time for lodging WHITE and YELLOW Application
Forms . . . . . . . . . . . . . . . . . . . . . . . . . . . . . . . . . . . . . . . . . . . . 12:00 noon on Friday, October 25, 2019Latest time for completing payment of HK eIPO White Form
applications by effecting internet banking transfer(s) or PPSpayment transfer(s) . . . . . . . . . . . . . . . . . . . . . . . . . . . . . . . . . 12:00 noon on Friday, October 25, 2019
Latest time for giving electronic application instructions toHKSCC(4) . . . . . . . . . . . . . . . . . . . . . . . . . . . . . . . . . . . . . . . . . 12:00 noon on Friday, October 25, 2019
Application lists close(3) . . . . . . . . . . . . . . . . . . . . . . . . . . . . . . . 12:00 noon on Friday, October 25, 2019Expected Price Determination Date(5) . . . . . . . . . . . . . . . . . . . . . Friday, October 25, 2019Announcement of the final Offer Price, the results of
applications in the Hong Kong Public Offering, the level ofindications of interest in the International Offering and thebasis of allocation of the Hong Kong Offer Shares under theHong Kong Public Offering to be published in the SouthChina Morning Post (in English) and the Hong KongEconomic Times (in Chinese) on or before(10) . . . . . . . . . . . . . Wednesday, October 30, 2019
Results of allocations in the Hong Kong Public Offering (withsuccessful applicants’ identification document numbers orHong Kong business registration numbers, whereappropriate) to be available through a variety of channels asdescribed in “How to Apply for the Hong Kong OfferShares” from(10) . . . . . . . . . . . . . . . . . . . . . . . . . . . . . . . . . . . . Wednesday, October 30, 2019
A full announcement containing the information above to bepublished on the website of the Hong Kong Stock Exchangeat www.hkexnews.hk and our Company’s website atwww.jsgloballife.com(6) from(10) . . . . . . . . . . . . . . . . . . . . . . . Wednesday, October 30, 2019
Results of allocations in the Hong Kong Public Offering will beavailable at “Allotment Result” in the IPO App or atwww.tricor.com.hk/ipo/result (or www.hkeipo.hk/IPOResult) with a “search by ID Number/BusinessRegistration Number” function from(10) . . . . . . . . . . . . . . . . . Wednesday, October 30, 2019
Dispatch/collection of Share certificates or deposit of the Sharecertificates into CCASS in respect of wholly or partiallysuccessful applications pursuant to the Hong Kong PublicOffering on or before(7)(9)(10) . . . . . . . . . . . . . . . . . . . . . . . . . . Wednesday, October 30, 2019
Dispatch/collection of refund checks and HK eIPO White Forme-Auto Refund payment instructions in respect of wholly orpartially successful applications (if applicable) or wholly orpartially unsuccessful applications pursuant to the HongKong Public Offering on or before(8)(9)(10) . . . . . . . . . . . . . . . . Wednesday, October 30, 2019
Dealings in Shares on the Hong Kong Stock Exchangeexpected to commence at 9:00 a.m. on(10) . . . . . . . . . . . . . . . . Thursday, October 31, 2019
i
EXPECTED TIMETABLE(1)
(1) All dates and times refer to Hong Kong local dates and times, except as otherwise stated. For details of the structure of the GlobalOffering, including conditions of the Hong Kong Public Offering, see “Structure of the Global Offering.”
(2) You will not be permitted to submit your application to the HK eIPO White Form Service Provider through the IPO App or thedesignated website at www.hkeipo.hk after 11:30 a.m. on the last day for submitting applications. If you have already submitted yourapplication and obtained an application reference number from the designated website at or before 11:30 a.m., you will be permitted tocontinue the application process (by completing payment of the application monies) until 12:00 noon on the last day for submittingapplications, when the application lists close.
(3) If there is a tropical cyclone warning signal number 8 or above or an announcement of “extreme conditions” by the Government ofHong Kong in accordance with the revised “Code of Practice in Times of Typhoons and Rainstorms” issued by the Hong Kong LabourDepartment in June 2019 and/or a “black” rainstorm warning in force in Hong Kong at any time between 9:00 a.m. and 12:00 noon onFriday, October 25, 2019, the application lists will not open or close on that day. See “How to Apply for the Hong Kong Offer Shares—10. Effect of Bad Weather and/or Extreme Conditions on the Opening of the Application Lists.” If the application lists do not open andclose on Friday, October 25, 2019, the dates mentioned in this section may be affected. A press announcement will be made by us in suchevent.
(4) Applicants who apply for Hong Kong Offer Shares by giving electronic application instructions to HKSCC via CCASS should refer to“How to Apply for the Hong Kong Offer Shares—6. Applying by Giving Electronic Application Instructions to HKSCC via CCASS.”
(5) The Price Determination Date is expected to be on or around Friday, October 25, 2019 and, in any event, not later than Monday,October 28, 2019. If, for any reason, the Offer Price is not agreed between the Joint Global Coordinators (for themselves and on behalfof the other Underwriters) and us by Monday, October 28, 2019, the Global Offering will not proceed and will lapse.
(6) Neither our Company’s website nor any of the information contained on our Company’s website forms part of this prospectus.(7) Share certificates of the Offer Shares will only become valid at 8:00 a.m., on Thursday, October 31, 2019 provided that the Global
Offering has become unconditional in all respects, and neither of the Underwriting Agreements has been terminated in accordance withits terms. Investors who trade Shares prior to the receipt of Share certificates or the Share certificates becoming valid do so at their ownrisk.
(8) e-Auto Refund payment instructions/refund checks will be issued in respect of wholly or partially unsuccessful applications pursuant tothe Hong Kong Public Offering and also in respect of wholly or partially successful applications in the event that the final Offer Price isless than the price payable per Offer Share on application. Part of the applicant’s Hong Kong identity card number or passport number,or, if the application is made by joint applicants, part of the Hong Kong identity card number or passport number of the first-namedapplicant, provided by the applicant(s) may be printed on the refund check, if any. Such data would also be transferred to a third partyfor refund purposes. Banks may require verification of an applicant’s Hong Kong identity card number or passport number beforeencashment of the refund check. Inaccurate completion of an applicant’s Hong Kong identity card number or passport number mayinvalidate or delay encashment of the refund checks.
(9) Applicants who have applied on WHITE Application Forms or HK eIPO White Form through the IPO App or the designated websitewww.hkeipo.hk for 1,000,000 or more Hong Kong Offer Shares and have provided all information required by the Application Formmay collect any refund checks and/or Share certificates in person from our Hong Kong Share Registrar, Tricor Investor Services Limitedat Level 54, Hopewell Centre, 183 Queen’s Road East, Hong Kong, from 9:00 a.m. to 1:00 p.m. on Wednesday, October 30, 2019 orsuch other date as notified by our Company in the newspapers as the date of dispatch/collection of Share certificates/e-Auto Refundpayment instructions/refund checks. Applicants being individuals who are eligible for personal collection must not authorize any otherperson to collect on their behalf. Applicants being corporations which are eligible for personal collection must attend through theirauthorized representatives bearing letters of authorization from their corporation stamped with the corporation’s chop. Both individualsand authorized representatives of corporations must produce evidence of identity acceptable to our Hong Kong Share Registrar at thetime of collection.
Applicants who have applied on YELLOW Application Forms for 1,000,000 or more Hong Kong Offer Shares may collect their refundchecks, if any, in person but may not elect to collect their Share certificates as such Share certificates will be issued in the name ofHKSCC Nominees and deposited into CCASS for the credit to their or the designated CCASS Participants’ stock account as stated intheir Application Forms. The procedures for collection of refund checks for YELLOW Application Form applicants are the same asthose for WHITE Application Form applicants.
Applicants who have applied for Hong Kong Offer Shares by giving electronic application instructions to HKSCC via CCASS shouldrefer to “How to Apply for the Hong Kong Offer Shares—14. Dispatch/Collection of Share Certificates and Refund Monies—PersonalCollection—(iv) If you apply via Electronic Application Instructions to HKSCC” for details.
Applicants who have applied through the HK eIPO White Form service and paid their applications monies through single bankaccounts may have refund monies (if any) dispatched to the bank account in the form of e-Auto Refund payment instructions. Applicantswho have applied through the HK eIPO White Form service and paid their application monies through multiple bank accounts mayhave refund monies (if any) dispatched to the address as specified in their application instructions in the form of refund checks byordinary post at their own risk.
Applicants who have applied for less than 1,000,000 Hong Kong Offer Shares and any uncollected Share certificates and/or refundchecks will be dispatched by ordinary post, at the applicants’ risk, to the addresses specified in the relevant applications.
Further information is set out in the sections headed “How to Apply for the Hong Kong Offer Shares—13. Refund of ApplicationMonies” and “How to Apply for the Hong Kong Offer Shares—14. Dispatch/Collection of Share Certificates and Refund Monies” in thisprospectus.
ii

EXPECTED TIMETABLE(1)
(10) In case a typhoon warning signal no.8 or above, a black rainstorm warning signal and/or extreme conditions is/are in force in any daysbetween Tuesday, October 22, 2019 to Thursday, October 31, 2019, then the day of (i) announcement of results of allocations in theHong Kong Public Offering; (ii) dispatch of Share certificates and refund check(s)/HK eIPO White Form e-Auto Refund paymentinstructions; and (iii) dealings in the Shares on the Stock Exchange will be postponed and an announcement will be made in such event.
The above expected timetable is a summary only. For details of the structure of the GlobalOffering, including its conditions, and the procedures for the applications of Hong Kong OfferShares, see “Structure of the Global Offering” and “How to Apply for the Hong Kong OfferShares.”
iii
CONTENTS
IMPORTANT NOTICE TO INVESTORS
This prospectus is issued by JS Global Lifestyle Company Limited solely in connectionwith the Hong Kong Public Offering and does not constitute an offer to sell or a solicitation of anoffer to buy any security other than the Hong Kong Offer Shares offered by this prospectuspursuant to the Hong Kong Public Offering. This prospectus may not be used for the purposes of,and does not constitute, an offer or invitation in any other jurisdiction or in any othercircumstances. No action has been taken to permit a public offering of the Offer Shares or thedistribution of this prospectus in any jurisdiction other than Hong Kong.
You should rely only on the information contained in this prospectus and the ApplicationForms to make your investment decision. Our Company has not authorized anyone to provide youwith information that is different from what is contained in this prospectus. Any information orrepresentation not made in this prospectus must not be relied on by you as having been authorizedby our Company, the Joint Sponsors, the Joint Global Coordinators, the Joint Bookrunners, theJoint Lead Managers, any of the Underwriters, any of their respective directors, officers,representatives or advisors or any other person involved in the Global Offering.
Page
Expected Timetable . . . . . . . . . . . . . . . . . . . . . . . . . . . . . . . . . . . . . . . . . . . . . . . . . . . . . . . . . . . . . . . . . . . i
Contents . . . . . . . . . . . . . . . . . . . . . . . . . . . . . . . . . . . . . . . . . . . . . . . . . . . . . . . . . . . . . . . . . . . . . . . . . . . . iv
Summary . . . . . . . . . . . . . . . . . . . . . . . . . . . . . . . . . . . . . . . . . . . . . . . . . . . . . . . . . . . . . . . . . . . . . . . . . . . 1
Definitions . . . . . . . . . . . . . . . . . . . . . . . . . . . . . . . . . . . . . . . . . . . . . . . . . . . . . . . . . . . . . . . . . . . . . . . . . . 20
Glossary of Technical Terms . . . . . . . . . . . . . . . . . . . . . . . . . . . . . . . . . . . . . . . . . . . . . . . . . . . . . . . . . . . 33
Forward-looking Statements . . . . . . . . . . . . . . . . . . . . . . . . . . . . . . . . . . . . . . . . . . . . . . . . . . . . . . . . . . . 35
Risk Factors . . . . . . . . . . . . . . . . . . . . . . . . . . . . . . . . . . . . . . . . . . . . . . . . . . . . . . . . . . . . . . . . . . . . . . . . . 36
Waivers from Strict Compliance with the Listing Rules . . . . . . . . . . . . . . . . . . . . . . . . . . . . . . . . . . . . 69
Information about the Prospectus and the Global Offering . . . . . . . . . . . . . . . . . . . . . . . . . . . . . . . . . . 73
Directors and Parties Involved in the Global Offering . . . . . . . . . . . . . . . . . . . . . . . . . . . . . . . . . . . . . . 76
Corporate Information . . . . . . . . . . . . . . . . . . . . . . . . . . . . . . . . . . . . . . . . . . . . . . . . . . . . . . . . . . . . . . . . 81
Industry Overview . . . . . . . . . . . . . . . . . . . . . . . . . . . . . . . . . . . . . . . . . . . . . . . . . . . . . . . . . . . . . . . . . . . 83
Regulatory Overview . . . . . . . . . . . . . . . . . . . . . . . . . . . . . . . . . . . . . . . . . . . . . . . . . . . . . . . . . . . . . . . . . 100
History, Reorganization and Corporate Structure . . . . . . . . . . . . . . . . . . . . . . . . . . . . . . . . . . . . . . . . . 119
Business . . . . . . . . . . . . . . . . . . . . . . . . . . . . . . . . . . . . . . . . . . . . . . . . . . . . . . . . . . . . . . . . . . . . . . . . . . . . 142
Relationship with our Controlling Shareholders . . . . . . . . . . . . . . . . . . . . . . . . . . . . . . . . . . . . . . . . . . . 195
Connected Transactions . . . . . . . . . . . . . . . . . . . . . . . . . . . . . . . . . . . . . . . . . . . . . . . . . . . . . . . . . . . . . . 205
Directors and Senior Management . . . . . . . . . . . . . . . . . . . . . . . . . . . . . . . . . . . . . . . . . . . . . . . . . . . . . . 213
Substantial Shareholders . . . . . . . . . . . . . . . . . . . . . . . . . . . . . . . . . . . . . . . . . . . . . . . . . . . . . . . . . . . . . . 227
Share Capital . . . . . . . . . . . . . . . . . . . . . . . . . . . . . . . . . . . . . . . . . . . . . . . . . . . . . . . . . . . . . . . . . . . . . . . . 229
Financial Information . . . . . . . . . . . . . . . . . . . . . . . . . . . . . . . . . . . . . . . . . . . . . . . . . . . . . . . . . . . . . . . . . 232
Future Plans and Use of Proceeds . . . . . . . . . . . . . . . . . . . . . . . . . . . . . . . . . . . . . . . . . . . . . . . . . . . . . . . 298
Underwriting . . . . . . . . . . . . . . . . . . . . . . . . . . . . . . . . . . . . . . . . . . . . . . . . . . . . . . . . . . . . . . . . . . . . . . . . 300
Structure of the Global Offering . . . . . . . . . . . . . . . . . . . . . . . . . . . . . . . . . . . . . . . . . . . . . . . . . . . . . . . . 312
How to Apply for the Hong Kong Offer Shares . . . . . . . . . . . . . . . . . . . . . . . . . . . . . . . . . . . . . . . . . . . . 322
iv

CONTENTS
Page
Appendix I—Accountants’ Report . . . . . . . . . . . . . . . . . . . . . . . . . . . . . . . . . . . . . . . . . . . . . . . . . . . . . . I-1
Appendix II—Unaudited Pro Forma Financial Information . . . . . . . . . . . . . . . . . . . . . . . . . . . . . . . . II-1
Appendix III—Summary of the Constitution of the Company and Cayman Islands CompanyLaw . . . . . . . . . . . . . . . . . . . . . . . . . . . . . . . . . . . . . . . . . . . . . . . . . . . . . . . . . . . . . . . . . . . . . . . . . . . . . . III-1
Appendix IV—Statutory and General Information . . . . . . . . . . . . . . . . . . . . . . . . . . . . . . . . . . . . . . . . IV-1
Appendix V—Documents Delivered to the Registrar of Companies in Hong Kong and Availablefor Inspection . . . . . . . . . . . . . . . . . . . . . . . . . . . . . . . . . . . . . . . . . . . . . . . . . . . . . . . . . . . . . . . . . . . . . . V-1
v
SUMMARY
This summary aims to give you an overview of the information contained in thisprospectus. As it is a summary, it does not contain all the information that may be important toyou. You should read the whole prospectus before you decide to invest in the Offer Shares. Thereare risks associated with any investment. Some of the particular risks in investing in the OfferShares are set out in “Risk Factors” in this prospectus. You should read that section carefully infull before you decide to invest in the Offer Shares.
OVERVIEW
Mission
Our mission is to positively impact people’s lives around the world every day throughtransformational, innovative and design-driven smart home products.
Company Profile
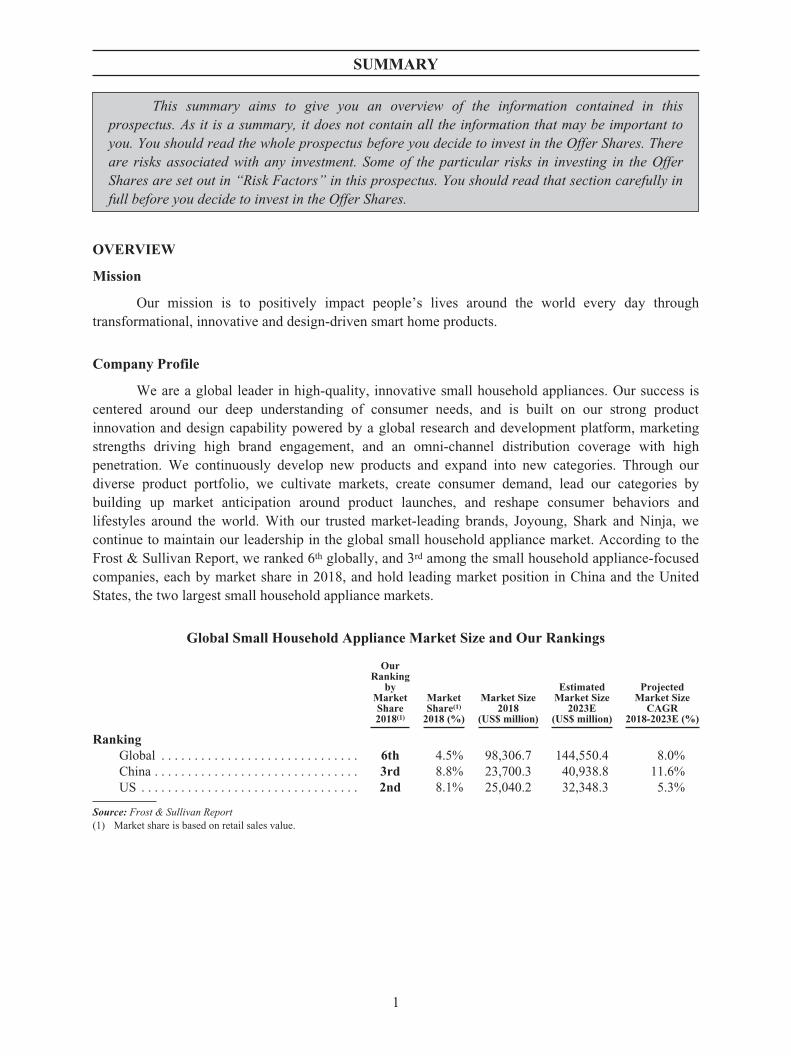
We are a global leader in high-quality, innovative small household appliances. Our success iscentered around our deep understanding of consumer needs, and is built on our strong productinnovation and design capability powered by a global research and development platform, marketingstrengths driving high brand engagement, and an omni-channel distribution coverage with highpenetration. We continuously develop new products and expand into new categories. Through ourdiverse product portfolio, we cultivate markets, create consumer demand, lead our categories bybuilding up market anticipation around product launches, and reshape consumer behaviors andlifestyles around the world. With our trusted market-leading brands, Joyoung, Shark and Ninja, wecontinue to maintain our leadership in the global small household appliance market. According to theFrost & Sullivan Report, we ranked 6th globally, and 3rd among the small household appliance-focusedcompanies, each by market share in 2018, and hold leading market position in China and the UnitedStates, the two largest small household appliance markets.
Global Small Household Appliance Market Size and Our Rankings
OurRanking
byMarketShare2018(1)
MarketShare(1)
2018 (%)
Market Size2018
(US$ million)
EstimatedMarket Size
2023E(US$ million)
ProjectedMarket Size
CAGR2018-2023E (%)
RankingGlobal . . . . . . . . . . . . . . . . . . . . . . . . . . . . . . 6th 4.5% 98,306.7 144,550.4 8.0%China . . . . . . . . . . . . . . . . . . . . . . . . . . . . . . . 3rd 8.8% 23,700.3 40,938.8 11.6%US . . . . . . . . . . . . . . . . . . . . . . . . . . . . . . . . . 2nd 8.1% 25,040.2 32,348.3 5.3%
Source: Frost & Sullivan Report(1) Market share is based on retail sales value.
1

SUMMARY
In our main product markets, we have gained and maintained an industry-leading market shareas indicated below:
Rankings of Our Selected Products in China and the United States
Our Rankingby Market
Share 2018(1)
MarketShare(1)
2018 (%)
Market Size2018
(US$ million)
EstimatedMarket Size
2023E(US$ million)
ProjectedMarket Size
CAGR2018-2023E (%)
Selected Product RankingHigh-performance Multifunctional
Blenders . . . . . . . . . . . . . . . . . . . . . . 1st in China 36.6% 1,707.3 4,980.0 23.9%Food Processors . . . . . . . . . . . . . . . . . . 1st in China 36.8% 445.8 671.8 8.5%Vacuums . . . . . . . . . . . . . . . . . . . . . . . 1st in US 36.4% 3,191.5 3,711.5 3.1%Robotic Vacuums . . . . . . . . . . . . . . . . 2nd in US 19.0% 935.6 2,312.4 19.8%Steam Mops . . . . . . . . . . . . . . . . . . . . . 2nd in US 28.5% 308.4 370.2 3.7%Multifunctional Cookers . . . . . . . . . . . 2nd in US 14.4% 598.4 1,195.7 14.8%
Source: Frost & Sullivan Report(1) Market share is based on retail sales value.
BUSINESS MODEL
Our business processes, from research and development, procurement and production to salesand marketing, are fully integrated and responsive to consumer needs. We focus on our three corecompetencies: (i) developing transformational innovative products with appealing designs, (ii)effecting multi-form brand marketing and (iii) building a global omni-channel sales network. They aresupported by our operational infrastructure, comprising global research and development platform,centralized supply chain with a global reach and our comprehensive information management systemacross the entire value chain.
Core Competencies
Š Innovative Products with Appealing Designs. Leveraging our global research anddevelopment network, we have introduced transformational innovative products withcutting-edge technologies and appealing designs to the markets, ranging fromrevolutionary products that are original or market-first, evolutionary products that aremarket-disruptive, to upgraded products with enhanced design and functionality.
Š Brand Marketing. We operate a number of successful and trusted brands, includingJoyoung, Shark and Ninja, and continuously drive high brand engagement and salesthrough our multi-channel marketing campaigns based on our profound market andconsumer insights to broaden consumer reach.
Š Global Omni-channel Sales Network. Our highly effective channel strategies andextensive omni-channel sales, marketing and distribution network are tailored to therespective local markets and maximize our international market penetration.
Operational Infrastructure
Š Global Research and Development. The amassing of information on consumer feedback,preferences and behaviors through our global operation has fueled our collaborative andsynergistic research and development platform led by our highly qualified and integratedinternational teams of experts in China, the United States and the United Kingdom.
2
SUMMARY
Š Centralized Supply Chain with a Global Reach. Our long history of operation, a strongrelationship with our highly flexible and accommodating supply chain and our leadingposition in China, supported by our supply chain hubs around the world, enable us toachieve synergies and maintain an agile position, thereby increasing efficiency andprofitability.
Š Comprehensive Information Management System. We design our information managementsystems to collect data on consumer feedback, preferences and behaviors, and keep ourbusiness processes, from research and development, procurement and production to salesand marketing, fully integrated and responsive to such data. Our information managementsystems seamlessly connect various business units and parties involved in our operation tooptimize efficiency.
OUR STRENGTHS
We believe that the following competitive strengths contribute to our success and distinguish usfrom our competitors:
Š Global industry leader with trusted household brands;
Š Category disruptor with a proven track record of introducing innovative products, creatingnew market segments and generating consumer demand;
Š Highly effective omni-channel sales, marketing and distribution strategy, maximizingglobal market penetration;
Š Loyal and engaged consumer base, driving virtuous cycle in our business ecosystem;
Š Synergies derived from our highly complementary global businesses, propellingsustainable future growth; and
Š Seasoned senior management team with global experience led by our visionary foundingshareholders.
OUR STRATEGIES
We are committed to driving sustainable long-term growth and strengthening our marketposition as a global leader in small household appliances through the following strategies:
Š Develop and commercialize innovative products, combining powerful technology andappealing designs;
Š Drive sustainable long-term growth through sales network and product categoryexpansion;
Š Maximize synergies between Joyoung segment and SharkNinja segment;
Š Strengthen our brand recognition and enhance consumer engagement; and
Š Pursue strategic partnerships and acquisitions.
TRANSFORMATIONAL PRODUCTS CREATED BY GLOBAL RESEARCH ANDDEVELOPMENT PLATFORM
We are relentlessly moving forward, adapting to the market environment and dedicated to beingon the leading edge of user-friendly innovation to make the lives of consumers easier and better. To
3
SUMMARY
achieve this goal, we have built a global innovation powerhouse running around the clock withresearch and development facilities and engineering talent spread across our five research anddevelopment centers in China, the United States and the United Kingdom. Our research anddevelopment process comprises product planning and development phases. In the product planningphase, we focus on NTD (New Technology Development) based on our profound industry expertiseand consumer insights, especially those technologies that may be applied to products across categories.We formulate predictive market trends watchlists and product roadmaps for the next one to five yearsbased on our NTD results. In the product development phase, we focus on NPD (New ProductDevelopment) to develop products that are expected to be launched within six months to three years.Throughout the whole research and development process, we value consumer feedback which providesvaluable guidance on our product planning and development.
In terms of development concepts, our products can generally be categorized into three groups:(i) revolutionary products, (ii) evolutionary products and (iii) upgraded products. Revolutionaryproducts are market-first products developed based on our in-depth understanding, as well as accurateanalysis and forecast, of consumer needs, such as Joyoung soymilk makers and Ninja Foodi series.Evolutionary products utilize evolutionary concepts or technologies to optimize an existing productline by providing more innovative features, and are developed based on our understanding of consumerpain points at different stages of the product life cycle, such as Joyoung high-performancemultifunctional blenders and Shark robotic vacuums. We also routinely upgrade our existing productsto roll out upgraded products with enhanced design and functionality catering to wider consumerdemographics.
OMNI-CHANNEL SALES NETWORK
As a leader in the global small household appliance market, we have established differentiatedchannel strategies and a robust omni-channel sales and distribution network that are tailored to therespective local markets. We generally hold a prominent position in the channels where consumerschoose to shop.
Our New Retail in China
Leveraging our established omni-channel sales and distribution network, we have adopted aclosed-loop new retail business model in China. New retail is an emerging consumer-centric retailbusiness model that integrates online and offline sales and distribution resources to enhance consumerexperience by increasing efficiency of inventory management, supply chain management, productselection and logistics. New retail is a leading and progressive business model in China. Through newretail, we enhance the connections among consumers, merchandises and stores which are the three coreelements of this model. Consumers participate in the development of products through information andfeedback which have become an integral part of the consumption process. In China, our products areavailable at various online and offline platforms such as Tmall, JD.com, Suning, Gome and WalmartChina.
Our Extensive Sales Channels in the United States, Canada and the United Kingdom
In the United States, Canada, and the United Kingdom, we primarily sell our products directlyto retailers or to consumers through our websites, instead of engaging distributors. We have a highpenetration rate in both online and offline retail channels and have formed our DTC (Direct to
4
SUMMARY
Consumer) and DTR (Direct to Retailer) sales models. For DTC, we sell products directly toconsumers through our SharkNinja website or television shopping platforms, which enable us to obtainfirst-hand knowledge of consumer behaviors. For DTR, we have established long-standingrelationships with key retailers, including Wal-Mart, Target, Costco, Amazon, Kohl’s, Bed Bath &Beyond and Sam’s Club, and we expand consumer reach by taking advantage of the establishedconsumer base and brand recognition of the top retailers.
OUR SUPPLIERS
Our dedicated in-house teams work closely with our suppliers to strengthen and enhance ourrelationship with them, implement our quality control standards and improve our bargaining power interms of pricing and overall risk management. Our suppliers primarily comprise OEM suppliers andsuppliers of components and raw materials for in-house production. Purchases from our five largestsuppliers in 2016, 2017, 2018 and the six months ended June 30, 2019 amounted to US$288.0 million,US$366.4 million, US$682.9 million and US$287.4 million, respectively, which represented 38.3%,35.7%, 40.5% and 37.7%, respectively, of our total purchase cost for the same periods. See“Business—Our Suppliers.”
OUR CUSTOMERS
In general, our products are sold first to distributors and retailers who are considered our directcustomers. Distributors generally resell these products to other distributors and retailers or directly toconsumers, while our retailers generally carry our products throughout their entire network of storeswithin a given country and sell directly to consumers. Revenue from our five largest customers in2016, 2017, 2018 and the six months ended June 30, 2019 amounted to US$305.7 million, US$330.8million, US$703.8 million and US$325.3 million, respectively, which represented 27.7%, 21.2%,26.2%, and 26.3%, respectively, of our total revenue for the same periods. See “Business—OurCustomers.”
INDUSTRY AND COMPETITIVE LANDSCAPE
We operate in highly competitive markets, which are characterized by frequent productintroductions and rapid technological advances. We generally compete with other householdappliances companies. Principal competitive factors include product features, relative price andperformance, product quality and reliability, design innovation, brands, consumer experience,marketing and distribution capability, customer service and support and corporate reputation. Our maincompetitors include domestic and global household appliance industry leaders. See “IndustryOverview—Competitive Landscape.”
CONTROLLING SHAREHOLDERS
The Controlling Shareholders Group, consisting of Mr. Wang Xuning, Mr. Zhu Hongtao,Mr. Zhu Zechun, Ms. Yang Ningning, Ms. Huang Shuling, Ms. Han Run and Mr. Jiang Guangyong, isa group of individuals holding their interests in our Company through a common investment holdingentity, namely, JS Holding. JS Holding will own approximately 48.12% of the total issued share capitalof our Company upon the completion of the Global Offering (assuming the Over-allotment Option isnot exercised); and accordingly the Controlling Shareholders Group, their respective BVI SPVs,Hezhou, Tong Zhou and JS Holding will be Controlling Shareholders of our Company being interestedin 48.12% of the Shares of our Company.
5

SUMMARY
In addition, STL holds 100 management shares (representing 100% of the voting rights) andone class B participating share (without voting rights) in Sol SPC, while Mr. Lee Puay Khng holds368,304.24536 class A participating shares (representing 100% of the issued class A participatingshares and without voting rights) in Sol SPC. STL is wholly owned by XNL, which is in turn whollyowned by Mr. Wang Xuning. Therefore, Mr. Wang Xuning will also be deemed to own the Shares ofour Company held by Sol SPC and each of Mr. Wang Xuning, STL and Sol SPC will be ControllingShareholders of the Company. As a result, Mr. Wang Xuning will be deemed to own 59.17% of thetotal issued share capital of our Company to be held in aggregate by JS Holding and Sol SPC, upon thecompletion of the Global Offering (assuming the Over-allotment Option is not exercised).
For further details about our Controlling Shareholders, see “Relationship with our ControllingShareholders.”
CONTINUING CONNECTED TRANSACTIONS
We have entered into and are expected to continue with certain transactions after the Listingwhich will constitute our non-exempt continuing connected transactions under Chapter 14A of ListingRules upon Listing. See “Connected Transactions” and “Waivers from Strict Compliance with theListing Rules.”
PRE-IPO INVESTMENTS
We introduced Comfort Home and Victory Ride as our Pre-IPO Investors through severalrounds of Pre-IPO Investments. For details, see “History, Reorganization and Corporate Structure.”
RSU PLAN
In order to recognize and reward our management and employees for their contribution, toattract the best available talents, and to provide additional incentives to them to remain with and furtherpromote the success of our business, we adopted the RSU Plan on October 9, 2019 and expect to issueand allot 141,618,409 ordinary shares with a par value of US$0.00001 pursuant to the RSU Plan priorto the completion of the Global Offering. As of the date of this prospectus, we had granted anaggregate of 129,265,801 restricted stock units, the underlying Shares of which will representapproximately 4.56% of our issued share capital (assuming the RSU Shares have been issued pursuantto the RSU Plan) prior to the Global Offering and approximately 3.88% of our issued share capitalupon the completion of the Global Offering (assuming the Over-allotment Option is not exercised). See“Appendix IV—Statutory and General Information—D. RSU Plan.”
SUMMARY FINANCIAL INFORMATION
The following tables set forth summary financial data from our consolidated financialinformation for the Track Record Period, extracted from the Accountants’ Reports set out in AppendixI to this prospectus. The summary consolidated financial data set forth below should be read togetherwith, and is qualified in its entirety by reference to, our consolidated financial statements contained inthis prospectus, including the related notes, which is prepared in accordance with IFRS. We completedthe acquisition of SharkNinja on September 29, 2017 and have consolidated its financial results sincethen. As a result, our results of operations in the post-acquisition periods are not directly comparablewith those in the previous periods and may have appeared to fluctuate during the Track Record Period.
In addition, to comply with the requirements of Rule 4.05A of the Listing Rules, as well as tofacilitate the understanding of the impact of the acquisition of SharkNinja, this prospectus also includes
6
SUMMARY
the pre-acquisition financial statements of SharkNinja as of and for the fiscal years ended March 31,2016 and 2017 and the period from April 1, 2017 to September 28, 2017, which have been audited byErnst & Young and are set forth in Section III of the notes to the Accountants’ Report in Appendix I tothis prospectus. For a discussion and analysis of our historical financial performance, see “FinancialInformation.”
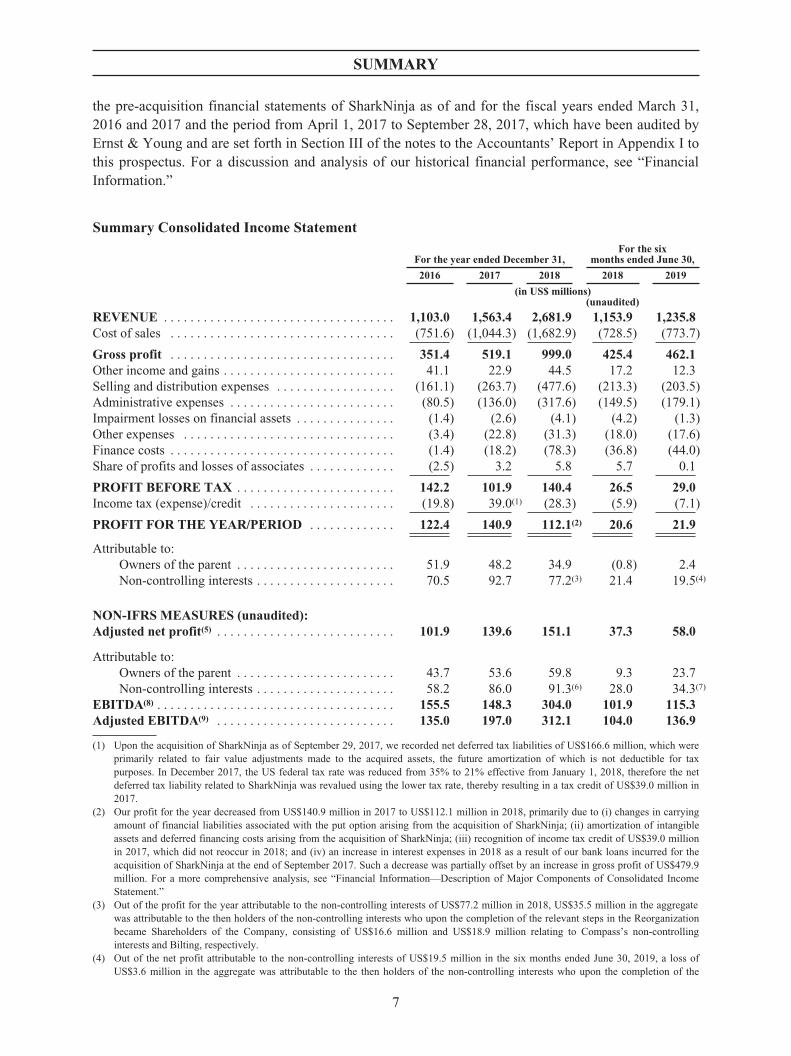
Summary Consolidated Income Statement
For the year ended December 31,For the six
months ended June 30,
2016 2017 2018 2018 2019
(in US$ millions)(unaudited)
REVENUE . . . . . . . . . . . . . . . . . . . . . . . . . . . . . . . . . . . 1,103.0 1,563.4 2,681.9 1,153.9 1,235.8Cost of sales . . . . . . . . . . . . . . . . . . . . . . . . . . . . . . . . . . (751.6) (1,044.3) (1,682.9) (728.5) (773.7)
Gross profit . . . . . . . . . . . . . . . . . . . . . . . . . . . . . . . . . . 351.4 519.1 999.0 425.4 462.1Other income and gains . . . . . . . . . . . . . . . . . . . . . . . . . . 41.1 22.9 44.5 17.2 12.3Selling and distribution expenses . . . . . . . . . . . . . . . . . . (161.1) (263.7) (477.6) (213.3) (203.5)Administrative expenses . . . . . . . . . . . . . . . . . . . . . . . . . (80.5) (136.0) (317.6) (149.5) (179.1)Impairment losses on financial assets . . . . . . . . . . . . . . . (1.4) (2.6) (4.1) (4.2) (1.3)Other expenses . . . . . . . . . . . . . . . . . . . . . . . . . . . . . . . . (3.4) (22.8) (31.3) (18.0) (17.6)Finance costs . . . . . . . . . . . . . . . . . . . . . . . . . . . . . . . . . . (1.4) (18.2) (78.3) (36.8) (44.0)Share of profits and losses of associates . . . . . . . . . . . . . (2.5) 3.2 5.8 5.7 0.1
PROFIT BEFORE TAX . . . . . . . . . . . . . . . . . . . . . . . . 142.2 101.9 140.4 26.5 29.0Income tax (expense)/credit . . . . . . . . . . . . . . . . . . . . . . (19.8) 39.0(1) (28.3) (5.9) (7.1)
PROFIT FOR THE YEAR/PERIOD . . . . . . . . . . . . . 122.4 140.9 112.1(2) 20.6 21.9
Attributable to:Owners of the parent . . . . . . . . . . . . . . . . . . . . . . . . 51.9 48.2 34.9 (0.8) 2.4Non-controlling interests . . . . . . . . . . . . . . . . . . . . . 70.5 92.7 77.2(3) 21.4 19.5(4)
NON-IFRS MEASURES (unaudited):Adjusted net profit(5) . . . . . . . . . . . . . . . . . . . . . . . . . . . 101.9 139.6 151.1 37.3 58.0
Attributable to:Owners of the parent . . . . . . . . . . . . . . . . . . . . . . . . 43.7 53.6 59.8 9.3 23.7Non-controlling interests . . . . . . . . . . . . . . . . . . . . . 58.2 86.0 91.3(6) 28.0 34.3(7)
EBITDA(8) . . . . . . . . . . . . . . . . . . . . . . . . . . . . . . . . . . . . 155.5 148.3 304.0 101.9 115.3Adjusted EBITDA(9) . . . . . . . . . . . . . . . . . . . . . . . . . . . 135.0 197.0 312.1 104.0 136.9
(1) Upon the acquisition of SharkNinja as of September 29, 2017, we recorded net deferred tax liabilities of US$166.6 million, which wereprimarily related to fair value adjustments made to the acquired assets, the future amortization of which is not deductible for taxpurposes. In December 2017, the US federal tax rate was reduced from 35% to 21% effective from January 1, 2018, therefore the netdeferred tax liability related to SharkNinja was revalued using the lower tax rate, thereby resulting in a tax credit of US$39.0 million in2017.
(2) Our profit for the year decreased from US$140.9 million in 2017 to US$112.1 million in 2018, primarily due to (i) changes in carryingamount of financial liabilities associated with the put option arising from the acquisition of SharkNinja; (ii) amortization of intangibleassets and deferred financing costs arising from the acquisition of SharkNinja; (iii) recognition of income tax credit of US$39.0 millionin 2017, which did not reoccur in 2018; and (iv) an increase in interest expenses in 2018 as a result of our bank loans incurred for theacquisition of SharkNinja at the end of September 2017. Such a decrease was partially offset by an increase in gross profit of US$479.9million. For a more comprehensive analysis, see “Financial Information—Description of Major Components of Consolidated IncomeStatement.”
(3) Out of the profit for the year attributable to the non-controlling interests of US$77.2 million in 2018, US$35.5 million in the aggregatewas attributable to the then holders of the non-controlling interests who upon the completion of the relevant steps in the Reorganizationbecame Shareholders of the Company, consisting of US$16.6 million and US$18.9 million relating to Compass’s non-controllinginterests and Bilting, respectively.
(4) Out of the net profit attributable to the non-controlling interests of US$19.5 million in the six months ended June 30, 2019, a loss ofUS$3.6 million in the aggregate was attributable to the then holders of the non-controlling interests who upon the completion of the
7

SUMMARY
relevant steps in the Reorganization became Shareholders of the Company, consisting of a loss of US$7.6 million and a profit of US$4.0million relating to Compass’s non-controlling interests and Bilting, respectively.
(5) We define adjusted net profit as profit for the year/period adjusted for certain items that do not affect our ongoing operating performance,including items arising from acquisition and relating to the Reorganization and non-recurring items and items not related to our ordinarycourse of business (each without considering tax effect). For a reconciliation of profit for the year/period to adjusted net profit as wedefine, see “Financial Information—Non-IFRS Measures.”
(6) Out of the adjusted net profit attributable to the non-controlling interests of US$91.3 million in 2018, US$59.9 million in the aggregatewas attributable to the then holders of the non-controlling interests who upon the completion of the relevant steps in the Reorganizationbecame Shareholders of the Company, consisting of US$45.9 million and US$14.0 million relating to Compass’s non-controllinginterests and Bilting, respectively.
(7) Out of the adjusted net profit attributable to the non-controlling interests of US$34.3 million in the six months ended June 30, 2019,US$11.7 million in the aggregate was attributable to the then holders of the non-controlling interests who upon the completion of therelevant steps in the Reorganization became Shareholders of the Company, consisting of US$7.6 million and US$4.1 million relating toCompass’s non-controlling interests and Bilting, respectively.
(8) We define EBITDA as profit before tax plus finance costs, depreciation and amortization, less interest income. For a reconciliation ofprofit before tax to EBITDA as we define, see “Financial Information—Non-IFRS Measures.”
(9) For a reconciliation of EBITDA for the year/period to adjusted EBITDA as we define, see “Financial Information—Non-IFRSMeasures.”
Revenue
Our revenue increased by 41.7% from US$1,103.0 million in 2016 to US$1,563.4 million in2017, and further increased by 71.5% to US$2,681.9 million in 2018. It increased by 7.1% fromUS$1,153.9 million for the six months ended June 30, 2018 to US$1,235.8 million for the same periodin 2019. The increase of revenue in 2017 and 2018 was primarily due to the acquisition of SharkNinja.Had the acquisition taken place at the beginning of 2017, our revenue for the year from January 1,2017 to December 31, 2017 would have been US$2,425.6 million.
The following table sets forth the breakdown of our revenue by brand for the periods indicated:
For the year ended December 31, For the six months ended June 30,
2016 2017 2018 2018 2019
Amount % Amount % Amount % Amount % Amount %
(in US$ millions, except percentages)(unaudited)
Joyoung . . . . . . . . . 1,103.0 100.0 1,086.8 69.5 1,201.4 44.8 582.5 50.5 564.0 45.6Shark . . . . . . . . . . . . — — 327.0 20.9 1,092.4 40.7 436.7 37.8 449.6 36.4Ninja . . . . . . . . . . . . — — 149.6 9.6 388.1 14.5 134.7 11.7 222.2 18.0
Total . . . . . . . . . . . . 1,103.0 100.0 1,563.4 100.0 2,681.9 100.0 1,153.9 100.0 1,235.8 100.0
Prior to the acquisition of SharkNinja in September 2017, we primarily derived our revenuefrom sales of kitchen appliances under the Joyoung brand. As a result of the acquisition of SharkNinja,we have additionally generated revenue from sales of cleaning appliances and kitchen appliances underthe Shark and Ninja brands.
8
SUMMARY
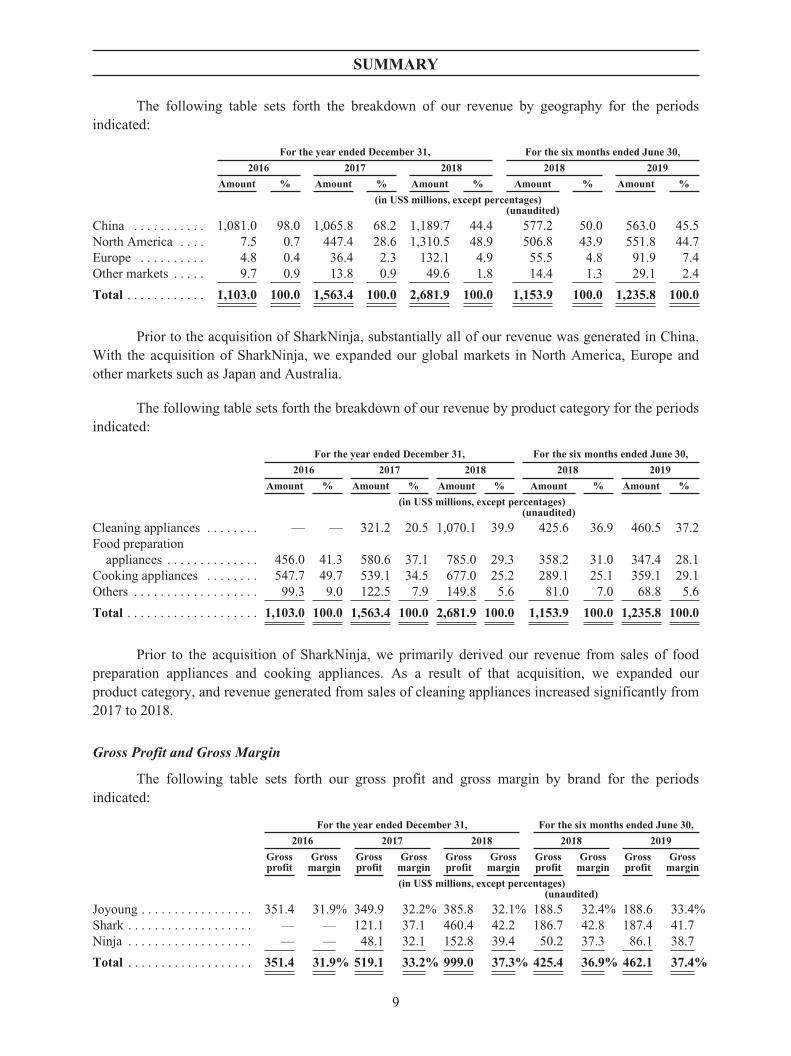
The following table sets forth the breakdown of our revenue by geography for the periodsindicated:
For the year ended December 31, For the six months ended June 30,
2016 2017 2018 2018 2019
Amount % Amount % Amount % Amount % Amount %
(in US$ millions, except percentages)(unaudited)
China . . . . . . . . . . . 1,081.0 98.0 1,065.8 68.2 1,189.7 44.4 577.2 50.0 563.0 45.5North America . . . . 7.5 0.7 447.4 28.6 1,310.5 48.9 506.8 43.9 551.8 44.7Europe . . . . . . . . . . 4.8 0.4 36.4 2.3 132.1 4.9 55.5 4.8 91.9 7.4Other markets . . . . . 9.7 0.9 13.8 0.9 49.6 1.8 14.4 1.3 29.1 2.4
Total . . . . . . . . . . . . 1,103.0 100.0 1,563.4 100.0 2,681.9 100.0 1,153.9 100.0 1,235.8 100.0
Prior to the acquisition of SharkNinja, substantially all of our revenue was generated in China.With the acquisition of SharkNinja, we expanded our global markets in North America, Europe andother markets such as Japan and Australia.
The following table sets forth the breakdown of our revenue by product category for the periodsindicated:
For the year ended December 31, For the six months ended June 30,
2016 2017 2018 2018 2019
Amount % Amount % Amount % Amount % Amount %
(in US$ millions, except percentages)(unaudited)
Cleaning appliances . . . . . . . . — — 321.2 20.5 1,070.1 39.9 425.6 36.9 460.5 37.2Food preparation
appliances . . . . . . . . . . . . . . 456.0 41.3 580.6 37.1 785.0 29.3 358.2 31.0 347.4 28.1Cooking appliances . . . . . . . . 547.7 49.7 539.1 34.5 677.0 25.2 289.1 25.1 359.1 29.1Others . . . . . . . . . . . . . . . . . . . 99.3 9.0 122.5 7.9 149.8 5.6 81.0 7.0 68.8 5.6
Total . . . . . . . . . . . . . . . . . . . . 1,103.0 100.0 1,563.4 100.0 2,681.9 100.0 1,153.9 100.0 1,235.8 100.0
Prior to the acquisition of SharkNinja, we primarily derived our revenue from sales of foodpreparation appliances and cooking appliances. As a result of that acquisition, we expanded ourproduct category, and revenue generated from sales of cleaning appliances increased significantly from2017 to 2018.
Gross Profit and Gross Margin
The following table sets forth our gross profit and gross margin by brand for the periodsindicated:
For the year ended December 31, For the six months ended June 30,
2016 2017 2018 2018 2019
Grossprofit
Grossmargin
Grossprofit
Grossmargin
Grossprofit
Grossmargin
Grossprofit
Grossmargin
Grossprofit
Grossmargin
(in US$ millions, except percentages)(unaudited)
Joyoung . . . . . . . . . . . . . . . . . 351.4 31.9% 349.9 32.2% 385.8 32.1% 188.5 32.4% 188.6 33.4%Shark . . . . . . . . . . . . . . . . . . . — — 121.1 37.1 460.4 42.2 186.7 42.8 187.4 41.7Ninja . . . . . . . . . . . . . . . . . . . — — 48.1 32.1 152.8 39.4 50.2 37.3 86.1 38.7
Total . . . . . . . . . . . . . . . . . . . 351.4 31.9% 519.1 33.2% 999.0 37.3% 425.4 36.9% 462.1 37.4%
9

SUMMARY
NON-IFRS MEASURES
To supplement our consolidated statements of profit or loss which are presented in accordancewith IFRS, we also use adjusted net profit, EBITDA and adjusted EBITDA as non-IFRS measures,which are not required by, or presented in accordance with, IFRS. We believe that the presentation ofnon-IFRS measures when shown in conjunction with the corresponding IFRS measures provides usefulinformation to potential investors and management in facilitating a comparison of our operatingperformance from period to period by eliminating potential impacts of certain items that do not affectour ongoing operating performance, including expense arising from the acquisition of SharkNinja andthe Reorganization, and non-recurring items and items not related to our ordinary course of business(each without considering tax effect). Such non-IFRS measures allow investors to consider matricesused by our management in evaluating our performance. From time to time in the future, there may beother items that we may exclude in reviewing our financial results. The use of the non-IFRS measureshas limitations as an analytical tool, and you should not consider it in isolation from, or as a substitutefor or superior to analysis of, our results of operations or financial condition as reported under IFRS. Inaddition, the non-IFRS financial measures may be defined differently from similar terms used by othercompanies.
The adjusted items for our non-IFRS measures can be categorized into two categories: (i) itemsarising from acquisition and relating to the Reorganization, and (ii) non-recurring items and items notrelated to our ordinary course of business. During the Track Record Period, we completed a majoracquisition, the acquisition of SharkNinja. Prior to the completion of the Global Offering, we alsounderwent the Reorganization. Both the acquisition of SharkNinja and the Reorganization areconsidered by our management as one-off and non-recurring events by nature. In addition, we adjustedfor certain items that are non-recurring in nature or may be considered recurring in nature but are notconsidered by us as normal in the ordinary course of our business nor indicative of our ongoing coreoperating performance, in order to provide the potential investors with a complete and fairunderstanding of our core operating results and financial performance, especially in (i) making period-to-period comparisons of, and assessing the profile of, our operating and financial performance; and(ii) making comparisons with other comparable companies. For further details on our presentation andclarification of the non-IFRS measures, see “Financial Information—Non-IFRS Measures.”
The following tables show our adjusted net profit, EBITDA and adjusted EBITDA for theperiods indicated:
For the year ended December 31,For the six months
ended June 30,
2016 2017 2018 2018 2019
(in US$ million)(unaudited)
Profit for the year/period . . . . . . . . . . . . . . . . . . . . . . . . . 122.4 140.9 112.1 20.6 21.9Add:Items arising from acquisition and relating to the
Reorganization . . . . . . . . . . . . . . . . . . . . . . . . . . . . . . . . — 0.1 60.7 29.1 32.2Changes in carrying amount of financial liabilities
associated with the put option . . . . . . . . . . . . . . . . . . . . . — 7.1 28.8 14.4 15.1Transaction cost arising from the acquisition of
SharkNinja . . . . . . . . . . . . . . . . . . . . . . . . . . . . . . . . . . . . — 13.3 — — —Amortization of intangible assets and deferred financing
costs arising from the acquisition of SharkNinja . . . . . . . — 6.0 30.9 14.6 14.5
10

SUMMARY
For the year ended December 31,For the six months
ended June 30,
2016 2017 2018 2018 2019
(in US$ million)(unaudited)
Revaluation of inventory arising from the acquisition ofSharkNinja . . . . . . . . . . . . . . . . . . . . . . . . . . . . . . . . . . . . — 29.1 — — —
Revaluation of the deferred taxes due to a change in UStax rate . . . . . . . . . . . . . . . . . . . . . . . . . . . . . . . . . . . . . . . — (56.0) — — —
Reorganization-related expenses including deferredfinancing cost . . . . . . . . . . . . . . . . . . . . . . . . . . . . . . . . . . — 0.6 1.0 0.1 2.6
Non-recurring items and items not related to ourordinary course of business . . . . . . . . . . . . . . . . . . . . . . (20.5) (1.4) (21.7) (12.4) 3.9
Stock-based compensation . . . . . . . . . . . . . . . . . . . . . . . . . . 0.5 0.4 5.1 1.1 2.9Gain on disposal of property, plant and equipment,
investment property and subsidiaries . . . . . . . . . . . . . . . . (7.0) (1.9) (27.9) (13.5) —Gain on fair value change from equity investments . . . . . . (14.0) 0.1 1.1 — (4.8)Listing expenses . . . . . . . . . . . . . . . . . . . . . . . . . . . . . . . . . . — — — — 5.8
Adjusted net profit (unaudited) . . . . . . . . . . . . . . . . . . . . 101.9 139.6 151.1 37.3 58.0
For the year ended December 31,For the six months
ended June 30,
2016 2017 2018 2018 2019
(in US$ million)(unaudited)
Profit before tax . . . . . . . . . . . . . . . . . . . . . . . . . . . . . . . . . 142.2 101.9 140.4 26.5 29.0Add:Finance cost . . . . . . . . . . . . . . . . . . . . . . . . . . . . . . . . . . . . . 1.4 18.2 78.3 36.8 44.0Depreciation . . . . . . . . . . . . . . . . . . . . . . . . . . . . . . . . . . . . . 10.7 20.1 51.9 22.4 25.9Amortization . . . . . . . . . . . . . . . . . . . . . . . . . . . . . . . . . . . . 3.0 9.6 35.6 16.8 18.3Bank interest income . . . . . . . . . . . . . . . . . . . . . . . . . . . . . . (1.8) (1.5) (2.2) (0.6) (1.9)
EBITDA (unaudited) . . . . . . . . . . . . . . . . . . . . . . . . . . . . . 155.5 148.3 304.0 101.9 115.3
Add:Items arising from acquisition and relating to the
Reorganization . . . . . . . . . . . . . . . . . . . . . . . . . . . . . . . . — 50.1 29.8 14.5 17.7Changes in carrying amount of financial liabilities
associated with the put option . . . . . . . . . . . . . . . . . . . . . — 7.1 28.8 14.4 15.1Transaction cost arising from the acquisition of
SharkNinja . . . . . . . . . . . . . . . . . . . . . . . . . . . . . . . . . . . . — 13.3 — — —Revaluation of inventory arising from the acquisition of
SharkNinja . . . . . . . . . . . . . . . . . . . . . . . . . . . . . . . . . . . . — 29.1 — — —Reorganization-related expenses including deferred
financing cost . . . . . . . . . . . . . . . . . . . . . . . . . . . . . . . . . . — 0.6 1.0 0.1 2.6Non-recurring items and items not related to our
ordinary course of business . . . . . . . . . . . . . . . . . . . . . . (20.5) (1.4) (21.7) (12.4) 3.9Stock-based compensation . . . . . . . . . . . . . . . . . . . . . . . . . . 0.5 0.4 5.1 1.1 2.9Gain on disposal of property, plant and equipment,
investment property and subsidiaries . . . . . . . . . . . . . . . . (7.0) (1.9) (27.9) (13.5) —Gain on fair value change from equity investments . . . . . . (14.0) 0.1 1.1 — (4.8)Listing expenses . . . . . . . . . . . . . . . . . . . . . . . . . . . . . . . . . . — — — — 5.8
Adjusted EBITDA (unaudited) . . . . . . . . . . . . . . . . . . . . . 135.0 197.0 312.1 104.0 136.9
11

SUMMARY
We set out below our key considerations for adjusting certain items for our non-IFRS measures.For more details, see “Financial Information—Non-IFRS Measures.”
I. Items arising from acquisition and relating to the Reorganization
(i) changes in carrying amount of financial liabilities associated with the put option
Such item is associated with the fair value change in the financial liabilities related to the PutOption granted by Compass, our Company’s subsidiary, to its non-controlling shareholders. The PutOption was replaced by the Put Right upon the completion of the restructuring of Compass, and the PutRight will be automatically terminated upon completion of the Global Offering.
(ii) transaction cost arising from the acquisition of SharkNinja
Such item primarily includes legal and other professional service fees associated with executionand completion of the acquisition of SharkNinja.
(iii) amortization of intangible assets and deferred financing costs arising from the acquisition ofSharkNinja
Amortization of intangible assets is related to costs of SharkNinja’s retailer relationships andpatents recognized under purchase accounting for the acquisition of SharkNinja. Amortization ofdeferred financing costs is related to upfront arrangement fees and other fees associated with the bankloans incurred and paid in September 2017 for the acquisition of SharkNinja.
(iv) revaluation of inventory arising from the acquisition of SharkNinja
Such item is caused by revaluation of SharkNinja’s inventories from book value to fair valueunder purchase accounting method for the acquisition of SharkNinja.
(v) revaluation of the deferred taxes due to a change in US tax rate
Such item is caused by revaluation of the deferred tax liabilities of SharkNinja as a result of thedecrease in the US tax rate from 35% to 21% effective from January 1, 2018, leading to a one-off taxcredit.
(vi) reorganization-related expenses including deferred financing cost
Such item includes professional fees and other expenses incurred in the Reorganization andupfront fees and other fees associated with the bank loans incurred during the Reorganization.
We adjusted for the above items primarily because (i) the acquisition of SharkNinja and theReorganization are out of our ordinary course of business, and the acquisition of SharkNinja and theReorganization are one-off and non-recurring events by nature; and (ii) the above items are notindicative of our core operating performance, due to their non-business related nature and/or non-cashnature.
II. Non-recurring items and items not related to our ordinary course of business
Such adjustments include stock-based compensation arising from granting stock-based awardsto select directors and employees, gain on disposal of property, plant and equipment, investment
12
SUMMARY
property and subsidiaries, gain on fair value change from equity investments that reflect year-over-yearchanges in the fair value of the Group’s equity holdings in other entities, and listing expenses. Weadjusted for such items as they are either non-recurring or not indicative of our ongoing core operatingperformance. For more information on the adjustment in relation to the stock-based compensation, see“Financial Information—Non-IFRS Measures—(iv) stock-based compensation.”
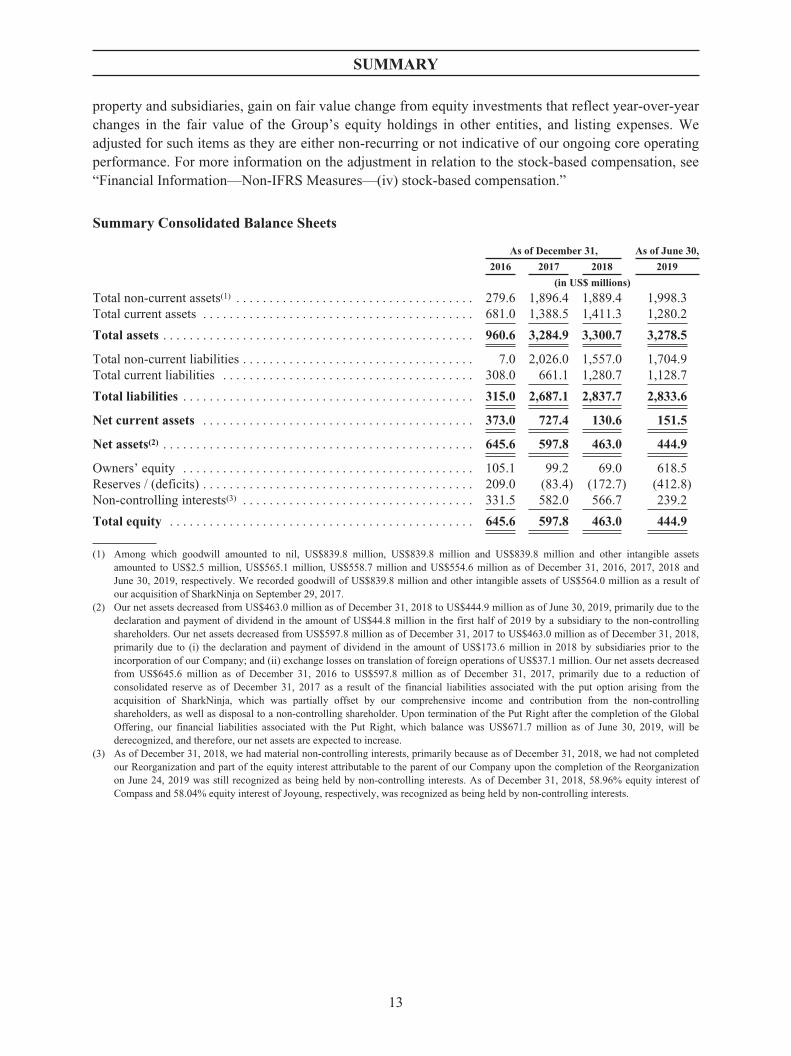
Summary Consolidated Balance Sheets
As of December 31, As of June 30,
2016 2017 2018 2019
(in US$ millions)
Total non-current assets(1) . . . . . . . . . . . . . . . . . . . . . . . . . . . . . . . . . . . . 279.6 1,896.4 1,889.4 1,998.3Total current assets . . . . . . . . . . . . . . . . . . . . . . . . . . . . . . . . . . . . . . . . . 681.0 1,388.5 1,411.3 1,280.2
Total assets . . . . . . . . . . . . . . . . . . . . . . . . . . . . . . . . . . . . . . . . . . . . . . . 960.6 3,284.9 3,300.7 3,278.5
Total non-current liabilities . . . . . . . . . . . . . . . . . . . . . . . . . . . . . . . . . . . 7.0 2,026.0 1,557.0 1,704.9Total current liabilities . . . . . . . . . . . . . . . . . . . . . . . . . . . . . . . . . . . . . . 308.0 661.1 1,280.7 1,128.7
Total liabilities . . . . . . . . . . . . . . . . . . . . . . . . . . . . . . . . . . . . . . . . . . . . 315.0 2,687.1 2,837.7 2,833.6
Net current assets . . . . . . . . . . . . . . . . . . . . . . . . . . . . . . . . . . . . . . . . . 373.0 727.4 130.6 151.5
Net assets(2) . . . . . . . . . . . . . . . . . . . . . . . . . . . . . . . . . . . . . . . . . . . . . . . 645.6 597.8 463.0 444.9
Owners’ equity . . . . . . . . . . . . . . . . . . . . . . . . . . . . . . . . . . . . . . . . . . . . 105.1 99.2 69.0 618.5Reserves / (deficits) . . . . . . . . . . . . . . . . . . . . . . . . . . . . . . . . . . . . . . . . . 209.0 (83.4) (172.7) (412.8)Non-controlling interests(3) . . . . . . . . . . . . . . . . . . . . . . . . . . . . . . . . . . . 331.5 582.0 566.7 239.2
Total equity . . . . . . . . . . . . . . . . . . . . . . . . . . . . . . . . . . . . . . . . . . . . . . 645.6 597.8 463.0 444.9
(1) Among which goodwill amounted to nil, US$839.8 million, US$839.8 million and US$839.8 million and other intangible assetsamounted to US$2.5 million, US$565.1 million, US$558.7 million and US$554.6 million as of December 31, 2016, 2017, 2018 andJune 30, 2019, respectively. We recorded goodwill of US$839.8 million and other intangible assets of US$564.0 million as a result ofour acquisition of SharkNinja on September 29, 2017.
(2) Our net assets decreased from US$463.0 million as of December 31, 2018 to US$444.9 million as of June 30, 2019, primarily due to thedeclaration and payment of dividend in the amount of US$44.8 million in the first half of 2019 by a subsidiary to the non-controllingshareholders. Our net assets decreased from US$597.8 million as of December 31, 2017 to US$463.0 million as of December 31, 2018,primarily due to (i) the declaration and payment of dividend in the amount of US$173.6 million in 2018 by subsidiaries prior to theincorporation of our Company; and (ii) exchange losses on translation of foreign operations of US$37.1 million. Our net assets decreasedfrom US$645.6 million as of December 31, 2016 to US$597.8 million as of December 31, 2017, primarily due to a reduction ofconsolidated reserve as of December 31, 2017 as a result of the financial liabilities associated with the put option arising from theacquisition of SharkNinja, which was partially offset by our comprehensive income and contribution from the non-controllingshareholders, as well as disposal to a non-controlling shareholder. Upon termination of the Put Right after the completion of the GlobalOffering, our financial liabilities associated with the Put Right, which balance was US$671.7 million as of June 30, 2019, will bederecognized, and therefore, our net assets are expected to increase.
(3) As of December 31, 2018, we had material non-controlling interests, primarily because as of December 31, 2018, we had not completedour Reorganization and part of the equity interest attributable to the parent of our Company upon the completion of the Reorganizationon June 24, 2019 was still recognized as being held by non-controlling interests. As of December 31, 2018, 58.96% equity interest ofCompass and 58.04% equity interest of Joyoung, respectively, was recognized as being held by non-controlling interests.
13

SUMMARY
Summary Consolidated Cash Flows
For the year ended December 31,For the six months
ended June 30,
2016 2017 2018 2018 2019
(in US$ millions)(unaudited)
Net cash flows from operating activities . . . . . . . . . . . . . . . 152.0 51.9 233.9 127.1 75.8Net cash flows used in investing activities . . . . . . . . . . . . . (69.3) (1,213.2) (9.9) 9.0 (62.7)Net cash flows from/(used in) financing activities . . . . . . . (121.1) 1,250.1 (260.8) (113.6) (42.2)
Net increase/(decrease) in cash and cash equivalents . . (38.4) 88.8 (36.8) 22.5 (29.1)Cash and cash equivalents at the beginning of the year/
period . . . . . . . . . . . . . . . . . . . . . . . . . . . . . . . . . . . . . . . . 175.3 127.2 211.0 211.0 180.9Effect of foreign exchange rate changes, net . . . . . . . . . . . . (9.7) (5.0) 6.7 (11.4) 0.7
Cash and cash equivalents at the end of theyear/period . . . . . . . . . . . . . . . . . . . . . . . . . . . . . . . . . . . 127.2 211.0 180.9 222.1 152.5
KEY FINANCIAL RATIOS
For the year ended December 31, For the six months ended June 30,
2016 2017 2018 2018 2019
(unaudited)
Gross profit margin . . . . . . . . . . . . . . . . 31.9% 33.2% 37.3% 36.9% 37.4%EBITDA margin(1) . . . . . . . . . . . . . . . . 14.1% 9.5% 11.3% 8.8% 9.3%Adjusted EBITDA margin(2) . . . . . . . . . 12.2% 12.6% 11.6% 9.0% 11.1%Net profit margin . . . . . . . . . . . . . . . . . 11.1% 9.0% 4.2% 1.8% 1.8%Adjusted net profit margin(3) . . . . . . . . . 9.2% 8.9% 5.6% 3.2% 4.7%
As of and/or for the year ended December 31,
As of and/or forthe six monthsended June 30,
20192016 2017 2018
Return on equity(4) . . . . . . . . . . . . . . . . . . . . . . . . . . . . 19.0% 23.6% 24.2% N/A(5)
Gearing ratio(6) . . . . . . . . . . . . . . . . . . . . . . . . . . . . . . . 0.01 2.13 2.70 2.07
(1) EBITDA margin equals EBITDA divided by revenue for the same year/period, multiplied by 100%.(2) Adjusted EBITDA margin equals adjusted EBITDA divided by revenue for the same year/period, multiplied by 100%.(3) For a reconciliation of profit for the year/period to adjusted net profit as we define this, see “Financial Information—Non-IFRS
Measures.”(4) Return on equity ratio is calculated using net profit divided by total equity at the end of the year/period, multiplied by 100%.(5) This semi-annual number is not meaningful as it is not comparable to the annual numbers.(6) Gearing ratio is calculated using total debt (including interest-bearing bank borrowings and lease liabilities) divided by total equity at the
end of the year/period.
GLOBAL OFFERING
The Global Offering comprises: (i) the Hong Kong Public Offering of 49,983,000 Offer Shares(subject to adjustment) in Hong Kong as described in “Structure of the Global Offering—The HongKong Public Offering;” and (ii) the International Offering of an aggregate of initially 449,847,000Shares (subject to adjustment and the Over-allotment Option), (a) in the United States to QIBs inreliance on Rule 144A or another available exemption, and (b) outside the United States in reliance onRegulation S (including to professional and institutional investors in Hong Kong).
The Offer Shares will represent approximately 15.0% of the enlarged issued share capital of ourCompany immediately following the completion of the Global Offering, assuming the Over-allotmentOption is not exercised. See “Structure of the Global Offering.”
14
SUMMARY
US CUSTOMS DUTIES
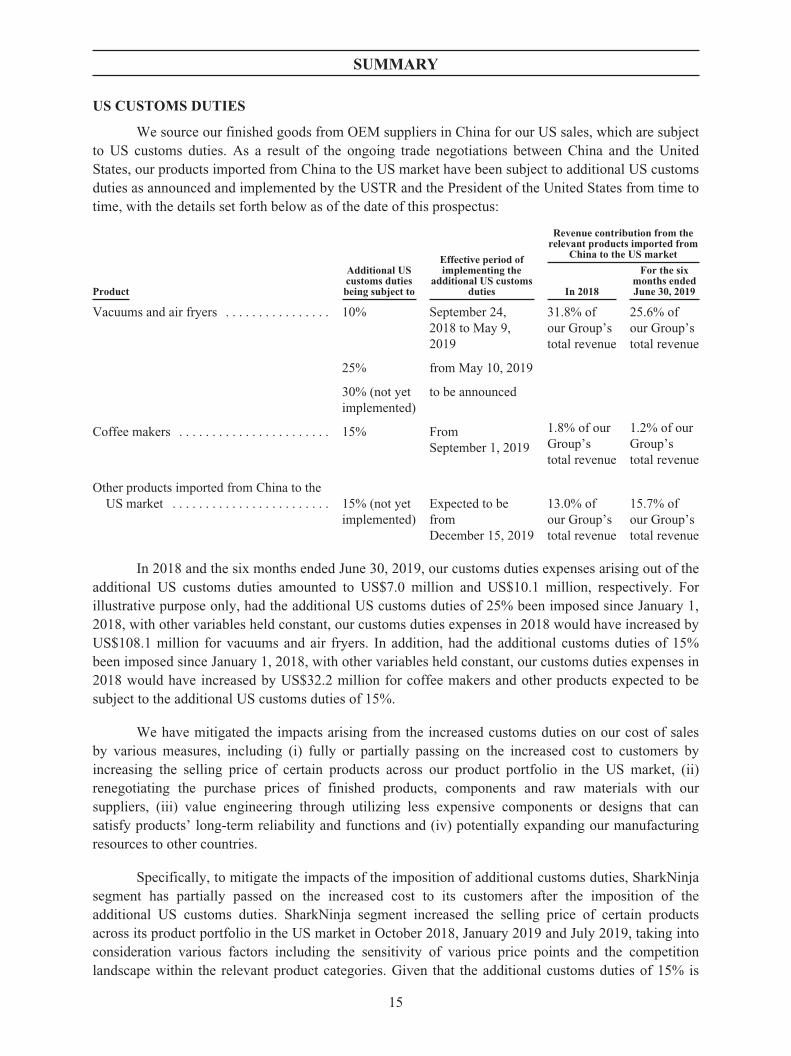
We source our finished goods from OEM suppliers in China for our US sales, which are subjectto US customs duties. As a result of the ongoing trade negotiations between China and the UnitedStates, our products imported from China to the US market have been subject to additional US customsduties as announced and implemented by the USTR and the President of the United States from time totime, with the details set forth below as of the date of this prospectus:
Product
Additional UScustoms dutiesbeing subject to
Effective period ofimplementing the
additional US customsduties
Revenue contribution from therelevant products imported from
China to the US market
In 2018
For the sixmonths endedJune 30, 2019
Vacuums and air fryers . . . . . . . . . . . . . . . . 10% September 24,2018 to May 9,2019
31.8% ofour Group’stotal revenue
25.6% ofour Group’stotal revenue
25% from May 10, 2019
30% (not yetimplemented)
to be announced
Coffee makers . . . . . . . . . . . . . . . . . . . . . . . 15% FromSeptember 1, 2019
1.8% of ourGroup’stotal revenue
1.2% of ourGroup’stotal revenue
Other products imported from China to theUS market . . . . . . . . . . . . . . . . . . . . . . . . 15% (not yet
implemented)Expected to befromDecember 15, 2019
13.0% ofour Group’stotal revenue
15.7% ofour Group’stotal revenue
In 2018 and the six months ended June 30, 2019, our customs duties expenses arising out of theadditional US customs duties amounted to US$7.0 million and US$10.1 million, respectively. Forillustrative purpose only, had the additional US customs duties of 25% been imposed since January 1,2018, with other variables held constant, our customs duties expenses in 2018 would have increased byUS$108.1 million for vacuums and air fryers. In addition, had the additional customs duties of 15%been imposed since January 1, 2018, with other variables held constant, our customs duties expenses in2018 would have increased by US$32.2 million for coffee makers and other products expected to besubject to the additional US customs duties of 15%.
We have mitigated the impacts arising from the increased customs duties on our cost of salesby various measures, including (i) fully or partially passing on the increased cost to customers byincreasing the selling price of certain products across our product portfolio in the US market, (ii)renegotiating the purchase prices of finished products, components and raw materials with oursuppliers, (iii) value engineering through utilizing less expensive components or designs that cansatisfy products’ long-term reliability and functions and (iv) potentially expanding our manufacturingresources to other countries.
Specifically, to mitigate the impacts of the imposition of additional customs duties, SharkNinjasegment has partially passed on the increased cost to its customers after the imposition of theadditional US customs duties. SharkNinja segment increased the selling price of certain productsacross its product portfolio in the US market in October 2018, January 2019 and July 2019, taking intoconsideration various factors including the sensitivity of various price points and the competitionlandscape within the relevant product categories. Given that the additional customs duties of 15% is
15
SUMMARY
not yet in full implementation, SharkNinja segment is monitoring the development and continuing toconduct analysis on the potential selling price increase for the products that are affected by theadditional customs duties of 15%.
SharkNinja segment has also mitigated and plans to continue mitigating the impacts arisingfrom the increased customs duties by renegotiating the purchase prices favorable to us with its OEMsuppliers leveraging the general depreciation of Renminbi against US dollar, and by reducing the costson selected products across its product portfolio through value engineering, including vacuums and airfryers that are already subject to, and products that are not yet affected by, the additional US customsduties.
In addition, although it takes time and effort to identify viable non-China suppliers that canmanufacture our products at comparable prices and quality as our existing suppliers in China, as of thedate of this prospectus, we do not foresee any impediment or major difficulty for SharkNinja segmentto source outside of China. To further mitigate the impacts arising from increased US customs duties,SharkNinja segment has been actively exploring alternative sourcing opportunities outside of China,and expects to have some of its vacuums manufactured in Vietnam by the end of 2019.
Furthermore, we typically stock up certain amounts of inventory in line with our businessoperations and risk mitigation strategy, including preparing for each increase in the US customs dutiesas announced. In line with our accounting policies, inventories cost is determined on a first-in, first-outbasis. Therefore, inventories stocked up prior to the imposition of applicable additional US customsduties helped to delay the impacts from the additional US customs duties on our financial performance.As a result, impacts from the additional US customs duties were minimal on our financial performanceduring the Track Record Period.
As a result of the various mitigation efforts as well as our contingency measure of stocking upinventory, we have been able to maintain relatively stable gross margins amid the increase in customsduties. For illustrative purpose only, for vacuums which constitute the biggest product line affected bythe additional US customs duties, for the six months ended June 30, 2018 and 2019, gross margin ofvacuums imported from China to the US market remained relatively stable at 43.5% and 41.9%,respectively. In addition, gross margins of our Group and SharkNinja segment also remained relativelystable before and after the imposition of the additional US customs duties. For the six months endedJune 30, 2018 and 2019, the gross margin of our Group was 36.9% and 37.4%, respectively, while thegross margin of SharkNinja segment was 41.4% and 40.4%, respectively.
In response to the increased customs duties, we plan to and have endeavored to implementvarious measures to mitigate the negative impacts from increased US customs duties as discussedabove. Having considered the effectiveness of our mitigation measures to date, and the relatively stablegross margins as mentioned above, our Directors believe that we can sell the relevant products at agross profit level taking into account the applicable maximum US customs duties as currentlyenvisaged as of the date of this prospectus.
As of the date of this prospectus, we have not received any indication from our US customersthat they may reduce their purchase volumes due to the imposition of the additional customs duties.
16
SUMMARY
RECENT DEVELOPMENT
Our profitability in 2019 may be affected by, among other things, (i) decreases in other incomeand gains due to the non-recurrence in 2019 of disposals of property, plant or subsidiaries, whichoccurred in 2018 and contributed to our other income and gains in 2018; (ii) increased administrativeexpenses due to listing expenses and expenses in relation to share-based payments, which we expect toincur in 2019 pursuant to a newly approved RSU Plan launched before the Global Offering, and theremainder of which we expect to incur pursuant to the existing ESOP and management incentive plans;(iii) increased finance costs due to additional interest-bearing bank borrowings that we incurred inrelation to the Reorganization; and (iv) increased US customs duties.
On October 15, 2019, iRobot Corporation (“iRobot”) filed a lawsuit against SharkNinja in aMassachusetts federal court, alleging that two of SharkNinja’s robotic vacuum models (the “DisputedProducts”) launched in September 2019 infringe six of iRobot’s US patents. SharkNinja has defendedand plans to continue defending itself and the Disputed Products vigorously. The dispute is at an earlystage and the parties have not yet commenced discovery; moreover, litigation is subject to a range ofinherent uncertainties and it is not possible to make predictions as to the outcome thereof. Subject tothese considerations, based on an initial assessment using information available to it as of the date ofthis prospectus, the Company believes that this dispute will not cause a material adverse effect onSharkNinja’s, or the Group’s, operations and financial results. For details of this case, SharkNinja’sresponses and the related risks, see “Business—Compliance and Legal Proceedings” and “RiskFactors—Risks Relating to Our Business and Industry—We could be impacted by unfavorable resultsof legal and administrative proceedings.”
As of the date of this prospectus, to the best of our knowledge, except as disclosed in thisprospectus, there has been no material change in the general economic and market conditions in Chinaand the United States or the industry in which we operate that have materially and adversely affectedour business, results of operations or financial condition since June 30, 2019.
OFFERING STATISTICS
The numbers in the following table are based on the assumptions that (i) the Global Offeringhas been completed and 499,830,000 Shares are issued and sold in the Global Offering, (ii) the Over-allotment Option is not exercised, and (iii) 3,332,198,177 Shares are issued and outstanding followingthe completion of the Global Offering.
Based on an OfferPrice of HK$5.55
Based on an OfferPrice of HK$7.25
Market capitalization(1) . . . . . . . . . . . . . . . . . . . . . . . . HK$18,493.7 million HK$24,158.4 millionUnaudited pro forma adjusted net tangible liabilities
per share(2) . . . . . . . . . . . . . . . . . . . . . . . . . . . . . . . . HK$(2.18) HK$(1.94)
(1) The calculation of market capitalization is based on 3,332,198,177 Shares expected to be issued and outstanding following the GlobalOffering.
(2) The unaudited pro forma adjusted net tangible liabilities per share is arrived at after the adjustments referred to in “Appendix II—Unaudited Pro Forma Financial Information.”
USE OF PROCEEDS
We estimate that we will receive net proceeds of approximately HK$2,962.4 million from theGlobal Offering, assuming that the Over-allotment Option is not exercised, after deducting theunderwriting commissions and other estimated offering expenses payable by us and assuming the
17
SUMMARY
Offer Price of HK$6.40 per Share, being the mid-point of the indicative Offer Price range of HK$5.55and HK$7.25. We intend to use the proceeds from the Global Offering for the purposes and in theamounts set out below:
Š approximately 50% of the net proceeds, or approximately HK$1,481.2 million, is expectedto be used to partially repay a term loan with a principal amount of US$470 million from acommercial bank for a dividend distribution. We declared a special dividend of US$464.0million to our shareholders on a pro rata basis pursuant to a shareholders’ agreement,which has been paid on October 16, 2019 and was funded by such term loan;
Š approximately 20% of the net proceeds, or approximately HK$592.5 million, is expectedto be used on the R&D of new products, and further integration and development of oursupply chain;
Š approximately 20% of the net proceeds, or approximately HK$592.5 million, is expectedto be used for market development and expansion, and enhancing our global brand imageand recognition; and
Š approximately 10% of the net proceeds, or approximately HK$296.2 million, is expectedto be used for working capital and general corporate purposes.
See “Future Plans and Use of Proceeds.”
DIVIDEND POLICY
As we are a holding company, our ability to declare and pay dividends will depend on receiptof sufficient funds from our subsidiaries. Any amount of dividends we pay will be at the discretion ofour Directors and will depend on our future operations and earnings, capital requirements and surplus,general financial condition, contractual restrictions and other factors that our Directors considerrelevant. Any declaration and payment as well as the amount of dividends will be subject to ourconstitutional documents and the Cayman Companies Law.
As of June 30, 2019, our Company had a net deficit of US$4.3 million on our Company’sstatement of financial position. Under Cayman Islands law, dividends may be paid only out of profitsand share premium. As advised by our legal advisors on Cayman Islands law, Maples and Calder(Hong Kong) LLP, the existence of a net deficit does not necessarily restrict us from declaring andpaying dividends to our Shareholders. Under Cayman Islands law, our Company may pay a dividendout of either our profits (realized or unrealized) or amounts standing to the credit of our share premiumaccount, provided that this would not result in our Company being unable to pay debts as they fall duein the ordinary course of business.
Historically, no dividend has been declared by our Company since incorporation. We declareda special dividend of US$464.0 million to our shareholders on a pro rata basis pursuant to ashareholders’ agreement, US$276.5 million of which was declared to JS Holding. Such specialdividend has been paid prior to the Global Offering and funded by a term loan borrowed from acommercial bank with a principal amount of US$470 million.
Currently we do not have a formal dividend policy or a fixed dividend distribution ratio. Thereis no assurance that dividends of any amount will be declared or distributed in any year.
See “Financial Information—Dividend Policy.”
18
SUMMARY
LISTING EXPENSES
During the Track Record Period, we incurred listing expenses of US$5.8 million. We expect toincur listing expenses of approximately US$30.2 million (equivalent to approximately HK$236.5million, assuming the Over-allotment Option is not exercised and an Offer Price of HK$6.40 per Share,being the mid-point of the indicative Offer Price range of HK$5.55 and HK$7.25), of which US$15.9million will be recognized as administrative expenses and US$14.3 million will be charged againstequity in the year ending December 31, 2019. We do not believe these expenses will have a materialimpact on our results of operations for 2019.
RISK FACTORS
We believe that there are risks involved in our operations, many of which are beyond ourcontrol. We have categorized these risks and uncertainties into: (i) risks relating to our business andindustry; (ii) risks relating to the countries in which we operate; and (iii) risks relating to the GlobalOffering. Our business may be materially and adversely affected by these risks, including thefollowing:
Š global markets for our products are highly competitive and subject to rapid technologicalchanges, and we may be unable to compete effectively in relevant markets;
Š if we fail to successfully manage frequent product introductions and transitions, we maynot remain competitive or be able to stimulate customer demand;
Š any trade or import protection policies may materially and adversely affect our business;
Š our global operations are subject to various risks;
Š maintaining the trusted brand image of our products is critical to our success, and anyfailure to do so could severely damage our reputation and brand, which would have amaterial adverse effect on our business, financial condition and results of operations;
Š if we are unable to manage our growth or execute our strategies effectively, our businessand prospects may be materially and adversely affected;
Š it may be difficult for investors to evaluate our business and our prospects due to theGroup’s limited operating history in its current form;
Š we face risks related to sales through distributors, as we do not exercise complete controlover the practice and manner of the ultimate retail sales by our distributors; and
Š we recorded a significant amount of goodwill and other intangible assets following theacquisition of SharkNinja and our net profit could be adversely affected if we recognizeimpairment losses on such goodwill or other intangible assets.
See “Risk Factors.”
19
DEFINITIONS
In this prospectus, unless the context otherwise requires, the following expressions havethe following meanings:
“affiliate(s)” with respect to any specific person, any other person,directly or indirectly, controlling or controlled by or underdirect or indirect common control with such specifiedperson
“Application Form(s)” WHITE Application Form(s), YELLOW ApplicationForm(s) and GREEN Application Form(s), or where thecontext so requires, any one of them, in relation to theHong Kong Public Offering
“Articles of Association” or “Articles” the articles of association of our Company conditionallyadopted on October 9, 2019 and effective on the ListingDate and as amended from time to time, a summary ofwhich is set out in Appendix III
“associate(s)” has the meaning ascribed to it under the Listing Rules
“Bilting” Bilting Developments Limited, a company incorporatedunder the laws of the BVI on October 19, 2004 with limitedliability, and a wholly-owned subsidiary of Mr. Lee PuayKhng, an Independent Third Party before theReorganization
“Board” or “Board of Directors” the board of Directors of our Company
“Business Day” or “business day” a day on which banks in Hong Kong are generally open fornormal banking business to the public and which is not aSaturday, Sunday or public holiday in Hong Kong
“BVI” the British Virgin Islands
“BVI SPVs” SPVs of the Controlling Shareholders Group, namely XNL,Jin Cheng, Fortune Spring, Tuo Ge, Yuan Jiu, Xi Yu andJin Yu holding interests in JS Holding
“CAGR” compound annual growth rate
“Cayman Companies Law” the Companies Law, Cap. 22 (Law 3 of 1961) of theCayman Islands, as amended, consolidated orsupplemented from time to time
“CCASS” the Central Clearing and Settlement System established andoperated by HKSCC
“CCASS Clearing Participant” a person admitted to participate in CCASS as a directclearing participant or general clearing participant
20

DEFINITIONS
“CCASS Custodian Participant” a person admitted to participate in CCASS as a custodianparticipant
“CCASS Investor Participant” a person admitted to participate in CCASS as an investorparticipant who may be an individual or joint individuals ora corporation
“CCASS Participant” a CCASS Clearing Participant, or a CCASS CustodianParticipant or a CCASS Investor Participant
“China” or “PRC” the People’s Republic of China excluding for the purposeof this prospectus, Hong Kong, the Macau SpecialAdministrative Region and Taiwan
“close associate(s)” has the meaning ascribed to it under the Listing Rules
“Comfort Home” Comfort Home Limited, one of our Pre-IPO Investors, thedetails of which are set out in “History, Reorganization andCorporate Structure”
“Companies Ordinance” the Companies Ordinance (Chapter 622 of the Laws ofHong Kong) as the same may be amended, supplementedor otherwise modified from time to time
“Companies (WUMP) Ordinance” the Companies (Winding Up and MiscellaneousProvisions) Ordinance (Chapter 32 of the Laws of HongKong) as the same may be amended, supplemented orotherwise modified from time to time
“Company” or “our Company” JS Global Lifestyle Company Limited(JS ), an exempted company incorporatedin the Cayman Islands with limited liability on July 26,2018 (formerly known as JY-Shark Company Limited fromJuly 26, 2018 to March 24, 2019 and JS Lifestyle GlobalCompany Limited from March 25, 2019 to March 26,2019), and registered as a non-Hong Kong company underPart 16 of the Companies Ordinance
“Compass” Compass Cayman SPV, Ltd., an exempted companyincorporated under the laws of the Cayman Islands onJune 27, 2017, and a wholly-owned subsidiary of theCompany after the Reorganization
“connected person(s)” has the meaning ascribed to it under the Listing Rules
“Controlling Shareholders” has the meaning ascribed to it under the Listing Rules andunless the context requires otherwise, refers to theControlling Shareholders Group, BVI SPVs, Hezhou, TongZhou, JS Holding, STL and Sol SPC
21
DEFINITIONS
“Controlling Shareholders Group” a group of individuals collectively and indirectly holding48.12% of equity interest in our Company upon thecompletion of the Global Offering (assuming the Over-allotment Option is not exercised), namely Mr. WangXuning, Mr. Zhu Hongtao, Mr. Zhu Zechun, Ms. YangNingning, Ms. Huang Shuling, Ms. Han Run, and Mr. JiangGuangyong
“core connected person(s)” has the meaning ascribed to it under the Listing Rules
“CSRC” China Securities Regulatory Commission (中國證券監督管理委員會)
“Dinghui” Dinghui Solar Energy (Hong Kong) Limited, a companyincorporated under the laws of Hong Kong on April 21,2006 with limited liability
“Director(s)” the directors of our Company
“Easy Appliance (Hong Kong)” Easy Appliance Hong Kong Limited, a companyincorporated under the laws of Hong Kong on November 6,2018 with limited liability, and a wholly-owned subsidiaryof the Company after the Reorganization
“Easy Home” Easy Home Limited, the details of which are set out in“History, Reorganization and Corporate Structure”
“EIT” enterprise income tax
“EIT Law” the PRC Enterprise Income Tax Law (《中華人民共和國企業所得稅法》), adopted by the National People’s Congressof the PRC on March 16, 2007 and became effective onJanuary 1, 2008
“Euro-Pro Group” Euro-Pro Holdco, LLC and its subsidiaries
“FIE” foreign invested enterprise
“Fortune Spring” Fortune Spring Company Limited, a company incorporatedunder the laws of BVI on April 16, 2018 and wholly ownedby Mr. Zhu Zechun, and one of our ControllingShareholders
“Frost & Sullivan” Frost & Sullivan (Beijing) Inc., Shanghai Branch Co., anindependent market research and consulting company
“Frost & Sullivan Report” an independent market research report prepared by Frost &Sullivan as commissioned by us
22

DEFINITIONS
“GA1” Global Appliance 1 Limited, an exempted companyincorporated under the laws of Cayman Islands on July 4,2017, and a wholly-owned subsidiary of the Company afterthe Reorganization
“GA2” Global Appliance 2 Limited, an exempted companyincorporated under the laws of Cayman Islands on July 4,2017, and a wholly-owned subsidiary of GA1
“GBP” Great British pound, the lawful currency for the timingbeing of the United Kingdom
“Global Offering” the Hong Kong Public Offering and the InternationalOffering
“Gong Ji” Gong Ji Company Limited, a company incorporated underthe laws of BVI on June 28, 2018, and merged with TongZhou on May 2, 2019 with Tong Zhou being the survivingcompany
“GREEN Application Form(s)” the application form(s) to be completed by HK eIPOWHITE Form Service Provider, designated by ourCompany
“Group,” “our Group,” “we” or “us” our Company, our subsidiaries, or, where the context sorequires in respect of the period before our Companybecame the holding company of our present subsidiaries,the entities which carried on the business of the presentGroup at the relevant time
“Hezhou” Hezhou Company Limited, an exempted companyincorporated under the laws of the Cayman Islands onJuly 18, 2018 and wholly owned by Xuning CompanyLimited, which is in turn wholly owned by Mr. WangXuning, and one of our Controlling Shareholders
“HK eIPO White Form” the application for the Hong Kong Offer Shares to beissued in applicant’s own name by submitting applicationsonline through the IPO App or the designated website atwww.hkeipo.hk
“HK eIPO White Form ServiceProvider”
The HK eIPO White Form service provider designated byour Company, as specified in the IPO App or on thedesignated website at www.hkeipo.hk
“HK$,” “Hong Kong dollar(s)” Hong Kong dollars and cents respectively, the lawfulcurrency for the time being of Hong Kong
“HKSCC” Hong Kong Securities Clearing Company Limited
23

DEFINITIONS
“Hong Kong” or “HK” the Hong Kong Special Administrative Region of the PRC
“HKSCC Nominees” HKSCC Nominees Limited, a wholly-owned subsidiary ofHKSCC
“Hong Kong Share Registrar” Tricor Investor Services Limited
“Hong Kong Offer Share(s)” the 49,983,000 Shares initially offered by our Company forsubscription at the Offer Price under the Hong Kong PublicOffering, subject to adjustment as described in “Structureof the Global Offering”
“Hong Kong Public Offering” the offer for subscription of the Hong Kong Offer Shares inHong Kong at the Offer Price and on, and subject to, theterms and conditions of this prospectus and the ApplicationForms. See “Structure of the Global Offering”
“Hong Kong Underwriters” the underwriters of the Hong Kong Public Offering
“Hong Kong Underwriting Agreement” the Hong Kong underwriting agreement dated on or aroundOctober 21, 2019, relating to the Hong Kong PublicOffering, entered into by, among others, our Company, JSHolding, Mr. Wang Xuning, the Joint Global Coordinatorsand the Hong Kong Underwriters. See “Underwriting—Hong Kong Public Offering”
“Implementation Regulations of EITLaw”
the Regulations of the People’s Republic of China on theImplementation of the Enterprise Income Tax Law (《中華人民共和國企業所得稅法實施條例》) promulgated by theState Council on December 6, 2007 and implemented fromJanuary 1, 2008
“Independent Third Party(ies)” individual(s) or company(ies) who or which is/areindependent of and not connected with (within the meaningof the Listing Rules) any Director, chief executive orsubstantial shareholder (within the meaning of the ListingRules) of our Company, its subsidiaries or any of theirrespective associates
“International Offer Share(s)” the 449,847,000 Shares initially offered by our Companyfor subscription at the Offer Price under the InternationalOffering (subject to adjustment as described in “Structureof the Global Offering”) together with (unless the contextotherwise requires) any Shares issued pursuant to anyexercise of the Over-allotment Option
“International Offering” the conditional placing of the International Offer Shares atthe Offer Price outside the United States in offshoretransactions in reliance on Regulation S under the U.S.
24

DEFINITIONS
Securities Act and in the United States to QIBs only inreliance on Rule 144A or any other available exemptionfrom the registration requirement under the U.S. SecuritiesAct, in each case on and subject to the terms and conditionsof the International Underwriting Agreement, as furtherdescribed in the section headed “Structure of the GlobalOffering”
“International Underwriters” the underwriters of the International Offering
“International Underwriting Agreement” the underwriting agreement expected to be entered into onor around October 25, 2019 by, among others, theCompany and the International Underwriters in respect ofthe International Offering. See “Underwriting—Underwriting Arrangements and Expenses—InternationalOffering”
“IPO App” the mobile application for HK eIPO White Form servicewhich can be downloaded by searching “IPO App” in AppStore or Google Play or downloaded at www.hkeipo.hk/IPOApp or www.tricorglobal.com/IPOApp
“Jin Cheng” Jin Cheng Company Limited, a company incorporatedunder the laws of BVI on April 16, 2018 and wholly ownedby Mr. Zhu Hongtao, and one of our ControllingShareholders
“Jin Yu” Jin Yu Company Limited, a company incorporated underthe laws of BVI on April 16, 2018 and wholly owned byMr. Jiang Guangyong, and one of our ControllingShareholders
“Jiuyang Bean” Hangzhou Jiuyang Bean Industry Limited (杭州九陽豆業有限公司), a company incorporated under the laws of the PRCon November 18, 2008 with limited liability, and anassociate of our Controlling Shareholders Group
“Joint Bookrunners” Credit Suisse (Hong Kong) Limited, Morgan Stanley AsiaLimited (in relation to Hong Kong Public Offering only),Morgan Stanley & Co. International plc (in relation toInternational Offering only), ICBC International CapitalLimited, China International Capital Corporation HongKong Securities Limited, CMB International CapitalLimited, China Merchants Securities (HK) Co., Limitedand CCB International Capital Limited
“Joint Global Coordinators” Credit Suisse (Hong Kong) Limited, Morgan Stanley AsiaLimited, ICBC International Capital Limited and ChinaInternational Capital Corporation Hong Kong SecuritiesLimited
25

DEFINITIONS
“Joint Lead Managers” Credit Suisse (Hong Kong) Limited, Morgan Stanley AsiaLimited (in relation to Hong Kong Public Offering only),Morgan Stanley & Co. International plc (in relation toInternational Offering only), ICBC International SecuritiesLimited, China International Capital Corporation HongKong Securities Limited, CMB International CapitalLimited, China Merchants Securities (HK) Co., Limitedand CCB International Capital Limited
“Joint Sponsors” Credit Suisse (Hong Kong) Limited, Morgan Stanley AsiaLimited and ICBC International Capital Limited
“Joyoung” Joyoung Co., Ltd. (九陽股份有限公司), a companyincorporated in the PRC on July 8, 2002, whose A shareshave been listed on the Shenzhen Stock Exchange sinceApril 28, 2008 under the stock code 002242, and asubsidiary of the Company directly held as to 50.11% byShanghai Lihong and 16.93% by Bilting as of the LatestPracticable Date
“Joyoung Household Appliances” Hangzhou Joyoung Household Electric Appliances Limited(杭州九陽小家電有限公司), a company incorporated in thePRC on September 5, 2007 with limited liability, and oneof our subsidiaries
“Joyoung Life Electric” Hangzhou Joyoung Life Electric Co., Ltd. (杭州九陽生活電器有限公司), a company incorporated in the PRC onNovember 24, 2010 with limited liability, and one of oursubsidiaries
“JS Holding” JS Holding Limited Partnership, an exempted limitedpartnership registered under the laws of Cayman Islands onJuly 18, 2018 (formerly known as Hezhou LimitedPartnership from July 18, 2018 to September 2, 2019), withHezhou being its general partner and Tong Zhou being itslimited partner, and one of our Controlling Shareholders
“JY-SN” JY-SN Company Limited, a company incorporated in theBVI on April 16, 2018 and a wholly-owned subsidiary ofthe Company
“Latest Practicable Date” October 13, 2019 being the latest practicable date for thepurpose of ascertaining certain information in thisprospectus prior to its publication
“Listing” the listing of our Shares on the Main Board of the StockExchange
“Listing Committee” the Listing Committee of the Stock Exchange
26

DEFINITIONS
“Listing Date” the date, expected to be on or about October 31, 2019, onwhich our Shares are listed and from which dealingstherein are permitted to take place on the Stock Exchange
“Listing Rules” The Rules Governing the Listing of Securities on the StockExchange, as amended from time to time
“Lock-up Period” a period commencing on the Listing Date and ending onthe six months after the Listing Date
“Main Board” the stock exchange (excluding the option market) operatedby the Stock Exchange which is independent from andoperated in parallel with the Growth Enterprise Market ofthe Stock Exchange
“Memorandum of Association” or“Memorandum”
the memorandum of association of our Company adoptedon October 9, 2019 and effective on the Listing Date and asamended from time to time
“MOFCOM” Ministry of Commerce of the PRC (中華人民共和國商務部)
“MB Investor” BMS Ventures LLC, a company incorporated under thelaws of Delaware on April 8, 2019 which is wholly ownedby Mr. Mark Adam Barrocas, the Global President of ourCompany
“MB Trust Investor” Barrocas Family 2017 Children’s Trust, a trust establishedunder the laws of the Commonwealth of Massachusettsdated May 11, 2017 for the benefits of spouse anddescendants of Mr. Mark Adam Barrocas
“MR Investor” Casa Brima LLC, a company incorporated under the lawsof Delaware on April 8, 2019 which is wholly owned byMr. Mark Rosenzweig, a director of Compass
“MR Trust Investor” The SMCSB 2018 Trust, a trust established under the lawsof Delaware dated January 3, 2018 for the benefits ofchildren of Mr. Mark Rosenzweig
“NDRC” National Development and Reform Commission of thePRC (中華人民共和國國家發展和改革委員會)
“North America” the United States and Canada for the purpose of thisprospectus
“Offer Price” the final price per Offer Share (exclusive of brokerage, SFCtransaction levy and Stock Exchange trading fee),expressed in Hong Kong dollars, at which Offer Shares areto be subscribed for and offered pursuant to the GlobalOffering, to be determined as described in “Structure of theGlobal Offering—Pricing and Allocation”
27

DEFINITIONS
“Offer Share(s)” the Hong Kong Offer Shares and the International OfferShares together with, where relevant, any additional Shareswhich may be issued by us pursuant to the exercise of theOver-allotment Option
“Over-Allotment Option” the option granted by our Company to the InternationalUnderwriters, exercisable by the Joint Global Coordinators(on behalf of the International Underwriters) pursuant tothe International Underwriting Agreement, to require ourCompany to allot and issue up to an aggregate of74,974,500 additional Shares at the Offer Price,representing approximately 15.0% of the initial size of theGlobal Offering, to cover, among other things, overallocations in the International Offering as described in“Structure of the Global Offering”
“PRC Company Law” the Company Law of the PRC (中華人民共和國公司法), asenacted by the Standing Committee of the Eighth NationalPeople’s Congress on December 29, 1993 and effective onJuly 1, 1994, and subsequently amended on December 25,1999, August 28, 2004, October 27, 2005, December 28,2013 and October 26, 2018
“PR2 LLC” a company incorporated under the laws of Delaware whichis wholly owned by Mr. Neil Shah, an Independent ThirdParty
“PRC Legal Advisor(s)” Grandall Law Firm (Shanghai), the PRC legal advisor toour Company
“Price Determination Agreement” an agreement between our Company and the Joint GlobalCoordinators (on behalf of the Underwriters) to fix theOffer Price
“Price Determination Date” the date, expected to be on or around Friday, October 25,2019 and, in any event, not later than Monday, October 28,2019 on which the Offer Price is to be fixed by agreementbetween our Company and the Joint Global Coordinators(on behalf of the Underwriters) to determine the Offer Price
“QFIIs” qualified foreign institutional investors licensed by theCSRC to invest in RMB-denominated shares listed onChina’s domestic securities exchanges
“QIB” a qualified institutional buyer within the meaning of Rule144A
“Regulation S” Regulation S under the U.S. Securities Act
28
DEFINITIONS
“Reorganization” the corporate reorganization of our Group conducted inpreparation for the Listing. See “History, Reorganizationand Corporate Structure—Reorganization”
“RMB” or “Renminbi” Renminbi, the lawful currency for the time being of thePRC
“RSU Holding Entities” the two Shareholders holding the Shares to be issued priorto the completion of the Global Offering pursuant to theRSU Plan on trust, which are wholly-owned by the trusteeof the RSU Plan, namely Golden Tide InternationalLimited and Grand Riches Ventures Limited, a limitedliability company incorporated under the laws of the BritishVirgin Islands on May 22, 2019 and August 20, 2019,respectively
“RSU Plan” the plan adopted by our Company on October 9, 2019, asamended or otherwise modified from time to time, to grantrestricted stock units to the incentive targets, which shallsurvive after Listing. See “Appendix IV—Statutory andGeneral Information—D. RSU Plan”
“RSU Shares” the 141,618,409 Shares to be issued pursuant to the RSUPlan prior to the completion of the Global Offering
“Rule 144A” Rule 144A under the U.S. Securities Act
“SAFE” State Administration of Foreign Exchange of the PRC (中華人民共和國國家外匯管理局), the China governmentalagency responsible for matters relating to foreign exchangeadministration, including local branches, when applicable
“SAMR” or “State Administration forMarket Regulation”
State Administration for Market Regulation (國家市場監督管理總局), established in 2018 by consolidating the dutiesand functions of various departments of the State Council,including but not limited to the State Administration forIndustry and Commerce of the PRC (中華人民共和國國家工商行政管理總局) and the General Administration of QualitySupervision, Inspection and Quarantine of the PRC (中華人民共和國國家質量監督檢驗檢疫總局)
“SAT” State Administration of Taxation of the PRC (中華人民共和國國家稅務總局)
“SFC” or “Securities and FuturesCommission”
the Securities and Futures Commission of Hong Kong
“SFO” or “Securities and FuturesOrdinance”
the Securities and Futures Ordinance (Chapter 571 of theLaws of Hong Kong), as amended and supplemented fromtime to time
29

DEFINITIONS
“Shandong Joyoung” Shandong Joyoung Small Appliance Limited (山東九陽小家電有限公司), a company incorporated in the PRC on July 8,2002 with limited liability, and the predecessor of Joyoung
“Shanghai Lihong” Shanghai Lihong Enterprise Management Limited (上海力鴻企業管理有限公司), a company incorporated in the PRCon February 14, 2003, and a subsidiary of the Company
“Share(s)” ordinary share(s) of US$0.00001 each in the share capitalof our Company
“Shareholder(s)” holder(s) of the Share(s)
“Shenzhen SharkNinja” Shenzhen SharkNinja Technology Co., Ltd (深圳尚科寧家科技有限公司), a wholly-owned subsidiary of our Groupincorporated under the laws of the PRC, and a party to oneof our non-exempt continuing connected transactions, thedetails of which are set out in the section headed“Connected Transactions”
“SN Investors” A Group of investors comprising MB Investor, MRInvestor, MB Trust Investor, MR Trust Investor, PR2 LLC,and SN Aggregator LLC
“Sol SPC” Sol Omnibus SPC, a segregated portfolio companyincorporated under the laws of Cayman Islands onMarch 14, 2019 which is owned by STL as to 100% of itsmanagement shares with voting power, and owned by Mr.Lee Puay Khng and STL as to its 368,304.24536 class Aparticipating shares and one class B participating share,respectively, and one of our Controlling Shareholders
“Stabilizing Manager” Credit Suisse (Hong Kong) Limited
“State Council” State Council of the PRC (中華人民共和國國務院)
“STL” Sol Target Limited, a company incorporated under the lawsof British Virgin Islands on March 26, 2019, and whollyowned by XNL, and one of our Controlling Shareholders
“Stock Borrowing Agreement” the agreement expected to be entered into on or about thePrice Determination Date between JS Holding as lenderand Credit Suisse (Hong Kong) Limited as borrower,pursuant to which JS Holding shall, upon request, makeavailable to Credit Suisse (Hong Kong) Limited up to74,974,500 Shares to cover, inter alia, over-allocation in theInternational Offering
30
DEFINITIONS
“Stock Exchange” or “Hong Kong StockExchange ”
The Stock Exchange of Hong Kong Limited
“subsidiary(ies)” has the meaning ascribed to it under the Listing Rules
“substantial Shareholder(s)” has the meaning ascribed to it under the Listing Rules
“Sunshine Rise” Sunshine Rise Company Limited, a company incorporatedin Hong Kong on April 26, 2018, and a subsidiary of theCompany
“Takeovers Code” the Hong Kong Code on Takeovers and Mergers, asamended and supplemented from time to time
“Tong Zhou” Tong Zhou Company Limited, a company incorporatedunder the laws of BVI on June 28, 2018 and being thesurviving company of the merger with Gong Ji on May 2,2019, beneficially wholly owned by our ControllingShareholders Group, and one of our ControllingShareholders
“Track Record Period” the three years ended December 31, 2018 and the sixmonths ended June 30, 2019
“Tuo Ge” Tuo Ge Company Limited, a company incorporated underthe laws of BVI on April 16, 2018 and wholly owned byMs. Yang Ningning, and one of our ControllingShareholders
“U.S.,” “US” or “United States” the United States of America, its territories, its possessionsand all areas subject to its jurisdiction
“U.S. Securities Act” the U.S. Securities Act of 1933, as amended from time totime, and the rules and regulations promulgated thereunder
“Underwriters” the Hong Kong Underwriters and the InternationalUnderwriters
“Underwriting Agreements” the Hong Kong Underwriting Agreement and theInternational Underwriting Agreement
“US dollar(s)” or “US$” or “USD” United States dollars, the lawful currency for the time beingof the United States
“USTR” Office of the U.S. Trade Representative
“WHITE Application Form(s)” the application form(s) for use by the public who require(s)such Hong Kong Offer Shares to be issued in theapplicant’s own name
31
DEFINITIONS
“Xiang Hong” Xiang Hong Company Limited, a company incorporatedunder the laws of BVI on July 4, 2017, and a wholly-ownedsubsidiary of the Company after the Reorganization
“Xi Yu” Xi Yu Company Limited, a company incorporated underthe laws of BVI on April 16, 2018 and wholly owned byMs. Han Run, and one of our Controlling Shareholders
“XNL” Xuning Company Limited, a company incorporated underthe laws of BVI on April 16, 2018 and wholly owned byMr. Wang Xuning, and one of our Controlling Shareholders
“YELLOW Application Form(s)” the application form(s) for use by the public who require(s)such Hong Kong Offer Shares to be deposited directly intoCCASS
“Yuan Jiu” Yuan Jiu Company Limited, a company incorporated underthe laws of BVI on April 16, 2018 and wholly owned byMs. Huang Shuling, and one of our ControllingShareholders
“%” per cent
Certain amounts and percentage figures included in this prospectus have been subject torounding adjustments. Accordingly, figures shown as totals in certain tables may not be an arithmeticaggregation of the figures preceding them.
If there is any inconsistency between the Chinese names of entities or enterprises established inthe PRC, PRC laws or regulations, and the PRC governmental authorities and their Englishtranslations, the Chinese names shall prevail.
Unless otherwise specified, all relevant information in this prospectus assumes no exercise ofthe Over-allotment Option.
32
GLOSSARY OF TECHNICAL TERMS
This glossary contains definitions of certain terms used in this prospectus in connectionwith our Company and our business. Some of these may not correspond to standard industrydefinitions.
“CCC” the China Compulsory Certification (中國強制性產品認證),a certification required for the sale of products on the list ofCatalog of Products subject to the China CompulsoryCertification (中國強制性認證產品目錄)
“CE” CE mark, a mandatory marking on certain products whichis required if they are placed on the market in the EuropeanEconomic Area (EEA), to indicate conformity with theessential health and safety requirements set out in allapplicable Directives issued by the European Union. Byaffixing the CE mark, a manufacturer, or its representative,or the importer assures that a product meets all the essentialrequirements of all applicable Directives issued by theEuropean Union
“C-TICK” the C-Tick mark, a marking for products that comply withElectromagnetic compatibility (EMC) standards.Compliance with the Australian EMC regulations ismandatory and EMC standards apply to almost allelectronic products supplied to the Australian market. TheC-Tick mark indicates that the product complies with theapplicable EMC standard and establishes a traceable linkbetween a product and the supplier responsible for placingit on the Australian market
“Double Eleven” the annual online shopping promotion event in China onNovember 11
“IEC” International Electrotechnical Commission which isrecognized by the World Trade Organization and entrustedby it for monitoring the national and regional organizationsagreeing to use the IEC’s international standards andconformity assessment for all electrical, electronic andrelated technologies
“international markets” we define our international markets as markets outsideChina and the United States
“IH” induction heating, the process of heating an electricallyconducting object by electromagnetic induction, throughheat generated in the object by eddy currents
“IoT” internet-of-things, the network of physical devices withinformation-sensing capabilities such as two-dimensional
33
GLOSSARY OF TECHNICAL TERMS
code reading, radio frequency identification (RFID),infrared sensors, global positioning systems and laserscanners to realize intelligent identification, positioning,tracking, monitoring and management
“IP” intellectual property
“ISO9001” an internationally recognized standard for a qualitymanagement system. It aims at the effectiveness of thequality management system in meeting consumerrequirements. It prescribes requirements for ongoingimprovement of quality assurance in design, development,production, installation and servicing
“KOL” key opinion leader, a person or organization who has expertproduct knowledge and influence in a particular field, whois trusted by relevant interest groups and has significanteffects on consumer behavior
“KTL” the Korea Testing Laboratory, a leading testing andcertification body in Korea established for the purpose ofimproving technology and global competitiveness ofindustries
“New Product” reference to the New Product in 2018 refers to the SKUs(stock keeping unit) newly introduced in 2018. We useSKU, a unique code for each product, to identify and trackinventories
“QB/T 4404-2012” Light Industry Standard of the PRC (中國輕工行業標準)issued by Ministry of Industry and Information Technologyof the PRC (中華人民共和國工業和信息化部)in relationto cooking range
“S-Mark” a voluntary certification which certifies that the productsfulfill valid European electrical safety requirementsconcerning fire, electric shock, mechanical injuries,radiation injuries and burns and certain types ofenvironmental damage
34
FORWARD-LOOKING STATEMENTS
This prospectus includes forward-looking statements. All statements other than statements ofhistorical facts contained in this prospectus, including, without limitation, those regarding our futurefinancial position, our strategy, plans, objectives, goals, targets and future developments in the marketswhere we participate or are seeking to participate, and any statements preceded by, followed by or thatinclude the words “believe,” “expect,” “estimate,” “predict,” “aim,” “intend,” “will,” “may,” “plan,”“consider,” “anticipate,” “seek,” “should,” “could,” “would,” “continue” or similar expressions or thenegative thereof, are forward-looking statements. These forward-looking statements involve knownand unknown risks, uncertainties and other factors, some of which are beyond our control, which maycause our actual results, performance or achievements, or industry results, to be materially differentfrom any future results, performance or achievements expressed or implied by the forward-lookingstatements. These forward-looking statements are based on numerous assumptions regarding ourpresent and future business strategies and the environment in which we will operate in the future.Important factors that could cause our actual performance or achievements to differ materially fromthose in the forward-looking statements include, among others, the following:
Š our business operations and prospects;
Š changes to the legal regulatory and operating conditions in the industry and markets inwhich we operate;
Š future developments, trends and conditions in the industry and markets in which weoperate;
Š our strategies, plans, objectives and goals and our ability to implement such strategies,plans, objectives and goals;
Š general economic conditions;
Š our capital expenditure programs and future capital requirements;
Š our ability to control costs;
Š our dividend policy;
Š the amount and nature of, and potential for, future development of our business;
Š capital market developments;
Š the actions and developments of our competitors; and
Š changes or volatility in interest rates, foreign exchange rates, equity prices or other rates orprices, including those pertaining to the PRC, the United States and Hong Kong and theindustry and markets in which we operate.
Additional factors that could cause actual performance or achievements to differ materiallyinclude, but are not limited to, those discussed under “Risk Factors” and elsewhere in this prospectus.We caution you not to place undue reliance on these forward-looking statements, which reflect ourmanagement’s view only as of the date of this prospectus. We undertake no obligation to update orrevise any forward-looking statements, whether as a result of new information, future events orotherwise. In light of these risks, uncertainties and assumptions, the forward-looking events discussedin this prospectus might not occur. All forward-looking statements contained in this prospectus arequalified by reference to the cautionary statements set out in this section.
35

RISK FACTORS
You should carefully consider all of the information in this prospectus, including thefollowing risk factors before making any investment decision in relation to the Offer Shares. Ourbusiness, financial condition or results of operations could be materially and adversely affected byany of these risks. The market price of the Offer Shares could fall significantly due to any of theserisks, and you may lose all or part of your investment.
We believe that there are certain risks involved in our operations, many of which are beyondour control. We have categorized these risks and uncertainties into: (i) risks relating to our businessand industry; (ii) risks relating to the countries in which we operate; and (iii) risks relating to theGlobal Offering. Additional risks and uncertainties that are presently not known to us or not expressedor implied below or that we currently deem immaterial could also harm our business, financialcondition and operating results. You should consider our business and prospects in light of thechallenges we face, including the ones discussed in this section.
RISKS RELATING TO OUR BUSINESS AND INDUSTRY
Global markets for our products are highly competitive and subject to rapid technologicalchanges, and we may be unable to compete effectively in relevant markets.
Our products compete in highly competitive global markets characterized by intense pricecompetition, frequent introduction of new products, short product life cycles, rapid adoption oftechnological and product advancements by competitors, price sensitivity and the individualpreferences of consumers.
Our ability to compete successfully depends heavily on our ability to continue to introduceinnovative new or enhanced products and technologies in a timely manner and shape the market. Ourcapability to introduce new or enhanced products and technologies in turn depends on a number offactors, including our timely and successful research and development efforts. The research anddevelopment efforts involve various risks and may not yield the benefits to the extent we expect, or atall.
We face substantial competition from companies that have significant technical, marketing,distribution and other resources, as well as established supplier relationships. Additionally, ourcompetitors may compete with us using lower selling prices or in collaboration with other alliances tooffer solutions that are more competitive. Some of our competitors have greater experience, brandrecognition, product breadth and distribution channels than us. Our competition is increasing as thetechnology and markets mature. Current competitors and new entrants may seek to develop newproduct offerings, technologies or capabilities that could render many of the products that we offerobsolete or less competitive. In addition, our competitors may in some cases be effective in causing ourcurrent and potential retailers to favor their products or prevent or reduce sales of ours. The occurrenceof any of these circumstances may hinder our growth and our ability to compete and reduce our marketshare. On the other hand, the markets of certain of our products are relatively saturated. We may notgrow as fast as we used to, or we expected to, which could materially and adversely affect ourbusiness, results of operations, financial condition and prospects.
36
RISK FACTORS
If we fail to successfully manage frequent product introductions and transitions, we may notremain competitive or be able to stimulate customer demand.
Due to the highly competitive nature of the industries in which we compete, we mustcontinually introduce new products and technologies, improve existing products, effectively stimulatecustomer demand for new and upgraded products, and successfully manage the transition to these newand upgraded products. The success of new product introductions depends on a number of factorsincluding, but not limited to, timely and successful product development, market acceptance, ourability to manage the risks associated with new product production ramp-up issues, the availability ofsoftware and technology for new products, the effective management of purchase commitments andinventory levels in line with anticipated product demand, the availability of products in appropriatequantities and at expected costs to meet anticipated demand, and the risk that new products may havequality or other defects or deficiencies in the early stages of introduction. Accordingly, we cannotdetermine in advance the ultimate effect of new product introductions and transitions. In addition, rapidtechnological development and advancements may render our products with the commonfunctionalities that are generally available to consumers today outdated or obsolete, and emergingproducts may be substituted for them. In such event, we cannot assure you that we will be able todevelop, introduce and commercialize new forms of products and technologies to the market in atimely manner, or at all, that would allow us to maintain or strengthen our leadership position in ourindustry. Failure to do so, or failure to generally stay abreast of the latest technological evolutions,could materially and adversely impact our business operations, prospects and financial performance. Ifwe are unable to continue to develop and offer innovative new products, or if we are slower than ourcompetitors, or our competitors infringe our intellectual property, our ability to maintain a competitiveadvantage could be adversely affected.
We may from time to time launch new product categories, which may subject us to additionalrisks and challenges. Our lack of experience with new product categories and lack of relevant customerdata relating to these products may make it more difficult for us to anticipate customer demand andpreferences. We may misjudge customer demand, resulting in excessive inventories and possibleinventory write-down. It may also be more difficult for us to inspect and control quality and ensureproper handling, storage and delivery. We may experience higher return rates on new products, receivemore customer complaints about them and face costly product liability claims as a result of sellingthem, which would harm our brand and reputation as well as our financial performance. Furthermore,we may not have much purchasing power in new categories of products and we may not be able tonegotiate favorable terms with suppliers. We may need to price aggressively to gain market share orremain competitive in new categories. It may be difficult for us to achieve profitability in the newproduct categories and our profit margin, if any, may be lower than we anticipate, which wouldadversely affect our overall profitability and results of operations. We cannot assure you that we willbe able to recoup our investments in introducing these new product categories.
Any trade or import protection policies may materially and adversely affect our business.
During the Track Record Period, the majority of our sales were generated from China and theUnited States. We source our finished goods from OEM suppliers in China for our US sales, which aresubject to US customs duties. The increased tension and ongoing negotiations between China and theUnited States have added to the customs duties imposed so far and may adversely affect our business,financial condition and results of operations. For example, recently the United States has introduced anumber of additional customs duties at different rates on various goods imported from China, including
37
RISK FACTORS
those small household appliances imported by us from China to the US market. In 2018 and the sixmonths ended June 30, 2019, our customs duties expense arising out of the additional US customsduties amounted to US$7.0 million and US$10.1 million, respectively. The trade tension betweenChina and the United States remains and it is uncertain whether any further action will be taken. Forinformation on the additional US customs duties imposed on our products and the correspondingeffective period as well as other details of the impacts, see “Summary—US Customs Duties.”
We have mitigated and plan to continue mitigating the impacts arising from the increasedcustoms duties on our cost of sales by various measures. However, these mitigation measures mayinvolve additional costs, diversion of resources and management attention as well as external economicconditions, such as foreign exchange rates. For example, our success in renegotiating the purchaseprices favorable to us with our OEM suppliers have leveraged the general depreciation of the Renminbiagainst the US dollar. If the depreciation ceases or reduces, we may not be able to reduce our purchaseprices as we currently do.
In addition, even if we were able to fully or partially pass on the increased cost to ourcustomers by increasing the selling price of certain products, due to market competition or factorsbeyond our control, such as a general market slowdown, we may experience a reduction of sales ordersand our business, financial condition and results of operations may be materially and adverselyaffected.
Furthermore, we have been actively exploring alternative sourcing opportunities outside ofChina and expect to have some of our vacuums manufactured in Vietnam by the end of 2019. Whileexpanding our manufacturing resources outside of China, we may experience new risks and challengesand may incur additional costs and efforts to identify viable non-China suppliers that can manufactureour products at comparable prices and quality as our existing suppliers in China.
We have managed to maintain relatively stable gross profit margins relying on our variousmitigation measures. Our gross profit is affected by various factors; for example, if we fail toimplement our mitigation measures to the extent we anticipate, our financial performance may beadversely affected by the additional US customs duties.
In addition to China and the United States, we sell our products to a large number of othercountries and derive considerable sales from exporting to them. In the event that any of these countriesimpose trade sanctions on China and/or the United States, or enforce import restrictions or customsduties in relation to our products, our business and operations may be adversely affected. In the eventthat the Chinese government and/or the U.S. government impose customs duties, trade restrictions orother trade barriers affecting the importation of such finished products, components or raw materials,we may be unable to obtain a steady supply of the necessary finished products, components or rawmaterials at competitive prices, and our business and operations may be materially and adverselyaffected. In addition, major political issues such as the United Kingdom’s withdrawal from theEuropean Union may also add to turbulence in international trade which may in turn affect ourbusiness.
Our global operations are subject to various risks.
We primarily operate in China and the United States, but have been actively expanding ourinternational markets. We may have to adapt our business models to local markets due to various legal
38
RISK FACTORS
requirements and market conditions. Our international operations and expansion efforts have resulted,and may continue to result, in increased costs, and are subject to a variety of risks, including increasedcompetition, uncertain enforcement of our intellectual property rights, more complex distributionlogistics, and the complexity of compliance with foreign laws and regulations. Compliance withapplicable Chinese, US and foreign laws and regulations, such as import and export requirements, anti-corruption laws, tax laws, foreign exchange controls and cash repatriation restrictions, data privacyrequirements, environmental laws, labor laws, restrictions on foreign investment, and anti-competitionregulations, increases the costs and risk exposure of doing business in foreign jurisdictions.
We also could be significantly affected by other risks associated with international activitiesincluding, but not limited to, economic and labor conditions, increased duties, tariffs, taxes and othercosts and political instability. Margins on sales of our products in foreign countries, and on sales ofproducts that include components obtained from foreign suppliers, could be materially and adverselyaffected by international trade regulations, including duties, tariffs and antidumping penalties. We arealso exposed to credit risk on our trade receivables with customers. There can be no assurance that wecan effectively limit our credit risk and avoid losses.
Maintaining the trusted brand image of our products is critical to our success, and any failure todo so could severely damage our reputation and brand, which would have a material adverseeffect on our business, financial condition and results of operations.
Our products enjoy strong brand names and reputation globally, especially in China and theUnited States. Since our inception, we built our world-renowned brand names leveraging our corecompetencies. Any loss of trust in our products could harm the value of our brands, which couldmaterially reduce our revenue and profitability. Our ability to maintain our position as a trusted brandfor small household appliances depends on various factors, such as our continued offering of qualityand well-designed products to our customers, as well as increasing brand awareness through marketingand brand promotion activities.
Brand image is particularly important to us, as our products are used daily in the everyday livesof consumers. Any public perception that our products are defective or otherwise unsatisfactory, evenif factually incorrect or based on isolated incidents, could damage our reputation, diminish the value ofour brand, undermine the trust and credibility we have established and have a negative impact on ourability to attract new customers or retain our current customers. If we are unable to maintain ourreputation, enhance our brand recognition or increase positive awareness of our products, it may bedifficult to maintain and grow our customer base, and our business and growth prospects may bematerially and adversely affected.
If we are unable to manage our growth or execute our strategies effectively, our business andprospects may be materially and adversely affected.
Our business has grown and is expected to continue growing, so is our business network andnumber of employees. In addition, as we expand our product profile and geographic markets, we willneed to work with a larger number of suppliers and partners efficiently and maintain and expandmutually-beneficial relationships with our existing and new suppliers and partners. We also need tocontinuously enhance and upgrade our infrastructure and technology, improve control over ouroperational, financial and management aspects, strengthen our supplier and distributor management,refine our reporting systems and procedures, and expand, train and manage our growing employee
39

RISK FACTORS
base. All these efforts will require significant managerial, financial and human resources. We cannotassure you that we will be able to effectively manage our growth, that our current infrastructure,systems, procedures and controls or any new measures to enhance them will be adequate andsuccessful to support our expanding operations or that our strategies and new business initiatives willbe executed successfully. If we are not able to manage our growth or execute our strategies effectively,our expansion may not be successful and our business and prospects may be materially and adverselyaffected.
It may be difficult for investors to evaluate our business and our prospects due to the Group’slimited operating history in its current form.
We completed the acquisition of SharkNinja in September 2017 and have a limited history ofoperating on a consolidated basis. The audited financial information included in this prospectusincludes financial information for the Group in its current state only from the date of the acquisition ofSharkNinja on September 29, 2017 through June 30, 2019. In particular, the year-on-year analysis onour financial performance may not be presented on a directly comparable basis. As a result of thelimited track record of the Group in its current state, it may be difficult for you to evaluate ourconsolidated business, results of operations and prospects.
We recorded non-recurring other income and gains during the Track Record Period.
In 2016, 2017, 2018 and the six months ended June 30, 2019, we recorded other income andgains of US$41.1 million, US$22.9 million, US$44.5 million and US$12.3 million, respectively, aconsiderable portion of which may not reoccur, such as the disposal of land and properties. For abreakdown of our other income and gains during the Track Record Period, see “FinancialInformation—Description of Major Components of Consolidated Income Statement—Other Incomeand Gains” and note 6 to the Accountants’ Report in Appendix I to this prospectus. Certain non-recurring or non-operational items under other income and gains have been adjusted for under the non-IFRS measures to eliminate potential impacts that do not affect our ongoing core operationalperformance. You are advised to exercise caution when considering the effects of other income andgains on our financial performance as they may not reoccur.
We will record net tangible liabilities upon the completion of the Global Offering.
As of June 30, 2019, we had consolidated net tangible liabilities attributable to Shareholders ofour Company of US$1,252.8 million, and expect to continue to have consolidated net tangibleliabilities upon the completion of the Global Offering, which is primarily attributable to the financialliabilities associated with the Put Option and our substantial borrowings during the Track RecordPeriod. For risks related to our borrowings, see “—Our financing arrangements will subject us tovarious restrictions, any default or breach of which could result in the loss of our business interest.”Having consolidated net tangible liabilities does not necessarily restrict us from declaring and payingdividends to our Shareholders, provided that we have sufficient profits or share premium and are ableto pay our debts as they fall due in the ordinary course of business immediately following the date onwhich the dividend is paid. However, we may not declare dividends as often or for as much aspotential investors may expect, or at all.
40
RISK FACTORS
We face risks related to sales through distributors, as we do not exercise complete control overthe practice and manner of the ultimate retail sales by our distributors.
We have entered into agreements with our distributors to help market and sell our products. Wedo not, however, exercise complete control over the practice and manner of the ultimate retail sales byour distributors, their sub-distributors or the retail outlets which they operate. Engagement ofdistributors may effectively increase our product sales, but we would expect a corresponding lowergross margin, since such distributors typically buy products from us at a discount to end user prices.For us to effectively work with a distributor, the distributor must agree to market and/or sell ourproducts and we must provide proper economic incentives to the distributor, as well as contendeffectively for the time, energy and focus of such distributor given the other products the distributormay be carrying, which potentially includes those of our competitors. If we fail to be effective withnew or existing distributors, our financial performance may suffer. Poor management by, or loss offurther resell network of, the distributors may cause loss of our customers and damage to our brands.Our distributors may also face financial difficulties, including loss of market share, insolvency orstrikes or other work stoppages, which could harm our collection of accounts receivables and financialresults.
We rely principally on OEM suppliers and suppliers of components and raw materials for in-house production.
Our operation is highly dependent on our relationships with OEM suppliers and suppliers ofcomponents and raw materials for in-house production. During the Track Record Period, we primarilyrely on purchase of finished products from our OEM suppliers, and to a lesser extent, rely on purchaseof raw materials and components for in-house production. In 2016, 2017, 2018 and the six monthsended June 30, 2018 and 2019, our cost of finished products accounted for 83.2%, 89.6%, 90.4%,92.8% and 90.2%, while our raw materials and components accounted for 15.7%, 7.4%, 3.9%, 2.0%and 3.2%, of our total cost of sales for the same periods, respectively. In 2016, 2017, 2018 and the sixmonths ended June 30, 2019, purchases from our five largest suppliers accounted for 38.3%, 35.7%,40.5% and 37.7%, of our total purchase amounts during those periods, respectively.
We do not have direct control over our suppliers, and may thus experience operationaldifficulties due to their reductions in the availability of production capacity, failures to comply withproduct specifications, insufficient quality control, failures to meet production deadlines, increases incosts and longer lead time, and their liquidity or solvency. In addition, any loss or deterioration of ourrelationship with major suppliers, the sale of products by suppliers directly to our customers or ourcompetitors, our failure to renegotiate the purchase prices with our suppliers, or to establishrelationships with new suppliers would adversely affect our business, financial position and operatingresults.
Our new products may utilize customized components available from limited sources. When acomponent or product uses new technologies, initial capacity constraints may exist until the suppliers’yields have matured or manufacturing capacity has increased. Continued availability of thesecomponents or products at acceptable prices, or at all, may be affected for various reasons, including ifthose suppliers decide to concentrate on the production of common components and products insteadof components and products customized to meet our requirements.
In addition, for our US operation, we do not typically have formal contractual agreements withour OEM suppliers. We make substantially all of our purchases from OEM suppliers on a purchase
41
RISK FACTORS
order basis. Any significant change in our relationships with these OEM suppliers could have amaterial adverse effect on our business, operating results and financial condition.
We could be impacted by unfavorable results of legal and administrative proceedings.
We are subject to various legal, administrative proceedings and claims that have arisen in theordinary course of business, and new claims may arise in the future. In addition, agreements enteredinto by us sometimes include indemnification provisions which may subject us to costs and damages inthe event of a claim against an indemnified third party.
In particular, we have been, and may continue to be, subject to various intellectual propertyclaims relating to technologies or intellectual property used in our products, alleging that we haveinfringed, misappropriated or otherwise violated the intellectual property rights of others. Such claimsmay be initiated by a demand letter, a lawsuit or an injunction. Patent and trademark infringement,trade secret misappropriation and other intellectual property claims and proceedings brought againstus, whether successful or not, can be complex and time-consuming and could result in substantial costsand harm to our reputation. Moreover, the legal threshold for initiating such claims and proceedings islow, especially in the United States, therefore even claims with a low probability of success could beinitiated and require significant resources and attention to defend. Intellectual property litigation ordisputes could force us to do one or more of the following: (i) cease developing, manufacturing orselling products that incorporate the challenged intellectual property; (ii) obtain and pay for licensesfrom the holder of the infringed intellectual property right, which licenses may not be available onreasonable terms, or at all; (iii) redesign or reengineer products; and (iv) pay substantial damages, courtcosts and attorneys’ fees, including potentially increased damages for any infringement or violationfound to be willful.
In addition, we have also been, and may continue to be, subject to various claims of falseadvertising. We may not be able to, in a timely manner, identify and remove all content in disputeduring our marketing activities, and cannot assure you that such false advertising claims will not occur.
Regardless of the merit of particular claims, legal and administrative proceedings, such aslitigation, injunctions and governmental investigations, may be expensive, time-consuming ordisruptive to our operations and distracting to management. In recognition of these considerations, wemay from time to time enter into settlement arrangements to settle litigation and resolve such disputeswhich may be confidential and the details, including at times even the existence of the settlementagreement, not disclosed due to confidentiality obligations. No assurance can be given that sucharrangements can be obtained on acceptable terms or that litigation will not occur. These arrangementsmay also significantly increase our operating expenses.
The legal or administrative proceedings and claims in which we may be involved may subjectus to inherent uncertainties. If one or more legal or administrative matters are resolved against us or anindemnified third party for amounts or scope beyond the coverage of our insurance or availableindemnity, or if certain injunctions are granted to prevent us from using certain technologies in ourproducts, our business and financial condition could be materially and adversely affected. Further, suchan outcome could result in significant compensatory, punitive or treble monetary damages,disgorgement of revenue or profits, remedial corporate measures, injunctive relief or specificperformance against us that could materially and adversely affect our business, financial condition andoperating results. For further details regarding our legal proceedings, see “Business—Compliance andLegal Proceedings.”
42
RISK FACTORS
We may be subject to product liability claims for compensation from time to time. Any failure inour quality control systems could harm our business and lead to such claims if our products arefound to be defective.
We manufacture products mainly through our OEM suppliers and, to a lesser extent, at ourin-house production facilities. We are committed to maintaining the highest level of quality in ourproducts and we therefore implement quality control measures suiting different scenarios withprofessional team members. For details of our testing and other quality control measures, see“Business—Procurement and Production—Quality Control and Product Safety.” Despite our efforts,there could be instances in which our products do not meet the specifications and requirements agreedupon with or requested by our customers, or our products could be found to be defective, or result inour customers suffering losses. Defects may also occur in components and products we purchase fromthird parties or which are assembled by our OEM suppliers. There can be no assurance that we will beable to detect and fix all defects in the products and components we offer. Failure to do so could resultin disputes and related legal proceedings, and may adversely affect our results of operations or harmour reputation.
If a consumer, user or bystander gets injured by a product that is defective or unreasonablydangerous, the manufacturer or anyone else in the supply chain can be held responsible for that injury.As a result, we have been, and will continue to be, subject to various personal injury, product liabilityand property damage claims and disputes arising out of our products. Although we may have legalrecourse against the parts and component suppliers and OEM suppliers of such products, attempting toenforce our rights against the suppliers and manufacturers may be expensive, time-consuming andultimately futile. We maintain insurance that provides coverage for personal injury, product liability,and property damage claims. However, such insurance coverage might be insufficient to fully cover alldamages sought and the claim process might be prolonged. See “Business—Insurance.” As a result,any material product liability claim or litigation could have a material and adverse effect on ourbusiness, financial condition and results of operations. Even unsuccessful claims could result in theexpenditure of funds and managerial efforts in defending them, and could have a negative impact onour brand and reputation.
We, especially our operations under SharkNinja, have been, and may continue to be, subject toproduct liability claims from time to time, which may come in the form of class actions. During theTrack Record Period, SharkNinja was subject to certain product liability claims which it generallysettled. After the acquisition of SharkNinja and up to the Latest Practicable Date, SharkNinja settled 32product liability claims. The aggregate settlement amount paid for SharkNinja’s product liabilityclaims amounted to US$1.7 million, among which US$1.1 million was paid by SharkNinja and US$0.6million was paid by SharkNinja’s insurers. We do not consider these product liability claims,individually or in the aggregate, material to our business or financial results.
43
RISK FACTORS
Our financing arrangements will subject us to various restrictions, any default or breach ofwhich could result in the loss of our business interest.
As of August 31, 2019, we had outstanding bank borrowings of US$851.3 million, primarilyrelated to the financing for our acquisition of SharkNinja and the Reorganization. We may continue tohave material indebtedness. Our indebtedness could have important consequences for our business andoperations including, but not limited to:
Š limiting or impairing our ability to obtain financing, refinance any of our indebtedness,obtain equity or debt financing on commercially reasonable terms or at all, which couldcause us to default on our obligations and materially impair our liquidity;
Š restricting or impeding our ability to access capital markets at attractive rates andincreasing the cost of future borrowings;
Š reducing our flexibility to respond to changing business and economic conditions or totake advantage of business opportunities that may arise;
Š requiring us to dedicate a substantial portion of our cash flow from operations to paymentsof principal and interest on our indebtedness, thereby reducing the availability of our cashflow for other purposes;
Š placing us at a competitive disadvantage compared to our competitors that have lowerleverage or better access to capital resources;
Š limiting our ability to dispose of assets that secure our indebtedness or utilize the proceedsof such dispositions and, upon an event of default under any such secured indebtedness,allowing the lenders thereunder to foreclose upon our assets pledged as collateral; and
Š increasing our vulnerability to downturns in general economic, or industry conditions, orin our business.
Furthermore, the terms of our indebtedness contain affirmative and negative covenants that,among other things, limit or restrict our abilities to declare or pay dividends, conduct acquisitions,create liens and encumbrances, incur additional debt, merge, dissolve, liquidate or consolidate, disposeof or transfer assets. In addition, we are required to comply with various financial covenants. Monetaryawards in litigations against us exceeding certain limit and not being indemnified or covered byinsurance may trigger event of default in our financing documents.
Should market conditions deteriorate, or if our operating results were to be depressed, we mayneed to request amendments or waivers to the covenants and restrictions under our debt agreements.There can be no assurance that we will be able to obtain such relief should it be needed. A breach ofany of these covenants or restrictions could result in a default that would permit our lenders to declareall amounts outstanding thereunder to be due and payable, together with accrued and unpaid interest,trigger cross-default provisions under other debt agreements and, as applicable, cause the terminationof commitments of relevant lenders to make further extensions of credit under our financingagreements or credit facilities. Our future ability to comply with financial covenants and otherconditions, make scheduled payments of principal and interest or refinance existing borrowingsdepends on our business performance, which is subject to economic, financial, competitive and otherfactors, including the other risks described in this prospectus. Any failure to comply with the covenantsof our financing agreements or to obtain financing for our business could have a material adverse effecton our business, financial condition, results of operations and prospects.
44
RISK FACTORS
The equity interests of our certain major operating entities are pledged under the loanarrangements for the benefit of the lenders. If these loan arrangements were in default or breached, theaffected lenders would be entitled, among other remedies, to seize the corresponding pledged shares tocover any shortfalls in amounts due under the loans. We may thus lose control of our revenuegenerating assets and consolidated subsidiaries. Our ability to conduct our business, as well as ourfinancial condition and results of operations, may be materially and adversely affected.
Our strategy of making acquisitions may result in material and adverse impact to our financialcondition and results of operations.
We may from time to time acquire suitable targets to expand our product profiles andgeographic markets. Such endeavors may involve significant risks and uncertainties, includingdistraction of management from current operations, inability to identify suitable acquisition targets orcomplete acquisitions at commercially acceptable terms or prices, greater than expected liabilities andexpenses, and unidentified issues not discovered in our due diligence. In addition, upon completion ofan acquisition, we may allocate significant resources to the integration of the new business into ourexisting business to realize synergetic benefits. The integration process involves certain risks anduncertainties, some of which are outside our control. There is no assurance that we will be able torealize the benefits, synergies, cost savings or efficiencies to the extent we anticipate, or at all.
We rely substantially on our distributors and retailers.
We have established comprehensive, intelligent and integrated distribution networks all overthe world. In many cases, we sell our products to our distributors or retailers who then in turn sell ourproducts, directly or indirectly, to our end customers. As of June 30, 2019, there was 487 distributorsand retailers for Joyoung segment and 141 distributors and retailers for SharkNinja segment. There canbe no assurance that we will be able to maintain our existing relationships with distributors or retailers,or secure alternative distributors or retailers at terms acceptable to us. In addition, as we seek to expandour product profile and geographic markets, there can be no assurance that we will be successful inestablishing relationships with new distributors or retailers on favorable terms or at all.
Furthermore, there can be no assurance that we will be successful in managing our distributorsand detecting their non-compliance with the provisions of our distribution agreements.Non-compliance by our distributors could, among other things, negatively affect our brand, demand forour products and our relationships with other distributors. Any of these could have a material andadverse effect on our business, financial condition, results of operations and prospects.
We rely on a small number of major customers that accounted for a significant portion of ourrevenue for our US operations.
Our SharkNinja segment contracts with a number of large retailers that have considerablebargaining power, which may require us to agree to terms and conditions that may have an adverseeffect on our business or financial performance. In 2018 and the six months ended June 30, 2019, ourfive largest customers and four largest customers, respectively, were customers within SharkNinjasegment and sales to these largest customers accounted for 26.2% and 23.5%, respectively, of our totalsales in the same periods. Our largest customer in 2018 and the six months ended June 30, 2019accounted for 8.3% and 9.9%, respectively, of our total sales in the same periods. There is noassurance that our business relationship with our existing major customers will be maintained upon
45

RISK FACTORS
expiry of our existing distribution agreements with these customers as they are not obliged to enter intonew agreements with us. If they choose not to do so or if they significantly reduce the amount ofpurchases from us, we may not be able to find other customers to recoup the loss of revenue. As aresult, our business operations, financial results and profitability may be adversely affected.
Any deterioration of our relationship with our channel partners could have a material adverseeffect on our business and results of operations.
We sell a large portion of our products online either via our own direct online retail channels orthrough a global online distribution network comprising of third-party online distribution partners. InChina and the United States, we cooperate with major e-commerce players such as JD.com,Suning.com, Amazon.com and Walmart.com and distribute our products. In China, we also workclosely with Tmall, an e-commerce platform, for our flagship store and distribution. These third-partye-commerce players are important distribution channels for our products.
Our current agreements with partners and other third parties generally do not prohibit themfrom working with our competitors or from selling competing products. Our competitors may be moreeffective in providing incentives to our third-party online distribution partners to favor ourcompetitors’ products and promote their sales. In addition, if our third-party online distributionpartners are not successful in selling our products due to various reasons, including lower demand,market competition and decreasing efficiency of distribution network, our revenue may decrease.Pursuing, establishing and maintaining relationships with our third-party online distribution partnersrequire significant time and resources. There is no assurance that we will be able to renew thoseframework agreements upon its expiry or on acceptable terms. If for any reason, our relationship withour third-party online distribution partners deteriorates, our business and results of operations may bematerially and adversely affected.
In addition, television broadcasting sales are a key component to our US operation. It is subjectto a number of industry, regulatory and governmental rules and regulations on advertising in the UnitedStates. Compliance with these rules and regulations can be costly, and we may be subject tocompetitive advertising claims.
Our success depends on our distribution and logistics networks.
We engage third-party logistics service providers to provide warehousing and distributionservices. Disputes with or a termination in our contractual relationships with one or more of ourlogistics service providers or courier companies could result in delayed delivery of products, increasedcosts or customer dissatisfaction. There can be no assurance that we can continue or extendrelationships with our current logistics service providers or courier companies on terms acceptable tous, or that we will be able to establish relationships with new logistics service providers or couriercompanies to ensure accurate, timely and cost-efficient delivery services. If we are unable to maintainor develop good relationships with logistics service providers or courier companies, it may inhibit ourability to offer products in sufficient quantities, on a timely basis, or at prices acceptable to ourend-customers. Freight rates may fluctuate according to our agreements with logistics service providersor courier companies. We cannot guarantee that no interruptions would occur which could materiallyand adversely affect our business, prospects or results of operations.
In addition, as we do not have any direct control over these logistics service providers orcourier companies, we cannot guarantee their quality of services. Also, services provided by these
46
RISK FACTORS
logistics service providers and courier companies could be interrupted by unforeseen events beyondour control such as poor handling provided by these logistics service providers and courier companies,natural disasters, pandemics, adverse weather conditions, riots, labor strikes and mishandling ofproducts. If there is any delay in delivery, damage to products or any other issue, we may loseend-customers and sales and our brand image may be tarnished.
We may not be able to prevent others from unauthorized use of our intellectual property, whichcould harm our business and competitive position.
Innovation is in our genes and has fueled our success. We regard our trademarks, copyrights,patents, domain names, know-how, proprietary technologies and similar intellectual property as criticalto our success, and we rely on a combination of intellectual property laws and contractualarrangements, including confidentiality, invention assignment and non-compete agreements with ouremployees and others, to protect our proprietary rights. We may become an attractive target tocounterfeiting and intellectual property theft activity because of our brand recognition. Despite thesemeasures, any of our intellectual property rights could be challenged, invalidated, circumvented ormisappropriated, or such intellectual property may not be sufficient to provide us with competitiveadvantages. In addition, there can be no assurance that our patent applications will be approved, thatany issued patents will adequately protect our intellectual property, or that such patents will not bechallenged by third parties or found by a judicial authority to be invalid or unenforceable. Further,because of the rapid pace of technological change in our industry, parts of our business rely ontechnologies developed or licensed by third parties, and we may not be able to obtain or continue toobtain licenses and technologies from these third parties at all or on reasonable terms.
It is often difficult to register, maintain and enforce intellectual property rights in China.Statutory laws and regulations are subject to judicial interpretation and enforcement and may not beapplied consistently due to the lack of clear guidance on statutory interpretation. Confidentiality,invention assignment and non-compete agreements may be breached by counterparties, and there maynot be adequate remedies available to us for any such breach. Accordingly, we may not be able toeffectively protect our intellectual property rights or to enforce our contractual rights in China.
Policing any unauthorized use of our intellectual property is difficult and costly and the stepswe take may be inadequate to prevent the infringement or misappropriation of our intellectual property.In the event that we resort to litigation to enforce our intellectual property rights, such litigation couldresult in substantial costs and a diversion of our managerial and financial resources, and could put ourintellectual property at risk of being invalidated or narrowed in scope. There is no assurance that wewill prevail in such litigation, and even if we do prevail, we may not obtain a meaningful recovery. Inaddition, our trade secrets may be leaked or otherwise become available to, or be independentlydiscovered by, our competitors. Any failure in maintaining, protecting or enforcing our intellectualproperty rights could have a material adverse effect on our business, financial condition and results ofoperations.
In addition, we may not have sufficient intellectual property rights in all countries and regionswhere unauthorized third-party copying or use of our proprietary technology may occur and the scopeof our intellectual property might be more limited in certain countries and regions. Our existing andfuture patents may not be sufficient to protect our products, technologies or designs and/or may notprevent others from developing competing products, technologies or designs. We cannot predict thevalidity and enforceability of our patents and other intellectual property with certainty.
47
RISK FACTORS
Our reputation and profitability may be adversely affected if our products are counterfeited orimitated in the market.
Our products may be counterfeited in the market, such as unauthorized imitation, replication ofour design, infringement of trademarks, or labeling by third parties, which may affect our reputationand profitability. We are not aware of any substantial counterfeiting and imitation of our productsduring the Track Record Period. We will closely monitor to see whether there will be any unauthorizeduse of our design and trademarks, counterfeiting or imitation of our products. We cannot assure youthat counterfeiting and imitation would not occur, or if it does occur, that we would be able to detectand address the problem effectively. A significant presence of counterfeit products in the market couldhave a negative impact on the value and image of our brand, lead to loss of consumer confidence in ourbrand and materially and adversely affect our business, results of operations and financial condition.
Our liquidity and financial condition may be materially and adversely affected if we fail to collecttrade receivables from our distributors and retailers in a timely manner, or at all.
Our operation generally allows a credit term that typically ranges from 30 to 60 days for ourdistributors and retailers. With the increased usage of bills to settlement the payments by ourdistributors and retailers, our average turnover of bills and trade receivables may be longer than 60days. We cannot assure you that our distributors and retailers will consistently make timely and fullpayments to us. If we fail to collect all or part of such payments in a timely manner, or at all, or if ourmajor distributors or retailers extend their bill and trade receivables turnover days, our liquidity andfinancial condition may be materially and adversely affected.
Our operating results could be materially harmed if we are unable to accurately forecast marketdemand for our products or manage our inventory.
Our inventory includes finished products and a small amount of components and raw materials.As of December 31, 2016, 2017, 2018 and June 30, 2019, we recorded inventories of US$59.5 million,US$272.2 million, US$349.9 million and US$330.0 million, respectively. We write down inventory tothe lower of book value or net realizable value, which includes an estimate for obsolescence or excessinventory based upon assumptions about future demand and market conditions. As of December 31,2016, 2017, 2018 and June 30, 2019, we recorded inventories impairment of US$1.9 million, US$2.7million, US$2.7 million and US$2.8 million, respectively. Although we believe our provisions relatedto inventory are currently adequate, there is no assurance that we will not incur additional relatedcharges given the rapid and unpredictable pace of product obsolescence in the industries in which wecompete. On the other hand, our retailers may not place orders to our distributors due to variousreasons, such as obsolete or excess inventory or limited space for inventories, and may have a materialadverse impact on our business. In addition, during the Track Record Period, we were able to carrylimited inventories and control our inventory risk. However, to avoid any shortage of supplies, we maystrategically keep a higher level of stock for certain key components for better cost management. Givenour markets are competitive and subject to rapid technological and price changes, there is a risk that wemay forecast incorrectly and order or produce excess or insufficient amounts of components, rawmaterials or finished products.
We may be unable to detect, deter and prevent misconduct by our employees, suppliers,customers and other third parties.
As of June 30, 2019, we had 4,157 full-time employees. Fraud or other misconduct byemployees at different operational levels of our Group, whether individually or in collusion with other
48
RISK FACTORS
employees, customers or other third parties, could reduce our operational efficiency and businessperformance, and may even result in violations of laws by us, third-party claims and regulatory actionsagainst us and serious reputational or financial harm to us. Although we have certain internal controlprocedures and systems in place, we cannot assure you that all our employees will fully comply withour internal control procedures and systems when performing their duties. In addition, we may also besubject to misconduct by third parties such as our suppliers and customers. We cannot assure you thatwe will be able to prevent or detect all incidents of wrongdoing by third parties. Any misconductcommitted against us or our interests, which may include past acts that have gone undetected or futureacts, could subject us to financial losses, harm our reputation and may have a material adverse effecton our business and results of operations.
In addition, we have been, and may from time to time be subject to disputes with respect to ouremployment practices. In particular, due to the litigious culture in the United States, we are more likelyto be subject to employment disputes for our US operation. Regardless of their merit, such disputescould lead to judicial or arbitral claims and/or settlement liabilities which may have adverse impacts onour reputation, business operations and/or our financial condition. Such disputes and claims are costly,time-consuming, difficult to predict, and distractive to our management, and may adversely affect ouroperations and financial performance.
An economic downturn or economic uncertainty in China and the United States, and to a lesserdegree in Europe, may adversely affect consumer discretionary spending and demand for ourproducts and services.
During the Track Record Period, revenue from China, United States and Europe accounted forsubstantially all of our total revenue. Our operations and performance depend significantly on China,the United States, Europe and global economic conditions. Uncertainty about China, the United States,Europe and global economic conditions pose a risk as consumers and businesses may postponespending in response to credit constraints, rising unemployment rates, financial market volatility,government austerity programs, negative financial news, declines in income or asset values and/orother factors. These worldwide and regional economic conditions could have a material adverse effecton demand for our products. Demand also could differ materially from our expectations as a result ofcurrency fluctuations. Other factors that could influence worldwide or regional demand includechanges in fuel and other energy costs, conditions in the real estate and mortgage markets,unemployment, labor and healthcare costs, access to credit, consumer confidence and othermacroeconomic factors affecting consumer spending behavior. These and other economic factors couldmaterially and adversely affect demand for our products.
We are subject to laws and regulations worldwide, changes to which could increase our costs andindividually or in the aggregate adversely affect our business.
We are subject to laws and regulations affecting our domestic and international operations in anumber of areas. These Chinese, US and foreign laws and regulations affect our activities including,but not limited to, in areas of labor, advertising, product liability, consumer protection, billing,e-commerce, promotions, quality of services, telecommunications, mobile communications and media,television, intellectual property ownership and infringement, tax, import and export requirements, anti-corruption, foreign exchange controls and cash repatriation restrictions, data privacy requirements,anti-competition, environmental, health and safety. If any of these laws and regulations are violatedand such violations lead to legal proceedings, it could disrupt our business, distract our management’s
49
RISK FACTORS
attention and subject us to substantial uncertainties as to the outcome of any such legal proceedings.Violations of these laws and regulations could materially and adversely affect our brand, internationalgrowth efforts and business.
Compliance with these laws, regulations and similar requirements may be onerous andexpensive, and they may be inconsistent from jurisdiction to jurisdiction, further increasing the cost ofcompliance and doing business. Any such costs, which may rise in the future as a result of changes inthese laws and regulations or in their interpretation, could individually or in the aggregate make ourproducts less attractive to our customers, delay the introduction of new products in one or moreregions, or cause us to change or limit our business practices. There can be no assurance that ouremployees, contractors, agents, or business partners will not violate such laws and regulations or ourcompliance policies and procedures.
Our business involves the potential for product recalls, which could affect our sales andprofitability.
As a manufacturer of consumer goods, we are subject to the risks of product recalls. Forexample, in the United States, SharkNinja is subject to the Consumer Products Safety Act and theFederal Hazardous Substances Act, which empower the U.S. Consumer Products Safety Commission,which is referred to as the CPSC, to seek to exclude from the market products that are found to beunsafe or hazardous. Under certain circumstances, the CPSC could require SharkNinja to repair,replace or refund the purchase price of one or more of our products, or SharkNinja may voluntarily doso. As an example, in 2015, a former distributor of SharkNinja in Australia and New Zealand,commenced, and notified Australian and New Zealand regulators of, voluntary recalls of affected unitsof three models of Shark vacuums across Australia and New Zealand, which affected 161,646 units intotal in Australia and 55,503 units in total in New Zealand. The total cost of this recall to SharkNinjawas US$3.8 million, which was partially covered by insurance, resulting in an actual cost of US$1.9million. The vacuum models affected were specific to the Australian and New Zealand markets andwere not sold in other countries. Any repurchases or recalls of our products could be costly to us andcould damage our reputation or the value of our brands. If SharkNinja is required to remove, orSharkNinja voluntarily removes, our products from the market, our reputation or brands could betarnished, and we might have large quantities of finished products that could not be sold. Furthermore,failure to timely notify the CPSC of a potential safety hazard can result in fines being assessed againstSharkNinja. Additionally, laws regulating certain consumer products exist in some states, as well as inother countries in which we sell our products, and more restrictive laws and regulations may beadopted in the future. Our results of operations are also susceptible to adverse publicity regarding thequality and safety of our products. In particular, product recalls may result in a decline in sales for aparticular product.
We are subject to governmental economic sanctions laws that could subject us to liability andimpair our ability to compete in international markets.
Exports of our products must be made in compliance with various economic and trade sanctionslaws in different jurisdictions. For example, US economic sanctions prohibit persons subject to USjurisdiction from engaging in the provision of products or services to or from certain countries,governments, entities and persons targeted by US economic sanctions. UK financial sanctions andEuropean Union sanctions impose similar restrictions. Even though we take precautions to prevent ourproducts from being provided to any target of these sanctions, our products could be provided to those
50
RISK FACTORS
targets without our knowledge or approval through independent distributors or otherwise despite suchprecautions. Under certain circumstances, any such provision could have negative consequences,including government investigations, penalties and reputational harm. We could be subject toenforcement actions with respect to compliance with economic sanctions laws that result in penaltiesand costs that could have a material effect on our business and results of operations.
In 2017, SharkNinja Operating LLC (“SN”), our US-incorporated subsidiary, and thus a USperson, engaged in a wire transfer in relation to a shipment on an Iranian-flagged vessel operated bythe Islamic Republic of Iran Shipping Line (“IRISL”) which could be deemed a violation of the IranianTransactions and Sanctions Regulations (“ITSR”) that prohibit US persons, individuals or companiesfrom engaging in a wide range of transactions, directly or indirectly, involving Iran (the “IranianTransaction”). If OFAC were to determine that SN has engaged in one or more violations of the ITSR,SN could likely be subject to a number of relevant outcomes imposed by OFAC’s enforcementguidelines, ranging from no action to a civil monetary penalty. Based on our current understanding,and after consulting with our legal advisers, we believe the maximum penalty allowed under therelevant statutes and enforcement guidelines in respect of the Iranian Transaction would not bematerial to SN.
We are committed to ensuring our compliances with relevant economic sanctions laws andpreventing such incident from occurring. However, we cannot assure you that we will always be ableto do so, for factors beyond our control or otherwise.
Our success depends largely on the continued contributions of our senior management and keypersonnel and maintaining our unique corporate culture and values.
Much of our future success depends on the continued contributions of our senior managementand other key employees, many of whom are difficult to replace. The loss of the services of any of ourexecutive officers, especially our Chairman, Mr. Wang Xuning and our Global President, Mr. MarkAdam Barrocas, our senior management team and other highly skilled employees could harm ourbusiness. Competition for qualified talent is intense, particularly in the robotics, IoT, internet andtechnology industries. Our future success depends on our ability to attract a large number of qualifiedemployees and retain existing key employees. If we are unable to do so, our business and growth maybe materially and adversely affected.
Our unique corporate culture, which encourages innovation and cooperation, is driven by ourfounding team members who were the pioneers in the soymilk maker market. We value our customershighly and tailor our products to facilitate a better and easier life. Our corporate culture and valueshave empowered our rapid growth in the past, and we may risk losing the trust of our customers,employees and partners and our operations may be materially and adversely affected if we fail tomaintain our unique corporate culture and values.
If we are unable to recruit, train and retain qualified personnel or a sufficient workforce whilecontrolling our labor costs, our business may be materially and adversely affected.
We intend to hire additional qualified employees to support our business operations andplanned expansion. Our future success depends, to a significant extent, on our ability to recruit, trainand retain qualified personnel, particularly technical, marketing and other operational personnel withexperience in the home appliance industry. Our experienced mid-level managers are instrumental in
51
RISK FACTORS
implementing our business strategies, executing our business plans and supporting our businessoperations and growth. The effective operation of our managerial and operating systems also dependson the hard work and quality performance of our management and employees. Since our industry ischaracterized by high demand and intense competition for talent and labor, there is no assurance thatwe will be able to attract or retain qualified staff or other highly skilled employees that we will need toachieve our strategic objectives. Labor costs in China and elsewhere have increased with globaleconomic development. In addition, our ability to train and integrate new employees into ouroperations may also be limited and may not meet the demand for our business growth in a timelyfashion, or at all, and rapid expansion may impair our ability to maintain our corporate culture.
Our delivery, return and exchange policies may adversely affect our results of operations.
We generally allow customers to return unused goods and to exchange defective goods withincertain periods in compliance with regulatory requirements. Our customers may also have their productreplaced for specific types of defects or quality issues as required under the relevant laws andregulations. We may also be required by law to adopt new or amend existing return and exchangepolicies from time to time. In addition, retailers in many of the markets that we sell to allow consumersto return products to their stores within a specified amount of time as determined by each retailer’spolicy. The retailers will in turn charge us for that returned product to the extent that it is not in aresellable condition once returned.
Our and our retailers’ delivery, return and exchange policies improve our customers’ shoppingexperiences and promote customer loyalty, which in turn helps us acquire and retain customers.However, these policies also subject us to additional costs and expenses. Generally, our distributors inChina will bear the cost of returned products and arrange for repairs if needed. In cases where we areliable for any of such cost, our suppliers generally indemnify us for losses due to their handling of theproducts. If after all these arrangements, we are still responsible for the costs of delivery, return andexchange of products, our results of operations may be materially and adversely affected. In addition,in the United States and other markets where it is customary to allow customers to return products forany reason within a specified amount of time, our results of operations may be materially andadversely affected if we sell products that do not meet consumer expectations, whether related to aproduct defect or quality issue or not. If we revise these policies to reduce our costs and expenses, ourcustomers may be dissatisfied, which may result in loss of existing customers or failure to acquire newcustomers at a desirable pace, which may materially and adversely affect our results of operations.
Failure to renew our current leases or locate desirable alternatives for our facilities couldmaterially and adversely affect our business.
We primarily lease properties for our manufacturing facilities, sales offices, warehouses, andretail stores. We may not be able to successfully extend or renew such leases upon expiration of thecurrent term on commercially reasonable terms, or at all, and may therefore be forced to relocate ouraffected operations. This could disrupt our operations and result in significant relocation expenses,which could adversely affect our business, financial condition and results of operations. In addition, wecompete with other businesses to obtain space at certain locations or of desirable sizes. As a result,even though we could extend or renew our leases, rental payments may significantly increase as aresult of the high demand for certain leased properties. In addition, we may not be able to locatedesirable alternative sites for our facilities as our business continues to grow and failure in relocatingour affected operations could adversely affect our business and operations.
52

RISK FACTORS
Our business is subject to seasonal fluctuations and if our sales fall below our forecasts, ouroverall financial condition and results of operations could be adversely affected.
Our business is subject to seasonal fluctuations, which are primarily driven by the consumptionhabits in the small household appliance market. We generally receive more orders during the holidayand shopping seasons. Accordingly, any shortfall during the period from September to December,which is typically our peak season in China and the United States, would adversely affect our annualoperating results. Furthermore, our rapid growth may obscure the extent to which seasonality trendshave affected our business. Accordingly, yearly or quarterly comparisons of our operating results maynot be useful and our results in any particular period will not necessarily be indicative of the results tobe expected for any future period.
We collect, store, process and use personal information and other customer data, which subjectsus to governmental regulations and other legal obligations related to privacy, informationsecurity, and data protection, and any security breaches or any actual or perceived failure tocomply with such legal obligations could harm our brand and business.
To foster our customer loyalty, we actively engage our customers to share and discuss theirthoughts and experiences regarding our products with us through our official WeChat platform, third-party online distributor, platforms, social media platforms and offline activities. During this process,we will have access to certain personal information and other customer data. Collection, storage,processing and use of personal information and other customer data subjects us to governmentalregulations and other legal obligations related to privacy, information security, and data protection.
We are committed to protecting our customer data. We have adopted security policies andmeasures, including encryption technology, to protect our proprietary data and customer information.However, our enterprise platform and information systems may be targets of attacks, such as viruses,malware or phishing attempts by cyber criminals or other wrongdoers seeking to steal our customerdata for financial gain or to harm our business operations or reputation. The loss, misuse orcompromise of such information may result in costly investigations, remediation efforts andnotification to affected customers. If such content is accessed by unauthorized third parties or deletedinadvertently by us or third parties, our brand and reputation could be adversely affected. Any failureor perceived failure by us to prevent information security breaches or to comply with privacy policiesor privacy-related legal obligations, or any compromise of security that results in the unauthorizedrelease or transfer of personally identifiable information or other customer data, could cause ourcustomers to lose trust in us and could expose us to legal claims.
Any interruption in the operation of our in-house production may have an adverse impact on ourbusiness.
We produce certain core or pioneer products as well as prototypes of our Joyoung brand withinour in-house production facilities in Hangzhou and Jinan. Any interruption in our in-house productioncould adversely affect our business operations.
Our production may be disrupted for a variety of reasons such as equipment breakdowns, laborstrikes or shortages, natural disasters, component and material shortages, environmental non-compliance, commercial disputes or information technology system failures such as power outages,computer viruses, hardware and software failures, telecommunications failures, fires and other similarevents to the information technology system. A prolonged disruption in the operations of any of our
53
RISK FACTORS
in-house production facilities, whether due to technical or labor difficulties or otherwise, could result indelays in the delivery of products to our customers, increased costs and reduced revenue.
Our business may be impacted by political events, war, terrorism, public health issues, naturaldisasters and other outbreaks of contagious diseases or business interruptions.
War, terrorism, geopolitical uncertainties, public health issues and other business interruptionshave caused and could cause damage or disruption to the economy and commerce on a global orregional basis, which could have a material adverse effect on us, our suppliers, logistics providers,OEM suppliers and customers. Our business operations are subject to interruption by, among others,natural disasters, whether as a result of climate change or otherwise, fire, power shortages and otherindustrial accidents, terrorist attacks and other hostile acts, labor disputes, public health issues andrelated events, demonstrations, and other events beyond our control. Such events could decreasedemand for our products, impact the productivity of our workforce, make it difficult or impossible forus to make and deliver products to our customers, or to receive components or products from oursuppliers, and create delays and inefficiencies in our supply chain. While our suppliers are required tomaintain safe working environments and operations, an industrial accident could occur and could resultin disruption to our business and harm to our reputation. Should major public health issues, includingpandemics, arise, we could be adversely affected by more stringent employee travel restrictions,additional limitations in freight services, governmental actions limiting the movement of productsbetween regions, delays in production ramps of new products and disruptions in the operations of ourOEM suppliers, component suppliers and logistics providers. In the event of a natural disaster, wecould incur significant losses, require substantial recovery time and experience significant expendituresin order to resume operations.
We are subject to risks associated with foreign exchange rate fluctuations.
We have significant operations in China and the United States. Particularly, our US operationsources products in China for its international sales. Fluctuations in the value of Renminbi against localcurrencies could result in currency exchange gains or losses. Additionally, we export products tooffshore markets, such as the United Kingdom. As an example, sales in the United Kingdom aredenominated in GBP, and costs of sales incurred in the United Kingdom are primarily denominated inUS dollars. Weakening of the GBP relative to the US dollar adversely affects the US dollar value ofour sales and earnings denominated in GBP, and generally leads to increased prices in the UnitedKingdom, potentially reducing demand for our products. Margins on sales of our products ininternational markets which include components procured with the US dollar could be materially andadversely affected by foreign currency exchange rate fluctuations. In some circumstances, forcompetitive or other reasons, we may decide not to raise local prices to fully offset the US dollar’sstrengthening, or at all, which could adversely affect our financial condition and results of operations.
In addition, our consolidated financial results are affected by currency exchange ratefluctuations. Our financial information is presented in US dollars. In connection with the preparation ofour financial information, the results of operations of subsidiaries, which are initially prepared in theirrespective local functional currencies, such as the Renminbi and GBP, are translated into US dollars.As a result, changes in the exchange rate between our functional currencies, particularly, Renminbi asone of our major operating currencies, and the US dollar could materially impact our reported resultsof operations and distort period to period comparisons. In particular, to the extent that foreigncurrency-denominated (i.e., non-US dollar) monetary assets do not equal the amount of our foreign
54

RISK FACTORS
currency-denominated monetary liabilities, foreign currency gains or losses could arise and materiallyimpact our financial statements. During the Track Record Period, we recorded exchange losses ontranslation of foreign operations of US$44.7 million and US$37.1 million in 2016 and 2018,respectively, and recorded exchange gains on translation of foreign operations of US$43.0 million andUS$1.8 million in 2017 and the six months ended June 30, 2019, respectively. As a result of suchforeign currency fluctuations, it could be more difficult to detect underlying trends in our business andresults of operations.
The fair value of our financial assets at fair value through profit or loss may face uncertaintiesand be subject to fluctuations as the valuation of its fair value involves the use of unobservableinputs.
We classified certain equity investments as financial assets at fair value through profit or loss asthey were held for trading. We also classified certain financial products as financial assets at fair valuethrough profit or loss as their contractual cash flows are not solely payments of principal and interest.See note 20 to the Accountants’ Report in Appendix I to this prospectus for details. These investmentswere measured at fair value through profit or loss at the end of each reporting period. At each reportingdate, we analyze movements in the values of financial instruments and determine the major inputsapplied in the valuation. We use valuation methodologies that are appropriate in the circumstances andfor which sufficient data are available to measure fair value, maximizing the use of relevant observableinputs and minimizing the use of unobservable inputs. See notes 2.4 and 44 to the Accountants’ Reportin Appendix I to this prospectus for details. In 2016, 2017 and 2018 and for the six months endedJune 30, 2019, for financial assets at fair value through profit or loss, we recorded gains on change infair value of US$17.9 million, US$5.7 million, US$0.7 million and US$6.0 million, respectively,credited to other income and gains. Changes in any of the unobservable inputs could result in changesof the fair value of our investments. As a result, the fair value of our financial assets at fair valuethrough profit or loss is subject to uncertainties in accounting estimate, which could negatively impactour financial condition and net profit or loss.
We are uncertain about the recoverability of our deferred tax assets, which may affect ourfinancial positions in the future.
As of December 31, 2016, 2017 and 2018 and June 30, 2019, our deferred tax assets amountedto US$11.2 million, US$45.4 million, US$46.5 million and US$43.9 million, respectively, whichmainly represent temporary differences arising from allowances on doubtful debt(s), accrued liabilitiesand provisions. For details of the movements in our deferred tax assets during the Track Record Period,please see note 30 to the Accountants’ Report in Appendix I to this prospectus. Deferred tax assets arerecognized for unused tax losses to the extent that it is probable that taxable profit will be availableagainst which the losses can be utilized. Significant management judgment is required to determine theamount of deferred tax assets that can be recognized, based upon the likely timing and level of futuretaxable profits together with future tax planning strategies. As of December 31, 2016, 2017 and 2018and June 30, 2019, our carrying amount of deferred tax assets relating to recognized tax losses wasUS$0.2 million, US$4.0 million, US$3.4 million and US$3.6 million, respectively. We cannotguarantee the recoverability or predict the movement of our deferred tax assets. If we fail to recoverour deferred tax assets, this may adversely affect our financial position in the future.
55

RISK FACTORS
Higher labor costs may adversely affect our business and our profitability.
Labor costs in China and elsewhere in the world have risen in recent years. Rising labor costsmay be reflected in our selling and distribution costs, administrative costs, the manufacturing feescharged by our OEM suppliers to us and the prices of finished goods. These increased costs resultingfrom higher labor cost of our component suppliers and OEM suppliers cannot be easily passed to endcustomers in the form of higher retail prices because of severe competition in the markets in which weoperate. Our profitability therefore may be adversely affected if labor costs continue to rise.
We rely on our information technology systems for our suppliers, sales and other functions andto maintain our research and development data. If our information technology systems fail toadequately perform these functions, or if we experience an interruption in their operation, ourbusiness and results of operations could be adversely affected.
The efficient operation of our business depends on our information technology systems. Werely on our information technology systems to effectively manage accounting and financial functions,order entry, order fulfillment, distribution scheduling and inventory replenishment processes, and tomaintain our research and development data. The failure of our information technology systems toperform as we anticipate could disrupt our business and product development and could result indecreased sales and increased overhead costs, all of which could materially and adversely affect ourbusiness, financial condition and results of operations. In addition, our information technology systemsare vulnerable to damage or interruption from:
Š earthquake, fire, flood and other natural disasters;
Š attacks by computer viruses or hackers;
Š power loss; and
Š computer systems, Internet, telecommunications or data network failure.
Any such damage or interruption could materially and adversely affect our business and resultsof operations.
We could be subject to changes in our tax rates, the adoption of new domestic or internationaltax legislation or exposure to additional tax liabilities.
We are subject to taxes in China, the United States and other jurisdictions, where a number ofour subsidiaries are organized. Due to economic and political conditions, tax rates in variousjurisdictions may be subject to significant change. Our effective tax rates could be affected by changesin the mix of earnings in countries with differing statutory tax rates, changes in the valuation ofdeferred tax assets and liabilities, or changes in tax laws or their interpretation.
We are also subject to the examination of tax returns, tax residency status and other tax mattersby tax authorities and governmental bodies in various jurisdictions. We regularly assess the likelihoodof an adverse outcome resulting from these examinations to determine the adequacy of our provisionfor taxes. There can be no assurance as to the outcome of these examinations. If our effective tax rateswere to increase, or if the ultimate determination of our taxes owed is for an amount in excess ofamounts previously accrued, our financial condition, operating results and cash flows could beadversely affected. Our tax expense and liabilities may also be affected by other factors, such as past orfuture changes in our business operations or ownership structure, acquisitions, investments, entry into
56
RISK FACTORS
new businesses and geographies. Significant judgment is required in evaluating and estimating our taxexpense and liabilities. We may be exposed to additional tax liabilities arising out of transactions andcalculations for which the ultimate tax determination is uncertain.
We have limited insurance coverage which could expose us to significant costs and businessdisruption.
We maintain various insurance policies to safeguard against risks and unexpected events. Wemaintain limited third-party insurance policies covering certain potential risks and liabilities includingproduct liability, property and construction liability. We also provide social security insuranceincluding pension insurance, unemployment insurance, work-related injury insurance and medicalinsurance for our employees in China, as well as statutorily required insurance coverage for overseasemployees. See “Business—Insurance” for details of our insurance policies. However, we cannotassure you that our insurance coverage is sufficient to cover all of our risk exposure and prevent usfrom any loss, or that we will be able to successfully claim our losses under our current insurancepolicies on a timely basis, or at all. If we incur any loss that is not covered by our insurance policies, orif the compensated amount is significantly less than our actual loss, our business, financial conditionand results of operations could be materially and adversely affected.
In addition, in line with general market practice, we do not maintain any business interruptioninsurance in China, which is not mandatory under the laws in China. We also do not maintain key-manlife insurance or insurance policies covering damages to our IT systems. Any disruption in our ITsystems or natural disasters may cause us to incur substantial costs to diversify our resources, and wehave no insurance to cover such losses. As a result, our business, financial condition and results ofoperations could be materially and adversely affected.
We face risks relating to our relationship with our A Share listed company in China.
Our principal business in China is operated by our A-Share listed subsidiary in China, Joyoung.Joyoung must comply with the rules of Shenzhen Stock Exchange and various provisions in relation tothe protection of minority shareholders under PRC laws and regulations. For instance, pursuant torelevant PRC laws and regulations, connected parties of Joyoung must abstain from voting in relationto major connected transactions. Therefore, subject to certain conditions, transactions underagreements entered into between Joyoung and/or its subsidiaries and the Company and/or itssubsidiaries (other than Joyoung and its subsidiaries), and/or other connected parties require theapproval of non-connected directors of Joyoung and/or the approval of the non-connected shareholdersof Joyoung. In the event that major operational decisions of the Company cannot be implemented dueto a failure to obtain approval from the non-connected directors of Joyoung and/or the non-connectedshareholders of Joyoung or, if applicable, waivers from the Shenzhen Stock Exchange, our operationsand the implementation of our strategies may be adversely affected.
We recorded a significant amount of goodwill following the acquisition of SharkNinja and ournet profit could be adversely affected if we recognize impairment losses on such goodwill.
Upon the completion of our acquisition of SharkNinja, we recorded goodwill of US$839.8million. The balance of goodwill was US$839.8 million as of June 30, 2019.
We test goodwill for impairment as of December 31 of each year, or more frequently if eventsor circumstances indicate that goodwill might be impaired. Examples of such events or circumstances
57
RISK FACTORS
include, but are not limited to, a significant adverse change in business performance and/or expectedfuture business performance driven by factors including but not limited to degradation in legal orbusiness climates, an adverse regulatory action, unanticipated competition or an inability to executeour strategy initiatives.
We did not recognize any impairment losses on the recorded goodwill associated with theacquisition of SharkNinja for the Track Record Period. However, we may recognize impairment losseson goodwill in the future and that impairment could negatively affect our results of operations andprofitability.
We recorded a significant amount of other intangible assets following the acquisition ofSharkNinja and our net profit could be adversely affected if we recognize impairment losses onsuch other intangible assets.
Upon completion of our acquisition of SharkNinja, we recorded other intangible assets ofUS$564.0 million, which primarily include trademarks, patents and retailer relationships. In addition,we recorded other intangible assets of software and patents acquired from third parties, as well as thecapitalized development cost of our own R&D. The balance of other intangible assets was US$554.6million as of June 30, 2019.
We test intangible assets with indefinite life and capitalized development costs not yet availablefor use for impairment annually, and at other times when there is an indicator that such intangible assetmay be impaired. We test intangible assets with finite lives for impairment when there is an indicatorthat the carrying amounts may not be recoverable.
We did not recognize any impairment losses on the recorded other intangible asset associatedwith the acquisition of SharkNinja for the Track Record Period. However, we may recognizeimpairment losses on other intangible assets in the future and that impairment could negatively affectour results of operations and profitability.
The discontinuation of the preferential tax treatments for “high and new technology enterprises”currently available to us in China could reduce our net income and profitability.
Joyoung Household Appliances (formerly known as Hangzhou Joyoung Ounanduo SmallAppliance Limited (杭州九陽歐南多小家電有限公司)) is currently qualified as a “high and newtechnology enterprise” under the EIT Law and was entitled to a preferential income tax rate of 15%during the Track Record Period. Its qualification as a “high and new technology enterprise” is validthrough 2019. We intend to reapply for such qualification thereafter but there is no assurance that ourapplication will succeed. In the event that this preferential tax treatment is discontinued, JoyoungHousehold Appliances will become subject to a 25% standard enterprise income tax rate, which wouldincrease our income tax expenses and could reduce our net income and profitability.
We may not be able to obtain adequate financing on commercially reasonable terms on a timelybasis, or at all.
We require significant working capital for our operations and capital expenditures for ourexpansion, to enhance global brand awareness and introduce new products and services. If capitalresources are not available, we may not be able to implement our strategy and future plans. We expectour total indebtedness will continue to increase as a result of our business expansion. Historically, we
58
RISK FACTORS
have generally relied on capital contributions from Shareholders, bank loans and cash generated fromour operations to fund our operations and expansion. Our ability to obtain adequate external financingdepends on a number of factors, including our financial performance and results of operations, as wellas other factors beyond our control, including the global and PRC economies, interest rates, theapplicable laws, regulations, rules and conditions related to the industry and the geographical regionswhere we operate. There can be no assurance that the cash flow generated by our operations will besufficient to fund our future operations and expansion plans, or that we will be able to obtain bankloans and other external financing on commercially reasonable terms or on a timely basis, or at all. Ifwe are unable to obtain financing in a timely manner, at a reasonable cost, on commercially reasonableterms, or at all, our business and operations may suffer, and the implementation of our expansion plansand our other strategies may be delayed.
RISKS RELATING TO THE COUNTRIES IN WHICH WE OPERATE
Changes in political, social and economic policies in any of China, the United States, the UnitedKingdom or Japan may materially and adversely affect our business, financial condition, resultsof operations and prospects.
Our business operations are primarily conducted in China, the United States, the UnitedKingdom and Japan. Accordingly, we are affected by the economic, political and legal environment inChina, the United States, the United Kingdom and Japan.
In particular, China’s economy differs from the economies of most developed countries inmany respects, including the fact that it:
Š has a high level of government involvement;
Š is in the early stages of development of a market-oriented economy;
Š has experienced rapid growth; and
Š has a tightly controlled foreign exchange policy.
China’s economy has been transitioning from a planned economy towards a more market-oriented economy. However, a substantial portion of productive assets in China remain state-ownedand the PRC government exercises a high degree of control over these assets. In addition, the PRCgovernment continues to play a significant role in regulating industrial development by imposingindustrial policies. For the past three decades, the PRC government has implemented economic reformmeasures to emphasize the utilization of market forces in economic development.
China’s economy has grown significantly in recent years; however, there can be no assurancethat such growth will continue. The PRC government exercises control over China’s economic growththrough the allocation of resources, controlling payment of foreign currency-denominated obligations,setting monetary policy and providing preferential treatment to particular industries or companies.Some of these measures benefit the overall economy of China, but may also have a negative effect onour business. For example, our financial condition and results of operations may be adversely affectedby government control over capital investments or changes in tax regulations that are applicable to us.As such, our future success is, to some extent, dependent on the economic conditions in China, and anysignificant downturn in market conditions may materially and adversely affect our business prospects,financial condition, results of operations and prospects.
59
RISK FACTORS
The legal system in China embodies uncertainties which could limit the legal protectionsavailable to us.
The legal system in China is a civil law system based on written statutes. Unlike common lawsystems, it is a system in which decided legal cases have little precedential value. PRC written statutesare often principle-oriented and require detailed interpretations by the enforcement bodies to furtherapply and enforce such laws. Our principal business in China is operated by our A-Share listedsubsidiary, Joyoung, on the Shenzhen Stock Exchange. Joyoung is subject to applicable PRC laws andregulations as well as specific regulations issued by the Shenzhen Stock Exchange. However, theselaws, regulations and legal requirements are constantly changing and their interpretation andenforcement involve uncertainties. These uncertainties could limit the legal protections available to us.In addition, we cannot predict the effect of future developments in the Chinese legal system, includingthe promulgation of new laws, changes to existing laws or the interpretation or enforcement thereof, orthe preemption of local regulations by national laws. Such unpredictability towards our contractual,property (including intellectual property) and procedural rights could adversely affect our business andimpede our ability to continue our operations. Furthermore, any litigation in China may be protractedand result in substantial costs and diversion of resources and management attention.
Under China EIT Law, we may be classified as a “resident enterprise in China”. Thisclassification could result in unfavorable tax consequences to us and our non-PRC Shareholders.
Under the EIT Law, an enterprise established outside China whose “de facto managementbody” is located in China is considered a “resident enterprise in China”, and will generally be subjectto the uniform 25% enterprise income tax rate on its global income. On April 22, 2009, theDetermination of Chinese-Controlled Enterprises Registered Abroad as Resident Enterprises on theBasis of Their Body of Actual Management (《國家稅務總局關於境外註冊中資控股企業依據實際管理機構標準認定為居民企業有關問題的通知》國稅發[2009]82號) issued by the State Administration ofTaxation regarding the standards used to classify certain Chinese-invested enterprises controlled byChinese enterprises or Chinese group enterprises and established outside China as “residententerprises” clarified that dividends and other income paid by such “resident enterprises” will beconsidered to be Chinese source income, subject to Chinese withholding tax, currently at a rate of 10%,when recognized by non-Chinese enterprise shareholders. This circular also subjects such “residententerprises” to various reporting requirements with the Chinese tax authorities. Under theImplementation Regulations of EIT Law, a “de facto management body” is defined as a body that hasmaterial and overall management and control over the manufacturing and business operations,personnel and human resources, finances and properties of an enterprise. In addition, the circularmentioned above sets out criteria for determining whether “de facto management bodies” are located inChina for overseas incorporated, domestically controlled enterprises. However, as this circular onlyapplies to enterprises established outside China that are controlled by Chinese enterprises or groups ofChinese enterprises, it remains unclear how the tax authorities will determine the location of “de factomanagement bodies” for overseas incorporated enterprises that are controlled by individual Chineseresidents like us and some of our subsidiaries. Therefore, although part of our management is currentlylocated in China, it remains unclear whether the Chinese tax authorities would require or permit ouroverseas registered entities to be treated as Chinese resident enterprises. We do not currently considerour Company to be a Chinese resident enterprise. However, if the Chinese tax authorities disagree withour assessment and determine that we are a “resident enterprise”, we may be subject to enterpriseincome tax at a rate of 25% on our worldwide income and dividends paid by us to our non-ChineseShareholders as well as capital gains recognized by them with respect to the sale of our Shares may be
60
RISK FACTORS
subject to a Chinese withholding tax. This will have an impact on our effective tax rate, a materialadverse effect on our net income and results of operations, and may require us to withhold tax on ournon-Chinese Shareholders.
The heightened scrutiny over acquisition transactions by tax authorities in China may have anegative impact on our business operations, our acquisition or restructuring strategy or the valueof your investment in us.
Pursuant to the Notice of State Administration for Taxation on Strengthening Administration ofEnterprise Income Tax for Share Transfers by Non-Resident Enterprises (《國家稅務總局關於加強非居民企業股權轉讓所得企業所得稅管理的通知》) (“SAT Circular 698”) issued by the SAT inDecember 2009 with retroactive effect from January 1, 2008, where a non-resident enterprise transfersthe equity interests of a Chinese resident enterprise indirectly by disposition of the equity interests ofan overseas non-public holding company (an “Indirect Transfer”), and such overseas holding companyis located in a tax jurisdiction that (i) has an effective tax rate of less than 12.5% or (ii) does not imposeincome tax on foreign income of its residents, the non-resident enterprise, being the transferor, mustreport to the competent tax authority of the Chinese resident enterprise this Indirect Transfer. Using a“substance over form” principle, the Chinese tax authority may disregard the existence of the overseasholding company if it lacks a reasonable commercial purpose and was established for the purpose ofreducing, avoiding or deferring Chinese tax.
On March 28, 2011, the SAT released the Public Notice on Several Issues Relating to theAdministration of Income Tax on Non-resident Enterprises (《關於非居民企業所得稅管理若干問題的公告》)(“SAT Public Notice 24”), which became effective on April 1, 2011, to clarify several issuesrelated to Circular 698. According to SAT Public Notice 24, the term “effective tax” refers to theeffective tax on the gain derived from disposition of the equity interests of an overseas holdingcompany; and the term “does not impose income tax” refers to the cases where the gain derived fromdisposition of the equity interests of an overseas holding company is not subject to income tax in thejurisdiction where the overseas holding company is a resident.
On February 3, 2015, the SAT issued the Announcement of the SAT on Several Issuesconcerning the Enterprise Income Tax on Income from the Indirect Transfer of Assets by Non-Resident Enterprises (《國家稅務總局關於非居民企業間接轉讓財產企業所得稅若干問題的公告》)(“SAT Circular 7”), which abolished certain provisions in SAT Circular 698 and SAT Public Notice24, as well as certain other rules providing clarification on such regulations. SAT Circular 7 providedcomprehensive guidelines relating to, and also heightened the Chinese tax authorities’ scrutiny over,indirect transfers by a non-resident enterprise of Chinese taxable assets. Under SAT Circular 7, the taxauthorities in China are entitled to reclassify the nature of an indirect transfer of Chinese taxable assets,when a non-resident enterprise transfers Chinese taxable assets indirectly by disposing of equityinterests in an overseas holding company directly or indirectly holding such Chinese taxable assets, bydisregarding the existence of such overseas holding company and considering the transaction to be adirect transfer of PRC taxable assets, if such transfer is deemed to have been conducted for thepurposes of avoiding Chinese enterprise income taxes and without any other reasonable commercialpurpose. However, SAT Circular 7 contains certain exemptions, including (i) where a non-residententerprise derives income from the indirect transfer of Chinese taxable assets by acquiring and sellingshares of an overseas listed company which holds such Chinese taxable assets on a public market; and(ii) where there is an indirect transfer of Chinese taxable assets, but if the non-resident enterprise had
61
RISK FACTORS
directly held and disposed of such Chinese taxable assets, the income from the transfer would havebeen exempted from enterprise income tax in China under an applicable tax treaty or arrangement.
On October 17, 2017, the SAT issued the Circular on the Source of Deduction of Income Taxfor Non-resident Enterprises (《國家稅務總局關於非居民企業所得稅源泉扣繳有關問題的公告》) (“SATCircular 37”), which became effective on December 1, 2017 and abolish SAT Circular 698 as well ascertain provisions in SAT Circular 7 and SAT Public Notice 24. Pursuant to SAT Circular 37, wherethe party responsible to deduct such income tax did not or was unable to make such deduction, thenon-resident enterprise receiving such income should declare and pay the taxes that should have beendeducted to the relevant tax authority. The taxable gain is calculated as the income from such transfernet of the net book value of equity interest.
We cannot assure you that the Chinese tax authorities will not, at their discretion, adjust anycapital gains and impose tax return filing obligations on us or require us to provide assistance for theinvestigation of Chinese tax authorities with respect thereto. Any Chinese tax imposed on a transfer ofour Shares or any adjustment of such gains would cause us to incur additional costs and may have anegative impact on the value of your investment in us.
You may be subject to Chinese income tax on dividends from us or on any gain realized on thetransfer of our Shares.
Under the EIT Law and its implementation rules, subject to any applicable tax treaty or similararrangement between China and your jurisdiction of residence that provides for a different income taxarrangement, Chinese withholding tax at the rate of 10% is normally applicable to dividends fromChinese sources payable to investors that are resident enterprises outside of China, which do not havean establishment or place of business in China, or which have such establishment or place of businessif the relevant income is not effectively connected with the establishment or place of business. Anygain realized on the transfer of shares by such investors is subject to 10% (or a lower rate) Chineseincome tax if such gain is regarded as income derived from sources within China unless a treaty orsimilar arrangement otherwise provides. Under the Individual Income Tax Law of the People’sRepublic of China (《中華人民共和國個人所得稅法》) and its implementation rules, dividends fromsources within China paid to foreign individual investors who are not residents in China are generallysubject to a Chinese withholding tax at a rate of 20% and gains from Chinese sources realized by suchinvestors on the transfer of shares are generally subject to 20% Chinese income tax, in each case,subject to any reduction or exemption set forth in applicable tax treaties and Chinese laws.
A large part of our business operations is in China, therefore, it is unclear whether dividends wepay with respect to our Shares, or the gain realized from the transfer of our Shares, would be treated asincome derived from sources within China and as a result be subject to Chinese income tax. If Chineseincome tax is imposed on gains realized through the transfer of our Shares or on dividends paid to ournon-resident investors, the value of your investment in our Shares may be materially and adverselyaffected. Furthermore, our Shareholders whose jurisdictions of residence have tax treaties orarrangements with China may not qualify for benefits under such tax treaties or arrangements.
62
RISK FACTORS
Chinese regulations of loans and direct investment by offshore holding companies to Chineseentities may delay or prevent us from using the proceeds of the Global Offering to make loans oradditional capital contributions to our Chinese subsidiaries, which could materially andadversely affect our liquidity and our ability to fund and expand our business.
We may transfer funds to our Chinese subsidiaries or finance our Chinese subsidiaries bymeans of Shareholders’ loans or capital contributions after completion of the Global Offering. Anyloans to our Chinese subsidiaries, which are FIEs, cannot exceed statutory limits based on thedifference between the registered capital and the investment amount of such subsidiaries, and shall beregistered with the SAFE or its local counterparts. Furthermore, any capital contributions we make toour Chinese subsidiaries are subject to filing with the MOFCOM in its foreign investmentcomprehensive management information system and registration with the relevant market regulationauthority. We may not be able to obtain these government registrations on a timely basis, if at all. If wefail to receive such registrations, our ability to provide loans or capital contributions to our Chinesesubsidiaries in a timely manner may be negatively affected, which could materially and adverselyaffect our liquidity and our ability to fund and expand our business.
On March 30, 2015, the SAFE promulgated the Circular on Reforming the AdministrationMeasures on Conversion of Foreign Exchange Registered Capital of Foreign-invested Enterprises(《國家外匯管理局關於改革外商投資企業外匯資本金結匯管理方式的通知》) (“Circular 19”). Circular19 allows FIEs in China to settle their foreign exchange capital at their discretion and use theirregistered capital settled in RMB converted from foreign currencies to make equity investments, butthe registered capital of a FIE settled in RMB converted from foreign currencies cannot be used forinvestment in the securities markets, offering entrustment loans or purchases of any investmentproperties, unless otherwise regulated by other laws and regulations. SAFE further promulgatedCircular on Reforming and Regulating the Policies for the Administration of Foreign ExchangeSettlement under the Capital Account (《關於改革和規範資本項目結匯管理政策的通知》) (“SAFECircular 16”), effective on June 9, 2016, which amended certain provisions of Circular 19. SAFECirculars 19 and 16 prohibit FIEs from, among other things, using the RMB converted from theirforeign exchange capitals for expenditure beyond their business scopes or domestic securitiesinvestment or other investments except for principal-secured bank products, and also prohibit FIEsfrom using such RMB to provide loans to non-affiliated parties or constructing or purchasing realestate not for self-use, unless otherwise permitted under its business scope. Circular 19 and Circular16 may limit our ability to transfer the net proceeds from the Global Offering to our Chinesesubsidiaries and use the net proceeds in China from this Offering.
We may be subject to penalties, including restriction on our ability to inject capital into ourChinese subsidiaries and our Chinese subsidiaries’ ability to distribute profits to us, if ourresident shareholders or beneficial owners in China fail to comply with relevant Chinese foreignexchange regulations.
The SAFE issued the Notice on Relevant Issues Relating to Domestic Residents’ Investmentand Financing and Round-Trip Investment through Special Purpose Vehicles (《關於境內居民通過特殊目的公司境外投融資及返程投資外匯管理有關問題的通知》) (“Circular 37”), effective on July 4,2014, which replaced the previous Notice on Relevant Issues Concerning Foreign ExchangeAdministration for the People’s Republic of China Residents Engaging in Financing and RoundtripInvestments via Overseas Special Purpose Vehicles (《關於境內居民通過境外特殊目的公司融資及返程投資外匯管理有關問題的通知》) (“Circular 75”). Circular 37 requires Chinese residents, including
63
RISK FACTORS
Chinese individuals and institutions, to register with the SAFE or its local branches in connection withtheir direct establishment or indirect control of an offshore special purpose vehicle, for the purpose ofoverseas investment and financing, with such Chinese residents’ legally owned assets or equityinterests in domestic enterprises or offshore assets or interests. In addition, such residents in Chinamust update their foreign exchange registrations with the SAFE or its local branches when the offshorespecial purpose vehicle undergoes material events relating to any change of basic information(including change of such Chinese individual shareholder, name and operation term), increases ordecreases in investment amount, share transfers or exchanges, or mergers or divisions.
If any shareholder holding interest in an offshore special purpose vehicle, who is a Chineseresident as determined by Circular 37, fails to fulfill the required foreign exchange registration, theChinese subsidiaries of that offshore special purpose vehicle may be prohibited from distributing theirprofits and dividends to their offshore parent company or from carrying out other subsequent cross-border foreign exchange activities, and the offshore special purpose vehicle may be restricted in itsability to contribute additional capital to its Chinese subsidiaries. Moreover, failure to comply with theSAFE registration described above could result in liability under Chinese laws for evasion ofapplicable foreign exchange restrictions.
We may not be fully informed of the identities of all our shareholders or beneficial owners whoare Chinese residents, and therefore, we may not be able to identify all our shareholders or beneficialowners who are Chinese residents to ensure their compliance with Circular 37 or other related rules. Inaddition, we cannot provide any assurance that all of our shareholders and beneficial owners who areresidents in China will comply with our request to make, obtain or update any applicable registrationsor comply with other requirements required by the Circular 37 or other related rules in a timelymanner. Even if our shareholders and beneficial owners who are residents in China comply with suchrequest, we cannot provide any assurance that they will successfully obtain or update any registrationrequired by the Circular 37 or other related rules in a timely manner due to many factors, includingthose beyond our and their control. If any of our shareholders who is a resident in China as determinedby Circular 37 fails to fulfill the required foreign exchange registration, our Chinese subsidiaries maybe prohibited from distributing their profits and dividends to us or from carrying out other subsequentcross-border foreign exchange activities, and we may be restricted in our ability to contributeadditional capital to our subsidiaries in China, which may adversely affect our business.
We rely on dividends and other distributions on equity paid by our subsidiaries in China and theUnited States to fund any cash and financing requirements we may have. Any limitation on theability of our Chinese and US subsidiaries to make payments to us could have a material adverseeffect on our ability to conduct our business or financial condition.
We are a holding company, and we principally rely on dividends and other distributions onequity that may be paid by our subsidiaries in China and the United States, for our cash and financingrequirements, including the funds necessary to pay dividends and other cash distributions to the holdersof our ordinary shares and service any debt we may incur. If our Chinese subsidiaries or USsubsidiaries incur debt on their own behalf in the future, the instruments governing the debt mayrestrict their ability to pay dividends or make other distributions to us.
In particular, under Chinese laws and regulations, Chinese enterprises may pay dividends onlyout of their retained earnings as determined in accordance with Chinese accounting standards andregulations. In addition, a Chinese enterprise is required to set aside at least 10% of its after-tax profits
64
RISK FACTORS
each year, after making up previous years’ accumulated losses, if any, to fund certain statutory reservefunds, until the aggregate amount of such a fund reaches 50% of its registered capital. Any limitationon the ability of our Chinese subsidiaries to pay dividends or make other distributions to us couldmaterially and adversely limit our ability to grow, make investments or acquisitions that could bebeneficial to our business, pay dividends, or otherwise fund and conduct our business.
Restrictions on the remittance of Renminbi into and out of China and governmental control ofcurrency conversion may limit our ability to pay dividends and other obligations, and affect thevalue of your investment.
The Chinese government imposes controls on the convertibility of Renminbi into foreigncurrencies and the remittance of currency out of China. We receive a considerable portion of ourrevenue in Renminbi. Under our current corporate structure, our income is primarily derived fromdividend payments from our subsidiaries in China and the United States. We may convert a portion ofour revenue into other currencies to meet our foreign currency obligations, such as payments to certainsuppliers and payments of dividends declared in respect of our Shares, if any. Shortages in theavailability of foreign currency may restrict the ability of our subsidiaries in China to remit sufficientforeign currency to pay dividends or other payments to us, or otherwise satisfy their foreign currencydenominated obligations.
Under existing Chinese foreign exchange regulations, payments of current account items,including profit distributions, interest payments and trade and service-related foreign exchangetransactions, can be made in foreign currencies without prior SAFE approval by complying withcertain procedural requirements. However, approval from or registration with competent governmentauthorities is required where Renminbi is to be converted into foreign currency and remitted out ofChina to pay capital expenses such as the repayment of loans denominated in foreign currencies. TheChinese government may at its discretion restrict access to foreign currencies for current accounttransactions in the future. If the foreign exchange control system prevents us from obtaining sufficientforeign currencies to satisfy our foreign currency demands, we may not be able to pay dividends inforeign currencies to our Shareholders. Further, there is no assurance that new regulations will not bepromulgated in the future that would have the effect of further restricting the remittance of Renminbiinto or out of China.
It may be difficult to effect service of process upon us or our Directors or officers named in thisprospectus who reside in China or to enforce non-China court judgments against them in China.
A material part of our assets is situated in China and most of our Directors and officers namedin this prospectus reside in, and most of their respective assets are located in, China. As a result, it maybe difficult to effect service of process outside China upon most of our Directors and officers,including with respect to matters arising under applicable securities laws. China does not have treatiesproviding for the reciprocal recognition and enforcement of judgments of courts with the United States,the United Kingdom and many other countries. Consequently, it may be difficult for you to enforce anyjudgments obtained from courts outside of China against us or our Directors or officers in China.
On July 14, 2006, Hong Kong and China entered into the Arrangement on ReciprocalRecognition and Enforcement of Judgments in Civil and Commercial Matters by the Courts of theMainland and of the Hong Kong Special Administrative Region Pursuant to Choice of CourtAgreements Between Parties Concerned (《關於內地與香港特別行政區法院相互認可和執行當事人協
65

RISK FACTORS
議管轄的民商事案件判決的安排》) (the “Arrangement”) and revised on July 3, 2008, pursuant to whicha party with a final court judgment rendered by a Hong Kong court requiring payment of money in acivil and commercial case pursuant to a choice of court agreement in writing may apply for recognitionand enforcement of the judgment in China. Similarly, a party with a final judgment rendered by aChinese court requiring payment of money in a civil and commercial case pursuant to a choice of courtagreement in writing may apply for recognition and enforcement of the judgment in Hong Kong. Achoice of court agreement in writing is defined as any agreement in writing entered into betweenparties after the effective date of the Arrangement in which a Hong Kong court or a Chinese court isexpressly designated as the court having sole jurisdiction for the dispute. Therefore, it is not possible toenforce a judgment rendered by a Hong Kong court in China if the parties in dispute have not agreed toenter into a choice of court agreement in writing. Although the revised Arrangement became effectiveon August 1, 2008, the outcome and effectiveness of any action brought under the Arrangement maystill be uncertain.
RISKS RELATING TO THE GLOBAL OFFERING
There has been no prior public market for our Shares and the liquidity and market price of ourShares may be volatile.
Prior to completion of the Global Offering, there has been no public market for our Shares.There can be no guarantee that an active trading market for our Shares will develop or be sustainedafter completion of the Global Offering. The Offer Price is the result of negotiations between ourCompany and the Joint Global Coordinators (for themselves and on behalf of the Underwriters), whichmay not be indicative of the price at which our Shares will be traded following completion of theGlobal Offering. The market price of our Shares may drop below the Offer Price at any time aftercompletion of the Global Offering.
The trading price of our Shares may be volatile, which could result in substantial losses to you.
The trading price of our Shares may be volatile and could fluctuate widely in response tofactors beyond our control, including general market conditions of the securities markets in HongKong, China, the United States and elsewhere in the world. A number of household appliancecompanies have listed their securities, and some may be in the process of preparing for listing theirsecurities, in Hong Kong. Some of these companies have experienced significant volatility, includingsignificant price declines after their initial public offerings. The trading performances of the securitiesof these companies at the time of or after their offerings may affect the overall investor sentimenttowards household appliance companies listed in Hong Kong and consequently may impact the tradingperformance of our Shares. These broad market and industry factors may significantly affect themarket price and volatility of our Shares, regardless of our actual operating performance.
The actual or perceived sale or availability for sale of substantial amounts of our Shares,especially by our Directors, executive officers and substantial shareholders, could adverselyaffect the market price of our Shares.
Future sales of a substantial number of our Shares, especially by our Directors, executiveofficers and substantial shareholders, or the perception or anticipation of such sales, could negativelyimpact the market price of our Shares in Hong Kong and our ability to raise equity capital in the futureat a time and price that we deem appropriate.
66

RISK FACTORS
The Shares held by certain shareholders are subject to certain lock-up periods beginning on thedate on which trading in our Shares commences on the Stock Exchange. While we currently are notaware of any intention of such persons to dispose of significant amounts of their Shares after the expiryof the lock-up periods, we cannot assure you that they will not dispose of any Shares they may ownnow or in the future.
Your shareholding will incur immediate and substantial dilution and may experience furtherdilution in the future.
As the Offer Price of our Shares is higher than the net tangible book value per Share of ourShares immediately prior to the Global Offering, purchasers of our Shares in the Global Offering willexperience an immediate dilution. If we issue additional Shares in the future, purchasers of our Sharesin the Global Offering may experience further dilution in their shareholding percentage.
There can be no assurance of the accuracy or completeness of certain facts, forecasts and otherstatistics obtained from various government publications, market data providers and otherindependent third-party sources, including the industry expert reports, contained in thisprospectus.
This prospectus, particularly the section headed “Industry Overview,” contains information andstatistics relating to the small household appliances and large kitchen appliances industries. Suchinformation and statistics have been derived from third-party reports, either commissioned by us orpublicly accessible, and other publicly available sources. We believe that the sources of theinformation are appropriate sources for such information, and we have taken reasonable care inextracting and reproducing such information. However, we cannot guarantee the quality or reliabilityof such source materials. The information has not been independently verified by us, the Joint GlobalCoordinators, the Joint Sponsors, the Joint Bookrunners, the Joint Lead Managers, the Underwriters orany other party involved in the Global Offering, and no representation is given as to its accuracy.Collection methods of such information may be flawed or ineffective, or there may be discrepanciesbetween published information and market practice, which may result in the statistics being inaccurateor not comparable to statistics produced for other economies. You should therefore not place unduereliance on such information. In addition, we cannot assure you that such information is stated orcompiled on the same basis or with the same degree of accuracy as similar statistics presentedelsewhere. In any event, you should consider carefully the importance placed on such information orstatistics.
Future financing may cause a dilution in your shareholding or place restrictions on ouroperations.
We may need to raise additional funds in the future to finance further expansion of our capacityand business relating to our existing operations, acquisitions or strategic partnerships. If additionalfunds are raised through the issuance of new equity or equity-linked securities of the Company otherthan on a pro rata basis to existing Shareholders, the percentage ownership of such Shareholders in theCompany may be reduced, and such new securities may confer rights and privileges that take priorityover those conferred by the Shares. Alternatively, if we meet such funding requirements by way ofadditional debt financing, we may have restrictions placed on us through such debt financingarrangements which may:
Š further limit our ability to pay dividends or require us to seek consents for the payment ofdividends;
67
RISK FACTORS
Š increase our vulnerability to general adverse economic and industry conditions;
Š require us to dedicate a substantial portion of our cash flows from operations to service ourdebt, thereby reducing the availability of our cash flow to fund capital expenditure,working capital requirements and other general corporate needs; and
Š limit our flexibility in planning for, or reacting to, changes in our business and ourindustry.
You should not place any reliance on any information released by Joyoung in connection with thelisting of its A shares on the Shenzhen Stock Exchange.
As Joyoung’s A shares are listed on the Shenzhen Stock Exchange, it has been subject toperiodic reporting and other information disclosure requirements in China. As a result, from time totime Joyoung publicly releases information relating to itself or its shareholders on the Shenzhen StockExchange or other media outlets designated by the CSRC. However, the information announced byJoyoung in connection with its A shares is based on the regulatory requirements of the securitiesauthorities and market practices in China which are different from those applicable to our Shares. Suchinformation does not and will not form a part of this prospectus. As a result, prospective investors inour Shares are reminded that, in making their investment decisions as to whether to purchase ourShares, they should rely only on the financial, operating and other information included in thisprospectus and the Application Forms. By applying to purchase our Shares in the Global Offering, youwill be deemed to have agreed that you will not rely on any information other than that contained inthis prospectus, the Application Forms and any formal announcements made by us in Hong Kong withrespect to the Global Offering.
You should read the entire prospectus carefully and should not rely on any informationcontained in press articles or other media regarding us and the Global Offering.
We strongly caution you not to rely on any information contained in press articles or othermedia regarding us and the Global Offering. Prior to the publication of this prospectus, there may bepress and media coverage regarding us and the Global Offering. Such press and media coverage mayinclude references to certain information that does not appear in this prospectus, including certainoperating and financial information and projections, valuations and other information disclosed byJoyoung as part of its publication as required by the Shenzhen Stock Exchange. We have notauthorized the disclosure of any such information in the press or media and do not accept anyresponsibility for any such press or media coverage or the accuracy or completeness of any suchinformation or publication. We make no representation as to the appropriateness, accuracy,completeness or reliability of any such information or publication. To the extent that any suchinformation is inconsistent or conflicts with the information contained in this prospectus, we disclaimresponsibility for it and you should not rely on such information. You should only rely on theinformation contained in this prospectus, the application forms and any formal announcement made byus in Hong Kong in making your investment decision regarding our Shares.
68
WAIVERS FROM STRICT COMPLIANCE WITH THE LISTING RULES
In preparation for the Listing, we have applied for the following waivers from strict compliancewith the relevant provisions of the Listing Rules:
WAIVER IN RELATION TO NON-EXEMPT CONTINUING CONNECTEDTRANSACTIONS
We have entered into and are expected to continue with certain transactions after the Listingwhich will constitute our non-exempt continuing connected transactions under Chapter 14A of ListingRules upon Listing. Accordingly, we have applied to the Stock Exchange for, and the Stock Exchangehas granted us waivers in relation to certain continuing connected transactions between us and certainconnected persons under Chapter 14A of the Listing Rules. See “Connected Transactions—Non-exempt Continuing Connected Transactions.”
WAIVER IN RELATION TO MANAGEMENT PRESENCE IN HONG KONG
Pursuant to Rule 8.12 of the Listing Rules, our Company must have sufficient managementpresence in Hong Kong, which normally means that at least two executive directors must be ordinarilyresident in Hong Kong. Given that (i) our core business operations are principally located, managedand conducted in the PRC and in the US; (ii) our executive Directors principally reside in China; and(iii) the management and operations of the Company have mainly been under the supervision of ourexecutive Directors and senior management of the Company, who are principally responsible for theoverall management, corporate strategy, planning, business development and control of the Group’sbusinesses and it is important for them to remain in close proximity to the Group’s operations locatedin the PRC and in the US, the Company considers that it would be more practical for its executiveDirectors and senior management of the Company to remain ordinarily resident in the PRC and in theUS where the Group has substantial operations. For the above reasons, we do not have, and do notcontemplate in the foreseeable future that we will have sufficient management presence in Hong Kongfor the purpose of satisfying the requirement under Rule 8.12 of the Listing Rules.
Accordingly, we have applied to the Stock Exchange for, and the Stock Exchange has grantedus, a waiver from strict compliance with Rule 8.12 of the Listing Rules. We will ensure that there areadequate and efficient arrangements to achieve regular and effective communication between us andthe Stock Exchange as well as compliance with the Listing Rules by way of the followingarrangements:
1. Authorized representatives: we have appointed Ms. Han Run (“Ms. Han”), the executiveDirector, and Mr. Shan Minqi, the Company Secretary, (“Mr. Shan”) as the authorizedrepresentatives (“Authorized Representatives”) for the purpose of Rules 3.05 of the ListingRules. The Authorized Representatives will act as our principal channel of communicationwith the Stock Exchange and would be readily contactable by phone, facsimile and emailto deal promptly with enquiries from the Stock Exchange. Ms. Han and Mr. Shanordinarily reside in China, and both possess valid travel documents and are able to renewsuch travel documents when they expire in order to visit Hong Kong. Accordingly, theAuthorized Representatives will also be able to meet with the relevant members of theStock Exchange to discuss any matters in relation to our Company within a reasonableperiod of time. See “Directors and Senior Management.”
2. Directors: to facilitate communication with the Stock Exchange, we have provided theAuthorized Representatives and the Stock Exchange with the contact details (such as
69
WAIVERS FROM STRICT COMPLIANCE WITH THE LISTING RULES
mobile phone numbers, office phone numbers, e-mail addresses and fax numbers, to theextent possible) of each of our Directors. In the event that any Director expects to travel orotherwise be out of office, he or she will provide the phone number of the place of his/heraccommodation to the Authorized Representatives. To the best of our knowledge andinformation, each Director who does not ordinarily reside in Hong Kong possesses or canapply for valid travel documents to visit Hong Kong and can meet with the StockExchange within a reasonable period after requested by the Stock Exchange; and
3. Compliance adviser: we have appointed Altus Capital Limited as our compliance adviser(the “Compliance Adviser”) in compliance with Rules 3A.19 of the Listing Rules. TheCompliance Adviser will, among other things and in addition to the AuthorizedRepresentatives, provide us with professional advice on continuing obligations under theListing Rules and act as additional channel of communication of the Company with theStock Exchange during the period from the Listing Date to the date on which theCompany complies with Rule 13.46 of the Listing Rules in respect of its financial resultsfor the first full financial year immediately after the Listing. The Compliance Adviser willbe available to answer enquiries from the Stock Exchange and will act as the principalchannel of communication with the Stock Exchange when the Authorized Representativesare not available.
WAIVER IN RELATION TO PUBLIC FLOAT
Rule 8.08(1)(a) of the Listing Rules requires that at least 25% of an issuer’s total issued sharecapital must at all times be held by the public. We expect to achieve a minimum market capitalizationof at least HK$10 billion upon Listing and we have applied to the Stock Exchange to request the StockExchange to exercise, and the Stock Exchange has confirmed that it will exercise, its discretion underRule 8.08(1)(d) of the Listing Rules, pursuant to which the public float of the Company may fall below25% of the issued share capital of the Company, to allow a minimum public float of the Company to bethe highest of: (i) 15% of the Company’s total issued share capital; (ii) such percentage of Shares heldby the public after completion of the Global Offering (assuming that the Over-allotment Option is notexercised); and (iii) such percentage of Shares held by the public after the full or partial exercise of theOver-allotment Option, subject to a maximum percentage of 25% pursuant to Rule 8.08(1)(a) of theListing Rules. The above discretion is subject to the condition that we make appropriate disclosure ofthe lower prescribed percentage of public float in this prospectus and confirm the sufficiency of thepublic float in our successive annual reports after the Listing. We and the Joint Sponsors will be able todemonstrate compliance with Rules 8.08(2) and 8.08(3) of the Listing Rules.
In addition, we will implement appropriate measures and mechanisms to ensure continualmaintenance of a 15% public float (or a higher percentage upon completion of any exercise of theOver-allotment Option). In the event that the public float percentage falls below the minimumpercentage prescribed by the Stock Exchange, the Directors and our Controlling Shareholders will takeappropriate steps to ensure the minimum percentage of public float prescribed by the Stock Exchangeis complied with.
WAIVER IN RELATION TO POST TRACK RECORD PERIOD ACQUISITION
Pursuant to Rules 4.04(2) and 4.04(4) of the Listing Rules, our Company shall include in itsaccountant’s report the results and balance sheet of any subsidiaries and/or businesses acquired, agreedto be acquired or proposed to be acquired since the date to which the latest audited accounts of the
70

WAIVERS FROM STRICT COMPLIANCE WITH THE LISTING RULES
Company have been made up in respect of each of the three financial years immediately preceding theissue of the listing document.
Pursuant to guidance letter HKEx-GL32-12 issued by the Stock Exchange (“GL32-12”), theStock Exchange may consider granting waiver of the requirements under Rules 4.04(2) and 4.04(4) ofthe Listing Rules on a case-by-case basis, and having regard to all relevant facts and circumstances, theStock Exchange will ordinarily grant a waiver in relation to acquisitions of a business or subsidiarysubject to the following conditions: (i) the percentage ratios (as defined under Rule 14.04(9) of theListing Rules) of the acquired or to be acquired business or subsidiary are all less than 5% by referenceto the most recent financial year of the applicant’s trading record period; (ii) the historical financialinformation of the acquired or to be acquired business or subsidiary is not available or would be undulyburdensome to obtain or prepare; and (iii) the listing document should include at least the informationthat would be required for a disclosable transaction under Chapter 14 of the Listing Rules on eachacquisition.
The Company is currently negotiating with a target company (“Target Company”), which is anIndependent Third Party, and its shareholders for potential acquisition of a portion or all of the equityinterest and/or business of the Target Company (“Proposed Acquisition”). See “History,Reorganization and Corporate Structure – Post Track Record Period Acquisition”.
Based on the following reasons, our Company has applied to and the Stock Exchange hasgranted us, a waiver from strict compliance with Rules 4.04(2) and 4.04(4) of the Listing Rules:
(a) Immateriality of the Proposed Acquisition: The scale of the businesses operated by theTarget Company as compared to that of our Group is not material. Each of the asset ratio,revenue ratio and profits ratio in relation to the Proposed Acquisition is below 5%. Inaddition, notwithstanding that the Proposed Acquisition represents suitable strategicacquisition target of the Group, the Company is of the view that the Proposed Acquisition,as and if completed, would not significantly affect the financial position of our Group as awhole. Furthermore, it is expected that the Target Company will not be a significantsubsidiary of the Company (as defined under Chapter 14A of the Listing Rules), even ifthe relevant acquisitions are completed or materialized.
(b) Undue burden to obtain and prepare historical financial information of the TargetCompany to be acquired: The Proposed Acquisition has not been completed as of thedate of this prospectus, and remains subject to the conditions precedent, including but notlimited to satisfactory due diligence results, entry into a definitive subscription agreementand internal and external approval and filing procedure, and the determination of initialbusiness plan and budget. As such, we do not have full access to the relevant financialrecords for purposes of audit by its reporting accountant and disclosure in this prospectus.Accordingly, having considered the immateriality of the Proposed Acquisition as well asthe time and resources required to obtain, compile and audit such historical financialinformation in conformity with the Company’s accounting policies, it would be undulyburdensome for the Company to prepare and include the financial information of theTarget Company under the Proposed Acquisition in this prospectus.
(c) Alternative disclosure: With a view of allowing the potential investors to understand theProposed Acquisition in greater details, we have disclosed in this prospectus the followinginformation in relation to the Proposed Acquisition, which is comparable to theinformation that is required to be included in the announcement of a discloseable
71
WAIVERS FROM STRICT COMPLIANCE WITH THE LISTING RULES
transaction under Chapter 14 of the Listing Rules, including (a) general description of thescope of principal business activities of the Target Company; (b) the basis on which theconsideration is determined; (c) how the consideration will be satisfied; (d) reasons for andbenefits of the Proposed Acquisition; and (e) other material terms of the sale and purchaseagreement in relation to the Proposed Acquisition (if any). See “History, Reorganizationand Corporate Structure – Post Track Record Period Acquisition.”
72

INFORMATION ABOUT THE PROSPECTUS AND THE GLOBAL OFFERING
DIRECTORS’ RESPONSIBILITY FOR THE CONTENTS OF THIS PROSPECTUS
This prospectus includes particulars given in compliance with the Companies (Winding Up andMiscellaneous Provisions) Ordinance, the Securities and Futures (Stock Market Listing) Rules and theListing Rules for the purposes of giving information to the public about us. The Directors collectivelyand individually accept full responsibility for the accuracy and completeness of the informationcontained in this prospectus and confirm, having made all reasonable enquiries, that to the best of theirknowledge and belief the information contained in this prospectus is accurate and complete in allmaterial respects and not misleading or deceptive, and that there are no other matters the omission ofwhich would make any statement herein or this prospectus misleading.
UNDERWRITING
This prospectus is published solely in connection with the Hong Kong Public Offering. Forapplicants under the Hong Kong Public Offering, this prospectus and the Application Forms containthe terms and conditions of the Hong Kong Public Offering.
Pursuant to the Hong Kong Underwriting Agreement, the Hong Kong Public Offering is fullyunderwritten by the Hong Kong Underwriters under the terms of the Hong Kong UnderwritingAgreement, subject to agreement on the Offer Price to be determined between the Joint GlobalCoordinators (on behalf of the Underwriters) and us on the Price Determination Date.
Further information about the Underwriters and the underwriting arrangements is set out in thesection headed “Underwriting.”
INFORMATION ON THE GLOBAL OFFERING
The Offer Shares are offered solely on the basis of the information contained andrepresentations made in this prospectus and the Application Forms and on the terms and subject to theconditions set out herein and therein. No person is authorized to give any information in connectionwith the Global Offering or to make any representation not contained in this prospectus, and anyinformation or representation not contained herein must not be relied upon as having been authorizedby the Company, the Joint Sponsors, the Joint Global Coordinators, the Joint Bookrunners, the JointLead Managers, the Underwriters, any of their respective directors, agents, employees or advisers orany other party involved in the Global Offering. Details of the structure of the Global Offering,including its conditions, are set out in the section headed “Structure of the Global Offering,” and theprocedures for applying for Hong Kong Public Offer Shares are set out in the section headed “How toApply for the Hong Kong Offer Shares” and in the relevant Application Forms.
RESTRICTIONS ON OFFER AND SALE OF THE OFFER SHARES
Each person acquiring the Hong Kong Offer Shares under the Hong Kong Public Offering willbe required to, or be deemed by his/her acquisition of Offer Shares to, confirm that he/she is aware ofthe restrictions on offers for the Offer Shares described in this prospectus. No action has been taken topermit a public offering of the Offer Shares in any jurisdiction other than in Hong Kong, or thedistribution of this prospectus in any jurisdiction other than Hong Kong. Accordingly, this prospectusmay not be used for the purpose of, and does not constitute an offer or invitation in any jurisdiction orin any circumstances in which such an offer or invitation is not authorized or to any person to whom itis unlawful to make such an offer or invitation. The distribution of this prospectus and the offer and
73

INFORMATION ABOUT THE PROSPECTUS AND THE GLOBAL OFFERING
sale of the Offer Shares in other jurisdictions are subject to restrictions and may not be made except aspermitted under the applicable securities laws of such jurisdictions pursuant to registration with orauthorization by the relevant securities regulatory authorities or an exemption therefrom.
APPLICATION FOR LISTING ON THE HONG KONG STOCK EXCHANGE
We have applied to the listing committee of the Stock Exchange for the granting of the listingof, and permission to deal in our Shares in issue and to be issued pursuant to the Global Offering(including the additional Shares which may be issued pursuant to the exercise of the Over-allotmentOption).
No part of our Shares or loan capital is listed on or dealt in on any other stock exchange and nosuch listing or permission to list is being or proposed to be sought in the near future. All the OfferShares will be registered on the branch register of our Company in Hong Kong in order to enable themto be traded on the Stock Exchange.
Under section 44B(1) of the Companies (Winding Up and Miscellaneous Provisions)Ordinance, any allotment made in respect of any application will be invalid if the Listing of, andpermission to deal in, the Shares on the Stock Exchange is refused before the expiration of three weeksfrom the date of the closing of the application lists, or such longer period (not exceeding six weeks) asmay, within the said three weeks, be notified to our Company by the Stock Exchange.
SHARES WILL BE ELIGIBLE FOR ADMISSION INTO CCASS
Subject to the granting of the listing of, and permission to deal in, the Shares on the StockExchange and compliance with the stock admission requirements of HKSCC, the Shares will beaccepted as eligible securities by HKSCC for deposit, clearance and settlement in CCASS with effectfrom the Listing Date or on any other date as determined by HKSCC. Settlement of transactionsbetween participants of the Stock Exchange is required to take place in CCASS on the second businessday after any trading day. All activities under CCASS are subject to the General Rules of CCASS andCCASS Operational Procedures in effect from time to time. All necessary arrangements have beenmade for the Shares to be admitted into CCASS. Investors should seek the advice of their stockbrokeror other professional advisor for details of those settlement arrangements and how such arrangementswill affect their rights and interests.
HONG KONG REGISTER OF MEMBERS AND STAMP DUTY
Our principal register of members will be maintained in the Cayman Islands by our principalregistrar, Maples Fund Services (Cayman) Limited, in the Cayman Islands, and our Hong Kongregister will be maintained by the Hong Kong Share Registrar, Tricor Investors Services Limited, inHong Kong.
All Offer Shares issued pursuant to applications made in the Hong Kong Public Offering andthe International Offering will be registered on the Hong Kong register of members of our Company inHong Kong. Dealings in the Shares will be subject to Hong Kong stamp duty. For further details ofHong Kong stamp duty, please seek professional tax advice. Unless otherwise determined by ourBoard, dividends will be paid to Shareholders whose names are listed on our register of members inHong Kong, by ordinary post, at the Shareholders’ risk in Hong Kong dollars.
74
INFORMATION ABOUT THE PROSPECTUS AND THE GLOBAL OFFERING
PROFESSIONAL TAX ADVICE RECOMMENDED
Applicants for the Offer Shares are recommended to consult their professional advisers if theyare in any doubt as to the taxation implications of holding and dealing in the Shares. It is emphasizedthat none of us, the Joint Global Coordinators, the Joint Sponsors, the Joint Bookrunners, the JointLead Managers, the Underwriters, any of our/their respective affiliates, directors, supervisors,employees, agents or advisers or any other party involved in the Global Offering accepts responsibilityfor any tax effects or liabilities of holders of the Shares resulting from the subscription, purchase,holding or disposal of the Shares.
EXCHANGE RATES
Solely for convenience purposes, this prospectus includes translations among certain amountsdenominated in Renminbi, Hong Kong dollars and US dollars. No representation is made that theRenminbi amounts could actually be converted into another currency at the rates indicated, or at all.Unless otherwise indicated, (i) the translation between US dollar and Hong Kong dollar was made atthe rate of HK$7.8420 to US$1.00, and (ii) the translation between Renminbi and Hong Kong dollarswas made at the rate of HK$1.1088 to RMB1.00, each based on the exchange rates prevailing onOctober 11, 2019 published by the PBOC for foreign exchange transactions.
LANGUAGE
If there is any inconsistency between this prospectus and the Chinese translation of thisprospectus, this prospectus shall prevail unless otherwise stated. However, the translated Englishnames of the PRC nationals, entities, departments, facilities, certificates, titles, laws, regulations(including certain of our subsidiaries) and the like included in this prospectus and for which no officialEnglish translation exists are unofficial translations for your reference only. If there is anyinconsistency, the Chinese name prevails.
ROUNDING
Certain amounts and percentages figures included in this prospectus have been subject torounding adjustments, or have been rounded to one or two decimal places. Any discrepancies in anytable in this prospectus between total and sum of amounts listed therein are due to rounding.
75
DIRECTORS AND PARTIES INVOLVED IN THE GLOBAL OFFERING
See “Directors and Senior Management” for further information on our Directors.
DIRECTORS
Name Address Nationality
Executive Directors
Mr. Wang Xuning (王旭寧) . . . . . . . . . . . . Room 101-1Unit 3, Building 5Liu Zhuang Advanced ApartmentHangzhou, ZhejiangPRC
Chinese
Ms. Han Run (韓潤) . . . . . . . . . . . . . . . . . G21-2-1804No. 21 Yangguang Xin RoadHuaiyin DistrictJinan, ShandongPRC
Chinese
Ms. Huang Shuling (黃淑玲) . . . . . . . . . . . No. 101Building 2, No. 3 DistrictGuohua Dongfang MeijunTravel RoadShizhong DistrictJinan, ShandongPRC
Chinese
Non-executive Directors
Mr. Hui Chi Kin Max (許志堅) . . . . . . . . . 49 ORIOLE CRESCENTSINGAPORE 288640
Singaporean
Mr. Stassi Anastas Anastassov . . . . . . . . . 26 Chemin de La Rochefoucauld1290 VersoixSwitzerland
Swedish
Independent non-executive Directors
Dr. Wong Tin Yau Kelvin (黃天祐) . . . . . Room 2, 4/FBlock D Greenville GardensShiu Fai TerraceNo. 14-17 Stubbs RoadHong Kong
British
Mr. Timothy Roberts Warner . . . . . . . . . . 350 Arden RoadMenlo ParkCaliforniaUSA
USA
Mr. Yang Xianxiang (楊現祥) . . . . . . . . . . Flat A68/F, Tower 211 Tai Hang RoadSerenade, Causeway BayHong Kong
Chinese (Hong Kong)
76
DIRECTORS AND PARTIES INVOLVED IN THE GLOBAL OFFERING
PARTIES INVOLVED IN THE GLOBAL OFFERING
Joint Sponsors Credit Suisse (Hong Kong) LimitedLevel 88, International Commerce Centre1 Austin Road WestKowloonHong Kong
Morgan Stanley Asia LimitedLevel 46, International Commerce Centre1 Austin Road WestKowloonHong Kong
ICBC International Capital Limited37/F, ICBC Tower3 Garden RoadHong Kong
Joint Global Coordinators Credit Suisse (Hong Kong) LimitedLevel 88, International Commerce Centre1 Austin Road WestKowloonHong Kong
Morgan Stanley Asia LimitedLevel 46, International Commerce Centre1 Austin Road WestKowloonHong Kong
ICBC International Capital Limited37/F, ICBC Tower3 Garden RoadHong Kong
China International Capital Corporation Hong KongSecurities Limited29/F, One International Finance Centre1 Harbour View StreetCentralHong Kong
Joint Bookrunners Credit Suisse (Hong Kong) LimitedLevel 88, International Commerce Centre1 Austin Road WestKowloonHong Kong
77
DIRECTORS AND PARTIES INVOLVED IN THE GLOBAL OFFERING
Morgan Stanley Asia Limited(in relation to the Hong Kong Public Offering only)Level 46, International Commerce Centre1 Austin Road WestKowloonHong Kong
Morgan Stanley & Co. International plc(in relation to the International Offering only)25 Cabot Square Canary WharfLondon E14 4QAUnited Kingdom
ICBC International Capital Limited37/F, ICBC Tower3 Garden RoadHong Kong
China International Capital Corporation Hong KongSecurities Limited29/F, One International Finance Centre1 Harbour View StreetCentralHong Kong
CMB International Capital Limited45/F, Champion Tower3 Garden RoadCentral, Hong Kong
China Merchants Securities (HK) Co., Limited48/F, One Exchange Square8 Connaught PlaceCentralHong Kong
CCB International Capital Limited12/F, CCB Tower3 Connaught Road CentralCentralHong Kong
Joint Lead Managers Credit Suisse (Hong Kong) LimitedLevel 88, International Commerce Centre1 Austin Road WestKowloonHong Kong
78
DIRECTORS AND PARTIES INVOLVED IN THE GLOBAL OFFERING
Morgan Stanley Asia Limited(in relation to the Hong Kong Public Offering only)Level 46, International Commerce Centre1 Austin Road WestKowloonHong Kong
Morgan Stanley & Co. International plc(in relation to the International Offering only)25 Cabot Square Canary WharfLondon E14 4QAUnited Kingdom
ICBC International Securities Limited37/F, ICBC Tower3 Garden RoadHong Kong
China International Capital Corporation Hong KongSecurities Limited29/F, One International Finance Centre1 Harbour View StreetCentralHong Kong
CMB International Capital Limited45/F, Champion Tower3 Garden RoadCentral, Hong Kong
China Merchants Securities (HK) Co., Limited48/F, One Exchange Square8 Connaught PlaceCentralHong Kong
CCB International Capital Limited12/F, CCB Tower3 Connaught Road CentralCentralHong Kong
Auditor and ReportingAccountant
Ernst & Young22/F, CITIC Tower1 Tim Mei AvenueCentralHong Kong
79

DIRECTORS AND PARTIES INVOLVED IN THE GLOBAL OFFERING
Legal Advisors to the Company As to Hong Kong and US laws:Clifford Chance27/F, Jardine HouseOne Connaught PlaceCentralHong Kong
As to PRC law:Grandall Law Firm (Shanghai)23/F-25/F, Garden SquareNo. 968 West Beijing RoadShanghaiPRC
As to Cayman Islands law:Maples and Calder (Hong Kong) LLP53/F, The Center99 Queen’s RoadCentralHong Kong
Legal Advisors to the JointSponsors and the Underwriters
As to Hong Kong and US laws:Paul Hastings21-22/F, Bank of China Tower1 Garden RoadCentralHong Kong
As to PRC law:Commerce & Finance Law Offices6/F NCI TowerA12 Jianguomenwai AvenueBeijingPRC
Industry Consultant Frost & Sullivan (Beijing) Inc., Shanghai Branch Co.Room 1014-1018, Tower BGreenland Hui Center500 Yunjin RoadXuhui DistrictShanghaiPRC
Receiving Banks Industrial and Commercial Bank of China (Asia) Limited33/F., ICBC Tower, 3 Garden Road, CentralHong Kong
China Construction Bank (Asia) Corporation Limited3/F, CCB Tower, 3 Connaught Road Central,CentralHong Kong
80

CORPORATE INFORMATION
Registered Office Maples Corporate Services LimitedPO Box 309Ugland HouseGrand Cayman KY1-1104Cayman Islands
Head Office and Principal Place of Business 21/F238 Des Voeux Road CentralSheung WanHong Kong
Principal Place of Business in Hong Kong 21/F238 Des Voeux Road CentralSheung WanHong Kong
Company’s Website www.jsgloballife.com
Company Secretary Shan MinqiRoom 902, Unit 3
Building 4, Pastoral LuyunyuanBanshan Town, Gongshu DistrictHangzhou, ZhejiangPRC
Authorized Representatives Han RunG21-2-1804No. 21 Yangquang Xin RoadHuaiyin DistrictJinan, ShandongPRC
Shan MinqiRoom 902, Unit 3
Building 4, Pastoral LuyunyuanBanshan Town, Gongshu DistrictHangzhou, ZhejiangPRC
Strategy Committee Wang Xuning (Chairman)Hui Chi Kin MaxStassi Anastas AnastassovWong Tin Yau KelvinTimothy Roberts WarnerYang Xianxiang
Audit Committee Wong Tin Yau Kelvin (Chairman)Timothy Roberts WarnerYang Xianxiang
Nomination Committee Wang Xuning (Chairman)Wong Tin Yau KelvinYang Xianxiang
81
CORPORATE INFORMATION
Remuneration Committee Timothy Roberts Warner (Chairman)Han RunYang Xianxiang
Compliance Adviser Altus Capital Limited21 Wing Wo StreetCentralHong Kong
Hong Kong Share Registrar Tricor Investor Services LimitedLevel 54, Hopewell Centre183 Queen’s Road EastHong Kong
Cayman Islands Principal Share Registrar andTransfer Office
Maples Fund Services (Cayman) LimitedPO Box 1093Boundaty HallCricket SquareGrand CaymanKY1-1102Cayman Islands
Principal Banks Industrial and Commercial Bank of China (Asia)Limited29F, ICBC Tower3 Garden RoadCentralHong Kong
82

INDUSTRY OVERVIEW
The information presented in this section is derived from the Frost & Sullivan Report, aswell as various official or publicly available publications. The information derived from theFrost & Sullivan Report reflects estimates of the market conditions based on information fromvarious sources. We believe that the sources of the information in this section are appropriatesources for such information and have taken reasonable care in extracting and reproducing suchinformation. We have no reason to believe that such information is false or misleading or thatany part has been omitted that would render such information false or misleading in any materialrespect. We, the Joint Sponsors, the Joint Global Coordinators, the Joint Bookrunners, the JointLead Managers, or their respective affiliates or advisors or any other party involved in theGlobal Offering, except the Industry Consultant, have not independently verified, and make norepresentation as to, the accuracy of the information from official government or other third-party sources. Accordingly, the official government and other third-party sources containedherein may not be accurate and should not be unduly relied upon. Our Directors confirm that,after due and reasonable consideration, there is no adverse change in the market informationsince the date of the Frost & Sullivan Report up to the date of this prospectus which may qualify,conflict with or have a material impact on, the information in this section.
SOURCES OF INFORMATION AND RESEARCH METHODOLOGY
We commissioned Frost & Sullivan, an independent market research and consulting companywhich is engaged in the provision of market research and economic research consultancy services, toconduct a detailed analysis of, and to prepare a report on, the global, the United States, China and theUnited Kingdom small household appliance markets. The report prepared by Frost & Sullivan isreferred to in this prospectus as the Frost & Sullivan Report. We have agreed to pay Frost & Sullivan afee of RMB780,000, which we believe reflects market rates for reports of this type.
We have included certain information from the Frost & Sullivan Report in this prospectusbecause we believe this information facilitates an understanding of the small household appliancemarket for prospective investors. Frost & Sullivan’s independent research consists of both primary andsecondary research obtained from various sources in respect of the small household appliance market.Primary research involved in-depth interviews with leading industry participants and experts.Secondary research involved reviewing company reports, independent research reports and data basedon Frost & Sullivan’s own research database and other data providers. Projected data were obtainedfrom historical data analysis plotted against macroeconomic data with reference to specific industry-related factors.
Except as otherwise noted, all of the data and forecasts contained in this section are derivedfrom the Frost & Sullivan Report, official government publications and other publications. Undercircumstances where information is not available, Frost & Sullivan leveraged models and indicatorswhich they believe to be appropriate to arrive at an estimate.
Frost & Sullivan has prepared the Frost & Sullivan Report on the assumptions that (i) the globalsocial, economic and political environment is likely to remain stable in the forecast period;(ii) purchasing power is expected to continue to rise rapidly in emerging regions and to grow steadilyin developed regions; and (iii) relevant industry key drivers are likely to drive the market in theforecast period. The reliability of the Frost & Sullivan Report may be affected by the accuracy of theforegoing assumptions.
83
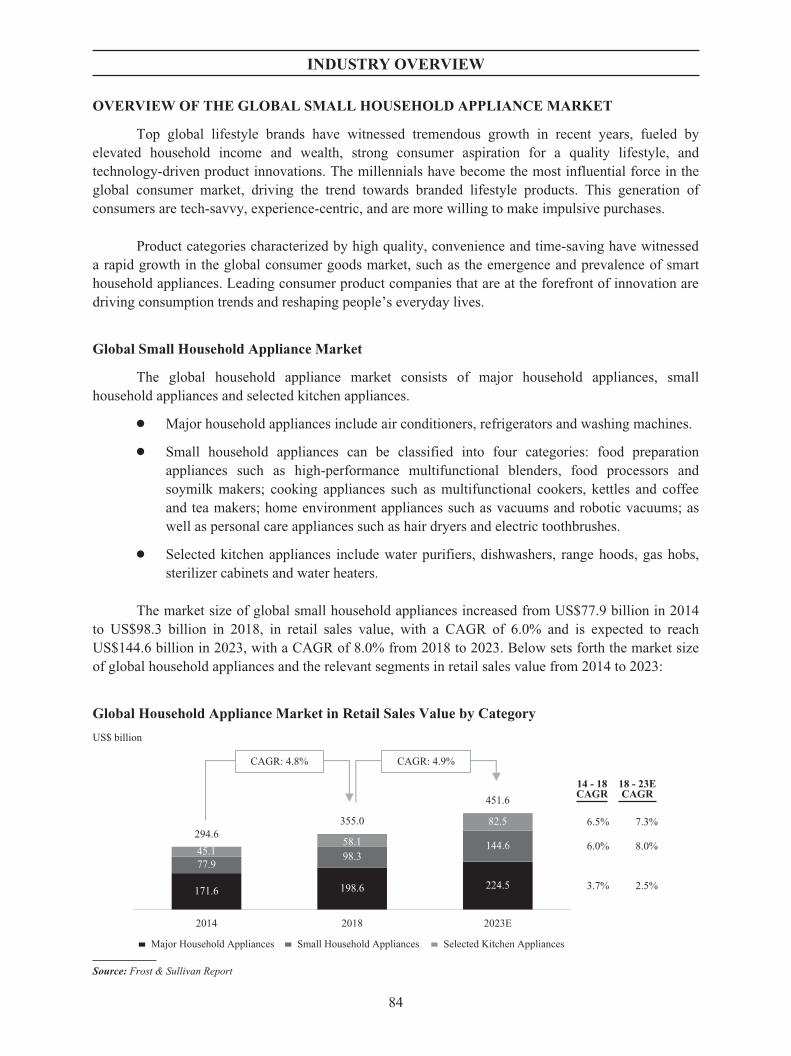
INDUSTRY OVERVIEW
OVERVIEW OF THE GLOBAL SMALL HOUSEHOLD APPLIANCE MARKET
Top global lifestyle brands have witnessed tremendous growth in recent years, fueled byelevated household income and wealth, strong consumer aspiration for a quality lifestyle, andtechnology-driven product innovations. The millennials have become the most influential force in theglobal consumer market, driving the trend towards branded lifestyle products. This generation ofconsumers are tech-savvy, experience-centric, and are more willing to make impulsive purchases.
Product categories characterized by high quality, convenience and time-saving have witnesseda rapid growth in the global consumer goods market, such as the emergence and prevalence of smarthousehold appliances. Leading consumer product companies that are at the forefront of innovation aredriving consumption trends and reshaping people’s everyday lives.
Global Small Household Appliance Market
The global household appliance market consists of major household appliances, smallhousehold appliances and selected kitchen appliances.
Š Major household appliances include air conditioners, refrigerators and washing machines.
Š Small household appliances can be classified into four categories: food preparationappliances such as high-performance multifunctional blenders, food processors andsoymilk makers; cooking appliances such as multifunctional cookers, kettles and coffeeand tea makers; home environment appliances such as vacuums and robotic vacuums; aswell as personal care appliances such as hair dryers and electric toothbrushes.
Š Selected kitchen appliances include water purifiers, dishwashers, range hoods, gas hobs,sterilizer cabinets and water heaters.
The market size of global small household appliances increased from US$77.9 billion in 2014to US$98.3 billion in 2018, in retail sales value, with a CAGR of 6.0% and is expected to reachUS$144.6 billion in 2023, with a CAGR of 8.0% from 2018 to 2023. Below sets forth the market sizeof global household appliances and the relevant segments in retail sales value from 2014 to 2023:
Global Household Appliance Market in Retail Sales Value by Category
US$ billion
294.6355.0
451.6
2023E20182014
CAGR: 4.8% CAGR: 4.9%
14 - 18CAGR
18 - 23ECAGR
6.0% 8.0%
3.7% 2.5%
6.5% 7.3%
Major Household Appliances Small Household Appliances Selected Kitchen Appliances
171.6 198.6 224.5
144.6
82.5
98.358.1
45.177.9
Source: Frost & Sullivan Report
84
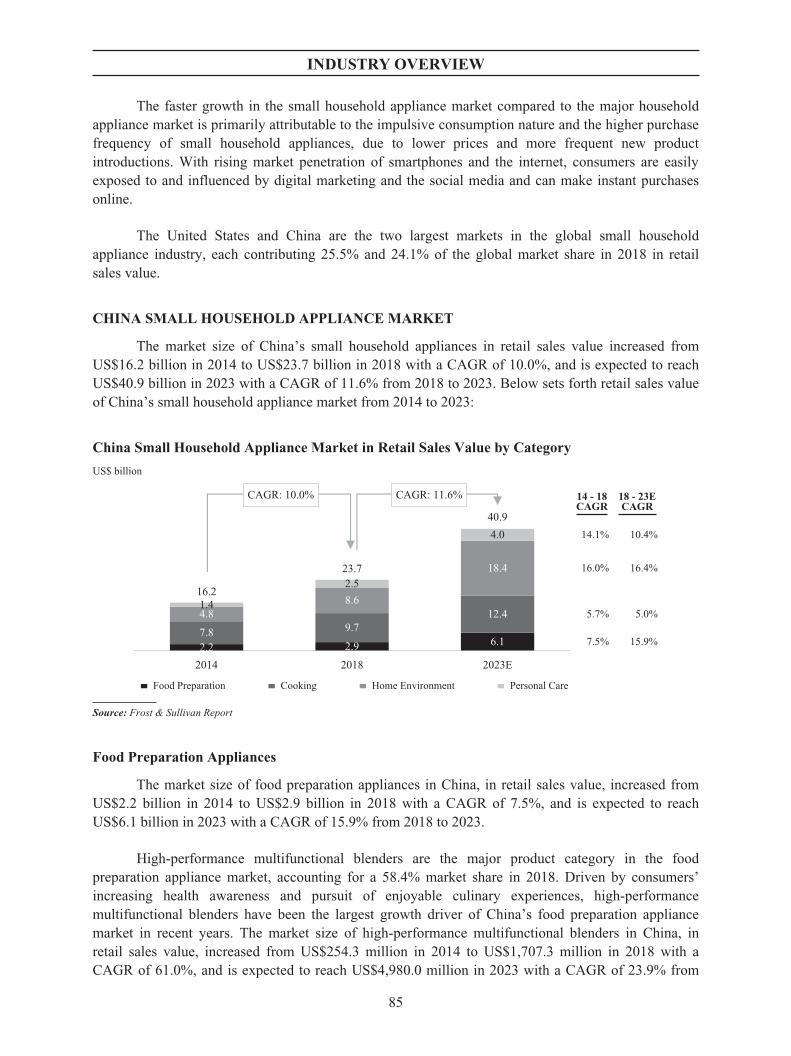
INDUSTRY OVERVIEW
The faster growth in the small household appliance market compared to the major householdappliance market is primarily attributable to the impulsive consumption nature and the higher purchasefrequency of small household appliances, due to lower prices and more frequent new productintroductions. With rising market penetration of smartphones and the internet, consumers are easilyexposed to and influenced by digital marketing and the social media and can make instant purchasesonline.
The United States and China are the two largest markets in the global small householdappliance industry, each contributing 25.5% and 24.1% of the global market share in 2018 in retailsales value.
CHINA SMALL HOUSEHOLD APPLIANCE MARKET
The market size of China’s small household appliances in retail sales value increased fromUS$16.2 billion in 2014 to US$23.7 billion in 2018 with a CAGR of 10.0%, and is expected to reachUS$40.9 billion in 2023 with a CAGR of 11.6% from 2018 to 2023. Below sets forth retail sales valueof China’s small household appliance market from 2014 to 2023:
China Small Household Appliance Market in Retail Sales Value by Category
US$ billion
16.2
23.7
40.9
2023E20182014
CAGR: 10.0% CAGR: 11.6% 14 - 18CAGR
18 - 23ECAGR
16.0% 16.4%
7.5% 15.9%
5.7% 5.0%
14.1% 10.4%
Food Preparation Cooking Home Environment Personal Care
2.27.8
4.81.4
2.9
9.7
8.6
2.5
6.1
12.4
18.4
4.0
Source: Frost & Sullivan Report
Food Preparation Appliances
The market size of food preparation appliances in China, in retail sales value, increased fromUS$2.2 billion in 2014 to US$2.9 billion in 2018 with a CAGR of 7.5%, and is expected to reachUS$6.1 billion in 2023 with a CAGR of 15.9% from 2018 to 2023.
High-performance multifunctional blenders are the major product category in the foodpreparation appliance market, accounting for a 58.4% market share in 2018. Driven by consumers’increasing health awareness and pursuit of enjoyable culinary experiences, high-performancemultifunctional blenders have been the largest growth driver of China’s food preparation appliancemarket in recent years. The market size of high-performance multifunctional blenders in China, inretail sales value, increased from US$254.3 million in 2014 to US$1,707.3 million in 2018 with aCAGR of 61.0%, and is expected to reach US$4,980.0 million in 2023 with a CAGR of 23.9% from
85

INDUSTRY OVERVIEW
2018 to 2023. To meet diversified household demand, high-performance multifunctional blenders haveevolved with more refined features such as low noise, LED touch screen, heating and self-cleaningcapabilities.
In established markets, such as soymilk makers, companies have turned to product innovationto create new areas of demand. For example, Joyoung’s K-series automatic soymilk makers aredesigned with the ultra-fine grinding technology to ensure instant and adequate grinding for bettertastes and nutrition absorptions. The self-cleaning function brings a breakthrough solution to anage-old consumer pain point. Below sets forth retail sales value of China’s food preparation appliancemarket from 2014 to 2023:
China Food Preparation Appliance Market in Retail Sales Value
US$ billion
2.2
2.9
6.1
2023E20182014
CAGR: 7.5% CAGR: 15.9%
Source: Frost & Sullivan Report
Cooking Appliances
The market size of cooking appliances in China in retail sales value increased fromUS$7.8 billion in 2014 to US$9.7 billion in 2018 with a CAGR of 5.7% and is expected to reachUS$12.4 billion in 2023 with a CAGR of 5.0% from 2018 to 2023. Rice cookers and pressure cookersare the largest product category in the cooking appliance market, accounting for 40.8% market share in2018. The combined market size of rice cookers and pressure cookers in China in retail sales valueincreased from US$3.4 billion in 2014 to US$4.0 billion in 2018 with a CAGR of 4.1% and is expectedto reach US$4.6 billion in 2023 with a CAGR of 3.1% from 2018 to 2023. Despite the relatively highmarket penetration, the rise of consumer sophistication has driven continuous replacement needs in thecooking appliance market, with consumers seeking products with stronger performance,multifunctionality and better technology. For example, compared to traditional rice cookers, IH ricecookers allow for a higher, more precise and more uniform cooking temperature, which make better-tasting rice and enhance user experience. Between 2014 and 2018, the share of IH rice cookers in thebroader rice cooker market increased from 28.8% to 47.0%, and is expected to further increase to66.7% in 2023.
Kettles are the second largest product category in the cooking appliance market. Kettles can beclassified into electric boilers, electric bottles and health pots. From 2014 to 2018, the kettle marketgrew at a CAGR of 12.2%, with most of the growth attributable to health pots. As Chinese consumersbecome increasingly health conscious, the concept of “health preservation” is getting widely accepted
86
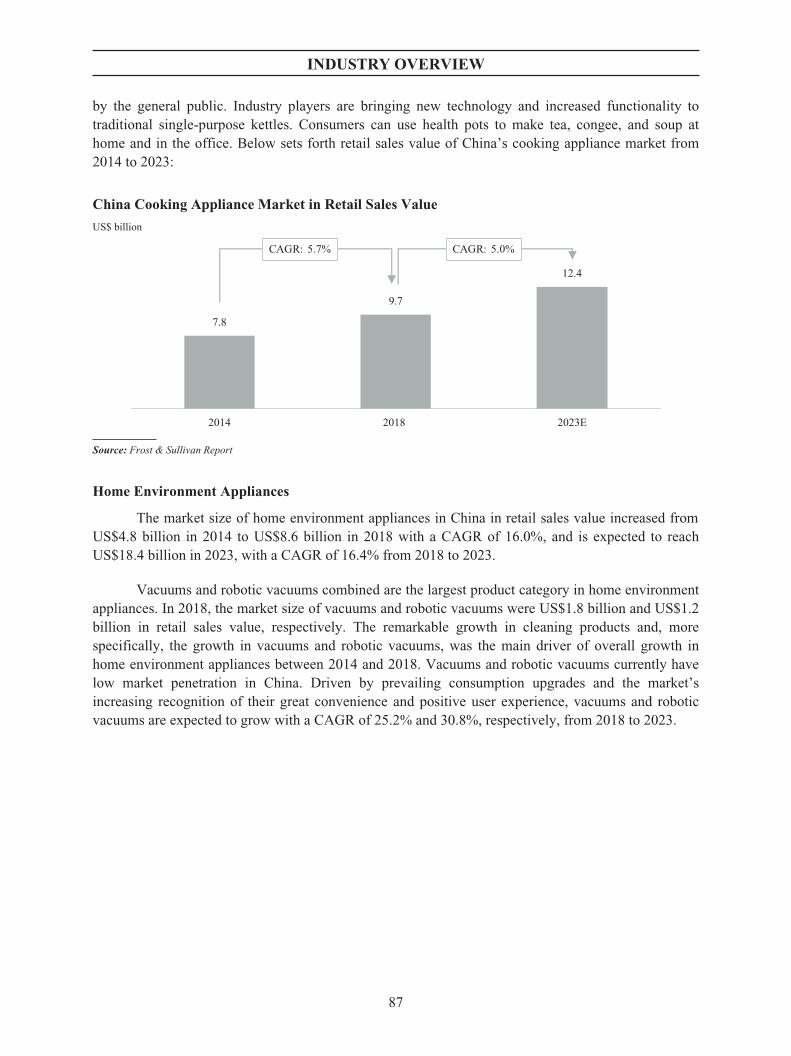
INDUSTRY OVERVIEW
by the general public. Industry players are bringing new technology and increased functionality totraditional single-purpose kettles. Consumers can use health pots to make tea, congee, and soup athome and in the office. Below sets forth retail sales value of China’s cooking appliance market from2014 to 2023:
China Cooking Appliance Market in Retail Sales Value
US$ billion
7.8
9.7
12.4
2023E20182014
CAGR: 5.7% CAGR: 5.0%
Source: Frost & Sullivan Report
Home Environment Appliances
The market size of home environment appliances in China in retail sales value increased fromUS$4.8 billion in 2014 to US$8.6 billion in 2018 with a CAGR of 16.0%, and is expected to reachUS$18.4 billion in 2023, with a CAGR of 16.4% from 2018 to 2023.
Vacuums and robotic vacuums combined are the largest product category in home environmentappliances. In 2018, the market size of vacuums and robotic vacuums were US$1.8 billion and US$1.2billion in retail sales value, respectively. The remarkable growth in cleaning products and, morespecifically, the growth in vacuums and robotic vacuums, was the main driver of overall growth inhome environment appliances between 2014 and 2018. Vacuums and robotic vacuums currently havelow market penetration in China. Driven by prevailing consumption upgrades and the market’sincreasing recognition of their great convenience and positive user experience, vacuums and roboticvacuums are expected to grow with a CAGR of 25.2% and 30.8%, respectively, from 2018 to 2023.
87
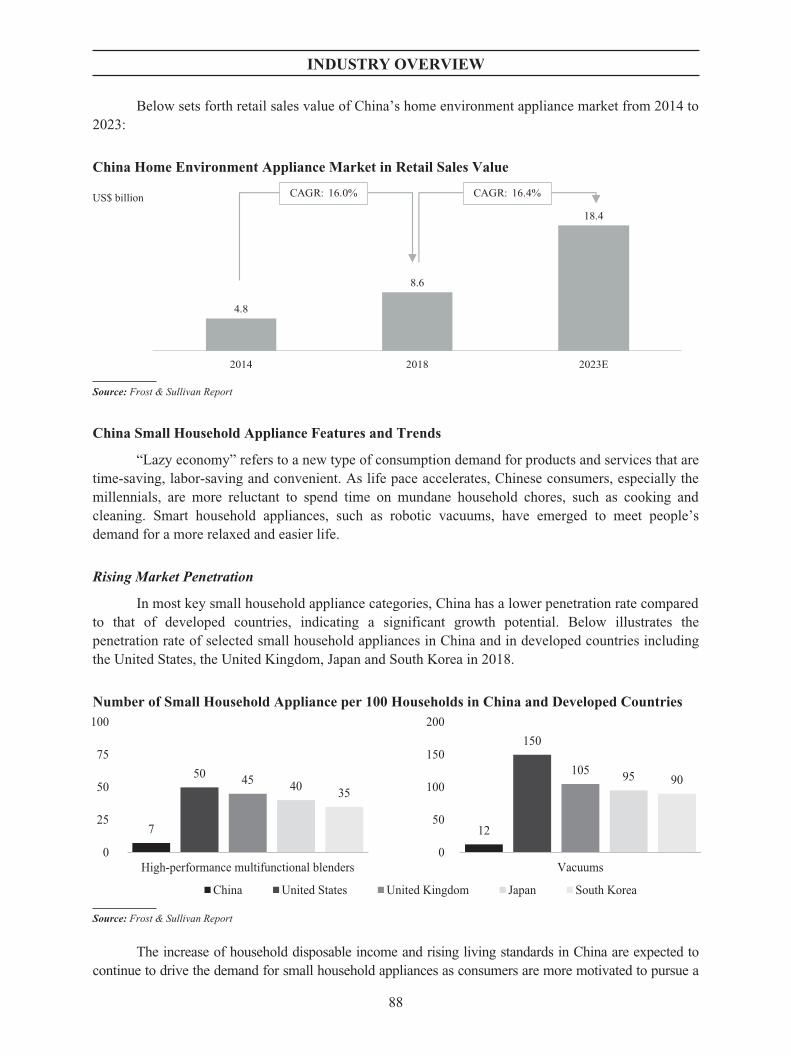
INDUSTRY OVERVIEW
Below sets forth retail sales value of China’s home environment appliance market from 2014 to2023:
China Home Environment Appliance Market in Retail Sales Value
US$ billion
2023E20182014
4.8
8.6
18.4
CAGR: 16.0% CAGR: 16.4%
Source: Frost & Sullivan Report
China Small Household Appliance Features and Trends
“Lazy economy” refers to a new type of consumption demand for products and services that aretime-saving, labor-saving and convenient. As life pace accelerates, Chinese consumers, especially themillennials, are more reluctant to spend time on mundane household chores, such as cooking andcleaning. Smart household appliances, such as robotic vacuums, have emerged to meet people’sdemand for a more relaxed and easier life.
Rising Market Penetration
In most key small household appliance categories, China has a lower penetration rate comparedto that of developed countries, indicating a significant growth potential. Below illustrates thepenetration rate of selected small household appliances in China and in developed countries includingthe United States, the United Kingdom, Japan and South Korea in 2018.
Number of Small Household Appliance per 100 Households in China and Developed Countries
China United States United Kingdom Japan South Korea
12
150
105 95 90
Vacuums0
50
100
150
200
7
50 45 40 35
0
25
50
75
100
High-performance multifunctional blenders
Source: Frost & Sullivan Report
The increase of household disposable income and rising living standards in China are expected tocontinue to drive the demand for small household appliances as consumers are more motivated to pursue a
88
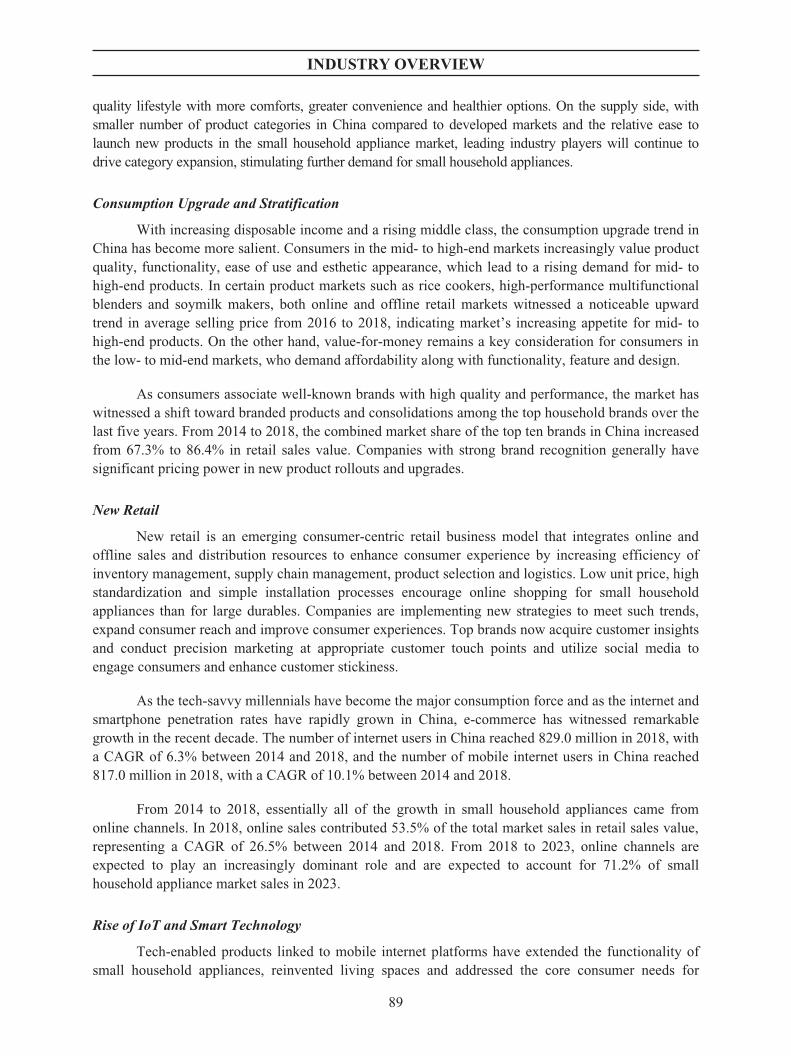
INDUSTRY OVERVIEW
quality lifestyle with more comforts, greater convenience and healthier options. On the supply side, withsmaller number of product categories in China compared to developed markets and the relative ease tolaunch new products in the small household appliance market, leading industry players will continue todrive category expansion, stimulating further demand for small household appliances.
Consumption Upgrade and Stratification
With increasing disposable income and a rising middle class, the consumption upgrade trend inChina has become more salient. Consumers in the mid- to high-end markets increasingly value productquality, functionality, ease of use and esthetic appearance, which lead to a rising demand for mid- tohigh-end products. In certain product markets such as rice cookers, high-performance multifunctionalblenders and soymilk makers, both online and offline retail markets witnessed a noticeable upwardtrend in average selling price from 2016 to 2018, indicating market’s increasing appetite for mid- tohigh-end products. On the other hand, value-for-money remains a key consideration for consumers inthe low- to mid-end markets, who demand affordability along with functionality, feature and design.
As consumers associate well-known brands with high quality and performance, the market haswitnessed a shift toward branded products and consolidations among the top household brands over thelast five years. From 2014 to 2018, the combined market share of the top ten brands in China increasedfrom 67.3% to 86.4% in retail sales value. Companies with strong brand recognition generally havesignificant pricing power in new product rollouts and upgrades.
New Retail
New retail is an emerging consumer-centric retail business model that integrates online andoffline sales and distribution resources to enhance consumer experience by increasing efficiency ofinventory management, supply chain management, product selection and logistics. Low unit price, highstandardization and simple installation processes encourage online shopping for small householdappliances than for large durables. Companies are implementing new strategies to meet such trends,expand consumer reach and improve consumer experiences. Top brands now acquire customer insightsand conduct precision marketing at appropriate customer touch points and utilize social media toengage consumers and enhance customer stickiness.
As the tech-savvy millennials have become the major consumption force and as the internet andsmartphone penetration rates have rapidly grown in China, e-commerce has witnessed remarkablegrowth in the recent decade. The number of internet users in China reached 829.0 million in 2018, witha CAGR of 6.3% between 2014 and 2018, and the number of mobile internet users in China reached817.0 million in 2018, with a CAGR of 10.1% between 2014 and 2018.
From 2014 to 2018, essentially all of the growth in small household appliances came fromonline channels. In 2018, online sales contributed 53.5% of the total market sales in retail sales value,representing a CAGR of 26.5% between 2014 and 2018. From 2018 to 2023, online channels areexpected to play an increasingly dominant role and are expected to account for 71.2% of smallhousehold appliance market sales in 2023.
Rise of IoT and Smart Technology
Tech-enabled products linked to mobile internet platforms have extended the functionality ofsmall household appliances, reinvented living spaces and addressed the core consumer needs for
89
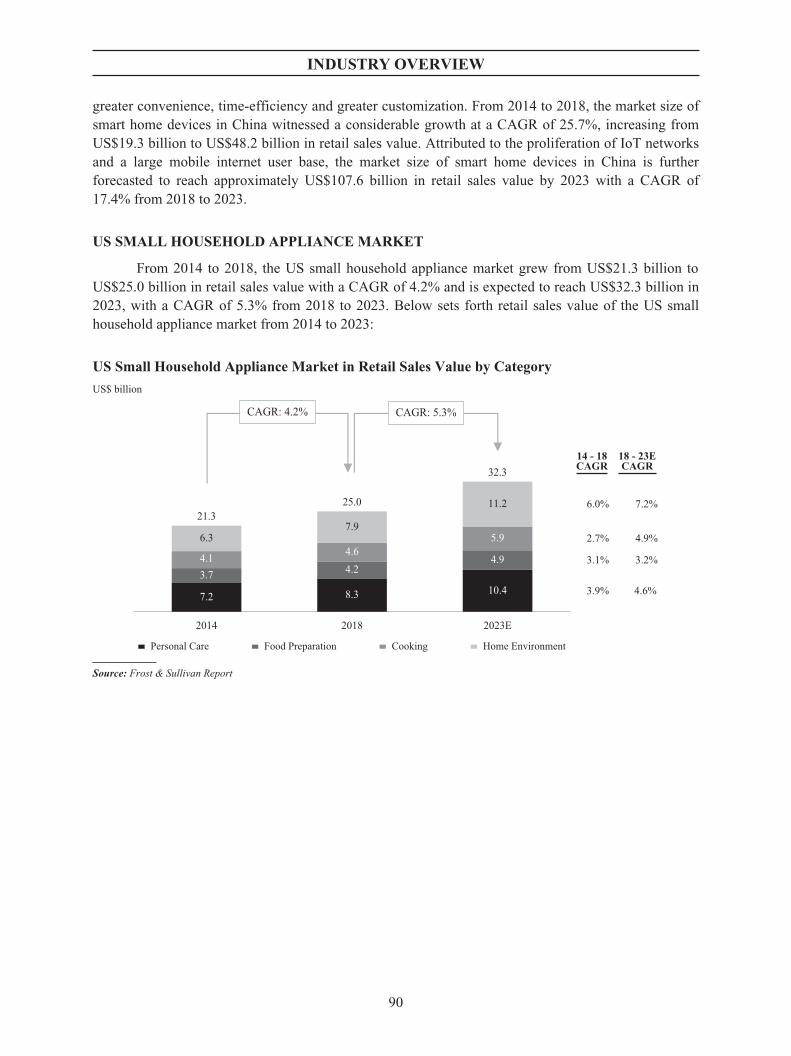
INDUSTRY OVERVIEW
greater convenience, time-efficiency and greater customization. From 2014 to 2018, the market size ofsmart home devices in China witnessed a considerable growth at a CAGR of 25.7%, increasing fromUS$19.3 billion to US$48.2 billion in retail sales value. Attributed to the proliferation of IoT networksand a large mobile internet user base, the market size of smart home devices in China is furtherforecasted to reach approximately US$107.6 billion in retail sales value by 2023 with a CAGR of17.4% from 2018 to 2023.
US SMALL HOUSEHOLD APPLIANCE MARKET
From 2014 to 2018, the US small household appliance market grew from US$21.3 billion toUS$25.0 billion in retail sales value with a CAGR of 4.2% and is expected to reach US$32.3 billion in2023, with a CAGR of 5.3% from 2018 to 2023. Below sets forth retail sales value of the US smallhousehold appliance market from 2014 to 2023:
US Small Household Appliance Market in Retail Sales Value by Category
US$ billion
Personal Care Food Preparation Cooking Home Environment
2023E20182014
21.3
6.3
4.13.7
7.2
7.9
4.64.2
8.3
25.0 11.2
5.9
4.9
10.4
32.3
CAGR: 4.2% CAGR: 5.3%
14 - 18CAGR
18 - 23ECAGR
6.0%
2.7%
3.1%
3.9%
7.2%
4.9%
3.2%
4.6%
Source: Frost & Sullivan Report
90

INDUSTRY OVERVIEW
Below sets forth retail sales value of the US small household appliance market by importingcountry from 2014 to 2018:
Retail Sales Value of US Small Household Appliance Market by Importing CountryUS$ billion
1.6 1.5
1.6 1.81.9
0.2 0.2
0.2 0.20.3
1.4 1.7
1.6 1.51.6
12.2 13.112.3
13.2 15.0
0.6 0.6
2018
0.60.8
2014
6.5
21.3
2015 2016
23.024.2
2017
22.0
25.0
0.6
0.3
0.30.4
5.0 4.76.5 5.0
ItalyChina Germany DomesticMexico Malaysia Other Importing Countries
0.3
0.3
Source: Frost & Sullivan Report
From 2014 and 2018, the majority of retail sales value in the US small household appliancemarket was attributable to imports from China. In 2018, imports from China contributed toapproximately 60.0% of the retail sales value in the US small household appliance market.
Home Environment Appliances
Home environment appliances were the fastest-growing category within the small householdappliance market in the United States by market share from 2014 to 2018. It is expected to continueleading the industry growth from 2018 to 2023. The market size of the US home environmentappliance, in retail sales value, increased from US$6.3 billion in 2014 to US$7.9 billion in 2018 with aCAGR of 6.0%, and is expected to reach US$11.2 billion in 2023 with a CAGR of 7.2% from 2018 to2023.
Vacuums are the largest product category in the US home environment appliance market with a40.4% market share in 2018. With a high market penetration predominantly in upright vacuums, theoverall US vacuum market has reached the stage of maturity, growing from US$2.9 billion in 2014 toUS$3.2 billion in 2018 in retail sales value with a CAGR of 2.4%. Driven by an increasing number ofsmaller housing units, increasing demand for multifunctional products and the popularity of cordless stickvacuums, the market is expected to reach US$3.7 billion in 2023 in retail sales value with a CAGR of3.1% from 2018 to 2023.
Upright vacuums are still the deep cleaning solution for carpeted floors with continuousupgrades to help reduce house cleaning time and optimize user experience. As the US households aremoving towards hard floors, the need for “sprint cleaning” has increased the demand for cordless stick
91

INDUSTRY OVERVIEW
vacuums. The ease of mobility and the lightweight feature of the cordless model have greatly expandedthe vacuum’s reach and applications in various scenarios.
Robotic vacuums, with a low penetration rate in the United States, are the fastest-growingproduct category in the home environment appliance market. As a supplement to upright and cordlessstick vacuums to further liberate consumers from floor cleaning chores, the market witnessed asignificant growth from US$444.1 million in 2014 to US$935.6 million in 2018, in retail sales value,with a CAGR of 20.5%, and is expected to reach US$2.3 billion in 2023 with a CAGR of 19.8% from2018 to 2023. Smart technologies such as Wi-Fi connectivity, floor navigation and voice recognitionhave greatly enhanced the product performance and consumer experience, driving the strong sales ofrobotic vacuums. Below sets forth retail sales value of the US home environment appliance marketfrom 2014 to 2023:
US Home Environment Appliance Market in Retail Sales ValueUS$ billion
2023E20182014
6.37.9
11.2
CAGR: 6.0% CAGR: 7.2%
Source: Frost & Sullivan Report
Cooking Appliances
The market size of cooking appliances in the United States, in retail sales value, increased fromUS$4.1 billion in 2014 to US$4.6 billion in 2018 with a CAGR of 2.7%, and is expected to reachUS$5.9 billion in 2023 with a CAGR of 4.9% from 2018 to 2023. The millennials are now the newgeneration of cooking enthusiasts in the United States. Food related programs are one of the mostwatched content in the country. The millennials’ desire for a healthier diet, experimentation,socializing and personal enjoyment have become an important motivation for home cooking. Withcooking instructions and recipes readily available throughout social media, cooking has becomeaccessible more than ever.
In cooking appliances, there has been a growing market for multifunctional cookers andcounter-top ovens that have made cooking easier and more convenient for passionate but less savvyyoung cooks. Multifunctional cookers are one of the fastest-growing product categories, increasingfrom US$406.4 million in 2014 to US$598.4 million in 2018 in retail sales value with a CAGR of10.2%, and are expected to reach US$1.2 billion in 2023 with a CAGR of 14.8% from 2018 to 2023.With continuous product developments, traditional cookers are transformed from a single-purposeappliance to a multifunctional cooking system with the capabilities for fast cooking, soup preparingand cake making. Coupled with the rising number of single person households, the sales of
92
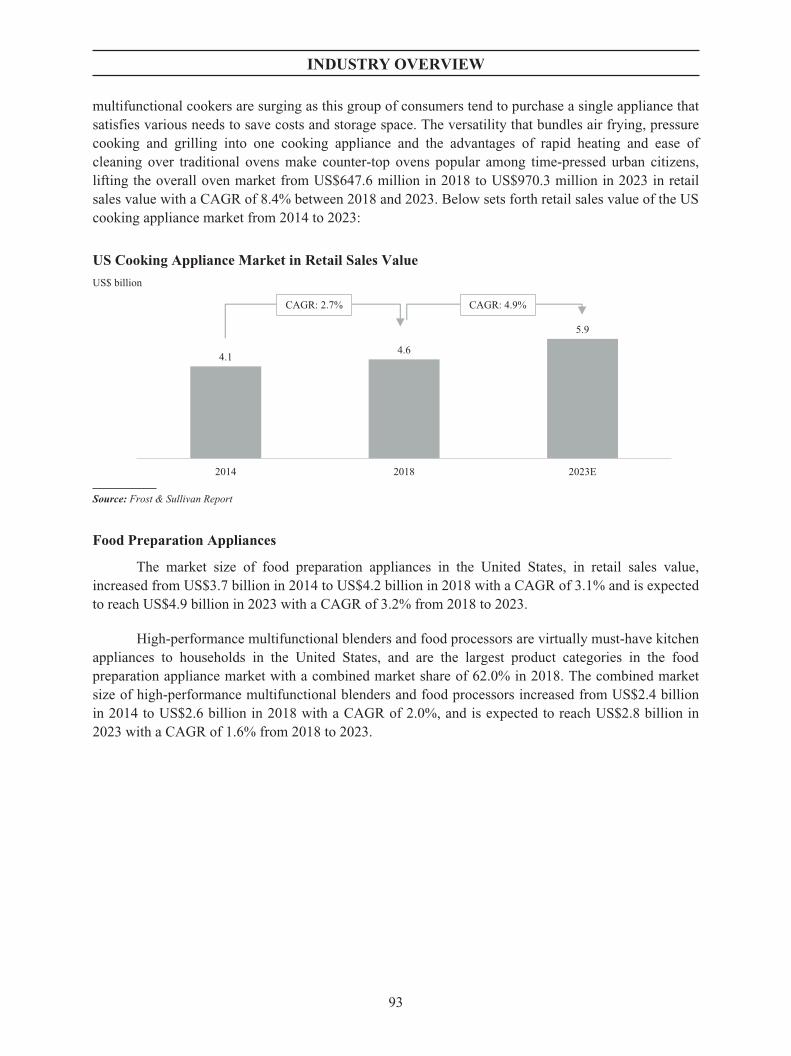
INDUSTRY OVERVIEW
multifunctional cookers are surging as this group of consumers tend to purchase a single appliance thatsatisfies various needs to save costs and storage space. The versatility that bundles air frying, pressurecooking and grilling into one cooking appliance and the advantages of rapid heating and ease ofcleaning over traditional ovens make counter-top ovens popular among time-pressed urban citizens,lifting the overall oven market from US$647.6 million in 2018 to US$970.3 million in 2023 in retailsales value with a CAGR of 8.4% between 2018 and 2023. Below sets forth retail sales value of the UScooking appliance market from 2014 to 2023:
US Cooking Appliance Market in Retail Sales Value
US$ billion
4.1 4.6
5.9
2023E20182014
CAGR: 2.7% CAGR: 4.9%
Source: Frost & Sullivan Report
Food Preparation Appliances
The market size of food preparation appliances in the United States, in retail sales value,increased from US$3.7 billion in 2014 to US$4.2 billion in 2018 with a CAGR of 3.1% and is expectedto reach US$4.9 billion in 2023 with a CAGR of 3.2% from 2018 to 2023.
High-performance multifunctional blenders and food processors are virtually must-have kitchenappliances to households in the United States, and are the largest product categories in the foodpreparation appliance market with a combined market share of 62.0% in 2018. The combined marketsize of high-performance multifunctional blenders and food processors increased from US$2.4 billionin 2014 to US$2.6 billion in 2018 with a CAGR of 2.0%, and is expected to reach US$2.8 billion in2023 with a CAGR of 1.6% from 2018 to 2023.
93
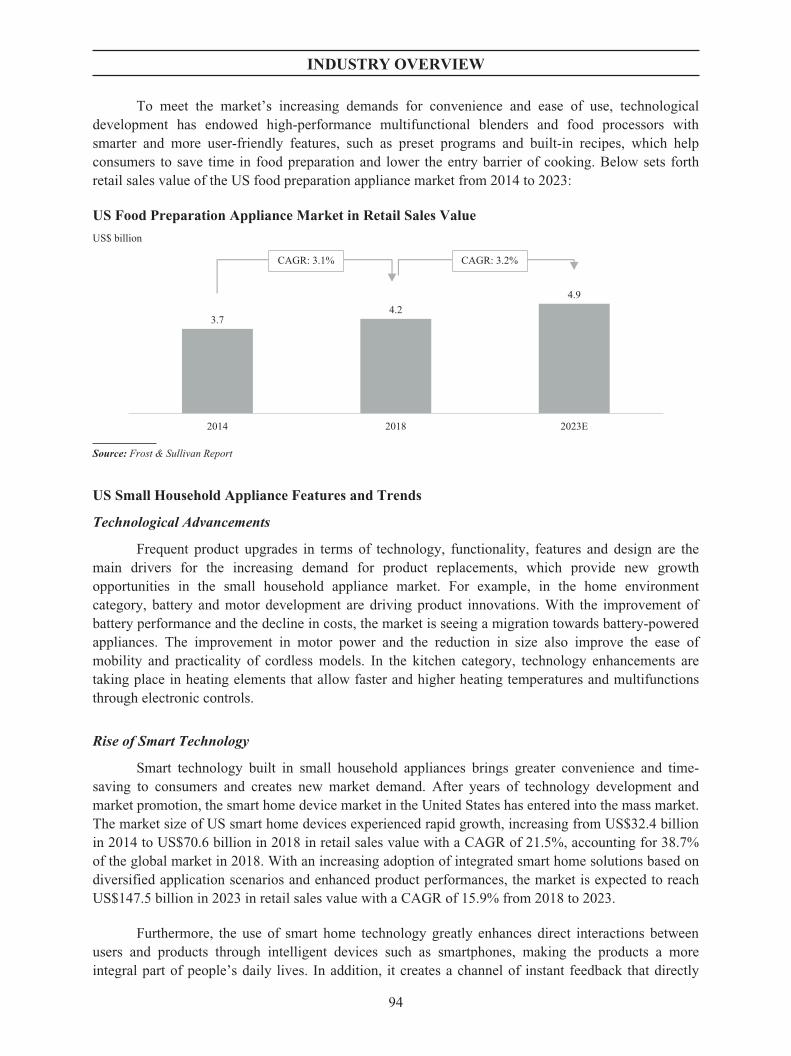
INDUSTRY OVERVIEW
To meet the market’s increasing demands for convenience and ease of use, technologicaldevelopment has endowed high-performance multifunctional blenders and food processors withsmarter and more user-friendly features, such as preset programs and built-in recipes, which helpconsumers to save time in food preparation and lower the entry barrier of cooking. Below sets forthretail sales value of the US food preparation appliance market from 2014 to 2023:
US Food Preparation Appliance Market in Retail Sales Value
US$ billion
3.74.2
4.9
2023E20182014
CAGR: 3.1% CAGR: 3.2%
Source: Frost & Sullivan Report
US Small Household Appliance Features and Trends
Technological Advancements
Frequent product upgrades in terms of technology, functionality, features and design are themain drivers for the increasing demand for product replacements, which provide new growthopportunities in the small household appliance market. For example, in the home environmentcategory, battery and motor development are driving product innovations. With the improvement ofbattery performance and the decline in costs, the market is seeing a migration towards battery-poweredappliances. The improvement in motor power and the reduction in size also improve the ease ofmobility and practicality of cordless models. In the kitchen category, technology enhancements aretaking place in heating elements that allow faster and higher heating temperatures and multifunctionsthrough electronic controls.
Rise of Smart Technology
Smart technology built in small household appliances brings greater convenience and time-saving to consumers and creates new market demand. After years of technology development andmarket promotion, the smart home device market in the United States has entered into the mass market.The market size of US smart home devices experienced rapid growth, increasing from US$32.4 billionin 2014 to US$70.6 billion in 2018 in retail sales value with a CAGR of 21.5%, accounting for 38.7%of the global market in 2018. With an increasing adoption of integrated smart home solutions based ondiversified application scenarios and enhanced product performances, the market is expected to reachUS$147.5 billion in 2023 in retail sales value with a CAGR of 15.9% from 2018 to 2023.
Furthermore, the use of smart home technology greatly enhances direct interactions betweenusers and products through intelligent devices such as smartphones, making the products a moreintegral part of people’s daily lives. In addition, it creates a channel of instant feedback that directly
94

INDUSTRY OVERVIEW
connects to the product development cycle. For example, smart technologies such as Wi-Ficonnectivity, navigation control, algorithm development and usage tracking embedded in roboticvacuums enable consumers to control and monitor robotic vacuums from their smartphones and tablets.In addition, better broadband and greater internet penetration that will be brought by future upgradessuch as the 5G network infrastructure, are expected to further increase the application of smarttechnologies in the small household appliance industry.
E-commerce
The development of online sales channels has boosted retail sales of small householdappliances in the United States over the past years. Attributed to the increasing internet penetration andthe adoption of mobile devices such as smartphones and tablets, consumers now rely more on digitalchannels to compare and purchase products. Small household appliances are popular online amongconsumers because of high product standardization and low average selling price.
Between 2014 and 2018, approximately 37.7% of the overall growth of the US small householdappliance market by market share was from online channels. From 2014 to 2018, online sales in the USsmall household appliance market increased from US$3,021.4 million to US$4,441.5 million in retailsales value with a CAGR of 10.1%, accounting for 17.7% of the total market sales in 2018. From 2018to 2023, online sales are expected to grow with a CAGR of 10.6%, contributing 22.8% of total marketsales in 2023. In particular, most of the leading US retailers have begun operating their onlineplatforms/websites to capture such growth. Companies are expected to further develop omni-channelsto create seamless customer experiences in the future.
Social Media
Social media and digitalization have played an important role in increasing brand awareness,loyalty and customer base. The rise in mobile solutions and internet access has created new channels toexpand consumer base, which also creates new opportunities such as providing constant and consistentcontent and advice, as well as building dedicated online communities to interact with consumers.
The increasing usage of social media as a customer engagement platform is becoming animportant marketing strategy. The rise of key opinion leaders, user-generated content and digitalinformation-sharing habits further facilitates direct and instant consumer interactions to spark curiosityand excitement among consumers and to further shape consumers’ purchase behaviors. Onlineplatforms such as YouTube and Facebook are becoming the mainstream for marketing campaigns. Forexample, companies are promoting kitchen appliances by sharing cooking recipes and user experienceon online platforms to create market momentum on new product launches.
Moreover, social media offers companies a new channel to acquire deep customer insights andto conduct precision marketing toward targeted customers. By selecting appropriate social contents andaudiences, small household appliance companies are able to reach their target customers, to build trustand to drive engagement, and are able to better predict market trends for future product developments.
UK SMALL HOUSEHOLD APPLIANCE MARKET
From 2014 to 2018, the market size of the UK small household appliances grew from US$4.7billion to US$4.9 billion in retail sales value with a CAGR of 1.2% and is expected to reach US$5.3billion in 2023, with a CAGR of 1.4% from 2018 to 2023.
95
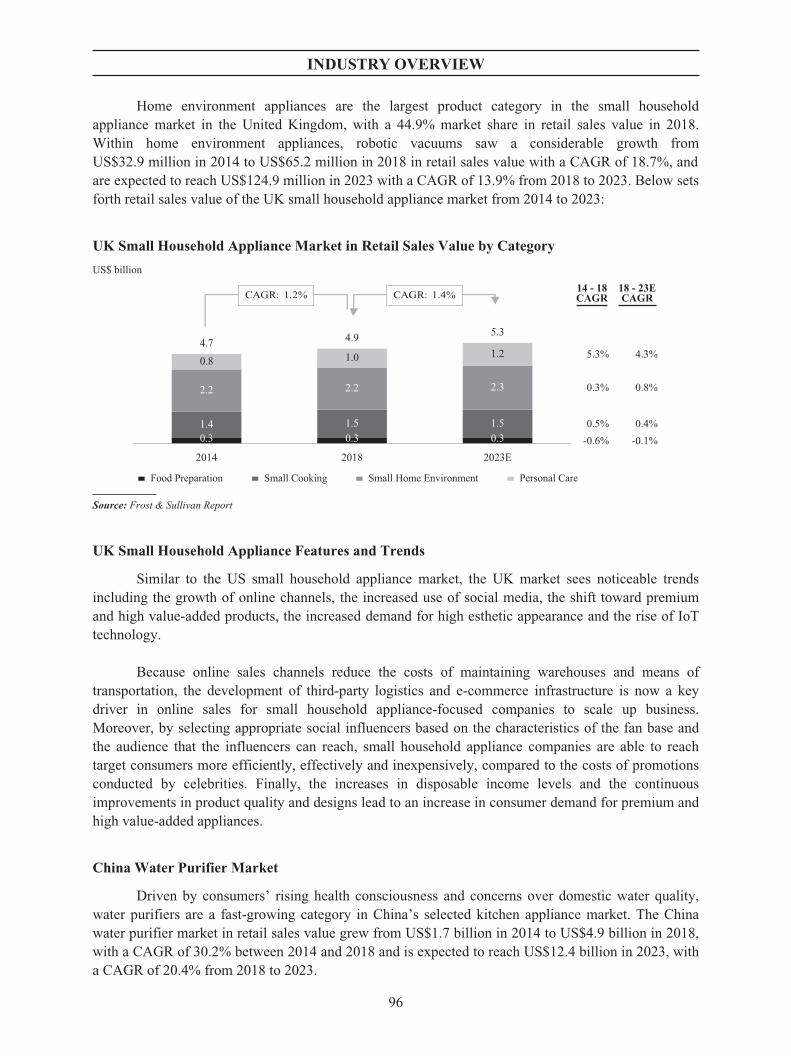
INDUSTRY OVERVIEW
Home environment appliances are the largest product category in the small householdappliance market in the United Kingdom, with a 44.9% market share in retail sales value in 2018.Within home environment appliances, robotic vacuums saw a considerable growth fromUS$32.9 million in 2014 to US$65.2 million in 2018 in retail sales value with a CAGR of 18.7%, andare expected to reach US$124.9 million in 2023 with a CAGR of 13.9% from 2018 to 2023. Below setsforth retail sales value of the UK small household appliance market from 2014 to 2023:
UK Small Household Appliance Market in Retail Sales Value by Category
US$ billion
Food Preparation Small Cooking Small Home Environment Personal Care
2023E20182014
4.7
0.31.4
2.2
0.8
4.9
0.31.5
2.2
1.0
5.3
0.31.5
2.3
1.2
14 - 18CAGR
18 - 23ECAGR
5.3% 4.3%
0.3%
0.5%
0.8%
0.4%
-0.6% -0.1%
CAGR: 1.2% CAGR: 1.4%
Source: Frost & Sullivan Report
UK Small Household Appliance Features and Trends
Similar to the US small household appliance market, the UK market sees noticeable trendsincluding the growth of online channels, the increased use of social media, the shift toward premiumand high value-added products, the increased demand for high esthetic appearance and the rise of IoTtechnology.
Because online sales channels reduce the costs of maintaining warehouses and means oftransportation, the development of third-party logistics and e-commerce infrastructure is now a keydriver in online sales for small household appliance-focused companies to scale up business.Moreover, by selecting appropriate social influencers based on the characteristics of the fan base andthe audience that the influencers can reach, small household appliance companies are able to reachtarget consumers more efficiently, effectively and inexpensively, compared to the costs of promotionsconducted by celebrities. Finally, the increases in disposable income levels and the continuousimprovements in product quality and designs lead to an increase in consumer demand for premium andhigh value-added appliances.
China Water Purifier Market
Driven by consumers’ rising health consciousness and concerns over domestic water quality,water purifiers are a fast-growing category in China’s selected kitchen appliance market. The Chinawater purifier market in retail sales value grew from US$1.7 billion in 2014 to US$4.9 billion in 2018,with a CAGR of 30.2% between 2014 and 2018 and is expected to reach US$12.4 billion in 2023, witha CAGR of 20.4% from 2018 to 2023.
96
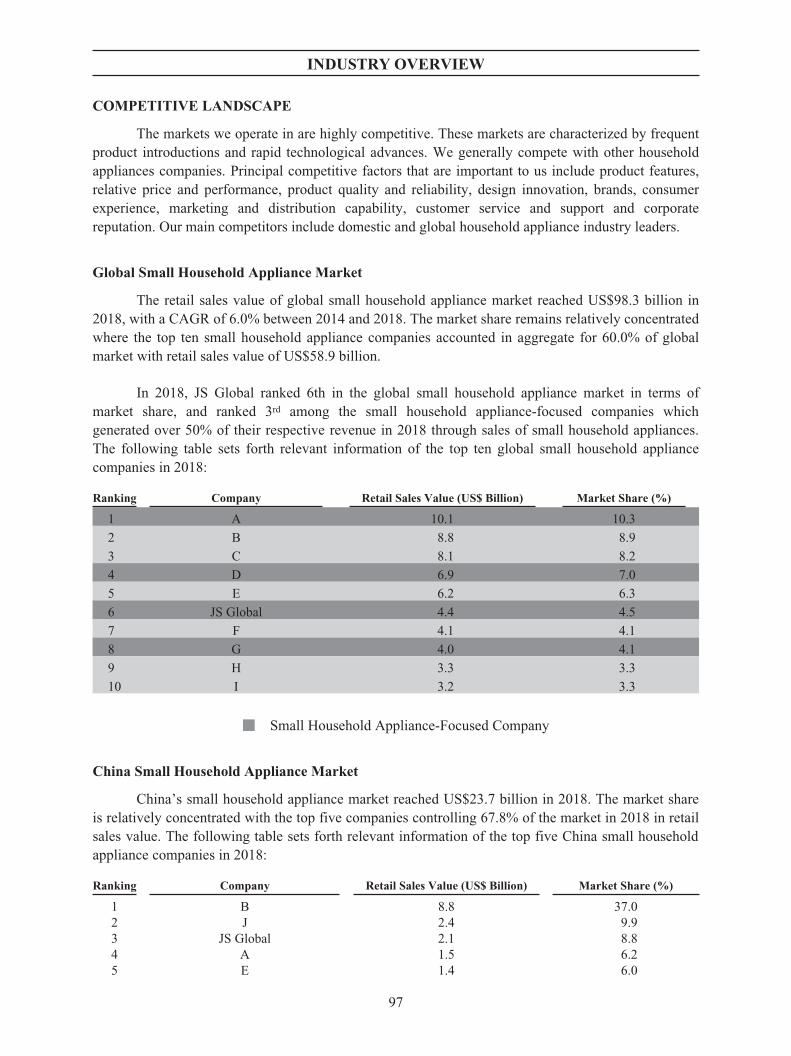
INDUSTRY OVERVIEW
COMPETITIVE LANDSCAPE
The markets we operate in are highly competitive. These markets are characterized by frequentproduct introductions and rapid technological advances. We generally compete with other householdappliances companies. Principal competitive factors that are important to us include product features,relative price and performance, product quality and reliability, design innovation, brands, consumerexperience, marketing and distribution capability, customer service and support and corporatereputation. Our main competitors include domestic and global household appliance industry leaders.
Global Small Household Appliance Market
The retail sales value of global small household appliance market reached US$98.3 billion in2018, with a CAGR of 6.0% between 2014 and 2018. The market share remains relatively concentratedwhere the top ten small household appliance companies accounted in aggregate for 60.0% of globalmarket with retail sales value of US$58.9 billion.
In 2018, JS Global ranked 6th in the global small household appliance market in terms ofmarket share, and ranked 3rd among the small household appliance-focused companies whichgenerated over 50% of their respective revenue in 2018 through sales of small household appliances.The following table sets forth relevant information of the top ten global small household appliancecompanies in 2018:
Ranking Company Retail Sales Value (US$ Billion) Market Share (%)
1 A 10.1 10.3
2 B 8.8 8.9
3 C 8.1 8.2
4 D 6.9 7.0
5 E 6.2 6.3
6 JS Global 4.4 4.5
7 F 4.1 4.1
8 G 4.0 4.1
9 H 3.3 3.3
10 I 3.2 3.3
� Small Household Appliance-Focused Company
China Small Household Appliance Market
China’s small household appliance market reached US$23.7 billion in 2018. The market shareis relatively concentrated with the top five companies controlling 67.8% of the market in 2018 in retailsales value. The following table sets forth relevant information of the top five China small householdappliance companies in 2018:
Ranking Company Retail Sales Value (US$ Billion) Market Share (%)
1 B 8.8 37.02 J 2.4 9.93 JS Global 2.1 8.84 A 1.5 6.25 E 1.4 6.0
97

INDUSTRY OVERVIEW
US Small Household Appliance Market
The US small household appliance market reached US$25.0 billion in 2018. The market shareis less concentrated with the top five companies controlling 36.7% of the total market share in 2018 interms of retail sales value. According to Frost & Sullivan, four out of the top five US small householdappliance companies in 2018, namely, JS Global, A, K and L in the table below, imported productsfrom China and therefore have been affected by the additional US customs duties. The following tablesets forth relevant information of the top five US small household appliance companies in 2018:
Ranking Company Retail Sales Value (US$ Billion) Market Share (%)
1 C 2.5 10.02 JS Global 2.0 8.13 A 1.7 6.64 K 1.5 6.15 L 1.5 5.9
ENTRY BARRIERS AND CHALLENGES
Distribution Channel
A well-established distribution network with a retail shelf space advantage is critical to captureopportunities in category expansion. Retailers, distribution resources and relationship building areimportant in establishing the sales and distribution network. In addition, it is essential for companies tohave an omni-channel sales and distribution network that integrates online and offline resources as theonline sales channels become increasingly popular and constitute a larger share in growth than offlinesales channels.
Supply Chain Management
Frequent new product introductions and upgrades require a flexible production capability tomatch constantly evolving business needs. Continuous technological advancements in small householdappliances impose increasingly stringent requirements on suppliers. With large and growing numbersof SKUs, companies that seek entry need strong supply chain management to ensure consistent highquality and effective cost control.
Brand Power
Top household brands command strong pricing power to ride the premiumization trend.Powerful brands are more effective in attracting and retaining customers through consumerengagements, which lead to greater brand loyalty. To penetrate the small household appliance market,companies need to place resources on brand building and develop their global marketing capabilities tomarket multiple categories of products across different markets around the globe. Existing, well-knownbrands, as well as the time and financial resources required to build a brand, may pose a challenge tocompanies trying to enter the industry.
Technology Capability
The industry requires frequent introductions of new products and upgrades. Therefore,companies need to have strong global R&D capabilities and knowledge of key technologies to competeeffectively. In addition, companies may need to obtain cutting-edge technology patents to build uptheir own competitive advantages in the industry. Finally, companies may need to develop big data
98
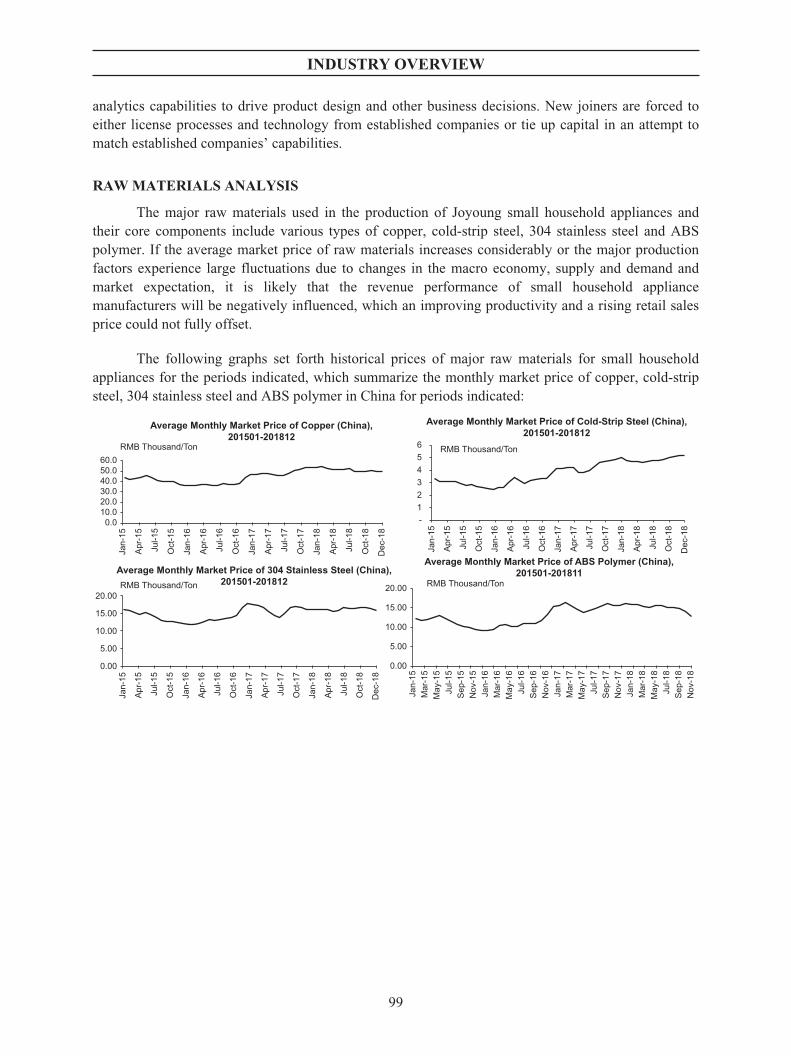
INDUSTRY OVERVIEW
analytics capabilities to drive product design and other business decisions. New joiners are forced toeither license processes and technology from established companies or tie up capital in an attempt tomatch established companies’ capabilities.
RAW MATERIALS ANALYSIS
The major raw materials used in the production of Joyoung small household appliances andtheir core components include various types of copper, cold-strip steel, 304 stainless steel and ABSpolymer. If the average market price of raw materials increases considerably or the major productionfactors experience large fluctuations due to changes in the macro economy, supply and demand andmarket expectation, it is likely that the revenue performance of small household appliancemanufacturers will be negatively influenced, which an improving productivity and a rising retail salesprice could not fully offset.
The following graphs set forth historical prices of major raw materials for small householdappliances for the periods indicated, which summarize the monthly market price of copper, cold-stripsteel, 304 stainless steel and ABS polymer in China for periods indicated:
60.0
RMB Thousand/TonRMB Thousand/Ton
RMB Thousand/Ton RMB Thousand/Ton
50.040.030.020.010.0
0.0 -123456
Jan-
15
Apr
-15
Jul-1
5
Oct
-15
Jan-
16
Apr
-16
Jul-1
6
Oct
-16
Jan-
17
Apr
-17
Jul-1
7
Oct
-17
Jan-
18
Apr
-18
Jul-1
8
Oct
-18
Dec
-18
Dec
-18
Dec
-18
Average Monthly Market Price of 304 Stainless Steel (China),201501-201812
Average Monthly Market Price of Copper (China),201501-201812
Average Monthly Market Price of ABS Polymer (China),201501-201811
Average Monthly Market Price of Cold-Strip Steel (China),201501-201812
Jan-
15
Apr
-15
Jul-1
5
Oct
-15
Jan-
16
Apr
-16
Jul-1
6
Oct
-16
Jan-
17
Apr
-17
Jul-1
7
Oct
-17
Jan-
18
Apr
-18
Jul-1
8
Oct
-18
5.00
10.00
15.00
20.00
0.00
5.00
10.00
15.00
20.00
0.00
Jan-
15
Apr
-15
Jul-1
5
Oct
-15
Jan-
16
Apr
-16
Jul-1
6
Oct
-16
Jan-
17
Apr
-17
Jul-1
7
Oct
-17
Jan-
18
Apr
-18
Jul-1
8
Oct
-18
Jan-
15M
ar-1
5M
ay-1
5Ju
l-15
Sep
-15
Nov
-15
Jan-
16M
ar-1
6M
ay-1
6Ju
l-16
Sep
-16
Nov
-16
Jan-
17M
ar-1
7M
ay-1
7Ju
l-17
Sep
-17
Nov
-17
Jan-
18M
ar-1
8M
ay-1
8Ju
l-18
Sep
-18
Nov
-18
99
REGULATORY OVERVIEW
PRC REGULATORY OVERVIEW
The PRC laws and regulations that have a significant impact on our business operations are setout below:
Laws and Regulations on Foreign Investment
PRC Company Law
The PRC Company Law was promulgated by the Standing Committee of the National People’sCongress (the “NPC Standing Committee”) on December 29, 1993 and implemented on July 1, 1994,and was subsequently revised on December 25, 1999, August 28, 2004, October 27, 2005,December 28, 2013 and October 26, 2018. Limited liability companies and joint stock limitedcompanies established in China are governed by the PRC Company Law. Foreign-invested enterprisesshall also be governed by the PRC Company Law, except as otherwise provided in the foreigninvestment laws including the Law of the People’s Republic of China on Wholly Foreign-OwnedEnterprises (《中華人民共和國外資企業法》) (the “WFOE Law”), the Law of the People’s Republic ofChina on Sino-Foreign Equity Joint Ventures (《中華人民共和國中外合資經營企業法》) (the “EJVLaw”), the Law of the People’s Republic of China on Sino-Foreign Cooperative Joint Ventures (《中華人民共和國中外合作經營企業法》) (the “CJV Law”), and the Foreign Investment Law of the People’sRepublic of China (《中華人民共和國外商投資法》) (the “Foreign Investment Law”).
WFOE Law and EJV Law
The WFOE Law was promulgated and implemented on April 12, 1986, and its first revisiondated October 31, 2000 went into effect on the same date and its second revision datedSeptember 3, 2016 went into effect on October 1, 2016. In addition, the Detailed Rules for TheImplementation of the Law of the People’s Republic of China on Wholly Foreign-Owned Enterprises(《中華人民共和國外資企業法實施細則》) (the “WFOE Law Implementation Rules”) was promulgatedand implemented on December 12, 1990, and subsequently revised on April 12, 2001 andFebruary 19, 2014. The EJV Law was promulgated and implemented on July 8, 1979, andsubsequently revised on April 4, 1990, March 15, 2001 and September 3, 2016. The latest revised EJVLaw was implemented on October 1, 2016; the Regulations for the Implementation of the Law of thePeople’s Republic of China on Sino-foreign Equity Joint Ventures (《中華人民共和國中外合資經營企業法實施條例》) (the “CJV Law Implementation Rules”) was promulgated and implemented onSeptember 20, 1983, and subsequently revised on January 15, 1986, December 21, 1987, July 22,2001, January 8, 2011 and February 19, 2014. The latest revised CJV Law Implementation Rules waspromulgated and implemented on March 2, 2019.
The WFOE Law, EJV Law and the relevant implementation rules stipulate the procedures forthe establishment of wholly foreign-owned enterprises and sino-foreign equity joint ventures, therelevant registered capital (including their registered capital shall be paid by foreign investors, and theliability of foreign investors is limited to the amount of registered capital they agree to pay), foreignexchange control, accounting, taxation, employment and other relevant matters. For establishment of aforeign-invested enterprise which is not subject to the implementation of special administrativemeasures for access as prescribed by the state, the foreign-invested enterprise shall be subject to filingprocedures.
According to the Interim Administrative Measures for the Record-filing of the Incorporationand Change of Foreign-invested Enterprises《外商投資企業設立及變更備案管理暫行辦法》 which was
100

REGULATORY OVERVIEW
promulgated and implemented by the MOFCOM on October 8, 2016, and subsequently revised onJuly 30, 2017 and June 30, 2018, for the changes of a foreign-invested enterprise which is not subjectto the implementation of special administrative measures for access as prescribed by the state, thedesignated representatives or entrusted agents of the foreign-invested enterprise shall proceed withonline filing procedures within 30 days upon the occurrence of the change matters.
Foreign Investment Law
The NPC Standing Committee promulgated the Foreign Investment Law on March 15, 2019,which will come into effect on January 1, 2020 and replace the WFOE Law, EJV Law and CJV Law asthe basic law on foreign investment in the PRC.
According to the Foreign Investment Law, the state implements the management scheme ofpre-establishment national treatment along with a negative list with respect to foreign investment, i.e.foreign investors shall not invest in any field prohibited by the Special Administrative Measures forForeign Investment Access (the “Negative List”); for any field with investment restricted by theNegative List for foreign investment, foreign investors shall meet the investment conditions stipulatedunder the Negative List; any field that does not fall within the Negative List shall be administeredunder the principle of consistency between domestic and foreign investment.
The Foreign Investment Law further stipulates that such as the foreign investors’ capitalcontributions, profits, capital gains, income from asset disposal, intellectual property royalties, legallyobtained compensation or indemnification, and liquidation income that are made or obtained in China,may be freely remitted in or out of China in RMB or foreign exchange according to law. In addition,the state protects the intellectual property rights of foreign investors and foreign-invested enterprises,and the legitimate rights and interests of intellectual property rights holders and relevant rights holders;the formulation of normative documents concerning foreign investment by governments at variouslevels and their relevant departments shall comply with the provisions of laws and regulations; withoutthe basis of laws and administrative regulations, they shall not reduce and prejudice the legitimaterights and interests of foreign-invested enterprises or increase their obligations, or set conditions formarket access and exit, or interfere with the normal production and operation activities of foreign-invested enterprises.
Encouraged Foreign Investment Catalog and Negative List
On June 30, 2019, the NDRC and the MOFCOM promulgated the Encouraged ForeignInvestment Catalog (2019 Edition)《鼓勵外商投資產業目錄(2019年版)》(the “2019 EncouragedList”) and the Special Administrative Measures for Foreign Investment Access (Negative List) (2019Edition) 《外商投資准入特別管理措施(負面清單)(2019年版)》(the “2019 Negative List”), bothimplemented on July 30, 2019. Industries which are listed in the 2019 Encouraged List shall becategorized as encouraged industries for foreign investment, foreign investors and foreign-investedenterprises may enjoy preferential treatments according to laws and administrative regulations.Industries which are neither listed in the 2019 Encouraged List nor in the 2019 Negative List shall becategorized as the permitted industries for foreign investment. The industries in which our PRCsubsidiaries are primarily engaged do not fall into the 2019 Negative List.
101
REGULATORY OVERVIEW
Laws and Regulations Relating to Product Quality
Product Quality Responsibility
In accordance with the Product Quality Law of the People’s Republic of China (《中華人民共和國產品質量法》) (the “Product Quality Law”) which was promulgated by the NPC StandingCommittee on February 22, 1993 and implemented on September 1, 1993, and subsequently revised onJuly 8, 2000, August 27, 2009 and December 29, 2018, the engagement in product manufacturing andsales activities in China shall abide by the Product Quality Law. Producers and sellers shall beresponsible for the quality of the products they produce and sell. Quality of products shall meet thefollowing requirements: (i) the products shall be free from any unreasonable threats to personal safetyor safety of property, and shall conform to national standards or trade standards for ensuring humanhealth and personal or property safety if there are such standards; (ii) the products shall have thefunction they are supposed to have, except where there are explanations about the functional defects;and (iii) the products shall meet the standards specified on the products or packages thereof and thequality condition specified by way of product instructions or samples.
In case of violation of the provisions of the Product Quality Law, the market supervision andmanagement department has the right to order producers and sellers to stop production and sales,confiscate products that are illegally produced or sold and impose fines. In case of seriouscircumstances, the business license of a producer or seller will be revoked. Those who constitute acrime will be held criminally liable.
According to the Tort Law of People’s Republic of China (《中華人民共和國侵權責任法》)which was promulgated by the NPC Standing Committee on December 26, 2009 and implemented onJuly 1, 2010, a manufacturer shall bear tort liability if its product causes damage to others due to adefect. If a product is defective due to the fault of the seller and results in damage to others, the sellershall bear tort liability. If the seller is unable to name the manufacturer or supplier of the defectiveproduct, the seller shall bear tort liability. In the event of damage being caused by a defective product,the infringed may seek compensation from either the manufacturer or the seller of the said product.
CCC
In accordance with the Regulations on Certification and Accreditation of the People’s Republicof China (《中華人民共和國認證認可條例》) which was promulgated by the State Council onSeptember 3, 2003, implemented on November 1, 2003 and subsequently revised on February 6, 2016and the Regulations on the Administration of Compulsory Product Certification (2009) (《強制性產品認證管理規定 (2009)》) which was promulgated by the General Administration of Quality Supervision,Inspection and Quarantine of the PRC on July 3, 2009 and implemented on September 1, 2009,products specified by the state shall not be delivered, sold, imported or used in other business activitiesuntil they are certified (the “Compulsory Certification”) and labeled with compulsory certificationmark. For products that are subject to Compulsory Certification, the state implements unified productcatalogs, unified compulsory requirements, standards and compliance assessment procedures intechnical specification, unified certification marks and unified charging standards. Producers, sellersand importers of the products listed in the catalogs shall entrust a certification body designated by theCertification and Accreditation Administration of the PRC (the “CNCA”) to certify the products theyproduce, sell or import. If the certification requirements are met, the certification body shall issue acertificate to the client. The certificate is valid for 5 years and can be re-applied after the expiration ofthe validity period.
102
REGULATORY OVERVIEW
According to the Catalog of Descriptions and Table of Definitions for Compulsory ProductCertification (2014 Revision) (《強制性產品認證目錄描述與界定表(2014修訂)》) which waspromulgated by the CNCA and implemented on December 16, 2014 and the Announcement of theSAMR and CNCA on Further Implementation of the Reform of Compulsory Product CertificationCatalog and Implementation Method (《市場監管總局、認監委關於進一步落實強制性產品認證目錄及實施方式改革的公告》) which was jointly promulgated by the SAMR and the CNCA and implementedon December 3, 2018, products including electric food processing equipment are products subject toCompulsory Certification.
Laws and Regulations on Food Safety
According to the Food Safety Law of the People’s Republic of China (《中華人民共和國食品安全法》) (the “Food Safety Law”) which was promulgated by the NPC Standing Committee onFebruary 28, 2009 and implemented on June 1, 2009, and subsequently revised on April 24, 2015 andDecember 29, 2018, and the Regulations on the Implementation of the Food Safety Law of thePeople’s Republic of China (《中華人民共和國食品安全法實施條例》) (the “ImplementationRegulations of Food Safety Law”) which was promulgated by the State Council on July 20, 2009 andimplemented on the same date and subsequently revised on February 6, 2016, enterprises engaged infood production and processing, food sales and catering services, as well as the production andoperation of packaging materials, containers, detergents and disinfectants used for food, and the toolsand equipment used for food production and operation, etc. in China, shall comply with the provisionsof the Food Safety Law and the Implementation Regulations of Food Safety Law and shall beresponsible for the safety of the food and food related products which are subject to their productionand operation. The food related products shall be produced in accordance with the laws, regulationsand national food safety standards, and shall be subject to and pass inspection conducted in accordancewith food safety standards before delivery or sales.
Laws and Regulations on Protection of Consumer Rights and Interests
Law on the Protection of the Rights and Interests of Consumer
Pursuant to the Law of the People’s Republic of China on the Protection of the Rights andInterests of Consumer (《中華人民共和國消費者權益保護法》) (the “Law on the Protection of theRights and Interests of Consumer”) which was promulgated by the NPC Standing Committee onOctober 31, 1993 and implemented on January 1, 1994, and subsequently revised on October 25, 2013,the operators to provide consumers with the goods they produce or sell or to provide services shallcomply with the Law on the Protection of the Rights and Interests of Consumer. Operators shall bearcivil liability where a defect exists in a product or service; where a product does not possess thefunctions it is supposed to possess, and no declaration thereof is made at the time of sale; where theproduct standards indicated on a product or on the package of such product are not met; where thequality condition indicated by way of product description or physical sample, etc. is not met; whereproducts that have been formally declared by the State to be obsolete are produced or expired ordeteriorated products are sold; where the products sold are short on quantity; or where the contents andcosts of the services are in violation of the agreement; where consumers’ requests for repair, redoing,replacement, return, making up the quantity of a product, refund of payment for the products orservices, or claims for compensation have been deliberately delayed or unreasonably rejected.Operators who fail to fulfill the security obligations and causes harm to consumers shall bear tortliability. If an operator’s provision of goods or services violates the provisions of the Law on theProtection of the Rights and Interests of Consumer and infringes upon the legitimate rights and
103

REGULATORY OVERVIEW
interests of consumers, which constitutes a crime, the operator shall be held criminally liable accordingto law.
Laws and Regulations on Import and Export
Import and Export Management
Pursuant to the Foreign Trade Law of the People’s Republic of China (《中華人民共和國對外貿易法》) which was promulgated by the NPC Standing Committee on May 12, 1994 and implementedon July 1, 1994, and subsequently revised on April 6, 2004 and November 7, 2016, and the Measuresfor the Record and Registration of Foreign Trade Operators (《對外貿易經營者備案登記辦法》) whichwas promulgated by the MOFCOM on June 25, 2004 and implemented on July 1, 2004, andsubsequently revised on August 18, 2016, foreign traders engaging in import and export of goods ortechnology shall complete the filing and registration with the MOFCOM or its delegated agencies.Where a foreign trade operator fails to complete the filing and registration, the customs will refuse tohandle customs declaration and the clearance of goods imported or exported by the operator. Pursuantto the Customs Law of the People’s Republic of China (《中華人民共和國海關法》) which waspromulgated by the NPC Standing Committee on January 22, 1987 and implemented on July 1, 1987,and subsequently revised on July 8, 2000, June 29, 2013, December 28, 2013, November 7, 2016 andNovember 4, 2017, and the Administrative Provisions of the General Administration of Customs of thePeople’s Republic of China on the Registration of Customs Declaration Entities (《中華人民共和國海關報關單位註冊登記管理規定》) which was promulgated by the General Administration of Customs onMarch 13, 2014 and implemented on the same date, and subsequently revised on December 20, 2017and May 29, 2018, the customs is the state’s entry and exit customs supervision and administrationauthority. The consignor or consignee of import and export goods and the declaration enterprise shallregister with the customs office according to law when handling the declaration procedure. Nodeclarations may be made without registering with the customs.
Imported and Exported Commodities Inspection
According to the Law of the People’s Republic of China on Import and Export CommodityInspection (《中華人民共和國進出口商品檢驗法》) which was promulgated by the NPC StandingCommittee on February 21, 1989 and implemented on August 1, 1989, and subsequently revised onApril 28, 2002, June 29, 2013, April 27, 2018 and December 29, 2018, and the Regulations for theImplementation of the Law of the People’s Republic of China on Import and Export CommodityInspection (《中華人民共和國進出口商品檢驗法實施條例》) which was promulgated by the StateCouncil on August 31, 2005 and implemented on December 1, 2005, and subsequently revised onJuly 18, 2013, February 6, 2016, March 1, 2017 and March 2, 2019, the General Administration ofCustoms is responsible for inspection of import and export commodities. The entry-exit inspection andquarantine authorities shall conduct inspection on the import and export commodities listed in thecatalog and other import and export commodities that shall be subject to the inspection of the entry-exitinspection organs as prescribed by laws and administrative regulations. For the import and exportcommodities other than those that are subject to statutory inspection by the entry-exit inspection andquarantine authorities as mentioned above, the entry-exit inspection and quarantine authorities mayconduct random inspection in accordance with state regulations. No import commodity subject tostatutory inspection that has not been inspected may be sold or used. No export commodity subject tostatutory inspection that has not been inspected or fails to pass the inspection may be exported.
104

REGULATORY OVERVIEW
Laws and Regulations on Production Safety
Production Safety Law
According to the Production Safety Law of the People’s Republic of China (《中華人民共和國安全生產法》) (the “Production Safety Law”) which was promulgated by the NPC Standing Committeeon June 29, 2002 and implemented on November 1, 2002, and subsequently revised onAugust 27, 2009 and August 31, 2014, entities engaged in production and business activities in Chinamust abide by the Production Safety Law and other laws and regulations related to production safetyby strengthen the administration, set up and improve the responsibility system and improve theconditions correspondingly, push forward the development of production safety standards, and raisethe production safety level for it to guarantee production safety. The primary persons in charge of theproduction and operation entities are fully responsible for the production safety of their entities.
Laws and Regulations on E-commerce
E-commerce Law
Pursuant to the E-Commerce Law of the People’s Republic of China (《中華人民共和國電子商務法》) (the “E-Commerce Law”) which was promulgated by the NPC Standing Committee onAugust 31, 2018 and implemented on January 1, 2019, the e-commerce operators refer to naturalpersons, legal persons or unincorporated organizations that engage in business activities of sellingcommodities or offering services through the internet and other information networks, includinge-commerce platform operators, intra-platform business operators, and other e-commerce operatorsthat sell commodities or offer services through a self-built website or any other network services.E-commerce operators to engage in operating activities shall abide by the principles of voluntariness,equality, fairness and integrity, abide by laws and business ethics, participate in market competitionfairly, and discharge obligations in terms of protection of consumer rights and interests, environmentalprotection, intellectual property protection, and network security and personal information protection.They shall be responsible for the quality of products and services and accept supervision by thegovernment and society.
Laws and Regulations on Anti-unfair Competition
Anti-unfair Competition Law
According to the Anti-unfair Competition Law of the People’s Republic of China (《中華人民共和國反不正當競爭法》) (the “Anti-unfair Competition Law”) which was promulgated by the NPCStanding Committee on September 2, 1993 and implemented on December 1, 1993, and subsequentlyrevised on November 4, 2017 and April 23, 2019, unfair competition refers to that the operator disruptsthe market competition order and damages the legitimate rights and interests of other operators orconsumers in violation of the provisions of the Anti-unfair Competition Law in the production andoperating activities. Pursuant to the Anti-unfair Competition Law, operators shall abide by theprinciple of voluntariness, equality, impartiality, integrity, and adhere to laws and business ethicsduring market transactions. Operators shall not conduct misleading behaviors which may confuseconsumers to take their commodities as the commodities of others or lead consumers to believe thatthere is a connection between their commodities and other persons. Operators shall not conduct anyfalse or misleading commercial publicity in respect of the performance, functions, quality, sales, userreviews, and honors received of its commodities, in order to defraud or mislead consumers. Operatorsshall not help other operators to conduct false or misleading commercial publicity by organizing false
105
REGULATORY OVERVIEW
transactions. Operators shall not infringe on trade secrets. Operators shall not fabricate or disseminatefalse or misleading information or damage the business reputation of the competitors or their goods.Operators engaging in production or operations activities online shall also abide by the provisions ofthe Anti-unfair Competition Law. No operator may, by technical means to affect users’ options, amongothers, commit the acts of interfering with or sabotaging the normal operation of online products orservices legally provided by another operator. Operators in violation of the Anti-unfair CompetitionLaw shall bear corresponding civil, administrative or criminal responsibilities depending on thespecific circumstances.
Anti-Monopoly Law
According to the Anti-Monopoly Law of the People’s Republic of China (《中華人民共和國反壟斷法》) (the “Anti-Monopoly Law”) which was promulgated by the NPC Standing CommitteeAugust 30, 2007 and implemented on August 1, 2008, the Anti-Monopoly Law applies to themonopolistic practices in domestic economic activities in China as well as the monopolistic practicesoutside China which have exclusion or restriction effects on domestic market competitions. Themonopolistic practices under the Anti-Monopoly Law include any monopoly agreement reached byany operators, abuse of market-dominating position by any operators and any concentration ofoperators which has eliminated or limited or may eliminate or limit the market competition. The anti-monopoly law enforcement agencies designated by the State Council are responsible for enforcementof the Anti-Monopoly Law in accordance with the provisions of the Anti-Monopoly Law. The anti-monopoly law enforcement agencies of the State Council may, according to the needs of their work,authorize the corresponding agencies of the people’s governments of provinces, autonomous regions,and municipalities to be responsible for enforcement of the Anti-Monopoly Law. Operators whoviolate the provisions of the Anti-Monopoly Law will be ordered by the anti-monopoly lawenforcement agencies to stop the illegal act and be imposed a fine.
Laws and Regulations on Environmental Protection
According to the Environmental Protection Law of the People’s Republic of China (《中華人民共和國環境保護法》) (the “Environmental Protection Law”) which was promulgated by the NPCStanding Committee on December 26, 1989 and implemented on the same date, and subsequentlyrevised on April 24, 2014, the Environmental Impact Assessment Law of the People’s Republic ofChina (《中華人民共和國環境影響評價法》) (the “Environmental Impact Assessment Law”) whichwas promulgated by the NPC Standing Committee on October 28, 2002 and implemented onSeptember 1, 2003, and subsequently revised on July 2, 2016 and December 29, 2018, and theRegulations on the Administration of Construction Project Environmental Protection (《建設項目環境保護管理條例》) (the “Regulations on Environmental Protection Administration”) which waspromulgated by the State Council on November 29, 1998 and implemented on the same date, andsubsequently revised on July 16, 2017, enterprises, public institutions and other producers andoperators shall prevent and reduce environmental pollution and ecological damage, and shall take theliabilities for the damages caused according to the laws. The state adopts the pollution discharge permitmanagement system. Enterprises, public institutions and other producers and operators which aresubject to the pollution discharge permit management shall discharge pollutants according to therequirements of the pollution discharge permit; and those that fail to obtain the pollution dischargepermit shall not discharge pollutants. In addition, the state implements a system to assess theenvironment impact of construction projects. If the construction project may result in a material impacton the environment, a thorough environmental impact report on the potential environmental impact is
106
REGULATORY OVERVIEW
required; if the construction project may result in only slight impact on the environment, anenvironmental impact statement of analyzing or special evaluation will be required; if the constructionproject may only result in very little impact on the environment and no environmental impact appraisalis required, a registration form of environmental impact shall be filed. Construction projects withoutundergoing assessment for environmental impact according to the laws cannot commence construction.After the completion of the construction projects for which environment effect report and environmenteffect statement was prepared, a construction unit shall, according to the standards and proceduresformulated by the competent administrative department for environment protection under the StateCouncil, conduct inspection and acceptance of supplementary environment protection facilities, andprepare inspection and acceptance report. No supplementary facilities of such projects may be put intoproduction or use until such facilities pass inspection and acceptance; no supplementary facilities thatfailed to undergo or pass the inspection and acceptance procedure may be put into production or use.
If an enterprise violates the provisions of the abovementioned pollutant discharge standards,environmental impact assessment system, and other provisions of the Environmental Protection Law,the Environmental Impact Assessment Law and the Regulations on Environmental ProtectionAdministration, the environmental protection administrative departments at the county level or abovemay order it to stop production or construction, impose a fine and order it to conduct rehabilitation; if acrime is constituted, the enterprise may be held criminally liable according to law.
Laws and Regulations on Foreign Exchange
Foreign Exchange Administration
The Regulations of the People’s Republic of China on Foreign Exchange Control (《中華人民共和國外匯管理條例》) (the “Foreign Exchange Control Regulations”), which was promulgated by theState Council on January 29, 1996 and implemented on April 1, 1996, and subsequently revised onJanuary 14, 1997 and August 5, 2008, constitutes an important legal basis for the PRC governmentalauthorities to supervise and regulate foreign exchange. On June 20, 1996, the People’s Bank of Chinafurther promulgated the Provisions on the Settlement and Sale and Payment in Foreign Exchange (《結匯、售匯及付匯管理規定》) (the “Settlement Provisions”) which was implemented on July 1, 1997.
Pursuant to the Foreign Exchange Control Regulations and the Settlement Provisions, RMB isgenerally freely convertible to foreign currencies for current account transactions (such as trade,service-related foreign exchange transactions and dividend payments), but not for capital accounttransactions (such as capital transfer, direct investment, securities investment, derivative products orloans), except where a prior approval from the SAFE and/or its competent local branches is obtained.Chinese foreign-invested enterprises can only conduct settlement, sales and payment of foreignexchange with the designated banks after provision of valid commercial documents and (in case ofcapital account transactions) the approval by the SAFE.
On November 19, 2012, the SAFE promulgated the Circular of Further Improving andAdjusting Foreign Exchange Administration Policies on Foreign Direct Investment (《國家外匯管理局關於進一步改進和調整直接投資外匯管理政策的通知》) (the “Circular 59”), which became effective onDecember 17, 2012 and was amended on May 4, 2015 and October 10, 2018. Circular 59 substantiallyamends and simplifies the current foreign exchange procedure. The opening of pre-establishmentexpenses account, foreign exchange capital account, assets realization account and deposit account nolonger requires the approval of the SAFE. Circular 59 further cancels the restrictions on the openingand number of foreign exchange capital accounts in other places. Meanwhile, under Circular 59,
107
REGULATORY OVERVIEW
reinvestment by foreign-invested companies in China no longer requires completion of foreignexchange registration procedures.
On May 10, 2013, the SAFE promulgated the Circular on Printing and Distributing theProvisions on Foreign Exchange Administration over Domestic Direct Investment by Foreign Investorsand the Supporting Documents (《關於印發<外國投資者境內直接投資外匯管理規定>及配套文件的通知》) (the “Circular 21”) which was implemented on May 13, 2013 and revised onOctober 10, 2018. Circular 21 specifies that the direct investment by foreign investors in China shall beconducted by way of registration. Institutions and individuals shall register with the SAFE and/or itsbranches for their direct investment in China. Banks shall process foreign exchange business relating tothe direct investment in China based on the registration information provided by the SAFE and itsbranches.
On February 13, 2015, the SAFE released the Circular on Further Simplifying and ImprovingPolicies for the Foreign Exchange Administration of Direct Investment (《國家外匯管理局關於進一步簡化和改進直接投資外匯管理政策的通知》) (the “Circular 13”) which was implemented onJune 1, 2015. Under the Circular 13, two administrative approval items, namely, foreign exchangeregistration approval under domestic direct investment and foreign exchange registration approvalunder overseas direct investment, were canceled, and the foreign-exchange procedures of certain directinvestments have been further simplified. Instead, banks review and carry out foreign exchangeregistration under domestic direct investment and overseas direct investment directly. The SAFE andits branches implement indirect supervision over foreign exchange registration of direct investment viathe banks.
On March 30, 2015, the SAFE released the Circular on the Reform of the Management Methodfor the Settlement of Foreign Exchange Capital of Foreign-invested Enterprises (《關於改革外商投資企業外匯資本金結匯管理方式的通知》) (the “Circular 19”) which was implemented on June 1, 2015. OnJune 9, 2016, the SAFE promulgated and implemented the Circular on the Reform and Standardizationof the Management Policy of the Settlement of Capital Projects (《關於改革和規範資本項目結匯管理政策的通知》) (the “Circular 16”). Under the Circular 19 and the Circular 16, the settlement of foreignexchange capital by foreign invested enterprises shall be conducted according to the method ofdiscretional foreign exchange settlement. The Circular 19 and Circular 16 further stipulate that the useof capital of a foreign-invested enterprise and its settled RMB funds shall follow the genuine andself-use principle within the business scope of the enterprise. Unless otherwise set forth in laws andregulations, the capital of a foreign-invested enterprise and its settled RMB funds shall not, directly orindirectly, be used for the expenditures beyond the business scope of the enterprise or the expendituresforbidden by PRC laws and regulations, or used to grant loans to non-affiliated enterprises, or forinvestment in securities directly or indirectly, or construction or purchase of real estate for purposeother than self-use.
SAFE Circular 37
The SAFE promulgated the Circular on Relevant Issues Concerning Foreign Exchange Controlon Domestic Residents’ Offshore Investment and Financing and Roundtrip Investment through SpecialPurpose Vehicles (《關於境內居民通過特殊目的公司境外投融資及返程投資外匯管理有關問題的通知》)(the “Circular 37”) on July 4, 2014. The Circular 37 requires domestic residents (including domesticinstitutions and domestic individual residents) to register with the SAFE and its branches in connectionwith their direct establishment or indirect control of an offshore entity (the “SPV”), for the purpose of
108
REGULATORY OVERVIEW
overseas investment and financing, with such domestic residents’ legally owned assets or equityinterests in domestic enterprises or offshore assets or interests. The Circular 37 further stipulates thatthe change of registration for overseas investment foreign exchange shall be completed in a timelymanner, and such changes shall include the change of basic information of the registered SPV such asindividual shareholder, name and business period, or its capital increase, decrease, equity transfer orreplacement, merger or division and other important matters. After the registration of theabovementioned changes is completed, the follow-up business such as remitting back of profits anddividends can be processed. Failure to comply with the relevant provisions of the Circular 37 mayresult in liability under the PRC law for violations of foreign exchange administration.
According to the Circular 13, the authority to handle foreign exchange registration of the SPVsof domestic individual residents has been delegated to banks by the SAFE and its branches.
Equity Incentive Plans
Under the Measures for the Administration of Individual Foreign Exchange (《個人外匯管理辦法》) which was promulgated by the People’s Bank of China on December 25, 2006 and implementedsince February 1, 2007, the SAFE and its branches supervises and manages individuals’ domestic andcross-border foreign exchange transactions. In addition, according to the Circular on Issues relating toForeign Exchange Administration for Domestic Individuals Participation in Equity Incentive Plans ofOverseas-Listed Companies (《關於境內個人參與境外上市公司股權激勵計劃外匯管理有關問題的通知》) which was promulgated and implemented on February 15, 2012 by the SAFE, domesticindividuals, including both Chinese citizens (including citizens of Hong Kong, Macau and Taiwan) andforeign individuals, who are the directors, supervisors, senior management or other employees ofoverseas listed companies registered in China, or domestic branches (or representative offices) ofoverseas listed companies, or parent companies, subsidiary companies, partnerships or other domesticinstitutions that directly or indirectly control or are controlled by overseas listed companies(collectively, the “domestic companies”), if they participate in equity incentive plans of the sameoverseas listed company, shall (i) through the domestic companies they serve, collectively entrust adomestic agency (which shall be a domestic company participated in the plans or other domesticagency as selected by the domestic companies according to law which can engage in assets trusteeship)to handle issues like foreign exchange registration, account opening, funds transfer and exchange, and(ii) entrust an overseas institution to handle issues like exercise of options, purchase and sale of relatedstocks or equity, and funds transfer.
In accordance with the SAFE Circular 37 and Circular 13, where a non-listed SPV uses its ownequity interests or options to grant equity incentives to the directors, supervisors and seniormanagement of a domestic enterprise under its direct or indirect control, as well as to other employeesin employment or labor relationships with the aforementioned company, relevant domestic residentindividuals may, before exercising their rights, submit relevant materials to banks for foreign exchangeregistration relating to the SPV.
Laws and Regulations on Taxation
Income Tax
As we carry out our PRC business operations through operating subsidiaries established underthe PRC law, our PRC operations and our operating subsidiaries in China are subject to PRC tax lawsand regulations.
109
REGULATORY OVERVIEW
According to the EIT Law, which was promulgated by the NPC on March 16, 2007 andimplemented on January 1, 2008, and subsequently revised on February 24, 2017 and December 29,2018, and the Implementation Regulations of EIT Law, which was promulgated by the State Councilon December 6, 2007 and implemented from January 1, 2008, and subsequently revised on April 23,2019, enterprises are divided into resident enterprises and non-resident enterprises. Residententerprises, which refer to enterprises that are set up in accordance with the PRC law, or that are set upin accordance with the law of the foreign country (region) but with its actual administration institutionin China, shall pay enterprise income tax originating both within and outside China at the tax rate of25%. Non-resident enterprises refer to entities established under foreign law whose actualadministration institution is not within China but have institution or premises in China, or which do nothave institution or premises in China but have income sourced within China. Non-resident enterprisesthat have set up institutions or premises in China shall pay enterprise income tax at the tax rate of 25%in relation to the income originated from China and obtained by the aforementioned institutions orpremises, as well as the income incurred outside China, provided there is an actual relationshipbetween such income and the aforementioned institutions or premises. For non-resident enterpriseswhich have no institutions or premises in China, or, although they have institutions or premises inChina, there is no actual relationship between the income and the aforementioned institutions orpremises, they shall pay enterprise income tax at the tax rate of 10% in relation to the incomeoriginated from China. The aforementioned income includes income from sales of goods, provision oflabor services, transfer of property, equity investment including dividends, interest income, rentalincome, income from royalties, donations and other income. In addition, according to the EIT Law andthe Implementation Regulations of EIT Law, for the income incurred from equity investment includingdividends and bonus among eligible resident enterprises, and the income which is incurred from equityinvestment including dividends and bonus obtained from resident enterprise by non-residententerprises that have set up institutions or premises in China and the income has an actual relationshipwith such institutions or premises, such incomes are tax-free income.
Pursuant to the EIT Law and the Administrative Measures for the Accreditation of High-techEnterprises (《高新技術企業認定管理辦法》) and the Administrative Guides for the Accreditation ofHigh-tech Enterprise (《高新技術企業認定管理工作指引》) which were promulgated by the Ministry ofScience, the Ministry of Finance and the SAT on January 29, 2016 and June 22, 2016, respectively,enterprises are entitled to enjoy the preferential enterprise income tax rate of 15% from the year inwhich they are accredited as high-tech enterprises. The validity period of the high-tech enterprisequalification shall be three years from the date of issuance of the certificate of high-tech enterprise.The enterprise can re-apply for such recognition upon expiry of the certificate of high-tech enterprise.
Withholding Income Tax and Tax Treaties
Under the EIT Law and the Implementation Regulations of EIT Law, where non-residententerprises that have not set up institutions or premises in China, or where the institutions or premisesset up have no actual relationship with the income obtained by such enterprises, they shall pay incometax generally at the tax rate of 10% in relation to the declared dividends originating from China. Wherethe treaty between the PRC governments and another foreign country contains provisions differentfrom those provided under the EIT Law, the provisions under the relevant treaty shall prevail.
Pursuant to the Arrangement Between the Mainland of China and the Hong Kong SpecialAdministrative Region for the Avoidance of Double Taxation on Income and Prevention of FiscalEvasion (《內地和香港特別行政區關於對所得稅避免雙重徵稅和防止偷漏稅的安排》) entered into
110
REGULATORY OVERVIEW
between the PRC government and Hong Kong government on August 21, 2006, in relation to paymentof dividends by Chinese resident companies to the resident companies in Hong Kong, if a Hong Kongresident company directly owns at least 25% of the shares of the company which pays dividends, thetax paid shall be 5% of the total dividends; otherwise tax paid shall be 10% of the total dividends.However, based on the Circular on Certain Issues with Respect to the Enforcement of DividendProvisions in Tax Treaties (《關於執行稅收協定股息條款有關問題的通知》) issued on February 20,2009 by the SAT, the competent tax authorities are entitled to adjust the preferential tax treatment forthe companies which improperly benefit from such reduced income tax rate due to a transaction orarrangement that is primarily tax-driven. According to the Announcement of the State Administrationof Taxation on Issues concerning “Beneficial Owners” in Tax Treaties (《國家稅務總局關於稅收協定中“受益所有人”有關問題的公告》) which was promulgated by the SAT on February 3, 2018 andimplemented on April 1, 2018, “beneficial owner” shall refer to a party who holds ownership andcontrol over incomes or the rights or assets from which the incomes are derived and is generallydetermined depending on whether the operating activities the beneficial owner is engaged in aresubstantive.
Pursuant to the Measures for the Administration of Non-Resident Taxpayers’ Enjoyment of theTreatment under Tax Agreements (《非居民納稅人享受稅收協定待遇管理辦法》), which waspromulgated by the SAT on August 27, 2015 and implemented since November 1, 2015, andsubsequently revised on June 15, 2018, any non-resident taxpayer (including non-resident enterprisesand non-resident individuals) meeting conditions for enjoying the convention treatment may be entitledto the convention treatment itself when filing a tax return or making a withholding declaration througha withholding agent, subject to the subsequent administration by the tax authorities. If a competent taxauthority, in the course of subsequent administration, finds out that a non-resident taxpayer enjoysconvention treatment without meeting the conditions thereof and underpays or fails to pay them at all,it may instruct the non-resident taxpayer to pay the overdue taxes within a prescribed period.
Value-Added Tax
According to the Interim Regulations of the People’s Republic of China on Value-added Tax(《中華人民共和國增值稅暫行條例》) which was promulgated by the State Council onDecember 13, 1993 and subsequently revised on November 10, 2008, February 6, 2016 andNovember 19, 2017 and the Detailed Rules for the Implementation of the Interim Regulations of thePeople’s Republic of China on Value-added Tax (《中華人民共和國增值稅暫行條例實施細則》) whichwas promulgated by the Ministry of Finance (the “MOF”) on December 25, 1993 and subsequentlyrevised on December 15, 2008 and October 28, 2011, entities and individuals that sell goods or laborservices of processing, repair or replacement, sell services, intangible assets, or immovables, or importgoods within the territory of China are taxpayers of value-added tax (“VAT”), and shall pay VAT inaccordance with law. Unless otherwise stipulated, the VAT rate is 17% for taxpayers selling goods,labor services, or tangible movable property leasing services or importing goods; 11% for taxpayersselling transportation, postal, basic telecommunications, construction, or immovable leasing services,selling immovables, transferring land use rights, or selling or importing specific goods; unlessotherwise stipulated, 6% for taxpayers selling services or intangible assets.
The MOF and the SAT published the Circular of the MOF and the SAT on Fully Launch of thePilot Scheme for the Conversion of Business Tax to Value-added Tax (《財政部、國家稅務總局關於全面推開營業稅改徵增值稅試點的通知》) and its annexes on March 23, 2016, and subsequently revised
111
REGULATORY OVERVIEW
on July 11, 2017 and March 20, 2019, pursuant to which entities and individuals that sell services,intangible assets, or immovables shall pay VAT instead of business tax since May 1, 2016.
According to the Circular of the MOF and the SAT on Adjusting Value-added Tax Rate (《財政部、稅務總局關於調整增值稅稅率的通知》) which was promulgated by the MOF and the SAT onApril 4, 2018 and became effective on May 1, 2018, the tax rates for the taxable sales or goods importactivity, which were subject to the tax rates of 17% and 11% respectively, were adjusted to 16% and10% respectively.
According to the Circular on Policies in Relation to the Deepening of Value-added TaxReforms (《關於深化增值稅改革有關政策的公告》) which was jointly promulgated by the MOF, theSAT and the General Administration of Customs on March 20, 2019, the tax rate of 16% and 10%originally applicable to general VAT taxpayers’ VAT taxable sales or goods import shall be adjusted to13% and 9%, respectively.
Stamp Tax
Under the Provisional Regulations of the People’s Republic of China on Stamp Tax (《中華人民共和國印花稅暫行條例》) (the “Provisional Regulations on Stamp Tax”) which was promulgated bythe State Council on August 6, 1988 and implemented on October 1, 1988, and subsequently revisedon January 8, 2011, all enterprises and individuals creating and obtaining taxable documents withinChina are taxpayers of stamp tax and shall pay stamp tax according to law. The list of taxabledocuments includes purchase and sale contracts, processing contracts, construction project contracts,property lease contracts, cargo freight contracts, warehousing and storage contracts, loan contracts,property insurance contracts, technical contracts, other documents resemble contract in nature, titletransfer deeds, business account books, certificate of rights, license and other taxable documentsspecified by the Ministry of Finance. The specific tax rates and mounts shall be subject to the List ofItems and Rates of Stamp Tax (《印花稅稅目稅率表》) which is attached to the ProvisionalRegulations on Stamp Tax.
Urban Maintenance and Construction Tax and Education Surcharges
According to the Circular of the State Council on Unifying the System of Urban Maintenanceand Construction Tax and Education Surcharge Paid by Domestic and Foreign-invested Enterprisesand Individuals (《國務院關於統一內外資企業和個人城市維護建設稅和教育費附加制度的通知》) whichwas promulgated by the State Council on October 18, 2010 and implemented on December 1, 2010,foreign invested enterprises, foreign enterprises and foreign individuals are applicable to theProvisional Regulations of the People’s Republic of China on City Maintenance and Construction Tax(《中華人民共和國城市維護建設稅暫行條例》) (the “Provisional Regulations on City Maintenance andConstruction Tax”) which was promulgated by the State Council on February 8, 1985 andimplemented on January 1, 1985, and subsequently revised on January 8, 2011, and the ProvisionalRegulations for Imposition of Education Surcharges (《徵收教育費附加的暫行規定》) (the “ProvisionalRegulations on Education Surcharges”) which was promulgated by the State Council on April 28, 1986and implemented on July 1, 1986, and subsequently revised on June 7, 1990, August 20, 2005 andJanuary 8, 2011.
According to the Provisional Regulations on City Maintenance and Construction Tax, all unitsand individuals that pay consumption tax, VAT and business tax are all taxpayers who pay taxes on
112
REGULATORY OVERVIEW
urban maintenance and construction. They shall pay the urban maintenance and construction taxaccording to the regulations. The computation of city maintenance and construction tax shall be basedon the amount of consumption tax, VAT and business tax actually paid by taxpayers, and the tax shallbe paid together with the payment of consumption tax, VAT and business tax. If the location of thetaxpayer is in the urban area, the tax rate of urban maintenance and construction shall be 7%; if thelocation of the taxpayer is in the county or town, the tax rate of urban maintenance and constructionshall be 5%; if the location of the taxpayer is not in the urban area, the county or town, the tax rate ofurban maintenance and construction shall be 1%.
According to the Provisional Regulations on Education Surcharges, all units and individualswho pay the consumption tax, VAT and business tax shall pay education surcharges in accordancewith the regulations of the Provisional Regulations on Education Surcharges, except the units that payrural surcharges of operating expenses of education in accordance with the regulations of the Circularof the State Council on Raising Funds for Running Schools in Rural Areas (《國務院關於籌措農村學校辦學經費的通知》). The computation of education surcharges shall be based on the amount of VAT,business tax, and consumption tax actually paid by each unit and individual. The education surchargesrate is 3%, and the tax shall be paid together with the payment of VAT, business tax, and consumptiontax.
Laws and Regulations on Labor and Social Security
Labor Law and Labor Contract Law
In accordance with the Labor Law of the People’s Republic of China (《中華人民共和國勞動法》) which was promulgated by the NPC Standing Committee on July 5, 1994 and implemented onJanuary 1, 1995, and subsequently revised on August 27, 2009 and December 29, 2018, the LaborContract Law of the People’s Republic of China (《中華人民共和國勞動合同法》) (the “Labor ContractLaw”) which was promulgated on June 29, 2007 and implemented on January 1, 2008, andsubsequently revised on December 28, 2012, and the Implementation Regulations of the LaborContract Law of the People’s Republic of China (《中華人民共和國勞動合同法實施條例》) which waspromulgated and implemented by the State Council on September 18, 2008, a labor contract shall beconcluded for the establishment of a labor relationship between the employer and the worker.Employers shall abide by the aforementioned laws and regulations and perform procedures fordissolution and termination of labor contracts, payment of labor remuneration and economiccompensation, use of labor dispatch and payment of social insurance.
Labor Dispatch
According to the Interim Provisions on Labor Dispatch (《勞務派遣暫行規定》) which waspromulgated by the Ministry of Human Resources and Social Security on January 24, 2014 andimplemented on March 1, 2014, enterprises shall strictly control the number of labor dispatch workers,and the number of the dispatched workers shall not exceed 10% of the total amount of their employees.
Pursuant to the Labor Contract Law and the Interim Provisions on Labor Dispatch, enterpriseswhich fail to comply with the relevant requirements on labor dispatch shall be ordered by the laboradministrative authorities to make correction within a stipulated period; where correction is not madewithin the stipulated period, the enterprises may be subject to a penalty ranging from RMB5,000 toRMB10,000 per dispatched worker.
113
REGULATORY OVERVIEW
Social Insurance and Housing Provident Fund
According to regulations of the Social Insurance Law of the People’s Republic of China(《中華人民共和國社會保險法》) issued by the NPC Standing Committee on October 28, 2010 andimplemented on July 1, 2011, and subsequently revised on December 29, 2018, the state establishessocial insurance system including basic pension insurance, basic medical insurance, work injuryinsurance, unemployment insurance, maternity insurance and so forth, so as to protect legitimate rightsand interests of Chinese citizens to get material assistance from the state and society according to laws,such as age, disease, work injury, unemployment, childbearing and so on. Enterprises within theterritory of China shall apply to the local social insurance agency for registration of social insurancewithin 30 days from the date of establishment, and shall declare and make social insurancecontributions in full and on time.
According to the Regulations on Management of Housing Provident Fund (《住房公積金管理條例》) which was promulgated and implemented by the State Council on April 3, 1999 andsubsequently revised on March 24, 2002 and March 24, 2019, enterprises in China shall register withthe housing provident fund management center within 30 days from the date of establishment, andcomplete the procedures for establishment of housing accumulation fund accounts for their employeeswithin 20 days from the date of registration.
Laws and Regulations on Intellectual Property Rights
Copyright
According to the Copyright Law of the People’s Republic of China (《中華人民共和國著作權法》) (the “Copyright Law”) which was promulgated by the NPC Standing Committee onSeptember 7, 1990 and implemented on June 1, 1991, and subsequently revised on October 27, 2001and February 26, 2010, and the Implementation Regulations of the Copyright Law of the People’sRepublic of China (《中華人民共和國著作權法實施條例》) (the “Implementation Regulations of theCopyright Law”) which was promulgated by the State Council on August 2, 2002 and implemented onSeptember 15, 2002, and subsequently revised on January 30, 2013, a Chinese citizen, legal person orother organization is entitled to the copyright thereunder for any works, whether published or not, thatare originated by them. The abovementioned works include literary works; oral works; music, theater,opera, dance and acrobatic works; art and architecture works; photograph works; film works and anyworks created through a process similar to cinematography; engineering design diagrams, productdesign graphics, maps, sketches and other graphic works and model works; and computer software,etc.; any work of a foreigner or stateless person which enjoys copyright under an agreement concludedbetween the country to which the author belongs or in which the author permanently resides and China,or under an international treaty to which both countries are parties, and any work of an author from acountry not having concluded an agreement with China or entered into an international treaty jointlywith China or of a stateless person, which is published for the first time in a country as a member of theinternational treaty into which China has entered or published in a member country and non-membercountry at the same time, shall be protected by the Copyright Law and the Implementation Regulationsof the Copyright Law. Any work of a foreigner or stateless person published for the first time andwithin the territory of China shall enjoy copyright according to law.
According to the Regulations for the Protection of Computer Software (《計算機軟件保護條例》) which was promulgated by the State Council on June 4, 1991 and implemented onOctober 1, 1991, and subsequently revised on December 20, 2001 and January 30, 2013, and the
114

REGULATORY OVERVIEW
Measures for Computer Software Copyright Registration (《計算機軟件著作權登記辦法》) which waspromulgated and implemented by the Ministry of Machine Building and Electronics Industry (currentlyknown as the Ministry of Industry and Information Technology (the “MIIT”)), on April 6, 1992 andsubsequently revised by the National Copyright Administration on February 20, 2002, the softwarecopyright holder can register the software copyright registration to the Copyright Protection Center ofChina, which is the software registration agency identified by the State Copyright Administration.
Patents
According to the Patent Law of the People’s Republic of China (《中華人民共和國專利法》)which was promulgated by the NPC Standing Committee on March 12, 1984 and implemented onApril 1, 1985, and subsequently revised on September 4, 1992, August 25, 2000 andDecember 27, 2008, and the Implementation Regulations of the Patent Law of the People’s Republic ofChina (《中華人民共和國專利法實施細則》) which was promulgated by the State Council onJune 15, 2001 and implemented on July 1, 2001, and subsequently revised on December 28, 2002 andJanuary 9, 2010, the patent protection is divided into three categories, namely, the patent for invention,patent for utility models and patent for designs. The duration of patent right for inventions shall be 20years, the duration of the patent for utility models and patent for designs shall be 10 years, countedfrom the date of filing. After the grant of the patent right for an invention or utility model, exceptwhere otherwise provided for in this Law, no entity or individual may, without the authorization of thepatentee, exploit the patent, that is, make, use, offer to sell, sell or import the patented product, or usethe patented process, and use, offer to sell, sell or import the product directly obtained by the patentedprocess, for production or operation purposes. After the grant of the patent right for a design, no entityor individual may, without the authorization of the patentee, exploit the patent, that is, make, offer tosell, sell or import the product incorporating its or his patented design, for production or operationpurposes.
Trademarks
According to the Trademark Law of the People’s Republic of China (《中華人民共和國商標法》) which was promulgated by the NPC Standing Committee on August 23, 1982 andimplemented on March 1, 1983, and subsequently revised on February 22, 1993, October 27, 2001,August 30, 2013 and April 23, 2019 and will be implemented on November 1, 2019, and theImplementation Regulations of the Trademark Law of the People’s Republic of China (《中華人民共和國商標法實施條例》) which was promulgated by the State Council on August 3, 2002 and implementedon September 15, 2002, and subsequently revised on April 29, 2014, a trademark registered by theTrademark Office is a registered trademark, including the commodity trademark, service trademark,collective trademark and certification trademark. The trademark registrant is entitled to the exclusiveright to use trademark and protected by law. The period of validity of a registered trademark shall be10 years, counted from the date of approval of the registration. The trademark registrant shall apply forrenewal within 12 months before the expiry date for further use of the registered trademark. The periodof validity for each renewal of registration is 10 years, commencing from the day immediately after theexpiry of the preceding period of validity for the subject trademark.
Domain Names
Those who carry out such activities as service provision, operation and maintenance as well assupervision and administration of Internet domains within the territory of China shall be subject to the
115
REGULATORY OVERVIEW
Internet Domain Name Regulations (《互聯網域名管理辦法》) which was promulgated by the MIIT onAugust 24, 2017 and implemented on November 1, 2017. According to the Internet Domain NameRegulations, the MIIT supervises and manages the domain name service in the whole country, and thecommunication administrative bureaus of all provinces, autonomous regions and centrally-administered municipalities supervise and manage the domain name service within their administrativearea. The Internet domain name system of China is announced by the MIIT. According to the actualsituation of the development of the domain name, the MIIT can adjust the Internet domain namesystem of China.
Regulations Relating to M&A Provisions
Under the Interim Provisions on Merger and Acquisition of Domestic Enterprises by ForeignInvestors (《關於外國投資者併購境內企業的規定》) (the “M&A Provisions”) which was promulgatedjointly by the MOFCOM, the State-owned Assets Supervision and Administration Commission of theState Council, the CSRC, the SAT, the State Administration for Industry and Commerce and the SAFEon August 8, 2006, implemented on September 8, 2006 and subsequently revised by the MOFCOM onJune 22, 2009, the mergers and acquisitions of domestic companies by foreign investors includeforeign investors’ acquisition of equity in the domestic non-foreign-invested enterprise or subscribe forincreased capital to convert the domestic non-foreign-invested enterprise into a foreign-investedenterprise; or foreign investors’ establishment of a foreign-invested enterprise to acquire the assets ofthe domestic enterprise by agreement and operates these assets; or foreign investors’ purchase of theassets from the domestic enterprise and invests such assets to establish foreign-invested enterprises foroperation of such assets. If a PRC enterprise or individual intends to acquire its/his/her relateddomestic company through an offshore company which it/he/she lawfully established or controls, suchacquisition shall be subject to approval by the MOFCOM.
US GOVERNMENTAL REGULATIONS
Consumer Product Regulations
As a manufacturer and distributor of consumer products, we are subject to the provisions of theConsumer Products Safety Act (“CPSA”), the Federal Hazardous Substances Act (“FHSA”), theConsumer Product Safety Improvement Act of 2008 (“CPSIA”), the United States Toxic SubstancesControl Act (“TSCA”) and the regulations promulgated pursuant to such statutes. These statutes banfrom the market consumer products that fail to comply with applicable product safety regulations. Inaddition, we are subject to certain laws existing in some cities and states regulating certain consumerproducts.
CPSA was enacted in 1972 to protect the public against unreasonable risks of injury associatedwith consumer products. Among other things, CPSA established the Consumer Product SafetyCommission (“CPSC”). The CPSA empowers CPSC to monitor, research, investigate and enforce rulesin order to further the objectives of the CPSA. While the CPSC has the authority to issue mandatoryconsumer product safety rules under certain circumstances, in most instances, the CPSA requiresCPSC to defer to voluntary consumer product safety standards that are drafted and developed byprivate industry. Therefore, CPSC provides technical assistance and otherwise helps industry groupsdevelop voluntary standards more frequently than it issues mandatory safety standards throughrulemakings. In addition, CPSC has the authority to recall, repurchase, replacement, or repair of anybanned products or products that otherwise create a substantial risk of injury and may seek penaltiesfor regulatory noncompliance under certain circumstances.
116
REGULATORY OVERVIEW
Given the broad statuary mandate and impact consumer products have on the day-to-day livesof the general public, CPSC has been of perennial interest to the U.S. Congress. In 2008, the U.S.Congress enacted CPSIA to, among other things, enhance the CPSC’s regulatory and enforcementpowers.
FHSA was passed in 1960 and requires certain household products to have warning labels.FHSA also gives CPSC the authority to regulate or ban a hazardous substance, and toys or otherarticles intended for use by children, under certain circumstances to protect the public. Examples ofproducts regulated under FHSA include electrically operated toys, cribs, rattles, pacifiers, bicycles, andchildren’s bunk beds.
TSCA was enacted in 1976 and amended in 2016. TSCA was enacted to control the adverseeffects of newly manufactured and existing chemical substances and addresses the production,importation, use, and disposal of specific chemicals including polychlorinated biphenyls (PCBs),asbestos, radon and lead-based paint. TSCA provides the U.S. Environmental Protection Agency (the“EPA”) with broad authority to issue specific rules and regulations governing the use, labeling,maintenance, removal and disposal of certain chemicals. The EPA is currently evaluating additionalchemicals for regulation under that amended law. Certain of our products may be manufactured usingchemicals or other ingredients that may be subject to regulation under current TSCA regulations, andother chemicals or ingredients may be regulated under the law in the future.
Additionally, throughout the world, electrical appliances are subject to various mandatory andvoluntary standards, including requirements in some jurisdictions that products be listed byUnderwriters’ Laboratories, Inc. (“UL”), an independent, not-for-profit corporation engaged in thetesting of products for compliance with certain public safety standards, or other similar recognizedlaboratories.
Other US Regulatory Bodies
The labeling, distribution, importation, marketing, and sale of our intended products are subjectto extensive regulation by various US states and federal agencies, including the CPSC, Federal TradeCommission (“FTC”), Food and Drug Administration (“FDA”), Federal Communications Commission(“FCC”), and state attorneys general, as well as by various other federal, state, provincial, local, andregulatory authorities in the countries in which our intended products and services are distributed orsold. If we fail to comply with any of these regulations, we could become subject to enforcementactions or the imposition of significant monetary fines, other penalties, or claims, which could harmour operating results or our ability to conduct our business.
The FDA regulates the promotional labeling for and the FTC regulates the advertising of ourproducts to ensure that the claims we make are consistent with our regulatory clearances, that there isscientific data to substantiate the claims and that our promotion and advertising is neither false normisleading.
The FCC regulates the limits of potentially harmful interference to licensed transmitters due tolow-power, unlicensed transmitters. The FCC takes into account the different potentials for causingharmful interference and, as a result, its regulations are most restrictive on products that are most likelyto cause harmful interference, and less restrictive on those that are least likely to cause interference.
117
REGULATORY OVERVIEW
The U.S. Department of Energy also regulates consumer battery chargers and regulatedproducts will require testing and certification. Battery chargers manufactured and distributed in UScommerce must meet specified energy conservation standards.
FCPA
We engage in operations and activities outside the United States and thus are subject to theForeign Corrupt Practices Act (the “FCPA”) which, among other restrictions, prohibits US companiesand their intermediaries from making payments to foreign officials for the purpose of obtaining orkeeping business or otherwise obtaining favorable treatment, and requires companies to maintainadequate record-keeping and internal accounting practices to accurately reflect their financial and othertransactions with foreign officials. The FCPA applies to companies, individual directors, officers,employees and agents. The FCPA also applies to foreign companies and persons taking any action infurtherance of such payments while in the United States Under the FCPA, US companies may also beheld liable for actions taken by strategic or local partners or representatives. In particular, we may beheld liable for actions taken by our strategic or local partners even though our partners are not subjectto the FCPA. The FCPA imposes civil and criminal penalties for violations of its provisions. Civilpenalties may include fines of up to US$500,000 per violation, and equitable remedies such asdisgorgement of profits causally connected to the violation (including prejudgment interest on suchprofits) and injunctive relief. Criminal penalties for violations of the payments provisions could rangeup to the greater of US$2 million per violation or twice the gross pecuniary gain sought by making thepayment, and/or incarceration for up to 5 years per violation. Moreover, if a director, officer oremployee of a company is found to have willfully violated the FCPA books and records provisions, themaximum penalty would be imprisonment for 20 years per violation. Maximum fines of up to US$25million may also be imposed for willful violations of the books and records provisions by a company.
118

HISTORY, REORGANIZATION AND CORPORATE STRUCTURE
OVERVIEW
Our Company was incorporated in the Cayman Islands under the Companies Law as anexempted company with limited liability on July 26, 2018, as part of the Reorganization. After theReorganization, our Company became the holding company of our Group for the purpose of the listingwith our businesses conducted through our subsidiaries. See “—Reorganization.”
History of Joyoung Segment
The history of our PRC business dates back to 1994, when Mr. Wang Xuning, our founder andone of our Controlling Shareholders, first conducted research and development on fully automaticsoymilk maker. On July 8, 2002, Mr. Wang Xuning and several other individuals incorporatedShandong Joyoung with a registered capital of RMB10 million. As of the time of the incorporation, ourbusiness focused on the developing, manufacturing and marketing of small household appliances.
From December 2003 to June 2007, a number of capital contributions and shareholdingchanges were carried out in Shandong Joyoung. On June 14, 2005 Shandong Joyoung received capitalcontributions of RMB3.5 million from Bilting. On December 22, 2005, Mr. Wang Xuning and otherindividual shareholders transferred their equity interests in Shandong Joyoung to Shanghai Lihong, theholding company of our PRC operating entities, for the purpose of optimizing the shareholdingstructure of Shandong Joyoung. On June 12, 2007, Shandong Joyoung received capital contributions ofRMB714,801 from Dinghui.
On September 19, 2007, Shandong Joyoung was converted into a joint stock company underthe name of “Joyoung Co., Ltd” with a registered capital of RMB200 million. After the conversion,Shanghai Lihong, Bilting and Dinghui, held approximately 66.36%, 22.79% and 6.86% of the sharecapital of Joyoung, respectively. On May 28, 2008, Joyoung was successfully listed on the ShenzhenStock Exchange (stock code: 002242) and issued 67,000,000 A Shares at RMB22.54 per share to thepublic through an initial public offering. As of the Latest Practicable Date, Joyoung was held byShanghai Lihong and Bilting as to 50.11% and 16.93%, respectively. Joyoung, together with itssubsidiaries, including Joyoung Household Appliances and Joyoung Life Electric, carried out businessincluding development, manufacturing and marketing of small household appliances.
History of SharkNinja Segment
To expand our overseas footprint and presence and enter the international market, we pursuedintegration and acquired 70% of the equity interest in Compass, the holding company of Euro-ProHoldCo, LLC and its subsidiaries (the “SharkNinja Acquisition”) together with Easy Home, a wholly-owned subsidiary of CDH Fund V, L.P., in September 2017. See “—Major Acquisition.”
Euro-Pro HoldCo, LLC is a company incorporated in the United States and it is the holdingcompany of SharkNinja group of companies. In the United States and Canada, our Shark and Ninjabrands under the operation of SharkNinja group of companies maintained a leading market share in anumber of product categories through relentless focus on quality, reliability, consumer satisfaction andaccessible innovation to consumers. We ranked second in the small household appliance market in theUnited States in terms of our retail sales value in 2018.
Over the years, we gradually developed into a global leader in high-quality, innovative smallhousehold appliances. We are committed to serving the local needs in household cleaning and kitchensacross the globe with our multi-brand and comprehensive product portfolio.
119
HISTORY, REORGANIZATION AND CORPORATE STRUCTURE
OUR MILESTONES
The following is a summary of our Group’s key business development milestones:
Year Event
1994 Mr. Wang Xuning founded our Group by first conducting research and development on fullyautomatic soymilk maker.
2002 Our Group started to conduct small household appliances business with the establishment ofShandong Joyoung.
2007 Dinghui was brought in as an investor in Shandong Joyoung.
2008 A Shares of Joyoung were listed on the Shenzhen Stock Exchange under the stock code002242.
Shark introduced its first No-Loss-of-Suction upright vacuum in the United States.
2010 Ninja total crushing blender was introduced in the United States.
2015 We launched a brand-new series of high-performance multifunctional blenders in China.
2017 We acquired Compass together with Easy Home.
We launched the heating, noiseless and wash-free fully automated “intelligent soymilk maker”.
We launched the intelligent Shark ION robotic vacuum in the United States.
2018 We launched Foodi, a pressure cooker that crisps and air fries.
OUR MAJOR SUBSIDIARIES
As of the Latest Practicable Date, the following subsidiaries serve as significant holding entitiesor principally account for the results, assets, liabilities or businesses of the Group:
1. Joyoung
Shandong Joyoung, the predecessor of Joyoung, was incorporated as a limited liabilitycompany in China on July 8, 2002 with a registered capital of RMB10 million. On September 19,2007, Shandong Joyoung was converted into a joint-stock company under the name “Joyoung Co.,Ltd.” and the shares of Joyoung were listed on the Shenzhen Stock Exchange on May 28, 2008 underthe stock code 002242. Joyoung is primarily engaged in development, manufacturing and marketing ofsmall household appliances. As of the Latest Practicable Date, Joyoung is approximately 50.11% heldby Shanghai Lihong and approximately 16.93% held by Bilting.
2. Joyoung Household Appliances
Joyoung Household Appliances was incorporated as a limited liability company in China onSeptember 5, 2007 under the name of its predecessor, Hangzhou Lv Jia Shi Ye Limited (杭州綠嘉實業有限公司), with a registered capital of RMB220 million and changed its name to HangzhouOunanduo Small Appliance Limited (杭州歐南多小家電有限公司) and Hangzhou Joyoung OunanduoSmall Appliance Limited (杭州九陽歐南多小家電有限公司) on October 14, 2008 and January 9, 2009,respectively, and further changed its name to “Hangzhou Joyoung Household Electric AppliancesLimited” after the acquisition of Hangzhou Jiuyang Small Appliance Limited in October 2018, which
120
HISTORY, REORGANIZATION AND CORPORATE STRUCTURE
was then a subsidiary of Joyoung. Joyoung Household Appliances is primarily engaged in thedevelopment and manufacture of small household appliances. As of the Latest Practicable Date,Joyoung Small Appliance is wholly owned by Joyoung.
3. Joyoung Life Electric
Joyoung Life Electric was incorporated as a limited liability company in China onNovember 24, 2010 with a registered capital of RMB3 million. Joyoung Life Electric is primarilyengaged in the manufacture and marketing of small household appliances. As of the Latest PracticableDate, Joyoung Life Electric is wholly owned by Joyoung.
4. SharkNinja Operating LLC
SharkNinja Operating LLC was incorporated as a limited liability company in the United Stateson July 22, 2003. SharkNinja Operating LLC is primarily engaged in wholesale and retail trade ofsmall household appliances. As of the Latest Practicable Date, SharkNinja Operating LLC is anindirect wholly-owned subsidiary of the Company.
5. SharkNinja Sales Company
SharkNinja Sales Company was incorporated as a limited liability company in the United Stateson February 26, 2013. SharkNinja Sales Company is primarily engaged in wholesale and retail trade ofsmall household appliances. As of the Latest Practicable Date, SharkNinja Sales Company is anindirect wholly-owned subsidiary of the Company.
MAJOR ACQUISITION
On May 4, 2016, Shanghai Lihong incorporated Zheng Hong Development Company Limited(“Zheng Hong”) in Hong Kong. On July 4, 2017, Zheng Hong incorporated Chen Hong CompanyLimited (“Chen Hong”) in the BVI as a limited liability company. Subsequently, Chen Hongincorporated Xiang Hong in the BVI as a limited liability company. After GA1 was incorporated in theCayman Islands as an exempted company on July 4, 2017, GA1 incorporated GA2 in the CaymanIslands as an exempted company on the same day. Easy Home acquired and subscribed for 30% equityinterest in GA1, while Xiang Hong subscribed for 70% equity interest in GA1.
On July 27, 2017, Global Appliance LLC (as buyer and an indirectly wholly-owned subsidiaryof Compass), New Euro-Pro Holdings LLC (as seller) and Euro-Pro HoldCo, LLC (as target) enteredinto a Membership Interest Purchase Agreement and, pursuant to such agreement and various closingand ancillary documents related thereto, (i) Global Appliance LLC directly acquired certainmembership interests (the “Direct Purchase Interests”) in Euro-Pro Holdco, LLC (the “DirectPurchase”) and (ii) New Euro-Pro Holdings LLC distributed the remaining membership interests inEuro-Pro Holdco, LLC (the “Rollover Interests”) to its equity holders, which in turn contributed theRollover Interests to Compass Aggregator, Ltd. in order for Compass Aggregator, Ltd. to furthercontribute the Rollover Interests to Compass in exchange for 30% of the ordinary shares of Compass(the “Rollover”). The Direct Purchase and the Rollover were properly and legally completed at thesame time on September 29, 2017 and, in connection therewith, Compass further contributed theRollover Interests, through its directly wholly-owned subsidiary, to Global Appliance LLC. Followingthe completion of the Direct Purchase and the Rollover, 70% of the ordinary shares of Compass washeld by GA1 (which was in turn indirectly 70% held by Shanghai Lihong through Xiang Hong, its
121
HISTORY, REORGANIZATION AND CORPORATE STRUCTURE
indirect wholly-owned subsidiary), while the remaining 30% of the ordinary shares of Compass wasdirectly held by Compass Aggregator, Ltd. In addition, Compass indirectly wholly owned GlobalAppliance LLC (which in turn directly held 100% membership interests of Euro-Pro HoldCo, LLC)and, at that time, Compass Cayman SPV 2 Limited had already been formed and was directly whollyowned by Compass.
The consideration for the Direct Purchase Interests pursuant to the Direct Purchase wasapproximately US$1,607.8 million payable to New Euro-Pro Holdings LLC upon completion (subjectto post-closing adjustment based on the closing-date balance sheet), which was determined withreference to the US$1,600 million enterprise value of Euro-Pro HoldCo, LLC on a debt-free andcash-free basis. Such amount of consideration was settled at the completion on September 29, 2017,with cash of approximately US$1,316.6 million, a 30% equity interest in Compass valued atapproximately US$258.3 million and a put option related to the 30% equity interest in Compass (the“Put Option”) valued at US$32.9 million. The cash portion of the consideration was funded from acash equity contribution by GA1 of approximately US$580.1 million and debt acquisition financing ofapproximately US$742.4 million. Except for the cash balance of US$5.9 million remained at theGlobal Appliance LLC (formerly known as Global Appliance Inc.)’s account, the balance of thoseproceeds were used to fund acquisition and expenses incurred in connection with closing the debtacquisition financing. The Put Option was terminated upon the completion of the restructuring ofCompass.
On June 14, 2019, we entered into a share subscription agreement with each of the SNInvestors, pursuant to which the SN Investors in aggregate agreed to transfer 12,674.56 ordinary sharesof Compass to the Company as a consideration of its share subscription of the Company. See“—Reorganization—5. Restructuring of Compass (SharkNinja).”
On June 14, 2019, we entered into a share subscription agreement with Easy Home, pursuant towhich Easy Home and Comfort Home transferred the 30% equity interest in GA1 and 2,325.44ordinary shares in Compass to us as a consideration of their subscription of the ordinary shares in ourCompany. See “—Reorganization—5.2 Share Subscription by SN Investors” and “—Reorganization—5. Restructuring of Compass (SharkNinja).”
On June 19, 2019, 100% equity interest in Xiang Hong (which in turn held 70% of the ordinaryshares of GA1, which in turn indirectly held 70% shares of Compass) was transferred to JY-SN, one ofour wholly-owned subsidiaries, as part of the Reorganization. See “—Reorganization—5. Restructuringof Compass (SharkNinja).”
Upon the completion of the abovementioned steps, we indirectly held 100% of the ordinaryshares of Compass.
During the Track Record Period and up to the Latest Practicable Date, save as disclosed above,we did not conduct any other major acquisitions, disposals or mergers.
REORGANIZATION
In anticipation of our Listing, we underwent the Reorganization pursuant to which ourCompany became the holding company and listing vehicle of our Group.
122
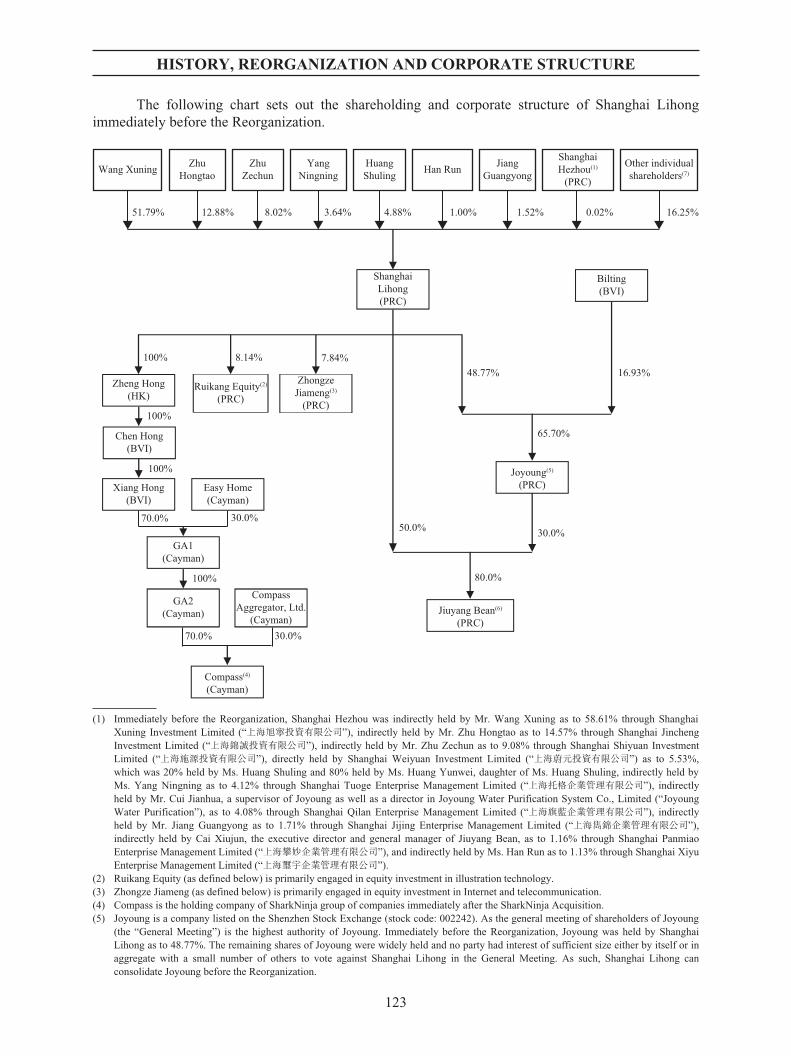
HISTORY, REORGANIZATION AND CORPORATE STRUCTURE
The following chart sets out the shareholding and corporate structure of Shanghai Lihongimmediately before the Reorganization.
16.25%0.02%
ShanghaiLihong(PRC)
Ruikang Equity(2)
(PRC)
ZhongzeJiameng(3)
(PRC)
8.14%100%
100%
100%
100%
70.0% 30.0%
70.0% 30.0%
7.84%
Jiuyang Bean(6)
(PRC)
Joyoung(5)
(PRC)
Bilting(BVI)
16.93%
65.70%
48.77%
50.0%
80.0%
30.0%
Zheng Hong(HK)
Easy Home(Cayman)
Xiang Hong(BVI)
CompassAggregator, Ltd.
(Cayman)
GA1(Cayman)
GA2(Cayman)
Chen Hong(BVI)
Compass(4)
(Cayman)
ShanghaiHezhou(1)
(PRC)
1.00%
Han Run
1.52%
JiangGuangyong
3.64%
YangNingning
4.88%
HuangShuling
8.02%
ZhuZechun
12.88%
ZhuHongtao
51.79%
Wang Xuning Other individualshareholders(7)
(1) Immediately before the Reorganization, Shanghai Hezhou was indirectly held by Mr. Wang Xuning as to 58.61% through ShanghaiXuning Investment Limited (“上海旭寧投資有限公司”), indirectly held by Mr. Zhu Hongtao as to 14.57% through Shanghai JinchengInvestment Limited (“上海錦誠投資有限公司”), indirectly held by Mr. Zhu Zechun as to 9.08% through Shanghai Shiyuan InvestmentLimited (“上海施源投資有限公司”), directly held by Shanghai Weiyuan Investment Limited (“上海蔚元投資有限公司”) as to 5.53%,which was 20% held by Ms. Huang Shuling and 80% held by Ms. Huang Yunwei, daughter of Ms. Huang Shuling, indirectly held byMs. Yang Ningning as to 4.12% through Shanghai Tuoge Enterprise Management Limited (“上海托格企業管理有限公司”), indirectlyheld by Mr. Cui Jianhua, a supervisor of Joyoung as well as a director in Joyoung Water Purification System Co., Limited (“JoyoungWater Purification”), as to 4.08% through Shanghai Qilan Enterprise Management Limited (“上海旗藍企業管理有限公司”), indirectlyheld by Mr. Jiang Guangyong as to 1.71% through Shanghai Jijing Enterprise Management Limited (“上海雋錦企業管理有限公司”),indirectly held by Cai Xiujun, the executive director and general manager of Jiuyang Bean, as to 1.16% through Shanghai PanmiaoEnterprise Management Limited (“上海攀妙企業管理有限公司”), and indirectly held by Ms. Han Run as to 1.13% through Shanghai XiyuEnterprise Management Limited (“上海璽宇企業管理有限公司”).
(2) Ruikang Equity (as defined below) is primarily engaged in equity investment in illustration technology.(3) Zhongze Jiameng (as defined below) is primarily engaged in equity investment in Internet and telecommunication.(4) Compass is the holding company of SharkNinja group of companies immediately after the SharkNinja Acquisition.(5) Joyoung is a company listed on the Shenzhen Stock Exchange (stock code: 002242). As the general meeting of shareholders of Joyoung
(the “General Meeting”) is the highest authority of Joyoung. Immediately before the Reorganization, Joyoung was held by ShanghaiLihong as to 48.77%. The remaining shares of Joyoung were widely held and no party had interest of sufficient size either by itself or inaggregate with a small number of others to vote against Shanghai Lihong in the General Meeting. As such, Shanghai Lihong canconsolidate Joyoung before the Reorganization.
123
HISTORY, REORGANIZATION AND CORPORATE STRUCTURE
(6) Jiuyang Bean is primarily engaged in providing soymilk powders and commercial soymilk makers. Immediately before the Reorganization,Jiuyang Bean was held by Shanghai Lihong, Joyoung and an Independent Third Party as to 50%, 30% and 20%, respectively.
(7) Other individual shareholders include Mr. Cui Jianhua, a supervisor of Joyoung as well as a director of Joyoung Water Purification,Ms. Tian Deling, a director of Shanghai Lihong, and other individuals who are Independent Third Parties.
The Reorganization involved the following steps:
1. Exclusion of Other Businesses
To streamline the business operations of the Group and focus more on our primary business,Shanghai Lihong transferred all of its interests other than interests in Joyoung and Compass toaffiliates of the Controlling Shareholders:
Š on May 17, 2018, Shanghai Lihong entered into a partnership interest transfer agreementwith respect to Shanghai Ruikang Equity Investment Partnership (Limited Partnership)(上海瑞康股權投資合夥企業(有限合夥)) (“Ruikang Equity”), pursuant to which ShanghaiLihong transferred its 8.14% interest in Ruikang Equity to Shanghai Hezhou for aconsideration of RMB8,000,000. Ruikang Equity is primarily engaged in investment inillustration technology;
Š on May 22, 2018, Shanghai Lihong entered into a partnership interest transfer agreementwith respect to Ningbo Zhongze Jiameng Equity Investment Partnership (LimitedPartnership) (寧波中澤嘉盟股權投資合夥企業(有限合夥)) (“Zhongze Jiameng”), pursuantto which Shanghai Lihong transferred its 7.84% interest in Zhongze Jiameng to ShanghaiHezhou for a consideration of RMB29,647,059. Zhongze Jiameng is primarily engaged ininvestment in Internet and telecommunication; and
Š on August 25, 2018, Shanghai Lihong entered into a share transfer agreement with NingboMeishan Free Trade Port Area Lihao Investment Limited (寧波梅山保稅港區力豪投資有限公司) (“Lihao Investment”), which was 88.39% held by Shanghai Hezhou, pursuant towhich Shanghai Lihong transferred its 50% equity interest in Jiuyang Bean to LihaoInvestment, for a consideration of RMB29,941,000. Jiuyang Bean is primarily engaged inproviding soymilk powders and commercial soymilk makers.
2. Incorporation of our Company and the Offshore Structure
1) Establishment of JS Holding
On April 16, 2018, each of the individual Controlling Shareholders, namely, Mr. Wang Xuning,Mr. Zhu Hongtao, Mr. Zhu Zechun, Ms. Yang Ningning, Ms. Huang Shuling, Ms. Han Run andMr. Jiang Guangyong, incorporated their wholly-owned special purpose vehicles in BVI, respectively,namely XNL, Jin Cheng, Fortune Spring, Tuo Ge, Yuan Jiu, Xi Yu and Jin Yu for the purpose of theReorganization.
On June 28, 2018, the BVI SPVs jointly incorporated Tong Zhou and Gong Ji in the BVI. Uponincorporation, Tong Zhou and Gong Ji each was wholly owned by the Controlling Shareholders Groupthrough the BVI SPVs.
On July 18, 2018, Mr. Wang Xuning’s BVI SPV, i.e. XNL, incorporated Hezhou, awholly-owned subsidiary in the Cayman Islands. On the same date, Hezhou, Tong Zhou and Gong Jientered into a partnership agreement (“Partnership Agreement”), pursuant to which JS Holding wasregistered as an exempted limited partnership under the laws of the Cayman Islands under the name of
124
HISTORY, REORGANIZATION AND CORPORATE STRUCTURE
Hezhou Limited Partnership, whose general partner was Hezhou and limited partners were Tong Zhouand Gong Ji. On May 2, 2019, Gong Ji merged into Tong Zhou (with Tong Zhou as the survivingentity). As of the Latest Practicable Date, Hezhou and Tong Zhou contributed US$1 and US$2,000,respectively, to JS Holding.
2) Incorporation of our Company
On April 16, 2018, Mr. Wang Xuning established JY-SN as a limited liability company in BVI.On April 26, 2018, JY-SN established Sunshine Rise as a company limited by shares in Hong Kong.
On July 26, 2018, our Company was incorporated in the Cayman Islands as an exemptedcompany (previously known as “JY-Shark Company Limited”) with an authorized share capital ofUS$50,000 divided into 500,000,000 ordinary shares with par value of US$0.0001 each and one sharewas issued to Mapcal Limited as the subscriber. On the same date, the one issued share was transferredfrom Mapcal Limited to JS Holding, which was then known as Hezhou Limited Partnership, at parvalue and JS Holding became the then sole shareholder of our Company.
On August 10, 2018, the Company acquired 100% equity interest in JY-SN, which in turn held100% equity interest in Sunshine Rise.
3. Capital Contribution to Shanghai Lihong
On November 13, 2018, Easy Appliance (Hong Kong), a then indirect wholly-ownedsubsidiary of Easy Home, entered into a capital increase agreement (“Easy Appliance Capital IncreaseAgreement”) with Shanghai Lihong, pursuant to which Easy Appliance (Hong Kong) agreed tocontribute RMB7,514,149.25 in cash to Shanghai Lihong, among which RMB2,748,536.84 wascredited as registered capital (representing 5% of the enlarged registered capital of Shanghai Lihong)and the remaining RMB4,765,612.41 was credited as the capital reserve. As a result, the registeredshare capital of Shanghai Lihong increased from RMB52,222,200.00 to RMB54,970,736.84 andShanghai Lihong was converted from a PRC domestic company to a sino-foreign joint venture onNovember 22, 2018. The capital contribution was completed on April 28, 2019.
On November 27, 2018, Sunshine Rise, the wholly-owned subsidiary of our Company, enteredinto a capital increase agreement (“Sunshine Rise Capital Increase Agreement”) with Shanghai Lihong,pursuant to which Sunshine Rise agreed to contribute RMB728,480,087.62 in cash to ShanghaiLihong, among which RMB266,464,544.78 would be credited as registered capital and the remainingRMB462,015,542.84 would be credited as capital reserve. Shanghai Lihong has been held by SunshineRise and ultimately controlled by our Company as to approximately 82.9% since December 4, 2018.For the source of funding for the share capital increase, see “Financial Information—Indebtedness.”
4. Share Exchange by Mr. Lee Puay Khng
On April 11, 2019, the Company and Mr. Lee Puay Khng, the then sole shareholder of Bilting,entered into a share subscription agreement (“Bilting Subscription Agreement”), pursuant to whichMr. Lee Puay Khng exchanged his 100% equity interest in Bilting with the Company in considerationfor 36,830,424.53 ordinary shares in the Company. The share exchange was completed on April 16,2019, upon which Bilting became a wholly-owned subsidiary of our Company.
On April 18, 2019, Mr. Lee Puay Khng further exchanged his entire interest in the Company(i.e. 36,830,424.53 ordinary shares) to Sol SPC in consideration for 368,304.24536 class A
125
HISTORY, REORGANIZATION AND CORPORATE STRUCTURE
participating shares (representing 100% of the issued class A participating shares) of Sol SPC. Sol SPCis a segregated portfolio company incorporated in the Cayman Islands with an authorized share capitalcomprising 100 management shares of par value US$0.01 each and 4,999,900 participating shares ofpar value US$0.01 each, among which holders of management shares shall have the right to receivenotice of, attend and vote as a member at any general meeting while the holders of participating sharesshall not have such rights. As of the Latest Practicable Date, STL, a company incorporated in the BVIand indirectly wholly owned by Mr. Wang Xuning, held 100 management shares as well as one class Bparticipating share of Sol SPC.
126
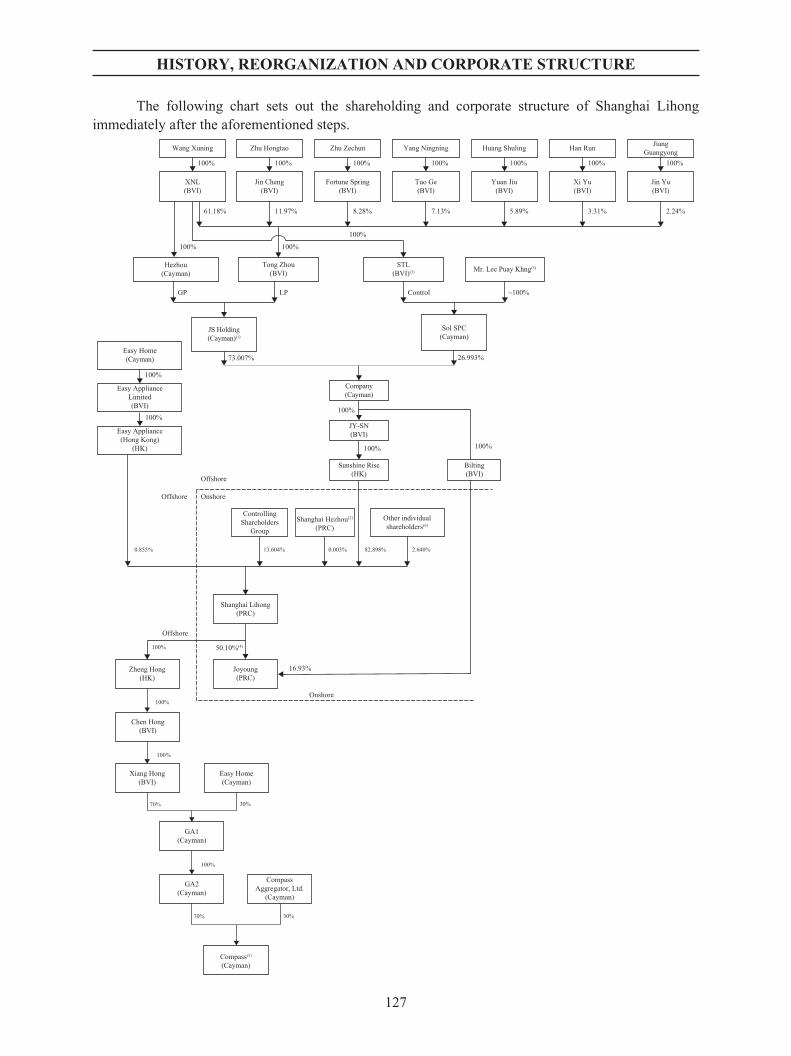
HISTORY, REORGANIZATION AND CORPORATE STRUCTURE
The following chart sets out the shareholding and corporate structure of Shanghai Lihongimmediately after the aforementioned steps.
Easy Appliance(Hong Kong)
(HK)
Easy ApplianceLimited(BVI)
Easy Home(Cayman)
JY-SN(BVI)
Sunshine Rise(HK)
Shanghai Hezhou(2)
(PRC)Other individualshareholders(6)
Shanghai Lihong(PRC)
50.10%(4)
16.93%
100%
100%
100%
100%
100%
0.003%0.855%
ControllingShareholders
Group
13.604% 82.898% 2.640%
Joyoung(PRC)
Onshore
Offshore
Offshore
OnshoreOffshore
XNL(BVI)
Wang Xuning Zhu Hongtao Zhu Zechun Yang Ningning Huang Shuling Han Run JiangGuangyong
100%
100%
61.18%
100%
100%
~100%Control
Hezhou(Cayman)
Tong Zhou(BVI)
JS Holding(Cayman)(1)
Company(Cayman)
STL(BVI)(3) Mr. Lee Puay Khng(3)
Jin Cheng(BVI)
Tuo Ge(BVI)
Yuan Jiu(BVI)
Xi Yu(BVI)
Fortune Spring(BVI)
Jin Yu(BVI)
5.89%11.97% 2.24%
100%100%100% 100%
8.28% 7.13% 3.31%
100% 100%
LPGP
73.007%
Sol SPC(Cayman)
26.993%
100%
100%
100%
100%
70% 30%
70% 30%
Zheng Hong(HK)
Easy Home(Cayman)
Xiang Hong(BVI)
CompassAggregator, Ltd.
(Cayman)
GA1(Cayman)
GA2(Cayman)
Chen Hong(BVI)
Compass(5)
(Cayman)
Bilting(BVI)
127
HISTORY, REORGANIZATION AND CORPORATE STRUCTURE
(1) JS Holding (which was then known as Hezhou Limited Partnership) subscribed for 99,613,965.34 ordinary shares in the Company onApril 10, 2019. See “—Reorganization—5.1 Share Subscription by JS Holding and Acquisition of Xiang Hong.”
(2) Shanghai Hezhou underwent certain restructuring steps with the updated shareholding structure being: Shanghai Hezhou was indirectlyheld by Mr. Wang Xuning as to 61.85% through Shanghai Xuning Investment Limited (“上海旭寧投資有限公司”), indirectly held byMr. Zhu Hongtao as to 15.38% through Shanghai Jincheng Investment Limited (“上海錦誠投資有限公司”), indirectly held by Mr. ZhuZechun as to 9.58% through Shanghai Shiyuan Investment Limited (“上海施源投資有限公司”), indirectly held by Ms. Yang Ningning asto 4.35% through Shanghai Tuoge Enterprise Management Limited (“上海托格企業管理有限公司”), indirectly held by Mr. JiangGuangyong as to 1.81% through Shanghai Jijing Enterprise Management Limited (“上海雋錦企業管理有限公司”), indirectly held byMs. Han Run as to 1.19% through Shanghai Xiyu Enterprise Management Limited (“上海璽宇企業管理有限公司”), and the remaining5.83% of interest in Shanghai Hezhou was directly held by Shanghai Weiyuan Investment Limited (“上海蔚元投資有限公司”), which was20% held by Ms. Huang Shuling and 80% held by Ms. Huang Yunwei, daughter of Ms. Huang Shuling.
(3) STL held 100 management shares (representing 100% voting rights) and one class B participating share (without voting rights) in SolSPC; Mr. Lee Puay Khng held 368,304.24536 class A participating shares (representing 100% issued class A participating shares andwithout voting rights) in Sol SPC.
(4) From February 13, 2018 to December 28, 2018, Shanghai Lihong cumulatively purchased in total of 14,477,566 shares of Joyoungthrough the Shenzhen Stock Exchange trading system. As a result, Shanghai Lihong’s shareholding in Joyoung increased from 48.77% to50.10%.
(5) Compass is the holding company of SharkNinja group of companies immediately after the SharkNinja Acquisition.(6) Other individual shareholders include Mr. Cui Jianhua, a supervisor of Joyoung as well as a director of Joyoung Water Purification,
Ms. Tian Deling, a director of Shanghai Lihong, and other individuals who are Independent Third Parties including Zhang Xiaobin, LiuMingliang, Shi Lei, Tang Jun, Cai Xiujun, Chen Liang, Li Jinsheng, Xu Yifan, Xu Xinhui, Wang Xiaoru, Wang Bo, Wang Shu’an, JiangJinke, Zhu Wanhe, Xu Qingliang and Xing Xiuying.
5. Restructuring of Compass (SharkNinja)
On September 29, 2017, Shanghai Lihong acquired 70% equity interest in Compass, the holdingcompany of SharkNinja group of companies immediately after the SharkNinja Acquisition together withEasy Home, a wholly-owned subsidiary of CDH Fund V, L.P. See “—Major Acquisition.”
5.1 Share Subscription by JS Holding and Acquisition of Xiang Hong
In September 2017, for the SharkNinja Acquisition, Zheng Hong obtained a facility letter fromIndustrial and Commercial Bank of China (Asia) Limited (“ICBC Asia”) with a principal amount of upto US$470 million (the “SharkNinja Acquisition Loan”). The SharkNinja Acquisition Loan wassecured by a pledge over 276,300,000 shares of Joyoung. See “Financial Information—Indebtedness.”On June 16, 2019, JS Holding (which was then known as Hezhou Limited Partnership) borrowed aloan of US$470 million from Industrial and Commercial Bank of China (Asia) Limited to replace theSharkNinja Acquisition Loan and acquired 100% equity interest in Xiang Hong via the followingsteps:
i. JS Holding subscribed for 160,357,832.17 ordinary shares of the Company for aconsideration of approximately US$470 million;
ii. through JY-SN, the Company in turn acquired 100% equity interest in Xiang Hong fromChen Hong (a wholly-owned subsidiary of Zheng Hong);
iii. Chen Hong distributed the consideration received for disposal of Xiang Hong to ZhengHong, which then repaid SharkNinja Acquisition Loan in full.
Upon completion of the steps above on June 19, 2019, JS Holding held approximately 81.32%ordinary shares in the Company, and GA1 was beneficially owned as to 70% by the Company. As partof the Reorganization and commercial arrangements among the Company and its existing shareholders,the Company agreed to deliver no less than US$455.9 million but up to US$470 million cash to theshareholders on a pro rata basis before the Global Offering as special dividend. Such special dividendwas paid on October 16, 2019. See “Financial Information—Indebtedness—Interest-bearing BankBorrowings”.
128
HISTORY, REORGANIZATION AND CORPORATE STRUCTURE
5.2 Share Subscription by SN Investors
During the period from June 22, 2019 to June 24, 2019, the SN Investors acquired in total 30%ordinary shares in Compass from Compass Aggregator, Ltd. through a series of share transfers. OnJune 24, 2019, MR Investor, one of the SN Investors, transferred 2,325.44 ordinary shares of Compassto Comfort Home for a consideration of US$49,000,000. The consideration was settled on June 24,2019.
On June 14, 2019, each of the SN Investors entered into a share subscription agreement withthe Company, pursuant to which the SN Investors agreed to exchange their respective shares inCompass with the Company in consideration for an aggregate of 35,730,688.99 ordinary shares to beissued by the Company on a pro rata basis. The consideration was settled on June 24, 2019.
5.3 Share Subscription by Easy Home and Comfort Home
On June 14, 2019, Easy Home entered into a share subscription agreement with the Company(“Easy Home JS Global Share Subscription Agreement”), pursuant to which (1) Easy Home agreed toexchange its entire 30% equity interest in GA1 with the Company in consideration for 29,600,413.96ordinary shares to be issued by the Company; and (2) Comfort Home agreed to exchange 2,325.44ordinary shares in Compass with the Company in consideration for 6,555,616.63 ordinary shares to beissued by the Company; and (3) Easy Home agreed to transfer its 100% equity interest in EasyAppliance Limited, which in turn held 100% equity interest in Easy Appliance (Hong Kong), to theCompany for a consideration of US$1,171,059.36. Upon completion of the share exchange above,Compass and Easy Appliance (Hong Kong) became wholly-owned subsidiaries of our Company.
6. RSU Plan
In order to provide incentives and rewards to directors, senior management and employees ofthe Group and other eligible individuals and entities, we have conditionally approved and adopted theRSU Plan. On October 9, 2019, the Board resolved to allot an aggregate of 141,618,409 Shares to theRSU Holding Entities, the issuance of which is expected to take place prior to the completion of theGlobal Offering, through which the trustee of the RSU Plan will hold our Shares pursuant to the RSUPlan on trust for the grantees. As of the date of this prospectus, 129,265,801 restricted stock units hadbeen granted under the RSU Plan. The principal terms of the RSU Plan are set out in the sectionheaded “Appendix IV—Statutory and General Information – D. RSU Plan.”
129
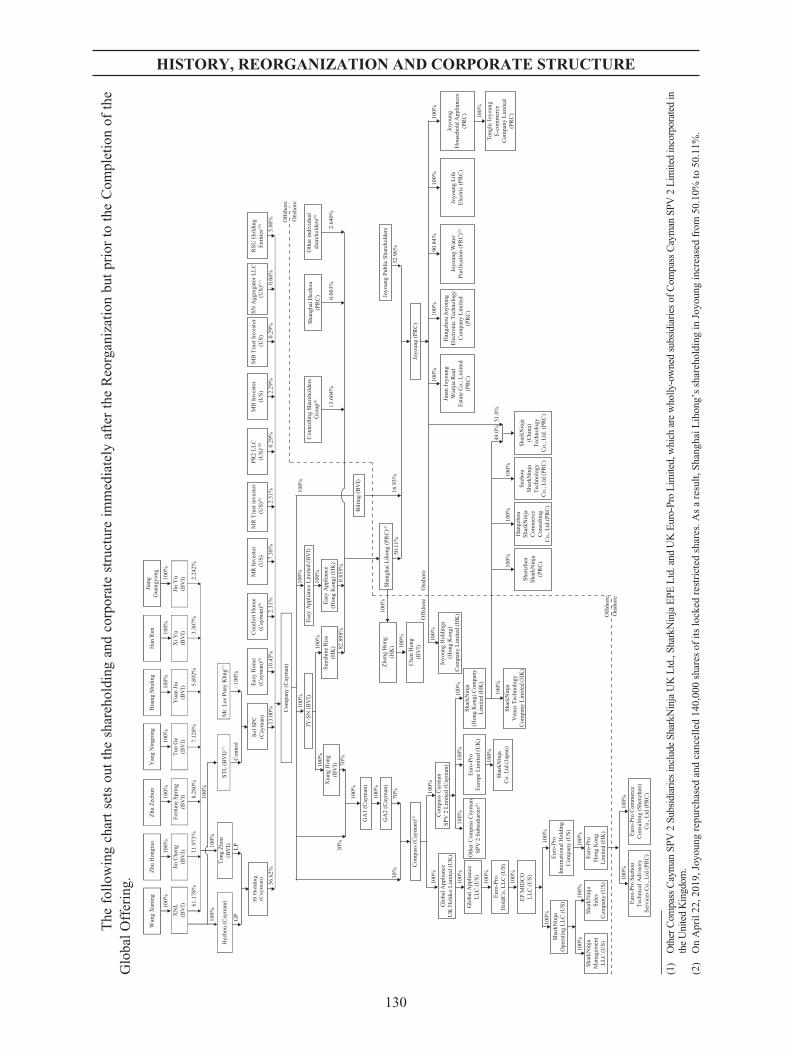
HISTORY, REORGANIZATION AND CORPORATE STRUCTURE
The
foll
owin
gch
art
sets
out
the
shar
ehol
ding
and
corp
orat
est
ruct
ure
imm
edia
tely
afte
rth
eR
eorg
aniz
atio
nbu
tpr
ior
toth
eC
ompl
etio
nof
the
Glo
balO
ffer
ing.
100%
100%
100%
100%
100%
100%
100%
100%
XN
L(B
VI)
Wan
g X
unin
gZh
u H
ongt
aoZh
u Ze
chun
Yan
g N
ingn
ing
Hua
ng S
hulin
gH
an R
unJi
ang
Gua
ngyo
ng
100%
61.1
78%
Jin
Che
ng(B
VI)
Tuo
Ge
(BV
I)Y
uan
Jiu
(BV
I)X
i Yu
(BV
I)Fo
rtune
Spr
ing
(BV
I)Ji
n Y
u(B
VI)
5.89
2%11
.973
%2.
242%
100%
100%
100%
100%
8.28
0%7.
128%
3.30
7%
100%
100%
~100
%C
ontro
l
Hez
hou
(Cay
man
)To
ng Z
hou
(BV
I)ST
L (B
VI)
(7)
Mr.
Lee
Puay
Khn
g(7)
LPG
P
70%
30%
30%
70
%
100%
100%
100%
100%
10
0%
100%
100%
100%
100%
100%
82.8
98%
0.85
5%
100%
16.9
3%50
.11%
JS H
oldi
ng(C
aym
an)
56.6
2%0.
06%
5.00
%
SN A
ggre
gato
r LLC
(US)
(11)
RSU
Hol
ding
Entit
ies(1
2)So
l SPC
(Cay
man
)13
.00%
10.4
5%
Easy
Hom
e(C
aym
an)(9
)
2.31
%
Com
fort
Hom
e(C
aym
an)(9
)
7.38
%
MR
Inve
stor
(US)
2.31
%
MR
Tru
st in
vest
or (U
S)(6
)
0.29
%
PR2
LLC
(US)
(10)
2.29
%
MB
Inve
stor
(US)
0.29
%
MB
Tru
st In
vest
or (U
S)
Com
pany
(Cay
man
)
JY-S
N (B
VI)
100%
100%
Easy
App
lianc
e Li
mite
d (B
VI)
Xia
ng H
ong
(BV
I)Su
nshi
ne R
ise
(HK
)
Zhen
g H
ong
(HK
)
100%
Easy
App
lianc
e(H
ong
Kon
g) (H
K)
Shan
ghai
Lih
ong
(PR
C)(2
)
0.00
3%13
.604
%2.
640%
Shan
ghai
Hez
hou
(PR
C)
Con
trolli
ng S
hare
hold
ers
Gro
up(4
)
Joyo
ung
Hol
ding
s (H
ong
Kon
g)C
ompa
ny L
imite
d (H
K)
Shen
zhen
Shar
kNin
ja(P
RC
)
Suzh
ouSh
arkN
inja
Tech
nolo
gyC
o., L
td (P
RC
)
Shar
kNin
ja(C
hina
)Te
chno
logy
Co.
, Ltd
. (PR
C)
Han
gzho
uSh
arkN
inja
Com
mer
ceC
onsu
lting
Co.
, Ltd
(PR
C)
Ons
hore
Off
shor
e
GA
1 (C
aym
an)
GA
2 (C
aym
an)
Com
pass
(Cay
man
)(3) C
ompa
ss C
aym
anSP
V 2
Lim
ited
(Cay
man
)
Oth
er C
ompa
ss C
aym
anSP
V 2
Sub
sidi
arie
s(1)
Euro
-Pro
Euro
pe L
imite
d (U
K)
Shar
kNin
ja(H
ong
Kon
g) C
ompa
nyLi
mite
d (H
K)
Glo
bal A
pplia
nce
UK
Hol
dco
Lim
ited
(UK
)
Glo
bal A
pplia
nce
LLC
(US)
EP M
IDC
OLL
C (U
S)
Euro
-Pro
Suz
hou
Tech
nica
l Adv
isor
ySe
rvic
es C
o., L
td (P
RC
)
Euro
-Pro
Com
mer
ceC
onsu
lting
(She
nzhe
n)C
o., L
td (P
RC
)
100%
100%
100%
100%
Joyo
ung
(PR
C)
Han
gzho
u Jo
youn
gEl
ectro
nic
Tech
nolo
gyC
ompa
ny L
imite
d(P
RC
)
Joyo
ung
Wat
erPu
rific
atio
n (P
RC
)(5)
Joyo
ung
Hou
seho
ld A
pplia
nces
(PR
C)
Joyo
ung
Life
Elec
tric
(PR
C)
Jina
n Jo
youn
gW
anjia
Rea
lEs
tate
Co.
, Lim
ited
(PR
C)100%
100%
90.8
4%10
0%10
0%
100%
49.0
%51
.0%
Oth
er in
divi
dual
sh
areh
olde
rs(8
)
Bilt
ing
(BV
I)
100%
Che
n H
ong
(BV
I)
100%
100%
Shar
kNin
jaC
o. L
td (J
apan
)
Tong
lu Jo
youn
gE-
com
mer
ceC
ompa
ny L
imite
d(P
RC
)
100%
10
0%
100%
100%
Shar
kNin
jaM
anag
emen
tLL
C (U
S)
Shar
kNin
jaSa
les
Com
pany
(US)
Euro
-Pro
Hon
g K
ong
Lim
ited
(HK
)
Euro
-Pro
Inte
rnat
iona
l Hol
ding
Com
pany
(US)
100%
Shar
kNin
jaO
pera
ting
LLC
(US)
32.9
6%
Ons
hore
Off
shor
e
Joyo
ung
Publ
ic S
hare
hold
ers
Ons
hore
Off
shor
e
Euro
-Pro
Hol
dCo,
LLC
(US)
Shar
kNin
jaV
enus
Tec
hnol
ogy
Com
pany
Lim
ited
(HK
)
(1)
Oth
erC
ompa
ssC
aym
anSP
V2
Subs
idia
ries
incl
ude
Shar
kNin
jaU
KL
td.,
Shar
kNin
jaE
PEL
td.a
ndU
KE
uro-
Pro
Lim
ited,
whi
char
ew
holly
-ow
ned
subs
idia
ries
ofC
ompa
ssC
aym
anSP
V2
Lim
ited
inco
rpor
ated
inth
eU
nite
dK
ingd
om.
(2)
On
Apr
il22
,201
9,Jo
youn
gre
purc
hase
dan
dca
ncel
led
140,
000
shar
esof
its
lock
edre
stri
cted
shar
es.A
sa
resu
lt,S
hang
haiL
ihon
g’s
shar
ehol
ding
inJo
youn
gin
crea
sed
from
50.1
0%to
50.1
1%.
130
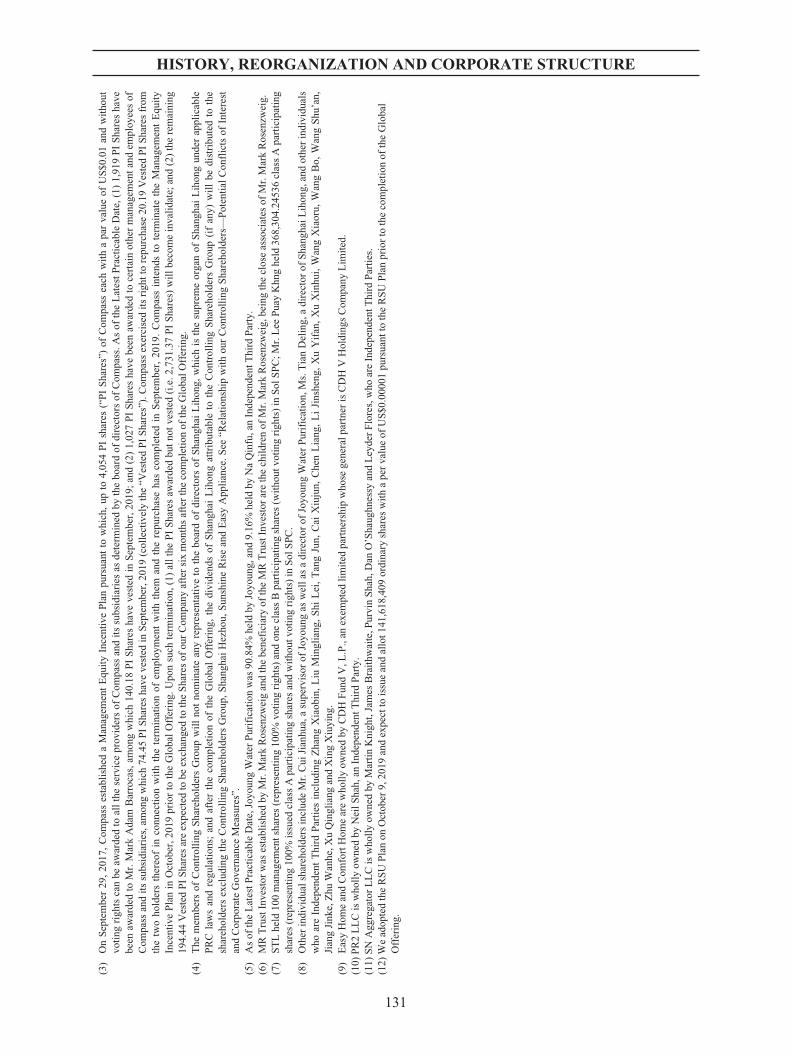
HISTORY, REORGANIZATION AND CORPORATE STRUCTURE
(3)
On
Sep
tem
ber
29,
2017
,C
ompa
sses
tabl
ishe
da
Man
agem
ent
Equ
ity
Ince
ntiv
eP
lan
purs
uant
tow
hich
,up
to4,
054
PI
shar
es(“
PI
Sha
res”
)of
Com
pass
each
wit
ha
par
valu
eof
US
$0.0
1an
dw
itho
utvo
ting
righ
tsca
nbe
awar
ded
toal
lth
ese
rvic
epr
ovid
ers
ofC
ompa
ssan
dit
ssu
bsid
iari
esas
dete
rmin
edby
the
boar
dof
dire
ctor
sof
Com
pass
.As
ofth
eL
ates
tPra
ctic
able
Dat
e,(1
)1,
919
PI
Sha
res
have
been
awar
ded
toM
r.M
ark
Ada
mB
arro
cas,
amon
gw
hich
140.
18P
IS
hare
sha
veve
sted
inS
epte
mbe
r,20
19;
and
(2)
1,02
7P
IS
hare
sha
vebe
enaw
arde
dto
cert
ain
othe
rm
anag
emen
tan
dem
ploy
ees
ofC
ompa
ssan
dit
ssu
bsid
iari
es,a
mon
gw
hich
74.4
5P
IS
hare
sha
veve
sted
inS
epte
mbe
r,20
19(c
olle
ctiv
ely
the
“Ves
ted
PI
Sha
res”
).C
ompa
ssex
erci
sed
its
righ
tto
repu
rcha
se20
.19
Ves
ted
PI
Sha
res
from
the
two
hold
ers
ther
eof
inco
nnec
tion
wit
hth
ete
rmin
atio
nof
empl
oym
ent
wit
hth
eman
dth
ere
purc
hase
has
com
plet
edin
Sep
tem
ber,
2019
.C
ompa
ssin
tend
sto
term
inat
eth
eM
anag
emen
tE
quit
yIn
cent
ive
Pla
nin
Oct
ober
,201
9pr
ior
toth
eG
loba
lO
ffer
ing.
Upo
nsu
chte
rmin
atio
n,(1
)al
lth
eP
IS
hare
saw
arde
dbu
tno
tve
sted
(i.e
.2,7
31.3
7P
IS
hare
s)w
illb
ecom
ein
vali
date
;an
d(2
)th
ere
mai
ning
194.
44V
este
dP
IS
hare
sar
eex
pect
edto
beex
chan
ged
toth
eS
hare
sof
our
Com
pany
afte
rsi
xm
onth
saf
ter
the
com
plet
ion
ofth
eG
loba
lOff
erin
g.(4
)T
hem
embe
rsof
Con
trol
ling
Sha
reho
lder
sG
roup
wil
lno
tno
min
ate
any
repr
esen
tati
veto
the
boar
dof
dire
ctor
sof
Sha
ngha
iL
ihon
g,w
hich
isth
esu
prem
eor
gan
ofS
hang
hai
Lih
ong
unde
rap
plic
able
PR
Cla
ws
and
regu
lati
ons;
and
afte
rth
eco
mpl
etio
nof
the
Glo
bal
Off
erin
g,th
edi
vide
nds
ofS
hang
hai
Lih
ong
attr
ibut
able
toth
eC
ontr
olli
ngS
hare
hold
ers
Gro
up(i
fan
y)w
ill
bedi
stri
bute
dto
the
shar
ehol
ders
excl
udin
gth
eC
ontr
olli
ngS
hare
hold
ers
Gro
up,S
hang
hai
Hez
hou,
Sun
shin
eR
ise
and
Eas
yA
ppli
ance
.See
“Rel
atio
nshi
pw
ith
our
Con
trol
ling
Sha
reho
lder
s—P
oten
tial
Con
flic
tsof
Inte
rest
and
Cor
pora
teG
over
nanc
eM
easu
res”
.(5
)A
sof
the
Lat
estP
ract
icab
leD
ate,
Joyo
ung
Wat
erP
urif
icat
ion
was
90.8
4%he
ldby
Joyo
ung,
and
9.16
%he
ldby
Na
Qin
fu,a
nIn
depe
nden
tThi
rdP
arty
.(6
)M
RT
rust
Inve
stor
was
esta
blis
hed
byM
r.M
ark
Ros
enzw
eig
and
the
bene
fici
ary
ofth
eM
RT
rust
Inve
stor
are
the
chil
dren
ofM
r.M
ark
Ros
enzw
eig,
bein
gth
ecl
ose
asso
ciat
esof
Mr.
Mar
kR
osen
zwei
g.(7
)S
TL
held
100
man
agem
ents
hare
s(r
epre
sent
ing
100%
voti
ngri
ghts
)an
don
ecl
ass
Bpa
rtic
ipat
ing
shar
es(w
itho
utvo
ting
righ
ts)
inS
olS
PC
;Mr.
Lee
Pua
yK
hng
held
368,
304.
2453
6cl
ass
Apa
rtic
ipat
ing
shar
es(r
epre
sent
ing
100%
issu
edcl
ass
Apa
rtic
ipat
ing
shar
esan
dw
itho
utvo
ting
righ
ts)
inS
olS
PC
.(8
)O
ther
indi
vidu
alsh
areh
olde
rsin
clud
eM
r.C
uiJi
anhu
a,a
supe
rvis
orof
Joyo
ung
asw
ella
sa
dire
ctor
ofJo
youn
gW
ater
Pur
ific
atio
n,M
s.T
ian
Del
ing,
adi
rect
orof
Sha
ngha
iLih
ong,
and
othe
rin
divi
dual
sw
hoar
eIn
depe
nden
tT
hird
Par
ties
incl
udin
gZ
hang
Xia
obin
,L
iuM
ingl
iang
,S
hiL
ei,
Tan
gJu
n,C
aiX
iuju
n,C
hen
Lia
ng,
Li
Jins
heng
,X
uY
ifan
,X
uX
inhu
i,W
ang
Xia
oru,
Wan
gB
o,W
ang
Shu
’an,
Jian
gJi
nke,
Zhu
Wan
he,X
uQ
ingl
iang
and
Xin
gX
iuyi
ng.
(9)
Eas
yH
ome
and
Com
fort
Hom
ear
ew
holl
yow
ned
byC
DH
Fun
dV
,L.P
.,an
exem
pted
lim
ited
part
ners
hip
who
sege
nera
lpar
tner
isC
DH
VH
oldi
ngs
Com
pany
Lim
ited
.(1
0)P
R2
LL
Cis
who
lly
owne
dby
Nei
lSha
h,an
Inde
pend
entT
hird
Par
ty.
(11)
SN
Agg
rega
tor
LL
Cis
who
lly
owne
dby
Mar
tin
Kni
ght,
Jam
esB
rait
hwai
te,P
urvi
nS
hah,
Dan
O’S
haug
hnes
syan
dL
eyde
rF
lore
s,w
hoar
eIn
depe
nden
tThi
rdP
arti
es.
(12)
We
adop
ted
the
RS
UP
lan
onO
ctob
er9,
2019
and
expe
ctto
issu
ean
dal
lot1
41,6
18,4
09or
dina
rysh
ares
wit
ha
per
valu
eof
US
$0.0
0001
purs
uant
toth
eR
SU
Pla
npr
ior
toth
eco
mpl
etio
nof
the
Glo
bal
Off
erin
g.
131

HISTORY, REORGANIZATION AND CORPORATE STRUCTURE
SHARE SUBDIVISION AND REPURCHASE AND CANCELLATION OF FRACTIONALSHARES
On October 9, 2019, our Shareholders resolved that, each issued and unissued ordinary share ofthen par value of US$0.0001 each will be subdivided into 10 Shares of par value of US$0.00001 each.Immediately upon such subdivision, our Board resolved on the same day that, the Company willrepurchase a total of 4.8 Shares from shareholders of the Company and cancelled such 4.8 Shares forthe purpose of eliminating fractional shares.
Upon the subdivision, repurchase and cancellation, the authorized share capital of the Companyshall be US$50,000 divided into 5,000,000,000 shares of a par value of US$0.00001 each, of which2,690,749,768 Shares are issued and fully paid-up.
PRE-IPO INVESTMENTS
1. Pre-IPO Investment by Comfort Home in 2019
On June 14, 2019 Comfort Home entered into a share subscription agreement with MRInvestor, pursuant to which Comfort Home agreed to purchase 2,325.44 ordinary shares in Compassheld by MR Investor through Comfort Home at a consideration of US$49,000,000.See “—Reorganization—5.3 Share Subscription by Easy Home and Comfort Home.” After thecompletion of this transaction, 2,325.44 ordinary shares in Compass were held by Comfort Home.
Name of Pre-IPO Investor Comfort Home
Date of investment June 14, 2019
Number of shares purchased 2,325.44 ordinary shares in Compass
The consideration paid US$49,000,000
Investment cost per Share after taking intoaccount share subdivision and repurchaseand cancellation of fractional shares(1) HK$5.85
Discount to the Offer Price(2) 8.6%
Closing date June 24, 2019
Basis of consideration Based on arm’s-length negotiations between the relevantparties after taking into consideration the business value ofCompass and its subsidiary at the time of the investment.
Lock-up period Six months
Notes:(1) The investment cost per share after taking into account share subdivision and repurchase and cancellation of fractional shares was
calculated based on dividing (a) total investment cost by (b) the number of Shares held following share subdivision and repurchase andcancellation of fractional shares.
(2) Calculated on the assumption that the price paid per share is adjusted for the dilutive effect of the Global Offering and the Offer Price isHK$6.40 per Offer Share, being the mid-point of the indicative Offer Price range of HK$5.55 to HK$7.25 per Offer Share and after theshare subdivision and repurchase and cancellation.
132
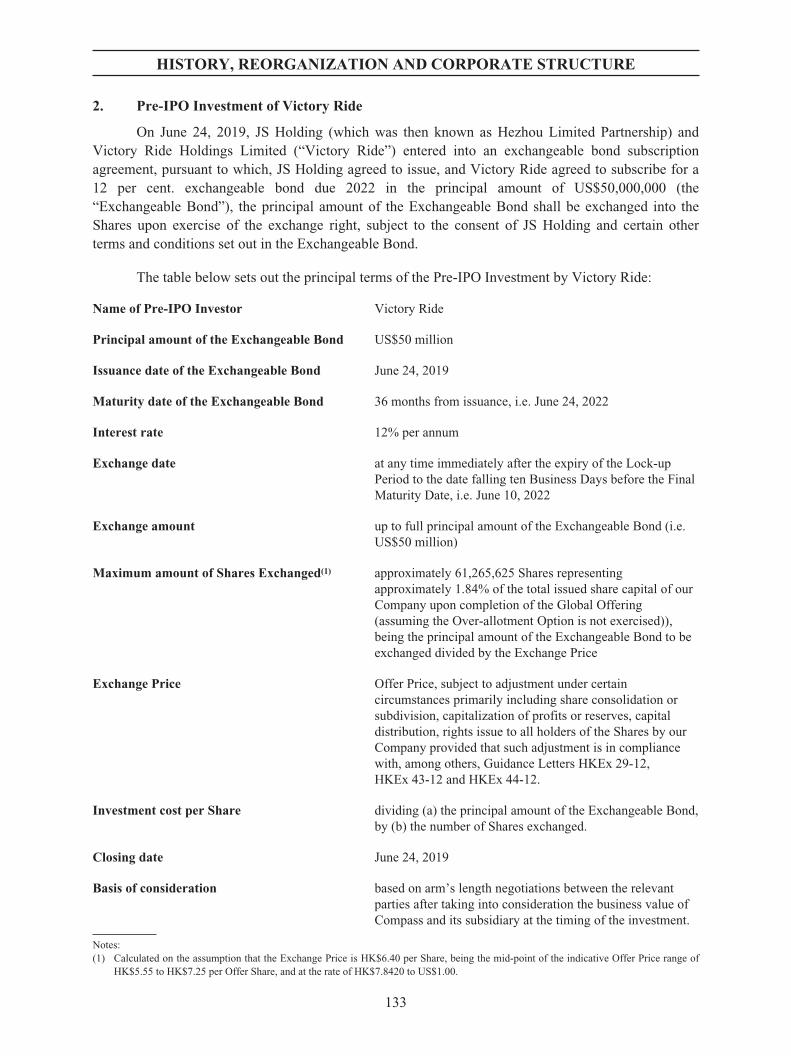
HISTORY, REORGANIZATION AND CORPORATE STRUCTURE
2. Pre-IPO Investment of Victory Ride
On June 24, 2019, JS Holding (which was then known as Hezhou Limited Partnership) andVictory Ride Holdings Limited (“Victory Ride”) entered into an exchangeable bond subscriptionagreement, pursuant to which, JS Holding agreed to issue, and Victory Ride agreed to subscribe for a12 per cent. exchangeable bond due 2022 in the principal amount of US$50,000,000 (the“Exchangeable Bond”), the principal amount of the Exchangeable Bond shall be exchanged into theShares upon exercise of the exchange right, subject to the consent of JS Holding and certain otherterms and conditions set out in the Exchangeable Bond.
The table below sets out the principal terms of the Pre-IPO Investment by Victory Ride:
Name of Pre-IPO Investor Victory Ride
Principal amount of the Exchangeable Bond US$50 million
Issuance date of the Exchangeable Bond June 24, 2019
Maturity date of the Exchangeable Bond 36 months from issuance, i.e. June 24, 2022
Interest rate 12% per annum
Exchange date at any time immediately after the expiry of the Lock-upPeriod to the date falling ten Business Days before the FinalMaturity Date, i.e. June 10, 2022
Exchange amount up to full principal amount of the Exchangeable Bond (i.e.US$50 million)
Maximum amount of Shares Exchanged(1) approximately 61,265,625 Shares representingapproximately 1.84% of the total issued share capital of ourCompany upon completion of the Global Offering(assuming the Over-allotment Option is not exercised)),being the principal amount of the Exchangeable Bond to beexchanged divided by the Exchange Price
Exchange Price Offer Price, subject to adjustment under certaincircumstances primarily including share consolidation orsubdivision, capitalization of profits or reserves, capitaldistribution, rights issue to all holders of the Shares by ourCompany provided that such adjustment is in compliancewith, among others, Guidance Letters HKEx 29-12,HKEx 43-12 and HKEx 44-12.
Investment cost per Share dividing (a) the principal amount of the Exchangeable Bond,by (b) the number of Shares exchanged.
Closing date June 24, 2019
Basis of consideration based on arm’s length negotiations between the relevantparties after taking into consideration the business value ofCompass and its subsidiary at the timing of the investment.
Notes:(1) Calculated on the assumption that the Exchange Price is HK$6.40 per Share, being the mid-point of the indicative Offer Price range of
HK$5.55 to HK$7.25 per Offer Share, and at the rate of HK$7.8420 to US$1.00.
133

HISTORY, REORGANIZATION AND CORPORATE STRUCTURE
The Exchangeable Bond is secured by, inter alia:
(1) prior to Listing, a mortgage granted by JS Holding in favor of Victory Ride over all thecertificated ordinary shares of our Company (representing approximately 59.59% of theoutstanding total issued share capital of our Company) held by JS Holding, whichmortgage shall be released on or prior to the Listing, provided that JS Holding shall notpermit any transfer of the same amount of ordinary shares subject to the mortgage duringthe Lock-up Period; and
(2) after expiry of the Lock-Up Period and to the extent permitted by Rule 10.07 of the ListingRules (i) security over the Shares in a restricted account (“Restricted Account”), in whicha sufficient amount of Shares and/or cash shall be deposited on the Listing date to ensurethat the Collateral Value Ratio (defined below) is no greater than 33.33%. After theListing date, the Issuer shall within three business days after the occurrence of a top-upevent (as defined in the Exchangeable Bond) (i) pay cash into or (ii) deposit additionalShares into the Restricted Account to ensure a Collateral Value Ratio of 33.33%.
Collateral Value Ratio means, at any time on or after the Listing, the ratio (expressed as apercentage) of:
(x) the sum of principal (i) outstanding, or (ii) converted into the Shares still held byVictory Ride, less the amount of cash deposited with the Restricted Account;
divided by:
(y) the market value of the Shares deposited in the Restricted Account calculated byreference to the most recent closing price.
In addition to the Restricted Account, JS Holding is required to open and maintain an“Unrestricted Account” and deposit sufficient Shares into the Unrestricted Account to ensure that thevalue of the Shares (and, where relevant, additional cash) standing to the credit of the UnrestrictedAccount complies with a ratio no greater than 33.33%, being the ratio of:
(a) the principal amount of the Exchangeable Bond that is outstanding at that time, minus thecash deposited in the Restricted Account at that time,
divided by:
(b) the market value of the Shares deposited in the Unrestricted Account calculated byreference to the most recent closing price.
Shares in the Restricted Account are subject to security starting from the expiry of the Lock-upPeriod, whereas Shares in the Unrestricted Account are never subject to security. Accordingly, JSHolding will not cease to be a Controlling Shareholder of our Company during the Lock-up Period.
Strategic Benefit from Pre-IPO Investments
We are of the view that our Company can benefit from the Pre-IPO investors’ investment in theCompany, and that their investments demonstrate their confidence in our Group’s operations and serveas an endorsement of our Company’s performance, strengths and prospects. Comfort Home andVictory Ride are professional strategic investors in relevant industries which can provide us withprofessional advice on our Group’s development and can help us achieve business synergies throughenhanced business cooperation.
134
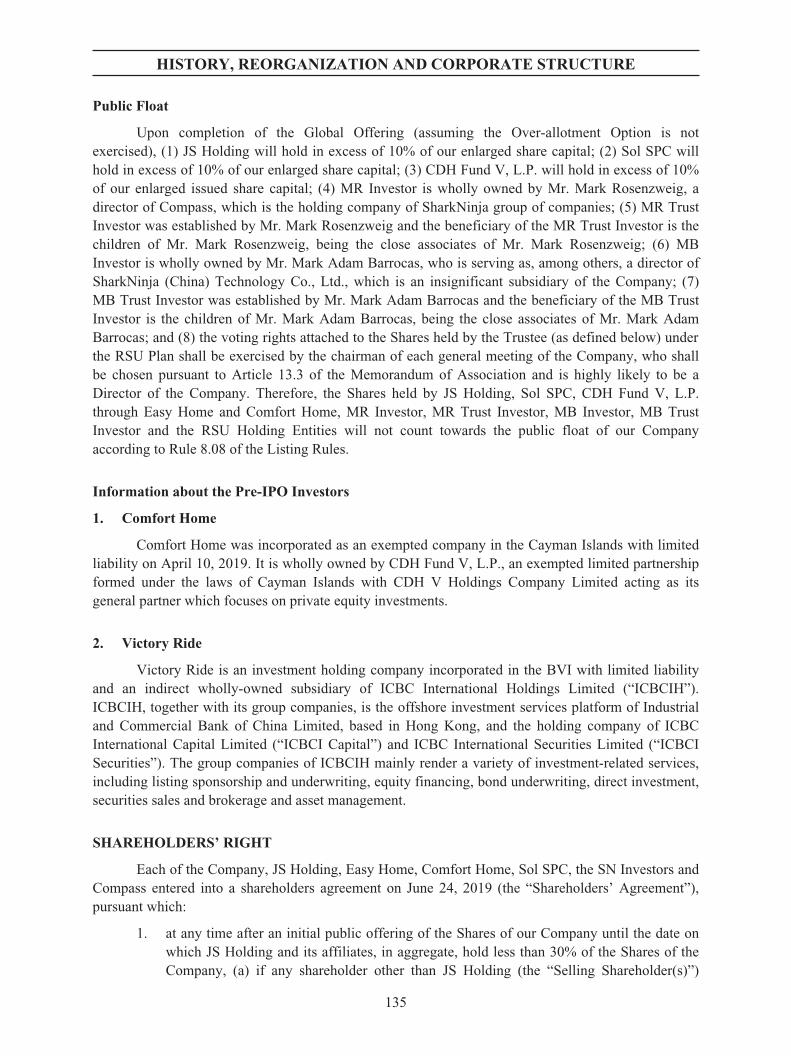
HISTORY, REORGANIZATION AND CORPORATE STRUCTURE
Public Float
Upon completion of the Global Offering (assuming the Over-allotment Option is notexercised), (1) JS Holding will hold in excess of 10% of our enlarged share capital; (2) Sol SPC willhold in excess of 10% of our enlarged share capital; (3) CDH Fund V, L.P. will hold in excess of 10%of our enlarged issued share capital; (4) MR Investor is wholly owned by Mr. Mark Rosenzweig, adirector of Compass, which is the holding company of SharkNinja group of companies; (5) MR TrustInvestor was established by Mr. Mark Rosenzweig and the beneficiary of the MR Trust Investor is thechildren of Mr. Mark Rosenzweig, being the close associates of Mr. Mark Rosenzweig; (6) MBInvestor is wholly owned by Mr. Mark Adam Barrocas, who is serving as, among others, a director ofSharkNinja (China) Technology Co., Ltd., which is an insignificant subsidiary of the Company; (7)MB Trust Investor was established by Mr. Mark Adam Barrocas and the beneficiary of the MB TrustInvestor is the children of Mr. Mark Adam Barrocas, being the close associates of Mr. Mark AdamBarrocas; and (8) the voting rights attached to the Shares held by the Trustee (as defined below) underthe RSU Plan shall be exercised by the chairman of each general meeting of the Company, who shallbe chosen pursuant to Article 13.3 of the Memorandum of Association and is highly likely to be aDirector of the Company. Therefore, the Shares held by JS Holding, Sol SPC, CDH Fund V, L.P.through Easy Home and Comfort Home, MR Investor, MR Trust Investor, MB Investor, MB TrustInvestor and the RSU Holding Entities will not count towards the public float of our Companyaccording to Rule 8.08 of the Listing Rules.
Information about the Pre-IPO Investors
1. Comfort Home
Comfort Home was incorporated as an exempted company in the Cayman Islands with limitedliability on April 10, 2019. It is wholly owned by CDH Fund V, L.P., an exempted limited partnershipformed under the laws of Cayman Islands with CDH V Holdings Company Limited acting as itsgeneral partner which focuses on private equity investments.
2. Victory Ride
Victory Ride is an investment holding company incorporated in the BVI with limited liabilityand an indirect wholly-owned subsidiary of ICBC International Holdings Limited (“ICBCIH”).ICBCIH, together with its group companies, is the offshore investment services platform of Industrialand Commercial Bank of China Limited, based in Hong Kong, and the holding company of ICBCInternational Capital Limited (“ICBCI Capital”) and ICBC International Securities Limited (“ICBCISecurities”). The group companies of ICBCIH mainly render a variety of investment-related services,including listing sponsorship and underwriting, equity financing, bond underwriting, direct investment,securities sales and brokerage and asset management.
SHAREHOLDERS’ RIGHT
Each of the Company, JS Holding, Easy Home, Comfort Home, Sol SPC, the SN Investors andCompass entered into a shareholders agreement on June 24, 2019 (the “Shareholders’ Agreement”),pursuant which:
1. at any time after an initial public offering of the Shares of our Company until the date onwhich JS Holding and its affiliates, in aggregate, hold less than 30% of the Shares of theCompany, (a) if any shareholder other than JS Holding (the “Selling Shareholder(s)”)
135
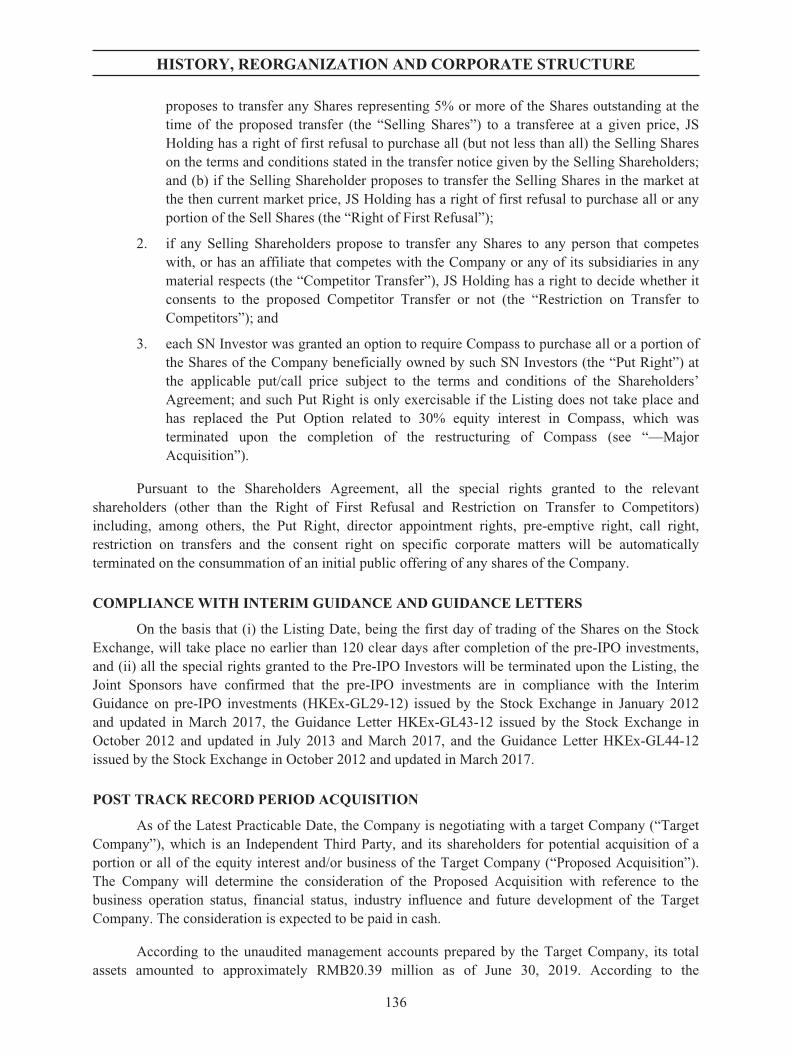
HISTORY, REORGANIZATION AND CORPORATE STRUCTURE
proposes to transfer any Shares representing 5% or more of the Shares outstanding at thetime of the proposed transfer (the “Selling Shares”) to a transferee at a given price, JSHolding has a right of first refusal to purchase all (but not less than all) the Selling Shareson the terms and conditions stated in the transfer notice given by the Selling Shareholders;and (b) if the Selling Shareholder proposes to transfer the Selling Shares in the market atthe then current market price, JS Holding has a right of first refusal to purchase all or anyportion of the Sell Shares (the “Right of First Refusal”);
2. if any Selling Shareholders propose to transfer any Shares to any person that competeswith, or has an affiliate that competes with the Company or any of its subsidiaries in anymaterial respects (the “Competitor Transfer”), JS Holding has a right to decide whether itconsents to the proposed Competitor Transfer or not (the “Restriction on Transfer toCompetitors”); and
3. each SN Investor was granted an option to require Compass to purchase all or a portion ofthe Shares of the Company beneficially owned by such SN Investors (the “Put Right”) atthe applicable put/call price subject to the terms and conditions of the Shareholders’Agreement; and such Put Right is only exercisable if the Listing does not take place andhas replaced the Put Option related to 30% equity interest in Compass, which wasterminated upon the completion of the restructuring of Compass (see “—MajorAcquisition”).
Pursuant to the Shareholders Agreement, all the special rights granted to the relevantshareholders (other than the Right of First Refusal and Restriction on Transfer to Competitors)including, among others, the Put Right, director appointment rights, pre-emptive right, call right,restriction on transfers and the consent right on specific corporate matters will be automaticallyterminated on the consummation of an initial public offering of any shares of the Company.
COMPLIANCE WITH INTERIM GUIDANCE AND GUIDANCE LETTERS
On the basis that (i) the Listing Date, being the first day of trading of the Shares on the StockExchange, will take place no earlier than 120 clear days after completion of the pre-IPO investments,and (ii) all the special rights granted to the Pre-IPO Investors will be terminated upon the Listing, theJoint Sponsors have confirmed that the pre-IPO investments are in compliance with the InterimGuidance on pre-IPO investments (HKEx-GL29-12) issued by the Stock Exchange in January 2012and updated in March 2017, the Guidance Letter HKEx-GL43-12 issued by the Stock Exchange inOctober 2012 and updated in July 2013 and March 2017, and the Guidance Letter HKEx-GL44-12issued by the Stock Exchange in October 2012 and updated in March 2017.
POST TRACK RECORD PERIOD ACQUISITION
As of the Latest Practicable Date, the Company is negotiating with a target Company (“TargetCompany”), which is an Independent Third Party, and its shareholders for potential acquisition of aportion or all of the equity interest and/or business of the Target Company (“Proposed Acquisition”).The Company will determine the consideration of the Proposed Acquisition with reference to thebusiness operation status, financial status, industry influence and future development of the TargetCompany. The consideration is expected to be paid in cash.
According to the unaudited management accounts prepared by the Target Company, its totalassets amounted to approximately RMB20.39 million as of June 30, 2019. According to the
136
HISTORY, REORGANIZATION AND CORPORATE STRUCTURE
accountants’ report prepared by the reporting accountants engaged by the Target Company, its lossbefore taxation and net loss amounted to RMB13.17 million and RMB26.92 million, respectively, forthe year ended December 31, 2017 and 2018.
The Target Company was incorporated in 2014 in the PRC primarily engaging in the provisionof vision navigation and orientation technology. The core products and services of the Target Companycomprise scene aware cameras, auto-drive navigation and orientation controllers as well as providingmobile robots planning and controlling hardware platform services. It is expected that the ProposedAcquisition would enable the Company to improve its innovative capability.
We have applied to the Stock Exchange for, and the Stock Exchange has granted us, a waiverfrom strict compliance with Rules 4.04(2) and 4.04(4) of the Listing Rules in relation to the ProposedAcquisition. See “Waivers from Strict Compliance with the Listing Rules – Waiver in Relation to PostTrack Record Period Acquisition.”
137

HISTORY, REORGANIZATION AND CORPORATE STRUCTURE
CO
RP
OR
AT
EA
ND
SHA
RE
HO
LD
ING
STR
UC
TU
RE
The
foll
owin
gch
arts
illu
stra
teou
rco
rpor
ate
and
shar
ehol
ding
stru
ctur
eim
med
iate
lyaf
ter
the
com
plet
ion
ofth
eG
loba
lO
ffer
ing
(ass
umin
gth
atth
eO
ver-
allo
tmen
tOpt
ion
has
notb
een
exer
cise
d).
Not
es:
(1)
Oth
erC
ompa
ssC
aym
anS
PV
2S
ubsi
diar
ies
incl
ude
Sha
rkN
inja
UK
Ltd
.,S
hark
Nin
jaE
PE
Ltd
.an
dU
KE
uro-
Pro
Lim
ited
,w
hich
are
who
lly-
owne
dsu
bsid
iari
esof
Com
pass
Cay
man
SP
V2
Lim
ited
inco
rpor
ated
inth
eU
nite
dK
ingd
om.
138
HISTORY, REORGANIZATION AND CORPORATE STRUCTURE
(2)
On
Sep
tem
ber
29,
2017
,C
ompa
sses
tabl
ishe
da
Man
agem
ent
Equ
ity
Ince
ntiv
eP
lan
purs
uant
tow
hich
,up
to4,
054
PI
shar
es(“
PI
Sha
res”
)of
Com
pass
each
wit
ha
par
valu
eof
US
$0.0
1an
dw
itho
utvo
ting
righ
tsca
nbe
awar
ded
toal
lth
ese
rvic
epr
ovid
ers
ofC
ompa
ssan
dit
ssu
bsid
iari
esas
dete
rmin
edby
the
boar
dof
dire
ctor
sof
Com
pass
.As
ofth
eL
ates
tPra
ctic
able
Dat
e,(1
)1,
919
PI
Sha
res
have
been
awar
ded
toM
r.M
ark
Ada
mB
arro
cas,
amon
gw
hich
140.
18P
IS
hare
sha
veve
sted
inS
epte
mbe
r,20
19;
and
(2)
1,02
7P
IS
hare
sha
vebe
enaw
arde
dto
cert
ain
othe
rm
anag
emen
tan
dem
ploy
ees
ofC
ompa
ssan
dit
ssu
bsid
iari
es,a
mon
gw
hich
74.4
5P
IS
hare
sha
veve
sted
inS
epte
mbe
r,20
19(c
olle
ctiv
ely
the
“Ves
ted
PI
Sha
res”
).C
ompa
ssex
erci
sed
its
righ
tto
repu
rcha
se20
.19
Ves
ted
PI
Sha
res
from
the
two
hold
ers
ther
eof
inco
nnec
tion
wit
hth
ete
rmin
atio
nof
empl
oym
ent
wit
hth
eman
dth
ere
purc
hase
has
com
plet
edin
Sep
tem
ber,
2019
.C
ompa
ssin
tend
sto
term
inat
eth
eM
anag
emen
tE
quit
yIn
cent
ive
Pla
nin
Oct
ober
,201
9pr
ior
toth
eG
loba
lO
ffer
ing.
Upo
nsu
chte
rmin
atio
n,(1
)al
lth
eP
IS
hare
saw
arde
dbu
tno
tve
sted
(i.e
.2,7
31.3
7P
IS
hare
s)w
illb
ecom
ein
vali
date
;an
d(2
)th
ere
mai
ning
194.
44V
este
dP
IS
hare
sar
eex
pect
edto
beex
chan
ged
toth
eS
hare
sof
our
Com
pany
afte
rth
eG
loba
lOff
erin
g.(3
)M
RT
rust
Inve
stor
was
esta
blis
hed
byM
r.M
ark
Ros
enzw
eig
and
the
bene
ficia
ryof
the
MR
Tru
stIn
vest
orar
eth
ech
ildre
nof
Mr.
Mar
kR
osen
zwei
g,be
ing
the
clos
eas
soci
ates
ofM
r.M
ark
Ros
enzw
eig.
(4)
As
ofth
eL
ates
tPr
actic
able
Dat
e,ST
Lhe
ld10
0m
anag
emen
tsh
ares
(rep
rese
ntin
g10
0%vo
ting
right
s)an
don
ecl
ass
Bpa
rtici
patin
gsh
ares
(with
out
votin
grig
hts)
,M
r.L
eePu
ayK
hng
held
368,
304.
2453
6cl
ass
Apa
rtici
patin
gsh
ares
(rep
rese
ntin
g10
0%is
sued
clas
sA
parti
cipa
ting
shar
esan
dw
ithou
tvot
ing
right
s).
(5)
Oth
erin
divi
dual
shar
ehol
ders
incl
ude
Mr.
Cui
Jian
hua,
asu
perv
isor
ofJo
youn
gas
wel
las
adi
rect
orof
Joyo
ung
Wat
erPu
rific
atio
n,M
s.T
ian
Del
ing,
adi
rect
orof
Shan
ghai
Lih
ong,
and
othe
rin
divi
dual
sw
hoar
eIn
depe
nden
tThi
rdPa
rties
incl
udin
gZ
hang
Xia
obin
,Liu
Min
glia
ng,S
hiL
ei,T
ang
Jun,
Cai
Xiu
jun,
Che
nL
iang
,LiJ
insh
eng,
Xu
Yifa
n,X
uX
inhu
i,W
ang
Xia
oru,
Wan
gB
o,W
ang
Shu’
an,J
iang
Jink
e,Z
huW
anhe
,Xu
Qin
glia
ngan
dX
ing
Xiu
ying
.(6
)E
asy
Hom
ean
dC
omfo
rtH
ome
are
who
llyow
ned
byC
DH
Fund
V,L
.P.,
anex
empt
edlim
ited
partn
ersh
ipw
hose
gene
ralp
artn
eris
CD
HV
Hol
ding
sC
ompa
nyL
imite
d.(7
)PR
2L
LC
isw
holly
owne
dby
Nei
lSha
h,an
Inde
pend
entT
hird
Party
.(8
)SN
Agg
rega
torL
LC
isw
holly
owne
dby
Mar
tinK
nigh
t,Ja
mes
Bra
ithw
aite
,Pur
vin
Shah
,Dan
O’S
haug
hnes
syan
dL
eyde
rFlo
res,
who
are
Inde
pend
entT
hird
Parti
es.
139
HISTORY, REORGANIZATION AND CORPORATE STRUCTURE
PRC REGULATORY REQUIREMENTS
M&A Rules
According to the Regulations on Merger with and Acquisition of Domestic Enterprises byForeign Investors (《關於外國投資者併購境內企業的規定》) (the “M&A Rules”) jointly issued by theMOFCOM, the State-owned Assets Supervision and Administration Commission of the State Council,the SAT, the CSRC, the State Administration for Industry and Commerce and the SAFE on August 8,2006, effective as of September 8, 2006 and amended on June 22, 2009, a foreign investor is requiredto obtain necessary approvals when it (1) acquires the equity of a domestic non-foreign-investedenterprise so as to convert the domestic enterprise into a foreign-invested enterprise; (2) subscribes theincreased capital of a domestic enterprise so as to convert the domestic enterprise into a foreign-invested enterprise; (3) establishes a foreign-invested enterprise through which it purchases the assetsof a domestic enterprise and operates these assets; or (4) purchases the assets of a domestic enterprise,and then invests such assets to establish a foreign-invested enterprise. The M&A Rules further purportto require that an offshore special vehicle, or a special purpose vehicle, formed for listing purposes andcontrolled directly or indirectly by PRC companies or individuals, shall obtain the approval of theCSRC prior to the listing and trading of such special purpose vehicle’s securities on an overseas stockexchange, especially in the event that the special purpose vehicle acquires shares or equity interests inPRC companies in exchange for the shares of offshore companies.
Our PRC Legal Advisors are of the opinion that (1) the Sunshine Rise Capital Increase wassubject to the Provisional Measures on Administration of Filing for Establishment and Change ofForeign Investment Enterprises (《外商投資企業設立及變更備案管理暫行辦法》) rather than the M&ARules because Shanghai Lihong, as a target, was a sino-foreign joint venture prior to the CapitalIncrease. Accordingly, the Sunshine Rise Capital Increase was not subject to approval from theMOFCOM under the M&A Rules; and (2) our listing on the Stock Exchange is not subject to priorapproval from CSRC under the M&A Rules.
SAFE Registration
Pursuant to the SAFE Circular on Foreign Exchange Administration of Overseas Investment,Financing and Round-trip Investments Conducted by Domestic Residents through Special PurposeVehicles (《國家外匯管理局關於境內居民通過特殊目的公司境外融資及返程投資外匯管理有關問題的通知》) (“SAFE Circular 37”), promulgated by SAFE and which became effective on July 4, 2014 andwhich replaced the Circular of the SAFE on Relevant Issues Concerning Foreign Exchange Control onDomestic Residents’ Corporate Financing and Round-trip Investment through Offshore SpecialPurpose Vehicles (《國家外匯管理局關於境內居民通過境外特殊目的公司融資及返程投資外匯管理有關問題的通知》), (a) a PRC resident must register with the local SAFE branch before he or shecontributes assets or equity interests to an overseas special purpose vehicle (the “Overseas SPV”) thatis directly established or indirectly controlled by the PRC resident for the purpose of conductinginvestment or financing, and (b) following the initial registration, the PRC resident is also required toregister with the local SAFE branch for any major change, in respect of the Overseas SPV, including,among other things, a change of the Overseas SPV’s PRC resident shareholder(s), the name of theOverseas SPV, terms of operation, or any increase or reduction of the Overseas SPV’s capital, sharetransfer or swap, and merger or division. In the event that a PRC shareholder holding interests in aspecial purpose vehicle fails to fulfill the required SAFE registration, the PRC subsidiaries of thatspecial purpose vehicle may be restricted from making profit distributions to the offshore parent andfrom carrying out subsequent cross-border foreign exchange activities, and the special purpose vehicle
140
HISTORY, REORGANIZATION AND CORPORATE STRUCTURE
may be restricted in its ability to contribute additional capital into its PRC subsidiary. Furthermore,failure to comply with the various SAFE registration requirements described above could result inliability under PRC law for evasion of foreign exchange controls.
Pursuant to the SAFE Circular on Further Simplification and Improvement in ForeignExchange Administration on Direct Investment (《國家外匯管理局關於進一步簡化和改進直接投資外匯管理政策的通知》) (“SAFE Circular 13”), promulgated by SAFE and which became effective onJune 1, 2015, the power to accept SAFE registration was delegated from local SAFE branches to localbanks where the assets or interests in the domestic entity are located.
As advised by our PRC Legal Advisors, Mr. Wang Xuning, Mr. Zhu Hongtao, Ms. YangNingning, Ms. Han Run, Ms. Huang Shuling, Mr. Jiang Guangyong and Mr. Zhu Zechun, who areknown to us as being PRC citizens, each has completed his/her registration in compliance with SAFECircular 37 and SAFE Circular 13.
141

BUSINESS
OVERVIEW
Mission
Our mission is to positively impact people’s lives around the world every day throughtransformational, innovative and design-driven smart home products.
Company Profile
We are a global leader in high-quality, innovative small household appliances. Our success iscentered around our deep understanding of consumer needs, and is built on our strong productinnovation and design capability powered by a global research and development platform, marketingstrengths driving high brand engagement, and an omni-channel distribution coverage with highpenetration. We continuously develop new products and expand into new categories. Through ourdiverse product portfolio, we cultivate markets, create consumer demand, lead our categories bybuilding up market anticipation around product launches, and reshape consumer behaviors andlifestyles around the world. With our trusted market-leading brands, Joyoung, Shark and Ninja, wecontinue to maintain our leadership in China and the United States, the two largest small householdappliance markets, and focus on expanding globally in new markets.
We are committed to serving local needs in cleaning and kitchen across the globe with ourmulti-brand and comprehensive product portfolio. In our main product categories, we have generatedand maintained an industry-leading market share.
Through our global research and development platform, we have introduced transformationalinnovative design-driven products to the markets, ranging from revolutionary products that are originalor market-first, to evolutionary products that are market-disruptive, to upgraded products withenhanced design and functionality.
OUR STRENGTHS
Global Industry Leader with Trusted Household Brands
We are a global leader in high-quality, innovative small household appliances, with a numberof successful and trusted brands worldwide, including Joyoung, Shark and Ninja. Our brands focus oncore values including technological innovation, high quality, health consciousness and consumer focus.We constantly enhance and revolutionize the consumer experience by leveraging our ability to identifyconsumer needs, our capability to drive product innovation and our strong global commercializationcapabilities, thereby improving consumers’ lifestyles. Our brands are trusted by retailers andconsumers, which enables us to continuously introduce new products to the markets.
We develop small household appliances, catering to local needs in different internationalmarkets. While our business is rooted in China and the United States, the two largest small householdappliance markets in the world, we have expanded into other developed markets around the world. Asan industry leader, we have successfully created a number of new white-space product categories. Inaddition, we maintain a leading market share in our major product categories which attests to ourbrands’ success:
Š In China, we ranked third in the small household appliance market in terms of retail salesvalue in 2018.
142
BUSINESS
Š In the United States, we ranked second in the small household appliance market in terms ofour retail sales value in 2018.
Š We have also established strong presence in the smart home product market. Weintroduced the Shark intelligent robotic vacuums in 2017 and quickly secured the second-largest market share in the United States of 19.0% in 2018. We also successfully launchedthe heating, noiseless and wash-free fully automated intelligent soymilk makers in Chinain 2017. In 2018, we successfully expanded in the cooking appliance market in the UnitedStates and Canada with our Ninja Foodi and have gained sizeable market share in thatmarket in less than a year.
Š We have successfully expanded into other markets around the world, such as the UnitedKingdom. We ranked sixth in the small household appliance market in the UnitedKingdom in terms of retail sales value in 2018.
We have a diverse portfolio of innovative products which allows us to maintain sustainablegrowth, create new product categories, grow the market share, lead the consumption upgrade andposition ourselves at the forefront of future trends for smart home product.
Category Disruptor with a Proven Track Record of Introducing Innovative Products, CreatingNew Market Segments and Generating Consumer Demand
We have the ability to continuously innovate through our intense focus on consumer needs, ourability to assess and predict future market development and consumption trends, as well as ourcontinuous pursuit of technology, high performance, functionality and ground-breaking appealingproduct design. By combining our consumer-centric product innovation and market-leading consumerdemand generation, we have been able to create new market segments and disrupt existing categories.See “—Awards and Recognitions.”
We have research and development centers around the globe located in the United States,China, and the United Kingdom. This global platform powers our product development capabilities byencouraging collaboration and knowledge sharing across locations and categories. They enable us toapply core technologies and engineering innovation across product categories to shorten our productdevelopment cycle.
We have the ability to create and define market segments. Through in-depth understanding andaccurate prediction of consumer needs, we have been continuously introducing revolutionary products,
143
BUSINESS
creating new market demands, and diversifying our product categories to establish a diversified andsizable portfolio. In a time when soymilk making was a time-consuming and cumbersome process, weinvented our first Joyoung automatic home-made soymilk maker which was revolutionary and the firstin the market in 1994. Thereafter, we have been continuously creating new product categories. Forexample, we successfully launched a brand-new series of high-performance multifunctional blenders inChina in 2016, and continued to develop customized product functionalities including heating,noiselessness and wash-free, opening up the market for high-performance multifunctional blenderswith this new series of products and quickly achieved US$196.9 million in sales revenue in 2018.Leveraging our strong technological expertise and global commercialization capabilities, we launchedour Shark Lift-Away vacuums in the United States in 2010 for the first time, allowing consumers to liftaway the canister for the freedom of easily cleaning above floors. We also introduced Foodi to the USand Canadian markets in 2018, a ground-breaking product series under the Ninja brand. Foodi was thefirst in the market that combines two popular cooking techniques, pressure cooking and air frying, intoone multifunctional cooker, achieving food texture that is tender inside and crispy outside. Foodiquickly became a blockbuster product in the US and Canadian markets, creating a new category in ourcooking appliances portfolio. In 2010, we also launched our Ninja Kitchen System, which combinesprofessional blending capabilities with food processing capabilities by utilizing one blender base withmultiple attachments, and it is another successful example of our market-first solution addressingconsumer pain points.
We consistently transform and upgrade our products. We have a deep understanding of theconsumer behaviors and pain points at different stages of the product life cycle, and focus on productoptimization. By addressing these pain points, we encourage consumers to upgrade their existingproducts to new generations of evolutionary products. Our Joyoung soymilk maker has gone throughgenerations of upgrades from the original series, to the soak-free generation released in 2009, to thefilter-free generation released in 2014, and to the heating, noiseless and wash-free fully automatedintelligent soymilk makers released in 2017. This has enabled us to continuously grow while securingthe leading market share in the industry for an extended period. Our Shark vacuums have also beencontinuously improved since their launch. From our original upright vacuums in the United States andCanada, we have introduced additional functionalities such as next-generation Lift-Away, PoweredLift-Away, DuoClean and ZeroM. We have further leveraged that technology and expanded intoadditional segments of the vacuum category including corded stick vacuums, cordless stick vacuums,cordless handheld vacuums and the intelligent Shark ION robotic vacuum. Our Shark products havetransformed cleaning appliance industry in the United States, securing the largest market share in thevacuum market and the second-largest market share in the robotic vacuum market in the United States.
Our innovation is driven by our pursuit of design optimization and accumulation of technologyexpertise. With the support of our global design and development teams, we continue to strengthen ourDNA of innovation and technological capabilities. Our products have won a number of world-renowned design and technology awards, including the iF Design Award, the Red Dot Design Award,and Red Star Award (China) (中國設計紅星獎). We apply the advanced technologies and developmentexperience across different product lines for the development of new products.
Highly Effective Omni-channel Sales, Marketing and Distribution Strategy, Maximizing GlobalMarket Penetration
We have secured the leading position in China and the United States, the two largest globalsmall household appliance markets, and have established differentiated channel strategies and a robust
144

BUSINESS
omni-channel sales, marketing and distribution network that are tailored to the respective localmarkets. Our global expansion has also extended our footprint to other international markets includingCanada, the United Kingdom, France, Germany, Japan, and Australia. We have a prominent and high-profile position in the channels where our consumers choose to shop.
In China, we have adopted the consumer-centric new retail business model of the smallhousehold appliance industry. Consumers participate in the development of products through providingtheir feedback, which has become part of the integrated consumer experience. Retailers have extendedfrom online-only or offline-only into seamless omni-channel distribution channels. We have beencultivating the regional markets for years, accumulating abundant valuable experience and localresources, and maintaining long-term in-depth cooperation with key distributors and retailers toestablish an extensive network of distributors and sales points nationwide. As of the Latest PracticableDate, we had approximately 40,000 sales points for Joyoung brand throughout China, among whichthere were approximately 700 Joyoung branded stores. We also had 188 offline sales points for Sharkbrand. Through our unique offline, experience-based marketing strategies, our consumers can try ourproducts and get first-hand experience of how our innovative products will improve their lives.Furthermore, we are one of the pioneers in the small household appliance industry to adopt an onlinesales model, and approximately 50% of Joyoung segment’s revenue in 2018 was generated from ouronline sales channels. We have an established system for online direct sales and distribution. Wedirectly operate our online flagship stores on Tmall for the Joyoung brand, the Shark brand and theNinja brand, and our “Joyoung Mall” through the WeChat platform to obtain first-hand feedback. Wedistribute through all major e-commerce platforms, such as Tmall, JD.com and Suning.com and webelieve that we can expand consumer reach by taking advantage of the established consumer base andbrand recognition of the major e-commerce platforms. We also constantly explore new e-commercemodels, such as developing a “micro partners” program through social e-commerce channels topromote the sales of our products. The average daily traffic in the month preceding the LatestPracticable Date through three of the e-commerce platforms that we have presence on, namely,Taobao, JD.com and Suning.com, reached 1.1 million in aggregate, with over 15.1 million subscribersin aggregate on these three platforms as of the Latest Practicable Date. The integration of our offlineand online resources has expanded our consumer reach and enhanced consumer experience.
In the US, Canada and the UK markets, we have a high penetration rate in both online andoffline retail channels. We have formed our DTC and DTR sales models. For DTC, we sell productsdirect to consumers through our SharkNinja website or television shopping platforms, which enable usto obtain first-hand knowledge of consumer behaviors. For DTR, we have established long-standingrelationships with key retailers. We sell our products through both online and offline channels of thekey retailers including Wal-Mart, Target, Costco, Amazon, Kohl’s, Bed Bath & Beyond and Sam’sClub. Through our proven track record of being able to launch transformational products, generatedemands and take market share in a product category while also contributing to the growth of thecategory itself, we have gained credibility with these retailers. As a result, we have been able togenerate wide distribution and retail penetration for our new product launches very quickly, whichallows us to rapidly generate significant sales volume for our new product. Our proven track record ofintroducing category-leading products has contributed to the performance of our retailers especiallyduring the peak holiday seasons, further solidifying the confidence our retailers have in our brands andour products.
In addition to China, the United States, Canada and the United Kingdom, we have entered otherinternational markets, including Germany, France, Japan, and Australia. We have adopted channel
145
BUSINESS
strategies tailored to different regions, to help us quickly penetrate the respective markets and obtainconsumer feedback, and ultimately proceed with improvements to our products based on local needs.
Loyal and Engaged Consumer Base, Driving Virtuous Cycle in Our Business Ecosystem
We highly value consumer reviews and use them to address consumers’ unmet needs and painpoints by creating new products and continuously improving our existing products, resulting in a highlevel of consumer confidence. Our consumer base is loyal and willing to make repeat purchasesthrough our product upgrades and cross-selling. In addition, we maintain close online and offlineinteractions with our consumers, and through continuous direct communication with consumers andthe collection and consolidation of data, we improve overall consumer experience and increaseconsumer activity and loyalty. At the same time, our consumer interactions drive product upgrades andinnovation, thereby achieving a virtuous cycle and propelling our future growth.
In China, we stimulate consumers’ frequency of communication and engagement throughdifferent online platforms: as of the Latest Practicable Date, we had more than six million subscriberson our WeChat platform and more than 15.1 million subscribers on three of our e-commerce platformsthat we have presence on, namely, Taobao, JD.com and Suning.com. Often times our products comewith a unique product code that consumers can scan or input to register the product on our officialWeChat or website platforms. Once registered, consumers can access comprehensive after-salesservices including consultation, news-sharing and warranty and send feedback to us directly.Meanwhile, we also leverage other new media and social platforms. For example, we cooperate withKey Opinion Leaders on platforms such as Weibo and TikTok, to expand the reach of our consumerinteraction, and we produce corresponding content for different products to improve ourcommunication quality with consumers. For offline consumer engagement, we interact with ourconsumers actively through store-based experiential marketing and over 2,300 offline after-salesservice centers, and we integrate consumer information into our online user system. Through bothonline and offline coverage, we serve our consumers through various channels and further enhancetheir consumer experience, as well as loyalty to our brands.
In the United States and Canada, significant marketing and advertising investment is a criticalcomponent of our go-to market strategy. A 52-week-a-year “always on” strategy consists of long-formand short-form television advertising as well as digital advertising. These investments help to educateconsumers on Shark and Ninja’s product innovation and create strong awareness and consumerdemand for Shark and Ninja’s products. This same strategy translates to creating consumer demand inthe United Kingdom and Japan as well. Also, understanding the consumers’ evolving habits inresearching products and shopping, we continuously work to ensure that our consumers are providedwith an engaging shopping experience with relevant information. We use social media platforms toensure our continuous and comprehensive consumer exposure. For example, we cooperate with KOLson platforms such as Instagram and Facebook. Several online communities have been spontaneouslycreated by our Shark and Ninja superusers in addition to actively following on mainstream socialmedia platforms. Furthermore, we have a consumer insights team which is responsible for gatheringand disseminating consumer feedback in support of product development and commercializationstrategies.
146
BUSINESS
Synergies Derived from Our Highly Complementary Global Businesses, Propelling SustainableFuture Growth
We have synergies among our product development, marketing, and operations teams in ourhighly complementary global business, running through our value chain including research anddevelopment collaboration, market expansion and supply chain purchasing scale.
We have an international design, research and development team located in five cities in China,the United States and the United Kingdom. Utilizing our understanding of different markets andaccumulated technology know-how and applications expertise, we have collaborated on thedevelopment of a number of products within a short period of time, and have carried out successfulcommercialization of those products in China and the United States including the revolutionary Foodiseries under our Ninja brand. Also, our robotic vacuum development is supported globally across theUnited States, United Kingdom and China. These collaboration efforts include peer review of ourprototypes, product engineering, safety and function reviews.
We also utilize the established sales network and omni-channel marketing strategies to activelyintroduce our Shark and Ninja brands to the Chinese market as well as bring our Joyoung products intothe US, Canada and other international markets. As of the Latest Practicable Date, we opened 188offline sales points for Shark brand in China and established its omni-channel sales network to helpChinese consumers better understand the outstanding product quality and user experience of the Sharkbrand, supporting fast product rollout and penetration.
We empower our global business with a highly flexible and accommodating supply chainsystem based in China. Our data-empowered supply chain management system, connected with oursuppliers, continues to lower supply chain cost and increase overall operational efficiency, as ourglobal business advances.
The continuous realization of synergies within our global business provides a strong drivingforce to our future development.
Seasoned Senior Management Team with Global Experience Led by Our Visionary FoundingShareholders
We are led by our founders and our global senior management team, which is equipped with anentrepreneurial spirit for continuous innovation.
Our Chairman, Chief Executive Officer and executive Director of the Company, chairman ofJoyoung, global chief executive officer of SharkNinja and chairman of the Strategy Committee andNomination Committee of the Company, Mr. Wang Xuning (王旭寧), founded our Group in 1994 andwas awarded the Ernst & Young (China) Entrepreneur Award (安永(中國)企業家獎) in 2012, the “TopTen Innovative Figures in Home Appliance Industry of China (中國家電十大創新人物)” bypeople.com.cn (人民網) in December 2008 and the Highest Technology Award of Jinan (濟南市科技最高獎) in 2011.
Our senior management team has valuable industry experience in various markets around theworld, and has been serving the Company for many years. See “Directors and Senior Management.”The entrepreneurial spirit has been the core of the company culture and our senior management teamhas led the creation of our successful and innovative products. We established reasonable management
147
BUSINESS
incentive plans to ensure that the interests of our senior leadership team and future public shareholdersare aligned.
Our shareholders are highly experienced in the consumer industry with a successful trackrecord of assisting with integrating cross-border businesses and will provide long-term support to ourCompany.
OUR STRATEGIES
We are committed to driving sustainable long-term growth and strengthening our marketposition as a global leader in small household appliances through the following strategies:
Develop and Commercialize Innovative Products, Combining Powerful Technology andAppealing Designs
We will continue to develop and commercialize innovative products combining powerfultechnology and appealing designs, contributing to the improvement of quality of life for consumersaround the world and further consolidating our leading position in our major product categories.
We plan to further invest in our capability in collecting and analyzing consumer feedback inorder to deepen our consumer insights, enabling our research and development centers around theglobe to timely upgrade our products and develop new products addressing consumers’ rapidlyevolving needs in cleaning and kitchen. We expect to continue to devote significant resources indeveloping our technological and hardware engineering capabilities through investing in talentretainment and recruitment, infrastructure and third-party partnership. We plan to continue to invest inIoT, robotics, battery and smart technologies to keep abreast of the latest consumption trends and bringour consumers the experience of smart home. We also aim to push our efforts in product design toachieve a high level of aesthetic refinement to meet consumer demand for appealing products toupgrade consumers’ lifestyle.
Drive Sustainable Long-term Growth Through Sales Network and Product Category Expansion
Expand Sales Network
We have implemented a globalization strategy by building up our sales and distributionnetwork and strong user base in the United States, China and the United Kingdom, and by extendingour sales to a variety of other countries. We aim to drive sustainable growth globally and furtherexpand market share mainly through the following strategies.
We plan to further consolidate our leading position in our major markets including China andthe United States by expanding our sales channels, maximizing distribution synergies, and increasingour marketing efforts within these two markets. In China, we aim to roll out our consumer-centric newretail strategy by further expanding our network of branded stores, developing our digital saleschannels and new e-commerce models, augmenting the synergies between our online and offlinechannels to effectively expand our consumer reach and enhance consumer experience. In the UnitedStates, we intend to continue to expand our online sales channels, deepen our cooperation with majore-commerce platforms and enhance customer engagement via new media. Meanwhile we intend tocontinuously enhance our offline presence and shelf position through broader product offerings.
148
BUSINESS
With respect to our growth strategy in other international markets, we expect to actively expandand enhance our sales channels and continuously enhance brand recognition in markets where we havepresence such as the United Kingdom, Germany, France, and Japan. We have achieved significantgrowth in the United Kingdom since we entered the market in 2013 and became the third largest playerin the vacuum market in 2018. We also plan to strategically expand our footprints in internationalmarkets through our distributor relationships and constantly monitor and re-assess market developmentfor the potential of direct entry.
Expand Product Category
With our innovative DNA, we aim to drive sustainable and resilient growth in every marketthrough expanding into new product categories, especially in the smart home categories. We expect tofurther strengthen our leading position in the robotic vacuum market by continuing to expand productofferings and further invest in research and development of robotic technology. We plan to leveragethe existing success with robotic vacuums by expanding into other robotic appliance markets to helpconsumers do household chores in a simple way. To take advantage of the smart kitchen trend andmeet consumers’ evolving demands, we expect to further expand and develop kitchen appliances thatcan simplify and personalize consumers’ culinary experience. For example, we will launch moreproducts in the Foodi series and multifunctional steamer with enhanced functionalities and designs tooptimize product operation and consumer experience.
Home environment appliances and kitchen appliances are our strategic growth areas. Sales inChina of home environment appliances and kitchen appliances are expected to reach US$37.0 billionin retail sales value in 2023. We intend to fuel growth of our existing home environment and kitchenappliance categories by introducing more innovative products and broaden our product offering. Forexample, we have introduced a series of high-performance multifunctional blenders with heating andwash-free functions in China in 2016, and we have launched heating, noiseless and wash-free fully-automated smart soymilk makers in 2017.
Maximize Synergies between Joyoung Segment and SharkNinja Segment
We seek to maximize synergies within our highly complementary global business operation,running through our value chain, including research and development, supply chain, products and salesnetwork. To realize such synergies, we have established integrated key performance assessment andincentive mechanism throughout our global operation.
For global research and development synergies, we have built a global innovation powerhouserunning around the clock with research and development facilities and engineering talent spread acrossour five research and development centers in China, the United States and the United Kingdom. Ourglobal research and development platform significantly enhances efficiency in new productdevelopment and minimizes time to market.
We also believe that there are strong synergies between Joyoung and SharkNinja’s supplychains, both of which are located in China. Our large procurement scale on a consolidated basis andcombined experience in supply chain management will enable us to continue to offer high-qualityproducts at competitive prices.
For product and sales network synergies, we plan to launch localized products under the Sharkand Ninja brands and leverage Joyoung’s nationwide network and strong consumer service capability
149
BUSINESS
to accelerate the penetration of the Shark and Ninja brands into China. We also expect to develop moreproducts under the Ninja brand and further enhance Ninja’s market share in the US market, leveragingJoyoung’s strong competitive advantage in kitchen appliance technology.
We have aligned our key performance assessment and incentive mechanism between Joyoungand SharkNinja, to create a transparent and merit-based global talent evaluation and reward system.Our equity compensation schemes have been effectively enhancing loyalty and maximally mobilizingour employees across the Group. In addition, we plan to increase the sharing of operational andmanagement’s best practices, technology and market know-how to further improve our globalcompetitiveness.
Strengthen Our Brand Recognition and Enhance Consumer Engagement
Our brands focus on core values including technological innovation, high quality, healthconsciousness and consumer focus. We intend to increase marketing and branding efforts to strengthenour brand recognition globally. For instance, we plan to increase our digital media investment andcontinue to implement a multi-channel marketing strategy that has been highly effective in educatingconsumers and creating and growing market demands for new products, and in quickly establishing ourbrand awareness in new international markets.
We intend to continue to leverage social media such as TikTok, Weibo, Facebook andInstagram to attract and expand our consumer reach within the younger generation, which will enlargeour consumer base and enhance brand loyalty through effective and interactive communication.
Our engagement with consumers through various online and offline formats, such as the focusgroup under SharkNinja, penetrates into every stage in our product development cycle that allows us tocreate products that are “designed” by our consumers and can satisfy evolving needs of our consumers.
Pursue Strategic Partnerships and Acquisitions
We have demonstrated our ability to execute synergistic acquisitions, such as the acquisition ofSharkNinja that has greatly improved our competitiveness and accelerated our expansion into newmarkets.
To achieve future growth, we may selectively pursue strategic partnerships and acquisitionsthat complement our business and strategic priorities, such as for tapping into new markets and forlocking in industry-leading proprietary technologies, taking into account factors such as the financialand competitive positions of the potential partners or acquisition targets. In pursuing strategicpartnerships and acquisitions, we intend to continue to be flexible in transaction structures. Through acontinued focus on effective cooperation with our strategic partners and integrating and enhancing thebusinesses we acquire, we plan to maximize synergies brought by the strategic partnerships andacquisitions. As of the Latest Practicable Date, except as disclosed in “History, Reorganization andCorporate Structure—Post Track Record Period Acquisition,” we did not identify any other definitiveacquisition target.
BUSINESS MODEL
We are a global leader in high-quality, innovative small household appliances. Our businessprocesses, from research and development, procurement and production to sales and marketing, are
150
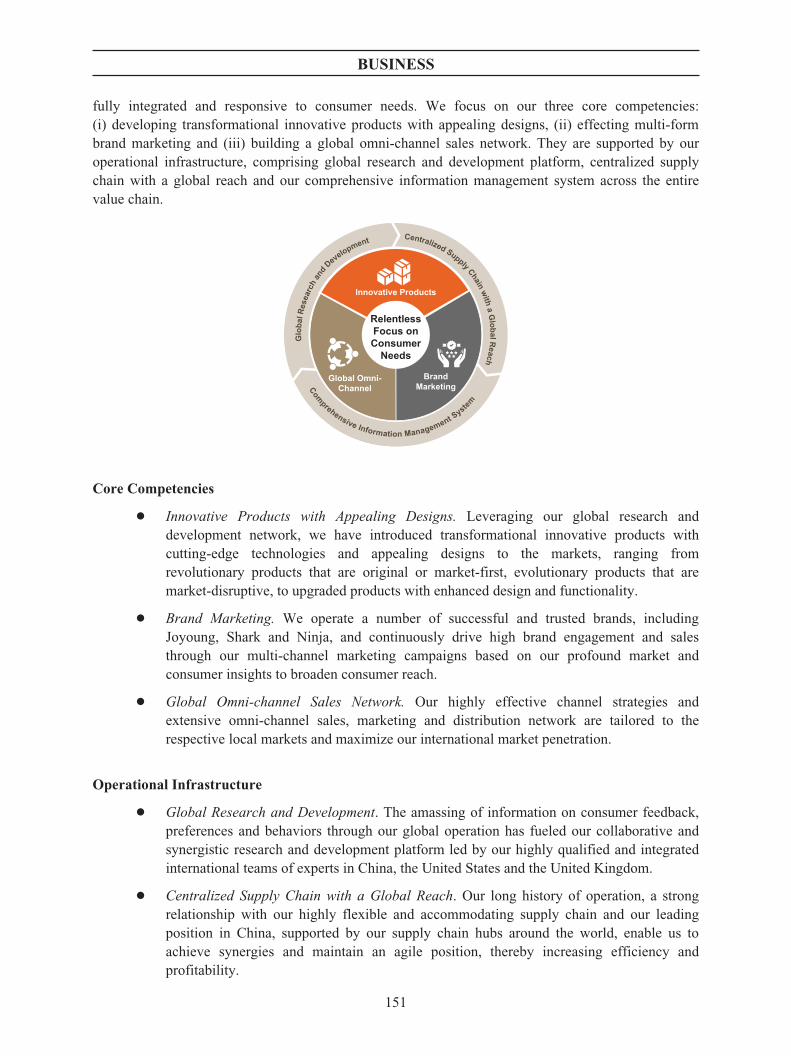
BUSINESS
fully integrated and responsive to consumer needs. We focus on our three core competencies:(i) developing transformational innovative products with appealing designs, (ii) effecting multi-formbrand marketing and (iii) building a global omni-channel sales network. They are supported by ouroperational infrastructure, comprising global research and development platform, centralized supplychain with a global reach and our comprehensive information management system across the entirevalue chain.
RelentlessFocus onConsumer
Needs
Innovative Products
Global Omni-Channel
BrandMarketing
Centralized Supply Chain with a G
lobal Reach
Comprehensive Information Management System
Glo
bal R
esea
rch
and D
evelopment
Core Competencies
Š Innovative Products with Appealing Designs. Leveraging our global research anddevelopment network, we have introduced transformational innovative products withcutting-edge technologies and appealing designs to the markets, ranging fromrevolutionary products that are original or market-first, evolutionary products that aremarket-disruptive, to upgraded products with enhanced design and functionality.
Š Brand Marketing. We operate a number of successful and trusted brands, includingJoyoung, Shark and Ninja, and continuously drive high brand engagement and salesthrough our multi-channel marketing campaigns based on our profound market andconsumer insights to broaden consumer reach.
Š Global Omni-channel Sales Network. Our highly effective channel strategies andextensive omni-channel sales, marketing and distribution network are tailored to therespective local markets and maximize our international market penetration.
Operational Infrastructure
Š Global Research and Development. The amassing of information on consumer feedback,preferences and behaviors through our global operation has fueled our collaborative andsynergistic research and development platform led by our highly qualified and integratedinternational teams of experts in China, the United States and the United Kingdom.
Š Centralized Supply Chain with a Global Reach. Our long history of operation, a strongrelationship with our highly flexible and accommodating supply chain and our leadingposition in China, supported by our supply chain hubs around the world, enable us toachieve synergies and maintain an agile position, thereby increasing efficiency andprofitability.
151
BUSINESS
Š Comprehensive Information Management System. We design our information managementsystems to collect data on consumer feedback, preferences and behaviors, and keep ourbusiness processes, from research and development, procurement and production to salesand marketing, fully integrated and responsive to such data. Our information managementsystems seamlessly connect various business units and parties involved in our operation tooptimize efficiency. For example, our systems integrate real-time supplier data to informand optimize our procurement and production planning as well as sales arrangements.
TRANSFORMATIONAL PRODUCTS CREATED BY GLOBAL RESEARCH ANDDEVELOPMENT PLATFORM
Global Research and Development Platform
We are relentlessly moving forward, adapting to the market environment and dedicated to beingon the leading edge of user-friendly innovation to make the lives of consumers easier and better. Toachieve this goal, we have built a global innovation powerhouse running around the clock withresearch and development facilities and engineering talent spread across our five research anddevelopment centers in China, the United States and the United Kingdom. See “—TransformationalProducts Created by Global Research and Development Platform—Global Platform and Research andDevelopment Cycle.” We have accumulated insights into the different consumer preferences in variousmarkets and have analyzed them in the context of local as well as global trends. Utilizing ourunderstanding of different markets and accumulated technology know-how and applications expertise,we have collaborated on the development of a number of products within a short period of time andcarried out successful commercialization of those products in China and the United States includingthe revolutionary Foodi product series under our Ninja brand. These collaboration efforts include peerreview of our prototypes, product engineering, safety and function reviews.
Transformational Products
Through our global research and development platform, we have been continuouslytransforming innovative concepts into home environment appliances and kitchen appliances withattractive appearances and functionalities addressing consumer pain points.
In terms of development concepts, our products can generally be categorized into three groups:(i) revolutionary products, (ii) evolutionary products and (iii) upgraded products. Revolutionaryproducts are market-first products developed based on our in-depth understanding, as well as accurateanalysis and forecast, of consumer needs. Evolutionary products utilize evolutionary concepts ortechnologies to optimize an existing product line by providing more innovative features and aredeveloped based on our understanding of consumer pain points at different stages of the product lifecycle. We also routinely upgrade our existing products to roll out upgraded products with enhanceddesign and functionality catering to wider consumer demographics. As of June 30, 2019, we had 54product lines. The following table summarizes our key revolutionary and evolutionary products:
152

BUSINESS
Rev
olut
iona
ryP
rodu
cts
(Ori
gina
lor
Mar
ket-
firs
tP
rodu
cts)
Evo
luti
onar
yP
rodu
cts
(Mar
ket-
Dis
rupt
ive
Pro
duct
s)
Hom
eE
nvir
onm
entA
ppli
ance
s
Sha
rkN
avig
ator
Lif
t-A
way
Upr
ight
Vac
uum
Sha
rkR
ocke
tUlt
ra-L
ight
Cor
ded
Sti
ckV
acuu
mS
hark
Ori
gina
lSte
amM
op
Sha
rkD
uoC
lean
wit
hZ
eroM
Sel
f-C
lean
ing
Bru
shro
llU
prig
htV
acuu
m
Sha
rkIO
NR
obot
750
Vac
uum
wit
hW
i-F
iCon
nect
ivit
yan
dV
oice
Con
trol
Sha
rkG
eniu
sS
team
Poc
ket
Mop
Sys
tem
Kit
chen
App
lian
ces
Joyo
ung
Soy
mil
kM
aker
Joyo
ung
Mul
tifu
ncti
onal
Ste
amer
Joyo
ung
Noo
dles
Mak
erJo
youn
gS
tir-
Fry
er
Joyo
ung
Soa
k-F
ree
and
Was
h-F
ree
Soy
mil
kM
aker
Joyo
ung
Hig
h-P
erfo
rman
ceM
ultif
unct
iona
lB
lend
erJo
youn
gH
oriz
onta
lJu
icer
Joyo
ung
Col
d-W
ater
Pre
ssur
eC
ooke
r
Nin
jaF
oodi
(the
pres
sure
cook
erth
atcr
isps
and
air
frie
s)N
inja
Meg
aK
itch
enS
yste
mN
inja
Cof
fee
Bar
Nin
jaC
ooki
ngS
yste
m
Nin
jaS
mar
tScr
een
Kit
chen
Sys
tem
wit
hF
resh
Vac
Tec
hnol
ogy
Nut
riN
inja
Aut
oIQ
Nin
jaH
otan
dC
old
Bre
wed
Sys
tem
153

BUSINESS
Selective Transformational Home Environment Appliances
Vacuums—No.1 in the United States
Our Shark brand ranked first with 36.4% market share in the vacuum market in the UnitedStates in retail sales value in 2018, according to the Frost & Sullivan Report. We introduced our firstNo-Loss-of-Suction upright vacuum into the US market in 2008. Since then, we have continuouslyrolled out both revolutionary and evolutionary products to continuously optimize the product line andaddress consumer pain points. After introducing high-performance No-Loss-of-Suction uprightvacuums in 2008, we introduced Rocket Ultra Light corded stick vacuums in 2013, ION Flex high-performance cordless stick vacuums in 2017 and Wandvac high-performance cordless handheldvacuums (隨手吸) in 2018. The portfolio addresses various consumer pain points and offers diversifiedshopping options: stick vacuums provide ultra light deep cleaning, upright vacuums are for whole-home deep cleaning, while handheld vacuums are for on-the-spot cleaning and high-performancecordless vacuums are for lightweight quick cleaning both on the floor and above floor. Ourcomprehensive product portfolio enables us to cater to localized and differentiated consumer needs tostand out among our competitors. For example, our Wandvac high-performance cordless handheldvacuums launched in 2018 received positive comments from consumers in China who are accustomedto on-the-spot cleaning. The high-performance cordless handheld vacuum is suitable for differentcleaning scenarios, especially for small-area cleaning, enabled by its compact design and light weight.
Throughout our entire vacuum portfolio, we have provided both revolutionary and evolutionaryimprovements to performance and cleaning through improved powerhead technology and other first-to-market product differentiators. For example, we launched the revolutionary No-Loss-of-Suctiontechnology in 2008. This was followed by Lift-Away technology in 2010, which changed the wayconsumers clean above-floor areas with their upright vacuums by enabling them to lift away thecanister for easy cleaning of stairs, furniture and other areas above the floor. We introduced therevolutionary Powered Lift-Away technology into the market in 2014. Powered Lift-Away provided allbenefits of Lift-Away and in addition allowed the consumers to deep clean hard-to-reach areas abovethe floor, under furniture and on surfaces such as furniture surfaces, while still delivering power tokeep the brush roll spinning. In 2016, we introduced DuoClean technology to our vacuums. Vacuumswith a DuoClean powerhead have two distinct brush rolls to take on carpets and floors with ease: Onebristle brush to deep clean carpets and an additional soft brush roll to pull in larger particles anddirectly engage floors to remove stuck on dust leaving behind a polished look. In 2018, we launchedZeroM which is a self-cleaning brush roll technology that eliminates hair wrap. It solves one of theconsumers’ biggest pain points of hair wrapping around the vacuum brushroll.
Robotic Vacuums—No.2 in the United States
We have capitalized our expertise and marketing strength in the vacuum market and haveinvested in considerable research efforts to launch a series of robotic vacuums to become a highlycompetitive player in the robotic vacuum market. We launched the intelligent Shark ION roboticvacuum in 2017, quickly securing the second-largest market share in the United States of 19.0% inretail sales value in 2018, according to the Frost & Sullivan Report. We have continued to build out aglobal team focusing on robotic technology which includes in-house resources as well as third-partyconsultants and experts.
Since the launch of our first robotic vacuum, we have rolled out evolutionary productsequipped with new technologies to optimize the product line. For example, we improved cleaning
154

BUSINESS
performance and increased dust cup capacity based on the 2017 Shark ION product. We alsodeveloped a Shark ION robotic vacuum app through which consumers can utilize Wi-Fi-connectivityto send cleaning and scheduling instructions from smartphones or, with voice control, using AmazonAlexa or Google Home. Through the Shark ION robotic vacuum app, consumer information and dataof the robotic vacuums on batteries, motors, sensors, camera, cleaning, and functionalities arecollected. Such data are uploaded to BlackBox Cloud every night for proactive monitoring andpredictive maintenance, which further facilitate our product optimization.
Steam Mops—No.2 in the United States
Our Shark brand ranked second with 28.5% market share in the steam mop cleaner market inthe United States in retail sales value in 2018, according to the Frost & Sullivan Report. We launchedour first steam mop in the United States market in 2006. Our Original Steam Mop introduced theconcept of cleaning hard floors with steam to the United States consumers, which enabled powerfulcleaning and sanitization without the use of chemicals. Since the launch, we have continued toinnovate. In 2010, we introduced the Steam Pocket Pad, and the double-sided all-purpose pads enabledconsumers to double their cleaning surface area and seamlessly switch to a clean pad without having todisrupt their cleaning routine. Consumer feedback suggesting the desire for a more automated approachled to the development and introduction of Intelligent Steam Control, which provides three steamsettings for dusting, mopping, or scrubbing. The rest of the steam mop products were built out aroundthe Steam Pocket Pad and Intelligent Steam Control, eventually also incorporating above-floor Lift-Away steam technology.
Selective Transformational Kitchen Appliances
Food Preparation Appliances
Soymilk makers—No.1 in China
In 1994, we invented our first Joyoung automatic home-made soymilk maker which wasrevolutionary and first in the market. The Joyoung brand has had a leading position in the soymilkmaker market in China in retail sales value during the Track Record Period. In 2018, the market shareof Joyoung soymilk makers is approximately 80.6% in retail sales value, according to the Frost &Sullivan Report.
We continuously introduced evolutionary improvements to performance of our soymilk makersthrough improved blending, heating, wash-free and other technologies. For example, by promotingblending technology through combining our original filter grid and tri-serrated blade propeller with ahigh-speed motor, our soymilk makers achieve filter-free function. With our 3D Heating technology,our soymilk makers can achieve a 360-degree efficient heating effect and heat can be spread moreevenly to avoid over-cooking. Our wash-free technology enables our soymilk makers to achieve 360-degree automatic self-cleaning through high-pressure spray washing, high-temperature steam washingand high-speed stirring washing. Facilitated by cutting-edge technologies, our Joyoung soymilk makerhas gone through various evolutionary upgrades, from the original series, to the soak-free makersreleased in 2009, to the filter-free makers released in 2014, and to the heating, noiseless and wash-freefully automated intelligent soymilk makers released in 2017.
The continuous improvement on technologies are accompanied by diversified and appealingproduct designs that capture the latest aesthetic trends, which enable us to maintain our popularity and
155
BUSINESS
attract more consumers. Some of our soymilk makers came with ceramic finish and sleek touchscreenand in various colors to cater to consumers’ diversified home decoration needs. We were awardedvarious honors including iF Design Award and Red Star Award for the appealing designs of oursoymilk makers. See “—Awards and Recognitions.”
Blenders, food processors and juicers—No.1 in all three products in China, No.1 in Blenders in theUnited States
Our Joyoung brand ranked first with 36.6%, 36.8% and 37.0% market share in the high-performance multifunctional blender market, the food processor market and juicer market,respectively, in China in retail sales value; our Ninja brand ranked first with 30.2% market share in theblender market, in the United States in retail sales value in 2018, according to the Frost & SullivanReport. Our blenders, food processors and juicers are versatile in functionality and cater to differentconsumer needs. We continuously introduce evolutionary products into the blender, food processor andjuicer product line, leveraging our advanced blending, heating, nutrient extraction and othertechnologies. Our advantages in global research and development platform as well as a centralized andsynergistic supply chain greatly benefited our blender, food processor and juicer product lines, as bothJoyoung and Ninja have abundant resources for these product categories and we have integrated suchresearch and development and supplying resources to enhance efficiency in new product developmentand to minimize time to market.
Ninja has been a trusted motorized kitchen brand for over a decade. In 2009, we launched theNinja Master Prep which provided consumers with the ability to turn ice into snow for at-home frozendrinks combined with precision chopping. In 2010, we launched the Ninja Kitchen System whichcombined professional blending capabilities with food processing capabilities by utilizing one blenderbase with multiple attachments. A year later, we added single cups to our kitchen systems which addedsingle-serve blending to the capabilities of our Ninja Kitchen Systems. Since then, we have continuedto evolve our blending and food processing lineup by adding additional attachments to our KitchenSystems. For example, we introduced Auto-IQ technology in 2014 which enables intelligent control tobreak down fruits and vegetables for nutrient extraction, and FreshVac technology in 2018 whichremoves oxygen from either a single-serve cup or full-size pitcher to maintain the color, flavor andtexture of blended fruits and vegetables for a longer time. In addition to the diversified functionalitiesenabled by the evolutionary technologies, our Ninja blenders are popular among the consumers fortheir chic appearances and harmonious accessory designs. We were awarded various honors includingRed Dot Award for the appealing designs of our Ninja blenders. See “—Awards and Recognitions.”
For the Joyoung brand, we are a highly competitive player in the blender market, foodprocessor market and juicer market in China. We build such success on our consumer-centric effortson product planning and product development, as we focus on consumer pain points and wecontinuously introduce evolutionary products equipped with cutting-edge technologies to addressconsumers’ concerns. For example, to cater to consumers’ preference for hot food in China, wecapitalized our expertise in heating technology on soymilk makers to equip our blenders with heatingfunction. We also introduced the wash-free technology from soymilk makers to our blenders. Wesuccessfully launched a brand-new series of high-performance multifunctional blenders with heatingand wash-free functions in China in 2016, and continued to develop customized product functionalitiesbased on evolutionary technologies including our proprietary Extra Merge technology which bestpreserves the flavor and nutrients of ingredients by ensuring that cell walls are broken down at theoptimum 97 Degrees Celsius, and Vacuum Seal technology which keeps juice fresh for up to 12 hours.
156
BUSINESS
We opened up the market for high-performance multifunctional blenders with this new series ofproducts and quickly achieved US$196.9 million in sales revenue in 2018. Our Joyoung high-performance multifunctional blenders are also with evolutionary appearances, with ceramic finish andsleek touchscreen. We were awarded various honors including iF Design Award and Red Dot Awardfor the appealing designs of our high-performance multifunctional blenders. See “—Awards andRecognitions.”
Cooking Appliances
Foodi—No.2 in multifunctional cookers in the United States
Our Ninja brand ranked second with 14.4% market share in the multifunctional cooker marketin the United States in retail sales value in 2018, according to the Frost & Sullivan Report. Launched in2018, Foodi, the pressure cooker that crisps and air fries, is the result of the collaboration of our globalresearch development centers in China, the United States and the United Kingdom. We utilized ourunderstanding of different markets, and accumulated technological know-how and applicationsexpertise to successfully commercialize this revolutionary product series of Foodi under the Ninjabrand. Foodi is able to combine pressure cooking and air frying into one multifunctional cooker withour TenderCrisp technology. This innovative product is a pressure cooker that crisps the food, allowingconsumers to get the speed and tenderness provided by pressure cooking along with the crispnessoffered by air frying all in one pot. Foodi quickly became a sell-out blockbuster product in the US andCanadian markets, adding a new category to our cooking appliances portfolio, because it achieves a“tender and crisp” finish that traditional cooking appliances cannot accomplish. When developingFoodi, we continuously optimized our product and function design by interacting with over 4,500consumers to gain insight through focus groups, observational trials, in-home trials and 28 prototypesbuilds before commercial production to successfully develop this revolutionary product that meetsconsumer needs.
Since the successful launch of the Foodi pressure cooker, we have been working on expandingFoodi into a product series by introducing other evolutionary products addressing a wide range ofconsumer needs.
Cookers—No.3 in rice cookers and pressure cookers in China
Our Joyoung brand ranked third with 12.5% market share in the rice cooker market in China in2018, and ranked third with 14.2% market share in the pressure cooker market in China, according tothe Frost & Sullivan Report. We provide various types of cookers including multifunctional steamer,pressure cookers, rice cookers, and slow cookers. These cookers have various functionalities to cater todifferentiated consumption needs and consumption levels.
Our revolutionary multifunctional steamer is a first-to-market differentiator as its functions goabove and beyond a traditional cooker. We applied an advanced Continuous High-Temperature Steam-Powered Heating technology to our multifunctional steamer, so that continuous, stable and controllablehigh-temperature steam can be circulated in the ingredients and our multifunctional steamer is thusable to deliver cooking results with better texture and no excess water. Our multifunctional steamer isequipped with accessories for steaming rice, fish, pumpkin and sweet potato, which provide versatilecooking options for consumers. We held a product launch for our multifunctional steamer in London inMay 2019 which received positive comments from mainstream media in Europe. We plan to expand
157

BUSINESS
the multifunctional steamer into a product series based on its successful launch. With its appearinglooking, the multifunctional steamer obtained iF Design Award and Red Dot Award.
Additionally, we provide cookers equipped with different levels of pressure control andtemperature control technologies. We have developed pressure cookers equipped with a cold-waterpressure-release system which can safely release pressure within two to four minutes after cooking, ascompared to the 20 to 40 minutes release time of more conventional alternatives. For our rice cookers,we focused on temperature control technology and our intelligent rice cookers can adjust temperatureat different stages of cooking to let rice fully absorb water. Our slow cookers are designed to simmer ata lower temperature to provide versatile cooking options. With all these various functionalities, ourcookers can satisfy consumers’ diversified needs over a wide price range.
Coffee and Tea Makers—No. 6 in coffee makers in the United States
Our Ninja brand ranked sixth with approximately 4.0% market share in the coffee makermarket in the United States in retail sales value in 2018, according to the Frost & Sullivan Report. Ourcoffee and tea makers deliver coffeeshop-quality beverages and styles in the convenience ofconsumers’ homes. We introduced the original Ninja Coffee Bar in 2015 that enabled coffee lovers tomake a variety of coffee sizes from a full carafe to a single cup and styles from hot to iced to specialtybrew for lattes, cappuccinos and more using our Thermal Flavor Extraction brewing technology. In2016, we introduced the Ninja Coffee Bar System that added even more drinks styles and a built-inintegrated milk frother for coffeeshop specialty drinks. Our most recent innovation of the Ninja Hotand Cold Brew System is one of our most precise coffee brewing systems in terms of adjustabletemperature according to different drink types and temperature control for enhanced drink quality.
Enabled by our Advanced Thermal Flavor Extraction technology, our coffee and tea maker notonly delivers the same variety of coffee sizes and styles as a regular coffee bar but also unlocks theability to create perfect teas from hot to iced to specialty tea drinks using any type of tea varieties.Capturing the latest trend of cold brew drinks, our coffee and tea maker is the first in the market thatallows consumers to make cold brew coffee or tea at home and combines the cold brew function withtraditional hot drink function in one maker. It can deliver a cup of cold brew coffee or tea in 10 to 15minutes.
Global Platform and Research and Development Cycle
As of June 30, 2019, our global research and development teams consisted of 913 employees.The global research and development centers running around the clock are located in five cities(Hangzhou, Shenzhen, Suzhou, Boston and London) in China, the United States and the UnitedKingdom. Our research and development teams comprise highly qualified professionals with a broadrange of skill sets such as industrial designers, electrical engineers, mechanical engineers, softwareengineers, firmware engineers and testing engineers.
Our research and development process comprises product planning phase and productdevelopment phase.
In the product planning phase, we focus on NTD based on our profound industry expertise andconsumer insights, especially those technologies that may be applied to products across categories. Weformulate predictive market trends watchlists and product roadmaps for the next one to five yearsbased on our NTD results. In addition, we continuously monitor consumer preferences to adjust andupdate our NTD process.
158
BUSINESS
In the product development phase, we focus on NPD to develop products that are expected tobe launched within six months to three years. For each product in plan, we form an independent multi-disciplinary NPD team with in-house designers supported by external consultants as needed. The NPDteam, equipped with relevant technical background, innovative design concepts and strong resourcebacking, aims to take approximately two to three months to prepare relevant technologies and toproduce a product blueprint through in-house research and development as well as licensing of third-party intellectual property, if necessary. Our NPD results undergo high-standard engineering validationtesting, design validation testing, production validation testing and analyzing prototype feedback. Wetake approximately one to three months to build prototypes for various product trials to obtainfeedback before commercial production. Through development and after product launch, wecontinuously upgrade our products and refine our designs based on consumer feedback. We collectfeedback regarding consumer experience through online reviews, in-home user testing, in-homeobservational testing and social media channels, where a large number of consumers consult with usafter-sale. We also collect comments from consumers through online platforms of our e-commercepartners, as well as from retail staff throughout our offline distribution network. The feedback fromconsumers provides valuable guidance on our product planning and development.
To meet consumer demand and to promote consumer experience, our research and developmentteam members devote significant time and resources to develop and upgrade our products. We incurredUS$33.5 million, US$55.8 million, US$118.9 million and US$60.0 million in research anddevelopment expenditure in 2016, 2017, 2018 and the six months ended June 30, 2019, respectively.
OMNI-CHANNEL SALES NETWORK
As a leader in the global small household appliance market, we have established differentiatedchannel strategies and a robust omni-channel sales and distribution network that are tailored to therespective local markets. We generally hold a prominent position in the channels where consumerschoose to shop.
The following table sets forth the breakdown of our revenue by brand for the periods indicated:
For the year ended December 31, For the six months ended June 30,
2016 2017 2018 2018 2019
Amount % Amount % Amount % Amount % Amount %
(in US$ millions, except percentages)(unaudited)
Joyoung . . . . . . . . . 1,103.0 100.0 1,086.8 69.5 1,201.4 44.8 582.5 50.5 564.0 45.6Shark . . . . . . . . . . . . — — 327.0 20.9 1,092.4 40.7 436.7 37.8 449.6 36.4Ninja . . . . . . . . . . . . — — 149.6 9.6 388.1 14.5 134.7 11.7 222.2 18.0
Total . . . . . . . . . . . . 1,103.0 100.0 1,563.4 100.0 2,681.9 100.0 1,153.9 100.0 1,235.8 100.0
Our New Retail in China
Leveraging our established omni-channel sales and distribution network covering both onlineand offline sales and distribution resources, we have adopted a leading and progressive business modelin China, the new retail business model. New retail is an emerging consumer-centric retail businessmodel that integrate online and offline sales and distribution resources to enhance consumerexperience. For example, consumer data and sales data from online and offline stores are rapidlycollected and uploaded to our IT system, and by analyzing the data we are able to increase theefficiency of inventory management, supply chain management, product selection and logistics.
159

BUSINESS
Through new retail, we enhance the connections among consumers, merchandises and stores which arethe three core elements of this model. Consumers participate in the development of products throughinformation and feedback which have become an integral part of the consumption process.
One key strength of the consumer-centric new retail business model is that we can collect andutilize more real-time consumer data and sales data. We integrate the consumer data and sales datagathered online and offline including the consumer purchase record, categories consumers browseonline, responses from consumers to digital marketing and the frequency of their visits to physicalstores. By collecting such comprehensive and dynamic consumer data and sales data, we gain moreknowledge of consumer needs and preferences so that we are able to develop consumer-data-inspiredproducts and to provide customized delivery services through our stores within our seamless omni-channel distribution network. We believe that we pioneered the small household appliance industry tooperate such consumer-centric new retail business models.
As of June 30, 2019, we accumulated five years of experience operating our new retail businessmodel, and continuously grow our new retail network. We have approximately 600 offline brandedstores connected to our new retail information system and we are able to access their real-timeconsumer data and sales data. The effectiveness of our new retail business model was further enhancedin 2018 as we connected to Alibaba’s new retail system to facilitate our new retail cooperation withTmall. Such new retail cooperation enables us to enhance consumer experience and satisfactionbecause once a consumer places an order on our Joyoung Tmall online store, the order information willbe pushed to our offline stores connected to Alibaba’s new retail system. Through our own new retailinformation system, the offline store near the delivery address with available stock of the orderedproducts will then ship the purchased product to the consumer, sometimes within hours of purchase. Asof the Latest Practicable Date, we had over 180 offline branded stores connected to Alibaba’s newretail system to facilitate our new retail cooperation with Tmall.
Based on our operational experience and optimization of our new retail system, we believe thatwe pioneered the new retail business model with comprehensive consumer profile and practicalexperience, and we are able to apply our new retail cooperation model to other e-commerce platformsthrough online direct sales and distribution channels. To accelerate the penetration of Shark brand andNinja brand into the Chinese market, SharkNinja leveraged Joyoung’s nationwide new retail networkby connecting to the new retail information system.
Online Sales Channels
We are one of the pioneers in the small household appliance industry to adopt an online salesmodel, and approximately 50% of Joyoung segment’s revenue in 2018 was generated from our onlinesales channels.
We have an established system for online direct sales and distribution. We directly operate ouronline flagship stores on Tmall for the Joyoung brand, the Shark brand and the Ninja brand, and our“Joyoung Mall” through the WeChat platform. Such directly operated online stores showcase ourproducts and enrich the consumer experience, performing not only as a sales channel but also as a userengagement and promotion channel. We also distribute our products through all major e-commerceplatforms, such as Tmall, JD.com and Suning.com. We build relationships with distributors whopurchase products from us and sell through their online stores on major e-commerce platforms. Byfully covering all major e-commerce platforms in our online distribution network, we believe we can
160

BUSINESS
expand consumer reach by taking advantage of the established consumer base and brand recognition ofthe platforms. For the salient contractual terms of the distribution arrangements during the TrackRecord Period, see “—Our Customers—Arrangements with Distributors in China and Certain OtherCountries and Regions.” We also constantly explore new e-commerce models, such as developing a“micro partners” program through social e-commerce channels to promote the sales of our products.The average daily traffic in the month preceding the Latest Practicable Date through three of the e-commerce platforms that we have presence on, namely, Taobao, JD.com and Suning.com, reached 1.1million in aggregate, with over 15.1 million subscribers in aggregate on these three platforms as of theLatest Practicable Date.
Offline Distribution Network
We have been cultivating the regional markets for years, accumulating abundant valuableexperience and local resources, and maintaining long-term in-depth cooperation with key distributorsand retailers. This has helped us establish a wide network of distributors and sales points nation-wide.We choose for each geographical region a limited number of key distributors to distribute to theretailers in the respective regions. Our retailers are generally department stores, specialized stores orsupermarkets/hypermarkets with strong track records and reputations, such as Suning and Gome. Wealso cooperated with reputable distributors to open branded stores in selected high consumer trafficareas to promote brand awareness and consumer engagement. The branded stores are generallyoperated in shopping malls and we designate them to be Joyoung Home Stores (九陽之家), flagshipstores, experience stores or dedicated stores depending on their functions, locations and sizes to caterto various shopping scenarios. As of the Latest Practicable Date, we had approximately 40,000 salespoints for Joyoung brand throughout China, among which there are approximately 700 Joyoungbranded stores. We also had 188 offline sales points for Shark brand which are primarily located inmid- to high-end shopping malls, and we plan to open more Shark offline sales points for Shark brandwhich to increase the penetration of Shark brand in China.
Due to increasing consumption in recent years, particularly in small cities and rural areas inChina, we continue to add new distributors and retailers, whilst expanding our offline sales network.Through these offline stores, we are able to employ experience-based marketing strategies to allowconsumers to try our products and obtain first-hand experience of ways our innovative products canchange their lives. For the salient contractual terms of the distribution arrangements during the TrackRecord Period, see “—Our Customers—Arrangements with Distributors in China and Certain OtherCountries and Regions.”
Distribution Channel Management
We select our distributors carefully. Our criteria for selection of potential distributors include,but are not limited to, their scale of operation, financial resources, market reputation, credit worthiness,management capabilities, compatibility with our brand positioning, location of retail stores and pointsof sale, pricing, target customers, market influence and competitiveness in the local market.
We manage the performance of our distributors by issuing strict policies, pricing guidelines,demanding sales reports from them and, providing them with information in relation to our products.To monitor the performance of our distributors, our internal management policy includes requiring oursales representatives to carry out random distributors-site-visits, and monitoring the sales performance,pricing and quality of the marketing activities of our distributors. All distributors are required to strictly
161
BUSINESS
follow our pricing policy with the aim to create uniform prices for our products. We work with ourdistributors to set up promotional or sales events by using differentiated promotional special productsor products with differentiated attachments or accessories. If a promotional price is to be adopted, suchprice shall be approved by us in advance.
To mitigate potential cannibalization among the distributors, (i) we typically do not allowdistributors to return products to us; (ii) products we assign for distribution online and offline aredifferentiated to some extent; (iii) we assign differentiated products for daily sales and promotionalactivities; (iv) we utilize our proprietary technology system to monitor the sales activities of ourdistributors; (v) we require distributors to periodically provide us with sales reports so that we canmonitor their sales activities in a timely manner; and (vi) for offline distributors, we grant specificgeographical regions to distributors so that we can monitor the degree of competition in eachdistribution region through various information system and random distributors-site-visits. See “—OurCustomers—Arrangements with Distributors in China and Certain Other Countries and Regions.” Tomanage inventory risk and/or detect any possible stuffing in the channels, we pay close attention to theinventory level of our distributors. Our distributors are generally required to maintain sufficientinventory levels to meet the demands of consumers. While we set minimum purchase requirementsunder a standard form of agreement with distributors in China, we require our distributors to provide asales report on a monthly basis so that we can monitor their sales and inventory levels. We alsoregularly visit our distributors and the physical sales locations that they cover to check the inventorylevels and to further mitigate the risk of inventory accumulation.
Our Extensive Sales Channels in the United States, Canada, the United Kingdom and Japan
In the United States, Canada, the United Kingdom and Japan, we primarily sell our productsdirectly to retailers or to consumers through our websites, instead of engaging distributors. In theUnited States, Canada and the United Kingdom, we have a high penetration rate in both online andoffline retail channels and have established long-standing relationships with key retailers. We launchedour business in Japan in 2018 and are continuously focusing on increasing our penetration into thatmarket. We aim to ensure that our products are available in as many places where consumers shop aspossible, thereby creating accessibility to our innovative products.
We have formed our DTC and DTR sales models. For DTC, we sell products direct toconsumers through our SharkNinja website or television shopping platforms, which enable us to obtainfirst-hand knowledge of consumer behaviors. For DTR, we have established long-standingrelationships with key retailers and we expand consumer reach by taking advantage of the establishedconsumer base and brand recognition of the top retailers.
Omni-channel Sales Network
In the United States, Canada, the United Kingdom and Japanese markets, we have a highpenetration rate in both online and offline retail channels.
We are actively developing online sales strategies. We operate our SharkNinja website as aone-stop shopping, marketing and consumer engagement platform. We have also established in-depthcooperation with major e-commerce platforms such as Amazon, Walmart.com, Target.com, andCostco.com. We believe that the online distribution of our products through these leading e-commerceplatforms enables us to expand consumer reach by taking advantage of the established consumer baseand brand recognition of the platforms.
162
BUSINESS
For offline channels, we have established long-term cooperation with the top retailers in theUnited States, Canada, including Wal-Mart, Target, Bed Bath & Beyond, Costco, Kohl’s, Sam’s Club,Best Buy, Lowe’s and Home Depot, and in the United Kingdom including Argos, Pricemart andCurrys. In Japan, we have established relationships with Yamada Denki and Bic Camera and areworking on increasing our penetration in those retail outlets. We believe that we can expand consumerreach by taking advantage of the established consumer base and brand recognition of the top retailers.
We also utilize localized sales channels catering to certain regional consumption habits. Forexample, in the United States and the United Kingdom we cooperated with QVC, a television-basedshopping platform, to sell our products through television shopping which is popular among consumersin the United States.
For the salient contractual terms of the retail arrangements during the Track Record Period, see“—Our Customers—Arrangements with Retailers in the United States, Canada, the United Kingdom,Japan, Germany and France.”
Established Relationship with Key Retailers
In the US, Canadian, the UK and Japanese markets, we have established long-standing,mutually beneficial relationships with key retailers. Most of the retailers sell our products on theirwebsites in addition to their physical stores, which expand consumer reach of our products.Meanwhile, retailers such as Amazon that primarily sell online are becoming a larger portion of ourbusiness.
We gain credibility with our key retailers through our proven track record of being able tolaunch transformational innovative products, generate demands and take market share in a productcategory while also contribute to the growth of the category itself. Our significant advertising andmarketing investment creates strong consumer demand and drives consumers to purchase from theretailers. We contribute to the performance of our retailers especially during the peak holiday seasons,which further solidify the confidence our retailers have in our brands and our products. As a result, wehave been able to generate wide distribution and retail penetration for our new product launches veryquickly, as our key retailers are very supportive during the introduction and promotion of our newproducts, which allows us to rapidly generate significant sales volume for our new product launches.This has, in turn, enabled us to gain additional shelf space and higher profile marketing andpromotional activities with the retailers.
Retail Channel Management
We strategically select our online and offline retailers. We factor in retailers’ scale of operation,financial resources, market reputation, credit worthiness, management capabilities, compatibility withour brand positioning, location of retail stores and points of sale, pricing, target customers, marketinfluence and competitiveness in local markets.
We aim to sell to a broad spectrum of channels while minimizing market conflict by(i) assigning differentiated products for daily sales and promotional activities and (ii) monitoring retailpartner operation and timely resolving problematic activities.
Our low concentration of retailers is driven by our strong marketing investment and broadproduct placement. We aim to balance our retailer mix and avoid outsized concentration of any
163
BUSINESS
particular retailer. See “Risk Factors—Risks Relating to Our Business and Industry—We rely on asmall number of major customers that accounted for a significant portion of our revenue for our USoperations.”
Other Countries/Regions
We also sell to other international markets, including Germany, France, Australia, NewZealand, Israel, South Korea and various countries in Latin America.
We operate in Germany and France through DTR by cooperating with local retailers. In otherinternational markets, we generally partner with distributors to sell our products within those respectivemarkets to generate sales and brand awareness for our products, without having to make a largeinvestment in setting up our own operation. The international distribution partners distribute to retailersas well as direct sales through selected e-commerce platforms and printed publications of generalmerchandise only within certain designated territories. With abundant local resources and valuablemarketing experience, these international distribution partners facilitate our penetration into their localmarkets.
For the salient contractual terms of the retail and distribution arrangements during the TrackRecord Period, see “—Our Customers.”
Relationship with our Distributors and Retailers
Our relationship with our distributors or retailers is not that of a principal and an agent. Wehave no management control over their daily operation, but can still monitor the sales performance andprovide marketing guidance to our distributors or retailers. We phase out distributors and retailers thatare no longer able to help us with competing effectively in the changing market. In general, ourrelationships with our major distributors and retailers have remained stable.
During the Track Record Period and up to the Latest Practicable Date, there is no materialnon-compliance with the terms and conditions of our distributorship or retail agreements that were notrectified in a timely manner by the relevant distributors or retailers and nothing has caused us tobelieve that the increase of our revenue is due to the accumulation of inventories by the distributors orretailers. See “Risk Factors—Risks Relating to Our Business and Industry—We rely substantially onour distributors and retailers.”
For Joyoung segment, we typically do not allow our distributors in China to return products tous to the extent that is compliant with relevant laws and regulations. For SharkNinja segment, whenconsumers request the return and replacement of products, or refunds, within certain time periods, incompliance with regulatory requirements and retailers’ policies on the return and replacement ofproducts or refunds, SharkNinja’s retailers generally pass on the associated cost of product returns andreplacements or refunds to SharkNinja. Retailers will generally return products to us if the productcannot be resold, either because the packaging has been opened or for reasons including design orquality deficiencies. From September 29, 2017 to December 31, 2017, the value of products returned interms of revenue amounted to US$22.7 million. In 2018 and the six months ended June 30, 2019, thevalue of products returned in terms of revenue amounted to US$98.6 million and US$50.5 million,respectively. We believe that the value of products returned is in line with the nature of thearrangements between our retailers and us. For details of our product return arrangements withdistributors and retailers, please see “—After-Sales Services—Product Return and Warranty.”
164
BUSINESS
The following table sets forth the changes in the number of our distributors and retailers forJoyoung segment for the periods indicated:
2016 2017 2018
For thesix
monthsended
June 30,2019
As of the beginning of the period . . . . . . . . . . . . . . . . . . . . . . . . . . . . . . . . . . . . . . . . . 475 471 469 464Addition of new distributors and retailers . . . . . . . . . . . . . . . . . . . . . . . . . . . . . . . . . . 60 94 90 60Number of distributors and retailers terminated during the period . . . . . . . . . . . . . . . 64 96 95 37Net increase in distributors and retailers . . . . . . . . . . . . . . . . . . . . . . . . . . . . . . . . . . . (4) (2) (5) 23As of the end of the period . . . . . . . . . . . . . . . . . . . . . . . . . . . . . . . . . . . . . . . . . . . . . . 471 469 464 487
The following table sets forth the changes in the number of our distributors and retailers forSharkNinja segment for the periods indicated:
For theperiod from
September 29,2017 to
December 31,2017 2018
For thesix
monthsended
June 30,2019
As of the beginning of the period . . . . . . . . . . . . . . . . . . . . . . . . . . . . . . . . . . . . . . . 130 120 153Addition of new distributors and retailers . . . . . . . . . . . . . . . . . . . . . . . . . . . . . . . . . 7 41 9Number of distributors and retailers terminated during the period . . . . . . . . . . . . . . 17 8 21Net increase in distributors and retailers . . . . . . . . . . . . . . . . . . . . . . . . . . . . . . . . . . (10) 33 (12)As of the end of the period . . . . . . . . . . . . . . . . . . . . . . . . . . . . . . . . . . . . . . . . . . . . . 120 153 141
BRAND POSITIONING
To meet the diversified needs of consumers around the globe, we offered a wide range ofproducts under three brands with differentiated positioning during the Track Record Period. Our Sharkand Ninja brands target mid- to high-end markets in the United States and other countries/regions, withShark focusing on home environment appliances and Ninja focusing on kitchen appliances. OurJoyoung brand targets mid- to high-end markets in China, focusing on kitchen appliances. Set forthbelow are our brand logos and values.
Enjoy quality and healthy lifestyle (悅享健康)
High-quality and superior performance at a great value
MARKETING AND CONSUMER ENGAGEMENT
To expand our consumer base and promote our brand image, we utilize various marketingchannels tailored to each of the different local markets we operate in to ensure our continuous andcomprehensive consumer exposure. We conduct marketing campaigns through television advertising,digital advertising, traditional media, online social media and various offline activities. We employ ayear-round 360-degree marketing strategy based on consumer insights by combining various mediaforms in a synergistic way to maximize the penetration of targeted consumer population. For example,when engaging brand ambassadors, we analyzed consumer preferences to identify the celebrities thatwere popular among our target audience and compatible with our marketing campaign. Our advertisingexpenses amounted to US$20.1 million, US$97.6 million, US$207.5 million and US$71.5 million in2016, 2017, 2018 and the six months ended June 30, 2019, respectively.
165
BUSINESS
We highly value consumer reviews and use them to identify consumer needs and pain points,and thus we are enabled to create new products and continuously improve our existing products. Weestablish continuous direct communication with consumers and collect consumer reviews to improvethe overall consumer experience, increase consumer activity and loyalty, and at the same time, driveproduct upgrade and innovation, thereby achieving a virtuous cycle and propelling our future growth.The consumer reviews also help our expansion and brand promotion, as existing consumer reviewsserve as testimonies to our product quality and enable new consumers to make educated buyingdecisions. Consumers are welcome to discuss or comment on our products through social mediachannels, platforms on our e-commerce stores and offline activities. We have a diverse yet close-knitconsumer community that interact with us and each other regarding their experience with our products,and our consumer base is loyal and willing to make repeat purchases through our product upgrades andcross-selling.
By accumulating insights into the differing consumer preferences in various markets and byanalyzing them in the context of local as well as global trends, we are then able to leverage our globalresources to create a market strategy that combines the keys to our previous success in existing marketswith our localized insights in order to replicate our success in new markets.
China
In China, we take advantage of our high level of penetration in the online market to stimulateconsumers’ frequency of communication and engagement through different online platforms: as of theLatest Practicable Date, we had more than six million subscribers on our WeChat platform and morethan 15.1 million subscribers on three of our e-commerce platforms that we have presence on, namelyTaobao, JD.com and Suning.com. Often our products come with a unique product code that consumerscan scan or input to register the product on our official WeChat or website platforms. Once registered,consumers can access comprehensive after-sales services including consultation, news-sharing andwarranty and send feedback to us directly. For offline consumer engagement, we interact with ourconsumers actively through store-based experiential marketing and over 2,300 offline after-salesservice centers, and the information gathered offline will be integrated into our online informationsystem. Through both online and offline coverage, we cultivate and support the growth of ourconsumer community as we serve our consumers by all means and further enhance their consumerexperience, as well as stickiness and loyalty to our brands.
We also leverage other new media, social platforms and offline interactive activities to expandthe reach of our consumer interaction. We enhance exposure to consumers through online marketingincluding live streaming and social media promotion which are increasingly popular among consumersin China, and through offline marketing including face-to-face interactive activities and product launchevents. We also actively integrate our online and offline marketing resources to maximize ourmarketing impact.
We are one of the pioneers in the small household appliance industry to utilize live streamingfor marketing. During major shopping festivals including Double Eleven, we engage KOLs andinfluencers to try our products through live streaming shows which successfully and significantly boostour sales volume. For example, we organized 34 live streaming shows via Joyoung Tmall platform inNovember 2018 before Double Eleven, and there were over 200,000 audiences attending 34 livestreaming shows while sales revenue through the 34 live streaming shows reached over RMB7.0million. Such effective marketing resource of Joyoung is shared with Shark brand. For example, we
166
BUSINESS
placed Shark products into live streaming shows via the Joyoung Tmall account to increase consumerawareness of the Shark brand in China. We also organize routine live streaming activities throughselective online stores of Joyoung on Taobao to increase continuous and comprehensive exposure toconsumers. To integrate our online and offline sales resources and knowledge, we sometimes engageexperienced offline sales personnel to introduce our products through our routine live streaming shows.Our strong marketing capability through live streaming is recognized by Taobao as we were awarded“Best Business Operator through Taobao Live Streaming” in 2018. See “—Awards andRecognitions—Awards to Our Brands.”
For marketing through social media, we cooperated with KOLs and influencers on major socialmedia platforms such as Weibo and TikTok to promote various forms of our product contents tailoredto different target consumer groups. We send our products to KOLs and influencers and they sharetheir experience of our products with their large network of subscribers. We also maintain variousofficial social media accounts to actively engage with consumers, directly addressing their questionsand concerns whilst promoting our products. As of Latest Practicable Date, we had more than sixmillion subscribers of our official Joyoung WeChat platform and over 1.7 million subscribers of ourseries of Joyoung Weibo accounts.
We organize various offline activities to increase face-to-face consumer engagement andenhance consumer experience, and we actively integrate our online and offline marketing resources tomaximize our marketing impact. For example, we organize a monthly “Fan’s Day (粉絲節)” activity inour offline stores, and the theme of the activity is selected based on feedback collected from consumersthrough our online Tmall store platform. We also established a “No. 9 Kitchen (玖號廚房)” thatcombines website, WeChat platform and offline marketing activities to strengthen our consumerengagement efforts. We share recipes with consumers on the “No. 9 Kitchen” WeChat platform whilewe hold offline gastronomic gatherings such as “No. 9 Private Kitchen Club (玖號廚房私廚會)” to offerconsumers food tasting and kitchen product tryout opportunities. We have organized such offlinegatherings in large cities including Beijing, Shanghai and Hangzhou to showcase products and enhanceconsumer engagement.
We leverage our multiform product launch campaign in the small household appliance industry.In March of each year, we invite representatives from mainstream media, KOLs/influencers andconsumers to attend our routine offline product launch events to showcase new products of that year.We also occasionally hold product launch campaigns for certain featured products through onlinechannels. For example, we cooperate with Tmall to launch our products such as multifunctionalsteamer online via occasional marketing events organized by Tmall to increase consumer awarenessabout our new products.
The United States, Canada, Europe, Japan and Other Countries/Regions
In the United States and the United Kingdom, significant marketing and advertising investmentis a critical component of our go-to market strategy. A 52-week-a-year “always on” strategy consists oflong-form and short-form television advertising as well as digital advertising. These investments helpto educate consumers on Shark and Ninja’s product innovation and create strong awareness andconsumer demand for Shark and Ninja’s products.
In the United States, Canada, Europe, Japan and Other Counties/Regions, our consumerinsights team is responsible for gathering and disseminating consumer feedback to support our various
167
BUSINESS
strategies, from product design to commercialization. This team focuses on both consumer insights andmarket intelligence and plays a critical role throughout the entire product development cycle. Ourconsumer insights team is charged with representing the voice of the consumer at each stage of productdevelopment as well as after the product goes to market.
Our consumer insights process uses an agile approach to continually pulse consumers to ensurethat our products deliver as close to a five-star rating through online consumer reviews as possible andachieve a high rate of sales before commercial production. This starts at the concept phase and leadsinto production using robust versions of the product including several rounds of prototype andengineering builds, which are made by our OEM’s on production lines but prior to commercialproduction. Consumer feedback is also used to refine the commercialization strategy includingadvertising, packaging and product collateral to ensure that our efforts are resonating with consumers.Additionally, the team iteratively runs competitive testing with shelf tests and mock retail.com pages tounderstand how our product fits in a retail line-up or how our Amazon pages resonate with consumers.During 2018, over 75,000 consumers participated in this iterative research approach.
Our market intelligence process measures the rate of sales of a product, identifies newmessaging opportunities or other product areas for post-launch refinement and delivers strategicforesight in service of future product spaces and technology advancements one to three years out. Wehave implemented IT solutions that have allowed us to scale our research efforts and examinein-market feedback from more than two million consumer contacts from our call center and over onemillion online product reviews. This provides insight into how our products compete in the market andinforms the development of our next generation of products. The team also utilizes market share data,retailer point-of-sale data and other sources to help identify consumer behaviors and market trends forfuture product development opportunities.
Due to our proven track record of introducing innovative and category-leading products whichhave contributed to the growth of the categories that we sell in and the sales performance of theretailers that we sell to, our retailers have strong confidence in us and are also generally verysupportive during the introduction and promotion of our new products. We have been activelydeveloping online sales strategies and invest heavily in digital advertising on the retailers’ websitesthat we sell on, as well as on various social media platforms and through paid internet search results.
Understanding the consumers’ evolving habits in researching products and shopping, we keepclose to the new marketing trends to ensure that our consumers are provided with an engagingshopping experience with relevant information. We use social media to share entertaining informationabout our most innovative products and then retarget the same consumers with purchase-driving offers.Each new product is supported by public relations and online media coverage and products are sent toinfluencers, so they can post about their positive experience to their large network of subscribers. Wealso use a weekly content series on Facebook and Instagram to keep top of mind with consumerssharing contests, inspiration and building our consumer community. Several online communities havebeen spontaneously created by our Shark and Ninja superusers and are approaching 100,000 membersin addition to an active following on mainstream social media platforms.
We also host offline marketing events including market launch or product launch to increaseour brand awareness and our face-to-face interaction with consumers. For example, SharkNinja held amarket launch event in Japan to enhance brand awareness when we entered into the Japan market in2018. Joyoung held a product launch for its multifunctional steamer in London in May 2019 whichreceived positive comments from mainstream media in Europe.
168
BUSINESS
AFTER-SALES SERVICES
We seek to provide a high level of after-sales service to consumers, which is commensuratewith the high level of consumer satisfaction that we seek to deliver with our products. We pursueconsumer satisfaction by actively establishing effective and direct after-sales communication withconsumers to obtain first-hand knowledge of their feedback while providing legally required productreturn and warranty.
After-Sales Communication with Consumers
By holding ourselves accountable to a consistent and high quality of service, we work to ensurethat no matter the channel through which consumers reach us, we have in-house consumer serviceexperts or trained associates ready to support any and all questions or concerns about either ourproducts or our services. This consistency is accomplished by constant training and calibration efforts.
We provide consumers with an omni-channel approach to contact us, whether it be morestandard channels such as telephone, chat and email, or more recently added social channels such asWeChat, Facebook, Twitter, and Instagram, fostering and supporting organic conversations. Oftentimes, we assign a unique product code for each of our products to ensure the identifiability andrecognizability of our products. Consumers are able to register on our online platforms to accesscomprehensive after-sales services, including consultation and instructions for product functions,complaints and suggestions, and applying for product repairs and membership award programs, byscanning or inputting the product code. In China, we also operate over 2,300 offline after-sales servicecenters which provide onsite maintenance and repairs. We interact with consumers actively throughour after-sales service centers and we promote our new products through our after-sales serviceschannels, so that some consumers may elect to, instead of repairing, purchase a new product, thusincreasing our product sale. Our first-hand knowledge of consumer information and feedback throughour offline after-sales service centers will be integrated into our online information system.
We analyze and categorize our conversations with consumers, and use them to driveimprovements to both our products and services. This is facilitated via regular meetings where samplecontacts are reviewed with cross-functional teams, including our engineering, marketing and qualitycontrol departments, keeping them abreast of the consumer feedback and market trend. This feedbackis collected and aggregated to allow us to uncover new trends to either exploit new messaging andfeature opportunities or reduce the impact of any issues reported by consumers.
Product Return and Warranty
Consumers can return unused products, replace defective products or ask for repair of defectiveproducts within certain time periods, in compliance with regulatory requirements or our or retailers’policies on return, replacement and repair of products. Consumers may also have their product replacedfor specific types of defects or quality issues as required pursuant to our warranty policies or relevantlaws and regulations. We typically offer basic warranties of one to five years on our products.
For Joyoung segment, we typically do not allow our distributors in China to return products tous to the extent that is compliant with relevant laws and regulations. When consumers request thereturn, replacement and repair of products within certain time periods, in compliance with regulatoryrequirements or our policies on returns, replacements and the repair of products, we generally bear theassociated costs if they fall within the scope of regulatory requirements, while our distributors
169
BUSINESS
generally bear the associated costs outside the scope of regulatory requirements. See “—OurCustomers.”
For SharkNinja segment, when consumers ask for return and replacement of products orrefunds within certain time periods, in compliance with regulatory requirements and retailers’ policieson returns and replacements of products, or refunds, SharkNinja’s retailers generally pass on theassociated cost of product returns and replacements, or refunds, to SharkNinja. It is typical for retailersin the United States, Canada and the United Kingdom to allow consumers to return products withincertain time periods regardless of whether the product has design or quality deficiencies or not.Retailers will generally return those products to us if the product cannot be resold, either because thepackaging has been opened or for reasons including design or quality deficiencies. Also, in certaincases, we may elect to buy back products from retailers if a product is being discontinued or replacedby a different product. During the Track Record Period, for the sales return as mentioned above, wenormally recognize (a) the refund liabilities for sales returns (with corresponding adjustments torevenue), and (b) the related right-of-return assets (with corresponding adjustments to cost of sales) forthe rights to recover the products expected to be returned. See “—Our Customers.” FromSeptember 29, 2017 to December 31, 2017, the value of products returned in terms of revenueamounted to US$22.7 million. In 2018 and the six months ended June 30, 2019, the value of productsreturned in terms of revenue amounted to US$98.6 million and US$50.5 million, respectively. Webelieve that the value of products returned is in line with the nature of the arrangements between ourretailers and us.
PROCUREMENT AND PRODUCTION
We produce certain core or pioneer products as well as prototypes of our Joyoung brand withinour in-house production facilities in Hangzhou and Jinan. Such in-house production facilities worksclosely with our research and development team to efficiently perfect the products by analyzing real-time production and testing data. We believe that preserving such in-house production capability alsomakes us more resilient to any potential supply-side fluctuation. See “—Procurement andProduction—In-house Production Facilities, Production Capacity and Utilization Rate.”
Meanwhile, to maximize production efficiency, we also cooperate with reliable OEM suppliers,all of which are located in China. The OEM suppliers are selected carefully, taking into account theirprice, quality, production capacity, financial conditions, delivery scheme, business scale andreputation. Some of the OEM suppliers have up to 20 years of long-term relationships with us. Most ofthe OEM suppliers work exclusively for us, which enhances protection of our intellectual propertyrights and control over supply chain stability. Our alliance with the long-term OEM suppliers is one ofthe key factors of our success, as it facilitates our design and development, engineering solutions,supply stability and quality control. For the salient contractual terms with our OEM suppliers duringthe Track Record Period, see “—Our Suppliers.”
To ensure the quality of our products, we also carefully select component and raw materialsuppliers with reliable quality and reasonable prices for certain materials such as circuit boards, electricwires, hardware and packaging materials. We generally designate certain key component and rawmaterial suppliers for OEM suppliers to cooperate with. In some cases in China, we purchase qualifiedmaterials directly from component and raw material suppliers and have the materials delivered toin-house production facilities or OEM suppliers for assembling. During the Track Record Period, wedid not experience material fluctuations in the costs of our components, raw materials and finished
170
BUSINESS
products. See “Financial Information—Factors Affecting Our Results of Operations and FinancialCondition—Prices and stable supplies of raw materials, components and finished products.” See “RiskFactors—Risks Relating to Our Business and Industry—We rely principally on OEM suppliers andsuppliers of components and raw materials for in-house production.”
Our centralized supply chain is facilitated by our global operation. We believe that there arestrong synergies between the Joyoung and SharkNinja supply chains. As a market leader in China,Joyoung utilizes its local negotiation power advantage to facilitate the centralized supply chainevolution by integrating both SharkNinja’s and Joyoung’s abundant resources in procurement andproduction in China. We have the strong capability to flexibly mobilize supplying resources in Chinato be shared through our global operation, and our significant procurement scale on a consolidatedbasis. Our combined experience in supply chain management will enable us to continue to offer high-quality products at competitive prices, which in turn will boost efficiency and profitability.
Procurement and Production Planning
Enabled by our technological competence and information infrastructure, we established aninternal resource planning platform to connect with our suppliers, distributors and retailers and createdirect access of production data and sales data. Such data includes the utilization rate of productionfacilities, inventory levels and inventory turnover of us and our distributors or retailers, historical salesrecords of our distributors or retailers and market trends. See “—Technology Infrastructure and DataProtection.” Based on the data gathered through the internal resource planning platform, ourprocurement department works closely with the sales and marketing department to conduct a rollingproduction forecast, which enables us to efficiently create an accurate procurement and production planand maintain suitable inventory level. Our reliable procurement and production plan is furthersupported by our strong capability of mobilizing the highly flexible and accommodating supply chainsystem in China. We always have alternatives to supply needed products so as to ensure that ourproduction schedule is strictly followed. As a result of accurate forecasts, we, along with ourdistributors and retailers, have quick inventory turnover cycles and rarely face the risk of accumulatingobsolescence or excess inventory which could affect the volume of future orders from our distributorsand retailers and thus have a material adverse impact on our business. See “Risk Factors—RisksRelating to Our Business and Industry—Our operating results could be materially harmed if we areunable to accurately forecast market demand for our products or manage our inventory.”
Logistics and Inventory
Inventory Management
Our inventory includes finished products and a small number of components and raw materials.
To monitor our finished product inventory levels and minimize obsolete inventory, we have astrict inventory control policy whilst closely monitoring sales records of our distributors and retailers.Through various data feeds, we are able to access information from most of our major distributors andretailers, including relevant product description, sales volume, unit selling price, total monetary amountof our products sold by the distributors and retailers to consumers, volume of inventory on hand andinventory turnover. With such information, we are able to: (i) monitor the sales performance of thedistributors and retailers; (ii) understand the latest market demand on our products; (iii) prepare salesforecasts and production schedules; and (iv) maintain an optimal inventory level which can satisfy themarket demand in a timely manner but without increasing the risk of inventory obsolescence. Our sales
171
BUSINESS
and marketing department and finance department will compare the information collected with ourinternal data on a periodic basis. See “Risk Factors—Risks Relating to Our Business and Industry—Our operating results could be materially harmed if we are unable to accurately forecast marketdemand for our products or manage our inventory.”
In China, we stock certain components and raw materials to be used in in-house production orto be shipped to our OEM suppliers. Through accurate procurement and production planning, closecoordination with our customers and suppliers, as well as making frequent purchases of componentsand raw materials from our suppliers, we are able to carry fewer components and raw materials andin-process inventories, which lowers our inventory risk. In the United States, we do not stockcomponents or raw materials and would direct our OEM suppliers to purchase such components ormaterials directly. See “—Procurement and Production Planning.”
During the Track Record Period, our inventory turnover days was 35, 58, 67 and 80 in 2016,2017, 2018 and the six months ended June 30, 2019, respectively.
Warehousing
In China, we own and operate two warehouses in Hangzhou and Jinan, as well as lease andoperate three warehouses in Hangzhou, Dezhou and Foshan. The warehouses are strategically locatedto ensure fast deliveries across China. Our Jinan and Dezhou warehouses generally process shipmentsin Northeast China; Hangzhou warehouse generally processes shipments in East and Central China;and Foshan warehouse generally processes shipments in South China.
In the United States, we operate one warehouse in Chino, California and utilize third-partylogistics providers for warehousing and distribution needs at other locations in California andMaryland. Our direct-to-consumer shipments are made either from a warehouse in Chino, California orin Curtis Bay, Maryland which enables us to deliver products to the entire continental United Stateswithin a competitive timeframe.
We also utilize warehouses operated by third-party logistics providers in Canada, the UnitedKingdom and Japan to service those markets.
Logistics
We engage third-party logistics service providers for delivery services. We choose such serviceproviders based on their qualifications, service coverage, track record, financial strength and price.
Typically, for Joyoung, finished products are transported by the logistics service providers fromour OEM suppliers to our warehouses, then to the distributors and retailers after quality inspections andpackaging. We may also use an expedited process for scenarios with high-efficiency requirements suchas major shopping events like Double Eleven, where finished products that have passed qualityinspections by our onsite representatives are transported by the logistics service providers from ourOEM suppliers directly to our distributors and retailers, in order to cope with the increasing salesvolume and to ensure the timely delivery of goods to consumers.
Typically, for SharkNinja, finished products are exported outside of China whilst the OEMsuppliers are responsible for delivering products to the port of export. These products are then shippedto SharkNinja’s warehouses using a combination of logistical transport service providers including
172
BUSINESS
international container shipping companies and inland drayage providers. Retailers typically arrangefor their own transportation from SharkNinja’s warehouses to their locations. In certain cases, retailersof SharkNinja will arrange for the transportation of products from the port of export in China directlyto their locations.
While third-party logistics service providers generally have their own operation insurance, wefurther control the residual risk by maintaining insurance coverages for our products while intransportation. See “—Insurance.”
During the Track Record Period, we did not experience any major disruption to logisticscapabilities or any major incidents of loss or theft during delivery.
Quality Control and Product Safety
We are committed to maintaining a high level of quality in our products and we thereforeimplement quality control measures suiting different scenarios with professional team members. As ofJune 30, 2019, our total quality control staff consisted of 728 employees. Our quality control team isresponsible for formulating our quality control policy which sets out guidelines in accordance with therespective applicable requirements under quality management standards, including ISO9001, CCC,CE, IEC, C-TICK, S-MARK, KTL and QB/T 4404-2012, covering various key steps fromprocurement, production, storage to sales and distribution of our products. Our quality control team isalso responsible for ensuring that we are in compliance with all applicable regulations, standards andinternal policies at all times.
Our quality control process generally comprises: (i) research and development quality control;(ii) quality control of component and raw material suppliers and OEM suppliers; and (iii) marketfeedback quality control.
For research and development quality control, we focus on engineering validation testing,design validation testing, production validation testing as well as analyzing prototype feedback. Onaverage, each of our products will go through 30 to 40 different tests to ensure its long-term in-homereliability. We value our rigorous testing procedures and we have four in-house testing facilitieslocated globally in Suzhou, Shenzhen, Boston and Auburn.
For quality control of component and raw material suppliers and OEM suppliers, we haveon-site representatives to communicate with suppliers about quality standards for each component andraw material and finished product and to conduct thorough examinations of product samples and eachof their components to make sure they satisfy all the technical requirements set forth in our productdesign. The framework for quality control is specified in the process quality plan which defines allaspects of inspection and measurement control from incoming quality of sourced components to in-lineinspections through to pre-shipment inspection. We maintain a proactive relationship of taking actionon information collected by our suppliers. Continual improvement activities are based on the qualitycontrol data, which enhances our ability to not only effectively manage the quality control processesbut also to conduct data analysis to optimize the process. Further, indemnification for products liabilityclaims caused by suppliers is generally included in the contract between us and the suppliers. See “—Our Suppliers.”
For market feedback quality control, we aim to establish effective direct communication withconsumers through online reviews, in-home user testing, in-home observational testing, and social
173

BUSINESS
media channels where a huge number of consumers conduct after-sale consultations with us. We alsocollect comments from consumers through our e-commerce platforms, as well as from offline after-sales service centers. See “—After-Sales Services.” Through the close network with our distributors orretailers and the intimate teamwork among our departments, information regarding consumerexperience is shared with our research and development team to improve our research anddevelopment. Using this method, we continuously enhance the competitiveness of our products byactively responding to the needs of consumers and reflecting their feedback on our products.
Our Joyoung brand was honored “National Exemplar Enterprise for Product and ServiceQuality” in 2016 and “China’s Most Influential Small Household Appliance Brand” since 2009 for 10consecutive years by the China Association for Quality Inspection. Our Shark brand was honored“Highest in Customer Satisfaction” in 2014, 2015, 2017 and 2018 by J.D. Power. These awards andrecognitions are further testaments to our strict requirements for quality control. See “—Awards andRecognitions.”
As a result of our stringent quality control procedures, we did not experience any material salesreturns or any material product liability or other legal claims due to quality control issues and we didnot recall any products during the Track Record Period. See “Risk Factors—Risks Relating to OurBusiness and Industry—We may be subject to product liability claims for compensation from time totime. Any failure in our quality control systems could harm our business and lead to such claims if ourproducts are found to be defective.”
In-house Production Facilities, Production Capacity and Utilization Rate
We produce certain core or pioneer products as well as prototypes within our in-houseproduction facilities which are located in Jinan and Hangzhou. The designated capacity for ourproduction facilities was 2,472,334 units, 1,991,030 units, 1,150,944 units and 597,290 units in 2016,2017, 2018 and the six months ended June 30, 2019, respectively. The actual production volume forour production facilities was 2,402,319 units, 1,934,172 units, 1,134,031 units and 565,884 units, andthe corresponding utilization rate was 97.2%, 97.1%, 98.5% and 94.7% in 2016, 2017, 2018 and the sixmonths ended June 30, 2019, respectively. The designated capacity and actual production volume forour in-house production facilities decreased in 2018, mainly because we focused our in-houseproduction effort more on advanced soymilk makers, which require more complex productionprocedures and are more resource- and capacity-consuming. We believe such shifting in focus andcapacity is in line with our overall production strategy and we expect the production output to stabilizeover time.
COMPREHENSIVE INFORMATION MANAGEMENT SYSTEM
We employ advanced information management systems to unlock synergies within our highlycomplementary global business operation. We leverage our global resources to collect informationfrom various markets on consumer feedback, preferences and behaviors and keep our businessprocesses, from research and development, procurement and production to sales and marketing, fullyconnected and responsive to such information. Reaching upstream and downstream of our value chain,the efficient and comprehensive information management system enables us to identify consumerdemand and market trends timely and precisely. Our information management system pools userinformation and data we obtained through our omni-channel approach on user engagement, seamlesslycollecting from online and offline sales and marketing channels and after-sales service platforms. Suchinformation forms the basis of, and guides, our various business activities.
174
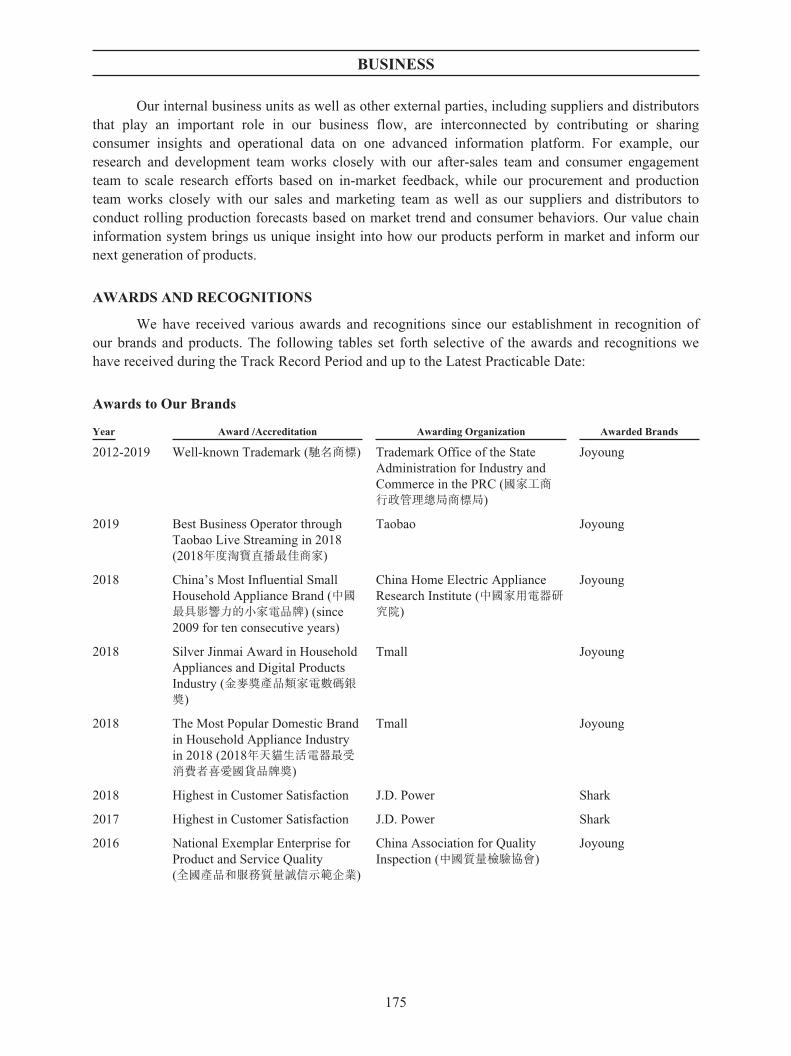
BUSINESS
Our internal business units as well as other external parties, including suppliers and distributorsthat play an important role in our business flow, are interconnected by contributing or sharingconsumer insights and operational data on one advanced information platform. For example, ourresearch and development team works closely with our after-sales team and consumer engagementteam to scale research efforts based on in-market feedback, while our procurement and productionteam works closely with our sales and marketing team as well as our suppliers and distributors toconduct rolling production forecasts based on market trend and consumer behaviors. Our value chaininformation system brings us unique insight into how our products perform in market and inform ournext generation of products.
AWARDS AND RECOGNITIONS
We have received various awards and recognitions since our establishment in recognition ofour brands and products. The following tables set forth selective of the awards and recognitions wehave received during the Track Record Period and up to the Latest Practicable Date:
Awards to Our Brands
Year Award /Accreditation Awarding Organization Awarded Brands
2012-2019 Well-known Trademark (馳名商標) Trademark Office of the StateAdministration for Industry andCommerce in the PRC (國家工商行政管理總局商標局)
Joyoung
2019 Best Business Operator throughTaobao Live Streaming in 2018(2018年度淘寶直播最佳商家)
Taobao Joyoung
2018 China’s Most Influential SmallHousehold Appliance Brand (中國最具影響力的小家電品牌) (since2009 for ten consecutive years)
China Home Electric ApplianceResearch Institute (中國家用電器研究院)
Joyoung
2018 Silver Jinmai Award in HouseholdAppliances and Digital ProductsIndustry (金麥獎產品類家電數碼銀獎)
Tmall Joyoung
2018 The Most Popular Domestic Brandin Household Appliance Industryin 2018 (2018年天貓生活電器最受消費者喜愛國貨品牌獎)
Tmall Joyoung
2018 Highest in Customer Satisfaction J.D. Power Shark
2017 Highest in Customer Satisfaction J.D. Power Shark
2016 National Exemplar Enterprise forProduct and Service Quality(全國產品和服務質量誠信示範企業)
China Association for QualityInspection (中國質量檢驗協會)
Joyoung
175

BUSINESS
Product Design Awards
Year Award Products Market
2019 Red Dot Award Joyoung Soymilk Maker DJ13E-Q15 China
2019 iF Design Award Joyoung High-Performance Blender YJ08 China
2019 Red Dot Award Joyoung Multifunctional Steamer S5 China
2019 iF Design Award Joyoung Multifunctional Steamer S5 China
2019 iF Design Award Joyoung Wash-free High-Performance BlenderY88
China
2019 Red Dot Award Ninja Hot and Cold Brewed System United States
2019 Red Dot Award Ninja Smart Screen Blender Duo with FreshVacTechnology
United States
2019 Red Dot Award Shark Cordless Handheld Vacuum ION W1 United States
2019 iF Design Award Shark Cordless Handheld Vacuum ION W1 United States
2018 Home Appliances WatchAward by Kaden Watchand GetNavi
Shark Evoflex Vacuum Japan
2018 Trusted Reviews – Blenderof the Year
Ninja Blender CT610UK United Kingdom
2017 Red Star Award (China)(中國設計紅星獎)
Joyoung Water Purifier 7501 China
2017 Red Dot Award Joyoung High-Performance Blender Y20 China
2016 Red Dot Award Joyoung Stir-Fryer J5 China
OUR SUPPLIERS
Our dedicated in-house teams work closely with our suppliers to strengthen and enhance ourrelationship with them, implement our quality control standards and improve our bargaining power interms of pricing and overall risk management. Our suppliers primarily comprise OEM suppliers andsuppliers of components and raw materials for in-house production. Purchases from our five largestsuppliers in 2016, 2017, 2018 and the six months ended June 30, 2019 amounted to US$288.0 million,US$366.4 million, US$682.9 million and US$287.4 million, respectively, which represented 38.3%,35.7%, 40.5% and 37.7%, respectively, of our total purchase cost for the same periods. In the sameperiods, purchases from our largest supplier accounted for 14.3%, 12.3%, 11.3% and 9.9% of our totalpurchases, respectively. See “Risk Factors—Risks Relating to Our Business and Industry—We relyprincipally on OEM suppliers and suppliers of components and raw materials for in-house production.”
176
BUSINESS
The tables below set out the details of our top five suppliers during the Track Record Period:
For the year ended December 31, 2016:
Name of suppliersPurchaseamount
Length ofrelationship
Credit periodgranted to the
Group
(US$’000)
Hangzhou XinDuoDa Electronic Technology Co.,Limited (杭州信多達電子科技有限公司)
107,334 10 years 60 days
Hangzhou Yongyao Technology Co., Limited (杭州永耀科技有限公司)
68,198 8 years 60 days
Hangzhou Hongfeng Electronic Fittings Co., Limited(杭州弘豐電子配件有限公司)
50,400 10+ years 60 days
Zhejiang Langke Intelligent Electric Co., Limited (浙江朗科智能電氣有限公司)
33,643 10+ years 60 days
Zhejiang City Kexin Electronic Co., Limited (中山市科欣電子有限公司)
28,473 10+ years 60 days
Total 288,048
For the year ended December 31, 2017:
Name of suppliersPurchaseamount
Length ofrelationship
Credit periodgranted to the
Group
(US$’000)
Hangzhou XinDuoDa Electronic Technology Co.,Limited (杭州信多達電子科技有限公司)
126,451 10 years 60 days
Kingclean Electric Co., Limited 75,057 10+ years 60 days
Kayue Electric Company Limited 57,569 10+ years 30 days
Hangzhou Yongyao Technology Co., Limited (杭州永耀科技有限公司)
55,782 8 years 60 days
Hangzhou Hongfeng Electronic Fittings Co., Limited(杭州弘豐電子配件有限公司)
51,585 10+ years 60 days
Total 366,444
For the year ended December 31, 2018:
Name of suppliersPurchaseamount
Length ofrelationship
Credit periodgranted to the
Group
(US$’000)
Ningbo Fujia Industrial Co., Limited 190,979 10+ years 60 days
Kayue Electric Company Limited 130,349 10+ years 30 days
Ecovacs Robotics Co., Limited 120,893 10+ years 60 days
Kingclean Electric Co., Limited 120,470 10+ years 60 days
Hangzhou XinDuoDa Electronic Technology Co.,Limited (杭州信多達電子科技有限公司)
120,226 10 years 60 days
Total 682,917
177
BUSINESS
For the six months ended June 30, 2019:
Name of suppliersPurchaseamount
Length ofrelationship
Credit periodgranted to the
Group
(US$’000)
Ningbo Fujia Industrial Co., Limited 75,719 10+ years 60 days
Kingclean Electric Co., Limited 59,995 10+ years 60 days
Kayue Electric Company Limited 55,511 10+ years 30 days
Hangzhou XinDuoDa Electronic Technology Co.,Limited (杭州信多達電子科技有限公司)
51,124 10 years 60 days
Ecovacs Robotics Co., Limited 45,041 10+ years 60 days
Total 287,390
We have held a 35% equity interest in Hangzhou XinDuoDa Electronic Technology Co.,Limited (杭州信多達電子科技有限公司) since 2011, which was one of our five largest suppliers in2016, 2017, 2018 and the six months ended June 30, 2019. We have held a 30% equity interest inHangzhou Hongfeng Electronic Fittings Co., Limited (杭州弘豐電子配件有限公司) since 2016, whichwas one of our five largest suppliers in 2016 and 2017. We have held a 25% equity interest inHangzhou Yongyao Technology Co., Limited (杭州永耀科技有限公司) since 2016, which was one ofour five largest suppliers in 2016 and 2017. Purchases from Hangzhou XinDuoDa ElectronicTechnology Co., Limited, Hangzhou Hongfeng Electronic Fittings Co., Limited and HangzhouYongyao Technology Co., Limited in 2016 and 2017 in aggregate amounted to US$225.9 million andUS$233.8 million, respectively, which represented 30.0% and 22.8%, respectively, of our totalpurchase cost for the same years. Purchases from Hangzhou XinDuoDa Electronic Technology Co.,Limited in 2018 and the six months ended June 30, 2019 amounted to US$120.2 million and US$51.1million, respectively, which represented 7.1% and 6.7% of our total purchase cost in the same periods.Except for Hangzhou XinDuoDa Electronic Technology Co., Limited, Hangzhou Hongfeng ElectronicFittings Co., Limited and Hangzhou Yongyao Technology Co., Limited, all of our other five largestsuppliers in 2016, 2017, 2018 and the six months ended June 30, 2019 were Independent Third Parties.None of our Directors, their respective associates or any Shareholder who, to our knowledge, ownsmore than 5% of the issued share capital of our Company has an interest in any of the above-mentionedsuppliers.
In 2016, 2017, 2018 and the six months ended June 30, 2019, we held an equity interest in five,seven, seven and seven of our suppliers in China, respectively. Such equity interests typically rangedfrom 25% to 35%. Such arrangement stemmed from our strategic need to secure high-quality supplychain resources. In particular, in selectively making such arrangements with high-quality and reputablesuppliers with strong research and development capability, we sought to (i) increase the “stickiness” ofour suppliers and encourage long-term and mutually beneficial relationships; and (ii) increaseinformation transparency through our supply chain. We do not participate in the daily operations ofthese suppliers. Purchases from suppliers in which we held an equity interest in 2016, 2017, 2018 andthe six months ended June 30, 2019 amounted to US$239.0 million, US$272.7 million, US$318.3million and US$144.7 million, respectively.
We deal with all our suppliers at arm’s length, regardless of their affiliation with us. Thetransaction terms with suppliers in which we hold an equity interest are comparable to those withIndependent Third Party suppliers.
178
BUSINESS
The salient terms of the agreements with our OEM suppliers and component and raw materialsuppliers are set forth as below:
i. Duration The term of our agreement with our suppliers generally ranges fromone to three years and may be renewed upon mutual agreement. Inrare circumstances, the term of our agreement with certain suppliersis perpetual. The agreements with certain of our suppliers may beterminated upon mutual consent, while certain other agreementsmay be unilaterally terminated by either party with one to sixmonths’ prior written notice. We are generally entitled to terminatethe agreements in the event of suppliers’ material breaches.
ii. Principal rights and obligations ofparties involved
The suppliers are liable for breaches of responsibilities includingtimely delivery and quality assurance of products. The suppliers areresponsible for indemnifying us for damages as a result of suchbreaches. We are responsible for timely payments.
iii. Warranty period The suppliers provide warranty generally for a period of one to fiveyears.
iv. Payment and credit terms We are normally granted by our suppliers a credit period from 30 to60 days.
OUR CUSTOMERS
In general, our products are sold first to distributors and retailers who are considered our directcustomers. Distributors generally resell these products to other distributors and retailers or, to a lesserextent, directly to consumers, while our retailers generally carry our products throughout their entirenetwork of stores within a given geographical area and sell directly to consumers. Revenue from ourfive largest customers in 2016, 2017, 2018 and the six months ended June 30, 2019 amounted toUS$305.7 million, US$330.8 million, US$703.8 million and US$325.3 million, respectively, whichrepresented 27.7%, 21.2%, 26.2% and 26.3%, respectively, of our total revenue for the same periods.In the same periods, revenue from our largest customer accounted for 9.9%, 7.5%, 8.3% and 9.9% ofour revenue, respectively.
179
BUSINESS
The tables below set out the details of our top five customers during the Track Record Period.
For the year ended December 31, 2016:
Name of customersSales
amountLength of
relationship
Credit periodgranted by the
Group
(US$’000)
Taipu (Shanghai) E-commerce Co., Limited (泰璞(上海)電子商務股份有限公司)
109,582 9 years 30 days
Shenzhen Huaqiang Joyoung Network TechnologyCo., Limited (深圳華強九陽網絡技術有限公司)
68,165 5 years 30 days
Wuhu Fanchen Electronic Commerce Co., Limited(and Wuhu Chuangmei Network Technology Co.,Limited) (蕪湖凡臣電子商務有限責任公司(及蕪湖創美網絡科技有限公司))
51,445 5 years 30 days
Guangzhou Founder Information System Co.,Limited (廣州市方正信息系統有限公司)
38,928 5 years 30 days
China Aviation Industry Supply and Marketing NorthChina Co., Limited (中國航空工業供銷華北有限公司)
37,594 9 years 30 days
Total 305,714
For the year ended December 31, 2017:
Name of customersSales
amountLength of
relationship
Credit periodgranted by the
Group
(US$’000)
Taipu (Shanghai) E-commerce Co., Limited (泰璞(上海)電子商務股份有限公司)
117,401 9 years 30 days
Walmart Stores Inc 70,628 10+ years 60 days
Amazon.com Inc 60,802 10+ years 30 days
China Aviation Industry Supply and Marketing NorthChina Co., Limited (中國航空工業供銷華北有限公司)
41,837 9 years 30 days
Target Corp. 40,159 10+ years 45 days
Total 330,827
For the year ended December 31, 2018:
Name of customersSales
amountLength of
relationship
Credit periodgranted by the
Group
(US$’000)
Walmart Stores Inc 221,468 10+ years 60 days
Amazon.com Inc 169,445 10+ years 30 days
Target Corp. 131,144 10+ years 45 days
Bed Bath & Beyond Inc. 96,326 10+ years 60 days
Costco Wholesale Corp. 85,405 10+ years 60 days
Total 703,788
180

BUSINESS
For the six months ended June 30, 2019:
Name of customersSales
amountLength of
relationship
Credit periodgranted by the
Group
(US$’000)
Walmart Stores Inc 122,560 10+ years 60 days
Amazon.com Inc 77,271 10+ years 30 days
Costco Wholesale Corp. 48,033 10+ years 60 days
Target Corp. 42,343 10+ years 45 days
Sichuan Changhong IT Information Products Co.,Limited (四川長虹佳華信息產品有限責任公司)
35,091 one year 30 days
Total 325,298
We have held a 5% equity interest in Taipu (Shanghai) E-commerce Co., Limited (泰璞(上海)電子商務股份有限公司) since 2015, which was one of our five largest customers in 2016 and 2017. Wehave held a 35% equity interest in Shenzhen Huaqiang Joyoung Network Technology Co., Limited (深圳華強九陽網絡技術有限公司) since 2014, which was one of our five largest customers in 2016.Revenue from Taipu (Shanghai) E-commerce Co., Limited and Shenzhen Huaqiang Joyoung NetworkTechnology Co., Limited in 2016 in aggregate amounted to US$177.7 million, which represented16.1% of our total revenue in 2016. Revenue from Taipu (Shanghai) E-commerce Co., Limited in 2017amounted to US$117.4 million, which represented 7.5% of our total revenue in 2017. Except for Taipu(Shanghai) E-commerce Co., Limited and Shenzhen Huaqiang Joyoung Network Technology Co.,Limited, all of our other five largest customers in 2016, 2017, 2018 and the six months ended June 30,2019 were Independent Third Parties. None of our Directors, their respective associates or anyShareholder who, to our knowledge, owns more than 5% of the issued share capital of our Companyhas an interest in any of the above-mentioned customers.
In 2016, 2017, 2018 and the six months ended June 30, 2019, we held an equity interest in 14,15, 14 and 13 of our customers, respectively. Such equity interests typically ranged from 25% to 35%.Such arrangements stemmed from our strategic need to secure high-quality distributorship resources.In particular, in selectively making such arrangements with resourceful and reputable distributors inkey regions, we sought to (i) increase the “stickiness” of our distributors and encourage long-term andmutually beneficial relationships; and (ii) increase information transparency through our distributionnetwork. We do not participate in the daily operations of these distributor customers. Sales tocustomers in which we held an equity interest in 2016, 2017, 2018 and the six months ended June 30,2019 amounted to US$249.7 million, US$243.2 million, US$164.8 million and US$69.7 million,respectively.
In 2016, 2017, 2018 and the six months ended June 30, 2019, we had a small number ofdistributors that are controlled or owned by our former employees. To our knowledge, sales tocustomers that are controlled or owned by our former employees in 2016, 2017, 2018 and the sixmonths ended June 30, 2019 amounted to US$0.4 million, US$5.9 million, US$9.8 million and US$5.8million, respectively, all representing less than 1% of our total revenue in the respective periods.
We deal with all of our customers at arm’s length. For instance, we negotiate and arrangepricing, credit terms and marketing and promotional activities based solely on commercialconsiderations, without taking into account their affiliation or other relationships with us. The
181
BUSINESS
transaction terms with customers in which we hold an equity interest, and with customers that arecontrolled or owned by our former employees, are comparable to those with Independent Third Partycustomers.
Arrangements with Distributors in China and Certain Other Countries and Regions
For distributors in China and international distribution partners in countries including Australia,South Korea and Israel, the principal terms of the distribution agreements are set forth below:
i. Duration The term of our agreement with distributors is generally one yearand may be renewed upon mutual agreement. In rare circumstances,we may enter into distribution agreements with internationaldistribution partners for a term of up to five years and may berenewed upon mutual agreement. Generally, the agreements may beterminated upon mutual consent. We are generally entitled toterminate the agreements in the event of distributors’ materialbreaches.
ii. Geographic allocation For offline distribution network, we manage cannibalization riskamong distributors through the distribution agreements byspecifying the relevant products to be distributed and thegeographic regions for which our distributors are responsible. Theagreements prohibit our distributors from selling the productsoutside the respective designated geographical regions withoutprior written consent from us.
iii. Inventory We require our distributors to keep sufficient inventory levelsbased on historical market demand to avoid stock shortage.
iv. Sales and pricing policies We typically do not specify pricing policies including the minimumsales price in our standard contract with distributors in China toprovide flexibility. We may supplement or adjust our pricingpolicies with separate deal letters from time to time.
We typically specify pricing policies in agreements with ourinternational distribution partners to increase our control.
v. Risk transfer The risk of damage and obsolescence is generally transferred todistributors when our products are picked up by third-partylogistics service providers. In certain circumstances when productsare delivered using third-party logistics service providers that arehired by us, the risk of damage and obsolescence transfers to thedistributors when the products are delivered to their designatedlocations.
vi. Quality, buy-back and return We typically do not allow our distributors in China to returnproducts to us to the extent that is compliant with relevant laws andregulations. As consumers can return unused products, replacedefective products or ask for repair of defective products withincertain time periods, in compliance with regulatory requirementsand our policies for return, replacement and repair of products, wegenerally bear the associated cost if they fall within the scope ofregulatory requirements, while our distributors generally bear theassociated cost outside the scope of regulatory requirements.
For international distribution partners, we may elect to buy backproducts upon termination of the agreement.
vii. Trademark license We authorize our distributors to use our trademarks for marketingand distribution purpose only.
182
BUSINESS
viii. Minimum purchase requirements We typically specify minimum purchase requirements underappendix of our standard contract with distributors in China.
We typically specify minimum purchase requirements for ourinternational distribution partners to increase our control overthem.
ix. Sales and inventory reports andestimates
Our distributors are generally required to provide periodic marketinformation related to the products that they distribute, such asconsumer demand forecasts, inventory levels, sales volumes, unitselling price and total monetary amount of our products sold by thedistributors to consumers.
x. Payment and credit terms In China, distributors generally pay upon ordering. For certaindistributors, we grant a payment credit period of 30 days.
We generally require payment from international distributorswithin a credit period that typically ranges from 30 to 90 days.
Our distributors generally have strong credit records and steadycash flow. We did not experience any material delays in paymentby our distributors during the Track Record Period.
Arrangements with Retailers in the United States, Canada, the United Kingdom, Japan,Germany and France
For retailers that we cooperated with in markets including the United States, Canada, the UnitedKingdom, Japan, Germany and France, we typically adopt the standard terms and conditions of theseretailers in our sales agreements or arrangements with them, which are supplemented by separate dealletters specifying detailed commercial terms. The salient terms and conditions of such agreements areset forth below:
i. Duration We typically adopt the standard terms and conditions of our retailersin our sales agreements or arrangements with them. Terms of suchagreements typically range from one to five years and may berenewed upon mutual agreement. In certain circumstances, wemight agree to transact with certain retailers on purchase orderbasis. The agreements may generally be terminated upon mutualconsent. We are generally entitled to terminate the agreements inthe event of retailers’ material breaches.
ii. Geographic allocation We permit sale of our products on retailers’ entire online and offlinenetwork.
iii. Inventory We generally do not enter into inventory arrangement with ourretailers.
iv. Sales and pricing policies Our pricing policy generally consists of a minimum price. Ifretailers breach our pricing policy, we may terminate agreements orarrangements and cease to perform.
v. Risk transfer The risk of damage and obsolescence is generally transferred toretailers when our products are picked up by third-party logisticsservice providers. In certain circumstances when products aredelivered using third-party logistics service providers that are hiredby us, the risk of damage and obsolescence transfers to the retailerswhen the products are delivered to their designated locations.
183
BUSINESS
vi. Quality, buy-back and return Retailers generally allow consumers to return products within acertain time period based on their retail policy, and retailerstypically pass on the associated costs to us. Retailers will generallyreturn those products to us if the product cannot be resold forreasons including design or quality deficiencies. In certain cases,we may elect to buy back products from retailers if a product isbeing discontinued or replaced by a different product.
vii. Trademark license We authorize our retailers to use our trademarks for marketing andsales purposes only.
viii. Minimum purchase requirements We do not set minimum purchase requirements for retailers.
ix. Payment and credit terms We generally require payment from retailers within a credit periodthat typically ranges from 30 to 90 days.
Our retailers generally have strong credit records and steady cashflow. We did not experience any material delays in payment by ourretailers during the Track Record Period.
Under such agreements with retailers, we are typically required to comply with the retailers’standards on the following matters.
Š Seller conduct code, including primarily prohibition of misrepresentation, maintainingcurrent information and active consumer respond, complying with social responsibilityrequirements relating to labor, employment, immigration, health, safety, trade and theenvironment;
Š Standard recall and product safety policies applicable to our product categories; and
Š Cooperation in matters including tax filing, audit, delivery and intellectual property rightsprotection.
SEASONALITY
Our revenue during the Track Record Period is subject to seasonal fluctuation, primarily due tothe impact of major holidays and shopping events. We typically experience sales peaks in the fourthquarter with a higher concentration of holidays such as Christmas and New Year and shopping eventssuch as Double Eleven and Black Friday. We believe that this pattern is likely to continue in theforeseeable future.
SUBCONTRACTING
We sometimes engage subcontractors to provide additional labor, specialty services or cost andoperational efficiency. During the Track Record Period, we primarily engaged subcontractors for ITand logistics services, which were independent third parties.
We select subcontractors primarily based on their qualifications, service coverage, track record,financial condition and price. We carefully manage and monitor the performance of our subcontractorsin terms of quality and delivery of their services.
We also require our subcontractors to comply with our internal guidelines and policies inrelation to their services. In the event of any failure by our subcontractors to meet our internalguidelines and policies, we may cease to work with them or claim damages.
184
BUSINESS
See “Risk Factors—Risks Relating to Our Business and Industry—Our success depends on ourdistribution and logistics networks.”
COMPETITION
The markets we operate in are highly competitive. These markets are characterized by frequentproduct introductions and rapid technological advances. We generally compete with other householdappliance companies. Principal competitive factors important to us include product features, relativeprice and performance, product quality and reliability, design innovation, brands, consumer experience,marketing and distribution capability, customer service and support and corporate reputation. Our maincompetitors include domestic and global household appliance industry leaders, such as Dyson, Philips,Midea and Supor.
We experience significant competition for highly skilled personnel, including management,engineers, designers and product managers. Our growth depends in part on our ability to retain ourexisting personnel and recruit highly skilled employees.
See “Industry Overview—Competitive Landscape.”
RISK MANAGEMENT AND INTERNAL CONTROL
We have devoted ourselves to establishing and maintaining risk management and internalcontrol systems consisting of policies, procedures and risk management methods that we consider to beappropriate for our business operations, and we are dedicated to continuously improving these systems.
We have adopted and implemented comprehensive risk management policies in various aspectsof our business operations such as quality control, financial reporting, information system, internalcontrol, human resources and information system risk management.
Quality Control and Product Safety Internal Control
We are committed to maintaining the highest level of quality in our products and we thereforeimplement quality control measures throughout our operational flow. Our quality control teamformulates our quality control policy and ensures our compliance with all applicable regulations,standards and internal policies at all times. Our quality control process generally comprises:(i) research and development quality control; (ii) quality control of component and raw materialsuppliers and OEM suppliers; and (iii) market feedback quality control. See “—Procurement andProduction—Quality Control and Product Safety.”
Financial Reporting Risk Management
We have in place a set of accounting policies in connection with our financial reporting riskmanagement, such as financial reporting management policies, budget management policies, financialstatement preparation policies and finance department and staff management policies. We have variousprocedures in place to implement accounting policies. Our finance department reviews ourmanagement accounts based on such procedures. We also provide regular training to our financedepartment staff to ensure that they understand our financial management and accounting policies andimplement them in our daily operations.
185

BUSINESS
Internal Control Risk Management
We have designed and adopted strict internal procedures to ensure the compliance of ourbusiness operations with the relevant rules and regulations. Our internal control and internal audit teamworks closely with our business units to: (i) perform risk assessments and give advice on riskmanagement strategies; (ii) improve business process efficiency and monitor internal controleffectiveness; and (iii) promote risk awareness throughout our Company.
In accordance with our procedures, our in-house legal department examines the contract termsand reviews all relevant documents for our business operations, including licenses and permitsobtained by the counterparties to perform their obligations under our business contracts and all thenecessary underlying due diligence materials, before we enter into any contract or businessarrangements.
We also have detailed internal procedures in place to ensure that our in-house quality and legaldepartments review our products and services, including upgrades to existing products, for regulatorycompliance before they are made available to the general public. Our in-house administrative and legaldepartments are responsible for obtaining any requisite governmental pre-approvals or consents,including preparing and submitting all necessary documents for filing with relevant governmentauthorities within the prescribed regulatory timelines.
For IP-related issues, we have an in-house legal team and an IP team supported by devoted andspecialized outside IP legal advisors, to assist us in registering, applying and reviewing the relevantpatent and trademark rights of our IPs.
We continually review the implementation of our risk management policies and measures toensure our policies and implementation are effective and sufficient.
Human Resources Risk Management
We set out systematic internal rules and guidelines for our employees, including bestcommercial practice, work ethics and a prevention mechanism to avoid fraud, negligence andcorruption. We provide employees with regular training and resources to keep them abreast of theguidelines contained in the employee handbook. We formulate the recruitment plan for the upcomingyear based on current turnover rate and our future business plan, and we constantly improve ourrecruitment process with the aid of information technology. We also have a rigorous background checkprocess for our incoming employees.
In addition, we provide regular and specialized trainings tailored to the needs of our employeesin different departments. Through such training, we ensure that our employees’ skill sets remainup-to-date.
We also have in place an Anti-Corruption Policy to safeguard against corruption within ourCompany. We have an internal reporting channel that is open and available for our employees to reportany suspected corrupt acts. Our employees can also make anonymous reports to our internal anti-corruption department. We have a team that is responsible for investigating the reported incidents andtaking appropriate measures.
186

BUSINESS
Information System Risk Management
Sufficient maintenance, storage and protection of consumer data and our business data arecritical to our success. We have implemented relevant internal procedures and controls to ensure thatsuch data is protected and that leakage and loss of such data is avoided. During the Track RecordPeriod and up to the Latest Practicable Date, we did not experience any material information leakageor loss of consumer or business data.
Audit Committee Experience and Qualification and Board Oversight
We have established an audit committee to monitor the implementation of our risk managementpolicies across our company on an ongoing basis to ensure that our internal control system is effectivein identifying, managing and mitigating risks involved in our business operations.
We also maintain an internal audit department which is responsible for reviewing theeffectiveness of internal controls and reporting to the audit committee on issues identified. Our internalaudit department members hold regular meetings to discuss any internal control issues we face and thecorresponding measures to implement toward resolving such issues. The internal audit departmentreports to the audit committee to ensure that major issues identified thus are channeled to thecommittee on a timely basis. The audit committee then discusses the issues and reports to the board ofdirectors if necessary. For composition of our audit committee, see “Directors and SeniorManagement—Board Committees—Audit Committee.” For qualification of our audit committeemembers, see “Directors and Senior Management—Directors—Independent Non-executive Directors.”
INTELLECTUAL PROPERTY RIGHTS
Intellectual property rights are fundamental to our business and we devote significant time andresources to their development and protection. We currently hold a broad collection of intellectualproperty rights relating to certain aspects of our products. Such rights include trademarks, copyrights,trade secrets, patents and other proprietary rights in China, the United States and a number of overseasjurisdictions.
It may be necessary in the future to seek or renew licenses relating to various aspects of ourproducts, processes and services. While we have generally been able to obtain such licenses oncommercially reasonable terms in the past, there is no guarantee that such licenses could be obtained inthe future on reasonable terms or at all. See “Risk Factors—Risks Relating to Our Business andIndustry—We may not be able to prevent others from unauthorized use of our intellectual property,which could harm our business and competitive position.”
Intellectual Property Protection
We rely on a combination of patent, trademark, copyright and other intellectual propertyprotection laws in China, the United States and other jurisdictions, fair trade practice, as well asconfidentiality procedures and contractual provisions to protect our intellectual property. In general,our employees must enter into a standard employment contract which includes a clause acknowledgingthat all inventions, trade secrets, developments and other processes generated by them on our behalfare our property, and assigning to us any ownership rights that they may claim in those works. Despiteour precautions, third parties may infringe our intellectual property rights. Unauthorized use of ourintellectual property by third parties and the expenses that may incur in protecting our intellectual
187

BUSINESS
property rights from such unauthorized use may adversely affect our business and results of operations.See “Risk Factors—Risks Relating to Our Business and Industry—We may not be able to preventothers from unauthorized use of our intellectual property, which could harm our business andcompetitive position.”
We did not have any material disputes or other pending material legal proceedings ofintellectual property rights with third parties during the Track Record Period and up to the LatestPracticable Date.
See “Appendix IV—Statutory and General Information” for details of our material intellectualproperty rights.
Measures against Counterfeited Products
The occurrence of counterfeiting of our products, such as unauthorized imitation, replication ofour design, infringement of trademarks or labeling by third parties may affect our reputation andprofitability. We designate a dedicated team to actively monitor the market for any problematicactivities and may submit complains to relevant governmental authorities or initiate legal actions toprevent counterfeiting and seek compensation.
We are not aware of any material counterfeiting and imitation of our products during the TrackRecord Period.
See “Risk Factors—Risks Relating to Our Business and Industry—Our reputation andprofitability may be adversely affected if our products are counterfeited or imitated in the market.”
TECHNOLOGY INFRASTRUCTURE AND DATA PROTECTION
Our technological competence and the stability of our information infrastructure are vital to ourbusiness operations. Our internal resource planning platform extends to connect with our suppliers anddistributors to create direct access of production data and sales data. Such data feeds back to ourproduct design to increase the commercialization potential of our products. We also use such data inour rolling production forecast algorithm to create an accurate procurement and production plan andmaintain suitable inventory level.
We are committed to protecting consumer and business data. We have implemented relevantinternal procedures and controls to ensure that such data is protected and that leakage and loss of suchdata is avoided.
ENVIRONMENTAL, HEALTH AND SAFETY MATTERS
We endeavor to minimize any adverse impact on the environment resulting from our businessactivities and create a healthy and safety environment for our employees and communities. Within-house production facilities in China, we are subject to certain environmental, health and safetyrequirements pursuant to the laws in China, such as the Environmental Protection Law of the PRC andProduction Safety Law of the PRC. See “Regulatory Overview—Laws and Regulations onEnvironmental Protection” and “Regulatory Overview—Laws and Regulations on Production Safety.”
In order to comply with the applicable environmental protection laws, we have implementedenvironmental protection policies, including but not limited to waste water discharge management
188

BUSINESS
policy and waste management policy. We also require our suppliers to comply with the laws andregulations of the jurisdictions that they operate in, which include the laws and regulation governingenvironmental, health and safety matters.
During the Track Record Period and up to the Latest Practicable Date, we had not been subjectto any fines or other penalties due to non-compliance with health safety or environmental regulations.
EMPLOYEES
As of June 30, 2019, we had 4,157 full-time employees.
The following table sets forth the breakdown of our employees by business function as ofJune 30, 2019:
Number ofEmployees Percent
Research and Development . . . . . . . . . . . . . . . . . . . . . . . . . . . . . . . . . . . . . . . . . . . . . . . . . . . . 913 22.0%Product and Procurement . . . . . . . . . . . . . . . . . . . . . . . . . . . . . . . . . . . . . . . . . . . . . . . . . . . . . . 844 20.3%Manufacturing . . . . . . . . . . . . . . . . . . . . . . . . . . . . . . . . . . . . . . . . . . . . . . . . . . . . . . . . . . . . . . 107 2.6%Quality Control . . . . . . . . . . . . . . . . . . . . . . . . . . . . . . . . . . . . . . . . . . . . . . . . . . . . . . . . . . . . . 728 17.5%Sales and Marketing . . . . . . . . . . . . . . . . . . . . . . . . . . . . . . . . . . . . . . . . . . . . . . . . . . . . . . . . . . 752 18.1%Management and Administration . . . . . . . . . . . . . . . . . . . . . . . . . . . . . . . . . . . . . . . . . . . . . . . . 552 13.3%Others . . . . . . . . . . . . . . . . . . . . . . . . . . . . . . . . . . . . . . . . . . . . . . . . . . . . . . . . . . . . . . . . . . . . 261 6.3%
Total . . . . . . . . . . . . . . . . . . . . . . . . . . . . . . . . . . . . . . . . . . . . . . . . . . . . . . . . . . . . . . . . . . . . . 4,157 100.0%
The following table sets forth the breakdown of our employees by location as of June 30, 2019:
Number ofEmployees Percent
China . . . . . . . . . . . . . . . . . . . . . . . . . . . . . . . . . . . . . . . . . . . . . . . . . . . . . . . . . . . . . . . . . . . . . 3,220 77.5%The United States . . . . . . . . . . . . . . . . . . . . . . . . . . . . . . . . . . . . . . . . . . . . . . . . . . . . . . . . . . . . 776 18.7%Other Countries/Regions . . . . . . . . . . . . . . . . . . . . . . . . . . . . . . . . . . . . . . . . . . . . . . . . . . . . . . 161 3.9%
Total . . . . . . . . . . . . . . . . . . . . . . . . . . . . . . . . . . . . . . . . . . . . . . . . . . . . . . . . . . . . . . . . . . . . . 4,157 100.0%
We have training programs for all our employees, from entry-level employees to managementon subjects such as corporate culture, research and development, strategies, policy and internal control,internal systems and business skills.
Some of our subsidiaries have labor unions that protect employees’ rights, help fulfill thesubsidiaries’ economic objectives, encourage employee participation in management decisions andassist in mediating disputes between the subsidiaries and union members. We did not experience anymaterial labor dispute during Track Record Period.
The remuneration package for our employees generally includes salary and bonuses.Employees typically receive welfare benefits, including medical care, pension, occupational injuryinsurance and other miscellaneous benefits.
INSURANCE
We maintain insurance coverage over our daily operations. We maintain limited third-partyinsurance policies covering certain potential risks and liabilities including product liability, property
189

BUSINESS
and construction liability. For product liability, SharkNinja maintains primary and excess commercialgeneral liability insurance. As of the Latest Practicable Date, the primary insurance had a self-insuredretention (SIR) which amounts to US$250,000. The SIR is the amount SharkNinja must pay toward thecost of handling a claim before the primary insurer is responsible for payment. Therefore, the SIR isthe cap on SharkNinja’s exposure in each matter subject to the limits of the applicable primary andexcess insurance policies. Once an applicable primary insurance policy is exhausted, SharkNinja’sexcess insurance carriers take over. The excess insurance policies do not have an SIR. SharkNinja hasexcess insurance coverage up to US$65,000,000 depending on the policy year applicable to its pendingproduct liability/personal injury claims. We are not aware of SharkNinja ever exhausting its excessinsurance coverage, although certain cases might not be covered by our insurance. We also providesocial security insurance including pension insurance, unemployment insurance, work-related injuryinsurance and medical insurance for our employees in China, as well as statutorily required insurancecoverage for overseas employees. In addition, in line with general market practice, we do not maintaincertain policies that are not available in the locations we operate or that are not generally required bylaws. For example, we do not maintain any business interruption insurance in China, which is notmandatory under laws in China. We also do not maintain key-man life insurance or insurance policiescovering damages to our IT infrastructure or IT systems.
We consider our current insurance coverage to be adequate. We will continue to review andassess our risk portfolio and make necessary and appropriate adjustment to our insurance plans to alignwith our needs and with industry practice.
See “Risk Factors—Risks Relating to Our Business and Industry—We have limited insurancecoverage which could expose us to significant costs and business disruption.”
SOCIAL RESPONSIBILITY
We have been and will continue to be highly committed to sustainable corporate responsibilityprojects, mainly through charitable endeavors and environmental protection efforts.
Charitable Endeavors
In China, we are committed to contributing to various charitable causes, with a special focus oneducation and other charitable causes in which we can leverage our resources and expertise. Forinstance, in 2008, we contributed RMB20 million to establish an education foundation to financiallyaid underprivileged students, donate to schools and provide scholarships; and in 2010, leveraging ourindustry and product resources, we cooperated with the China Youth Development Foundation (中國青少年發展基金會) and contributed approximately RMB50 million establish a Joyoung Hope Kitchen (九陽希望廚房) Project to build and renovate kitchens and canteens that can meet national food hygienerequirements in schools in poverty-stricken regions; and we frequently organize onsite trips, especiallyfor kids, to our headquarters in Hangzhou to conduct kitchen culture educational program and werehonored for “Science Education Base for Youth in Hangzhou” in 2017.
In the United States we partner with and donate to a number of different charitableorganizations. For example, a significant number of our employees in the United States participated ina volunteer day with Cradles to Crayons in each year during the Track Record Period. Cradles toCrayons is an organization that provides children from birth through age 12, living in homeless or low-income situations, with the essential items they need to thrive at home, at school and at play. In
190
BUSINESS
addition, we partnered with the Make-a-Wish foundation in 2018 to fulfill the wish of a child byallowing him to customize the design of one of our vacuums and then producing a working version ofit. In 2018, we provided monetary or other resources to more than nine charitable organizations in theUnited States.
Environmental Protection Efforts
We attempt to responsibly recycle materials from returned products that cannot be put back onthe shelf. In the United States, we now primarily use either pulp or cardboard instead of styrofoam forpackaging inserts for our products from Shark brand. The accessories and other included items arewrapped mostly with plastic that is recyclable. In the United Kingdom, we are supported by externalconsultants to assess environmental risks and opportunities, including areas such as carbonmanagement, waste management and data management. We are evaluating similar consultants in theUnited States. In China, we team up with other manufactures and recycling service providers toexplore innovative and sustainable method for household appliance recycling.
Overall, we believe our sense of social responsibility is embedded in our corporate culture.
PROPERTIES
Our headquarters office is located in Hong Kong.
We have owned and leased properties in China, the United States, the United Kingdom, Canadaand Hong Kong, including six parcels of owned land, 205 owned properties and 27 leased properties.As of the Latest Practicable Date, none of the properties held or leased by us had a carrying amount of15% or more of our consolidated total assets. According to Chapter 5 of the Hong Kong Listing Rulesand section 6(2) of the Companies Ordinance (Exemption of Companies and Prospectuses fromCompliance with Provisions) Notice, this prospectus is exempt from the requirements of section342(1)(b) of the Companies (Winding up and Miscellaneous Provisions) Ordinance to include allinterests in land or properties in a valuation report as described under paragraph 34(2) of the ThirdSchedule to the Companies (Winding up and Miscellaneous Provisions) Ordinance.
Properties in Mainland China
Owned Land
As of the Latest Practicable Date, we owned land use rights of six parcels of land in China withan aggregate site area of 453,181 sq.m., which were primarily used for operation and management.Among them, we had obtained the land use right certificates for six parcels of land with an aggregatesite area of 453,181 sq.m., accounting for 100% of the aggregate site area of lands owned by us.
Owned Properties
As of the Latest Practicable Date, we owned 205 properties in China with a gross floor area ofapproximately 435,510.7 sq.m., which were primarily used for operation and management. Amongsuch 205 properties that we owned, we have obtained the properties ownership certificates for 205properties with a gross floor area of approximately 435,510.7 sq.m., representing 100% of the grossfloor area of the properties that we owned. Our PRC legal advisors are of the view that we have thelegal ownership of these 205 properties and thus have the right to occupy and use such properties in
191
BUSINESS
accordance with applicable PRC laws and regulations and there is no restriction on the seizure,mortgage and other forms of rights in the ownership of such properties or existence of any third-partyrights.
Leased Properties
As of the Latest Practicable Date, we leased 15 properties in China with a gross floor area ofapproximately 92,823.7 sq.m., which were primarily used for operation and management. Among such15 properties that we leased, our landlords of nine properties have obtained the relevant propertyownership certificates or other documentary evidence in respect of the right to dispose of such leasedproperties, with a gross floor area of approximately 40,401.8 sq.m., representing 43.5% of the grossfloor area of the properties that we leased. Our PRC legal advisors are of the view that the landlords ofthese nine leased properties are the owners or persons who are authorized to lease or sublease therespective properties. The landlords have obtained the valid titles to the respective leased propertiesand the lease agreements are legally binding and effective.
Our landlords of the remaining six leased properties have not provided the relevant propertyownership certificates or any documentary evidence in respect of the right to dispose of such leaseholdproperties, with a gross floor area of approximately 52,421.9 sq.m., representing 56.5% of the grossfloor area of the properties that we leased. Since the above-mentioned leased properties are used asstorage or office space, we believe we can easily find alternative properties at similar costs if we arenot able to use such properties or have to relocate our businesses in case of any dispute on the leaseagreements. Besides, we have not completed rental registration for such 15 leased properties. Our PRClegal advisors have advised us that the lack of registration of the lease agreements will not affect thevalidity of the lease agreements under PRC law, and have also advised us that a maximum penalty ofRMB10,000 may be imposed for non-registration of each lease. Our PRC legal advisors are of theview that our leased properties with defective titles and the lack of registration of the lease agreementswill not materially and adversely impact our business operations.
Properties in Hong Kong
As of the Latest Practicable Date, we leased one property in Hong Kong with a site area of165.4 sq.m., which was primarily used for office purpose.
Properties in the United States
As of the Latest Practicable Date, we leased seven properties in the United States with anaggregate site area of 92,336.8 sq.m., which were primarily used for office and warehousing purpose.
Properties in Other Jurisdictions
As of the Latest Practicable Date, we leased four properties in Canada and the United Kingdomwith an aggregate site area of 5,908.2 sq.m., which were primarily used for office purpose.
COMPLIANCE AND LEGAL PROCEEDINGS
During the Track Record Period and up to the Latest Practicable Date, we had not been andwere not involved in any non-compliance incidents that led to fines, enforcement actions or otherpenalties that could, individually or in the aggregate, have a material adverse effect on our business,
192
BUSINESS
financial condition or results of operations. We are of the view that, we had complied, in all materialrespects, with all relevant laws and regulations in the jurisdictions we operate in during the TrackRecord Period and up to the Latest Practicable Date.
From time to time, we have been, and may in the future be, involved in arbitration, litigation orregulatory proceedings relating to various aspects of our operations in the ordinary course of ourbusiness. In particular, we have been, and may continue to be, subject to various intellectual propertyclaims relating to technologies or intellectual property used in our products. For example, onOctober 8, 2019, SharkNinja received a demand letter from iRobot Corporation (“iRobot”), in whichiRobot alleges that two of SharkNinja’s robotic vacuum models (the “Disputed Products”) launched inSeptember 2019 (and, accordingly, not comprising any part of our sales during the Track RecordPeriod) infringe at least 11 of iRobot’s US patents. iRobot demands that SharkNinja cease production,importation into the United States, and sale of the Disputed Products until the allegedly patentedfeatures are removed. In response to iRobot’s demand letter, on October 11, 2019 SharkNinja filed alawsuit against iRobot in a Delaware federal court, seeking a declaratory judgment that the DisputedProducts do not infringe these 11 patents as alleged. On October 15, 2019, iRobot proceeded to file alawsuit against SharkNinja in a Massachusetts federal court, alleging that the Disputed Productsinfringe six of the 11 patents identified in iRobot’s demand letter and seeking, among other relief,injunctions and monetary damages. In addition, iRobot has filed a motion for a preliminary injunctionon an expedited schedule on November 11, 2019. SharkNinja plans to defend itself and the DisputedProducts vigorously. However, if a court or jury were to determine that the Disputed Productsinfringed one or more of iRobot’s patents, then in terms of monetary damages, SharkNinja may beliable to pay compensatory damages commonly calculated as (1) a reasonable royalty applied to theDisputed Products sold in the United States, or (2) lost profits iRobot would have made but for theinfringement, which iRobot bears the burden to prove based on, among other factors, salesperformance of the Disputed Products. If SharkNinja is found to be a willful infringer, compensatorydamages may be increased up to three times. Taking into account that (i) the alleged infringementclaim was related to US patents and may affect the sales of Disputed Products only in the United Statesand (ii) the sales of the Disputed Products in the United States have comprised, and are expected tocontinue comprising, only a small percentage of the Group’s revenue since their introduction to themarket in September 2019, we do not believe that our exposure to monetary damages in this case, inlight of the size of SharkNinja’s and the Group’s business, would be material.
The dispute is at an early stage and the parties have not yet commenced discovery; moreover,litigation is subject to a range of inherent uncertainties and it is not possible to make predictions as tothe outcome thereof. Subject to these considerations, based on an initial assessment using informationavailable to it as of the date of this prospectus, the Company believes that this dispute will not cause amaterial adverse effect on SharkNinja’s, or the Group’s, operations and financial results. See “RiskFactors—Risks Relating to Our Business and Industry—We could be impacted by unfavorable resultsof legal and administrative proceedings.”
From time to time, we settle certain of the litigations we have been involved in. For example, inNovember 2014, one of our competitors alleged that we falsely advertised certain products by makinginaccurate comparisons with certain of their products. In August 2018, in connection with theforegoing case with the competitor, one insurer to SharkNinja filed a lawsuit seeking a declarationregarding its insurance coverage over the dispute with the competitor. In January 2017, we faced alawsuit for patent infringement and trade secret misappropriation, among other claims, in breach of a
193
BUSINESS
confidentiality agreement. We subsequently settled all three cases and paid the relevant settlementamounts, which were recovered from the seller in relation to our acquisition of SharkNinja accordingto the arrangement mentioned in detail below. We believe none of these settlements have a materialadverse effect on our financial results and reputations.
The total amount we paid or agreed to pay for settlements, excluding the amount contributed byour insurers, during the Track Record Period and up to the Latest Practicable Date was US$17.3million. During the acquisition of SharkNinja, the seller agreed to indemnify us for our losses (otherthan reasonable attorney’s fees incurred) resulting from certain litigation or settlements of SharkNinjaup to an aggregate amount of US$50.0 million. Out of the US$17.3 million that we paid or agreed topay for settlements during the Track Record Period and up to the Latest Practicable Date,approximately US$15.4 million was recovered from the seller, reduced by any tax benefit that we mayrealize by paying these settlements. Other than the total amount we paid or agreed to pay forsettlements as disclosed, as of the Latest Practicable Date, we were not aware of, and had not made anyprovisions for, any liabilities for any other litigation.
We confirm that, during the Track Record Period and up to the Latest Practicable Date, therewas no legal proceeding pending or threatened against us or our Directors that could, individually or inthe aggregate, have a material adverse effect on our business, financial condition and results ofoperations.
LICENSES, PERMITS AND APPROVALS
According to our PRC legal advisor, we have obtained all licenses, permits, approvals andcertificates that are material for our business operations in the PRC and such licenses, permits,approvals and certificates are valid and subsisting.
We have obtained all licenses, permits, approvals and certificates that are material for ourbusiness operations in the United States and such licenses, permits, approvals and certificates are validand subsisting.
194
RELATIONSHIP WITH OUR CONTROLLING SHAREHOLDERS
THE CONTROLLING SHAREHOLDERS GROUP
The Controlling Shareholders Group, including Mr. Wang Xuning, Mr. Zhu Hongtao, Mr. ZhuZechun, Ms. Yang Ningning, Ms. Huang Shuling, Ms. Han Run and Mr. Jiang Guangyong, is a groupof individuals holding interests in our Company through a common investment holding entity, namely,JS Holding. JS Holding is an exempted limited partnership registered in the Cayman Islands onJuly 18, 2018 under the name of Hezhou Limited Partnership, with Hezhou, a company wholly ownedby Mr. Wang Xuning, being its general partner. On the same date, members of the ControllingShareholders Group, through their respective holding entities, incorporated Tong Zhou and Gong Ji(which was subsequently merged into Tong Zhou) in BVI, which further subscribed all the limitedpartnership interest of JS Holding. As a result, the members of the Controlling Shareholders Groupestablished JS Holding to commonly held their interests in our Company. See “History, Reorganizationand Corporate Structure—Reorganization.”
As of the date of this prospectus and assuming the RSU Shares have been issued, JS Holdingwas interested in approximately 56.62% of the total issued Shares of our Company, thus the membersof the Controlling Shareholders Group, their respective BVI SPVs, Hezhou, Tong Zhou and JSHolding were deemed to be Controlling Shareholders of the Company as to 56.62%. Upon thecompletion of the Global Offering (assuming the Over-Allotment Option is not exercised), themembers of the Controlling Shareholders Group, their respective BVI SPVs, Hezhou, Tong Zhou andJS Holding will continue to be Controlling Shareholders of the Company being interested inapproximately 48.12% of the Shares of our Company.
In addition, STL holds 100 management shares (representing 100% voting rights) and one classB participating share (without voting rights) in Sol SPC, while Mr. Lee Puay Khng held 368,304.24536class A participating shares (representing 100% issued class A participating shares and without votingrights) in Sol SPC. STL is wholly owned by XNL, which is in turn wholly owned by Mr. WangXuning. Therefore, Mr. Wang Xuning will also be deemed to be interested in the Shares of ourCompany held by Sol SPC and each of Mr. Wang Xuning, STL and Sol SPC will be ControllingShareholders of the Company. As of the date of this prospectus and assuming the RSU Shares havebeen issued, Sol SPC was interested in approximately 13.00% of the total issued share capital of ourCompany. As a result, Mr. Wang Xuning is deemed to be interested in the Shares of our Company heldin aggregate by JS Holding and Sol SPC, thus upon the completion of the Global Offering (assumingthe Over-Allotment Option is not exercised), Mr. Wang Xuning will be deemed to be interested inapproximately 59.17% of the Shares of our Company.
The Controlling Shareholders Group will continue to be our controlling shareholders upon thecompletion of the Global Offering.
Other Business Held by the Controlling Shareholders Group
Our Group principally engages in the development, manufacturing, and marketing of smallhousehold appliances, including kitchen appliances and cleaning appliances.
In addition to its interest in our Group, the Controlling Shareholders Group also helddirectorships and/or equity interest in the following companies:
(i) Hangzhou Lexiu Electrical Technology Company Limited (杭州樂秀電子科技有限公司)(“Hangzhou Lexiu”): As of the Latest Practicable Date, Hangzhou Lexiu was held as to
195
RELATIONSHIP WITH OUR CONTROLLING SHAREHOLDERS
10% by Ningbo Meishan Free Trade Port Area Xuning Innovation Investment Partnership(Limited Partnership) (寧波梅山保稅港區旭寧創新投資合夥企業(有限合夥)), whose generalpartner is Ningbo Meishan Free Trade Port Area Xuning Investment Limited (寧波梅山保稅港區旭寧投資有限公司) which is 99% held by Mr. Wang Xuning. Hangzhou Lexiu isprimarily engaged in the industry of personal care appliances;
(ii) Jiuyang Bean: Jiuyang Bean was established in China in November 2008. In preparationfor the Listing, we undertook a corporate reorganization in November 2018 andtransferred all of our equity interests in Jiuyang Bean to Ningbo Meishan Free Trade PortArea Lihao Investment Limited (寧波梅山保稅港區力豪投資有限公司), a company 88.39%held by Shanghai Hezhou, which is in turn as to 95.34% held by the ControllingShareholders Group. See “History, Reorganization and Corporate Structure—Reorganization.” As of the Latest Practicable Date, Jiuyang Bean was owned as to 50%,30% and 20% by Ningbo Meishan Free Trade Port Area Lihao Investment Limited,Joyoung, and an Independent Third Party, respectively. Jiuyang Bean generally providessoymilk powder and commercial soymilk makers; and
(iii) Hangzhou Yibei Food Technology Company Limited (杭州易杯食品科技有限公司)(“Hangzhou Yibei”): As of the Latest Practicable Date, Hangzhou Yibei was directly heldas to approximately 54.08% by Mr. Wang Xuning and his close associate, and Mr. WangXuning serves as a director of Hangzhou Yibei. Hangzhou Yibei primarily providescapsule machines, drinks capsules and other capsule machine accessories.
On the basis that: (i) we have different product categories with Hangzhou Lexiu, as we areprimarily engaged in the kitchen and cleaning appliance market, while Hangzhou Lexiu is primarilyengaged in the personal care appliance market; (ii) our products have different usage scenarios fromthe products of Jiuyang Bean, as our products are generally for home use and targeted at individualcustomers while Jiuyang Bean generally provides soymilk powder and commercial soymilk makers tofactories, schools, stores and restaurants; and (iii) our household appliance products, especiallysoymilk makers and blenders have different usage scenarios as Hangzhou Yibei’s capsule machines, asour soymilk makers and blenders are primarily used in household kitchens to make soymilk, juice andother drinks, while Hangzhou Yibei’s capsule machines mainly target at hotels, restaurants and officesto produce drinks such as coffee and milk tea, in addition, Mr. Wang Xuning only holds a non-executive role in Hangzhou Yibei and our senior management does not overlap with the managementof Hangzhou Yibei, our Directors are of the view that the directorships and/or equity interest held bythe Controlling Shareholders Group in Hangzhou Lexiu, Jiuyang Bean and Hangzhou Yibei would notgive rise to any material competition issue under Rule 8.10 of the Listing Rules. As of the LatestPracticable Date, the Controlling Shareholders Group did not intend to inject its equity interest in suchcompanies into our Group.
Confirmation
Saved as disclosed in this prospectus, neither any member of the Controlling Shareholders norany of our Directors was, as of the Latest Practicable Date, interested in any business which competes,or is likely to compete, directly or indirectly, with the business of our Group or would otherwiserequire disclosure under Rule 8.10 of the Listing Rules.
196
RELATIONSHIP WITH OUR CONTROLLING SHAREHOLDERS
INDEPENDENCE FROM THE CONTROLLING SHAREHOLDERS GROUP
Having considered the following factors, we believe that we are capable of carrying on ourbusiness independently from the Controlling Shareholders Group and its close associates aftercompletion of the Global Offering.
Management Independence
Our daily operational and management decisions are made by our Board and our seniormanagement. Our Board consists of three executive Directors, two non-executive Directors and threeindependent non-executive Directors. Mr. Wang Xuning is our Chairman of the Board, Ms. Han Runand Ms. Huang Shuling are executive Directors. Notwithstanding that Mr. Wang Xuning, Ms. Han Runand Ms. Huang Shuling are members of the Controlling Shareholders Group, our Directors are of theview that our Company is capable of maintaining management independence due to the followingreasons:
(1) Each of our Directors is aware of his/her fiduciary duties as a director of our Companywhich require, among other things, that he/she acts for the benefit and in the best interestsof our Company and does not allow any conflict between his/her duties as a Director andhis/her personal interests.
(2) In the event that there is a potential conflict of interest arising out of any transaction to beentered into between our Group and our Directors or their respective close associates, theinterested Director(s) shall abstain from voting at the relevant Board meetings of ourCompany in respect of such transactions and shall not be counted in the quorum.
(3) Our Board has a balanced composition of executive Directors and independentnon-executive Directors which ensures the independence of the Board in making decisionsaffecting our Company. Specifically, (a) our independent non-executive Directors are notassociated with the members of the Controlling Shareholders Group or their respectiveclose associates; (b) our independent non-executive Directors account for more thanone-third of the Board; and (c) our independent non-executive Directors individually andcollectively possess the requisite knowledge and experience, and most of them haveexperience as independent non-executive directors of listed companies and will be able toprovide professional and experienced advice to our Company. In conclusion, the Directorsbelieve that our independent non-executive Directors are able to bring impartial and soundjudgment to the decision-making process of our Board and protect the interests of ourCompany and our Shareholders as a whole.
(4) We will establish corporate governance measures and adopt sufficient and effectivecontrol mechanisms to manage conflicts of interest, if any, between our Group and theControlling Shareholders Group, which would support our independent management. See“—Potential Conflicts of Interest and Corporate Governance Measures.”
Having considered the above factors, our Directors are satisfied that they are able to performtheir managerial roles in our Company independently, and our Directors are of the view that we arecapable of managing our business independently from the Controlling Shareholders Group after theListing.
197
RELATIONSHIP WITH OUR CONTROLLING SHAREHOLDERS
Operational Independence
Our Group holds all the relevant material licenses, qualifications and permits required forconducting our business. Our Group has sufficient capital, facilities and employees to operate ourbusiness independently from the Controlling Shareholders Group and its close associates. Our Groupalso has independent access to our clients. We have our own accounting and financial department,human resources and administration department, internal control department and technologydepartment (including research and development function). We have also established a set of internalcontrol procedures and adopted corporate governance practices to facilitate the effective operation ofour business.
We believe that we are capable of carrying on our business independently of the ControllingShareholders Group and its close associates. Our Directors are of the view that our Group will be ableto operate independently from the Controlling Shareholders Group and its respective close associatesafter the Listing.
Financial Independence
Our Group has an independent internal control, accounting and financial management systems,as well as an independent finance department which makes financial decisions according to our ownbusiness needs. Our Group’s accounting and finance functions are independent of those of theControlling Shareholders Group.
Our source of funding was independent from the Controlling Shareholders Group, and nomembers of the Controlling Shareholders Group or their respective close associates financed ourbusiness operations during the Track Record Period.
Based on the aforesaid, our Directors believe that we have the ability to conduct our businessindependently from the Controlling Shareholders Group and its close associates from a financialperspective, and are able to maintain financial independence from the Controlling Shareholders Groupand its close associates.
NON-COMPETE UNDERTAKING
Each member of the Controlling Shareholders Group signed a non-competition undertaking onOctober 10, 2019 in favor of our Group (the “Non-competition Undertaking”). Pursuant to the Non-competition Undertaking, the members of the Controlling Shareholders Group have irrevocablyundertaken that they would not and will procure that their close associates (except any members of ourGroup) would not, directly or indirectly, whether as principal or agent, either on their own account orin conjunction with or on behalf of any person, firm or company, among other things, carry on, engage,participate or hold any right or interest in or render any services to or otherwise be involved in anybusiness which is or may be in competition with the business of any member of our Group from timeto time (the “Restricted Business”).
The above undertaking does not apply where:
(i) the Controlling Shareholders Group and/or its close associates hold any interests in theshares of any member of our Group or conduct business on behalf of any member of ourGroup;
198
RELATIONSHIP WITH OUR CONTROLLING SHAREHOLDERS
(ii) the Controlling Shareholders Group and/or its close associates hold, directly or indirectly,any equity interests in any companies listed on an accepted stock exchange other thanthose of our Group;
(iii) the Controlling Shareholders Group and/or its close associates hold any equity interests inany company other than those of our Group, which:
(a) according to the latest audited accounts of the company, the Restricted Business inwhich the company is engaged (and its related assets) accounts for less than 10% ofthe consolidated sales or consolidated assets of the company; and
(b) the total number of shares held by the Controlling Shareholders Group and/or itsclose associates accounts for no more than 5% of the shares of the same class issuedby the relevant company, and the Controlling Shareholders Group and/or its closeassociates have no right to appoint most of the directors of the company; or
(iv) any opportunity to invest, participate, be engaged in and/or operate any RestrictedBusiness has first been offered or made available by the Controlling Shareholders Groupand/or its respective close associates to us and, after decision by the Company, we havedeclined in writing or failed to respond within thirty (30) working days (the notificationperiod could be extended to sixty (60) working days if requested by us) after beingnotified of such opportunity to invest, participate, be engaged in or operate the RestrictedBusiness.
Pursuant to the Non-competition Undertaking, the above restrictions would only cease to haveeffect on a Controlling Shareholder upon the earlier of: (i) the Shares of our Company ceasing to belisted on the Stock Exchange; and (ii) such Controlling Shareholder ceasing to be a ControllingShareholder.
Option for New Business Opportunities
The Controlling Shareholders Group has undertaken in the Non-competition Undertaking that ifour Controlling Shareholders Group and its close associates (excluding our Group’s membercompanies) become aware of, have received notice about, are recommended or provided with newbusiness opportunities which will or may directly or indirectly compete with the Restricted Business,including but not limited to the opportunities which are the same as or similar to the RestrictedBusiness (the “New Business Opportunities”), our Controlling Shareholders Group shall refer orrecommend, and shall procure that its close associates (excluding the Group’s member companies) torefer or recommend, the New Business Opportunities to our Group subject to relevant laws,requirements or contractual arrangements with third parties in accordance with the following:
(1) The Controlling Shareholders Group shall provide our Group with a written notificationwhich includes all reasonable and necessary information known to the ControllingShareholders Group and/or its close associates (excluding the Group’s membercompanies) (including but not limited to the nature of the New Business Opportunities andnecessary information relating to the cost of the relevant investment or acquisition) for ourGroup to consider (a) whether the New Business Opportunities constitute competition orpotential competition to the Restricted Business; and (b) whether engaging in such NewBusiness Opportunities would be in the best interests of our Group (the “Offer Notice”);and
199
RELATIONSHIP WITH OUR CONTROLLING SHAREHOLDERS
(2) The Group shall respond to the Controlling Shareholders Group and/or its close associates(excluding the Group’s member companies) within thirty (30) working days after receiptof the Offer Notice (the notification period could be extended to sixty (60) working days ifrequested by us). If our Group fails to reply to the Controlling Shareholders and/or itsclose associates (excluding the Group’s member companies) within the above period, itshall be deemed to have abandoned the New Business Opportunities. If our Groupdetermines to take up the New Business Opportunities, the Controlling Shareholdersand/or its close associates (excluding the Group’s member companies) would be obligatedto offer such New Business Opportunities to our Group.
Our independent non-executive Directors will be responsible for reviewing, considering anddeciding whether or not to take up a new business opportunity referred to us by the ControllingShareholders Group and/or its close associates. When the Controlling Shareholders Group and/or itsclose associates deliver to us the Offer Notice, we will report to our independent non-executiveDirectors within seven days of receipt for their consideration before returning to the ControllingShareholders Group and/or its close associates within the 30-day period from the date of receiving suchOffer Notice. When considering whether or not to exercise the option for an acquisition, ourindependent non-executive Directors will form their views based on a range of factors, including, butnot limited to, the development stage of the business, estimate profitability and investment as well aswhether it is in line with our strategy.
Pre-emptive Right
The Controlling Shareholders Group has undertaken that if the Controlling Shareholders and/ortheir close associates (excluding the Group’s member companies) intend to transfer, sell, lease orlicense a concession to a third party, any businesses engaged in by the Controlling Shareholders Groupand/or its close associates which compete or may compete with the Restricted Business or any otherbusinesses which would cause direct or indirect competition with the Restricted Business, it shall offerour Group such opportunity with a pre-emptive right on equal terms subject to the relevant laws,regulations and contractual arrangements with third parties in accordance with the following:
(1) The Controlling Shareholders Group and/or its close associates (excluding the Group’smember companies) shall provide the Company with written notice no later than the timeof any such disposal (the “Disposal Notice”). For the avoidance of doubt, the ControllingShareholders and/or their close associates (excluding the Group’s member companies) areentitled to provide information and/or a Disposal Notice relating to such disposal to anythird parties at the same time as or after providing the Disposal Notice to the Company;
(2) The Company shall reply to the Controlling Shareholders Group and/or its close associates(excluding the Group’s member companies) in writing by whichever is the later of thethirtieth (30th) working day after receipt of the Disposal Notice (the notification periodcould be extended to sixty (60) working days if requested by us) or the expiration of theperiod offered to third parties for them to reply in writing, before exercising the pre-emptive right;
(3) If the Company intends to take up such pre-emptive right, the terms shall be determinedwith reference to fair market terms; and
(4) The Controlling Shareholders Group and/or its close associates (excluding the Group’smember companies) shall not dispose of such businesses and interests to any third parties
200

RELATIONSHIP WITH OUR CONTROLLING SHAREHOLDERS
unless (a) the Company declines to purchase such businesses and interests in writing; (b)the notice of exercising such pre-emptive right has not been received by the ControllingShareholders Group and/or its close associates (excluding the Group’s membercompanies) from the Company by whichever is the later of the thirtieth (30th) working dayafter receipt of the Disposal Notice (the notification period could be extended to sixty (60)working days if requested by us) and the expiration of the period offered to third partiesfor them to reply; or (c) the Company fails to offer the Controlling Shareholders and/ortheir close associates (excluding the Group’s member companies) the same or morefavorable terms of acquisition than those offered by any third parties to the ControllingShareholders and/or their close associates.
For the avoidance of doubt, the terms of disposal offered by the Controlling ShareholdersGroup and/or its close associates (excluding the Group’s member companies) to any third parties shallnot be more favorable than those to be offered to the Company.
Our independent non-executive Directors will be responsible for reviewing, considering anddeciding whether or not to exercise our pre-emptive right. When the Controlling Shareholders Groupand/or its close associates deliver to us the Disposal Notice, we will report to our independent non-executive Directors within seven days of receipt for their consideration before reverting to theControlling Shareholders Group and/or its close associates within the 30-day period from the date ofreceiving such Disposal Notice. When considering whether or not to exercise our pre-emptive right,our independent non-executive Directors will form their views based on a range of factors, including,but not limited to, the development stage of the business, estimate profitability and investment as wellas whether it is in line with our strategy.
Option for Purchase
To the extent that no relevant laws and regulations are breached and agreements with thirdparties are complied with, the Company is entitled to acquire any businesses operated by theControlling Shareholders Group and/or its close associates (excluding the Group’s member companies)which compete or may compete with the Restricted Business or have the option to acquire anybusinesses or any interests engaged in by the Controlling Shareholders Group and/or its closeassociates (excluding the Group’s member companies) through the abovementioned New BusinessOpportunities (the “Option for Purchase”). The Company is entitled to exercise the Option forPurchase, whether singly or separately, at any time, and the Controlling Shareholders Group and/ortheir its associates (excluding the Group’s member companies) shall offer the Option for Purchase tothe Company on the condition that the commercial terms of a proposed acquisition shall be arrived atsolely by a committee consisting of our independent non-executive Directors after consulting the viewsof independent experts (if necessary). Furthermore, such commercial terms shall be based onnegotiation between the parties involved in line with the normal commercial practice of the Company,and shall be fair, reasonable and in the interests of the Company as a whole through negotiation withthe Controlling Shareholders Group and its close associates (other than the Group’s membercompanies).
However, if a third party has the pre-emptive right in accordance with applicable laws andregulations and/or a prior legally binding document (including, but not limited to, articles ofassociation and/or shareholders’ agreements), the Company’s Option for Purchase shall be subject tosuch third-party rights. In such case, the Controlling Shareholders Group and/or its close associates
201
RELATIONSHIP WITH OUR CONTROLLING SHAREHOLDERS
(excluding the Group’s member companies) will use their best efforts to persuade the third party towaive his/her/its pre-emptive rights.
Controlling Shareholders Group’s Further Undertakings
The Controlling Shareholders Group has further undertaken that, subject to relevant laws,regulations or contractual arrangements with third parties:
(1) at the request of the Group, it shall provide, and shall procure that its close associates(excluding the Group’s member companies) will provide, any necessary information forthe implementation of the Non-competition Undertaking;
(2) it shall allow the authorized representatives or auditors of the Group to have reasonableaccess to the financial and corporate information necessary to its transactions with thirdparties, which would assist with the judgment of the Group in respect of whether theControlling Shareholders Group and/or its close associates have complied with the Non-competition Undertaking; and
(3) it shall ensure that, within ten (10) working days of receipt of the written request from theGroup, necessary confirmation shall be made in writing to the Group as to theperformance of the Non-competition Undertaking by the Controlling Shareholders Groupand its close associates (other than the Group’s member companies), and the consent ofthe Controlling Shareholders Group and its close associates to allow such confirmation tobe included in the our annual reports.
POTENTIAL CONFLICTS OF INTEREST AND CORPORATE GOVERNANCE MEASURES
After completion of the Reorganization and as of the Latest Practicable Date, the ControllingShareholders Group collectively directly holds approximately 13.60% equity interest in ShanghaiLihong (the “Remaining Interest”). This is because, among others, as advised by our tax advisors, theBoard of Directors is of the opinion that if the Controlling Shareholders Group transferred theRemaining Interest to our Company (the “Transfer”), such Transfer would subject the ControllingShareholders Group to a significant amount of tax payment. Meanwhile, the swap of RemainingInterest of the Controlling Shareholders Group at Shanghai Lihong level to the Company level (the“Share Swap”) is not feasible due to regulatory restrictions under PRC law. As advised by our PRClegal advisors, such proposed swap would constitute a cross-border share swap, and, according to theProvisions on Merger and Acquisition of Domestic Enterprises by Foreign Investors (the “M&ARules”), the Share Swap should be subject to review and approval by MOFCOM on the condition thatthe overseas company is being listed and traded on a legitimate overseas stock exchange (the “ListingCondition of the Share Swap”).
To mitigate the potential conflict of interest and stemming from commercial understandingamong shareholders of Shanghai Lihong, shareholders of Shanghai Lihong have agreed in theShanghai Lihong joint venture agreement dated November 27, 2018 that: (i) the members ofControlling Shareholders Group, with their direct equity interests as to 13.60% in Shanghai Lihong,will not nominate any representative to the board of directors, which is the supreme organ of ShanghaiLihong under applicable PRC laws and regulations; and (ii) after the completion of the GlobalOffering, the dividend distribution of Shanghai Lihong would not be made to Shanghai Lihong’sshareholders according to their respective shareholding in Shanghai Lihong, rather, the dividendattributable to the Controlling Shareholders Group (if any) would be paid to shareholders other than the
202
RELATIONSHIP WITH OUR CONTROLLING SHAREHOLDERS
Controlling Shareholders Group, Shanghai Hezhou, Sunshine Rise and Easy Appliance (the “OtherShareholders”). Such dividend payment arrangement stemmed from the commercial understandingamong the shareholders of Shanghai Lihong, which enables the Other Shareholders to maintain theireconomic interests in Shanghai Lihong after the Reorganization and also serves to minimize thepotential conflict of interests caused by the Remaining Interest. In particular, the aggregate equityinterest held by the Other Shareholders in Shanghai Lihong were diluted from approximately 16.25%to approximately 2.64% upon completion of the Reorganization. Considering that the OtherShareholders wished to maintain their economic interests in Shanghai Lihong (i.e., 16.25%) after theReorganization, the Controlling Shareholders Group, Shanghai Hezhou, Sunshine Rise and EasyAppliance on the one hand, and the Other Shareholders on the other hand, discussed and agreed, froma commercial perspective, that any dividends that the Controlling Shareholders Group is entitled to(i.e. approximately 13.60%) will be transferred to the Other Shareholders, meanwhile the ControllingShareholders Group would not receive any dividend distribution. Moreover, with respect to thetransactions between Shanghai Lihong and/or its subsidiary(ies) on the one hand, and our Companyand/or its subsidiary(ies) (other than Shanghai Lihong and its subsidiary(ies)) on the other hand (the“Shanghai Lihong Transaction”), the Controlling Shareholders Group undertakes to abstain fromvoting in the relevant board meeting(s)/shareholder meeting(s) with respect to any Shanghai LihongTransactions to avoid any potential conflict of interest.
Furthermore, our Company, the Controlling Shareholders Group and Shanghai Lihongundertake to apply for the Share Swap as soon as the Listing Condition of the Share Swap is satisfied.The Share Swap will constitute a connected transaction under Chapter 14A of the Listing Rules. TheCompany will comply with the reporting, annual review, announcement, circular and independentshareholders’ approval requirements (where applicable) under Chapter 14A of the Listing Rules tocomplete the Share Swap. By the time the Controlling Shareholders Group disposes of the RemainingInterest, the remaining shareholders of Shanghai Lihong will enter into a new Shanghai Lihong jointventure agreement providing that the dividend distribution of Shanghai Lihong would be made toShanghai Lihong’s shareholders according to their respective shareholdings in Shanghai Lihong.
In addition, our Directors recognize the importance of good corporate governance to protect theinterests of our Shareholders. We would also adopt the following corporate governance measures tomanage potential conflicts of interest between our Group and the Controlling Shareholders Group:
(a) Where a Shareholders’ meeting is held for considering proposed transactions in which theControlling Shareholders Group has a material interest, the Controlling ShareholdersGroup shall abstain from voting on the relevant resolutions and shall not be counted in thequorum for voting.
(b) Where a Board meeting is held for the matters in which a Director has a material interest,such Director shall abstain from voting on the relevant resolutions and shall not be countedin the quorum for voting.
(c) In the event that our independent non-executive Directors are requested to review anyconflict of interests between our Group and the Controlling Shareholders Group, theControlling Shareholders Group shall provide the independent non-executive Directorswith all necessary information and our Company shall disclose the decisions of theindependent non-executive Directors either in its annual reports or by way ofannouncements.
203

RELATIONSHIP WITH OUR CONTROLLING SHAREHOLDERS
(d) Our Directors (including the independent non-executive Directors) will seek independentand professional opinions from external advisors at our Company’s cost as and whenappropriate in accordance with the Corporate Governance Code and CorporateGovernance Report as set out in Appendix 14 to the Listing Rules.
(e) Any transactions between our Company and its connected persons shall be in compliancewith the relevant requirements of Chapter 14A of the Listing Rules, including theannouncement, annual reporting and independent shareholders’ approval requirements (ifapplicable) under the Listing Rules.
(f) We have appointed Altus Capital Limited as our compliance advisor, which will provideadvice and guidance to us in respect of compliance with applicable laws and the ListingRules, including various requirements relating to directors’ duties and corporategovernance.
Based on the above, our Directors are satisfied that sufficient measures have been put in placeto manage conflicts of interest between our Group and the Controlling Shareholders Group and/orother Directors to protect minority Shareholders’ rights after Listing.
204
CONNECTED TRANSACTIONS
Upon Listing, transactions between members of our Group and our connected persons willconstitute connected transactions or continuing connected transactions of our Company under Chapter14A of the Listing Rules.
SUMMARY OF OUR CONNECTED PERSONS
The table below sets forth parties who will become our connected persons upon Listing and thenature of their relationship with our Group. We have entered into certain transactions with thefollowing connected persons, which will constitute our continuing connected transactions upon Listing:
Name Connected Relationship
Jiuyang Bean associate of the Controlling Shareholders Group.
Total Shareholder Return Limited associate of Mr. Stassi Anastas Anastassov, ournon-executive Director.
Joyoung Joyoung is owned as to 50.11% by Shanghai Lihongthus a subsidiary of Shanghai Lihong. ShanghaiLihong is a non-wholly owned subsidiary of ourCompany, which is owned as to 13.60% by theControlling Shareholders Group. Accordingly,Shanghai Lihong and its subsidiaries (the “ShanghaiLihong Group”) are connected subsidiaries of theCompany under Rule 14A.16 of the Listing Rules.
SharkNinja (China) SharkNinja (China) is owned as to 51% and 49% byJoyoung and SharkNinja (Hong Kong), respectively,thus a member of the Shanghai Lihong Group.Accordingly, SharkNinja (China) is a connectedsubsidiary of the Company under Rule 14A.16 of theListing Rules.
SUMMARY OF OUR CONTINUING CONNECTED TRANSACTIONS
Nature of transactionsApplicable
Listing Rules Waiver sought
Proposed annual cap forthe years ending
December 31
2019 2020 2021
(RMB in millions)
Exempt continuing connected transactions
1. Jiuyang Bean Mutual Provision of Products andService Framework Agreement
14A.76(1) N/A N/A N/A N/A
2. Jiuyang Bean Property Leasing Framework Agreement 14A.76(1) N/A N/A N/A N/A
3. Total Shareholder Return Limited AdvisoryAgreement
14A.76(1) N/A N/A N/A N/A
205
CONNECTED TRANSACTIONS
Nature of transactionsApplicable
Listing Rules Waiver sought
Proposed annual cap forthe years ending
December 31
2019 2020 2021
(RMB in millions)
Non-exempt continuing connected transactions
4. Purchasing Distribution Agreement 14A.3414A.3514A.4914A.7114A.7614A.105
Announcementrequirement
60.0 190.0 N/A
5. Commissioned Manufacturing Framework Agreement 14A.3414A.3514A.4914A.7114A.7614A.105
Announcementrequirement
450.0 500.0 550.0
EXEMPT CONTINUING CONNECTED TRANSACTIONS
1. Jiuyang Bean Mutual Provision of Products and Service Framework Agreement
We entered into a mutual provision of products and service framework agreement with JiuyangBean (the “Jiuyang Bean Mutual Provision of Products and Service Framework Agreement”) onOctober 10, 2019, pursuant to which we and Jiuyang Bean will mutually provide various types ofproducts and services to each other in our ordinary course of business, and the party receiving suchproducts and/or services shall, in return, pay relevant purchase fees and/or service fees. Specifically,we will provide small household appliances including soymilk makers and legal and businessconsultancy services to Jiuyang Bean, and Jiuyang Bean will provide bottled soymilk drinks to us. Theinitial term of the Jiuyang Bean Mutual Provision of Products and Service Framework Agreement willcommence on the Listing Date and end on December 31, 2021, subject to renewal upon the mutualconsent of both parties. The prices to be provided under the Jiuyang Bean Mutual Provision ofProducts and Service Framework Agreement will be determined with reference to market price andwill not be less favorable to us than the price of relevant products and services provided to/byindependent purchasers/providers.
As the highest applicable percentage ratio for the fees payable by our Group to Jiuyang Beanand fees payable by Jiuyang Bean to our Group will be less than 0.1% on an annual basis, thetransactions under the Jiuyang Bean Mutual Provision of Products and Service Framework Agreementwill be fully exempt from all of the reporting, annual review, announcement, circular and independentshareholders’ approval requirements under Chapter 14A of the Listing Rules pursuant to Rule14A.76(1).
2. Jiuyang Bean Property Leasing Framework Agreement
We entered into a property leasing framework agreement with Jiuyang Bean (the “JiuyangBean Property Leasing Framework Agreement”) on October 10, 2019, pursuant to which we may leaseproperties as factory buildings and dormitories to Jiuyang Bean, for which we may charge rental,property management fees, utility charges, device fees and other charges. The initial term of theJiuyang Bean Property Leasing Framework Agreement will commence on the Listing Date and end on
206

CONNECTED TRANSACTIONS
December 31, 2021, subject to renewal upon the mutual consent of both parties. The rental and othercharges to be paid to our Group under the Jiuyang Bean Property Leasing Framework Agreement willbe determined with reference to the rental of properties with similar construction standard located inthe same geographical location and fees we are charged by our property managers.
As the highest applicable percentage ratio for the fees payable by Jiuyang Bean to our Groupwill be less than 0.1% on an annual basis, the transactions under the Jiuyang Bean Property LeasingFramework Agreement will be fully exempt from all of the reporting, annual review, announcement,circular and independent shareholders’ approval requirements under Chapter 14A of the Listing Rulespursuant to Rule 14A.76(1).
3. Total Shareholder Return Limited Advisory Agreement
We entered into an advisory agreement with Total Shareholder Return Limited (the “TotalShareholder Return Limited Advisory Agreement”) on July 1, 2017, pursuant to which we engagedTotal Shareholder Return Limited as our corporate strategy advisor to provide business consultingservices. The parties agreed in the Total Shareholder Return Limited Advisory Agreement that theinitial term of the Total Shareholder Return Limited Advisory Agreement was from July 1, 2017 toJuly 1, 2018, and the agreement will be automatically renewed for another one year if no party choosesto terminate the agreement. The Total Shareholder Return Limited Advisory Agreement was renewedon July 1, 2018 and July 1, 2019. The annual retainer fee under the Total Shareholder Return LimitedAdvisory Agreement is USD120,000.
As the highest applicable percentage ratio for the fees payable by us to Total ShareholderReturn Limited will be less than 0.1% on an annual basis, the transactions under the Total ShareholderReturn Limited Advisory Agreement will be fully exempt from all of the reporting, annual review,announcement, circular and independent shareholders’ approval requirements under Chapter 14A ofthe Listing Rules pursuant to Rule 14A.76(1).
NON-EXEMPT CONTINUING CONNECTED TRANSACTIONS
4. Purchasing Distribution Agreement
Parties
Shenzhen SharkNinja (as supplier) andSharkNinja (China) (as distributor)
Principal terms
Shenzhen SharkNinja, one of our wholly-owned subsidiaries, entered into a purchasingdistribution agreement (the “Purchasing Distribution Agreement”) with SharkNinja (China) onMarch 1, 2018, pursuant to which SharkNinja (China) would purchase the small household appliancesfrom Shenzhen SharkNinja for distribution. The initial term of the Purchasing Distribution Agreementcommenced on March 1, 2018 and will expire on December 31, 2020, subject to renewal upon themutual consent of both parties.
Reasons for the transaction
The Purchasing Distribution Agreement serves as the underlying agreement of the distributionarrangement between Shenzhen SharkNinja and SharkNinja (China), pursuant to which Shenzhen
207
CONNECTED TRANSACTIONS
SharkNinja engaged SharkNinja (China) as its exclusive and sole distributor in the PRC to distribute itsand its subsidiaries’ small household appliances and conduct corresponding promotional activities inthe PRC. By entering into the Purchasing Distribution Agreement with SharkNinja (China), we canleverage Joyoung’s nationwide network and strong consumer base to accelerate the penetration of ourShark brand and Ninja brand into the Chinese market. In addition, being a member of our Group,SharkNinja (China) possesses a more comprehensive understanding of our products and has a fastercommunication channel with us compared with other Independent Third Party distributors, which isessential in facilitating distributing our products to Chinese consumers.
Pricing policies
The abovementioned small household appliances Shenzhen SharkNinja provides to SharkNinja(China) under the Purchasing Distribution Agreement comprise various products. According to thePurchasing Distribution Agreement, the transactions contemplated thereunder are on normalcommercial terms. We will make reference to the price of similar products in the PRC and will basesuch on cost-plus basis, including product cost, logistic cost, marketing expenses and commerciallyreasonable margin, to ensure that the terms of supplying products to SharkNinja (China) are fair andreasonable. With the assistance of the relevant procurement experience of our procurement department,we gather information on market prices and profit margin levels of small household appliances in theindustry through industrial associations and other small household appliance suppliers in the PRC.
Historical amounts
Shenzhen SharkNinja and SharkNinja (China) commenced cooperation under the PurchasingDistribution Agreement in April 2018. For the year ended December 31, 2018 and the six monthsended June 30, 2019, the aggregated connected transaction amount were RMB23.0 million andRMB40.2 million, respectively.
Annual caps
The transaction amount to be paid by SharkNinja (China) to Shenzhen SharkNinja under thePurchasing Distribution Agreement for the two years ending December 31, 2019 and 2020 are notexpected to exceed the proposed annual caps set out below:
Proposed annual capsfor the years ending
December 31,
2019 2020
(RMB in millions)
Transaction amount to be paid by SharkNinja (China) to Shenzhen SharkNinja . . . . . . 60.0 190.0
Basis of caps
The above proposed annual caps are determined with reference to the following factors:
Š the historic transaction amounts and the growth trend under the existing productdistribution arrangements between Shenzhen SharkNinja and SharkNinja (China) duringthe Track Record Period. In particular, the purchase price paid by SharkNinja (China) toShenzhen SharkNinja amounted to RMB40.2 million for the six months ended June 30,2019;
208
CONNECTED TRANSACTIONS
Š the expected increase in the sales of the small household products under our Shark brandand Ninja brand because of (i) the expected significant growth of recognition andconsumer base expansion of our Shark brand and Ninja brand in China in the two yearsending December 31, 2020 as a result of the expected accelerated market penetration ofour Shark brand and Ninja brand since they entered the Chinese market in 2018; and (ii)the expected expansion of the Chinese small household appliance market; and
Š the expected increase in purchase fees to be charged by us due to the estimated increase inthe cost of labor for the provision of products and services.
Listing Rules implications
As the highest applicable percentage ratio of the transactions under the Purchasing DistributionAgreement for each of the two years ending December 31, 2020 calculated for the purpose of Chapter14A of the Listing Rules is expected to exceed 0.1% but be less than 5% on an annual basis, suchtransactions will, upon Listing, constitute continuing connected transactions of the Company subject tothe annual reporting requirement under Rules 14A.49 and 14A.71 of the Listing Rules and theannouncement requirement under Rule 14A.35 of the Listing Rules.
5. Commissioned Manufacturing Framework Agreement
Parties
SharkNinja (Hong Kong) (as purchaser) andJoyoung (as manufacturer)
Principal terms
We entered into a Commissioned Manufacturing Framework Agreement (the “CommissionedManufacturing Framework Agreement”) with Joyoung on October 10, 2019, pursuant to whichSharkNinja (Hong Kong) will commission Joyoung and/or its subsidiaries to manufacture, orcommission Joyoung and/or its subsidiaries to engage their OEM suppliers to manufacture, smallhousehold products and SharkNinja (Hong Kong) in return will pay purchase fees to Joyoung and/or itssubsidiaries for the products manufactured. The initial term of the Commissioned ManufacturingFramework Agreement will commence on the Listing Date and will end on December 31, 2021,subject to renewal upon the mutual consent of both parties.
Reasons for the transaction
Being the market leader in China in respect of the small household appliance industry for years,Joyoung can utilize its local negotiation power to facilitate the synergistic supply chain evolution byintegrating both Joyoung’s and SharkNinja’s abundant resources in procurement and production inChina, which will enable us to offer high-quality products at more competitive prices. In addition,Joyoung maintains long-term and stable relationship with its suppliers, including OEM suppliers, whocan well understand the sophisticated technical standards of our products under our Shark brand andNinja brand based on their cooperative experience with Joyoung and secure proper use of ourintellectual property and prevent the leakage of our technical and trade secrets. We believe thatentering into the Commissioned Manufacturing Framework Agreement would minimize the potentialrisk of disruption to our Company’s operations and ensure efficient and reliable supply of our products.
209
CONNECTED TRANSACTIONS
Pricing policies
The purchase fees to be paid by SharkNinja (Hong Kong) to Joyoung and/or its subsidiariesunder the Commissioned Manufacturing Framework Agreement will be determined on normalcommercial terms after arm’s-length negotiations between the relevant parties on a cost-plus basis,taking into consideration the purchase amount paid to Joyoung’s OEM suppliers, price of componentsand raw materials, depreciation of manufacturing facilities, as well as the cost of labor employed inmanufacturing.
Historical amounts
SharkNinja (Hong Kong) and Joyoung and/or its subsidiaries commenced cooperation underthe Commissioned Manufacturing Framework Agreement in May 2018. For the year endedDecember 31, 2018 and the six months ended June 30, 2019, the aggregated connected transactionamount were RMB188.5 million and RMB262.2 million, respectively.
Annual caps
The transaction amounts to be paid by SharkNinja (Hong Kong) to Joyoung and/or itssubsidiaries under the Commissioned Manufacturing Framework Agreement for the three years endingDecember 31, 2019, 2020 and 2021 are not expected to exceed the proposed annual caps set out below:
Proposed annual caps for the years endingDecember 31,
2019 2020 2021
(RMB in millions)
The transaction amount to be paid by SharkNinja (Hong Kong) toJoyoung and/or its subsidiaries . . . . . . . . . . . . . . . . . . . . . . . . . . . . . . . 450.0 500.0 550.0
Basis of caps
The above proposed annual caps are determined with reference to the following factors:
Š the historic transaction amounts and the growth trend under the existing arrangementbetween SharkNinja (Hong Kong) and Joyoung during the Track Record Period. Inparticular, the purchase price paid by SharkNinja (Hong Kong) to Joyoung and/or itssubsidiaries amounted to RMB262.2 million for the six months ended June 30, 2019;
Š the expected significant growth of recognition and consumer base expansion of our Sharkbrand and Ninja brand in the three years ending December 31, 2021, and accordingly theexpected increasing demand for small household products manufactured by Joyoung and/or its subsidiaries; and
Š the expected increase in purchase fees to be charged by Joyoung and/or its subsidiaries,and/or their OEM suppliers, due to the estimated increase in the cost of labor for theprovision of products and services by Joyoung and/or its subsidiaries.
Listing Rules implications
As the highest applicable percentage ratio of the transactions under the CommissionedManufacturing Framework Agreement for each of the three years ending December 31, 2021calculated for the purpose of Chapter 14A of the Listing Rules is expected to exceed 0.1% but be less
210
CONNECTED TRANSACTIONS
than 5% on an annual basis, such transactions will, upon Listing, constitute continuing connectedtransactions of the Company subject to the annual reporting requirement under Rules 14A.49 and14A.71 of the Listing Rules and the announcement requirement under Rule 14A.35 of the ListingRules.
INTERNAL CONTROL MEASURES
In order to ensure that the terms under the relevant framework agreements for the continuingconnected transactions are fair and reasonable, or no less favorable than terms available fromIndependent Third Parties, and are carried out under normal commercial terms, we have adopted thefollowing internal control procedures:
Š we have adopted and implemented a management system on connected transactions.Under such system, the Audit Committee under the Board is responsible for conductingreviews on compliance with relevant laws, regulations, our Company’s policies and theListing Rules in respect of the connected transactions. In addition, the Audit Committeeunder the Board, the Board and various other internal departments of the Company(including but not limited to the finance department and compliance and legal department)are jointly responsible for evaluating the terms under the framework agreements forconnected transactions, in particular, with respect to the fairness of the pricing policies andannual caps under each agreement;
Š the Audit Committee under the Board, the Board and various other internal departments ofthe Company also regularly monitor the fulfillment status and the transaction updatesunder the framework agreements. In addition, the management of the Company alsoregularly reviews the pricing policies of the framework agreements;
Š our independent non-executive Directors and auditors will conduct annual reviews of thecontinuing connected transactions under the framework agreements and provide annualconfirmations to ensure that, pursuant to Rules 14A.55 and 14A.56 of the Listing Rules,the transactions are conducted in accordance with the terms of the agreements, on normalcommercial terms and in accordance with the relevant pricing policies;
Š when considering service fees for the services to be provided to the Group by the aboveconnected persons or the service fees for the services to be provided by the Group to theabove connected persons, the Group will constantly research prevailing market conditionsand practices and make reference to the pricing and terms between the Group andIndependent Third Parties for similar transactions, to ensure that the pricing and termsoffered by the above connected persons from mutual commercial negotiations (as the casemay be) are fair, reasonable and are no less favorable than those to be offered byIndependent Third Parties; and
Š when considering any renewal or revisions to the framework agreements after Listing, theinterested Directors and Shareholders shall abstain from voting on the resolutions toapprove such transactions at board meetings or shareholders’ general meetings (as the casemay be), and our independent non-executive Directors and independent Shareholders havethe right to consider if the terms of the non-exempt continuing connected transactions(including the proposed annual caps) are fair and reasonable, on normal commercial termsand in the interests of our Company and our Shareholders as a whole. If the independentnon-executive Directors’ or independent Shareholders’ approvals cannot be obtained, we
211

CONNECTED TRANSACTIONS
will not continue the transactions under the framework agreement(s) to the extent that theyconstitute non-exempt continuing connected transactions under Rule 14A.35 of the ListingRules.
WAIVERS GRANTED BY THE STOCK EXCHANGE
As the above non-exempt continuing connected transactions are expected to be carried out on arecurring basis, our Directors consider that strict compliance with the aforesaid announcement will beimpractical, and such requirements will lead to unnecessary administrative costs and create an onerousburden on us. Accordingly, we have applied to the Stock Exchange, and the Stock Exchange hasgranted us, pursuant to Rule 14A.105 of the Listing Rules, waivers from strict compliance with theannouncement requirements under Rule 14A.35 of the Listing Rules in respect of the transactionsunder the Purchasing Distribution Agreement and the Commissioned Manufacturing FrameworkAgreement, provided that the total amount of transactions for years ending December 31, 2019, 2020and 2021 will not exceed the relevant proposed annual caps as set out above. In addition, the Companywill comply with the reporting, annual review, circular and independent shareholders’ approvalrequirements (where applicable) under Chapter 14A of the Listing Rules. The independent non-executive Directors and auditors of the Company will review whether the transactions under the non-exempt continuing connected transactions have been entered into pursuant to the principal terms andpricing policies under the relevant agreements as disclosed in this section. The confirmation from ourindependent non-executive Directors and our auditors will be disclosed annually according to therequirements of the Listing Rules.
In the event of any future amendments to the Listing Rules imposing more stringentrequirements than those applicable as of the Latest Practicable Date on the continuing connectedtransactions referred to in this section, we will take immediate steps to ensure compliance with suchnew requirements within a reasonable time.
CONFIRMATION BY DIRECTORS
The Directors (including the independent non-executive Directors) are of the view that thenon-exempt continuing connected transactions have been and will continue to be carried out in ourordinary and usual course of business of the Company and on normal commercial terms that are fairand reasonable and in the interests of the Company and our Shareholders as a whole; and that theproposed annual caps for the non-exempt continuing connected transactions are fair and reasonable andin the interests of the Company and our Shareholders as a whole.
CONFIRMATION BY THE JOINT SPONSORS
The Joint Sponsors have (i) reviewed the relevant documents and information provided by theGroup, (ii) obtained necessary representations and confirmation from the Company and the Directorsand (iii) participated in the due diligence and discussion with the management of the Company and thePRC Legal Advisors. Based on the above, the Joint Sponsors are of the view that the non-exemptcontinuing connected transactions have been carried out in the ordinary and usual course of business ofthe Company and on normal commercial terms that are fair and reasonable and in the interests of theCompany and our Shareholders as a whole; and that the proposed annual caps of the non-exemptcontinuing connected transactions are fair and reasonable and in the interests of the Company and ourShareholders as a whole.
212

DIRECTORS AND SENIOR MANAGEMENT
OVERVIEW
The Board currently consists of eight Directors, comprising three executive Directors, twonon-executive Directors and three independent non-executive Directors. All Directors are elected bythe general meeting for a term of three years which is renewable upon re-election. The major powersand functions of the Board include, but are not limited to, convening the general meetings, presentingreports to the general meetings, implementing the resolutions passed at the general meetings,determining the operational plans and investment plans of the Group, determining the annual financialbudgets and final accounts of the Group, determining the fundamental management systems of theGroup, and formulating profit distribution plans and loss recovery plans of the Group.
The following tables set forth information regarding our Directors and senior management.
Directors and Senior Management
The table below sets forth certain information regarding our Directors:
Name Age Position Roles and responsibilities
Date ofjoining
the Group
Date ofappointmentas Director
Relationshipwith otherDirectorsand senior
management
Executive Director
Mr. Wang Xuning (王旭寧) . . 50 ChairmanandExecutiveDirector
Formulating the businessstrategies, making majorcorporate and operationaldecisions of theCompany and ensuringthe Board’s effectiveperformance of itsfunction; responsible forthe overall managementof our Group; Chairmanof the StrategyCommittee andNomination Committee
March 1,1994
July 26,2018
None
Ms. Han Run (韓潤) . . . . . . . . 40 ExecutiveDirector
Assisting the Chairmanin formulating businessstrategies and makingmajor corporate andoperational decisions ofthe Company andensuring the Board’seffective performance ofits function; member ofthe RemunerationCommittee
February 26,2004
June 25,2019
None
213
DIRECTORS AND SENIOR MANAGEMENT
Name Age Position Roles and responsibilities
Date ofjoining
the Group
Date ofappointmentas Director
Relationshipwith otherDirectorsand senior
management
Ms. Huang Shuling(黃淑玲) . . . . . . . . . . 55 Executive
DirectorAssisting the Chairmanin formulating businessstrategies and makingmajor corporate andoperational decisions ofthe Company andensuring the Board’seffective performance ofits function
October 14,1994
June 25,2019
None
Non-executive Directors
Mr. Hui Chi Kin Max(許志堅) . . . . . . . . . . 46 Non-executive
DirectorProviding professionalopinion and judgment tothe Board; member of theStrategy Committee
September 29,2017
June 25,2019
None
Mr. Stassi AnastasAnastassov . . . . . . . 57 Non-executive
DirectorProviding professionalopinion and judgment tothe Board; member of theStrategy Committee
June 25, 2019 June 25,2019
None
Independent Non-executive Directors
Dr. Wong Tin YauKelvin (黃天祐) . . . . 58 Independent
Non-executiveDirector
Providing independentopinion and judgment tothe Board; Chairman ofthe Audit Committee andmember of the StrategyCommittee andNomination Committee
October 11,2019
October 11,2019
None
Mr. Timothy RobertsWarner . . . . . . . . . . 68 Independent
Non-executiveDirector
Providing independentopinion and judgment tothe Board; Chairman ofthe RemunerationCommittee and memberof the StrategyCommittee and AuditCommittee
October 11,2019
October 11,2019
None
Mr. Yang Xianxiang(楊現祥) . . . . . . . . . . 52 Independent
Non-executiveDirector
Providing independentopinion and judgment tothe Board; member of theStrategy Committee,Audit Committee,Nomination Committeeand RemunerationCommittee
October 11,2019
October 11,2019
None
214
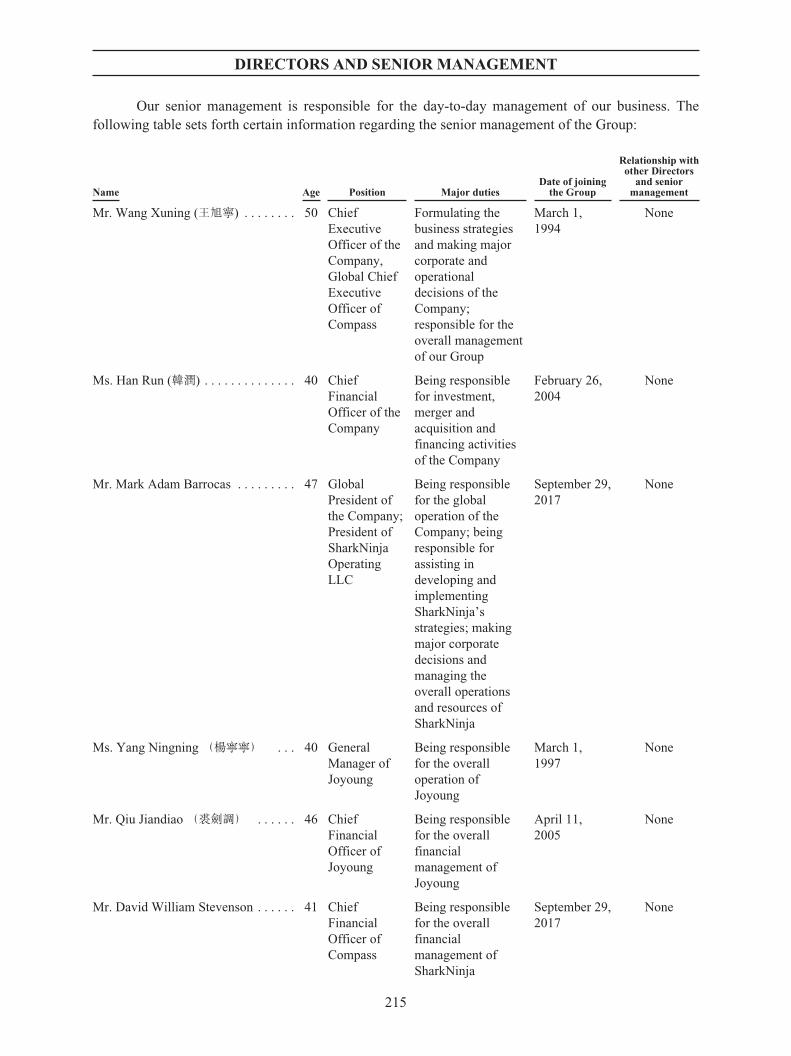
DIRECTORS AND SENIOR MANAGEMENT
Our senior management is responsible for the day-to-day management of our business. Thefollowing table sets forth certain information regarding the senior management of the Group:
Name Age Position Major dutiesDate of joining
the Group
Relationship withother Directors
and seniormanagement
Mr. Wang Xuning (王旭寧) . . . . . . . . 50 ChiefExecutiveOfficer of theCompany,Global ChiefExecutiveOfficer ofCompass
Formulating thebusiness strategiesand making majorcorporate andoperationaldecisions of theCompany;responsible for theoverall managementof our Group
March 1,1994
None
Ms. Han Run (韓潤) . . . . . . . . . . . . . . 40 ChiefFinancialOfficer of theCompany
Being responsiblefor investment,merger andacquisition andfinancing activitiesof the Company
February 26,2004
None
Mr. Mark Adam Barrocas . . . . . . . . . 47 GlobalPresident ofthe Company;President ofSharkNinjaOperatingLLC
Being responsiblefor the globaloperation of theCompany; beingresponsible forassisting indeveloping andimplementingSharkNinja’sstrategies; makingmajor corporatedecisions andmanaging theoverall operationsand resources ofSharkNinja
September 29,2017
None
Ms. Yang Ningning(楊寧寧) . . . 40 GeneralManager ofJoyoung
Being responsiblefor the overalloperation ofJoyoung
March 1,1997
None
Mr. Qiu Jiandiao(裘劍調) . . . . . . 46 ChiefFinancialOfficer ofJoyoung
Being responsiblefor the overallfinancialmanagement ofJoyoung
April 11,2005
None
Mr. David William Stevenson . . . . . . 41 ChiefFinancialOfficer ofCompass
Being responsiblefor the overallfinancialmanagement ofSharkNinja
September 29,2017
None
215
DIRECTORS AND SENIOR MANAGEMENT
DIRECTORS
Executive Directors
Mr. Wang Xuning (王旭寧), age 50, has been the Chairman and Chief Executive Officer sinceJune 25, 2019, the executive Director of the Company since July 2018, and the Global Chief ExecutiveOfficer of Compass since September 2017. He will also be appointed as the Chairman of the StrategyCommittee and Nomination Committee of the Company upon the completion of the Global Offering.Mr. Wang has held several positions within the Group, including serving as a director of SharkNinjaOperating LLC since April 2019, a director of SharkNinja Sales Company since September 2017, andthe Chairman of Joyoung since September 2007. He also served as the General Manager and thePresident of Joyoung from September 2007 to March 2019. In 1994, Mr. Wang founded our Group byfirst conducting research and development on fully automatic soymilk maker. Mr. Wang receivedseveral awards and recognitions for his industry expertise, including being awarded the Ernst & Young(China) Entrepreneur Award (安永(中國)企業家獎) in 2012, being listed as one of the “Top TenInnovative Figures in Household Appliance Industry of China (中國家電十大創新人物)” bypeople.com.cn (人民網) in December 2008 and he received the Highest Technology Award of Jinan (濟南市科技最高獎) in 2011. Mr. Wang was recognized as a senior engineer in October 1999.
Mr. Wang received a Bachelor’s degree in electric traction and transmission control fromBeijing Jiaotong University (北京交通大學) (formerly known as North Jiaotong University (北方交通大學)) in China in July 1991, and a Master of Business Administration from China Europe InternationalBusiness School (中歐國際工商學院) in China in October 2003.
Ms. Han Run (韓潤), age 40, has been an executive Director, the Chief Financial Officer sinceJune 25, 2019 and will be a member of the Remuneration Committee of the Company upon thecompletion of the Global Offering. Ms. Han has held several positions within the Group, includingserving as the Vice Chairwoman of Joyoung since April 2019, and a director of Compass sinceSeptember 2017. She also served as the Board Secretary and Vice General Manager of Joyoung fromMarch 2015 to March 2019, the Vice President of Joyoung from March 2007 to March 2015, theDirector of legal department of the board and the Chief Officer of the administrative center ofShandong Joyoung from March 2005 to March 2007, and the Manager of the administrative center ofShandong Joyoung from February 2004 to April 2005. Ms. Han also holds several positions withinnon-commercial organizations. She has served as the Vice President of China Household ElectricalAppliances Association (中國家用電器協會) since December 2015, and successively served as amember of the eighth and ninth sessions of the Huaiyin District Committee of the CPPCC (政協槐蔭區委員會) since 2012. Ms. Han was granted the “New Fortune Gold Medal Board Secretary (新財富金牌董秘)” by New Fortune magazine in April 2019, the “Industry Elite Award (行業精英獎)” at the 30th
anniversary ceremony of the China Household Electrical Appliances Association (中國家用電器協會)in December 2018, the “Advanced Individual of Enterprise Intellectual Property (企業知識產權工作先進個人)” by the State Intellectual Property Office (國家知識產權局) in December 2016, as well as the“First Award of the Science and Technology Progress of China Light Industry Council (中國輕工業聯合會科學技術進步一等獎)” by the China Light Industry Council (中國輕工業聯合會) in 2014.
Ms. Han received an Executive Master of Business Administration from Guanghua School ofManagement of Peking University (北京大學光華管理學院) in China in January 2014.
Ms. Huang Shuling (黃淑玲), age 55, has been an executive Director of the Company sinceJune 25, 2019. Ms. Huang has also been an executive director of Shanghai Lihong since November
216
DIRECTORS AND SENIOR MANAGEMENT
2010, and the Chairwoman and General Manager of Shanghai Lihong since December 2018. Sheserved as the Vice Chairwoman of Joyoung from September 2007 to March 2019, and the Chairwomanof Shandong Joyoung from July 2002 to September 2007. Ms. Huang co-founded our Group inOctober 1994. She has also held several other positions within non-commercial organizations,including serving as a standing committee member of the Twelfth Session of Executive Committee ofAll-China Federation of Industry and Commerce (中華全國工商業聯合會第十二屆執行委員會) sinceNovember 2017. She is also currently the Vice Chairwoman of the Association of Industry andCommerce of Shandong (山東省工商業聯合會) and a standing committee member of the twelfthsession of the Shandong Committee of the CPPCC (政協山東省委員會).
Ms. Huang received a Bachelor of Economics in planning statistics from Shandong Universityof Finance and Economics (山東財經大學) (formerly known as Shandong Economic School (山東經濟學院)) in Shandong, China in July 1987, and an Executive Master of Business Administration in seniormanagement business administration from Cheung Kong School of Business (長江商學院) in Beijing,China in September 2007.
Non-executive Directors
Mr. Hui Chi Kin Max (許志堅), age 46, has been a non-executive Director since June 25, 2019and will be a member of the Strategy Committee of the Company upon the completion of the GlobalOffering, and has also served as a director of Compass, primarily responsible for company oversightand formation since July 2017. Mr. Hui has more than 20 years of experience in investment and fundmanagement. He has served as the Chief Executive Officer and a managing director of CDHInvestment Advisory Private Limited in Singapore since July 2013, primarily responsible for fundmanagement business. Mr. Hui also served as a non-executive director of China Modern DairyHoldings Ltd. (中國現代牧業控股有限公司), a company listed on the Hong Kong Stock Exchange(Stock Code: 01117), for corporate development and strategic planning from 2009 to 2017. Prior tojoining CDH Investments in 2003, Mr. Hui worked with the investment banking department ofSchroders & Co in New York and the private equity division of Morgan Stanley Dean Witter Asia inHong Kong from 1999 to 2003. Prior to working in the financial industry, Mr. Hui was an Engineer atthe oil and gas pipeline division of Bechtel Corporation in San Francisco from 1997 to 1998.
Mr. Hui received a Bachelor’s degree in chemical engineering from the University ofCalifornia, Berkeley in December 1996, and a Master of Engineering from Princeton University inJune 1999.
Mr. Stassi Anastas Anastassov, age 57, has been a non-executive Director since June 25,2019 and will be a member of the Strategy Committee of the Company upon the completion of theGlobal Offering. He has served as a Senior Consultant in Total Shareholder Return Limited, a privateequity-focused advisory firm, since July 2015. He served as the U.S.A. Global President and ChiefExecutive Officer of Duracell Company, a former division of Procter & Gamble (“P&G”), fromNovember 2010 to January 2015. From 2001 to November 2010 he served as a Vice President at P&G,being responsible for babycare products, feminine care products and snacks in the Central Europe,Eastern Europe, Middle East and Africa markets. From July 1999 to June 2001 he was a GeneralManager of P&G responsible for Near East Markets (including Lebanon, Jordan, Syria and Israel) andthe Eastern Europe market (Moscow). From May 1987 to August 1999 he held different positionswithin P&G, successively serving as an Assistant Brand Manager being responsible for babycareproducts in France, a Brand Manager being responsible for paper and dish products in Nordic, a
217
DIRECTORS AND SENIOR MANAGEMENT
Marketing Manager being responsible for laundry and cleaning products in Nordic, a MarketingDirector in charge of marketing operations in Russia and a General Manager being responsible forRussian business operations covering laundry, cleaning, baby and feminine products.
Mr. Anastassov received a Bachelor’s degree in business administration and economics fromUppsala University in Sweden in June 1987.
Independent Non-Executive Directors
Dr. Wong Tin Yau Kelvin (黃天祐), Justice of the Peace, age 58, has been an independentnon-executive Director, the Chairman of the Audit Committee and will be a member of the StrategyCommittee and Nomination Committee of the Company upon the completion of the Global Offering.Dr. Wong has served as an independent non-executive director and a member of the audit committee ofXinjiang Goldwind Science & Technology Co., Ltd. (新疆金風科技股份有限公司), a company listed onthe Shenzhen Stock Exchange (Stock Code: 02202) and the Hong Kong Stock Exchange (Stock Code:02208), since October 2016 and from June 2011 to June 2016; as an independent non-executivedirector and the chairman of the audit committee of Huarong International Financial Holdings Limited(華融國際金融控股有限公司), a company listed on the Hong Kong Stock Exchange (Stock Code:00993), since October 2015; as an independent non-executive director of Shanghai FosunPharmaceutical (Group) Co., Ltd (上海復星醫藥(集團)股份有限公司), a company listed on the ShanghaiStock Exchange (Stock Code: 600196) and the Hong Kong Stock Exchange (Stock Code: 02196),since June 2015; as an independent non-executive director and a member of the audit committee of theBank of Qingdao Co., Ltd. (青島銀行股份有限公司), a company listed on the Shenzhen StockExchange (Stock Code: 002948) and the Hong Kong Stock Exchange (Stock Code: 03866), since April2015; as an independent non-executive director of China ZhengTong Auto Services Holdings Limited(中國正通汽車服務控股有限公司), a company listed on the Hong Kong Stock Exchange (Stock Code:01728), since November 2010; as an independent non-executive director and a member of the auditcommittee of I.T Limited, a company listed on the Hong Kong Stock Exchange (Stock Code: 00999),since August 2007; and as an executive director and deputy managing director of COSCO SHIPPINGPorts Limited (“COSCO Ports”) (中遠海運港口有限公司), a company listed on the Hong Kong StockExchange (Stock Code: 01199), since July 1996. Dr. Wong also served as an independentnon-executive director of Mingfa Group (International) Company Limited (明發集團(國際)有限公司), acompany listed on the Hong Kong Stock Exchange (Stock Code: 00846), from September 2018 toMarch 2019, and as an independent non-executive director and a member of the audit committee ofAsia Investment Finance Group Limited (亞投金融集團有限公司), a company listed on the Hong KongStock Exchange (Stock Code: 00033), from October 2016 to February 2018.
Notwithstanding the fact that Dr. Wong currently has independent directorship engagementswith six listed companies, Dr. Wong confirmed that he would devote sufficient time to act as ournon-executive Director based on the following:
Š his role in our Group is non-executive in nature and he will not be involved in the dailymanagement of our Group’s business, and thus his engagement as our independentnon-executive Director will not require his full-time participation;
Š except in COSCO Ports, he is neither a full-time member of the aforementioned listedcompanies nor involved in day-to-day operations or management of such companies, andthus has no management responsibility therein;
218
DIRECTORS AND SENIOR MANAGEMENT
Š he has maintained a high attendance rate for board meetings, committee meetings andshareholders’ meetings for the aforementioned listed companies during the respectivelatest financial periods since his appointment date;
Š with his knowledge and experience, Dr. Wong has not found difficulties in devoting histime to and managing his time with the listed companies where he serves as anindependent non-executive director, and he is confident that with his experience in beingresponsible for several roles, he will be able to fulfill his duties to our Company properly;and
Š none of the listed companies that he has directorship engagement with has questioned orcomplained about his time devoted to such listed companies.
Dr. Wong has undertaken to devote sufficient time to attend to his work as an independentnon-executive Director of our Group, and also, based on the foregoing, the Board does not have reasonto believe that the directorships currently held by Dr. Wong will result in his having insufficient time toact as our independent non-executive Director or improperly discharge his fiduciary duties as aDirector of our Company.
Dr. Wong has also served as the Chairman of the Financial Reporting Council (財務匯報局)since December 2018, as the immediate past Chairman of The Hong Kong Institute of Directors (香港董事學會) since July 2014, and as a committee member of the Operations Review Committee of theIndependent Commission Against Corruption (“ICAC”) (香港廉政公署審查貪污舉報諮詢委員會) sinceJanuary 2017.
Dr. Wong received a Master of Business Administration from Andrews University in theUnited States in August 1992 and a Doctorate of Business Administration from The Hong KongPolytechnic University in December 2007.
Mr. Timothy Roberts Warner, age 68, has been appointed as an independent non-executiveDirector, the Chairman of the Remuneration Committee and will be appointed as a member of theStrategy Committee and Audit Committee of the Company upon the completion of the GlobalOffering. Mr. Warner has extensive experience in corporate finance and management operations. Hehas also served as the Chairman of the board of the Tuition Plan Consortium, a national prepaid tuitionplan for private colleges and universities in the United States, and has served as the Co-President ofBoard of Trustees of the Western Reserve Academy since 2010. He has been a Vice Provost for budgetand auxiliaries management at Stanford University since 1994, primarily responsible for strategic andfinancial planning and the line management of several large important service organizations withinStanford University.
Mr. Warner received a Bachelor of Arts with honors in history from Wesleyan University in theUnited States in May 1973, and a Master of Business Administration from the Graduate School ofBusiness of Stanford University in the United States in June 1977.
Mr. Yang Xianxiang (楊現祥), age 52, has been an independent non-executive Director, andwill be a member of the Strategy Committee, Audit Committee, Nomination Committee andRemuneration Committee of the Company upon the completion of the Global Offering. He has heldseveral positions in SITC International Holdings Company Limited (海豐國際控股有限公司), acompany listed on the Hong Kong Stock Exchange (Stock Code: 1308), including as the Chief
219
DIRECTORS AND SENIOR MANAGEMENT
Executive Officer from January 2008 to March 2010, the Chief Executive Officer and executivedirector from April 2010 to February 2013, as well as Vice Chairman since March 2013. He served asthe Chief Executive Officer of Shanghai Haifeng Shipping Ltd. (上海海豐航運有限公司) as well as thePresident of Xin Haifeng Container Transportation Co., Ltd. (新海豐集裝箱運輸有限公司) from May2007 to January 2008, the Executive Vice President and President of Shandong Haifeng InternationalShipping Group Limited (山東海豐國際航運集團有限公司) from January 2002 to January 2005 andJanuary 2005 to May 2007, respectively. He served as the General Manager of Shandong HaifengShipping Business Limited (山東海豐船務有限公司) from August 1997 to December 2001. Mr. Yangcurrently also holds positions in non-commercial organizations, including serving as a VisitingProfessor at the School of Economics and Management of Shanghai Maritime University (上海海事大學經濟管理學院) from June 2015 to June 2018 and from June 2019 until now. He also served as theManaging Director and the Chairman of the Member Recruitment Committee of Y-Triangle CEOOrganization Learning Oasis (楊三角組織能力CEO學習聯盟) since January 2013. Mr. Yang wasgranted the “Leadership Award” at the China Shipping Forum (中國航運論壇) hosted by Capital Linkin May 2016, and the “Best Senior Management Award (最佳高管獎)” at the Eighth TradeWindsShipping China in May 2012.
Mr. Yang received an Associate in English Literature from Shandong University (山東大學) inShandong, China in December 1991, a Master of Business Administration from Asia InternationalOpen University (Macau) in September 2000, and an Executive Master of Business Administrationfrom China Europe International Business School (中歐國際工商學院) in China in April 2006.
Save as disclosed above, none of the Directors held any directorship in public companies, thesecurities of which are listed on any securities market in Hong Kong or overseas in the last three yearsimmediately preceding the date of this prospectus. Save as disclosed herein, to the best knowledge,information and belief of the Directors and having made all reasonable inquiries, there were no othermatters with respect to the appointment of the Directors that need to be brought to the attention of theShareholders and there was no information relating to the Directors that is required to be disclosedpursuant to Rule 13.51(2)(a) to (v) of the Listing Rules. Save as disclosed in the sections headed“Relationships with Controlling Shareholders,” none of the Directors have any interest in any business,other than our Group’s business, which competes or is likely to compete, either directly or indirectly,with our Group’s business.
SENIOR MANAGEMENT
Mr. Wang Xuning (王旭寧), age 50, is the Chairman, Chief Executive Officer and anexecutive Director of the Company, the Chairman of Joyoung and the Global Chief Executive officerof Compass. See “—Directors—Executive Directors.”
Ms. Han Run (韓潤), age 40, is an executive Director and the Chief Financial Officer of theCompany and the Vice Chairwoman of Joyoung. See “—Directors—Executive Directors.”
Mr. Mark Adam Barrocas, age 47, has served as the Global President of the Company sinceJune 2019. He has also served in various other positions within the Group, including serving as thePresident of SharkNinja Operating LLC since September 2008 with responsibility for all of itssubsidiaries. Prior to joining the Group, Mr. Barrocas served as the President of the WearguardDivision of Aramark Uniform Services from November 2005 to September 2008, and also served asSale and Marketing President, Alpha Division and Executive Vice President of Broder Bros., Co. from
220
DIRECTORS AND SENIOR MANAGEMENT
December 2003 to February 2005, and President of Broder Bros., Co. from February 2005 toNovember 2005, respectively.
Mr. Barrocas received a Bachelor’s degree in general studies from the University of Michigan,U.S. in August 2004.
Ms. Yang Ningning (楊寧寧), age 40, has served as the General Manager and a director ofJoyoung since March 2019 and October 2010, respectively, and the Chairwoman of SharkNinja(China) Technology Co., Ltd. since August 2018. She also served as the Vice General Manager ofJoyoung from April 2014 to March 2019, and the Chief Financial Officer of Joyoung from September2007 to October 2013.
Ms. Yang is now attending the City University of Hong Kong Executive M.B.A. program andis expected to receive an Executive Master of Business Administration in October 2019.
Mr. Qiu Jiandiao (裘劍調), age 46, has served as the Chief Financial Officer of Joyoung sinceApril 2014. He also served as the Chief Financial Officer and Financial Manager of JoyoungHousehold Appliances, a subsidiary of the Company, from February 2009 to April 2014 and fromApril 2005 to February 2009, respectively.
Mr. Qiu received an Associate in Accounting from Zhejiang University of Finance andEconomics (浙江財經大學) (formerly known as Zhejiang School of Finance and Economics (浙江財經學院)) in Zhejiang, China in December 1995, and a Master of Business Administration from AsiaMetropolitan University in Selangor Darul Ehsan, Malaysia in July 2018.
Mr. David William Stevenson, age 41, has served as the Chief Financial Officer of Compass,the parent company of the SharkNinja group of companies, since April 2019. He had successively heldseveral positions in SharkNinja, including as Interim Chief Financial Officer from December 2018 toApril 2019, Senior Vice President of Finance and the Chief Accounting Officer from September 2017to December 2018, Vice President of Finance from June 2015 to September 2017 and CorporateController from July 2013 to June 2015. Prior to joining SharkNinja, Mr. Stevenson served as theSenior Manager in the audit practice of Grant Thornton LLP from December 2011 to June 2013, andheld various positions at the accounting firm CCR LLP from September 2002 to November 2011 withthe eventual title of partner.
Mr. Stevenson received a Bachelor of Science in business and economics from LehighUniversity in Pennsylvania, U.S. in June 2000.
COMPANY SECRETARY
Mr. Shan Minqi (單敏奇), has been our Company Secretary since June 25, 2019. He has servedas the director of investment department of Joyoung since March 2017, primarily responsible fordomestic and foreign investment. Prior to joining our Group, he served as an assistant vice president inDBS Bank (星展銀行) in Hong Kong and Singapore from April 2014 to March 2017 and as a staffaccountant and senior accountant in Ernst & Young (安永會計師事務所) in Hong Kong fromSeptember 2008 to September 2011. Mr. Shan has been a member of the Hong Kong Institute ofCertified Public Accountants since November 2011.
221
DIRECTORS AND SENIOR MANAGEMENT
Mr. Shan received a Bachelor of Business Administration in accounting and finance from theUniversity of Hong Kong (香港大學) in November 2008 and a Master of Business Administration fromthe Hong Kong University of Science and Technology (香港科技大學) in May 2013.
BOARD COMMITTEES
The Company has established four Board committees in accordance with the relevant laws andregulations and the corporate governance practice under the Listing Rules, including the StrategyCommittee, the Audit Committee, the Remuneration Committee and the Nomination Committee.
Strategy Committee
The Strategy Committee of the Company consists of six members, including one executiveDirector, namely Mr. Wang Xuning, two non-executive Directors, namely Mr. Hui Chi Kin Max andMr. Stassi Anastas Anastassov, and three independent non-executive Directors, namely Dr. Wong TinYau Kelvin, Mr. Timothy Roberts Warner and Mr. Yang Xianxiang. Mr. Wang Xuning currentlyserves as the Chairman of the Strategy Committee. The primary duties of the Strategy Committee areas follows:
1. to research and make recommendations to the Board on the long-term developmentstrategies and plans of the Company;
2. to research and make recommendations to the Board on the major financing plans of theCompany and other major strategic issues influencing the development of the Company;and
3. to review the implementation of the above matters.
Audit Committee
The Audit Committee of the Company consists of three members, including three independentnon-executive Directors, namely Dr. Wong Tin Yau Kelvin, Mr. Timothy Roberts Warner andMr. Yang Xianxiang. Dr. Wong Tin Yau Kelvin currently serves as the Chairman of the AuditCommittee. The primary duties of the Audit Committee are as follows:
1. to review significant financial policies of the Company and their implementation, andsupervise the financial activities of the Company;
2. to review the financial information and relevant disclosures of the Company;
3. to consider and approve the risk management and internal control evaluation proposal ofthe Company, and supervise and evaluate the risk management and internal control of theCompany;
4. to consider and approve the audit budget, remuneration of staff and appointment anddismissal of major officers of the Company, supervise and evaluate the work of internalaudit of the Company and formulate the medium- to long-term audit plan, annual workingplan and internal audit system-setting plan of the Company as authorized by the Board,and report to the Board;
5. to propose the appointment or dismissal of an external accounting firm, supervise the workof the external accounting firm, and evaluate the report of the external accounting firm toensure that the external accounting firm undertakes its audit responsibilities;
222

DIRECTORS AND SENIOR MANAGEMENT
6. to facilitate communications and monitor the relationship between the internal auditdepartment and the external accounting firm;
7. to monitor the non-compliance of the Company in respect of the financial reports, riskmanagement and internal control; and
8. other matters required by laws, regulations, regulatory documents, the rules of thesecurities regulatory authority of the place where the Shares of the Company are listed andthe requirements of the Memorandum and the Articles of Association, and as authorizedby the Board.
Nomination Committee
The Nomination Committee of the Company consists of three members, including oneexecutive Director, namely Mr. Wang Xuning, and two independent non-executive Directors, namelyDr. Wong Tin Yau Kelvin and Mr. Yang Xianxiang. Mr. Wang Xuning currently serves as theChairman of the Nomination Committee. The primary duties of the Nomination Committee are asfollows:
1. to formulate procedures and standards for the election of Directors and senior managementand make recommendations to the Board on the proposed procedures and standards;
2. to make recommendations to the Board on the nomination of candidates for Directors,Presidents and secretary of the Board;
3. to preliminarily examine the eligibility of candidates for Directors and seniormanagement;
4. to make recommendations to the Board on the nomination of candidates for chairmen andmembers of the Board committees; and
5. other matters required by laws, regulations, regulatory documents, the rules of thesecurities regulatory authority of the place where the Shares of the Company are listed andthe requirements of the Memorandum and the Articles of Association, and as authorizedby the Board.
Remuneration Committee
The Remuneration Committee of the Company consists of one executive Director, namelyMs. Han Run, and two independent non-executive Directors, namely Mr. Timothy Roberts Warner andMr. Yang Xianxiang. Mr. Timothy Roberts Warner currently serves as the Chairman of theRemuneration Committee. The primary duties of the Remuneration Committee are as follows:
1. to organize and formulate the remuneration policy and plan of Directors and seniormanagement and submit to the Board for approval, and propose the remunerationdistribution plan according to the performance evaluation of Directors and seniormanagement and submit to the Board for approval; and
2. other matters required by laws, regulations, regulatory documents, the rules of thesecurities regulatory authority of the place where the Shares of the Company are listed andthe requirements of the Memorandum and the Articles of Association, and as authorizedby the Board.
223
DIRECTORS AND SENIOR MANAGEMENT
BOARD DIVERSITY POLICY
In order to enhance the effectiveness of our Board and to maintain the high standard ofcorporate governance, our Board has adopted a diversity policy which sets forth the objective and theapproach to achieve and maintain an appropriate balance of diversity of perspectives of our Board.Pursuant to the diversity policy of our Board, selection of Directors will be based on a number offactors, including but not limited to, gender, skills, age, professional experience, knowledge, culturaland educational background, and length of service. The final decision of the appointment will be basedon the merit and contribution that the selected candidate may bring to our Board.
DIRECTORS’ AND SENIOR MANAGEMENT’S REMUNERATION
For details of the service contracts and appointment letters that we have entered into with ourDirectors, see “Appendix IV—Statutory and General Information—C. Further Information about OurDirectors—1. Particulars of Directors’ service contracts and appointment letters.”
The aggregate amount of fees, salaries, allowances, performance-related bonuses, share awardexpense, pension scheme contributions and benefits in kind we paid to our Directors in respect of thefinancial years ended December 31, 2016, 2017 and 2018 and the six months ended June 30, 2019were US$1,251,000, US$1,284,000, US$1,607,000 and US$926,000, respectively. Further informationon the remuneration of each Director during the Track Record Period is set out in “Appendix I—Accountants’ Report.”
Under the arrangements currently in force, the aggregate amount of remuneration payable to,and benefits in kind received by our Directors by our Group for the financial year ending December 31,2019 is expected to be approximately US$1,864,000.
The five highest paid individuals in our Group for the financial years ended December 31, 2016,2017 and 2018 and the six months ended June 30, 2019 included three, two, nil and nil Director(s),respectively, whose remuneration is included in the aggregate amount of fees, salaries, allowances,performance-related bonuses, share award expense, pension scheme contributions and benefits in kind wepaid to the relevant Director(s) as set out above. For the financial years ended December 31, 2016, 2017and 2018 and the six months ended June 30, 2019, the aggregate amount of salaries, allowances andbenefits in kind, performance-related bonuses, share award expenses, and pension scheme contributionspaid to the remaining two, three, five and five individuals were US$518,000, US$2,014,000,US$8,453,000 and US$4,340,000, respectively. Further details on the remuneration of the five highestpaid individuals during the Track Record Period is set out in “Appendix I—Accountants’ Report.”
During the Track Record Period, no remuneration was paid to any Director or any of the fivehighest paid individuals of our Group as an inducement to join or upon joining our Group. Nocompensation was paid to or receivable by any Director or any of the five highest paid individualsduring the Track Record Period for the loss of any office in connection with the management of theaffairs of any member of our Group. None of our Directors waived any emoluments during the TrackRecord Period.
Save as disclosed above, no other payments have been paid or are payable in respect of theTrack Record Period to our Directors by our Group.
224

DIRECTORS AND SENIOR MANAGEMENT
RSU PLAN
In order to recognize and reward our management and employees for their contribution to ourGroup, to attract best available personnel to provide service to our Group, and to provide additionalincentives to them to remain with and further promote the success of our Group’s business, ourCompany adopted the RSU Plan on October 9, 2019. See “Appendix IV—Statutory and GeneralInformation—D. RSU Plan.”
CORPORATE GOVERNANCE
Our Company intends to comply with all code provisions under the Principles of GoodGovernance, Code Provisions and Recommended Best Practices in Appendix 14 to the Listing Rules(the “Code”) after the Listing except for paragraph A.2.1 of the Code, which provides that the roles ofchairman and chief executive officer should be separate and should not be performed by the sameindividual. Also as informed and recommended by the Code, an issuer could adopt a more suitablealternative to a code provision, so long as reasons for such deviation are given.
The roles of Chairman and Chief Executive Officer of our Company are both performed byMr. Wang Xuning. Mr. Wang is responsible for formulating the overall business strategies andconducting general management of our Group. He is the key person contributive to the developmentand business expansion of Joyoung since the invention of the soymilk maker in 1990s as mentioned inthe section headed “Business.” Also, ever since the SharkNinja Acquisition, being the chairman ofJoyoung and Global Chief Executive Officer of Compass, he has acted as the main point ofcommunication between the corporate operation of Joyoung and SharkNinja. Regarding the rapidlyevolving small household appliance industry in which our Group operates, our Chairman and ChiefExecutive Officer needs to have a profound understanding and be equipped with extensive industryknowledge to stay abreast of market changes, so as to facilitate our business development. After takinginto consideration the aforesaid factors, we consider that vesting the roles of our Chairman and ChiefExecutive Officer in the same person, being Mr. Wang, is beneficial to our business prospects andoperational coordination between Joyoung and SharkNinja.
The balance of power and authority is ensured by the composition and operation of our Board.Our Board currently comprises three executive Directors (including Mr. Wang), two non-executiveDirectors and three independent non-executive Directors, and therefore the overall strategic and other keybusiness policies of our Group are made collectively by our eight Directors after thorough discussion atour Board. The Board encourages all Directors to attend Board meetings and meetings of relevant Boardcommittees, at which (i) the Chairman of the Board and the Chairmen of relevant Board committees willmake sure that all Directors are informed of, and given sufficient time to discuss, all matters proposed atthe meetings; and (ii) the senior management will provide adequate, accurate, clear, complete and reliabledata and information to the Board members in a timely manner. Therefore, the Board believes that ourbalance of power and authority has been well guaranteed considering the above factors, and does notpropose to separate the functions of our Chairman and Chief Executive Officer.
The Board will also continue to review the effectiveness of the corporate governance structureof our Group in order to assess the reasonableness and necessity of the roles of the Chairman and theChief Executive Officer being vested in the same person.
225
DIRECTORS AND SENIOR MANAGEMENT
COMPLIANCE ADVISER
We have appointed Altus Capital Limited as our compliance adviser (the “ComplianceAdviser”) pursuant to Rule 3A.19 of the Listing Rules for a period commencing on the date of theListing of our Shares on the Stock Exchange and ending on the date on which the Company distributesthe annual report in respect of the financial results for the first full financial year commencing after thedate of the Listing, or the date on which the agreement between the Compliance adviser and us isterminated, whichever is earlier.
The Compliance Adviser shall provide the Company with certain services, including guidanceand advice as to compliance with the requirements under the Listing Rules and applicable laws, rules,codes and guidelines.
The Company agrees to indemnify the Compliance Adviser for actions against and lossesincurred by the Compliance Adviser arising out of, or in connection with, certain events, including theperformance by the Compliance Adviser of its duties under the agreement between the ComplianceAdviser and us.
The Compliance Adviser will act as the additional channel of communication between theCompany and the Stock Exchange.
226

SUBSTANTIAL SHAREHOLDERS
SUBSTANTIAL SHAREHOLDERS
So far as our Directors are aware, immediately following the completion of the GlobalOffering, the following persons are expected to have an interest and/or short positions in the Shares orunderlying Shares of our Company which would fall to be disclosed to us pursuant to the provisions ofDivisions 2 and 3 of Part XV of the SFO, or, who are, directly or indirectly, interested in 10% or moreof the nominal value of any class of our share capital carrying rights to vote in all circumstances atgeneral meetings of our Company:
Name of shareholder Nature of interest
Shares held as of the date ofthis prospectus (assumingthe RSU Shares have been
issued)
Shares held immediatelyfollowing the completion of the
Global Offering (assumingthe Over-allotment Option is
not exercised)
Shares held immediatelyfollowing the completion of
the Global Offering(assuming the Over-allotment
Option is exercised in full)
Number Percentage Number Percentage Number Percentage
JS Holding . . . . . . . . . . . . . . . . . Beneficial interest 1,603,578,331 56.62% 1,603,578,331 48.12% 1,603,578,331 47.06%Hezhou(1) . . . . . . . . . . . . . . . . . . Interest in controlled
corporations1,603,578,331 56.62% 1,603,578,331 48.12% 1,603,578,331 47.06%
Tong Zhou(1) . . . . . . . . . . . . . . . Interest in controlledcorporations
1,603,578,331 56.62% 1,603,578,331 48.12% 1,603,578,331 47.06%
Jin Cheng(2) . . . . . . . . . . . . . . . . Interest held jointlywith other persons
1,603,578,331 56.62% 1,603,578,331 48.12% 1,603,578,331 47.06%
Mr. Zhu Hongtao(2) . . . . . . . . . . Interest held jointlywith other persons
1,603,578,331 56.62% 1,603,578,331 48.12% 1,603,578,331 47.06%
Fortune Spring(2) . . . . . . . . . . . . Interest held jointlywith other persons
1,603,578,331 56.62% 1,603,578,331 48.12% 1,603,578,331 47.06%
Mr. Zhu Zechun(2) . . . . . . . . . . . Interest held jointlywith other persons
1,603,578,331 56.62% 1,603,578,331 48.12% 1,603,578,331 47.06%
Tuo Ge(2) . . . . . . . . . . . . . . . . . . Interest held jointlywith other persons
1,603,578,331 56.62% 1,603,578,331 48.12% 1,603,578,331 47.06%
Ms. Yang Ningning(2) . . . . . . . . Interest held jointlywith other persons
1,603,578,331 56.62% 1,603,578,331 48.12% 1,603,578,331 47.06%
Yuan Jiu(2) . . . . . . . . . . . . . . . . . Interest held jointlywith other persons
1,603,578,331 56.62% 1,603,578,331 48.12% 1,603,578,331 47.06%
Ms. Huang Shuling(2) . . . . . . . . . Interest held jointlywith other persons
1,603,578,331 56.62% 1,603,578,331 48.12% 1,603,578,331 47.06%
Xi Yu(2) . . . . . . . . . . . . . . . . . . . Interest held jointlywith other persons
1,603,578,331 56.62% 1,603,578,331 48.12% 1,603,578,331 47.06%
Ms. Han Run(2)(7) . . . . . . . . . . . . Interest held jointlywith other persons
1,603,578,331 56.62% 1,603,578,331 48.12% 1,603,578,331 47.06%
Beneficial owner 11,329,472 0.40% 11,329,472 0.34% 11,329,472 0.33%Jin Yu(2) . . . . . . . . . . . . . . . . . . . Interest held jointly
with other persons1,603,578,331 56.62% 1,603,578,331 48.12% 1,603,578,331 47.06%
Mr. Jiang Guangyong(2) . . . . . . . Interest held jointlywith other persons
1,603,578,331 56.62% 1,603,578,331 48.12% 1,603,578,331 47.06%
Sol SPC(3) . . . . . . . . . . . . . . . . . Beneficial interest 368,304,245 13.00% 368,304,245 11.05% 368,304,245 10.81%STL(3) . . . . . . . . . . . . . . . . . . . . . Interest in controlled
corporations368,304,245 13.00% 368,304,245 11.05% 368,304,245 10.81%
Mr. Lee Puay Khng(3) . . . . . . . . Interest in controlledcorporations
368,304,245 13.00% 368,304,245 11.05% 368,304,245 10.81%
XNL(1)(2)(3)(4) . . . . . . . . . . . . . . . Interest in controlledcorporations,interest held jointlywith other persons
1,971,882,576 69.62% 1,971,882,576 59.17% 1,971,882,576 57.87%
Mr. Wang Xuning(1)(2)(3)(4)(8) . . . Interest in controlledcorporations,interest held jointlywith other persons
1,971,882,576 69.62% 1,971,882,576 59.17% 1,971,882,576 57.87%
Beneficial owner 45,317,890 1.60% 45,317,890 1.36% 45,317,890 1.33%Easy Home(5) . . . . . . . . . . . . . . . Beneficial interest 296,004,139 10.45% 296,004,139 8.88% 296,004,139 8.69%Comfort Home(5) . . . . . . . . . . . . Beneficial interest 65,556,166 2.31% 65,556,166 1.97% 65,556,166 1.92%CDH Fund V, L.P.(5) . . . . . . . . . Interest in controlled
corporations361,560,305 12.76% 361,560,305 10.85% 361,560,305 10.61%
CDH V Holdings CompanyLimited . . . . . . . . . . . . . . . . .
Interest in controlledcorporations
361,560,305 12.76% 361,560,305 10.85% 361,560,305 10.61%
MR Investor(6) . . . . . . . . . . . . . . Beneficial interest 209,014,116 7.38% 209,014,116 6.27% 209,014,116 6.13%MR Trust Investor(6) . . . . . . . . . Beneficial interest 65,556,166 2.31% 65,556,166 1.97% 65,556,166 1.92%Mr. Mark Rosenzweig(6) . . . . . . Interest in controlled
corporations,Family interest
274,570,282 9.69% 274,570,282 8.24% 274,570,282 8.05%
227
SUBSTANTIAL SHAREHOLDERS
(1) As of the date of this prospectus, JS Holding directly held 1,603,578,331 Shares in our Company. Hezhou is the general partnerexercising operational control over JS Holding, meanwhile Tong Zhou is the limited partner of JS Holding established by the ControllingShareholders Group through its investment entities with almost 100% of partnership interest. In addition, Hezhou is a wholly-ownedsubsidiary of XNL which is wholly owned by Mr. Wang Xuning. Therefore, each of Hezhou, Tong Zhou, XNL and Mr. Wang Xuning isdeemed to be interested in the 1,603,578,331 Shares held by JS Holding for the purpose of Part XV of the SFO.
(2) As of the date of this prospectus, XNL was wholly owned by Mr. Wang Xuning, Jin Cheng was wholly owned by Mr. Zhu Hongtao,Fortune Spring was wholly owned by Mr. Zhu Zechun, Tuo Ge was wholly owned by Ms. Yang Ningning, Yuan Jiu was wholly ownedby Ms. Huang Shuling, Xi Yu was wholly owned by Ms. Han Run, and Jin Yu was wholly owned by Mr. Jiang Guangyong. Mr. WangXuning, Mr. Zhu Hongtao, Mr. Zhu Zechun, Ms. Yang Ningning, Ms. Huang Shuling, Ms. Han Run and Mr. Jiang Guangyong,respectively through XNL, Jin Cheng, Fortune Spring, Tuo Ge, Yuan Jiu, Xi Yu and Jin Yu commonly hold their interest in ourCompany through JS Holding and formed the Controlling Shareholders Group. As such, each of Mr. Wang Xuning, Mr. Zhu Hongtao,Mr. Zhu Zechun, Ms. Yang Ningning, Ms. Huang Shuling, Ms. Han Run and Mr. Jiang Guangyong is deemed to be interested in theShares held by other members of the Controlling Shareholders Group, and each of the Controlling Shareholders Group is deemed to beinterested in the 1,603,578,331 Shares held by Hezhou Limited Partnership for the purpose of Part XV of the SFO.
(3) As of the date of this prospectus, Sol SPC directly held 368,304,245 Shares in our Company. Mr. Lee Puay Khng held 368,304.24536class A participating shares in Sol SPC, while STL, which is wholly owned by XNL, which is in turn wholly owned by Mr. WangXuning, held 100 management shares with the right to receive notice of, attend at and vote at general meeting of Sol SPC. Therefore,each of Mr. Lee Puay Khng, STL, XNL and Mr. Wang Xuning are deemed to be interested in the 368,304,245 Shares held by Sol SPCfor the purpose of Part XV of the SFO. As of the date of this prospectus and assuming the RSU Shares have been issued, Sol SPCpledged approximately 1.9% of the total issued Shares of the Company in favor of OCI Capital Limited, an Independent Third Party, asthe security for a two year 10.5 per cent. notes (“OCI Notes”) of up to US$18 million issued by Sol SPC to OCI Capital Limited.According to the OCI Notes, (1) the pledge will be released upon completion of the Global Offering; and (2) after expiry of the Lock-upPeriod, Sol SPC is required to re-pledge such amount of Shares with a total value equals to approximately three times the total principalamount of the OCI Notes. As of the date of this prospectus and assuming the RSU Shares have been issued, Sol SPC pledgedapproximately 6.9% of the total issued Shares of the Company in favor of certain Independent Third Parties as the security for severalloan facilities with a total principal amount of US$65 million entered into between Sol SPC and such Independent Third Parties.According to the loan facilities, (1) the pledge will be released upon completion of the Global Offering; and (2) after expiry of the Lock-up Period, Sol SPC is required to re-pledge such amount of Shares with a total value equals to approximately three times the totalprincipal amount of the loan facilities.
(4) Each of XNL and Mr. Wang Xuning is deemed to be interested in the 1,971,882,576 Shares held by both JS Holding and Sol SPC. Seenote (2) and note (3) above.
(5) As of the date of this prospectus, Easy Home and Comfort Home directly held 296,004,139 and 65,556,166 Shares in our Company,respectively. Each of Easy Home and Comfort Home is a wholly-owned subsidiary of CDH Fund V, L.P. whose general partner is CDHV Holdings Company Limited which focuses on private equity investments. Therefore, each of CDH Fund V, L.P. and CDH V HoldingsLimited are deemed to be interested in the 296,004,139 and 65,556,166 Shares held by Easy Home and Comfort Home, for the purposeof Part XV of the SFO.
(6) As of the date of this prospectus, MR Investor directly held 209,014,116 Shares in our Company. MR Investor was wholly owned byMr. Mark Rosenzweig. Therefore, Mr. Mark Rosenzweig is deemed to be interested in the 209,014,116 Shares held by MR Investor forthe purpose of Part XV of the SFO. As of the date of this prospectus, MR Trust Investor directly held 65,556,166 Shares in ourCompany, which were held for the benefits of the family interest of Mr. Mark Rosenzweig. Therefore, Mr. Mark Rosenzweig is deemedto be interested in the 65,556,166 Shares held by MR Trust Investor for the purpose of Part XV of the SFO.
(7) Ms. Han Run is interested in 11,329,472 restricted stock units granted to her under the RSU Plan entitling her to receive up to 11,329,472Shares subject to vesting.
(8) Mr. Wang Xuning is interested in 45,317,890 restricted stock units granted to him under the RSU Plan entitling him to receive up to45,317,890 Shares subject to vesting.
Except as disclosed above, our Directors are not aware of any other person who will,immediately following the completion of the Global Offering, have any interest and/or short positionsin the Shares or underlying shares of our Company which would fall to be disclosed to us pursuant tothe provisions of Divisions 2 and 3 of Part XV of the SFO, or, who are, directly or indirectly, interestedin 10% or more of the nominal value of any class of our share capital carrying rights to vote in allcircumstances at general meetings of our Company.
228

SHARE CAPITAL
AUTHORIZED AND ISSUED SHARE CAPITAL
The following is a description of the authorized and issued share capital of our Company inissue and to be issued as fully paid or credited as fully paid immediately following the completion ofthe Global Offering:
Aggregatenominalvalue ofShares(US$)
As of the Date of this ProspectusAuthorized share capital5,000,000,000 shares of US$0.00001 each . . . . . . . . . . . . . . . . . . . . . . . . . . . . . . . . . . . . . . . . . . . . . . . 50,000Issued share capital2,832,368,177 shares of US$0.00001 each . . . . . . . . . . . . . . . . . . . . . . . . . . . . . . . . . . . . . . . . . . . . . . . 28,323.68
Immediately after completion of the Global OfferingAuthorized Share capital5,000,000,000 shares of US$0.00001 each . . . . . . . . . . . . . . . . . . . . . . . . . . . . . . . . . . . . . . . . . . . . . . . 50,000Issued Share capital2,832,368,177 shares of US$0.00001 each . . . . . . . . . . . . . . . . . . . . . . . . . . . . . . . . . . . . . . . . . . . . . . . 28,323.68Shares to be issued under the Global Offering (assuming the Over-allotment Option is not exercised)499,830,000 shares of US$0.00001 each . . . . . . . . . . . . . . . . . . . . . . . . . . . . . . . . . . . . . . . . . . . . . . . . 4,998.3Total issued Shares immediately after completion of the Global Offering (assuming the Over-allotment Option is
not exercised)3,332,198,177 shares of US$0.00001 each . . . . . . . . . . . . . . . . . . . . . . . . . . . . . . . . . . . . . . . . . . . . . . . 33,321.98
ASSUMPTIONS
The above table assume that: (i) the RSU Shares have been issued prior to the completion of theGlobal Offering; (ii) the Global Offering becomes unconditional and the Shares are issued pursuant tothe Global Offering; and (iii) the Over-allotment Option is not exercised. The above table also does nottake into account any Shares which may be issued or repurchased by us under the general mandatesgranted to our Directors as referred to below.
RANKING
The Offer Shares will rank pari passu in all respects with all Shares currently in issue or to beissued as mentioned in this prospectus, and will qualify and rank equally for all dividends or otherdistributions declared, made or paid on the Shares on a record date which falls after the date of thisprospectus.
CIRCUMSTANCES UNDER WHICH GENERAL MEETINGS ARE REQUIRED
Pursuant to the Cayman Companies Law and the terms of the Memorandum of Association andArticles of Association, our Company may from time to time by ordinary resolution of shareholders(i) increase its capital; (ii) consolidate and divide its capital into shares of larger amount; (iii) divide itsshares into several classes; (iv) subdivide its shares into shares of smaller amount; and (v) cancel anyshares which have not been taken. In addition, our Company may be subject to the provisions of theCayman Companies Law reduce its share capital or capital redemption reserve by its shareholderspassing a special resolution. See “Appendix III—Summary of the Constitution of the Company andCayman Islands Company Law—Summary of the Constitution of the Company—2. Articles ofAssociation.”
229
SHARE CAPITAL
GENERAL MANDATE TO ISSUE SHARES
Subject to the Global Offering becoming unconditional, our Directors have been granted ageneral unconditional mandate to allot, issue and deal with Shares with a total nominal value of notmore than the sum of:
Š 20% of the aggregate nominal value of the Shares in issue immediately followingcompletion of the Global Offering; and
Š the aggregate nominal value of Shares repurchased by us under the authority referred to inthe paragraph headed “—General Mandate to Repurchase Shares” in this section.
This general mandate to issue Shares will expire at the earliest of:
Š the conclusion of the next annual general meeting of our Company unless otherwiserenewed by an ordinary resolution of our Shareholders in a general meeting, eitherunconditionally or subject to conditions; or
Š the expiration of the period within which our Company’s next annual general meeting isrequired by the Memorandum of Association and Articles of Association or any otherapplicable laws to be held; or
Š the date on which it is varied or revoked by an ordinary resolution of our Shareholders ingeneral meeting.
See “Appendix IV—Statutory and General Information—A. Further Information about OurCompany and Our Subsidiaries—4. Resolutions of the Shareholders of Our Company dated October 9,2019.”
GENERAL MANDATE TO REPURCHASE SHARES
Subject to the Global Offering becoming unconditional, our Directors have been granted ageneral unconditional mandate to exercise all the powers of our Company to repurchase our ownsecurities with nominal value of up to 10% of the aggregate nominal value of our Shares in issueimmediately following the completion of the Global Offering (excluding any Shares which may beissued pursuant to the exercise of the Over-allotment Option).
The repurchase mandate only relates to repurchases made on the Stock Exchange, or on anyother stock exchange on which our Shares are listed (and which are recognized by the SFC and theStock Exchange for this purpose), and which are in accordance with the Listing Rules. A summary ofthe relevant Listing Rules is set out in the section headed “Appendix IV—Statutory and GeneralInformation—A. Further Information about Our Company and Our Subsidiaries—4. Resolutions of theShareholders of Our Company dated October 9, 2019.”
This general mandate to repurchase Shares will expire at the earliest of:
Š the conclusion of the next annual general meeting of our Company unless otherwiserenewed by an ordinary resolution of our Shareholders in a general meeting, eitherunconditionally or subject to conditions; or
Š the expiration of the period within which our Company’s next annual general meeting isrequired by the Memorandum of Association and Articles of Association or any otherapplicable laws to be held; or
230

SHARE CAPITAL
Š the date on which it is varied or revoked by an ordinary resolution of our Shareholders in ageneral meeting.
See “Appendix IV—Statutory and General Information—A. Further Information about OurCompany and Our Subsidiaries—4. Resolutions of the Shareholders of Our Company dated October 9,2019.”
RSU PLAN
We adopted the RSU Plan on October 9, 2019. See “Appendix IV—Statutory and GeneralInformation—D. RSU Plan” for further information.
231
FINANCIAL INFORMATION
You should read this section in conjunction with our consolidated financial information,including the accompanying notes thereto, as set out in “Appendix I—Accountants’ Report.” Ourconsolidated financial information has been prepared in accordance with IFRS, which may differin material respects from generally accepted accounting principles in other jurisdictions,including the United States.
Our business expanded significantly following our acquisition of SharkNinja onSeptember 29, 2017. As a result, our results of operations in the subsequent periods are notdirectly comparable with those in the previous periods.
To comply with the applicable regulations and disclosure requirements, as well as topresent material information necessary to assess the impact of the acquisition of SharkNinja, thisprospectus contains pre-acquisition financial statements of SharkNinja for the fiscal years endedMarch 31, 2016 and 2017 and the period from April 1, 2017 to September 28, 2017, which havebeen audited by Ernst & Young and are disclosed in Section III of the notes to the Accountants’Report in Appendix I to this prospectus.
The following discussion and analysis contain forward-looking statements that reflect ourcurrent views with respect to future events and financial performance. These statements arebased on our assumptions and analysis in light of our experience and perception of historicaltrends, current conditions and expected future developments, as well as other factors we believeare appropriate under the circumstances. However, whether actual outcomes and developmentswill meet our expectations and predictions depends on a number of risks and uncertainties. Inevaluating our business, you should carefully consider the information provided in thisprospectus, including but not limited to the sections headed “Risk Factors” and “Business.”
OVERVIEW
We are a global leader in high-quality, innovative small household appliances. Our success iscentered around our deep understanding of consumer needs, and is built on our strong productinnovation and design capability powered by a global research and development platform, marketingstrengths driving high brand engagement, and an omni-channel distribution coverage with highpenetration. We continuously develop new products and expand into new categories. Through ourdiverse product portfolio, we cultivate markets, create consumer demand, lead our categories bybuilding up market anticipation around product launches, and reshape consumer behaviors andlifestyles around the world. With our trusted market-leading brands, Joyoung, Shark and Ninja, wecontinue to maintain our leadership in China and the United States, the two largest small householdappliance markets, and to focus on expanding globally in new markets.
Through our global research and development platform, we have introduced transformationalinnovative design-driven products to the markets, ranging from revolutionary products that are originalor market-first, to evolutionary products that are market-disruptive, to upgraded products withimproved functionalities and designs.
Our business processes, from research and development, procurement and production to salesand marketing, are fully integrated and responsive to consumer needs. We focus on our three corecompetencies: (i) developing transformational innovative products with appealing designs,(ii) effecting multi-form brand marketing and (iii) building a global omni-channel sales network. They
232
FINANCIAL INFORMATION
are supported by our operational infrastructure, including global research and development platform,centralized supply chain with a global reach and our comprehensive information management systemacross the entire value chain.
We offered our transformational innovative small household appliances under the brand nameof Joyoung prior to the acquisition of SharkNinja in September 2017 and have expanded our businesssignificantly since then. We operated three business segments during the Track Record Period:
Joyoung segment continues offering small household appliances, focusing on kitchenappliances. In China, our Joyoung brand maintains the largest market share in several innovativeproduct categories. For example, according to the Frost & Sullivan Report, the market share of oursoymilk makers was 80.6%, that of our blenders was 36.6% and that of our food processors was36.8%, each in terms of retail sales value in 2018.
SharkNinja segment focuses on home environment appliances and kitchen appliances. In NorthAmerica, Shark and Ninja brands maintain leading market share in a number of product categoriesthrough an intense focus on quality, reliability, consumer satisfaction and accessible innovation toconsumers. According to the Frost & Sullivan Report, the market share in the United States of ourShark brand in the vacuum market was 36.4% in 2018, and that of our Ninja brand in the blendersmarket was 30.2% in the same year.
Others segment represents Jiuyang Bean’s business of selling soymilk powder and commercialsoymilk makers. We ceased to have this segment since November 2018, following the deconsolidationof Jiuyang Bean. See “—Description of Major Components of Consolidated Income Statement—Revenue—Others Segment.”
Our revenue increased from US$1,103.0 million in 2016 to US$1,563.4 million in 2017, andincreased further to US$2,681.9 million in 2018, representing a CAGR of 55.9%. It increased by 7.1%from US$1,153.9 million for the six months ended June 30, 2018 to US$1,235.8 million for the sameperiod in 2019. Our gross profit increased from US$351.4 million in 2016 to US$519.1 million in2017, and increased further to US$999.0 million in 2018, representing a CAGR of 68.6%. It increasedby 8.6% from US$425.4 million for the six months ended June 30, 2018 to US$462.1 million for thesame period in 2019. Our net profit was US$122.4 million, US$140.9 million, US$112.1 million,US$20.6 million and US$21.9 million in 2016, 2017, 2018 and the six months ended June 30, 2018and 2019, respectively.
OUR ACQUISITION OF SHARKNINJA
We completed the acquisition of SharkNinja on September 29, 2017, and its results ofoperations have been consolidated in our financial statements since then. Our statement of profit andloss for the year ended December 31, 2017 reflects the results of SharkNinja from September 29, 2017to December 31, 2017.
Prior to the acquisition, SharkNinja’s revenue was US$1,438.4 million, US$1,354.8 million andUS$588.5 million for its fiscal years ended March 31, 2016 and 2017 and the period from April 1,2017 to September 28, 2017, respectively. For the same periods, its gross profit was US$594.1 million,US$576.7 million and US$241.8 million, respectively. The consolidated financial statements and theaccompanying notes of SharkNinja prior to the acquisition are set forth in Section III of the notes to theAccountants’ Report in Appendix I to this prospectus.
233

FINANCIAL INFORMATION
For more information regarding the acquisition, see “History, Reorganization and CorporateStructure—Major Acquisition” and note 36 to the Accountants’ Report in Appendix I to thisprospectus.
FACTORS AFFECTING OUR RESULTS OF OPERATIONS AND FINANCIAL CONDITION
Our results of operations, financial condition and the period-to-period comparability of ourfinancial performance are principally affected by the following factors:
Our ability to continuously offer innovative products and maintain our leadership in acompetitive industry
We operate in highly competitive markets characterized by, among other things, frequentintroduction of new products, short product life cycles, rapid adoption of technological and productadvancements. Capitalizing on our relentless efforts in studying consumers’ preferences and behaviorsand the insight gained therefrom, we have been continuously focusing on developing innovativeproducts which address their needs and pain points. For example, we have successfully launched ourblockbuster products such as robotic vacuums, cordless stick vacuums, Foodi and high-performancemultifunctional blenders, which reflect our deep understanding of customers and the market. In 2018,New Products contributed approximately 22.4% to our total revenue. It is essential for us to continuedoing so in a timely manner in order for us to maintain and strengthen our market position. Our abilityto continuously launch innovative products that are well received by the market and our customerscould increase our sales volume and market share, as well as increase our economies of scale.
Our ability to capture the market opportunities of consumption upgrade and enhance our resultsof operations
Our results of operations are affected by, among other things, the combined effect of salesvolume, selling prices and mix of our products. As a general matter, our sales volume is affected by anumber of factors, including general market conditions, product innovation, consumer behaviors andaccess to consumers. In established markets, such as the United States, sales volume is primarilydriven by product replacements and upgrades. Our ability to increase sales volume in these markets isparticularly dependent on the introduction of, and attracting customer demand for, innovative products.In emerging markets such as China, where sales volume is to a larger extent driven by introduction ofnew product lines and penetration, our success is largely dependent on expansion of our distributionnetwork to broaden our access to consumers and on introduction of new products to cultivate andgenerate consumer demand.
The recent consumption upgrade generally features consumers’ strong desire for better productfunctionalities, design and qualities as well as better experiences, and consumers’ willingness to paymore for them. To embrace this trend and to attract customers with stronger purchasing power, wehave developed and launched innovative products with revolutionary or evolutionary functionalities,which generally commanded premium pricing during the Track Record Period. At the same time, forthe consumers with more focus on value for money, we continue to launch products that meet theirneeds and maintain our market share in this market, which generates reoccurring revenue and stableprofit. At times, we may launch various promotion activities which may affect our selling prices.
Our results of operations are further dependent on our ability to achieve a favorable productmix. To this end, we maintain an extensive product portfolio with a wide range of pricing and margin
234
FINANCIAL INFORMATION
levels catering to the diverse needs of consumers with different purchasing power and preferences,which helps to maintain our overall profit margin.
Brand recognition and commercialization capabilities
In line with the consumption upgrade in China and elsewhere in the world, consumers are moresensitive and exposed to brands. Acknowledging that brand recognition plays an increasinglyimportant role in consumers’ purchasing decisions, we continue to enhance our brand recognition inthe market. We are a global leader in high-quality, innovative small household appliances, with oursuccessful and renowned brands worldwide of Joyoung, Shark and Ninja. Our strongcommercialization capabilities reinforce our established brand image. We believe that our strong brandnames, product quality and strong commercialization capabilities have enabled us to build a highdegree of confidence and brand loyalty among our consumers in our products, which generally enableus to continuously introduce new products and have a strong pricing power on new product rolloutsand upgrades. To improve brand recognition, we have invested and will continue to invest in marketingand advertising programs.
Our ability to expand and manage our omni-channel network
We have established differentiated channel strategies and robust omni-channel sales anddistribution networks that are tailored to the respective local markets, involving extensive online andoffline sales and distribution resources. Consolidation and optimization of our omni channels maytemporarily affect our sales performance and revenue. In addition, as we pursue a global expansionstrategy to extend our business into other international markets, we may not implement our sales andmarketing strategies and utilize our omni-channel sales, marketing and distribution networks as well aswe do in our existing markets, and our financial performance may be affected as a result.
Prices and stable supplies of raw materials, components and finished products
We primarily rely on OEM suppliers to provide finished products and, to a much lesser extent,procure certain raw materials and components for in-house manufacturing. Our ability to purchaseparts and components and finished products from our suppliers at commercially reasonable pricesaffects our profitability. Our major raw materials include copper, cold-strip steel, 304 stainless steeland ABS polymer. In 2016, 2017, 2018 and the six months ended June 30, 2018 and 2019,procurement costs to our OEM suppliers and for procurement of components and raw materialsamounted to US$743.5 million, US$1,013.2 million, US$1,587.1 million, US$690.6 million andUS$722.7 million, respectively, accounting for 98.9%, 97.0%, 94.3%, 94.8% and 93.4% of our totalcost of sales, respectively. During the Track Record Period, price fluctuations in our major rawmaterials, components and finished products did not have a material impact on our gross profitmargins. Significant price fluctuations in our major raw materials, components and finished productsmay affect our financial results if we are unable to pass along the increased purchase costs to ourcustomers at the time and in the manner we expect.
Our cost of sales had also been impacted by fluctuations in foreign currency exchange rates as aresult of our global operations. The recent tension between China and the United States over trade mayintensify the fluctuations in US dollars and Renminbi, which may adversely affect our profitability.
235
FINANCIAL INFORMATION
Synergies among our PRC, the US and international operations
Our acquisition of SharkNinja has delivered and is expected to continue delivering synergiesamong our PRC, the US and international operations across product development, marketing andoperations, spanning through our entire value chain including R&D collaboration, market expansionand supply chain purchasing scale.
During the Track Record Period, our international design, research and development teamshave collaborated on the development of a number of products within a short period of time, and havesuccessfully commercialized those products in China and the United States. Our synergetic salesnetwork and omni-channel marketing strategies greatly facilitate our sales and marketing efforts inintroducing our products to the global markets and enhance our revenue generating power. As ourglobal business advances, we expect to continue to lower supply chain cost and increase overalloperational efficiency, which we expect to positively affect our sales and profitability.
Seasonality
Our results of operations are subject to seasonality, primarily due to holidays and shoppingseasons. We typically experience sales peaks in the fourth quarter of a year with higher concentrationof holidays such as Christmas and New Year and shopping events such as Double Eleven and BlackFriday. Particularly, we usually see increased sales in cooking appliances close to holiday seasons.Accordingly, our results of operations fluctuate over the year, and our interim results may not beindicative of our annual results.
Currency fluctuation
Our financial information is presented in US dollars. In connection with the preparation of ourfinancial information, the results of operations of subsidiaries, which are initially prepared in theirrespective local functional currencies, such as the Renminbi and GBP, are translated into US dollars.Fluctuations in the value of exchange rates impact our consolidated other comprehensive income and,depending on the magnitude of these fluctuations, could obscure underlying trends that would havebeen apparent if consolidated financial statements had been prepared on a constant currency basis. Forexample, the results of operations of Joyoung segment for the six months ended June 30, 2019compared to those for the same period in 2018 were generally adversely affected by the significantdepreciation of the Renminbi against the US dollar for the same periods. We used the exchange ratesof RMB6.3740 to US$1.00 and RMB6.7668 to US$1.00, which represented a decrease ofapproximately 6.2%, for the six months ended June 30, 2018 and 2019, respectively, in preparation ofour audited financial statements for the six months ended June 30, 2019.
In our consolidated statements of comprehensive income, we recognized exchange losses ontranslation of foreign operations of US$44.7 million and US$37.1 million in 2016 and 2018,respectively, compared with exchange gains on translation of foreign operations of US$43.0 millionand US$1.8 million in 2017 and the six months ended June 30, 2019, respectively. Such exchangedifferences were recorded as our other comprehensive income during the Track Record Period. Alsosee “Risk Factors—Risks Relating to Our Business and Industry—We are subject to risks associatedwith foreign exchange rate fluctuations.”
236
FINANCIAL INFORMATION
Customs duties
We source our finished goods from OEM suppliers in China for our US sales, which are subjectto the US customs duties. As a result of the ongoing trade negotiations between China and theUnited States, our products imported from China to the US market have been subject to additional UScustoms duties as announced and implemented by the USTR and the President of the United Statesfrom time to time. This may affect our cost of sales and, consequently, our profitability.
Up to the date of this prospectus, our Company has not received any indication from our UScustomers that they may reduce their purchase volumes due to the imposition of the additional customsduties. There is no assurance that we may not experience reduced purchases from our customers andthat our sales and profitability will not be impacted by the increase of customs duties. See“Summary—US Customs Duties” and “Risk Factors—Risks Relating to Our Business and Industry—Any trade or import protection policies may materially and adversely affect our business.” In 2018 andthe six months ended June 30, 2019, our customs duties expenses arising out of the additional UScustoms duties amounted to US$7.0 million and US$10.1 million, respectively. For illustrative purposeonly, had the additional US customs duties of 25% been imposed since January 1, 2018, with othervariables held constant, our customs duties expenses in 2018 would have increased by US$108.1million for vacuums and air fryers. In addition, had the additional US customs duties of 15% beenimposed since January 1, 2018, with other variables held constant, our customs duties expenses in2018 would have increased by US$32.2 million for coffee makers and other products expected to besubject to the additional US customs duties of 15%.
We have mitigated and plan to continue mitigating the impacts arising from the increasedcustoms duties on our cost of sales by a combination of (i) fully or partially passing on the increasedcost to customers by increasing the selling price of certain products across our product portfolio in theUS market, (ii) renegotiating the purchase prices of finished products, components and raw materialswith our suppliers, (iii) value engineering through utilizing less expensive components or designs thatcan satisfy the products’ long-term reliability and functions and (iv) expanding our manufacturingresources to potentially other countries. For example, among all measures to mitigate the impactsarising from the increased customs duties, we have renegotiated the purchase prices of finishedproducts with our OEM suppliers. The depreciation of the Renminbi against the US dollar since theimposition of additional US customs duties on products imported from China to the United Statesgenerally gives us a strong position in the renegotiation of purchase prices favorable to us with OEMsuppliers, given that we pay our OEM suppliers in US dollars for such imports. Based on the above, asof the Latest Practicable Date, our Directors did not believe that the increased customs duties expenseswill have a material adverse impact on our financial results.
BASIS OF PRESENTATION
Our Controlling Shareholders owned and controlled the companies now comprising our Groupimmediately before the Reorganization and continue to own and control these companies after theReorganization. Our financial information has been prepared on a basis in accordance with theprinciples of the Auditing Guideline 3.340 “Prospectuses and the Reporting Accountant” issued by theHong Kong Institute of Certified Public Accountants (the “HKICPA”). The consolidated balancesheets, the consolidated income statements, the consolidated statements of comprehensive income, theconsolidated statements of changes in equity and the consolidated cash flow statements of our Groupfor the Track Record Period have been prepared as if the current group structure had been in existencethroughout the Track Record Period, since their respective dates of incorporation/establishment, or
237
FINANCIAL INFORMATION
since the date when the companies first came under the control of our Controlling Shareholders,whichever is the shorter period, in a manner similar to the principles of merger accounting under HongKong Accounting Guideline 5 “Merger Accounting for Common Control Combination” issued by theHKICPA.
Inter-company transactions, balances and unrealized gains/losses on transactions betweengroup companies are eliminated on combination.
CRITICAL ACCOUNTING POLICIES AND ESTIMATES
The preparation of our consolidated financial information requires us to make significantestimates and assumptions that affect the reported amounts of revenue, expenses, assets and liabilitiesand their accompanying disclosures, and the disclosure of contingent liabilities. Uncertainty aboutthese significant assumptions and estimates could result in outcomes that could require a materialadjustment to the carrying amounts of the assets and liabilities affected in the future. We haveidentified below the accounting policies that we believe are the most critical to our consolidatedfinancial information and that involve the most significant estimates.
Early adoption of IFRS 9
For the purpose of the preparation of our financial information for the years endedDecember 31, 2016, 2017 and 2018 and the six months ended June 30, 2019, we have adopted IFRS 9“Financial Instruments” since January 1, 2016. The impacts on the financial information upon theadoption of IFRS 9 are considered material due to classification and measurement as explained indetail below:
Available-for-sale investment under IAS 39 were classified to financial assets at fair valuethrough profit or loss and financial assets designated at fair value through other comprehensive incomeunder IFRS 9. Accordingly, unquoted equity investments stated as cost less impairment loss underIAS 39 are stated with fair value under IFRS 9. The investments were measured at fair value throughprofit or loss at the end of each reporting period, with a corresponding gain on change in fair value ofUS$17,948,000, US$5,675,000, US$742,000 and US$5,988,000, respectively, credited to other incomeand gains in 2016, 2017, 2018 and the six months ended June 30, 2019, respectively. The equityinvestments were irrevocably designated at fair value through other comprehensive income at the endof each reporting period as our Group considers these investments to be strategic in nature. The fairvalue changes in these investments resulted in a loss (net of tax) amounting to US$6,446,000 in 2016,a gain (net of tax) amounting to US$4,759,000 and US$4,287,000 in 2017 and 2018, and nil in the sixmonths ended June 30, 2019, respectively, as recorded in other comprehensive income.
Early adoption of IFRS 15
For the purpose of preparation of our financial information for the years ended December 31,2016, 2017 and 2018 and the six months ended June 30, 2019, we have adopted IFRS 15 “Revenuefrom Contracts with Customers” since January 1, 2016. Except for changes in certain reporting itemscaused by reclassification, there is no material impact on our financial information due to the adoptionof IFRS 15.
Early adoption of IFRS 16
IFRS 16 supersedes IAS 17 “Leases”, IFRIC 4 “Determining Whether an ArrangementContains a Lease”, SIC-15 “Operating Leases-Incentives” and SIC-27 “Evaluating the Substance of
238
FINANCIAL INFORMATION
Transactions Involving the Legal Form of a Lease”. The standard sets out the principles for therecognition, measurement, presentation and disclosure of leases and requires lessees to account formost leases under a single on-balance sheet model.
Lessor accounting under IFRS 16 is substantially unchanged from IAS 17. Lessors willcontinue to classify leases as either operating or finance leases using similar principles as in IAS 17.Therefore, IFRS 16 does not have an impact on leases where our Group is the lessor.
We adopted IFRS 16 using the full retrospective method since the beginning of the TrackRecord Period. We elected to use the transition practical expedient allowing the standard to be appliedonly to contracts that were previously identified as leases applying IAS 17 and IFRIC 4 at the date ofinitial application. We also elected to use the recognition exemptions for lease contracts that, at thecommencement date, have a lease term of 12 months or less and do not contain a purchase option, andlease contracts for which the underlying asset is of low value. Based on the historical financialinformation, our management believes that the adoption of IFRS 16 has a significant impact on theabsolute amount of the total assets and total liabilities, but does not have a significant impact on ourfinancial position and performance compared to those prepared under IAS 17.
Revenue recognition
Revenue from contracts with customers
Revenue from contracts with customers is recognized when control of goods or services istransferred to the customers at an amount that reflects the consideration to which we expect to beentitled in exchange for those goods or services.
When the consideration in a contract includes a variable amount, the amount of consideration isestimated to which we will be entitled in exchange for transferring the goods or services to thecustomer. The variable consideration is estimated at contract inception and constrained until it is highlyprobable that a significant revenue reversal in the amount of cumulative revenue recognized will notoccur when the associated uncertainty with the variable consideration is subsequently resolved.
When the contract contains a financing component which provides the customer a significantbenefit of financing the transfer of goods or services to the customer for more than one year, revenue ismeasured at the present value of the amount receivable, discounted using the discount rate that wouldbe reflected in a separate financing transaction between us and the customer at contract inception.When the contract contains a financing component which provides us a significant financial benefit formore than one year, revenue recognized under the contract includes the interest expense accreted onthe contract liability under the effective interest method. For a contract where the period between thepayment by the customer and the transfer of the promised goods or services is one year or less, thetransaction price is not adjusted for the effects of a significant financing component, using the practicalexpedient in IFRS 15.
Revenue from the sale of products is recognized at the point in time when control of the asset istransferred to the customer, generally on delivery of the products.
Some contracts for the sale of products provide customers with rights of return and sales rebate.We provide extended warranties which are accounted for as service-type warranties. The rights ofreturn, sales rebates give rise to variable consideration. Consideration payable to a customer also
239
FINANCIAL INFORMATION
includes credit that can be applied against amounts owed to us. We account for consideration payableto a customer as a reduction of the transaction price unless the payment to the customer is in exchangefor a distinct good or service.
Variable consideration
(a) Rights of return
For contracts which provide a customer with a right to return the goods, either the expectedvalue method or the most likely amount method is used to estimate the goods for different contractsthat will not be returned. The selected method best predicts the amount of variable consideration towhich we will be entitled for different contracts and customers. The requirements in IFRS 15 onconstraining estimates of variable consideration are applied in order to determine the amount ofvariable consideration that can be included in the transaction price. For goods that are expected to bereturned, instead of revenue, a refund liability is recognized. A right-of-return asset (and thecorresponding adjustment to cost of sales) is also recognized for the right to recover products from acustomer.
(b) Sales rebates
Various types of sales rebates may be provided to different customers. Rebates are offsetagainst amounts payable by the customer. To estimate the variable consideration for the expectedfuture rebates, the most likely amount method is used. Because this method best predicts the amount ofvariable consideration in the contract, given the large number of customer contracts that have similarcharacteristics. The requirements on constraining estimates of variable consideration are applied and arefund liability for the expected future rebates is recognized.
Consideration payable to a customer
We account for consideration payable to a customer as a reduction of revenue unless thepayment to the customer is in exchange for a distinct good or service that the customer transfers to us.If the consideration payable to a customer includes a variable amount, we estimate the transactionprice, including assessing whether the estimate of variable consideration is constrained. To estimate thevariable consideration, the most likely amount method is used, as this method best predicts the amountof variable consideration, given the large number of customer contracts that have similarcharacteristics.
Extended warranty
We generally provide warranties for general repairs of defects that existed at the time of sale, asrequired by law. As such, most warranties are assurance-type warranties. However, in certaincontracts, we provide extended warranties. Such warranties are accounted for as service-typewarranties and, therefore, are accounted for as separate performance obligations to which we recognizecontract liabilities for the unfulfilled extended warranties by allocating a portion of the transactionprice based on the relative stand-alone selling price. Revenue are subsequently recognized over timebased on the time elapsed.
Other income
Interest income is recognized on an accrual basis using the effective interest method byapplying the rate that exactly discounts the estimated future cash receipts over the expected life of the
240
FINANCIAL INFORMATION
financial instrument or a shorter period, when appropriate, to the net carrying amount of the financialasset.
Rental income is recognized on a time proportion basis over the lease terms.
Dividends income is recognized when the shareholders’ right to receive payment has beenestablished, it is probable that the economic benefits associated with the dividends will flow to us andthe amount of the dividends can be measured reliably.
Investments in associates
An associate is an entity in which we have a long-term interest of generally not less than 20%of the equity voting rights and over which we are in a position to exercise significant influence.Significant influence is the power to participate in the financial and operating policy decisions of theinvestee but is not control or joint control over those policies.
Our investments in associates are stated in the consolidated statements of financial position atour share of net assets under the equity method of accounting, less any impairment losses.
Our share of the post-acquisition results and other comprehensive income of associates isincluded in the consolidated statements of profit or loss and consolidated statements of comprehensiveincome, respectively. In addition, when there has been a change recognized directly in the equity of theassociate, we recognize our share of any changes, when applicable, in the consolidated statements ofchanges in equity. Unrealized gains and losses resulting from transactions between our associates andus are eliminated to the extent of our investments in the associates, except where unrealized lossesprovide evidence of an impairment of the assets transferred. Goodwill arising from the acquisition ofassociates is included as part of our investments in associates.
If an investment in an associate becomes an investment in a joint venture or vice versa, theretained interest is not remeasured. Instead, the investment continues to be accounted for under theequity method. In all other cases, upon loss of significant influence over the associate, we measure andrecognize any retained investment at its fair value. Any difference between the carrying amount of theassociate upon loss of significant influence and the fair value of the retained investment and proceedsfrom disposal is recognized in profit or loss.
When an investment in an associate is classified as held for sale, it is accounted for inaccordance with IFRS 5 “Non-current Assets Held for Sale and Discontinued Operations.”
Business combination and goodwill
We apply the acquisition method to account for business combinations. The considerationtransferred is measured at the acquisition date fair value, which is the sum of the acquisition date fairvalues of assets that we transfer, liabilities that we assume from the former owners of the acquiree andthe equity interests that we issue in exchange for control of the acquiree. For each businesscombination, we elect whether to measure the non-controlling interests in the acquiree that are presentownership interests and entitle their holders to a proportionate share of net assets in the event ofliquidation at fair value or at the proportionate share of the acquiree’s identifiable net assets. All othercomponents of non-controlling interests are measured at fair value. Acquisition-related costs areexpensed as incurred.
241
FINANCIAL INFORMATION
When we acquire a business, we assess the financial assets and liabilities assumed forappropriate classification and designation in accordance with the contractual terms, economiccircumstances and pertinent conditions as of the acquisition date. If the business combination isachieved in stages, the previously held equity interest is remeasured at its acquisition date fair valueand any resulting gain or loss is recognized in profit or loss. Any contingent consideration to betransferred by the acquirer is recognized at fair value at the acquisition date. Contingent consideration,classified as an asset or liability, is measured at fair value with changes in fair value recognized inprofit or loss. Contingent consideration that is classified as equity is not remeasured and subsequentsettlement is accounted for within equity.
Goodwill is initially measured at cost, which is the excess of the aggregate of (1) theconsideration transferred, (2) the amount recognized for non-controlling interests and (3) any fair valueof our previously held equity interests in the acquiree over the identifiable net assets acquired andliabilities assumed. If the sum of this consideration and other items is lower than the fair value of thenet assets acquired, the difference is recognized in profit or loss as a gain on a bargain purchase afterreassessment.
After initial recognition, goodwill is measured at cost, less any accumulated impairment losses.Goodwill is tested for impairment annually or more frequently if events or changes in circumstancesindicate that the carrying value may be impaired. We perform the annual impairment test of goodwillas of December 31 of each year. For the purpose of impairment testing, goodwill acquired in a businesscombination is, from the acquisition date, allocated to each of our cash-generating units or groups ofcash-generating units, that are expected to benefit from the synergies of the combination, irrespectiveof whether our other assets or liabilities are assigned to those units or groups of units.
Impairment is determined by assessing the recoverable amount of the cash-generating unit(group of cash-generating units) to which the goodwill relates. Where the recoverable amount of thecash-generating unit (group of cash-generating units) is less than the carrying amount, an impairmentloss is recognized. An impairment loss recognized for goodwill is not reversed in a subsequent period.
Fair value measurement
During the Track Record Period, we measured our financial assets at fair value through profitor loss, financial assets designated at fair value through other comprehensive income and financialliabilities associated with put option. Fair value is the price that would be received to sell an asset orpaid to transfer a liability in an orderly transaction between market participants at the measurementdate. The fair value measurement is based on the presumption that the transaction to sell the asset or totransfer the liability takes place either in the principal market for the asset or liability, or, in the absenceof a principal market, in the most advantageous market for the asset or liability. The principal or themost advantageous market must be accessible by us. The fair value of an asset or a liability ismeasured using the assumptions that market participants would use when pricing the asset or liability,assuming that market participants act in their economic best interest. A fair value measurement of anon-financial asset takes into account a market participant’s ability to generate economic benefits byusing the asset in its highest and best use or by selling it to another market participant that would usethe asset in its highest and best use. We use valuation methodologies that are appropriate in thecircumstances and for which sufficient data are available to measure fair value, maximizing the use ofrelevant observable inputs and minimizing the use of unobservable inputs.
242

FINANCIAL INFORMATION
We have financial assets including equity investments and financial products issued by banks inChina during the Track Record Period as set out in note 20 to the Accountants’ Report in Appendix I tothis prospectus. We irrevocably designated some equity investments as financial assets at fair valuethrough other comprehensive income as these investments are considered to be strategic in nature, andother equity investments held for trading are financial products classified to financial assets at fairvalue through profit or loss, for which no quoted prices in an active market exist. The fair value isestablished by using valuation methodologies which are mainly the discounted cash flows method andvaluation methodologies for financial assets that are certified by an independent and recognizedbusiness valuer before being implemented for valuation and are calibrated to ensure that outputs reflectmarket conditions. Valuation models established by the valuer make the maximum use of marketinputs and rely as little as possible on our own specific data. The fair values of the financial assets areset out in note 20 to the Accountants’ Report in Appendix I to this prospectus.
In relation to the valuation of the financial assets, our Directors, based on the professionaladvice received, adopted the following procedures: (i) reviewed the terms of investment agreements;(ii) obtained the necessary financial and non-financial information from investees and assessed itsreasonableness; (iii) engaged an independent business valuer and provided the necessary financial andnon-financial information so as to enable the valuer to perform valuation procedures and discussedrelevant assumptions with the valuer; and (iv) reviewed the valuation working papers and resultsprepared by the valuer. Based on the procedures set forth above, our Directors are of the view that thevaluation analysis performed by the valuer is fair and reasonable and the financial statements of ourGroup are properly prepared.
Details of the fair value measurement of financial assets, the valuation methodologies and keyinputs, including significant unobservable inputs, the relationship of unobservable inputs to fair valueand reconciliation of level 3 measurements, are disclosed in note 44 to the Accountants’ Report inAppendix I to this prospectus. The reporting accountants’ opinion on the historical financialinformation of our Group for the Track Record Period as a whole is set out on page I-2 of Appendix Ito this prospectus.
In relation to the valuation analysis performed by the valuers on financial assets classified aslevel 3 of fair value measurement, the Joint Sponsors have conducted relevant due diligence work,including, but not limited to: (i) review of the relevant notes in the Accountants’ Report in Appendix Ito this prospectus and relevant documents provided by the valuers; and (ii) discussion with theCompany, the reporting accountants and the valuers about the key basis and assumptions for thevaluation of financial assets. Having considered the work done by the Directors and reportingaccountants and the relevant due diligence work done as stated above, nothing has come to the JointSponsors’ attention that would cause the Joint Sponsors to question the valuation analysis performedby the valuers on the financial assets classified as level 3 of fair value measurement.
Financial liabilities associated with the put option
For the acquisition of SharkNinja, Compass, one of our subsidiaries, granted a right (the “PutOption”) to its non-controlling shareholder, under which such non-controlling shareholder was entitledto require Compass to repurchase all or a portion of Compass’s own shares beneficially owned by suchnon-controlling shareholders at an agreed price within an agreed period. The Put Option wasterminated upon the completion of the restructuring of Compass and replaced by the Put Right. See“History, Reorganization and Corporate Structure—Shareholders’ Right.” As such, there was no
243
FINANCIAL INFORMATION
additional charge involved in the termination of the Put Option. Put options are financial instrumentsthat we grant whereby counterparties may have the rights to request us to purchase their own equityinterests or other financial assets when certain conditions are met. If we do not have the unconditionalright to avoid delivering cash or other financial assets under the put option, we have to recognize afinancial liability at the present value of the estimated future cash outflows under the put option.Subsequently, if we revise our estimates of payments, we then adjust the carrying amount of thefinancial liability to reflect actual and revised estimated cash outflows. During the Track RecordPeriod, we recalculate the carrying amount by computing the present value of the revised estimatedfuture cash outflows at the financial instrument’s original effective interest rate and adjustment to itscarrying amount is to be recognized as income or expenses in profit or loss. If the put option expireswithout being exercised, the carrying amount of the liability will be reclassified as equity.
Intangible assets (other than goodwill)
Our intangible assets during the Track Record Period include trademarks, patents, retailerrelationships, capitalized development costs, software and leases.
Intangible assets acquired separately are measured on initial recognition at cost. The cost ofintangible assets acquired in a business combination is the fair value as of the date of acquisition.
The useful lives of intangible assets are assessed to be either finite or indefinite. Intangibleassets with finite lives are subsequently amortized over the useful economic life of 2.5 to 12.5 yearsand assessed for impairment whenever there is an indication that the intangible asset may be impaired.The amortization period and the amortization method for an intangible asset with a finite useful life arereviewed at least at the end of each financial year. Intangible assets with indefinite useful lives aretested for impairment annually either individually or at the cash-generating unit level. Such intangibleassets are not amortized. The useful life of an intangible asset with an indefinite life is reviewedannually to determine whether the indefinite life assessment continues to be supportable. If not, thechange in the useful life assessment from indefinite to finite is accounted for on a prospective basis.
Particularly, all research costs are charged to profit or loss as incurred. Expenditure incurred onprojects to develop new products is capitalized and deferred only when we can demonstrate (1) thetechnical feasibility of completing the intangible asset so that it will be available for use or sale, (2) ourintention to complete and our ability to use or sell the asset, (3) how the asset will generate futureeconomic benefits, (4) the availability of resources to complete the project and (5) the ability tomeasure reliably the expenditure during the development. Product development expenditure whichdoes not meet these criteria is expensed when incurred. During the Track Record Period, certainexternal consulting, prototype and legal expenditure incurred on projects to develop new corecomponents of new product categories was capitalized. Deferred development costs are stated at costless any impairment losses and are amortized on the straight-line basis from the date when they areavailable for use over their estimated useful lives of 10 years with reference to the historical life cycleof core components of a similar kind which can be utilized in several generations of products.
Impairment for goodwill and intangible assets with indefinite useful lives
Our goodwill and certain intangible assets are considered as having indefinite useful lives. Forthe purpose of impairment tests, the recoverable amount of the Compass cash-generating units isdetermined based on value-in-use calculations by using the discounted cash flow method. The keyparameters applied in the calculation are revenue growth and discount rate.
244
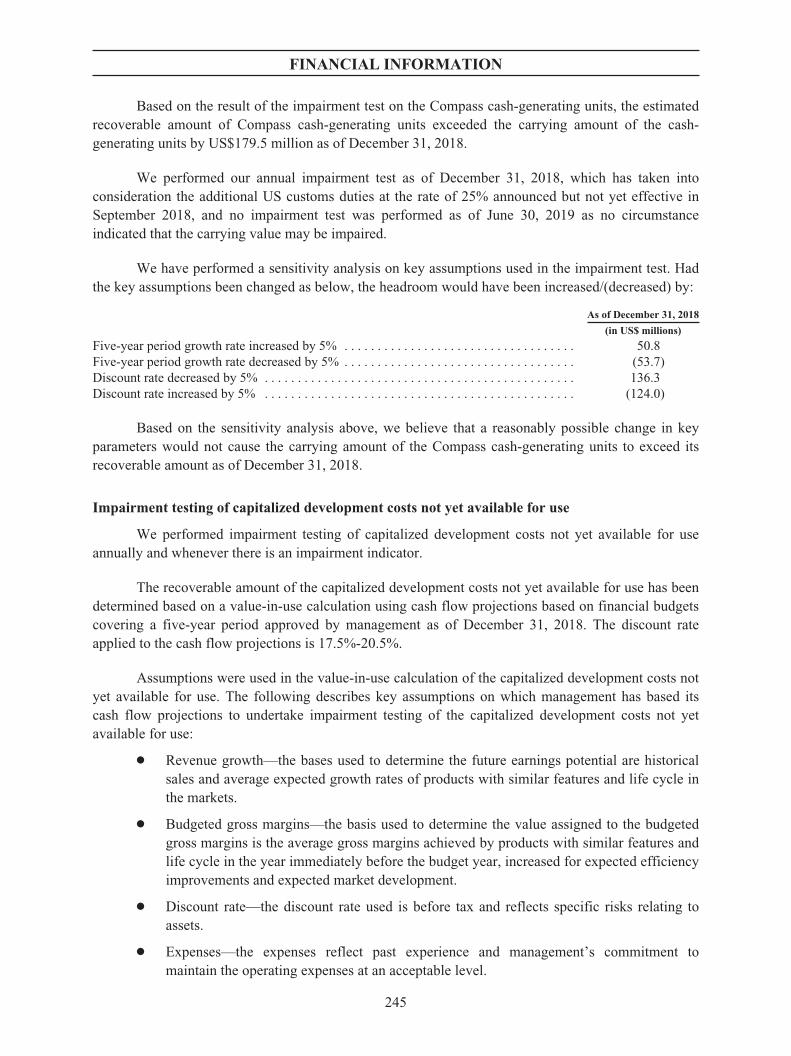
FINANCIAL INFORMATION
Based on the result of the impairment test on the Compass cash-generating units, the estimatedrecoverable amount of Compass cash-generating units exceeded the carrying amount of the cash-generating units by US$179.5 million as of December 31, 2018.
We performed our annual impairment test as of December 31, 2018, which has taken intoconsideration the additional US customs duties at the rate of 25% announced but not yet effective inSeptember 2018, and no impairment test was performed as of June 30, 2019 as no circumstanceindicated that the carrying value may be impaired.
We have performed a sensitivity analysis on key assumptions used in the impairment test. Hadthe key assumptions been changed as below, the headroom would have been increased/(decreased) by:
As of December 31, 2018
(in US$ millions)
Five-year period growth rate increased by 5% . . . . . . . . . . . . . . . . . . . . . . . . . . . . . . . . . . . 50.8Five-year period growth rate decreased by 5% . . . . . . . . . . . . . . . . . . . . . . . . . . . . . . . . . . . (53.7)Discount rate decreased by 5% . . . . . . . . . . . . . . . . . . . . . . . . . . . . . . . . . . . . . . . . . . . . . . . 136.3Discount rate increased by 5% . . . . . . . . . . . . . . . . . . . . . . . . . . . . . . . . . . . . . . . . . . . . . . . (124.0)
Based on the sensitivity analysis above, we believe that a reasonably possible change in keyparameters would not cause the carrying amount of the Compass cash-generating units to exceed itsrecoverable amount as of December 31, 2018.
Impairment testing of capitalized development costs not yet available for use
We performed impairment testing of capitalized development costs not yet available for useannually and whenever there is an impairment indicator.
The recoverable amount of the capitalized development costs not yet available for use has beendetermined based on a value-in-use calculation using cash flow projections based on financial budgetscovering a five-year period approved by management as of December 31, 2018. The discount rateapplied to the cash flow projections is 17.5%-20.5%.
Assumptions were used in the value-in-use calculation of the capitalized development costs notyet available for use. The following describes key assumptions on which management has based itscash flow projections to undertake impairment testing of the capitalized development costs not yetavailable for use:
Š Revenue growth—the bases used to determine the future earnings potential are historicalsales and average expected growth rates of products with similar features and life cycle inthe markets.
Š Budgeted gross margins—the basis used to determine the value assigned to the budgetedgross margins is the average gross margins achieved by products with similar features andlife cycle in the year immediately before the budget year, increased for expected efficiencyimprovements and expected market development.
Š Discount rate—the discount rate used is before tax and reflects specific risks relating toassets.
Š Expenses—the expenses reflect past experience and management’s commitment tomaintain the operating expenses at an acceptable level.
245
FINANCIAL INFORMATION
The values assigned to the key assumptions on market development and discount rates areconsistent with external information sources.
Based on the result of the impairment testing, the estimated recoverable amount of thecapitalized development costs not yet available for use exceeded the carrying amount byUS$15,953,000 as of December 31, 2018.
Sensitivity to changes in assumptions
We have performed a sensitivity analysis on key assumptions used in the impairment testing.Had the estimated key assumption, discount rate been increased by 0.5%, from 17.5%-20.5% to18.0%-21.0%, the headroom would have been decreased by US$368,000.
With regards to the assessment of the value in use of the capitalized development costs not yetavailable for use, our management believes that no reasonably possible change in any of the above keyassumptions would cause the carrying value of the capitalized development costs not yet available foruse to exceed the recoverable amount.
Income tax
Income tax comprises current and deferred tax. Income tax relating to items recognized outsideprofit or loss is recognized outside profit or loss, either in other comprehensive income or directly inequity.
Current tax assets and liabilities are measured at the amounts expected to be recovered from orpaid to the taxation authorities, based on tax rates (and tax laws) that have been enacted orsubstantively enacted by the end of each reporting period, taking into consideration interpretations andpractices prevailing in the countries in which we operate.
Deferred tax is provided using the liability method, on all temporary differences at the end ofeach reporting period between the tax bases of assets and liabilities and their carrying amounts forfinancial reporting purposes.
Deferred tax liabilities are recognized for all taxable temporary differences, except:
Š when the deferred tax liability arises from the initial recognition of goodwill or an asset orliability in a transaction that is not a business combination and, at the time of thetransaction, affects neither the accounting profit nor taxable profit or loss; and
Š in respect of taxable temporary differences associated with investments in subsidiaries,when the timing of the reversal of the temporary differences can be controlled and it isprobable that the temporary differences will not reverse in the foreseeable future.
Deferred tax assets are recognized for all deductible temporary differences, the carryforward ofunused tax credits and any unused tax losses. Deferred tax assets are recognized to the extent that it isprobable that taxable profit will be available against which the deductible temporary differences, thecarryforward of unused tax credits and unused tax losses can be utilized, except:
Š when the deferred tax asset relating to the deductible temporary differences arises from theinitial recognition of an asset or liability in a transaction that is not a business combinationand, at the time of the transaction, affects neither the accounting profit nor taxable profit orloss; and
246
FINANCIAL INFORMATION
Š in respect of deductible temporary differences associated with investments in subsidiaries,deferred tax assets are only recognized to the extent that it is probable that the temporarydifferences will reverse in the foreseeable future and taxable profit will be availableagainst which the temporary differences can be utilized.
The carrying amount of deferred tax assets is reviewed at the end of each reporting period andreduced to the extent that it is no longer probable that sufficient taxable profit will be available to allowall or part of the deferred tax asset to be utilized. Unrecognized deferred tax assets are reassessed at theend of each reporting period and are recognized to the extent that it has become probable that sufficienttaxable profit will be available to allow all or part of the deferred tax asset to be recovered.
Deferred tax assets and liabilities are measured at the tax rates that are expected to apply to theperiod when the asset is realized or the liability is settled, based on tax rates (and tax laws) that havebeen enacted or substantively enacted by the end of each reporting period.
Deferred tax assets and deferred tax liabilities are offset if and only if the Group has a legallyenforceable right to set off current tax assets and current tax liabilities and the deferred tax assets anddeferred tax liabilities relate to income taxes levied by the same taxation authority on either the sametaxable entity or different taxable entities which intend either to settle current tax liabilities and assetson a net basis, or to realize the assets and settle the liabilities simultaneously, in each future period inwhich significant amounts of deferred tax liabilities or assets are expected to be settled or recovered.
247
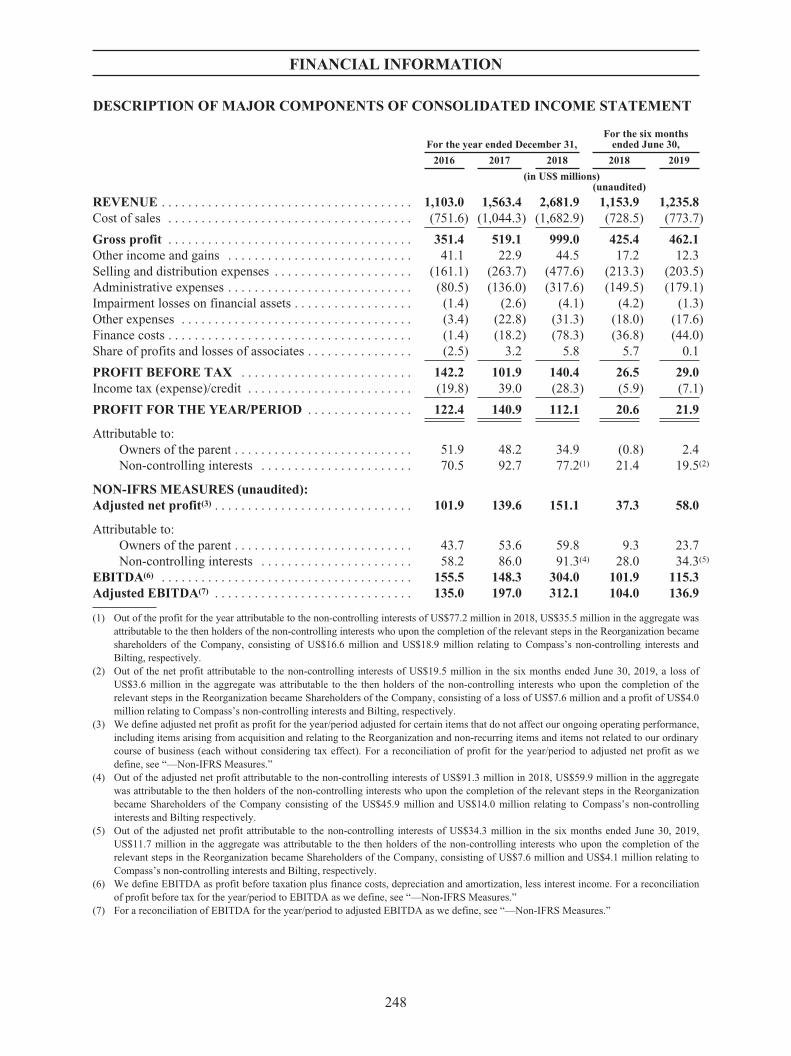
FINANCIAL INFORMATION
DESCRIPTION OF MAJOR COMPONENTS OF CONSOLIDATED INCOME STATEMENT
For the year ended December 31,For the six months
ended June 30,
2016 2017 2018 2018 2019
(in US$ millions)(unaudited)
REVENUE . . . . . . . . . . . . . . . . . . . . . . . . . . . . . . . . . . . . . . 1,103.0 1,563.4 2,681.9 1,153.9 1,235.8Cost of sales . . . . . . . . . . . . . . . . . . . . . . . . . . . . . . . . . . . . . (751.6) (1,044.3) (1,682.9) (728.5) (773.7)
Gross profit . . . . . . . . . . . . . . . . . . . . . . . . . . . . . . . . . . . . . 351.4 519.1 999.0 425.4 462.1Other income and gains . . . . . . . . . . . . . . . . . . . . . . . . . . . . 41.1 22.9 44.5 17.2 12.3Selling and distribution expenses . . . . . . . . . . . . . . . . . . . . . (161.1) (263.7) (477.6) (213.3) (203.5)Administrative expenses . . . . . . . . . . . . . . . . . . . . . . . . . . . . (80.5) (136.0) (317.6) (149.5) (179.1)Impairment losses on financial assets . . . . . . . . . . . . . . . . . . (1.4) (2.6) (4.1) (4.2) (1.3)Other expenses . . . . . . . . . . . . . . . . . . . . . . . . . . . . . . . . . . . (3.4) (22.8) (31.3) (18.0) (17.6)Finance costs . . . . . . . . . . . . . . . . . . . . . . . . . . . . . . . . . . . . . (1.4) (18.2) (78.3) (36.8) (44.0)Share of profits and losses of associates . . . . . . . . . . . . . . . . (2.5) 3.2 5.8 5.7 0.1
PROFIT BEFORE TAX . . . . . . . . . . . . . . . . . . . . . . . . . . 142.2 101.9 140.4 26.5 29.0Income tax (expense)/credit . . . . . . . . . . . . . . . . . . . . . . . . . (19.8) 39.0 (28.3) (5.9) (7.1)
PROFIT FOR THE YEAR/PERIOD . . . . . . . . . . . . . . . . 122.4 140.9 112.1 20.6 21.9
Attributable to:Owners of the parent . . . . . . . . . . . . . . . . . . . . . . . . . . . 51.9 48.2 34.9 (0.8) 2.4Non-controlling interests . . . . . . . . . . . . . . . . . . . . . . . 70.5 92.7 77.2(1) 21.4 19.5(2)
NON-IFRS MEASURES (unaudited):Adjusted net profit(3) . . . . . . . . . . . . . . . . . . . . . . . . . . . . . . 101.9 139.6 151.1 37.3 58.0
Attributable to:Owners of the parent . . . . . . . . . . . . . . . . . . . . . . . . . . . 43.7 53.6 59.8 9.3 23.7Non-controlling interests . . . . . . . . . . . . . . . . . . . . . . . 58.2 86.0 91.3(4) 28.0 34.3(5)
EBITDA(6) . . . . . . . . . . . . . . . . . . . . . . . . . . . . . . . . . . . . . . 155.5 148.3 304.0 101.9 115.3Adjusted EBITDA(7) . . . . . . . . . . . . . . . . . . . . . . . . . . . . . . 135.0 197.0 312.1 104.0 136.9
(1) Out of the profit for the year attributable to the non-controlling interests of US$77.2 million in 2018, US$35.5 million in the aggregate wasattributable to the then holders of the non-controlling interests who upon the completion of the relevant steps in the Reorganization becameshareholders of the Company, consisting of US$16.6 million and US$18.9 million relating to Compass’s non-controlling interests andBilting, respectively.
(2) Out of the net profit attributable to the non-controlling interests of US$19.5 million in the six months ended June 30, 2019, a loss ofUS$3.6 million in the aggregate was attributable to the then holders of the non-controlling interests who upon the completion of therelevant steps in the Reorganization became Shareholders of the Company, consisting of a loss of US$7.6 million and a profit of US$4.0million relating to Compass’s non-controlling interests and Bilting, respectively.
(3) We define adjusted net profit as profit for the year/period adjusted for certain items that do not affect our ongoing operating performance,including items arising from acquisition and relating to the Reorganization and non-recurring items and items not related to our ordinarycourse of business (each without considering tax effect). For a reconciliation of profit for the year/period to adjusted net profit as wedefine, see “—Non-IFRS Measures.”
(4) Out of the adjusted net profit attributable to the non-controlling interests of US$91.3 million in 2018, US$59.9 million in the aggregatewas attributable to the then holders of the non-controlling interests who upon the completion of the relevant steps in the Reorganizationbecame Shareholders of the Company consisting of the US$45.9 million and US$14.0 million relating to Compass’s non-controllinginterests and Bilting respectively.
(5) Out of the adjusted net profit attributable to the non-controlling interests of US$34.3 million in the six months ended June 30, 2019,US$11.7 million in the aggregate was attributable to the then holders of the non-controlling interests who upon the completion of therelevant steps in the Reorganization became Shareholders of the Company, consisting of US$7.6 million and US$4.1 million relating toCompass’s non-controlling interests and Bilting, respectively.
(6) We define EBITDA as profit before taxation plus finance costs, depreciation and amortization, less interest income. For a reconciliationof profit before tax for the year/period to EBITDA as we define, see “—Non-IFRS Measures.”
(7) For a reconciliation of EBITDA for the year/period to adjusted EBITDA as we define, see “—Non-IFRS Measures.”
248

FINANCIAL INFORMATION
Revenue
The following table sets forth the breakdown of our revenue by business segment for theperiods indicated:
For the year ended December 31, For the six months ended June 30,
2016 2017 2018 2018 2019
Amount % Amount % Amount % Amount % Amount %
(in US$ millions, except percentages)(unaudited)
Joyoung segment . . 1,080.3 97.9 1,053.5 67.4 1,179.0 44.0 563.1 48.8 572.3 46.3SharkNinja
segment . . . . . . . . — — 476.6 30.5 1,477.4 55.1 570.3 49.4 663.5 53.7Others segment . . . . 22.7 2.1 33.3 2.1 25.5 0.9 20.5 1.8 — —
Total . . . . . . . . . . . . 1,103.0 100.0 1,563.4 100.0 2,681.9 100.0 1,153.9 100.0 1,235.8 100.0
Joyoung segment represents our Joyoung business unit, which focuses on kitchen appliances inChina. SharkNinja segment represents our SharkNinja business unit, which primarily operates in theUnited States and was acquired in September 2017. Others segment represented Jiuyang Bean businessunit, which primarily sold soymilk powder and commercial soymilk makers. In November 2018, wedisposed of a majority of our equity interest in Jiuyang Bean to a related party, ceased to consolidate itas a subsidiary and no longer have the others segment since then.
The following table sets forth the breakdown of our revenue by brand for the periods indicated:
For the year ended December 31, For the six months ended June 30,
2016 2017 2018 2018 2019
Amount % Amount % Amount % Amount % Amount %
(in US$ millions, except percentages)(unaudited)
Joyoung . . . . . . . . . 1,103.0 100.0 1,086.8 69.5 1,201.4 44.8 582.5 50.5 564.0 45.6Shark . . . . . . . . . . . . — — 327.0 20.9 1,092.4 40.7 436.7 37.8 449.6 36.4Ninja . . . . . . . . . . . . — — 149.6 9.6 388.1 14.5 134.7 11.7 222.2 18.0
Total . . . . . . . . . . . . 1,103.0 100.0 1,563.4 100.0 2,681.9 100.0 1,153.9 100.0 1,235.8 100.0
Prior to the acquisition of SharkNinja in September 2017, we primarily derived our revenuefrom sales of kitchen appliances under the Joyoung brand. As a result of the acquisition of SharkNinja,we have additionally generated revenue from sales of cleaning appliances and kitchen appliances underthe Shark and Ninja brands.
The following table sets forth the breakdown of our revenue by geography for the periodsindicated:
For the year ended December 31, For the six months ended June 30,
2016 2017 2018 2018 2019
Amount % Amount % Amount % Amount % Amount %
(in US$ millions, except percentages)(unaudited)
China . . . . . . . . . . . 1,081.0 98.0 1,065.8 68.2 1,189.7 44.4 577.2 50.0 563.0 45.5North America . . . . 7.5 0.7 447.4 28.6 1,310.5 48.9 506.8 43.9 551.8 44.7Europe . . . . . . . . . . 4.8 0.4 36.4 2.3 132.1 4.9 55.5 4.8 91.9 7.4Other markets . . . . . 9.7 0.9 13.8 0.9 49.6 1.8 14.4 1.3 29.1 2.4
Total . . . . . . . . . . . . 1,103.0 100.0 1,563.4 100.0 2,681.9 100.0 1,153.9 100.0 1,235.8 100.0
249

FINANCIAL INFORMATION
Prior to the acquisition of SharkNinja, substantially all of our revenue was generated in China.With the acquisition of SharkNinja, we expanded our global markets in North America, Europe andother markets such as Japan and Australia. In the six months ended June 30, 2019, 54.5% of ourrevenue was from sales in the North American, the European and other markets in aggregate.
The following table sets forth the breakdown of our revenue by product category for the periodsindicated:
For the year ended December 31, For the six months ended June 30,
2016 2017 2018 2018 2019
Amount % Amount % Amount % Amount % Amount %
(in US$ millions, except percentages)(unaudited)
Cleaning appliances . . . . . . . . — — 321.2 20.5 1,070.1 39.9 425.6 36.9 460.5 37.2Food preparation
appliances . . . . . . . . . . . . . . 456.0 41.3 580.6 37.1 785.0 29.3 358.2 31.0 347.4 28.1Cooking appliances . . . . . . . . 547.7 49.7 539.1 34.5 677.0 25.2 289.1 25.1 359.1 29.1Others . . . . . . . . . . . . . . . . . . . 99.3 9.0 122.5 7.9 149.8 5.6 81.0 7.0 68.8 5.6
Total . . . . . . . . . . . . . . . . . . . . 1,103.0 100.0 1,563.4 100.0 2,681.9 100.0 1,153.9 100.0 1,235.8 100.0
Cleaning appliances include primarily upright vacuums, robotic vacuums, cordless and cordedstick vacuums and other floor care products. Cleaning appliances constituted our largest productcategory in terms of revenue in 2018 and the six months ended June 30, 2019, contributing 39.9% and37.2%, respectively, of our total revenue in the same periods. Food preparation appliances includeprimarily high-performance multifunctional blenders, soymilk makers, food processors and other smallhousehold appliances facilitating the food preparation process. Cooking appliances include primarilyrice cookers, pressure cookers, induction cookers, Foodi, coffee and tea makers and other appliancesfor cooking. Others product category includes small household appliances ranging from waterpurifiers, ventilators and water heaters to garment care and thermos.
Our revenue increased by 41.7% from US$1,103.0 million in 2016 to US$1,563.4 million in2017, and further increased by 71.5% to US$2,681.9 million in 2018. It increased by 7.1% fromUS$1,153.9 million for the six months ended June 30, 2018 to US$1,235.8 million for the same periodin 2019. The increase of revenue in 2017 and 2018 was primarily due to the acquisition of SharkNinja.Had the acquisition taken place at the beginning of 2017, our revenue for the year from January 1,2017 to December 31, 2017 would have been US$2,425.6 million.
250
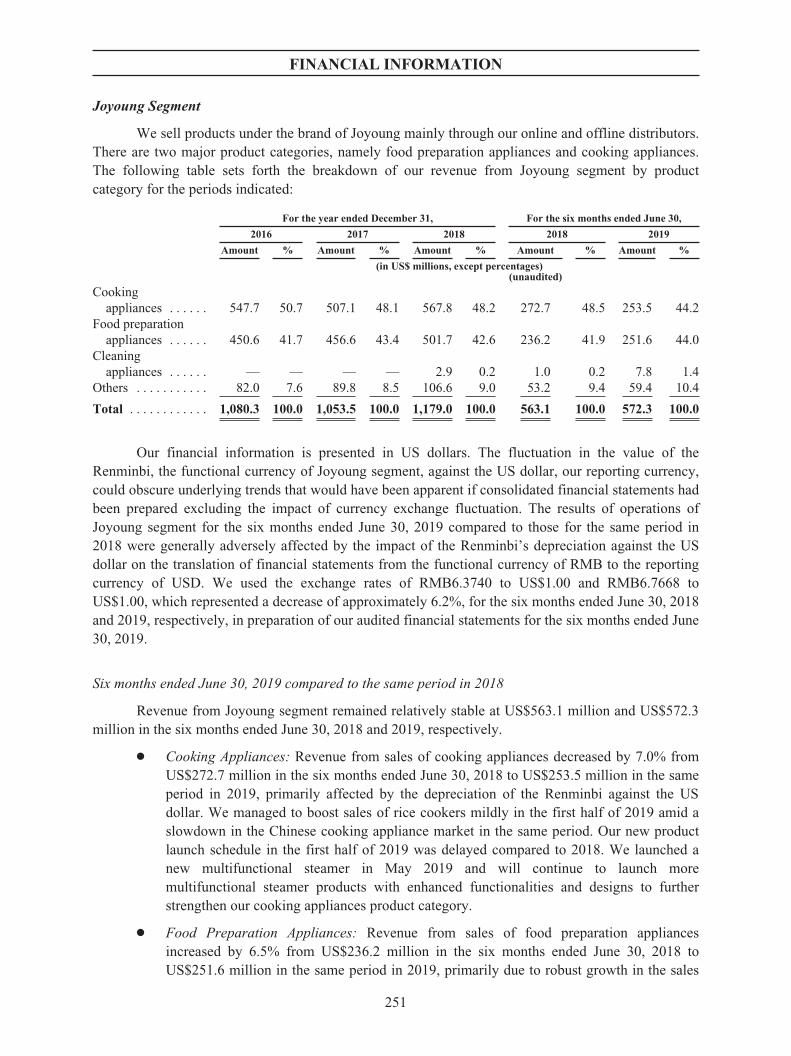
FINANCIAL INFORMATION
Joyoung Segment
We sell products under the brand of Joyoung mainly through our online and offline distributors.There are two major product categories, namely food preparation appliances and cooking appliances.The following table sets forth the breakdown of our revenue from Joyoung segment by productcategory for the periods indicated:
For the year ended December 31, For the six months ended June 30,
2016 2017 2018 2018 2019
Amount % Amount % Amount % Amount % Amount %
(in US$ millions, except percentages)(unaudited)
Cookingappliances . . . . . . 547.7 50.7 507.1 48.1 567.8 48.2 272.7 48.5 253.5 44.2
Food preparationappliances . . . . . . 450.6 41.7 456.6 43.4 501.7 42.6 236.2 41.9 251.6 44.0
Cleaningappliances . . . . . . — — — — 2.9 0.2 1.0 0.2 7.8 1.4
Others . . . . . . . . . . . 82.0 7.6 89.8 8.5 106.6 9.0 53.2 9.4 59.4 10.4
Total . . . . . . . . . . . . 1,080.3 100.0 1,053.5 100.0 1,179.0 100.0 563.1 100.0 572.3 100.0
Our financial information is presented in US dollars. The fluctuation in the value of theRenminbi, the functional currency of Joyoung segment, against the US dollar, our reporting currency,could obscure underlying trends that would have been apparent if consolidated financial statements hadbeen prepared excluding the impact of currency exchange fluctuation. The results of operations ofJoyoung segment for the six months ended June 30, 2019 compared to those for the same period in2018 were generally adversely affected by the impact of the Renminbi’s depreciation against the USdollar on the translation of financial statements from the functional currency of RMB to the reportingcurrency of USD. We used the exchange rates of RMB6.3740 to US$1.00 and RMB6.7668 toUS$1.00, which represented a decrease of approximately 6.2%, for the six months ended June 30, 2018and 2019, respectively, in preparation of our audited financial statements for the six months ended June30, 2019.
Six months ended June 30, 2019 compared to the same period in 2018
Revenue from Joyoung segment remained relatively stable at US$563.1 million and US$572.3million in the six months ended June 30, 2018 and 2019, respectively.
Š Cooking Appliances: Revenue from sales of cooking appliances decreased by 7.0% fromUS$272.7 million in the six months ended June 30, 2018 to US$253.5 million in the sameperiod in 2019, primarily affected by the depreciation of the Renminbi against the USdollar. We managed to boost sales of rice cookers mildly in the first half of 2019 amid aslowdown in the Chinese cooking appliance market in the same period. Our new productlaunch schedule in the first half of 2019 was delayed compared to 2018. We launched anew multifunctional steamer in May 2019 and will continue to launch moremultifunctional steamer products with enhanced functionalities and designs to furtherstrengthen our cooking appliances product category.
Š Food Preparation Appliances: Revenue from sales of food preparation appliancesincreased by 6.5% from US$236.2 million in the six months ended June 30, 2018 toUS$251.6 million in the same period in 2019, primarily due to robust growth in the sales
251
FINANCIAL INFORMATION
of our high-performance multifunctional blenders. We launched the first wash-free noise-free high-performance multifunctional blenders in the first half of 2019, and expanded ourproduct portfolio to enhance our competitiveness among customers with differentpurchasing power and preference, which boosted our sales of high-performancemultifunctional blenders. In addition, our premium K-series soymilk makers, one of ourevolutionary products in the soymilk series, continued to gain popularity and salesincreased. Such increases were partially offset by the depreciation of the Renminbi againstthe US dollar.
Š Cleaning Appliances: Revenue from sales of cleaning appliances increased significantlyfrom US$1.0 million in the six months ended June 30, 2018 to US$7.8 million in the sameperiod in 2019. Revenue resulting from sales of cleaning appliances represents revenuefrom reselling Shark-branded cleaning products in China through SharkNinja (China)following the acquisition of SharkNinja. Capitalized on the quality and wide variety ofShark-branded cleaning products, and our promotion efforts as well as the expansion ofsales channels in China, we achieved strong momentum in the sales of Shark-brandedcleaning products in the first half of 2019. We launched multi-purpose disinfectionsolution products in 2018 and handheld vacuum products (particularly, a collaborationversion with Line Friends) in 2019, which received positive market feedback.
Š Others: Revenue from sales of other products increased by 11.7% from US$53.2 millionin the six months ended June 30, 2018 to US$59.4 million in the same period in 2019,primarily due to the increased sales of reverse osmosis (RO) water purifiers in the first halfof 2019.
2018 compared to 2017
Revenue from Joyoung segment increased by 11.9% from US$1,053.5 million in 2017 toUS$1,179.0 million in 2018, with a revenue increase in each of our major product categories.
Š Cooking Appliances: Revenue from sales of cooking appliances increased by 12.0% fromUS$507.1 million in 2017 to US$567.8 million in 2018, primarily due to (i) an increase inthe sales of our rice cookers, pressure cookers and kettles in 2018 as a result of our newproducts such as new IH rice cookers with cast iron pot and pressure cookers with cold-water pressure-release systems, and our vast customer base for these necessities in theChinese household; and (ii) an increase in the total sales of electrical hot pots, automaticcookers and air fryers in 2018, our new product lines, as a result of our continuous effortsin product development and marketing.
Š Food Preparation Appliances: Revenue from sales of food preparation appliancesincreased by 9.9% from US$456.6 million in 2017 to US$501.7 million in 2018, primarilydue to the strong growth of our high-performance multifunctional blenders, which echothe current trend in China for premium products and increased health consciousness.Given our high-performance multifunctional blender is a multifunctional product, it couldcover functions of certain other kitchen appliances such as soymilk makers, foodprocessors and juicers, and therefore may affect our sales of other food preparationappliances. We continued to develop our soymilk makers through launching evolutionaryproducts, such as our premium K-series soymilk makers.
Š Cleaning Appliances: Revenue from sales of cleaning appliances in 2018 wasUS$2.9 million, accounting for 0.2% of the segment revenue.
252

FINANCIAL INFORMATION
Š Others: Revenue from sales of other products increased by 18.7% from US$89.8 millionin 2017 to US$106.6 million in 2018. Such increase was primarily due to an increase inthe sales of our water purifier product line in 2018, which is the largest component of thissubset, as a result of our efforts in developing this product line to address consumer needsfor water with healthier qualities.
2017 compared to 2016
Revenue from Joyoung segment decreased slightly by 2.5% from US$1,080.3 million in 2016to US$1,053.5 million in 2017.
Š Cooking Appliances: Revenue from sales of cooking appliances decreased by 7.4% fromUS$547.7 million in 2016 to US$507.1 million in 2017, primarily due to the consolidationand optimization of our distribution network in 2017, which affected our salesperformance in 2017.
Š Food Preparation Appliances: Revenue from sales of food preparation appliancesincreased by 1.3% from US$450.6 million in 2016 to US$456.6 million in 2017. Suchincrease was primarily driven by the increase in sales of our high-performancemultifunctional blenders, which was partially offset by the impact due to the consolidationand optimization of our distribution network in 2017.
Š Others: Revenue from sales of other products increased by 9.5% from US$82.0 million in2016 to US$89.8 million in 2017, primarily due to increased sales in water purifiers.Market penetration rate of water purifiers in China is relatively low currently, and providessignificant growth opportunities.
SharkNinja Segment
We completed the acquisition of SharkNinja on September 29, 2017. Under IFRS, the financialresults of SharkNinja have been reflected in our consolidated financial information since then. For thepurposes of presenting SharkNinja’s results of operations during the Track Record Period, we haveincluded below its historical financial information prior to the acquisition. SharkNinja had a financialyear end of March 31 prior to the acquisition. We have included SharkNinja’s results of operations(i) for the financial year ended March 31, 2016 (“Predecessor Financial Year 2016”), (ii) for thefinancial year ended March 31, 2017 (“Predecessor Financial Year 2017”), (iii) for the period fromApril 1, 2017 to September 28, 2017 (“Predecessor Period 2017”), (iv) for the period fromSeptember 29, 2017 to December 31, 2017 (“Successor Period 2017”), (v) for the year endedDecember 31, 2018 and (vi) for the six months ended June 30, 2018 and 2019. The financial results ofSharkNinja for Predecessor Financial Year 2016, Predecessor Financial Year 2017 and PredecessorPeriod 2017 are derived from SharkNinja’s stand-alone pre-acquisition financial statements, whichhave been audited by Ernst & Young and are disclosed in Section III in the notes to the Accountants’Report in Appendix I to this prospectus. The financial results of SharkNinja for Successor Period 2017,the year ended December 31, 2018 and the six months ended June 30, 2018 and 2019 are derived fromthe segment financial information. We present these data for information and illustrative purposesonly. As we did not control SharkNinja’s business prior to September 29, 2017, we are not permittedunder IFRS to include its financial results in our consolidated financial statements prior to that date.
As a result of the acquisition of SharkNinja, we started offering small household appliancesunder the brands of Shark and Ninja and have been generating revenue therefrom. The following table
253
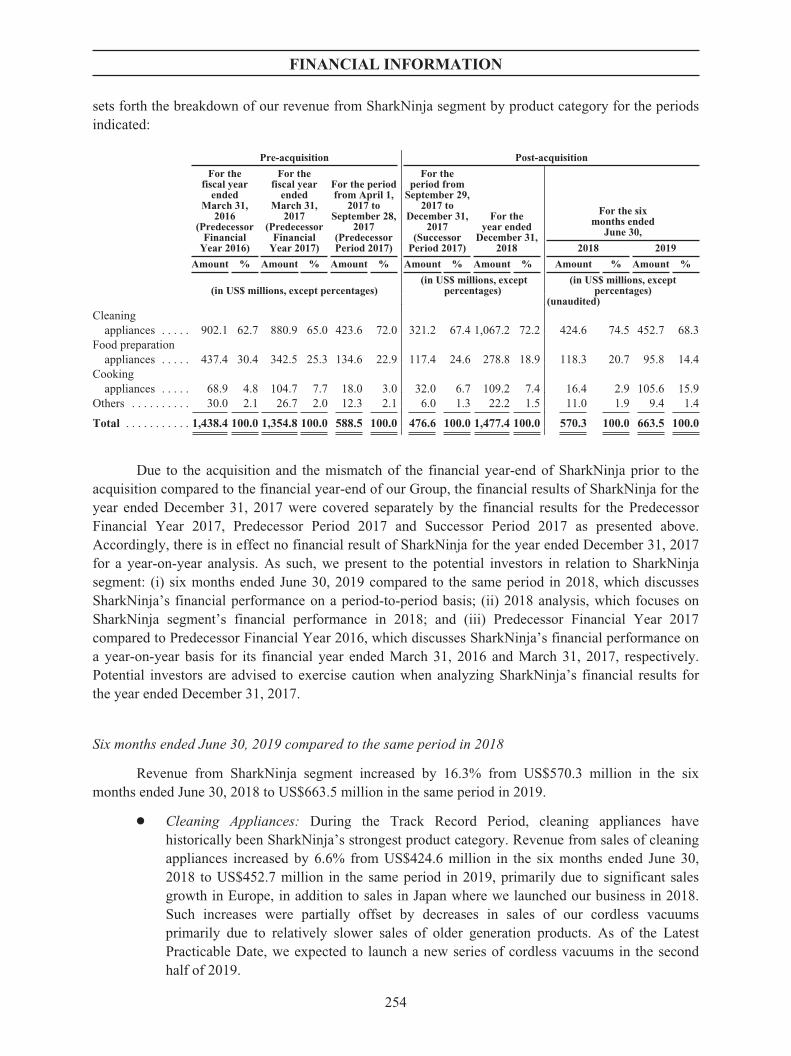
FINANCIAL INFORMATION
sets forth the breakdown of our revenue from SharkNinja segment by product category for the periodsindicated:
Pre-acquisition Post-acquisition
For thefiscal year
endedMarch 31,
2016(Predecessor
FinancialYear 2016)
For thefiscal year
endedMarch 31,
2017(Predecessor
FinancialYear 2017)
For the periodfrom April 1,
2017 toSeptember 28,
2017(PredecessorPeriod 2017)
For theperiod from
September 29,2017 to
December 31,2017
(SuccessorPeriod 2017)
For theyear ended
December 31,2018
For the sixmonths ended
June 30,
2018 2019
Amount % Amount % Amount % Amount % Amount % Amount % Amount %
(in US$ millions, except percentages)(in US$ millions, except
percentages)(in US$ millions, except
percentages)(unaudited)
Cleaningappliances . . . . . 902.1 62.7 880.9 65.0 423.6 72.0 321.2 67.4 1,067.2 72.2 424.6 74.5 452.7 68.3
Food preparationappliances . . . . . 437.4 30.4 342.5 25.3 134.6 22.9 117.4 24.6 278.8 18.9 118.3 20.7 95.8 14.4
Cookingappliances . . . . . 68.9 4.8 104.7 7.7 18.0 3.0 32.0 6.7 109.2 7.4 16.4 2.9 105.6 15.9
Others . . . . . . . . . . 30.0 2.1 26.7 2.0 12.3 2.1 6.0 1.3 22.2 1.5 11.0 1.9 9.4 1.4
Total . . . . . . . . . . . 1,438.4 100.0 1,354.8 100.0 588.5 100.0 476.6 100.0 1,477.4 100.0 570.3 100.0 663.5 100.0
Due to the acquisition and the mismatch of the financial year-end of SharkNinja prior to theacquisition compared to the financial year-end of our Group, the financial results of SharkNinja for theyear ended December 31, 2017 were covered separately by the financial results for the PredecessorFinancial Year 2017, Predecessor Period 2017 and Successor Period 2017 as presented above.Accordingly, there is in effect no financial result of SharkNinja for the year ended December 31, 2017for a year-on-year analysis. As such, we present to the potential investors in relation to SharkNinjasegment: (i) six months ended June 30, 2019 compared to the same period in 2018, which discussesSharkNinja’s financial performance on a period-to-period basis; (ii) 2018 analysis, which focuses onSharkNinja segment’s financial performance in 2018; and (iii) Predecessor Financial Year 2017compared to Predecessor Financial Year 2016, which discusses SharkNinja’s financial performance ona year-on-year basis for its financial year ended March 31, 2016 and March 31, 2017, respectively.Potential investors are advised to exercise caution when analyzing SharkNinja’s financial results forthe year ended December 31, 2017.
Six months ended June 30, 2019 compared to the same period in 2018
Revenue from SharkNinja segment increased by 16.3% from US$570.3 million in the sixmonths ended June 30, 2018 to US$663.5 million in the same period in 2019.
Š Cleaning Appliances: During the Track Record Period, cleaning appliances havehistorically been SharkNinja’s strongest product category. Revenue from sales of cleaningappliances increased by 6.6% from US$424.6 million in the six months ended June 30,2018 to US$452.7 million in the same period in 2019, primarily due to significant salesgrowth in Europe, in addition to sales in Japan where we launched our business in 2018.Such increases were partially offset by decreases in sales of our cordless vacuumsprimarily due to relatively slower sales of older generation products. As of the LatestPracticable Date, we expected to launch a new series of cordless vacuums in the secondhalf of 2019.
254

FINANCIAL INFORMATION
Š Food Preparation Appliances: Revenue from sales of food preparation appliancesdecreased by 19.0% from US$118.3 million in the six months ended June 30, 2018 toUS$95.8 million in the same period in 2019, primarily due to an overall slowdown in thiscategory in North America. In addition, we reduced long-form advertising in the UnitedStates for this category in the first half 2019 in response to the market slowdown.
Š Cooking Appliances: Foodi, which combines pressure cooking and air frying in onemultifunctional cooker, has been a blockbuster product in the US market since itsintroduction in 2018. It continued to generate robust sales growth in the first half of 2019.Revenue from sales of cooking appliances increased by 543.9% from US$16.4 million inthe six months ended June 30, 2018 to US$105.6 million in the same period in 2019,primarily contributed by the sales of Foodi.
Š Others: Other products are primarily represented by our garment care products. Garmentcare products generally have a lower price point compared with other Shark or Ninjabranded products, and accounted for less than 2.5% of the segment revenue for any givenperiod above. Revenue from sales of other products decreased by 14.5% from US$11.0million in the six months ended June 30, 2018 to US$9.4 million in the same period in2019, primarily due to a reduction in placement at our retailers of our garment careproducts.
2018 analysis
Revenue from SharkNinja segment was US$588.5 million in Predecessor Period 2017,US$476.6 million in Successor Period 2017, and US$1,477.4 million in 2018.
In 2018, the effect of our increased focus on product categories with higher price pointsreflected on our financial performance. We introduced more products at higher price points to capturethe opportunities in premium market segments, such as our robotic vacuums, cordless stick vacuumsand the Foodi series.
Š Cleaning Appliances: In 2018, revenue from sales of cleaning appliances amounted toUS$1,067.2 million, contributing 72.2% of the segment revenue in the same year.Revenue from sales of cleaning appliances for the Predecessor Period 2017 and theSuccessor Period 2017 was US$423.6 million and US$321.2 million, respectively.
We have increasingly focused on premium product lines. For example, products that canfurther relieve consumers from household chores, such as our robotic vacuums, andproducts that are easier or more fun to use, such as our cordless stick vacuums, generallycommand higher pricing. Meanwhile, we continued to launch new products, such asDuo-Clean vacuums and Zero-M vacuums, to strengthen our leading market position inthe vacuum market.
Š Food Preparation Appliances: In 2018, revenue from sales of food preparation appliancesamounted to US$278.8 million, contributing 18.9% of the segment revenue in the sameyear. Revenue from sales of food preparation appliances for the Predecessor Period 2017and the Successor Period 2017 was US$134.6 million and US$117.4 million, respectively.
In particular, we launched Fresh-Vac technology for our Ninja FreshVac Blenders in 2018,which enabled consumers to lengthen the amount of time their smoothies remain fresh.
Š Cooking Appliances: In 2018, revenue from sales of cooking appliances amounted toUS$109.2 million, contributing 7.4% to the segment revenue in the same year. Revenue
255
FINANCIAL INFORMATION
from sales of cooking appliances for the Predecessor Period 2017 and the SuccessorPeriod 2017 was US$18.0 million and US$32.0 million, respectively.
We launched Foodi in 2018 and it has quickly become a blockbuster product in the USmarket. In addition, we launched an air-fryer and a stand-alone pressure cooker to furtherpenetrate the cooking appliance market.
Š Others: In 2018, revenue from sales of other products amounted to US$22.2 million,contributing 1.5% of segment revenue in the same year. Revenue from sales of otherproducts for the Predecessor Period 2017 and the Successor Period 2017 wasUS$12.3 million and US$6.0 million, respectively.
In addition, in 2018, we achieved strong sales performance in the UK market, primarily drivenby sales of our cleaning appliances due to a combination of the following factors: (i) we have raisedbrand awareness in the UK market as a result of our continuous marketing efforts; (ii) we increased ourretailer penetration in the UK market in 2018 and (iii) our direct sales channel through our companywebsite, which typically only takes one day delivery in the United Kingdom, increased in 2018.
Predecessor Financial Year 2017 compared to Predecessor Financial Year 2016
Revenue from SharkNinja segment decreased by 5.8% from US$1,438.4 million in PredecessorFinancial Year 2016 to US$1,354.8 million in Predecessor Financial Year 2017. This decrease wasprimarily due to a combination of the following factors: (i) reduction in sales generated by direct-response television broadcasting advertising as SharkNinja shifted towards other advertising formatswhich it considered more effective and efficient; (ii) reduction in international sales outside of NorthAmerica as it strategically transitioned away from certain distributors in certain markets whichtemporarily affected the sales performance; and (iii) reduction in sales of food preparation appliancesas a result of shifts in consumer preferences in the market, all of which were partially offset by anincrease in the growth of vacuum sales.
Others Segment
In 2016, 2017 and 2018, we generated revenue from selling soymilk powder and commercialsoymilk makers under our Jiuyang Bean business unit. In November 2018, we disposed of a majorityof our equity interest in Jiuyang Bean to a related party, ceased to consolidate it as a subsidiary and nolonger have the others segment since then.
Cost of Sales
The table below sets forth the breakdown of our cost of sales by segment for the periodsindicated:
For the year ended December 31, For the six months ended June 30,
2016 2017 2018 2018 2019
Amount % Amount % Amount % Amount % Amount %
(in US$ millions, except percentages)(unaudited)
Joyoung segment . . . 736.9 98.0 715.0 68.5 797.9 47.4 380.9 52.3 378.5 48.9SharkNinja
segment . . . . . . . . — — 307.4 29.4 868.1 51.6 334.0 45.8 395.2 51.1Others segment . . . . 14.7 2.0 21.9 2.1 16.9 1.0 13.6 1.9 — —
Total . . . . . . . . . . . . 751.6 100.0 1,044.3 100.0 1,682.9 100.0 728.5 100.0 773.7 100.0
256
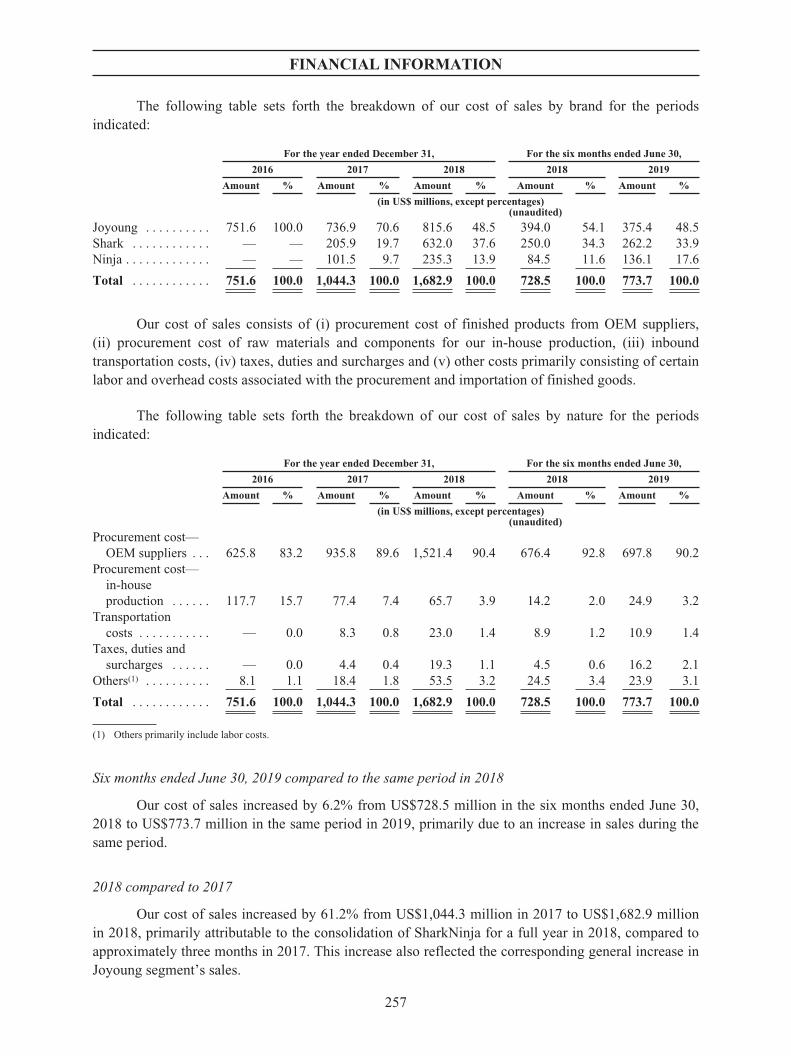
FINANCIAL INFORMATION
The following table sets forth the breakdown of our cost of sales by brand for the periodsindicated:
For the year ended December 31, For the six months ended June 30,
2016 2017 2018 2018 2019
Amount % Amount % Amount % Amount % Amount %
(in US$ millions, except percentages)(unaudited)
Joyoung . . . . . . . . . . 751.6 100.0 736.9 70.6 815.6 48.5 394.0 54.1 375.4 48.5Shark . . . . . . . . . . . . — — 205.9 19.7 632.0 37.6 250.0 34.3 262.2 33.9Ninja . . . . . . . . . . . . . — — 101.5 9.7 235.3 13.9 84.5 11.6 136.1 17.6
Total . . . . . . . . . . . . 751.6 100.0 1,044.3 100.0 1,682.9 100.0 728.5 100.0 773.7 100.0
Our cost of sales consists of (i) procurement cost of finished products from OEM suppliers,(ii) procurement cost of raw materials and components for our in-house production, (iii) inboundtransportation costs, (iv) taxes, duties and surcharges and (v) other costs primarily consisting of certainlabor and overhead costs associated with the procurement and importation of finished goods.
The following table sets forth the breakdown of our cost of sales by nature for the periodsindicated:
For the year ended December 31, For the six months ended June 30,
2016 2017 2018 2018 2019
Amount % Amount % Amount % Amount % Amount %
(in US$ millions, except percentages)(unaudited)
Procurement cost—OEM suppliers . . . 625.8 83.2 935.8 89.6 1,521.4 90.4 676.4 92.8 697.8 90.2
Procurement cost—in-houseproduction . . . . . . 117.7 15.7 77.4 7.4 65.7 3.9 14.2 2.0 24.9 3.2
Transportationcosts . . . . . . . . . . . — 0.0 8.3 0.8 23.0 1.4 8.9 1.2 10.9 1.4
Taxes, duties andsurcharges . . . . . . — 0.0 4.4 0.4 19.3 1.1 4.5 0.6 16.2 2.1
Others(1) . . . . . . . . . . 8.1 1.1 18.4 1.8 53.5 3.2 24.5 3.4 23.9 3.1
Total . . . . . . . . . . . . 751.6 100.0 1,044.3 100.0 1,682.9 100.0 728.5 100.0 773.7 100.0
(1) Others primarily include labor costs.
Six months ended June 30, 2019 compared to the same period in 2018
Our cost of sales increased by 6.2% from US$728.5 million in the six months ended June 30,2018 to US$773.7 million in the same period in 2019, primarily due to an increase in sales during thesame period.
2018 compared to 2017
Our cost of sales increased by 61.2% from US$1,044.3 million in 2017 to US$1,682.9 millionin 2018, primarily attributable to the consolidation of SharkNinja for a full year in 2018, compared toapproximately three months in 2017. This increase also reflected the corresponding general increase inJoyoung segment’s sales.
257
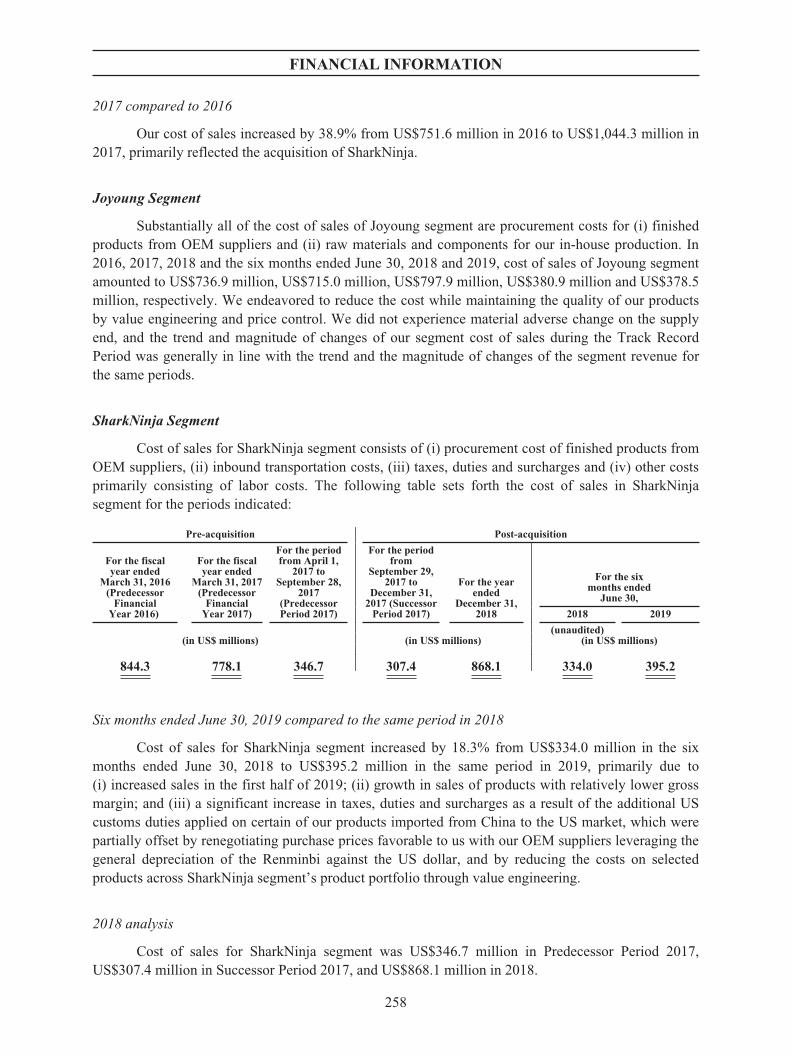
FINANCIAL INFORMATION
2017 compared to 2016
Our cost of sales increased by 38.9% from US$751.6 million in 2016 to US$1,044.3 million in2017, primarily reflected the acquisition of SharkNinja.
Joyoung Segment
Substantially all of the cost of sales of Joyoung segment are procurement costs for (i) finishedproducts from OEM suppliers and (ii) raw materials and components for our in-house production. In2016, 2017, 2018 and the six months ended June 30, 2018 and 2019, cost of sales of Joyoung segmentamounted to US$736.9 million, US$715.0 million, US$797.9 million, US$380.9 million and US$378.5million, respectively. We endeavored to reduce the cost while maintaining the quality of our productsby value engineering and price control. We did not experience material adverse change on the supplyend, and the trend and magnitude of changes of our segment cost of sales during the Track RecordPeriod was generally in line with the trend and the magnitude of changes of the segment revenue forthe same periods.
SharkNinja Segment
Cost of sales for SharkNinja segment consists of (i) procurement cost of finished products fromOEM suppliers, (ii) inbound transportation costs, (iii) taxes, duties and surcharges and (iv) other costsprimarily consisting of labor costs. The following table sets forth the cost of sales in SharkNinjasegment for the periods indicated:
Pre-acquisition Post-acquisition
For the fiscalyear ended
March 31, 2016(Predecessor
FinancialYear 2016)
For the fiscalyear ended
March 31, 2017(Predecessor
FinancialYear 2017)
For the periodfrom April 1,
2017 toSeptember 28,
2017(PredecessorPeriod 2017)
For the periodfrom
September 29,2017 to
December 31,2017 (Successor
Period 2017)
For the yearended
December 31,2018
For the sixmonths ended
June 30,
2018 2019
(unaudited)(in US$ millions) (in US$ millions) (in US$ millions)
844.3 778.1 346.7 307.4 868.1 334.0 395.2
Six months ended June 30, 2019 compared to the same period in 2018
Cost of sales for SharkNinja segment increased by 18.3% from US$334.0 million in the sixmonths ended June 30, 2018 to US$395.2 million in the same period in 2019, primarily due to(i) increased sales in the first half of 2019; (ii) growth in sales of products with relatively lower grossmargin; and (iii) a significant increase in taxes, duties and surcharges as a result of the additional UScustoms duties applied on certain of our products imported from China to the US market, which werepartially offset by renegotiating purchase prices favorable to us with our OEM suppliers leveraging thegeneral depreciation of the Renminbi against the US dollar, and by reducing the costs on selectedproducts across SharkNinja segment’s product portfolio through value engineering.
2018 analysis
Cost of sales for SharkNinja segment was US$346.7 million in Predecessor Period 2017,US$307.4 million in Successor Period 2017, and US$868.1 million in 2018.
258
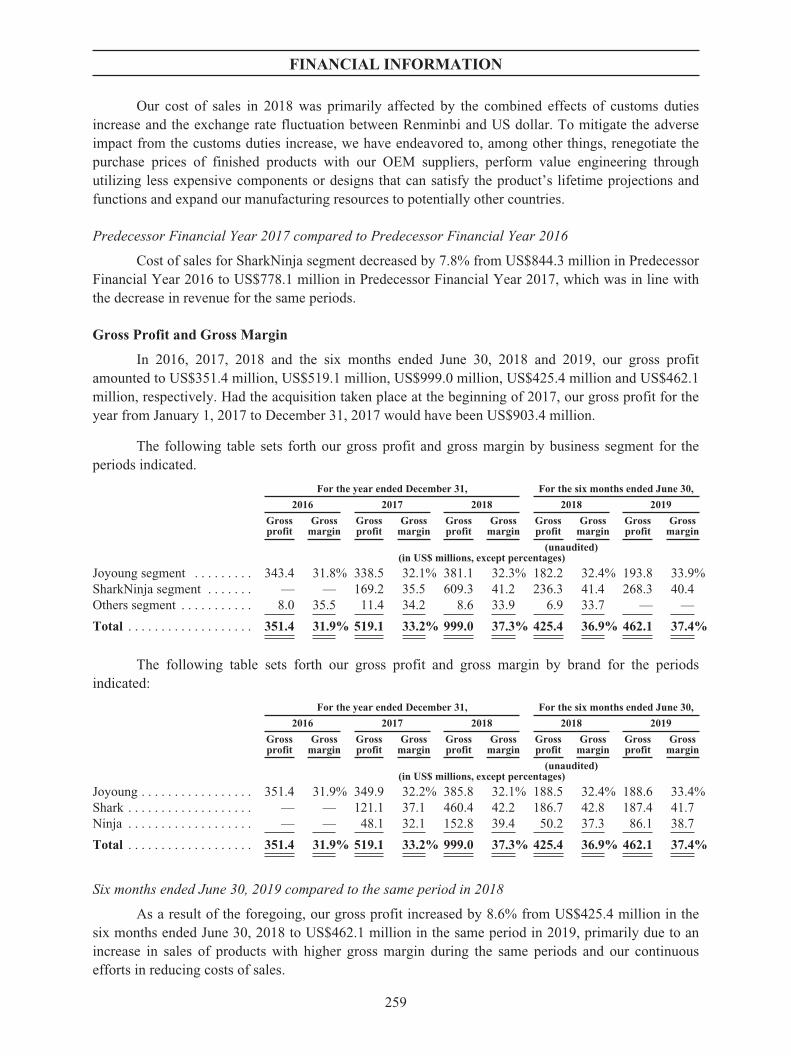
FINANCIAL INFORMATION
Our cost of sales in 2018 was primarily affected by the combined effects of customs dutiesincrease and the exchange rate fluctuation between Renminbi and US dollar. To mitigate the adverseimpact from the customs duties increase, we have endeavored to, among other things, renegotiate thepurchase prices of finished products with our OEM suppliers, perform value engineering throughutilizing less expensive components or designs that can satisfy the product’s lifetime projections andfunctions and expand our manufacturing resources to potentially other countries.
Predecessor Financial Year 2017 compared to Predecessor Financial Year 2016
Cost of sales for SharkNinja segment decreased by 7.8% from US$844.3 million in PredecessorFinancial Year 2016 to US$778.1 million in Predecessor Financial Year 2017, which was in line withthe decrease in revenue for the same periods.
Gross Profit and Gross Margin
In 2016, 2017, 2018 and the six months ended June 30, 2018 and 2019, our gross profitamounted to US$351.4 million, US$519.1 million, US$999.0 million, US$425.4 million and US$462.1million, respectively. Had the acquisition taken place at the beginning of 2017, our gross profit for theyear from January 1, 2017 to December 31, 2017 would have been US$903.4 million.
The following table sets forth our gross profit and gross margin by business segment for theperiods indicated.
For the year ended December 31, For the six months ended June 30,
2016 2017 2018 2018 2019
Grossprofit
Grossmargin
Grossprofit
Grossmargin
Grossprofit
Grossmargin
Grossprofit
Grossmargin
Grossprofit
Grossmargin
(unaudited)(in US$ millions, except percentages)
Joyoung segment . . . . . . . . . 343.4 31.8% 338.5 32.1% 381.1 32.3% 182.2 32.4% 193.8 33.9%SharkNinja segment . . . . . . . — — 169.2 35.5 609.3 41.2 236.3 41.4 268.3 40.4Others segment . . . . . . . . . . . 8.0 35.5 11.4 34.2 8.6 33.9 6.9 33.7 — —
Total . . . . . . . . . . . . . . . . . . . 351.4 31.9% 519.1 33.2% 999.0 37.3% 425.4 36.9% 462.1 37.4%
The following table sets forth our gross profit and gross margin by brand for the periodsindicated:
For the year ended December 31, For the six months ended June 30,
2016 2017 2018 2018 2019
Grossprofit
Grossmargin
Grossprofit
Grossmargin
Grossprofit
Grossmargin
Grossprofit
Grossmargin
Grossprofit
Grossmargin
(unaudited)(in US$ millions, except percentages)
Joyoung . . . . . . . . . . . . . . . . . 351.4 31.9% 349.9 32.2% 385.8 32.1% 188.5 32.4% 188.6 33.4%Shark . . . . . . . . . . . . . . . . . . . — — 121.1 37.1 460.4 42.2 186.7 42.8 187.4 41.7Ninja . . . . . . . . . . . . . . . . . . . — — 48.1 32.1 152.8 39.4 50.2 37.3 86.1 38.7
Total . . . . . . . . . . . . . . . . . . . 351.4 31.9% 519.1 33.2% 999.0 37.3% 425.4 36.9% 462.1 37.4%
Six months ended June 30, 2019 compared to the same period in 2018
As a result of the foregoing, our gross profit increased by 8.6% from US$425.4 million in thesix months ended June 30, 2018 to US$462.1 million in the same period in 2019, primarily due to anincrease in sales of products with higher gross margin during the same periods and our continuousefforts in reducing costs of sales.
259

FINANCIAL INFORMATION
Our gross margin increased from 36.9% in the six months ended June 30, 2018 to 37.4% in thesame period in 2019, primarily due to our increased sales of products with higher gross margin.
2018 compared to 2017
As a result of the foregoing, our gross profit increased by 92.4% from US$519.1 million in2017 to US$999.0 million in 2018. The increase primarily reflected the consolidation of SharkNinja fora full year in 2018 compared to only approximately three months in 2017.
Our gross profit margin increased from 33.2% in 2017 to 37.3% in 2018 primarily due to theconsolidation of SharkNinja, which generally has a higher gross margin than Joyoung segment’s, for afull year in 2018, compared to partially in 2017. Such increase was partially offset by the inventorystep up from SharkNinja segment due to the revaluation of its inventories at the acquisition ofSharkNinja.
2017 compared to 2016
As a result of the foregoing, our gross profit increased by 47.7% from US$351.4 million in2016 to US$519.1 million in 2017. The increase primarily reflected the consolidation of SharkNinjasegment after the acquisition in September 2017.
Our gross margin increased from 31.9% in 2016 to 33.2% in 2017, primarily due to theconsolidation of SharkNinja with higher profit margin since September 2017, which was partiallyoffset by the inventory step up from SharkNinja segment due to the revaluation of its inventories at theacquisition of SharkNinja.
Joyoung Segment
The gross margin of Joyoung segment is generally affected by product mix. The overall profitmargin of Joyoung segment remained relatively stable, primarily because we maintain an extensiveproduct portfolio with a wide range of pricing and margin levels, which enable us to maintain abalanced and stable gross margin level. As of June 30, 2019, Joyoung segment product portfolioreached 34 product lines.
Six months ended June 30, 2019 compared to the same period in 2018
As a result of the foregoing, the gross profit of Joyoung segment increased by 6.4% fromUS$182.2 million in the six months ended June 30, 2018 to US$193.8 million in the same period in2019. The gross margin of Joyoung segment increased from 32.4% in the six months ended June 30,2018 to 33.9% in the same period in 2019, as a result of increased sales of products with higher grossmargin.
2018 compared to 2017
As a result of the foregoing, the gross profit of Joyoung segment increased by 12.6% fromUS$338.5 million in 2017 to US$381.1 million in 2018. The gross margin of Joyoung segmentremained relatively stable at 32.1% and 32.3% in 2017 and 2018, respectively.
260
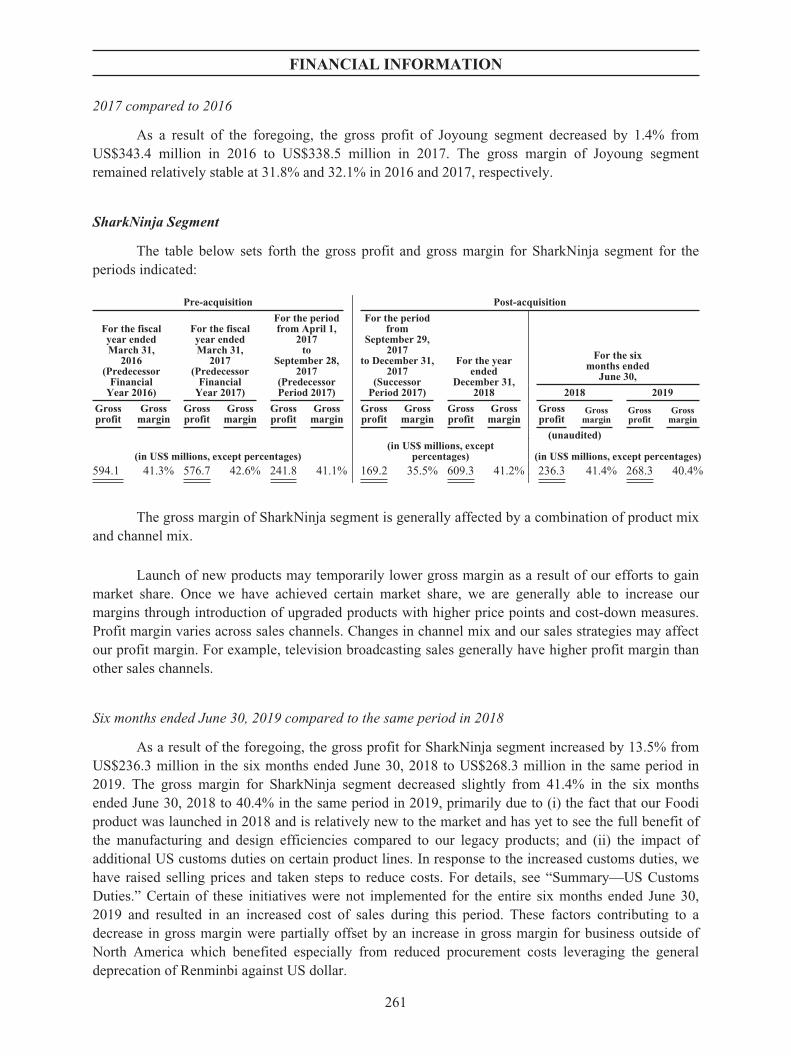
FINANCIAL INFORMATION
2017 compared to 2016
As a result of the foregoing, the gross profit of Joyoung segment decreased by 1.4% fromUS$343.4 million in 2016 to US$338.5 million in 2017. The gross margin of Joyoung segmentremained relatively stable at 31.8% and 32.1% in 2016 and 2017, respectively.
SharkNinja Segment
The table below sets forth the gross profit and gross margin for SharkNinja segment for theperiods indicated:
Pre-acquisition Post-acquisition
For the fiscalyear endedMarch 31,
2016(Predecessor
FinancialYear 2016)
For the fiscalyear endedMarch 31,
2017(Predecessor
FinancialYear 2017)
For the periodfrom April 1,
2017to
September 28,2017
(PredecessorPeriod 2017)
For the periodfrom
September 29,2017
to December 31,2017
(SuccessorPeriod 2017)
For the yearended
December 31,2018
For the sixmonths ended
June 30,
2018 2019
Grossprofit
Grossmargin
Grossprofit
Grossmargin
Grossprofit
Grossmargin
Grossprofit
Grossmargin
Grossprofit
Grossmargin
Grossprofit
Grossmargin
Grossprofit
Grossmargin
(unaudited)
(in US$ millions, except percentages)(in US$ millions, except
percentages) (in US$ millions, except percentages)594.1 41.3% 576.7 42.6% 241.8 41.1% 169.2 35.5% 609.3 41.2% 236.3 41.4% 268.3 40.4%
The gross margin of SharkNinja segment is generally affected by a combination of product mixand channel mix.
Launch of new products may temporarily lower gross margin as a result of our efforts to gainmarket share. Once we have achieved certain market share, we are generally able to increase ourmargins through introduction of upgraded products with higher price points and cost-down measures.Profit margin varies across sales channels. Changes in channel mix and our sales strategies may affectour profit margin. For example, television broadcasting sales generally have higher profit margin thanother sales channels.
Six months ended June 30, 2019 compared to the same period in 2018
As a result of the foregoing, the gross profit for SharkNinja segment increased by 13.5% fromUS$236.3 million in the six months ended June 30, 2018 to US$268.3 million in the same period in2019. The gross margin for SharkNinja segment decreased slightly from 41.4% in the six monthsended June 30, 2018 to 40.4% in the same period in 2019, primarily due to (i) the fact that our Foodiproduct was launched in 2018 and is relatively new to the market and has yet to see the full benefit ofthe manufacturing and design efficiencies compared to our legacy products; and (ii) the impact ofadditional US customs duties on certain product lines. In response to the increased customs duties, wehave raised selling prices and taken steps to reduce costs. For details, see “Summary—US CustomsDuties.” Certain of these initiatives were not implemented for the entire six months ended June 30,2019 and resulted in an increased cost of sales during this period. These factors contributing to adecrease in gross margin were partially offset by an increase in gross margin for business outside ofNorth America which benefited especially from reduced procurement costs leveraging the generaldeprecation of Renminbi against US dollar.
261
FINANCIAL INFORMATION
2018 analysis
As a result of the foregoing, the gross profit for SharkNinja segment was US$241.8 million inPredecessor Period 2017, US$169.2 million in Successor Period 2017, and US$609.3 million in 2018.Gross margin of SharkNinja segment was 41.1%, 35.5% and 41.2% for Predecessor Period 2017,Successor Period 2017 and 2018, respectively.
The gross margin of SharkNinja segment was 35.5% for Successor Period 2017, primarily dueto a revaluation of its inventories from purchase price to fair value under the purchase accountingmethod at the acquisition of SharkNinja, which contributed US$29.1 million to the segment cost ofsales in 2017.
Predecessor Financial Year 2017 compared to Predecessor Financial Year 2016
As a result of the foregoing, the gross profit for SharkNinja segment decreased by 2.9% fromUS$594.1 million in Predecessor Financial Year 2016 to US$576.7 million in Predecessor FinancialYear 2017. The gross margin for SharkNinja segment increased from 41.3% in Predecessor FinancialYear 2016 to 42.6% in Predecessor Financial Year 2017, primarily due to a combined effect ofincreased sales of our premium vacuums with higher gross margin and decreased sales of our foodpreparation appliances with lower gross margin.
Other Income and Gains
Our other income and gains primarily include (i) gain on disposal of property, plant andequipment, (ii) government grant, (iii) gain on disposal of subsidiaries and (iv) bank interest income.We receive various government grants mainly for our research activities, innovation and patents. Thereare no unfulfilled conditions or contingencies relating to these government grants during the TrackRecord Period.
262
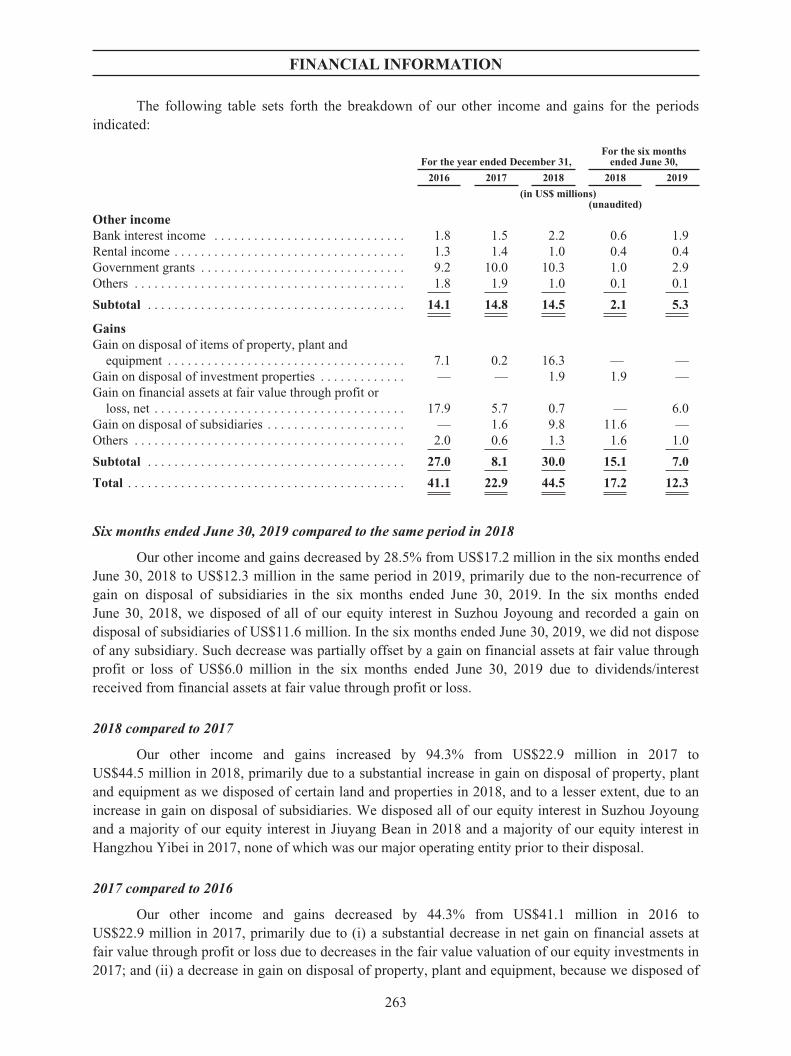
FINANCIAL INFORMATION
The following table sets forth the breakdown of our other income and gains for the periodsindicated:
For the year ended December 31,For the six months
ended June 30,
2016 2017 2018 2018 2019
(in US$ millions)(unaudited)
Other incomeBank interest income . . . . . . . . . . . . . . . . . . . . . . . . . . . . . 1.8 1.5 2.2 0.6 1.9Rental income . . . . . . . . . . . . . . . . . . . . . . . . . . . . . . . . . . . 1.3 1.4 1.0 0.4 0.4Government grants . . . . . . . . . . . . . . . . . . . . . . . . . . . . . . . 9.2 10.0 10.3 1.0 2.9Others . . . . . . . . . . . . . . . . . . . . . . . . . . . . . . . . . . . . . . . . . 1.8 1.9 1.0 0.1 0.1
Subtotal . . . . . . . . . . . . . . . . . . . . . . . . . . . . . . . . . . . . . . . 14.1 14.8 14.5 2.1 5.3
GainsGain on disposal of items of property, plant and
equipment . . . . . . . . . . . . . . . . . . . . . . . . . . . . . . . . . . . . 7.1 0.2 16.3 — —Gain on disposal of investment properties . . . . . . . . . . . . . — — 1.9 1.9 —Gain on financial assets at fair value through profit or
loss, net . . . . . . . . . . . . . . . . . . . . . . . . . . . . . . . . . . . . . . 17.9 5.7 0.7 — 6.0Gain on disposal of subsidiaries . . . . . . . . . . . . . . . . . . . . . — 1.6 9.8 11.6 —Others . . . . . . . . . . . . . . . . . . . . . . . . . . . . . . . . . . . . . . . . . 2.0 0.6 1.3 1.6 1.0
Subtotal . . . . . . . . . . . . . . . . . . . . . . . . . . . . . . . . . . . . . . . 27.0 8.1 30.0 15.1 7.0
Total . . . . . . . . . . . . . . . . . . . . . . . . . . . . . . . . . . . . . . . . . . 41.1 22.9 44.5 17.2 12.3
Six months ended June 30, 2019 compared to the same period in 2018
Our other income and gains decreased by 28.5% from US$17.2 million in the six months endedJune 30, 2018 to US$12.3 million in the same period in 2019, primarily due to the non-recurrence ofgain on disposal of subsidiaries in the six months ended June 30, 2019. In the six months endedJune 30, 2018, we disposed of all of our equity interest in Suzhou Joyoung and recorded a gain ondisposal of subsidiaries of US$11.6 million. In the six months ended June 30, 2019, we did not disposeof any subsidiary. Such decrease was partially offset by a gain on financial assets at fair value throughprofit or loss of US$6.0 million in the six months ended June 30, 2019 due to dividends/interestreceived from financial assets at fair value through profit or loss.
2018 compared to 2017
Our other income and gains increased by 94.3% from US$22.9 million in 2017 toUS$44.5 million in 2018, primarily due to a substantial increase in gain on disposal of property, plantand equipment as we disposed of certain land and properties in 2018, and to a lesser extent, due to anincrease in gain on disposal of subsidiaries. We disposed all of our equity interest in Suzhou Joyoungand a majority of our equity interest in Jiuyang Bean in 2018 and a majority of our equity interest inHangzhou Yibei in 2017, none of which was our major operating entity prior to their disposal.
2017 compared to 2016
Our other income and gains decreased by 44.3% from US$41.1 million in 2016 toUS$22.9 million in 2017, primarily due to (i) a substantial decrease in net gain on financial assets atfair value through profit or loss due to decreases in the fair value valuation of our equity investments in2017; and (ii) a decrease in gain on disposal of property, plant and equipment, because we disposed of
263
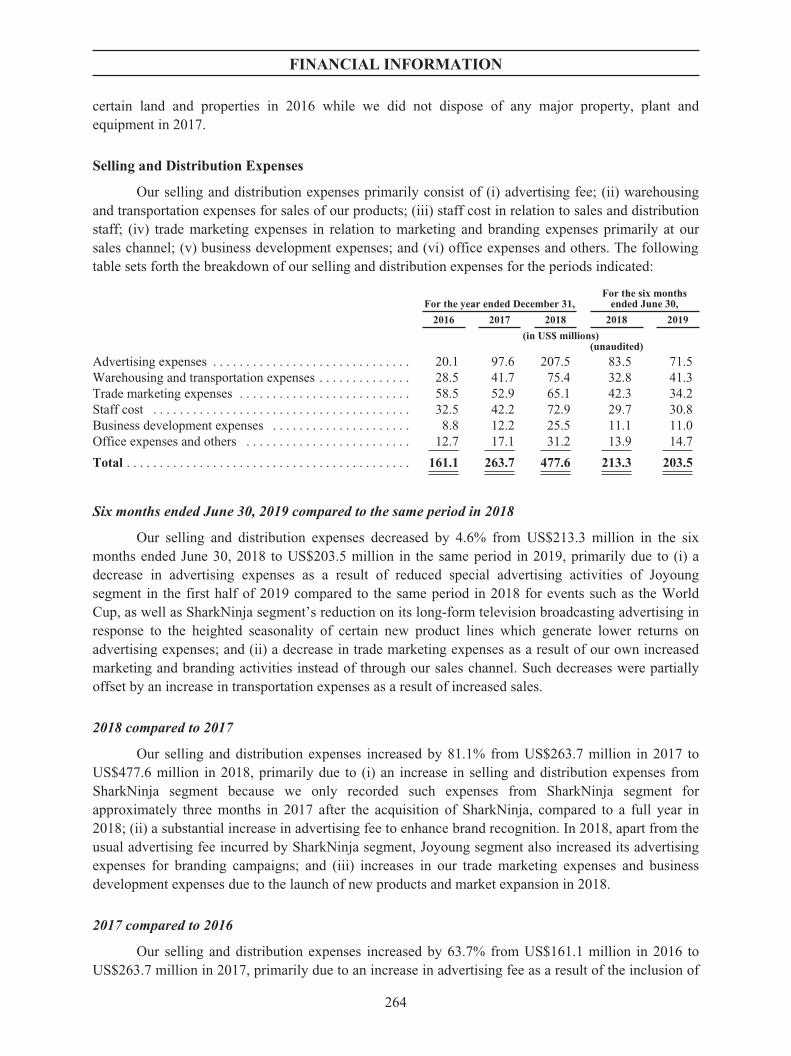
FINANCIAL INFORMATION
certain land and properties in 2016 while we did not dispose of any major property, plant andequipment in 2017.
Selling and Distribution Expenses
Our selling and distribution expenses primarily consist of (i) advertising fee; (ii) warehousingand transportation expenses for sales of our products; (iii) staff cost in relation to sales and distributionstaff; (iv) trade marketing expenses in relation to marketing and branding expenses primarily at oursales channel; (v) business development expenses; and (vi) office expenses and others. The followingtable sets forth the breakdown of our selling and distribution expenses for the periods indicated:
For the year ended December 31,For the six months
ended June 30,
2016 2017 2018 2018 2019
(in US$ millions)(unaudited)
Advertising expenses . . . . . . . . . . . . . . . . . . . . . . . . . . . . . . 20.1 97.6 207.5 83.5 71.5Warehousing and transportation expenses . . . . . . . . . . . . . . 28.5 41.7 75.4 32.8 41.3Trade marketing expenses . . . . . . . . . . . . . . . . . . . . . . . . . . 58.5 52.9 65.1 42.3 34.2Staff cost . . . . . . . . . . . . . . . . . . . . . . . . . . . . . . . . . . . . . . . 32.5 42.2 72.9 29.7 30.8Business development expenses . . . . . . . . . . . . . . . . . . . . . 8.8 12.2 25.5 11.1 11.0Office expenses and others . . . . . . . . . . . . . . . . . . . . . . . . . 12.7 17.1 31.2 13.9 14.7
Total . . . . . . . . . . . . . . . . . . . . . . . . . . . . . . . . . . . . . . . . . . . 161.1 263.7 477.6 213.3 203.5
Six months ended June 30, 2019 compared to the same period in 2018
Our selling and distribution expenses decreased by 4.6% from US$213.3 million in the sixmonths ended June 30, 2018 to US$203.5 million in the same period in 2019, primarily due to (i) adecrease in advertising expenses as a result of reduced special advertising activities of Joyoungsegment in the first half of 2019 compared to the same period in 2018 for events such as the WorldCup, as well as SharkNinja segment’s reduction on its long-form television broadcasting advertising inresponse to the heighted seasonality of certain new product lines which generate lower returns onadvertising expenses; and (ii) a decrease in trade marketing expenses as a result of our own increasedmarketing and branding activities instead of through our sales channel. Such decreases were partiallyoffset by an increase in transportation expenses as a result of increased sales.
2018 compared to 2017
Our selling and distribution expenses increased by 81.1% from US$263.7 million in 2017 toUS$477.6 million in 2018, primarily due to (i) an increase in selling and distribution expenses fromSharkNinja segment because we only recorded such expenses from SharkNinja segment forapproximately three months in 2017 after the acquisition of SharkNinja, compared to a full year in2018; (ii) a substantial increase in advertising fee to enhance brand recognition. In 2018, apart from theusual advertising fee incurred by SharkNinja segment, Joyoung segment also increased its advertisingexpenses for branding campaigns; and (iii) increases in our trade marketing expenses and businessdevelopment expenses due to the launch of new products and market expansion in 2018.
2017 compared to 2016
Our selling and distribution expenses increased by 63.7% from US$161.1 million in 2016 toUS$263.7 million in 2017, primarily due to an increase in advertising fee as a result of the inclusion of
264
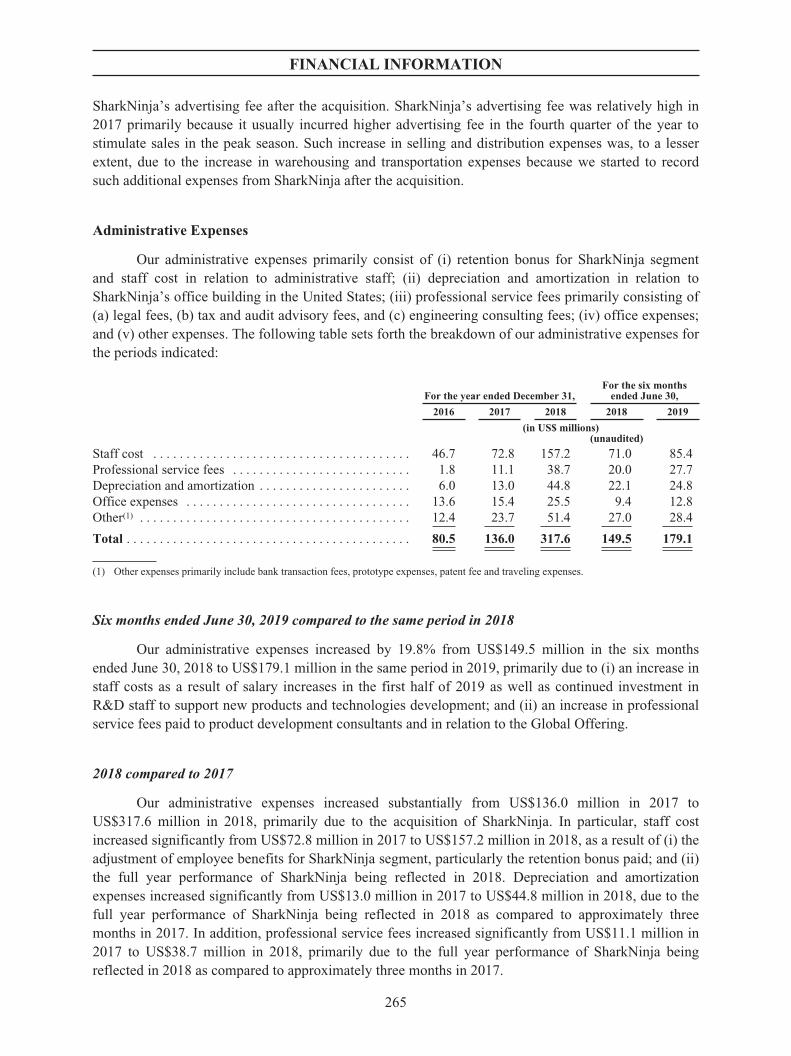
FINANCIAL INFORMATION
SharkNinja’s advertising fee after the acquisition. SharkNinja’s advertising fee was relatively high in2017 primarily because it usually incurred higher advertising fee in the fourth quarter of the year tostimulate sales in the peak season. Such increase in selling and distribution expenses was, to a lesserextent, due to the increase in warehousing and transportation expenses because we started to recordsuch additional expenses from SharkNinja after the acquisition.
Administrative Expenses
Our administrative expenses primarily consist of (i) retention bonus for SharkNinja segmentand staff cost in relation to administrative staff; (ii) depreciation and amortization in relation toSharkNinja’s office building in the United States; (iii) professional service fees primarily consisting of(a) legal fees, (b) tax and audit advisory fees, and (c) engineering consulting fees; (iv) office expenses;and (v) other expenses. The following table sets forth the breakdown of our administrative expenses forthe periods indicated:
For the year ended December 31,For the six months
ended June 30,
2016 2017 2018 2018 2019
(in US$ millions)(unaudited)
Staff cost . . . . . . . . . . . . . . . . . . . . . . . . . . . . . . . . . . . . . . . 46.7 72.8 157.2 71.0 85.4Professional service fees . . . . . . . . . . . . . . . . . . . . . . . . . . . 1.8 11.1 38.7 20.0 27.7Depreciation and amortization . . . . . . . . . . . . . . . . . . . . . . . 6.0 13.0 44.8 22.1 24.8Office expenses . . . . . . . . . . . . . . . . . . . . . . . . . . . . . . . . . . 13.6 15.4 25.5 9.4 12.8Other(1) . . . . . . . . . . . . . . . . . . . . . . . . . . . . . . . . . . . . . . . . . 12.4 23.7 51.4 27.0 28.4
Total . . . . . . . . . . . . . . . . . . . . . . . . . . . . . . . . . . . . . . . . . . . 80.5 136.0 317.6 149.5 179.1
(1) Other expenses primarily include bank transaction fees, prototype expenses, patent fee and traveling expenses.
Six months ended June 30, 2019 compared to the same period in 2018
Our administrative expenses increased by 19.8% from US$149.5 million in the six monthsended June 30, 2018 to US$179.1 million in the same period in 2019, primarily due to (i) an increase instaff costs as a result of salary increases in the first half of 2019 as well as continued investment inR&D staff to support new products and technologies development; and (ii) an increase in professionalservice fees paid to product development consultants and in relation to the Global Offering.
2018 compared to 2017
Our administrative expenses increased substantially from US$136.0 million in 2017 toUS$317.6 million in 2018, primarily due to the acquisition of SharkNinja. In particular, staff costincreased significantly from US$72.8 million in 2017 to US$157.2 million in 2018, as a result of (i) theadjustment of employee benefits for SharkNinja segment, particularly the retention bonus paid; and (ii)the full year performance of SharkNinja being reflected in 2018. Depreciation and amortizationexpenses increased significantly from US$13.0 million in 2017 to US$44.8 million in 2018, due to thefull year performance of SharkNinja being reflected in 2018 as compared to approximately threemonths in 2017. In addition, professional service fees increased significantly from US$11.1 million in2017 to US$38.7 million in 2018, primarily due to the full year performance of SharkNinja beingreflected in 2018 as compared to approximately three months in 2017.
265
FINANCIAL INFORMATION
2017 compared to 2016
Our administrative expenses increased by 68.9% from US$80.5 million in 2016 toUS$136.0 million in 2017, primarily due to the acquisition of SharkNinja. Particularly, there was (i) anincrease in staff cost, primarily due to the acquisition of SharkNinja and consequently the increase inthe number of full-time employees; (ii) an increase in professional services fees paid to our consultantsand auditors for the acquisition of SharkNinja; and (iii) an increase in depreciation and amortization inrelation to SharkNinja’s office building in the United States.
Impairment Losses on Financial Assets
Our impairment losses on financial assets include primarily impairment losses on tradereceivables, and impairment losses on financial assets included in prepayments, other receivables andother assets. We recognize an allowance for expected credit losses (“ECLs”) for all financialinstruments not held at fair value through profit or loss. ECLs are based on the difference between thecontractual cash flows due in accordance with the contract and all the cash flows that we expect toreceive, discounted at an approximation of the original effective interest rate. For trade receivables thatare overdue, we recorded impairment losses for expected losses of such receivables at different ratesdepending on the length of the overdue period. During the Track Record Period, we recordedimpairment losses on financial assets of US$1.4 million, US$2.6 million, US$4.1 million and US$1.3million, respectively.
Other Expenses
Our other expenses primarily consist of (i) changes in carrying amount in relation to the putoption; and (ii) business combination transaction costs in relation to the acquisition of SharkNinja.
Six months ended June 30, 2019 compared to the same period in 2018
Our other expenses remained relatively stable at US$18.0 million and US$17.6 million in thesix months ended June 30, 2018 and 2019, respectively.
2018 compared to 2017
Our other expenses increased substantially from US$22.9 million in 2017 to US$31.4 million in2018, primarily as a result of an increase in the carrying amount of the put option from US$7.1 millionin 2017 to US$28.8 million in 2018, according to the present value of the redemption liability of theput option, which was partially offset by an elimination of business combination transaction costs in2018, given such costs were only recorded in 2017.
2017 compared to 2016
Our other expenses increased substantially from US$3.4 million in 2016 to US$22.9 million in2017, primarily as a result of (i) an increase of US$13.3 million in business combination transactioncosts in 2017, because we recorded such costs in 2017 incurred for the acquisition of SharkNinja; and(ii) an increase of US$7.1 million in the carrying amount of the put option, which reflected an increasein the balance of redemption liabilities associated with the put option from US$620.7 million as ofSeptember 29, 2017 to US$627.8 million as of December 31, 2017.
266
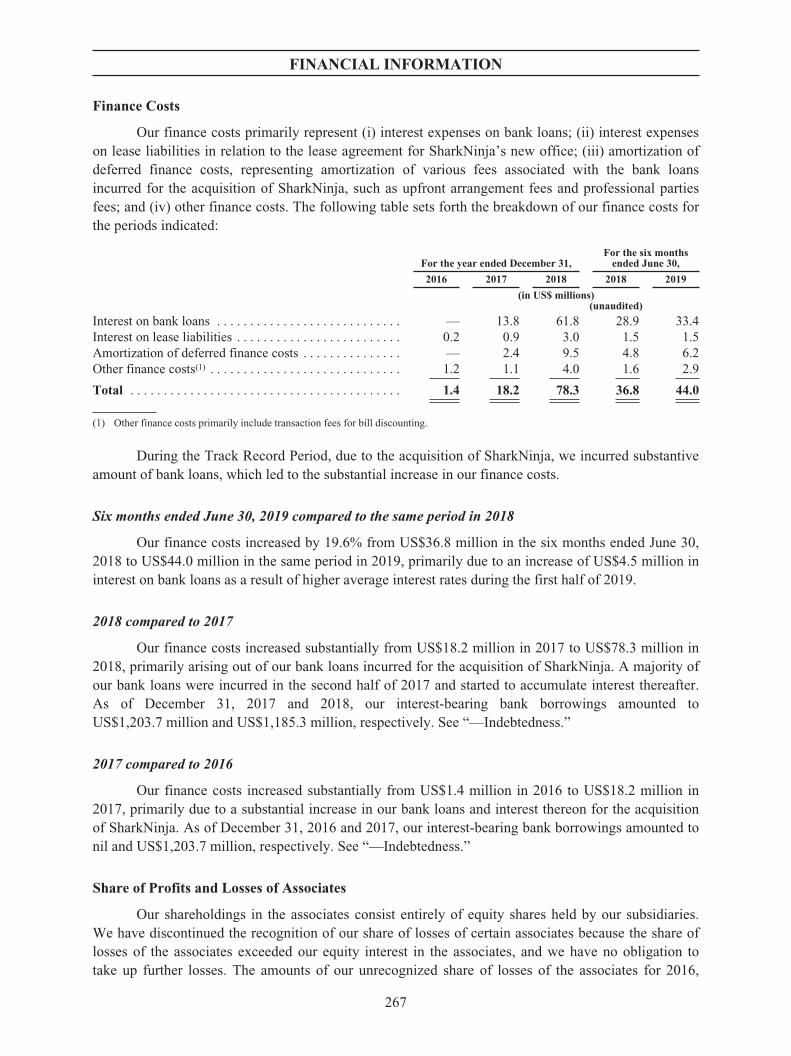
FINANCIAL INFORMATION
Finance Costs
Our finance costs primarily represent (i) interest expenses on bank loans; (ii) interest expenseson lease liabilities in relation to the lease agreement for SharkNinja’s new office; (iii) amortization ofdeferred finance costs, representing amortization of various fees associated with the bank loansincurred for the acquisition of SharkNinja, such as upfront arrangement fees and professional partiesfees; and (iv) other finance costs. The following table sets forth the breakdown of our finance costs forthe periods indicated:
For the year ended December 31,For the six months
ended June 30,
2016 2017 2018 2018 2019
(in US$ millions)(unaudited)
Interest on bank loans . . . . . . . . . . . . . . . . . . . . . . . . . . . . — 13.8 61.8 28.9 33.4Interest on lease liabilities . . . . . . . . . . . . . . . . . . . . . . . . . 0.2 0.9 3.0 1.5 1.5Amortization of deferred finance costs . . . . . . . . . . . . . . . — 2.4 9.5 4.8 6.2Other finance costs(1) . . . . . . . . . . . . . . . . . . . . . . . . . . . . . 1.2 1.1 4.0 1.6 2.9
Total . . . . . . . . . . . . . . . . . . . . . . . . . . . . . . . . . . . . . . . . . 1.4 18.2 78.3 36.8 44.0
(1) Other finance costs primarily include transaction fees for bill discounting.
During the Track Record Period, due to the acquisition of SharkNinja, we incurred substantiveamount of bank loans, which led to the substantial increase in our finance costs.
Six months ended June 30, 2019 compared to the same period in 2018
Our finance costs increased by 19.6% from US$36.8 million in the six months ended June 30,2018 to US$44.0 million in the same period in 2019, primarily due to an increase of US$4.5 million ininterest on bank loans as a result of higher average interest rates during the first half of 2019.
2018 compared to 2017
Our finance costs increased substantially from US$18.2 million in 2017 to US$78.3 million in2018, primarily arising out of our bank loans incurred for the acquisition of SharkNinja. A majority ofour bank loans were incurred in the second half of 2017 and started to accumulate interest thereafter.As of December 31, 2017 and 2018, our interest-bearing bank borrowings amounted toUS$1,203.7 million and US$1,185.3 million, respectively. See “—Indebtedness.”
2017 compared to 2016
Our finance costs increased substantially from US$1.4 million in 2016 to US$18.2 million in2017, primarily due to a substantial increase in our bank loans and interest thereon for the acquisitionof SharkNinja. As of December 31, 2016 and 2017, our interest-bearing bank borrowings amounted tonil and US$1,203.7 million, respectively. See “—Indebtedness.”
Share of Profits and Losses of Associates
Our shareholdings in the associates consist entirely of equity shares held by our subsidiaries.We have discontinued the recognition of our share of losses of certain associates because the share oflosses of the associates exceeded our equity interest in the associates, and we have no obligation totake up further losses. The amounts of our unrecognized share of losses of the associates for 2016,
267
FINANCIAL INFORMATION
2017, 2018 and the six months ended June 30, 2019 were US$5,000, nil, US$57,000 and nil,respectively. In 2016, we recognized share of losses of associates of US$2.5 million, while, in 2017,2018 and the six months ended June 30, 2019, we recognized share of profits of associates ofUS$3.2 million. US$5.8 million and US$92,000, respectively.
Six months ended June 30, 2019 compared to the same period in 2018
Our share of profits of associates decreased from US$5.7 million in the six months endedJune 30, 2018 to US$92,000 in the same period in 2019, primarily attributed to dividend declared byone of our associate companies in the first half of 2018, which did not occur in the same period in2019.
2018 compared to 2017
Our share of profits of associates increased from US$3.2 million in 2017 to US$5.8 million in2018, primarily attributed to the operational results and financial performance of our associates in thesame year.
2017 compared to 2016
In 2017, we recognized share of profits of associates of US$3.2 million, while in 2016, werecognized share of losses of associates of US$2.5 million, primarily attributed to the operationalresults and financial performance of our associates in the same year.
Income Tax
Income tax expense/credit represents current and deferred income tax expenses/credits. We aresubject to income tax on an entity basis on the profit arising in or derived from the tax jurisdictions inwhich we are domiciled and operate. The determination of current and deferred income taxes wasbased on the enacted tax rates.
We are not subject to any income tax in the Cayman Islands and the British Virgin Islands.
Our subsidiaries located in mainland China were subject to PRC corporate income tax at a rateof 25% on the assessable profits generated during the Track Record Period. Our subsidiary JoyoungHousehold Appliances, currently qualified as a high and new technology enterprise under the PRCincome tax law, was entitled to preferential tax rate of 15% during the Track Record Period and willcontinue to enjoy such preferential tax rate until the end of 2019. We plan to reapply for suchqualification and preferential tax rate, and as of the Latest Practicable Date, we do not foresee materialobstacles in being requalified. According to the EIT Law and the relevant regulations and rulespromulgated by the SAT, enterprises engaging in research and development activities are entitled toclaim 150% of their research and development expenses before 2018 and 175% since 2018 so incurredas tax deductible expenses when determining their assessable profits for that year (“Super Deduction”).We have made our best estimate for the Super Deduction to be claimed for our entities in ascertainingtheir assessable profits during the Track Record Period.
Our US subsidiaries were subject to US federal income tax at the rate of 35%, which wassubsequently decreased to 21% since January 1, 2018, and to various US state income taxes at ratesranging from 0.38% to 9.99%.
268
FINANCIAL INFORMATION
We recorded income tax expenses of US$19.8 million and US$28.3 million in 2016 and 2018,respectively, with an effective income tax rate of 13.9% and 20.1%, respectively. We recorded incometax credit of US$39.0 million in 2017. For the six months ended June 30, 2018 and 2019, we recordedincome tax expenses of US$5.9 million and US$7.1 million, respectively, with an effective income taxrate of 22.1% and 24.3% respectively. As of the Latest Practicable Date, we do not have any disputewith any tax authority.
Six months ended June 30, 2019 compared to the same period in 2018
Our income tax expenses increased from US$5.9 million in the six months ended June 30, 2018to US$7.1 million in the same period in 2019, primarily due to the increase in profit before tax.
2018 compared to 2017
We recorded income tax expenses of US$28.3 million in 2018, while we recorded an incometax credit of US$39.0 million in 2017. Upon the acquisition of SharkNinja as of September 29, 2017,we recorded net deferred tax liabilities of US$166.6 million, which were primarily related to fair valueadjustments made to the acquired assets, the future amortization of which is not deductible for taxpurposes. In December 2017, the US federal tax rate was reduced from 35% to 21% effective fromJanuary 1, 2018, therefore the net deferred tax liability related to SharkNinja was revalued using thelower tax rate, thereby resulting in a tax credit in 2017.
2017 compared to 2016
We recorded income tax credit of US$39.0 million in 2017, while we recorded income taxexpenses of US$19.8 million in 2016, for the same reason above.
Net Profit
As a result of the reasons above, our net profit amounted to US$122.4 million, US$140.9million, US$112.1 million, US$20.6 million and US$21.9 million in 2016, 2017, 2018 and the sixmonths ended June 30, 2018 and 2019, respectively. Had the acquisition of SharkNinja taken place atthe beginning of the year, our net profit for the period from January 1, 2017 to December 31, 2017would have been US$165.4 million.
NON-IFRS MEASURES
To supplement our consolidated statements of profit or loss which are presented in accordancewith IFRS, we also use adjusted net profit, EBITDA and adjusted EBITDA as non-IFRS measures,which are not required by, or presented in accordance with, IFRS. We believe that the presentation ofnon-IFRS measures when shown in conjunction with the corresponding IFRS measures provides usefulinformation to potential investors and management in facilitating a comparison of our operatingperformance from period to period by eliminating potential impacts of certain items that do not affectour ongoing operating performance, including expenses arising from the acquisition of SharkNinja andReorganization, and non-operational or one-off expenses and gains (each without considering taxeffect). Such non-IFRS measures allow investors to consider matrices used by our management inevaluating our performance. From time to time in the future, there may be other items that we mayexclude in reviewing our financial results. The use of the non-IFRS measures has limitations as ananalytical tool, and you should not consider it in isolation from, or as a substitute for or superior to
269
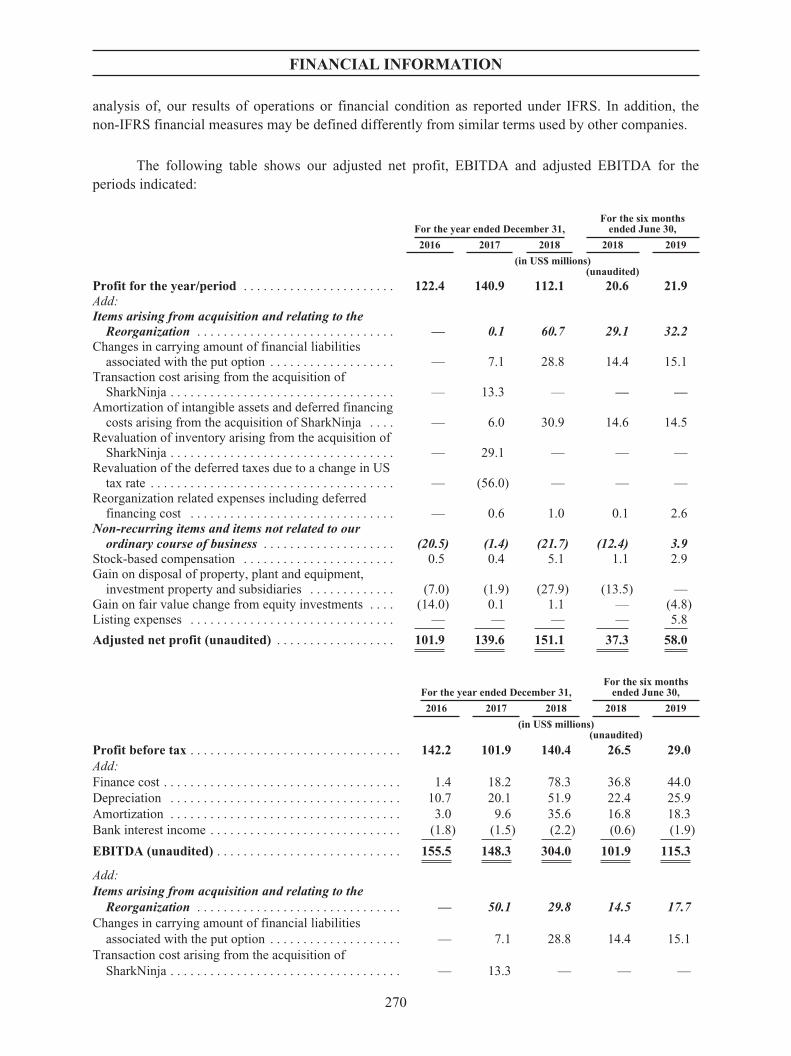
FINANCIAL INFORMATION
analysis of, our results of operations or financial condition as reported under IFRS. In addition, thenon-IFRS financial measures may be defined differently from similar terms used by other companies.
The following table shows our adjusted net profit, EBITDA and adjusted EBITDA for theperiods indicated:
For the year ended December 31,For the six months
ended June 30,
2016 2017 2018 2018 2019
(in US$ millions)(unaudited)
Profit for the year/period . . . . . . . . . . . . . . . . . . . . . . . 122.4 140.9 112.1 20.6 21.9Add:Items arising from acquisition and relating to the
Reorganization . . . . . . . . . . . . . . . . . . . . . . . . . . . . . . — 0.1 60.7 29.1 32.2Changes in carrying amount of financial liabilities
associated with the put option . . . . . . . . . . . . . . . . . . . — 7.1 28.8 14.4 15.1Transaction cost arising from the acquisition of
SharkNinja . . . . . . . . . . . . . . . . . . . . . . . . . . . . . . . . . . — 13.3 — — —Amortization of intangible assets and deferred financing
costs arising from the acquisition of SharkNinja . . . . — 6.0 30.9 14.6 14.5Revaluation of inventory arising from the acquisition of
SharkNinja . . . . . . . . . . . . . . . . . . . . . . . . . . . . . . . . . . — 29.1 — — —Revaluation of the deferred taxes due to a change in US
tax rate . . . . . . . . . . . . . . . . . . . . . . . . . . . . . . . . . . . . . — (56.0) — — —Reorganization related expenses including deferred
financing cost . . . . . . . . . . . . . . . . . . . . . . . . . . . . . . . — 0.6 1.0 0.1 2.6Non-recurring items and items not related to our
ordinary course of business . . . . . . . . . . . . . . . . . . . . (20.5) (1.4) (21.7) (12.4) 3.9Stock-based compensation . . . . . . . . . . . . . . . . . . . . . . . 0.5 0.4 5.1 1.1 2.9Gain on disposal of property, plant and equipment,
investment property and subsidiaries . . . . . . . . . . . . . (7.0) (1.9) (27.9) (13.5) —Gain on fair value change from equity investments . . . . (14.0) 0.1 1.1 — (4.8)Listing expenses . . . . . . . . . . . . . . . . . . . . . . . . . . . . . . . — — — — 5.8
Adjusted net profit (unaudited) . . . . . . . . . . . . . . . . . . 101.9 139.6 151.1 37.3 58.0
For the year ended December 31,For the six months
ended June 30,
2016 2017 2018 2018 2019
(in US$ millions)(unaudited)
Profit before tax . . . . . . . . . . . . . . . . . . . . . . . . . . . . . . . . 142.2 101.9 140.4 26.5 29.0Add:Finance cost . . . . . . . . . . . . . . . . . . . . . . . . . . . . . . . . . . . . 1.4 18.2 78.3 36.8 44.0Depreciation . . . . . . . . . . . . . . . . . . . . . . . . . . . . . . . . . . . 10.7 20.1 51.9 22.4 25.9Amortization . . . . . . . . . . . . . . . . . . . . . . . . . . . . . . . . . . . 3.0 9.6 35.6 16.8 18.3Bank interest income . . . . . . . . . . . . . . . . . . . . . . . . . . . . . (1.8) (1.5) (2.2) (0.6) (1.9)
EBITDA (unaudited) . . . . . . . . . . . . . . . . . . . . . . . . . . . . 155.5 148.3 304.0 101.9 115.3
Add:Items arising from acquisition and relating to the
Reorganization . . . . . . . . . . . . . . . . . . . . . . . . . . . . . . . — 50.1 29.8 14.5 17.7Changes in carrying amount of financial liabilities
associated with the put option . . . . . . . . . . . . . . . . . . . . — 7.1 28.8 14.4 15.1Transaction cost arising from the acquisition of
SharkNinja . . . . . . . . . . . . . . . . . . . . . . . . . . . . . . . . . . . — 13.3 — — —
270
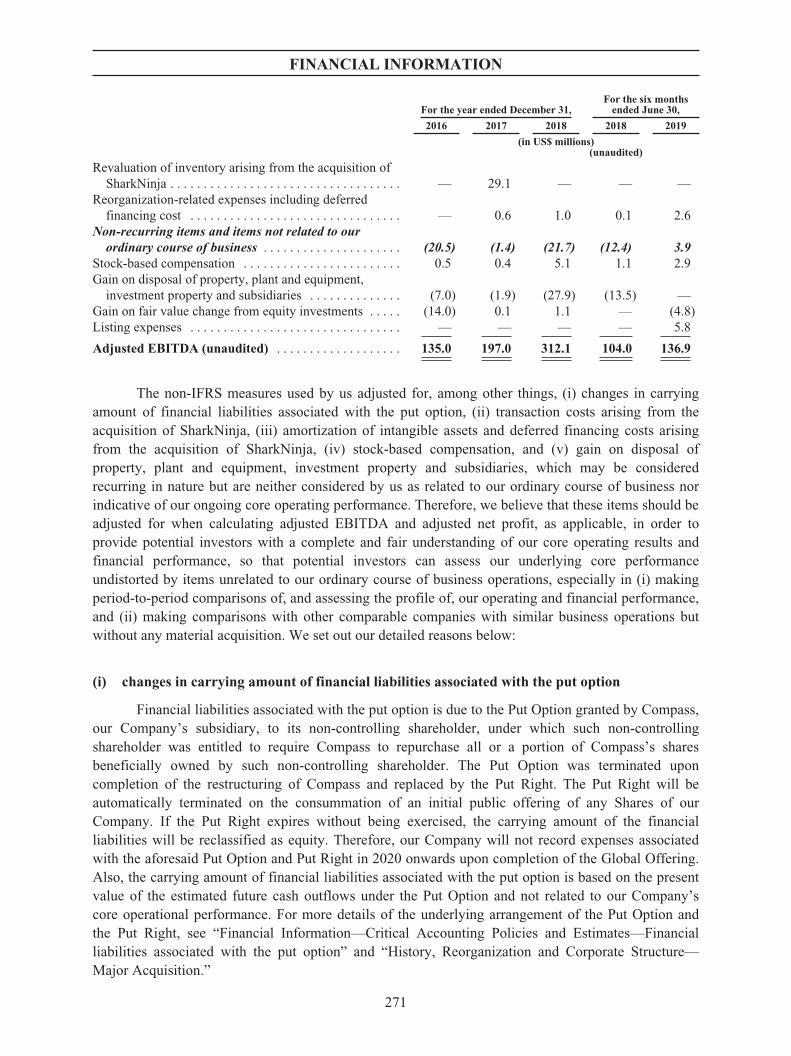
FINANCIAL INFORMATION
For the year ended December 31,For the six months
ended June 30,
2016 2017 2018 2018 2019
(in US$ millions)(unaudited)
Revaluation of inventory arising from the acquisition ofSharkNinja . . . . . . . . . . . . . . . . . . . . . . . . . . . . . . . . . . . — 29.1 — — —
Reorganization-related expenses including deferredfinancing cost . . . . . . . . . . . . . . . . . . . . . . . . . . . . . . . . — 0.6 1.0 0.1 2.6
Non-recurring items and items not related to ourordinary course of business . . . . . . . . . . . . . . . . . . . . . (20.5) (1.4) (21.7) (12.4) 3.9
Stock-based compensation . . . . . . . . . . . . . . . . . . . . . . . . 0.5 0.4 5.1 1.1 2.9Gain on disposal of property, plant and equipment,
investment property and subsidiaries . . . . . . . . . . . . . . (7.0) (1.9) (27.9) (13.5) —Gain on fair value change from equity investments . . . . . (14.0) 0.1 1.1 — (4.8)Listing expenses . . . . . . . . . . . . . . . . . . . . . . . . . . . . . . . . — — — — 5.8
Adjusted EBITDA (unaudited) . . . . . . . . . . . . . . . . . . . 135.0 197.0 312.1 104.0 136.9
The non-IFRS measures used by us adjusted for, among other things, (i) changes in carryingamount of financial liabilities associated with the put option, (ii) transaction costs arising from theacquisition of SharkNinja, (iii) amortization of intangible assets and deferred financing costs arisingfrom the acquisition of SharkNinja, (iv) stock-based compensation, and (v) gain on disposal ofproperty, plant and equipment, investment property and subsidiaries, which may be consideredrecurring in nature but are neither considered by us as related to our ordinary course of business norindicative of our ongoing core operating performance. Therefore, we believe that these items should beadjusted for when calculating adjusted EBITDA and adjusted net profit, as applicable, in order toprovide potential investors with a complete and fair understanding of our core operating results andfinancial performance, so that potential investors can assess our underlying core performanceundistorted by items unrelated to our ordinary course of business operations, especially in (i) makingperiod-to-period comparisons of, and assessing the profile of, our operating and financial performance,and (ii) making comparisons with other comparable companies with similar business operations butwithout any material acquisition. We set out our detailed reasons below:
(i) changes in carrying amount of financial liabilities associated with the put option
Financial liabilities associated with the put option is due to the Put Option granted by Compass,our Company’s subsidiary, to its non-controlling shareholder, under which such non-controllingshareholder was entitled to require Compass to repurchase all or a portion of Compass’s sharesbeneficially owned by such non-controlling shareholder. The Put Option was terminated uponcompletion of the restructuring of Compass and replaced by the Put Right. The Put Right will beautomatically terminated on the consummation of an initial public offering of any Shares of ourCompany. If the Put Right expires without being exercised, the carrying amount of the financialliabilities will be reclassified as equity. Therefore, our Company will not record expenses associatedwith the aforesaid Put Option and Put Right in 2020 onwards upon completion of the Global Offering.Also, the carrying amount of financial liabilities associated with the put option is based on the presentvalue of the estimated future cash outflows under the Put Option and not related to our Company’score operational performance. For more details of the underlying arrangement of the Put Option andthe Put Right, see “Financial Information—Critical Accounting Policies and Estimates—Financialliabilities associated with the put option” and “History, Reorganization and Corporate Structure—Major Acquisition.”
271
FINANCIAL INFORMATION
(ii) transaction cost arising from the acquisition of SharkNinja
Transaction cost arising from the acquisition of SharkNinja refers to the costs associated withexecution and completion of the acquisition of SharkNinja, which is a one-off and non-recurring eventby nature, and primarily includes legal and other professional service fees, and we do not have frequentbusiness acquisitions out of our ordinary course of business. We only recorded transaction cost arisingfrom the acquisition of SharkNinja in 2017, the year when the acquisition took place, and did not havesuch expense in 2018 and the six months ended June 30, 2019 and will not record such expense itemgoing forward.
(iii) amortization of intangible assets and deferred financing costs arising from the acquisition ofSharkNinja
We do not consider amortization of intangible assets and deferred financing costs arising fromthe acquisition of SharkNinja to be related to our ordinary course of business or indicative of our coreoperating performance, even though such expenses will recur in certain periods in the future. We donot have frequent business acquisitions, and during the Track Record Period, we only completed onemajor acquisition, the acquisition of SharkNinja. Firstly, amortization of intangible assets and deferredfinancing costs arising from the acquisition of SharkNinja are non-business related items as theacquisition of SharkNinja is a one-off and non-recurring event by nature. Secondly, such amortizationsare of non-cash nature and therefore do not impact our operations after the acquisition. Thirdly, suchamortizations do not correlate with our core operating performance and their exclusion assists ourmanagement and potential investors in making period-to-period comparisons of our core operatingperformance.
For amortization of intangible assets, we recognized costs of SharkNinja’s retailer relationshipsand patents (both under intangible assets) at their fair value as of the date of the acquisition due topurchase accounting of the acquisition, which is a one-off, non-recurring event by nature. Additionally,as the cash consideration of the acquisition had already been paid in September 2017, the subsequentamortization of intangible assets arising from such one-off event is of non-cash nature, and neithercorrelates with our core operating performance nor impacts our operations after the acquisition.
For amortization of deferred financing costs arising from the acquisition of SharkNinja, it isrelated to various fees associated with the bank loans incurred and paid in September 2017, such asupfront arrangement fees and professional parties fees, for the acquisition of SharkNinja, which is aone-off, non-recurring event by nature. The subsequent amortization of the deferred financing costsarising from such one-off event is of non-cash nature, and neither correlates to our core operatingperformance nor impacts our operations after the acquisition.
(iv) stock-based compensation
Stock-based compensation expense is a non-cash expense arising from granting stock-basedawards to selected directors and employees. The amount of such expenses may not directly correlatewith the underlying performance of our business operations and is also affected by non-operatingperformance related factors that are not closely or directly related to our business activities, such astiming of grants of new stock-based awards, vesting period and staff turnover rate. Determining the fairvalue of the stock-based awards involves a high-degree of judgment and the expenses recorded maynot bear strong resemblance to the actual value realized upon the future exercise or termination of therelated stock-based awards. Furthermore, historical occurrence of such stock-based compensation is
272
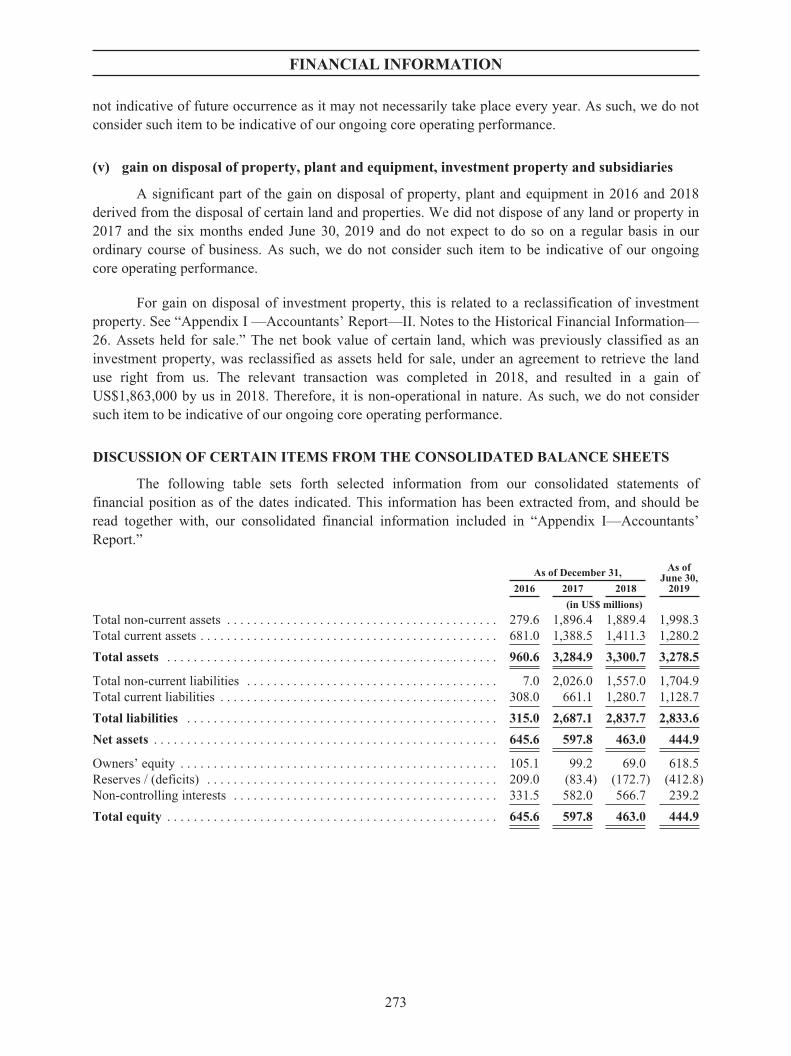
FINANCIAL INFORMATION
not indicative of future occurrence as it may not necessarily take place every year. As such, we do notconsider such item to be indicative of our ongoing core operating performance.
(v) gain on disposal of property, plant and equipment, investment property and subsidiaries
A significant part of the gain on disposal of property, plant and equipment in 2016 and 2018derived from the disposal of certain land and properties. We did not dispose of any land or property in2017 and the six months ended June 30, 2019 and do not expect to do so on a regular basis in ourordinary course of business. As such, we do not consider such item to be indicative of our ongoingcore operating performance.
For gain on disposal of investment property, this is related to a reclassification of investmentproperty. See “Appendix I —Accountants’ Report—II. Notes to the Historical Financial Information—26. Assets held for sale.” The net book value of certain land, which was previously classified as aninvestment property, was reclassified as assets held for sale, under an agreement to retrieve the landuse right from us. The relevant transaction was completed in 2018, and resulted in a gain ofUS$1,863,000 by us in 2018. Therefore, it is non-operational in nature. As such, we do not considersuch item to be indicative of our ongoing core operating performance.
DISCUSSION OF CERTAIN ITEMS FROM THE CONSOLIDATED BALANCE SHEETS
The following table sets forth selected information from our consolidated statements offinancial position as of the dates indicated. This information has been extracted from, and should beread together with, our consolidated financial information included in “Appendix I—Accountants’Report.”
As of December 31, As ofJune 30,
20192016 2017 2018
(in US$ millions)
Total non-current assets . . . . . . . . . . . . . . . . . . . . . . . . . . . . . . . . . . . . . . . . . 279.6 1,896.4 1,889.4 1,998.3Total current assets . . . . . . . . . . . . . . . . . . . . . . . . . . . . . . . . . . . . . . . . . . . . . 681.0 1,388.5 1,411.3 1,280.2
Total assets . . . . . . . . . . . . . . . . . . . . . . . . . . . . . . . . . . . . . . . . . . . . . . . . . . 960.6 3,284.9 3,300.7 3,278.5
Total non-current liabilities . . . . . . . . . . . . . . . . . . . . . . . . . . . . . . . . . . . . . . 7.0 2,026.0 1,557.0 1,704.9Total current liabilities . . . . . . . . . . . . . . . . . . . . . . . . . . . . . . . . . . . . . . . . . . 308.0 661.1 1,280.7 1,128.7
Total liabilities . . . . . . . . . . . . . . . . . . . . . . . . . . . . . . . . . . . . . . . . . . . . . . . 315.0 2,687.1 2,837.7 2,833.6
Net assets . . . . . . . . . . . . . . . . . . . . . . . . . . . . . . . . . . . . . . . . . . . . . . . . . . . . 645.6 597.8 463.0 444.9
Owners’ equity . . . . . . . . . . . . . . . . . . . . . . . . . . . . . . . . . . . . . . . . . . . . . . . . 105.1 99.2 69.0 618.5Reserves / (deficits) . . . . . . . . . . . . . . . . . . . . . . . . . . . . . . . . . . . . . . . . . . . . 209.0 (83.4) (172.7) (412.8)Non-controlling interests . . . . . . . . . . . . . . . . . . . . . . . . . . . . . . . . . . . . . . . . 331.5 582.0 566.7 239.2
Total equity . . . . . . . . . . . . . . . . . . . . . . . . . . . . . . . . . . . . . . . . . . . . . . . . . . 645.6 597.8 463.0 444.9
273
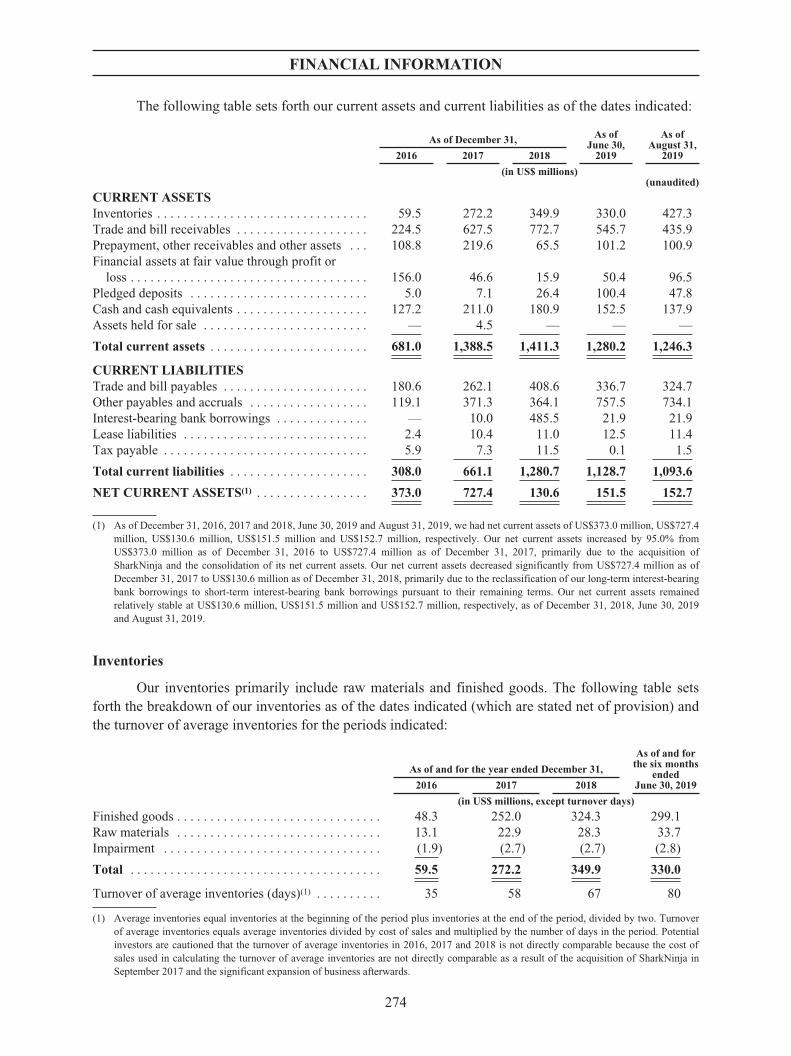
FINANCIAL INFORMATION
The following table sets forth our current assets and current liabilities as of the dates indicated:
As of December 31, As ofJune 30,
2019
As ofAugust 31,
20192016 2017 2018
(in US$ millions)(unaudited)
CURRENT ASSETSInventories . . . . . . . . . . . . . . . . . . . . . . . . . . . . . . . . 59.5 272.2 349.9 330.0 427.3Trade and bill receivables . . . . . . . . . . . . . . . . . . . . 224.5 627.5 772.7 545.7 435.9Prepayment, other receivables and other assets . . . 108.8 219.6 65.5 101.2 100.9Financial assets at fair value through profit or
loss . . . . . . . . . . . . . . . . . . . . . . . . . . . . . . . . . . . . 156.0 46.6 15.9 50.4 96.5Pledged deposits . . . . . . . . . . . . . . . . . . . . . . . . . . . 5.0 7.1 26.4 100.4 47.8Cash and cash equivalents . . . . . . . . . . . . . . . . . . . . 127.2 211.0 180.9 152.5 137.9Assets held for sale . . . . . . . . . . . . . . . . . . . . . . . . . — 4.5 — — —
Total current assets . . . . . . . . . . . . . . . . . . . . . . . . 681.0 1,388.5 1,411.3 1,280.2 1,246.3
CURRENT LIABILITIESTrade and bill payables . . . . . . . . . . . . . . . . . . . . . . 180.6 262.1 408.6 336.7 324.7Other payables and accruals . . . . . . . . . . . . . . . . . . 119.1 371.3 364.1 757.5 734.1Interest-bearing bank borrowings . . . . . . . . . . . . . . — 10.0 485.5 21.9 21.9Lease liabilities . . . . . . . . . . . . . . . . . . . . . . . . . . . . 2.4 10.4 11.0 12.5 11.4Tax payable . . . . . . . . . . . . . . . . . . . . . . . . . . . . . . . 5.9 7.3 11.5 0.1 1.5
Total current liabilities . . . . . . . . . . . . . . . . . . . . . 308.0 661.1 1,280.7 1,128.7 1,093.6
NET CURRENT ASSETS(1) . . . . . . . . . . . . . . . . . 373.0 727.4 130.6 151.5 152.7
(1) As of December 31, 2016, 2017 and 2018, June 30, 2019 and August 31, 2019, we had net current assets of US$373.0 million, US$727.4million, US$130.6 million, US$151.5 million and US$152.7 million, respectively. Our net current assets increased by 95.0% fromUS$373.0 million as of December 31, 2016 to US$727.4 million as of December 31, 2017, primarily due to the acquisition ofSharkNinja and the consolidation of its net current assets. Our net current assets decreased significantly from US$727.4 million as ofDecember 31, 2017 to US$130.6 million as of December 31, 2018, primarily due to the reclassification of our long-term interest-bearingbank borrowings to short-term interest-bearing bank borrowings pursuant to their remaining terms. Our net current assets remainedrelatively stable at US$130.6 million, US$151.5 million and US$152.7 million, respectively, as of December 31, 2018, June 30, 2019and August 31, 2019.
Inventories
Our inventories primarily include raw materials and finished goods. The following table setsforth the breakdown of our inventories as of the dates indicated (which are stated net of provision) andthe turnover of average inventories for the periods indicated:
As of and for the year ended December 31,
As of and forthe six months
endedJune 30, 20192016 2017 2018
(in US$ millions, except turnover days)
Finished goods . . . . . . . . . . . . . . . . . . . . . . . . . . . . . . . 48.3 252.0 324.3 299.1Raw materials . . . . . . . . . . . . . . . . . . . . . . . . . . . . . . . 13.1 22.9 28.3 33.7Impairment . . . . . . . . . . . . . . . . . . . . . . . . . . . . . . . . . (1.9) (2.7) (2.7) (2.8)
Total . . . . . . . . . . . . . . . . . . . . . . . . . . . . . . . . . . . . . . 59.5 272.2 349.9 330.0
Turnover of average inventories (days)(1) . . . . . . . . . . 35 58 67 80
(1) Average inventories equal inventories at the beginning of the period plus inventories at the end of the period, divided by two. Turnoverof average inventories equals average inventories divided by cost of sales and multiplied by the number of days in the period. Potentialinvestors are cautioned that the turnover of average inventories in 2016, 2017 and 2018 is not directly comparable because the cost ofsales used in calculating the turnover of average inventories are not directly comparable as a result of the acquisition of SharkNinja inSeptember 2017 and the significant expansion of business afterwards.
274
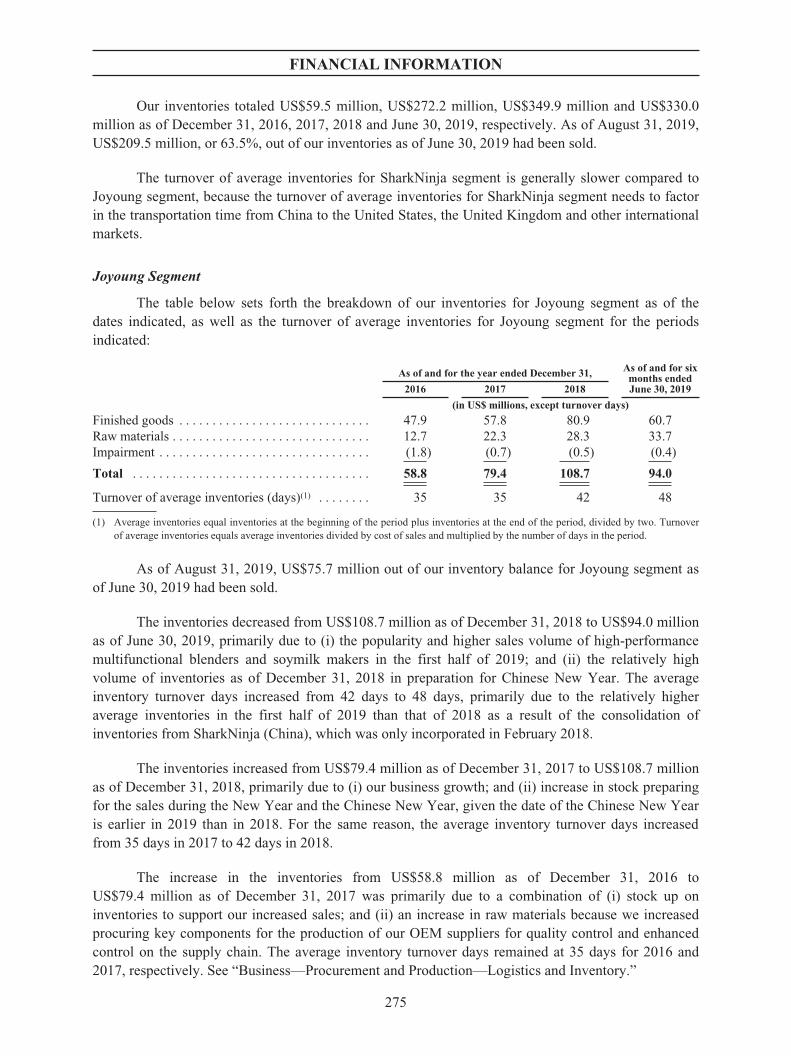
FINANCIAL INFORMATION
Our inventories totaled US$59.5 million, US$272.2 million, US$349.9 million and US$330.0million as of December 31, 2016, 2017, 2018 and June 30, 2019, respectively. As of August 31, 2019,US$209.5 million, or 63.5%, out of our inventories as of June 30, 2019 had been sold.
The turnover of average inventories for SharkNinja segment is generally slower compared toJoyoung segment, because the turnover of average inventories for SharkNinja segment needs to factorin the transportation time from China to the United States, the United Kingdom and other internationalmarkets.
Joyoung Segment
The table below sets forth the breakdown of our inventories for Joyoung segment as of thedates indicated, as well as the turnover of average inventories for Joyoung segment for the periodsindicated:
As of and for the year ended December 31, As of and for sixmonths endedJune 30, 20192016 2017 2018
(in US$ millions, except turnover days)
Finished goods . . . . . . . . . . . . . . . . . . . . . . . . . . . . . 47.9 57.8 80.9 60.7Raw materials . . . . . . . . . . . . . . . . . . . . . . . . . . . . . . 12.7 22.3 28.3 33.7Impairment . . . . . . . . . . . . . . . . . . . . . . . . . . . . . . . . (1.8) (0.7) (0.5) (0.4)
Total . . . . . . . . . . . . . . . . . . . . . . . . . . . . . . . . . . . . 58.8 79.4 108.7 94.0
Turnover of average inventories (days)(1) . . . . . . . . 35 35 42 48
(1) Average inventories equal inventories at the beginning of the period plus inventories at the end of the period, divided by two. Turnoverof average inventories equals average inventories divided by cost of sales and multiplied by the number of days in the period.
As of August 31, 2019, US$75.7 million out of our inventory balance for Joyoung segment asof June 30, 2019 had been sold.
The inventories decreased from US$108.7 million as of December 31, 2018 to US$94.0 millionas of June 30, 2019, primarily due to (i) the popularity and higher sales volume of high-performancemultifunctional blenders and soymilk makers in the first half of 2019; and (ii) the relatively highvolume of inventories as of December 31, 2018 in preparation for Chinese New Year. The averageinventory turnover days increased from 42 days to 48 days, primarily due to the relatively higheraverage inventories in the first half of 2019 than that of 2018 as a result of the consolidation ofinventories from SharkNinja (China), which was only incorporated in February 2018.
The inventories increased from US$79.4 million as of December 31, 2017 to US$108.7 millionas of December 31, 2018, primarily due to (i) our business growth; and (ii) increase in stock preparingfor the sales during the New Year and the Chinese New Year, given the date of the Chinese New Yearis earlier in 2019 than in 2018. For the same reason, the average inventory turnover days increasedfrom 35 days in 2017 to 42 days in 2018.
The increase in the inventories from US$58.8 million as of December 31, 2016 toUS$79.4 million as of December 31, 2017 was primarily due to a combination of (i) stock up oninventories to support our increased sales; and (ii) an increase in raw materials because we increasedprocuring key components for the production of our OEM suppliers for quality control and enhancedcontrol on the supply chain. The average inventory turnover days remained at 35 days for 2016 and2017, respectively. See “Business—Procurement and Production—Logistics and Inventory.”
275
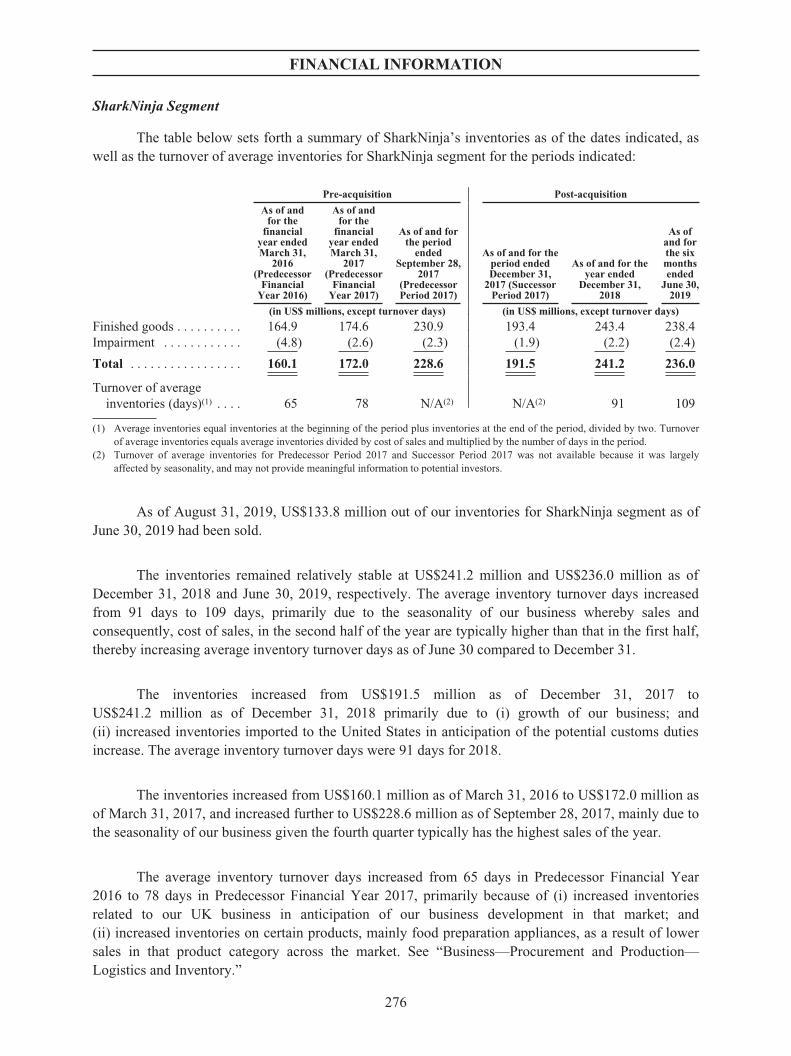
FINANCIAL INFORMATION
SharkNinja Segment
The table below sets forth a summary of SharkNinja’s inventories as of the dates indicated, aswell as the turnover of average inventories for SharkNinja segment for the periods indicated:
Pre-acquisition Post-acquisition
As of andfor the
financialyear endedMarch 31,
2016(Predecessor
FinancialYear 2016)
As of andfor the
financialyear endedMarch 31,
2017(Predecessor
FinancialYear 2017)
As of and forthe period
endedSeptember 28,
2017(PredecessorPeriod 2017)
As of and for theperiod endedDecember 31,
2017 (SuccessorPeriod 2017)
As of and for theyear ended
December 31,2018
As ofand forthe sixmonthsended
June 30,2019
(in US$ millions, except turnover days) (in US$ millions, except turnover days)
Finished goods . . . . . . . . . . 164.9 174.6 230.9 193.4 243.4 238.4Impairment . . . . . . . . . . . . (4.8) (2.6) (2.3) (1.9) (2.2) (2.4)
Total . . . . . . . . . . . . . . . . . 160.1 172.0 228.6 191.5 241.2 236.0
Turnover of averageinventories (days)(1) . . . . 65 78 N/A(2) N/A(2) 91 109
(1) Average inventories equal inventories at the beginning of the period plus inventories at the end of the period, divided by two. Turnoverof average inventories equals average inventories divided by cost of sales and multiplied by the number of days in the period.
(2) Turnover of average inventories for Predecessor Period 2017 and Successor Period 2017 was not available because it was largelyaffected by seasonality, and may not provide meaningful information to potential investors.
As of August 31, 2019, US$133.8 million out of our inventories for SharkNinja segment as ofJune 30, 2019 had been sold.
The inventories remained relatively stable at US$241.2 million and US$236.0 million as ofDecember 31, 2018 and June 30, 2019, respectively. The average inventory turnover days increasedfrom 91 days to 109 days, primarily due to the seasonality of our business whereby sales andconsequently, cost of sales, in the second half of the year are typically higher than that in the first half,thereby increasing average inventory turnover days as of June 30 compared to December 31.
The inventories increased from US$191.5 million as of December 31, 2017 toUS$241.2 million as of December 31, 2018 primarily due to (i) growth of our business; and(ii) increased inventories imported to the United States in anticipation of the potential customs dutiesincrease. The average inventory turnover days were 91 days for 2018.
The inventories increased from US$160.1 million as of March 31, 2016 to US$172.0 million asof March 31, 2017, and increased further to US$228.6 million as of September 28, 2017, mainly due tothe seasonality of our business given the fourth quarter typically has the highest sales of the year.
The average inventory turnover days increased from 65 days in Predecessor Financial Year2016 to 78 days in Predecessor Financial Year 2017, primarily because of (i) increased inventoriesrelated to our UK business in anticipation of our business development in that market; and(ii) increased inventories on certain products, mainly food preparation appliances, as a result of lowersales in that product category across the market. See “Business—Procurement and Production—Logistics and Inventory.”
276
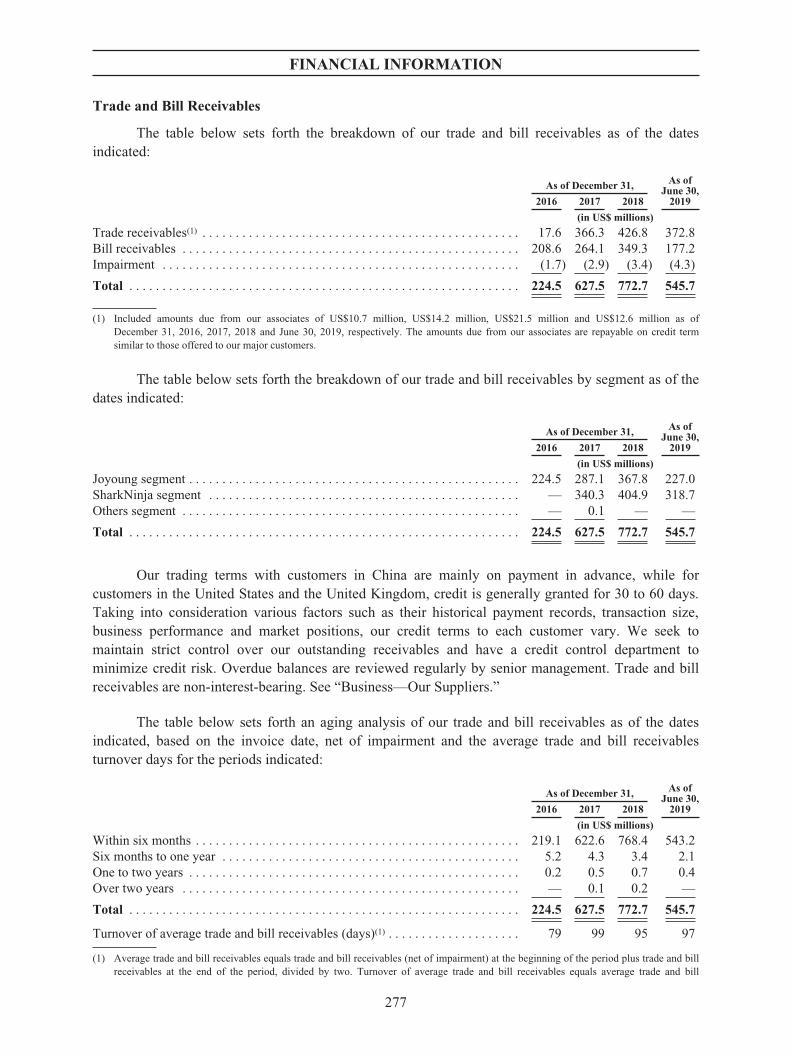
FINANCIAL INFORMATION
Trade and Bill Receivables
The table below sets forth the breakdown of our trade and bill receivables as of the datesindicated:
As of December 31, As ofJune 30,
20192016 2017 2018
(in US$ millions)
Trade receivables(1) . . . . . . . . . . . . . . . . . . . . . . . . . . . . . . . . . . . . . . . . . . . . . . . . 17.6 366.3 426.8 372.8Bill receivables . . . . . . . . . . . . . . . . . . . . . . . . . . . . . . . . . . . . . . . . . . . . . . . . . . . 208.6 264.1 349.3 177.2Impairment . . . . . . . . . . . . . . . . . . . . . . . . . . . . . . . . . . . . . . . . . . . . . . . . . . . . . . (1.7) (2.9) (3.4) (4.3)
Total . . . . . . . . . . . . . . . . . . . . . . . . . . . . . . . . . . . . . . . . . . . . . . . . . . . . . . . . . . . 224.5 627.5 772.7 545.7
(1) Included amounts due from our associates of US$10.7 million, US$14.2 million, US$21.5 million and US$12.6 million as ofDecember 31, 2016, 2017, 2018 and June 30, 2019, respectively. The amounts due from our associates are repayable on credit termsimilar to those offered to our major customers.
The table below sets forth the breakdown of our trade and bill receivables by segment as of thedates indicated:
As of December 31, As ofJune 30,
20192016 2017 2018
(in US$ millions)
Joyoung segment . . . . . . . . . . . . . . . . . . . . . . . . . . . . . . . . . . . . . . . . . . . . . . . . . . 224.5 287.1 367.8 227.0SharkNinja segment . . . . . . . . . . . . . . . . . . . . . . . . . . . . . . . . . . . . . . . . . . . . . . . — 340.3 404.9 318.7Others segment . . . . . . . . . . . . . . . . . . . . . . . . . . . . . . . . . . . . . . . . . . . . . . . . . . . — 0.1 — —
Total . . . . . . . . . . . . . . . . . . . . . . . . . . . . . . . . . . . . . . . . . . . . . . . . . . . . . . . . . . . 224.5 627.5 772.7 545.7
Our trading terms with customers in China are mainly on payment in advance, while forcustomers in the United States and the United Kingdom, credit is generally granted for 30 to 60 days.Taking into consideration various factors such as their historical payment records, transaction size,business performance and market positions, our credit terms to each customer vary. We seek tomaintain strict control over our outstanding receivables and have a credit control department tominimize credit risk. Overdue balances are reviewed regularly by senior management. Trade and billreceivables are non-interest-bearing. See “Business—Our Suppliers.”
The table below sets forth an aging analysis of our trade and bill receivables as of the datesindicated, based on the invoice date, net of impairment and the average trade and bill receivablesturnover days for the periods indicated:
As of December 31, As ofJune 30,
20192016 2017 2018
(in US$ millions)
Within six months . . . . . . . . . . . . . . . . . . . . . . . . . . . . . . . . . . . . . . . . . . . . . . . . . 219.1 622.6 768.4 543.2Six months to one year . . . . . . . . . . . . . . . . . . . . . . . . . . . . . . . . . . . . . . . . . . . . . 5.2 4.3 3.4 2.1One to two years . . . . . . . . . . . . . . . . . . . . . . . . . . . . . . . . . . . . . . . . . . . . . . . . . . 0.2 0.5 0.7 0.4Over two years . . . . . . . . . . . . . . . . . . . . . . . . . . . . . . . . . . . . . . . . . . . . . . . . . . . — 0.1 0.2 —
Total . . . . . . . . . . . . . . . . . . . . . . . . . . . . . . . . . . . . . . . . . . . . . . . . . . . . . . . . . . . 224.5 627.5 772.7 545.7
Turnover of average trade and bill receivables (days)(1) . . . . . . . . . . . . . . . . . . . . 79 99 95 97
(1) Average trade and bill receivables equals trade and bill receivables (net of impairment) at the beginning of the period plus trade and billreceivables at the end of the period, divided by two. Turnover of average trade and bill receivables equals average trade and bill
277
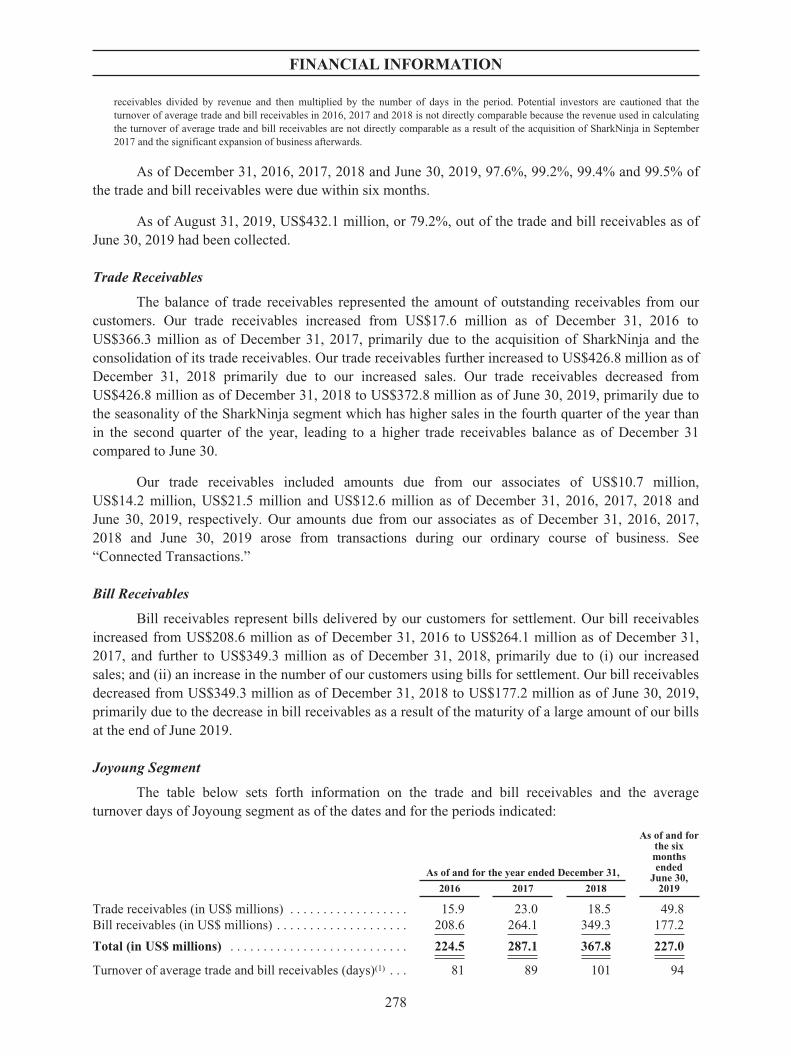
FINANCIAL INFORMATION
receivables divided by revenue and then multiplied by the number of days in the period. Potential investors are cautioned that theturnover of average trade and bill receivables in 2016, 2017 and 2018 is not directly comparable because the revenue used in calculatingthe turnover of average trade and bill receivables are not directly comparable as a result of the acquisition of SharkNinja in September2017 and the significant expansion of business afterwards.
As of December 31, 2016, 2017, 2018 and June 30, 2019, 97.6%, 99.2%, 99.4% and 99.5% ofthe trade and bill receivables were due within six months.
As of August 31, 2019, US$432.1 million, or 79.2%, out of the trade and bill receivables as ofJune 30, 2019 had been collected.
Trade Receivables
The balance of trade receivables represented the amount of outstanding receivables from ourcustomers. Our trade receivables increased from US$17.6 million as of December 31, 2016 toUS$366.3 million as of December 31, 2017, primarily due to the acquisition of SharkNinja and theconsolidation of its trade receivables. Our trade receivables further increased to US$426.8 million as ofDecember 31, 2018 primarily due to our increased sales. Our trade receivables decreased fromUS$426.8 million as of December 31, 2018 to US$372.8 million as of June 30, 2019, primarily due tothe seasonality of the SharkNinja segment which has higher sales in the fourth quarter of the year thanin the second quarter of the year, leading to a higher trade receivables balance as of December 31compared to June 30.
Our trade receivables included amounts due from our associates of US$10.7 million,US$14.2 million, US$21.5 million and US$12.6 million as of December 31, 2016, 2017, 2018 andJune 30, 2019, respectively. Our amounts due from our associates as of December 31, 2016, 2017,2018 and June 30, 2019 arose from transactions during our ordinary course of business. See“Connected Transactions.”
Bill Receivables
Bill receivables represent bills delivered by our customers for settlement. Our bill receivablesincreased from US$208.6 million as of December 31, 2016 to US$264.1 million as of December 31,2017, and further to US$349.3 million as of December 31, 2018, primarily due to (i) our increasedsales; and (ii) an increase in the number of our customers using bills for settlement. Our bill receivablesdecreased from US$349.3 million as of December 31, 2018 to US$177.2 million as of June 30, 2019,primarily due to the decrease in bill receivables as a result of the maturity of a large amount of our billsat the end of June 2019.
Joyoung Segment
The table below sets forth information on the trade and bill receivables and the averageturnover days of Joyoung segment as of the dates and for the periods indicated:
As of and for the year ended December 31,
As of and forthe sixmonthsended
June 30,20192016 2017 2018
Trade receivables (in US$ millions) . . . . . . . . . . . . . . . . . . 15.9 23.0 18.5 49.8Bill receivables (in US$ millions) . . . . . . . . . . . . . . . . . . . . 208.6 264.1 349.3 177.2
Total (in US$ millions) . . . . . . . . . . . . . . . . . . . . . . . . . . . 224.5 287.1 367.8 227.0
Turnover of average trade and bill receivables (days)(1) . . . 81 89 101 94
278
FINANCIAL INFORMATION
(1) Average trade and bill receivables equal trade and bill receivables (net of impairment) at the beginning of the period plus trade and billreceivables at the end of the period, divided by two. Turnover of average trade and bill receivables equals average trade and billreceivables divided by revenue and then multiplied by the number of days in the period.
We typically require our customers to pay in advance, before we deliver our products. We maygrant a credit term of typically 30 days to our selected distributors considering, among other things,their historical payment records, transaction size, business performance and market positions. Duringthe Track Record Period, we have increased our acceptance to the use of bills for settlement by ourcustomers, depending on our working capital needs and liquidity management. Compared to tradereceivables, bill receivables have a stronger liquidity.
The amount of trade and bill receivables for Joyoung segment increased from US$224.5 millionas of December 31, 2016 to US$287.1 million as of December 31, 2017, and increased further toUS$367.8 million as of December 31, 2018, primarily due to (i) increased sales and (ii) increased useof bills for settlement. As a result, its turnover days increased from 81 days in 2016 to 89 days in 2017,and further to 101 days in 2018. The amount of trade and bill receivables for Joyoung segmentdecreased from US$367.8 million as of December 31, 2018 to US$227.0 million as of June 30, 2019,primarily due to the decrease in bill receivables, which was partially offset by the increase in tradereceivables, due to (i) the increased revenue during the corresponding period, and (ii) increased sales atsales promotions and our own flagship stores. Its turnover days decreased from 101 days to 94 days,primarily due to the reduction of bill receivables which by nature generally have longer turnover dayscompared to trade receivables.
As of August 31, 2019, US$133.6 million out of the trade and bill receivables of Joyoungsegment as of June 30, 2019 had been collected.
SharkNinja Segment
The table below sets forth information on the trade receivables and the average turnover days ofSharkNinja segment as of the dates and for the periods indicated:
Pre-acquisition Post-acquisition
As of and forthe financialyear endedMarch 31,
2016(Predecessor
FinancialYear 2016)
As of and forthe financialyear endedMarch 31,
2017(Predecessor
FinancialYear 2017)
As of and forthe period
endedSeptember 28,
2017(PredecessorPeriod 2017)
As of and forthe period
endedDecember 31,
2017(Successor
Period 2017)
As of and forthe yearended
December 31,2018
As ofand forthe sixmonthsended
June 30,2019
Trade receivables (in US$ millions) . . . 233.3 234.2 302.5 340.3 404.9 318.7Turnover of average trade receivables
(days)(1) . . . . . . . . . . . . . . . . . . . . . . . 58 63 N/A(2) N/A(2) 92 99
(1) Average trade receivables equal trade receivables (net of impairment) at the beginning of the period plus trade receivables at the end ofthe period, divided by two. Turnover of average trade receivables equals average trade receivables divided by revenue and thenmultiplied by the number of days in the period.
(2) Turnover of average trade receivables for Predecessor Period 2017 and Successor Period 2017 was not available because it was largelyaffected by seasonality, and may not provide meaningful information to potential investors.
The credit period given by SharkNinja segment to its customers is generally 30 to 60 days. Theaverage trade receivables turnover days may be higher than 60 days due to the seasonality of ourbusiness. In particular, in North America and Europe, the fourth quarter typically has the highest salesof the year, leading to large trade receivables as of December 31 of each year. In addition, trade
279
FINANCIAL INFORMATION
receivables as of December 31 and for the year ended December 31 are not directly comparable withthose as of March 31 and for the year ended March 31.
The trade receivables for SharkNinja segment decreased from US$404.9 million as ofDecember 31, 2018 to US$318.7 million as of June 30, 2019, primarily due to the seasonality of ourbusiness as mentioned above, whereby sales in the fourth quarter are typically higher than those in therest of the year which leads to a higher trade receivables balance as of December 31. The average tradereceivables turnover days for SharkNinja segment increased from 92 days in 2018 to 99 days in the sixmonths ended June 30, 2019, primarily due to the seasonality of our business, whereby the first half ofthe year contributes to a lower percentage of total annual sales compared to the second half of the year.
The trade receivables for SharkNinja segment increased from US$340.3 million as ofDecember 31, 2017 to US$404.9 million as of December 31, 2018 and the average trade receivablesturnover days for SharkNinja segment were 92 days in 2018, primarily affected by seasonality asmentioned above.
The trade receivables for SharkNinja segment increased from US$233.3 million as ofMarch 31, 2016 to US$234.2 million as of March 31, 2017, and increased further to US$302.5 millionas of September 28, 2017. The average trade receivables turnover days for SharkNinja segmentincreased from 58 days in Predecessor Financial Year 2016 to 63 days in Predecessor Financial Year2017. Our trade receivables for SharkNinja segment and its turnover days remained relatively stable asof and for the fiscal years ended March 31, 2016 and 2017. See “Business—Procurement andProduction—Logistics and Inventory.”
As of August 31, 2019, US$298.5 million out of the trade receivables of SharkNinja segment asof June 30, 2019 had been collected.
Prepayments, Other Receivables and Other Assets
Our prepayments and other receivables mainly consist of (i) indemnification assets representingthe amount of indemnification we estimate to recover from the former shareholders of SharkNinja forthe ongoing litigation and tax liabilities that we assumed in the acquisition of SharkNinja; (ii) due fromrelated companies; (iii) deposits and other receivables; and (iv) right-of-return assets in relation to ourright to recover the goods expected to be returned by customers. The table below sets forth thebreakdown of our prepayments, other receivables and other assets as of the dates indicated:
As of December 31, As ofJune 30,
20192016 2017 2018
(in US$ millions)
Deposits and other receivables . . . . . . . . . . . . . . . . . . . . . . . . 4.7 13.6 13.2 33.0Indemnification assets . . . . . . . . . . . . . . . . . . . . . . . . . . . . . . — 50.9 24.3 23.9Due from related companies(1) . . . . . . . . . . . . . . . . . . . . . . . . 103.5 130.2 13.7 21.8Prepayments . . . . . . . . . . . . . . . . . . . . . . . . . . . . . . . . . . . . . . 1.1 8.4 12.4 13.1Right-of-return assets . . . . . . . . . . . . . . . . . . . . . . . . . . . . . . . — 2.0 2.7 2.4Income tax recoverable . . . . . . . . . . . . . . . . . . . . . . . . . . . . . — 15.4 0.4 8.2
109.3 220.5 66.7 102.4Impairment allowance . . . . . . . . . . . . . . . . . . . . . . . . . . . . . . (0.5) (0.9) (1.2) (1.2)
Total . . . . . . . . . . . . . . . . . . . . . . . . . . . . . . . . . . . . . . . . . . . . 108.8 219.6 65.5 101.2
(1) Included in the amounts due from related parties were (i) trade payment from associates of US$0.7 million, US$0.6 million, US$1.7million and US$5.3 million, respectively, as of December 31, 2016, 2017, 2018 and June 30, 2019, (ii) the non-trade amounts due from
280
FINANCIAL INFORMATION
shareholders of US$102.8 million, US$128.2 million, US$6.4 million and US$10.6 million, respectively, as of December 31, 2016,2017, 2018 and June 30, 2019, in relation to advances to minority shareholders by one of our subsidiaries, and (iii) the non-trade amountsdue from related parties of nil, US$1.3 million, US$5.7 million and US$5.9 million, respectively, as of December 31, 2016, 2017, 2018and June 30, 2019, in relation to disposal of financial assets.
Our prepayments, other receivables and other assets increased from US$65.5 million as ofDecember 31, 2018 to US$101.2 million as of June 30, 2019, as a combination of the followingfactors: (i) an increase in deposits and other receivables as a result of increased payment for channelexpansion; and (ii) an increase in amounts due from related companies as a result of increased trade-related prepayment and increased borrowing to a related party.
Our prepayments, other receivables and other assets decreased from US$219.6 million as ofDecember 31, 2017 to US$65.5 million as of December 31, 2018, as a combination of the followingfactors: (i) a decrease in our due from related companies, as a result of settlement of advances toshareholders by one of our subsidiaries; (ii) a decrease in indemnification assets as a result of paymentsby former shareholders of SharkNinja in relation to their indemnification for certain litigations and tax;and (iii) a decrease in income tax receivables because we recorded an income tax receivables in 2017for a refund in income tax. See “—Description of Major Components of Consolidated IncomeStatement—Income Tax.” The decreases were partially offset by an increase in prepayments in 2018,which reflected our agreement with the suppliers to lock the supply of raw materials to us at currentprices to avoid price increases.
Our prepayments, other receivables and other assets increased from US$108.8 million as ofDecember 31, 2016 to US$219.6 million as of December 31, 2017, as a combination of the followingfactors: (i) we recorded indemnification assets, right-of-return assets and income tax receivables in2017 after our acquisition of SharkNinja; and (ii) we recorded increased due from related companies asa result of an increase in non-operational related advances to minority shareholders by our subsidiary.
Financial Assets at Fair Value Through Profit or Loss/Financial Assets Designated at Fair ValueThrough Other Comprehensive Income
During the Track Record Period, we held financial assets principally of equity investments andfinancial products, which can be categorized as our current or non-current assets. The table below setsforth information of our investments classified as financial assets at fair value:
As of December 31, As ofJune 30,
20192016 2017 2018
(in US$ million)
Unlisted financial assets, at fair value through profit orloss:
Non-current – equity investments(1) . . . . . . . . . . . . . . . . . . . . 53.4 67.7 60.8 59.0Current – financial products(2) . . . . . . . . . . . . . . . . . . . . . . . . 156.0 46.6 15.9 50.4
Sub-total . . . . . . . . . . . . . . . . . . . . . . . . . . . . . . . . . . . . . . . . 209.4 114.3 76.7 109.4
Unlisted financial assets, at fair value through othercomprehensive income:
Non-current – equity investments(3) . . . . . . . . . . . . . . . . . . . . 24.2 31.9 35.6 35.7
Total . . . . . . . . . . . . . . . . . . . . . . . . . . . . . . . . . . . . . . . . . . . . 233.6 146.2 112.3 145.1
(1) The equity investments were classified as financial assets at fair value through profit or loss as they were held for trading, which aremanaged by licensed financial institutions in the PRC to invest principally in certain financial assets including investment funds and
281
FINANCIAL INFORMATION
unlisted equity investments issued, and can be transferred in China in accordance with the entrusted agreements entered into between theparties involved.
(2) The investments in financial products (current portion) as of December 31, 2016, 2017, 2018 and June 30, 2019 were products issued bybanks in China. They were mandatorily classified as financial assets at fair value through profit or loss as their contractual cash flows arenot solely payments of principal and interest. The investments were measured at fair value through profit or loss as of December 31,2016, 2017, 2018 and June 30, 2019, with a corresponding gain on change in fair value of US$17.9 million, US$5.7 million, US$0.7million and US$6.0 million, respectively, credited to other income and gains in 2016, 2017, 2018 and the six months ended June 30,2019, respectively.
(3) The equity investments were irrevocably designated at fair value through other comprehensive income at the end of each reporting periodas we consider these investments to be strategic in nature. The fair value changes in these investments resulted in a loss (net of tax) ofUS$6.4 million in 2016, a gain (net of tax) of US$4.8 million and US$4.3 million in 2017 and 2018, respectively, and nil for the sixmonths ended June 30, 2019, recorded in other comprehensive income.
Trade and Bill Payables
Trade and bill payables are obligations to pay for goods or services that have been acquired inthe ordinary course of business from suppliers.
The table below sets forth the breakdown of our trade and bill payables by segment as of thedates indicated:
As of December 31, As ofJune 30,
20192016 2017 2018
(in US$ millions)
Joyoung segment . . . . . . . . . . . . . . . . . . . . . . . . . . . . . . . . . . 177.0 141.9 224.3 236.3SharkNinja segment . . . . . . . . . . . . . . . . . . . . . . . . . . . . . . . . — 112.4 184.3 100.4Others segment . . . . . . . . . . . . . . . . . . . . . . . . . . . . . . . . . . . . 3.6 7.8 — —
Total . . . . . . . . . . . . . . . . . . . . . . . . . . . . . . . . . . . . . . . . . . . . 180.6 262.1 408.6 336.7
The following table sets forth an aging analysis of our trade and bill payables as of the datesindicated and the average trade and bill payables turnover days for the periods indicated:
As of and for the year ended December 31,
As of and forthe six months
endedJune 30, 20192016 2017 2018
(in US$ millions, except turnover days)
Within one year . . . . . . . . . . . . . . . . . . . . . . . . . . . . . . . 179.0 260.7 408.3 335.5One to two years . . . . . . . . . . . . . . . . . . . . . . . . . . . . . . 0.9 0.6 0.3 1.2Two to three years . . . . . . . . . . . . . . . . . . . . . . . . . . . . . 0.4 0.2 — —Over three years . . . . . . . . . . . . . . . . . . . . . . . . . . . . . . . 0.3 0.6 — —
Total . . . . . . . . . . . . . . . . . . . . . . . . . . . . . . . . . . . . . . . 180.6 262.1 408.6 336.7
Turnover of average trade and bill payables (days)(1) . . 105 77 73 87
(1) Average trade and bill payables equals trade and bill payables (net of impairment) at the beginning of the period plus trade and billpayables at the end of the period, divided by two. Turnover of average trade and bill payables equals average trade and bill payablesdivided by cost of sales and then multiplied by the number of days in the period. Potential investors are cautioned that because the cost ofsales used in calculating the turnover of average trade and bill payables are not directly comparable as a result of the acquisition ofSharkNinja in September 2017 and the significant expansion of business afterwards.
Our trade and bill payables increased from US$180.6 million as of December 31, 2016 toUS$262.1 million as of December 31, 2017, primarily due to the consolidation of SharkNinja’s tradepayables into our Group following the acquisition in September 2017. Our trade and bill payablesfurther increased to US$408.6 million as of December 31, 2018, primarily due to the optimization ofour payment arrangement by using more bill payables instead of cash. Our trade and bill payablesdecreased from US$408.6 million as of December 31, 2018 to US$336.7 million as of June 30, 2019,
282
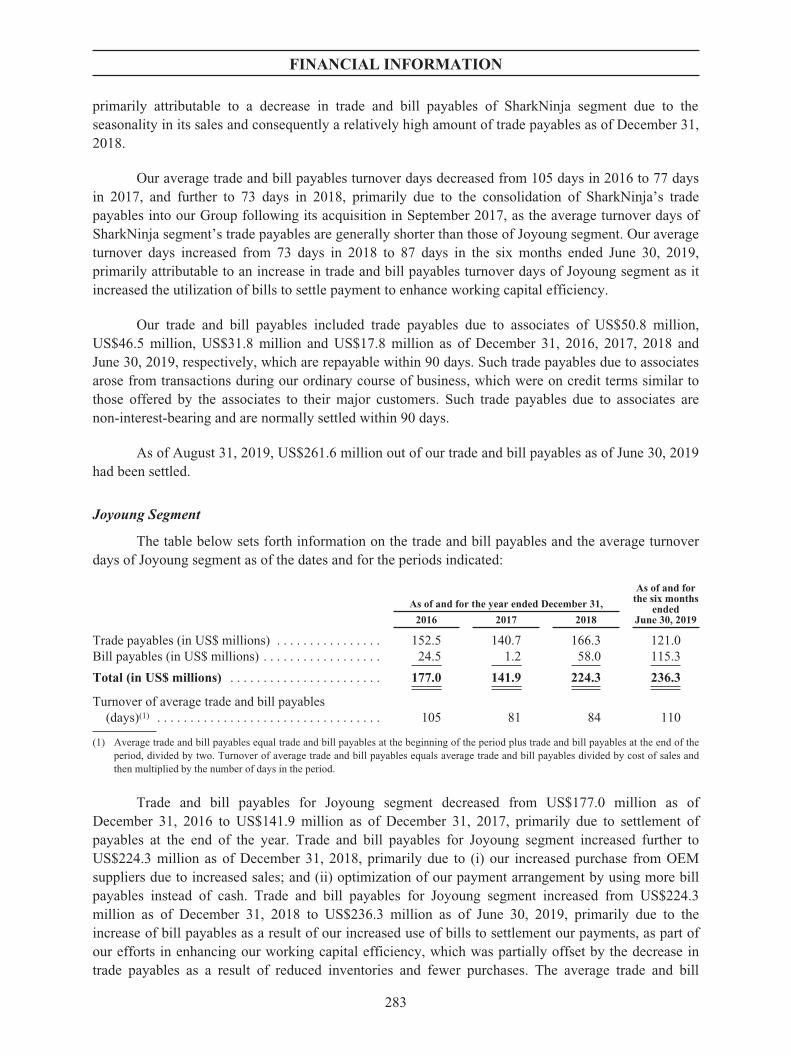
FINANCIAL INFORMATION
primarily attributable to a decrease in trade and bill payables of SharkNinja segment due to theseasonality in its sales and consequently a relatively high amount of trade payables as of December 31,2018.
Our average trade and bill payables turnover days decreased from 105 days in 2016 to 77 daysin 2017, and further to 73 days in 2018, primarily due to the consolidation of SharkNinja’s tradepayables into our Group following its acquisition in September 2017, as the average turnover days ofSharkNinja segment’s trade payables are generally shorter than those of Joyoung segment. Our averageturnover days increased from 73 days in 2018 to 87 days in the six months ended June 30, 2019,primarily attributable to an increase in trade and bill payables turnover days of Joyoung segment as itincreased the utilization of bills to settle payment to enhance working capital efficiency.
Our trade and bill payables included trade payables due to associates of US$50.8 million,US$46.5 million, US$31.8 million and US$17.8 million as of December 31, 2016, 2017, 2018 andJune 30, 2019, respectively, which are repayable within 90 days. Such trade payables due to associatesarose from transactions during our ordinary course of business, which were on credit terms similar tothose offered by the associates to their major customers. Such trade payables due to associates arenon-interest-bearing and are normally settled within 90 days.
As of August 31, 2019, US$261.6 million out of our trade and bill payables as of June 30, 2019had been settled.
Joyoung Segment
The table below sets forth information on the trade and bill payables and the average turnoverdays of Joyoung segment as of the dates and for the periods indicated:
As of and for the year ended December 31,
As of and forthe six months
endedJune 30, 20192016 2017 2018
Trade payables (in US$ millions) . . . . . . . . . . . . . . . . 152.5 140.7 166.3 121.0Bill payables (in US$ millions) . . . . . . . . . . . . . . . . . . 24.5 1.2 58.0 115.3
Total (in US$ millions) . . . . . . . . . . . . . . . . . . . . . . . 177.0 141.9 224.3 236.3
Turnover of average trade and bill payables(days)(1) . . . . . . . . . . . . . . . . . . . . . . . . . . . . . . . . . . 105 81 84 110
(1) Average trade and bill payables equal trade and bill payables at the beginning of the period plus trade and bill payables at the end of theperiod, divided by two. Turnover of average trade and bill payables equals average trade and bill payables divided by cost of sales andthen multiplied by the number of days in the period.
Trade and bill payables for Joyoung segment decreased from US$177.0 million as ofDecember 31, 2016 to US$141.9 million as of December 31, 2017, primarily due to settlement ofpayables at the end of the year. Trade and bill payables for Joyoung segment increased further toUS$224.3 million as of December 31, 2018, primarily due to (i) our increased purchase from OEMsuppliers due to increased sales; and (ii) optimization of our payment arrangement by using more billpayables instead of cash. Trade and bill payables for Joyoung segment increased from US$224.3million as of December 31, 2018 to US$236.3 million as of June 30, 2019, primarily due to theincrease of bill payables as a result of our increased use of bills to settlement our payments, as part ofour efforts in enhancing our working capital efficiency, which was partially offset by the decrease intrade payables as a result of reduced inventories and fewer purchases. The average trade and bill
283
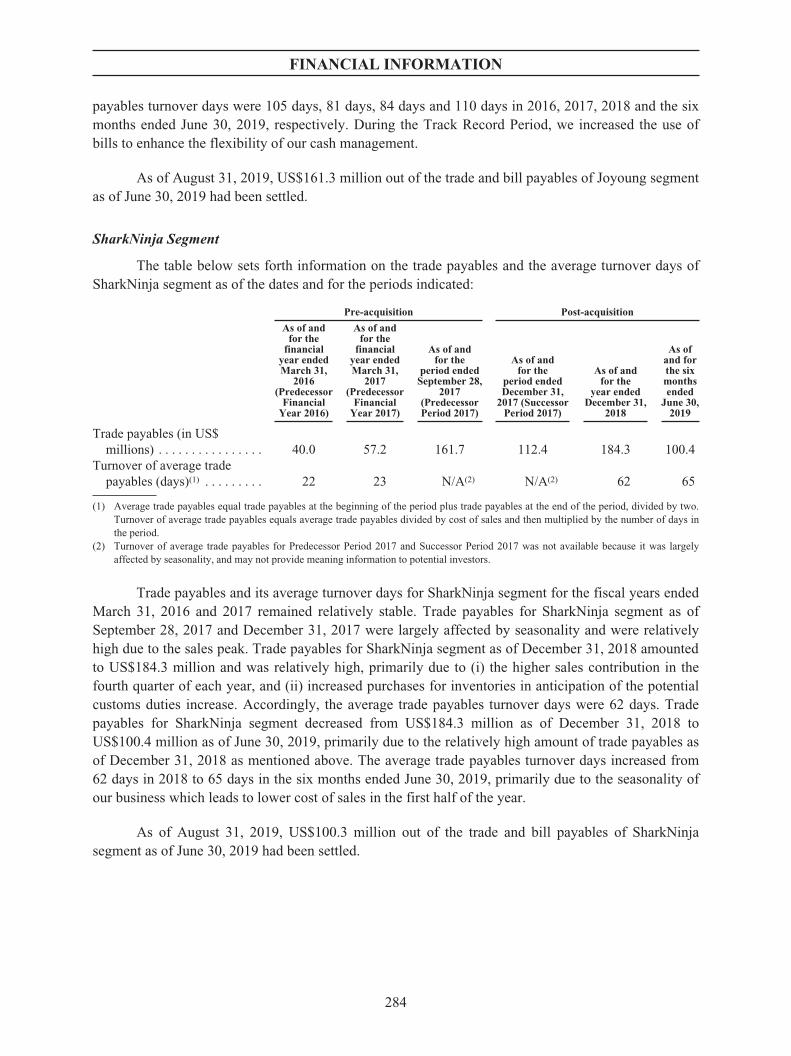
FINANCIAL INFORMATION
payables turnover days were 105 days, 81 days, 84 days and 110 days in 2016, 2017, 2018 and the sixmonths ended June 30, 2019, respectively. During the Track Record Period, we increased the use ofbills to enhance the flexibility of our cash management.
As of August 31, 2019, US$161.3 million out of the trade and bill payables of Joyoung segmentas of June 30, 2019 had been settled.
SharkNinja Segment
The table below sets forth information on the trade payables and the average turnover days ofSharkNinja segment as of the dates and for the periods indicated:
Pre-acquisition Post-acquisition
As of andfor the
financialyear endedMarch 31,
2016(Predecessor
FinancialYear 2016)
As of andfor the
financialyear endedMarch 31,
2017(Predecessor
FinancialYear 2017)
As of andfor the
period endedSeptember 28,
2017(PredecessorPeriod 2017)
As of andfor the
period endedDecember 31,
2017 (SuccessorPeriod 2017)
As of andfor the
year endedDecember 31,
2018
As ofand forthe sixmonthsended
June 30,2019
Trade payables (in US$millions) . . . . . . . . . . . . . . . . 40.0 57.2 161.7 112.4 184.3 100.4
Turnover of average tradepayables (days)(1) . . . . . . . . . 22 23 N/A(2) N/A(2) 62 65
(1) Average trade payables equal trade payables at the beginning of the period plus trade payables at the end of the period, divided by two.Turnover of average trade payables equals average trade payables divided by cost of sales and then multiplied by the number of days inthe period.
(2) Turnover of average trade payables for Predecessor Period 2017 and Successor Period 2017 was not available because it was largelyaffected by seasonality, and may not provide meaning information to potential investors.
Trade payables and its average turnover days for SharkNinja segment for the fiscal years endedMarch 31, 2016 and 2017 remained relatively stable. Trade payables for SharkNinja segment as ofSeptember 28, 2017 and December 31, 2017 were largely affected by seasonality and were relativelyhigh due to the sales peak. Trade payables for SharkNinja segment as of December 31, 2018 amountedto US$184.3 million and was relatively high, primarily due to (i) the higher sales contribution in thefourth quarter of each year, and (ii) increased purchases for inventories in anticipation of the potentialcustoms duties increase. Accordingly, the average trade payables turnover days were 62 days. Tradepayables for SharkNinja segment decreased from US$184.3 million as of December 31, 2018 toUS$100.4 million as of June 30, 2019, primarily due to the relatively high amount of trade payables asof December 31, 2018 as mentioned above. The average trade payables turnover days increased from62 days in 2018 to 65 days in the six months ended June 30, 2019, primarily due to the seasonality ofour business which leads to lower cost of sales in the first half of the year.
As of August 31, 2019, US$100.3 million out of the trade and bill payables of SharkNinjasegment as of June 30, 2019 had been settled.
284
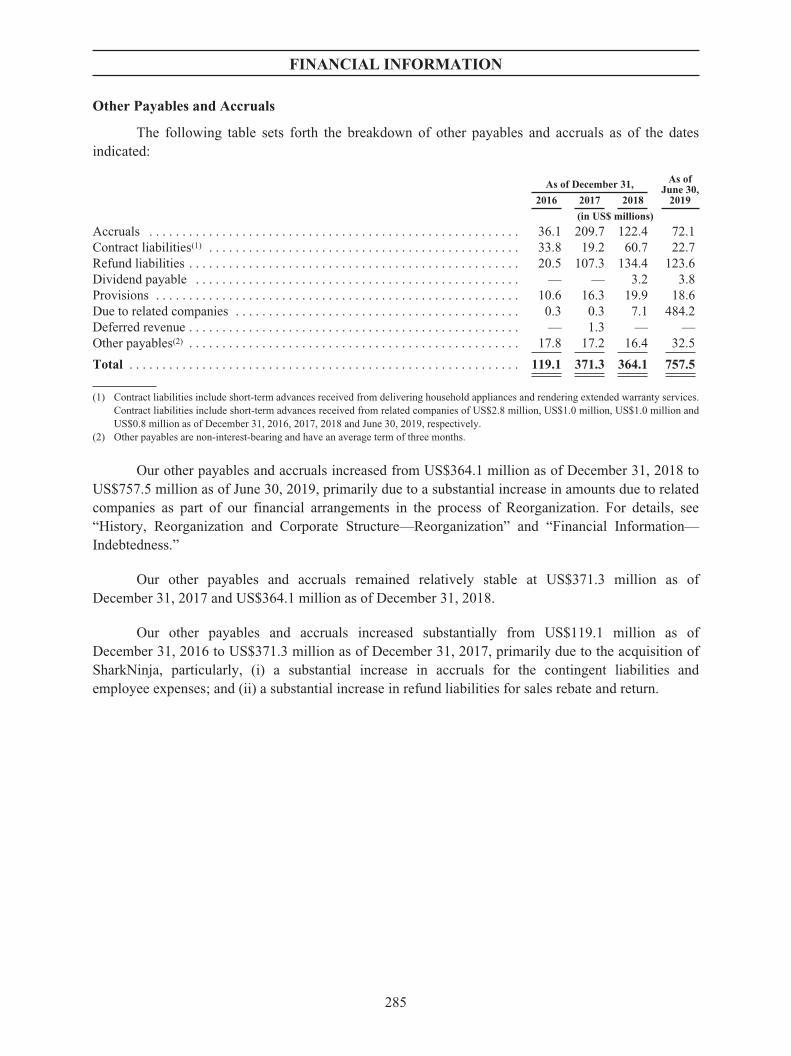
FINANCIAL INFORMATION
Other Payables and Accruals
The following table sets forth the breakdown of other payables and accruals as of the datesindicated:
As of December 31, As ofJune 30,
20192016 2017 2018
(in US$ millions)
Accruals . . . . . . . . . . . . . . . . . . . . . . . . . . . . . . . . . . . . . . . . . . . . . . . . . . . . . . . . 36.1 209.7 122.4 72.1Contract liabilities(1) . . . . . . . . . . . . . . . . . . . . . . . . . . . . . . . . . . . . . . . . . . . . . . . 33.8 19.2 60.7 22.7Refund liabilities . . . . . . . . . . . . . . . . . . . . . . . . . . . . . . . . . . . . . . . . . . . . . . . . . . 20.5 107.3 134.4 123.6Dividend payable . . . . . . . . . . . . . . . . . . . . . . . . . . . . . . . . . . . . . . . . . . . . . . . . . — — 3.2 3.8Provisions . . . . . . . . . . . . . . . . . . . . . . . . . . . . . . . . . . . . . . . . . . . . . . . . . . . . . . . 10.6 16.3 19.9 18.6Due to related companies . . . . . . . . . . . . . . . . . . . . . . . . . . . . . . . . . . . . . . . . . . . 0.3 0.3 7.1 484.2Deferred revenue . . . . . . . . . . . . . . . . . . . . . . . . . . . . . . . . . . . . . . . . . . . . . . . . . . — 1.3 — —Other payables(2) . . . . . . . . . . . . . . . . . . . . . . . . . . . . . . . . . . . . . . . . . . . . . . . . . . 17.8 17.2 16.4 32.5
Total . . . . . . . . . . . . . . . . . . . . . . . . . . . . . . . . . . . . . . . . . . . . . . . . . . . . . . . . . . . 119.1 371.3 364.1 757.5
(1) Contract liabilities include short-term advances received from delivering household appliances and rendering extended warranty services.Contract liabilities include short-term advances received from related companies of US$2.8 million, US$1.0 million, US$1.0 million andUS$0.8 million as of December 31, 2016, 2017, 2018 and June 30, 2019, respectively.
(2) Other payables are non-interest-bearing and have an average term of three months.
Our other payables and accruals increased from US$364.1 million as of December 31, 2018 toUS$757.5 million as of June 30, 2019, primarily due to a substantial increase in amounts due to relatedcompanies as part of our financial arrangements in the process of Reorganization. For details, see“History, Reorganization and Corporate Structure—Reorganization” and “Financial Information—Indebtedness.”
Our other payables and accruals remained relatively stable at US$371.3 million as ofDecember 31, 2017 and US$364.1 million as of December 31, 2018.
Our other payables and accruals increased substantially from US$119.1 million as ofDecember 31, 2016 to US$371.3 million as of December 31, 2017, primarily due to the acquisition ofSharkNinja, particularly, (i) a substantial increase in accruals for the contingent liabilities andemployee expenses; and (ii) a substantial increase in refund liabilities for sales rebate and return.
285
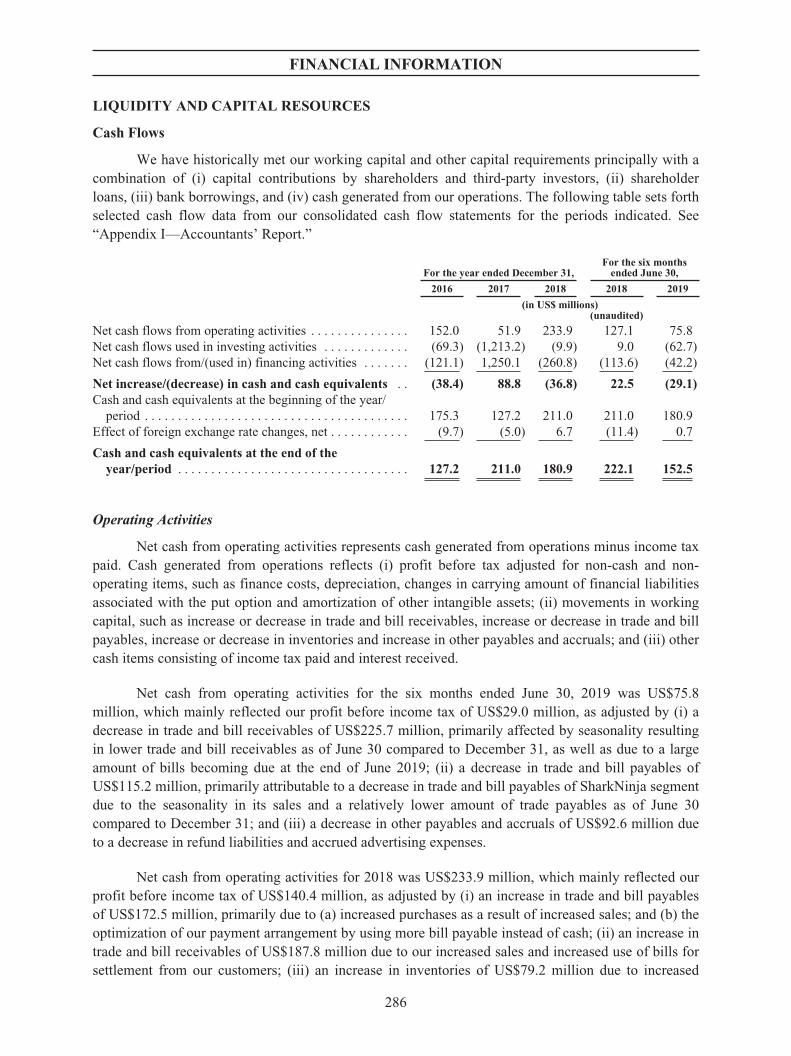
FINANCIAL INFORMATION
LIQUIDITY AND CAPITAL RESOURCES
Cash Flows
We have historically met our working capital and other capital requirements principally with acombination of (i) capital contributions by shareholders and third-party investors, (ii) shareholderloans, (iii) bank borrowings, and (iv) cash generated from our operations. The following table sets forthselected cash flow data from our consolidated cash flow statements for the periods indicated. See“Appendix I—Accountants’ Report.”
For the year ended December 31,For the six months
ended June 30,
2016 2017 2018 2018 2019
(in US$ millions)(unaudited)
Net cash flows from operating activities . . . . . . . . . . . . . . . 152.0 51.9 233.9 127.1 75.8Net cash flows used in investing activities . . . . . . . . . . . . . (69.3) (1,213.2) (9.9) 9.0 (62.7)Net cash flows from/(used in) financing activities . . . . . . . (121.1) 1,250.1 (260.8) (113.6) (42.2)
Net increase/(decrease) in cash and cash equivalents . . (38.4) 88.8 (36.8) 22.5 (29.1)Cash and cash equivalents at the beginning of the year/
period . . . . . . . . . . . . . . . . . . . . . . . . . . . . . . . . . . . . . . . . 175.3 127.2 211.0 211.0 180.9Effect of foreign exchange rate changes, net . . . . . . . . . . . . (9.7) (5.0) 6.7 (11.4) 0.7
Cash and cash equivalents at the end of theyear/period . . . . . . . . . . . . . . . . . . . . . . . . . . . . . . . . . . . 127.2 211.0 180.9 222.1 152.5
Operating Activities
Net cash from operating activities represents cash generated from operations minus income taxpaid. Cash generated from operations reflects (i) profit before tax adjusted for non-cash and non-operating items, such as finance costs, depreciation, changes in carrying amount of financial liabilitiesassociated with the put option and amortization of other intangible assets; (ii) movements in workingcapital, such as increase or decrease in trade and bill receivables, increase or decrease in trade and billpayables, increase or decrease in inventories and increase in other payables and accruals; and (iii) othercash items consisting of income tax paid and interest received.
Net cash from operating activities for the six months ended June 30, 2019 was US$75.8million, which mainly reflected our profit before income tax of US$29.0 million, as adjusted by (i) adecrease in trade and bill receivables of US$225.7 million, primarily affected by seasonality resultingin lower trade and bill receivables as of June 30 compared to December 31, as well as due to a largeamount of bills becoming due at the end of June 2019; (ii) a decrease in trade and bill payables ofUS$115.2 million, primarily attributable to a decrease in trade and bill payables of SharkNinja segmentdue to the seasonality in its sales and a relatively lower amount of trade payables as of June 30compared to December 31; and (iii) a decrease in other payables and accruals of US$92.6 million dueto a decrease in refund liabilities and accrued advertising expenses.
Net cash from operating activities for 2018 was US$233.9 million, which mainly reflected ourprofit before income tax of US$140.4 million, as adjusted by (i) an increase in trade and bill payablesof US$172.5 million, primarily due to (a) increased purchases as a result of increased sales; and (b) theoptimization of our payment arrangement by using more bill payable instead of cash; (ii) an increase intrade and bill receivables of US$187.8 million due to our increased sales and increased use of bills forsettlement from our customers; (iii) an increase in inventories of US$79.2 million due to increased
286
FINANCIAL INFORMATION
stock imported to the United States in anticipation of the potential customs duties increase andincreased stock for the Chinese New Year; and (iv) an increase in other payables and accruals ofUS$18.5 million for the purchase of our offices in Hangzhou. We purchased certain commercialproperties for office use in Hangzhou in 2018, with an aggregate purchase amount of US$17.0 million,majority of which were paid by cash and the rest was recorded as other payables.
Net cash from operating activities in 2017 was US$51.9 million, which mainly reflected ourprofit before income tax of US$101.9 million, as adjusted by (i) a decrease in trade and bill payable ofUS$90.8 million, primarily due to settlement of our trade and bill payable; (ii) an increase in trade andbill receivables of US$80.0 million, primarily due to our increased sales; (iii) recognition of leaseliabilities of US$64.2 million in relation to SharkNinja’s office building in the United States; and(iv) recognition of right-of-use assets of US$62.7 million recorded in relation to SharkNinja’s officebuilding in the United States.
Net cash from operating activities for 2016 was US$152.0 million, which mainly reflected ourprofit before income tax of US$142.2 million, as adjusted by (i) a decrease in trade and billsreceivables of US$61.4 million, primarily due to payments by our customers of the trade and billreceivables; (ii) a decrease in trade and bill payables of US$55.8 million, due to settlement of our tradeand bill payable; and (iii) a decrease in inventories of US$23.7 million, largely affected by ourinventory stock up schedules for the Chinese New Year.
Investing Activities
Net cash used in investing activities for the six months ended June 30, 2019 was US$62.7million, which was mainly attributable to purchases of financial assets at fair value through profit orloss of US$116.1 million for bank financial products, which were offset by the disposal of financialassets at fair value through profit or loss of US$83.8 million of bank financial products.
Net cash used in investing activities in 2018 was US$9.9 million, which was mainlyattributable to (i) purchases of financial assets of US$170.3 million for primarily bank financialproducts; and (ii) purchase of property, plant and equipment of US$67.3 million for primarily ouroffices in Hangzhou, which were offset by the disposal of financial assets of US$187.5 million.
Net cash used in investing activities in 2017 was US$1,213.2 million, primarily due to (i) cashof US$1,300.4 million used in the acquisition of SharkNinja; and (ii) purchase of financial assets ofUS$427.7 million for primarily bank financial products; which were partially offset by disposal offinancial assets of US$537.2 million.
Net cash used in investing activities in 2016 was US$69.3 million, primarily due to purchase offinancial assets of US$331.3 million, which was partially offset by disposal of financial assets ofUS$297.2 million.
Financing Activities
Net cash used in financing activities for the six months ended June 30, 2019 was US$42.2million, primarily due to repayment of bank loans of US$751.3 million, and an increase in pledgeddeposits to secure our bank loans, which were partially offset by an increase in amounts due toshareholders of US$477.1 million for the Reorganization, and new bank loans incurred in the amountof US$409.5 million in relation to the Reorganization.
287
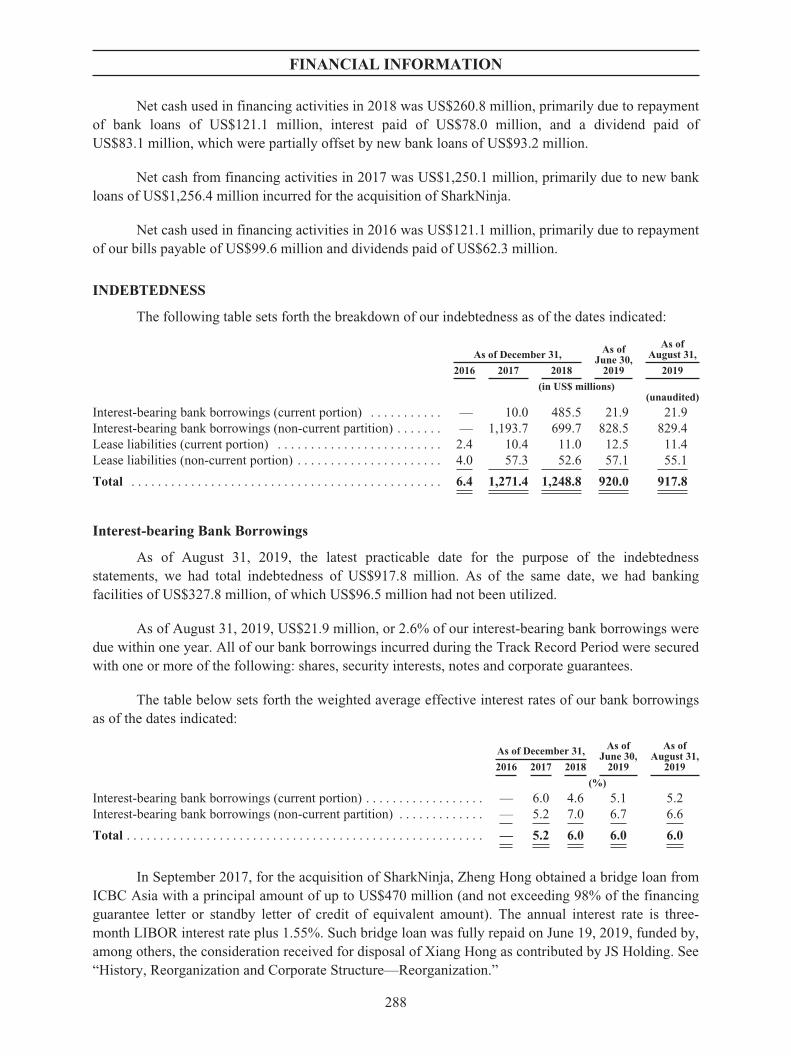
FINANCIAL INFORMATION
Net cash used in financing activities in 2018 was US$260.8 million, primarily due to repaymentof bank loans of US$121.1 million, interest paid of US$78.0 million, and a dividend paid ofUS$83.1 million, which were partially offset by new bank loans of US$93.2 million.
Net cash from financing activities in 2017 was US$1,250.1 million, primarily due to new bankloans of US$1,256.4 million incurred for the acquisition of SharkNinja.
Net cash used in financing activities in 2016 was US$121.1 million, primarily due to repaymentof our bills payable of US$99.6 million and dividends paid of US$62.3 million.
INDEBTEDNESS
The following table sets forth the breakdown of our indebtedness as of the dates indicated:
As of December 31, As ofJune 30,
2019
As ofAugust 31,
2016 2017 2018 2019
(in US$ millions)(unaudited)
Interest-bearing bank borrowings (current portion) . . . . . . . . . . . — 10.0 485.5 21.9 21.9Interest-bearing bank borrowings (non-current partition) . . . . . . . — 1,193.7 699.7 828.5 829.4Lease liabilities (current portion) . . . . . . . . . . . . . . . . . . . . . . . . . 2.4 10.4 11.0 12.5 11.4Lease liabilities (non-current portion) . . . . . . . . . . . . . . . . . . . . . . 4.0 57.3 52.6 57.1 55.1
Total . . . . . . . . . . . . . . . . . . . . . . . . . . . . . . . . . . . . . . . . . . . . . . . 6.4 1,271.4 1,248.8 920.0 917.8
Interest-bearing Bank Borrowings
As of August 31, 2019, the latest practicable date for the purpose of the indebtednessstatements, we had total indebtedness of US$917.8 million. As of the same date, we had bankingfacilities of US$327.8 million, of which US$96.5 million had not been utilized.
As of August 31, 2019, US$21.9 million, or 2.6% of our interest-bearing bank borrowings weredue within one year. All of our bank borrowings incurred during the Track Record Period were securedwith one or more of the following: shares, security interests, notes and corporate guarantees.
The table below sets forth the weighted average effective interest rates of our bank borrowingsas of the dates indicated:
As of December 31, As ofJune 30,
2019
As ofAugust 31,
20192016 2017 2018
(%)
Interest-bearing bank borrowings (current portion) . . . . . . . . . . . . . . . . . . — 6.0 4.6 5.1 5.2Interest-bearing bank borrowings (non-current partition) . . . . . . . . . . . . . — 5.2 7.0 6.7 6.6
Total . . . . . . . . . . . . . . . . . . . . . . . . . . . . . . . . . . . . . . . . . . . . . . . . . . . . . . — 5.2 6.0 6.0 6.0
In September 2017, for the acquisition of SharkNinja, Zheng Hong obtained a bridge loan fromICBC Asia with a principal amount of up to US$470 million (and not exceeding 98% of the financingguarantee letter or standby letter of credit of equivalent amount). The annual interest rate is three-month LIBOR interest rate plus 1.55%. Such bridge loan was fully repaid on June 19, 2019, funded by,among others, the consideration received for disposal of Xiang Hong as contributed by JS Holding. See“History, Reorganization and Corporate Structure—Reorganization.”
288

FINANCIAL INFORMATION
In September 2017, for the acquisition of SharkNinja, Compass and its two subsidiaries, as theborrowers, entered into a credit agreement with a banking syndicate. The credit agreement includes (a)tranche A term loans in an aggregate principal amount not in excess of US$225 million with an interestrate of LIBOR plus 3.25%, (b) tranche B term loans in an aggregate principal amount not in excess ofUS$455 million with an interest rate of LIBOR plus 4.00%, and (c) revolving loans, swingline loansand letters of credit, in each case at any time and from time to time during certain period such that theaggregate revolving exposure will not exceed US$225 million at any time, with an interest rate ofLIBOR plus 2.75%.
On May 15, 2019, Sunshine Rise, as the borrower, entered into a facility agreement with ChinaMerchants Bank Hong Kong Branch, as the lender, for a three-year RMB denominated term loan witha floating interest rate of RMB HIBOR plus 120 bps. A principal amount of RMB800 million wasdrawn down under this facility agreement on June 14, 2019 to fund the capital injection in ShanghaiLihong. Also see “History, Reorganization and Corporate Structure—Reorganization.”
On June 16, 2019, as a step in the Reorganization, our Company, through JY-SN, acquired100% equity interest in Xiang Hong from Chen Hong, using consideration of approximately US$470million from the share subscription by JS Holding. Based on the commercial understanding andarrangement agreed among the existing shareholders of the Company during the Reorganizationprocess, the Company and the shareholders entered into a shareholders’ agreement, pursuant to whichour Company has a contractual obligation to deliver no less than US$455.9 million but up to US$470million cash to the shareholders on a pro rata basis before the Global Offering as special dividend,approximately US$271.7 million of which will be declared to JS Holding. As such, the considerationwas an amount due to related companies under other payables and accruals instead of equitycontribution from an accounting perspective. Such amount is interest free and has no fixed paymentterm. The special dividend was paid on October 16, 2019 and was funded by a term loan borrowedfrom a commercial bank with a principal amount of US$470 million. Upon distribution of the specialdividend, such amount due to related companies has been eliminated.
Upon completion of the Reorganization on June 24, 2019, we had total interest-bearing bankborrowings of US$848.4 million, US$23.3 million of which were due within one year.
During the Track Record Period and up to the Latest Practicable Date, we had not been indefault of these debt covenants that could cause any material adverse impact on our businessoperations.
We have not experienced any default or withdrawal or request for early repayment of bankborrowings during the Track Record Period.
Except as disclosed above, during the Track Record Period and up to August 31, 2019, beingthe latest practicable date for the purpose of the indebtedness statement, we did not have any materialmortgages, charges, debentures, loan capital, debt securities, loans, bank overdrafts or other similarindebtedness, finance lease or hire purchase commitments, liabilities under acceptances (other thannormal trade bills), acceptance credits, which are either guaranteed, unguaranteed, secured orunsecured, or guarantees.
Lease Liabilities
We adopted IFRS 16 using the full retrospective method since January 1, 2016. We elected touse the transition practical expedient allowing the standard to be applied only to contracts that were
289

FINANCIAL INFORMATION
previously identified as “leases” applying IAS 17 and IFRIC 4 at the date of initial application. Wealso elected to use the recognition exemptions for lease contracts that, at the commencement date, havea lease term of 12 months or less and do not contain a purchase option (“short-term leases”), and leasecontracts for which the underlying asset is of low value (“low-value assets”).
We have lease contracts for various items of buildings, machinery, vehicles and otherequipment. Upon the adoption of IRFS 16, we recognized right-of-use assets and corresponding leaseliabilities in respect of all relevant leases, except for short-term leases and low-value assets. As ofAugust 31, 2019, we, as a lessee, had outstanding lease liabilities for the remaining terms of relevantlease agreements in an aggregate amount of US$66.5 million.
Saved as disclosed in the prospectus, there has been no material adverse change in ourindebtedness since August 31, 2019.
KEY FINANCIAL RATIOS
In addition to the measures presented in the consolidated financial statements, we use thefollowing key financial ratios to evaluate our business, measure our performance, develop financialforecasts, and make strategic decisions. The following table sets forth certain key financial ratios as ofthe dates or for the periods indicated:
For the year ended December 31, For the six months ended June 30,
2016 2017 2018 2018 2019
(unaudited)
Gross profit margin . . . . . . . . . . . . . . . . 31.9% 33.2% 37.3% 36.9% 37.4%EBITDA margin(1) . . . . . . . . . . . . . . . . 14.1% 9.5% 11.3% 8.8% 9.3%Adjusted EBITDA margin(2) . . . . . . . . . 12.2% 12.6% 11.6% 9.0% 11.1%Net profit margin . . . . . . . . . . . . . . . . . 11.1% 9.0% 4.2% 1.8% 1.8%Adjusted net profit margin(3) . . . . . . . . . 9.2% 8.9% 5.6% 3.2% 4.7%
As of and/or for the year ended December 31,
As of and/or forthe six monthsended June 30,
20192016 2017 2018
Return on equity(4) . . . . . . . . . . . . . . . . . . . . . . . . . . . . 19.0% 23.6% 24.2% N/A(5)
Gearing ratio(6) . . . . . . . . . . . . . . . . . . . . . . . . . . . . . . . 0.01 2.13 2.70 2.07
(1) EBITDA margin equals EBITDA divided by revenue for the same year/period, multiplied by 100%.(2) Adjusted EBITDA margin equals adjusted EBITDA divided by revenue for the same year/period, multiplied by 100%.(3) For a reconciliation of profit for the year/period to adjusted net profit as we define this, see “—Non-IFRS Measures.”(4) Return on equity ratio is calculated using net profit divided by total equity at the end of the year/period, multiplied by 100%.(5) This semi-annual number is not meaningful as it is not comparable to the annual numbers.(6) Gearing ratio is calculated using total debt (including interest-bearing bank borrowings and lease liabilities) divided by total equity at the
end of the year/period.
The following is a brief analysis of the salient aspects of the selected financial ratios:
Return on Equity
Our return on equity increased from 23.6% in 2017 to 24.2% in 2018, primarily due to adecrease in our equity by 22.5% from US$597.8 million in 2017 to US$463.0 million in 2018, whichwas primarily as a result of the dividend declared and paid by subsidiaries prior to the incorporation ofour Company in the amount of US$173.6 million in 2018.
290

FINANCIAL INFORMATION
Our return on equity increased from 19.0% in 2016 to 23.6% in 2017, primarily due to anincrease in net profit by 15.1% from US$122.4 million in 2016 to US$140.9 million in 2017 and adecrease in our Company’s equity by 7.4% from US$645.6 million in 2016 to US$597.8 million in2017. The increase in our net profit was primarily due to the acquisition of SharkNinja in September2017 and the consolidation of its financial results since then. The decrease in our Company’s equitywas primarily due to (i) the addition to the put option reserve as a result of recognizing put optionliability arising from the acquisition of SharkNinja, and (ii) the dividend declared and paid bysubsidiaries prior to the incorporation of our Company of US$61.7 million in 2017.
Gearing Ratio
Our gearing ratio decreased from 2.70 as of December 31, 2018 to 2.07 as of June 30, 2019,primarily due to a decrease in total indebtedness from US$1,248.8 million as of December 31, 2018 toUS$920.0 million as of June 30, 2019.
Our gearing ratio increased from 2.13 as of December 31, 2017 to 2.70 as of December 31, 2018,primarily due to a decrease in our Company’s equity by 22.5% as mentioned above.
Our gearing ratio increased from 0.01 as of December 31, 2016 to 2.13 as of December 31,2017, primarily due to the debt financing incurred for the acquisition of SharkNinja in 2017.
CONTINGENT LIABILITIES
On May 14, 2015, the Euro-Pro Group entered into a five-year agreement for advertisingservices that can be extended at Euro-Pro Group’s option, if certain conditions are met, for two24-month terms. The agreement can be terminated in the third year if net sales of products covered bythe agreement are less than US$100,000,000, or upon default by the parties. Under the agreement, ourGroup is required to make annual payments of US$3,500,000, as well as pay additional contingentamounts based on a percentage of net sales, as defined in the agreement. As of December 31, 2018, theagreement was terminated early, and there were no contingent payments probable under the agreement.
OPERATING LEASE COMMITMENTS
We lease a number of commercial properties and warehouses under non-cancellable operatinglease arrangements, with lease terms negotiated ranging from one to six years. The majority of theselease agreements are renewable at the end of the lease period at market rate.
We adopted IFRS 16 on January 1, 2016, replacing IAS 17 that we adopted prior to January 1,2016. IFRS 16 primarily affected our accounting as a lessee of the lease for certain office premiseswhich were currently classified as operating leases. Under IFRS 16, we recognized right-of-use assetsand lease liabilities on our balance sheet for most leases which were classified as operating leasesunder IAS 17. Upon adoption of IFRS 16, we recognized right-of-use assets of US$1.3 million andlease liabilities of US$1.3 million as of January 1, 2016.
CAPITAL EXPENDITURES
Our capital expenditures consist of additions to property, plant and equipment, investmentproperties, prepaid land lease payments and other intangible assets, including assets from theacquisition of SharkNinja. In 2016, 2017, 2018 and the six months ended June 30, 2019, our capitalexpenditures amounted to US$11.6 million, US$727.8 million, US$97.7 million and US$46.0 million,respectively.
291
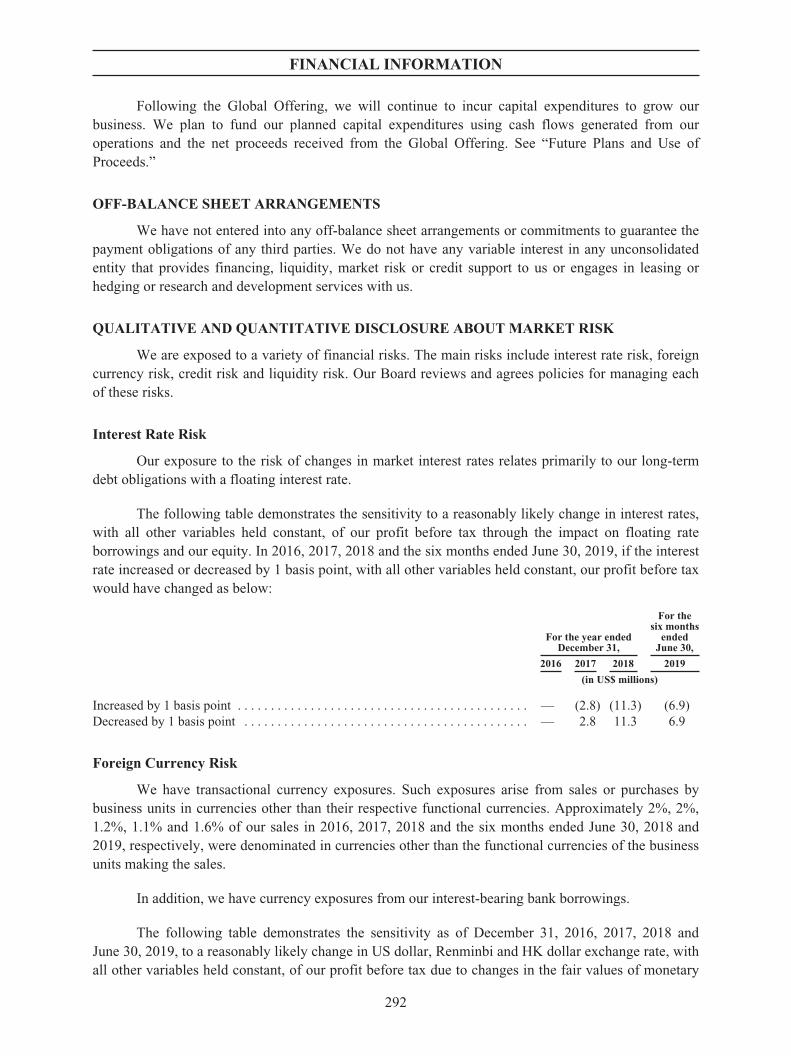
FINANCIAL INFORMATION
Following the Global Offering, we will continue to incur capital expenditures to grow ourbusiness. We plan to fund our planned capital expenditures using cash flows generated from ouroperations and the net proceeds received from the Global Offering. See “Future Plans and Use ofProceeds.”
OFF-BALANCE SHEET ARRANGEMENTS
We have not entered into any off-balance sheet arrangements or commitments to guarantee thepayment obligations of any third parties. We do not have any variable interest in any unconsolidatedentity that provides financing, liquidity, market risk or credit support to us or engages in leasing orhedging or research and development services with us.
QUALITATIVE AND QUANTITATIVE DISCLOSURE ABOUT MARKET RISK
We are exposed to a variety of financial risks. The main risks include interest rate risk, foreigncurrency risk, credit risk and liquidity risk. Our Board reviews and agrees policies for managing eachof these risks.
Interest Rate Risk
Our exposure to the risk of changes in market interest rates relates primarily to our long-termdebt obligations with a floating interest rate.
The following table demonstrates the sensitivity to a reasonably likely change in interest rates,with all other variables held constant, of our profit before tax through the impact on floating rateborrowings and our equity. In 2016, 2017, 2018 and the six months ended June 30, 2019, if the interestrate increased or decreased by 1 basis point, with all other variables held constant, our profit before taxwould have changed as below:
For the year endedDecember 31,
For thesix months
endedJune 30,
2016 2017 2018 2019
(in US$ millions)
Increased by 1 basis point . . . . . . . . . . . . . . . . . . . . . . . . . . . . . . . . . . . . . . . . . . . . — (2.8) (11.3) (6.9)Decreased by 1 basis point . . . . . . . . . . . . . . . . . . . . . . . . . . . . . . . . . . . . . . . . . . . — 2.8 11.3 6.9
Foreign Currency Risk
We have transactional currency exposures. Such exposures arise from sales or purchases bybusiness units in currencies other than their respective functional currencies. Approximately 2%, 2%,1.2%, 1.1% and 1.6% of our sales in 2016, 2017, 2018 and the six months ended June 30, 2018 and2019, respectively, were denominated in currencies other than the functional currencies of the businessunits making the sales.
In addition, we have currency exposures from our interest-bearing bank borrowings.
The following table demonstrates the sensitivity as of December 31, 2016, 2017, 2018 andJune 30, 2019, to a reasonably likely change in US dollar, Renminbi and HK dollar exchange rate, withall other variables held constant, of our profit before tax due to changes in the fair values of monetary
292

FINANCIAL INFORMATION
assets and liabilities and our equity. As of December 31, 2016, 2017, 2018 and June 30, 2019, if theexchange rates between US dollar, our reporting currency, against Renminbi, our major transactionalcurrency, weakened or strengthened by 5%, with all other variables held constant, our profit before taxwould have changed as below:
For the year endedDecember 31,
For thesix months
endedJune 30,
2016 2017 2018 2019
(in US$ millions)
US dollar weakened against Renminbi . . . . . . . . . . . . . . . . . . . . . . . . . . . . . . . . 18.9 20.1 13.4 0.2US dollar strengthened against Renminbi . . . . . . . . . . . . . . . . . . . . . . . . . . . . . . (18.9) (20.1) (13.4) (0.2)
Credit Risk
We are exposed to credit risk in relation to our trade receivables and other receivables, pledgeddeposits, and cash and cash equivalents.
We expect that there is no significant credit risk associated with pledged deposits, and cash andcash equivalents, since they are substantially deposited at state-owned banks and other institutions orlarge-sized listed banks. Our management does not expect that there will be any significant losses fromnon-performance by these counterparties.
We expect that the credit risk associated with trade receivables and other receivables due fromrelated parties to be low, since our related parties generally have strong capacities to meet theircontractual cash flow obligation in the near-term. Thus, we did not recognize any impairment provisionduring the Track Record Periods for the trade receivables and other receivables due from relatedparties.
We trade with recognized and creditworthy third parties. Concentrations of credit risk aremanaged through analysis by customer/counterparty. We do not face significant concentrations ofcredit risk as the customer base for our trade receivables and other receivables is widely dispersed. Inaddition, receivable balances are monitored on an ongoing basis and our exposure to bad debts is notsignificant.
Liquidity Risk
Liquidity risk is the risk originating from the difficulty in meeting financial obligations due toshortage of funds. Our exposure to liquidity risk arises primarily from mismatches of the maturities offinancial assets and liabilities. Our objective is to maintain a balance between continuity of funding tofinance our working capital needs, as well as capital expenditure in respect of our developmentprojects, and flexibility through the use of stand-by credit facilities.
293

FINANCIAL INFORMATION
The maturity profile of our financial liabilities as of December 31, 2016, 2017 and 2018 andJune 30, 2019, based on contractual undiscounted payments, is as below:
December 31, 2016
Less thanthree
months
Three toless than 12
monthsOne to five
yearsOver five
years Total
(in US$ millions)
Trade and bill payables . . . . . . . . . . . . . . . . . . . . . . 180.6 — — — 180.6Financial liabilities included in other payables and
accruals . . . . . . . . . . . . . . . . . . . . . . . . . . . . . . . . 18.1 — — — 18.1Lease liabilities . . . . . . . . . . . . . . . . . . . . . . . . . . . . 0.7 2.0 4.1 0.6 7.4
199.4 2.0 4.1 0.6 206.1
December 31, 2017
Less thanthree
months
Three toless than 12
monthsOne to five
yearsOver five
years Total
(in US$ millions)
Interest-bearing bank borrowings . . . . . . . . . . . . . . 7.3 23.7 781.2 427.0 1,239.2Trade and bill payables . . . . . . . . . . . . . . . . . . . . . . 262.1 — — — 262.1Financial liabilities included in other payables and
accruals . . . . . . . . . . . . . . . . . . . . . . . . . . . . . . . . 17.4 — — — 17.4Lease liabilities . . . . . . . . . . . . . . . . . . . . . . . . . . . . 3.4 10.1 27.3 47.1 87.9
290.2 33.8 808.5 474.1 1,606.6
December 31, 2018
Less thanthree
months
Three toless than 12
monthsOne to five
yearsOver five
years Total
(in US$ millions)
Interest-bearing bank borrowings . . . . . . . . . . . . . . 7.7 492.1 274.9 424.8 1,199.5Trade and bill payables . . . . . . . . . . . . . . . . . . . . . . 408.6 — — — 408.6Financial liabilities included in other payables and
accruals . . . . . . . . . . . . . . . . . . . . . . . . . . . . . . . . 23.4 — — — 23.4Lease liabilities . . . . . . . . . . . . . . . . . . . . . . . . . . . . 3.5 10.3 25.8 42.0 81.6
443.2 502.4 300.7 466.8 1,713.1
June 30, 2019
Less thanthree
months
Three toless than 12
monthsOne to five
yearsOver five
years Total
(in US$ millions)
Interest-bearing bank borrowings . . . . . . . . . . . . . . 13.9 50.7 443.3 428.5 936.4Trade and bill payables . . . . . . . . . . . . . . . . . . . . . . 336.7 — — — 336.7Financial liabilities included in other payables and
accruals . . . . . . . . . . . . . . . . . . . . . . . . . . . . . . . . 509.6 — — — 509.6Lease liabilities . . . . . . . . . . . . . . . . . . . . . . . . . . . . 4.6 10.9 28.4 43.6 87.5
864.8 61.6 471.7 472.1 1,870.2
UNAUDITED PRO FORMA ADJUSTED NET TANGIBLE ASSETS
The following unaudited pro forma adjusted net tangible assets prepared in accordance withRule 4.29 of the Listing Rules are set out below to illustrate the effect of the Global Offering on theconsolidated net tangible assets of the Group attributable to the equity owners of our Company as ofJune 30, 2019 as if the Global Offering had taken place on that date.
The unaudited pro forma adjusted net tangible assets have been prepared for illustrativepurposes only and, because of their hypothetical nature, they may not give a true picture of the
294

FINANCIAL INFORMATION
consolidated net tangible assets of the Group, had the Global Offering been completed as of June 30,2019 or at any future dates. The unaudited pro forma adjusted net tangible assets are prepared based onthe audited consolidated net tangible assets of the Group attributable to the equity owners of theCompany as of June 30, 2019 as set out in the Accountants’ Report of the Company, the text of whichis set out in Appendix I and adjusted as described below:
Consolidatednet tangible
liabilitiesattributable
toShareholders
of ourCompany asof June 30,
2019(1)
Estimatednet proceeds
from theGlobal
Offering(2)
Unauditedpro formaadjusted
consolidatednet tangible
liabilitiesattributable
toshareholders
of ourCompany(3)
Unaudited pro formaadjusted consolidated net
tangible liabilities per share(4)
US$’000 US$’000 US$’000 (US$) (HK$)(5)
Based on an Offer Price of HK$5.55 perOffer Share . . . . . . . . . . . . . . . . . . . . . . . . . (1,252,840) 325,212 (927,628) (0.28) (2.18)
Based on an Offer Price of HK$7.25 perOffer Share . . . . . . . . . . . . . . . . . . . . . . . . . (1,252,840) 430,307 (822,533) (0.25) (1.94)
(1) The consolidated net tangible liabilities attributable to owners of the Company as at June 30, 2019 are based on the consolidated equityattributable to owners of the Company in the amount of US$205.6 million and adjusted intangible assets in the amount of US$1,458.5million.
(2) The estimated net proceeds from the Global Offering are based on the indicative offer prices of HK$5.55 per Offer Share (being theminimum offer price), and HK$7.25 per Offer Share (being the maximum offer price), respectively, after deduction of the estimatedunderwriting fees and other listing expenses payable by the Company, taking no account of any shares which may be issued upon theexercise of the Over-allotment Option for the Global Offering.
(3) The unaudited pro forma adjusted consolidated net tangible liabilities do not take into account the operational results or other transactionof the Group subsequent to June 30, 2019.
(4) The unaudited pro forma adjusted net tangible liabilities per share is arrived at after the adjustment referred to in note (2) above and onthe basis that 3,332,198,117 shares were in issue assuming that the Global Offering had been completed on June 30, 2019 and that Over-allotment Option for the Global Offering is not exercised.
(5) For the purpose of this unaudited pro forma adjusted net tangible liabilities, the amounts stated in US dollars are converted into HongKong dollars at a rate of US$1.00 to HK$7.8420. No representation is made that US dollars amounts have been, could have been or maybe converted into Hong Kong dollars, or vice versa, at that rate.
DISTRIBUTABLE RESERVES
As of June 30, 2019, we had distributable reserves of US$127.2 million.
DISCLOSURE PURSUANT TO RULES 13.13 TO 13.19 OF THE LISTING RULES
Except as otherwise disclosed in this prospectus, we confirm that, as of the Latest PracticableDate, we were not aware of any circumstances that would give rise to a disclosure requirement underRules 13.13 to Rules 13.19 of the Listing Rules.
WORKING CAPITAL CONFIRMATION
Taking into account the financial resources available to our Group, including the internallygenerated funds, the available banking facilities and the estimated net proceeds from the GlobalOffering, our Directors are of the opinion that our Group has sufficient working capital for its presentrequirements, that is, for at least the next 12 months from the date of this prospectus.
295
FINANCIAL INFORMATION
DIVIDEND POLICY
As we are a holding company, our ability to declare and pay dividends will depend on receiptof sufficient funds from our subsidiaries. Our subsidiaries must comply with their respectiveconstitutional documents and the applicable local laws and regulations in declaring and payingdividends to us. As of June 30, 2019, our Company had a net deficit of US$4.3 million on ourCompany’s statement of financial position. Under Cayman Islands law, dividends may be paid onlyout of profits and share premiums. As advised by our legal advisors on Cayman Islands law, Maplesand Calder (Hong Kong) LLP, the existence of a net deficit does not necessarily restrict us fromdeclaring and paying dividends to our Shareholders. Under Cayman Islands law, our Company maypay a dividend out of either our profits (realized or unrealized) or amounts standing to the credit of ourshare premium account, provided that this would not result in our Company being unable to pay ourdebts as they fall due in the ordinary course of business.
Any amount of dividends we pay will be at the discretion of our Directors and will depend onour future operations and earnings, capital requirements and surplus, general financial condition,contractual restrictions and other factors that our Directors consider relevant. Any declaration andpayment as well as the amount of dividends will be subject to our constitutional documents and theCayman Companies Law. Our Shareholders in a general meeting may approve any declaration ofdividends, which must not exceed the amount recommended by our Board of Directors. No dividendwill be declared or payable except out of our profits and reserves lawfully available for distribution.Our future declarations of dividends may or may not reflect our historical declarations of dividends andwill be at the absolute discretion of the Board of Directors.
Historically, no dividend has been declared by our Company since incorporation. We declareda special dividend of US$464.0 million to our shareholders on a pro rata basis pursuant to ashareholders’ agreement, US$276.5 million of which was declared to JS Holding. Such specialdividend was paid on October 16, 2019 and funded by a term loan borrowed from a commercial bankwith a principal amount of US$470 million. Such term loan is secured by a pledge over approximately276,300,000 shares of Joyoung. Such term loan contains a covenant to prohibit our Company from,among other things, declaring, making or paying any dividend, except for the special dividend ofUS$464.0 million, (i) prior to the Listing Date, and (ii) unless a principal amount of no less thanUS$250 million in aggregate has been repaid or prepaid within one year after the Listing Date.
Currently we do not have a formal dividend policy or a fixed dividend distribution ratio. Thereis no assurance that dividends of any amount will be declared or distributed in any year.
LISTING EXPENSES
During the Track Record Period, we incurred listing expenses of US$5.8 million. We expect toincur listing expenses of approximately US$30.2 million (equivalent to approximately HK$236.5million, assuming the Over-allotment Option is not exercised and an Offer Price of HK$6.40 per Share,being the mid-point of the indicative Offer Price range of HK$5.55 and HK$7.25), of which US$15.9million will be recognized as administrative expenses and US$14.3 million will be charged againstequity in the year ending December 31, 2019. We do not believe these expenses will have a materialimpact on our results of operations for 2019.
296

FINANCIAL INFORMATION
DIRECTORS’ CONFIRMATION ON NO MATERIAL ADVERSE CHANGE
As of the date of this prospectus, our Directors confirm that there has been no material adversechange in the financial or trading positions or prospects of our Company since June 30, 2019, the dateof the latest audited financial statements of our Company.
297

FUTURE PLANS AND USE OF PROCEEDS
FUTURE PLANS
See “Business—Our Strategies.”
USE OF PROCEEDS
We estimate that we will receive net proceeds of approximately HK$2,962.4 million from theGlobal Offering, assuming that the Over-allotment Option is not exercised, after deducting theunderwriting commissions and other estimated offering expenses payable by us and assuming the OfferPrice of HK$6.40 per Share, being the mid-point of the indicative Offer Price range of HK$5.55 andHK$7.25. We intend to use the proceeds from the Global Offering for the purposes and in the amountsset out below:
Š approximately 50% of the net proceeds, or approximately HK$1,481.2 million, is expectedto be used to partially repay a term loan for dividend distribution with a principal amountof US$470 million from a commercial bank. We obtained such bank loan on October 16,2019, with an interest rate of three month LIBOR interest rate plus 1.60% and a maturityof five years.
Š approximately 20% of the net proceeds, or approximately HK$592.5 million, is expectedto be used on R&D of new products and further integration and development of our supplychain. In particular, we plan to
(i) maintain and improve our existing R&D facilities in Hangzhou, Boston, London andother locations for the development of new products and technologies, hire talentsglobally and use for general R&D expenditure to support our new product rollout andupgrades; and
(ii) facilitate the further integration of Joyoung and SharkNinja supply chain to achievegreater synergies, enhance the overall competitiveness of our supply chain network,and strengthen our partnership with key suppliers through investment and strategicalliance.
Š approximately 20% of the net proceeds, or approximately HK$592.5 million, is expectedto be used for market development and expansion, and enhancing our brand image andrecognition globally. In particular, we plan to
(i) expand and accelerate our market penetration in the international markets by furtherexpanding and enhancing our sales channel, and recruiting and retaining local talentsacross business functions;
(ii) further enhance our brand awareness and increase our advertising and otherpromotional efforts of our brands in the global market; and
(iii) fund our branding and marketing efforts of our SharkNinja business in China throughonline and offline channels.
Š approximately 10% of the net proceeds, or approximately HK$296.2 million, is expectedto be used for working capital and general corporate purposes.
In the event that the Offer Price is set at HK$5.55 per Offer Share (being the bottom end of theindicative Offer Price range), the estimated net proceeds we will receive will be reduced byapproximately HK$412.1 million. In the event that the Offer Price is set at HK$7.25 per Offer
298
FUTURE PLANS AND USE OF PROCEEDS
Share (being the top end of the indicative Offer Price range), the estimated net proceeds we willreceive will be increased by approximately HK$412.1 million. To the extent our net proceeds are eithermore or less than expected, we will adjust our allocation of the net proceeds for the above purposesaccordingly on a pro-rata basis, and we will consider internal resources or external financing for therelevant purposes in the case of decrease of net proceeds.
If the Over-allotment Option is exercised in full, the net proceeds from the Global Offering willincrease to approximately HK$3,427.8 million, assuming an Offer price of HK$6.40 per Offer Share,being the mid-point of the proposed Offer Price range. If the Offer Price is set at the high-end or low-end of the proposed Offer Price range, the net proceeds from the Global Offering (including theproceeds from the exercise of the Over-allotment Option) will increase or decrease by approximatelyHK$473.9 million, respectively. We intend to apply the additional net proceeds to the above uses in theproportions stated above.
To the extent that the net proceeds from the Global Offering are not immediately applied to theabove purposes, it is our present intention to hold such net proceeds in short term interest-bearingdeposits with, or wealth management products issued by, licensed banks and/or financial institutions.
299
UNDERWRITING
HONG KONG UNDERWRITERS
Credit Suisse (Hong Kong) LimitedMorgan Stanley Asia LimitedICBC International Securities LimitedChina International Capital Corporation Hong Kong Securities LimitedCMB International Capital LimitedChina Merchants Securities (HK) Co., LimitedCCB International Capital Limited
UNDERWRITING
This prospectus is published solely in connection with the Hong Kong Public Offering. TheHong Kong Public Offering is fully underwritten by the Hong Kong Underwriters on a conditionalbasis. The International Offering is expected to be fully underwritten by the International Underwriterssubject to the terms and conditions of the International Underwriting Agreement. If, for any reason, theOffer Price is not agreed between the Joint Global Coordinators and our Company, the Global Offeringwill not proceed and will lapse.
The Global Offering comprises the Hong Kong Public Offering of initially 49,983,000 HongKong Offer Shares and the International Offering of initially 449,847,000 International Offer Shares,subject, in each case, to reallocation on the basis as described in “Structure of the Global Offering” aswell as to the Over-allotment Option in the case of the International Offering.
UNDERWRITING ARRANGEMENTS AND EXPENSES
Hong Kong Public Offering
Hong Kong Underwriting Agreement
Pursuant to the Hong Kong Underwriting Agreement, we are offering the Hong Kong OfferShares (subject to adjustment) for subscription by the public in Hong Kong in accordance with theterms and conditions of this prospectus and the Application Forms relating thereto.
Subject to the Listing Committee of the Hong Kong Stock Exchange granting the listing of, andpermission to deal in, the Shares in issue and to be issued as mentioned in this prospectus, and certainother conditions set forth in the Hong Kong Underwriting Agreement (including the Joint GlobalCoordinators (on behalf of the Hong Kong Underwriters) and our Company agreeing upon the OfferPrice) being satisfied (or, as the case may be, waived), the Hong Kong Underwriters have agreed tosubscribe or procure subscribers for their respective applicable portions of the Hong Kong Offer Sharesin aggregate, now being offered which are not taken up under the Hong Kong Public Offering on theterms and conditions of this prospectus, the Application Forms relating thereto and the Hong KongUnderwriting Agreement.
The Hong Kong Underwriting Agreement is conditional on and subject to, among other things,the International Underwriting Agreement having been executed and becoming unconditional and nothaving been terminated in accordance with its terms.
300
UNDERWRITING
Grounds for Termination
The obligations of the Hong Kong Underwriters to subscribe or procure subscribers for theHong Kong Offer Shares are subject to termination by written notice from the Joint GlobalCoordinators (for themselves and on behalf of the Hong Kong Underwriters) and the Joint Sponsors, ifany of the events set forth below occur at any time prior to 8:00 a.m. on the Listing Date:
(1) there develops, occurs, exists or comes into effect:
(i) any event or circumstance in the nature of force majeure (including, withoutlimitation, any acts of government, declaration of a national or internationalemergency or war, calamity, crisis, epidemic, pandemic, outbreak of infectiousdisease, economic sanctions, strikes, lock-outs, fire, explosion, flooding,earthquake, volcanic eruption, civil commotion, riots, public disorder, acts of war,outbreak or escalation of hostilities (whether or not war is declared), acts of Godor acts of terrorism) in or affecting Hong Kong, China, the Cayman Islands, theBVI, the United States, the United Kingdom, the European Union, Japan or anyother jurisdictions relevant to any member of the Group or the Global Offering(collectively, the “Relevant Jurisdictions”); or
(ii) any change, or any development involving a prospective change, or any event orcircumstance likely to result in any change or development involving aprospective change in any local, national, regional or international financial,economic, political, military, industrial, fiscal, regulatory, currency, credit ormarket conditions (including, without limitation, conditions in the stock and bondmarkets, money and foreign exchange markets, the interbank markets and creditmarkets) in or affecting any of the Relevant Jurisdictions; or
(iii) any moratorium, suspension or restriction (including, without limitation, anyimposition of or requirement for any minimum or maximum price limit or pricerange) in or on trading in securities generally on the Hong Kong Stock Exchange,the New York Stock Exchange, the NASDAQ Global Market, the London StockExchange, the Tokyo Stock Exchange, the Shanghai Stock Exchange or theShenzhen Stock Exchange; or
(iv) any general moratorium on commercial banking activities in Hong Kong(imposed by the Financial Secretary or the Hong Kong Monetary Authority orother competent authority), New York (imposed at Federal or New York Statelevel or other competent authority), London, China, the European Union, Japan,or any other Relevant Jurisdictions, or any disruption in commercial banking orforeign exchange trading or securities settlement or clearance services, proceduresor matters in any Relevant Jurisdictions; or
(v) any new laws, or any change or any development involving a prospective changeor any event or circumstance likely to result in a change or a developmentinvolving a prospective change in, or in the interpretation or application by anycourt or other competent authority of, existing laws, in each case, in or affectingany of the Relevant Jurisdictions; or
(vi) the imposition of economic sanctions in whatever form, directly or indirectly, by,or for, any of the Relevant Jurisdictions; or
301

UNDERWRITING
(vii) a change or development involving a prospective change in or affecting taxationor exchange control, currency exchange rates or foreign investment regulations(including, without limitation, a material devaluation of the US dollar, Euro,Pound Sterling, Japanese Yen, Hong Kong Dollar or the Renminbi against anyforeign currencies), or the implementation of any exchange control, in any of theRelevant Jurisdictions; or
(viii) any proceedings of any third party being threatened or instigated against anymember of the Group; or
(ix) non-compliance of this prospectus (or any other documents used in connectionwith the contemplated offer and sale of the Shares) or any aspect of the GlobalOffering with the Listing Rules or any other applicable laws; or
(x) the issue or requirement to issue by the Company of any supplement oramendment to this Prospectus (or to any other documents used in connection withthe contemplated offer and sale of the Shares) pursuant to the CompaniesOrdinance, the Companies (Winding Up and Miscellaneous Provisions)Ordinance or the Listing Rules or any requirement or request of the Hong KongStock Exchange and/or the SFC; or
(xi) an order or petition for the winding up of any major subsidiaries of the Group orany composition or arrangement made by any major subsidiaries of the Groupwith its creditors or a scheme of arrangement entered into by any majorsubsidiaries of the Group or any resolution for the winding-up of any majorsubsidiaries of the Group or the appointment of a provisional liquidator, receiveror manager over all or part of the material assets or undertaking of any majorsubsidiaries of the Group or anything analogous thereto occurring in respect ofany major subsidiaries of the Group; or
(xii) a contravention by any member of the Group of the Listing Rules or applicablelaws in any material respects,
which, individually or in the aggregate, in the sole and absolute opinion of the JointGlobal Coordinators and the Joint Sponsors:
(a) has or will have or may have a material adverse effect on the assets,liabilities, business, general affairs, management, prospects, Shareholders’equity, profits, losses, results of operations, positions or conditions,financial or otherwise, or performance of the Group as a whole; or
(b) has or will have or may have a material adverse effect on the success of theGlobal Offering or the level of applications under the Hong Kong PublicOffering or the level of interest under the International Offering; or
(c) makes or will make or is likely to make it inadvisable or inexpedient orimpracticable for the Global Offering to proceed or to market the GlobalOffering; or
(d) has or will have or is likely to have the effect of making any part of theHong Kong Underwriting Agreement (including underwriting) incapableof performance in accordance with its terms or preventing or delaying theprocessing of applications and/or payments pursuant to the Global Offeringor pursuant to the underwriting thereof; or
302
UNDERWRITING
(2) there has come to the notice of the Joint Global Coordinators and the JointSponsors:
(a) an executive Director being charged with an indictable offence orprohibited by operation of law or otherwise disqualified from taking part inthe management of a company; or
(b) the chairman and chief executive officer of the Company vacating hisoffice; or
(c) an authority or a political body or organization in any of the RelevantJurisdictions commencing any investigation or other action, or announcingan intention to investigate or take other action, against any member of theGroup, any Director or the Controlling Shareholders; or
(d) a prohibition on the Company or the Controlling Shareholders for whateverreason from offering, allotting, issuing, selling or delivering any of theOffer Shares (including any exercise of the Over-allotment Option)pursuant to the terms of the Global Offering; or
(e) that any statement contained in any of the Hong Kong Public OfferingDocuments (as defined in the Hong Kong Underwriting Agreement) and/orin any notices or announcements, advertisements, communications or otherdocuments issued or used by or on behalf of the Company in connectionwith the Hong Kong Public Offering (including any supplement oramendment thereto) was, when it was issued, or has become, untrue,incorrect, inaccurate or misleading in any material respect, or that anyforecast, estimate, expression of opinion, intention or expectationcontained in any of the Hong Kong Public Offering Documents and/or anynotices, announcements, advertisements, communications or otherdocuments issued or used by or on behalf of the Company in connectionwith the Hong Kong Public Offering (including any supplement oramendment thereto) is not fair and honest and based on reasonableassumptions taken as a whole; or
(f) that any matter has arisen or has been discovered which would, had itarisen or been discovered immediately before the date of this prospectus,constitute a material omission from any of the Hong Kong Public OfferingDocuments and/or any notices, announcements, advertisements,communications or other documents issued or used by or on behalf of theCompany in connection with the Hong Kong Public Offering (includingany supplement or amendment thereto); or
(g) any material breach of any of the obligations imposed upon any party tothe Hong Kong Underwriting Agreement or the International UnderwritingAgreement (other than upon any of the Hong Kong Underwriters or theInternational Underwriters); or
(h) any material adverse change (as defined in the Hong Kong UnderwritingAgreement); or
303

UNDERWRITING
(i) any event, act or omission which gives or is likely to give rise to anyliability of any of the indemnifying parties as defined in the Hong KongUnderwriting Agreement; or
(j) any material adverse change, or any development involving a prospectivematerial adverse change, in or affecting the assets, liabilities, business,general affairs, management, prospects, Shareholders’ equity, profits,losses, results of operations, position or condition, financial or otherwise,or performance of the Group as a whole; or
(k) any breach of, or any event or circumstance rendering untrue or incorrector misleading in any respect, any of the representations, warranties,agreements and undertakings given by the Company, Mr. Wang Xuning orJS Holding in the Hong Kong Underwriting Agreement; or
(l) approval by the Listing Committee of the Hong Kong Stock Exchange ofthe listing of, and permission to deal in, the Shares to be issued (includingany additional Shares that may be issued pursuant to the exercise of theOver-allotment Option) under the Global Offering is refused or notgranted, other than subject to customary conditions, on or before theListing Date, or if granted, the approval is subsequently withdrawn,qualified (other than by customary conditions) or withheld; or
(m) the Company withdraws this prospectus (and/or any other documentsissued or used in connection with the Global Offering) or the GlobalOffering; or
(n) that any person (including the reporting accountants, PRC counsel orCayman Islands counsel of the Company or the industry consultant) haswithdrawn or is subject to withdrawal of its respective consent to the issueof any of the offering documents as defined in the Hong KongUnderwriting Agreement, with the inclusion of its reports, letters and/orlegal opinions (as the case may be) and references to its name included inthe form and context in which it respectively appears.
Undertakings to the Hong Kong Stock Exchange Pursuant to the Listing Rules
A. Undertakings by our Company
Pursuant to Rule 10.08 of the Listing Rules, we have undertaken to the Hong Kong StockExchange that, no further Shares or securities convertible into equity securities of the Company(whether or not of a class already listed) shall be issued by us or form the subject of any agreement tosuch issue within six months from the Listing Date (whether or not such issue of Shares or securitieswill be completed within six months from the commencement of dealing), except for (i) anycapitalization issue, capital reduction or consolidation or sub-division of shares; or (ii) issue of sharesor securities pursuant to the Global Offering (including any exercise of the Over-allotment Option); or(iii) any other applicable circumstances provided under Rule 10.08 of the Listing Rules.
304
UNDERWRITING
B. Undertakings by our Controlling Shareholders
Pursuant to Rule 10.07(1) of the Listing Rules, the group of our Controlling Shareholders havecollectively undertaken to the Hong Kong Stock Exchange that, he/she/it shall not, unless incompliance with the requirements of the Listing Rules:
(i) in the period commencing on the date by reference to which disclosure of his/her/itsshareholding is made in this prospectus and ending on the date which is six months fromthe Listing Date, dispose of, nor enter into any agreement to dispose of or otherwise createany options, rights, interests or encumbrances in respect of, any of the Shares in respect ofwhich he/she/it is shown by this prospectus to be the beneficial owner; or
(ii) in the period of six months commencing on the date on which the period referred to in thepreceding paragraph expires, dispose of, or enter into any agreement to dispose of orotherwise create, any options, rights, interests or encumbrances in respect of, any of theShares referred to in the preceding paragraph to such an extent that immediately followingsuch disposal, or upon the exercise or enforcement of such options, rights, interests orencumbrances, he or she or it would cease to be a Controlling Shareholder (as defined inthe Listing Rules) of our Company.
Note 2 to Rule 10.07(2) of the Listing Rules provides that Rule 10.07 does not prevent thegroup of Controlling Shareholders from using the Shares beneficially owned by him/her/it as security(including a charge or pledge) in favor of an authorized institution (as defined in the BankingOrdinance (Chapter 155 of the Laws of Hong Kong) for a bona fide commercial loan.
Pursuant to Note (3) to Rule 10.07(2) of the Listing Rules, the group of our ControllingShareholders have collectively further undertaken to the Hong Kong Stock Exchange and to ourCompany that within the period commencing on the date by reference to which disclosure of his/her/itsshareholding is made in this prospectus and ending on the date which is 12 months from the ListingDate, he/she/it shall:
(i) when he/she/it or the relevant registered holders pledge or charge any Shares beneficiallyowned by him/her/its in favor of an authorized institution (as defined in the BankingOrdinance (Chapter 155 of the Laws of Hong Kong)) for a bona fide commercial loan,immediately inform our Company of such pledge or charge together with the number ofShares so pledged or charged; and
(ii) when he/she/it or the relevant registered holders receive indications, either verbal orwritten, from the pledgee or chargee of any Shares that any of the pledged or chargedShares will be disposed of, immediately inform our Company in writing of suchindications.
We will inform the Hong Kong Stock Exchange as soon as we have been informed of thematters referred to in paragraph (i) and (ii) above (if any) by any of our Controlling Shareholders andsubject to the then requirements of the Listing Rules disclose such matters by way of an announcementwhich is published in accordance with Rule 2.07C of the Listing Rules as soon as possible.
Undertakings Pursuant to the Hong Kong Underwriting Agreement
A Undertakings by our Company
Our Company, has undertaken to each of the Joint Global Coordinators, the Joint Sponsors, theJoint Bookrunners, the Joint Lead Managers and the Hong Kong Underwriters that, except pursuant to
305
UNDERWRITING
the Global Offering (including pursuant to the exercise of the Over-allotment Option), at any time afterthe date of the Hong Kong Underwriting Agreement up to and including the date falling six monthsfrom the Listing Date (the “First Six-Month Period”), our Company will not, without the prior writtenconsent of the Joint Sponsors and the Joint Global Coordinators (for themselves and on behalf of theHong Kong Underwriters) and unless in compliance with the requirements set out in the Listing Rules:
(i) allot, issue, sell, accept subscription for, offer to allot, issue or sell, contract or agree toallot, issue or sell, mortgage, charge, pledge, hypothecate, hedge, lend, grant or sell anyoption, warrant, contract or right to subscribe for or purchase, grant or purchase anyoption, warrant, contract or right to allot, issue or sell, or otherwise transfer or dispose ofor create an encumbrance over, or agree to transfer or dispose of or create an encumbranceover, either directly or indirectly, conditionally or unconditionally, any Shares or otherequity securities of the Company, or any interest in any of the foregoing (including,without limitation, any securities convertible into or exchangeable or exercisable for orthat represent the right to receive, or any warrants or other rights to subscribe for orpurchase, any Shares or other equity securities of the Company, or any interest in any ofthe foregoing), or deposit any Shares or other equity securities of the Company, with adepositary in connection with the issue of depositary receipts; or
(ii) enter into any swap or other arrangement that transfers to another, in whole or in part, anyof the economic consequences of ownership (legal or beneficial) of any Shares or anyother equity securities of the Company, or any interest in any of the foregoing (including,without limitation, any securities convertible into or exchangeable or exercisable for orthat represent the right to receive, or any warrants or other rights to purchase, any Sharesor other equity securities of the Company, or any interest in any of the foregoing); or
(iii) enter into any transaction with the same economic effect as any transaction specified insub-paragraph (i) or (ii) above; or
(iv) offer to or agree to, or announce any intention to effect any transaction specified insub-paragraph (i), (ii) or (iii) above,
in each case, whether any of the foregoing transactions specified in sub-paragraph (i), (ii) or (iii) aboveis to be settled by the delivery of Shares or such other equity securities of the Company, or, in cash orotherwise (whether or not the issue of such Shares or other shares or equity securities will becompleted within the First Six-Month Period). In the event that, during the period of six monthscommencing on the date on which the First Six-Month Period expires (the “Second Six-MonthPeriod”), the Company enters into any of the transactions specified in sub-paragraph (i), (ii) or(iii) above or offers to or agrees to or announces any intention to effect any such transaction, theCompany shall take all reasonable steps to ensure that it will not create a disorderly or false market inthe securities of the Company. Mr. Wang Xuning and JS Holding jointly and severally undertake toeach of the Joint Sponsors, the Joint Global Coordinators, the Joint Bookrunners, the Joint LeadManagers and the Hong Kong Underwriters to procure the Company to comply with the undertakingsabove.
B Undertakings by Mr. Wang Xuning and JS Holding as our Controlling Shareholder(s)
Each of Mr. Wang Xuning and JS Holding has undertaken to each of the Company, the JointGlobal Coordinators, the Joint Sponsors, the Joint Bookrunners, the Joint Lead Managers and the HongKong Underwriters that, except as pursuant to the Global Offering (including pursuant to the exercise
306

UNDERWRITING
of the Over-allotment Option) and the Stock Borrowing Agreement, without the prior written consentof the Joint Sponsors and the Joint Global Coordinators and unless in compliance with therequirements of the Listing Rules:
(i) he/it will not, during the First Six-Month Period, (a) sell, offer to sell, contract or agree tosell, mortgage, charge, pledge, hypothecate, lend, grant or sell any option, warrant,contract or right to purchase, grant or purchase any option, warrant, contract or right tosell, or otherwise transfer or dispose of or create an encumbrance over, or agree to transferor dispose of or create an encumbrance over, either directly or indirectly, conditionally orunconditionally, any Shares or other securities of the Company or any interest therein(including, without limitation, any securities convertible into or exchangeable orexercisable for or that represent the right to receive, or any warrants or other rights topurchase, any Shares or any such other securities, as applicable or any interest in any ofthe foregoing) beneficially owned by him/it as at the Listing Date (the “Locked-upSecurities”), or (b) enter into any swap or other arrangement that transfers to another, inwhole or in part, any of the economic consequences of ownership of any Locked-upSecurities, or (c) enter into any transaction with the same economic effect as anytransaction specified in (a) or (b) above, or (d) offer to or agree to or announce anyintention to effect any transaction specified in (a), (b) or (c) above, in each case, whetherany of the transactions specified in (a), (b) or (c) above is to be settled by delivery ofShares or other securities of the Company or in cash or otherwise (whether or not the issueof such Shares or other securities will be completed within the First Six-Month Period);and
(ii) he/it will not, until the expiry of the Second Six-Month Period, enter into any of thetransactions specified in (a), (b) or (c) above or offer to or agree to or announce anyintention to effect any such transaction if, immediately following any sale, transfer ordisposal or upon the exercise or enforcement of any option, right, interest or encumbrancepursuant to such transaction, he/it will cease to be a controlling shareholder (as defined inthe Listing Rules) of the Company; and
(iii) until the expiry of the Second Six-Month Period, in the event that he/it enters into any ofthe transactions specified in (a), (b) or (c) above or offers to or agrees to or announces anyintention to effect any such transaction, he/it will take all reasonable steps to ensure that itwill not create a disorderly or false market in the securities of the Company.
Lock-up Undertakings from the Remaining Controlling Shareholders
To facilitate the Global Offering, in addition to the lock-up undertakings given by Mr. WangXuning and JS Holding pursuant to the Hong Kong Underwriting Agreement as disclosed above (the“Major Controlling Shareholders Undertakings”), the remaining Controlling Shareholders haveentered into the lock-up undertakings in favor of the Company, the Joint Global Coordinators, the JointSponsors, the Joint Bookrunners, the Joint Lead Managers and the Underwriters pursuant to which theremaining Controlling Shareholders have also given lock-up undertakings on terms same as those ofthe Major Controlling Shareholders Undertakings.
Undertakings by Certain of Our Shareholders
Each of Easy Home, Comfort Home and the SN Investors (the “Undersigned Shareholders”)has entered into a lock-up undertaking deed (each a “Lock-up Undertaking Deed” and altogether the
307

UNDERWRITING
“Lock-up Undertaking Deeds”) in favor of the Joint Sponsors and the Joint Global Coordinators (onbehalf of the Underwriters). Pursuant to the Lock-up Undertaking Deeds (which are in largely similarform, except certain special circumstances), each of the Undersigned Shareholders agrees that, it willnot, from the date of the respective Lock-up Undertaking Deed and ending on, and including, the datethat is six months after the Listing Date (the “Six-Month Period”), dispose of any Relevant Shares orany interest in any company or entity holding or controlling (directly or indirectly) any RelevantShares or, permit or cause a change in control of any company or entity holding or controlling (directlyor indirectly) any Relevant Shares (the “Lock-up Undertaking”).
“Relevant Shares” mean any and all Shares, as reclassified, redesignated and subdivided fromthe Shares as held by the relevant Undersigned Shareholder on the date of the Lock-up UndertakingDeed it signed, in the manner as set out in the prospectus as if the reclassification, redesignation andsubdivision has been completed on the date of the relevant Lock-up Undertaking Deed.
The Lock-up Undertaking does not apply to situations including:
(a) any transfer with the prior written consent of the Company and the Joint GlobalCoordinators, having due regard to any applicable requirements of the Stock Exchange;
(b) any shares acquired by the Undersigned Shareholder or its affiliate in open markettransactions after the completion of the Global Offering;
(c) any transfer to any of the Undersigned Shareholder’s wholly-owned subsidiaries, directlyor indirectly, provided that, as a condition to such transfer, such wholly-owned subsidiarygives a written undertaking (addressed to and in favor of the Joint Global Coordinators andthe Joint Sponsors substantially the same as the relevant Lock-up Undertaking Deed)agreeing to be bound by the provisions of the relevant Lock-up Undertaking Deed;
(d) as may be required by applicable law or regulation;
(e) the use of the Relevant Shares by the Undersigned Shareholder or its affiliate (as the casemay be) as security (including a charge or a pledge) in favor of an authorized institutionfor a bona fide commercial loan provided that the person making such loan undertakes tobe bound by the restrictions on disposal as set out in the relevant Lock-up UndertakingDeed during the Six-Month Period and which restrictions shall apply to any disposal of theRelevant Shares on exercise of any enforcement action or foreclosure following a defaultunder such loan; and
(f) sale, transfer or disposal of any Relevant Share for estate planning purposes or pursuant tolaws of descent, provided that, as a condition to such transfer, such transferee gives awritten undertaking (addressed to and in favor of the Joint Global Coordinators and theJoint Sponsors substantially the same as the relevant Lock-up Undertaking Deed) agreeingto be bound by the provisions of the relevant Lock-up Undertaking Deed.
For the purpose of the Lock-up Undertaking Deeds, “dispose of” means:
(a) offer, pledge, charge, sell, mortgage, lend, create, transfer, assign or otherwise dispose,grant any option, warrant or right to purchase, sell, lend or otherwise transfer or disposeof, either directly or indirectly, conditionally or unconditionally, or create any third partyright over any Relevant Shares or any other securities convertible into or exercisable orexchangeable for such Relevant Shares, or that represent the right to receive, suchRelevant Shares, or any interest in them; or
308

UNDERWRITING
(b) enter into any option, swap or other arrangement that transfers to another, in whole or inpart, any beneficial ownership of the Relevant Shares or any of the economicconsequences or incidents of ownership of Relevant Shares or any other securities of theCompany or any interest therein or which transfers or derives any significant part of itsvalue from such Relevant Shares; or
(c) enter into any transaction, directly or indirectly, with the same economic effect as anytransaction specified in paragraph (a) or (b) above; or
(d) agree or contract to effect any transaction specified in paragraph (a), (b) or (c) above, ineach case, whether any of the transactions specified in paragraph (a), (b) or (c) above is tobe settled by delivery of Relevant Shares or such other securities convertible into orexercisable or exchangeable for the Relevant Shares or in cash or otherwise (whether ornot the issue of Relevant Shares or such other securities will be completed within theaforesaid period).
Indemnity
We, Mr. Wang Xuning and JS Holding have agreed to indemnify, among the others, the JointGlobal Coordinators, the Joint Sponsors and the Hong Kong Underwriters for certain losses which theymay suffer, including, amongst others, losses arising from their performance of their obligations underthe Hong Kong Underwriting Agreement and any breach by our Company of the Hong KongUnderwriting Agreement.
Hong Kong Underwriters’ Interests in the Company
Save as disclosed in the prospectus, except for its obligations under the Hong KongUnderwriting Agreement, the Hong Kong Underwriters do not have any shareholding interest in ourCompany or any right or option (whether legally enforceable or not) to subscribe for or nominatepersons to subscribe for securities in our Company or any member of our Group.
Following the completion of the Global Offering, the Hong Kong Underwriters and theiraffiliated companies may hold a certain portion of the Shares as a result of fulfilling their obligationsunder the Hong Kong Underwriting Agreement.
International Offering
International Underwriting Agreement
In connection with the International Offering, it is expected that we, Mr. Wang Xuning and JSHolding will enter into the International Underwriting Agreement with the Joint Global Coordinatorsand the International Underwriters. Under the International Underwriting Agreement, subject to theconditions set forth therein, the International Underwriters would agree to purchase, or procuresubscribers to purchase, the Offer Shares being offered pursuant to the International Offering (subjectto, amongst others, any reallocation between the International Offering and the Hong Kong PublicOffering). It is expected that the International Underwriting Agreement may be terminated on similargrounds as the Hong Kong Underwriting Agreement. Potential investors are reminded that in the eventthat the International Underwriting Agreement is not entered into, the Global Offering will notproceed.
309
UNDERWRITING
Over-allotment Option
Our Company expects to grant to the International Underwriters, exercisable in whole or in partby the Joint Global Coordinators at their sole and absolute discretion (on behalf of the InternationalUnderwriters), the Over-allotment Option, which will be exercisable from the Listing Date until 30days after the last day for the lodging of applications under the Hong Kong Public Offering, to requireour Company to issue and allot, up to an aggregate of 74,974,500 Shares, representing no more than15.0% of the initial Offer Shares, at the Offer Price under the International Offering, to cover over-allocations in the International Offering, if any.
Commissions and Expenses
The Hong Kong Underwriters will receive a gross underwriting commission equal to 2.50% ofthe aggregate Offer Price in respect of all the Hong Kong Offer Shares (excluding any InternationalOffer Shares reallocated to and from the Hong Kong Public Offering). Our Company may also in oursole discretion pay the Hong Kong Underwriters an additional incentive fee.
For unsubscribed Hong Kong Offer Shares reallocated to the International Offering (in suchproportion as the Joint Global Coordinators (for themselves and on behalf of the Hong KongUnderwriters) in their sole discretion consider appropriate), the underwriting commission regardingsuch Hong Kong Offer Shares shall be reallocated to the International Underwriters (in such proportionas the Joint Global Coordinators in their sole discretion consider appropriate).
Assuming the Over-allotment Option is not exercised, the aggregate commissions and fees,together with Hong Kong Stock Exchange listing fees, SFC transaction levy and Hong Kong StockExchange trading fee, legal and other professional fees and printing and other expenses relating to theGlobal Offering, which are currently estimated to amount in aggregate to approximately HK$236.5million (assuming an Offer Price of HK$6.40 per Offer Share, being the mid-point of the indicativeOffering Price range stated in this prospectus), are payable and borne by our Company.
INDEPENDENCE OF THE JOINT SPONSORS
Morgan Stanley Asia Limited satisfies the independence criteria applicable to sponsors set outin Rule 3A.07 of the Listing Rules.
JS Holding, one of the Controlling Shareholders of the Company, has a private banking accountwith Credit Suisse (Hong Kong) Limited. Prior to completion of the Listing, certain partners of JSHolding may appoint an affiliate of Credit Suisse (Hong Kong) Limited to act as trustee for trusts ofwhich such partners or their close associates are beneficiaries. Therefore, Credit Suisse (Hong Kong)Limited is not considered as an independent sponsor according to the independence criteria applicableto sponsors set out in Rule 3A.07 of the Listing Rules.
As of the Latest Practicable Date, certain group entities of the Industrial and Commercial Bankof China Limited (“ICBC”), the parent company of ICBC International Capital Limited, have lendingrelationship with the Group and its Controlling Shareholders. ICBC International Capital Limited istherefore not considered as an independent sponsor according to the independence criteria applicable tosponsors set out in Rule 3A.07 of the Listing Rules.
310

UNDERWRITING
ACTIVITIES BY SYNDICATE MEMBERS
The underwriters of the Hong Kong Public Offering and the International Offering (together,the “Syndicate Members”) and their affiliates may each individually undertake a variety of activities(as further described below) which do not form part of the underwriting or stabilizing process.
The Syndicate Members and their affiliates are diversified financial institutions withrelationships in countries around the world. These entities engage in a wide range of commercial andinvestment banking, brokerage, funds management, trading, hedging, investing and other activities fortheir own account and for the account of others. In relation to the Shares, those activities could includeacting as agent for buyers and sellers of the Shares, entering into transactions with those buyers andsellers in a principal capacity, proprietary trading in the Shares, and entering into over the counter orlisted derivative transactions or listed and unlisted securities transactions (including issuing securitiessuch as derivative warrants listed on a stock exchange) which have as their underlying assets, assetsincluding the Shares. Those activities may require hedging activity by those entities involving, directlyor indirectly, the buying and selling of the Shares. All such activity could occur in Hong Kong andelsewhere in the world and may result in the Syndicate Members and their affiliates holding long and/or short positions in the Shares, in baskets of securities or indices including the Shares, in units offunds that may purchase the Shares, or in derivatives related to any of the foregoing.
In relation to issues by Syndicate Members or their affiliates of any listed securities having theShares as their underlying securities, whether on the Hong Kong Stock Exchange or on any other stockexchange, the rules of the exchange may require the issuer of those securities (or one of its affiliates oragents) to act as a market maker or liquidity provider in the security, and this will also result in hedgingactivity in the Shares in most cases.
All such activities may occur both during and after the end of the stabilizing period described inthe section headed “Structure of the Global Offering.” Such activities may affect the market price orvalue of the Shares, the liquidity or trading volume in the Shares and the volatility of the price of theShares, and the extent to which this occurs from day to day cannot be estimated.
It should be noted that when engaging in any of these activities, the Syndicate Members will besubject to certain restrictions, including the following:
(a) the Syndicate Members (other than the Stabilizing Manager or any person acting for it)must not, in connection with the distribution of the Offer Shares, effect any transactions(including issuing or entering into any option or other derivative transactions relating tothe Offer Shares), whether in the open market or otherwise, with a view to stabilizing ormaintaining the market price of any of the Offer Shares at levels other than those whichmight otherwise prevail in the open market; and
(b) the Syndicate Members must comply with all applicable laws and regulations, includingthe market misconduct provisions of the SFO, including the provisions prohibiting insiderdealing, false trading, price rigging and stock market manipulation.
Certain of the Syndicate Members or their respective affiliates have provided from time to time,and expect to provide in the future, investment banking and other services to our Company and itsaffiliates for which such Syndicate Members or their respective affiliates have received or will receivecustomary fees and commissions.
311

STRUCTURE OF THE GLOBAL OFFERING
THE GLOBAL OFFERING
This prospectus is published in connection with the Hong Kong Public Offering as part of theGlobal Offering. The Global Offering comprises (subject to adjustment and the Over-allotmentOption):
(a) the Hong Kong Public Offering of 49,983,000 Shares (subject to adjustment as mentionedbelow) for subscription by the public in Hong Kong as described in “Structure of theGlobal Offering—The Hong Kong Public Offering” below; and
(b) the International Offering of 449,847,000 Shares (subject to adjustment and the Over-allotment Option as mentioned below) outside the United States (including to professionaland institutional investors within Hong Kong) in offshore transactions in reliance onRegulation S and in the United States only to QIBs in reliance on Rule 144A or any otheravailable exemption from registration under the U.S. Securities Act as described in“Structure of the Global Offering—The International Offering” below.
Investors may apply for the Hong Kong Offer Shares under the Hong Kong Public Offering orindicate an interest, if qualified to do so, for the International Offer Shares under the InternationalOffering, but may not do both.
The Offer Shares will represent approximately 15.0% of the enlarged issued share capital of ourCompany immediately after completion of the Global Offering without taking into account the exerciseof the Over-allotment Option. If the Over-allotment Option is exercised in full, the additionalInternational Offer Shares will represent approximately 2.2% of the enlarged issued share capital ofour Company immediately after completion of the Global Offering and the exercise of the Over-allotment Option as set out in “Structure of the Global Offering—The International Offering—Over-allotment Option” below.
The Hong Kong Public Offering is open to members of the public in Hong Kong as well as toinstitutional and professional investors in Hong Kong. The International Offering will involve selectivemarketing of the International Offer Shares to institutional and professional investors and otherinvestors expected to have a sizeable demand for the International Offer Shares in Hong Kong andother jurisdictions outside the United States in reliance on Regulation S. The InternationalUnderwriters are soliciting from prospective investors’ indications of interest in acquiring theInternational Offer Shares. Prospective investors will be required to specify the number of InternationalOffer Shares under the International Offering they would be prepared to acquire either at differentprices or at a particular price.
References in this prospectus to applications, Application Forms, application monies or theprocedure for application relate solely to the Hong Kong Public Offering.
The number of Offer Shares to be offered under the Hong Kong Public Offering and theInternational Offering, respectively, may be subject to reallocation as described in “Structure of theGlobal Offering—The Hong Kong Public Offering—Reallocation” below.
312
STRUCTURE OF THE GLOBAL OFFERING
THE HONG KONG PUBLIC OFFERING
Number of Hong Kong Offer Shares Initially Offered
We are initially offering 49,983,000 Shares for subscription by the public in Hong Kong at theOffer Price, representing 10.0% of the total number of the Offer Shares initially available under theGlobal Offering. Subject to the reallocation of the Offer Shares between the International Offering andthe Hong Kong Public Offering, the Hong Kong Offer Shares will represent approximately 1.5% of theenlarged issued share capital of our Company immediately following the completion of the GlobalOffering (assuming the Over-allotment Option is not exercised).
The Hong Kong Public Offering is open to members of the public in Hong Kong as well as toinstitutional and professional investors. Professional investors generally include brokers, dealers, andcompanies (including fund managers) whose ordinary business involves dealing in shares and othersecurities, and corporate entities which regularly invest in shares and other securities.
Completion of the Hong Kong Public Offering is subject to the conditions as set forth in“Structure of the Global Offering—Conditions of the Global Offering” below.
Allocation
Allocation of the Offer Shares to investors under the Hong Kong Public Offering will be basedsolely on the level of valid applications received under the Hong Kong Public Offering. The basis ofallocation may vary, depending on the number of Hong Kong Offer Shares validly applied for byapplicants. Such allocation could, where appropriate, consist of balloting, which would mean that someapplicants may receive a higher allocation than the others who have applied for the same number of theHong Kong Offer Shares, and those applicants who are not successful in the ballot may not receive anyHong Kong Offer Shares.
The total number of the Offer Shares initially available under the Hong Kong Public Offering(after taking into account any adjustment in the number of the Offer Shares allocated between theHong Kong Public Offering and the International Offering) is to be divided into two pools forallocation purposes: Pool A and Pool B. Accordingly, the maximum number of Hong Kong OfferShares initially in Pool A and Pool B will be 24,991,500 respectively. The Offer Shares in Pool A willbe allocated on an equitable basis to applicants who have applied for Offer Shares with an aggregateprice of HK$5 million (excluding the brokerage, SFC transaction levy and the Hong Kong StockExchange trading fee payable) or less. The Offer Shares in Pool B will be allocated on an equitablebasis to applicants who have applied for Offer Shares with an aggregate price of more than HK$5million (excluding the brokerage, SFC transaction levy and the Hong Kong Stock Exchange trading feepayable).
Investors should be aware that applications in Pool A and applications in Pool B may receivedifferent allocation ratios. If the Offer Shares in one (but not both) of the pools are under-subscribed,the surplus Offer Shares will be transferred to the other pool to satisfy demand in that other pool and beallocated accordingly. For the purpose of this paragraph only, the “price” for the Offer Shares meansthe price payable on application therein (without regard to the Offer Price as finally determined).Applicants can only receive an allocation of the Offer Shares from either Pool A or Pool B but notfrom both pools. Multiple or suspected multiple applications and any application for more than24,991,500 Hong Kong Offer Shares (being 50% of the 49,983,000 Shares initially available under theHong Kong Public Offering) are liable to be rejected.
313
STRUCTURE OF THE GLOBAL OFFERING
Reallocation
The allocation of the Offer Shares between the Hong Kong Public Offering and theInternational Offering is subject to adjustment. Paragraph 4.2 of Practice Note 18 of the Listing Rulesrequires a clawback mechanism to be put in place which would have the effect of increasing thenumber of the Offer Shares under the Hong Kong Public Offering to a certain percentage of the totalnumber of the Offer Shares offered under the Global Offering if certain prescribed total demand levelsare reached as further described below:
Š if the number of Offer Shares validly applied for under the Hong Kong Public Offeringrepresents 15 times or more but less than 50 times the number of Offer Shares initiallyavailable for subscription under the Hong Kong Public Offering, then Offer Shares will bereallocated to the Hong Kong Public Offering from the International Offering so that thetotal number of Offer Shares available under the Hong Kong Public Offering will be149,949,000 Shares, representing 30% of the Offer Shares initially available under theGlobal Offering;
Š if the number of Offer Shares validly applied for under the Hong Kong Public Offeringrepresents 50 times or more but less than 100 times the number of Offer Shares initiallyavailable for subscription under the Hong Kong Public Offering, then the number of OfferShares to be reallocated to the Hong Kong Public Offering from the International Offeringwill be increased so that the total number of Offer Shares available under the Hong KongPublic Offering will be 199,932,000 Shares, representing 40% of the Offer Shares initiallyavailable under the Global Offering; and
Š if the number of Offer Shares validly applied for under the Hong Kong Public Offeringrepresents 100 times or more the number of Offer Shares initially available forsubscription under the Hong Kong Public Offering, then the number of Offer Shares to bereallocated to the Hong Kong Public Offering from the International Offering will beincreased so that the total number of Offer Shares available under the Hong Kong PublicOffering will be 249,915,000 Shares, representing 50% of the Offer Shares initiallyavailable under the Global Offering.
The Offer Shares to be offered in the Hong Kong Public Offering and the International Offeringmay, in certain circumstances, be reallocated as between these offerings at the discretion of the JointGlobal Coordinators. In accordance with Guidance Letter HKEX-GL91-18 issued by the Hong KongStock Exchange, if such reallocation is done other than pursuant to Practice Note 18 of the ListingRules for:
Š if the International Offer Shares are fully subscribed or oversubscribed, and the number ofOffer Shares validly applied for under the Hong Kong Public Offering represents less than15 times the number of the Offer Shares initially available for subscription under the HongKong Public Offering
Š if the International Offer Shares are undersubscribed, and the Hong Kong Offer Shares arefully subscribed or oversubscribed (irrespective of the extent of over-subscription)
the maximum total number of Shares that may be reallocated to the Hong Kong Public Offering shallbe not more than 99,966,000 Shares, representing two times the number of Hong Kong Offer Sharesinitially available under the Hong Kong Public Offering and 20% of the number of Offer Sharesinitially available under the Global Offering; and the final Offer Price shall be fixed at HK$5.55 perOffer Share, the low-end of the Offer Price range stated in this prospectus.
314
STRUCTURE OF THE GLOBAL OFFERING
Any such clawback and reallocation between the International Offering and the Hong KongPublic Offering will be completed prior to any adjustments of the number of the Offer Shares pursuantto the exercise of the Over-allotment Option, if any.
In each case, the additional Offer Shares reallocated to the Hong Kong Public Offering will beallocated between Pool A and Pool B and the number of Offer Shares allocated to the InternationalOffering will be correspondingly reduced in such manner as the Joint Global Coordinators in their solediscretion consider appropriate.
Applications
Each applicant under the Hong Kong Public Offering will also be required to give anundertaking and confirmation in the Application Form submitted by him/her that he/she and anyperson(s) for whose benefit he/she is making the application have not applied for or taken up, orindicated an interest for, and will not apply for or take up, or indicate an interest for, any Offer Sharesunder the International Offering, and such applicant’s application is liable to be rejected if the saidundertaking and/or confirmation is breached and/or untrue (as the case may be) or it has been or will beplaced or allocated Offer Shares under the International Offering.
Applicants under the Hong Kong Public Offering are required to pay, on application, themaximum Offer Price of HK$7.25 per Offer Share in addition to the brokerage, SFC transaction levyand the Hong Kong Stock Exchange trading fee payable on each Offer Share. If the Offer Price, asfinally determined in the manner described in “Structure of the Global Offering—Pricing andAllocation” below, is less than the maximum price of HK$7.25 per Offer Share, appropriate refundpayments (including the brokerage, SFC transaction levy and the Hong Kong Stock Exchange tradingfee attributable to the surplus application monies) will be made to successful applicants, withoutinterest. Further details are set out below in “How to Apply for the Hong Kong Offer Shares.”
THE INTERNATIONAL OFFERING
Number of International Offer Shares Initially Offered
Subject to reallocation as described in this section and the exercise of the Over-allotmentOption, the International Offering will consist of an initial offering of 449,847,000 Offer Shares,representing 90.0% of the total number of Offer Shares initially available under the Global Offeringsubject to the reallocation of Offer Shares between the International Offering and the Hong KongPublic Offering and assuming that the Over-allotment Option is not exercised.
Allocation
The International Offering will include selective marketing of the Offer Shares to institutionaland professional investors and other investors anticipated to have a sizeable demand for such OfferShares. Professional investors generally include brokers, dealers, companies (including fund managers)whose ordinary business involves dealing in shares and other securities and corporate entities whichregularly invest in shares and other securities. Allocation of the Offer Shares pursuant to theInternational Offering will be effected in accordance with the “book-building” process described in“Structure of the Global Offering—Pricing and Allocation” and based on a number of factors,including the level and timing of demand, the total size of the relevant investor’s invested assets orequity assets in the relevant sector and whether or not it is expected that the relevant investor is likely
315
STRUCTURE OF THE GLOBAL OFFERING
to buy further Offer Shares, and/or hold or sell its Offer Shares, after the listing of the Offer Shares onthe Hong Kong Stock Exchange. Such allocation is intended to result in a distribution of theInternational Offer Shares on a basis which would lead to the establishment of a solid professional andinstitutional shareholder base to the benefit of our Company and its Shareholders as a whole.
The Joint Global Coordinators (for themselves and on behalf of the International Underwriters)may require any investor who has been offered the International Offer Shares under the InternationalOffering, and who has made an application under the Hong Kong Public Offering, to provide sufficientinformation to the Joint Global Coordinators so as to allow them to identify the relevant applicationsunder the Hong Kong Public Offering and to ensure that they are excluded from any application of theOffer Shares under the Hong Kong Public Offering.
Reallocation
The total number of the Offer Shares to be issued or sold pursuant to the International Offeringmay change as a result of the clawback arrangement described in “Structure of the Global Offering—The Hong Kong Public Offering—Reallocation,” the exercise of the Over-allotment Option in wholeor in part and/or any reallocation of unsubscribed Offer Shares originally included in the Hong KongPublic Offering to the International Offering.
Over-allotment Option
Our Company expects to grant to the International Underwriters, exercisable in whole or in partby the Joint Global Coordinators at their sole and absolute discretion (on behalf of the InternationalUnderwriters), the Over-allotment Option, which will be exercisable from the Listing Date until30 days after the last day for the lodging of applications under the Hong Kong Public Offering, torequire our Company to issue and allot, up to an aggregate of 74,974,500 Shares, representing no morethan 15.0% of the Offer Shares initially available under the Global Offering, at the Offer Price, tocover over-allocations in the International Offering, if any. If the Over-allotment Option is exercised infull, the additional International Offer Shares will represent approximately 2.2% of our Company’senlarged issued share capital immediately following completion of the Global Offering and theexercise of the Over-allotment Option. In the event that the Over-allotment Option is exercised, wewill make an announcement in due course.
STABILIZATION
Stabilization is a practice used by underwriters in some markets to facilitate the distribution ofsecurities. To stabilize, the underwriters may bid for, or purchase, the newly issued securities in thesecondary market, during a specified period of time, to retard and, if possible, prevent any decline inthe market price of the securities below the offer price. In Hong Kong and a number of otherjurisdictions, activity aimed at reducing the market price is prohibited, and the price at whichstabilization is effected is not permitted to exceed the offer price.
In connection with the Global Offering, the Stabilizing Manager, its affiliates or any personacting for it, as stabilizing manager, on behalf of the Underwriters, may to the extent permitted byapplicable laws of Hong Kong or elsewhere, over-allocate or effect transactions with a view tostabilizing or supporting the market price of the Shares at a level higher than that which mightotherwise prevail for a limited period after the Listing Date. However, there is no obligation on theStabilizing Manager, its affiliates or any persons acting for it, to conduct any such stabilizing action.
316
STRUCTURE OF THE GLOBAL OFFERING
Such stabilization action, if commenced, may be discontinued at any time, and is required to bebrought to an end within 30 days after the last day for the lodging of applications under the Hong KongPublic Offering. Should stabilizing transactions be effected in connection with the Global Offering,this will be effected at the absolute discretion of the Stabilizing Manager, its affiliates or any personacting for it.
Stabilizing action permitted in Hong Kong pursuant to the Securities and Futures (PriceStabilizing) Rules (Chapter 571W of the Laws of Hong Kong), as amended, includes (i) over-allocation for the purpose of preventing or minimizing any reduction in the market price of the Shares,(ii) selling or agreeing to sell the Shares so as to establish a short position in them for the purpose ofpreventing or minimizing any reduction in the market price of the Shares, (iii) purchasing orsubscribing for, or agreeing to purchase or subscribe for, the Shares pursuant to the Over-allotmentOption in order to close out any position established under (i) or (ii) above, (iv) purchasing, or agreeingto purchase, any of the Shares for the sole purpose of preventing or minimizing any reduction in themarket price of the Shares, (v) selling or agreeing to sell any Shares in order to liquidate any positionestablished as a result of those purchases and (vi) offering or attempting to do anything as described inparagraph (ii), (iii), (iv) or (v).
Specifically, prospective applicants for and investors in the Offer Shares should note that:
Š the Stabilizing Manager, its affiliates or any person acting for it may, in connection withthe stabilizing action, maintain a long position in the Shares;
Š there is no certainty regarding the extent to which and the time or period for which theStabilizing Manager, or any person acting for it, will maintain such a long position;
Š liquidation of any such long position by the Stabilizing Manager, its affiliates or anyperson acting for it may have an adverse impact on the market price of the Shares;
Š no stabilizing action can be taken to support the price of the Shares for longer than thestabilizing period which will begin on the Listing Date, and is expected to expire on the30th day after the last day for the lodging of applications under the Hong Kong PublicOffering. After this date, when no further stabilizing action may be taken, demand for theShares, and therefore the price of the Shares, could fall;
Š the price of the Shares cannot be assured to stay at or above the Offer Price by the takingof any stabilizing action; and
Š stabilizing bids may be made or transactions effected in the course of the stabilizing actionat any price at or below the Offer Price, which means that stabilizing bids may be made ortransactions effected at a price below the price paid by applicants for, or investors in, theShares.
The Company will ensure or procure that an announcement in compliance with the Securitiesand Futures (Price Stabilizing) Rules (Chapter 571W of the Laws of Hong Kong) will be made withinseven days of the expiration of the stabilization period.
Over-allocation
Following any over-allocation of the Shares in connection with the Global Offering, the JointGlobal Coordinators, their affiliates or any person acting for it may cover such over-allocation by,amongst other methods, exercising the Over-allotment Option in full or in part, by using Shares
317
STRUCTURE OF THE GLOBAL OFFERING
purchased by the Stabilizing Manager, its affiliates or any person acting for it in the secondary market,or through the stock borrowing arrangement mentioned below or by a combination of these means.Any such purchases will be made in accordance with the laws, rules and regulations in place in HongKong on stabilization. The number of Shares which can be over-allocated will not exceed the numberof the Shares which may be allotted and/or issued pursuant to the exercise in full of the Over-allotmentOption, being 74,974,500 Shares, representing 15.0% of the Offer Shares initially available under theGlobal Offering.
STOCK BORROWING AGREEMENT
In order to facilitate the settlement of over-allocation in connection with the Global Offering,the Stabilizing Manager may choose to borrow up to 74,974,500 Shares from JS Holding pursuant tothe Stock Borrowing Agreement.
The stock borrowing arrangement under the Stock Borrowing Agreement complies with therequirements set forth in Rule 10.07(3) of the Listing Rules and thus is not subject to the restrictions ofRule 10.07(1) of the Listing Rules.
PRICING AND ALLOCATION
The International Underwriters will be soliciting from prospective investors indications ofinterest in acquiring the Offer Shares in the International Offering. Prospective professional andinstitutional investors will be required to specify the number of Offer Shares under the InternationalOffering they would be prepared to acquire either at different prices or at a particular price. Thisprocess, known as “book-building,” is expected to continue up to, and to cease on or about, the last dayfor lodging applications under the Hong Kong Public Offering.
The Offer Price is expected to be fixed by agreement between our Company and the JointGlobal Coordinators (for themselves and on behalf of the Underwriters) on the Price DeterminationDate, which is expected to be on or about Friday, October 25, 2019 and in any event no later thanMonday, October 28, 2019, by agreement among the Joint Global Coordinators (on behalf of theUnderwriters) and our Company. The number of Offer Shares to be allocated under the variousofferings will be determined shortly thereafter.
The Offer Price will not be more than HK$7.25 per Offer Share and is expected to be not lessthan HK$5.55 per Offer Share unless otherwise announced, as further explained below, not later thanthe morning of the last day for lodging applications under the Hong Kong Public Offering. Prospectiveinvestors should be aware that the Offer Price to be determined on the Price Determination Date maybe, but is not expected to be, lower than the indicative Offer Price range stated in this prospectus.
If, for any reason, the Offer Price is not agreed between the Joint Global Coordinators (forthemselves and on behalf of the Underwriters) and us by Monday, October 28, 2019, the GlobalOffering will not proceed and will lapse.
Reduction in Offer Price range and/or number of Offer Shares
If, based on the level of interest expressed by prospective institutional, professional and otherinvestors during the book-building process, the Joint Global Coordinators (on behalf of theUnderwriters) considers it appropriate and together with the Company’s consent, the number of Offer
318
STRUCTURE OF THE GLOBAL OFFERING
Shares and/or the indicative Offer Price range may be reduced below that stated in this prospectus atany time prior to the morning of the last day for lodging applications under the Hong Kong PublicOffering.
In such a case, the Company will as soon as practicable following the decision to make anysuch reduction, and in any event not later than the morning of the last day for lodging applicationsunder the Hong Kong Public Offering:
(a) issue a supplemental prospectus, as the relevant laws or government authority orregulatory authorities may require as soon as practicable following the decision to makethe change, updating investors of the change in the indicative Offer Price together with anupdate of all financial and other information in connection with such change;
(b) extend the period under which the Global Offering was open for acceptance to allowpotential investors the sufficient time to consider their subscriptions or reconsider theirexisting subscriptions; and
(c) give potential investors who had applied for the Offer Shares the right to withdraw theirapplications given the change in circumstances.
In the absence of the publication of any such notice, the Offer Price shall under nocircumstances be set outside the Offer Price range indicated in this prospectus. If the number of OfferShares and/or the indicative Offer Price range is reduced, applicants who have submitted an applicationunder the Hong Kong Public Offering will be entitled to withdraw their applications unless positiveconfirmations from the applicants to proceed are received.
Before submitting applications for Hong Kong Offer Shares, applicants should have regard tothe possibility that any announcement of a reduction in the indicative Offer Price range and/or numberof Offer Shares may not be made until the day which is the last day for lodging applications under theHong Kong Public Offering.
In the event of a reduction in the number of Offer Shares, the Joint Global Coordinators may, attheir discretion, reallocate the number of Offer Shares to be offered in the Hong Kong Public Offeringand the International Offering, provided that the number of Offer Shares comprised in the Hong KongPublic Offering shall not be less than 10.0% of the total number of Offer Shares available under theGlobal Offering. The Offer Shares to be offered in the Hong Kong Public Offering and the OfferShares to be offered in the International Offering may, in certain circumstances, be reallocated betweenthese offerings solely in the discretion of the Joint Global Coordinators but the number of Offer Sharesto be offered in the Hong Kong Public Offering shall not in any event be less than 10.0% of the totalnumber of Offer Shares available under the Global Offering.
If applications for the Offer Shares have been submitted prior to the day which is the last dayfor lodging applications under the Hong Kong Public Offering, such applications can be subsequentlywithdrawn if the number of Offer Shares and/or the indicative Offer Price range is so reduced.
The net proceeds from the Global Offering accruing to us (after deduction of underwriting feesand estimated expenses payable by us in relation to the Global Offering) are estimated to beapproximately HK$2,962.4 million, assuming an Offer Price of HK$6.40 per Offer Share, being theapproximate mid-point of the proposed Offer Price range of HK$5.55 to HK$7.25.
319
STRUCTURE OF THE GLOBAL OFFERING
The final Offer Price, the level of indications of interest in the International Offering, the levelof applications in the Hong Kong Public Offering and the basis of allocations of Offer Shares under theHong Kong Public Offering are expected to be announced on Wednesday, October 30, 2019 in theSouth China Morning Post (in English) and the Hong Kong Economic Times (in Chinese) and on thewebsite of our Company (www.jsgloballife.com) and the website of the Hong Kong Stock Exchange(www.hkexnews.hk).
HONG KONG UNDERWRITING AGREEMENT
The Hong Kong Public Offering is fully underwritten by the Hong Kong Underwriters underthe terms of the Hong Kong Underwriting Agreement and is subject to agreement on the Offer Pricebetween our Company and the Joint Global Coordinators (for themselves and on behalf of theUnderwriters) on the Price Determination Date.
We expect that our Company will, on or about Friday, October 25, 2019, shortly after thedetermination of the Offer Price, enter into the International Underwriting Agreement relating to theInternational Offering.
The underwriting arrangements under the Hong Kong Underwriting Agreement and theInternational Underwriting Agreement are summarized in the section headed “Underwriting.”
CONDITIONS OF THE GLOBAL OFFERING
Acceptances of all applications for Offer Shares will be conditional on:
(a) the Listing Committee granting listing of, and permission to deal in, the Shares in issueand to be issued as described in this prospectus (including the additional Shares whichmay be issued pursuant to the exercise of the Over-allotment Option);
(b) the Offer Price having been agreed between our Company and the Joint GlobalCoordinators (on behalf of the Underwriters) on the Price Determination Date;
(c) the execution and delivery of the International Underwriting Agreement on or about thePrice Determination Date; and
(d) the obligations of the Underwriters under each of the respective Underwriting Agreementsbecoming and remaining unconditional and not having been terminated in accordance withthe terms of the respective Underwriting Agreements,
in each case on or before the dates and times specified in the respective Underwriting Agreements(unless and to the extent such conditions are validly waived on or before such dates and times).
If, for any reason, the Offer Price is not agreed between our Company and the Joint GlobalCoordinators (on behalf of the Underwriters) on or before Monday, October 28, 2019, the GlobalOffering will not proceed and will lapse.
The consummation of each of the Hong Kong Public Offering and the International Offering isconditional upon, amongst other things, the other becoming unconditional and not having beenterminated in accordance with its terms.
If the above conditions are not fulfilled or waived prior to the times and dates specified, theGlobal Offering will lapse and the Hong Kong Stock Exchange will be notified immediately. We will
320
STRUCTURE OF THE GLOBAL OFFERING
as soon as possible publish or cause to be published a notice of the lapse of the Hong Kong PublicOffering in the South China Morning Post (in English) and the Hong Kong Economic Times (inChinese) and on the website of our Company (www.jsgloballife.com) and the website of the HongKong Stock Exchange (www.hkexnews.hk). In such eventuality, all application monies will bereturned, without interest, on the terms set forth “How to Apply for the Hong Kong Offer Shares—14.Dispatch/ Collection of Share Certificates and Refund Monies.” In the meantime, all applicationmonies will be held in a separate bank account(s) with the receiving banks or other bank(s) in HongKong licensed under the Banking Ordinance (Chapter 155 of the Laws of Hong Kong), as amended.
Share certificates issued in respect of the Hong Kong Offer Shares will only become valid at8:00 a.m. on the Listing Date provided that the Global Offering has become unconditional in allrespects (including the Underwriting Agreements not having been terminated in accordance with theirterms) at any time prior to 8: 00 a.m. on the Listing Date.
APPLICATION FOR LISTING ON THE HONG KONG STOCK EXCHANGE
We have applied to the Listing Committee for the listing of, and permission to deal in, theShares in issue and to be issued pursuant to the Global Offering (including pursuant to the exercise ofthe Over-allotment Option).
No part of our Company’s Share or loan capital is listed on or dealt in on any other stockexchange and no such listing or permission to deal is being or proposed to be sought in the near future.
SHARES WILL BE ELIGIBLE FOR CCASS
All necessary arrangements have been made to enable the Shares to be admitted into CCASS. Ifthe Hong Kong Stock Exchange grants the listing of, and permission to deal in, the Shares and wecomply with the stock admission requirements of HKSCC, the Shares will be accepted as eligiblesecurities by HKSCC for deposit, clearance and settlement in CCASS with effect from the date ofcommencement of dealings in the Shares on the Hong Kong Stock Exchange or any other date HKSCCchooses. Settlement of transactions between Exchange Participants (as defined in the Listing Rules) isrequired to take place in CCASS on the second business day after any trading day. All activities underCCASS are subject to the General Rules of CCASS and CCASS Operational Procedures in effect fromtime to time. Investors should seek the advice of their stockbroker or other professional advisors fordetails of the settlement arrangements as such arrangements may affect their rights and interests.
DEALING ARRANGEMENTS
Assuming that the Hong Kong Public Offering becomes unconditional at or before 8:00 a.m. inHong Kong on Thursday, October 31, 2019, it is expected that dealings in the Shares on the HongKong Stock Exchange will commence at 9:00 a.m. on Thursday, October 31, 2019. The Shares will betraded on the Main Board of the Hong Kong Stock Exchange in board lots of 500 Shares each. Thestock code of the Shares will be 1691.
321
HOW TO APPLY FOR THE HONG KONG OFFER SHARES
1. HOW TO APPLY
If you apply for Hong Kong Offer Shares, then you may not apply for or indicate an interest forInternational Offer Shares.
To apply for Hong Kong Offer Shares, you may:
Š use a WHITE or YELLOW Application Form;
Š apply online via the HK eIPO White Form service by the IPO App or atwww.hkeipo.hk; or
Š electronically cause HKSCC Nominees to apply on your behalf.
None of you or your joint applicant(s) may make more than one application, except where youare a nominee and provide the required information in your application.
The Company, the Joint Global Coordinators, the HK eIPO White Form Service Provider andtheir respective agents may reject or accept any application in full or in part for any reason at theirdiscretions.
2. WHO CAN APPLY
You can apply for Hong Kong Offer Shares on a WHITE or YELLOW Application Form ifyou or the person(s) for whose benefit you are applying:
Š are 18 years of age or older;
Š have a Hong Kong address;
Š are outside the United States, and are not a US Person (as defined in Regulation S underthe U.S. Securities Act); and
Š are not a legal or natural person of China.
If you apply online through the HK eIPO White Form service, in addition to the above, youmust also: (i) have a valid Hong Kong identity card number; and (ii) provide a valid e-mail address anda contact telephone number.
If you are a firm, the application must be in the individual members’ names. If you are a bodycorporate, the Application Form must be signed by a duly authorized officer, who must state his/herrepresentative capacity, and stamped with your corporation’s chop.
If an application is made by a person under a power of attorney, the Joint Global Coordinatorsmay accept it at their discretion and on any conditions they think fit, including evidence of theattorney’s authority.
The number of joint applicants may not exceed four and they may not apply by means ofHK eIPO White Form service for the Hong Kong Offer Shares.
Unless permitted by the Listing Rules, you cannot apply for any Hong Kong Offer Shares ifyou are:
Š an existing beneficial owner of any Shares in the Company and/or any of its subsidiaries;
322
HOW TO APPLY FOR THE HONG KONG OFFER SHARES
Š a Director or chief executive officer of the Company and/or any of its subsidiaries;
Š a connected person (as defined in the Listing Rules) of the Company or will become aconnected person of the Company immediately upon completion of the Global Offering;
Š an associate or close associate (as defined in the Listing Rules) of any of the above; and
Š have been allocated or have applied for any International Offer Shares or otherwiseparticipate in the International Offering.
3. APPLYING FOR HONG KONG OFFER SHARES
Which Application Channel to Use
For Hong Kong Offer Shares to be issued in your own name, use a WHITE Application Formor apply online through the IPO App or www.hkeipo.hk.
For Hong Kong Offer Shares to be issued in the name of HKSCC Nominees and depositeddirectly into CCASS to be credited to your or a designated CCASS Participant’s stock account, use aYELLOW Application Form or electronically instruct HKSCC via CCASS to cause HKSCCNominees to apply for you.
Where to Collect the Application Forms
You can collect a WHITE Application Form and a prospectus during normal business hoursfrom 9:00 a.m. on Tuesday, October 22, 2019 until 12:00 noon on Friday, October 25, 2019 from:
(i) any of the following offices of the Hong Kong Underwriters:
Credit Suisse (Hong Kong) Limited Level 88, International Commerce Centre1 Austin Road WestKowloonHong Kong
Morgan Stanley Asia Limited Level 46, International Commerce Centre1 Austin Road WestKowloonHong Kong
ICBC International Securities Limited 37/F, ICBC Tower3 Garden RoadHong Kong
China International Capital CorporationHong Kong Securities Limited
29/F, One International Finance Centre1 Harbour View StreetCentralHong Kong
CMB International Capital Limited 45/F, Champion Tower3 Garden RoadCentral, Hong Kong
China Merchants Securities (HK) Co., Limited 48/F, One Exchange Square8 Connaught PlaceCentralHong Kong
CCB International Capital Limited 12/F, CCB Tower3 Connaught Road CentralCentralHong Kong
323

HOW TO APPLY FOR THE HONG KONG OFFER SHARES
(ii) any of the branches of the receiving banks:
(a) Industrial and Commercial Bank of China (Asia) Limited
Branch name Address
Hong Kong Island Central Branch 1/F., 9 Queen’s Road Central,Hong Kong
Wanchai Branch 117-123 Hennessy Road,Wanchai, Hong Kong
Quarry Bay Branch Shop SLG1, Sub-LowerGround Floor, WestlandsGardens, Nos. 2-12,Westlands Road, Quarry Bay,Hong Kong
Kowloon Tsim Sha Tsui Branch Shop 1&2, G/F, No. 35-37Hankow Road, Tsimshatsui,Kowloon
Jordan Branch 1/F, JD Mall, No. 233 NathanRoad, Jordan, Kowloon
Lai Chi Kok Branch Shop G06, G/F, Cheung ShaWan Plaza, 833 Cheung ShaWan Road, Lai Chi Kok,Kowloon
Telford Branch Shop F19, Telford Plaza,Kowloon Bay, Kowloon
New Territories Tseung Kwan O Branch Shop 1025A, Level 1, MetroCity Phase II, 8 Yan KingRoad, Tseung Kwan O, NewTerritories
Sha Tsui Road Branch Shop 4, G/F Chung OnBuilding, 297-313 Sha TsuiRoad, Tsuen Wan, NewTerritories
Tai Po Branch Shop F, G/F, Mee FatBuilding, No 34-38 Tai WingLane, Tai Po, New Territories
(b) China Construction Bank (Asia) Corporation Limited
Branch name Address
Hong Kong Island Central Branch 6 Des Voeux Road Central,Central
Causeway Bay Plaza Branch G/F, Causeway Bay Plaza 1,Causeway Bay
Kowloon Mongkok Nathan RoadBranch
788 Nathan Road, Mongkok
Kwun Tong Hoi Yuen RoadBranch
56 Hoi Yuen Road, KwunTong
New Territories Yuen Long Branch 68 Castle Peak Road, YuenLong
324

HOW TO APPLY FOR THE HONG KONG OFFER SHARES
You can collect a YELLOW Application Form and a prospectus during normal business hoursfrom 9:00 a.m. on Tuesday, October 22, 2019 until 12:00 noon on Friday, October 25, 2019 from theDepository Counter of HKSCC at 1/F, One & Two Exchange Square, 8 Connaught Place, Central,Hong Kong or from your stockbroker.
Time for Lodging Application Forms
Your completed WHITE or YELLOW Application Form, together with a check or a banker’scashier order attached and marked payable to “ICBC (Asia) Nominee Limited—JS Global LifestyleCompany Public Offer” for the payment, should be deposited in the special collection boxes providedat any of the branches of the receiving banks listed above, at the following times:
Tuesday, October 22, 2019 – 9:00 a.m. to 5:00 p.m.Wednesday, October 23, 2019 – 9:00 a.m. to 5:00 p.m.Thursday, October 24, 2019 – 9:00 a.m. to 5:00 p.m.Friday, October 25, 2019 – 9:00 a.m. to 12:00 noon
The application lists will be open from 11:45 a.m. to 12:00 noon on Friday, October 25, 2019,the last application day or such later time as described in “How to Apply for the Hong Kong OfferShares—10. Effect of Bad Weather and/or Extreme Conditions on the Opening of the ApplicationLists.”
4. TERMS AND CONDITIONS OF AN APPLICATION
Follow the detailed instructions in the Application Form carefully; otherwise, your applicationmay be rejected.
By submitting an Application Form or applying through the HK eIPO White Form service,among other things, you:
(i) undertake to execute all relevant documents and instruct and authorize the Companyand/or the Joint Global Coordinators (or their agents or nominees), as agents of theCompany, to execute any documents for you and to do on your behalf all thingsnecessary to register any Hong Kong Offer Shares allocated to you in your name asrequired by the Articles of Association;
(ii) agree to comply with the Cayman Companies Law, Companies Ordinance, theCompanies (Winding Up and Miscellaneous Provisions) Ordinance and the Articles ofAssociation;
(iii) confirm that you have read the terms and conditions and application procedures set outin this prospectus and in the Application Forms and agree to be bound by them;
(iv) confirm that you have received and read this prospectus and have only relied on theinformation and representations contained in this prospectus in making your applicationand will not rely on any other information or representations except those in anysupplement to this prospectus;
(v) confirm that you are aware of the restrictions on the Global Offering in this prospectus;
(vi) agree that none of the Company, the Joint Global Coordinators, the Joint Sponsors, theJoint Bookrunners, the Joint Lead Managers, the Underwriters, their respective
325
HOW TO APPLY FOR THE HONG KONG OFFER SHARES
directors, officers, employees, partners, agents, advisors and any other parties involvedin the Global Offering is or will be liable for any information and representations not inthis prospectus (and any supplement to it);
(vii) undertake and confirm that you or the person(s) for whose benefit you have made theapplication have not applied for or taken up, or indicated an interest for, and will notapply for or take up, or indicate an interest for, any Offer Shares under the InternationalOffering nor participated in the International Offering;
(viii) agree to disclose to the Company, the Hong Kong Share Registrar, receiving banks, theJoint Global Coordinators, the Joint Sponsors, the Joint Bookrunners, the Joint LeadManagers, the Underwriters and/or their respective advisors and agents any personaldata which they may require about you and the person(s) for whose benefit you havemade the application;
(ix) if the laws of any place outside Hong Kong apply to your application, agree and warrantthat you have complied with all such laws and none of the Company, the Joint GlobalCoordinators, the Joint Sponsors, the Joint Bookrunners, the Joint Lead Managers andthe Underwriters nor any of their respective officers or advisors will breach any lawoutside Hong Kong as a result of the acceptance of your offer to purchase, or any actionarising from your rights and obligations under the terms and conditions contained in thisprospectus and the Application Forms;
(x) agree that once your application has been accepted, you may not rescind it because of aninnocent misrepresentation;
(xi) agree that your application will be governed by the laws of Hong Kong;
(xii) represent, warrant and undertake that (a) you understand that the Hong Kong OfferShares have not been and will not be registered under the U.S. Securities Act; and(b) you and any person for whose benefit you are applying for the Hong Kong OfferShares are outside the United States (as defined in Regulation S) or are a persondescribed in paragraph (h)(3) of Rule 902 of Regulation S;
(xiii) warrant that the information you have provided is true and accurate;
(xiv) agree to accept the Hong Kong Offer Shares applied for, or any lesser number allocatedto you under the application;
(xv) authorize the Company to place your name(s) or the name of the HKSCC Nominees, onthe Company’s register of members as the holder(s) of any Hong Kong Offer Sharesallocated to you, and the Company and/or its agents to send any share certificate(s) and/or any e-Auto Refund payment instructions and/or any refund check(s) to you or thefirst-named applicant for joint application by ordinary post at your own risk to theaddress stated on the application, unless you have fulfilled the criteria mentioned in theparagraph headed ‘‘Personal Collection’’ in this section to collect the share certificate(s)and/or refund check(s) in person;
(xvi) declare and represent that this is the only application made and the only applicationintended by you to be made to benefit you or the person for whose benefit you areapplying;
(xvii) understand that the Company and the Joint Global Coordinators will rely on yourdeclarations and representations in deciding whether or not to make any allotment ofany of the Hong Kong Offer Shares to you and that you may be prosecuted for making afalse declaration;
326

HOW TO APPLY FOR THE HONG KONG OFFER SHARES
(xviii) (if the application is made for your own benefit) warrant that no other application hasbeen or will be made for your benefit on a WHITE or YELLOW Application Form orby giving electronic application instructions to HKSCC or to the HK eIPO WhiteForm Service Provider by you or by any one as your agent or by any other person; and
(xix) (if you are making the application as an agent for the benefit of another person) warrantthat (a) no other application has been or will be made by you as agent for or for thebenefit of that person or by that person or by any other person as agent for that personon a WHITE or YELLOW Application Form or by giving electronic applicationinstructions to HKSCC; and (b) you have due authority to sign the Application Form orgive electronic application instructions on behalf of that other person as their agent.
Additional Instructions for the YELLOW Application Form
You may refer to the YELLOW Application Form for details.
5. APPLYING THROUGH THE HK eIPO WHITE FORM SERVICE
General
Individuals who meet the criteria in “How to Apply for the Hong Kong Offer Shares—2. WhoCan Apply,” may apply through the HK eIPO White Form service for the Hong Kong Offer Shares tobe allotted and registered in their own names through the IPO App or the designated website atwww.hkeipo.hk.
Detailed instructions for application through the HK eIPO White Form service are in the IPOApp or on the designated website at www.hkeipo.hk. If you do not follow the instructions, yourapplication may be rejected and may not be submitted to the Company. If you apply through the IPOApp or the designated website at www.hkeipo.hk, you authorize the HK eIPO White Form ServiceProvider to apply on the terms and conditions in this prospectus, as supplemented and amended by theterms and conditions of the HK eIPO White Form service.
Time for Submitting Applications under the HK eIPO White Form Service
You may submit your application to the HK eIPO White Form Service Provider in the IPOApp or on the designated website at www.hkeipo.hk (24 hours daily, except on the last applicationday) from 9:00 a.m. on Tuesday, October 22, 2019 until 11:30 a.m. on Friday, October 25, 2019 andthe latest time for completing full payment of application monies in respect of such applications will be12:00 noon on Friday, October 25, 2019 or such later time under “How to Apply for the Hong KongOffer Shares—10. Effect of Bad Weather and/or Extreme Conditions on the Opening of theApplication Lists.”
No Multiple Applications
If you apply by means of HK eIPO White Form, once you complete payment in respect of anyelectronic application instruction given by you or for your benefit through the HK eIPO White Formservice to make an application for Hong Kong Offer Shares, an actual application shall be deemed to
327

HOW TO APPLY FOR THE HONG KONG OFFER SHARES
have been made. For the avoidance of doubt, giving an electronic application instruction underHK eIPO White Form service more than once and obtaining different application reference numberswithout effecting full payment in respect of a particular reference number will not constitute an actualapplication.
If you are suspected of submitting more than one application through the HK eIPO WhiteForm service or by any other means, all of your applications are liable to be rejected.
Section 40 of the Companies (Winding Up and Miscellaneous Provisions) Ordinance
For the avoidance of doubt, the Company and all other parties involved in the preparation ofthis prospectus acknowledge that each applicant who gives or causes to give electronic applicationinstructions is a person who may be entitled to compensation under Section 40 of the Companies(Winding Up and Miscellaneous Provisions) Ordinance (as applied by Section 342E of the Companies(Winding Up and Miscellaneous Provisions) Ordinance).
6. APPLYING BY GIVING ELECTRONIC APPLICATION INSTRUCTIONS TOHKSCC VIA CCASS
General
CCASS Participants may give electronic application instructions to apply for the Hong KongOffer Shares and to arrange payment of the money due on application and payment of refunds undertheir participant agreements with HKSCC and the General Rules of CCASS and the CCASSOperational Procedures.
If you are a CCASS Investor Participant, you may give these electronic application instructionsthrough the CCASS Phone System by calling +852 2979 7888 or through the CCASS Internet System(https://ip.ccass.com) (using the procedures in HKSCC’s “An Operating Guide for InvestorParticipants” in effect from time to time).
HKSCC can also input electronic application instructions for you if you go to:
Hong Kong Securities Clearing Company LimitedCustomer Service Center
1/F, One & Two Exchange Square8 Connaught Place
CentralHong Kong
and complete an input request form.
You can also collect a prospectus from this address.
If you are not a CCASS Investor Participant, you may instruct your broker or custodian who isa CCASS Clearing Participant or a CCASS Custodian Participant to give electronic applicationinstructions via CCASS terminals to apply for the Hong Kong Offer Shares on your behalf.
You will be deemed to have authorized HKSCC and/or HKSCC Nominees to transfer thedetails of your application to the Company, the Joint Global Coordinators and the Hong Kong ShareRegistrar.
328
HOW TO APPLY FOR THE HONG KONG OFFER SHARES
GIVING ELECTRONIC APPLICATION INSTRUCTIONS TO HKSCC VIA CCASS
Where you have given electronic application instructions to apply for the Hong Kong OfferShares and a WHITE Application Form is signed by HKSCC Nominees on your behalf:
(i) HKSCC Nominees will only be acting as a nominee for you and is not liable for anybreach of the terms and conditions of the WHITE Application Form or this prospectus;
(ii) HKSCC Nominees will do the following things on your behalf:
Š agree that the Hong Kong Offer Shares to be allotted shall be issued in the name ofHKSCC Nominees and deposited directly into CCASS for the credit of the CCASSParticipant’s stock account on your behalf or your CCASS Investor Participant’sstock account;
Š agree to accept the Hong Kong Offer Shares applied for or any lesser numberallocated;
Š undertake and confirm that you have not applied for or taken up, will not apply for ortake up, have not indicated or will not indicate an interest for, any Offer Shares underthe International Offering nor otherwise participate in the International Offering;
Š (if the electronic application instructions are given for your benefit) declare that onlyone set of electronic application instructions has been given for your benefit;
Š (if you are an agent for another person) declare that you have only given one set ofelectronic application instructions for the other person’s benefit and are dulyauthorized to give those instructions as their agent;
Š confirm that you understand that the Company, the Directors and the Joint GlobalCoordinators will rely on your declarations and representations in deciding whetheror not to make any allotment of any of the Hong Kong Offer Shares to you and thatyou may be prosecuted if you make a false declaration;
Š authorize the Company to place HKSCC Nominees’ name on the Company’s registerof members as the holder of the Hong Kong Offer Shares allocated to you and to sendshare certificate(s) and/or refund monies under the arrangements separately agreedbetween us and HKSCC;
Š confirm that you have read the terms and conditions and application procedures setout in this prospectus and agree to be bound by them;
Š confirm that you have received and/or read a copy of this prospectus and have reliedonly on the information and representations in this prospectus in causing theapplication to be made, save as set out in any supplement to this prospectus;
Š agree that none of the Company, the Joint Global Coordinators, the Underwriters,their respective directors, officers, employees, partners, agents, advisors and anyother parties involved in the Global Offering, is or will be liable for any informationand representations not contained in this prospectus (and any supplement to it);
Š agree to disclose your personal data to the Company, the Hong Kong Share Registrar,receiving banks, the Joint Global Coordinators, the Underwriters and/or its respectiveadvisors and agents;
329
HOW TO APPLY FOR THE HONG KONG OFFER SHARES
Š agree (without prejudice to any other rights which you may have) that once HKSCCNominees’ application has been accepted, it cannot be rescinded for innocentmisrepresentation;
Š agree that any application made by HKSCC Nominees on your behalf is irrevocablebefore the fifth day after the time of the opening of the application lists (excludingany day which is Saturday, Sunday or public holiday in Hong Kong), such agreementto take effect as a collateral contract with us and to become binding when you givethe instructions and such collateral contract to be in consideration of the Companyagreeing that it will not offer any Hong Kong Offer Shares to any person before thefifth day after the time of the opening of the application lists (excluding any daywhich is Saturday, Sunday or public holiday in Hong Kong), except by means of oneof the procedures referred to in this prospectus. However, HKSCC Nominees mayrevoke the application before the fifth day after the time of the opening of theapplication lists (excluding for this purpose any day which is a Saturday, Sunday orpublic holiday in Hong Kong) if a person responsible for this prospectus underSection 40 of the Companies (Winding Up and Miscellaneous Provisions) Ordinancegives a public notice under that section which excludes or limits that person’sresponsibility for this prospectus;
Š agree that once HKSCC Nominees’ application is accepted, neither that applicationnor your electronic application instructions can be revoked, and that acceptance ofthat application will be evidenced by the Company’s announcement of the HongKong Public Offering results;
Š agree to the arrangements, undertakings and warranties under the participantagreement between you and HKSCC, read with the General Rules of CCASS and theCCASS Operational Procedures, for the giving electronic application instructions toapply for Hong Kong Offer Shares;
Š agree with the Company, for itself and for the benefit of each Shareholder (and sothat the Company will be deemed by its acceptance in whole or in part of theapplication by HKSCC Nominees to have agreed, for itself and on behalf of each ofthe Shareholders, with each CCASS Participant giving electronic applicationinstructions) to observe and comply with the Companies (Winding up andMiscellaneous Provisions) Ordinance and the Articles of Association;
Š agree that your application, any acceptance of it and the resulting contract will begoverned by the Laws of Hong Kong.
EFFECT OF GIVING ELECTRONIC APPLICATION INSTRUCTIONS TO HKSCC VIA CCASS
By giving electronic application instructions to HKSCC or instructing your broker or custodianwho is a CCASS Clearing Participant or a CCASS Custodian Participant to give such instructions toHKSCC, you (and, if you are joint applicants, each of you jointly and severally) are deemed to havedone the following things. Neither HKSCC nor HKSCC Nominees shall be liable to the Company orany other person in respect of the things mentioned below:
Š instructed and authorized HKSCC to cause HKSCC Nominees (acting as nominee for therelevant CCASS Participants) to apply for the Hong Kong Offer Shares on your behalf;
330

HOW TO APPLY FOR THE HONG KONG OFFER SHARES
Š instructed and authorized HKSCC to arrange payment of the maximum Offer Price,brokerage, SFC transaction levy and the Hong Kong Stock Exchange trading fee bydebiting your designated bank account and, in the case of a wholly or partiallyunsuccessful application and/or if the Offer Price is less than the maximum Offer Price perOffer Share initially paid on application, refund of the application monies (includingbrokerage, SFC transaction levy and the Hong Kong Stock Exchange trading fee) bycrediting your designated bank account; and
Š instructed and authorized HKSCC to cause HKSCC Nominees to do on your behalf all thethings stated in the WHITE Application Form and in this prospectus.
Minimum Purchase Amount and Permitted Numbers
You may give or cause your broker or custodian who is a CCASS Clearing Participant or aCCASS Custodian Participant to give electronic application instructions for a minimum number of 500Hong Kong Offer Shares. Instructions for more than 500 Hong Kong Offer Shares must be in one ofthe numbers set out in the table in the Application Forms. No application for any other number ofHong Kong Offer Shares will be considered and any such application is liable to be rejected.
Time for Inputting Electronic Application Instructions(1)
CCASS Clearing/Custodian Participants can input electronic application instructions at thefollowing times on the following dates:
Tuesday, October 22, 2019 – 9:00 a.m. to 8:30 p.m.Wednesday, October 23, 2019 – 8:00 a.m. to 8:30 p.m.Thursday, October 24, 2019 – 8:00 a.m. to 8:30 p.m.Friday, October 25, 2019 – 8:00 a.m. to 12:00 noon
(1) These times in this sub-section are subject to change as HKSCC may determine from time to time with prior notification to CCASSClearing/Custodian Participants and/or CCASS Investor participants.
CCASS Investor Participants can input electronic application instructions from 9:00 a.m. onTuesday, October 22, 2019 until 12:00 noon on Friday, October 25, 2019 (24 hours daily, except onFriday, October 25, 2019 the last application day).
The latest time for inputting your electronic application instructions will be 12:00 noon onFriday, October 25, 2019, the last application day or such later time as described in “How to Apply forthe Hong Kong Offer Shares—10. Effect of Bad Weather and/or Extreme Conditions on the Openingof the Application Lists.”
No Multiple Applications
If you are suspected of having made multiple applications or if more than one application ismade for your benefit, the number of Hong Kong Offer Shares applied for by HKSCC Nominees willbe automatically reduced by the number of Hong Kong Offer Shares for which you have given suchinstructions and/or for which such instructions have been given for your benefit. Any electronicapplication instructions to make an application for the Hong Kong Offer Shares given by you or foryour benefit to HKSCC shall be deemed to be an actual application for the purposes of consideringwhether multiple applications have been made.
331
HOW TO APPLY FOR THE HONG KONG OFFER SHARES
Section 40 of the Companies (Winding Up and Miscellaneous Provisions) Ordinance
For the avoidance of doubt, the Company and all other parties involved in the preparation ofthis prospectus acknowledge that each CCASS Participant who gives or causes to give electronicapplication instructions is a person who may be entitled to compensation under Section 40 of theCompanies (Winding Up and Miscellaneous Provisions) Ordinance (as applied by Section 342E of theCompanies (Winding Up and Miscellaneous Provisions) Ordinance).
Personal Data
The section of the Application Form headed “Personal Data” applies to any personal data heldby the Company, the Hong Kong Share Registrar, the receiving banks, the Joint Global Coordinators,the Underwriters and any of their respective advisors and agents about you in the same way as itapplies to personal data about applicants other than HKSCC Nominees.
7. WARNING FOR ELECTRONIC APPLICATIONS
The subscription of the Hong Kong Offer Shares by giving electronic application instructions toHKSCC is only a facility provided to CCASS Participants. Similarly, the application for Hong KongOffer Shares through the HK eIPO White Form service is also only a facility provided by theHK eIPO White Form Service Provider to public investors. Such facilities are subject to capacitylimitations and potential service interruptions and you are advised not to wait until the last applicationday in making your electronic applications. The Company, the Directors, the Joint GlobalCoordinators, the Joint Sponsors, the Joint Bookrunners, the Joint Lead Managers and theUnderwriters take no responsibility for such applications and provide no assurance that any CCASSParticipant or person applying through the HK eIPO White Form service will be allotted anyHong Kong Offer Shares.
To ensure that CCASS Investor Participants can give their electronic application instructions,they are advised not to wait until the last minute to input their instructions to the systems. In the eventthat CCASS Investor Participants have problems in the connection to CCASS Phone System/CCASSInternet System for submission of electronic application instructions, they should either (i) submit aWHITE or YELLOW Application Form, or (ii) go to HKSCC’s Customer Service center to completean input request form for electronic application instructions before 12:00 noon on Friday, October 25,2019.
8. HOW MANY APPLICATIONS CAN YOU MAKE
Multiple applications for the Hong Kong Offer Shares are not allowed except by nominees. Ifyou are a nominee, in the box on the Application Form marked “For nominees” you must include:
Š an account number; or
Š some other identification code,
for each beneficial owner or, in the case of joint beneficial owners, for each joint beneficial owner. Ifyou do not include this information, the application will be treated as being made for your benefit.
All of your applications will be rejected if more than one application on a WHITE orYELLOW Application Form or by giving electronic application instructions to HKSCC or through the
332

HOW TO APPLY FOR THE HONG KONG OFFER SHARES
HK eIPO White Form service, is made for your benefit (including the part of the application made byHKSCC Nominees acting on electronic application instructions). If an application is made by anunlisted company and:
Š the principal business of that company is dealing in securities; and
Š you exercise statutory control over that company,
then the application will be treated as being made for your benefit.
“Unlisted company” means a company with no equity securities listed on the Hong Kong StockExchange.
“Statutory control” means you:
Š control the composition of the board of directors of the company;
Š control more than half of the voting power of the company; or
Š hold more than half of the issued share capital of the company (not counting any part of itwhich carries no right to participate beyond a specified amount in a distribution of eitherprofits or capital).
9. HOW MUCH ARE THE HONG KONG OFFER SHARES
The WHITE and YELLOW Application Forms have tables showing the exact amount payablefor Shares.
You must pay the maximum Offer Price, brokerage, SFC transaction levy and the Hong KongStock Exchange trading fee in full upon application for the Hong Kong Offer Shares under the termsset out in the Application Forms.
You may submit an application using a WHITE or YELLOW Application Form or throughthe HK eIPO White Form service in respect of a minimum of 500 Hong Kong Offer Shares. Eachapplication or electronic application instruction in respect of more than 500 Hong Kong Offer Sharesmust be in one of the numbers set out in the table in the Application Form, or as otherwise specified inthe IPO App or on the designated website at www.hkeipo.hk.
If your application is successful, brokerage will be paid to the Exchange Participants, and theSFC transaction levy and the Hong Kong Stock Exchange trading fee are paid to the Hong Kong StockExchange (in the case of the SFC transaction levy, collected by the Hong Kong Stock Exchange onbehalf of the SFC).
See “Structure of the Global Offering—Pricing and Allocation” for further details on the OfferPrice.
333

HOW TO APPLY FOR THE HONG KONG OFFER SHARES
10. EFFECT OF BAD WEATHER AND/OR EXTREME CONDITIONS ON THEOPENING OF THE APPLICATION LISTS
The application lists will not open if there is:
Š a tropical cyclone warning signal number 8 or above; or
Š a “black” rainstorm warning; and /or
Š an announcement of “extreme conditions” by the Government of Hong Kong inaccordance with the revised “Code of Practice in Times of Typhoons and Rainstorms”issued by the Hong Kong Labour Department in June 2019;
in force in Hong Kong at any time between 9:00 a.m. and 12:00 noon on Friday, October 25, 2019.Instead they will open between 11:45 a.m. and 12:00 noon on the next business day which does nothave either of those warnings in Hong Kong in force at any time between 9:00 a.m. and 12:00 noon.
If the application lists do not open and close on Friday, October 25, 2019 or if there is a tropicalcyclone warning signal number 8 or above or an announcement of “extreme conditions” by theGovernment of Hong Kong in accordance with the revised “Code of Practice in Times of Typhoonsand Rainstorms” issued by the Hong Kong Labour Department in June 2019 and/or a “black”rainstorm warning signal in force in Hong Kong that may affect the dates mentioned in “ExpectedTimetable”, an announcement will be made in such event.
11. PUBLICATION OF RESULTS
The Company expects to announce the final Offer Price, the level of indication of interest in theInternational Offering, the level of applications in the Hong Kong Public Offering and the basis ofallocation of the Hong Kong Offer Shares on Wednesday, October 30, 2019 in the South ChinaMorning Post (in English) and the Hong Kong Economic Times (in Chinese) and on the Company’swebsite at www.jsgloballife.com and the website of the Hong Kong Stock Exchange atwww.hkexnews.hk.
The results of allocations and the Hong Kong identity card/passport/Hong Kong businessregistration numbers of successful applicants under the Hong Kong Public Offering will be available atthe times and date and in the manner specified below:
Š in the announcement to be posted on the Company’s website at www.jsgloballife.com andthe Hong Kong Stock Exchange’s website at www.hkexnews.hk by no later than 9:00a.m. on Wednesday, October 30, 2019;
Š from “Allotment Result” function in the IPO App or the designated results of allocationswebsite at www.tricor.com.hk/ipo/result (or www.hkeipo.hk/IPOResult) with a “searchby ID” function on a 24-hour basis from 8:00 a.m. on Wednesday, October 30, 2019 to12:00 midnight on Tuesday, November 5, 2019;
Š by telephone enquiry line by calling +852 3691 8488 between 9:00 a.m. and 6:00 p.m.from Wednesday, October 30, 2019 to Monday, November 4, 2019 on a business day(excluding Saturday, Sunday and Hong Kong public holiday);
Š in the special allocation results booklets which will be available for inspection duringopening hours from Wednesday, October 30, 2019 to Friday, November 1, 2019 at all thereceiving banks’ designated branches.
334
HOW TO APPLY FOR THE HONG KONG OFFER SHARES
If the Company accepts your offer to purchase (in whole or in part), which it may do byannouncing the basis of allocations and/or making available the results of allocations publicly, therewill be a binding contract under which you will be required to purchase the Hong Kong Offer Shares ifthe conditions of the Global Offering are satisfied and the Global Offering is not otherwise terminated.Further details are contained in the “Structure of the Global Offering.”
You will not be entitled to exercise any remedy of rescission for innocent misrepresentation atany time after acceptance of your application. This does not affect any other right you may have.
12. CIRCUMSTANCES IN WHICH YOU WILL NOT BE ALLOTTED OFFER SHARES
You should note the following situations in which the Hong Kong Offer Shares will not beallotted to you:
(i) If your application is revoked:
By completing and submitting an Application Form or giving electronic application instructionsto HKSCC or to the HK eIPO White Form Service Provider, you agree that your application or theapplication made by HKSCC Nominees on your behalf cannot be revoked on or before the fifth dayafter the time of the opening of the application lists (excluding for this purpose any day which isSaturday, Sunday or public holiday in Hong Kong). This agreement will take effect as a collateralcontract with the Company.
Your application or the application made by HKSCC Nominees on your behalf may only berevoked on or before such fifth day if a person responsible for this prospectus under Section 40 of theCompanies (Winding Up and Miscellaneous Provisions) Ordinance (as applied by Section 342E of theCompanies (Winding Up and Miscellaneous Provisions) Ordinance) gives a public notice under thatsection which excludes or limits that person’s responsibility for this prospectus.
If any supplement to this prospectus is issued, applicants who have already submitted anapplication will be notified that they are required to confirm their applications. If applicants have beenso notified but have not confirmed their applications in accordance with the procedure to be notified,all unconfirmed applications will be deemed revoked.
If your application or the application made by HKSCC Nominees on your behalf has beenaccepted, it cannot be revoked. For this purpose, acceptance of applications which are not rejected willbe constituted by notification in the press of the results of allocation, and where such basis ofallocation is subject to certain conditions or provides for allocation by ballot, such acceptance will besubject to the satisfaction of such conditions or results of the ballot respectively.
(ii) If the Company or our agents exercise their discretion to reject your application:
The Company, the Joint Global Coordinators, the HK eIPO White Form Service Provider andtheir respective agents and nominees have full discretion to reject or accept any application, or toaccept only part of any application, without giving any reasons.
(iii) If the allotment of Hong Kong Offer Shares is void:
The allotment of Hong Kong Offer Shares will be void if the Listing Committee of the HongKong Stock Exchange does not grant permission to list the Shares either:
Š within three weeks from the closing date of the application lists; or
335
HOW TO APPLY FOR THE HONG KONG OFFER SHARES
Š within a longer period of up to six weeks if the Listing Committee notifies the Company ofthat longer period within three weeks of the closing date of the application lists.
(iv) If:
Š you make multiple applications or suspected multiple applications;
Š you or the person for whose benefit you are applying have applied for or taken up, orindicated an interest for, or have been or will be placed or allocated (includingconditionally and/or provisionally) Hong Kong Offer Shares and International OfferShares;
Š your Application Form is not completed in accordance with the stated instructions;
Š your electronic application instructions through the HK eIPO White Form service are notcompleted in accordance with the instructions, terms and conditions in the IPO App or onthe designated website at www.hkeipo.hk;
Š your payment is not made correctly or the check or banker’s cashier order paid by you isdishonored upon its first presentation;
Š the Underwriting Agreements do not become unconditional or are terminated;
Š the Company or the Joint Global Coordinators believe that by accepting your application,it or they would violate applicable securities or other laws, rules or regulations; or
Š your application is for more than 50% of the Hong Kong Offer Shares initially offeredunder the Hong Kong Public Offering.
13. REFUND OF APPLICATION MONIES
If an application is rejected, not accepted or accepted in part only, or if the Offer Price as finallydetermined is less than the maximum offer price of HK$7.25 per Offer Share (excluding brokerage,SFC transaction levy and the Hong Kong Stock Exchange trading fee thereon), or if the conditions ofthe Global Offering are not fulfilled in accordance with “Structure of the Global Offering—Conditionsof the Global Offering” or if any application is revoked, the application monies, or the appropriateportion thereof, together with the related brokerage, SFC transaction levy and the Hong Kong StockExchange trading fee, will be refunded, without interest or the check or banker’s cashier order will notbe cleared.
Any refund of your application monies will be made on or before Wednesday, October 30,2019.
14. DISPATCH/COLLECTION OF SHARE CERTIFICATES AND REFUND MONIES
You will receive one share certificate for all Hong Kong Offer Shares allotted to you under theHong Kong Public Offering (except pursuant to applications made on YELLOW Application Formsor by electronic application instructions to HKSCC via CCASS where the share certificates will bedeposited into CCASS as described below).
No temporary document of title will be issued in respect of the Shares. No receipt will be issuedfor sums paid on application. If you apply by a WHITE or YELLOW Application Form, subject topersonal collection as mentioned below, the following will be sent to you (or, in the case of joint
336
HOW TO APPLY FOR THE HONG KONG OFFER SHARES
applicants, to the first-named applicant) by ordinary post, at your own risk, to the address specified onthe Application Form:
Š share certificate(s) for all the Hong Kong Offer Shares allotted to you (for YELLOWApplication Forms, share certificates will be deposited into CCASS as described below);and
Š refund check(s) crossed “Account Payee Only” in favor of the applicant (or, in the case ofjoint applicants, the first-named applicant) for (i) all or the surplus application monies forthe Hong Kong Offer Shares, wholly or partially unsuccessfully applied for; and/or (ii) thedifference between the Offer Price and the maximum Offer Price per Offer Share paid onapplication in the event that the Offer Price is less than the maximum Offer Price(including brokerage, SFC transaction levy and the Hong Kong Stock Exchange tradingfee but without interest). Part of the Hong Kong identity card number/passport number,provided by you or the first-named applicant (if you are joint applicants), may be printedon your refund check, if any. Your banker may require verification of your Hong Kongidentity card number/passport number before encashment of your refund check(s).Inaccurate completion of your Hong Kong identity card number/passport number mayinvalidate or delay encashment of your refund check(s).
Subject to the arrangement on dispatch/collection of share certificates and refund monies asmentioned below, any refund checks and share certificates are expected to be posted on or beforeWednesday, October 30, 2019. The right is reserved to retain any share certificate(s) and any surplusapplication monies pending clearance of check(s) or banker’s cashier’s order(s).
Share certificates will only become valid at 8:00 a.m. on Thursday, October 31, 2019 providedthat the Global Offering has become unconditional and the right of termination described in the“Underwriting” section has not been exercised. Investors who trade shares prior to the receipt of sharecertificates or the share certificates becoming valid do so at their own risk.
Personal Collection
(i) If you apply using a WHITE Application Form
If you apply for 1,000,000 Hong Kong Offer Shares or more and have provided all informationrequired by your Application Form, you may collect your refund check(s) and/or share certificate(s)from the Hong Kong Share Registrar, Tricor Investor Services Limited at Level 54, Hopewell Centre,183 Queen’s Road East, Hong Kong, from 9:00 a.m. to 1:00 p.m. on Wednesday, October 30, 2019 orsuch other date as notified by us in the newspapers.
If you are an individual who is eligible for personal collection, you must not authorize anyother person to collect for you. If you are a corporate applicant which is eligible for personalcollection, your authorized representative must bear a letter of authorization from your corporationstamped with your corporation’s chop. Both individuals and authorized representatives must produce,at the time of collection, evidence of identity acceptable to the Hong Kong Share Registrar.
If you do not collect your refund check(s) and/or share certificate(s) personally within the timespecified for collection, they will be dispatched promptly to the address specified in your ApplicationForm by ordinary post at your own risk.
337
HOW TO APPLY FOR THE HONG KONG OFFER SHARES
If you apply for less than 1,000,000 Hong Kong Offer Shares, your refund check(s) and/orshare certificate(s) will be sent to the address on the relevant Application Form on or beforeWednesday, October 30, 2019, by ordinary post and at your own risk.
(ii) If you apply using a YELLOW Application Form
If you apply for 1,000,000 Hong Kong Offer Shares or more, please follow the sameinstructions as described above. If you have applied for less than 1,000,000 Hong Kong Offer Shares,your refund check(s) will be sent to the address on the relevant Application Form on or beforeWednesday, October 30, 2019, by ordinary post and at your own risk.
If you apply by using a YELLOW Application Form and your application is wholly orpartially successful, your share certificate(s) will be issued in the name of HKSCC Nominees anddeposited into CCASS for credit to your or the designated CCASS Participant’s stock account as statedin your Application Form on Wednesday, October 30, 2019, or upon contingency, on any other datedetermined by HKSCC or HKSCC Nominees.
Š If you apply through a designated CCASS Participant (other than a CCASS InvestorParticipant)
For Hong Kong Offer Shares credited to your designated CCASS Participant’s stock account(other than CCASS Investor Participant), you can check the number of Hong Kong Offer Sharesallotted to you with that CCASS Participant.
Š If you are applying as a CCASS Investor Participant
The Company will publish the results of CCASS Investor Participants’ applications togetherwith the results of the Hong Kong Public Offering in the manner described in “How to Apply for theHong Kong Offer Shares—11. Publication of Results” above. You should check the announcementpublished by the Company and report any discrepancies to HKSCC before 5:00 p.m. on Wednesday,October 30, 2019 or any other date as determined by HKSCC or HKSCC Nominees. Immediately afterthe credit of the Hong Kong Offer Shares to your stock account, you can check your new accountbalance via the CCASS Phone System and CCASS Internet System.
(iii) If you apply through the HK eIPO White Form service
If you apply for 1,000,000 Hong Kong Offer Shares or more and your application is wholly orpartially successful, you may collect your share certificate(s) from the Hong Kong Share Registrar,Tricor Investor Services Limited at Level 54, Hopewell Centre, 183 Queen’s Road East, Hong Kong,from 9:00 a.m. to 1:00 p.m. on Wednesday, October 30, 2019, or such other date as notified by theCompany in the newspapers as the date of dispatch/collection of share certificates/e-Auto Refundpayment instructions/refund checks.
If you do not collect your share certificate(s) personally within the time specified for collection,they will be sent to the address specified in your application instructions by ordinary post at your ownrisk.
If you apply for less than 1,000,000 Hong Kong Offer Shares, your Share certificate(s) (whereapplicable) will be sent to the address specified in your application instructions on or beforeWednesday, October 30, 2019 by ordinary post at your own risk.
338
HOW TO APPLY FOR THE HONG KONG OFFER SHARES
If you apply and pay the application monies from a single bank account, any refund monies willbe dispatched to that bank account in the form of e-Auto Refund payment instructions. If you applyand pay the application monies from multiple bank accounts, any refund monies will be dispatched tothe address as specified in your application instructions in the form of refund check(s) by ordinary postat your own risk.
(iv) If you apply via Electronic Application Instructions to HKSCC
Allocation of Hong Kong Offer Shares
For the purposes of allocating Hong Kong Offer Shares, HKSCC Nominees will not be treatedas an applicant. Instead, each CCASS Participant who gives electronic application instructions or eachperson for whose benefit instructions are given will be treated as an applicant.
Deposit of Share Certificates into CCASS and Refund of Application Monies
Š If your application is wholly or partially successful, your share certificate(s) will be issuedin the name of HKSCC Nominees and deposited into CCASS for the credit of yourdesignated CCASS Participant’s stock account or your CCASS Investor Participant stockaccount on Wednesday, October 30, 2019, or, on any other date determined by HKSCC orHKSCC Nominees.
Š The Company expects to publish the application results of CCASS Participants (and wherethe CCASS Participant is a broker or custodian, the Company will include informationrelating to the relevant beneficial owner), your Hong Kong identity card number/passportnumber or other identification code (Hong Kong business registration number forcorporations) and the basis of allotment of the Hong Kong Public Offering in the mannerspecified in “How to Apply for the Hong Kong Offer Shares—11. Publication of Results”above on Wednesday, October 30, 2019. You should check the announcement publishedby the Company and report any discrepancies to HKSCC before 5:00 p.m. on Wednesday,October 30, 2019 or such other date as determined by HKSCC or HKSCC Nominees.
Š If you have instructed your broker or custodian to give electronic application instructionson your behalf, you can also check the number of Hong Kong Offer Shares allotted to youand the amount of refund monies (if any) payable to you with that broker or custodian.
Š If you have applied as a CCASS Investor Participant, you can also check the number ofHong Kong Offer Shares allotted to you and the amount of refund monies (if any) payableto you via the CCASS Phone System and the CCASS Internet System (under theprocedures contained in HKSCC’s “An Operating Guide for Investor Participants” ineffect from time to time) on Wednesday, October 30, 2019. Immediately following thecredit of the Hong Kong Offer Shares to your stock account and the credit of refundmonies to your bank account, HKSCC will also make available to you an activitystatement showing the number of Hong Kong Offer Shares credited to your CCASSInvestor Participant stock account and the amount of refund monies (if any) credited toyour designated bank account.
Š Refund of your application monies (if any) in respect of wholly and partially unsuccessfulapplications and/or difference between the Offer Price and the maximum Offer Price perOffer Share initially paid on application (including brokerage, SFC transaction levy and
339
HOW TO APPLY FOR THE HONG KONG OFFER SHARES
the Hong Kong Stock Exchange trading fee but without interest) will be credited to yourdesignated bank account or the designated bank account of your broker or custodian onWednesday, October 30, 2019.
15. ADMISSION OF THE SHARES INTO CCASS
If the Hong Kong Stock Exchange grants the listing of, and permission to deal in, the Sharesand we comply with the stock admission requirements of HKSCC, the Shares will be accepted aseligible securities by HKSCC for deposit, clearance and settlement in CCASS with effect from the dateof commencement of dealings in the Shares or any other date HKSCC chooses. Settlement oftransactions between Exchange Participants (as defined in the Listing Rules) is required to take placein CCASS on the second business day after any trading day.
All activities under CCASS are subject to the General Rules of CCASS and CCASSOperational Procedures in effect from time to time.
Investors should seek the advice of their stockbroker or other professional adviser for details ofthe settlement arrangement as such arrangements may affect their rights and interests.
All necessary arrangements have been made enabling the Shares to be admitted into CCASS.
340
APPENDIX I ACCOUNTANTS’ REPORT
Ernst & Young22/F, CITIC Tower1 Tim Mei AvenueCentral, Hong Kong
122
Tel : +852 2846 9888 Fax : +852 2868 4432 ey.com
The DirectorsJS Global Lifestyle Company LimitedCredit Suisse (Hong Kong) LimitedMorgan Stanley Asia LimitedICBC International Capital Limited
Dear Sirs,
We report on the historical financial information of JS Global Lifestyle Company Limited (the“Company”) and its subsidiaries (together, the “Group”) set out on pages I-4 to I-155, which comprisesthe consolidated statements of profit or loss, consolidated statements of comprehensive income,consolidated statements of changes in equity and consolidated statements of cash flows of the Groupfor each of the years ended December 31, 2016, 2017 and 2018 and the six months ended June 30,2019 (the “Relevant Periods”), and the consolidated statements of financial position of the Group as atDecember 31, 2016, 2017 and 2018 and June 30, 2019, the statements of financial position of theCompany as at December 31, 2018 and June 30, 2019 and a summary of significant accountingpolicies and other explanatory information (together, the “Historical Financial Information”). TheHistorical Financial Information set out on pages I-4 to I-155 forms an integral part of this report,which has been prepared for inclusion in the prospectus of the Company dated October 22, 2019 (the“Prospectus”) in connection with the initial listing of the shares of the Company on the Main Board ofThe Stock Exchange of Hong Kong Limited (the “Stock Exchange”).
Directors’ responsibility for the Historical Financial Information
The directors of the Company are responsible for the preparation of the Historical FinancialInformation that gives a true and fair view in accordance with the basis of presentation and the basis ofpreparation set out in notes II 2.1 and II 2.2 to the Historical Financial Information, respectively, andfor such internal control as the directors determine is necessary to enable the preparation of theHistorical Financial Information that is free from material misstatement, whether due to fraud or error.
Reporting accountants’ responsibility
Our responsibility is to express an opinion on the Historical Financial Information and to reportour opinion to you. We conducted our work in accordance with Hong Kong Standard on InvestmentCircular Reporting Engagements 200 Accountants’ Reports on Historical Financial Information inInvestment Circulars issued by the Hong Kong Institute of Certified Public Accountants (“HKICPA”).This standard requires that we comply with ethical standards and plan and perform our work to obtainreasonable assurance about whether the Historical Financial Information is free from materialmisstatement.
Our work involved performing procedures to obtain evidence about the amounts anddisclosures in the Historical Financial Information. The procedures selected depend on the reportingaccountants’ judgment, including the assessment of risks of material misstatement of the HistoricalFinancial Information, whether due to fraud or error. In making those risk assessments, the reporting
I-1
APPENDIX I ACCOUNTANTS’ REPORT
accountants consider internal control relevant to the entity’s preparation of the Historical FinancialInformation that gives a true and fair view in accordance with the basis of presentation and the basis ofpreparation set out in notes II 2.1 and II 2.2 to the Historical Financial Information, respectively, inorder to design procedures that are appropriate in the circumstances, but not for the purpose ofexpressing an opinion on the effectiveness of the entity’s internal control. Our work also includedevaluating the appropriateness of accounting policies used and the reasonableness of accountingestimates made by the directors, as well as evaluating the overall presentation of the HistoricalFinancial Information.
We believe that the evidence we have obtained is sufficient and appropriate to provide a basisfor our opinion.
Opinion
In our opinion, the Historical Financial Information gives, for the purposes of the accountants’report, a true and fair view of the financial position of the Group as at December 31, 2016, 2017 and2018 and June 30, 2019, of the financial position of the Company as at December 31, 2018 andJune 30, 2019, and of the financial performance and cash flows of the Group for each of the RelevantPeriods in accordance with the basis of presentation and the basis of preparation set out in notes II 2.1and II 2.2 to the Historical Financial Information, respectively.
Review of interim comparative financial information
We have reviewed the interim comparative financial information of the Group which comprisesthe consolidated statement of profit or loss, consolidated statement of comprehensive income,consolidated statement of changes in equity and consolidated statement of cash flows for thesix months ended June 30, 2018 and other explanatory information (the “Interim ComparativeFinancial Information”). The directors of the Company are responsible for the preparation andpresentation of the Interim Comparative Financial Information in accordance with the basis ofpresentation and the basis of preparation set out in notes II 2.1 and II 2.2 to the Historical FinancialInformation, respectively. Our responsibility is to express a conclusion on the Interim ComparativeFinancial Information based on our review. We conducted our review in accordance with Hong KongStandard on Review Engagements 2410 Review of Interim Financial Information Performed by theIndependent Auditor of the Entity issued by the HKICPA. A review consists of making inquiries,primarily of persons responsible for financial and accounting matters, and applying analytical and otherreview procedures. A review is substantially less in scope than an audit conducted in accordance withHong Kong Standards on Auditing and consequently does not enable us to obtain assurance that wewould become aware of all significant matters that might be identified in an audit. Accordingly, we donot express an audit opinion. Based on our review, nothing has come to our attention that causes us tobelieve that the Interim Comparative Financial Information, for the purposes of the accountants’ report,is not prepared, in all material respects, in accordance with the basis of presentation and the basis ofpreparation set out in notes II 2.1 and II 2.2 to the Historical Financial Information, respectively.
Report on matters under the Rules Governing the Listing of Securities on the Stock Exchangeand the Companies (Winding Up and Miscellaneous Provisions) Ordinance
Adjustments
In preparing the Historical Financial Information, no adjustments to the Underlying FinancialStatements as defined on page I-4 have been made.
I-2

APPENDIX I ACCOUNTANTS’ REPORT
Dividends
We refer to note II 11 to the Historical Financial Information which states that no dividendshave been paid by the Company in respect of the Relevant Periods.
Yours faithfully,
Ernst & YoungCertified Public AccountantsHong KongOctober 22, 2019
I-3

APPENDIX I ACCOUNTANTS’ REPORT
I HISTORICAL FINANCIAL INFORMATION
Preparation of Historical Financial Information
Set out below is the Historical Financial Information which forms an integral part of thisaccountants’ report.
The financial statements of the Group for the Relevant Periods, on which the HistoricalFinancial Information is based, were audited by Ernst & Young in accordance with Hong KongStandards on Auditing (“HKSAs”) issued by the Hong Kong Institute of Certified Public Accountants(the “HKICPA”) (the “Underlying Financial Statements”).
The Historical Financial Information is presented in United States dollars (“US$”) and allvalues are rounded to the nearest thousand (US$’000) except when otherwise indicated.
I-4
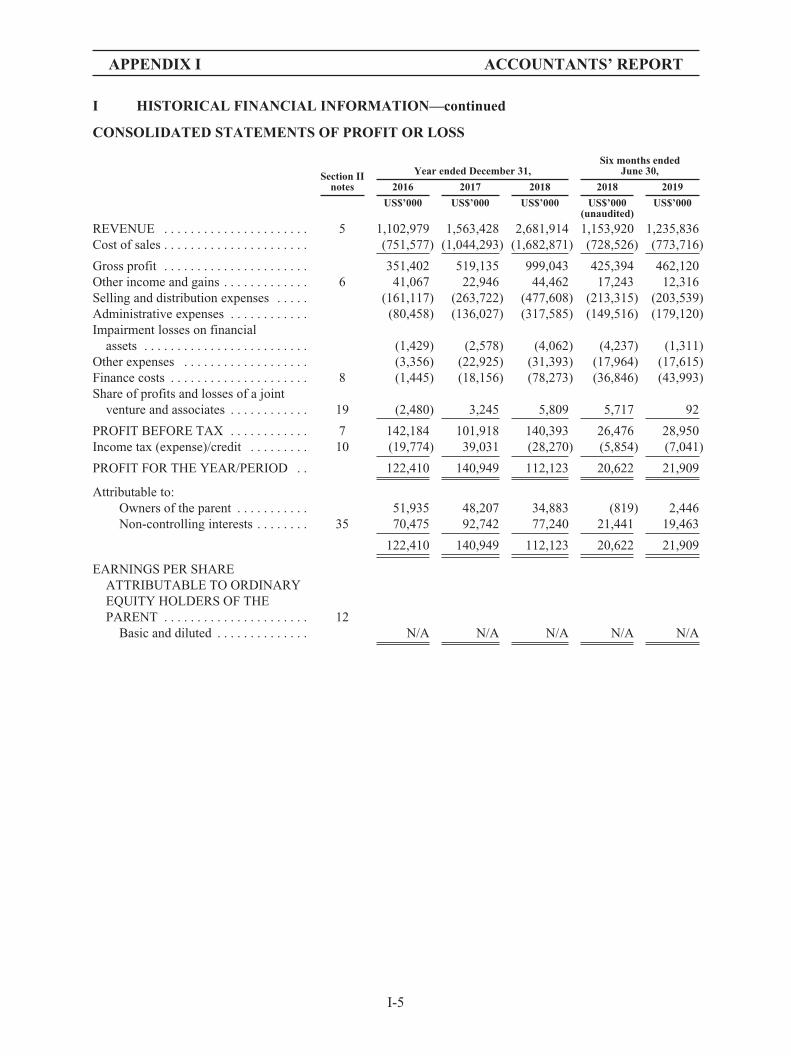
APPENDIX I ACCOUNTANTS’ REPORT
I HISTORICAL FINANCIAL INFORMATION—continued
CONSOLIDATED STATEMENTS OF PROFIT OR LOSS
Section IInotes
Year ended December 31,Six months ended
June 30,
2016 2017 2018 2018 2019
US$’000 US$’000 US$’000 US$’000 US$’000(unaudited)
REVENUE . . . . . . . . . . . . . . . . . . . . . . 5 1,102,979 1,563,428 2,681,914 1,153,920 1,235,836Cost of sales . . . . . . . . . . . . . . . . . . . . . . (751,577) (1,044,293) (1,682,871) (728,526) (773,716)
Gross profit . . . . . . . . . . . . . . . . . . . . . . 351,402 519,135 999,043 425,394 462,120Other income and gains . . . . . . . . . . . . . 6 41,067 22,946 44,462 17,243 12,316Selling and distribution expenses . . . . . (161,117) (263,722) (477,608) (213,315) (203,539)Administrative expenses . . . . . . . . . . . . (80,458) (136,027) (317,585) (149,516) (179,120)Impairment losses on financial
assets . . . . . . . . . . . . . . . . . . . . . . . . . (1,429) (2,578) (4,062) (4,237) (1,311)Other expenses . . . . . . . . . . . . . . . . . . . (3,356) (22,925) (31,393) (17,964) (17,615)Finance costs . . . . . . . . . . . . . . . . . . . . . 8 (1,445) (18,156) (78,273) (36,846) (43,993)Share of profits and losses of a joint
venture and associates . . . . . . . . . . . . 19 (2,480) 3,245 5,809 5,717 92
PROFIT BEFORE TAX . . . . . . . . . . . . 7 142,184 101,918 140,393 26,476 28,950Income tax (expense)/credit . . . . . . . . . 10 (19,774) 39,031 (28,270) (5,854) (7,041)
PROFIT FOR THE YEAR/PERIOD . . 122,410 140,949 112,123 20,622 21,909
Attributable to:Owners of the parent . . . . . . . . . . . 51,935 48,207 34,883 (819) 2,446Non-controlling interests . . . . . . . . 35 70,475 92,742 77,240 21,441 19,463
122,410 140,949 112,123 20,622 21,909
EARNINGS PER SHAREATTRIBUTABLE TO ORDINARYEQUITY HOLDERS OF THEPARENT . . . . . . . . . . . . . . . . . . . . . . 12
Basic and diluted . . . . . . . . . . . . . . N/A N/A N/A N/A N/A
I-5

APPENDIX I ACCOUNTANTS’ REPORT
I HISTORICAL FINANCIAL INFORMATION—continued
CONSOLIDATED STATEMENTS OF COMPREHENSIVE INCOME
Year ended December 31, Six months ended June 30,
2016 2017 2018 2018 2019
US$’000 US$’000 US$’000 US$’000 US$’000(unaudited)
PROFIT FOR THE YEAR/PERIOD . . . . . . . . . . . . . . . 122,410 140,949 112,123 20,622 21,909
OTHER COMPREHENSIVE INCOMEExchange differences on translation of foreign
operations . . . . . . . . . . . . . . . . . . . . . . . . . . . . . . . . . . (44,734) 42,954 (37,105) (17,341) 1,806
Other comprehensive income that will not bereclassified to profit or loss in subsequent periods:
Financial assets designated at fair value throughother comprehensive income:
Changes in fair value . . . . . . . . . . . . . . . . . . . . (7,721) 5,748 5,055 — —Income tax effect . . . . . . . . . . . . . . . . . . . . . . . 1,275 (989) (768) — —
(6,446) 4,759 4,287 — —Net other comprehensive income that will not be
reclassified to profit or loss in subsequent periods . . . (6,446) 4,759 4,287 — —
OTHER COMPREHENSIVE INCOME FOR THEYEAR/PERIOD, NET OF TAX . . . . . . . . . . . . . . . . . (51,180) 47,713 (32,818) (17,341) 1,806
TOTAL COMPREHENSIVE INCOME FOR THEYEAR/PERIOD . . . . . . . . . . . . . . . . . . . . . . . . . . . . . . 71,230 188,662 79,305 3,281 23,715
Attributable to:Owners of the parent . . . . . . . . . . . . . . . . . . . . . . . . 27,468 71,147 19,566 (8,302) 1,768Non-controlling interests . . . . . . . . . . . . . . . . . . . . . 43,762 117,515 59,739 11,583 21,947
71,230 188,662 79,305 3,281 23,715
I-6

APPENDIX I ACCOUNTANTS’ REPORT
I HISTORICAL FINANCIAL INFORMATION—continued
CONSOLIDATED STATEMENTS OF FINANCIAL POSITION
Section IInotes
As at December 31, As at June 30,20192016 2017 2018
US$’000 US$’000 US$’000 US$’000
NON-CURRENT ASSETSProperty, plant and equipment . . . . . . . . . . . . 13 97,126 180,471 191,314 193,158Investment properties . . . . . . . . . . . . . . . . . . . 14 39,802 37,473 28,250 27,222Prepaid land lease payments . . . . . . . . . . . . . . 15 19,854 21,653 16,130 16,008Goodwill . . . . . . . . . . . . . . . . . . . . . . . . . . . . . 16 — 839,767 839,767 839,767Right-of-use assets . . . . . . . . . . . . . . . . . . . . . 17 6,345 64,499 58,840 64,098Other intangible assets . . . . . . . . . . . . . . . . . . 18 2,525 565,061 558,651 554,589Investment in a joint venture . . . . . . . . . . . . . 19 — — — 2,883Investments in associates . . . . . . . . . . . . . . . . 19 25,159 37,220 36,003 36,376Financial assets at fair value through profit or
loss . . . . . . . . . . . . . . . . . . . . . . . . . . . . . . . 20 53,431 67,714 60,794 59,059Financial assets designated at fair value
through other comprehensive income . . . . . 20 24,164 31,921 35,643 35,651Deferred tax assets . . . . . . . . . . . . . . . . . . . . . 30 11,215 45,377 46,532 43,901Pledged deposits . . . . . . . . . . . . . . . . . . . . . . . 25 — — — 116,533Other non-current assets . . . . . . . . . . . . . . . . . 21 — 5,293 17,430 9,086
Total non-current assets . . . . . . . . . . . . . . . . . 279,621 1,896,449 1,889,354 1,998,331
CURRENT ASSETSInventories . . . . . . . . . . . . . . . . . . . . . . . . . . . 22 59,470 272,229 349,862 329,985Trade and bills receivables . . . . . . . . . . . . . . . 23 224,541 627,523 772,660 545,684Prepayments, other receivables and other
assets . . . . . . . . . . . . . . . . . . . . . . . . . . . . . . 24 108,773 219,630 65,510 101,237Financial assets at fair value through profit or
loss . . . . . . . . . . . . . . . . . . . . . . . . . . . . . . . 20 155,996 46,564 15,853 50,369Pledged deposits . . . . . . . . . . . . . . . . . . . . . . . 25 4,974 7,080 26,588 100,396Cash and cash equivalents . . . . . . . . . . . . . . . 25 127,220 211,003 180,872 152,475Assets held for sale . . . . . . . . . . . . . . . . . . . . . 26 — 4,507 — —
Total current assets . . . . . . . . . . . . . . . . . . . . . 680,974 1,388,536 1,411,345 1,280,146
CURRENT LIABILITIESTrade and bills payables . . . . . . . . . . . . . . . . . 27 180,647 262,076 408,632 336,680Other payables and accruals . . . . . . . . . . . . . . 28 119,133 371,312 364,098 757,452Interest-bearing bank borrowings . . . . . . . . . . 29 — 10,039 485,544 21,857Lease liabilities . . . . . . . . . . . . . . . . . . . . . . . . 17 2,411 10,361 10,980 12,472Tax payable . . . . . . . . . . . . . . . . . . . . . . . . . . . 5,807 7,333 11,421 223
Total current liabilities . . . . . . . . . . . . . . . . . . 307,998 661,121 1,280,675 1,128,684
NET CURRENT ASSETS . . . . . . . . . . . . . . . 372,976 727,415 130,670 151,462
TOTAL ASSETS LESS CURRENTLIABILITIES . . . . . . . . . . . . . . . . . . . . . . . 652,597 2,623,864 2,020,024 2,149,793
NON-CURRENT LIABILITIESInterest-bearing bank borrowings . . . . . . . . . . 29 — 1,193,682 699,721 828,484Deferred tax liabilities . . . . . . . . . . . . . . . . . . 30 1,783 131,952 133,578 133,070Lease liabilities . . . . . . . . . . . . . . . . . . . . . . . . 17 4,033 57,330 52,612 57,123Financial liabilities associated with put
option . . . . . . . . . . . . . . . . . . . . . . . . . . . . . 31 — 627,833 656,650 671,719Other non-current liabilities . . . . . . . . . . . . . . 32 1,190 15,262 14,459 14,544
Total non-current liabilities . . . . . . . . . . . . . . 7,006 2,026,059 1,557,020 1,704,940
Net assets . . . . . . . . . . . . . . . . . . . . . . . . . . . . 645,591 597,805 463,004 444,853
I-7
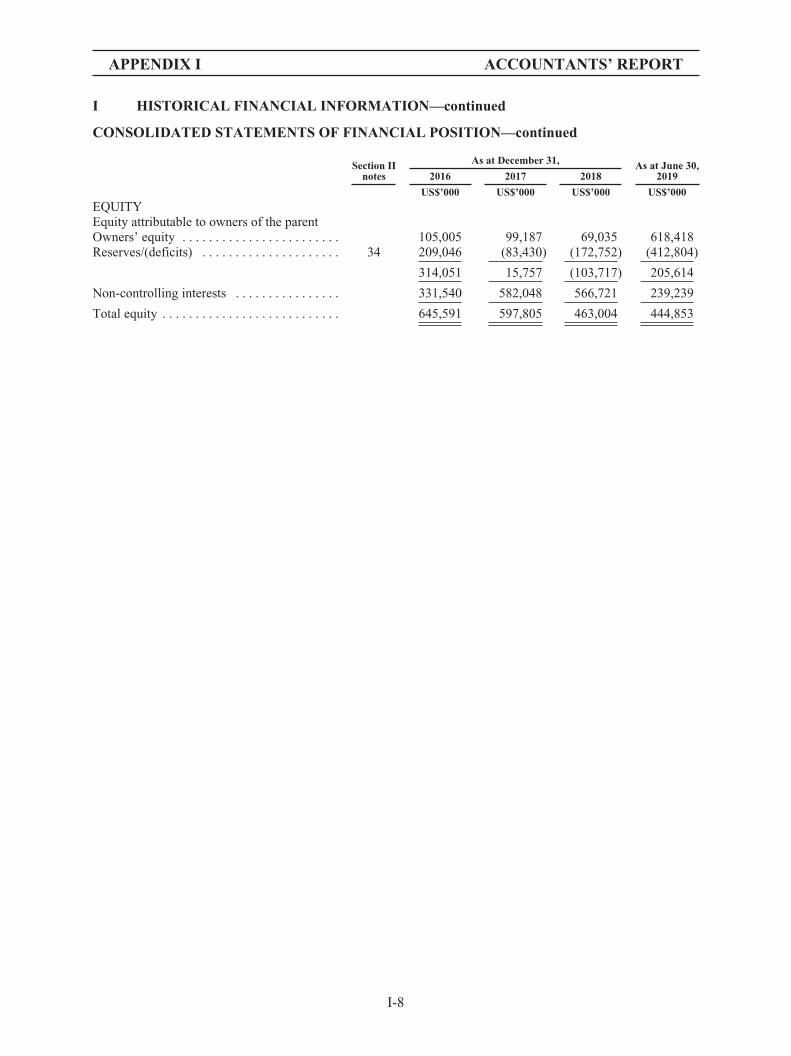
APPENDIX I ACCOUNTANTS’ REPORT
I HISTORICAL FINANCIAL INFORMATION—continued
CONSOLIDATED STATEMENTS OF FINANCIAL POSITION—continued
Section IInotes
As at December 31, As at June 30,20192016 2017 2018
US$’000 US$’000 US$’000 US$’000
EQUITYEquity attributable to owners of the parentOwners’ equity . . . . . . . . . . . . . . . . . . . . . . . . 105,005 99,187 69,035 618,418Reserves/(deficits) . . . . . . . . . . . . . . . . . . . . . 34 209,046 (83,430) (172,752) (412,804)
314,051 15,757 (103,717) 205,614
Non-controlling interests . . . . . . . . . . . . . . . . 331,540 582,048 566,721 239,239
Total equity . . . . . . . . . . . . . . . . . . . . . . . . . . . 645,591 597,805 463,004 444,853
I-8
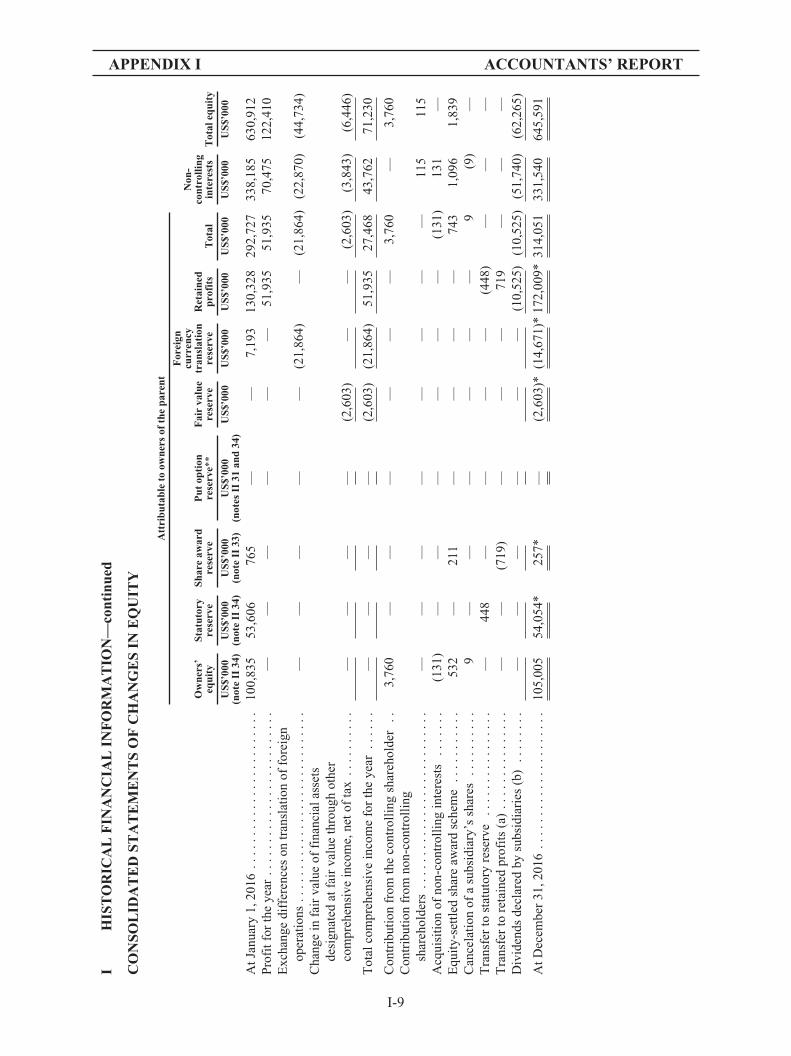
APPENDIX I ACCOUNTANTS’ REPORT
IH
IST
OR
ICA
LF
INA
NC
IAL
INF
OR
MA
TIO
N—
cont
inue
d
CO
NSO
LID
AT
ED
STA
TE
ME
NT
SO
FC
HA
NG
ES
INE
QU
ITY
Att
ribu
tabl
eto
owne
rsof
the
pare
nt
Ow
ners
’eq
uity
Stat
utor
yre
serv
eSh
are
awar
dre
serv
eP
utop
tion
rese
rve*
*F
air
valu
ere
serv
e
For
eign
curr
ency
tran
slat
ion
rese
rve
Ret
aine
dpr
ofit
sT
otal
Non
-co
ntro
lling
inte
rest
sT
otal
equi
ty
US$
’000
US$
’000
US$
’000
US$
’000
US$
’000
US$
’000
US$
’000
US$
’000
US$
’000
US$
’000
(not
eII
34)
(not
eII
34)
(not
eII
33)
(not
esII
31an
d34
)
AtJ
anua
ry1,
2016
....
....
....
....
....
....
100,
835
53,6
0676
5—
—7,
193
130,
328
292,
727
338,
185
630,
912
Pro
fitf
orth
eye
ar..
....
....
....
....
....
...
——
——
——
51,9
3551
,935
70,4
7512
2,41
0E
xcha
nge
diff
eren
ces
ontr
ansl
atio
nof
fore
ign
oper
atio
ns..
....
....
....
....
....
....
...
——
——
—(2
1,86
4)—
(21,
864)
(22,
870)
(44,
734)
Cha
nge
infa
irva
lue
offi
nanc
iala
sset
sde
sign
ated
atfa
irva
lue
thro
ugh
othe
rco
mpr
ehen
sive
inco
me,
neto
fta
x..
....
....
——
——
(2,6
03)
——
(2,6
03)
(3,8
43)
(6,4
46)
Tot
alco
mpr
ehen
sive
inco
me
for
the
year
....
..—
——
—(2
,603
)(2
1,86
4)51
,935
27,4
6843
,762
71,2
30
Con
trib
utio
nfr
omth
eco
ntro
llin
gsh
areh
olde
r..
3,76
0—
——
——
—3,
760
—3,
760
Con
trib
utio
nfr
omno
n-co
ntro
llin
gsh
areh
olde
rs..
....
....
....
....
....
....
.—
——
——
——
—11
511
5A
cqui
siti
onof
non-
cont
roll
ing
inte
rest
s..
....
.(1
31)
——
——
——
(131
)13
1—
Equ
ity-
sett
led
shar
eaw
ard
sche
me
....
....
...
532
—21
1—
——
—74
31,
096
1,83
9C
ance
lati
onof
asu
bsid
iary
’ssh
ares
....
....
..9
——
——
——
9(9
)—
Tra
nsfe
rto
stat
utor
yre
serv
e..
....
....
....
..—
448
——
——
(448
)—
——
Tra
nsfe
rto
reta
ined
prof
its
(a)
....
....
....
...
——
(719
)—
——
719
——
—D
ivid
ends
decl
ared
bysu
bsid
iari
es(b
)..
....
..—
——
——
—(1
0,52
5)(1
0,52
5)(5
1,74
0)(6
2,26
5)
AtD
ecem
ber
31,2
016
....
....
....
....
....
.10
5,00
554
,054
*25
7*—
(2,6
03)*
(14,
671)
*17
2,00
9*31
4,05
133
1,54
064
5,59
1
I-9
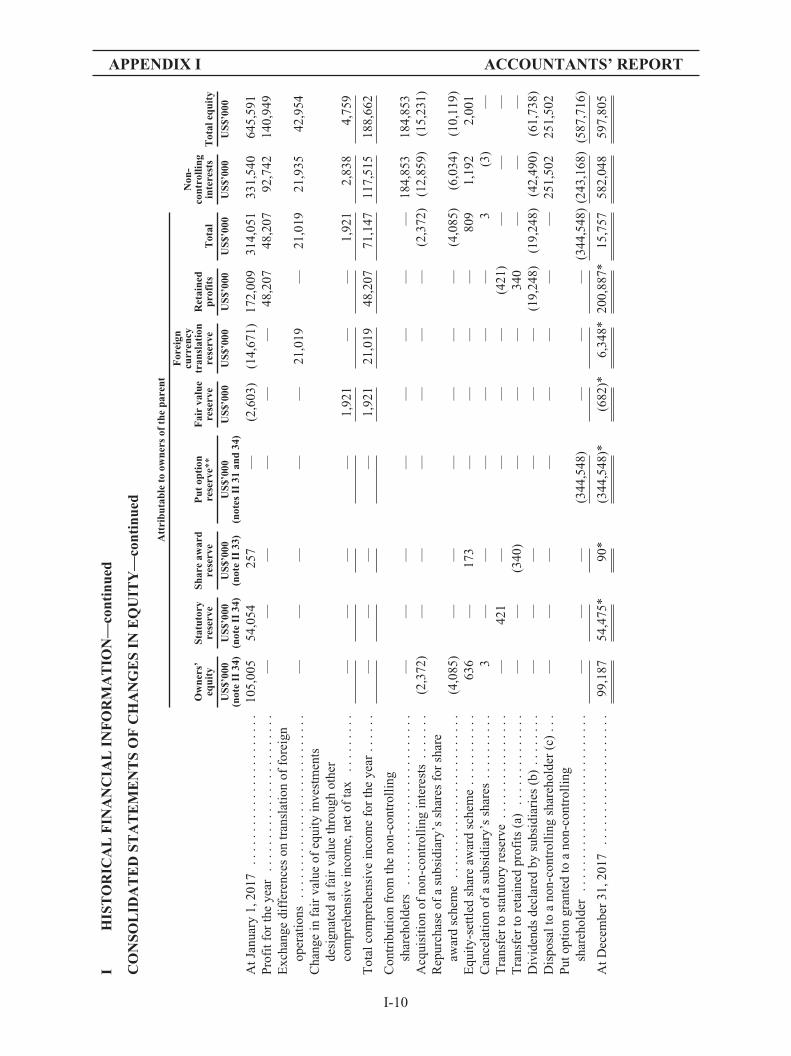
APPENDIX I ACCOUNTANTS’ REPORT
IH
IST
OR
ICA
LF
INA
NC
IAL
INF
OR
MA
TIO
N—
cont
inue
d
CO
NSO
LID
AT
ED
STA
TE
ME
NT
SO
FC
HA
NG
ES
INE
QU
ITY
—co
ntin
ued
Att
ribu
tabl
eto
owne
rsof
the
pare
nt
Ow
ners
’eq
uity
Stat
utor
yre
serv
eSh
are
awar
dre
serv
eP
utop
tion
rese
rve*
*F
air
valu
ere
serv
e
For
eign
curr
ency
tran
slat
ion
rese
rve
Ret
aine
dpr
ofit
sT
otal
Non
-co
ntro
lling
inte
rest
sT
otal
equi
ty
US$
’000
US$
’000
US$
’000
US$
’000
US$
’000
US$
’000
US$
’000
US$
’000
US$
’000
US$
’000
(not
eII
34)
(not
eII
34)
(not
eII
33)
(not
esII
31an
d34
)
AtJ
anua
ry1,
2017
....
....
....
....
....
...
105,
005
54,0
5425
7—
(2,6
03)
(14,
671)
172,
009
314,
051
331,
540
645,
591
Pro
fitf
orth
eye
ar..
....
....
....
....
....
..—
——
——
—48
,207
48,2
0792
,742
140,
949
Exc
hang
edi
ffer
ence
son
tran
slat
ion
offo
reig
nop
erat
ions
....
....
....
....
....
....
....
——
——
—21
,019
—21
,019
21,9
3542
,954
Cha
nge
infa
irva
lue
ofeq
uity
inve
stm
ents
desi
gnat
edat
fair
valu
eth
roug
hot
her
com
preh
ensi
vein
com
e,ne
tof
tax
....
....
.—
——
—1,
921
——
1,92
12,
838
4,75
9
Tot
alco
mpr
ehen
sive
inco
me
for
the
year
....
..—
——
—1,
921
21,0
1948
,207
71,1
4711
7,51
518
8,66
2
Con
trib
utio
nfr
omth
eno
n-co
ntro
llin
gsh
areh
olde
rs..
....
....
....
....
....
....
——
——
——
——
184,
853
184,
853
Acq
uisi
tion
ofno
n-co
ntro
llin
gin
tere
sts
....
...
(2,3
72)
——
——
——
(2,3
72)
(12,
859)
(15,
231)
Rep
urch
ase
ofa
subs
idia
ry’s
shar
esfo
rsh
are
awar
dsc
hem
e..
....
....
....
....
....
...
(4,0
85)
——
——
——
(4,0
85)
(6,0
34)
(10,
119)
Equ
ity-
sett
led
shar
eaw
ard
sche
me
....
....
...
636
—17
3—
——
—80
91,
192
2,00
1C
ance
lati
onof
asu
bsid
iary
’ssh
ares
....
....
..3
——
——
——
3(3
)—
Tra
nsfe
rto
stat
utor
yre
serv
e..
....
....
....
..—
421
——
——
(421
)—
——
Tra
nsfe
rto
reta
ined
prof
its
(a)
....
....
....
..—
—(3
40)
——
—34
0—
——
Div
iden
dsde
clar
edby
subs
idia
ries
(b)
....
....
——
——
——
(19,
248)
(19,
248)
(42,
490)
(61,
738)
Dis
posa
lto
ano
n-co
ntro
llin
gsh
areh
olde
r(c
)..
.—
——
——
——
—25
1,50
225
1,50
2P
utop
tion
gran
ted
toa
non-
cont
roll
ing
shar
ehol
der
....
....
....
....
....
....
...
——
—(3
44,5
48)
——
—(3
44,5
48)
(243
,168
)(5
87,7
16)
AtD
ecem
ber
31,2
017
....
....
....
....
....
99,1
8754
,475
*90
*(3
44,5
48)*
(682
)*6,
348*
200,
887*
15,7
5758
2,04
859
7,80
5
I-10

APPENDIX I ACCOUNTANTS’ REPORT
IH
IST
OR
ICA
LF
INA
NC
IAL
INF
OR
MA
TIO
N—
cont
inue
d
CO
NSO
LID
AT
ED
STA
TE
ME
NT
SO
FC
HA
NG
ES
INE
QU
ITY
—co
ntin
ued
Att
ribu
tabl
eto
owne
rsof
the
pare
nt
Ow
ners
’eq
uity
Stat
utor
yre
serv
eSh
are
awar
dre
serv
eP
utop
tion
rese
rve*
*F
air
valu
ere
serv
e
For
eign
curr
ency
tran
slat
ion
rese
rve
Ret
aine
dpr
ofit
sT
otal
Non
-co
ntro
lling
inte
rest
sT
otal
equi
ty
US$
’000
US$
’000
US$
’000
US$
’000
US$
’000
US$
’000
US$
’000
US$
’000
US$
’000
US$
’000
(not
eII
34)
(not
eII
34)
(not
eII
33)
(not
esII
31an
d34
)
AtJ
anua
ry1,
2018
....
....
....
....
....
...
99,1
8754
,475
90(3
44,5
48)
(682
)6,
348
200,
887
15,7
5758
2,04
859
7,80
5P
rofi
tfor
the
year
....
....
....
....
....
....
——
——
——
34,8
8334
,883
77,2
4011
2,12
3E
xcha
nge
diff
eren
ces
ontr
ansl
atio
nof
fore
ign
oper
atio
ns..
....
....
....
....
....
....
..—
——
——
(17,
116)
—(1
7,11
6)(1
9,98
9)(3
7,10
5)C
hang
ein
fair
valu
eof
fina
ncia
lass
ets
desi
gnat
edat
fair
valu
eth
roug
hot
her
com
preh
ensi
vein
com
e,ne
tof
tax
....
....
.—
——
—1,
799
——
1,79
92,
488
4,28
7
Tot
alco
mpr
ehen
sive
inco
me
for
the
year
....
.—
——
—1,
799
(17,
116)
34,8
8319
,566
59,7
3979
,305
Dis
posa
lof
subs
idia
ries
(not
eII
37)
....
....
.—
——
——
——
—(6
,224
)(6
,224
)A
cqui
siti
onof
non-
cont
roll
ing
inte
rest
s..
....
(28,
794)
——
——
——
(28,
794)
(8,0
97)
(36,
891)
Rep
urch
ase
ofa
subs
idia
ry’s
shar
esfo
rsh
are
awar
dsc
hem
e..
....
....
....
....
....
...
(1,3
58)
——
——
——
(1,3
58)
(1,8
81)
(3,2
39)
Equ
ity-
sett
led
shar
eaw
ard
sche
me
....
....
..—
—2,
132
——
——
2,13
22,
976
5,10
8D
ivid
ends
decl
ared
bysu
bsid
iari
es(b
)..
....
.—
——
——
—(1
11,0
20)
(111
,020
)(6
2,59
0)(1
73,6
10)
Cap
ital
rese
rve
aris
ing
from
othe
rsh
areh
olde
r..
....
....
....
....
....
....
.—
——
——
——
—75
075
0
AtD
ecem
ber
31,2
018
....
....
....
....
....
69,0
3554
,475
*2,
222*
(344
,548
)*1,
117*
(10,
768)
*12
4,75
0*(1
03,7
17)
566,
721
463,
004
I-11

APPENDIX I ACCOUNTANTS’ REPORT
IH
IST
OR
ICA
LF
INA
NC
IAL
INF
OR
MA
TIO
N—
cont
inue
d
CO
NSO
LID
AT
ED
STA
TE
ME
NT
SO
FC
HA
NG
ES
INE
QU
ITY
—co
ntin
ued
Att
ribu
tabl
eto
owne
rsof
the
pare
nt
Ow
ners
’eq
uity
Stat
utor
yre
serv
eSh
are
awar
dre
serv
eP
utop
tion
rese
rve*
*F
air
valu
ere
serv
e
For
eign
curr
ency
tran
slat
ion
rese
rve
Ret
aine
dpr
ofit
sT
otal
Non
-co
ntro
lling
inte
rest
sT
otal
equi
ty
US$
’000
US$
’000
US$
’000
US$
’000
US$
’000
US$
’000
US$
’000
US$
’000
US$
’000
US$
’000
(not
eII
34)
(not
eII
34)
(not
eII
33)
(not
esII
31an
d34
)
AtJ
anua
ry1,
2018
....
....
....
....
....
....
.99
,187
54,4
7590
(344
,548
)(6
82)
6,34
820
0,88
715
,757
582,
048
597,
805
Pro
fitf
orth
epe
riod
....
....
....
....
....
....
——
——
——
(819
)(8
19)
21,4
4120
,622
Exc
hang
edi
ffer
ence
son
tran
slat
ion
offo
reig
nop
erat
ions
....
....
....
....
....
....
....
.—
——
——
(7,4
83)
—(7
,483
)(9
,858
)(1
7,34
1)
Tot
alco
mpr
ehen
sive
inco
me
for
the
peri
od..
...
——
——
—(7
,483
)(8
19)
(8,3
02)
11,5
833,
281
Acq
uisi
tion
ofno
n-co
ntro
llin
gin
tere
sts
....
....
(19,
187)
——
——
——
(19,
187)
(5,3
70)
(24,
557)
Rep
urch
ase
ofa
subs
idia
ry’s
shar
esfo
rsh
are
awar
dsc
hem
e..
....
....
....
....
....
....
(1,3
58)
——
——
——
(1,3
58)
(1,8
81)
(3,2
39)
Equ
ity-
sett
led
shar
eaw
ard
sche
me
....
....
....
——
462
——
——
462
658
1,12
0D
ivid
ends
decl
ared
bysu
bsid
iari
es(b
)..
....
...
——
——
——
——
(41,
049)
(41,
049)
AtJ
une
30,2
018
....
....
....
....
....
....
..78
,642
54,4
75*
552*
(344
,548
)*(6
82)*
(1,1
35)*
200,
068*
(12,
628)
545,
989
533,
361
I-12
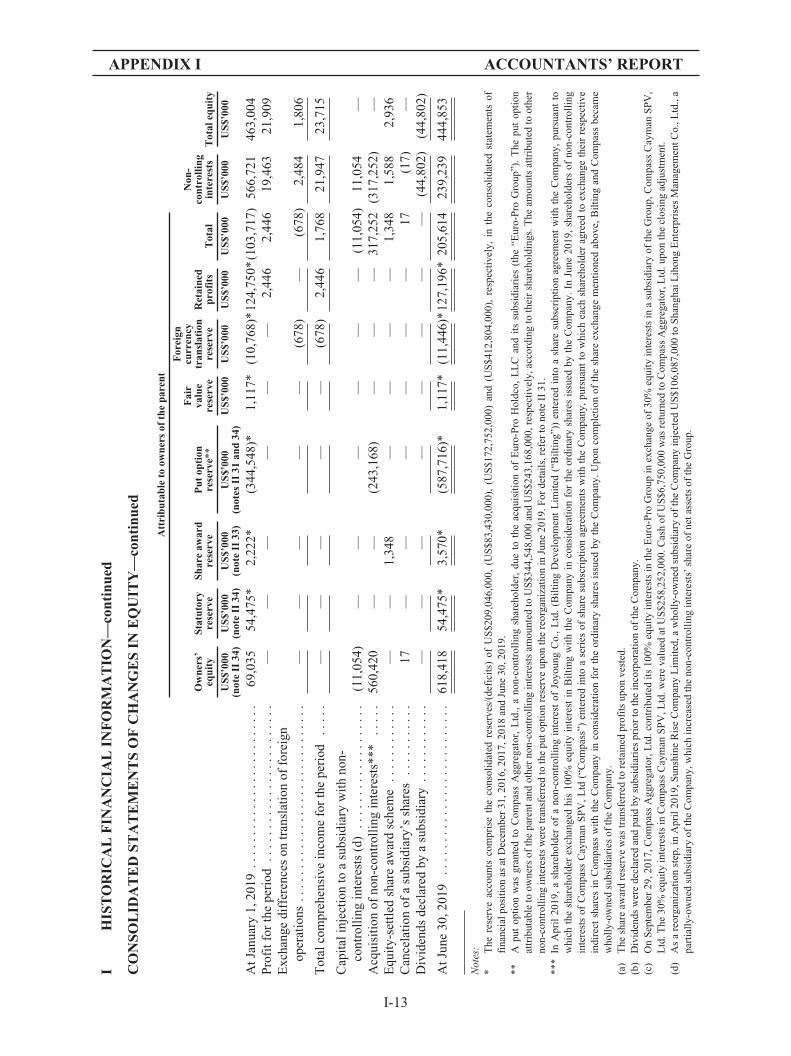
APPENDIX I ACCOUNTANTS’ REPORT
IH
IST
OR
ICA
LF
INA
NC
IAL
INF
OR
MA
TIO
N—
cont
inue
d
CO
NSO
LID
AT
ED
STA
TE
ME
NT
SO
FC
HA
NG
ES
INE
QU
ITY
—co
ntin
ued
Att
ribu
tabl
eto
owne
rsof
the
pare
nt
Ow
ners
’eq
uity
Stat
utor
yre
serv
eSh
are
awar
dre
serv
eP
utop
tion
rese
rve*
*
Fai
rva
lue
rese
rve
For
eign
curr
ency
tran
slat
ion
rese
rve
Ret
aine
dpr
ofit
sT
otal
Non
-co
ntro
lling
inte
rest
sT
otal
equi
ty
US$
’000
US$
’000
US$
’000
US$
’000
US$
’000
US$
’000
US$
’000
US$
’000
US$
’000
US$
’000
(not
eII
34)
(not
eII
34)
(not
eII
33)
(not
esII
31an
d34
)
AtJ
anua
ry1,
2019
....
....
....
....
....
....
.69
,035
54,4
75*
2,22
2*(3
44,5
48)*
1,11
7*(1
0,76
8)*
124,
750*
(103
,717
)56
6,72
146
3,00
4P
rofi
tfor
the
peri
od..
....
....
....
....
....
..—
——
——
—2,
446
2,44
619
,463
21,9
09E
xcha
nge
diff
eren
ces
ontr
ansl
atio
nof
fore
ign
oper
atio
ns..
....
....
....
....
....
....
....
——
——
—(6
78)
—(6
78)
2,48
41,
806
Tot
alco
mpr
ehen
sive
inco
me
for
the
peri
od..
...
——
——
—(6
78)
2,44
61,
768
21,9
4723
,715
Cap
ital
inje
ctio
nto
asu
bsid
iary
wit
hno
n-co
ntro
llin
gin
tere
sts
(d)
....
....
....
....
...
(11,
054)
——
——
——
(11,
054)
11,0
54—
Acq
uisi
tion
ofno
n-co
ntro
llin
gin
tere
sts*
**..
...
560,
420
——
(243
,168
)—
——
317,
252
(317
,252
)—
Equ
ity-
sett
led
shar
eaw
ard
sche
me
....
....
....
——
1,34
8—
——
—1,
348
1,58
82,
936
Can
cela
tion
ofa
subs
idia
ry’s
shar
es..
....
....
.17
——
——
——
17(1
7)—
Div
iden
dsde
clar
edby
asu
bsid
iary
....
....
....
——
——
——
——
(44,
802)
(44,
802)
AtJ
une
30,2
019
....
....
....
....
....
....
..61
8,41
854
,475
*3,
570*
(587
,716
)*1,
117*
(11,
446)
*12
7,19
6*20
5,61
423
9,23
944
4,85
3
Not
es:
*T
here
serv
eac
coun
tsco
mpr
ise
the
cons
olid
ated
rese
rves
/(de
fici
ts)
ofU
S$2
09,0
46,0
00,
(US
$83,
430,
000)
,(U
S$1
72,7
52,0
00)
and
(US
$412
,804
,000
),re
spec
tive
ly,
inth
eco
nsol
idat
edst
atem
ents
offi
nanc
ialp
osit
ion
asat
Dec
embe
r31
,201
6,20
17,2
018
and
June
30,2
019.
**A
put
opti
onw
asgr
ante
dto
Com
pass
Agg
rega
tor,
Ltd
.,a
non-
cont
roll
ing
shar
ehol
der,
due
toth
eac
quis
itio
nof
Eur
o-P
roH
oldc
o,L
LC
and
its
subs
idia
ries
(the
“Eur
o-P
roG
roup
”).
The
put
opti
onat
trib
utab
leto
owne
rsof
the
pare
ntan
dot
her
non-
cont
roll
ing
inte
rest
sam
ount
edto
US
$344
,548
,000
and
US
$243
,168
,000
,res
pect
ivel
y,ac
cord
ing
toth
eir
shar
ehol
ding
s.T
heam
ount
sat
trib
uted
toot
her
non-
cont
roll
ing
inte
rest
sw
ere
tran
sfer
red
toth
epu
topt
ion
rese
rve
upon
the
reor
gani
zati
onin
June
2019
.For
deta
ils,
refe
rto
note
II31
.**
*In
Apr
il20
19,
ash
areh
olde
rof
ano
n-co
ntro
llin
gin
tere
stof
Joyo
ung
Co.
,L
td.
(Bil
ting
Dev
elop
men
tL
imit
ed(“
Bil
ting
”))
ente
red
into
ash
are
subs
crip
tion
agre
emen
tw
ith
the
Com
pany
,pu
rsua
ntto
whi
chth
esh
areh
olde
rex
chan
ged
his
100%
equi
tyin
tere
stin
Bil
ting
wit
hth
eC
ompa
nyin
cons
ider
atio
nfo
rth
eor
dina
rysh
ares
issu
edby
the
Com
pany
.In
June
2019
,sh
areh
olde
rsof
non-
cont
roll
ing
inte
rest
sof
Com
pass
Cay
man
SP
V,
Ltd
(“C
ompa
ss”)
ente
red
into
ase
ries
ofsh
are
subs
crip
tion
agre
emen
tsw
ith
the
Com
pany
,pu
rsua
ntto
whi
chea
chsh
areh
olde
rag
reed
toex
chan
geth
eir
resp
ecti
vein
dire
ctsh
ares
inC
ompa
ssw
ith
the
Com
pany
inco
nsid
erat
ion
for
the
ordi
nary
shar
esis
sued
byth
eC
ompa
ny.
Upo
nco
mpl
etio
nof
the
shar
eex
chan
gem
enti
oned
abov
e,B
ilti
ngan
dC
ompa
ssbe
cam
ew
holl
y-ow
ned
subs
idia
ries
ofth
eC
ompa
ny.
(a)
The
shar
eaw
ard
rese
rve
was
tran
sfer
red
tore
tain
edpr
ofit
sup
onve
sted
.(b
)D
ivid
ends
wer
ede
clar
edan
dpa
idby
subs
idia
ries
prio
rto
the
inco
rpor
atio
nof
the
Com
pany
.(c
)O
nS
epte
mbe
r29
,201
7,C
ompa
ssA
ggre
gato
r,L
td.c
ontr
ibut
edit
s10
0%eq
uity
inte
rest
sin
the
Eur
o-P
roG
roup
inex
chan
geof
30%
equi
tyin
tere
sts
ina
subs
idia
ryof
the
Gro
up,C
ompa
ssC
aym
anS
PV
,L
td.T
he30
%eq
uity
inte
rest
sin
Com
pass
Cay
man
SP
V,L
td.w
ere
valu
edat
US
$258
,252
,000
.Cas
hof
US
$6,7
50,0
00w
asre
turn
edto
Com
pass
Agg
rega
tor,
Ltd
.upo
nth
ecl
osin
gad
just
men
t.(d
)A
sa
reor
gani
zati
onst
ep,i
nA
pril
2019
,Sun
shin
eR
ise
Com
pany
Lim
ited
,aw
holl
y-ow
ned
subs
idia
ryof
the
Com
pany
inje
cted
US
$106
,087
,000
toS
hang
haiL
ihon
gE
nter
pris
esM
anag
emen
tCo.
,Ltd
.,a
part
iall
y-ow
ned
subs
idia
ryof
the
Com
pany
,whi
chin
crea
sed
the
non-
cont
roll
ing
inte
rest
s’sh
are
ofne
tass
ets
ofth
eG
roup
.
I-13
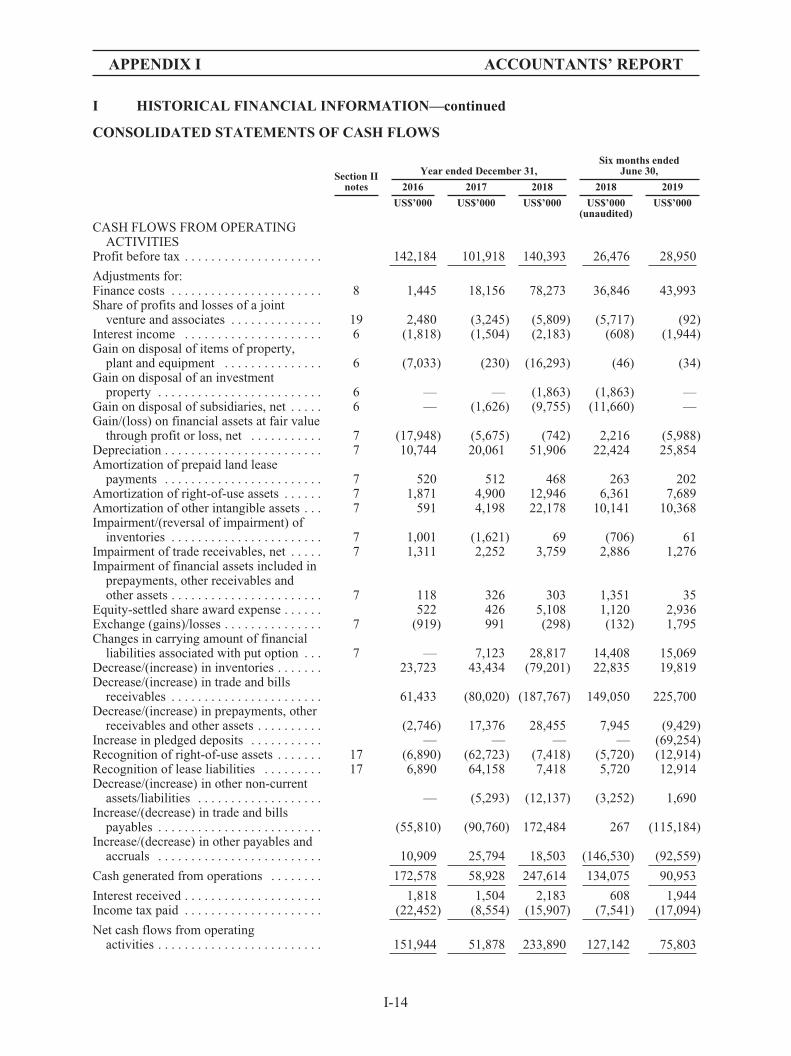
APPENDIX I ACCOUNTANTS’ REPORT
I HISTORICAL FINANCIAL INFORMATION—continued
CONSOLIDATED STATEMENTS OF CASH FLOWS
Section IInotes
Year ended December 31,Six months ended
June 30,
2016 2017 2018 2018 2019
US$’000 US$’000 US$’000 US$’000 US$’000(unaudited)
CASH FLOWS FROM OPERATINGACTIVITIES
Profit before tax . . . . . . . . . . . . . . . . . . . . . 142,184 101,918 140,393 26,476 28,950
Adjustments for:Finance costs . . . . . . . . . . . . . . . . . . . . . . . 8 1,445 18,156 78,273 36,846 43,993Share of profits and losses of a joint
venture and associates . . . . . . . . . . . . . . 19 2,480 (3,245) (5,809) (5,717) (92)Interest income . . . . . . . . . . . . . . . . . . . . . 6 (1,818) (1,504) (2,183) (608) (1,944)Gain on disposal of items of property,
plant and equipment . . . . . . . . . . . . . . . 6 (7,033) (230) (16,293) (46) (34)Gain on disposal of an investment
property . . . . . . . . . . . . . . . . . . . . . . . . . 6 — — (1,863) (1,863) —Gain on disposal of subsidiaries, net . . . . . 6 — (1,626) (9,755) (11,660) —Gain/(loss) on financial assets at fair value
through profit or loss, net . . . . . . . . . . . 7 (17,948) (5,675) (742) 2,216 (5,988)Depreciation . . . . . . . . . . . . . . . . . . . . . . . . 7 10,744 20,061 51,906 22,424 25,854Amortization of prepaid land lease
payments . . . . . . . . . . . . . . . . . . . . . . . . 7 520 512 468 263 202Amortization of right-of-use assets . . . . . . 7 1,871 4,900 12,946 6,361 7,689Amortization of other intangible assets . . . 7 591 4,198 22,178 10,141 10,368Impairment/(reversal of impairment) of
inventories . . . . . . . . . . . . . . . . . . . . . . . 7 1,001 (1,621) 69 (706) 61Impairment of trade receivables, net . . . . . 7 1,311 2,252 3,759 2,886 1,276Impairment of financial assets included in
prepayments, other receivables andother assets . . . . . . . . . . . . . . . . . . . . . . . 7 118 326 303 1,351 35
Equity-settled share award expense . . . . . . 522 426 5,108 1,120 2,936Exchange (gains)/losses . . . . . . . . . . . . . . . 7 (919) 991 (298) (132) 1,795Changes in carrying amount of financial
liabilities associated with put option . . . 7 — 7,123 28,817 14,408 15,069Decrease/(increase) in inventories . . . . . . . 23,723 43,434 (79,201) 22,835 19,819Decrease/(increase) in trade and bills
receivables . . . . . . . . . . . . . . . . . . . . . . . 61,433 (80,020) (187,767) 149,050 225,700Decrease/(increase) in prepayments, other
receivables and other assets . . . . . . . . . . (2,746) 17,376 28,455 7,945 (9,429)Increase in pledged deposits . . . . . . . . . . . — — — — (69,254)Recognition of right-of-use assets . . . . . . . 17 (6,890) (62,723) (7,418) (5,720) (12,914)Recognition of lease liabilities . . . . . . . . . 17 6,890 64,158 7,418 5,720 12,914Decrease/(increase) in other non-current
assets/liabilities . . . . . . . . . . . . . . . . . . . — (5,293) (12,137) (3,252) 1,690Increase/(decrease) in trade and bills
payables . . . . . . . . . . . . . . . . . . . . . . . . . (55,810) (90,760) 172,484 267 (115,184)Increase/(decrease) in other payables and
accruals . . . . . . . . . . . . . . . . . . . . . . . . . 10,909 25,794 18,503 (146,530) (92,559)
Cash generated from operations . . . . . . . . 172,578 58,928 247,614 134,075 90,953
Interest received . . . . . . . . . . . . . . . . . . . . . 1,818 1,504 2,183 608 1,944Income tax paid . . . . . . . . . . . . . . . . . . . . . (22,452) (8,554) (15,907) (7,541) (17,094)
Net cash flows from operatingactivities . . . . . . . . . . . . . . . . . . . . . . . . . 151,944 51,878 233,890 127,142 75,803
I-14
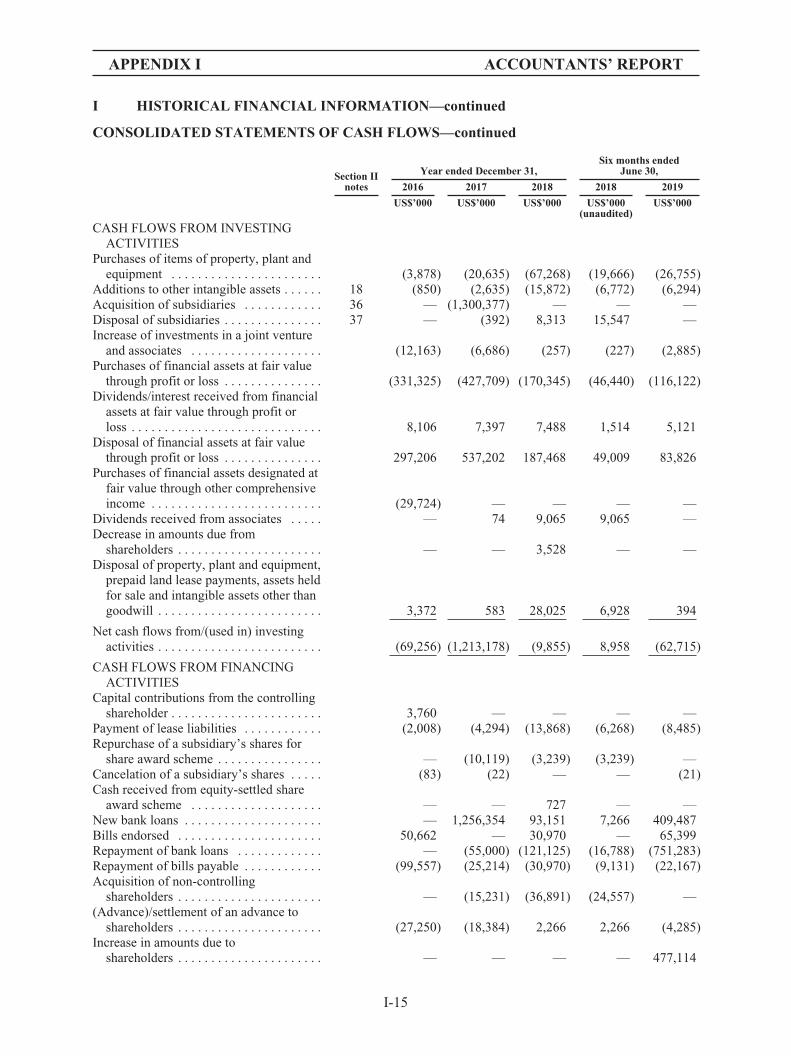
APPENDIX I ACCOUNTANTS’ REPORT
I HISTORICAL FINANCIAL INFORMATION—continued
CONSOLIDATED STATEMENTS OF CASH FLOWS—continued
Section IInotes
Year ended December 31,Six months ended
June 30,
2016 2017 2018 2018 2019
US$’000 US$’000 US$’000 US$’000 US$’000(unaudited)
CASH FLOWS FROM INVESTINGACTIVITIES
Purchases of items of property, plant andequipment . . . . . . . . . . . . . . . . . . . . . . . (3,878) (20,635) (67,268) (19,666) (26,755)
Additions to other intangible assets . . . . . . 18 (850) (2,635) (15,872) (6,772) (6,294)Acquisition of subsidiaries . . . . . . . . . . . . 36 — (1,300,377) — — —Disposal of subsidiaries . . . . . . . . . . . . . . . 37 — (392) 8,313 15,547 —Increase of investments in a joint venture
and associates . . . . . . . . . . . . . . . . . . . . (12,163) (6,686) (257) (227) (2,885)Purchases of financial assets at fair value
through profit or loss . . . . . . . . . . . . . . . (331,325) (427,709) (170,345) (46,440) (116,122)Dividends/interest received from financial
assets at fair value through profit orloss . . . . . . . . . . . . . . . . . . . . . . . . . . . . . 8,106 7,397 7,488 1,514 5,121
Disposal of financial assets at fair valuethrough profit or loss . . . . . . . . . . . . . . . 297,206 537,202 187,468 49,009 83,826
Purchases of financial assets designated atfair value through other comprehensiveincome . . . . . . . . . . . . . . . . . . . . . . . . . . (29,724) — — — —
Dividends received from associates . . . . . — 74 9,065 9,065 —Decrease in amounts due from
shareholders . . . . . . . . . . . . . . . . . . . . . . — — 3,528 — —Disposal of property, plant and equipment,
prepaid land lease payments, assets heldfor sale and intangible assets other thangoodwill . . . . . . . . . . . . . . . . . . . . . . . . . 3,372 583 28,025 6,928 394
Net cash flows from/(used in) investingactivities . . . . . . . . . . . . . . . . . . . . . . . . . (69,256) (1,213,178) (9,855) 8,958 (62,715)
CASH FLOWS FROM FINANCINGACTIVITIES
Capital contributions from the controllingshareholder . . . . . . . . . . . . . . . . . . . . . . . 3,760 — — — —
Payment of lease liabilities . . . . . . . . . . . . (2,008) (4,294) (13,868) (6,268) (8,485)Repurchase of a subsidiary’s shares for
share award scheme . . . . . . . . . . . . . . . . — (10,119) (3,239) (3,239) —Cancelation of a subsidiary’s shares . . . . . (83) (22) — — (21)Cash received from equity-settled share
award scheme . . . . . . . . . . . . . . . . . . . . — — 727 — —New bank loans . . . . . . . . . . . . . . . . . . . . . — 1,256,354 93,151 7,266 409,487Bills endorsed . . . . . . . . . . . . . . . . . . . . . . 50,662 — 30,970 — 65,399Repayment of bank loans . . . . . . . . . . . . . — (55,000) (121,125) (16,788) (751,283)Repayment of bills payable . . . . . . . . . . . . (99,557) (25,214) (30,970) (9,131) (22,167)Acquisition of non-controlling
shareholders . . . . . . . . . . . . . . . . . . . . . . — (15,231) (36,891) (24,557) —(Advance)/settlement of an advance to
shareholders . . . . . . . . . . . . . . . . . . . . . . (27,250) (18,384) 2,266 2,266 (4,285)Increase in amounts due to
shareholders . . . . . . . . . . . . . . . . . . . . . . — — — — 477,114
I-15
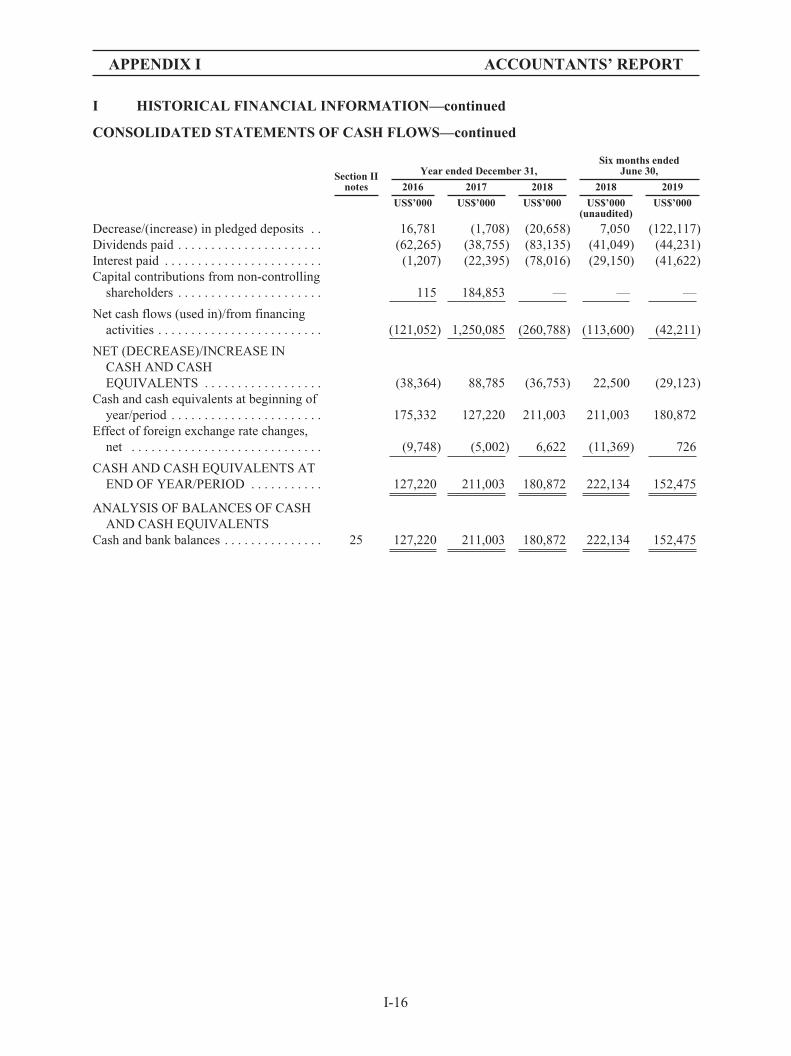
APPENDIX I ACCOUNTANTS’ REPORT
I HISTORICAL FINANCIAL INFORMATION—continued
CONSOLIDATED STATEMENTS OF CASH FLOWS—continued
Section IInotes
Year ended December 31,Six months ended
June 30,
2016 2017 2018 2018 2019
US$’000 US$’000 US$’000 US$’000 US$’000(unaudited)
Decrease/(increase) in pledged deposits . . 16,781 (1,708) (20,658) 7,050 (122,117)Dividends paid . . . . . . . . . . . . . . . . . . . . . . (62,265) (38,755) (83,135) (41,049) (44,231)Interest paid . . . . . . . . . . . . . . . . . . . . . . . . (1,207) (22,395) (78,016) (29,150) (41,622)Capital contributions from non-controlling
shareholders . . . . . . . . . . . . . . . . . . . . . . 115 184,853 — — —
Net cash flows (used in)/from financingactivities . . . . . . . . . . . . . . . . . . . . . . . . . (121,052) 1,250,085 (260,788) (113,600) (42,211)
NET (DECREASE)/INCREASE INCASH AND CASHEQUIVALENTS . . . . . . . . . . . . . . . . . . (38,364) 88,785 (36,753) 22,500 (29,123)
Cash and cash equivalents at beginning ofyear/period . . . . . . . . . . . . . . . . . . . . . . . 175,332 127,220 211,003 211,003 180,872
Effect of foreign exchange rate changes,net . . . . . . . . . . . . . . . . . . . . . . . . . . . . . (9,748) (5,002) 6,622 (11,369) 726
CASH AND CASH EQUIVALENTS ATEND OF YEAR/PERIOD . . . . . . . . . . . 127,220 211,003 180,872 222,134 152,475
ANALYSIS OF BALANCES OF CASHAND CASH EQUIVALENTS
Cash and bank balances . . . . . . . . . . . . . . . 25 127,220 211,003 180,872 222,134 152,475
I-16
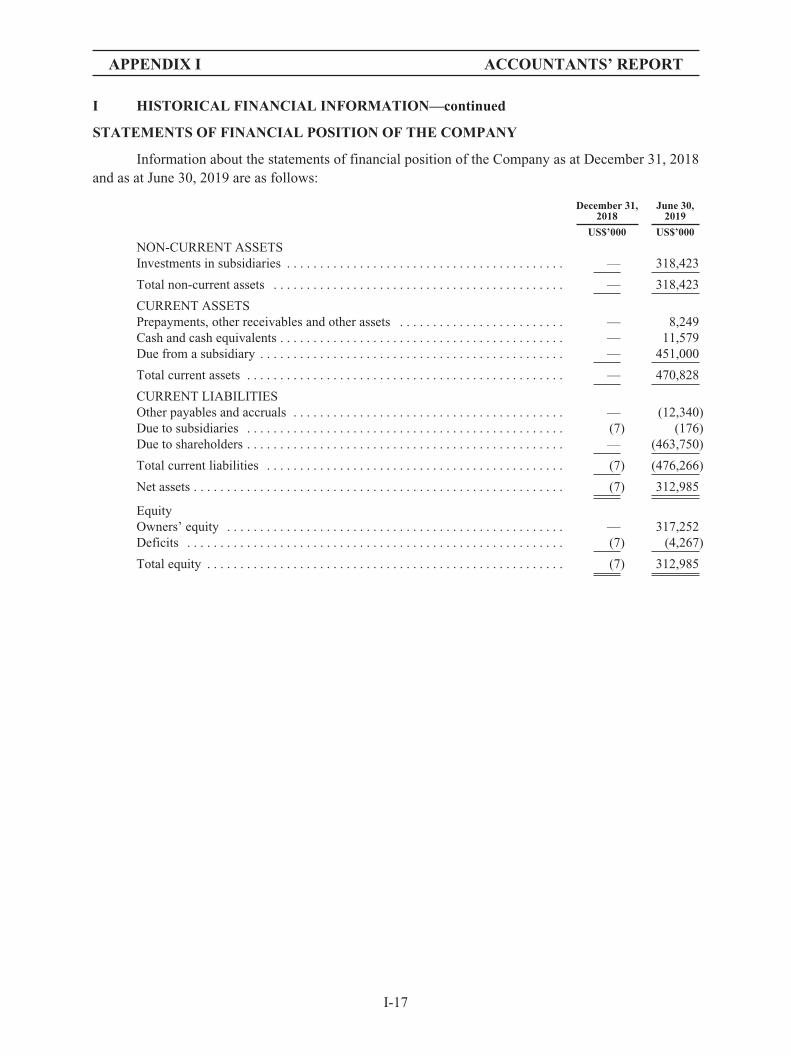
APPENDIX I ACCOUNTANTS’ REPORT
I HISTORICAL FINANCIAL INFORMATION—continued
STATEMENTS OF FINANCIAL POSITION OF THE COMPANY
Information about the statements of financial position of the Company as at December 31, 2018and as at June 30, 2019 are as follows:
December 31,2018
June 30,2019
US$’000 US$’000
NON-CURRENT ASSETSInvestments in subsidiaries . . . . . . . . . . . . . . . . . . . . . . . . . . . . . . . . . . . . . . . . . . — 318,423
Total non-current assets . . . . . . . . . . . . . . . . . . . . . . . . . . . . . . . . . . . . . . . . . . . . — 318,423
CURRENT ASSETSPrepayments, other receivables and other assets . . . . . . . . . . . . . . . . . . . . . . . . . — 8,249Cash and cash equivalents . . . . . . . . . . . . . . . . . . . . . . . . . . . . . . . . . . . . . . . . . . . — 11,579Due from a subsidiary . . . . . . . . . . . . . . . . . . . . . . . . . . . . . . . . . . . . . . . . . . . . . . — 451,000
Total current assets . . . . . . . . . . . . . . . . . . . . . . . . . . . . . . . . . . . . . . . . . . . . . . . . — 470,828
CURRENT LIABILITIESOther payables and accruals . . . . . . . . . . . . . . . . . . . . . . . . . . . . . . . . . . . . . . . . . — (12,340)Due to subsidiaries . . . . . . . . . . . . . . . . . . . . . . . . . . . . . . . . . . . . . . . . . . . . . . . . (7) (176)Due to shareholders . . . . . . . . . . . . . . . . . . . . . . . . . . . . . . . . . . . . . . . . . . . . . . . . — (463,750)
Total current liabilities . . . . . . . . . . . . . . . . . . . . . . . . . . . . . . . . . . . . . . . . . . . . . (7) (476,266)
Net assets . . . . . . . . . . . . . . . . . . . . . . . . . . . . . . . . . . . . . . . . . . . . . . . . . . . . . . . . (7) 312,985
EquityOwners’ equity . . . . . . . . . . . . . . . . . . . . . . . . . . . . . . . . . . . . . . . . . . . . . . . . . . . — 317,252Deficits . . . . . . . . . . . . . . . . . . . . . . . . . . . . . . . . . . . . . . . . . . . . . . . . . . . . . . . . . (7) (4,267)
Total equity . . . . . . . . . . . . . . . . . . . . . . . . . . . . . . . . . . . . . . . . . . . . . . . . . . . . . . (7) 312,985
I-17
APPENDIX I ACCOUNTANTS’ REPORT
II NOTES TO THE HISTORICAL FINANCIAL INFORMATION
1. CORPORATE AND GROUP INFORMATION
JS Global Lifestyle Company Limited (JS , the “Company”) is a limitedliability company incorporated in the Cayman Islands on July 26, 2018, with an authorized sharecapital of US$50,000 divided into 500,000,000 ordinary shares with par value of US$0.0001 each. Theregistered office of the Company is located at the offices of Maples Corporate Services Limited, POBox 309, Ugland House, Grand Cayman, KY1-1104, Cayman Islands.
The Company is an investment holding company. During the Relevant Periods, the Companyand its subsidiaries (collectively referred to as the “Group”) were involved in the following principalactivities in the United States, the People’s Republic of China (the “PRC”), Japan, the United Kingdomand other European countries:
Š Design, manufacture, marketing, export and distribution of small kitchen electricalappliances under the brand of “Joyoung”.
Š Design, marketing, manufacture, export, import and distribution of a full range of floorcare products, hard-surface steam cleaning products, small kitchen appliances and garmentcare products under the brand of “Shark” and “Ninja”.
The Company and its subsidiaries now comprising the Group underwent the Reorganization asset out in the paragraph headed “Reorganization” in the section headed “History, Reorganization andCorporate Structure” in the Prospectus. Apart from the Reorganization, the Company has notcommenced any business or operation since its incorporation.
I-18
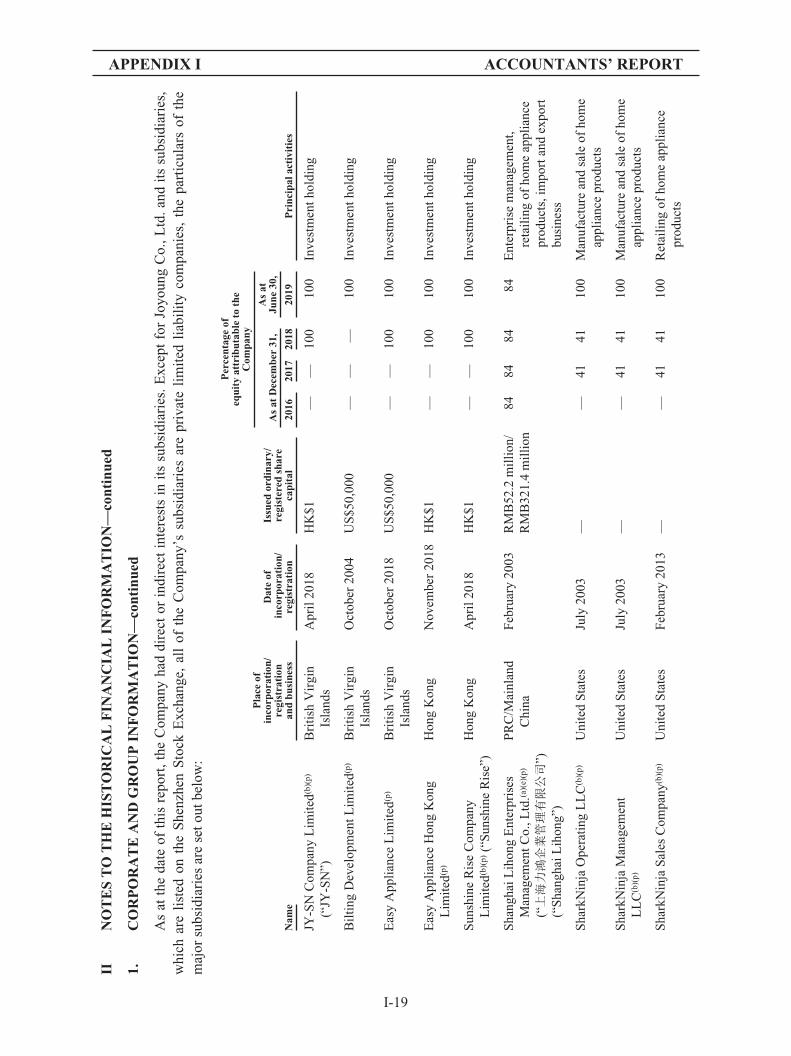
APPENDIX I ACCOUNTANTS’ REPORT
IIN
OT
ES
TO
TH
EH
IST
OR
ICA
LF
INA
NC
IAL
INF
OR
MA
TIO
N—
cont
inue
d
1.C
OR
PO
RA
TE
AN
DG
RO
UP
INF
OR
MA
TIO
N—
cont
inue
d
As
atth
eda
teof
this
repo
rt,t
heC
ompa
nyha
ddi
rect
orin
dire
ctin
tere
sts
init
ssu
bsid
iari
es.E
xcep
tfo
rJo
youn
gC
o.,L
td.a
ndit
ssu
bsid
iari
es,
whi
char
eli
sted
onth
eS
henz
hen
Sto
ckE
xcha
nge,
all
ofth
eC
ompa
ny’s
subs
idia
ries
are
priv
ate
lim
ited
liab
ilit
yco
mpa
nies
,th
epa
rtic
ular
sof
the
maj
orsu
bsid
iari
esar
ese
tout
belo
w:
Nam
e
Pla
ceof
inco
rpor
atio
n/re
gist
rati
onan
dbu
sine
ss
Dat
eof
inco
rpor
atio
n/re
gist
rati
on
Issu
edor
dina
ry/
regi
ster
edsh
are
capi
tal
Per
cent
age
ofeq
uity
attr
ibut
able
toth
eC
ompa
ny
Pri
ncip
alac
tivi
ties
As
atD
ecem
ber
31,
As
atJu
ne30
,
2016
2017
2018
2019
JY-S
NC
ompa
nyL
imit
ed(b
)(p)
(“JY
-SN
”)B
riti
shV
irgi
nIs
land
sA
pril
2018
HK
$1—
—10
010
0In
vest
men
thol
ding
Bil
ting
Dev
elop
men
tLim
ited
(p)
Bri
tish
Vir
gin
Isla
nds
Oct
ober
2004
US
$50,
000
——
—10
0In
vest
men
thol
ding
Eas
yA
ppli
ance
Lim
ited
(p)
Bri
tish
Vir
gin
Isla
nds
Oct
ober
2018
US
$50,
000
——
100
100
Inve
stm
enth
oldi
ng
Eas
yA
ppli
ance
Hon
gK
ong
Lim
ited
(p)
Hon
gK
ong
Nov
embe
r20
18H
K$1
——
100
100
Inve
stm
enth
oldi
ng
Sun
shin
eR
ise
Com
pany
Lim
ited
(b)(
p)(“
Sun
shin
eR
ise”
)H
ong
Kon
gA
pril
2018
HK
$1—
—10
010
0In
vest
men
thol
ding
Sha
ngha
iLih
ong
Ent
erpr
ises
Man
agem
entC
o.,L
td.(a
)(e)
(p)
(“上海力鴻企業管理有限公司
”)(“
Sha
ngha
iLih
ong”
)
PR
C/M
ainl
and
Chi
naF
ebru
ary
2003
RM
B52
.2m
illi
on/
RM
B32
1.4
mil
lion
8484
8484
Ent
erpr
ise
man
agem
ent,
reta
ilin
gof
hom
eap
plia
nce
prod
ucts
,im
port
and
expo
rtbu
sine
ss
Sha
rkN
inja
Ope
rati
ngL
LC
(b)(
p)U
nite
dS
tate
sJu
ly20
03—
—41
4110
0M
anuf
actu
rean
dsa
leof
hom
eap
plia
nce
prod
ucts
Sha
rkN
inja
Man
agem
ent
LL
C(b
)(p)
Uni
ted
Sta
tes
July
2003
——
4141
100
Man
ufac
ture
and
sale
ofho
me
appl
ianc
epr
oduc
ts
Sha
rkN
inja
Sal
esC
ompa
ny(b
)(p)
Uni
ted
Sta
tes
Feb
ruar
y20
13—
—41
4110
0R
etai
ling
ofho
me
appl
ianc
epr
oduc
ts
I-19

APPENDIX I ACCOUNTANTS’ REPORT
IIN
OT
ES
TO
TH
EH
IST
OR
ICA
LF
INA
NC
IAL
INF
OR
MA
TIO
N—
cont
inue
d
1.C
OR
PO
RA
TE
AN
DG
RO
UP
INF
OR
MA
TIO
N—
cont
inue
d
Nam
e
Pla
ceof
inco
rpor
atio
n/re
gist
rati
onan
dbu
sine
ss
Dat
eof
inco
rpor
atio
n/re
gist
rati
on
Issu
edor
dina
ry/
regi
ster
edsh
are
capi
tal
Per
cent
age
ofeq
uity
attr
ibut
able
toth
eC
ompa
ny
Pri
ncip
alac
tivi
ties
As
atD
ecem
ber
31,
As
atJu
ne30
,
2016
2017
2018
2019
Sha
rkN
inja
(Hon
gK
ong)
Com
pany
Lim
ited
(o)(
p)
Hon
gK
ong
Nov
embe
r20
17H
K$1
—41
4110
0H
ome
appl
ianc
esre
sear
chan
dde
velo
pmen
t,im
port
and
expo
rtbu
sine
ssan
deq
uity
inve
stm
ent
Eur
o-P
roC
omm
erce
Con
sult
ing
(She
nzhe
n)C
o.,L
td.(a
)(m
)(p)
(“歐優普洛商務諮詢
(深圳
)有限公司
”)
PR
C/M
ainl
and
Chi
naM
ay20
11R
MB
100,
000
—41
4110
0M
anuf
actu
rean
dsa
leof
hom
eap
plia
nce
prod
ucts
,m
arke
ting
,sup
ply
chai
nm
anag
emen
tand
cons
ulta
ncy
She
nzhe
nS
hark
Nin
jaT
echn
olog
yC
o.,L
td.(a
)(f)
(p)
(“深圳尚科寧家科技有限公
司”)
PR
C/M
ainl
and
Chi
naM
arch
2018
RM
B13
.5m
illi
on—
—41
100
Man
ufac
ture
and
sale
ofho
me
appl
ianc
epr
oduc
ts,
mar
keti
ng,s
uppl
ych
ain
man
agem
enta
ndco
nsul
tanc
y
Suz
hou
Sha
rkN
inja
Tec
hnol
ogy
Co.
,Ltd
.(a)(
f)(p
)
(“蘇州尚科寧家科技有限公
司”)
PR
C/M
ainl
and
Chi
naF
ebru
ary
2018
US
$1m
illi
on—
—41
100
Man
ufac
ture
and
sale
ofho
me
appl
ianc
epr
oduc
ts,
mar
keti
ng,s
uppl
ych
ain
man
agem
enta
ndco
nsul
tanc
y
Han
gzho
uS
hark
Nin
jaC
omm
erce
Con
sult
ing
Co.
,L
td.(a
)(f)
(p)
(“杭州尚科寧家商務諮詢有限
公司
”)
PR
C/M
ainl
and
Chi
naM
arch
2018
US
$100
,000
——
4110
0M
anuf
actu
rean
dsa
leof
hom
eap
plia
nce
prod
ucts
,m
arke
ting
,sup
ply
chai
nm
anag
emen
tand
cons
ulta
ncy
Sha
rkN
inja
UK
Ltd
.(b)(
p)U
nite
dK
ingd
omN
ovem
ber
2018
——
—41
100
Inve
stm
enth
oldi
ng
I-20
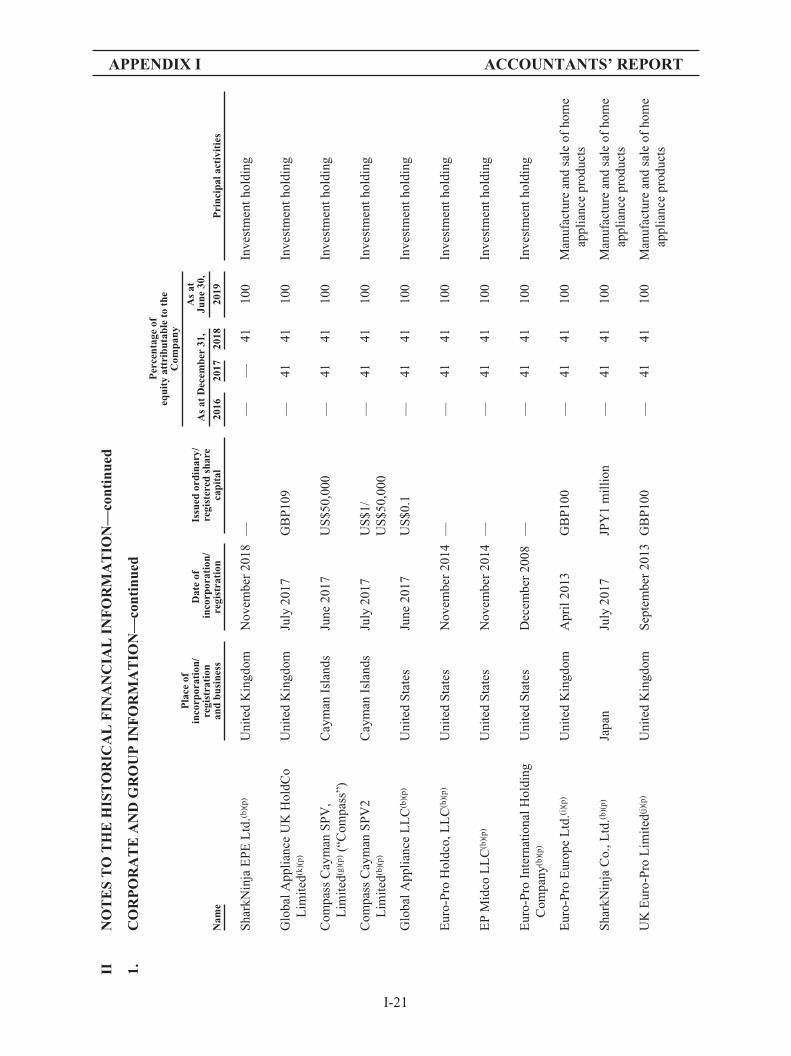
APPENDIX I ACCOUNTANTS’ REPORT
IIN
OT
ES
TO
TH
EH
IST
OR
ICA
LF
INA
NC
IAL
INF
OR
MA
TIO
N—
cont
inue
d
1.C
OR
PO
RA
TE
AN
DG
RO
UP
INF
OR
MA
TIO
N—
cont
inue
d
Nam
e
Pla
ceof
inco
rpor
atio
n/re
gist
rati
onan
dbu
sine
ss
Dat
eof
inco
rpor
atio
n/re
gist
rati
on
Issu
edor
dina
ry/
regi
ster
edsh
are
capi
tal
Per
cent
age
ofeq
uity
attr
ibut
able
toth
eC
ompa
ny
Pri
ncip
alac
tivi
ties
As
atD
ecem
ber
31,
As
atJu
ne30
,
2016
2017
2018
2019
Sha
rkN
inja
EP
EL
td.(b
)(p)
Uni
ted
Kin
gdom
Nov
embe
r20
18—
——
4110
0In
vest
men
thol
ding
Glo
balA
ppli
ance
UK
Hol
dCo
Lim
ited
(k)(
p)
Uni
ted
Kin
gdom
July
2017
GB
P10
9—
4141
100
Inve
stm
enth
oldi
ng
Com
pass
Cay
man
SP
V,
Lim
ited
(g)(
p)(“
Com
pass
”)C
aym
anIs
land
sJu
ne20
17U
S$5
0,00
0—
4141
100
Inve
stm
enth
oldi
ng
Com
pass
Cay
man
SP
V2
Lim
ited
(b)(
p)
Cay
man
Isla
nds
July
2017
US
$1/
US
$50,
000
—41
4110
0In
vest
men
thol
ding
Glo
balA
ppli
ance
LL
C(b
)(p)
Uni
ted
Sta
tes
June
2017
US
$0.1
—41
4110
0In
vest
men
thol
ding
Eur
o-P
roH
oldc
o,L
LC
(h)(
p)U
nite
dS
tate
sN
ovem
ber
2014
——
4141
100
Inve
stm
enth
oldi
ng
EP
Mid
coL
LC
(b)(
p)U
nite
dS
tate
sN
ovem
ber
2014
——
4141
100
Inve
stm
enth
oldi
ng
Eur
o-P
roIn
tern
atio
nalH
oldi
ngC
ompa
ny(b
)(p)
Uni
ted
Sta
tes
Dec
embe
r20
08—
—41
4110
0In
vest
men
thol
ding
Eur
o-P
roE
urop
eL
td.(i
)(p)
Uni
ted
Kin
gdom
Apr
il20
13G
BP
100
—41
4110
0M
anuf
actu
rean
dsa
leof
hom
eap
plia
nce
prod
ucts
Sha
rkN
inja
Co.
,Ltd
.(b)(
p)Ja
pan
July
2017
JPY
1m
illi
on—
4141
100
Man
ufac
ture
and
sale
ofho
me
appl
ianc
epr
oduc
ts
UK
Eur
o-P
roL
imit
ed(j
)(p)
Uni
ted
Kin
gdom
Sep
tem
ber
2013
GB
P10
0—
4141
100
Man
ufac
ture
and
sale
ofho
me
appl
ianc
epr
oduc
ts
I-21
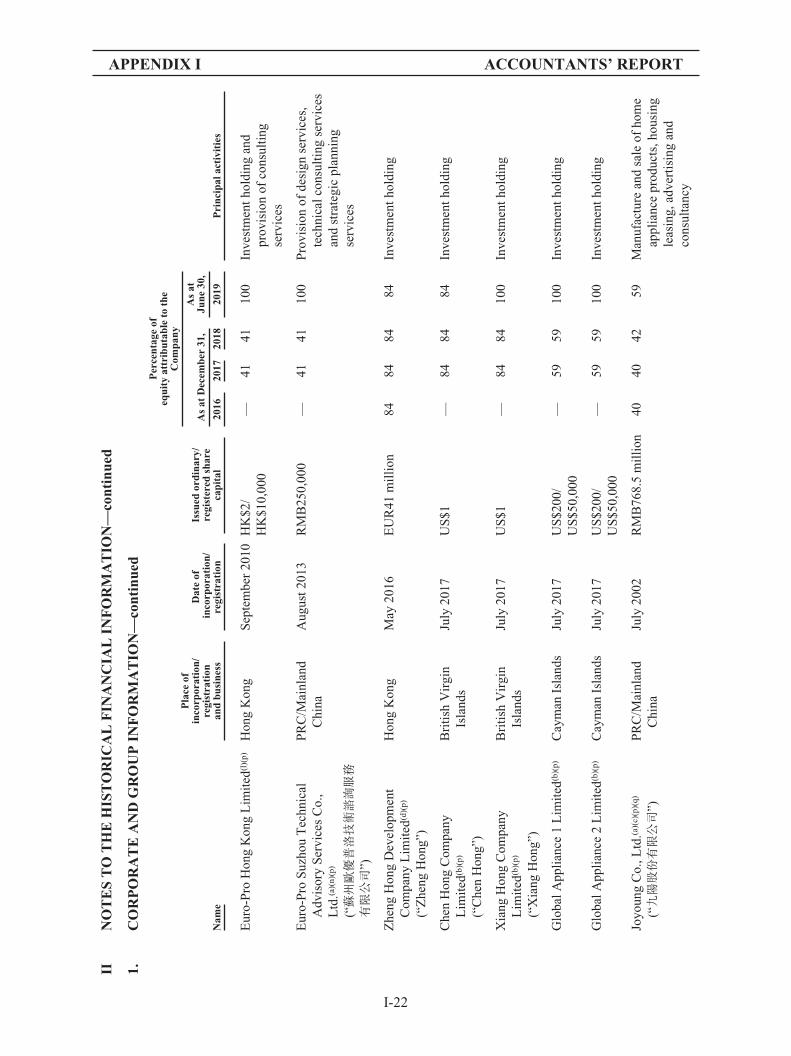
APPENDIX I ACCOUNTANTS’ REPORT
IIN
OT
ES
TO
TH
EH
IST
OR
ICA
LF
INA
NC
IAL
INF
OR
MA
TIO
N—
cont
inue
d
1.C
OR
PO
RA
TE
AN
DG
RO
UP
INF
OR
MA
TIO
N—
cont
inue
d
Nam
e
Pla
ceof
inco
rpor
atio
n/re
gist
rati
onan
dbu
sine
ss
Dat
eof
inco
rpor
atio
n/re
gist
rati
on
Issu
edor
dina
ry/
regi
ster
edsh
are
capi
tal
Per
cent
age
ofeq
uity
attr
ibut
able
toth
eC
ompa
ny
Pri
ncip
alac
tivi
ties
As
atD
ecem
ber
31,
As
atJu
ne30
,
2016
2017
2018
2019
Eur
o-P
roH
ong
Kon
gL
imit
ed(l
)(p)
Hon
gK
ong
Sep
tem
ber
2010
HK
$2/
HK
$10,
000
—41
4110
0In
vest
men
thol
ding
and
prov
isio
nof
cons
ulti
ngse
rvic
es
Eur
o-P
roS
uzho
uT
echn
ical
Adv
isor
yS
ervi
ces
Co.
,L
td.(a
)(n)
(p)
(“蘇州歐優普洛技術諮詢服務
有限公司
”)
PR
C/M
ainl
and
Chi
naA
ugus
t201
3R
MB
250,
000
—41
4110
0P
rovi
sion
ofde
sign
serv
ices
,te
chni
calc
onsu
ltin
gse
rvic
esan
dst
rate
gic
plan
ning
serv
ices
Zhe
ngH
ong
Dev
elop
men
tC
ompa
nyL
imit
ed(d
)(p)
(“Z
heng
Hon
g”)
Hon
gK
ong
May
2016
EU
R41
mil
lion
8484
8484
Inve
stm
enth
oldi
ng
Che
nH
ong
Com
pany
Lim
ited
(b)(
p)
(“C
hen
Hon
g”)
Bri
tish
Vir
gin
Isla
nds
July
2017
US
$1—
8484
84In
vest
men
thol
ding
Xia
ngH
ong
Com
pany
Lim
ited
(b)(
p)
(“X
iang
Hon
g”)
Bri
tish
Vir
gin
Isla
nds
July
2017
US
$1—
8484
100
Inve
stm
enth
oldi
ng
Glo
balA
ppli
ance
1L
imit
ed(b
)(p)
Cay
man
Isla
nds
July
2017
US
$200
/U
S$5
0,00
0—
5959
100
Inve
stm
enth
oldi
ng
Glo
balA
ppli
ance
2L
imit
ed(b
)(p)
Cay
man
Isla
nds
July
2017
US
$200
/U
S$5
0,00
0—
5959
100
Inve
stm
enth
oldi
ng
Joyo
ung
Co.
,Ltd
.(a)(
c)(p
)(q)
(“九陽股份有限公司
”)P
RC
/Mai
nlan
dC
hina
July
2002
RM
B76
8.5
mil
lion
4040
4259
Man
ufac
ture
and
sale
ofho
me
appl
ianc
epr
oduc
ts,h
ousi
ngle
asin
g,ad
vert
isin
gan
dco
nsul
tanc
y
I-22
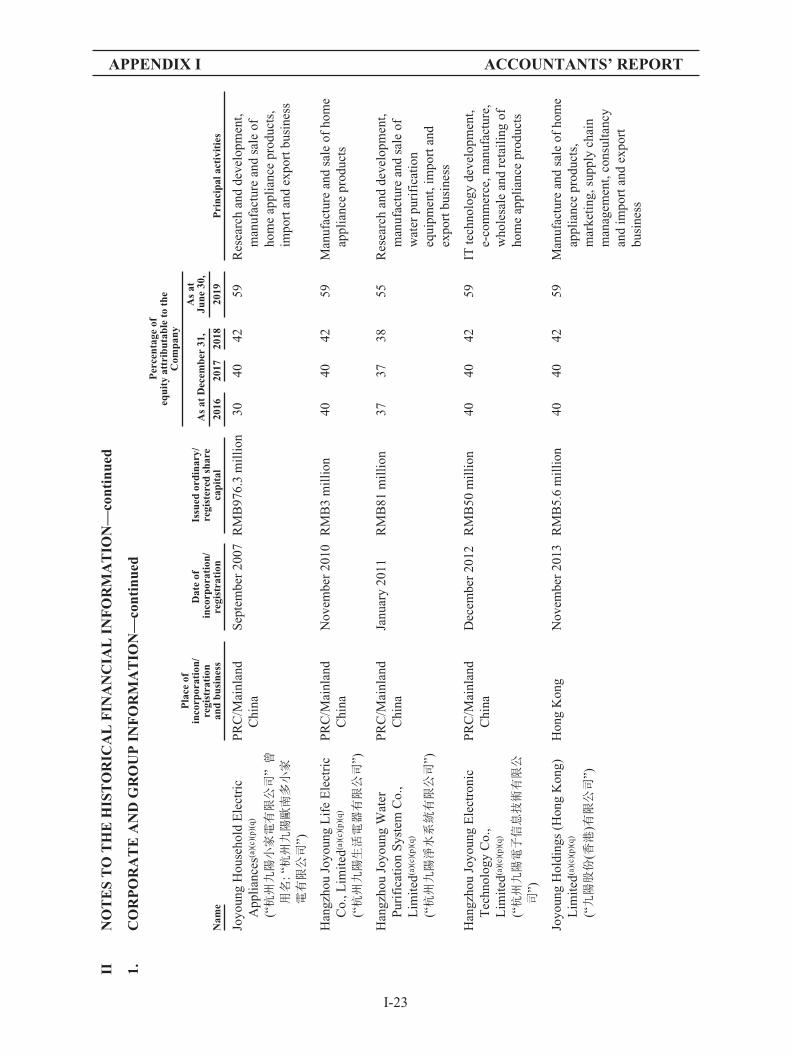
APPENDIX I ACCOUNTANTS’ REPORT
IIN
OT
ES
TO
TH
EH
IST
OR
ICA
LF
INA
NC
IAL
INF
OR
MA
TIO
N—
cont
inue
d
1.C
OR
PO
RA
TE
AN
DG
RO
UP
INF
OR
MA
TIO
N—
cont
inue
d
Nam
e
Pla
ceof
inco
rpor
atio
n/re
gist
rati
onan
dbu
sine
ss
Dat
eof
inco
rpor
atio
n/re
gist
rati
on
Issu
edor
dina
ry/
regi
ster
edsh
are
capi
tal
Per
cent
age
ofeq
uity
attr
ibut
able
toth
eC
ompa
ny
Pri
ncip
alac
tivi
ties
As
atD
ecem
ber
31,
As
atJu
ne30
,
2016
2017
2018
2019
Joyo
ung
Hou
seho
ldE
lect
ric
App
lian
ces(
a)(c
)(p)
(q)
(“杭州九陽小家電有限公司
”曾
用名
:“杭州九陽歐南多小家
電有限公司
”)
PR
C/M
ainl
and
Chi
naS
epte
mbe
r20
07R
MB
976.
3m
illi
on30
4042
59R
esea
rch
and
deve
lopm
ent,
man
ufac
ture
and
sale
ofho
me
appl
ianc
epr
oduc
ts,
impo
rtan
dex
port
busi
ness
Han
gzho
uJo
youn
gL
ife
Ele
ctri
cC
o.,L
imit
ed(a
)(c)
(p)(
q)
(“杭州九陽生活電器有限公司
”)
PR
C/M
ainl
and
Chi
naN
ovem
ber
2010
RM
B3
mil
lion
4040
4259
Man
ufac
ture
and
sale
ofho
me
appl
ianc
epr
oduc
ts
Han
gzho
uJo
youn
gW
ater
Pur
ific
atio
nS
yste
mC
o.,
Lim
ited
(a)(
c)(p
)(q)
(“杭州九陽淨水系統有限公司
”)
PR
C/M
ainl
and
Chi
naJa
nuar
y20
11R
MB
81m
illi
on37
3738
55R
esea
rch
and
deve
lopm
ent,
man
ufac
ture
and
sale
ofw
ater
puri
fica
tion
equi
pmen
t,im
port
and
expo
rtbu
sine
ss
Han
gzho
uJo
youn
gE
lect
roni
cT
echn
olog
yC
o.,
Lim
ited
(a)(
c)(p
)(q)
(“杭州九陽電子信息技術有限公
司”)
PR
C/M
ainl
and
Chi
naD
ecem
ber
2012
RM
B50
mil
lion
4040
4259
ITte
chno
logy
deve
lopm
ent,
e-co
mm
erce
,man
ufac
ture
,w
hole
sale
and
reta
ilin
gof
hom
eap
plia
nce
prod
ucts
Joyo
ung
Hol
ding
s(H
ong
Kon
g)L
imit
ed(a
)(c)
(p)(
q)
(“九陽股份
(香港
)有限公司
”)
Hon
gK
ong
Nov
embe
r20
13R
MB
5.6
mil
lion
4040
4259
Man
ufac
ture
and
sale
ofho
me
appl
ianc
epr
oduc
ts,
mar
keti
ng,s
uppl
ych
ain
man
agem
ent,
cons
ulta
ncy
and
impo
rtan
dex
port
busi
ness
I-23
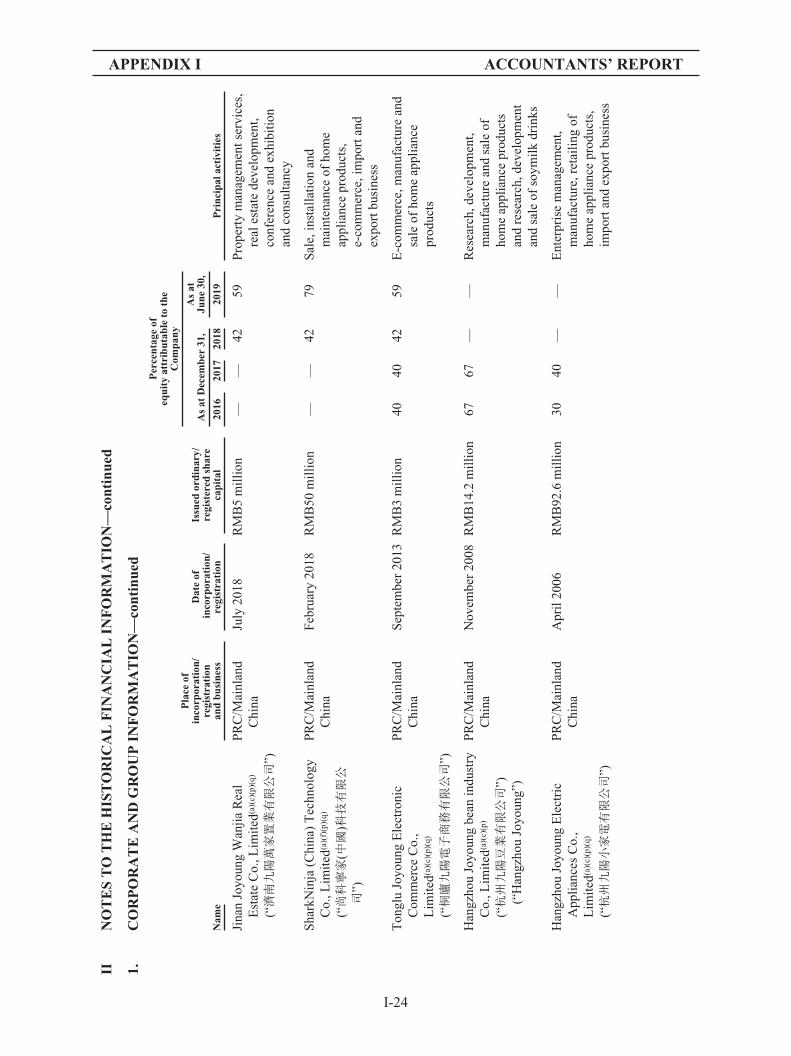
APPENDIX I ACCOUNTANTS’ REPORT
IIN
OT
ES
TO
TH
EH
IST
OR
ICA
LF
INA
NC
IAL
INF
OR
MA
TIO
N—
cont
inue
d
1.C
OR
PO
RA
TE
AN
DG
RO
UP
INF
OR
MA
TIO
N—
cont
inue
d
Nam
e
Pla
ceof
inco
rpor
atio
n/re
gist
rati
onan
dbu
sine
ss
Dat
eof
inco
rpor
atio
n/re
gist
rati
on
Issu
edor
dina
ry/
regi
ster
edsh
are
capi
tal
Per
cent
age
ofeq
uity
attr
ibut
able
toth
eC
ompa
ny
Pri
ncip
alac
tivi
ties
As
atD
ecem
ber
31,
As
atJu
ne30
,
2016
2017
2018
2019
Jina
nJo
youn
gW
anji
aR
eal
Est
ate
Co.
,Lim
ited
(a)(
c)(p
)(q)
(“濟南九陽萬家置業有限公司
”)
PR
C/M
ainl
and
Chi
naJu
ly20
18R
MB
5m
illi
on—
—42
59P
rope
rty
man
agem
ents
ervi
ces,
real
esta
tede
velo
pmen
t,co
nfer
ence
and
exhi
biti
onan
dco
nsul
tanc
y
Sha
rkN
inja
(Chi
na)
Tec
hnol
ogy
Co.
,Lim
ited
(a)(
f)(p
)(q)
(“尚科寧家
(中國
)科技有限公
司”)
PR
C/M
ainl
and
Chi
naF
ebru
ary
2018
RM
B50
mil
lion
——
4279
Sal
e,in
stal
lati
onan
dm
aint
enan
ceof
hom
eap
plia
nce
prod
ucts
,e-
com
mer
ce,i
mpo
rtan
dex
port
busi
ness
Ton
glu
Joyo
ung
Ele
ctro
nic
Com
mer
ceC
o.,
Lim
ited
(a)(
c)(p
)(q)
(“桐廬九陽電子商務有限公司
”)
PR
C/M
ainl
and
Chi
naS
epte
mbe
r20
13R
MB
3m
illi
on40
4042
59E
-com
mer
ce,m
anuf
actu
rean
dsa
leof
hom
eap
plia
nce
prod
ucts
Han
gzho
uJo
youn
gbe
anin
dust
ryC
o.,L
imit
ed(a
)(c)
(p)
(“杭州九陽豆業有限公司
”)(“
Han
gzho
uJo
youn
g”)
PR
C/M
ainl
and
Chi
naN
ovem
ber
2008
RM
B14
.2m
illi
on67
67—
—R
esea
rch,
deve
lopm
ent,
man
ufac
ture
and
sale
ofho
me
appl
ianc
epr
oduc
tsan
dre
sear
ch,d
evel
opm
ent
and
sale
ofso
ymil
kdr
inks
Han
gzho
uJo
youn
gE
lect
ric
App
lian
ces
Co.
,L
imit
ed(a
)(c)
(p)(
q)
(“杭州九陽小家電有限公司
”)
PR
C/M
ainl
and
Chi
naA
pril
2006
RM
B92
.6m
illi
on30
40—
—E
nter
pris
em
anag
emen
t,m
anuf
actu
re,r
etai
ling
ofho
me
appl
ianc
epr
oduc
ts,
impo
rtan
dex
port
busi
ness
I-24
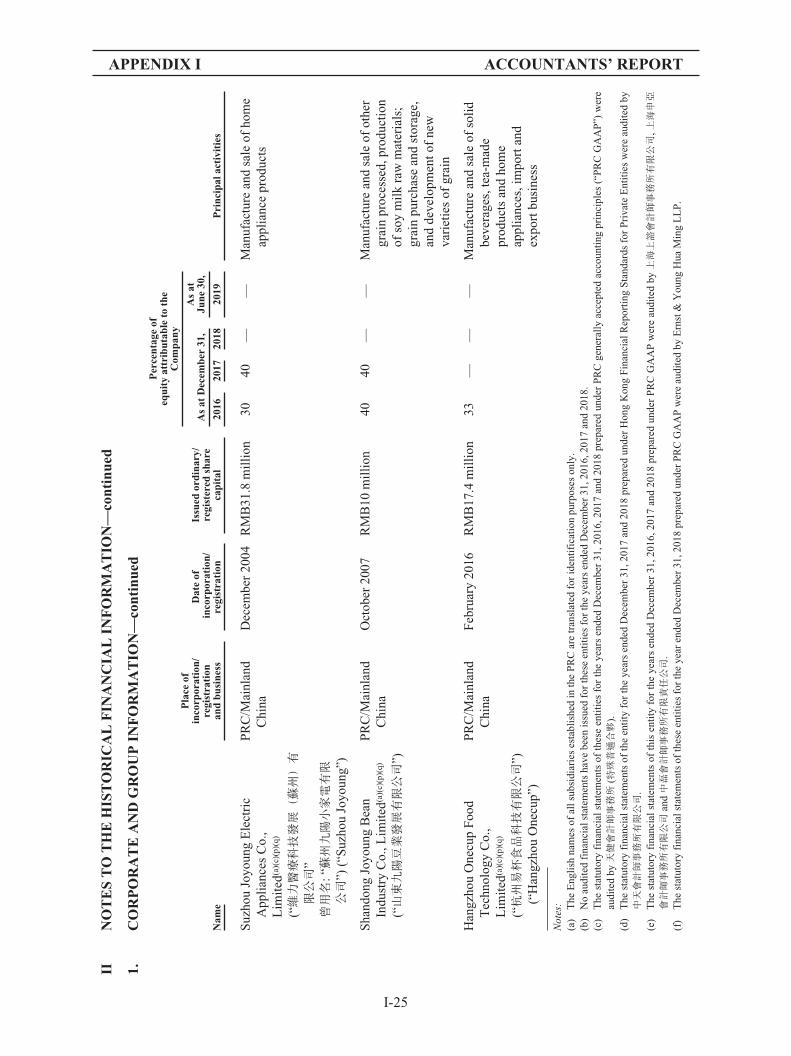
APPENDIX I ACCOUNTANTS’ REPORT
IIN
OT
ES
TO
TH
EH
IST
OR
ICA
LF
INA
NC
IAL
INF
OR
MA
TIO
N—
cont
inue
d
1.C
OR
PO
RA
TE
AN
DG
RO
UP
INF
OR
MA
TIO
N—
cont
inue
d
Nam
e
Pla
ceof
inco
rpor
atio
n/re
gist
rati
onan
dbu
sine
ss
Dat
eof
inco
rpor
atio
n/re
gist
rati
on
Issu
edor
dina
ry/
regi
ster
edsh
are
capi
tal
Per
cent
age
ofeq
uity
attr
ibut
able
toth
eC
ompa
ny
Pri
ncip
alac
tivi
ties
As
atD
ecem
ber
31,
As
atJu
ne30
,
2016
2017
2018
2019
Suz
hou
Joyo
ung
Ele
ctri
cA
ppli
ance
sC
o.,
Lim
ited
(a)(
c)(p
)(q)
(“維力醫療科技發展(蘇州)有
限公司
”曾用名
:“蘇州九陽小家電有限
公司
”)(“
Suz
hou
Joyo
ung”
)
PR
C/M
ainl
and
Chi
naD
ecem
ber
2004
RM
B31
.8m
illi
on30
40—
—M
anuf
actu
rean
dsa
leof
hom
eap
plia
nce
prod
ucts
Sha
ndon
gJo
youn
gB
ean
Indu
stry
Co.
,Lim
ited
(a)(
c)(p
)(q)
(“山東九陽豆業發展有限公司
”)
PR
C/M
ainl
and
Chi
naO
ctob
er20
07R
MB
10m
illi
on40
40—
—M
anuf
actu
rean
dsa
leof
othe
rgr
ain
proc
esse
d,pr
oduc
tion
ofso
ym
ilk
raw
mat
eria
ls;
grai
npu
rcha
sean
dst
orag
e,an
dde
velo
pmen
tof
new
vari
etie
sof
grai
n
Han
gzho
uO
necu
pF
ood
Tec
hnol
ogy
Co.
,L
imit
ed(a
)(c)
(p)(
q)
(“杭州易杯食品科技有限公司
”)(“
Han
gzho
uO
necu
p”)
PR
C/M
ainl
and
Chi
naF
ebru
ary
2016
RM
B17
.4m
illi
on33
——
—M
anuf
actu
rean
dsa
leof
soli
dbe
vera
ges,
tea-
mad
epr
oduc
tsan
dho
me
appl
ianc
es,i
mpo
rtan
dex
port
busi
ness
Not
es:
(a)
The
Eng
lish
nam
esof
alls
ubsi
diar
ies
esta
blis
hed
inth
eP
RC
are
tran
slat
edfo
rid
enti
fica
tion
purp
oses
only
.(b
)N
oau
dite
dfi
nanc
ials
tate
men
tsha
vebe
enis
sued
for
thes
een
titi
esfo
rth
eye
ars
ende
dD
ecem
ber
31,2
016,
2017
and
2018
.(c
)T
hest
atut
ory
fina
ncia
lsta
tem
ents
ofth
ese
enti
ties
for
the
year
sen
ded
Dec
embe
r31
,201
6,20
17an
d20
18pr
epar
edun
der
PR
Cge
nera
lly
acce
pted
acco
unti
ngpr
inci
ples
(“P
RC
GA
AP
”)w
ere
audi
ted
by天健會計師事務所
(特殊普通合夥
).(d
)T
hest
atut
ory
fina
ncia
lsta
tem
ents
ofth
een
tity
for
the
year
sen
ded
Dec
embe
r31
,201
7an
d20
18pr
epar
edun
der
Hon
gK
ong
Fin
anci
alR
epor
ting
Sta
ndar
dsfo
rP
riva
teE
ntit
ies
wer
eau
dite
dby
中天會計師事務所有限公司
.(e
)T
hest
atut
ory
fina
ncia
lst
atem
ents
ofth
isen
tity
for
the
year
sen
ded
Dec
embe
r31
,201
6,20
17an
d20
18pr
epar
edun
der
PR
CG
AA
Pw
ere
audi
ted
by上海上諮會計師事務所有限公司
,上海申亞
會計師事務所有限公司
and中磊會計師事務所有限責任公司
.(f
)T
hest
atut
ory
fina
ncia
lsta
tem
ents
ofth
ese
enti
ties
for
the
year
ende
dD
ecem
ber
31,2
018
prep
ared
unde
rP
RC
GA
AP
wer
eau
dite
dby
Ern
st&
You
ngH
uaM
ing
LL
P.
I-25

APPENDIX I ACCOUNTANTS’ REPORT
II NOTES TO THE HISTORICAL FINANCIAL INFORMATION—continued
1. CORPORATE AND GROUP INFORMATION—continued
(g) The statutory financial statements of this entity for the four-month period ended December 31, 2017 and the year endedDecember 31, 2018 prepared under International Financial Reporting Standards (“IFRSs”) were audited by Ernst & YoungHua Ming LLP.
(h) The consolidated financial statements of this entity for the nine-month period ended December 31, 2017 prepared underaccounting principles generally accepted in the United States of America (“US GAAP”) were audited by Ernst & Young LLP.
(i) The statutory financial statements of the entity for the years ended March 31, 2016, March 31, 2017 and the nine-month periodended December 31, 2017 prepared under accounting principles generally accepted in the United Kingdom (“UK GAAP”)were audited by Ernst and Young LLP.
(j) The statutory financial statements of the entity for the years ended March 31, 2016, March 31, 2017 and the nine-month periodended December 31, 2017 prepared under UK GAAP were audited by Brown Butler.
(k) The statutory financial statements of the entity for the period ended December 31, 2018 prepared under UK GAAP wereaudited by Brown Butler.
(l) The statutory financial statements of the entity for the years ended March 31, 2016, March 31, 2017 and the nine-month periodended December 31, 2017 prepared under Hong Kong Financial Reporting Standards (“HKFRS”) were audited by RSM HongKong.
(m) The statutory financial statements for the entity for the years ended December 31, 2016, 2017 and 2018 prepared under PRCGAAP were audited by Jiahe CPA firm.
(n) The statutory financial statements for the entity for the years ended December 31, 2016, 2017 and 2018 prepared under PRCGAAP were audited by Huyxin CAP firm.
(o) The statutory financial statements for the entity for the year ended December 31, 2018 prepared under HKFRS were audited byErnst & Young Hua Ming LLP.
(p) No audited financial statements have been issued for all these entities for the six months ended June 30, 2019.(q) The general meeting of shareholders of Joyoung Co., Ltd. (the “General Meeting”) is the highest authority of Joyoung Co.,
Ltd.. Immediately before the Reorganization, Joyoung Co., Ltd. was held by Shanghai Lihong as to 48.77%. The remainingshares of Joyoung Co., Ltd. were widely held, and no party had interest of sufficient size either by itself or in aggregate with asmall number of others to vote against Shanghai Lihong in the General Meeting. As such, Shanghai Lihong achieved controlover Joyoung Co., Ltd. and its subsidiaries before the Reorganization.
I-26
APPENDIX I ACCOUNTANTS’ REPORT
II NOTES TO THE HISTORICAL FINANCIAL INFORMATION—continued
2.1 BASIS OF PRESENTATION
Pursuant to the Reorganization, as more fully explained in the paragraph headed“Reorganization” in the section headed “History, Reorganization and Corporate Structure” in theProspectus, the Company became the holding company of the companies now comprising the Groupon December 4, 2018. As the Reorganization involved inserting new holding companies at the top ofan existing group, that have resulted in a change of the respective voting and beneficial interests. Thecompanies now comprising the Group were under the common control of the controlling shareholderbefore and after the Reorganization. Accordingly, for the purpose of this report, the HistoricalFinancial Information has been prepared on a consolidated basis as a continuation of the existing groupby applying the principles of merger accounting as if the Reorganization had been completed at thebeginning of the Relevant Periods.
The consolidated statements of profit or loss, the consolidated statements of comprehensiveincome, the consolidated statements of changes in equity and the consolidated statements of cash flowsof the Group for the Relevant Periods and the six months ended June 30, 2018 include the results andcash flows of all companies now comprising the Group from the earliest date presented or since thedate when the subsidiaries and/or businesses first came under the common control of the controllingshareholder, where this is a shorter period. The consolidated statements of financial position of theGroup as at December 31, 2016, 2017 and 2018 and June 30, 2019 have been prepared to present theassets and liabilities of the subsidiaries and/or businesses using the existing book values from thecontrolling shareholder’s perspective. No adjustments are made to reflect fair values, or recognize anynew assets or liabilities as a result of the Reorganization.
Equity interests in subsidiaries and/or businesses held by parties other than the controllingshareholder prior to the Reorganization are presented as non-controlling interests in equity in applyingthe principles of merger accounting.
All intra-group transactions and balances have been eliminated on consolidation.
2.2 BASIS OF PREPARATION
The Historical Financial Information has been prepared in accordance with InternationalFinancial Reporting Standards (“IFRSs”), which include all International Financial ReportingStandards, International Accounting Standards (“IASs”) and Standing Interpretations Committeeinterpretations issued and approved by the International Accounting Standards Board (the “IASB”). AllIFRSs effective for the accounting period commencing from January 1, 2019, together with therelevant transitional provisions, have been early adopted by the Group in the preparation of theHistorical Financial Information throughout the Relevant Periods. These financial statements arepresented in United States dollars (“US$”) and all values are rounded to the nearest thousand(US$’000) except when otherwise indicated.
The Historical Financial Information has been prepared under the historical cost convention,except for financial assets at fair value through profit or loss, financial assets at fair value through othercomprehensive income and financial liabilities associated with put option.
The preparation of the Historical Financial Information in conformity with IFRSs requires theuse of certain critical accounting estimates. It also requires the directors of the Group to exercisejudgment in the process of applying the Group’s accounting policies. The area including a higher
I-27

APPENDIX I ACCOUNTANTS’ REPORT
II NOTES TO THE HISTORICAL FINANCIAL INFORMATION—continued
2.2 BASIS OF PREPARATION—continued
degree of judgment or complexity, or areas where assumptions and estimates are significant to theHistorical Financial Information are disclosed in note II 3.
Basis of consolidation
The Historical Financial Information includes the financial information of the Group for theRelevant Periods. As explained in note II 2.1 above, the Historical Financial Information for theRelevant Periods has been prepared on a consolidated basis using the merger accounting.
A subsidiary is an entity (including a structured entity), directly or indirectly, controlled by theCompany. Control is achieved when the Group is exposed, or has rights, to variable returns from itsinvolvement with the investee and has the ability to affect those returns through its power over theinvestee (i.e., existing rights that give the Group the current ability to direct the relevant activities ofthe investee).
When the Company has, directly or indirectly, less than a majority of the voting or similarrights of an investee, the Group considers all relevant facts and circumstances in assessing whether ithas power over an investee, including:
(a) the contractual arrangement with the other vote holders of the investee;
(b) rights arising from other contractual arrangements; and
(c) the Group’s voting rights and potential voting rights.
The financial information of the subsidiaries is prepared for the same reporting period as theCompany, using consistent accounting policies. The results of subsidiaries are consolidated from thedate on which the Group obtains control, and continue to be consolidated until the date that suchcontrol ceases.
Profit or loss and each component of other comprehensive income are attributed to the ownersof the parent of the Company and to the non-controlling interests, even if this results in thenon-controlling interests having a deficit balance. All intra-group assets and liabilities, equity, income,expenses and cash flows relating to transactions between members of the Group are eliminated in fullon consolidation.
The Group reassesses whether or not it controls an investee if facts and circumstances indicatethat there are changes to one or more of the three elements of control described above. A change in theownership interest of a subsidiary, without a loss of control, is accounted for as an equity transaction.
If the Group loses control over a subsidiary, it derecognizes (i) the assets (including goodwill)and liabilities of the subsidiary, (ii) the carrying amount of any non-controlling interest and (iii) thecumulative translation differences recorded in equity; and recognizes (i) the fair value of theconsideration received, (ii) the fair value of any investment retained and (iii) any resulting surplus ordeficit in profit or loss. The Group’s share of components previously recognized in othercomprehensive income is reclassified to profit or loss or retained profits, as appropriate, on the samebasis as would be required if the Group had directly disposed of the related assets or liabilities.
I-28
APPENDIX I ACCOUNTANTS’ REPORT
II NOTES TO THE HISTORICAL FINANCIAL INFORMATION—continued
2.3 ISSUED BUT NOT YET EFFECTIVE INTERNATIONAL FINANCIAL REPORTINGSTANDARDS
The Group has not applied the following new and revised IFRSs, which are applicable to theGroup’s operation, that have been issued but are not yet effective, in this Historical FinancialInformation.
Amendments to IFRS 3 Definition of a Business(1)
IFRS 17 Insurance Contracts(2)
Amendments to IAS 1 and IAS 8 Definition of Material(1)
Notes:(1) Effective for annual periods beginning on or after January 1, 2020.(2) Effective for annual periods beginning on or after January 1, 2021.
Further information about those IFRSs that are expected to be applicable to the Group isdescribed below.
Amendments to IFRS 3 clarify and provide additional guidance on the definition of a business.The amendments clarify that for an integrated set of activities and assets to be considered a business, itmust include, at a minimum, an input and a substantive process that together significantly contribute tothe ability to create output. A business can exist without including all of the inputs and processesneeded to create outputs. The amendments remove the assessment of whether market participants arecapable of acquiring the business and continue to produce outputs. Instead, the focus is on whetheracquired inputs and acquired substantive processes together significantly contribute to the ability tocreate outputs. The amendments have also narrowed the definition of outputs to focus on goods orservices provided to customers, investment income or other income from ordinary activities.Furthermore, the amendments provide guidance to assess whether an acquired process is substantiveand introduce an optional fair value concentration test to permit a simplified assessment of whether anacquired set of activities and assets is not a business. The Group expects to adopt the amendmentsprospectively from January 1, 2020.
IFRS 17 is a comprehensive new accounting standard for insurance contracts coveringrecognition and measurement, presentation and disclosure. Once effective, IFRS 17 will replace theexisting IFRS 4 Insurance Contracts. The standard applies to all types of insurance contracts (i.e., life,non-life, direct insurance and re-insurance), regardless of the type of entities that issue them, as well asto certain guarantees and financial instruments with discretionary participation features. A few scopeexceptions will apply. The overall objective of the standard is to provide an accounting model forinsurance contracts that is more useful and consistent for insurers. In contrast to the requirements inIFRS 4, which are largely based on grandfathering previous local accounting policies, the standardprovides a comprehensive model for insurance contracts, covering all relevant accounting aspects. Thecore of the standard is the general model, supplemented by:
Š a specific adaptation for contracts with direct participation features (the variable feeapproach);
Š a simplified approach (the premium allocation approach) mainly for short-durationcontracts.
IFRS 17 is effective for reporting periods beginning on or after January 1, 2021. Earlyapplication is permitted, provided the entity also applies IFRS 9 and IFRS 15 on or before the date itfirst applies IFRS 17. The standard is not expected to have any impact on the Group.
I-29

APPENDIX I ACCOUNTANTS’ REPORT
II NOTES TO THE HISTORICAL FINANCIAL INFORMATION—continued
2.3 ISSUED BUT NOT YET EFFECTIVE INTERNATIONAL FINANCIAL REPORTINGSTANDARDS—continued
Amendments to IAS 1 and IAS 8 provide a new definition of material. The new definitionstates that information is material if omitting, misstating or obscuring it could reasonably be expectedto influence decisions that the primary users of general purpose financial statements make on the basisof those financial statements. The amendments clarify that materiality will depend on the nature ormagnitude of information. A misstatement of information is material if it could reasonably be expectedto influence decisions made by the primary users. The Group expects to adopt the amendmentsprospectively from January 1, 2020. The amendments are not expected to have any significant impacton the Group’s financial statements.
2.4 SUMMARY OF SIGNIFICANT ACCOUNTING POLICIES
Investments in associates and a joint venture
An associate is an entity in which the Group has a long term interest of generally not less than20% of the equity voting rights and over which it is in a position to exercise significant influence.Significant influence is the power to participate in the financial and operating policy decisions of theinvestee, but is not control or joint control over those policies.
A joint venture is a type of joint arrangement whereby the parties that have joint control of thearrangement have rights to the net assets of the joint venture. Joint control is the contractually agreedsharing of control of an arrangement, which exists only when decisions about the relevant activitiesrequire the unanimous consent of the parties sharing control.
The Group’s investments in associates and a joint venture are stated in the consolidatedstatement of financial position at the Group’s share of net assets under the equity method ofaccounting, less any impairment losses.
The Group’s share of the post-acquisition results and other comprehensive income of associatesand a joint venture is included in the consolidated statement of profit or loss and consolidatedstatement of comprehensive income, respectively. In addition, when there has been a changerecognized directly in the equity of the associate or a joint venture, the Group recognizes its share ofany changes, when applicable, in the consolidated statement of changes in equity. Unrealized gains andlosses resulting from transactions between the Group and its associates or a joint venture are eliminatedto the extent of the Group’s investments in the associates or a joint venture, except where unrealizedlosses provide evidence of an impairment of the assets transferred. Goodwill arising from theacquisition of associates or a joint venture is included as part of the Group’s investments in associatesor a joint venture.
If an investment in an associate becomes an investment in a joint venture or vice versa, theretained interest is not remeasured. Instead, the investment continues to be accounted for under theequity method. In all other cases, upon loss of significant influence over the associate or joint controlover the joint venture, the Group measures and recognizes any retained investment at its fair value.Any difference between the carrying amount of the associate or joint venture upon loss of significantinfluence or joint control and the fair value of the retained investment and proceeds from disposal isrecognized in profit or loss.
When an investment in an associate or joint venture is classified as assets held for sale, it isaccounted for in accordance with IFRS 5 Non-current Assets Held for Sale and DiscontinuedOperations.
I-30
APPENDIX I ACCOUNTANTS’ REPORT
II NOTES TO THE HISTORICAL FINANCIAL INFORMATION—continued
2.4 SUMMARY OF SIGNIFICANT ACCOUNTING POLICIES—continued
Business combinations and goodwill
Business combinations are accounted for using the acquisition method. The considerationtransferred is measured at the acquisition date fair value which is the sum of the acquisition date fairvalues of assets transferred by the Group, liabilities assumed by the Group to the former owners of theacquiree and the equity interests issued by the Group in exchange for control of the acquiree. For eachbusiness combination, the Group elects whether to measure the non-controlling interests in theacquiree that are present ownership interests and entitle their holders to a proportionate share of netassets in the event of liquidation at fair value or at the proportionate share of the acquiree’s identifiablenet assets. All other components of non-controlling interests are measured at fair value. Acquisition-related costs are expensed as incurred.
When the Group acquires a business, it assesses the financial assets and liabilities assumed forappropriate classification and designation in accordance with the contractual terms, economiccircumstances and pertinent conditions as at the acquisition date.
If the business combination is achieved in stages, the previously held equity interest isremeasured at its acquisition date fair value and any resulting gain or loss is recognized in profit orloss.
Any contingent consideration to be transferred by the acquirer is recognized at fair value at theacquisition date. Contingent consideration classified as an asset or liability is measured at fair valuewith changes in fair value recognized in profit or loss. Contingent consideration that is classified asequity is not remeasured and subsequent settlement is accounted for within equity.
Goodwill is initially measured at cost, being the excess of the aggregate of the considerationtransferred, the amount recognized for non-controlling interests and any fair value of the Group’spreviously held equity interests in the acquiree over the identifiable net assets acquired and liabilitiesassumed. If the sum of this consideration and other items is lower than the fair value of the net assetsacquired, the difference is, after reassessment, recognized in profit or loss as a gain on bargainpurchase.
After initial recognition, goodwill is measured at cost less any accumulated impairment losses.Goodwill is tested for impairment annually or more frequently if events or changes in circumstancesindicate that the carrying value may be impaired. The Group performs its annual impairment test ofgoodwill as at December 31. For the purpose of impairment testing, goodwill acquired in a businesscombination is, from the acquisition date, allocated to each of the Group’s cash-generating units, orgroups of cash-generating units, that are expected to benefit from the synergies of the combination,irrespective of whether other assets or liabilities of the Group are assigned to those units or groups ofunits.
Impairment is determined by assessing the recoverable amount of the cash-generating unit(group of cash-generating units) to which the goodwill relates. Where the recoverable amount of thecash-generating unit (group of cash-generating units) is less than the carrying amount, an impairmentloss is recognized. An impairment loss recognized for goodwill is not reversed in a subsequent period.
I-31
APPENDIX I ACCOUNTANTS’ REPORT
II NOTES TO THE HISTORICAL FINANCIAL INFORMATION—continued
2.4 SUMMARY OF SIGNIFICANT ACCOUNTING POLICIES—continued
Business combinations and goodwill—continued
Where goodwill has been allocated to a cash-generating unit (or group of cash-generating units)and part of the operation within that unit is disposed of, the goodwill associated with the operationdisposed of is included in the carrying amount of the operation when determining the gain or loss onthe disposal. Goodwill disposed of in these circumstances is measured based on the relative value ofthe operation disposed of and the portion of the cash-generating unit retained.
Fair value measurement
The Group measures its financial assets at fair value through profit or loss, financial assetsdesignated at fair value through other comprehensive income and financial liabilities associated withput option at the end of the Relevant Periods. Fair value is the price that would be received to sell anasset or paid to transfer a liability in an orderly transaction between market participants at themeasurement date. The fair value measurement is based on the presumption that the transaction to sellthe asset or transfer the liability takes place either in the principal market for the asset or liability, or inthe absence of a principal market, in the most advantageous market for the asset or liability. Theprincipal or the most advantageous market must be accessible by the Group. The fair value of an assetor a liability is measured using the assumptions that market participants would use when pricing theasset or liability, assuming that market participants act in their economic best interest.
A fair value measurement of a non-financial asset takes into account a market participant’sability to generate economic benefits by using the asset in its highest and best use or by selling it toanother market participant that would use the asset in its highest and best use.
The Group uses valuation techniques that are appropriate in the circumstances and for whichsufficient data are available to measure fair value, maximizing the use of relevant observable inputsand minimizing the use of unobservable inputs.
All assets and liabilities for which fair value is measured or disclosed in the financialstatements are categorized within the fair value hierarchy, described as follows, based on the lowestlevel input that is significant to the fair value measurement as a whole:
Level 1 — based on quoted prices (unadjusted) in active markets for identical assets orliabilities
Level 2 — based on valuation techniques for which the lowest level input that is significant tothe fair value measurement is observable, either directly or indirectly
Level 3 — based on valuation techniques for which the lowest level input that is significant tothe fair value measurement is unobservable
For assets and liabilities that are recognized in the financial statements on a recurring basis, theGroup determines whether transfers have occurred between levels in the hierarchy by reassessingcategorization (based on the lowest level input that is significant to the fair value measurement as awhole) at the end of each reporting period.
I-32
APPENDIX I ACCOUNTANTS’ REPORT
II NOTES TO THE HISTORICAL FINANCIAL INFORMATION—continued
2.4 SUMMARY OF SIGNIFICANT ACCOUNTING POLICIES—continued
Impairment of non-financial assets
Where an indication of impairment exists, or when annual impairment testing for an asset isrequired (other than inventories, deferred tax assets, financial assets and investment properties), theasset’s recoverable amount is estimated. An asset’s recoverable amount is the higher of the asset’s orcash-generating unit’s value in use and its fair value less costs of disposal, and is determined for anindividual asset, unless the asset does not generate cash inflows that are largely independent of thosefrom other assets or groups of assets, in which case the recoverable amount is determined for the cash-generating unit to which the asset belongs.
An impairment loss is recognized only if the carrying amount of an asset exceeds itsrecoverable amount. In assessing value in use, the estimated future cash flows are discounted to theirpresent value using a pre-tax discount rate that reflects current market assessments of the time value ofmoney and the risks specific to the asset. An impairment loss is charged to the statement of profit orloss in the period in which it arises in those expense categories consistent with the function of theimpaired asset.
An assessment is made at the end of each reporting period as to whether there is an indicationthat previously recognized impairment losses may no longer exist or may have decreased. If such anindication exists, the recoverable amount is estimated. A previously recognized impairment loss of anasset other than goodwill is reversed only if there has been a change in the estimates used to determinethe recoverable amount of that asset, but not to an amount higher than the carrying amount that wouldhave been determined (net of any depreciation/amortization) had no impairment loss been recognizedfor the asset in prior years. A reversal of such an impairment loss is credited to the statement of profitor loss in the period in which it arises, unless the asset is carried at a revalued amount, in which casethe reversal of the impairment loss is accounted for in accordance with the relevant accounting policyfor that revalued asset.
Related parties
A party is considered to be related to the Group if:
(a) the party is a person or a close member of that person’s family and that person:
(i) has control or joint control over the Group;
(ii) has significant influence over the Group; or
(iii) is a member of the key management personnel of the Group or of a parent of theGroup;
or
(b) the party is an entity where any of the following conditions applies:
(i) the entity and the Group are members of the same group;
(ii) one entity is an associate or joint venture of the other entity (or of a parent,subsidiary or fellow subsidiary of the other entity);
(iii) the entity and the Group are joint ventures of the same third party;
I-33
APPENDIX I ACCOUNTANTS’ REPORT
II NOTES TO THE HISTORICAL FINANCIAL INFORMATION—continued
2.4 SUMMARY OF SIGNIFICANT ACCOUNTING POLICIES—continued
Related parties—continued
(iv) one entity is a joint venture of a third entity and the other entity is an associate of thethird entity;
(v) the entity is a post-employment benefit plan for the benefit of employees of eitherthe Group or an entity related to the Group;
(vi) the entity is controlled or jointly controlled by a person identified in (a);
(vii) a person identified in (a)(i) has significant influence over the entity or is a memberof the key management personnel of the entity (or of a parent of the entity); and
(viii) the entity, or any member of a group of which it is a part, provides key managementpersonnel services to the Group or to the parent of the Group.
Property, plant and equipment and depreciation
Property, plant and equipment, other than construction in progress, are stated at cost lessaccumulated depreciation and any impairment losses. The cost of an item of property, plant andequipment comprises its purchase price and any directly attributable costs of bringing the asset to itsworking condition and location for its intended use.
Expenditure incurred after items of property, plant and equipment have been put into operation,such as repairs and maintenance, is normally charged to the statement of profit or loss in the period inwhich it is incurred. In situations where the recognition criteria are satisfied, the expenditure for amajor inspection is capitalized in the carrying amount of the asset as a replacement. Where significantparts of property, plant and equipment are required to be replaced at intervals, the Group recognizessuch parts as individual assets with specific useful lives and depreciates them accordingly.
Depreciation is calculated on the straight-line basis to write off the cost of each item ofproperty, plant and equipment to its residual value over its estimated useful life. The principal annualrates used for this purpose are as follows:
Buildings 4.5% to 19.0%Leasehold improvements Over the shorter of the lease terms and estimated useful lifeFurniture and fixtures 9.0% to 48.5%Machinery 9.0% to 33.3%Motor vehicles 11.3% to 23.8%
Where parts of an item of property and equipment have different useful lives, the cost of thatitem is allocated on a reasonable basis among the parts and each part is depreciated separately. Usefullives and the depreciation method are reviewed, and adjusted if appropriate, at least at each financialyear end.
An item of property and equipment including any significant part initially recognized isderecognized upon disposal or when no future economic benefits are expected from its use or disposal.Any gain or loss on disposal or retirement recognized in the statement of profit or loss in the year theasset is derecognized is the difference between the net sales proceeds and the carrying amount of therelevant asset.
I-34
APPENDIX I ACCOUNTANTS’ REPORT
II NOTES TO THE HISTORICAL FINANCIAL INFORMATION—continued
2.4 SUMMARY OF SIGNIFICANT ACCOUNTING POLICIES—continued
Property, plant and equipment and depreciation—continued
Construction in progress represents the Group’s buildings, furniture and fixtures, andmachinery under construction and leasehold improvements, which are stated at cost less anyimpairment loss, and are not depreciated. Cost comprises the direct costs of construction during theperiod of construction. Construction in progress is reclassified to the appropriate category of propertyand equipment when completed and ready for use.
Investment properties
Investment properties are interests in land and buildings (including the leasehold interest underan operating lease for a property which would otherwise meet the definition of an investment property)held to earn rental income and/or for capital appreciation, rather than for use in the production orsupply of goods or services or for administrative purposes; or for sale in the ordinary course ofbusiness. Such properties are measured initially at cost, including transaction costs. Subsequent toinitial recognition, investment properties are stated at cost less accumulated depreciation and anyimpairment losses.
Depreciation is calculated on the straight-line basis to write off the cost of each item ofinvestment properties to its residual value over its estimated useful life of 20 to 40 years.
For a transfer from investment properties to owner-occupied properties, the deemed cost of aproperty for subsequent accounting is its carrying amount at the date of change in use and vice versa.No gain or loss is recognized in profit or loss during the change in use of the property.
Non-current assets and disposal groups held for sale
Non-current assets and disposal groups are classified as held for sale if their carrying amountswill be recovered principally through a sales transaction rather than through continuing use. For this tobe the case, the asset or disposal group must be available for immediate sale in its present conditionsubject only to terms that are usual and customary for the sale of such assets or disposal groups and itssale must be highly probable. All assets and liabilities of a subsidiary classified as a disposal group arereclassified as held for sale regardless of whether the Group retains a non-controlling interest in itsformer subsidiary after the sale.
Non-current assets and disposal groups (other than investment properties and financial assets)classified as held for sale are measured at the lower of their carrying amounts and fair values less coststo sell. Property, plant and equipment and intangible assets classified as held for sale are notdepreciated or amortized.
Intangible assets (other than goodwill)
Intangible assets acquired separately are measured on initial recognition at cost. The cost ofintangible assets acquired in a business combination is the fair value as at the date of acquisition. Theuseful lives of intangible assets are assessed to be either finite or indefinite. Intangible assets with finitelives are subsequently amortized over the useful economic life of 2.5 to 12.5 years and assessed for
I-35
APPENDIX I ACCOUNTANTS’ REPORT
II NOTES TO THE HISTORICAL FINANCIAL INFORMATION—continued
2.4 SUMMARY OF SIGNIFICANT ACCOUNTING POLICIES—continued
Intangible assets (other than goodwill)—continued
impairment whenever there is an indication that the intangible asset may be impaired. The amortizationperiod and the amortization method for an intangible asset with a finite useful life are reviewed at leastat each financial year end.
Intangible assets with indefinite useful lives are tested for impairment annually eitherindividually or at the cash-generating unit level. Such intangible assets are not amortized. The usefullife of an intangible asset with indefinite life is reviewed annually to determine whether the indefinitelife assessment continues to be supportable. If not, the change in the useful life assessment fromindefinite to finite is accounted for on a prospective basis.
Trademarks
The cost of trademarks acquired in the business combination is the fair value at the date ofacquisition. The Group intends to continuously renew the trademarks and such renewal is expected tobe at little costs. Thus, the useful lives of these trademarks are considered to be indefinite as it isexpected to contribute to net cash inflow of the Group indefinitely. Considering their indefinite usefullives, the trademarks are not amortized and individually tested for impairment annually. The useful lifeof trademark is reviewed annually to determine whether the indefinite life assessment continues to besupportable. If not, the change in the useful life assessment from indefinite to finite is accounted for ona prospective basis.
Patents
Purchased patents are amortized on the straight-line basis over their remaining legal life of 2.5to 12.5 years since being purchased.
The patents acquired in business combinations included a wide range portfolio of patents whichcovers and protects the design and utility for the technology that were applied in the Euro-Pro Group’sproducts. Each patent can contribute to several products and can be used for several generations ofproducts. The Group’s technology is considered one of the successful factors to the business andoperation. Based on historical lives of the Group’s products and technology, the technology contentgrowth is slow and existing technology will be gradually developed and replaced by new technology.Management expected most of the estimated economic benefit would be realized in 10 years eventhough the remaining legal term of individual registered patents are 15 years. The patents acquired inbusiness combinations are subsequently amortized on the straight-line basis of 10 years, which is theshorter of the legal terms and the estimated useful life.
Retailer relationships
The Euro-Pro Group sells to most of the major retailers in the US and Canada (for exampleWalmart, Costco, Amazon). This retailer base has been very stable for many years. The retailerrelationships can ensure that the Company has shelf space at these retailers. The Company expectedmost of the estimated economic benefit will be realized in 9 years based on yearly attrition in revenuegenerated from these existing relationships. The retailer relationships acquired in business
I-36
APPENDIX I ACCOUNTANTS’ REPORT
II NOTES TO THE HISTORICAL FINANCIAL INFORMATION—continued
2.4 SUMMARY OF SIGNIFICANT ACCOUNTING POLICIES—continued
Intangible assets (other than goodwill)—continued
Retailer relationships—continued
combinations are subsequently amortized on the straight-line basis over their estimated useful lives of9 years.
Research and development costs
All research costs are charged to profit or loss as incurred.
Certain external consulting, prototype and legal expenditures incurred on projects to developnew core components of new product categories are capitalized and deferred only when the Group candemonstrate the technical feasibility of completing the intangible asset so that it will be available foruse or sale, its intention to complete and its ability to use or sell the asset, how the asset will generatefuture economic benefits, the availability of resources to complete the project and the ability tomeasure reliably the expenditure during the development.
Product development expenditure which does not meet these criteria is expensed whenincurred. Deferred development costs are stated at cost less any impairment losses and are amortizedon the straight-line basis from the date when they are available for use over their estimated useful livesof 10 years with reference to the historical life cycle of core components of a similar kind which can beutilized in several generations of products.
Software
Purchased software is stated at cost less any impairment losses and is amortized on the straight-line basis over its estimated useful lives of 5 to 10 years.
Leases
IFRS 16 supersedes IAS 17 Leases, IFRIC 4 Determining Whether an Arrangement Contains aLease, SIC-15 Operating Leases-Incentives and SIC-27 Evaluating the Substance of TransactionsInvolving the Legal Form of a Lease. The standard sets out the principles for the recognition,measurement, presentation and disclosure of leases and requires lessees to account for most leasesunder a single on-balance sheet model.
Lessor accounting under IFRS 16 is substantially unchanged from IAS 17. Lessors willcontinue to classify leases as either operating or finance leases using similar principles as in IAS 17.Therefore, IFRS 16 did not have an impact on leases where the Group is the lessor.
The Group adopted IFRS 16 using the full retrospective method since the beginning of theRelevant Periods. The Group elected to use the transition practical expedient allowing the standard tobe applied only to contracts that were previously identified as leases applying IAS 17 and IFRIC 4 atthe date of initial application. The Group also elected to use the recognition exemptions for leasecontracts that, at the commencement date, have a lease term of 12 months or less and do not contain apurchase option (“short-term leases”), and lease contracts for which the underlying asset is of low
I-37
APPENDIX I ACCOUNTANTS’ REPORT
II NOTES TO THE HISTORICAL FINANCIAL INFORMATION—continued
2.4 SUMMARY OF SIGNIFICANT ACCOUNTING POLICIES—continued
Leases—continued
value (“low-value assets”). The Group recognized right-of-use assets of US$6,345,000,US$64,499,000, US$58,840,000 and US$64,098,000, respectively, as at December 31, 2016, 2017,2018 and June 30, 2019, and lease liabilities of US$6,444,000, US$67,691,000, US$63,592,000 andUS$69,595,000, respectively, as at December 31, 2016, 2017, 2018 and June 30, 2019 upon adoptionof IFRS 16. It is considered that the adoption of IFRS 16 did not have a significant impact on theperformance of the Group during the Relevant Periods.
The Group has lease contracts for various items of buildings, machinery, vehicles and otherequipment. Before the adoption of IFRS 16, the Group classified each of its leases (as lessee) at theinception date as either a finance lease or an operating lease. In an operating lease, the leased propertywas not capitalized and the lease payments were recognized as rental expenses in the statement ofprofit or loss on a straight-line basis over the lease term. Any prepaid rent and accrued rent wererecognized under prepayments and other payables, respectively.
Upon adoption of IFRS 16, the Group applied a single recognition and measurement approachfor all leases that it is the lessee, except for short-term leases and leases of low-value assets. The Grouprecognized lease liabilities to make lease payments and right-of-use assets representing the right to usethe underlying assets. In accordance with the full retrospective method of adoption, the Group hasapplied IFRS 16 since January 1, 2016.
Investments and other financial assets
Initial recognition and measurement
Financial assets are classified, at initial recognition, as subsequently measured at amortizedcost, fair value through other comprehensive income, and fair value through profit or loss.
The classification of financial assets at initial recognition depends on the financial asset’scontractual cash flow characteristics and the Group’s business model for managing them. With theexception of trade receivables that do not contain a significant financing component or for which theGroup has applied the practical expedient of not adjusting the effect of a significant financingcomponent, the Group initially measures a financial asset at its fair value, plus in the case of a financialasset not at fair value through profit or loss, transaction costs. Trade receivables that do not contain asignificant financing component or for which the Group has applied the practical expedient aremeasured at the transaction price determined under IFRS 15 in accordance with the policies set out for“Revenue recognition” below.
In order for a financial asset to be classified and measured at amortized cost or fair valuethrough other comprehensive income, it needs to give rise to cash flows that are solely payments ofprincipal and interest (“SPPI”) on the principal amount outstanding.
The Group’s business model for managing financial assets refers to how it manages itsfinancial assets in order to generate cash flows. The business model determines whether cash flowswill result from collecting contractual cash flows, selling the financial assets, or both.
I-38
APPENDIX I ACCOUNTANTS’ REPORT
II NOTES TO THE HISTORICAL FINANCIAL INFORMATION—continued
2.4 SUMMARY OF SIGNIFICANT ACCOUNTING POLICIES—continued
Investments and other financial assets—continued
Initial recognition and measurement—continued
All regular way purchases and sales of financial assets are recognized on the trade date, that is,the date that the Group commits to purchase or sell the asset. Regular way purchases or sales arepurchases or sales of financial assets that require delivery of assets within the period generallyestablished by regulation or convention in the marketplace.
Subsequent measurement
The subsequent measurement of financial assets depends on their classification as follows:
Financial assets at amortized cost (debt instruments)
The Group measures financial assets at amortized cost if both of the following conditions aremet:
Š The financial asset is held within a business model with the objective to hold financialassets in order to collect contractual cash flows.
Š The contractual terms of the financial asset give rise on specified dates to cash flows thatare solely payments of principal and interest on the principal amount outstanding.
Financial assets at amortized cost are subsequently measured using the effective interestmethod and are subject to impairment. Gains and losses are recognized in the statement of profit orloss when the asset is derecognized, modified or impaired.
Financial assets at fair value through other comprehensive income (debt instruments)
The Group measures debt investments at fair value through other comprehensive income if bothof the following conditions are met:
Š The financial asset is held within a business model with the objective of both holding tocollect contractual cash flows and selling.
Š The contractual terms of the financial asset give rise on specified dates to cash flows thatare solely payments of principal and interest on the principal amount outstanding.
For debt investments at fair value through other comprehensive income, interest income,foreign exchange revaluation and impairment losses or reversals are recognized in the statement ofprofit or loss and computed in the same manner as for financial assets measured at amortized cost. Theremaining fair value changes are recognized in other comprehensive income. Upon derecognition, thecumulative fair value change recognized in other comprehensive income is recycled to the statement ofprofit or loss.
Financial assets designated at fair value through other comprehensive income (equityinvestments)
Upon initial recognition, the Group can elect to classify irrevocably its equity investments asfinancial assets designated at fair value through other comprehensive income when they meet the
I-39
APPENDIX I ACCOUNTANTS’ REPORT
II NOTES TO THE HISTORICAL FINANCIAL INFORMATION—continued
2.4 SUMMARY OF SIGNIFICANT ACCOUNTING POLICIES—continued
Investments and other financial assets—continued
Subsequent measurement—continued
Financial assets designated at fair value through other comprehensive income (equityinvestments)—continued
definition of equity under IAS 32 Financial Instruments: Presentation and are not held for trading. Theclassification is determined on an instrument-by-instrument basis.
Gains and losses on these financial assets are never recycled to the statement of profit or loss.Dividends are recognized as other income in the statement of profit or loss when the right of paymenthas been established, it is probable that the economic benefits associated with the dividends will flowto the Group and the amount of the dividends can be measured reliably, except when the Groupbenefits from such proceeds as a recovery of part of the cost of the financial asset, in which case, suchgains are recorded in other comprehensive income. Financial assets designated at fair value throughother comprehensive income are not subject to impairment assessment.
Financial assets at fair value through profit or loss
Financial assets at fair value through profit or loss include financial assets held for trading,financial assets designated upon initial recognition at fair value through profit or loss, or financialassets mandatorily required to be measured at fair value. Financial assets are classified as held fortrading if they are acquired for the purpose of selling or repurchasing in the near term. Derivatives,including separated embedded derivatives, are also classified as held for trading unless they aredesignated as effective hedging instruments. Financial assets with cash flows that are not solelypayments of principal and interest are classified and measured at fair value through profit or loss,irrespective of the business model. Notwithstanding the criteria for debt instruments to be classified atamortized cost or at fair value through other comprehensive income, as described above, debtinstruments may be designated at fair value through profit or loss on initial recognition if doing soeliminates, or significantly reduces, an accounting mismatch.
Financial assets at fair value through profit or loss are carried in the statement of financialposition at fair value with net changes in fair value recognized in the statement of profit or loss.
This category includes derivative instruments and equity investments which the Group had notirrevocably elected to classify at fair value through other comprehensive income. Dividends on equityinvestments classified as financial assets at fair value profit or loss are also recognized as other incomein the statement of profit or loss when the right of payment has been established, it is probable that theeconomic benefits associated with the dividends will flow to the Group and the amount of thedividends can be measured reliably.
Derecognition of financial assets
A financial asset (or, where applicable, a part of a financial asset or part of a group of similarfinancial assets) is primarily derecognized (i.e., removed from the Group’s statement of financialposition) when:
Š the rights to receive cash flows from the asset have expired; or
I-40
APPENDIX I ACCOUNTANTS’ REPORT
II NOTES TO THE HISTORICAL FINANCIAL INFORMATION—continued
2.4 SUMMARY OF SIGNIFICANT ACCOUNTING POLICIES—continued
Derecognition of financial assets—continued
Š the Group has transferred its rights to receive cash flows from the asset, or has assumed anobligation to pay the received cash flows in full without material delay to a third partyunder a “pass-through” arrangement; and either (a) the Group has transferred substantiallyall the risks and rewards of the asset, or (b) the Group has neither transferred nor retainedsubstantially all the risks and rewards of the asset, but has transferred control of the asset.
When the Group has transferred its rights to receive cash flows from an asset or has enteredinto a pass-through arrangement, it evaluates if, and to what extent, it has retained the risk and rewardsof ownership of the asset. When it has neither transferred nor retained substantially all the risks andrewards of the asset nor transferred control of the asset, the Group continues to recognize thetransferred asset to the extent of the Group’s continuing involvement. In that case, the Group alsorecognizes an associated liability. The transferred asset and the associated liability are measured on abasis that reflects the rights and obligations that the Group has retained.
Continuing involvement that takes the form of a guarantee over the transferred asset ismeasured at the lower of the original carrying amount of the asset and the maximum amount ofconsideration that the Group could be required to repay.
Impairment of financial assets
The Group recognizes an allowance for expected credit losses (“ECLs”) for all debt instrumentsnot held at fair value through profit or loss. ECLs are based on the difference between the contractualcash flows due in accordance with the contract and all the cash flows that the Group expects to receive,discounted at an approximation of the original effective interest rate. The expected cash flows willinclude cash flows from the sale of collateral held or other credit enhancements that are integral to thecontractual terms.
General approach
ECLs are recognized in two stages. For credit exposures for which there has not been asignificant increase in credit risk since initial recognition, ECLs are provided for credit losses thatresult from default events that are possible within the next 12 months (a 12-month ECL). For thosecredit exposures for which there has been a significant increase in credit risk since initial recognition, aloss allowance is required for credit losses expected over the remaining life of the exposure,irrespective of the timing of the default (a lifetime ECL).
At each reporting date, the Group assesses whether the credit risk on a financial instrument hasincreased significantly since initial recognition. When making the assessment, the Group compares therisk of a default occurring on the financial instrument as at the reporting date with the risk of a defaultoccurring on the financial instrument as at the date of initial recognition and considers reasonable andsupportable information that is available without undue cost or effort, including historical and forward-looking information.
I-41
APPENDIX I ACCOUNTANTS’ REPORT
II NOTES TO THE HISTORICAL FINANCIAL INFORMATION—continued
2.4 SUMMARY OF SIGNIFICANT ACCOUNTING POLICIES—continued
Impairment of financial assets—continued
General approach—continued
The Group considers a financial asset in default when contractual payments are 90 days pastdue. However, in certain cases, the Group may also consider a financial asset to be in default wheninternal or external information indicates that the Group is unlikely to receive the outstandingcontractual amounts in full before taking into account any credit enhancements held by the Group. Afinancial asset is written off when there is no reasonable expectation of recovering the contractual cashflows.
Financial assets at amortized cost are subject to impairment under the general approach andthey are classified within the following stages for measurement of ECLs except for trade receivableswhich apply the simplified approach as detailed below.
Stage 1 — Financial instruments for which credit risk has not increased significantly sinceinitial recognition and for which the loss allowance is measured at an amount equalto 12-month ECLs
Stage 2 — Financial instruments for which credit risk has increased significantly since initialrecognition but that are not credit-impaired financial assets and for which the lossallowance is measured at an amount equal to lifetime ECLs
Stage 3 — Financial assets that are credit-impaired at the reporting date (but that are notpurchased or originated credit-impaired) and for which the loss allowance ismeasured at an amount equal to lifetime ECLs
Simplified approach
For trade receivables that do not contain a significant financing component or when the Groupapplies the practical expedient of not adjusting the effect of a significant financing component, theGroup applies the simplified approach in calculating ECLs. Under the simplified approach, the Groupdoes not track changes in credit risk, but instead recognizes a loss allowance based on lifetime ECLs ateach reporting date. The Group has established a provision matrix that is based on its historical creditloss experience, adjusted for forward-looking factors specific to the debtors and the economicenvironment.
Financial liabilities (other than those associated with put option)
Initial recognition and measurement
Financial liabilities are classified, at initial recognition, as loans and borrowings, or payables.
All financial liabilities are recognized initially at fair value and, in the case of loans andborrowings and payables, net of directly attributable transaction costs.
The Group’s financial liabilities include trade and bills payables, financial liabilities included inother payables and accruals, interest-bearing bank borrowings and lease liabilities.
I-42
APPENDIX I ACCOUNTANTS’ REPORT
II NOTES TO THE HISTORICAL FINANCIAL INFORMATION—continued
2.4 SUMMARY OF SIGNIFICANT ACCOUNTING POLICIES—continued
Financial liabilities (other than those associated with put option)—continued
Subsequent measurement
The subsequent measurement of financial liabilities depends on their classification as follows:
Loans and borrowings
After initial recognition, interest-bearing bank borrowings are subsequently measured atamortized cost, using the effective interest rate method unless the effect of discounting would beimmaterial, in which case they are stated at cost. Gains and losses are recognized in the statement ofprofit or loss when the liabilities are derecognized as well as through the effective interest rateamortization process.
Amortized cost is calculated by taking into account any discount or premium on acquisition andfees or costs that are an integral part of the effective interest rate. The effective interest rateamortization is included in finance costs in the statement of profit or loss.
Financial liabilities associated with put option
Put option are financial instruments granted by the Group whereby counterparties may have therights to request the Group to purchase their own equity interests or other financial assets when certainconditions are met. If the Group does not have the unconditional right to avoid delivering cash or otherfinancial assets under the put option, the Group has to recognize a financial liability at the presentvalue of the estimated future cash outflows under the put option. Subsequently, if the Group revises itsestimates of payments, the Group will adjust the carrying amount of the financial liability to reflectactual and revised estimated cash outflows. At the end of each reporting period, the Group recalculatesthe carrying amount by computing the present value of revised estimated future cash outflows at thefinancial instrument’s effective interest rate and adjusting to its carrying amount is to be recognized asincome or expenses in profit or loss. If the put option expires without being exercised, the carryingamount of the liability will be reclassified as equity.
Derecognition of financial liabilities
A financial liability is derecognized when the obligation under the liability is discharged orcanceled, or expires.
When an existing financial liability is replaced by another from the same lender on substantiallydifferent terms, or the terms of an existing liability are substantially modified, such an exchange ormodification is treated as a derecognition of the original liability and a recognition of a new liability,and the difference between the respective carrying amounts is recognized in the statement of profit orloss.
Offsetting of financial instruments
Financial assets and financial liabilities are offset and the net amount is reported in thestatements of financial position if there is a currently enforceable legal right to offset the recognized
I-43
APPENDIX I ACCOUNTANTS’ REPORT
II NOTES TO THE HISTORICAL FINANCIAL INFORMATION—continued
2.4 SUMMARY OF SIGNIFICANT ACCOUNTING POLICIES—continued
Offsetting of financial instruments—continued
amounts and there is an intention to settle on a net basis, or to realize the assets and settle the liabilitiessimultaneously.
Inventories
Inventories are stated at the lower of cost and net realizable value. Cost is determined on thefirst-in, first-out basis and, in the case of finished goods, comprises direct materials, direct labor and anappropriate proportion of overheads. Net realizable value is based on estimated selling prices less anyestimated costs to be incurred to completion and disposal.
Cash and cash equivalents
For the purpose of the statement of cash flows, cash and cash equivalents comprise cash onhand and demand deposits, and short term highly liquid investments that are readily convertible intoknown amounts of cash, are subject to an insignificant risk of changes in value, and have a shortmaturity of generally within three months when acquired, less bank overdrafts which are repayable ondemand and form an integral part of the Group’s cash management.
For the purpose of the statement of financial position, cash and cash equivalents comprise cashon hand and at banks, including current deposits, which are not restricted as to use.
Provisions
A provision is recognized when a present obligation (legal or constructive) has arisen as a resultof a past event and it is probable that a future outflow of resources will be required to settle theobligation, provided that a reliable estimate can be made of the amount of the obligation.
When the effect of discounting is material, the amount recognized for a provision is the presentvalue at the end of the each reporting period of the future expenditures expected to be required to settlethe obligation. The increase in the discounted present value amount arising from the passage of time isincluded in finance costs in the statement of profit or loss.
The Group provides for warranties in relation to the sale of certain products and the provisionof services for general repairs of defects occurring during the warranty period. Provisions for theseassurance-type warranties granted by the Group are recognized based on sales volume and pastexperience of the level of repairs and returns.
Income tax
Income tax comprises current and deferred tax. Income tax relating to items recognized outsideprofit or loss is recognized outside profit or loss, either in other comprehensive income or directly inequity.
Current tax assets and liabilities are measured at the amounts expected to be recovered from orpaid to the taxation authorities, based on tax rates (and tax laws) that have been enacted or
I-44
APPENDIX I ACCOUNTANTS’ REPORT
II NOTES TO THE HISTORICAL FINANCIAL INFORMATION—continued
2.4 SUMMARY OF SIGNIFICANT ACCOUNTING POLICIES—continued
Income tax—continued
substantively enacted by the end of each reporting period, taking into consideration interpretations andpractices prevailing in the countries in which the Group operates.
Deferred tax is provided using the liability method, on all temporary differences at the end ofeach reporting period between the tax bases of assets and liabilities and their carrying amounts forfinancial reporting purposes.
Deferred tax liabilities are recognized for all taxable temporary differences, except:
Š when the deferred tax liability arises from the initial recognition of goodwill or an asset orliability in a transaction that is not a business combination and, at the time of thetransaction, affects neither the accounting profit nor taxable profit or loss; and
Š in respect of taxable temporary differences associated with investments in subsidiaries,when the timing of the reversal of the temporary differences can be controlled and it isprobable that the temporary differences will not reverse in the foreseeable future.
Deferred tax assets are recognized for all deductible temporary differences, the carryforward ofunused tax credits and any unused tax losses. Deferred tax assets are recognized to the extent that it isprobable that taxable profit will be available against which the deductible temporary differences, thecarryforward of unused tax credits and unused tax losses can be utilized, except:
Š when the deferred tax asset relating to the deductible temporary differences arises from theinitial recognition of an asset or liability in a transaction that is not a business combinationand, at the time of the transaction, affects neither the accounting profit nor taxable profit orloss; and
Š in respect of deductible temporary differences associated with investments in subsidiaries,deferred tax assets are only recognized to the extent that it is probable that the temporarydifferences will reverse in the foreseeable future and taxable profit will be availableagainst which the temporary differences can be utilized.
The carrying amount of deferred tax assets is reviewed at the end of each reporting period andreduced to the extent that it is no longer probable that sufficient taxable profit will be available to allowall or part of the deferred tax asset to be utilized. Unrecognized deferred tax assets are reassessed at theend of each reporting period and are recognized to the extent that it has become probable that sufficienttaxable profit will be available to allow all or part of the deferred tax asset to be recovered.
Deferred tax assets and liabilities are measured at the tax rates that are expected to apply to theperiod when the asset is realized or the liability is settled, based on tax rates (and tax laws) that havebeen enacted or substantively enacted by the end of each reporting period.
Deferred tax assets and deferred tax liabilities are offset if and only if the Group has a legallyenforceable right to set off current tax assets and current tax liabilities and the deferred tax assets anddeferred tax liabilities relate to income taxes levied by the same taxation authority on either the sametaxable entity or different taxable entities which intend either to settle current tax liabilities and assets
I-45
APPENDIX I ACCOUNTANTS’ REPORT
II NOTES TO THE HISTORICAL FINANCIAL INFORMATION—continued
2.4 SUMMARY OF SIGNIFICANT ACCOUNTING POLICIES—continued
Income tax—continued
on a net basis, or to realize the assets and settle the liabilities simultaneously, in each future period inwhich significant amounts of deferred tax liabilities or assets are expected to be settled or recovered.
Government grants
Government grants are recognized at their fair value when there is reasonable assurance that thegrant will be received and all attaching conditions will be complied with. When the grant relates to anexpense item, it is recognized as income on a systematic basis over the periods that the costs, which itis intended to compensate, are expensed.
Where the grant relates to an asset, the fair value is credited to a deferred revenue account andis released to the statement of profit or loss over the expected useful life of the relevant asset by equalannual installments or deducted from the carrying amount of the asset and released to the statement ofprofit or loss by way of a reduced depreciation charge.
Revenue recognition
Revenue from contracts with customers
Revenue from contracts with customers is recognized when control of goods or services istransferred to the customers at an amount that reflects the consideration to which the Group expects tobe entitled in exchange for those goods or services.
When the consideration in a contract includes a variable amount, the amount of consideration isestimated to which the Group will be entitled in exchange for transferring the goods or services to thecustomer. The variable consideration is estimated at contract inception and constrained until it is highlyprobable that a significant revenue reversal in the amount of cumulative revenue recognized will notoccur when the associated uncertainty with the variable consideration is subsequently resolved.
When the contract contains a financing component which provides the customer a significantbenefit of financing the transfer of goods or services to the customer for more than one year, revenue ismeasured at the present value of the amount receivable, discounted using the discount rate that wouldbe reflected in a separate financing transaction between the Group and the customer at contractinception. When the contract contains a financing component which provides the Group a significantfinancial benefit for more than one year, revenue recognized under the contract includes the interestexpense accreted on the contract liability under the effective interest method. For a contract where theperiod between the payment by the customer and the transfer of the promised goods or services is oneyear or less, the transaction price is not adjusted for the effects of a significant financing component,using the practical expedient in IFRS 15.
Revenue from the sale of products is recognized at the point in time when control of the asset istransferred to the customer, generally on delivery of the products.
Some contracts for the sale of products provide customers with rights of return and sales rebate.The Group provides extended warranties which are accounted for as service-type warranties. The rights
I-46
APPENDIX I ACCOUNTANTS’ REPORT
II NOTES TO THE HISTORICAL FINANCIAL INFORMATION—continued
2.4 SUMMARY OF SIGNIFICANT ACCOUNTING POLICIES—continued
Revenue recognition—continued
Revenue from contracts with customers—continued
of return and sales rebates give rise to variable consideration. Consideration payable to a customer alsoincludes credit that can be applied against amounts owed to the Group. The Group accounts forconsideration payable to a customer as a reduction of the transaction price unless the payment to thecustomer is in exchange for a distinct good or service.
(i) Variable consideration
(a) Rights of return
For contracts which provide a customer with a right to return the goods, either theexpected value method or the most likely amount method is used to estimate thegoods for different contracts that will not be returned. The selected method bestpredicts the amount of variable consideration to which the Group will be entitled fordifferent contracts and customers. The requirements in IFRS 15 on constrainingestimates of variable consideration are applied in order to determine the amount ofvariable consideration that can be included in the transaction price. For goods that areexpected to be returned, instead of revenue, a refund liability is recognized. Aright-of-return asset (and the corresponding adjustment to cost of sales) is alsorecognized for the right to recover products from a customer.
(b) Sales rebates
Various types of sales rebates may be provided to different customers. Rebates areoffset against amounts payable by the customer. To estimate the variableconsideration for the expected future rebates, the most likely amount method is used.Because this method best predicts the amount of variable consideration in thecontract, given the large number of customer contracts that have similarcharacteristics. The requirements on constraining estimates of variable considerationare applied and a refund liability for the expected future rebates is recognized.
(ii) Consideration payable to a customer
The Group accounts for consideration payable to a customer as a reduction of revenueunless the payment to the customer is in exchange for a distinct good or service that thecustomer transfers to the Group. If the consideration payable to a customer includes avariable amount, the Group estimates the transaction price, including assessing whetherthe estimate of variable consideration is constrained. To estimate the variableconsideration, the most likely amount method is used, as this method best predicts theamount of variable consideration, given the large number of customer contracts that havesimilar characteristics.
(iii) Extended warranties
The Group generally provides warranties for general repairs of defects that existed at thetime of sale, as required by law. As such, most warranties are assurance-type warranties.
I-47
APPENDIX I ACCOUNTANTS’ REPORT
II NOTES TO THE HISTORICAL FINANCIAL INFORMATION—continued
2.4 SUMMARY OF SIGNIFICANT ACCOUNTING POLICIES—continued
Revenue recognition—continued
Revenue from contracts with customers—continued
(iii) Extended warranties—continued
However, in certain contracts, the Group provides extended warranties. Such warrantiesare accounted for as service-type warranties and, therefore, are accounted for as separateperformance obligations to which the Group recognize contract liabilities for theunfulfilled extended warranties by allocating a portion of the transaction price based onthe relative stand-alone selling price. Revenue is subsequently recognized over time basedon the time elapsed.
Other income
Interest income is recognized on an accrual basis using the effective interest method byapplying the rate that exactly discounts the estimated future cash receipts over the expected life of thefinancial instrument or a shorter period, when appropriate, to the net carrying amount of the financialasset.
Rental income is recognized on a time proportion basis over the lease terms.
Dividend income is recognized when the shareholders’ right to receive payment has beenestablished, it is probable that the economic benefits associated with the dividends will flow to theGroup and the amount of the dividends can be measured reliably.
Contract liabilities
A contract liability is the obligation to transfer goods or services to a customer for which theGroup has received a consideration (or an amount of consideration that is due) from the customer. If acustomer pays the consideration before the Group transfers goods or services to the customer, acontract liability is recognized when the payment is made, or the payment is due (whichever is earlier).Contract liabilities are recognized as revenue when the Group performs under the contract.
Right-of-return assets
A right-of-return asset represents the Group’s right to recover the goods expected to be returnedby customers. The asset is measured at the former carrying amount of the goods to be returned, lessany expected costs to recover the goods, including any potential decreases in the value of the returnedgoods. The Group updates the measurement of the asset recorded for any revisions to its expected levelof returns, as well as any additional decreases in the value of the returned goods.
Refund liabilities
A refund liability is the obligation to refund some or all of the consideration received (orreceivable) from the customer and is measured at the amount the Group ultimately expects it will haveto return to the customer. The Group updates its estimates of refund liabilities (and the correspondingchange in the transaction price) at the end of each reporting period.
I-48
APPENDIX I ACCOUNTANTS’ REPORT
II NOTES TO THE HISTORICAL FINANCIAL INFORMATION—continued
2.4 SUMMARY OF SIGNIFICANT ACCOUNTING POLICIES—continued
Share-based payments
Some subsidiaries of the Company operates share award schemes for the purpose of providingincentives and rewards to eligible participants who contribute to the success of the Group’s operations.Employees (including directors) of the Group receive remuneration in the form of share-basedpayments, whereby employees render services as consideration for equity instruments (“equity-settledtransactions”).
The cost of equity-settled transactions with employees for grants is measured by reference tothe fair value at the date on which they are granted. The fair value is determined by an external valuer,further details of which are given in note II 33.
The cost of equity-settled transactions is recognized in employee benefit expense, together witha corresponding increase in equity, over the period in which the performance and/or service conditionsare fulfilled. The cumulative expense recognized for equity-settled transactions at the end of eachreporting period until the vesting date reflects the extent to which the vesting period has expired andthe Group’s best estimate of the number of equity instruments that will ultimately vest. The charge orcredit to the statement of profit or loss for a period represents the movement in cumulative expenserecognized as at the beginning and end of that period.
Service and non-market performance conditions are not taken into account when determiningthe grant date fair value of awards, but the likelihood of the conditions being met is assessed as part ofthe Group’s best estimate of the number of equity instruments that will ultimately vest. Marketperformance conditions are reflected within the grant date fair value. Any other conditions attached toan award, but without an associated service requirement, are considered to be non-vesting conditions.Non-vesting conditions are reflected in the fair value of an award and lead to an immediate expensingof an award unless there are also service and/or performance conditions.
For awards that do not ultimately vest because non-market performance and/or serviceconditions have not been met, no expense is recognized. Where awards include a market condition ornon-vesting condition, the transactions are treated as vesting irrespective of whether the market ornon-vesting condition is satisfied, provided that all other performance or service conditions aresatisfied.
Where the terms of an equity-settled award are modified, as a minimum an expense isrecognized as if the terms had not been modified, if the original terms of the award are met. Inaddition, an expense is recognized for any modification that increases the total fair value of the share-based payments, or is otherwise beneficial to the employee as measured at the date of modification.
Where an equity-settled award is canceled, it is treated as if it had vested on the date ofcancelation, and any expense not yet recognized for the award is recognized immediately. Thisincludes any award where non-vesting conditions within the control of either the Group or theemployee are not met. However, if a new award is substituted for the canceled award, and isdesignated as a replacement award on the date that it is granted, the canceled and new awards aretreated as if they were a modification of the original award, as described in the previous paragraph.
I-49

APPENDIX I ACCOUNTANTS’ REPORT
II NOTES TO THE HISTORICAL FINANCIAL INFORMATION—continued
2.4 SUMMARY OF SIGNIFICANT ACCOUNTING POLICIES—continued
Other employee benefits
PRC contribution plan
Pursuant to the relevant PRC laws and regulations, each of the PRC subsidiaries of the Group isrequired to participate in a retirement benefit scheme organized by the local municipal governmentwhereby the Group is required to contribute a certain percentage of the salaries of its employees to theretirement benefit scheme. The only obligation of the Group with respect to the retirement benefitscheme is to pay the ongoing required contributions. Contributions made to the defined contributionretirement benefit scheme are charged to profit or loss as incurred.
Defined contribution plan
Some subsidiaries of the Group maintain a defined contribution retirement plan underSection 401(k) of the United States Internal Revenue Code. The plan covers all United States full-timeemployees of the Group. An eligible employee may elect to make a before-tax contribution of 100% ofhis other compensation through payroll deductions with a dollar limit of nil, US$18,000, US$18,500,US$18,500 and US$19,000 for the years ended December 31, 2016, 2017, 2018, and the six monthsended June 30, 2018 and 2019, respectively. The Group matches the first 3% of participantcontributions at 100% and the next 2% of contributions at 50%, for a maximum matching percentageof 4%.
Pension scheme
The Group operates a defined contribution Mandatory Provident Fund retirement benefitscheme (the “MPF Scheme”) under the Mandatory Provident Fund Schemes Ordinance for all of itsHong Kong employees. Contributions are made based on a percentage of the employees’ basic salariesand are charged to the statement of profit or loss as they become payable in accordance with the rulesof the MPF Scheme. The assets of the MPF Scheme are held separately from those of the Group in anindependently administered fund. The Group’s employer contributions vest fully with the employeeswhen contributed into the MPF Scheme.
Termination benefits
Termination benefits are recognized at the earlier of when the Group can no longer withdrawthe offer of those benefits and when the Group recognizes restructuring costs involving the payment oftermination benefits.
Borrowing costs
Borrowing costs directly attributable to the acquisition, construction or production of qualifyingassets, i.e., assets that necessarily take a substantial period of time to get ready for their intended use orsale, are capitalized as part of the cost of those assets. The capitalization of such borrowing costsceases when the assets are substantially ready for their intended use or sale. Investment income earnedon the temporary investment of specific borrowings pending their expenditure on qualifying assets isdeducted from the borrowing costs capitalized. All other borrowing costs are expensed in the period inwhich they are incurred. Borrowing costs consist of interest and other costs that an entity incurs inconnection with the borrowing of funds.
I-50
APPENDIX I ACCOUNTANTS’ REPORT
II NOTES TO THE HISTORICAL FINANCIAL INFORMATION—continued
2.4 SUMMARY OF SIGNIFICANT ACCOUNTING POLICIES—continued
Dividends
Final dividends are recognized as a liability when they are approved by the shareholders in ageneral meeting.
Interim dividends are simultaneously proposed and declared, because the Company’smemorandum and articles of association grant the directors the authority to declare interim dividends.Consequently, interim dividends are recognized immediately as a liability when they are proposed anddeclared.
Foreign currencies
The Historical Financial Information is presented in US$, which is the Company’s functionalcurrency. Each entity in the Group determines its own functional currency and items included in thefinancial statements of each entity are measured using that functional currency. Foreign currencytransactions recorded by the entities in the Group are initially recorded using their respective functionalcurrency rates prevailing at the dates of the transactions. Monetary assets and liabilities denominated inforeign currencies are translated at the functional currency rates of exchange ruling at the end of eachreporting period. Differences arising on settlement or translation of monetary items are recognized inprofit or loss.
Non-monetary items that are measured in terms of historical cost in a foreign currency aretranslated using the exchange rates at the dates of the initial transactions. Non-monetary itemsmeasured at fair value in a foreign currency are translated using the exchange rates at the date when thefair value was measured. The gain or loss arising on translation of a non-monetary item measured atfair value is treated in line with the recognition of the gain or loss on change in fair value of the item(i.e., translation difference on the item whose fair value gain or loss is recognized in othercomprehensive income or profit or loss is also recognized in other comprehensive income or profit orloss, respectively).
In determining the exchange rate on initial recognition of the related asset, expense or incomeon the derecognition of a non-monetary asset or non-monetary liability relating to an advanceconsideration, the date of initial transaction is the date on which the Group initially recognizes thenon-monetary asset or non-monetary liability arising from the advance consideration. If there aremultiple payments or receipts in advance, the Group determines the transaction date for each paymentor receipt of the advance consideration.
The functional currencies of certain overseas subsidiaries are currencies other than US$. As atthe end of each reporting period, the assets and liabilities of these entities are translated into US$ at theexchange rates prevailing at the end of each reporting period and their statements of profit or loss aretranslated into US$ at the weighted average exchange rates for the year. The resulting exchangedifferences are recognized in other comprehensive income and accumulated in a separate component ofequity. On disposal of a foreign operation, the component of other comprehensive income relating tothat particular foreign operation is recognized in profit or loss.
I-51
APPENDIX I ACCOUNTANTS’ REPORT
II NOTES TO THE HISTORICAL FINANCIAL INFORMATION—continued
2.4 SUMMARY OF SIGNIFICANT ACCOUNTING POLICIES—continued
Foreign currencies—continued
Any goodwill arising on the acquisition of a foreign operation and any fair value adjustments tothe carrying amounts of assets and liabilities arising on acquisition are treated as assets and liabilitiesof the foreign operation and translated at the closing rate.
For the purpose of the consolidated statement of cash flows, the cash flows of overseassubsidiaries are translated into US$ at the exchange rates ruling at the dates of the cash flows.Frequently recurring cash flows of overseas subsidiaries which arise throughout the year are translatedinto US$ at the weighted average exchange rates for the year.
3. SIGNIFICANT ACCOUNTING JUDGMENTS AND ESTIMATES
The preparation of the Historical Financial Information requires management to makejudgments, estimates and assumptions that affect the reported amounts of revenues, expenses, assetsand liabilities, and their accompanying disclosures, and the disclosure of contingent liabilities.Uncertainty about these assumptions and estimates could result in outcomes that could require amaterial adjustment to the carrying amounts of the assets or liabilities affected in the future.
Judgments
In the process of applying the Group’s accounting policies, management has made thefollowing judgments, apart from those involving estimations, which have the most significant effect onthe amounts recognized in the Historical Financial Information:
Revenue from contracts with customers
The Group applied the following judgments that significantly affect the determination of theamount of revenue from contracts with customers:
(i) Determining the method to estimate variable consideration and assessing the constraint forthe sale of products
Certain contracts for the sale of products include a right of return and sales rebates thatgive rise to variable consideration. In estimating the variable consideration, the Group isrequired to use either the expected value method or the most likely amount method basedon which method better predicts the amount of consideration to which it will be entitled.
The Group determined that using a combination of the most likely amount and theexpected value method is appropriate in estimating the variable consideration for the saleof products with rights of return. The selected method best predicts the amount of variableconsideration to which the Group will be entitled for different contracts and customers. Inestimating the variable consideration for the sale of products with sales rebates andconsideration payable to a customer, the Group determined that using the most likelyamount method is appropriate.
Before including any amount of variable consideration in the transaction price, the Groupconsiders whether the amount of variable consideration is constrained. The Group
I-52
APPENDIX I ACCOUNTANTS’ REPORT
II NOTES TO THE HISTORICAL FINANCIAL INFORMATION—continued
3. SIGNIFICANT ACCOUNTING JUDGMENTS AND ESTIMATES—continued
Judgments—continued
Revenue from contracts with customers—continued
determined that the estimates of variable consideration are not constrained based on itshistorical experience, business forecast and the current economic conditions. In addition,the uncertainty on the variable consideration will be resolved within a short time frame.
(ii) Operating lease commitments—Group as lessor
The Group has entered into commercial property leases on its investment propertyportfolio. The Group has determined, based on an evaluation of the terms and conditionsof the arrangements, that it retains all the significant risks and rewards of ownership ofthese properties which are leased out on operating leases.
Estimation uncertainty
The key assumptions concerning the future and other key sources of estimation uncertainty atthe end of each reporting period, that have a significant risk of causing a material adjustment to thecarrying amounts of assets and liabilities within the next financial year, are described below.
Variable consideration for returns, sales rebates and consideration payable to a customer
The Group estimates variable consideration to be included in the transaction price for the saleof products with rights of return, sales rebates and consideration payable to a customer.
The Group developed a statistical model for forecasting sales returns. The model used thehistorical return data of each product to come up with expected return percentages. These percentagesare applied to determine the expected value of the variable consideration. Any significant changes inexperience as compared to historical return pattern will impact the expected return percentagesestimated by the Group.
The Group’s expected sales rebates are analyzed on a per customer basis for contracts that aresubject to different percentages of gross purchase by product categories. Determining whether acustomer will likely be entitled to a sales rebates depends on the customer’s historical rebateentitlement and accumulated purchases to date and the negotiated terms of the sales rebates programs.
The model uses the historical purchasing patterns and rebate entitlement of customers todetermine the expected rebate percentages and the expected value of the variable consideration. Anysignificant changes in experience as compared to historical purchasing patterns and rebate entitlementsof customers will impact the expected rebate percentages estimated by the Group.
The Group’s expected consideration payable to customers is analysed on a per customer basis.Determining whether a customer will likely be entitled to the payment and whether the payment will befor a distinct good or service from the customer depends on the customer’s historical entitlement andthe negotiated terms of the different promotion programs.
The Group updates its assessment of expected returns, sales rebates and consideration payableto a customer monthly and the refund liabilities are adjusted accordingly. Estimates of expected
I-53
APPENDIX I ACCOUNTANTS’ REPORT
II NOTES TO THE HISTORICAL FINANCIAL INFORMATION—continued
3. SIGNIFICANT ACCOUNTING JUDGMENTS AND ESTIMATES—continued
Estimation uncertainty—continued
Variable consideration for returns, sales rebates and consideration payable to a customer—continued
returns, sales rebates and consideration payable to a customer are sensitive to changes in circumstancesand the Group’s past experience regarding returns, sales rebates and consideration payable to acustomer entitlements may not be representative of customers’ actual returns, sales rebates andconsideration payable to a customer entitlements in the future. The amounts recognized as refundliabilities were US$20,478,000, US$107,274,000, US$134,411,000 and US$123,649,000, respectively,as at December 31, 2016, 2017, 2018 and June 30, 2019 for the expected returns, sales rebates andconsideration payable to a customer.
Impairment of goodwill
The Group determines whether goodwill is impaired at least on an annual basis. This requiresan estimation of the value in use of the cash-generating units to which the goodwill is allocated.Estimating the value in use requires the Group to make an estimate of the expected future cash flowsfrom the cash-generating units and also to choose a suitable discount rate in order to calculate thepresent value of those cash flows. The carrying amounts of goodwill were nil, US$839,767,000,US$839,767,000 and US$839,767,000, respectively, as at December 31, 2016, 2017, 2018 andJune 30, 2019. Further details are given in note II 16.
Impairment of non-financial assets (other than goodwill)
The Group assesses whether there are any indicators of impairment for all non-financial assetsat the end of each reporting period. Indefinite life intangible assets are tested for impairment annuallyand at other times when such an indicator exists. Other non-financial assets are tested for impairmentwhen there are indicators that the carrying amounts may not be recoverable. An impairment existswhen the carrying value of an asset or a cash-generating unit exceeds its recoverable amount, which isthe higher of its fair value less costs of disposal and its value in use. The calculation of the fair valueless costs of disposal is based on available data from binding sales transactions in an arm’s lengthtransaction of similar assets or observable market prices less incremental costs for disposing of theasset. When value in use calculations are undertaken, management must estimate the expected futurecash flows from the asset or cash-generating unit and choose a suitable discount rate in order tocalculate the present value of those cash flows. Further details, including a sensitivity analysis of keyassumptions, are given in note II 16 and 18.
Deferred tax assets
Deferred tax assets are recognized for unused tax losses to the extent that it is probable thattaxable profit will be available against which the losses can be utilized. Significant managementjudgment is required to determine the amount of deferred tax assets that can be recognized, based uponthe likely timing and level of future taxable profits together with future tax planning strategies. Thecarrying values of deferred tax assets relating to recognized tax losses were US$201,000,US$4,049,000, US$3,400,000 and US$3,640,000, respectively, as at December 31, 2016, 2017 and
I-54
APPENDIX I ACCOUNTANTS’ REPORT
II NOTES TO THE HISTORICAL FINANCIAL INFORMATION—continued
3. SIGNIFICANT ACCOUNTING JUDGMENTS AND ESTIMATES—continued
Estimation uncertainty—continued
Deferred tax assets—continued
2018, June 30, 2019. The amounts of unrecognized tax losses were US$376,000, US$16,723,000,US$24,806,000 and US$18,572,000, respectively, as at December 31, 2016, 2017, 2018 and June 30,2019.
Fair value of financial assets
Where the fair value of financial assets recorded in the statement of financial position cannot bederived from active markets, they are determined using valuation techniques including the discountedcash flow model. The inputs to these models are taken from observable markets where possible, butwhere this is not feasible, a degree of estimates is required in establishing fair values. The estimatesinclude considerations of inputs such as liquidity risk, credit risk and volatility. Changes inassumptions about these factors could affect the reported fair value of financial instruments.
The Group classifies the fair value of these financial assets as Level 3. The fair values of thefinancial assets were US$233,591,000, US$146,199,000, US$112,290,000 and US$145,079,000,respectively, as at December 31, 2016, 2017, 2018 and June 30, 2019. Further details are included innote II 20.
Development costs
Development costs are capitalized in accordance with the accounting policy for research anddevelopment costs in note II 2.4. Determining the amounts to be capitalized requires management tomake assumptions regarding the expected future cash generation of the assets, discount rates to beapplied and the expected period of benefits. The best estimates of the carrying amount of capitalizeddevelopment costs were nil, US$2,358,000, US$17,878,000 and US$23,747,000, respectively, as atDecember 31, 2016, 2017, 2018 and June 30, 2019.
Useful lives of property, plant and equipment
The Group’s management determines the estimated useful lives. This estimate is based on thehistorical experience of the actual useful lives of property, plant and equipment of similar nature andfunctions. Management will increase the depreciation charge where useful lives are less thanpreviously estimated lives, or will write off or write down technically obsolete or non-strategic assetsthat have been abandoned or sold. Periodic review could result in a change in depreciable lives andtherefore depreciation charge in the future periods.
4. OPERATING SEGMENT INFORMATION
For management purposes, the Group is organized into business units based on operation andhas three reportable operating segments of Joyoung, SharkNinja and Other.
(a) the Joyoung segment was involved in the design, manufacture, marketing, export anddistribution of small kitchen electrical appliances;
I-55
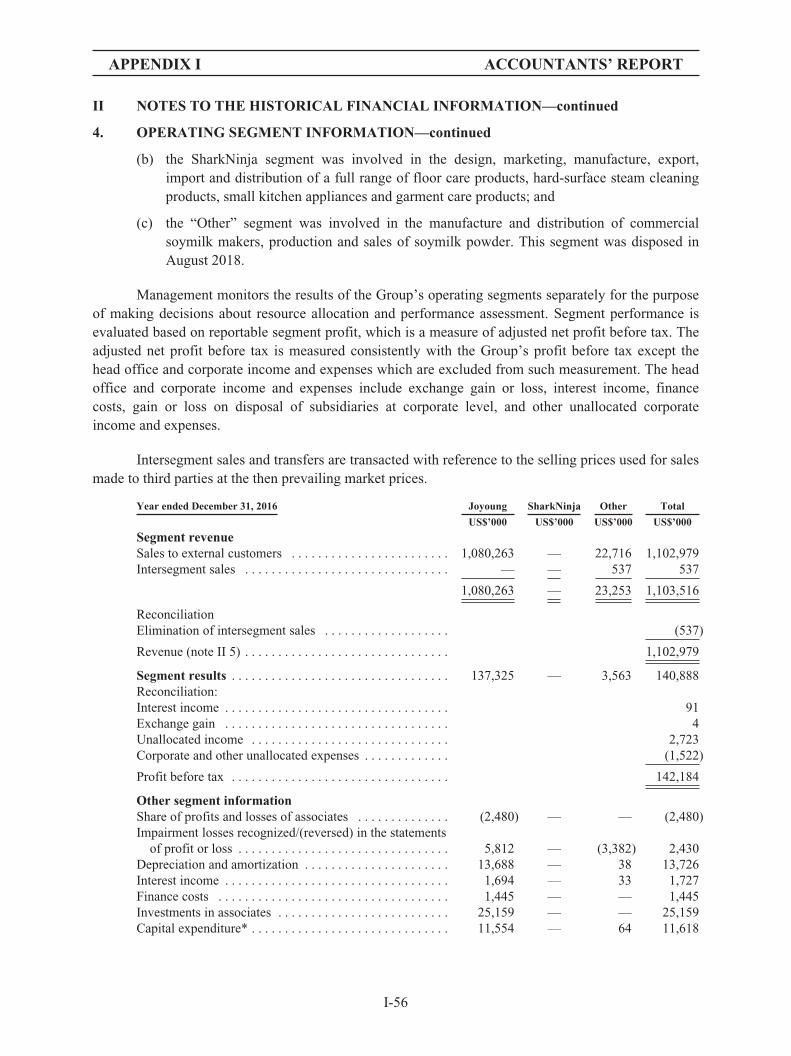
APPENDIX I ACCOUNTANTS’ REPORT
II NOTES TO THE HISTORICAL FINANCIAL INFORMATION—continued
4. OPERATING SEGMENT INFORMATION—continued
(b) the SharkNinja segment was involved in the design, marketing, manufacture, export,import and distribution of a full range of floor care products, hard-surface steam cleaningproducts, small kitchen appliances and garment care products; and
(c) the “Other” segment was involved in the manufacture and distribution of commercialsoymilk makers, production and sales of soymilk powder. This segment was disposed inAugust 2018.
Management monitors the results of the Group’s operating segments separately for the purposeof making decisions about resource allocation and performance assessment. Segment performance isevaluated based on reportable segment profit, which is a measure of adjusted net profit before tax. Theadjusted net profit before tax is measured consistently with the Group’s profit before tax except thehead office and corporate income and expenses which are excluded from such measurement. The headoffice and corporate income and expenses include exchange gain or loss, interest income, financecosts, gain or loss on disposal of subsidiaries at corporate level, and other unallocated corporateincome and expenses.
Intersegment sales and transfers are transacted with reference to the selling prices used for salesmade to third parties at the then prevailing market prices.
Year ended December 31, 2016 Joyoung SharkNinja Other Total
US$’000 US$’000 US$’000 US$’000
Segment revenueSales to external customers . . . . . . . . . . . . . . . . . . . . . . . . 1,080,263 — 22,716 1,102,979Intersegment sales . . . . . . . . . . . . . . . . . . . . . . . . . . . . . . . — — 537 537
1,080,263 — 23,253 1,103,516
ReconciliationElimination of intersegment sales . . . . . . . . . . . . . . . . . . . (537)
Revenue (note II 5) . . . . . . . . . . . . . . . . . . . . . . . . . . . . . . . 1,102,979
Segment results . . . . . . . . . . . . . . . . . . . . . . . . . . . . . . . . . 137,325 — 3,563 140,888Reconciliation:Interest income . . . . . . . . . . . . . . . . . . . . . . . . . . . . . . . . . . 91Exchange gain . . . . . . . . . . . . . . . . . . . . . . . . . . . . . . . . . . 4Unallocated income . . . . . . . . . . . . . . . . . . . . . . . . . . . . . . 2,723Corporate and other unallocated expenses . . . . . . . . . . . . . (1,522)
Profit before tax . . . . . . . . . . . . . . . . . . . . . . . . . . . . . . . . . 142,184
Other segment informationShare of profits and losses of associates . . . . . . . . . . . . . . (2,480) — — (2,480)Impairment losses recognized/(reversed) in the statements
of profit or loss . . . . . . . . . . . . . . . . . . . . . . . . . . . . . . . . 5,812 — (3,382) 2,430Depreciation and amortization . . . . . . . . . . . . . . . . . . . . . . 13,688 — 38 13,726Interest income . . . . . . . . . . . . . . . . . . . . . . . . . . . . . . . . . . 1,694 — 33 1,727Finance costs . . . . . . . . . . . . . . . . . . . . . . . . . . . . . . . . . . . 1,445 — — 1,445Investments in associates . . . . . . . . . . . . . . . . . . . . . . . . . . 25,159 — — 25,159Capital expenditure* . . . . . . . . . . . . . . . . . . . . . . . . . . . . . . 11,554 — 64 11,618
I-56

APPENDIX I ACCOUNTANTS’ REPORT
II NOTES TO THE HISTORICAL FINANCIAL INFORMATION—continued
4. OPERATING SEGMENT INFORMATION—continued
Year ended December 31, 2017 Joyoung SharkNinja Other Total
US$’000 US$’000 US$’000 US$’000
Segment revenueSales to external customers . . . . . . . . . . . . . . . . . . . . . . . . 1,053,501 476,608 33,319 1,563,428Intersegment sales . . . . . . . . . . . . . . . . . . . . . . . . . . . . . . . — — 340 340
1,053,501 476,608 33,659 1,563,768Reconciliation:Elimination of intersegment sales . . . . . . . . . . . . . . . . . . . (340)
Revenue (note II 5) . . . . . . . . . . . . . . . . . . . . . . . . . . . . . . . 1,563,428
Segment results . . . . . . . . . . . . . . . . . . . . . . . . . . . . . . . . . 114,829 5,117 5,915 125,861Reconciliation:Interest income . . . . . . . . . . . . . . . . . . . . . . . . . . . . . . . . . . 124Exchange gain . . . . . . . . . . . . . . . . . . . . . . . . . . . . . . . . . . 114Gain on disposal of a subsidiary . . . . . . . . . . . . . . . . . . . . . 1,626Unallocated income . . . . . . . . . . . . . . . . . . . . . . . . . . . . . . 3,666Finance costs . . . . . . . . . . . . . . . . . . . . . . . . . . . . . . . . . . . (16,133)Corporate and other unallocated expenses . . . . . . . . . . . . . (13,340)
Profit before tax . . . . . . . . . . . . . . . . . . . . . . . . . . . . . . . . . 101,918
Other segment informationShare of profits and losses of associates . . . . . . . . . . . . . . 3,245 — — 3,245Impairment losses recognized/(reversed) in the statements
of profit or loss . . . . . . . . . . . . . . . . . . . . . . . . . . . . . . . . 1,315 272 (630) 957Depreciation and amortization . . . . . . . . . . . . . . . . . . . . . . 14,106 15,541 24 29,671Interest income . . . . . . . . . . . . . . . . . . . . . . . . . . . . . . . . . . 1,316 — 64 1,380Finance costs . . . . . . . . . . . . . . . . . . . . . . . . . . . . . . . . . . . 1,315 708 — 2,023Investments in associates . . . . . . . . . . . . . . . . . . . . . . . . . . 37,220 — — 37,220Capital expenditure* . . . . . . . . . . . . . . . . . . . . . . . . . . . . . . 4,854 715,149 7,760 727,763
I-57
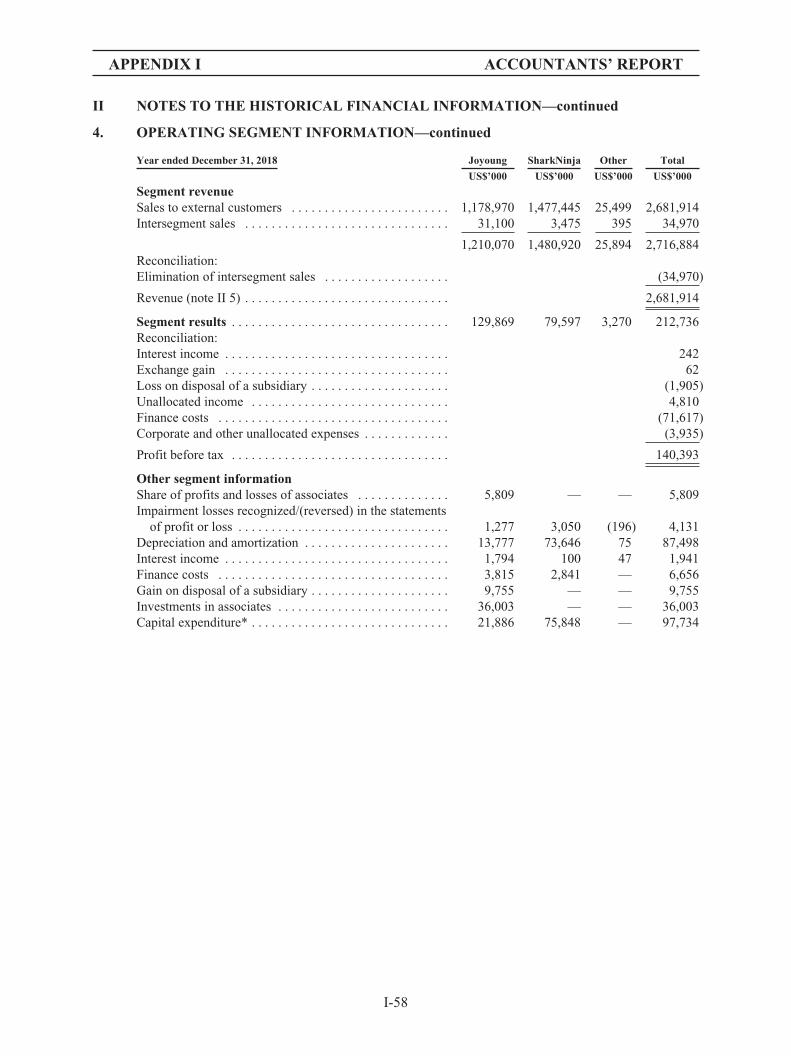
APPENDIX I ACCOUNTANTS’ REPORT
II NOTES TO THE HISTORICAL FINANCIAL INFORMATION—continued
4. OPERATING SEGMENT INFORMATION—continued
Year ended December 31, 2018 Joyoung SharkNinja Other Total
US$’000 US$’000 US$’000 US$’000
Segment revenueSales to external customers . . . . . . . . . . . . . . . . . . . . . . . . 1,178,970 1,477,445 25,499 2,681,914Intersegment sales . . . . . . . . . . . . . . . . . . . . . . . . . . . . . . . 31,100 3,475 395 34,970
1,210,070 1,480,920 25,894 2,716,884Reconciliation:Elimination of intersegment sales . . . . . . . . . . . . . . . . . . . (34,970)
Revenue (note II 5) . . . . . . . . . . . . . . . . . . . . . . . . . . . . . . . 2,681,914
Segment results . . . . . . . . . . . . . . . . . . . . . . . . . . . . . . . . . 129,869 79,597 3,270 212,736Reconciliation:Interest income . . . . . . . . . . . . . . . . . . . . . . . . . . . . . . . . . . 242Exchange gain . . . . . . . . . . . . . . . . . . . . . . . . . . . . . . . . . . 62Loss on disposal of a subsidiary . . . . . . . . . . . . . . . . . . . . . (1,905)Unallocated income . . . . . . . . . . . . . . . . . . . . . . . . . . . . . . 4,810Finance costs . . . . . . . . . . . . . . . . . . . . . . . . . . . . . . . . . . . (71,617)Corporate and other unallocated expenses . . . . . . . . . . . . . (3,935)
Profit before tax . . . . . . . . . . . . . . . . . . . . . . . . . . . . . . . . . 140,393
Other segment informationShare of profits and losses of associates . . . . . . . . . . . . . . 5,809 — — 5,809Impairment losses recognized/(reversed) in the statements
of profit or loss . . . . . . . . . . . . . . . . . . . . . . . . . . . . . . . . 1,277 3,050 (196) 4,131Depreciation and amortization . . . . . . . . . . . . . . . . . . . . . . 13,777 73,646 75 87,498Interest income . . . . . . . . . . . . . . . . . . . . . . . . . . . . . . . . . . 1,794 100 47 1,941Finance costs . . . . . . . . . . . . . . . . . . . . . . . . . . . . . . . . . . . 3,815 2,841 — 6,656Gain on disposal of a subsidiary . . . . . . . . . . . . . . . . . . . . . 9,755 — — 9,755Investments in associates . . . . . . . . . . . . . . . . . . . . . . . . . . 36,003 — — 36,003Capital expenditure* . . . . . . . . . . . . . . . . . . . . . . . . . . . . . . 21,886 75,848 — 97,734
I-58
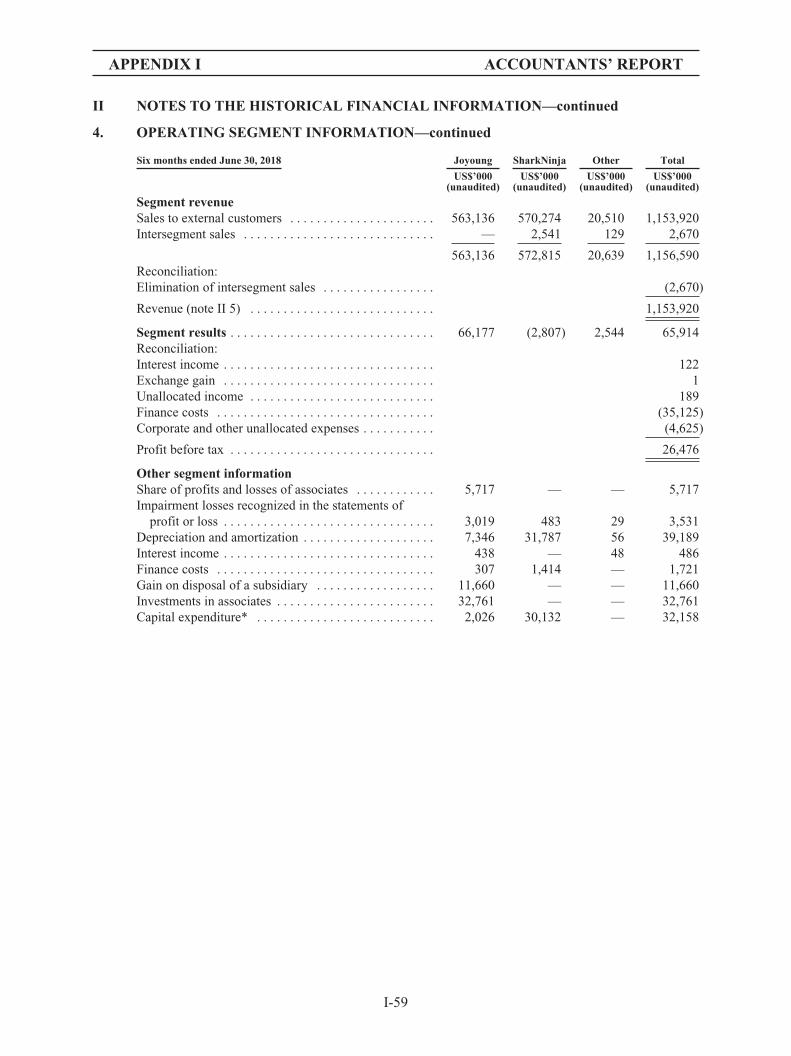
APPENDIX I ACCOUNTANTS’ REPORT
II NOTES TO THE HISTORICAL FINANCIAL INFORMATION—continued
4. OPERATING SEGMENT INFORMATION—continued
Six months ended June 30, 2018 Joyoung SharkNinja Other Total
US$’000 US$’000 US$’000 US$’000(unaudited) (unaudited) (unaudited) (unaudited)
Segment revenueSales to external customers . . . . . . . . . . . . . . . . . . . . . . 563,136 570,274 20,510 1,153,920Intersegment sales . . . . . . . . . . . . . . . . . . . . . . . . . . . . . — 2,541 129 2,670
563,136 572,815 20,639 1,156,590Reconciliation:Elimination of intersegment sales . . . . . . . . . . . . . . . . . (2,670)
Revenue (note II 5) . . . . . . . . . . . . . . . . . . . . . . . . . . . . 1,153,920
Segment results . . . . . . . . . . . . . . . . . . . . . . . . . . . . . . . 66,177 (2,807) 2,544 65,914Reconciliation:Interest income . . . . . . . . . . . . . . . . . . . . . . . . . . . . . . . . 122Exchange gain . . . . . . . . . . . . . . . . . . . . . . . . . . . . . . . . 1Unallocated income . . . . . . . . . . . . . . . . . . . . . . . . . . . . 189Finance costs . . . . . . . . . . . . . . . . . . . . . . . . . . . . . . . . . (35,125)Corporate and other unallocated expenses . . . . . . . . . . . (4,625)
Profit before tax . . . . . . . . . . . . . . . . . . . . . . . . . . . . . . . 26,476
Other segment informationShare of profits and losses of associates . . . . . . . . . . . . 5,717 — — 5,717Impairment losses recognized in the statements of
profit or loss . . . . . . . . . . . . . . . . . . . . . . . . . . . . . . . . 3,019 483 29 3,531Depreciation and amortization . . . . . . . . . . . . . . . . . . . . 7,346 31,787 56 39,189Interest income . . . . . . . . . . . . . . . . . . . . . . . . . . . . . . . . 438 — 48 486Finance costs . . . . . . . . . . . . . . . . . . . . . . . . . . . . . . . . . 307 1,414 — 1,721Gain on disposal of a subsidiary . . . . . . . . . . . . . . . . . . 11,660 — — 11,660Investments in associates . . . . . . . . . . . . . . . . . . . . . . . . 32,761 — — 32,761Capital expenditure* . . . . . . . . . . . . . . . . . . . . . . . . . . . 2,026 30,132 — 32,158
I-59

APPENDIX I ACCOUNTANTS’ REPORT
II NOTES TO THE HISTORICAL FINANCIAL INFORMATION—continued
4. OPERATING SEGMENT INFORMATION—continued
Six months ended June 30, 2019 Joyoung SharkNinja Total
US$’000 US$’000 US$’000
Segment revenueSales to external customers . . . . . . . . . . . . . . . . . . . . . . . . . . . . . . . . . . 572,318 663,518 1,235,836Intersegment sales . . . . . . . . . . . . . . . . . . . . . . . . . . . . . . . . . . . . . . . . . 37,572 6,206 43,778
609,890 669,724 1,279,614Reconciliation:Elimination of intersegment sales . . . . . . . . . . . . . . . . . . . . . . . . . . . . . (43,778)
Revenue (note II 5) . . . . . . . . . . . . . . . . . . . . . . . . . . . . . . . . . . . . . . . . 1,235,836
Segment results . . . . . . . . . . . . . . . . . . . . . . . . . . . . . . . . . . . . . . . . . . 69,506 7,607 77,113Reconciliation:Interest income . . . . . . . . . . . . . . . . . . . . . . . . . . . . . . . . . . . . . . . . . . . 85Exchange loss . . . . . . . . . . . . . . . . . . . . . . . . . . . . . . . . . . . . . . . . . . . . (1,731)Finance costs . . . . . . . . . . . . . . . . . . . . . . . . . . . . . . . . . . . . . . . . . . . . . (40,797)Corporate and other unallocated expenses . . . . . . . . . . . . . . . . . . . . . . (5,720)
Profit before tax . . . . . . . . . . . . . . . . . . . . . . . . . . . . . . . . . . . . . . . . . . 28,950
Other segment informationShare of profits and losses of a joint venture and associates . . . . . . . . 92 — 92Impairment losses recognized in the statements of profit or loss . . . . . 513 859 1,372Depreciation and amortization . . . . . . . . . . . . . . . . . . . . . . . . . . . . . . . 7,779 36,334 44,113Interest income . . . . . . . . . . . . . . . . . . . . . . . . . . . . . . . . . . . . . . . . . . . 1,859 — 1,859Finance costs . . . . . . . . . . . . . . . . . . . . . . . . . . . . . . . . . . . . . . . . . . . . . 1,841 1,355 3,196Investments in a joint venture and associates . . . . . . . . . . . . . . . . . . . . 39,259 — 39,259Capital expenditure* . . . . . . . . . . . . . . . . . . . . . . . . . . . . . . . . . . . . . . . 15,790 30,173 45,963
Note:* Capital expenditure consists of additions to property, plant and equipment, investment properties, prepaid land lease payments,
right-of-use assets and other intangible assets including assets from the acquisition of a subsidiary.
Geographical information
(a) Revenue from external customers
Year ended December 31, Six months ended June 30,
2016 2017 2018 2018 2019
US$’000 US$’000 US$’000 US$’000 US$’000(unaudited)
Mainland China . . . . . . . . . . . . . . . . . . . . 1,080,969 1,065,826 1,189,742 577,224 562,986North America . . . . . . . . . . . . . . . . . . . . 7,481 447,399 1,310,458 506,800 551,847Europe . . . . . . . . . . . . . . . . . . . . . . . . . . . 4,838 36,376 132,127 55,476 91,854Other countries/regions . . . . . . . . . . . . . . 9,691 13,827 49,587 14,420 29,149
1,102,979 1,563,428 2,681,914 1,153,920 1,235,836
The revenue information above is based on the locations of the customers.
I-60
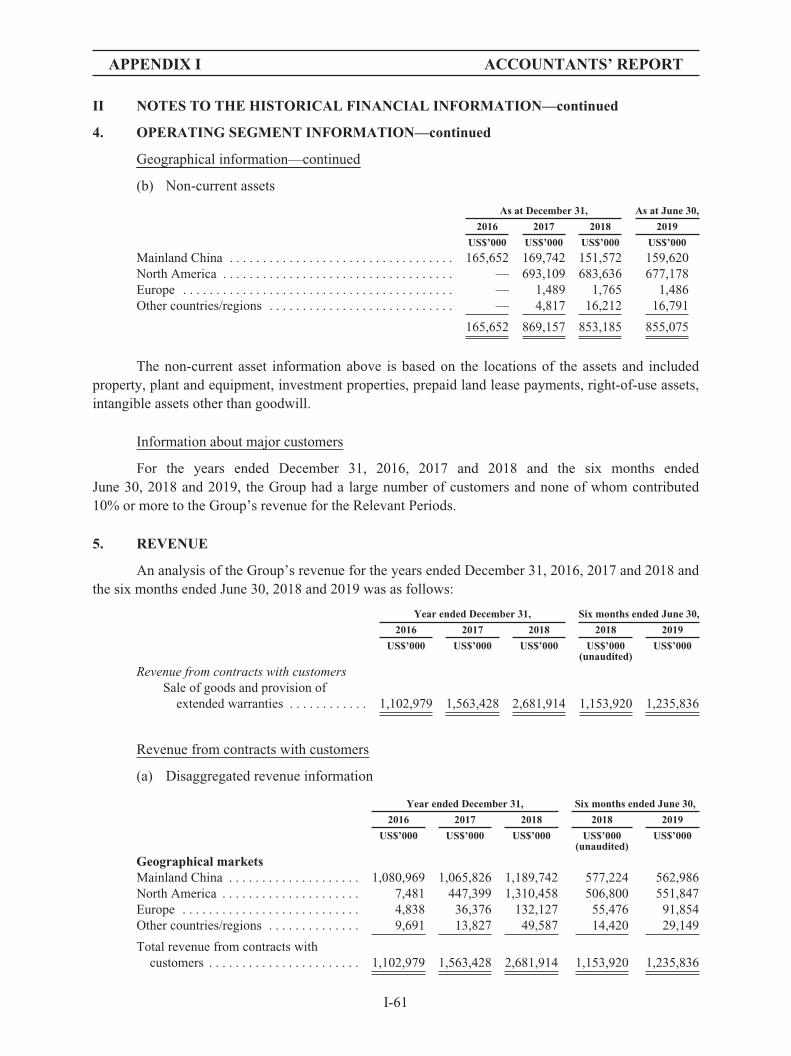
APPENDIX I ACCOUNTANTS’ REPORT
II NOTES TO THE HISTORICAL FINANCIAL INFORMATION—continued
4. OPERATING SEGMENT INFORMATION—continued
Geographical information—continued
(b) Non-current assets
As at December 31, As at June 30,
2016 2017 2018 2019
US$’000 US$’000 US$’000 US$’000
Mainland China . . . . . . . . . . . . . . . . . . . . . . . . . . . . . . . . . . 165,652 169,742 151,572 159,620North America . . . . . . . . . . . . . . . . . . . . . . . . . . . . . . . . . . . — 693,109 683,636 677,178Europe . . . . . . . . . . . . . . . . . . . . . . . . . . . . . . . . . . . . . . . . . — 1,489 1,765 1,486Other countries/regions . . . . . . . . . . . . . . . . . . . . . . . . . . . . — 4,817 16,212 16,791
165,652 869,157 853,185 855,075
The non-current asset information above is based on the locations of the assets and includedproperty, plant and equipment, investment properties, prepaid land lease payments, right-of-use assets,intangible assets other than goodwill.
Information about major customers
For the years ended December 31, 2016, 2017 and 2018 and the six months endedJune 30, 2018 and 2019, the Group had a large number of customers and none of whom contributed10% or more to the Group’s revenue for the Relevant Periods.
5. REVENUE
An analysis of the Group’s revenue for the years ended December 31, 2016, 2017 and 2018 andthe six months ended June 30, 2018 and 2019 was as follows:
Year ended December 31, Six months ended June 30,
2016 2017 2018 2018 2019
US$’000 US$’000 US$’000 US$’000 US$’000(unaudited)
Revenue from contracts with customersSale of goods and provision of
extended warranties . . . . . . . . . . . . 1,102,979 1,563,428 2,681,914 1,153,920 1,235,836
Revenue from contracts with customers
(a) Disaggregated revenue information
Year ended December 31, Six months ended June 30,
2016 2017 2018 2018 2019
US$’000 US$’000 US$’000 US$’000 US$’000(unaudited)
Geographical marketsMainland China . . . . . . . . . . . . . . . . . . . . 1,080,969 1,065,826 1,189,742 577,224 562,986North America . . . . . . . . . . . . . . . . . . . . . 7,481 447,399 1,310,458 506,800 551,847Europe . . . . . . . . . . . . . . . . . . . . . . . . . . . 4,838 36,376 132,127 55,476 91,854Other countries/regions . . . . . . . . . . . . . . 9,691 13,827 49,587 14,420 29,149
Total revenue from contracts withcustomers . . . . . . . . . . . . . . . . . . . . . . . 1,102,979 1,563,428 2,681,914 1,153,920 1,235,836
I-61
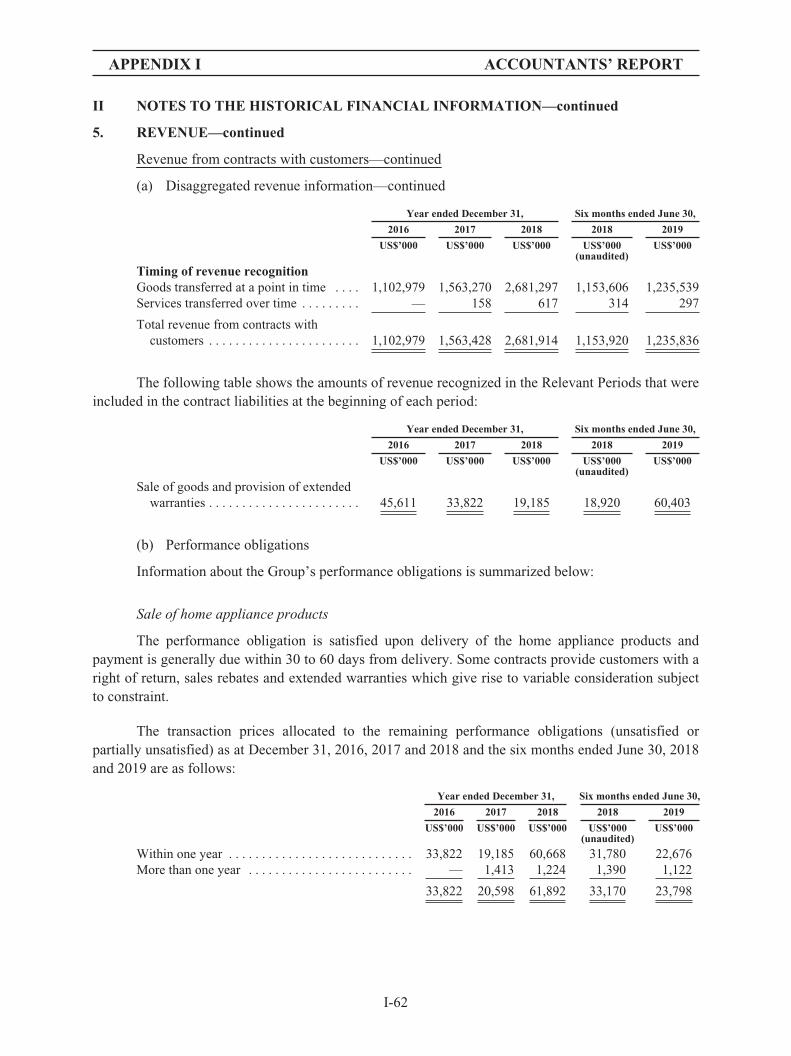
APPENDIX I ACCOUNTANTS’ REPORT
II NOTES TO THE HISTORICAL FINANCIAL INFORMATION—continued
5. REVENUE—continued
Revenue from contracts with customers—continued
(a) Disaggregated revenue information—continued
Year ended December 31, Six months ended June 30,
2016 2017 2018 2018 2019
US$’000 US$’000 US$’000 US$’000 US$’000(unaudited)
Timing of revenue recognitionGoods transferred at a point in time . . . . 1,102,979 1,563,270 2,681,297 1,153,606 1,235,539Services transferred over time . . . . . . . . . — 158 617 314 297
Total revenue from contracts withcustomers . . . . . . . . . . . . . . . . . . . . . . . 1,102,979 1,563,428 2,681,914 1,153,920 1,235,836
The following table shows the amounts of revenue recognized in the Relevant Periods that wereincluded in the contract liabilities at the beginning of each period:
Year ended December 31, Six months ended June 30,
2016 2017 2018 2018 2019
US$’000 US$’000 US$’000 US$’000 US$’000(unaudited)
Sale of goods and provision of extendedwarranties . . . . . . . . . . . . . . . . . . . . . . . 45,611 33,822 19,185 18,920 60,403
(b) Performance obligations
Information about the Group’s performance obligations is summarized below:
Sale of home appliance products
The performance obligation is satisfied upon delivery of the home appliance products andpayment is generally due within 30 to 60 days from delivery. Some contracts provide customers with aright of return, sales rebates and extended warranties which give rise to variable consideration subjectto constraint.
The transaction prices allocated to the remaining performance obligations (unsatisfied orpartially unsatisfied) as at December 31, 2016, 2017 and 2018 and the six months ended June 30, 2018and 2019 are as follows:
Year ended December 31, Six months ended June 30,
2016 2017 2018 2018 2019
US$’000 US$’000 US$’000 US$’000 US$’000(unaudited)
Within one year . . . . . . . . . . . . . . . . . . . . . . . . . . . . 33,822 19,185 60,668 31,780 22,676More than one year . . . . . . . . . . . . . . . . . . . . . . . . . — 1,413 1,224 1,390 1,122
33,822 20,598 61,892 33,170 23,798
I-62

APPENDIX I ACCOUNTANTS’ REPORT
II NOTES TO THE HISTORICAL FINANCIAL INFORMATION—continued
6. OTHER INCOME AND GAINS
Year ended December 31, Six months ended June 30,
2016 2017 2018 2018 2019
US$’000 US$’000 US$’000 US$’000 US$’000(unaudited)
Other incomeBank interest income . . . . . . . . . . . . . . . . . . . . . . . 1,818 1,504 2,183 608 1,944Rental income . . . . . . . . . . . . . . . . . . . . . . . . . . . . . 1,254 1,348 969 432 384Government grants . . . . . . . . . . . . . . . . . . . . . . . . . 9,218 9,995 10,272 977 2,885Others . . . . . . . . . . . . . . . . . . . . . . . . . . . . . . . . . . . 1,825 1,926 1,066 40 146
14,115 14,773 14,490 2,057 5,359
GainsGain on disposal of items of property, plant and
equipment . . . . . . . . . . . . . . . . . . . . . . . . . . . . . . 7,033 230 16,293 46 34Gain on disposal of an investment property . . . . . . — — 1,863 1,863 —Gain on financial assets at fair value through profit
or loss, net . . . . . . . . . . . . . . . . . . . . . . . . . . . . . . 17,948 5,675 742 — 5,988Gain on disposal of subsidiaries (note II 37) . . . . . — 1,626 9,755 11,660 —Others . . . . . . . . . . . . . . . . . . . . . . . . . . . . . . . . . . . 1,971 642 1,319 1,617 935
26,952 8,173 29,972 15,186 6,957
41,067 22,946 44,462 17,243 12,316
I-63
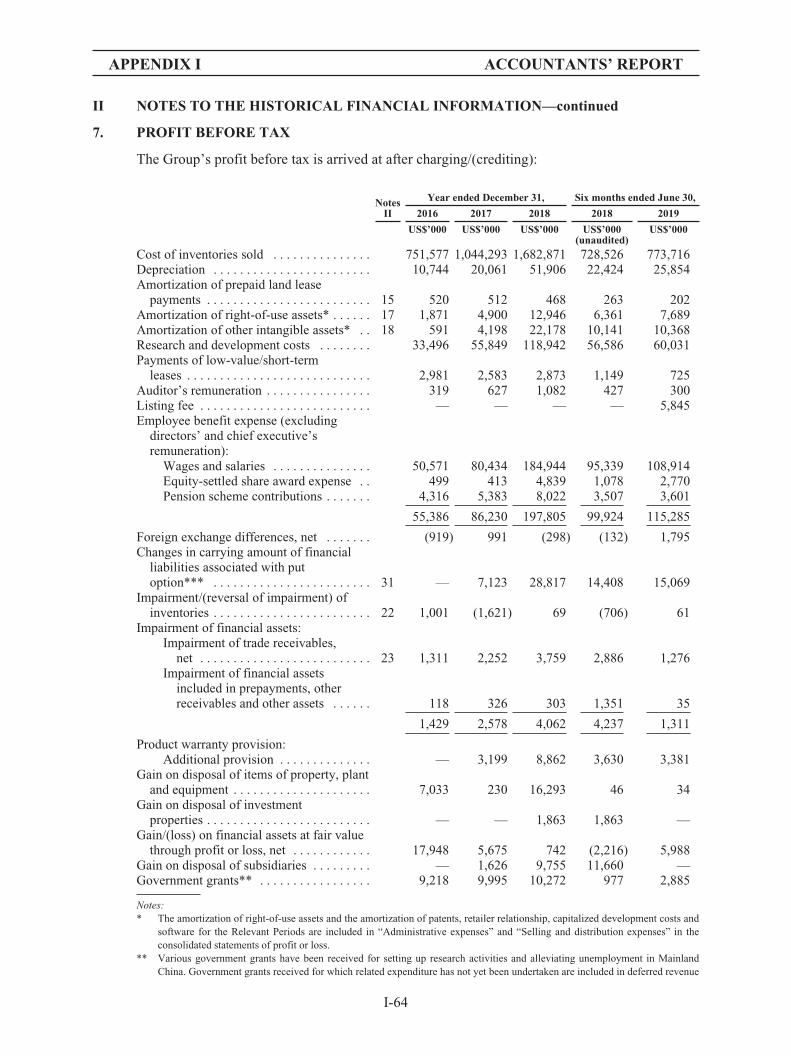
APPENDIX I ACCOUNTANTS’ REPORT
II NOTES TO THE HISTORICAL FINANCIAL INFORMATION—continued
7. PROFIT BEFORE TAX
The Group’s profit before tax is arrived at after charging/(crediting):
NotesII
Year ended December 31, Six months ended June 30,
2016 2017 2018 2018 2019
US$’000 US$’000 US$’000 US$’000 US$’000(unaudited)
Cost of inventories sold . . . . . . . . . . . . . . . 751,577 1,044,293 1,682,871 728,526 773,716Depreciation . . . . . . . . . . . . . . . . . . . . . . . . 10,744 20,061 51,906 22,424 25,854Amortization of prepaid land lease
payments . . . . . . . . . . . . . . . . . . . . . . . . . 15 520 512 468 263 202Amortization of right-of-use assets* . . . . . . 17 1,871 4,900 12,946 6,361 7,689Amortization of other intangible assets* . . 18 591 4,198 22,178 10,141 10,368Research and development costs . . . . . . . . 33,496 55,849 118,942 56,586 60,031Payments of low-value/short-term
leases . . . . . . . . . . . . . . . . . . . . . . . . . . . . 2,981 2,583 2,873 1,149 725Auditor’s remuneration . . . . . . . . . . . . . . . . 319 627 1,082 427 300Listing fee . . . . . . . . . . . . . . . . . . . . . . . . . . — — — — 5,845Employee benefit expense (excluding
directors’ and chief executive’sremuneration):
Wages and salaries . . . . . . . . . . . . . . . 50,571 80,434 184,944 95,339 108,914Equity-settled share award expense . . 499 413 4,839 1,078 2,770Pension scheme contributions . . . . . . . 4,316 5,383 8,022 3,507 3,601
55,386 86,230 197,805 99,924 115,285
Foreign exchange differences, net . . . . . . . (919) 991 (298) (132) 1,795Changes in carrying amount of financial
liabilities associated with putoption*** . . . . . . . . . . . . . . . . . . . . . . . . 31 — 7,123 28,817 14,408 15,069
Impairment/(reversal of impairment) ofinventories . . . . . . . . . . . . . . . . . . . . . . . . 22 1,001 (1,621) 69 (706) 61
Impairment of financial assets:Impairment of trade receivables,
net . . . . . . . . . . . . . . . . . . . . . . . . . . 23 1,311 2,252 3,759 2,886 1,276Impairment of financial assets
included in prepayments, otherreceivables and other assets . . . . . . 118 326 303 1,351 35
1,429 2,578 4,062 4,237 1,311
Product warranty provision:Additional provision . . . . . . . . . . . . . . — 3,199 8,862 3,630 3,381
Gain on disposal of items of property, plantand equipment . . . . . . . . . . . . . . . . . . . . . 7,033 230 16,293 46 34
Gain on disposal of investmentproperties . . . . . . . . . . . . . . . . . . . . . . . . . — — 1,863 1,863 —
Gain/(loss) on financial assets at fair valuethrough profit or loss, net . . . . . . . . . . . . 17,948 5,675 742 (2,216) 5,988
Gain on disposal of subsidiaries . . . . . . . . . — 1,626 9,755 11,660 —Government grants** . . . . . . . . . . . . . . . . . 9,218 9,995 10,272 977 2,885
Notes:* The amortization of right-of-use assets and the amortization of patents, retailer relationship, capitalized development costs and
software for the Relevant Periods are included in “Administrative expenses” and “Selling and distribution expenses” in theconsolidated statements of profit or loss.
** Various government grants have been received for setting up research activities and alleviating unemployment in MainlandChina. Government grants received for which related expenditure has not yet been undertaken are included in deferred revenue
I-64
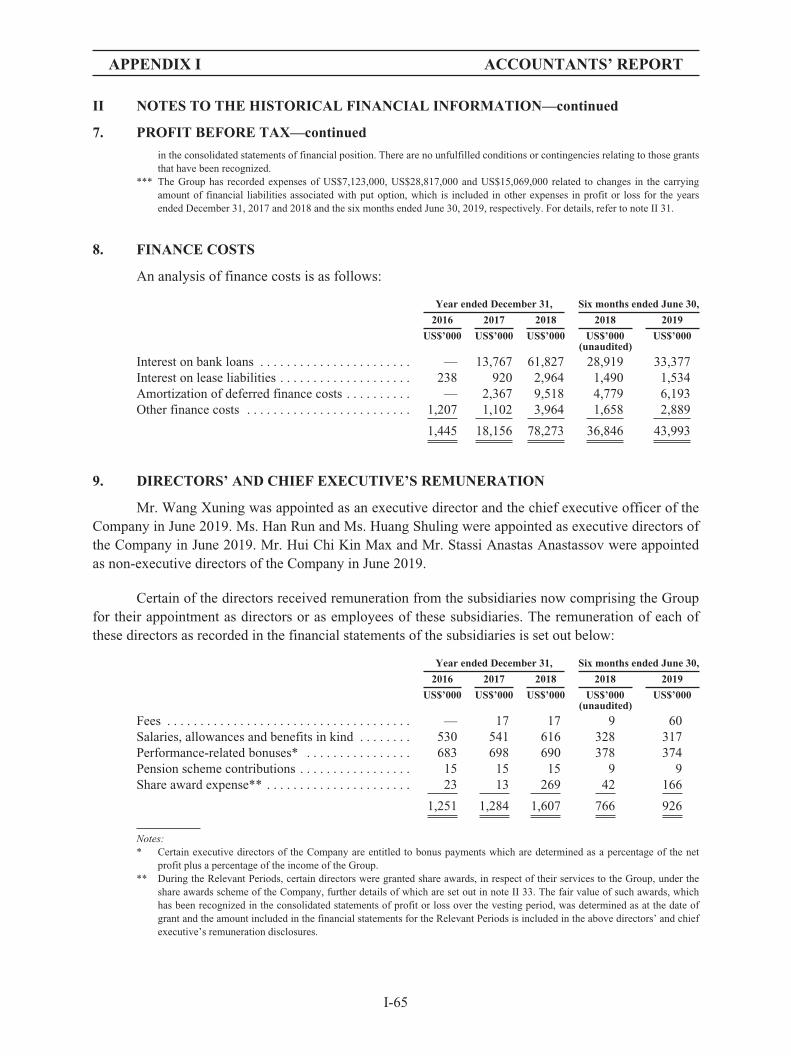
APPENDIX I ACCOUNTANTS’ REPORT
II NOTES TO THE HISTORICAL FINANCIAL INFORMATION—continued
7. PROFIT BEFORE TAX—continued
in the consolidated statements of financial position. There are no unfulfilled conditions or contingencies relating to those grantsthat have been recognized.
*** The Group has recorded expenses of US$7,123,000, US$28,817,000 and US$15,069,000 related to changes in the carryingamount of financial liabilities associated with put option, which is included in other expenses in profit or loss for the yearsended December 31, 2017 and 2018 and the six months ended June 30, 2019, respectively. For details, refer to note II 31.
8. FINANCE COSTS
An analysis of finance costs is as follows:
Year ended December 31, Six months ended June 30,
2016 2017 2018 2018 2019
US$’000 US$’000 US$’000 US$’000 US$’000(unaudited)
Interest on bank loans . . . . . . . . . . . . . . . . . . . . . . . — 13,767 61,827 28,919 33,377Interest on lease liabilities . . . . . . . . . . . . . . . . . . . . 238 920 2,964 1,490 1,534Amortization of deferred finance costs . . . . . . . . . . — 2,367 9,518 4,779 6,193Other finance costs . . . . . . . . . . . . . . . . . . . . . . . . . 1,207 1,102 3,964 1,658 2,889
1,445 18,156 78,273 36,846 43,993
9. DIRECTORS’ AND CHIEF EXECUTIVE’S REMUNERATION
Mr. Wang Xuning was appointed as an executive director and the chief executive officer of theCompany in June 2019. Ms. Han Run and Ms. Huang Shuling were appointed as executive directors ofthe Company in June 2019. Mr. Hui Chi Kin Max and Mr. Stassi Anastas Anastassov were appointedas non-executive directors of the Company in June 2019.
Certain of the directors received remuneration from the subsidiaries now comprising the Groupfor their appointment as directors or as employees of these subsidiaries. The remuneration of each ofthese directors as recorded in the financial statements of the subsidiaries is set out below:
Year ended December 31, Six months ended June 30,
2016 2017 2018 2018 2019
US$’000 US$’000 US$’000 US$’000 US$’000(unaudited)
Fees . . . . . . . . . . . . . . . . . . . . . . . . . . . . . . . . . . . . . — 17 17 9 60Salaries, allowances and benefits in kind . . . . . . . . 530 541 616 328 317Performance-related bonuses* . . . . . . . . . . . . . . . . 683 698 690 378 374Pension scheme contributions . . . . . . . . . . . . . . . . . 15 15 15 9 9Share award expense** . . . . . . . . . . . . . . . . . . . . . . 23 13 269 42 166
1,251 1,284 1,607 766 926
Notes:* Certain executive directors of the Company are entitled to bonus payments which are determined as a percentage of the net
profit plus a percentage of the income of the Group.** During the Relevant Periods, certain directors were granted share awards, in respect of their services to the Group, under the
share awards scheme of the Company, further details of which are set out in note II 33. The fair value of such awards, whichhas been recognized in the consolidated statements of profit or loss over the vesting period, was determined as at the date ofgrant and the amount included in the financial statements for the Relevant Periods is included in the above directors’ and chiefexecutive’s remuneration disclosures.
I-65
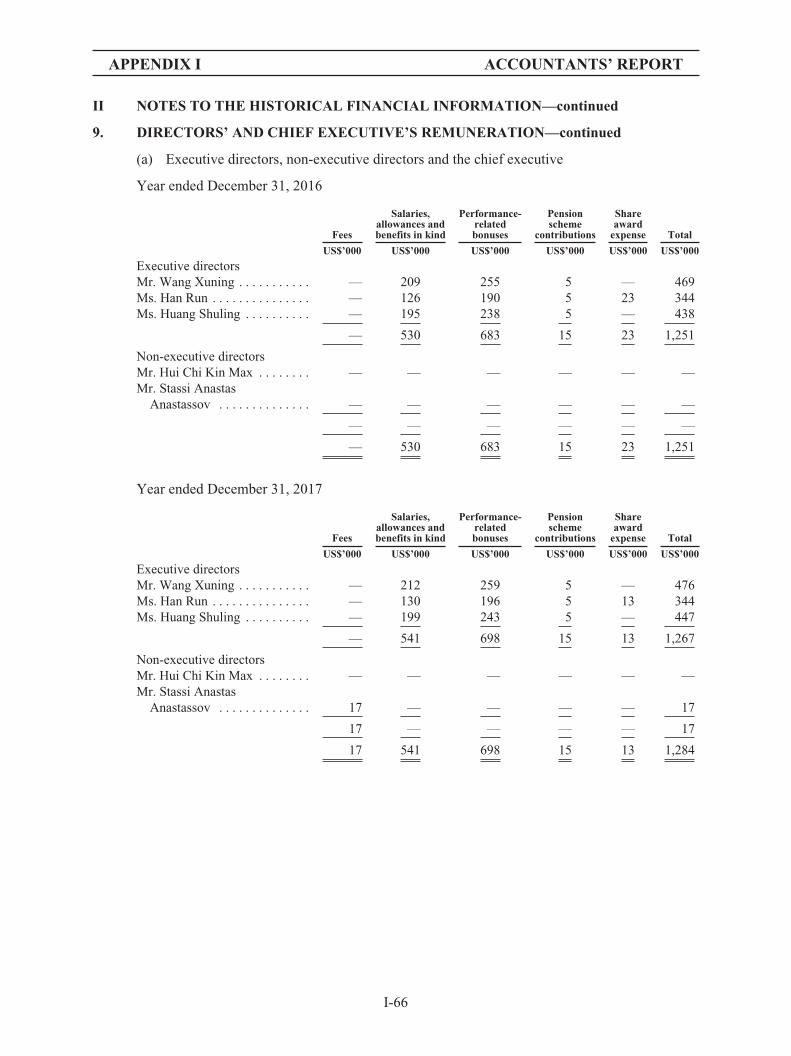
APPENDIX I ACCOUNTANTS’ REPORT
II NOTES TO THE HISTORICAL FINANCIAL INFORMATION—continued
9. DIRECTORS’ AND CHIEF EXECUTIVE’S REMUNERATION—continued
(a) Executive directors, non-executive directors and the chief executive
Year ended December 31, 2016
Fees
Salaries,allowances andbenefits in kind
Performance-relatedbonuses
Pensionscheme
contributions
Shareaward
expense Total
US$’000 US$’000 US$’000 US$’000 US$’000 US$’000
Executive directorsMr. Wang Xuning . . . . . . . . . . . — 209 255 5 — 469Ms. Han Run . . . . . . . . . . . . . . . — 126 190 5 23 344Ms. Huang Shuling . . . . . . . . . . — 195 238 5 — 438
— 530 683 15 23 1,251
Non-executive directorsMr. Hui Chi Kin Max . . . . . . . . — — — — — —Mr. Stassi Anastas
Anastassov . . . . . . . . . . . . . . — — — — — —
— — — — — —
— 530 683 15 23 1,251
Year ended December 31, 2017
Fees
Salaries,allowances andbenefits in kind
Performance-relatedbonuses
Pensionscheme
contributions
Shareaward
expense Total
US$’000 US$’000 US$’000 US$’000 US$’000 US$’000
Executive directorsMr. Wang Xuning . . . . . . . . . . . — 212 259 5 — 476Ms. Han Run . . . . . . . . . . . . . . . — 130 196 5 13 344Ms. Huang Shuling . . . . . . . . . . — 199 243 5 — 447
— 541 698 15 13 1,267
Non-executive directorsMr. Hui Chi Kin Max . . . . . . . . — — — — — —Mr. Stassi Anastas
Anastassov . . . . . . . . . . . . . . 17 — — — — 17
17 — — — — 17
17 541 698 15 13 1,284
I-66

APPENDIX I ACCOUNTANTS’ REPORT
II NOTES TO THE HISTORICAL FINANCIAL INFORMATION—continued
9. DIRECTORS’ AND CHIEF EXECUTIVE’S REMUNERATION—continued
(a) Executive directors, non-executive directors and the chief executive—continued
Year ended December 31, 2018
Fees
Salaries,allowances andbenefits in kind
Performance-relatedbonuses
Pensionscheme
contributions
Shareaward
expense Total
US$’000 US$’000 US$’000 US$’000 US$’000 US$’000
Executive directorsMr. Wang Xuning . . . . — 238 258 5 — 501Ms. Han Run . . . . . . . . — 162 198 5 154 519Ms. Huang Shuling . . . — 216 234 5 115 570
— 616 690 15 269 1,590
Non-executivedirectors
Mr. Hui Chi KinMax . . . . . . . . . . . . . — — — — — —
Mr. Stassi AnastasAnastassov . . . . . . . . 17 — — — — 17
17 — — — — 17
17 616 690 15 269 1,607
Six months ended June 30, 2018
Fees
Salaries,allowances andbenefits in kind
Performance-relatedbonuses
Pensionscheme
contributions
Shareaward
expense Total
US$’000 US$’000 US$’000 US$’000 US$’000 US$’000(unaudited) (unaudited) (unaudited) (unaudited) (unaudited) (unaudited)
Executive directorsMr. Wang Xuning . . . . — 127 142 3 — 272Ms. Han Run . . . . . . . . — 86 103 3 24 216Ms. Huang Shuling . . . — 115 133 3 18 269
— 328 378 9 42 757
Non-executivedirectors
Mr. Hui Chi KinMax . . . . . . . . . . . . . — — — — — —
Mr. Stassi AnastasAnastassov . . . . . . . . 9 — — — — 9
9 — — — — 9
9 328 378 9 42 766
I-67

APPENDIX I ACCOUNTANTS’ REPORT
II NOTES TO THE HISTORICAL FINANCIAL INFORMATION—continued
9. DIRECTORS’ AND CHIEF EXECUTIVE’S REMUNERATION—continued
(a) Executive directors, non-executive directors and the chief executive—continued
Six months ended June 30, 2019
Fees
Salaries,allowances andbenefits in kind
Performance-relatedbonuses
Pensionscheme
contributions
Shareaward
expense Total
US$’000 US$’000 US$’000 US$’000 US$’000 US$’000
Executive directorsMr. Wang Xuning . . . . . . . . . . . — 122 141 3 — 266Ms. Han Run . . . . . . . . . . . . . . . — 87 107 3 95 292Ms. Huang Shuling . . . . . . . . . . — 108 126 3 71 308
— 317 374 9 166 866
Non-executive directorsMr. Hui Chi Kin Max . . . . . . . . — — — — — —Mr. Stassi Anastas
Anastassov . . . . . . . . . . . . . . 60 — — — — 60
60 — — — — 60
60 317 374 9 166 926
There was no arrangement under which a director or the chief executive waived or agreed towaive any remuneration during the Relevant Periods.
(b) Five highest paid employees
The five highest paid employees included three, two, nil, nil and nil directors and the chiefexecutive during the years ended December 31, 2016, 2017, 2018, and the six months ended June 30,2018 and 2019, respectively, details of whose remuneration are set out above. Details of theremuneration for the remaining two, three, five, five and five highest paid employees who are neither adirector nor chief executive of the Company during the years ended December 31, 2016, 2017, 2018,and the six months ended June 30, 2018 and 2019, respectively, are as follows:
Year ended December 31, Six months ended June 30,
2016 2017 2018 2018 2019
US$’000 US$’000 US$’000 US$’000 US$’000(unaudited)
Salaries, allowances and benefits in kind . . . 187 771 3,511 1,733 1,616Performance-related bonuses . . . . . . . . . . . . 280 1,212 4,515 2,404 2,451Pension scheme contributions . . . . . . . . . . . 6 10 42 41 36Share award expense . . . . . . . . . . . . . . . . . . 45 21 385 — 237
518 2,014 8,453 4,178 4,340
I-68
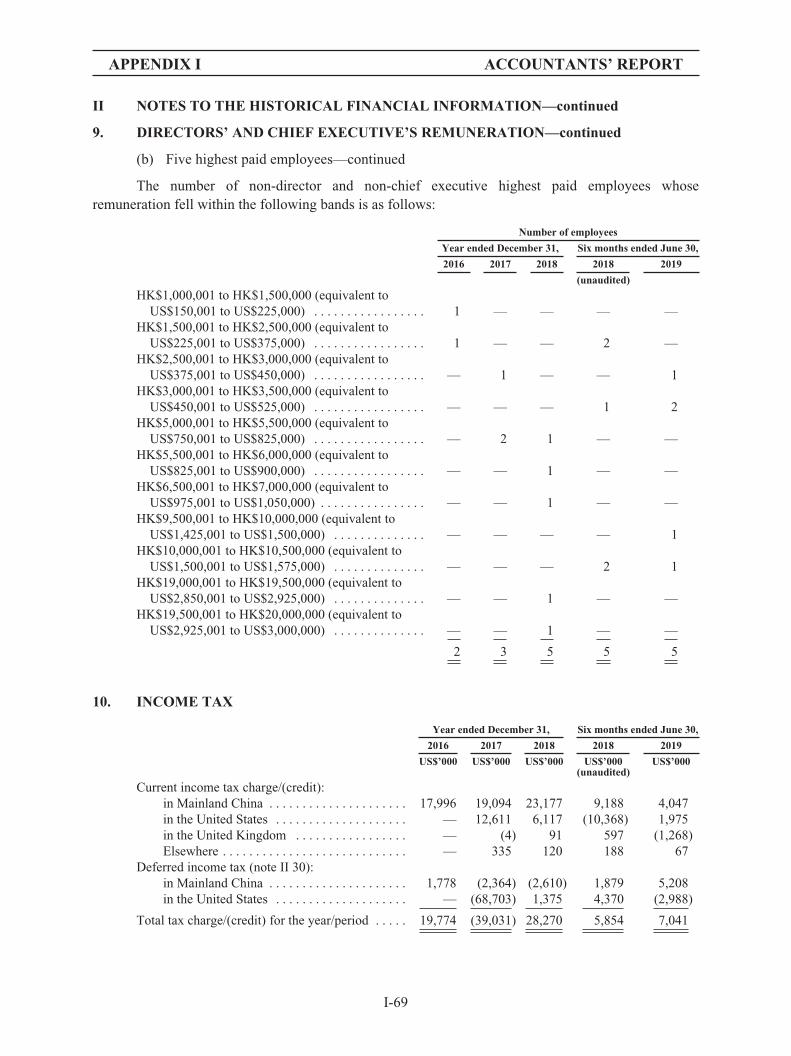
APPENDIX I ACCOUNTANTS’ REPORT
II NOTES TO THE HISTORICAL FINANCIAL INFORMATION—continued
9. DIRECTORS’ AND CHIEF EXECUTIVE’S REMUNERATION—continued
(b) Five highest paid employees—continued
The number of non-director and non-chief executive highest paid employees whoseremuneration fell within the following bands is as follows:
Number of employees
Year ended December 31, Six months ended June 30,
2016 2017 2018 2018 2019
(unaudited)
HK$1,000,001 to HK$1,500,000 (equivalent toUS$150,001 to US$225,000) . . . . . . . . . . . . . . . . . 1 — — — —
HK$1,500,001 to HK$2,500,000 (equivalent toUS$225,001 to US$375,000) . . . . . . . . . . . . . . . . . 1 — — 2 —
HK$2,500,001 to HK$3,000,000 (equivalent toUS$375,001 to US$450,000) . . . . . . . . . . . . . . . . . — 1 — — 1
HK$3,000,001 to HK$3,500,000 (equivalent toUS$450,001 to US$525,000) . . . . . . . . . . . . . . . . . — — — 1 2
HK$5,000,001 to HK$5,500,000 (equivalent toUS$750,001 to US$825,000) . . . . . . . . . . . . . . . . . — 2 1 — —
HK$5,500,001 to HK$6,000,000 (equivalent toUS$825,001 to US$900,000) . . . . . . . . . . . . . . . . . — — 1 — —
HK$6,500,001 to HK$7,000,000 (equivalent toUS$975,001 to US$1,050,000) . . . . . . . . . . . . . . . . — — 1 — —
HK$9,500,001 to HK$10,000,000 (equivalent toUS$1,425,001 to US$1,500,000) . . . . . . . . . . . . . . — — — — 1
HK$10,000,001 to HK$10,500,000 (equivalent toUS$1,500,001 to US$1,575,000) . . . . . . . . . . . . . . — — — 2 1
HK$19,000,001 to HK$19,500,000 (equivalent toUS$2,850,001 to US$2,925,000) . . . . . . . . . . . . . . — — 1 — —
HK$19,500,001 to HK$20,000,000 (equivalent toUS$2,925,001 to US$3,000,000) . . . . . . . . . . . . . . — — 1 — —
2 3 5 5 5
10. INCOME TAX
Year ended December 31, Six months ended June 30,
2016 2017 2018 2018 2019
US$’000 US$’000 US$’000 US$’000 US$’000(unaudited)
Current income tax charge/(credit):in Mainland China . . . . . . . . . . . . . . . . . . . . . 17,996 19,094 23,177 9,188 4,047in the United States . . . . . . . . . . . . . . . . . . . . — 12,611 6,117 (10,368) 1,975in the United Kingdom . . . . . . . . . . . . . . . . . — (4) 91 597 (1,268)Elsewhere . . . . . . . . . . . . . . . . . . . . . . . . . . . . — 335 120 188 67
Deferred income tax (note II 30):in Mainland China . . . . . . . . . . . . . . . . . . . . . 1,778 (2,364) (2,610) 1,879 5,208in the United States . . . . . . . . . . . . . . . . . . . . — (68,703) 1,375 4,370 (2,988)
Total tax charge/(credit) for the year/period . . . . . 19,774 (39,031) 28,270 5,854 7,041
I-69
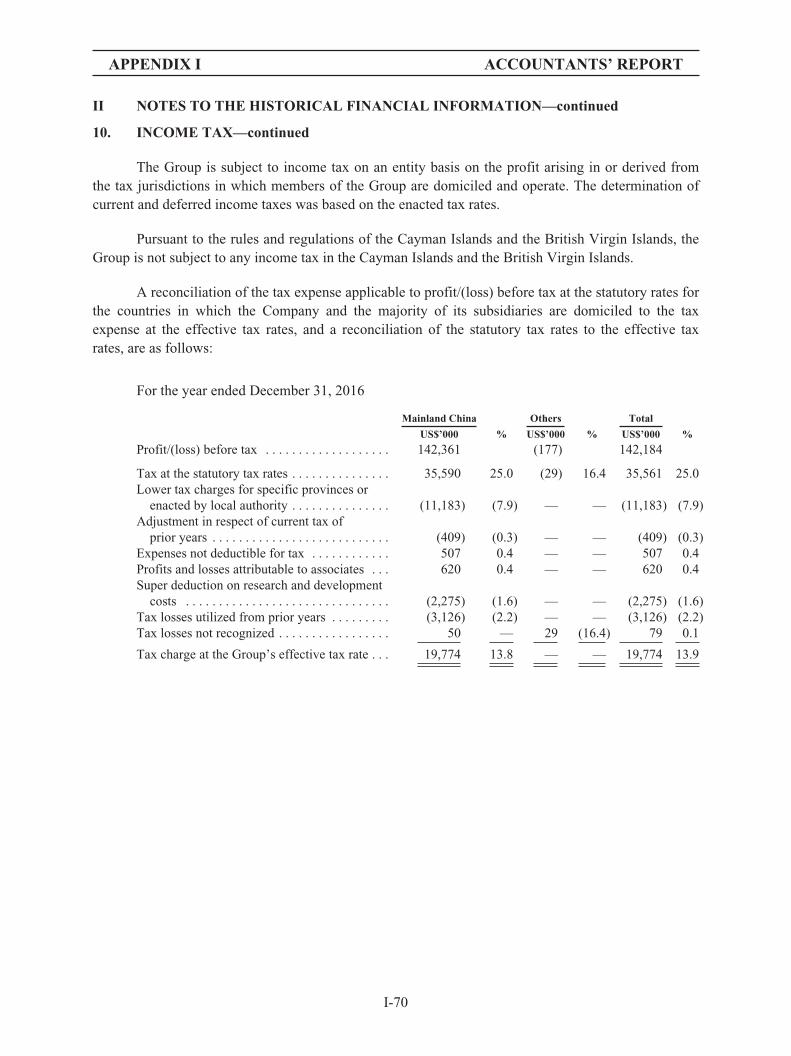
APPENDIX I ACCOUNTANTS’ REPORT
II NOTES TO THE HISTORICAL FINANCIAL INFORMATION—continued
10. INCOME TAX—continued
The Group is subject to income tax on an entity basis on the profit arising in or derived fromthe tax jurisdictions in which members of the Group are domiciled and operate. The determination ofcurrent and deferred income taxes was based on the enacted tax rates.
Pursuant to the rules and regulations of the Cayman Islands and the British Virgin Islands, theGroup is not subject to any income tax in the Cayman Islands and the British Virgin Islands.
A reconciliation of the tax expense applicable to profit/(loss) before tax at the statutory rates forthe countries in which the Company and the majority of its subsidiaries are domiciled to the taxexpense at the effective tax rates, and a reconciliation of the statutory tax rates to the effective taxrates, are as follows:
For the year ended December 31, 2016
Mainland China Others Total
US$’000 % US$’000 % US$’000 %
Profit/(loss) before tax . . . . . . . . . . . . . . . . . . . 142,361 (177) 142,184
Tax at the statutory tax rates . . . . . . . . . . . . . . . 35,590 25.0 (29) 16.4 35,561 25.0Lower tax charges for specific provinces or
enacted by local authority . . . . . . . . . . . . . . . (11,183) (7.9) — — (11,183) (7.9)Adjustment in respect of current tax of
prior years . . . . . . . . . . . . . . . . . . . . . . . . . . . (409) (0.3) — — (409) (0.3)Expenses not deductible for tax . . . . . . . . . . . . 507 0.4 — — 507 0.4Profits and losses attributable to associates . . . 620 0.4 — — 620 0.4Super deduction on research and development
costs . . . . . . . . . . . . . . . . . . . . . . . . . . . . . . . (2,275) (1.6) — — (2,275) (1.6)Tax losses utilized from prior years . . . . . . . . . (3,126) (2.2) — — (3,126) (2.2)Tax losses not recognized . . . . . . . . . . . . . . . . . 50 — 29 (16.4) 79 0.1
Tax charge at the Group’s effective tax rate . . . 19,774 13.8 — — 19,774 13.9
I-70
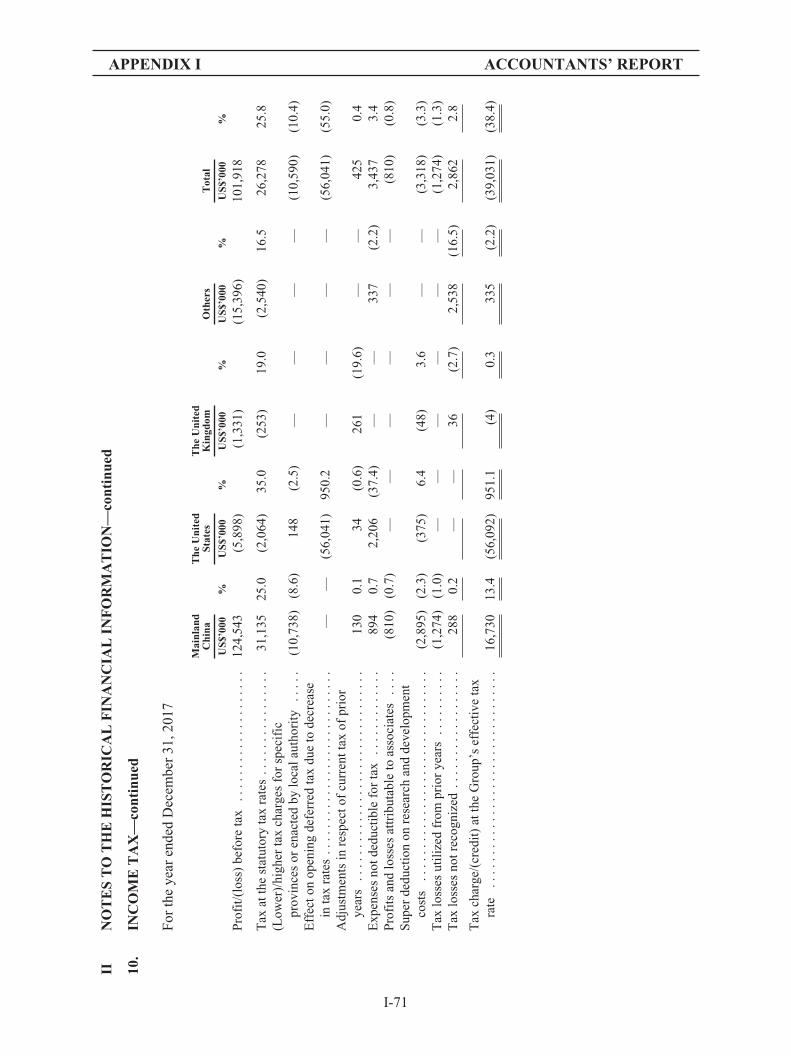
APPENDIX I ACCOUNTANTS’ REPORT
IIN
OT
ES
TO
TH
EH
IST
OR
ICA
LF
INA
NC
IAL
INF
OR
MA
TIO
N—
cont
inue
d
10.
INC
OM
ET
AX
—co
ntin
ued
For
the
year
ende
dD
ecem
ber
31,2
017
Mai
nlan
dC
hina
The
Uni
ted
Stat
esT
heU
nite
dK
ingd
omO
ther
sT
otal
US$
’000
%U
S$’0
00%
US$
’000
%U
S$’0
00%
US$
’000
%
Pro
fit/
(los
s)be
fore
tax
....
....
....
....
....
124,
543
(5,8
98)
(1,3
31)
(15,
396)
101,
918
Tax
atth
est
atut
ory
tax
rate
s..
....
....
....
..31
,135
25.0
(2,0
64)
35.0
(253
)19
.0(2
,540
)16
.526
,278
25.8
(Low
er)/
high
erta
xch
arge
sfo
rsp
ecif
icpr
ovin
ces
oren
acte
dby
loca
laut
hori
ty..
...
(10,
738)
(8.6
)14
8(2
.5)
——
——
(10,
590)
(10.
4)E
ffec
ton
open
ing
defe
rred
tax
due
tode
crea
sein
tax
rate
s..
....
....
....
....
....
....
..—
—(5
6,04
1)95
0.2
——
——
(56,
041)
(55.
0)A
djus
tmen
tsin
resp
ecto
fcu
rren
ttax
ofpr
ior
year
s..
....
....
....
....
....
....
....
..13
00.
134
(0.6
)26
1(1
9.6)
——
425
0.4
Exp
ense
sno
tded
ucti
ble
for
tax
....
....
....
.89
40.
72,
206
(37.
4)—
—33
7(2
.2)
3,43
73.
4P
rofi
tsan
dlo
sses
attr
ibut
able
toas
soci
ates
....
(810
)(0
.7)
——
——
——
(810
)(0
.8)
Sup
erde
duct
ion
onre
sear
chan
dde
velo
pmen
tco
sts
....
....
....
....
....
....
....
....
(2,8
95)
(2.3
)(3
75)
6.4
(48)
3.6
——
(3,3
18)
(3.3
)T
axlo
sses
util
ized
from
prio
rye
ars
....
....
..(1
,274
)(1
.0)
——
——
——
(1,2
74)
(1.3
)T
axlo
sses
notr
ecog
nize
d..
....
....
....
....
288
0.2
——
36(2
.7)
2,53
8(1
6.5)
2,86
22.
8
Tax
char
ge/(
cred
it)
atth
eG
roup
’sef
fect
ive
tax
rate
....
....
....
....
....
....
....
....
.16
,730
13.4
(56,
092)
951.
1(4
)0.
333
5(2
.2)
(39,
031)
(38.
4)
I-71
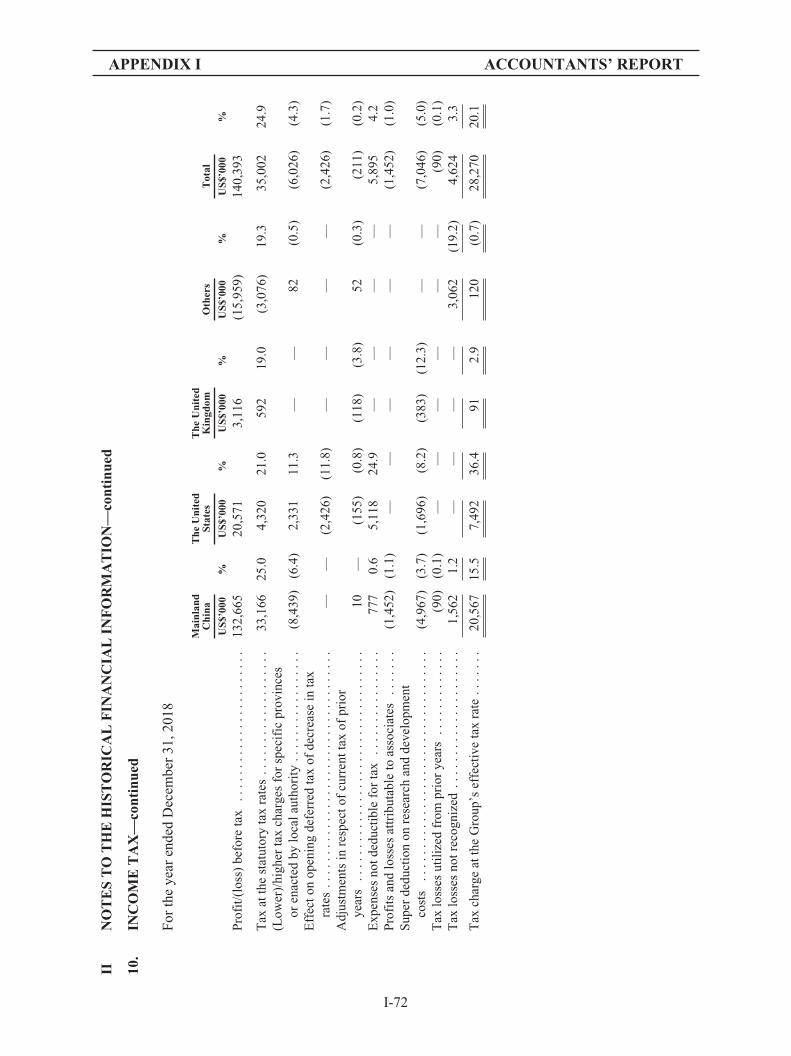
APPENDIX I ACCOUNTANTS’ REPORT
IIN
OT
ES
TO
TH
EH
IST
OR
ICA
LF
INA
NC
IAL
INF
OR
MA
TIO
N—
cont
inue
d
10.
INC
OM
ET
AX
—co
ntin
ued
For
the
year
ende
dD
ecem
ber
31,2
018
Mai
nlan
dC
hina
The
Uni
ted
Stat
esT
heU
nite
dK
ingd
omO
ther
sT
otal
US$
’000
%U
S$’0
00%
US$
’000
%U
S$’0
00%
US$
’000
%
Pro
fit/
(los
s)be
fore
tax
....
....
....
....
....
...
132,
665
20,5
713,
116
(15,
959)
140,
393
Tax
atth
est
atut
ory
tax
rate
s..
....
....
....
....
.33
,166
25.0
4,32
021
.059
219
.0(3
,076
)19
.335
,002
24.9
(Low
er)/
high
erta
xch
arge
sfo
rsp
ecif
icpr
ovin
ces
oren
acte
dby
loca
laut
hori
ty..
....
....
....
...
(8,4
39)
(6.4
)2,
331
11.3
——
82(0
.5)
(6,0
26)
(4.3
)E
ffec
ton
open
ing
defe
rred
tax
ofde
crea
sein
tax
rate
s..
....
....
....
....
....
....
....
....
..—
—(2
,426
)(1
1.8)
——
——
(2,4
26)
(1.7
)A
djus
tmen
tsin
resp
ecto
fcu
rren
ttax
ofpr
ior
year
s..
....
....
....
....
....
....
....
....
.10
—(1
55)
(0.8
)(1
18)
(3.8
)52
(0.3
)(2
11)
(0.2
)E
xpen
ses
notd
educ
tibl
efo
rta
x..
....
....
....
..77
70.
65,
118
24.9
——
——
5,89
54.
2P
rofi
tsan
dlo
sses
attr
ibut
able
toas
soci
ates
....
...
(1,4
52)
(1.1
)—
——
——
—(1
,452
)(1
.0)
Sup
erde
duct
ion
onre
sear
chan
dde
velo
pmen
tco
sts
....
....
....
....
....
....
....
....
...
(4,9
67)
(3.7
)(1
,696
)(8
.2)
(383
)(1
2.3)
——
(7,0
46)
(5.0
)T
axlo
sses
util
ized
from
prio
rye
ars
....
....
....
.(9
0)(0
.1)
——
——
——
(90)
(0.1
)T
axlo
sses
notr
ecog
nize
d..
....
....
....
....
...
1,56
21.
2—
——
—3,
062
(19.
2)4,
624
3.3
Tax
char
geat
the
Gro
up’s
effe
ctiv
eta
xra
te..
....
.20
,567
15.5
7,49
236
.491
2.9
120
(0.7
)28
,270
20.1
I-72

APPENDIX I ACCOUNTANTS’ REPORT
IIN
OT
ES
TO
TH
EH
IST
OR
ICA
LF
INA
NC
IAL
INF
OR
MA
TIO
N—
cont
inue
d
10.
INC
OM
ET
AX
—co
ntin
ued
Six
mon
ths
ende
dJu
ne30
,201
8
Mai
nlan
dC
hina
The
Uni
ted
Stat
esT
heU
nite
dK
ingd
omO
ther
sT
otal
US$
’000
%U
S$’0
00%
US$
’000
%U
S$’0
00%
US$
’000
%(u
naud
ited
)(u
naud
ited
)(u
naud
ited
)(u
naud
ited
)(u
naud
ited
)
Pro
fit/
(los
s)be
fore
tax
....
....
....
....
....
....
....
.66
,915
(33,
571)
3,34
1(1
0,20
9)26
,476
Tax
atth
est
atut
ory
tax
rate
s..
....
....
....
....
....
..16
,729
25.0
(7,0
50)
21.0
635
19.0
(1,7
25)
16.9
8,58
932
.4L
ower
tax
char
ges
for
spec
ific
prov
ince
sor
enac
ted
bylo
cala
utho
rity
....
....
....
....
....
....
....
....
.(4
,405
)(6
.6)
(1,0
61)
3.2
——
——
(5,4
66)
(20.
6)A
djus
tmen
tsin
resp
ecto
fcu
rren
ttax
ofpr
ior
year
s..
....
1—
——
——
——
1—
Exp
ense
sno
tded
ucti
ble
for
tax
....
....
....
....
....
..48
80.
72,
961
(8.8
)15
44.
618
2(1
.8)
3,78
514
.3P
rofi
tsan
dlo
sses
attr
ibut
able
toas
soci
ates
....
....
....
.(1
,429
)(2
.1)
——
——
——
(1,4
29)
(5.4
)S
uper
dedu
ctio
non
rese
arch
and
deve
lopm
entc
osts
....
.(1
,837
)(2
.7)
(848
)2.
5(1
92)
(5.7
)—
—(2
,877
)(1
0.9)
Tax
loss
esno
trec
ogni
zed
....
....
....
....
....
....
..1,
520
2.3
——
——
1,73
1(1
7.0)
3,25
112
.3
Tax
char
ge/(
cred
it)
atth
eG
roup
’sef
fect
ive
tax
rate
....
..11
,067
16.6
(5,9
98)
17.9
597
17.9
188
(1.9
)5,
854
22.1
I-73
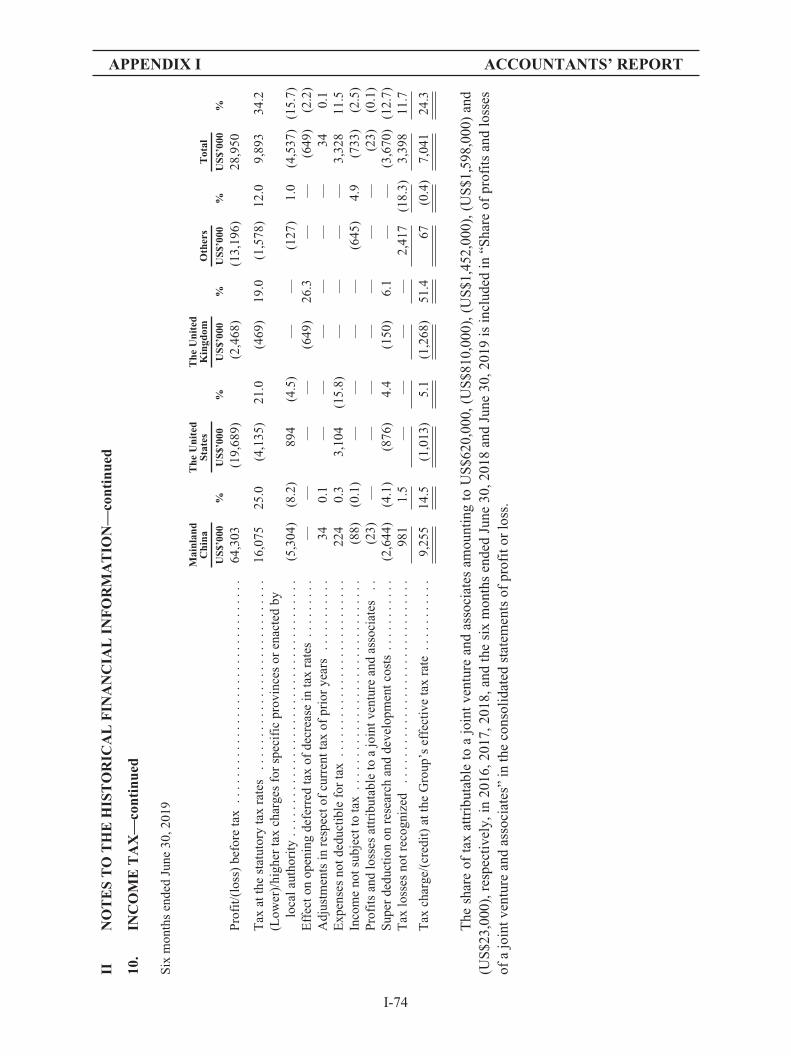
APPENDIX I ACCOUNTANTS’ REPORT
IIN
OT
ES
TO
TH
EH
IST
OR
ICA
LF
INA
NC
IAL
INF
OR
MA
TIO
N—
cont
inue
d
10.
INC
OM
ET
AX
—co
ntin
ued
Six
mon
ths
ende
dJu
ne30
,201
9
Mai
nlan
dC
hina
The
Uni
ted
Stat
esT
heU
nite
dK
ingd
omO
ther
sT
otal
US$
’000
%U
S$’0
00%
US$
’000
%U
S$’0
00%
US$
’000
%
Pro
fit/
(los
s)be
fore
tax
....
....
....
....
....
....
....
....
..64
,303
(19,
689)
(2,4
68)
(13,
196)
28,9
50
Tax
atth
est
atut
ory
tax
rate
s..
....
....
....
....
....
....
...
16,0
7525
.0(4
,135
)21
.0(4
69)
19.0
(1,5
78)
12.0
9,89
334
.2(L
ower
)/hi
gher
tax
char
ges
for
spec
ific
prov
ince
sor
enac
ted
bylo
cala
utho
rity
....
....
....
....
....
....
....
....
....
...
(5,3
04)
(8.2
)89
4(4
.5)
——
(127
)1.
0(4
,537
)(1
5.7)
Eff
ecto
nop
enin
gde
ferr
edta
xof
decr
ease
inta
xra
tes
....
....
.—
——
—(6
49)
26.3
——
(649
)(2
.2)
Adj
ustm
ents
inre
spec
tof
curr
entt
axof
prio
rye
ars
....
....
...
340.
1—
——
——
—34
0.1
Exp
ense
sno
tded
ucti
ble
for
tax
....
....
....
....
....
....
...
224
0.3
3,10
4(1
5.8)
——
——
3,32
811
.5In
com
eno
tsub
ject
tota
x..
....
....
....
....
....
....
....
..(8
8)(0
.1)
——
——
(645
)4.
9(7
33)
(2.5
)P
rofi
tsan
dlo
sses
attr
ibut
able
toa
join
tven
ture
and
asso
ciat
es..
(23)
——
——
——
—(2
3)(0
.1)
Sup
erde
duct
ion
onre
sear
chan
dde
velo
pmen
tcos
ts..
....
....
.(2
,644
)(4
.1)
(876
)4.
4(1
50)
6.1
——
(3,6
70)
(12.
7)T
axlo
sses
notr
ecog
nize
d..
....
....
....
....
....
....
....
.98
11.
5—
——
—2,
417
(18.
3)3,
398
11.7
Tax
char
ge/(
cred
it)
atth
eG
roup
’sef
fect
ive
tax
rate
....
....
...
9,25
514
.5(1
,013
)5.
1(1
,268
)51
.467
(0.4
)7,
041
24.3
The
shar
eof
tax
attr
ibut
able
toa
join
tve
ntur
ean
das
soci
ates
amou
ntin
gto
US
$620
,000
,(U
S$8
10,0
00),
(US
$1,4
52,0
00),
(US
$1,5
98,0
00)
and
(US
$23,
000)
,res
pect
ivel
y,in
2016
,201
7,20
18,a
ndth
esi
xm
onth
sen
ded
June
30,2
018
and
June
30,2
019
isin
clud
edin
“Sha
reof
prof
its
and
loss
esof
ajo
intv
entu
rean
das
soci
ates
”in
the
cons
olid
ated
stat
emen
tsof
prof
itor
loss
.
I-74
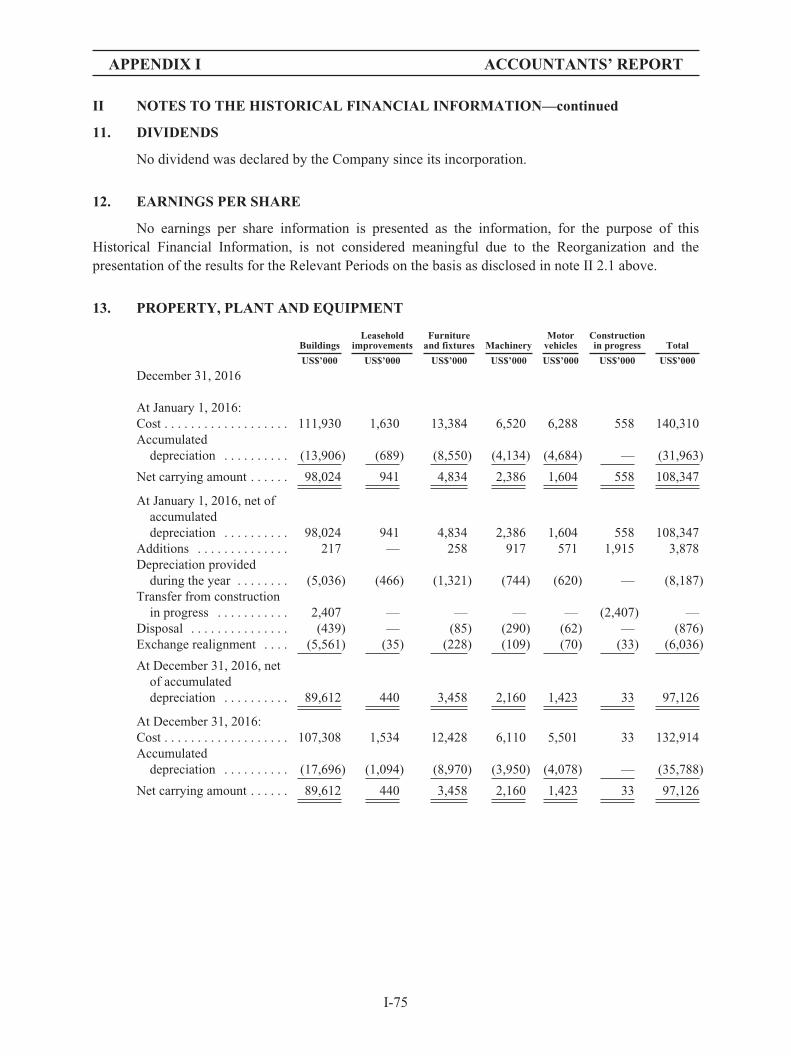
APPENDIX I ACCOUNTANTS’ REPORT
II NOTES TO THE HISTORICAL FINANCIAL INFORMATION—continued
11. DIVIDENDS
No dividend was declared by the Company since its incorporation.
12. EARNINGS PER SHARE
No earnings per share information is presented as the information, for the purpose of thisHistorical Financial Information, is not considered meaningful due to the Reorganization and thepresentation of the results for the Relevant Periods on the basis as disclosed in note II 2.1 above.
13. PROPERTY, PLANT AND EQUIPMENT
BuildingsLeasehold
improvementsFurniture
and fixtures MachineryMotor
vehiclesConstructionin progress Total
US$’000 US$’000 US$’000 US$’000 US$’000 US$’000 US$’000
December 31, 2016
At January 1, 2016:Cost . . . . . . . . . . . . . . . . . . . 111,930 1,630 13,384 6,520 6,288 558 140,310Accumulated
depreciation . . . . . . . . . . (13,906) (689) (8,550) (4,134) (4,684) — (31,963)
Net carrying amount . . . . . . 98,024 941 4,834 2,386 1,604 558 108,347
At January 1, 2016, net ofaccumulateddepreciation . . . . . . . . . . 98,024 941 4,834 2,386 1,604 558 108,347
Additions . . . . . . . . . . . . . . 217 — 258 917 571 1,915 3,878Depreciation provided
during the year . . . . . . . . (5,036) (466) (1,321) (744) (620) — (8,187)Transfer from construction
in progress . . . . . . . . . . . 2,407 — — — — (2,407) —Disposal . . . . . . . . . . . . . . . (439) — (85) (290) (62) — (876)Exchange realignment . . . . (5,561) (35) (228) (109) (70) (33) (6,036)
At December 31, 2016, netof accumulateddepreciation . . . . . . . . . . 89,612 440 3,458 2,160 1,423 33 97,126
At December 31, 2016:Cost . . . . . . . . . . . . . . . . . . . 107,308 1,534 12,428 6,110 5,501 33 132,914Accumulated
depreciation . . . . . . . . . . (17,696) (1,094) (8,970) (3,950) (4,078) — (35,788)
Net carrying amount . . . . . . 89,612 440 3,458 2,160 1,423 33 97,126
I-75
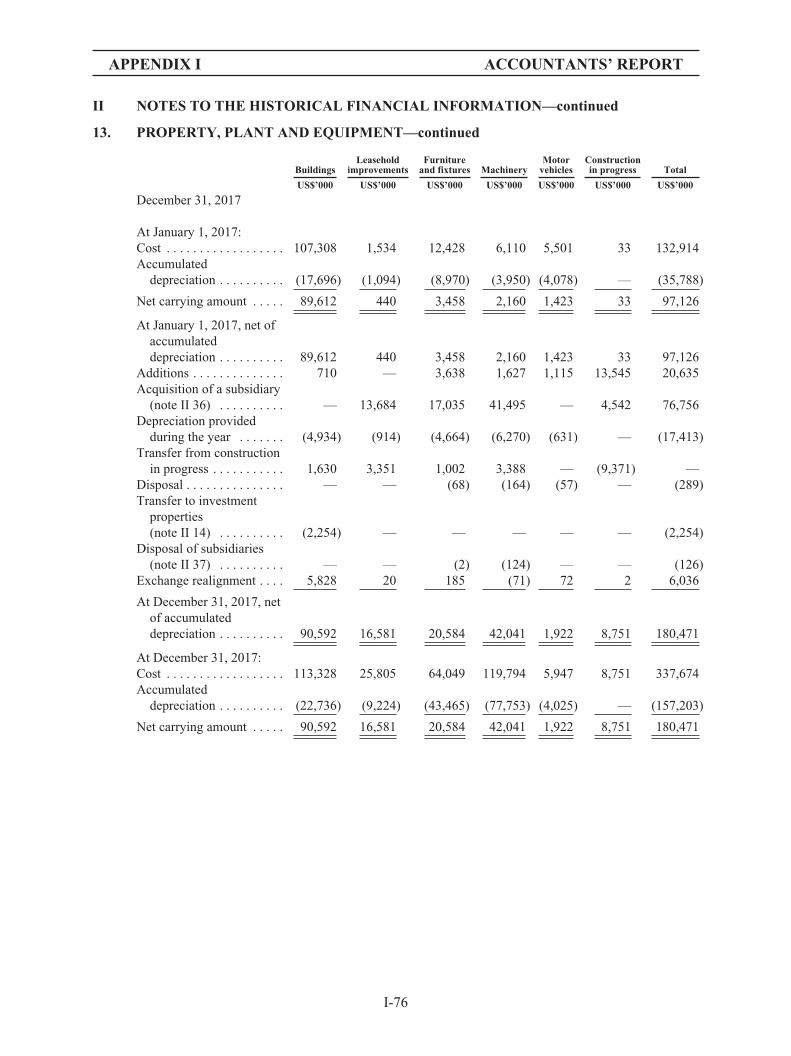
APPENDIX I ACCOUNTANTS’ REPORT
II NOTES TO THE HISTORICAL FINANCIAL INFORMATION—continued
13. PROPERTY, PLANT AND EQUIPMENT—continued
BuildingsLeasehold
improvementsFurniture
and fixtures MachineryMotor
vehiclesConstructionin progress Total
US$’000 US$’000 US$’000 US$’000 US$’000 US$’000 US$’000
December 31, 2017
At January 1, 2017:Cost . . . . . . . . . . . . . . . . . . 107,308 1,534 12,428 6,110 5,501 33 132,914Accumulated
depreciation . . . . . . . . . . (17,696) (1,094) (8,970) (3,950) (4,078) — (35,788)
Net carrying amount . . . . . 89,612 440 3,458 2,160 1,423 33 97,126
At January 1, 2017, net ofaccumulateddepreciation . . . . . . . . . . 89,612 440 3,458 2,160 1,423 33 97,126
Additions . . . . . . . . . . . . . . 710 — 3,638 1,627 1,115 13,545 20,635Acquisition of a subsidiary
(note II 36) . . . . . . . . . . — 13,684 17,035 41,495 — 4,542 76,756Depreciation provided
during the year . . . . . . . (4,934) (914) (4,664) (6,270) (631) — (17,413)Transfer from construction
in progress . . . . . . . . . . . 1,630 3,351 1,002 3,388 — (9,371) —Disposal . . . . . . . . . . . . . . . — — (68) (164) (57) — (289)Transfer to investment
properties(note II 14) . . . . . . . . . . (2,254) — — — — — (2,254)
Disposal of subsidiaries(note II 37) . . . . . . . . . . — — (2) (124) — — (126)
Exchange realignment . . . . 5,828 20 185 (71) 72 2 6,036
At December 31, 2017, netof accumulateddepreciation . . . . . . . . . . 90,592 16,581 20,584 42,041 1,922 8,751 180,471
At December 31, 2017:Cost . . . . . . . . . . . . . . . . . . 113,328 25,805 64,049 119,794 5,947 8,751 337,674Accumulated
depreciation . . . . . . . . . . (22,736) (9,224) (43,465) (77,753) (4,025) — (157,203)
Net carrying amount . . . . . 90,592 16,581 20,584 42,041 1,922 8,751 180,471
I-76
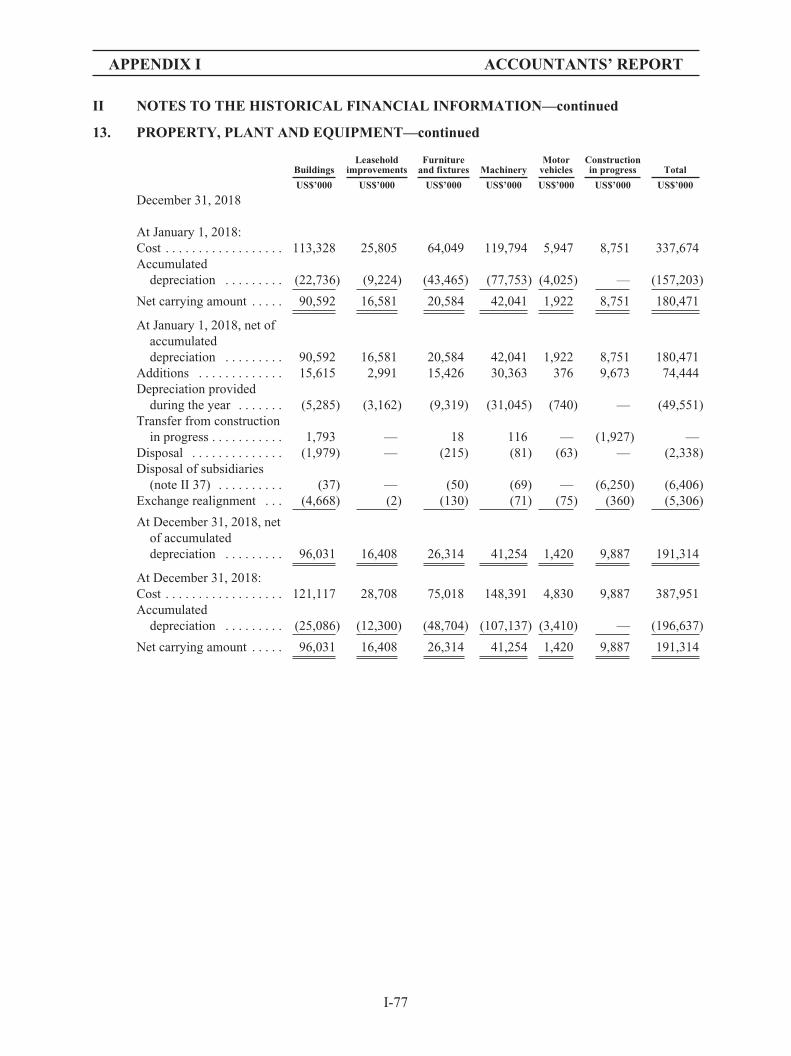
APPENDIX I ACCOUNTANTS’ REPORT
II NOTES TO THE HISTORICAL FINANCIAL INFORMATION—continued
13. PROPERTY, PLANT AND EQUIPMENT—continued
BuildingsLeasehold
improvementsFurniture
and fixtures MachineryMotor
vehiclesConstructionin progress Total
US$’000 US$’000 US$’000 US$’000 US$’000 US$’000 US$’000
December 31, 2018
At January 1, 2018:Cost . . . . . . . . . . . . . . . . . . 113,328 25,805 64,049 119,794 5,947 8,751 337,674Accumulated
depreciation . . . . . . . . . (22,736) (9,224) (43,465) (77,753) (4,025) — (157,203)
Net carrying amount . . . . . 90,592 16,581 20,584 42,041 1,922 8,751 180,471
At January 1, 2018, net ofaccumulateddepreciation . . . . . . . . . 90,592 16,581 20,584 42,041 1,922 8,751 180,471
Additions . . . . . . . . . . . . . 15,615 2,991 15,426 30,363 376 9,673 74,444Depreciation provided
during the year . . . . . . . (5,285) (3,162) (9,319) (31,045) (740) — (49,551)Transfer from construction
in progress . . . . . . . . . . . 1,793 — 18 116 — (1,927) —Disposal . . . . . . . . . . . . . . (1,979) — (215) (81) (63) — (2,338)Disposal of subsidiaries
(note II 37) . . . . . . . . . . (37) — (50) (69) — (6,250) (6,406)Exchange realignment . . . (4,668) (2) (130) (71) (75) (360) (5,306)
At December 31, 2018, netof accumulateddepreciation . . . . . . . . . 96,031 16,408 26,314 41,254 1,420 9,887 191,314
At December 31, 2018:Cost . . . . . . . . . . . . . . . . . . 121,117 28,708 75,018 148,391 4,830 9,887 387,951Accumulated
depreciation . . . . . . . . . (25,086) (12,300) (48,704) (107,137) (3,410) — (196,637)
Net carrying amount . . . . . 96,031 16,408 26,314 41,254 1,420 9,887 191,314
I-77
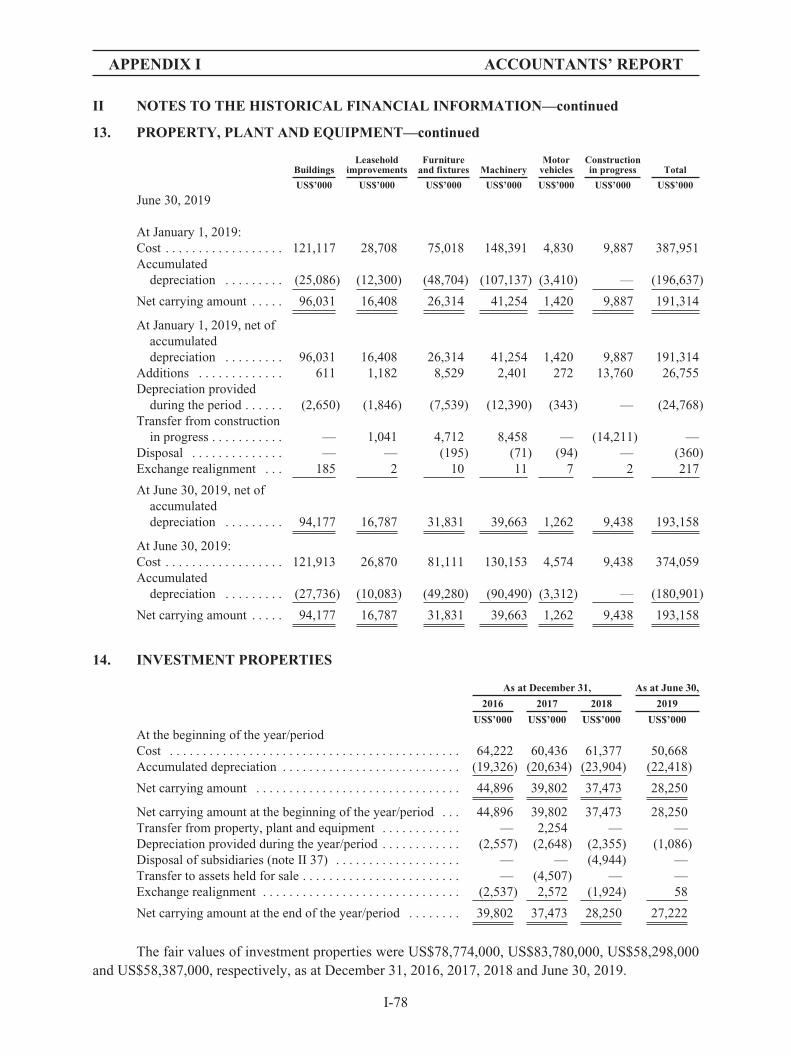
APPENDIX I ACCOUNTANTS’ REPORT
II NOTES TO THE HISTORICAL FINANCIAL INFORMATION—continued
13. PROPERTY, PLANT AND EQUIPMENT—continued
BuildingsLeasehold
improvementsFurniture
and fixtures MachineryMotor
vehiclesConstructionin progress Total
US$’000 US$’000 US$’000 US$’000 US$’000 US$’000 US$’000
June 30, 2019
At January 1, 2019:Cost . . . . . . . . . . . . . . . . . . 121,117 28,708 75,018 148,391 4,830 9,887 387,951Accumulated
depreciation . . . . . . . . . (25,086) (12,300) (48,704) (107,137) (3,410) — (196,637)
Net carrying amount . . . . . 96,031 16,408 26,314 41,254 1,420 9,887 191,314
At January 1, 2019, net ofaccumulateddepreciation . . . . . . . . . 96,031 16,408 26,314 41,254 1,420 9,887 191,314
Additions . . . . . . . . . . . . . 611 1,182 8,529 2,401 272 13,760 26,755Depreciation provided
during the period . . . . . . (2,650) (1,846) (7,539) (12,390) (343) — (24,768)Transfer from construction
in progress . . . . . . . . . . . — 1,041 4,712 8,458 — (14,211) —Disposal . . . . . . . . . . . . . . — — (195) (71) (94) — (360)Exchange realignment . . . 185 2 10 11 7 2 217
At June 30, 2019, net ofaccumulateddepreciation . . . . . . . . . 94,177 16,787 31,831 39,663 1,262 9,438 193,158
At June 30, 2019:Cost . . . . . . . . . . . . . . . . . . 121,913 26,870 81,111 130,153 4,574 9,438 374,059Accumulated
depreciation . . . . . . . . . (27,736) (10,083) (49,280) (90,490) (3,312) — (180,901)
Net carrying amount . . . . . 94,177 16,787 31,831 39,663 1,262 9,438 193,158
14. INVESTMENT PROPERTIES
As at December 31, As at June 30,
2016 2017 2018 2019
US$’000 US$’000 US$’000 US$’000
At the beginning of the year/periodCost . . . . . . . . . . . . . . . . . . . . . . . . . . . . . . . . . . . . . . . . . . . . 64,222 60,436 61,377 50,668Accumulated depreciation . . . . . . . . . . . . . . . . . . . . . . . . . . . (19,326) (20,634) (23,904) (22,418)
Net carrying amount . . . . . . . . . . . . . . . . . . . . . . . . . . . . . . . 44,896 39,802 37,473 28,250
Net carrying amount at the beginning of the year/period . . . 44,896 39,802 37,473 28,250Transfer from property, plant and equipment . . . . . . . . . . . . — 2,254 — —Depreciation provided during the year/period . . . . . . . . . . . . (2,557) (2,648) (2,355) (1,086)Disposal of subsidiaries (note II 37) . . . . . . . . . . . . . . . . . . . — — (4,944) —Transfer to assets held for sale . . . . . . . . . . . . . . . . . . . . . . . . — (4,507) — —Exchange realignment . . . . . . . . . . . . . . . . . . . . . . . . . . . . . . (2,537) 2,572 (1,924) 58
Net carrying amount at the end of the year/period . . . . . . . . 39,802 37,473 28,250 27,222
The fair values of investment properties were US$78,774,000, US$83,780,000, US$58,298,000and US$58,387,000, respectively, as at December 31, 2016, 2017, 2018 and June 30, 2019.
I-78

APPENDIX I ACCOUNTANTS’ REPORT
II NOTES TO THE HISTORICAL FINANCIAL INFORMATION—continued
15. PREPAID LAND LEASE PAYMENTS
As at December 31, As at June 30,
2016 2017 2018 2019
US$’000 US$’000 US$’000 US$’000
Carrying amount at the beginning of the year/period . . . . . . . 22,156 20,352 22,184 16,581Additions . . . . . . . . . . . . . . . . . . . . . . . . . . . . . . . . . . . . . . . . . — 998 — —Recognized during the year/period . . . . . . . . . . . . . . . . . . . . . (520) (512) (468) (202)Disposal . . . . . . . . . . . . . . . . . . . . . . . . . . . . . . . . . . . . . . . . . . — — (3,017) —Disposal of subsidiaries (note II 37) . . . . . . . . . . . . . . . . . . . . — — (944) —Exchange realignment . . . . . . . . . . . . . . . . . . . . . . . . . . . . . . . (1,284) 1,346 (1,174) 33
Carrying amount at the end of the year/period . . . . . . . . . . . . 20,352 22,184 16,581 16,412Current portion included in prepayments, other receivables
and other assets . . . . . . . . . . . . . . . . . . . . . . . . . . . . . . . . . . (498) (531) (451) (404)
Non-current portion of carrying amount at the end of theyear/period . . . . . . . . . . . . . . . . . . . . . . . . . . . . . . . . . . . . . . 19,854 21,653 16,130 16,008
16. GOODWILL
US$’000
December 31, 2017Cost at January 1, 2017, net of accumulated impairment . . . . . . . . . . . . . . . . . . . . . . . . . . . . . . . —Acquisition of subsidiaries (note II 36) . . . . . . . . . . . . . . . . . . . . . . . . . . . . . . . . . . . . . . . . . . . . 839,767
Cost and net carrying amount at December 31, 2017 . . . . . . . . . . . . . . . . . . . . . . . . . . . . . . . . . . 839,767
At December 31, 2017:Cost . . . . . . . . . . . . . . . . . . . . . . . . . . . . . . . . . . . . . . . . . . . . . . . . . . . . . . . . . . . . . . . . . . . . 839,767Accumulated impairment . . . . . . . . . . . . . . . . . . . . . . . . . . . . . . . . . . . . . . . . . . . . . . . . . . . —
Net carrying amount . . . . . . . . . . . . . . . . . . . . . . . . . . . . . . . . . . . . . . . . . . . . . . . . . . . . . . . 839,767
December 31, 2018Cost at January 1, 2018, net of accumulated impairment . . . . . . . . . . . . . . . . . . . . . . . . . . . . . . . 839,767
Cost and net carrying amount at December 31, 2018 . . . . . . . . . . . . . . . . . . . . . . . . . . . . . . . . . . 839,767
At December 31, 2018:Cost . . . . . . . . . . . . . . . . . . . . . . . . . . . . . . . . . . . . . . . . . . . . . . . . . . . . . . . . . . . . . . . . . . . . 839,767Accumulated impairment . . . . . . . . . . . . . . . . . . . . . . . . . . . . . . . . . . . . . . . . . . . . . . . . . . . —
Net carrying amount . . . . . . . . . . . . . . . . . . . . . . . . . . . . . . . . . . . . . . . . . . . . . . . . . . . . . . . 839,767
June 30, 2019Cost at January 1, 2019, net of accumulated impairment . . . . . . . . . . . . . . . . . . . . . . . . . . . . . . . 839,767
Cost and net carrying amount at June 30, 2019 . . . . . . . . . . . . . . . . . . . . . . . . . . . . . . . . . . . . . . 839,767
At June 30, 2019:Cost . . . . . . . . . . . . . . . . . . . . . . . . . . . . . . . . . . . . . . . . . . . . . . . . . . . . . . . . . . . . . . . . . . . . 839,767Accumulated impairment . . . . . . . . . . . . . . . . . . . . . . . . . . . . . . . . . . . . . . . . . . . . . . . . . . . —
Net carrying amount . . . . . . . . . . . . . . . . . . . . . . . . . . . . . . . . . . . . . . . . . . . . . . . . . . . . . . . 839,767
Impairment testing of goodwill and indefinite life intangible assets
Goodwill and trademarks recorded in other intangible assets with indefinite lives acquiredthrough business combinations are allocated to the cash-generating unit (“CGU”) of Compass and itssubsidiaries (collectively referred to as the “Compass”) for impairment testing.
I-79
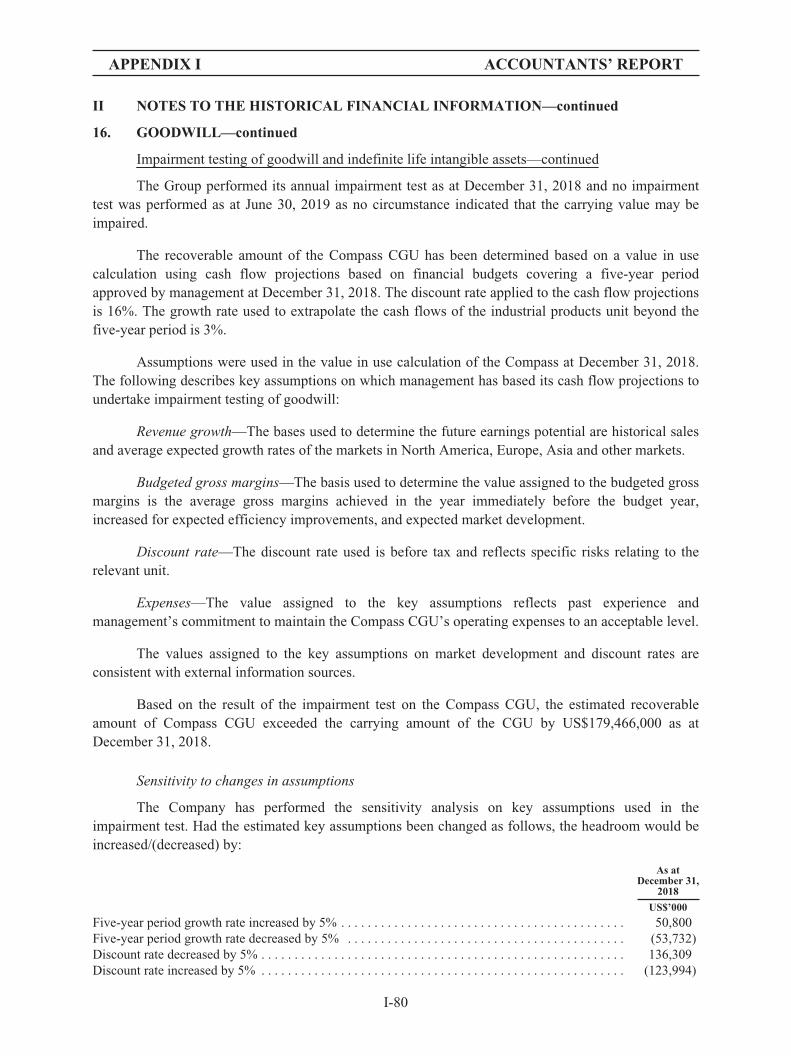
APPENDIX I ACCOUNTANTS’ REPORT
II NOTES TO THE HISTORICAL FINANCIAL INFORMATION—continued
16. GOODWILL—continued
Impairment testing of goodwill and indefinite life intangible assets—continued
The Group performed its annual impairment test as at December 31, 2018 and no impairmenttest was performed as at June 30, 2019 as no circumstance indicated that the carrying value may beimpaired.
The recoverable amount of the Compass CGU has been determined based on a value in usecalculation using cash flow projections based on financial budgets covering a five-year periodapproved by management at December 31, 2018. The discount rate applied to the cash flow projectionsis 16%. The growth rate used to extrapolate the cash flows of the industrial products unit beyond thefive-year period is 3%.
Assumptions were used in the value in use calculation of the Compass at December 31, 2018.The following describes key assumptions on which management has based its cash flow projections toundertake impairment testing of goodwill:
Revenue growth—The bases used to determine the future earnings potential are historical salesand average expected growth rates of the markets in North America, Europe, Asia and other markets.
Budgeted gross margins—The basis used to determine the value assigned to the budgeted grossmargins is the average gross margins achieved in the year immediately before the budget year,increased for expected efficiency improvements, and expected market development.
Discount rate—The discount rate used is before tax and reflects specific risks relating to therelevant unit.
Expenses—The value assigned to the key assumptions reflects past experience andmanagement’s commitment to maintain the Compass CGU’s operating expenses to an acceptable level.
The values assigned to the key assumptions on market development and discount rates areconsistent with external information sources.
Based on the result of the impairment test on the Compass CGU, the estimated recoverableamount of Compass CGU exceeded the carrying amount of the CGU by US$179,466,000 as atDecember 31, 2018.
Sensitivity to changes in assumptions
The Company has performed the sensitivity analysis on key assumptions used in theimpairment test. Had the estimated key assumptions been changed as follows, the headroom would beincreased/(decreased) by:
As atDecember 31,
2018
US$’000
Five-year period growth rate increased by 5% . . . . . . . . . . . . . . . . . . . . . . . . . . . . . . . . . . . . . . . . . . . 50,800Five-year period growth rate decreased by 5% . . . . . . . . . . . . . . . . . . . . . . . . . . . . . . . . . . . . . . . . . . (53,732)Discount rate decreased by 5% . . . . . . . . . . . . . . . . . . . . . . . . . . . . . . . . . . . . . . . . . . . . . . . . . . . . . . . 136,309Discount rate increased by 5% . . . . . . . . . . . . . . . . . . . . . . . . . . . . . . . . . . . . . . . . . . . . . . . . . . . . . . . (123,994)
I-80

APPENDIX I ACCOUNTANTS’ REPORT
II NOTES TO THE HISTORICAL FINANCIAL INFORMATION—continued
16. GOODWILL—continued
Impairment testing of goodwill and indefinite life intangible assets—continued
Sensitivity to changes in assumptions—continued
With regard to the assessment of the value in use of the CGU, management believes that noreasonably possible change in any of the above key assumptions would cause the carrying value,including goodwill, of the CGU to exceed its recoverable amount.
17. RIGHT-OF-USE ASSETS AND LEASE LIABILITIES
The Group’s right-of-use assets are recognized for lease contracts of buildings. The movementsof right-of-use assets during the Relevant Periods are as follows:
As at December 31, As at June 30,
2016 2017 2018 2019
US$’000 US$’000 US$’000 US$’000
Cost of right-of-use assets:At the beginning of the year/period . . . . . . . . . . . . . . . . . 1,324 8,136 71,405 78,357Additions . . . . . . . . . . . . . . . . . . . . . . . . . . . . . . . . . . . . . 6,890 — 7,418 12,914Acquisition of a subsidiary (note II 36) . . . . . . . . . . . . . — 62,723 — —Exchange realignment . . . . . . . . . . . . . . . . . . . . . . . . . . . (78) 546 (466) 13
At the end of the year/period . . . . . . . . . . . . . . . . . . . . . . 8,136 71,405 78,357 91,284
Accumulated amortization:At the beginning of the year/period . . . . . . . . . . . . . . . . . — (1,791) (6,906) (19,517)Amortization provided during the year/period . . . . . . . . (1,871) (4,900) (12,946) (7,689)Exchange realignment . . . . . . . . . . . . . . . . . . . . . . . . . . . 80 (215) 335 20
At the end of the year/period . . . . . . . . . . . . . . . . . . . . . . . . . . (1,791) (6,906) (19,517) (27,186)
Net carrying amount:At the end of the year/period . . . . . . . . . . . . . . . . . . . . . . 6,345 64,499 58,840 64,098
I-81

APPENDIX I ACCOUNTANTS’ REPORT
II NOTES TO THE HISTORICAL FINANCIAL INFORMATION—continued
17. RIGHT-OF-USE ASSETS AND LEASE LIABILITIES—continued
The movements of lease liabilities during the Relevant Periods are as follows:
As of December 31, As at June 30,
2016 2017 2018 2019
US$’000 US$’000 US$’000 US$’000
Lease liabilities:At the beginning of the year/period . . . . . . . . . . . . . . . . . 1,324 8,136 72,840 79,792Additions . . . . . . . . . . . . . . . . . . . . . . . . . . . . . . . . . . . . . 6,890 — 7,418 12,914Acquisition of a subsidiary (note II 36) . . . . . . . . . . . . . — 64,158 — —Exchange realignment . . . . . . . . . . . . . . . . . . . . . . . . . . . (78) 546 (466) 13
At the end of the year/period . . . . . . . . . . . . . . . . . . . . . . 8,136 72,840 79,792 92,719
Accumulated payment:At the beginning of the year/period . . . . . . . . . . . . . . . . . — (1,692) (5,149) (16,200)Interest expense during the year/period . . . . . . . . . . . . . 238 920 2,964 1,534Payment during the year/period . . . . . . . . . . . . . . . . . . . (2,008) (4,294) (13,868) (8,485)Exchange realignment . . . . . . . . . . . . . . . . . . . . . . . . . . . 78 (83) (147) 27
At the end of the year/period . . . . . . . . . . . . . . . . . . . . . . (1,692) (5,149) (16,200) (23,124)
Net carrying amount:At the end of the year/period . . . . . . . . . . . . . . . . . . . . . . 6,444 67,691 63,592 69,595
Analyzed into:Within one year . . . . . . . . . . . . . . . . . . . . . . . . . . . . . . . . 2,411 10,361 10,980 12,472In the second year . . . . . . . . . . . . . . . . . . . . . . . . . . . . . . 2,517 9,390 5,578 12,825In the third to fifth years, inclusive . . . . . . . . . . . . . . . . . 972 7,741 10,360 5,398Beyond five years . . . . . . . . . . . . . . . . . . . . . . . . . . . . . . 544 40,199 36,674 38,900
At the end of the year/period . . . . . . . . . . . . . . . . . . . . . . 6,444 67,691 63,592 69,595
18. OTHER INTANGIBLE ASSETS
Patents Software Total
US$’000 US$’000 US$’000
January 1, 2016:Cost . . . . . . . . . . . . . . . . . . . . . . . . . . . . . . . . . . . . . . . . . . . . . . . . . . . . . . . . . 7,100 3,749 10,849Accumulated amortization and impairment . . . . . . . . . . . . . . . . . . . . . . . . . . (6,241) (2,228) (8,469)
Net carrying amount . . . . . . . . . . . . . . . . . . . . . . . . . . . . . . . . . . . . . . . . . . . . 859 1,521 2,380
Cost at January 1, 2016, net of accumulated amortization andimpairment . . . . . . . . . . . . . . . . . . . . . . . . . . . . . . . . . . . . . . . . . . . . . . . . . 859 1,521 2,380
Additions . . . . . . . . . . . . . . . . . . . . . . . . . . . . . . . . . . . . . . . . . . . . . . . . . . . . . — 850 850Amortization provided during the year . . . . . . . . . . . . . . . . . . . . . . . . . . . . . (241) (350) (591)Exchange realignment . . . . . . . . . . . . . . . . . . . . . . . . . . . . . . . . . . . . . . . . . . (38) (76) (114)
At December 31, 2016 . . . . . . . . . . . . . . . . . . . . . . . . . . . . . . . . . . . . . . . . . . 580 1,945 2,525
At December 31, 2016:Cost . . . . . . . . . . . . . . . . . . . . . . . . . . . . . . . . . . . . . . . . . . . . . . . . . . . . . . . . . 6,682 4,197 10,879Accumulated amortization and impairment . . . . . . . . . . . . . . . . . . . . . . . . . . (6,102) (2,252) (8,354)
Net carrying amount . . . . . . . . . . . . . . . . . . . . . . . . . . . . . . . . . . . . . . . . . . . . 580 1,945 2,525
I-82
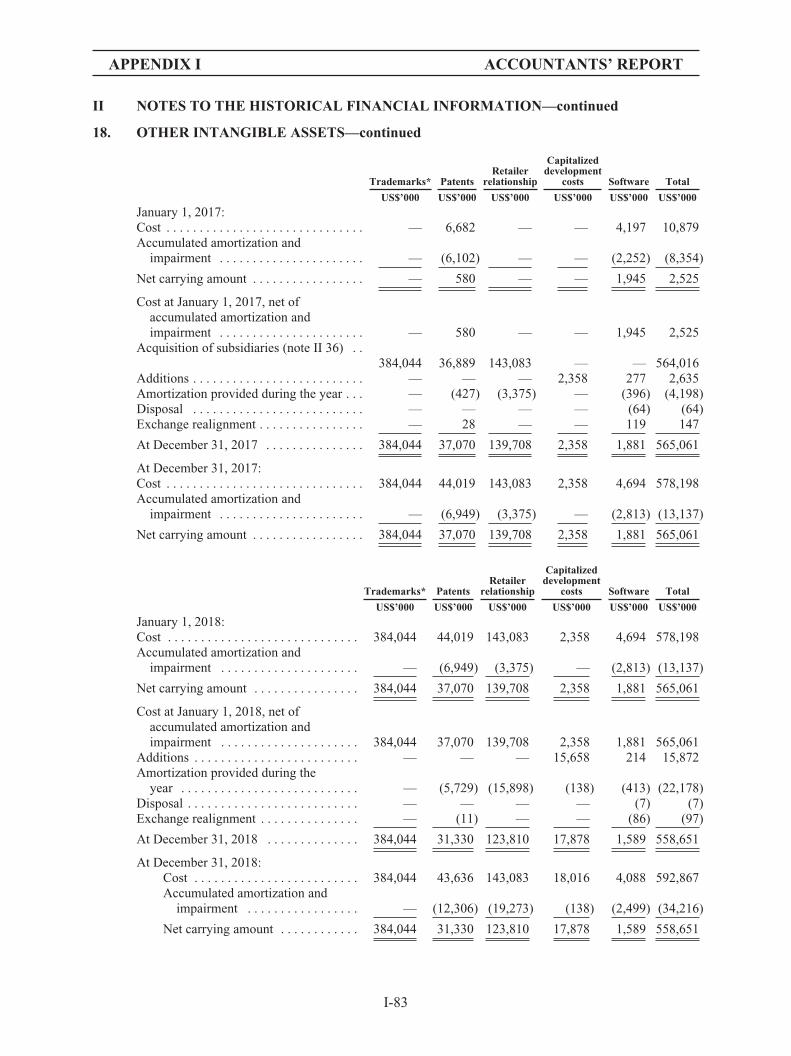
APPENDIX I ACCOUNTANTS’ REPORT
II NOTES TO THE HISTORICAL FINANCIAL INFORMATION—continued
18. OTHER INTANGIBLE ASSETS—continued
Trademarks* PatentsRetailer
relationship
Capitalizeddevelopment
costs Software Total
US$’000 US$’000 US$’000 US$’000 US$’000 US$’000
January 1, 2017:Cost . . . . . . . . . . . . . . . . . . . . . . . . . . . . . . — 6,682 — — 4,197 10,879Accumulated amortization and
impairment . . . . . . . . . . . . . . . . . . . . . . — (6,102) — — (2,252) (8,354)
Net carrying amount . . . . . . . . . . . . . . . . . — 580 — — 1,945 2,525
Cost at January 1, 2017, net ofaccumulated amortization andimpairment . . . . . . . . . . . . . . . . . . . . . . — 580 — — 1,945 2,525
Acquisition of subsidiaries (note II 36) . .384,044 36,889 143,083 — — 564,016
Additions . . . . . . . . . . . . . . . . . . . . . . . . . . — — — 2,358 277 2,635Amortization provided during the year . . . — (427) (3,375) — (396) (4,198)Disposal . . . . . . . . . . . . . . . . . . . . . . . . . . — — — — (64) (64)Exchange realignment . . . . . . . . . . . . . . . . — 28 — — 119 147
At December 31, 2017 . . . . . . . . . . . . . . . 384,044 37,070 139,708 2,358 1,881 565,061
At December 31, 2017:Cost . . . . . . . . . . . . . . . . . . . . . . . . . . . . . . 384,044 44,019 143,083 2,358 4,694 578,198Accumulated amortization and
impairment . . . . . . . . . . . . . . . . . . . . . . — (6,949) (3,375) — (2,813) (13,137)
Net carrying amount . . . . . . . . . . . . . . . . . 384,044 37,070 139,708 2,358 1,881 565,061
Trademarks* PatentsRetailer
relationship
Capitalizeddevelopment
costs Software Total
US$’000 US$’000 US$’000 US$’000 US$’000 US$’000
January 1, 2018:Cost . . . . . . . . . . . . . . . . . . . . . . . . . . . . . 384,044 44,019 143,083 2,358 4,694 578,198Accumulated amortization and
impairment . . . . . . . . . . . . . . . . . . . . . — (6,949) (3,375) — (2,813) (13,137)
Net carrying amount . . . . . . . . . . . . . . . . 384,044 37,070 139,708 2,358 1,881 565,061
Cost at January 1, 2018, net ofaccumulated amortization andimpairment . . . . . . . . . . . . . . . . . . . . . 384,044 37,070 139,708 2,358 1,881 565,061
Additions . . . . . . . . . . . . . . . . . . . . . . . . . — — — 15,658 214 15,872Amortization provided during the
year . . . . . . . . . . . . . . . . . . . . . . . . . . . — (5,729) (15,898) (138) (413) (22,178)Disposal . . . . . . . . . . . . . . . . . . . . . . . . . . — — — — (7) (7)Exchange realignment . . . . . . . . . . . . . . . — (11) — — (86) (97)
At December 31, 2018 . . . . . . . . . . . . . . 384,044 31,330 123,810 17,878 1,589 558,651
At December 31, 2018:Cost . . . . . . . . . . . . . . . . . . . . . . . . . 384,044 43,636 143,083 18,016 4,088 592,867Accumulated amortization and
impairment . . . . . . . . . . . . . . . . . — (12,306) (19,273) (138) (2,499) (34,216)
Net carrying amount . . . . . . . . . . . . 384,044 31,330 123,810 17,878 1,589 558,651
I-83

APPENDIX I ACCOUNTANTS’ REPORT
II NOTES TO THE HISTORICAL FINANCIAL INFORMATION—continued
18. OTHER INTANGIBLE ASSETS—continued
Trademarks* PatentsRetailer
relationship
Capitalizeddevelopment
costs Software Total
US$’000 US$’000 US$’000 US$’000 US$’000 US$’000
January 1, 2019:Cost . . . . . . . . . . . . . . . . . . . . . . . . . . . . . 384,044 43,636 143,083 18,016 4,088 592,867Accumulated amortization and
impairment . . . . . . . . . . . . . . . . . . . . . . — (12,306) (19,273) (138) (2,499) (34,216)
Net carrying amount . . . . . . . . . . . . . . . . . 384,044 31,330 123,810 17,878 1,589 558,651
Cost at January 1, 2019, net ofaccumulated amortization andimpairment . . . . . . . . . . . . . . . . . . . . . . 384,044 31,330 123,810 17,878 1,589 558,651
Additions . . . . . . . . . . . . . . . . . . . . . . . . . — — — 6,145 149 6,294Amortization provided during the
period . . . . . . . . . . . . . . . . . . . . . . . . . . — (1,941) (7,949) (281) (197) (10,368)Exchange realignment . . . . . . . . . . . . . . . — 1 — 5 6 12
At June 30, 2019 . . . . . . . . . . . . . . . . . . . 384,044 29,390 115,861 23,747 1,547 554,589
At June 30, 2019:Cost . . . . . . . . . . . . . . . . . . . . . . . . . 384,044 43,647 143,083 24,162 3,127 598,063Accumulated amortization and
impairment . . . . . . . . . . . . . . . . . . — (14,257) (27,222) (415) (1,580) (43,474)
Net carrying amount . . . . . . . . . . . . . 384,044 29,390 115,861 23,747 1,547 554,589
Note:* Trademarks are not amortized due to indefinite useful lives, and are allocated to the Group’s Compass CGU. Refer to
note II 16 for the impairment testing and sensitivity analysis of the trademarks with indefinite useful lives. No provision ismade for impairment of trademarks after being tested for impairment of the Compass CGU as at the end of 2018, and noimpairment indicator was noted as at June 30, 2019.
Impairment testing of capitalized development costs not yet available for use
The Group performed impairment testing of capitalized development costs not yet available foruse annually and whenever there is an impairment indicator.
The recoverable amount of the capitalized development costs not yet available for use has beendetermined based on a value in use calculation using cash flow projections based on financial budgetscovering a five-year period approved by management as at December 31, 2018. The discount rateapplied to the cash flow projections is 17.5%-20.5%.
Assumptions were used in the value in use calculation of the capitalized development costs notyet available for use. The following describes key assumptions on which management has based itscash flow projections to undertake impairment testing of the capitalized development costs not yetavailable for use:
Revenue growth—The bases used to determine the future earnings potential are historical salesand average expected growth rates of products with similar features and life cycles in the markets.
Budgeted gross margins—The basis used to determine the value assigned to the budgeted grossmargins is the average gross margins achieved by products with similar features and life cycles in theyear immediately before the budget year, increased for expected efficiency improvements, andexpected market development.
I-84
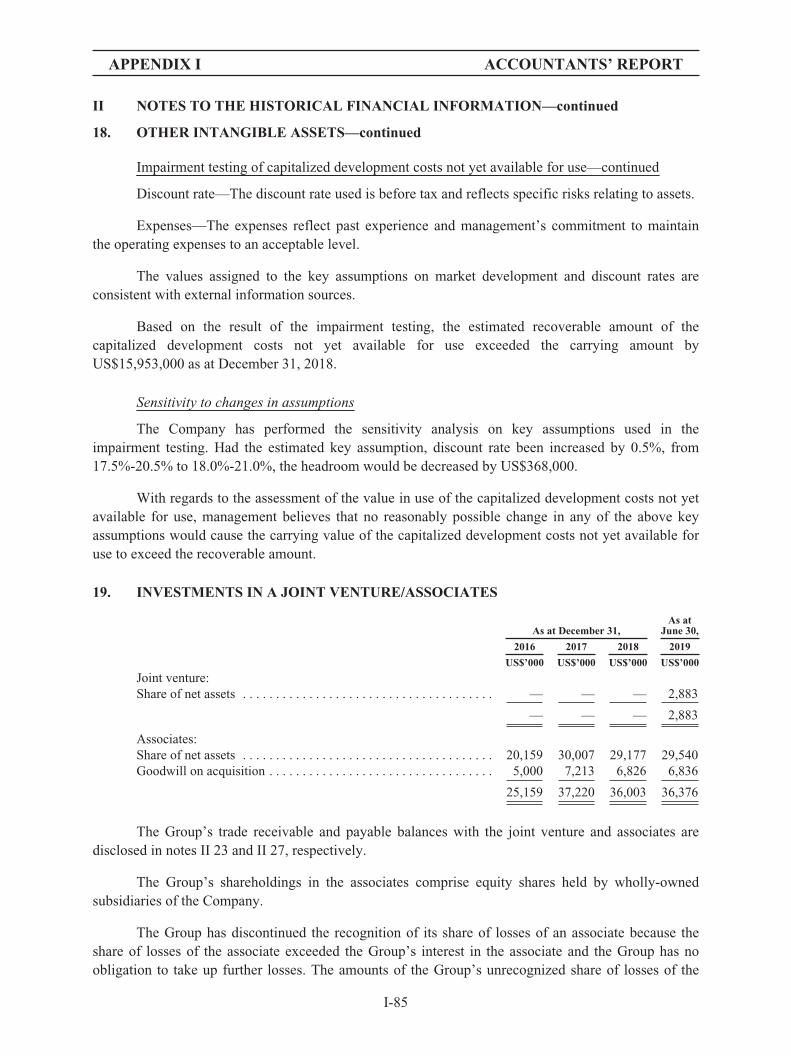
APPENDIX I ACCOUNTANTS’ REPORT
II NOTES TO THE HISTORICAL FINANCIAL INFORMATION—continued
18. OTHER INTANGIBLE ASSETS—continued
Impairment testing of capitalized development costs not yet available for use—continued
Discount rate—The discount rate used is before tax and reflects specific risks relating to assets.
Expenses—The expenses reflect past experience and management’s commitment to maintainthe operating expenses to an acceptable level.
The values assigned to the key assumptions on market development and discount rates areconsistent with external information sources.
Based on the result of the impairment testing, the estimated recoverable amount of thecapitalized development costs not yet available for use exceeded the carrying amount byUS$15,953,000 as at December 31, 2018.
Sensitivity to changes in assumptions
The Company has performed the sensitivity analysis on key assumptions used in theimpairment testing. Had the estimated key assumption, discount rate been increased by 0.5%, from17.5%-20.5% to 18.0%-21.0%, the headroom would be decreased by US$368,000.
With regards to the assessment of the value in use of the capitalized development costs not yetavailable for use, management believes that no reasonably possible change in any of the above keyassumptions would cause the carrying value of the capitalized development costs not yet available foruse to exceed the recoverable amount.
19. INVESTMENTS IN A JOINT VENTURE/ASSOCIATES
As at December 31,As at
June 30,
2016 2017 2018 2019
US$’000 US$’000 US$’000 US$’000
Joint venture:Share of net assets . . . . . . . . . . . . . . . . . . . . . . . . . . . . . . . . . . . . . . — — — 2,883
— — — 2,883
Associates:Share of net assets . . . . . . . . . . . . . . . . . . . . . . . . . . . . . . . . . . . . . . 20,159 30,007 29,177 29,540Goodwill on acquisition . . . . . . . . . . . . . . . . . . . . . . . . . . . . . . . . . . 5,000 7,213 6,826 6,836
25,159 37,220 36,003 36,376
The Group’s trade receivable and payable balances with the joint venture and associates aredisclosed in notes II 23 and II 27, respectively.
The Group’s shareholdings in the associates comprise equity shares held by wholly-ownedsubsidiaries of the Company.
The Group has discontinued the recognition of its share of losses of an associate because theshare of losses of the associate exceeded the Group’s interest in the associate and the Group has noobligation to take up further losses. The amounts of the Group’s unrecognized share of losses of the
I-85
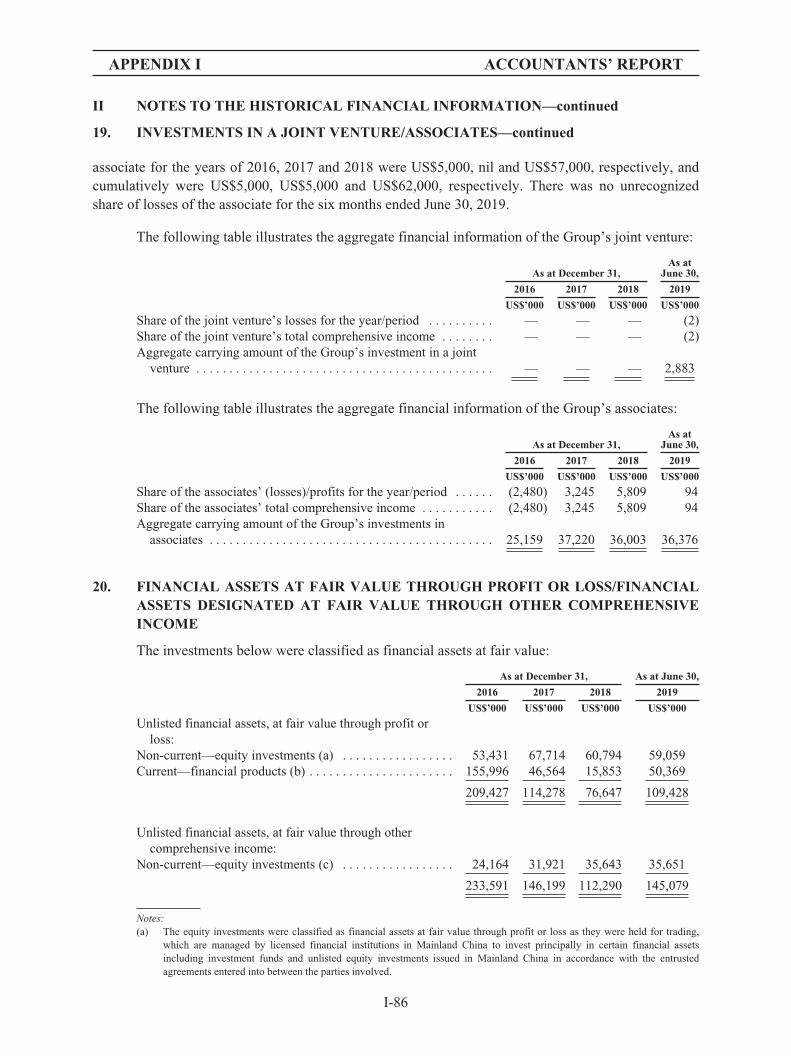
APPENDIX I ACCOUNTANTS’ REPORT
II NOTES TO THE HISTORICAL FINANCIAL INFORMATION—continued
19. INVESTMENTS IN A JOINT VENTURE/ASSOCIATES—continued
associate for the years of 2016, 2017 and 2018 were US$5,000, nil and US$57,000, respectively, andcumulatively were US$5,000, US$5,000 and US$62,000, respectively. There was no unrecognizedshare of losses of the associate for the six months ended June 30, 2019.
The following table illustrates the aggregate financial information of the Group’s joint venture:
As at December 31,As at
June 30,
2016 2017 2018 2019
US$’000 US$’000 US$’000 US$’000
Share of the joint venture’s losses for the year/period . . . . . . . . . . — — — (2)Share of the joint venture’s total comprehensive income . . . . . . . . — — — (2)Aggregate carrying amount of the Group’s investment in a joint
venture . . . . . . . . . . . . . . . . . . . . . . . . . . . . . . . . . . . . . . . . . . . . . — — — 2,883
The following table illustrates the aggregate financial information of the Group’s associates:
As at December 31,As at
June 30,
2016 2017 2018 2019
US$’000 US$’000 US$’000 US$’000
Share of the associates’ (losses)/profits for the year/period . . . . . . (2,480) 3,245 5,809 94Share of the associates’ total comprehensive income . . . . . . . . . . . (2,480) 3,245 5,809 94Aggregate carrying amount of the Group’s investments in
associates . . . . . . . . . . . . . . . . . . . . . . . . . . . . . . . . . . . . . . . . . . . 25,159 37,220 36,003 36,376
20. FINANCIAL ASSETS AT FAIR VALUE THROUGH PROFIT OR LOSS/FINANCIALASSETS DESIGNATED AT FAIR VALUE THROUGH OTHER COMPREHENSIVEINCOME
The investments below were classified as financial assets at fair value:
As at December 31, As at June 30,
2016 2017 2018 2019
US$’000 US$’000 US$’000 US$’000
Unlisted financial assets, at fair value through profit orloss:
Non-current—equity investments (a) . . . . . . . . . . . . . . . . . 53,431 67,714 60,794 59,059Current—financial products (b) . . . . . . . . . . . . . . . . . . . . . . 155,996 46,564 15,853 50,369
209,427 114,278 76,647 109,428
Unlisted financial assets, at fair value through othercomprehensive income:
Non-current—equity investments (c) . . . . . . . . . . . . . . . . . 24,164 31,921 35,643 35,651
233,591 146,199 112,290 145,079
Notes:(a) The equity investments were classified as financial assets at fair value through profit or loss as they were held for trading,
which are managed by licensed financial institutions in Mainland China to invest principally in certain financial assetsincluding investment funds and unlisted equity investments issued in Mainland China in accordance with the entrustedagreements entered into between the parties involved.
I-86
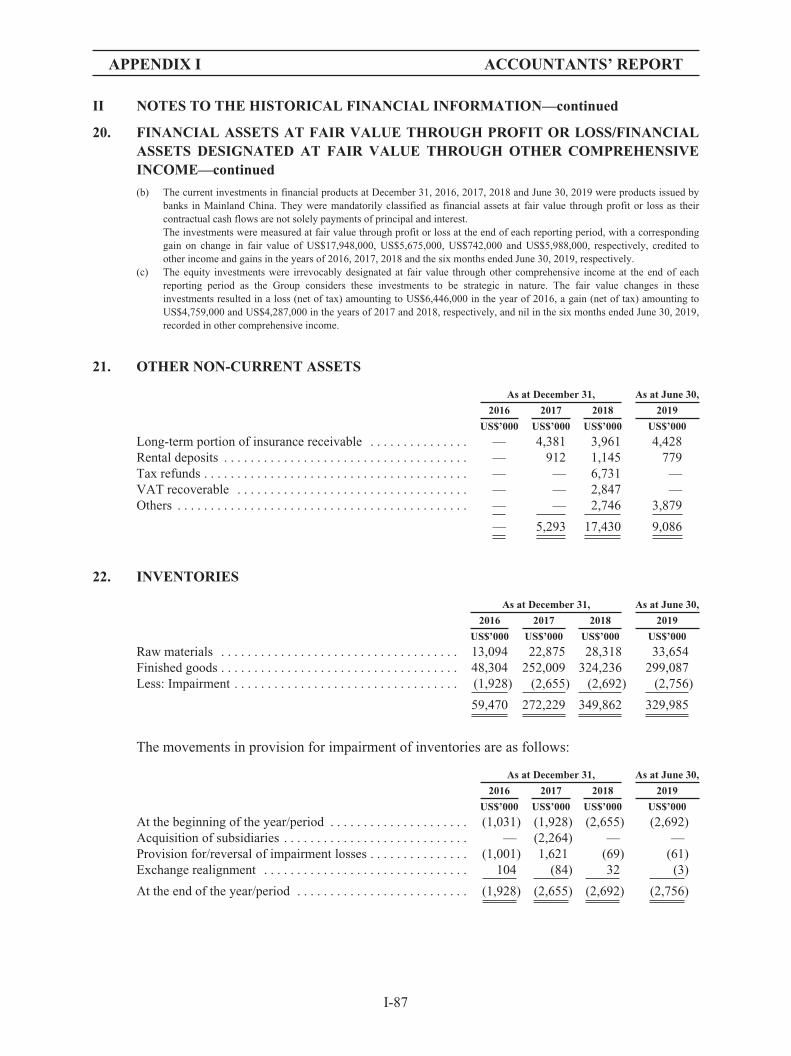
APPENDIX I ACCOUNTANTS’ REPORT
II NOTES TO THE HISTORICAL FINANCIAL INFORMATION—continued
20. FINANCIAL ASSETS AT FAIR VALUE THROUGH PROFIT OR LOSS/FINANCIALASSETS DESIGNATED AT FAIR VALUE THROUGH OTHER COMPREHENSIVEINCOME—continued
(b) The current investments in financial products at December 31, 2016, 2017, 2018 and June 30, 2019 were products issued bybanks in Mainland China. They were mandatorily classified as financial assets at fair value through profit or loss as theircontractual cash flows are not solely payments of principal and interest.The investments were measured at fair value through profit or loss at the end of each reporting period, with a correspondinggain on change in fair value of US$17,948,000, US$5,675,000, US$742,000 and US$5,988,000, respectively, credited toother income and gains in the years of 2016, 2017, 2018 and the six months ended June 30, 2019, respectively.
(c) The equity investments were irrevocably designated at fair value through other comprehensive income at the end of eachreporting period as the Group considers these investments to be strategic in nature. The fair value changes in theseinvestments resulted in a loss (net of tax) amounting to US$6,446,000 in the year of 2016, a gain (net of tax) amounting toUS$4,759,000 and US$4,287,000 in the years of 2017 and 2018, respectively, and nil in the six months ended June 30, 2019,recorded in other comprehensive income.
21. OTHER NON-CURRENT ASSETS
As at December 31, As at June 30,
2016 2017 2018 2019
US$’000 US$’000 US$’000 US$’000
Long-term portion of insurance receivable . . . . . . . . . . . . . . . — 4,381 3,961 4,428Rental deposits . . . . . . . . . . . . . . . . . . . . . . . . . . . . . . . . . . . . . — 912 1,145 779Tax refunds . . . . . . . . . . . . . . . . . . . . . . . . . . . . . . . . . . . . . . . . — — 6,731 —VAT recoverable . . . . . . . . . . . . . . . . . . . . . . . . . . . . . . . . . . . — — 2,847 —Others . . . . . . . . . . . . . . . . . . . . . . . . . . . . . . . . . . . . . . . . . . . . — — 2,746 3,879
— 5,293 17,430 9,086
22. INVENTORIES
As at December 31, As at June 30,
2016 2017 2018 2019
US$’000 US$’000 US$’000 US$’000
Raw materials . . . . . . . . . . . . . . . . . . . . . . . . . . . . . . . . . . . . 13,094 22,875 28,318 33,654Finished goods . . . . . . . . . . . . . . . . . . . . . . . . . . . . . . . . . . . . 48,304 252,009 324,236 299,087Less: Impairment . . . . . . . . . . . . . . . . . . . . . . . . . . . . . . . . . . (1,928) (2,655) (2,692) (2,756)
59,470 272,229 349,862 329,985
The movements in provision for impairment of inventories are as follows:
As at December 31, As at June 30,
2016 2017 2018 2019
US$’000 US$’000 US$’000 US$’000
At the beginning of the year/period . . . . . . . . . . . . . . . . . . . . . (1,031) (1,928) (2,655) (2,692)Acquisition of subsidiaries . . . . . . . . . . . . . . . . . . . . . . . . . . . . — (2,264) — —Provision for/reversal of impairment losses . . . . . . . . . . . . . . . (1,001) 1,621 (69) (61)Exchange realignment . . . . . . . . . . . . . . . . . . . . . . . . . . . . . . . 104 (84) 32 (3)
At the end of the year/period . . . . . . . . . . . . . . . . . . . . . . . . . . (1,928) (2,655) (2,692) (2,756)
I-87
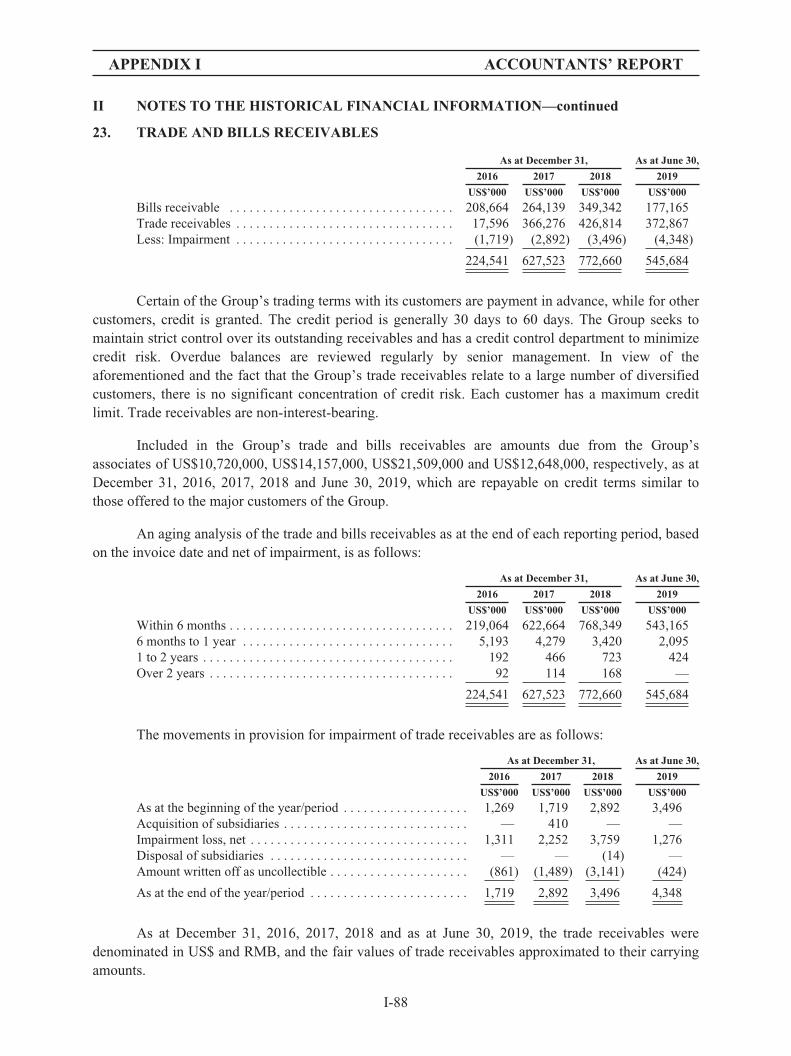
APPENDIX I ACCOUNTANTS’ REPORT
II NOTES TO THE HISTORICAL FINANCIAL INFORMATION—continued
23. TRADE AND BILLS RECEIVABLES
As at December 31, As at June 30,
2016 2017 2018 2019
US$’000 US$’000 US$’000 US$’000
Bills receivable . . . . . . . . . . . . . . . . . . . . . . . . . . . . . . . . . . 208,664 264,139 349,342 177,165Trade receivables . . . . . . . . . . . . . . . . . . . . . . . . . . . . . . . . . 17,596 366,276 426,814 372,867Less: Impairment . . . . . . . . . . . . . . . . . . . . . . . . . . . . . . . . . (1,719) (2,892) (3,496) (4,348)
224,541 627,523 772,660 545,684
Certain of the Group’s trading terms with its customers are payment in advance, while for othercustomers, credit is granted. The credit period is generally 30 days to 60 days. The Group seeks tomaintain strict control over its outstanding receivables and has a credit control department to minimizecredit risk. Overdue balances are reviewed regularly by senior management. In view of theaforementioned and the fact that the Group’s trade receivables relate to a large number of diversifiedcustomers, there is no significant concentration of credit risk. Each customer has a maximum creditlimit. Trade receivables are non-interest-bearing.
Included in the Group’s trade and bills receivables are amounts due from the Group’sassociates of US$10,720,000, US$14,157,000, US$21,509,000 and US$12,648,000, respectively, as atDecember 31, 2016, 2017, 2018 and June 30, 2019, which are repayable on credit terms similar tothose offered to the major customers of the Group.
An aging analysis of the trade and bills receivables as at the end of each reporting period, basedon the invoice date and net of impairment, is as follows:
As at December 31, As at June 30,
2016 2017 2018 2019
US$’000 US$’000 US$’000 US$’000
Within 6 months . . . . . . . . . . . . . . . . . . . . . . . . . . . . . . . . . . 219,064 622,664 768,349 543,1656 months to 1 year . . . . . . . . . . . . . . . . . . . . . . . . . . . . . . . . 5,193 4,279 3,420 2,0951 to 2 years . . . . . . . . . . . . . . . . . . . . . . . . . . . . . . . . . . . . . . 192 466 723 424Over 2 years . . . . . . . . . . . . . . . . . . . . . . . . . . . . . . . . . . . . . 92 114 168 —
224,541 627,523 772,660 545,684
The movements in provision for impairment of trade receivables are as follows:
As at December 31, As at June 30,
2016 2017 2018 2019
US$’000 US$’000 US$’000 US$’000
As at the beginning of the year/period . . . . . . . . . . . . . . . . . . . 1,269 1,719 2,892 3,496Acquisition of subsidiaries . . . . . . . . . . . . . . . . . . . . . . . . . . . . — 410 — —Impairment loss, net . . . . . . . . . . . . . . . . . . . . . . . . . . . . . . . . . 1,311 2,252 3,759 1,276Disposal of subsidiaries . . . . . . . . . . . . . . . . . . . . . . . . . . . . . . — — (14) —Amount written off as uncollectible . . . . . . . . . . . . . . . . . . . . . (861) (1,489) (3,141) (424)
As at the end of the year/period . . . . . . . . . . . . . . . . . . . . . . . . 1,719 2,892 3,496 4,348
As at December 31, 2016, 2017, 2018 and as at June 30, 2019, the trade receivables weredenominated in US$ and RMB, and the fair values of trade receivables approximated to their carryingamounts.
I-88
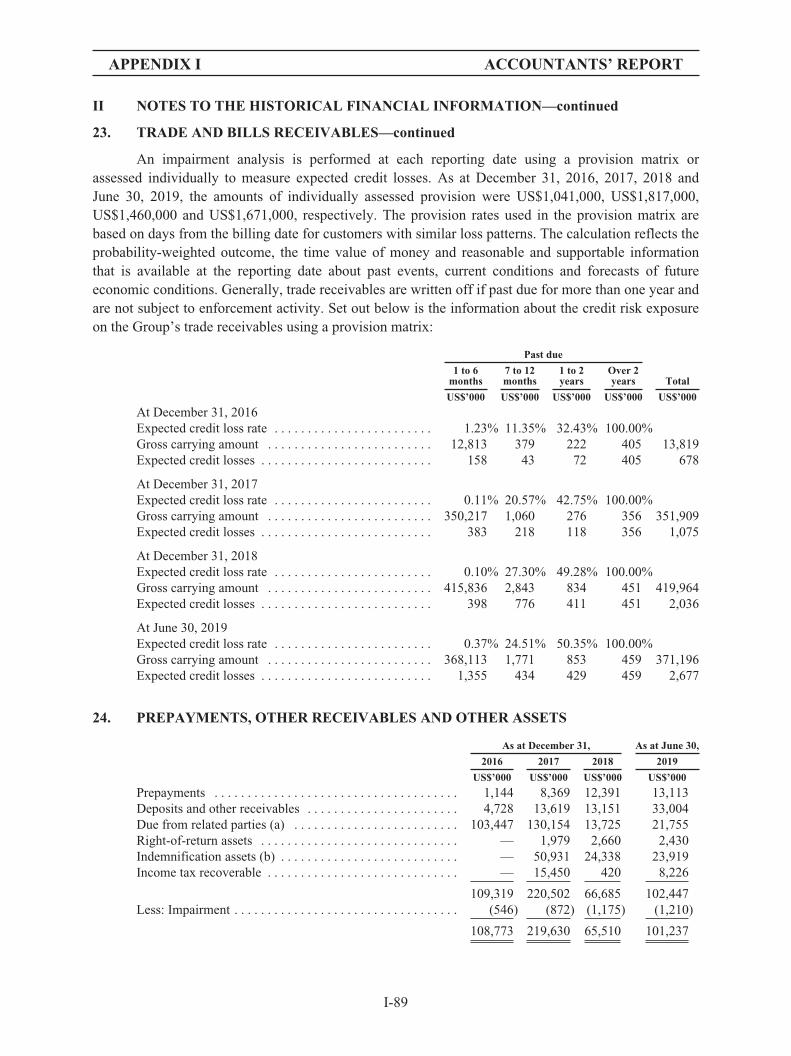
APPENDIX I ACCOUNTANTS’ REPORT
II NOTES TO THE HISTORICAL FINANCIAL INFORMATION—continued
23. TRADE AND BILLS RECEIVABLES—continued
An impairment analysis is performed at each reporting date using a provision matrix orassessed individually to measure expected credit losses. As at December 31, 2016, 2017, 2018 andJune 30, 2019, the amounts of individually assessed provision were US$1,041,000, US$1,817,000,US$1,460,000 and US$1,671,000, respectively. The provision rates used in the provision matrix arebased on days from the billing date for customers with similar loss patterns. The calculation reflects theprobability-weighted outcome, the time value of money and reasonable and supportable informationthat is available at the reporting date about past events, current conditions and forecasts of futureeconomic conditions. Generally, trade receivables are written off if past due for more than one year andare not subject to enforcement activity. Set out below is the information about the credit risk exposureon the Group’s trade receivables using a provision matrix:
Past due
1 to 6months
7 to 12months
1 to 2years
Over 2years Total
US$’000 US$’000 US$’000 US$’000 US$’000
At December 31, 2016Expected credit loss rate . . . . . . . . . . . . . . . . . . . . . . . . 1.23% 11.35% 32.43% 100.00%Gross carrying amount . . . . . . . . . . . . . . . . . . . . . . . . . 12,813 379 222 405 13,819Expected credit losses . . . . . . . . . . . . . . . . . . . . . . . . . . 158 43 72 405 678
At December 31, 2017Expected credit loss rate . . . . . . . . . . . . . . . . . . . . . . . . 0.11% 20.57% 42.75% 100.00%Gross carrying amount . . . . . . . . . . . . . . . . . . . . . . . . . 350,217 1,060 276 356 351,909Expected credit losses . . . . . . . . . . . . . . . . . . . . . . . . . . 383 218 118 356 1,075
At December 31, 2018Expected credit loss rate . . . . . . . . . . . . . . . . . . . . . . . . 0.10% 27.30% 49.28% 100.00%Gross carrying amount . . . . . . . . . . . . . . . . . . . . . . . . . 415,836 2,843 834 451 419,964Expected credit losses . . . . . . . . . . . . . . . . . . . . . . . . . . 398 776 411 451 2,036
At June 30, 2019Expected credit loss rate . . . . . . . . . . . . . . . . . . . . . . . . 0.37% 24.51% 50.35% 100.00%Gross carrying amount . . . . . . . . . . . . . . . . . . . . . . . . . 368,113 1,771 853 459 371,196Expected credit losses . . . . . . . . . . . . . . . . . . . . . . . . . . 1,355 434 429 459 2,677
24. PREPAYMENTS, OTHER RECEIVABLES AND OTHER ASSETS
As at December 31, As at June 30,
2016 2017 2018 2019
US$’000 US$’000 US$’000 US$’000
Prepayments . . . . . . . . . . . . . . . . . . . . . . . . . . . . . . . . . . . . . 1,144 8,369 12,391 13,113Deposits and other receivables . . . . . . . . . . . . . . . . . . . . . . . 4,728 13,619 13,151 33,004Due from related parties (a) . . . . . . . . . . . . . . . . . . . . . . . . . 103,447 130,154 13,725 21,755Right-of-return assets . . . . . . . . . . . . . . . . . . . . . . . . . . . . . . — 1,979 2,660 2,430Indemnification assets (b) . . . . . . . . . . . . . . . . . . . . . . . . . . . — 50,931 24,338 23,919Income tax recoverable . . . . . . . . . . . . . . . . . . . . . . . . . . . . . — 15,450 420 8,226
109,319 220,502 66,685 102,447Less: Impairment . . . . . . . . . . . . . . . . . . . . . . . . . . . . . . . . . . (546) (872) (1,175) (1,210)
108,773 219,630 65,510 101,237
I-89
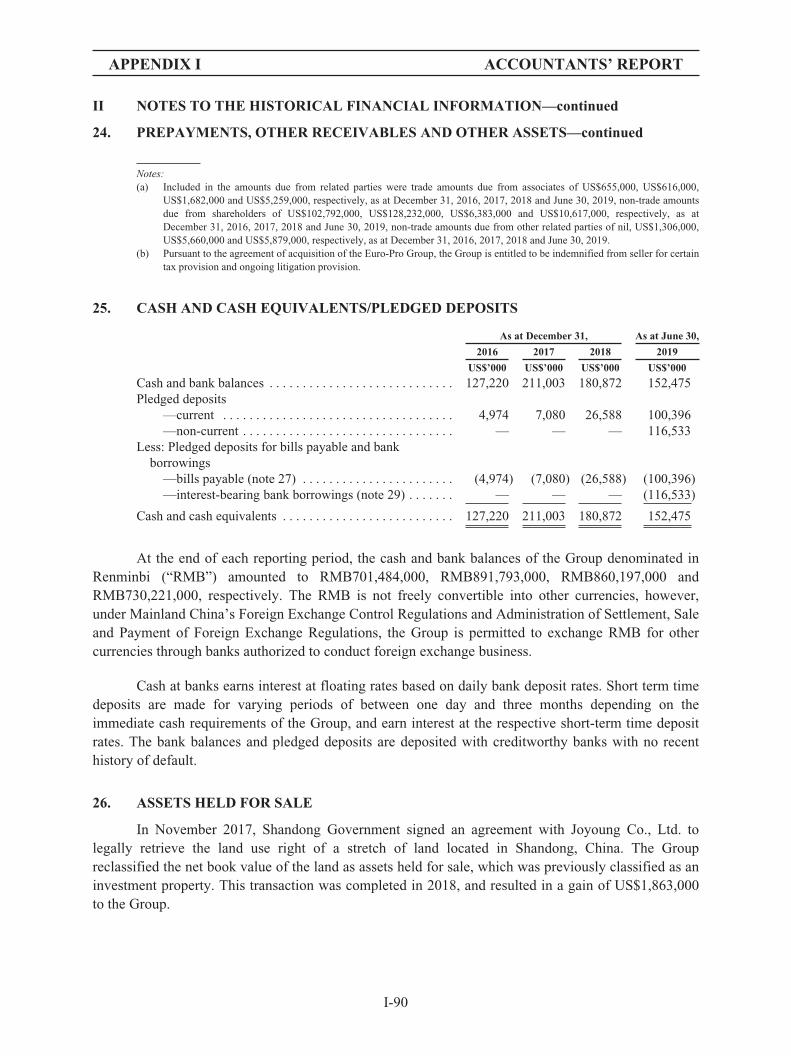
APPENDIX I ACCOUNTANTS’ REPORT
II NOTES TO THE HISTORICAL FINANCIAL INFORMATION—continued
24. PREPAYMENTS, OTHER RECEIVABLES AND OTHER ASSETS—continued
Notes:(a) Included in the amounts due from related parties were trade amounts due from associates of US$655,000, US$616,000,
US$1,682,000 and US$5,259,000, respectively, as at December 31, 2016, 2017, 2018 and June 30, 2019, non-trade amountsdue from shareholders of US$102,792,000, US$128,232,000, US$6,383,000 and US$10,617,000, respectively, as atDecember 31, 2016, 2017, 2018 and June 30, 2019, non-trade amounts due from other related parties of nil, US$1,306,000,US$5,660,000 and US$5,879,000, respectively, as at December 31, 2016, 2017, 2018 and June 30, 2019.
(b) Pursuant to the agreement of acquisition of the Euro-Pro Group, the Group is entitled to be indemnified from seller for certaintax provision and ongoing litigation provision.
25. CASH AND CASH EQUIVALENTS/PLEDGED DEPOSITS
As at December 31, As at June 30,
2016 2017 2018 2019
US$’000 US$’000 US$’000 US$’000
Cash and bank balances . . . . . . . . . . . . . . . . . . . . . . . . . . . . 127,220 211,003 180,872 152,475Pledged deposits
—current . . . . . . . . . . . . . . . . . . . . . . . . . . . . . . . . . . . 4,974 7,080 26,588 100,396—non-current . . . . . . . . . . . . . . . . . . . . . . . . . . . . . . . . — — — 116,533
Less: Pledged deposits for bills payable and bankborrowings
—bills payable (note 27) . . . . . . . . . . . . . . . . . . . . . . . (4,974) (7,080) (26,588) (100,396)—interest-bearing bank borrowings (note 29) . . . . . . . — — — (116,533)
Cash and cash equivalents . . . . . . . . . . . . . . . . . . . . . . . . . . 127,220 211,003 180,872 152,475
At the end of each reporting period, the cash and bank balances of the Group denominated inRenminbi (“RMB”) amounted to RMB701,484,000, RMB891,793,000, RMB860,197,000 andRMB730,221,000, respectively. The RMB is not freely convertible into other currencies, however,under Mainland China’s Foreign Exchange Control Regulations and Administration of Settlement, Saleand Payment of Foreign Exchange Regulations, the Group is permitted to exchange RMB for othercurrencies through banks authorized to conduct foreign exchange business.
Cash at banks earns interest at floating rates based on daily bank deposit rates. Short term timedeposits are made for varying periods of between one day and three months depending on theimmediate cash requirements of the Group, and earn interest at the respective short-term time depositrates. The bank balances and pledged deposits are deposited with creditworthy banks with no recenthistory of default.
26. ASSETS HELD FOR SALE
In November 2017, Shandong Government signed an agreement with Joyoung Co., Ltd. tolegally retrieve the land use right of a stretch of land located in Shandong, China. The Groupreclassified the net book value of the land as assets held for sale, which was previously classified as aninvestment property. This transaction was completed in 2018, and resulted in a gain of US$1,863,000to the Group.
I-90
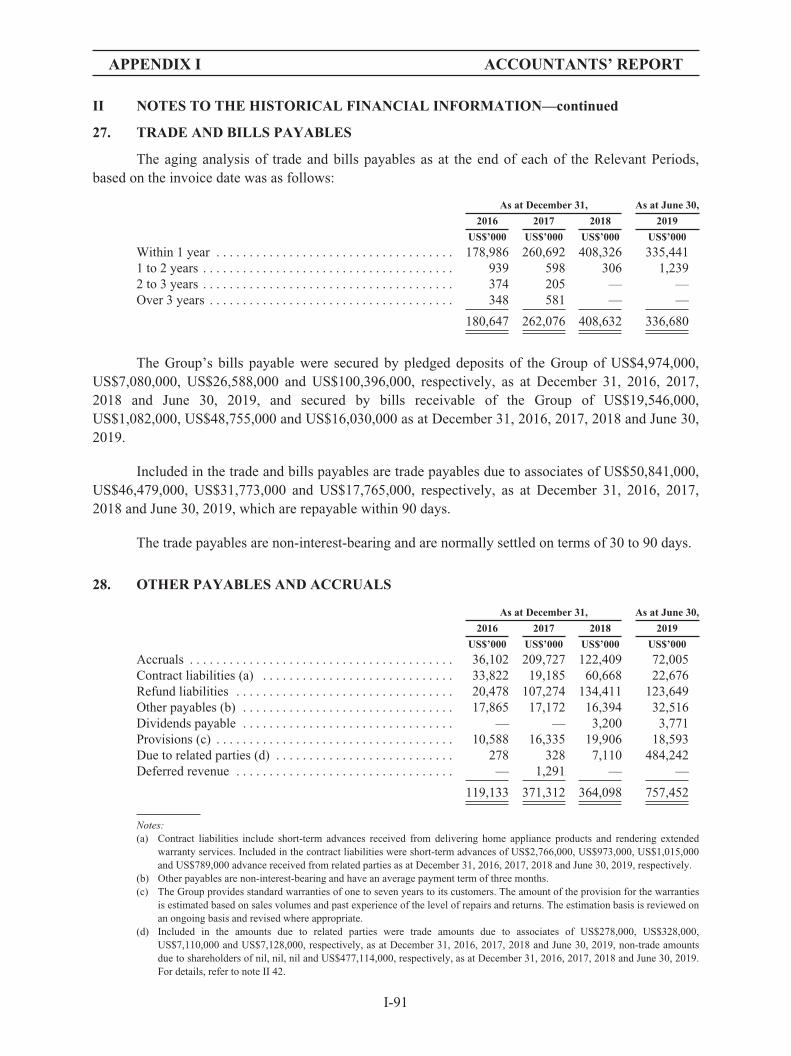
APPENDIX I ACCOUNTANTS’ REPORT
II NOTES TO THE HISTORICAL FINANCIAL INFORMATION—continued
27. TRADE AND BILLS PAYABLES
The aging analysis of trade and bills payables as at the end of each of the Relevant Periods,based on the invoice date was as follows:
As at December 31, As at June 30,
2016 2017 2018 2019
US$’000 US$’000 US$’000 US$’000
Within 1 year . . . . . . . . . . . . . . . . . . . . . . . . . . . . . . . . . . . . 178,986 260,692 408,326 335,4411 to 2 years . . . . . . . . . . . . . . . . . . . . . . . . . . . . . . . . . . . . . . 939 598 306 1,2392 to 3 years . . . . . . . . . . . . . . . . . . . . . . . . . . . . . . . . . . . . . . 374 205 — —Over 3 years . . . . . . . . . . . . . . . . . . . . . . . . . . . . . . . . . . . . . 348 581 — —
180,647 262,076 408,632 336,680
The Group’s bills payable were secured by pledged deposits of the Group of US$4,974,000,US$7,080,000, US$26,588,000 and US$100,396,000, respectively, as at December 31, 2016, 2017,2018 and June 30, 2019, and secured by bills receivable of the Group of US$19,546,000,US$1,082,000, US$48,755,000 and US$16,030,000 as at December 31, 2016, 2017, 2018 and June 30,2019.
Included in the trade and bills payables are trade payables due to associates of US$50,841,000,US$46,479,000, US$31,773,000 and US$17,765,000, respectively, as at December 31, 2016, 2017,2018 and June 30, 2019, which are repayable within 90 days.
The trade payables are non-interest-bearing and are normally settled on terms of 30 to 90 days.
28. OTHER PAYABLES AND ACCRUALS
As at December 31, As at June 30,
2016 2017 2018 2019
US$’000 US$’000 US$’000 US$’000
Accruals . . . . . . . . . . . . . . . . . . . . . . . . . . . . . . . . . . . . . . . . 36,102 209,727 122,409 72,005Contract liabilities (a) . . . . . . . . . . . . . . . . . . . . . . . . . . . . . 33,822 19,185 60,668 22,676Refund liabilities . . . . . . . . . . . . . . . . . . . . . . . . . . . . . . . . . 20,478 107,274 134,411 123,649Other payables (b) . . . . . . . . . . . . . . . . . . . . . . . . . . . . . . . . 17,865 17,172 16,394 32,516Dividends payable . . . . . . . . . . . . . . . . . . . . . . . . . . . . . . . . — — 3,200 3,771Provisions (c) . . . . . . . . . . . . . . . . . . . . . . . . . . . . . . . . . . . . 10,588 16,335 19,906 18,593Due to related parties (d) . . . . . . . . . . . . . . . . . . . . . . . . . . . 278 328 7,110 484,242Deferred revenue . . . . . . . . . . . . . . . . . . . . . . . . . . . . . . . . . — 1,291 — —
119,133 371,312 364,098 757,452
Notes:(a) Contract liabilities include short-term advances received from delivering home appliance products and rendering extended
warranty services. Included in the contract liabilities were short-term advances of US$2,766,000, US$973,000, US$1,015,000and US$789,000 advance received from related parties as at December 31, 2016, 2017, 2018 and June 30, 2019, respectively.
(b) Other payables are non-interest-bearing and have an average payment term of three months.(c) The Group provides standard warranties of one to seven years to its customers. The amount of the provision for the warranties
is estimated based on sales volumes and past experience of the level of repairs and returns. The estimation basis is reviewed onan ongoing basis and revised where appropriate.
(d) Included in the amounts due to related parties were trade amounts due to associates of US$278,000, US$328,000,US$7,110,000 and US$7,128,000, respectively, as at December 31, 2016, 2017, 2018 and June 30, 2019, non-trade amountsdue to shareholders of nil, nil, nil and US$477,114,000, respectively, as at December 31, 2016, 2017, 2018 and June 30, 2019.For details, refer to note II 42.
I-91

APPENDIX I ACCOUNTANTS’ REPORT
II NOTES TO THE HISTORICAL FINANCIAL INFORMATION—continued
29. INTEREST-BEARING BANK BORROWINGS
December 31, 2017 December 31, 2018 June 30, 2019
Interestrate (%) Maturity US$’000
Interestrate (%) Maturity US$’000
Interestrate (%) Maturity US$’000
CurrentBank loans—
secured . . . . (b) 3.25+LIBOR 2018 6,797 3.25+LIBOR 2019 16,379 3.25+LIBOR 2019-2020 21,857Bank loans—
secured . . . . (b) 4.00+LIBOR 2018 3,242 4.00+LIBOR 2019 1,989 —Bank loans—
secured . . . . (a) — 1.55+LIBOR 2019 467,176 —
10,039 485,544 21,857
Non-currentBank loans—
secured . . . . (b) 3.25+LIBOR 2020-2022 211,983 3.25+LIBOR 2020-2022 193,864 3.25+LIBOR 2022 181,360Bank loans—
secured . . . . (b) 4.00+LIBOR 2020-2024 435,528 4.00+LIBOR 2020-2024 433,376 4.00+LIBOR 2024 419,736Bank loans—
secured . . . . (a)/(b) 2.75+LIBOR 2022 79,278 2.75+LIBOR 2022 72,481 2.75+LIBOR 2022 112,914Bank loans—
secured . . . . (a) 1.55+LIBOR 2019 466,893 — —Bank loans—
secured . . . . (c) — — 1.20+HIBOR 2022 114,474
1,193,682 699,721 828,484
1,203,721 1,185,265 850,341
Analyzed into:Bank loans repayable:
Within one year or on demand . . . . . . . . 10,039 485,544 21,857In the second year . . . . . . . . . . . . . . . . . . 484,915 28,345 28,579In the third to fifth years, inclusive . . . . . 281,819 246,589 376,213Beyond five years . . . . . . . . . . . . . . . . . . 426,948 424,787 423,692
1,203,721 1,185,265 850,341
Notes:(a) The bank loans are secured by the pledge of 257,430,810, 320,403,436 and 62,973,000 shares of Joyoung Co., Ltd. as at
December 31, 2017, December 31, 2018 and June 30, 2019, respectively.
(b) Certain of the bank loans are secured by:
(i) The pledge of equity interests in certain subsidiaries of Compass Cayman SPV Limited:
Issuer Percentage of equity interests
Global Appliance UK HoldCo Limited . . . . . . . . . . . . . . . . . . . . . . . . . . . . . . . . . . . . . . 100%Compass Cayman SPV2 Limited . . . . . . . . . . . . . . . . . . . . . . . . . . . . . . . . . . . . . . . . . . . 100%Global Appliance LLC . . . . . . . . . . . . . . . . . . . . . . . . . . . . . . . . . . . . . . . . . . . . . . . . . . . 100%Euro-Pro Holdco, LLC . . . . . . . . . . . . . . . . . . . . . . . . . . . . . . . . . . . . . . . . . . . . . . . . . . . 100%EP Midco LLC . . . . . . . . . . . . . . . . . . . . . . . . . . . . . . . . . . . . . . . . . . . . . . . . . . . . . . . . . 100%SharkNinja Operating LLC . . . . . . . . . . . . . . . . . . . . . . . . . . . . . . . . . . . . . . . . . . . . . . . . 100%Euro-Pro International Holding Company . . . . . . . . . . . . . . . . . . . . . . . . . . . . . . . . . . . . 65%SharkNinja Sales Company . . . . . . . . . . . . . . . . . . . . . . . . . . . . . . . . . . . . . . . . . . . . . . . . 100%SharkNinja Management LLC . . . . . . . . . . . . . . . . . . . . . . . . . . . . . . . . . . . . . . . . . . . . . 100%
(ii) The security interest of certain subsidiaries, including all accounts that certain subsidiaries organized in a U.S. jurisdictionat any time opens or maintains; all chattel paper; all cash and cash equivalents; all documents; all equipment; all generalintangibles, including all intellectual property; all instruments; all inventories; all other goods; all investment properties;all letter-of-credit rights; all fixtures; all books and records pertaining to the security interest; and to the extent nototherwise included, all proceeds and products of any and all of the foregoing and all collateral security and guaranteesgiven by any person with respect to any of the foregoing of the subsidiaries in (i);
(iii) A subordinated promissory note, made by certain subsidiaries of Compass, in the original principal amount ofUS$50,000,000;
(iv) A global intercompany note, made by Compass and certain subsidiaries of Compass; and(v) A corporate guarantee provided by Compass and certain subsidiaries of Compass.
(c) The bank loans are secured by a pledged deposit of US$116,533,000 as at June 30, 2019.
I-92

APPENDIX I ACCOUNTANTS’ REPORT
II NOTES TO THE HISTORICAL FINANCIAL INFORMATION—continued
29. INTEREST-BEARING BANK BORROWINGS—continued
The Group’s unutilised available bank borrowing facilities were nil, US$140,000,000,US$120,000,000 and US$77,917,000 as at December 31, 2016, 2017, 2018 and June 30, 2019,respectively.
30. DEFERRED TAX ASSETS/LIABILITIES
The analysis of deferred tax assets and liabilities in the consolidated statements of financialposition is as follows:
The movements in deferred income tax assets and liabilities during the Relevant Periods,without taking into consideration the offsetting of balances within the same tax jurisdiction, are asfollows:
I-93
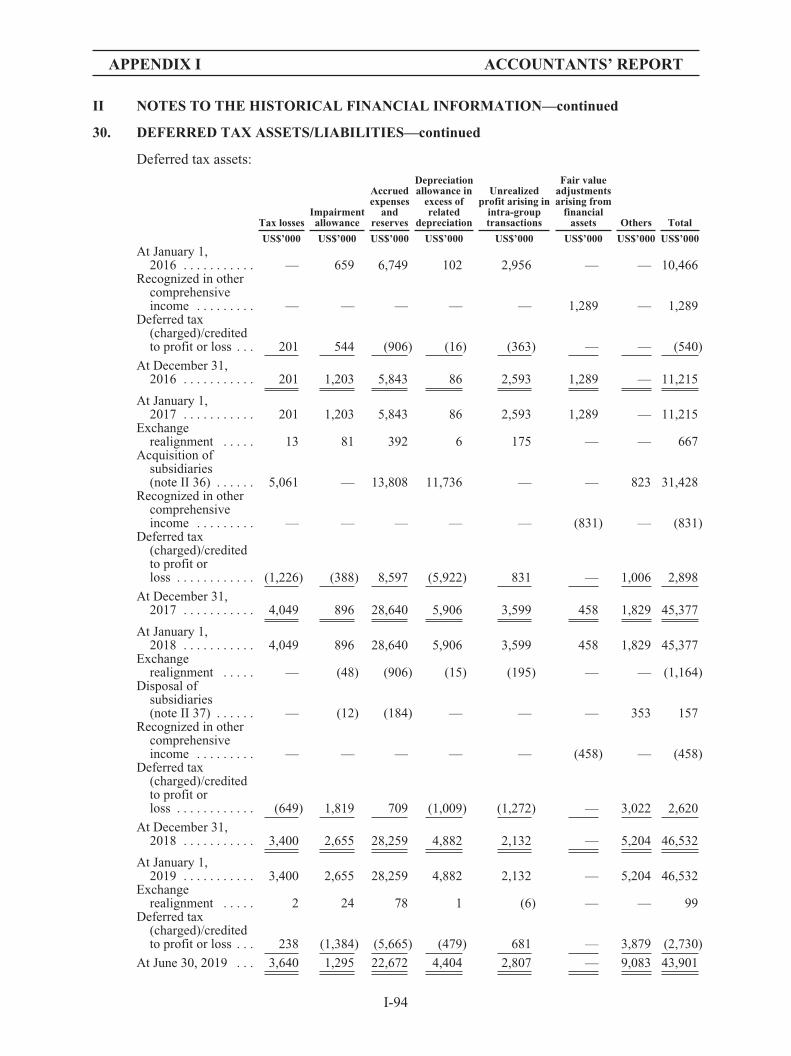
APPENDIX I ACCOUNTANTS’ REPORT
II NOTES TO THE HISTORICAL FINANCIAL INFORMATION—continued
30. DEFERRED TAX ASSETS/LIABILITIES—continued
Deferred tax assets:
Tax lossesImpairmentallowance
Accruedexpenses
andreserves
Depreciationallowance in
excess ofrelated
depreciation
Unrealizedprofit arising in
intra-grouptransactions
Fair valueadjustmentsarising from
financialassets Others Total
US$’000 US$’000 US$’000 US$’000 US$’000 US$’000 US$’000 US$’000At January 1,
2016 . . . . . . . . . . . — 659 6,749 102 2,956 — — 10,466Recognized in other
comprehensiveincome . . . . . . . . . — — — — — 1,289 — 1,289
Deferred tax(charged)/creditedto profit or loss . . . 201 544 (906) (16) (363) — — (540)
At December 31,2016 . . . . . . . . . . . 201 1,203 5,843 86 2,593 1,289 — 11,215
At January 1,2017 . . . . . . . . . . . 201 1,203 5,843 86 2,593 1,289 — 11,215
Exchangerealignment . . . . . 13 81 392 6 175 — — 667
Acquisition ofsubsidiaries(note II 36) . . . . . . 5,061 — 13,808 11,736 — — 823 31,428
Recognized in othercomprehensiveincome . . . . . . . . . — — — — — (831) — (831)
Deferred tax(charged)/creditedto profit orloss . . . . . . . . . . . . (1,226) (388) 8,597 (5,922) 831 — 1,006 2,898
At December 31,2017 . . . . . . . . . . . 4,049 896 28,640 5,906 3,599 458 1,829 45,377
At January 1,2018 . . . . . . . . . . . 4,049 896 28,640 5,906 3,599 458 1,829 45,377
Exchangerealignment . . . . . — (48) (906) (15) (195) — — (1,164)
Disposal ofsubsidiaries(note II 37) . . . . . . — (12) (184) — — — 353 157
Recognized in othercomprehensiveincome . . . . . . . . . — — — — — (458) — (458)
Deferred tax(charged)/creditedto profit orloss . . . . . . . . . . . . (649) 1,819 709 (1,009) (1,272) — 3,022 2,620
At December 31,2018 . . . . . . . . . . . 3,400 2,655 28,259 4,882 2,132 — 5,204 46,532
At January 1,2019 . . . . . . . . . . . 3,400 2,655 28,259 4,882 2,132 — 5,204 46,532
Exchangerealignment . . . . . 2 24 78 1 (6) — — 99
Deferred tax(charged)/creditedto profit or loss . . . 238 (1,384) (5,665) (479) 681 — 3,879 (2,730)
At June 30, 2019 . . . 3,640 1,295 22,672 4,404 2,807 — 9,083 43,901
I-94
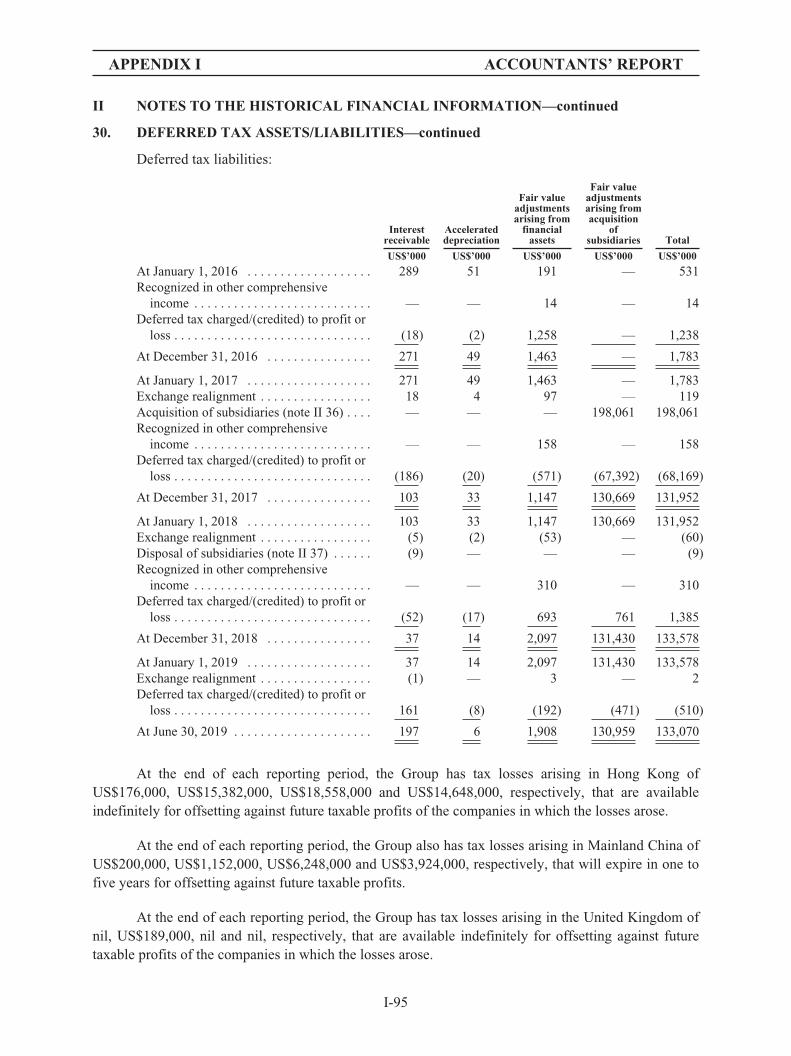
APPENDIX I ACCOUNTANTS’ REPORT
II NOTES TO THE HISTORICAL FINANCIAL INFORMATION—continued
30. DEFERRED TAX ASSETS/LIABILITIES—continued
Deferred tax liabilities:
Interestreceivable
Accelerateddepreciation
Fair valueadjustmentsarising from
financialassets
Fair valueadjustmentsarising fromacquisition
ofsubsidiaries Total
US$’000 US$’000 US$’000 US$’000 US$’000
At January 1, 2016 . . . . . . . . . . . . . . . . . . . 289 51 191 — 531Recognized in other comprehensive
income . . . . . . . . . . . . . . . . . . . . . . . . . . . — — 14 — 14Deferred tax charged/(credited) to profit or
loss . . . . . . . . . . . . . . . . . . . . . . . . . . . . . . (18) (2) 1,258 — 1,238
At December 31, 2016 . . . . . . . . . . . . . . . . 271 49 1,463 — 1,783
At January 1, 2017 . . . . . . . . . . . . . . . . . . . 271 49 1,463 — 1,783Exchange realignment . . . . . . . . . . . . . . . . . 18 4 97 — 119Acquisition of subsidiaries (note II 36) . . . . — — — 198,061 198,061Recognized in other comprehensive
income . . . . . . . . . . . . . . . . . . . . . . . . . . . — — 158 — 158Deferred tax charged/(credited) to profit or
loss . . . . . . . . . . . . . . . . . . . . . . . . . . . . . . (186) (20) (571) (67,392) (68,169)
At December 31, 2017 . . . . . . . . . . . . . . . . 103 33 1,147 130,669 131,952
At January 1, 2018 . . . . . . . . . . . . . . . . . . . 103 33 1,147 130,669 131,952Exchange realignment . . . . . . . . . . . . . . . . . (5) (2) (53) — (60)Disposal of subsidiaries (note II 37) . . . . . . (9) — — — (9)Recognized in other comprehensive
income . . . . . . . . . . . . . . . . . . . . . . . . . . . — — 310 — 310Deferred tax charged/(credited) to profit or
loss . . . . . . . . . . . . . . . . . . . . . . . . . . . . . . (52) (17) 693 761 1,385
At December 31, 2018 . . . . . . . . . . . . . . . . 37 14 2,097 131,430 133,578
At January 1, 2019 . . . . . . . . . . . . . . . . . . . 37 14 2,097 131,430 133,578Exchange realignment . . . . . . . . . . . . . . . . . (1) — 3 — 2Deferred tax charged/(credited) to profit or
loss . . . . . . . . . . . . . . . . . . . . . . . . . . . . . . 161 (8) (192) (471) (510)
At June 30, 2019 . . . . . . . . . . . . . . . . . . . . . 197 6 1,908 130,959 133,070
At the end of each reporting period, the Group has tax losses arising in Hong Kong ofUS$176,000, US$15,382,000, US$18,558,000 and US$14,648,000, respectively, that are availableindefinitely for offsetting against future taxable profits of the companies in which the losses arose.
At the end of each reporting period, the Group also has tax losses arising in Mainland China ofUS$200,000, US$1,152,000, US$6,248,000 and US$3,924,000, respectively, that will expire in one tofive years for offsetting against future taxable profits.
At the end of each reporting period, the Group has tax losses arising in the United Kingdom ofnil, US$189,000, nil and nil, respectively, that are available indefinitely for offsetting against futuretaxable profits of the companies in which the losses arose.
I-95

APPENDIX I ACCOUNTANTS’ REPORT
II NOTES TO THE HISTORICAL FINANCIAL INFORMATION—continued
30. DEFERRED TAX ASSETS/LIABILITIES—continued
Deferred tax assets have not been recognized in respect of these losses as they have arisen insubsidiaries that have been loss-making for some time and it is not considered probable that taxableprofits will be available against which the tax losses can be utilized.
Pursuant to the PRC Corporate Income Tax Law, a 10% withholding tax is levied on dividendsdeclared to foreign investors from the foreign investment enterprises established in Mainland China.The requirement is effective from January 1, 2008 and applies to earnings after December 31, 2007. Alower withholding tax rate may be applied if there is a tax treaty between Mainland China and thejurisdiction of the foreign investors. For the Group, the applicable rate is 10%. The Group is thereforeliable for withholding taxes on dividends distributed by those subsidiaries established in MainlandChina in respect of earnings generated from January 1, 2008.
At the end of each reporting period, no deferred tax has been recognized for withholding taxesthat would be payable on the unremitted earnings that are subject to withholding taxes of the Group’ssubsidiaries established in Mainland China. In the opinion of the directors, it is not probable that thesesubsidiaries will distribute such earnings in the foreseeable future. The aggregate amount of temporarydifferences associated with investments in subsidiaries in Mainland China for which deferred taxliabilities have not been recognized totalled approximately US$12,775,000, US$13,545,000,US$4,449,000 and US$17,929,000 at December 31, 2016, 2017, 2018 and June 30, 2019 respectively.
31. FINANCIAL LIABILITIES ASSOCIATED WITH PUT OPTION
Original put option (the “Put Option”)
On September 29, 2017 (the “Grant Date”), a subsidiary of the Group, Compass Cayman SPVLimited (“Compass”) entered into a shareholders agreement (“the Agreement”) with itsnon-controlling shareholder, Compass Aggregator, Ltd. (“Aggregator”), simultaneously with the entryinto the Membership Interest Purchase Agreement in relation to the acquisition of Euro-Pro Holdco,LLC and its subsidiaries (the “Acquisition”). Aggregator is controlled by the previous ultimatecontroller of the Euro-Pro Group. Under the Agreement, Aggregator is entitled to a right (the “PutOption”) to require Compass to repurchase all or a portion of Compass’ own shares beneficially ownedby Aggregator at an agreed price (the “Repurchase Price”) within an agreed period.
Pursuant to the Agreement, from and after the earlier of (i) the third anniversary of the closingdate of the Acquisition (ii) any time after the board of directors resolves to engage a specific sponsor orunderwriter in connection with a proposed initial public offering of the Company (the “IPO”) of theshares of Compass (the “Board IPO Determination Date”), Aggregator could exercise the Put Optionby providing a written notice to Compass (“exercisable period”). As at the date on which an IPO isconsummated, Aggregator’s right to exercise the Put Option shall automatically expire for all purposes.
If (i) Aggregator has not exercised the Put Option prior to the sixth anniversary of the closingdate of the Acquisition and (ii) no IPO has occurred prior to such date, Compass shall have the option,exercisable upon the provision of a written notice to Aggregator, to require it to sell to Compass all ofthe shares beneficially owned by Aggregator. As at the date on which an IPO is consummated,Compass’ right to exercise the Call Option shall automatically expire for all purposes.
I-96

APPENDIX I ACCOUNTANTS’ REPORT
II NOTES TO THE HISTORICAL FINANCIAL INFORMATION—continued
31. FINANCIAL LIABILITIES ASSOCIATED WITH PUT OPTION—continued
Original put option (the “Put Option”)—continued
The Repurchase Price means, percentage interest of the Aggregator as at the exercise date,multiplied by an amount equal to (x) on the product of 10 times Compass’ forecasted earnings beforeinterest, taxes, depreciation and amortization (the “EBITDA”) during a 12-month period prior to theexercise date, less (y) Compass’ net indebtedness as at the exercise date. As at December 31, 2017 and2018, management did not have an estimate of the Board IPO determination date, the starting day ofthe exercisable period is assumed to be the third anniversary of the closing date of the acquisition,which is September 30, 2020.
If (x) payment of the Repurchase Price on or prior to the four weeks after the date on which therepurchase price is determined in the case of the put or call option (the “Last Date”) would causeCompass or any of its subsidiaries to be in breach or default under any indebtedness or other financingarrangement (and such indebtedness or other arrangement could not be refinanced by the Last Date oncommercially reasonably terms which would not materially adversely affect Compass) or (y) Compassand its subsidiaries are unable to obtain the cash funds required to pay in full the Repurchase Price bythe Last Date, on the Last Date Compass shall deliver to the Aggregator a written notice irrevocablyoffering to both (x) pay a portion of the Repurchase Price, as set forth in such notice, with all the cashfunds that Compass and its subsidiaries have at such time that are permitted to be used for suchpurpose under any indebtedness or other financing arrangements and after taking into account thereasonable anticipated cash needs of Compass as set forth in the budget approved by the board and(y) issue to the Aggregator a promissory note of Compass (bearing interest at 3% plus the greater of (x)3 month LIBOR and (y) 1% with a face value equal to the remainder of the Repurchase Price notpayable in cash pursuant to clause (x) above).
The fair value of the Put Option as at September 29, 2017 was US$32,994,000, whichconstituted a part of purchase consideration of the Acquisition. The Group recorded goodwill in respectof the Put Option of US$32,994,000 with a corresponding credit to the put option reserve and non-controlling interests.
Under current IFRSs, when the Put Option is granted, the Group is required to record afinancial liability which is to be measured at the present value of the redemption amount. On initialrecognition, the corresponding debit is made to the put option reserve which is a component of equity.The financial liability is subsequently measured in accordance with IFRS 9.
The directors have estimated that at the Grant Date, the potential redemption amount would beapproximately US$620,709,000, based on the present value of the Repurchase Price as atSeptember 30, 2020. Accordingly, the Group recorded financial liabilities in respect of the Put Optionof US$620,709,000 as at September 29, 2017 with a corresponding debit to the put option reserve andnon-controlling interests.
Accordingly, the Group has recorded expenses of US$7,123,000 and US$28,817,000 associatedwith the Put Option according to the present value of the redemption liability, which are included inother expenses in profit or loss for the years 2017 and 2018, respectively. The balance of financialliabilities associated with the Put Option was US$627,833,000 and US$656,650,000 as atDecember 31, 2017 and 2018, respectively.
I-97
APPENDIX I ACCOUNTANTS’ REPORT
II NOTES TO THE HISTORICAL FINANCIAL INFORMATION—continued
31. FINANCIAL LIABILITIES ASSOCIATED WITH PUT OPTION—continued
Replacement of the Put Option (the “Put Right”)
Pursuant to the Reorganization, as more fully explained in the paragraph headed“Reorganization” in the section headed “History, Reorganization and Corporate Structure” in theProspectus, shareholders of Aggregator (“SN Investor”) acquired shares in Compass from Aggregatorand exchanged their respective shares in Compass with the Company in consideration for the sharesissued by the Company.
The put Option was terminated upon the completion of the restructuring and replaced by the putright. Pursuant to the shareholders’ agreement, if no IPO of the Company has been consummatedbefore or on September 30, 2020 (the “End Date”), from and after the End Date, each SN Investor shallhave the option to require Compass to purchase all or a portion of the shares beneficially owned bysuch SN Investor (the “Put Right”) at the applicable put/call price which is substantially the same withthe Repurchase Price of the Put Option. If, on or after December 31, 2020, the board of directors hasresolved to engage a specific sponsor or underwriter in connection with a proposed IPO after the EndDate (the “Board IPO Determination Date”), and any SN Investor has not delivered a written noticewithin 30 days after the Board IPO Determination Date, such SN Investor’s right to exercise the PutRight shall be suspended for all purposes while the Company pursues the proposed IPO; provided thatsuch suspension shall terminate on the earlier of (x) the date on which the Company is no longerpursuing the proposed IPO, including if the Company provides the SN Investors with a written noticethat it is no longer pursuing such IPO, (y) the date on which the Company withdraws any documentsthat were filed in connection with such IPO without promptly filing replacements thereof, and (z) six(6) months following the Board IPO Determination Date. The board of directors shall immediatelyprovide written notice to the SN Investors of the Board IPO Determination Date upon suchdetermination. As of the date on which an IPO is consummated, each SN Investor’s right to exercisethe Put Right shall automatically expire for all purposes.
If (i) any SN Investor has not exercised the Put Right prior to September 28, 2023 and (ii) noIPO has occurred prior to such date, the Company shall have the option, exercisable upon the provisionof a written notice to such SN Investor to require such SN Investor to sell to Compass Cayman all ofthe Shares beneficially owned by such SN Investor (the “Call Right”) at the applicable put/call price.Notwithstanding the foregoing, if (i) the Call Right is consummated by the Company, (ii) the primarydocuments that must be filed by the Listing Vehicle to effect an IPO with the applicable regulatorybody are filed within six months of the date on which the Call Right was consummated and (iii) suchIPO is ultimately consummated, in addition to the put/call price that has been, or otherwise will be,paid, the Company shall also pay the SN Investor an amount equal to the difference between (ifpositive) (1) the product of (x) the price per share for the shares sold in the IPO multiplied by (y) 20%of the total number of Shares held by the SN Investor immediately prior to the consummation of theCall Right (the “20% Amount”) and (2) the portion of the put/call price paid in satisfaction of the CallRight with respect to the 20% Amount (such amount, the “Additional Call Right Payment”). As of thedate on which an IPO is consummated, the Company’s right to exercise the Call Right shallautomatically expire for all purposes.
As at June 30, 2019, the Company was in the process of pursuing an IPO, and therefore thestarting day of the exercisable period is assumed to be September 30, 2020. Accordingly, the Grouphas recorded expenses of US$15,069,000 associated with the Put Option and Put Right according to
I-98
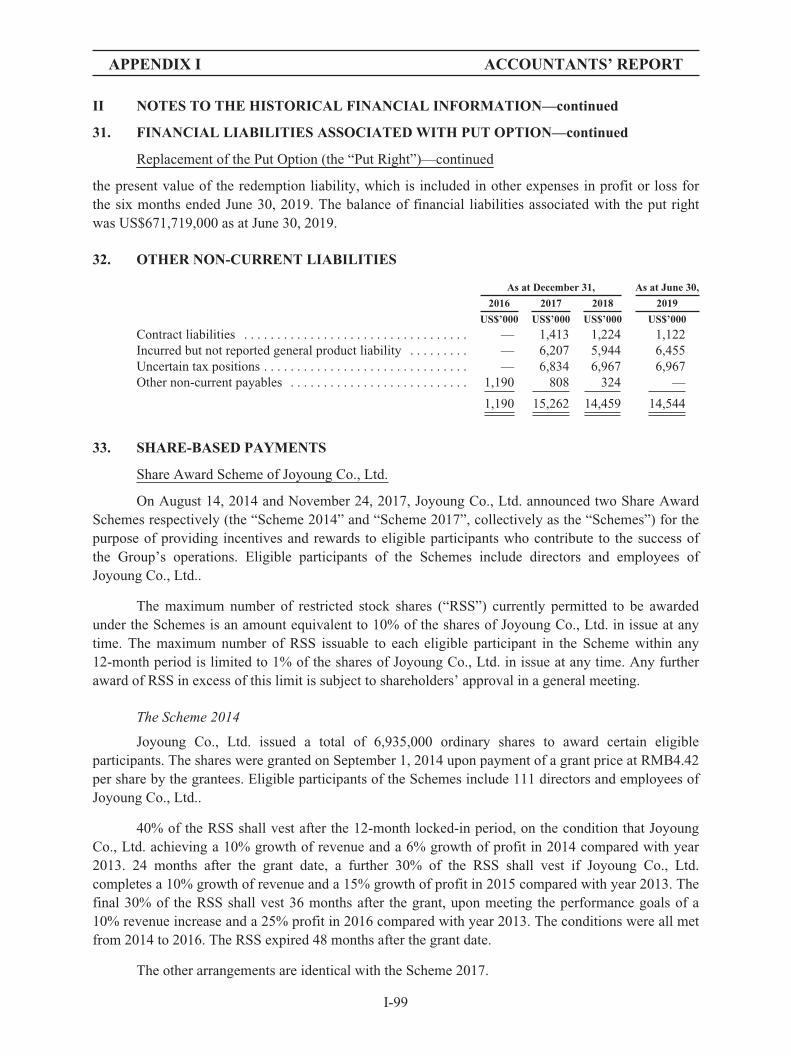
APPENDIX I ACCOUNTANTS’ REPORT
II NOTES TO THE HISTORICAL FINANCIAL INFORMATION—continued
31. FINANCIAL LIABILITIES ASSOCIATED WITH PUT OPTION—continued
Replacement of the Put Option (the “Put Right”)—continued
the present value of the redemption liability, which is included in other expenses in profit or loss forthe six months ended June 30, 2019. The balance of financial liabilities associated with the put rightwas US$671,719,000 as at June 30, 2019.
32. OTHER NON-CURRENT LIABILITIES
As at December 31, As at June 30,
2016 2017 2018 2019
US$’000 US$’000 US$’000 US$’000
Contract liabilities . . . . . . . . . . . . . . . . . . . . . . . . . . . . . . . . . . — 1,413 1,224 1,122Incurred but not reported general product liability . . . . . . . . . — 6,207 5,944 6,455Uncertain tax positions . . . . . . . . . . . . . . . . . . . . . . . . . . . . . . . — 6,834 6,967 6,967Other non-current payables . . . . . . . . . . . . . . . . . . . . . . . . . . . 1,190 808 324 —
1,190 15,262 14,459 14,544
33. SHARE-BASED PAYMENTS
Share Award Scheme of Joyoung Co., Ltd.
On August 14, 2014 and November 24, 2017, Joyoung Co., Ltd. announced two Share AwardSchemes respectively (the “Scheme 2014” and “Scheme 2017”, collectively as the “Schemes”) for thepurpose of providing incentives and rewards to eligible participants who contribute to the success ofthe Group’s operations. Eligible participants of the Schemes include directors and employees ofJoyoung Co., Ltd..
The maximum number of restricted stock shares (“RSS”) currently permitted to be awardedunder the Schemes is an amount equivalent to 10% of the shares of Joyoung Co., Ltd. in issue at anytime. The maximum number of RSS issuable to each eligible participant in the Scheme within any12-month period is limited to 1% of the shares of Joyoung Co., Ltd. in issue at any time. Any furtheraward of RSS in excess of this limit is subject to shareholders’ approval in a general meeting.
The Scheme 2014
Joyoung Co., Ltd. issued a total of 6,935,000 ordinary shares to award certain eligibleparticipants. The shares were granted on September 1, 2014 upon payment of a grant price at RMB4.42per share by the grantees. Eligible participants of the Schemes include 111 directors and employees ofJoyoung Co., Ltd..
40% of the RSS shall vest after the 12-month locked-in period, on the condition that JoyoungCo., Ltd. achieving a 10% growth of revenue and a 6% growth of profit in 2014 compared with year2013. 24 months after the grant date, a further 30% of the RSS shall vest if Joyoung Co., Ltd.completes a 10% growth of revenue and a 15% growth of profit in 2015 compared with year 2013. Thefinal 30% of the RSS shall vest 36 months after the grant, upon meeting the performance goals of a10% revenue increase and a 25% profit in 2016 compared with year 2013. The conditions were all metfrom 2014 to 2016. The RSS expired 48 months after the grant date.
The other arrangements are identical with the Scheme 2017.
I-99
APPENDIX I ACCOUNTANTS’ REPORT
II NOTES TO THE HISTORICAL FINANCIAL INFORMATION—continued
33. SHARE-BASED PAYMENTS—continued
Share Award Scheme of Joyoung Co., Ltd.—continued
The Scheme 2017
On operation of the Scheme 2017, Joyoung Co., Ltd. repurchased a total of 4,999,960 ordinaryshares of Joyoung Co., Ltd., listed on the Shenzhen Stock Exchange, to award certain eligibleparticipants, among which 4,800,000 shares were granted on June 8, 2018, and 199,960 shares weregranted on December 7, 2018, both upon payment of grant price at RMB1.00 per share by the grantees.Eligible participants of the Schemes include 202 directors and employees of Joyoung Co., Ltd..
For the 4,800,000 shares granted to the eligible participants as RSS on June 8, 2018, 30% of theshares shall vest after the 12-month locked-in period from the grant date, on the condition that JoyoungCo., Ltd. achieving a 6% growth of revenue and a 2% growth of profit in 2018 compared with year2017. 24 months after the grant date, a further 30% of the RSS shall vest if Joyoung Co., Ltd. achievesan 11% growth of revenue and an 8% growth of profit in 2019 compared with year 2018. The final40% of the RSS shall vest 36 months after the grant, upon meeting the performance goals of a 17%revenue increase and a 15% profit increase in 2020 compared with year 2019. The RSS expires 48months after the grant date.
For the 199,960 shares granted on December 7, 2018, 50% of the RSS shall vest after the12-month locked-in period, and the other shall vest 24 months after the grant date. Performanceconditions are the same as the above arrangement for 4,800,000 shares granted on June 8, 2018.
Before the expiration, in the case that Joyoung Co., Ltd. does not meet the performance goals,or certain eligible participants resign, the board of directors will decide to repurchase for the cancelaction of the related RSS. The repurchase price of RSS is the lowest of (i) the grant price after anadjustment of dividends; (ii) the average stock price of Joyoung Co., Ltd.’s shares for the 20 tradingdays immediately preceding the date of repurchase; and (iii) the average stock price of Joyoung Co.,Ltd.’s shares for the day immediately preceding the date of repurchase.
In the first 12-month vesting period, the RSS do not confer rights of dividends and votes to theeligible participants. After the first 12 months, the eligible participants are entitled to rights ofdividends only.
I-100
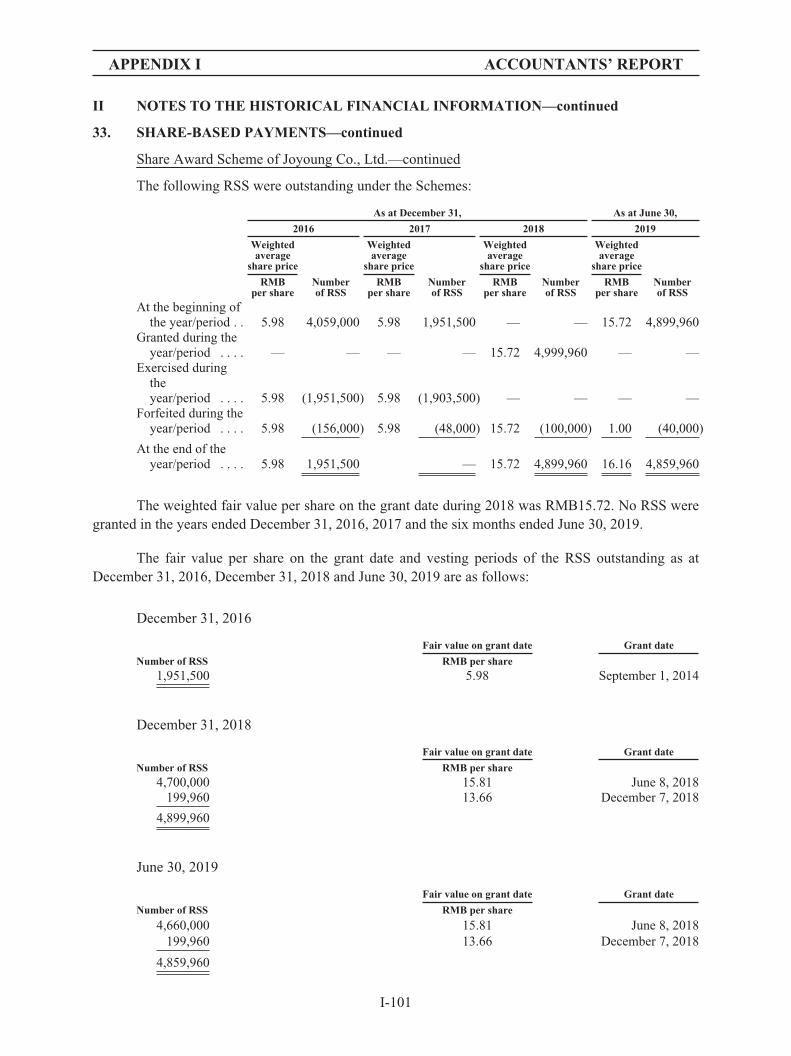
APPENDIX I ACCOUNTANTS’ REPORT
II NOTES TO THE HISTORICAL FINANCIAL INFORMATION—continued
33. SHARE-BASED PAYMENTS—continued
Share Award Scheme of Joyoung Co., Ltd.—continued
The following RSS were outstanding under the Schemes:
As at December 31, As at June 30,
2016 2017 2018 2019
Weightedaverage
share price
Weightedaverage
share price
Weightedaverage
share price
Weightedaverage
share price
RMB Number RMB Number RMB Number RMB Numberper share of RSS per share of RSS per share of RSS per share of RSS
At the beginning ofthe year/period . . 5.98 4,059,000 5.98 1,951,500 — — 15.72 4,899,960
Granted during theyear/period . . . . — — — — 15.72 4,999,960 — —
Exercised duringtheyear/period . . . . 5.98 (1,951,500) 5.98 (1,903,500) — — — —
Forfeited during theyear/period . . . . 5.98 (156,000) 5.98 (48,000) 15.72 (100,000) 1.00 (40,000)
At the end of theyear/period . . . . 5.98 1,951,500 — 15.72 4,899,960 16.16 4,859,960
The weighted fair value per share on the grant date during 2018 was RMB15.72. No RSS weregranted in the years ended December 31, 2016, 2017 and the six months ended June 30, 2019.
The fair value per share on the grant date and vesting periods of the RSS outstanding as atDecember 31, 2016, December 31, 2018 and June 30, 2019 are as follows:
December 31, 2016
Fair value on grant date Grant date
Number of RSS RMB per share
1,951,500 5.98 September 1, 2014
December 31, 2018
Fair value on grant date Grant date
Number of RSS RMB per share
4,700,000 15.81 June 8, 2018199,960 13.66 December 7, 2018
4,899,960
June 30, 2019
Fair value on grant date Grant date
Number of RSS RMB per share
4,660,000 15.81 June 8, 2018199,960 13.66 December 7, 2018
4,859,960
I-101
APPENDIX I ACCOUNTANTS’ REPORT
II NOTES TO THE HISTORICAL FINANCIAL INFORMATION—continued
33. SHARE-BASED PAYMENTS—continued
Share Award Scheme of Joyoung Co., Ltd.—continued
The fair value of the RSS granted during 2018 was RMB78.6 million (RMB15.72 each, totallyequivalent to US$11.9 million) and no RSS were granted during the years ended December 31, 2016,2017 and the six months ended June 30, 2019. During the years ended December 31, 2016, 2017, 2018and the six months ended June 30, 2018 and 2019, Joyoung Co., Ltd. recognized share award expensesof RMB3,470,000 (equivalent to US$522,000), RMB1,955,000 (equivalent to US$290,000),RMB25,418,000 (equivalent to US$3,846,000), RMB2,809,000 (equivalent to US$424,000) andRMB15,775,000 (equivalent to US$2,326,000), respectively.
At the date of approval of this report, Joyoung Co., Ltd. had 4,859,960 RSS outstanding underthe Scheme 2017, which represented approximately 0.62% of Joyoung Co., Ltd.’s shares in issue as atthat date.
Management Equity Incentive Plan of Compass
Compass operates a management equity incentive plan (the “Plan”) for the purpose of providingincentives and rewards to eligible participants who contribute to the success of the Group’s operations.Eligible participants of the Plan are all executives of the Euro-Pro Group. The Plan became effective onSeptember 29, 2017 and, unless otherwise canceled or amended, will be terminated after both thecompletion of an IPO and the determination of the full number of vested shares in accordance with the Planfollowing December 31, 2021.
Compass issued Profit Interests (“PI”) shares which do not confer rights on the holders to vote atshareholders’ meetings. Vesting of awards shall be calculated following each of Compass’ four fiscal yearsending December 31, of 2018, 2019, 2020 and 2021 respectively.
Upon the conclusion of each such fiscal year, a number of PI shares subject to each awardoutstanding shall vest with a value determined by the formula: (Audited net profit—US$53 million) x 16 x1.875% x applicable percentage, where the applicable percentage is a proportion of the number of sharesgranted to an individual employee to the total number of shares granted to all employees entitled this equityincentive plan, subject to the grantee’s continued service through the end of the applicable fiscal year. Thenumber of Class PI shares vested shall be determined by converting such value to a number of shares usingan amount equal to 16 times of the audited net profit. Awards granted are subject to performance conditionsrelating to the audited net profit of each of the fiscal years ending December 31 of 2018, 2019, 2020 and2021.
On September 29, 2017 (“First Grant Date”), a total of 2,919 PI Share awards were granted to 9eligible employees at nil consideration. The fair value of the share awards granted during the period onthe First Grant Date was US$8,210,000, of which Compass recognized share award expenses ofUS$136,000, US$1,184,000, US$657,000 and US$528,000, respectively, during the period endedDecember 31, 2017, the year ended December 31, 2018 and the six months ended June 30, 2018 and2019.
On March 30, 2018 (“Second Grant Date”) and October 15, 2018 (“Third Grant Date”),Compass granted 162 and 135 PI Share awards to 2 eligible employees at nil consideration,
I-102
APPENDIX I ACCOUNTANTS’ REPORT
II NOTES TO THE HISTORICAL FINANCIAL INFORMATION—continued
33. SHARE-BASED PAYMENTS—continued
Management Equity Incentive Plan of Compass—continued
respectively. The fair values of the share awards granted on the Second Grant Date and the Third GrantDate were US$461,000 and US$387,000, respectively. During the year ended December 31, 2018 andthe six months ended June 30, 2018 and 2019, Compass recognized share award expenses ofUS$78,000, US$39,000 and US$82,000, respectively.
As the performance conditions relating to the audited net profit of the fiscal year endedDecember 31, 2018 were not met, no share was vested in 2018.
The fair values of equity-settled share awards were estimated as at the date of grant, using aMonte-Carlo Simulation Model, taking into account the terms and conditions upon which the PI shareswere granted. The following table lists the key inputs to the model used:
2017 2018
Life of Management Equity Incentive Plan . . . . . . . . . . . . . . . . . . . . 1.25~4.25 years 0.21~3.21 years0.76~3.76 years
Annualized staff turnover rate . . . . . . . . . . . . . . . . . . . . . . . . . . . . . . 17.0% 18.0%Expected EBITDA volatility* . . . . . . . . . . . . . . . . . . . . . . . . . . . . . . 37.7% 35.2%-36.9%Discount rate (“WACC”) . . . . . . . . . . . . . . . . . . . . . . . . . . . . . . . . . . 15.5% 16.0%
Note:* The expected volatility reflects the assumption that the historical volatility is indicative of future trends, which may also not
necessarily be the actual outcome.
In 2018, 270 PI Shares were forfeited. At the date of approval of these financial statements,Compass had 2,946 PI Shares granted to eligible participants outstanding under the Plan, whichrepresented approximately 1.16% of Compass’ shares in issue as at that date.
34. RESERVES/(DEFICITS)
The amounts of the Group’s reserves/(deficits) and the movements therein for the RelevantPeriods are presented in the consolidated statements of changes in equity on pages I-9 to I-13 of theHistorical Financial Information.
Pursuant to the relevant rules and regulations in the PRC and the articles of association ofcertain PRC subsidiaries of the Group, the subsidiaries appropriate 10% of their profit after taxation tothe statutory reserve fund, until the accumulated total of the fund reaches 50% of their respectiveregistered capital.
Put option was granted to a non-controlling shareholder due to the acquisition of the Euro-ProGroup. Financial liability is recorded at the present value of the redemption amount and thecorresponding debit is made to the put option reserve and non-controlling interests on initialrecognition. Put option attributable to owners of the parent and other non-controlling interestsamounted to US$344,548,000 and US$243,168,000, respectively according to their shareholdings. Theamounts attributed to other non-controlling interests were transferred to the put option reserve upon thereorganization in June 2019. For details, refer to note II 31.
I-103

APPENDIX I ACCOUNTANTS’ REPORT
II NOTES TO THE HISTORICAL FINANCIAL INFORMATION—continued
35. NON-CONTROLLING INTERESTSYear ended December 31, Six months ended June 30,
2016 2017 2018 2018 2019
US$’000 US$’000 US$’000 US$’000 US$’000
Profit/(loss) for the year/period allocated to non-controlling interests:
Compass . . . . . . . . . . . . . . . . . . . . . . . . . . . . . — 30,042 16,593 (10,387) (7,601)Joyoung Co., Ltd. . . . . . . . . . . . . . . . . . . . . . . 68,014 64,016 64,686 33,691 29,329Shanghai Lihong . . . . . . . . . . . . . . . . . . . . . . . 2,461 (1,316) (4,039) (1,863) (2,265)
70,475 92,742 77,240 21,441 19,463
Details of the Group’s subsidiaries that have material non-controlling interests are set outbelow:
As at December 31, As at June 30,
2016 2017 2018 2019
US$’000 US$’000 US$’000 US$’000
Percentage of equity interest held by non-controllinginterests:
Compass (a) . . . . . . . . . . . . . . . . . . . . . . . . . . . . . . . . . — 58.96% 58.96% —Joyoung Co., Ltd. (b) . . . . . . . . . . . . . . . . . . . . . . . . . . 59.63% 59.63% 58.04% 41.11%
Profit/(loss) for the year/period allocated to non-controlling interests:
Compass (a) . . . . . . . . . . . . . . . . . . . . . . . . . . . . . . . . . — 30,042 16,593 ( 7,601)Joyoung Co., Ltd. (b) . . . . . . . . . . . . . . . . . . . . . . . . . . 68,014 64,016 64,686 29,329
Dividends paid to non-controlling interests:Compass (a) . . . . . . . . . . . . . . . . . . . . . . . . . . . . . . . . . — — — —Joyoung Co., Ltd. (b) . . . . . . . . . . . . . . . . . . . . . . . . . . 49,698 38,755 41,049 44,802
Accumulated balances of non-controlling interests at thereporting date:
Compass (a) . . . . . . . . . . . . . . . . . . . . . . . . . . . . . . . . . — 290,406 295,075 —Joyoung Co., Ltd. (b) . . . . . . . . . . . . . . . . . . . . . . . . . . 304,928 287,523 275,130 219,110
Notes:(a) As at June 24, 2019, the non-controlling interests of Compass became the shareholders of the Company and Compass became
a wholly-owned subsidiary of the Company after the completion of a series of share transfers arrangement.(b) As at April 16, 2019, an individual who was the sole shareholder of Bilting Developments Limited (“Bilting”), a non-
controlling interest of Joyoung Co., Ltd., entered into a share exchange arrangement with the Company. Upon the completionof the arrangement in April 2019, the individual became a shareholder of the Company and Bilting became a wholly-ownedsubsidiary of the Company. Profit for the year/period of Joyoung Co., Ltd. allocated to non-controlling interests for the yearended December 31, 2018, and the six months ended June 30, 2019, comprised amounts of US$18,868,000 and US$4,040,000allocated to Bilting prior to the reorganization.
I-104

APPENDIX I ACCOUNTANTS’ REPORT
II NOTES TO THE HISTORICAL FINANCIAL INFORMATION—continued
35. NON-CONTROLLING INTERESTS—continued
The following tables illustrate the summarized financial information of the above subsidiaries.The amounts disclosed are before any inter-company eliminations:
2016 Joyoung Co., Ltd.
US$’000
Revenue . . . . . . . . . . . . . . . . . . . . . . . . . . . . . . . . . . . . . . . . . . . . . . . . . . . . . . . . . . . . . . . 1,080,263Total expenses . . . . . . . . . . . . . . . . . . . . . . . . . . . . . . . . . . . . . . . . . . . . . . . . . . . . . . . . . . (969,838)Profit for the year . . . . . . . . . . . . . . . . . . . . . . . . . . . . . . . . . . . . . . . . . . . . . . . . . . . . . . . . 110,425Total comprehensive income for the year . . . . . . . . . . . . . . . . . . . . . . . . . . . . . . . . . . . . . 68,085
Current assets . . . . . . . . . . . . . . . . . . . . . . . . . . . . . . . . . . . . . . . . . . . . . . . . . . . . . . . . . . . 612,625Non-current assets . . . . . . . . . . . . . . . . . . . . . . . . . . . . . . . . . . . . . . . . . . . . . . . . . . . . . . . 198,774Current liabilities . . . . . . . . . . . . . . . . . . . . . . . . . . . . . . . . . . . . . . . . . . . . . . . . . . . . . . . . (299,740)Non-current liabilities . . . . . . . . . . . . . . . . . . . . . . . . . . . . . . . . . . . . . . . . . . . . . . . . . . . . (5,573)
Net cash flows from operating activities . . . . . . . . . . . . . . . . . . . . . . . . . . . . . . . . . . . . . . 151,490Net cash flows used in investing activities . . . . . . . . . . . . . . . . . . . . . . . . . . . . . . . . . . . . (73,868)Net cash flows used in financing activities . . . . . . . . . . . . . . . . . . . . . . . . . . . . . . . . . . . . (122,094)
Net decrease in cash and cash equivalents . . . . . . . . . . . . . . . . . . . . . . . . . . . . . . . . . . . . (44,472)
2017 Compass Joyoung Co., Ltd.
US$’000 US$’000
Revenue . . . . . . . . . . . . . . . . . . . . . . . . . . . . . . . . . . . . . . . . . . . . . . . . . . . . 476,608 1,053,501Total expenses . . . . . . . . . . . . . . . . . . . . . . . . . . . . . . . . . . . . . . . . . . . . . . . (427,781) (948,254)Profit for the period/year . . . . . . . . . . . . . . . . . . . . . . . . . . . . . . . . . . . . . . . 48,827 105,247Total comprehensive income for the period/year . . . . . . . . . . . . . . . . . . . . . 48,982 144,327
Current assets . . . . . . . . . . . . . . . . . . . . . . . . . . . . . . . . . . . . . . . . . . . . . . . . 641,558 600,022Non-current assets . . . . . . . . . . . . . . . . . . . . . . . . . . . . . . . . . . . . . . . . . . . . 1,577,214 210,984Current liabilities . . . . . . . . . . . . . . . . . . . . . . . . . . . . . . . . . . . . . . . . . . . . . (363,570) (257,722)Non-current liabilities . . . . . . . . . . . . . . . . . . . . . . . . . . . . . . . . . . . . . . . . . (1,555,457) (2,634)
Net cash flows from operating activities . . . . . . . . . . . . . . . . . . . . . . . . . . . 35,602 7,244Net cash flows from/(used in) investing activities . . . . . . . . . . . . . . . . . . . . (1,311,837) 102,791Net cash flows from/(used in) financing activities . . . . . . . . . . . . . . . . . . . 1,305,558 (115,933)
Net increase/(decrease) in cash and cash equivalents . . . . . . . . . . . . . . . . . 29,323 (5,898)
2018 Compass Joyoung Co., Ltd.
US$’000 US$’000
Revenue . . . . . . . . . . . . . . . . . . . . . . . . . . . . . . . . . . . . . . . . . . . . . . . . . . . . 1,480,920 1,210,070Total expenses . . . . . . . . . . . . . . . . . . . . . . . . . . . . . . . . . . . . . . . . . . . . . . . (1,461,374) (1,095,345)Profit for the year . . . . . . . . . . . . . . . . . . . . . . . . . . . . . . . . . . . . . . . . . . . . . 19,546 114,725Total comprehensive income for the year . . . . . . . . . . . . . . . . . . . . . . . . . . 16,805 88,561
Current assets . . . . . . . . . . . . . . . . . . . . . . . . . . . . . . . . . . . . . . . . . . . . . . . . 701,640 755,717Non-current assets . . . . . . . . . . . . . . . . . . . . . . . . . . . . . . . . . . . . . . . . . . . . 1,590,228 203,354Current liabilities . . . . . . . . . . . . . . . . . . . . . . . . . . . . . . . . . . . . . . . . . . . . . (420,384) (399,893)Non-current liabilities . . . . . . . . . . . . . . . . . . . . . . . . . . . . . . . . . . . . . . . . . (1,553,673) (1,332)
Net cash flows from operating activities . . . . . . . . . . . . . . . . . . . . . . . . . . . 134,860 61,745Net cash flows (used in)/from investing activities . . . . . . . . . . . . . . . . . . . . (72,601) 51,609Net cash flows used in financing activities . . . . . . . . . . . . . . . . . . . . . . . . . (68,967) (77,976)
Net (decrease)/increase in cash and cash equivalents . . . . . . . . . . . . . . . . . (6,708) 35,378
I-105
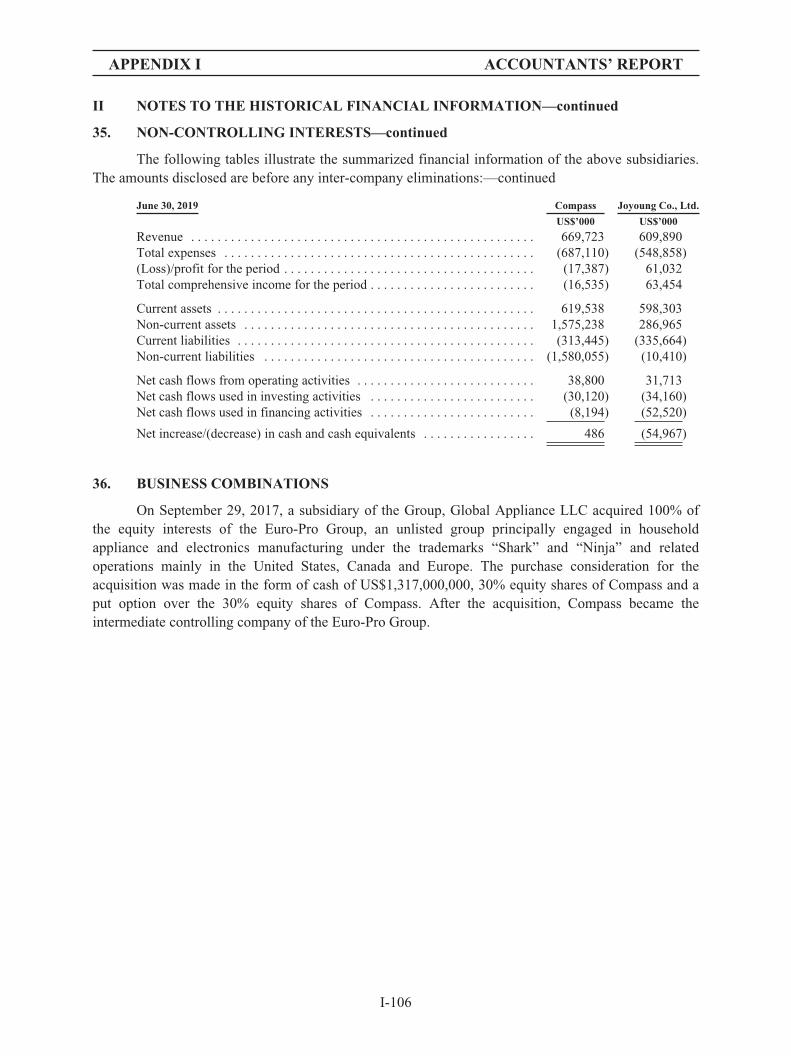
APPENDIX I ACCOUNTANTS’ REPORT
II NOTES TO THE HISTORICAL FINANCIAL INFORMATION—continued
35. NON-CONTROLLING INTERESTS—continued
The following tables illustrate the summarized financial information of the above subsidiaries.The amounts disclosed are before any inter-company eliminations:—continued
June 30, 2019 Compass Joyoung Co., Ltd.
US$’000 US$’000
Revenue . . . . . . . . . . . . . . . . . . . . . . . . . . . . . . . . . . . . . . . . . . . . . . . . . . . . 669,723 609,890Total expenses . . . . . . . . . . . . . . . . . . . . . . . . . . . . . . . . . . . . . . . . . . . . . . . (687,110) (548,858)(Loss)/profit for the period . . . . . . . . . . . . . . . . . . . . . . . . . . . . . . . . . . . . . . (17,387) 61,032Total comprehensive income for the period . . . . . . . . . . . . . . . . . . . . . . . . . (16,535) 63,454
Current assets . . . . . . . . . . . . . . . . . . . . . . . . . . . . . . . . . . . . . . . . . . . . . . . . 619,538 598,303Non-current assets . . . . . . . . . . . . . . . . . . . . . . . . . . . . . . . . . . . . . . . . . . . . 1,575,238 286,965Current liabilities . . . . . . . . . . . . . . . . . . . . . . . . . . . . . . . . . . . . . . . . . . . . . (313,445) (335,664)Non-current liabilities . . . . . . . . . . . . . . . . . . . . . . . . . . . . . . . . . . . . . . . . . (1,580,055) (10,410)
Net cash flows from operating activities . . . . . . . . . . . . . . . . . . . . . . . . . . . 38,800 31,713Net cash flows used in investing activities . . . . . . . . . . . . . . . . . . . . . . . . . (30,120) (34,160)Net cash flows used in financing activities . . . . . . . . . . . . . . . . . . . . . . . . . (8,194) (52,520)
Net increase/(decrease) in cash and cash equivalents . . . . . . . . . . . . . . . . . 486 (54,967)
36. BUSINESS COMBINATIONS
On September 29, 2017, a subsidiary of the Group, Global Appliance LLC acquired 100% ofthe equity interests of the Euro-Pro Group, an unlisted group principally engaged in householdappliance and electronics manufacturing under the trademarks “Shark” and “Ninja” and relatedoperations mainly in the United States, Canada and Europe. The purchase consideration for theacquisition was made in the form of cash of US$1,317,000,000, 30% equity shares of Compass and aput option over the 30% equity shares of Compass. After the acquisition, Compass became theintermediate controlling company of the Euro-Pro Group.
I-106
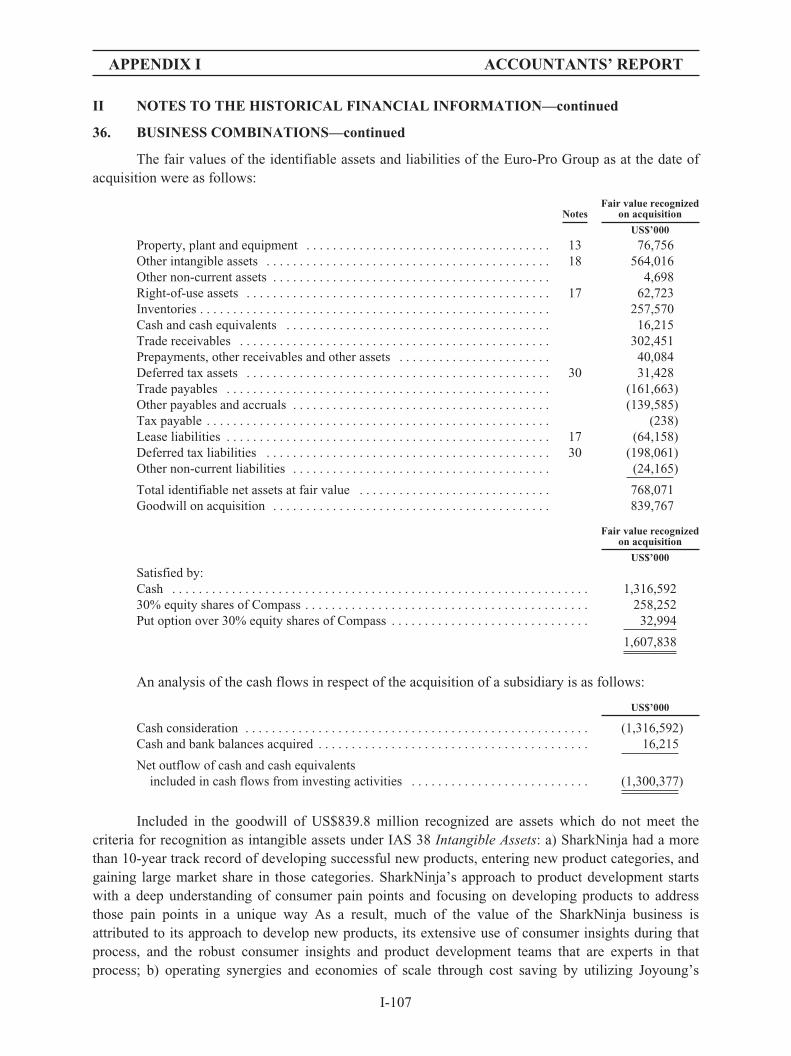
APPENDIX I ACCOUNTANTS’ REPORT
II NOTES TO THE HISTORICAL FINANCIAL INFORMATION—continued
36. BUSINESS COMBINATIONS—continued
The fair values of the identifiable assets and liabilities of the Euro-Pro Group as at the date ofacquisition were as follows:
NotesFair value recognized
on acquisition
US$’000
Property, plant and equipment . . . . . . . . . . . . . . . . . . . . . . . . . . . . . . . . . . . . . 13 76,756Other intangible assets . . . . . . . . . . . . . . . . . . . . . . . . . . . . . . . . . . . . . . . . . . . 18 564,016Other non-current assets . . . . . . . . . . . . . . . . . . . . . . . . . . . . . . . . . . . . . . . . . . 4,698Right-of-use assets . . . . . . . . . . . . . . . . . . . . . . . . . . . . . . . . . . . . . . . . . . . . . . 17 62,723Inventories . . . . . . . . . . . . . . . . . . . . . . . . . . . . . . . . . . . . . . . . . . . . . . . . . . . . . 257,570Cash and cash equivalents . . . . . . . . . . . . . . . . . . . . . . . . . . . . . . . . . . . . . . . . 16,215Trade receivables . . . . . . . . . . . . . . . . . . . . . . . . . . . . . . . . . . . . . . . . . . . . . . . 302,451Prepayments, other receivables and other assets . . . . . . . . . . . . . . . . . . . . . . . 40,084Deferred tax assets . . . . . . . . . . . . . . . . . . . . . . . . . . . . . . . . . . . . . . . . . . . . . . 30 31,428Trade payables . . . . . . . . . . . . . . . . . . . . . . . . . . . . . . . . . . . . . . . . . . . . . . . . . (161,663)Other payables and accruals . . . . . . . . . . . . . . . . . . . . . . . . . . . . . . . . . . . . . . . (139,585)Tax payable . . . . . . . . . . . . . . . . . . . . . . . . . . . . . . . . . . . . . . . . . . . . . . . . . . . . (238)Lease liabilities . . . . . . . . . . . . . . . . . . . . . . . . . . . . . . . . . . . . . . . . . . . . . . . . . 17 (64,158)Deferred tax liabilities . . . . . . . . . . . . . . . . . . . . . . . . . . . . . . . . . . . . . . . . . . . 30 (198,061)Other non-current liabilities . . . . . . . . . . . . . . . . . . . . . . . . . . . . . . . . . . . . . . . (24,165)
Total identifiable net assets at fair value . . . . . . . . . . . . . . . . . . . . . . . . . . . . . 768,071Goodwill on acquisition . . . . . . . . . . . . . . . . . . . . . . . . . . . . . . . . . . . . . . . . . . 839,767
Fair value recognizedon acquisition
US$’000
Satisfied by:Cash . . . . . . . . . . . . . . . . . . . . . . . . . . . . . . . . . . . . . . . . . . . . . . . . . . . . . . . . . . . . . . . 1,316,59230% equity shares of Compass . . . . . . . . . . . . . . . . . . . . . . . . . . . . . . . . . . . . . . . . . . . 258,252Put option over 30% equity shares of Compass . . . . . . . . . . . . . . . . . . . . . . . . . . . . . . 32,994
1,607,838
An analysis of the cash flows in respect of the acquisition of a subsidiary is as follows:
US$’000
Cash consideration . . . . . . . . . . . . . . . . . . . . . . . . . . . . . . . . . . . . . . . . . . . . . . . . . . . . (1,316,592)Cash and bank balances acquired . . . . . . . . . . . . . . . . . . . . . . . . . . . . . . . . . . . . . . . . . 16,215
Net outflow of cash and cash equivalentsincluded in cash flows from investing activities . . . . . . . . . . . . . . . . . . . . . . . . . . . (1,300,377)
Included in the goodwill of US$839.8 million recognized are assets which do not meet thecriteria for recognition as intangible assets under IAS 38 Intangible Assets: a) SharkNinja had a morethan 10-year track record of developing successful new products, entering new product categories, andgaining large market share in those categories. SharkNinja’s approach to product development startswith a deep understanding of consumer pain points and focusing on developing products to addressthose pain points in a unique way As a result, much of the value of the SharkNinja business isattributed to its approach to develop new products, its extensive use of consumer insights during thatprocess, and the robust consumer insights and product development teams that are experts in thatprocess; b) operating synergies and economies of scale through cost saving by utilizing Joyoung’s
I-107
APPENDIX I ACCOUNTANTS’ REPORT
II NOTES TO THE HISTORICAL FINANCIAL INFORMATION—continued
36. BUSINESS COMBINATIONS—continued
negotiation power to integrate both Joyoung’s and SharkNinja’s abundant resources in procurementand production in China and offer high-quality products at more competitive prices; and c) opportunityto further growth in regions other than North America with more diverse product portfolio.
The Group incurred transaction costs of US$13,339,000 for the acquisition. These transactioncosts have been expensed and are included in other expenses in the consolidated statements of profit orloss.
Since the acquisition, the Euro-Pro Group contributed US$476,608,000 to the Group’s turnoverand US$70,361,000 to the consolidated profit for the period from the acquisition date to December 31,2017.
Had the combination taken place at the beginning of the year, the revenue of the Group, thegross profit of the Group and the profit of the Group for the period from January 1, 2017 toDecember 31, 2017 would have been US$2,425,644,000, US$903,408,000 and US$165,394,000,respectively.
37. DISPOSAL OF SUBSIDIARIES
On November 29, 2017, a subsidiary of the Group, disposed of 80% share interests inHangzhou Onecup to Lcer Three Limited (a related party of the Group), at a consideration ofRMB8,500,000 (equivalent to US$1,306,000). After the disposal, Hangzhou Onecup became anassociate of the Group.
On August 25, 2018, a subsidiary of the Group, disposed of 50% share interests in HangzhouJoyoung to Ningbo Meishan Free Trade Port Area Lihao Investment Limited (寧波梅山保稅港區力豪投資有限公司) (a related party of the Group), at a consideration of RMB29,941,000 (equivalent toUS$4,354,000). After the disposal, Hangzhou Joyoung became an associate of the Group.
I-108

APPENDIX I ACCOUNTANTS’ REPORT
II NOTES TO THE HISTORICAL FINANCIAL INFORMATION—continued
37. DISPOSAL OF SUBSIDIARIES—continued
On May 31, 2018, a subsidiary of the Group, disposed of 100% share interests in SuzhouJoyoung to Well Lead Medical Co., Ltd. (廣州維力醫療器械股份有限公司) (a third party of the Group),at a consideration of RMB106,890,000 (equivalent to US$15,547,000).
Notes 2017 2018
US$’000 US$’000
Net assets disposed of:Property, plant and equipment . . . . . . . . . . . . . . . . . . . . . . . . . . . . . . . . . . . . . . 13 126 6,406Investment properties . . . . . . . . . . . . . . . . . . . . . . . . . . . . . . . . . . . . . . . . . . . . . 14 — 4,944Cash and bank balances . . . . . . . . . . . . . . . . . . . . . . . . . . . . . . . . . . . . . . . . . . . . 392 7,234Trade receivables . . . . . . . . . . . . . . . . . . . . . . . . . . . . . . . . . . . . . . . . . . . . . . . . . 107 249Prepayments, other receivables and other assets . . . . . . . . . . . . . . . . . . . . . . . . . 556 9,087Inventories . . . . . . . . . . . . . . . . . . . . . . . . . . . . . . . . . . . . . . . . . . . . . . . . . . . . . . 650 1,531Prepaid land lease payments . . . . . . . . . . . . . . . . . . . . . . . . . . . . . . . . . . . . . . . . 15 — 944Other non-current assets . . . . . . . . . . . . . . . . . . . . . . . . . . . . . . . . . . . . . . . . . . . — 5,269Deferred tax assets . . . . . . . . . . . . . . . . . . . . . . . . . . . . . . . . . . . . . . . . . . . . . . . 30 — 157Interest-bearing bank borrowings . . . . . . . . . . . . . . . . . . . . . . . . . . . . . . . . . . . . — (7,272)Trade payables . . . . . . . . . . . . . . . . . . . . . . . . . . . . . . . . . . . . . . . . . . . . . . . . . . . (996) (6,211)Other payables and accruals . . . . . . . . . . . . . . . . . . . . . . . . . . . . . . . . . . . . . . . . (828) (3,058)Tax payable . . . . . . . . . . . . . . . . . . . . . . . . . . . . . . . . . . . . . . . . . . . . . . . . . . . . . — (288)Deferred tax liabilities . . . . . . . . . . . . . . . . . . . . . . . . . . . . . . . . . . . . . . . . . . . . . 30 — (9)
7 18,983Net: net assets associated with the equity interests in non-controlling
interests . . . . . . . . . . . . . . . . . . . . . . . . . . . . . . . . . . . . . . . . . . . . . . . . . . . . . . — (6,224)
Net assets associated with the equity interests in subsidiaries . . . . . . . . . . . . . . 7 12,759
Fair value of the residual investment . . . . . . . . . . . . . . . . . . . . . . . . . . . . . . . . . 327 2,613
Gain on disposal of subsidiaries . . . . . . . . . . . . . . . . . . . . . . . . . . . . . . . . . . . . . 6 1,626 9,755
Satisfied by:Cash . . . . . . . . . . . . . . . . . . . . . . . . . . . . . . . . . . . . . . . . . . . . . . . . . . . . . . . . . . . — 15,547Other receivables . . . . . . . . . . . . . . . . . . . . . . . . . . . . . . . . . . . . . . . . . . . . . . . . . 1,306 4,354
1,306 19,901
An analysis of the net inflow/(outflow) of cash and cash equivalents in respect of the disposalof subsidiaries is as follows:
2017 2018
US$’000 US$’000
Cash consideration . . . . . . . . . . . . . . . . . . . . . . . . . . . . . . . . . . . . . . . . . . . . . . . . . . . . . — 15,547Cash and bank balances disposed of . . . . . . . . . . . . . . . . . . . . . . . . . . . . . . . . . . . . . . . . (392) (7,234)
Net inflow/(outflow) of cash and cash equivalents in respect of the disposal ofsubsidiaries . . . . . . . . . . . . . . . . . . . . . . . . . . . . . . . . . . . . . . . . . . . . . . . . . . . . . . . . . (392) 8,313
I-109
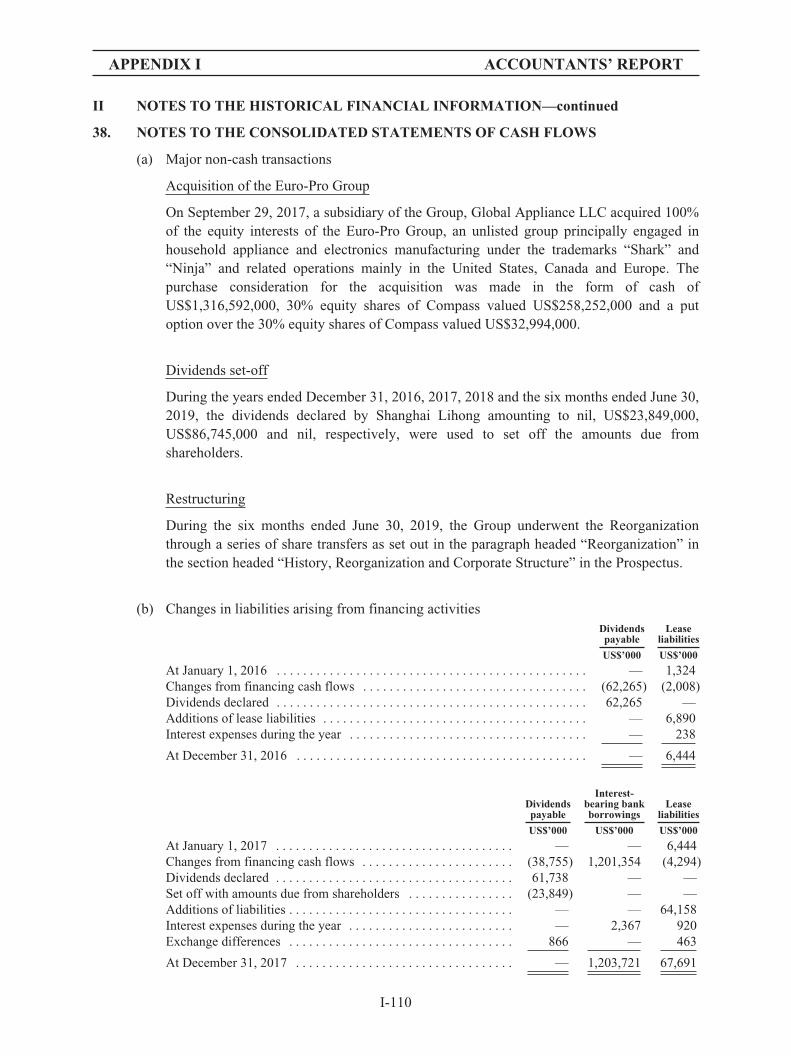
APPENDIX I ACCOUNTANTS’ REPORT
II NOTES TO THE HISTORICAL FINANCIAL INFORMATION—continued
38. NOTES TO THE CONSOLIDATED STATEMENTS OF CASH FLOWS
(a) Major non-cash transactions
Acquisition of the Euro-Pro Group
On September 29, 2017, a subsidiary of the Group, Global Appliance LLC acquired 100%of the equity interests of the Euro-Pro Group, an unlisted group principally engaged inhousehold appliance and electronics manufacturing under the trademarks “Shark” and“Ninja” and related operations mainly in the United States, Canada and Europe. Thepurchase consideration for the acquisition was made in the form of cash ofUS$1,316,592,000, 30% equity shares of Compass valued US$258,252,000 and a putoption over the 30% equity shares of Compass valued US$32,994,000.
Dividends set-off
During the years ended December 31, 2016, 2017, 2018 and the six months ended June 30,2019, the dividends declared by Shanghai Lihong amounting to nil, US$23,849,000,US$86,745,000 and nil, respectively, were used to set off the amounts due fromshareholders.
Restructuring
During the six months ended June 30, 2019, the Group underwent the Reorganizationthrough a series of share transfers as set out in the paragraph headed “Reorganization” inthe section headed “History, Reorganization and Corporate Structure” in the Prospectus.
(b) Changes in liabilities arising from financing activitiesDividendspayable
Leaseliabilities
US$’000 US$’000
At January 1, 2016 . . . . . . . . . . . . . . . . . . . . . . . . . . . . . . . . . . . . . . . . . . . . . . . — 1,324Changes from financing cash flows . . . . . . . . . . . . . . . . . . . . . . . . . . . . . . . . . . (62,265) (2,008)Dividends declared . . . . . . . . . . . . . . . . . . . . . . . . . . . . . . . . . . . . . . . . . . . . . . . 62,265 —Additions of lease liabilities . . . . . . . . . . . . . . . . . . . . . . . . . . . . . . . . . . . . . . . . — 6,890Interest expenses during the year . . . . . . . . . . . . . . . . . . . . . . . . . . . . . . . . . . . . — 238
At December 31, 2016 . . . . . . . . . . . . . . . . . . . . . . . . . . . . . . . . . . . . . . . . . . . . — 6,444
Dividendspayable
Interest-bearing bankborrowings
Leaseliabilities
US$’000 US$’000 US$’000
At January 1, 2017 . . . . . . . . . . . . . . . . . . . . . . . . . . . . . . . . . . . . — — 6,444Changes from financing cash flows . . . . . . . . . . . . . . . . . . . . . . . (38,755) 1,201,354 (4,294)Dividends declared . . . . . . . . . . . . . . . . . . . . . . . . . . . . . . . . . . . . 61,738 — —Set off with amounts due from shareholders . . . . . . . . . . . . . . . . (23,849) — —Additions of liabilities . . . . . . . . . . . . . . . . . . . . . . . . . . . . . . . . . . — — 64,158Interest expenses during the year . . . . . . . . . . . . . . . . . . . . . . . . . — 2,367 920Exchange differences . . . . . . . . . . . . . . . . . . . . . . . . . . . . . . . . . . 866 — 463
At December 31, 2017 . . . . . . . . . . . . . . . . . . . . . . . . . . . . . . . . . — 1,203,721 67,691
I-110
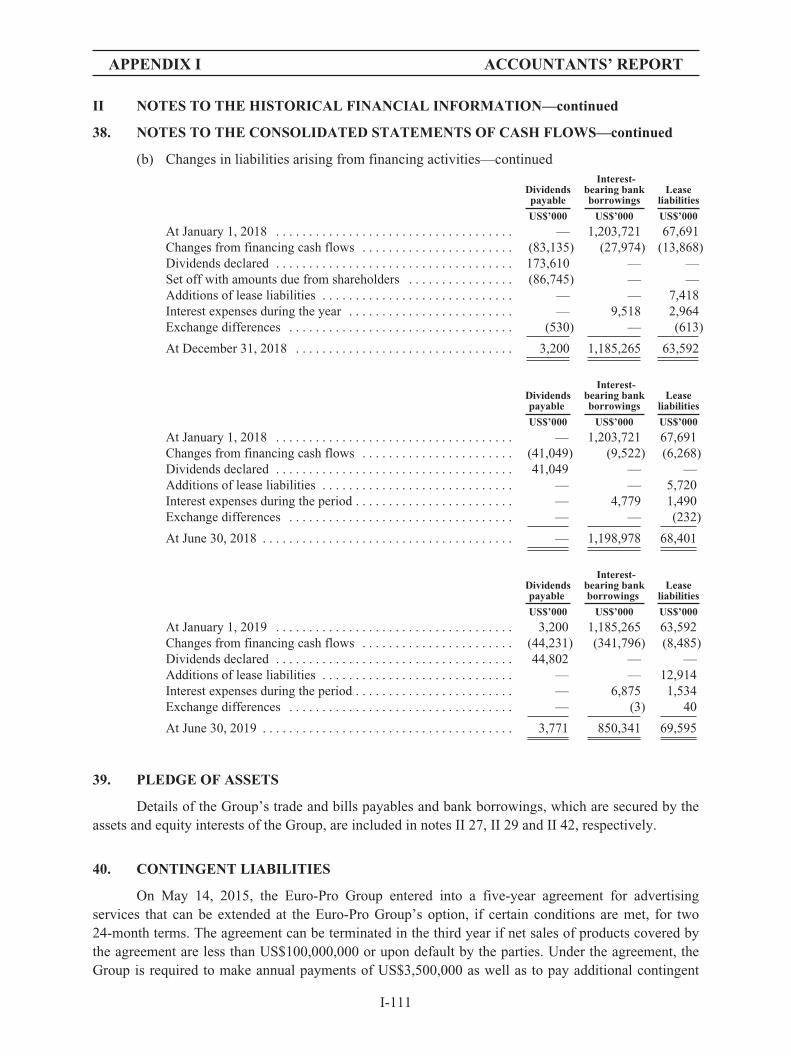
APPENDIX I ACCOUNTANTS’ REPORT
II NOTES TO THE HISTORICAL FINANCIAL INFORMATION—continued
38. NOTES TO THE CONSOLIDATED STATEMENTS OF CASH FLOWS—continued
(b) Changes in liabilities arising from financing activities—continued
Dividendspayable
Interest-bearing bankborrowings
Leaseliabilities
US$’000 US$’000 US$’000
At January 1, 2018 . . . . . . . . . . . . . . . . . . . . . . . . . . . . . . . . . . . . — 1,203,721 67,691Changes from financing cash flows . . . . . . . . . . . . . . . . . . . . . . . (83,135) (27,974) (13,868)Dividends declared . . . . . . . . . . . . . . . . . . . . . . . . . . . . . . . . . . . . 173,610 — —Set off with amounts due from shareholders . . . . . . . . . . . . . . . . (86,745) — —Additions of lease liabilities . . . . . . . . . . . . . . . . . . . . . . . . . . . . . — — 7,418Interest expenses during the year . . . . . . . . . . . . . . . . . . . . . . . . . — 9,518 2,964Exchange differences . . . . . . . . . . . . . . . . . . . . . . . . . . . . . . . . . . (530) — (613)
At December 31, 2018 . . . . . . . . . . . . . . . . . . . . . . . . . . . . . . . . . 3,200 1,185,265 63,592
Dividendspayable
Interest-bearing bankborrowings
Leaseliabilities
US$’000 US$’000 US$’000
At January 1, 2018 . . . . . . . . . . . . . . . . . . . . . . . . . . . . . . . . . . . . — 1,203,721 67,691Changes from financing cash flows . . . . . . . . . . . . . . . . . . . . . . . (41,049) (9,522) (6,268)Dividends declared . . . . . . . . . . . . . . . . . . . . . . . . . . . . . . . . . . . . 41,049 — —Additions of lease liabilities . . . . . . . . . . . . . . . . . . . . . . . . . . . . . — — 5,720Interest expenses during the period . . . . . . . . . . . . . . . . . . . . . . . . — 4,779 1,490Exchange differences . . . . . . . . . . . . . . . . . . . . . . . . . . . . . . . . . . — — (232)
At June 30, 2018 . . . . . . . . . . . . . . . . . . . . . . . . . . . . . . . . . . . . . . — 1,198,978 68,401
Dividendspayable
Interest-bearing bankborrowings
Leaseliabilities
US$’000 US$’000 US$’000
At January 1, 2019 . . . . . . . . . . . . . . . . . . . . . . . . . . . . . . . . . . . . 3,200 1,185,265 63,592Changes from financing cash flows . . . . . . . . . . . . . . . . . . . . . . . (44,231) (341,796) (8,485)Dividends declared . . . . . . . . . . . . . . . . . . . . . . . . . . . . . . . . . . . . 44,802 — —Additions of lease liabilities . . . . . . . . . . . . . . . . . . . . . . . . . . . . . — — 12,914Interest expenses during the period . . . . . . . . . . . . . . . . . . . . . . . . — 6,875 1,534Exchange differences . . . . . . . . . . . . . . . . . . . . . . . . . . . . . . . . . . — (3) 40
At June 30, 2019 . . . . . . . . . . . . . . . . . . . . . . . . . . . . . . . . . . . . . . 3,771 850,341 69,595
39. PLEDGE OF ASSETS
Details of the Group’s trade and bills payables and bank borrowings, which are secured by theassets and equity interests of the Group, are included in notes II 27, II 29 and II 42, respectively.
40. CONTINGENT LIABILITIES
On May 14, 2015, the Euro-Pro Group entered into a five-year agreement for advertisingservices that can be extended at the Euro-Pro Group’s option, if certain conditions are met, for two24-month terms. The agreement can be terminated in the third year if net sales of products covered bythe agreement are less than US$100,000,000 or upon default by the parties. Under the agreement, theGroup is required to make annual payments of US$3,500,000 as well as to pay additional contingent
I-111
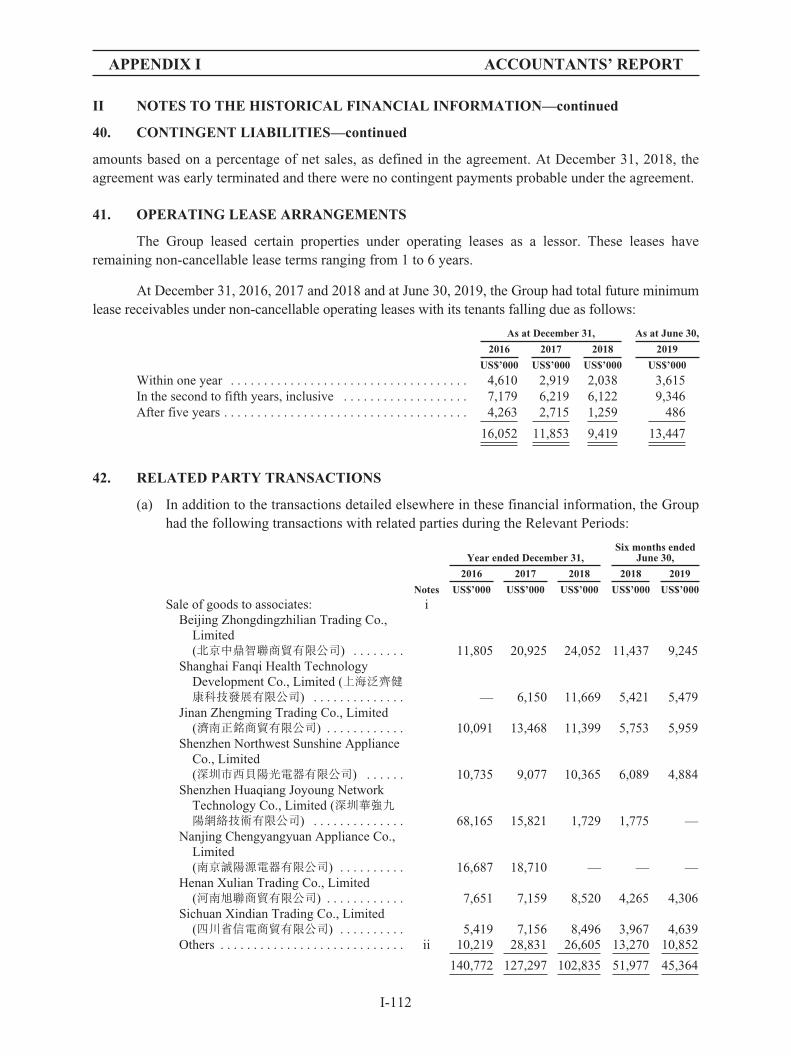
APPENDIX I ACCOUNTANTS’ REPORT
II NOTES TO THE HISTORICAL FINANCIAL INFORMATION—continued
40. CONTINGENT LIABILITIES—continued
amounts based on a percentage of net sales, as defined in the agreement. At December 31, 2018, theagreement was early terminated and there were no contingent payments probable under the agreement.
41. OPERATING LEASE ARRANGEMENTS
The Group leased certain properties under operating leases as a lessor. These leases haveremaining non-cancellable lease terms ranging from 1 to 6 years.
At December 31, 2016, 2017 and 2018 and at June 30, 2019, the Group had total future minimumlease receivables under non-cancellable operating leases with its tenants falling due as follows:
As at December 31, As at June 30,
2016 2017 2018 2019
US$’000 US$’000 US$’000 US$’000
Within one year . . . . . . . . . . . . . . . . . . . . . . . . . . . . . . . . . . . . 4,610 2,919 2,038 3,615In the second to fifth years, inclusive . . . . . . . . . . . . . . . . . . . 7,179 6,219 6,122 9,346After five years . . . . . . . . . . . . . . . . . . . . . . . . . . . . . . . . . . . . . 4,263 2,715 1,259 486
16,052 11,853 9,419 13,447
42. RELATED PARTY TRANSACTIONS
(a) In addition to the transactions detailed elsewhere in these financial information, the Grouphad the following transactions with related parties during the Relevant Periods:
Year ended December 31,Six months ended
June 30,
2016 2017 2018 2018 2019
Notes US$’000 US$’000 US$’000 US$’000 US$’000
Sale of goods to associates: iBeijing Zhongdingzhilian Trading Co.,
Limited(北京中鼎智聯商貿有限公司) . . . . . . . . 11,805 20,925 24,052 11,437 9,245
Shanghai Fanqi Health TechnologyDevelopment Co., Limited (上海泛齊健康科技發展有限公司) . . . . . . . . . . . . . . — 6,150 11,669 5,421 5,479
Jinan Zhengming Trading Co., Limited(濟南正銘商貿有限公司) . . . . . . . . . . . . 10,091 13,468 11,399 5,753 5,959
Shenzhen Northwest Sunshine ApplianceCo., Limited(深圳市西貝陽光電器有限公司) . . . . . . 10,735 9,077 10,365 6,089 4,884
Shenzhen Huaqiang Joyoung NetworkTechnology Co., Limited (深圳華強九陽網絡技術有限公司) . . . . . . . . . . . . . . 68,165 15,821 1,729 1,775 —
Nanjing Chengyangyuan Appliance Co.,Limited(南京誠陽源電器有限公司) . . . . . . . . . . 16,687 18,710 — — —
Henan Xulian Trading Co., Limited(河南旭聯商貿有限公司) . . . . . . . . . . . . 7,651 7,159 8,520 4,265 4,306
Sichuan Xindian Trading Co., Limited(四川省信電商貿有限公司) . . . . . . . . . . 5,419 7,156 8,496 3,967 4,639
Others . . . . . . . . . . . . . . . . . . . . . . . . . . . . ii 10,219 28,831 26,605 13,270 10,852
140,772 127,297 102,835 51,977 45,364
I-112
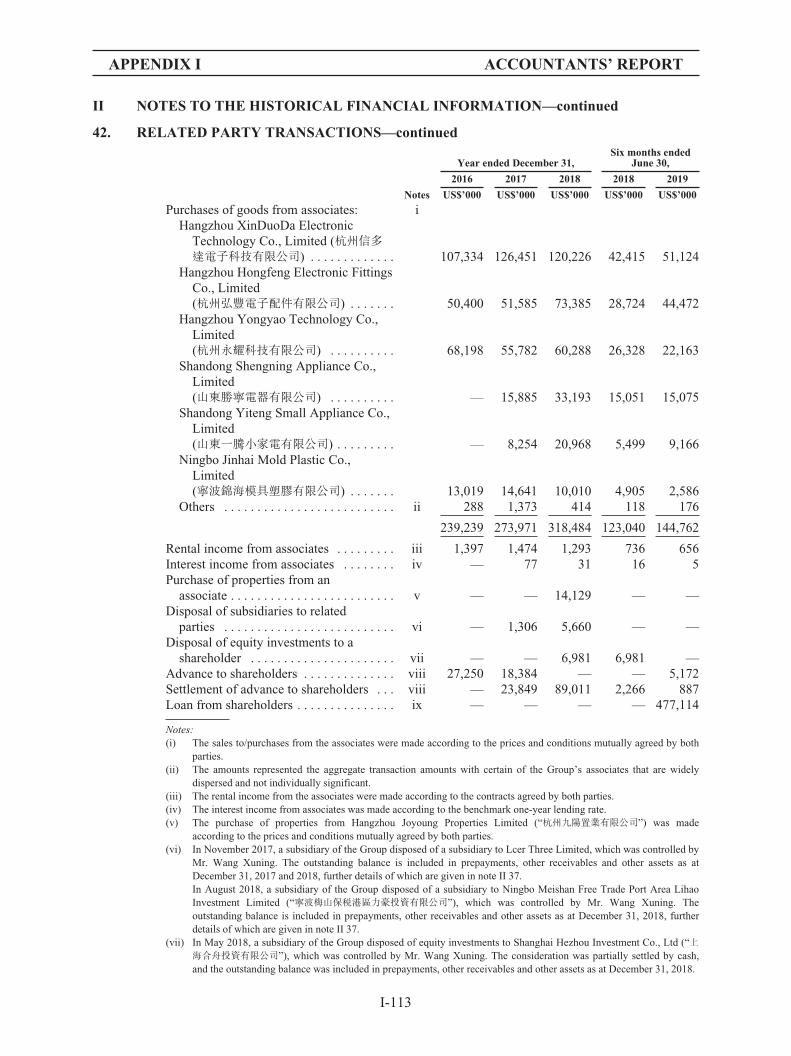
APPENDIX I ACCOUNTANTS’ REPORT
II NOTES TO THE HISTORICAL FINANCIAL INFORMATION—continued
42. RELATED PARTY TRANSACTIONS—continued
Year ended December 31,Six months ended
June 30,
2016 2017 2018 2018 2019
Notes US$’000 US$’000 US$’000 US$’000 US$’000
Purchases of goods from associates: iHangzhou XinDuoDa Electronic
Technology Co., Limited (杭州信多達電子科技有限公司) . . . . . . . . . . . . . 107,334 126,451 120,226 42,415 51,124
Hangzhou Hongfeng Electronic FittingsCo., Limited(杭州弘豐電子配件有限公司) . . . . . . . 50,400 51,585 73,385 28,724 44,472
Hangzhou Yongyao Technology Co.,Limited(杭州永耀科技有限公司) . . . . . . . . . . 68,198 55,782 60,288 26,328 22,163
Shandong Shengning Appliance Co.,Limited(山東勝寧電器有限公司) . . . . . . . . . . — 15,885 33,193 15,051 15,075
Shandong Yiteng Small Appliance Co.,Limited(山東一騰小家電有限公司) . . . . . . . . . — 8,254 20,968 5,499 9,166
Ningbo Jinhai Mold Plastic Co.,Limited(寧波錦海模具塑膠有限公司) . . . . . . . 13,019 14,641 10,010 4,905 2,586
Others . . . . . . . . . . . . . . . . . . . . . . . . . . ii 288 1,373 414 118 176
239,239 273,971 318,484 123,040 144,762
Rental income from associates . . . . . . . . . iii 1,397 1,474 1,293 736 656Interest income from associates . . . . . . . . iv — 77 31 16 5Purchase of properties from an
associate . . . . . . . . . . . . . . . . . . . . . . . . . v — — 14,129 — —Disposal of subsidiaries to related
parties . . . . . . . . . . . . . . . . . . . . . . . . . . vi — 1,306 5,660 — —Disposal of equity investments to a
shareholder . . . . . . . . . . . . . . . . . . . . . . vii — — 6,981 6,981 —Advance to shareholders . . . . . . . . . . . . . . viii 27,250 18,384 — — 5,172Settlement of advance to shareholders . . . viii — 23,849 89,011 2,266 887Loan from shareholders . . . . . . . . . . . . . . . ix — — — — 477,114
Notes:(i) The sales to/purchases from the associates were made according to the prices and conditions mutually agreed by both
parties.(ii) The amounts represented the aggregate transaction amounts with certain of the Group’s associates that are widely
dispersed and not individually significant.(iii) The rental income from the associates were made according to the contracts agreed by both parties.(iv) The interest income from associates was made according to the benchmark one-year lending rate.(v) The purchase of properties from Hangzhou Joyoung Properties Limited (“杭州九陽置業有限公司”) was made
according to the prices and conditions mutually agreed by both parties.(vi) In November 2017, a subsidiary of the Group disposed of a subsidiary to Lcer Three Limited, which was controlled by
Mr. Wang Xuning. The outstanding balance is included in prepayments, other receivables and other assets as atDecember 31, 2017 and 2018, further details of which are given in note II 37.In August 2018, a subsidiary of the Group disposed of a subsidiary to Ningbo Meishan Free Trade Port Area LihaoInvestment Limited (“寧波梅山保稅港區力豪投資有限公司”), which was controlled by Mr. Wang Xuning. Theoutstanding balance is included in prepayments, other receivables and other assets as at December 31, 2018, furtherdetails of which are given in note II 37.
(vii) In May 2018, a subsidiary of the Group disposed of equity investments to Shanghai Hezhou Investment Co., Ltd (“上海合舟投資有限公司”), which was controlled by Mr. Wang Xuning. The consideration was partially settled by cash,and the outstanding balance was included in prepayments, other receivables and other assets as at December 31, 2018.
I-113
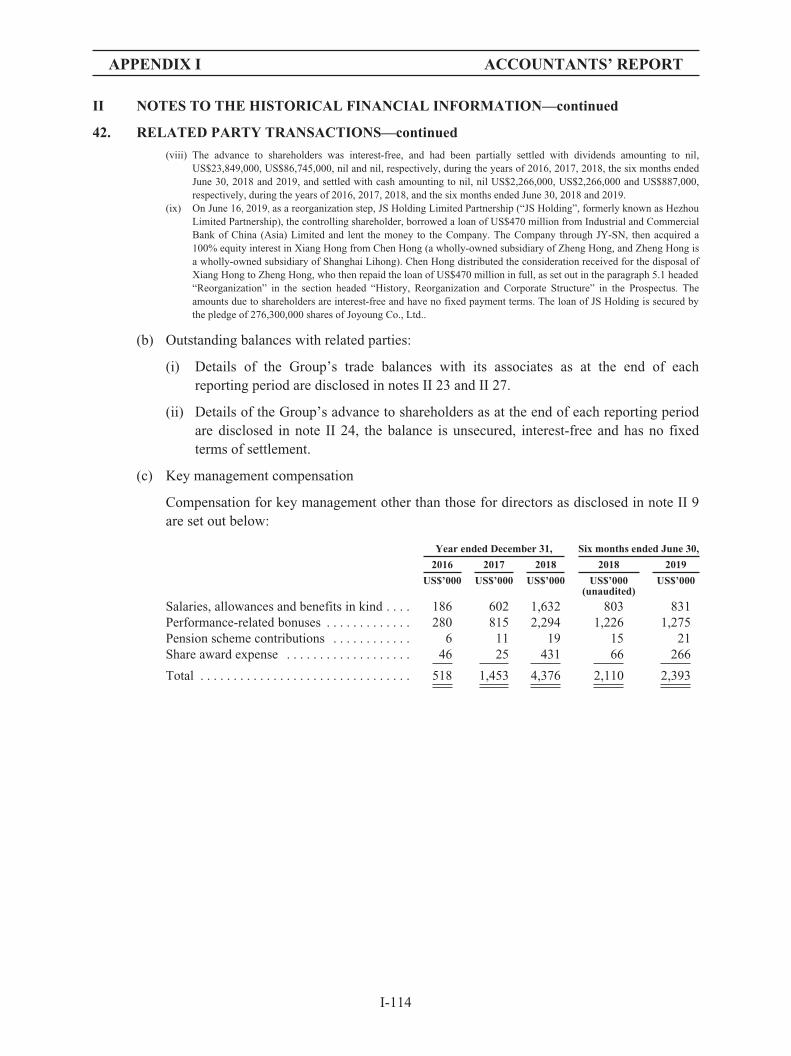
APPENDIX I ACCOUNTANTS’ REPORT
II NOTES TO THE HISTORICAL FINANCIAL INFORMATION—continued
42. RELATED PARTY TRANSACTIONS—continued
(viii) The advance to shareholders was interest-free, and had been partially settled with dividends amounting to nil,US$23,849,000, US$86,745,000, nil and nil, respectively, during the years of 2016, 2017, 2018, the six months endedJune 30, 2018 and 2019, and settled with cash amounting to nil, nil US$2,266,000, US$2,266,000 and US$887,000,respectively, during the years of 2016, 2017, 2018, and the six months ended June 30, 2018 and 2019.
(ix) On June 16, 2019, as a reorganization step, JS Holding Limited Partnership (“JS Holding”, formerly known as HezhouLimited Partnership), the controlling shareholder, borrowed a loan of US$470 million from Industrial and CommercialBank of China (Asia) Limited and lent the money to the Company. The Company through JY-SN, then acquired a100% equity interest in Xiang Hong from Chen Hong (a wholly-owned subsidiary of Zheng Hong, and Zheng Hong isa wholly-owned subsidiary of Shanghai Lihong). Chen Hong distributed the consideration received for the disposal ofXiang Hong to Zheng Hong, who then repaid the loan of US$470 million in full, as set out in the paragraph 5.1 headed“Reorganization” in the section headed “History, Reorganization and Corporate Structure” in the Prospectus. Theamounts due to shareholders are interest-free and have no fixed payment terms. The loan of JS Holding is secured bythe pledge of 276,300,000 shares of Joyoung Co., Ltd..
(b) Outstanding balances with related parties:
(i) Details of the Group’s trade balances with its associates as at the end of eachreporting period are disclosed in notes II 23 and II 27.
(ii) Details of the Group’s advance to shareholders as at the end of each reporting periodare disclosed in note II 24, the balance is unsecured, interest-free and has no fixedterms of settlement.
(c) Key management compensation
Compensation for key management other than those for directors as disclosed in note II 9are set out below:
Year ended December 31, Six months ended June 30,
2016 2017 2018 2018 2019
US$’000 US$’000 US$’000 US$’000 US$’000(unaudited)
Salaries, allowances and benefits in kind . . . . 186 602 1,632 803 831Performance-related bonuses . . . . . . . . . . . . . 280 815 2,294 1,226 1,275Pension scheme contributions . . . . . . . . . . . . 6 11 19 15 21Share award expense . . . . . . . . . . . . . . . . . . . 46 25 431 66 266
Total . . . . . . . . . . . . . . . . . . . . . . . . . . . . . . . . 518 1,453 4,376 2,110 2,393
I-114

APPENDIX I ACCOUNTANTS’ REPORT
II NOTES TO THE HISTORICAL FINANCIAL INFORMATION—continued
43. FINANCIAL INSTRUMENTS BY CATEGORY
The carrying amounts of each of the categories of financial instruments as at the end of eachreporting period are as follows:
December 31, 2016
Financial assets
Financial assetsat fair value throughother comprehensive
income
Financial assetsat fair value
through profitor loss
Financialassets at
amortizedcost Total
US$’000 US$’000 US$’000 US$’000
Financial assets at fair value through profit orloss . . . . . . . . . . . . . . . . . . . . . . . . . . . . . . . . — 209,427 — 209,427
Financial assets designated at fair valuethrough other comprehensive income . . . . . 24,164 — — 24,164
Trade and bills receivables . . . . . . . . . . . . . . . . 208,664 — 15,877 224,541Financial assets included in prepayments,
other receivables and other assets . . . . . . . . . — — 107,520 107,520Pledged deposits . . . . . . . . . . . . . . . . . . . . . . . . — — 4,974 4,974Cash and cash equivalents . . . . . . . . . . . . . . . . — — 127,220 127,220
232,828 209,427 255,591 697,846
Financial liabilitiesFinancial liabilitiesat amortized cost Total
US$’000 US$’000
Trade and bills payables . . . . . . . . . . . . . . . . . . . . . . . . . . . . . . . . . . . . . . . . . 180,647 180,647Financial liabilities included in other payables and accruals . . . . . . . . . . . . . 18,070 18,070Lease liabilities . . . . . . . . . . . . . . . . . . . . . . . . . . . . . . . . . . . . . . . . . . . . . . . . 6,444 6,444
205,161 205,161
December 31, 2017
Financial assets
Financial assetsat fair value throughother comprehensive
income
Financial assetsat fair value
through profitor loss
Financialassets
at amortizedcost Total
US$’000 US$’000 US$’000 US$’000
Financial assets at fair value through profitor loss . . . . . . . . . . . . . . . . . . . . . . . . . . . — 114,278 — 114,278
Financial assets designated at fair valuethrough other comprehensive income . . . 31,921 — — 31,921
Other non-current assets . . . . . . . . . . . . . . . — — 912 912Trade and bills receivables . . . . . . . . . . . . . 264,139 — 363,384 627,523Financial assets included in prepayments,
other receivables and other assets . . . . . . — — 143,157 143,157Pledged deposits . . . . . . . . . . . . . . . . . . . . . — — 7,080 7,080Cash and cash equivalents . . . . . . . . . . . . . — — 211,003 211,003
296,060 114,278 725,536 1,135,874
I-115

APPENDIX I ACCOUNTANTS’ REPORT
II NOTES TO THE HISTORICAL FINANCIAL INFORMATION—continued
43. FINANCIAL INSTRUMENTS BY CATEGORY—continued
The carrying amounts of each of the categories of financial instruments as at the end of eachreporting period are as follows:—continued
December 31, 2017—continued
Financial liabilities
Financial liabilitiesat fair value through
profit or lossFinancial liabilitiesat amortized cost Total
US$’000 US$’000 US$’000
Trade and bills payables . . . . . . . . . . . . . . . . . . . . . . . — 262,076 262,076Financial liabilities included in other payables and
accruals . . . . . . . . . . . . . . . . . . . . . . . . . . . . . . . . . . — 17,422 17,422Interest-bearing bank borrowings . . . . . . . . . . . . . . . . — 1,203,721 1,203,721Financial liabilities associated with put option . . . . . . 627,833 — 627,833Lease liabilities . . . . . . . . . . . . . . . . . . . . . . . . . . . . . . — 67,691 67,691
627,833 1,550,910 2,178,743
December 31, 2018
Financial assets
Financial assetsat fair value throughother comprehensive
income
Financial assetsat fair value
through profitor loss
Financialassets
at amortizedcost Total
US$’000 US$’000 US$’000 US$’000
Financial assets at fair value through profitor loss . . . . . . . . . . . . . . . . . . . . . . . . . . . — 76,647 — 76,647
Financial assets designated at fair valuethrough other comprehensive income . . . 35,643 — — 35,643
Other non-current assets . . . . . . . . . . . . . . . — — 1,145 1,145Trade and bills receivables . . . . . . . . . . . . . 349,342 — 423,318 772,660Financial assets included in prepayments,
other receivables and other assets . . . . . . — — 25,194 25,194Pledged deposits . . . . . . . . . . . . . . . . . . . . . — — 26,588 26,588Cash and cash equivalents . . . . . . . . . . . . . — — 180,872 180,872
384,985 76,647 657,117 1,118,749
Financial liabilities
Financial liabilitiesat fair value through
profit or lossFinancial liabilitiesat amortized cost Total
US$’000 US$’000 US$’000
Trade and bills payables . . . . . . . . . . . . . . . . . . . . . — 408,632 408,632Financial liabilities included in other payables and
accruals . . . . . . . . . . . . . . . . . . . . . . . . . . . . . . . . — 23,430 23,430Interest-bearing bank borrowings . . . . . . . . . . . . . . — 1,185,265 1,185,265Financial liabilities associated with put option . . . . 656,650 — 656,650Lease liabilities . . . . . . . . . . . . . . . . . . . . . . . . . . . . — 63,592 63,592
656,650 1,680,919 2,337,569
I-116
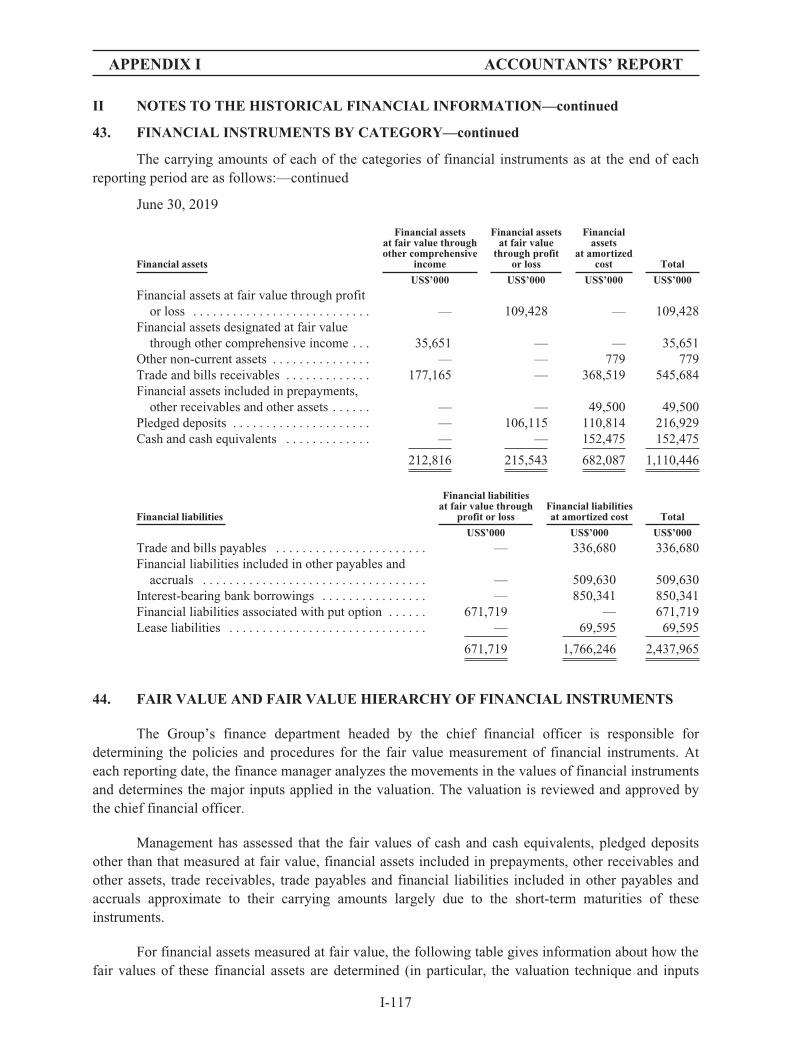
APPENDIX I ACCOUNTANTS’ REPORT
II NOTES TO THE HISTORICAL FINANCIAL INFORMATION—continued
43. FINANCIAL INSTRUMENTS BY CATEGORY—continued
The carrying amounts of each of the categories of financial instruments as at the end of eachreporting period are as follows:—continued
June 30, 2019
Financial assets
Financial assetsat fair value throughother comprehensive
income
Financial assetsat fair value
through profitor loss
Financialassets
at amortizedcost Total
US$’000 US$’000 US$’000 US$’000
Financial assets at fair value through profitor loss . . . . . . . . . . . . . . . . . . . . . . . . . . . — 109,428 — 109,428
Financial assets designated at fair valuethrough other comprehensive income . . . 35,651 — — 35,651
Other non-current assets . . . . . . . . . . . . . . . — — 779 779Trade and bills receivables . . . . . . . . . . . . . 177,165 — 368,519 545,684Financial assets included in prepayments,
other receivables and other assets . . . . . . — — 49,500 49,500Pledged deposits . . . . . . . . . . . . . . . . . . . . . — 106,115 110,814 216,929Cash and cash equivalents . . . . . . . . . . . . . — — 152,475 152,475
212,816 215,543 682,087 1,110,446
Financial liabilities
Financial liabilitiesat fair value through
profit or lossFinancial liabilitiesat amortized cost Total
US$’000 US$’000 US$’000
Trade and bills payables . . . . . . . . . . . . . . . . . . . . . . . — 336,680 336,680Financial liabilities included in other payables and
accruals . . . . . . . . . . . . . . . . . . . . . . . . . . . . . . . . . . — 509,630 509,630Interest-bearing bank borrowings . . . . . . . . . . . . . . . . — 850,341 850,341Financial liabilities associated with put option . . . . . . 671,719 — 671,719Lease liabilities . . . . . . . . . . . . . . . . . . . . . . . . . . . . . . — 69,595 69,595
671,719 1,766,246 2,437,965
44. FAIR VALUE AND FAIR VALUE HIERARCHY OF FINANCIAL INSTRUMENTS
The Group’s finance department headed by the chief financial officer is responsible fordetermining the policies and procedures for the fair value measurement of financial instruments. Ateach reporting date, the finance manager analyzes the movements in the values of financial instrumentsand determines the major inputs applied in the valuation. The valuation is reviewed and approved bythe chief financial officer.
Management has assessed that the fair values of cash and cash equivalents, pledged depositsother than that measured at fair value, financial assets included in prepayments, other receivables andother assets, trade receivables, trade payables and financial liabilities included in other payables andaccruals approximate to their carrying amounts largely due to the short-term maturities of theseinstruments.
For financial assets measured at fair value, the following table gives information about how thefair values of these financial assets are determined (in particular, the valuation technique and inputs
I-117

APPENDIX I ACCOUNTANTS’ REPORT
II NOTES TO THE HISTORICAL FINANCIAL INFORMATION—continued
44. FAIR VALUE AND FAIR VALUE HIERARCHY OF FINANCIAL INSTRUMENTS—continued
used), as well as the level of the fair value hierarchy into which the fair value measurements arecategorized (levels 1 to 3) based on the degree to which the inputs to the fair value measurements areobservable.
Level 1 — based on quoted prices (unadjusted) in active markets for identical assets orliabilities
Level 2 — based on valuation techniques for which the lowest level input that is significant tothe fair value measurement is observable, either directly or indirectly
Level 3 — based on valuation techniques for which the lowest level input that is significant tothe fair value measurement is unobservable
Bills receivables and pledged deposits measured at fair value are categorized as level 2, whilefinancial assets through profit and loss, financial assets designated at fair value through othercomprehensive income and financial liabilities associated with put option are categorized as level 3.
I-118
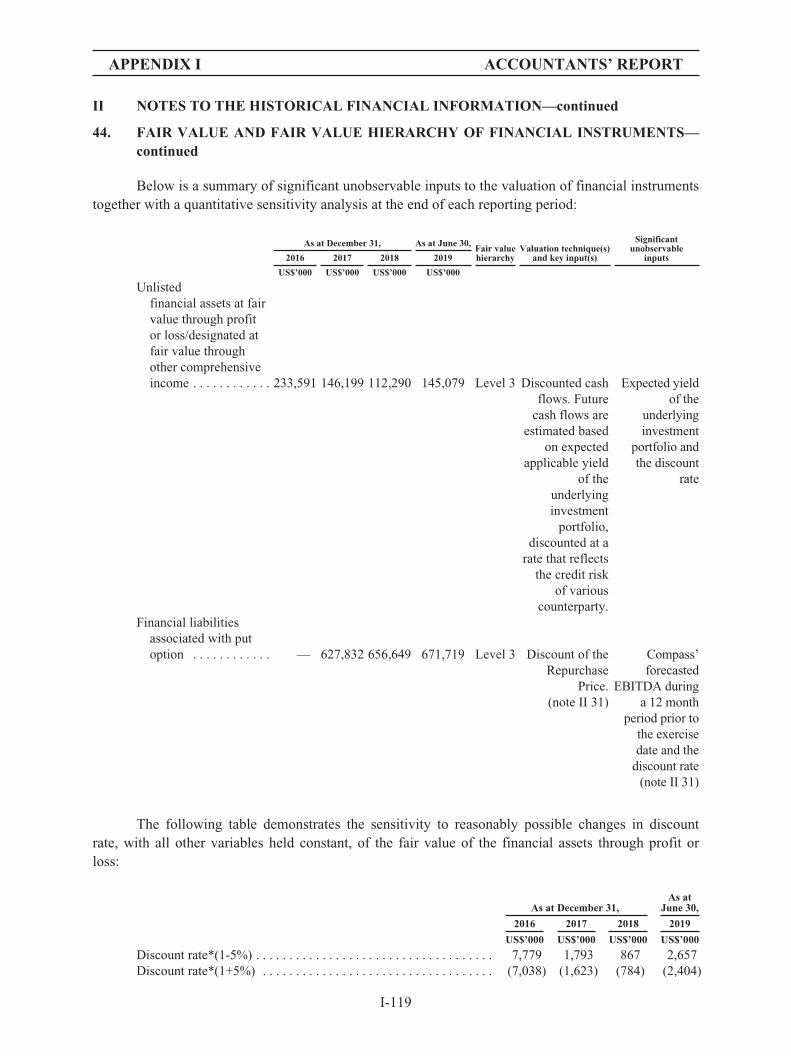
APPENDIX I ACCOUNTANTS’ REPORT
II NOTES TO THE HISTORICAL FINANCIAL INFORMATION—continued
44. FAIR VALUE AND FAIR VALUE HIERARCHY OF FINANCIAL INSTRUMENTS—continued
Below is a summary of significant unobservable inputs to the valuation of financial instrumentstogether with a quantitative sensitivity analysis at the end of each reporting period:
As at December 31, As at June 30,Fair valuehierarchy
Valuation technique(s)and key input(s)
Significantunobservable
inputs2016 2017 2018 2019
US$’000 US$’000 US$’000 US$’000
Unlistedfinancial assets at fairvalue through profitor loss/designated atfair value throughother comprehensiveincome . . . . . . . . . . . . 233,591 146,199 112,290 145,079 Level 3 Discounted cash
flows. Futurecash flows are
estimated basedon expected
applicable yieldof the
underlyinginvestment
portfolio,discounted at a
rate that reflectsthe credit risk
of variouscounterparty.
Expected yieldof the
underlyinginvestment
portfolio andthe discount
rate
Financial liabilitiesassociated with putoption . . . . . . . . . . . . — 627,832 656,649 671,719 Level 3 Discount of the
RepurchasePrice.
(note II 31)
Compass’forecasted
EBITDA duringa 12 month
period prior tothe exercisedate and the
discount rate(note II 31)
The following table demonstrates the sensitivity to reasonably possible changes in discountrate, with all other variables held constant, of the fair value of the financial assets through profit orloss:
As at December 31,As at
June 30,
2016 2017 2018 2019
US$’000 US$’000 US$’000 US$’000
Discount rate*(1-5%) . . . . . . . . . . . . . . . . . . . . . . . . . . . . . . . . . . . . 7,779 1,793 867 2,657Discount rate*(1+5%) . . . . . . . . . . . . . . . . . . . . . . . . . . . . . . . . . . . (7,038) (1,623) (784) (2,404)
I-119

APPENDIX I ACCOUNTANTS’ REPORT
II NOTES TO THE HISTORICAL FINANCIAL INFORMATION—continued
44. FAIR VALUE AND FAIR VALUE HIERARCHY OF FINANCIAL INSTRUMENTS—continued
The following table demonstrates the sensitivity to reasonably possible changes in discountrate, with all other variables held constant, of the fair value of the financial assets designated at fairvalue through other comprehensive income:
As at December 31,As at
June 30,
2016 2017 2018 2019
US$’000 US$’000 US$’000 US$’000
Discount rate*(1-5%) . . . . . . . . . . . . . . . . . . . . . . . . . . . . . . . . . . . . 5,018 4,737 4,254 4,254Discount rate*(1+5%) . . . . . . . . . . . . . . . . . . . . . . . . . . . . . . . . . . . (4,542) (4,269) (3,907) (3,907)
The following table demonstrates the sensitivity to reasonably possible changes in discount rateand the repurchase price as at September 30, 2020, with all other variables held constant, of the fairvalue of the financial liabilities associated with put option.
As at December 31,As at
June 30,
2017 2018 2019
US$’000 US$’000 US$’000
Discount rate*(1-5%) . . . . . . . . . . . . . . . . . . . . . . . . . . . . . . . . . . . . . . . . . . 3,804 2,529 1,850Discount rate*(1+5%) . . . . . . . . . . . . . . . . . . . . . . . . . . . . . . . . . . . . . . . . . . (3,733) (2,514) (1,841)Compass’ forecasted EBITDA during a 12-month period prior to the
exercise date*(1+3%) . . . . . . . . . . . . . . . . . . . . . . . . . . . . . . . . . . . . . . . . 18,835 19,696 20,141Compass’ forecasted EBITDA during a 12-month period prior to the
exercise date*(1-3%) . . . . . . . . . . . . . . . . . . . . . . . . . . . . . . . . . . . . . . . . . (18,835) (19,696) (20,141)
45. FINANCIAL RISK MANAGEMENT OBJECTIVES AND POLICIES
The Group’s principal financial instruments, comprise bank loans, other interest-bearing loans,financial assets at fair value through profit or loss, and cash and cash equivalents. The main purpose ofthese financial instruments is to raise finance for the Group’s operations. The Group has various otherfinancial assets and liabilities such as trade receivables, financial assets included in prepayments, otherreceivables and other assets, trade payables and financial liabilities included in other payables andaccruals, which arise directly from its operations.
The main risks arising from the Group’s financial instruments are interest rate risk, foreigncurrency risk, credit risk and liquidity risk. The board of directors reviews and agrees policies formanaging each of these risks and they are summarized below.
Interest rate risk
The Group’s exposure to the risk of changes in market interest rates relates primarily to theGroup’s long-term debt obligations with a floating interest rate.
I-120
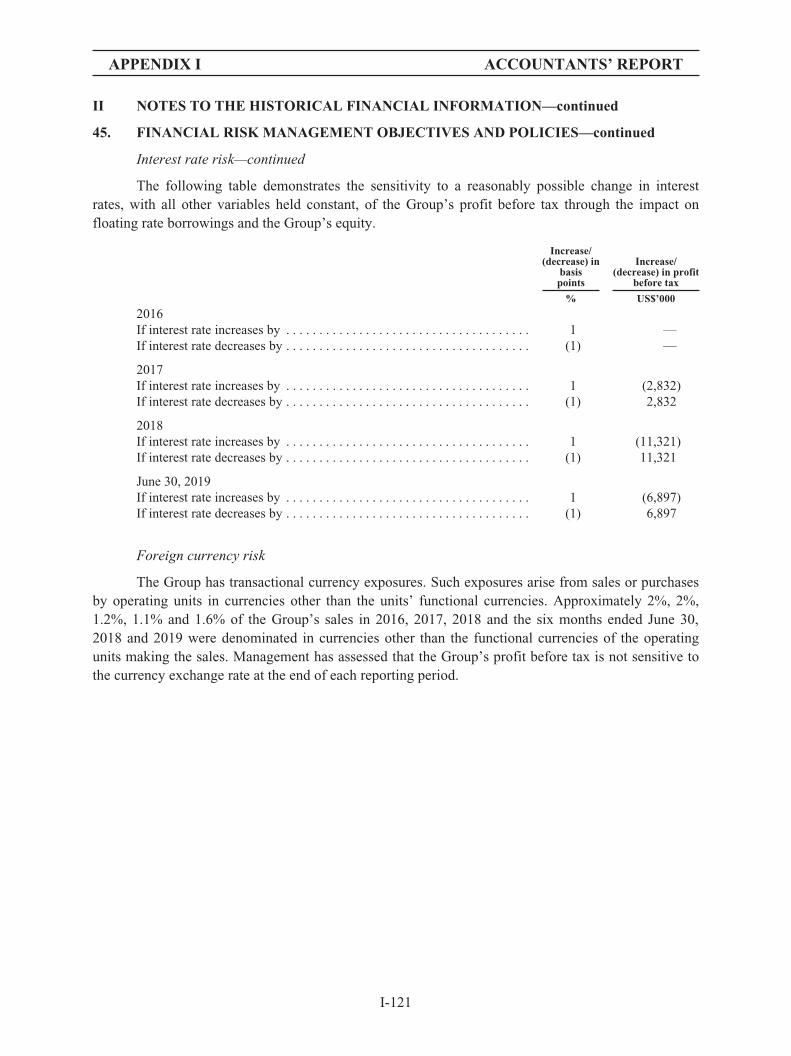
APPENDIX I ACCOUNTANTS’ REPORT
II NOTES TO THE HISTORICAL FINANCIAL INFORMATION—continued
45. FINANCIAL RISK MANAGEMENT OBJECTIVES AND POLICIES—continued
Interest rate risk—continued
The following table demonstrates the sensitivity to a reasonably possible change in interestrates, with all other variables held constant, of the Group’s profit before tax through the impact onfloating rate borrowings and the Group’s equity.
Increase/(decrease) in
basispoints
Increase/(decrease) in profit
before tax
% US$’000
2016If interest rate increases by . . . . . . . . . . . . . . . . . . . . . . . . . . . . . . . . . . . . . 1 —If interest rate decreases by . . . . . . . . . . . . . . . . . . . . . . . . . . . . . . . . . . . . . (1) —
2017If interest rate increases by . . . . . . . . . . . . . . . . . . . . . . . . . . . . . . . . . . . . . 1 (2,832)If interest rate decreases by . . . . . . . . . . . . . . . . . . . . . . . . . . . . . . . . . . . . . (1) 2,832
2018If interest rate increases by . . . . . . . . . . . . . . . . . . . . . . . . . . . . . . . . . . . . . 1 (11,321)If interest rate decreases by . . . . . . . . . . . . . . . . . . . . . . . . . . . . . . . . . . . . . (1) 11,321
June 30, 2019If interest rate increases by . . . . . . . . . . . . . . . . . . . . . . . . . . . . . . . . . . . . . 1 (6,897)If interest rate decreases by . . . . . . . . . . . . . . . . . . . . . . . . . . . . . . . . . . . . . (1) 6,897
Foreign currency risk
The Group has transactional currency exposures. Such exposures arise from sales or purchasesby operating units in currencies other than the units’ functional currencies. Approximately 2%, 2%,1.2%, 1.1% and 1.6% of the Group’s sales in 2016, 2017, 2018 and the six months ended June 30,2018 and 2019 were denominated in currencies other than the functional currencies of the operatingunits making the sales. Management has assessed that the Group’s profit before tax is not sensitive tothe currency exchange rate at the end of each reporting period.
I-121

APPENDIX I ACCOUNTANTS’ REPORT
II NOTES TO THE HISTORICAL FINANCIAL INFORMATION—continued
45. FINANCIAL RISK MANAGEMENT OBJECTIVES AND POLICIES—continued
Foreign currency risk—continued
The following table demonstrates the sensitivity at the end of each reporting period to areasonably possible change in the RMB and HK$ exchange rate of the Group’s equity due to changesin the currency translation.
Increase/(decrease) inexchange rate
Increase/(decrease) in equity*
% US$’000
December 31, 2016If US$ weakens against RMB . . . . . . . . . . . . . . . . . . . . . . . . . . . . . . . . . . . . . . . 5 18,941If US$ strengthens against RMB . . . . . . . . . . . . . . . . . . . . . . . . . . . . . . . . . . . . . (5) (18,941)If US$ weakens against HK$ . . . . . . . . . . . . . . . . . . . . . . . . . . . . . . . . . . . . . . . . 5 3If US$ strengthens against HK$ . . . . . . . . . . . . . . . . . . . . . . . . . . . . . . . . . . . . . . (5) (3)
December 31, 2017If US$ weakens against RMB . . . . . . . . . . . . . . . . . . . . . . . . . . . . . . . . . . . . . . . 5 20,072If US$ strengthens against RMB . . . . . . . . . . . . . . . . . . . . . . . . . . . . . . . . . . . . . (5) (20,072)If US$ weakens against HK$ . . . . . . . . . . . . . . . . . . . . . . . . . . . . . . . . . . . . . . . . 5 1If US$ strengthens against HK$ . . . . . . . . . . . . . . . . . . . . . . . . . . . . . . . . . . . . . . (5) (1)
December 31, 2018If US$ weakens against RMB . . . . . . . . . . . . . . . . . . . . . . . . . . . . . . . . . . . . . . . 5 13,363If US$ strengthens against RMB . . . . . . . . . . . . . . . . . . . . . . . . . . . . . . . . . . . . . (5) (13,363)If US$ weakens against HK$ . . . . . . . . . . . . . . . . . . . . . . . . . . . . . . . . . . . . . . . . 5 (6)If US$ strengthens against HK$ . . . . . . . . . . . . . . . . . . . . . . . . . . . . . . . . . . . . . . (5) 6
June 30, 2019If US$ weakens against RMB . . . . . . . . . . . . . . . . . . . . . . . . . . . . . . . . . . . . . . . 5 179If US$ strengthens against RMB . . . . . . . . . . . . . . . . . . . . . . . . . . . . . . . . . . . . . (5) (179)If US$ weakens against HK$ . . . . . . . . . . . . . . . . . . . . . . . . . . . . . . . . . . . . . . . . 5 (123)If US$ strengthens against HK$ . . . . . . . . . . . . . . . . . . . . . . . . . . . . . . . . . . . . . . (5) 123
* Excluding retained profits.
Credit risk
The Group is exposed to credit risk in relation to its trade receivables and other receivables,pledged deposits, and cash and cash equivalents.
The Group expects that there is no significant credit risk associated with pledged deposits, andcash and cash equivalents, since they are substantially deposited at state-owned banks and othermedium or large-sized listed banks. Management does not expect that there will be any significantlosses from non-performance by these counterparties.
The Group expects that the credit risk associated with trade receivables and other receivablesdue from related parties is considered to be low, since related parties have a strong capacity to meet itscontractual cash flow obligation in the near term. Thus, impairment provision was recognized duringthe Relevant Periods was nil for the trade receivables and other receivables due from related parties.
The Group trades only with recognized and creditworthy third parties. Concentrations of creditrisk are managed by analysis by customer/counterparty. There are no significant concentrations of
I-122
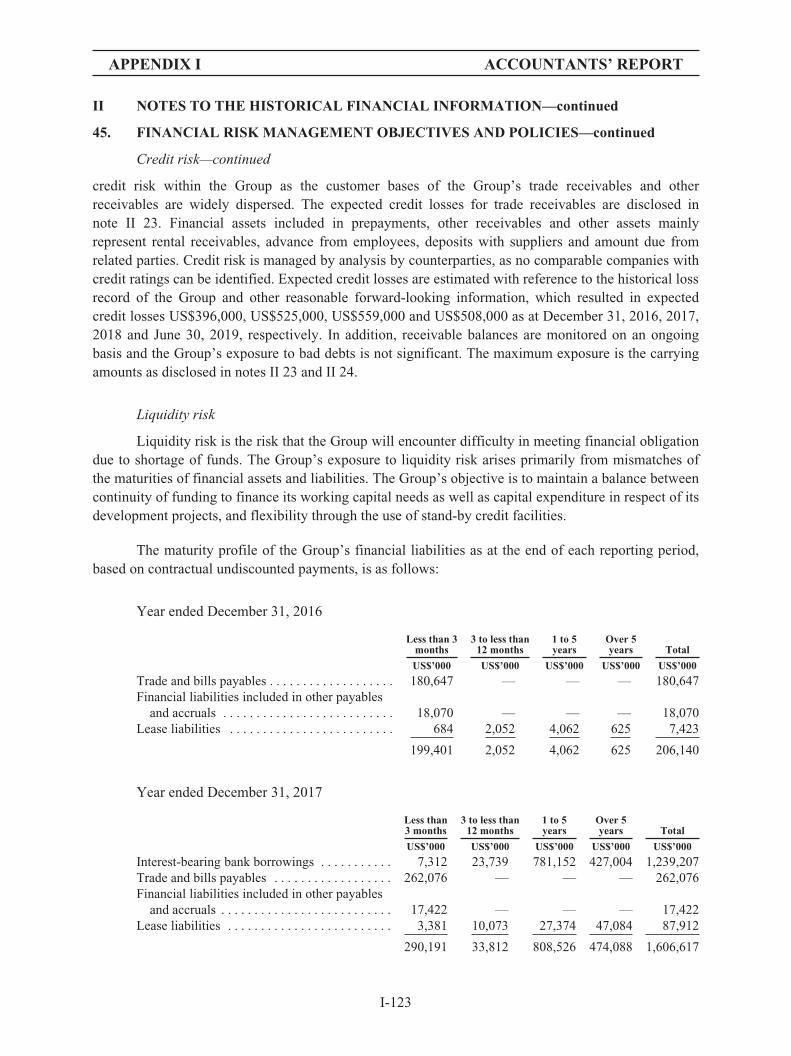
APPENDIX I ACCOUNTANTS’ REPORT
II NOTES TO THE HISTORICAL FINANCIAL INFORMATION—continued
45. FINANCIAL RISK MANAGEMENT OBJECTIVES AND POLICIES—continued
Credit risk—continued
credit risk within the Group as the customer bases of the Group’s trade receivables and otherreceivables are widely dispersed. The expected credit losses for trade receivables are disclosed innote II 23. Financial assets included in prepayments, other receivables and other assets mainlyrepresent rental receivables, advance from employees, deposits with suppliers and amount due fromrelated parties. Credit risk is managed by analysis by counterparties, as no comparable companies withcredit ratings can be identified. Expected credit losses are estimated with reference to the historical lossrecord of the Group and other reasonable forward-looking information, which resulted in expectedcredit losses US$396,000, US$525,000, US$559,000 and US$508,000 as at December 31, 2016, 2017,2018 and June 30, 2019, respectively. In addition, receivable balances are monitored on an ongoingbasis and the Group’s exposure to bad debts is not significant. The maximum exposure is the carryingamounts as disclosed in notes II 23 and II 24.
Liquidity risk
Liquidity risk is the risk that the Group will encounter difficulty in meeting financial obligationdue to shortage of funds. The Group’s exposure to liquidity risk arises primarily from mismatches ofthe maturities of financial assets and liabilities. The Group’s objective is to maintain a balance betweencontinuity of funding to finance its working capital needs as well as capital expenditure in respect of itsdevelopment projects, and flexibility through the use of stand-by credit facilities.
The maturity profile of the Group’s financial liabilities as at the end of each reporting period,based on contractual undiscounted payments, is as follows:
Year ended December 31, 2016
Less than 3months
3 to less than12 months
1 to 5years
Over 5years Total
US$’000 US$’000 US$’000 US$’000 US$’000
Trade and bills payables . . . . . . . . . . . . . . . . . . . 180,647 — — — 180,647Financial liabilities included in other payables
and accruals . . . . . . . . . . . . . . . . . . . . . . . . . . 18,070 — — — 18,070Lease liabilities . . . . . . . . . . . . . . . . . . . . . . . . . 684 2,052 4,062 625 7,423
199,401 2,052 4,062 625 206,140
Year ended December 31, 2017
Less than3 months
3 to less than12 months
1 to 5years
Over 5years Total
US$’000 US$’000 US$’000 US$’000 US$’000
Interest-bearing bank borrowings . . . . . . . . . . . 7,312 23,739 781,152 427,004 1,239,207Trade and bills payables . . . . . . . . . . . . . . . . . . 262,076 — — — 262,076Financial liabilities included in other payables
and accruals . . . . . . . . . . . . . . . . . . . . . . . . . . 17,422 — — — 17,422Lease liabilities . . . . . . . . . . . . . . . . . . . . . . . . . 3,381 10,073 27,374 47,084 87,912
290,191 33,812 808,526 474,088 1,606,617
I-123
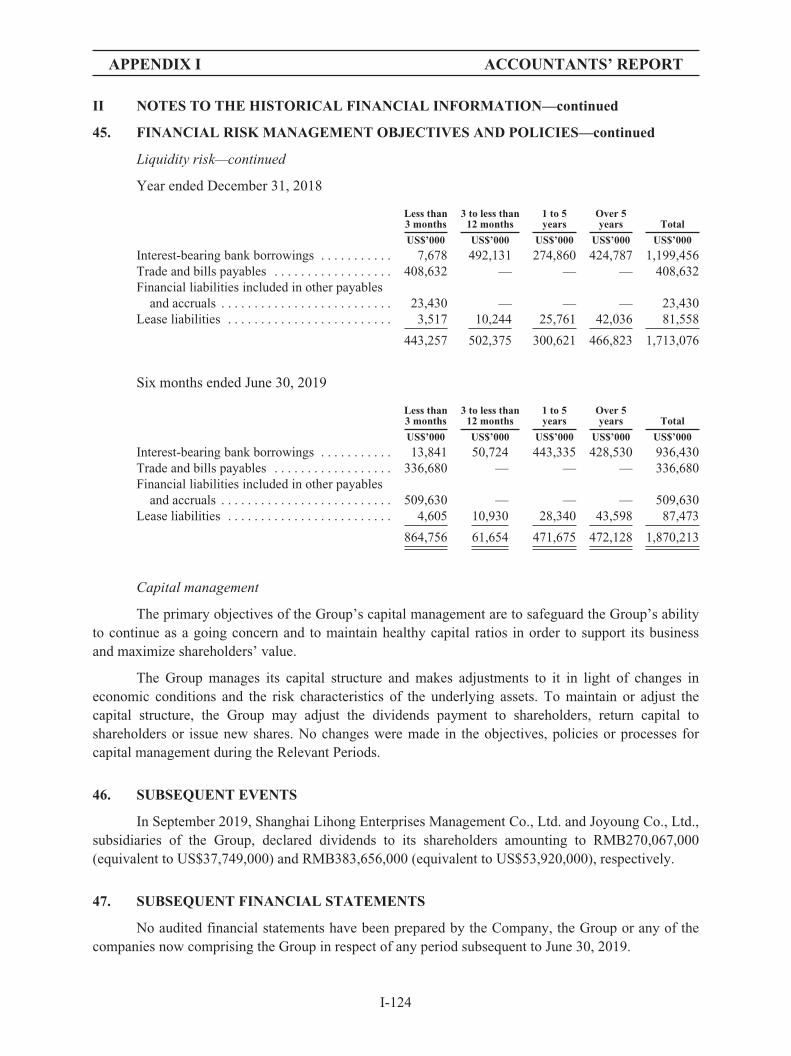
APPENDIX I ACCOUNTANTS’ REPORT
II NOTES TO THE HISTORICAL FINANCIAL INFORMATION—continued
45. FINANCIAL RISK MANAGEMENT OBJECTIVES AND POLICIES—continued
Liquidity risk—continued
Year ended December 31, 2018
Less than3 months
3 to less than12 months
1 to 5years
Over 5years Total
US$’000 US$’000 US$’000 US$’000 US$’000
Interest-bearing bank borrowings . . . . . . . . . . . 7,678 492,131 274,860 424,787 1,199,456Trade and bills payables . . . . . . . . . . . . . . . . . . 408,632 — — — 408,632Financial liabilities included in other payables
and accruals . . . . . . . . . . . . . . . . . . . . . . . . . . 23,430 — — — 23,430Lease liabilities . . . . . . . . . . . . . . . . . . . . . . . . . 3,517 10,244 25,761 42,036 81,558
443,257 502,375 300,621 466,823 1,713,076
Six months ended June 30, 2019
Less than3 months
3 to less than12 months
1 to 5years
Over 5years Total
US$’000 US$’000 US$’000 US$’000 US$’000
Interest-bearing bank borrowings . . . . . . . . . . . 13,841 50,724 443,335 428,530 936,430Trade and bills payables . . . . . . . . . . . . . . . . . . 336,680 — — — 336,680Financial liabilities included in other payables
and accruals . . . . . . . . . . . . . . . . . . . . . . . . . . 509,630 — — — 509,630Lease liabilities . . . . . . . . . . . . . . . . . . . . . . . . . 4,605 10,930 28,340 43,598 87,473
864,756 61,654 471,675 472,128 1,870,213
Capital management
The primary objectives of the Group’s capital management are to safeguard the Group’s abilityto continue as a going concern and to maintain healthy capital ratios in order to support its businessand maximize shareholders’ value.
The Group manages its capital structure and makes adjustments to it in light of changes ineconomic conditions and the risk characteristics of the underlying assets. To maintain or adjust thecapital structure, the Group may adjust the dividends payment to shareholders, return capital toshareholders or issue new shares. No changes were made in the objectives, policies or processes forcapital management during the Relevant Periods.
46. SUBSEQUENT EVENTS
In September 2019, Shanghai Lihong Enterprises Management Co., Ltd. and Joyoung Co., Ltd.,subsidiaries of the Group, declared dividends to its shareholders amounting to RMB270,067,000(equivalent to US$37,749,000) and RMB383,656,000 (equivalent to US$53,920,000), respectively.
47. SUBSEQUENT FINANCIAL STATEMENTS
No audited financial statements have been prepared by the Company, the Group or any of thecompanies now comprising the Group in respect of any period subsequent to June 30, 2019.
I-124
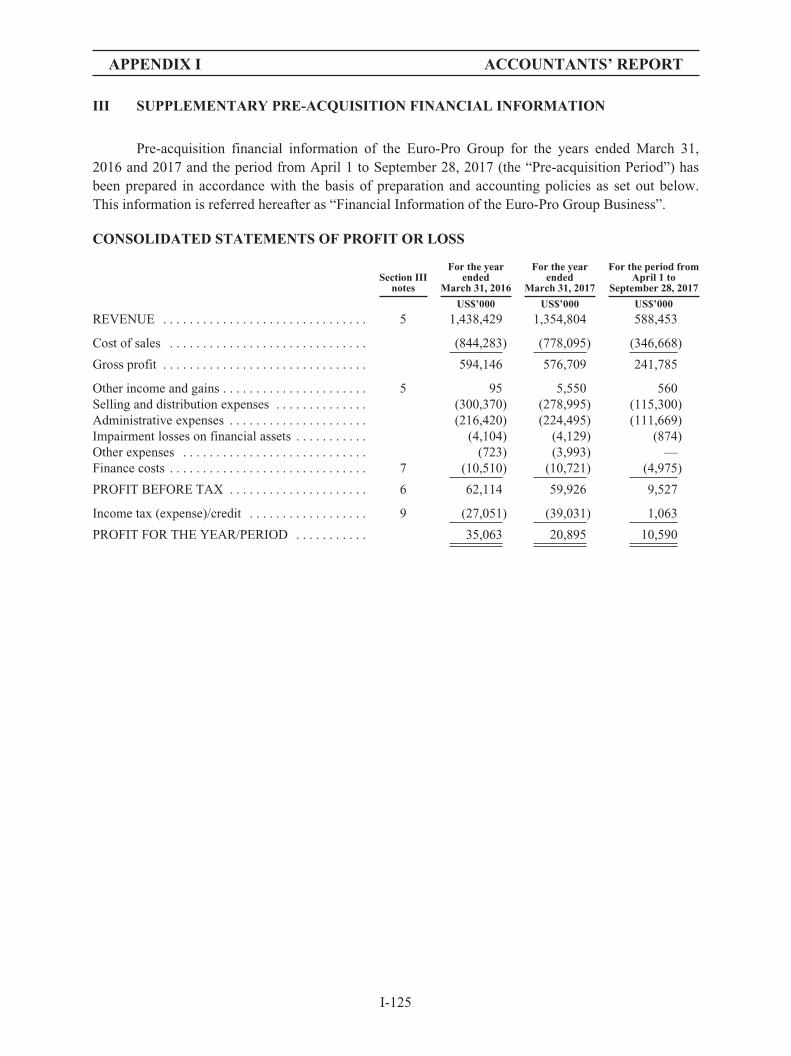
APPENDIX I ACCOUNTANTS’ REPORT
III SUPPLEMENTARY PRE-ACQUISITION FINANCIAL INFORMATION
Pre-acquisition financial information of the Euro-Pro Group for the years ended March 31,2016 and 2017 and the period from April 1 to September 28, 2017 (the “Pre-acquisition Period”) hasbeen prepared in accordance with the basis of preparation and accounting policies as set out below.This information is referred hereafter as “Financial Information of the Euro-Pro Group Business”.
CONSOLIDATED STATEMENTS OF PROFIT OR LOSS
Section IIInotes
For the yearended
March 31, 2016
For the yearended
March 31, 2017
For the period fromApril 1 to
September 28, 2017
US$’000 US$’000 US$’000
REVENUE . . . . . . . . . . . . . . . . . . . . . . . . . . . . . . . 5 1,438,429 1,354,804 588,453
Cost of sales . . . . . . . . . . . . . . . . . . . . . . . . . . . . . . (844,283) (778,095) (346,668)
Gross profit . . . . . . . . . . . . . . . . . . . . . . . . . . . . . . . 594,146 576,709 241,785
Other income and gains . . . . . . . . . . . . . . . . . . . . . . 5 95 5,550 560Selling and distribution expenses . . . . . . . . . . . . . . (300,370) (278,995) (115,300)Administrative expenses . . . . . . . . . . . . . . . . . . . . . (216,420) (224,495) (111,669)Impairment losses on financial assets . . . . . . . . . . . (4,104) (4,129) (874)Other expenses . . . . . . . . . . . . . . . . . . . . . . . . . . . . (723) (3,993) —Finance costs . . . . . . . . . . . . . . . . . . . . . . . . . . . . . . 7 (10,510) (10,721) (4,975)
PROFIT BEFORE TAX . . . . . . . . . . . . . . . . . . . . . 6 62,114 59,926 9,527
Income tax (expense)/credit . . . . . . . . . . . . . . . . . . 9 (27,051) (39,031) 1,063
PROFIT FOR THE YEAR/PERIOD . . . . . . . . . . . 35,063 20,895 10,590
I-125
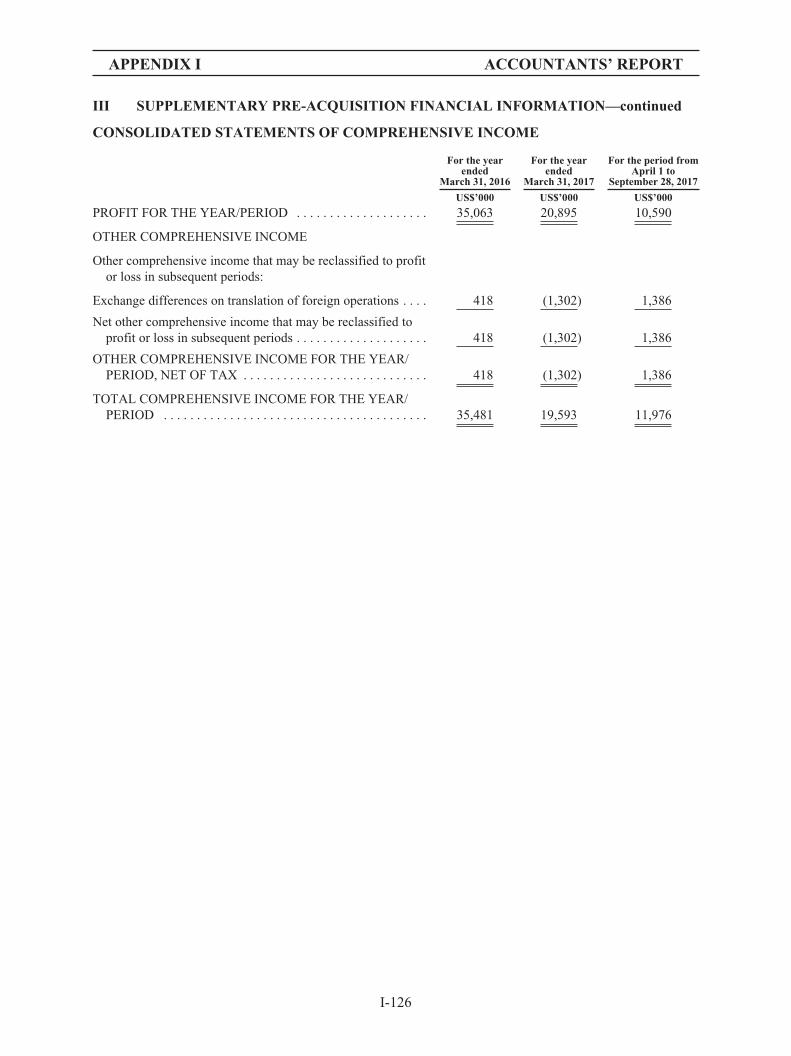
APPENDIX I ACCOUNTANTS’ REPORT
III SUPPLEMENTARY PRE-ACQUISITION FINANCIAL INFORMATION—continued
CONSOLIDATED STATEMENTS OF COMPREHENSIVE INCOME
For the yearended
March 31, 2016
For the yearended
March 31, 2017
For the period fromApril 1 to
September 28, 2017
US$’000 US$’000 US$’000
PROFIT FOR THE YEAR/PERIOD . . . . . . . . . . . . . . . . . . . . 35,063 20,895 10,590
OTHER COMPREHENSIVE INCOME
Other comprehensive income that may be reclassified to profitor loss in subsequent periods:
Exchange differences on translation of foreign operations . . . . 418 (1,302) 1,386
Net other comprehensive income that may be reclassified toprofit or loss in subsequent periods . . . . . . . . . . . . . . . . . . . . 418 (1,302) 1,386
OTHER COMPREHENSIVE INCOME FOR THE YEAR/PERIOD, NET OF TAX . . . . . . . . . . . . . . . . . . . . . . . . . . . . 418 (1,302) 1,386
TOTAL COMPREHENSIVE INCOME FOR THE YEAR/PERIOD . . . . . . . . . . . . . . . . . . . . . . . . . . . . . . . . . . . . . . . . 35,481 19,593 11,976
I-126
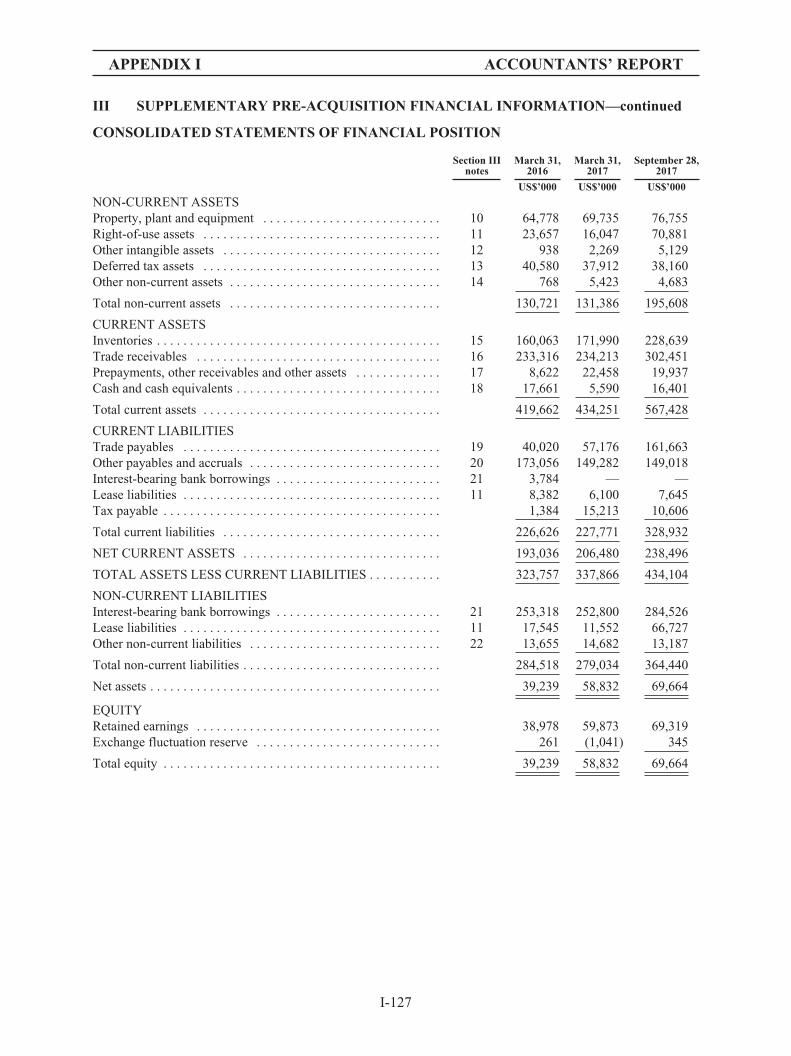
APPENDIX I ACCOUNTANTS’ REPORT
III SUPPLEMENTARY PRE-ACQUISITION FINANCIAL INFORMATION—continued
CONSOLIDATED STATEMENTS OF FINANCIAL POSITION
Section IIInotes
March 31,2016
March 31,2017
September 28,2017
US$’000 US$’000 US$’000
NON-CURRENT ASSETSProperty, plant and equipment . . . . . . . . . . . . . . . . . . . . . . . . . . . 10 64,778 69,735 76,755Right-of-use assets . . . . . . . . . . . . . . . . . . . . . . . . . . . . . . . . . . . . 11 23,657 16,047 70,881Other intangible assets . . . . . . . . . . . . . . . . . . . . . . . . . . . . . . . . . 12 938 2,269 5,129Deferred tax assets . . . . . . . . . . . . . . . . . . . . . . . . . . . . . . . . . . . . 13 40,580 37,912 38,160Other non-current assets . . . . . . . . . . . . . . . . . . . . . . . . . . . . . . . . 14 768 5,423 4,683
Total non-current assets . . . . . . . . . . . . . . . . . . . . . . . . . . . . . . . . 130,721 131,386 195,608
CURRENT ASSETSInventories . . . . . . . . . . . . . . . . . . . . . . . . . . . . . . . . . . . . . . . . . . . 15 160,063 171,990 228,639Trade receivables . . . . . . . . . . . . . . . . . . . . . . . . . . . . . . . . . . . . . 16 233,316 234,213 302,451Prepayments, other receivables and other assets . . . . . . . . . . . . . 17 8,622 22,458 19,937Cash and cash equivalents . . . . . . . . . . . . . . . . . . . . . . . . . . . . . . . 18 17,661 5,590 16,401
Total current assets . . . . . . . . . . . . . . . . . . . . . . . . . . . . . . . . . . . . 419,662 434,251 567,428
CURRENT LIABILITIESTrade payables . . . . . . . . . . . . . . . . . . . . . . . . . . . . . . . . . . . . . . . 19 40,020 57,176 161,663Other payables and accruals . . . . . . . . . . . . . . . . . . . . . . . . . . . . . 20 173,056 149,282 149,018Interest-bearing bank borrowings . . . . . . . . . . . . . . . . . . . . . . . . . 21 3,784 — —Lease liabilities . . . . . . . . . . . . . . . . . . . . . . . . . . . . . . . . . . . . . . . 11 8,382 6,100 7,645Tax payable . . . . . . . . . . . . . . . . . . . . . . . . . . . . . . . . . . . . . . . . . . 1,384 15,213 10,606
Total current liabilities . . . . . . . . . . . . . . . . . . . . . . . . . . . . . . . . . 226,626 227,771 328,932
NET CURRENT ASSETS . . . . . . . . . . . . . . . . . . . . . . . . . . . . . . 193,036 206,480 238,496
TOTAL ASSETS LESS CURRENT LIABILITIES . . . . . . . . . . . 323,757 337,866 434,104
NON-CURRENT LIABILITIESInterest-bearing bank borrowings . . . . . . . . . . . . . . . . . . . . . . . . . 21 253,318 252,800 284,526Lease liabilities . . . . . . . . . . . . . . . . . . . . . . . . . . . . . . . . . . . . . . . 11 17,545 11,552 66,727Other non-current liabilities . . . . . . . . . . . . . . . . . . . . . . . . . . . . . 22 13,655 14,682 13,187
Total non-current liabilities . . . . . . . . . . . . . . . . . . . . . . . . . . . . . . 284,518 279,034 364,440
Net assets . . . . . . . . . . . . . . . . . . . . . . . . . . . . . . . . . . . . . . . . . . . . 39,239 58,832 69,664
EQUITYRetained earnings . . . . . . . . . . . . . . . . . . . . . . . . . . . . . . . . . . . . . 38,978 59,873 69,319Exchange fluctuation reserve . . . . . . . . . . . . . . . . . . . . . . . . . . . . 261 (1,041) 345
Total equity . . . . . . . . . . . . . . . . . . . . . . . . . . . . . . . . . . . . . . . . . . 39,239 58,832 69,664
I-127
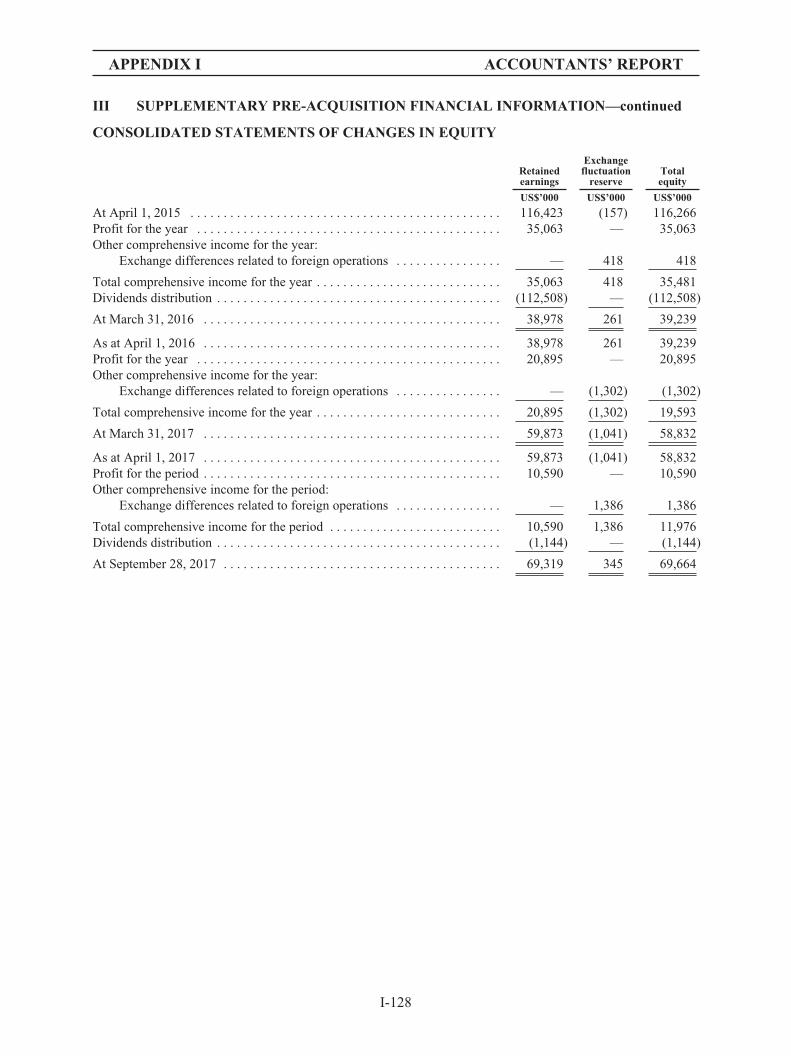
APPENDIX I ACCOUNTANTS’ REPORT
III SUPPLEMENTARY PRE-ACQUISITION FINANCIAL INFORMATION—continued
CONSOLIDATED STATEMENTS OF CHANGES IN EQUITY
Retainedearnings
Exchangefluctuation
reserveTotalequity
US$’000 US$’000 US$’000
At April 1, 2015 . . . . . . . . . . . . . . . . . . . . . . . . . . . . . . . . . . . . . . . . . . . . . . . 116,423 (157) 116,266Profit for the year . . . . . . . . . . . . . . . . . . . . . . . . . . . . . . . . . . . . . . . . . . . . . . 35,063 — 35,063Other comprehensive income for the year:
Exchange differences related to foreign operations . . . . . . . . . . . . . . . . — 418 418
Total comprehensive income for the year . . . . . . . . . . . . . . . . . . . . . . . . . . . . 35,063 418 35,481Dividends distribution . . . . . . . . . . . . . . . . . . . . . . . . . . . . . . . . . . . . . . . . . . . (112,508) — (112,508)
At March 31, 2016 . . . . . . . . . . . . . . . . . . . . . . . . . . . . . . . . . . . . . . . . . . . . . 38,978 261 39,239
As at April 1, 2016 . . . . . . . . . . . . . . . . . . . . . . . . . . . . . . . . . . . . . . . . . . . . . 38,978 261 39,239Profit for the year . . . . . . . . . . . . . . . . . . . . . . . . . . . . . . . . . . . . . . . . . . . . . . 20,895 — 20,895Other comprehensive income for the year:
Exchange differences related to foreign operations . . . . . . . . . . . . . . . . — (1,302) (1,302)
Total comprehensive income for the year . . . . . . . . . . . . . . . . . . . . . . . . . . . . 20,895 (1,302) 19,593
At March 31, 2017 . . . . . . . . . . . . . . . . . . . . . . . . . . . . . . . . . . . . . . . . . . . . . 59,873 (1,041) 58,832
As at April 1, 2017 . . . . . . . . . . . . . . . . . . . . . . . . . . . . . . . . . . . . . . . . . . . . . 59,873 (1,041) 58,832Profit for the period . . . . . . . . . . . . . . . . . . . . . . . . . . . . . . . . . . . . . . . . . . . . . 10,590 — 10,590Other comprehensive income for the period:
Exchange differences related to foreign operations . . . . . . . . . . . . . . . . — 1,386 1,386
Total comprehensive income for the period . . . . . . . . . . . . . . . . . . . . . . . . . . 10,590 1,386 11,976Dividends distribution . . . . . . . . . . . . . . . . . . . . . . . . . . . . . . . . . . . . . . . . . . . (1,144) — (1,144)
At September 28, 2017 . . . . . . . . . . . . . . . . . . . . . . . . . . . . . . . . . . . . . . . . . . 69,319 345 69,664
I-128
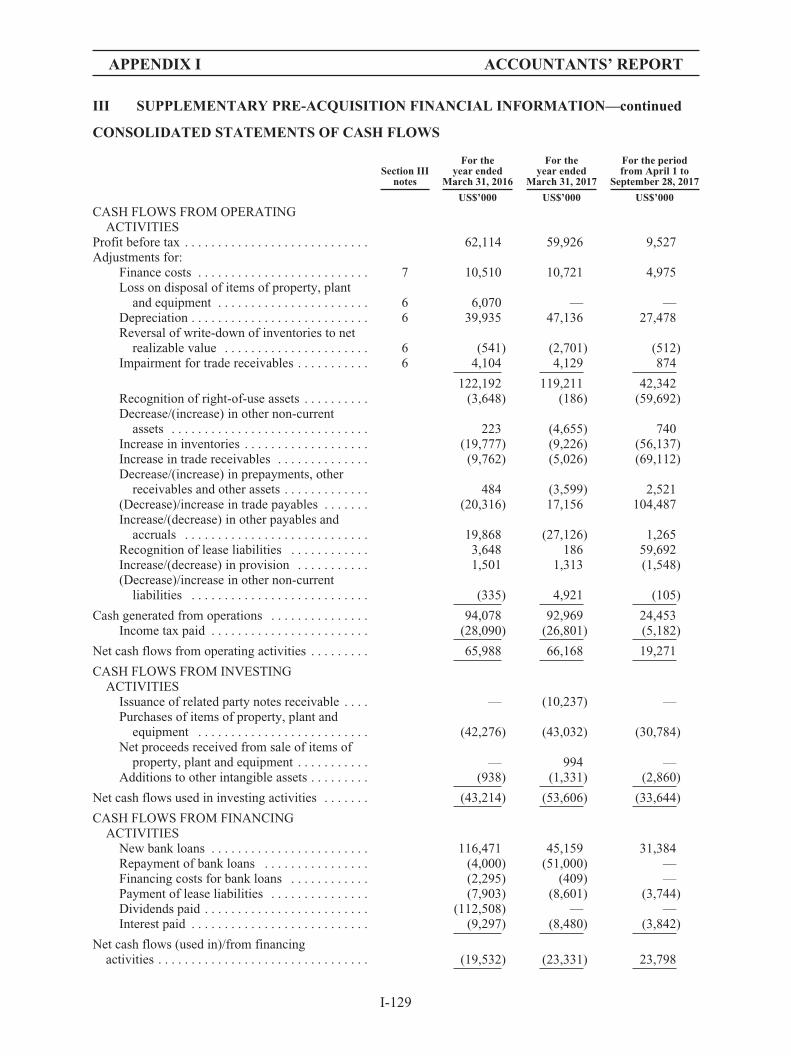
APPENDIX I ACCOUNTANTS’ REPORT
III SUPPLEMENTARY PRE-ACQUISITION FINANCIAL INFORMATION—continued
CONSOLIDATED STATEMENTS OF CASH FLOWS
Section IIInotes
For theyear ended
March 31, 2016
For theyear ended
March 31, 2017
For the periodfrom April 1 to
September 28, 2017
US$’000 US$’000 US$’000
CASH FLOWS FROM OPERATINGACTIVITIES
Profit before tax . . . . . . . . . . . . . . . . . . . . . . . . . . . . 62,114 59,926 9,527Adjustments for:
Finance costs . . . . . . . . . . . . . . . . . . . . . . . . . . 7 10,510 10,721 4,975Loss on disposal of items of property, plant
and equipment . . . . . . . . . . . . . . . . . . . . . . . 6 6,070 — —Depreciation . . . . . . . . . . . . . . . . . . . . . . . . . . . 6 39,935 47,136 27,478Reversal of write-down of inventories to net
realizable value . . . . . . . . . . . . . . . . . . . . . . 6 (541) (2,701) (512)Impairment for trade receivables . . . . . . . . . . . 6 4,104 4,129 874
122,192 119,211 42,342Recognition of right-of-use assets . . . . . . . . . . (3,648) (186) (59,692)Decrease/(increase) in other non-current
assets . . . . . . . . . . . . . . . . . . . . . . . . . . . . . . 223 (4,655) 740Increase in inventories . . . . . . . . . . . . . . . . . . . (19,777) (9,226) (56,137)Increase in trade receivables . . . . . . . . . . . . . . (9,762) (5,026) (69,112)Decrease/(increase) in prepayments, other
receivables and other assets . . . . . . . . . . . . . 484 (3,599) 2,521(Decrease)/increase in trade payables . . . . . . . (20,316) 17,156 104,487Increase/(decrease) in other payables and
accruals . . . . . . . . . . . . . . . . . . . . . . . . . . . . 19,868 (27,126) 1,265Recognition of lease liabilities . . . . . . . . . . . . 3,648 186 59,692Increase/(decrease) in provision . . . . . . . . . . . 1,501 1,313 (1,548)(Decrease)/increase in other non-current
liabilities . . . . . . . . . . . . . . . . . . . . . . . . . . . (335) 4,921 (105)
Cash generated from operations . . . . . . . . . . . . . . . 94,078 92,969 24,453Income tax paid . . . . . . . . . . . . . . . . . . . . . . . . (28,090) (26,801) (5,182)
Net cash flows from operating activities . . . . . . . . . 65,988 66,168 19,271
CASH FLOWS FROM INVESTINGACTIVITIES
Issuance of related party notes receivable . . . . — (10,237) —Purchases of items of property, plant and
equipment . . . . . . . . . . . . . . . . . . . . . . . . . . (42,276) (43,032) (30,784)Net proceeds received from sale of items of
property, plant and equipment . . . . . . . . . . . — 994 —Additions to other intangible assets . . . . . . . . . (938) (1,331) (2,860)
Net cash flows used in investing activities . . . . . . . (43,214) (53,606) (33,644)
CASH FLOWS FROM FINANCINGACTIVITIES
New bank loans . . . . . . . . . . . . . . . . . . . . . . . . 116,471 45,159 31,384Repayment of bank loans . . . . . . . . . . . . . . . . (4,000) (51,000) —Financing costs for bank loans . . . . . . . . . . . . (2,295) (409) —Payment of lease liabilities . . . . . . . . . . . . . . . (7,903) (8,601) (3,744)Dividends paid . . . . . . . . . . . . . . . . . . . . . . . . . (112,508) — —Interest paid . . . . . . . . . . . . . . . . . . . . . . . . . . . (9,297) (8,480) (3,842)
Net cash flows (used in)/from financingactivities . . . . . . . . . . . . . . . . . . . . . . . . . . . . . . . . (19,532) (23,331) 23,798
I-129
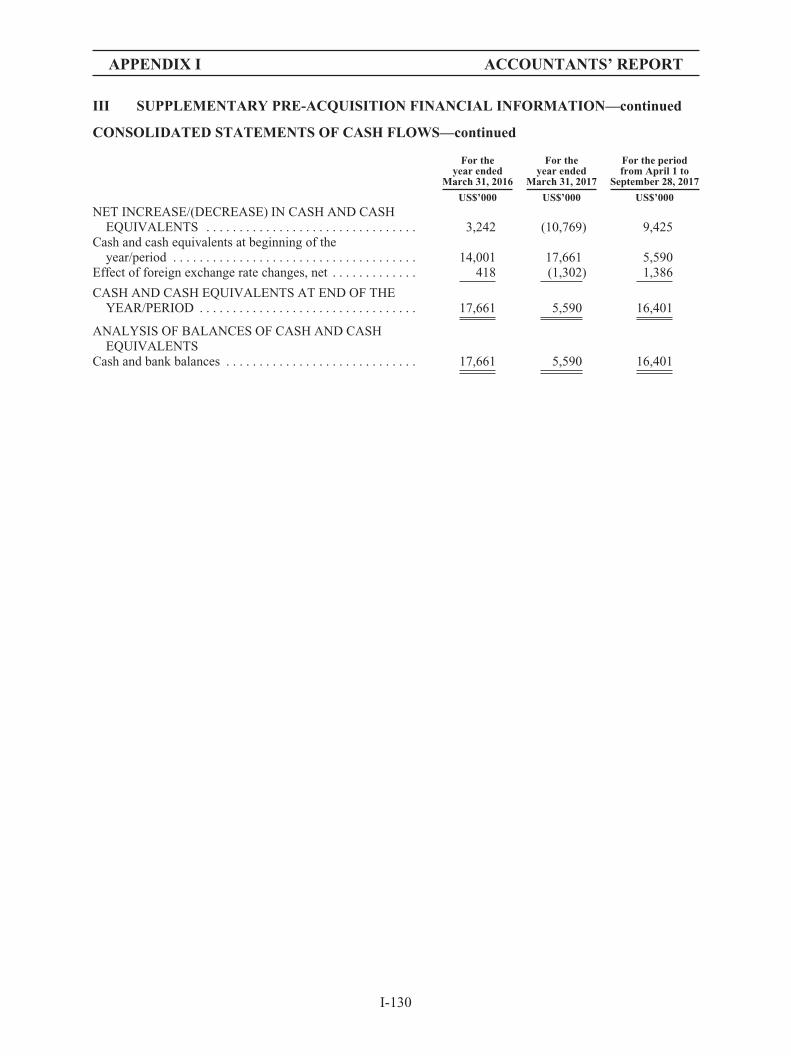
APPENDIX I ACCOUNTANTS’ REPORT
III SUPPLEMENTARY PRE-ACQUISITION FINANCIAL INFORMATION—continued
CONSOLIDATED STATEMENTS OF CASH FLOWS—continued
For theyear ended
March 31, 2016
For theyear ended
March 31, 2017
For the periodfrom April 1 to
September 28, 2017
US$’000 US$’000 US$’000
NET INCREASE/(DECREASE) IN CASH AND CASHEQUIVALENTS . . . . . . . . . . . . . . . . . . . . . . . . . . . . . . . . 3,242 (10,769) 9,425
Cash and cash equivalents at beginning of theyear/period . . . . . . . . . . . . . . . . . . . . . . . . . . . . . . . . . . . . . 14,001 17,661 5,590
Effect of foreign exchange rate changes, net . . . . . . . . . . . . . 418 (1,302) 1,386
CASH AND CASH EQUIVALENTS AT END OF THEYEAR/PERIOD . . . . . . . . . . . . . . . . . . . . . . . . . . . . . . . . . 17,661 5,590 16,401
ANALYSIS OF BALANCES OF CASH AND CASHEQUIVALENTS
Cash and bank balances . . . . . . . . . . . . . . . . . . . . . . . . . . . . . 17,661 5,590 16,401
I-130
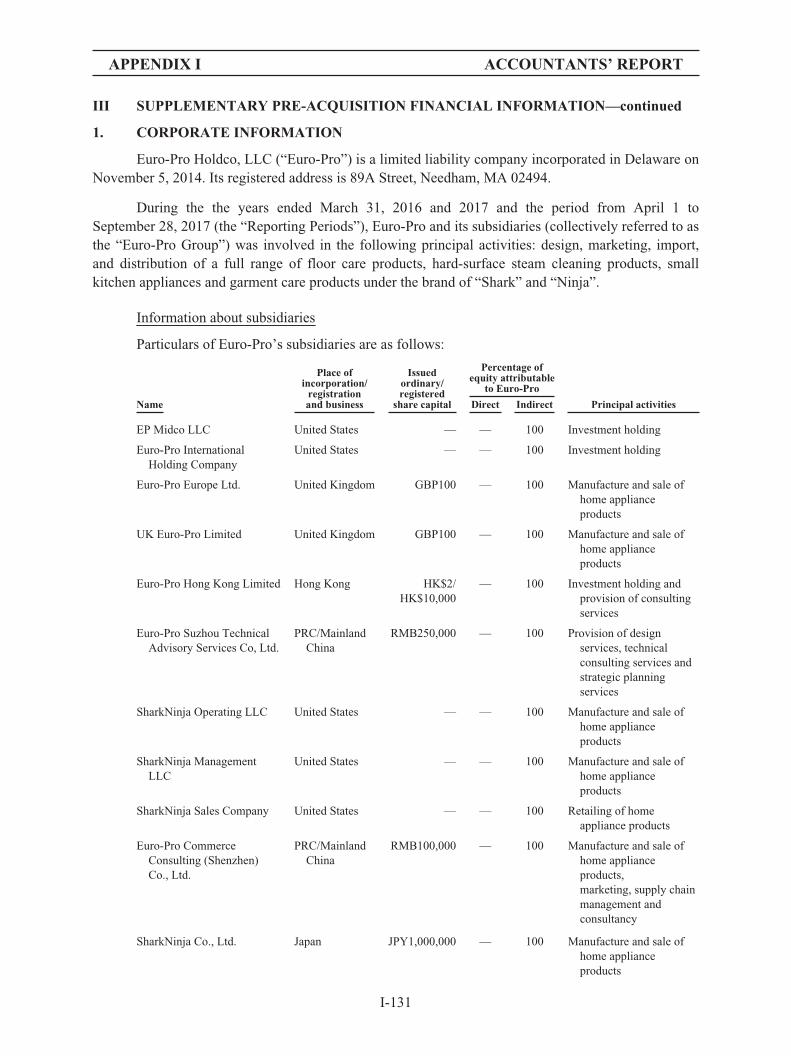
APPENDIX I ACCOUNTANTS’ REPORT
III SUPPLEMENTARY PRE-ACQUISITION FINANCIAL INFORMATION—continued
1. CORPORATE INFORMATION
Euro-Pro Holdco, LLC (“Euro-Pro”) is a limited liability company incorporated in Delaware onNovember 5, 2014. Its registered address is 89A Street, Needham, MA 02494.
During the the years ended March 31, 2016 and 2017 and the period from April 1 toSeptember 28, 2017 (the “Reporting Periods”), Euro-Pro and its subsidiaries (collectively referred to asthe “Euro-Pro Group”) was involved in the following principal activities: design, marketing, import,and distribution of a full range of floor care products, hard-surface steam cleaning products, smallkitchen appliances and garment care products under the brand of “Shark” and “Ninja”.
Information about subsidiaries
Particulars of Euro-Pro’s subsidiaries are as follows:
Name
Place ofincorporation/
registrationand business
Issuedordinary/registered
share capital
Percentage ofequity attributable
to Euro-Pro
Principal activitiesDirect Indirect
EP Midco LLC United States — — 100 Investment holding
Euro-Pro InternationalHolding Company
United States — — 100 Investment holding
Euro-Pro Europe Ltd. United Kingdom GBP100 — 100 Manufacture and sale ofhome applianceproducts
UK Euro-Pro Limited United Kingdom GBP100 — 100 Manufacture and sale ofhome applianceproducts
Euro-Pro Hong Kong Limited Hong Kong HK$2/HK$10,000
— 100 Investment holding andprovision of consultingservices
Euro-Pro Suzhou TechnicalAdvisory Services Co, Ltd.
PRC/MainlandChina
RMB250,000 — 100 Provision of designservices, technicalconsulting services andstrategic planningservices
SharkNinja Operating LLC United States — — 100 Manufacture and sale ofhome applianceproducts
SharkNinja ManagementLLC
United States — — 100 Manufacture and sale ofhome applianceproducts
SharkNinja Sales Company United States — — 100 Retailing of homeappliance products
Euro-Pro CommerceConsulting (Shenzhen)Co., Ltd.
PRC/MainlandChina
RMB100,000 — 100 Manufacture and sale ofhome applianceproducts,marketing, supply chainmanagement andconsultancy
SharkNinja Co., Ltd. Japan JPY1,000,000 — 100 Manufacture and sale ofhome applianceproducts
I-131
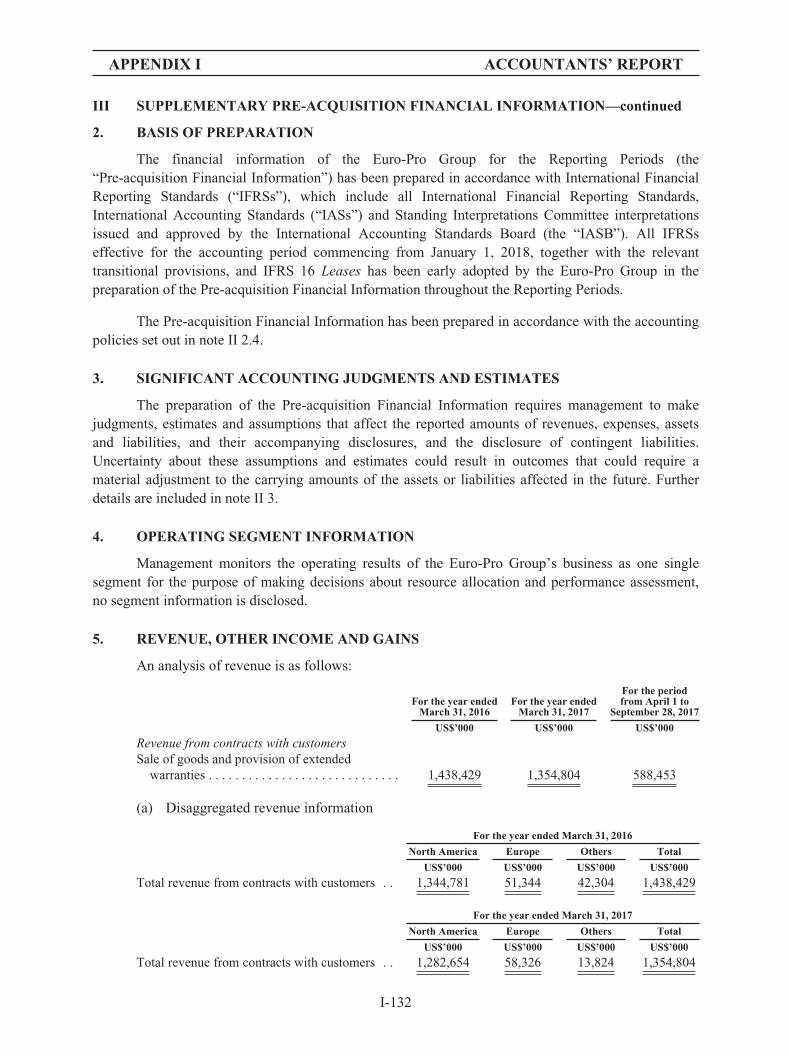
APPENDIX I ACCOUNTANTS’ REPORT
III SUPPLEMENTARY PRE-ACQUISITION FINANCIAL INFORMATION—continued
2. BASIS OF PREPARATION
The financial information of the Euro-Pro Group for the Reporting Periods (the“Pre-acquisition Financial Information”) has been prepared in accordance with International FinancialReporting Standards (“IFRSs”), which include all International Financial Reporting Standards,International Accounting Standards (“IASs”) and Standing Interpretations Committee interpretationsissued and approved by the International Accounting Standards Board (the “IASB”). All IFRSseffective for the accounting period commencing from January 1, 2018, together with the relevanttransitional provisions, and IFRS 16 Leases has been early adopted by the Euro-Pro Group in thepreparation of the Pre-acquisition Financial Information throughout the Reporting Periods.
The Pre-acquisition Financial Information has been prepared in accordance with the accountingpolicies set out in note II 2.4.
3. SIGNIFICANT ACCOUNTING JUDGMENTS AND ESTIMATES
The preparation of the Pre-acquisition Financial Information requires management to makejudgments, estimates and assumptions that affect the reported amounts of revenues, expenses, assetsand liabilities, and their accompanying disclosures, and the disclosure of contingent liabilities.Uncertainty about these assumptions and estimates could result in outcomes that could require amaterial adjustment to the carrying amounts of the assets or liabilities affected in the future. Furtherdetails are included in note II 3.
4. OPERATING SEGMENT INFORMATION
Management monitors the operating results of the Euro-Pro Group’s business as one singlesegment for the purpose of making decisions about resource allocation and performance assessment,no segment information is disclosed.
5. REVENUE, OTHER INCOME AND GAINS
An analysis of revenue is as follows:
For the year endedMarch 31, 2016
For the year endedMarch 31, 2017
For the periodfrom April 1 to
September 28, 2017
US$’000 US$’000 US$’000
Revenue from contracts with customersSale of goods and provision of extended
warranties . . . . . . . . . . . . . . . . . . . . . . . . . . . . . 1,438,429 1,354,804 588,453
(a) Disaggregated revenue information
For the year ended March 31, 2016
North America Europe Others Total
US$’000 US$’000 US$’000 US$’000
Total revenue from contracts with customers . . 1,344,781 51,344 42,304 1,438,429
For the year ended March 31, 2017
North America Europe Others Total
US$’000 US$’000 US$’000 US$’000
Total revenue from contracts with customers . . 1,282,654 58,326 13,824 1,354,804
I-132
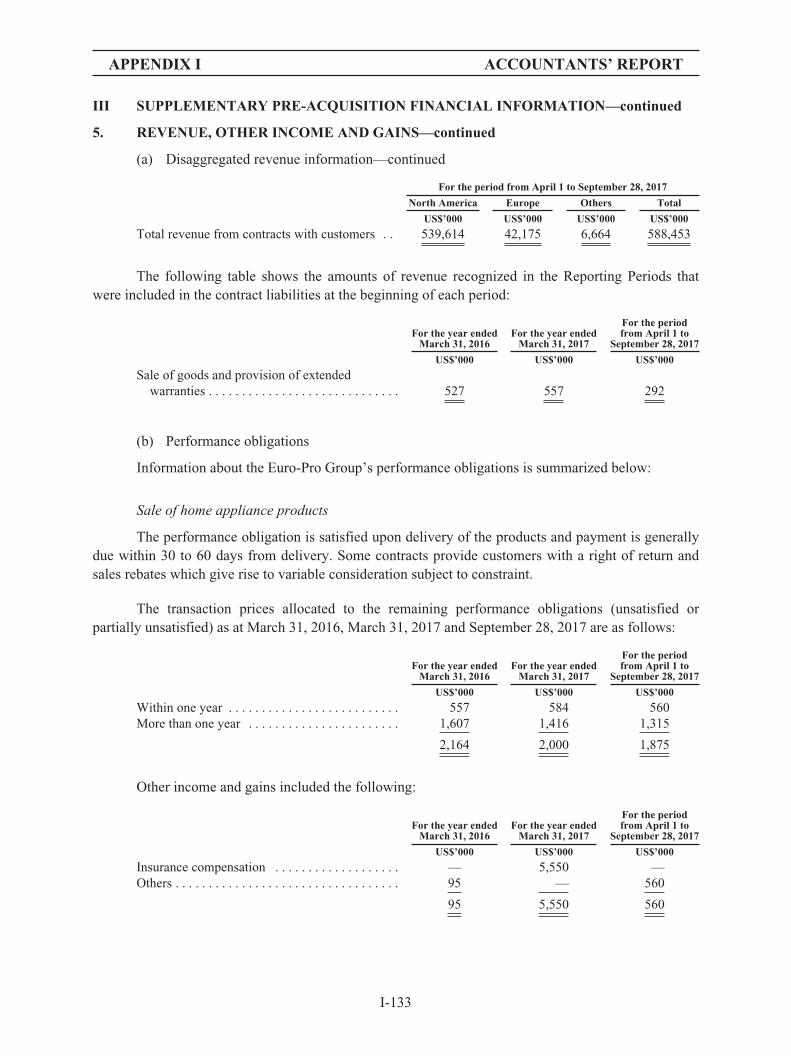
APPENDIX I ACCOUNTANTS’ REPORT
III SUPPLEMENTARY PRE-ACQUISITION FINANCIAL INFORMATION—continued
5. REVENUE, OTHER INCOME AND GAINS—continued
(a) Disaggregated revenue information—continued
For the period from April 1 to September 28, 2017
North America Europe Others Total
US$’000 US$’000 US$’000 US$’000
Total revenue from contracts with customers . . 539,614 42,175 6,664 588,453
The following table shows the amounts of revenue recognized in the Reporting Periods thatwere included in the contract liabilities at the beginning of each period:
For the year endedMarch 31, 2016
For the year endedMarch 31, 2017
For the periodfrom April 1 to
September 28, 2017
US$’000 US$’000 US$’000
Sale of goods and provision of extendedwarranties . . . . . . . . . . . . . . . . . . . . . . . . . . . . . 527 557 292
(b) Performance obligations
Information about the Euro-Pro Group’s performance obligations is summarized below:
Sale of home appliance products
The performance obligation is satisfied upon delivery of the products and payment is generallydue within 30 to 60 days from delivery. Some contracts provide customers with a right of return andsales rebates which give rise to variable consideration subject to constraint.
The transaction prices allocated to the remaining performance obligations (unsatisfied orpartially unsatisfied) as at March 31, 2016, March 31, 2017 and September 28, 2017 are as follows:
For the year endedMarch 31, 2016
For the year endedMarch 31, 2017
For the periodfrom April 1 to
September 28, 2017
US$’000 US$’000 US$’000
Within one year . . . . . . . . . . . . . . . . . . . . . . . . . . 557 584 560More than one year . . . . . . . . . . . . . . . . . . . . . . . 1,607 1,416 1,315
2,164 2,000 1,875
Other income and gains included the following:
For the year endedMarch 31, 2016
For the year endedMarch 31, 2017
For the periodfrom April 1 to
September 28, 2017
US$’000 US$’000 US$’000
Insurance compensation . . . . . . . . . . . . . . . . . . . — 5,550 —Others . . . . . . . . . . . . . . . . . . . . . . . . . . . . . . . . . . 95 — 560
95 5,550 560
I-133
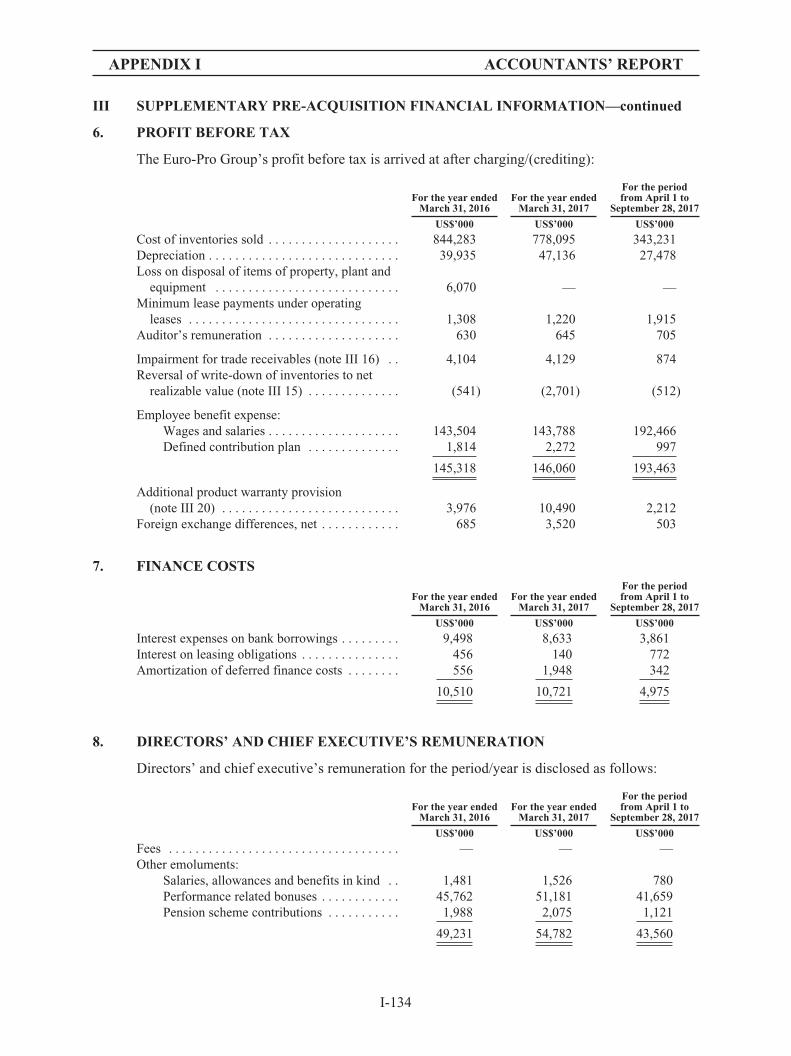
APPENDIX I ACCOUNTANTS’ REPORT
III SUPPLEMENTARY PRE-ACQUISITION FINANCIAL INFORMATION—continued
6. PROFIT BEFORE TAX
The Euro-Pro Group’s profit before tax is arrived at after charging/(crediting):
For the year endedMarch 31, 2016
For the year endedMarch 31, 2017
For the periodfrom April 1 to
September 28, 2017
US$’000 US$’000 US$’000
Cost of inventories sold . . . . . . . . . . . . . . . . . . . . 844,283 778,095 343,231Depreciation . . . . . . . . . . . . . . . . . . . . . . . . . . . . . 39,935 47,136 27,478Loss on disposal of items of property, plant and
equipment . . . . . . . . . . . . . . . . . . . . . . . . . . . . 6,070 — —Minimum lease payments under operating
leases . . . . . . . . . . . . . . . . . . . . . . . . . . . . . . . . 1,308 1,220 1,915Auditor’s remuneration . . . . . . . . . . . . . . . . . . . . 630 645 705
Impairment for trade receivables (note III 16) . . 4,104 4,129 874Reversal of write-down of inventories to net
realizable value (note III 15) . . . . . . . . . . . . . . (541) (2,701) (512)
Employee benefit expense:Wages and salaries . . . . . . . . . . . . . . . . . . . . 143,504 143,788 192,466Defined contribution plan . . . . . . . . . . . . . . 1,814 2,272 997
145,318 146,060 193,463
Additional product warranty provision(note III 20) . . . . . . . . . . . . . . . . . . . . . . . . . . . 3,976 10,490 2,212
Foreign exchange differences, net . . . . . . . . . . . . 685 3,520 503
7. FINANCE COSTS
For the year endedMarch 31, 2016
For the year endedMarch 31, 2017
For the periodfrom April 1 to
September 28, 2017
US$’000 US$’000 US$’000
Interest expenses on bank borrowings . . . . . . . . . 9,498 8,633 3,861Interest on leasing obligations . . . . . . . . . . . . . . . 456 140 772Amortization of deferred finance costs . . . . . . . . 556 1,948 342
10,510 10,721 4,975
8. DIRECTORS’ AND CHIEF EXECUTIVE’S REMUNERATION
Directors’ and chief executive’s remuneration for the period/year is disclosed as follows:
For the year endedMarch 31, 2016
For the year endedMarch 31, 2017
For the periodfrom April 1 to
September 28, 2017
US$’000 US$’000 US$’000
Fees . . . . . . . . . . . . . . . . . . . . . . . . . . . . . . . . . . . — — —Other emoluments:
Salaries, allowances and benefits in kind . . 1,481 1,526 780Performance related bonuses . . . . . . . . . . . . 45,762 51,181 41,659Pension scheme contributions . . . . . . . . . . . 1,988 2,075 1,121
49,231 54,782 43,560
I-134

APPENDIX I ACCOUNTANTS’ REPORT
III SUPPLEMENTARY PRE-ACQUISITION FINANCIAL INFORMATION—continued
9. INCOME TAX
Taxes on assessable profits have been provided at the rates of tax prevailing in the countries inwhich the Euro-Pro Group operates.
For the year endedMarch 31, 2016
For the year endedto March 31, 2017
For the periodfrom April 1 to
September 28, 2017
US$’000 US$’000 US$’000
Current—United States . . . . . . . . . . . . . . . . . . . . 20,781 22,980 6,656Current—elsewhere . . . . . . . . . . . . . . . . . . . . . . . 565 1,712 591Uncertain tax positions (a) . . . . . . . . . . . . . . . . . . 2,981 11,671 (8,062)Deferred tax (note III 13) . . . . . . . . . . . . . . . . . . . 2,724 2,668 (248)
Tax charge/(credit) for the year/period . . . . . . . . 27,051 39,031 (1,063)
Note:(a) The Company’s federal tax returns for the years ended March 31, 2011, 2012, 2013 and 2014 were under IRS audit during
the year ended March 31, 2016 and 2017. The Company accrued uncertain tax liabilities based on the status of IRS audit,which was asserting that a portion of the director’s compensation was considered excessive compensation that was notdeductible for tax purposes. The case was settled in December 2017.
I-135
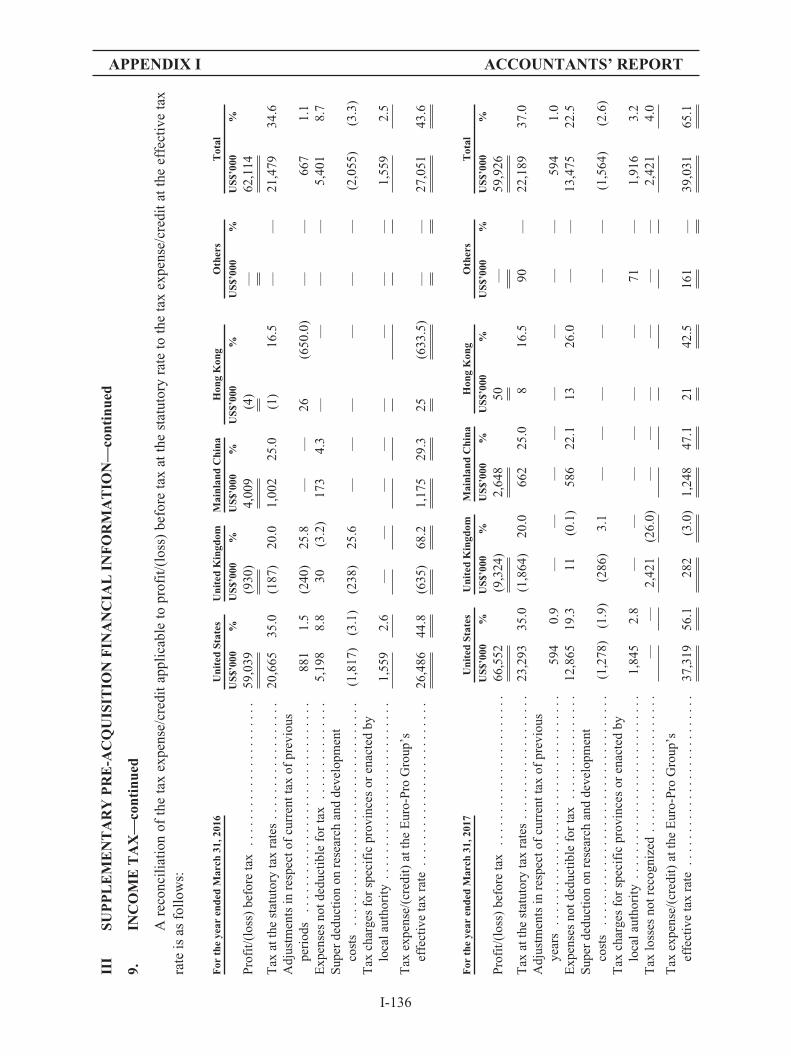
APPENDIX I ACCOUNTANTS’ REPORT
III
SUP
PL
EM
EN
TA
RY
PR
E-A
CQ
UIS
ITIO
NF
INA
NC
IAL
INF
OR
MA
TIO
N—
cont
inue
d
9.IN
CO
ME
TA
X—
cont
inue
d
Are
conc
ilia
tion
ofth
eta
xex
pens
e/cr
edit
appl
icab
leto
prof
it/(
loss
)be
fore
tax
atth
est
atut
ory
rate
toth
eta
xex
pens
e/cr
edit
atth
eef
fect
ive
tax
rate
isas
foll
ows:
For
the
year
ende
dM
arch
31,2
016
Uni
ted
Stat
esU
nite
dK
ingd
omM
ainl
and
Chi
naH
ong
Kon
gO
ther
sT
otal
US$
’000
%U
S$’0
00%
US$
’000
%U
S$’0
00%
US$
’000
%U
S$’0
00%
Pro
fit/
(los
s)be
fore
tax
....
....
....
....
....
..59
,039
(930
)4,
009
(4)
—62
,114
Tax
atth
est
atut
ory
tax
rate
s..
....
....
....
....
20,6
6535
.0(1
87)
20.0
1,00
225
.0(1
)16
.5—
—21
,479
34.6
Adj
ustm
ents
inre
spec
tof
curr
entt
axof
prev
ious
peri
ods
....
....
....
....
....
....
....
....
881
1.5
(240
)25
.8—
—26
(650
.0)
——
667
1.1
Exp
ense
sno
tded
ucti
ble
for
tax
....
....
....
...
5,19
88.
830
(3.2
)17
34.
3—
——
—5,
401
8.7
Sup
erde
duct
ion
onre
sear
chan
dde
velo
pmen
tco
sts
....
....
....
....
....
....
....
....
..(1
,817
)(3
.1)
(238
)25
.6—
——
——
—(2
,055
)(3
.3)
Tax
char
ges
for
spec
ific
prov
ince
sor
enac
ted
bylo
cala
utho
rity
....
....
....
....
....
....
...
1,55
92.
6—
——
——
——
—1,
559
2.5
Tax
expe
nse/
(cre
dit)
atth
eE
uro-
Pro
Gro
up’s
effe
ctiv
eta
xra
te..
....
....
....
....
....
...
26,4
8644
.8(6
35)
68.2
1,17
529
.325
(633
.5)
——
27,0
5143
.6
For
the
year
ende
dM
arch
31,2
017
Uni
ted
Stat
esU
nite
dK
ingd
omM
ainl
and
Chi
naH
ong
Kon
gO
ther
sT
otal
US$
’000
%U
S$’0
00%
US$
’000
%U
S$’0
00%
US$
’000
%U
S$’0
00%
Pro
fit/
(los
s)be
fore
tax
....
....
....
....
....
...
66,5
52(9
,324
)2,
648
50—
59,9
26
Tax
atth
est
atut
ory
tax
rate
s..
....
....
....
....
.23
,293
35.0
(1,8
64)
20.0
662
25.0
816
.590
—22
,189
37.0
Adj
ustm
ents
inre
spec
tof
curr
entt
axof
prev
ious
year
s..
....
....
....
....
....
....
....
....
.59
40.
9—
——
——
——
—59
41.
0E
xpen
ses
notd
educ
tibl
efo
rta
x..
....
....
....
..12
,865
19.3
11(0
.1)
586
22.1
1326
.0—
—13
,475
22.5
Sup
erde
duct
ion
onre
sear
chan
dde
velo
pmen
tco
sts
....
....
....
....
....
....
....
....
...
(1,2
78)
(1.9
)(2
86)
3.1
——
——
——
(1,5
64)
(2.6
)T
axch
arge
sfo
rsp
ecif
icpr
ovin
ces
oren
acte
dby
loca
laut
hori
ty..
....
....
....
....
....
....
..1,
845
2.8
——
——
——
71—
1,91
63.
2T
axlo
sses
notr
ecog
nize
d..
....
....
....
....
...
——
2,42
1(2
6.0)
——
——
——
2,42
14.
0
Tax
expe
nse/
(cre
dit)
atth
eE
uro-
Pro
Gro
up’s
effe
ctiv
eta
xra
te..
....
....
....
....
....
....
37,3
1956
.128
2(3
.0)
1,24
847
.121
42.5
161
—39
,031
65.1
I-136
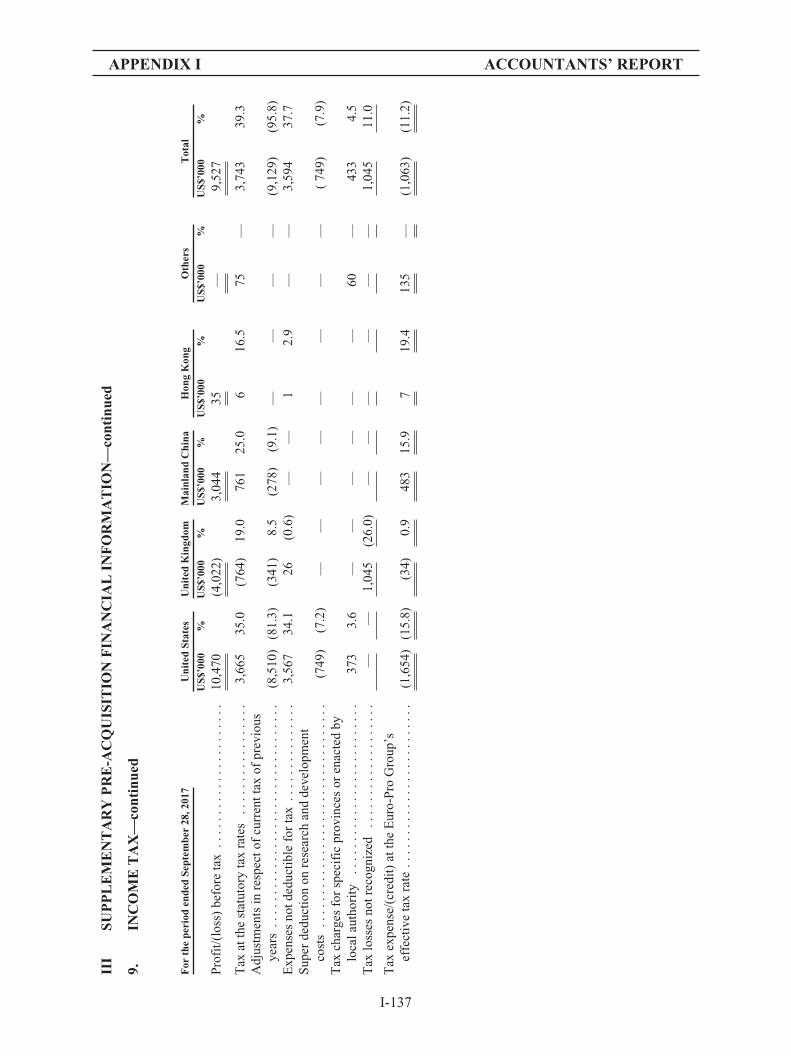
APPENDIX I ACCOUNTANTS’ REPORT
III
SUP
PL
EM
EN
TA
RY
PR
E-A
CQ
UIS
ITIO
NF
INA
NC
IAL
INF
OR
MA
TIO
N—
cont
inue
d
9.IN
CO
ME
TA
X—
cont
inue
d
For
the
peri
oden
ded
Sept
embe
r28
,201
7U
nite
dSt
ates
Uni
ted
Kin
gdom
Mai
nlan
dC
hina
Hon
gK
ong
Oth
ers
Tot
al
US$
’000
%U
S$’0
00%
US$
’000
%U
S$’0
00%
US$
’000
%U
S$’0
00%
Pro
fit/
(los
s)be
fore
tax
....
....
....
....
....
..10
,470
(4,0
22)
3,04
435
—9,
527
Tax
atth
est
atut
ory
tax
rate
s..
....
....
....
...
3,66
535
.0(7
64)
19.0
761
25.0
616
.575
—3,
743
39.3
Adj
ustm
ents
inre
spec
tof
curr
entt
axof
prev
ious
year
s..
....
....
....
....
....
....
....
....
(8,5
10)
(81.
3)(3
41)
8.5
(278
)(9
.1)
——
——
(9,1
29)
(95.
8)E
xpen
ses
notd
educ
tibl
efo
rta
x..
....
....
....
.3,
567
34.1
26(0
.6)
——
12.
9—
—3,
594
37.7
Sup
erde
duct
ion
onre
sear
chan
dde
velo
pmen
tco
sts
....
....
....
....
....
....
....
....
..(7
49)
(7.2
)—
——
——
——
—(
749)
(7.9
)T
axch
arge
sfo
rsp
ecif
icpr
ovin
ces
oren
acte
dby
loca
laut
hori
ty..
....
....
....
....
....
....
373
3.6
——
——
——
60—
433
4.5
Tax
loss
esno
trec
ogni
zed
....
....
....
....
...
——
1,04
5(2
6.0)
——
——
——
1,04
511
.0
Tax
expe
nse/
(cre
dit)
atth
eE
uro-
Pro
Gro
up’s
effe
ctiv
eta
xra
te..
....
....
....
....
....
...
(1,6
54)
(15.
8)(3
4)0.
948
315
.97
19.4
135
—(1
,063
)(1
1.2)
I-137
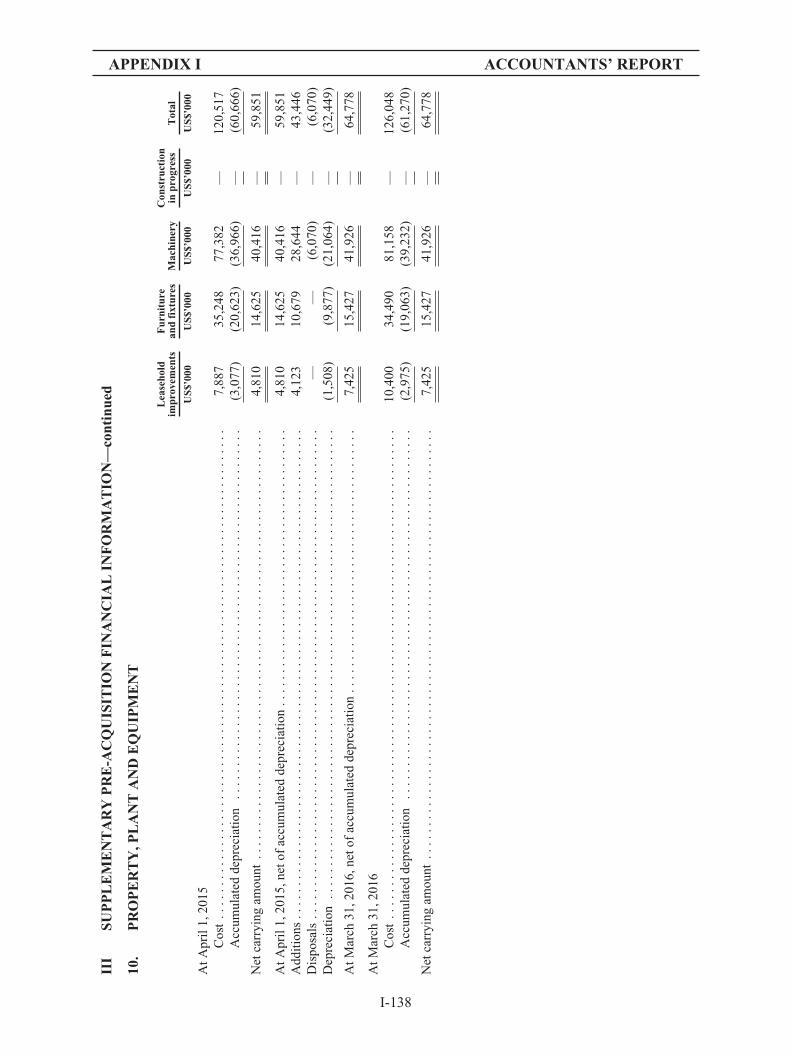
APPENDIX I ACCOUNTANTS’ REPORT
III
SUP
PL
EM
EN
TA
RY
PR
E-A
CQ
UIS
ITIO
NF
INA
NC
IAL
INF
OR
MA
TIO
N—
cont
inue
d
10.
PR
OP
ER
TY
,PL
AN
TA
ND
EQ
UIP
ME
NT
Lea
seho
ldim
prov
emen
tsF
urni
ture
and
fixt
ures
Mac
hine
ryC
onst
ruct
ion
inpr
ogre
ssT
otal
US$
’000
US$
’000
US$
’000
US$
’000
US$
’000
AtA
pril
1,20
15C
ost
....
....
....
....
....
....
....
....
....
....
....
....
....
....
....
....
....
....
..7,
887
35,2
4877
,382
—12
0,51
7A
ccum
ulat
edde
prec
iati
on..
....
....
....
....
....
....
....
....
....
....
....
....
....
..(3
,077
)(2
0,62
3)(3
6,96
6)—
(60,
666)
Net
carr
ying
amou
nt..
....
....
....
....
....
....
....
....
....
....
....
....
....
....
....
...
4,81
014
,625
40,4
16—
59,8
51
AtA
pril
1,20
15,n
etof
accu
mul
ated
depr
ecia
tion
....
....
....
....
....
....
....
....
....
....
..4,
810
14,6
2540
,416
—59
,851
Add
itio
ns..
....
....
....
....
....
....
....
....
....
....
....
....
....
....
....
....
....
....
4,12
310
,679
28,6
44—
43,4
46D
ispo
sals
....
....
....
....
....
....
....
....
....
....
....
....
....
....
....
....
....
....
..—
—(6
,070
)—
(6,0
70)
Dep
reci
atio
n..
....
....
....
....
....
....
....
....
....
....
....
....
....
....
....
....
....
.(1
,508
)(9
,877
)(2
1,06
4)—
(32,
449)
AtM
arch
31,2
016,
neto
fac
cum
ulat
edde
prec
iati
on..
....
....
....
....
....
....
....
....
....
..7,
425
15,4
2741
,926
—64
,778
AtM
arch
31,2
016
Cos
t..
....
....
....
....
....
....
....
....
....
....
....
....
....
....
....
....
....
....
10,4
0034
,490
81,1
58—
126,
048
Acc
umul
ated
depr
ecia
tion
....
....
....
....
....
....
....
....
....
....
....
....
....
....
(2,9
75)
(19,
063)
(39,
232)
—(6
1,27
0)
Net
carr
ying
amou
nt..
....
....
....
....
....
....
....
....
....
....
....
....
....
....
....
...
7,42
515
,427
41,9
26—
64,7
78
I-138

APPENDIX I ACCOUNTANTS’ REPORT
III
SUP
PL
EM
EN
TA
RY
PR
E-A
CQ
UIS
ITIO
NF
INA
NC
IAL
INF
OR
MA
TIO
N—
cont
inue
d
10.
PR
OP
ER
TY
,PL
AN
TA
ND
EQ
UIP
ME
NT
—co
ntin
ued
Lea
seho
ldim
prov
emen
tsF
urni
ture
and
fixt
ures
Mac
hine
ryC
onst
ruct
ion
inpr
ogre
ssT
otal
US$
’000
US$
’000
US$
’000
US$
’000
US$
’000
AtA
pril
1,20
16C
ost
....
....
....
....
....
....
....
....
....
....
....
....
....
....
....
....
....
....
..10
,400
34,4
9081
,158
—12
6,04
8A
ccum
ulat
edde
prec
iati
on..
....
....
....
....
....
....
....
....
....
....
....
....
....
..(2
,975
)(1
9,06
3)(3
9,23
2)—
(61,
270)
Net
carr
ying
amou
nt..
....
....
....
....
....
....
....
....
....
....
....
....
....
....
....
...
7,42
515
,427
41,9
26—
64,7
78
AtA
pril
1,20
16,n
etof
accu
mul
ated
depr
ecia
tion
....
....
....
....
....
....
....
....
....
....
..7,
425
15,4
2741
,926
—64
,778
Add
itio
ns..
....
....
....
....
....
....
....
....
....
....
....
....
....
....
....
....
....
....
3,05
710
,176
28,0
263,
868
45,1
27D
epre
ciat
ion
....
....
....
....
....
....
....
....
....
....
....
....
....
....
....
....
....
...
(3,3
21)
(11,
464)
(24,
555)
—(3
9,34
0)D
ispo
sals
....
....
....
....
....
....
....
....
....
....
....
....
....
....
....
....
....
....
..—
(830
)—
—(8
30)
AtM
arch
31,2
017,
neto
fac
cum
ulat
edde
prec
iati
on..
....
....
....
....
....
....
....
....
....
..7,
161
13,3
0945
,397
3,86
869
,735
AtM
arch
31,2
017
Cos
t..
....
....
....
....
....
....
....
....
....
....
....
....
....
....
....
....
....
....
13,4
5737
,170
106,
469
3,86
816
0,96
4A
ccum
ulat
edde
prec
iati
on..
....
....
....
....
....
....
....
....
....
....
....
....
....
..(6
,296
)(2
3,86
1)(6
1,07
2)—
(91,
229)
Net
carr
ying
amou
nt..
....
....
....
....
....
....
....
....
....
....
....
....
....
....
....
...
7,16
113
,309
45,3
973,
868
69,7
35
I-139
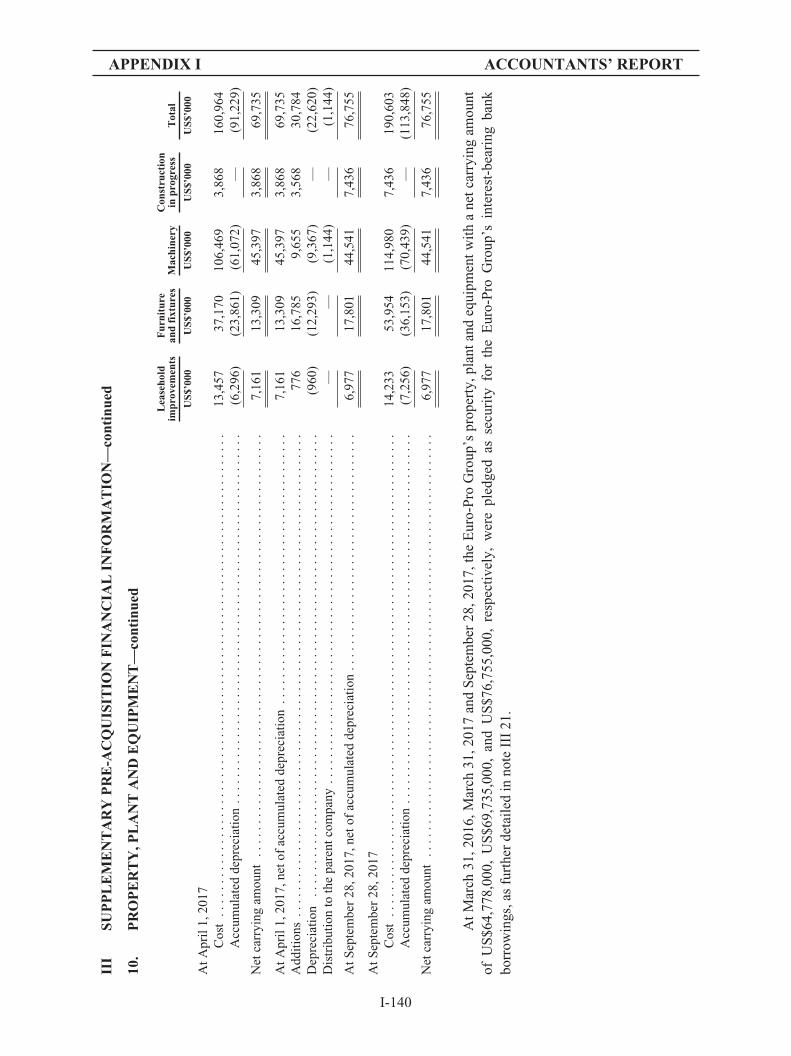
APPENDIX I ACCOUNTANTS’ REPORT
III
SUP
PL
EM
EN
TA
RY
PR
E-A
CQ
UIS
ITIO
NF
INA
NC
IAL
INF
OR
MA
TIO
N—
cont
inue
d
10.
PR
OP
ER
TY
,PL
AN
TA
ND
EQ
UIP
ME
NT
—co
ntin
ued
Lea
seho
ldim
prov
emen
tsF
urni
ture
and
fixt
ures
Mac
hine
ryC
onst
ruct
ion
inpr
ogre
ssT
otal
US$
’000
US$
’000
US$
’000
US$
’000
US$
’000
AtA
pril
1,20
17C
ost
....
....
....
....
....
....
....
....
....
....
....
....
....
....
....
....
....
....
.13
,457
37,1
7010
6,46
93,
868
160,
964
Acc
umul
ated
depr
ecia
tion
....
....
....
....
....
....
....
....
....
....
....
....
....
....
(6,2
96)
(23,
861)
(61,
072)
—(9
1,22
9)
Net
carr
ying
amou
nt..
....
....
....
....
....
....
....
....
....
....
....
....
....
....
....
..7,
161
13,3
0945
,397
3,86
869
,735
AtA
pril
1,20
17,n
etof
accu
mul
ated
depr
ecia
tion
....
....
....
....
....
....
....
....
....
....
.7,
161
13,3
0945
,397
3,86
869
,735
Add
itio
ns..
....
....
....
....
....
....
....
....
....
....
....
....
....
....
....
....
....
...
776
16,7
859,
655
3,56
830
,784
Dep
reci
atio
n..
....
....
....
....
....
....
....
....
....
....
....
....
....
....
....
....
....
(960
)(1
2,29
3)(9
,367
)—
(22,
620)
Dis
trib
utio
nto
the
pare
ntco
mpa
ny..
....
....
....
....
....
....
....
....
....
....
....
....
...
——
(1,1
44)
—(1
,144
)
AtS
epte
mbe
r28
,201
7,ne
tof
accu
mul
ated
depr
ecia
tion
....
....
....
....
....
....
....
....
....
6,97
717
,801
44,5
417,
436
76,7
55
AtS
epte
mbe
r28
,201
7C
ost
....
....
....
....
....
....
....
....
....
....
....
....
....
....
....
....
....
....
.14
,233
53,9
5411
4,98
07,
436
190,
603
Acc
umul
ated
depr
ecia
tion
....
....
....
....
....
....
....
....
....
....
....
....
....
....
(7,2
56)
(36,
153)
(70,
439)
—(1
13,8
48)
Net
carr
ying
amou
nt..
....
....
....
....
....
....
....
....
....
....
....
....
....
....
....
..6,
977
17,8
0144
,541
7,43
676
,755
At
Mar
ch31
,201
6,M
arch
31,2
017
and
Sep
tem
ber
28,2
017,
the
Eur
o-P
roG
roup
’spr
oper
ty,p
lant
and
equi
pmen
twit
ha
netc
arry
ing
amou
ntof
US
$64,
778,
000,
US
$69,
735,
000,
and
US
$76,
755,
000,
resp
ecti
vely
,w
ere
pled
ged
asse
curi
tyfo
rth
eE
uro-
Pro
Gro
up’s
inte
rest
-bea
ring
bank
borr
owin
gs,a
sfu
rthe
rde
tail
edin
note
III
21.
I-140

APPENDIX I ACCOUNTANTS’ REPORT
III SUPPLEMENTARY PRE-ACQUISITION FINANCIAL INFORMATION—continued
11. RIGHT-OF-USE ASSETS AND LEASE LIABILITIES
The movements of right-of-use assets during each period are as follows:
March 31,2016
March 31,2017
September 28,2017
US$’000 US$’000 US$’000
Cost of right-of-use assets:At the beginning of the year/period . . . . . . . . . . . . . . . . . . . . . . 27,495 31,143 31,329Additions . . . . . . . . . . . . . . . . . . . . . . . . . . . . . . . . . . . . . . . . . . 3,648 186 59,692
At the end of the year/period . . . . . . . . . . . . . . . . . . . . . . . . . . . 31,143 31,329 91,021
Accumulated depreciation:At the beginning of the year/period . . . . . . . . . . . . . . . . . . . . . . — (7,486) (15,282)Depreciation provided during the year/period . . . . . . . . . . . . . . (7,486) (7,796) (4,858)
At the end of the year/period . . . . . . . . . . . . . . . . . . . . . . . . . . . (7,486) (15,282) (20,140)
Net carrying amount:At the end of the year/period . . . . . . . . . . . . . . . . . . . . . . . . . . . 23,657 16,047 70,881
The movements of lease liabilities during each period are as follows:
March 31,2016
March 31,2017
September 28,2017
US$’000 US$’000 US$’000
Lease liabilities:At the beginning of the year/period . . . . . . . . . . . . . . . . . . . . . . 29,726 33,374 33,560Additions . . . . . . . . . . . . . . . . . . . . . . . . . . . . . . . . . . . . . . . . . . 3,648 186 59,692
At the end of the year/period . . . . . . . . . . . . . . . . . . . . . . . . . . . 33,374 33,560 93,252
Accumulated payment:At the beginning of the the year/period . . . . . . . . . . . . . . . . . . . — (7,447) (15,908)Interest expense during the year/period . . . . . . . . . . . . . . . . . . . 456 140 772Payment during the year/period . . . . . . . . . . . . . . . . . . . . . . . . . (7,903) (8,601) (3,744)
At the end of the year/period . . . . . . . . . . . . . . . . . . . . . . . . . . . (7,447) (15,908) (18,880)
Net carrying amount:At the end of the year/period . . . . . . . . . . . . . . . . . . . . . . . . . . . 25,927 17,652 74,372
Analyzed into:Within one year . . . . . . . . . . . . . . . . . . . . . . . . . . . . . . . . . . . . . 8,382 6,100 7,645In the second year . . . . . . . . . . . . . . . . . . . . . . . . . . . . . . . . . . . . 6,002 5,989 9,845In the third to fifth years, inclusive . . . . . . . . . . . . . . . . . . . . . . 11,222 5,501 15,650Beyond five years . . . . . . . . . . . . . . . . . . . . . . . . . . . . . . . . . . . . 321 62 41,232
At the end of the year/period . . . . . . . . . . . . . . . . . . . . . . . . . . . 25,927 17,652 74,372
I-141
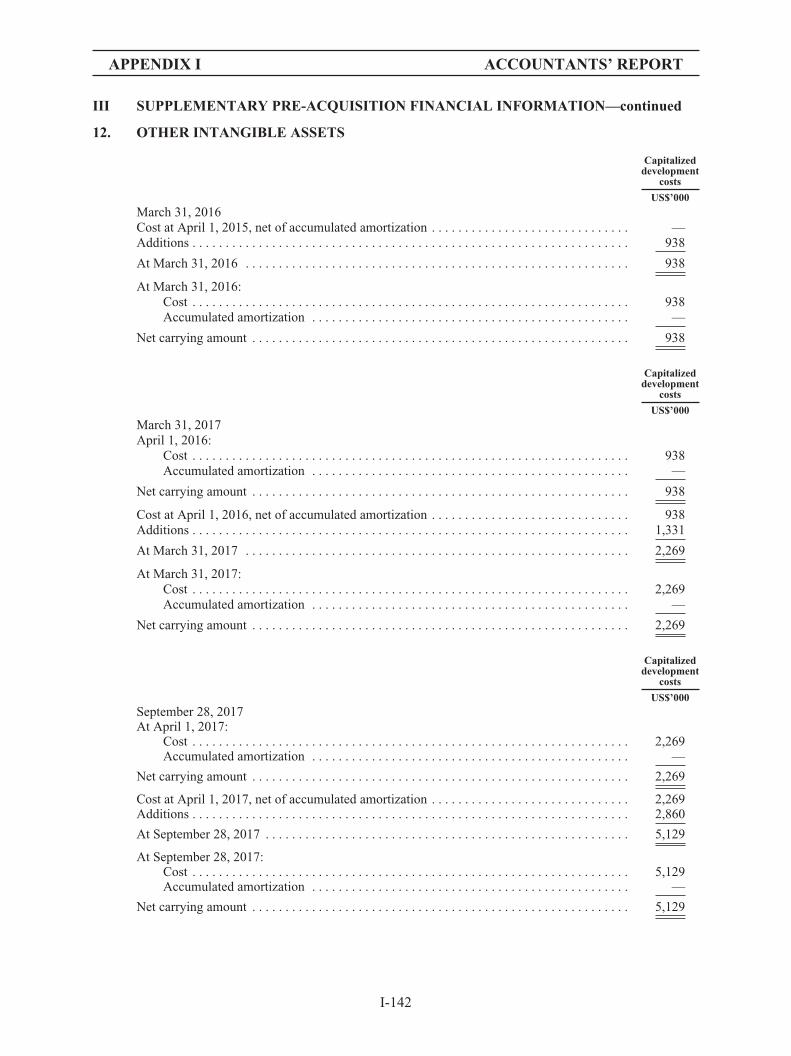
APPENDIX I ACCOUNTANTS’ REPORT
III SUPPLEMENTARY PRE-ACQUISITION FINANCIAL INFORMATION—continued
12. OTHER INTANGIBLE ASSETS
Capitalizeddevelopment
costs
US$’000
March 31, 2016Cost at April 1, 2015, net of accumulated amortization . . . . . . . . . . . . . . . . . . . . . . . . . . . . . . —Additions . . . . . . . . . . . . . . . . . . . . . . . . . . . . . . . . . . . . . . . . . . . . . . . . . . . . . . . . . . . . . . . . . . 938
At March 31, 2016 . . . . . . . . . . . . . . . . . . . . . . . . . . . . . . . . . . . . . . . . . . . . . . . . . . . . . . . . . . 938
At March 31, 2016:Cost . . . . . . . . . . . . . . . . . . . . . . . . . . . . . . . . . . . . . . . . . . . . . . . . . . . . . . . . . . . . . . . . . . 938Accumulated amortization . . . . . . . . . . . . . . . . . . . . . . . . . . . . . . . . . . . . . . . . . . . . . . . . —
Net carrying amount . . . . . . . . . . . . . . . . . . . . . . . . . . . . . . . . . . . . . . . . . . . . . . . . . . . . . . . . . 938
Capitalizeddevelopment
costs
US$’000
March 31, 2017April 1, 2016:
Cost . . . . . . . . . . . . . . . . . . . . . . . . . . . . . . . . . . . . . . . . . . . . . . . . . . . . . . . . . . . . . . . . . . 938Accumulated amortization . . . . . . . . . . . . . . . . . . . . . . . . . . . . . . . . . . . . . . . . . . . . . . . . —
Net carrying amount . . . . . . . . . . . . . . . . . . . . . . . . . . . . . . . . . . . . . . . . . . . . . . . . . . . . . . . . . 938
Cost at April 1, 2016, net of accumulated amortization . . . . . . . . . . . . . . . . . . . . . . . . . . . . . . 938Additions . . . . . . . . . . . . . . . . . . . . . . . . . . . . . . . . . . . . . . . . . . . . . . . . . . . . . . . . . . . . . . . . . . 1,331
At March 31, 2017 . . . . . . . . . . . . . . . . . . . . . . . . . . . . . . . . . . . . . . . . . . . . . . . . . . . . . . . . . . 2,269
At March 31, 2017:Cost . . . . . . . . . . . . . . . . . . . . . . . . . . . . . . . . . . . . . . . . . . . . . . . . . . . . . . . . . . . . . . . . . . 2,269Accumulated amortization . . . . . . . . . . . . . . . . . . . . . . . . . . . . . . . . . . . . . . . . . . . . . . . . —
Net carrying amount . . . . . . . . . . . . . . . . . . . . . . . . . . . . . . . . . . . . . . . . . . . . . . . . . . . . . . . . . 2,269
Capitalizeddevelopment
costs
US$’000
September 28, 2017At April 1, 2017:
Cost . . . . . . . . . . . . . . . . . . . . . . . . . . . . . . . . . . . . . . . . . . . . . . . . . . . . . . . . . . . . . . . . . . 2,269Accumulated amortization . . . . . . . . . . . . . . . . . . . . . . . . . . . . . . . . . . . . . . . . . . . . . . . . —
Net carrying amount . . . . . . . . . . . . . . . . . . . . . . . . . . . . . . . . . . . . . . . . . . . . . . . . . . . . . . . . . 2,269
Cost at April 1, 2017, net of accumulated amortization . . . . . . . . . . . . . . . . . . . . . . . . . . . . . . 2,269Additions . . . . . . . . . . . . . . . . . . . . . . . . . . . . . . . . . . . . . . . . . . . . . . . . . . . . . . . . . . . . . . . . . . 2,860
At September 28, 2017 . . . . . . . . . . . . . . . . . . . . . . . . . . . . . . . . . . . . . . . . . . . . . . . . . . . . . . . 5,129
At September 28, 2017:Cost . . . . . . . . . . . . . . . . . . . . . . . . . . . . . . . . . . . . . . . . . . . . . . . . . . . . . . . . . . . . . . . . . . 5,129Accumulated amortization . . . . . . . . . . . . . . . . . . . . . . . . . . . . . . . . . . . . . . . . . . . . . . . . —
Net carrying amount . . . . . . . . . . . . . . . . . . . . . . . . . . . . . . . . . . . . . . . . . . . . . . . . . . . . . . . . . 5,129
I-142
APPENDIX I ACCOUNTANTS’ REPORT
III SUPPLEMENTARY PRE-ACQUISITION FINANCIAL INFORMATION—continued
12. OTHER INTANGIBLE ASSETS—continued
Impairment testing of capitalized development costs not yet available for use
The Euro-Pro Group performed impairment testing of capitalized development costs not yetavailable for use annually and whenever there is an impairment indicator.
The recoverable amount of the capitalized development costs not yet available for use has beendetermined based on a value in use calculation using cash flow projections based on financial budgetscovering a five-year period approved by management as at March 31, 2017. The discount rate appliedto the cash flow projections is 17.5%-20.5%.
Assumptions were used in the value in use calculation of the capitalized development costs notyet available for use. The following describes key assumptions on which management has based itscash flow projections to undertake impairment testing of the capitalized development costs not yetavailable for use:
Revenue growth—The bases used to determine the future earnings potential are historical salesand average expected growth rates of products with similar features and life cycle in the markets.
Budgeted gross margins—The basis used to determine the value assigned to the budgeted grossmargins is the average gross margins achieved by products with similar features and life cycle in theyear immediately before the budget year, increased for expected efficiency improvements, andexpected market development.
Discount rate—The discount rate used is before tax and reflects specific risks relating to assets.
Expenses—The expenses reflect past experience and management’s commitment to maintainthe operating expenses to an acceptable level.
The values assigned to the key assumptions on market development and discount rates areconsistent with external information sources.
Based on the result of the impairment testing, the estimated recoverable amount of thecapitalized development costs not yet available for use exceeded the carrying amount byUS$10,979,000 as at March 31, 2017.
Sensitivity to changes in assumptions
The Company has performed the sensitivity analysis on key assumptions used in theimpairment testing. Had the estimated key assumption, discount rate been increased by 0.5%, from17.5%-20.5% to 18.0%-21.0%, the headroom would be decreased by US$125,000.
With regards to the assessment of the value in use of the capitalized development costs not yetavailable for use, management believes that no reasonably possible change in any of the above keyassumptions would cause the carrying value of the capitalized development costs not yet available foruse to exceed the recoverable amount.
At March 31, 2016, March 31, 2017 and September 28, 2017, the Euro-Pro Group’s otherintangible assets with a carrying amount of US$938,000, US$2,269,000 and US$5,129,000,respectively, were pledged as security for the Euro-Pro Group’s interest-bearing bank borrowings, asfurther detailed in note III 21.
I-143
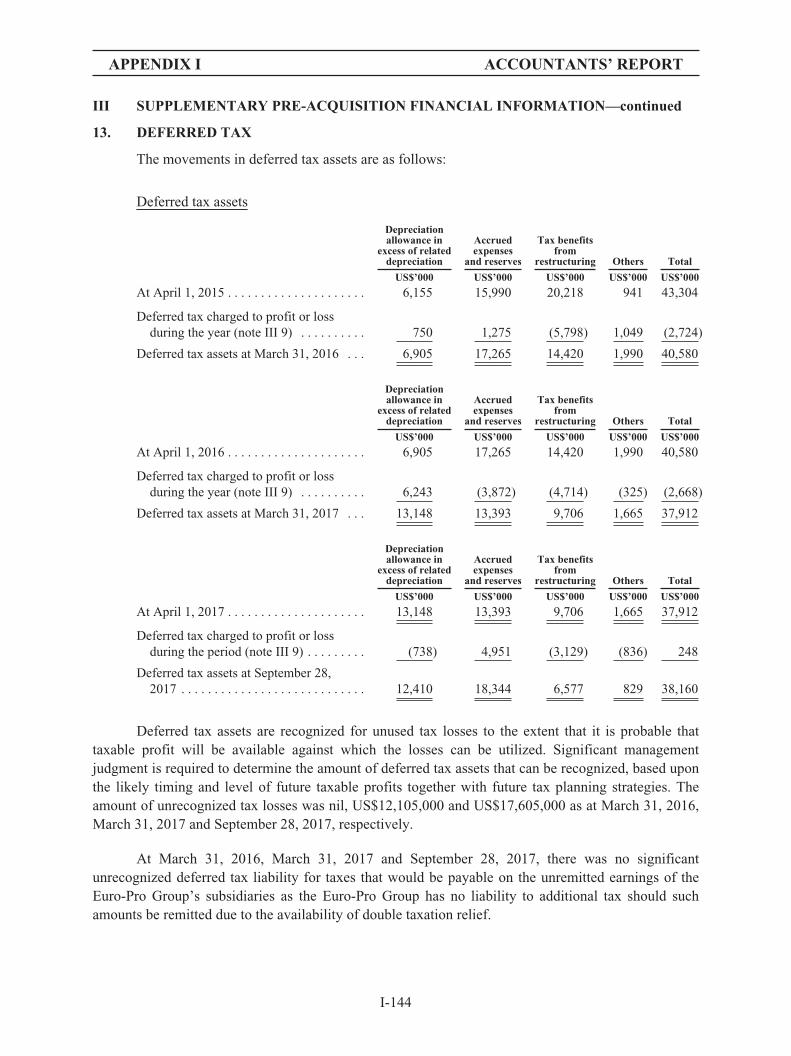
APPENDIX I ACCOUNTANTS’ REPORT
III SUPPLEMENTARY PRE-ACQUISITION FINANCIAL INFORMATION—continued
13. DEFERRED TAX
The movements in deferred tax assets are as follows:
Deferred tax assets
Depreciationallowance in
excess of relateddepreciation
Accruedexpenses
and reserves
Tax benefitsfrom
restructuring Others Total
US$’000 US$’000 US$’000 US$’000 US$’000
At April 1, 2015 . . . . . . . . . . . . . . . . . . . . . 6,155 15,990 20,218 941 43,304
Deferred tax charged to profit or lossduring the year (note III 9) . . . . . . . . . . 750 1,275 (5,798) 1,049 (2,724)
Deferred tax assets at March 31, 2016 . . . 6,905 17,265 14,420 1,990 40,580
Depreciationallowance in
excess of relateddepreciation
Accruedexpenses
and reserves
Tax benefitsfrom
restructuring Others Total
US$’000 US$’000 US$’000 US$’000 US$’000
At April 1, 2016 . . . . . . . . . . . . . . . . . . . . . 6,905 17,265 14,420 1,990 40,580
Deferred tax charged to profit or lossduring the year (note III 9) . . . . . . . . . . 6,243 (3,872) (4,714) (325) (2,668)
Deferred tax assets at March 31, 2017 . . . 13,148 13,393 9,706 1,665 37,912
Depreciationallowance in
excess of relateddepreciation
Accruedexpenses
and reserves
Tax benefitsfrom
restructuring Others Total
US$’000 US$’000 US$’000 US$’000 US$’000
At April 1, 2017 . . . . . . . . . . . . . . . . . . . . . 13,148 13,393 9,706 1,665 37,912
Deferred tax charged to profit or lossduring the period (note III 9) . . . . . . . . . (738) 4,951 (3,129) (836) 248
Deferred tax assets at September 28,2017 . . . . . . . . . . . . . . . . . . . . . . . . . . . . 12,410 18,344 6,577 829 38,160
Deferred tax assets are recognized for unused tax losses to the extent that it is probable thattaxable profit will be available against which the losses can be utilized. Significant managementjudgment is required to determine the amount of deferred tax assets that can be recognized, based uponthe likely timing and level of future taxable profits together with future tax planning strategies. Theamount of unrecognized tax losses was nil, US$12,105,000 and US$17,605,000 as at March 31, 2016,March 31, 2017 and September 28, 2017, respectively.
At March 31, 2016, March 31, 2017 and September 28, 2017, there was no significantunrecognized deferred tax liability for taxes that would be payable on the unremitted earnings of theEuro-Pro Group’s subsidiaries as the Euro-Pro Group has no liability to additional tax should suchamounts be remitted due to the availability of double taxation relief.
I-144
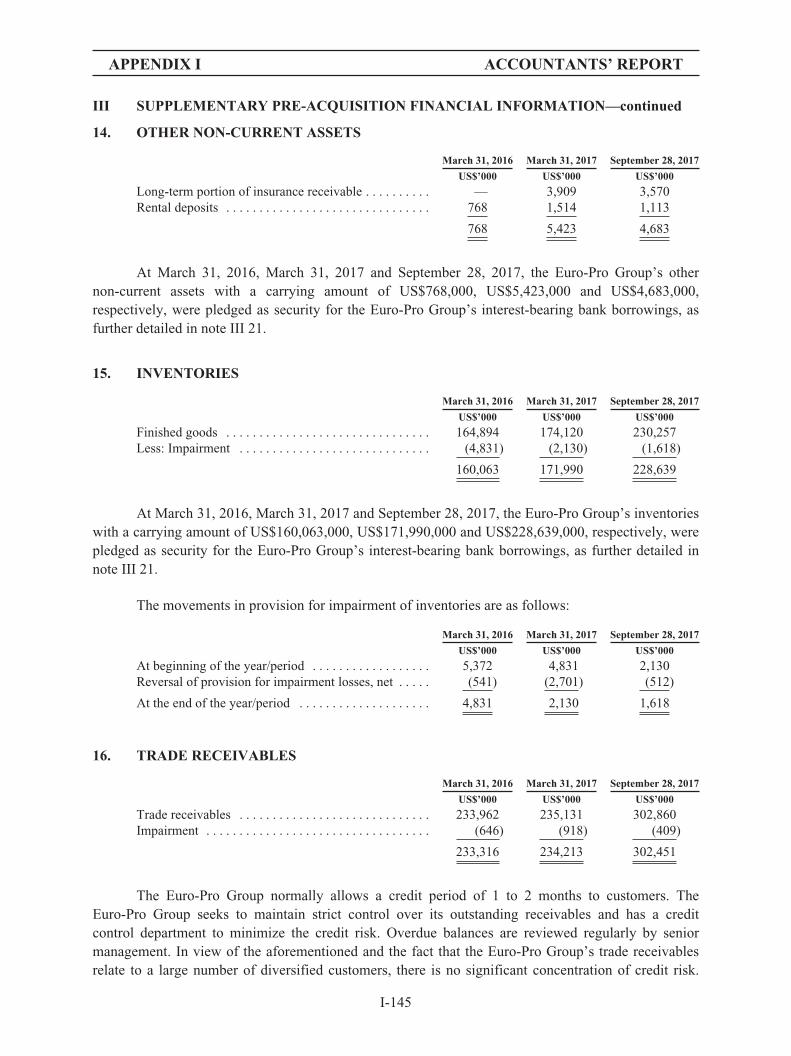
APPENDIX I ACCOUNTANTS’ REPORT
III SUPPLEMENTARY PRE-ACQUISITION FINANCIAL INFORMATION—continued
14. OTHER NON-CURRENT ASSETS
March 31, 2016 March 31, 2017 September 28, 2017
US$’000 US$’000 US$’000
Long-term portion of insurance receivable . . . . . . . . . . — 3,909 3,570Rental deposits . . . . . . . . . . . . . . . . . . . . . . . . . . . . . . . 768 1,514 1,113
768 5,423 4,683
At March 31, 2016, March 31, 2017 and September 28, 2017, the Euro-Pro Group’s othernon-current assets with a carrying amount of US$768,000, US$5,423,000 and US$4,683,000,respectively, were pledged as security for the Euro-Pro Group’s interest-bearing bank borrowings, asfurther detailed in note III 21.
15. INVENTORIES
March 31, 2016 March 31, 2017 September 28, 2017
US$’000 US$’000 US$’000
Finished goods . . . . . . . . . . . . . . . . . . . . . . . . . . . . . . . 164,894 174,120 230,257Less: Impairment . . . . . . . . . . . . . . . . . . . . . . . . . . . . . (4,831) (2,130) (1,618)
160,063 171,990 228,639
At March 31, 2016, March 31, 2017 and September 28, 2017, the Euro-Pro Group’s inventorieswith a carrying amount of US$160,063,000, US$171,990,000 and US$228,639,000, respectively, werepledged as security for the Euro-Pro Group’s interest-bearing bank borrowings, as further detailed innote III 21.
The movements in provision for impairment of inventories are as follows:
March 31, 2016 March 31, 2017 September 28, 2017
US$’000 US$’000 US$’000
At beginning of the year/period . . . . . . . . . . . . . . . . . . 5,372 4,831 2,130Reversal of provision for impairment losses, net . . . . . (541) (2,701) (512)
At the end of the year/period . . . . . . . . . . . . . . . . . . . . 4,831 2,130 1,618
16. TRADE RECEIVABLES
March 31, 2016 March 31, 2017 September 28, 2017
US$’000 US$’000 US$’000
Trade receivables . . . . . . . . . . . . . . . . . . . . . . . . . . . . . 233,962 235,131 302,860Impairment . . . . . . . . . . . . . . . . . . . . . . . . . . . . . . . . . . (646) (918) (409)
233,316 234,213 302,451
The Euro-Pro Group normally allows a credit period of 1 to 2 months to customers. TheEuro-Pro Group seeks to maintain strict control over its outstanding receivables and has a creditcontrol department to minimize the credit risk. Overdue balances are reviewed regularly by seniormanagement. In view of the aforementioned and the fact that the Euro-Pro Group’s trade receivablesrelate to a large number of diversified customers, there is no significant concentration of credit risk.
I-145
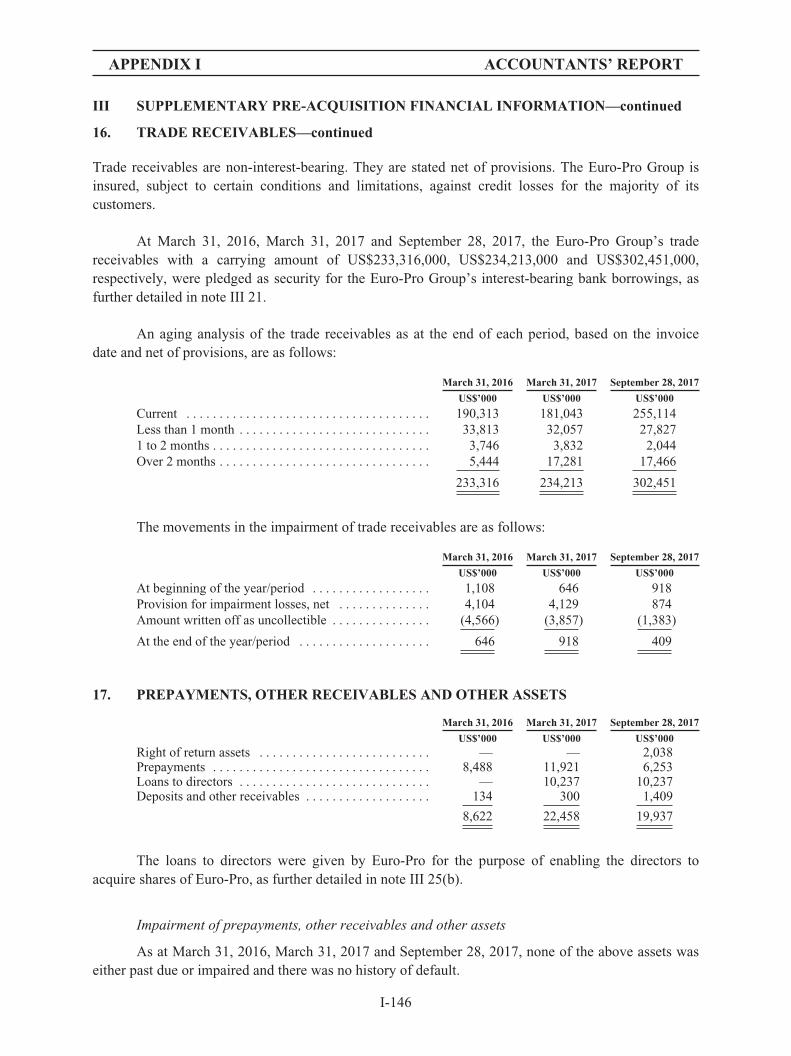
APPENDIX I ACCOUNTANTS’ REPORT
III SUPPLEMENTARY PRE-ACQUISITION FINANCIAL INFORMATION—continued
16. TRADE RECEIVABLES—continued
Trade receivables are non-interest-bearing. They are stated net of provisions. The Euro-Pro Group isinsured, subject to certain conditions and limitations, against credit losses for the majority of itscustomers.
At March 31, 2016, March 31, 2017 and September 28, 2017, the Euro-Pro Group’s tradereceivables with a carrying amount of US$233,316,000, US$234,213,000 and US$302,451,000,respectively, were pledged as security for the Euro-Pro Group’s interest-bearing bank borrowings, asfurther detailed in note III 21.
An aging analysis of the trade receivables as at the end of each period, based on the invoicedate and net of provisions, are as follows:
March 31, 2016 March 31, 2017 September 28, 2017
US$’000 US$’000 US$’000
Current . . . . . . . . . . . . . . . . . . . . . . . . . . . . . . . . . . . . . 190,313 181,043 255,114Less than 1 month . . . . . . . . . . . . . . . . . . . . . . . . . . . . . 33,813 32,057 27,8271 to 2 months . . . . . . . . . . . . . . . . . . . . . . . . . . . . . . . . . 3,746 3,832 2,044Over 2 months . . . . . . . . . . . . . . . . . . . . . . . . . . . . . . . . 5,444 17,281 17,466
233,316 234,213 302,451
The movements in the impairment of trade receivables are as follows:
March 31, 2016 March 31, 2017 September 28, 2017
US$’000 US$’000 US$’000
At beginning of the year/period . . . . . . . . . . . . . . . . . . 1,108 646 918Provision for impairment losses, net . . . . . . . . . . . . . . 4,104 4,129 874Amount written off as uncollectible . . . . . . . . . . . . . . . (4,566) (3,857) (1,383)
At the end of the year/period . . . . . . . . . . . . . . . . . . . . 646 918 409
17. PREPAYMENTS, OTHER RECEIVABLES AND OTHER ASSETS
March 31, 2016 March 31, 2017 September 28, 2017
US$’000 US$’000 US$’000Right of return assets . . . . . . . . . . . . . . . . . . . . . . . . . . — — 2,038Prepayments . . . . . . . . . . . . . . . . . . . . . . . . . . . . . . . . . 8,488 11,921 6,253Loans to directors . . . . . . . . . . . . . . . . . . . . . . . . . . . . . — 10,237 10,237Deposits and other receivables . . . . . . . . . . . . . . . . . . . 134 300 1,409
8,622 22,458 19,937
The loans to directors were given by Euro-Pro for the purpose of enabling the directors toacquire shares of Euro-Pro, as further detailed in note III 25(b).
Impairment of prepayments, other receivables and other assets
As at March 31, 2016, March 31, 2017 and September 28, 2017, none of the above assets waseither past due or impaired and there was no history of default.
I-146
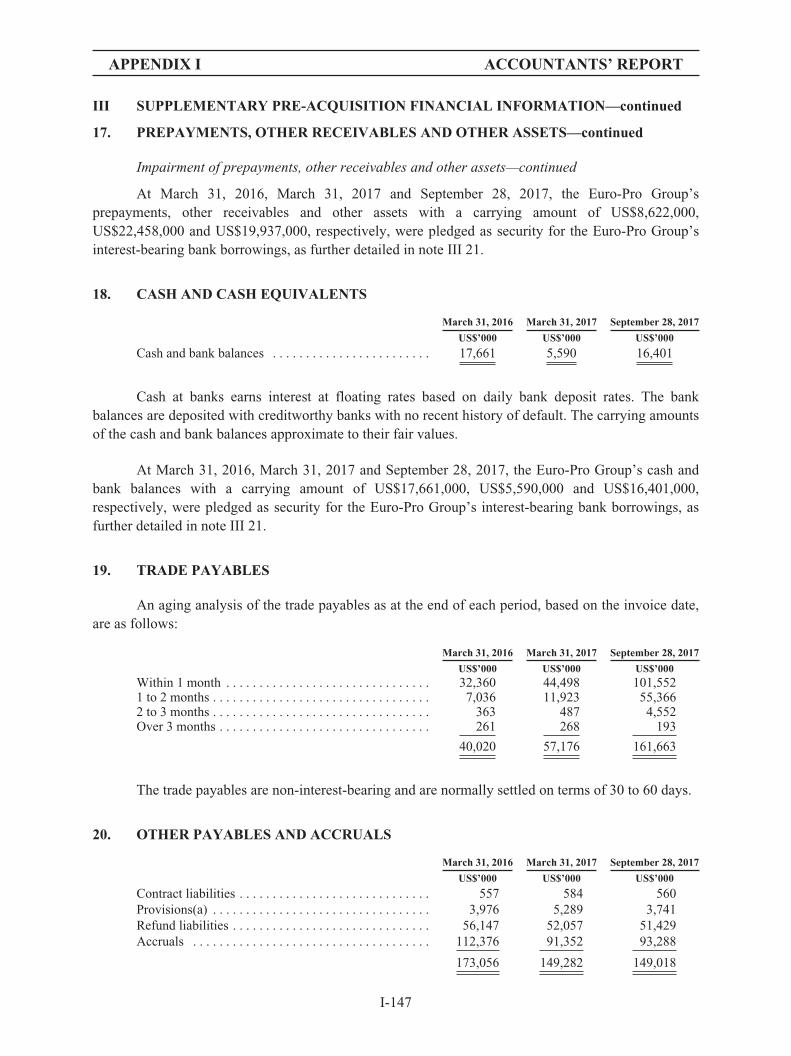
APPENDIX I ACCOUNTANTS’ REPORT
III SUPPLEMENTARY PRE-ACQUISITION FINANCIAL INFORMATION—continued
17. PREPAYMENTS, OTHER RECEIVABLES AND OTHER ASSETS—continued
Impairment of prepayments, other receivables and other assets—continued
At March 31, 2016, March 31, 2017 and September 28, 2017, the Euro-Pro Group’sprepayments, other receivables and other assets with a carrying amount of US$8,622,000,US$22,458,000 and US$19,937,000, respectively, were pledged as security for the Euro-Pro Group’sinterest-bearing bank borrowings, as further detailed in note III 21.
18. CASH AND CASH EQUIVALENTS
March 31, 2016 March 31, 2017 September 28, 2017
US$’000 US$’000 US$’000
Cash and bank balances . . . . . . . . . . . . . . . . . . . . . . . . 17,661 5,590 16,401
Cash at banks earns interest at floating rates based on daily bank deposit rates. The bankbalances are deposited with creditworthy banks with no recent history of default. The carrying amountsof the cash and bank balances approximate to their fair values.
At March 31, 2016, March 31, 2017 and September 28, 2017, the Euro-Pro Group’s cash andbank balances with a carrying amount of US$17,661,000, US$5,590,000 and US$16,401,000,respectively, were pledged as security for the Euro-Pro Group’s interest-bearing bank borrowings, asfurther detailed in note III 21.
19. TRADE PAYABLES
An aging analysis of the trade payables as at the end of each period, based on the invoice date,are as follows:
March 31, 2016 March 31, 2017 September 28, 2017
US$’000 US$’000 US$’000Within 1 month . . . . . . . . . . . . . . . . . . . . . . . . . . . . . . . 32,360 44,498 101,5521 to 2 months . . . . . . . . . . . . . . . . . . . . . . . . . . . . . . . . . 7,036 11,923 55,3662 to 3 months . . . . . . . . . . . . . . . . . . . . . . . . . . . . . . . . . 363 487 4,552Over 3 months . . . . . . . . . . . . . . . . . . . . . . . . . . . . . . . . 261 268 193
40,020 57,176 161,663
The trade payables are non-interest-bearing and are normally settled on terms of 30 to 60 days.
20. OTHER PAYABLES AND ACCRUALS
March 31, 2016 March 31, 2017 September 28, 2017
US$’000 US$’000 US$’000
Contract liabilities . . . . . . . . . . . . . . . . . . . . . . . . . . . . . 557 584 560Provisions(a) . . . . . . . . . . . . . . . . . . . . . . . . . . . . . . . . . 3,976 5,289 3,741Refund liabilities . . . . . . . . . . . . . . . . . . . . . . . . . . . . . . 56,147 52,057 51,429Accruals . . . . . . . . . . . . . . . . . . . . . . . . . . . . . . . . . . . . 112,376 91,352 93,288
173,056 149,282 149,018
I-147

APPENDIX I ACCOUNTANTS’ REPORT
III SUPPLEMENTARY PRE-ACQUISITION FINANCIAL INFORMATION—continued
20. OTHER PAYABLES AND ACCRUALS—continued
(a) The movements in provisions are as follows:
Warranties
US$’000
At April 1, 2015 . . . . . . . . . . . . . . . . . . . . . . . . . . . . . . . . . . . . . . . . . . . . . . . . . . . . . . . . . . . . . 2,475Additional provision . . . . . . . . . . . . . . . . . . . . . . . . . . . . . . . . . . . . . . . . . . . . . . . . . . . . . . . . . . 3,976Amounts utilized during the year . . . . . . . . . . . . . . . . . . . . . . . . . . . . . . . . . . . . . . . . . . . . . . . . (2,475)
At March 31, 2016 . . . . . . . . . . . . . . . . . . . . . . . . . . . . . . . . . . . . . . . . . . . . . . . . . . . . . . . . . . . 3,976Portion classified as current liabilities . . . . . . . . . . . . . . . . . . . . . . . . . . . . . . . . . . . . . . . . . . . . (3,976)
Non-current portion . . . . . . . . . . . . . . . . . . . . . . . . . . . . . . . . . . . . . . . . . . . . . . . . . . . . . . . . . . —
Warranties
US$’000
At April 1, 2016 . . . . . . . . . . . . . . . . . . . . . . . . . . . . . . . . . . . . . . . . . . . . . . . . . . . . . . . . . . . . . 3,976Additional provision . . . . . . . . . . . . . . . . . . . . . . . . . . . . . . . . . . . . . . . . . . . . . . . . . . . . . . . . . . 10,490Amounts utilized during the year . . . . . . . . . . . . . . . . . . . . . . . . . . . . . . . . . . . . . . . . . . . . . . . . (9,177)
At March 31, 2017 . . . . . . . . . . . . . . . . . . . . . . . . . . . . . . . . . . . . . . . . . . . . . . . . . . . . . . . . . . . 5,289Portion classified as current liabilities . . . . . . . . . . . . . . . . . . . . . . . . . . . . . . . . . . . . . . . . . . . . (5,289)
Non-current portion . . . . . . . . . . . . . . . . . . . . . . . . . . . . . . . . . . . . . . . . . . . . . . . . . . . . . . . . . . —
Warranties
US$’000
At April 1, 2017 . . . . . . . . . . . . . . . . . . . . . . . . . . . . . . . . . . . . . . . . . . . . . . . . . . . . . . . . . . . . . 5,289Additional provision . . . . . . . . . . . . . . . . . . . . . . . . . . . . . . . . . . . . . . . . . . . . . . . . . . . . . . . . . . 2,212Amounts utilized during the period . . . . . . . . . . . . . . . . . . . . . . . . . . . . . . . . . . . . . . . . . . . . . . (3,760)
At September 28, 2017 . . . . . . . . . . . . . . . . . . . . . . . . . . . . . . . . . . . . . . . . . . . . . . . . . . . . . . . . 3,741Portion classified as current liabilities . . . . . . . . . . . . . . . . . . . . . . . . . . . . . . . . . . . . . . . . . . . . (3,741)
Non-current portion . . . . . . . . . . . . . . . . . . . . . . . . . . . . . . . . . . . . . . . . . . . . . . . . . . . . . . . . . . —
The Euro-Pro Group provides standard warranties of one to seven years to its customers. Theamount of the provision for the warranties is estimated based on sales volumes and past experience ofthe level of repairs and returns. The estimation basis is reviewed on an ongoing basis and is revisedwhere appropriate.
21. INTEREST-BEARING BANK BORROWINGS
Interest rate MaturityMarch 31,
2016March 31,
2017September 28,
2017
% US$’000 US$’000 US$’000
CurrentBank loans—secured . . . . . . . . 6.00+LIBOR 2017 3,784 — —
Non-currentBank loans—secured . . . . . . . . 6.00+LIBOR 2020 45,903 — —Bank loans—secured . . . . . . . . 1.25-1.75+LIBOR 2022 207,415 252,800 284,526
253,318 252,800 284,526
257,102 252,800 284,526
I-148
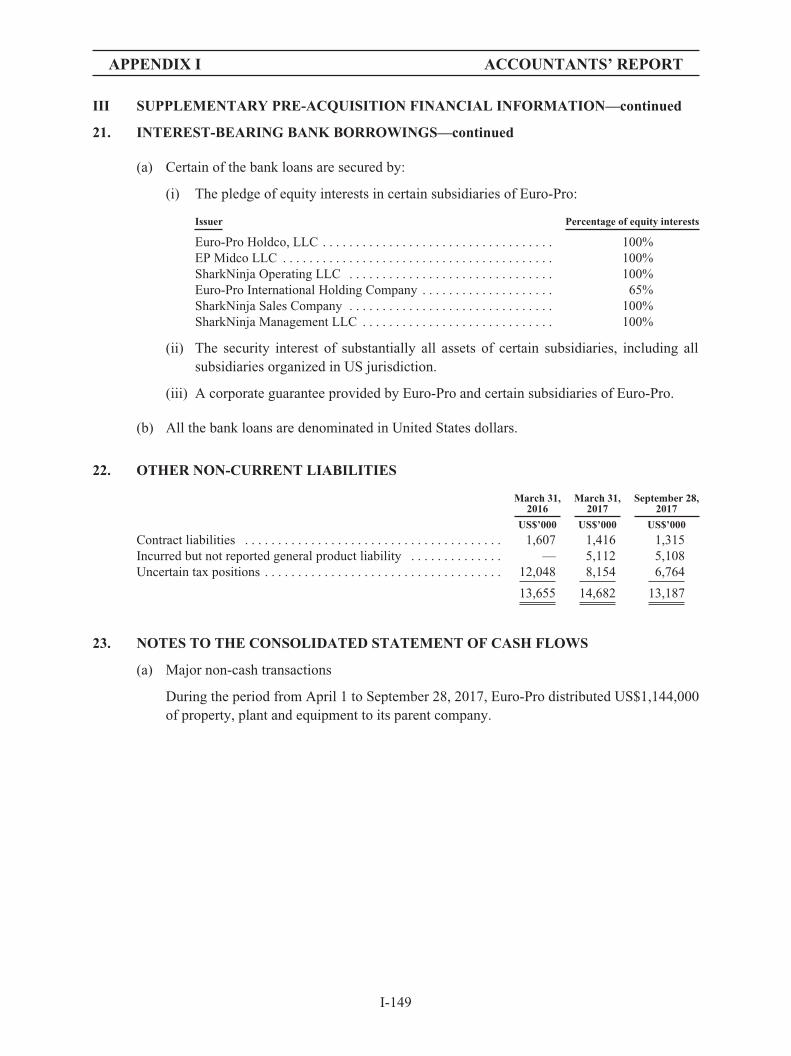
APPENDIX I ACCOUNTANTS’ REPORT
III SUPPLEMENTARY PRE-ACQUISITION FINANCIAL INFORMATION—continued
21. INTEREST-BEARING BANK BORROWINGS—continued
(a) Certain of the bank loans are secured by:
(i) The pledge of equity interests in certain subsidiaries of Euro-Pro:
Issuer Percentage of equity interests
Euro-Pro Holdco, LLC . . . . . . . . . . . . . . . . . . . . . . . . . . . . . . . . . . . 100%EP Midco LLC . . . . . . . . . . . . . . . . . . . . . . . . . . . . . . . . . . . . . . . . . 100%SharkNinja Operating LLC . . . . . . . . . . . . . . . . . . . . . . . . . . . . . . . 100%Euro-Pro International Holding Company . . . . . . . . . . . . . . . . . . . . 65%SharkNinja Sales Company . . . . . . . . . . . . . . . . . . . . . . . . . . . . . . . 100%SharkNinja Management LLC . . . . . . . . . . . . . . . . . . . . . . . . . . . . . 100%
(ii) The security interest of substantially all assets of certain subsidiaries, including allsubsidiaries organized in US jurisdiction.
(iii) A corporate guarantee provided by Euro-Pro and certain subsidiaries of Euro-Pro.
(b) All the bank loans are denominated in United States dollars.
22. OTHER NON-CURRENT LIABILITIES
March 31,2016
March 31,2017
September 28,2017
US$’000 US$’000 US$’000
Contract liabilities . . . . . . . . . . . . . . . . . . . . . . . . . . . . . . . . . . . . . . . 1,607 1,416 1,315Incurred but not reported general product liability . . . . . . . . . . . . . . — 5,112 5,108Uncertain tax positions . . . . . . . . . . . . . . . . . . . . . . . . . . . . . . . . . . . . 12,048 8,154 6,764
13,655 14,682 13,187
23. NOTES TO THE CONSOLIDATED STATEMENT OF CASH FLOWS
(a) Major non-cash transactions
During the period from April 1 to September 28, 2017, Euro-Pro distributed US$1,144,000of property, plant and equipment to its parent company.
I-149
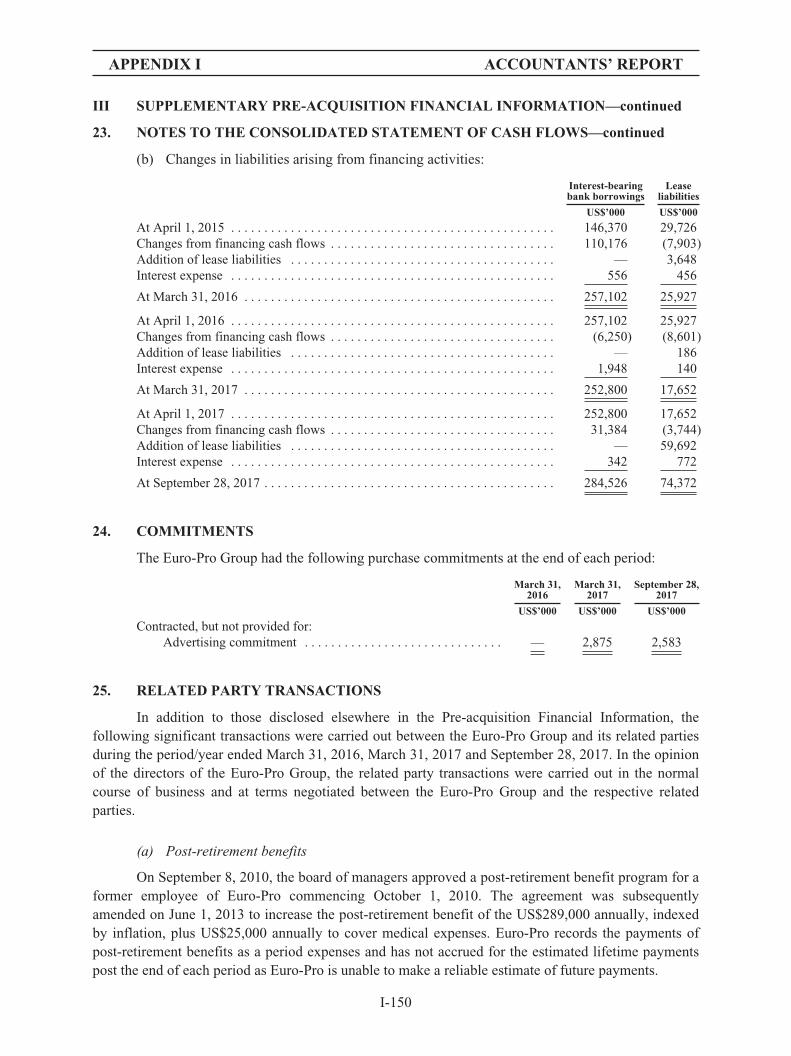
APPENDIX I ACCOUNTANTS’ REPORT
III SUPPLEMENTARY PRE-ACQUISITION FINANCIAL INFORMATION—continued
23. NOTES TO THE CONSOLIDATED STATEMENT OF CASH FLOWS—continued
(b) Changes in liabilities arising from financing activities:
Interest-bearingbank borrowings
Leaseliabilities
US$’000 US$’000
At April 1, 2015 . . . . . . . . . . . . . . . . . . . . . . . . . . . . . . . . . . . . . . . . . . . . . . . . . 146,370 29,726Changes from financing cash flows . . . . . . . . . . . . . . . . . . . . . . . . . . . . . . . . . . 110,176 (7,903)Addition of lease liabilities . . . . . . . . . . . . . . . . . . . . . . . . . . . . . . . . . . . . . . . . — 3,648Interest expense . . . . . . . . . . . . . . . . . . . . . . . . . . . . . . . . . . . . . . . . . . . . . . . . . 556 456
At March 31, 2016 . . . . . . . . . . . . . . . . . . . . . . . . . . . . . . . . . . . . . . . . . . . . . . . 257,102 25,927
At April 1, 2016 . . . . . . . . . . . . . . . . . . . . . . . . . . . . . . . . . . . . . . . . . . . . . . . . . 257,102 25,927Changes from financing cash flows . . . . . . . . . . . . . . . . . . . . . . . . . . . . . . . . . . (6,250) (8,601)Addition of lease liabilities . . . . . . . . . . . . . . . . . . . . . . . . . . . . . . . . . . . . . . . . — 186Interest expense . . . . . . . . . . . . . . . . . . . . . . . . . . . . . . . . . . . . . . . . . . . . . . . . . 1,948 140
At March 31, 2017 . . . . . . . . . . . . . . . . . . . . . . . . . . . . . . . . . . . . . . . . . . . . . . . 252,800 17,652
At April 1, 2017 . . . . . . . . . . . . . . . . . . . . . . . . . . . . . . . . . . . . . . . . . . . . . . . . . 252,800 17,652Changes from financing cash flows . . . . . . . . . . . . . . . . . . . . . . . . . . . . . . . . . . 31,384 (3,744)Addition of lease liabilities . . . . . . . . . . . . . . . . . . . . . . . . . . . . . . . . . . . . . . . . — 59,692Interest expense . . . . . . . . . . . . . . . . . . . . . . . . . . . . . . . . . . . . . . . . . . . . . . . . . 342 772
At September 28, 2017 . . . . . . . . . . . . . . . . . . . . . . . . . . . . . . . . . . . . . . . . . . . . 284,526 74,372
24. COMMITMENTS
The Euro-Pro Group had the following purchase commitments at the end of each period:
March 31,2016
March 31,2017
September 28,2017
US$’000 US$’000 US$’000
Contracted, but not provided for:Advertising commitment . . . . . . . . . . . . . . . . . . . . . . . . . . . . . . — 2,875 2,583
25. RELATED PARTY TRANSACTIONS
In addition to those disclosed elsewhere in the Pre-acquisition Financial Information, thefollowing significant transactions were carried out between the Euro-Pro Group and its related partiesduring the period/year ended March 31, 2016, March 31, 2017 and September 28, 2017. In the opinionof the directors of the Euro-Pro Group, the related party transactions were carried out in the normalcourse of business and at terms negotiated between the Euro-Pro Group and the respective relatedparties.
(a) Post-retirement benefits
On September 8, 2010, the board of managers approved a post-retirement benefit program for aformer employee of Euro-Pro commencing October 1, 2010. The agreement was subsequentlyamended on June 1, 2013 to increase the post-retirement benefit of the US$289,000 annually, indexedby inflation, plus US$25,000 annually to cover medical expenses. Euro-Pro records the payments ofpost-retirement benefits as a period expenses and has not accrued for the estimated lifetime paymentspost the end of each period as Euro-Pro is unable to make a reliable estimate of future payments.
I-150
APPENDIX I ACCOUNTANTS’ REPORT
III SUPPLEMENTARY PRE-ACQUISITION FINANCIAL INFORMATION—continued
25. RELATED PARTY TRANSACTIONS—continued
(b) Loans receivable
On January 11, 2017, Euro-Pro loaned US$10,237,000 to officers in order for the officers topurchase matured units from a former unit holder in the form of recourse notes. The notes mature inJanuary 2022 and 100% of principal is due upon maturity. The notes can be repaid at any time withoutpenalty and payment on the notes will be accelerated upon the sale of substantially all of the equity orassets of Euro-Pro. The notes have been recorded as prepayments, other receivables and other assets inthe consolidated statement of financial position.
The loans receivable bear interest at the applicable federal rate for the short-term obligations(with annual interest payments) prescribed in Section 1274(d) of the Internal Revenue Code of 1986, asamended (or any successor provision with similar applicability), as in effect from time to time.
(c) Key management compensation
Compensation for key management other than those for directors as disclosed in note III 8 areset out below:
For the year endedMarch 31, 2016
For the year endedMarch 31, 2017
For the period fromApril 1 to
September 28, 2017
US$’000 US$’000 US$’000
Salaries, allowances and benefits . . . . . . . . . . . . 1,481 1,526 780Performance-related bonuses . . . . . . . . . . . . . . . 45,762 51,181 41,659Pension scheme contributions . . . . . . . . . . . . . . . 1,988 2,075 1,121
Total . . . . . . . . . . . . . . . . . . . . . . . . . . . . . . . . . . 49,231 54,782 43,560
26. FINANCIAL INSTRUMENTS BY CATEGORY
The carrying amounts of each of the categories of financial instruments as at March 31, 2016,March 31, 2017 and September 28, 2017 are as follows:
March 31, 2016
Financial assets
Financial assets atamortized cost
US$’000
Trade receivables . . . . . . . . . . . . . . . . . . . . . . . . . . . . . . . . . . . . . . . . . . . . . . . . . . . . . . . 233,316Financial assets included in prepayments, other receivables and other assets . . . . . . . . . 134Cash and cash equivalents . . . . . . . . . . . . . . . . . . . . . . . . . . . . . . . . . . . . . . . . . . . . . . . . . 17,661Other non-current assets including insurance receivables and deposits . . . . . . . . . . . . . . 768
251,879
I-151

APPENDIX I ACCOUNTANTS’ REPORT
III SUPPLEMENTARY PRE-ACQUISITION FINANCIAL INFORMATION—continued
26. FINANCIAL INSTRUMENTS BY CATEGORY—continued
March 31, 2016—continued
Financial liabilitiesFinancial liabilitiesat amortized cost
US$’000
Trade payables . . . . . . . . . . . . . . . . . . . . . . . . . . . . . . . . . . . . . . . . . . . . . . . . . . . . . . . . . 40,020Interest-bearing bank borrowings . . . . . . . . . . . . . . . . . . . . . . . . . . . . . . . . . . . . . . . . . . 257,102
297,122
March 31, 2017
Financial assetsFinancial assets
at amortized cost
US$’000
Trade receivables . . . . . . . . . . . . . . . . . . . . . . . . . . . . . . . . . . . . . . . . . . . . . . . . . . . . . . . . 234,213Financial assets included in prepayments, other receivables and other assets . . . . . . . . . . 10,537Cash and cash equivalents . . . . . . . . . . . . . . . . . . . . . . . . . . . . . . . . . . . . . . . . . . . . . . . . . 5,590Other non-current assets including insurance receivables and deposits . . . . . . . . . . . . . . . 1,514
251,854
Financial liabilitiesFinancial liabilitiesat amortized cost
US$’000
Trade payables . . . . . . . . . . . . . . . . . . . . . . . . . . . . . . . . . . . . . . . . . . . . . . . . . . . . . . . . . 57,176Interest-bearing bank borrowings . . . . . . . . . . . . . . . . . . . . . . . . . . . . . . . . . . . . . . . . . . 252,800
309,976
September 28, 2017
Financial assetsFinancial assets
at amortized cost
US$’000
Trade receivables . . . . . . . . . . . . . . . . . . . . . . . . . . . . . . . . . . . . . . . . . . . . . . . . . . . . . . . . 302,451Financial assets included in prepayments, other receivables and other assets . . . . . . . . . . 11,646Cash and cash equivalents . . . . . . . . . . . . . . . . . . . . . . . . . . . . . . . . . . . . . . . . . . . . . . . . . 16,401Other non-current assets including insurance receivables and deposits . . . . . . . . . . . . . . . 1,113
331,611
Financial liabilitiesFinancial liabilitiesat amortized cost
US$’000
Trade payables . . . . . . . . . . . . . . . . . . . . . . . . . . . . . . . . . . . . . . . . . . . . . . . . . . . . . . . . . 161,663Interest-bearing bank borrowings . . . . . . . . . . . . . . . . . . . . . . . . . . . . . . . . . . . . . . . . . . 284,526
446,189
I-152
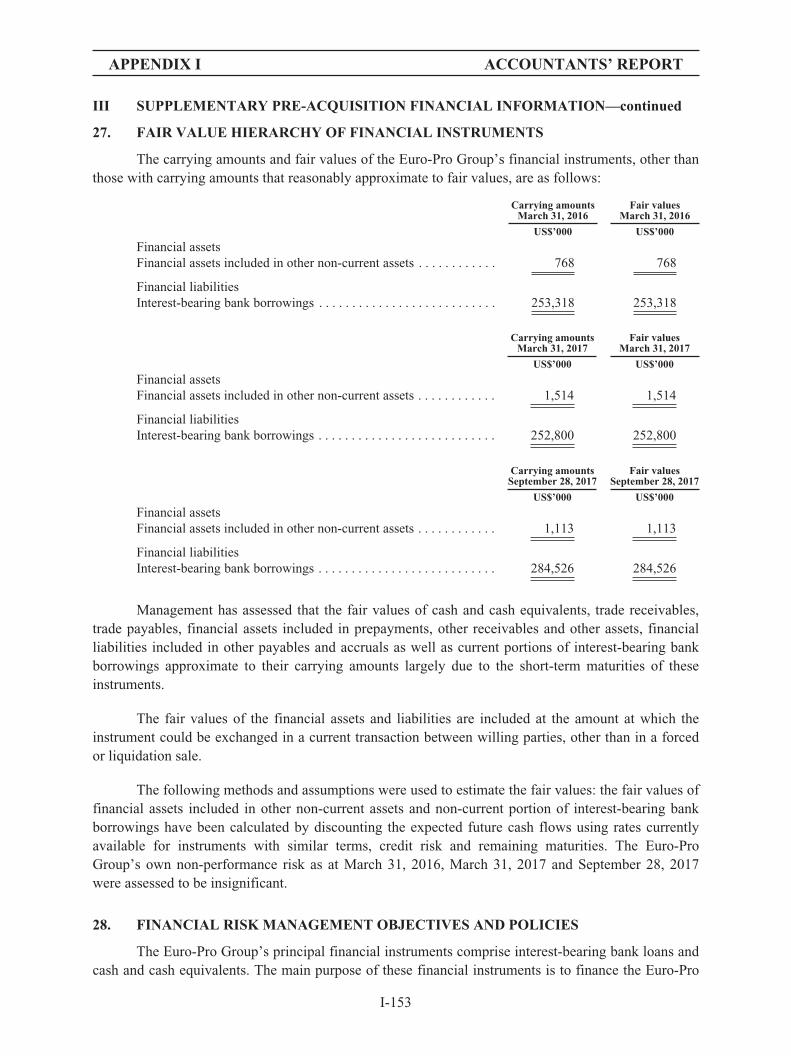
APPENDIX I ACCOUNTANTS’ REPORT
III SUPPLEMENTARY PRE-ACQUISITION FINANCIAL INFORMATION—continued
27. FAIR VALUE HIERARCHY OF FINANCIAL INSTRUMENTS
The carrying amounts and fair values of the Euro-Pro Group’s financial instruments, other thanthose with carrying amounts that reasonably approximate to fair values, are as follows:
Carrying amountsMarch 31, 2016
Fair valuesMarch 31, 2016
US$’000 US$’000
Financial assetsFinancial assets included in other non-current assets . . . . . . . . . . . . 768 768
Financial liabilitiesInterest-bearing bank borrowings . . . . . . . . . . . . . . . . . . . . . . . . . . . 253,318 253,318
Carrying amountsMarch 31, 2017
Fair valuesMarch 31, 2017
US$’000 US$’000
Financial assetsFinancial assets included in other non-current assets . . . . . . . . . . . . 1,514 1,514
Financial liabilitiesInterest-bearing bank borrowings . . . . . . . . . . . . . . . . . . . . . . . . . . . 252,800 252,800
Carrying amountsSeptember 28, 2017
Fair valuesSeptember 28, 2017
US$’000 US$’000
Financial assetsFinancial assets included in other non-current assets . . . . . . . . . . . . 1,113 1,113
Financial liabilitiesInterest-bearing bank borrowings . . . . . . . . . . . . . . . . . . . . . . . . . . . 284,526 284,526
Management has assessed that the fair values of cash and cash equivalents, trade receivables,trade payables, financial assets included in prepayments, other receivables and other assets, financialliabilities included in other payables and accruals as well as current portions of interest-bearing bankborrowings approximate to their carrying amounts largely due to the short-term maturities of theseinstruments.
The fair values of the financial assets and liabilities are included at the amount at which theinstrument could be exchanged in a current transaction between willing parties, other than in a forcedor liquidation sale.
The following methods and assumptions were used to estimate the fair values: the fair values offinancial assets included in other non-current assets and non-current portion of interest-bearing bankborrowings have been calculated by discounting the expected future cash flows using rates currentlyavailable for instruments with similar terms, credit risk and remaining maturities. The Euro-ProGroup’s own non-performance risk as at March 31, 2016, March 31, 2017 and September 28, 2017were assessed to be insignificant.
28. FINANCIAL RISK MANAGEMENT OBJECTIVES AND POLICIES
The Euro-Pro Group’s principal financial instruments comprise interest-bearing bank loans andcash and cash equivalents. The main purpose of these financial instruments is to finance the Euro-Pro
I-153
APPENDIX I ACCOUNTANTS’ REPORT
III SUPPLEMENTARY PRE-ACQUISITION FINANCIAL INFORMATION—continued
28. FINANCIAL RISK MANAGEMENT OBJECTIVES AND POLICIES—continued
Group’s operations. The Euro-Pro Group has various other financial assets and liabilities such as tradereceivables, trade payables, financial assets included in prepayments, other receivables and other assetsand financial assets included in other non-current assets which arise directly from its operations.
The main risks arising from the Euro-Pro Group’s financial instruments are interest rate risk,foreign currency risk, credit risk and liquidity risk. The board of directors reviews and agrees policiesfor managing each of these risks and they are summarized below.
Interest rate risk
The Euro-Pro Group’s exposure to interest rate risk relates principally to the Euro-Pro Group’sshort term and long term interest-bearing bank loans which are based on the London Inter-BankOffered Rate. The Euro-Pro Group mitigates the risk by monitoring closely the movements in interestrates and reviewing its banking facilities regularly. The Euro-Pro Group has not used any interest rateswap to hedge its exposure to interest rate risk.
As at March 31, 2016, March 31, 2017 and September 28, 2017, if the interest rates onborrowings had been 100 basis points higher/lower, which was considered reasonably possible bymanagement, with all other variables held constant, the profit after tax for the period would have beendecreased/increased by US$2,027,000, US$2,550,000 and US$2,687,000 as a result of higher/lowerinterest expenses on bank borrowings.
Foreign currency risk
The Euro-Pro Group has transactional currency exposures. These exposures mainly arise fromsales or purchases by the Euro-Pro Group’s operating units in Europe, Mainland China and Japan incurrencies other than the Euro-Pro Group’s functional currency. In addition, the Euro-Pro Group’scertain revenue, cost and expenses of subsidiaries of the Euro-Pro Group are denominated in GBP,RMB and JPY.
Credit risk
The Euro-Pro Group is exposed to credit risk in relation to its trade receivables and otherreceivables and cash and cash equivalents.
All the Euro-Pro Group’s cash and cash equivalents are held in major financial institutionslocated in the United States and Europe, which management believes are of high credit quality. TheEuro-Pro Group has policies in place to evaluate credit risk when accepting new business and to limitits credit exposure to individual customers.
The Euro-Pro Group trades only with recognized and creditworthy third parties. Concentrationsof credit risk are managed by analysis by customer/counterparty. There are no significantconcentrations of credit risk within the Euro-Pro Group as the customer bases of the Euro-Pro Group’strade receivables and other receivables are widely dispersed. In addition, receivable balances aremonitored on an ongoing basis and the Euro-Pro Group’s exposure to bad debts is not significant. Themaximum exposure is the carrying amounts as disclosed in notes III 16 and III 17.
I-154

APPENDIX I ACCOUNTANTS’ REPORT
III SUPPLEMENTARY PRE-ACQUISITION FINANCIAL INFORMATION—continued
28. FINANCIAL RISK MANAGEMENT OBJECTIVES AND POLICIES—continued
Liquidity risk
The Euro-Pro Group monitors its risk to a shortage of funds using a recurring liquidity planningtool. This tool considers the maturity of both its financial instruments and financial assets and projectcash flows from operations.
The Euro-Pro Group’s objective is to maintain a balance between continuity of funding andflexibility through the use of bank loans and other interest-bearing loans.
The maturity profile of the Euro-Pro Group’s financial liabilities as at the end of each period,based on the contractual undiscounted payments, is as follows:
March 31, 2016
Less than3 months
3 to less than12 months
1 to 5years
Over5 years Total
US$’000 US$’000 US$’000 US$’000 US$’000
Interest-bearing bank borrowings . . . . . . . . . . . . . 2,442 7,272 50,568 218,731 279,013Trade payables . . . . . . . . . . . . . . . . . . . . . . . . . . . . 39,759 261 — — 40,020
Total . . . . . . . . . . . . . . . . . . . . . . . . . . . . . . . . . . . . 42,201 7,533 50,568 218,731 319,033
March 31, 2017
Less than3 months
3 to less than12 months
1 to 5years
Over5 years Total
US$’000 US$’000 US$’000 US$’000 US$’000
Interest-bearing bank borrowings . . . . . . . . . . . . . 1,930 5,789 266,203 — 273,922Trade payables . . . . . . . . . . . . . . . . . . . . . . . . . . . . 56,908 268 — — 57,176
Total . . . . . . . . . . . . . . . . . . . . . . . . . . . . . . . . . . . . 58,838 6,057 266,203 — 331,098
September 28, 2017
Less than3 months
3 to less than12 months
1 to 5years
Over5 years Total
US$’000 US$’000 US$’000 US$’000 US$’000
Interest-bearing bank borrowings . . . . . . . . . . . . . 2,114 5,600 296,180 — 303,894Trade payables . . . . . . . . . . . . . . . . . . . . . . . . . . . . 161,470 193 — — 161,663
Total . . . . . . . . . . . . . . . . . . . . . . . . . . . . . . . . . . . . 163,584 5,793 296,180 — 465,557
Capital management
The primary objective of the Euro-Pro Group’s capital management is to ensure that itmaintains healthy capital ratios in order to support its business and maximize shareholders’ value.
The Euro-Pro Group manages its capital structure and makes adjustments to it in light ofchanges in economic conditions and the risk characteristics of the underlying assets. To maintain oradjust the capital structure, the Euro-Pro Group may adjust the dividends payment to shareholders. Nochanges were made in the objectives, policies or processes for managing capital during each period.
I-155

APPENDIX II UNAUDITED PRO FORMA FINANCIAL INFORMATION
The information set out in this Appendix does not form part of the Accountants’ Reportprepared by our Company’s reporting accountants, Ernst & Young, Certified Public Accountants,Hong Kong, as set out in Appendix I to this prospectus, and is included for information purpose only.The unaudited pro forma financial information should be read in conjunction with the section headed“Financial Information” in this prospectus and the Accountants’ Report set out in Appendix I to thisprospectus.
A. UNAUDITED PRO FORMA STATEMENT OF ADJUSTED CONSOLIDATED NETTANGIBLE ASSETS
The following unaudited pro forma adjusted net tangible assets prepared in accordance withrule 4.29 of the Listing Rules are set out below to illustrate the effect of the Global Offering on theconsolidated net tangible assets of the Group attributable to the owners of the Company as of June 30,2019 as if the Global Offering had taken place on that date. The unaudited pro forma adjusted nettangible assets have been prepared for illustrative purposes only and, because of their hypotheticalnature, it may not give a true picture of the consolidated net tangible assets of the Group had the GlobalOffering been completed as at June 30, 2019 or any future dates.
Consolidated net tangibleliabilities attributable toowners of the Company
as of June 30, 2019(1)
Estimated netproceeds from theGlobal Offering(2)
Unaudited pro formaadjusted consolidatednet tangible liabilitiesattributable to owners
of the Company(3)
Unaudited pro formaadjusted consolidated net
tangible liabilities pershare(4)(5)
US$’000 US$’000 US$’000 US$ HK$
Based on an Offer Price ofHK$5.55 per Offer Share . . (1,252,840) 325,212 (927,628) (0.28) (2.18)
Based on an Offer Price ofHK$7.25 per Offer Share . . (1,252,840) 430,307 (822,533) (0.25) (1.94)
Notes:(1) The consolidated net tangible liabilities attributable to owners of the Company as at June 30, 2019 are based on the consolidated equity
attributable to owners of the Company in the amount of US$205.6 million, adjusted intangible assets in the amount of US$1,458.5million.
(2) The estimated net proceeds from the Global Offering are based on the indicative offer prices of HK$5.55 per Offer Share (being theminimum offer price), and HK$7.25 per Offer Share (being the maximum offer price), respectively, after deduction of the estimatedunderwriting fees and other listing expenses payable by the Company, taking no account of any shares which may be issued upon theexercise of the Over-allotment Option for the Global Offering.
(3) The unaudited pro forma adjusted consolidated net tangible liabilities do not take into account the operational results or other transactionof the Group subsequent to June 30, 2019.
(4) The unaudited pro forma adjusted net tangible liabilities per share is arrived at after the adjustment referred to in note (2) above and onthe basis that 3,332,198,117 shares were in issue assuming that the Global Offering had been completed on June 30, 2019 and that Over-allotment Option for the Global Offering is not exercised.
(5) For the purpose of this unaudited pro forma adjusted net tangible liabilities, the amounts stated in US dollars are converted into HongKong dollars at a rate of US$1.00 to HK$7.8420. No representation is made that US dollars amounts have been, could have been or maybe converted into Hong Kong dollars, or vice versa, at that rate.
II-1
APPENDIX II UNAUDITED PRO FORMA FINANCIAL INFORMATION
B. LETTER FROM THE REPORTING ACCOUNTANTS ON UNAUDITED PROFORMA INFORMATION
The following is the text of a report received from our independent accountants, Ernst &Young, Certified Public Accountants, Hong Kong, prepared for the purpose of incorporation in thisdocument, in respect of unaudited pro forma financial information of the Group.
Ernst & Young22/F, CITIC Tower1 Tim Mei AvenueCentral, Hong Kong
122
Tel : +852 2846 9888 Fax : +852 2868 4432 ey.com
To the Directors of JS Global Lifestyle Company Limited
We have completed our assurance engagement to report on the compilation of pro formafinancial information of JS Global Lifestyle Company Limited (the “Company”) and its subsidiaries(hereinafter collectively referred to as the “Group”) by the directors of the Company (the “Directors”)for illustrative purposes only. The pro forma financial information consists of the pro formaconsolidated net tangible assets as at June 30, 2019, and related notes as set out on page II-1 of theCompany’s prospectus dated October 22, 2019 (the “Prospectus”) issued by the Company (the “ProForma Financial Information”). The applicable criteria on the basis of which the Directors havecompiled the Pro Forma Financial Information are described in Appendix II-A to the Prospectus.
The Pro Forma Financial Information has been compiled by the Directors to illustrate theimpact of the global offering of shares of the Company on the Group’s financial position as at June 30,2019 as if the transaction had taken place at June 30, 2019. As part of this process, information aboutthe Group’s financial position has been extracted by the Directors from the Group’s financialstatements for the year ended June 30, 2019, on which an accountants’ report has been published.
Directors’ responsibility for the Pro Forma Financial Information
The Directors are responsible for compiling the Pro Forma Financial Information in accordancewith paragraph 4.29 of the Rules Governing the Listing of Securities on The Stock Exchange of HongKong Limited (the “Listing Rules”) and with reference to Accounting Guideline (“AG”) 7 Preparationof Pro Forma Financial Information for Inclusion in Investment Circulars issued by the Hong KongInstitute of Certified Public Accountants (the “HKICPA”).
Our independence and quality control
We have complied with the independence and other ethical requirements of the Code of Ethicsfor Professional Accountants issued by the HKICPA, which is founded on fundamental principles ofintegrity, objectivity, professional competence and due care, confidentiality and professional behavior.
Our firm applies Hong Kong Standard on Quality Control 1 Quality Control for Firms thatPerform Audits and Reviews of Financial Statements, and Other Assurance and Related ServicesEngagements, and accordingly maintains a comprehensive system of quality control includingdocumented policies and procedures regarding compliance with ethical requirements, professionalstandards and applicable legal and regulatory requirements.
II-2
APPENDIX II UNAUDITED PRO FORMA FINANCIAL INFORMATION
Reporting accountants’ responsibilities
Our responsibility is to express an opinion, as required by paragraph 4.29(7) of the ListingRules, on the Pro Forma Financial Information and to report our opinion to you. We do not accept anyresponsibility for any reports previously given by us on any financial information used in thecompilation of the Pro Forma Financial Information beyond that owed to those to whom those reportswere addressed by us at the dates of their issue.
We conducted our engagement in accordance with Hong Kong Standard on AssuranceEngagements 3420 Assurance Engagements to Report on the Compilation of Pro Forma FinancialInformation Included in a Prospectus issued by the HKICPA. This standard requires that the reportingaccountants plan and perform procedures to obtain reasonable assurance about whether the Directorshave compiled the Pro Forma Financial Information in accordance with paragraph 4.29 of the ListingRules and with reference to AG 7 issued by the HKICPA.
For purposes of this engagement, we are not responsible for updating or reissuing any reports oropinions on any historical financial information used in compiling the Pro Forma FinancialInformation, nor have we, in the course of this engagement, performed an audit or review of thefinancial information used in compiling the Pro Forma Financial Information.
The purpose of the Pro Forma Financial Information included in the Prospectus is solely toillustrate the impact of the global offering of shares of the Company on unadjusted financialinformation of the Group as if the transaction had been undertaken at an earlier date selected forpurposes of the illustration. Accordingly, we do not provide any assurance that the actual outcome ofthe transaction would have been as presented.
A reasonable assurance engagement to report on whether the Pro Forma Financial Informationhas been properly compiled on the basis of the applicable criteria involves performing procedures toassess whether the applicable criteria used by the Directors in the compilation of the Pro FormaFinancial Information provide a reasonable basis for presenting the significant effects directlyattributable to the transaction, and to obtain sufficient appropriate evidence about whether:
Š the related pro forma adjustments give appropriate effect to those criteria; and
Š the Pro Forma Financial Information reflects the proper application of those adjustments tothe unadjusted financial information.
The procedures selected depend on the reporting accountants’ judgment, having regard to thereporting accountants’ understanding of the nature of the Group, the transaction in respect of which thePro Forma Financial Information has been compiled, and other relevant engagement circumstances.
The engagement also involves evaluating the overall presentation of the Pro Forma FinancialInformation.
We believe that the evidence we have obtained is sufficient and appropriate to provide a basisfor our opinion.
II-3
APPENDIX II UNAUDITED PRO FORMA FINANCIAL INFORMATION
Opinion
In our opinion:
(a) the Pro Forma Financial Information has been properly compiled on the basis stated;
(b) such basis is consistent with the accounting policies of the Group; and
(c) the adjustments are appropriate for the purpose of the Pro Forma Financial Information asdisclosed pursuant to paragraph 4.29(1) of the Listing Rules.
Yours faithfully,
Ernst & YoungCertified Public AccountantsHong KongOctober 22, 2019
II-4
APPENDIX III SUMMARY OF THE CONSTITUTION OF THE COMPANYAND CAYMAN ISLANDS COMPANY LAW
SUMMARY OF THE CONSTITUTION OF THE COMPANY
1 Memorandum of Association
The Memorandum of Association of the Company was conditionally adopted on October 9,2019 and states, inter alia, that the liability of the members of the Company is limited, that the objectsfor which the Company is established are unrestricted and the Company shall have full power andauthority to carry out any object not prohibited by the Companies Law or any other law of the CaymanIslands.
The Memorandum of Association is available for inspection at the address specified inAppendix V in the section headed “Documents Delivered to the Registrar of Companies in Hong Kongand Available for Inspection”.
2 Articles of Association
The Articles of Association of the Company were conditionally adopted on October 9, 2019and include provisions to the following effect:
2.1 Classes of Shares
The share capital of the Company consists of ordinary shares. The capital of the Company atthe date of adoption of the Articles is US$50,000 divided into 5,000,000,000 shares of US$0.00001each.
2.2 Directors
(a) Power to allot and issue Shares
Subject to the provisions of the Companies Law and the Memorandum and Articles ofAssociation, the unissued shares in the Company (whether forming part of its original or any increasedcapital) shall be at the disposal of the Directors, who may offer, allot, grant options over or otherwisedispose of them to such persons, at such times and for such consideration, and upon such terms, as theDirectors shall determine.
Subject to the provisions of the Articles of Association and to any direction that may be givenby the Company in general meeting and without prejudice to any special rights conferred on theholders of any existing shares or attaching to any class of shares, any share may be issued with or haveattached thereto such preferred, deferred, qualified or other special rights or restrictions, whether inregard to dividend, voting, return of capital or otherwise, and to such persons at such times and forsuch consideration as the Directors may determine. Subject to the Companies Law and to any specialrights conferred on any shareholders or attaching to any class of shares, any share may, with thesanction of a special resolution, be issued on terms that it is, or at the option of the Company or theholder thereof, liable to be redeemed.
(b) Power to dispose of the assets of the Company or any subsidiary
The management of the business of the Company shall be vested in the Directors who, inaddition to the powers and authorities by the Articles of Association expressly conferred upon them,may exercise all such powers and do all such acts and things as may be exercised or done or approvedby the Company and are not by the Articles of Association or the Companies Law expressly directed orrequired to be exercised or done by the Company in general meeting, but subject nevertheless to the
III-1
APPENDIX III SUMMARY OF THE CONSTITUTION OF THE COMPANYAND CAYMAN ISLANDS COMPANY LAW
provisions of the Companies Law and of the Articles of Association and to any regulation from time totime made by the Company in general meeting not being inconsistent with such provisions or theArticles of Association, provided that no regulation so made shall invalidate any prior act of theDirectors which would have been valid if such regulation had not been made.
(c) Compensation or payment for loss of office
Payment to any Director or past Director of any sum by way of compensation for loss of officeor as consideration for or in connection with his retirement from office (not being a payment to whichthe Director is contractually entitled) must first be approved by the Company in general meeting.
(d) Loans to Directors
There are provisions in the Articles of Association prohibiting the making of loans to Directorsor their respective close associates which are equivalent to the restrictions imposed by the CompaniesOrdinance.
(e) Financial assistance to purchase Shares
Subject to all applicable laws, the Company may give financial assistance to Directors andemployees of the Company, its subsidiaries or any holding company or any subsidiary of such holdingcompany in order that they may buy shares in the Company or any such subsidiary or holdingcompany. Further, subject to all applicable laws, the Company may give financial assistance to atrustee for the acquisition of shares in the Company or shares in any such subsidiary or holdingcompany to be held for the benefit of employees of the Company, its subsidiaries, any holdingcompany of the Company or any subsidiary of any such holding company (including salariedDirectors).
(f) Disclosure of interest in contracts with the Company or any of its subsidiaries
No Director or proposed Director shall be disqualified by his office from contracting with theCompany either as vendor, purchaser or otherwise nor shall any such contract or any contract orarrangement entered into by or on behalf of the Company with any person, company or partnership ofor in which any Director shall be a member or otherwise interested be capable on that account of beingavoided, nor shall any Director so contracting or being any member or so interested be liable toaccount to the Company for any profit so realized by any such contract or arrangement by reason onlyof such Director holding that office or the fiduciary relationship thereby established, provided that suchDirector shall, if his interest in such contract or arrangement is material, declare the nature of hisinterest at the earliest meeting of the board of Directors at which it is practicable for him to do so,either specifically or by way of a general notice stating that, by reason of the facts specified in thenotice, he is to be regarded as interested in any contracts of a specified description which may be madeby the Company.
A Director shall not be entitled to vote on (nor shall be counted in the quorum in relation to)any resolution of the Directors in respect of any contract or arrangement or any other proposal in whichthe Director or any of his close associates (or, if required by the Listing Rules, his other associates) has
III-2

APPENDIX III SUMMARY OF THE CONSTITUTION OF THE COMPANYAND CAYMAN ISLANDS COMPANY LAW
any material interest, and if he shall do so his vote shall not be counted (nor is he to be counted in thequorum for the resolution), but this prohibition shall not apply to any of the following matters, namely:
(i) the giving to such Director or any of his close associates of any security or indemnity inrespect of money lent or obligations incurred or undertaken by him or any of them at therequest of or for the benefit of the Company or any of its subsidiaries;
(ii) the giving of any security or indemnity to a third party in respect of a debt or obligation ofthe Company or any of its subsidiaries for which the Director or any of his close associateshas himself/themselves assumed responsibility in whole or in part and whether alone orjointly under a guarantee or indemnity or by the giving of security;
(iii) any proposal concerning an offer of shares, debentures or other securities of or by theCompany or any other company which the Company may promote or be interested in forsubscription or purchase where the Director or any of his close associates is/are or is/are tobe interested as a participant in the underwriting or sub-underwriting of the offer;
(iv) any proposal or arrangement concerning the benefit of employees of the Company or anyof its subsidiaries including:
(A) the adoption, modification or operation of any employees’ share scheme or any shareincentive scheme or share option scheme under which the Director or any of his closeassociates may benefit; or
(B) the adoption, modification or operation of a pension or provident fund or retirement,death or disability benefits scheme which relates both to Directors, their closeassociates and employees of the Company or any of its subsidiaries and does notprovide in respect of any Director or any of his close associates, as such any privilegeor advantage not generally accorded to the class of persons to which such scheme orfund relates; and
(v) any contract or arrangement in which the Director or any of his close associates is/areinterested in the same manner as other holders of shares or debentures or other securitiesof the Company by virtue only of his/their interest in shares or debentures or othersecurities of the Company.
(g) Remuneration
The Directors shall be entitled to receive by way of remuneration for their services such sum asshall from time to time be determined by the Directors, or the Company in general meeting, as the casemay be, such sum (unless otherwise directed by the resolution by which it is determined) to be dividedamongst the Directors in such proportions and in such manner as they may agree, or failing agreement,equally, except that in such event any Director holding office for less than the whole of the relevantperiod in respect of which the remuneration is paid shall only rank in such division in proportion to thetime during such period for which he has held office. Such remuneration shall be in addition to anyother remuneration to which a Director who holds any salaried employment or office in the Companymay be entitled by reason of such employment or office.
The Directors shall also be entitled to be paid all expenses, including travel expenses,reasonably incurred by them in or in connection with the performance of their duties as Directorsincluding their expenses of traveling to and from board meetings, committee meetings or general
III-3

APPENDIX III SUMMARY OF THE CONSTITUTION OF THE COMPANYAND CAYMAN ISLANDS COMPANY LAW
meetings or otherwise incurred whilst engaged on the business of the Company or in the discharge oftheir duties as Directors.
The Directors may grant special remuneration to any Director who shall perform any special orextra services at the request of the Company. Such special remuneration may be made payable to suchDirector in addition to or in substitution for his ordinary remuneration as a Director, and may be madepayable by way of salary, commission or participation in profits or otherwise as may be agreed.
The remuneration of an executive Director or a Director appointed to any other office in themanagement of the Company shall from time to time be fixed by the Directors and may be by way ofsalary, commission or participation in profits or otherwise or by all or any of those modes and withsuch other benefits (including share option and/or pension and/or gratuity and/or other benefits onretirement) and allowances as the Directors may from time to time decide. Such remuneration shall bein addition to such remuneration as the recipient may be entitled to receive as a Director.
(h) Retirement, appointment and removal
The Directors shall have power at any time and from time to time to appoint any person to be aDirector, either to fill a casual vacancy or as an addition to the existing Directors. Any Director soappointed shall hold office only until the next general meeting of the Company and shall then beeligible for re-election at that meeting, but shall not be taken into account in determining the number ofDirectors and which Directors are to retire by rotation at such meeting.
The Company may by ordinary resolution remove any Director (including a Managing Directoror other executive Director) before the expiration of his period of office notwithstanding anything inthe Articles of Association or in any agreement between the Company and such Director (but withoutprejudice to any claim for compensation or damages payable to him in respect of the termination of hisappointment as Director or of any other appointment of office as a result of the termination of thisappointment as Director). The Company may by ordinary resolution appoint another person in hisplace. Any Director so appointed shall hold office during such time only as the Director in whose placehe is appointed would have held the same if he had not been removed.
The Company may also by ordinary resolution elect any person to be a Director, either to fill acasual vacancy or as an addition to the existing Directors. No person shall, unless recommended by theDirectors, be eligible for election to the office of Director at any general meeting unless, during theperiod, which shall be at least seven days, commencing no earlier than the day after the despatch of thenotice of the meeting appointed for such election and ending no later than seven days prior to the dateof such meeting, there has been given to the Secretary of the Company notice in writing by a memberof the Company (not being the person to be proposed) entitled to attend and vote at the meeting forwhich such notice is given of his intention to propose such person for election and also notice inwriting signed by the person to be proposed of his willingness to be elected.
There is no shareholding qualification for Directors nor is there any specified age limit forDirectors.
The office of a Director shall be vacated:
(i) if he resigns his office by notice in writing to the Company at its registered office or itsprincipal office in Hong Kong;
III-4
APPENDIX III SUMMARY OF THE CONSTITUTION OF THE COMPANYAND CAYMAN ISLANDS COMPANY LAW
(ii) if an order is made by any competent court or official on the grounds that he is or maybe suffering from mental disorder or is otherwise incapable of managing his affairs andthe Directors resolve that his office be vacated;
(iii) if, without leave, he is absent from meetings of the Directors (unless an alternateDirector appointed by him attends) for 12 consecutive months, and the Directors resolvethat his office be vacated;
(iv) if he becomes bankrupt or has a receiving order made against him or suspends paymentor compounds with his creditors generally;
(v) if he ceases to be or is prohibited from being a Director by law or by virtue of anyprovision in the Articles of Association;
(vi) if he is removed from office by notice in writing served upon him signed by not lessthan three-fourths in number (or, if that is not a round number, the nearest lower roundnumber) of the Directors (including himself) for the time being then in office; or
(vii) if he shall be removed from office by an ordinary resolution of the members of theCompany under the Articles of Association.
At every annual general meeting of the Company one-third of the Directors for the time being,or, if their number is not three or a multiple of three, then the number nearest to, but not less than,one-third, shall retire from office by rotation, provided that every Director (including those appointedfor a specific term) shall be subject to retirement by rotation at least once every three years. A retiringDirector shall retain office until the close of the meeting at which he retires and shall be eligible forre-election thereat. The Company at any annual general meeting at which any Directors retire may fillthe vacated office by electing a like number of persons to be Directors.
(i) Borrowing powers
The Directors may from time to time at their discretion exercise all the powers of the Companyto raise or borrow or to secure the payment of any sum or sums of money for the purposes of theCompany and to mortgage or charge its undertaking, property and assets (present and future) anduncalled capital or any part thereof.
(j) Proceedings of the Board
The Directors may meet together for the despatch of business, adjourn and otherwise regulatetheir meetings and proceedings as they think fit in any part of the world. Questions arising at anymeeting shall be determined by a majority of votes. In the case of an equality of votes, the chairman ofthe meeting shall have a second or casting vote.
2.3 Alteration to constitutional documents
No alteration or amendment to the Memorandum or Articles of Association may be madeexcept by special resolution.
2.4 Variation of rights of existing shares or classes of shares
If at any time the share capital of the Company is divided into different classes of shares, all orany of the rights attached to any class of shares for the time being issued (unless otherwise provided
III-5

APPENDIX III SUMMARY OF THE CONSTITUTION OF THE COMPANYAND CAYMAN ISLANDS COMPANY LAW
for in the terms of issue of the shares of that class) may, subject to the provisions of the CompaniesLaw, be varied or abrogated either with the consent in writing of the holders of not less than three-fourths in nominal value of the issued shares of that class or with the sanction of a special resolutionpassed at a separate meeting of the holders of the shares of that class. To every such separate meetingall the provisions of the Articles of Association relating to general meetings shall mutatis mutandisapply, but so that the quorum for the purposes of any such separate meeting and of any adjournmentthereof shall be a person or persons together holding (or representing by proxy or duly authorizedrepresentative) at the date of the relevant meeting not less than one-third in nominal value of the issuedshares of that class.
The special rights conferred upon the holders of shares of any class shall not, unless otherwiseexpressly provided in the rights attaching to or the terms of issue of such shares, be deemed to bevaried by the creation or issue of further shares ranking pari passu therewith.
2.5 Alteration of capital
The Company may, from time to time, whether or not all the shares for the time beingauthorized shall have been issued and whether or not all the shares for the time being issued shall havebeen fully paid up, by ordinary resolution, increase its share capital by the creation of new shares, suchnew capital to be of such amount and to be divided into shares of such respective amounts as theresolution shall prescribe.
The Company may from time to time by ordinary resolution:
(a) consolidate and divide all or any of its share capital into shares of a larger amount than itsexisting shares. On any consolidation of fully paid shares and division into shares of largeramount, the Directors may settle any difficulty which may arise as they think expedientand in particular (but without prejudice to the generality of the foregoing) may as betweenthe holders of shares to be consolidated determine which particular shares are to beconsolidated into each consolidated share, and if it shall happen that any person shallbecome entitled to fractions of a consolidated share or shares, such fractions may be soldby some person appointed by the Directors for that purpose and the person so appointedmay transfer the shares so sold to the purchaser thereof and the validity of such transfershall not be questioned, and so that the net proceeds of such sale (after deduction of theexpenses of such sale) may either be distributed among the persons who would otherwisebe entitled to a fraction or fractions of a consolidated share or shares ratably in accordancewith their rights and interests or may be paid to the Company for the Company’s benefit;
(b) cancel any shares which at the date of the passing of the resolution have not been taken oragreed to be taken by any person, and diminish the amount of its share capital by theamount of the shares so canceled subject to the provisions of the Companies Law; and
(c) sub-divide its shares or any of them into shares of smaller amount than is fixed by theMemorandum of Association, subject nevertheless to the provisions of the CompaniesLaw, and so that the resolution whereby any share is sub-divided may determine that, asbetween the holders of the shares resulting from such sub-division, one or more of theshares may have any such preferred or other special rights, over, or may have suchdeferred rights or be subject to any such restrictions as compared with the others as theCompany has power to attach to unissued or new shares.
III-6

APPENDIX III SUMMARY OF THE CONSTITUTION OF THE COMPANYAND CAYMAN ISLANDS COMPANY LAW
The Company may by special resolution reduce its share capital or any capital redemptionreserve in any manner authorized and subject to any conditions prescribed by the Companies Law.
2.6 Special resolution—majority required
A “special resolution” is defined in the Articles of Association to have the meaning ascribedthereto in the Companies Law, for which purpose, the requisite majority shall be not less than three-fourths of the votes of such members of the Company as, being entitled to do so, vote in person or, inthe case of corporations, by their duly authorized representatives or, where proxies are allowed, byproxy at a general meeting of which notice specifying the intention to propose the resolution as aspecial resolution has been duly given and includes a special resolution approved in writing by all ofthe members of the Company entitled to vote at a general meeting of the Company in one or moreinstruments each signed by one or more of such members, and the effective date of the specialresolution so adopted shall be the date on which the instrument or the last of such instruments (if morethan one) is executed.
In contrast, an “ordinary resolution” is defined in the Articles of Association to mean aresolution passed by a simple majority of the votes of such members of the Company as, being entitledto do so, vote in person or, in the case of corporations, by their duly authorized representatives or,where proxies are allowed, by proxy at a general meeting held in accordance with the Articles ofAssociation and includes an ordinary resolution approved in writing by all the members of theCompany aforesaid.
2.7 Voting rights
Subject to any special rights, privileges or restrictions as to voting for the time being attached toany class or classes of shares, at any general meeting on a poll every member present in person (or, inthe case of a member being a corporation, by its duly authorized representative) or by proxy shall haveone vote for each share registered in his name in the register of members of the Company.
Where any member is, under the Listing Rules, required to abstain from voting on anyparticular resolution or restricted to voting only for or only against any particular resolution, any votescast by or on behalf of such member in contravention of such requirement or restriction shall not becounted.
In the case of joint registered holders of any share, any one of such persons may vote at anymeeting, either personally or by proxy, in respect of such share as if he were solely entitled thereto; butif more than one of such joint holders be present at any meeting personally or by proxy, that one of thesaid persons so present being the most or, as the case may be, the more senior shall alone be entitled tovote in respect of the relevant joint holding and, for this purpose, seniority shall be determined byreference to the order in which the names of the joint holders stand on the register in respect of therelevant joint holding.
A member of the Company in respect of whom an order has been made by any competent courtor official on the grounds that he is or may be suffering from mental disorder or is otherwise incapableof managing his affairs may vote by any person authorized in such circumstances to do so and suchperson may vote by proxy.
III-7
APPENDIX III SUMMARY OF THE CONSTITUTION OF THE COMPANYAND CAYMAN ISLANDS COMPANY LAW
Save as expressly provided in the Articles of Association or as otherwise determined by theDirectors, no person other than a member of the Company duly registered and who shall have paid allsums for the time being due from him payable to the Company in respect of his shares shall be entitledto be present or to vote (save as proxy for another member of the Company), or to be reckoned in aquorum, either personally or by proxy at any general meeting.
At any general meeting a resolution put to the vote of the meeting shall be decided by way of apoll save that the chairman of the meeting may allow a resolution which relates purely to a proceduralor administrative matter as prescribed under the Listing Rules to be voted on by a show of hands.
If a recognized clearing house (or its nominee(s)) is a member of the Company it may authorizesuch person or persons as it thinks fit to act as its proxy(ies) or representative(s) at any general meetingof the Company or at any general meeting of any class of members of the Company provided that, ifmore than one person is so authorized, the authorization shall specify the number and class of shares inrespect of which each such person is so authorized. A person authorized pursuant to this provision shallbe entitled to exercise the same rights and powers on behalf of the recognized clearing house (or itsnominee(s)) which he represents as that recognized clearing house (or its nominee(s)) could exercise asif it were an individual member of the Company holding the number and class of shares specified insuch authorization, including, where a show of hands is allowed, the right to vote individually on ashow of hands.
2.8 Annual general meetings and extraordinary general meetings
The Company shall hold a general meeting as its annual general meeting each year, within aperiod of not more than 15 months after the holding of the last preceding annual general meeting (orsuch longer period as the Stock Exchange may authorize). The annual general meeting shall bespecified as such in the notices calling it.
The board of Directors may, whenever it thinks fit, convene an extraordinary general meeting.General meetings shall also be convened on the written requisition of any one or more membersholding together, as at the date of deposit of the requisition, shares representing not less than one-tenthof the paid up capital of the Company which carry the right of voting at general meetings of theCompany. The written requisition shall be deposited at the principal office of the Company inHong Kong or, in the event the Company ceases to have such a principal office, the registered office ofthe Company, specifying the objects of the meeting and signed by the requisitionist(s). If the Directorsdo not within 21 days from the date of deposit of the requisition proceed duly to convene the meetingto be held within a further 21 days, the requisitionist(s) themselves or any of them representing morethan one-half of the total voting rights of all of them, may convene the general meeting in the samemanner, as nearly as possible, as that in which meetings may be convened by the Directors providedthat any meeting so convened shall not be held after the expiration of three months from the date ofdeposit of the requisition, and all reasonable expenses incurred by the requisitionist(s) as a result of thefailure of the Directors shall be reimbursed to them by the Company.
2.9 Accounts and audit
The Directors shall cause to be kept such books of account as are necessary to give a true andfair view of the state of the Company’s affairs and to show and explain its transactions and otherwisein accordance with the Companies Law.
III-8
APPENDIX III SUMMARY OF THE CONSTITUTION OF THE COMPANYAND CAYMAN ISLANDS COMPANY LAW
The Directors shall from time to time determine whether, and to what extent, and at what timesand places and under what conditions or regulations, the accounts and books of the Company, or any ofthem, shall be open to the inspection by members of the Company (other than officers of the Company)and no such member shall have any right of inspecting any accounts or books or documents of theCompany except as conferred by the Companies Law or any other relevant law or regulation or asauthorized by the Directors or by the Company in general meeting.
The Directors shall, commencing with the first annual general meeting, cause to be preparedand to be laid before the members of the Company at every annual general meeting a profit and lossaccount for the period, in the case of the first account, since the incorporation of the Company and, inany other case, since the preceding account, together with a balance sheet as at the date to which theprofit and loss account is made up and a Director’s report with respect to the profit or loss of theCompany for the period covered by the profit and loss account and the state of the Company’s affairsas at the end of such period, an auditor’s report on such accounts and such other reports and accountsas may be required by law. Copies of those documents to be laid before the members of the Companyat an annual general meeting shall not less than 21 days before the date of the meeting, be sent in themanner in which notices may be served by the Company as provided in the Articles of Association toevery member of the Company and every holder of debentures of the Company provided that theCompany shall not be required to send copies of those documents to any person of whose address theCompany is not aware or to more than one of the joint holders of any shares or debentures.
2.10 Auditors
The Company shall at every annual general meeting appoint an auditor or auditors of theCompany who shall hold office until the next annual general meeting. The removal of an auditorbefore the expiration of his period of office shall require the approval of an ordinary resolution of themembers in general meeting. The remuneration of the auditors shall be fixed by the Company at theannual general meeting at which they are appointed provided that in respect of any particular year theCompany in general meeting may delegate the fixing of such remuneration to the Directors.
2.11 Notice of meetings and business to be conducted thereat
An annual general meeting shall be called by not less than 21 days’ notice in writing and anyextraordinary general meeting shall be called by not less than 14 days’ notice in writing. The noticeshall be exclusive of the day on which it is served or deemed to be served and of the day for which it isgiven, and shall specify the time, place and agenda of the meeting, particulars of the resolutions andthe general nature of the business to be considered at the meeting. The notice convening an annualgeneral meeting shall specify the meeting as such, and the notice convening a meeting to pass a specialresolution shall specify the intention to propose the resolution as a special resolution. Notice of everygeneral meeting shall be given to the auditors and all members of the Company (other than those who,under the provisions of the Articles of Association or the terms of issue of the shares they hold, are notentitled to receive such notice from the Company).
Notwithstanding that a meeting of the Company is called by shorter notice than that mentionedabove, it shall be deemed to have been duly called if it is so agreed:
(a) in the case of a meeting called as an annual general meeting, by all members of theCompany entitled to attend and vote thereat or their proxies; and
III-9
APPENDIX III SUMMARY OF THE CONSTITUTION OF THE COMPANYAND CAYMAN ISLANDS COMPANY LAW
(b) in the case of any other meeting, by a majority in number of the members having a right toattend and vote at the meeting, being a majority together holding not less than 95% innominal value of the shares giving that right.
If, after the notice of a general meeting has been sent but before the meeting is held, or after theadjournment of a general meeting but before the adjourned meeting is held (whether or not notice ofthe adjourned meeting is required), the Directors, in their absolute discretion, consider that it isimpractical or unreasonable for any reason to hold a general meeting on the date or at the time andplace specified in the notice calling such meeting, it may change or postpone the meeting to anotherdate, time and place.
The Directors also have the power to provide in every notice calling a general meeting that inthe event of a gale warning or a black rainstorm warning is in force at any time on the day of thegeneral meeting (unless such warning is canceled at least a minimum period of time prior to thegeneral meeting as the Directors may specify in the relevant notice), the meeting shall be postponedwithout further notice to be reconvened on a later date. Where a general meeting is so postponed, theCompany shall endeavor to cause a notice of such postponement to be placed on the Company’swebsite and published on the Stock Exchange’s website as soon as practicable, but failure to place orpublish such notice shall not affect the automatic postponement of such meeting.
Where a general meeting is postponed:
(a) the Directors shall fix the date, time and place for the reconvened meeting and at leastseven clear days’ notice shall be given for the reconvened meeting; and such notice shallspecify the date, time and place at which the postponed meeting will be reconvened andthe date and time by which proxies shall be submitted in order to be valid at suchreconvened meeting (provided that any proxy submitted for the original meeting shallcontinue to be valid for the reconvened meeting unless revoked or replaced by a newproxy); and
(b) notice of the business to be transacted at the reconvened meeting shall not be required, norshall any accompanying documents be required to be recirculated, provided that thebusiness to be transacted at the reconvened meeting is the same as that set out in the noticeof the original meeting circulated to the members of the Company.
2.12 Transfer of shares
Transfers of shares may be effected by an instrument of transfer in the usual common form orin such other form as the Directors may approve which is consistent with the standard form of transferas prescribed by the Stock Exchange.
The instrument of transfer shall be executed by or on behalf of the transferor and, unless theDirectors otherwise determine, the transferee, and the transferor shall be deemed to remain the holderof the share until the name of the transferee is entered in the register of members of the Company inrespect thereof. All instruments of transfer shall be retained by the Company.
III-10

APPENDIX III SUMMARY OF THE CONSTITUTION OF THE COMPANYAND CAYMAN ISLANDS COMPANY LAW
The Directors may refuse to register any transfer of any share which is not fully paid up or onwhich the Company has a lien. The Directors may also decline to register any transfer of any sharesunless:
(a) the instrument of transfer is lodged with the Company accompanied by the certificate forthe shares to which it relates (which shall upon the registration of the transfer be canceled)and such other evidence as the Directors may reasonably require to show the right of thetransferor to make the transfer;
(b) the instrument of transfer is in respect of only one class of shares;
(c) the instrument of transfer is properly stamped (in circumstances where stamping isrequired);
(d) in the case of a transfer to joint holders, the number of joint holders to whom the share isto be transferred does not exceed four;
(e) the shares concerned are free of any lien in favor of the Company; and
(f) a fee of such amount not exceeding the maximum amount as the Stock Exchange mayfrom time to time determine to be payable (or such lesser sum as the Directors may fromtime to time require) is paid to the Company in respect thereof.
If the Directors refuse to register a transfer of any share they shall, within two months after thedate on which the transfer was lodged with the Company, send to each of the transferor and thetransferee notice of such refusal.
The registration of transfers may, on 10 business days’ notice (or on 6 business days’ notice inthe case of a rights issue) being given by advertisement published on the Stock Exchange’s website, or,subject to the Listing Rules, by electronic communication in the manner in which notices may beserved by the Company by electronic means as provided in the Articles of Association or byadvertisement published in the newspapers, be suspended and the register of members of the Companyclosed at such times for such periods as the Directors may from time to time determine, provided thatthe registration of transfers shall not be suspended or the register closed for more than 30 days in anyyear (or such longer period as the members of the Company may by ordinary resolution determineprovided that such period shall not be extended beyond 60 days in any year).
2.13 Power of the Company to purchase its own shares
The Company is empowered by the Companies Law and the Articles of Association topurchase its own shares subject to certain restrictions and the Directors may only exercise this poweron behalf of the Company subject to the authority of its members in general meeting as to the mannerin which they do so and to any applicable requirements imposed from time to time by the StockExchange and the Securities and Futures Commission of Hong Kong. Shares which have beenrepurchased will be treated as canceled upon the repurchase.
2.14 Power of any subsidiary of the Company to own shares
There are no provisions in the Articles of Association relating to the ownership of shares by asubsidiary.
III-11

APPENDIX III SUMMARY OF THE CONSTITUTION OF THE COMPANYAND CAYMAN ISLANDS COMPANY LAW
2.15 Dividends and other methods of distribution
Subject to the Companies Law and the Articles of Association, the Company in generalmeeting may declare dividends in any currency but no dividends shall exceed the amountrecommended by the Directors. No dividend may be declared or paid other than out of profits andreserves of the Company lawfully available for distribution, including share premium.
Unless and to the extent that the rights attached to any shares or the terms of issue thereofotherwise provide, all dividends shall (as regards any shares not fully paid throughout the period inrespect of which the dividend is paid) be apportioned and paid pro rata according to the amounts paidup on the shares during any portion or portions of the period in respect of which the dividend is paid.For these purposes no amount paid up on a share in advance of calls shall be treated as paid up on theshare.
The Directors may from time to time pay to the members of the Company such interimdividends as appear to the Directors to be justified by the profits of the Company. The Directors mayalso pay half-yearly or at other intervals to be selected by them any dividend which may be payable ata fixed rate if they are of the opinion that the profits available for distribution justify the payment.
The Directors may retain any dividends or other monies payable on or in respect of a shareupon which the Company has a lien, and may apply the same in or towards satisfaction of the debts,liabilities or engagements in respect of which the lien exists. The Directors may also deduct from anydividend or other monies payable to any member of the Company all sums of money (if any) presentlypayable by him to the Company on account of calls, installments or otherwise.
No dividend shall carry interest against the Company.
Whenever the Directors or the Company in general meeting have resolved that a dividend bepaid or declared on the share capital of the Company, the Directors may further resolve: (a) that suchdividend be satisfied wholly or in part in the form of an allotment of shares credited as fully paid up onthe basis that the shares so allotted are to be of the same class as the class already held by the allottee,provided that the members of the Company entitled thereto will be entitled to elect to receive suchdividend (or part thereof) in cash in lieu of such allotment; or (b) that the members of the Companyentitled to such dividend will be entitled to elect to receive an allotment of shares credited as fully paidup in lieu of the whole or such part of the dividend as the Directors may think fit on the basis that theshares so allotted are to be of the same class as the class already held by the allottee. The Companymay upon the recommendation of the Directors by ordinary resolution resolve in respect of any oneparticular dividend of the Company that notwithstanding the foregoing a dividend may be satisfiedwholly in the form of an allotment of shares credited as fully paid without offering any right tomembers of the Company to elect to receive such dividend in cash in lieu of such allotment.
Any dividend, interest or other sum payable in cash to a holder of shares may be paid by checkor warrant sent through the post addressed to the registered address of the member of the Companyentitled, or in the case of joint holders, to the registered address of the person whose name stands firstin the register of members of the Company in respect of the joint holding or to such person and to suchaddress as the holder or joint holders may in writing direct. Every check or warrant so sent shall bemade payable to the order of the holder or, in the case of joint holders, to the order of the holder whosename stands first on the register of members of the Company in respect of such shares, and shall be
III-12

APPENDIX III SUMMARY OF THE CONSTITUTION OF THE COMPANYAND CAYMAN ISLANDS COMPANY LAW
sent at his or their risk and the payment of any such check or warrant by the bank on which it is drawnshall operate as a good discharge to the Company in respect of the dividend and/or bonus representedthereby, notwithstanding that it may subsequently appear that the same has been stolen or that anyendorsement thereon has been forged. The Company may cease sending such checks for dividendentitlements or dividend warrants by post if such checks or warrants have been left uncashed on twoconsecutive occasions. However, the Company may exercise its power to cease sending checks fordividend entitlements or dividend warrants after the first occasion on which such a check or warrant isreturned undelivered. Any one of two or more joint holders may give effectual receipts for anydividends or other monies payable or property distributable in respect of the shares held by such jointholders.
Any dividend unclaimed for six years from the date of declaration of such dividend may beforfeited by the Directors and shall revert to the Company.
The Directors may, with the sanction of the members of the Company in general meeting,direct that any dividend be satisfied wholly or in part by the distribution of specific assets of any kind,and in particular of paid up shares, debentures or warrants to subscribe securities of any othercompany, and where any difficulty arises in regard to such distribution the Directors may settle it asthey think expedient, and in particular may disregard fractional entitlements, round the same up ordown or provide that the same shall accrue to the benefit of the Company, and may fix the value fordistribution of such specific assets and may determine that cash payments shall be made to anymembers of the Company upon the footing of the value so fixed in order to adjust the rights of allparties, and may vest any such specific assets in trustees as may seem expedient to the Directors.
2.16 Proxies
Any member of the Company entitled to attend and vote at a meeting of the Company shall beentitled to appoint another person who must be an individual as his proxy to attend and vote instead ofhim and a proxy so appointed shall have the same right as the member to speak at the meeting. A proxyneed not be a member of the Company.
Instruments of proxy shall be in common form or in such other form as the Directors may fromtime to time approve provided that it shall enable a member to instruct his proxy to vote in favor of oragainst (or in default of instructions or in the event of conflicting instructions, to exercise his discretionin respect of) each resolution to be proposed at the meeting to which the form of proxy relates. Theinstrument of proxy shall be deemed to confer authority to vote on any amendment of a resolution putto the meeting for which it is given as the proxy thinks fit. The instrument of proxy shall, unless thecontrary is stated therein, be valid as well for any adjournment of the meeting as for the meeting towhich it relates provided that the meeting was originally held within 12 months from such date.
The instrument appointing a proxy shall be in writing under the hand of the appointor or hisattorney authorized in writing or if the appointor is a corporation either under its seal or under the handof an officer, attorney or other person authorized to sign the same.
The instrument appointing a proxy and (if required by the Directors) the power of attorney orother authority (if any) under which it is signed, or a notarially certified copy of such power orauthority, shall be delivered at the registered office of the Company (or at such other place as may bespecified in the notice convening the meeting or in any notice of any adjournment or, in either case, in
III-13
APPENDIX III SUMMARY OF THE CONSTITUTION OF THE COMPANYAND CAYMAN ISLANDS COMPANY LAW
any document sent therewith) not less than 48 hours before the time appointed for holding the meetingor adjourned meeting at which the person named in the instrument proposes to vote or, in the case of apoll taken subsequently to the date of a meeting or adjourned meeting, not less than 48 hours before thetime appointed for the taking of the poll and in default the instrument of proxy shall not be treated asvalid. No instrument appointing a proxy shall be valid after the expiration of 12 months from the datenamed in it as the date of its execution. Delivery of any instrument appointing a proxy shall notpreclude a member of the Company from attending and voting in person at the meeting or pollconcerned and, in such event, the instrument appointing a proxy shall be deemed to be revoked.
2.17 Calls on shares and forfeiture of shares
The Directors may from time to time make calls upon the members of the Company in respectof any monies unpaid on their shares (whether on account of the nominal amount of the shares or byway of premium or otherwise) and not by the conditions of allotment thereof made payable at fixedtimes and each member of the Company shall (subject to the Company serving upon him at least 14days’ notice specifying the time and place of payment and to whom such payment shall be made) payto the person at the time and place so specified the amount called on his shares. A call may be revokedor postponed as the Directors may determine. A person upon whom a call is made shall remain liableon such call notwithstanding the subsequent transfer of the shares in respect of which the call wasmade.
A call may be made payable either in one sum or by installments and shall be deemed to havebeen made at the time when the resolution of the Directors authorizing the call was passed. The jointholders of a share shall be jointly and severally liable to pay all calls and installments due in respect ofsuch share or other monies due in respect thereof.
If a sum called in respect of a share shall not be paid before or on the day appointed forpayment thereof, the person from whom the sum is due shall pay interest on the sum from the dayappointed for payment thereof to the time of actual payment at such rate, not exceeding 15% perannum, as the Directors may determine, but the Directors shall be at liberty to waive payment of suchinterest wholly or in part.
If any call or installment of a call remains unpaid on any share after the day appointed forpayment thereof, the Directors may at any time during such time as any part thereof remains unpaidserve a notice on the holder of such shares requiring payment of so much of the call or installment as isunpaid together with any interest which may be accrued and which may still accrue up to the date ofactual payment.
The notice shall name a further day (not being less than 14 days from the date of service of thenotice) on or before which, and the place where, the payment required by the notice is to be made, andshall state that in the event of non-payment at or before the time and at the place appointed, the sharesin respect of which such call was made or installment is unpaid will be liable to be forfeited.
If the requirements of such notice are not complied with, any share in respect of which suchnotice has been given may at any time thereafter, before payment of all calls or installments andinterest due in respect thereof has been made, be forfeited by a resolution of the Directors to that effect.Such forfeiture shall include all dividends and bonuses declared in respect of the forfeited shares andnot actually paid before the forfeiture. A forfeited share shall be deemed to be the property of theCompany and may be re-allotted, sold or otherwise disposed of.
III-14
APPENDIX III SUMMARY OF THE CONSTITUTION OF THE COMPANYAND CAYMAN ISLANDS COMPANY LAW
A person whose shares have been forfeited shall cease to be a member of the Company inrespect of the forfeited shares but shall, notwithstanding the forfeiture, remain liable to pay to theCompany all monies which at the date of forfeiture were payable by him to the Company in respect ofthe shares, together with (if the Directors shall in their discretion so require) interest thereon at suchrate not exceeding 15% per annum as the Directors may prescribe from the date of forfeiture untilpayment, and the Directors may enforce payment thereof without being under any obligation to makeany allowance for the value of the shares forfeited, at the date of forfeiture.
2.18 Inspection of register of members
The register of members of the Company shall be kept in such manner as to show at all timesthe members of the Company for the time being and the shares respectively held by them. The registermay, on 10 business days’ notice (or on 6 business days’ notice in the case of a rights issue) beinggiven by advertisement published on the Stock Exchange’s website, or, subject to the Listing Rules, byelectronic communication in the manner in which notices may be served by the Company by electronicmeans as provided in the Articles of Association or by advertisement published in the newspapers, beclosed at such times and for such periods as the Directors may from time to time determine eithergenerally or in respect of any class of shares, provided that the register shall not be closed for morethan 30 days in any year (or such longer period as the members of the Company may by ordinaryresolution determine provided that such period shall not be extended beyond 60 days in any year).
Any register of members kept in Hong Kong shall during normal business hours (subject tosuch reasonable restrictions as the Directors may impose) be open to inspection by any member of theCompany without charge and by any other person on payment of a fee of such amount not exceedingthe maximum amount as may from time to time be permitted under the Listing Rules as the Directorsmay determine for each inspection.
2.19 Quorum for meetings and separate class meetings
No business shall be transacted at any general meeting unless a quorum is present when themeeting proceeds to business, but the absence of a quorum shall not preclude the appointment, choiceor election of a chairman which shall not be treated as part of the business of the meeting.
Two members of the Company present in person or by proxy shall be a quorum providedalways that if the Company has only one member of record the quorum shall be that one memberpresent in person or by proxy.
A corporation being a member of the Company shall be deemed for the purpose of the Articlesof Association to be present in person if represented by its duly authorized representative being theperson appointed by resolution of the directors or other governing body of such corporation or bypower of attorney to act as its representative at the relevant general meeting of the Company or at anyrelevant general meeting of any class of members of the Company.
The quorum for a separate general meeting of the holders of a separate class of shares of theCompany is described in paragraph 2.4 above.
2.20 Rights of minorities in relation to fraud or oppression
There are no provisions in the Articles of Association concerning the rights of minorityshareholders in relation to fraud or oppression.
III-15
APPENDIX III SUMMARY OF THE CONSTITUTION OF THE COMPANYAND CAYMAN ISLANDS COMPANY LAW
2.21 Procedure on liquidation
If the Company shall be wound up, and the assets available for distribution amongst themembers of the Company as such shall be insufficient to repay the whole of the paid-up capital, suchassets shall be distributed so that, as nearly as may be, the losses shall be borne by the members of theCompany in proportion to the capital paid up, or which ought to have been paid up, at thecommencement of the winding up on the shares held by them respectively. If in a winding up the assetsavailable for distribution amongst the members of the Company shall be more than sufficient to repaythe whole of the capital paid up at the commencement of the winding up, the excess shall be distributedamongst the members of the Company in proportion to the capital paid up at the commencement of thewinding up on the shares held by them respectively. The foregoing is without prejudice to the rights ofthe holders of shares issued upon special terms and conditions.
If the Company shall be wound up, the liquidator may with the sanction of a special resolutionof the Company and any other sanction required by the Companies Law, divide amongst the membersof the Company in specie or kind the whole or any part of the assets of the Company (whether theyshall consist of property of the same kind or not) and may, for such purpose, set such value as hedeems fair upon any property to be divided as aforesaid and may determine how such division shall becarried out as between the members or different classes of members of the Company. The liquidatormay, with the like sanction, vest the whole or any part of such assets in trustees upon such trusts for thebenefit of the members of the Company as the liquidator, with the like sanction and subject to theCompanies Law, shall think fit, but so that no member of the Company shall be compelled to acceptany assets, shares or other securities in respect of which there is a liability.
2.22 Untraceable members
The Company shall be entitled to sell any shares of a member of the Company or the shares towhich a person is entitled by virtue of transmission on death or bankruptcy or operation of law if:(a) all checks or warrants, not being less than three in number, for any sums payable in cash to theholder of such shares have remained uncashed for a period of 12 years; (b) the Company has not duringthat time or before the expiry of the three month period referred to in (d) below received any indicationof the whereabouts or existence of the member; (c) during the 12 year period, at least three dividendsin respect of the shares in question have become payable and no dividend during that period has beenclaimed by the member; and (d) upon expiry of the 12 year period, the Company has caused anadvertisement to be published in the newspapers or subject to the Listing Rules, by electroniccommunication in the manner in which notices may be served by the Company by electronic means asprovided in the Articles of Association, giving notice of its intention to sell such shares and a period ofthree months has elapsed since such advertisement and the Stock Exchange has been notified of suchintention. The net proceeds of any such sale shall belong to the Company and upon receipt by theCompany of such net proceeds it shall become indebted to the former member for an amount equal tosuch net proceeds.
SUMMARY OF CAYMAN ISLANDS COMPANY LAW AND TAXATION
1 Introduction
The Companies Law is derived, to a large extent, from the older Companies Acts of England,although there are significant differences between the Companies Law and the current Companies Act
III-16
APPENDIX III SUMMARY OF THE CONSTITUTION OF THE COMPANYAND CAYMAN ISLANDS COMPANY LAW
of England. Set out below is a summary of certain provisions of the Companies Law, although thisdoes not purport to contain all applicable qualifications and exceptions or to be a complete review ofall matters of corporate law and taxation which may differ from equivalent provisions in jurisdictionswith which interested parties may be more familiar.
2 Incorporation
The Company was incorporated in the Cayman Islands as an exempted company with limitedliability on July 26, 2018 under the Companies Law. As such, its operations must be conducted mainlyoutside the Cayman Islands. The Company is required to file an annual return each year with theRegistrar of Companies of the Cayman Islands and pay a fee which is based on the size of itsauthorized share capital.
3 Share Capital
The Companies Law permits a company to issue ordinary shares, preference shares,redeemable shares or any combination thereof.
The Companies Law provides that where a company issues shares at a premium, whether forcash or otherwise, a sum equal to the aggregate amount of the value of the premia on those shares shallbe transferred to an account called the “share premium account”. At the option of a company, theseprovisions may not apply to premia on shares of that company allotted pursuant to any arrangement inconsideration of the acquisition or cancelation of shares in any other company and issued at apremium. The Companies Law provides that the share premium account may be applied by a company,subject to the provisions, if any, of its memorandum and articles of association, in such manner as thecompany may from time to time determine including, but without limitation:
(a) paying distributions or dividends to members;
(b) paying up unissued shares of the company to be issued to members as fully paid bonusshares;
(c) in the redemption and repurchase of shares (subject to the provisions of section 37 of theCompanies Law);
(d) writing-off the preliminary expenses of the company;
(e) writing-off the expenses of, or the commission paid or discount allowed on, any issue ofshares or debentures of the company; and
(f) providing for the premium payable on redemption or purchase of any shares or debenturesof the company.
No distribution or dividend may be paid to members out of the share premium account unlessimmediately following the date on which the distribution or dividend is proposed to be paid thecompany will be able to pay its debts as they fall due in the ordinary course of business.
The Companies Law provides that, subject to confirmation by the Grand Court of the CaymanIslands, a company limited by shares or a company limited by guarantee and having a share capitalmay, if so authorized by its articles of association, by special resolution reduce its share capital in anyway.
III-17

APPENDIX III SUMMARY OF THE CONSTITUTION OF THE COMPANYAND CAYMAN ISLANDS COMPANY LAW
Subject to the detailed provisions of the Companies Law, a company limited by shares or acompany limited by guarantee and having a share capital may, if so authorized by its articles ofassociation, issue shares which are to be redeemed or are liable to be redeemed at the option of thecompany or a shareholder. In addition, such a company may, if authorized to do so by its articles ofassociation, purchase its own shares, including any redeemable shares. The manner of such a purchasemust be authorized either by the articles of association or by an ordinary resolution of the company.The articles of association may provide that the manner of purchase may be determined by thedirectors of the company. At no time may a company redeem or purchase its shares unless they arefully paid. A company may not redeem or purchase any of its shares if, as a result of the redemption orpurchase, there would no longer be any member of the company holding shares. A payment out ofcapital by a company for the redemption or purchase of its own shares is not lawful unless immediatelyfollowing the date on which the payment is proposed to be made, the company shall be able to pay itsdebts as they fall due in the ordinary course of business.
There is no statutory restriction in the Cayman Islands on the provision of financial assistanceby a company for the purchase of, or subscription for, its own or its holding company’s shares.Accordingly, a company may provide financial assistance if the directors of the company consider, indischarging their duties of care and to act in good faith, for a proper purpose and in the interests of thecompany, that such assistance can properly be given. Such assistance should be on an arm’s-lengthbasis.
4 Dividends and Distributions
With the exception of section 34 of the Companies Law, there are no statutory provisionsrelating to the payment of dividends. Based upon English case law which is likely to be persuasive inthe Cayman Islands in this area, dividends may be paid only out of profits. In addition, section 34 ofthe Companies Law permits, subject to a solvency test and the provisions, if any, of the company’smemorandum and articles of association, the payment of dividends and distributions out of the sharepremium account (see paragraph 3 above for details).
5 Shareholders’ Suits
The Cayman Islands courts can be expected to follow English case law precedents. The rule inFoss v. Harbottle (and the exceptions thereto which permit a minority shareholder to commence a classaction against or derivative actions in the name of the company to challenge (a) an act which is ultravires the company or illegal, (b) an act which constitutes a fraud against the minority where thewrongdoers are themselves in control of the company, and (c) an action which requires a resolutionwith a qualified (or special) majority which has not been obtained) has been applied and followed bythe courts in the Cayman Islands.
6 Protection of Minorities
In the case of a company (not being a bank) having a share capital divided into shares, theGrand Court of the Cayman Islands may, on the application of members holding not less than one-fifthof the shares of the company in issue, appoint an inspector to examine into the affairs of the companyand to report thereon in such manner as the Grand Court shall direct.
III-18
APPENDIX III SUMMARY OF THE CONSTITUTION OF THE COMPANYAND CAYMAN ISLANDS COMPANY LAW
Any shareholder of a company may petition the Grand Court of the Cayman Islands which maymake a winding up order if the court is of the opinion that it is just and equitable that the companyshould be wound up.
Claims against a company by its shareholders must, as a general rule, be based on the generallaws of contract or tort applicable in the Cayman Islands or their individual rights as shareholders asestablished by the company’s memorandum and articles of association.
The English common law rule that the majority will not be permitted to commit a fraud on theminority has been applied and followed by the courts of the Cayman Islands.
7 Disposal of Assets
The Companies Law contains no specific restrictions on the powers of directors to dispose ofassets of a company. As a matter of general law, in the exercise of those powers, the directors mustdischarge their duties of care and to act in good faith, for a proper purpose and in the interests of thecompany.
8 Accounting and Auditing Requirements
The Companies Law requires that a company shall cause to be kept proper books of accountwith respect to:
(a) all sums of money received and expended by the company and the matters in respect ofwhich the receipt and expenditure takes place;
(b) all sales and purchases of goods by the company; and
(c) the assets and liabilities of the company.
Proper books of account shall not be deemed to be kept if there are not kept such books as arenecessary to give a true and fair view of the state of the company’s affairs and to explain itstransactions.
9 Register of Members
An exempted company may, subject to the provisions of its articles of association, maintain itsprincipal register of members and any branch registers at such locations, whether within or without theCayman Islands, as its directors may from time to time think fit. There is no requirement under theCompanies Law for an exempted company to make any returns of members to the Registrar ofCompanies of the Cayman Islands. The names and addresses of the members are, accordingly, not amatter of public record and are not available for public inspection.
10 Inspection of Books and Records
Members of a company will have no general right under the Companies Law to inspect orobtain copies of the register of members or corporate records of the company. They will, however,have such rights as may be set out in the company’s articles of association.
III-19
APPENDIX III SUMMARY OF THE CONSTITUTION OF THE COMPANYAND CAYMAN ISLANDS COMPANY LAW
11 Special Resolutions
The Companies Law provides that a resolution is a special resolution when it has been passedby a majority of at least two-thirds of such members as, being entitled to do so, vote in person or,where proxies are allowed, by proxy at a general meeting of which notice specifying the intention topropose the resolution as a special resolution has been duly given, except that a company may in itsarticles of association specify that the required majority shall be a number greater than two-thirds, andmay additionally so provide that such majority (being not less than two-thirds) may differ as betweenmatters required to be approved by a special resolution. Written resolutions signed by all the membersentitled to vote for the time being of the company may take effect as special resolutions if this isauthorized by the articles of association of the company.
12 Subsidiary Owning Shares in Parent
The Companies Law does not prohibit a Cayman Islands company acquiring and holding sharesin its parent company provided its objects so permit. The directors of any subsidiary making suchacquisition must discharge their duties of care and to act in good faith, for a proper purpose and in theinterests of the subsidiary.
13 Mergers and Consolidations
The Companies Law permits mergers and consolidations between Cayman Islands companiesand between Cayman Islands companies and non-Cayman Islands companies. For these purposes, (a)“merger” means the merging of two or more constituent companies and the vesting of theirundertaking, property and liabilities in one of such companies as the surviving company, and (b)“consolidation” means the combination of two or more constituent companies into a consolidatedcompany and the vesting of the undertaking, property and liabilities of such companies to theconsolidated company. In order to effect such a merger or consolidation, the directors of eachconstituent company must approve a written plan of merger or consolidation, which must then beauthorized by (a) a special resolution of each constituent company and (b) such other authorization, ifany, as may be specified in such constituent company’s articles of association. The written plan ofmerger or consolidation must be filed with the Registrar of Companies of the Cayman Islands togetherwith a declaration as to the solvency of the consolidated or surviving company, a list of the assets andliabilities of each constituent company and an undertaking that a copy of the certificate of merger orconsolidation will be given to the members and creditors of each constituent company and thatnotification of the merger or consolidation will be published in the Cayman Islands Gazette. Dissentingshareholders have the right to be paid the fair value of their shares (which, if not agreed between theparties, will be determined by the Cayman Islands court) if they follow the required procedures, subjectto certain exceptions. Court approval is not required for a merger or consolidation which is effected incompliance with these statutory procedures.
14 Reconstructions
There are statutory provisions which facilitate reconstructions and amalgamations approved bya majority in number representing 75% in value of shareholders or creditors, depending on thecircumstances, as are present at a meeting called for such purpose and thereafter sanctioned by theGrand Court of the Cayman Islands. Whilst a dissenting shareholder would have the right to express tothe Grand Court his view that the transaction for which approval is sought would not provide the
III-20

APPENDIX III SUMMARY OF THE CONSTITUTION OF THE COMPANYAND CAYMAN ISLANDS COMPANY LAW
shareholders with a fair value for their shares, the Grand Court is unlikely to disapprove the transactionon that ground alone in the absence of evidence of fraud or bad faith on behalf of management and ifthe transaction were approved and consummated the dissenting shareholder would have no rightscomparable to the appraisal rights (i.e. the right to receive payment in cash for the judiciallydetermined value of his shares) ordinarily available, for example, to dissenting shareholders ofUS corporations.
15 Take-overs
Where an offer is made by a company for the shares of another company and, within fourmonths of the offer, the holders of not less than 90% of the shares which are the subject of the offeraccept, the offeror may at any time within two months after the expiration of the said four months, bynotice require the dissenting shareholders to transfer their shares on the terms of the offer. A dissentingshareholder may apply to the Grand Court of the Cayman Islands within one month of the noticeobjecting to the transfer. The burden is on the dissenting shareholder to show that the Grand Courtshould exercise its discretion, which it will be unlikely to do unless there is evidence of fraud or badfaith or collusion as between the offeror and the holders of the shares who have accepted the offer as ameans of unfairly forcing out minority shareholders.
16 Indemnification
Cayman Islands law does not limit the extent to which a company’s articles of association mayprovide for indemnification of officers and directors, except to the extent any such provision may beheld by the Cayman Islands courts to be contrary to public policy (e.g. for purporting to provideindemnification against the consequences of committing a crime).
17 Liquidation
A company may be placed in liquidation compulsorily by an order of the court, or voluntarily(a) by a special resolution of its members if the company is solvent, or (b) by an ordinary resolution ofits members if the company is insolvent. The liquidator’s duties are to collect the assets of thecompany (including the amount (if any) due from the contributories (shareholders)), settle the list ofcreditors and discharge the company’s liability to them, ratably if insufficient assets exist to dischargethe liabilities in full, and to settle the list of contributories and divide the surplus assets (if any)amongst them in accordance with the rights attaching to the shares.
18 Stamp Duty on Transfers
No stamp duty is payable in the Cayman Islands on transfers of shares of Cayman Islandscompanies except those which hold interests in land in the Cayman Islands.
19 Taxation
Pursuant to section 6 of the Tax Concessions Law (2018 Revision) of the Cayman Islands, theCompany may obtain an undertaking from the Financial Secretary of the Cayman Islands:
(a) that no law which is enacted in the Cayman Islands imposing any tax to be levied onprofits, income, gains or appreciations shall apply to the Company or its operations; and
III-21
APPENDIX III SUMMARY OF THE CONSTITUTION OF THE COMPANYAND CAYMAN ISLANDS COMPANY LAW
(b) in addition, that no tax to be levied on profits, income, gains or appreciations or which isin the nature of estate duty or inheritance tax shall be payable:
(i) on or in respect of the shares, debentures or other obligations of the Company; or
(ii) by way of the withholding in whole or in part of any relevant payment as defined insection 6(3) of the Tax Concessions Law (2018 Revision).
The Cayman Islands currently levy no taxes on individuals or corporations based upon profits,income, gains or appreciations and there is no taxation in the nature of inheritance tax or estate duty.There are no other taxes likely to be material to the Company levied by the Government of the CaymanIslands save certain stamp duties which may be applicable, from time to time, on certain instrumentsexecuted in or brought within the jurisdiction of the Cayman Islands. The Cayman Islands are not partyto any double tax treaties that are applicable to any payments made by or to the Company.
20 Exchange Control
There are no exchange control regulations or currency restrictions in the Cayman Islands.
21 General
Maples and Calder (Hong Kong) LLP, the Company’s legal advisers on Cayman Islands law,have sent to the Company a letter of advice summarizing aspects of Cayman Islands company law.This letter, together with a copy of the Companies Law, is available for inspection as referred to in thesection headed “Documents Delivered to the Registrar of Companies in Hong Kong and available forinspection” in Appendix V. Any person wishing to have a detailed summary of Cayman Islandscompany law or advice on the differences between it and the laws of any jurisdiction with which he/she is more familiar is recommended to seek independent legal advice.
III-22
APPENDIX IV STATUTORY AND GENERAL INFORMATION
A. FURTHER INFORMATION ABOUT OUR COMPANY AND OUR SUBSIDIARIES
1. Incorporation
Our Company was incorporated in the Cayman Islands on July 26, 2018 as an exemptedcompany with limited liability. Our registered office address is at the offices of Maples CorporateServices Limited, PO Box 309, Ugland House, Grand Cayman, KY1-1104, Cayman Islands.Accordingly, our Company’s corporate structure and Memorandum and Articles of Association aresubject to the relevant laws of the Cayman Islands. A summary of our Memorandum and Articles ofAssociation is set out in the section headed “Summary of the Constitution of the Company andCayman Islands Company Law” in Appendix III to this prospectus.
Our place of business in Hong Kong is at 21/F, 238 Des Voeux Road Central, Sheung Wan,Hong Kong. Our Company was registered as a non-Hong Kong company under Part 16 of theCompanies Ordinance with the Registrar of Companies in Hong Kong on May 28, 2019. Mr. LeeLeong Yin has been appointed as the authorized representatives of our Company for the acceptance ofservice of process in Hong Kong. The address for service of process is 40/F, Sunlight Tower, No. 248,Queen’s Road East, Wanchai, Hong Kong.
As at the date of this prospectus, our Company’s head office was located at 21/F, 238 DesVoeux Road Central, Sheung Wan, Hong Kong.
2. Changes in Share Capital
On July 26, 2018, our Company was incorporated with an authorized share capital ofUS$50,000 divided into 500,000,000 shares of a par value of US$0.0001 each.
The following changes in the share capital of our Company took place during the two yearsimmediately preceding the date of this prospectus:
(a) On July 26, 2018, our Company issued one Share with a par value of US$0.0001 toMapcal Limited as the initial subscriber at par, and Mapcal Limited subsequentlytransferred the share to JS Holding on the same day;
(b) On April 10, 2019, our Company issued 99,613,965.34 Shares with a par value ofUS$0.0001 to JS Holding in exchange for US$9,961.40;
(c) On April 16, 2019, our Company issued 36,830,424.53 Shares with a par value ofUS$0.0001 to Mr. Lee Puay Khng in exchange for his 100% equity interests in Bilting,and Mr. Lee Puay Khng subsequently transferred the 36,830,424.53 Shares to SolOmnibus SPC on April 18, 2019 in exchange for the subscription of 368,304.24536participating shares of Sol Omnibus SPC. As a result, Bilting became a wholly-ownedsubsidiary of our Company;
(d) On June 19, 2019, our Company issued 60,743,866.83 Shares with a par value ofUS$0.0001 to JS Holding in exchange for US$470,000,000;
(e) On June 24, 2019, our Company issued 29,600,413.96 Shares with a par value ofUS$0.0001 to Easy Home in exchange for its 30% equity interests in GA1. As a result,GA1 became a wholly-owned subsidiary of our Company;
(f) On June 24, 2019, our Company issued 6,555,616.63 Shares with a par value ofUS$0.0001 to Comfort Home, and as the consideration, Comfort Home transferred2,325.44 ordinary shares of Compass it held to the Company;
IV-1

APPENDIX IV STATUTORY AND GENERAL INFORMATION
(g) On June 24, 2019, our Company issued an aggregate of 35,730,688.99 ordinary shareswith a par value of US$0.0001 to the SN Investors, and as the consideration, SN Investorstransferred their respective equity interests in Compass to the Company. As a result,Compass became an indirect wholly-owned subsidiary of our Company;
(h) On October 9, 2019, our Company conducted a share subdivision such that every share ofUS$0.0001 was subdivided into 10 shares of US$0.00001;
(i) Immediately after the subdivision of Shares referred to in the preceding paragraph, onOctober 9, 2019, our Company repurchased a total of 4.8 Shares from shareholders of theCompany and canceled such 4.8 Shares for the purpose of eliminating fractional shares,following which, the issued share capital of our Company was reduced fromUS$26,907.497728 divided into 2,690,749,772.80 Shares to US$26,907.49768 dividedinto 2,690,749,768 Shares;
(j) Our Company is expected to issue and allot 141,618,409 ordinary shares with a par valueof US$0.00001 to the RSU Holding Entities prior to the completion of the GlobalOffering.
Save as disclosed below in “—4. Resolutions of the Shareholders of Our Company datedOctober 9, 2019” below and in the section headed “History, Reorganization and Corporate Structure”of this prospectus, there has been no other alteration in the share capital of our Company during thetwo years immediately preceding the date of this prospectus.
3. Changes in the Share Capital of our Subsidiaries
A summary of the corporate information and the particulars of our subsidiaries are set out in theAccountants’ Report as set out in Appendix I to this prospectus.
The following sets out the changes in the share capital of our subsidiaries during the two yearsimmediately preceding the date of this prospectus:
(a) JY-SN
(1) On April 23, 2018, JY-SN issued one share to Mr. Wang Xuning, and Mr. Wang Xuningsubsequently transferred the one share to the Company on August 10, 2018; and
(2) On June 19, 2019, JY-SN issued one share to the Company.
(b) Sunshine Rise
On April 26, 2018, Sunshine Rise issued one share with a par value of US$1.00 to MaplesFiduciary Services (Hong Kong) Limited, and Maples Fiduciary Services (Hong Kong) Limitedsubsequently transferred the one share to JY-SN on the same date.
(c) Shanghai Lihong
(1) On November 22, 2018, Easy Appliance (Hong Kong) made capital contributions ofRMB7.51 million to Shanghai Lihong, among which RMB2.75 million were counted as registeredcapital, to acquire 5% of the equity interest in Shanghai Lihong. The registered capital of ShanghaiLihong was increased from RMB52.22 million to RMB54.97 million, and Shanghai Lihong wasconverted from a PRC domestic company to a sino-foreign joint venture. The capital contribution wascompleted on April 28, 2019.
IV-2

APPENDIX IV STATUTORY AND GENERAL INFORMATION
(2) On December 4, 2018, Sunshine Rise made capital contributions of RMB728.48 million toShanghai Lihong, among which RMB266.46 million were counted as registered capital. As a result,the registered capital of Shanghai Lihong was increased from RMB54.97 million toRMB321.44 million. The capital contribution was completed on June 4, 2019.
(d) Joyoung
(1) On January 19, 2018, the issued shares of Joyoung were decreased from 767.523 millionshares to 767.511 million shares with a par value of RMB1.00 as a result of the repurchase andcancelation of the locked restricted shares;
(2) On June 11, 2019, the issued shares of Joyoung were decreased from 767.511 million sharesto 767.371 million shares with a par value of RMB1.00 as a result of the repurchase and cancelation ofthe locked restricted shares;
(e) Compass
(1) In September 2019, 214.63 PI Shares were vested to certain management and employees ofCompass and its subsidiaries (collectively the “Vested PI Shares”). Compass exercised its right torepurchase 20.19 Vested PI Shares from the two holders thereof in connection with the termination ofemployment with them and the repurchase has completed in September 2019.
(f) SharkNinja Venus Technology Company Limited
On September 23, SharkNinja Venus Technology Company Limited issued one share with apar value of HK$1.00 to Maples Fiduciary Services (Hong Kong) Limited, and Maples FiduciaryServices (Hong Kong) Limited subsequently transferred the one share to SharkNinja (Hong Kong)Company Limited.
4. Resolutions of the Shareholders of Our Company dated October 9, 2019
On October 9, 2019, resolutions of the Company were passed by the Shareholders that, amongother things, conditional upon the satisfaction (or, if applicable, waiver) of the conditions set out in“Structure of the Global Offering—Conditions of the Global Offering” and pursuant to the terms setout therein:
(a) our Company approved and adopted the Memorandum and Articles of Association witheffect conditional and immediately upon the Global Offering;
(b) the Global Offering and the grant of the Over-allotment Option were approved andexecutive Directors of our Company from time to time or (if applicable), any of their dulyauthorized attorney (the “Authorized Signatory”) were authorized to allot and issue theShares pursuant to the Global Offering and the exercise of the Over-allotment Option;
(c) the Global Offering was approved and any Authorized Signatory would be authorized toimplement the Global Offering;
(d) every Share of US$0.0001 of the Company was subdivided into 10 Shares of US$0.00001each;
(e) subject to and immediately after the subdivision of Shares as referred to in paragraph (d)above, the repurchase of 4.8 Shares of a par value of US$0.00001 each of our Companywas approved;
IV-3

APPENDIX IV STATUTORY AND GENERAL INFORMATION
(f) subject to the “lock-up” provisions under Rule 10.08 of the Listing Rules, a generalunconditional mandate would be granted to the Directors to allot, issue and deal with theShares or securities convertible into Shares or options, warrants or similar rights tosubscribe for the Shares or such convertible securities and to make or grant offers,agreements or options which would or might require the exercise of such powers whetherduring or after the end of the Relevant Period (as defined below), provided that theaggregate number of Shares allotted or agreed to be allotted by the Directors other thanpursuant to a (i) rights issue, (ii) any scrip dividend scheme or similar arrangementproviding for the allotment of the Shares in lieu of the whole or part of a dividend on theShares; or (iii) a specific authority granted by the Shareholder(s) in general meeting, shallnot exceed the aggregate of:
(A) 20% of the total number of Shares in issue immediately following the completion ofthe Global Offering; and
(B) the aggregate number of Shares repurchased by the Company (if any) under thegeneral mandate to repurchase Shares referred to in paragraph below,
such mandate to remain in effect during the period from the passing of the resolution untilthe earliest of (i) the conclusion of the next annual general meeting of the Company unlessrenewed by an ordinary resolution of our Shareholders in a general meeting, eitherunconditionally or subject to conditions, (ii) the expiration of the period within which thenext annual general meeting of the Company is required by the Memorandum and Articlesof Association or any applicable laws to be held, and (iii) the date on which the mandate isvaried or revoked by an ordinary resolution of the Shareholder(s) in general meeting (the“Relevant Period”); and
(g) a general unconditional mandate would be granted to the Directors to exercise all thepowers of the Company to repurchase the Shares on the Stock Exchange, or on any otherstock exchange on which the Shares may be listed (and which is recognized by the SFCand the Stock Exchange for this purpose) not exceeding in aggregate 10% of the totalnumber of Shares in issue immediately following the completion of the Global Offeringbut excluding (where applicable) any Shares which may be issued pursuant to the exerciseof the Over-allotment Option of the Company in accordance with all applicable laws andthe requirements of the Listing Rules, such mandate to remain in effect during the periodfrom the passing of the resolution until the earliest of (i) the conclusion of the next annualmeeting of the Company unless renewed by an ordinary resolution of our Shareholders ina general meeting, either unconditionally or subject to conditions, (ii) the expiration of theperiod within which the next annual general meeting of the Company is required by theMemorandum and Articles of Association or any applicable laws to be held, and (iii) thedate on which the mandate is varied or revoked by an ordinary resolution of theShareholder(s) in general meeting.
IV-4
APPENDIX IV STATUTORY AND GENERAL INFORMATION
5. Repurchase of Our Own Securities
The following paragraphs include, among others, certain information required by the StockExchange to be included in this prospectus concerning the repurchase of our own securities.
(a) Provision of the Listing Rules
The Listing Rules permit companies with a primary listing on the Stock Exchange torepurchase their own securities on the Stock Exchange subject to certain restrictions, the mostimportant of which are summarized below:
(i) Shareholders’ Approval
All proposed repurchases of securities (which must be fully paid up in the case of shares)by a company with a primary listing on the Stock Exchange must be approved in advanceby an ordinary resolution of the shareholders in general meeting, either by way of generalmandate or by specific approval of a particular transaction.
Pursuant to a resolution passed by our Shareholders on October 9, 2019, the RepurchaseMandate was given to our Directors authorizing them to exercise all powers of ourCompany to repurchase Shares on the Stock Exchange, or on any other stock exchange onwhich the securities of our Company may be listed and which is recognized by the SFCand the Stock Exchange for this purpose, with a total nominal value up to 10% of theaggregate nominal value of our Shares in issue immediately following the completion ofthe Global Offering (excluding any Shares which may be issued under the Over-allotmentOption, with such mandate to expire at the earliest of (i) the conclusion of the next annualgeneral meeting of our Company (unless renewed by an ordinary resolution of ourShareholders in a general meeting, either unconditionally or subject to conditions), (ii) theexpiration of the period within which our Company’s next annual general meeting isrequired by the Articles of Association or any other applicable laws to be held, and (iii) thedate when it is varied or revoked by an ordinary resolution of our Shareholders in generalmeeting.
(ii) Source of Funds
Purchases must be funded out of funds legally available for the purpose in accordance withthe Memorandum and Articles of Association and the applicable laws and regulations ofHong Kong and the Cayman Islands. A listed company may not purchase its ownsecurities on the Stock Exchange for a consideration other than cash or for settlementotherwise than in accordance with the trading rules of the Stock Exchange from time totime. As a matter of Cayman Law, any par value of shares payable on purchases by ourCompany may be made out of profits or out of the proceeds of a new issue of shares madefor the purpose of the purchase or out of capital, if so authorized by the Articles ofAssociation and subject to the Cayman Companies Law. Any premium payable on thepurchase over the par value of the shares to be purchased must have been provided for outof profits or from sums standing to the credit of our share premium account or out ofcapital, if so authorized by the Articles of Association and subject to the CaymanCompanies Law.
IV-5
APPENDIX IV STATUTORY AND GENERAL INFORMATION
(iii) Trading Restrictions
The total number of shares which a listed company may repurchase on the Stock Exchangeis the number of shares representing up to a maximum of 10% of the aggregate number ofshares in issue. A company may not issue or announce a proposed issue of new securitiesfor a period of 30 days immediately following a repurchase (other than an issue ofsecurities pursuant to an exercise of warrants, share options or similar instrumentsrequiring the company to issue securities which were outstanding prior to such repurchase)without the prior approval of the Stock Exchange. In addition, a listed company isprohibited from repurchasing its shares on the Stock Exchange if the purchase price is 5%or more than the average closing market price for the five preceding trading days on whichits shares were traded on the Stock Exchange. The Listing Rules also prohibit a listedcompany from repurchasing its securities if the repurchase would result in the number oflisted securities which are in the hands of the public falling below the relevant prescribedminimum percentage as required by the Stock Exchange. A company is required toprocure that the broker appointed by it to effect a repurchase of securities discloses to theStock Exchange such information with respect to the repurchase as the Stock Exchangemay require.
(iv) Status of Repurchased Shares
The listing of all purchased securities (whether on the Stock Exchange or otherwise) isautomatically canceled and the relative certificates must be canceled and destroyed. Underthe laws of the Cayman Islands, unless, prior to the purchase the directors of our Companyresolve to hold the shares purchased by our Company as treasury shares, shares purchasedby our Company shall be treated as canceled and the amount of our Company’s issuedshare capital shall be diminished by the nominal value of those shares. However, thepurchase of shares will not be taken as reducing the amount of the authorized share capitalunder Cayman Companies Law.
(v) Suspension of Repurchase
A listed company may not make any repurchase of securities after a price sensitivedevelopment has occurred or has been the subject of a decision until such time as the pricesensitive information has been made publicly available. In particular, during the period ofone month immediately preceding the earlier of (a) the date of the board meeting (as suchdate is first notified to the Stock Exchange in accordance with the Listing Rules) for theapproval of a listed company’s results for any year, half- year, quarterly or any otherinterim period (whether or not required under the Listing Rules) and (b) the deadline forpublication of an announcement of a listed company’s results for any year or half-yearunder the Listing Rules, or quarterly or any other interim period (whether or not requiredunder the Listing Rules), the listed company may not repurchase its shares on the StockExchange other than in exceptional circumstances. In addition, the Stock Exchange mayprohibit a repurchase of securities on the Stock Exchange if a listed company has breachedthe Listing Rules.
(vi) Reporting Requirements
Certain information relating to repurchases of securities on the Stock Exchange orotherwise must be reported to the Stock Exchange not later than 30 minutes before the
IV-6

APPENDIX IV STATUTORY AND GENERAL INFORMATION
earlier of the commencement of the morning trading session or any pre-opening session onthe following business day. In addition, a listed company’s annual report is required todisclose details regarding repurchases of securities made during the year, including amonthly analysis of the number of securities repurchased, the purchase price per share orthe highest and lowest price paid for all such repurchases, where relevant, and theaggregate prices paid.
(vii) Core Connected Persons
The Listing Rules prohibit a company from knowingly purchasing securities on the StockExchange from “a core connected person”, that is, a director, chief executive or substantialshareholder of the company or any of its subsidiaries or a close associate of any of them(as defined in the Listing Rules) and a core connected person shall not knowingly sell hissecurities to the company.
(b) Reasons for Repurchases
Our Directors believe that it is in the best interests of our Company and Shareholders for ourDirectors to have a general authority from our Shareholders to enable our Company to repurchaseShares in the market. Such repurchases may, depending on market conditions and fundingarrangements at the time, lead to an enhancement of the net asset value per Share and/or earnings perShare and will only be made where our Directors believe that such repurchases will benefit ourCompany and Shareholders.
(c) Funding of Repurchases
Repurchase of our Shares must be funded out of funds legally available for such purpose inaccordance with the Articles of Association and the applicable laws of the Cayman Islands. OurDirectors may not repurchase our Shares on the Stock Exchange for a consideration other than cash orfor settlement otherwise than in accordance with the trading rules of the Stock Exchange. Subject tothe foregoing, our Directors may make repurchases with profits of our Company or out of a newissuance of shares made for the purpose of the repurchase or, if authorized by the Articles ofAssociation and subject to the Cayman Companies Law, out of capital and, in the case of any premiumpayable on the repurchase, out of profits of our Company or from sums standing to the credit of theshare premium account of our Company or, if authorized by the Articles of Association and subject tothe Cayman Companies Law, out of capital.
However, our Directors do not propose to exercise the Repurchase Mandate to such an extentas would, in the circumstances, have a material adverse effect on the working capital requirements ofour Company or its gearing levels which, in the opinion of the Directors, are from time to timeappropriate for our Company.
IV-7
APPENDIX IV STATUTORY AND GENERAL INFORMATION
(d) General
The exercise in full of the Repurchase Mandate, on the basis of 3,332,198,177 Shares in issueimmediately following the completion of the Global Offering, assuming the Over-allotment Option isnot exercised, could accordingly result in up to approximately 333,219,818 Shares being repurchasedby our Company during the period prior to the earliest of:
Š the conclusion of the next annual general meeting of our Company unless renewed by anordinary resolution of our Shareholders in a general meeting, either unconditionally orsubject to conditions;
Š the expiration of the period within which our Company’s next annual general meeting isrequired by the Articles of Association or any other applicable laws to be held; or
Š the date when it is varied or revoked by an ordinary resolution of our Shareholders ingeneral meeting.
Our Directors have undertaken to the Stock Exchange that, so far as the same may beapplicable, they will exercise the Repurchase Mandate in accordance with the Listing Rules and theapplicable laws in the Cayman Islands.
None of our Directors nor, to the best of their knowledge having made all reasonable enquiries,any of their respective close associates, have any present intention, if the Repurchase Mandate isexercised, to sell any Shares to our Company.
No core connected person (as defined in the Listing Rules) has notified us that he/she or it has apresent intention to sell Shares to us, or has undertaken not to do so, if the Repurchase Mandate isexercised.
If, as a result of any repurchase of Shares, a Shareholder’s proportionate interest in the votingrights of our Company increases, such increase will be treated as an acquisition for the purposes of theHong Kong Code on Takeovers and Mergers (the “Takeovers Code”). Accordingly, a Shareholder or agroup of Shareholders acting in concert, depending on the level of increase of Shareholders’ interest,could obtain or consolidate control of our Company and become obliged to make a mandatory offer inaccordance with Rule 26 of the Takeovers Code. Save as aforesaid, our Directors are not aware of anyconsequences which would arise under the Takeovers Code as a consequence of any repurchasespursuant to the Repurchase Mandate.
Any repurchase of Shares that results in the number of Shares held by the public being reducedto less than the highest of (i) 15% of the Company’s total issued share capital; (ii) such percentage ofShares held by the public after completion of the Global Offering (assuming that the Over-allotmentOption is not exercised); and (iii) such percentage of Shares held by the public after the full or partialexercise of the Over-allotment Option could only be implemented if the Stock Exchange agreed towaive the Listing Rules requirements regarding the public shareholding referred to above. It is believedthat a waiver of this provision would not normally be given other than in exceptional circumstances.
IV-8
APPENDIX IV STATUTORY AND GENERAL INFORMATION
B. FURTHER INFORMATION ABOUT OUR BUSINESS
1. Summary of Material Contracts
The following contracts (not being contracts entered into in the ordinary course of business)have been entered into by members of our Group within the two years preceding the date of thisprospectus and are or may be material:
(a) a share subscription agreement dated June 14, 2019 entered into between Easy HomeLimited and the Company, pursuant to which, among others, (I) the Company agreed toissue and allot to Easy Home Limited and Comfort Home Limited, and Easy HomeLimited agreed to subscribe (and cause Comfort Home Limited to subscribe)36,156,030.59 ordinary shares of par value USD0.0001 each in the Company in exchangefor the transfer and assignment of (i) sixty (60) ordinary shares in GA1 from Easy HomeLimited to the Company; and (ii) 2,325.44 ordinary shares in Compass from ComfortHome Limited to the Company; and (II) Easy Home Limited agreed to sell to theCompany the entire equity interest of Easy Appliance Limited for a cash consideration ofUS$1,171,059.36;
(b) a share subscription agreement dated June 14, 2019 entered into between Casa Brima LLCand the Company, pursuant to which Casa Brima LLC agreed to subscribe, and theCompany agreed to issue and allot 20,901,411.60 ordinary shares of par value USD0.0001each in the Company in exchange for the transfer and assignment of 7,414.25 ordinaryshares in Compass from Casa Brima LLC to the Company;
(c) a share subscription agreement dated June 14, 2019 entered into between The SMCSBTrust and the Company, pursuant to which The SMCSB Trust agreed to subscribe, and theCompany agreed to issue and allot 6,555,616.63 ordinary shares of par value USD0.0001each in the Company in exchange for the transfer and assignment of 2,325.44 ordinaryshares in Compass from The SMCSB Trust to the Company;
(d) a share subscription agreement dated June 14, 2019 entered into between BMS VenturesLLC and the Company, pursuant to which BMS Ventures LLC agreed to subscribe, andthe Company agreed to issue and allot 6,490,482.79 ordinary shares of par valueUSD0.0001 each in the Company in exchange for the transfer and assignment of 2,302.34ordinary shares in Compass from BMS Ventures LLC to the Company;
(e) a share subscription agreement dated June 14, 2019 entered into between Barrocas Family2017 Children’s Trust and the Company, pursuant to which Barrocas Family 2017Children’s Trust agreed to subscribe, and the Company agreed to issue and allot809,712.18 ordinary shares of par value USD0.0001 each in the Company in exchange forthe transfer and assignment of 287.22 ordinary shares in Compass from Barrocas Family2017 Children’s Trust to the Company;
(f) a share subscription agreement dated June 14, 2019 entered into between PR2 LLC andthe Company, pursuant to which PR2 LLC agreed to subscribe, and the Company agreedto issue and allot, 807,441.63 ordinary shares of par value USD0.0001 each in theCompany in exchange for the transfer and assignment of 286.42 ordinary shares inCompass from PR2 LLC to the Company;
(g) a share subscription agreement dated June 14, 2019 entered into between SN AggregatorLLC and the Company, pursuant to which SN Aggregator LLC agreed to subscribe, andthe Company agreed to issue and allot 166,024.16 ordinary shares of par value USD0.0001
IV-9

APPENDIX IV STATUTORY AND GENERAL INFORMATION
each in the Company in exchange for the transfer and assignment of 58.89 ordinary sharesin Compass from SN Aggregator LLC to the Company;
(h) a shareholders agreement dated June 24, 2019 entered into between the Company, HezhouLimited Partnership (now known as JS Holding Limited Partnership), Easy Home Limited,Comfort Home Limited, Sol Omnibus SPC, Casa Brima LLC, The SMCSB Trust, BMSVentures LLC, Barrocas Family 2017 Children’s Trust, PR2 LLC, SN Aggregator LLCand Compass Cayman SPV, Ltd., relating to, among others, the beneficial rights forrelevant shareholders, the corporate governance of the Company, and limitation ontransfer of shares of the Company; and
(i) the Hong Kong Underwriting Agreement.
2. Intellectual Property Rights
(a) Trademarks
(i) Registered Trademarks
As at the Latest Practicable Date, we had registered the following trademarks which weconsider to be or may be material to our business:
No. TrademarkPlace of
RegistrationRegistered
Owner Class Registered Number Expiry Date
1. PRC Joyoung 7 23688230 April 6, 2028
2. PRC Joyoung 7 20874405 September 27, 2027
11 20899782 September 27, 2027
3. PRC Joyoung 7 3407087 August 20, 2024
11 3407086 September 6, 2024
4. PRC Joyoung 7 5205567 April 6, 2029
11 5205566 January 6, 2024
5. International Joyoung 7, 11 887959 March 3, 2026
6. Hong Kong Joyoung 7, 11 300585667AA February 21, 2026
7. Hong Kong Joyoung 7, 11 300585676AA February 21, 2026
8. PRC SharkNinjaOperating LLC
07 6689108 June 20, 2020
9. PRC SharkNinjaOperating LLC
07 5459424 May 27, 2029Renewal
10. UnitedStates
SharkNinjaOperating LLC
07 4119051 March 27, 2022Sec. 8 & 15
11. UnitedStates
SharkNinjaOperating LLC
07 3794590 May 25, 2020Sec. 8 & 15
12. UnitedStates
SharkNinjaOperating LLC
11 4242279 November 13, 2022Sec. 8 & 15
IV-10
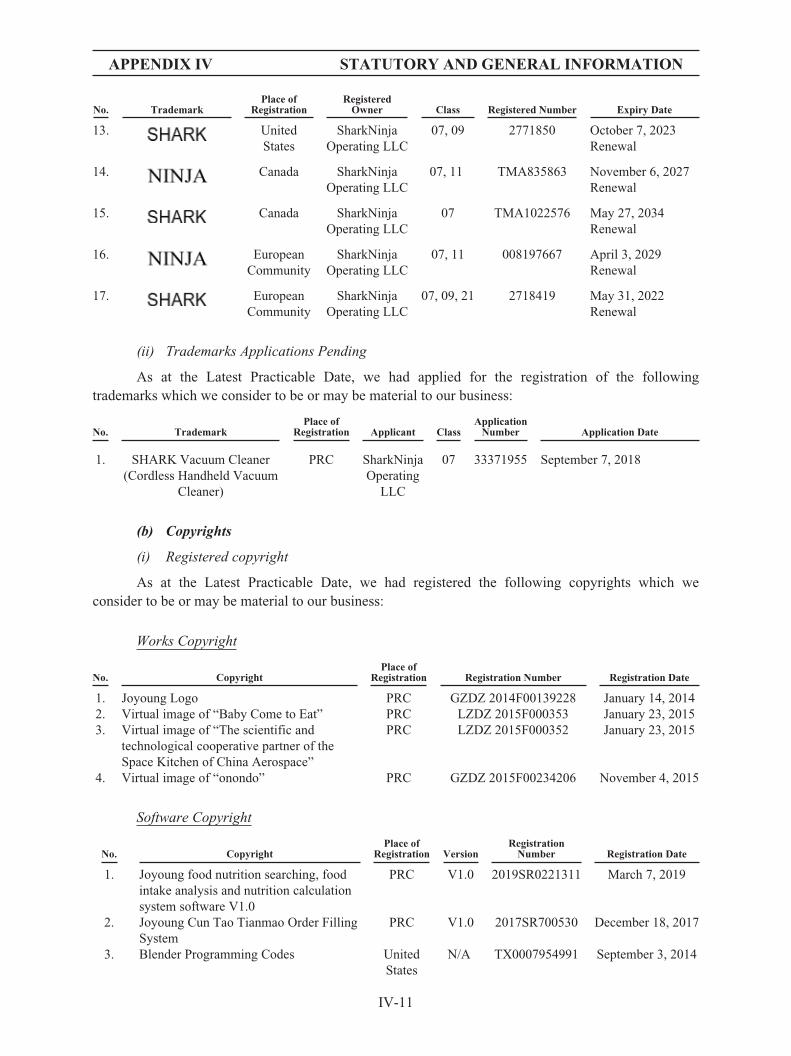
APPENDIX IV STATUTORY AND GENERAL INFORMATION
No. TrademarkPlace of
RegistrationRegistered
Owner Class Registered Number Expiry Date
13. UnitedStates
SharkNinjaOperating LLC
07, 09 2771850 October 7, 2023Renewal
14. Canada SharkNinjaOperating LLC
07, 11 TMA835863 November 6, 2027Renewal
15. Canada SharkNinjaOperating LLC
07 TMA1022576 May 27, 2034Renewal
16. EuropeanCommunity
SharkNinjaOperating LLC
07, 11 008197667 April 3, 2029Renewal
17. EuropeanCommunity
SharkNinjaOperating LLC
07, 09, 21 2718419 May 31, 2022Renewal
(ii) Trademarks Applications Pending
As at the Latest Practicable Date, we had applied for the registration of the followingtrademarks which we consider to be or may be material to our business:
No. TrademarkPlace of
Registration Applicant ClassApplication
Number Application Date
1. SHARK Vacuum Cleaner(Cordless Handheld Vacuum
Cleaner)
PRC SharkNinjaOperating
LLC
07 33371955 September 7, 2018
(b) Copyrights
(i) Registered copyright
As at the Latest Practicable Date, we had registered the following copyrights which weconsider to be or may be material to our business:
Works Copyright
No. CopyrightPlace of
Registration Registration Number Registration Date
1. Joyoung Logo PRC GZDZ 2014F00139228 January 14, 20142. Virtual image of “Baby Come to Eat” PRC LZDZ 2015F000353 January 23, 20153. Virtual image of “The scientific and
technological cooperative partner of theSpace Kitchen of China Aerospace”
PRC LZDZ 2015F000352 January 23, 2015
4. Virtual image of “onondo” PRC GZDZ 2015F00234206 November 4, 2015
Software Copyright
No. CopyrightPlace of
Registration VersionRegistration
Number Registration Date
1. Joyoung food nutrition searching, foodintake analysis and nutrition calculationsystem software V1.0
PRC V1.0 2019SR0221311 March 7, 2019
2. Joyoung Cun Tao Tianmao Order FillingSystem
PRC V1.0 2017SR700530 December 18, 2017
3. Blender Programming Codes UnitedStates
N/A TX0007954991 September 3, 2014
IV-11

APPENDIX IV STATUTORY AND GENERAL INFORMATION
(c) Patents
As at the Latest Practicable Date, we had registered the following patents which we consider tobe or may be material to our business:
No. Patent PatenteePlace of
registration Patent Number Application DateAnnouncement/
Issue Date
1. A pressure-controlledelectric pressurecooker
Joyoung PRC 2013102016391 May 27, 2013 August 10,2016
2. An electric pressurecooker capable oflow-pressure cooking
Joyoung PRC 2014106867528 November 25,2014
August 17,2016
3. Low radiationinduction cooker
Joyoung PRC 2014107203613 December 1,2014
October 20,2017
4. A soybean milkmachine
Joyoung PRC 2015102791863 May 28, 2015 February 1,2019
5. A low-interferencefood processingmachine
Joyoung PRC 2015102960289 June 2, 2015 December 5,2017
6. A noodle makerconvenient for makinggluten noodles
Joyoung PRC 2015105549382 September 2,2015
July 31, 2018
7. A safe large-caliberscrew squeeze juicer
Joyoung PRC 2015107342644 November 2,2015
July 27, 2018
8. A power controlmethod for foodprocessing machine
Joyoung PRC 2015108187294 November 23,2015
October 20,2017
9. A meshlesseasy-to-clean juicer
Joyoung PRC 201510927122X December 11,2015
October 19,2018
10. A cooking pot withuniform heating andcooking device thereof
Joyoung PRC 2016100481424 January 25,2016
December 26,2017
11. A cooking method ofstir fryer
Joyoung PRC 2016100703453 February 2,2016
August 31,2018
12. A cup bodyidentification methodof food processingmachine
Joyoung PRC 2016101798198 March 25,2016
July 31, 2018
13. A soybean milkmachine
Joyoung PRC 2016104320258 June 17, 2016 February 1,2019
14. A food processingmethod of high-speedblender
Joyoung PRC 201610437206X June 17, 2016 October 19,2018
15. A pot with retractablehandle and stir fryer
Joyoung PRC 2016200513613 January 19,2016
August 17,2016
16. A dishwasher withdoor fasteningprotection mechanism
Joyoung PRC 2016201016209 February 1,2016
August 17,2016
17. An inner pot andcooking utensil withsuch inner pot
Joyoung PRC 2017208550155 July 14, 2017 October 9,2018
18. An electric rice cookercapable ofautomatically washingrice
Joyoung PRC 2017208622717 July 17, 2017 October 9,2018
IV-12
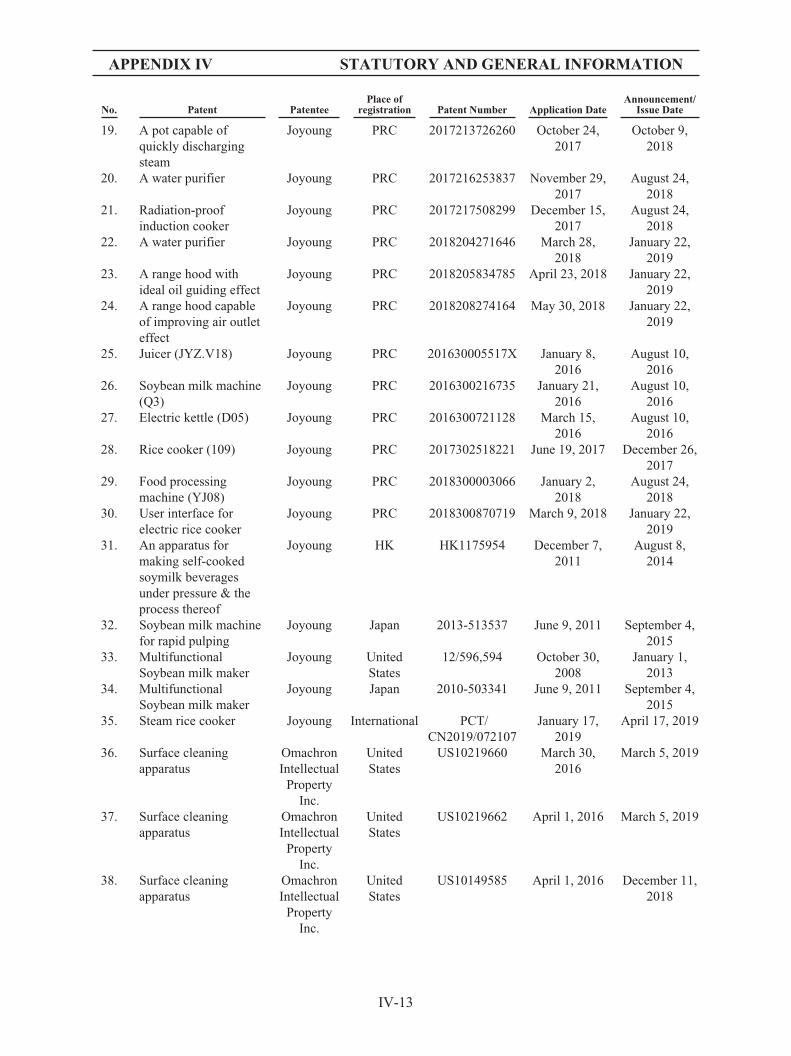
APPENDIX IV STATUTORY AND GENERAL INFORMATION
No. Patent PatenteePlace of
registration Patent Number Application DateAnnouncement/
Issue Date
19. A pot capable ofquickly dischargingsteam
Joyoung PRC 2017213726260 October 24,2017
October 9,2018
20. A water purifier Joyoung PRC 2017216253837 November 29,2017
August 24,2018
21. Radiation-proofinduction cooker
Joyoung PRC 2017217508299 December 15,2017
August 24,2018
22. A water purifier Joyoung PRC 2018204271646 March 28,2018
January 22,2019
23. A range hood withideal oil guiding effect
Joyoung PRC 2018205834785 April 23, 2018 January 22,2019
24. A range hood capableof improving air outleteffect
Joyoung PRC 2018208274164 May 30, 2018 January 22,2019
25. Juicer (JYZ.V18) Joyoung PRC 201630005517X January 8,2016
August 10,2016
26. Soybean milk machine(Q3)
Joyoung PRC 2016300216735 January 21,2016
August 10,2016
27. Electric kettle (D05) Joyoung PRC 2016300721128 March 15,2016
August 10,2016
28. Rice cooker (109) Joyoung PRC 2017302518221 June 19, 2017 December 26,2017
29. Food processingmachine (YJ08)
Joyoung PRC 2018300003066 January 2,2018
August 24,2018
30. User interface forelectric rice cooker
Joyoung PRC 2018300870719 March 9, 2018 January 22,2019
31. An apparatus formaking self-cookedsoymilk beveragesunder pressure & theprocess thereof
Joyoung HK HK1175954 December 7,2011
August 8,2014
32. Soybean milk machinefor rapid pulping
Joyoung Japan 2013-513537 June 9, 2011 September 4,2015
33. MultifunctionalSoybean milk maker
Joyoung UnitedStates
12/596,594 October 30,2008
January 1,2013
34. MultifunctionalSoybean milk maker
Joyoung Japan 2010-503341 June 9, 2011 September 4,2015
35. Steam rice cooker Joyoung International PCT/CN2019/072107
January 17,2019
April 17, 2019
36. Surface cleaningapparatus
OmachronIntellectual
PropertyInc.
UnitedStates
US10219660 March 30,2016
March 5, 2019
37. Surface cleaningapparatus
OmachronIntellectual
PropertyInc.
UnitedStates
US10219662 April 1, 2016 March 5, 2019
38. Surface cleaningapparatus
OmachronIntellectual
PropertyInc.
UnitedStates
US10149585 April 1, 2016 December 11,2018
IV-13
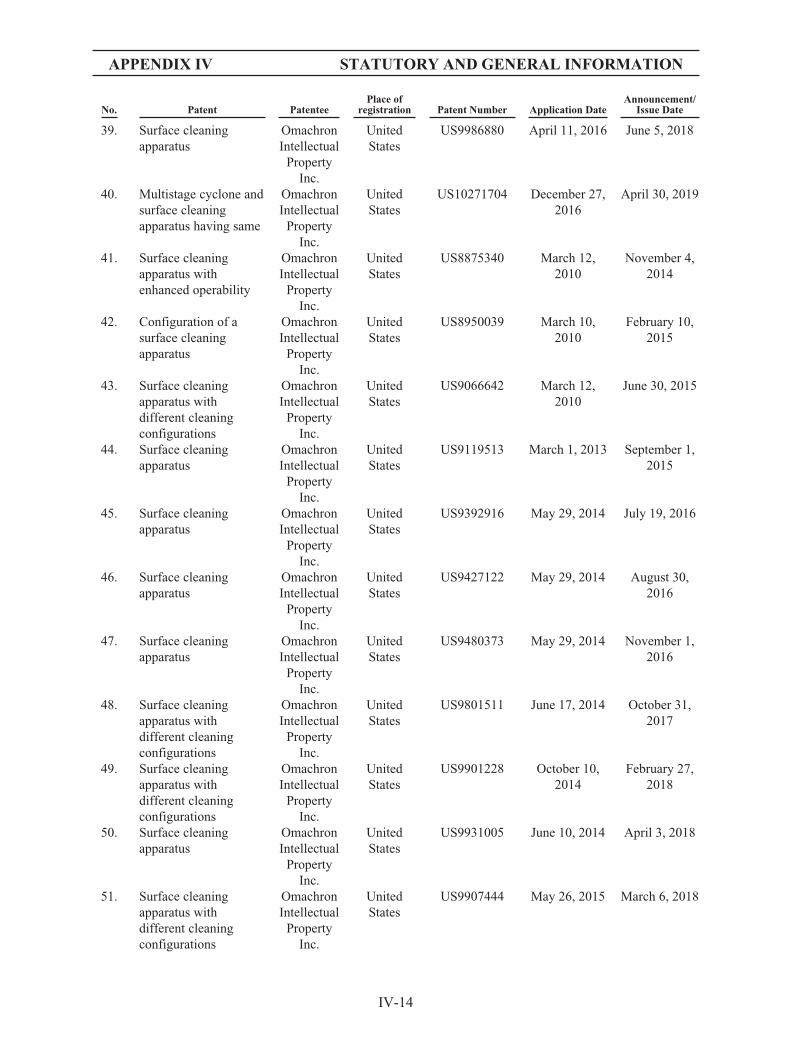
APPENDIX IV STATUTORY AND GENERAL INFORMATION
No. Patent PatenteePlace of
registration Patent Number Application DateAnnouncement/
Issue Date
39. Surface cleaningapparatus
OmachronIntellectual
PropertyInc.
UnitedStates
US9986880 April 11, 2016 June 5, 2018
40. Multistage cyclone andsurface cleaningapparatus having same
OmachronIntellectual
PropertyInc.
UnitedStates
US10271704 December 27,2016
April 30, 2019
41. Surface cleaningapparatus withenhanced operability
OmachronIntellectual
PropertyInc.
UnitedStates
US8875340 March 12,2010
November 4,2014
42. Configuration of asurface cleaningapparatus
OmachronIntellectual
PropertyInc.
UnitedStates
US8950039 March 10,2010
February 10,2015
43. Surface cleaningapparatus withdifferent cleaningconfigurations
OmachronIntellectual
PropertyInc.
UnitedStates
US9066642 March 12,2010
June 30, 2015
44. Surface cleaningapparatus
OmachronIntellectual
PropertyInc.
UnitedStates
US9119513 March 1, 2013 September 1,2015
45. Surface cleaningapparatus
OmachronIntellectual
PropertyInc.
UnitedStates
US9392916 May 29, 2014 July 19, 2016
46. Surface cleaningapparatus
OmachronIntellectual
PropertyInc.
UnitedStates
US9427122 May 29, 2014 August 30,2016
47. Surface cleaningapparatus
OmachronIntellectual
PropertyInc.
UnitedStates
US9480373 May 29, 2014 November 1,2016
48. Surface cleaningapparatus withdifferent cleaningconfigurations
OmachronIntellectual
PropertyInc.
UnitedStates
US9801511 June 17, 2014 October 31,2017
49. Surface cleaningapparatus withdifferent cleaningconfigurations
OmachronIntellectual
PropertyInc.
UnitedStates
US9901228 October 10,2014
February 27,2018
50. Surface cleaningapparatus
OmachronIntellectual
PropertyInc.
UnitedStates
US9931005 June 10, 2014 April 3, 2018
51. Surface cleaningapparatus withdifferent cleaningconfigurations
OmachronIntellectual
PropertyInc.
UnitedStates
US9907444 May 26, 2015 March 6, 2018
IV-14
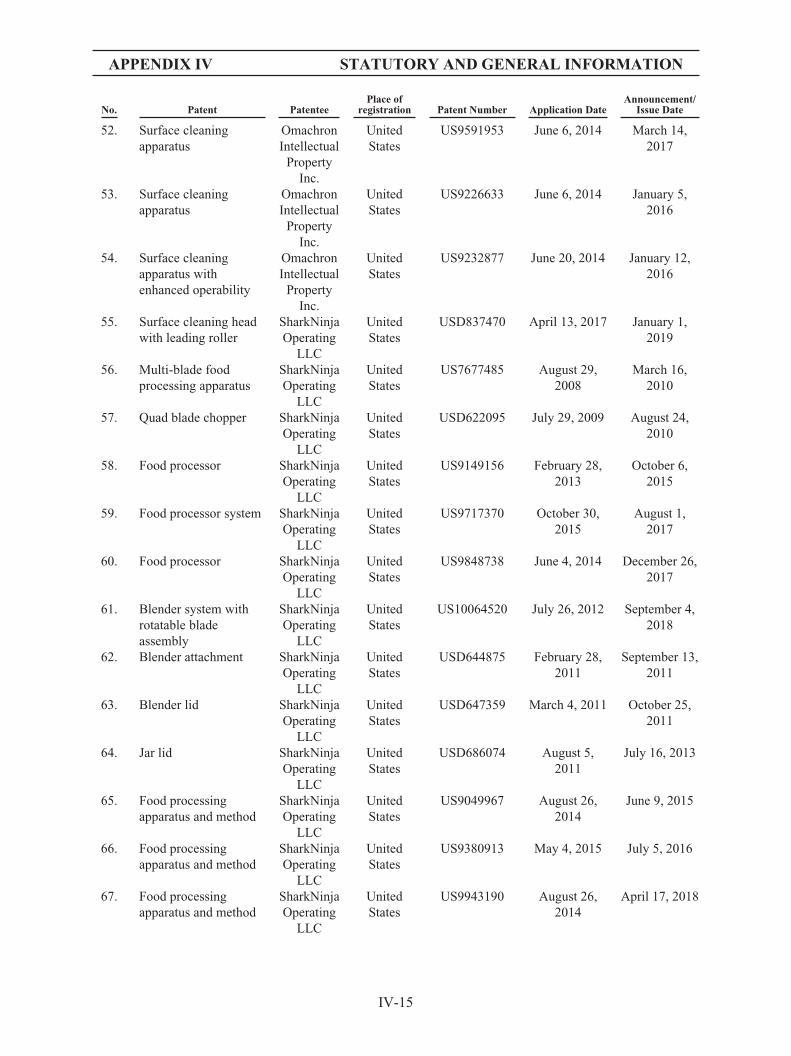
APPENDIX IV STATUTORY AND GENERAL INFORMATION
No. Patent PatenteePlace of
registration Patent Number Application DateAnnouncement/
Issue Date
52. Surface cleaningapparatus
OmachronIntellectual
PropertyInc.
UnitedStates
US9591953 June 6, 2014 March 14,2017
53. Surface cleaningapparatus
OmachronIntellectual
PropertyInc.
UnitedStates
US9226633 June 6, 2014 January 5,2016
54. Surface cleaningapparatus withenhanced operability
OmachronIntellectual
PropertyInc.
UnitedStates
US9232877 June 20, 2014 January 12,2016
55. Surface cleaning headwith leading roller
SharkNinjaOperating
LLC
UnitedStates
USD837470 April 13, 2017 January 1,2019
56. Multi-blade foodprocessing apparatus
SharkNinjaOperating
LLC
UnitedStates
US7677485 August 29,2008
March 16,2010
57. Quad blade chopper SharkNinjaOperating
LLC
UnitedStates
USD622095 July 29, 2009 August 24,2010
58. Food processor SharkNinjaOperating
LLC
UnitedStates
US9149156 February 28,2013
October 6,2015
59. Food processor system SharkNinjaOperating
LLC
UnitedStates
US9717370 October 30,2015
August 1,2017
60. Food processor SharkNinjaOperating
LLC
UnitedStates
US9848738 June 4, 2014 December 26,2017
61. Blender system withrotatable bladeassembly
SharkNinjaOperating
LLC
UnitedStates
US10064520 July 26, 2012 September 4,2018
62. Blender attachment SharkNinjaOperating
LLC
UnitedStates
USD644875 February 28,2011
September 13,2011
63. Blender lid SharkNinjaOperating
LLC
UnitedStates
USD647359 March 4, 2011 October 25,2011
64. Jar lid SharkNinjaOperating
LLC
UnitedStates
USD686074 August 5,2011
July 16, 2013
65. Food processingapparatus and method
SharkNinjaOperating
LLC
UnitedStates
US9049967 August 26,2014
June 9, 2015
66. Food processingapparatus and method
SharkNinjaOperating
LLC
UnitedStates
US9380913 May 4, 2015 July 5, 2016
67. Food processingapparatus and method
SharkNinjaOperating
LLC
UnitedStates
US9943190 August 26,2014
April 17, 2018
IV-15

APPENDIX IV STATUTORY AND GENERAL INFORMATION
No. Patent PatenteePlace of
registration Patent Number Application DateAnnouncement/
Issue Date
68. Blender SharkNinjaOperating
LLC
UnitedStates
USD818308 April 10, 2017 May 22, 2018
69. Blender base SharkNinjaOperating
LLC
UnitedStates
USD696063 February 28,2013
December 24,2013
70. Blender container SharkNinjaOperating
LLC
UnitedStates
USD760026 February 20,2015
June 28, 2016
71. Method of brewingcoffee
SharkNinjaOperating
LLC
UnitedStates
US10028615 June 17, 2014 July 24, 2018
72. Dynamic calibrationcompensation for flowmeter
SharkNinjaOperating
LLC
UnitedStates
US10156468 October 20,2015
December 18,2018
73. Coffee maker SharkNinjaOperating
LLC
UnitedStates
USD823035 May 16, 2016 July 17, 2018
As of the Latest Practicable Date, we had applied for the registration of the following patentswhich we consider to be or may be material to our business:
No. Patent ApplicantPlace of
applicationApplication
Number Application DateAnnouncementDate/Issue Date
1. Surface cleaninghead with leadingroller
SharkNinjaOperating
LLC
International WO2017/070489
October 21,2016
April 27,2017
2. Surface cleaninghead with dualrotating agitators
SharkNinjaOperating
LLC
International WO2017/070492
October 21,2016
April 27,2017
3. Surface cleaninghead with dualrotating agitators
SharkNinjaOperating
LLC
UnitedStates
US 15/331045 October 21,2016
May 11,2017
4. Surface cleaninghead for vacuumcleaner
SharkNinjaOperating
LLC
UnitedStates
US 15/685456 August 24,2017
December 7,2017
5. Cleaning apparatuswith combing unitfor removing debrisfrom cleaning roller
SharkNinjaOperating
LLC
UnitedStates
US 15/492320 April 20, 2017 August 3,2017
6. Surface cleaninghead with leadingroller
SharkNinjaOperating
LLC
UnitedStates
US 15/768879 April 17, 2018 October 18,2018
7. Agitator with hairremoval
SharkNinjaOperating
LLC
UnitedStates
US2018/0070785
September 8,2017
March 15,2018
8. Agitator withdebrider and hairremoval
SharkNinjaOperating
LLC
International WO2018165639 March 10, 2018 September 13,2018
9. Cleaning apparatuswith combing unitfor removing debrisfrom cleaning roller
SharkNinjaOperating
LLC
International WO2018195470 April 20, 2018 October 25,2018
IV-16
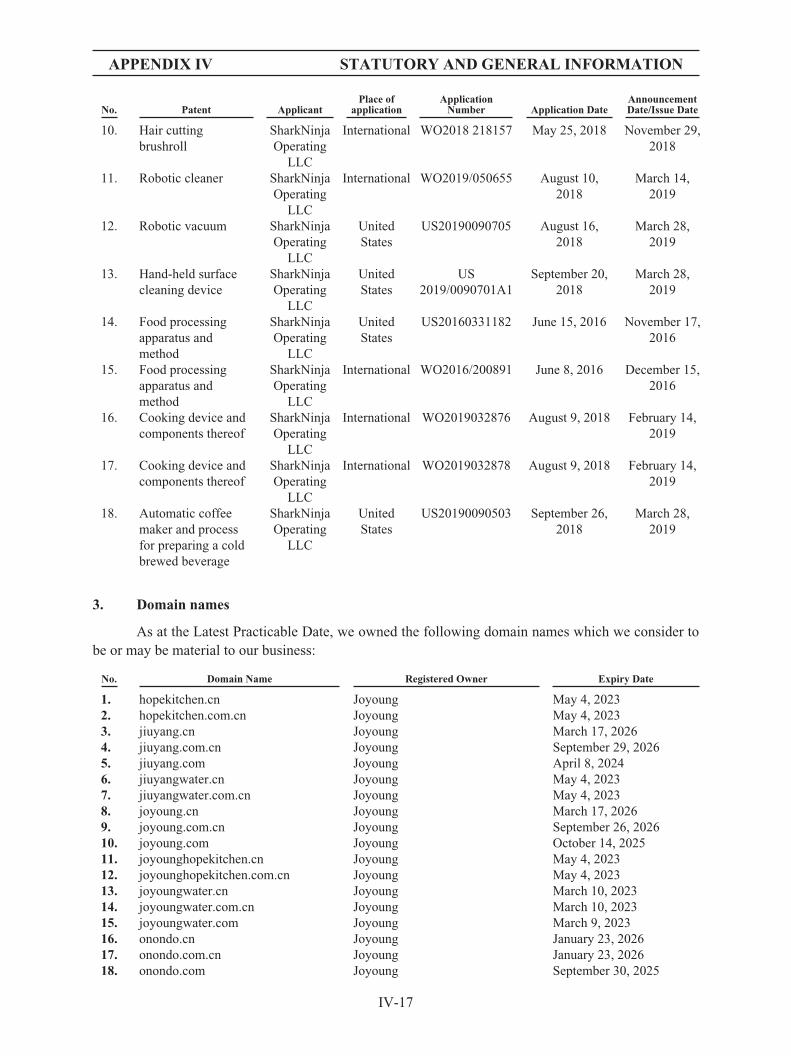
APPENDIX IV STATUTORY AND GENERAL INFORMATION
No. Patent ApplicantPlace of
applicationApplication
Number Application DateAnnouncementDate/Issue Date
10. Hair cuttingbrushroll
SharkNinjaOperating
LLC
International WO2018 218157 May 25, 2018 November 29,2018
11. Robotic cleaner SharkNinjaOperating
LLC
International WO2019/050655 August 10,2018
March 14,2019
12. Robotic vacuum SharkNinjaOperating
LLC
UnitedStates
US20190090705 August 16,2018
March 28,2019
13. Hand-held surfacecleaning device
SharkNinjaOperating
LLC
UnitedStates
US2019/0090701A1
September 20,2018
March 28,2019
14. Food processingapparatus andmethod
SharkNinjaOperating
LLC
UnitedStates
US20160331182 June 15, 2016 November 17,2016
15. Food processingapparatus andmethod
SharkNinjaOperating
LLC
International WO2016/200891 June 8, 2016 December 15,2016
16. Cooking device andcomponents thereof
SharkNinjaOperating
LLC
International WO2019032876 August 9, 2018 February 14,2019
17. Cooking device andcomponents thereof
SharkNinjaOperating
LLC
International WO2019032878 August 9, 2018 February 14,2019
18. Automatic coffeemaker and processfor preparing a coldbrewed beverage
SharkNinjaOperating
LLC
UnitedStates
US20190090503 September 26,2018
March 28,2019
3. Domain names
As at the Latest Practicable Date, we owned the following domain names which we consider tobe or may be material to our business:
No. Domain Name Registered Owner Expiry Date
1. hopekitchen.cn Joyoung May 4, 20232. hopekitchen.com.cn Joyoung May 4, 20233. jiuyang.cn Joyoung March 17, 20264. jiuyang.com.cn Joyoung September 29, 20265. jiuyang.com Joyoung April 8, 20246. jiuyangwater.cn Joyoung May 4, 20237. jiuyangwater.com.cn Joyoung May 4, 20238. joyoung.cn Joyoung March 17, 20269. joyoung.com.cn Joyoung September 26, 202610. joyoung.com Joyoung October 14, 202511. joyounghopekitchen.cn Joyoung May 4, 202312. joyounghopekitchen.com.cn Joyoung May 4, 202313. joyoungwater.cn Joyoung March 10, 202314. joyoungwater.com.cn Joyoung March 10, 202315. joyoungwater.com Joyoung March 9, 202316. onondo.cn Joyoung January 23, 202617. onondo.com.cn Joyoung January 23, 202618. onondo.com Joyoung September 30, 2025
IV-17
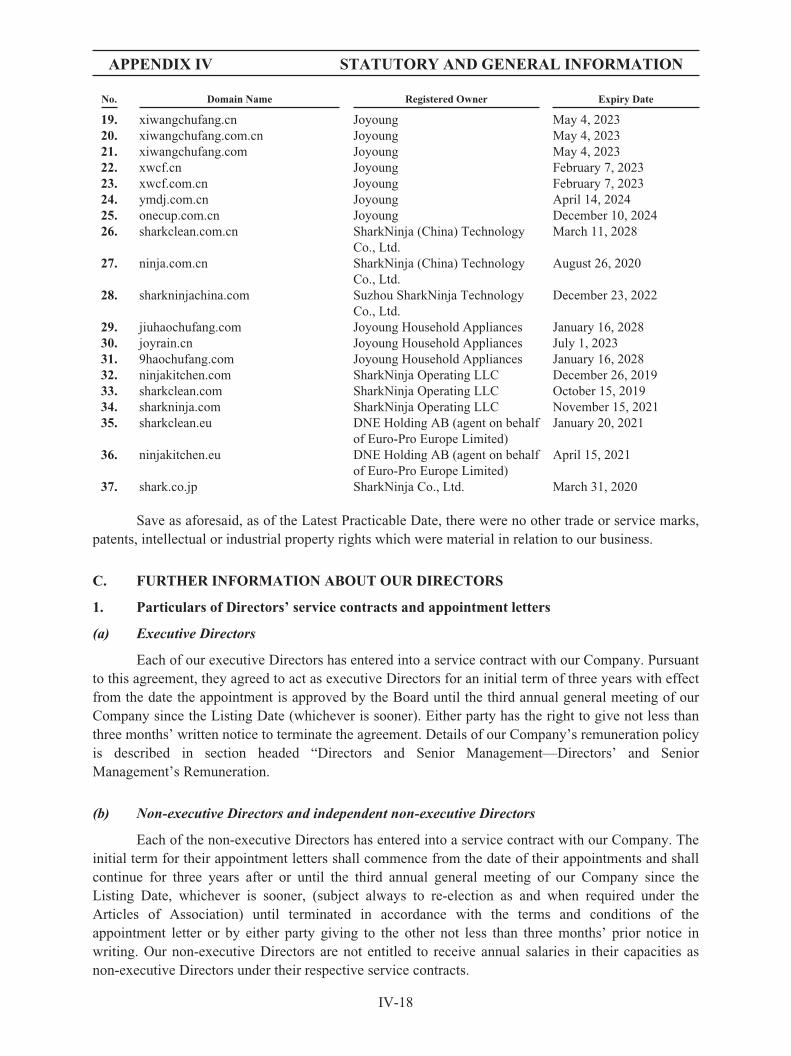
APPENDIX IV STATUTORY AND GENERAL INFORMATION
No. Domain Name Registered Owner Expiry Date
19. xiwangchufang.cn Joyoung May 4, 202320. xiwangchufang.com.cn Joyoung May 4, 202321. xiwangchufang.com Joyoung May 4, 202322. xwcf.cn Joyoung February 7, 202323. xwcf.com.cn Joyoung February 7, 202324. ymdj.com.cn Joyoung April 14, 202425. onecup.com.cn Joyoung December 10, 202426. sharkclean.com.cn SharkNinja (China) Technology
Co., Ltd.March 11, 2028
27. ninja.com.cn SharkNinja (China) TechnologyCo., Ltd.
August 26, 2020
28. sharkninjachina.com Suzhou SharkNinja TechnologyCo., Ltd.
December 23, 2022
29. jiuhaochufang.com Joyoung Household Appliances January 16, 202830. joyrain.cn Joyoung Household Appliances July 1, 202331. 9haochufang.com Joyoung Household Appliances January 16, 202832. ninjakitchen.com SharkNinja Operating LLC December 26, 201933. sharkclean.com SharkNinja Operating LLC October 15, 201934. sharkninja.com SharkNinja Operating LLC November 15, 202135. sharkclean.eu DNE Holding AB (agent on behalf
of Euro-Pro Europe Limited)January 20, 2021
36. ninjakitchen.eu DNE Holding AB (agent on behalfof Euro-Pro Europe Limited)
April 15, 2021
37. shark.co.jp SharkNinja Co., Ltd. March 31, 2020
Save as aforesaid, as of the Latest Practicable Date, there were no other trade or service marks,patents, intellectual or industrial property rights which were material in relation to our business.
C. FURTHER INFORMATION ABOUT OUR DIRECTORS
1. Particulars of Directors’ service contracts and appointment letters
(a) Executive Directors
Each of our executive Directors has entered into a service contract with our Company. Pursuantto this agreement, they agreed to act as executive Directors for an initial term of three years with effectfrom the date the appointment is approved by the Board until the third annual general meeting of ourCompany since the Listing Date (whichever is sooner). Either party has the right to give not less thanthree months’ written notice to terminate the agreement. Details of our Company’s remuneration policyis described in section headed “Directors and Senior Management—Directors’ and SeniorManagement’s Remuneration.
(b) Non-executive Directors and independent non-executive Directors
Each of the non-executive Directors has entered into a service contract with our Company. Theinitial term for their appointment letters shall commence from the date of their appointments and shallcontinue for three years after or until the third annual general meeting of our Company since theListing Date, whichever is sooner, (subject always to re-election as and when required under theArticles of Association) until terminated in accordance with the terms and conditions of theappointment letter or by either party giving to the other not less than three months’ prior notice inwriting. Our non-executive Directors are not entitled to receive annual salaries in their capacities asnon-executive Directors under their respective service contracts.
IV-18
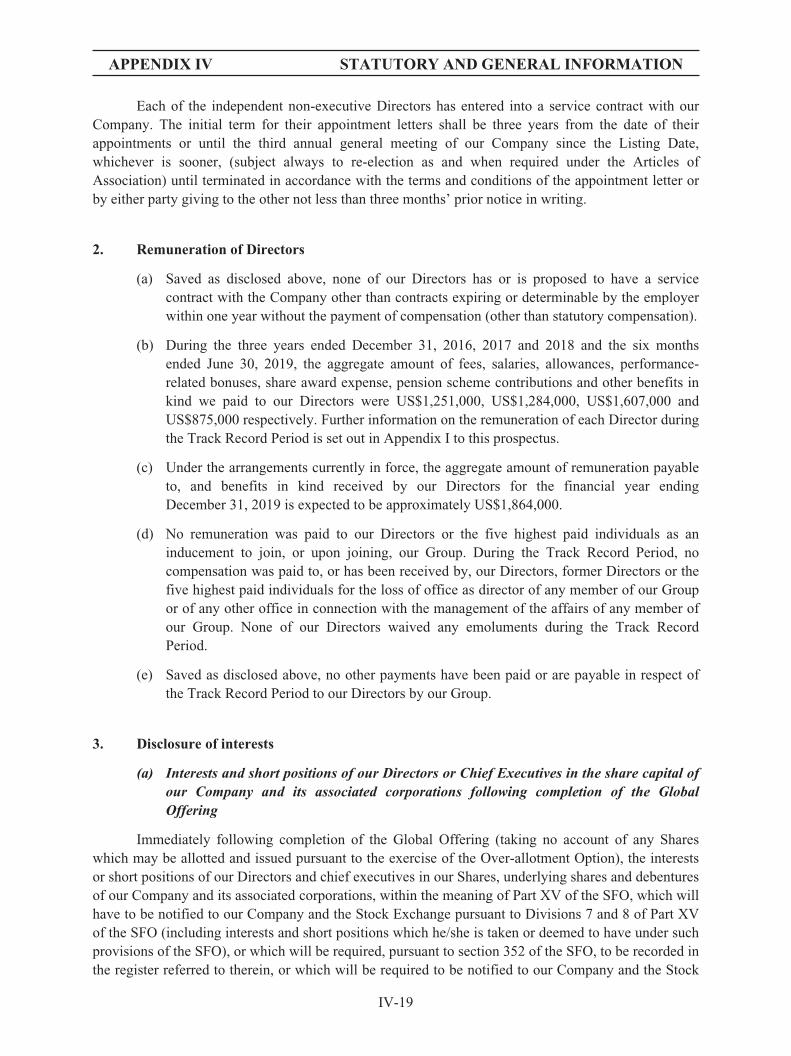
APPENDIX IV STATUTORY AND GENERAL INFORMATION
Each of the independent non-executive Directors has entered into a service contract with ourCompany. The initial term for their appointment letters shall be three years from the date of theirappointments or until the third annual general meeting of our Company since the Listing Date,whichever is sooner, (subject always to re-election as and when required under the Articles ofAssociation) until terminated in accordance with the terms and conditions of the appointment letter orby either party giving to the other not less than three months’ prior notice in writing.
2. Remuneration of Directors
(a) Saved as disclosed above, none of our Directors has or is proposed to have a servicecontract with the Company other than contracts expiring or determinable by the employerwithin one year without the payment of compensation (other than statutory compensation).
(b) During the three years ended December 31, 2016, 2017 and 2018 and the six monthsended June 30, 2019, the aggregate amount of fees, salaries, allowances, performance-related bonuses, share award expense, pension scheme contributions and other benefits inkind we paid to our Directors were US$1,251,000, US$1,284,000, US$1,607,000 andUS$875,000 respectively. Further information on the remuneration of each Director duringthe Track Record Period is set out in Appendix I to this prospectus.
(c) Under the arrangements currently in force, the aggregate amount of remuneration payableto, and benefits in kind received by our Directors for the financial year endingDecember 31, 2019 is expected to be approximately US$1,864,000.
(d) No remuneration was paid to our Directors or the five highest paid individuals as aninducement to join, or upon joining, our Group. During the Track Record Period, nocompensation was paid to, or has been received by, our Directors, former Directors or thefive highest paid individuals for the loss of office as director of any member of our Groupor of any other office in connection with the management of the affairs of any member ofour Group. None of our Directors waived any emoluments during the Track RecordPeriod.
(e) Saved as disclosed above, no other payments have been paid or are payable in respect ofthe Track Record Period to our Directors by our Group.
3. Disclosure of interests
(a) Interests and short positions of our Directors or Chief Executives in the share capital ofour Company and its associated corporations following completion of the GlobalOffering
Immediately following completion of the Global Offering (taking no account of any Shareswhich may be allotted and issued pursuant to the exercise of the Over-allotment Option), the interestsor short positions of our Directors and chief executives in our Shares, underlying shares and debenturesof our Company and its associated corporations, within the meaning of Part XV of the SFO, which willhave to be notified to our Company and the Stock Exchange pursuant to Divisions 7 and 8 of Part XVof the SFO (including interests and short positions which he/she is taken or deemed to have under suchprovisions of the SFO), or which will be required, pursuant to section 352 of the SFO, to be recorded inthe register referred to therein, or which will be required to be notified to our Company and the Stock
IV-19

APPENDIX IV STATUTORY AND GENERAL INFORMATION
Exchange pursuant to the Model Code for Securities Transactions by Directors of Listed Companiescontained in the Listing Rules, will be as follows:
(i) Interest in Shares
Name of Director or chief executive Nature of interest Numbers of securities
Approximate percentageof Interest in our
Company immediatelyafter the Global Offering
(assuming the Over-allotment Option is not
exercised)
Approximate percentageof Interest in our
Company immediatelyafter the Global Offering
(assuming the Over-allotment Option is fully
exercised)
Mr. Wang Xuning(1)(2)(3) . . . . Interest in controlledcorporations, interest
held jointly withother persons 1,971,882,576 59.17% 57.87%
Beneficial owner 45,317,890 1.36% 1.33%Ms. Han Run(1)(4) . . . . . . . . . . Interest in controlled
corporations, interestheld jointly with
other persons 1,603,578,331 48.12% 47.06%Beneficial owner 11,329,472 0.34% 0.33%
Ms. Huang Shuling(1) . . . . . . Interest in controlledcorporations, interest
held jointly withother persons 1,603,578,331 48.12% 47.06%
Notes:(1) Hezhou is the general partner exercising operational control over JS Holding, meanwhile Tong Zhou acts as its limited partner
established by the Controlling Shareholders Group with almost 100% of the partnership interest. Hezhou is wholly owned by XNL,which is wholly owned by Mr. Wang Xuning. Tong Zhou is held by the investment entities of the Controlling Shareholders Group. Uponthe completion of the Global Offering, JS Holding will directly hold 1,603,578,331 Shares in our Company. Therefore, each ofMr. Wang Xuning, Ms. Han Run and Ms. Huang Shuling is deemed to be interested in the 1,603,578,331 Shares held by JS Holding forthe purpose of Part XV of the SFO.
(2) Sol SPC is an investment entity holding company incorporated in the Cayman Islands, and STL, which is wholly owned by XNL, awholly owned subsidiary of Mr. Wang Xuning, held 100 management shares in Sol SPC. Therefore, Mr. Wang Xuning is deemed to beinterested in the 1,971,882,576 Shares held by Sol SPC for the purpose of Part XV of the SFO.
(3) Mr. Wang Xuning is interested in 45,317,890 restricted stock units granted to him under the RSU Plan entitling him to receive up to45,317,890 Shares subject to vesting.
(4) Ms. Han Run is interested in 11,329,472 restricted stock units granted to her under the RSU Plan entitling her to receive up to 11,329,472Shares subject to vesting.
(ii) Interest in associated corporations
Name of Director or chief executive Nature of InterestAssociatedcorporation
Percentageshareholding
of theassociated
corporations
Mr. Wang Xuning(1)(2) . . . . . . . . . . . . . . . . . Beneficial owner Shanghai Lihong 8.414%Interest in controlled corporations Shanghai Lihong 0.003%
Ms. Han Run(1) . . . . . . . . . . . . . . . . . . . . . . . Beneficial owner Shanghai Lihong 0.162%Ms. Huang Shuling(1) . . . . . . . . . . . . . . . . . . Beneficial owner Shanghai Lihong 0.794%
Notes:(1) Shanghai Lihong is directly held as to 8.414%, 0.162% and 0.794% by Mr. Wang Xuning, Ms. Han Run and Ms. Huang Shuling,
respectively. Mr. Wang Xuning, Ms. Han Run and Ms. Huang Shuling, as members of the Controlling Shareholders Group, with theirdirect equity interests in Shanghai Lihong, will not nominate any representative to the board of directors of Shanghai Lihong, which isthe supreme organ of Shanghai Lihong under applicable PRC laws and regulations. In addition, the dividend distribution of ShanghaiLihong will not be made to them pursuant to the dividend payment arrangement among the shareholders of Shanghai Lihong. See“Relationship with our Controlling Shareholders – Potential conflict of interest and corporate governance measure”.
(2) Shanghai Lihong is directly held as to 0.003% by Shanghai Hezhou, which is in turn held as to 61.85% by Mr. Wang Xuning. Therefore,Mr. Wang Xuning is deemed to be interested in the equity interests held by Shanghai Hezhou for the purpose of Part XV of the SFO. The
IV-20
APPENDIX IV STATUTORY AND GENERAL INFORMATION
dividend distribution of Shanghai Lihong will not be made to Shanghai Hezhou pursuant to the dividend payment arrangement amongthe shareholders of Shanghai Lihong. See “Relationship with our Controlling Shareholders – Potential conflict of interest and corporategovernance measure”.
Save as set out above, the Directors are not aware of any of our Directors or chief executiveswho will, immediately following completion of the Global Offering, has any interests and/or shortpositions in the Shares, underlying shares and debentures of our Company’s associated corporations(within the meaning of Part XV of the SFO), which will have to be notified to our Company and theStock Exchange pursuant to Divisions 7 and 8 of Part XV of the SFO (including interests and shortpositions which he/she is taken or deemed to have under such provisions of the SFO), or which will berequired, pursuant to section 352 of the SFO, to be recorded in the register referred to therein, or whichwill be required to be notified to our Company and the Stock Exchange pursuant to the Model Code forSecurities Transactions by Directors of Listed Companies contained in the Listing Rules.
(b) Interests and short positions disclosable under Divisions 2 and 3 of Part XV of the SFO
For information on the persons who will, immediately following the completion of the GlobalOffering, having or be deemed or taken to have beneficial interests or short position in our Shares orunderlying shares which would fall to be disclosed to our Company under the provisions of 2 and 3 ofPart XV of the SFO, or directly or indirectly be interested in 10% or more of the nominal value of anyclass of share capital carrying rights to vote in all circumstances at general meetings of any othermember of our Group, see the section headed “Substantial Shareholders”.
Save as set out above, as of the Latest Practicable Date, our Directors were not aware of anypersons who would, immediately following the completion of the Global Offering, be interested,directly or indirectly, in 10% or more of the nominal of any class of share capital carrying rights tovote in all circumstances at general meetings of any member of our Group or had option in respect ofsuch capital.
4. Disclaimers
Save as disclosed in this prospectus:
(a) there are no existing or proposed service contracts (excluding contracts expiring ordeterminable by the employer within one year without payment of compensation (otherthan statutory compensation)) between the Directors and any member of our Group;
(b) none of the Directors or the experts named in the paragraph headed “—E. OtherInformation—4. Consents of Experts” in this section is materially interested in anycontract or arrangement subsisting at the date of this prospectus which is significant inrelation to the business of our Group taken as a whole;
(c) none of the Directors or the experts named in the paragraph headed “—E. OtherInformation—4. Consents of Experts” in this section has any direct or indirect interest inthe promotion of, or in any assets which have been, within the two years immediatelypreceding the date of this prospectus, acquired or disposed of by or leased to any memberof our Group, or are proposed to be acquired or disposed of by or leased to any member ofour Group;
(d) no commissions, discounts, brokerages or other special terms have been granted inconnection with the issue or sale of any Shares in or debentures of our Company withinthe two years ended on the date of this prospectus;
IV-21
APPENDIX IV STATUTORY AND GENERAL INFORMATION
(e) none of the Directors is materially interested in any contract or arrangement subsisting atthe date of this prospectus which is significant in relation to the business of our Grouptaken as a whole;
(f) saved as disclosed in this prospectus, none of the Directors is interested in any businessapart from our Group’s business which competes or is likely to compete, directly orindirectly, with the business of our Group;
(g) taking no account of any Shares which may be taken up under the Global Offering, so faras is known to any Director or chief executive of our Company, no other person (otherthan a Director or chief executive of our Company) will, immediately followingcompletion of the Global Offering, have interests or short positions in our Shares andunderlying Shares which would fall to be disclosed to our Company and the StockExchange under the provisions of Divisions 2 and 3 of Part XV of the SFO or (not being amember of our Group), be interested, directly or indirectly, in 10% or more of the nominalvalue of any class of share capital carrying rights to vote in all circumstances at generalmeetings of any member of our Group; and
(h) none of the Directors or chief executive of our Company has any interests or shortpositions in our Shares, underlying shares or debentures of our Company or its associatedcorporations (within the meaning of Part XV of the SFO) which will have to be notified toour Company and the Stock Exchange pursuant to Divisions 7 and 8 of Part XV of theSFO (including interests and short positions which he is taken or deemed to have undersuch provisions of the SFO) or which will be required, pursuant to section 352 of the SFO,to be entered into the register referred to therein, or will be required, pursuant to the ModelCode for Securities Transaction by Directors of Listed Issuers, to be notified to ourCompany and the Stock Exchange once our Shares are listed thereon.
D. RSU Plan
1. Summary
The following is a summary of the principal terms of the restricted stock unit plan (the “RSUPlan”) of our Company as approved by the Board on October 9, 2019. The terms of the RSU Plan arenot subject to the provisions of Chapter 17 of the Listing Rules as the RSU Plan will not involve thegrant of options by us to subscribe for our Shares. In addition, the grant of RSUs by our Company ortransfer upon vesting of the RSUs of any of the Shares issued pursuant to the RSU Plan by any trusteeor trust or representative holding company(ies) to a connected person of our Company should not besubject to the requirement of Chapter 14A of the Listing Rules.
2. Purpose
The purpose of the RSU Plan is to recognize and reward participants for their contribution toour Group, to attract best available personnel to provide service to our Group, and to provide additionalincentives to them to remain with and further promote the success of our Group’s business.
3. Effectiveness and Duration
Subject to any early termination as may be determined by the Board pursuant to terms of theRSU Plan, the RSU Plan shall be valid and effective for a period of 10 years commencing on theadoption date of October 9, 2019, after which no further awards will be granted, but the provisions of
IV-22
APPENDIX IV STATUTORY AND GENERAL INFORMATION
this RSU Plan shall in all other respects remain in full force and effect and the awards granted duringthe term of the RSU Plan may continue to be valid and exercisable in accordance with their respectiveterms of grant.
4. Administration
The RSU Plan shall be subject to the administration of the administrator (the “Administrator”),being (i) prior to the Listing, our Board, and (ii) immediately after the consummation of the Listing,our Board or a committee comprising of certain members of our Board as authorized by our Boardfrom time to time for the purpose of administering the RSU Plan, in accordance with the terms andconditions of the RSU Plan. The Administrator may, from time to time, select the participants to whomrestricted stock units may be granted (“Awards”).
The Administrator shall have the sole and absolute right to (a) interpret and construe theprovisions of RSU Plan, (b) determine the persons who will be granted awards under the RSU Plan, theterms and conditions on which awards are granted and when the RSUs granted pursuant to the RSUPlan may vest, (c) make such appropriate and equitable adjustments to the terms of the awards grantedunder the RSU Plan as it deems necessary; and (d) make such other decisions or determinations as itshall deem appropriate or desirable in respect of the foregoing matters stated (a), (b) and (c).
5. Who may join
Those eligible to participate in the RSU Plan (the “Participants”) include: (a) full-timeemployees (including directors, officers and members of senior management) of our Group; and(b) any person who, in the sole opinion of the Administrator, has contributed or will contribute to anymember of our Group (including business partners of any member of our Group, such as suppliers,clients, or any persons who provide technical support, consultancy, advisory or other services to anymember of our Group).
6. Maximum number of Shares
The total number of Shares underlying the RSU Plan (“RSU Limit”) shall not exceed theaggregate of 141,618,409 Shares as of the date of adoption of the RSU Plan, representing 5% of theissued Shares of our Company immediately prior to the completion of the Global Offering. Vistra Trust(Hong Kong) Limited has been appointed as the trustee (the “Trustee”) pursuant to the trust deed toassist the Administrator with the administration of the RSU Plan. The Trustee will hold the Sharesissued by the Company pursuant to the RSU Plan on trust for the grantees through its wholly-ownedRSU Holding Entities.
7. Terms and Conditions of Award
(a) Grant of Awards
The Administrator may, from time to time, select the Participants to whom a grant of an Awardmay be made. The amount of an Award may be determined at the sole and absolute discretion of theAdministrator and may differ among selected Participants.
(b) Consideration
The consideration (if any) payable by a selected Participant to the trustee for acceptance of theAward under the RSU Plan shall be determined at the sole and absolute discretion of the Administrator
IV-23

APPENDIX IV STATUTORY AND GENERAL INFORMATION
and any such consideration shall be held by the trustee as income of the trust funds and be applied bythe trustee as it deems appropriate or desirable in accordance with the terms of the RSU Plan and thetrust deed.
(c) Conditions of Award
Subject to the terms of the RSU Plan, the Awards may be granted on such terms and conditions(such as by linking the vesting of their RSU to the attainment or performance of milestones or targetsby any member of our Group, the grantee or any group of grantees) as the Administrator maydetermine, provided such terms and conditions shall not be inconsistent with any other terms andconditions of this RSU Plan. The terms and conditions of an Award may be determined at the sole andabsolute discretion of the Administrator and may differ among selected Participants.
(d) Separate Programs
The Administrator may establish one or more separate programs under the RSU Plan for thepurpose of issuing particular forms of Awards to one or more classes of grantees on such terms andconditions as determined by the Administrator from time to time.
(e) Restrictions
No grant of Award shall be made to any selected Participant at a time when the selectedParticipant would or might be prohibited from dealing in our Shares by the Listing Rules (whereapplicable) or by any other applicable rules, regulations or law.
For as long as our Shares are listed on the Stock Exchange, a grant of Award must not be madeafter inside information has come to the knowledge of the Company until such inside information hasbeen announced in accordance with the requirements of the Listing Rules and the relevant securitieslaws. For as long as our Shares are listed on the Stock Exchange, a grant shall not be made on any dayon which the financial results of our Company are published and during the period of: (i) 60 daysimmediately preceding the publication date of the annual results or, if shorter, the period from the endof the relevant financial year up to the publication date of the results; and (ii) 30 days immediatelypreceding the publication date of the quarterly results (if any) and half-year results or, if shorter, theperiod from the end of the relevant quarterly or half-year period up to the publication date of theresults.
For as long as the Shares are listed on the Stock Exchange, if required by the Stock Exchangeor the Listing Rules, any grant of an Award shall be subject to the compliance with the requisiterequirements under the Listing Rules or otherwise required by the Stock Exchange. The Administratormay not grant any Awards to any Participant in any of the following circumstances:
(i) the requisite approvals for that grant of Award from any applicable regulatory authoritieshave not been obtained; or
(ii) the securities laws or regulations require that a prospectus or other offering documents beissued in respect of the grant of Award or in respect of the RSU Plan, unless theAdministrator determines otherwise; or
(iii) where the grant of Award would result in a breach of any applicable securities laws, rulesor regulations by any member of our Group or any of its directors; or
(iv) the grant of Award would result in breach of the RSU Limit or other rules of the RSUPlan.
IV-24

APPENDIX IV STATUTORY AND GENERAL INFORMATION
(f) Transferability of Awards
RSUs granted pursuant to the RSU Plan shall be personal to the grantee and shall not beassignable or transferable, except assignment or transfer from a grantee to a company wholly owned byhim or between two companies both of which are wholly owned by him.
8. Taxes
The grantee shall be solely liable to pay all the relevant portion of taxes, stamp duty and otherlevies responsible by the grantees that may be assessed or assessable on any transfer of Shares orpayments made by the Administrator, the Trustee or our Company (either directly or indirectly) underthe RSU Plan and all transfers or payments required to be made hereunder by the Administrator, theTrustee or our Company shall be subject to the deduction or withholding of such amounts as theAdministrator may reasonably determine is necessary or desirable by reason of any liability to tax orobligation to account for tax or loss of any relief from tax that may fall on the Administrator or ourCompany, any member of our Group, or the Trustee in respect of, or by reason of such delivery orsales of Shares underlying an RSU and/or the making of such payments, and the grantee agrees toindemnify and keep the Administrator, our Company (for itself and as trustee for members of ourGroup) and the Trustee indemnified in respect of any such liability, obligation or loss and accepts thatany claim in respect of such indemnity may be satisfied by set-off against any sums due from theAdministrator or our Company, any Group Company, and/or the Trustee to such grantee from time totime.
9. Vesting
(a) Vesting Notice
Upon fulfillment or waiver (by the Administrator in its sole and absolute discretion) of thevesting period and vesting conditions (if any) applicable to a grantee or a grant, a vesting notice will besent to the grantee by the Administrator, or by the Trustee under the authorization and instruction bythe Administrator, confirming (a) the extent to which the vesting period and vesting conditions havebeen fulfilled or waived; (b) the number of Shares (and, if applicable, the cash or non-cash income,dividends or distributions and/or the sale proceeds of non-cash and non-scrip dividends in respect ofthese Shares) or the amount of cash the grantee will receive; and (c) where the grantee will receiveShares, the lock-up arrangements for such Shares (if applicable). The grantee may be required toexecute, after receiving the vesting notice, certain documents set out in the vesting notice that theAdministrator considers necessary (which may include, without limitation, a certification that he or shehas complied with all the terms and conditions set out in the RSU Plan and the Award Agreement). Inthe event that the grantee fails to execute the required documents within 30 business days afterreceiving the vesting notice (if the documents to be executed by the grantee is set out in the vestingnotice), the vested RSUs will lapse.
(b) RSUs which have vested
Subject to the execution of documents by the grantee as set out above, the RSUs which havevested shall be satisfied, at the Administrator’s sole and absolute discretion within a reasonable periodfrom the vesting date of such RSUs, either by:
(i) subject to the above paragraph 8, the Administrator directing and procuring the Trustee totransfer our Shares underlying the RSUs (and, if applicable, the cash or non-cash income,
IV-25

APPENDIX IV STATUTORY AND GENERAL INFORMATION
dividends or distributions and/or the sale proceeds of non-cash and non-scrip distributionsin respect of those Shares) to the grantee or his wholly-owned entity (as represented by thegrantee) from the trust fund; and/or
(ii) the Administrator directing and procuring the Trustee to pay to the grantee in cash anamount which is equivalent to the market value of our Shares (and, if applicable, the cashor non-cash income, dividends or distributions and/or the sale proceeds of non-cash andnon-scrip distributions in respect of those Shares) set out in the paragraph (i) above bymaking on-market sales of such Shares and/or utilizing the cash in the trust fund accordingto the Administrator’s instruction and after deduction or withholding of any tax, fines,levies, stamp duty and other charges applicable to the entitlement of the grantee and thesales of any Shares to fund such payment and in relation thereto.
The Administrator shall have the sole and absolute discretion to determine whether or not agrantee shall have any rights to any cash or non-cash income, dividends or distributions and/or the saleproceeds of non-cash and non-scrip distributions from any Shares underlying a RSU prior to vesting ofthe RSU.
(c) Voting Rights
Subject to any applicable laws, regulations and rules, the powers and obligations of the Trusteewill be limited as set forth in the trust deed and the Trustee shall, prior to the Shares being transferredto the grantees pursuant to this RSU Plan, exercise all powers and rights attached to the Shares(including the voting rights thereof) under this RSU Plan but shall be required to give a proxy (withoutspecifying voting direction) to the chairman of each general meeting in terms of the voting over theShares held by the Trustee. The Trustee will hold the trust fund in accordance with the terms of thetrust deed and the Trustee will hold the Shares which are part of the trust fund.
10. Treatment under takeover, scheme of arrangement, voluntarily wind-up and compromiseor arrangement
(a) Takeover
In the event a general offer by way of voluntary offer, takeover or otherwise (other than by wayof scheme of arrangement pursuant to paragraph (b) below) is made to all the Shareholders (or all suchShareholders other than the offeror and/or any person controlled by the offeror and/or any personacting in association or concert with the offeror) and such offer becomes or is declared unconditionalprior to the vesting date of any RSU, the Administrator shall, prior to or immediately upon the offerbecoming or being declared unconditional, determine at its absolute discretion whether the remainingunvested RSU shall vest and if any RSU shall vest, it shall vest on the day on which such offerbecomes or is declared unconditional. If the Administrator determines that such RSU shall vest, it shallnotify the grantee, the Trustee and the Company the number of RSUs to be vested on the day on whichsuch offer becomes or is declared unconditional.
(b) Scheme of Arrangement
In the event a general offer for Shares by way of scheme of arrangement is made to all theShareholders and has been approved by the necessary number of Shareholders at the requisite meetingsprior to the vesting of any RSU, the Administrator shall, on the same day as and immediately after theclose of such Shareholders’ meetings, determine at its sole and absolute discretion whether the
IV-26
APPENDIX IV STATUTORY AND GENERAL INFORMATION
remaining unvested RSU shall vest and if any RSU shall vest, it shall vest on the same day as theShareholders’ meetings. If the Administrator determines that such RSU shall vest, it shall notify thegrantee, the Trustee and the Company the number of RSUs to be vested on the same day as theShareholders’ meeting.
(c) Voluntarily winding-up
In the event a notice is given by the Company to the Shareholders to convene a Shareholders’meeting for the purposes of considering and, if thought fit, approving a resolution to voluntarily wind-up the Company prior to the vesting date of any RSU, the Administrator shall, on the same day as andimmediately after the close of such Shareholders’ meeting, determine at its sole and absolute discretionwhether the remaining unvested RSU shall vest, and if any RSU shall vest, it shall vest on the sameday as the Shareholders’ meeting. If the Administrator determines that such RSU shall vest, it shallnotify the grantee, the Trustee and the Company the number of RSUs to be vested on the same day asthe Shareholders’ meetings.
(d) Compromise or arrangement
In the event a compromise or arrangement, other than a scheme of arrangement contemplated inparagraph (b) above, between the Company and the Shareholders and/or creditors is proposed inconnection with a scheme for the reconstruction of the Company or its amalgamation with any othercompany or companies and a notice is given by the Company to the Shareholders to convene aShareholders’ meeting for the purpose of considering the same, the Administrator shall, on the sameday as and immediately after the close of such Shareholders’ meeting, determine at its sole andabsolute discretion whether the remaining unvested RSU shall vest, and if any RSU shall vest, it shallvest on the same day as the Shareholders’ meetings. If the Administrator determines that such RSUshall vest, it shall notify the grantee, the Trustee and the Company the number of RSUs to be vested onthe same day as the Shareholders’ meeting.
11. Lapse and Forfeiture
Subject to terms and conditions of the RSU Plan where the Administrator would otherwisespecify, the unvested RSUs shall automatically lapse upon the earliest of:
(i) the date of the termination of a grantee’s employment or service by any member of ourGroup; or
(ii) in the event that certain general offer for Shares is made to our Shareholders, the date onwhich the offer (or, as the case may be, revised offer) closes; or
(iii) in the event certain general offer for Shares by way of scheme of arrangement is made toour Shareholders, the date on which the scheme of arrangement becomes effective; or
(iv) the date of the commencement of the winding-up of our Company; or
(v) the date of the commencement of the compromise or arrangement in respect ofreconstruction or amalgamation of the Company; or
(vi) the date on which the grantee commits a breach under the RSU Plan by contravening theterm that no grantee shall in any way sell, transfer, assign, charge, mortgage, encumber,hedge or create any interest in favor of any other person over or in relation to any RSU orany property held by the trustees on trust for the grantees, Awards, Shares underlying anyAwards or RSUs or any interest or benefits therein; or
IV-27
APPENDIX IV STATUTORY AND GENERAL INFORMATION
(vii) the date on which it is no longer possible to satisfy any outstanding conditions to vesting;or
(viii) the Administrator has decided that the unvested RSUs shall not be vested for the grantee inaccordance with the rules of the RSU Plan and the terms and conditions as set out in theAward Agreement.
Notwithstanding the aforesaid, in each case, the Administrator may in its sole and absolutediscretion decide that any RSU shall not lapse or shall be subject to such conditions or limitations asthe Administrator may decide.
12. Reorganization of Capital Structure
(1) In the event of any alteration in the capital structure of our Company, such ascapitalization issue, consolidation, sub-division and reduction of the share capital of ourCompany, the Administrator may make equitable adjustments that it considers appropriate,at its sole and absolute discretion, including:
(a) make arrangements for the grant of substitute RSUs of equivalent fair value to anAward in the purchasing or surviving company;
(b) reach such accommodation with the grantee as it considers appropriate, including thepayment of cash compensation to the grantee equivalent to the fair value to any RSUto the extent not vested;
(c) waive any conditions to vesting of any RSU to the extent not already vested; or
(d) permit the continuation of an Award in accordance with its original terms.
(2) Without prejudice to the above paragraph (1):
(a) In the event our Company undertakes an open offer of new securities in respect ofany Shares which are held by the Trustee under the RSU Plan, the Trustee shall notsubscribe for any new Shares. In the event of a rights issue, the Trustee shall not takeup any rights Shares and shall, if possible, sell the amount of the nil-paid rightsallotted to it during a specific period and at a specific price range as determined bythe Trustee in its sole and absolute discretion and the net proceeds of sale of suchrights shall be held as part of the trust fund and be applied in accordance with theterms of this RSU Plan.
(b) In the event our Company issues bonus warrants in respect of any Shares which areheld by the Trustee, the Trustee shall not subscribe for any new Shares by exercisingany of the subscription rights attached to the bonus warrants and shall, if possible,sell the bonus warrants created and granted to it during a specific period and at aspecific price range as determined by the Trustee in its sole and absolute discretionand the net proceeds of sale of such bonus warrants shall be held as part of the trustfund and be applied in accordance with the terms of this RSU Plan.
(c) In the event our Company undertakes a scrip dividend scheme, the Trustee shall electcash dividend and the cash dividend will be treated as part of the trust fund and beapplied in accordance the terms of this RSU Plan.
(d) In the event of other non-cash and non-scrip distribution made by our Company inrespect of Shares held upon the Trust, the Trustee shall dispose of such distribution as
IV-28

APPENDIX IV STATUTORY AND GENERAL INFORMATION
determined by the Trustee in its sole and absolute discretion, the net sale proceedsthereof shall be deemed as part of the trust fund and shall be applied in accordancewith the terms of this RSU Plan.
13. Alteration or Termination of the RSU Plan
(a) Alteration
The terms of the RSU Plan may be altered, amended or waived in any respect by the Boardprovided that such alteration, amendment or waiver shall not negatively affect or prejudice anysubsisting rights of any grantee thereunder.
(b) Termination
The RSU Plan may be terminated at any time prior to the expiry of its term by the Boardprovided that such termination shall not affect any subsisting rights of any grantee under the RSU Plan.For the avoidance of doubt, no further Awards shall be granted after the RSU Plan is terminated but inall other respects the provisions of the RSU Plan shall remain in full force and effect. All RSUs grantedprior to such termination and not vested on the date of termination shall remain valid. In such event,(i) the Trustee shall act in accordance with the instruction of the Administrator to notify all grantees ofsuch termination and how the trust fund held by the trustees on trust and other interests or benefits inrelation to the outstanding RSUs shall be dealt with, and (ii) to the extent that any part of the trust fundwill not be transferred to the grantees under (i), the trust fund held by the trustee and any incomethereof shall be held by the trustee for the purpose of the future incentive plans of the Company or asotherwise instructed by the Administrator.
14. No Effect on Contract of Employment
The RSU Plan shall not form part of any contract of employment or engagement of servicesbetween our Group and any Participant and the rights and obligations of any Participant under theterms of his office, employment or engagement in services shall not be affected by the participation ofthe Participants in the RSU Plan or any rights which he may have to participate in it and the RSU Planshall afford such a Participant no additional rights to compensation or damages in consequence of thetermination of such office, employment or engagement for any reason.
15. Details of the RSUs granted under the RSU Plan
As of the date of this prospectus and assuming the RSU Shares have been issued, the aggregatenumber of Shares underlying the granted RSUs is 129,265,801, representing approximately 4.56% ofthe issued share capital of our Company immediately prior to the completion of the Global Offeringand approximately 3.88% of the issued share capital of our Company immediately following thecompletion of the Global Offering (assuming that the Over-allotment Option will not be exercised).
IV-29
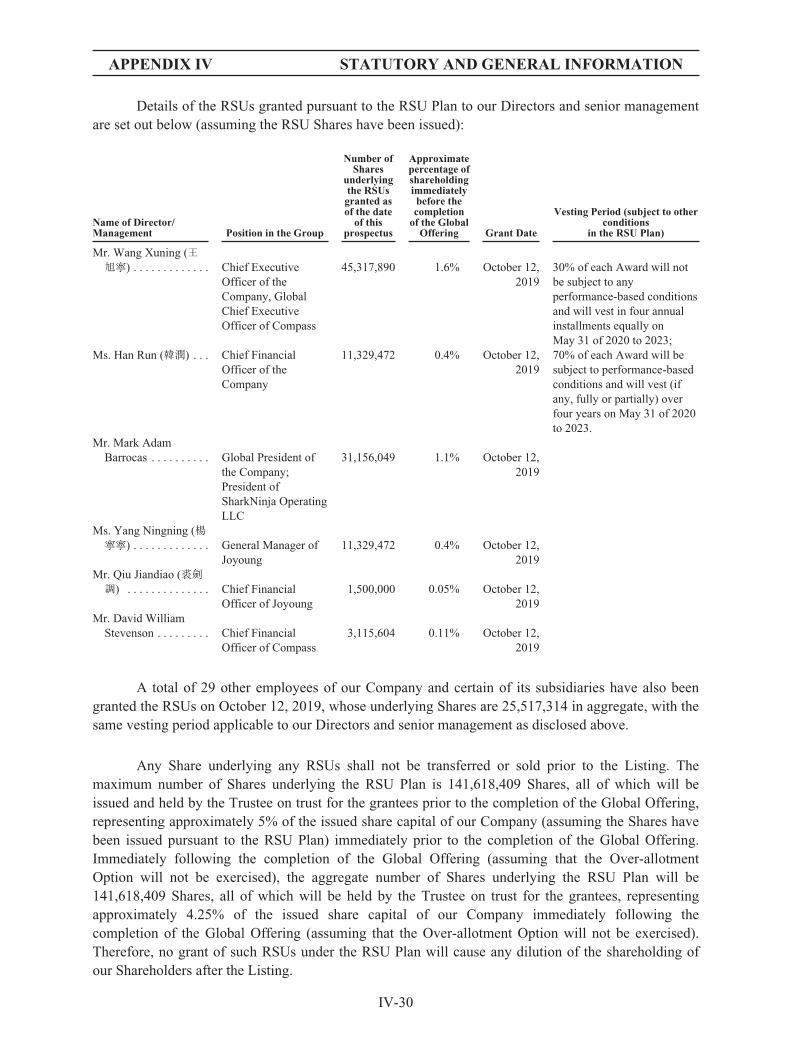
APPENDIX IV STATUTORY AND GENERAL INFORMATION
Details of the RSUs granted pursuant to the RSU Plan to our Directors and senior managementare set out below (assuming the RSU Shares have been issued):
Name of Director/Management Position in the Group
Number ofShares
underlyingthe RSUsgranted asof the date
of thisprospectus
Approximatepercentage ofshareholdingimmediatelybefore thecompletion
of the GlobalOffering Grant Date
Vesting Period (subject to otherconditions
in the RSU Plan)
Mr. Wang Xuning (王旭寧) . . . . . . . . . . . . . Chief Executive
Officer of theCompany, GlobalChief ExecutiveOfficer of Compass
45,317,890 1.6% October 12,2019
30% of each Award will notbe subject to anyperformance-based conditionsand will vest in four annualinstallments equally onMay 31 of 2020 to 2023;
Ms. Han Run (韓潤) . . . Chief FinancialOfficer of theCompany
11,329,472 0.4% October 12,2019
70% of each Award will besubject to performance-basedconditions and will vest (ifany, fully or partially) overfour years on May 31 of 2020to 2023.
Mr. Mark AdamBarrocas . . . . . . . . . . Global President of
the Company;President ofSharkNinja OperatingLLC
31,156,049 1.1% October 12,2019
Ms. Yang Ningning (楊寧寧) . . . . . . . . . . . . . General Manager of
Joyoung11,329,472 0.4% October 12,
2019Mr. Qiu Jiandiao (裘劍調) . . . . . . . . . . . . . . Chief Financial
Officer of Joyoung1,500,000 0.05% October 12,
2019Mr. David William
Stevenson . . . . . . . . . Chief FinancialOfficer of Compass
3,115,604 0.11% October 12,2019
A total of 29 other employees of our Company and certain of its subsidiaries have also beengranted the RSUs on October 12, 2019, whose underlying Shares are 25,517,314 in aggregate, with thesame vesting period applicable to our Directors and senior management as disclosed above.
Any Share underlying any RSUs shall not be transferred or sold prior to the Listing. Themaximum number of Shares underlying the RSU Plan is 141,618,409 Shares, all of which will beissued and held by the Trustee on trust for the grantees prior to the completion of the Global Offering,representing approximately 5% of the issued share capital of our Company (assuming the Shares havebeen issued pursuant to the RSU Plan) immediately prior to the completion of the Global Offering.Immediately following the completion of the Global Offering (assuming that the Over-allotmentOption will not be exercised), the aggregate number of Shares underlying the RSU Plan will be141,618,409 Shares, all of which will be held by the Trustee on trust for the grantees, representingapproximately 4.25% of the issued share capital of our Company immediately following thecompletion of the Global Offering (assuming that the Over-allotment Option will not be exercised).Therefore, no grant of such RSUs under the RSU Plan will cause any dilution of the shareholding ofour Shareholders after the Listing.
IV-30
APPENDIX IV STATUTORY AND GENERAL INFORMATION
E. OTHER INFORMATION
1. Estate Duty
Our Directors have been advised that no material liability for estate duty is likely to fall on ourCompany or any of our subsidiaries.
2. Litigation
Save as disclosed in this prospectus and so far as our Directors are aware, no litigation or claimof material importance is pending or threatened against any member of our Group.
3. Joint Sponsors
The Joint Sponsors have made an application on our behalf to the Listing Committee for thelisting of, and permission to deal in, our Shares in issue, our Shares to be issued pursuant to the GlobalOffering (including any Shares which may fall to be issued pursuant to the exercise of the Over-allotment Option).
As of the Latest Practicable Date, certain group entities of the Industrial and Commercial Bankof China Limited (“ICBC”), the parent company of ICBC International Capital Limited, have lendingrelationship with the Group and its Controlling Shareholders. ICBC International Capital Limited istherefore not considered as an independent sponsor according to the independence criteria applicable tosponsors set out in Rule 3A.07 of the Listing Rules.
Saved as disclosed above, the Joint Sponsors satisfy the independence criteria applicable tosponsors as set out in Rule 3A.07 of the Listing Rules.
The Joint Sponsors’ fee in relation to the Listing is US$1.4 million.
IV-31
APPENDIX IV STATUTORY AND GENERAL INFORMATION
4. Consents of Experts
The following experts have each given and have not withdrawn their respective writtenconsents to the issue of this prospectus with copies of their reports, letters, opinions or summaries ofopinions (as the case may be) and the references to their names included herein in the form and contextin which they are respectively included.
Name Qualification
Credit Suisse (Hong Kong) Limited . . . . . . . . . . . . . Credit Suisse (Hong Kong) Limited, a companyincorporated in Hong Kong, that is licensed for Type 1(dealing in securities), Type 2 (dealing in futurescontracts), Type 4 (advising on securities), Type 5(advising on futures contracts), Type 6 (advising oncorporate finance) and Type 9 (asset management)regulated activities under the SFO
Morgan Stanley Asia Limited . . . . . . . . . . . . . . . . . . Morgan Stanley Asia Limited, a company incorporated inHong Kong, that is licensed for Type 1 (dealing insecurities), Type 4 (advising on securities), Type 5(advising on futures contracts), Type 6 (advising oncorporate finance) and Type 9 (asset management)regulated activities under the SFO
ICBC International Capital Limited . . . . . . . . . . . . . ICBC International Capital Limited, a companyincorporated in Hong Kong, that is licensed for Type 1(dealing in securities), Type 4 (advising on securities) andType 6 (advising on corporate finance) regulated activitiesunder the SFO
Ernst & Young . . . . . . . . . . . . . . . . . . . . . . . . . . . . . Certified public accountants
Grandall Law Firm (Shanghai) . . . . . . . . . . . . . . . . . Qualified PRC Lawyers
Maples and Calder (Hong Kong) LLP . . . . . . . . . . . Cayman Islands attorneys-at-law
Frost & Sullivan (Beijing) Inc., ShanghaiBranch Co. . . . . . . . . . . . . . . . . . . . . . . . . . . . . . . Industry consultant
As of the Latest Practicable Date, none of the experts named above has any shareholdinginterest in our Company or any of our subsidiaries or the right (whether legally enforceable or not) tosubscribe for or to nominate persons to subscribe for securities in any member of our Group.
5. Binding Effect
This prospectus shall have the effect, if an application is made in pursuance hereof, ofrendering all persons concerned bound by all the provisions (other than the penal provisions) ofsections 44A and 44B of the Companies Ordinance so far as applicable.
6. Bilingual Document
The English language and Chinese language versions of this prospectus are being publishedseparately in reliance upon the exemption provided by section 4 of the Companies Ordinance(Exemption of Companies and Prospectuses from Compliance with Provisions) Notice (Chapter 32L ofthe Laws of Hong Kong).
IV-32
APPENDIX IV STATUTORY AND GENERAL INFORMATION
7. Compliance Adviser
Our Company has appointed Altus Capital Limited as its compliance adviser in compliancewith Rule 3A.19 of the Listing Rules.
8. Preliminary Expenses
Our Company did not incur any material preliminary expenses.
9. No Material Adverse Change
The Directors confirm that there has been no material change in our financial or tradingposition since June 30, 2019.
10. Miscellaneous
(a) Save as disclosed in this prospectus, within the two years immediately preceding the dateof this prospectus:
(i) no share or loan capital or debenture of our Company or any of our subsidiaries hasbeen issued or agreed to be issued or is proposed to be issued for cash or as fully orpartly paid other than in cash or otherwise;
(ii) no share or loan capital of our Company or any of our subsidiaries is under option oris agreed conditionally or unconditionally to be put under option; and
(iii) no commissions, discounts, brokerages or other special terms have been granted oragreed to be granted in connection with the issue or sale of any share or loan capitalof our Company or any of our subsidiaries.
(b) Save as disclosed in this prospectus:
(i) there are no founder, management or deferred shares nor any debentures in ourCompany or any of our subsidiaries;
(ii) no share or loan capital or debenture of our Company or any of our subsidiaries isunder option or is agreed conditionally or unconditionally to be put under option; and
(iii) no commissions, discounts, brokerages or other special terms have been granted inconnection with the issue or sale of any share or loan capital of our Company or anyof its subsidiaries by our Company for subscribing or agreeing to subscribe, orprocuring or agreeing to procure subscriptions, for any shares in or debentures of ourCompany or any of our subsidiaries.
(c) Save as disclosed in the paragraph headed “B. Further Information about our Business—1.Summary of Material Contracts” in this section, none of our Directors or proposedDirectors or experts (as named in this prospectus), have any interest, direct or indirect, inany assets which have been, within the two years immediately preceding the date of thisprospectus, acquired or disposed of by or leased to, any member of our Group, or areproposed to be acquired or disposed of by or leased to any member of our Group.
(d) We do not have any promoter. No cash, securities or other benefit has been paid, allottedor given nor are any proposed to be paid, allotted or given to any promoters in connectionwith the Global Offering and the related transactions described in this prospectus withinthe two years immediately preceding the date of this prospectus.
IV-33
APPENDIX IV STATUTORY AND GENERAL INFORMATION
(e) Save as disclosed in this prospectus, no equity or debt securities of any company withinour Group is presently listed on any stock exchange or traded on any trading system nor isany listing or permission to deal being or proposed to be sought.
(f) Save as disclosed in this prospectus, our Company has no outstanding convertible debtsecurities or debentures.
(g) There is no arrangement under which future dividends are waived or agreed to be waived.
(h) There has not been any interruption in the business of our Group which may have or hashad a significant effect on the financial position of our Group in the 12 months precedingthe date of this prospectus.
IV-34
APPENDIX V DOCUMENTS DELIVERED TO THE REGISTRAROF COMPANIES IN HONG KONG AND
AVAILABLE FOR INSPECTION
DOCUMENTS DELIVERED TO THE REGISTRAR OF COMPANIES
The documents attached to the copy of this prospectus delivered to the Registrar of Companiesin Hong Kong for registration were, among other documents:
(a) copies of white, yellow and green Application Forms;
(b) the written consents referred to under the paragraph headed “Statutory and GeneralInformation—E. Other Information—4. Consents of experts” in Appendix IV to thisprospectus; and
(c) copies of the material contracts referred to in the paragraph headed “Appendix IV—Statutory and General Information—B. Further Information about Our Business—1.Summary of Material Contracts.”
DOCUMENTS AVAILABLE FOR INSPECTION
Copies of the following documents will be available for inspection at our office in Hong Kongat Clifford Chance at 27/F, Jardine House, One Connaught Place, Central, Hong Kong during normalbusiness hours from 9:00 a.m. to 5:00 p.m. up to and including the date which is 14 days from the dateof this prospectus:
(a) the Memorandum and Articles of Associations;
(b) the Accountants’ Report of our Group issued by Ernst & Young, the text of which is setout in Appendix I to this prospectus;
(c) the report on the unaudited pro forma financial information of our Group issued by Ernst& Young, the text of which is set out in Appendix II to this prospectus;
(d) the audited consolidated financial statements of our Group for the three financial yearsended December 31, 2018 and the six months ended June 30, 2019;
(e) the PRC legal opinions issued by Grandall Law Firm (Shanghai), our legal advisor as toPRC law, in respect of certain general corporate matters and property interests of ourGroup;
(f) the letter of advice prepared by Maples and Calder (Hong Kong) LLP, our legal advisorsas to Cayman Islands law, summarizing certain aspects of the Cayman Companies Lawreferred to in Appendix III to this prospectus;
(g) the Cayman Companies Law;
(h) the report issued by Frost & Sullivan (Beijing) Inc., Shanghai Branch Co., the summary ofwhich is set forth in the section headed “Industry Overview” in this prospectus;
(i) the written consents referred to under the paragraph headed “Statutory and GeneralInformation—E. Other Information—4. Consents of experts” in Appendix IV to thisprospectus;
(j) the material contracts referred to in “Statutory and General Information—B. FurtherInformation about Our Business—1. Summary of Material Contracts” in Appendix IV tothis prospectus;
V-1
APPENDIX V DOCUMENTS DELIVERED TO THE REGISTRAROF COMPANIES IN HONG KONG AND
AVAILABLE FOR INSPECTION
(k) the service contracts and the letters of appointment with our Directors referred to in“Statutory and General Information—C. Further Information about our Directors—1.Particulars of Directors’ service contracts and appointment letters” in Appendix IV to thisprospectus; and
(l) the Restricted Stock Unit Plan.
V-2

JS 環球生活有限公司
JS GLO
BAL LIFESTYLE C
OM
PAN
Y LIMITED
Stock Code: 1691
Joint Sponsors
Joint Global Coordinators, Joint Bookrunners and Joint Lead Managers
GLOBALOFFERING
(Incorporated in the Cayman Islands with limited liability)
JS 環球生活有限公司JS GLOBAL LIFESTYLE COMPANY LIMITED
C
M
Y
CM
MY
CY
CMY
K
Golf_PPTUS Cover_24_R1_Eng_OP.pdf 1 19/10/2019 下午3:17