printmgr file - Pearson plc
181
AS FILED WITH THE SECURITIES AND EXCHANGE COMMISSION ON APRIL 1, 2020 UNITED STATES SECURITIES AND EXCHANGE COMMISSION Washington, D.C. 20549 Form 20-F (Mark One) ‘ REGISTRATION STATEMENT PURSUANT TO SECTION 12(b) OR (g) OF THE SECURITIES EXCHANGE ACT OF 1934 or È ANNUAL REPORT PURSUANT TO SECTION 13 OR 15(d) OF THE SECURITIES EXCHANGE ACT OF 1934 for the fiscal year ended December 31, 2019 or ‘ TRANSITION REPORT PURSUANT TO SECTION 13 OR 15(d) OF THE SECURITIES EXCHANGE ACT OF 1934 for the transition period from to or ‘ SHELL COMPANY REPORT PURSUANT TO SECTION 13 OR 15(d) OF THE SECURITIES EXCHANGE ACT OF 1934 Date of event requiring this shell company report Commission file number 1-16055 PEARSON PLC (Exact name of Registrant as specified in its charter) England and Wales (Jurisdiction of incorporation or organization) 80 Strand London, England WC2R 0RL (Address of principal executive offices) Stephen Jones Telephone: +44 20 7010 2000 Fax: +44 20 7010 6060 80 Strand London, England WC2R 0RL (Name, Telephone, E-mail and/or Facsimile Number and Address of Company Contact Person) Securities registered or to be registered pursuant to Section 12(b) of the Act: Title of Class Trading Symbol Name of Each Exchange on Which Registered *Ordinary Shares, 25p par value PSO New York Stock Exchange American Depositary Shares, each New York Stock Exchange Representing One Ordinary Share, 25p per Ordinary Share * Not for trading, but only in connection with the registration of American Depositary Shares, pursuant to the requirements of the SEC. Securities registered or to be registered pursuant to Section 12(g) of the Act: None Securities for which there is a reporting obligation pursuant to Section 15(d) of the Act: None Indicate the number of outstanding shares of each of the issuer’s classes of capital or common stock at the close of the period covered by the annual report: Ordinary Shares, 25p par value .................................................... 782,098,929 Indicate by check mark if the registrant is a well-known seasoned issuer, as defined in Rule 405 of the Securities Act. Yes È No ‘ If this report is an annual or transition report, indicate by check mark if the registrant is not required to file reports pursuant to Section 13 or 15(d) of the Securities Exchange Act of 1934. Yes ‘ No È Note — Checking the box above will not relieve any registrant required to file reports pursuant to Section 13 or 15(d) of the Securities Exchange Act of 1934 from their obligations under those Sections. Indicate by check mark whether the registrant (1) has filed all reports required to be filed by Section 13 or 15(d) of the Securities Exchange Act of 1934 during the preceding 12 months (or for such shorter period that the registrant was required to file such reports) and (2) has been subject to such filing requirements for the past 90 days. Yes È No ‘ Indicate by check mark whether the registrant has submitted electronically every Interactive Data File required to be submitted pursuant to Rule 405 of Regulation S-T during the preceding 12 months (or for such shorter period that the registrant was required to submit such files). Yes È No ‘ Indicate by check mark whether the registrant is a large accelerated filer, an accelerated filer, a non-accelerated filer or an emerging growth company. See definition of “accelerated file”, “large accelerated filer” and “emerging growth company”, in Rule 12b-2 of the Exchange Act. È Large accelerated filer ‘ Accelerated filer ‘ Non-accelerated filer ‘ Emerging growth company If an emerging growth company that prepares its financial statements in accordance with US GAAP, indicate by check mark if the registrant has elected not to use the extended transition period for complying with any new or revised financial accounting standards provided pursuant to Section 13(a) of the Exchange Act. ‘ Indicate by check mark which basis of accounting the registrant has used to prepare the financial statements included in this filing ‘ US GAAP È International financial Reporting Standards as Issued by the International Accounting Standards Board ‘ Other If “Other” has been checked in response to the previous question, indicate by check mark which financial statement item the Registrant has elected to follow: Item 17 ‘ Item 18 ‘ If this is an annual report, indicate by check mark whether the registrant is a shell company (as defined in Rule 12b-2 of the Exchange Act): Yes ‘ No È
-
Upload
khangminh22 -
Category
Documents
-
view
3 -
download
0
Transcript of printmgr file - Pearson plc

AS FILED WITH THE SECURITIES AND EXCHANGE COMMISSION ON APRIL 1, 2020
UNITED STATESSECURITIES AND EXCHANGE COMMISSION
Washington, D.C. 20549
Form 20-F(Mark One)
‘ REGISTRATION STATEMENT PURSUANT TO SECTION 12(b) OR (g) OF THE SECURITIES EXCHANGE ACT OF1934
orÈ ANNUAL REPORT PURSUANT TO SECTION 13 OR 15(d) OF THE SECURITIES EXCHANGE ACT OF 1934
for the fiscal year ended December 31, 2019or
‘ TRANSITION REPORT PURSUANT TO SECTION 13 OR 15(d) OF THE SECURITIES EXCHANGE ACT OF 1934for the transition period from to
or‘ SHELL COMPANY REPORT PURSUANT TO SECTION 13 OR 15(d) OF THE SECURITIES EXCHANGE ACT OF 1934
Date of event requiring this shell company reportCommission file number 1-16055
PEARSON PLC(Exact name of Registrant as specified in its charter)
England and Wales(Jurisdiction of incorporation or organization)
80 StrandLondon, England WC2R 0RL
(Address of principal executive offices)Stephen Jones
Telephone: +44 20 7010 2000Fax: +44 20 7010 6060
80 StrandLondon, England WC2R 0RL
(Name, Telephone, E-mail and/or Facsimile Number and Address of Company Contact Person)Securities registered or to be registered pursuant to Section 12(b) of the Act:
Title of Class Trading Symbol Name of Each Exchange on Which Registered
*Ordinary Shares, 25p par value PSO New York Stock ExchangeAmerican Depositary Shares, each New York Stock Exchange
Representing One Ordinary Share, 25p per OrdinaryShare
* Not for trading, but only in connection with the registration of American Depositary Shares, pursuant to the requirements of the SEC.
Securities registered or to be registered pursuant to Section 12(g) of the Act:None
Securities for which there is a reporting obligation pursuant to Section 15(d) of the Act:None
Indicate the number of outstanding shares of each of the issuer’s classes of capital or common stock at the close of the period covered by the annual report:Ordinary Shares, 25p par value . . . . . . . . . . . . . . . . . . . . . . . . . . . . . . . . . . . . . . . . . . . . . . . . . . . . 782,098,929
Indicate by check mark if the registrant is a well-known seasoned issuer, as defined in Rule 405 of the Securities Act. Yes È No ‘
If this report is an annual or transition report, indicate by check mark if the registrant is not required to file reports pursuant to Section 13 or 15(d) of theSecurities Exchange Act of 1934. Yes ‘ No È
Note — Checking the box above will not relieve any registrant required to file reports pursuant to Section 13 or 15(d) of the Securities Exchange Act of 1934from their obligations under those Sections.
Indicate by check mark whether the registrant (1) has filed all reports required to be filed by Section 13 or 15(d) of the Securities Exchange Act of 1934 duringthe preceding 12 months (or for such shorter period that the registrant was required to file such reports) and (2) has been subject to such filing requirements for the past90 days. Yes È No ‘
Indicate by check mark whether the registrant has submitted electronically every Interactive Data File required to be submitted pursuant to Rule 405 ofRegulation S-T during the preceding 12 months (or for such shorter period that the registrant was required to submit such files). Yes È No ‘
Indicate by check mark whether the registrant is a large accelerated filer, an accelerated filer, a non-accelerated filer or an emerging growth company. Seedefinition of “accelerated file”, “large accelerated filer” and “emerging growth company”, in Rule 12b-2 of the Exchange Act.
È Large accelerated filer ‘ Accelerated filer ‘ Non-accelerated filer ‘ Emerging growth companyIf an emerging growth company that prepares its financial statements in accordance with US GAAP, indicate by check mark if the registrant has elected not to use
the extended transition period for complying with any new or revised financial accounting standards provided pursuant to Section 13(a) of the Exchange Act. ‘
Indicate by check mark which basis of accounting the registrant has used to prepare the financial statements included in this filing‘ US GAAP È International financial Reporting Standards as Issued
by the International Accounting Standards Board‘ Other
If “Other” has been checked in response to the previous question, indicate by check mark which financial statement item the Registrant has elected tofollow: Item 17 ‘ Item 18 ‘
If this is an annual report, indicate by check mark whether the registrant is a shell company (as defined in Rule 12b-2 of the Exchange Act): Yes ‘ No È

TABLE OF CONTENTS
Page
Introduction . . . . . . . . . . . . . . . . . . . . . . . . . . . . . . . . . . . . . . . . . . . . . . . . . . . . . . . . . . . . . . . . . 3Forward-Looking Statements . . . . . . . . . . . . . . . . . . . . . . . . . . . . . . . . . . . . . . . . . . . . . . . . . . . 4
PART I
Item 1. Identity of Directors, Senior Management and Advisers . . . . . . . . . . . . . . . . . . . . . . . . . . . 5Item 2. Offer Statistics and Expected Timetable . . . . . . . . . . . . . . . . . . . . . . . . . . . . . . . . . . . . . . . . . 5Item 3. Key Information . . . . . . . . . . . . . . . . . . . . . . . . . . . . . . . . . . . . . . . . . . . . . . . . . . . . . . . . . . . . 5
Selected Consolidated Financial Data . . . . . . . . . . . . . . . . . . . . . . . . . . . . . . . . . . . . . . . . . . . . . 5Dividend Information . . . . . . . . . . . . . . . . . . . . . . . . . . . . . . . . . . . . . . . . . . . . . . . . . . . . . . . . . 6Risk Factors . . . . . . . . . . . . . . . . . . . . . . . . . . . . . . . . . . . . . . . . . . . . . . . . . . . . . . . . . . . . . . . . . 7
Item 4. Information on the Company . . . . . . . . . . . . . . . . . . . . . . . . . . . . . . . . . . . . . . . . . . . . . . . . . . 15Pearson plc . . . . . . . . . . . . . . . . . . . . . . . . . . . . . . . . . . . . . . . . . . . . . . . . . . . . . . . . . . . . . . . . . . 15Overview . . . . . . . . . . . . . . . . . . . . . . . . . . . . . . . . . . . . . . . . . . . . . . . . . . . . . . . . . . . . . . . . . . . 15Recent Developments . . . . . . . . . . . . . . . . . . . . . . . . . . . . . . . . . . . . . . . . . . . . . . . . . . . . . . . . . 15The Group’s Strategy . . . . . . . . . . . . . . . . . . . . . . . . . . . . . . . . . . . . . . . . . . . . . . . . . . . . . . . . . 16Operating Divisions . . . . . . . . . . . . . . . . . . . . . . . . . . . . . . . . . . . . . . . . . . . . . . . . . . . . . . . . . . . 17Operating Cycles . . . . . . . . . . . . . . . . . . . . . . . . . . . . . . . . . . . . . . . . . . . . . . . . . . . . . . . . . . . . . 20Competition . . . . . . . . . . . . . . . . . . . . . . . . . . . . . . . . . . . . . . . . . . . . . . . . . . . . . . . . . . . . . . . . . 21Intellectual Property . . . . . . . . . . . . . . . . . . . . . . . . . . . . . . . . . . . . . . . . . . . . . . . . . . . . . . . . . . 21Raw Materials . . . . . . . . . . . . . . . . . . . . . . . . . . . . . . . . . . . . . . . . . . . . . . . . . . . . . . . . . . . . . . . 22Government Regulation . . . . . . . . . . . . . . . . . . . . . . . . . . . . . . . . . . . . . . . . . . . . . . . . . . . . . . . . 22Licenses, Patents and Contracts . . . . . . . . . . . . . . . . . . . . . . . . . . . . . . . . . . . . . . . . . . . . . . . . . 22Legal Proceedings . . . . . . . . . . . . . . . . . . . . . . . . . . . . . . . . . . . . . . . . . . . . . . . . . . . . . . . . . . . . 22Organizational Structure . . . . . . . . . . . . . . . . . . . . . . . . . . . . . . . . . . . . . . . . . . . . . . . . . . . . . . . 22Property, Plant and Equipment . . . . . . . . . . . . . . . . . . . . . . . . . . . . . . . . . . . . . . . . . . . . . . . . . . 23Capital Expenditures . . . . . . . . . . . . . . . . . . . . . . . . . . . . . . . . . . . . . . . . . . . . . . . . . . . . . . . . . . 24
Item 4A. Unresolved Staff Comments . . . . . . . . . . . . . . . . . . . . . . . . . . . . . . . . . . . . . . . . . . . . . . . . . . . 24Item 5. Operating and Financial Review and Prospects . . . . . . . . . . . . . . . . . . . . . . . . . . . . . . . . . . . 24
General Overview . . . . . . . . . . . . . . . . . . . . . . . . . . . . . . . . . . . . . . . . . . . . . . . . . . . . . . . . . . . . 24Results of Operations . . . . . . . . . . . . . . . . . . . . . . . . . . . . . . . . . . . . . . . . . . . . . . . . . . . . . . . . . 30Liquidity and Capital Resources . . . . . . . . . . . . . . . . . . . . . . . . . . . . . . . . . . . . . . . . . . . . . . . . . 47Accounting Policies . . . . . . . . . . . . . . . . . . . . . . . . . . . . . . . . . . . . . . . . . . . . . . . . . . . . . . . . . . . 50
Item 6. Directors, Senior Management and Employees . . . . . . . . . . . . . . . . . . . . . . . . . . . . . . . . . . . 50Directors and Senior Management . . . . . . . . . . . . . . . . . . . . . . . . . . . . . . . . . . . . . . . . . . . . . . . 50Compensation of Senior Management . . . . . . . . . . . . . . . . . . . . . . . . . . . . . . . . . . . . . . . . . . . . 55Share Options of Senior Management . . . . . . . . . . . . . . . . . . . . . . . . . . . . . . . . . . . . . . . . . . . . . 63Share Ownership of Senior Management . . . . . . . . . . . . . . . . . . . . . . . . . . . . . . . . . . . . . . . . . . 64Employee Share Ownership Plans . . . . . . . . . . . . . . . . . . . . . . . . . . . . . . . . . . . . . . . . . . . . . . . . 64Board Practices . . . . . . . . . . . . . . . . . . . . . . . . . . . . . . . . . . . . . . . . . . . . . . . . . . . . . . . . . . . . . . 65Employees . . . . . . . . . . . . . . . . . . . . . . . . . . . . . . . . . . . . . . . . . . . . . . . . . . . . . . . . . . . . . . . . . . 66
Item 7. Major Shareholders and Related Party Transactions . . . . . . . . . . . . . . . . . . . . . . . . . . . . . . 66Item 8. Financial Information . . . . . . . . . . . . . . . . . . . . . . . . . . . . . . . . . . . . . . . . . . . . . . . . . . . . . . . . 67Item 9. The Offer and Listing . . . . . . . . . . . . . . . . . . . . . . . . . . . . . . . . . . . . . . . . . . . . . . . . . . . . . . . . 67Item 10. Additional Information . . . . . . . . . . . . . . . . . . . . . . . . . . . . . . . . . . . . . . . . . . . . . . . . . . . . . . . 67
Articles of Association . . . . . . . . . . . . . . . . . . . . . . . . . . . . . . . . . . . . . . . . . . . . . . . . . . . . . . . . 67Material Contracts . . . . . . . . . . . . . . . . . . . . . . . . . . . . . . . . . . . . . . . . . . . . . . . . . . . . . . . . . . . . 73Exchange Controls . . . . . . . . . . . . . . . . . . . . . . . . . . . . . . . . . . . . . . . . . . . . . . . . . . . . . . . . . . . . 73Tax Considerations . . . . . . . . . . . . . . . . . . . . . . . . . . . . . . . . . . . . . . . . . . . . . . . . . . . . . . . . . . . 73Documents on Display . . . . . . . . . . . . . . . . . . . . . . . . . . . . . . . . . . . . . . . . . . . . . . . . . . . . . . . . 76
1

Page
Item 11. Quantitative and Qualitative Disclosures about Market Risk . . . . . . . . . . . . . . . . . . . . . . . 76Introduction . . . . . . . . . . . . . . . . . . . . . . . . . . . . . . . . . . . . . . . . . . . . . . . . . . . . . . . . . . . . . . . . . 76Capital Risk . . . . . . . . . . . . . . . . . . . . . . . . . . . . . . . . . . . . . . . . . . . . . . . . . . . . . . . . . . . . . . . . . 77Interest and Foreign Exchange Rate Management . . . . . . . . . . . . . . . . . . . . . . . . . . . . . . . . . . . 77Liquidity and Re-financing Risk Management . . . . . . . . . . . . . . . . . . . . . . . . . . . . . . . . . . . . . . 77Financial Counterparty Risk Management . . . . . . . . . . . . . . . . . . . . . . . . . . . . . . . . . . . . . . . . . 77
Item 12. Description of Securities Other Than Equity Securities . . . . . . . . . . . . . . . . . . . . . . . . . . . . 78American Depositary Shares . . . . . . . . . . . . . . . . . . . . . . . . . . . . . . . . . . . . . . . . . . . . . . . . . . . . 78Fees paid by ADR holders . . . . . . . . . . . . . . . . . . . . . . . . . . . . . . . . . . . . . . . . . . . . . . . . . . . . . . 78Fees incurred in past annual period and fees to be paid in the future . . . . . . . . . . . . . . . . . . . . . 78
PART II
Item 13. Defaults, Dividend Arrearages and Delinquencies . . . . . . . . . . . . . . . . . . . . . . . . . . . . . . . . . 80Item 14. Material Modifications to the Rights of Security Holders and Use of Proceeds . . . . . . . . . 80Item 15. Controls and Procedures . . . . . . . . . . . . . . . . . . . . . . . . . . . . . . . . . . . . . . . . . . . . . . . . . . . . . . 80
Disclosure Controls and Procedures . . . . . . . . . . . . . . . . . . . . . . . . . . . . . . . . . . . . . . . . . . . . . . 80Management’s Annual Report on Internal Control over Financial Reporting . . . . . . . . . . . . . . 80Change in Internal Control over Financial Reporting . . . . . . . . . . . . . . . . . . . . . . . . . . . . . . . . . 80
Item 16A. Audit Committee Financial Expert . . . . . . . . . . . . . . . . . . . . . . . . . . . . . . . . . . . . . . . . . . . . . 80Item 16B. Code of Ethics . . . . . . . . . . . . . . . . . . . . . . . . . . . . . . . . . . . . . . . . . . . . . . . . . . . . . . . . . . . . . . 81Item 16C. Principal Accountant Fees and Services . . . . . . . . . . . . . . . . . . . . . . . . . . . . . . . . . . . . . . . . . 81Item 16D. Exemptions from the Listing Standards for Audit Committees . . . . . . . . . . . . . . . . . . . . . . 81Item 16E. Purchases of Equity Securities by the Issuer and Affiliated Purchases . . . . . . . . . . . . . . . . 81Item 16F. Change in Registrant’s Certifying Auditor . . . . . . . . . . . . . . . . . . . . . . . . . . . . . . . . . . . . . . . 82Item 16G. Corporate Governance . . . . . . . . . . . . . . . . . . . . . . . . . . . . . . . . . . . . . . . . . . . . . . . . . . . . . . . 82Item 16H. Mine Safety Disclosure . . . . . . . . . . . . . . . . . . . . . . . . . . . . . . . . . . . . . . . . . . . . . . . . . . . . . . . 82
PART III
Item 17. Financial Statements . . . . . . . . . . . . . . . . . . . . . . . . . . . . . . . . . . . . . . . . . . . . . . . . . . . . . . . . . 83Item 18. Financial Statements . . . . . . . . . . . . . . . . . . . . . . . . . . . . . . . . . . . . . . . . . . . . . . . . . . . . . . . . . 83Item 19. Exhibits . . . . . . . . . . . . . . . . . . . . . . . . . . . . . . . . . . . . . . . . . . . . . . . . . . . . . . . . . . . . . . . . . . . . 83
2

INTRODUCTION
In this Annual Report on Form 20-F (the “Annual Report”) references to “Pearson”, the “Company” or the“Group” are references to Pearson plc and its consolidated subsidiaries, except as the context otherwise requires.“Ordinary Shares” refer to the ordinary share capital of Pearson of par value 25p each. “ADSs” refer to AmericanDepositary Shares which are Ordinary Shares deposited pursuant to the Second Amended and Restated DepositAgreement dated August 15, 2014, amended and restated as of August 8, 2000 among Pearson, The Bank of NewYork Mellon as depositary (the “Depositary”) and owners and holders of ADSs (the “Deposit Agreement”).ADSs are represented by American Depositary Receipts (“ADRs”) delivered by the Depositary under the termsof the Deposit Agreement.
The Group has prepared the financial information contained in this Annual Report in accordance withInternational Financial Reporting Standards (“IFRS”) and IFRS Interpretations Committee (“IFRS IC”)interpretations as issued by the International Accounting Standards Board (“IASB”) and in conformity withInternational Financial Reporting Standards as adopted by the European Union (“EU”). Unless otherwiseindicated, any reference in this Annual Report to consolidated financial statements is to the consolidated financialstatements and the related notes, included elsewhere in this Annual Report.
The Group publishes its consolidated financial statements in sterling. The Group has included, however,references to other currencies. In this Annual Report:
• references to “sterling”, “pounds”, “pence” or “£” are to the lawful currency of the United Kingdom,
• references to “euro” or “€” are to the euro, the lawful currency of the participating Member States inthe Third Stage of the European Economic and Monetary Union of the Treaty Establishing theEuropean Commission, and
• references to “US dollars”, “dollars”, “cents” or “$” are to the lawful currency of the United States.
For convenience and except where specified otherwise, the Group has translated some sterling figures intoUS dollars at the rate of £1.00 = $1.33, the noon buying rate in The City of New York for cable transfers andforeign currencies as certified by the Federal Reserve Bank of New York for customs purposes on December 31,2019. The Group does not make any representation that the amounts of sterling have been, could have been orcould be converted into dollars at the rates indicated. On February 29, 2020 the noon buying rate for sterling was£1.00 = $1.28.
The Group currently consists of its education business and a 25% equity interest in the consumer publishingbusiness Penguin Random House. In December 2019, the Group announced that it would sell this 25% interest toBertelsmann, the owner of the 75% interest. The sale is expected to be completed in the first half of 2020. See“Item 4. Information on the Company — Overview of operating divisions”. The Pearson plc ConsolidatedFinancial Statements are included in this report on pages F-1 to F-95.
3

FORWARD-LOOKING STATEMENTS
You should not rely unduly on forward-looking statements in this Annual Report. This Annual Report,including the sections entitled “Item 3. Key Information — Risk Factors”, “Item 4. Information on theCompany” and “Item 5. Operating and Financial Review and Prospects”, contains forward-looking statementswithin the meaning of Section 27A of the U.S. Securities Act of 1933, as amended, and Section 21E of theSecurities Exchange Act of 1934, as amended (the “Exchange Act”), that relate to future events or the Group’sfuture financial performance. In some cases, you can identify forward-looking statements by terms such as“may”, “will”, “should”, “expect”, “intend”, “plan”, “anticipate”, “believe”, “estimate”, “predict”, “potential”,“continue” or the negative of these terms or other comparable terminology. Examples of these forward-lookingstatements include, but are not limited to, statements regarding the following:
• operations and prospects,
• growth strategy,
• funding needs and financing resources,
• expected financial position,
• market risk,
• currency risk,
• US federal and state spending patterns,
• debt levels, and
• general market and economic conditions.
These forward-looking statements involve known and unknown risks, uncertainties and other factors thatmay cause the Group’s or its industry’s actual results, levels of activity, performance or achievements to bematerially different from any future results, levels of activity, performance or achievements expressed or impliedby the forward-looking statements. In evaluating them, you should consider various factors, including the risksoutlined under “Item 3. Key Information — Risk Factors”, which may cause actual events or industry results todiffer materially from those expressed or implied by any forward-looking statement. Although the Groupbelieves that the expectations reflected in the forward-looking statements are reasonable, it cannot guaranteefuture results, levels of activity, performance or achievements.
4

PART I
ITEM 1. IDENTITY OF DIRECTORS, SENIOR MANAGEMENT AND ADVISERS
Not applicable.
ITEM 2. OFFER STATISTICS AND EXPECTED TIMETABLE
Not applicable.
ITEM 3. KEY INFORMATION
Selected consolidated financial data
The table below shows selected consolidated financial data under IFRS as issued by the IASB and inconformity with IFRS as adopted by the EU. The selected consolidated income statement data for the yearsended December 31, 2019, 2018 and 2017 and the selected consolidated balance sheet data as at December 31,2019 and 2018 have been derived from the Group’s audited consolidated financial statements included in “Item18. Financial Statements” in this Annual Report.
On October 16, 2015, the Group completed the sale of its 50% stake in The Economist Group. The share ofprofit after tax from the associate interest in the Economist Group has been included in discontinued operationsfor the period of 2015 until October 16, 2015.
On November 30, 2015, the Group completed the sale of The Financial Times to Nikkei Inc. The results ofThe Financial Times have been included in discontinued operations for the 11 months to November 30, 2015.
On October 5, 2017 the Group completed the sale of a 22% share in Penguin Random House toBertelsmann, retaining a 25% share. The Group accounted for its remaining 25% associate interest in PenguinRandom House on an equity basis and following the December announcement of the planned sale of this interestto Bertelsmann presented the investment as held for sale as at December 31, 2019. The sale is expected to becompleted in the first half of 2020.
On May 5, 2017, the Group announced that it was undertaking a strategic review of its US K12 coursewarebusiness. The US K12 business was classified as held for sale on the Group’s balance sheet as at December 31,2017 and December 31, 2018. On March 29, 2019 the Group completed the sale of its US K12 coursewarebusiness to Nexus Capital Management LP resulting in a pre-tax profit on sale of $13m.
On August 16, 2017 the Group completed the sale of its test preparation business in China, Global English(GEDU), to Puxin Education.
On November 27, 2017 the Group announced that it had agreed to the sale of Wall Street English (WSE) toa consortium consisting of funds affiliated with Baring Private Equity Asia and CITIC Capital. Consequently,WSE was classified as held for sale on the Group’s balance sheet as at December 31, 2017. The disposalcompleted on March 15, 2018.
During 2019 the Group made some small acquisitions for total consideration of $53m. Details of the assetsacquired, and the associated consideration are shown in “Item 18. Financial Statements” in this Annual Report.
The selected consolidated financial information should be read in conjunction with “Item 5. Operating andFinancial Review and Prospects” and the Group’s consolidated financial statements and the related notesappearing elsewhere in this Annual Report. The information provided below is not necessarily indicative of theresults that may be expected from future operations.
5

For convenience, the Group has translated the 2019 amounts into US dollars at the rate of £1.00 = $1.33, thenoon buying rate in The City of New York for cable transfers and foreign currencies as certified by the FederalReserve Bank of New York for customs purposes on December 31, 2019.
Year Ended December 31
2019 2019 2018 2017 2016 2015
$ £ £ £ £ £(In millions, except for per share amounts)
Consolidated Income Statement dataSales . . . . . . . . . . . . . . . . . . . . . . . . . . . . . . . . . . . . . . . . . 5,146 3,869 4,129 4,513 4,552 4,468Operating profit/(loss) . . . . . . . . . . . . . . . . . . . . . . . . . . . 366 275 553 451 (2,497) (404)Profit/(loss) after taxation from continuing
operations . . . . . . . . . . . . . . . . . . . . . . . . . . . . . . . . . . . 354 266 590 408 (2,335) (352)Profit/(loss) for the financial year . . . . . . . . . . . . . . . . . . 354 266 590 408 (2,335) 823Consolidated Earnings data per shareBasic earnings/(loss) per equity share(1) . . . . . . . . . . . . . 45.2¢ 34.0p 75.6p 49.9p (286.8)p 101.2pDiluted earnings/(loss) per equity share(2) . . . . . . . . . . . 45.2¢ 34.0p 75.5p 49.9p (286.8)p 101.2pBasic earnings/(loss) from continuing operations per
equity share(1) . . . . . . . . . . . . . . . . . . . . . . . . . . . . . . . 45.2¢ 34.0p 75.6p 49.9p (286.8)p (43.3)pDiluted earnings/(loss) from continuing operations per
equity share(2) . . . . . . . . . . . . . . . . . . . . . . . . . . . . . . . 45.2¢ 34.0p 75.5p 49.9p (286.8)p (43.3)pDividends per ordinary share . . . . . . . . . . . . . . . . . . . . . . 25.9¢ 19.5p 18.5p 17.0p 52.0p 52.0pConsolidated Balance Sheet data at period endTotal assets (non-current assets plus current assets) . . . . 10,175 7,650 7,905 7,888 10,066 11,635Net assets . . . . . . . . . . . . . . . . . . . . . . . . . . . . . . . . . . . . . 5,750 4,323 4,525 4,021 4,348 6,418Long-term obligations(3) . . . . . . . . . . . . . . . . . . . . . . . . . (2,441) (1,835) (1,246) (1,662) (3,794) (3,310)Capital stock . . . . . . . . . . . . . . . . . . . . . . . . . . . . . . . . . . 259 195 195 200 205 205Number of equity shares outstanding (millions of
ordinary shares) . . . . . . . . . . . . . . . . . . . . . . . . . . . . . . 782 782 781 802 822 821
Notes:(1) Basic earnings per equity share is based on profit for the financial period and the weighted average number
of ordinary shares in issue during the period.(2) Diluted earnings per equity share is based on diluted earnings for the financial period and the diluted
weighted average number of ordinary shares in issue during the period. Diluted earnings comprise earningsadjusted for the tax benefit on the conversion of share options by employees and the weighted averagenumber of ordinary shares adjusted for the dilutive effect of share options. There is no dilution in 2015 and2016 due to there being a loss from continuing operations.
(3) Long-term obligations comprise any liabilities with a maturity of more than one year, including medium andlong-term borrowings, derivative financial instruments, pension obligations and deferred income taxliabilities.
Dividend information
The Group pays dividends to holders of ordinary shares on dates that are fixed in accordance with theguidelines of the London Stock Exchange. The board of directors normally declares an interim dividend in Julyor August of each year to be paid in September or October. The board of directors normally recommends a finaldividend following the end of the fiscal year to which it relates, to be paid in the following May or June, subjectto shareholders’ approval at the annual general meeting. At the Group’s annual general meeting on April 24,2020 shareholders will be asked to approve a final dividend of 13.5p per ordinary share for the year endedDecember 31, 2019.
6

The table below sets forth the amounts of interim, final and total dividends paid in respect of each fiscalyear indicated and is translated into cents per ordinary share at the noon buying rate in The City of New York oneach of the respective payment dates for interim and final dividends. The final dividend for the 2019 fiscal yearwill be paid on May 7, 2020 (subject to shareholder approval).
Fiscal year Interim Final Total Interim Final Total
(Pence per ordinary share) (Cents per ordinary share)
2019 . . . . . . . . . . . . . . . . . . . . . . . . . . . . . . . . . . . . . . . . . . . . . . 6.0 13.5 19.5 8.0 18.0* 26.02018 . . . . . . . . . . . . . . . . . . . . . . . . . . . . . . . . . . . . . . . . . . . . . . 5.5 13.0 18.5 7.2 16.9 24.12017 . . . . . . . . . . . . . . . . . . . . . . . . . . . . . . . . . . . . . . . . . . . . . . 5.0 12.0 17.0 6.8 16.2 23.02016 . . . . . . . . . . . . . . . . . . . . . . . . . . . . . . . . . . . . . . . . . . . . . . 18.0 34.0 52.0 23.6 43.8 67.42015 . . . . . . . . . . . . . . . . . . . . . . . . . . . . . . . . . . . . . . . . . . . . . . 18.0 34.0 52.0 27.8 49.0 76.8
* As the 2019 final dividend had not been paid by the filing date, the dividend has been translated into centsusing the noon buying rate for sterling as at December 31, 2019.
Future dividends will be dependent on the Group’s future earnings, financial condition and cash flow, aswell as other factors affecting the Group. The dividend was rebased in 2017 to reflect portfolio changes,increased product investment, and the outlook for 2017.
Risk Factors
You should carefully consider the risk factors described below, as well as the other information included inthe rest of this document. The Group’s business, financial condition or results from operations could bematerially adversely affected by any or all of these risks, or by other risks that it presently cannot identify.
Our business, results of operations and financial condition could be adversely affected by the effects of theglobal COVID-19 pandemic.
In December 2019, a novel strain of COVID-19 was reported in China. Since then, COVID-19 has spreadglobally, to include the United Kingdom, United States and other countries where we operate. The spread ofCOVID-19 has resulted in the World Health Organization (WHO) declaring the outbreak of COVID-19 as a“pandemic,” or a worldwide spread of a new disease, on March 11, 2020. Many countries around the world haveimposed quarantines and restrictions on travel and large gatherings to slow the spread of the virus and haveclosed non-essential businesses. We are closely monitoring developments on a day-by-day basis. Our primaryfocus is on ensuring the safety and well-being of our employees, customers and learners. We have invoked ourbusiness resilience plans to help support our customers and maintain our business operations.
As local jurisdictions continue to put restrictions in place, our ability to continue to operate our businessmay be disrupted for an indefinite period of time. If the COVID-19 outbreak continues to spread, we may need tofurther limit operations, including due to shutdowns that may be requested or mandated by governmentalauthorities.
In addition, the spread of COVID-19, which has caused a broad impact globally, may materially affect useconomically. While the potential economic impact brought by, and the duration of, COVID-19 may be difficultto assess or predict, a widespread pandemic could result in significant disruption of global financial markets,reducing our ability to access capital, which could in the future negatively affect our liquidity. In addition, arecession or market correction resulting from the spread of COVID-19 could materially affect our business andthe value of our common shares.
The global outbreak of COVID-19 continues to rapidly evolve. The extent to which COVID-19 may impactour business and operations will depend on future developments, including the duration of the outbreak, travel
7

restrictions and social distancing in the United Kingdom, the United States and other countries where we operate,the effectiveness of actions taken by governmental authorities to contain and treat the disease and whetheradditional countries where we operate are required to move to complete lock-down status. There is a risk thatcertain countries or regions where we operate may be less effective at containing COVID-19, or it may be moredifficult to contain if the outbreak reaches a larger population or broader geography, in which case the risksdescribed herein could be elevated significantly. The ultimate long-term impact of COVID-19 is highly uncertainand cannot be predicted with confidence.
The accelerated pace and scope of our business transformation initiatives increase our risk to executiontimelines and to business adoption of change. The risk is that benefits may not be fully realized, costs mayincrease, or that the Group’s business as usual activities are adversely impacted.
Business transformation and change initiatives in support of the Group’s strategic goals to accelerate itsdigital transition and to simplify its business continued throughout 2019. A range of transformation initiativeswere successfully completed during the year with further ones identified for completion in H1 2020. The paceand scope of change potentially increases the risk that not all these changes will deliver within anticipatedtimeframes, and that the costs of these changes may increase. In addition, as a result of the increased pressure oftransformational change, business as usual activities may not perform in line with plans or the level of customerservice may not meet expectations. In parallel with the business transformation, as the Group responds to thedigital revolution and shift from a product to a services business, it will continue to look at opportunities todevelop business models and further refine organization structures. Resistance to change could restrict theorganization from making the necessary changes to the business model. We maintained strong governance,leadership and control of the transformation program.
Failure to use the Group’s data effectively to enhance the quality and scope of current products and servicesin order to improve learning outcomes could adversely affect the Group’s business.
The Group seeks to maximize data to enhance the quality and scope of current products and services inorder to improve learning outcomes while managing associated risks. The Group’s ability to continue to do somay be subject to factors beyond the Group’s control. In addition, the unavailability of timely, complete andaccurate data limits informed decision-making and increases the risk of non-compliance with legal, regulatoryand reporting requirements. Business change and transformation success is dependent on migration of asignificant number of datasets and our inability to effectively accomplish this could adversely affect the Group’sresults.
Global economy and cyclical market factors may adversely impact the Group’s financial performance.
With the continued pressure and uncertainty in the worldwide economies, particularly in light of COVID-19pandemic, there remains a risk of a weakening in trading conditions, which could adversely impact futurefinancial performance. The effect of continued deterioration or lack of recovery in the global recovery will varyacross different businesses and will depend on the depth, length and severity of any economic downturn. Theeducation market can be affected by cyclical factors which, although can have a positive impact for many of theGroup’s businesses, could for others lead to a reduction in demand for the Group’s products and services.
Failure to successfully invest in and deliver the right products and services and respond to competitive threatscould result in lower than expected revenues and profits.
A common trend facing all the Group’s businesses is the digitization of content and proliferation ofdistribution channels, either over the internet, or via other electronic means, replacing traditional print formats.The digital migration brings the need for change in product and content distribution, consumers’ perception ofvalue and the publisher’s position between consumers, retailers and authors.
8

This is a highly competitive market that is subject to rapid change. The Group faces competitive threats bothfrom large media players and from smaller businesses, online and mobile portals and operators in the digitalarena that provide alternative sources of content. Alternative distribution channels, e.g. digital format, theinternet, online retailers, growing delivery platforms (e.g., e-readers or tablets), pose both threats andopportunities to traditional publishing business models, potentially impacting both sales volumes and pricing.
Students are seeking cheaper sources of content, e.g. second hand and rental copies, online discounters, filesharing and use of pirated copies. This change in behavior puts downward pressure on textbook prices in majormarkets, and this could adversely impact the Group’s results.
If the Group does not adapt rapidly to these changes, it may lose business to ‘faster’ and more ‘agile’competitors, who increasingly are non-traditional competitors, making their identification all the more difficult.The Group may be required to invest significant resources to further adapt to the changing competitiveenvironment.
Changes in government policy and/or regulations have the potential to affect the Group’s business model and/or decisions across all markets.
The Group’s educational services and assessment businesses may be adversely affected by changes ingovernment funding resulting from either trends that are beyond the Group’s direct control, such as generaleconomic conditions, changes in government educational funding, programs, policy decisions, legislation and/orchanges in the procurement process, or the Group’s failure to successfully deliver previous contracts.
The results and growth of the Group’s US educational services and assessment businesses are dependent onthe level of federal and state educational funding, which in turn is dependent on the robustness of state financesand the level of funding allocated to educational programs. State, local and municipal education fundingpressures remain, competition from low price and disruptive new business models continues and open source ispromoted as a way to keep costs down for customers. The current challenging environment could impact theGroup’s ability to collect education-related debt.
State and local government leadership changes and resultant shifts in education policy can also affect thefunding available for educational expenditure, which include the impact of educational reform. Similarly,changes in the government procurement process for textbooks, learning material and student tests, and vocationaltraining programs can also affect the Group’s markets. Political pressure on testing, changes in curricula, delaysin the timing of the adoptions and changes in the student testing process can all affect these programs andtherefore the size of the market in any given year. There was during 2019, a risk of political instability in the UKarising from the Brexit deal with the EU. As at the date of this Annual report, and with the UK exit completed on31st January 2020, the immediate risks are lesser, with trade arrangements yet to be decided. There are otherexamples of wider uncertainty and instability in the rest of the world, particularly in light of the COVID-19pandemic, which can affect governments education policy and decisions.
There are multiple competing demands for educational funds and there is no guarantee that new coursewareor testing or training programs will be funded, or that the Group will win or retain this business.
Failure to comply with antitrust and competition legislation could result in costly legal proceedings and/oradversely impact the Group’s reputation.
The Group is subject to global and local antitrust and competition law and although it is committed toconducting business in compliance with local and international laws, there is a risk that management, employeesor representatives may act in a way that violates applicable antitrust or competition laws. As a result, there is arisk of litigation and regulatory proceedings in the countries in which the Group operates. These legalproceedings could result in greater scrutiny of the Group’s operations in other countries for anti-competitivebehavior and, in the worst case, incur a substantial financial cost. This would also have an adverse impact on theGroup’s reputation.
9

If the Group does not adequately protect its intellectual property and proprietary rights, its competitiveposition and results may be adversely affected and its ability to grow limited.
The Group’s products and services largely comprise intellectual property delivered through a variety of printand digital media, online software applications and platforms. The Group relies on trademark, patent, copyrightand other intellectual property laws to establish and protect its proprietary rights in these products and services.Failure to adequately manage, procure, register or protect intellectual property rights (including trademarks,patents, trade secrets and copyright) in the Group’s brands, content and technology, may (1) prevent the Groupfrom enforcing its rights, and (2) enable bad actors to illegally access and duplicate the Group’s content (printand digital counterfeit, digital piracy), which will reduce sales and/or erode revenues.
The Group’s intellectual property rights (IPR) in brands and content — historically its core assets — aregenerally well established in key markets. As technology has become an increasingly critical component of theGroup’s business strategy, it has also been steadily increasing investment in its patent program to expand itsprotection of high value inventions in the US and key international markets.
Online copying and security circumvention have become increasingly sophisticated and resistant toavailable countermeasures. Notably, 2018 introduced “digital counterfeit” web sites selling unprotected PDF filesof many of Pearson’s titles, at scale, using modern and sophisticated ecommerce methods, with a professionaland polished look and feel. From an IP perspective, increasing the Group’s digital business exposes it to moretrademark, copyright and patent infringement risks.
The Group’s forward-looking IP strategy also includes plans to continue increasing its global patentfootprint in key markets outside the US. However, the Group also conducts business in other countries where itsprotection efforts have been limited or inconsistent and the extent of effective legal protection for intellectualproperty rights is uncertain, and this uncertainty could affect future growth. Where the Group has registered orotherwise established its IPR, it cannot guarantee that such rights will provide competitive advantages due to: thechallenges and costs of monitoring and enforcement in jurisdictions where competition may be intense; thelimited and/or ineffective IPR protection and enforcement mechanisms available to it in many countries; thepotential that its IPR may lapse, be invalidated, circumvented, challenged, or abandoned, or that it may otherwiselose the ability to assert its intellectual property rights against others. The loss or diminution in value of theseproprietary rights or the Group’s intellectual property could have a material adverse effect on the Group’sbusiness and financial performance.
A control breakdown or service failure in the Group’s school assessment and qualification businesses couldresult in financial loss and reputational damage.
The Group’s professional services and assessment businesses involve complex contractual relationshipswith both government agencies and commercial customers for the provision of various testing services. TheGroup’s financial results, growth prospects and/or reputation may be adversely affected if these contracts andrelationships are poorly managed or face increased competitive pressures.
There are inherent risks associated with the Group’s assessment and qualification businesses, both in the USand the UK. A service failure caused by a breakdown in testing and assessment processes could lead to amis-grading of student tests and/or late delivery of test results to students and their schools. In either event theGroup may be subject to legal claims, penalty charges under contracts, non-renewal of contracts and/or thesuspension or withdrawal of its accreditation to conduct tests. A late delivery of qualification results could resultin a potentially significant regulatory fine in addition to the contractual penalties. It is also possible that suchevents would result in adverse publicity, which may affect the Group’s ability to retain existing contracts and/orobtain new customers.
10

The Group’s investment in inherently riskier emerging markets may deliver returns that are lower thananticipated.
To take advantage of international growth opportunities and to reduce its reliance on the US and UKmarkets, the Group has invested in a number of emerging markets, some of which are inherently riskier than itstraditional markets. Political, regulatory, economic and legal systems in emerging markets may be lesspredictable than in countries with more developed institutional structures. Political, regulatory, economic,currency, reputational and corporate governance and compliance risks (including fraud, sanctions, bribery andcorruption) as well as unmanaged expansion are all factors which could limit returns on investments made inthese markets.
Failure to effectively manage risks associated with compliance to global and local anti-bribery and corruption(ABC) legislation could result in costly legal investigations and/or adversely impact the Group’s reputation.
Although the Group is committed to conducting business in a legal and ethical manner in compliance withlocal and international statutory requirements and standards applicable to its business, there is a risk that theGroup’s management, employees or representatives may take actions that violate applicable laws and regulationsprohibiting the making of improper payments for the purposes of obtaining or keeping business, including lawssuch as the US Foreign Corrupt Practices Act or the UK Bribery Act. Responding to investigations is costly andrequires a significant amount of management’s time and attention. In addition, investigations may adverselyimpact the Group’s reputation, or lead to litigation and financial impacts.
Failure to generate anticipated revenue growth, synergies and/or cost savings from acquisitions, mergers andother business combinations, could lead to goodwill and intangible asset impairments.
The Group periodically acquires and disposes of businesses to achieve its strategic objectives and willcontinue to consider both as means to pursue its strategic priorities.
All the Group’s businesses depend on Information Technology (IT) systems and technological change.Failure to maintain and support customer facing services, systems, and platforms, including addressingquality issues and execution on time of new products and enhancements, could negatively impact the Group’srevenues and reputation.
All the Group’s businesses, to a greater or lesser extent, are dependent on information technology. It eitherprovides software and/or internet services to its customers or uses complex IT systems and products to support itsbusiness activities, including customer-facing systems, back-office processing and infrastructure. The Groupfaces several technological risks associated with software product development and service delivery, informationtechnology security (including viruses and cyber-attacks), e-commerce, enterprise resource planning systemimplementation and upgrades. Although plans and procedures are in place to reduce such risks, from time to timethe Group has experienced verifiable attacks on its systems by unauthorized parties. To date, such attacks havenot resulted in any material damage, but the Group’s businesses could be adversely affected if its systems andinfrastructure experience a significant failure or interruption.
From time to time, the Group’s business has experienced, and may continue to experience in the future, anunauthorised disclosure of personal information despite best efforts to prevent it. Such an incident, togetherwith a failure to comply with data privacy regulations could result in damage to the customer experience, theGroup’s reputation and financial loss.
Across its businesses, the Group holds large volumes of personally identifiable information (PII), includingthat of employees, customers, students and citizens. Any perceived or actual unauthorized disclosure of PII,whether through breach of the Group’s network by an unauthorized party, employee theft, misuse or error orotherwise, could harm the Group’s reputation, impair its ability to attract and retain its customers, or subject the
11

Group to claims or litigation arising from damages suffered by individuals, and thereby harm its business andoperational results. Failure to adequately protect PII could potentially lead to regulatory penalties, litigationdamages, significant remediation costs, reputational damage, cancellation of some existing contracts anddifficulty in competing for future business. In addition, the Group could incur significant costs in complying withthe relevant laws and regulations regarding the unauthorized disclosure of personal information. Changes to dataprivacy legislation must also be monitored and acted upon to ensure the Group remains in compliance acrossdifferent markets.
Failure to prevent or detect a malicious attack on the Group’s systems could result in a breach ofconfidentiality, integrity and/or availability of sensitive information.
Information security and cyber risk is continually evolving and comprises many complex external drivers:increasing customer demand to demonstrate a strong security posture, external compliance requirements, ongoingdigital revolution, increasing use of the cloud and increasingly sophisticated attack strategies. Across itsbusinesses, the Group holds large volumes of personally identifiable information including that of employees,customers, students and citizens, and other highly sensitive business critical data such as financial data, internalsensitive information, and intellectual property. Despite its implementation of security measures, individuals,criminal organizations, state sponsored operatives or other threat action may try to gain unauthorized access tothe Group’s data in order to misappropriate such information for potentially fraudulent or other purposes. Asignificant breach can result in a devastating impact on the Group’s reputation, customer loyalty, and studentexperience. Inability to prove due diligence can result in severe penalties and loss of business (existing andfuture).
The Group’s reported earnings and cash flows may be adversely affected by changes in its pension costs andfunding requirements.
The Group operates a number of pension plans throughout the world, the principal ones being in the UK andthe US. The major plans are self-administered with the plans’ assets held independently of the Group. Regularvaluations, conducted by independent qualified actuaries, are used to determine pension costs and fundingrequirements. As these assets are invested in the capital markets, which are often volatile, the plans may requireadditional funding from the Group, which could have an adverse impact on its results.
It is the Group’s policy to ensure that each pension plan is adequately funded, over time, to meet its ongoingand future liabilities. The target for the UK defined benefit plan is a self-sufficient level of funding. The Group’searnings and cash flows may be adversely affected by the need to provide additional funding to eliminate pensionfund deficits in its defined benefit plans. The Group’s greatest exposure relates to the UK defined benefit pensionplan, which is valued every three years. Pension fund deficits may arise because of inadequate investmentreturns, increased member life expectancy, changes in actuarial assumptions and changes in pension regulations,including accounting rules and minimum funding requests.
Although the UK defined benefit plan is significantly de-risked (as it is in surplus with effect from 1 January2018 as per the latest valuation), the ability to achieve and maintain this standard remains subject to marketconditions, meaning that additional funding could still be required from the Group in the future.
Operational disruption to its business, including those caused by third party providers, a major disaster and/orexternal threats, could restrict the Group’s ability to supply products and services to its customers.
Across all its businesses, the Group manages complex operational and logistical arrangements includingdistribution centers, data centers, and educational and office facilities, as well as relationships with third partyprint sites. It has also outsourced some support functions, including information technology, warehousing andlogistics to third party providers. The failure of third parties to whom it has outsourced business functions couldadversely affect its reputation or financial condition. Failure to recover from a major disaster, (e.g. fire, flood,
12

etc.) at a key facility or the disruption of supply from a key third party vendor or partner (e.g. due to bankruptcy)could restrict the Group’s ability to service its customers and meet the terms of its contractual relationships withboth government agencies and commercial customers. Penalty clauses and/or the failure to retain these contractsat the end of the contract term could adversely impact future revenue growth.
A significant deterioration in the Group’s profitability and/or cash flow caused by prolonged economicinstability could reduce its liquidity and/or impair its financial ratios and trigger a need to raise additionalfunds from the capital markets and/or renegotiate its banking covenants.
To the extent that worldwide economic conditions materially deteriorate, as a result of the COVID-19pandemic or otherwise the Group’s revenues, profitability and cash flows could be significantly reduced ascustomers would be unable to purchase products and services in the expected quantities and/or pay for themwithin normal agreed terms.
Disruption in capital markets or potential concerns about the Group’s credit, such as downgrades or negativeoutlooks by the credit rating agencies, may mean that this capital may not be available on favorable terms or maynot be available at all.
The Group generates a substantial proportion of its revenue in foreign currencies, particularly the US dollar,and foreign exchange rate fluctuations could adversely affect the Group’s earnings and the strength of itsbalance sheet.
As with any international business, the Group’s earnings can be materially affected by exchange ratemovements. The main exposure is to movements in the US dollar to sterling exchange rate as approximately 60%of the Group’s total revenue is generated in US dollars. The Group also has exposure to a range of otherinternational currencies including emerging market currencies. Operating profit for 2019, translated at 2018average rates, would have been £15m or 5% lower.
A lack of sufficient capital resources could adversely impact the Group’s ability to operate.
If the global economy weakens further and/or the global financial markets collapse, as a result of COVID-19pandemic or otherwise, the Group may not have access to or could lose its bank deposits or suffer a significantincrease in customer bad debts. Lack of sufficient capital resources could significantly limit the Group’s abilityto take advantage of business and strategic opportunities. If replacement funds are not available, the Group maybe required to delay, reduce the scope of, or eliminate material parts of its business strategy, including potentialadditional acquisitions or development of new products, services and technologies.
Changes in tax law or perceptions on tax planning strategies may lead to higher effective tax rate or negativereputational impact.
Changes in corporate tax rates and/or other relevant tax laws in the UK, US or other jurisdictions could havea material impact on the Group’s future reported tax rate and/or its future tax payments. The Group has beensubject to audit by tax authorities. Although the Group believes its tax provision is reasonable, the finaldetermination of its tax liability could be materially different from its historical income tax provisions, whichcould have a material effect on the Group’s financial position, results of operations or cash flows.
The Group’s tax strategy reflects its business strategy and the locations and financing needs of itsoperations. In common with many companies, the Group seeks to manage its tax affairs to protect value for itsshareholders, in line with its broader fiduciary duties. The Group is committed to complying with all statutoryobligations, to undertake full disclosure to tax authorities and to follow agreed policies and procedures withregard to tax planning and strategy.
13

If the Group fails to attract, retain and develop appropriately skilled employees, it may limit its ability toachieve its strategic and operational goals and its business may be harmed.
The Group’s success depends on the skill, experience and engagement of its employees. If it is unable toattract, retain and develop sufficiently experienced and capable staff, especially in technology, productdevelopment, sales and leadership, its business and financial results may suffer. When talented employees leave,the Group may have difficulty replacing those skills, and its business may suffer. There can be no assurance thatthe Group will be able to successfully retain and attract the skills that it needs.
Failure to adequately protect learners could result in significant harm to one or more learners.
Incidents may occur where learners are abused or harassed. For example, where the Group has direct learnercontact via online learning, or in its direct delivery businesses where it is operating, either directly or in a thirdparty partnership. These incidents can cause harm to learners, which is something the Group takes extremelyseriously, and could also have a negative financial, legal and reputational impact to the business.
Failure to adequately protect the health, safety and well-being of the Group’s employees, learners and otherstakeholders could adversely impact the Group’s reputation, profitability and future growth.
Although the Group has invested in global Health and Safety procedures and controls to safeguard thehealth, safety and wellbeing of its employees and other stakeholders, accidents or incidents could still occur dueto unforeseen risks, causing injury or harm to individuals and impacting the Group’s business operations. Theeffects of the COVID-19 pandemic may exacerbate the risk. This has the potential to lead to criminal and civillitigation, business disruption leading to operational loss, reduction in profitability and impact on the Group’sglobal reputation.
Failure to ensure security for the Group’s staff, learners, assets and reputation, due to increasing numbers ofand variety of local and global threats.
Pearson is a global business with locations in diverse, sometimes high-risk, locations worldwide. Althoughit has protective measures in place to secure its staff, learners and assets, the Group could still be impacted byexternal threats, such as localized incidents, terrorist attacks, strikes or extreme weather. Future occurrencescould cause harm to individuals and/or disrupt business operations. These have the potential to lead tooperational loss, a reduction in profitability and impact on the Group’s global reputation.
Environmental, social and governance risks may also adversely impact the Group’s business.
The Group considers environmental, social and governance (ESG) risks no differently to the way it managesany other business risk. These include ethical business behavior, compliance with UN Global Compact standards,environmental impact, people and editorial standards. A failure to comply with such standards would adverselyaffect the Group’s reputation and have a negative impact on its relations with employees, vendors and customers.
The Group’s business depends on a strong brand, and any failure to maintain, protect and enhance its brandwould hurt its ability to retain or expand its business.
Protecting the Pearson brand is critical to expanding the Group’s business and will depend largely on itsability to maintain its customers’ trust in its solutions and in the quality and integrity of its products and services.If the Group does not successfully maintain a strong brand, its business could be harmed. Beyond protection,strengthening the Pearson brand will enable the Group to more effectively engage governments, administrators,teachers, learners and influencers more effectively.
14

ITEM 4. INFORMATION ON THE COMPANY
Pearson plc
Pearson plc, (Pearson or the Group) is an international education company with its principal operations inthe education and consumer publishing markets. The Group delivers content, assessment and services, poweredby technology, in order to drive personalized learning at scale. The Group creates and manages intellectualproperty, which it promotes and sells to its customers under well-known brand names. The Group delivers itscontent in a variety of forms and through a variety of channels, including books and online services. The Groupoffers services as well as content, from test creation, administration and processing to teacher development andschool software. Though it operates in more than 70 countries around the world, today its largest markets areNorth America (65% of sales) and Europe (16% of sales).
Pearson was incorporated and registered in 1897 under the laws of England and Wales as a limited companyand re-registered under the UK Companies Act as a public limited company in 1981. The Group conducts itsoperations primarily through its subsidiaries and other affiliates. Its principal executive offices are located at 80Strand, London WC2R 0RL, United Kingdom (telephone: +44 20 7010 2000) and its website address iswww.pearson.com
Overview
The Group consists of its worldwide education business plus a 25% interest in Penguin Random House.
The Group is a leading provider of educational materials and learning technologies. It provides testdevelopment, processing and scoring services to governments, educational institutions, corporations andprofessional bodies around the world. It publishes across the curriculum and provides a range of educationservices including teacher development, educational software and system-wide solutions, and also owns andoperates colleges and schools.
The Group is run as one global education company, organized around three geographical operatingsegments (North America, Core and Growth). Within each segment, the Group provides content, assessment anddigital services to schools, colleges and universities, as well as professional and vocational education to learners.
The Group owns a 25% interest in Penguin Random House, which was formed on July 1, 2013, upon thecompletion of an agreement between Pearson and Bertelsmann to merge their respective publishing companies,Penguin and Random House. Pearson originally owned a 47% stake in Penguin Random House but sold 22% toBertelsmann on October 5, 2017. In December 2019, the Group announced the sale of its remaining 25% interestto Bertelsmann in a transaction expected to close in the first half of 2020. Following this announcement theGroup has accounted for its interest in Penguin Random House as held for sale.
Recent developments
In January 2020, the Group commenced £350m a share buyback program in connection with theannouncement in December 2019 of the sale of its remaining 25% interest in Penguin Random House. On 23March 2020, in response to the uncertainty surrounding the impact of the COVID-19 pandemic, the Groupannounced it was prudent to pause this share buyback program. At this date the Group had completed thebuyback of £167m of shares.
On 23 March 2020, the Group announced an update to its guidance for 2020 to consider the impact of theCOVID-19 pandemic on Pearson’s businesses. The update outlined the impact on trading in 2020 anddocumented some of the uncertainties for the business. The Group does not believe that any of the impactsconstitute an adjusting post balance sheet event for the purposes of the 2019 financial statements. The Groupincludes reference to critical accounting assumptions and judgements in note 1a within Item 18 — Financial
15

Statements. The potential impact of the COVID-19 pandemic on the business is highly uncertain and cannot bepredicted with confidence but may cause the Group, in 2020, to reassess some of the areas requiring a higherdegree of judgement or complexity or areas where assumptions and estimates are significant to the financialstatements. These areas include the assessment of goodwill for impairment, as set out in note 11 within Item 18— Financial Statements, where the Group has noted that a number of its cash generating units (CGUs) aresensitive to reasonably possible changes in key assumptions. It is highlighted that a relatively small reduction incontribution, that could arise from longer-term disruption caused by the COVID-19, may result in an impairmentcharge in any of these CGUs. Other areas where assumptions and estimates are significant include the valuationof pre-publication assets, tax balances, provisions for returns and pension assets and liabilities. The assumptionsand estimates relating to these areas could change as the impact of COVID-19 becomes clearer althoughcurrently they are not expected to have a material impact on the income statement.
The Group’s strategy
The Group’s mission is to help people make progress in their lives through learning and its vision is to havea direct relationship with millions of lifelong learners, to link education to the way people aspire to live and workevery day and to collaborate with a wide group of partners to help shape the future of learning. To deliver on this,the Group has three key strategic priorities:
• Grow market share through the digital transformation of the Group’s courseware and assessmentbusinesses;
• Invest in structural growth opportunities; and
• Become a simpler, more efficient and more sustainable business.
The Group strives to leverage its core strengths in combining world-class content and assessment, poweredby services and technology, to enable more effective teaching and personalized learning at scale. More detail onthe three areas of focus is set out below.
Grow market share through digital transformation of the Group’s courseware and assessment businesses
Digitization enables us to drive improvements in learning outcomes. It allows the Group to build a moresustainable and profitable business with a more visible and predictable revenue profile, based around access notownership models. The businesses where digital transformation is the key focus are:
• Higher Education Courseware — the Group’s course content and digital resources help educators gainbetter insights on their students and unlock learners’ potential. The Group increasingly sells directly toconsumers and to educational institutions enabling the business to become more predictable. The shiftto digital means students can come to class better prepared from day one. This helps drive betterlearning experiences and outcomes.
• US Assessment — The Group partners with US educators and states to develop new, personalizedways of learning through effective, scalable assessments that measure 21st century skills and informinstruction for all learners.
• UK Assessment & Qualifications — In the UK, Pearson is a market leading organization offeringacademic qualifications including GCSEs and A Levels. The Group is driving the adoption of artificialintelligence (AI) in assessment to support better learning.
Invest in structural growth opportunities
Investment in fast growing areas that will be the long-term growth drivers of Pearson, such as:
• Online Program Management (OPM) — Pearson helps higher education institutions launch or expandonline degrees, enabling them to increase enrolments, support online learning, boost graduation ratesand deliver on employability.
16

• Virtual Schools — Pearson delivers K12 online education to schools and students across the US andthe world. Solutions include the accredited Connections Academy, an online school program which isdelivered via full time, online public schools. This is an option for families seeking personalizedlearning and a high-quality alternative to the traditional classroom. A global online private school,International Connections Academy, is also available.
• Professional Certification — Pearson helps organizations measure and make improvements to ensurethe success of employees and learners, helping support lifelong learning. Test owners and test takersacross the world choose us to help develop, manage, deliver and grow their computer-based testingprograms. With some of the industry’s most secure testing environments, Pearson is a leader incomputer-based testing.
• English Language Learning — Pearson English language teaching develops courses, qualifications andlearning tools to make teaching English easier. Pearson’s fast-growing test, Pearson Test of EnglishAcademic (PTEA), is a leading computer-based test of English for study abroad and immigration.
Become a simpler and more efficient company
This third strategic priority involves further simplification through shared service centers, leanerorganizations through reduction in headcount and a reduction in the number of legacy applications, data centersand office locations. This does not just cut costs, it also provides an important platform for future growth becauseit enables the Group to reallocate investment to its growth areas more quickly, innovate at scale, and build a moredirect, longer term relationship with the tens of millions of learners who use Pearson products each year.
Operating divisions
Pearson is one of the leading providers of educational courseware, assessment and digital services. TheGroup provides test development, processing and scoring services to governments, educational institutions,corporations and professional bodies around the world. The Group publishes across the curriculum and providesa range of education services including teacher development, educational software and system-wide solutions.
The Group’s primary segments for management and reporting are geographical as follows: North America,comprising the courseware, assessment and services businesses in the US and Canada; Core, comprising thecourseware, assessment and services businesses in more mature markets outside North America, including theUK, Australia and Italy; and Growth, comprising the courseware, assessment and services businesses inemerging markets, including Brazil, China, India and South Africa. In addition, the Group separately reports onan equity basis the results from its 25% interest in Penguin Random House (PRH), which has been accounted foras an asset held for sale following the December 2019 announcement of the Group’s sale of this interest.
North America Segment
The North American business serves educators and students in the US and Canada from early educationthrough elementary, middle and high schools and into higher education and beyond with a wide range ofproducts and services: courseware including curriculum textbooks and other learning materials; assessmentsincluding test development and scoring; and services including the provision of online learning services. TheGroup has a leading position in each of these areas and a distinctive strategy of connecting those parts to supportinstitutions and personalize learning. Across the US the business works with states, schools and colleges to helpmake education more effective, accessible and affordable for a diverse community of learners.
The North America Higher Education business offers learning services for students, instructors andinstitutions in the US. It provides learning tools and technologies. Custom content and curriculum solutions offereducators the opportunity to tailor their programs based on the needs of students. The business also offersworkforce education products and flexible workforce development solutions to fill the growing skills gap andincreased demand for quality certification prep training.
17

US Higher Education Courseware digital registrations including eBooks are more than 10 million. The useof these digital homeworking platforms and integrated digital courseware provides a wealth of data and analyticsto improve the performance of individual students. The business’s advanced capabilities in data, analytics andadaptive learning, and its leading efficacy research, enable it to design a smart learning path for every student.
The demand for online learning is steadily rising and management see this area as one of the fastest growingparts of the market with demand expected to increase significantly over the next few years both in school andhigher education.
In higher education, Pearson Online Services provides Online Program Management (OPM) services toinstitutions including Arizona State University, Rutgers University and Maryville University, partnering withthem to provide fully online undergraduate and graduate degree courses.
The North America school business offers early learning solutions that help educators and families teachfundamental math and literacy skills; elementary and secondary imprints publish school programs in reading,literature, math, science, and social studies; and digital instructional solutions for pre K-12, such asenVisionMATH and Miller-Levine Biology. In order to focus on its digital strategy, on March 29, 2019 theGroup completed the sale of its US K12 courseware business.
The Connections Academy business provides school management services and operates virtual and blendedschools, serving around 76,000 full time equivalent students.
School testing plays an integral role in determining educator and student success and the business is one ofthe largest providers of educational assessment services in the US. It marks large-scale school examinations forthe US federal government and more than 23 American states, scoring billions of machine-scorable test questionsand evaluating approximately 109 million essays, portfolios and open-ended test questions every year. Workingwith educators and education advocates, the business experts help to lead the development of Next-GenerationAssessments that feature technology-enhanced items, performance-based assessments, and adaptive learning tofoster problem-solvers and critical thinkers ready to compete in the global economy.
The clinical assessment businesses’ solutions include learning assessments to help gauge how studentslearn, talent assessments to help growing companies develop their workforce, and clinical assessments to helppsychologists and speech/ language/ hearing/occupational and physical therapists diagnose and monitor patients.
The professional certification business, Pearson VUE (VUE), is a leading provider of electronic testing forregulatory and certification boards, providing a full suite of services from test development to test delivery anddata management. Pearson VUE offers exams through an extensive network of over 20,000 test centers acrossthe globe, delivering the NCLEX exam for the National Council of State Boards of Nursing, the GMAT for theGraduate Management Admissions Council and numerous IT exams such as Cisco, Microsoft, Amazon andCompTIA.
Pearson VUE also includes Certiport, the world-leader in IT performance-based exams delivered through aglobal network of academic test centers, and GED Testing Service, a joint venture with the American Council onEducation to deliver a leading high school equivalency exam.
See “Item 5. Operating and Financial Review and Prospects — Results of Operations — Year endedDecember 31, 2019 compared to year ended December 31, 2018 — Sales and operating profit by division —North America” for a discussion of developments during 2019 with respect to this segment.
Core Segment
Core markets operate across the UK, Europe, Asia Pacific and North / Sub Saharan Africa. These aremarkets where the business works closely with educators and policy makers to improve learning through creatingcurriculum, designing assessments and developing digital learning systems.
18

Pearson is the UK’s largest awarding organization, offering academic and vocational qualifications that areglobally recognized and benchmarked, with educational excellence rooted in names like Edexcel and BTEC.Learners take the business’s qualifications in many countries worldwide. Online marking technology is used tomark most examination papers and the ResultsPlus service provides detailed analysis of every learner’sexamination results. Innovation is also being driven through digital products such as ActiveLearn, and throughsupporting skills for employability for progression in study, work and life.
The Higher Education business has seen good growth in Online Program Management in both Australia andthe UK, having degree programs with Monash and Griffith Universities in Australia and Kings College London,University of Leeds and Manchester Metropolitan University in the UK.
In English, the Pearson Test of English supports visa applications to the Australian Department ofImmigration and Border Protection resulting in significant growth in market share.
In the UK, the professional certification business, Pearson VUE, works with professional and governmentbodies including the Driving and Vehicle Standards Agency (DVSA), Chartered Institute of ManagementAccountants (CIMA) and the Construction Industry Training Board (CITB).
See “Item 5. Operating and Financial Review and Prospects — Results of Operations — Year endedDecember 31, 2019 compared to year ended December 31, 2018 — Sales and operating profit by division —Core” for a discussion of developments during 2019 with respect to this segment.
Growth Segment
The business takes educational products and services and applies them at scale in regions such as Brazil,India, South Africa, Hispano-America, China and the Middle East. The main product segments for the Growthregions are English and schools.
English language teaching and learning is one of the biggest opportunities in global education. The Grouphas refocused its activities in English, with disposals of its Chinese direct delivery businesses, GEDU and WallStreet English, taking place in 2017 and 2018 respectively. The opportunity in English is now addressed in threemain ways:
• Pearson ELT courseware (institutional English language courses) is a significant player in the globalEnglish market, with products such as MyEnglish Lab;
• Pearson Test of English Academic, a computer-based test of English for study abroad and immigration;
• the Brazilian adult English language school franchises including Wizard.
The Brazilian business serves primary and secondary education with its ‘sistemas’ or learning systemswhich include COC, Dom Bosco and NAME.
In South Africa, the business is one of the largest players in the school textbook market.
See “Item 5. Operating and Financial Review and Prospects — Results of Operations — Year EndedDecember 31, 2019 compared to year ended December 31, 2018 — Sales and operating profit by division —Growth” for a discussion of developments during 2018 with respect to this segment.
Penguin Random House
On July 1, 2013 Penguin Random House was formed, upon the completion of an agreement betweenPearson and Bertelsmann to merge their respective publishing companies, Penguin and Random House, with theparent companies owning 47% and 53% respectively. The Group completed the sale of 22% of Penguin RandomHouse to Bertelsmann on October 5, 2017. The Group used the proceeds from this transaction to maintain astrong balance sheet; invest in its business; and return excess capital to shareholders, whilst retaining aninvestment grade credit rating. The Group announced the sale of its remaining 25% stake in Penguin RandomHouse to Bertelsmann in December 2019, accounting for the investment as held for sale. The transaction isexpected to complete in H1 2020.
19

Penguin Random House comprises the adult and children’s fiction and nonfiction print and digital bookpublishing businesses of Penguin and Random House in the US, UK, Canada, Australia, New Zealand and India,Penguin’s publishing activity in Asia and South Africa, as well as Dorling Kindersley worldwide, and RandomHouse’s companies in Spain, Mexico, Argentina, Uruguay, Columbia and Chile.
Penguin Random House sells directly to bookshops and through wholesalers. Retail bookshops normallymaintain relationships with both publishers and wholesalers and use the channel that best serves the specificrequirements of an order. It also sells through online retailers such as Amazon.com, as well as its own websitesand direct to the customer via digital sales agents.
In 2019, the Group’s share of Penguin Random House profit after tax was £51m.
See “Item 5. Operating and Financial Review and Prospects — Results of Operations — Year endedDecember 31, 2019 compared to year ended December 31, 2018 — Sales and operating profit by division —Penguin Random House” for a discussion of developments during 2019 with respect to Penguin Random House.
Operating cycles
The Group determines a normal operating cycle separately for each entity/cash generating unit with distincteconomic characteristics. The “normal operating cycle” for each of the Group’s education businesses is primarilybased on the expected period over which the educational programs and titles will generate cash flows, and alsotakes account of the time it takes to produce the educational programs. The operating cycles for the coursewaremarkets are typically longer than one year as described below.
Particularly for the North American businesses, there are well established cycles operating in thecourseware market:
• The School courseware market is primarily driven by an adoption cycle in which major state educationboards ‘adopt’ programs and provide funding to schools for the purchase of these programs. There is anestablished and published adoption cycle with new adoptions taking place on average every 5 years fora particular subject. Once adopted, a program will typically sell over the course of the subsequent 5years. The Company renews its pre-publication assets to meet the market adoption cycles. Therefore,the operating cycle naturally follows the market cycle. Since the sale of the Group’s US K12 business,which completed in March 2019, the school operating cycle in North America has become lessimportant than in previous years.
• The Higher Education courseware market has historically had a similar pattern, with colleges andprofessors typically refreshing their courses and selecting revised programs on a regular basis, often inline with the release of new editions or new technology offerings. The Company renews itspre-publication assets to meet the typical demand for new editions of, or revisions to, educationalprograms. Analysis of historical data shows that the typical life cycle of Higher Education content is upto 5 years but increasingly the Group’s strategy of increasing the focus on digital product is likely tomean shorter cycles with content being refreshed more regularly with smaller updates than would bethe case for physical product. In addition to content the Group also develops technology platforms forproducts and the life cycle for these platforms can be in excess of the 5 years cycle for content. Again,the operating cycle for content and platforms mirrors the market cycle.
Historically a development phase of typically 12 to 18 months for Higher Education and up to 24 months forSchool precedes the period during which the Company receives and delivers against orders for the products it hasdeveloped for the program.
The Core and Growth courseware markets operate in a similar way although often with less formal‘adoption’ processes.
20

The operating cycles in respect of the Group’s professional content are more specialized in nature as theyrelate to educational or heavy reference products released into smaller markets (e.g. the financial training and ITsectors). Nevertheless, in these markets, there is still a regular cycle of product renewal, in line with demandwhich management monitor. Typically, the life cycle is 5 years for Professional content. Elsewhere in the Group,operating cycles are typically less than one year.
Competition
The Group’s businesses operate in highly competitive environments.
The Group competes with other publishers and creators of educational materials and services. Thesecompanies include publishers such as Cengage Learning, McGraw-Hill Education and Houghton MifflinHarcourt.
In services, the Group competes with companies such as K-12 Inc in virtual schools and 2U Inc. in onlineprogram management, alongside smaller niche players that specialize in a particular academic discipline or focuson a learning technology.
In US assessment, the Group competes with other companies offering test development and administrationincluding Educational Testing Service (ETS), American Institute for Research (AIR), Measured Progress Inc,and others. The Professional Certification business competes with Prometric globally and a number of othersmaller players in local markets.
In Core student assessment, the UK qualifications business competes with AQA and OCR in generalqualifications and a number of smaller players in vocational qualifications.
In English language teaching (ELT) courseware, the Group competes with Oxford University Press,Macmillan and other publishers. In English language testing Pearson Test of English Academic competes withalternative tests including iELTS and TOEFL.
Competition is based on the ability to deliver quality products and services that address the specifiedcurriculum needs and appeal to the student, organizations, school boards, educators and government officialsmaking purchasing decisions.
Intellectual property
The Group’s principal intellectual property assets consist of its:
• trademarks and other rights via its brands (including corporate and business unit brands, imprints, aswell as product and service brands);
• copyrights for its textbook and related educational content and software code; and
• patents and trade secrets related to the innovative methods deployed in its key technologies.
The Group believes it has taken all reasonable legal steps to protect its key brands in its major markets andcopyright in its content and has taken appropriate steps to develop a comprehensive patent program to ensureappropriate protection of emerging inventions that are critical to its new business strategies.
Raw materials
Paper remains the principal raw material used by the Group. The Group purchases most of its paper throughits global outsourcing partner LSC Communications located in the United States. The Group has not experiencedand does not anticipate difficulty in obtaining adequate supplies of paper for its operations, with sourcingavailable from numerous suppliers. While local prices fluctuate depending upon local market conditions, theGroup has not experienced extensive volatility in fulfilling paper requirements. In the event of a sharp increase inpaper prices, the Group has a number of alternatives to minimize the impact on its operating margins, includingmodifying the grades of paper used in production.
21

Government regulation
The manufacture of certain products in various markets is subject to governmental regulation relating to thedischarge of materials into the environment. Operations are also subject to the risks and uncertainties attendant todoing business in numerous countries. Some of the countries in which the Group conducts these operationsmaintain controls on the repatriation of earnings and capital and restrict the means available for hedging potentialcurrency fluctuation risks. The operations that are affected by these controls, however, are not material.Accordingly, these controls have not significantly affected the Group’s international operations. Regulatoryauthorities may have enforcement powers that could have an impact. The Group believes, however, that in lightof the nature of its business the risk of these sanctions does not represent a material threat.
Licenses, patents and contracts
The Group is not dependent upon any particular licenses, patents or new manufacturing processes that arematerial to its business or profitability. Likewise, it is not materially dependent upon any particular contracts withsuppliers or customers, including contracts of an industrial, commercial or financial nature. Notwithstanding theforegoing, the Group’s education business is dependent upon licensed rights since most textbooks and digitallearning tools include content and/or software that is licensed to it by third parties (or assigned subject to royaltyarrangements). In addition, some software products in various business lines, particularly those of its Clinicalbusiness, rely upon patents licensed from third parties.
Legal proceedings
The Group and its subsidiaries are from time to time the subject of legal proceedings incidental to the natureof its and their operations. These may include private litigation or arbitrations, governmental proceedings andinvestigations by regulatory bodies. The Group does not currently expect that the outcome of pendingproceedings or investigations, either individually or in aggregate, will have a significant effect on its financialposition or profitability nor have any such proceedings had such effect in the recent past. The Group is not awareof material proceedings in which any member of senior management or any of its affiliates is a party adverse to itor any of its subsidiaries or in respect of which any of those persons has a material interest adverse to it or any ofits subsidiaries.
Organizational structure
Pearson plc is a holding company which conducts its business primarily through subsidiaries and otheraffiliates throughout the world. Below is a list of its significant subsidiaries and associates as at December 31,2019, including name, country of incorporation or residence, proportion of ownership interest and, if different,proportion of voting power held.
Name Country of incorporation/residence
Percentageinterest/voting
power
Pearson Education Inc. . . . . . . . . . . . . United States (Delaware) 100%Pearson Education Ltd. . . . . . . . . . . . . England and Wales 100%NCS Pearson Inc. . . . . . . . . . . . . . . . . . United States (Minnesota) 100%Penguin Random House LLC . . . . . . . United States (Delaware) 25%Penguin Random House Ltd. . . . . . . . . England and Wales 25%
On October 16, 2015, the Group completed the sale of its 50% stake in The Economist Group. The share ofprofit after tax from the associate interest in the Economist Group has been included in discontinued operationsfor the period of 2015 until October 16, 2015.
22
On November 30, 2015, the Group completed the sale of The Financial Times to Nikkei Inc. The results ofThe Financial Times have been included in discontinued operations for the 11 months to November 30, 2015.
In October 2017, the Group disposed of 22% of PRH to Bertelsmann, and in December 2019 it announcedthe sale of its remaining 25% interest to Bertelsmann. The disposal is expected to complete in H1 2020.
On May 5, 2017, the Group announced that it was undertaking a strategic review of its US K12 coursewarebusiness. The US K12 business was classified as held for sale on the Group’s balance sheet as at December 31,2017 and December 31, 2018. On March 29, 2019 the Group completed the sale of its US K12 coursewarebusiness to Nexus Capital Management LP resulting in a pre-tax profit on sale of $13m.
On August 16, 2017 the Group completed the sale of its test preparation business in China, Global English(GEDU), to Puxin Education.
On November 27, 2017 the Group announced that it had agreed to the sale of Wall Street English (WSE) toa consortium consisting of funds affiliated with Baring Private Equity Asia and CITIC Capital. Consequently,WSE was classified as held for sale on the Group’s balance sheet as at December 31, 2017. The disposalcompleted on March 15, 2018.
During 2019 the Group made some small acquisitions for total consideration of $53m. Details of the assetsacquired, and the associated consideration are shown in “Item 18. Financial Statements” in this Annual Report.
Property, plant and equipment
The Group’s headquarters are located at leasehold premises in London, England. As at December 31, 2019it owned or leased approximately 750 properties, including approximately 580 testing/teaching centers in over 59countries worldwide, the majority of which are located in the United Kingdom and the United States.Approximately 80 properties, primarily testing/teaching centers in China, were disposed in March 2018 as part ofthe WSE disposal.
The properties owned and leased by the Group consist mainly of offices, distribution centers and computertesting/ teaching centers.
In some cases properties leased by the Group are then sublet to third parties. These properties are notincluded in the list below as they are not considered to be principal properties.
The vast majority of printing is carried out by third party suppliers. The Group operates a small digital printoperation as part of its Pearson Assessment & Testing businesses which provides short-run and print-on-demandproducts, typically custom client applications.
The Group owns the following principal properties at December 31, 2019:
General use of property Location Area in square feet
Office . . . . . . . . . . . . . . . . . . . . . Iowa City, Iowa, USA 312,760Warehouse/Office . . . . . . . . . . . . Cedar Rapids, Iowa, USA 205,000Printing . . . . . . . . . . . . . . . . . . . . Owatonna, Minnesota, USA 128,000
23

The Group leased the following principal properties at December 31, 2019:
General use of property Location Area in square feet
Teaching Centre . . . . . . . . . . . . . . . . . . . . . . . . Midrand, South Africa 351,755Office . . . . . . . . . . . . . . . . . . . . . . . . . . . . . . . . Westminster, London, UK 300,503Office . . . . . . . . . . . . . . . . . . . . . . . . . . . . . . . . Hoboken, New Jersey, USA 216,273Office . . . . . . . . . . . . . . . . . . . . . . . . . . . . . . . . Glenview, Illinois, USA 187,500Office . . . . . . . . . . . . . . . . . . . . . . . . . . . . . . . . Bloomington, Minnesota, USA 147,159Office . . . . . . . . . . . . . . . . . . . . . . . . . . . . . . . . Chandler, Arizona, USA 135,460Teaching Centre . . . . . . . . . . . . . . . . . . . . . . . . Pretoria, South Africa 134,553Office . . . . . . . . . . . . . . . . . . . . . . . . . . . . . . . . Boston, Massachusetts, USA 122,548Warehouse/Office . . . . . . . . . . . . . . . . . . . . . . . Cedar Rapids, Iowa, USA 119,682Office . . . . . . . . . . . . . . . . . . . . . . . . . . . . . . . . San Antonio, Texas, USA 117,063Warehouse . . . . . . . . . . . . . . . . . . . . . . . . . . . . . Naucalpan de Juarez, Mexico 113,638
Capital Expenditures
See “Item 5. Operating and Financial Review and Prospects — Liquidity and Capital Resources” fordescription of the Company’s capital expenditure.
ITEM 4A. UNRESOLVED STAFF COMMENTS
The Company has not received, 180 days or more before the end of the 2019 fiscal year, any writtencomments from the Securities and Exchange Commission staff regarding its periodic reports under the ExchangeAct which remain unresolved.
ITEM 5. OPERATING AND FINANCIAL REVIEW AND PROSPECTS
The following discussion and analysis is based on and should be read in conjunction with the consolidatedfinancial statements, including the related notes, appearing elsewhere in this Annual Report. The financialstatements have been prepared in accordance with IFRS as issued by the IASB and in conformity with IFRS asadopted by the EU.
Where this discussion refers to constant currency comparisons, these are estimated by re-calculating thecurrent year results using the exchange rates prevailing for the prior period. The increase or reduction in thevalue calculated is the estimate of the impact of exchange rates. The Group believes this presentation provides amore useful period to period comparison as changes due solely to movements in exchange rates are eliminated.
General overview
Introduction
The Group’s primary segments for management and reporting are geographical as follows: North America,comprising the courseware, assessments and services businesses in the US and Canada; Core, comprising thecourseware, assessments and services businesses in more mature markets outside North America, including theUK, Europe, Asia Pacific and North Africa, and Growth, comprising the courseware, assessments and servicesbusinesses in emerging markets, including Brazil, India, South Africa, Hispano-America, Hong Kong and Chinaand the Middle East. In addition, the Group has separately reported on an equity basis the results from its 25%interest in Penguin Random House (PRH). Following the Group’s announcement that it had entered into anagreement to sell its remaining stake in PRH, the Group’s equity investment in this business has been classifiedas held for sale (see below).
24

On August 16, 2017, the Group completed the sale of its test preparation business in China (GEDU) toPuxin Education, realizing a pre-tax profit on sale of £44m. On October 5, 2017, the Group also completed thesale of a 22% share in Penguin Random House to Bertelsmann, realizing a pre-tax profit on sale of £96m.
On March 15, 2018, the Group completed the sale of Wall Street English (WSE) to a consortium of fundsaffiliated with Baring Private Equity Asia and CITIC Capital realizing a profit before tax of £207m. The businesshad been classified as held for sale at December 31, 2017.
On March 29, 2019, the Group completed the sale of the US K12 courseware business (K12) to NexusCapital Management LP for headline consideration of $250m comprising an initial cash payment of $25m and anunconditional vendor note for $225m expected to be repaid in three to seven years. The K12 business had beenheld for sale on the balance sheet following a strategic review and discussion with potential buyers since the endof 2017 until the disposal in 2019.
In December 2019, the Group announced the sale of its remaining 25% interest in PRH. The sale is expectedto complete in the first half of 2020. At the end of December our share of the assets of PRH has been classified asheld for sale on the balance sheet.
None of the disposals referred to above were significant enough to meet the definition of a discontinuedbusiness and their results to the date of disposal are included in continuing operations.
The Group’s total sales decreased from £4,129m in 2018 to £3,869m in 2019, a decrease of £260m or 6%.This year on year decrease was impacted by currency movements, primarily the comparative strength of the USdollar relative to sterling during the year. In 2019 currency movements increased sales by £97m when comparedto the equivalent figures at constant 2018 rates. When measured at 2018 constant exchange rates, the Group’ssales declined by 9%. Part of the decrease is due to the absence of sales from businesses sold during 2018 and2019. The Group estimates that after excluding the impact of disposals sales were flat in 2019 compared to 2018at constant exchange rates. Although sales at constant rates after taking account of disposals were flat there werefurther significant decreases in North America in higher education courseware, offset by aggregate growth in therest of the business.
In 2019, the Group reported an operating profit of £275m compared to an operating profit of £553m in2018. The decrease in profit of £278m mainly reflects the absence of significant gains on disposal in 2019compared to 2018, an increase in intangible charges and restructuring costs and the lost contribution frombusinesses disposed which more than offset a favorable impact from currency movements and the adoption ofIFRS 16 ‘Leases’. After stripping out the effect of the sale of businesses, intangible charges, restructuring costs,one-off pension related charges and the impact of currency movements and IFRS 16, profits from tradingincreased by around £30m. This underlying trading increase was primarily due to savings from restructuring andlower staff incentives which offset the impact on profits of lower sales in North America higher educationcourseware and inflationary pressures.
IFRS 16 ‘Leases’ was adopted on 1 January 2019 but the comparative figures for 2018 have not beenrestated. The impact in 2019 was to increase adjusted operating profit by £25m (see also note 1 within Item 18–Financial Statements).
In May 2017, the Group announced a new restructuring program, the 2017-2019 restructuring program. Thisprogram began in the second half of 2017 and costs incurred were £79m in 2017, £102m in 2018 and £159m in2019 (including the share of costs incurred by associates). The costs relate to delivery of cost efficiencies in theenabling functions and US higher education courseware business together with further rationalization of theproperty and supplier portfolio. The restructuring costs in 2019 and 2018 relate predominantly to staffredundancies and in 2018 to the net cost of property rationalization. Included in the property rationalization in2018 is the impact of the consolidation of the Group’s property footprint in London which resulted in a chargefor onerous leases of £91m partially offset by profit from the sale of property of £81m.
25

Operating profit in 2019 included a gain of £16m on the sale of businesses. This gain mainly relates to thesale of the K12 school courseware business in the US. In 2018 a £230m gain from the sale of businesses relatedto the sale of the Wall Street English language teaching business (WSE), realizing a gain of £207m, the disposalof the Group’s equity interest in UTEL, the online University partnership in Mexico, realizing a gain of £19m,and various other smaller disposal items realizing a net gain of £4m.
Currency movements increased 2019 operating profit by £15m when compared to the equivalent figurestranslated at constant 2018 exchange rates.
The profit before taxation in 2019 of £232m compares to a profit before taxation of £498m in 2018. Thedecrease in profit of £266m reflects the £278m decrease in the reported operating profit identified above offsetby a decrease in net finance costs of £12m, from £55m in 2018 to £43m in 2019.
The Group’s net interest payable increased from £24m in 2018 to £41m in 2019. The increase is due to theadoption of IFRS 16 which resulted in an additional £34m of net interest payable in 2019. After excluding theimpact of IFRS 16 there was a reduction in net interest payable due to lower levels of average net debt togetherwith favorable movements in interest on tax and the absence of one-off costs relating to the redemption of bonds.Also included in net finance costs are net finance costs relating to employee benefit plans, foreign exchange andother gains and losses. In 2019 the total of these items was a loss of £2m compared to a loss of £31m 2018.Income relating to employee benefit plans was £2m higher in 2019 than in 2018 reflecting the higher net surpluson pension balances at the beginning of 2019 compared to the beginning of 2018. Other losses in both 2019 and2018 primarily relate to foreign exchange differences on un-hedged cash and cash equivalents, and otherfinancial instruments although these losses were much lower in 2019.
The reported tax credit in 2019 was £34m (14.7%) compared to a credit of £92m (18.5%) in 2018. Themovement in the tax rate reflects several one-off benefits in 2018 including provision releases due to the expiryof relevant statutes of limitation and due to the reassessment of historical positions, as well as a one-off benefitfrom a reassessment of the tax treatment of certain items of income and expenditure. In 2019, the credit isprimarily due to US tax losses generated on the disposal of the K12 business.
Net cash generated from operations decreased to £480m in 2019 from £547m in 2018. The decrease in cashgenerated from operations was largely due to increased investment in pre-publication and other increases inworking capital, including the impact of reduced staff incentives, together with increased restructuring spend andthe absence of a contribution from the K12 business following its disposal in the first half of 2019. Thesedecreases were partially offset by the impact of IFRS 16 which reclassified lease cash flows as financing,investment and interest items rather than as cash flows from operations as was previously the case.
Net interest paid at £64m in 2019 compares to £22m in 2018 and reflects the adoption of IFRS 16 and theincorporation of lease interest for the first time as referred to above. Tax paid in 2019 was £30m compared to£43m in 2018 with the decrease mainly explained by a refund received in the US relating to historical periodstogether with no US tax being paid in relation to 2019 as a result of the tax loss on the sale of the US K12business. In addition to the refund in the US in 2019, there was tax paid to the Chinese tax authorities followingthe disposal of WSE during 2018 and New York state and city taxes paid in the US as a result of a settlementwith the tax authorities relating to past disposals.
Capital expenditure on property, plant and equipment was £55m in 2019 compared to £70m in 2018.Proceeds from the sale of property in 2018 of £128m includes proceeds from the sale of the Group’s Londonproperty as part of the restructuring program. There were no material property sales in 2019. Capital expenditureon software intangibles increased from £130m in 2018 to £138m in 2019. The expenditure on both tangible andintangible capital includes the continuing investment in enabling function technology designed to loweradministrative costs.
26

Cash outflow from acquisitions including £40m of additional capital invested in PRH in 2019 was £97mcompared to £15m in 2018 relating to investment purchases and prior year acquisitions. There were two smallacquisitions in 2019, Lumerit and Smart Sparrow which together accounted for £40m of cash consideration withthe balance of the cash outflow on acquisitions in 2019 being in relation to investments and prior year items. Thenet cash inflow in respect of businesses and investments disposed was £107m in 2018 compared to a net outflowof £96m in 2019. In 2018 the cash received largely related to proceeds from the sale of WSE and UTEL. In 2019the cash outflow mainly relates to the US K-12 Courseware business and reflects the deferral of proceeds and thelevel of working capital in the business at the disposal date.
Dividends from joint ventures and associates decreased from £117m in 2018 to £64m in 2019. Thereduction is primarily due to the impact of the PRH sale transaction in 2017 which resulted in a reduced equityshare from 47% to 25% and involved recapitalization dividends which were £50m in 2018. Dividends paid tocompany shareholders in 2019 of £147m compares to £136m in 2018. Cash returned to shareholders via the sharebuyback program, announced in October 2017 and completed in February 2018, amounted to £153m in 2018.Treasury share purchases in 2019 in respect of employee share plans were £52m. There were no purchases oftreasury shares for this purpose in 2018.
Overall the Group’s net borrowings increased from £143m at the end of 2018 to £1,016m at the end of 2019.In addition to the cash flows referred to above, the adoption of IFRS 16 added £666m of net debt on transitionafter taking account of both lease liabilities and the investment in finance lease receivable brought on balancesheet at 1 January 2019.
Outlook
On 23 March 2020, the Group updated its guidance for trading in 2020 to take account of the impact of theCOVID-19 pandemic on the business. This guidance was given whilst recognising that, during a prolongedperiod of uncertainty, it may need to be updated. The Group will continue to monitor the situation closely andwill update further as appropriate.
Original guidance for 2020 was announced in February 2020 with the Group then expecting to reportadjusted operating profit of between £410m and £490m for 2020. Adjusted operating profit is the key financialmeasure used by management to evaluate the performance of the Group and allocate resources to businesssegments over time by separating out those items of income and expenditure relating to acquisitions anddisposals, major restructuring programs and certain other items that are not representative of underlyingperformance. Reconciliations of adjusted operating profit to operating profit are included below under ‘Sales andoperating profit by segment’ and in note 2 within Item 18 — Financial Statements.
In the revised guidance issued on 23 March, the Group identified three major trends in the business resultingfrom the impact of COVID-19 as follows
• Uncertainty in businesses that rely on learners and staff being able to access physical sites, such asPearson VUE, the Pearson Test of English, US Student Assessments, Higher Education institutions inSouth Africa and, to a lesser extent, UK qualifications, which will have a negative impact on Pearsonprofits. If the crisis broadens, it could also impact the English franchise business in Brazil. The Groupis making both variable and discretionary cost savings to partially mitigate these impacts and isconsidering further actions.
• A significant uplift in the use of the Group’s digital products and services, as Pearson enables existingcourseware and assessment customers to migrate quickly to online learning and testing. This willstrengthen and deepen these relationships, and should, in time, accelerate the shift to online learning.
27

• Rapidly growing interest in the Global Online Learning businesses, focused initially on the Group’svirtual school offerings, but expected also to include fully online university programs. The Groupbelieves that this growing interest should translate into increased billings later in the year andthereafter, although the scale will depend in part on how long the disruption to face to face teachingand learning persists.
Restrictions on access to physical infrastructure is mainly expected to impact the Group’s assessment andqualifications businesses. As a result of the outbreak, the majority of Pearson VUE test centres were closedduring March 2020 for an initial period until the middle of April. The business is evaluating local regulationsaround re-opening sites to address essential testing services such as for health care workers. It is estimated thatthe financial impact of these closures will be to reduce 2020 adjusted operating profit by approximately £25m to£35m. If closures last longer than the period above, then it is expected that there would be an operating impact ofsimilar scale for each additional month partially offset by cost actions taken. Tests run throughout the yearproviding time for pent up demand to strengthen the performance once the test centres are re-opened. Thebusiness is also working with clients who are able to take advantage of Pearson VUE’s online proctoringoffering.
With the acceleration of the spread of COVID-19 across the US, a number of states and boards have decidedto postpone or waive testing for the academic year. To date, there have been test cancellations which impact 2020operating profit by around £15m after mitigating actions. There is a risk of further state test cancellations whichcould have a similar impact on profit.
In the UK, Pearson offers academic and vocational qualifications including GCSEs, A Levels and BTECs.The UK Government has closed UK schools and announced that the high stakes exams which usually take placein May and June will be cancelled for the academic year. The Group continues to work closely with theDepartment for Education, Ofqual and the other awarding bodies to implement the plan announced by the UKGovernment and support teacher assessment to ensure students receive qualifications. In line with the agreedapproach, the UK business will to continue to award qualifications and provide the opportunity to sit exams laterin the year and expect any impact on profits to be modest.
The Group has seen impacts from closures of schools in China and Italy, but the financial impact is modest,given the size of our businesses in these countries. The impact to sales of products in other regions is uncertain,especially given that the period for which educational institutions may be closed is unclear, and the businessessales periods are seasonal.
The outlook for 2020 is based on the following factors when comparing to 2019. Guidance is based onexchange rates at 31 December 2019 and these rates would generate approximately £17m less adjusted operatingprofit than would be the case at constant 2019 average exchange rates. In 2019, the Group generatedapproximately 62% of its sales in the US, 3% in Greater China, 5% in the Eurozone, 3% in Brazil, 3% in Canada,4% in Australia, 2% in South Africa and 2% in India. Guidance for 2020 excludes a contribution from PRHwhich is expected to be sold in the first half of 2020 and is held for sale at the end of 2019. In addition, the 2019results include the K12 business to the point of sale in March 2019. The reduction in adjusted operating profit in2020 from portfolio changes compared to 2019 is expected to be £55m including £65m in relation to PRH. In2020, the Group expects cost inflation of around £30m and reinstatement of staff incentives and increasedinvestment in strategic growth areas together are expected to account for an increase in costs of £45m.Incremental in-year benefits from the 2017-2019 restructuring program are expected to be £60m in 2020.
The Group sets out in note 11 within Item 18 — Financial Statements, as part of its assessment of goodwillfor impairment, the sensitivity to impairment resulting from reasonably possible changes in key assumptions. It ishighlighted that a relatively small reduction in contribution, that could arise from longer-term disruption causedby the COVID-19, may result in impairment charges.
28

The impact of the pandemic has been modelled under several scenarios to ensure that the likelihood of aprolonged period of disruption has been appropriately considered in assessing the availability of funding to theGroup and the ability of the Group to comply with its banking covenants. In addition to the impacts on revenueand profit referred to above the Group expects an impact on its operating cash flows including the normal impactfrom conversion of profits but also additional deterioration from adverse movements in working capital. Themodelling includes a severe reduction in revenue and profit that extends from March into the second and thirdquarters of 2020 with conditions returning to normal in the course of the fourth quarter. The Group believes it hassignificant financial headroom, is projected to comply with its banking covenants and is working to protect itscash flow and pro-actively manage working capital. At the end of February, the Company had approximately£1bn in total liquidity immediately available from cash and its Revolving Credit Facility and is looking at alloptions to further maximize liquidity.
Sales information by segment
The following table shows sales information for each of the past three years by segment:
Year ended December 31
2019 2018 2017
£m £m £m
North America . . . . . . . . . . . . . . . . . . . . . . . . . . . . . . . . . . . . . . . . 2,534 2,784 2,929Core . . . . . . . . . . . . . . . . . . . . . . . . . . . . . . . . . . . . . . . . . . . . . . . . 838 806 815Growth . . . . . . . . . . . . . . . . . . . . . . . . . . . . . . . . . . . . . . . . . . . . . . 497 539 769
Total continuing operations . . . . . . . . . . . . . . . . . . . . . . . . . . . . . . 3,869 4,129 4,513
Sales information by geographic market supplied
The following table shows sales information for each of the past three years by geographic region:
Year ended December 31
2019 2018 2017
£m £m £m
Europe . . . . . . . . . . . . . . . . . . . . . . . . . . . . . . . . . . . . . . . . . . . . . 629 623 646North America . . . . . . . . . . . . . . . . . . . . . . . . . . . . . . . . . . . . . . . 2,522 2,7536 2,896Asia Pacific . . . . . . . . . . . . . . . . . . . . . . . . . . . . . . . . . . . . . . . . . 441 455 643Other countries . . . . . . . . . . . . . . . . . . . . . . . . . . . . . . . . . . . . . . 277 298 328
Total continuing operations . . . . . . . . . . . . . . . . . . . . . . . . . . . . . 3,869 4,129 4,513
In the table above sales are allocated based on the country in which the customer is located.
Exchange rate fluctuations
The Group earns a significant proportion of its sales and profits in overseas currencies, principally the USdollar. Sales and profits are translated into sterling in the consolidated financial statements using average rates.The average rate used for the US dollar was £1:$1.28 in 2019, £1:$1.34 in 2018 and £1:$1.30 in 2017.Fluctuations in exchange rates can have a significant impact on the Group’s reported sales and profits. In 2019,the Group generated 62% of its continuing sales in the US (2018: 64%; 2017: 65%). In 2019 the Group estimatesthat a five-cent change in the average exchange rate between the US dollar and sterling would have had animpact on its reported earnings per share of approximately 1.5p. See “Item 11. Quantitative and QualitativeDisclosures about Market Risk” for more information on how foreign exchange risk is managed. The year-endUS dollar rate for 2018 was £1:$1.32 compared to £1:$1.27 for 2018 and £1:$1.35 for 2017. The total impact onshareholders’ funds of foreign exchange translation was a loss of £111m in 2019 compared to a gain of £86m in2018. These net movements are principally driven by movements in the US dollar as a significant portion of theGroup’s operations are in the US.
29

Critical accounting policies
The Group’s consolidated financial statements included in “Item 18. Financial statements” are preparedbased on the accounting policies described in note 1 to the consolidated financial statements.
Certain of these accounting policies require the application of management judgment in selectingassumptions when making significant estimates about matters that are inherently uncertain. Management basesits estimates on historical experience and other assumptions that it believes are reasonable. These policies aredescribed in note 1a (3) in “Item 18. Financial Statements”.
Results of operations
Year ended December 31, 2019 compared to year ended December 31, 2018
Consolidated results of operations
Sales
The Group’s total sales decreased from £4,129m in 2018 to £3,869m in 2019, a decrease of £260m or 6%.The year on year movement was impacted by exchange rates, primarily the comparative strength of the US dollarrelative to sterling during the year. In 2019, currency movements increased sales by £97m when compared to theequivalent figures at constant 2018 rates. When measured at 2018 constant exchange rates, the Group’s salesdeclined by 9%. Part of the decrease is due to the absence of sales from businesses sold during 2018 and 2019.The Group estimates that after excluding the impact of disposals sales were flat in 2019 compared to 2018 atconstant exchange rates. Although sales at constant rates after taking account of disposals were flat there werefurther significant decreases in North America in higher education courseware, offset by aggregate growth in therest of the business.
North America sales decreased by £250m or 9% from £2,784m in 2018 to £2,534m in 2019. The Groupestimates that after excluding the impact of exchange rates, the contribution from businesses disposed in 2018and 2019, North America sales declined by 3% in 2019 compared to 2018. This decline was primarily due toNorth American Higher Education Courseware which declined 12% with print declining by close to 30%,partially offset by modest growth in digital. In US School Assessment, revenue declined slightly with continuedcontraction in revenue associated with the PARCC and ACT-Aspire multi state contracts and contract losseswere partially offset by new contract wins. In Professional Certification (Pearson VUE) revenue grew driven byincreases in global test volumes. Revenue at Virtual Schools and OPM grew at 6% and 4% respectively due toincreased enrolment and course registrations. North America was the most significant source of the Group’s salesand as a proportion of total sales contributed 65% in 2019 and 67% in 2018.
Core sales increased by £32m or 4% from £806m in 2018 to £838m in 2019. The Group estimates that afterexcluding the impact of exchange, the contribution from businesses disposed in 2018, Core sales were up 5%when comparing 2019 and 2018. Although Courseware sales declined moderately, there was strong growth inStudent Assessment and Qualifications due to price and volume increases for A levels and GCSEs in the UK andthe delivery of a new digital assessment contract in Egypt. In addition, there was good growth in Pearson Test ofEnglish Academic, OPM in the UK and Australia and Professional Certification.
Growth sales decreased by £42m from £539m in 2018 to £497m in 2019 principally due to the lostcontribution in China following the disposal of WSE in 2018. The Group estimates that after excluding theimpact of exchange rates and the contribution from businesses disposed, Growth sales increased by 4% whencomparing 2019 and 2018. Strong growth in China and good growth in Brazil and the Middle East were partiallyoffset by declines in Higher Education Courseware in South Africa following a change in government funding.
30

Cost of goods sold and operating expenses
The following table summarizes the Group’s cost of sales, net operating expenses and impairment ofintangible assets:
Year ended December 31
2019 2018
£m £m
Cost of goods sold . . . . . . . . . . . . . . . . . . . . . . . . . . . .Operating expenses: 1,858 1,943
Distribution costs . . . . . . . . . . . . . . . . . . . . . . . . . . 73 88Selling, marketing and product development costs
. . . . . . . . . . . . . . . . . . . . . . . . . . . . . . . . . . . . . . 631 759Administrative and other expenses . . . . . . . . . . . . 999 1,039Restructuring costs . . . . . . . . . . . . . . . . . . . . . . . . 157 90Other income . . . . . . . . . . . . . . . . . . . . . . . . . . . . (54) (69)
Total net operating expenses . . . . . . . . . . . . . . . . . . . . 1,806 1,907Other net gains . . . . . . . . . . . . . . . . . . . . . . . . . . . . . . . (16) (230)
Total continuing operations . . . . . . . . . . . . . . . . . . . . . 3,648 3,620
Cost of goods sold. Cost of sales consists of costs for raw materials, primarily paper, printing and bindingcosts, amortization of pre-publication costs, royalty charges, the cost of service provision in the assessment andtesting business and the cost of teaching and facilities in direct delivery businesses. The Group’s cost of salesdecreased by £85m, or 4%, from £1,943m in 2018, to £1,858m in 2019. The decrease largely reflects the decreasein sales but also includes some continuing benefit from restructuring. In addition, cost of sales as a percentage ofsales increased largely as a result of the mix effect caused by a sales decline in businesses with generally highergross margins than Pearson as a whole. Cost of sales was 48.0% of sales in 2019 compared to 47.1% in 2018.
Distribution costs. Distribution costs consist primarily of shipping costs, postage and packing. Distributioncosts decreased by £15m reflecting the flow through of restructuring savings, the absence of costs frombusinesses disposed, the decrease in physical print sales and some one-off costs in the Core business in 2018relating to a change in distribution arrangements that year.
Selling, marketing and product development costs. The Group’s selling, marketing and product developmentcosts decreased by £128m or 17% from £759m in 2018 to £631m in 2019. The decrease is explained by theabsence of costs from businesses disposed and restructuring savings realized in the year. As a percentage ofsales, these costs decreased in 2019 from 18.4% in 2018 to 16.3% in 2019.
Administrative and other expenses. The Group’s administrative and other expenses decreased by £40m or4% from £1,039m in 2018 to £999m in 2019. This decrease is explained by the absence of costs from businessesdisposed, the impact of restructuring savings particularly in enabling functions and the benefit from adoption ofIFRS 16 partly offset by continuing investment in technology and the impact of higher intangible charges. In2019 intangible charges increased due to an additional £65m impairment charge relating to acquired intangiblesin the Brazil business following a reassessment of the relative risk in that market.
Restructuring costs. Restructuring costs of £157m in 2019 and £90m in 2018 (excluding the share ofassociate restructuring charges) relate to the 2017-2019 restructuring program announced in May 2017. Thisprogram began in the second half of 2017 and costs incurred related to delivery of cost efficiencies in enablingfunctions and the US higher education courseware business together with further rationalization of the propertyand supplier portfolio. The restructuring costs in 2018 and 2019 relate predominantly to staff redundancies and,in 2018, to the net cost of property rationalization. Included in the property rationalization in 2018 is the impactof the consolidation of the Group’s property footprint in London which resulted in a charge for onerous leases of£91m partially offset by profit from the sale of property of £81m.
31

Other income. Other operating income mainly consists of freight recharges, sub-rights and licensing income,distribution commissions, investment income and gains on minor asset disposals together with service feeincome from Penguin Random House. Other operating income decreased to £54m in 2019 compared to £69m in2018 mainly due to decreased rights income, the absence of recoveries following legal settlements in 2018 andfewer asset gains in 2019.
Other net gains and losses. In 2019 gains of £16m largely relate to the sale of the K12 school coursewarebusiness in the US. In 2018 a £230m gain from the sale of businesses related to the sale of the Wall StreetEnglish language teaching business (WSE), realizing a gain of £207m, the disposal of the Group’s equity interestin UTEL, the online University partnership in Mexico, realizing a gain of £19m, and various other smallerdisposal items realizing a net gain of £4m.
Share of results of joint ventures and associates
The contribution from the Group’s joint ventures and associates increased by £10m to £54m in 2019 from£44m in 2018. The increase is mainly due to reduced intangible and restructuring charges in PRH in 2019 and inaddition, there were restructuring costs incurred in respect of the Group’s ACT Aspire joint venture in 2018 thatwere absent in 2019.
Operating profit
In 2019, the Group reported an operating profit of £275m compared to an operating profit of £553m in2018. The decrease in profit of £278m mainly reflects the absence of significant gains on disposal in 2019compared to 2018, an increase in intangible charges and restructuring costs and the lost contribution frombusinesses disposed which more than offset a favorable impact from currency movements and the adoption ofIFRS 16 ‘Leases’. Excluding out the effect of the sale of businesses, intangible charges, restructuring costs,one-off pension related charges and the impact of currency movements and IFRS 16, profits from tradingincreased by around £30m. This underlying trading increase was primarily due to savings from restructuring andlower staff incentives which offset the impact on profits of lower sales in North America higher educationcourseware and inflationary pressures.
Net finance costs
Net finance costs decreased from £55m in 2018 to £43m in 2019. Net interest payable increased from £24min 2018 to £41m in 2019. The increase is due to the adoption of IFRS 16 which resulted in an additional £34m ofnet interest payable in 2019. After excluding the impact of IFRS 16 there was a reduction in net interest payabledue to lower levels of average net debt together with favorable movements in interest on tax and the absence ofone-off costs relating to the redemption of bonds. Also included in net finance costs are net finance costs relatingto employee benefit plans, foreign exchange and other gains and losses. In 2019 the total of these items was aloss of £2m compared to a loss of £31m 2018. Income relating to employee benefit plans was £2m higher in 2019than in 2018 reflecting the higher net surplus on pension balances at the beginning of 2019 compared to thebeginning of 2018. Other losses in both 2019 and 2018 primarily relate to foreign exchange differences onun-hedged cash and cash equivalents, and other financial instruments although these losses were much lower in2019.
For a more detailed discussion of the Group’s borrowings and interest expenses see “— Liquidity andCapital Resources — Capital Resources” and “— Borrowings” below and “Item 11. Quantitative and QualitativeDisclosures about Market Risk”.
Taxation
The reported tax credit in 2019 was £34m (14.7%) compared to a credit of £92m (18.5%) in 2018. Themovement in the tax rate reflects several one-off benefits in 2018 including provision releases due to the expiryof relevant statutes of limitation and due to the reassessment of historical positions, as well as a one-off benefitfrom a reassessment of the tax treatment of certain items of income and expenditure. In 2019, the credit isprimarily due to US tax losses generated on the disposal of the K12 business.
32

Discontinued operations
There were no discontinued operations in either 2018 or 2019.
Profit for the year
The profit for the financial year in 2019 was £266m compared to a profit in 2018 of £590m. The decreasedprofit reflects decreased operating profit and reduced tax credits partially offset by lower net finance costs as setout above.
Earnings per ordinary share
The basic earnings per ordinary share, which is defined as the profit for the financial year divided by theweighted average number of shares in issue, was 34.0p in 2019 compared to 75.6p in 2018 based on a weightedaverage number of shares in issue of 777.0m in 2019 and 778.1m in 2018. The decrease in earnings per share wasdue to the decrease in profit for 2019 as described above and was not significantly impacted by the smalldecrease in the number of weighted average number of shares in 2019 compared to 2018.
The diluted earnings per ordinary share was 34.0p in 2019 and 75.5p in 2018, with the dilutive effect ofoptions being minimal.
Exchange rate fluctuations
Currency movements increased sales by £97m and increased operating profit by £15m. See “Item 11.Quantitative and Qualitative Disclosures about Market Risk” for a discussion regarding the Group’s managementof exchange rate risks.
Sales and operating profit by segment
The following tables summarize the Group’s sales and adjusted operating profit for each of the Group’sbusiness segments. Adjusted operating profit is included as it is the key financial measure used by managementto evaluate the performance of the Group and allocate resources to business segments over time by separating outthose items of income and expenditure relating to acquisitions and disposals, major restructuring programs andcertain other items that are not representative of underlying performance. Reconciliations of adjusted operatingprofit to statutory operating profit are included below and in note 2 within Item 18 — Financial Statements.
In the Group’s adjusted operating profit, it has excluded other net gains and losses, acquisition related costs,amortization and impairment of acquired intangibles and the cost of major restructuring programs. In 2018, theGroup also excluded the impact of adjustments arising from clarification of guaranteed minimum pension (GMP)equalization legislation in the UK. The intangible charges relate only to intangible assets acquired throughbusiness combinations and acquisition costs are the direct costs of acquiring those businesses. The Group doesnot believe these charges are relevant to an understanding of the underlying performance. Charges relating toacquired intangible assets are non-cash charges that reflect the historical expenditure of the acquired business.These acquired intangible assets continue to be supported by ongoing expenditure that is reported within adjustedoperating profit. Other net gains and losses that represent profits and losses on the sale of subsidiaries, jointventures, associates and other financial assets are also excluded from adjusted operating profit as it is importantto highlight their impact on operating profit, as reported, in the period in which the disposal transaction takesplace in order to understand the underlying trend in the performance of the Group. The GMP equalization chargearises from the ruling in the Lloyds Bank High Court case in the UK in October 2018 that provided clarity onhow pension plans should equalize GMP between males and females. The case ruling results in an incomestatement charge, an additional liability and the potential requirement to make back-payments to pensioners whomay have been retired for some years. The Group excluded this charge from adjusted earnings as it related tohistorical circumstances.
33

A reconciliation of operating profit to adjusted operating profit for continuing operations is included in thetables below:
Year ended December 31, 2019
NorthAmerica Core Growth PRH Total
£m £m £m £m £m
Sales . . . . . . . . . . . . . . . . . . . . . . . . . . . . . . . . . . . . . . . . . . . . . . . . . 2,534 838 497 — 3,86965% 22% 13% — 100%
Total operating profit / (loss) . . . . . . . . . . . . . . . . . . . . . . . . . . . . . . 202 65 (43) 51 275Add back:
Cost of major restructuring . . . . . . . . . . . . . . . . . . . . . . . . . . . 110 28 19 2 159Intangible charges . . . . . . . . . . . . . . . . . . . . . . . . . . . . . . . . . . 62 7 82 12 163Other net gains and losses . . . . . . . . . . . . . . . . . . . . . . . . . . . . (13) (8) 5 — (16)UK pension GMP equalization . . . . . . . . . . . . . . . . . . . . . . . . . — — — — —
Total adjusted operating profit . . . . . . . . . . . . . . . . . . . . . . . . . . . . 361 92 63 65 581
62% 16% 11% 11% 100%
Year ended December 31, 2018
NorthAmerica Core Growth PRH Total
£m £m £m £m £m
Sales . . . . . . . . . . . . . . . . . . . . . . . . . . . . . . . . . . . . . . . . . . . . . . . . . 2,784 806 539 — 4,12967% 20% 13% — 100%
Total operating profit . . . . . . . . . . . . . . . . . . . . . . . . . . . . . . . . . . . 216 25 266 46 553Add back:
Cost of major restructuring . . . . . . . . . . . . . . . . . . . . . . . . . . . 78 16 — 8 102Intangible charges . . . . . . . . . . . . . . . . . . . . . . . . . . . . . . . . . . 72 8 19 14 113Other net gains and losses . . . . . . . . . . . . . . . . . . . . . . . . . . . . (4) — (226) — (230)UK pension GMP equalization . . . . . . . . . . . . . . . . . . . . . . . . — 8 — — 8
Total adjusted operating profit . . . . . . . . . . . . . . . . . . . . . . . . . . . . 362 57 59 68 546
66% 10% 11% 13% 100%
North America
Sales in North America decreased by £250m or 9% from £2,784m in 2018 to £2,534m in 2019 and adjustedoperating profit decreased by £1m, from £362m in 2018 to £361m in 2019. The Group estimates that afterexcluding the impact of exchange, the contribution from businesses disposed in 2019 and 2018 and the impact ofadopting IFRS 16 on profits, North America sales declined by 3% in 2019 compared to 2018 and adjustedoperating profit also decreased by 3%. The sales decline was primarily due to North American Higher EducationCourseware which declined 12% with print declining by close to 30%, partially offset by modest growth indigital. In US School Assessment revenue declined slightly with continued contraction in revenue associated withthe PARCC and ACT-Aspire multi state contracts and contract losses were partially offset by new contract wins.In Professional Certification (Pearson VUE) revenue grew driven by increases in test volumes. Revenue atVirtual Schools and OPM grew at 6% and 4% respectively due to increased enrolment and course registrations.The decrease in adjusted operating profit reflected the sales shortfall, inflation and investment in strategic growthareas which offset the impact of restructuring savings and lower staff incentives.
34

The North America results also include costs of £110m in 2019 and £78m in 2018 in respect of the 2017-2019 restructuring program. Amortization relating to acquired intangibles was £62m in 2019 compared to £72min 2018 reflecting lower acquisition activity in recent years. Net gains on business disposals of £13m in 2019relate to the K12 sale with £4m of profits on several small disposals in 2018. Overall adjusted operating marginsin the North America business increased in 2019 to 14.2% compared to 13.0% in 2018 primarily due torestructuring savings and the disposal of the K12 business, as noted below, which generally had lower margins.
On March 29, 2019 the Group completed the sale of the US K12 school courseware business to NexusCapital Management LP for headline consideration of $250m comprising an initial cash payment of $25m and anunconditional vendor note for $225m expected to be repaid in three to seven years.
North America — courseware
In US Higher Education Courseware, the revenue decline of 12% with print declining close to 30% waspartially offset by modest growth in digital. In 2019 the weaker performance was driven by several factors:Premium-priced print and digital products were substituted for digital only formats and sales of bundle unitsdeclined 45% during 2019; Campus bookstores bought less physical inventory due to changing student behavior,with over 50% of learners now preferring an eBook to a physical text with offsetting eBook growth of 18%during 2019 and; There were modest adoption share losses caused by delivery issues due to the implementationof the new ERP system in the second half of 2018 as well as the re-organization of the sales force.
The business is focused on regaining share over time as it builds traction from the rollout of our next waveof digital products on the Pearson Learning Platform (PLP), which launched in September 2019. 60% of allRevel titles will migrate onto the PLP in 2020 enhancing the faculty and student experience. The business is alsolaunching a direct-to-learner version of the Pearson eBook in 2020, with enhanced features and AI-driventext-to-speech.
US Higher Education Courseware digital registrations, including eBooks, declined 2%. Good registrationgrowth in Revel, up 9%, was offset by continued market pressure in Developmental Mathematics and theplanned retirement and reprioritization of niche products with lower demand. There was continued good progresswith Inclusive Access signing 162 new institutions in 2019, taking the total not-for-profit and public institutionsserved to 779. The business now has direct relationships with over 850 institutions, including 80 longer-standingcontracts with for-profit colleges. In 2019, 1.8m Inclusive Access enrolments were served up from 1.4m in 2018,making up 9% of 2019 US Higher Education Courseware revenue, up 19% on 2018 on a like-for-like basis,excluding the 80 for-profit colleges.
North America — assessment
In Student Assessment, revenue declined slightly in 2019 with continued contraction in revenue associatedwith PARCC and ACT-Aspire multi-state contracts and contract losses which were partially offset by newcontract wins. During 2019, Pearson won new contracts or signed renewals in several key incumbent statesincluding Kentucky, Maryland, Colorado and New Jersey, as well as the federal NCES contract for delivering theNational Assessment of Educational Progress (NAEP). Pearson also won back the testing contract in the state ofTennessee. Automated scoring continues to be a competitive strength for Pearson. In 2019, we scored 39 millionresponses with AI, up 8% from 2018.
In Professional Certification (VUE), global test volume rose 8% to c.16.5 million tests. Revenue in NorthAmerica was up a high single-digit percentage, mostly driven by the IT sector with increased demand for cloudtechnology certifications through Microsoft and Amazon, and volume growth in an education contract launchedat the end of 2018 which is now operating at its full run-rate. VUE signed over 40 new contracts in 2019,including the Project Management Institute (PMI) and our renewal rate on existing contracts continues to be over95%.
35

Clinical Assessment declined as demand for new product only partially offset normal declines in products inthe later stages of their lifecycle.
North America — services
School Services (Virtual Schools) grew revenue 6% and served 76,000 full time equivalent students through42 continuing full-time virtual partner schools in 28 states, up 5% on last year. Six new full-time online, state-wide partner schools opened in the 2019-20 school year in the states of Oregon, Washington, Tennessee,Minnesota and California, while a contract was exited in North Carolina.
Higher Education Services (including OPM and Learning Studio) grew revenue 4%, due to growth in OPM,partially offset by a small drag from Learning Studio revenue, a learning management system, which was fullyretired in 2019. In OPM, revenue grew 9%, with growth in course registrations of 5% and new programslaunched more than offsetting programs terminated. The overall active program count grew to 347 from 325 in2018.
During 2019, the OPM business continued to optimize its portfolio and reduced the number of partners to 25from 35. This will allow the business to shift towards enterprise models where it has a number of programs witha single partner and can benefit from economies of scale in marketing and recruitment and integrate more contentand assessment services into these partnerships.
Core
Sales in Core markets increased by £32m, or 4%, from £806m in 2018 to £838m in 2019 while adjustedoperating profit increased by £35m, or 61%, from £57m in 2018 to £92m in 2019. At constant exchange and afterexcluding the contribution from disposals and the impact of adoption of IFRS 16 on profit, Core sales were up5% year on year and adjusted operating profit increased by 58%. Although Courseware sales declinedmoderately, there was strong growth in Student Assessment and Qualifications due to price and volume increasesfor A levels and GCSEs in the UK and the delivery of a new digital assessment contract in Egypt. In addition,there was good growth in Pearson Test of English Academic, OPM in the UK and Australia and ProfessionalCertification.
The increase in adjusted operating profit was mainly due to trading growth and restructuring savings. Alsoincluded in the Core statutory operating profit were restructuring costs of £28m in 2019 and £16m in 2018 andamortization of acquired intangibles of £7m in 2019 and £8m in 2018. The statutory operating profit in 2018 alsoincludes the one-off £8m charge in respect of guaranteed minimum pension (GMP) equalization in the UK.
Core — courseware
Courseware revenue declined moderately. Declines in School Courseware in the UK and Australia offsetgrowth in Italy. In Higher Education Courseware, revenue declines in the UK and Europe more than offsetgrowth in Australia.
Core — assessments
In Student Assessment and Qualifications, revenue grew strongly, due to price and volume increases for Alevels and GCSE qualifications in the UK and the delivery of a new digital assessment contract in Egypt. Thiswas partially offset by continued market declines in Apprenticeships. In 2019, the business successfully deliveredthe UK’s National Curriculum Test (NCT), marking 3.8m scripts, up slightly from 2018. The NCT will bedelivered by another provider in 2020.
In Professional Certification (VUE), revenue was up due to good growth in the DVSA test in the UK (UKdriving test), an additional exam series added to the ICAEW (Institute of Chartered Accountants in England andWales) contract and good growth in the MOI (French driving test) which launched in late 2017. ClinicalAssessment sales declined primarily in France and the Netherlands due to an absence of new major productintroductions.
36
PTE Academic saw continued strong growth in test volumes in Australia and New Zealand up 14% from2018. This was driven by its use to support visa applications to the Australian Department of Home Affairs aswell as good growth in New Zealand. The business recently announced the win of the UK Secure EnglishLanguage Test (SELT) contract with the UK Home Office which is expected to drive future growth.
Core — services
In Higher Education Services (OPM), revenue growth was driven by course enrolment growth in the UK.During the year, the business also announced new OPM partnerships in Australia with the University of Adelaideand University of Wollongong.
Growth
Growth sales decreased by £42m or 8%, to £497m in 2019 from £539m in 2018. Adjusted operating profitincreased by £4m or 7% to £63m in 2019 from £59m in 2018. The Group estimates that, after excluding theimpact of exchange rates, the incremental contribution from businesses disposed in 2019 and 2018 and theimpact of adoption of IFRS 16 on profits, sales were up 4% year on year and adjusted operating profit was up24%. Strong sales growth in China and good growth in Brazil and the Middle East was partially offset bydeclines in South Africa.
Adjusted operating profit benefitted from higher revenue together with the benefits of restructuring. TheGroup’s statutory operating profit included restructuring costs of £19m in 2019 and in 2018 restructuring costswere offset by credits to leave a net charge of nil. Also included in the statutory operating profit is amortizationand impairment of acquired intangibles and gains and losses on disposal of businesses. In 2019 intangiblecharges of £82m compare to a charge of £19m in 2018 and this increase was due to an additional £65mimpairment charge relating to acquired intangibles in the Brazil business following a reassessment of the relativerisk in that market. In 2018 gains on the disposal of businesses amounted to £226m and result from the sale of theWall Street English language teaching business (WSE), realizing a gain of £207m and the disposal of the equityinterest in UTEL, the online University partnership in Mexico, realizing a gain of £19m. Losses on disposals in2019 of £5m relate to adjustments to prior year disposals.
Growth — courseware
After taking account of currency movements courseware revenue was flat, with growth in English LanguageCourseware in China and School Courseware in the Middle East and Hispano America, offset by declines inschool courseware in India and Higher Education courseware in South Africa following a change in governmentfunding.
Growth — assessments
Professional Certification grew well due to a large ICT infrastructure certification contract, and several newsmaller contract launches in China. PTE Academic saw strong growth in revenue with test volumes up 25% inIndia and China.
Growth — services
In English Services, underlying revenue grew slightly in our English Language School franchise in Brazildue to new product launches. In School Services, underlying revenue grew slightly due to price increases andnew product launches in our private sistemas in Brazil. In Higher Education Services, enrolments grew 3% at thePearson Institute of Higher Education (formerly CTI), however revenue declined modestly due to changes inmix.
37

Penguin Random House
The Group owns 25% of Penguin Random House, the first truly global consumer book publishing company.The Group’s share of Penguin Random House adjusted operating profits were £65m in 2019 compared to £68min 2018. Penguin Random House performed solidly in 2019 with underlying revenue growth from a rise in audiosales, stable print sales, and the industry’s top bestsellers, including “Where the Crawdads Sing” by Delia Owen,“Becoming” by Michelle Obama, and bestselling books by Margaret Atwood, Tara Westover, Lee Child, JamieOliver, Jeff Kinney, and Dr. Seuss.
In December 2019, the Group announced the sale of its remaining 25% interest in PRH. The sale is expectedto complete in the first half of 2020. At the end of December our share of the assets of PRH has been classified asheld for sale on the balance sheet.
Results of operations
Year ended December 31, 2018 compared to year ended December 31, 2017
Consolidated results of operations
Sales
The Group’s total sales decreased from £4,513m in 2017 to £4,129m in 2018, a decrease of £384m or 9%.The year on year movement was impacted by exchange rates, primarily the comparative strength of the US dollarrelative to sterling during the year. In 2018, currency movements decreased sales by £134m when compared tothe equivalent figures at constant 2017 rates. When measured at 2017 constant exchange rates, the Group’s salesdeclined by 6%. Part of the decrease is due to the absence of sales from businesses sold during the year offset bythe £9m additional sales recorded as a result of adopting IFRS 15. The Group estimates that after excluding theimpact of disposals and the adoption of IFRS 15, sales declined by 1% at constant exchange rates.
North America sales decreased by £145m or 5% from £2,929m in 2017 to £2,784m in 2018. The Groupestimates that after excluding the impact of exchange, the contribution from businesses disposed in 2017 and2018, and the impact of adopting IFRS 15, North America sales declined by 1% in 2018 compared to 2017. Thisdecline was primarily due to North American Higher Education Courseware which declined 5%, SchoolCourseware which was down 4%, impacted by weak Open Territory sales in the second half of the year, thecontinued decline in Learning Studio as that product moved towards retirement in 2019 and Student Assessmentwhich declined moderately. Offsetting that, was good growth in Virtual Schools, Online Program Management(OPM) and Professional Certification revenue. North America was the most significant source of the Group’ssales and as a proportion of sales contributed 67% in 2018 and 65% in 2017.
Core sales decreased by £9m or 1% from £815m in 2017 to £806m in 2018. The Group estimates that afterexcluding the impact of exchange rates, the contribution from businesses disposed in 2018 and the impact ofadoption of IFRS 15, Core sales were flat when comparing 2018 and 2017. Sales growth in Pearson Test ofEnglish Academic, OPM in the UK and Australia and Professional Certification were offset by declines inHigher Education and Student Assessment and Qualifications.
Growth sales decreased by £230m from £769m in 2017 to £539m in 2018 principally due to the lostcontribution in China following the disposal of GEDU in 2017 and WSE in 2018. The Group estimates that afterexcluding the impact of exchange rates, the contribution from businesses disposed and the impact of adoption ofIFRS 15, Growth sales increased by 1% when comparing 2018 and 2017. Strong growth in China and modestgrowth in Brazil and Hispano-America were partially offset by declines in South Africa following a large one-offorder in 2017.
38

Cost of goods sold and operating expenses
The following table summarizes the Group’s cost of sales, net operating expenses and impairment ofintangible assets:
Year ended December 31
2018 2017
£m £m
Cost of goods sold . . . . . . . . . . . . . . . . . . . . . . . . . . . 1,943 2,066Operating expenses:
Distribution costs . . . . . . . . . . . . . . . . . . . . . . . . 88 84Selling, marketing and product development
costs . . . . . . . . . . . . . . . . . . . . . . . . . . . . . . . . 759 896Administrative and other expenses . . . . . . . . . . 1,039 1,207Restructuring costs . . . . . . . . . . . . . . . . . . . . . . 90 79Other income . . . . . . . . . . . . . . . . . . . . . . . . . . . (69) (64)
Total net operating expenses . . . . . . . . . . . . . . . . . . . 1,907 2,202Other net gains . . . . . . . . . . . . . . . . . . . . . . . . . . . . . (230) (128)
Total continuing operations . . . . . . . . . . . . . . . . . . . . 3,620 4,140
Cost of goods sold. Cost of sales consists of costs for raw materials, primarily paper, printing and bindingcosts, amortization of pre-publication costs, royalty charges, the cost of service provision in the assessment andtesting business and the cost of teaching and facilities in direct delivery businesses. The Group’s cost of salesdecreased by £123m, or 6%, from £2,066m in 2017, to £1,943m in 2018. The decrease largely reflects thedecrease in sales but also includes some continuing benefit from restructuring. Cost of sales as a percentage ofsales increased largely as a result of the mix effect caused by the disposal of businesses with generally highergross margins than Pearson as a whole. Cost of sales was 47.1% of sales in 2018 compared to 45.8% in 2017.
Distribution costs. Distribution costs consist primarily of shipping costs, postage and packing. Distributioncosts increased by £4m reflecting some one-off costs in the Core business relating to a change in distributionarrangements in 2018.
Selling, marketing and product development costs. The Group’s selling, marketing and product developmentcosts decreased by £137m or 15% from £896m in 2017 to £759m in 2018. The decrease is partly explained bythe absence of costs from businesses disposed and restructuring savings realized in the year. As a percentage ofsales, these costs decreased in 2018 from 19.9% in 2017 to 18.4% in 2018.
Administrative and other expenses. The Group’s administrative and other expenses decreased by £168m or13.9% from £1,207m in 2017 to £1,039m in 2018. This decrease is explained by reductions in intangibleamortization relating to past acquisitions, the absence of costs from businesses disposed and the impact ofrestructuring savings particularly in enabling functions partly offset by continuing investment in technology.
Restructuring costs. Restructuring costs of £90m in 2018 and £79m in 2017 relate to the 2017-2019restructuring program announced in May 2017. This program began in the second half of 2017 and costs incurredwere £79m in 2017 and £90m (excluding restructuring costs related to associates) in 2018 relating to delivery ofcost efficiencies in enabling functions and the US higher education courseware business together with furtherrationalization of the property and supplier portfolio. The restructuring costs in 2018 relate predominantly to staffredundancies and the net cost of property rationalization. Included in the property rationalization in 2018 is theimpact of the consolidation of the Group’s property footprint in London which resulted in a charge for onerousleases of £91m partially offset by profit from the sale of property of £81m.
39

Other income. Other operating income mainly consists of freight recharges, sub-rights and licensing income,distribution commissions, investment income and gains on minor asset disposals together with the service feeincome from Penguin Random House. Other operating income increased to £69m in 2018 compared to £64m in2017 mainly due to increased rights income and recoveries following legal settlements.
Other net gains and losses. Other net gains and losses relate to the sale of businesses and in 2018 these gainsamounted to £230m and result from the sale of the Wall Street English language teaching business (WSE),realizing a gain of £207m, the disposal of the equity interest in UTEL, the online University partnership inMexico, realizing a gain of £19m, and various other smaller disposal items realizing a net gain of £4m. Other netgains and losses in 2017 include the sale of the Group’s test preparation business in China, which resulted in apre-tax profit on sale of £44m, the sale of a 22% share in PRH, which resulted in a pre-tax profit on sale of £96mand net losses of £12m relating to other smaller disposals.
Share of results of joint ventures and associates
The contribution from the Group’s joint ventures and associates decreased by £34m to £44m in 2018 from£78m in 2017. The decrease is mainly due to the sale of 22% of PRH in 2017 which resulted in a lower share ofprofits for the final quarter of 2017 and the whole of 2018. In addition, there were restructuring costs incurred atPRH and in respect of the Group’s ACT Aspire joint venture in 2018 that were absent in 2017.
Operating profit
In 2018, the Group reported an operating profit of £553m compared to an operating profit of £451m in2017. The increase in profit of £102m mainly reflects an increase in gains on disposal and reduced intangiblecharges which more than offset increased restructuring, the lost contribution from businesses disposed and theimpact of currency movements. After stripping out the effect of gains on the sale of businesses, reducedintangible charges, increased restructuring costs and one-off pension related charges, profits from tradingdeclined by around £30m. This trading decline was primarily due to currency movements and the lostcontribution from businesses disposed which offset the increased year on year benefit from restructuring savings.
Net finance costs
Net interest payable decreased from £79m in 2017 to £24m in 2018. The decrease was primarily due to areduction in gross debt achieved through the early redemption of bonds in 2017 and in early 2018. Chargesrelating to early redemptions increased finance charges in 2017 but were not as significant in 2018. Additionally,there was a reduction in interest on tax provisions following reassessment of those provisions in 2018. InFebruary 2018, the Group bought back an aggregate nominal amount of €450,000,000 of 2021 and 2025 notes.There was a charge in respect of these early redemptions however there were partial year savings as a resultwhich have flowed through the income statement in the period since redemption. In March and November 2017respectively, the Group redeemed the $550m 6.25% Global dollar bonds and $300m 4.625% US dollar notes,both originally due in 2018. In addition, in August 2017, the Group redeemed $383m out of the $500m 3.75%US dollar notes due in 2022 and $406m out of the $500m 3.25% US dollar notes due in 2023. The charge inrespect of these early redemptions was booked in 2017 with partial year savings in 2017 and the full annualizedsavings coming through in 2018.
Other net finance costs are finance income and costs on retirement benefits, foreign exchange, interest costsrelating to acquisition consideration and other gains and losses on derivative financial instruments. In 2017 thetotal of these items was a gain of £49m compared to a loss of £31m in 2018. Income relating to employee benefitplans was £8m higher in 2018 than in 2017 reflecting the higher net surplus on pension balances at the beginningof 2018 compared to the beginning of 2017. Other losses in 2018 primarily relate to foreign exchange differenceson un-hedged cash and cash equivalents, and other financial instruments that generated gains in 2017.
40

For a more detailed discussion of the Group’s borrowings and interest expenses see “— Liquidity andCapital Resources — Capital Resources” and “— Borrowings” below and “Item 11. Quantitative and QualitativeDisclosures about Market Risk”.
Taxation
The reported tax credit in 2018 was £92m (18.5%) compared to a charge of £13m (3.1%) in 2017. Themovement in the tax rate mainly reflects several one-off benefits in 2018 including provision releases due to theexpiry of relevant statutes of limitation and due to the reassessment of historical positions including thoserelating to prior year disposals (£111m), as well as a one off benefit from a reassessment of the tax treatment ofcertain items of income and expenditure (£25m). The provision releases in 2018 were more significant than theyhad been in 2017 although in 2017 these releases partly explain a lower tax rate than might be expected given thenational tax rates that the group is exposed to. As a result of US tax reform, the reported tax charge in 2017includes a benefit from revaluation of deferred tax balances to the reduced federal rate of £5m and a repatriationtax charge of £6m.
Discontinued operations
There were no discontinued operations in either 2017 or 2018.
Profit for the year
The profit for the financial year in 2018 was £590m compared to a profit in 2017 of £408m. The increasedprofit reflects increased operating profit and tax credits offset by higher net finance costs as set out above.
Earnings per ordinary share
The basic earnings per ordinary share, which is defined as the profit for the financial year divided by theweighted average number of shares in issue, was 75.6p in 2018 compared to 49.9p in 2017 based on a weightedaverage number of shares in issue of 778.1m in 2018 and 813.4m in 2017. The increase in earnings per share wasdue to the increase in profit for 2018 as described above and was also due to the decrease in the number ofweighted average number of shares following the share buyback during late 2017 and early 2018.
The diluted earnings per ordinary share was 75.5p in 2018 and 49.9p in 2017, with the dilutive effect ofoptions being minimal.
Exchange rate fluctuations
Currency movements decreased sales by £134m and decreased the operating profit by £17m. See “Item 11.Quantitative and Qualitative Disclosures about Market Risk” for a discussion regarding the Group’s managementof exchange rate risks.
Sales and operating profit by segment
The following tables summarize the Group’s sales and adjusted operating profit for each of the Group’sbusiness segments. Adjusted operating profit is included as it is the key financial measure used by managementto evaluate the performance of the Group and allocate resources to business segments over time by separating outthose items of income and expenditure relating to acquisitions and disposals, major restructuring programs andcertain other items that are not representative of underlying performance. Reconciliations of adjusted operatingprofit to statutory operating profit are included below and in note 2 within Item 18 — Financial Statements.
41

In the Group’s adjusted operating profit, it has excluded other net gains and losses, acquisition related costs,amortization and impairment of acquired intangibles and the cost of major restructuring programs. In 2018, theGroup has also excluded the impact of adjustments arising from clarification of guaranteed minimum pension(GMP) equalization legislation in the UK and in 2017, excluded the impact of US tax reform on associateoperating profit. The intangible charges relate only to intangible assets acquired through business combinationsand acquisition costs are the direct costs of acquiring those businesses. The Group does not believe these chargesare relevant to an understanding of the underlying performance. Charges relating to acquired intangible assets arenon-cash charges that reflect the historical expenditure of the acquired business. These acquired intangible assetscontinue to be supported by ongoing expenditure that is reported within adjusted operating profit. Other net gainsand losses that represent profits and losses on the sale of subsidiaries, joint ventures, associates and otherfinancial assets are also excluded from adjusted operating profit as it is important to highlight their impact onoperating profit, as reported, in the period in which the disposal transaction takes place in order to understand theunderlying trend in the performance of the Group. The GMP equalization charge arises from the ruling in theLloyds Bank High Court case in the UK in October 2018 that provided clarity on how pension plans shouldequalize GMP between males and females. The case ruling results in an income statement charge, an additionalliability and the potential requirement to make back-payments to pensioners who may have been retired for someyears. The Group has excluded this charge from adjusted earnings as it relates to historical circumstances. Thecharge is an estimate based on available data and revisions to these estimates in future years will be treated asassumption changes and recorded in other comprehensive income rather than the income statement. US taxreform in 2017 resulted in the revaluation of deferred tax balances in associates. These revaluations have beenexcluded from adjusted earnings in 2017 due to their one-off nature.
A reconciliation of operating profit to adjusted operating profit for continuing operations is included in thetables below:
Year ended December 31, 2018
NorthAmerica Core Growth PRH Total
£m £m £m £m £m
Sales . . . . . . . . . . . . . . . . . . . . . . . . . . . . . . . . . . . . . . . . . . . . . . . . . 2,784 806 539 — 4,12967% 20% 13% — 100%
Total operating profit . . . . . . . . . . . . . . . . . . . . . . . . . . . . . . . . . . . . 216 25 266 46 553Add back:
Cost of major restructuring . . . . . . . . . . . . . . . . . . . . . . . . . . . 78 16 — 8 102Intangible charges . . . . . . . . . . . . . . . . . . . . . . . . . . . . . . . . . . 72 8 19 14 113Other net gains and losses . . . . . . . . . . . . . . . . . . . . . . . . . . . . (4) — (226) — (230)UK pension GMP equalization . . . . . . . . . . . . . . . . . . . . . . . . . — 8 — — 8
Total adjusted operating profit . . . . . . . . . . . . . . . . . . . . . . . . . . . . . 362 57 59 68 546
66% 10% 11% 13% 100%
42

Year ended December 31, 2017
NorthAmerica Core Growth PRH Total
£m £m £m £m £m
Sales . . . . . . . . . . . . . . . . . . . . . . . . . . . . . . . . . . . . . . . . . . . . . . . . . 2,929 815 769 — 4,51365% 18% 17% — 100%
Total operating profit . . . . . . . . . . . . . . . . . . . . . . . . . . . . . . . . . . . 242 27 28 154 451Add back:
Cost of major restructuring . . . . . . . . . . . . . . . . . . . . . . . . . . . 60 11 8 — 79Intangible charges . . . . . . . . . . . . . . . . . . . . . . . . . . . . . . . . . . . 89 12 37 28 166Other net gains and losses . . . . . . . . . . . . . . . . . . . . . . . . . . . . 3 — (35) (96) (128)Impact of US tax reform . . . . . . . . . . . . . . . . . . . . . . . . . . . . . . — — — 8 8
Total adjusted operating profit . . . . . . . . . . . . . . . . . . . . . . . . . . . . . 394 50 38 94 576
68% 9% 7% 16% 100%
North America
Sales in North America decreased by £145m or 5% from £2,929m in 2017 to £2,784m in 2018 and adjustedoperating profit decreased by £32m, or 8%, from £394m in 2017 to £362m in 2018. The Group estimates thatafter excluding the impact of exchange, the contribution from businesses disposed in 2018 and 2017 and theimpact of adopting IFRS 15, North America sales declined by 1% in 2018 compared to 2017 and adjustedoperating profit increased by 1%. The sales decline was primarily due to North American Higher EducationCourseware declining 5%, School Courseware which was down 4%, impacted by weak Open Territory sales inthe second half of the year, the continued decline in Learning Studio as the product moved towards the retirementin 2019 and Student Assessment which declined moderately. Offsetting that, was good growth in VirtualSchools, Online Program Management (OPM) and Professional Certification revenue. The adjusted operatingprofit benefited from restructuring savings which more than offset the impact of lower sales, inflation and otheroperating factors.
The North America results also include £78m in 2018 and £60m in 2017 in respect of the 2017-2019restructuring program. Amortization relating to acquired intangibles was £72m in 2018 compared to £89m in2017 and there were net gains on business disposals of £4m and net losses of £3m in 2017. None of the disposalsin either 2018 or 2017 were material. Overall adjusted operating margins in the North America businessdecreased in 2018 to 13.0% compared to 13.5% in 2017 due to sales mix offset partly by restructuring savings.
North America — courseware
In School Courseware, revenue declined primarily due to declines in Open Territory states. This waspartially offset by growth in Adoption state revenue on strong performance in Science in Florida, South Carolinaand Tennessee, Elementary Math in Oklahoma and Elementary Social Studies in California and South Carolina.The Group’s new adoption participation rate rose to 80% in 2018 from 61% in 2017 and the Group won anestimated 33% share of adoptions competed for (38% in 2017) and 26% of total new adoption expenditure of$509m (29% of $365m in 2017).
In Higher Education Courseware, total US college enrolments, as reported by the National StudentClearinghouse, fell 1.4%, with combined two-year public and four-year for-profit enrolments declining 4.8%.Enrolment weakness was particularly focused on part-time students where enrolment declined 2.9% compared tofull-time enrolment which declined 1.1%. Net revenue in the US Higher Education Courseware businessdeclined. Enrolment weakness was particularly focused on part-time students where enrolment declined 2.9%compared to full-time enrolment which declined 1.1%. Net revenue in the US Higher Education Coursewarebusiness declined 5% during the year. The Group estimates that around 2% of this decline was driven by lower
43

enrolment; around 1.5% from the adoption of Open Educational Resources (OER); around 2.5% from thecombined impact of shifts in the secondary market, more cautious buying by the channel and lower returns;offset by around a 1% benefit from the shift to digital. In 2018, Pearson’s US Higher Education Coursewaremarket share, as reported by MPI, was within the 40-41.5% range seen over the previous five years.
Digital revenue grew 2% benefiting from continued growth in direct sales and favorable mix. Global digitalregistrations of MyLab and related products were flat. In North America, digital registrations fell 3% with goodgrowth in Science, Business & Economics and Revel offset by lower overall enrolment and continued softness inDevelopmental Mathematics. Revel registrations grew more than 40%. Including stand-alone eBookregistrations, total North American digital registrations rose 1% and global registrations rose 3%.
The actions announced in early 2017 to promote access over ownership met with continued success. Stand-alone eBook volumes grew 34% in the US with revenue up 25% and the partner print rental program has had asuccessful start with 130 titles in the program in 2018.
The North America business continued to make good progress with the Inclusive Access (Direct DigitalAccess) solutions product signing 192 new institutions in 2018, taking the total of not-for-profit and publicinstitutions served to 617. Including 80 longer- standing contracts with for-profit colleges, there are now directcourseware relationships with nearly 700 institutions. Inclusive Access ensures that students have affordableaccess to the courseware that they need on day one of the course, whilst further shifting the Group’s businessmodel in this segment away from ownership and towards subscription. During the 2018, the business deliveredover 1.4m course enrolments with inclusive access revenues from non-profit and public institutions rising toc.8% of the higher education courseware revenue as more colleges and faculties saw the benefit of this model.
North America — assessment
In Student Assessment, revenue declined moderately in 2018 due to the faster than expected contraction inrevenue associated with the PARCC and ACT-Aspire multi-state volume-based contracts and a more disciplinedcompetitive approach. During 2018, Pearson successfully renewed contracts in Arizona and Kentucky throughcompetitive procurements and secured business with the District of Columbia, New Jersey, New Mexico, andMaryland under new contracts with these PARCC states. The business also won new contracts for Utah’s HighSchool Assessments and with the University of Iowa for the delivery of Iowa’s new assessment system.
In 2018, the Group delivered 24m standardized online tests to K12 students, down 5% from 2017. TestNav8, Pearson’s next-generation online test platform, supported a peak load of 825,000 tests in a single day andprovided 99.99% up time. The AI scoring systems scored 36m responses to open-ended test items, around 33%of the total. Paper based standardized test volumes fell 9% to 18.5m.
In Professional Certification, VUE global test volume rose 4% to over 15m. Revenue in North America wasup due to growth in medical college admissions testing and certification for professional bodies, offset bycontinued declines in volumes in the GED High School Equivalency Test and higher-level IT certifications in anenvironment of low unemployment.
The business signed over 70 new contracts in 2018 and the renewal rate on existing contracts continued tobe over 95%. During the year, over 80 contracts were renewed including the National Council of State Boards ofNursing (NCLEX exam), Microsoft and Adobe. Clinical Assessment sales declined slightly on an absence of newmajor product introductions. Late in 2018 the Group launched a refresh of the Peabody Picture Vocabulary Testand Expressive Vocabulary Test (PPVT/EVT). Q-interactive, Pearson’s digital solution for Clinical Assessmentadministration, saw continued strong growth in license sales with sub-test administrations up more than 37%over the same period last year.
44

North America — services
Connections Academy, the K12 online school business grew revenue 8%. Connections Academy served73,000 Full Time Equivalent (FTE) students through 37 continuing full-time virtual partner schools in 28 states,up 11% on last year. Total FTE virtual school students declined 3% to 75,400 as expected due to contract exits atCommonwealth Charter Academy in Pennsylvania and Florida Virtual School. Three new full-time online, state-wide partner schools opened in the 2018-19 school year in Florida, Michigan, and Ohio. The 2018 ConnectionsAcademy Parent Satisfaction Survey continued to show solid endorsement for the schools with 93% of familieswith enrolled students stating they would recommend Connections virtual schools to others and 95% agreeingthat the curriculum is of high quality.
In Pearson Online Services, revenue grew 3%, primarily due to growth in OPM, partially offset by a declinein Learning Studio revenue as the product is retired and declines as smaller non-OPM contracts wererestructured. In OPM, revenue grew 9% as course registration grew strongly, up 14% to more than 388,000, inprograms at key partners including Arizona State University Online, Maryville University, Regis College,Bradley University, Ohio University and the University of Southern California. The overall active program countgrew by 33 to 325. The launch of 46 new programs were offset by 13 discontinued programs. During 2018, 27new multi-year programs were signed including programs at new partners the University of North Dakota andRider University. The business closed nine out of 15 renewal opportunities and as part of broader efforts aroundportfolio optimization agreed with partners to terminate 23 programs that were not mutually viable.
Core
Sales in Core markets decreased by £9m, or 1%, from £815m in 2017 to £806m in 2018 while adjustedoperating profit increased by £7m, or 14%, from £50m in 2017 to £57m in 2018. At constant exchange and afterexcluding the contribution from disposals, Core sales were flat year on year and profits increased by 10%.Growth in Pearson Test of English Academic, OPM in the UK and Australia and Professional Certification wasoffset by declines in Higher Education and Student Assessment and Qualifications.
The increase in adjusted operating profit was mainly due to restructuring savings partly offset by costinflation. Also included in the Core statutory operating profit were restructuring costs of £16m in 2018 and £11min 2017 and amortization of acquired intangibles of £8m in 2018 and £12m in 2017. The statutory operatingprofit in 2018 also includes the one-off £8m charge in respect of guaranteed minimum pension (GMP)equalization in the UK. The GMP equalization charge arises from the ruling in the Lloyds Bank High Court casein the UK in October 2018 that provided clarity on how pension plans should equalize GMP between males andfemales. The case ruling results in an income statement charge, an additional liability and the potentialrequirement to make back- payments to pensioners who may have been retired for some years.
Core — courseware
Courseware revenue declined moderately. Slight growth in School Courseware was offset by declines inHigher Education Courseware. In Higher Education Courseware, revenue was down due to market declines inEurope and Asia, partially offset by growth in digital sales to institutional partners in the UK and Australia.
Core — assessments
In Student Assessment and Qualifications, revenue fell as modest growth in BTEC Firsts and GCE A-Levelwas more than offset by declines in AS levels, international GCSEs in the UK and UK Apprenticeships due topolicy changes in the schools’ qualifications and the apprenticeships market. The business successfully deliveredthe National Curriculum Test (NCT) for 2018, marking 3.6m scripts, up slightly from 2017.
Clinical Assessment sales declined, primarily in Australia, due to an absence of new major productintroductions. Q-Interactive, Pearson’s digital solution for Clinical Assessment administration, saw continued
45

strong growth. Pearson Test of English Academic also saw continued strong growth in test volumes andsuccessfully extended its agreement with the Department of Home Affairs in Australia for another two years. InProfessional Certification, revenue was up modestly due to the launch of additional computer-based exams for anexisting customer in the UK and the MOI, the French Driving Test.
Core — services
In Higher Education Services, revenue grew strongly. OPM revenue was up 34%. In Australia, there wasgood growth due to the successful partnership with Monash University, and continued success of the GraduateDiploma in Psychology. There was a total of around 10,200 course registrations across the seven programs inAustralia up from around 9,300 in 2017. In the UK, there were 11 new programs launched and courseregistrations grew, reaching around 3,000 compared to around 1,400 in 2017. During the year, new partnershipswith the University of Northumbria in the UK, and ESSEC Business School in France were announced.
Growth
Growth sales decreased by £230m, to £539m in 2018 from £769 in 2017. Adjusted operating profitincreased by £21m or 55% to £59m in 2018 from £38m in 2017. The Group estimates that, after excluding theimpact of exchange rates and the incremental contribution from businesses disposed in 2018 and 2017, sales wereup 1% year on year. Strong growth in China and modest growth in Brazil and Hispano America were partiallyoffset by declines in South Africa following a large one-off order in 2017.
The adjusted operating profit increase reflected the higher revenue and benefits of current and prior yearrestructuring. The Group’s statutory operating profit included restructuring costs of £8m in 2017. In 2018restructuring costs were offset by credits to leave a net charge of nil in 2018. Also included in the statutoryoperating profit was amortization of acquired intangibles of £19m in 2018 and £37m in 2017 and gains onbusiness disposals. In 2018 these gains amounted to £226m and result from the sale of the Wall Street Englishlanguage teaching business (WSE), realizing a gain of £207m and the disposal of the equity interest in UTEL, theonline University partnership in Mexico, realizing a gain of £19m. Gains in 2017 of £35m include the sale of theGroup’s test preparation business in China.
Growth — courseware
Courseware revenue grew slightly, with strong growth in English Language Courseware in China, partiallyoffset by declines in School Courseware in South Africa following a large one-off order in 2017.
Growth — assessments
Professional Certification grew well due to a new ICT infrastructure certification contract. Pearson Test ofEnglish Academic saw strong growth in revenue with over 10% growth in the volume of tests taken in India,China and the Middle East and moderate price increases.
Growth — services
In English Services, revenue grew slightly in the English language school franchise, Wizard, due to newproduct launches. In School Services, revenue was flat, with declines in student enrolment in the public sistemasbusiness in Brazil offset by price increases, improved products and better student retention across the Group’sprivate sistemas. In India, Pearson MyPedia, an inside service ‘sistema’ solution for schools, expanded to over700 schools with over 200,000 learners. In Higher Education services revenue declined slightly due to businessexits in India and slight revenue decline at Pearson Institute of Higher Education (formerly CTI), the universitybusiness in South Africa, due to a change in mix with total enrolment broadly flat and new student enrolment up18%.
46

Penguin Random House
The Group owns 25% of Penguin Random House, the first truly global consumer book publishing company.The Group owned 47% until October 5, 2017, when it completed the sale of 22% to Bertelsmann. The Group’sshare of Penguin Random House adjusted operating profits were £68m in 2018 compared to £94m in 2017, thedecrease is primarily due to the reduced contribution following the sale of part of the Group’s share.
Penguin Random House performed solidly with underlying revenue growth on increased audio sales andstable print sales, whilst the business benefitted from international bestseller “Becoming” by Michelle Obama,the year’s top-selling U.S. title, and bestsellers from Bill Clinton & James Patterson, Jordan Peterson, JamieOliver, Dr. Seuss, John Grisham, and Lee Child.
Liquidity and capital resources
Cash flows and financing
Net cash generated from operations decreased to £480m in 2019 from £547m in 2018. The decrease in cashgenerated from operations was largely due to increased investment in pre-publication and other increases inworking capital, including the impact of reduced staff incentives, together with increased restructuring spend andthe absence of a contribution from the K12 business following its disposal in the first half of 2019. Thesedecreases were partially offset by the impact of IFRS 16 which reclassified lease cash flows as financing,investment and interest items rather than as cash flows from operations as was previously the case.
Net interest paid at £64m in 2019 compares to £22m in 2018 and reflects the adoption of IFRS 16 and theincorporation of lease interest for the first time as referred to above. Tax paid in 2019 was £30m compared to£43m in 2018 with the decrease mainly explained by a refund received in the US relating to historical periodstogether with no US tax being paid in relation to 2019 as a result of the tax loss on the sale of the US K12business. In addition to the refund in the US in 2019, there was tax paid to the Chinese tax authorities followingthe disposal of WSE during 2018 and New York state and city taxes paid in the US as a result of a settlementwith the tax authorities relating to past disposals.
Capital expenditure on property, plant and equipment was £55m in 2019 compared to £70m in 2018.Proceeds from the sale of property in 2018 of £128m includes proceeds from the sale of the Group’s Londonproperty as part of the restructuring program. There were no material property sales in 2019. Capital expenditureon software intangibles increased from £130m in 2018 to £138m in 2019. The expenditure on both tangible andintangible capital includes the continuing investment in enabling function technology designed to loweradministrative costs.
Cash outflow from acquisitions including £40m of additional capital invested in PRH in 2019 was £97mcompared to £15m in 2018 relating to investment purchases and prior year acquisitions. There were two smallacquisitions in 2019, Lumerit and Smart Sparrow which together accounted for £40m of cash consideration withthe balance of the cash outflow on acquisitions in 2019 being in relation to investments and prior year items. Thenet cash inflow in respect of businesses and investments disposed was £107m in 2018 compared to a net outflowof £96m in 2019. In 2018 the cash received largely related to proceeds from the sale of WSE and UTEL. In 2019the cash outflow mainly relates to the K12 business and reflects the deferral of proceeds and the level of workingcapital in the business at the disposal date.
Dividends from joint ventures and associates decreased from £117m in 2018 to £64m in 2019. Thereduction is primarily due to the impact of the PRH sale transaction in 2017 which resulted in a reduced equityshare from 47% to 25% and involved recapitalization dividends which were £50m in 2018.
The cash outflow from financing of £102m in 2019 compares to £729m in 2018 and includes the repaymentof borrowings of £48m in 2019 and £441m in 2018. These repayments include the early redemption of various
47

bonds (and their associated swaps). In March 2019, the Group executed market tenders to repurchase €55m of its€500m 1.875% notes due 2021 of which €250m were outstanding at 31 December 2018. In January 2018, theGroup repurchased €250m of its €500m Euro 1.875% Notes due May 2021 and €200m of its €500m Euro1.375% Notes due May 2025. Also included in financing cash flows are repayments of lease liabilities whichincreased from £4m in 2018 to £91m following the adoption of IFRS 16. In 2019, the Group announced therefinancing of its bank facility, reducing its size to $1.19bn and extending its maturity date to February 2024.Drawings of £230m representing a financing cash inflow in 2019 were outstanding on this facility at the end ofDecember 2019. Dividends paid to company shareholders in 2019 of £147m compares to £136m in 2018. Cashreturned to shareholders via the share buyback program, announced in October 2017 and completed in February2018, amounted to £153m in 2018. Treasury share purchases in 2019 in respect of employee share plans were£52m. There were no purchases of treasury shares for this purpose in 2018.
Overall the Group’s net borrowings increased from £143m at the end of 2018 to £1,016m at the end of 2019.In addition to the cash flows referred to above, the adoption of IFRS 16 added £666m of net debt on transitionafter taking account of both lease liabilities and the investment in finance lease receivable brought on balancesheet at 1 January 2019.
Capital resources
The Group’s borrowings fluctuate by season because of the school year’s effect on the working capitalrequirements in the educational materials business. Assuming no acquisitions or disposals, the Group’smaximum level of net debt normally occurs in July, and its minimum level of net debt normally occurs inDecember.
In March 2020, the Group has reassessed its funding requirements considering the impact of the COVID-19pandemic on the business. As a result of the pandemic the Group anticipates that there will be an impact on profitand cash flows in 2020 as set out in the outlook section above. The impact has been modelled under severalscenarios to ensure that the likelihood of a prolonged period of disruption has been appropriately considered inassessing the availability of funding to the Group and the ability of the Group to comply with its bankingcovenants. The modelling includes a severe reduction in revenue, profit and operating cash flow that extendsfrom March into the second and third quarters of 2020 with conditions returning to normal in the course of thefourth quarter. At the end of February 2020, the Group had significant financial headroom with approximately£1bn in total liquidity immediately available from cash and its Revolving Credit Facility. In response to theuncertainty, the Group paused its share buyback program on 23 March 2020 having purchased £167m of sharesof the £350m originally planned. Based on the review of potential impacts to the business from the pandemic anda review of historical trends in working capital requirements and of forecast balance sheets for the next 12months, the Group believes that it will comply with its banking covenants and has sufficient funds available forthe Group’s present requirements, with an appropriate level of headroom given its portfolio of businesses andcurrent plans. The Group’s ability to expand and grow its business in accordance with current plans and to meetlong-term capital requirements beyond this 12-month period will depend on many factors, including the rate, ifany, at which its cash flow changes and the availability of public and private debt and equity financing, includingits ability to secure bank lines of credit. The Group cannot be certain that additional financing, if required, will beavailable on favorable terms, if at all.
At December 31, 2019, the Group’s net debt was £1,016m compared to £143m at December 31, 2018. Themain reason for the increase was the adoption of IFRS 16 which added £666m of net debt on transition aftertaking account of both lease liabilities and the investment in finance lease receivable brought on balance sheet at1 January 2019. The remaining decrease in net debt was principally due to cash outflows from acquisition anddisposal activity, purchase of fixed assets and treasury shares and the payment of dividends which more thanoffset cash generated from operations.
48

Net debt is defined as all short-term, medium-term and long-term borrowing (including leases and relatedderivatives), less all cash, cash equivalents, other liquid resources and the net investment in finance leasereceivables. Cash equivalents comprise short-term deposits with a maturity of up to 90 days, while liquidresources comprise short-term deposits with maturities of more than 90 days and other marketable instrumentswhich are readily realizable and held on a short-term basis. Total short-term, medium- term and long-termborrowing excluding derivatives amounted to £1,664m at December 31, 2019, compared to £720m at December31, 2018 reflecting the adoption of IFRS 16, drawings on the revolving credit facility and reductions due tobonds repaid during the year. At December 31, 2019, total cash and liquid resources were £437m, compared to£568m at December 31, 2018. This decrease reflects the utilization of cash to pay down long-term debt andcreate a more efficient balance sheet.
Contractual obligations
The following table summarizes the maturity of the Group’s borrowings, its obligations under non-cancellableleases, deferred consideration and pension funding obligations, exclusive of anticipated interest payments. Due tothe variability of future interest payments, these have been excluded from the table below.
Year ended December 31, 2019
TotalLess thanone year
One toTwo years
Two tofive years
Afterfive years
£m £m £m £m £m
Gross Borrowings:Bank loans and overdrafts . . . . . . . . . . . . . . . . . . . . . . . . 3 3 — — —Revolving credit facility . . . . . . . . . . . . . . . . . . . . . . . . . 230 — — 230 —
Bonds . . . . . . . . . . . . . . . . . . . . . . . . . . . . . . . . . . . . . . . . . . . . 593 — 170 161 262Lease liabilities . . . . . . . . . . . . . . . . . . . . . . . . . . . . . . . . . . . . 838 89 81 218 450Deferred consideration . . . . . . . . . . . . . . . . . . . . . . . . . . . . . . 36 5 5 15 11UK pension funding obligation . . . . . . . . . . . . . . . . . . . . . . . . — — — — —
Total . . . . . . . . . . . . . . . . . . . . . . . . . . . . . . . . . . . . . . . . . . . . . 1,700 97 256 624 723
The UK pension plan’s most recent triennial actuarial valuation for funding purposes was completed as at1 January 2018 and this valuation revealed a technical provision funding surplus of £163m. The plan expects tobe able to provide benefits (in accordance with the plan rules) with a very low level of reliance on future fundingfrom the Group.
At December 31, 2019 the Group had no capital commitments for fixed assets. There are contingentliabilities in respect of indemnities, warranties, legal and royalty claims and guarantees in relation to formersubsidiaries and in respect of guarantees in relation to subsidiaries and associates. In addition, there arecontingent liabilities in respect of tax assessments as outlined in note 34 in “Item 18. Financial statements”. Noneof these claims, guarantees or assessments is currently expected to result in a material gain or loss.
Off-balance sheet arrangements
The Group does not have any off-balance sheet arrangements, as defined by the SEC for the purposes ofForm 20-F, that have or are reasonably likely to have a material current or future effect on the Group’s financialposition or results of operations.
Borrowings
The Group finances its operations by a mixture of cash flows from operations, short-term borrowings frombanks and commercial paper markets, and longer-term loans from banks and capital markets.
At December 31, 2019, the Group had a $1.19bn committed revolving credit facility with a maturity date inFebruary 2024. At December 31, 2019, £230m of the $1.19bn credit facility had been drawn. The facility set inplace in March 2019, contains two key covenants measured for each 12-month period ending June 30 andDecember 31:
49

The Group must maintain the ratio of its profit before interest, tax and amortization to its net interestpayable at no less than 3:1; and must maintain the ratio of its net debt to its EBITDA at no more than 4:1.“EBITDA” refers to earnings before interest, taxes, depreciation and amortization. The Group is currently incompliance with these covenants.
See note 18 of “Item 18. Financial Statements” for information on the Group’s longer-term loans frombanks and capital markets.
Treasury policy
The Group’s treasury policy is described in note 19 of “Item 18. Financial Statements”. For a more detaileddiscussion of the Group’s borrowing and use of derivatives, see “Item 11. Quantitative and QualitativeDisclosures about Market Risk”.
Related parties
There were no significant or unusual related party transactions in 2019, 2018 or 2017. Refer to note 36 in“Item 18. Financial Statements”.
Accounting policies
For a description of the Group’s principal accounting policies used refer to note 1 in “Item 18. FinancialStatements.
ITEM 6. DIRECTORS, SENIOR MANAGEMENT AND EMPLOYEES
Directors and senior management
The Group is managed by a board of directors and a chief executive who reports to the board and managesthrough an executive committee. The Group refers to the board of directors, the chair of the board of directorsand the executive committee as its “senior management”.
The following table sets forth information concerning directors, as of February 29, 2020.Name Age Position
Sidney Taurel . . . . . . . . . . . . . . . . . . . . . . . . . . . . . . 71 ChairJohn Fallon . . . . . . . . . . . . . . . . . . . . . . . . . . . . . . . . 57 Chief ExecutiveDame Elizabeth Corley, DBE . . . . . . . . . . . . . . . . . . 63 Non-executive DirectorSherry Coutu, CBE . . . . . . . . . . . . . . . . . . . . . . . . . . 56 Non-executive DirectorVivienne Cox, CBE . . . . . . . . . . . . . . . . . . . . . . . . . . 60 Senior Independent DirectorJosh Lewis . . . . . . . . . . . . . . . . . . . . . . . . . . . . . . . . . 57 Non-executive DirectorGraeme Pitkethly . . . . . . . . . . . . . . . . . . . . . . . . . . . . 53 Non-executive DirectorLinda Lorimer . . . . . . . . . . . . . . . . . . . . . . . . . . . . . . 67 Non-executive DirectorMichael Lynton . . . . . . . . . . . . . . . . . . . . . . . . . . . . . 60 Non-executive DirectorTim Score . . . . . . . . . . . . . . . . . . . . . . . . . . . . . . . . . 59 Non-executive DirectorLincoln Wallen . . . . . . . . . . . . . . . . . . . . . . . . . . . . . 59 Non-executive DirectorCoram Williams . . . . . . . . . . . . . . . . . . . . . . . . . . . . 46 Chief Financial Officer
Sidney Taurel
Appointed January 1, 2016. Member of the nomination & governance and remuneration committees.
Sidney has over 45 years of experience in business and finance, and is currently a Director of IBMCorporation, where he also serves on the directors and corporate governance committee. Sidney is an advisoryboard member at pharmaceutical firm Almirall. He was Chief Executive Officer of global pharmaceutical firm EliLilly and Company from 1998 until 2008, Chairman from 1999 until 2008, and has been Chairman Emeritus since2009. He was also a Director at McGraw Hill Financial, Inc., a role which he held from 1996 until April 2016 and atITT Industries from 1996 to 2001. In 2002, Sidney received three US presidential appointments to: the HomelandSecurity Advisory Council, the President’s Export Council and the Advisory Committee for Trade Policy andNegotiations, and is an officer of the French Legion of Honour. Current notable commitments: IBM Corporation.
50

John Fallon
Appointed October 3, 2012.
John became Pearson’s Chief Executive on 1 January 2013. Since 2008, he had been responsible for theCompany’s education businesses outside North America and a member of the Pearson management committee.He joined Pearson in 1997 as Director of Communications and was appointed President of Pearson Inc. in 2000.In 2003, he was appointed CEO of Pearson’s educational publishing businesses for Europe, Middle East &Africa. Prior to joining Pearson, John was Director of Corporate Affairs at Powergen plc and was also a memberof the company’s executive committee. Earlier in his career, John held senior public policy and communicationsroles in UK local government. John is also President of the London Chamber of Commerce & Industry (LCCI).John has announced his intention to retire from Pearson during 2020.
Dame Elizabeth Corley, DBE
Appointed May 1, 2014. Chair of the remuneration committee and member of the audit and nomination &governance committees.
Elizabeth has extensive experience in the financial services industry having been CEO of Allianz GlobalInvestors, initially for Europe then globally, from 2005 to 2016, and was a senior adviser to the firm until the endof December 2019. She was previously at Merrill Lynch Investment Managers and Coopers & Lybrand.Elizabeth is a Non-Executive Director of BAE Systems plc and Morgan Stanley Inc. Elizabeth is active inrepresenting the investment industry and developing standards within it. She is a member of the Committee of200. She was appointed Dame Commander of the Order of the British Empire in the Queen’s Birthday Honoursin 2019 for her services to the economy and financial services. Current notable commitments: BAE Systems plc(Non-Executive Director), Morgan Stanley Inc. (Non-Executive Director).
Vivienne Cox, CBE
Appointed on January 1, 2012. Chair of the nomination & governance committee and member of the auditand reputation & responsibility committees.
Vivienne has wide experience in energy, natural resources and business innovation. She worked for BP plcfor 28 years in global roles including Executive Vice President and Chief Executive of BP’s gas, power andrenewables business and its alternative energy unit. She is Chair of the supervisory board of Vallourec S.A., aleader in the seamless steel pipe markets, and a Non-Executive Director at pharmaceutical companyGlaxoSmithKline plc. She serves as Chair of the Rosalind Franklin Institute and Vice Chair of the Saïd BusinessSchool (part of Oxford University). She was appointed Commander of the British Empire in the 2016 New YearHonours for her services to the economy and sustainability. Current notable commitments: GlaxoSmithKline plc(Non-Executive Director), Vallourec S.A. (Chair of the supervisory board).
Sherry Coutu, CBE
Sherry has an extensive experience in the technology industry. She is the Charmain of Funders4Schools andfounder of the Scaleup Institute. Previously, she was CEO of Interactive Investor International plc, served on theboard of Bloomberg New Energy Finance and the London Stock Exchange plc. In education, she was SID andRemuneration Committee Chair of RM plc, on the board of Cambridge University, Cambridge Assessment andCambridge University Press, and Chesterton Community College. Sherry has started and or invested in over 60technology businesses and served on the boards of Zoopla plc, Raspberry Pi, NESTA, and the Advisory boards ofthe National Gallery, Royal Society and LinkedIn. She was appointed Commander of the British Empire in the2013 New Year Honours for services to her entrepreneurship.
Josh Lewis
Appointed on March 1, 2011. Member of the nomination & governance and remuneration committees.
51

Josh’s experience spans finance, education and the development of digital enterprises. He is founder ofSalmon River Capital LLC, a New York-based private equity/venture capital firm focused on technology-enabledbusinesses in education, financial services and other sectors, through which he has taken on the role ofNon-Executive Director of several enterprises. Over a 25-year career in active, principal investing, he has beeninvolved in a broad range of successful companies, including several pioneering enterprises in the educationsector. In addition, he has long been active in the non-profit education sector. Current notable commitments:Salmon River Capital LLC (Founder & Managing Principal).
Graeme Pitkethly
Appointed on May 1, 2019. Member of the audit and reputation & responsibility committees.
Graeme joined Unilever in 2002 and, prior to being appointed CFO and Board member, was responsible forUnilever’s UK and Ireland business. Previously, he had held a number of senior financial and commercial roleswithin Unilever and spent the earlier part of his career in senior corporate finance roles in thetelecommunications industry. Graeme served as Vice President of Financial Planning and Vice President ofCorporate Development at FLAG Telecom and started his career at PricewaterhouseCoopers. Graeme is a ViceChair of the Task Force on Climate Related Financial Disclosures and is a Chartered Accountant. Current notablecommitments: Unilever plc and Unilever NV (Chief Financial Officer).
Linda Lorimer
Appointed July 1, 2013. Chair of the reputation & responsibility committee and member of the auditcommittee.
Linda has spent almost 40 years serving higher education. She retired from Yale in 2016 after 34 years atthe university where she served in an array of senior positions including Vice President for Global & StrategicInitiatives. She oversaw the development of Yale’s burgeoning online education division and the expansion ofYale’s international programs and centers. During her tenure, she was responsible for many administrativeservices, ranging from Yale’s public communications and alumni relations to sustainability, human resources andthe university press. She also served on the boards of several public companies, including as Presiding Directorof the McGraw-Hill companies. Linda is a member of the board of Yale New Haven Hospital, where she chairsthe nominating and governance committee and is a trustee of Hollins University. She also remains on severalconsequential advisory committees at Yale University.
Michael Lynton
Appointed on February 1, 2018. Member of the audit and reputation & responsibility committees.
Michael served as CEO of Sony Entertainment from 2012 until 2017, overseeing Sony’s globalentertainment businesses. He was also Chairman and CEO of Sony Pictures Entertainment from 2004. Prior tothat, he held senior roles within Time Warner and AOL, and earlier served as Chairman and CEO of PenguinGroup where he extended the Penguin brand to music and the internet. Michael is Chairman of Snap, Inc.,Schrödinger LLC and Warner Music, and currently serves on the boards of IEX and Ares ManagementCorporation LLC. Current notable commitments: Ares Management Corporation LLC (Non-Executive Director),Snap, Inc (Chairman).
Tim Score
Appointed January 1, 2015. Chair of the audit committee and member of the nomination & governance andremuneration committees.
52

Tim has extensive experience of the technology sector in both developed and emerging markets, havingserved as Chief Financial Officer of ARM Holdings plc, the world’s leading semiconductor IP company, for 13years. He is an experienced non-executive director and serves as Chairman of The British Land Company plc, arole to which he was appointed in July 2019, a non-executive director of HM Treasury, and a Trustee of theNational Theatre. He served on the board of National Express Group plc from 2005 to 2014, including time asinterim Chairman and six years as the Senior Independent Director. Earlier in his career Tim held senior financeroles with Rebus Group, William Baird, LucasVarity plc and BTR plc. Current notable commitments: TheBritish Land Company plc (Chairman).
Lincoln Wallen
Appointed January 1, 2016. Member of the audit and reputation & responsibility committees.
Lincoln has extensive experience in the technology and media industries, and is currently CTO ofImprobable, a technology start-up supplying next-generation cloud hosting and networking services to the videogame industry. Lincoln was CEO of DWA Nova, a software-as-a-service company spun out of DreamWorksAnimation Studios in Los Angeles, a position he held until 2017. He worked at DreamWorks Animation for nineyears in a variety of leadership roles including Chief Technology Officer and Head of Animation Technology. Hewas formerly CTO at Electronic Arts Mobile, leading their entry into the mobile gaming business internationally.Lincoln is a Non-Executive Director of the Smith Institute for Industrial Mathematics and Systems Engineering.His early career involved 20 years of professional IT and mathematics research, including as a reader inComputer Science at Oxford. Current notable commitments: Improbable (Chief Technology Officer).
Coram Williams
Appointed August 1, 2015.
Coram joined Pearson in 2003 and has held a number of senior positions including Finance and OperationsDirector for Pearson’s English language teaching business in Europe, Middle East & Africa, Interim President ofPearson Education Italia and Head of Financial Planning and Analysis for Pearson. In 2008, Coram became CFOof The Penguin Group and was latterly appointed CFO of Penguin Random House in 2013, where he oversaw theintegration of the two businesses. Coram trained at Arthur Andersen, and subsequently worked in both theauditing and consulting practices of the firm. He is a Non-Executive Director and Chairman of the auditcommittee for the Guardian Media Group. Coram will be stepping down from the Board and his role as ChiefFinancial Officer at the Annual General Meeting on 24 April 2020.
Sally Johnson Chief Financial Officer-elect
To be appointed 24 April 2020
Sally joined Pearson in 2000 and has held various finance and operations roles across The Penguin Group,the education business and at a corporate level. She brings to the Board extensive commercial and strategicfinance experience as well as transformation, treasury, tax, risk management, business and financial operations,investor relations and M&A expertise. She has held various senior level roles across the business, most recentlyas Deputy CFO of Pearson. Sally is a member of the Institute of Chartered Accountants in England and Walesand trained at PricewaterhouseCoopers. She was also a Trustee for the Pearson Pension Plan from 2012 to 2018.
53

The following table sets forth information concerning the executive committee, as at February 29, 2020.
Name Position
Tim Bozik . . . . . . . . . . . . . . . . . . . . . . . . . . . . . . . . . . President, Global Product & North America CoursewareRod Bristow . . . . . . . . . . . . . . . . . . . . . . . . . . . . . . . . . President, UK & Global Online LearningJonathan Chocqueel-Mangan . . . . . . . . . . . . . . . . . . . . Chief Strategy OfficerGio Giovannelli . . . . . . . . . . . . . . . . . . . . . . . . . . . . . . President, Growth & Core MarketsAlbert Hitchcock . . . . . . . . . . . . . . . . . . . . . . . . . . . . . Chief Technology & Operations OfficerDeirdre Latour . . . . . . . . . . . . . . . . . . . . . . . . . . . . . . . Chief Corporate Affairs OfficerBjarne Tellmann . . . . . . . . . . . . . . . . . . . . . . . . . . . . . . General Counsel & Chief Legal OfficerAnna Vikström Persson . . . . . . . . . . . . . . . . . . . . . . . . Chief Human Resources OfficerBob Whelan . . . . . . . . . . . . . . . . . . . . . . . . . . . . . . . . . President, Assessment
Tim Bozik
Tim Bozik is President, Global Product and North America Courseware. He has extensive experience inproduct development and higher education. Tim joined Pearson in 1983 as a sales representative and has sinceheld leadership roles in product and general management, including President of US Higher Education.
Rod Bristow
Rod Bristow is President, UK & Global Online Learning. Rod is a Trustee for the Education and EmployersTaskforce, a Fellow of the Royal Society of Arts, and Governor for Harlow College and the BMAT multiacademy trust.
Jonathan Chocqueel-Mangan
Jonathan Chocqueel-Mangan is Chief Strategy Officer. He was formerly Chief Strategy and TransformationOfficer at Kantar Consumer Insights. Jonathan has professional qualifications in Consulting and Coaching forChange from the Saïd Business School and a Doctor of Business Administration in Organizational Behavior fromthe University of Surrey.
Gio Giovannelli
Gio Giovannelli is President, Growth & Core Markets. He was previously CEO of Grupo Multi, which wasacquired by Pearson in 2013. He has also held three other CEO positions in Brazil, across different sectors. Gio isa former board member of Natura and of CVC Viagens, both listed on the Sao Paulo Stock Exchange.
Albert Hitchcock
Albert Hitchcock is Chief Technology & Operations Officer, a position he has held since March 2014. Heleads digital product development, enterprise technology and operations encompassing supply chain,procurement, customer service and real estate. Previously, Albert was Group CIO at Vodafone and prior to thiswas Global CIO at Nortel.
Deirdre Latour
Deirdre Latour is Chief Corporate Affairs Officer, a position she has held since January 2019. She bringsover 20 years of experience in corporate communications and issues management. Previously, Deirdre was thechief communications officer for GE and worked for the global public relations firm Edelman.
Bjarne Tellmann
Bjarne Tellmann is General Counsel & Chief Legal Officer. He previously worked across Europe, Asia andthe United States in various capacities with The Coca-Cola Company, most recently as Associate GeneralCounsel. He has also held legal positions at Kimberly-Clark and the law firms of Sullivan & Cromwell LLP andWhite & Case LLP.
54

Anna Vikström Persson
Anna Vikström Persson is Chief Human Resources Officer, a position she has held since February 2018.She has over 20 years of international HR experience. Previously, Anna served as EVP & Head of Group HumanResources for Sandvik, and similarly for SSAB. She was also VP, HR & Organization for Ericsson.
Bob Whelan
Bob Whelan is President, Assessment. He has significant expertise in assessment and has driven Pearson’sgrowth as a global leader in computer-based assessments since 2000. Bob leads Pearson’s combined assessmentbusinesses including US Student Assessment, Clinical Assessment, as well as Pearson VUE.
Compensation of senior management
It is the role of the remuneration committee (the committee) to approve the remuneration and benefitspackages of the executive directors and other members of the Pearson Executive.
The principal duties of the committee are to:
• Determine and regularly review the remuneration policies for the Executive Directors, the presidentsand other members of Pearson’s Executive management (who report directly to the Chief Executive).These policies include base salary, annual and long-term incentives, pension arrangements, any otherbenefits and termination of employment. When setting remuneration policy, the Committee also takesinto account remuneration practices and related policies for the wider workforce.
• Ensure the company maintains an appropriate level of engagement with its shareholders andshareholder representative bodies in relation to the remuneration policy and its implementation.
• Regularly review the implementation and operation of the remuneration policy and approve theindividual remuneration and benefits packages of Executive management.
• Approve the design of, and determine targets for, any performance-related pay plans operated by theGroup for Pearson Executive management and approve the total payments to be made under suchplans.
• Advise and decide on general and specific remuneration arrangements in connection with thetermination of employment of Executive management.
• Delegated responsibility for determining the remuneration and benefits package of the Chair of theBoard.
• Appoint and set the terms of engagement for any remuneration consultants who advise the Committeeand monitor the cost of such advice.
• Appoint and set the terms of engagement for any remuneration review updates from management ontalent, retention and gender pay gap.
Remuneration policy
The 2020 directors’ remuneration policy (2020 policy) described below will be put to shareholders forbinding vote at the Annual General Meeting to be held on 24 April 2020. Subject to shareholder approval, theeffective date of this policy will be 24 April 2020. However, it is proposed, subject to approval at the AGM, thatchanges to executive director incentives be made effective from the start of the 2020 performance periods. Theintention of the committee is that the policy will remain in place for three years from the date of its approval.
The committee’s starting point continues to be that total remuneration should reward both short and long-term results, delivering competitive rewards for target performance, but outstanding rewards for exceptionalperformance.
Total remuneration is made up of fixed and performance-linked elements, with each element supportingdifferent objectives. Base salary helps to recruit, reward and retain people and reflects competitive market level,role, skills, experience and individual contribution. Allowances and benefits help to recruit and retain people and
55

reflect the local competitive market. Retirement benefits help to recruit and retain people and recognize theirlong-term commitment to the company. Annual incentives motivate the achievement of annual strategic goalsand personal objectives, provide focus on key financial metrics and reward individual contribution to the successof the company. Long-term incentives help to recruit, reward and retain people, drive long-term earnings, shareprice growth and value creation, align interests of executives and shareholders, encourage long-termshareholding and commitment to the company and link management’s long-term reward and wealth to corporateperformance in a flexible way.
For Executive Director benchmarking purposes, the committee reviews remuneration by reference todifferent comparator groups including survey data from companies of similar size and scope, excluding financialservices companies.
Consistent with its policy, the committee places considerable emphasis on the performance-linked elementsi.e. annual and long-term incentives. The committee will continue to review the mix of fixed and performance-linked remuneration on an annual basis, consistent with its overall philosophy.
Base salary
Base salaries are set to provide the appropriate rate of remuneration for the job, taking into account relevantrecruitment markets, business sectors and geographic regions.
Base salaries are normally reviewed annually taking into account: general economic and market conditions;the level of increases made across the company as a whole; particular circumstances such as changes in role,responsibilities or organization; the remuneration and level of increases for executives in similar positions incomparable companies in both the UK, US and internationally; and individual performance.
While there is no maximum salary level or maximum increase that may be offered, salary increases willnormally be in line with typical increases awarded to other employees in the Group.
However, increases may be above this level in certain circumstances such as:
• Where a new Executive Director has been appointed to the Board at a lower than typical market salaryto allow for growth in the role then larger increases may be awarded to move salary positioning closerto typical market level as the Executive Director gains experience.
• Where an Executive Director has been promoted or has had a change in responsibilities.
• Where there has been a significant change in market practice or where there has been a significantchange in the size and/or scope of the business.
Allowances and benefits
Allowances and benefits comprise cash allowances and non-cash benefits and which may include:
• travel-related benefits (such as company car, car allowance and private use of a driver);
• health-related benefits (such as healthcare, health assessment and gym subsidy);
• and risk benefits (such as additional life cover and long-term disability insurance that are not coveredby the company’s retirement plans).
Executive directors are also eligible to participate in savings-related share acquisition programs, which arenot subject to any performance conditions, on the same terms and to the same value as other employees.
Where an Executive Director is required to relocate to perform their role, appropriate one-off or on-goingexpatriate/relocation benefits may be provided (e.g. housing, schooling etc.)
56

The Committee may introduce other benefits it is considered appropriate to do so, taking into account theindividual circumstances, the country of residence of a Director, the benefits available to all employees and thewider external market.
The cost of the provision of allowances and benefits varies from year to year depending on the cost toPearson and there is no prescribed maximum limit. However, the Committee monitors annually the overall costof the benefits provided, to ensure that it remains appropriate.
Retirement benefits
Employees in the UK are eligible to join the Money Purchase 2003 section of the Pearson Group PensionPlan. Executive directors are eligible to join this plan or receive a cash allowance of equivalent value.
If any executive director is from, or works, outside the UK, the committee retains a discretion to put in placeretirement benefit arrangements for that director in line with local market practice including defined benefitpension arrangements operated by Pearson locally. The maximum value of such arrangement will reflect localmarket practice at the relevant time.
The committee will also honor all pre-existing retirement benefit obligations, commitments or otherentitlements that were entered into by a member of the Pearson Group before that person became a director, suchas participation in the Final Pay section of the Pearson Group Pension Plan which is now closed to new members.
New appointments: New appointments to the board are eligible to receive pension contributions of up to16% of pensionable salary or a cash allowance of up to 16% of salary in line with the maximum companycontribution as a percentage salary that UK employees who are over 45 are eligible to receive.
UK executive directors who are, or become, affected by the lifetime allowance may be provided withappropriate benefits, as an alternative to further accrual of pension benefits such as a cash supplement.
The pension entitlements of each director are as follows:
John Fallon
John Fallon is a member of the Final Pay section of the Pearson Group Pension Plan. His pension accrualrate is 1/30th of pensionable salary per annum, restricted to the plan earnings cap. Until April 2006, the companyalso contributed to a Funded Unapproved Retirement Benefits Scheme (FURBS) on his behalf. Since April 2006,he has received a taxable and non-pensionable cash supplement in replacement of the FURBS of 26% of salary.
John attained the maximum service accrual under the Final Pay section of his pension benefit when hereached 20 years’ service in October 2017. Since this time, John receives the pension supplement of 26% ofsalary only. The Committee reviewed the approach to the Chief Executive’s pension in light of shareholder viewsand best practice, and agreed with John Fallon that his pension allowance would be reduced on a phased basisover the next three years to bring it into line with the UK workforce at 16% of salary. Notwithstanding hisplanned retirement, John Fallon’s cash pension allowance has been reduced by 3 percentage points to 23% ofsalary as the first step on his planned phased reduction.
Coram Williams
Coram Williams is a member of the Final Pay section of the Pearson Group Pension Plan with continuousservice with a service gap. His pension accrual rate is 1/60th of pensionable salary per annum, restricted to theplan earnings cap.
57

Sally Johnson
Sally Johnson is a member of the Final Pay section of the Pearson Group Pension Plan with continuousservice. Her pension accrual rate is 1/60th of pensionable salary per annum, restricted to the plan earnings cap.
Annual incentives
Measures and performance targets are set by the committee at the start of the year with payment made afteryear end following the committee’s assessment of performance relative to targets.
Annual incentive plans are discretionary. The committee reserves the right to adjust payments up or down ifit believes that the outcome does not reflect underlying financial or non-financial performance or if such otherexceptional factors warrant doing so.
The committee may apply malus and / or clawback for a period of five years in circumstances, such asfinancial misstatement, individual misconduct or reputational damage to the company.
Annual incentives will not exceed 200% of base salary.
For the Chief Executive, the individual maximum incentive opportunity is 180% of base salary and 170%for the CFO (which are the same opportunities as applied under the previous policy).
There is normally no pay-out for performance at threshold. 50% of the maximum is payable for on-targetlevels of performance. This represents a reduction in the Chief Executive’s target opportunity, from 100% ofsalary to 90% of salary.
The committee has the discretion to select the performance measures and relative weightings from year toyear to ensure continuing alignment with strategy and to ensure targets are sufficiently stretching. The committeesets performance targets for each measure annually.
Annual incentives will normally be based on financial and strategic performance targets. Financial metricswill normally account for at least 75% of the total annual opportunity with the remaining portion normally beingbased on strategic and / or performance against personal objectives.
The plan is designed to incentivize and reward underlying performance. Actual results may be adjusted toremove the effect of foreign exchange and portfolio changes (acquisitions and disposals) and other relevantfactors that the committee considers do not reflect the underlying performance of the business in the performanceyear.
The funding of annual incentives will normally be related to the performance against financial and strategicimperatives performance targets. For the 2020 financial year the annual bonus will be based 30% on operatingprofit, 30% on sale performance, 20% on operating cash flow and 20% on strategic measures. Each performancemeasure will operate independently. There will be no changes to the maximum annual incentive opportunities for2019.
Strategic measures will be measured, using third party data or externally audited internal data (where third-party data is not available or applicable). Performance metrics linked to strategic objectives can be selectedannually to support the Group’s strategy.
A pay-out will only be made if a minimum level of performance has been achieved under the financialmetrics, as determined by the committee each year.
58

Details of performance measures, weightings and targets will be disclosed in the annual remuneration reportfor the relevant financial year if and to the extent that the committee deems them to be no longer commerciallysensitive.
The performance period is one year.
Long-term incentives
Awards of shares are made on an annual basis, which vest on a sliding scale based on performance againststretching corporate performance targets measured at the end of the three-year performance period.
Awards are normally subject to a post vesting holding period for two years following the end of theperformance period. For awards granted prior to 2020 the holding period applied will be in-line with theapproach set out in the Directors’ Remuneration Policy in place at the time of award.
Participants may receive additional shares representing the gross value of dividends that would have beenpaid on shares that vest during the performance period.
The committee reserves the right to adjust pay-outs up or down before they are released if it believes thatthe vesting outcome does not reflect underlying financial or non-financial performance or if such otherexceptional factors warrant doing so. In making such adjustments, the committee is guided by the principle ofaligning shareholder and management interests.
The committee may apply malus and / or clawback for a period of five years in circumstances, such asfinancial misstatement, individual misconduct or reputational damage to the company.
The maximum award is 350% of base salary in respect of a financial year.
Coram Williams and John Fallon will not be eligible for an LTIP award in 2020. The LTIP award level forthe incoming CFO is 245% of base salary (which is the same award opportunity as for Coram Williams in 2017,2018 and 2019), reflecting the discounts to LTIP awards in light of share price performance.
The committee believe that a further reduction in the incoming CFO’s award level is not appropriate,beyond the discount already applied. This discount was set at a time when the share price was comparable to thecurrent share price and the Committee considered that alignment between management and shareholders wouldbe better supported by maintaining her level of grant at 245% of salary in 2020.
The committee will determine the performance measures, weightings and targets governing an award ofshares prior to grant to ensure continuing alignment with strategy and to ensure that targets are sufficientlystretching.
The committee establishes a threshold below which no pay-out is achieved and a maximum at or abovewhich the award pays out in full. The proportion of the award that vests at threshold may be up to 25%.
Awards will normally be subject to the achievement of targets for earnings per share, return on investedcapital and relative total shareholder return (weighted equally). The committee may determine that differentmeasures or weightings may apply for future awards, however, the committee would intend to consult withshareholders in advance if a different performance measure was to be used or if there was to be a significantchange in the weighting of measures.
The 2020 LTIP award which will vest on 1 May 2023 will be subject to the following performanceconditions:
• 1/3 of the award will be based on Pearson’s earnings per share (EPS) in 2022;
59

• 1/3 of the award will be based on Pearson’s net return on invested capital (Net ROIC) in 2022; and
• 1/3 of the award will be based on Pearson’s total shareholder return (TSR) performance relative to theconstituents of the FTSE 100 index over the three-year period 1 January 2020 to 31 December 2022
Details of the performance targets for each of the performance conditions are set out in the table below:
EPS (1/3) Net ROIC (1/3) Relative TSR (1/3)
Vestingschedule(% max)
AdjustedEPS for FY22
Vestingschedule(% max)
Adjusted netROIC for FY22
Vestingschedule(% max)
Ranked position vsFTSE 100
15% 45.5p 15% 5.2% 25% Median65% 52.5p 65% 6.2% — —
100% 60p 100% 7.5% 100% Upper quartile
Note: straight line vesting between points shown, with no vesting for performance below threshold
Shareholding policy
Executive Directors are expected to build up a shareholding in the company.
Executive Directors are expected to reach the guideline within five years from the date of appointment
Post-employment shareholding: Executive Directors are expected to retain their shareholding guideline (oractual holding if lower) for two years following down as an Executive Director. This provision does not apply toany shares purchased by the executive director.
The target holding is 300% of salary for the Chief Executive and 200% of salary for other ExecutiveDirectors
Service agreements
In accordance with long established policy, all executive directors have service agreements under which,other than by termination in accordance with the terms of these agreements, employment continues indefinitely.
There are no special provisions for notice or non-share-based compensation in the event of a change ofcontrol of Pearson.
It is the company’s policy that the company may terminate the chairman’s and executive directors’ serviceagreements by giving no more than 12 months’ notice.
Payment in lieu of notice
As an alternative, for executive directors the company may at its discretion pay in lieu of that notice.Payment in lieu of notice may be made in equal monthly instalments from the date of termination to the end ofany unexpired notice period. Payment in lieu of notice in instalments may also be subject to mitigation andreduced taking into account earnings from alternative employment.
For executive directors, payment in lieu of notice comprises 100% of the annual salary at the date oftermination and the annual cost to the company of providing pension and all other benefits. For the chairman,payment in lieu of notice comprises 100% of the annual fees at the date of termination.
60
The company may, depending on the circumstances of the termination, determine that it will not pay thedirector in lieu of notice and may instead terminate a director’s contract in breach and make a damages payment,taking into account as appropriate the director’s ability to mitigate his or her loss.
The company may also pay an amount considered to be reasonable by the remuneration committee inrespect of fees for legal and tax advice and outplacement support for the departing director. The Committeereserves the right to make any other payments in connection with a director’s cessation of office or employmentwhere the payments are made in good faith, in discharge of an existing legal obligation (or by way of damagesfor breach of such an obligation) or by way of settlement of any claim arising in connection with the cessation ofa director’s office or employment.
Share awards
On cessation of employment, unless otherwise provided for under the rules of Pearson’s discretionary shareplans, executive directors’ entitlements to any unvested awards lapse automatically. In the case of injury,disability, ill-health or redundancy (as determined by the committee), where a participant’s employing companyceases to be part of Pearson, or any other reason if the committee so decides in its absolute discretion:
• Awards that are subject to performance conditions will stay in force as if the participant had not ceasedemployment and shall vest on the original vesting date / be released in line with normal time horizons.
• Awards that are not subject to a performance condition will be released as soon as practicablefollowing cessation of employment.
• The number of shares that are released shall be pro-rated for the period of the participant’s service inthe restricted period (although the committee may in its absolute discretion waive or vary thepro-rating).
In determining whether and how to exercise its discretion under Pearson’s discretionary share plans, thecommittee will have regard to all relevant circumstances distinguishing between different types of leaver, thecircumstances at the time the award was originally made, the director’s performance and the circumstances inwhich the director left employment.
The rules of Pearson’s discretionary share plans also make provision for the treatment of awards in respectof corporate activity, including a change of control of Pearson. The committee would act in accordance with theterms of the awards in these circumstances, which includes terms as to the assessment of performance conditionsand time apportionment.
Annual bonus
On cessation of employment, executive directors, having been notified of participation in an annual incentiveplan for the relevant financial year, may, at the committee’s discretion, retain entitlement to a pro rata annualincentive for their period of service in the financial year prior to their leaving date. Such pay-out will normally becalculated in good faith on the same terms and paid at the same time as for continuing executive directors.
Other elements of remuneration
Eligibility for allowances and benefits including retirement benefits normally ceases on retirement or on thetermination of employment for any other reason.
Executive directors’ non-executive directorships
The Group’s policy is that executive directors may, by agreement with the board, serve as non-executives ofother companies and retain any fees payable for their services.
61

Coram Williams is engaged as a non-executive director and chair of the audit committee of Guardian MediaGroup plc. He received fees of £39,000 during 2019. In accordance with the Group’s policy, Coram is permittedto retain these fees.
Chair’s and non-executive directors’ remuneration
The chair is paid a single fee for all of his responsibilities.
The chair’s fee is set at a level that is competitive with those of chairmen in similar positions in comparablecompanies.
The non-executive directors are paid a basic fee. The chair and members of the main board committees andthe senior independent director are paid an additional fee to reflect their extra responsibilities. Fees fornon-executive directors are determined by the full board having regard to market practice.
Additional fees or other payments may be paid to reflect additional responsibilities, roles or contribution, asappropriate.
The chair and non-executive directors are not entitled to any annual or long-term incentive, retirement orother employee benefits. Selected benefits may be introduced, if considered appropriate.
The company reimburses the chair’s and non-executive directors’ travel and other business expenses andany tax incurred thereon, if applicable.
Normally a minimum of 25% of the non-executive directors’ basic fee is paid in Pearson shares that thenon-executive directors have committed to retain for the period of their directorships. Shares are normallyacquired quarterly at the prevailing market price with the individual’s after-tax fee payments.
Fee levels are reviewed on a periodic basis.
The total fees payable to the non-executive directors (excluding the chair) are subject to the limit set out inthe Articles of Association of the company (currently £750,000) and as increased by ordinary resolution fromtime to time.
With effect fromApril 24, 2020
Non-executive director . . . . . . . . . . . . . . . . . . . . . . . . . . . . . . . . . . . . . . . . . . £70,000Chairmanship of audit committee . . . . . . . . . . . . . . . . . . . . . . . . . . . . . . . . . £27,500Chairmanship of remuneration committee . . . . . . . . . . . . . . . . . . . . . . . . . . . £22,000Chairmanship of nomination and governance committee . . . . . . . . . . . . . . . £15,000Chairmanship of reputation and responsibility committee . . . . . . . . . . . . . . . £15,000Membership of audit committee . . . . . . . . . . . . . . . . . . . . . . . . . . . . . . . . . . . £15,000Membership of remuneration committee . . . . . . . . . . . . . . . . . . . . . . . . . . . . £10,000Membership of nomination and governance committee . . . . . . . . . . . . . . . . £ 8,000Membership of reputation and responsibility committee . . . . . . . . . . . . . . . . £ 8,000Senior independent director . . . . . . . . . . . . . . . . . . . . . . . . . . . . . . . . . . . . . . £22,000
Notes:(1) The fee paid to the chair remains unchanged at £500,000.(2) A minimum of 25% of the basic fee is paid in Pearson shares that the chairman and non-executive directors
have committed to retain for the period of their directorships.(3) Non-executive directors serve Pearson under letters of appointment and do not have service contracts. There
is no entitlement to compensation on the termination of their directorships.
62

Remuneration of senior management
The remuneration received by the chair and executive directors in respect of the financial year endingDecember 31, 2019 was as follows:
Base Salary/Fees
Allowances &Benefits(1)
AnnualIncentives
Long-termIncentives
RetirementBenefits Total
£000 £000 £000 £000 £000 £000ChairSidney Taurel . . . . . . . . . . . . . . . . . . . . . . . 500 8 508Non-executive directorsElizabeth Corley . . . . . . . . . . . . . . . . . . . . . 115 — 115Sherry Coutu . . . . . . . . . . . . . . . . . . . . . . . . 56 — —Vivienne Cox . . . . . . . . . . . . . . . . . . . . . . . . 128 1 129Josh Lewis . . . . . . . . . . . . . . . . . . . . . . . . . . 88 2 90Linda Lorimer . . . . . . . . . . . . . . . . . . . . . . . 98 4 102Michael Lynton . . . . . . . . . . . . . . . . . . . . . . 91 — —Graeme Pitkethly . . . . . . . . . . . . . . . . . . . . . 57 — —Tim Score . . . . . . . . . . . . . . . . . . . . . . . . . . 116 1 117Lincoln Wallen . . . . . . . . . . . . . . . . . . . . . . 91 4 95Executive directors . . . . . . . . . . . . . . . . . . .John Fallon . . . . . . . . . . . . . . . . . . . . . . . . . 813 30 — 803 211 1,857Coram Williams . . . . . . . . . . . . . . . . . . . . . 537 8 — — 62 607
Senior management as a group . . . . . . . . 2,690 58 — 803 273 3,621
Notes:(1) Benefits include company car, car allowance, private use of a driver, healthcare, additional life cover, long-
term disability insurance and subsistence expenses.
Share options for senior management
There are no share options outstanding for senior management.
63

Share ownership of senior management
The table below shows the number of ordinary shares and conditional shares held by directors and theirconnected persons as at December 31, 2019. Additional information with respect to share options held by, andbonus awards for, these persons is set out above in “Remuneration of Senior Management” and “Share Optionsof Senior Management”. The total number of ordinary shares held by senior management as of December 31,2019 was 670,338.
As at 31 December 2019OrdinaryShares(1)
ConditionalShares
Sidney Taurel . . . . . . . . . . . . . . . . . . . . . . . . . . . . . . . . . . . 103,224 —John Fallon . . . . . . . . . . . . . . . . . . . . . . . . . . . . . . . . . . . . . 397,313 923,215Coram Williams . . . . . . . . . . . . . . . . . . . . . . . . . . . . . . . . . 56,108 542,310Elizabeth Corley . . . . . . . . . . . . . . . . . . . . . . . . . . . . . . . . . 22,028 —Sherry Coutu . . . . . . . . . . . . . . . . . . . . . . . . . . . . . . . . . . . 3,175 —Vivienne Cox . . . . . . . . . . . . . . . . . . . . . . . . . . . . . . . . . . . 7,430 —Josh Lewis . . . . . . . . . . . . . . . . . . . . . . . . . . . . . . . . . . . . . 14,200 —Linda Lorimer . . . . . . . . . . . . . . . . . . . . . . . . . . . . . . . . . . 11,040 —Michael Lynton . . . . . . . . . . . . . . . . . . . . . . . . . . . . . . . . . 8,535 —Graeme Pitkethly . . . . . . . . . . . . . . . . . . . . . . . . . . . . . . . . 785 —Tim Score . . . . . . . . . . . . . . . . . . . . . . . . . . . . . . . . . . . . . . 37,893 —Lincoln Wallen . . . . . . . . . . . . . . . . . . . . . . . . . . . . . . . . . . 8,607 —
Notes(1) Ordinary shares include both ordinary shares listed on the London Stock Exchange and American
Depositary Receipts (ADRs) listed on the New York Stock Exchange. The figures include both shares andADRs acquired by individuals under the long-term incentive plan and any legacy share plans they mighthave participated in.
(2) Conditional shares means unvested shares which remain subject to performance conditions and/orcontinuing employment for a pre-defined period.
(2) The register of directors’ interests (which is open to inspection during normal office hours) contains fulldetails of directors’ shareholdings and options to subscribe for shares. The market price on December 31,2019 was 637.0p per share and the range during the year was 615.0p to 1027.5p.
(3) Ordinary shares do not include any shares vested but held pending release under a restricted share plan.
The total remuneration of the executive committee is set out in the table below:
All figures in £ millions 2019
Short-term employee benefits . . . . . . . . . . . . . . . . . . . . . . . . . . . . . . . . . . . . . . . . . . . . . . . . . . . . . . . . . . . . . 5Retirement benefits . . . . . . . . . . . . . . . . . . . . . . . . . . . . . . . . . . . . . . . . . . . . . . . . . . . . . . . . . . . . . . . . . . . . . 1Share-based payment costs . . . . . . . . . . . . . . . . . . . . . . . . . . . . . . . . . . . . . . . . . . . . . . . . . . . . . . . . . . . . . . . . 4
Total . . . . . . . . . . . . . . . . . . . . . . . . . . . . . . . . . . . . . . . . . . . . . . . . . . . . . . . . . . . . . . . . . . . . . . . . . . . . . . . . 10
Employee share ownership plans
In 1998, the Group introduced a worldwide save for shares plan. Under this plan, employees around theworld have the option to save a portion of their monthly salary over periods of three or five years. At the end ofthis period, the employee has the option to purchase ordinary shares with the accumulated funds at a purchaseprice equal to 80% of the market price prevailing at the commencement of the employee’s participation in theplan. In 2020, the three-year plan will be in operation only, and the five year plan will be discontinued.
In 2014, shareholders approved the renewal and extension of the life of the UK plan by a further ten years,until 2024 and the renewal of the directors’ authority to continue to operate equivalent arrangements for non-UKemployees. As part of this renewal, the savings limit for the UK HMRC-approved part of the plan (which formsthe basis of the plan in the rest of the world outside the US) was increased from £250 to £500 per month.
64

In the United States, this plan operates as a stock purchase plan under Section 423 of the US InternalRevenue Code of 1986. This plan was introduced in 2000 following Pearson’s listing on the New York StockExchange. Under it, participants save a portion of their monthly salary over six month periods, at the end ofwhich they have the option to purchase ADRs with their accumulated funds at a purchase price equal to 85% ofthe lower of the market price prevailing at the beginning or end of the period. The maximum employeecontribution under the plan is $1,000 per month.
Board practices
As at February 29, 2020, the Group’s board comprises the chair, two executive directors and ninenon-executive directors. The articles of association provide that at every annual general meeting, one-third of theboard of directors, or the number nearest to one-third, shall retire from office. The directors to retire each year arethe directors who have been longest in office since their last election or appointment. A retiring director iseligible for re-election. If at any annual general meeting, the place of a retiring director is not filled, the retiringdirector, if willing, is deemed to have been re-elected, unless at or prior to such meeting it is expressly resolvednot to fill the vacated office, or unless a resolution for the re-election of that director has been put to the meetingand lost. The articles of association also provide that every director be subject to re-appointment by shareholdersat the next annual general meeting following their appointment.
However in accordance with the UK Corporate Governance Code, the board has resolved that all directorsshould offer themselves for re-election on an annual basis at the company’s annual general meeting.Accordingly, all of the directors, other than Coram Williams and Josh Lewis who are standing down at theconclusion of the meeting, will offer themselves for re-election at the forthcoming annual general meeting onApril 24, 2020.
Pearson is listed on the New York Stock Exchange (“NYSE”). As a listed non-US issuer, the Group isrequired to comply with some of the NYSE’s corporate governance rules, and otherwise must disclose on itswebsite any significant ways in which its corporate governance practices differ from those followed by UScompanies under the NYSE listing standards. At this time, the Group believes that it is in compliance in allmaterial respects with all the NYSE rules except that the Remuneration Committee and the Nomination &Governance Committee are not composed entirely of independent directors as the Chair, who is not consideredindependent under NYSE rules, is a member of each committee in addition to independent directors.
The board of directors has established the following formal committees, all of which report to the board.Each committee has its own written terms of reference setting out its authority and duties. These can be found onthe Group’s website (https://www.pearson.com/investors/governance.html).
Audit committee
This committee appraises the Group’s financial management and reporting and assesses the integrity of itsaccounting procedures and financial control. Tim Score chairs this committee and its other members areElizabeth Corley, Vivienne Cox, Linda Lorimer, Michael Lynton, Graeme Pitkethly and Lincoln Wallen. TimScore is also the designated audit committee financial expert within the meaning of the applicable rules andregulations of the US Securities and Exchange Commission. Each member is “financially literate” for thepurposes of the NYSE listing standards. The Group’s internal and external auditors have direct access to thecommittee to raise any matter of concern and to report the results of work directed by the committee.
Remuneration committee
This committee meets regularly to determine the remuneration and benefits of the executive directors andoversees remuneration arrangements for the Pearson Executive. The committee also recommends the chair’sremuneration to the board of directors for its decision. Elizabeth Corley chairs this committee and its othermembers are Sherry Coutu, Josh Lewis, Tim Score and Sidney Taurel.
Nomination & governance committee
This committee reviews corporate governance matters including UK Corporate Governance Codecompliance and board evaluation, considers the appointment of new directors, board experience and diversity,and reviews board induction and succession plans. The committee is chaired by Vivienne Cox and its othermembers are Elizabeth Corley, Sherry Coutu, Josh Lewis, Tim Score and Sidney Taurel.
65

Reputation & responsibility committee
This committee considers the Group’s impact on society and the communities in which the Group operates,including to ensure strategies are in place to manage and improve the Group’s reputation. Linda Lorimer chairsthis committee and its other members are Vivienne Cox, Michael Lynton, Graeme Pitkethly and Lincoln Wallen.
Employees
The average number of persons employed by the Group in continuing operations during each of the threefiscal years ended 2019 were as follows:
• 22,734 in fiscal 2019, and
• 24,322 in fiscal 2018, and
• 30,339 in fiscal 2017.
Through its subsidiaries, the Group has entered into collective bargaining agreements with employees invarious locations. The Group’s management has no reason to believe that it would not be able to renegotiate anysuch agreements on satisfactory terms. The Group encourages employees to contribute actively to the business inthe context of their particular job roles and believes that the relations with its employees are generally good.
The table set forth below shows for 2019, 2018 and 2017 the average number of persons employed in eachof the Group’s segments.
Average number employed 2019 2018 2017
North America . . . . . . . . . . . . . . . . . . . . . . . . . . . . . . . . . . . . . 13,564 14,113 16,295Core . . . . . . . . . . . . . . . . . . . . . . . . . . . . . . . . . . . . . . . . . . . . . 4,951 5,192 5,291Growth . . . . . . . . . . . . . . . . . . . . . . . . . . . . . . . . . . . . . . . . . . . 3,693 4,521 8,268Other . . . . . . . . . . . . . . . . . . . . . . . . . . . . . . . . . . . . . . . . . . . . . 526 496 485
Continuing operations . . . . . . . . . . . . . . . . . . . . . . . . . . . . . . . 22,734 24,322 30,339
The average number employed in discontinued operations was nil in 2019, nil in 2018, and nil in 2017.
ITEM 7. MAJOR SHAREHOLDERS AND RELATED PARTY TRANSACTIONS
As at February 29, 2020, the company had been notified under the Financial Conduct Authority’s Disclosureand Transparency Rules of the following significant voting rights in its shares:
Name of ShareholderNumber of ordinary
shares held
% of outstandingordinary shares
represented by numberof shares held*
Schroders plc . . . . . . . . . . . . . . . . . . . . . . . . . . . . . . . . . . . . . . . . . . . . . 101,370,711 13.00Silchester International Investors LLP . . . . . . . . . . . . . . . . . . . . . . . . 85,106,480 11.00Lindsell Train Limited . . . . . . . . . . . . . . . . . . . . . . . . . . . . . . . . . . . . . 78,465,444 10.04Blackrock, Inc . . . . . . . . . . . . . . . . . . . . . . . . . . . . . . . . . . . . . . . . . . . . 50,946,154 6.51Ameriprise Financial Inc and its group . . . . . . . . . . . . . . . . . . . . . . . . 41,236,375 5.02Libyan Investment Authority** . . . . . . . . . . . . . . . . . . . . . . . . . . . . . . 24,431,000 3.01
* % of Issued share capital on date notified** Based on notification to the company dated 7 June 2010. We have been notified of no change to this holding
since that date. Assets belonging to, or owned, held or controlled since 16 September 2011 by the LibyanInvestment Authority and located outside Libya on that date, are frozen in accordance with Article 5(4) ofRegulation 2016/44 of the Council of the European Union.
66

On February 29, 2020, 2,682 record holders with registered addresses in the United States held 21,118,921ADRs, which represented 2.7% of the Group’s outstanding ordinary shares. Some of these ADRs are held bynominees and so these numbers may not accurately represent the number of shares beneficially owned in theUnited States.
Loans and equity advanced to joint ventures and associates during the year and as at December 31, 2019 areshown in note 12 in “Item 18. Financial Statements.” Dividends receivable from joint ventures and associates areset out in note 12 in “Item 18. Financial Statements”. There were no other related party transactions in 2019.
ITEM 8. FINANCIAL INFORMATION
The financial statements filed as part of this Annual Report are included on pages F-1 through F-95 hereof.
Other than those events described in note 37 in “Item 18. Financial Statements” of this Form 20-F andseasonal fluctuations in borrowings, there has been no significant change to the Group’s financial condition orresults of operations since December 31, 2019. The Group’s borrowings fluctuate by season due to the effect ofthe school year on the working capital requirements of the educational book business. Assuming no acquisitionsor disposals, the maximum level of net debt normally occurs in the third quarter, and the minimum level of netdebt normally occurs in December.
The Group’s policy with respect to dividend distributions is described in response to “Item 3. KeyInformation” above.
See “Item 4. Information on the Company — Legal Proceedings” for information with respect to legalproceedings to which the Group may be subject from time to time.
ITEM 9. THE OFFER AND LISTING
The principal trading market for the Group’s ordinary shares is the London Stock Exchange which tradeunder the symbol “PSON”. Its ordinary shares also trade in the United States in the form of ADSs evidenced byADRs under a sponsored ADR facility with The Bank of New York Mellon, as depositary. The Groupestablished this facility in March 1995 and most recently amended it in August 2014 in connection with its NewYork Stock Exchange listing. Each ADS represents one ordinary share.
The ADSs trade on the New York Stock Exchange under the symbol “PSO”.
ITEM 10. ADDITIONAL INFORMATION
Articles of association
The Group summarizes below the material provisions of its articles of association, as amended, which havebeen filed as an exhibit to its annual report on Form 20-F for the year ended December 31, 2019. The summarybelow is qualified entirely by reference to the Articles of Association. The Group has multiple businessobjectives and purposes and is authorized to do such things as the board may consider fit to further its interests orincidental or conducive to the attainment of its objectives and purposes.
Directors’ powers
The Group’s business shall be managed by the board of directors and the board may exercise all such of itspowers as are not required by law or by the Articles of Association or by any directions given by the Companyby special resolution, to be exercised in a general meeting.
Interested directors
For the purposes of section 175 of the Companies Act 2006, the board may authorize any matter proposed toit which would, if not so authorized, involve a breach of duty by a Director under that section, including, without
67

limitation, any matter which relates to a situation in which a Director has, or can have, an interest whichconflicts, or possibly may conflict, with the interests of the Company. Any such authorization will be effectiveonly if:
(a) any requirement as to quorum at the meeting at which the matter is considered is met without countingthe Director in question or any other interested Director; and
(b) the matter was agreed to without their voting or would have been agreed to if their votes had not beencounted.
The board may (whether at the time of the giving of the authorization or subsequently) make any suchauthorization subject to any limits or conditions it expressly imposes but such authorization is otherwise given tothe fullest extent permitted. The board may vary or terminate any such authorization at any time.
Provided that he has disclosed to the board the nature and extent of his interest (or else that the Director isnot aware of the interest or not aware of the transaction or arrangement in question, or else that the interestcannot be reasonably regarded to give rise to a conflict of interest), a Director notwithstanding his office:
(a) may be a party to, or otherwise interested in, any transaction or arrangement with the Company or inwhich the Company is otherwise (directly or indirectly) interested;
(b) may act by himself or his firm in a professional capacity for the Company (otherwise than as auditor)and he or his firm shall be entitled to remuneration for professional services as if he were not aDirector;
(c) may be a director or other officer of, or employed by, or a party to a transaction or arrangement with, orotherwise interested in, any body corporate in which the Company is otherwise (directly or indirectly)interested.
A Director shall not, by reason of his office, be accountable to the Company for any remuneration or otherbenefit which he derives from any office or employment or from any transaction or arrangement or from anyinterest in any body corporate:
(a) the acceptance, entry into or existence of which has been approved by the board (subject, in any suchcase, to any limits or conditions to which such approval was subject); or
(b) which he is permitted to hold or enter into by virtue of paragraph (a), (b) or (c) above;
nor shall the receipt of any such remuneration or other benefit constitute a breach of his duty under section 176 ofthe Act.
A Director shall be under no duty to the Company with respect to any information which he obtains or hasobtained otherwise than as a Director of the Company and in respect of which he owes a duty of confidentialityto another person. However, to the extent that his relationship with that other person gives rise to a conflict ofinterest or possible conflict of interest, the preceding sentence only applies if the existence of such relationshiphas been approved by the board. In such circumstances, the Director shall not be in breach of the general dutieshe owes to the Company by virtue of sections 171 to 177 of the Act because he fails:
(a) to disclose any such information to the board or to any Director or other officer or employee of theCompany; and/or
(b) to use or apply any such information in performing his duties as a Director of the Company.
Where the existence of a Director’s relationship with another person has been approved by the board and hisrelationship with that person gives rise to a conflict of interest or possible conflict of interest, the Director shall
68

not be in breach of the general duties he owes to the Company by virtue of sections 171 to 177 of the Actbecause he:
(a) absents himself from meetings of the board at which any matter relating to the conflict of interest orpossible conflict of interest will or may be discussed or from the discussion of any such matter at ameeting or otherwise; and/or
(b) makes arrangements not to receive documents and information relating to any matter which gives riseto the conflict of interest or possible conflict of interest sent or supplied by the Company and/or forsuch documents and information to be received and read by a professional adviser, for so long as hereasonably believes such conflict of interest or possible conflict of interest subsists.
Except as stated below, a Director shall not vote in respect of any contract or arrangement or any otherproposal whatsoever in which he has an interest which is, to his knowledge, a material interest, otherwise than byvirtue of his interests in shares or debentures or other securities of or otherwise in or through the Company. ADirector shall not be counted in the quorum at a meeting of the Board in relation to any resolution on which he isdebarred from voting.
Notwithstanding the foregoing, a Director will be entitled to vote, and be counted in the quorum, on anyresolution concerning any of the following matters:
• the giving of any guarantee, security or indemnity in respect of money lent or obligations incurred byhim or by any other person at the request of or for the benefit of the Company or any of its subsidiaries;
• the giving of any guarantee, security or indemnity to a third party in respect of a debt or obligation ofthe Company or any of its subsidiaries for which he himself has assumed responsibility in whole or inpart and whether alone or jointly with others under a guarantee or indemnity or by the giving ofsecurity;
• any proposal relating to the Company or any of its subsidiary undertakings where it is offeringsecurities in which offer a Director is or may be entitled to participate as a holder of securities or in theunderwriting or sub-underwriting of which a Director is to participate;
• any proposal relating to another company in which he and any persons connected with him do not tohis knowledge hold an interest in shares (as that term is used in sections 820 to 825 of the CompaniesAct 2006) representing one per cent or more of either any class of the equity share capital, or the votingrights, in such company;
• any proposal relating to an arrangement for the benefit of the employees of the Company or any of itssubsidiary undertakings which does not award him any privilege or benefit not generally awarded tothe employees to whom such arrangement relates; and
• any proposal concerning insurance that the Company proposes to maintain or purchase for the benefitof directors or for the benefit of persons, including Directors.
Where proposals are under consideration concerning the appointment of two or more Directors to offices oremployment with us or any company in which the Group is interested, these proposals may be divided andconsidered separately and each of these directors, if not prohibited from voting under the provisions of the eighthparagraph before this one, will be entitled to vote and be counted in the quorum with respect to each resolutionexcept that concerning his or her own appointment.
Borrowing powers
The board of Directors may exercise all powers to borrow money and to mortgage or charge the Group’sundertaking, property and uncalled capital and to issue debentures and other securities, whether outright or ascollateral security for any of its or any third party’s debts, liabilities or obligations. The board of directors must
69

restrict the borrowings in order to secure that the aggregate amount of undischarged monies borrowed by theGroup (and any of its subsidiaries), but excluding any intra-group debts, shall not at any time (without theprevious sanction of the Company in the form of an ordinary resolution) exceed a sum equal to twice theaggregate of the adjusted capital and reserves.
Other provisions relating to directors
Under the articles of association, directors are paid out of the Group’s funds for their services as it may fromtime to time determine by ordinary resolution and, in the case of non-executive directors, up to an aggregate of£750,000 or such other amounts as resolved by the shareholders at a general meeting. Any Director who is not anExecutive Director and who performs special services which in the opinion of the Board are outside the scope ofthe ordinary duties of a Director, may be paid such extra remuneration by way of additional fee, salary,commission or otherwise as the Board may determine in accordance with the Group’s remuneration policy.Under the articles of association, Directors currently are not required to hold any share qualification. However,the remuneration policy mandates a shareholding guideline for executive directors which they are expected tobuild towards over a specified period.
Annual general meetings
Pursuant to the Companies Act 2006, the Company must hold an annual general meeting (‘AGM’) (withinsix months beginning with the day following its accounting reference date) at a place and time determined by theboard. The following matters are usually considered at an annual general meeting:
• approving final dividends;
• consideration of the accounts and balance sheet;
• ordinary reports of the board of directors and auditors and any other documents required to be annexedto the balance sheet;
• the appointment or election of directors Notwithstanding the provisions of the Articles, the board hasresolved that all directors should offer themselves for re-election annually, in accordance with the UKCorporate Governance Code;
• appointment or reappointment of, and determination of the remuneration of, the auditors; and
• the renewal, limitation, extension, variation or grant of any authority to the board in relation to theallotment of securities.
The board may call a general meeting whenever it thinks fit. If at any time there are not within the UnitedKingdom sufficient directors capable of acting to form a quorum, any director or any two members may convenea general meeting in the same manner as nearly as possible as that in which meetings may be convened by theboard.
No business shall be dealt with at any general meeting unless a quorum is present when the meetingproceeds to business. Three members present in person and entitled to vote shall be a quorum for all purposes. Acorporation being a member shall be deemed to be personally present if represented by its duly authorizedrepresentative.
If a quorum for a meeting convened at the request of shareholders is not present within fifteen minutes ofthe appointed time, the meeting will be dissolved. In any other case, the general meeting will be adjourned to thesame day in the next week, at the same time and place, or to a time and place that the chair fixes. If at thatrescheduled meeting a quorum is not present within fifteen minutes from the time appointed for holding themeeting, the shareholders present in person or by proxy will be a quorum. The chair or, in his absence, the deputychair or any other director nominated by the board, will preside as chair at every general meeting. If no director ispresent at the general meeting or no director consents to act as chair, the shareholders present shall elect one oftheir number to be chair of the meeting.
70

Share Certificates
Every person whose name is entered as a member in the Company’s Register of Members shall be entitledto one certificate in respect of each class of shares held (the law regarding this does not apply to stock exchangenominees). Subject to the terms of issue of the shares, certificates are issued following allotment or receipt of therelevant transfer by the Group’s registrar, Equiniti, Aspect House, Spencer Road, Lancing, West Sussex, BN996DA, United Kingdom, telephone number +44 121-415-7062.
Share capital
Any share may be issued with such preferred, deferred or other special rights or other restrictions as may bedetermined by way of a shareholders’ vote in general meeting. Subject to the Companies Act 2006, any sharesmay be issued which are to be redeemed or are liable to be redeemed at the option of the Company or theshareholders.
There are no provisions in the Articles of Association which discriminate against any existing or prospectiveshareholder as a result of such shareholder owning a substantial number of shares.
Subject to the terms of the shares which have been issued, the directors may from time to time make callsupon the shareholders in respect of any moneys unpaid on their shares, provided that (subject to the terms of theshares so issued) no call on any share shall be payable at less than fourteen clear days from the last call. Thedirectors may, if they see fit, receive from any shareholder willing to advance the same, all and any part of themoneys uncalled and unpaid upon any shares held by him.
Changes in capital
The Group may, from time to time by ordinary resolution subject to the Companies Act 2006:
• consolidate and divide all or any of its share capital into shares of a larger nominal amount than itsexisting shares; or
• sub-divide all of or any of its existing shares into shares of smaller nominal amounts.
The Group may, from time to time increase its share capital by allotting new shares in accordance with theprescribed threshold authorized by shareholders at the last annual general meeting and subject to the consents andprocedures required by the Companies Act 2006, may by special resolution reduce its share capital.
Voting rights
Every holder of ordinary shares present in person or by proxy at a meeting of shareholders has one vote on avote taken by a show of hands. On a poll, every holder of ordinary shares who is present in person or by proxyhas one vote for every twenty-five pence of nominal share capital (being one ordinary share) of which he or sheis the holder. Voting at any meeting of shareholders is usually on a poll rather than by show of hands. Voting ona poll is more transparent and equitable because it includes the votes of all shareholders, including those cast byproxies, rather than just the votes of those shareholders who attend the meeting. A poll may be also demandedby:
• the chair of the meeting;
• at least three shareholders present in person or by proxy and entitled to vote;
• any shareholder or shareholders present in person or by proxy representing not less than one-tenth ofthe total voting rights of all shareholders having the right to vote at the meeting; or
• any shareholder or shareholders present in person or by proxy holding shares conferring a right to voteat the meeting being shares on which the aggregate sum paid up is equal to not less than one-tenth ofthe total sum paid up on all shares conferring that right.
Dividends
Holders of ordinary shares are entitled to receive dividends out of Group profits that are available by law fordistribution, as the Group may declare by ordinary resolution, subject to the terms of issue thereof. However, no
71

dividends may be declared in excess of an amount recommended by the board of directors. The board may payinterim dividends on the shares of any class as it deems fit. It may invest or otherwise use all dividends leftunclaimed for six months after having been declared for its benefit, until claimed. All dividends unclaimed for aperiod of twelve years after having been declared will be forfeited and revert to the Group.
The directors may, with the sanction of an ordinary resolution of the shareholders, offer any holders ofordinary shares the right to elect to receive ordinary shares credited as fully paid, in whole or in part, instead ofcash in respect of such dividend.
The directors may deduct from any dividend payable to any shareholder all sums of money (if any)presently payable by that shareholder to the Group on account of calls or otherwise in relation to its shares.
Liquidation rights
In the event of the Group’s liquidation, after payment of all liabilities, its remaining assets would be used torepay the holders of ordinary shares the amount they paid for their ordinary shares. Any balance would bedivided among the holders of ordinary shares in proportion to the nominal amount of the ordinary shares held bythem.
Other provisions of the articles of association
Whenever the Group’s capital is divided into different classes of shares, the special rights attached to anyclass may, unless otherwise provided by the terms of the issue of the shares of that class, be varied or abrogated,either with the written consent of the holders of three-fourths of the issued shares of the class (excluding anyissued as treasury shares) or with the sanction of a special resolution passed at a separate meeting of theseholders. In the event that a shareholder or other person appearing to the board of directors to be interested inordinary shares fails to comply with a notice requiring him or her to provide information with respect to theirinterest in voting shares pursuant to section 793 of the Companies Act 2006, the board may serve thatshareholder with a notice of default. After service of a default notice, that shareholder shall not be entitled toattend or vote at any general meeting or at a separate meeting of holders of a class of shares or on a poll until heor she has complied in full with the Group’s information request.
If the shares described in the default notice represent at least one-fourth of 1% in nominal value of theissued ordinary shares, then the default notice may additionally direct that in respect of those shares:
• the Group will not pay dividends (or issue shares in lieu of dividends); and
• the Group will not register transfers of shares unless the shareholder is not himself in default as regardssupplying the information requested and the transfer, when presented for registration, is in such form asthe board of directors may require to the effect that after due and careful inquiry, the shareholder issatisfied that no person in default is interested in any of the ordinary shares which are being transferredor the transfer is an approved transfer, as defined in the Group’s articles of association.
No provision of the articles of association expressly governs the ordinary share ownership threshold abovewhich shareholder ownership must be disclosed. Under the Disclosure and Transparency Rules of the FinancialConduct Authority, any person who acquires, either alone or, in specified circumstances, with others an interestin the Group’s voting share capital equal to or in excess of 3% comes under an obligation to disclose prescribedparticulars to the Group in respect of those ordinary shares. A disclosure obligation also arises where a person’snotifiable interests fall below 3%, or where, at or above 3%, the percentage of the Group’s voting share capital inwhich a person has a notifiable interest increases or decreases by 1% or more.
Limitations affecting holders of ordinary shares or ADSs
Under English law and articles of association, persons who are neither UK residents nor UK nationals mayfreely hold, vote and transfer ordinary shares in the same manner as UK residents or nationals.
72

With respect to the items discussed above, applicable UK law is not materially different from applicable USlaw.
Material contracts
The Group has not entered into any contracts outside the ordinary course of business during the two-yearperiod immediately preceding the date of this annual report. The Trust Deed entered into in 2015 with respect to€500.0 million aggregate principal amount of 1.375% guaranteed notes due 2025, issued by a subsidiary andguaranteed by Pearson, is filed as Exhibit 2.6 of this report.
Executive employment contracts
The Group has entered into agreements with each of its executive directors pursuant to which suchexecutive director is employed by the Group. These agreements describe the duties of such executive director andthe compensation to be paid by us. See “Item 6. Directors, Senior Management and Employees — Compensationof Senior Management”.
It is the Group’s policy that it may terminate the executive directors’ service agreements by giving no morethan 12 months’ notice. As an alternative, the Group may at its discretion pay in lieu of that notice.Payment-in-lieu of notice may be made in equal monthly installments from the date of termination to the end ofany unexpired notice period. In the case of the CEO, payment-in-lieu of notice in installments may also besubject to mitigation and reduced taking into account earnings from alternative employment. For executivedirectors, pay in lieu of notice comprises 100% of the annual salary at the date of termination and the annual costto the company of providing pension and all other benefits. In limited circumstances, in addition to making a fullpayment in lieu of notice, the Group may permit an executive director to stay employed after the announcementof his or her departure for a limited period to ensure an effective hand-over and/or allow time for a successor tobe appointed. The Group may, depending on the circumstances of the termination, determine that it will not paythe director in lieu of notice and may instead terminate a director’s contract in breach and make a damagespayment, taking into account as appropriate the director’s ability to mitigate his or her loss.
Exchange controls
There are no UK government laws, decrees, regulations or other legislation which restrict or which mayaffect the import or export of capital, including the availability of cash and cash equivalents for use by us or theremittance of dividends, interest or other payments to nonresident holders of the Group’s securities, except asotherwise described under “— Tax Considerations” below.
Tax considerations
The following is a discussion of the material US federal income tax considerations and UK taxconsiderations arising from the acquisition, ownership and disposition of ordinary shares and ADSs by a USholder. A US holder is:
• an individual citizen or resident of the US, or
• a corporation created or organized in or under the laws of the US or any of its political subdivisions, or
• an estate or trust the income of which is subject to US federal income taxation regardless of its source.
This discussion deals only with ordinary shares and ADSs that are held as capital assets by a US holder, anddoes not address tax considerations applicable to US holders that may be subject to special tax rules, such as:
• dealers or traders in securities or currencies,
73

• financial institutions or other US holders that treat income in respect of the ordinary shares or ADSs asfinancial services income,
• insurance companies,
• tax-exempt entities,
• persons acquiring shares or ADSs in connection with employment,
• US holders that hold the ordinary shares or ADSs as a part of a straddle or conversion transaction orother arrangement involving more than one position,
• US holders that own, or are deemed for US tax purposes to own, 10% or more of the total combinedvoting power of all classes of the Group’s voting stock,
• US holders that have a principal place of business or “tax home” outside the United States, or
• US holders whose “functional currency” is not the US dollar.
For US federal income tax purposes, holders of ADSs will be treated as the owners of the ordinary sharesrepresented by those ADSs. In practice, HM Revenue & Customs (HMRC) will also regard holders of ADSs asthe beneficial owners of the ordinary shares represented by those ADSs, although case law has cast some doubton this. The discussion below assumes that HMRC’s position is followed.
In addition, the following discussion assumes that The Bank of New York Mellon will perform itsobligations as depositary in accordance with the terms of the depositary agreement and any related agreements.
Because US and UK tax consequences may differ from one holder to the next, the discussion set out belowdoes not purport to describe all of the tax considerations that may be relevant to you and your particular situation.Accordingly, you are advised to consult your own tax advisor as to the US federal, state and local, UK and other,including foreign, tax consequences of investing in the ordinary shares or ADSs. Except where otherwiseindicated, the statements of US and UK tax law set out below are based on the laws, interpretations and taxauthority practice in force or applicable as of February 29, 2020 and are subject to any changes occurring afterthat date, possibly with retroactive effect.
UK income taxation of distributions
The UK does not impose dividend withholding tax on dividends paid by the Company.
A US holder that is not resident in the UK for UK tax purposes and does not carry on a trade, profession orvocation in the UK through a branch or agency (or in the case of a company a permanent establishment) to whichthe ordinary shares or ADSs are attributable will not generally be liable to pay UK tax on dividends paid by theCompany.
US income taxation of distributions
Distributions that the Group makes with respect to the ordinary shares or ADSs, other than distributions inliquidation and distributions in redemption of stock that are treated as exchanges, will be taxed to US holders asordinary dividend income to the extent that the distributions do not exceed the Group’s current and accumulatedearnings and profits. The amount of any distribution will equal the amount of the cash distribution. Distributions,if any, in excess of the Group’s current and accumulated earnings and profits will constitute a non-taxable returnof capital to a US holder and will be applied against and reduce the US holder’s tax basis in its ordinary shares orADSs. To the extent that these distributions exceed the tax basis of the US holder in its ordinary shares or ADSs,the excess generally will be treated as capital gain.
Dividends that the Group pays will not be eligible for the dividends received deduction generally allowed toUS corporations under Section 243 of the Code.
74

In the case of distributions in pounds sterling, the amount of the distributions generally will equal the USdollar value of the pounds sterling distributed, determined by reference to the spot currency exchange rate on thedate of receipt of the distribution by the US holder in the case of shares or by The Bank of New York Mellon inthe case of ADSs, regardless of whether the US holder reports income on a cash basis or an accrual basis. The USholder will realize separate foreign currency gain or loss only to the extent that this gain or loss arises on theactual disposition of pounds sterling received. For US holders claiming tax credits on a cash basis, taxes withheldfrom the distribution are translated into US dollars at the spot rate on the date of the distribution; for US holdersclaiming tax credits on an accrual basis, taxes withheld from the distribution are translated into US dollars at theaverage rate for the taxable year.
A distribution by the Company to non-corporate shareholders will be taxed as net capital gain at a maximumrate of 20%, provided certain holding periods are met, to the extent such distribution is treated as a dividendunder US federal income tax principles. In addition, a 3.8% Medicare tax will generally be imposed on the netinvestment income, which generally would include distributions treated as dividends under US federal incometax principles, of non-corporate taxpayers whose adjusted gross income exceeds a threshold amount.
UK taxation of capital gains
A US holder that is not resident in the UK for UK tax purposes and does not carry on a trade, profession orvocation in the UK through a branch or agency (or in the case of a company a permanent establishment) to whichthe ordinary shares or ADSs are attributable will not generally be liable for UK taxation on capital gains oreligible for relief for allowable losses, realized on the sale or other disposal of the ordinary shares or ADSs.
A US holder who is an individual who has been resident for tax purposes in the UK but who ceases to be soresident or becomes regarded as resident outside the UK for the purposes of any double tax treaty (“TreatyNon-resident”) and continues to not be resident in the UK, or continues to be Treaty Non-resident, for a period offive years or less and who disposes of his ordinary shares or ADSs during that period may also be liable on hisreturn to the UK to UK tax on capital gains, subject to any available exemption or relief, even though he is notresident in the UK, or is Treaty Non-resident, at the time of the disposal.
US income taxation of capital gains
Upon a sale or exchange of ordinary shares or ADSs to a person other than Pearson, a US holder will recognizegain or loss in an amount equal to the difference between the amount realized on the sale or exchange and the USholder’s adjusted tax basis in the ordinary shares or ADSs. Any gain or loss recognized will be capital gain or lossand will be long-term capital gain or loss if the US holder has held the ordinary shares or ADSs for more than oneyear. Long-term capital gain of a non-corporate US holder is generally taxed at a maximum rate of 20%. Inaddition, a 3.8% Medicare tax will generally be imposed on the net investment income, which generally wouldinclude capital gains, of non-corporate taxpayers whose adjusted gross income exceeds a threshold amount.
Gain or loss realized by a US holder on the sale or exchange of ordinary shares or ADSs generally will betreated as US-source gain or loss for US foreign tax credit purposes.
Estate and gift tax
The current Estate and Gift Tax Convention (referred to in this paragraph as the “Convention”), between theUS and the UK generally relieves from UK inheritance tax (the equivalent of US estate and gift tax) the transferof ordinary shares or of ADSs where the transferor is domiciled in the US for the purposes of the Convention.This relief will not apply if the ordinary shares or ADSs are part of the business property of an individual’spermanent establishment in the UK or pertain to the fixed base in the UK of a person providing independentpersonal services. If no relief is given under the Convention, inheritance tax may be charged on death and also onthe amount by which the value of an individual’s estate is reduced as a result of any transfer made by way of gift
75

or other gratuitous or undervalue transfer, in general within seven years of death, and in certain othercircumstances. In the unusual case where ordinary shares or ADSs are subject to both UK inheritance tax and USestate or gift tax, the Convention generally provides for tax paid in the UK to be credited against tax payable inthe US or for tax paid in the US to be credited against tax payable in the UK based on priority rules set forth inthe Convention.
Stamp duty
No stamp duty or stamp duty reserve tax (SDRT) will generally be payable in the UK on the purchase ortransfer of an ADS, provided that the ADS, and any separate instrument or written agreement of transfer, remainat all times outside the UK and that the instrument or written agreement of transfer is not executed in the UK.Subject to the following paragraph, UK legislation does however provide for SDRT or (in the case of transfers)stamp duty to be chargeable at the rate of 1.5% of the amount or value of the consideration or, in somecircumstances, the value of the ordinary shares (rounded up to the next multiple of £5 in the case of stamp duty),where ordinary shares are issued or transferred to a person whose business is or includes issuing depositaryreceipts, or to a nominee or agent for such a person, or issued or transferred to a person whose business is orincludes the provision of clearance services or to a nominee or agent for such a person.
Following litigation, HM Revenue & Customs (HMRC) has accepted that it will no longer seek to apply the1.5% SDRT charge when new shares are issued to a clearance service or depositary receipt system on the basisthat the charge is not compatible with EU law. The UK Government have announced their intention to continuewith this approach following the UK’s departure from the EU. HMRC’s view is that the 1.5% SDRT or stampduty charge will continue to apply to transfers of shares into a clearance service or depositary receipt system,unless they are an integral part of an issue of share capital. However, further litigation indicates that certain othertransfers are also not chargeable under EU law. Accordingly, specific professional advice should be soughtbefore paying the 1.5% SDRT or stamp duty charge in any circumstances.
A transfer for value of the underlying ordinary shares will generally be subject to either stamp duty orSDRT, normally at the rate of 0.5% of the amount or value of the consideration (rounded up to the next multipleof £5 in the case of stamp duty). A transfer of ordinary shares from a nominee to its beneficial owner, includingthe transfer of underlying ordinary shares from the Depositary to an ADS holder, under which no beneficialinterest passes will not be subject to stamp duty or SDRT.
Close company status
The Group believes that the close company provisions of the UK Corporation Tax Act 2010 do not apply toit.
Documents on display
Copies of the Group’s Memorandum and Articles of Association are filed as exhibits to this Annual Reportand certain other documents referred to in this Annual Report are available for inspection at its registered officeat 80 Strand, London WC2R 0RL (c/o the Company Secretary), during usual business hours upon reasonableprior request.
ITEM 11. QUANTITATIVE AND QUALITATIVE DISCLOSURES ABOUT MARKET RISK
Introduction
Pearson’s treasury policies set out the group’s principles for addressing key financial risks including capitalrisk, liquidity risk, foreign exchange risk and interest rate risk and sets out measurable targets for each. The AuditCommittee receive quarterly reports incorporating compliance with these measurable targets and review andapprove the treasury policies annually.
76

The treasury function is permitted to use derivatives where their use reduces a risk or allows a transaction tobe undertaken more cost effectively. Derivatives permitted include swaps, forwards and collars to manageforeign exchange and interest rate risk, with foreign exchange swap and forward contracts the most commonlyexecuted. Speculative transactions are not permitted.
Capital risk
The Group’s objectives when managing capital are:
• To maintain a strong balance sheet and a solid investment grade rating;
• To continue to invest in the business;
• To have a sustainable and progressive dividend policy, and;
• To return surplus cash to our shareholders where appropriate.
The Group is currently rated BBB (negative outlook) with Standard and Poor’s and Baa2 (stable outlook)with Moody’s.
Interest and foreign exchange rate management
The Group’s principal currency exposure is to the US dollar (USD) which represents more than 60% of theGroup’s sales. A portion of the Group’s debt is held in US dollars to provide a natural hedge of this exposure.
Pearson achieves this mix in one of three ways:
1. Issuing fixed rate debt in USD;
2. Issuing fixed debt in euro and swapping it to British Pounds Sterling (GBP) either at fixed or floatingrates and swapping an element to USD either using cross currency swaps or foreign exchange swaps;
3. Borrowing in USD at floating rates on the group’s bank facility.
At December 31, 2019, the group had swap contracts and fixed rate bonds to fix the interest rate on $1,058m(2018: $477m) of total fixed debt, excluding leases.
Liquidity and re-financing risk management
The Group regularly reviews the level of cash and debt facilities required to fund its activities. This involvespreparing a prudent cash flow forecast for the next three to five years, determining the level of debt facilitiesrequired to fund the business, planning for repayments of debt at its maturity and identifying an appropriateamount of headroom to provide a reserve against unexpected outflows.
At December 31, 2019, the Group had cash of £0.4 billion and was drawn at £230m/$303m of $1.9bn(£902m) US dollar denominated revolving credit facility due 2024.
At December 31, 2018, the Group had cash of £0.5 billion and an undrawn US dollar denominated revolvingcredit facility of $1.75 billion (£1.4 bn) due 2021.
The $1.19 billion facility contains interest cover and leverage covenants which the Group has complied withfor both the years ended December 31, 2018 and December 31, 2019.
Financial counterparty risk management
Counterparty credit limits, which take published credit rating and other factors into account, are set to coverthe Group’s total aggregate exposure to a single financial institution. The limits applicable to published creditratings bands are approved by the chief financial officer within guidelines approved by the board. Exposures andlimits applicable to each financial institution are reviewed on a regular basis.
77

ITEM 12. DESCRIPTION OF SECURITIES OTHER THAN EQUITY SECURITIES
AMERICAN DEPOSITARY SHARES
Fees paid by ADR holders
The Group’s ordinary shares trade in the United States under a sponsored ADR facility with The Bank ofNew York Mellon as depositary.
The depositary collects its fees for delivery and surrender of ADSs directly from investors depositing sharesor surrendering ADSs for the purpose of withdrawal, or from intermediaries acting for them. The depositarycollects fees for making distributions to investors by deducting those fees from the amounts distributed or byselling a portion of distributable property to pay the fees. The depositary may collect its annual fee for depositaryservices by deductions from cash distributions or by directly billing investors or by charging the book-entrysystem accounts of participants acting for them. The depositary may generally refuse to provide fee-attractingservices until its fees for those services are paid.
The following table summarizes various fees currently charged by The Bank of New York Mellon:
Person depositing or withdrawing shares must pay to thedepositary: For:
$5.00 (or less) per 100 ADSs (or portion of 100 ADSs) • Issuance of ADSs, including issuances resultingfrom a distribution of shares or rights or otherproperty •
• Cancellation of ADSs for the purpose ofwithdrawal, including if the deposit agreementterminates
$.05 (or less) per ADS • Any cash distribution to ADS registered holders
A fee equivalent to the fee that would be payable ifsecurities distributed had been shares and the shares hadbeen deposited for issuance of ADSs
• Distribution of securities by the depositary toADS registered holders of deposited securities
$.05 (or less) per ADS per calendar year • Depositary services
Registration of transfer fees • Transfer and registration of shares on the shareregister to or from the name of the depositary orits agent when shares are deposited orwithdrawn
Expenses of the depositary • Cable, telex and facsimile transmissions (whenexpressly provided in the deposit agreement)
• Converting foreign currency to US dollars
Taxes and other governmental charges the depositary orthe custodian have to pay on any ADS or shareunderlying an ADS, for example, stock transfer taxes,stamp duty or withholding taxes
• As necessary
Any charges incurred by the depositary or its agents forservicing the deposited securities
• As necessary
Fees incurred in past annual period and fees to be paid in the future
The Company received $70,223 as reimbursement from the depositary with respect to 2019 for standardout-of-pocket maintenance costs for the ADRs (consisting of the expenses of postage and envelopes for mailingthe proxy voting materials, and tabulation for the non-registered holders, any applicable performance indicatorsrelating to the ADR facility, and legal fees).
78

The depositary has agreed to reimburse the Company for expenses they incur that are related toestablishment and maintenance expenses of the ADS program. The depositary also agrees to pay the standardout-of-pocket maintenance costs for the registered ADR holders, which consists of the expenses of postage andenvelopes for mailing proxy voting materials, printing and distributing dividend cheques, electronic filing of USFederal tax information, mailing required tax forms, stationery, postage, facsimile and telephone calls. It has alsoagreed to reimburse the Company annually for certain investor relationship programs or special investor relationspromotional activities. In certain instances, the depositary has agreed to provide additional payments to theCompany based on any applicable performance indicators relating to the ADR facility. There are limits on theamount of expenses for which the depositary will reimburse the Company, but the amount of reimbursementavailable to the Company is not necessarily tied to the amount of fees the depositary collects from investors.
79

PART II
ITEM 13. DEFAULTS, DIVIDEND ARREARAGES AND DELINQUENCIES
None.
ITEM 14. MATERIAL MODIFICATIONS TO THE RIGHTS OF SECURITY HOLDERS AND USE OFPROCEEDS
None.
ITEM 15. CONTROLS AND PROCEDURES
Disclosure controls and procedures
An evaluation of the effectiveness the Group’s disclosure controls and procedures as of December 31, 2019was carried out by management, under the supervision and with the participation of the Chief Executive Officerand Chief Financial Officer. Based on that evaluation, the Chief Executive Officer and Chief Financial Officerconcluded that the Company’s disclosure controls and procedures (as defined in Rules 13a- 15(e) and 15d-15(e)under the Securities Exchange Act of 1934, as amended) were effective as at December 31, 2019 at a reasonableassurance level. A controls system, no matter how well designed and operated, cannot provide absolute assuranceto achieve its objectives.
Management’s annual report on internal control over financial reporting
Management is responsible for establishing and maintaining adequate internal control over financialreporting for the Company. Internal control over financial reporting is a process designed by, or under thesupervision of, the Chief Executive Officer and Chief Financial Officer, or persons performing similar functions,and effected by the Company’ board of directors, management and other personnel to provide reasonableassurance regarding the reliability of financial reporting and the preparation of financial statements for externalpurposes in accordance with generally accepted accounting principles. Management has assessed theeffectiveness of internal control over financial reporting as of December 31, 2019 based on the framework inInternal Control — Integrated Framework (2013) issued by the Committee of Sponsoring Organizations of theTreadway Commission (“COSO”). Based on this evaluation, management has concluded that the Company’sinternal control over financial reporting was effective as of December 31, 2019 based on criteria in InternalControl — Integrated Framework (2013) issued by the COSO.
PricewaterhouseCoopers LLP, an independent registered public accounting firm, has audited theeffectiveness of the Company’s internal control over financial reporting as of December 31, 2019, as stated intheir report which appears on page F-2.
Change in internal control over financial reporting
During the period covered by this Annual Report on Form 20-F, the Company has embarked on a programof work to deliver a single Pearson-wide solution to integrate data, systems and processes across humanresources, finance, procurement and supply chain. This program went live in the UK in 2016, in the US in 2018and remaining countries in 2019, with a resulting change in some aspects of the control environment. Other thanthe foregoing, there have been no changes in our internal control over financial reporting during the year endedDecember 31, 2019 that have materially affected, or are reasonably likely to materially affect, the Company’sinternal control over financial reporting.
ITEM 16A. AUDIT COMMITTEE FINANCIAL EXPERT
The members of the Board of Directors of Pearson plc have determined that Tim Score is an auditcommittee financial expert within the meaning of the applicable rules and regulations of the US Securities andExchange Commission.
80

ITEM 16B. CODE OF ETHICS
Pearson has adopted a code of ethics (the Pearson code of conduct) which applies to all employees includingthe chief executive officer and chief financial officer and other senior financial management. This code of ethicsis available on the Group’s website (www.pearson.com/corporate/code-of-conduct.html). The information on thiswebsite is not incorporated by reference into this report.
ITEM 16C. PRINCIPAL ACCOUNTANT FEES AND SERVICES
In line with best practice, the Group’s relationship with PricewaterhouseCoopers LLP (PwC) is governed byits external auditor policy, which is reviewed and approved annually by the audit committee. The policyestablishes procedures to ensure the auditors’ independence is not compromised as well as defining thosenon-audit services that PwC may or may not provide to Pearson. These allowable services are in accordance withrelevant UK and US legislation.
The audit committee approves all audit and non-audit services provided by PwC. Where appropriate,services will be tendered prior to awarding this work to the auditor.
The following table sets forth remuneration paid to PwC for 2019 and 2018:
Auditors’ Remuneration 2019 2018
£m £m
Audit fees . . . . . . . . . . . . . . . . . . . . . . . . . . . . . . . . . . . . . . . . . . . . . . 7 6Tax fees . . . . . . . . . . . . . . . . . . . . . . . . . . . . . . . . . . . . . . . . . . . . . . . — —Audit-related fees . . . . . . . . . . . . . . . . . . . . . . . . . . . . . . . . . . . . . . . . — 1All other fees . . . . . . . . . . . . . . . . . . . . . . . . . . . . . . . . . . . . . . . . . . . — 1
Audit fees include £35,000 (2018: £35,000) of audit fees relating to the audit of the parent company.
Fees for the audit of the effectiveness of the Group’s internal control over financial reporting are allocatedto audit fees paid.
Included in audit related fees is audit related work in relation to disposal transactions and other assurancework related to the audit of the Group’s efficacy program.
ITEM 16D. EXEMPTIONS FROM THE LISTING STANDARDS FOR AUDIT COMMITTEES
Not applicable.
ITEM 16E. PURCHASES OF EQUITY SECURITIES BY THE ISSUER AND AFFILIATED PURCHASES
PeriodTotal number ofshares purchased
Average pricepaid per share
Total numberof units purchasedas part of publiclyannounced plans
or programs
Approximatemaximum value
of shares thatmay yet be
purchased underthe plans orprograms
October 1, 2017 – October 31, 2017 . . . . . . . . 4,846,809 £7.03 4,846,809 £266mNovember 1, 2017 – November 30, 2017 . . . . 11,210,922 £6.99 11,210,922 £187mDecember 1, 2017 – December 31, 2017 . . . . 4,938,170 £7.23 4,938,170 £151mJanuary 1, 2018 – January 31, 2018 . . . . . . . . 9,895,690 £7.03 9,895,690 £ 81mFebruary 1, 2018 – February 28, 2018 . . . . . . 11,943,986 £6.77 11,943,986 £ 22mFebruary 1, 2019 – February 28, 2019 . . . . . . 1,500,000 £8.97 n/a n/aMarch 1, 2019 – March 31, 2019 . . . . . . . . . . 3,000,000 £8.74 n/a n/aOctober 1, 2019 – October 31, 2019 . . . . . . . . 1,600,000 £7.39 n/a n/aJanuary 1, 2020 – January 31, 2020 . . . . . . . . 6,680,158 £5.80 6,680,158 £310mFebruary 1, 2020 – February 29, 2020 . . . . . . 9,958,033 £5.72 9,958,033 £ 253
81

All purchases were made in open-market transactions.
Purchases of shares in 2019 were made to satisfy obligations under Pearson employee share awardprograms. None of the foregoing share purchases was made as part of a publicly announced plan or program.
In January 2020, the Group announced a £350m share buyback program. In 2020, the Group’s brokerspurchased 16.9m shares at a total value of £97m. All shares had been cancelled at February 29, 2020. The sharesbought back were cancelled and the nominal value of these shares was transferred to a capital redemptionreserve. The nominal value of shares cancelled at December 31, 2019 was £nil (2018: £11m).
As a result of COVID-19 pandemic, and with a likelihood of prolonged uncertainty, the share buybackprogram has, as of 23 March 2020, been paused until further notice.
ITEM 16F. CHANGE IN REGISTRANT’S CERTIFYING AUDITOR
Not applicable.
ITEM 16G. CORPORATE GOVERNANCE
Pearson is listed on the New York Stock Exchange (“NYSE”). As a listed non-US issuer, the Group isrequired to comply with some of the NYSE’s corporate governance rules, and otherwise must disclose on itswebsite any significant ways in which its corporate governance practices differ from those followed by UScompanies under the NYSE listing standards. At this time, the Company believes that it is in compliance in allmaterial respects with all the NYSE rules except that the Remuneration Committee and the Nomination &Governance Committee are not composed entirely of independent directors as the Chairman, who is notconsidered independent under NYSE rules, is a member of each committee in addition to independent directors.
ITEM 16H. MINE SAFETY DISCLOSURE
Not applicable.
82

PART III
ITEM 17. FINANCIAL STATEMENTS
Not applicable.
ITEM 18. FINANCIAL STATEMENTS
The financial statements filed as part of this Annual Report are included on pages F-1 through F-95 hereof.
ITEM 19. EXHIBITS
1.1 Articles of Association of Pearson plc. ∞2.1 Indenture dated May 8, 2012 between Pearson Funding Four plc, as the Issuer, Pearson plc,
Guarantor, and The Bank of New York Mellon, as trustee, Paying Agent and Calculation Agent ϕ2.2 Indenture dated May 8, 2013 between Pearson Funding Five plc, as the Issuer, Pearson plc,
Guarantor, and The Bank of New York Mellon, as trustee, Paying Agent and Calculation Agent. θ2.3 Trust Deed dated May 19, 2014 between Pearson Funding Five plc, as the Issuer, Pearson plc,
Guarantor, and The Law Debenture Trust Corporation P.L.C, as trustee. ∞2.4 Trust Deed dated May 6, 2015 between Pearson Funding Five plc, as the Issuer, Pearson plc,
Guarantor, and The Law Debenture Trust Corporation P.L.C, as trustee. λ2.5 Indenture dated September 5, 2019 between Pearson Funding Four plc, as the Company, Pearson plc,
Guarantor and The Bank of New York Mellon, as trustee, Paying Agent and Calculation Agent.
2.6 Description of securities of Pearson plc.
8.1 List of Significant Subsidiaries.
12.1 Certification of Chief Executive Officer.
12.2 Certification of Chief Financial Officer.
13.1 Certification of Chief Executive Officer.
13.2 Certification of Chief Financial Officer.
15.1 Consent of PricewaterhouseCoopers LLP.
101.INS XBRL Instance Document.
101.SCH XBRL Taxonomy Extension Schema Document
101.CAL XBRL Taxonomy Extension Calculation Linkbase Document.
101.DEF XBRL Taxonomy Extension Definition Linkbase Document.
101.LAB XBRL Taxonomy Extension Label Linkbase Document.
101.PRE XBRL Taxonomy Extension Presentation Linkbase Document.
ϕ Incorporated by reference from the Form 20-F of Pearson plc for the year ended December 31, 2012 andfiled March 22, 2013
θ Incorporated by reference from the Form 20-F of Pearson plc for the year ended December 31, 2013 andfiled March 27, 2014.
∞ Incorporated by reference from the Form 20-F of Pearson plc for the year ended December 31, 2014 andfiled March 26, 2015.
λ Incorporated by reference from the Form 20-F of Pearson plc for the year ended December 31, 2015 andfiled March 23, 2016.
83

[THIS PAGE INTENTIONALLY LEFT BLANK]

FINANCIAL STATEMENTS: CONTENTS
Pearson plc Consolidated Financial StatementsReport of Independent Registered Public Accounting Firm . . . . . . . . . . . . . . . . . . . . . . . . . . . . . . . . . . . . . . F-2Consolidated Income Statement for the year ended December 31, 2019, 2018 and 2017 . . . . . . . . . . . . . . . F-8Consolidated Statement of Comprehensive Income for the year ended December 31, 2019,
2018 and 2017 . . . . . . . . . . . . . . . . . . . . . . . . . . . . . . . . . . . . . . . . . . . . . . . . . . . . . . . . . . . . . . . . . . . . . . . F-9Consolidated Balance Sheet as at December 31, 2019 and 2018 . . . . . . . . . . . . . . . . . . . . . . . . . . . . . . . . . . F-10Consolidated Statement of Changes in Equity for the year ended December 31, 2019, 2018 and 2017 . . . . F-12Consolidated Cash Flow Statement for the year ended December 31, 2019, 2018 and 2017 . . . . . . . . . . . . . F-14Notes to the Consolidated Financial Statements . . . . . . . . . . . . . . . . . . . . . . . . . . . . . . . . . . . . . . . . . . . . . . . F-15
F-1

Report of Independent Registered Public Accounting Firm
To the Board of Directors and Shareholders of Pearson plc
Opinions on the Financial Statements and Internal Control over Financial Reporting
We have audited the accompanying consolidated balance sheets of Pearson plc and its subsidiaries (the“Company”) as of December 31, 2019 and 2018 and the related consolidated income statements, consolidatedstatements of comprehensive income, consolidated statements of changes in equity and consolidated cash flowstatements for each of the three years in the period ended December 31, 2019, including the related notes(collectively referred to as the “consolidated financial statements”). We also have audited the Company’s internalcontrol over financial reporting as of December 31, 2019, based on criteria established in Internal Control —Integrated Framework (2013) issued by the Committee of Sponsoring Organizations of the TreadwayCommission (COSO).
In our opinion, the consolidated financial statements referred to above present fairly, in all material respects, thefinancial position of the Company as of December 31, 2019 and 2018 and the results of its operations and its cashflows for each of the three years in the period ended December 31, 2019 in conformity with InternationalFinancial Reporting Standards as issued by the International Accounting Standards Board and InternationalFinancial Reporting Standards as adopted by the European Union. Also in our opinion, the Company maintained,in all material respects, effective internal control over financial reporting as of December 31, 2019, based oncriteria established in Internal Control — Integrated Framework (2013) issued by the COSO.
Change in Accounting Principle
As discussed in note 1b to the consolidated financial statements, the Company changed the manner in which itaccounted for leases in 2019 due to the adoption of IFRS 16.
Basis for Opinions
The Company’s management is responsible for these consolidated financial statements, for maintaining effectiveinternal control over financial reporting and for its assessment of the effectiveness of internal control overfinancial reporting included in “Management’s Annual Report on Internal Control over Financial Reporting”appearing under Item 15 of this Form 20-F. Our responsibility is to express opinions on the Company’sconsolidated financial statements and on the Company’s internal control over financial reporting based on ouraudits. We are a public accounting firm registered with the Public Company Accounting Oversight Board(United States) (PCAOB) and are required to be independent with respect to the Company in accordance with theU.S. federal securities laws and the applicable rules and regulations of the Securities and Exchange Commissionand the PCAOB.
We conducted our audits in accordance with the standards of the PCAOB. Those standards require that we planand perform the audits to obtain reasonable assurance about whether the consolidated financial statements arefree of material misstatement, whether due to error or fraud, and whether effective internal control over financialreporting was maintained in all material respects.
Our audits of the consolidated financial statements included performing procedures to assess the risks of materialmisstatement of the consolidated financial statements, whether due to error or fraud, and performing proceduresthat respond to those risks. Such procedures included examining, on a test basis, evidence regarding the amountsand disclosures in the consolidated financial statements. Our audits also included evaluating the accountingprinciples used and significant estimates made by management, as well as evaluating the overall presentation ofthe consolidated financial statements. Our audit of internal control over financial reporting included obtaining anunderstanding of internal control over financial reporting, assessing the risk that a material weakness exists andtesting and evaluating the design and operating effectiveness of internal control based on the assessed risk. Ouraudits also included performing such other procedures as we considered necessary in the circumstances. Webelieve that our audits provide a reasonable basis for our opinions.
F-2

Definition and Limitations of Internal Control over Financial Reporting
A company’s internal control over financial reporting is a process designed to provide reasonable assuranceregarding the reliability of financial reporting and the preparation of financial statements for external purposes inaccordance with generally accepted accounting principles. A company’s internal control over financial reportingincludes those policies and procedures that (i) pertain to the maintenance of records that, in reasonable detail,accurately and fairly reflect the transactions and dispositions of the assets of the company; (ii) provide reasonableassurance that transactions are recorded as necessary to permit preparation of financial statements in accordancewith generally accepted accounting principles and that receipts and expenditures of the company are being madeonly in accordance with authorizations of management and directors of the company; and (iii) provide reasonableassurance regarding prevention or timely detection of unauthorized acquisition, use or disposition of thecompany’s assets that could have a material effect on the financial statements.
Because of its inherent limitations, internal control over financial reporting may not prevent or detectmisstatements. Also, projections of any evaluation of effectiveness to future periods are subject to the risk thatcontrols may become inadequate because of changes in conditions or that the degree of compliance with thepolicies or procedures may deteriorate.
Critical Audit Matters
The critical audit matters communicated below are matters arising from the current period audit of theconsolidated financial statements that were communicated or required to be communicated to the auditcommittee and that (i) relate to accounts or disclosures that are material to the consolidated financial statementsand (ii) involved our especially challenging, subjective or complex judgments. The communication of criticalaudit matters does not alter in any way our opinion on the consolidated financial statements, taken as a whole,and we are not, by communicating the critical audit matters below, providing separate opinions on the criticalaudit matters or on the accounts or disclosures to which they relate.
Carrying value of goodwill
As described in note 11 to the consolidated financial statements, the Company’s goodwill balance was £2,139million as of December 31, 2019. Goodwill has been allocated to cash generating units (“CGUs”) or to anaggregation of CGUs where goodwill could not be reasonably allocated to individual CGUs. CGUs have beenrevised in 2019 as a result of organisation changes and system consolidation. As a result, goodwill has beenreallocated to these revised CGUs. Goodwill is tested at least annually for impairment. The recoverable amountof each aggregated CGU is based on the higher of value in use and fair value less costs of disposal. The value inuse was higher than the fair value less costs of disposal for each of the CGUs. For the purpose of estimatingvalue in use, management has used an income approach based on present value techniques. These calculationsrequire management judgement in respect of the use of estimates for discount rates, perpetuity growth rates andsales and operating profit forecasts. In evaluating the implications of subsequent events on the Company’simpairment judgments as of December 31, 2019, management has separately determined that COVID-19 is anon-adjusting post balance sheet event.
The principal considerations for our determination that performing procedures relating to the carrying value ofgoodwill is a critical audit matter are that there were judgments and estimates made by management indetermining the revised CGUs, in reallocating goodwill to the CGUs and in determining the recoverable amountof the CGUs. This in turn led to a high degree of auditor judgment, subjectivity, and effort in performingprocedures to evaluate management’s CGU assessment and goodwill allocation and the present value techniquesused to calculate value in use such as sales and operating profit forecasts and significant assumptions, includingdiscount rates and perpetuity growth rates. In addition, the audit effort involved the use of professionals withspecialized skill and knowledge to assist in performing these procedures and in evaluating the audit evidenceobtained.
F-3

Addressing the matter involved performing procedures and evaluating audit evidence in connection with formingour overall opinion on the consolidated financial statements. These procedures included testing the effectivenessof controls relating to management’s impairment assessment of the carrying value of goodwill. These proceduresalso included, among others:
— testing management’s CGU reassessment and reallocation of goodwill, including evaluating themethodology applied by management to reallocate goodwill and testing the mathematical accuracy ofthe allocation exercise. We assessed whether goodwill is monitored or measured at a level lower thanmanagement’s revised CGU groupings;
— testing the mathematical integrity of management’s value in use impairment model and the forecastsand carrying values used;
— comparing the forecast cash flows (which include forecast sales and operating profit) to boardapproved budgets and strategic plans and assessing how these budgets and strategic plans are compiled,including an assessment of historical accuracy of budgets;
— evaluating management’s related judgments and estimates, including short-term revenue and operatingprofit projections;
— comparing management’s forecasts and key assumptions to industry projections and to comparablecompanies where this information was available;
— using professionals with specialized skill and knowledge to assist in evaluating the appropriateness ofthe perpetuity growth rate and discount rate for each CGU by comparison with third party information,past performance and relevant risk factors;
— evaluating management’s rationale why a longer forecast period until 2030 was appropriate for specificcash flow projections for Online Program Management (“OPM”) compared to the three year periodcovered by the Group’s strategic planning process and applied to each of the other CGUs and whymanagement was able to prepare longer-term forecasts for OPM;
— testing the calculation of the impairment charge for Brazil based on value in use and evaluatingmanagement’s calculation of the fair value less costs of disposal to assess whether that would give riseto a higher recoverable amount;
— performing independent sensitivity analyses to understand the impact of reasonably possible changes tokey assumptions;
— evaluating the sufficiency of disclosures in relation to the North American Courseware, OPM, Coreand Brazil CGUs where headroom is lower or more sensitive to changes in key assumptions; and
— evaluating management’s judgment disclosed in note 37 to the consolidated financial statements thatCOVID-19 is a non-adjusting post balance sheet event.
Provisions for tax uncertainties
As described in note 7 to the consolidated financial statements, the Company has recorded provisions for taxuncertainties of £152 million as of December 31, 2019. The Company is subject to income taxes in numerousjurisdictions. Significant judgment is required in determining the estimates in relation to the worldwideprovisioning for income taxes. There are many transactions and calculations for which the ultimate taxdetermination is uncertain during the ordinary course of business. The Company recognises tax provisions whenit is considered probable that there will be a future outflow of funds to a tax authority. The provisions are basedon management’s judgment regarding the application of tax legislation, the results of any tax audits, and bestestimates of future settlement amounts. The Company discloses tax exposures in respect of unsettled or disputedtax liabilities when it is considered possible that there will be a future outflow of funds to a tax authority.
F-4

The principal considerations for our determination that performing procedures relating to provisions for taxuncertainties is a critical audit matter are that there was judgment applied by management when determininguncertain tax positions, including a high degree of estimation uncertainty relative to the application of tax laws,findings of tax audits, and potential for significant adjustments as a result of such audits. This in turn led to ahigh degree of auditor judgment, subjectivity, and effort in performing procedures to evaluate the timelyidentification and accurate measurement of provisions for tax uncertainties. Also, the evaluation of auditevidence available to support the provisions for tax uncertainties is complex and required significant auditorjudgment as the nature of the evidence is often highly subjective and the audit effort involved the use ofprofessionals with specialized skill and knowledge to assist in performing these procedures and in evaluating theaudit evidence obtained.
Addressing the matter involved performing procedures and evaluating audit evidence in connection with formingour overall opinion on the consolidated financial statements. These procedures included testing the effectivenessof controls relating to the identification, completeness and measurement of provisions for tax uncertainties. Usingprofessionals with specialized skill and knowledge to assist in undertaking this testing, these procedures alsoincluded, among others:
— assessing the tax impact of business developments in 2019, including the disposal of the US K12Courseware business;
— recalculating the Company’s tax provisions and considering whether the treatments adopted were inline with the Company’s tax policies and had been applied consistently;
— evaluating the key underlying assumptions. In making this evaluation, the status of tax authority auditsand enquiries was considered. We considered the basis and support in particular for provisions notsubject to tax audit in comparison with experience of similar situations at comparable companies;
— evaluating the consistency of settled amounts against provisions booked in prior years;
— evaluating the consistency of management’s approach to establishing or changing prior provisionestimates and considering whether changes in prior provisions reflected a change in facts andcircumstances during 2019; and
— evaluating the basis for management’s judgments where provisions have not been established,including for material potential exposures like EU state aid and the assessment from the Brazilian taxauthorities disclosed in note 34 to the consolidated financial statements, and assessing third partyadvice obtained by the Group as we independently formed our own view about the likelihood of thesepossible tax risks crystallising in future cash outflows.
Sales return liability
As described in notes 3 and 24 to the consolidated financial statements, the Company’s sales return liability was£122 million as of December 31, 2019. Revenue from the sale of books is recognised net of a provision foranticipated returns. This liability requires management to consider historical return rates, customer buyingpatterns, and retailer behaviours, including stock levels.
The principal considerations for our determination that performing procedures relating to the sales return liabilityis a critical audit matter are that there were estimates made by management when determining the level ofprovisioning. This in turn led to a high degree of auditor judgment, subjectivity, and effort in performingprocedures to evaluate management’s significant assumptions, including historical return rates, customer buyingpatterns and retailer behaviours, including stock levels.
F-5

Addressing the matter involved performing procedures and evaluating audit evidence in connection with formingour overall opinion on the consolidated financial statements. These procedures included testing the effectivenessof controls relating to the sales return liability. These procedures also included, among others:
— assessing management’s evaluation of market trends and the Company’s responses and consideringwhether management’s provisioning methodology is appropriate in this context;
— testing the sales return liability calculation and evaluating the completeness and accuracy of historicalsales and return experience data;
— performing detailed testing over shipment and return levels around year-end (and extending through thedate of this opinion) and evaluating whether these gave rise to an increased risk of future returns;
— considering whether the reduction in the sales return liability in 2019 is consistent with evidenceobtained in other areas of the audit; and
— evaluating whether management has adopted methods and made estimates for future returns that weresupportable and appropriate.
Recoverability of pre-publication assets
As described in note 20 to the consolidated financial statements, the Company’s pre-publication assets amountedto £870 million as of December 31, 2019. Pre-publication assets represent direct costs incurred in thedevelopment of educational programmes and titles prior to their publication. These costs are recognised ascurrent intangible assets when the title will generate probable future economic benefits and costs can bemeasured reliably. Pre-publication assets are amortised on publication over their estimated economic lives. Theestimate of the economic lives and the recoverability of pre-publication assets involves a significant degree ofjudgment based on historical trends and management estimates of future potential sales.
The principal considerations for our determination that performing procedures relating to the recoverability ofpre-publication assets is a critical audit matter are that there were judgments and estimates applied bymanagement when assessing the estimated economic lives and the recoverability of pre-publication assets,including the application of future potential sales. This in turn led to a high degree of auditor judgment,subjectivity, and effort in performing procedures to evaluate management’s judgments and estimates.
Addressing the matter involved performing procedures and evaluating audit evidence in connection with formingour overall opinion on the consolidated financial statements. These procedures included testing the effectivenessof controls relating to the pre-publication assets. These procedures also included, among others:
— assessing the appropriateness of capitalisation and amortisation policies and considering whether thesepolicies had been consistently applied;
— selecting a sample of costs to test their accuracy and appropriateness for capitalisation;
— evaluating the reasonableness of amortisation periods and profiles compared to sales forecasts andhistorical sales experience;
— evaluating the carrying value of certain pre-publication assets where products are yet to be launched,are less proven or where sales are lower than originally anticipated; and
— comparing forecast sales with historical experience, including an evaluation of the historical accuracyof budgeting, and obtaining supporting evidence for management’s explanations of variances.
F-6

Valuation of other receivables in relation to the disposal of US K12 Courseware
As described in note 14 to the consolidated financial statements, other receivables in relation to the disposal ofUS K12 Courseware amounted to £182 million as of December 31, 2019. As described in note 31 to theconsolidated financial statements, the Company completed the disposal of its US K12 Courseware business in2019, resulting in a pre-tax profit of £13 million. The total gross proceeds amounted to £200 million of which£180 million was deferred in other receivables at the date of disposal. The deferred proceeds related to anunconditional vendor note for $225 million and an entitlement to 20% of future cash flows to equity holders andto 20% of net proceeds in the event of a subsequent sale of K12. The fair value of the other receivables ondisposal and on subsequent measurement is determined using present value techniques whereby the expectedvalue of future cash flows is discounted using a rate which is representative of the creditworthiness of the USK12 Courseware business. The key inputs used in the present value calculations on initial disposal were forecastsales, discount rate and the expected date of a subsequent sale of the US K12 Courseware business.
The principal considerations for our determination that performing procedures relating to the valuation of otherreceivables in relation to the disposal of US K12 Courseware is a critical audit matter are that there werejudgments and estimates applied by management in establishing the fair value of the other receivables. This inturn led to a high degree of auditor judgment, subjectivity, and effort in performing procedures to evaluatemanagement’s judgments and estimates including forecast sales, discount rate and the expected date of asubsequent sale of the US K12 Courseware business. In addition, the audit effort involved the use ofprofessionals with specialized skill and knowledge to assist in performing these procedures and in evaluating theaudit evidence obtained.
Addressing the matter involved performing procedures and evaluating audit evidence in connection with formingour overall opinion on the consolidated financial statements. These procedures included testing the effectivenessof controls relating to the valuation of other receivables. These procedures also included, among others:
— assessing management’s assumptions on initial disposal related to the expected payment profile of thedeferred proceeds, the expected timing of the vendor’s potential exit and the estimated equity value ofK12 at that time;
— comparing management’s assumptions including forecast sales, discount rate and the expected date of asubsequent sale of the US K12 Courseware business against external evidence where available;
— performing independent sensitivity analyses to understand the impact of reasonably possible changes inthe key assumptions including forecast sales, discount rate and the expected date of a subsequent saleof the US K12 Courseware business;
— the involvement of professionals with specialized skill and knowledge to assist in testing theappropriateness of the discount rate used to calculate the present value of the future cash flows and toassist with assessing management’s valuation methodology for the other receivables; and
— subsequently testing management’s remeasurement of the other receivables as of December 31, 2019by evaluating recent trading of the US K12 Courseware business and by considering businessdevelopments subsequent to the disposal.
/s/ PricewaterhouseCoopers LLPLondon, United KingdomApril 1, 2020
We have served as the Company’s auditor since 1996.
F-7

Consolidated income statementYear ended 31 December 2019
All figures in £ millions Notes 2019 2018 2017
Continuing operationsSales . . . . . . . . . . . . . . . . . . . . . . . . . . . . . . . . . . . . . . . . . . . . . . . . 2 3,869 4,129 4,513Cost of goods sold . . . . . . . . . . . . . . . . . . . . . . . . . . . . . . . . . . . . . 4 (1,858) (1,943) (2,066)
Gross profit . . . . . . . . . . . . . . . . . . . . . . . . . . . . . . . . . . . . . . . . . 2,011 2,186 2,447Operating expenses . . . . . . . . . . . . . . . . . . . . . . . . . . . . . . . . . . . . 4 (1,806) (1,907) (2,202)Other net gains and losses . . . . . . . . . . . . . . . . . . . . . . . . . . . . . . . 4 16 230 128Share of results of joint ventures and associates . . . . . . . . . . . . . . 12 54 44 78
Operating profit . . . . . . . . . . . . . . . . . . . . . . . . . . . . . . . . . . . . . . 2 275 553 451Finance costs . . . . . . . . . . . . . . . . . . . . . . . . . . . . . . . . . . . . . . . . . 6 (84) (91) (110)Finance income . . . . . . . . . . . . . . . . . . . . . . . . . . . . . . . . . . . . . . . 6 41 36 80
Profit before tax . . . . . . . . . . . . . . . . . . . . . . . . . . . . . . . . . . . . . . 232 498 421Income tax . . . . . . . . . . . . . . . . . . . . . . . . . . . . . . . . . . . . . . . . . . . 7 34 92 (13)
Profit for the year . . . . . . . . . . . . . . . . . . . . . . . . . . . . . . . . . . . . 266 590 408
Attributable to:Equity holders of the company . . . . . . . . . . . . . . . . . . . . . . . . . . . 264 588 406Non-controlling interest . . . . . . . . . . . . . . . . . . . . . . . . . . . . . . . . . 2 2 2
Earnings per share attributable to equity holders of thecompany during the year (expressed in pence per share)
– basic . . . . . . . . . . . . . . . . . . . . . . . . . . . . . . . . . . . . . . . . . . . . . . 8 34.0p 75.6p 49.9p– diluted . . . . . . . . . . . . . . . . . . . . . . . . . . . . . . . . . . . . . . . . . . . . . 8 34.0p 75.5p 49.9p
F-8

Consolidated statement of comprehensive incomeYear ended 31 December 2019
All figures in £ millions Notes 2019 2018 2017
Profit/(loss) for the year . . . . . . . . . . . . . . . . . . . . . . . . . . . . . . . . . 266 590 408Items that may be reclassified to the income statementNet exchange differences on translation of foreign operations –
Group . . . . . . . . . . . . . . . . . . . . . . . . . . . . . . . . . . . . . . . . . . . . . (113) 91 (158)Net exchange differences on translation of foreign operations –
associates . . . . . . . . . . . . . . . . . . . . . . . . . . . . . . . . . . . . . . . . . . (2) (1) (104)Currency translation adjustment disposed . . . . . . . . . . . . . . . . . . . 4 (4) (51)Attributable tax . . . . . . . . . . . . . . . . . . . . . . . . . . . . . . . . . . . . . . . 7 5 (4) 9
Items that are not reclassified to the income statementFair value gain on other financial assets . . . . . . . . . . . . . . . . . . . . 20 8 13Attributable tax . . . . . . . . . . . . . . . . . . . . . . . . . . . . . . . . . . . . . . . 7 (4) — (4)Remeasurement of retirement benefit obligations – Group . . . . . 25 (145) 22 175Remeasurement of retirement benefit obligations – associates . . . (4) 3 7Attributable tax . . . . . . . . . . . . . . . . . . . . . . . . . . . . . . . . . . . . . . . 7 22 9 (42)
Other comprehensive income/(expense) for the year . . . . . . . . 29 (217) 124 (155)
Total comprehensive income for the year . . . . . . . . . . . . . . . . . 49 714 253
Attributable to:Equity holders of the company . . . . . . . . . . . . . . . . . . . . . . . . . . . 47 712 251Non-controlling interest . . . . . . . . . . . . . . . . . . . . . . . . . . . . . . . . . 2 2 2
F-9

Consolidated balance sheetAs at 31 December 2019
All figures in £ millions Notes 2019 2018
AssetsNon-current assetsProperty, plant and equipment . . . . . . . . . . . . . . . . . . . . . . . . . . . . . . . . . . . . . . . 10 618 237Intangible assets . . . . . . . . . . . . . . . . . . . . . . . . . . . . . . . . . . . . . . . . . . . . . . . . . . 11 2,900 3,009Investments in joint ventures and associates . . . . . . . . . . . . . . . . . . . . . . . . . . . . 12 7 392Deferred income tax assets . . . . . . . . . . . . . . . . . . . . . . . . . . . . . . . . . . . . . . . . . 13 59 60Financial assets – derivative financial instruments . . . . . . . . . . . . . . . . . . . . . . . 16 29 67Retirement benefit assets . . . . . . . . . . . . . . . . . . . . . . . . . . . . . . . . . . . . . . . . . . . 25 429 571Other financial assets . . . . . . . . . . . . . . . . . . . . . . . . . . . . . . . . . . . . . . . . . . . . . . 15 122 93Trade and other receivables . . . . . . . . . . . . . . . . . . . . . . . . . . . . . . . . . . . . . . . . . 22 313 100
4,477 4,529
Current assetsIntangible assets – pre-publication . . . . . . . . . . . . . . . . . . . . . . . . . . . . . . . . . . . 20 870 817Inventories . . . . . . . . . . . . . . . . . . . . . . . . . . . . . . . . . . . . . . . . . . . . . . . . . . . . . . 21 169 164Trade and other receivables . . . . . . . . . . . . . . . . . . . . . . . . . . . . . . . . . . . . . . . . . 22 1,275 1,178Financial assets – derivative financial instruments . . . . . . . . . . . . . . . . . . . . . . . 16 25 1Cash and cash equivalents (excluding overdrafts) . . . . . . . . . . . . . . . . . . . . . . . 17 437 568
2,776 2,728
Assets classified as held for sale . . . . . . . . . . . . . . . . . . . . . . . . . . . . . . . . . . . . . 32 397 648
Total assets . . . . . . . . . . . . . . . . . . . . . . . . . . . . . . . . . . . . . . . . . . . . . . . . . . . . . 7,650 7,905
Liabilities
Non-current liabilitiesFinancial liabilities – borrowings . . . . . . . . . . . . . . . . . . . . . . . . . . . . . . . . . . . . 18 (1,572) (674)Financial liabilities – derivative financial instruments . . . . . . . . . . . . . . . . . . . . 16 (24) (36)Deferred income tax liabilities . . . . . . . . . . . . . . . . . . . . . . . . . . . . . . . . . . . . . . 13 (48) (136)Retirement benefit obligations . . . . . . . . . . . . . . . . . . . . . . . . . . . . . . . . . . . . . . 25 (92) (100)Provisions for other liabilities and charges . . . . . . . . . . . . . . . . . . . . . . . . . . . . . 23 (13) (145)Other liabilities . . . . . . . . . . . . . . . . . . . . . . . . . . . . . . . . . . . . . . . . . . . . . . . . . . 24 (86) (155)
(1,835) (1,246)
F-10

Consolidated balance sheet continuedAs at 31 December 2019
All figures in £ millions Notes 2019 2018
Current liabilitiesTrade and other liabilities . . . . . . . . . . . . . . . . . . . . . . . . . . . . . . . . . . . . . . . . . . 24 (1,278) (1,400)Financial liabilities – borrowings . . . . . . . . . . . . . . . . . . . . . . . . . . . . . . . . . . . . 18 (92) (46)Financial liabilities – derivative financial instruments . . . . . . . . . . . . . . . . . . . . 16 (15) (23)Current income tax liabilities . . . . . . . . . . . . . . . . . . . . . . . . . . . . . . . . . . . . . . . (55) (72)Provisions for other liabilities and charges . . . . . . . . . . . . . . . . . . . . . . . . . . . . . 23 (52) (20)
(1,492) (1,561)
Liabilities classified as held for sale . . . . . . . . . . . . . . . . . . . . . . . . . . . . . . . . . . 32 — (573)
Total liabilities . . . . . . . . . . . . . . . . . . . . . . . . . . . . . . . . . . . . . . . . . . . . . . . . . . (3,327) (3,380)
Net assets . . . . . . . . . . . . . . . . . . . . . . . . . . . . . . . . . . . . . . . . . . . . . . . . . . . . . . 4,323 4,525
EquityShare capital . . . . . . . . . . . . . . . . . . . . . . . . . . . . . . . . . . . . . . . . . . . . . . . . . . . . 27 195 195Share premium . . . . . . . . . . . . . . . . . . . . . . . . . . . . . . . . . . . . . . . . . . . . . . . . . . . 27 2,614 2,607Treasury shares . . . . . . . . . . . . . . . . . . . . . . . . . . . . . . . . . . . . . . . . . . . . . . . . . . 28 (24) (33)Capital redemption reserve . . . . . . . . . . . . . . . . . . . . . . . . . . . . . . . . . . . . . . . . . 11 11Fair value reserve . . . . . . . . . . . . . . . . . . . . . . . . . . . . . . . . . . . . . . . . . . . . . . . . . 39 19Translation reserve . . . . . . . . . . . . . . . . . . . . . . . . . . . . . . . . . . . . . . . . . . . . . . . 567 678Retained earnings . . . . . . . . . . . . . . . . . . . . . . . . . . . . . . . . . . . . . . . . . . . . . . . . 911 1,039
Total equity attributable to equity holders of the company . . . . . . . . . . . . . 4,313 4,516Non-controlling interest . . . . . . . . . . . . . . . . . . . . . . . . . . . . . . . . . . . . . . . . . . . . 10 9
Total equity . . . . . . . . . . . . . . . . . . . . . . . . . . . . . . . . . . . . . . . . . . . . . . . . . . . . 4,323 4,525
These financial statements have been approved for issue by the Board of Directors on April 1, 2020 and signedon its behalf by
Coram WilliamsChief Financial Officer
F-11

Consolidated statement of changes in equityYear ended 31 December 2019
Equity attributable to equity holders of the company
All figures In £ millionsSharecapital
Sharepremium
Treasuryshares
Capitalredemption
reserveFair value
reserveTranslation
reserveRetainedearnings Total
Non-controlling
interestTotalequity
At 1 January 2019 . . . . . . . . . . . . 195 2,607 (33) 11 19 678 1,039 4,516 9 4,525
Adjustment on initial applicationof IFRS 16 net of tax (see note1b) . . . . . . . . . . . . . . . . . . . . . . — — — — — — (83) (83) — (83)
Adjustment on initial applicationof IFRIC 23 net of tax (seenote 1c) . . . . . . . . . . . . . . . . . . — — — — — — 5 5 — 5
At 1 January 2019 (restated) . . . . 195 2,607 (33) 11 19 678 961 4,438 9 4,447Profit for the year . . . . . . . . . . . — — — — — — 264 264 2 266Other comprehensive lncome/
(expense) . . . . . . . . . . . . . . . — — — — 20 (111) (126) (217) — (217)Total comprehensive income/
(expense) . . . . . . . . . . . . . . . . . — — — — 20 (111) 138 47 2 49Equity-settled transactions . . . . . . — — — — — — 25 25 — 25Tax on equity-settled
transactions . . . . . . . . . . . . . . . — — — — — — (5) (5) — (5)Issue of ordinary shares under
share option schemes . . . . . . . . — 7 — — — — — 7 — 7Buyback of equity . . . . . . . . . . . . — — — — — — — — —Purchase of treasury shares . . . . . — — (52) — — — — (52) — (52)Release of treasury shares . . . . . . — — 61 — — — (61) — — —Transfer of gain on disposal of
FVOCI investment . . . . . . . . . . — — — — — — — — — —Dividends . . . . . . . . . . . . . . . . . . . — — — — — — (147) (147) (1) (148)
At 31 December 2019 . . . . . . . . . 195 2,614 (24) 11 39 567 911 4,313 10 4,323
Equity attributable to equity holders of the company
All figures in £ millionsSharecapital
Sharepremium
Treasuryshares
Capitalredemption
reserveFair value
reserveTranslation
reserveRetainedearnings Total
Non-controlling
interestTotalequity
At 1 January 2018 . . . . . . . . . . . . 200 2,602 (61) 5 13 592 544 3,895 8 3,903
Profit for the year . . . . . . . . . . . — — — — — — 588 588 2 590Other comprehensive
income . . . . . . . . . . . . . . . . . — — — — 8 86 30 124 — 124
Total comprehensive income . . — — — — 8 86 618 712 2 714Equity-settled transactions . . . . . . — — — — — — 37 37 — 37Tax on equity-settled
transactions . . . . . . . . . . . . . . . — — — — — — 4 4 — 4Issue of ordinary shares under
share option schemes . . . . . . . . 1 5 — — — — — 6 — 6Buyback of equity . . . . . . . . . . . . (6) — — 6 — — (2) (2) — (2)Purchase of treasury shares . . . . .Release of treasury shares . . . . . . — — 28 — — — (28) — — —Transfer of gain on disposal of
FVOCI investment . . . . . . . . . . — — — — (2) — 2 — — —Dividends . . . . . . . . . . . . . . . . . . . — — — — — — (136) (136) (1) (137)
At 31 December 2018 . . . . . . . . . 195 2,607 (33) 11 19 678 1,039 4,516 9 4,525
F-12

Consolidated statement of changes in equity continuedYear ended 31 December 2019
Equity attributable to equity holders of the company
All figures in £ millionsSharecapital
Sharepremium
Treasuryshares
Capitalredemption
reserveFair value
reserveTranslation
reserveRetainedearnings Total
Non-controlling
interestTotalequity
At 1 January 2017 . . . . . . . . . 205 2,597 (79) — — 905 716 4,344 4 4,348
Loss for the year . . . . . . . . . . — — — — — — 406 406 2 408Other comprehensive income/
(expense) . . . . . . . . . . . . . . — — — — 13 (313) 145 (155) — (155)
Total comprehensiveincome/(expense) . . . . . . . — — — — 13 (313) 551 251 2 253
Equity-settled transactions . . — — — — — — 33 33 — 33Issue of ordinary shares under
share option schemes . . . . . — 5 — — — — — 5 — 5Buyback of equity . . . . . . . . . (5) — — 5 — — (300) (300) — (300)Release of treasury shares . . . — — 18 — — — (18) — — —Transfer of gain on disposal
of FVOCI investment . . . . — — — — — — — — — —Changes in non-controlling
interest . . . . . . . . . . . . . . . . — — — — — — (2) (2) 2Dividends . . . . . . . . . . . . . . . . — — — — — — (318) (318) — (318)
At 31 December 2017 . . . . . 200 2,602 (61) 5 13 592 662 4,013 8 4,021
The capital redemption reserve reflects the nominal value of shares cancelled in the Group’s share buybackprogramme. The fair value reserve arises on revaluation of other financial assets. The translation reserve includesexchange differences arising from the translation of the net investment in foreign operations and of borrowingsand other currency instruments designated as hedges of such investments.
F-13

Consolidated cash flow statementYear ended 31 December 2019
All figures in £ millions Notes 2019 2018 2017
Cash flows from operating activitiesNet cash generated from operations . . . . . . . . . . . . . . . . . . . . . . . 33 480 547 462Interest paid . . . . . . . . . . . . . . . . . . . . . . . . . . . . . . . . . . . . . . . . . . (81) (42) (89)Tax paid . . . . . . . . . . . . . . . . . . . . . . . . . . . . . . . . . . . . . . . . . . . . . (30) (43) (75)
Net cash generated from operating activities . . . . . . . . . . . . . . 369 462 298Cash flows from investing activitiesAcquisition of subsidiaries, net of cash acquired . . . . . . . . . . . . . 30 (45) (5) (11)Additional capital invested in associates . . . . . . . . . . . . . . . . . . . . (40) — —Purchase of investments . . . . . . . . . . . . . . . . . . . . . . . . . . . . . . . . (12) (10) (3)Purchase of property, plant and equipment . . . . . . . . . . . . . . . . . . (55) (70) (82)Purchase of intangible assets . . . . . . . . . . . . . . . . . . . . . . . . . . . . . (138) (130) (150)Disposal of subsidiaries, net of cash disposed . . . . . . . . . . . . . . . . 31 (101) 83 19Proceeds from sale of associates . . . . . . . . . . . . . . . . . . . . . . . . . . 31 — 18 411Proceeds from sale of investments . . . . . . . . . . . . . . . . . . . . . . . . 5 6 —Proceeds from sale of property, plant and equipment . . . . . . . . . . 33 1 128 —Proceeds from sale of liquid resources . . . . . . . . . . . . . . . . . . . . . — 10 20Lease receivables repaid . . . . . . . . . . . . . . . . . . . . . . . . . . . . . . . . 26 — —Loans repaid by/(advance to) related parties . . . . . . . . . . . . . . . . . (49) 46 (13)Investment in liquid resources . . . . . . . . . . . . . . . . . . . . . . . . . . . . — (2) (18)Interest received . . . . . . . . . . . . . . . . . . . . . . . . . . . . . . . . . . . . . . . 17 20 20Investment income . . . . . . . . . . . . . . . . . . . . . . . . . . . . . . . . . . . . . 2 — —Dividends received from joint ventures and associates . . . . . . . . . 64 117 458
Net cash generated from/(used in) investing activities . . . . . . . (325) 211 651Cash flows from financing activitiesProceeds from issue of ordinary shares . . . . . . . . . . . . . . . . . . . . . 27 7 6 5Buyback of equity . . . . . . . . . . . . . . . . . . . . . . . . . . . . . . . . . . . . . 27 — (153) (149)Purchase of treasury shares . . . . . . . . . . . . . . . . . . . . . . . . . . . . . . (52) — —Proceeds from borrowings . . . . . . . . . . . . . . . . . . . . . . . . . . . . . . . 230 — 2Repayment of borrowings . . . . . . . . . . . . . . . . . . . . . . . . . . . . . . . (48) (441) (1,294)Repayment of lease liabilities . . . . . . . . . . . . . . . . . . . . . . . . . . . . (91) (4) (5)Dividends paid to company’s shareholders . . . . . . . . . . . . . . . . . . 9 (147) (136) (318)Dividends paid to non-controlling interest . . . . . . . . . . . . . . . . . . (1) (1) —
Net cash used in financing activities . . . . . . . . . . . . . . . . . . . . . (102) (729) (1,759)Effects of exchange rate changes on cash and cash
equivalents . . . . . . . . . . . . . . . . . . . . . . . . . . . . . . . . . . . . . . . . . (33) (49) 16
Net decrease in cash and cash equivalents . . . . . . . . . . . . . . . . (91) (105) (794)Cash and cash equivalents at beginning of year . . . . . . . . . . . . . . 525 630 1,424
Cash and cash equivalents at end of year . . . . . . . . . . . . . . . . . 17 434 525 630
F-14

Notes to the consolidated financial statements
General information
Pearson plc (the company), its subsidiaries and associates (together the Group) are international businessescovering educational courseware, assessments and services, and consumer publishing through its associateinterest in Penguin Random House.
The company is a public limited company incorporated and domiciled in England. The address of its registeredoffice is 80 Strand, London WC2R 0RL.
The company has its primary listing on the London Stock Exchange and is also listed on the New York StockExchange.
These consolidated financial statements were approved for issue by the Board of Directors on 6 March 2020.
1a. Accounting policies
The principal accounting policies applied in the preparation of these consolidated financial statements are set outbelow.
Basis of preparation
These consolidated financial statements have been prepared on the going concern basis and in accordance withInternational Financial Reporting Standards (IFRS) and IFRS Interpretations Committee (IFRS IC)interpretations as adopted by the European Union (EU) and with those parts of the Companies Act 2006applicable to companies reporting under IFRS. In respect of the accounting standards applicable to the Group;there is no difference between EU-adopted and IASB-adopted IFRS.
These consolidated financial statements have been prepared under the historical cost convention as modified bythe revaluation of financial assets and liabilities (including derivative financial instruments) at fair value.
These accounting policies have been consistently applied to all years presented, unless otherwise stated.
1. Interpretations and amendments to published standards effective 2019 – The following standards were adoptedin 2019:
• IFRS 16 Leases
• IFRIC 23 Uncertainty over Income Tax Treatments
• IFRS 9 and IFRS 7 Amendments
The impact of the adoption of these new standards is set out in notes 1b, 1c and 1d.
A number of other new pronouncements are also effective from 1 January 2019 but they do not have a materialimpact on the consolidated financial statements. Additional disclosure has been given where relevant.
2. Standards, interpretations and amendments to published standards that are not yet effective – A number ofother new standards and amendments to standards and interpretations are effective for annual periods beginningafter 1 January 2020, and have not been applied in preparing these financial statements. None of these isexpected to have a material impact on the consolidated financial statements.
F-15

Notes to the consolidated financial statements
1a. Accounting policies continued
Basis of preparation continued
3. Critical accounting assumptions and judgements – The preparation of financial statements in conformity withIFRS requires the use of certain critical accounting assumptions. It also requires management to exercise itsjudgement in the process of applying the Group’s accounting policies.
The areas requiring a higher degree of judgement or complexity, or areas where assumptions and estimates aresignificant to the consolidated financial statements, are discussed in the relevant accounting policies under thefollowing headings and in the notes to the accounts where appropriate:
Intangible assets: GoodwillIntangible assets: Pre-publication assetsTaxationRevenue: Provisions for returnsEmployee benefits: Pensions
In addition, certain assumptions have been used and judgements exercised in the valuation of the other receivablewhich arose on the disposal of the US K12 Courseware business (see note 14).
Consolidation
1. Business combinations – The acquisition method of accounting is used to account for business combinations.
The consideration transferred for the acquisition of a subsidiary is the fair value of the assets transferred, theliabilities incurred and the equity interest issued by the Group. The consideration transferred includes the fairvalue of any asset or liability resulting from a contingent consideration arrangement. Acquisition-related costsare expensed as incurred in the operating expenses line of the income statement. Identifiable assets acquired andidentifiable liabilities and contingent liabilities assumed in a business combination are measured initially at theirfair values at the acquisition date. The determination of fair values often requires significant judgements and theuse of estimates, and, for material acquisitions, the fair value of the acquired intangible assets is determined byan independent valuer. The excess of the consideration transferred, the amount of any non-controlling interest inthe acquiree and the acquisition date fair value of any previous equity interest in the acquiree over the fair valueof the identifiable net assets acquired is recorded as goodwill (see note 30).
See the ‘Intangible assets’ policy for the accounting policy on goodwill. If this is less than the fair value of thenet assets of the subsidiary acquired, in the case of a bargain purchase, the difference is recognised directly in theincome statement.
On an acquisition-by-acquisition basis, the Group recognises any non-controlling interest in the acquiree either atfair value or at the non-controlling interest’s proportionate share of the acquiree’s net assets.
IFRS 3 ‘Business Combinations’ has not been applied retrospectively to business combinations before the date oftransition to IFRS.
Management exercises judgement in determining the classification of its investments in its businesses, in linewith the following:
2. Subsidiaries – Subsidiaries are entities over which the Group has control. The Group controls an entity whenthe Group is exposed to, or has rights to, variable returns from its involvement with the entity and has the abilityto affect those returns through its power over the entity. Subsidiaries are fully consolidated from the date onwhich control is transferred to the Group. They are deconsolidated from the date that control ceases.
F-16

Notes to the consolidated financial statements
1a. Accounting policies continued
Consolidation continued
3. Transactions with non-controlling interests – Transactions with non-controlling interests that do not result inloss of control are accounted for as equity transactions, that is, as transactions with the owners in their capacity asowners. Any surplus or deficit arising from disposals to a non-controlling interest is recorded in equity. Forpurchases from a non-controlling interest, the difference between consideration paid and the relevant shareacquired of the carrying value of the subsidiary is recorded in equity.
4. Joint ventures and associates – Joint ventures are entities in which the Group holds an interest on a long-termbasis and has rights to the net assets through contractually agreed sharing of control. Associates are entities overwhich the Group has significant influence but not the power to control the financial and operating policies,generally accompanying a shareholding of between 20% and 50% of the voting rights. Ownership percentage islikely to be the key indicator of investment classification; however, other factors, such as Board representation,may also affect the accounting classification. Judgement is required to assess all of the qualitative andquantitative factors which may indicate that the Group does, or does not, have significant influence over aninvestment. Penguin Random House is the Group’s only material associate – see note 12 for further details on thejudgements involved in its accounting classification. Investments in joint ventures and associates are accountedfor by the equity method and are initially recognised at the fair value of consideration transferred.
The Group’s share of its joint ventures’ and associates’ post-acquisition profits or losses is recognised in theincome statement and its share of post-acquisition movements in reserves is recognised in reserves.
The Group’s share of its joint ventures’ and associates’ results is recognised as a component of operating profitas these operations form part of the core publishing business of the Group and are an integral part of existingwholly-owned businesses. The cumulative post-acquisition movements are adjusted against the carrying amountof the investment. When the Group’s share of losses in a joint venture or associate equals or exceeds its interestin the joint venture or associate, the Group does not recognise further losses unless the Group has incurredobligations or made payments on behalf of the joint venture or associate.
Unrealised gains and losses on transactions between the Group and its joint ventures and associates areeliminated to the extent of the Group’s interest in these entities.
5. Contribution of a subsidiary to an associate or joint venture – The gain or loss resulting from the contributionor sale of a subsidiary to an associate or a joint venture is recognised in full. Where such transactions do notinvolve cash consideration, significant judgements and estimates are used in determining the fair values of theconsideration received.
Foreign currency translation
1. Functional and presentation currency – Items included in the financial statements of each of the Group’sentities are measured using the currency of the primary economic environment in which the entity operates (thefunctional currency). The consolidated financial statements are presented in sterling, which is the company’sfunctional and presentation currency.
2. Transactions and balances – Foreign currency transactions are translated into the functional currency using theexchange rates prevailing at the dates of the transactions. Foreign exchange gains and losses resulting from thesettlement of such transactions and from the translation at year-end exchange rates of monetary assets andliabilities denominated in foreign currencies are recognised in the income statement, except when deferred inequity as qualifying net investment hedges.
F-17

Notes to the consolidated financial statements
1a. Accounting policies continued
Foreign currency translation continued
3. Group companies – The results and financial position of all Group companies that have a functional currencydifferent from the presentation currency are translated into the presentation currency as follows:
i) Assets and liabilities are translated at the closing rate at the date of the balance sheet
ii) Income and expenses are translated at average exchange rates
iii) All resulting exchange differences are recognised as a separate component of equity.
On consolidation, exchange differences arising from the translation of the net investment in foreign entities, andof borrowings and other currency instruments designated as hedges of such investments, are taken toshareholders’ equity. The Group treats specific inter-company loan balances, which are not intended to be repaidin the foreseeable future, as part of its net investment. When a foreign operation is sold, such exchangedifferences are recognised in the income statement as part of the gain or loss on sale.
The principal overseas currency for the Group is the US dollar. The average rate for the year against sterling was$1.28 (2018: $1.34) and the year-end rate was $1.32 (2018: $1.27).
Property, plant and equipment
Property, plant and equipment are stated at historical cost less depreciation. Cost includes the original purchaseprice of the asset and the costs attributable to bringing the asset to its working condition for intended use. Land isnot depreciated. Depreciation on other assets is calculated using the straight-line method to allocate their cost lesstheir residual values over their estimated useful lives as follows:
Buildings (freehold): 20 – 50 yearsBuildings (leasehold): over the period of the leasePlant and equipment: 3 – 10 years
The assets’ residual values and useful lives are reviewed, and adjusted if appropriate, at each balance sheet date.
The carrying value of an asset is written down to its recoverable amount if the carrying value of the asset isgreater than its estimated recoverable amount.
Intangible assets
1. Goodwill – For the acquisition of subsidiaries made on or after 1 January 2010, goodwill represents the excessof the consideration transferred, the amount of any non-controlling interest in the acquiree and the acquisitiondate fair value of any previous equity interest in the acquiree over the fair value of the identifiable net assetsacquired. For the acquisition of subsidiaries made from the date of transition to IFRS to 31 December 2009,goodwill represents the excess of the cost of an acquisition over the fair value of the Group’s share of the netidentifiable assets acquired. Goodwill on acquisitions of subsidiaries is included in intangible assets. Goodwill onacquisition of associates and joint ventures represents the excess of the cost of an acquisition over the fair valueof the Group’s share of the net identifiable assets acquired. Goodwill on acquisitions of associates and jointventures is included in investments in associates and joint ventures.
Goodwill is tested at least annually for impairment and carried at cost less accumulated impairment losses. Animpairment loss is recognised to the extent that the carrying value of goodwill exceeds the recoverable amount.The recoverable amount is the higher of fair value less costs of disposal and value in use. These calculations
F-18

Notes to the consolidated financial statements
1a. Accounting policies continued
Intangible assets continued
require the use of estimates in respect of forecast cash flows and discount rates and significant managementjudgement in respect of CGU and cost allocation; impairment is a key source of estimation uncertainty and has asignificant risk of resulting in a material adjustment to the carrying amount of relevant assets within the nextfinancial year. A summary of these assets by CGU and a description of the key assumptions and sensitivities isincluded in note 11.
Goodwill is allocated to aggregated cash-generating units for the purpose of impairment testing. The allocation ismade to those aggregated cash-generating units that are expected to benefit from the business combination inwhich the goodwill arose.
Gains and losses on the disposal of an entity include the carrying amount of goodwill relating to the entity sold.
2. Acquired software – Software separately acquired for internal use is capitalised at cost. Software acquired inmaterial business combinations is capitalised at its fair value as determined by an independent valuer. Acquiredsoftware is amortised on a straight-line basis over its estimated useful life of between three and eight years.
3. Internally developed software – Internal and external costs incurred during the preliminary stage of developingcomputer software for internal use are expensed as incurred. Internal and external costs incurred to developcomputer software for internal use during the application development stage are capitalised if the Group expectseconomic benefits from the development. Capitalisation in the application development stage begins once theGroup can reliably measure the expenditure attributable to the software development and has demonstrated itsintention to complete and use the software. Internally developed software is amortised on a straight-line basisover its estimated useful life of between three and ten years.
4. Acquired intangible assets – Acquired intangible assets include customer lists, contracts and relationships,trademarks and brands, publishing rights, content, technology and software rights. These assets are capitalised onacquisition at cost and included in intangible assets. Intangible assets acquired in material business combinationsare capitalised at their fair value as determined by an independent valuer. Intangible assets are amortised overtheir estimated useful lives of between two and 20 years, using an amortisation method that reflects the pattern oftheir consumption.
5. Pre-publication assets – Pre-publication assets represent direct costs incurred in the development ofeducational programmes and titles prior to their publication. These costs are recognised as current intangibleassets where the title will generate probable future economic benefits and costs can be measured reliably.
Pre-publication assets relating to content are amortised upon publication of the title over estimated economiclives of five years or less, being an estimate of the expected operating lifecycle of the title, with a higherproportion of the amortisation taken in the earlier years. Pre-publication assets relating to product platforms areamortised over ten years or less being an estimate of the expected useful life.
The assessment of the useful economic life and the recoverability of pre-publication assets involves a significantdegree of judgement based on historical trends and management estimation of future potential sales. An incorrectamortisation profile could result in excess amounts being carried forward as intangible assets that wouldotherwise have been written off to the income statement in an earlier period.
Reviews are performed regularly to estimate recoverability of pre-publication assets. The carrying amount ofpre-publication assets is set out in note 20.
F-19

Notes to the consolidated financial statements
1a. Accounting policies continued
Intangible assets continued
The investment in pre-publication assets has been disclosed as part of cash generated from operations in the cashflow statement (see note 33).
Other financial assets
Other financial assets are non-derivative financial assets classified and measured at estimated fair value.
Marketable securities and cash deposits with maturities of greater than three months are classified andsubsequently measured at fair value through profit and loss.
They are remeasured at each balance sheet date by using market data and the use of established valuationtechniques. Any movement in the fair value is immediately recognised in finance income or finance costs in theincome statement.
Investments in the equity instruments of other entities are classified and subsequently measured at fair valuethrough other comprehensive income. Changes in fair value are recorded in equity in the fair value reserve viaother comprehensive income. On subsequent disposal of the asset, the net fair value gains or losses arereclassified from the fair value reserve to retained earnings. Any dividends received from equity investmentsclassified as fair value through other comprehensive income are recognised in the income statement unless theyrepresent a return of capital.
Inventories
Inventories are stated at the lower of cost and net realisable value. Cost is determined using the weighted averagemethod or an approximation thereof, such as the first in first out (FIFO) method. The cost of finished goods andwork in progress comprises raw materials, direct labour, other direct costs and related production overheads. Netrealisable value is the estimated selling price in the ordinary course of business, less estimated costs necessary tomake the sale. Provisions are made for slow-moving and obsolete stock.
Royalty advances
Advances of royalties to authors are included within trade and other receivables when the advance is paid lessany provision required to adjust the advance to its net realisable value. The realisable value of royalty advancesrelies on a degree of management estimation in determining the profitability of individual author contracts. If theestimated realisable value of author contracts is overstated, this will have an adverse effect on operating profits asthese excess amounts will be written off.
The recoverability of royalty advances is based upon an annual detailed management review of the age of theadvance, the future sales projections for new authors and prior sales history of repeat authors.
The royalty advance is expensed at the contracted or effective royalty rate as the related revenues are earned.Royalty advances which will be consumed within one year are held in current assets. Royalty advances whichwill be consumed after one year are held in non-current assets.
Cash and cash equivalents
Cash and cash equivalents in the cash flow statement include cash in hand, deposits held on call with banks, othershort-term highly liquid investments with original maturities of three months or less, and bank overdrafts. Bankoverdrafts are included in borrowings in current liabilities in the balance sheet.
F-20

Notes to the consolidated financial statements
1a. Accounting policies continued
Cash and cash equivalents continued
Short-term deposits and marketable securities with maturities of greater than three months do not qualify as cashand cash equivalents and are reported as financial assets. Movements on these financial assets are classified ascash flows from financing activities in the cash flow statement where these amounts are used to offset theborrowings of the Group or as cash flows from investing activities where these amounts are held to generate aninvestment return.
Share capital
Ordinary shares are classified as equity.
Incremental costs directly attributable to the issue of new shares or options are shown in equity as a deduction,net of tax, from the proceeds.
Where any Group company purchases the company’s equity share capital (treasury shares), the considerationpaid, including any directly attributable incremental costs, net of income taxes, is deducted from equityattributable to the company’s equity holders until the shares are cancelled, reissued or disposed of. Where suchshares are subsequently sold or reissued, any consideration received, net of any directly attributable transactioncosts and the related income tax effects, is included in equity attributable to the company’s equity holders.
Ordinary shares purchased under a buyback programme are cancelled and the nominal value of the shares istransferred to a capital redemption reserve.
Borrowings
Borrowings are recognised initially at fair value, which is proceeds received net of transaction costs incurred.Borrowings are subsequently stated at amortised cost with any difference between the proceeds (net oftransaction costs) and the redemption value being recognised in the income statement over the period of theborrowings using the effective interest method. Accrued interest is included as part of borrowings.
Where a debt instrument is in a fair value hedging relationship, an adjustment is made to its carrying value in theincome statement to reflect the hedged risk.
Where a debt instrument is in a net investment hedge relationship gains and losses on the effective portion of thehedge are recognised in other comprehensive income.
Derivative financial instruments
Derivatives are recognised at fair value and remeasured at each balance sheet date. The fair value of derivativesis determined by using market data and the use of established estimation techniques such as discounted cash flowand option valuation models.
For derivatives in a hedge relationship, the currency basis spread is excluded from the designation as a hedginginstrument.
Changes in the fair value of derivatives are recognised immediately in finance income or costs. However,derivatives relating to borrowings and certain foreign exchange contracts are designated as part of a hedgingtransaction.
F-21

Notes to the consolidated financial statements
1a. Accounting policies continued
Derivative financial instruments continued
The accounting treatment is summarised as follows:
Typical reason for designationReporting of gains and losses on
effective portion of the hedgeReporting of gains and
losses on disposal
Net investment hedge
The derivative creates a foreigncurrency liability which is used tohedge changes in the value of asubsidiary which transacts in thatcurrency.
Recognised in othercomprehensive income.
On disposal, the accumulatedvalue of gains and losses reportedin other comprehensive income istransferred to the incomestatement.
Fair value hedges
The derivative transforms the interestprofile on debt from fixed rate tofloating rate. Changes in the value ofthe debt as a result of changes ininterest rates and foreign exchangerates are offset by equal and oppositechanges in the value of thederivative. When the Group’s debt isswapped to floating rates, thecontracts used are designated as fairvalue hedges.
Gains and losses on the derivativeare reported in finance income orfinance costs. However, an equaland opposite change is made to thecarrying value of the debt (a ‘fairvalue adjustment’) with thebenefit/cost reported in financeincome or finance costs. The netresult should be a zero charge on aperfectly effective hedge.
If the debt and derivative aredisposed of, the value of thederivative and the debt (includingthe fair value adjustment) are resetto zero. Any resultant gain or lossis recognised in finance income orfinance costs.
Non-hedge accounted contracts
These are not designated as hedginginstruments. Typically these areshort-term contracts to convert debtback to fixed rates or foreignexchange contracts where a naturaloffset exists.
No hedge accounting applies.
Policy applicable from 1 January 2018: IFRS 9
The Group adopted IFRS 9 ‘Financial Instruments’ at 1 January 2018 and applied the new rules in accordancewith the transitional provisions. Comparatives for 2017 have not been restated. The Group assessed the impact ofadopting IFRS 9 and the only material adjustment was a £13m increase in the provision for losses against tradedebtors which was reflected as an adjustment to retained earnings at 1 January 2018. The adjustment arises fromadoption of the expected credit loss model for impairments under IFRS 9. Although there is a transition impactfrom adoption of the new model there was no material impact on profit before tax for 2018. Also under IFRS 9,the Group’s equity financial investments continue to be recognised at fair value and the Group has elected to takethe option to recognise all movements in fair value in other comprehensive income (FVOCI). Gains or lossesrealised on the subsequent sale of these financial assets (FVOCI investments) are no longer recycled through theprofit and loss account, but are instead reclassified from the FVOCI reserve to retained earnings. IFRS 9 alsointroduced a new, simpler hedge accounting model with a principles-based approach designed to align theaccounting result with the economic hedging strategy. The Group has confirmed that its previous hedgerelationships continue to qualify as hedges under IFRS 9 in 2018.
F-22

Notes to the consolidated financial statements
1a. Accounting policies continued
Taxation
Current tax is recognised at the amounts expected to be paid or recovered under the tax rates and laws that havebeen enacted or substantively enacted at the balance sheet date.
Deferred income tax is provided, using the balance sheet liability method, on temporary differences arisingbetween the tax bases of assets and liabilities and their carrying amounts. Deferred income tax is determinedusing tax rates and laws that have been enacted or substantively enacted by the balance sheet date and areexpected to apply when the related deferred tax asset is realised or the deferred income tax liability is settled.
Deferred tax assets are recognised to the extent that it is probable that future taxable profit will be availableagainst which the temporary differences can be utilised.
Deferred income tax is provided in respect of the undistributed earnings of subsidiaries, associates and jointventures other than where it is intended that those undistributed earnings will not be remitted in the foreseeablefuture.
Current and deferred tax are recognised in the income statement, except when the tax relates to items charged orcredited directly to equity or other comprehensive income, in which case the tax is also recognised in equity orother comprehensive income.
The Group is subject to income taxes in numerous jurisdictions. Significant judgement is required in determiningthe estimates in relation to the worldwide provision for income taxes. There are many transactions andcalculations for which the ultimate tax determination is uncertain during the ordinary course of business. TheGroup recognises tax provisions when it is considered probable that there will be a future outflow of funds to atax authority. The provisions are based on management’s best judgement of the application of tax legislation andbest estimates of future settlement amounts (see note 7). Where the final tax outcome of these matters is differentfrom the amounts that were initially recorded, such differences will impact the income tax and deferred taxprovisions in the period in which such determination is made.
Deferred tax assets and liabilities require management judgement and estimation in determining the amounts tobe recognised. In particular, when assessing the extent to which deferred tax assets should be recognised,significant judgement is used when considering the timing of the recognition and estimation is used to determinethe level of future taxable income together with any future tax planning strategies (see note 13).
Employee benefits
1. Pensions – The retirement benefit asset and obligation recognised in the balance sheet represent the net of thepresent value of the defined benefit obligation and the fair value of plan assets at the balance sheet date. The definedbenefit obligation is calculated annually by independent actuaries using the projected unit credit method. Thepresent value of the defined benefit obligation is determined by discounting estimated future cash flows using yieldson high-quality corporate bonds which have terms to maturity approximating the terms of the related liability.
When the calculation results in a potential asset, the recognition of that asset is limited to the asset ceiling – thatis the present value of any economic benefits available in the form of refunds from the plan or a reduction infuture contributions. Management uses judgement to determine the level of refunds available from the plan inrecognising an asset.
F-23

Notes to the consolidated financial statements
1a. Accounting policies continued
Employee benefits continued
The determination of the pension cost and defined benefit obligation of the Group’s defined benefit pensionschemes depends on the selection of certain assumptions, which include the discount rate, inflation rate, salarygrowth and longevity (see note 25).
Actuarial gains and losses arising from experience adjustments and changes in actuarial assumptions are chargedor credited to equity in other comprehensive income in the period in which they arise.
The service cost, representing benefits accruing over the year, is included in the income statement as an operatingcost. Net interest is calculated by applying the discount rate to the net defined benefit obligation and is presentedas finance costs or finance income.
Obligations for contributions to defined contribution pension plans are recognised as an operating expense in theincome statement as incurred.
2. Other post-retirement obligations – The expected costs of post-retirement medical and life assurance benefitsare accrued over the period of employment, using a similar accounting methodology as for defined benefitpension obligations. The liabilities and costs relating to significant other post-retirement obligations are assessedannually by independent qualified actuaries.
3. Share-based payments – The fair value of options or shares granted under the Group’s share and option plansis recognised as an employee expense after taking into account the Group’s best estimate of the number ofawards expected to vest. Fair value is measured at the date of grant and is spread over the vesting period of theoption or share. The fair value of the options granted is measured using an option model that is most appropriateto the award. The fair value of shares awarded is measured using the share price at the date of grant unlessanother method is more appropriate. Any proceeds received are credited to share capital and share premium whenthe options are exercised.
Provisions
Provisions are recognised if the Group has a present legal or constructive obligation as a result of past events, itis more likely than not that an outflow of resources will be required to settle the obligation and the amount can bereliably estimated. Provisions are discounted to present value where the effect is material.
Prior to 1 January 2019 the Group recognised a provision for onerous lease contracts when the expected benefitsto be derived from a contract were less than the unavoidable costs of meeting the obligations under the contract.The calculation of onerous lease provisions involved estimates of potential sublet income, lease terms includingrent free periods, void periods, lease incentives and running costs. On the initial application of IFRS 16 on1 January 2019, onerous lease provisions have been offset against the relevant right-of-use asset (see note 23).
The provision was based on the present value of future payments for surplus leased properties undernon-cancellable operating leases, net of estimated sub-leasing income.
Revenue recognition
The Group’s revenue streams are courseware, assessments and services. Courseware includes curriculummaterials provided in book form and/or via access to digital content. Assessments includes test development,processing and scoring services provided to governments, educational institutions, corporations and professionalbodies. Services includes the operation of schools, colleges and universities, including sistemas in Brazil, as wellas the provision of online learning services in partnership with universities and other academic institutions.
Revenue is recognised in order to depict the transfer of control of promised goods and services to customers in anamount that reflects the consideration to which we expect to be entitled in exchange for those goods and services.
F-24

Notes to the consolidated financial statements
1a. Accounting policies continued
Revenue recognition continued
This process begins with the identification of our contract with a customer, which is generally through a masterservices agreement, customer purchase order, or a combination thereof. Within each contract, judgement isapplied to determine the extent to which activities within the contract represent distinct performance obligationsto be delivered and the total amount of transaction price to which we expect to be entitled.
The transaction price determined is net of sales taxes, rebates and discounts, and after eliminating sales withinthe Group. Where a contract contains multiple performance obligations such as the provision of supplementarymaterials or online access with textbooks, revenue is allocated on the basis of relative standalone selling prices.Where a contract contains variable consideration significant estimation is required to determine the amount towhich the Group is expected to be entitled.
Revenue is recognised on contracts with customers when or as performance obligations are satisfied which is theperiod or the point in time where control of goods or services transfers to the customer. Judgement is applied todetermine first whether control passes over time and if not, then the point in time at which control passes. Whererevenue is recognised over time judgement is used to determine the method which best depicts the transfer ofcontrol. Where an input method is used significant estimation is required to determine the progress towardsdelivering the performance obligation.
Revenue from the sale of books is recognised net of a provision for anticipated returns. This provision is basedprimarily on historical return rates, customer buying patterns and retailer behaviours including stock levels (seenote 22). If these estimates do not reflect actual returns in future periods then revenues could be understated oroverstated for a particular period. When the provision for returns is remeasured at each reporting date to reflectchanges in estimates, a corresponding adjustment is also recorded to revenue.
The Group may enter into contracts with another party in addition to our customer. In making the determinationas to whether revenue should be recognised on a gross or net basis, the contract with the customer is analysed tounderstand which party controls the relevant good or service prior to transferring to the customer. Thisjudgement is informed by facts and circumstances of the contract in determining whether the Group has promisedto provide the specified good or service or whether the Group is arranging for the transfer of the specified goodor service, including which party is responsible for fulfilment, has discretion to set the price to the customer andis responsible for inventory risk. On certain contracts, where the Group acts as an agent, only commissions andfees receivable for services rendered are recognised as revenue. Any third party costs incurred on behalf of theprincipal that are rechargeable under the contractual arrangement are not included in revenue.
Income from recharges of freight and other activities which are incidental to the normal revenue-generatingactivities is included in other income.
Additional details on the Group’s revenue streams are also included in note 3.
Policy applicable from 1 January 2018: IFRS 15
The Group adopted IFRS 15 ‘Revenue from Contracts with Customers’ at 1 January 2018 and applied themodified retrospective approach. Comparatives for 2017 have not been restated and continued to be reportedunder IAS 18 and IAS 11. The cumulative impact of adoption has been recognised as a £108m decrease toretained earnings with a corresponding decrease in net assets at 1 January 2018. The changes were impacted byfour areas: unexercised customer rights (breakage), Online Program Management (OPM) marketing,administration fees, and commissions costs. Additionally, the provision for sales returns, which was previouslynetted off in trade receivables, from 1 January 2018 is now shown in two parts: as a separate sales return liability
F-25

Notes to the consolidated financial statements
1a. Accounting policies continued
Revenue recognition continued
within trade and other liabilities, and an inventory returns asset within inventory. The adoption of IFRS 15increased 2018 sales and profit by £9m and £7m, respectively. Had the Group been applying IFRS 15 during2017, it is estimated that both sales and profit before tax would have been £2m higher for the full year, with thebalance sheet impact at the beginning and end of the year being similar.
Leases
Policy applicable from 1 January 2019
The Group as a lessee
The Group assesses whether a contract is or contains a lease at the inception of the contract. A contract is, orcontains a lease, if the contract conveys the right to control the use of an identified asset for a period of time inexchange for consideration. The Group recognises a right-of-use asset and a lease liability at the leasecommencement date with respect to all lease arrangements except for short-term leases (leases with a lease termof 12 months or less) and leases of low value assets. For these leases, the lease payments are recognised as anoperating expense on a straight-line basis over the term of the lease.
The right-of-use asset is initially measured at cost, comprising the initial amount of the lease liability plus anyinitial direct costs incurred and an estimate of costs to restore the underlying asset, less any lease incentivesreceived. The right-of-use asset is subsequently depreciated using the straight-line method from thecommencement date to the earlier of the end of the useful life of the asset or the end of the lease term. The Groupapplies IAS 36 to determine whether a right-of-use asset is impaired. The lease liability is initially measured atthe present value of the lease payments that are not paid at the commencement date, discounted using the interestrate implicit in the lease or, if that rate cannot be readily determined, the incremental borrowing rate. The leaseliability is measured at amortised cost using the effective interest method. It is remeasured when there is a changein future lease payments arising from a change in an index or a rate or a change in the Group’s assessment ofwhether it will exercise an extension or termination option. When the lease liability is remeasured, acorresponding adjustment is made to the right-of-use asset.
Management uses judgement to determine the lease term where extension and termination options are availablewithin the lease.
The Group as a lessor:
When the Group is an intermediate lessor, the head lease and sub-lease are accounted for as two separatecontracts. The head lease is accounted for as per the lessee policy above. The sub-lease is classified as a financelease or operating lease by reference to the right-of-use asset arising from the head lease. Where the leasetransfers substantially all the risks and rewards of ownership to the lessee the contract is classified as a financelease; all other leases are classified as operating leases. Rental income from operating leases is recognised on astraight-line basis over the term of the relevant lease. Amounts due from lessees under finance sub-leases arerecognised as receivables at the amount of the Group’s net investment in the leases discounted using the interestrate implicit in the lease or, if that rate cannot be readily determined, the discount rate used in the head lease.
Policy applicable before 1 January 2019
Leases of property, plant and equipment where the Group has substantially all the risks and rewards of ownershipare classified as finance leases. Finance leases are capitalised at the commencement of the lease at the lower ofthe fair value of the leased property and the present value of the minimum lease payments. Each lease payment isallocated between the liability and finance charges to achieve a constant rate on the finance balance outstanding.The corresponding rental obligations, net of finance charges, are included in financial liabilities – borrowings.
F-26

Notes to the consolidated financial statements
1a. Accounting policies continued
Leases continued
The interest element of the finance cost is charged to the income statement over the lease period to produce aconstant periodic rate of interest on the remaining balance of the liability for each period. The property, plant andequipment acquired under finance leases are depreciated over the shorter of the useful life of the asset or thelease term.
Leases where a significant portion of the risks and rewards of ownership are retained by the lessor are classifiedas operating leases by the lessee. Payments made under operating leases (net of any incentives received from thelessor) are charged to the income statement on a straight-line basis over the period of the lease.
Dividends
Final dividends are recorded in the Group’s financial statements in the period in which they are approved by thecompany’s shareholders. Interim dividends are recorded when paid.
Discontinued operations
A discontinued operation is a component of the Group’s business that represents a separate major line of businessor geographical area of operations that has been disposed of or meets the criteria to be classified as held for sale.
Discontinued operations are presented in the income statement as a separate line and are shown net of tax.
Assets and liabilities held for sale
Assets and liabilities are classified as held for sale and stated at the lower of carrying amount and fair value lesscosts to sell if it is highly probable that the carrying amount will be recovered principally through a saletransaction rather than through continuing use. No depreciation is charged in respect of non-current assetsclassified as held for sale. Amounts relating to non-current assets and liabilities held for sale are classified asdiscontinued operations in the income statement where appropriate.
Trade receivables
Trade receivables are stated at fair value after provision for bad and doubtful debts. Provisions for bad anddoubtful debts are based on the expected credit loss model. The ‘simplified approach’ is used with the expectedloss allowance measured at an amount equal to the lifetime expected credit losses. Trade receivables are alsostated after provision for anticipated future sales returns (also see Revenue recognition policy).
F-27

Notes to the consolidated financial statements
1b. Change of accounting policy: IFRS 16
The Group has adopted IFRS 16 ‘Leases’ at 1 January 2019 and applied the modified retrospective approach.Comparatives for 2018 have not been restated and the cumulative impact of adoption has been recognised as adecrease to net assets with a corresponding decrease in retained earnings at 1 January 2019 as follows:
All figures in £ millions2019
1 January
Non-current assetsProperty, plant and equipment (right-of-use assets) . . . . . . . . . . . . . . . . . . . . . . . . 424Investment in joint ventures and associates . . . . . . . . . . . . . . . . . . . . . . . . . . . . . . (2)Deferred income tax assets . . . . . . . . . . . . . . . . . . . . . . . . . . . . . . . . . . . . . . . . . . . 1Trade and other receivables . . . . . . . . . . . . . . . . . . . . . . . . . . . . . . . . . . . . . . . . . . . 185
Current assetsTrade and other receivables . . . . . . . . . . . . . . . . . . . . . . . . . . . . . . . . . . . . . . . . . . . 7Non-current liabilitiesFinancial liabilities – borrowings . . . . . . . . . . . . . . . . . . . . . . . . . . . . . . . . . . . . . . (792)Deferred income tax liabilities . . . . . . . . . . . . . . . . . . . . . . . . . . . . . . . . . . . . . . . . 14Provisions for other liabilities and charges . . . . . . . . . . . . . . . . . . . . . . . . . . . . . . . 101Other liabilities . . . . . . . . . . . . . . . . . . . . . . . . . . . . . . . . . . . . . . . . . . . . . . . . . . . . 58Current liabilitiesFinancial liabilities – borrowings . . . . . . . . . . . . . . . . . . . . . . . . . . . . . . . . . . . . . . (89)Trade and other liabilities . . . . . . . . . . . . . . . . . . . . . . . . . . . . . . . . . . . . . . . . . . . . 10
Total decrease in retained earnings at 1 January 2019 . . . . . . . . . . . . . . . . . . . (83)
The Group’s lease portfolio consists of approximately 750 property leases together with a number of vehicle andequipment leases. The lease liability has been measured at the present value of the remaining lease payments,discounted using the incremental borrowing rate at transition. The right-of-use asset has been measured at thecarrying amount as if the standard had been applied since the commencement of the lease, discounted using theincremental borrowing rate at transition. Where data was not available to enable this measurement to be made,the right-of-use asset has been measured at an amount equal to the lease liability.
On transition the Group elected not to reassess whether a contract is, or contains, a lease, instead relying on theassessment already made applying IAS 17 ‘Leases’ and IFRIC 4 ‘Determining whether and Arrangementcontains a Lease’. In addition, the Group applied the available practical expedients as follows:
• Relied on its assessment of whether leases are onerous immediately prior to the date of initial application.
• Applied the short-term leases exemptions to leases with lease term ending within 12 months at the date ofthe initial application.
• Excluded the initial direct costs from the measurement of the right-to-use asset at the date of the initialapplication.
• Used hindsight in determining the lease term where the contract contains options to extend or terminate thelease.
Adoption of the new standard has a material impact on the Group. The lease liability brought onto the balancesheet at transition was £881m with the corresponding right-of-use asset valued at £424m. In addition, certainsubleases have been reclassified as finance leases resulting in an additional lease receivable of £215m beingbrought on balance sheet. The net impact on the balance sheet is a reduction of net assets of £83m after takinginto account existing liabilities relating to onerous lease provisions, lease incentives, prepayments, adjustments totax and the net impact on associates. There were no leases relating to held for sale assets at 1 January 2019.
F-28

Notes to the consolidated financial statements
1b. Change of accounting policy: IFRS 16 continued
For leases previously classified as finance leases under IAS 17 ‘Leases’, the carrying amount of the right-of-useasset and the lease liability at 1 January 2019 are determined at the carrying amount of the lease asset and leaseliability under IAS 17 immediately before that date.
The impact on the income statement for 2019 was to reduce profit before tax by £9m (increasing both adjustedand statutory operating profit by £25m and increasing net finance costs by £34m). The operating lease expenserecognised under the previous accounting standards is now replaced by depreciation and net finance costs. Theimpact on the Group’s share of joint venture and associate profit is not material.
There is no overall impact on the Group’s cash and cash equivalents although there is a change to theclassification of cash flows in the cash flow statement with lease payments and finance lease receipts previouslycategorised as net cash used in operations now being split between the principal element (categorised infinancing activities for payments and investing activities for receipts) and the interest element (categorised asinterest paid in operating activities or interest received in investing activities). In 2019 there were £91m of leasepayments classified as financing cash flows, £26m of lease receipts classified as investing cash flows, £45m oflease interest payments and £11m of lease interest receipts.
The Group has also included the lease liability and investment in finance lease as part of its net debt whichimpacts the calculation of the Group’s non-GAAP measures for operating cash flow and free cash flow.
The lease liabilities at 1 January 2019 can be reconciled to the operating lease commitments at 31 December2018 as follows:
All figures in £ millions1 January
2019
Operating lease commitments disclosed at 31 December 2018 (note 35) . . . . . . . 1,175Discounted using the lessee’s incremental borrowing rate at the date of initial
application . . . . . . . . . . . . . . . . . . . . . . . . . . . . . . . . . . . . . . . . . . . . . . . . . . . . . . (290)(Less): commitments relating to short-term leases . . . . . . . . . . . . . . . . . . . . . . . . . (7)Add: adjustments relating to the different treatment of extension and termination
options . . . . . . . . . . . . . . . . . . . . . . . . . . . . . . . . . . . . . . . . . . . . . . . . . . . . . . . . . 3
Additional lease liability recognised at 1 January 2019 . . . . . . . . . . . . . . . . . . . 881
Analysed at:Current lease liabilities . . . . . . . . . . . . . . . . . . . . . . . . . . . . . . . . . . . . . . . . . . . . . . 89Non-current lease liabilities . . . . . . . . . . . . . . . . . . . . . . . . . . . . . . . . . . . . . . . . . . . 792
In addition to the lease liabilities transitioned above, the Group had £5m of lease liabilities that were accountedfor as finance leases at 31 December 2018. The weighted average incremental borrowing rate applied to the leaseliabilities on 1 January 2019 was 5.0%.
1c. Change of accounting policy: IFRIC 23
The Group adopted IFRIC 23 ‘Uncertainty over Income Tax Treatments’ effective 1 January 2019. Theinterpretation clarifies the application of the recognition and measurement requirements in IAS 12 ‘Income taxes’where there is uncertainty over income tax treatments. The interpretation provides guidance to determine whetheruncertain tax positions should be considered separately or together, and that measurement should be whether thesingle most likely outcome or the probability weighted sum of a range of outcomes, whichever better predicts theresolution. The reassessment of current tax liabilities resulted in a decrease in liabilities of £5m but does not havea material impact on the income statement.
F-29

Notes to the consolidated financial statements
1d. Change of accounting policy: Amendments to IFRS 9 and IFRS 7
The Group has considered the impact of IBOR reform on its hedge accounting. The Group has elected to earlyadopt amendments to IFRS 9 and IFRS 7 ‘Interest Rate Benchmark Reform’ issued in September 2019. Inaccordance with the transition provisions, the amendments have been adopted retrospectively to hedgingrelationships that existed at the start of the reporting period or were designated thereafter. The amendmentsprovide temporary relief from applying specific hedge accounting requirements to hedging relationships directlyaffected by IBOR reform. The adoption of these amendments has not had a material impact on these financialstatements (see note 19).
2. Segment information
The primary segments for management and reporting are geographies as outlined below. In addition, the Groupseparately discloses the results from the Penguin Random House associate.
The chief operating decision-maker is the Pearson executive.
North America: Courseware, Assessments and Services businesses in the US and Canada.
Core: Courseware, Assessments and Services businesses in more mature markets including UK, Europe, AsiaPacific and North Africa.
Growth: Courseware, Assessments and Services businesses in emerging markets including Brazil, India, SouthAfrica, Hispano-America, Hong Kong and China, and the Middle East.
For more detail on the services and products included in each business segment refer to Item 4.
2019
All figures in £ millions NotesNorth
America Core Growth
PenguinRandomHouse Corporate Group
Sales . . . . . . . . . . . . . . . . . . . . . . . . . . . . . . . . . . 2,534 838 497 — — 3,869Adjusted operating profit . . . . . . . . . . . . . . . . . . 361 92 63 65 — 581Cost of major restructuring . . . . . . . . . . . . . . . . . (110) (28) (19) (2) — (159)Intangible charges . . . . . . . . . . . . . . . . . . . . . . . . (62) (7) (82) (12) — (163)Other net gains and losses . . . . . . . . . . . . . . . . . . 13 8 (5) — — 16
Operating profit (loss) . . . . . . . . . . . . . . . . . . . 202 65 (43) 51 — 275Finance costs . . . . . . . . . . . . . . . . . . . . . . . . . . . . 6 (84)Finance income . . . . . . . . . . . . . . . . . . . . . . . . . . 6 41
Profit before tax . . . . . . . . . . . . . . . . . . . . . . . . 232Income tax . . . . . . . . . . . . . . . . . . . . . . . . . . . . . . 7 34
Profit for the year . . . . . . . . . . . . . . . . . . . . . . . 266
Segment assets . . . . . . . . . . . . . . . . . . . . . . . . . . 4,316 1,957 484 — 489 7,246Associates . . . . . . . . . . . . . . . . . . . . . . . . . . . . . . 12 — 7 — 397 — 404
Total assets . . . . . . . . . . . . . . . . . . . . . . . . . . . . . 4,316 1,964 484 397 489 7,650
Other segment itemsShare of results of joint ventures and
associates . . . . . . . . . . . . . . . . . . . . . . . . . . . . 12 — 3 — 51 — 54Capital expenditure . . . . . . . . . . . . . . . . . . . . . . . 10, 11 176 35 51 — — 262Pre-publication investment . . . . . . . . . . . . . . . . . 20 189 81 49 — — 319Depreciation . . . . . . . . . . . . . . . . . . . . . . . . . . . . 10 75 23 25 — — 123Amortisation . . . . . . . . . . . . . . . . . . . . . . . . . . . . 11, 20 305 85 147 — — 537
F-30
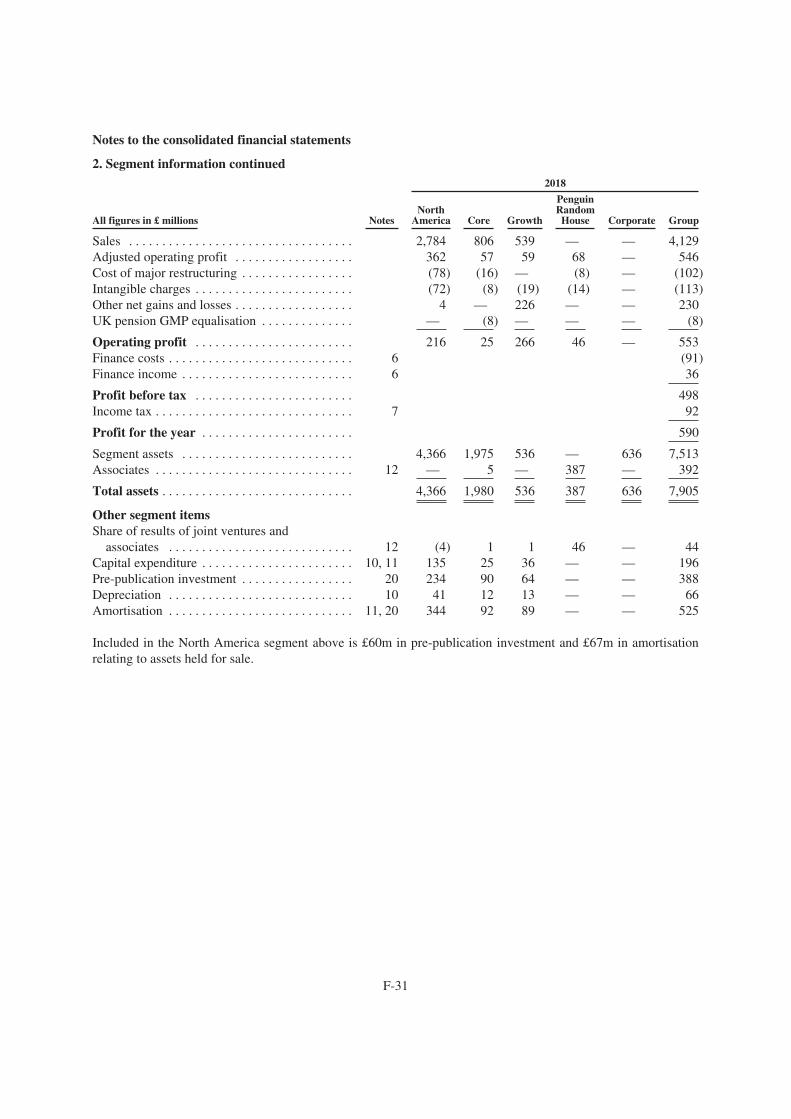
Notes to the consolidated financial statements
2. Segment information continued2018
All figures in £ millions NotesNorth
America Core Growth
PenguinRandomHouse Corporate Group
Sales . . . . . . . . . . . . . . . . . . . . . . . . . . . . . . . . . . 2,784 806 539 — — 4,129Adjusted operating profit . . . . . . . . . . . . . . . . . . 362 57 59 68 — 546Cost of major restructuring . . . . . . . . . . . . . . . . . (78) (16) — (8) — (102)Intangible charges . . . . . . . . . . . . . . . . . . . . . . . . (72) (8) (19) (14) — (113)Other net gains and losses . . . . . . . . . . . . . . . . . . 4 — 226 — — 230UK pension GMP equalisation . . . . . . . . . . . . . . — (8) — — — (8)
Operating profit . . . . . . . . . . . . . . . . . . . . . . . . 216 25 266 46 — 553Finance costs . . . . . . . . . . . . . . . . . . . . . . . . . . . . 6 (91)Finance income . . . . . . . . . . . . . . . . . . . . . . . . . . 6 36
Profit before tax . . . . . . . . . . . . . . . . . . . . . . . . 498Income tax . . . . . . . . . . . . . . . . . . . . . . . . . . . . . . 7 92
Profit for the year . . . . . . . . . . . . . . . . . . . . . . . 590
Segment assets . . . . . . . . . . . . . . . . . . . . . . . . . . 4,366 1,975 536 — 636 7,513Associates . . . . . . . . . . . . . . . . . . . . . . . . . . . . . . 12 — 5 — 387 — 392
Total assets . . . . . . . . . . . . . . . . . . . . . . . . . . . . . 4,366 1,980 536 387 636 7,905
Other segment itemsShare of results of joint ventures and
associates . . . . . . . . . . . . . . . . . . . . . . . . . . . . 12 (4) 1 1 46 — 44Capital expenditure . . . . . . . . . . . . . . . . . . . . . . . 10, 11 135 25 36 — — 196Pre-publication investment . . . . . . . . . . . . . . . . . 20 234 90 64 — — 388Depreciation . . . . . . . . . . . . . . . . . . . . . . . . . . . . 10 41 12 13 — — 66Amortisation . . . . . . . . . . . . . . . . . . . . . . . . . . . . 11, 20 344 92 89 — — 525
Included in the North America segment above is £60m in pre-publication investment and £67m in amortisationrelating to assets held for sale.
F-31

Notes to the consolidated financial statements
2. Segment information continued2017
All figures in £ millions NotesNorth
America Core Growth
PenguinRandomHouse Corporate Group
Sales . . . . . . . . . . . . . . . . . . . . . . . . . . . . . . . . . . . 2,929 815 769 — — 4,513Adjusted operating profit . . . . . . . . . . . . . . . . . . . 394 50 38 94 — 576Cost of major restructuring . . . . . . . . . . . . . . . . . (60) (11) (8) — — (79)Intangible charges . . . . . . . . . . . . . . . . . . . . . . . . (89) (12) (37) (28) — (166)Other net gains and losses . . . . . . . . . . . . . . . . . . (3) — 35 96 — 128Impact of US tax reform . . . . . . . . . . . . . . . . . . . — — — (8) — (8)
Operating profit . . . . . . . . . . . . . . . . . . . . . . . . . 242 27 28 154 — 451Finance costs . . . . . . . . . . . . . . . . . . . . . . . . . . . . 6 (110)Finance income . . . . . . . . . . . . . . . . . . . . . . . . . . 6 80
Profit before tax . . . . . . . . . . . . . . . . . . . . . . . . . 421Income tax . . . . . . . . . . . . . . . . . . . . . . . . . . . . . . 7 (13)
Profit for the year . . . . . . . . . . . . . . . . . . . . . . . 408
Segment assets . . . . . . . . . . . . . . . . . . . . . . . . . . . 4,116 1,914 667 — 793 7,490Joint ventures . . . . . . . . . . . . . . . . . . . . . . . . . . . . 12 — — 3 — — 3Associates . . . . . . . . . . . . . . . . . . . . . . . . . . . . . . 12 4 3 — 388 — 395
Total assets . . . . . . . . . . . . . . . . . . . . . . . . . . . . . 4,120 1,917 670 388 793 7,888
Other segment itemsShare of results of joint ventures and
associates . . . . . . . . . . . . . . . . . . . . . . . . . . . . . 12 5 1 1 71 — 78Capital expenditure . . . . . . . . . . . . . . . . . . . . . . . 10,11 162 35 43 — — 240Pre-publication investment . . . . . . . . . . . . . . . . . 20 218 84 59 — — 361Depreciation . . . . . . . . . . . . . . . . . . . . . . . . . . . . . 10 56 13 21 — — 90Amortisation . . . . . . . . . . . . . . . . . . . . . . . . . . . . 11,20 348 103 110 — — 561
There were no material inter-segment sales in either 2019, 2018 or 2017.
Adjusted operating profit is shown in the above tables as it is the key financial measure used by management toevaluate the performance of the Group and allocate resources to business segments. The measure also enablesinvestors to more easily, and consistently, track the underlying operational performance of the Group and itsbusiness segments over time by separating out those items of income and expenditure relating to acquisition anddisposal transactions, major restructuring programmes and certain other items that are also not representative ofunderlying performance, which are explained below.
Cost of major restructuring: In May 2017, the Group announced a restructuring programme, to run between 2017and 2019, to drive significant cost savings. This programme began in the second half of 2017 and net costsincurred were £79m in 2017, £102m in 2018 and £159m in 2019 and relate to delivery of cost efficiencies in theenabling functions and the US Higher Education Courseware business together with further rationalisation of theproperty and supplier portfolio. The restructuring costs in 2019 relate predominantly to staff redundancies whilethe restructuring costs in 2018 relate predominantly to staff redundancies and the net cost of propertyrationalisation including the net impact of the consolidation of the Group’s property footprint in London. Thecosts of this restructuring programme are significant enough to exclude from the adjusted operating profitmeasure so as to better highlight the underlying performance (see note 4).
F-32

Notes to the consolidated financial statements
2. Segment information continued
Intangible charges: These represent charges relating to acquired intangibles, acquisition costs and movements incontingent acquisition and disposal consideration. These charges are excluded as they reflect past acquisitionactivity and do not necessarily reflect the current year performance of the Group. Intangible amortisation chargesin 2019 were £163m, including an impairment charge of £65m relating to acquired intangibles in Brazil,compared with a charge of £113m in 2018 and £166m in 2017.
Other net gains and losses: These represent profits and losses on the sale of subsidiaries, joint ventures,associates and other financial assets and are excluded from adjusted operating profit as they distort theperformance of the Group as reported on a statutory basis. Other net gains of £16m in 2019 mainly relate to thesale of the US K12 Courseware business. Other net gains of £230m in 2018 relate to the sale of the Wall StreetEnglish language teaching business (WSE), realising a gain of £207m, the disposal of the Group’s equity interestin UTEL, the online university partnership in Mexico, realising a gain of £19m, and various other smallerdisposal items for a net gain of £4m. Other net gains of £128m in 2017 relate to the sale of the test preparationbusiness in China which resulted in a profit on sale of £44m and the part sale of the Group’s share in PenguinRandom House which resulted in a profit of £96m and other smaller disposal items for a net loss of £12m(see note 31).
UK pension GMP equalisation: In 2018, also excluded is the impact of adjustments arising from clarification ofguaranteed minimum pension (GMP) equalisation legislation in the UK as this relates to historical circumstances.
Impact of US tax reform: In 2017, as a result of US tax reform, the Group’s share of profit from associates wasadversely impacted by £8m. This amount was excluded from adjusted operating profit as it is considered to be atransition adjustment that is not expected to recur in the near future.
Corporate costs are allocated to business segments on an appropriate basis depending on the nature of the costand therefore the total segment result is equal to the Group operating profit.
Segment assets, excluding corporate assets, consist of property, plant and equipment, intangible assets,inventories, receivables, deferred taxation and other financial assets and exclude cash and cash equivalents andderivative assets. Corporate assets comprise cash and cash equivalents, marketable securities and derivativefinancial instruments. Capital expenditure comprises additions to property, plant and equipment and software(see notes 10 and 11).
Property, plant and equipment and intangible assets acquired through business combinations were £23m(2018: £nil), (2017: £nil) (see note 30).
The Group operates in the following main geographic areas:
Sales Non-current assets
All figures in £ millions 2019 2018 2017 2019 2018
UK . . . . . . . . . . . . . . . . . . . . . . . . . . . . . . . . . . . . . . . . . . . . . . . . . . . . . 385 377 384 694 900Other European countries . . . . . . . . . . . . . . . . . . . . . . . . . . . . . . . . . . . 244 246 262 125 143US . . . . . . . . . . . . . . . . . . . . . . . . . . . . . . . . . . . . . . . . . . . . . . . . . . . . . 2,417 2,627 2,770 2,604 2,162Canada . . . . . . . . . . . . . . . . . . . . . . . . . . . . . . . . . . . . . . . . . . . . . . . . . . 105 126 126 163 250Asia Pacific . . . . . . . . . . . . . . . . . . . . . . . . . . . . . . . . . . . . . . . . . . . . . . 441 455 643 149 146Other countries . . . . . . . . . . . . . . . . . . . . . . . . . . . . . . . . . . . . . . . . . . . . 277 298 328 103 137
Total . . . . . . . . . . . . . . . . . . . . . . . . . . . . . . . . . . . . . . . . . . . . . . . . . . . 3,869 4,129 4,513 3,838 3,738
F-33

Notes to the consolidated financial statements
2. Segment information continued
Sales are allocated based on the country in which the customer is located. This does not differ materially from thelocation where the order is received. The geographical split of non-current assets is based on the subsidiary’scountry of domicile. This is not materially different to the location of the assets. Non-current assets compriseproperty, plant and equipment, intangible assets, investments in joint ventures and associates and trade and otherreceivables.
3. Revenue from contracts with customers
The following tables analyse the Group’s revenue streams. Courseware includes curriculum materials provided inbook form and/or via access to digital content. Assessments includes test development, processing and scoringservices provided to governments, educational institutions, corporations and professional bodies. Servicesincludes the operation of schools, colleges and universities, including sistemas in Brazil, as well as the provisionof online learning services in partnership with universities and other academic institutions.
2019
All figures in £ millionsNorth
America Core Growth Group
Sales:CoursewareSchool Courseware . . . . . . . . . . . . . . . . . . . . . . . . . . . . . . . . . . . . . . . . . . . . 86 169 118 373Higher Education Courseware . . . . . . . . . . . . . . . . . . . . . . . . . . . . . . . . . . . 975 81 44 1,100English Courseware . . . . . . . . . . . . . . . . . . . . . . . . . . . . . . . . . . . . . . . . . . . 14 56 107 177
1,075 306 269 1,650
AssessmentsSchool and Higher Education Assessments . . . . . . . . . . . . . . . . . . . . . . . . . 309 264 26 599Clinical Assessments . . . . . . . . . . . . . . . . . . . . . . . . . . . . . . . . . . . . . . . . . . . 175 52 — 227Professional and English Certification . . . . . . . . . . . . . . . . . . . . . . . . . . . . . 390 168 80 638
874 484 106 1,464
ServicesSchool Services . . . . . . . . . . . . . . . . . . . . . . . . . . . . . . . . . . . . . . . . . . . . . . . 319 2 46 367Higher Education Services . . . . . . . . . . . . . . . . . . . . . . . . . . . . . . . . . . . . . . 266 45 26 337English Services . . . . . . . . . . . . . . . . . . . . . . . . . . . . . . . . . . . . . . . . . . . . . . — 1 50 51
585 48 122 755
Total . . . . . . . . . . . . . . . . . . . . . . . . . . . . . . . . . . . . . . . . . . . . . . . . . . . . . . . 2,534 838 497 3,869
F-34

Notes to the consolidated financial statements
3. Revenue from contracts with customers continued2018
All figures in £ millionsNorth
America Core Growth Group
Sales:CoursewareSchool Courseware . . . . . . . . . . . . . . . . . . . . . . . . . . . . . . . . . . . . . . . . . . . . 378 172 127 677Higher Education Courseware . . . . . . . . . . . . . . . . . . . . . . . . . . . . . . . . . . . 1,042 87 57 1,186English Courseware . . . . . . . . . . . . . . . . . . . . . . . . . . . . . . . . . . . . . . . . . . . 16 58 102 176
1,436 317 286 2,039
AssessmentsSchool and Higher Education Assessments1 . . . . . . . . . . . . . . . . . . . . . . . . 298 237 23 558Clinical Assessments1 . . . . . . . . . . . . . . . . . . . . . . . . . . . . . . . . . . . . . . . . . . 174 55 — 229Professional and English Certification . . . . . . . . . . . . . . . . . . . . . . . . . . . . . 344 150 64 558
816 442 87 1,345
ServicesSchool Services . . . . . . . . . . . . . . . . . . . . . . . . . . . . . . . . . . . . . . . . . . . . . . . 288 2 47 337Higher Education Services . . . . . . . . . . . . . . . . . . . . . . . . . . . . . . . . . . . . . . 244 40 29 313English Services . . . . . . . . . . . . . . . . . . . . . . . . . . . . . . . . . . . . . . . . . . . . . . — 5 90 95
532 47 166 745
Total . . . . . . . . . . . . . . . . . . . . . . . . . . . . . . . . . . . . . . . . . . . . . . . . . . . . . . . 2,784 806 539 4,129
2017
All figures in £ millionsNorth
America Core Growth Group
Sales:CoursewareSchool Courseware . . . . . . . . . . . . . . . . . . . . . . . . . . . . . . . . . . . . . . . . . . . . 394 171 139 704Higher Education Courseware . . . . . . . . . . . . . . . . . . . . . . . . . . . . . . . . . . . 1,146 93 63 1,302English Courseware . . . . . . . . . . . . . . . . . . . . . . . . . . . . . . . . . . . . . . . . . . . 20 60 102 182
1,560 324 304 2,188
AssessmentsSchool and Higher Education Assessments1 . . . . . . . . . . . . . . . . . . . . . . . . . 318 256 23 597Clinical Assessments1 . . . . . . . . . . . . . . . . . . . . . . . . . . . . . . . . . . . . . . . . . . 183 46 — 229Professional and English Certification . . . . . . . . . . . . . . . . . . . . . . . . . . . . . 341 138 60 539
842 440 83 1,365
ServicesSchool Services . . . . . . . . . . . . . . . . . . . . . . . . . . . . . . . . . . . . . . . . . . . . . . . 274 5 54 333Higher Education Services . . . . . . . . . . . . . . . . . . . . . . . . . . . . . . . . . . . . . . 253 34 32 319English Services . . . . . . . . . . . . . . . . . . . . . . . . . . . . . . . . . . . . . . . . . . . . . . — 12 296 308
527 51 382 960
Total . . . . . . . . . . . . . . . . . . . . . . . . . . . . . . . . . . . . . . . . . . . . . . . . . . . . . . . 2,929 815 769 4,513
1 The analysis of Assessments revenues in 2018 and 2017 have been re-presented to reflect the transfer of aproduct from School to Clinical.
F-35

Notes to the consolidated financial statements
3. Revenue from contracts with customers continued
The Group derived revenue from the transfer of goods and services over time and at a point in time in thefollowing major product lines:
2019
All figures in £ millionsNorth
America Core Growth Total
CoursewareProducts transferred at a point in time (sale or return) . . . . . . . . . . . . . . . . . 448 291 178 917Products transferred at a point in time (other) . . . . . . . . . . . . . . . . . . . . . . . — — 37 37Products and services transferred over time . . . . . . . . . . . . . . . . . . . . . . . . . 627 15 54 696
1,075 306 269 1,650AssessmentsProducts transferred at a point in time . . . . . . . . . . . . . . . . . . . . . . . . . . . . . 113 55 6 174Products and services transferred over time . . . . . . . . . . . . . . . . . . . . . . . . . 761 429 100 1,290
874 484 106 1,464ServicesProducts transferred at a point in time . . . . . . . . . . . . . . . . . . . . . . . . . . . . . — 26 — 26Products and services transferred over time . . . . . . . . . . . . . . . . . . . . . . . . . 585 22 122 729
585 48 122 755
Total . . . . . . . . . . . . . . . . . . . . . . . . . . . . . . . . . . . . . . . . . . . . . . . . . . . . . . . 2,534 838 497 3,869
2018
All figures in £ millionsNorth
America Core Growth Total
CoursewareProducts transferred at a point in time (sale or return) . . . . . . . . . . . . . . . . . 718 313 197 1,228Products transferred at a point in time (other) . . . . . . . . . . . . . . . . . . . . . . . — — 35 35Products and services transferred over time . . . . . . . . . . . . . . . . . . . . . . . . . 718 4 54 776
1,436 317 286 2,039Assessments1
Products transferred at a point in time . . . . . . . . . . . . . . . . . . . . . . . . . . . . . 106 52 — 158Products and services transferred over time . . . . . . . . . . . . . . . . . . . . . . . . . 710 390 87 1,187
816 442 87 1,345ServicesProducts transferred at a point in time . . . . . . . . . . . . . . . . . . . . . . . . . . . . . — 26 38 64Products and services transferred over time . . . . . . . . . . . . . . . . . . . . . . . . . 532 21 128 681
532 47 166 745
Total . . . . . . . . . . . . . . . . . . . . . . . . . . . . . . . . . . . . . . . . . . . . . . . . . . . . . . . 2,784 806 539 4,129
1 The analysis of Assessments revenues in 2018 has been re-presented to better reflect the nature of sales.
F-36

Notes to the consolidated financial statements
3. Revenue from contracts with customers continued
a. Nature of goods and services
The following is a description of the nature of the Group’s performance obligations within contracts withcustomers broken down by revenue stream, along with significant judgements and estimates made within each ofthose revenue streams.
Courseware
Revenue is generated from customers through the sales of print and digital courseware materials to schools,bookstores and direct to individual learners. Goods and services may be sold separately or purchased together inbundled packages. The goods and services included in bundled arrangements are considered distinct performanceobligations, except for where Pearson provides both a licence of intellectual property and an on-going hostingservice. As the licence of intellectual property is only available with the concurrent hosting service, the licence isnot treated as a distinct performance obligation separate from the hosting service.
The transaction price is allocated between distinct performance obligations on the basis of their relativestandalone selling prices.
In determining the transaction price, variable consideration exists in the form of discounts and anticipatedreturns. Discounts reduce the transaction price on a given transaction. A provision for anticipated returns is madebased primarily on historical return rates, customer buying patterns and retailer behaviours including stock levels(see note 24). If these estimates do not reflect actual returns in future periods then revenues could be understatedor overstated for a particular period. Variable consideration as described above is determined using the expectedvalue approach. The sales return liability at the end of 2019 was £122m (see note 24). This represents 3% ofannual sales subject to sale or return.
While payment for these goods and services generally occurs at the start of these arrangements, the length oftime between payment and delivery of the performance obligations is generally short-term in nature or the reasonfor early payment relates to reasons other than financing, including customers securing a vendor in a longer-termarrangement or the transfer of goods or services is at the discretion of the customer. For these reasons and the useof the practical expedient on short-term financing, significant financing components are not recognised withinCourseware transactions.
Revenue from the sale of physical books is recognised at a point in time when control passes. This is generally atthe point of shipment when title passes to the customer, when the Group has a present right to payment and thesignificant risks and rewards of ownership have passed to the customer. Revenue from physical books soldthrough the direct print rental method is recognised over the rental period, as the customer is simultaneouslyreceiving and consuming the benefits of this rental service through the passage of time.
Revenue from the sale of digital courseware products is recognised on a straight-line basis over the subscriptionperiod, unless hosted by a third party or representative of a downloadable product, in which case Pearson has noon-going obligation and recognises revenue when control transfers as the customer is granted access to the digitalproduct.
Revenue from the sale of ‘off-the-shelf’ software is recognised on delivery or on installation of the softwarewhere that is a condition of the contract. In certain circumstances, where installation is complex, revenue isrecognised when the customer has completed their acceptance procedures.
F-37

Notes to the consolidated financial statements
3. Revenue from contracts with customers continued
a. Nature of goods and services continued
Assessments
Revenue is primarily generated from multi-year contractual arrangements related to large-scale assessmentdelivery, such as contracts to process qualifying tests for individual professions and government departments,and is recognised as performance occurs. Under these arrangements, while the agreement spans multiple years,the contract duration has been determined to be each testing cycle based on contract structure, including clausesregarding termination. While in some cases the customer may have the ability to terminate during the term forconvenience, significant financial or qualitative barriers exist limiting the potential for such terminations in themiddle of a testing cycle.
Within each testing cycle, a variety of service activities are performed such as test administration, delivery,scoring, reporting, item development, operational services and programme management. These services are nottreated as distinct in the context of the customer contract as Pearson provides an integrated managed serviceoffering and these activities are accounted for together as one comprehensive performance obligation.
Within each testing cycle, the transaction price may contain both fixed and variable amounts. Variableconsideration within these transactions primarily relates to expected testing volumes to be delivered in the cycle.The assumptions, risks and uncertainties inherent to long-term contract accounting can affect the amounts andtiming of revenue and related expenses reported. Variable consideration is measured using the expected valuemethod, except where amounts are contingent upon a future event’s occurrence, such as performance bonuses.Such event-driven contingency payments are measured using the most likely amount approach. To the extent thata higher degree of uncertainty exists regarding variable consideration, these amounts are excluded from thetransaction price and expensed when the uncertainty is reasonably removed.
Customer payments are generally defined in the contract through a payment schedule, which may requirecustomer acceptance for services rendered. Pearson has a history of providing satisfactory services which areaccepted by the customer. While a delay between rendering of services and payment may exist, payment termsare within 12 months and the Group has elected to use the practical expedient available in IFRS 15 Revenue fromContracts with Customers and not identify a significant financing component on these transactions.
Revenue is recognised for Assessment contracts over time as the customer is benefiting as performance takesplace through a continuous transfer of control to the customer. This continuous transfer of control to the customeris supported by clauses in the contracts which may allow the customer to terminate for convenience, compensateus for work performed to date, and take possession of work in process.
As control transfers over time, revenue is recognised based on the extent of progress towards completion of theperformance obligation. The selection of the method to measure progress towards completion requires judgementand is based on the nature of the services provided. Revenue is recognised on a percentage completion basis,calculated using the proportion of the total estimated costs incurred to date. Percentage of completion is used torecognise the transfer of control of services provided as these services are not provided evenly throughout thetesting cycle and involve varying degrees of effort during the term.
Losses on contracts are recognised in the period in which the loss first becomes foreseeable. Contract losses aredetermined to be the amount by which estimated total costs of the contract exceed the estimated total revenuesthat will be generated.
In Assessments contracts driven primarily by transactions directly to end users, Pearson’s main obligation to thecustomer involves test delivery and scoring. Test delivery and scoring are defined as a single performance
F-38

Notes to the consolidated financial statements
3. Revenue from contracts with customers continued
a. Nature of goods and services continued
Assessments continued
obligation delivered over time whether the test is subsequently manually scored or digitally scored on the day ofthe assessment. Customers may also purchase print and digital supplemental materials. Print products in thisrevenue stream are recognised at a point in time when control passes to the customer upon shipment. Recognitionof digital revenue will occur based on the extent of Pearson’s on-going hosting obligation.
Services
Revenue is primarily generated from multi-year contractual arrangements related to large-scale educationalservice delivery to academic institutions, such as schools and higher education universities. Under thesearrangements, while an agreement may span multiple years, the contract duration has been determined to be eachacademic period based on the structure of contracts, including clauses regarding termination. While in somecases the customer may have the ability to terminate during the term for convenience, significant financial orqualitative barriers exist limiting the potential for such terminations in the middle of an academic period. Theacademic period for this customer base is normally an academic year for schools and a semester for highereducation universities.
Within each academic period, a variety of services are provided such as programme development, studentacquisition, education technology and student support services. These services are not distinct in the context ofthe customer contract as Pearson provides an integrated managed service offering and these activities areaccounted for together as a comprehensive performance obligation.
Where Services are provided to university customers, volume and transaction price are fixed at the start of thesemester. Where Services are provided to School customers, the transaction price may contain both fixedand variable amounts which require estimation during the academic period. Estimation is required whereconsideration is based upon average enrolments or other metrics which are not known at the start of the academicyear. Variable consideration is measured using the expected value method. To the extent that a higher degree ofuncertainty exists regarding variable consideration, these amounts are excluded from the transaction price andrecognised when the uncertainty is reasonably removed.
Customer payments are generally defined in the contract as occurring shortly after invoicing. Where there is alonger payment term offered to a customer through a payment schedule, payment terms are within 12 months andthe Group has elected to use the practical expedient available in IFRS 15 and not identify a significant financingcomponent on these transactions.
Revenue is recognised for Service contracts over time as the customer is benefiting as performance takes placethrough a continuous transfer of control to the customer. This continuous transfer of control to the customer issupported by clauses in the contracts which may allow the customer to terminate for convenience, compensatefor work performed to date, and take possession of work in process.
As control transfers over time, revenue is recognised based on the extent of progress towards completion of theperformance obligation. The selection of the method to measure progress towards completion requires judgementand is based on the nature of the products or services provided. Within the comprehensive service obligation, thetiming of services occurs relatively evenly over each academic period and, as such, time elapsed is used torecognise the transfer of control to the customer on a straight-line basis.
F-39

Notes to the consolidated financial statements
3. Revenue from contracts with customers continued
a. Nature of goods and services continued
Services continued
Losses on contracts are recognised in the period in which the loss first becomes foreseeable. Contract losses aredetermined to be the amount by which estimated total costs of the contract exceed the estimated total revenuesthat will be generated.
In cases of optional or add-on purchases, institutions may purchase physical goods priced at their standalonevalue, which are accounted for separately and recognised at the point in time when control passes to the customerupon shipment.
b. Disaggregation of revenue
The tables in notes 2 and 3 show revenue from contracts with customers disaggregated by operating segment,geography and revenue stream. These disaggregation categories are appropriate as they represent the keygroupings used in managing and evaluating underlying performance of each of the businesses. The categoriesalso reflect groups of similar types of transactional characteristics, among similar customers, with similaraccounting conclusions.
c. Contract balances
Transactions within the Courseware revenue stream generally entail customer billings at or near the contract’sinception and accordingly Courseware deferred income balances are primarily related to subscriptionperformance obligations to be delivered over time.
Transactions within the Assessments and Services revenue streams generally entail customer billings over timebased on periodic intervals, progress towards milestones or enrolment census dates. As the performanceobligations within these arrangements are delivered over time, the extent of accrued income or deferred incomewill ultimately depend upon the difference between revenue recognised and billings to date.
Refer to note 22 for opening and closing balances of accrued income. Refer to note 24 for opening and closingbalances of deferred income. Revenue recognised during the period from changes in deferred income was drivenprimarily by the release of revenue over time from digital subscriptions.
d. Contract costs
The Group capitalises incremental costs to obtain contracts with customers where it is expected these costs willbe recoverable. Incremental costs to obtain contracts with customers are considered those which would not havebeen incurred if the contract had not been obtained. For the Group, these costs relate primarily to salescommissions. The Group has elected to use the practical expedient as allowable by IFRS 15 whereby such costswill be expensed as incurred where the expected amortisation period is one year or less. Where the amortisationperiod is greater than one year, these costs are amortised over the contract term on a systematic basis consistentwith the transfer of the underlying goods and services within the contract to which these costs relate, which willgenerally be on a ratable basis. Impairment of capitalised contract costs was £nil in 2019, 2018 and 2017.
The Group does not recognise any material costs to fulfil contracts with customers as these types of activities aregoverned by other accounting standards.
Refer to note 22 for further details of opening and closing balances of these costs reflected within deferredcontract costs.
F-40

Notes to the consolidated financial statements
3. Revenue from contracts with customers continued
e. Remaining transaction price
The below table depicts the remaining transaction price on unsatisfied or partially unsatisfied performanceobligations from contracts with customers.
2019
All figures in £ millions SalesDeferredincome
Committedsales
Total remainingtransaction price 2020 2021
2022and later
CoursewareProducts transferred at a point in time (sale or
return) . . . . . . . . . . . . . . . . . . . . . . . . . . . . . . . 917 1 — 1 1 — —Products transferred at a point in time (other) . . 37 1 — 1 1 — —Products and services transferred over time . . . . 696 118 — 118 82 13 23
AssessmentsProducts transferred at a point in time . . . . . . . . 174 — — — — — —Products and services transferred over time . . . . 1,290 206 375 581 433 146 2
ServicesProducts transferred at a point in time . . . . . . . . 26 3 — 3 3 — —Products and services transferred over time –
subscriptions . . . . . . . . . . . . . . . . . . . . . . . . . . 310 11 — 11 11 — —Products and services transferred over time –
other ongoing performance obligations . . . . . 419 20 106 126 125 1 —
Total . . . . . . . . . . . . . . . . . . . . . . . . . . . . . . . . . . 3,869 360 481 841 656 160 25
2018
All figures in £ millions SalesDeferredincome
Committedsales
Total remainingtransaction price 2019 2020
2021and later
CoursewareProducts transferred at a point in time (sale or
return) . . . . . . . . . . . . . . . . . . . . . . . . . . . . . . . 1,228 1 — 1 1 — —Products transferred at a point in time (other) . . 35 — — — — — —Products and services transferred over time . . . . 776 679 8 687 272 131 284
Assessments1
Products transferred at a point in time . . . . . . . . 158 — — — — — —Products and services transferred over time . . . . 1,187 196 402 598 420 173 5
ServicesProducts transferred at a point in time . . . . . . . . 64 — — — — — —Products and services transferred over time –
subscriptions . . . . . . . . . . . . . . . . . . . . . . . . . . 310 17 — 17 13 3 1Products and services transferred over time –
other ongoing performance obligations . . . . . 371 19 145 164 162 1 1
Total . . . . . . . . . . . . . . . . . . . . . . . . . . . . . . . . . . 4,129 912 555 1,467 868 308 291
1 The analysis of Assessments revenues in 2018 has been re-presented to better reflect the nature of sales.
Committed sales amounts are equal to the transaction price from contracts with customers, excluding thoseamounts previously recognised as revenue and amounts currently recognised in deferred income. The total ofcommitted sales and deferred income is equal to the remaining transaction price.
F-41

Notes to the consolidated financial statements
3. Revenue from contracts with customers continued
e. Remaining transaction price continued
Time bands stated above represent the expected timing of when the remaining transaction price will berecognised as revenue.
4. Operating expenses
All figures in £ millions 2019 2018 2017
By function:Cost of goods sold . . . . . . . . . . . . . . . . . . . . . . . . . . . . . 1,858 1,943 2,066
Operating expensesDistribution costs . . . . . . . . . . . . . . . . . . . . . . . . . . . . . . 73 88 84Selling, marketing and product development costs . . . . 631 759 896Administrative and other expenses . . . . . . . . . . . . . . . . 999 1,039 1,207Restructuring costs . . . . . . . . . . . . . . . . . . . . . . . . . . . . . 157 90 79Other income . . . . . . . . . . . . . . . . . . . . . . . . . . . . . . . . . (54) (69) (64)
Total net operating expenses . . . . . . . . . . . . . . . . . . . . 1,806 1,907 2,202Other net gains and losses . . . . . . . . . . . . . . . . . . . . . . . (16) (230) (128)
Total . . . . . . . . . . . . . . . . . . . . . . . . . . . . . . . . . . . . . . . . 3,648 3,620 4,140
Included in other income is service fee income from Penguin Random House of £4m (2018: £3m, 2017: £3m).Included in administrative and other expenses are research and efficacy costs of £13m (2018: £14m,2017: £14m). In addition to the restructuring costs shown above, there were major restructuring costs in relationto associates of £2m (2018: £12m, 2017: £nil).
An analysis of major restructuring costs is as follows:
All figures in £ millions 2019 2018 2017
By nature:Product costs . . . . . . . . . . . . . . . . . . . . . . . . . . . . . . . . . 16 12 15Employee costs . . . . . . . . . . . . . . . . . . . . . . . . . . . . . . . . 90 56 11Depreciation and amortisation . . . . . . . . . . . . . . . . . . . . 14 1 13Property and facilities . . . . . . . . . . . . . . . . . . . . . . . . . . 12 (5) 24Technology and communications . . . . . . . . . . . . . . . . . . 2 1 2Professional and outsourced services . . . . . . . . . . . . . . . 17 9 12General and administrative costs . . . . . . . . . . . . . . . . . . 6 16 2
Total restructuring – operating expenses . . . . . . . . . . 157 90 79Share of associate restructuring . . . . . . . . . . . . . . . . . . . 2 12 —
Total . . . . . . . . . . . . . . . . . . . . . . . . . . . . . . . . . . . . . . . . 159 102 79
F-42

Notes to the consolidated financial statements
4. Operating expenses continued
In May 2017, the Group announced a restructuring programme to run between 2017 and 2019 to drive furthersignificant cost savings. The costs of this programme have been excluded from adjusted operating profit so as tobetter highlight the underlying performance (see note 8). In 2018, property and facilities costs include gains onthe disposal of properties sold as part of the restructuring programme.
All figures in £ millions Notes 2019 2018 2017
By nature:Royalties expensed . . . . . . . . . . . . . . . . . . . . . . . . . . . . . . 242 236 246Other product costs . . . . . . . . . . . . . . . . . . . . . . . . . . . . . . 466 516 564Employee benefit expense . . . . . . . . . . . . . . . . . . . . . . . . 5 1,452 1,637 1,805Contract labour . . . . . . . . . . . . . . . . . . . . . . . . . . . . . . . . . 139 161 152Employee-related expense . . . . . . . . . . . . . . . . . . . . . . . . 94 115 127Promotional costs . . . . . . . . . . . . . . . . . . . . . . . . . . . . . . . 254 233 229Depreciation of property, plant and equipment . . . . . . . . 10 123 66 90Amortisation of intangible assets – pre-publication . . . . . 20 271 338 338Amortisation of intangible assets – software . . . . . . . . . . 11 115 88 85Amortisation and impairment of intangible assets –
other . . . . . . . . . . . . . . . . . . . . . . . . . . . . . . . . . . . . . . . 11 151 99 138Property and facilities . . . . . . . . . . . . . . . . . . . . . . . . . . . . 96 147 202Technology and communications . . . . . . . . . . . . . . . . . . . 196 192 218Professional and outsourced services . . . . . . . . . . . . . . . . 480 396 322Other general and administrative costs . . . . . . . . . . . . . . . 104 85 140Costs capitalised to intangible assets . . . . . . . . . . . . . . . . (465) (390) (324)Other net gains and losses . . . . . . . . . . . . . . . . . . . . . . . . (16) (230) (128)Other income . . . . . . . . . . . . . . . . . . . . . . . . . . . . . . . . . . (54) (69) (64)
Total . . . . . . . . . . . . . . . . . . . . . . . . . . . . . . . . . . . . . . . . . 3,648 3,620 4,140
During the year the Group obtained the following services from the Group’s auditors:
All figures in £ millions 2019 2018 2017
The audit of parent company and consolidated financialstatements . . . . . . . . . . . . . . . . . . . . . . . . . . . . . . . . . . 5 4 4
The audit of the company’s subsidiaries . . . . . . . . . . . . . 2 2 2
Total audit fees . . . . . . . . . . . . . . . . . . . . . . . . . . . . . . . 7 6 6Audit-related and other assurance services . . . . . . . . . . . — 1 1Other non-audit services . . . . . . . . . . . . . . . . . . . . . . . . . — — 1
Total other services . . . . . . . . . . . . . . . . . . . . . . . . . . . . — 1 2Total non-audit services . . . . . . . . . . . . . . . . . . . . . . . . — 1 2
Total . . . . . . . . . . . . . . . . . . . . . . . . . . . . . . . . . . . . . . . . 7 7 8
Reconciliation between audit and non-audit service fees is shown below:
All figures in £ millions 2019 2018 2017
Group audit fees including fees for attestation undersection 404 of the Sarbanes-Oxley Act . . . . . . . . . . . . 7 6 6
Non-audit fees . . . . . . . . . . . . . . . . . . . . . . . . . . . . . . . . . — 1 2
Total . . . . . . . . . . . . . . . . . . . . . . . . . . . . . . . . . . . . . . . . 7 7 8
F-43

Notes to the consolidated financial statements
4. Operating expenses continued
Fees for attestation under section 404 of the Sarbanes-Oxley Act are allocated between fees payable for the auditsof consolidated and subsidiary accounts.
Included in non-audit fees is audit related work in relation to disposal transactions and other assurance workrelated to the audit of the Group’s efficacy programme. Included in Group audit fees for 2019 are additional feesin relation to prior year audit work.
5. Employee information
All figures in £ millions Notes 2019 2018 2017
Employee benefit expenseWages and salaries (including termination costs) . . . . . . 1,258 1,421 1,567Social security costs . . . . . . . . . . . . . . . . . . . . . . . . . . . . . 100 112 130Share-based payment costs . . . . . . . . . . . . . . . . . . . . . . . . 26 25 37 33Retirement benefits – defined contribution plans . . . . . . . 25 57 56 57Retirement benefits – defined benefit plans . . . . . . . . . . . 25 13 23 19Other post-retirement medical benefits . . . . . . . . . . . . . . 25 (1) (12) (1)
Total . . . . . . . . . . . . . . . . . . . . . . . . . . . . . . . . . . . . . . . . . 1,452 1,637 1,805
The details of the emoluments of the Directors of Pearson plc are shown in the report on Directors’ remuneration.
Average number employed 2019 2018 2017
Employee numbersNorth America . . . . . . . . . . . . . . . . . . . . . . . . . . . . . 13,564 14,113 16,295Core . . . . . . . . . . . . . . . . . . . . . . . . . . . . . . . . . . . . . 4,951 5,192 5,291Growth . . . . . . . . . . . . . . . . . . . . . . . . . . . . . . . . . . . 3,693 4,521 8,268Other . . . . . . . . . . . . . . . . . . . . . . . . . . . . . . . . . . . . . 526 496 485
Total . . . . . . . . . . . . . . . . . . . . . . . . . . . . . . . . . . . . . 22,734 24,322 30,339
F-44

Notes to the consolidated financial statements
6. Net finance costs
All figures in £ millions Notes 2019 2018 2017
Interest payable on financial liabilities at amortised cost andassociated derivatives . . . . . . . . . . . . . . . . . . . . . . . . . . . . . (22) (42) (99)
Interest on lease liabilities . . . . . . . . . . . . . . . . . . . . . . . . . . . . (45) — —Net foreign exchange losses . . . . . . . . . . . . . . . . . . . . . . . . . . (5) (36) —Finance costs associated with transactions . . . . . . . . . . . . . . . — (1) (6)Derivatives not in a hedge relationship . . . . . . . . . . . . . . . . . . (12) (7) (5)Derivatives in a hedge relationship . . . . . . . . . . . . . . . . . . . . . — (5) —
Finance costs . . . . . . . . . . . . . . . . . . . . . . . . . . . . . . . . . . . . . (84) (91) (110)
Interest receivable on financial assets at amortised cost . . . . . 15 18 20Interest on lease receivables . . . . . . . . . . . . . . . . . . . . . . . . . . 11 — —Net finance income in respect of retirement benefits . . . . . . . 25 13 11 3Net foreign exchange gains . . . . . . . . . . . . . . . . . . . . . . . . . . . — — 44Derivatives not in a hedge relationship . . . . . . . . . . . . . . . . . . 2 6 12Derivatives in a hedge relationship . . . . . . . . . . . . . . . . . . . . . — 1 1
Finance income . . . . . . . . . . . . . . . . . . . . . . . . . . . . . . . . . . . 41 36 80
Net finance costs . . . . . . . . . . . . . . . . . . . . . . . . . . . . . . . . . . (43) (55) (30)
Included in interest receivable is £1m (2018: £1m, 2017: £1m) of interest receivable from related parties. Netmovement in fair value of hedges is explained in note 16.
For further information on adjusted measures above, see note 8.
7. Income tax
All figures in £ millions Notes 2019 2018 2017
Current taxCredit/(charge) in respect of current year . . . . . . . . . . . . . . . . (51) 92 (121)Adjustments in respect of prior years . . . . . . . . . . . . . . . . . . . 21 34 (2)
Total current tax credit/(charge) . . . . . . . . . . . . . . . . . . . . . (30) 126 (123)
Deferred taxIn respect of temporary differences . . . . . . . . . . . . . . . . . . . . . 59 (6) 96Other adjustments in respect of prior years . . . . . . . . . . . . . . . 5 (28) 14
Total deferred tax (charge)/credit . . . . . . . . . . . . . . . . . . . . 13 64 (34) 110
Total tax credit/(charge) . . . . . . . . . . . . . . . . . . . . . . . . . . . . 34 92 (13)
The adjustments in respect of prior years in 2019, 2018 and 2017 primarily arise from revising the previousyear’s reported tax provision to reflect the tax returns subsequently filed. This results in a change betweendeferred and current tax as well as an absolute benefit to the total tax charge.
F-45

Notes to the consolidated financial statements
7. Income tax continued
The tax on the Group’s profit before tax differs from the theoretical amount that would arise using the UK taxrate as follows:
All figures in £ millions 2019 2018 2017
Profit before tax . . . . . . . . . . . . . . . . . . . . . . . . . . . . . . . . . . . . . . . . . 232 498 421Tax calculated at UK rate (2019: 19%, 2018: 19%, 2017: 19.25%) . . . (44) (94) (81)Effect of overseas tax rates . . . . . . . . . . . . . . . . . . . . . . . . . . . . . . . . (2) (28) 15Joint venture and associate income reported net of tax . . . . . . . . . . . 10 8 15Intangible impairment not subject to tax . . . . . . . . . . . . . . . . . . . . . . — — —Intra-group financing benefit . . . . . . . . . . . . . . . . . . . . . . . . . . . . . . . 11 25 26Movement in provisions for tax uncertainties . . . . . . . . . . . . . . . . . . 3 111 49Impact of US tax reform . . . . . . . . . . . . . . . . . . . . . . . . . . . . . . . . . . — — (1)Net expense not subject to tax . . . . . . . . . . . . . . . . . . . . . . . . . . . . . . (10) (29) (39)Benefit from change in US tax accounting treatment . . . . . . . . . . . . — 25 —Gains and losses on sale of businesses not subject to tax . . . . . . . . . 57 77 8Utilisation of previously unrecognised tax losses and credits . . . . . . — — (1)Unrecognised tax losses . . . . . . . . . . . . . . . . . . . . . . . . . . . . . . . . . . . (17) (9) (16)Adjustments in respect of prior years . . . . . . . . . . . . . . . . . . . . . . . . 26 6 12
Total tax credit/(charge) . . . . . . . . . . . . . . . . . . . . . . . . . . . . . . . . . 34 92 (13)
UK . . . . . . . . . . . . . . . . . . . . . . . . . . . . . . . . . . . . . . . . . . . . . . . . . . . (12) 37 (36)Overseas . . . . . . . . . . . . . . . . . . . . . . . . . . . . . . . . . . . . . . . . . . . . . . . 46 55 23
Total tax credit/(charge) . . . . . . . . . . . . . . . . . . . . . . . . . . . . . . . . . 34 92 (13)
Tax rate reflected in earnings . . . . . . . . . . . . . . . . . . . . . . . . . . . . . . . (14.7)% (18.5)% 3.1%
Included in net expense not subject to tax are foreign taxes not creditable, the tax impact of share-based paymentsand other expenses not deductible.
Factors which may affect future tax charges include changes in tax legislation, transfer pricing regulations, thelevel and mix of profitability in different countries, and settlements with tax authorities.
The movement in provisions for tax uncertainties primarily reflects releases due to the expiry of relevant statutesof limitation, utilisation of brought forward provisions and the establishment of provisions for new uncertain taxpositions. The current tax liability of £55m (2018: £72m) includes £152m (2018: £181m) of provisions for taxuncertainties principally in respect of a number of issues in the US, the UK and China. The issues provided forinclude the allocation between territories of proceeds of historical business disposals and the potentialdisallowance of intra-Group recharges. The Group is currently under audit in a number of countries, and thetiming of any resolution of these audits is uncertain. Of the balance of £152m, £88m relates to 2015 and earlierand is mostly under audit. In most countries, tax years up to and including 2014 are now statute barred fromexamination by tax authorities. Of the remaining balance, £18m relates to 2016, £30m to 2017, £4m to 2018 and£12m to 2019. If relevant enquiry windows pass with no audit, management believes it is reasonably possiblethat provision levels will reduce by an estimated £3m within the next 12 months. However the tax authoritiesmay take a different view from management and the final liability may be greater than provided. For itemscurrently under audit if tax authorities are successful, any incremental exposure is not expected to be material thisyear (2018: £25m). Contingent liabilities relating to tax are disclosed in note 34.
F-46

Notes to the consolidated financial statements
7. Income tax continued
The tax benefit/(charge) recognised in other comprehensive income is as follows:
All figures in £ millions 2019 2018 2017
Net exchange differences on translation of foreignoperations . . . . . . . . . . . . . . . . . . . . . . . . . . . . . . . 5 (4) 9
Fair value gain on other financial assets . . . . . . . . . . (4) — (4)Remeasurement of retirement benefit obligations . . 22 9 (42)
23 5 (37)
A tax charge of £5m (2018: £4m, 2017: £nil) relating to share-based payments has been recognised directly inequity.
8. Earnings per share
Basic
Basic earnings per share is calculated by dividing the profit attributable to equity shareholders of the company bythe weighted average number of ordinary shares in issue during the year, excluding ordinary shares purchased bythe company and held as treasury shares.
Diluted
Diluted earnings per share is calculated by adjusting the weighted average number of ordinary shares to takeaccount of all dilutive potential ordinary shares and adjusting the profit attributable, if applicable, to account forany tax consequences that might arise from conversion of those shares.
All figures in £ millions Notes 2019 2018 2017
Earnings/(loss) for the year from continuing operations . . . . . . . . . . . . . . . . . . . . . 266 590 408Non-controlling interest . . . . . . . . . . . . . . . . . . . . . . . . . . . . . . . . . . . . . . . . . . . . . . (2) (2) (2)
Earnings/(loss) attributable to equity holders of the company . . . . . . . . . . . . . 264 588 406
Weighted average number of shares (millions) . . . . . . . . . . . . . . . . . . . . . . . . . . . . 777.0 778.1 813.4Effect of dilutive share options (millions) . . . . . . . . . . . . . . . . . . . . . . . . . . . . . . . . 0.5 0.6 0.3Weighted average number of shares (millions) for diluted earnings . . . . . . . . . . . . 777.5 778.7 813.7
Earnings/(loss) per shareBasic . . . . . . . . . . . . . . . . . . . . . . . . . . . . . . . . . . . . . . . . . . . . . . . . . . . . . . . . . . . . . 34.0p 75.6p 49.9pDiluted . . . . . . . . . . . . . . . . . . . . . . . . . . . . . . . . . . . . . . . . . . . . . . . . . . . . . . . . . . . 34.0p 75.5p 49.9p
9. Dividends
All figures in £ millions 2019 2018 2017
Final paid in respect of prior year 13.5p (2018: 12.0p, 2017:34.0p) . . . . . . . . . . . . . . . . . . . . . . . . . . . . . . . . . . . . . . . . . 101 93 277
Interim paid in respect of current year 6.0p (2018: 5.5p,2017: 5.0p) . . . . . . . . . . . . . . . . . . . . . . . . . . . . . . . . . . . . . 46 43 41
147 136 318
The Directors are proposing a final dividend in respect of the financial year ended 31 December 2019 of 13.5p pershare which will absorb an estimated £106m of shareholders’ funds. It will be paid on 7 May 2020 to shareholders whoare on the register of members on 27 March 2020. These financial statements do not reflect this dividend.
F-47

Notes to the consolidated financial statements
10. Property, plant and equipmentRight-of-use assets Owned assets
All figures in £ millionsLand andbuildings
Plant andequipment
Land andbuildings
Plant andequipment
Assets incourse of
construction Total
CostAt 1 January 2018 . . . . . . . . . . . . . . . . . . . . . . . — — 330 527 29 886Exchange differences . . . . . . . . . . . . . . . . . . . . . — — 11 14 1 26Additions . . . . . . . . . . . . . . . . . . . . . . . . . . . . . . — — 32 22 12 66Disposals . . . . . . . . . . . . . . . . . . . . . . . . . . . . . . — — (75) (97) — (172)Reclassifications . . . . . . . . . . . . . . . . . . . . . . . . — — 19 (8) (11) —Transfer to intangible assets . . . . . . . . . . . . . . . — — — — (11) (11)Transfer to intangible assets –
pre-publication . . . . . . . . . . . . . . . . . . . . . . . . — — — — (2) (2)
At 31 December 2018 . . . . . . . . . . . . . . . . . . . . — — 317 458 18 793Adjustment on initial application of IFRS 16
(see note 1b) . . . . . . . . . . . . . . . . . . . . . . . . . . 418 6 — — — 424Exchange differences . . . . . . . . . . . . . . . . . . . . . (9) — (8) (15) — (32)Additions . . . . . . . . . . . . . . . . . . . . . . . . . . . . . . 64 2 — 18 40 124Disposals . . . . . . . . . . . . . . . . . . . . . . . . . . . . . . (13) (4) (13) (108) (8) (146)Reclassifications . . . . . . . . . . . . . . . . . . . . . . . . — — 4 (4) — —Transfer of finance leases . . . . . . . . . . . . . . . . . — 19 — (19) — —Transfer to intangible assets . . . . . . . . . . . . . . . — — — (3) (4) (7)Transfer to intangible assets –
pre-publication . . . . . . . . . . . . . . . . . . . . . . . . — — — (2) (10) (12)
At 31 December 2019 . . . . . . . . . . . . . . . . . . . . 460 23 300 325 36 1,144Right-of-use assets Owned assets
All figures in £ millionsLand andbuildings
Plant andequipment
Land andbuildings
Plant andequipment
Assets incourse of
construction Total
DepreciationAt 1 January 2018 . . . . . . . . . . . . . . . . . . . . . . . — — (197) (408) — (605)Exchange differences . . . . . . . . . . . . . . . . . . . . . — — (5) (11) — (16)Charge for the year . . . . . . . . . . . . . . . . . . . . . . — — (20) (46) — (66)Disposals . . . . . . . . . . . . . . . . . . . . . . . . . . . . . . — — 34 97 — 131Reclassifications . . . . . . . . . . . . . . . . . . . . . . . . — — (7) 7 — —
At 31 December 2018 . . . . . . . . . . . . . . . . . . . . — — (195) (361) — (556)Exchange differences . . . . . . . . . . . . . . . . . . . . . 2 — 6 13 — 21Charge for the year . . . . . . . . . . . . . . . . . . . . . . (60) (4) (21) (38) — (123)Disposals . . . . . . . . . . . . . . . . . . . . . . . . . . . . . . — — 10 116 — 126Transfer of finance leases . . . . . . . . . . . . . . . . . — (12) — 12 — —Transfer to intangible assets . . . . . . . . . . . . . . . — — — 3 — 3Transfer to intangible assets –
pre-publication . . . . . . . . . . . . . . . . . . . . . . . . — — — 3 — 3
At 31 December 2019 . . . . . . . . . . . . . . . . . . . . (58) (16) (200) (252) — (526)
Carrying amountsAt 1 January 2018 . . . . . . . . . . . . . . . . . . . . . . . — — 133 119 29 281At 31 December 2018 . . . . . . . . . . . . . . . . . . . . — — 122 97 18 237
At 31 December 2019 . . . . . . . . . . . . . . . . . . . . 402 7 100 73 36 618
F-48

Notes to the consolidated financial statements
10. Property, plant and equipment continued
Depreciation expense of £42m (2018: £18m) has been included in the income statement in cost of goods sold and£81m (2018: £48m) in operating expenses.
Prior to 1 January 2019 the Group leased certain equipment under a number of finance lease agreements. The netcarrying amount of leased plant and equipment included within property, plant and equipment in 2018 was £7m.On the initial application of IFRS 16 these finance leases have been transferred from owned assets to right-of-useassets within property, plant and equipment.
11. Intangible assets
All figures in £ millions Goodwill Software
Acquiredcustomer
lists,contracts andrelationships
Acquiredtrademarksand brands
Acquiredpublishing
rights
Otherintangiblesacquired Total
CostAt 1 January 2018 . . . . . . . . . . . . . . . . . . . . . 2,030 882 889 281 184 489 4,755Exchange differences . . . . . . . . . . . . . . . . . . . 74 32 39 (2) — 1 144Additions – internal development . . . . . . . . . — 124 — — — — 124Additions – purchased . . . . . . . . . . . . . . . . . . — 6 — — — — 6Disposals . . . . . . . . . . . . . . . . . . . . . . . . . . . . — (94) (18) (12) — (33) (157)Disposal through business disposal . . . . . . . . — (2) — — — — (2)Transfer from property, plant and
equipment . . . . . . . . . . . . . . . . . . . . . . . . . — 11 — — — — 11Transfer to assets classified as held for
sale . . . . . . . . . . . . . . . . . . . . . . . . . . . . . . . 7 — — — — — 7
At 31 December 2018 . . . . . . . . . . . . . . . . . . 2,111 959 910 267 184 457 4,888Exchange differences . . . . . . . . . . . . . . . . . . . (57) (22) (29) (10) (5) (20) (143)Additions – internal development . . . . . . . . . — 137 — — — — 137Additions – purchased . . . . . . . . . . . . . . . . . . — 1 — — — — 1Disposals . . . . . . . . . . . . . . . . . . . . . . . . . . . . — (15) (88) (19) — (47) (169)Acquisition through business combination . . 18 — — — — 23 41Transfer from property, plant and
equipment . . . . . . . . . . . . . . . . . . . . . . . . . — 7 — — — — 7Transfer to intangible assets – pre-
publication . . . . . . . . . . . . . . . . . . . . . . . . . — (28) — — — — (28)Movement in held for sale . . . . . . . . . . . . . . . 67 — — — — — 67
At 31 December 2019 . . . . . . . . . . . . . . . . . . 2,139 1,039 793 238 179 413 4,801
F-49

Notes to the consolidated financial statements
11. Intangible assets continued
All figures in £ millions Goodwill Software
Acquiredcustomer
lists,contracts andrelationships
Acquiredtrademarksand brands
Acquiredpublishing
rights
Otherintangiblesacquired Total
AmortisationAt 1 January 2018 . . . . . . . . . . . . . . . . . . . . . — (493) (580) (180) (178) (360) (1,791)Exchange differences . . . . . . . . . . . . . . . . . . — (23) (26) 1 2 (10) (56)Charge for the year . . . . . . . . . . . . . . . . . . . . — (88) (59) (14) (2) (24) (187)Disposals . . . . . . . . . . . . . . . . . . . . . . . . . . . — 92 18 12 — 33 155
At 31 December 2018 . . . . . . . . . . . . . . . . . — (512) (647) (181) (178) (361) (1,879)Exchange differences . . . . . . . . . . . . . . . . . . — 16 22 7 4 19 68Charge for the year . . . . . . . . . . . . . . . . . . . . — (115) (51) (23) (2) (75) (266)Disposals . . . . . . . . . . . . . . . . . . . . . . . . . . . — 10 88 19 — 46 163Transfer from property, plant and
equipment . . . . . . . . . . . . . . . . . . . . . . . . . — (3) — — — — (3)Transfer to intangible assets – pre-
publication . . . . . . . . . . . . . . . . . . . . . . . . — 16 — — — — 16
At 31 December 2019 . . . . . . . . . . . . . . . . . — (588) (588) (178) (176) (371) (1,901)
Carrying amountsAt 1 January 2018 . . . . . . . . . . . . . . . . . . . . . 2,030 389 309 101 6 129 2,964At 31 December 2018 . . . . . . . . . . . . . . . . . . 2,111 447 263 86 6 96 3,009
At 31 December 2019 . . . . . . . . . . . . . . . . . 2,139 451 205 60 3 42 2,900
Goodwill
The goodwill carrying value of £2,139m relates to acquisitions completed after 1 January 1998. Prior to 1January 1998 all goodwill was written off to reserves on the date of acquisition. For acquisitions completedbetween 1 January 1998 and 31 December 2002, no value was ascribed to intangibles other than goodwill whichwas amortised over a period of up to 20 years. On adoption of IFRS on 1 January 2003, the Group chose not torestate the goodwill balance and at that date the balance was frozen (i.e. amortisation ceased). If goodwill hadbeen restated, then a significant value would have been ascribed to other intangible assets, which would besubject to amortisation, and the carrying value of goodwill would be significantly lower. For acquisitionscompleted after 1 January 2003, value has been ascribed to other intangible assets which are amortised.
Other intangible assets
Other intangibles acquired include content, technology and software rights.
Intangible assets are valued separately for each acquisition and the primary method of valuation used is thediscounted cash flow method. The majority of acquired intangibles are amortised using an amortisation profilebased on the projected cash flows underlying the acquisition date valuation of the intangible asset, whichgenerally results in a larger proportion of amortisation being recognised in the early years of the asset’s life. TheGroup keeps the expected pattern of consumption under review.
Amortisation of £19m (2018: £18m) is included in the income statement in cost of goods sold and £182m (2018:£169m) in operating expenses. Impairment of £65m (2018: £nil), of which £53m relates to other intangiblesacquired and £12m to acquired trademarks and brands, is included in operating expenses.
F-50

Notes to the consolidated financial statements
11. Intangible assets continued
Other intangible assets continued
The range of useful economic lives for each major class of intangible asset (excluding goodwill and software) isshown below:
2019
Class of intangible asset Useful economic life
Acquired customer lists, contracts and relationships . . . . . . . . . 3-20 yearsAcquired trademarks and brands . . . . . . . . . . . . . . . . . . . . . . . . 2-20 yearsAcquired publishing rights . . . . . . . . . . . . . . . . . . . . . . . . . . . . . 5-20 yearsOther intangibles acquired . . . . . . . . . . . . . . . . . . . . . . . . . . . . . 2-20 years
The expected amortisation profile of acquired intangible assets is shown below:
2019
All figures in £ millionsOne to
five yearsSix to
ten yearsMore thanten years Total
Class of intangible assetAcquired customer lists, contracts and
relationships . . . . . . . . . . . . . . . . . . . . . . . 154 49 2 205Acquired trademarks and brands . . . . . . . . . 42 14 4 60Acquired publishing rights . . . . . . . . . . . . . . 3 — — 3Other intangibles acquired . . . . . . . . . . . . . . 31 11 — 42
Impairment tests for cash-generating units (CGUs) containing goodwill
Impairment tests have been carried out where appropriate as described below. Goodwill was allocated to CGUs,or an aggregation of CGUs, where goodwill could not be reasonably allocated to individual business units. CGUshave been revised in 2019. Impairment reviews were conducted on these revised CGUs as summarised below:
2019 CGUs
2019
All figures in £ millions Goodwill
North American Courseware . . . . . . . . . . . . . . . . . . . . . . . . . . . . . . . . . . —OPM . . . . . . . . . . . . . . . . . . . . . . . . . . . . . . . . . . . . . . . . . . . . . . . . . . . . . 18Virtual Schools . . . . . . . . . . . . . . . . . . . . . . . . . . . . . . . . . . . . . . . . . . . . . 386Assessments . . . . . . . . . . . . . . . . . . . . . . . . . . . . . . . . . . . . . . . . . . . . . . . 1,035Core . . . . . . . . . . . . . . . . . . . . . . . . . . . . . . . . . . . . . . . . . . . . . . . . . . . . . . 700Growth (includes the separate CGUs of Brazil, China, India and
South Africa) . . . . . . . . . . . . . . . . . . . . . . . . . . . . . . . . . . . . . . . . . . . . . —
Total . . . . . . . . . . . . . . . . . . . . . . . . . . . . . . . . . . . . . . . . . . . . . . . . . . . . . 2,139
Goodwill is tested at least annually for impairment. The recoverable amount of each aggregated CGU is based onthe higher of value in use and fair value less costs of disposal. The value in use was higher than the fair value lesscosts of disposal in each of the CGUs. Other than goodwill there are no intangible assets with indefinite lives.
F-51

Notes to the consolidated financial statements
11. Intangible assets continued
2018 CGUs
All figures in £ millions 2018
North America . . . . . . . . . . . . . . . . . . . . . . . . . . . . . . . . . . . . . . . . . . . . . . . 930Core . . . . . . . . . . . . . . . . . . . . . . . . . . . . . . . . . . . . . . . . . . . . . . . . . . . . . . . 701Growth (includes the separate CGUs of Brazil, China, India and
South Africa) . . . . . . . . . . . . . . . . . . . . . . . . . . . . . . . . . . . . . . . . . . . . . . —Pearson VUE . . . . . . . . . . . . . . . . . . . . . . . . . . . . . . . . . . . . . . . . . . . . . . . . 480
Total . . . . . . . . . . . . . . . . . . . . . . . . . . . . . . . . . . . . . . . . . . . . . . . . . . . . . . . 2,111
Following a reassessment of the relative risk in the Brazil CGU compared to Pearson as a whole, it wasdetermined in the course of the impairment review that neither the value in use nor the fair value less costs ofdisposal of the Brazil CGU supported the carrying value of the CGU. As the goodwill related to the Brazil CGUwas fully impaired in prior years, the acquired intangibles of the Brazil CGU were impaired by £65m, bringingtheir carrying value to £27m. The Brazil CGU incorporates all the Group’s trading operations in Brazil. A pre-taxdiscount rate of 16.3% was used to determine the value in use of the Brazil CGU. At 31 December 2018, theimpairment review showed headroom of £20m in the Brazil CGU.
Determination of CGUs and reallocation of goodwill
Pearson identifies its CGUs based on its operating model and how data is collected and reviewed formanagement reporting and strategic planning purposes in accordance with IAS 36 “Impairment of assets”. In2019, the CGUs and aggregation of CGUs have been revised to take account of the following:
• The implementation of a new Enterprise Resource Planning (ERP) system in North America meant thatledgers are structured on a legal entity basis rather than the previous divisional basis. This has meant it is nolonger possible to identify the carrying values of the Pearson VUE business separately from the widerAssessments business. As a result, the Pearson VUE business has been combined with the Assessmentsbusiness as one CGU for impairment testing.
• The disposal of the US K12 Courseware business in 2019 has caused management to disaggregate the NorthAmerica CGU.
At 1 January 2019, the goodwill of the previous North America and Pearson VUE CGUs was thereforereallocated between North American Courseware, OPM, Virtual Schools and Assessments, based on theirrelative fair value at 1 January 2019 amended to take into account previous impairments taken. No goodwill wasallocated to the North American Courseware CGU reflecting the significant impairments taken in 2015 and 2016.
Key assumptions
For the purpose of estimating the value in use of the CGUs, management has used an income approach based onpresent value techniques. The calculations use cash flow projections based on financial budgets approved bymanagement covering a three-year period, whilst a projection to 2030 was available and used for the OPM CGU,as the three-year projection reflected the investment phase and not the longer-term return of this business, andbecause the long-term nature of OPM’s contracts allows for reliable forecasts to be prepared beyond three years.OPM relies on contracts with key customers and the forecast to 2030 assumes these are renewed or replaced. Thekey assumptions used by management in the value in use calculations were:
Discount rates – The discount rate is based on the risk-free rate for government bonds, adjusted for a riskpremium to reflect the increased risk in investing in equities. The risk premium adjustment is assessed for eachCGU. The average pre-tax discount rates range from 9.5% to 17% (2018: post-tax 7.9% to 15.8%). Discountrates are lower for those businesses which operate in more mature markets with low inflation and higher for thoseoperating in emerging markets with higher inflation.
F-52

Notes to the consolidated financial statements
11. Intangible assets continued
Key assumptions continued
Perpetuity growth rates – A perpetuity growth rate of 2% (2018: 2%) was used for cash flows subsequent to theapproved budget period for CGUs operating in mature markets. This perpetuity growth rate is a conservative rateand is considered to be lower than the long-term historical growth rates of the underlying territories in which theCGU operates and the long-term growth rate prospects of the sectors in which the CGU operates. CGU growthrates between 3.2% to 6.5% (2018: 3.0% and 6.5%) were used for cash flows subsequent to the approved budgetperiod for CGUs operating in emerging markets with high inflation. These growth rates are also below the long-term historical growth rates in these markets.
The key assumptions used by management in setting the financial budgets were as follows:
Forecast sales growth rates – Forecast sales growth rates are based on past experience adjusted for the strategicdirection and near-term investment priorities within each CGU. Key assumptions include growth in OnlineProgram Management, Virtual Schools and Professional Certification, stabilisation in UK Qualifications and USAssessments, and ongoing pressures in the US Higher Education Courseware market. The sales forecasts useaverage nominal growth rates between (5%) and 11% (2018: 2% and 3%) for mature markets and between 5%and 11% (2018: (1)% and 12%) for emerging markets with high inflation.
Operating profits – operating profits are forecast based on historical experience of operating margins, adjustedfor the impact of changes to product costs and the impact of the implementation of our 2017-2019 cost efficiencyprogramme. Management applies judgement in allocating corporate costs in order to determine operating profitat a CGU level.
The table below shows the key assumptions for those CGUs for which the carrying value of goodwill issignificant in comparison to the total carrying value of goodwill:
Discount ratePerpetuity
growth rate
Virtual Schools . . . . . . . . . . . . . . . . . . . . . . . . . . . . . . . 10% 2%Core . . . . . . . . . . . . . . . . . . . . . . . . . . . . . . . . . . . . . . . . 10% 2%Assessments . . . . . . . . . . . . . . . . . . . . . . . . . . . . . . . . . 10% 2%
Comparative figures have not been shown as CGUs have been changed in 2019.
Sensitivities
Impairment testing for the year ended 31 December 2019 has identified the following CGUs, or groups of CGUs,as being sensitive to reasonably possible changes in key assumptions. The table below shows the headroom at31 December 2019 and the changes in the key assumptions required in order for the recoverable amount to equalthe carrying value.
Headroom at31 December 2019 Discount rate
Discount ratefor zero
headroomPerpetuity
growth rate
Perpetuitygrowth rate
for zeroheadroom
Contribution*reduction p.a.
for zeroheadroom
North American Courseware . . . . . £115m 10.0% 10.3% 2.0% 1.6% £ 9mOPM . . . . . . . . . . . . . . . . . . . . . . . . £ 81m 10.0% 10.3% 2.0% 0.3% £ 7mCore . . . . . . . . . . . . . . . . . . . . . . . . £191m 10.0% 10.7% 2.0% 1.2% £15mBrazil . . . . . . . . . . . . . . . . . . . . . . . — 16.3% 16.3% 4.1% 4.1% —
* CGU contribution is operating profit excluding fixed costs and corporate overheads.
F-53

Notes to the consolidated financial statements
12. Investments in joint ventures and associates
The amounts recognised in the balance sheet are as follows:
All figures in £ millions 2019 2018
Associates . . . . . . . . . . . . . . . . . . . . . . . . . . . . . . . . . . . . . . . . . . . . . . . . 7 392Joint ventures . . . . . . . . . . . . . . . . . . . . . . . . . . . . . . . . . . . . . . . . . . . . . — —Associates classified as held for sale . . . . . . . . . . . . . . . . . . . . . . . . . . . 397 —
Total . . . . . . . . . . . . . . . . . . . . . . . . . . . . . . . . . . . . . . . . . . . . . . . . . . . . 404 392
The amounts recognised in the income statement are as follows:
All figures in £ millions 2019 2018
Associates . . . . . . . . . . . . . . . . . . . . . . . . . . . . . . . . . . . . . . . . . . . . . . . . 54 43Joint ventures . . . . . . . . . . . . . . . . . . . . . . . . . . . . . . . . . . . . . . . . . . . . . — 1
Total . . . . . . . . . . . . . . . . . . . . . . . . . . . . . . . . . . . . . . . . . . . . . . . . . . . . 54 44
Investment in associates
The Group has the following material associates:
Principal placeof business
Ownershipinterest
Nature ofrelationship
Measurementmethod
Penguin Random House Ltd . . . . . . . . UK/Global 25% See below EquityPenguin Random House LLC . . . . . . . US 25% See below Equity
On 1 July 2013, Penguin Random House was formed, upon the completion of an agreement between Pearson andBertelsmann to merge their respective trade publishing companies, Penguin and Random House, with the parentcompanies owning 47% and 53% of the combined business respectively. On 5 October 2017, Pearson sold a 22%stake in Penguin Random House to Bertelsmann, retaining a 25% share. Pearson owns its 25% interest inPenguin Random House via 25% interests in each of the two entities listed in the table above. Despite theseparate legal structures of the two Penguin Random House entities, Pearson regards Penguin Random House asone combined global business. Pearson discloses Penguin Random House separately, presenting disclosuresrelated to its interests in Penguin Random House on a combined basis.
The shareholder agreement includes protective rights for Pearson as the minority shareholder, including rights todividends. Management considers ownership percentage, Board composition and the additional protective rights,and exercises judgement to determine that Pearson has significant influence over Penguin Random House andBertelsmann has the power to direct the relevant activities and therefore control. Following the transaction in2017 the assessment of significant influence did not change. Penguin Random House does not have a quotedmarket price.
In December 2019, the Group announced the sale of its remaining 25% interest in Penguin Random House. Atthe end of 2019 the Group’s share of the assets of Penguin Random House has been classified as held for sale onthe balance sheet. (see note 32).
F-54

Notes to the consolidated financial statements
12. Investments in joint ventures and associates continued
Investment in associates continued
The summarised financial information of the material associate is detailed below:
2019 2018
All figures in £ millions
PenguinRandomHouse
PenguinRandomHouse
AssetsNon-current assets . . . . . . . . . . . . . . . . . . . . . . . . . . . . . . . . . . 1,346 1,043Current assets . . . . . . . . . . . . . . . . . . . . . . . . . . . . . . . . . . . . . . 2,273 1,929LiabilitiesNon-current liabilities . . . . . . . . . . . . . . . . . . . . . . . . . . . . . . . (1,357) (1,104)Current liabilities . . . . . . . . . . . . . . . . . . . . . . . . . . . . . . . . . . . (1,874) (1,546)
Net assets . . . . . . . . . . . . . . . . . . . . . . . . . . . . . . . . . . . . . . . . . 388 322
Sales . . . . . . . . . . . . . . . . . . . . . . . . . . . . . . . . . . . . . . . . . . . . . 2,916 2,775
Profit for the year . . . . . . . . . . . . . . . . . . . . . . . . . . . . . . . . . . . 205 185Other comprehensive income/(expense) . . . . . . . . . . . . . . . . . (27) 13
Total comprehensive income . . . . . . . . . . . . . . . . . . . . . . . . 178 198
Dividends received from associate in relation to profits . . . . . 63 67Re-capitalisation dividends received from associate . . . . . . . . — 50
The information above reflects the amounts presented in the financial statements of the associate, adjusted forfair value and similar adjustments. The tax on Penguin Random House LLC is settled by the partners. For thepurposes of clear and consistent presentation, the tax has been shown in the associate line items in theconsolidated income statement and consolidated balance sheet, recording the Group’s share of profit after taxconsistently for the Penguin Random House associates.
A reconciliation of the summarised financial information to the carrying value of the material associate is shownbelow:
2019 2018
All figures in £ millions
PenguinRandomHouse
PenguinRandomHouse
Opening net assets . . . . . . . . . . . . . . . . . . . . . . . . . . . . . . . . . . 322 368Adjustment on initial application of IFRS 16 . . . . . . . . . . . . . (7) —Exchange differences . . . . . . . . . . . . . . . . . . . . . . . . . . . . . . . . (9) 18Profit for the year . . . . . . . . . . . . . . . . . . . . . . . . . . . . . . . . . . . 205 185Other comprehensive income/(expense) . . . . . . . . . . . . . . . . . (27) 13Dividends, net of tax paid . . . . . . . . . . . . . . . . . . . . . . . . . . . . (260) (262)Capital contribution . . . . . . . . . . . . . . . . . . . . . . . . . . . . . . . . . 164 —
Closing net assets . . . . . . . . . . . . . . . . . . . . . . . . . . . . . . . . . . 388 322Share of net assets . . . . . . . . . . . . . . . . . . . . . . . . . . . . . . . . . . 97 80Goodwill . . . . . . . . . . . . . . . . . . . . . . . . . . . . . . . . . . . . . . . . . 300 307
Carrying value of associate . . . . . . . . . . . . . . . . . . . . . . . . . . 397 387
F-55

Notes to the consolidated financial statements
12. Investments in joint ventures and associates continued
Investment in associates continued
Information on other individually immaterial associates is detailed below:
All figures in £ millions 2019 2018
Profit/(loss) for the year . . . . . . . . . . . . . . . . . . . . . . . . . . . . . . 3 (3)
Total comprehensive (expense)/income . . . . . . . . . . . . . . . . 3 (3)
Transactions with material associates
From time to time the Group loans funds to Penguin Random House which are unsecured and interest iscalculated based on market rates. The amount outstanding at 31 December 2019 was £49m (2018: £nil) andinterest received was £1m (2018: £1m). The loans are provided under a working capital facility and fluctuateduring the year.
The Group also has a current asset receivable of £16m (2018: £17m) from Penguin Random House arising fromthe provision of services. Included in other income (note 4) is £4m (2018: £3m) of service fees. In 2018 theGroup received a further re-capitalisation dividend of £50m which was triggered by the Group’s decision to sell a22% stake in Penguin Random House in 2017.
Investment in joint ventures
Information on joint ventures, all of which are individually immaterial, is detailed below:
All figures in £ millions 2019 2018
Profit for the year . . . . . . . . . . . . . . . . . . . . . . . . . . . . . . . . . . . . — 1
Total comprehensive income . . . . . . . . . . . . . . . . . . . . . . . . . . — 1
13. Deferred income tax
All figures in £ millions 2019 2018
Deferred income tax assets . . . . . . . . . . . . . . . . . . . . . . . . . . . . . . . . 59 60Deferred income tax liabilities . . . . . . . . . . . . . . . . . . . . . . . . . . . . . (48) (136)
Net deferred income tax . . . . . . . . . . . . . . . . . . . . . . . . . . . . . . . . . 11 (76)
Substantially all of the deferred income tax assets are expected to be recovered after more than one year.
Deferred income tax assets and liabilities shall be offset when there is a legally enforceable right to offset currentincome tax assets with current income tax liabilities and where the deferred income taxes relate to the same fiscalauthority. At 31 December 2019, the Group has unrecognised deferred income tax assets of £28m (2018: £31m)in respect of UK losses, £20m (2018: £28m) in respect of US losses and approximately £100m (2018: £90m) inrespect of losses in other territories. The UK losses are capital losses. The US losses relate to federal and statetaxes. Federal tax losses can be carried forward indefinitely; state tax losses have expiry periods of between fiveand 20 years. Other deferred tax assets of £25m (2018: £12m) have not been recognised.
Deferred tax assets of £41m (2018: £43m) have been recognised in countries that reported a tax loss in either thecurrent or preceding year. The majority arises in Brazil in respect of tax deductible goodwill. It is consideredmore likely than not that there will be sufficient future taxable profits to realise these assets.
F-56

Notes to the consolidated financial statements
13. Deferred income tax continued
The recognition of the deferred income tax assets is supported by management’s forecasts of the futureprofitability of the relevant countries. In some cases deferred income tax assets are forecast to be recoveredthrough taxable profits over a period that exceeds five years. Management consider these forecasts aresufficiently reliable to support the recovery of the assets.
The movement in deferred income tax assets and liabilities during the year is as follows:
All figures in £ millionsTrading
lossesReturns
provisions
Retirementbenefit
obligationsDeferredrevenue
Goodwill andintangibles Other Total
Deferred income tax assets/(liabilities)At 1 January 2018 . . . . . . . . . . . . . . . . . . . . . . 9 34 (44) 42 (155) 64 (50)Exchange differences . . . . . . . . . . . . . . . . . . . . — 1 1 6 (16) (5) (13)Income statement (charge)/benefit . . . . . . . . . . 11 (4) (21) 20 (34) (14) (42)Disposal through business disposal . . . . . . . . . — — — — — 16 16Tax benefit in other comprehensive income . . — — 9 — — — 9Tax benefit in equity . . . . . . . . . . . . . . . . . . . . — — — — — 4 4
At 31 December 2018 . . . . . . . . . . . . . . . . . . . 20 31 (55) 68 (205) 65 (76)Adjustment on initial application of IFRS 16
(see note 1b) . . . . . . . . . . . . . . . . . . . . . . . . . — — — — — 15 15Exchange differences . . . . . . . . . . . . . . . . . . . . (1) (1) (1) (3) 6 (5) (5)Income statement benefit/(charge) . . . . . . . . . . 70 (10) (4) (24) — 32 64Tax benefit/(charge) in other comprehensive
income . . . . . . . . . . . . . . . . . . . . . . . . . . . . . — — 22 — — (4) 18Tax charge in equity . . . . . . . . . . . . . . . . . . . . . — — — — — (5) (5)At 31 December 2019 . . . . . . . . . . . . . . . . . . . 89 20 (38) 41 (199) 98 11
Other deferred income tax items include temporary differences in respect of share-based payments, provisions,depreciation, interest limitation and royalty advances.
As at 31 December 2019, no deferred tax assets or liabilities were classified as held for sale (2018: £98m asset).In 2018 there was a charge of £8m relating to assets and liabilities held for sale.
F-57

Notes to the consolidated financial statements
14. Classification of financial instruments
The accounting classification of each class of the Group’s financial assets, and their carrying values, is asfollows:
2019 2018
Fair valueAmortised
cost Fair valueAmortised
cost
All figures in £ millions Notes FVOCI FVTPL
Fair value– hedging
instrumentFinancial
assets
Totalcarrying
value FVOCI FVTPL
Fair value– hedging
instrumentFinancial
assets
Totalcarrying
value
Investments in unlistedsecurities . . . . . . . . . . . . . . 15 122 — — — 122 93 — — — 93
Cash and cash equivalents . . . 17 — — — 437 437 — — — 568 568Derivative financial
instruments . . . . . . . . . . . . . 16 — 6 48 — 54 — 4 64 — 68Trade receivables . . . . . . . . . . 22 — — — 918 918 — — — 904 904Other receivable . . . . . . . . . . . — 182 — — 182 — — — — —Trade receivables – within
assets classified as held forsale . . . . . . . . . . . . . . . . . . . — — — — — — — — 49 49
Total financial assets . . . . . . 122 188 48 1,355 1,713 93 4 64 1,521 1,682
The carrying value of the Group’s financial assets is equal to, or approximately equal to, the market value. Theother receivable relates to the receivable which arose on the disposal of the US K12 Courseware business and isincluded in other receivables, non-current and current, in note 22.
The accounting classification of each class of the Group’s financial liabilities, together with their carrying valuesand market values, is as follows:
2019 2018
Fair valueAmortised
cost Fair valueAmortised
cost
All figures in £ millions Notes FVTPL
Fair value– hedging
instrument
Otherfinancialliabilities
Totalcarrying
value
Totalmarketvalue FVTPL
Fair value– hedging
instrument
Otherfinancialliabilities
Totalcarrying
value
Totalmarketvalue
Derivative financialinstruments . . . . . . . . . . . . . 16 (7) (32) — (39) (39) — (59) — (59) (59)
Trade payables . . . . . . . . . . . . 24 — — (358) (358) (358) — — (311) (311) (311)Trade payables – within
liabilities classified as heldfor sale . . . . . . . . . . . . . . . . — — — — — — — (22) (22) (22)
Bank loans and overdrafts . . . 18 — — (3) (3) (3) — — (43) (43) (43)Other borrowings due within
one year . . . . . . . . . . . . . . . 18 — — (89) (89) (89) — — (3) (3) (3)Borrowings due after more
than one year . . . . . . . . . . . 18 — — (1,572) (1,572) (1,574) — — (674) (674) (663)
Total financial liabilities . . . (7) (32) (2,022) (2,061) (2,063) — (59) (1,053) (1,112) (1,101)
The market value of leases has been stated at book value.
F-58

Notes to the consolidated financial statements
14. Classification of financial instruments continued
Fair value measurement
As shown above, the Group’s derivative assets and liabilities, unlisted securities and marketable securities areheld at fair value. Financial instruments that are measured subsequently to initial recognition at fair value aregrouped into levels 1 to 3, based on the degree to which the fair value is observable, as follows:
Level 1 fair value measurements are those derived from unadjusted quoted prices in active markets for identicalassets or liabilities.
Level 2 fair value measurements are those derived from inputs, other than quoted prices included within level 1,that are observable for the asset or liability, either directly (as prices) or indirectly (derived from prices).
Level 3 fair value measurements are those derived from valuation techniques that include inputs for the asset orliability that are not based on observable market data (unobservable inputs).
The Group’s bonds valued at £595m (2018: £661m) are classified as level 1. The Group’s derivative assetsvalued at £54m (2018: £68m) and derivative liabilities valued at £39m (2018: £59m) are classified as level 2.The Group’s investments in unlisted securities are valued at £122m (2018: £93m) and holding in other receivableis valued at £182m (2018: £nil); both are classified as level 3.
The following table analyses the movements in level 3 fair value remeasurements:
2019 2018
All figures in £ millionsOther
receivable
Investmentsin unlistedsecurities Total
Investmentsin unlistedsecurities
At beginning of year . . . . . . . . . . . . . . . . . . . . . . . . . . . — 93 93 77Exchange differences . . . . . . . . . . . . . . . . . . . . . . . . . . 1 (3) (2) 4Acquisition of investments and other receivable . . . . . 181 12 193 13Fair value movements . . . . . . . . . . . . . . . . . . . . . . . . . . — 20 20 7Disposal of investments . . . . . . . . . . . . . . . . . . . . . . . . — — — (8)
At end of year . . . . . . . . . . . . . . . . . . . . . . . . . . . . . . . 182 122 304 93
The fair value of the investments in unlisted securities is determined by reference to the financial performance ofthe underlying asset, recent funding rounds and amounts realised on the sale of similar assets.
The fair value of the other receivable, which arose on the disposal of the US K12 Courseware business, isdetermined using present value techniques whereby the expected value of future cash flows is discounted using arate which is representative of the creditworthiness of the US K12 Courseware business. The key inputs used inthe present value calculations are forecast sales, discount rate and the expected date of a subsequent sale of theUS K12 Courseware business. If the forecast sales used in the calculations were increased/ decreased by 5%, thevalue of the receivable would increase/decrease by approximately £20m. If the discount rate used in thecalculations of 3.25% was increased/decreased by 1%, the value of the receivable would decrease/increase byapproximately £5m. The calculations are not materially sensitive to reasonable changes in the expected date of asubsequent sale of the K12 business.
F-59

Notes to the consolidated financial statements
15. Other financial assets
All figures in £ millions 2019 2018
At beginning of year . . . . . . . . . . . . . . . . . . . . . . . . . . . . . . . . . . . . . . . . 93 77Exchange differences . . . . . . . . . . . . . . . . . . . . . . . . . . . . . . . . . . . . . . . (3) 4Acquisition of investments . . . . . . . . . . . . . . . . . . . . . . . . . . . . . . . . . . . 12 13Fair value movements . . . . . . . . . . . . . . . . . . . . . . . . . . . . . . . . . . . . . . 20 7Disposal of investments . . . . . . . . . . . . . . . . . . . . . . . . . . . . . . . . . . . . . — (8)
At end of year . . . . . . . . . . . . . . . . . . . . . . . . . . . . . . . . . . . . . . . . . . . . 122 93
Other financial assets include unlisted securities of £122m (2018: £93m) that are classified at fair value throughother comprehensive income (FVOCI). The assets, which are not held for trading, relate to the Group’s interestsin new and innovative educational ventures across the world. These are strategic investments and the Groupconsiders the classification as FVOCI to be more relevant. None of the investments are individually significant tothe financial statements. In 2018, equities held at a fair value of £8m were disposed. The cumulative gain ondisposal was £nil and £2m was recycled from the fair value reserve to retained earnings.
16. Derivative financial instruments and hedge accounting
The Group’s approach to the management of financial risks is set out in note 19. The Group’s outstandingderivative financial instruments are as follows:
2019 2018
All figures in £ millionsGross notional
amounts Assets LiabilitiesGross notional
amounts Assets Liabilities
Interest rate derivatives – in a fair value hedgerelationship . . . . . . . . . . . . . . . . . . . . . . . . . . . . . . . . . . . . 336 13 — 404 13 —
Interest rate derivatives – not in a hedge relationship . . . . . 557 2 (6) 362 3 —Cross-currency rate derivatives – in a hedge relationship . . 502 29 (31) 577 51 (35)FX derivatives – in a hedge relationship . . . . . . . . . . . . . . . 555 6 (1) 434 — (24)FX derivatives – not in a hedge relationship . . . . . . . . . . . . 386 4 (1) 473 1 —
Total . . . . . . . . . . . . . . . . . . . . . . . . . . . . . . . . . . . . . . . . . . . 2,336 54 (39) 2,250 68 (59)
Analysed as expiring:In less than one year . . . . . . . . . . . . . . . . . . . . . . . . . . . . . . . 1,167 25 (15) 771 1 (23)Later than one year and not later than five years . . . . . . . . . 694 13 (6) 795 22 (1)Later than five years . . . . . . . . . . . . . . . . . . . . . . . . . . . . . . . 475 16 (18) 684 45 (35)
Total . . . . . . . . . . . . . . . . . . . . . . . . . . . . . . . . . . . . . . . . . . . 2,336 54 (39) 2,250 68 (59)
The Group’s treasury policies only allow derivatives to be traded where the objective is risk mitigation. These arethen designated for hedge accounting using the following criteria:
• If the derivative and the underlying hedged exposure would normally be revalued through the incomestatement and valuation changes are expected to be perfectly or near perfectly equal and opposite, these willnot be classified in a hedge relationship.
• Where interest rate and cross currency interest rate swaps are used to convert fixed rate debt to floating andwe expect to receive inflows equal to the fixed rate debt interest, these are classified as fair value hedges.
• Where derivatives are used to create a future foreign currency liability to provide protection againstcurrency movements affecting the valuation of an overseas investment, these are designated as a netinvestment hedge.
F-60

Notes to the consolidated financial statements
16. Derivative financial instruments and hedge accounting continued
The Group’s fixed rate USD debt is held as fixed rate instruments at amortised cost.
The majority of the Group’s fixed rate euro debt is converted to a floating rate exposure using interest rate andcross-currency swaps. The Group receives interest under its euro debt related swap contracts to match the intereston the bonds (ranging from a receipt of 1.375% on its euro 2025 notes to 1.875% on its euro 2021 notes) and, inturn, pays either a floating US dollar or sterling variable rates of GBP Libor + 0.81% and US Libor + 1.36%.
GBP and USD Interest rate swaps are subsequently used to fix an element of the interest charge. The all-in rates(including the spread above Libor) that the Group pays are between 2.2% and 3.6%. In addition to this the Grouphas executed additional interest rate swaps to offset the floating rate borrowings paying between 0.83% and2.1%. At 31 December 2019, the Group had interest rate swap contracts to fix £557m of debt and a further£246m of outstanding fixed rate bonds bringing the total fixed rate debt to £803m. These fixed interest ratederivatives are not in designated hedging relationships. Additionally the Group uses FX derivatives includingforwards, collars and cross currency swaps to create synthetic USD debt as a hedge of its USD assets and toachieve certainty of USD currency conversion rates, in line with the Group’s FX hedging policy. Outstandingcontracts as at 31 December 2019 were held at an average GBP/USD rate of 1.34. These derivatives are indesignated net investment hedging relationships. The weighted average rate achieved for the bonds in a netinvestment hedge relationship was GBP/USD 1.59 for the USD bonds and EUR/GBP 0.86 for the euro bonds.Outstanding contracts on the cross currency swaps at 31 December 2019 were held at an average EUR/GBP rateof 0.79. These derivatives are in designated fair value hedging relationships.
At the end of 2019, the currency split of the mark-to-market values of rate derivatives, including the exchange ofprincipal on cross currency rate derivatives, was US dollar £(167)m, sterling £(166)m and euro £336m(2018: US dollar £(185)m, sterling £(215)m and euro £432m).
The Group’s portfolio of rate derivatives is diversified by maturity, counterparty and type. Natural offsetsbetween transactions within the portfolio and the designation of certain derivatives as hedges significantly reducethe risk of income statement volatility. The sensitivity of the portfolio to changes in market rates is set out innote 19.
Fair value hedges
The Group uses Interest Rate Swaps and Cross Currency Swaps as Fair value hedges of the Groups euro issueddebt.
Interest rate exposure arises from movements in the fair value of the Group’s euro debt attributable tomovements in euro interest rates. The hedged risk is the change in the euro bonds fair value attributable tointerest rate movements. The hedged items are the Group’s euro bonds which are issued at a fixed rate. Thehedging instruments are fixed to floating euro interest rate swaps where the Group receives fixed interestpayments and pays three month Euribor.
As the critical terms of the interest rate swaps match the bonds, there is an expectation that the value of thehedging instrument and the value of the hedged item will move in the opposite direction as a result of movementsin the zero coupon Euribor curve. The hedge ratio is therefore expected to be 100%. Sources of hedgeineffectiveness are a reduction or modification in the hedged item or a material change in the credit risk of swapcounterparties.
F-61

Notes to the consolidated financial statements
16. Derivative financial instruments and hedge accounting continued
Fair value hedges continued
A foreign currency exposure arises from foreign exchange fluctuations on translation of the Group’s euro debtinto GBP. The hedged risk is the risk of changes in the GBPEUR spot rate that will result in changes in the valueof the euro debt when translated into GBP. The hedged items are a portion of the Group’s euro bonds. Thehedging instruments are floating to floating cross currency swaps which creates an exposure to eurostrengthening against GBP within the hedge item. The final exchange on the cross currency swap creates anexposure to euro weakening against GBP.
As the critical terms of the cross currency swap match the bonds there is an expectation that the value of thehedging instrument and the value of the hedged item move in the opposite direction as a result of movements inthe EURGBP exchange rate. The hedge ratio is 100%. Sources of hedge ineffectiveness are a reduction ormodification in the hedged item or a material change in the credit risk of swap counterparties.
The Group held the following instruments to hedge exposures to changes in interest rates and foreign currencyrisk associated with borrowings:
2019
All figures in £ millionsCarrying amount ofhedging instruments
Change in fair value ofhedging instrumentused to determine
hedge ineffectivenessNominal amounts ofhedging instruments
Derivative financial instruments for interest raterisk . . . . . . . . . . . . . . . . . . . . . . . . . . . . . . . . . . . . . . 13 — 336
Derivative financial instruments for currency risk . . . 25 (21) 336
2018
All figures in £ millionsCarrying amount ofhedging instruments
Change in fair value ofhedging instrumentused to determine
hedge ineffectivenessNominal amounts ofhedging instruments
Derivative financial instruments for interest raterisk . . . . . . . . . . . . . . . . . . . . . . . . . . . . . . . . . . . . . . 13 (7) 404
Derivative financial instruments for currency risk . . . 51 3 404
The amounts at the reporting date relating to items designated as hedge items were as follows:
2019
All figures in£ millions
Carrying amountof hedged items
Accumulated amountof fair value hedge
adjustments onthe hedged itemincluded in the
carrying amount
Change in fair value ofhedged item used to
determine hedgeineffectiveness
Hedgeineffectiveness
Line item in profit orloss that includes
hedge ineffectiveness
Interest rate riskFinancial liabilities
– borrowings . . . (347) (9) — — n/aCurrency riskFinancial liabilities
– borrowings . . . (347) n/a 21 — n/a
F-62

Notes to the consolidated financial statements
16. Derivative financial instruments and hedge accounting continued
Fair value hedges continued
2018
All figures in£ millions
Carrying amountof hedged items
Accumulated amountof fair value hedge
adjustments onthe hedged itemincluded in the
carrying amount
Change in fair value ofhedged item used to
determine hedgeineffectiveness
Hedgeineffectiveness
Line item in profit orloss that includes
hedge ineffectiveness
Interest rate riskFinancial liabilities
– borrowings . . . (416) (9) 7 — n/aCurrency riskFinancial liabilities
– borrowings . . . (416) n/a (3) — n/a
Hedge of net investment in a foreign operation
A foreign currency exposure arises from the translation of the Group’s net investments in its subsidiaries whichhave USD and euro functional currencies. The hedged risk is the risk of changes in the GBPUSD and GBPEURspot rates that will result in changes in the value of the Group’s net investment in its USD and euro assets whentranslated into GBP. The hedged items are a portion of the Group’s assets which are denominated in USD andeuro. The hedging instruments are debt and derivative financial instruments, including Cross Currency Swaps,FX Forwards and FX Collars which creates an exposure to USD and euro weakening against GBP.
It is expected that the change in value of each of these items will mirror each other as there is a clear and directeconomic relationship between the hedge and the hedged item in the hedge relationship.
Hedge ineffectiveness would arise if the value of the hedged items fell below the value of the hedginginstruments however this is unlikely as the value of the Group’s assets denominated in USD and euro aresignificantly greater than the proposed net investment programme.
The amounts related to items designated as hedging instruments were as follows:
2019
All figures in £ millions
Carryingamount of
hedgedinstruments
Change in value ofhedging
instrument usedto determine
hedgeineffectiveness
Nominalamounts
of hedginginstruments
Hedginggains/(losses)recognised in
OCI
Hedgeineffectivenessrecognised inprofit or loss
Derivative financial instruments . . . . . . . . . . . (21) 13 (722) 13 —Financial liabilities – borrowings . . . . . . . . . . (246) 10 (246) 10 —
2018
All figures in £ millions
Carryingamount of
hedgedinstruments
Change in value ofhedging
instrument usedto determine
hedgeineffectiveness
Nominalamounts
of hedginginstruments
Hedginggains/(losses)recognised in
OCI
Hedgeineffectivenessrecognised inprofit or loss
Derivative financial instruments . . . . . . . . . . . (59) (22) (607) (22) —Financial liabilities – borrowings . . . . . . . . . . (256) (10) (256) (10) —
F-63

Notes to the consolidated financial statements
16. Derivative financial instruments and hedge accounting continued
Hedge of net investment in a foreign operation continued
In addition to the above, £3m of hedging gains were recognised in OCI in relation to derivative financialinstruments that matured during the year. Included in the translation reserve is a cost of hedging reserve of £2mrelating to the time value of FX collars which is not separately disclosed due to materiality.
Offsetting arrangements with derivative counterparties
All of the Group’s derivative financial instruments are subject to enforceable netting arrangements withindividual counterparties, allowing net settlement in the event of default of either party. Derivative financialassets and liabilities subject to offsetting arrangements are as follows:
2019 2018
All figures in £ millions
Grossderivative
assets
Grossderivativeliabilities
Net derivativeassets/
liabilities
Grossderivative
assets
Grossderivativeliabilities
Netderivative
assets/liabilities
Counterparties in an asset position . . . . . . . 52 (34) 18 67 (44) 23Counterparties in a liability position . . . . . . 2 (5) (3) 1 (15) (14)
Total as presented in the balance sheet . . 54 (39) 15 68 (59) 9
All of the Group’s derivative financial instruments are subject to enforceable netting arrangements withindividual counterparties, allowing net settlement in the event of default of either party. Offset arrangements inrespect of cash balances are described in note 17.
Counterparty exposure from all derivatives is managed, together with that from deposits and bank accountbalances, within credit limits that reflect published credit ratings and by reference to other market measures (e.g.market prices for credit default swaps) to ensure that there is no significant risk to any one counterparty.
The Group has no material embedded derivatives that are required to be separately accounted for in accordancewith IFRS 9 ‘Financial Instruments’.
17. Cash and cash equivalents (excluding overdrafts)
All figures in £ millions 2019 2018
Cash at bank and in hand . . . . . . . . . . . . . . . . . . . . . . . . . . . . . . . . . . . . 401 533Short-term bank deposits . . . . . . . . . . . . . . . . . . . . . . . . . . . . . . . . . . . . 36 35
437 568
Short-term bank deposits are invested with banks and earn interest at the prevailing short-term deposit rates.
At the end of 2019, the currency split of cash and cash equivalents was US dollar 30% (2018: 18%), sterling 12%(2018: 30%), and other 58% (2018: 52%).
F-64

Notes to the consolidated financial statements
17. Cash and cash equivalents (excluding overdrafts) continued
Cash and cash equivalents have fair values that approximate to their carrying value due to their short-term nature.Cash and cash equivalents include the following for the purpose of the cash flow statement:
All figures in £ millions 2019 2018
Cash and cash equivalents . . . . . . . . . . . . . . . . . . . . . . . . . . . . . . . . . 437 568Bank overdrafts . . . . . . . . . . . . . . . . . . . . . . . . . . . . . . . . . . . . . . . . . (3) (43)
434 525
The Group has certain cash pooling arrangements in US dollars, sterling, euro and Canadian dollars where boththe company and the bank have a legal right of offset. Offsetting amounts are presented gross in the balancesheet. Offset arrangements in respect of derivatives are shown in note 16.
18. Financial liabilities – borrowings
The Group’s current and non-current borrowings are as follows:
All figures in £ millions 2019 2018
Non-current1.875% euro notes 2021 (nominal amount €195m; 2018 nominal
amount €250m) . . . . . . . . . . . . . . . . . . . . . . . . . . . . . . . . . . . . . . . 170 2333.75% US dollar notes 2022 (nominal amount $117m) . . . . . . . . . . 89 923.25% US dollar notes 2023 (nominal amount $94m) . . . . . . . . . . . 72 741.375% euro notes 2025 (nominal amount €300m) . . . . . . . . . . . . . 262 273Revolving credit facility . . . . . . . . . . . . . . . . . . . . . . . . . . . . . . . . . . 230 —Lease liabilities (see note 35) . . . . . . . . . . . . . . . . . . . . . . . . . . . . . . 749 2
1,572 674
CurrentDue within one year or on demand:Bank loans and overdrafts . . . . . . . . . . . . . . . . . . . . . . . . . . . . . . . . . 3 43Lease liabilities (see note 35) . . . . . . . . . . . . . . . . . . . . . . . . . . . . . . 89 3
92 46
Total borrowings . . . . . . . . . . . . . . . . . . . . . . . . . . . . . . . . . . . . . . . 1,664 720
Included in the non-current borrowings above is £5m of accrued interest (2018: £6m). Included in the currentborrowings above is £nil of accrued interest (2018: £nil).
Prior to 1 January 2019 the Group leased certain equipment under a number of finance lease agreements whichwere included within Financial liabilities – borrowings. On the application of IFRS 16 at 1 January 2019 (seenote 1b) all lease liabilities are now included within Financial liabilities – borrowings.
The maturities of the Group’s non-current borrowings are as follows:
All figures in £ millions 2019 2018
Between one and two years . . . . . . . . . . . . . . . . . . . . . . . . . . . . . . . . 251 1Between two and five years . . . . . . . . . . . . . . . . . . . . . . . . . . . . . . . 609 400Over five years . . . . . . . . . . . . . . . . . . . . . . . . . . . . . . . . . . . . . . . . . 712 273
1,572 674
F-65

Notes to the consolidated financial statements
18. Financial liabilities – borrowings continued
The carrying amounts and market values of borrowings are as follows:
2019 2018
All figures in £ millionsEffective
interest rateCarrying
valueMarketvalue
Effectiveinterest rate
Carryingvalue
Marketvalue
Bank loans and overdrafts . . . . . . . . . . . . . . . . . . n/a 3 3 n/a 43 431.875% euro notes 2021 . . . . . . . . . . . . . . . . . . . . 2.04% 170 170 2.04% 233 2333.75% US dollar notes 2022 . . . . . . . . . . . . . . . . . 3.94% 89 90 3.94% 92 913.25% US dollar notes 2023 . . . . . . . . . . . . . . . . . 3.36% 72 72 3.36% 74 711.375% euro notes 2025 . . . . . . . . . . . . . . . . . . . . 1.44% 262 263 1.44% 273 266Revolving credit facility . . . . . . . . . . . . . . . . . . . . 1.075% 230 230 — — —Lease liabilities . . . . . . . . . . . . . . . . . . . . . . . . . . . n/a 838 838 n/a 5 5
1,664 1,666 720 709
The market values stated above are based on clean market prices at the year end or, where these are not available,on the quoted market prices of comparable debt issued by other companies. The effective interest rates aboverelate to the underlying debt instruments.
The carrying amounts of the Group’s borrowings before the effect of derivatives (see notes 16 and 19 for furtherinformation on the impact of derivatives) are denominated in the following currencies:
All figures in £ millions 2019 2018
US dollar . . . . . . . . . . . . . . . . . . . . . . . . . . . . . . . . . . . . . . . . . . . . . . . 539 188Sterling . . . . . . . . . . . . . . . . . . . . . . . . . . . . . . . . . . . . . . . . . . . . . . . . . 576 23Euro . . . . . . . . . . . . . . . . . . . . . . . . . . . . . . . . . . . . . . . . . . . . . . . . . . . 442 506Other . . . . . . . . . . . . . . . . . . . . . . . . . . . . . . . . . . . . . . . . . . . . . . . . . . 107 3
1,664 720
The Group has $0.9bn (£0.7bn) of undrawn capacity on its committed borrowing facilities as at 31 December2019 (2018: $1.75bn (£1.4bn) undrawn). In addition, there are a number of short-term facilities that are utilisedin the normal course of business. All of the Group’s borrowings are unsecured. In respect of lease obligations, therights to the leased asset revert to the lessor in the event of default.
19. Financial risk management
The Group’s approach to the management of financial risks together with sensitivity analyses of its financialinstruments is set out below.
Treasury policy
Pearson’s treasury policies set out the Group’s principles for addressing key financial risks including capital risk,liquidity risk, foreign exchange risk and interest rate risk, and sets out measurable targets for each. The AuditCommittee receives quarterly reports incorporating compliance with measurable targets and review, and approve,any changes to treasury policies annually.
The treasury function is permitted to use derivatives where their use reduces a risk or allows a transaction to beundertaken more cost effectively. Derivatives permitted include swaps, forwards and collars to manage foreignexchange and interest rate risk, with foreign exchange swap and forward contracts the most commonly executed.Speculative transactions are not permitted.
F-66

Notes to the consolidated financial statements
19. Financial risk management continued
Capital risk
The Group’s objectives when managing capital are:
• To maintain a strong balance sheet and a solid investment grade rating;
• To continue to invest in the business organically and through acquisitions;
• To have a sustainable and progressive dividend policy, and;
• To return surplus cash to our shareholders where appropriate.
The Group aimed to maintain net debt at a level less than 1.5 times adjusted EBITDA before the adoption ofIFRS 16 and less than 2.2 times adjusted EBITDA after the adoption of IFRS 16. This is consistent with a solidinvestment-grade rating (assuming no material deterioration in trading performance) and provides comfortableheadroom against covenants.
At 31 December 2019 the Group was rated BBB (negative outlook) with Standard and Poor’s and Baa2 (stableoutlook) with Moody’s.
Net debt
The Group’s net debt position is set out below:
All figures in £ millions 2019 2018
Cash and cash equivalents . . . . . . . . . . . . . . . . . . . . . . . . . . . . . . . . . 437 568Derivative financial instruments . . . . . . . . . . . . . . . . . . . . . . . . . . . . 15 9Bank loans and overdrafts . . . . . . . . . . . . . . . . . . . . . . . . . . . . . . . . . (3) (43)Bonds . . . . . . . . . . . . . . . . . . . . . . . . . . . . . . . . . . . . . . . . . . . . . . . . . (593) (672)Revolving credit facility . . . . . . . . . . . . . . . . . . . . . . . . . . . . . . . . . . (230) —Investment in finance lease receivable . . . . . . . . . . . . . . . . . . . . . . . 196 —Lease liabilities . . . . . . . . . . . . . . . . . . . . . . . . . . . . . . . . . . . . . . . . . (838) (5)
Net debt . . . . . . . . . . . . . . . . . . . . . . . . . . . . . . . . . . . . . . . . . . . . . . . (1,016) (143)
Interest and foreign exchange rate management
The Group’s principal currency exposure is to the US dollar which represents more than 60% of the Group’ssales.
The Group’s long-term debt is primarily held in US dollars to provide a natural hedge of this exposure, which isachieved through issued US dollar debt or converting euro debt to US dollars using cross-currency swaps,forwards and collars. As at 31 December 2019, £1,641m of the Group’s debt is held at fixed rates (2018: £674m),with £23m held at floating rates (2018: £103m), partially offset by US dollar cash balances which attract floatingrate interest.
See note 16 for details of the Group’s hedging programme which addresses interest rate risk and foreign currencyrisk.
Overseas profits are converted to sterling to satisfy sterling cash outflows such as dividends at the prevailing spotrate at the time of the transaction. To the extent the Group has sufficient sterling, US dollars may be held asdollar cash to provide a natural offset to the Group’s debt or to satisfy future US dollar cash outflows.
F-67

Notes to the consolidated financial statements
19. Financial risk management continued
Interest and foreign exchange rate management continued
The Group does not have significant cross-border foreign exchange transactional exposures.
As at 31 December 2019, the sensitivity of the carrying value of the Group’s financial instruments to fluctuationsin interest rates and exchange rates is as follows:
2019
All figures in £ millionsCarrying
value
Impact of 1%increase in
interest rates
Impact of 1%decrease in
interest rates
Impact of 10%strengthening
in sterling
Impact of 10%weakening in
sterling
Investments in unlisted securities . . . . . . . . 122 — — (9) 11Other receivable . . . . . . . . . . . . . . . . . . . . . . 182 — — (17) 20Cash and cash equivalents . . . . . . . . . . . . . . 437 — — (32) 39Derivative financial instruments . . . . . . . . . 15 16 (18) 22 (23)Bonds . . . . . . . . . . . . . . . . . . . . . . . . . . . . . . (593) 11 (12) 53 (64)Other borrowings . . . . . . . . . . . . . . . . . . . . . (1,071) 2 (2) 46 (56)Other net financial assets . . . . . . . . . . . . . . . 560 — — (43) 52
Total financial instruments . . . . . . . . . . . . (348) 29 (32) 20 (21)
2018
All figures in £ millionsCarrying
value
Impact of 1%increase in
interest rates
Impact of 1%decrease in
interest rates
Impact of 10%strengthening
in sterling
Impact of 10%weakening in
sterling
Investments in unlisted securities . . . . . . . . 93 — — (7) 9Cash and cash equivalents . . . . . . . . . . . . . . 568 — — (36) 45Derivative financial instruments . . . . . . . . . 9 (3) 3 1 (1)Bonds . . . . . . . . . . . . . . . . . . . . . . . . . . . . . . (672) 17 (17) 61 (74)Other borrowings . . . . . . . . . . . . . . . . . . . . . (48) — — 2 (3)Other net financial assets . . . . . . . . . . . . . . . 620 — — (51) 62
Total financial instruments . . . . . . . . . . . . 570 14 (14) (30) 38
The table shows the sensitivities of the fair values of each class of financial instrument to an isolated change ineither interest rates or foreign exchange rates. Other net financial assets comprises trade receivables less tradepayables. A significant proportion of the movements shown above would impact equity rather than the incomestatement due to the location and functional currency of the entities in which they arise and the availability of netinvestment hedging.
The Group’s income statement is reported at average rates for the year while the balance sheet is translated at theyear-end closing rate. Differences between these rates can distort ratio calculations such as debt to EBITDA andinterest cover. Adjusted operating profit translated at year-end closing rates would be £22m lower than thereported figure of £581m at £559m. Adjusted EBITDA translated at year-end closing rates would be £26m lowerthan the reported figure of £804m at £778m.
Liquidity and re-financing risk management
The Group regularly reviews the level of cash and debt facilities required to fund its activities. This involvespreparing a prudent cash flow forecast for the next three to five years, determining the level of debt facilitiesrequired to fund the business, planning for shareholder returns and repayments of maturing debt, and identifyingan appropriate amount of headroom to provide a reserve against unexpected outflows.
F-68

Notes to the consolidated financial statements
19. Financial risk management continued
Liquidity and re-financing risk management continued
At 31 December 2019, the Group had cash of £0.4bn and an outstanding drawing of £230m on the US dollardenominated revolving credit facility due 2024 of $1.19bn (£0.9bn).
The $1.19bn facility contains interest cover and leverage covenants which the Group has complied with for theyear ended 31 December 2019. The maturity of the carrying values of the Group’s borrowings and trade payablesare set out in notes 18 and 24 respectively.
At the end of 2019, the currency split of the Group’s trade payables was US dollar £214m, sterling £57m andother currencies £87m (2018: US dollar £178m, sterling £57m and other currencies £98m) . Trade payables areall due within one year (2018: all due within one year).
The table opposite analyses the Group’s bonds and derivative assets and liabilities into relevant maturitygroupings based on the remaining period at the balance sheet date to the contractual maturity date. Short datedderivative instruments have not been included in this table. The amounts disclosed in the table are the contractualundiscounted cash flows (including interest) and as such may differ from the amounts disclosed on the balancesheet.
Financial counterparty and credit risk management
Financial counterparty and credit risk arises from cash and cash equivalents, favourable derivative financialinstruments and deposits with banks and financial institutions, as well as credit exposures to customers, includingoutstanding receivables. Counterparty credit limits, which take published credit rating and other factors intoaccount, are set to cover the Group’s total aggregate exposure to a single financial institution. The limitsapplicable to published credit rating bands are approved by the Chief Financial Officer within guidelinesapproved by the Board. Exposures and limits applicable to each financial institution are reviewed on a regularbasis.
Analysed by maturity Analysed by currency
All figures in £ millions
Greater thanone month
and less thanone year
Later thanone year
but less thanfive years
Five yearsor more Total USD GBP Other Total
At 31 December 2019Bonds . . . . . . . . . . . . . . . . . . . . . . . . . . . 12 354 259 625 177 — 448 625Rate derivatives – inflows . . . . . . . . . . . (19) (223) (332) (574) (41) (172) (361) (574)Rate derivatives – outflows . . . . . . . . . . 23 237 331 591 242 344 5 591FX forwards – inflows . . . . . . . . . . . . . . (186) (24) — (210) — (210) — (210)FX forwards – outflows . . . . . . . . . . . . . 186 23 — 209 209 — — 209
Total . . . . . . . . . . . . . . . . . . . . . . . . . . . 16 367 258 641 587 (38) 92 641
At 31 December 2018Bonds . . . . . . . . . . . . . . . . . . . . . . . . . . . 14 431 277 722 189 — 533 722Rate derivatives – inflows . . . . . . . . . . . (20) (288) (343) (651) (40) (167) (444) (651)Rate derivatives – outflows . . . . . . . . . . 23 289 341 653 254 390 9 653FX forwards – inflows . . . . . . . . . . . . . . (251) (35) — (286) — (286) — (286)FX forwards – outflows . . . . . . . . . . . . . 275 37 — 312 312 — — 312
Total . . . . . . . . . . . . . . . . . . . . . . . . . . . 41 434 275 750 715 (63) 98 750
F-69

Notes to the consolidated financial statements
19. Financial risk management continued
Financial counterparty and credit risk management continued
Cash deposits and derivative transactions are made with approved counterparties up to pre-agreed limits. Tomanage counterparty risk associated with cash and cash equivalents, the Group uses a mixture of money marketfunds as well as bank deposits. As at 31 December 2019, 84% of cash and cash equivalents was held withinvestment grade bank counterparties, 12% with AAA money market funds and 4% held with non-investmentgrade bank counterparties.
For trade receivables and contract assets the Group’s exposure to credit risk is influenced mainly by theindividual characteristics of each customer. However, risk associated with the industry and country in whichcustomers operate may also influence the credit risk. The credit quality of customers is assessed by taking intoaccount financial position, past experience and other relevant factors. Individual credit limits are set for eachcustomer based on internal ratings. The compliance with credit limits is regularly monitored by the Group. Adefault on a trade receivable is when the counterparty fails to make contractual payments within the statedpayment terms. Trade receivables and contract assets are written off when there is no reasonable expectation ofrecovery. The carrying amounts of financial assets, trade receivables and contract assets represent the maximumcredit exposure.
Trade receivables and contract assets are subject to impairment using the expected credit loss model. The Groupapplies the IFRS 9 simplified approach to measuring expected credit losses which uses a lifetime expected creditloss allowance for all trade receivables and contract assets. To measure the expected credit losses, tradereceivables and contract assets have been grouped based on shared credit risk characteristics and the days pastdue. See note 22 for further details about trade receivables and contract assets including movements in provisionsfor bad and doubtful debts.
Change of accounting policy: Amendments to IFRS 9 and IFRS 7
Pearson has considered the impact of IBOR reform on Pearson’s hedge accounting. The Group has elected toearly adopt the ‘Amendments to IFRS 9, and IFRS 7 Interest Rate Benchmark Reform’ issued in September2019. In accordance with the transition provisions, the amendments have been adopted retrospectively to hedgingrelationships that existed at the start of the reporting period or were designated thereafter. The amendmentsprovide temporary relief from applying specific hedge accounting requirements to hedging relationships directlyaffected by IBOR reform.
The reliefs have the effect that IBOR reform should not generally cause hedge accounting to terminate. However,any hedge ineffectiveness continue should be recorded in the income statement. Furthermore, the amendmentsset out triggers for when the reliefs will end, which include the uncertainty arising from interest rate benchmarkreform no longer being present.
Pearson has a limited exposure to changes in the EUR IBOR benchmark. The Group has €395m (£336m) ofInterest Rate Swaps which are in fair value hedge relationships of €395m (£336m). Pearson has considered aIBOR transition plan. Pearson currently anticipates that the areas of greatest change will be amendments to thecontractual terms of EUR-IBOR-referenced floating-rate swaps, and updating hedge designations
In summary, the reliefs provided by the amendments that apply to the Group are:
• In assessing whether the hedge is expected to be highly effective on a forward-looking basis, the Group hasassumed that the Euribor interest rate on which the cash flows of the interest rate swap that hedges fixed-rate Euro bonds is not altered by IBOR reform.
F-70

Notes to the consolidated financial statements
19. Financial risk management continued
Change of accounting policy: Amendments to IFRS 9 and IFRS 7 continued
• The Group will not discontinue hedge accounting during the period of IBOR-related uncertainty solelybecause the retrospective effectiveness demonstrates ineffectiveness due to IBOR reform. The Group hasassessed whether the hedged Euribor risk component is a separately identifiable risk only when it firstdesignates the hedge and not on an ongoing basis
20. Intangible assets – pre-publication
All figures in £ millions 2019 2018
CostAt beginning of year . . . . . . . . . . . . . . . . . . . . . . . . . . . . . . . . . . 2,096 1,854Exchange differences . . . . . . . . . . . . . . . . . . . . . . . . . . . . . . . . . (66) 70Additions . . . . . . . . . . . . . . . . . . . . . . . . . . . . . . . . . . . . . . . . . . 306 328Disposals . . . . . . . . . . . . . . . . . . . . . . . . . . . . . . . . . . . . . . . . . . . (82) (158)Transfer from property, plant and equipment . . . . . . . . . . . . . . . 9 2Transfer from intangible assets . . . . . . . . . . . . . . . . . . . . . . . . . 12 —
At end of year . . . . . . . . . . . . . . . . . . . . . . . . . . . . . . . . . . . . . . 2,275 2,096
AmortisationAt beginning of year . . . . . . . . . . . . . . . . . . . . . . . . . . . . . . . . . . (1,279) (1,113)Exchange differences . . . . . . . . . . . . . . . . . . . . . . . . . . . . . . . . . 53 (53)Charge for the year . . . . . . . . . . . . . . . . . . . . . . . . . . . . . . . . . . . (261) (271)Disposals . . . . . . . . . . . . . . . . . . . . . . . . . . . . . . . . . . . . . . . . . . . 82 158
At end of year . . . . . . . . . . . . . . . . . . . . . . . . . . . . . . . . . . . . . . (1,405) (1,279)
Carrying amounts at end of year . . . . . . . . . . . . . . . . . . . . . . 870 817
Included in the above are pre-publication assets amounting to £585m (2018: £577m) which will be realised inmore than one year.
Amortisation is included in the income statement in cost of goods sold.
In addition to the above, in 2019 there was a £10m charge and additions of £13m relating to assets and liabilitiesheld for sale. In 2018 £242m of pre-publication assets were included in assets classified as held for sale (seenote 32) with a charge of £67m and additions of £60m in 2018 related to assets and liabilities held for sale.
21. Inventories
All figures in £ millions 2019 2018
Raw materials . . . . . . . . . . . . . . . . . . . . . . . . . . . . . . . . . . . . . . . 5 5Work in progress . . . . . . . . . . . . . . . . . . . . . . . . . . . . . . . . . . . . 2 —Finished goods . . . . . . . . . . . . . . . . . . . . . . . . . . . . . . . . . . . . . . 155 149Returns asset . . . . . . . . . . . . . . . . . . . . . . . . . . . . . . . . . . . . . . . . 7 10
169 164
The cost of inventories recognised as an expense and included in the income statement in cost of goods soldamounted to £231m (2018: £375m). In 2019, £33m (2018: £39m) of inventory provisions was charged in theincome statement. None of the inventory is pledged as security.
F-71

Notes to the consolidated financial statements
21. Inventories continued
Included within the inventory balance is the estimation of the right to receive goods from contracts withcustomers via returns. The value of the returns asset is measured at the carrying amount of the assets at the timeof sale aligned to the Group’s normal inventory valuation methodology less any expected costs to recover theasset and any expected reduction in value. Impairment charges against the inventory returns asset are £nil in 2019(2018: £nil). The returns asset all relates to finished goods.
22. Trade and other receivables
All figures in £ millions 2019 2018
CurrentTrade receivables . . . . . . . . . . . . . . . . . . . . . . . . . . . . . . . . . . . . . . 903 874Royalty advances . . . . . . . . . . . . . . . . . . . . . . . . . . . . . . . . . . . . . . 4 5Prepayments . . . . . . . . . . . . . . . . . . . . . . . . . . . . . . . . . . . . . . . . . 138 103Investment in finance lease receivable . . . . . . . . . . . . . . . . . . . . . 25 —Deferred contract costs . . . . . . . . . . . . . . . . . . . . . . . . . . . . . . . . . — 1Accrued income . . . . . . . . . . . . . . . . . . . . . . . . . . . . . . . . . . . . . . . 11 2Other receivables . . . . . . . . . . . . . . . . . . . . . . . . . . . . . . . . . . . . . . 194 193
1,275 1,178
Non-currentTrade receivables . . . . . . . . . . . . . . . . . . . . . . . . . . . . . . . . . . . . . . 15 30Royalty advances . . . . . . . . . . . . . . . . . . . . . . . . . . . . . . . . . . . . . . — 21Prepayments . . . . . . . . . . . . . . . . . . . . . . . . . . . . . . . . . . . . . . . . . 7 13Investment in finance lease receivable . . . . . . . . . . . . . . . . . . . . . 171 —Deferred contract costs . . . . . . . . . . . . . . . . . . . . . . . . . . . . . . . . . — 1Accrued income . . . . . . . . . . . . . . . . . . . . . . . . . . . . . . . . . . . . . . . 5 10Other receivables . . . . . . . . . . . . . . . . . . . . . . . . . . . . . . . . . . . . . . 115 25
313 100
Accrued income represents contract assets which are unbilled amounts generally resulting from assessments andservices revenue streams where revenue to be recognised over time has been recognised in excess of customerbillings to date. Impairment charges on accrued income assets are £nil (2018: £nil). The carrying value of theGroup’s trade and other receivables approximates its fair value. Trade receivables are stated net of provisions forbad and doubtful debts.
The movements in the provision for bad and doubtful debts are as follows:
All figures in £ millions 2019 2018
At beginning of year . . . . . . . . . . . . . . . . . . . . . . . . . . . . . . . . . . . (96) (116)Adjustment on initial application of IFRS 9 . . . . . . . . . . . . . . . . . — (12)Exchange differences . . . . . . . . . . . . . . . . . . . . . . . . . . . . . . . . . . 3 2Income statement movements . . . . . . . . . . . . . . . . . . . . . . . . . . . . (35) (1)Utilised . . . . . . . . . . . . . . . . . . . . . . . . . . . . . . . . . . . . . . . . . . . . . 36 31
At end of year . . . . . . . . . . . . . . . . . . . . . . . . . . . . . . . . . . . . . . . . (92) (96)
Concentrations of credit risk with respect to trade receivables are limited due to the Group’s large number ofcustomers, who are internationally dispersed.
F-72

Notes to the consolidated financial statements
22. Trade and other receivables continued
The ageing of the Group’s trade receivables is as follows:
All figures in £ millions 2019 2018
Within due date . . . . . . . . . . . . . . . . . . . . . . . . . . . . . . . . . . . . . . . . . . 654 606Up to three months past due date . . . . . . . . . . . . . . . . . . . . . . . . . . . . 155 172Three to six months past due date . . . . . . . . . . . . . . . . . . . . . . . . . . . 35 72Six to nine months past due date . . . . . . . . . . . . . . . . . . . . . . . . . . . . 9 16Nine to 12 months past due date . . . . . . . . . . . . . . . . . . . . . . . . . . . . 14 24More than 12 months past due date . . . . . . . . . . . . . . . . . . . . . . . . . . 51 14
Net trade receivables . . . . . . . . . . . . . . . . . . . . . . . . . . . . . . . . . . . . 918 904
The Group reviews its bad debt provision at least twice a year following a detailed review of receivable balancesand historical payment profiles, and assessment of forward looking risk factors. Management believes all theremaining receivable balances are fully recoverable.
23. Provisions for other liabilities and charges
All figures in £ millionsDeferred
consideration PropertyDisposals
and closuresLegal
and other Total
At 1 January 2019 . . . . . . . . . . . . . . . . . . . . . . . . . . . . . . . . 42 102 5 16 165Adjustment on initial application of IFRS 16 (see
note 1b) . . . . . . . . . . . . . . . . . . . . . . . . . . . . . . . . . . . . . . — (101) — — (101)Exchange differences . . . . . . . . . . . . . . . . . . . . . . . . . . . . . (1) — — (2) (3)Charged to income statement . . . . . . . . . . . . . . . . . . . . . . . — 10 — 67 77Released to income statement . . . . . . . . . . . . . . . . . . . . . . . — — (5) (15) (20)Utilised . . . . . . . . . . . . . . . . . . . . . . . . . . . . . . . . . . . . . . . . (5) (1) — (17) (23)Transfer from trade and other liabilities . . . . . . . . . . . . . . . — 6 — — 6Transfer to other liabilities . . . . . . . . . . . . . . . . . . . . . . . . . (36) — — — (36)
At 31 December 2019 . . . . . . . . . . . . . . . . . . . . . . . . . . . . — 16 — 49 65
Analysis of provisions:
2019
All figures in £ millionsDeferred
consideration PropertyDisposals
and closuresLegal
and other Total
Current . . . . . . . . . . . . . . . . . . . . . . . . . . . . . . . . . . . . . . . . — 9 — 43 52Non-current . . . . . . . . . . . . . . . . . . . . . . . . . . . . . . . . . . . . . — 7 — 6 13
— 16 — 49 65
2018
Current . . . . . . . . . . . . . . . . . . . . . . . . . . . . . . . . . . . . . . . . 6 2 5 7 20Non-current . . . . . . . . . . . . . . . . . . . . . . . . . . . . . . . . . . . . . 36 100 — 9 145
42 102 5 16 165
Deferred consideration primarily related to the formation of a venture in North America in 2011. This provisionwas reclassified to other liabilities during 2019.
F-73

Notes to the consolidated financial statements
23. Provisions for other liabilities and charges continued
Property provisions in 2018 predominantly related to restructuring and onerous leases. The main provisionsrelated to the consolidation of London properties and were expected to be utilised from 2020. Uncertaintiesaround property provisions related to prevailing market conditions including potential sublet income, lease termsincluding rent free periods, void periods, lease incentives and running costs. On the initial application of IFRS 16(see note 1b) in 2019 onerous lease provisions have been offset against the relevant right-of-use asset. Propertyprovisions in 2019 relate to restructuring and dilapidation provisions.
Legal and other includes legal claims, contract disputes and potential contract losses with the provisions utilisedas the cases are settled. Also included in legal and other are other restructuring provisions that are generallyutilised within one year.
24. Trade and other liabilities
All figures in £ millions 2019 2018
Trade payables . . . . . . . . . . . . . . . . . . . . . . . . . . . . . . . . . . . . . . . . 358 311Sales return liability . . . . . . . . . . . . . . . . . . . . . . . . . . . . . . . . . . . 122 173Social security and other taxes . . . . . . . . . . . . . . . . . . . . . . . . . . . 13 16Accruals . . . . . . . . . . . . . . . . . . . . . . . . . . . . . . . . . . . . . . . . . . . . . 295 397Deferred income . . . . . . . . . . . . . . . . . . . . . . . . . . . . . . . . . . . . . . 360 387Interest payable . . . . . . . . . . . . . . . . . . . . . . . . . . . . . . . . . . . . . . . 28 46Other liabilities . . . . . . . . . . . . . . . . . . . . . . . . . . . . . . . . . . . . . . . 188 225
1,364 1,555Less: non-current portionAccruals . . . . . . . . . . . . . . . . . . . . . . . . . . . . . . . . . . . . . . . . . . . . . — 15Deferred income . . . . . . . . . . . . . . . . . . . . . . . . . . . . . . . . . . . . . . 55 66Other liabilities . . . . . . . . . . . . . . . . . . . . . . . . . . . . . . . . . . . . . . . 31 74
86 155
Current portion . . . . . . . . . . . . . . . . . . . . . . . . . . . . . . . . . . . . . . 1,278 1,400
The carrying value of the Group’s trade and other liabilities approximates its fair value. The deferred incomebalance comprises contract liabilities in respect of advance payments in assessment, testing and trainingbusinesses; subscription income in school and college businesses; and obligations to deliver digital content infuture periods.
25. Retirement benefit and other post-retirement obligations
Background
The Group operates a number of defined benefit and defined contribution retirement plans throughout the world.
The largest plan is The Pearson Pension Plan (UK Group plan) in the UK, which is sectionalised to provide bothdefined benefit and defined contribution pension benefits. The defined benefit section was closed to newmembers from 1 November 2006. The defined contribution section, opened in 2003, is open to new and existingemployees. Finally, there is a separate section within the UK Group plan set up for auto-enrolment. The definedbenefit section of the UK Group plan is a final salary pension plan which provides benefits to members in theform of a guaranteed level of pension payable for life. The level of benefits depends on the length of service andfinal pensionable pay. The UK Group plan is funded with benefit payments from trustee-administered funds. TheUK Group plan is administered in accordance with the Trust Deed and Rules in the interests of its beneficiariesby Pearson Group Pension Trustee Limited.
F-74

Notes to the consolidated financial statements
25. Retirement benefit and other post-retirement obligations continued
Background continued
At 31 December 2019, the UK Group plan had approximately 26,000 members, analysed in the following table:
All figures in % Active Deferred Pensioners Total
Defined benefit . . . . . . . . . . . . . . . . . . . . . — 20 33 53Defined contribution . . . . . . . . . . . . . . . . 12 35 — 47
Total . . . . . . . . . . . . . . . . . . . . . . . . . . . . . 12 55 33 100
The other major defined benefit plans are based in the US. These are also final salary pension plans whichprovide benefits to members in the form of a guaranteed pension payable for life, with the level of benefitsdependent on length of service and final pensionable pay. The majority of the US plans are funded.
The Group also has several post-retirement medical benefit plans (PRMBs), principally in the US. PRMBs areunfunded but are accounted for and valued similarly to defined benefit pension plans.
The defined benefit schemes expose the Group to actuarial risks, such as life expectancy, inflation risks, andinvestment risk including asset volatility and changes in bond yields. The Group is not exposed to any unusual,entity-specific or plan-specific risks.
The defined contribution section of the UK Group plan operates a Reference Scheme Test (RST) pensionunderpin for its members. Where a member’s fund value is insufficient to purchase the RST pension uponretirement, the UK Group plan is liable for the shortfall to cover the member’s RST pension. A liability of £33m(2018: £23m) in respect of the underpin is included in the UK Group plan’s defined benefit obligation, calculatedas the present value of projected payments less the fund value. From 1 January 2018, members who havesufficient funds to purchase an RST pension are able to convert their fund value into a pension in the UK Groupplan as an alternative to purchasing an annuity with an insurer. The Group does not recognise the assets andliabilities for members of the defined contribution section of the UK Group plan whose fund values are expectedto be sufficient to purchase an RST pension without assistance from the UK Group plan. The definedcontribution section of the UK Group plan had gross assets of £512m at 31 December 2019 (2018: £453m).
Assumptions
The principal assumptions used for the UK Group plan and the US PRMB are shown below. Weighted averageassumptions have been shown for the other plans, which primarily relate to US pension plans.
2019 2018
All figures in %UK Group
planOtherplans PRMB
UK Groupplan
Otherplans PRMB
Inflation . . . . . . . . . . . . . . . . . . . . . . . . . . . . . . . . . . . . . . . . . . . . 3.0 1.7 1.5 3.3 1.6 1.5Rate used to discount plan liabilities . . . . . . . . . . . . . . . . . . . . . . 2.0 3.0 3.1 2.8 4.0 4.1Expected rate of increase in salaries . . . . . . . . . . . . . . . . . . . . . . 3.5 2.9 3.0 3.8 2.9 3.0Expected rate of increase for pensions in payment and deferred
pensions . . . . . . . . . . . . . . . . . . . . . . . . . . . . . . . . . . . . . . . . . . 1.85 to 5.05 — — 2.1 to 5.1 — —Initial rate of increase in healthcare rate . . . . . . . . . . . . . . . . . . . — — 6.8 — — 7.0Ultimate rate of increase in healthcare rate . . . . . . . . . . . . . . . . . — — 5.0 — — 5.5
The UK discount rate is based on corporate bond yields adjusted to reflect the duration of liabilities.
The US discount rate is set by reference to a US bond portfolio matching model.
F-75

Notes to the consolidated financial statements
25. Retirement benefit and other post-retirement obligations continued
Assumptions continued
The inflation rate for the UK Group plan of 3% reflects the RPI rate. In line with changes to legislation in 2010,certain benefits have been calculated with reference to CPI as the inflationary measure and in these instances arate of 2% has been used.
The expected rate of increase in salaries has been set at 3.5% for 2019.
For the UK Group plan, the mortality base table assumptions have been updated and are derived from the SAPSS2 for males and females, adjusted to reflect the observed experience of the plan, with CMI model improvementfactors. A 1.5% long-term rate improvement on the CMI model is applied for both males and females.
For the US plans, the mortality table (Pri – 2012) and 2019 improvement scale (MP – 2019) with generationalprojection for male and female annuitants has been adopted.
Using the above tables, the remaining average life expectancy in years of a pensioner retiring at age 65 on thebalance sheet date for the UK Group plan and US plans is as follows:
UK US
All figures in years 2019 2018 2019 2018
Male . . . . . . . . . . . . . . . . . . . . . . . . . . . . . . . . . . . . . 24.0 23.8 20.6 20.7Female . . . . . . . . . . . . . . . . . . . . . . . . . . . . . . . . . . . 24.3 24.5 22.6 22.7
The remaining average life expectancy in years of a pensioner retiring at age 65, 20 years after the balance sheetdate, for the UK and US Group plans is as follows:
UK US
All figures in years 2019 2018 2019 2018
Male . . . . . . . . . . . . . . . . . . . . . . . . . . . . . . . . . . . . . 25.5 25.4 22.2 22.3Female . . . . . . . . . . . . . . . . . . . . . . . . . . . . . . . . . . . 26.1 26.3 24.1 24.2
Although the Group anticipates that plan surpluses will be utilised during the life of the plan to address memberbenefits, the Group recognises its pension surplus in full in respect of the UK Group plan on the basis that it ismanagement’s judgement that there are no substantive restrictions on the return of residual plan assets in theevent of a winding up of the plan after all member obligations have been met.
Financial statement information
The amounts recognised in the income statement are as follows:
2019
All figures in £ millionsUK
Group plan
Definedbenefitother Sub-total
Definedcontribution PRMB Total
Current service cost . . . . . . . . . . . . . . . . . . . . . . . . . . 6 3 9 57 — 66Past service cost . . . . . . . . . . . . . . . . . . . . . . . . . . . . . — — — — — —Curtailments . . . . . . . . . . . . . . . . . . . . . . . . . . . . . . . . (2) — (2) — (1) (3)Administration expenses . . . . . . . . . . . . . . . . . . . . . . 6 — 6 — — 6
Total operating expense . . . . . . . . . . . . . . . . . . . . . . 10 3 13 57 (1) 69Interest on plan assets . . . . . . . . . . . . . . . . . . . . . . . . . (89) (5) (94) — — (94)Interest on plan liabilities . . . . . . . . . . . . . . . . . . . . . . 73 6 79 — 2 81
Net finance (income)/expense . . . . . . . . . . . . . . . . . (16) 1 (15) — 2 (13)
Net income statement charge . . . . . . . . . . . . . . . . . (6) 4 (2) 57 1 56
F-76

Notes to the consolidated financial statements
25. Retirement benefit and other post-retirement obligations continued
Financial statement information continued2018
All figures in £ millionsUK
Group plan
Definedbenefitother Sub-total
Definedcontribution PRMB Total
Current service cost . . . . . . . . . . . . . . . . . . . . . . . . . . 7 2 9 56 (1) 64Past service cost . . . . . . . . . . . . . . . . . . . . . . . . . . . . . 8 — 8 — — 8Curtailments . . . . . . . . . . . . . . . . . . . . . . . . . . . . . . . . — — — — (11) (11)Administration expenses . . . . . . . . . . . . . . . . . . . . . . 6 — 6 — — 6
Total operating expense . . . . . . . . . . . . . . . . . . . . . . 21 2 23 56 (12) 67Interest on plan assets . . . . . . . . . . . . . . . . . . . . . . . . . (82) (5) (87) — — (87)Interest on plan liabilities . . . . . . . . . . . . . . . . . . . . . . 68 6 74 — 2 76
Net finance (income)/expense . . . . . . . . . . . . . . . . . (14) 1 (13) — 2 (11)
Net income statement charge . . . . . . . . . . . . . . . . . 7 3 10 56 (10) 56
2017
All figures in £ millionsUK Group
plan
Definedbenefitother Sub-total
Definedcontribution PRMB Total
Current service cost . . . . . . . . . . . . . . . . . . . . . . . . . . . 8 1 9 57 (1) 65Administration expenses . . . . . . . . . . . . . . . . . . . . . . . 9 1 10 — — 10
Total operating expense . . . . . . . . . . . . . . . . . . . . . . 17 2 19 57 (1) 75Interest on plan assets . . . . . . . . . . . . . . . . . . . . . . . . . (84) (5) (89) — — (89)Interest on plan liabilities . . . . . . . . . . . . . . . . . . . . . . 77 7 84 — 2 86
Net finance (income)/expense . . . . . . . . . . . . . . . . . . (7) 2 (5) — 2 (3)
Net income statement charge . . . . . . . . . . . . . . . . . . 10 4 14 57 1 72
The amounts recognised in the balance sheet are as follows:
2019 2018
All figures in £ millionsUK
Group planOther
funded plans
Otherunfunded
plans TotalUK
Group planOther
funded plans
Otherunfunded
plans Total
Fair value of plan assets . . . . . . . . 3,341 120 — 3,461 3,240 141 — 3,381Present value of defined benefit
obligation . . . . . . . . . . . . . . . . . (2,912) (138) (19) (3,069) (2,671) (158) (19) (2,848)
Net pension asset/(liability) . . . . 429 (18) (19) 392 569 (17) (19) 533Other post-retirement medical
benefit obligation . . . . . . . . . . . (43) (49)Other pension accruals . . . . . . . . . (12) (13)
Net retirement benefit asset . . . . 337 471
Analysed as:Retirement benefit assets . . . . . . . 429 571Retirement benefit obligations . . . (92) (100)
F-77

Notes to the consolidated financial statements
25. Retirement benefit and other post-retirement obligations continued
Financial statement information continued
The following gains/(losses) have been recognised in other comprehensive income:
All figures in £ millions 2019 2018 2017
Amounts recognised for defined benefit plans . . . . . . . . . . . . . . . . . . . (148) 16 175Amounts recognised for post-retirement medical benefit plans . . . . . . 3 6 —
Total recognised in year . . . . . . . . . . . . . . . . . . . . . . . . . . . . . . . . . . . (145) 22 175
The fair value of plan assets comprises the following:
2019 2018
All figures in %UK Group
planOther
funded plans TotalUK Group
planOther
funded plans Total
Insurance . . . . . . . . . . . . . . . . . . . . . . . . . . . . . . . 43 — 43 28 1 29Equities . . . . . . . . . . . . . . . . . . . . . . . . . . . . . . . . . 1 1 2 1 1 2Bonds . . . . . . . . . . . . . . . . . . . . . . . . . . . . . . . . . . 5 2 7 — 2 2Property . . . . . . . . . . . . . . . . . . . . . . . . . . . . . . . . 5 — 5 7 — 7Pooled asset investment funds . . . . . . . . . . . . . . . 30 — 30 44 — 44Other . . . . . . . . . . . . . . . . . . . . . . . . . . . . . . . . . . . 13 — 13 16 — 16
The plan assets do not include any of the Group’s own financial instruments, or any property occupied by theGroup. The table below further disaggregates the plan assets into additional categories and those assets whichhave a quoted market price in an active market and those that do not:
2019 2018
All figures in %Quoted
market priceNo quoted
market priceQuoted
market priceNo quoted
market price
Insurance . . . . . . . . . . . . . . . . . . . . . . . . . . . . 43 — 29 —Non-UK equities . . . . . . . . . . . . . . . . . . . . . . — 2 — 2Fixed-interest securities . . . . . . . . . . . . . . . . 7 — 2 —Property . . . . . . . . . . . . . . . . . . . . . . . . . . . . — 5 — 7Pooled asset investment funds . . . . . . . . . . . 30 — 44 —Other . . . . . . . . . . . . . . . . . . . . . . . . . . . . . . . — 13 — 16
Total . . . . . . . . . . . . . . . . . . . . . . . . . . . . . . . 80 20 75 25
The liquidity profile of the UK Group plan assets is as follows:
All figures in % 2019 2018
Liquid – call <1 month . . . . . . . . . . . . . . . . . . . . . . . . . . . . . . . . . . . . 37 51Less liquid – call 1–3 months . . . . . . . . . . . . . . . . . . . . . . . . . . . . . . . — —Illiquid – call >3 months . . . . . . . . . . . . . . . . . . . . . . . . . . . . . . . . . . 63 49
F-78

Notes to the consolidated financial statements
25. Retirement benefit and other post-retirement obligations continued
Financial statement information continued
Changes in the values of plan assets and liabilities of the retirement benefit plans are as follows:
2019 2018
All figures in £ millionsUK Group
planOtherplans Total
UK Groupplan
Otherplans Total
Fair value of plan assetsOpening fair value of plan assets . . . . . . . . . . . . . . . . . . . . . . . 3,240 141 3,381 3,337 155 3,492Exchange differences . . . . . . . . . . . . . . . . . . . . . . . . . . . . . . . . — (5) (5) — 4 4Interest on plan assets . . . . . . . . . . . . . . . . . . . . . . . . . . . . . . . . 89 5 94 82 5 87Return on plan assets excluding interest . . . . . . . . . . . . . . . . . . 133 13 146 (45) (13) (58)Contributions by employer . . . . . . . . . . . . . . . . . . . . . . . . . . . . 3 2 5 6 1 7Benefits paid . . . . . . . . . . . . . . . . . . . . . . . . . . . . . . . . . . . . . . . (124) (16) (140) (140) (11) (151)Other . . . . . . . . . . . . . . . . . . . . . . . . . . . . . . . . . . . . . . . . . . . . . — (20) (20) — — —
Closing fair value of plan assets . . . . . . . . . . . . . . . . . . . . . . . 3,341 120 3,461 3,240 141 3,381
Present value of defined benefit obligationOpening defined benefit obligation . . . . . . . . . . . . . . . . . . . . . (2,671) (177) (2,848) (2,792) (181) (2,973)Exchange differences . . . . . . . . . . . . . . . . . . . . . . . . . . . . . . . . — 5 5 — (3) (3)Current service cost . . . . . . . . . . . . . . . . . . . . . . . . . . . . . . . . . . (6) (3) (9) (7) (2) (9)Past service cost . . . . . . . . . . . . . . . . . . . . . . . . . . . . . . . . . . . . — — — (8) — (8)Curtailments . . . . . . . . . . . . . . . . . . . . . . . . . . . . . . . . . . . . . . . 2 — 2 — — —Administration expenses . . . . . . . . . . . . . . . . . . . . . . . . . . . . . . (6) — (6) (6) — (6)Interest on plan liabilities . . . . . . . . . . . . . . . . . . . . . . . . . . . . . (73) (6) (79) (68) (6) (74)Actuarial gains/(losses) – experience . . . . . . . . . . . . . . . . . . . . (6) (1) (7) (49) (2) (51)Actuarial gains/(losses) – demographic . . . . . . . . . . . . . . . . . . 18 1 19 (12) — (12)Actuarial gains/(losses) – financial . . . . . . . . . . . . . . . . . . . . . . (294) (12) (306) 131 6 137Contributions by employee . . . . . . . . . . . . . . . . . . . . . . . . . . . . — — — — — —Other . . . . . . . . . . . . . . . . . . . . . . . . . . . . . . . . . . . . . . . . . . . . . — 20 20 — — —Benefits paid . . . . . . . . . . . . . . . . . . . . . . . . . . . . . . . . . . . . . . . 124 16 140 140 11 151
Closing defined benefit obligation . . . . . . . . . . . . . . . . . . . . . (2,912) (157) (3,069) (2,671) (177) (2,848)
The weighted average duration of the defined benefit obligation is 16 years for the UK and 8 years for the US.
Changes in the value of the US PRMB are as follows:
All figures in £ millions 2019 2018
Opening defined benefit obligation . . . . . . . . . . . . . . . . . . . . . . . . (49) (67)Exchange differences . . . . . . . . . . . . . . . . . . . . . . . . . . . . . . . . . . . 1 (2)Current service cost . . . . . . . . . . . . . . . . . . . . . . . . . . . . . . . . . . . . — 1Curtailments . . . . . . . . . . . . . . . . . . . . . . . . . . . . . . . . . . . . . . . . . . 1 11Interest on plan liabilities . . . . . . . . . . . . . . . . . . . . . . . . . . . . . . . . (2) (2)Actuarial gains/(losses) – experience . . . . . . . . . . . . . . . . . . . . . . . 4 4Actuarial gains/(losses) – demographic . . . . . . . . . . . . . . . . . . . . . 1 —Actuarial gains/(losses) – financial . . . . . . . . . . . . . . . . . . . . . . . . (2) 2Benefits paid . . . . . . . . . . . . . . . . . . . . . . . . . . . . . . . . . . . . . . . . . . 3 4
Closing defined benefit obligation . . . . . . . . . . . . . . . . . . . . . . . . (43) (49)
F-79

Notes to the consolidated financial statements
25. Retirement benefit and other post-retirement obligations continued
Funding
The UK Group plan is self-administered with the plan’s assets being held independently of the Group in trust.The trustee of the plan is required to act in the best interest of the plan’s beneficiaries. The most recent triennialactuarial valuation for funding purposes was completed as at 1 January 2018 and this valuation revealed atechnical provisions funding surplus of £163m. The plan expects to be able to provide benefits (in accordancewith the plan rules) with a very low level of reliance on future funding from the Group.
Assets of the plan are divided into two elements: matching assets, which are assets that produce cash flows thatcan be expected to match the cash flows for a proportion of the membership, and include a liability-driveninvestment mandate (UK bonds, interest rate/inflation swaps and other derivative instruments), pensioner buy-ininsurance policies, inflation-linked property and infrastructure; and return seeking assets, which are assetsinvested with a longer-term horizon to generate the returns needed to provide the remaining expected cash flowsfor the beneficiaries, and include diversified growth funds, property and alternative asset classes. The plan’slong-term investment strategy allocates 91.5% to matching assets and 8.5% to return-seeking assets.
In February 2019, the UK Group plan purchased a further pensioner buy-in policy valued at approximately£500m with Legal & General. This is in addition to the previous buy-in policies with Aviva and Legal & Generaltotalling £1.2bn which were purchased in 2017. As a result of this latest transaction, 95% of the UK Group plan’spensioner liabilities are now matched with buy-in policies. These transfer significant longevity risk to Aviva andLegal & General, reducing the pension risks being underwritten by the Group and providing additional securityfor members.
Regular employer contributions to the plan in respect of the defined benefit sections are estimated to be £3m for2020.
Sensitivities
The effect of a one percentage point increase and decrease in the discount rate on the defined benefit obligationand the total pension expense is as follows:
2019
All figures in £ millions1%
increase1%
decrease
Effect:(Decrease)/increase in defined benefit obligation – UK Group plan . . . . . . . (434) 591(Decrease)/increase in defined benefit obligation – US plan . . . . . . . . . . . . . (11) 13
The effect of members living one year more or one year less on the defined benefit obligation is as follows:
2019
All figures in £ millionsOne yearincrease
One yeardecrease
Effect:Increase/(decrease) in defined benefit obligation – UK Group plan . . . . . . . . 132 (126)Increase/(decrease) in defined benefit obligation – US plan . . . . . . . . . . . . . 8 (8)
F-80

Notes to the consolidated financial statements
25. Retirement benefit and other post-retirement obligations continued
Sensitivities continued
The effect of a half percentage point increase and decrease in the inflation rate is as follows:
2019
All figures in £ millions0.5%
increase0.5%
decrease
Effect:Increase/(decrease) in defined benefit obligation – UK Group plan . . . . . . . . . . . . 153 (136)Increase/(decrease) in defined benefit obligation – US plan . . . . . . . . . . . . . . . . . . — —
The above sensitivity analyses are based on a change in an assumption while holding all other assumptionsconstant, although in practice this is unlikely to occur and changes in some assumptions may be correlated. Whencalculating these sensitivities, the same method has been applied to calculate the defined benefit obligation as hasbeen applied when calculating the liability recognised in the balance sheet. This methodology is the same as priorperiods.
26. Share-based payments
The Group recognised the following charges in the income statement in respect of its equity-settled share-basedpayment plans:
All figures in £ millions 2019 2018
Pearson plans . . . . . . . . . . . . . . . . . . . . . . . . . . . . . . . . . . . 25 37
The Group operates the following equity-settled employee option and share plans:
Worldwide Save for Shares Plan – Since 1994, the Group has operated a Save-As-You-Earn plan for UKemployees. In 1998, the Group introduced a Worldwide Save for Shares Plan. Under these plans, employees cansave a portion of their monthly salary over periods of three or five years. At the end of this period, the employeehas the option to purchase ordinary shares with the accumulated funds at a purchase price equal to 80% of themarket price prevailing at the time of the commencement of the employee’s participation in the plan. Optionsthat are not exercised within six months of the end of the savings period lapse unconditionally.
Employee Stock Purchase Plan – In 2000, the Group established an Employee Stock Purchase Plan whichallows all employees in the US to save a portion of their monthly salary over six-month periods. At the end of theperiod, the employee has the option to purchase American Depositary Receipts (ADRs) with their accumulatedfunds at a purchase price equal to 85% of the lower of the market prices prevailing at the beginning or end of theperiod.
Long-Term Incentive Plan – The plan was first introduced in 2001, renewed again in 2006 and again in 2011.The plan consists of restricted shares. The vesting of restricted shares is normally dependent on continuingservice over a three to five-year period, and in the case of executive directors and senior management upon thesatisfaction of corporate performance targets over a three-year period. These targets may be based on market and/or non-market performance criteria. Restricted shares awarded to executive directors in May 2019 and May 2018vest dependent on relative total shareholder return, return on invested capital and adjusted earnings per sharegrowth. Other restricted shares awarded in 2019 and 2018 vest depending on continuing service over periods ofup to three years.
F-81

Notes to the consolidated financial statements
26. Share-based payments continued
Management Incentive Plan – The plan was introduced in 2017 combining the Group’s Annual Incentive Planand Long-Term Incentive Plan for senior management. The number of shares to be granted to participants isdependent on Group performance in the calendar year preceding the date of grant (on the same basis as theAnnual Incentive Plan). Subsequently, the shares vest dependent on continuing service over a three-year period,and additionally in the case of Pearson Executive management, upon satisfaction of non-market basedperformance criteria as determined by the Remuneration Committee. Restricted shares awarded as part of the2018 Management Incentive Plan were granted in April 2019. Restricted shares awarded as part of the 2019Management Incentive Plan will be granted in April 2020.
The number and weighted average exercise prices of share options granted under the Group’s plans are asfollows:
2019 2018
Number ofshare options
000s
Weighted averageexercise price
£
Number ofshare options
000s
Weighted averageexercise price
£
Outstanding at beginning of year . . . . . . . . . . . . . . 2,728 5.76 2,981 6.84Granted during the year . . . . . . . . . . . . . . . . . . . . . 660 6.77 729 5.80Exercised during the year . . . . . . . . . . . . . . . . . . . (419) 6.74 (70) 6.57Forfeited during the year . . . . . . . . . . . . . . . . . . . . (492) 6.21 (668) 7.58Expired during the year . . . . . . . . . . . . . . . . . . . . . (83) 11.15 (244) 8.19
Outstanding at end of year . . . . . . . . . . . . . . . . . 2,394 6.06 2,728 5.76
Options exercisable at end of year . . . . . . . . . . . 161 7.14 169 11.31
Options were exercised regularly throughout the year. The weighted average share price during the year was£8.07 (2018: £8.45). Early exercises arising from redundancy, retirement or death are treated as an accelerationof vesting and the Group therefore recognises in the income statement the amount that otherwise would havebeen recognised for services received over the remainder of the original vesting period.
The options outstanding at the end of the year have weighted average remaining contractual lives and exerciseprices as follows:
2019 2018
Range of exercise prices£
Number ofshare options
000s
Weighted averagecontractual life
Years
Number ofshare options
000s
Weighted averagecontractual life
Years
5–10 . . . . . . . . . . . . . . . . . . . . . . . . 2,376 1.94 2,553 2.29>10 . . . . . . . . . . . . . . . . . . . . . . . . . 18 1.04 175 0.29
2,394 1.93 2,728 2.16
In 2019 and 2018, options were granted under the Worldwide Save for Shares Plan. The weighted averageestimated fair value for the options granted was calculated using a Black-Scholes option pricing model.
F-82

Notes to the consolidated financial statements
26. Share-based payments continued
The weighted average estimated fair values and the inputs into the Black-Scholes model are as follows:
2019Weightedaverage
2018Weightedaverage
Fair value . . . . . . . . . . . . . . . . . . . . . . . . . . . . . . . . . . . . £ 2.31 £ 1.88Weighted average share price . . . . . . . . . . . . . . . . . . . . £ 8.30 £ 7.49Weighted average exercise price . . . . . . . . . . . . . . . . . . £ 6.77 £ 5.80Expected volatility . . . . . . . . . . . . . . . . . . . . . . . . . . . . . 32.07% 35.78%Expected life . . . . . . . . . . . . . . . . . . . . . . . . . . . . . . . . . 3.7 years 3.7 yearsRisk-free rate . . . . . . . . . . . . . . . . . . . . . . . . . . . . . . . . . 0.66% 0.87%Expected dividend yield . . . . . . . . . . . . . . . . . . . . . . . . 2.11% 5.21%Forfeiture rate . . . . . . . . . . . . . . . . . . . . . . . . . . . . . . . . 3.2% 3.2%
The expected volatility is based on the historical volatility of the company’s share price over the previous three toseven years depending on the vesting term of the options.
The following shares were granted under restricted share arrangements:
2019 2018
Number ofshares000s
Weighted averagefair value
£
Number ofshares000s
Weighted averagefair value
£
Long-Term Incentive Plan . . . . . . . . . . . . . . . . . . . . . . 2,785 8.09 2,907 7.55Management Incentive Plan . . . . . . . . . . . . . . . . . . . . . 1,435 8.49 2,035 7.45
The fair value of shares granted under the Long-Term Incentive Plan and the Management Incentive Plan thatvest unconditionally is determined using the share price at the date of grant. The number of shares expected tovest is adjusted, based on historical experience, to account for potential forfeitures. Participants under the plansare entitled to dividends during the vesting period and therefore the share price is not discounted.
Restricted shares with a market performance condition were valued by an independent actuary using a MonteCarlo model. Restricted shares with a non-market performance condition were fair valued based on the shareprice at the date of grant. Non-market performance conditions are taken into consideration by adjusting thenumber of shares expected to vest based on the most likely outcome of the relevant performance criteria.
27. Share capital and share premium
Number ofshares000s
Sharecapital
£m
Sharepremium
£m
At 1 January 2018 . . . . . . . . . . . . . . . . . . . . . . . . . . . . . . . . . 802,054 200 2,602Issue of ordinary shares – share option schemes . . . . . . . . . 864 1 5Purchase of own shares . . . . . . . . . . . . . . . . . . . . . . . . . . . . . (21,840) (6) —
At 31 December 2018 . . . . . . . . . . . . . . . . . . . . . . . . . . . . . 781,078 195 2,607Issue of ordinary shares – share option schemes . . . . . . . . . 1,021 — 7Purchase of own shares . . . . . . . . . . . . . . . . . . . . . . . . . . . . . — — —
At 31 December 2019 . . . . . . . . . . . . . . . . . . . . . . . . . . . . . 782,099 195 2,614
F-83

Notes to the consolidated financial statements
27. Share capital and share premium continued
The ordinary shares have a par value of 25p per share (2018: 25p per share). All issued shares are fully paid. Allshares have the same rights.
The £300m share buyback programme announced in October 2017 was completed on 16 February 2018. Afurther 22m shares were purchased under the programme in 2018. The shares bought back have been cancelledand the nominal value of these shares transferred to a capital redemption reserve. The nominal value of sharescancelled at 31 December 2019 was £11m (2018: £11m).
The Group manages its capital to ensure that entities in the Group will be able to continue as a going concernwhile maximising the return to shareholders through the optimisation of the debt and equity balance.
The capital structure of the Group consists of debt (see note 18), cash and cash equivalents (see note 17) andequity attributable to equity holders of the parent, comprising issued capital, reserves and retained earnings.
The Group reviews its capital structure on a regular basis and will balance its overall capital structure throughpayments of dividends, new share issues as well as the issue of new debt or the redemption of existing debt inline with the financial risk policies outlined in note 19.
28. Treasury shares
Pearson plc
Number ofshares000s £m
At 1 January 2018 . . . . . . . . . . . . . . . . . . . . . . . . . . . . . . . . . . . . 5,994 61Purchase of treasury shares . . . . . . . . . . . . . . . . . . . . . . . . . . . . — —Release of treasury shares . . . . . . . . . . . . . . . . . . . . . . . . . . . . . (2,769) (28)
At 31 December 2018 . . . . . . . . . . . . . . . . . . . . . . . . . . . . . . . . 3,225 33Purchase of treasury shares . . . . . . . . . . . . . . . . . . . . . . . . . . . . 6,100 52Release of treasury shares . . . . . . . . . . . . . . . . . . . . . . . . . . . . . (6,067) (61)
At 31 December 2019 . . . . . . . . . . . . . . . . . . . . . . . . . . . . . . . . 3,258 24
The Group holds Pearson plc shares in trust to satisfy its obligations under its restricted share plans (see note 26).These shares, representing 0.4% (2018: 0.4%) of called-up share capital, are treated as treasury shares foraccounting purposes and have a par value of 25p per share.
The nominal value of Pearson plc treasury shares amounts to £0.8m (2018: £0.8m). Dividends on treasury sharesare waived.
At 31 December 2019, the market value of Pearson plc treasury shares was £21m (2018: £30m).
F-84

Notes to the consolidated financial statements
29. Other comprehensive income
2019
Attributable to equity holders of the company Non-controlling
interest TotalAll figures in £ millionsFair value
reserveTranslation
reserveRetainedearnings Total
Items that may be reclassified to the incomestatement
Net exchange differences on translation of foreignoperations – Group . . . . . . . . . . . . . . . . . . . . . . . . . — (113) — (113) — (113)
Net exchange differences on translation of foreignoperations – associates . . . . . . . . . . . . . . . . . . . . . . — (2) — (2) — (2)
Currency translation adjustment disposed . . . . . . . . . — 4 — 4 — 4Attributable tax . . . . . . . . . . . . . . . . . . . . . . . . . . . . . . — — 5 5 — 5
Items that are not reclassified to the incomestatement
Fair value gain on other financial assets . . . . . . . . . . . 20 — — 20 — 20Attributable tax . . . . . . . . . . . . . . . . . . . . . . . . . . . . . . — — (4) (4) — (4)Remeasurement of retirement benefit obligations –
Group . . . . . . . . . . . . . . . . . . . . . . . . . . . . . . . . . . . — — (145) (145) — (145)Remeasurement of retirement benefit obligations –
associates . . . . . . . . . . . . . . . . . . . . . . . . . . . . . . . . — — (4) (4) — (4)Attributable tax . . . . . . . . . . . . . . . . . . . . . . . . . . . . . . — — 22 22 — 22
Other comprehensive (expense)/income for theyear . . . . . . . . . . . . . . . . . . . . . . . . . . . . . . . . . . . . . 20 (111) (126) (217) — (217)
2018
Attributable to equity holders of the company Non-controlling
interest TotalAll figures in £ millionsFair value
reserveTranslation
reserveRetainedearnings Total
Items that may be reclassified to the incomestatement
Net exchange differences on translation of foreignoperations – Group . . . . . . . . . . . . . . . . . . . . . . . . . — 91 — 91 — 91
Net exchange differences on translation of foreignoperations – associates . . . . . . . . . . . . . . . . . . . . . . — (1) — (1) — (1)
Currency translation adjustment disposed . . . . . . . . . — (4) — (4) — (4)Attributable tax . . . . . . . . . . . . . . . . . . . . . . . . . . . . . . — — (4) (4) — (4)
Items that are not reclassified to the incomestatement
Fair value gain on other financial assets . . . . . . . . . . . 8 — — 8 — 8Attributable tax . . . . . . . . . . . . . . . . . . . . . . . . . . . . . . — — — — — —Remeasurement of retirement benefit obligations –
Group . . . . . . . . . . . . . . . . . . . . . . . . . . . . . . . . . . . — — 22 22 — 22Remeasurement of retirement benefit obligations –
associates . . . . . . . . . . . . . . . . . . . . . . . . . . . . . . . . — — 3 3 — 3Attributable tax . . . . . . . . . . . . . . . . . . . . . . . . . . . . . . — — 9 9 — 9
Other comprehensive income/(expense) for theyear . . . . . . . . . . . . . . . . . . . . . . . . . . . . . . . . . . . . . 8 86 30 124 — 124
F-85

Notes to the consolidated financial statements
29. Other comprehensive income continued
2017
Attributable to equity holders of the company Non-controlling
interest TotalAll figures in £ millionsFair value
reserveTranslation
reserveRetainedearnings Total
Items that may be reclassified to the incomestatement
Net exchange differences on translation of foreignoperations – Group . . . . . . . . . . . . . . . . . . . . . . . . . — (158) — (158) — (158)
Net exchange differences on translation of foreignoperations – associates . . . . . . . . . . . . . . . . . . . . . . — (104) — (104) — (104)
Currency translation adjustment disposed . . . . . . . . . — (51) — (51) — (51)Attributable tax . . . . . . . . . . . . . . . . . . . . . . . . . . . . . . — — 9 9 — 9
Items that are not reclassified to the incomestatement
Fair value gain on other financial assets . . . . . . . . . . . 13 — — 13 — 13Attributable tax . . . . . . . . . . . . . . . . . . . . . . . . . . . . . . — — (4) (4) — (4)Remeasurement of retirement benefit obligations –
Group . . . . . . . . . . . . . . . . . . . . . . . . . . . . . . . . . . . — — 175 175 — 175Remeasurement of retirement benefit obligations –
associates . . . . . . . . . . . . . . . . . . . . . . . . . . . . . . . . — — 7 7 — 7Attributable tax . . . . . . . . . . . . . . . . . . . . . . . . . . . . . . — — (42) (42) — (42)
Other comprehensive income/(expense) for theyear . . . . . . . . . . . . . . . . . . . . . . . . . . . . . . . . . . . . . 13 (313) 145 (155) — (155)
30. Business combinations
During the year the Group made some small acquisitions, including Lumerit Education and Smart Sparrow, fortotal consideration of £40m. Details of the assets acquired, and the associated consideration, are shown in thetable below.
all figures in £ millions 2019
Intangible assets . . . . . . . . . . . . . . . . . . . . . . . . . . . . . . . . . . . . . . . 23Trade and other receivables . . . . . . . . . . . . . . . . . . . . . . . . . . . . . . 1Trade and other liabilities . . . . . . . . . . . . . . . . . . . . . . . . . . . . . . . . (2)Net assets acquired . . . . . . . . . . . . . . . . . . . . . . . . . . . . . . . . . . . . 22Goodwill . . . . . . . . . . . . . . . . . . . . . . . . . . . . . . . . . . . . . . . . . . . . . 18Total . . . . . . . . . . . . . . . . . . . . . . . . . . . . . . . . . . . . . . . . . . . . . . . . 40Satisfied by:Cash . . . . . . . . . . . . . . . . . . . . . . . . . . . . . . . . . . . . . . . . . . . . . . . . . 40Total consideration . . . . . . . . . . . . . . . . . . . . . . . . . . . . . . . . . . . . 40
There were no significant acquisitions in 2018. There were no material adjustments to prior year acquisitions in2019. The net cash outflow relating to acquisitions in the year is shown below.
All figures in £ millions 2019 2018 2017
Cash flow on acquisitionsCash – current year acquisitions . . . . . . . . . . . . . . . . . . . . . . . . . . . . . . (40) — —Deferred payments for prior year acquisitions and other items . . . . . . . (5) (5) (11)
Net cash outflow . . . . . . . . . . . . . . . . . . . . . . . . . . . . . . . . . . . . . . . . . . (45) (5) (11)
F-86

Notes to the consolidated financial statements
30. Business combinations continued
During 2019, the Group’s associate, Penguin Random House raised additional capital from its owners inproportion to their equity interests with the Group’s share being £40m.
31. Disposals
In March 2019, the Group completed the sale of its US K12 Courseware business resulting in a pre-tax profit onsale of £13m. Total gross proceeds were £200m including £180m of deferred proceeds which include the fairvalue of an unconditional vendor note for $225m and an entitlement to 20% of future cash flows to equityholders and 20% of net proceeds in the event of a subsequent sale (see note 14 for further details). Tax on thedisposal is a benefit of £51m. Other disposal items relate to investment sales and adjustments to prior yeartransactions.
2019 2018 2017
All figures in £ millions Notes K12 Other Total Total Total
Disposal of subsidiaries and associatesProperty, plant and equipment . . . . . . . . . . . . . . . . . . . . . . . . . . . . . . . . — — — (17) (7)Intangible assets . . . . . . . . . . . . . . . . . . . . . . . . . . . . . . . . . . . . . . . . . . . (101) — (101) (17) (9)Investments in joint ventures and associates . . . . . . . . . . . . . . . . . . . . . — — — (3) (352)Net deferred income tax assets . . . . . . . . . . . . . . . . . . . . . . . . . . . . . . . . (100) — (100) — (3)Intangible assets – pre-publication . . . . . . . . . . . . . . . . . . . . . . . . . . . . . (238) — (238) (8) (1)Inventories . . . . . . . . . . . . . . . . . . . . . . . . . . . . . . . . . . . . . . . . . . . . . . . (64) — (64) (1) (2)Trade and other receivables . . . . . . . . . . . . . . . . . . . . . . . . . . . . . . . . . . (70) — (70) (30) (16)Cash and cash equivalents (excluding overdrafts) . . . . . . . . . . . . . . . . . (104) — (104) (119) (13)Net deferred income tax liabilities . . . . . . . . . . . . . . . . . . . . . . . . . . . . . — — — 16 —Trade and other liabilities . . . . . . . . . . . . . . . . . . . . . . . . . . . . . . . . . . . 520 — 520 172 34Provisions for other liabilities and charges . . . . . . . . . . . . . . . . . . . . . . — — — 1 —Cumulative currency translation adjustment . . . . . . . . . . . . . . . . . . . . . 29 (4) — (4) 4 51
Net assets disposed . . . . . . . . . . . . . . . . . . . . . . . . . . . . . . . . . . . . . . . . (161) — (161) (2) (323)Cash received . . . . . . . . . . . . . . . . . . . . . . . . . . . . . . . . . . . . . . . . . . . . . 20 — 20 243 468Deferred proceeds . . . . . . . . . . . . . . . . . . . . . . . . . . . . . . . . . . . . . . . . . 180 — 180 2 —Fair value of financial asset acquired . . . . . . . . . . . . . . . . . . . . . . . . . . . — — — 3 —Costs . . . . . . . . . . . . . . . . . . . . . . . . . . . . . . . . . . . . . . . . . . . . . . . . . . . . (26) 3 (23) (16) (17)
Gain on disposal . . . . . . . . . . . . . . . . . . . . . . . . . . . . . . . . . . . . . . . . . . 13 3 16 230 128
All figures in £ millions 2019 2018 2017
Cash flow from disposalsCash – current year disposals . . . . . . . . . . . . . . . . . . . . . . . . 20 243 468Cash and cash equivalents disposed . . . . . . . . . . . . . . . . . . . (104) (119) (13)Costs and other disposal liabilities paid . . . . . . . . . . . . . . . . (17) (23) (25)
Net cash (outflow)/inflow . . . . . . . . . . . . . . . . . . . . . . . . . . (101) 101 430
Analysed as:Cash (outflow)/inflow from sale of subsidiaries . . . . . . . . . (101) 83 19Cash inflow from sale of joint ventures and associates . . . . — 18 411
F-87

Notes to the consolidated financial statements
32. Held for sale
The held for sale asset in 2019 is the 25% holding in Penguin Random House following announcement of thesale in December 2019. Held for sale assets and liabilities in 2018 related to the US K12 Courseware businessprior to disposal in 2019.
2019 2018
All figures in £ millions Total Total
Non-current assetsIntangible assets . . . . . . . . . . . . . . . . . . . . . . . . . . . . . . . . . . . . . . . . . . . . . . . . — 168Investments in joint ventures and associates . . . . . . . . . . . . . . . . . . . . . . . . . . 397 —Deferred income tax assets . . . . . . . . . . . . . . . . . . . . . . . . . . . . . . . . . . . . . . . . — 98Trade and other receivables . . . . . . . . . . . . . . . . . . . . . . . . . . . . . . . . . . . . . . . — 25
397 291
Current assetsIntangible assets – pre-publication . . . . . . . . . . . . . . . . . . . . . . . . . . . . . . . . . . — 242Inventories . . . . . . . . . . . . . . . . . . . . . . . . . . . . . . . . . . . . . . . . . . . . . . . . . . . . — 55Trade and other receivables . . . . . . . . . . . . . . . . . . . . . . . . . . . . . . . . . . . . . . . — 60
— 357
Assets classified as held for sale . . . . . . . . . . . . . . . . . . . . . . . . . . . . . . . . . . . 397 648
Non-current liabilitiesOther liabilities . . . . . . . . . . . . . . . . . . . . . . . . . . . . . . . . . . . . . . . . . . . . . . . . . — (371)
— (371)
Current liabilitiesTrade and other liabilities . . . . . . . . . . . . . . . . . . . . . . . . . . . . . . . . . . . . . . . . . — (202)
— (202)
Liabilities classified as held for sale . . . . . . . . . . . . . . . . . . . . . . . . . . . . . . . — (573)
Net assets classified as held for sale . . . . . . . . . . . . . . . . . . . . . . . . . . . . . . . 397 75
Goodwill is allocated to the held for sale businesses on a relative fair value basis where these businesses formpart of a larger cash generating unit (CGU).
The Group has historically presented the results of PRH separately within segment information (see note 2) toprovide further information about the composition of the Group outside of the primary segments. The Group hasnot viewed Penguin Random House as comprising a separate major line of business since the sale of 22% of theGroup’s stake in Penguin Random House to Bertelsmann in 2017. On this basis, the Group has not classifiedPenguin Random House as a discontinued operation.
F-88

Notes to the consolidated financial statements
33. Cash generated from operations
All figures in £ millions Notes 2019 2018 2017
Profit . . . . . . . . . . . . . . . . . . . . . . . . . . . . . . . . . . . . . . . . . . . . . . . . . . . . . . . . . . . . . . . 266 590 408Adjustments for:Income tax . . . . . . . . . . . . . . . . . . . . . . . . . . . . . . . . . . . . . . . . . . . . . . . . . . . . . . . . . . . (34) (92) 13Depreciation . . . . . . . . . . . . . . . . . . . . . . . . . . . . . . . . . . . . . . . . . . . . . . . . . . . . . . . . . . 10 123 66 90Amortisation and impairment of acquired intangibles and goodwill . . . . . . . . . . . . . . 11 151 99 138Amortisation of software . . . . . . . . . . . . . . . . . . . . . . . . . . . . . . . . . . . . . . . . . . . . . . . . 11 115 88 85Net finance costs . . . . . . . . . . . . . . . . . . . . . . . . . . . . . . . . . . . . . . . . . . . . . . . . . . . . . . 6 43 55 30Charges relating to GMP equalisation . . . . . . . . . . . . . . . . . . . . . . . . . . . . . . . . . . . . . . — 8 —Share of results of joint ventures and associates . . . . . . . . . . . . . . . . . . . . . . . . . . . . . . 12 (54) (44) (78)Profit on disposal of subsidiaries, associates, investments and fixed assets . . . . . . . . . (9) (315) (116)Net profit on disposal of right-of-use assets held under leases . . . . . . . . . . . . . . . . . . . (4) — —Net foreign exchange adjustment from transactions . . . . . . . . . . . . . . . . . . . . . . . . . . . (21) 28 (26)Investment income . . . . . . . . . . . . . . . . . . . . . . . . . . . . . . . . . . . . . . . . . . . . . . . . . . . . . (2) — —Share-based payment costs . . . . . . . . . . . . . . . . . . . . . . . . . . . . . . . . . . . . . . . . . . . . . . 26 25 37 33Pre-publication . . . . . . . . . . . . . . . . . . . . . . . . . . . . . . . . . . . . . . . . . . . . . . . . . . . . . . . . (55) (37) (35)Inventories . . . . . . . . . . . . . . . . . . . . . . . . . . . . . . . . . . . . . . . . . . . . . . . . . . . . . . . . . . . (20) (10) 24Trade and other receivables . . . . . . . . . . . . . . . . . . . . . . . . . . . . . . . . . . . . . . . . . . . . . . 59 (15) 133Trade and other liabilities . . . . . . . . . . . . . . . . . . . . . . . . . . . . . . . . . . . . . . . . . . . . . . . (157) 35 6Retirement benefit obligations . . . . . . . . . . . . . . . . . . . . . . . . . . . . . . . . . . . . . . . . . . . 5 (9) (232)Provisions for other liabilities and charges . . . . . . . . . . . . . . . . . . . . . . . . . . . . . . . . . . 49 63 (11)
Net cash generated from operations . . . . . . . . . . . . . . . . . . . . . . . . . . . . . . . . . . . . . 480 547 462
Net cash generated from operations is translated at an exchange rate approximating the rate at the date of cashflow. The difference between this rate and the average rate used to translate profit gives rise to a currencyadjustment in the reconciliation between net profit and net cash generated from operations. This adjustmentreflects the timing difference between recognition of profit and the related cash receipts or payments.
Operating cash flow,operating free cash flow and total free cash flow are non-GAAP (non-statutory) measuresand have been disclosed and reconciled in the above table as they are commonly used by investors to measure thecash performance of the Group. In the cash flow statement, proceeds from sale of property, plant and equipmentcomprise:
All figures in £ millions 2019 2018 2017
Net book amount . . . . . . . . . . . . . . . . . . . . . . . . . . . . . . . . . . 3 41 12Profit/(loss) on sale of property, plant and equipment . . . . . . (2) 87 (12)
Proceeds from sale of property, plant and equipment . . . 1 128 —
F-89

Notes to the consolidated financial statements
33. Cash generated from operations continued
The movements in the Group’s current and non-current borrowings are as follows:
All figures in £ millions 2018IFRS 16
Transition
New leases/disposal of
leases
Transfer fromnon-currentto current
Financingcash flows
Foreignexchange
movements
Fair valueand other
movements 2019
Financial liabilitiesNon-current
borrowings . . . . . . . . . 643 792 61 (88) 230 (80) 9 1,567Current borrowings . . . . . 25 89 — 88 (139) 16 — 79
Total . . . . . . . . . . . . . . . . 668 881 61 — 91 (64) 9 1,646
All figures in £ millions 2017Financingcash flows
Foreignexchange
movements
Fair valueand other
movements 2018
Financial liabilitiesNon-current borrowings . . . . . . . . . . . . . . . . . 1,066 (441) 10 8 643Current borrowings . . . . . . . . . . . . . . . . . . . . . 4 (1) 22 — 25
Total . . . . . . . . . . . . . . . . . . . . . . . . . . . . . . . . 1,070 (442) 32 8 668
2016Financingcash flows
Foreignexchange
movements
Fair valueand other
movements 2017
Financial liabilitiesNon-current borrowings . . . . . . . . . . . . . . . . . 2,517 (1,292) (149) (10) 1,066Current borrowings . . . . . . . . . . . . . . . . . . . . . 9 (7) (1) 3 4
Total . . . . . . . . . . . . . . . . . . . . . . . . . . . . . . . . 2,526 (1,299) (150) (7) 1,070
Non-current borrowings include bonds, derivative financial instruments and leases. Current borrowings includeloans repayable within one year and leases, but exclude overdrafts classified within cash and cash equivalents.
34. Contingencies and commitments
There are contingent Group liabilities that arise in the normal course of business in respect of indemnities,warranties and guarantees in relation to former subsidiaries and in respect of guarantees in relation tosubsidiaries, joint ventures and associates. In addition, there are contingent liabilities of the Group in respect ofunsettled or disputed tax liabilities, legal claims, contract disputes, royalties, copyright fees, permissions andother rights. None of these claims are expected to result in a material gain or loss to the Group.
On 25 April 2019, the European Commission published the full decision that the United Kingdom controlledforeign company group financing partial exemption (FCPE) partially constitutes State Aid. The Group has lodgedan appeal. The Group has benefited from the FCPE in 2018 and prior years by approximately £116m. At presentthe Group believes no provision is required in respect of this issue.
During 2019 the Group received an assessment from the tax authorities in Brazil challenging the deduction fortax purposes of goodwill amortisation for the years 2013 to 2016. Similar assessments may be raised for otheryears. Potential total exposure could be up to £124m (BRL 656m) upto 31 December 2019, with additionalpotential exposure of £45m (BRL 239m) in relation to deductions expected to be taken in future periods. Suchassessments are common in Brazil. The Group believes that the likelihood that the tax authorities will ultimatelyprevail is low, and that the Group’s position is strong. At present the Group believes no provision is required.
F-90
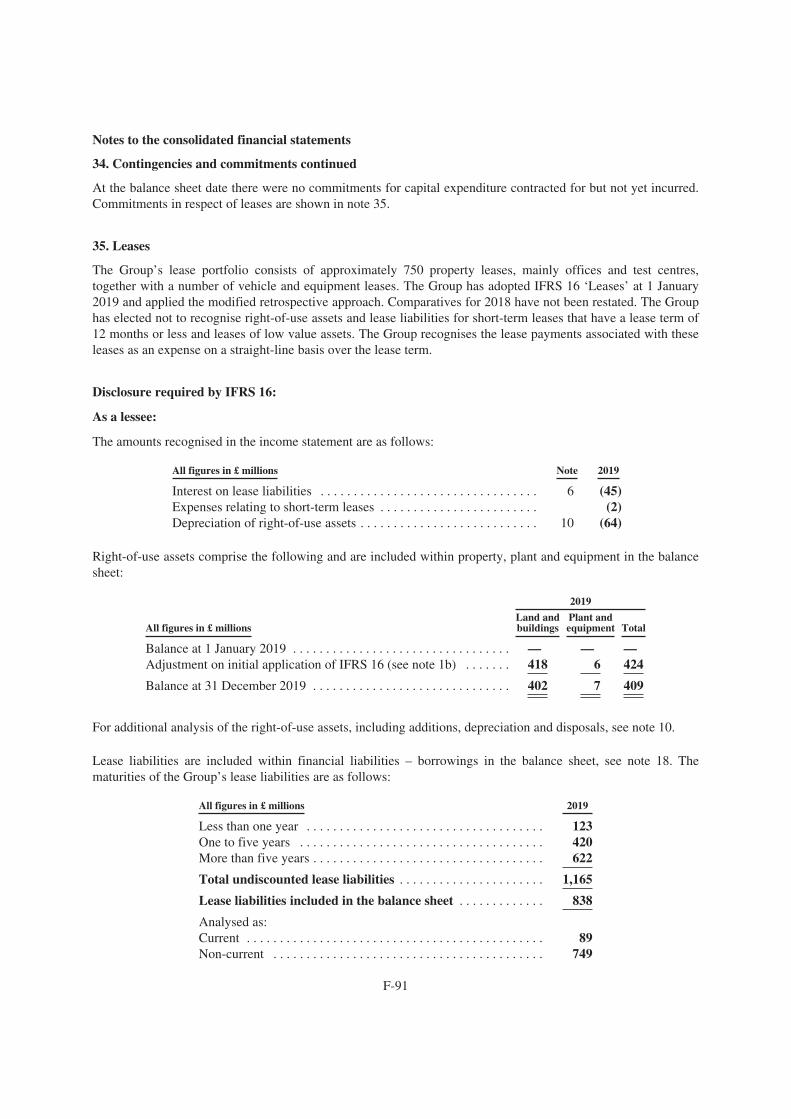
Notes to the consolidated financial statements
34. Contingencies and commitments continued
At the balance sheet date there were no commitments for capital expenditure contracted for but not yet incurred.Commitments in respect of leases are shown in note 35.
35. Leases
The Group’s lease portfolio consists of approximately 750 property leases, mainly offices and test centres,together with a number of vehicle and equipment leases. The Group has adopted IFRS 16 ‘Leases’ at 1 January2019 and applied the modified retrospective approach. Comparatives for 2018 have not been restated. The Grouphas elected not to recognise right-of-use assets and lease liabilities for short-term leases that have a lease term of12 months or less and leases of low value assets. The Group recognises the lease payments associated with theseleases as an expense on a straight-line basis over the lease term.
Disclosure required by IFRS 16:
As a lessee:
The amounts recognised in the income statement are as follows:
All figures in £ millions Note 2019
Interest on lease liabilities . . . . . . . . . . . . . . . . . . . . . . . . . . . . . . . . . 6 (45)Expenses relating to short-term leases . . . . . . . . . . . . . . . . . . . . . . . . (2)Depreciation of right-of-use assets . . . . . . . . . . . . . . . . . . . . . . . . . . . 10 (64)
Right-of-use assets comprise the following and are included within property, plant and equipment in the balancesheet:
2019
All figures in £ millionsLand andbuildings
Plant andequipment Total
Balance at 1 January 2019 . . . . . . . . . . . . . . . . . . . . . . . . . . . . . . . . . — — —Adjustment on initial application of IFRS 16 (see note 1b) . . . . . . . 418 6 424
Balance at 31 December 2019 . . . . . . . . . . . . . . . . . . . . . . . . . . . . . . 402 7 409
For additional analysis of the right-of-use assets, including additions, depreciation and disposals, see note 10.
Lease liabilities are included within financial liabilities – borrowings in the balance sheet, see note 18. Thematurities of the Group’s lease liabilities are as follows:
All figures in £ millions 2019
Less than one year . . . . . . . . . . . . . . . . . . . . . . . . . . . . . . . . . . . . 123One to five years . . . . . . . . . . . . . . . . . . . . . . . . . . . . . . . . . . . . . 420More than five years . . . . . . . . . . . . . . . . . . . . . . . . . . . . . . . . . . . 622
Total undiscounted lease liabilities . . . . . . . . . . . . . . . . . . . . . . 1,165
Lease liabilities included in the balance sheet . . . . . . . . . . . . . 838
Analysed as:Current . . . . . . . . . . . . . . . . . . . . . . . . . . . . . . . . . . . . . . . . . . . . . 89Non-current . . . . . . . . . . . . . . . . . . . . . . . . . . . . . . . . . . . . . . . . . 749
F-91

Notes to the consolidated financial statements
35. Leases continued
The amounts recognised in the cash flow statement are as follows:
All figures in £ millions 2019
Total cash outflow for leases as a lessee . . . . . . . . . . . . . . . . . . . . . 136
At the balance sheet date commitments for capital leases contracted for but not yet incurred were £25m.Extension and termination options and variable lease payments are not significant within the lease portfolio.Short-term leases to which the Group is committed at the balance sheet date are similar to the portfolio ofshort-term leases to which the short-term lease expense is disclosed above.
As a lessor:
In the event that the Group has excess capacity in its leased offices and warehouses, the Group sub-leases someof its properties under operating and finance leases.
The amounts recognised in the income statement are as follows:
All figures in £ millions Note 2019
Interest on finance lease receivable . . . . . . . . . . . . . . . . . . . . . . . . . . . . . . 6 11Income from sub-leasing right-of-use assets (within other income) . . . . . 17
The amounts recognised in the cash flow statement are as follows:
All figures in £ millions 2019
Total cash inflow for leases as a lessor . . . . . . . . . . . . . . . . . . . . . . 37
During the year the investment in finance lease receivable decreased by £19m due to payments received.
The following table sets out the maturity analysis of lease payments receivable for sub-leases classified asoperating leases, showing the undiscounted lease payments to be received after the reporting date, and sub-leasesclassified as finance leases showing the undiscounted lease payments to be received after the reporting date andthe net investment in the finance lease receivable.
All figures in £ millionsOperating
leasesFinanceleases
2019Total
Less than one year . . . . . . . . . . . . . . . . . . . . . . . . . . . 12 34 46One to two years . . . . . . . . . . . . . . . . . . . . . . . . . . . . 4 40 44Two to three years . . . . . . . . . . . . . . . . . . . . . . . . . . . 4 33 37Three to four years . . . . . . . . . . . . . . . . . . . . . . . . . . 3 30 33Four to five years . . . . . . . . . . . . . . . . . . . . . . . . . . . 3 31 34More than five years . . . . . . . . . . . . . . . . . . . . . . . . . 20 67 87
Total undiscounted lease payments receivable . . . . . 46 235 281Unearned finance income . . . . . . . . . . . . . . . . . . . . . (39)
Net investment in finance lease receivable . . . . . . . . 196
F-92

Notes to the consolidated financial statements
35. Leases continued
IAS 17 disclosure for 2018:
The maturity of the Group’s finance lease obligations is as follows:
All figures in £ millions 2018
Finance lease liabilities – minimum lease paymentsNot later than one year . . . . . . . . . . . . . . . . . . . . . . . . . . . . . . . . . . 3Later than one year and not later than two years . . . . . . . . . . . . . . 1Later than two years and not later than three years . . . . . . . . . . . . 1Later than three years and not later than four years . . . . . . . . . . . . —Later than four years and not later than five years . . . . . . . . . . . . . —Later than five years . . . . . . . . . . . . . . . . . . . . . . . . . . . . . . . . . . . . —Future finance charges on finance leases . . . . . . . . . . . . . . . . . . . . —
Present value of finance lease liabilities . . . . . . . . . . . . . . . . . . . 5
The present value of the Group’s finance lease obligations is as follows:
All figures in £ millions 2018
Not later than one year . . . . . . . . . . . . . . . . . . . . . . . . . . . . . . . . . 3Later than one year and not later than five years . . . . . . . . . . . . . 2Later than five years . . . . . . . . . . . . . . . . . . . . . . . . . . . . . . . . . . . —
5
The carrying amounts of the Group’s lease obligations approximate their fair value.
In 2018 the Group leased various offices and warehouses under non-cancellable operating lease agreements. Theleases had varying terms and renewal rights. The Group also leased various plant and equipment under operatinglease agreements, also with varying terms. Lease expenditure charged to the income statement in 2018 was£128m. The future aggregate minimum lease payments in respect of operating leases were as follows:
All figures in £ millions 2018
Not later than one year . . . . . . . . . . . . . . . . . . . . . . . . . . . . . . . . . 143Later than one year and not later than two years . . . . . . . . . . . . . 130Later than two years and not later than three years . . . . . . . . . . . 115Later than three years and not later than four years . . . . . . . . . . . 101Later than four years and not later than five years . . . . . . . . . . . . 91Later than five years . . . . . . . . . . . . . . . . . . . . . . . . . . . . . . . . . . . 595
1,175
F-93

Notes to the consolidated financial statements
35. Leases continued
In the event that the Group had excess capacity in its leased offices and warehouses, it entered into sub-leasecontracts in order to offset costs. The future aggregate minimum sub-lease payments expected to be receivedunder non-cancellable sub-leases were as follows:
All figures in £ millions 2018
Not later than one year . . . . . . . . . . . . . . . . . . . . . . . . . . . . . . . . . 51Later than one year and not later than two years . . . . . . . . . . . . . 44Later than two years and not later than three years . . . . . . . . . . . 41Later than three years and not later than four years . . . . . . . . . . . 39Later than four years and not later than five years . . . . . . . . . . . . 35Later than five years . . . . . . . . . . . . . . . . . . . . . . . . . . . . . . . . . . . 124
334
36. Related party transactions
Joint ventures and associates
Amounts advanced to joint ventures and associates during the year and at the balance sheet date are set out innote 12.
Key management personnel
Key management personnel are deemed to be the members of the Pearson executive. It is this Committee whichhad responsibility for planning, directing and controlling the activities of the Group in 2019. Key managementpersonnel compensation is disclosed below:
All figures in £ millions 2019 2018
Short-term employee benefits . . . . . . . . . . . . . . . . . . . . . . . . . . . . . . 5 6Retirement benefits . . . . . . . . . . . . . . . . . . . . . . . . . . . . . . . . . . . . . . 1 1Share-based payment costs . . . . . . . . . . . . . . . . . . . . . . . . . . . . . . . . 4 7
Total . . . . . . . . . . . . . . . . . . . . . . . . . . . . . . . . . . . . . . . . . . . . . . . . . 10 14
There were no other material related party transactions. No guarantees have been provided to related parties.
37. Post balance sheet events
In January 2020, the Group commenced £350m share buyback program in connection with the announcement inDecember 2019 of the sale of its remaining 25% interest in Penguin Random House. On 23 March 2020, inresponse to the uncertainty surrounding the impact of the COVID-19 pandemic, the Group announced it waspausing this share buyback program. At this date the Group had completed the buyback of £167m of shares.
On 23 March 2020, the Group announced an update to its guidance for 2020 to consider the impact of theCOVID-19 pandemic on Pearson’s businesses. The update outlined the impact on trading in 2020 anddocumented some of the uncertainties for the business. The Group does not believe that any of the impactsconstitute an adjusting post balance sheet event for the purposes of the 2019 financial statements. The Groupincludes reference to critical accounting assumptions and judgements in note 1a. The potential impact of theCOVID-19 pandemic on the business is highly uncertain and cannot be predicted with confidence but may cause
F-94

Notes to the consolidated financial statements
37. Post balance sheet events continued
the Group, in 2020, to reassess some of the areas requiring a higher degree of judgement or complexity or areaswhere assumptions and estimates are significant to the financial statements. These areas include the assessmentof goodwill for impairment, as set out in note 11, where the Group has noted that a number of its cash generatingunits (CGUs) are sensitive to reasonably possible changes in key assumptions. It is highlighted that a relativelysmall reduction in contribution, that could arise from longer-term disruption caused by the COVID-19, mayresult in an impairment charge in any of these CGUs. Other areas where assumptions and estimates aresignificant include the valuation of pre-publication assets, tax balances, provisions for returns and pension assetsand liabilities. The assumptions and estimates relating to these areas could change as the impact of COVID-19becomes clearer although currently they are not expected to have a material impact on the income statement. TheGroup has also reassessed its funding requirements considering the impact of the COVID-19 pandemic on thebusiness. The impact has been modelled under several scenarios to ensure that the likelihood of a prolongedperiod of disruption has been appropriately considered in assessing the availability of funding to the Group andthe ability of the Group to comply with its banking covenants. Based on this modelling and a review of historicaltrends in working capital requirements and forecast balance sheets for the next 12 months, the Group believesthat it will comply with its banking covenants and has sufficient funds available for the Group’s presentrequirements.
F-95

SIGNATURES
The registrant hereby certifies that it meets the requirements for filing a Form 20-F and that it has caused andauthorized the undersigned for sign this annual report on its behalf.
Pearson plc
/s/ Coram Williams
Coram WilliamsChief Financial Officer
Date: April 1, 2020