Q3 2017 MDA AOC - Athabasca Oil Corporation
25
Management’s Discussion and Analysis Q3 2017 This Management’s Discussion and Analysis of the financial condition and results of operations (“MD&A”) of Athabasca Oil Corporation (“Athabasca” or the “Company”) is dated November 2, 2017 and should be read in conjunction with the audited consolidated financial statements of the Company for the years ended December 31, 2016 and 2015 and the unaudited condensed interim consolidated financial statements of the Company for the three and nine months ended September 30, 2017. These financial statements, including the comparative figures, were prepared in accordance with International Financial Reporting Standards (“IFRS”). This MD&A contains forward looking information based on the Company’s current expectations and projections. For information on the material factors and assumptions underlying such forward looking information, refer to the “Forward Looking Information” advisory on page 20 of this MD&A. See "Reserves and Resource Information" on page 22 for important information regarding the Company's reserves and resource information included in this MD&A. For a listing of abbreviations, refer to “Abbreviations” on page 24 of this MD&A. Additional information relating to Athabasca is available on SEDAR at www.sedar.com, including the Company’s most recent Annual Information Form dated March 9, 2017 (“AIF”). The Company’s common shares are listed on the Toronto Stock Exchange under the trading symbol “ATH”. FOCUSED | EXECUTING | DELIVERING
-
Upload
khangminh22 -
Category
Documents
-
view
0 -
download
0
Transcript of Q3 2017 MDA AOC - Athabasca Oil Corporation
Management’s Discussion and Analysis
Q3 2017
This Management’s Discussion and Analysis of the financial condition and results of operations (“MD&A”) of Athabasca Oil Corporation (“Athabasca” or the “Company”) is dated November 2, 2017 and should be read in conjunction with the audited consolidated financial statements of the Company for the years ended December 31, 2016 and 2015 and the unaudited condensed interim consolidated financial statements of the Company for the three and nine months ended September 30, 2017. These financial statements, including the comparative figures, were prepared in accordance with International Financial Reporting Standards (“IFRS”). This MD&A contains forward looking information based on the Company’s current expectations and projections. For information on the material factors and assumptions underlying such forward looking information, refer to the “Forward Looking Information” advisory on page 20 of this MD&A. See "Reserves and Resource Information" on page 22 for important information regarding the Company's reserves and resource information included in this MD&A. For a listing of abbreviations, refer to “Abbreviations” on page 24 of this MD&A. Additional information relating to Athabasca is available on SEDAR at www.sedar.com, including the Company’s most recent Annual Information Form dated March 9, 2017 (“AIF”). The Company’s common shares are listed on the Toronto Stock Exchange under the trading symbol “ATH”.
FOCUSED | EXECUTING | DELIVERING
Athabasca Oil Corporation Q3 2017 Management's Discussion and Analysis 1
ATHABASCA'S STRATEGY Athabasca is an intermediate oil weighted producer with exposure to several of the largest resource plays in Western Canada, including the Montney, Duvernay and oil sands. The Company has a funded and flexible development outlook capable of delivering strong economic growth.
The Company's near term focus is maximizing profitability and shareholder returns through modest activity in Light Oil and ongoing Thermal Oil optimization. Both divisions are positioned for accelerated operations and growth with commodity price support. The Company is guided by a strategy that includes:
Light Oil: Defined and Material Margin Growth
• A scalable operated Montney position at Placid ("Greater Placid")• Funded Kaybob Duvernay ("Greater Kaybob") development through the joint venture with Murphy Oil Company Ltd. ("Murphy")• Current production in excess of 10,000 boe/d with scalable growth to 20,000 boe/d by 2020 with a 1-rig program in the Montney
and current Duvernay development plans
Thermal Oil: Free Cash Flow with Leverage to Oil Prices
• A large and established low decline production base• Significant free cash flow generation in the current environment• Reserve life index of over 70 years (proved plus probable)
Financial Sustainability
• Maturing cash flow profile with strong sustainability metrics and a low overall corporate production decline of approximately 10% annually
• Diverse asset base provides flexibility in future capital allocation decisions• Five year term debt with no financial covenants and strong liquidity
HIGHLIGHTS FOR THE QUARTER ENDED SEPTEMBER 30, 2017Light Oil Division
• Achieved third quarter 2017 production of 7,875 boe/d (54% liquids), representing growth of 9% over the second quarter of 2017, and 161% compared to the third quarter of 2016 despite a planned Keyera turnaround in the third quarter which impacted production by approximately 600 boe/d. Continued growth was driven by the tie-in of the liquids rich Placid Montney wells drilled in Q1 2017 resulting in net production rates exceeding 10,000 boe/d in September.
• Realized netback of $18.98/boe, and generated operating income of $13.7 million, an increase of 149% over the prior year. • At Greater Placid, eight (gross) wells were completed, three (gross) wells were placed on production and a six (gross) well pad
was spud. Five (gross) wells have been brought on production in October.• At Greater Kaybob, two (gross) wells were rig released and three (gross) wells were placed on production. An additional six (gross)
Duvernay wells are planned to be spud in the fourth quarter of 2017.
Thermal Oil Division
• Achieved third quarter 2017 production of 28,258 bbl/d, 220% higher than the third quarter of 2016. Year over year growth was driven by the Statoil Leismer acquisition. Current Thermal Oil production is approximately 30,400 bbl/d (October field estimate).
• Generated operating income of $38.6 million, which exceeded capital expenditures for the quarter by $18.2 million. Realized netbacks of $14.66/bbl including $17.78/bbl for Leismer and $2.90/bbl for Hangingstone.
• Increased commodity hedge positions to protect near-term cash flow with 20,000 bbl/d hedged for the fourth quarter of 2017 at approximately $50.75/bbl WCS, 18,000 bbl/d hedged for the first quarter of 2018 at approximately $48/bbl WCS, 11,000 bbl/d hedged for the second quarter of 2018 at approximately $48/bbl WCS and 5,000 bbl/d hedged for the third quarter of 2018 at approximately $48/bbl WCS.
Corporate
• Achieved third quarter production of 36,133 bbl/d, an increase of 205% over the prior year. • Generated record funds flow from operations of $34.4 million and net income of $5.1 million.• Reduced G&A to $2.00/boe, a decrease of 64% from the prior year.• Exited the quarter with $174 million of cash and cash equivalents, a $120 million credit facility and a $183 million (undiscounted)
capital carry balance.

Athabasca Oil Corporation Q3 2017 Management's Discussion and Analysis 2
FINANCIAL & OPERATIONAL HIGHLIGHTSThe following tables summarize selected financial information of the Company for the periods indicated:
Three months ended September 30,
Nine months ended September 30,
($ Thousands, unless otherwise noted)(1) 2017 2016 2017 2016
CONSOLIDATED PRODUCTION
Petroleum and natural gas volumes (boe/d) 36,133 11,848 33,183 12,098
LIGHT OIL DIVISION
Petroleum and natural gas volumes (boe/d) 7,875 3,018 6,197 5,019
Light Oil Operating Income(1) $ 13,748 $ 5,511 $ 37,001 $ 17,632
Light Oil Operating Netback(1) ($/boe) $ 18.98 $ 19.85 $ 21.87 $ 12.82
Capital expenditures $ 53,406 $ 18,920 $ 162,113 $ 55,095
Recovery of capital-carry through capital expenditures $ (6,092) $ (4,286) $ (30,265) $ (5,760)
THERMAL OIL DIVISION
Bitumen production (bbl/d) 28,258 8,830 26,986 7,079
Thermal Oil Operating Income (Loss)(1) $ 38,610 $ (6,088) $ 78,345 $ (41,079)
Thermal Oil Operating Netback(1) ($/bbl) $ 14.66 $ (6.80) $ 10.64 $ (20.99)
Capital expenditures(2) $ 20,382 $ 3,754 $ 45,376 $ 6,857
CASH FLOW AND FUNDS FLOW
Cash flow from operating activities $ 49,488 $ (18,990) $ 24,637 $ (51,297)
per share (basic) $ 0.10 $ (0.05) $ 0.05 $ (0.13)
Funds Flow from Operations(1) $ 34,400 $ (15,778) $ 60,315 $ (84,622)
per share (basic) $ 0.07 $ (0.04) $ 0.12 $ (0.21)
NET INCOME (LOSS) AND COMPREHENSIVE INCOME (LOSS)
Net income (loss) and comprehensive income (loss) $ 5,113 $ (33,032) $ 181 $ (157,331)
per share (basic and diluted) $ 0.01 $ (0.08) $ — $ (0.39)
COMMON SHARES OUTSTANDING
Weighted average shares outstanding - basic 509,335,251 405,556,092 496,845,215 405,357,248
Weighted average shares outstanding - diluted 513,332,423 405,556,092 502,283,110 405,357,248
ACQUISITIONS AND FINANCINGS
Leismer Corner Acquisition(3) $ (881) $ — $ (626,645) $ —
Net proceeds from sale of assets $ — $ (1,944) $ 90,205 $ 390,394
Net proceeds from issuance of 2022 Notes $ — $ — $ 542,117 $ —
Repayment of 2017 Notes and term loan $ — $ — $ (550,000) $ (285,441)(1) Refer to "Advisories and Other Guidance" beginning on page 18 for additional information on Non-GAAP Financial Measures. (2) Thermal Oil capital expenditures excludes the cost of the Leismer Corner Acquisition (see page 7).(3) Consists of cash of $435.9 million, common shares of $166.0 million and contingent payment obligations of $24.7 million for the nine months ended September 30, 2017.
September 30, December 31,
As at ($ Thousands) 2017 2016
LIQUIDITY AND INDEBTEDNESS
Cash and cash equivalents $ 174,076 $ 650,301
Restricted cash $ 113,372 $ 107,012
Capital-carry receivable (current and long-term portion - undiscounted) $ 183,204 $ 213,469
Face value of long-term debt (current and long-term portion)(4) $ 562,950 $ 550,000(4) Face value of the US dollar denominated 2022 Notes as at September 30, 2017 is US$450 million. The 2022 Notes were translated into Canadian dollars at the period end exchange
rate of US$1.00 = C$1.2510.
Athabasca Oil Corporation Q3 2017 Management's Discussion and Analysis 3
OUTLOOK
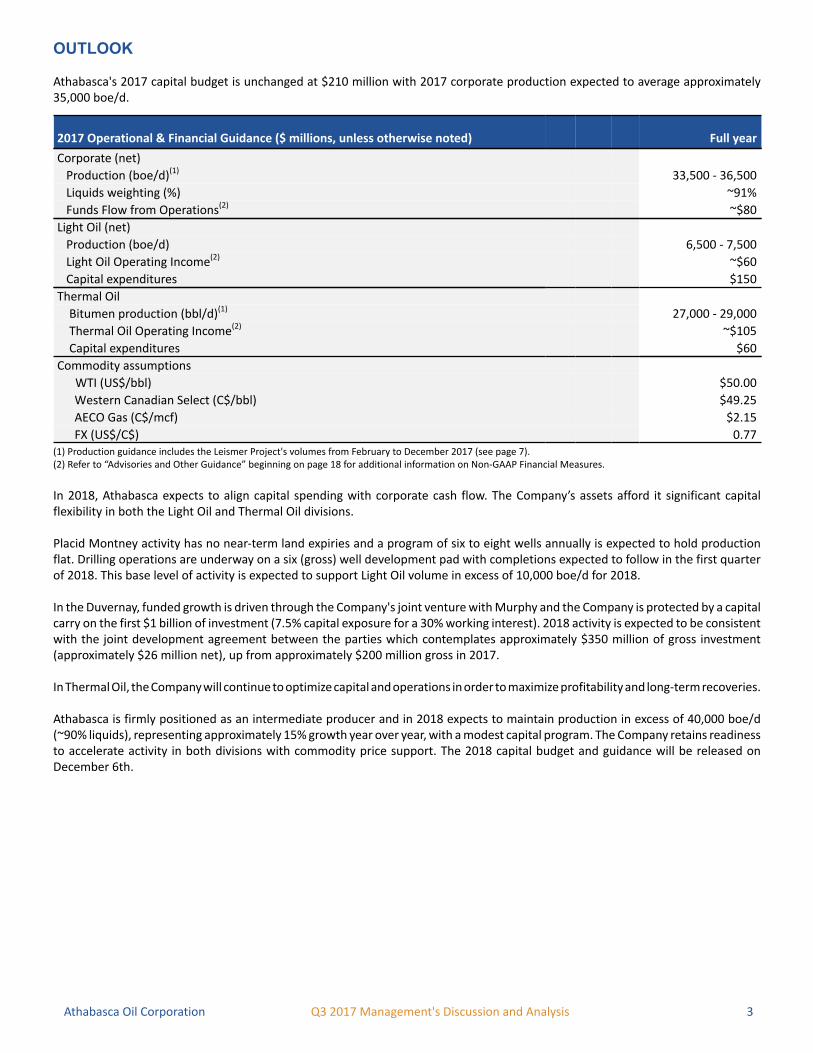
Athabasca's 2017 capital budget is unchanged at $210 million with 2017 corporate production expected to average approximately 35,000 boe/d.
2017 Operational & Financial Guidance ($ millions, unless otherwise noted) Full year
Corporate (net)
Production (boe/d)(1) 33,500 - 36,500
Liquids weighting (%) ~91%
Funds Flow from Operations(2) ~$80
Light Oil (net)
Production (boe/d) 6,500 - 7,500
Light Oil Operating Income(2) ~$60
Capital expenditures $150
Thermal Oil
Bitumen production (bbl/d)(1) 27,000 - 29,000
Thermal Oil Operating Income(2) ~$105
Capital expenditures $60
Commodity assumptions
WTI (US$/bbl) $50.00
Western Canadian Select (C$/bbl) $49.25
AECO Gas (C$/mcf) $2.15
FX (US$/C$) 0.77(1) Production guidance includes the Leismer Project's volumes from February to December 2017 (see page 7).(2) Refer to “Advisories and Other Guidance” beginning on page 18 for additional information on Non-GAAP Financial Measures.
In 2018, Athabasca expects to align capital spending with corporate cash flow. The Company’s assets afford it significant capital flexibility in both the Light Oil and Thermal Oil divisions. Placid Montney activity has no near-term land expiries and a program of six to eight wells annually is expected to hold production flat. Drilling operations are underway on a six (gross) well development pad with completions expected to follow in the first quarter of 2018. This base level of activity is expected to support Light Oil volume in excess of 10,000 boe/d for 2018.
In the Duvernay, funded growth is driven through the Company's joint venture with Murphy and the Company is protected by a capital carry on the first $1 billion of investment (7.5% capital exposure for a 30% working interest). 2018 activity is expected to be consistent with the joint development agreement between the parties which contemplates approximately $350 million of gross investment (approximately $26 million net), up from approximately $200 million gross in 2017.
In Thermal Oil, the Company will continue to optimize capital and operations in order to maximize profitability and long-term recoveries.
Athabasca is firmly positioned as an intermediate producer and in 2018 expects to maintain production in excess of 40,000 boe/d (~90% liquids), representing approximately 15% growth year over year, with a modest capital program. The Company retains readiness to accelerate activity in both divisions with commodity price support. The 2018 capital budget and guidance will be released on December 6th.
Athabasca Oil Corporation Q3 2017 Management's Discussion and Analysis 4
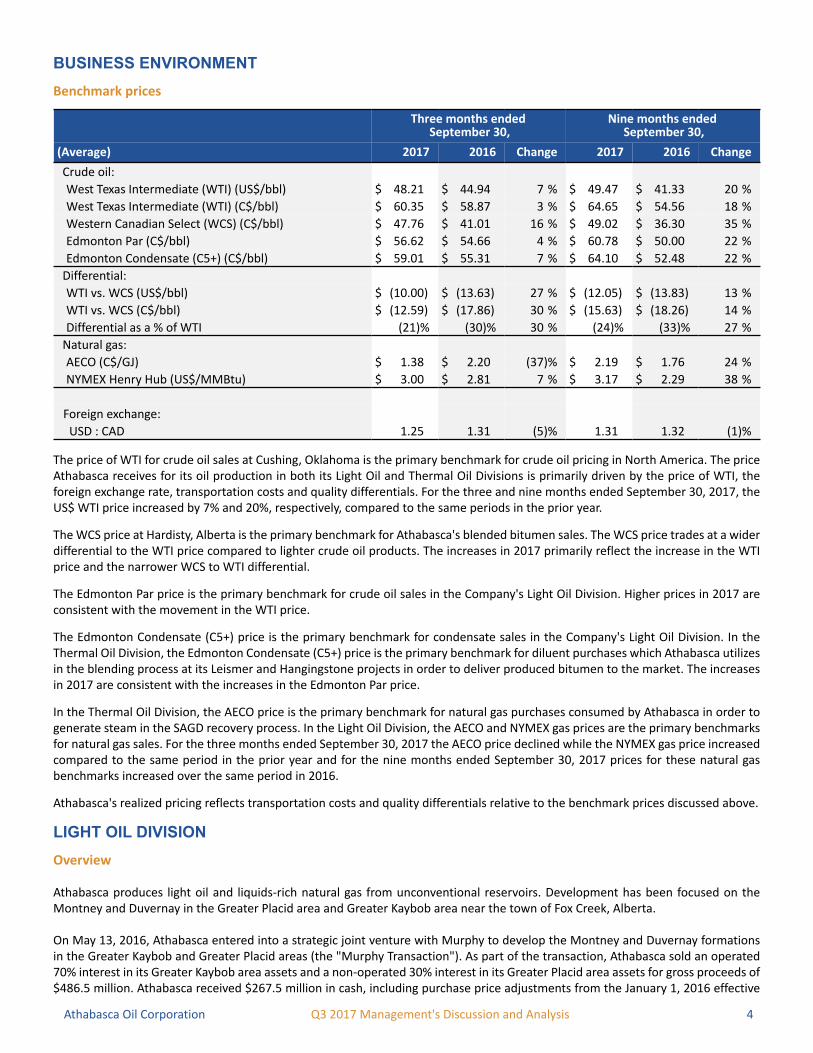
BUSINESS ENVIRONMENTBenchmark prices
Three months ended September 30,
Nine months ended September 30,
(Average) 2017 2016 Change 2017 2016 Change
Crude oil:
West Texas Intermediate (WTI) (US$/bbl) $ 48.21 $ 44.94 7 % $ 49.47 $ 41.33 20 %
West Texas Intermediate (WTI) (C$/bbl) $ 60.35 $ 58.87 3 % $ 64.65 $ 54.56 18 %
Western Canadian Select (WCS) (C$/bbl) $ 47.76 $ 41.01 16 % $ 49.02 $ 36.30 35 %
Edmonton Par (C$/bbl) $ 56.62 $ 54.66 4 % $ 60.78 $ 50.00 22 %
Edmonton Condensate (C5+) (C$/bbl) $ 59.01 $ 55.31 7 % $ 64.10 $ 52.48 22 %
Differential:
WTI vs. WCS (US$/bbl) $ (10.00) $ (13.63) 27 % $ (12.05) $ (13.83) 13 %
WTI vs. WCS (C$/bbl) $ (12.59) $ (17.86) 30 % $ (15.63) $ (18.26) 14 %
Differential as a % of WTI (21)% (30)% 30 % (24)% (33)% 27 %
Natural gas:
AECO (C$/GJ) $ 1.38 $ 2.20 (37)% $ 2.19 $ 1.76 24 %
NYMEX Henry Hub (US$/MMBtu) $ 3.00 $ 2.81 7 % $ 3.17 $ 2.29 38 %
Foreign exchange:
USD : CAD 1.25 1.31 (5)% 1.31 1.32 (1)%
The price of WTI for crude oil sales at Cushing, Oklahoma is the primary benchmark for crude oil pricing in North America. The price Athabasca receives for its oil production in both its Light Oil and Thermal Oil Divisions is primarily driven by the price of WTI, the foreign exchange rate, transportation costs and quality differentials. For the three and nine months ended September 30, 2017, the US$ WTI price increased by 7% and 20%, respectively, compared to the same periods in the prior year.
The WCS price at Hardisty, Alberta is the primary benchmark for Athabasca's blended bitumen sales. The WCS price trades at a wider differential to the WTI price compared to lighter crude oil products. The increases in 2017 primarily reflect the increase in the WTI price and the narrower WCS to WTI differential.
The Edmonton Par price is the primary benchmark for crude oil sales in the Company's Light Oil Division. Higher prices in 2017 are consistent with the movement in the WTI price.
The Edmonton Condensate (C5+) price is the primary benchmark for condensate sales in the Company's Light Oil Division. In the Thermal Oil Division, the Edmonton Condensate (C5+) price is the primary benchmark for diluent purchases which Athabasca utilizes in the blending process at its Leismer and Hangingstone projects in order to deliver produced bitumen to the market. The increases in 2017 are consistent with the increases in the Edmonton Par price.
In the Thermal Oil Division, the AECO price is the primary benchmark for natural gas purchases consumed by Athabasca in order to generate steam in the SAGD recovery process. In the Light Oil Division, the AECO and NYMEX gas prices are the primary benchmarks for natural gas sales. For the three months ended September 30, 2017 the AECO price declined while the NYMEX gas price increased compared to the same period in the prior year and for the nine months ended September 30, 2017 prices for these natural gas benchmarks increased over the same period in 2016.
Athabasca's realized pricing reflects transportation costs and quality differentials relative to the benchmark prices discussed above.
LIGHT OIL DIVISIONOverview
Athabasca produces light oil and liquids-rich natural gas from unconventional reservoirs. Development has been focused on the Montney and Duvernay in the Greater Placid area and Greater Kaybob area near the town of Fox Creek, Alberta.
On May 13, 2016, Athabasca entered into a strategic joint venture with Murphy to develop the Montney and Duvernay formations in the Greater Kaybob and Greater Placid areas (the "Murphy Transaction"). As part of the transaction, Athabasca sold an operated 70% interest in its Greater Kaybob area assets and a non-operated 30% interest in its Greater Placid area assets for gross proceeds of $486.5 million. Athabasca received $267.5 million in cash, including purchase price adjustments from the January 1, 2016 effective
Athabasca Oil Corporation Q3 2017 Management's Discussion and Analysis 5
date, and also recognized additional consideration of $219.0 million (undiscounted) in the form of a capital-carry in the Greater Kaybob area, whereby Murphy will fund 75% of Athabasca's share of development capital up to a maximum five year period. The carry supports approximately $1 billion of Duvernay investment over the next four years of which Athabasca’s financial exposure is limited to $75 million to retain its 30% working interest.
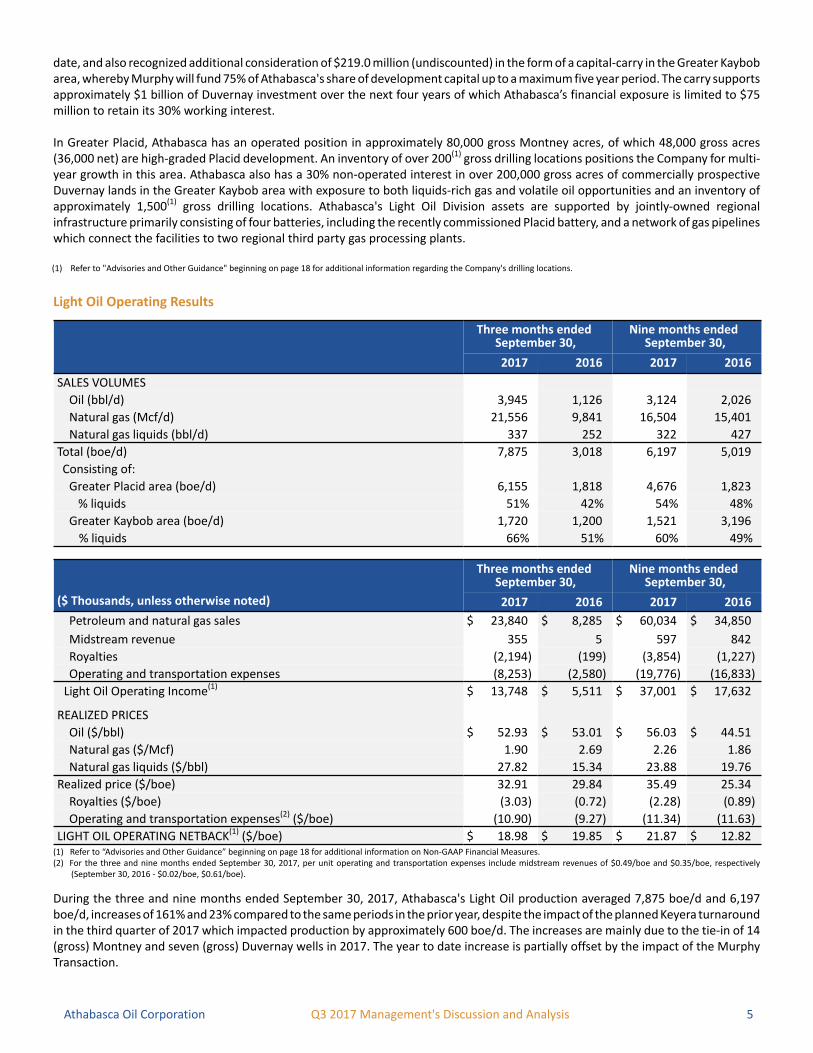
In Greater Placid, Athabasca has an operated position in approximately 80,000 gross Montney acres, of which 48,000 gross acres (36,000 net) are high-graded Placid development. An inventory of over 200(1) gross drilling locations positions the Company for multi-year growth in this area. Athabasca also has a 30% non-operated interest in over 200,000 gross acres of commercially prospective Duvernay lands in the Greater Kaybob area with exposure to both liquids-rich gas and volatile oil opportunities and an inventory of approximately 1,500(1) gross drilling locations. Athabasca's Light Oil Division assets are supported by jointly-owned regional infrastructure primarily consisting of four batteries, including the recently commissioned Placid battery, and a network of gas pipelines which connect the facilities to two regional third party gas processing plants.
(1) Refer to "Advisories and Other Guidance" beginning on page 18 for additional information regarding the Company's drilling locations.
Light Oil Operating Results
Three months ended September 30,
Nine months ended September 30,
2017 2016 2017 2016
SALES VOLUMES
Oil (bbl/d) 3,945 1,126 3,124 2,026
Natural gas (Mcf/d) 21,556 9,841 16,504 15,401
Natural gas liquids (bbl/d) 337 252 322 427
Total (boe/d) 7,875 3,018 6,197 5,019
Consisting of:
Greater Placid area (boe/d) 6,155 1,818 4,676 1,823
% liquids 51% 42% 54% 48%
Greater Kaybob area (boe/d) 1,720 1,200 1,521 3,196
% liquids 66% 51% 60% 49%
($ Thousands, unless otherwise noted)
Three months ended September 30,
Nine months ended September 30,
2017 2016 2017 2016
Petroleum and natural gas sales $ 23,840 $ 8,285 $ 60,034 $ 34,850
Midstream revenue 355 5 597 842
Royalties (2,194) (199) (3,854) (1,227)
Operating and transportation expenses (8,253) (2,580) (19,776) (16,833)
Light Oil Operating Income(1) $ 13,748 $ 5,511 $ 37,001 $ 17,632
REALIZED PRICES
Oil ($/bbl) $ 52.93 $ 53.01 $ 56.03 $ 44.51
Natural gas ($/Mcf) 1.90 2.69 2.26 1.86
Natural gas liquids ($/bbl) 27.82 15.34 23.88 19.76
Realized price ($/boe) 32.91 29.84 35.49 25.34
Royalties ($/boe) (3.03) (0.72) (2.28) (0.89)
Operating and transportation expenses(2) ($/boe) (10.90) (9.27) (11.34) (11.63)
LIGHT OIL OPERATING NETBACK(1) ($/boe) $ 18.98 $ 19.85 $ 21.87 $ 12.82(1) Refer to “Advisories and Other Guidance” beginning on page 18 for additional information on Non-GAAP Financial Measures.(2) For the three and nine months ended September 30, 2017, per unit operating and transportation expenses include midstream revenues of $0.49/boe and $0.35/boe, respectively
(September 30, 2016 - $0.02/boe, $0.61/boe).
During the three and nine months ended September 30, 2017, Athabasca's Light Oil production averaged 7,875 boe/d and 6,197 boe/d, increases of 161% and 23% compared to the same periods in the prior year, despite the impact of the planned Keyera turnaround in the third quarter of 2017 which impacted production by approximately 600 boe/d. The increases are mainly due to the tie-in of 14 (gross) Montney and seven (gross) Duvernay wells in 2017. The year to date increase is partially offset by the impact of the Murphy Transaction.
Athabasca Oil Corporation Q3 2017 Management's Discussion and Analysis 6
Athabasca's Light Oil Operating Netbacks were $18.98/boe and $21.87/boe during the three and nine months ended September 30, 2017. The Light Oil Operating Netback for the three months ended September 30, 2017 was 4% lower compared to 2016 primarily due to gas cost allowance and equalization credits in 2016 which resulted in lower royalty and operating & transportation per unit costs in 2016, partially offset by higher liquids rates in 2017. Year to date 2017 Light Oil Operating Netback increased 71% over 2016 primarily due to higher liquids content and commodity prices, both of which resulted in a higher realized price, and lower per unit operating expenses, partially offset by higher royalties.
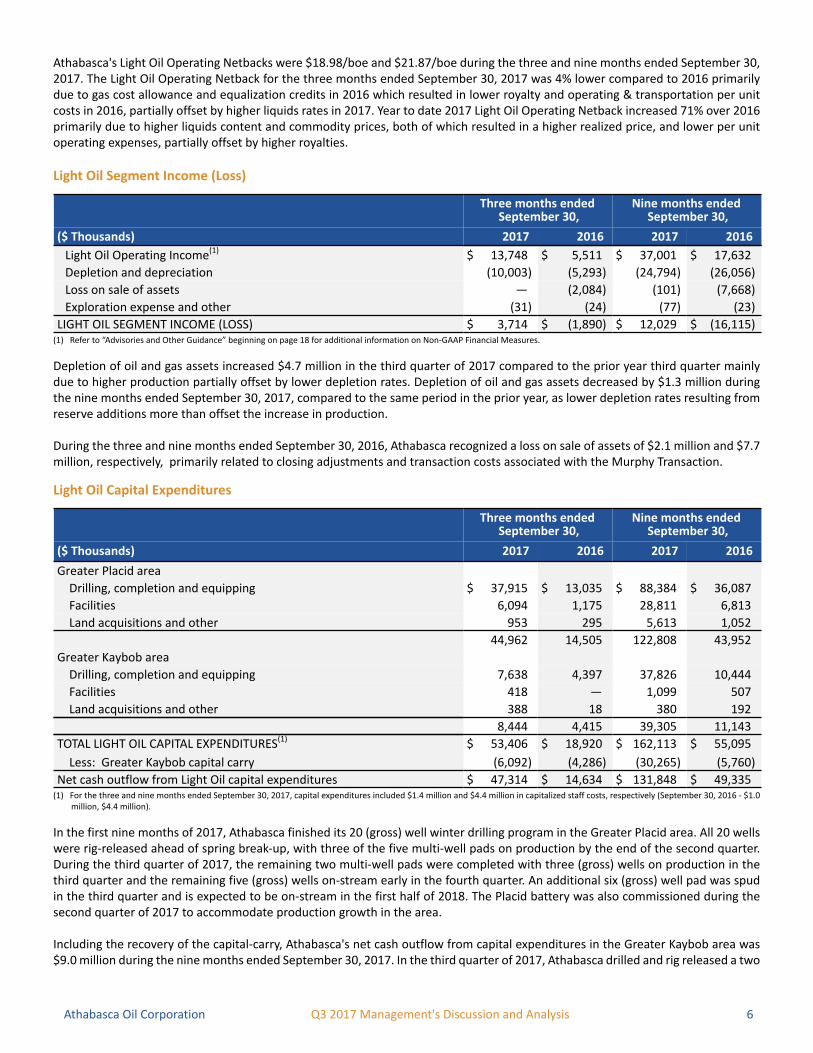
Light Oil Segment Income (Loss)
Three months ended September 30,
Nine months ended September 30,
($ Thousands) 2017 2016 2017 2016
Light Oil Operating Income(1) $ 13,748 $ 5,511 $ 37,001 $ 17,632
Depletion and depreciation (10,003) (5,293) (24,794) (26,056)
Loss on sale of assets — (2,084) (101) (7,668)
Exploration expense and other (31) (24) (77) (23)
LIGHT OIL SEGMENT INCOME (LOSS) $ 3,714 $ (1,890) $ 12,029 $ (16,115)(1) Refer to “Advisories and Other Guidance” beginning on page 18 for additional information on Non-GAAP Financial Measures.
Depletion of oil and gas assets increased $4.7 million in the third quarter of 2017 compared to the prior year third quarter mainly due to higher production partially offset by lower depletion rates. Depletion of oil and gas assets decreased by $1.3 million during the nine months ended September 30, 2017, compared to the same period in the prior year, as lower depletion rates resulting from reserve additions more than offset the increase in production.
During the three and nine months ended September 30, 2016, Athabasca recognized a loss on sale of assets of $2.1 million and $7.7 million, respectively, primarily related to closing adjustments and transaction costs associated with the Murphy Transaction.
Light Oil Capital Expenditures
Three months ended September 30,
Nine months ended September 30,
($ Thousands) 2017 2016 2017 2016
Greater Placid area
Drilling, completion and equipping $ 37,915 $ 13,035 $ 88,384 $ 36,087
Facilities 6,094 1,175 28,811 6,813
Land acquisitions and other 953 295 5,613 1,052
44,962 14,505 122,808 43,952
Greater Kaybob area
Drilling, completion and equipping 7,638 4,397 37,826 10,444
Facilities 418 — 1,099 507
Land acquisitions and other 388 18 380 192
8,444 4,415 39,305 11,143
TOTAL LIGHT OIL CAPITAL EXPENDITURES(1) $ 53,406 $ 18,920 $ 162,113 $ 55,095
Less: Greater Kaybob capital carry (6,092) (4,286) (30,265) (5,760)
Net cash outflow from Light Oil capital expenditures $ 47,314 $ 14,634 $ 131,848 $ 49,335(1) For the three and nine months ended September 30, 2017, capital expenditures included $1.4 million and $4.4 million in capitalized staff costs, respectively (September 30, 2016 - $1.0
million, $4.4 million).
In the first nine months of 2017, Athabasca finished its 20 (gross) well winter drilling program in the Greater Placid area. All 20 wells were rig-released ahead of spring break-up, with three of the five multi-well pads on production by the end of the second quarter. During the third quarter of 2017, the remaining two multi-well pads were completed with three (gross) wells on production in the third quarter and the remaining five (gross) wells on-stream early in the fourth quarter. An additional six (gross) well pad was spud in the third quarter and is expected to be on-stream in the first half of 2018. The Placid battery was also commissioned during the second quarter of 2017 to accommodate production growth in the area.
Including the recovery of the capital-carry, Athabasca's net cash outflow from capital expenditures in the Greater Kaybob area was $9.0 million during the nine months ended September 30, 2017. In the third quarter of 2017, Athabasca drilled and rig released a two
Athabasca Oil Corporation Q3 2017 Management's Discussion and Analysis 7
(gross) well Duvernay pad and brought on-stream a three (gross) well Duvernay pad. An additional six (gross) Duvernay wells are anticipated to be spud in the fourth quarter of 2017.
THERMAL OIL DIVISION
Overview
Athabasca's Thermal Oil Division consists of two operating oil sands projects and a large resource base of exploration areas in the Athabasca region of northeastern Alberta.
On January 31, 2017, Athabasca completed the acquisition of Canadian oil sands assets from Statoil Canada Ltd. and its wholly-owned affiliate KKD Oil Sands Partnership, both subsidiaries of Statoil ASA (collectively "Statoil"). The acquired assets include the operating Leismer Thermal Oil Project (the "Leismer Project"), the delineated Corner exploration area and related strategic infrastructure (the "Leismer Corner Acquisition"). The acquisition had an effective date of January 1, 2017.
The Leismer Project was commissioned in 2010 and has proven reserves in place to support a flat production profile for over 30 years. The acquired assets are high quality and resilient to lower commodity prices which has resulted in higher year-over-year netbacks and operating income within the Thermal Oil Division.
Strategic infrastructure acquired as part of the acquisition includes ownership of dilbit and diluent pipelines from Leismer to the Cheecham Terminal, 300,000 barrels of storage capacity at the Cheecham Terminal and access to multiple sales points with marketing agreements on the Enbridge Waupisoo transportation pipeline. Athabasca has also secured 20,000 bbl/d of blended bitumen capacity on the Trans Mountain Pipeline Expansion (the "TMX Pipeline") which will provide the Company with exposure to long-term global oil demand growth.
Consideration for the transaction included cash of $435.9 million, including $0.9 million in purchase price adjustments, and the issuance of 100 million common shares which were valued at $166.0 million based on Athabasca's January 31, 2017 closing share price of $1.66/share. Athabasca also agreed to a series of annual contingent payments which are only triggered at oil prices above US$65/bbl WTI for a four year term ending in 2020. Each annual payment is calculated on one-third of the Leismer Project bitumen production multiplied by an oil price factor (monthly average US$WTI/bbl less US$65/bbl, adjusted for inflation). The payments are capped at $75.0 million annually and $250.0 million over the four year term. Athabasca incurred $11.0 million in acquisition costs associated with the Leismer Corner Acquisition.
Athabasca also operates the Hangingstone Thermal Oil Project (the “Hangingstone Project"), a SAGD oilsands project with a design capacity of 12,000 bbl/d.
Athabasca's legacy Thermal Oil exploration areas consist of Dover West Leduc Carbonates, Dover West Sands, Birch and Grosmont. Future development targets include oil sands in the McMurray and Wabiskaw formations as well as carbonates in the Leduc formation.
Athabasca Oil Corporation Q3 2017 Management's Discussion and Analysis 8
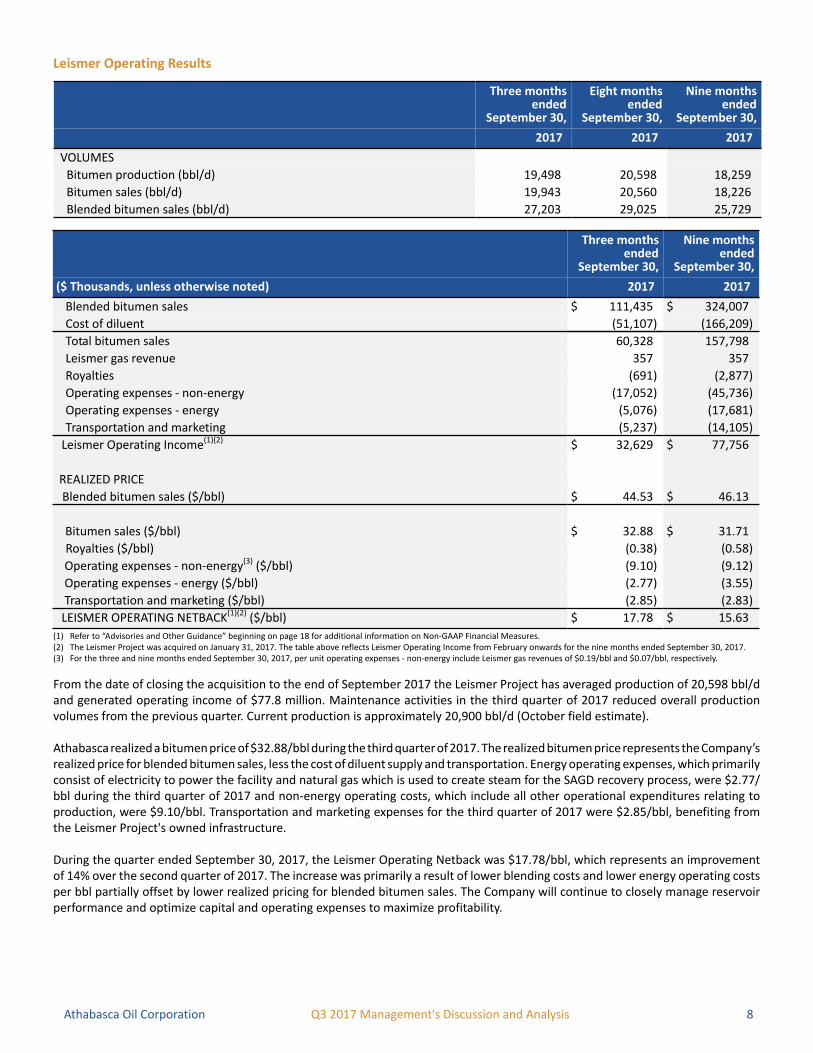
Leismer Operating Results
Three monthsended
September 30,
Eight monthsended
September 30,
Nine monthsended
September 30,
2017 2017 2017
VOLUMES
Bitumen production (bbl/d) 19,498 20,598 18,259
Bitumen sales (bbl/d) 19,943 20,560 18,226
Blended bitumen sales (bbl/d) 27,203 29,025 25,729
Three monthsended
September 30,
Nine months ended
September 30,
($ Thousands, unless otherwise noted) 2017 2017
Blended bitumen sales $ 111,435 $ 324,007
Cost of diluent (51,107) (166,209)
Total bitumen sales 60,328 157,798
Leismer gas revenue 357 357
Royalties (691) (2,877)
Operating expenses - non-energy (17,052) (45,736)
Operating expenses - energy (5,076) (17,681)
Transportation and marketing (5,237) (14,105)
Leismer Operating Income(1)(2) $ 32,629 $ 77,756
REALIZED PRICE
Blended bitumen sales ($/bbl) $ 44.53 $ 46.13
Bitumen sales ($/bbl) $ 32.88 $ 31.71
Royalties ($/bbl) (0.38) (0.58)
Operating expenses - non-energy(3) ($/bbl) (9.10) (9.12)
Operating expenses - energy ($/bbl) (2.77) (3.55)
Transportation and marketing ($/bbl) (2.85) (2.83)
LEISMER OPERATING NETBACK(1)(2) ($/bbl) $ 17.78 $ 15.63(1) Refer to “Advisories and Other Guidance” beginning on page 18 for additional information on Non-GAAP Financial Measures.(2) The Leismer Project was acquired on January 31, 2017. The table above reflects Leismer Operating Income from February onwards for the nine months ended September 30, 2017.(3) For the three and nine months ended September 30, 2017, per unit operating expenses - non-energy include Leismer gas revenues of $0.19/bbl and $0.07/bbl, respectively.
From the date of closing the acquisition to the end of September 2017 the Leismer Project has averaged production of 20,598 bbl/d and generated operating income of $77.8 million. Maintenance activities in the third quarter of 2017 reduced overall production volumes from the previous quarter. Current production is approximately 20,900 bbl/d (October field estimate).
Athabasca realized a bitumen price of $32.88/bbl during the third quarter of 2017. The realized bitumen price represents the Company’s realized price for blended bitumen sales, less the cost of diluent supply and transportation. Energy operating expenses, which primarily consist of electricity to power the facility and natural gas which is used to create steam for the SAGD recovery process, were $2.77/bbl during the third quarter of 2017 and non-energy operating costs, which include all other operational expenditures relating to production, were $9.10/bbl. Transportation and marketing expenses for the third quarter of 2017 were $2.85/bbl, benefiting from the Leismer Project's owned infrastructure.
During the quarter ended September 30, 2017, the Leismer Operating Netback was $17.78/bbl, which represents an improvement of 14% over the second quarter of 2017. The increase was primarily a result of lower blending costs and lower energy operating costs per bbl partially offset by lower realized pricing for blended bitumen sales. The Company will continue to closely manage reservoir performance and optimize capital and operating expenses to maximize profitability.

Athabasca Oil Corporation Q3 2017 Management's Discussion and Analysis 9
Hangingstone Operating Results
Three months ended September 30,
Nine months ended September 30,
2017 2016 2017 2016
VOLUMES
Bitumen production (bbl/d) 8,760 8,830 8,727 7,079
Bitumen sales (bbl/d) 8,697 9,744 8,750 7,138
Blended bitumen sales (bbl/d) 11,906 13,286 12,259 9,952
Three months ended September 30,
Nine months ended September 30,
($ Thousands, unless otherwise noted) 2017 2016 2017 2016
Blended bitumen sales $ 49,607 $ 45,276 $ 153,525 $ 85,878
Cost of diluent (21,973) (19,674) (77,922) (45,575)
Total bitumen sales 27,634 25,602 75,603 40,303
Royalties (295) (152) (1,210) (291)
Operating expenses - non-energy (12,000) (16,152) (36,394) (43,846)
Operating expenses - energy (3,810) (4,658) (15,357) (11,126)
Transportation and marketing (9,213) (10,728) (28,744) (26,119)
Hangingstone Operating Income (Loss)(1) $ 2,316 $ (6,088) $ (6,102) $ (41,079)
REALIZED PRICE
Blended bitumen sales ($/bbl) $ 45.29 $ 37.04 $ 45.87 $ 31.49
Bitumen sales ($/bbl) $ 34.54 $ 28.56 $ 31.65 $ 20.61
Royalties ($/bbl) (0.37) (0.17) (0.51) (0.15)
Operating expenses - non-energy ($/bbl) (15.00) (18.02) (15.24) (22.42)
Operating expenses - energy ($/bbl) (4.76) (5.20) (6.43) (5.69)
Transportation and marketing ($/bbl) (11.51) (11.97) (12.03) (13.34)
HANGINGSTONE OPERATING NETBACK(1) ($/bbl) $ 2.90 $ (6.80) $ (2.56) $ (20.99)(1) Refer to “Advisories and Other Guidance” beginning on page 18 for additional information on Non-GAAP Financial Measures.
For the three and nine months ended September 30, 2017, Athabasca averaged 8,760 bbl/d and 8,727 bbl/d of bitumen production, respectively, a decrease of 1% and an increase of 23% compared to the same periods in the prior year. Maintenance activities in the third quarter of 2017 reduced overall production volumes. The Hangingstone Project achieved first oil during the third quarter of 2015. Current production is approximately 9,500 bbl/d (October field estimate).
The Hangingstone Operating Netback was $2.90/bbl and $(2.56)/bbl for the three and nine months ended September 30, 2017, compared to $(6.80)/bbl and $(20.99)/bbl during the same periods in 2016. The improvement in the Hangingstone Operating Netback is primarily due to higher realized pricing, lower non-energy operating expenses and higher production volumes for the year to date period.
Compared to the same periods in the prior year, operating expenses per bbl decreased by 15% and 23% to $19.76/bbl and $21.67/bbl during the three and nine months ended September 30, 2017, respectively. The decreases were primarily due to lower non-energy operating expenses combined with higher production for the year to date period.
In the second quarter of 2016, Hangingstone bitumen production was impacted by a 19 day shutdown as a result of the regional Fort McMurray wildfires. In the second quarter of 2017, Athabasca recognized $8.0 million of insurance proceeds in Other Income with respect to the settlement of an insurance claim filed to recover certain losses associated with the shutdown.
Athabasca Oil Corporation Q3 2017 Management's Discussion and Analysis 10
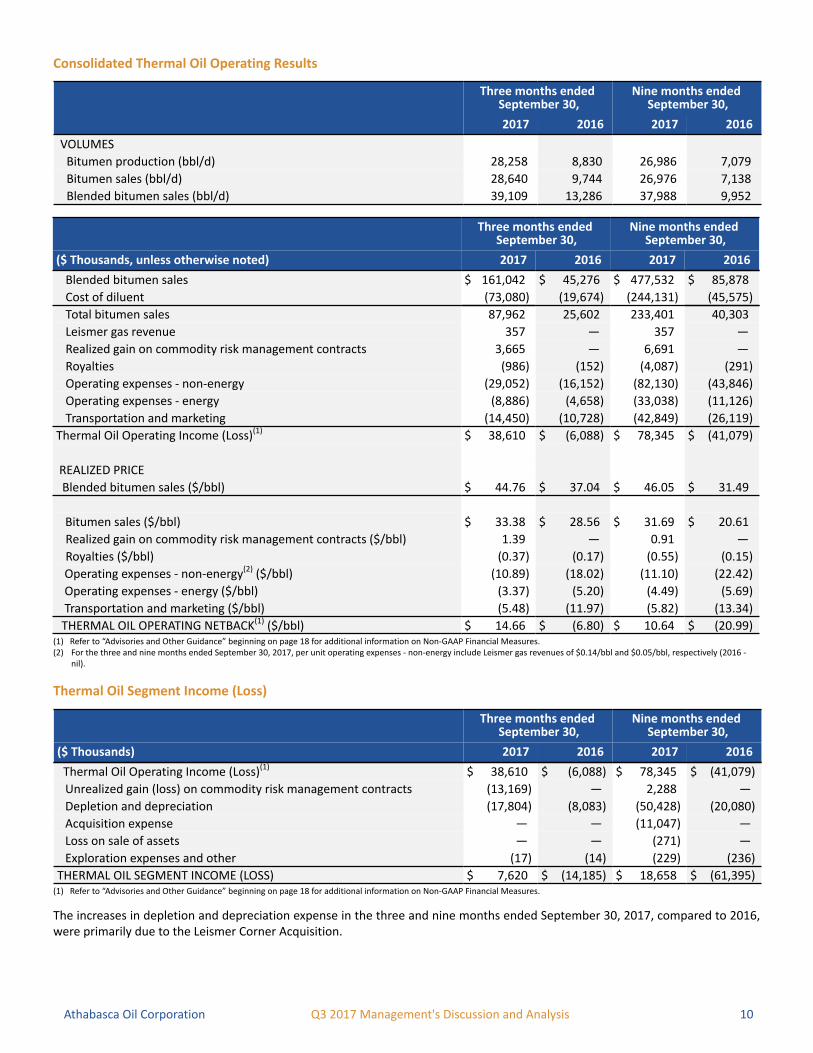
Consolidated Thermal Oil Operating Results
Three months ended September 30,
Nine months ended September 30,
2017 2016 2017 2016
VOLUMES
Bitumen production (bbl/d) 28,258 8,830 26,986 7,079
Bitumen sales (bbl/d) 28,640 9,744 26,976 7,138
Blended bitumen sales (bbl/d) 39,109 13,286 37,988 9,952
Three months ended September 30,
Nine months ended September 30,
($ Thousands, unless otherwise noted) 2017 2016 2017 2016
Blended bitumen sales $ 161,042 $ 45,276 $ 477,532 $ 85,878
Cost of diluent (73,080) (19,674) (244,131) (45,575)
Total bitumen sales 87,962 25,602 233,401 40,303
Leismer gas revenue 357 — 357 —
Realized gain on commodity risk management contracts 3,665 — 6,691 —
Royalties (986) (152) (4,087) (291)
Operating expenses - non-energy (29,052) (16,152) (82,130) (43,846)
Operating expenses - energy (8,886) (4,658) (33,038) (11,126)
Transportation and marketing (14,450) (10,728) (42,849) (26,119)
Thermal Oil Operating Income (Loss)(1) $ 38,610 $ (6,088) $ 78,345 $ (41,079)
REALIZED PRICE
Blended bitumen sales ($/bbl) $ 44.76 $ 37.04 $ 46.05 $ 31.49
Bitumen sales ($/bbl) $ 33.38 $ 28.56 $ 31.69 $ 20.61
Realized gain on commodity risk management contracts ($/bbl) 1.39 — 0.91 —
Royalties ($/bbl) (0.37) (0.17) (0.55) (0.15)
Operating expenses - non-energy(2) ($/bbl) (10.89) (18.02) (11.10) (22.42)
Operating expenses - energy ($/bbl) (3.37) (5.20) (4.49) (5.69)
Transportation and marketing ($/bbl) (5.48) (11.97) (5.82) (13.34)
THERMAL OIL OPERATING NETBACK(1) ($/bbl) $ 14.66 $ (6.80) $ 10.64 $ (20.99)(1) Refer to “Advisories and Other Guidance” beginning on page 18 for additional information on Non-GAAP Financial Measures.(2) For the three and nine months ended September 30, 2017, per unit operating expenses - non-energy include Leismer gas revenues of $0.14/bbl and $0.05/bbl, respectively (2016 -
nil).
Thermal Oil Segment Income (Loss)
Three months ended September 30,
Nine months ended September 30,
($ Thousands) 2017 2016 2017 2016
Thermal Oil Operating Income (Loss)(1) $ 38,610 $ (6,088) $ 78,345 $ (41,079)
Unrealized gain (loss) on commodity risk management contracts (13,169) — 2,288 —
Depletion and depreciation (17,804) (8,083) (50,428) (20,080)
Acquisition expense — — (11,047) —
Loss on sale of assets — — (271) —
Exploration expenses and other (17) (14) (229) (236)
THERMAL OIL SEGMENT INCOME (LOSS) $ 7,620 $ (14,185) $ 18,658 $ (61,395)(1) Refer to “Advisories and Other Guidance” beginning on page 18 for additional information on Non-GAAP Financial Measures.
The increases in depletion and depreciation expense in the three and nine months ended September 30, 2017, compared to 2016, were primarily due to the Leismer Corner Acquisition.

Athabasca Oil Corporation Q3 2017 Management's Discussion and Analysis 11
Thermal Oil Capital Expenditures
Three months ended September 30,
Nine months ended September 30,
($ Thousands) 2017 2016 2017 2016
Leismer Project(1) $ 13,471 $ — $ 26,376 $ —
Hangingstone Project 5,496 1,960 16,528 4,437
Other Thermal Oil exploration 1,415 1,794 2,472 2,420
TOTAL THERMAL OIL CAPITAL EXPENDITURES(2) $ 20,382 $ 3,754 $ 45,376 $ 6,857(1) Thermal Oil capital expenditures in the table above exclude the cost of the Leismer Corner Acquisition.(2) For the three and nine months ended September 30, 2017, capital expenditures included $2.1 million and $5.0 million in capitalized staff costs, respectively (September 30, 2016 - $0.5
million, $1.2 million).
Thermal Oil capital expenditures for the nine months ended September 30, 2017 were primarily related to downhole pump conversions and replacements, an enhanced diluent recovery project at Hangingstone and work performed on previously drilled infill wells at Leismer. In response to lower commodity prices, the Company previously reduced its 2017 capital budget to $60 million, from its initial 2017 budget of $105 million, with near-term activity focused on production optimization across the fields.
Sale of Contingent Bitumen Royalty to Burgess
During the year ended December 31, 2016, Athabasca granted a Contingent Bitumen Royalty (the "Royalty") on its legacy Thermal Oil assets to Burgess Energy Holdings L.L.C. ("Burgess") for gross cash proceeds of $307.0 million. Under the terms of the Royalty, Athabasca will pay Burgess a linear-scale Royalty of 0% - 12%, relative to a WCS benchmark price, applied to Athabasca’s realized bitumen price (C$), which is determined net of diluent, transportation and storage costs.
On February 24, 2017, Athabasca granted an additional Royalty under the same terms to Burgess on its newly acquired Leismer and Corner assets for additional cash proceeds of $90.0 million, bringing the total gross proceeds received by the Company from the sale of the Royalty to $397.0 million.
The Royalty has been structured so that the assets will not be encumbered at lower pricing levels nor is it expected to materially impact the economics of future Leismer or Hangingstone expansion phases or other future Thermal Oil exploration projects. The Royalty has no associated commitments to develop future expansions or projects and Burgess has the option of either receiving the Royalty in cash or in kind.
The following table summarizes the Royalty rates applicable at different WCS benchmark prices:
Hangingstone, Leismer and Corner
WCS benchmark price (US$/bbl) Royalty rate
Below $60/bbl --
$60/bbl to $139.99/bbl(1) 2% - 12%
$140/bbl and above 12%
Dover West, Birch and Grosmont
WCS benchmark price (US$/bbl) Royalty rate
Below $70/bbl --
$70/bbl to $149.99/bbl(1) 2% - 12%
$150/bbl and above 12%
(1) The WCS benchmark price is used to determine the linear sliding-scale royalty rate.
During the nine months ended September 30, 2017 and 2016, no amounts were payable in respect of the Royalty to Burgess.
CORPORATE REVIEW
Liquidity and Capital Resources
Funding
Balance sheet strength and flexibility continues to remain a key priority for Athabasca and the Company’s objective in managing capital is to maintain sufficient available reserves to meet its liquidity requirements at any point in time. The Company expects to achieve this objective by aligning capital expenditures with cash flow from operating activities, an active commodity risk management program and by maintaining sufficient funds for anticipated short-term spending in cash, cash equivalent and short-term investment accounts and through available credit facilities.
Athabasca Oil Corporation Q3 2017 Management's Discussion and Analysis 12
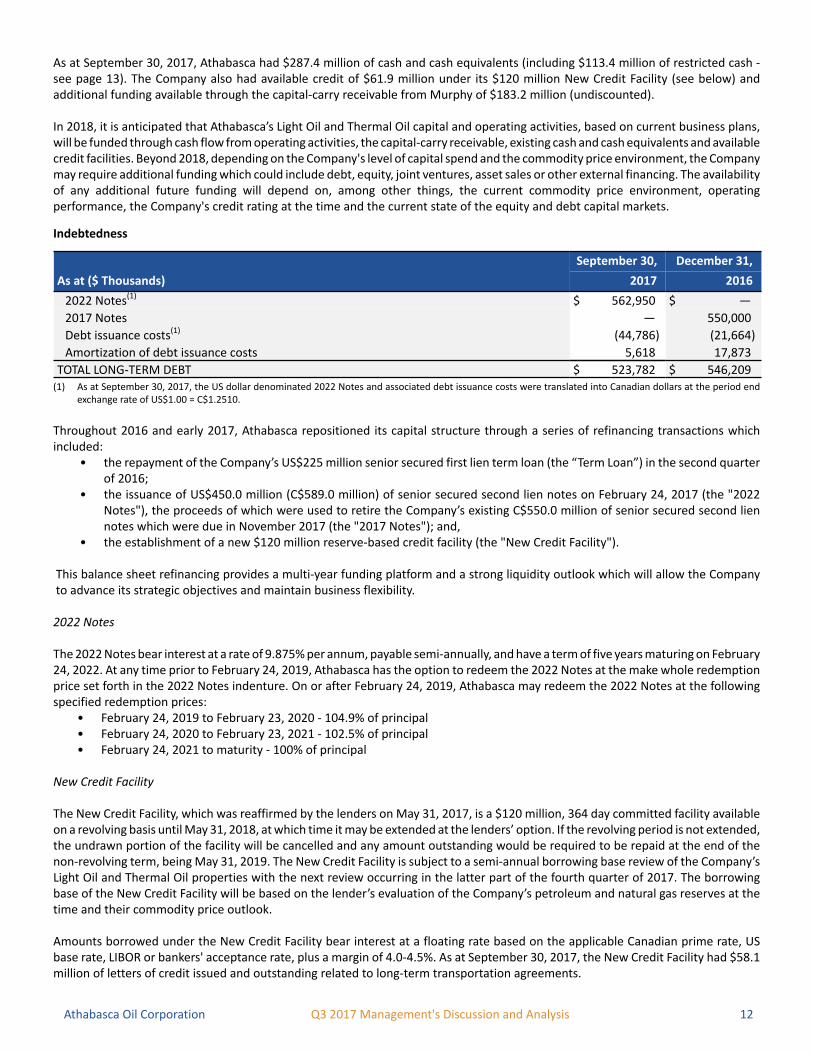
As at September 30, 2017, Athabasca had $287.4 million of cash and cash equivalents (including $113.4 million of restricted cash - see page 13). The Company also had available credit of $61.9 million under its $120 million New Credit Facility (see below) and additional funding available through the capital-carry receivable from Murphy of $183.2 million (undiscounted).
In 2018, it is anticipated that Athabasca’s Light Oil and Thermal Oil capital and operating activities, based on current business plans, will be funded through cash flow from operating activities, the capital-carry receivable, existing cash and cash equivalents and available credit facilities. Beyond 2018, depending on the Company's level of capital spend and the commodity price environment, the Company may require additional funding which could include debt, equity, joint ventures, asset sales or other external financing. The availability of any additional future funding will depend on, among other things, the current commodity price environment, operating performance, the Company's credit rating at the time and the current state of the equity and debt capital markets.
Indebtedness
As at ($ Thousands)
September 30, December 31,
2017 2016
2022 Notes(1) $ 562,950 $ —
2017 Notes — 550,000
Debt issuance costs(1) (44,786) (21,664)
Amortization of debt issuance costs 5,618 17,873
TOTAL LONG-TERM DEBT $ 523,782 $ 546,209(1) As at September 30, 2017, the US dollar denominated 2022 Notes and associated debt issuance costs were translated into Canadian dollars at the period end
exchange rate of US$1.00 = C$1.2510.
Throughout 2016 and early 2017, Athabasca repositioned its capital structure through a series of refinancing transactions which included:
• the repayment of the Company’s US$225 million senior secured first lien term loan (the “Term Loan”) in the second quarter of 2016;
• the issuance of US$450.0 million (C$589.0 million) of senior secured second lien notes on February 24, 2017 (the "2022 Notes"), the proceeds of which were used to retire the Company’s existing C$550.0 million of senior secured second lien notes which were due in November 2017 (the "2017 Notes"); and,
• the establishment of a new $120 million reserve-based credit facility (the "New Credit Facility").
This balance sheet refinancing provides a multi-year funding platform and a strong liquidity outlook which will allow the Company to advance its strategic objectives and maintain business flexibility.
2022 Notes
The 2022 Notes bear interest at a rate of 9.875% per annum, payable semi-annually, and have a term of five years maturing on February 24, 2022. At any time prior to February 24, 2019, Athabasca has the option to redeem the 2022 Notes at the make whole redemption price set forth in the 2022 Notes indenture. On or after February 24, 2019, Athabasca may redeem the 2022 Notes at the following specified redemption prices:
• February 24, 2019 to February 23, 2020 - 104.9% of principal • February 24, 2020 to February 23, 2021 - 102.5% of principal • February 24, 2021 to maturity - 100% of principal
New Credit Facility
The New Credit Facility, which was reaffirmed by the lenders on May 31, 2017, is a $120 million, 364 day committed facility available on a revolving basis until May 31, 2018, at which time it may be extended at the lenders’ option. If the revolving period is not extended, the undrawn portion of the facility will be cancelled and any amount outstanding would be required to be repaid at the end of the non-revolving term, being May 31, 2019. The New Credit Facility is subject to a semi-annual borrowing base review of the Company’s Light Oil and Thermal Oil properties with the next review occurring in the latter part of the fourth quarter of 2017. The borrowing base of the New Credit Facility will be based on the lender’s evaluation of the Company’s petroleum and natural gas reserves at the time and their commodity price outlook.
Amounts borrowed under the New Credit Facility bear interest at a floating rate based on the applicable Canadian prime rate, US base rate, LIBOR or bankers' acceptance rate, plus a margin of 4.0-4.5%. As at September 30, 2017, the New Credit Facility had $58.1 million of letters of credit issued and outstanding related to long-term transportation agreements.
Athabasca Oil Corporation Q3 2017 Management's Discussion and Analysis 13
Cash-Collateralized Letter of Credit Facility
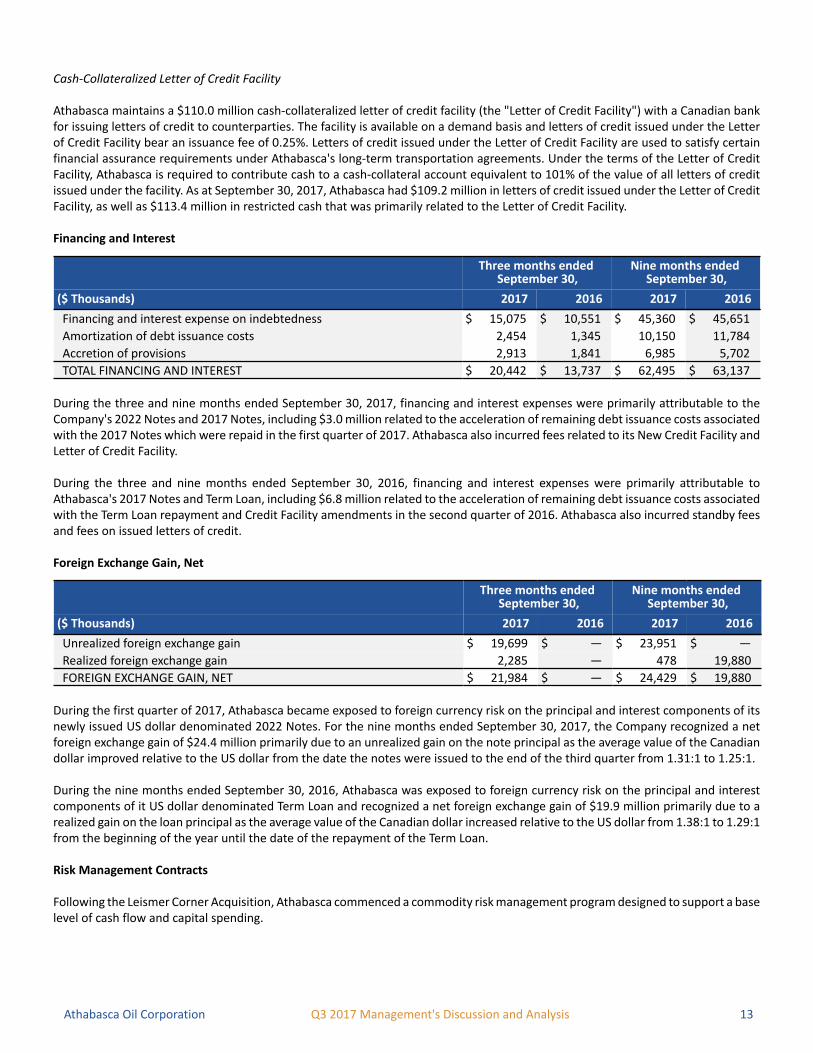
Athabasca maintains a $110.0 million cash-collateralized letter of credit facility (the "Letter of Credit Facility") with a Canadian bank for issuing letters of credit to counterparties. The facility is available on a demand basis and letters of credit issued under the Letter of Credit Facility bear an issuance fee of 0.25%. Letters of credit issued under the Letter of Credit Facility are used to satisfy certain financial assurance requirements under Athabasca's long-term transportation agreements. Under the terms of the Letter of Credit Facility, Athabasca is required to contribute cash to a cash-collateral account equivalent to 101% of the value of all letters of credit issued under the facility. As at September 30, 2017, Athabasca had $109.2 million in letters of credit issued under the Letter of Credit Facility, as well as $113.4 million in restricted cash that was primarily related to the Letter of Credit Facility.
Financing and Interest
Three months ended September 30,
Nine months ended September 30,
($ Thousands) 2017 2016 2017 2016
Financing and interest expense on indebtedness $ 15,075 $ 10,551 $ 45,360 $ 45,651
Amortization of debt issuance costs 2,454 1,345 10,150 11,784
Accretion of provisions 2,913 1,841 6,985 5,702
TOTAL FINANCING AND INTEREST $ 20,442 $ 13,737 $ 62,495 $ 63,137
During the three and nine months ended September 30, 2017, financing and interest expenses were primarily attributable to the Company's 2022 Notes and 2017 Notes, including $3.0 million related to the acceleration of remaining debt issuance costs associated with the 2017 Notes which were repaid in the first quarter of 2017. Athabasca also incurred fees related to its New Credit Facility and Letter of Credit Facility.
During the three and nine months ended September 30, 2016, financing and interest expenses were primarily attributable to Athabasca's 2017 Notes and Term Loan, including $6.8 million related to the acceleration of remaining debt issuance costs associated with the Term Loan repayment and Credit Facility amendments in the second quarter of 2016. Athabasca also incurred standby fees and fees on issued letters of credit.
Foreign Exchange Gain, Net
Three months ended September 30,
Nine months ended September 30,
($ Thousands) 2017 2016 2017 2016
Unrealized foreign exchange gain $ 19,699 $ — $ 23,951 $ —
Realized foreign exchange gain 2,285 — 478 19,880
FOREIGN EXCHANGE GAIN, NET $ 21,984 $ — $ 24,429 $ 19,880
During the first quarter of 2017, Athabasca became exposed to foreign currency risk on the principal and interest components of its newly issued US dollar denominated 2022 Notes. For the nine months ended September 30, 2017, the Company recognized a net foreign exchange gain of $24.4 million primarily due to an unrealized gain on the note principal as the average value of the Canadian dollar improved relative to the US dollar from the date the notes were issued to the end of the third quarter from 1.31:1 to 1.25:1.
During the nine months ended September 30, 2016, Athabasca was exposed to foreign currency risk on the principal and interest components of it US dollar denominated Term Loan and recognized a net foreign exchange gain of $19.9 million primarily due to a realized gain on the loan principal as the average value of the Canadian dollar increased relative to the US dollar from 1.38:1 to 1.29:1 from the beginning of the year until the date of the repayment of the Term Loan.
Risk Management Contracts
Following the Leismer Corner Acquisition, Athabasca commenced a commodity risk management program designed to support a base level of cash flow and capital spending.
Athabasca Oil Corporation Q3 2017 Management's Discussion and Analysis 14
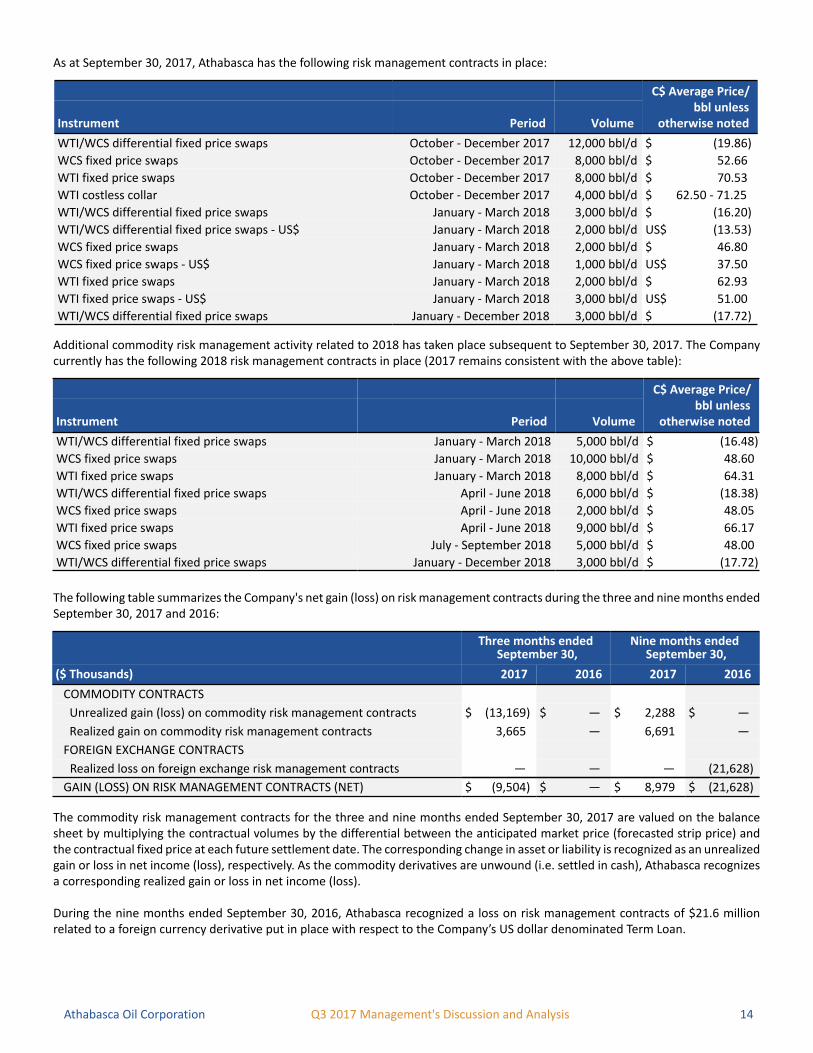
As at September 30, 2017, Athabasca has the following risk management contracts in place:
C$ Average Price/bbl unless
otherwise notedInstrument Period Volume
WTI/WCS differential fixed price swaps October - December 2017 12,000 bbl/d $ (19.86)
WCS fixed price swaps October - December 2017 8,000 bbl/d $ 52.66
WTI fixed price swaps October - December 2017 8,000 bbl/d $ 70.53
WTI costless collar October - December 2017 4,000 bbl/d $ 62.50 - 71.25
WTI/WCS differential fixed price swaps January - March 2018 3,000 bbl/d $ (16.20)
WTI/WCS differential fixed price swaps - US$ January - March 2018 2,000 bbl/d US$ (13.53)
WCS fixed price swaps January - March 2018 2,000 bbl/d $ 46.80
WCS fixed price swaps - US$ January - March 2018 1,000 bbl/d US$ 37.50
WTI fixed price swaps January - March 2018 2,000 bbl/d $ 62.93
WTI fixed price swaps - US$ January - March 2018 3,000 bbl/d US$ 51.00
WTI/WCS differential fixed price swaps January - December 2018 3,000 bbl/d $ (17.72)
Additional commodity risk management activity related to 2018 has taken place subsequent to September 30, 2017. The Company currently has the following 2018 risk management contracts in place (2017 remains consistent with the above table):
C$ Average Price/bbl unless
otherwise notedInstrument Period Volume
WTI/WCS differential fixed price swaps January - March 2018 5,000 bbl/d $ (16.48)
WCS fixed price swaps January - March 2018 10,000 bbl/d $ 48.60
WTI fixed price swaps January - March 2018 8,000 bbl/d $ 64.31
WTI/WCS differential fixed price swaps April - June 2018 6,000 bbl/d $ (18.38)
WCS fixed price swaps April - June 2018 2,000 bbl/d $ 48.05
WTI fixed price swaps April - June 2018 9,000 bbl/d $ 66.17
WCS fixed price swaps July - September 2018 5,000 bbl/d $ 48.00
WTI/WCS differential fixed price swaps January - December 2018 3,000 bbl/d $ (17.72)
The following table summarizes the Company's net gain (loss) on risk management contracts during the three and nine months ended September 30, 2017 and 2016:
Three months ended September 30,
Nine months ended September 30,
($ Thousands) 2017 2016 2017 2016
COMMODITY CONTRACTS
Unrealized gain (loss) on commodity risk management contracts $ (13,169) $ — $ 2,288 $ —
Realized gain on commodity risk management contracts 3,665 — 6,691 —
FOREIGN EXCHANGE CONTRACTS
Realized loss on foreign exchange risk management contracts — — — (21,628)
GAIN (LOSS) ON RISK MANAGEMENT CONTRACTS (NET) $ (9,504) $ — $ 8,979 $ (21,628)
The commodity risk management contracts for the three and nine months ended September 30, 2017 are valued on the balance sheet by multiplying the contractual volumes by the differential between the anticipated market price (forecasted strip price) and the contractual fixed price at each future settlement date. The corresponding change in asset or liability is recognized as an unrealized gain or loss in net income (loss), respectively. As the commodity derivatives are unwound (i.e. settled in cash), Athabasca recognizes a corresponding realized gain or loss in net income (loss).
During the nine months ended September 30, 2016, Athabasca recognized a loss on risk management contracts of $21.6 million related to a foreign currency derivative put in place with respect to the Company’s US dollar denominated Term Loan.
Athabasca Oil Corporation Q3 2017 Management's Discussion and Analysis 15
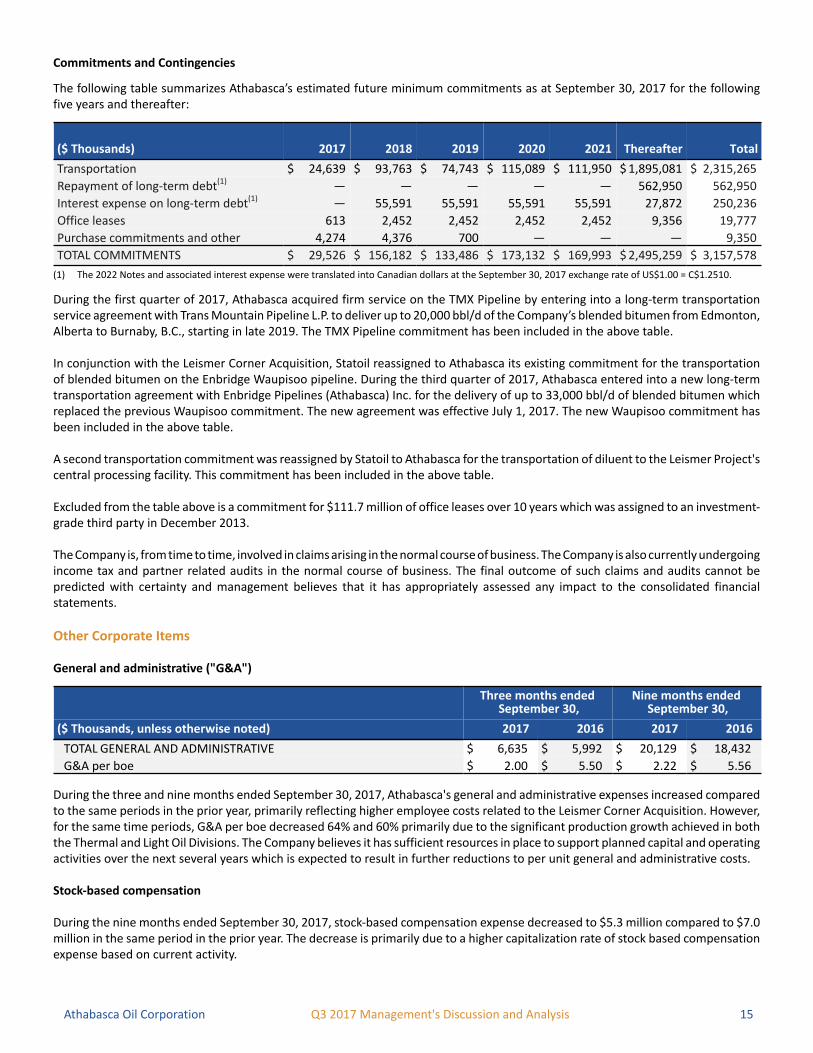
Commitments and Contingencies
The following table summarizes Athabasca’s estimated future minimum commitments as at September 30, 2017 for the following five years and thereafter:
($ Thousands) 2017 2018 2019 2020 2021 Thereafter Total
Transportation $ 24,639 $ 93,763 $ 74,743 $ 115,089 $ 111,950 $ 1,895,081 $ 2,315,265
Repayment of long-term debt(1) — — — — — 562,950 562,950
Interest expense on long-term debt(1) — 55,591 55,591 55,591 55,591 27,872 250,236
Office leases 613 2,452 2,452 2,452 2,452 9,356 19,777
Purchase commitments and other 4,274 4,376 700 — — — 9,350
TOTAL COMMITMENTS $ 29,526 $ 156,182 $ 133,486 $ 173,132 $ 169,993 $ 2,495,259 $ 3,157,578
(1) The 2022 Notes and associated interest expense were translated into Canadian dollars at the September 30, 2017 exchange rate of US$1.00 = C$1.2510.
During the first quarter of 2017, Athabasca acquired firm service on the TMX Pipeline by entering into a long-term transportation service agreement with Trans Mountain Pipeline L.P. to deliver up to 20,000 bbl/d of the Company’s blended bitumen from Edmonton, Alberta to Burnaby, B.C., starting in late 2019. The TMX Pipeline commitment has been included in the above table.
In conjunction with the Leismer Corner Acquisition, Statoil reassigned to Athabasca its existing commitment for the transportation of blended bitumen on the Enbridge Waupisoo pipeline. During the third quarter of 2017, Athabasca entered into a new long-term transportation agreement with Enbridge Pipelines (Athabasca) Inc. for the delivery of up to 33,000 bbl/d of blended bitumen which replaced the previous Waupisoo commitment. The new agreement was effective July 1, 2017. The new Waupisoo commitment has been included in the above table.
A second transportation commitment was reassigned by Statoil to Athabasca for the transportation of diluent to the Leismer Project's central processing facility. This commitment has been included in the above table.
Excluded from the table above is a commitment for $111.7 million of office leases over 10 years which was assigned to an investment-grade third party in December 2013.
The Company is, from time to time, involved in claims arising in the normal course of business. The Company is also currently undergoing income tax and partner related audits in the normal course of business. The final outcome of such claims and audits cannot be predicted with certainty and management believes that it has appropriately assessed any impact to the consolidated financial statements.
Other Corporate Items
General and administrative ("G&A")
Three months ended September 30,
Nine months ended September 30,
($ Thousands, unless otherwise noted) 2017 2016 2017 2016
TOTAL GENERAL AND ADMINISTRATIVE $ 6,635 $ 5,992 $ 20,129 $ 18,432
G&A per boe $ 2.00 $ 5.50 $ 2.22 $ 5.56
During the three and nine months ended September 30, 2017, Athabasca's general and administrative expenses increased compared to the same periods in the prior year, primarily reflecting higher employee costs related to the Leismer Corner Acquisition. However, for the same time periods, G&A per boe decreased 64% and 60% primarily due to the significant production growth achieved in both the Thermal and Light Oil Divisions. The Company believes it has sufficient resources in place to support planned capital and operating activities over the next several years which is expected to result in further reductions to per unit general and administrative costs.
Stock-based compensation
During the nine months ended September 30, 2017, stock-based compensation expense decreased to $5.3 million compared to $7.0 million in the same period in the prior year. The decrease is primarily due to a higher capitalization rate of stock based compensation expense based on current activity.

Athabasca Oil Corporation Q3 2017 Management's Discussion and Analysis 16
Gain (loss) on Revaluation of Provisions and Other
During the nine months ended September 30, 2017, Athabasca incurred a gain of $14.2 million relating to a decline in the fair value of the Company's contingent payment obligation to Statoil, mainly due to declines in the forecasted price for WTI from the date of closing of the Leismer Corner Acquisition on January 31, 2017 to the end of the third quarter of 2017. The contingent payment obligation is remeasured at each reporting period with any gains or losses recognized in net income (loss). No amounts are currently payable with respect to the continent payment obligation.
Off Balance Sheet Arrangements
The Company does not have any off-balance sheet arrangements that have or are reasonably likely to have a material current or future effect on the Company’s consolidated financial statements.
Equity Instruments
On January 31, 2017, Athabasca issued 100 million common shares to Statoil in respect of the Leismer Corner Acquisition. During the nine months ended September 30, 2017, Athabasca also issued 3.3 million common shares in respect of the Company’s equity-settled share-based compensation plans.
Outstanding Share Data
The following table summarizes the number of share capital instruments outstanding at the date indicated:
As at October 24, 2017
Common shares issued and outstanding 509,780,486
Convertible securities:
Stock options 12,362,032
Restricted share units (2010 RSU Plan) 2,929,252
Restricted share units (2015 RSU Plan) 9,417,632
Performance share units 3,414,267
Deferred share units 1,828,066
For additional information regarding these compensation plans, refer to the consolidated financial statements of the Company for the year ended December 31, 2016.
Athabasca Oil Corporation Q3 2017 Management's Discussion and Analysis 17
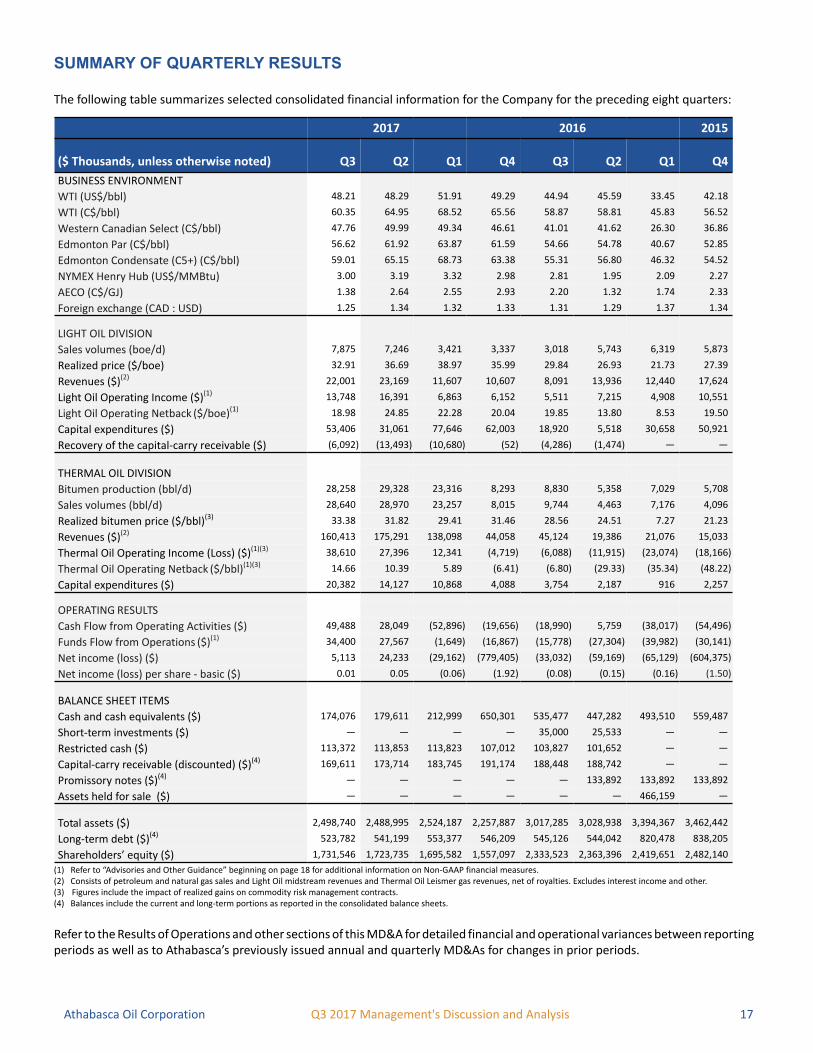
SUMMARY OF QUARTERLY RESULTS
The following table summarizes selected consolidated financial information for the Company for the preceding eight quarters:
2017 2016 2015
($ Thousands, unless otherwise noted) Q3 Q2 Q1 Q4 Q3 Q2 Q1 Q4
BUSINESS ENVIRONMENT
WTI (US$/bbl) 48.21 48.29 51.91 49.29 44.94 45.59 33.45 42.18
WTI (C$/bbl) 60.35 64.95 68.52 65.56 58.87 58.81 45.83 56.52
Western Canadian Select (C$/bbl) 47.76 49.99 49.34 46.61 41.01 41.62 26.30 36.86
Edmonton Par (C$/bbl) 56.62 61.92 63.87 61.59 54.66 54.78 40.67 52.85
Edmonton Condensate (C5+) (C$/bbl) 59.01 65.15 68.73 63.38 55.31 56.80 46.32 54.52
NYMEX Henry Hub (US$/MMBtu) 3.00 3.19 3.32 2.98 2.81 1.95 2.09 2.27
AECO (C$/GJ) 1.38 2.64 2.55 2.93 2.20 1.32 1.74 2.33
Foreign exchange (CAD : USD) 1.25 1.34 1.32 1.33 1.31 1.29 1.37 1.34
LIGHT OIL DIVISION
Sales volumes (boe/d) 7,875 7,246 3,421 3,337 3,018 5,743 6,319 5,873
Realized price ($/boe) 32.91 36.69 38.97 35.99 29.84 26.93 21.73 27.39
Revenues ($)(2) 22,001 23,169 11,607 10,607 8,091 13,936 12,440 17,624
Light Oil Operating Income ($)(1) 13,748 16,391 6,863 6,152 5,511 7,215 4,908 10,551
Light Oil Operating Netback ($/boe)(1) 18.98 24.85 22.28 20.04 19.85 13.80 8.53 19.50
Capital expenditures ($) 53,406 31,061 77,646 62,003 18,920 5,518 30,658 50,921
Recovery of the capital-carry receivable ($) (6,092) (13,493) (10,680) (52) (4,286) (1,474) — —
THERMAL OIL DIVISION
Bitumen production (bbl/d) 28,258 29,328 23,316 8,293 8,830 5,358 7,029 5,708
Sales volumes (bbl/d) 28,640 28,970 23,257 8,015 9,744 4,463 7,176 4,096
Realized bitumen price ($/bbl)(3) 33.38 31.82 29.41 31.46 28.56 24.51 7.27 21.23
Revenues ($)(2) 160,413 175,291 138,098 44,058 45,124 19,386 21,076 15,033
Thermal Oil Operating Income (Loss) ($)(1)(3) 38,610 27,396 12,341 (4,719) (6,088) (11,915) (23,074) (18,166)
Thermal Oil Operating Netback ($/bbl)(1)(3) 14.66 10.39 5.89 (6.41) (6.80) (29.33) (35.34) (48.22)
Capital expenditures ($) 20,382 14,127 10,868 4,088 3,754 2,187 916 2,257
OPERATING RESULTS
Cash Flow from Operating Activities ($) 49,488 28,049 (52,896) (19,656) (18,990) 5,759 (38,017) (54,496)
Funds Flow from Operations ($)(1) 34,400 27,567 (1,649) (16,867) (15,778) (27,304) (39,982) (30,141)
Net income (loss) ($) 5,113 24,233 (29,162) (779,405) (33,032) (59,169) (65,129) (604,375)
Net income (loss) per share - basic ($) 0.01 0.05 (0.06) (1.92) (0.08) (0.15) (0.16) (1.50)
BALANCE SHEET ITEMS
Cash and cash equivalents ($) 174,076 179,611 212,999 650,301 535,477 447,282 493,510 559,487
Short-term investments ($) — — — — 35,000 25,533 — —
Restricted cash ($) 113,372 113,853 113,823 107,012 103,827 101,652 — —
Capital-carry receivable (discounted) ($)(4) 169,611 173,714 183,745 191,174 188,448 188,742 — —
Promissory notes ($)(4) — — — — — 133,892 133,892 133,892
Assets held for sale ($) — — — — — — 466,159 —
Total assets ($) 2,498,740 2,488,995 2,524,187 2,257,887 3,017,285 3,028,938 3,394,367 3,462,442
Long-term debt ($)(4) 523,782 541,199 553,377 546,209 545,126 544,042 820,478 838,205
Shareholders’ equity ($) 1,731,546 1,723,735 1,695,582 1,557,097 2,333,523 2,363,396 2,419,651 2,482,140
(1) Refer to “Advisories and Other Guidance” beginning on page 18 for additional information on Non-GAAP financial measures.(2) Consists of petroleum and natural gas sales and Light Oil midstream revenues and Thermal Oil Leismer gas revenues, net of royalties. Excludes interest income and other.(3) Figures include the impact of realized gains on commodity risk management contracts.(4) Balances include the current and long-term portions as reported in the consolidated balance sheets.
Refer to the Results of Operations and other sections of this MD&A for detailed financial and operational variances between reporting periods as well as to Athabasca’s previously issued annual and quarterly MD&As for changes in prior periods.
Athabasca Oil Corporation Q3 2017 Management's Discussion and Analysis 18
ACCOUNTING POLICIES AND ESTIMATES
During the nine months ended September 30, 2017, there were no changes to Athabasca's accounting policies or use of estimates in the preparation of the consolidated financial statements and the notes thereto that had a material impact to the consolidated financial statements. Refer to the December 31, 2016 audited consolidated financial statements of the Company for further guidance regardingAthabasca's accounting policies and use of estimates.
Future Accounting Pronouncements
The following standards that have been issued, but are not yet effective, up to the date of issuance of the Company's consolidated financial statements are disclosed below. The Company intends to adopt these standards, if applicable, when they become effective.
IFRS 15 Revenue from Contracts with Customers The IASB issued IFRS 15 Revenue from Contracts with Customers in May 2014. This IFRS replaces IAS 18 Revenue, IAS 11 Construction Contracts and several revenue-related interpretations. IFRS 15 establishes a single revenue recognition framework which requires an entity to recognize revenue to reflect the transfer of goods and services for the amount it expects to receive, when control is transferred to the purchaser. The new standard is effective for periods beginning on or after January 1, 2018, with earlier adoption permitted. The Company has completed its review of its various revenue streams and is in the final stages of its review of the underlying contracts and potential impact on the consolidated financial statements. Work will continue on determining the extent of the new additional disclosures required under IFRS 15. The Company does not expect IFRS 15 to have a material impact on its consolidated financial statements outside of additional disclosures. Athabasca will adopt the new standard on the required effective date.
IFRS 9 Financial Instruments In July 2014, the IASB issued the final version of IFRS 9 Financial Instruments that replaces IAS 39 and all previous versions of IFRS 9. IFRS 9 brings together all three aspects of the accounting for financial instruments: classification & measurement, impairment and hedge accounting. IFRS 9 is effective for annual periods beginning on or after January 1, 2018, with early adoption permitted. IFRS 9 introduces a single approach to determine whether a financial asset is measured at amortized cost or fair value and replaces the multiple rules in IAS 39. The approach is based on how an entity manages its financial instruments in the context of its business model and the contractual cash flow characteristics of the financial assets. For financial liabilities, IFRS 9 retains most of the requirements of IAS 39; however, where the fair value option is applied to financial liabilities, any change in fair value resulting from an entity’s own credit risk is recorded in other comprehensive income. The Company does not currently apply hedge accounting to its risk management contracts and does not currently intend to apply hedge accounting to any of its existing risk management contracts on adoption of IFRS 9. The Company continues to assess the impact of IFRS 9, however it does not currently expect a material impact on its consolidated financial statements on applying these new requirements. Athabasca will adopt the new standard on the required effective date.
IFRS 16 LeasesThe IASB issued its new Lease Standard on January 13, 2016. This new IFRS requires that, for lessees, former operating leases will now be capitalized and recognized on the balance sheet (exceptions for short-term leases and low-value assets are provided). Lease assets and liabilities will be initially measured at the present value of the unavoidable lease payments and amortized over the lease term. Lessor accounting remains consistent with current IFRS standards. Two transition methods are available under IFRS 16: full retrospective and cumulative catch-up. A significant amount of transition relief is permitted under the cumulative catch-up method, but will require additional disclosure information. The effective date will be for annual periods beginning on or after January 1, 2019. Earlier adoption is permitted, but only if IFRS 15 - Revenue from Contracts with Customers is also applied. The Company is currently evaluating the impact of adopting IFRS 16 on its consolidated financial statements.
ADVISORIES AND OTHER GUIDANCE
Non-GAAP Financial Measures
The "Funds Flow from Operations”, "Light Oil Operating Income", “Light Oil Operating Netback”, "Thermal Oil Operating Income" and "Thermal Oil Operating Netback" financial measures contained in this MD&A do not have standardized meanings which are prescribed by IFRS and they are considered to be non-GAAP measures. These measures may not be comparable to similar measures presented by other issuers and should not be considered in isolation with measures that are prepared in accordance with IFRS.
Athabasca Oil Corporation Q3 2017 Management's Discussion and Analysis 19
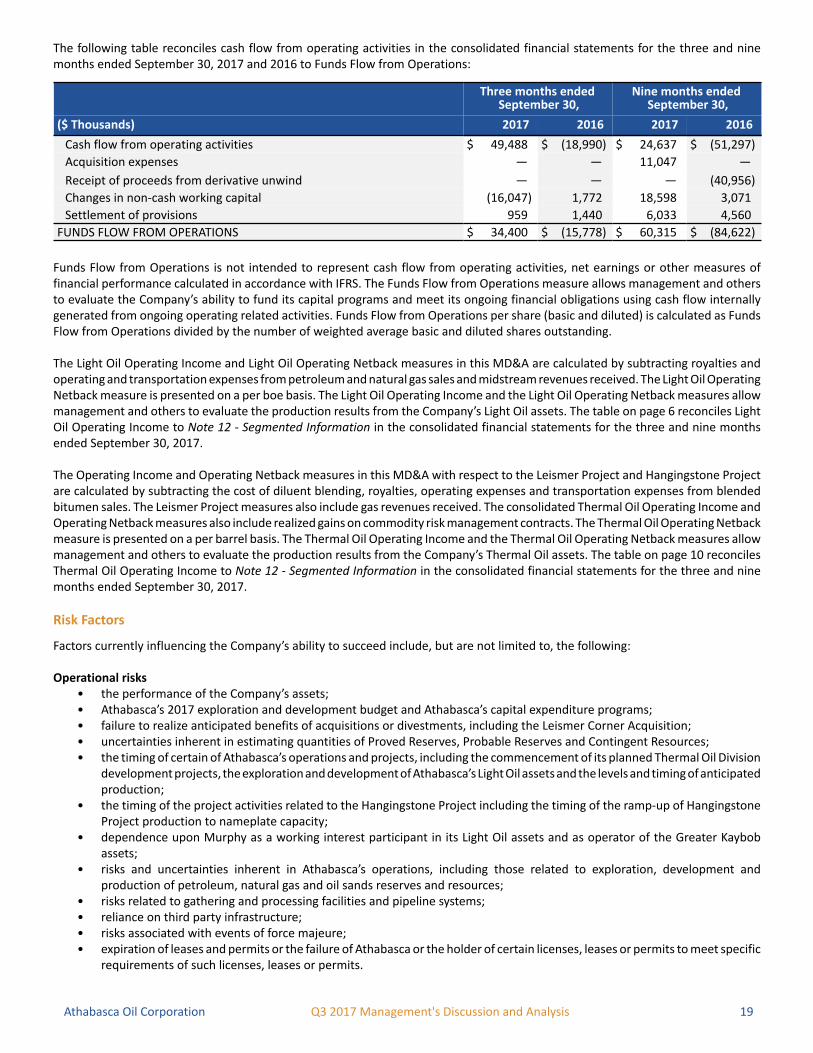
The following table reconciles cash flow from operating activities in the consolidated financial statements for the three and nine months ended September 30, 2017 and 2016 to Funds Flow from Operations:
Three months ended September 30,
Nine months ended September 30,
($ Thousands) 2017 2016 2017 2016
Cash flow from operating activities $ 49,488 $ (18,990) $ 24,637 $ (51,297)
Acquisition expenses — — 11,047 —
Receipt of proceeds from derivative unwind — — — (40,956)
Changes in non-cash working capital (16,047) 1,772 18,598 3,071
Settlement of provisions 959 1,440 6,033 4,560
FUNDS FLOW FROM OPERATIONS $ 34,400 $ (15,778) $ 60,315 $ (84,622)
Funds Flow from Operations is not intended to represent cash flow from operating activities, net earnings or other measures of financial performance calculated in accordance with IFRS. The Funds Flow from Operations measure allows management and others to evaluate the Company’s ability to fund its capital programs and meet its ongoing financial obligations using cash flow internally generated from ongoing operating related activities. Funds Flow from Operations per share (basic and diluted) is calculated as Funds Flow from Operations divided by the number of weighted average basic and diluted shares outstanding.
The Light Oil Operating Income and Light Oil Operating Netback measures in this MD&A are calculated by subtracting royalties and operating and transportation expenses from petroleum and natural gas sales and midstream revenues received. The Light Oil Operating Netback measure is presented on a per boe basis. The Light Oil Operating Income and the Light Oil Operating Netback measures allow management and others to evaluate the production results from the Company’s Light Oil assets. The table on page 6 reconciles Light Oil Operating Income to Note 12 - Segmented Information in the consolidated financial statements for the three and nine months ended September 30, 2017.
The Operating Income and Operating Netback measures in this MD&A with respect to the Leismer Project and Hangingstone Project are calculated by subtracting the cost of diluent blending, royalties, operating expenses and transportation expenses from blended bitumen sales. The Leismer Project measures also include gas revenues received. The consolidated Thermal Oil Operating Income and Operating Netback measures also include realized gains on commodity risk management contracts. The Thermal Oil Operating Netback measure is presented on a per barrel basis. The Thermal Oil Operating Income and the Thermal Oil Operating Netback measures allow management and others to evaluate the production results from the Company’s Thermal Oil assets. The table on page 10 reconciles Thermal Oil Operating Income to Note 12 - Segmented Information in the consolidated financial statements for the three and nine months ended September 30, 2017.
Risk Factors
Factors currently influencing the Company’s ability to succeed include, but are not limited to, the following:
Operational risks• the performance of the Company’s assets;• Athabasca’s 2017 exploration and development budget and Athabasca’s capital expenditure programs;• failure to realize anticipated benefits of acquisitions or divestments, including the Leismer Corner Acquisition;• uncertainties inherent in estimating quantities of Proved Reserves, Probable Reserves and Contingent Resources;• the timing of certain of Athabasca’s operations and projects, including the commencement of its planned Thermal Oil Division
development projects, the exploration and development of Athabasca’s Light Oil assets and the levels and timing of anticipated production;
• the timing of the project activities related to the Hangingstone Project including the timing of the ramp-up of Hangingstone Project production to nameplate capacity;
• dependence upon Murphy as a working interest participant in its Light Oil assets and as operator of the Greater Kaybob assets;
• risks and uncertainties inherent in Athabasca’s operations, including those related to exploration, development and production of petroleum, natural gas and oil sands reserves and resources;
• risks related to gathering and processing facilities and pipeline systems;• reliance on third party infrastructure;• risks associated with events of force majeure;• expiration of leases and permits or the failure of Athabasca or the holder of certain licenses, leases or permits to meet specific
requirements of such licenses, leases or permits.
Athabasca Oil Corporation Q3 2017 Management's Discussion and Analysis 20
Planning risks• the business strategy, objectives and business strengths of Athabasca;• Athabasca’s growth strategy and opportunities;• Athabasca’s plans to submit additional regulatory applications;• Athabasca’s drilling plans and plans and results regarding the completion of wells that have been drilled and other exploration
and development activities;• failure to accurately estimate abandonment and reclamation costs;• the potential for management estimates and assumptions to be inaccurate.
Financial and market risks• general economic, market and business conditions in Canada, the United States and globally;• future market prices for crude oil, natural gas, condensate and bitumen blend;• Athabasca’s projections of commodity prices, costs and netbacks;• the substantial capital requirements of Athabasca’s projects and the Company’s ability to raise capital;• the potential for future joint venture arrangements;• insurance risks;• hedging risks;• variations in foreign exchange and interest rates;• risks related to the New Credit Facility, the Letter of Credit Facility and the 2022 Notes;• risks related to the Common Shares.
Legal and compliance risks• the regulatory framework governing royalties, taxes, environmental matters and foreign investment in the jurisdictions in
which Athabasca conducts and will conduct its business;• actions taken by the new American administration, including the potential renegotiation of the terms of the North American
Free Trade Agreement, the withdrawal of the United States from the Trans-Pacific Partnership and the imposition of taxes on the importation of goods into the United States;
• aboriginal claims;• risks associated with establishing and maintaining systems of internal controls;• inaccuracy of forward-looking information.
For additional information regarding the risks and uncertainties to which the Company and its business are subject, please see the information under the headings “Forward Looking Information” below, and under the headings “Forward Looking Statements” and “Risk Factors” in the Company’s most recent AIF, on the Company’s SEDAR profile at www.sedar.com.
Forward Looking Information
This MD&A contains forward-looking information that involves various risks, uncertainties and other factors. All information other than statements of historical fact is forward-looking information. The use of any of the words “anticipate,” “plan,” “continue”, “estimate”, “expect”, “may”, “will”, “project”, “target”, “should”, “believe”, “predict”, “pursue” and “potential” and similar expressions are intended to identify forward-looking information. The forward-looking information is not historical fact, but rather is based on the Company’s current plans, objectives, goals, strategies, estimates, assumptions and projections about the Company’s industry, business and future financial results. This information involves known and unknown risks, uncertainties and other factors that may cause actual results or events to differ materially from those anticipated in such forward-looking information. No assurance can be given that these expectations will prove to be correct and such forward-looking information included in this MD&A should not be unduly relied upon. This information speaks only as of the date of this MD&A. In particular, this MD&A may contain forward-looking information pertaining to the following: the Company's five-year growth outlook and how that growth outlook is funded; the benefits expected to be realized by the Company from the offering of the 2022 Notes and the New Credit Facility; the benefits expected to be realized by the Company from the Leismer Corner Acquisition; the timing by which the Corporation expects to achieve sustainable free cash flow generation, cash and cash equivalents and liquidity, for certain future periods; expectations with respect to future production hedging levels; estimates of corporate, Thermal Oil and Light Oil production levels and base decline rates; estimates of future depletion rates on the Hangingstone Project; the expectation that operating and transportation expenses will decrease at Hangingstone; the in-service date of the TMX Pipeline and the benefits Athabasca expects to realize by having capacity thereon; estimates of funds flow from operations, operating income and capital expenditures; the capability of the Company's five-year development outlook to deliver potential growth in per share production; the estimated impact of the Royalty on the economics of future expansion phases and development projects; future drilling and completion plans; the timing for achievement of name plate capacity at the Hangingstone Project the timing of facilities construction and in service dates and the capacity thereof; the timing of well spudding and completion operations and wells coming on-stream; the Company’s expected flexibility in its pace of development; the Company’s plans for, and results of, exploration and development activities; the Company’s estimated future commitments;

Athabasca Oil Corporation Q3 2017 Management's Discussion and Analysis 21
Athabasca's continued balance-sheet strength; the Company’s business and financing plans and strategies; expectations regarding the 2017 capital budget; the Company's anticipated sources of funding for 2017 and beyond; the Company's estimate future minimum capital commitments; the future allocation of capital; and other matters.
Information relating to "reserves" is also deemed to be forward-looking information, as it involves the implied assessment, based on certain estimates and assumptions, that the reserves described exist in the quantities predicted or estimated and that the reserves can be profitably produced in the future.
With respect to forward-looking information contained in this MD&A, assumptions have been made regarding, among other things: that Athabasca and its security holders will obtain the anticipated benefits from the 2022 Notes and the New Credit Facility; commodity prices, including for petroleum, natural gas and blended bitumen; the regulatory framework governing royalties, taxes and environmental matters in the jurisdiction in which the Company conducts and will conduct business and the effects that such regulatory framework will have on the Company, including on the Company’s financial condition and results of operations; the Company’s financial and operational flexibility; the Company’s financial sustainability; Athabasca's cash flow break-even commodity price; the Company’s ability to obtain qualified staff and equipment in a timely and cost-efficient manner; the applicability of technologies for the recovery and production of the Company’s reserves and resources; future capital expenditures to be made by the Company; future sources of funding for the Company’s capital programs; the Company’s future debt levels; future production levels; the Company’s ability to obtain financing and/or enter into joint venture arrangements, on acceptable terms; operating costs; compliance of counterparties with the terms of contractual arrangements; impact of increasing competition; collection risk of outstanding accounts receivable from third parties; geological and engineering estimates in respect of the Company’s reserves and resources; recoverability of reserves and resources; the geography of the areas in which the Company is conducting exploration and development activities and the quality of its assets.
Actual results could differ materially from those anticipated in this forward-looking information as a result of the risk factors set forth in the Company’s most recent AIF available on SEDAR at www.sedar.com, including, but not limited to: weakness in the oil and gas industry; fluctuations in market prices for crude oil, natural gas and bitumen blend; general economic, market and business conditions in Canada, the United States and globally; insurance risks; claims made in respect of Athabasca’s operations, properties or assets; the substantial capital requirements of Athabasca’s projects and the ability to obtain financing for Athabasca’s capital requirements; global financial uncertainty; failure to realize anticipated benefits of acquisitions or divestments; risks related to hydraulic fracturing; factors affecting potential profitability; failure to obtain regulatory approvals or maintain compliance with regulatory requirements; extent of, and cost of compliance with, government laws and regulations and the effect of changes in such laws and regulations from time to time; risks relating to changing royalty regimes; additional funding requirements and liquidity risk; variations in foreign exchange and interest rates; environmental risks and hazards and the cost of compliance with environmental regulations, including the licensee liability rating program, seismic activity regulations, greenhouse gas regulations and potential Canadian and U.S. climate change legislation; risks related to the Murphy Transaction, dependence on Murphy as the operator of the Greater Kaybob assets, dependence on Murphy as the Company’s joint venture participant in the Company’s Greater Kaybob and Greater Placid assets and dependence on Murphy’s continued ability to pay the Greater Kaybob carry commitment, risks associated with events of force majeure; risks related to the New Credit Facility, the Letter of Credit Facility and the 2022 Notes; geopolitical risks; uncertainties inherent in estimating quantities of reserves and resources; contractual counterparty risks and operational dependence; risks related to future acquisition and joint venture activities; risks and uncertainties inherent in Athabasca’s operations, including those related to exploration, development and production of petroleum, natural gas and oil sands reserves and resources, including the production of oil sands reserves and resources using SAGD, TAGD or other in-situ recovery technologies; failure to meet development schedules and potential cost overruns; aboriginal claims; reliance on, competition for, loss of, and failure to attract key personnel; financial assurance covenants and collateral requirements under the Company’s pipeline transportation agreements; risks related to gathering and processing facilities and pipeline systems; availability of drilling and related equipment and limitations on access to Athabasca’s assets; increases in operating costs could make Athabasca’s projects uneconomic; the effect of diluent and natural gas supply constraints and increases in the costs thereof; costs of new technologies; alternatives to and changing demand for petroleum products; gas over bitumen issues affecting operational results; risks related to Athabasca’s filings with taxation authorities, including the risk of tax related reviews and reassessments; failure to accurately estimate abandonment and reclamation costs; the potential for management estimates and assumptions to be inaccurate; long-term reliance on third parties; reliance on third party infrastructure; seasonality; risks associated with establishing and maintaining systems of internal controls; competition for, among other things, capital, the acquisition of reserves and resources, export pipeline capacity and skilled personnel; expiration of leases and permits or the failure of Athabasca or the holder of certain licenses, leases or permits to meet specific requirements of such licenses, leases or permits; breaches of confidentiality; inaccuracy of forward-looking information; expansion into new activities; risks related to the Common Shares.
In addition, information and statements in this MD&A relating to “Reserves” and “Resources” are deemed to be forward-looking information, as they involve the implied assessment, based on certain estimates and assumptions, that the reserves and resources described exist in the quantities predicted or estimated, and that the reserves and resources described can be profitably produced in the future. Certain assumptions related to the Company’s Reserves and Resources are contained in the reports of GLJ and D&M
Athabasca Oil Corporation Q3 2017 Management's Discussion and Analysis 22
evaluating Athabasca’s Proved Reserves, Probable Reserves and Contingent Resources as at December 31, 2016 (which are respectively referred to herein as the “GLJ Report” and the “D&M Report”).
The risks and uncertainties referred to above are described in more detail in Athabasca’s most recent AIF, which is available on the Company’s SEDAR profile at www.sedar.com. Readers are cautioned that the foregoing list of risk factors should not be construed as exhaustive. The forward-looking information included in this MD&A is expressly qualified by this cautionary statement and is made as of the date of this MD&A. The Company does not undertake any obligation to publicly update or revise any forward-looking information except as required by applicable securities laws.
The Company’s financial condition and results of operations discussed in this MD&A will not necessarily be indicative of the Company’s future performance, particularly considering that many of the Company’s activities are currently in the early stages of their planned exploration and/or development.
Reserves and Resource Information
Both the GLJ Report and the D&M Report were prepared using the assumptions and methodology guidelines outlined in the COGE Handbook and in accordance with National Instrument 51-101 Standards of Disclosure for Oil and Gas Activities, effective December 31, 2016. There are numerous uncertainties inherent in estimating quantities of bitumen, crude oil, natural gas and natural gas liquids reserves and the future cash flows attributed to such reserves. The reserve and associated cash flow information set forth above are estimates only. In general, estimates of economically recoverable reserves and the future net cash flows therefrom are based upon a number of variable factors and assumptions, such as historical production from the properties, production rates, ultimate reserve recovery, timing and amount of capital expenditures, marketability of oil and natural gas, royalty rates, the assumed effects of regulation by governmental agencies and future operating costs, all of which may vary materially. For those reasons, estimates of the economically recoverable reserves attributable to any particular group of properties, classification of such reserves based on risk of recovery and estimates of future net revenues associated with reserves prepared by different engineers, or by the same engineers at different times, may vary. The Company's actual production, revenues, taxes and development and operating expenditures with respect to its reserves will vary from estimates thereof and such variations could be material. There is no certainty that it will be commercially viable to produce any portion of the resources. Reserves figures described herein have been rounded to the nearest MMbbl or MMboe. Contingent Resources described herein have been rounded to the nearest billion barrels. For additional information regarding the consolidated reserves and resources of the Company as evaluated by GLJ in the GLJ Report and by D&M in the D&M Report, please refer to the Company’s AIF that is available on SEDAR at www.sedar.com.
Additionally, the reserves and resources data relating to the Leismer and Corner assets is based on a report prepared by GLJ reporting the reserves attributable to such assets as at December 31, 2016, and was prepared in accordance with the standards contained in the COGE Handbook and the reserve definitions contained in NI 51-101 and the COGE Handbook.
Oil and Gas Information
“Boe" may be misleading, particularly if used in isolation. A BOE conversion ratio of six thousand cubic feet of natural gas to one barrel of oil equivalent (6 Mcf: 1 bbl) is based on an energy equivalency conversion method primarily applicable at the burner tip and does not represent a value equivalency at the wellhead. As the value ratio between natural gas and crude oil based on the current prices of natural gas and crude oil is significantly different from the energy equivalency of 6:1, utilizing a conversion on a 6:1 basis may be misleading as an indication of value.
Drilling Locations
The 1,500 Duvernay drilling locations referenced on page 5 of this MD&A include: 31 proved undeveloped or non-producing locations and 42 probable undeveloped locations for a total of 73 undeveloped booked locations with the balance being unbooked locations. The 200 Montney drilling locations referenced on page 5 of this MD&A include: 34 proved undeveloped and 12 probable undeveloped locations, for a total of 46 undeveloped booked locations with the balance being unbooked locations. Proved undeveloped locations and probable undeveloped locations are booked and derived from the Company's most recent independent reserves evaluation as prepared by GLJ as of December 31, 2016 and account for drilling locations that have associated proved and/or probable reserves, as applicable. Unbooked locations are internal management estimates. Unbooked locations do not have attributed reserves or resources (including contingent or prospective). Unbooked locations have been identified by management as an estimation of Athabasca’s multi-year drilling activities expected to occur over the next two decades based on evaluation of applicable geologic, seismic, engineering, production and reserves information. There is no certainty that the Company will drill all unbooked drilling locations and if drilled there is no certainty that such locations will result in additional oil and gas reserves, resources or production. The drilling locations on which the Company will actually drill wells, including the number and timing thereof is ultimately dependent
Athabasca Oil Corporation Q3 2017 Management's Discussion and Analysis 23
upon the availability of funding, oil and natural gas prices, provincial fiscal and royalty policies, costs, actual drilling results and additional reservoir information that is obtained and other factors.
Definitions
“Best Estimate” is a classification of estimated resources described in the COGE Handbook as being considered to be the best estimate of the quantity that will actually be recovered. It is equally likely that the actual remaining quantities recovered will be greater or less than the Best Estimate. If probabilistic methods are used, there should be a 50% probability (P50) that the quantities actually recovered will equal or exceed the Best Estimate.
“Contingent Resources” are those quantities of petroleum estimated, as of a given date, to be potentially recoverable from known accumulations using established technology or technology under development, but which are not currently considered to be commercially recoverable due to one or more contingencies. Contingencies may include such factors as economic, legal, environmental, political and regulatory matters or a lack of markets. It is also appropriate to classify as “Contingent Resources” the estimated discovered recoverable quantities associated with a project in the early evaluation stage. Contingent resources may be divided into the following project maturity sub-classes: “Development Pending” is assigned to Contingent Resources for a particular project where resolution of the final conditions for development is being actively pursued (high chance of development); “Development On Hold” is assigned to Contingent Resources for a particular project where there is a reasonable chance of development, but there are major non-technical contingencies to be resolved that are usually beyond the control of the operator; “Development Unclarified” is assigned to Contingent Resources for a particular project where evaluation is incomplete and there is ongoing activity to resolve any risks or uncertainties or which require significant further appraisal to clarify potential for development and where contingencies have yet to be defined; “Development Not Viable” is assigned to Contingent Resources for a particular project where no further data acquisition or evaluation is currently planned and there is a low chance of development. As at December 31, 2016, the Company is reporting Contingent Resources on a risked and unrisked basis located in its: Hangingstone asset area in the Development Pending project maturity sub-class; and, Hangingstone, Dover West Sands and Birch asset areas for Development On Hold and Development Unclarified project maturity sub-classes.
“Proved Reserves” are those reserves that can be estimated with a high degree of certainty to be recoverable. It is likely that the actual remaining quantities recovered will exceed the estimated Proved Reserves.
“Probable Reserves” are those additional reserves that are less certain to be recovered than Proved Reserves. It is equally likely that the actual remaining quantities recovered will be greater or less than the sum of the estimated Proved Reserves plus Probable Reserves.
"Reserve Life Index" is a measure of the estimated length of time it will take to deplete the Company's oil and gas reserves (typically reported in number of years).
“Risked” or "risked" means the applicable reported volumes or revenues have been risked (or adjusted) based on the chance of commerciality of such resources in accordance with the COGE Handbook. In accordance with the COGE Handbook for contingent resources, the chance of commerciality is solely based on the chance of development based on all contingencies required for the re-classification of the contingent resources as reserves being resolved. Therefore risked reported volumes and values of contingent resources reflect the risking (or adjustment) of such volumes or values based on the chance of development of such resources.
“Unrisked” or "unrisked" means applicable reported volumes or values of resources have not been risked (or adjusted) based on the chance of commerciality of such resources. In accordance with the COGE Handbook for contingent resources, the chance of commerciality is solely based on the chance of development based on all contingencies required for the re-classification of the contingent resources as reserves being resolved. Therefore unrisked reported volumes and values of contingent resources do not reflect the risking (or adjustment) of such volumes or values based on the chance of development of such resources.
Athabasca Oil Corporation Q3 2017 Management's Discussion and Analysis 24
Abbreviations
AECO physical storage and trading hub for natural gas on the TransCanada Alberta transmission system which is the delivery point for various benchmark Alberta index prices.
bbl barrelbbl/d barrels per day boe barrels of oil equivalent boe/d barrels of oil equivalent per dayC$ Canadian DollarsCOGE Canadian Oil and Gas EvaluationGAAP Generally Accepted Accounting PrinciplesG&A general and administrativeLIBOR London interbank offered rateMcf thousand cubic feetMcf/d thousand cubic feet per dayMMbbl millions of barrelsMMboe millions of barrels of oil equivalentMMBtu million British thermal unitsNYMEX New York Mercantile Exchange OPEC Organization of the Petroleum Exporting CountriesSAGD steam assisted gravity drainageSOR steam to oil ratioTAGD thermal assisted gravity drainageUS$ United States DollarsWTI West Texas IntermediateWCS Western Canadian Select