Q2 2016 PR MDA and FS July 20 (FINAL) revised - AltaGas
68
NEWS RELEASE ALTAGAS LTD. REPORTS STRONG SECOND QUARTER RESULTS AND INCREASES DIVIDEND 6.1 PERCENT Calgary, Alberta (July 21, 2016) (all financial figures are unaudited and in Canadian dollars unless otherwise noted) Highlights • Record second quarter normalized EBITDA of $153 million, a 43 percent increase over the second quarter of 2015; • 68 percent increase in normalized funds from operations to $114 million; • Increased common share dividend by $0.01 per share per month to $2.10 per share annualized beginning with the September 15, 2016 payment, a 6.1 percent increase; • Signed Memorandum of Understanding (MOU) with Astomos Energy Corporation (Astomos) for 50 percent of the 1.2 million tonnes of Liquefied Petroleum Gas (LPG) available to be shipped from the proposed Ridley Island Propane Export Terminal; • Completed the 198 Mmcf/d shallow-cut Townsend Facility ahead of schedule and under budget; • Completed restructuring of non-utility workforce which is expected to reduce operating and administrative expenses by approximately $7 million on a full year basis; and • Invested $150 million into Petrogas Energy Corp. (Petrogas) preferred shares. AltaGas Ltd. (AltaGas) (TSX:ALA) today reported second quarter 2016 normalized EBITDA of $153 million, an increase of 43 percent over the same quarter of 2015. Normalized funds from operations were $114 million ($0.75 per share) for the second quarter of 2016, compared to $68 million ($0.50 per share) in the same period of 2015. Normalized net income was $29 million ($0.19 per share) for the second quarter of 2016, compared to $9 million ($0.07 per share) in the same period of 2015. “Our second quarter results reflect the strength of our assets and the significant growth we had in our power segment in late 2015 with the addition of the San Joaquin assets and our McLymont Hydro facility,” said David Harris, President and CEO of AltaGas. “We also made substantial progress on our growth initiatives throughout the quarter. The MOU with Astomos helps underpin our Ridley Island Propane Export Terminal and brings us one step closer to a final investment decision, expected in the fourth quarter of 2016. We also started up Townsend successfully ahead of schedule and under budget. We remain focused on delivering on our growth projects and on efficiencies throughout our business to lower our costs. Our results, the strong execution of our growth projects, and our dividend increase, all underscore the value we bring shareholders.” The increase in normalized EBITDA for the second quarter of 2016 was mainly due to the San Joaquin Facilities acquired late in 2015 which contributed approximately $27 million, higher contributions from the Northwest Hydro Facilities as a result of McLymont entering commercial service in the fourth quarter of 2015 and improved performance at Forrest Kerr after a full year of operations, as well as higher river flow, the absence of turnarounds at the Younger and Harmattan facilities compared to the second quarter of 2015, and higher realized hedging gains on the Alberta power portfolio. These increases were partially offset by lower gains from frac hedges, the absence of equity income from the Sundance B Power Purchase Arrangements (the Sundance B PPAs) terminated in the first quarter of 2016, and the impact of the sale of non-core assets to Tidewater Midstream and Infrastructure Ltd. (Tidewater) on February 29, 2016.
-
Upload
khangminh22 -
Category
Documents
-
view
0 -
download
0
Transcript of Q2 2016 PR MDA and FS July 20 (FINAL) revised - AltaGas

NEWS RELEASE ALTAGAS LTD. REPORTS STRONG SECOND QUARTER RESULTS AND
INCREASES DIVIDEND 6.1 PERCENT
Calgary, Alberta (July 21, 2016)
(all financial figures are unaudited and in Canadian dollars unless otherwise noted)
Highlights
• Record second quarter normalized EBITDA of $153 million, a 43 percent increase over the second quarter of 2015;
• 68 percent increase in normalized funds from operations to $114 million;
• Increased common share dividend by $0.01 per share per month to $2.10 per share annualized beginning with the
September 15, 2016 payment, a 6.1 percent increase;
• Signed Memorandum of Understanding (MOU) with Astomos Energy Corporation (Astomos) for 50 percent of the
1.2 million tonnes of Liquefied Petroleum Gas (LPG) available to be shipped from the proposed Ridley Island
Propane Export Terminal;
• Completed the 198 Mmcf/d shallow-cut Townsend Facility ahead of schedule and under budget;
• Completed restructuring of non-utility workforce which is expected to reduce operating and administrative expenses
by approximately $7 million on a full year basis; and
• Invested $150 million into Petrogas Energy Corp. (Petrogas) preferred shares.
AltaGas Ltd. (AltaGas) (TSX:ALA) today reported second quarter 2016 normalized EBITDA of $153 million, an increase of 43
percent over the same quarter of 2015. Normalized funds from operations were $114 million ($0.75 per share) for the second
quarter of 2016, compared to $68 million ($0.50 per share) in the same period of 2015. Normalized net income was $29 million
($0.19 per share) for the second quarter of 2016, compared to $9 million ($0.07 per share) in the same period of 2015.
“Our second quarter results reflect the strength of our assets and the significant growth we had in our power segment in late 2015
with the addition of the San Joaquin assets and our McLymont Hydro facility,” said David Harris, President and CEO of AltaGas.
“We also made substantial progress on our growth initiatives throughout the quarter. The MOU with Astomos helps underpin our
Ridley Island Propane Export Terminal and brings us one step closer to a final investment decision, expected in the fourth
quarter of 2016. We also started up Townsend successfully ahead of schedule and under budget. We remain focused on
delivering on our growth projects and on efficiencies throughout our business to lower our costs. Our results, the strong
execution of our growth projects, and our dividend increase, all underscore the value we bring shareholders.”
The increase in normalized EBITDA for the second quarter of 2016 was mainly due to the San Joaquin Facilities acquired late in
2015 which contributed approximately $27 million, higher contributions from the Northwest Hydro Facilities as a result of
McLymont entering commercial service in the fourth quarter of 2015 and improved performance at Forrest Kerr after a full year of
operations, as well as higher river flow, the absence of turnarounds at the Younger and Harmattan facilities compared to the
second quarter of 2015, and higher realized hedging gains on the Alberta power portfolio. These increases were partially offset
by lower gains from frac hedges, the absence of equity income from the Sundance B Power Purchase Arrangements (the
Sundance B PPAs) terminated in the first quarter of 2016, and the impact of the sale of non-core assets to Tidewater Midstream
and Infrastructure Ltd. (Tidewater) on February 29, 2016.

AltaGas Ltd. – Q2 2016 - 2
The increase in normalized funds from operations in the second quarter of 2016 was driven by the same factors as normalized
EBITDA, as well as higher distributions from Petrogas, partially offset by higher interest expense and current income tax
expense.
The increase in normalized net income in the second quarter of 2016 was driven by the same factors as normalized EBITDA,
partially offset by higher depreciation and amortization expense, interest expense and preferred share dividends.
During the quarter AltaGas announced that AltaGas LPG Limited Partnership, a wholly owned subsidiary, entered into a MOU
with Astomos, setting out key commercial terms for the sale and purchase of LPG from the proposed Ridley Island Propane
Export Terminal. Under the terms of a contemplated multi-year agreement, it is anticipated that Astomos will purchase at least 50
percent of the 1.2 million tonnes of propane available to be shipped from the export terminal each year. Active commercial
discussions are continuing for additional capacity commitments.
In June 2016, AltaGas completed a restructuring that reduced its non-utility workforce by approximately 10 percent. Total pre-tax
restructuring costs incurred were approximately $7 million, which were charged to operating and administrative expenses. The
restructuring is expected to reduce operating and administrative expenses by approximately $7 million on an annualized basis.
On June 29, 2016, AltaGas directly invested $150 million to subscribe for 6,000,000 cumulative redeemable convertible
preferred shares of Petrogas (the Petrogas Preferred Shares). The Petrogas Preferred Shares are non-voting and entitle
AltaGas to a fixed, cumulative, preferential cash dividend at a rate of 8.5 percent per annum payable quarterly. These preferred
shares are, in the normal course, redeemable at any time on or after January 1, 2018 and convertible into a specified number of
common shares at the option of either holder at any time on or after April 19, 2018.
For the second quarter of 2016, AltaGas recorded income tax expense of $4 million compared to $10 million in the same quarter
of 2015. The decrease was mainly due to the absence of a one-time, non-cash $14 million charge recorded in the second quarter
of 2015 related to a 2 percent increase in the Alberta corporate income tax rate. This was partially offset by higher earnings in the
second quarter of 2016.
On a U.S. GAAP basis, net income applicable to common shares for the second quarter of 2016 was $16 million ($0.10 per
share) compared to net loss applicable to common shares of $22 million ($0.16 per share) for the same quarter in 2015. Net
income applicable to common shares for the second quarter of 2016 was normalized for after-tax amounts related to unrealized
losses on risk management contracts and restructuring costs. In the second quarter of 2015, net loss applicable to common
shares was normalized for after-tax amounts related to unrealized losses on risk management contracts, energy export
development costs, unrealized gains on long-term investments, and a statutory tax rate change.
For the six months ended June 30, 2016, AltaGas reported normalized EBITDA of $332 million compared to $284 million for the
same period in 2015. The increase was primarily due to EBITDA generated from the San Joaquin Facilities, rate base and
customer growth at the Utilities, the impact of the stronger US dollar on reported results of the U.S. assets, higher contributions
from the Northwest Hydro Facilities, the absence of turnarounds at the Younger and Harmattan facilities, and higher earnings
from Petrogas. This was partially offset by the impact of significantly warmer weather experienced at all of AltaGas’ Utilities
during the winter heating season, lower gains from frac hedges, lower fee-for-service revenue, and low Alberta power pool prices
prior to the termination of the Sundance B PPAs.

AltaGas Ltd. – Q2 2016 - 3
Normalized funds from operations for the first half of 2016 was $248 million ($1.66 per share), compared to $208 million ($1.54
per share) for the same period in 2015, driven by the same factors impacting normalized EBITDA as well as an increase in
common share dividends from Petrogas, partially offset by higher interest and current income tax expense.
For the six months ended June 30, 2016, AltaGas recorded income tax expense of $10 million compared to $41 million for the
same period in 2015. Income tax expense decreased primarily due to the absence of the one-time, non-cash $14 million charge
related to the increase in the Alberta corporate income tax rate, and the $10 million tax recovery related to the Tidewater Gas
Asset Disposition recorded in the first quarter of 2016, as well as lower earnings from operations in Canada.
Normalized net income for the first half of 2016 was $68 million ($0.46 per share), compared to $66 million ($0.49 per share)
reported for the same period in 2015. The variance was driven by the same factors impacting normalized EBITDA as well as
higher depreciation and amortization expense, interest expense and preferred share dividends.
On a U.S. GAAP basis, net income applicable to common shares for the first half of 2016 was $71 million ($0.48 per share)
compared to $44 million ($0.33 per share) for the same period in 2015. Net income applicable to common shares for the first half
of 2016 was normalized for after-tax amounts related to unrealized losses on risk management contracts, transaction costs
related to acquisitions, gains on sale of assets and related tax recovery, dilution loss recognized on investment accounted for by
the equity method, provision on investment accounted for by the equity method, and restructuring costs. In the first half of 2015,
net income applicable to common shares was normalized for after-tax amounts related to unrealized losses on risk management
contracts, unrealized gains on long-term investments, development costs incurred for the energy export projects and a statutory
tax rate change.
Based on projects currently under review, development or construction, AltaGas expects capital expenditures in the range of
$600 to $650 million for 2016. Gas and Power maintenance capital is expected to be less than $40 million of total capital
expenditures. With the completion of the Townsend Facility, a significant portion of the 2016 committed growth capital has been
incurred. A large portion of the remaining 2016 growth capital expenditures is discretionary and AltaGas has the flexibility to
adjust the pace of spending at its option. The Corporation continues to focus on enhancing productivity and streamlining
businesses, including the disposition of smaller non-core assets.
AltaGas maintains financial strength and flexibility, investment grade credit ratings, and ready access to capital markets. On April
7, 2016, AltaGas issued $350 million of senior unsecured medium-term notes (MTNs). The MTNs carry a coupon rate of 4.12
percent and will mature on April 7, 2026. On June 6, 2016, AltaGas closed a public offering of 14,685,000 Common Shares, on
a bought deal basis, at an issue price of $30 per Common Share, for total gross proceeds of approximately $440 million. AltaGas
has solid cash flow coming from its diversified base businesses and the Premium Dividend™, Dividend Reinvestment and
Optional Cash Purchase Plan. With ample bank line reserves and the flexibility to manage the timing of capital spending,
AltaGas is fully funded and well positioned for 2016. AltaGas had $1.4 billion available on its credit facilities at the end of the
second quarter of 2016 and cash of $77 million.
2016 Outlook
AltaGas continues to expect to deliver overall normalized EBITDA growth of approximately 20 percent in 2016 compared to
2015. The majority of the annual growth in 2016 is expected to be driven by the Power segment, with Utilities also expected to
increase by a small amount from 2015, while the Gas segment is expected to see a small decline versus 2015 mainly due to the
Tidewater Gas Asset Disposition. The most significant driver of normalized EBITDA growth is a full year contribution from the

AltaGas Ltd. – Q2 2016 - 4
San Joaquin Facilities acquired on November 30, 2015. 2016 will also be the first year that all three Northwest Hydro Facilities
provide a full year contribution as McLymont entered commercial service in the fourth quarter of 2015. AltaGas’ integrated
northeast British Columbia strategy is expected to add additional EBITDA in 2016 with a partial year contribution from the first
phase of the Townsend Facility entering commercial operations on July 10, 2016. The Townsend Facility is expected to generate
normalized EBITDA of approximately $20 million for 2016 as volumes from Painted Pony Petroleum Ltd. (Painted Pony)
progressively increase through year-end. The Utilities segment is expected to report increased normalized EBITDA in 2016
driven by rate base and customer growth while also benefitting from a favorable US dollar exchange rate. The overall forecasted
growth in normalized EBITDA includes lower commodity hedge gains in the Gas segment compared with 2015 as well as higher
operating and administrative costs due to new assets placed into service.
AltaGas continues to expect normalized funds from operations to grow by up to approximately 15 percent in 2016, driven by the
factors noted above for normalized EBITDA growth, partially offset by higher financing costs related to new assets acquired as
well as new assets in service and higher current tax expenses. AltaGas’ $150 million investment in the Petrogas Preferred
Shares will contribute to funds from operations as dividends on such shares are expected to be paid quarterly. In the first half of
2016, AltaGas received $12 million in common share dividends from Petrogas and currently expects to receive a similar amount
in the second half of 2016. For the full year of 2015, AltaGas received $11 million in common share dividends from Petrogas.
The non-utility workforce restructuring that was completed in June 2016 is expected to reduce operating and administrative
expenses by approximately $7 million on an annualized basis.
Project Updates
Townsend Facility, Gas Gathering Line, Liquids Egress Lines and Truck Terminal
Construction of AltaGas’ integrated midstream complex at Townsend in Northeast British Columbia, including the Townsend
Facility, gas gathering line, liquids egress lines and truck terminal, was largely completed by the end of the second quarter of
2016. The total project is expected to have a final cost of approximately $430 million. This represents a savings of approximately
$40 million less than what was originally anticipated. The cost savings were achieved through in-house construction capabilities
and efficiencies, and will benefit both Painted Pony and AltaGas.
The Townsend Facility is a 198 Mmcf/d shallow-cut gas processing facility located approximately 100 km north of Fort St. John
and 20 km southeast of AltaGas' Blair Creek Facility. Painted Pony has reserved all of the firm capacity under a 20-year
take-or-pay agreement. The estimated final cost for the Townsend Facility and associated infrastructure is expected to be
approximately $330 million and includes the plant, sales gas line, improvements to site, local roads and the Alaska Highway, as
well as additional compression. On July 7, 2016, the Townsend Facility officially processed sales gas volumes and started
commercial operations on July 10, 2016. Volumes are expected to progressively ramp up through the fourth quarter of 2016.
AltaGas achieved capital efficiencies during construction of the Townsend Facility and related infrastructure and the project is
expected to be completed under budget.
Incremental to the Townsend Facility are two other related projects. The first is a 25 km gas gathering line, which connects the
Blair Creek field gathering area to the Townsend Facility. This gathering line was completed under budget at approximately $35
million and on schedule. Painted Pony has reserved all of the firm service for the gas gathering line under a 20-year take-or-pay
agreement. The second project consists of two 30 km liquids egress lines running from the Townsend Facility to a new truck
terminal on the Alaska Highway. The pipelines can move initial liquids volumes of up to 10,000 Bbls/d each, and with pumping

AltaGas Ltd. – Q2 2016 - 5
modifications can accommodate up to 30,000 Bbls/d each. These twin pipelines were substantially constructed in the first
quarter of 2016. Construction of the truck terminal is also substantially complete and pre-commissioning is expected to be
completed by the end of July 2016. Painted Pony is expected to reserve firm liquids capacity on the liquids egress lines for all the
liquids from the first phase of the Townsend facility under a 20-year take-or-pay agreement. The two liquids egress lines and the
truck terminal are now estimated to cost approximately $65 million when completed, well under the original budget.
North Pine Liquids Separation Project
AltaGas is developing a liquids separation and handling facility (the North Pine Facility) located approximately 40 km northwest
of Fort St. John, British Columbia. The North Pine Facility will be connected to existing AltaGas infrastructure in the region,
including the proposed Ridley Island Propane Export Terminal, and will serve producers in the Montney region. The North Pine
Facility is being designed with capacity to process up to 20,000 bbls/d of C3+ and handle up to 20,000 bbls/d of C5+.
Engagement with First Nations and key stakeholders continues, and on April 14, 2016 AltaGas filed its application with the B.C.
Oil and Gas Commission (OGC) for permitting of North Pine. Approval is expected in the third quarter of 2016. A front-end
engineering and design (FEED) study was completed in March, with assessment of further capital optimization opportunities to
be completed in the third quarter of 2016. In conjunction with the North Pine Facility, AltaGas is developing two liquids supply
lines connecting the North Pine Facility to the Alaska Highway truck terminal. Completion of the FEED study and application with
the OGC is expected in the third quarter of 2016. The North Pine Facility and the two liquids supply lines are expected to cost
approximately $190 to $210 million. AltaGas expects to receive permits and reach a Final Investment Decision (FID) in 2016 with
commercial operations commencing in the first half of 2018.
Ridley Island Propane Export Terminal
AltaGas signed a sublease and related agreements with Ridley Terminals Inc. to develop, build, own and operate the proposed
Ridley Island Propane Export Terminal located near Prince Rupert, British Columbia on lands leased from Ridley Terminals Inc.
and the Prince Rupert Port Authority. The proposed Ridley Island Propane Export Terminal is estimated to cost approximately
$400 to $500 million and is to be designed to ship up to 1.2 million tonnes of propane per annum. It will be built on a brownfield
site with a history of industrial development, connections to existing rail lines and an existing marine jetty with deep water access
to the Pacific Ocean. Propane from British Columbia and Alberta natural gas producers will be transported to the facility using the
existing CN rail network.
AltaGas has begun the formal environmental review process. AltaGas also continues to engage closely with First Nations. On
February 11, 2016, AltaGas filed an application with the National Energy Board (NEB) for a 25-year propane export licence.
Preliminary engineering and the FEED study have been completed and further capital optimization opportunities are currently
being addressed. AltaGas expects to reach FID in the fourth quarter of 2016, subject to First Nations engagement and necessary
approvals.
Early Stage Deep Basin Liquids Separation Facility
AltaGas is in the early stages of development of a liquids separation facility which will serve producers in the Deep Basin region
of northwest Alberta. A pre-FEED study was completed in May 2016. The facility is being designed with capacity to process up to
10,000 Bbls/d of C3+ and handle up to 10,000 Bbls/d of C5+. The Deep Basin facility will have access to existing rail and can be
connected to AltaGas’ proposed Ridley Island Propane Export Terminal. Active discussions with producers to contractually
underpin the base capacity are continuing, and engagement with First Nations and key stakeholders is underway. Facility and
rail applications have been submitted to the Alberta Energy Regulator in May 2016. AltaGas will target to reach FID in 2016,

AltaGas Ltd. – Q2 2016 - 6
subject to completing commercial arrangements, stakeholder engagement, and regulatory approvals. The liquids separation
facility is expected to cost approximately $60 to $80 million.
Blythe Energy Center (Blythe)
The Blythe Facility, and the Blythe II Facility (Sonoran) currently under development, are well situated to serve a larger western
regional transmission organization comprised of several western U.S. states. AltaGas expects several request for proposals to
emerge from these states throughout the course of 2016 and 2017, and expects to bid both the potential re-contracting of its
Blythe Facility after its PPA expires July 31, 2020, and the potential Sonoran Facility, into these upcoming RFPs. Separately,
AltaGas continues to have bilateral discussions with utilities and municipalities for multi-year capacity agreements, while also
considering Resource Adequacy market pricing, potential energy and ancillary service offerings, and alternative configurations
(gas, combined with solar and energy storage) for the Blythe facilities. It is expected that up to 15,000 megawatts (MW) will need
to be replaced in California due to retirements over the next decade. As utilities, non-utility and large generators continue to
determine their future resource needs to achieve California’s 50 percent renewable portfolio standard, sufficient flexible, fast
ramping gas-fired capability will be required to help backstop intermittent renewable capacity and meet peak load requirements.
Repowering of Pomona Facility
In the first quarter of 2016 AltaGas submitted an application with the California Energy Commission to repower the Pomona
Facility to a flexible, fast ramping peaking facility under the small power plant exemption process. It is anticipated that the
application review process will be approximately 12 months and include a review of the emissions profile by the local air district.
The existing Pomona Facility is a 44.5 MW gas-fired peaking plant strategically located in the Los Angeles load pocket. The
repowered facility could be comprised of more efficient gas-fired technology with capacity up to 100 MW. Following approval
AltaGas will be ready to bid the repowered Pomona facility into upcoming RFPs or enter into other bilateral contract
arrangements. At the same time, AltaGas is also reviewing commercial opportunities for energy storage at the Pomona facility.

AltaGas Ltd. – Q2 2016 - 7
Monthly Common Share Dividend and Quarterly Preferr ed Share Dividend
• The Board of Directors approved a dividend of $0.175 per common share. The dividend will be paid on September 15,
2016, to common shareholders of record on August 25, 2016. The ex-dividend date is August 23, 2016. This dividend is
an eligible dividend for Canadian income tax purposes;
• The Board of Directors approved a dividend of $0.21125 per share for the period commencing June 30, 2016 and
ending September 29, 2016, on AltaGas' outstanding Series A Preferred Shares. The dividend will be paid on
September 30, 2016 to shareholders of record on September 16, 2016. The ex-dividend date is September 14, 2016;
• The Board of Directors approved a dividend of $0.20109 per share for the period commencing June 30, 2016 and
ending September 29, 2016, on AltaGas' outstanding Series B Preferred Shares. The dividend will be paid on
September 30, 2016 to shareholders of record on September 16, 2016. The ex-dividend date is September 14, 2016;
• The Board of Directors approved a dividend of US$0.275 per share for the period commencing June 30, 2016 and
ending September 29, 2016, on AltaGas' outstanding Series C Preferred Shares. The dividend will be paid on
September 30, 2016 to shareholders of record on September 16, 2016. The ex-dividend date is September 14, 2016;
• The Board of Directors approved a dividend of $0.3125 per share for the period commencing June 30, 2016, and
ending September 29, 2016, on AltaGas' outstanding Series E Preferred Shares. The dividend will be paid on
September 30, 2016 to shareholders of record on September 16, 2016. The ex-dividend date is September 14, 2016;
• The Board of Directors approved a dividend of $0.296875 per share for the period commencing June 30, 2016, and
ending September 29, 2016, on AltaGas' outstanding Series G Preferred Shares. The dividend will be paid on
September 30, 2016 to shareholders of record on September 16, 2016. The ex-dividend date is September 14, 2016;
and
• The Board of Directors approved a dividend of $0.328125 per share for the period commencing June 30, 2016, and
ending September 29, 2016, on AltaGas' outstanding Series I Preferred Shares. The dividend will be paid on
September 30, 2016 to shareholders of record on September 16, 2016. The ex-dividend date is September 14, 2016.

AltaGas Ltd. – Q2 2016 - 8
Consolidated Financial Review
Three Months Ended
June 30
Six Months Ended
June 30
($ millions) 2016 2015 2016 2015
Revenue 426 416 1,036 1,161
Normalized EBITDA(1) 153 107 332 284
Net income (loss) applicable to common shares 16 (22) 71 44
Normalized net income(1) 29 9 68 66
Total assets 9,858 8,479 9,858 8,479
Total long-term liabilities 4,561 4,139 4,561 4,139
Net additions to property, plant and equipment 126 143 206 253
Dividends declared(2) 76 63 148 123
Cash flows
Normalized funds from operations(1) 114 68 248 208
Three Months Ended
June 30
Six Months Ended
June 30
($ per share, except shares outstanding) 2016 2015 2016 2015
Normalized EBITDA(1) 1.01 0.79 2.23 2.10
Net income (loss) per common share - basic 0.10 (0.16) 0.48 0.33
Net income (loss) per common share - diluted 0.10 (0.16) 0.48 0.33
Normalized net income(1) 0.19 0.07 0.46 0.49
Dividends declared(2) 0.50 0.47 0.99 0.91
Cash flows
Normalized funds from operations(1) 0.75 0.50 1.66 1.54
Shares outstanding - basic (millions)
During the period(3) 152 135 149 135
End of period 163 135 163 135
(1) Non-GAAP financial measure; see discussion in Non-GAAP Financial Measures section of this MD&A.
(2) Dividends declared per common share per month $0.1475 beginning on May 26, 2014, $0.16 beginning on May 26, 2015 and $0.165 beginning on October 26,
2015.
(3) Weighted average.
AltaGas Ltd. – Q2 2016 - 9
Conference Call and Webcast Details:
AltaGas will hold a conference call, July 21, 2016 at 9:00 a.m. MT (11:00 a.m. ET) to discuss second quarter financial results,
progress on construction projects and other corporate developments.
Members of the investment communities and other interested parties may dial (416) 340-2216 or call toll free at 1-866-225-0198.
There is no passcode. Please note that the conference call will also be webcast. To listen, please go to
http://www.altagas.ca/investors/presentations_and_events. The webcast will be archived for one year.
Shortly after the conclusion of the call, a replay will be available by dialing (905) 694-9451 or 1-800-408-3053. The passcode is
4242465. The replay will expire at midnight (Eastern) on July 28, 2016.
Additional information relating to AltaGas’ results can be found in the Management’s Discussion and Analysis and unaudited
condensed interim consolidated financial statements as at and for the period ended June 30, 2016 available through AltaGas'
website at www.altagas.ca or through SEDAR at www.sedar.com.
AltaGas is an energy infrastructure business with a focus on natural gas, power and regulated utilities. AltaGas creates value by
acquiring, growing and optimizing its energy infrastructure, including a focus on clean energy sources. For more information visit:
www.altagas.ca
Investment Community
1-877-691-7199
Media
(403) 691-7197
TM denotes trademark of Canaccord Genuity Corp. This news release contains forward-looking statements. When used in this news release, the words “may”, “would”, “could”, “will”, “intend”, “plan”, “anticipate”, “believe”, “seek”, "contemplate", “projection”, “propose”, “focus”, “estimate”, “target”, “on track”, “expect”, and similar expressions, as they relate to AltaGas or an affiliate of AltaGas, are intended to identify forward-looking statements. This news release contains forward-looking statements with respect to, among other things, business objectives, expected growth, results of operations, performance, business projects and opportunities, capital expenditures, and financial results. In particular this news release contains forward looking statements with respect to the projected growth or decline in normalized EBITDA and normalized funds from operations (including per business segment); expectations with respect to the Townsend Facility and related projects including progress of construction, estimated cost, expected commissioning timeline, expected earnings and impact on earnings, capacity and cost of egress lines and truck terminal and expectations regarding Painted Pony’s reservation of firm capacity on egress lines and delivery of gas volumes; expectations with respect to the development of the proposed Ridley Island Propane Export Terminal including development costs, propane transport capability, initial shipment capacity, sale and purchase of LPG from the terminal, timing of final investment decision and commercial operations, entering into a multi-year agreement with Astomos and impact MOU has on underpinning project and final investment decision; expectations relating to the development of the North Pine Facility and liquid supply lines including connection capability to rail, existing AltaGas infrastructure, the proposed Ridley Island Propane Export Terminal and the Alaska highway truck terminal, facility specifications, handling capability, service area cost, completion date of studies and permitting, final investment decision date and commercial operation date; expectations with respect to the development of the Deep Basin facility including facility specifications, design and handling capacity, access to rail, connection capability to proposed Ridley Island Propane Export Terminal and target for final investment decision and completion of studies and permitting; expectations relating to AltaGas’ ability to fund its projects and business, including its access to capital markets and credit facilities and its flexibility to manage timing of capital spending; expectations that AltaGas is well-positioned to fund its growth capital and to take advantage of growth opportunities as they arise; expectations relating to the energy needs of California; the potential for, and timing of, RFPs from western U.S. states, the ability to bid the Blythe and Sonoran facilities into these upcoming RFPs, reconfigure, recontract and pursue other opportunities available for these facilities and pursue other opportunities; expectations with respect to the Pomona facility including expected timeline, ability to repower, increase capacity, reconfigure, bid into RFPs and pursue other opportunities; expectations relating to the San Joaquin Facilities including expected contributions to growth and impact on earnings; expectations relating to the Northwest Hydro Facilities including expected contributions to earnings; expected impact on earnings of the sale of gas assets to Tidewater; expectations regarding Petrogas including earnings and dividends from Petrogas and contributions to AltaGas' growth; expectations regarding U.S. dollar exchange rate, commodity hedge gains and operating and administrative

AltaGas Ltd. – Q2 2016 - 10
expenses; expected earnings from the utilities segment including from rate base and customer growth; expectations regarding the payment of dividends; and ability to dispose of smaller non-core assets.
These statements involve known and unknown risks, uncertainties and other factors that may cause actual results or events to differ materially from those anticipated in such forward looking statements. Such statements reflect AltaGas' current views with respect to future events based on certain material factors and assumptions and are subject to certain risks and uncertainties including, without limitation, changes in market competition, governmental or regulatory developments, changes in tax legislation, fluctuations in commodity prices, interest or foreign exchange rates, access to capital markets, general economic conditions, changes in the political environment, changes to environmental and other laws and regulations, cost for labour, equipment and materials and other factors set out in AltaGas’ continuous disclosure documents, including the Annual Information Form and the MD&A as at and for the year ended December 31, 2015.
Many factors could cause AltaGas’ actual results, performance or achievements to vary from those described in this news release, including without limitation those listed above as well as the assumptions upon which they are based proving incorrect. These factors should not be construed as exhaustive. Should one or more of these risks or uncertainties materialize, or should assumptions underlying forward-looking statements prove incorrect, actual results may vary materially from those described in this news release as intended, planned, anticipated, believed, sought, proposed, estimated, forecasted, expected, projected or targeted, and such forward-looking statements included in, or incorporated by reference in this news release, should not be unduly relied upon. Such statements speak only as of the date of this news release. AltaGas does not intend, and does not assume any obligation, to update these forward-looking statements. The forward-looking statements contained in this news release are expressly qualified by this cautionary statement.
Financial outlook information contained in this news release about prospective financial performance, financial position or cash flows is based on assumptions about future events, including economic conditions and proposed courses of action, based on management’s assessment of the relevant information currently available. Readers are cautioned that such financial outlook information contained in this news release should not be used for purposes other than for which it is disclosed herein.
This news release contains references to certain financial measures that do not have a standardized meaning prescribed by GAAP and may not be comparable to similar measures presented by other entities. The non-GAAP measures and their reconciliation to GAAP financial measures are shown in AltaGas’ Management's Discussion and Analysis (MD&A) as at and for the three and six months ended June 30, 2016. These measures provide additional information that management believes is meaningful regarding AltaGas' operational performance, liquidity and capacity to fund dividends, capital expenditures, and other investing activities. The specific rationale for and incremental information associated with each non-GAAP measure is discussed in AltaGas’ MD&A as at and for the three and six months ended June 30, 2016. Readers are cautioned that these non-GAAP measures should not be construed as alternatives to other measures of financial performance calculated in accordance with GAAP.

AltaGas Ltd. – Q2 2016 - 11
MANAGEMENT'S DISCUSSION AND ANALYSIS
The Management's Discussion and Analysis (MD&A) of operations and unaudited condensed interim Consolidated Financial
Statements presented herein are provided to enable readers to assess the results of operations, liquidity and capital resources of
AltaGas Ltd. (AltaGas or the Corporation) as at and for the three and six months ended June 30, 2016. This MD&A, dated July
20, 2016, should be read in conjunction with the accompanying unaudited condensed interim Consolidated Financial Statements
and notes thereto of AltaGas as at and for the three and six months ended June 30, 2016, and the audited Consolidated
Financial Statements and MD&A as at and for the year ended December 31, 2015.
The unaudited condensed interim Consolidated Financial Statements and comparative information have been prepared in
accordance with United States (U.S.) generally accepted accounting principles (U.S. GAAP or GAAP) and in Canadian dollars,
unless otherwise indicated.
Abbreviations, acronyms and other capitalized terms used in this MD&A without express definition shall have the same
meanings given to those terms in the MD&A as at and for the year ended December 31, 2015.
This MD&A contains forward-looking statements. When used in this MD&A the words “may”, “would”, “could”, “should”, “will”,
“intend”, “plan”, “anticipate”, “believe”, “aim”, “seek”, “propose”, “contemplate”, “estimate”, “forecast”, “expect”, “project”, “target”,
“potential” and similar expressions suggesting future events or future performance, as they relate to the Corporation or any
affiliate of the Corporation, are intended to identify forward-looking statements. In particular, this MD&A contains forward-looking
statements with respect to, among others things, business objectives, the anticipated benefits of acquisitions and other major
projects, the anticipated timing of commercial operations and investment decisions, expenditures, licensing and permitting,
expected growth, capital expenditures, results of operations, operational and financial performance, business projects,
opportunities and financial results.
Specifically, such forward-looking statements are set forth under the headings: “2016 Outlook”, “Growth Capital” and “Future
Changes in Accounting Principles” and under those headings specifically include expectations with respect to the projected
growth or decline in normalized EBITDA and normalized funds from operations (including per business segment); expectations
with respect to the Townsend Facility and related projects including progress of construction, estimated cost, expected
commissioning timeline, expected earnings and impact on earnings, capacity, and cost of egress lines and truck terminal and
expectations regarding Painted Pony’s reservation of firm capacity on egress lines and delivery of gas volumes; expectations
with respect to the development of the proposed Ridley Island Propane Export Terminal including development costs, propane
transport capability, initial shipment capacity, sale and purchase of liquefied petroleum gas from the terminal, entering into a
multi-year agreement with Astomos and timing of final investment decision and commercial operations; expectations relating to
the development of the North Pine Facility and liquid supply lines including connection capability to rail, existing AltaGas
infrastructure, the proposed Ridley Island Propane Export Terminal and Alaska highway truck terminal, facility specifications,
handling capability, service area, cost, completion date of studies and permitting, final investment decision date and commercial
operation date; expectations with respect to the development of the Deep Basin facility including facility specifications, design
and handling capacity, access to rail, connection capability to the proposed Ridley Island Propane Export Terminal and target for
final investment decision and completion of studies and permitting; expectations that AltaGas is well-positioned to fund its growth
capital and to take advantage of growth opportunities as they arise; expectations relating to AltaGas’ ability to fund its projects
and business and its flexibility to manage timing of capital spending; expectations relating to the energy needs of California; the
potential for, and timing of, RFPs from western U.S. states, the ability to bid the Blythe and Sonoran facilities into these upcoming
RFPs, reconfigure, recontract and pursue other opportunities available for these facilities; expectations with respect to the
Pomona facility including expected timeline, ability to repower, increase capacity, reconfigure, bid into RFPs and pursue other
opportunities; expectations relating to the San Joaquin Facilities including expected contributions to growth and impact on
earnings; expectations relating to the Northwest Hydro Facilities including expected contributions to earnings and seasonality
impacts; expected impact on earnings of the Tidewater Gas Asset Disposition; expectations regarding gas processing volumes
at non-core facilities and disposition of smaller non-core assets; expectations regarding Petrogas including earnings and
dividends from Petrogas and contributions to growth of AltaGas; expectations regarding the U.S. dollar exchange rate,

AltaGas Ltd. – Q2 2016 - 12
commodity hedge gains and operating and administrative costs; expected earnings from the utilities segment including from rate
base and customer growth, from SEMCO Gas as a result of its Main Replacement Program, from ENSTAR in connection with its
2016 rate case and from Heritage Gas if the NSUARB approves its application relating to customer retention; expected decision
date on ENSTAR's rates; expectations with respect to the Alton Natural Gas Storage Project including expected natural gas
storage capacity, construction timeline and storage in service date and expectations regarding the adoption of changes in
accounting principles and impact on financial statements.
These statements involve known and unknown risks, uncertainties and other factors that may cause actual results or events to
differ materially from those anticipated in such forward-looking statements. Such statements reflect AltaGas' current views with
respect to future events based on certain material factors and assumptions and are subject to certain risks and uncertainties
including, without limitation, changes in market competition, governmental or regulatory developments, changes in tax
legislation, fluctuations in commodity prices, interest or foreign exchange rates, access to capital markets, general economic
conditions, changes in the political environment, changes to environmental and other laws and regulations, cost for labour,
equipment and materials and other factors set out in AltaGas’ continuous disclosure documents, including the Annual
Information Form and the MD&A as at and for the year ended December 31, 2015.
Many factors could cause AltaGas' or any of its business segments' actual results, performance or achievements to vary from
those described in this MD&A including, without limitation, those listed above as well as the assumptions upon which they are
based proving incorrect. These factors should not be construed as exhaustive. Should one or more of these risks or uncertainties
materialize, or should assumptions underlying forward-looking statements prove incorrect, actual results may vary materially
from those described in this MD&A as intended, planned, anticipated, believed, sought, proposed, estimated, forecasted,
expected, projected or targeted and such forward-looking statements included in this MD&A should not be unduly relied upon.
These statements speak only as of the date of this MD&A. AltaGas does not intend, and does not assume any obligation, to
update these forward-looking statements except as required by law. The forward-looking statements contained in this MD&A are
expressly qualified by these cautionary statements.
Financial outlook information contained in this MD&A about prospective financial performance, financial position, or cash flows is
based on assumptions about future events, including economic conditions and proposed courses of action, based on
management's assessment of the relevant information currently available. Readers are cautioned that such financial outlook
information contained in this MD&A should not be used for purposes other than for which it is disclosed herein.
Additional information relating to AltaGas can be found on its website at www.altagas.ca. The continuous disclosure documents
of AltaGas, including its audited Consolidated Financial Statements and MD&A as at and for the year ended December 31, 2015,
Annual Information Form, Management Information Circular, material change reports and press releases, are also available
through AltaGas' website or through SEDAR at www.sedar.com.

AltaGas Ltd. – Q2 2016 - 13
ALTAGAS ORGANIZATION
The businesses of AltaGas are operated by AltaGas and a number of its subsidiaries including, without limitation, AltaGas
Extraction and Transmission Limited Partnership, AltaGas Pipeline Partnership, AltaGas Processing Partnership, Harmattan
Gas Processing Limited Partnership, AltaGas Utilities Inc. (AUI), Heritage Gas Limited (Heritage Gas), Pacific Northern Gas Ltd.
(PNG), Coast Mountain Hydro Limited Partnership, AltaGas Services (U.S.) Inc., Blythe Energy Inc. (Blythe), AltaGas San
Joaquin Energy Inc., and SEMCO Energy, Inc. (SEMCO). SEMCO conducts its Michigan natural gas distribution business under
the name SEMCO Energy Gas Company (SEMCO Gas) and its Alaska natural gas distribution business under the name
ENSTAR Natural Gas Company (ENSTAR).
SECOND QUARTER FINANCIAL HIGHLIGHTS (1)
• Normalized EBITDA was $153 million, an increase of 43 percent compared to $107 million in the second quarter of
2015;
• Normalized funds from operations was $114 million ($0.75 per share), an increase of 68 percent compared to $68
million ($0.50 per share) in the second quarter of 2015;
• Net income applicable to common shares was $16 million ($0.10 per share) compared to net loss applicable to common
shares of $22 million ($0.16 per share) in the second quarter of 2015;
• Net debt was $3.7 billion as at June 30, 2016, compared to $3.0 billion as at June 30, 2015, and $3.9 billion as at
December 31, 2015;
• Debt-to-total capitalization ratio was 45 percent as at June 30, 2016, compared to 45 percent as at June 30, 2015, and
48 percent as at December 31, 2015;
• On April 7, 2016, AltaGas issued $350 million of senior unsecured medium-term notes (MTNs). The MTNs carry a
coupon rate of 4.12 percent and will mature on April 7, 2026;
• On May 24, 2016, AltaGas LPG Limited Partnership, a wholly-owned subsidiary, entered into a Memorandum of
Understanding with Astomos Energy Corporation setting out key commercial terms for the sale and purchase of
liquefied petroleum gas (LPG) from the proposed Ridley Island Propane Export Terminal;
• On June 6, 2016, AltaGas closed a public offering of 14,685,000 Common Shares, on a bought deal basis, at an issue
price of $30 per Common Share, for total gross proceeds of approximately $440 million;
• In June 2016, AltaGas completed a restructuring that reduced its total non-utility workforce by approximately 10 percent
(the Workforce Restructuring). Total pre-tax restructuring costs incurred were approximately $7 million. On an
annualized basis, operating and administrative expenses are expected to be reduced by approximately $7 million; and
• On June 29, 2016, AltaGas directly invested $150 million to subscribe for 6,000,000 cumulative redeemable convertible
preferred shares (the Petrogas Preferred Shares) of Petrogas Energy Corp. (Petrogas). These preferred shares are
non-voting and entitle AltaGas to a fixed, cumulative, preferential cash dividend at a rate of 8.5 percent per annum
payable quarterly.
(1) Includes non-GAAP financial measures; see discussion in Non-GAAP Financial Measures section of this MD&A.

AltaGas Ltd. – Q2 2016 - 14
CONSOLIDATED FINANCIAL REVIEW
Three Months Ended
June 30 Six Months Ended
June 30($ millions) 2016 2015 2016 2015 Revenue 426 416 1,036 1,161
Normalized EBITDA(1) 153 107 332 284 Net income (loss) applicable to common shares 16 (22) 71 44
Normalized net income(1) 29 9 68 66 Total assets 9,858 8,479 9,858 8,479 Total long-term liabilities 4,561 4,139 4,561 4,139 Net additions to property, plant and equipment 126 143 206 253
Dividends declared(2) 76 63 148 123 Cash flows
Normalized funds from operations(1) 114 68 248 208
Three Months Ended
June 30 Six Months Ended
June 30($ per share, except shares outstanding) 2016 2015 2016 2015
Normalized EBITDA(1) 1.01 0.79 2.23 2.10 Net income (loss) per common share - basic 0.10 (0.16) 0.48 0.33 Net income (loss) per common share - diluted 0.10 (0.16) 0.48 0.33
Normalized net income(1) 0.19 0.07 0.46 0.49
Dividends declared(2) 0.50 0.47 0.99 0.91 Cash flows
Normalized funds from operations(1) 0.75 0.50 1.66 1.54 Shares outstanding - basic (millions)
During the period(3) 152 135 149 135
End of period 163 135 163 135 (1) Non-GAAP financial measure; see discussion in Non-GAAP Financial Measures section of this MD&A.
(2) Dividends declared per common share per month $0.1475 beginning on May 26, 2014, $0.16 beginning on May 26, 2015 and $0.165 beginning on October 26,
2015.
(3) Weighted average.
Three Months Ended June 30
Normalized EBITDA for the second quarter of 2016 was $153 million, compared to $107 million for the same quarter in 2015. The
increase was mainly due to the San Joaquin Facilities acquired on November 30, 2015, which contributed to EBITDA growth of
approximately $27 million, higher contributions from the Northwest Hydro Facilities as a result of McLymont entering commercial
service in the fourth quarter of 2015, improved performance at Forrest Kerr after a full year of operations and higher river flow, the
absence of turnarounds at the Younger and Harmattan facilities compared to the second quarter of 2015, and higher realized
hedging gains on the Alberta power portfolio. These increases were partially offset by lower gains from frac hedges, the absence
of equity income from the Sundance B Power Purchase Arrangements (the Sundance B PPAs) terminated in the first quarter of
2016, and the impact of the sale of non-core assets to Tidewater Midstream and Infrastructure Ltd. (Tidewater) on February 29,
2016.
Normalized funds from operations for the second quarter of 2016 was $114 million ($0.75 per share), compared to $68 million
($0.50 per share) for the same quarter in 2015, reflecting the same drivers as normalized EBITDA as well as higher distributions
from Petrogas, partially offset by higher interest and current income tax expense.

AltaGas Ltd. – Q2 2016 - 15
In June 2016, AltaGas completed the Workforce Restructuring that reduced its non-utility workforce by approximately 10
percent. Total pre-tax restructuring costs incurred were approximately $7 million, which were charged to operating and
administrative expenses.
Operating and administrative expenses for the second quarter of 2016 were $133 million, compared to $121 million for the same
quarter in 2015. The increase was primarily due to the restructuring costs and higher operating and administrative costs incurred
by the Power segment due to new assets placed into service or acquired. Depreciation and amortization expense for the second
quarter of 2016 was $66 million, compared to $50 million for the same quarter in 2015. The increase was mainly due to new
assets placed into service or acquired. Interest expense for the second quarter of 2016 was $36 million, compared to $30 million
for the same quarter in 2015. The increase was mainly due to higher average debt outstanding and lower capitalized interest,
partially offset by lower interest rates.
AltaGas recorded income tax expense of $4 million for the second quarter of 2016, compared to $10 million in the same quarter
of 2015. The decrease was mainly due to the absence of a one-time, non-cash $14 million charge recorded in the second quarter
of 2015 related to a 2 percent increase in the Alberta corporate income tax rate. This was partially offset by higher earnings in the
second quarter of 2016.
Normalized net income was $29 million ($0.19 per share) for the second quarter of 2016, compared to $9 million ($0.07 per
share) reported for the same quarter in 2015. The variance was driven by the same factors impacting normalized EBITDA as well
as higher depreciation and amortization expense, interest expense and preferred share dividends.
Net income applicable to common shares for the second quarter of 2016 was $16 million ($0.10 per share) compared to net loss
applicable to common shares of $22 million ($0.16 per share) for the same quarter in 2015. Net income applicable to common
shares for the second quarter of 2016 was normalized for after-tax amounts related to unrealized losses on risk management
contracts and restructuring costs. In the second quarter of 2015, net loss applicable to common shares was normalized for
after-tax amounts related to unrealized losses on risk management contracts, energy export development costs, unrealized
gains on long-term investments, and a statutory tax rate change.
Six Months Ended June 30
Normalized EBITDA for the first half of 2016 was $332 million, compared to $284 million for the same period in 2015. The increase was primarily due to EBITDA generated from the San Joaquin Facilities, rate base and customer growth at the Utilities,
the impact of the stronger US dollar on reported results of the U.S. assets, higher contributions from the Northwest Hydro Facilities, the absence of turnarounds at the Younger and Harmattan facilities, and higher earnings from Petrogas. This was partially offset by the impact of significantly warmer weather experienced at all of AltaGas’ Utilities during the winter heating
season, lower gains from frac hedges, lower fee-for-service revenue, and low Alberta power pool prices prior to the termination of the Sundance B PPAs.
Normalized funds from operations for the first half of 2016 was $248 million ($1.66 per share), compared to $208 million ($1.54
per share) for the same period in 2015, driven by the same factors impacting normalized EBITDA as well as an increase in common share dividends from Petrogas, partially offset by higher interest and current income tax expense.
Operating and administrative expenses for the first half of 2016 were $265 million, compared to $238 million for the same period
in 2015. The increase was primarily due to higher operating and administrative costs incurred by the Power segment due to new assets placed into service or acquired, the restructuring costs and the impact of the stronger US dollar. Depreciation and amortization expense for the first half of 2016 increased to $135 million, compared to $100 million for the same period in 2015
mainly due to new assets placed into service or acquired and the impact of the stronger US dollar. Interest expense for the first half of 2016 was $72 million, compared to $60 million for the same period in 2015. The increase was mainly due to higher average debt outstanding and lower capitalized interest, partially offset by lower interest rates.

AltaGas Ltd. – Q2 2016 - 16
In the first quarter of 2016, ASTC Power Partnership (ASTC) exercised its right to terminate the Sundance B PPAs effective
March 8, 2016 pursuant to the change in law provisions of the Sundance B PPAs as a result of recent changes in law regarding
the Alberta Specified Gas Emitters Regulation. Upon the termination of the Sundance B PPAs, AltaGas recognized a pre-tax
provision of $4 million on its investment in ASTC to settle the working capital deficiency in the first quarter of 2016.
On February 29, 2016, AltaGas completed the sale of certain non-core natural gas gathering and processing assets located
primarily in central and north central Alberta totaling approximately 490 Mmcf/d of gross licensed natural gas processing capacity
to Tidewater (the Tidewater Gas Asset Disposition) for $30 million of cash and approximately 43.7 million common shares of
Tidewater. At the time of disposition, the volumes processed at these facilities totaled approximately 120 mmcf/d. A pre-tax gain
of $4 million was recognized on the sale in the first quarter of 2016.
AltaGas recorded income tax expense of $10 million for the first half of 2016 compared to $41 million for the same period in
2015. Income tax expense decreased primarily due to the absence of the one-time, non-cash $14 million charge related to the increase in the Alberta corporate income tax rate, the $10 million tax recovery related to the Tidewater Gas Asset Disposition recorded in the first quarter of 2016 and lower earnings from operations in Canada.
Normalized net income for the first half of 2016 was $68 million ($0.46 per share), compared to $66 million ($0.49 per share) reported for the same period in 2015. The variance was driven by the same factors impacting normalized EBITDA as well as
higher depreciation and amortization expense, interest expense and preferred share dividends. Net income applicable to common shares for the first half of 2016 was $71 million ($0.48 per share) compared to $44 million
($0.33 per share) for the same period in 2015. Net income applicable to common shares for the first half of 2016 was normalized for after-tax amounts related to unrealized losses on risk management contracts, transaction costs related to acquisitions, gains on sale of assets and related tax recovery, dilution loss recognized on investment accounted for by the equity method, provision
on investment accounted for by the equity method, and restructuring costs. In the first half of 2015, net income applicable to common shares was normalized for after-tax amounts related to unrealized losses on risk management contracts, unrealized gains on long-term investments, development costs incurred for the energy export projects and a statutory tax rate change.
2016 OUTLOOK
AltaGas continues to expect to deliver overall normalized EBITDA growth of approximately 20 percent in 2016 compared to
2015. The majority of the annual growth in 2016 is expected to be driven by the Power segment, with Utilities also expected to
increase by a small amount from 2015, while the Gas segment is expected to see a small decline versus 2015 mainly due to the
Tidewater Gas Asset Disposition. The most significant driver of normalized EBITDA growth is a full year contribution from the
San Joaquin Facilities acquired on November 30, 2015. 2016 will also be the first year that all three Northwest Hydro Facilities
provide a full year contribution as McLymont entered commercial service in the fourth quarter of 2015. AltaGas’ integrated
northeast British Columbia strategy is expected to add additional EBITDA in 2016 with a partial year contribution from the first
phase of the Townsend Facility entering commercial operations on July 10, 2016. The Townsend Facility is expected to generate
normalized EBITDA of approximately $20 million for 2016 as volumes from Painted Pony Petroleum Ltd. (Painted Pony)
progressively increase through year-end. The Utilities segment is expected to report increased normalized EBITDA in 2016
driven by rate base and customer growth while also benefitting from a favorable US dollar exchange rate. The overall forecasted
growth in normalized EBITDA includes lower commodity hedge gains in the Gas segment compared with 2015 as well as higher
operating and administrative costs due to new assets placed into service.
AltaGas continues to expect normalized funds from operations to grow by up to approximately 15 percent in 2016, driven by the
factors noted above for normalized EBITDA growth, partially offset by higher financing costs related to new assets acquired as
well as new assets in service and higher current tax expenses. AltaGas’ $150 million investment in the Petrogas Preferred
Shares will contribute to funds from operations as dividends on such shares are expected to be paid quarterly. In the first half of
2016, AltaGas received $12 million in common share dividends from Petrogas and currently expects to receive a similar amount
in the second half of 2016. For the full year of 2015 AltaGas received $11 million in common share dividends from Petrogas.

AltaGas Ltd. – Q2 2016 - 17
The Workforce Restructuring is expected to reduce operating and administrative expenses by approximately $7 million on an
annualized basis.
In the Power segment, increased earnings are expected to be driven by the San Joaquin Facilities and a full-year contribution
from McLymont. The earnings and cash flows from the Northwest Hydro Facilities are expected to be seasonally stronger
through early fourth quarter based on normal water flow patterns. Actual seasonal water flows will vary with rainfall and
snowpack levels.
In the Utilities segment, AltaGas expects the fourth quarter to be seasonally stronger due to the winter heating season, while the
third quarter is expected to be seasonally weaker. The Utilities segment is expected to report increased earnings in 2016 driven
by rate base and customer growth. SEMCO Gas expects approximately $8 million of margin in 2016 as a result of a full year
contribution of its Main Replacement Program (MRP). In July, the Regulatory Commission of Alaska approved an interim and
refundable rate increase of approximately US$5 million (annualized) for ENSTAR effective August 1, 2016 with final rates to be
set in 2017. Earnings at all of the utilities (except PNG) are affected by weather in their franchise areas, with colder weather
generally benefiting earnings. If the weather varies from normal weather, earnings at the utilities would be affected.
In order to maintain competitive pricing and customer retention, Heritage Gas filed a Customer Retention Program application
with the Nova Scotia Utility and Review Board (NSUARB) on March 2, 2016 requesting a decrease in distribution rates for certain
commercial customers, a suspension of depreciation and an increase to capitalization rate for operating, maintenance and
administrative expenses while the program is in effect. The NSUARB granted interim approval for Heritage Gas’ revised rates
effective March 22, 2016. The full hearing occurred on July 4, 2016 and if the NSUARB approves the application in its entirety,
normalized EBITDA is expected to decrease by approximately $4 million in 2016. Heritage Gas is currently awaiting the
NSUARB ruling.
In the Gas segment, additional earnings are expected to be driven by a partial year contribution from the first phase of the
Townsend Facility, higher earnings from Petrogas and the absence of turnarounds at the Harmattan and Younger facilities. The
additional earnings are expected to be offset by lower commodity hedge gains, the Tidewater Gas Asset Disposition, as well as
approximately a 5 percent decrease in volumes at non-core gas facilities. The Tidewater Gas Asset Disposition represented
approximately 5 percent of 2015 normalized EBITDA for the Gas segment and less than 2 percent of AltaGas’ expected 2016
normalized EBITDA. AltaGas has entered into a summer and winter frac hedge with bifurcated volumes which range between
750 to 3,000 Bbls/d at an average price of approximately $22/Bbl excluding basis differentials. Based on recent strength seen in
commodity prices, AltaGas estimates an average of approximately 7,000 Bbls/d will be exposed to frac spread for the remainder
of 2016.
If the US dollar remains strong compared with 2015, the EBITDA and operating income reported for AltaGas’ U.S. assets will
benefit accordingly in 2016. Some of this benefit will be offset by US dollar denominated depreciation, interest on US dollar
denominated debt, dividends on US dollar denominated preferred shares and U.S. income tax expense.
GROWTH CAPITAL
Based on projects currently under review, development or construction, AltaGas expects capital expenditures in the range of
$600 to $650 million for 2016. Gas and Power maintenance capital is expected to be less than $40 million of total capital
expenditures. With the completion of the Townsend Facility, a significant portion of the 2016 committed growth capital has been
incurred. A large portion of the remaining 2016 growth capital expenditures is discretionary and AltaGas has the flexibility to
adjust the pace of spending at its option. The Corporation continues to focus on enhancing productivity and streamlining
businesses, including the disposition of smaller non-core assets.

AltaGas Ltd. – Q2 2016 - 18
AltaGas' 2016 committed capital program is expected to be funded through internally-generated cash flow and the Premium
DividendTM, Dividend Reinvestment and Optional Cash Purchase Plan (DRIP). In addition, as at June 30, 2016, the Corporation
had approximately $1.4 billion available under its credit facilities and cash of $77 million.
Townsend Gas Processing Facility
Construction of AltaGas’ integrated midstream complex at Townsend in Northeast British Columbia, including the Townsend
Facility, gas gathering line, liquids egress lines and truck terminal, was largely completed by the end of the second quarter of
2016. The total project is expected to have a final cost of approximately $430 million. This represents a savings of approximately
$40 million less than what was originally anticipated. The cost savings were achieved through in-house construction capabilities
and efficiencies, and will benefit both Painted Pony and AltaGas.
The Townsend Facility is a 198 Mmcf/d shallow-cut gas processing facility located approximately 100 km north of Fort St. John
and 20 km southeast of AltaGas' Blair Creek Facility. Painted Pony has reserved all of the firm capacity under a 20-year
take-or-pay agreement. The estimated final cost for the Townsend Facility and associated infrastructure is expected to be
approximately $330 million, and includes the plant, sales gas line, improvements to site, local roads and the Alaska Highway, as
well as additional compression. On July 7, 2016, the Townsend Facility officially processed sales gas volumes and started
commercial operations on July 10, 2016. Volumes are expected to progressively ramp up through the fourth quarter of 2016.
AltaGas achieved capital efficiencies during construction of the Townsend Facility and related infrastructure and the project is
expected to be completed under budget.
Incremental to the Townsend Facility are two other related projects. The first is a 25 km gas gathering line, which connects the
Blair Creek field gathering area to the Townsend Facility. This gathering line was completed under budget at approximately $35
million and on schedule. Painted Pony has reserved all of the firm service for the gas gathering line under a 20-year take-or-pay
agreement. The second project consists of two 30 km liquids egress lines running from the Townsend Facility to a truck terminal
on the Alaska Highway. The pipelines can move initial liquids volumes of up to 10,000 Bbls/d each, and with pumping
modifications can accommodate up to 30,000 Bbls/d each. These twin pipelines were substantially constructed in the first
quarter of 2016. Construction of the truck terminal is also substantially complete and pre-commissioning is expected to be
completed by the end of July 2016. Painted Pony is expected to reserve firm liquids capacity on the liquids egress lines for all the
liquids from the first phase of the Townsend Facility under a 20-year take-or-pay agreement. The two liquids egress lines and the
truck terminal are now estimated to cost approximately $65 million when completed, well under the original budget.
North Pine Liquids Separation Project
AltaGas is developing a liquids separation and handling facility (the North Pine Facility) located approximately 40 km northwest
of Fort St. John, British Columbia. The North Pine Facility will be connected to existing AltaGas infrastructure in the region,
including the proposed Ridley Island Propane Export Terminal, and will serve producers in the Montney region. The North Pine
Facility is being designed with capacity to process up to 20,000 bbls/d of C3+ and handle up to 20,000 bbls/d of C5+.
Engagement with First Nations and key stakeholders continues, and on April 14, 2016 AltaGas filed its application with the B.C.
Oil and Gas Commission (OGC) for permitting of North Pine. Approval from the OGC is expected in the third quarter of 2016. A
front-end engineering and design (FEED) study was completed in March, with assessment of further capital optimization
opportunities to be completed in the third quarter of 2016. In conjunction with the North Pine Facility, AltaGas is developing two
liquids supply lines connecting the North Pine Facility to the Alaska Highway truck terminal. Completion of the FEED study and
application with the OGC is expected in the third quarter of 2016. The North Pine Facility and the two liquids supply lines are
expected to cost approximately $190 to $210 million. AltaGas expects to receive permits and reach a Final Investment Decision
(FID) in 2016 with commercial operations commencing in the first half of 2018.
Ridley Island Propane Export Terminal
AltaGas signed a sublease and related agreements with Ridley Terminals Inc. to develop, build, own and operate the proposed
Ridley Island Propane Export Terminal located near Prince Rupert, British Columbia on lands leased from Ridley Terminals Inc.
and the Prince Rupert Port Authority. The proposed Ridley Island Propane Export Terminal is estimated to cost approximately
TM Denotes trademark of Canaccord Genuity Corp.

AltaGas Ltd. – Q2 2016 - 19
$400 to $500 million and is to be designed to ship up to 1.2 million tonnes of propane per annum. It will be built on a brownfield
site with a history of industrial development, connections to existing rail lines and an existing marine jetty with deep water access
to the Pacific Ocean. Propane from British Columbia and Alberta natural gas producers will be transported to the facility using the
existing CN rail network.
AltaGas has begun the formal environmental review process. AltaGas also continues to engage closely with First Nations. On
February 11, 2016, AltaGas filed an application with the National Energy Board (NEB) for a 25-year propane export licence.
Preliminary engineering and the FEED study have been completed and further capital optimization opportunities are currently
being addressed. AltaGas expects to reach FID in the fourth quarter of 2016, subject to First Nations engagement and necessary
approvals.
On May 24, 2016, AltaGas LPG Limited Partnership, a wholly owned subsidiary, entered into a Memorandum of Understanding
with Astomos Energy Corporation (Astomos) setting out key commercial terms for the sale and purchase of LPG from the
proposed Ridley Island Propane Export Terminal. Under the terms of a contemplated multi-year agreement, it is anticipated that
Astomos will purchase at least 50 percent of the 1.2 million tonnes of propane available to be shipped from the export terminal
each year. Active commercial discussions are continuing for additional capacity commitments.
Alton Natural Gas Storage Project
In January 2016, the Government of Nova Scotia issued permits to resume construction of the Alton Natural Gas Storage
Project. In order to allow more time for discussions and public engagement, AltaGas deferred major civil construction until
summer 2016. Construction resumed on July 5, 2016 and brining of the storage caverns is expected to start later in the summer.
The Alton Natural Gas Storage project located near Truro, Nova Scotia, is expected to provide up to 10 Bcf of natural gas storage
capacity. Storage service is expected to commence in 2019.
Early Stage Deep Basin Liquids Separation Facility
AltaGas is in the early stages of development of a liquids separation facility which will serve producers in the Deep Basin region
of northwest Alberta. A pre-FEED study was completed in May 2016. The facility is being designed with capacity to process up to
10,000 Bbls/d of C3+ and handle up to 10,000 Bbls/d of C5+. The Deep Basin facility will have access to existing rail and can be
connected to AltaGas’ proposed Ridley Island Propane Export Terminal. Active discussions with producers to contractually
underpin the base capacity are continuing, and engagement with First Nations and key stakeholders is underway. Facility and
rail applications have been submitted to the Alberta Energy Regulator in May 2016. AltaGas will target to reach FID in 2016,
subject to completing commercial arrangements, stakeholder engagement, and regulatory approvals. The liquids separation
facility is expected to cost approximately $60 to $80 million.
Blythe Energy Center (Blythe)
The Blythe Facility, and the Blythe II Facility (Sonoran) currently under development, are well situated to serve a larger western
regional transmission organization comprised of several western U.S. states. AltaGas expects several request for proposals
(RFPs) to emerge from these states throughout the course of 2016 and 2017, and expects to bid both the potential re-contracting
of its Blythe Facility after its PPA expires July 31, 2020, and the potential Sonoran Facility, into these upcoming RFPs.
Separately, AltaGas continues to have bilateral discussions with utilities and municipalities for multi-year capacity agreements,
while also considering Resource Adequacy market pricing, potential energy and ancillary service offerings, and alternative
configurations (gas, combined with solar and energy storage) for the Blythe facilities. It is expected that up to 15,000 megawatts
(MW) will need to be replaced in California due to retirements over the next decade. As utilities, non-utility and large generators
continue to determine their future resource needs to achieve California’s 50 percent renewable portfolio standard, sufficient
flexible, fast ramping gas-fired capability will be required to help backstop intermittent renewable capacity and meet peak load
requirements.
Repowering of Pomona Facility
In the first quarter of 2016 AltaGas submitted an application with the California Energy Commission to repower the Pomona
Facility to a flexible, fast ramping peaking facility under the small power plant exemption process. It is anticipated that the
application review process will be approximately 12 months and include a review of the emissions profile by the local air district.
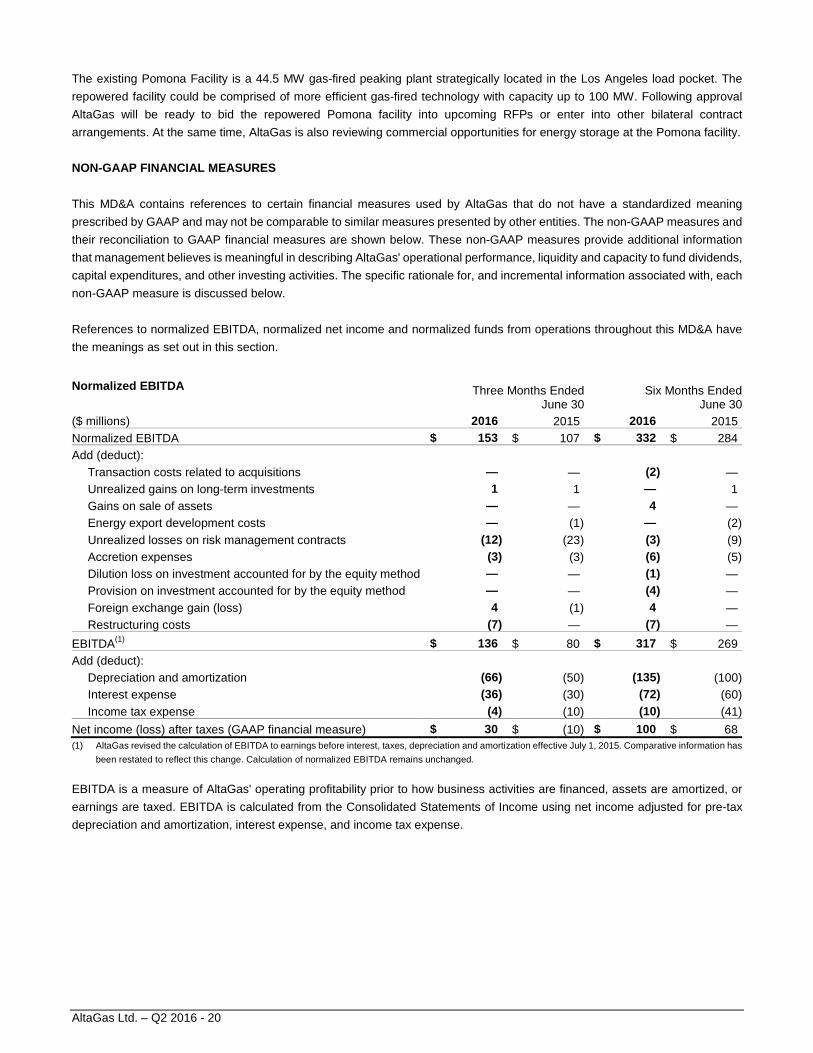
AltaGas Ltd. – Q2 2016 - 20
The existing Pomona Facility is a 44.5 MW gas-fired peaking plant strategically located in the Los Angeles load pocket. The
repowered facility could be comprised of more efficient gas-fired technology with capacity up to 100 MW. Following approval
AltaGas will be ready to bid the repowered Pomona facility into upcoming RFPs or enter into other bilateral contract
arrangements. At the same time, AltaGas is also reviewing commercial opportunities for energy storage at the Pomona facility.
NON-GAAP FINANCIAL MEASURES
This MD&A contains references to certain financial measures used by AltaGas that do not have a standardized meaning
prescribed by GAAP and may not be comparable to similar measures presented by other entities. The non-GAAP measures and
their reconciliation to GAAP financial measures are shown below. These non-GAAP measures provide additional information
that management believes is meaningful in describing AltaGas' operational performance, liquidity and capacity to fund dividends,
capital expenditures, and other investing activities. The specific rationale for, and incremental information associated with, each
non-GAAP measure is discussed below.
References to normalized EBITDA, normalized net income and normalized funds from operations throughout this MD&A have
the meanings as set out in this section.
Normalized EBITDA Three Months EndedJune 30
Six Months Ended June 30
($ millions) 2016 2015 2016 2015 Normalized EBITDA $ 153 $ 107 $ 332 $ 284 Add (deduct):
Transaction costs related to acquisitions — — (2) — Unrealized gains on long-term investments 1 1 — 1 Gains on sale of assets — — 4 — Energy export development costs — (1) — (2) Unrealized losses on risk management contracts (12) (23) (3) (9) Accretion expenses (3) (3) (6) (5) Dilution loss on investment accounted for by the equity method — — (1) — Provision on investment accounted for by the equity method — — (4) — Foreign exchange gain (loss) 4 (1) 4 — Restructuring costs (7) — (7) —
EBITDA(1) $ 136 $ 80 $ 317 $ 269 Add (deduct):
Depreciation and amortization (66) (50) (135) (100) Interest expense (36) (30) (72) (60) Income tax expense (4) (10) (10) (41)
Net income (loss) after taxes (GAAP financial measure) $ 30 $ (10) $ 100 $ 68
(1) AltaGas revised the calculation of EBITDA to earnings before interest, taxes, depreciation and amortization effective July 1, 2015. Comparative information has
been restated to reflect this change. Calculation of normalized EBITDA remains unchanged.
EBITDA is a measure of AltaGas' operating profitability prior to how business activities are financed, assets are amortized, or
earnings are taxed. EBITDA is calculated from the Consolidated Statements of Income using net income adjusted for pre-tax
depreciation and amortization, interest expense, and income tax expense.

AltaGas Ltd. – Q2 2016 - 21
Normalized EBITDA includes additional adjustments for unrealized gains (losses) on risk management contracts and long-term
investments, transaction costs related to acquisitions, gains (losses) on sale of assets, accretion expense, foreign exchange
gain (loss), provision on investment accounted for by the equity method, restructuring costs, and dilution loss on investment
accounted for by the equity method. Normalized EBITDA also includes an adjustment for certain non-capitalizable project
development costs related to energy export projects. AltaGas presents normalized EBITDA as a supplemental measure as it is
frequently used by analysts and investors in the evaluation of entities within the industry as it excludes items that can vary
substantially between entities depending on the accounting policies chosen, the book value of assets and the capital structure.
Normalized Net Income Three Months EndedJune 30
Six Months Ended June 30
($ millions) 2016 2015 2016 2015 Normalized net income $ 29 $ 9 $ 68 $ 66 Add (deduct) after-tax:
Transaction costs related to acquisitions — — (1) — Unrealized losses on risk management contracts (8) (17) (2) (8) Unrealized gains on long-term investments — 1 — 1 Gains on sale of assets — — 14 — Dilution loss on investment accounted for by the equity method — — (1) — Provision on investments accounted for by equity method — — (2) — Energy export development costs — (1) — (1) Restructuring costs (5) — (5) — Statutory tax rate change — (14) — (14)
Net income (loss) applicable to common shares (GAAP financial measure) $ 16 $ (22) $ 71 $ 44
Normalized net income represents net income applicable to common shares adjusted for the after-tax impact of unrealized gains
(losses) on risk management contracts and long-term investments, transaction costs related to acquisitions, gains (losses) on
sale of assets, provision on investment accounted for by the equity method, restructuring costs, dilution loss on investment
accounted for by the equity method, and statutory tax rate changes. Normalized net income also includes an adjustment for
certain non-capitalizable project development costs related to energy export projects. This measure is presented in order to
enhance the comparability of AltaGas’ earnings, as it reflects the underlying performance of AltaGas’ business activities.
Normalized Funds from Operations Three Months EndedJune 30
Six Months Ended June 30
($ millions) 2016 2015 2016 2015 Normalized funds from operations $ 114 $ 68 $ 248 $ 208 Add (deduct):
Transaction costs related to acquisitions — — (2) — Restructuring costs (7) — (7) —
Funds from operations 107 68 239 208 Add (deduct):
Net change in operating assets and liabilities — 80 8 143 Asset retirement obligations settled — (1) (2) (2)
Cash from operations (GAAP financial measure) $ 107 $ 147 $ 245 $ 349
Normalized funds from operations is used to assist management and investors in analyzing the liquidity of the Corporation
without regard to changes in operating assets and liabilities in the period and non-operating related expenses such as
transaction costs related to acquisitions and restructuring costs.
Funds from operations are calculated from the Consolidated Statements of Cash Flows and are defined as cash from operations
before net changes in operating assets and liabilities and expenditures incurred to settle asset retirement obligations.

AltaGas Ltd. – Q2 2016 - 22
Management uses this measure to understand the ability to generate funds for capital investments, debt repayment, dividend
payments and other investing activities.
Funds from operations and normalized funds from operations as presented should not be viewed as an alternative to cash from
operations or other cash flow measures calculated in accordance with GAAP.
RESULTS OF OPERATIONS BY REPORTING SEGMENT
Normalized EBITDA (1) Three Months Ended
June 30Six Months Ended
June 30($ millions) 2016 2015 2016 2015Gas $ 37 $ 37 $ 72 $ 84 Power 75 34 119 66 Utilities 46 41 154 145 Sub-total: Operating Segments 158 112 345 295 Corporate (5) (5) (13) (11) $ 153 $ 107 $ 332 $ 284 (1) Non-GAAP financial measure; See discussion in Non-GAAP Financial Measures section of this MD&A.
GAS
OPERATING STATISTICS
Three Months Ended June 30
Six Months Ended June 30
2016 2015 2016 2015
Extraction inlet gas processed (Mmcf/d)(1) 839 719 855 910
FG&P inlet gas processed (Mmcf/d)(1) 244 404 298 400
Total inlet gas processed (Mmcf/d)(1) 1,083 1,123 1,153 1,310
Extraction ethane volumes (Bbls/d)(1) 26,959 23,722 28,204 30,690
Extraction NGL volumes (Bbls/d)(1) 31,106 25,566 33,032 30,534
Total extraction volumes (Bbls/d)(1) (2) 58,065 49,288 61,236 61,224
Frac spread - realized ($/Bbl)(1) (3) 10.00 20.58 9.07 14.56
Frac spread - average spot price ($/Bbl)(1) (4) 10.62 2.51 9.36 3.31
(1) Average for the period.
(2) Includes Harmattan NGL processed on behalf of customers.
(3) Realized frac spread or NGL margin, expressed in dollars per barrel of NGL, is derived from sales recorded by the segment during the period for frac exposed
volumes plus the settlement value of frac hedges settled in the period less extraction premiums, divided by the total frac exposed volumes produced during the
period.
(4) Average spot frac spread or NGL margin, expressed in dollars per barrel of NGL, is indicative of the average sales price that AltaGas receives for propane,
butane and condensate less extraction premiums, divided by the respective frac exposed volumes for the period.
Inlet gas volumes processed at the extraction facilities for the three months ended June 30, 2016 increased by 120 Mmcf/d,
compared to the same period in 2015. The increase was due to higher volumes at the Younger and Harmattan facilities primarily
due to major turnarounds in the prior year partially offset by a temporary plant shut-in at the Edmonton Ethane Extraction Plant
(EEEP). Inlet gas volumes processed at the field gathering and processing (FG&P) facilities for the three months ended June 30,
2016 decreased by 160 Mmcf/d primarily due to the Tidewater Gas Asset Disposition.
Inlet gas volumes processed at the extraction facilities for the six months ended June 30, 2016 decreased by 55 Mmcf/d,
compared to the same period in 2015. The decrease was mainly due to temporary plant shut-ins at EEEP, the Joffre Ethane
Extraction Plant (JEEP) and the Empress Gas Liquids Joint Venture (EGLJV) plant, as low commodity prices made extraction of
certain NGL at some of the facilities uneconomical. The decrease was partially offset by higher volumes at the Younger and
Harmattan facilities primarily due to major turnarounds in the prior year. Inlet gas volumes processed at the FG&P facilities for
the six months ended June 30, 2016 decreased by 102 Mmcf/d mainly due to the Tidewater Gas Asset Disposition.

AltaGas Ltd. – Q2 2016 - 23
Average ethane and NGL volumes for the three months ended June 30, 2016 increased by 3,237 Bbls/d and 5,540 Bbls/d
respectively, compared to the same period in 2015. Higher ethane and NGL volumes were due to the Harmattan and Younger
turnarounds in the second quarter of 2015, partially offset by lower ethane volumes at EEEP due to a temporary plant shut-in.
Average ethane volumes for the six months ended June 30, 2016 decreased by 2,486 Bbls/d, while average NGL volumes
increased by 2,498 bbl/d, compared to the same period in 2015. Lower ethane volumes were due to lower produced volumes at
EGLJV, JEEP, and EEEP, partially offset by higher volumes at Harmattan. Higher NGL volumes at Harmattan and Younger were
primarily due to the turnarounds in the second quarter of 2015.
Three Months Ended June 30
The Gas segment reported normalized EBITDA of $37 million in the second quarter of 2016, consistent with the same quarter in
2015. In the second quarter of 2016, normalized EBITDA was impacted by the Tidewater Gas Asset Disposition, lower realized
frac spread due to lower hedging gains, and lower FG&P processed volumes at non-core facilities, partially offset by the
completion of major turnarounds at the Younger and Harmattan facilities during the second quarter of 2015. During the second
quarter of 2016, AltaGas recorded equity earnings of $4 million from Petrogas, compared to $2 million in the same quarter of
2015. The increase in equity earnings from Petrogas was mainly due to increased volumes at the Ferndale Terminal and
generally improved conditions in certain of the Petrogas NGL and crude oil business segments in the second quarter of 2016
compared to the same quarter of 2015.
During the second quarter of 2016, AltaGas hedged approximately 500 Bbls/d of NGL volumes at an average price of $19/Bbl,
inclusive of basis differentials. During the second quarter of 2015, AltaGas hedged 3,300 Bbls/d of NGL at an average price of
$26/Bbl, inclusive of basis differentials. The average indicative spot NGL frac spread in the second quarter of 2016 was
approximately $11/Bbl compared to $3/Bbl in the same quarter of 2015. Realized frac spread of $10/Bbl in the second quarter of
2016 (2015 - $21/Bbl) was lower than the same quarter in 2015 due to realized gains on NGL frac hedges in the second quarter
of 2015.
Six Months Ended June 30
The Gas segment reported normalized EBITDA of $72 million for the first half of 2016, compared to $84 million for the same
period in 2015. The decrease in normalized EBITDA was due to lower hedging gains on frac hedges, and the Tidewater Gas
Asset Disposition, partially offset by the completion of major turnarounds at the Younger and Harmattan facilities during the
second quarter of 2015. During the first half of 2016, AltaGas recorded equity earnings of $7 million from Petrogas, compared to
$2 million in the same period of 2015. The increase in equity earnings from Petrogas was mainly due to increased volumes at the
Ferndale Terminal and generally improved conditions in certain of the Petrogas NGL and crude oil business segments compared
to the same period in 2015.
During the first half of 2016, AltaGas hedged approximately 300 Bbls/d of NGL volumes at an average price of $19/Bbl, inclusive
of basis differentials. During the first half of 2015, AltaGas hedged 3,100 Bbls/d of NGL at an average price of $27/Bbl, inclusive
of basis differentials. The average indicative spot NGL frac spread for first half of 2016 was approximately $9/Bbl compared to
$3/Bbl in the same period of 2015. Realized frac spread of $9/Bbl in the first half of 2016 (2015 - $15/Bbl) was lower than the
same period in 2015 due to realized gains on NGL frac hedges in 2015.
During the first quarter of 2016, AltaGas recognized a pre-tax gain of $4 million on the Tidewater Gas Asset Disposition.

AltaGas Ltd. – Q2 2016 - 24
POWER
OPERATING STATISTICS
Three Months Ended June 30
Six Months Ended June 30
2016 2015 2016 2015
Renewable power sold (GWh) 544 342 686 503
Conventional power sold (GWh) 293 945 991 1,934
Renewable capacity factor (%) 56.8 39.6 33.6 27.2
Contracted conventional equivalent availability factor (%) (1) 92.4 91.2 95.0 94.0 (1) Calculated as the availability factor contracted under long-term tolling arrangements adjusted for occasions where partial or excess capacity payments have
been added or deducted.
During the second quarter of 2016, the volume of renewable power sold increased by 202 GWh compared to the same quarter in
2015, and the volume of conventional power sold decreased by 652 GWh compared to the same quarter in 2015. The increase
in renewable volumes was due to volumes from the Northwest Hydro Facilities as a result of McLymont entering commercial
service in the fourth quarter of 2015, as well as an earlier start to seasonally higher river flows. The decrease in conventional
volumes was due to the impact of the termination of the Sundance B PPAs effective March 8, 2016, the expiration of the Pomona
PPA, and lower volumes at Blythe, partially offset by the volumes provided by the San Joaquin Facilities. The lower volumes at
Blythe had a minimal impact on EBITDA as Blythe earns fixed capacity payments under its PPA with Southern California Edison.
Normalized EBITDA for conventional power assets increased in the second quarter of 2016 compared to the same quarter in
2015 notwithstanding the lower conventional power volumes.
The renewable capacity factor for the second quarter of 2016 increased due to McLymont being in-service, improved
performance capability at Forrest Kerr after a full year of operations, and overall higher river flow at the Northwest Hydro
Facilities in the second quarter of 2016. The contracted conventional equivalent availability factor is higher as a result of the
acquisition of the San Joaquin Facilities in November 2015, which have been running well with no operational issues.
During the first half of 2016, volume of renewable power sold increased by 183 GWh compared to the same period in 2015, and
volumes of conventional power sold decreased by 943 GWh compared to the same period in 2015. The increase in renewable
volumes was due to McLymont being in-service, as well as higher river flow at the Northwest Hydro Facilities in the second
quarter of 2016. The decrease in conventional volumes was due to the impact of the termination of the Sundance B PPAs
effective March 8, 2016, lower dispatch at Blythe, and the expiration of the Pomona PPA, partially offset by the volumes provided
by the San Joaquin Facilities.
The renewable capacity factor and contracted conventional availability factor for the first half of 2016 increased due to the same
reasons as noted above for the second quarter of 2016.
With the termination of the Sundance B PPAs, AltaGas’ power portfolio in Alberta has been reduced to 65 MW, representing 4
percent of AltaGas’ total generation capacity. AltaGas’ overall power portfolio now consists of 1,688 MW of clean natural
gas-fired and renewable generation sources and is now approximately 95 percent contracted under long term power purchase
agreements.
Three Months Ended June 30
The Power segment reported normalized EBITDA of $75 million in the second quarter of 2016, compared to $34 million in the
same quarter of 2015. Normalized EBITDA increased as a result of the acquisition of the San Joaquin Facilities in November
2015, realized hedging gains on the Alberta power portfolio, and higher Northwest Hydro Facilities volumes as a result of
McLymont entering commercial service in the fourth quarter of 2015, strong performance at Forrest Kerr, as well as an earlier
start to seasonally higher river flow, partially offset by the absence of equity income from the Sundance B PPAs.

AltaGas Ltd. – Q2 2016 - 25
Six Months Ended June 30
The Power segment reported normalized EBITDA of $119 million in the first half of 2016, compared to $66 million in the same
period of 2015. Normalized EBITDA increased as a result of the impact of the acquisition of the San Joaquin Facilities in
November 2015, higher Northwest Hydro Facilities volumes due to McLymont entering commercial service in the fourth quarter
of 2015 and an earlier start to seasonally higher river flow, the stronger US dollar, and lower costs associated with the Sundance
B PPAs. These increases were partially offset by lower Alberta conventional power prices and volumes.
In the first quarter of 2016, ASTC exercised its right to terminate the Sundance B PPAs effective March 8, 2016 pursuant to the
change in law provisions of the Sundance B PPAs. Upon the termination of the Sundance B PPAs, AltaGas recognized a pre-tax
provision of $4 million on its investment in ASTC to settle the working capital deficiency. Under the Balancing Pool Regulation,
the Balancing Pool is required to conduct an investigation into the termination and this process is ongoing. If the Balancing Pool
disputes the termination claim, AltaGas may be required to refund the Balancing Pool for its share of the net PPA costs incurred
from March 8, 2016 to when the matter is resolved.
UTILITIES
OPERATING STATISTICS
Three Months Ended
June 30Six Months Ended
June 30
2016 2015 2016 2015 Canadian utilities
Natural gas deliveries - end-use (PJ)(1) 4.8 5.2 16.0 18.3
Natural gas deliveries - transportation (PJ)(1) 1.5 1.5 3.3 3.4 U.S. utilities
Natural gas deliveries - end-use (Bcf)(1) 10.3 10.0 37.1 42.1
Natural gas deliveries - transportation (Bcf)(1) 11.8 10.0 26.3 23.8
Service sites (2) 568,606 560,755 568,606 560,755
Degree day variance from normal - AUI (%) (3) (28.0) (9.7) (20.4) (10.9)
Degree day variance from normal - Heritage Gas (%) (3) 3.6 14.7 (4.0) 15.4
Degree day variance from normal - SEMCO Gas (%) (4) 11.8 (1.7) (4.6) 12.6
Degree day variance from normal - ENSTAR (%) (4) (26.4) (17.4) (22.5) (10.8)
(1) Petajoule (PJ) is one million gigajoules. Bcf is one billion cubic feet.
(2) Service sites reflect all of the service sites of AUI, PNG, Heritage Gas and U.S. utilities, including transportation and non-regulated business lines.
(3) A degree day for AUI and Heritage Gas is the cumulative extent to which the daily mean temperature falls below 15 degrees Celsius at AUI and 18 degrees
Celsius at Heritage Gas. Normal degree days are based on a 20-year rolling average. Positive variances from normal lead to increased delivery volumes from
normal expectations. Degree day variances do not materially affect the results of PNG, as the BCUC has approved a rate stabilization mechanism for its
residential and small commercial customers.
(4) A degree day for U.S. utilities is a measure of coldness determined daily as the number of degrees the average temperature during the day in question is below
65 degrees Fahrenheit. Degree days for a particular period are determined by adding the degree days incurred during each day of the period. Normal degree
days for a particular period are the average of degree days during the prior 15 years for SEMCO Gas and during the prior 10 years for ENSTAR.
Three Months Ended June 30
The Utilities segment reported normalized EBITDA of $46 million in the second quarter of 2016, compared to $41 million in the
same quarter of 2015. The increase was mainly due to the impact of the stronger US dollar, colder weather in Michigan, and rate
and customer growth. The increase was partially offset by warmer weather in Alberta, Nova Scotia, and Alaska, and higher other
employee benefit costs at the U.S. utilities.
Six Months Ended June 30
The Utilities segment reported normalized EBITDA of $154 million in the first half of 2016, compared to $145 million in the same
period of 2015. The increase was mainly due to the impact of the stronger US dollar, rate base and customer growth, combined

AltaGas Ltd. – Q2 2016 - 26
with favorable services revenue. These variances are partially offset by significantly warmer weather experienced at all of
AltaGas’ Utilities during the first quarter of 2016.
CORPORATE
Three Months Ended June 30
In the Corporate segment, normalized EBITDA for the second quarter of 2016 was a loss of $5 million, consistent with the same
quarter in 2015.
Six Months Ended June 30
In the Corporate segment, normalized EBITDA for the first half of 2016 was a loss of $13 million, compared to $11 million for the
same period in 2015. The increase was mainly due to lower capitalized labor costs due to major IT projects placed into service in
the second half of 2015 as well as administrative costs related to establishing AltaGas’ U.S. office in Dallas.
INVESTED CAPITAL
During the second quarter of 2016, AltaGas increased property, plant and equipment, intangible assets and long-term
investments by $282 million, compared to $149 million in the same quarter of 2015. The net invested capital was $282 million for
the second quarter of 2016, compared to $149 million in the same quarter of 2015.
On June 29, 2016, AltaGas directly invested $150 million in Petrogas Preferred Shares. The proceeds were used by Petrogas to
reduce its existing debt.
The invested capital in the second quarter of 2016 included maintenance capital of $nil (2015 - $11 million) in the Gas segment
and $5 million (2015 - $1 million) in the Power segment. Gas segment maintenance capital included $7 million related to the
Harmattan facility turnaround in the second quarter of 2015, while there were no major turnaround activities in the second quarter
of 2016.
Three Months Ended
June 30, 2016($ millions) Gas Power Utilities Corporate TotalInvested capital:
Property, plant and equipment $ 86 $ 10 $ 28 $ 2 $ 126 Intangible assets 1 2 1 2 6 Long-term investments 150 — — — 150
Invested capital 237 12 29 4 282 Disposals:
Property, plant and equipment — — — — —
Net invested capital $ 237 $ 12 $ 29 $ 4 $ 282
Three Months Ended
June 30, 2015($ millions) Gas Power Utilities Corporate TotalInvested capital:
Property, plant and equipment $ 50 $ 44 $ 48 $ 1 $ 143 Intangible assets 1 — 1 4 6 Long-term investments — — — — —
Invested capital 51 44 49 5 149 Disposals:
Property, plant and equipment — — — — —Net invested capital $ 51 $ 44 $ 49 $ 5 $ 149

AltaGas Ltd. – Q2 2016 - 27
During the first half of 2016, AltaGas increased property, plant and equipment, intangible assets and long-term investments by
$527 million, compared to $280 million in the same period in 2015. The increase in property, plant and equipment reflects the
costs incurred related to the construction of the Townsend Facility, which began construction in the second half of 2015, and the
purchase of the remaining 51 percent interest in EEEP. The increase in long-term investments mainly relates to the investment in
Petrogas Preferred Shares and the investment in Tidewater. As part of the Tidewater Gas Asset Disposition, AltaGas received
non-cash consideration of approximately $65 million in the form of Tidewater common shares as at February 29, 2016. The net
invested capital was $433 million for the first half of 2016, compared to $280 million in the same period of 2015.
The invested capital in the first half of 2016 included maintenance capital of $nil (2015 - $12 million) in the Gas segment and $9
million (2015 - $1 million) in the Power segment.
Six Months Ended
June 30, 2016
($ millions) Gas Power Utilities Corporate TotalInvested capital:
Property, plant and equipment $ 231 $ 21 $ 45 $ 3 $ 300 Intangible assets 1 2 1 2 6 Long-term investments 221 — — — 221
Invested capital 453 23 46 5 527 Disposals:
Property, plant and equipment (94) — — — (94)Net invested capital $ 359 $ 23 $ 46 $ 5 $ 433
Six Months Ended
June 30, 2015($ millions) Gas Power Utilities Corporate TotalInvested capital:
Property, plant and equipment $ 71 $ 109 $ 71 $ 2 $ 253 Intangible assets 1 9 1 10 21 Long-term investments 6 — — — 6
Invested capital 78 118 72 12 280 Disposals:
Property, plant and equipment — — — — —Net invested capital $ 78 $ 118 $ 72 $ 12 $ 280
RISK MANAGEMENT
AltaGas is exposed to various market risks in the normal course of operations that could impact earnings and cash flows. At
times, AltaGas will enter into financial derivative contracts to manage exposure to fluctuations in commodity prices, interest
rates, and foreign exchange rates. The Board of Directors of AltaGas has established a risk management policy for AltaGas
establishing AltaGas’ risk management control framework. Financial derivative instruments are governed under, and subject to,
this policy. As at June 30, 2016 and December 31, 2015, the fair values of the Corporation’s derivatives were as follows:
($ millions) June 30,
2016December 31,
2015Natural gas $ 3 $ 3 Storage optimization (1) 3 NGL frac spread (3) — Power 24 20 Foreign exchange — (1) Net derivative asset $ 23 $ 25

AltaGas Ltd. – Q2 2016 - 28
Commodity Price Contracts
From time to time, the Corporation executes gas, power, and other commodity contracts to manage its asset portfolio and lock in
margins from back-to-back purchase and sale agreements. The fair value of power, natural gas, and NGL derivatives was
calculated using estimated forward prices from published sources for the relevant period. Quoted market rates were used in the
calculation of the fair value of foreign exchange derivatives. AltaGas has not elected hedge accounting for any of its derivative
contracts currently in place. Changes in the fair value of these derivative contracts are recorded in the consolidated statements
of income in the period in which the change occurs.
The Power segment has various fixed price power purchase and sale contracts in the Alberta market, which are expected to be
settled over the next five years. During the second quarter of 2016, the average Alberta spot price was approximately $17/MWh
(2015 – $57/MWh).
The Corporation also executes fixed-for-floating NGL frac spread swaps to manage its exposure to frac spreads. The financial
results of several extraction plants are affected by fluctuations in NGL frac spreads. The average indicative spot NGL frac spread
in the second quarter of 2016 was an estimated $11/Bbl (2015 – $3/Bbl). AltaGas currently has a summer and winter frac hedge
in place with bifurcated volumes which range between 750 to 3,000 Bbls/d at an average price of approximately $22/Bbl
excluding basis differentials.
Foreign Exchange
AltaGas has foreign operations whereby the functional currency is the US dollar. As a result, the Corporation’s earnings, cash
flows, and other comprehensive income are exposed to fluctuations resulting from changes in foreign exchange rates. This risk
is partially mitigated by AltaGas’ US dollar-denominated debt and preferred shares. AltaGas may also enter into foreign
exchange forward derivatives to manage the risk of fluctuating cash flows due to variations in foreign exchange rates. As at
June 30, 2016, AltaGas has no foreign exchange forward contracts outstanding.
In addition, as at June 30, 2016, management designated US$322 million of outstanding debt to hedge against the currency
translation effect of its foreign investments (December 31, 2015 - US$724 million). US dollar denominated long-term debt
instruments have been designated as a hedge of the net investment in foreign subsidiaries. This designation has the effect of
mitigating volatility on net income by offsetting foreign exchange gains and losses on US dollar denominated long-term debt and
foreign net investment. For the three and six months ended June 30, 2016, AltaGas incurred an after-tax unrealized loss of $7
million and an after-tax unrealized gain of $44 million arising from the translation of debt in other comprehensive income (three
and six months ended June 30, 2015 – after-tax unrealized gain of $6 million and after-tax unrealized loss of $30 million,
respectively).
The Effects of Derivative Instruments on the Consol idated Statements of Income
The following table presents the unrealized gains (losses) on derivative instruments as recorded in the Corporation’s
consolidated statements of income:
Three Months Ended
June 30 Six Months Ended
June 30($ millions) 2016 2015 2016 2015 Natural gas $ — $ 2 $ — $ 3 Storage optimization (1) — (4) (1) NGL frac spread (3) 4 (3) 8 Power (9) (28) 3 (18) Heat rate — (1) — (1) Foreign exchange 1 — 1 — Embedded derivative — — — — $ (12) $ (23) $ (3) $ (9)

AltaGas Ltd. – Q2 2016 - 29
Please refer to Note 19 of the 2015 Annual Consolidated Financial Statements and Note 10 of the unaudited condensed interim
Consolidated Financial Statements as at and for the three and six months ended June 30, 2016 for further details regarding
AltaGas’ risk management activities.
LIQUIDITY
Three Months EndedJune 30
Six Months Ended June 30
($ millions) 2016 2015 2016 2015 Cash from operations $ 107 $ 147 $ 245 $ 349 Investing activities (330) (89) (482) (250) Financing activities 293 (58) 21 (183) Effect of exchange rate — (1) — 3
Increase (decrease) in cash and cash equivalents $ 70 $ (1) $ (216) $ (81)
Cash from Operations
Cash from operations decreased by $104 million for the six months ended June 30, 2016 compared to the same period in 2015
primarily due to the unfavorable variance in the net change in operating assets and liabilities. The net change in operating assets
and liabilities was a net cash inflow of $8 million for the six months ended June 30, 2016 compared to $143 million during the
same period in 2015. The net reduction in cash inflow was due to changes in inventory, accounts receivable, regulatory assets
and accounts payable related to the Utilities segment due to warmer weather in 2016. In addition, other operating assets
increased in 2016 due to the acquisition of the San Joaquin Facilities.
Working Capital ($ millions except current ratio)
June 30, 2016
December 31, 2015
Current assets $ 557 $ 1,038 Current liabilities 795 948 Working capital (deficiency) $ (238) $ 90
Working capital ratio 0.70 1.09
The decrease in working capital ratio was primarily due to the decrease in cash and cash equivalents and accounts receivable,
as well as a higher current portion of long-term debt due, partially offset by the decrease in accounts payable and short-term debt
compared to December 31, 2015. Cash was primarily used to repay short-term borrowings and U.S. Libor loans under the $1.4
billion revolving credit facility during the first half of 2016. In addition, the completion of the Tidewater Gas Asset Disposition,
which was classified as assets held for sale also impacted working capital ratio as a part of the consideration received for the sale
was non-cash. AltaGas’ working capital will fluctuate in the normal course of business and the working capital deficiency will be
funded using cash flow from operations, DRIP and available credit facilities as required.
Investing Activities
Cash used in investing activities for the six months ended June 30, 2016 was $482 million, compared to $250 million in the same
period of 2015. Investing activities for the six months ended June 30, 2016 primarily included AltaGas’ $150 million investment in
Petrogas Preferred Shares, a $25 million loan to Petrogas under the $100 million interest bearing secured loan facility provided
to Petrogas, approximately $21 million for the purchase of EEEP, approximately $305 million for property, plant, and equipment,
partially offset by cash inflow of approximately $29 million, net of transaction costs, from the Tidewater Gas Asset Disposition.
Investing activities for the six months ended June 30, 2015 primarily comprised of expenditures of approximately $244 million for
property, plant, and equipment, approximately $19 million for intangible assets, and approximately $34 million for a business
acquisition, partially offset by a cash inflow of $50 million relating to the maturity of a short-term investment.
Financing Activities
Cash from financing activities for the six months ended June 30, 2016 was $21 million, compared to cash used in financing
activities of $183 million in the same period of 2015. Financing activities for the six months ended June 30, 2016 were primarily
comprised of net proceeds from the issuance of MTNs, net of issuance costs of $348 million, borrowings from credit facilities of

AltaGas Ltd. – Q2 2016 - 30
$264 million, and the issuance of common shares of $486 million (including common shares issued through DRIP), partially
offset by the repayment of $800 million of long-term debt and $102 million of short-term debt. Financing activities for the six
months ended June 30, 2015 were primarily comprised of net proceeds from issuance of common shares of $53 million,
issuance of MTNs of $156 million, and borrowings from credit facilities of $220 million, partially offset by repayments of long-term
and short-term debt of $404 million and $64 million, respectively. Total dividends paid to common and preferred shareholders of
AltaGas in the first half of 2016 were $171 million, compared to $141 million in the same period in 2015, of which $62 million was
reinvested through the DRIP in the first half of 2016 (2015 - $43 million). The increase was due to more common shares and
preferred shares outstanding and dividend increases on common shares declared in the latter half of 2015.
CAPITAL RESOURCES
AltaGas' objective for managing capital is to maintain its investment grade credit ratings, ensure adequate liquidity, maximize the
profitability of its existing assets and grow its energy infrastructure to create long-term value and enhance returns for its
investors. AltaGas' capital structure is comprised of shareholders' equity (including non-controlling interests), short-term and
long-term debt (including current portion) less cash and cash equivalents.
The use of debt or equity funding is based on AltaGas’ capital structure, which is determined by considering the norms and risks
associated with operations and cash flow stability and sustainability.
($ millions) June 30,
2016December 31,
2015Short-term debt $ 22 $ 131 Current portion of long-term debt 373 288
Long-term debt(1) 3,363 3,732
Total debt 3,758 4,151 Less: cash and cash equivalents (77) (293)
Net debt $ 3,681 $ 3,858 Shareholders' equity 4,468 4,168 Non-controlling interests 35 35 Total capitalization $ 8,184 $ 8,061
Debt-to-total capitalization (%) 45 48 (1) Net of debt issuance costs of $16 million as at June 30, 2016 (December 31, 2015 - $15 million).
On April 7, 2016, AltaGas issued $350 million of MTNs. The MTNs carry a coupon rate of 4.12 percent and will mature on April 7,
2026. Net proceeds were used to pay down existing indebtedness under AltaGas’ credit facility and for general corporate
purposes.
On June 6, 2016, AltaGas closed a public offering of 14,685,000 Common Shares, on a bought deal basis, at an issue price of
$30 per Common Share, for total gross proceeds of approximately $440 million. Net proceeds have been and will be used to
partially fund AltaGas’ capital growth program, reduce existing indebtedness under AltaGas’ credit facility and for general
corporate purposes.
As at June 30, 2016, AltaGas’ total debt primarily consisted of outstanding MTNs of $2.8 billion (December 31, 2015 - $2.8
billion), PNG debenture notes of $46 million (December 31, 2015 - $47 million), SEMCO long-term debt of $488 million
(December 31, 2015 - $522 million) and $405 million drawn under the bank credit facilities (December 31, 2015 - $811 million). In
addition, AltaGas had $164 million of letters of credit (December 31, 2015 - $147 million) outstanding.
As at June 30, 2016, AltaGas’ total market capitalization was approximately $5.9 billion based on approximately 163 million
common shares; approximately 6 million series A Preferred Shares; approximately 2 million series B Preferred Shares; 8 million
series C US$ Preferred Shares; 8 million series E Preferred Shares; 8 million series G Preferred Shares; and 8 million series I
Preferred Shares outstanding, and a closing trading price on June 30, 2016 of $31.40 per common share; $15.75 per series A

AltaGas Ltd. – Q2 2016 - 31
Preferred Share; $14.80 per series B Preferred Share; US$19.18 per series C US$ Preferred Share; $18.93 per series E
Preferred Share; $18.38 per series G Preferred Share; and $25.27 per series I Preferred Share, respectively.
AltaGas' earnings interest coverage for the rolling 12 months ended June 30, 2016 was 1.5 times.
Credit Facilities Drawn at Drawn at
($ millions) Borrowing
capacityJune 30,
2016December 31,
2015Demand operating facilities $ 70 $ 4 $ 4 Extendible revolving letter of credit facility 150 58 56 Letter of credit demand facility 150 97 80 PNG operating facility 25 4 10
AltaGas Ltd. revolving credit facility (1) 1,400 379 690
SEMCO Energy US$ unsecured credit facility (1) (2) 150 27 118 $ 1,945 $ 569 $ 958 (1) Amount drawn at June 30, 2016 converted at the month-end rate of 1 US dollar = 1.3009 Canadian dollar (December 31, 2015 - 1 US dollar = 1.3840 Canadian
dollar).
(2) Borrowing capacity assumed at par.
All of the borrowing facilities have covenants customary for these types of facilities, which must be met at each quarter end.
AltaGas and its subsidiaries have been in compliance with all financial covenants each quarter since the establishment of the
facilities.
The following table summarizes the Corporation's primary financial covenants as defined by the credit facility agreements:
Ratios Debt covenant requirements As at June 30, 2016 Bank debt-to-capitalization(1) not greater than 65 percent 44.5%
Bank EBITDA-to-interest expense (1) (2) not less than 2.5x 4.2
Bank debt-to-capitalization (SEMCO)(3) not greater than 60 percent 41.7%
Bank EBITDA-to-interest expense (SEMCO)(3) not less than 2.25x 6.3 (1) Calculated in accordance with the Corporation’s credit facility agreement, which is available on SEDAR at www.sedar.com.
(2) Estimated, subject to final adjustments.
(3) Bank EBITDA-to-interest expense (SEMCO) and Bank debt-to-capitalization (SEMCO) are calculated based on SEMCO’s consolidated financial statements
and are calculated similar to Bank debt-to-capitalization and Bank EBITDA-to-interest expense.
On August 10, 2015, a $5 billion base shelf prospectus was filed. The purpose of the base shelf prospectus is to facilitate timely
offerings of certain types of future public debt and/or equity issuances during the 25-month period that the base shelf prospectus
remains effective, by disclosing standardized information required for such issuances. As at June 30, 2016, $3.7 billion remains
available under the base shelf prospectus.
RELATED PARTY TRANSACTIONS
In the normal course of business, AltaGas transacts with its subsidiaries, affiliates and joint ventures. Other than as described in
Note 17 of the unaudited condensed interim consolidated financial statements as at and for the three and six months ended June
30, 2016, there are no significant changes in the nature of the related party transactions described in Note 26 of the 2015 Annual
Consolidated Financial Statements.

AltaGas Ltd. – Q2 2016 - 32
SHARE INFORMATION
As at July 15, 2016Issued and outstanding Common shares 163,730,640Preferred Shares
Series A 5,511,220Series B 2,488,780Series C 8,000,000Series E 8,000,000Series G 8,000,000Series I 8,000,000
Issued Share options 4,411,636Share options exercisable 3,063,384 DIVIDENDS
AltaGas declares and pays a monthly dividend to its common shareholders. Dividends on preferred shares are paid quarterly.
Dividends are at the discretion of the Board of Directors and dividend levels are reviewed periodically, giving consideration to the
ongoing sustainable cash flow as impacted by the consolidated net income, maintenance and growth capital expenditures, and
debt repayment requirements of AltaGas.
On July 20, 2016, the Board of Directors approved an increase in the monthly dividend to $0.175 per common share from $0.165
per common share effective with the August 2016 dividend, payable on September 15, 2016.
The following table summarizes AltaGas’ dividend declaration history:
Dividends Years ended December 31 ($ per common share) 2016 2015First quarter $ 0.49500 $ 0.44250 Second quarter 0.49500 0.46750 Third quarter — 0.48000 Fourth quarter — 0.49500 Total $ 0.99000 $ 1.88500
Series A Preferred Share Dividends Years ended December 31 ($ per preferred share) 2016 2015First quarter $ 0.21125 $ 0.31250 Second quarter 0.21125 0.31250 Third quarter — 0.31250 Fourth quarter — 0.21125 Total $ 0.42250 $ 1.14875

AltaGas Ltd. – Q2 2016 - 33
Series B Preferred Share Dividends Years ended December 31 ($ per preferred share) 2016 2015First quarter $ 0.19269 $ —Second quarter 0.19393 —Third quarter — —Fourth quarter — 0.19156 Total $ 0.38662 $ 0.19156
Series C Preferred Share Dividends Years ended December 31 (US$ per preferred share) 2016 2015First quarter $ 0.27500 $ 0.27500 Second quarter 0.27500 0.27500 Third quarter — 0.27500 Fourth quarter — 0.27500 Total $ 0.55000 $ 1.10000
Series E Preferred Share Dividends Years ended December 31 ($ per preferred share) 2016 2015First quarter $ 0.31250 $ 0.31250 Second quarter 0.31250 0.31250 Third quarter — 0.31250 Fourth quarter — 0.31250 Total $ 0.62500 $ 1.25000
Series G Preferred Share Dividends Years ended December 31 ($ per preferred share) 2016 2015First quarter $ 0.296875 $ 0.296875 Second quarter 0.296875 0.296875 Third quarter — 0.296875 Fourth quarter — 0.296875 Total $ 0.593750 $ 1.187500
Series I Preferred Share Dividends Years ended December 31 ($ per preferred share) 2016 2015First quarter $ 0.463870 $ —Second quarter 0.328125 —Third quarter — —Fourth quarter — —Total $ 0.791995 $ —
CRITICAL ACCOUNTING ESTIMATES
Since a determination of the value of many assets, liabilities, revenues and expenses is dependent upon future events, the
preparation of AltaGas' Consolidated Financial Statements requires the use of estimates and assumptions that have been made
using careful judgment. Other than described below, AltaGas’ significant accounting policies have remained unchanged and are
contained in the notes to the audited Consolidated Financial Statements as at and for the year ended December 31, 2015.
Certain of these policies involve critical accounting estimates as a result of the requirement to make particularly subjective or

AltaGas Ltd. – Q2 2016 - 34
complex judgments about matters that are inherently uncertain and because of the likelihood that materially different amounts
could be reported under different conditions or using different assumptions.
AltaGas’ critical accounting estimates continue to be financial instruments, depreciation and amortization expense, asset
retirement obligations and other environmental costs, asset impairment assessment, income taxes, pension plans and
post-retirement benefits, and regulatory assets and liabilities. For a full discussion of these accounting estimates, refer to the
audited Consolidated Financial Statements and MD&A as at and for the year ended December 31, 2015.
ADOPTION OF NEW ACCOUNTING STANDARDS
Effective January 1, 2016, AltaGas adopted the following Financial Accounting Standards Board (FASB) issued Accounting
Standards Update (ASU):
• ASU No. 2014-12, “Accounting for Share-Based Payments When the Terms of an Award Provide That a Performance
Target Could Be Achieved after the Requisite Service Period”, which requires a performance target that affects vesting
and that could be achieved after the requisite service period be treated as a performance condition. The adoption of this
ASU did not have a material impact on AltaGas' consolidated financial statements;
• ASU No. 2015-01, “Income Statement – Extraordinary and Unusual Items”, which eliminates the concept of
extraordinary items. The adoption of this ASU did not have a material impact on AltaGas' consolidated financial
statements; and
• ASU No. 2015-02, “Consolidation: Amendments to Consolidation Analysis”. The amendments in this ASU affect all
reporting entities that are required to evaluate whether certain legal entities should be consolidated. The amendments
a) modify the evaluation of whether limited partnerships and similar legal entities are variable interest entities (VIEs) or
voting interest entities; b) eliminate the presumption that a general partner should consolidate a limited partnership; c)
affect the consolidation analysis of reporting entities that are involved with VIEs, particularly those that have fee
arrangements and related party relationships; and d) provide a scope exception from consolidation guidance for
reporting entities with interests in certain legal entities (i.e. money market and other investment funds). The adoption of
this ASU did not have a material impact on AltaGas’ consolidated financial statements.
FUTURE CHANGES IN ACCOUNTING PRINCIPLES
In May 2014, FASB issued ASU No. 2014-09 “Revenue from Contracts with Customers”. The core principle of the amendments
in this ASU is that an entity should recognize revenue to depict the transfer of promised goods or services to customers in an
amount that reflects the consideration to which the entity expects to be entitled in exchange for those goods or services. The
amendments specify various disclosure requirements that would enable users of financial statements to understand the nature,
amount, timing, and uncertainty of revenue and cash flows arising from contracts with customers. In March 2016, FASB issued
ASU No. 2016-08 “Revenue from Contracts with Customers: Principal versus Agent Consideration”. The amendments in this
ASU clarify the implementation guidance on the principal versus agent considerations in the new revenue recognition standard.
In April 2016, FASB issued ASU No. 2016-10 “Revenue from Contracts with Customers: Identifying Performance Obligation and
Licensing”, which reduces the complexity when applying the guidance for identifying performance obligations and improves the
operability and understandability of the license implementation guidance. In May 2016, FASB issued ASU No. 2016-12
“Revenue from Contracts with Customers: Narrow Scope Improvements and Practical Expedients”, clarifying several
implementation issues, including collectability, presentation of sales taxes, non-cash consideration, contract modification,
completed contracts, and transition. The new revenue recognition standard will be effective for annual and interim periods
beginning on or after December 15, 2017. FASB permits adoption of the standard as early as the original effective date of
December 15, 2016. Early adoption prior to that date would not be permitted. AltaGas commenced a process for the adoption of
the ASU and the impact on AltaGas' consolidated financial statements is under assessment.

AltaGas Ltd. – Q2 2016 - 35
In January 2016, FASB issued ASU No. 2016-01 “Recognition and Measurement of Financial Assets and Financial Liabilities”
which revises an entity’s accounting related to (1) the classification and measurement of investments in equity securities and (2)
the presentation of certain fair value changes for financial liabilities measured at fair value. It also amends certain disclosure
requirements associated with the fair value of financial instruments. The amendments in this ASU are effective for fiscal years
beginning after December 15, 2017, including interim periods within those fiscal years. Upon adoption, entities will be required to
make a cumulative-effect adjustment to the statement of financial position as of the beginning of the first reporting period in which
the guidance is effective. The guidance on equity securities without readily determinable fair value will be applied prospectively
to all equity investments that exist as of the date of adoption of the standard. AltaGas is currently evaluating the impact of
adopting this ASU on its consolidated financial statements.
In February 2016, FASB issued ASU No. 2016-02 “Leases”, which requires lessees to recognize on the balance sheet a
right-of-use asset and a lease liability for all leases with lease terms greater than 12 months. Lessor accounting remains
substantially unchanged. The ASU also requires additional disclosures regarding leasing arrangements. The amendments in
this ASU are effective for fiscal years beginning after December 15, 2018, including interim periods within those fiscal years. In
transition, lessees and lessors are required to recognize and measure leases at the beginning of the earliest period presented
using a modified retrospective approach. AltaGas is currently evaluating the impact of adopting this ASU on its consolidated
financial statements.
In March 2016, FASB issued ASU No. 2016-05 “Derivatives and Hedging: Effect of Derivative Contract Novations on Existing
Hedge Accounting Relationships”. The amendments in this ASU apply to all entities for which there is a change in the
counterparty to a derivative instrument that has been designated as a hedging instrument. This ASU clarifies that a change in the
counterparty does not require de-designation of that hedging relationship. The amendments in this ASU are effective for financial
statements issued for fiscal years beginning after December 15, 2016, and interim periods within those fiscal years. An entity has
an option to apply for amendments in this ASU on either a prospective basis or a modified retrospective basis. Early adoption is
permitted. The adoption of this ASU is not expected to have a material impact on AltaGas’ consolidated financial statements.
In March 2016, FASB issued ASU No. 2016-06 “Derivatives and Hedging: Contingent Put and Call Options in Debt Instruments”.
The amendments in this ASU clarify the requirements for assessing whether contingent call (put) options that can accelerate the
payment of principal on debt instruments are clearly and closely related to their debt hosts. An entity performing the assessment
under the amendments in this ASU is required to assess the embedded call (put) options solely in accordance with the four-step
decision sequence. The amendments in this ASU are effective for fiscal years beginning after December 15, 2016, and interim
periods within those fiscal years. An entity should apply the amendment in this ASU on a modified retrospective basis, early
adoption is also permitted. The adoption of this ASU is not expected to have a material impact on AltaGas’ consolidated financial
statements.
In March 2016, FASB issued ASU No. 2016-07 “Equity Method and Joint Ventures Investments: Simplifying the Transition to the
Equity Method of Accounting”. The amendments in this ASU eliminate the requirement to retrospectively apply the equity method
as a result of an increase in the level of ownership interest or degree of influence. The amendments in this ASU are effective for
all entities for fiscal years, and interim periods within those fiscal years, beginning after December 15, 2016. The amendments
should be applied prospectively upon their effective date to increases in level of ownership interest or degree of influence. Early
adoption is permitted. AltaGas will apply the amendments prospectively.
In March 2016, FASB issued ASU No. 2016-09 “Stock Compensation: Improvements to Employee Share-Based Payment
Accounting”. The amendments in this ASU focuses on simplifying several areas of the accounting for share-based payment
transactions, including the accounting for income taxes, forfeitures, and statutory withholding requirements, as well as the
classification on the statement of cash flow. The amendments in this ASU are effective for fiscal periods beginning after
December 15, 2016, and interim periods within those fiscal periods. Early adoption is permitted. AltaGas is currently assessing
the impact of this ASU on its consolidated financial statements.
In June 2016, FASB issued ASU No. 2016-13 “Financial Instruments – Credit Losses: Measurement of Credit Losses on
Financial Instruments”. The amendments in this ASU replace the current “incurred loss” impairment methodology with an

AltaGas Ltd. – Q2 2016 - 36
“expected loss” model for financial assets measured at amortized cost. The amendments in this ASU are effective for fiscal
periods beginning after December 15, 2020, and interim periods within those fiscal periods. Early adoption is permitted. AltaGas
is currently assessing the impact of this ASU on its consolidated financial statements.
OFF-BALANCE SHEET ARRANGEMENTS
Reference should be made to the audited Consolidated Financial Statements and MD&A as at and for the year ended
December 31, 2015 for information on off-balance sheet arrangements.
DISCLOSURE CONTROLS AND PROCEDURES (DCP) AND INTERN AL CONTROL OVER FINANCIAL REPORTING
(ICFR)
AltaGas' management, including its Chief Executive Officer and Chief Financial Officer, is responsible for establishing and
maintaining DCP and ICFR, as those terms are defined in National Instrument 52-109 "Certification of Disclosure in Issuers'
Annual and Interim Filings". The objective of this instrument is to improve the quality, reliability, and transparency of information
that is filed or submitted under securities legislation.
AltaGas’ management, including the Chief Executive Officer and the Chief Financial Officer, have designed, or caused to be
designed under their supervision, DCP and ICFR to provide reasonable assurance that information required to be disclosed by
AltaGas in its annual filings, interim filings or other reports to be filed or submitted by it under securities legislation is made known
to them, is reported on a timely basis, financial reporting is reliable, and financial statements prepared for external purposes are
in accordance with U.S. GAAP.
The ICFR has been designed based on the framework established in the 2013 Internal Control - Integrated Framework issued by the Committee of Sponsoring Organizations of the Treadway Commission (COSO).
The Chief Executive Officer and the Chief Financial Officer have evaluated, with the assistance of AltaGas' employees, the
effectiveness of AltaGas' DCP and ICFR as at June 30, 2016 and concluded that as at June 30, 2016, AltaGas' DCP and ICFR
were effective.
During the second quarter of 2016, there were no changes made to AltaGas’ ICFR that materially affected, or are reasonably
likely to materially affect, its ICFR.
Pursuant to Section 3.3(1)(b) of National Instrument 52-109, the Chief Executive Officer and Chief Financial Officer of AltaGas,
with the assistance of AltaGas employees, have limited the scope of AltaGas’ design of DCP and ICFR to exclude the controls,
policies and procedures relating to the San Joaquin Facilities acquired on November 30, 2015. Summary financial information
related to the San Joaquin Facilities, which have been included in the unaudited condensed interim Consolidated Financial
Statements as at and for the three and six months ended June 30, 2016, is as follows:
($ millions) Three Months Ended
June 30, 2016Six Months Ended
June 30, 2016Revenues $ 33 $ 64 Pre-tax income $ 17 $ 33
($ millions) As at June 30, 2016Current assets $ 68 Non-current assets $ 920 Current liabilities $ 9 Non-current liabilities $ 98

AltaGas Ltd. – Q2 2016 - 37
It should be noted that a control system, no matter how well conceived and operated, can provide only reasonable, not absolute,
assurance that the objectives of the control system are met. Because of the inherent limitations in all control systems, no
evaluation of controls can provide absolute assurance that all control issues, including instances of fraud, if any, have been
detected. The design of any system of controls is also based in part on certain assumptions about the likelihood of future events,
and there can be no assurances that any design will succeed in achieving its stated goals under all potential conditions.
SUMMARY OF CONSOLIDATED RESULTS FOR THE EIGHT MOST RECENT QUARTERS (1)
($ millions) Q2-16 Q1-16 Q4-15 Q3-15 Q2-15 Q1-15 Q4-14 Q3-14Total revenue 426 611 580 452 416 744 667 444
Normalized EBITDA(2) 153 178 173 125 107 178 155 105
Net income (loss) applicable to common shares 16 55 (54) 20 (22) 66 10 17 ($ per share) Q2-16 Q1-16 Q4-15 Q3-15 Q2-15 Q1-15 Q4-14 Q3-14Net income (loss) per common share
Basic 0.10 0.38 (0.37) 0.15 (0.16) 0.49 0.08 0.13 Diluted 0.10 0.38 (0.37) 0.14 (0.16) 0.49 0.08 0.13
Dividends declared 0.50 0.50 0.50 0.48 0.47 0.44 0.44 0.44 (1) Amounts may not add due to rounding.
(2) Non-GAAP financial measure. See discussion in the "Non-GAAP Financial Measures" section of this MD&A.
AltaGas’ quarter-over-quarter financial results are impacted by seasonality, fluctuations in commodity prices, weather, the
US/Canadian dollar exchange rate, planned and unplanned plant outages, timing of in-service dates of new projects, and
acquisition and divestiture activities.
Revenue for the Utilities is generally the highest in the first and fourth quarter of any given year as the majority of natural gas
demand occurs during the winter heating season, which typically extends from November to March. Other significant items that
impacted quarter-over-quarter revenue during the periods noted include:
• The commissioning of the hydroelectric power generating facilities, Forrest Kerr and Volcano during the latter part of
2014 and McLymont in the fourth quarter of 2015. These run-of-river hydroelectric facilities are impacted by seasonal
precipitation and snowpack melt, which create periods of high flow during the spring and summer months;
• The acquisition of three natural gas-fired power assets (Ripon, Pomona and Brush II) in the U.S. with a total capacity of
164 MW in the first quarter of 2015;
• The Harmattan and Younger turnarounds in the second quarter of 2015;
• The weak NGL commodity prices throughout 2015 and in the first quarter of 2016;
• The San Joaquin Facilities acquired on November 30, 2015;
• The closing of the Tidewater Gas Asset Disposition on February 29, 2016; and
• The stronger US dollar on translated results of the U.S. assets throughout 2015 and in the first half of 2016.
Net income (loss) applicable to common shares is also affected by non-cash items such as deferred income tax, depreciation
and amortization expense, accretion expense, provision on assets and gains or losses on sale of assets. In addition, net income
(loss) applicable to common shares is also impacted by preferred share dividends. For these reasons, the net income (loss) may
not necessarily reflect the same trends as revenue. Net income (loss) applicable to common shares during the periods noted was
impacted by:
• Higher interest and depreciation and amortization expense since the third quarter of 2014 due to new assets placed into
service and interest no longer eligible for capitalization;
• An after-tax provision of $52 million for certain gas processing assets in the fourth quarter of 2014;
• A one-time non-cash expense of $14 million related to the revaluation of deferred income tax liabilities based on the
increased Alberta corporate income tax rate from 10 to 12 percent in the second quarter of 2015;

AltaGas Ltd. – Q2 2016 - 38
• An after-tax provision of $6 million related to the planned sale of certain development stage wind assets in northern
California in the third quarter of 2015;
• After-tax provisions totaling $114 million in the fourth quarter of 2015 related to AltaGas’ investment in common shares
of Painted Pony, investment in ASTC, investment in its joint ventures with Idemitsu Kosan Co.,Ltd. and the DC LNG
Project, certain wind development projects, certain gas processing assets that were held for sale, and AltaGas’ one
third interest in Inuvik Gas Ltd. and assets in the Ikhil Joint Venture;
• An after-tax gain on sale of $14 million in the first quarter of 2016 related to the sale of certain non-core natural gas
gathering and processing assets located primarily in central and north central Alberta;
• The termination of the Sundance B PPAs effective March 8, 2016; and
• After-tax restructuring charges of $5 million in the second quarter of 2016 related to the reduction of non-utility
workforce.

AltaGas Ltd. – Q2 2016 - 39
Consolidated Balance Sheets (condensed and unaudited)
As at ($ millions) June 30,
2016December 31,
2015 ASSETS Current assets
Cash and cash equivalents $ 77.4 $ 293.4 Accounts receivable, net of allowances 204.9 333.3 Inventory (note 5) 199.0 204.0 Restricted cash holdings from customers 4.0 5.4 Regulatory assets 0.9 4.3 Risk management assets (note 10) 44.5 50.4 Prepaid expenses and other current assets 26.5 48.3 Assets held for sale (note 4) — 98.7
557.2 1,037.8 Property, plant and equipment 6,647.0 6,597.9 Intangible assets 695.8 735.1 Goodwill (note 6) 841.2 877.3 Regulatory assets 322.1 333.3 Risk management assets (note 10) 23.1 23.5 Deferred income taxes 2.8 4.5 Restricted cash holdings from customers 9.7 12.5 Long-term investments and other assets 139.4 64.3 Investments accounted for by equity method (notes 4 and 7) 619.6 413.3 $ 9,857.9 $ 10,099.5 LIABILITIES AND SHAREHOLDERS' EQUITY Current liabilities
Accounts payable and accrued liabilities $ 271.2 $ 383.1 Dividends payable 26.9 24.1 Short-term debt 21.7 130.7 Current portion of long-term debt (notes 8 and 10) 372.9 287.5 Customer deposits 29.1 41.0 Regulatory liabilities 23.9 21.3 Risk management liabilities (note 10) 30.3 33.5 Other current liabilities 19.0 17.8 Liabilities associated with assets held for sale (note 4) — 8.7
795.0 947.7 Long-term debt (notes 8 and 10) 3,363.0 3,732.4 Asset retirement obligations 78.9 67.9 Deferred income taxes 602.4 621.7 Regulatory liabilities 162.2 167.6 Risk management liabilities (note 10) 14.0 15.7 Other long-term liabilities 206.1 206.7 Future employee obligations (note 15) 133.9 136.9 $ 5,355.5 $ 5,896.6
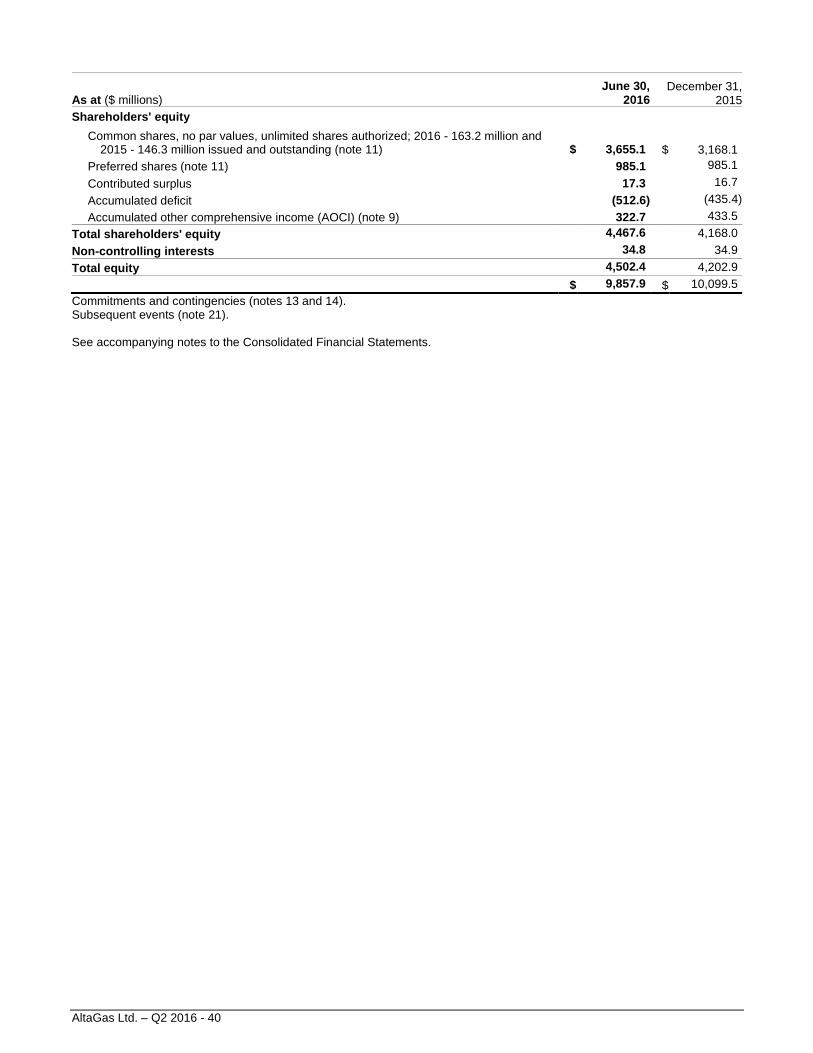
AltaGas Ltd. – Q2 2016 - 40
As at ($ millions)
June 30, 2016
December 31, 2015
Shareholders' equity
Common shares, no par values, unlimited shares authorized; 2016 - 163.2 million and 2015 - 146.3 million issued and outstanding (note 11) $ 3,655.1 $ 3,168.1
Preferred shares (note 11) 985.1 985.1
Contributed surplus 17.3 16.7
Accumulated deficit (512.6) (435.4)
Accumulated other comprehensive income (AOCI) (note 9) 322.7 433.5
Total shareholders' equity 4,467.6 4,168.0
Non-controlling interests 34.8 34.9
Total equity 4,502.4 4,202.9 $ 9,857.9 $ 10,099.5 Commitments and contingencies (notes 13 and 14). Subsequent events (note 21). See accompanying notes to the Consolidated Financial Statements.

AltaGas Ltd. – Q2 2016 - 41
Consolidated Statements of Income (Loss) (condensed and unaudited)
Three Months EndedJune 30
Six Months EndedJune 30
($ millions except per share amounts) 2016 2015 2016 2015 REVENUE
Sales $ 54.1 $ 80.0 $ 92.9 $ 212.9 Services 200.2 180.5 382.3 351.2 Regulated operations 182.8 178.5 563.5 605.9 Other loss — (0.3) — (0.2) Unrealized losses on risk management contracts (note 10) (11.5) (22.6) (2.6) (9.2)
425.6 416.1 1,036.1 1,160.6 EXPENSES
Cost of sales, exclusive of items shown separately 164.2 219.3 452.9 652.5 Operating and administrative 133.2 120.7 264.8 238.1 Accretion expenses 2.8 2.7 5.5 5.4 Depreciation and amortization 66.3 49.8 134.8 99.6
366.5 392.5 858.0 995.6 Income (loss) from equity investments (notes 4 and 13) 5.7 5.3 (5.0) (0.4) Other income (note 4) 1.5 2.4 5.9 4.2 Foreign exchange gain (loss) 4.1 (0.8) 3.5 0.4 Interest expense
Short-term debt (0.1) (0.3) (0.2) (0.7) Long-term debt (36.2) (30.1) (72.2) (59.5)
Income before income taxes 34.1 0.1 110.1 109.0 Income tax expense (recovery) (notes 4 and 16)
Current 9.8 3.2 19.8 15.0 Deferred (5.8) 6.8 (9.9) 25.5
Net income (loss) after taxes 30.1 (9.9) 100.2 68.5 Net income applicable to non-controlling interests 2.2 2.0 5.0 4.1 Net income (loss) applicable to controlling interes ts 27.9 (11.9) 95.2 64.4 Preferred share dividends (12.0) (10.1) (24.0) (20.2) Net income (loss) applicable to common shares $ 15.9 $ (22.0) $ 71.2 $ 44.2 Net income (loss) per common share (note 12)
Basic $ 0.10 $ (0.16) $ 0.48 $ 0.33 Diluted $ 0.10 $ (0.16) $ 0.48 $ 0.33
Weighted average number of common shares outstanding (millions) (note 12)
Basic 151.6 135.0 149.2 134.6 Diluted 152.0 135.0 149.6 135.9
See accompanying notes to the Consolidated Financial Statements.
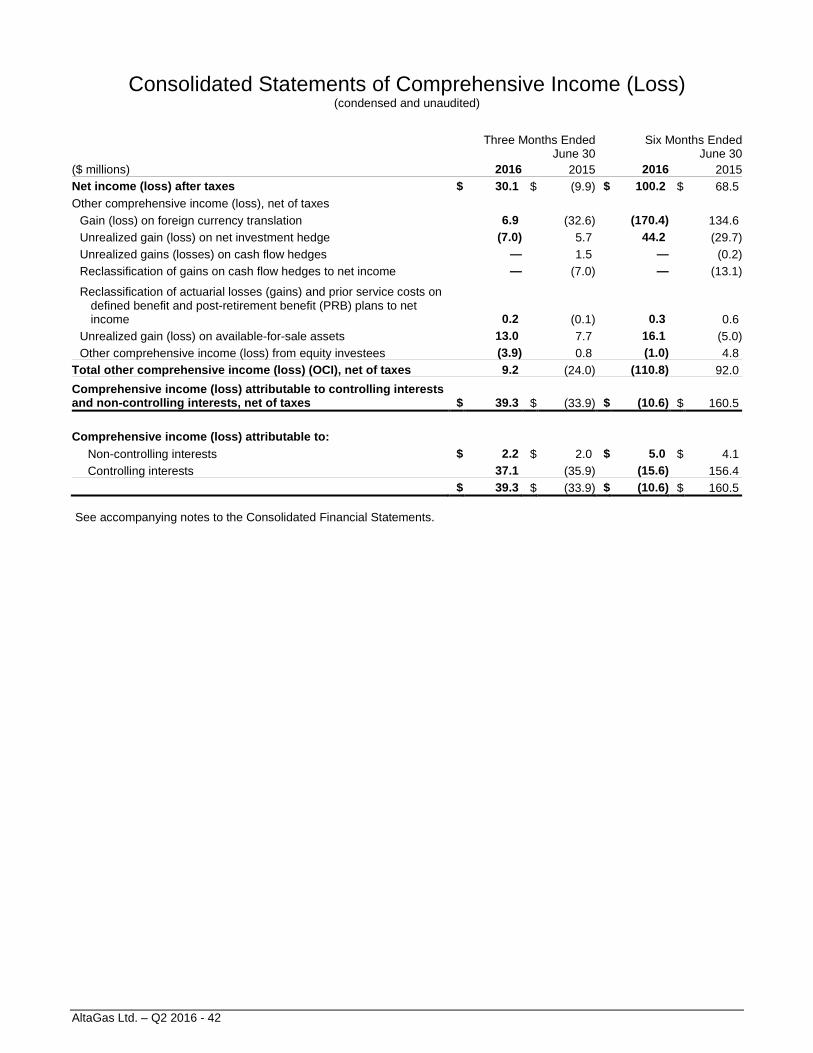
AltaGas Ltd. – Q2 2016 - 42
Consolidated Statements of Comprehensive Income (Loss) (condensed and unaudited)
Three Months EndedJune 30
Six Months EndedJune 30
($ millions) 2016 2015 2016 2015Net income (loss) after taxes $ 30.1 $ (9.9) $ 100.2 $ 68.5 Other comprehensive income (loss), net of taxes
Gain (loss) on foreign currency translation 6.9 (32.6) (170.4) 134.6 Unrealized gain (loss) on net investment hedge (7.0) 5.7 44.2 (29.7)Unrealized gains (losses) on cash flow hedges — 1.5 — (0.2)Reclassification of gains on cash flow hedges to net income — (7.0) — (13.1)
Reclassification of actuarial losses (gains) and prior service costs on defined benefit and post-retirement benefit (PRB) plans to net income 0.2 (0.1) 0.3 0.6
Unrealized gain (loss) on available-for-sale assets 13.0 7.7 16.1 (5.0)Other comprehensive income (loss) from equity investees (3.9) 0.8 (1.0) 4.8
Total other comprehensive income (loss) (OCI), net of taxes 9.2 (24.0) (110.8) 92.0
Comprehensive income (loss) attributable to control ling interests and non-controlling interests, net of taxes $ 39.3 $ (33.9) $ (10.6) $ 160.5 Comprehensive income (loss) attributable to:
Non-controlling interests $ 2.2 $ 2.0 $ 5.0 $ 4.1 Controlling interests 37.1 (35.9) (15.6) 156.4
$ 39.3 $ (33.9) $ (10.6) $ 160.5 See accompanying notes to the Consolidated Financial Statements.
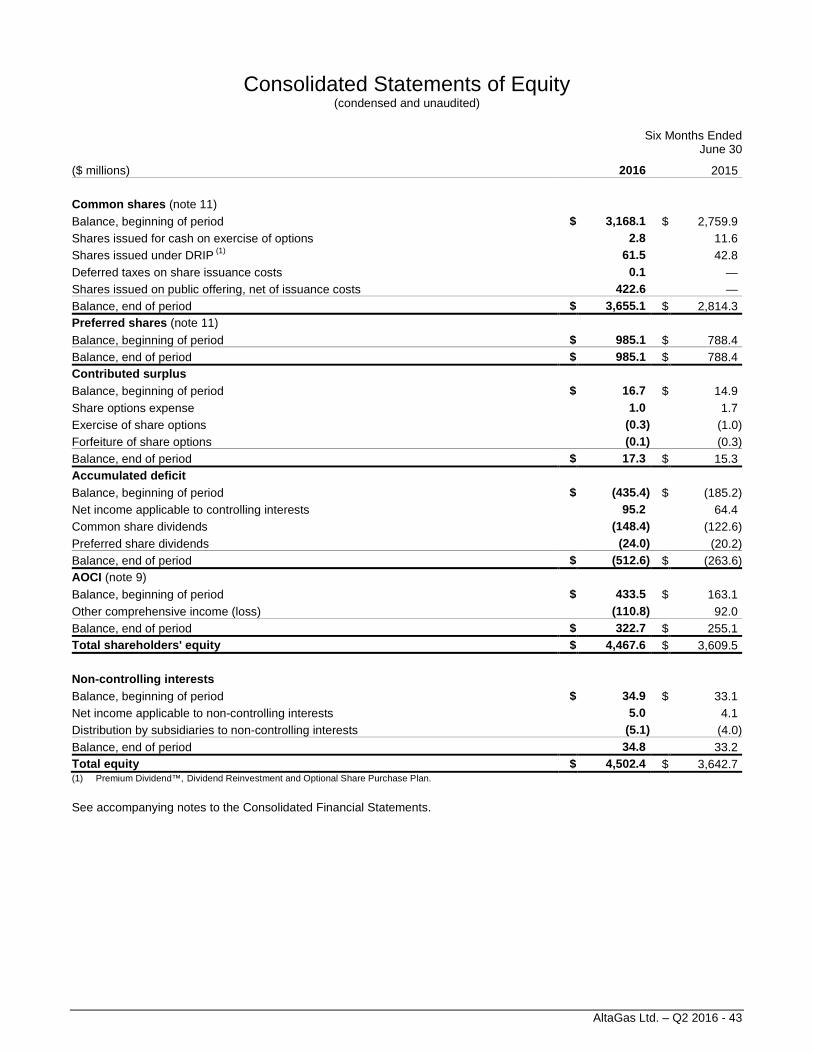
AltaGas Ltd. – Q2 2016 - 43
Consolidated Statements of Equity (condensed and unaudited)
Six Months Ended June 30
($ millions) 2016 2015 Common shares (note 11) Balance, beginning of period $ 3,168.1 $ 2,759.9 Shares issued for cash on exercise of options 2.8 11.6 Shares issued under DRIP (1) 61.5 42.8 Deferred taxes on share issuance costs 0.1 — Shares issued on public offering, net of issuance costs 422.6 — Balance, end of period $ 3,655.1 $ 2,814.3 Preferred shares (note 11) Balance, beginning of period $ 985.1 $ 788.4 Balance, end of period $ 985.1 $ 788.4 Contributed surplus Balance, beginning of period $ 16.7 $ 14.9 Share options expense 1.0 1.7 Exercise of share options (0.3) (1.0) Forfeiture of share options (0.1) (0.3) Balance, end of period $ 17.3 $ 15.3 Accumulated deficit Balance, beginning of period $ (435.4) $ (185.2) Net income applicable to controlling interests 95.2 64.4 Common share dividends (148.4) (122.6) Preferred share dividends (24.0) (20.2) Balance, end of period $ (512.6) $ (263.6) AOCI (note 9) Balance, beginning of period $ 433.5 $ 163.1 Other comprehensive income (loss) (110.8) 92.0 Balance, end of period $ 322.7 $ 255.1 Total shareholders' equity $ 4,467.6 $ 3,609.5 Non-controlling interests Balance, beginning of period $ 34.9 $ 33.1 Net income applicable to non-controlling interests 5.0 4.1 Distribution by subsidiaries to non-controlling interests (5.1) (4.0) Balance, end of period 34.8 33.2 Total equity $ 4,502.4 $ 3,642.7 (1) Premium Dividend™, Dividend Reinvestment and Optional Share Purchase Plan.
See accompanying notes to the Consolidated Financial Statements.

AltaGas Ltd. – Q2 2016 - 44
Consolidated Statements of Cash Flows (condensed and unaudited)
Three Months Ended
June 30Six Months Ended
June 30($ millions) 2016 2015 2016 2015 Cash from operations Net income (loss) after taxes $ 30.1 $ (9.9) $ 100.2 $ 68.5 Items not involving cash:
Depreciation and amortization 66.3 49.8 134.8 99.6 Accretion expenses 2.8 2.7 5.5 5.4 Share-based compensation (note 11) 0.4 0.7 0.9 1.4 Deferred income tax expense (recovery) (notes 4 and 16) (5.8) 6.8 (9.9) 25.5 Gain on sale of assets (note 4) — — (4.0) — Loss (income) from equity investments (notes 4 and 13) (5.7) (5.3) 5.0 0.4 Unrealized losses on risk management contracts (note 10) 11.5 22.6 2.6 9.2 Gain on long-term investments (0.5) (0.6) (0.3) (0.9) Other 0.5 2.0 1.5 4.2
Asset retirement obligations settled (0.4) (1.2) (1.6) (1.7) Contributions to equity investments, net of distributions 7.6 (0.6) 1.7 (4.9) Changes in operating assets and liabilities (note 18) (0.3) 79.6 8.4 142.6 $ 106.5 $ 146.6 $ 244.8 $ 349.3 Investing activities Business acquisitions, net of cash acquired (note 3) 1.0 (1.6) (20.0) (33.6) Acquisition of property, plant and equipment (151.8) (128.9) (305.0) (243.6) Acquisition of intangible assets (5.1) (9.1) (5.9) (18.5) Contributions to equity investments — (0.3) (6.6) (6.1) Maturity of short-term investment — 50.0 — 50.0 Change in restricted cash holdings from customers 0.3 0.4 1.0 1.4 Investments in Petrogas preferred shares (note 7) (150.0) — (150.0) — Loan to affiliate (note 17) (25.0) — (25.0) — Proceeds from disposition of assets, net of transaction costs (note 4) 0.4 0.1 29.6 0.1 $ (330.2) $ (89.4) $ (481.9) $ (250.3)
Financing activities Net issuance (repayment) of short-term debt (14.8) 12.5 (102.0) (63.8) Issuance of long-term debt, net of debt issuance costs 330.1 376.2 612.0 375.9 Repayment of long-term debt (392.3) (400.2) (799.8) (403.7) Dividends - common shares (73.0) (61.4) (145.6) (120.7) Dividends - preferred shares (12.0) (10.1) (25.1) (20.2) Distributions to non-controlling interest (3.2) (2.5) (5.1) (4.0) Net proceeds from shares issued on exercise of options 0.6 6.2 2.2 10.6 Net proceeds from issuance of common shares 457.2 21.7 484.1 42.7 $ 292.6 $ (57.6) $ 20.7 $ (183.2) Change in cash and cash equivalents 68.9 (0.4) (216.4) (84.2) Effect of exchange rate changes on cash and cash eq uivalents — (0.7) 0.4 2.8 Cash and cash equivalents, beginning of period 8.5 290.7 293.4 371.0 Cash and cash equivalents, end of period $ 77.4 $ 289.6 $ 77.4 $ 289.6 See accompanying notes to the Consolidated Financial Statements.

AltaGas Ltd. – Q2 2016 - 45
Notes to the Condensed Interim Consolidated Financial Statements (unaudited)
(Tabular amounts and amounts in footnotes to tables are in millions of Canadian dollars unless otherwise indicated.)
1. ORGANIZATION AND OVERVIEW OF BUSINESS
The businesses of AltaGas Ltd. (AltaGas or the Corporation) are operated by AltaGas and a number of its subsidiaries including,
without limitation, AltaGas Extraction and Transmission Limited Partnership, AltaGas Pipeline Partnership, AltaGas Processing
Partnership, Harmattan Gas Processing Limited Partnership, AltaGas Utilities Inc. (AUI), Heritage Gas Limited (Heritage Gas),
Pacific Northern Gas Ltd. (PNG), Coast Mountain Hydro Limited Partnership, AltaGas Services (U.S.) Inc., Blythe Energy Inc.
(Blythe), AltaGas San Joaquin Energy Inc., and SEMCO Energy, Inc. (SEMCO). SEMCO conducts its Michigan natural gas
distribution business under the name SEMCO Energy Gas Company (SEMCO Gas) and its Alaska natural gas distribution
business under the name ENSTAR Natural Gas Company (ENSTAR).
AltaGas, a Canadian corporation, is a North American diversified energy infrastructure business with a focus on owning and
operating assets to provide clean and affordable energy to its customers. AltaGas has three business segments: Gas, Power
and Utilities.
AltaGas' Gas segment serves producers in the Western Canada Sedimentary Basin (WCSB) and includes natural gas gathering
and processing, natural gas liquids (NGL) extraction and separation, gas transmission, gas storage and natural gas marketing,
and the one-third ownership investment, through AltaGas Idemitsu Joint Venture Limited Partnership (AIJVLP), in Petrogas
Energy Corp. (Petrogas).
The Power segment includes 1,688 MW of generating capacity from natural gas-fired, wind, biomass and hydro assets in
Canada and the United States, along with an additional 1,253 MW of assets under development.
The Utilities segment is predominantly comprised of natural gas distribution rate regulated utilities in Canada and the United
States. The utilities are generally allowed the opportunity to earn regulated returns that provide for recovery of costs and a return
on, and of, capital from the regulator-approved capital investment base.
2. SUMMARY OF SIGNIFICANT ACCOUNTING POLICIES
BASIS OF PRESENTATION
These unaudited condensed interim Consolidated Financial Statements have been prepared by management in accordance
with United States Generally Accepted Accounting Principles (U.S. GAAP). As a result, these condensed interim Consolidated
Financial Statements do not include all of the information and disclosures required in the annual Consolidated Financial
Statements and should be read in conjunction with the Corporation's 2015 annual audited Consolidated Financial Statements
prepared in accordance with U.S. GAAP. In management's opinion, the condensed interim Consolidated Financial Statements
include all adjustments that are all of a recurring nature and necessary to present fairly the financial position of the Corporation.
Pursuant to National Instrument 52-107, "Acceptable Accounting Principles and Auditing Standards" (NI 52-107), U.S. GAAP
reporting is generally permitted by Canadian securities laws for companies subject to reporting obligations under U.S. securities
laws. However, given that AltaGas is not subject to such reporting obligations and could not therefore rely on the provisions of NI
52-107 to that effect, AltaGas sought and obtained exemptive relief by the securities regulators in Alberta and Ontario to permit
it to prepare its financial statements in accordance with U.S. GAAP. The exemption will terminate on or after the earlier of
January 1, 2019, the date to which AltaGas ceases to have activities subject to rate regulation, or the effective date prescribed for
a mandatory application of International Financial Reporting Standard for rate-regulated accounting.

AltaGas Ltd. – Q2 2016 - 46
PRINCIPLES OF CONSOLIDATION
These unaudited condensed interim Consolidated Financial Statements of AltaGas include the accounts of the Corporation and
all of its wholly-owned subsidiaries, and its interest in various partnerships and joint ventures where AltaGas has an undivided
interest in the assets and liabilities of the joint venture or partnership. Investments in unconsolidated companies that AltaGas has
significant influence over, but not control, are accounted for using the equity method.
Transactions between and amongst AltaGas and its wholly-owned subsidiaries, and the proportionate interests in joint ventures
or partnerships are eliminated on consolidation as required by U.S. GAAP. Where there is a party with a non-controlling interest
in a subsidiary that AltaGas controls, that non-controlling interest is reflected as “Non-controlling interests” in the Consolidated
Financial Statements. The non-controlling interests in net income (or loss) of consolidated subsidiaries is shown as an allocation
of the consolidated net income and is presented separately in "Net income applicable to non-controlling interests".
USE OF ESTIMATES AND MEASUREMENT UNCERTAINTY
The preparation of Consolidated Financial Statements in accordance with U.S. GAAP requires management to make estimates
and assumptions that affect the reported amounts of assets and liabilities and the reported amounts of revenue and expenses
during the period. Key areas where management has made complex or subjective judgments, when matters are inherently
uncertain, include but are not limited to: depreciation and amortization expense, asset retirement obligations, assets impairment
assessment, fair value of financial instruments, income taxes, employee future benefits, contingencies, share-based
compensation, and regulatory assets and liabilities. Certain estimates are necessary for the regulatory environment in which
AltaGas' subsidiaries or affiliates operate, which often require amounts to be recorded at estimated values until these amounts
are finalized pursuant to regulatory decisions or other regulatory proceedings. By their nature, these estimates are subject to
measurement uncertainty and may impact the Consolidated Financial Statements of future periods.
SIGNIFICANT ACCOUNTING POLICIES
Except as noted below, these condensed interim Consolidated Financial Statements have been prepared following the same
accounting policies and methods as those used in preparing the Corporation's 2015 annual audited Consolidated Financial
Statements.
ADOPTION OF NEW ACCOUNTING STANDARDS
Effective January 1, 2016, AltaGas adopted the following Financial Accounting Standards Board (FASB) issued Accounting
Standards Update (ASU):
• ASU No. 2014-12, “Accounting for Share-Based Payments When the Terms of an Award Provide That a Performance
Target Could Be Achieved after the Requisite Service Period”, which requires a performance target that affects vesting
and that could be achieved after the requisite service period be treated as a performance condition. The adoption of this
ASU did not have a material impact on AltaGas' consolidated financial statements;
• ASU No. 2015-01, “Income Statement – Extraordinary and Unusual Items”, which eliminates the concept of
extraordinary items. The adoption of this ASU did not have a material impact on AltaGas' consolidated financial
statements; and
• ASU No. 2015-02, “Consolidation: Amendments to Consolidation Analysis”. The amendments in this ASU affect all
reporting entities that are required to evaluate whether certain legal entities should be consolidated. The amendments
a) modify the evaluation of whether limited partnerships and similar legal entities are variable interest entities (VIEs) or
voting interest entities; b) eliminate the presumption that a general partner should consolidate a limited partnership; c)
affect the consolidation analysis of reporting entities that are involved with VIEs, particularly those that have fee
arrangements and related party relationships; and d) provide a scope exception from consolidation guidance for

AltaGas Ltd. – Q2 2016 - 47
reporting entities with interests in certain legal entities (i.e. money market and other investment funds). The adoption of
this ASU did not have a material impact on AltaGas’ consolidated financial statements.
FUTURE CHANGES IN ACCOUNTING PRINCIPLES
In May 2014, FASB issued ASU No. 2014-09 “Revenue from Contracts with Customers”. The core principle of the amendments
in this ASU is that an entity should recognize revenue to depict the transfer of promised goods or services to customers in an
amount that reflects the consideration to which the entity expects to be entitled in exchange for those goods or services. The
amendments specify various disclosure requirements that would enable users of financial statements to understand the nature,
amount, timing, and uncertainty of revenue and cash flows arising from contracts with customers. In March 2016, FASB issued
ASU No. 2016-08 “Revenue from Contracts with Customers: Principal versus Agent Consideration”. The amendments in this
ASU clarify the implementation guidance on the principal versus agent considerations in the new revenue recognition standard.
In April 2016, FASB issued ASU No. 2016-10 “Revenue from Contracts with Customers: Identifying Performance Obligation and
Licensing”, which reduces the complexity when applying the guidance for identifying performance obligations and improves the
operability and understandability of the license implementation guidance. In May 2016, FASB issued ASU No. 2016-12
“Revenue from Contracts with Customers: Narrow Scope Improvements and Practical Expedients”, clarifying several
implementation issues, including collectability, presentation of sales taxes, non-cash consideration, contract modification,
completed contracts, and transition. The new revenue recognition standard will be effective for annual and interim periods
beginning on or after December 15, 2017. FASB permits adoption of the standard as early as the original effective date of
December 15, 2016. Early adoption prior to that date would not be permitted. AltaGas commenced a process for the adoption of
the ASU and the impact on AltaGas' consolidated financial statements is under assessment.
In January 2016, FASB issued ASU No. 2016-01 “Recognition and Measurement of Financial Assets and Financial Liabilities”
which revises an entity’s accounting related to (1) the classification and measurement of investments in equity securities and (2)
the presentation of certain fair value changes for financial liabilities measured at fair value. It also amends certain disclosure
requirements associated with the fair value of financial instruments. The amendments in this ASU are effective for fiscal years
beginning after December 15, 2017, including interim periods within those fiscal years. Upon adoption, entities will be required to
make a cumulative-effect adjustment to the statement of financial position as of the beginning of the first reporting period in which
the guidance is effective. The guidance on equity securities without readily determinable fair value will be applied prospectively
to all equity investments that exist as of the date of adoption of the standard. AltaGas is currently evaluating the impact of
adopting this ASU on its consolidated financial statements.
In February 2016, FASB issued ASU No. 2016-02 “Leases”, which requires lessees to recognize on the balance sheet a
right-of-use asset and a lease liability for all leases with lease terms greater than 12 months. Lessor accounting remains
substantially unchanged. The ASU also requires additional disclosures regarding leasing arrangements. The amendments in
this ASU are effective for fiscal years beginning after December 15, 2018, including interim periods within those fiscal years. In
transition, lessees and lessors are required to recognize and measure leases at the beginning of the earliest period presented
using a modified retrospective approach. AltaGas is currently evaluating the impact of adopting this ASU on its consolidated
financial statements.
In March 2016, FASB issued ASU No. 2016-05 “Derivatives and Hedging: Effect of Derivative Contract Novations on Existing
Hedge Accounting Relationships”. The amendments in this ASU apply to all entities for which there is a change in the
counterparty to a derivative instrument that has been designated as a hedging instrument. This ASU clarifies that a change in the
counterparty does not require de-designation of that hedging relationship. The amendments in this ASU are effective for financial
statements issued for fiscal years beginning after December 15, 2016, and interim periods within those fiscal years. An entity has
an option to apply for amendments in this ASU on either a prospective basis or a modified retrospective basis. Early adoption is
permitted. The adoption of this ASU is not expected to have a material impact on AltaGas’ consolidated financial statements.
In March 2016, FASB issued ASU No. 2016-06 “Derivatives and Hedging: Contingent Put and Call Options in Debt Instruments”.
The amendments in this ASU clarify the requirements for assessing whether contingent call (put) options that can accelerate the
payment of principal on debt instruments are clearly and closely related to their debt hosts. An entity performing the assessment

AltaGas Ltd. – Q2 2016 - 48
under the amendments in this ASU is required to assess the embedded call (put) options solely in accordance with the four-step
decision sequence. The amendments in this ASU are effective for fiscal years beginning after December 15, 2016, and interim
periods within those fiscal years. An entity should apply the amendment in this ASU on a modified retrospective basis, early
adoption is also permitted. The adoption of this ASU is not expected to have a material impact on AltaGas’ consolidated financial
statements.
In March 2016, FASB issued ASU No. 2016-07 “Equity Method and Joint Ventures Investments: Simplifying the Transition to the
Equity Method of Accounting”. The amendments in this ASU eliminate the requirement to retrospectively apply the equity method
as a result of an increase in the level of ownership interest or degree of influence. The amendments in this ASU are effective for
all entities for fiscal years, and interim periods within those fiscal years, beginning after December 15, 2016. The amendments
should be applied prospectively upon their effective date to increases in level of ownership interest or degree of influence. Early
adoption is permitted. AltaGas will apply the amendments prospectively.
In March 2016, FASB issued ASU No. 2016-09 “Stock Compensation: Improvements to Employee Share-Based Payment
Accounting”. The amendments in this ASU focuses on simplifying several areas of the accounting for share-based payment
transactions, including the accounting for income taxes, forfeitures, and statutory withholding requirements, as well as the
classification on the statement of cash flow. The amendments in this ASU are effective for fiscal periods beginning after
December 15, 2016, and interim periods within those fiscal periods. Early adoption is permitted. AltaGas is currently assessing
the impact of this ASU on its consolidated financial statements.
In June 2016, FASB issued ASU No. 2016-13 “Financial Instruments – Credit Losses: Measurement of Credit Losses on
Financial Instruments”. The amendments in this ASU replace the current “incurred loss” impairment methodology with an
“expected loss” model for financial assets measured at amortized cost. The amendments in this ASU are effective for fiscal
periods beginning after December 15, 2020, and interim periods within those fiscal periods. Early adoption is permitted. AltaGas
is currently assessing the impact of this ASU on its consolidated financial statements.
3. ACQUISITIONS
GWF Energy Holdings LLC (San Joaquin Facilities)
On November 30, 2015 AltaGas completed the acquisition of GWF Energy Holdings LLC, which holds a portfolio of three natural
gas-fired electrical generation facilities in northern California totaling 523 MW, for approximately US$642 million before working
capital adjustments. Subsequent to the acquisition, GWF Energy Holdings LLC and the other entities acquired were restructured
ultimately resulting in the sole successor being AltaGas San Joaquin Energy Inc. For the three and six months ended June 30,
2016, transaction costs, such as legal, accounting, valuation and other professional fees of $0.1 million and $1.5 million before
taxes, respectively, were incurred and included in the Consolidated Statement of Income, within “Operating and administrative
expenses”. Acquisition costs of $3.4 million before taxes have been incurred on the acquisition to date. The purchase price
allocation representing the consideration paid and the fair value of the net assets acquired as at November 30, 2015 is
substantially complete except for the amounts related to deferred income taxes. Below is the purchase price allocation using an
exchange rate of 1.3333 to convert US dollars to Canadian dollars.

AltaGas Ltd. – Q2 2016 - 49
Cash consideration $ 881.4
Total consideration $ 881.4 Fair value of net assets acquired Current assets $ 31.8 Property, plant and equipment 591.3 Intangible assets 355.4 Current liabilities (13.0) Deferred income taxes (84.1)
$ 881.4
The consolidated results for the three and six months ended June 30, 2016 incorporate the results of operations from the San
Joaquin Facilities. If the acquisition had occurred on January 1, 2015, revenues and pre-tax income would have increased by
approximately $29.1 million (US$23.6 million) and $23.4 million (US$19.1 million), respectively, for the three months ended June
30, 2015 and approximately $58.4 million (US$47.3 million) and $47.1 million (US$38.1 million), respectively, for the six months
ended June 30, 2015.
Edmonton Ethane Extract Plant (EEEP)
Effective January 1, 2016, AltaGas acquired the remaining 51 percent interest in EEEP for cash consideration of approximately
$21.0 million, increasing its ownership interest to 100 percent. AltaGas accounted for the acquisition as a business combination
achieved in stages and remeasured the previously held 49 percent interest in EEEP at fair value on the acquisition date using the
discounted cash flow approach. The significant inputs include contracted cash flows for the facility, forecasted commodity prices,
and projected operating costs based on historical pattern. No gain or loss was recorded as a result of the remeasurement. Upon
the acquisition of control, AltaGas began consolidating the results of EEEP. Prior to the acquisition, AltaGas proportionately
consolidated the 49 percent interest in EEEP.
Below is the provisional purchase price allocation of the estimated fair values of the net assets acquired as at the acquisition
date:
Fair value of net assets acquired Property, plant and equipment $ 67.1 Asset retirement obligations (15.0)Deferred income taxes (3.3) $ 48.8
The total estimated fair value of $48.8 million included $21.0 million of cash paid to acquire the remaining 51 percent interest and
$27.8 million related to the previously held interest.
The consolidated results for the three and six months ended June 30, 2016 incorporate the results of operations from the
additional ownership interest in EEEP. If the acquisition of the additional interest had occurred on January 1, 2015, changes to
revenues and pre-tax income for the three and six months ended June 30, 2015 would have been nominal.

AltaGas Ltd. – Q2 2016 - 50
4. ASSETS HELD FOR SALE
As at June 30,
2016December 31,
2015Assets held for sale Property, plant and equipment $ — $ 97.7 Intangible assets — 1.0 $ — $ 98.7 Liabilities associated with assets held for sale Asset retirement obligations $ — $ 8.7 $ — $ 8.7
On February 29, 2016, AltaGas completed the disposition of certain non-core natural gas gathering and processing assets in the
Gas segment to Tidewater Midstream and Infrastructure Ltd. (Tidewater) for total gross consideration of $30.0 million in cash and
approximately 43.7 million of common shares of Tidewater. The assets were located primarily in central and north central Alberta
and totaled approximately 490 Mmcf/d of gross licensed natural gas processing capacity. AltaGas recognized a pre-tax gain on
disposition of $4.0 million in the Consolidated Statement of Income under the line item “Other income” for the six months ended
June 30, 2016. In addition, AltaGas recorded a tax recovery of $10.4 million related to the asset sale for the six months ended
June 30, 2016.
AltaGas accounted for its investment in Tidewater using the equity method. On March 22, 2016 Tidewater closed a public
offering and issued a total of 57.5 million common shares (including shares issued pursuant to the over-allotment option, which
was exercised in full) and as a result, AltaGas’ interest in Tidewater decreased from 19.9 percent to approximately 15.8 percent.
On March 30, 2016, Tidewater issued approximately 7.4 million of common shares as part of an early settlement of a holdback
liability. This further diluted AltaGas' interest in Tidewater to approximately 15.4 percent. A pre-tax dilution loss of approximately
$0.7 million was recognized for the six months ended June 30, 2016.
5. INVENTORY
As at June 30,
2016December 31,
2015Natural gas held in storage $ 150.9 $ 166.0 Other inventory 48.1 38.0
$ 199.0 $ 204.0
6. GOODWILL
June 30, December 31,As at 2016 2015 Balance, beginning of period $ 877.3 $ 785.1 Provision on assets — (5.1) Foreign exchange translation (36.1) 97.3
$ 841.2 $ 877.3 7. INVESTMENTS ACCOUNTED FOR BY THE EQUITY METHOD AltaGas, indirectly through its investment in AltaGas Idemitsu Joint Venture Limited Partnership (AIJVLP) holds a one-third
equity interest in Petrogas Energy Corp. (Petrogas). On June 29, 2016, AltaGas, directly invested $150.0 million to subscribe for
6,000,000 cumulative redeemable convertible preferred shares of Petrogas. These preferred shares form part of AltaGas’ overall

AltaGas Ltd. – Q2 2016 - 51
investment in Petrogas and entitle AltaGas to a fixed, cumulative, preferential cash dividend at a rate of 8.5 percent per annum
payable quarterly. These preferred shares are, in the normal course, redeemable at any time on or after January 1, 2018 and
convertible into a specified number of common shares at the option of either holder at any time on or after April 19, 2018.
8. LONG-TERM DEBT
June 30, December 31,As at Maturity date 2016 2015 Credit facilities
$1,400 million unsecured extendible revolving(a) 15-Dec-2019 $ 378.6 $ 689.9 Medium-term notes (MTNs)
$200 million Senior unsecured - 5.49 percent 27-Mar-2017 200.0 200.0 $175 million Senior unsecured - 4.60 percent 15-Jan-2018 175.0 175.0 $200 million Senior unsecured - 4.55 percent 17-Jan-2019 200.0 200.0 $200 million Senior unsecured - 4.07 percent 1-Jun-2020 200.0 200.0 $350 million Senior unsecured - 3.72 percent 28-Sep-2021 350.0 350.0 $300 million Senior unsecured - 3.57 percent 12-Jun-2023 300.0 300.0 $200 million Senior unsecured - 4.40 percent 15-Mar-2024 200.0 200.0 $300 million Senior unsecured - 3.84 percent 15-Jan-2025 299.9 299.9 $100 million Senior unsecured - 5.16 percent 13-Jan-2044 100.0 100.0 $300 million Senior unsecured - 4.50 percent 15-Aug-2044 299.8 299.8 $350 million Senior unsecured - 4.12 percent 7-Apr-2026 349.8 —
US$200 million Senior unsecured - floating(b) 24-Mar-2016 — 276.8
US$125 million Senior unsecured - floating(c) 17-Apr-2017 162.6 173.0 SEMCO long-term debt
US$300 million SEMCO Senior secured - 5.15 percent(d) 21-Apr-2020 390.3 415.2
US$82 million CINGSA Senior secured - 4.48 percent (e) 2-Mar-2032 97.5 107.0 Debenture notes
PNG RoyNat Debenture - 3.38 percent(f) 15-Sep-2017 8.0 8.6
PNG 2018 Series Debenture - 8.75 percent(f) 15-Nov-2018 9.0 9.0
PNG 2025 Series Debenture - 9.30 percent(f) 18-Jul-2025 14.0 14.0
PNG 2027 Series Debenture - 6.90 percent(f) 2-Dec-2027 15.0 15.0
Loan from Province of Nova Scotia (g) 31-Jul-2017 1.1 1.1 CINGSA capital lease - 3.50 percent 1-May-2040 0.6 0.6 CINGSA capital lease - 4.48 percent 4-Jun-2068 0.2 0.2
$ 3,751.4 $ 4,035.1 Less debt issuance costs (15.5) (15.2) 3,735.9 4,019.9 Less current portion (372.9) (287.5)
$ 3,363.0 $ 3,732.4
(a) Borrowings on the facility can be by way of prime loans, U.S. base-rate loans, LIBOR loans, bankers' acceptances or letters of credit. Borrowings on the facility
have fees and interest at rates relevant to the nature of the draw made.
(b) The notes carried a floating rate coupon of three months LIBOR plus 0.72 percent.
(c) The notes carry a floating rate coupon of three months LIBOR plus 0.85 percent.
(d) Collateral for the US$ MTNs is certain SEMCO assets.
(e) Collateral for the CINGSA Senior secured loan is certain CINGSA assets. Alaska Storage Holding Company, LLC, a subsidiary in which AltaGas has a
controlling interest, is the non-recourse guarantor of this loan.
(f) Collateral for the Secured Debentures consists of a specific first mortgage on substantially all of PNG's property, plant and equipment, and gas purchase and
gas sales contracts, and a first floating charge on other property, assets and undertakings.
(g) The loan is non-interest bearing and, if certain prescribed revenue targets are achieved, interest will immediately begin to accumulate on a prospective basis at
a rate of 6 percent per annum. In July 2011, Heritage Gas elected to repay the loan in five equal installments beginning July 31, 2012. Heritage Gas may also
elect to fully repay the loan at any time with no penalty.

AltaGas Ltd. – Q2 2016 - 52
9. ACCUMULATED OTHER COMPREHENSIVE INCOME
($ millions) Available-
for-saleCash flow
hedges
Definedbenefit
pension and PRB
plansHedge net
investments
Translationforeign
operationsEquity
Investee Total
Opening balance, January 1, 2016 $ (2.4) $ — $ (9.6) $ (169.6) $ 610.5 $ 4.6 $ 433.5 OCI before reclassification 18.6 — — 58.2 (170.4) (1.0) (94.6)Amounts reclassified from OCI — — 0.4 — — — 0.4
Current period OCI (pre-tax) 18.6 — 0.4 58.2 (170.4) (1.0) (94.2)
Income tax on amounts retained in AOCI (2.5) — — (14.0) — — (16.5)
Income tax on amounts reclassified to earnings — — (0.1) — — — (0.1)
Net current period OCI 16.1 — 0.3 44.2 (170.4) (1.0) (110.8)
Ending balance, June 30, 2016 $ 13.7 $ — $ (9.3) $ (125.4) $ 440.1 $ 3.6 $ 322.7 Opening balance, January 1, 2015 $ (12.0) $ 13.3 $ (9.6) $ (70.9) $ 242.3 $ — $ 163.1
OCI before reclassification (4.9) (0.3) — (31.8) 134.6 4.8 102.4 Amounts reclassified from OCI — (17.5) 0.8 — — — (16.7)
Current period OCI (pre-tax) (4.9) (17.8) 0.8 (31.8) 134.6 4.8 85.7
Income tax on amounts retained in AOCI (0.1) 0.1 — 2.1 — — 2.1
Income tax on amounts reclassified to earnings — 4.4 (0.2) — — — 4.2
Net current period OCI (5.0) (13.3) 0.6 (29.7) 134.6 4.8 92.0
Ending balance, June 30, 2015 $ (17.0) $ — $ (9.0) $ (100.6) $ 376.9 $ 4.8 $ 255.1
Reclassification From Accumulated Other Comprehensi ve Income
Three Months Ended Six Months EndedAOCI components reclassified Income statement line item June 30, 2016 June 30, 2016Defined benefit pension plans Operating and administrative
expense $ 0.3 $ 0.4
Deferred income taxes Income tax expenses – deferred (0.1) (0.1) $ 0.2 $ 0.3
Three Months Ended Six Months EndedAOCI components reclassified Income Statement line item June 30, 2015 June 30, 2015Cash flow hedges - commodity contracts
Commodity contracts - NGL (ineffective hedge) Service revenue $ (3.3) $ (7.2)
Commodity contracts - NGL (discontinuation of hedge accounting)
Unrealized gains on risk management contracts (6.2) (10.3)
Defined benefit pension plans Operating and administrative expense
— 0.8 Total before income taxes (9.5) (16.7)Deferred income taxes Income tax expenses – deferred 2.4 4.2 $ (7.1) $ (12.5)

AltaGas Ltd. – Q2 2016 - 53
10. FINANCIAL INSTRUMENTS AND FINANCIAL RISK MANAGE MENT
The Corporation’s financial instruments consist of cash and cash equivalents, accounts receivable, risk management contracts,
certain long-term investments and other assets, accounts payable and accrued liabilities, dividends payable, short-term and
long-term debt and certain current and long-term liabilities.
Fair Value Hierarchy
AltaGas categorizes its financial assets and financial liabilities into one of three levels based on fair value measurements and
inputs used to determine the fair value.
Level 1 - fair values are based on unadjusted quoted prices in active markets for identical assets or liabilities. Fair values are
based on direct observations of transactions involving the same assets or liabilities and no assumptions are used. Included in
this category are publicly traded shares valued at the closing price as at the balance sheet date.
Level 2 - fair values are determined based on valuation models and techniques where inputs other than quoted prices included
within level 1 are observable for the asset or liability either directly or indirectly. AltaGas uses over-the-counter derivative
instruments to manage fluctuations in commodity prices, and foreign exchange rates. AltaGas estimates forward prices based
on published sources adjusted for factors specific to the asset or liability, including basis and location differentials, discount rates,
and currency exchange. The forward curves used to mark-to-market these derivative instruments are vetted against public
sources.
Level 3 - fair values are based on inputs for the asset or liability that are not based on observable market data. AltaGas uses
valuation techniques when observable market data is not available.
The following methods and assumptions were used to estimate the fair value of each significant class of financial instruments:
Cash and cash equivalents, Accounts receivable, Accounts payable, Short-term debt and Dividends payable - the carrying
amounts approximate fair value because of the short maturity of these instruments.
Current portion of long-term debt, Long-term debt and Other long-term liabilities - the fair value of these liabilities has been
estimated based on discounted future interest and principal payments using the current market interest rates of instruments with
similar terms.
Risk management assets and liabilities - the fair values of power, natural gas and NGL derivative contracts were calculated using
discounted cash flow analysis based upon forward prices from published sources for the relevant period. The fair value of foreign
exchange derivative contracts was calculated using quoted market rates.

AltaGas Ltd. – Q2 2016 - 54
June 30, 2016
Carrying Amount Level 1 Level 2 Level 3
TotalFair Value
Financial assets Cash and cash equivalents $ 77.4 $ 77.4 $ — $ — $ 77.4 Risk management assets - current 44.5 — 44.5 — 44.5 Risk management assets - non-current 23.1 — 23.1 — 23.1 Long-term investments and other assets (a) 67.9 42.2 25.7 — 67.9 $ 212.9 $ 119.6 $ 93.3 $ — $ 212.9
Financial liabilities Risk management liabilities - current $ 30.3 $ — $ 30.3 $ — $ 30.3 Risk management liabilities - non-current 14.0 — 14.0 — 14.0 Current portion of long-term debt 372.9 — 376.4 — 376.4 Long-term debt 3,363.0 — 3,471.2 — 3,471.2 Other current liabilities (b) 10.9 — 10.9 — 10.9 Other long-term liabilities (b) 154.7 — 152.5 — 152.5 $ 3,945.8 $ — $ 4,055.3 $ — $ 4,055.3
(a) Excludes non-financial assets.
(b) Excludes non-financial liabilities.
December 31, 2015
Carrying Amount Level 1 Level 2 Level 3
TotalFair Value
Financial assets Cash and cash equivalents $ 293.4 $ 293.4 $ — $ — $ 293.4 Risk management assets - current 50.4 — 50.4 — 50.4 Risk management assets - non-current 23.5 — 23.5 — 23.5 Long-term investments and other assets (a) 24.0 24.0 — — 24.0 $ 391.3 $ 317.4 $ 73.9 $ — $ 391.3
Financial liabilities Risk management liabilities - current $ 33.5 $ — $ 33.5 $ — $ 33.5 Risk management liabilities - non-current 15.7 — 15.7 — 15.7 Current portion of long-term debt 287.5 — 286.2 — 286.2 Long-term debt 3,732.4 — 3,787.5 — 3,787.5 Other current liabilities (b) 11.0 — 11.0 — 11.0 Other long-term liabilities (b) 151.2 — 144.9 — 144.9 $ 4,231.3 $ — $ 4,278.8 $ — $ 4,278.8
(a) Excludes non-financial assets.
(b) Excludes non-financial liabilities.

AltaGas Ltd. – Q2 2016 - 55
Summary of Unrealized Gains (Losses) on Risk Manage ment Contracts Recognized in Net Income
Three Months Ended
June 30Six Months Ended
June 30 2016 2015 2016 2015Natural gas $ 0.5 $ 1.5 $ (0.4) $ 3.0 Storage optimization (1.3) — (3.7) (0.9)NGL frac spread (2.5) 4.2 (2.5) 7.6 Power (9.1) (27.8) 3.0 (18.5)Heat rate (0.1) (0.7) (0.1) (0.9)Foreign exchange 1.0 0.2 0.9 0.4 Embedded derivative — — 0.2 0.1 $ (11.5) $ (22.6) $ (2.6) $ (9.2)
Offsetting of Derivative Assets and Derivative Liab ilities
Certain AltaGas risk management contracts are subject to master netting arrangements that create a legally enforceable right to
offset by counterparty the related financial assets and financial liabilities.
June 30, 2016
Risk management assets (a)
Gross amounts of recognized
assets/liabilities
Gross amountsoffset in
balance sheet
Net amountspresented in
balance sheetNatural gas $ 32.3 $ (2.1) $ 30.2 Storage optimization 0.4 (0.2) 0.2 NGL frac spread 1.4 — 1.4 Power 35.7 (0.3) 35.4 Foreign exchange 2.7 (2.3) 0.4
$ 72.5 $ (4.9) $ 67.6
Risk management liabilities (b) Natural gas $ 29.4 $ (2.1) $ 27.3 Storage optimization 1.5 (0.2) 1.3 NGL frac spread 3.9 — 3.9 Power 12.1 (0.3) 11.8 Foreign exchange 2.3 (2.3) —
$ 49.2 $ (4.9) $ 44.3 (a) Net amount of risk management assets on the Balance Sheet is comprised of risk management assets (current) balance of $44.5 million and risk management
assets (non-current) balance of $23.1 million.
(b) Net amount of risk management liabilities on the Balance Sheet is comprised of risk management liabilities (current) balance of $30.3 million and risk
management liabilities (non-current) balance of $14.0 million.

AltaGas Ltd. – Q2 2016 - 56
December 31, 2015
Risk management assets (a)
Gross amounts of recognized
assets/liabilities
Gross amounts offset in
balance sheet
Net amountspresented in
balance sheetNatural gas $ 40.1 $ (1.9) $ 38.2 Storage optimization 3.0 (0.5) 2.5 Power 34.0 (0.9) 33.1 Heat rate 0.1 — 0.1 Foreign exchange 2.2 (2.2) — $ 79.4 $ (5.5) $ 73.9
Risk management liabilities (b) Natural gas $ 37.0 $ (1.9) $ 35.1 Storage optimization 0.5 (0.5) —Power 14.5 (0.9) 13.6 Foreign exchange 2.7 (2.2) 0.5 $ 54.7 $ (5.5) $ 49.2 (a) Net amount of risk management assets on the Balance Sheet is comprised of risk management assets (current) balance of $50.4 million and risk management
assets (non-current) balance of $23.5 million.
(b) Net amount of risk management liabilities on the Balance Sheet is comprised of risk management liabilities (current) balance of $33.5 million and risk
management liabilities (non-current) balance of $15.7 million.
11. SHAREHOLDERS’ EQUITY
Authorization
AltaGas is authorized to issue an unlimited number of voting common shares. AltaGas is also authorized to issue preferred
shares not to exceed 50 percent of the voting rights attached to the issued and outstanding common shares.
On June 6, 2016, AltaGas closed a public offering of 14,685,000 Common Shares, on a bought deal basis, at an issue price of
$30 per Common Share, for total gross proceeds of approximately $440 million.
Dividend Reinvestment Plan (DRIP)
Effective May 17, 2016, AltaGas replaced in its entirety, its existing plan with the Premium DividendTM, Dividend Reinvestment
and Optional Cash Purchase Plan (the Plan). The Plan consists of three components: a Premium Dividend™ component, a
Dividend Reinvestment component and an Optional Cash Payment component.
The Plan provides eligible holders of common shares with the opportunity to, at their election, either: (1) to reinvest the cash
dividends paid by AltaGas on their common shares towards the purchase of new common shares at a 3 percent discount to the
average market price (as defined below) of the common shares on the applicable dividend payment date (the Dividend
Reinvestment component of the Plan); or (2) to reinvest the cash dividends paid by AltaGas on their common shares towards the
purchase of new common shares at a 3 percent discount to the average market price (as defined below) on the applicable
dividend payment date and have these additional common shares of AltaGas exchanged for a cash payment equal to 101
percent of the reinvested amount (the Premium Dividend™ component of the Plan).
In addition, the Plan provides shareholders who are enrolled in the Dividend Reinvestment component of the Plan with the
opportunity to purchase new common shares at the average market price (with no discount) on the applicable dividend payment
date (the Optional Cash Payment component of the Plan).
Each of the components of the Plan is subject to prorating and other limitations on availability of new common shares in certain
events. The "average market price", in respect of a particular dividend payment date, refers to the arithmetic average (calculated
to four decimal places) of the daily volume weighted average trading prices of common shares on the Toronto Stock Exchange
TM Denotes trademark of Canaccord Genuity Corp.

AltaGas Ltd. – Q2 2016 - 57
for the trading days on which at least one board lot of common shares is traded during the 10 business days immediately
preceding the applicable dividend payment date. Such trading prices will be appropriately adjusted for certain capital changes
(including common share subdivisions, common share consolidations, certain rights offerings and certain dividends).
Shareholders resident outside of Canada are not entitled to participate in the Plan.
Common Shares Issued and Outstanding Number of
shares AmountJanuary 1, 2015 133,941,749 $ 2,759.9 Shares issued on public offering 8,760,000 287.9 Shares issued for cash on exercise of options 834,268 20.8 Deferred taxes on share issuance cost — 3.3 Shares issued under DRIP 2,745,230 96.2 December 31, 2015 146,281,247 3,168.1 Shares issued on public offering 14,685,000 422.6 Shares issued for cash on exercise of options 109,375 2.8 Deferred taxes on share issuance costs — 0.1 Shares issued under DRIP 2,081,024 61.5
Issued and outstanding at June 30, 2016 163,156,646 $ 3,655.1
Preferred Shares
Preferred Shares Series A Issued and Outstanding Number of
shares Amount January 1, 2015 8,000,000 $ 195.9 Shares converted to Series B (2,488,780) (60.9) December 31, 2015 5,511,220 135.0
Issued and outstanding at June 30, 2016 5,511,220 $ 135.0
Preferred Shares Series B Issued and Outstanding Number of
shares Amount January 1, 2015 — $ —Shares issued on conversion from Series A 2,488,780 60.9 December 31, 2015 2,488,780 60.9 Issued and outstanding at June 30, 2016 2,488,780 $ 60.9
Preferred Shares Series C Issued and Outstanding Number of
shares Amount January 1, 2015 8,000,000 $ 200.6 December 31, 2015 8,000,000 200.6 Issued and outstanding at June 30, 2016 8,000,000 $ 200.6
Preferred Shares Series E Issued and Outstanding Number of
shares Amount January 1, 2015 8,000,000 $ 195.8 December 31, 2015 8,000,000 195.8 Issued and outstanding at June 30, 2016 8,000,000 $ 195.8
Preferred Shares Series G Issued and Outstanding Number of
shares Amount January 1, 2015 8,000,000 $ 196.1 December 31, 2015 8,000,000 196.1 Issued and outstanding at June 30, 2016 8,000,000 $ 196.1

AltaGas Ltd. – Q2 2016 - 58
Preferred Shares Series I Issued and Outstanding Number of
shares Amount January 1, 2015 — $ —Shares issued 8,000,000 200.0 Share issuance costs, net of taxes — (3.3)December 31, 2015 8,000,000 196.7 Issued and outstanding at June 30, 2016 8,000,000 $ 196.7
Share Option Plan
AltaGas has an employee share option plan under which employees and directors are eligible to receive grants. As at June 30,
2016, 11,904,029 shares were reserved for issuance under the plan. As at June 30, 2016, options granted under the plan have
a term between six and ten years until expiry and vest no longer than over a four-year period.
As at June 30, 2016, unexpensed fair value of share option compensation cost associated with future periods was $1.7 million
(December 31, 2015 - $2.7 million).
The following table summarizes information about the Corporation’s share options:
As at June 30 2016 December 31, 2015 Options outstanding Options outstanding
Number of
options Exercise
price (a)Number of
optionsExercise
price(a)
Share options outstanding, beginning of period 4,559,261 $ 32.02 5,123,655 $ 30.28 Granted 61,500 30.75 470,000 36.94 Exercised (109,375) 23.51 (834,268) 22.93 Expired (46,875) 33.81 (19,125) 41.67 Forfeited (52,875) 37.29 (181,001) 36.88
Share options outstanding, end of period 4,411,636 $ 32.13 4,559,261 $ 32.02
Share options exercisable, end of period 3,062,134 $ 29.16 3,009,946 $ 28.71 (a) Weighted average.
As at June 30, 2016, the aggregate intrinsic value of the total options exercisable was $12.4 million (December 31, 2015 - $12.0
million), the total intrinsic value of options outstanding was $12.5 million (December 31, 2015 - $12.2 million) and the total
intrinsic value of options exercised was $0.9 million (December 31, 2015 - $12.0 million).
The following table summarizes the employee share option plan as at June 30, 2016:
Options outstanding Options exercisable
Weighted average Number Weighted average remaining Number Weighted average
outstanding exercise price contractual life exercisable exercise price$14.24 to $18.00 204,500 $ 15.22 2.79 204,500 $ 15.22 $18.01 to $25.08 621,600 21.40 3.86 621,600 21.40 $25.09 to $50.89 3,585,536 34.95 4.96 2,236,034 32.59 4,411,636 $ 32.13 4.71 3,062,134 $ 29.16
Medium Term Incentive Plan (MTIP)
AltaGas' MTIP for employees and executive officers includes two types of awards: restricted units (RUs) and performance units
(PUs). Both RUs and PUs have vesting periods between 36 to 44 months from the grant date. Both RUs and PUs are valued
based on the dividends declared during the vesting period and the weighted average share price of AltaGas' common shares
multiplied by the units outstanding at the end of the vesting period. Upon vesting, the RUs and PUs are paid in cash or at the

AltaGas Ltd. – Q2 2016 - 59
election of AltaGas, its equivalent in common shares purchased from the market. The PUs are also subject to a performance
multiplier ranging from 0 to 2 dependent on the Corporation's performance relative to performance targets agreed between the
Corporation and the employees.
Performance and Restricted Units June 30, 2016 December 31, 2015(number of units) Balance, beginning of period 409,037 282,817 Granted 17,488 196,770 Vested and paid out (54,773) (71,883)Forfeited (10,623) (7,133)Units in lieu of dividends 13,022 8,466
Outstanding, end of period 374,151 409,037
For the three and six months ended June 30, 2016, the compensation expense recorded for the MTIP was $1.9 million and $3.3
million, respectively (2015 - $0.8 million and $2.2 million, respectively). As at June 30, 2016, the unrecognized compensation
expense relating to the remaining vesting period was $11.7 million (December 31, 2015 - $12.6 million) and is expected to be
recognized over the vesting period.
12. NET INCOME (LOSS) PER COMMON SHARE
The following table summarizes the computation of net income (loss) per common share:
Three Months Ended
June 30Six Months Ended
June 30 2016 2015 2016 2015 Numerator:
Net income (loss) applicable to controlling interests $ 27.9 $ (11.9) $ 95.2 $ 64.4 Less: Preferred share dividends (12.0) (10.1) (24.0) (20.2) Net income (loss) per common share $ 15.9 $ (22.0) $ 71.2 $ 44.2
Denominator: (millions)
Weighted average number of common shares outstanding 151.6 135.0 149.2 134.6
Dilutive equity instruments(a) 0.4 — 0.4 1.3
Weighted average number of common shares outstanding - diluted 152.0 135.0 149.6 135.9 Basic net income (loss) per common share $ 0.10 $ (0.16) $ 0.48 $ 0.33
Diluted net income (loss) per common share $ 0.10 $ (0.16) $ 0.48 $ 0.33 (a) Includes all options that have a strike price lower than the market share price of AltaGas' common shares as at June 30, 2016 and 2015.
For the three and six months ended June 30, 2016, 2.3 million of share options for both periods, (2015 – 4.8 million and 0.8
million, respectively) were excluded from the diluted net income (loss) per share calculation as their effects were anti-dilutive.
13. SUNDANCE B POWER PURCHASE ARRANGEMENTS (PPAs)
In the first quarter of 2016, ASTC Power Partnership (ASTC) exercised its right to terminate the Sundance B PPAs effective
March 8, 2016 pursuant to the change in law provisions of the Sundance B PPAs as a result of recent changes in law regarding
the Alberta Specified Gas Emitters Regulation. Upon the termination of the Sundance B PPAs, AltaGas recognized a pre-tax
provision of $4.0 million in the first quarter of 2016 on its investment in ASTC to settle the working capital deficiency.
Under the Balancing Pool Regulation, the Balancing Pool is required to conduct an investigation into the termination and this
process is ongoing. If the Balancing Pool disputes the termination claim, AltaGas may be required to refund the Balancing Pool
for its share of the net PPA costs incurred from March 8, 2016 to when the matter is resolved. As at June 30, 2016, no accrual
has been recognized but AltaGas estimates that the possible range of its share of the net PPA costs is between $nil and $14.8
million from March 8 to June 30, 2016.

AltaGas Ltd. – Q2 2016 - 60
14. COMMITMENTS AND CONTINGENCIES
Commitments
AltaGas has long-term natural gas purchase arrangements, service agreements, power purchase agreements, and operating
leases for office space, office equipment and automobile equipment, all of which are transacted at market prices and in the
normal course of business.
AltaGas enters into contracts to purchase natural gas and natural gas transportation and storage services from various suppliers
for its utilities. These contracts, which have expiration dates that range from 2016 to 2021, are used to ensure that there is an
adequate supply of natural gas to meet the needs of customers and to minimize exposure to market price fluctuations.
In 2014, AltaGas' Blythe facility entered into a Long-Term Service Agreement with Siemens to complete various upgrade and
maintenance services on the Combustion Turbines at the Blythe facility over 116,000 EOH/CT, or 20 years, whichever comes
first. As at June 30, 2016, approximately $213.3 million is expected to be paid over the next 18 years, of which $55.8 million is
expected to be paid over the next five years.
In 2009, AltaGas entered into a 20-year storage contract at the Dawn Hub in southwest Ontario. AltaGas is obligated to pay
approximately $3.5 million per annum over the term of the contract for storage services.
In 2007, AltaGas entered into a service and maintenance agreement with Enercon GmbH for the wind turbines for Bear
Mountain. AltaGas has an obligation to pay a minimum of $10.9 million over the next 6 years, of which $9.1 million is payable in
the next five years.
Guarantees
On October 2014, Heritage Gas Limited, a wholly-owned subsidiary of AltaGas, entered into a throughput contract with the third
party owners of the transportation facility for the use of their pipelines in the U.S. and Canada. The contract will commence at
completion of the construction of the pipelines and it will expire 15 years thereafter. AltaGas has two guarantees outstanding that
total US $91.7 million to stand by all payment obligations under the transportation agreement.
Contingencies
AltaGas is participating in a proceeding underway before the Alberta Utilities Commission (AUC) regarding factors that form the
basis for certain transmission charges paid by Alberta generators. On January 20, 2015, the AUC released a decision
concerning the complaints regarding the ISO Transmission Loss Factor Rule and Loss Factor Methodology used for the power
distribution in Alberta. The AUC will proceed to determine the relief and remedies to be granted in accordance with its findings
and conclusions regarding its authority and jurisdiction made in its decision. AltaGas is one of the respondents to the complaint
and it has assessed that it may incur additional payments for transmission charges, but the timing and amount, or range of
amounts, required to settle the claim cannot be estimated and, accordingly, no accrual of the loss contingency was recognized
as at June 30, 2016.
15. PENSION PLANS AND RETIREE BENEFITS
The costs of the defined benefit and post-retirement benefit plans are based on management's estimate of the future rate of
return on the fair value of pension plan assets, salary escalations, mortality rates and other factors affecting the payment of future
benefits.

AltaGas Ltd. – Q2 2016 - 61
The net pension expense by plan for the period was as follows:
Three Months Ended June 30, 2016 Canada United States Total Post- Post- Post- Defined retirement Defined retirement Defined retirement Benefit Benefits Benefit Benefits Benefit BenefitsCurrent service cost $ 1.7 $ 0.2 $ 1.9 $ 0.5 $ 3.6 $ 0.7 Interest cost 1.4 0.2 3.1 1.0 4.5 1.2 Expected return on plan assets (1.3) (0.1) (3.9) (1.2) (5.2) (1.3)Amortization of net actuarial loss 0.2 — — — 0.2 — Amortization of regulatory asset 0.3 — 1.6 0.2 1.9 0.2
Net benefit cost recognized $ 2.3 $ 0.3 $ 2.7 $ 0.5 $ 5.0 $ 0.8
Six Months Ended June 30, 2016 Canada United States Total Post- Post- Post- Defined retirement Defined retirement Defined retirement Benefit Benefits Benefit Benefits Benefit BenefitsCurrent service cost $ 3.5 $ 0.3 $ 3.8 $ 1.0 $ 7.3 $ 1.3 Interest cost 2.8 0.3 6.1 2.0 8.9 2.3 Expected return on plan assets (2.7) (0.1) (7.8) (2.4) (10.5) (2.5)Cost / income special events — — 0.1 — 0.1 —Amortization of past service cost 0.1 — — — 0.1 —Amortization of net actuarial loss 0.3 — — — 0.3 —Amortization of regulatory asset 0.6 0.1 3.3 0.4 3.9 0.5 Net benefit cost recognized $ 4.6 $ 0.6 $ 5.5 $ 1.0 $ 10.1 $ 1.6
Three Months Ended June 30, 2015 Canada United States Total Post- Post- Post- Defined retirement Defined retirement Defined retirement Benefit Benefits Benefit Benefits Benefit BenefitsCurrent service cost $ 1.7 $ 0.2 $ 1.9 $ 0.5 $ 3.6 $ 0.7 Interest cost 1.3 0.1 2.5 0.8 3.8 0.9 Expected return on plan assets (1.3) — (3.5) (1.1) (4.8) (1.1)Amortization of net actuarial loss 0.5 — — — 0.5 —Amortization of regulatory asset 0.4 — 1.0 0.2 1.4 0.2 Net benefit cost recognized $ 2.6 $ 0.3 $ 1.9 $ 0.4 $ 4.5 $ 0.7
Six Months Ended June 30, 2015 Canada United States Total Post- Post- Post- Defined retirement Defined retirement Defined retirement Benefit Benefits Benefit Benefits Benefit BenefitsCurrent service cost $ 3.5 $ 0.3 $ 3.7 $ 1.0 $ 7.2 $ 1.3 Interest cost 2.6 0.3 5.1 1.7 7.7 2.0 Expected return on plan assets (2.6) (0.1) (7.1) (2.2) (9.7) (2.3)Amortization of net actuarial loss 1.0 — — — 1.0 —Amortization of regulatory asset 0.7 — 2.1 0.3 2.8 0.3 Net benefit cost recognized $ 5.2 $ 0.5 $ 3.8 $ 0.8 $ 9.0 $ 1.3

AltaGas Ltd. – Q2 2016 - 62
16. INCOME TAX EXPENSE
The effective income tax rates for the three and six months ended June 30, 2016 were 11.4 percent and 8.9 percent, respectively
(2015 – over 100 percent and 37.1 percent, respectively). The changes in the effective tax rates were mainly due to the increase
in the Alberta corporate income tax rate from 10 percent to 12 percent effective July 1, 2015, which resulted in an additional
$14.0 million of deferred income tax expense being recorded for the three and six months ended June 30, 2015. The effective
income tax rate for the six months ended June 30, 2016 was further impacted by the tax recovery related to the sale of assets to
Tidewater as discussed under Note 4 as well as a tax recovery of $2.6 million related to a previous impairment charge becoming
tax deductible in the first quarter of 2016.
17. RELATED PARTY TRANSACTIONS
AltaGas has provided a $100.0 million interest bearing secured loan facility to Petrogas of which $50.0 million is committed. The
facility is available for Petrogas to draw on from time to time for general corporate purposes. The facility is subject to annual
renewal and has a maturity date of June 27, 2021. As at June 30, 2016, Petrogas had drawn $25.0 million under the facility,
which has been recorded under the line item “long-term investments and other assets” on the consolidated balance sheet. In
addition, during the second quarter of 2016, AltaGas directly acquired $150.0 million of cumulative redeemable convertible
preferred shares of Petrogas (see Note 7).
18. SUPPLEMENTAL CASH FLOW INFORMATION
The following table details the changes in operating assets and liabilities from operating activities:
Three Months Ended
June 30Six Months Ended
June 30 2016 2015 2016 2015 Source (use) of cash:
Accounts receivable $ 58.6 $ 146.7 $ 113.8 $ 149.2 Inventory (37.9) (36.4) (1.9) 50.9 Other current assets 8.1 4.4 8.1 14.3 Regulatory assets (current) 9.4 4.6 3.1 8.9 Accounts payable and accrued liabilities (22.5) (34.5) (73.9) (57.0) Customer deposits 1.1 1.5 (10.0) (13.0) Regulatory liabilities (current) 4.5 0.5 3.8 8.1 Other current liabilities 0.5 (1.2) (2.3) (11.7) Other operating assets and liabilities (22.1) (6.0) (32.3) (7.1)
Changes in operating assets and liabilities $ (0.3) $ 79.6 $ 8.4 $ 142.6 The following cash payments have been included in the determination of earnings:
Three Months EndedJune 30
Six Months EndedJune 30
2016 2015 2016 2015Interest paid (net of capitalized interest) $ 22.2 $ 21.5 $ 70.1 $ 58.9 Income taxes paid $ 10.6 $ 3.4 $ 23.0 $ 12.2 19.
19. SEASONALITY
The utility business is highly seasonal with the majority of natural gas deliveries occurring during the winter heating season. Gas
sales increase during the winter resulting in stronger first and fourth quarter results and weaker second and third quarters.
The power generation at the run-of-river hydro-facilities Forrest Kerr, Volcano Creek, and McLymont Creek occurs substantially
from mid second quarter through mid fourth quarter, resulting in weaker results in the first and fourth quarters.

AltaGas Ltd. – Q2 2016 - 63
20. SEGMENTED INFORMATION
AltaGas owns and operates a portfolio of assets and services used to move energy from the source to the end-user. The
following describes the Corporation’s four reporting segments:
Gas – NGL processing and extraction plants;
– transmission pipelines to transport natural gas and NGL;
– natural gas gathering lines and field processing facilities;
– purchase and sale of natural gas, including to commercial and industrial users;
– natural gas storage facilities;
– liquefied petroleum gas (LPG) development projects; and
– equity investment in a North American entity engaged in the marketing, storage and
distribution of NGL, drilling fluids, crude oil and condensate diluents.
Power – natural gas-fired, wind, biomass and hydro power generation assets, whereby outputs are
generally sold under long term power purchase agreements, both operational and under
development; and
– sale of power to commercial and industrial users in Alberta.
Utilities – rate-regulated natural gas distribution assets in Michigan, Alaska, Alberta, British
Columbia and Nova Scotia; and
– rate-regulated natural gas storage in Michigan and Alaska.
Corporate – the cost of providing corporate services, financing and general corporate overhead,
investments in public and private entities, corporate assets, financing other segments and
the effects of changes in the fair value of risk management contracts.

AltaGas Ltd. – Q2 2016 - 64
The following tables show the composition by segment:
Three Months Ended June 30, 2016
Gas Power Utilities CorporateIntersegment Elimination (a) Total
Revenue $ 146.6 $ 140.5 $ 186.2 $ 5.1 $ (41.3) $ 437.1 Unrealized losses on risk management —
— —
— —
— (11.5)
— —
— (11.5)
Cost of sales (75.2) —
(40.8) —
(83.0) —
— —
34.8 —
(164.2)Operating and administrative (39.8)
— (25.6)
— (59.0)
— (15.4)
— 6.6
— (133.2)
Accretion expenses (1.0) —
(1.8) —
— —
— —
— —
(2.8)Depreciation and amortization (15.1)
— (26.6)
— (20.6)
— (4.0)
— —
— (66.3)
Income from equity investments 3.9 —
1.1 —
0.7 —
— —
— —
5.7 Other income (loss) —
— —
— 0.8
— 0.8
— (0.1)
— 1.5
Foreign exchange gain 0.1 —
— —
— —
4.0 —
— —
4.1 Interest expense —
— —
— —
— (36.3)
— —
— (36.3)
Income (loss) before income taxes $ 19.5 $ 46.8 $ 25.1 $ (57.3) $ — $ 34.1 Net additions (reductions) to:
Property, plant and equipment(b) $ 85.7 $ 10.0 $ 28.4 $ 1.7 $ — $ 125.8
Intangible assets $ 1.0 $ 2.0 $ 0.7 $ 1.8 $ — $ 5.5
Six Months Ended June 30, 2016
Gas Power Utilities CorporateIntersegment Elimination (a) Total
Revenue $ 385.5 $ 263.4 $ 570.1 $ 6.9 $ (187.2) $ 1,038.7 Unrealized losses on risk management — — — (2.6) — (2.6)Cost of sales (239.0) (88.7) (302.5) — 177.3 (452.9)Operating and administrative (81.7) (51.7) (116.3) (25.3) 10.2 (264.8)Accretion expenses (2.0) (3.5) — — — (5.5)Depreciation and amortization (30.0) (53.9) (43.1) (7.8) — (134.8)Income (loss) from equity investments 4.6 (10.9) 1.3 — — (5.0)Other income (loss) 4.0 0.1 1.0 1.1 (0.3) 5.9 Foreign exchange gain — — — 3.5 — 3.5 Interest expense — —
— —
— (72.4)
— — (72.4)
Income (loss) before income taxes $ 41.4 $ 54.8 $ 110.5 $ (96.6) $ — $ 110.1 Net additions (reductions) to:
Property, plant and equipment(b) $ 231.3 $ 21.3 $ 44.5 $ 2.5 $ — $ 299.6
Intangible assets $ 1.1 $ 2.0 $ 0.9 $ 2.1 $ — $ 6.1 (a) Intersegment transactions are recorded at market value.
(b) Net additions to property, plant, and equipment, and intangible assets may not agree to changes reflected in Consolidated Balance Sheets due to classification
of business acquisition and foreign exchange changes on U.S. assets.

AltaGas Ltd. – Q2 2016 - 65
Three Months Ended June 30, 2015
Gas Power Utilities Corporate Intersegment Elimination(a) Total
Revenue $ 177.4 $ 104.1 $ 179.9 $ — $ (22.7) $ 438.7 Unrealized losses on risk management — — — (22.6) — (22.6)Cost of sales (97.3) (56.8) (86.8) — 21.6 (219.3)Operating and administrative (43.7) (18.1) (53.8) (6.2) 1.1 (120.7)Accretion expenses (0.9) (1.8) — — — (2.7)Depreciation and amortization (15.3) (14.5) (18.3) (1.7) — (49.8)Income from equity investments 0.3 4.9 0.1 — — 5.3 Other income — — 1.1 1.3 — 2.4 Foreign exchange loss — — — (0.8) — (0.8)Interest expense — — — (30.4) — (30.4)Income (loss) before income taxes $ 20.5 $ 17.8 $ 22.2 $ (60.4) $ — $ 0.1 Net additions (reductions) to:
Property, plant and equipment(b) $ 49.5 $ 44.3 $ 47.6 $ 1.4 $ — $ 142.8 Intangible assets $ 1.0 $ 0.1 $ 0.7 $ 4.2 $ — $ 6.0
Six Months Ended June 30, 2015
Gas Power Utilities Corporate Intersegment Elimination(a) Total
Revenue $ 462.1 $ 214.3 $ 610.8 $ — $ (117.4) $ 1,169.8 Unrealized losses on risk management — — — (9.2) — (9.2)Cost of sales (291.8) (117.2) (358.0) — 114.5 (652.5)Operating and administrative (86.3) (31.9) (110.4) (12.4) 2.9 (238.1)Accretion expenses (1.8) (3.6) — — — (5.4)Depreciation and amortization (30.4) (29.1) (36.8) (3.3) — (99.6)Income (loss) from equity investments (1.7) 0.4 0.9 — — (0.4)Other income — — 1.5 2.7 — 4.2 Foreign exchange gain — — — 0.4 — 0.4 Interest expense — — — (60.2) — (60.2)Income (loss) before income taxes $ 50.1 $ 32.9 $ 108.0 $ (82.0) $ — $ 109.0 Net additions (reductions) to:
Property, plant and equipment(b) $ 71.1 $ 109.3 $ 70.5 $ 1.8 $ — $ 252.7 Intangible assets $ 1.1 $ 9.3 $ 1.1 $ 10.0 $ — $ 21.5
(a) Intersegment transactions are recorded at market value.
(b) Net additions to property, plant, and equipment, and intangible assets may not agree to changes reflected in Consolidated Balance Sheets due to classification
of business acquisition and foreign exchange changes on U.S. assets.
The following table shows goodwill and total assets by segment:
Gas Power Utilities Corporate TotalAs at June 30, 2016
Goodwill $ 156.3 $ — $ 684.9 $ — $ 841.2 Segmented assets $ 2,759.5 $ 3,479.4 $ 3,317.0 $ 302.0 $ 9,857.9
As at December 31, 2015 Goodwill $ 156.3 $ — $ 721.0 $ — $ 877.3 Segmented assets $ 2,449.0 $ 3,579.9 $ 3,576.7 $ 493.9 $ 10,099.5

AltaGas Ltd. – Q2 2016 - 66
21. SUBSEQUENT EVENTS
Subsequent events have been reviewed through July 20, 2016, the date these unaudited condensed interim consolidated
financial statements were issued. There were no subsequent events requiring disclosure or adjustment to the unaudited
condensed interim consolidated financial statements.

AltaGas Ltd. – Q2 2016 - 67
Supplementary Quarterly Operating Information (unaudited)
Q2-16 Q1-16 Q4-15 Q3-15 Q2-15OPERATING HIGHLIGHTS GAS
Total inlet gas processed (Mmcf/d)(1) 1,083 1,222 1,298 1,293 1,123
Extraction volumes (Bbls/d)(1) (2) 58,065 64,408 65,465 30,241 49,288
Frac spread - realized ($/Bbl)(1) (3) 10.00 8.22 15.55 34.58 20.58
Frac spread - average spot price ($/Bbl)(1)(4) 10.62 8.22 5.06 11.11 2.51 POWER
Renewable power sold (GWh) 544 142 310 487 342 Conventional power sold (GWh) 293 698 1,264 1,210 945 Renewable capacity factor (%) 56.8 10.5 30.2 57.5 39.6 Contracted conventional availability factor (%) 92.4 97.6 99.1 99.5 91.2
UTILITIES Canadian utilities
Natural gas deliveries - end-use (PJ)(5) 4.8 12.3 10.2 3.3 5.2
Natural gas deliveries - transportation (PJ)(5) 1.5 1.8 1.9 1.6 1.5 U.S. utilities
Natural gas deliveries end use (Bcf) (5) 10.3 28.2 20.2 5.9 10.0
Natural gas deliveries transportation (Bcf) (5) 11.8 14.2 13.5 10.5 10.0
Service sites(6) 568,606 570,681 568,751 562,301 560,755
Degree day variance from normal - AUI (%)(7) (28.0) (18.5) (10.0) 3.9 (9.7)
Degree day variance from normal - Heritage Gas (%)(7) 3.6 (6.9) (8.0) (42.0) 14.7
Degree day variance from normal - SEMCO Gas (%)(8) 11.8 (8.5) (20.4) (28.4) (1.7)
Degree day variance from normal - ENSTAR (%)(8) (26.4) (21.0) (6.1) (9.6) (17.4)
(1) Average for the period.
(2) Includes Harmattan NGL processed on behalf of customers.
(3) Realized frac spread or NGL margin, expressed in dollars per barrel of NGL, is derived from sales recorded by the segment during the period for frac
exposed volumes plus the settlement value of frac hedges settled in the period less extraction premiums, divided by the total frac exposed volumes
produced during the period.
(4) Average spot frac spread or NGL margin, expressed in dollars per barrel of NGL, is indicative of the average sales price that AltaGas receives for
propane, butane and condensate less extraction premiums, divided by the respective frac exposed volumes for the period.
(5) Petajoule (PJ) is one million gigajoules (GJ). Bcf is one billion cubic feet.
(6) Service sites reflect all of the service sites of AUI, PNG, Heritage Gas and U.S. utilities, including transportation and non-regulated business lines.
(7) A degree day for AUI and Heritage Gas is the cumulative extent to which the daily mean temperature falls below 15 degrees Celsius at AUI and 18
degrees Celsius at Heritage Gas. Normal degree days are based on a 20-year rolling average. Positive variances from normal lead to increased
delivery volumes from normal expectations. Degree day variances do not materially affect the results of PNG as the BCUC has approved a rate
stabilization mechanism for its residential and small commercial customers.
(8) A degree day for U.S. utilities is a measure of coldness, determined daily as the number of degrees the average temperature during the day in question
is below 65 degrees Fahrenheit. Degree days for a particular period are determined by adding the degree days incurred during each day of the period.
Normal degree days for a particular period are the average of degree days during the prior 15 years for SEMCO Energy Gas Company and during the
prior 10 years for ENSTAR.

AltaGas Ltd. – Q2 2016 - 68
Other Information
DEFINITIONS
Bbls/d barrels per day
Bcf billion cubic feet
GJ gigajoule
GWh gigawatt-hour
Mcf thousand cubic feet
Mmcf/d million cubic feet per day
MW megawatt
MWh megawatt-hour
PJ petajoule
MMBTU million British thermal unit
ABOUT ALTAGAS
AltaGas is an energy infrastructure business with a focus on natural gas, power and regulated utilities. The Corporation creates
value by acquiring, growing and optimizing its energy infrastructure, including a focus on clean energy sources. For more
information visit: www.altagas.ca.
For further information contact:
Investment Community
1-877-691-7199